UNITED STATES
SECURITIES AND EXCHANGE COMMISSION
Washington, DC 20549
FORM N-CSR/A
CERTIFIED SHAREHOLDER REPORT OF REGISTERED
MANAGEMENT INVESTMENT COMPANIES
Investment Company Act file number
811-23029
Principal Exchange-Traded Funds
(Exact name of registrant as specified in charter)
| |
| 801 Grand Avenue, Des Moines, IA 50309 | |
| (Address of principal executive offices) | (Zip code) |
Principal Global Investors, LLC, 801 Grand Avenue, Des Moines, IA 50309 (Name and address of agent for service)
| | |
| Registrant’s telephone number, including area code: | 515-235-1719 |
| Date of fiscal year end: | June 30, 2021 | |
| Date of reporting period: | June 30, 2021 | |
EXPLANATORY NOTE
The Registrant is filing this amendment (the “Amendment”) to its Certified Shareholder Report on Form
N-CSR for the period ended June 30, 2021, originally filed with the United States Securities and Exchange Commission on August 26, 2021 (Accession Number 0001572661-21-000113) (the “Report”) to amend Item 1 (Report to Stockholders). The purpose of the amendment to Item 1 is to reflect a 2 for 1 stock split effective after the close of trading on August 30, 2021 for the Principal Active Income ETF (now known as the Principal Active High Yield ETF). The stock split has been reflected in the shares outstanding, NAV per share and other per share information on the accompanying Statements of Assets and Liabilities, Statement of Changes in Net Assets and Financial Highlights.
Other than as described above, this Amendment does not reflect events occurring after the filing of the Report or modify or update the disclosures contained therein.
ITEM 1 – REPORT TO STOCKHOLDERS

| |
| Table of Contents | |
| Economic & Financial Market Review | 1 |
| Important Fund Information | 2 |
| Principal Active Income ETF (unaudited) | 3 |
| Principal Healthcare Innovators Index ETF (unaudited) | 4 |
| Principal International Multi-Factor ETF (unaudited) | 5 |
| Principal Investment Grade Corporate Active ETF (unaudited) | 6 |
| Principal Millennials Index ETF (unaudited) | 7 |
| Principal Quality ETF (unaudited) | 8 |
| Principal Spectrum Preferred Securities Active ETF (unaudited) | 9 |
| Principal Spectrum Tax-Advantaged Dividend Active ETF (unaudited) | 10 |
| Principal Ultra-Short Active Income ETF (unaudited) | 11 |
| Principal U.S. Mega-Cap ETF (unaudited) | 12 |
| Principal U.S. Small-Cap Multi-Factor ETF (unaudited) | 13 |
| Principal Value ETF (unaudited) | 14 |
| Statements of Assets and Liabilities | 15 |
| Statements of Operations | 20 |
| Statements of Changes in Net Assets | 25 |
| Notes to Financial Statements | 40 |
| Schedules of Investments | 56 |
| Financial Highlights (Includes Performance Information) | 174 |
| Report of Independent Registered Public Accounting Firm | 189 |
| Shareholder Expense Example | 192 |
| Supplemental Information | 194 |
Not FDIC or NCUA insured
May lose value • Not a deposit • No bank or credit union guarantee Not insured by any Federal government agency
Economic & Financial Market Review
The major theme for the past twelve months is the global economic recovery from the COVID-19 related shocks. U.S. real GDP grew at an average quarter-over-quarter rate of 14.7% in the last three quarters after a 31.4% drop in 2Q 2020 and the growth rate is expected to remain strong in the coming quarters. Germany and Japan GDP also bottomed in 2Q 2020 and grew at three-quarter-average rates of 2.5% and 10.2% respectively. Except for China, emerging markets economic recovery have been generally slower than developed markets due to slow vaccination progress. Global manufacturing Purchasing Managers’ Index (PMI) improved to above 50 since July 2020 (a number above 50 means manufacturing activity is expanding and number below 50 indicates contraction), and the latest reading as of June 2021 is 57.1. 92% of the countries tracked showed PMIs higher than 50. GDP-weighted developed market PMI is 60.3, much higher than 51.6 of emerging market. The strong global recovery was helped by extraordinarily easy financial conditions. Central banks around the globe maintained low policy rates and ample liquidity throughout this crisis and the following recovery period.
Strong but desynchronized growth have created a demand-supply gap in global goods which pushed inflation higher during the last twelve months. Global inflation increased from 1.5% in June 2020 to 2.8% in May 2021. Considering low vaccination progress in a lot of export-oriented countries, supply bottlenecks could persist a little longer, adding upward pressure to the inflation. Commodity prices were initially fueled by investment growth in China and then boosted by expectations of infrastructure investments in U.S. During this period, copper recovered from 6008 to 9364 USD/MT (metric ton) and Nymex crude oil rose from 39.3 to 73.5 USD/Barrel.
As of June 2021, global earnings have almost recovered to pre-crisis levels. Compared to same time last year, MSCI All Country World Index (ACWI) trailing 12 months earnings per share (TTM EPS) grew by 27%. MSCI World ex U.S. Index experienced bigger losses in earnings (TTM EPS down -52% as of June 2020) but exhibited faster recovery with a 43% increase during the last twelve months. MSCI U.S. trailing 12 months EPS grew by 13% year-over-year (yoy), helped by strong recovery in small-cap and mid-cap companies. Technology stocks earnings were the most resilient, with only marginal decline as of June 2020 (NASDAQ TTM EPS -3% yoy) and decent growth during recovery phase (25% yoy as of June 2021). MSCI Emerging Markets (EM) trailing 12 months EPS increased by 48% compared to same time last year, boosted by strong earnings growth in China.
Global equities outperformed global fixed income over the last twelve months. In U.S. dollar (USD) terms, MSCI ACWI recorded 39% gains year-over-year while Bloomberg Barclays Global Aggregate Corporate index delivered 6% returns. Within equities, emerging markets slightly outperformed developed market by 2% and U.S. outperformed developed market ex U.S. by 8%. Within U.S., small and mid-cap outperformed large-cap and value outperformed growth. Bloomberg Barclays US treasury delivered 3% loss as U.S. 10-year treasury yield rising from 66 basis points (bps) to 147bps. U.S. Dollar Index (DXY) declined by 5% during this period, which helped the 1% rally of global government bonds. Commodity prices represented by S&P Goldman Sachs Commodity Index (GSCI) had a 57% increase over the last twelve months.
* Unless otherwise stated, data sources are Bloomberg, FactSet, and Principal Global Asset Allocation. Data as of June 30, 2021.
1
Important Fund Information
The following information applies to all funds shown in the annual report:
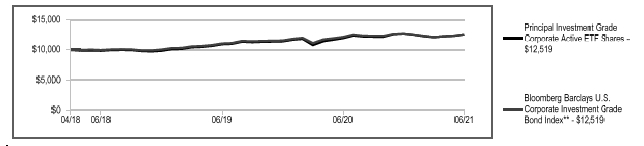
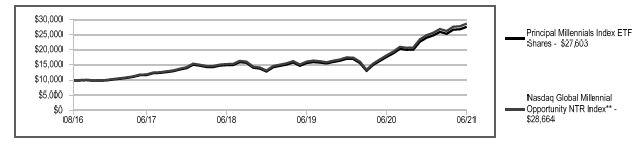
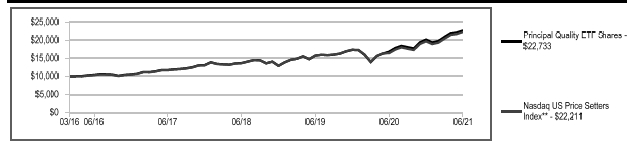
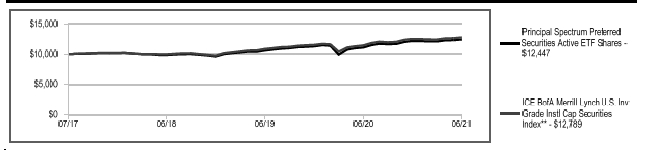
The line graph illustrates the growth of a hypothetical $10,000 investment.
Investment results shown represent historical performance and do not guarantee future results. Your investment’s returns and principal values will fluctuate with changes in interest rates and other market conditions so the value, when redeemed, may be worth more or less than original costs. Current performance may be lower or higher than the performance shown. You may get updated performance information by calling 1-800-787-1621 or online at
| www. | PrincipalETFs.com. |
| * | Performance is based on net asset value (NAV) and assumes reinvestment of all dividends and capital gains. Performance does not |
reflect the impact of federal, state, or municipal taxes. If it did, performance would be lower. Since inception returns less than one year are not annualized.
** Performance shown for the benchmark assumes reinvestment of all dividends and capital gain distributions. Indices are unmanaged, and individuals cannot invest directly in an index.
2
Principal Active Income ETF
Investment Advisor: Principal Global Investors, LLC
Value of a $10,000 Investment* July 8, 2015 - June 30, 2021

| | | | | | | |
| Average Annual Total Returns* as of June 30, 2021 | | | | | | |
| | 1-Year | | 5-Year | | Since Inception | | Inception Date |
| Principal Active Income ETF | 20.25 | % | 6.57 | % | 5.83 | % | 7/8/2015 |
What contributed to or detracted from Fund performance during the fiscal year?
The Principal Active Income ETF seeks to provide current income. The Fund is an actively managed exchange-traded fund (“ETF”) that seeks to achieve its investment objective by investing, under normal circumstances, its assets in investment grade and non-investment grade (commonly known as “junk”) fixed income securities and in equity securities. The Fund’s advisor actively and tactically allocates the fund’s assets among fixed income securities and equity securities in an effort to take advantage of changing economic conditions that the advisor believes favors one asset class over another.
The portfolio's strategic and tactical allocation to North American high dividend equities was the largest positive contributor to performance for the period, as it outperformed the high yield benchmark. In addition, within equities, the portfolio's tactical underweight to REITs aided performance for the period. The double-digit positive returns for the REITs in the portfolio underperformed the high yield bond benchmark's larger double-digit positive returns. Lastly, security selection in high yield corporate bonds positively contributed to performance for the period. In particular, security selection in the electric and REITs sectors contributed, but was partially offset by security selection in the basic industry and transportation sectors.
The portfolio's strategic allocation to commercial mortgage-backed securities (CMBS) was the largest detractor to performance for the period. Despite CMBS' underperformance versus high yield bonds, the asset class can provide positive diversification benefits. In addition, the portfolio's tactical underweight to equities versus fixed income for most of the period detracted. Equities and fixed income both posted positive returns, but equities outperformed fixed income for the period. Lastly, the portfolio's strategic allocation to Preferred Stock hindered performance for the period. The portfolio's Preferred Stocks posted positive double-digit returns but underperformed the higher double-digit return by the high yield bond benchmark.
**The benchmark performance for Principal Active Income ETF is calculated from 6/30/2015 to 6/30/2021.
3
Principal Healthcare Innovators Index ETF
Investment Advisor: Principal Global Investors, LLC
Value of a $10,000 Investment* August 19, 2016 - June 30, 2021

| | | | | |
| Average Annual Total Returns* as of June 30, 2021 | | | | |
| | 1-Year | | Since Inception | | Inception Date |
| Principal Healthcare Innovators Index ETF | 37.51 | % | 20.16 | % | 08/19/2016 |
What contributed to or detracted from Fund performance during the fiscal year?
The Principal Healthcare Innovators Index ETF seeks to provide investment results that closely correspond, before expenses, to the performance of the Nasdaq US Health Care Innovators Index (the “Index”). Under normal circumstances, the Fund invests at least 80% of its net assets, plus any borrowings for investment purposes, in equity securities of companies that compose the Index at the time of purchase. The Index uses a quantitative model designed to identify equity securities (emphasizing growth stock) in the Nasdaq US Benchmark Index (the "Parent Index") that are small and medium capitalization U.S. healthcare companies.
The Principal Healthcare Innovators Index ETF performed in line with the Nasdaq US Health Care Innovators Index. The chemicals industry outperformed within the Index. Pacific Biosciences of California, Intellia Therapeutics, and Surgery Partners outperformed within the Index while our positioning in Horizon Therapeutics, Zimmer Biomet Holdings, and Elanco Animal Health contributed to performance.
The healthcare technology industry underperformed during the period. Tricida, Assembly Biosciences, and Adverum Biotechnologies underperformed within the Index while our positioning in Exact Sciences, Apellis Pharmaceuticals, and Pacific Biosciences of California detracted from performance.
**The benchmark performance for the Principal Healthcare Innovators Index ETF is calculated from 8/31/2016 to 6/30/2021.
4
Principal International Multi-Factor ETF
Investment Advisor: Principal Global Investors, LLC
Value of a $10,000 Investment* July 23, 2019 - June 30, 2021

| | | | | |
| Average Annual Total Returns* as of June 30, 2021 | | | | | |
| | 1-Year | | Since Inception | | Inception Date |
| Principal International Multi-Factor | 35.54 | % | 15.07 | % | 7/23/2019 |
| ETF | | | | | |
What contributed to or detracted from Fund performance during the fiscal year?
The Principal International Multi-Factor ETF seeks to provide investment results that closely correspond, before expenses, to the performance of the Nasdaq Developed Select Leaders Core Index (the "Index"). Under normal circumstances, the Fund invests at least 80% of its net assets, plus any borrowings for investment purposes, in equity securities of companies that compose the Index at the time of purchase. The Index uses a quantitative model designed to identify equity securities of companies in the Nasdaq Developed Market Ex-US Ex-Korea Large Mid Cap Index (the "Parent Index") that exhibit potential for high degrees of value, quality growth and strong momentum.
The Principal International Multi-Factor ETF performed in line with the Nasdaq Developed Select Leaders Core Index. Eleven sectors within the Index posted positive returns, led by consumer discretionary and industrials. AP Moller, Pandora, and Ashtead Group outperformed within the Index while our positioning in Roche Holding, Investor, and Novartis contributed to performance.
The healthcare and utilities sectors recorded the worst returns during the period. AGL Energy, Grenke, and Micro Focus International underperformed within the Index while our positioning in Mizuho Financial Group, Fast Retailing, and International Consolidated Airlines Group detracted from performance.
**The benchmark performance for Principal International Multi-Factor ETF is calculated from 7/31/2019 to 6/30/2021.
5
Principal Investment Grade Corporate Active ETF
Investment Advisor: Principal Global Investors, LLC
Value of a $10,000 Investment* April 18, 2018 - June 30, 2021
| | | | | |
| Average Annual Total Returns* as of June 30, 2021 | | | | |
| | 1-Year | | Since Inception | | Inception Date |
| Principal Investment Grade | 4.90 | % | 7.27 | % | 4/18/2018 |
| Corporate Active ETF | | | | | |
What contributed to or detracted from Fund performance during the fiscal year?
The Principal Investment Grade Corporate Active ETF seeks to provide current income and, as a secondary objective, capital appreciation. The Fund is an actively managed exchange-traded fund (“ETF”) that seeks to achieve its investment objective by investing, under normal circumstances, at least 80% of its net assets, plus any borrowings for investment purposes, in investment grade corporate bonds and other fixed income securities at the time of purchase. “Investment grade” securities are rated BBB- or higher by S&P Global Ratings (“S&P Global”) or Baa3 or higher by Moody’s Investors Service, Inc. (“Moody’s”) or, if unrated, of comparable quality in the opinion of those selecting such investments.
Contributors included sector allocations to banking, metals and mining, REITs and wirelines. Detractors included sector allocations to consumer non-cyclicals, treasurys and utilities. An underweight position to midstream also detracted.
**The benchmark performance for the Principal Investment Grade Corporate Active ETF is calculated from 4/30/2018 to 6/30/2021.
6
Principal Millennials Index ETF
Investment Advisor: Principal Global Investors, LLC
Value of a $10,000 Investment* August 19, 2016 - June 30, 2021
| | | | | |
| Average Annual Total Returns* as of June 30, 2021 | | | | |
| | 1-Year | | Since Inception | | Inception Date |
| Principal Millennials Index ETF | 56.45 | % | 23.21 | % | 8/19/2016 |
What contributed to or detracted from Fund performance during the fiscal year?
The Principal Millennials Index ETF seeks to provide investment results that closely correspond, before expenses, to the performance of the Nasdaq Global Millennial Opportunity Index (the “Index”). Under normal circumstances, the Fund invests at least 80% of its net assets, plus any borrowings for investment purposes, in equity securities of companies that compose the Index at the time of purchase. The Index uses a quantitative model designed to identify equity securities of companies in the Nasdaq Global Index (the “Parent Index”) that are impacted by the spending and lifestyle activities of the Millennial generation, which refers to people born from 1980 to the mid-2000s.
The Principal Millennials Index ETF performed in line the Nasdaq Global Millennial Opportunity Index. All eight sectors within the Index posted positive returns, led by financials and consumer discretionary. Signet Jewelers, Roku, and Li Ning outperformed within the Index while our positioning in Apple, NVIDIA, and Spotify Technology contributed to performance.
The materials and consumer staples sectors recorded the worst returns during the period. IQIYI, Tal Education Group, and JOYY underperformed in the Index while our positioning in Alibaba, AfreecaTV, and Funko detracted from performance.
**The benchmark performance for the Principal Millennials Index ETF is calculated from 8/31/2016 to 6/30/2021.
7
Principal Quality ETF
Investment Advisor: Principal Global Investors, LLC
Value of a $10,000 Investment* March 21, 2016 - June 30, 2021
| | | | | | | |
| Average Annual Total Returns* as of June 30, 2021 | | | | | | |
| | 1-Year | | 5-Year | | Since Inception | | Inception Date |
| Principal Quality ETF | 34.83 | % | 16.85 | % | 16.83 | % | 3/21/2016 |
What contributed to or detracted from Fund performance during the fiscal year?
The Principal Quality ETF seeks to provide investment results that closely correspond, before expenses, to the performance of the Nasdaq US Price Setters Index (the "Index"). Under normal circumstances, the Fund invests at least 80% of its net assets, plus any borrowings for investment purposes, in equity securities of companies that compose the Index at the time of purchase. The Index uses a quantitative model designed to identify equity securities of mid-to large-capitalization companies in the Nasdaq US Large Mid Cap Index (the “Parent Index”) that exhibit higher quality, growth potential, and pricing power. "Pricing power" refers to the extent to which a company can raise the prices of its products without reducing the demand for them.
The Principal Quality ETF performed in line with the Nasdaq US Price Setters Index. All ten sectors in the Index posted positive returns, led by communication services and consumer discretionary. Ubiquiti, Align Technology, and Waters Corporation outperformed within the Index while our positioning in eBay, Scotts Miracle-Gro Company, and Booz Allen Hamilton Holding Corporation contributed to performance.
The utilities and consumer staples recorded the worst returns during the period. Citrix Systems, Scotts Miracle-Gro Company, and Clorox underperformed in the index while our positioning in Sherwin-Williams, Waters Corporation, and Church & Dwight detracted from performance.
**The benchmark performance for the Principal Quality ETF is calculated from 3/31/2016 to 6/30/2021.
8
Principal Spectrum Preferred Securities Active ETF
Investment Advisor: Principal Global Investors, LLC
Sub-Advisor: Spectrum Asset Management, Inc.
Value of a $10,000 Investment* July 10, 2017 - June 30, 2021
| | | | | |
| Average Annual Total Returns* as of June 30, 2021 | | | | | |
| | 1-Year | | Since Inception | | Inception Date |
| Principal Spectrum Preferred Securities Active | 11.58 | % | 5.66 | % | 7/10/2017 |
| ETF | | | | | |
What contributed to or detracted from Fund performance during the fiscal year?
The Principal Spectrum Preferred Securities Active ETF seeks to provide current income. Under normal circumstances, the Fund invests at least 80% of its net assets, plus any borrowings for investment purposes, in preferred securities at the time of purchase. Examples of preferred securities include preferred stock, certain depositary receipts, and various types of junior subordinated debt (such debt generally includes the contractual ability to defer payment of interest without accelerating an immediate default event). It concentrates its investments (invests more than 25% of its net assets) in securities in one or more industries within the financial services sector.
The top returning sectors were MLPs (19.0%), Additional Tier1 - Non-Viability Type (13.4%), and Utility Hybrids (10.3%). Over the period US Treasury rates increased (10 year yield increased by 81 bps) but fixed income tightened to more than offset long-dated risk free yield increase. The ICE BofA US Investment Grade Institutional Capital Securities (CIPS) index tightened by 104 bps.
The detracting or bottom return sectors were Cash (-2.9%) and US Treasuries (0.6%).
**The benchmark performance for Principal Spectrum Preferred Securities Active ETF is calculated from 6/30/2017 to 6/30/2021.
9
Principal Spectrum Tax-Advantaged Dividend Active ETF
Investment Advisor: Principal Global Investors, LLC
Sub-Advisor: Spectrum Asset Management, Inc.
Value of a $10,000 Investment* June 16, 2020 - June 30, 2021

| | | | | |
| Average Annual Total Returns* as of June 30, 2021 | | | | | |
| | 1-Year | | Since Inception | | Inception Date |
| Principal Spectrum Tax-Advantaged Dividend | 13.42 | % | 12.61 | % | 6/16/2020 |
| Active ETF | | | | | |
What contributed to or detracted from Fund performance during the fiscal year?
The Principal Spectrum Tax-Advantaged Dividend Active ETF seeks to provide current income. Under normal circumstances, the Fund invests at least 80% of its net assets, plus any borrowings for investment purposes, in dividend-paying securities at the time of purchase. Such securities include, without limitation, preferred securities and capital securities of U.S. and non-U.S. issuers. The Fund invests significantly in securities that, at the time of issuance, are eligible to pay dividends that qualify for favorable U.S. federal income tax treatment, such as dividends treated as “qualified dividend income” (“QDI”) or qualified dividends from real estate investment trusts (“REITS”). However, the Fund also invests in securities that are not eligible for such treatment.
The top returning sectors were $1,000 par NYSE traded Preferred Stock (21.9%), $25 par Preferred Stock (19.0%), and Additional Tier1 - Non-Viability Type (17.2%). Over the period US Treasury rates increased (10 year yield increased by 81 bps) but fixed income tightened to more than offset long-dated risk free yield increase. The ICE BofA Merrill Lynch 7% Constrained DRD Eligible Preferred Securities Index tightened by 184 bps.
The detracting or bottom return sector was Cash (-0.6%) and the next weakest sector was $1,000 par Preferred Stock (11.8%).
**The benchmark performance for Principal Spectrum Tax-Advantaged Dividend Active ETF is calculated from 6/30/2020 to 6/30/2021.
10
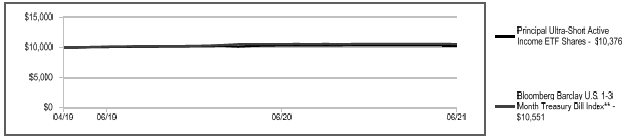
Principal Ultra-Short Active Income ETF
Investment Advisor: Principal Global Investors, LLC
Value of a $10,000 Investment* April 24, 2019 - June 30, 2021
| | | | | |
| Average Annual Total Returns* as of June 30, 2021 | | | | | |
| | 1-Year | | Since Inception | | Inception Date |
| Principal Ultra-Short Active Income ETF | 0.57 | % | 1.70 | % | 4/24/2019 |
What contributed to or detracted from Fund performance during the fiscal year?
The Principal Ultra-Short Active Income ETF seeks to provide current income. The Fund is an actively managed exchange-traded fund (“ETF”) that seeks to achieve its investment objective by investing, under normal circumstances, at least 80% of its net assets, plus any borrowings for investment purposes, in investment-grade bonds and other debt securities. The Fund invests in fixed- and floating-rate securities. Under normal circumstances, the Fund maintains an average effective maturity of three years or less and an average portfolio duration of one year or less.
Contributors included sector allocations to banking, consumer non-cyclical, student loan asset backed securities (ABS), communications and electric utilities. Detractors included an underweight to treasurys as well sector allocations to finance companies, technology, basic industry and consumer cyclical.
**The benchmark performance for Principal Ultra-Short Active Income ETF is calculated from 4/30/2019 to 6/30/2021.
11
Principal U.S. Mega-Cap ETF
Investment Advisor: Principal Global Investors, LLC
Value of a $10,000 Investment* October 11, 2017 - June 30, 2021
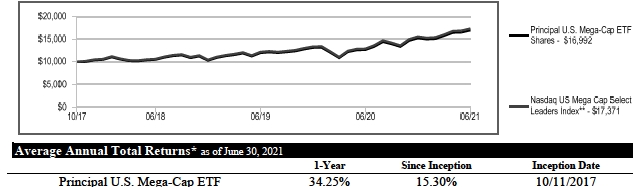
What contributed to or detracted from Fund performance during the fiscal year?
The Principal U.S. Mega-Cap ETF seeks to provide investment results that closely correspond, before expenses, to the performance of the Nasdaq US Mega Cap Select Leaders Index (the “Index”). Under normal circumstances, the Fund invests at least 80% of its net assets, plus any borrowings for investment purposes, in equity securities that compose the Index at the time of purchase. The Index uses a quantitative model designed to identify equity securities of companies in the Nasdaq US 500 Large Cap Index (the “Parent Index”) that have the largest market capitalizations, with higher weights given to less volatile securities.
The Principal U.S. Mega-Cap ETF performed in line with the Nasdaq US Mega Cap Select Leaders Index. Seven of the eight sectors within the Index posted positive returns, led by financials and consumer discretionary. NVIDIA, Bank of America, and Tesla outperformed within the Index while our positioning in Apple, Danaher, and PayPal contributed to performance.
The energy and consumer staples sectors posted the worst returns during the period. Organon, Chevron, and Exxon Mobil underperformed in the Index while our positioning in Pfizer, Merck, and Walmart detracted from performance.
**The benchmark performance for Principal U.S. Mega-Cap ETF is calculated from 9/30/2017 to 6/30/2021.
12
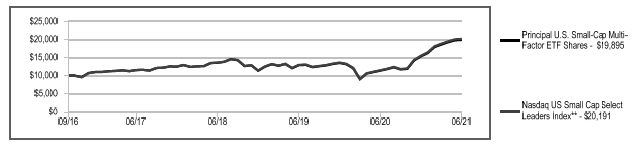
Principal U.S. Small-Cap Multi-Factor ETF
Investment Advisor: Principal Global Investors, LLC
Value of a $10,000 Investment* September 21, 2016 - June 30, 2021
| | | | | |
| Average Annual Total Returns* as of June 30, 2021 | | | | | |
| | 1-Year | | Since Inception | | Inception Date |
| Principal U.S. Small-Cap Multi-Factor ETF | 74.05 | % | 15.49 | % | 9/21/2016 |
What contributed to or detracted from Fund performance during the fiscal year?
The Principal U.S. Small-Cap Multi-Factor ETF seeks to provide investment results that closely correspond, before expenses, to the performance of the Nasdaq US Small Cap Select Leaders Index (the "Index"). Under normal circumstances, the Fund invests at least 80% of its net assets, plus any borrowings for investment purposes, in equity securities of companies that compose the Index at the time of purchase. The Index uses a quantitative model designed to identify equity securities (including growth and value stock) of small-capitalization companies in the Nasdaq US Small Cap Index (the “Parent Index”) that exhibit potential for high degrees of value, quality growth, and strong momentum, while adjusting for liquidity and volatility.
The Principal U.S. Small-Cap Multi-Factor ETF performed in line with the Nasdaq US Small Cap Select Leaders Index. All eleven sectors within the Index posted positive returns, led by energy and consumer discretionary. Signet Jewelers, Surgery Partners, and Owens & Minor outperformed within the Index while our positioning in Aytu BioPharma, EyePoint Pharmaceuticals, and ACRES Commercial Realty contributed to performance.
The utilities and consumer staples recorded the worst returns during the period. Denbury Resources, GTT Communications, and Akebia Therapeutics underperformed within the Index while our positioning in Mallinckrodt, SmileDirectClub, and Realogy Holdings detracted from performance.
**The benchmark performance for Principal U.S. Small-Cap Multi-Factor ETF is calculated from 9/30/2016 to 6/30/2021.
13
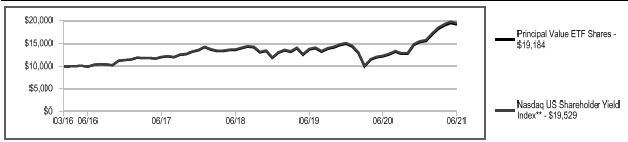
Principal Value ETF
Investment Advisor: Principal Global Investors, LLC
Value of a $10,000 Investment* March 21, 2016 - June 30, 2021
| | | | | | | |
| Average Annual Total Returns* as of June 30, 2021 | | | | | | |
| | 1-Year | | 5-Year | | Since Inception | | Inception Date |
| Principal Value ETF | 57.97 | % | 14.21 | % | 13.11 | % | 3/21/2016 |
What contributed to or detracted from Fund performance during the fiscal year?
The Principal Value ETF seeks to provide investment results that closely correspond, before expenses, to the performance of the Nasdaq US Shareholder Yield Index (the "Index). Under normal circumstances, the Fund invests at least 80% of its net assets, plus any borrowings for investment purposes, in equity securities of companies that compose the Index at the time of purchase. The Index uses a quantitative model designed to identify equity securities (emphasizing value stock) of mid- to large-capitalization companies in the Nasdaq US Large Mid Cap Index (the “Parent Index”) that exhibit higher degrees of shareholder yield, in an effort to produce a value-based portfolio with a higher quality focus than is customary in traditional value approaches.
The Principal Value ETF performed in line with the Nasdaq US Shareholder Yield Index. All eleven sectors within the Index posted positive returns, led by financials and consumer discretionary. Kohl’s, Western Alliance, and Alliance Data Systems outperformed within the Index while our positioning in ADT, Broadcom, and State Street contributed to performance.
The utilities and healthcare sectors recorded the worst returns during the period. ViacomCBS, Thor Industries, and NewMarket underperformed in the Index while our positioning in Vornado Realty Trust, Kohl’s, and H&R Block detracted from performance.
**The benchmark performance for the Principal Value ETF is calculated from 3/31/2016 to 6/30/2021.
14
| | | | | | | | | | |
| | Statements of Assets and Liabilities | | | | | | | |
| | Principal Exchange-Traded Funds | | | | | | | |
| | June 30, 2021 | | | | | | | |
| |
| | | | | | | | | | Principal | |
| | | | | | | Principal | | | International | |
| | | | Principal | | | Healthcare | | | Adaptive | |
| | | | Active | | | Innovators | | | Multi-Factor | |
| | | | Income ETF | | | Index ETF | | | ETF | |
| Investment in securities — at cost | | $ | 205,632,474 | | $ | 155,005,189 | | $ | 48,100,349 | |
| Investment in affiliated funds — at cost | | $ | 3,145,675 | | $ | 6,534,128 | | $ | — | |
| Foreign currency — at cost | | $ | — | | $ | — | | $ | 11,690 | |
| Assets | | | | | | | | | | |
| Investment in securities — at value | | $ | 230,919,868 | (a) | $ | 176,241,895 | (a) | $ | 47,074,755 | |
| Investment in affiliated funds — at value | | | 3,145,675 | | | 6,534,128 | | | — | |
| Foreign currency — at value | | | — | | | — | | | 11,463 | |
| Receivables: | | | | | | | | | | |
| Dividends | | | 174,123 | | | 5 | | | 37,536 | |
| Interest | | | 1,439,328 | | | — | | | — | |
| Securities lending income | | | 2,382 | | | 11,753 | | | — | |
| Fund shares sold | | | — | | | 5,416 | | | 568,203 | |
| | Total Assets | | 235,681,376 | | | 182,793,197 | | | 47,691,957 | |
| |
| Liabilities | | | | | | | | | | |
| Accrued management and investment advisory fees | | | 93,089 | | | 56,290 | | | 5,219 | |
| Payables: | | | | | | | | | | |
| Investment securities purchased | | | — | | | 5,417 | | | 568,701 | |
| Collateral obligation on securities loaned — at value | | | 3,145,675 | | | 6,534,128 | | | — | |
| | Total Liabilities | | 3,238,764 | | | 6,595,835 | | | 573,920 | |
| Net Assets Applicable to Outstanding Shares | | $ | 232,442,612 | | $ | 176,197,362 | | $ | 47,118,037 | |
| |
| Net Assets Consist of: | | | | | | | | | | |
| Capital shares and additional paid-in-capital | | $ | 221,140,566 | | $ | 158,188,062 | | $ | 48,077,850 | |
| Total distributable earnings (accumulated loss) | | | 11,302,046 | | | 18,009,300 | | | (959,813 | ) |
| | Total Net Assets | $ | 232,442,612 | | $ | 176,197,362 | | $ | 47,118,037 | |
| |
| Net Asset Value Per Share: | | | | | | | | | | |
| Net assets | | $ | 232,442,612 | | $ | 176,197,362 | | $ | 47,118,037 | |
| Shares issued and outstanding | | | 11,150,000 | (b) | | 2,900,001 | | | 1,900,001 | |
| Net asset value per share | | $ | 20.85 | (b) | $ | 60.76 | | $ | 24.80 | |
| (a) | Includes fair market value of securities loaned, see 'Securities Lending' in Notes to Financial Statements. |
| (b) | Reflects a 2 to 1 stock split effective after the close of trading on August 30, 2021, see 'Subsequent Events' in Notes to Financial Statements. |
See accompanying notes.
15
| | | | | | | | | |
| Statements of Assets and Liabilities | | | | | | | |
| Principal Exchange-Traded Funds | | | | | | | |
| June 30, 2021 | | | | | | | |
| |
| | | | | | Principal | | | | |
| | | Principal | | | Investment | | | | |
| | | International | | | Grade | | | Principal | |
| | | Multi-Factor | | | Corporate | | | Millennials | |
| | | ETF (a) | | | Active ETF | | | Index ETF | |
| Investment in securities — at cost | $ | 86,010,549 | | $ | 470,389,461 | | $ | 115,333,378 | |
| Investment in affiliated funds — at cost | $ | 1,088,545 | | $ | 2,138,163 | | $ | 4,595,808 | |
| Foreign currency — at cost | $ | 51,247 | | $ | — | | $ | — | |
| Assets | | | | | | | | | |
| Investment in securities — at value | $ | 91,646,932 | (b) | $ | 478,709,840 | (b) | $ | 126,606,969 | (b) |
| Investment in affiliated funds — at value | | 1,088,545 | | | 2,138,163 | | | 4,595,808 | |
| Foreign currency — at value | | 51,009 | | | — | | | — | |
| Cash | | — | | | 222 | | | — | |
| Deposits with counterparty | | — | | | 454,750 | | | — | |
| Receivables: | | | | | | | | | |
| Dividends | | 194,754 | | | 179 | | | 55,519 | |
| Interest | | — | | | 3,687,505 | | | — | |
| Securities lending income | | — | | | 327 | | | 1,766 | |
| Fund shares sold | | 6,177,478 | | | 31,218 | | | 830,807 | |
| Investment securities sold | | — | | | 7,311,259 | | | — | |
| Total Assets | | 99,158,718 | | | 492,333,463 | | | 132,090,869 | |
| |
| Liabilities | | | | | | | | | |
| Accrued management and investment advisory fees | | 17,272 | | | 74,344 | | | 43,147 | |
| Payables: | | | | | | | | | |
| Investment securities purchased | | 6,358,524 | | | 8,799,331 | | | 1,052,618 | |
| Variation margin on financial derivative instruments | | — | | | 50,363 | | | — | |
| Collateral obligation on securities loaned — at value | | 1,088,545 | | | 2,138,163 | | | 4,595,808 | |
| Total Liabilities | | 7,464,341 | | | 11,062,201 | | | 5,691,573 | |
| Net Assets Applicable to Outstanding Shares | $ | 91,694,377 | | $ | 481,271,262 | | $ | 126,399,296 | |
| |
| Net Assets Consist of: | | | | | | | | | |
| Capital shares and additional paid-in-capital | $ | 84,706,738 | | $ | 473,145,472 | | $ | 117,973,983 | |
| Total distributable earnings (accumulated loss) | | 6,987,639 | | | 8,125,790 | | | 8,425,313 | |
| Total Net Assets | $ | 91,694,377 | | $ | 481,271,262 | | $ | 126,399,296 | |
| |
| Net Asset Value Per Share: | | | | | | | | | |
| Net assets | $ | 91,694,377 | | $ | 481,271,262 | | $ | 126,399,296 | |
| Sharesissued and outstanding | | 2,900,001 | | | 18,000,001 | | | 1,900,001 | |
| Net asset value per share | $ | 31.62 | | $ | 26.74 | | $ | 66.53 | |
| (a) | Effective September 30, 2020, Principal International Multi-Factor Core Index ETF changed its name to Principal International Multi-Factor ETF. |
| (b) | Includes fair market value of securities loaned, see 'Securities Lending' in Notes to Financial Statements. |
See accompanying notes.
16
| | | | | | | | |
| | Statements of Assets and Liabilities | | | | | |
| | Principal Exchange-Traded Funds | | | | | |
| | June 30, 2021 | | | | | |
| |
| |
| | | | | | | | | Principal |
| | | | | | Principal | | | Spectrum |
| | | | | | Spectrum | | | Tax- |
| | | | | | Preferred | | | Advantaged |
| | | | Principal | | Securities | | | Dividend |
| | | | Quality ETF (a) | | Active ETF | | | Active ETF |
| Investment in securities — at cost | | $ | 56,082,177 | $ | 346,114,134 | | $ | 20,887,862 |
| Investment in affiliated funds — at cost | | $ | — | $ | 10,355,640 | | $ | — |
| Assets | | | | | | | | |
| Investment in securities — at value | | $ | 58,457,177 | $ | 359,706,036 | (b) | $ | 22,452,933 |
| Investment in affiliated funds — at value | | | — | | 10,355,640 | | | — |
| Cash | | | — | | 11,194 | | | 5,625 |
| Receivables: | | | | | | | | |
| Dividends | | | 34,322 | | 102 | | | 16,157 |
| Interest | | | — | | 3,310,062 | | | 183,829 |
| Securities lending income | | | — | | 1,848 | | | — |
| Fund shares sold | | | — | | 1,032,195 | | | — |
| Investment securities sold | | | — | | 112,652 | | | — |
| | Total Assets | | 58,491,499 | | 374,529,729 | | | 22,658,544 |
| |
| Liabilities | | | | | | | | |
| Accrued management and investment advisory fees | | | 5,872 | | 159,354 | | | 11,113 |
| Payables: | | | | | | | | |
| Investment securities purchased | | | — | | 681,601 | | | — |
| Collateral obligation on securities loaned — at value | | | — | | 10,355,640 | | | — |
| | Total Liabilities | | 5,872 | | 11,196,595 | | | 11,113 |
| Net Assets Applicable to Outstanding Shares | | $ | 58,485,627 | $ | 363,333,134 | | $ | 22,647,431 |
| |
| Net Assets Consist of: | | | | | | | | |
| Capital shares and additional paid-in-capital | | $ | 57,506,067 | $ | 353,650,686 | | $ | 21,070,152 |
| Total distributable earnings (accumulated loss) | | | 979,560 | | 9,682,448 | | | 1,577,279 |
| | Total Net Assets | $ | 58,485,627 | $ | 363,333,134 | | $ | 22,647,431 |
| |
| Net Asset Value Per Share: | | | | | | | | |
| Net assets | | $ | 58,485,627 | $ | 363,333,134 | | $ | 22,647,431 |
| Shares issued and outstanding | | | 1,100,001 | | 17,600,005 | | | 1,050,001 |
| Net asset value per share | | $ | 53.17 | $ | 20.64 | | $ | 21.57 |
| (a) | Effective September 30, 2020, Principal Price Setters Index ETF changed its name to Principal Quality ETF. |
| (b) | Includes fair market value of securities loaned, see 'Securities Lending' in Notes to Financial Statements. |
See accompanying notes.
17
| | | | | | | | |
| | Statements of Assets and Liabilities | | | | | |
| | Principal Exchange-Traded Funds | | | | | |
| | June 30, 2021 | | | | | |
| |
| |
| | | | | | | Principal U.S. | | |
| | | | Principal | | | Large-Cap | | |
| | | | Ultra-Short | | | Adaptive | | Principal U.S. |
| | | | Active | | | Multi-Factor | | Mega-Cap |
| | | | Income ETF | | | ETF | | ETF (a) |
| Investment in securities — at cost | | $ | 8,625,697 | | $ | 29,514,061 | $ | 1,566,763,067 |
| Assets | | | | | | | | |
| Investment in securities — at value | | $ | 8,637,114 | | $ | 29,887,025 | $ | 1,957,308,012 |
| Receivables: | | | | | | | | |
| Dividends | | | 19 | | | 11,128 | | 944,945 |
| Interest | | | 21,496 | | | — | | — |
| Fund shares sold | | | — | | | — | | 1,983,854 |
| Investment securities sold | | | — | | | — | | 1,979,907 |
| Expensereimbursement from Advisor | | | — | | | — | | 47,193 |
| | Total Assets | | 8,658,629 | | | 29,898,153 | | 1,962,263,911 |
| |
| Liabilities | | | | | | | | |
| Accrued management and investment advisory fees | | | 1,610 | | | 1,980 | | 235,964 |
| Fund shares redeemed | | | — | | | — | | 1,981,796 |
| Payables: | | | | | | | | |
| Investment securities purchased | | | — | | | 54,200 | | 1,981,975 |
| | Total Liabilities | | 1,610 | | | 56,180 | | 4,199,735 |
| Net Assets Applicable to Outstanding Shares | | $ | 8,657,019 | | $ | 29,841,973 | $ | 1,958,064,176 |
| |
| Net Assets Consist of: | | | | | | | | |
| Capital shares and additional paid-in-capital | | $ | 8,800,419 | | $ | 29,453,588 | $ | 1,623,507,483 |
| Total distributable earnings (accumulated loss) | | | (143,400 | ) | | 388,385 | | 334,556,693 |
| | Total Net Assets | $ | 8,657,019 | | $ | 29,841,973 | $ | 1,958,064,176 |
| |
| Net Asset Value Per Share: | | | | | | | | |
| Net assets | | $ | 8,657,019 | | $ | 29,841,973 | $ | 1,958,064,176 |
| Shares issued and outstanding | | | 350,001 | | | 1,150,001 | | 49,350,001 |
| Net asset value per share | | $ | 24.73 | | $ | 25.95 | $ | 39.68 |
(a) Effective September 30, 2020, Principal U.S. Mega-Cap Multi-Factor Index ETF changed its name to Principal U.S. Mega-Cap ETF.
See accompanying notes.
18
| | | | | | | | |
| | Statements of Assets and Liabilities | | | | | |
| | Principal Exchange-Traded Funds | | | | | |
| | June 30, 2021 | | | | | |
| |
| | | | Principal U.S. | | | | | |
| | | | Small-Cap | | Principal U.S. | | | |
| | | | Adaptive | | Small-Cap | | | |
| | | | Multi-Factor | | Multi-Factor | | | Principal |
| | | | ETF | | ETF (a) | | | Value ETF (b) |
| Investment in securities — at cost | | $ | 6,267,882 | $ | 1,403,455,272 | | $ | 41,625,130 |
| Investment in affiliated funds — at cost | | $ | — | $ | 16,551,960 | | $ | — |
| Assets | | | | | | | | |
| Investment in securities — at value | | $ | 6,399,546 | $ | 1,627,063,403 | (c) | $ | 44,422,214 |
| Investment in affiliated funds — at value | | | — | | 16,551,960 | | | — |
| Cash | | | — | | 149,693 | | | — |
| Receivables: | | | | | | | | |
| Dividends | | | 4,158 | | 1,468,183 | | | 81,439 |
| Securities lending income | | | — | | 21,148 | | | — |
| Fund shares sold | | | — | | 2,345,824 | | | — |
| | Total Assets | | 6,403,704 | | 1,647,600,211 | | | 44,503,653 |
| |
| Liabilities | | | | | | | | |
| Cash overdraft | | | — | | — | | | 95 |
| Accrued management and investment advisory fees | | | 1,006 | | 506,572 | | | 5,222 |
| Payables: | | | | | | | | |
| Investment securities purchased | | | — | | 2,538,380 | | | — |
| Collateral obligation on securities loaned — at value | | | — | | 16,551,960 | | | — |
| | Total Liabilities | | 1,006 | | 19,596,912 | | | 5,317 |
| Net Assets Applicable to Outstanding Shares | | $ | 6,402,698 | $ | 1,628,003,299 | | $ | 44,498,336 |
| |
| Net Assets Consist of: | | | | | | | | |
| Capital shares and additional paid-in-capital | | $ | 6,262,759 | $ | 1,485,773,411 | | $ | 43,548,481 |
| Total distributable earnings (accumulated loss) | | | 139,939 | | 142,229,888 | | | 949,855 |
| | Total Net Assets | $ | 6,402,698 | $ | 1,628,003,299 | | $ | 44,498,336 |
| |
| Net Asset Value Per Share: | | | | | | | | |
| Net assets | | $ | 6,402,698 | $ | 1,628,003,299 | | $ | 44,498,336 |
| Shares issued and outstanding | | | 250,001 | | 34,700,001 | | | 1,050,001 |
| Net asset value per share | | $ | 25.61 | $ | 46.92 | | $ | 42.38 |
| (a) | Effective September 30, 2020, Principal U.S. Small-Cap Multi-Factor Index ETF changed its name to Principal U.S. Small-Cap Multi-Factor ETF. |
| (b) | Effective September 30, 2020, Principal Shareholder Yield Index ETF changed its name to Principal Value ETF. |
| (c) | Includes fair market value of securities loaned, see 'Securities Lending' in Notes to Financial Statements. |
See accompanying notes.
19
| | | | | | | | | |
| Statements of Operations | | | | | | | |
| Principal Exchange-Traded Funds | | | | | | | |
| Year Ended June 30, 2021 | | | | | | | |
| |
| |
| | | | | | | | | Principal | |
| | | | | | Principal | | | International | |
| | | Principal | | | Healthcare | | | Adaptive | |
| | | Active | | | Innovators | | | Multi-Factor | |
| | | Income ETF | | | Index ETF | | | ETF (a) | |
| Net Investment Income (Loss) | | | | | | | | | |
| Income: | | | | | | | | | |
| Dividend | $ | 2,071,544 | | $ | 44,999 | | $ | 81,788 | |
| Withholding tax | | (11,799 | ) | | — | | | (8,928 | ) |
| Interest | | 8,214,195 | | | — | | | — | |
| Securities lending — net | | 80,561 | | | 163,588 | | | — | |
| Total Income | | 10,354,501 | | | 208,587 | | | 72,860 | |
| |
| Expenses: | | | | | | | | | |
| Management and investment advisory fees | | 1,155,328 | | | 581,097 | | | 5,548 | |
| Total Expenses | | 1,155,328 | | | 581,097 | | | 5,548 | |
| Net Investment Income (Loss) | | 9,199,173 | | | (372,510 | ) | | 67,312 | |
| |
| Net Realized and Unrealized Gain (Loss) on Investments and Foreign Currency: | | | | | | | | |
| Net realized gain (loss) from: | | | | | | | | �� | |
| Investment transactions | | (6,479,132 | ) | | 3,456,368 | | | 11,703 | |
| In-kind redemptions | | — | | | 25,523,383 | | | — | |
| Foreign currency transactions | | 33 | | | — | | | 2,209 | |
| Change in unrealized appreciation (depreciation) of: | | | | | | | | | |
| Investments | | 42,205,344 | | | 6,955,733 | | | (1,025,594 | ) |
| Foreign currency transactions | | (283 | ) | | — | | | (443 | ) |
| Net Realized and Unrealized Gain (Loss) on Investments and Foreign Currency | | 35,725,962 | | | 35,935,484 | | | (1,012,125 | ) |
| Net Increase (Decrease) in Net Assets Resulting from Operations | $ | 44,925,135 | | $ | 35,562,974 | | $ | (944,813 | ) |
| |
| (a) Period from May 26, 2021, date operations commenced, through June 30, 2021. | | | | | | | | | |
See accompanying notes.
20
| | | | | | | | | |
| Statements of Operations | | | | | | | |
| Principal Exchange-Traded Funds | | | | | | | |
| Year Ended June 30, 2021 | | | | | | | |
| |
| |
| | | | | | Principal | | | | |
| | | Principal | | | Investment | | | | |
| | | International | | | Grade | | | Principal | |
| | | Multi-Factor | | | Corporate | | | Millennials | |
| | | ETF (a) | | | Active ETF | | | Index ETF | |
| Net Investment Income (Loss) | | | | | | | | | |
| Income: | | | | | | | | | |
| Dividend | $ | 1,889,250 | | $ | 1,835 | | $ | 674,465 | |
| Withholding tax | | (208,433 | ) | | — | | | (26,193 | ) |
| Interest | | — | | | 8,441,720 | | | — | |
| Securities lending — net | | 6,045 | | | 2,014 | | | 4,227 | |
| Total Income | | 1,686,862 | | | 8,445,569 | | | 652,499 | |
| |
| Expenses: | | | | | | | | | |
| Management and investment advisory fees | | 138,036 | | | 828,583 | | | 321,145 | |
| Total Expenses | | 138,036 | | | 828,583 | | | 321,145 | |
| Net Investment Income (Loss) | | 1,548,826 | | | 7,616,986 | | | 331,354 | |
| |
| Net Realized and Unrealized Gain (Loss) on Investments, Foreign Currency and Futures: | | | | | | | |
| Net realized gain (loss) from: | | | | | | | | | |
| Investment transactions | | 1,118,937 | | | 3,673,687 | | | (1,422,495 | ) |
| In-kind redemptions | | 6,681,105 | | | 265,112 | | | 23,129,108 | |
| Foreign currency transactions | | (6,364 | ) | | — | | | 5,695 | |
| Futures contracts | | — | | | (43,401 | ) | | — | |
| Change in unrealized appreciation (depreciation) of: | | | | | | | | | |
| Investments | | 6,229,277 | | | 408,820 | | | 7,402,982 | |
| Futures contracts | | — | | | (4,831 | ) | | — | |
| Foreign currency transactions | | (1,802 | ) | | — | | | 1,284 | |
| Net Realized and Unrealized Gain (Loss) on Investments, Foreign Currency and | | | | | | | | | |
| Futures | | 14,021,153 | | | 4,299,387 | | | 29,116,574 | |
| Net Increase (Decrease) in Net Assets Resulting from Operations | $ | 15,569,979 | | $ | 11,916,373 | | $ | 29,447,928 | |
(a) Effective September 30, 2020, Principal International Multi-Factor Core Index ETF changed its name to Principal International Multi-Factor ETF.
See accompanying notes.
21
| | | | | | | |
| Statements of Operations | | | | | |
| Principal Exchange-Traded Funds | | | | | |
| Year Ended June 30, 2021 | | | | | |
| |
| |
| | | | | | | | Principal |
| | | | | Principal | | Spectrum |
| | | | | Spectrum | | Tax- |
| | | | | Preferred | | Advantaged |
| | Principal | | Securities | | Dividend |
| | Quality ETF (a) | | Active ETF | | Active ETF |
| Net Investment Income (Loss) | | | | | | | |
| Income: | | | | | | | |
| Dividend | $ | 426,595 | | $ | 1,585 | $ | 170,250 |
| Interest | | — | | | 9,439,611 | | 882,366 |
| Securities lending — net | | 33 | | | 20,230 | | — |
| Total Income | | 426,628 | | | 9,461,426 | | 1,052,616 |
| |
| Expenses: | | | | | | | |
| Management and investment advisory fees | | 46,473 | | | 1,304,780 | | 132,920 |
| Total Expenses | | 46,473 | | | 1,304,780 | | 132,920 |
| Net Investment Income (Loss) | | 380,155 | | | 8,156,646 | | 919,696 |
| |
| Net Realized and Unrealized Gain (Loss) on Investments: | | | | | | | |
| Net realized gain (loss) from: | | | | | | | |
| Investment transactions | | (163,521 | ) | | 550,789 | | 129,559 |
| In-kind redemptions | | 7,581,780 | | | — | | — |
| Change in unrealized appreciation (depreciation) of: | | | | | | | |
| Investments | | 1,633,115 | | | 13,134,839 | | 1,712,911 |
| Net Realized and Unrealized Gain (Loss) on Investments | | 9,051,374 | | | 13,685,628 | | 1,842,470 |
| Net Increase (Decrease) in Net Assets Resulting from Operations | $ | 9,431,529 | | $ | 21,842,274 | $ | 2,762,166 |
| |
| (a) Effective September 30, 2020, Principal Price Setters Index ETF changed its name to Principal Quality ETF. | | | |
See accompanying notes.
22
| | | | | | | | | |
| Statements of Operations | | | | | | | |
| Principal Exchange-Traded Funds | | | | | | | |
| Year Ended June 30, 2021 | | | | | | | |
| |
| |
| | | | | | Principal U.S. | | | | |
| | | Principal | | | Large-Cap | | | | |
| | | Ultra-Short | | | Adaptive | | | Principal U.S. | |
| | | Active | | | Multi-Factor | | | Mega-Cap | |
| | | Income ETF | | | ETF (a) | | | ETF (b) | |
| Net Investment Income (Loss) | | | | | | | | | |
| Income: | | | | | | | | | |
| Dividend | $ | 125 | | $ | 17,480 | | $ | 30,899,239 | |
| Withholding tax | | — | | | (2 | ) | | — | |
| Interest | | 111,252 | | | — | | | — | |
| Securities lending — net | | 11 | | | — | | | — | |
| Total Income | | 111,388 | | | 17,478 | | | 30,899,239 | |
| |
| Expenses: | | | | | | | | | |
| Management and investment advisory fees | | 22,368 | | | 2,167 | | | 2,589,968 | |
| Total Gross Expenses | | 22,368 | | | 2,167 | | | 2,589,968 | |
| Less: Reimbursement from Advisor | | — | | | — | | | (517,994 | ) |
| Total Net Expenses | | 22,368 | | | 2,167 | | | 2,071,974 | |
| Net Investment Income (Loss) | | 89,020 | | | 15,311 | | | 28,827,265 | |
| |
| Net Realized and Unrealized Gain (Loss) on Investments: | | | | | | | | | |
| Net realized gain (loss) from: | | | | | | | | | |
| Investment transactions | | 13,955 | | | 110 | | | 16,308,960 | |
| In-kind redemptions | | — | | | — | | | 175,851,158 | |
| Change in unrealized appreciation (depreciation) of: | | | | | | | | | |
| Investments | | (32,874 | ) | | 372,964 | | | 284,619,935 | |
| Net Realized and Unrealized Gain (Loss) on Investments | | (18,919 | ) | | 373,074 | | | 476,780,053 | |
| Net Increase (Decrease) in Net Assets Resulting from Operations | $ | 70,101 | | $ | 388,385 | | $ | 505,607,318 | |
| (a) | Period from May 19, 2021, date operations commenced, through June 30, 2021. |
| (b) | Effective September 30, 2020, Principal U.S. Mega-Cap Multi-Factor Index ETF changed its name to Principal U.S. Mega-Cap ETF. |
See accompanying notes.
23
| | | | | | | | | |
| Statements of Operations | | | | | | | |
| Principal Exchange-Traded Funds | | | | | | | |
| Year Ended June 30, 2021 | | | | | | | |
| |
| |
| | | Principal U.S. | | | | | | | |
| | | Small-Cap | | | Principal U.S. | | | | |
| | | Adaptive | | | Small-Cap | | | | |
| | | Multi-Factor | | | Multi-Factor | | | Principal | |
| | | ETF (a) | | | ETF (b) | | | Value ETF (c) | |
| Net Investment Income (Loss) | | | | | | | | | |
| Income: | | | | | | | | | |
| Dividend | $ | 8,296 | | $ | 15,943,409 | | $ | 862,934 | |
| Withholding tax | | (18 | ) | | (1,172 | ) | | (216 | ) |
| Securities lending — net | | — | | | 927,281 | | | 807 | |
| Total Income | | 8,278 | | | 16,869,518 | | | 863,525 | |
| |
| Expenses: | | | | | | | | | |
| Management and investment advisory fees | | 1,298 | | | 3,591,467 | | | 37,250 | |
| Total Expenses | | 1,298 | | | 3,591,467 | | | 37,250 | |
| Net Investment Income (Loss) | | 6,980 | | | 13,278,051 | | | 826,275 | |
| |
| Net Realized and Unrealized Gain (Loss) on Investments: | | | | | | | | | |
| Net realized gain (loss) from: | | | | | | | | | |
| Investment transactions | | 1,295 | | | (22,025,066 | ) | | (235,456 | ) |
| In-kind redemptions | | — | | | 208,602,343 | | | 7,842,752 | |
| Change in unrealized appreciation (depreciation) of: | | | | | | | | | |
| Investments | | 131,664 | | | 264,338,863 | | | 1,803,600 | |
| Net Realized and Unrealized Gain (Loss) on Investments | | 132,959 | | | 450,916,140 | | | 9,410,896 | |
| Net Increase (Decrease) in Net Assets Resulting from Operations | $ | 139,939 | | $ | 464,194,191 | | $ | 10,237,171 | |
| (a) | Period from May 19, 2021, date operations commenced, through June 30, 2021. |
| (b) | Effective September 30, 2020, Principal U.S. Small-Cap Multi-Factor Index ETF changed its name to Principal U.S. Small-Cap Multi-Factor ETF. |
| (c) | Effective September 30, 2020, Principal Shareholder Yield Index ETF changed its name to Principal Value ETF. |
See accompanying notes.
24
| | | | | | |
| Statement of Changes in Net Assets | | | | | | |
| Principal Exchange-Traded Funds | | | | | | |
| |
| |
| | | Principal Active Income ETF | |
| | | Year ended | | | Year ended | |
| | | June 30, 2021 | | | June 30, 2020 | |
| Operations | | | | | | |
| Net investment income (loss) | $ | 9,199,173 | | $ | 13,044,523 | |
| Net realized gain (loss) on investments and foreign currency | | (6,479,099 | ) | | (6,438,943 | ) |
| Change in unrealized appreciation (depreciation) of investments and foreign currency | | 42,205,061 | | | (21,774,093 | ) |
| Net Increase (Decrease) in Net Assets Resulting from Operations | | 44,925,135 | | | (15,168,513 | ) |
| |
| Dividends to Shareholders | | | | | | |
| From net investment income and net realized gain on investments | | (9,881,656 | ) | | (13,270,230 | ) |
| Total Dividends | | (9,881,656 | ) | | (13,270,230 | ) |
| |
| Capital Share Transactions | | | | | | |
| Net increase (decrease) in capital share transactions | | (72,696,915 | ) | | 82,015,573 | |
| Total Increase (Decrease) in Net Assets | | (37,653,436 | ) | | 53,576,830 | |
| |
| Net Assets | | | | | | |
| Beginning of year | | 270,096,048 | | | 216,519,218 | |
| End of year | $ | 232,442,612 | | $ | 270,096,048 | |
| |
| Capital Share Transactions | | | | | | |
| Dollars: | | | | | | |
| Sold | $ | 2,059,299 | | $ | 83,568,006 | |
| Redeemed | | (74,756,214 | ) | | (1,552,433 | ) |
| Net Increase (Decrease) | $ | (72,696,915 | ) | $ | 82,015,573 | |
| Shares: (a) | | | | | | |
| Sold | | 100,000 | | | 4,200,000 | |
| Redeemed | | (3,900,000 | ) | | (100,000 | ) |
| Net Increase (Decrease) | | (3,800,000 | ) | | 4,100,000 | |
(a) Reflects a 2 to 1 stock split effective after the close of trading on August 30, 2021, see 'Subsequent Events' in Notes to Financial Statements.
See accompanying notes.
25
| | | | | | |
| Statement of Changes in Net Assets | | | | | | |
| Principal Exchange-Traded Funds | | | | | | |
| |
| |
| | | Principal Healthcare Innovators Index ETF | |
| | | Year ended | | Year ended | |
| | | June 30, 2021 | | June 30, 2020 | |
| Operations | | | | | | |
| Net investment income (loss) | $ | (372,510 | ) | $ | (169,265 | ) |
| Net realized gain (loss) on investments | | 28,979,751 | | | 6,249,529 | |
| Change in unrealized appreciation (depreciation) of investments | | 6,955,733 | | | 10,242,069 | |
| Net Increase (Decrease) in Net Assets Resulting from Operations | | 35,562,974 | | | 16,322,333 | |
| |
| Dividends to Shareholders | | | | | | |
| From net investment income and net realized gain on investments | | (527,787 | ) | | — | |
| Total Dividends | | (527,787 | ) | | — | |
| |
| Capital Share Transactions | | | | | | |
| Net increase (decrease) in capital share transactions | | 45,823,914 | | | 22,302,643 | |
| Total Increase (Decrease) in Net Assets | | 80,859,101 | | | 38,624,976 | |
| |
| Net Assets | | | | | | |
| Beginning of year | | 95,338,261 | | | 56,713,285 | |
| End of year | $ | 176,197,362 | | $ | 95,338,261 | |
| |
| Capital Share Transactions | | | | | | |
| Dollars: | | | | | | |
| Sold | $ | 111,095,936 | | $ | 43,226,695 | |
| Redeemed | | (65,272,022 | ) | | (20,924,052 | ) |
| Net Increase (Decrease) | $ | 45,823,914 | | $ | 22,302,643 | |
| Shares: | | | | | | |
| Sold | | 1,900,000 | | | 1,100,000 | |
| Redeemed | | (1,150,000 | ) | | (600,000 | ) |
| Net Increase (Decrease) | | 750,000 | | | 500,000 | |
26
| | | |
| Statement of Changes in Net Assets | | | |
| Principal Exchange-Traded Funds | | | |
| |
| |
| | | Principal | |
| | | International | |
| | | Adaptive Multi- | |
| | | Factor ETF | |
| | | Period ended | |
| | | June 30, 2021 (a) | |
| Operations | | | |
| Net investment income (loss) | $ | 67,312 | |
| Net realized gain (loss) on investments and foreign currency | | 13,912 | |
| Change in unrealized appreciation (depreciation) of investments and foreign currency | | (1,026,037 | ) |
| Net Increase (Decrease) in Net Assets Resulting from Operations | | (944,813 | ) |
| |
| |
| Capital Share Transactions | | | |
| Net increase (decrease) in capital share transactions | | 48,062,850 | |
| Total Increase (Decrease) in Net Assets | | 47,118,037 | |
| |
| Net Assets | | | |
| Beginning of period | | — | |
| End of period | $ | 47,118,037 | |
| |
| Capital Share Transactions | | | |
| Dollars: | | | |
| Sold | $ | 48,062,850 | |
| Redeemed | | — | |
| Net Increase (Decrease) | $ | 48,062,850 | |
| Shares: | | | |
| Sold | | 1,900,001 | |
| Redeemed | | — | |
| Net Increase (Decrease) | | 1,900,001 | |
| |
| (a) Period from May 26, 2021, date operations commenced, through June 30, 2021. | | | |
27
| | | | | | |
| Statement of Changes in Net Assets | | | | | | |
| Principal Exchange-Traded Funds | | | | | | |
| |
| |
| | | Principal International Multi-Factor ETF (a) |
| | | | | | | |
| | | Year ended | | Period ended | |
| | | June 30, 2021 | | June 30, 2020 (b) | |
| Operations | | | | | | |
| Net investment income (loss) | $ | 1,548,826 | | $ | 378,838 | |
| Net realized gain (loss) on investments and foreign currency | | 7,793,678 | | | (236,359 | ) |
| Change in unrealized appreciation (depreciation) of investments and foreign currency | | 6,227,475 | | | (592,573 | ) |
| Net Increase (Decrease) in Net Assets Resulting from Operations | | 15,569,979 | | | (450,094 | ) |
| |
| Dividends to Shareholders | | | | | | |
| From net investment income and net realized gain on investments | | (962,266 | ) | | (286,121 | ) |
| Total Dividends | | (962,266 | ) | | (286,121 | ) |
| |
| Capital Share Transactions | | | | | | |
| Net increase (decrease) in capital share transactions | | 60,425,974 | | | 17,396,905 | |
| Total Increase (Decrease) in Net Assets | | 75,033,687 | | | 16,660,690 | |
| |
| Net Assets | | | | | | |
| Beginning of period | | 16,660,690 | | | — | |
| End of period | $ | 91,694,377 | | $ | 16,660,690 | |
| |
| Capital Share Transactions | | | | | | |
| Dollars: | | | | | | |
| Sold | $ | 93,957,653 | | $ | 19,968,892 | |
| Redeemed | | (33,531,679 | ) | | (2,571,987 | ) |
| Net Increase (Decrease) | $ | 60,425,974 | | $ | 17,396,905 | |
| Shares: | | | | | | |
| Sold | | 3,300,000 | | | 800,001 | |
| Redeemed | | (1,100,000 | ) | | (100,000 | ) |
| Net Increase (Decrease) | | 2,200,000 | | | 700,001 | |
| (a) | Effective September 30, 2020, Principal International Multi-Factor Core Index ETF changed its name to Principal International Multi-Factor ETF. |
| (b) | Period from July 23, 2019, date operations commenced, through June 30, 2020. |
See accompanying notes.
28
| | | | | | |
| Statement of Changes in Net Assets |
| Principal Exchange-Traded Funds |
|
| |
| |
| | | Principal Investment Grade Corporate Active | |
| | | | | ETF | | |
| | | Year ended | | | Year ended | |
| | | June 30, 2021 | | | June 30, 2020 | |
| Operations | | | | | | |
| Net investment income (loss) | $ | 7,616,986 | | $ | 3,950,555 | |
| Net realized gain (loss) on investments and futures | | 3,895,398 | | | 5,659,953 | |
| Change in unrealized appreciation (depreciation) of investments and futures | | 403,989 | | | 872,812 | |
| Net Increase (Decrease) in Net Assets Resulting from Operations | | 11,916,373 | | | 10,483,320 | |
| |
| Dividends to Shareholders | | | | | | |
| From net investment income and net realized gain on investments | | (14,392,204 | ) | | (8,211,758 | ) |
| Total Dividends | | (14,392,204 | ) | | (8,211,758 | ) |
| |
| Capital Share Transactions | | | | | | |
| Net increase (decrease) in capital share transactions | | 373,054,558 | | | (12,119,128 | ) |
| Total Increase (Decrease) in Net Assets | | 370,578,727 | | | (9,847,566 | ) |
| |
| Net Assets | | | | | | |
| Beginning of year | | 110,692,535 | | | 120,540,101 | |
| End of year | $ | 481,271,262 | | $ | 110,692,535 | |
| |
| Capital Share Transactions | | | | | | |
| Dollars: | | | | | | |
| Sold | $ | 383,550,803 | | $ | 3,894,368 | |
| Redeemed | | (10,496,245 | ) | | (16,013,496 | ) |
| Net Increase (Decrease) | $ | 373,054,558 | | $ | (12,119,128 | ) |
| Shares: | | | | | | |
| Sold | | 14,250,000 | | | 150,000 | |
| Redeemed | | (400,000 | ) | | (600,000 | ) |
| Net Increase (Decrease) | | 13,850,000 | | | (450,000 | ) |
29
| | | | | | |
| Statement of Changes in Net Assets |
| Principal Exchange-Traded Funds |
|
| |
| |
| | | Principal Millennials Index ETF | |
| | | Year ended | | | Year ended | |
| | | June 30, 2021 | | | June 30, 2020 | |
| Operations | | | | | | |
| Net investment income (loss) | $ | 331,354 | | $ | 192,829 | |
| Net realized gain (loss) on investments and foreign currency | | 21,712,308 | | | (975,862 | ) |
| Change in unrealized appreciation (depreciation) of investments and foreign currency | | 7,404,266 | | | 3,510,428 | |
| Net Increase (Decrease) in Net Assets Resulting from Operations | | 29,447,928 | | | 2,727,395 | |
| |
| Dividends to Shareholders | | | | | | |
| From net investment income and net realized gain on investments | | (481,261 | ) | | (175,301 | ) |
| Total Dividends | | (481,261 | ) | | (175,301 | ) |
| |
| Capital Share Transactions | | | | | | |
| Net increase (decrease) in capital share transactions | | 71,724,249 | | | 2,125,336 | |
| Total Increase (Decrease) in Net Assets | | 100,690,916 | | | 4,677,430 | |
| |
| Net Assets | | | | | | |
| Beginning of year | | 25,708,380 | | | 21,030,950 | |
| End of year | $ | 126,399,296 | | $ | 25,708,380 | |
| |
| Capital Share Transactions | | | | | | |
| Dollars: | | | | | | |
| Sold | $ | 147,097,949 | | $ | 2,125,336 | |
| Redeemed | | (75,373,700 | ) | | — | |
| Net Increase (Decrease) | $ | 71,724,249 | | $ | 2,125,336 | |
| Shares: | | | | | | |
| Sold | | 2,550,000 | | | 50,000 | |
| Redeemed | | (1,250,000 | ) | | — | |
| Net Increase (Decrease) | | 1,300,000 | | | 50,000 | |
See accompanying notes.
30
| | | | | | |
| Statement of Changes in Net Assets |
| Principal Exchange-Traded Funds |
|
| |
| |
| | | Principal Quality ETF (a) | |
| | | Year ended | | | Year ended | |
| | | June 30, 2021 | | June 30, 2020 | |
| Operations | | | | | | |
| Net investment income (loss) | $ | 380,155 | | $ | 269,166 | |
| Net realized gain (loss) on investments | | 7,418,259 | | | 612,248 | |
| Change in unrealized appreciation (depreciation) of investments | | 1,633,115 | | | (392,815 | ) |
| Net Increase (Decrease) in Net Assets Resulting from Operations | | 9,431,529 | | | 488,599 | |
| |
| Dividends to Shareholders | | | | | | |
| From net investment income and net realized gain on investments | | (296,923 | ) | | (260,900 | ) |
| Total Dividends | | (296,923 | ) | | (260,900 | ) |
| |
| Capital Share Transactions | | | | | | |
| Net increase (decrease) in capital share transactions | | 31,399,812 | | | (3,062,580 | ) |
| Total Increase (Decrease) in Net Assets | | 40,534,418 | | | (2,834,881 | ) |
| |
| Net Assets | | | | | | |
| Beginning of year | | 17,951,209 | | | 20,786,090 | |
| End of year | $ | 58,485,627 | | $ | 17,951,209 | |
| |
| Capital Share Transactions | | | | | | |
| Dollars: | | | | | | |
| Sold | $ | 83,793,358 | | $ | 25,326,160 | |
| Redeemed | | (52,393,546 | ) | | (28,388,740 | ) |
| Net Increase (Decrease) | $ | 31,399,812 | | $ | (3,062,580 | ) |
| Shares: | | | | | | |
| Sold | | 1,700,000 | | | 650,000 | |
| Redeemed | | (1,050,000 | ) | | (750,000 | ) |
| Net Increase (Decrease) | | 650,000 | | | (100,000 | ) |
| |
| (a) Effective September 30, 2020, Principal Price Setters Index ETF changed its name to Principal Quality ETF. | | | | |
31
| | | | | | |
| Statement of Changes in Net Assets |
| Principal Exchange-Traded Funds |
|
| |
| |
| | | Principal Spectrum Preferred | |
| | | Securities Active ETF | |
| | Year ended | | | Year ended | |
| | June 30, 2021 | | June 30, 2020 | |
| Operations | | | | | | |
| Net investment income (loss) | $ | 8,156,646 | | $ | 4,190,654 | |
| Net realized gain (loss) on investments | | 550,789 | | | (138,163 | ) |
| Change in unrealized appreciation (depreciation) of investments | | 13,134,839 | | | 225,581 | |
| Net Increase (Decrease) in Net Assets Resulting from Operations | | 21,842,274 | | | 4,278,072 | |
| |
| Dividends to Shareholders | | | | | | |
| From net investment income and net realized gain on investments | | (9,608,037 | ) | | (4,757,405 | ) |
| Total Dividends | | (9,608,037 | ) | | (4,757,405 | ) |
| |
| Capital Share Transactions | | | | | | |
| Net increase (decrease) in capital share transactions | | 211,103,817 | | | 72,724,847 | |
| Total Increase (Decrease) in Net Assets | | 223,338,054 | | | 72,245,514 | |
| |
| Net Assets | | | | | | |
| Beginning of year | | 139,995,080 | | | 67,749,566 | |
| End of year | $ | 363,333,134 | | $ | 139,995,080 | |
| |
| Capital Share Transactions | | | | | | |
| Dollars: | | | | | | |
| Sold | $ | 211,103,817 | | $ | 87,341,857 | |
| Redeemed | | — | | | (14,617,010 | ) |
| Net Increase (Decrease) | $ | 211,103,817 | | $ | 72,724,847 | |
| Shares: | | | | | | |
| Sold | | 10,350,000 | | | 4,500,000 | (a) |
| Redeemed | | — | | | (750,000 | )(a) |
| Net Increase (Decrease) | | 10,350,000 | | | 3,750,000 | |
| |
| (a) Reflects a 5 to 1 stock split after the close of trading on July 22, 2020; see Notes to Financial Statements. | | | | | |
32
| | | | | | |
| Statement of Changes in Net Assets | | | | | | |
| Principal Exchange-Traded Funds | | | | | | |
| |
| |
| | | Principal Spectrum Tax-Advantaged | |
| | | Dividend Active ETF | |
| | | Year ended | | Period ended | |
| | | June 30, 2021 | | June 30, 2020 (a) | |
| Operations | | | | | | |
| Net investment income (loss) | $ | 919,696 | | $ | 33,207 | |
| Net realized gain (loss) on investments | | 129,559 | | | 62,208 | |
| Change in unrealized appreciation (depreciation) of investments | | 1,712,911 | | | (147,840 | ) |
| Net Increase (Decrease) in Net Assets Resulting from Operations | | 2,762,166 | | | (52,425 | ) |
| |
| Dividends to Shareholders | | | | | | |
| From net investment income and net realized gain on investments | | (1,062,462 | ) | | — | |
| Total Dividends | | (1,062,462 | ) | | — | |
| |
| Capital Share Transactions | | | | | | |
| Net increase (decrease) in capital share transactions | | 1,000,132 | | | 20,000,020 | |
| Total Increase (Decrease) in Net Assets | | 2,699,836 | | | 19,947,595 | |
| |
| Net Assets | | | | | | |
| Beginning of period | | 19,947,595 | | | — | |
| End of period | $ | 22,647,431 | | $ | 19,947,595 | |
| |
| Capital Share Transactions | | | | | | |
| Dollars: | | | | | | |
| Sold | $ | 1,000,132 | | $ | 20,000,020 | |
| Redeemed | | — | | | — | |
| Net Increase (Decrease) | $ | 1,000,132 | | $ | 20,000,020 | |
| Shares: | | | | | | |
| Sold | | 50,000 | | | 1,000,001 | |
| Redeemed | | — | | | — | |
| Net Increase (Decrease) | | 50,000 | | | 1,000,001 | |
| |
| (a) Period from June 16, 2020, date operations commenced, through June 30, 2020. | | | | | | |
See accompanying notes.
33
| | | | | | |
| Statement of Changes in Net Assets | | | | | | |
| Principal Exchange-Traded Funds | | | | | | |
| |
| |
| | | Principal Ultra-Short Active | |
| | | Income ETF | |
| | | Year ended | | Year ended | |
| | | June 30, 2021 | | June 30, 2020 | |
| Operations | | | | | | |
| Net investment income (loss) | $ | 89,020 | | $ | 273,078 | |
| Net realized gain (loss) on investments | | 13,955 | | | 13,894 | |
| Change in unrealized appreciation (depreciation) of investments | | (32,874 | ) | | 26,421 | |
| Net Increase (Decrease) in Net Assets Resulting from Operations | | 70,101 | | | 313,393 | |
| |
| Dividends to Shareholders | | | | | | |
| From net investment income and net realized gain on investments | | (215,987 | ) | | (346,501 | ) |
| Total Dividends | | (215,987 | ) | | (346,501 | ) |
| |
| Capital Share Transactions | | | | | | |
| Net increase (decrease) in capital share transactions | | (3,706,573 | ) | | — | |
| Total Increase (Decrease) in Net Assets | | (3,852,459 | ) | | (33,108 | ) |
| |
| Net Assets | | | | | | |
| Beginning of year | | 12,509,478 | | | 12,542,586 | |
| End of year | $ | 8,657,019 | | $ | 12,509,478 | |
| |
| Capital Share Transactions | | | | | | |
| Dollars: | | | | | | |
| Sold | $ | 1,238,181 | | $ | — | |
| Redeemed | | (4,944,754 | ) | | — | |
| Net Increase (Decrease) | $ | (3,706,573 | ) | $ | — | |
| Shares: | | | | | | |
| Sold | | 50,000 | | | — | |
| Redeemed | | (200,000 | ) | | — | |
| Net Increase (Decrease) | | (150,000 | ) | | — | |
See accompanying notes.
34
| | |
| Statement of Changes in Net Assets | | |
| Principal Exchange-Traded Funds | | |
| |
| |
| | | Principal U.S. Large- |
| | | Cap Adaptive Multi- |
| | | Factor ETF |
| | | Period ended |
| | | June 30, 2021 (a) |
| Operations | | |
| Net investment income (loss) | $ | 15,311 |
| Net realized gain (loss) on investments | | 110 |
| Change in unrealized appreciation (depreciation) of investments | | 372,964 |
| Net Increase (Decrease) in Net Assets Resulting from Operations | | 388,385 |
| |
| |
| Capital Share Transactions | | |
| Net increase (decrease) in capital share transactions | | 29,453,588 |
| Total Increase (Decrease) in Net Assets | | 29,841,973 |
| |
| Net Assets | | |
| Beginning of period | | — |
| End of period | $ | 29,841,973 |
| |
| Capital Share Transactions | | |
| Dollars: | | |
| Sold | $ | 29,453,588 |
| Redeemed | | — |
| Net Increase (Decrease) | $ | 29,453,588 |
| Shares: | | |
| Sold | | 1,150,001 |
| Redeemed | | — |
| Net Increase (Decrease) | | 1,150,001 |
| |
| (a) Period from May 19, 2021, date operations commenced, through June 30, 2021. | | |
See accompanying notes.
35
| | | | | | |
| Statement of Changes in Net Assets |
| Principal Exchange-Traded Funds |
|
| |
| |
| | | Principal U.S. Mega-Cap ETF (a) | |
| | | Year ended | | Year ended | |
| | | June 30, 2021 | | June 30, 2020 | |
| Operations | | | | | | |
| Net investment income (loss) | $ | 28,827,265 | | $ | 29,796,945 | |
| Net realized gain (loss) on investments | | 192,160,118 | | | 37,623,191 | |
| Change in unrealized appreciation (depreciation) of investments | | 284,619,935 | | | 3,750,721 | |
| Net Increase (Decrease) in Net Assets Resulting from Operations | | 505,607,318 | | | 71,170,857 | |
| |
| Dividends to Shareholders | | | | | | |
| From net investment income and net realized gain on investments | | (27,303,682 | ) | | (31,719,706 | ) |
| Total Dividends | | (27,303,682 | ) | | (31,719,706 | ) |
| |
| Capital Share Transactions | | | | | | |
| Net increase (decrease) in capital share transactions | | (25,285,343 | ) | | (153,346,324 | ) |
| Total Increase (Decrease) in Net Assets | | 453,018,293 | | | (113,895,173 | ) |
| |
| Net Assets | | | | | | |
| Beginning of year | | 1,505,045,883 | | | 1,618,941,056 | |
| End of year | $ | 1,958,064,176 | | $ | 1,505,045,883 | |
| |
| Capital Share Transactions | | | | | | |
| Dollars: | | | | | | |
| Sold | $ | 526,851,840 | | $ | 413,860,349 | |
| Redeemed | | (552,137,183 | ) | | (567,206,673 | ) |
| Net Increase (Decrease) | $ | (25,285,343 | ) | $ | (153,346,324 | ) |
| Shares: | | | | | | |
| Sold | | 14,150,000 | | | 13,900,000 | |
| Redeemed | | (14,900,000 | ) | | (19,500,000 | ) |
| Net Increase (Decrease) | | (750,000 | ) | | (5,600,000 | ) |
| |
| (a) Effective September 30, 2020, Principal U.S. Mega-Cap Multi-Factor Index ETF changed its name to Principal U.S. Mega-Cap ETF. | | |
36
| | |
| Statement of Changes in Net Assets | | |
| Principal Exchange-Traded Funds | | |
| |
| |
| | | Principal U.S. Small- |
| | | Cap Adaptive Multi- |
| | | Factor ETF |
| | | Period ended |
| | | June 30, 2021 (a) |
| Operations | | |
| Net investment income (loss) | $ | 6,980 |
| Net realized gain (loss) on investments | | 1,295 |
| Change in unrealized appreciation (depreciation) of investments | | 131,664 |
| Net Increase (Decrease) in Net Assets Resulting from Operations | | 139,939 |
| |
| |
| Capital Share Transactions | | |
| Net increase (decrease) in capital share transactions | | 6,262,759 |
| Total Increase (Decrease) in Net Assets | | 6,402,698 |
| |
| Net Assets | | |
| Beginning of period | | — |
| End of period | $ | 6,402,698 |
| |
| Capital Share Transactions | | |
| Dollars: | | |
| Sold | $ | 6,262,759 |
| Redeemed | | — |
| Net Increase (Decrease) | $ | 6,262,759 |
| Shares: | | |
| Sold | | 250,001 |
| Redeemed | | — |
| Net Increase (Decrease) | | 250,001 |
| |
| (a) Period from May 19, 2021, date operations commenced, through June 30, 2021. | | |
See accompanying notes.
37
| | | | | | |
| Statement of Changes in Net Assets | | | | | | |
| Principal Exchange-Traded Funds | | | | | | |
| |
| |
| | | Principal U.S. Small-Cap Multi-Factor | |
| | | | | ETF (a) | | |
| | | Year ended | | | Year ended | |
| | | June 30, 2021 | | June 30, 2020 | |
| Operations | | | | | | |
| Net investment income (loss) | $ | 13,278,051 | | $ | 5,411,731 | |
| Net realized gain (loss) on investments | | 186,577,277 | | | (11,982,621 | ) |
| Change in unrealized appreciation (depreciation) of investments | | 264,338,863 | | | (38,339,811 | ) |
| Net Increase (Decrease) in Net Assets Resulting from Operations | | 464,194,191 | | | (44,910,701 | ) |
| |
| Dividends to Shareholders | | | | | | |
| From net investment income and net realized gain on investments | | (10,376,768 | ) | | (4,965,930 | ) |
| Total Dividends | | (10,376,768 | ) | | (4,965,930 | ) |
| |
| Capital Share Transactions | | | | | | |
| Net increase (decrease) in capital share transactions | | 845,880,659 | | | 22,981,970 | |
| Total Increase (Decrease) in Net Assets | | 1,299,698,082 | | | (26,894,661 | ) |
| |
| Net Assets | | | | | | |
| Beginning of year | | 328,305,217 | | | 355,199,878 | |
| End of year | $ | 1,628,003,299 | | $ | 328,305,217 | |
| |
| Capital Share Transactions | | | | | | |
| Dollars: | | | | | | |
| Sold | $ | 1,451,694,258 | | $ | 113,314,051 | |
| Redeemed | | (605,813,599 | ) | | (90,332,081 | ) |
| Net Increase (Decrease) | $ | 845,880,659 | | $ | 22,981,970 | |
| Shares: | | | | | | |
| Sold | | 36,050,000 | | | 3,650,000 | |
| Redeemed | | (13,350,000 | ) | | (2,950,000 | ) |
| Net Increase (Decrease) | | 22,700,000 | | | 700,000 | |
(a) Effective September 30, 2020, Principal U.S. Small-Cap Multi-Factor Index ETF changed its name to Principal U.S. Small-Cap Multi-Factor ETF.
See accompanying notes.
38
| | | | | | |
| Statement of Changes in Net Assets | | | | | | |
| Principal Exchange-Traded Funds | | | | | | |
| |
| | | Principal Value ETF (a) | |
| | | Year ended | | Year ended | |
| | | June 30, 2021 | | June 30, 2020 | |
| Operations | | | | | | |
| Net investment income (loss) | $ | 826,275 | | $ | 417,491 | |
| Net realized gain (loss) on investments | | 7,607,296 | | | (430,875 | ) |
| Change in unrealized appreciation (depreciation) of investments | | 1,803,600 | | | 1,221,147 | |
| Net Increase (Decrease) in Net Assets Resulting from Operations | | 10,237,171 | | | 1,207,763 | |
| |
| Dividends to Shareholders | | | | | | |
| From net investment income and net realized gain on investments | | (700,888 | ) | | (284,301 | ) |
| Total Dividends | | (700,888 | ) | | (284,301 | ) |
| |
| Capital Share Transactions | | | | | | |
| Net increase (decrease) in capital share transactions | | 3,055,086 | | | 16,588,925 | |
| Total Increase (Decrease) in Net Assets | | 12,591,369 | | | 17,512,387 | |
| |
| Net Assets | | | | | | |
| Beginning of year | | 31,906,967 | | | 14,394,580 | |
| End of year | $ | 44,498,336 | | $ | 31,906,967 | |
| |
| Capital Share Transactions | | | | | | |
| Dollars: | | | | | | |
| Sold | $ | 38,529,990 | | $ | 24,375,394 | |
| Redeemed | | (35,474,904 | ) | | (7,786,469 | ) |
| Net Increase (Decrease) | $ | 3,055,086 | | $ | 16,588,925 | |
| Shares: | | | | | | |
| Sold | | 950,000 | | | 950,000 | |
| Redeemed | | (1,050,000 | ) | | (250,000 | ) |
| Net Increase (Decrease) | | (100,000 | ) | | 700,000 | |
| |
| (a) Effective September 30, 2020, Principal Shareholder Yield Index ETF changed its name to Principal Value ETF. | | | | |
| |
| |
| | | | | | | |
See accompanying notes.
39
Notes to Financial Statements
Principal Exchange-Traded Funds
June 30, 2021
1. Organization
The Principal Exchange-Traded Funds (the “Trust”) is a statutory trust organized under the laws of the State of Delaware in 2013 and is authorized to have multiple series or portfolios. The Trust is an open-end management investment company, registered under the Investment Company Act of 1940, as amended (the “1940 Act”). The Trust currently consists of fifteen series, Principal Active Income ETF, Principal Healthcare Innovators Index ETF, Principal International Adaptive Multi-Factor ETF, Principal International Multi-Factor ETF, Principal Investment Grade Corporate Active ETF, Principal Millennials Index ETF, Principal Quality ETF, Principal Spectrum Preferred Securities Active ETF, Principal Spectrum Tax-Advantaged Dividend Active ETF, Principal Ultra-Short Active Income ETF, Principal U.S. Large-Cap Adaptive Multi-Factor ETF, Principal U.S. Mega-Cap ETF, Principal U.S. Small-Cap Adaptive Multi-Factor ETF, Principal U.S. Small-Cap Multi-Factor ETF and Principal Value ETF
(collectively, the “Funds” and individually, a “Fund”). The Funds are “diversified”, and as such, the Funds' investments are required to meet certain diversification requirements under the 1940 Act. The shares of the Funds are referred to herein as “Shares”.
Each of the Funds is an investment company and applies specialized accounting and reporting under Accounting Standards Codification Topic 946, Financial Services - Investment Companies. The Funds have not provided financial support and are not contractually required to provide financial support to any investee.
The Trust issues and redeems Shares at net asset value (“NAV”) only with Authorized Participants (“APs”) and only in aggregations of 50,000 Shares with the exception of Principal International Adaptive Multi-Factor ETF and Principal International Multi-Factor ETF which are issued and redeemed in aggregations of 100,000 shares (each a “Creation Unit” or multiples thereof “Creation Unit Aggregations”), which is subject to change. The Trust issues and redeems Creation Unit Aggregations in exchange for portfolio securities and/or cash, plus a fixed and/or variable transaction fee.
Shares trade on exchanges at market prices that may be below, at, or above NAV. Shares are listed on the respective exchanges as listed below:
| |
| Fund | Exchange |
| Principal Active Income ETF | NYSE Arca |
| Principal Healthcare Innovators Index ETF | The Nasdaq Stock Market LLC |
| Principal International Adaptive Multi-Factor ETF | Cboe BZX Exchange, Inc. |
| Principal International Multi-Factor ETF | The Nasdaq Stock Market LLC |
| Principal Investment Grade Corporate Active ETF | NYSE Arca |
| Principal Millennials Index ETF | The Nasdaq Stock Market LLC |
| Principal Quality ETF | The Nasdaq Stock Market LLC |
| Principal Spectrum Preferred Securities Active ETF * | NYSE Arca |
| Principal Spectrum Tax-Advantaged Dividend Active ETF | NYSE Arca |
| Principal Ultra-Short Active Income ETF | NYSE Arca |
| Principal U.S. Large-Cap Adaptive Multi-Factor ETF | Cboe BZX Exchange, Inc. |
| Principal U.S. Mega-Cap ETF | The Nasdaq Stock Market LLC |
| Principal U.S. Small-Cap Adaptive Multi-Factor ETF | Cboe BZX Exchange, Inc. |
| Principal U.S. Small-Cap Multi-Factor ETF | The Nasdaq Stock Market LLC |
| Principal Value ETF | The Nasdaq Stock Market LLC |
* Effective August 17, 2020, Principal Spectrum Preferred Securities Active ETF changed its primary listing exchange to NYSE Arca from Cboe BZX Exchange, Inc..
Principal International Multi-Factor ETF initial investment and commencement of operations was July 23, 2019. Principal Spectrum Tax-Advantaged Dividend Active ETF initial investment and commencement of operations was June 16, 2020. Principal U.S. Large-Cap Adaptive Multi-Factor ETF and Principal U.S. Small-Cap Adaptive Multi-Factor ETF initial investments and commencement of operations was May 19, 2021. Principal International Adaptive Multi-Factor ETF initial investment and commencement of operations was May 26, 2021.
40
Notes to Financial Statements
Principal Exchange-Traded Funds
June 30, 2021
1. Organization (continued)
Effective July 22, 2020, Principal Spectrum Preferred Securities Active ETF issued a 5 to 1 stock split. The stock split has been retroactively reflected on the Statement of Changes in Net Assets and Financial Highlights.
Effective September 30, 2020, the following Funds changed their names as shown below:
| |
| Previous Name | New Name |
| Principal International Multi-Factor Core Index ETF | Principal International Multi-Factor ETF |
| Principal Price Setters Index ETF | Principal Quality ETF |
| Principal Shareholder Yield Index ETF | Principal Value ETF |
| Principal U.S. Mega-Cap Multi-Factor Index ETF | Principal U.S. Mega-Cap ETF |
| Principal U.S. Small-Cap Multi-Factor Index ETF | Principal U.S. Small-Cap Multi-Factor ETF |
2. Significant Accounting Policies
The preparation of financial statements in conformity with U.S. Generally Accepted Accounting Principles (“U.S. GAAP”) requires management to make estimates and assumptions that affect the reported amounts of assets and liabilities and disclosure of contingent assets and liabilities at the date of the financial statements and the reported amounts of revenues and expenses during the reporting period. Actual results could differ from those estimates. The following summarizes the significant accounting policies of the Funds:
Security Valuation. The Funds value securities for which market quotations are readily available at fair value, which is determined using the last reported sale price. If no sales are reported, as is regularly the case for some securities traded over-the-counter, securities are valued using the last reported bid price or an evaluated bid price provided by a pricing service. Pricing services use modeling techniques that incorporate security characteristics such as current quotations by broker/dealers, coupon, maturity, quality, type of issue, trading characteristics, other yield and risk factors and other market conditions to determine an evaluated bid price. When reliable market quotations are not considered to be readily available, which may be the case, for example, with respect to restricted securities, certain debt securities, preferred stocks, and foreign securities, the investments are valued at their fair value as determined in good faith by the Principal Global Investors, LLC (“the Advisor”) under procedures established and periodically reviewed by the Fund's Board of Trustees. The Funds invest in other publicly traded investment funds, which are valued at the respective fund's NAV.
The value of foreign securities used in computing the NAV per share is generally determined as of the close of the foreign exchange where the security is principally traded. Events that occur after the close of the applicable foreign market or exchange but prior to the calculation of the Fund’s NAV are reflected in the Fund’s NAV and these securities are valued at fair value. Many factors, provided by independent pricing services, are reviewed in the course of making a good faith determination of a security's fair value including, but not limited to, price movements in American Depository Receipts (“ADRs”), futures contracts, industry indices, general indices, and foreign currencies.
To the extent the Funds invest in foreign securities listed on foreign exchanges which trade on days on which the Funds do not determine NAV, for example, weekends and other customary national U.S. holidays, the Fund’s NAV could be significantly affected on days when shares are not able to be issued or redeemed by APs.
Certain securities issued by companies in emerging market countries may have more than one quoted valuation at any given point in time, sometimes referred to as a “local” price and a “premium” price. The premium price is often a negotiated price, which may not consistently represent a price at which a specific transaction can be effected. It is the policy of the Funds to value such securities at prices at which it is expected those shares may be sold, and the Advisor, or any sub-advisor, is authorized to make such determinations subject to such oversight by the Trust's Board of Trustees, as may occasionally be necessary.
41
Notes to Financial Statements
Principal Exchange-Traded Funds
June 30, 2021
2. Significant Accounting Policies (continued)
Income and Investment Transactions. The Funds record investment transactions on a trade date basis. The identified cost basis has been used in determining the net realized gain or loss from investment transactions and unrealized appreciation or depreciation of investments. The Funds record dividend income on the ex-dividend date, except dividend income from foreign securities whereby the ex-dividend date has passed; such dividends are recorded as soon as the Funds are informed of the ex-dividend date. Interest income is recognized on an accrual basis. Discounts and premiums on securities are accreted/amortized, respectively, on the level yield method over the expected lives of the respective securities. Callable debt securities purchased at a premium are amortized to the earliest call date and to the callable amount, if other than par.
Capital Share Transactions. Capital shares are issued and redeemed by the Funds only in a Creation Unit or Creation Unit Aggregations. Except when aggregated into at least a Creation Unit, Shares are not redeemable.
The consideration for the purchase of a Creation Unit or Creation Unit Aggregations of a Fund generally consists of a basket of cash and/or securities that the Fund specifies each business day. To offset transfer and other transaction costs associated with the issuance and redemption of Creation Unit Aggregations, APs are subject to standard creation and redemption transaction fees.
Expenses. For all Funds, a unitary investment management and advisory fee is charged. The Advisor covers all operating expenses through the investment management and advisory fee with the exception of 12b-1 fees, brokerage commissions and other expenses connected to the execution of portfolio transactions, interest expense, taxes, acquired fund fees and expenses, litigation expenses and other extraordinary expenses, if applicable.
Dividends to Shareholders. Dividends to shareholders of the Funds are recorded on the ex-dividend date. Dividends to shareholders from net investment income and net realized gain from investments and foreign currency transactions are determined in accordance with federal tax regulations, which may differ from U.S. GAAP. These differences are primarily due to differing treatments for amortization of premiums and discounts, futures contracts, net operating losses, sales of passive foreign investment companies, partnership investments, foreign currency transactions, losses deferred due to wash sales, tax straddles, mortgage-backed securities, certain preferred securities, redemptions-in-kind, real estate investment trusts (“REITs”), utilization of earnings and profits distributed to shareholders on redemption of Shares, and limitations imposed by Sections 381-384 of the Internal Revenue Code (“IRC”). Permanent book and tax basis differences are reclassified within the capital accounts based on federal tax-basis treatment; temporary differences do not require reclassification. To the extent dividends exceed current and accumulated earnings and profits for federal income tax purposes, they are reported as return of capital distributions.
Federal Income Taxes. No provision for federal income taxes is considered necessary because the Funds each intend to qualify as a “regulated investment company” under the IRC and they intend to distribute each year substantially all of their net investment income and realized capital gains to shareholders.
Management evaluates tax positions taken or expected to be taken in the course of preparing the Funds' tax returns to determine whether it is “more likely than not” that each tax position would be sustained upon examination by a taxing authority based on the technical merits of their position. Tax positions not deemed to meet the “more likely than not” threshold would be recorded as a tax benefit or expense in the current year. During the year ended June 30, 2021, the Funds did not record any such tax benefit or expense in the accompanying financial statements. The statute of limitations remains open for the last three years, once a return is filed. No examinations are in progress at this time.
Foreign Taxes. Certain Funds are subject to foreign income taxes imposed by certain countries in which they invest. Foreign income taxes are accrued by the Funds as a reduction of income. These amounts are shown as withholding tax on the Statements of Operations.
42
Notes to Financial Statements
Principal Exchange-Traded Funds
June 30, 2021
2. Significant Accounting Policies (continued)
Recent Accounting Pronouncements. In March 2020, the Financial Accounting Standards Board (“FASB”) issued Accounting Standards Update (“ASU”) No. 2020-04, Reference Rate Reform (Topic 848); Facilitation of the Effects of Reference Rate Reform on Financial Reporting, which provides optional guidance for a limited period of time to ease the potential burden in accounting for (or recognizing the effects of) reference rate reform. The guidance is applicable to contracts referencing London Inter-Bank Offered Rate (“LIBOR”) or another reference rate that is expected to be discontinued due to reference rate reform. The ASU is effective as of March 12, 2020 and generally can be applied through December 31, 2022. Management is evaluating the impact of the ASU over the period of time the ASU is effective.
3. Operating Policies
Contingent Convertible Securities (“CoCos”). As footnoted in the Schedules of Investments, certain of the Funds invest in contingent convertible securities. CoCos are hybrid debt securities that may convert into equity or have their principal written down upon the occurrence of certain “triggers”. Although a contingent convertible security's equity conversion and principal write-down features are tailored to the particular issuing banking institution and its regulatory requirements, triggers are generally linked to regulatory capital thresholds or regulatory actions calling into question such institution's continued viability as a going-concern. CoCos may have no stated maturity and fully discretionary coupons, which means coupon payments can be canceled at the issuing banking institution's discretion or at the request of the relevant regulatory authority without causing a default. To provide the appropriate regulatory capital treatment, CoCos are usually issued in the form of subordinated debt instruments that rank junior to the claims of holders of more senior obligations in the event of the issuer's liquidation. If CoCos are converted into equity securities due to a trigger event, holders will be further subordinated. The future value of CoCos is unpredictable and is influenced by many factors including, without limitation: the creditworthiness of the issuer and/or fluctuations in such issuer's applicable capital ratios; supply and demand for CoCos; general market conditions and available liquidity; and economic, financial and political events that affect the issuer, its particular market or the financial markets in general. Due to these features, CoCos may have substantially greater risk than other securities in times of financial stress.
Because of the uncertainty regarding whether a conversion event will occur, it may be difficult to predict when, if at all, a contingent convertible security will be converted to equity, and a fund may suffer losses as a result. If the trigger level is breached, the issuer's decision to write down, write off or convert a contingent convertible security may result in the fund's complete loss on an investment in CoCos with no chance of recovery even if the issuer remains in existence.
Cross Trades. The Funds may engage in cross trades. A cross trade is a purchase or sale transaction between affiliated portfolios executed directly or through an intermediary. Mutual funds and other managed portfolios may be considered affiliated if they have a common investment advisor, so a fund may be considered affiliated with any portfolio for which the fund's sub-advisor acts as an investment advisor. Such transactions are permissible provided that the conditions of Rule 17a-7 under the 1940 Act are satisfied. For the year ended June 30, 2021, the Funds did not engage in cross trades.
Deposits with Counterparty. Cash pledged as collateral is reflected as an asset on the Statements of Assets and Liabilities as deposits with counterparty. There are a variety of security types which require varying levels of pledged collateral. Customer account agreements govern cleared derivatives transactions such as futures contracts. Such transactions require posting of initial margin as determined by each relevant clearing agency which is segregated in an account at a futures commission merchant (“FCM”) registered with the Commodity Futures Trading Commission. As of June 30, 2021, deposits with counterparty for Principal Investment Grade Corporate Active ETF were $454,750.
43
Notes to Financial Statements
Principal Exchange-Traded Funds
June 30, 2021
3. Operating Policies (continued)
Futures Contracts. The Funds are subject to equity price risk, interest rate risk, and foreign currency exchange rate risk in the normal course of pursuing its investment objectives. The Funds may enter into futures contracts to hedge against changes in, or to gain exposure to, change in the value of equities, interest rates and foreign currencies. Initial margin deposits are made by cash deposits or segregation of specific securities as may be required by the exchange on which the transaction was conducted. Pursuant to the contracts, typically a Fund agrees to receive from or pay to the broker, an amount of cash equal to the daily fluctuation in the value of the contract. Such receipts or payments are known as “variation margin” and are recorded by the Funds as variation margin receivable or payable on financial derivative instruments. For those contracts where daily variation margin payments are not received from or paid to the broker, the cumulative unrealized gains or losses are included in variation margin receivable or payable on financial derivative instruments. Futures contracts are marked to market daily at the closing settlement price or in the absence of such a price, the most recent quoted bid price. If there are no quotations available, the security is valued at the last available closing settlement price. During the period the futures contracts are open, daily changes in the fair value of the contracts are recognized as unrealized gains or losses. These unrealized gains or losses are included as a component of net unrealized appreciation (depreciation) of investments on the Statements of Assets and Liabilities. When the contracts are closed, the Funds recognize a realized gain or loss equal to the difference between the proceeds from, or cost of, the closing transaction and the Fund’s cost basis in the contract. There is minimal counterparty credit risk to the Funds because futures are exchange traded and the exchange’s clearinghouse, as counterparty to all exchange traded futures, guarantees the futures against default.
Long and short U.S. Treasury futures contracts are used to obtain interest rate exposure in order to manage duration of the Principal Investment Grade Corporate Active ETF. The notional values of the futures contracts will vary in accordance with changing duration of this Fund.
Illiquid Securities. Illiquid securities generally cannot be sold or disposed of in the ordinary course of business (within seven calendar days) at approximately the value at which each of the Funds has valued the investments. This may have an adverse effect on each of the Funds’ ability to dispose of particular illiquid securities at fair value and may limit each of the Funds’ ability to obtain accurate market quotations for purposes of valuing the securities.
Indemnification. In a normal course of business, the Funds enter into contracts that contain a variety of indemnifications. The Funds’ maximum exposure under these arrangements is unknown as this would involve potential future claims against the Funds that have not yet occurred. Based on management's experience, the risk of loss would be remote.
Restricted Securities. Certain of the Funds may invest in securities that are subject to legal or contractual restrictions on resale. These securities generally may be resold in transactions exempt from registration or to the public if the securities are registered. Disposal of these securities may involve time-consuming negotiations and expense, and prompt sale at an acceptable price may be difficult.
Securities Lending. As footnoted in the Schedules of Investments, certain of the Funds may lend portfolio securities to approved brokerage firms. The Funds receive collateral, in the form of cash, against the loaned securities. During the period of the loan, the borrower must maintain collateral in an amount not less than 102% of the market value of the domestic and foreign fixed income loaned securities and 105% of the market value of the foreign equity loaned securities. The market value of the loaned securities is determined at the close of business of the Funds and any additional required collateral is delivered to the Funds on the next business day. The cash collateral received is usually invested in a SEC-registered money market mutual fund and the Funds could realize a loss on such investments. Further, the Funds could experience a delay in recovering their securities and possible loss of income or value if the borrower fails to return them. Securities lending income, net of related fees, is shown on the Statements of Operations.
44
Notes to Financial Statements
Principal Exchange-Traded Funds
June 30, 2021
3. Operating Policies (continued)
Underlying Funds. Series of Principal Funds, Inc. and Principal Variable Contracts Funds, Inc., affiliates of the Advisor, may invest in certain of the Funds (the “underlying funds”).
An underlying fund may experience relatively large redemptions or purchases as the investee fund periodically reallocates or rebalances its assets. These transactions may accelerate the realization of taxable income if sales of portfolio securities result in gains and could increase transaction costs.
The Advisor is the advisor to Principal Funds, Inc., Principal Variable Contracts Funds, Inc., and the underlying funds. The Advisor is committed to minimizing the potential impact of underlying fund risk to the underlying funds to the extent consistent with pursuing the investment objectives of the investee funds which it manages. Each may face conflicts of interest in fulfilling its responsibilities to all such funds.
As of June 30, 2021, Principal Funds, Inc. and Principal Variable Contracts Funds, Inc. owned the following percentages, in aggregate, of the outstanding Shares of the underlying funds listed below:
| | |
| | Total Percentage of | |
| Fund | Outstanding Shares Owned | |
| Principal Active Income ETF | 85.15 | % |
| Principal Investment Grade Corporate Active ETF | 96.94 | |
| Principal U.S. Mega-Cap ETF | 88.04 | |
| Principal U.S. Small-Cap Multi-Factor ETF | 95.24 | |
U.S. Government Agencies or Government-Sponsored Enterprises. Certain of the Funds may invest in U.S. Government agencies or government-sponsored enterprises. U.S. Government securities are obligations of, and in certain cases, guaranteed by, the U.S. Government or its agencies. The U.S. Government does not guarantee the NAV of the Funds’ Shares. Some U.S. Government securities such as treasury bills, notes and bonds, and securities guaranteed by the Government National Mortgage Association (“GNMA”) are supported by the full faith and credit of the U.S. Government. Other securities, such as those of the Federal Home Loan Bank, are supported by the right of the issuer to borrow from the U.S. Department of the Treasury. Still other securities, such as those of the Federal National Mortgage Association (“FNMA”), are supported by the discretionary authority of the U.S. Government to purchase the agency’s obligations.
Government related guarantors (those not backed by the full faith and credit of the U.S. Government) include FNMA and Federal Home Loan Mortgage Corporation (“FHLMC”). FNMA is a government sponsored corporation, the common stock of which is owned entirely by private stockholders. FNMA purchases conventional residential mortgages from a list of approved seller/servicers which include state and federally chartered savings and loan associations, mutual savings banks, commercial banks, credit unions, and mortgage bankers. Pass-through securities issued by FNMA are guaranteed as to the timely payment of principal and interest by FNMA, but are not backed by the full faith and credit of the U.S. Government. FHLMC issues participation certificates, which are pass-through securities, each representing an undivided interest in a pool of residential mortgages. FHLMC guarantees the timely payment of interest and ultimate collection of principal, but participation certificates are not backed by the full faith and credit of the U.S. Government.
45
Notes to Financial Statements
Principal Exchange-Traded Funds
June 30, 2021
3. Operating Policies (continued)
Derivatives. The following tables provide information about where on the Statements of Assets and Liabilities and Statements of Operations information about derivatives can be found:
| | | | | | | | |
| | Asset Derivatives | | | | Liability Derivatives | | | |
| | June 30, 2021 | | | | June 30, 2021 | | | |
| |
| | Statement of Assets and | | | | Statement of Assets and | | | |
| Derivatives not accounted for as hedging instruments | Liabilities Location | | Fair Value | | Liabilities Location | | Fair Value | |
| Principal Investment Grade Corporate Active ETF | | | | | | | | |
| Interest rate contracts | Receivables, Total | | | | Payables, Total | | | |
| | distributable earnings | | | | distributable earnings | | | |
| | (accumulated loss) | $ | 14,996 | * | (accumulated loss) | $ | (104,775 | )* |
* Includes cumulative unrealized appreciation (depreciation) of futures contracts as shown in the Schedule of Investments. Only the portion of the unrealized appreciation (depreciation) not yet cash settled is shown in the Statements of Assets and Liabilities as variation margin.
| | | | | | | |
| | | | Net Realized Gain or | | | Net Change in Unrealized | |
| | | | (Loss) on Derivatives | | | Appreciation | |
| | Location of Gain or (Loss) on | | Recognized in | | | (Depreciation) of | |
| | Derivatives Recognized in | | Statement of | | | Derivatives Recognized in | |
| Derivatives not accounted for as hedging instruments | Statement of Operations | | Operations | | | Statement of Operations | |
| Principal Investment Grade Corporate Active ETF | | | | | | | |
| Interest rate contracts | Net realized gain (loss) from | | | | | | |
| Futures contracts/Net change |
| in unrealized appreciation/ |
| (depreciation) of Futures |
| | contracts | $ | (43,401 | ) | $ | (4,831 | ) |
The following table includes a summary of the monthly average outstanding notional by derivative instrument type for the year ended June 30, 2021:
| | | |
| Contract Type | Derivative Type | | Average Notional |
| Principal Investment Grade Corporate Active ETF | | | |
| Interest rate contracts | Futures — Long | $ | 3,545,741 |
| | Futures — Short | | 18,080,982 |
| |
| 4. Fair Valuation | | | |
Fair value is defined as the price that the Funds would receive upon selling a security or transferring a liability in a timely transaction to an independent buyer in the principal or most advantageous market of the security at the measurement date. In determining fair value, the Funds may use one or more of the following approaches: market, income and/or cost. A hierarchy for inputs is used in measuring fair value that maximizes the use of observable inputs and minimizes the use of unobservable inputs by requiring that the most observable inputs be used when available.
Observable inputs are inputs that reflect the assumptions market participants would use in pricing the asset or liability developed based on market data obtained from sources independent of the Funds. Unobservable inputs are inputs that reflect the Fund’s own estimates about the estimates market participants would use in pricing the asset or liability developed based on the best information available in the circumstances.
46
Notes to Financial Statements
Principal Exchange-Traded Funds
June 30, 2021
4. Fair Valuation (continued)
The three-tier hierarchy of inputs is summarized in the three broad levels listed below.
Level 1 — Quoted prices are available in active markets for identical securities as of the reporting date. Investments which are generally included in this category include listed equities and listed derivatives.
Level 2 — Other significant observable inputs (including quoted prices for similar investments, interest rates, prepayment speeds, credit risk, etc.). Investments which are generally included in this category include certain corporate bonds, over-the-counter (“OTC”) derivatives, mortgage-backed securities and municipal bonds.
Level 3 — Significant unobservable inputs (including the Funds' assumptions in determining the fair value of investments). Investments which are generally included in this category include certain corporate bonds and certain mortgage-backed securities.
The availability of observable inputs can vary from security to security and is affected by a wide variety of factors, including, for example, the type of security, whether the security is new and not yet established in the market place, and other characteristics particular to the transaction. To the extent that valuation is based on models or inputs that are less observable or unobservable in the market, the determination of fair value requires more judgment. Accordingly, the degree of judgment exercised by the Funds in determining fair value is greatest for instruments categorized in Level 3.
In certain cases, the inputs used to measure fair value may fall into different levels of the fair value hierarchy. In such cases, for disclosure purposes, the level in the fair value hierarchy within which the fair value measurement in its entirety falls is determined based on the lowest level input that is significant to the fair value measurement in its entirety.
Fair value is a market based measure considered from the perspective of a market participant who holds the asset rather than an entity specific measure. Therefore, even when market assumptions are not readily available, the Funds’ own assumptions are set to reflect those that market participants would use in pricing the asset or liability at the measurement date. The Funds use prices and inputs that are current as of the measurement date, to the extent available.
Investments which are included in the Level 3 category may be valued using indicative quoted prices from brokers and dealers participating in the market for these investments. These investments are classified as Level 3 investments due to the lack of market transparency and market corroboration to support these quoted prices.
Valuation models may be used as the pricing source for other investments classified as Level 3. Valuation models rely on one or more significant unobservable inputs such as prepayment rates, probability of default, or loss severity in the event of default. Significant increases in any of those inputs in isolation would result in a significantly lower fair value measurement.
The fair values of these entities are dependent on economic, political and other considerations. The values of the underlying investee entities may be affected by significant changes in the economic conditions, changes in government policies, and other factors (e.g., natural disasters, pandemics, accidents, conflicts, etc.).
The inputs or methodology used for valuing securities are not necessarily an indication of the risk associated with investing in those instruments.
During the period there were no significant purchases, sales, or transfers into or out of Level 3.
47
Notes to Financial Statements
Principal Exchange-Traded Funds
June 30, 2021
4. Fair Valuation (continued)
The following is a summary of the inputs used as of June 30, 2021 in valuing the Funds' securities carried at fair value:
| | | | | | | | |
| | | | | Level 2 — | | | | |
| | | | | Other | | Level 3 — | | |
| | | Level 1 — | | Significant | | Significant | | |
| | | Quoted | | Observable | | Unobservable | | |
| Fund | | Prices | | Inputs | | Inputs | Totals (Level 1,2,3) | |
| |
| Principal Active Income ETF | | | | | | | | |
| Common Stocks* | $ | 58,354,201 | $ | — $ | | — $ | 58,354,201 | |
| Preferred Stocks* | | 18,464,400 | | — | | — | 18,464,400 | |
| Bonds* | | — | | 145,433,479 | | — | 145,433,479 | |
| Investment Companies | | 11,813,463 | | — | | — | 11,813,463 | |
| Total investments in securities | $ | 88,632,064 | $ | 145,433,479 | $ | — $ | 234,065,543 | |
| |
| Principal Healthcare Innovators Index ETF | | | | | | | | |
| Common Stocks* | $ | 175,986,387 | $ | — $ | | — $ | 175,986,387 | |
| Investment Companies | | 6,789,636 | | — | | — | 6,789,636 | |
| Total investments in securities | $ | 182,776,023 | $ | — $ | | — $ | 182,776,023 | |
| |
| Principal International Adaptive Multi-Factor ETF | | | | | | |
| Common Stocks* | $ | 46,780,738 | $ | — $ | | — $ | 46,780,738 | |
| Preferred Stocks* | | 163,339 | | — | | — | 163,339 | |
| Investment Companies | | 130,678 | | — | | — | 130,678 | |
| Total investments in securities | $ | 47,074,755 | $ | — $ | | — $ | 47,074,755 | |
| |
| Principal International Multi-Factor ETF | | | | | | | | |
| Common Stocks* | $ | 89,892,467 | $ | — $ | | — $ | 89,892,467 | |
| Preferred Stocks* | | 1,090,308 | | — | | — | 1,090,308 | |
| Investment Companies | | 1,752,702 | | — | | — | 1,752,702 | |
| Total investments in securities | $ | 92,735,477 | $ | — $ | | — $ | 92,735,477 | |
| |
| Principal Investment Grade Corporate Active ETF | | | | | | |
| Bonds* | $ | — $ | | 469,977,898 | $ | — $ | 469,977,898 | |
| Investment Companies | | 10,870,105 | | — | | — | 10,870,105 | |
| Total investments in securities | $ | 10,870,105 | $ | 469,977,898 | $ | — $ | 480,848,003 | |
| Assets | | | | | | | | |
| Interest rate contracts | | | | | | | | |
| Futures | $ | 14,996 | $ | — $ | | — $ | 14,996 | |
| Liabilities | | | | | | | | |
| Interest rate contracts | | | | | | | | |
| Futures | $ | (104,775 | ) $ | — $ | | — $ | (104,775 | ) |
| |
| Principal Millennials Index ETF | | | | | | | | |
| Common Stocks* | $ | 126,087,993 | $ | — $ | | — $ | 126,087,993 | |
| Investment Companies | | 5,114,784 | | — | | — | 5,114,784 | |
| Total investments in securities | $ | 131,202,777 | $ | — $ | | — $ | 131,202,777 | |
| |
| Principal Quality ETF | | | | | | | | |
| Common Stocks* | $ | 58,292,554 | $ | — $ | | — $ | 58,292,554 | |
| Investment Companies | | 164,623 | | — | | — | 164,623 | |
| Total investments in securities | $ | 58,457,177 | $ | — $ | | — $ | 58,457,177 | |
| |
| Principal Spectrum Preferred Securities Active ETF | | | | | | |
| Bonds* | $ | — $ | | 352,900,703 | $ | — $ | 352,900,703 | |
| Investment Companies | | 17,160,973 | | — | | — | 17,160,973 | |
| Total investments in securities | $ | 17,160,973 | $ | 352,900,703 | $ | — $ | 370,061,676 | |
48
| | | | | | | |
| Notes to Financial Statements |
| Principal Exchange-Traded Funds |
| June 30, 2021 |
|
| |
| |
| 4. Fair Valuation (continued) | | | | | | | |
| |
| | | | | Level 2 — | | | |
| | | | | Other | | Level 3 — | |
| | | Level 1 — | | Significant | | Significant | |
| | | Quoted | | Observable | | Unobservable | |
| Fund | | Prices | | Inputs | | Inputs | Totals (Level 1,2,3) |
| |
| Principal Spectrum Tax-Advantaged Dividend Active ETF | | | | | |
| Preferred Stocks* | $ | 3,099,462 | $ | — $ | | — $ | 3,099,462 |
| Bonds* | | — | | 19,092,475 | | — | 19,092,475 |
| Investment Companies | | 260,996 | | — | | — | 260,996 |
| Total investments in securities | $ | 3,360,458 | $ | 19,092,475 | $ | — $ | 22,452,933 |
| |
| Principal Ultra-Short Active Income ETF | | | | | | | |
| Bonds* | $ | — $ | | 8,253,844 | $ | — $ | 8,253,844 |
| Investment Companies | | 383,270 | | — | | — | 383,270 |
| Total investments in securities | $ | 383,270 | $ | 8,253,844 | $ | — $ | 8,637,114 |
| |
| Principal U.S. Large-Cap Adaptive Multi-Factor ETF | | | | | |
| Common Stocks* | $ | 29,771,947 | $ | — $ | | — $ | 29,771,947 |
| Investment Companies | | 115,078 | | — | | — | 115,078 |
| Total investments in securities | $ | 29,887,025 | $ | — $ | | — $ | 29,887,025 |
| |
| Principal U.S. Mega-Cap ETF | | | | | | | |
| Common Stocks* | $ | 1,953,147,984 | $ | — $ | | — $ | 1,953,147,984 |
| Investment Companies | | 4,160,028 | | — | | — | 4,160,028 |
| Total investments in securities | $ | 1,957,308,012 | $ | — $ | | — $ | 1,957,308,012 |
| |
| Principal U.S. Small-Cap Adaptive Multi-Factor ETF | | | | | |
| Common Stocks* | $ | 6,383,377 | $ | — $ | | — $ | 6,383,377 |
| Investment Companies | | 16,169 | | — | | — | 16,169 |
| Total investments in securities | $ | 6,399,546 | $ | — $ | | — $ | 6,399,546 |
| |
| Principal U.S. Small-Cap Multi-Factor ETF | | | | | | |
| Common Stocks* | $ | 1,623,399,604 | $ | — $ | | — $ | 1,623,399,604 |
| Investment Companies | | 20,215,759 | | — | | — | 20,215,759 |
| Total investments in securities | $ | 1,643,615,363 | $ | — $ | | — $ | 1,643,615,363 |
| |
| Principal Value ETF | | | | | | | |
| Common Stocks* | $ | 44,292,676 | $ | — $ | | — $ | 44,292,676 |
| Investment Companies | | 129,538 | | — | | — | 129,538 |
| Total investments in securities | $ | 44,422,214 | $ | — $ | | — $ | 44,422,214 |
| * | For additional detail regarding sector classifications, please see the Schedules of Investments. |
| 5. | Management Agreement and Transactions with Affiliates |
Management Services. The Funds have agreed to pay management and investment advisory fees to the Advisor computed at an annual percentage rate of each of the Funds' average daily net assets. A portion of the management fee is paid by the Advisor to the sub-advisor of the Funds, which is also an affiliate of the Advisor. The management fee schedule for the Funds is as follows:
| | | | | | | | |
| | First | | Next | | Next | | Over | |
| Fund | $500 Million | | $500 Million | | $500 Million | | $1.5 Billion | |
| Principal Healthcare Innovators Index ETF | 0.42 | % | 0.40 | % | 0.38 | % | 0.37 | % |
| Principal Millennials Index ETF | 0.45 | | 0.43 | | 0.41 | | 0.40 | |
49
| | |
| Notes to Financial Statements | | |
| Principal Exchange-Traded Funds | | |
| June 30, 2021 | | |
| |
| 5. Management Agreement and Transactions with Affiliates (continued) | | |
| |
| Fund | All Assets | |
| Principal Active Income ETF | 0.49 | % |
| Principal International Adaptive Multi-Factor ETF | 0.24 | |
| Principal International Multi-Factor ETF | 0.25 | |
| Principal Investment Grade Corporate Active ETF | 0.19 | * |
| Principal Quality ETF | 0.15 | |
| Principal Spectrum Preferred Securities Active ETF | 0.55 | |
| Principal Spectrum Tax-Advantaged Dividend Active ETF | 0.60 | |
| Principal Ultra-Short Active Income ETF | 0.18 | |
| Principal U.S. Large-Cap Adaptive Multi-Factor ETF | 0.15 | |
| Principal U.S. Mega-Cap ETF | 0.15 | |
| Principal U.S. Small-Cap Adaptive Multi-Factor ETF | 0.19 | |
| Principal U.S. Small-Cap Multi-Factor ETF | 0.38 | |
| Principal Value ETF | 0.15 | |
| |
| * Prior to June 1, 2021, the management fee was 0.26%. | | |
The Advisor has contractually agreed to limit the expenses (excluding interest expense, expenses related to fund investments, acquired fund fees and expenses, tax reclaim recovery expenses, and other extraordinary expenses) for certain of the Funds. The reductions and reimbursements are in amounts that maintain total operating expenses at or below certain limits.
The limit is expressed as a percentage of average daily net assets attributable to each Fund on an annualized basis during the reporting period. The expenses borne by the Advisor are subject to reimbursement by the Fund through the fiscal year end, provided no reimbursement will be made if it would result in the Fund exceeding the total operating expense limit. Any amount outstanding at the end of the period are shown as an expense reimbursement from Advisor or expense reimbursement to Advisor on the Statements of Assets and Liabilities. The expense limit for Principal U.S. Mega-Cap ETF is 0.12% through October 31, 2021.
Affiliated Ownership. At June 30, 2021, Principal Financial Services, Inc., Principal Funds, Inc., and Principal Variable Contracts Funds, Inc. (each an affiliate of the Advisor) owned Shares as follows:
| | |
| Fund | Shares | |
| Principal Active Income ETF | 9,494,200 | (a) |
| Principal International Adaptive Multi-Factor ETF | 390,000 | |
| Principal International Multi-Factor ETF | 556,897 | |
| Principal Investment Grade Corporate Active ETF | 17,450,000 | |
| Principal Spectrum Tax-Advantaged Dividend Active ETF | 995,521 | |
| Principal Ultra-Short Active Income ETF | 199,681 | |
| Principal U.S. Large-Cap Adaptive Multi-Factor ETF | 198,570 | |
| Principal U.S. Mega-Cap ETF | 43,450,000 | |
| Principal U.S. Small-Cap Adaptive Multi-Factor ETF | 200,964 | |
| Principal U.S. Small-Cap Multi-Factor ETF | 33,050,000 | |
(a) Reflects a 2 to 1 stock split effective after the close of trading on August 30, 2021, see 'Subsequent Events' in Notes to Financial Statements.
Affiliated Brokerage Commissions. With respect to Principal Spectrum Tax-Advantaged Dividend Active ETF, $772 of brokerage commissions were paid to SAMI Brokerage LLC, a member of the Principal Financial Group. The other Funds did not pay brokerage commissions to any member of the Principal Financial Group during the year ended June 30, 2021.
50
Notes to Financial Statements
Principal Exchange-Traded Funds
June 30, 2021
6. Investment Transactions
For the period ended June 30, 2021, the cost of investment securities purchased and proceeds from investment securities sold (not including short-term investments and in-kind transactions) by the Funds were as follows:
| | | | | | | | | | |
| | | Non-U.S. Government | | U.S. Government |
| Fund | | Purchases | | | Sales | | Purchases | | | Sales |
| Principal Active Income ETF | $ | 44,389,712 | $ | | 119,841,296 | $ | — | | $ | — |
| Principal Healthcare Innovators Index ETF | | 62,980,849 | | | 63,455,691 | | — | | | — |
| Principal International Adaptive Multi-Factor ETF | | 13,150,139 | | | 437,048 | | — | | | — |
| Principal International Multi-Factor ETF | | 39,916,031 | | | 36,699,260 | | — | | | — |
| Principal Investment Grade Corporate Active ETF | | 520,675,360 | | | 217,056,080 | | — | | | — |
| Principal Millennials Index ETF | | 42,936,777 | | | 38,551,515 | | — | | | — |
| Principal Quality ETF | | 13,783,531 | | | 13,756,534 | | — | | | — |
| Principal Spectrum Preferred Securities Active ETF | | 160,095,367 | | | 16,682,208 | | 11,700,625 | | | 12,585,940 |
| Principal Spectrum Tax-Advantaged Dividend Active ETF | | 3,152,242 | | | 3,225,572 | | 200,000 | | | 214,500 |
| Principal Ultra-Short Active Income ETF | | 9,433,042 | | | 8,972,027 | | 203,406 | | | 306,078 |
| Principal U.S. Large-Cap Adaptive Multi-Factor ETF | | 366,657 | | | 62,791 | | — | | | — |
| Principal U.S. Mega-Cap ETF | | 737,425,590 | | | 735,948,461 | | — | | | — |
| Principal U.S. Small-Cap Adaptive Multi-Factor ETF | | 219,371 | | | 13,518 | | — | | | — |
| Principal U.S. Small-Cap Multi-Factor ETF | | 870,695,172 | | | 865,314,761 | | — | | | — |
| Principal Value ETF | | 12,112,346 | | | 11,763,975 | | — | | | — |
| |
| For the period ended June 30, 2021, in-kind transactions were as follows: | | | | | | | | |
| |
| Fund | | | | | Purchases | | | Sales |
| Principal Healthcare Innovators Index ETF | | | | $ | 107,800,468 | $ | | 62,425,496 |
| Principal International Adaptive Multi-Factor ETF | | | | | 35,269,100 | | | — |
| Principal International Multi-Factor ETF | | | | | 90,841,934 | | | 33,635,816 |
| Principal Investment Grade Corporate Active ETF | | | | | 71,142,148 | | | 5,126,785 |
| Principal Millennials Index ETF | | | | | 143,130,562 | | | 76,176,933 |
| Principal Quality ETF | | | | | 83,768,741 | | | 52,437,451 |
| Principal Spectrum Preferred Securities Active ETF | | | | | 61,985,661 | | | — |
| Principal Spectrum Tax-Advantaged Dividend Active ETF | | | | | 954,222 | | | — |
| Principal U.S. Large-Cap Adaptive Multi-Factor ETF | | | | | 29,095,403 | | | — |
| Principal U.S. Mega-Cap ETF | | | | | 527,295,322 | | | 552,831,173 |
| Principal U.S. Small-Cap Adaptive Multi-Factor ETF | | | | | 6,072,159 | | | — |
| Principal U.S. Small-Cap Multi-Factor ETF | | | | | 1,448,818,704 | | | 607,806,268 |
| Principal Value ETF | | | | | 36,756,920 | | | 33,956,456 |
Unsettled in-kind purchases and sales at the end of the period are included in investment securities purchased and investment securities sold, respectively, on the Statements of Assets and Liabilities.
51
Notes to Financial Statements
Principal Exchange-Traded Funds
June 30, 2021
7. Federal Tax Information
Distributions to Shareholders. The federal income tax character of distributions paid for the periods ended June 30, 2021, and June 30, 2020 was as follows:
| | | | | | | |
| | | Ordinary Income | | Long-Term Capital Gain* |
| | | Period ended | | Period ended | | Period ended | Period ended |
| Fund | | June 30, 2021 | | June 30, 2020 | | June 30, 2021 | June 30, 2020 |
| Principal Active Income ETF | $ | 9,881,656 | $ | 13,270,230 | $ | — $ | — |
| Principal Healthcare Innovators Index ETF | | 527,787 | | — | | — | — |
| Principal International Adaptive Multi-Factor ETF | | — | | N/A | | — | N/A |
| Principal International Multi-Factor ETF | | 962,266 | | 286,121 | | — | — |
| Principal Investment Grade Corporate Active ETF | | 10,618,462 | | 7,184,698 | | 3,773,742 | 1,027,060 |
| Principal Millennials Index ETF | | 481,261 | | 175,301 | | — | — |
| Principal Quality ETF | | 296,923 | | 260,900 | | — | — |
| Principal Spectrum Preferred Securities Active ETF | | 9,608,037 | | 4,757,405 | | — | — |
| Principal Spectrum Tax-Advantaged Dividend Active ETF | | 1,062,462 | | — | | — | — |
| Principal Ultra-Short Active Income ETF | | 215,987 | | 346,501 | | — | — |
| Principal U.S. Large-Cap Adaptive Multi-Factor ETF | | — | | N/A | | — | N/A |
| Principal U.S. Mega-Cap ETF | | 27,303,682 | | 31,719,706 | | — | — |
| Principal U.S. Small-Cap Adaptive Multi-Factor ETF | | — | | N/A | | — | N/A |
| Principal U.S. Small-Cap Multi-Factor ETF | | 10,376,768 | | 4,965,930 | | — | — |
| Principal Value ETF | | 700,888 | | 284,301 | | — | — |
* The Funds designate these distributions as long-term capital gain dividends per IRC Sec. 852(b)(3)(C) in the 20-percent group (which may be taxed at a 20-percent rate, a 15-percent rate or a 0-percent rate, depending on the shareholder’s taxable income).
For U.S. federal income tax purposes, short-term capital gain distributions are considered ordinary income distributions.
Distributable Earnings. As of June 30, 2021, the components of distributable earnings (accumulated loss) on a federal income tax basis were:
| | | | | | | | | | | |
| | | | | | | | | Late Year | | | |
| | | | | | | | | Ordinary and | | | |
| | | Undistributed | | Undistributed | Unrealized | | | Post Oct | | | |
| | | Ordinary | | Long-Term | Appreciation/ | | | Capital Loss | | Capital Loss | |
| Fund | | Income | | Capital Gains | (Depreciation) | | | Deferrals | | Carryforward | |
| Principal Active Income ETF | $ | 831,649 | $ | — | $24,849,782 | | $ | — | $ | (14,379,385) | |
| Principal Healthcare Innovators Index ETF | | 861,124 | | — | 19,384,511 | | | (1,381,846) | | (854,489) | |
| Principal International Adaptive Multi-Factor ETF | | 75,711 | | — | (1,035,524) | | | — | | — | |
| Principal International Multi-Factor ETF | | 1,563,053 | | 349,597 | 5,074,989 | | | — | | — | |
| Principal Investment Grade Corporate Active ETF | | 1,067,183 | | 65,131 | 6,993,476 | | | — | | — | |
| Principal Millennials Index ETF | | 65,272 | | — | 11,188,422 | | | — | | (2,828,381) | |
| Principal Quality ETF | | 142,898 | | — | 2,374,987 | | | — | | (1,538,325) | |
| Principal Spectrum Preferred Securities Active ETF | | 1,381,160 | | — | 10,176,459 | | | — | | (1,875,171) | |
| Principal Spectrum Tax-Advantaged Dividend Active ETF | | 149,815 | | — | 1,427,464 | | | — | | — | |
| Principal Ultra-Short Active Income ETF | | 9,140 | | — | (26,912) | | | — | | (125,628) | |
| Principal U.S. Large-Cap Adaptive Multi-Factor ETF | | 15,441 | | 247 | 372,697 | | | — | | — | |
| Principal U.S. Mega-Cap ETF | | 8,465,068 | | — | 389,916,580 | | | — | | (63,824,955) | |
| Principal U.S. Small-Cap Adaptive Multi-Factor ETF | | 8,240 | | 35 | 131,664 | | | — | | — | |
| Principal U.S. Small-Cap Multi-Factor ETF | | 4,414,408 | | — | 223,375,303 | | | — | | (85,559,823) | |
| Principal Value ETF | | 340,273 | | — | 2,791,996 | | | — | | (2,182,414) | |
52
Notes to Financial Statements
Principal Exchange-Traded Funds
June 30, 2021
7. Federal Tax Information (continued)
Capital Loss Carryforwards. For federal income tax purposes, capital loss carryforwards are losses that can be used to offset future capital gains of the Fund. As of June 30, 2021, the Funds had approximate net capital loss carryforwards as follows:
| | | | | | | | | |
| | | No Expiration | | No Expiration | | | | | Annual |
| Fund | | Short-Term | | Long-Term | | Total | Limitations* |
| Principal Active Income ETF | $ | 5,508,508 | $ | 8,870,877 | $ | 14,379,385 | $ | 1,874,152 |
| Principal Healthcare Innovators Index ETF | | — | | 854,489 | | 854,489 | | — |
| Principal International Adaptive Multi-Factor ETF | | — | | — | | | — | | — |
| Principal International Multi-Factor ETF | | — | | — | | | — | | — |
| Principal Investment Grade Corporate Active ETF | | — | | — | | | — | | — |
| Principal Millennials Index ETF | | 2,819,136 | | 9,245 | | 2,828,381 | | — |
| Principal Quality ETF | | 1,157,520 | | 380,805 | | 1,538,325 | | 294,429 |
| Principal Spectrum Preferred Securities Active ETF | | 957,946 | | 917,225 | | 1,875,171 | | — |
| Principal Spectrum Tax-Advantaged Dividend Active ETF | | — | | — | | | — | | — |
| Principal Ultra-Short Active Income ETF | | 71,425 | | 54,203 | | 125,628 | | — |
| Principal U.S. Large-Cap Adaptive Multi-Factor ETF | | — | | — | | | — | | — |
| Principal U.S. Mega-Cap ETF | | 57,299,653 | | 6,525,302 | | 63,824,955 | | — |
| Principal U.S. Small-Cap Adaptive Multi-Factor ETF | | — | | — | | | — | | — |
| Principal U.S. Small-Cap Multi-Factor ETF | | 56,960,496 | | 28,599,327 | | 85,559,823 | | — |
| Principal Value ETF | | 869,689 | | 1,312,725 | | 2,182,414 | | 230,798 |
* In accordance with IRC Sections 381-384, a portion of certain Funds’ losses have been subjected to an annual limitation.
All of these capital losses were generated in taxable years beginning after the enactment date of the Regulated Investment Company Modernization Act of 2010 on December 22, 2010, and will be carried forward with no expiration and with the character of the loss retained.
For the year ended June 30, 2021, the Funds utilized capital loss carryforwards as follows:
| | |
| Fund | | Utilized |
| Principal Healthcare Innovators Index ETF | $ | 2,985,702 |
| Principal Spectrum Tax-Advantaged Dividend Active ETF | | 5,892 |
| Principal U.S. Mega-Cap ETF | | 16,646,055 |
Late-Year Losses. A regulated investment company may elect to treat any portion of its qualified late-year loss as arising on the first day of the next taxable year. Qualified late-year losses are certain capital and ordinary losses which occur during the portion of the Fund’s taxable year subsequent to October 31 and December 31, respectively.
For the taxable year ended June 30, 2021, the Funds intend to defer late-year capital and ordinary losses as follows:
| | | | | |
| Fund | | Late Year Ordinary Loss | | Post October Loss Capital Loss | |
| Principal Healthcare Innovators Index ETF | $ | — | $ | (1,381,846 | ) |
53
Notes to Financial Statements
Principal Exchange-Traded Funds
June 30, 2021
7. Federal Tax Information (continued)
Reclassification of Capital Accounts. The Funds may record reclassifications in their capital accounts. These reclassifications have no impact on the total net assets of the Funds. The reclassifications are a result of permanent differences between U.S. GAAP and tax accounting. Adjustments are made to reflect the impact these items have on current and future distributions to shareholders. Therefore, the source of the Funds’ distributions may be shown in the accompanying Statement of Changes in Net Assets as from net investment income and net realized gains on investments or from tax return of capital depending on the type of book and tax differences that exist. For the period ended June 30, 2021, the Funds recorded reclassifications as follows:
| | | | | |
| | | Total | | | |
| | | Distributable Earnings | | | |
| Fund | | (Accumulated Loss) | | | Paid In Capital |
| Principal Active Income ETF | $ | (268,856 | ) | $ | 268,856 |
| Principal Healthcare Innovators Index ETF | | (26,764,189 | ) | | 26,764,189 |
| Principal International Adaptive Multi-Factor ETF | | (15,000 | ) | | 15,000 |
| Principal International Multi-Factor ETF | | (6,677,500 | ) | | 6,677,500 |
| Principal Investment Grade Corporate Active ETF | | (1,023,845 | ) | | 1,023,845 |
| Principal Millennials Index ETF | | (22,957,641 | ) | | 22,957,641 |
| Principal Quality ETF | | (7,315,778 | ) | | 7,315,778 |
| Principal Spectrum Preferred Securities Active ETF | | (757,854 | ) | | 757,854 |
| Principal Spectrum Tax-Advantaged Dividend Active ETF | | — | | | — |
| Principal Ultra-Short Active Income ETF | | (3,091 | ) | | 3,091 |
| Principal U.S. Large-Cap Adaptive Multi-Factor ETF | | — | | | — |
| Principal U.S. Mega-Cap ETF | | (175,651,470 | ) | | 175,651,470 |
| Principal U.S. Small-Cap Adaptive Multi-Factor ETF | | — | | | — |
| Principal U.S. Small-Cap Multi-Factor ETF | | (208,573,293 | ) | | 208,573,293 |
| Principal Value ETF | | (7,817,645 | ) | | 7,817,645 |
Federal Income Tax Basis. As of June 30, 2021, the net federal income tax unrealized appreciation (depreciation) and federal tax cost of investments held by each Fund were as follows:
| | | | | | | | | |
| | | | | | | | | | Cost for |
| | | | | | | Net Unrealized | | | Federal |
| | | Unrealized | | Unrealized | | Appreciation | | | Income Tax |
| Fund | | Appreciation | | Depreciation | | (Depreciation) | | | Purposes |
| Principal Active Income ETF | $ | 27,746,110 | $ | (2,896,082 | ) $ | 24,850,028 | | $ | 209,215,515 |
| Principal Healthcare Innovators Index ETF | | 32,133,352 | | (12,748,841 | ) | 19,384,511 | | | 163,391,512 |
| Principal International Adaptive Multi-Factor ETF | | 284,101 | | (1,319,182 | ) | (1,035,081 | ) | | 48,109,836 |
| Principal International Multi-Factor ETF | | 6,300,488 | | (1,224,018 | ) | 5,076,470 | | | 87,659,007 |
| Principal Investment Grade Corporate Active ETF | | 8,896,060 | | (1,902,584 | ) | 6,993,476 | | | 473,764,748 |
| Principal Millennials Index ETF | | 13,595,959 | | (2,407,370 | ) | 11,188,589 | | | 120,014,188 |
| Principal Quality ETF | | 2,915,066 | | (540,078 | ) | 2,374,988 | | | 56,082,189 |
| Principal Spectrum Preferred Securities Active ETF | | 11,030,241 | | (853,781 | ) | 10,176,460 | | | 359,885,216 |
| Principal Spectrum Tax-Advantaged Dividend Active ETF | | 1,430,511 | | (3,048 | ) | 1,427,463 | | | 21,025,470 |
| Principal Ultra-Short Active Income ETF | | 9,124 | | (36,036 | ) | (26,912 | ) | | 8,664,026 |
| Principal U.S. Large-Cap Adaptive Multi-Factor ETF | | 666,512 | | (293,815 | ) | 372,697 | | | 29,514,328 |
| Principal U.S. Mega-Cap ETF | | 395,022,185 | | (5,105,605 | ) | 389,916,580 | | | 1,567,391,432 |
| Principal U.S. Small-Cap Adaptive Multi-Factor ETF | | 331,137 | | (199,473 | ) | 131,664 | | | 6,267,882 |
| Principal U.S. Small-Cap Multi-Factor ETF | | 250,054,123 | | (26,678,820 | ) | 223,375,303 | | | 1,420,240,060 |
| Principal Value ETF | | 3,225,909 | | (433,914 | ) | 2,791,995 | | | 41,630,219 |
54
Notes to Financial Statements
Principal Exchange-Traded Funds
June 30, 2021
8. Subsequent Events
Management has evaluated events or transactions that have occurred through the date the financial statements were issued that would merit recognition or disclosure in the financial statements. Effective September 1, 2021, Principal Active Income ETF changed its name to Principal Active High Yield ETF, and its objective to seek to provide a high level of current income. In addition to the name change, the Trust's Board of Trustees authorized a 2 for 1 stock split effective after the close of trading on August 30, 2021. The stock split has been reflected in the shares outstanding, NAV per share and other per share information on the accompanying Statement of Assets and Liabilities, Statement of Changes in Net Assets and Financial Highlights. The stock split had no impact on the net assets or the total value of a shareholder's investment of Principal Active Income ETF. There were no additional items requiring adjustment of the financial statements or additional disclosure.
55
| | | | |
| Schedule of Investments |
| Principal Active Income ETF |
| June 30, 2021 |
| |
| COMMON STOCKS — 25.11% | | Shares Held | | Value |
| Advertising — 0.79% | | | | |
| Interpublic Group of Cos Inc/The | | 56,880 | $ | 1,848,031 |
| Apparel — 0.06% | | | | |
| VF Corp | | 1,628 | | 133,561 |
| Auto Manufacturers — 0.40% | | | | |
| PACCAR Inc | | 10,436 | | 931,413 |
| Auto Parts & Equipment — 0.30% | | | | |
| Magna International Inc | | 7,456 | | 690,724 |
| Banks — 2.09% | | | | |
| Bank of Hawaii Corp | | 8,751 | | 737,009 |
| Columbia Banking System Inc | | 5,275 | | 203,404 |
| Cullen / Frost Bankers Inc | | 3,849 | | 431,088 |
| East West Bancorp Inc | | 17,922 | | 1,284,828 |
| JPMorgan Chase & Co | | 10,698 | | 1,663,967 |
| PacWest Bancorp | | 6,629 | | 272,850 |
| US Bancorp | | 3,604 | | 205,320 |
| Washington Trust Bancorp Inc | | 1,061 | | 54,482 |
| | | | $ | 4,852,948 |
| |
| Chemicals — 0.47% | | | | |
| Air Products & Chemicals Inc | | 3,758 | | 1,081,101 |
| Computers — 0.87% | | | | |
| Apple Inc | | 14,831 | | 2,031,254 |
| Diversified Financial Services — 1.50% | | | | |
| BlackRock Inc | | 1,968 | | 1,721,941 |
| KKR & Co Inc, Class A | | 29,740 | | 1,761,798 |
| | | | $ | 3,483,739 |
| |
| Electric — 1.60% | | | | |
| ALLETE Inc | | 14,108 | | 987,278 |
| Eversource Energy | | 10,176 | | 816,522 |
| WEC Energy Group Inc | | 10,002 | | 889,678 |
| Xcel Energy Inc | | 15,402 | | 1,014,684 |
| | | | $ | 3,708,162 |
| |
| Electronics — 0.48% | | | | |
| Honeywell International Inc | | 5,097 | | 1,118,027 |
| Food — 0.60% | | | | |
| Hormel Foods Corp | | 18,268 | | 872,297 |
| Tyson Foods Inc, Class A | | 7,170 | | 528,859 |
| | | | $ | 1,401,156 |
| |
| Hand/Machine Tools — 0.62% | | | | |
| Lincoln Electric Holdings Inc | | 6,497 | | 855,720 |
| Snap-on Inc | | 2,618 | | 584,940 |
| | | | $ | 1,440,660 |
| |
| Healthcare — Products — 1.81% | | | | |
| Abbott Laboratories | | 12,596 | | 1,460,254 |
| Medtronic PLC | | 12,989 | | 1,612,324 |
| Teleflex Inc | | 2,797 | | 1,123,807 |
| | | | $ | 4,196,385 |
| |
| Home Builders — 0.24% | | | | |
| LCI Industries | | 4,291 | | 563,923 |
| Insurance — 0.81% | | | | |
| Chubb Ltd | | 6,054 | | 962,223 |
See accompanying notes.
56
| | | | |
| Schedule of Investments |
| Principal Active Income ETF |
| June 30, 2021 |
| |
| COMMON STOCKS (continued) | | Shares Held | | Value |
| Insurance (continued) | | | | |
| Fidelity National Financial Inc | | 20,926 | $ | 909,444 |
| | | | $ | 1,871,667 |
| |
| Leisure Time — 0.30% | | | | |
| Acushnet Holdings Corp | | 14,019 | | 692,539 |
| Machinery — Diversified — 0.93% | | | | |
| Deere & Co | | 2,940 | | 1,036,967 |
| Nordson Corp | | 5,143 | | 1,128,940 |
| | | | $ | 2,165,907 |
| |
| Media — 0.84% | | | | |
| Comcast Corp, Class A | | 34,394 | | 1,961,146 |
| Oil & Gas — 2.02% | | | | |
| Chevron Corp | | 6,517 | | 682,591 |
| EOG Resources Inc | | 9,595 | | 800,607 |
| Exxon Mobil Corp | | 3,325 | | 209,741 |
| Marathon Petroleum Corp | | 15,086 | | 911,496 |
| Whiting Petroleum Corp (a) | | 38,475 | | 2,098,811 |
| | | | $ | 4,703,246 |
| |
| Packaging & Containers — 0.47% | | | | |
| Packaging Corp of America | | 7,996 | | 1,082,818 |
| Pharmaceuticals — 1.00% | | | | |
| Johnson & Johnson | | 3,674 | | 605,255 |
| Merck & Co Inc | | 13,049 | | 1,014,821 |
| Pfizer Inc | | 17,889 | | 700,533 |
| | | | $ | 2,320,609 |
| |
| REITs — 1.56% | | | | |
| Alexandria Real Estate Equities Inc | | 6,763 | | 1,230,460 |
| Digital Realty Trust Inc | | 8,404 | | 1,264,466 |
| Medical Properties Trust Inc | | 56,809 | | 1,141,861 |
| | | | $ | 3,636,787 |
| |
| Retail — 2.56% | | | | |
| Costco Wholesale Corp | | 3,847 | | 1,522,143 |
| Home Depot Inc/The | | 4,851 | | 1,546,935 |
| Starbucks Corp | | 12,216 | | 1,365,871 |
| Tractor Supply Co | | 8,108 | | 1,508,574 |
| | | | $ | 5,943,523 |
| |
| Semiconductors — 1.53% | | | | |
| Applied Materials Inc | | 13,182 | | 1,877,117 |
| Microchip Technology Inc | | 11,216 | | 1,679,484 |
| | | | $ | 3,556,601 |
| |
| Software — 0.58% | | | | |
| Broadridge Financial Solutions Inc | | 3,922 | | 633,521 |
| SAP SE | | 5,103 | | 716,767 |
| | | | $ | 1,350,288 |
| |
| Telecommunications — 0.40% | | | | |
| BCE Inc | | 19,089 | | 941,469 |
| Toys, Games & Hobbies — 0.28% | | | | |
| Hasbro Inc | | 6,840 | | 646,517 |
| TOTAL COMMON STOCKS | | | $ | 58,354,201 |
See accompanying notes.
57
| | | |
| Schedule of Investments |
| Principal Active Income ETF |
| June 30, 2021 |
| |
| PREFERRED STOCKS — 7.94% | Shares Held | | Value |
| |
| Banks — 3.22% | | | |
| Bank of America Corp; Series KK | | | |
| 5.38%, 06/25/2024 (b) (c) | 30,000 | $ | 838,200 |
| Bank of America Corp; Series NN | | | |
| 4.38%, 09/01/2066 (b) | 20,000 | | 524,000 |
| JPMorgan Chase & Co; Series LL | | | |
| 4.63%, 06/01/2026 (b),(c) | 25,000 | | 665,750 |
| KeyCorp; Series F | | | |
| 5.65%, 12/15/2023 (b),(c) | 40,000 | | 1,108,800 |
| Morgan Stanley; Series E | | | |
| (3-month USD LIBOR + 4.32%), | | | |
| 7.13%, 10/15/2023 (b),(c),(d) | 30,000 | | 867,600 |
| Morgan Stanley; Series I | | | |
| (3-month USD LIBOR + 3.71%), | | | |
| 6.38%, 10/15/2024 (b),(d) | 10,000 | | 290,800 |
| Truist Financial Corp; Series O | | | |
| 5.25%, 06/01/2025 (b),(c) | 40,000 | | 1,138,000 |
| US Bancorp; Series L | | | |
| 3.75%, 01/15/2026 (b),(c) | 40,000 | | 998,800 |
| Wells Fargo & Co; Series Y | | | |
| 5.63%, 06/15/2022 (b),(c) | 20,000 | | 529,600 |
| Wells Fargo & Co; Series Z | | | |
| 4.75%, 03/15/2025 (b),(c) | 20,000 | | 523,000 |
| | | $ | 7,484,550 |
| |
| Electric — 1.33% | | | |
| Alabama Power Co; Series A | | | |
| 5.00%, 10/01/2022 (b),(c) | 40,000 | | 1,075,200 |
| Duke Energy Corp; Series A | | | |
| 5.75%, 06/15/2024 (b),(c) | 35,000 | | 1,005,550 |
| Entergy Louisiana LLC | | | |
| 4.88%, 09/01/2066 (c) | 20,000 | | 510,200 |
| Entergy Mississippi LLC | | | |
| 4.90%, 10/01/2066 (c) | 20,000 | | 507,600 |
| | | $ | 3,098,550 |
| |
| Gas — 0.49% | | | |
| NiSource Inc | | | |
| (5-year Treasury Constant Maturity Rate + 3.63%), | | | |
| 6.50%, 03/15/2024 (b), (c),(d) | 40,000 | | 1,146,400 |
| |
| Insurance — 0.95% | | | |
| Allstate Corp/The; Series H | | | |
| 5.10%, 10/15/2024 (b),(c) | 40,000 | | 1,125,600 |
| MetLife Inc; Series F | | | |
| 4.75%, 03/15/2025 (b) | 40,000 | | 1,079,600 |
| | | $ | 2,205,200 |
| |
| REITs — 1.95% | | | |
| Kimco Realty Corp; Series L | | | |
| 5.13%, 08/16/2022 (b) | 40,000 | | 1,037,200 |
| PS Business Parks Inc; Series W | | | |
| 5.20%, 10/20/2021 (b) | 20,000 | | 509,800 |
| PS Business Parks Inc; Series Y | | | |
| 5.20%, 12/07/2022 (b) | 20,000 | | 534,200 |
| Public Storage; Series E | | | |
| 4.90%, 10/14/2021 (b) | 10,000 | | 255,100 |
| Public Storage; Series H | | | |
| 5.60%, 03/11/2024 (b),(c) | 30,000 | | 858,000 |
| Public Storage; Series O | | | |
| 3.90%, 11/17/2025 (b) | 10,000 | | 262,200 |
See accompanying notes.
58
| | | | |
| Schedule of Investments |
| Principal Active Income ETF |
| June 30, 2021 |
| |
| PREFERRED STOCKS (continued) | | Shares Held | | Value |
| |
| REITs (continued) | | | | |
| Vornado Realty Trust; Series M | | | | |
| 5.25%, 12/13/2022 (b) | | 40,000 | $ | 1,073,200 |
| | | | $ | 4,529,700 |
| TOTAL PREFERRED STOCKS | | | $ | 18,464,400 |
| | | Principal | | |
| BONDS — 62.57% | | Amount | | Value |
| |
| Apparel — 1.78% | | | | |
| Under Armour Inc | | | | |
| 3.25%, 06/15/2026 (c) | $ | 4,000,000 | $ | 4,144,320 |
| |
| Banks — 5.39% | | | | |
| Citigroup Inc | | | | |
| (5-year Treasury Constant Maturity Rate + 3.60%), | | | | |
| 4.00%, 12/10/2025 (b),(d) | | 4,000,000 | | 4,135,000 |
| Goldman Sachs Group Inc/The | | | | |
| (5-year Treasury Constant Maturity Rate + 3.22%), | | | | |
| 4.95%, 02/10/2025 (b),(d) | | 4,000,000 | | 4,275,440 |
| JPMorgan Chase & Co | | | | |
| (3-month USD LIBOR + 3.25%), | | | | |
| 5.15%, 05/01/2023 (b),(d) | | 4,000,000 | | 4,130,000 |
| | | | $ | 12,540,440 |
| |
| Chemicals — 3.76% | | | | |
| HB Fuller Co | | | | |
| 4.25%, 10/15/2028 | | 4,500,000 | | 4,650,885 |
| Kraton Polymers LLC / Kraton Polymers Capital Corp | | | | |
| 4.25%, 12/15/2025 (e) | | 4,000,000 | | 4,080,000 |
| | | | $ | 8,730,885 |
| |
| Electric — 5.68% | | | | |
| Emera Inc | | | | |
| (3-month USD LIBOR + 5.44%), | | | | |
| 6.75%, 06/15/2076 (d) | | 3,000,000 | | 3,513,750 |
| GenOn Energy Inc | | | | |
| 0.00%, 10/15/2049 (a),(f),(g) | | 3,100,000 | | — |
| PPL Capital Funding Inc | | | | |
| (3-month USD LIBOR + 2.67%), | | | | |
| 2.81%, 03/30/2067 (d) | | 5,000,000 | | 4,912,500 |
| Talen Energy Supply LLC | | | | |
| 4.60%, 12/15/2021 | | 5,000,000 | | 4,775,000 |
| | | | $ | 13,201,250 |
| |
| Environmental Control — 2.67% | | | | |
| Covanta Holding Corp | | | | |
| 5.88%, 07/01/2025 | | 2,000,000 | | 2,067,400 |
| Waste Pro USA Inc | | | | |
| 5.50%, 02/15/2026 (e) | | 4,000,000 | | 4,129,000 |
| | | | $ | 6,196,400 |
| |
| Food — 1.75% | | | | |
| Post Holdings Inc | | | | |
| 4.63%, 04/15/2030 (e) | | 4,000,000 | | 4,067,320 |
| |
| Healthcare — Products — 1.81% | | | | |
| Hologic Inc | | | | |
| 4.63%, 02/01/2028 (e) | | 4,000,000 | | 4,200,000 |
| |
| Healthcare — Services — 5.66% | | | | |
| Encompass Health Corp | | | | |
| 4.75%, 02/01/2030 | | 2,000,000 | | 2,125,000 |
| 5.75%, 09/15/2025 | | 2,000,000 | | 2,057,500 |
See accompanying notes.
59
| | | | |
| Schedule of Investments |
| Principal Active Income ETF |
| June 30, 2021 |
| |
| | | Principal | | |
| BONDS (continued) | | Amount | | Value |
| |
| Healthcare — Services (continued) | | | | |
| HCA Inc | | | | |
| 5.63%, 09/01/2028 | $ | 4,000,000 | $ | 4,740,000 |
| MEDNAX Inc | | | | |
| 6.25%, 01/15/2027 (e) | | 4,000,000 | | 4,235,000 |
| | | | $ | 13,157,500 |
| |
| Home Builders — 1.70% | | | | |
| PulteGroup Inc | | | | |
| 6.38%, 05/15/2033 | | 3,000,000 | | 3,962,280 |
| |
| Insurance — 1.30% | | | | |
| MetLife Inc | | | | |
| 9.25%, 04/08/2068 (e) | | 2,000,000 | | 3,032,928 |
| |
| Iron & Steel — 0.94% | | | | |
| Allegheny Technologies Inc | | | | |
| 7.88%, 08/15/2023 | | 2,000,000 | | 2,192,500 |
| |
| Lodging — 1.34% | | | | |
| Boyd Gaming Corp | | | | |
| 4.75%, 12/01/2027 | | 3,000,000 | | 3,105,000 |
| |
| Media — 8.99% | | | | |
| Cable One Inc | | | | |
| 4.00%, 11/15/2030 (e) | | 4,750,000 | | 4,767,813 |
| CCO Holdings LLC / CCO Holdings Capital Corp | | | | |
| 5.13%, 05/01/2027 (e) | | 1,000,000 | | 1,048,900 |
| 5.38%, 06/01/2029 (e) | | 2,000,000 | | 2,186,200 |
| CSC Holdings LLC | | | | |
| 6.75%, 11/15/2021 | | 3,000,000 | | 3,059,100 |
| DISH DBS Corp | | | | |
| 5.13%, 06/01/2029 (e) | | 3,000,000 | | 2,962,290 |
| 5.88%, 11/15/2024 | | 2,000,000 | | 2,147,500 |
| Sirius XM Radio Inc | | | | |
| 4.13%, 07/01/2030 (e) | | 1,500,000 | | 1,513,320 |
| 5.00%, 08/01/2027 (e) | | 1,000,000 | | 1,047,750 |
| ViacomCBS Inc | | | | |
| (3-month USD LIBOR + 3.90%), | | | | |
| 5.88%, 02/28/2057 (d) | | 1,000,000 | | 1,017,700 |
| (3-month USD LIBOR + 3.90%), | | | | |
| 6.25%, 02/28/2057 (d) | | 1,000,000 | | 1,145,080 |
| | | | $ | 20,895,653 |
| |
| Mining — 1.47% | | | | |
| Hudbay Minerals Inc | | | | |
| 4.50%, 04/01/2026 (e) | | 1,275,000 | | 1,279,781 |
| 6.13%, 04/01/2029 (e) | | 2,000,000 | | 2,130,000 |
| | | | $ | 3,409,781 |
| |
| Office & Business Equipment — 1.30% | | | | |
| CDW LLC / CDW Finance Corp | | | | |
| 4.25%, 04/01/2028 | | 750,000 | | 787,500 |
| 5.50%, 12/01/2024 | | 2,000,000 | | 2,229,460 |
| | | | $ | 3,016,960 |
| |
| Oil & Gas — 1.25% | | | | |
| W&T Offshore Inc | | | | |
| 9.75%, 11/01/2023 (e) | | 3,000,000 | | 2,910,000 |
| |
| Packaging & Containers — 3.54% | | | | |
| Graphic Packaging International LLC | | | | |
| 3.50%, 03/15/2028 (e) | | 5,000,000 | | 5,037,500 |
See accompanying notes.
60
| | | | | |
| Schedule of Investments |
| Principal Active Income ETF |
| June 30, 2021 |
| |
| | | Principal | | | |
| BONDS (continued) | | Amount | | Value | |
| Packaging & Containers (continued) | | | | | |
| Sealed Air Corp | | | | | |
| 4.00%, 12/01/2027 (e) | $ | 3,000,000 | $ | 3,191,250 | |
| | | | $ | 8,228,750 | |
| |
| Pharmaceuticals — 1.73% | | | | | |
| HLF Financing Sarl LLC / Herbalife International Inc | | | | | |
| 4.88%, 06/01/2029 (e) | | 4,000,000 | | 4,030,000 | |
| Pipelines — 5.40% | | | | | |
| Buckeye Partners LP | | | | | |
| 3.95%, 12/01/2026 | | 4,000,000 | | 4,070,000 | |
| EnLink Midstream Partners LP | | | | | |
| 4.15%, 06/01/2025 | | 4,000,000 | | 4,189,360 | |
| 4.85%, 07/15/2026 | | 1,000,000 | | 1,035,000 | |
| Transcanada Trust | | | | | |
| (3-month USD LIBOR + 3.53%), | | | | | |
| 5.63%, 05/20/2075 (d) | | 3,000,000 | | 3,247,500 | |
| | | | $ | 12,541,860 | |
| |
| REITs — 1.45% | | | | | |
| CBL & Associates LP | | | | | |
| 0.00%, 12/15/2026 (a),(g) | | 6,000,000 | | 3,375,000 | |
| Telecommunications — 2.74% | | | | | |
| CommScope Technologies LLC | | | | | |
| 5.00%, 03/15/2027 (c),(e) | | 4,000,000 | | 4,095,000 | |
| Sprint Corp | | | | | |
| 7.88%, 09/15/2023 | | 2,000,000 | | 2,272,152 | |
| | | | $ | 6,367,152 | |
| |
| Transportation — 0.92% | | | | | |
| XPO Logistics Inc | | | | | |
| 6.25%, 05/01/2025 (e) | | 2,000,000 | | 2,127,500 | |
| TOTAL BONDS | | | $ | 145,433,479 | |
| INVESTMENT COMPANIES — 5.08% | | Shares Held | | Value | |
| Money Market Funds — 5.08% | | | | | |
| Principal Government Money Market Fund — Institutional Class 0.00% (a),(h),(i),(j) | | 3,145,675 | $ | 3,145,675 | |
| State Street Institutional U.S. Government Money Market Fund — Institutional | | | | | |
| Class 0.03% (j) | | 8,667,788 | | 8,667,788 | |
| TOTAL INVESTMENT COMPANIES | | | $ | 11,813,463 | |
| Total Investments | | | $ | 234,065,543 | |
| Other Assets and Liabilities — (0.70)% | | | | (1,622,931 | ) |
| Total Net Assets — 100.00% | | | $ | 232,442,612 | |
| (a) | Non-income producing security. |
| (b) | Perpetual security. Perpetual securities pay an indefinite stream of interest, but they may be called by the issuer at an earlier date. Date shown, if any, reflects the next call date or final legal maturity date. Rate shown is as of period end. |
| (c) | Security or a portion of the security was on loan. At the end of the period, the value of these securities totaled $3,082,002 or 1.33% of net assets. |
| (d) | Rate shown is as of period end. The rate may be a variable or floating rate or a fixed rate which may convert to a variable or floating rate in the future. |
| (e) | Security exempt from registration under Rule 144A of the Securities Act of 1933. These securities may be resold in transactions exempt from registration, normally to qualified institutional buyers. At the end of the period, the value of these securities totaled $62,071,552 or 26.70% of net assets. |
| (f) | The value of these investments was determined using significant unobservable inputs, in good faith by the Advisor, under procedures established and periodically reviewed by the Board of Trustees. |
| (g) | Security is defaulted. |
| (h) | Affiliated Security. Security is either an affiliate (and registered under the Investment Company Act of 1940) or an affiliate as defined by the Investment Company Act of 1940 (controls 5.00% or more of the outstanding voting shares of the security). |
| | Please see Affiliated Securities sub-schedule for transactional information. |
See accompanying notes.
61
Schedule of Investments
Principal Active Income ETF
June 30, 2021
| (i) | Security or a portion of the security was received as collateral for securities lending. At the end of the period, the value of these securities totaled $3,145,675 or 1.35% of net assets. |
| (j) | Current yield shown is as of period end. |
| | | | | | | | | | |
| Portfolio Summary (unaudited) | | | | | | | |
| Sector | | | | | Percent | | | | | |
| Financial | | | | | 19.47 | % | | | | |
| Consumer, Non-cyclical | | | | | 14.36 | % | | | | |
| Communications | | | | | 13.77 | % | | | | |
| Industrial | | | | | 10.38 | % | | | | |
| Utilities | | | | | 9.10 | % | | | | |
| Consumer, Cyclical | | | | | 8.96 | % | | | | |
| Energy | | | | | 8.67 | % | | | | |
| Basic Materials | | | | | 6.63 | % | | | | |
| Money Market Funds | | | | | 5.08 | % | | | | |
| Technology | | | | | 4.28 | % | | | | |
| Other Assets and Liabilities | | | | | (0.70 | )% | | | | |
| TOTAL NET ASSETS | | | | | 100.00 | % | | | | |
| |
| | | | June 30, 2020 | | Purchases | | | Sales | | June 30, 2021 |
| Affiliated Securities | | | Value | | Cost | | | Proceeds | | Value |
| Principal Government Money | | | | | | | | | | |
| Market Fund — Institutional Class | | | | | | | | | | |
| 0.00 | % | $ | 2,918,957 | $ | 41,021,991 | | $ | 40,795,273 | $ | 3,145,675 |
| | | $ | 2,918,957 | $ | 41,021,991 | | $ | 40,795,273 | $ | 3,145,675 |
| |
| | | | | | | | | Realized Gain | | |
| | | | | | Realized | | | from | | Change in |
| | | | | | Gain/Loss on | | | Capital Gain | | Unrealized |
| | | | Income (a) | | Investments | | | Distributions | | Gain/Loss |
| Principal Government Money | | | | | | | | | | |
| Market Fund — Institutional Class | | | | | | | | | | |
| 0.00 | % | $ | — | $ | — | | $ | — | $ | — |
| | | $ | — | $ | — | | $ | — | $ | — |
| (a) | Amount excludes earnings from securities lending collateral. |
See accompanying notes.
62
| | | |
| Schedule of Investments |
| Principal Healthcare Innovators Index ETF |
| June 30, 2021 |
| |
| COMMON STOCKS — 99.88% | Shares Held | | Value |
| |
| Biotechnology — 55.92% | | | |
| 9 Meters Biopharma Inc (a),(b) | 49,881 | $ | 54,869 |
| Abeona Therapeutics Inc (a),(b) | 22,746 | | 35,484 |
| ACADIA Pharmaceuticals Inc (a) | 36,948 | | 901,162 |
| Acceleron Pharma Inc (a) | 14,168 | | 1,777,942 |
| ADMA Biologics Inc (a) | 21,827 | | 34,923 |
| Adverum Biotechnologies Inc (a) | 22,503 | | 78,760 |
| Agenus Inc (a) | 47,253 | | 259,419 |
| Akero Therapeutics Inc (a) | 8,016 | | 198,877 |
| Albireo Pharma Inc (a) | 4,412 | | 155,214 |
| Aldeyra Therapeutics Inc (a) | 10,906 | | 123,565 |
| Allakos Inc (a) | 12,305 | | 1,050,478 |
| Allogene Therapeutics Inc (a) | 32,469 | | 846,792 |
| Alnylam Pharmaceuticals Inc (a) | 27,305 | | 4,628,744 |
| Altimmune Inc (a),(b) | 8,576 | | 84,474 |
| Amicus Therapeutics Inc (a) | 60,155 | | 579,894 |
| AnaptysBio Inc (a) | 6,318 | | 163,826 |
| Anavex Life Sciences Corp (a) | 16,042 | | 366,720 |
| Apellis Pharmaceuticals Inc (a) | 18,552 | | 1,172,486 |
| Applied Genetic Technologies Corp (a) | 9,848 | | 38,506 |
| Applied Molecular Transport Inc (a),(b) | 8,052 | | 368,298 |
| Arcturus Therapeutics Holdings Inc (a) | 5,970 | | 202,025 |
| Arcus Biosciences Inc (a) | 16,362 | | 449,301 |
| Arcutis Biotherapeutics Inc (a) | 11,562 | | 315,527 |
| Ardelyx Inc (a) | 20,834 | | 157,922 |
| Arena Pharmaceuticals Inc (a) | 13,929 | | 949,958 |
| Arrowhead Pharmaceuticals Inc (a) | 24,287 | | 2,011,449 |
| Assembly Biosciences Inc (a) | 8,829 | | 34,257 |
| Atara Biotherapeutics Inc (a) | 19,119 | | 297,300 |
| Atossa Therapeutics Inc (a) | 2,422 | | 15,307 |
| AVEO Pharmaceuticals Inc (a) | 7,648 | | 50,400 |
| Avid Bioservices Inc (a) | 14,043 | | 360,203 |
| Avidity Biosciences Inc (a),(b) | 8,663 | | 214,063 |
| Avrobio Inc (a) | 9,569 | | 85,068 |
| Axsome Therapeutics Inc (a) | 8,621 | | 581,573 |
| Beam Therapeutics Inc (a),(b) | 13,381 | | 1,722,268 |
| BioCryst Pharmaceuticals Inc (a) | 40,759 | | 644,400 |
| Biohaven Pharmaceutical Holding Co Ltd (a) | 14,294 | | 1,387,662 |
| BioMarin Pharmaceutical Inc (a) | 42,446 | | 3,541,694 |
| Black Diamond Therapeutics Inc (a),(b) | 8,338 | | 101,640 |
| Bluebird Bio Inc (a) | 15,500 | | 495,690 |
| Blueprint Medicines Corp (a) | 13,582 | | 1,194,673 |
| BrainStorm Cell Therapeutics Inc (a) | 8,247 | | 31,339 |
| Bridgebio Pharma Inc (a) | 34,837 | | 2,123,663 |
| Cara Therapeutics Inc (a) | 11,514 | | 164,305 |
| Cardiff Oncology Inc (a),(b) | 8,554 | | 56,884 |
| CEL-SCI Corp (a),(b) | 9,356 | | 81,210 |
| Celldex Therapeutics Inc (a) | 9,134 | | 305,441 |
| ChemoCentryx Inc (a) | 15,977 | | 213,932 |
| ChromaDex Corp (a),(b) | 15,407 | | 151,913 |
| Constellation Pharmaceuticals Inc (a) | 11,048 | | 373,422 |
| Cortexyme Inc (a),(b) | 6,810 | | 360,930 |
| CRISPR Therapeutics AG (a) | 17,629 | | 2,853,959 |
| Curis Inc (a),(b) | 21,125 | | 170,479 |
| Cymabay Therapeutics Inc (a) | 15,903 | | 69,337 |
| CytomX Therapeutics Inc (a) | 14,956 | | 94,671 |
| Deciphera Pharmaceuticals Inc (a) | 13,303 | | 487,023 |
| Denali Therapeutics Inc (a) | 28,314 | | 2,220,950 |
| Dicerna Pharmaceuticals Inc (a) | 17,619 | | 657,541 |
| Dynavax Technologies Corp (a),(b) | 26,146 | | 257,538 |
| Editas Medicine Inc (a) | 15,551 | | 880,809 |
| Epizyme Inc (a) | 23,498 | | 195,268 |
| Esperion Therapeutics Inc (a),(b) | 6,451 | | 136,439 |
| Evolus Inc (a) | 7,791 | | 98,556 |
See accompanying notes.
63
| | | |
| Schedule of Investments |
| Principal Healthcare Innovators Index ETF |
| June 30, 2021 |
| |
| COMMON STOCKS (continued) | Shares Held | | Value |
| |
| Biotechnology (continued) | | | |
| Exact Sciences Corp (a) | 38,968 | $ | 4,844,112 |
| Fate Therapeutics Inc (a) | 21,936 | | 1,903,825 |
| FibroGen Inc (a) | 21,010 | | 559,496 |
| Forma Therapeutics Holdings Inc (a),(b) | 10,330 | | 257,114 |
| Frequency Therapeutics Inc (a),(b) | 7,788 | | 77,568 |
| Generation Bio Co (a) | 12,585 | | 338,536 |
| Global Blood Therapeutics Inc (a) | 14,349 | | 502,502 |
| Gossamer Bio Inc (a) | 17,436 | | 141,580 |
| Greenwich Lifesciences Inc (a),(b) | 2,775 | | 124,708 |
| Guardant Health Inc (a) | 23,438 | | 2,910,765 |
| Halozyme Therapeutics Inc (a) | 31,672 | | 1,438,226 |
| Homology Medicines Inc (a) | 10,450 | | 75,971 |
| Humanigen Inc (a) | 12,347 | | 214,591 |
| iBio Inc (a),(b) | 49,864 | | 75,295 |
| Idera Pharmaceuticals Inc (a),(b) | 9,753 | | 11,704 |
| IGM Biosciences Inc (a) | 5,883 | | 489,466 |
| ImmunityBio Inc (a) | 25,163 | | 359,328 |
| ImmunoGen Inc (a) | 44,950 | | 296,220 |
| Immunovant Inc (a) | 22,617 | | 239,062 |
| Infinity Pharmaceuticals Inc (a),(b) | 20,463 | | 61,184 |
| Inmune Bio Inc (a),(b) | 3,447 | | 60,564 |
| Inovio Pharmaceuticals Inc (a),(b) | 47,726 | | 442,420 |
| Insmed Inc (a) | 23,788 | | 677,006 |
| Intercept Pharmaceuticals Inc (a) | 7,622 | | 152,211 |
| Intra-Cellular Therapies Inc (a) | 18,680 | | 762,518 |
| Ionis Pharmaceuticals Inc (a) | 33,001 | | 1,316,410 |
| Iovance Biotherapeutics Inc (a) | 33,930 | | 882,859 |
| iTeos Therapeutics Inc (a) | 8,090 | | 207,508 |
| Kadmon Holdings Inc (a),(b) | 39,595 | | 153,233 |
| Karuna Therapeutics Inc (a) | 6,237 | | 710,956 |
| Karyopharm Therapeutics Inc (a) | 17,230 | | 177,814 |
| Kiniksa Pharmaceuticals Ltd, Class A (a) | 7,370 | | 102,664 |
| Kodiak Sciences Inc (a) | 11,883 | | 1,105,119 |
| Krystal Biotech Inc (a) | 5,060 | | 344,080 |
| Lexicon Pharmaceuticals Inc (a) | 33,325 | | 152,962 |
| Ligand Pharmaceuticals Inc (a) | 3,835 | | 503,114 |
| MacroGenics Inc (a) | 12,988 | | 348,858 |
| Mersana Therapeutics Inc (a) | 15,939 | | 216,452 |
| Mirati Therapeutics Inc (a) | 11,842 | | 1,912,838 |
| Mustang Bio Inc (a) | 14,866 | | 49,355 |
| Myriad Genetics Inc (a) | 17,363 | | 530,961 |
| Nektar Therapeutics (a) | 42,058 | | 721,715 |
| NGM Biopharmaceuticals Inc (a) | 16,999 | | 335,220 |
| Nkarta Inc (a) | 7,525 | | 238,467 |
| Novavax Inc (a) | 14,860 | | 3,154,927 |
| Omeros Corp (a),(b) | 14,233 | | 211,218 |
| Oncternal Therapeutics Inc (a),(b) | 11,377 | | 54,041 |
| Organogenesis Holdings Inc (a) | 29,543 | | 491,005 |
| Ovid therapeutics Inc (a) | 14,641 | | 57,246 |
| Pacific Biosciences of California Inc (a) | 45,253 | | 1,582,497 |
| Precigen Inc (a),(b) | 46,798 | | 305,123 |
| Precision BioSciences Inc (a) | 12,114 | | 151,667 |
| Prothena Corp PLC (a) | 9,231 | | 474,566 |
| Provention Bio Inc (a),(b) | 14,630 | | 123,331 |
| PTC Therapeutics Inc (a) | 16,234 | | 686,211 |
| Radius Health Inc (a) | 10,826 | | 197,466 |
| REGENXBIO Inc (a) | 9,767 | | 379,448 |
| Relay Therapeutics Inc (a) | 20,774 | | 760,121 |
| Replimune Group Inc (a) | 10,731 | | 412,285 |
| REVOLUTION Medicines Inc (a) | 16,662 | | 528,852 |
| Rigel Pharmaceuticals Inc (a) | 39,010 | | 169,303 |
| Rocket Pharmaceuticals Inc (a) | 13,984 | | 619,351 |
| Rubius Therapeutics Inc (a) | 18,741 | | 457,468 |
See accompanying notes.
64
| | | | |
| Schedule of Investments |
| Principal Healthcare Innovators Index ETF |
| June 30, 2021 |
| |
| COMMON STOCKS (continued) | | Shares Held | | Value |
| |
| Biotechnology (continued) | | | | |
| Sage Therapeutics Inc (a) | | 13,478 | $ | 765,685 |
| Sangamo Therapeutics Inc (a) | | 33,070 | | 395,848 |
| Scholar Rock Holding Corp (a) | | 7,766 | | 224,437 |
| Seagen Inc (a) | | 36,980 | | 5,838,402 |
| Seelos Therapeutics Inc (a) | | 17,873 | | 47,185 |
| Selecta Biosciences Inc (a) | | 24,939 | | 104,245 |
| Sesen Bio Inc (a) | | 38,687 | | 178,734 |
| Solid Biosciences Inc (a) | | 25,426 | | 93,059 |
| Sorrento Therapeutics Inc (a),(b) | | 64,711 | | 627,050 |
| SpringWorks Therapeutics Inc (a) | | 11,303 | | 931,480 |
| Stoke Therapeutics Inc (a) | | 8,365 | | 281,566 |
| Surface Oncology Inc (a) | | 9,391 | | 70,057 |
| Sutro Biopharma Inc (a) | | 10,384 | | 193,039 |
| Syndax Pharmaceuticals Inc (a) | | 10,893 | | 187,033 |
| TCR2 Therapeutics Inc (a) | | 8,772 | | 143,949 |
| TG Therapeutics Inc (a) | | 32,929 | | 1,277,316 |
| Theravance Biopharma Inc (a) | | 14,850 | | 215,622 |
| Translate Bio Inc (a) | | 17,158 | | 472,531 |
| TransMedics Group Inc (a) | | 6,319 | | 209,664 |
| Travere Therapeutics Inc (a) | | 13,298 | | 194,018 |
| Turning Point Therapeutics Inc (a) | | 11,121 | | 867,660 |
| Twist Bioscience Corp (a) | | 11,392 | | 1,517,984 |
| Tyme Technologies Inc (a) | | 39,344 | | 49,573 |
| Ultragenyx Pharmaceutical Inc (a) | | 15,666 | | 1,493,753 |
| UNITY Biotechnology Inc (a) | | 12,215 | | 56,678 |
| Vaxart Inc (a) | | 27,184 | | 203,608 |
| Veracyte Inc (a) | | 15,468 | | 618,411 |
| Verastem Inc (a) | | 39,194 | | 159,520 |
| Vericel Corp (a) | | 10,641 | | 558,652 |
| Viking Therapeutics Inc (a),(b) | | 17,114 | | 102,513 |
| Vir Biotechnology Inc (a) | | 29,947 | | 1,415,894 |
| VYNE Therapeutics Inc (a),(b) | | 11,849 | | 41,590 |
| Xencor Inc (a) | | 13,374 | | 461,269 |
| Y-mAbs Therapeutics Inc (a) | | 10,036 | | 339,217 |
| Zentalis Pharmaceuticals Inc (a) | | 9,376 | | 498,803 |
| ZIOPHARM Oncology Inc (a),(b) | | 49,469 | | 130,598 |
| | | | $ | 98,527,748 |
| |
| Chemicals — 0.19% | | | | |
| Codexis Inc (a) | | 14,675 | | 332,536 |
| |
| Commercial Services — 1.53% | | | | |
| Multiplan Corp (a),(b) | | 156,922 | | 1,493,897 |
| Progyny Inc (a) | | 20,460 | | 1,207,140 |
| | | | $ | 2,701,037 |
| |
| Electronics — 0.06% | | | | |
| Fluidigm Corp (a),(b) | | 17,210 | | 106,014 |
| |
| Healthcare — Products — 18.48% | | | | |
| 10X Genomics Inc, Class A (a) | | 20,085 | | 3,933,045 |
| Accelerate Diagnostics Inc (a) | | 13,696 | | 110,390 |
| Adaptive Biotechnologies Corp (a) | | 32,622 | | 1,332,935 |
| Alphatec Holdings Inc (a) | | 22,282 | | 341,360 |
| Asensus Surgical Inc (a),(b) | | 53,695 | | 170,213 |
| AtriCure Inc (a) | | 10,521 | | 834,631 |
| Avanos Medical Inc (a) | | 11,095 | | 403,525 |
| AxoGen Inc (a) | | 9,404 | | 203,220 |
| Axonics Inc (a) | | 9,586 | | 607,848 |
| BioLife Solutions Inc (a) | | 7,557 | | 336,362 |
| Bionano Genomics Inc (a) | | 64,034 | | 469,369 |
| Cardiovascular Systems Inc (a) | | 9,279 | | 395,749 |
| CareDx Inc (a) | | 11,964 | | 1,094,945 |
| Castle Biosciences Inc (a) | | 5,643 | | 413,801 |
See accompanying notes.
65
| | | | |
| Schedule of Investments |
| Principal Healthcare Innovators Index ETF |
| June 30, 2021 |
| |
| COMMON STOCKS (continued) | | Shares Held | | Value |
| |
| Healthcare — Products (continued) | | | | |
| Cerus Corp (a) | | 38,835 | $ | 229,515 |
| ClearPoint Neuro Inc (a),(b) | | 4,772 | | 91,098 |
| Co-Diagnostics Inc (a),(b) | | 6,526 | | 53,840 |
| CryoLife Inc (a) | | 8,993 | | 255,401 |
| DermTech Inc (a) | | 6,638 | | 275,942 |
| Glaukos Corp (a) | | 10,570 | | 896,653 |
| Inogen Inc (a) | | 5,136 | | 334,713 |
| Inspire Medical Systems Inc (a) | | 6,536 | | 1,263,147 |
| Insulet Corp (a) | | 15,416 | | 4,231,846 |
| Intersect ENT Inc (a) | | 7,622 | | 130,260 |
| iRhythm Technologies Inc (a) | | 6,732 | | 446,668 |
| Lantheus Holdings Inc (a) | | 15,560 | | 430,078 |
| Merit Medical Systems Inc (a) | | 12,857 | | 831,334 |
| NanoString Technologies Inc (a) | | 10,173 | | 659,109 |
| Natera Inc (a) | | 20,237 | | 2,297,507 |
| Natus Medical Inc (a) | | 7,820 | | 203,164 |
| Nevro Corp (a) | | 8,112 | | 1,344,889 |
| OrthoPediatrics Corp (a) | | 4,538 | | 286,711 |
| Penumbra Inc (a) | | 8,515 | | 2,333,621 |
| Pulmonx Corp (a) | | 8,239 | | 363,505 |
| Quanterix Corp (a) | | 8,370 | | 490,984 |
| Shockwave Medical Inc (a) | | 8,166 | | 1,549,335 |
| SI-BONE Inc (a) | | 7,555 | | 237,756 |
| Sientra Inc (a) | | 13,222 | | 105,247 |
| Silk Road Medical Inc (a) | | 7,933 | | 379,673 |
| SmileDirectClub Inc (a),(b) | | 27,096 | | 235,193 |
| T2 Biosystems Inc (a),(b) | | 34,153 | | 40,642 |
| Tandem Diabetes Care Inc (a) | | 14,649 | | 1,426,813 |
| Varex Imaging Corp (a) | | 9,050 | | 242,721 |
| ViewRay Inc (a) | | 37,122 | | 245,005 |
| | | | $ | 32,559,763 |
| |
| Healthcare — Services — 6.63% | | | | |
| Accolade Inc (a) | | 13,515 | | 734,000 |
| Brookdale Senior Living Inc (a) | | 42,353 | | 334,589 |
| Clover Health Investments Corp (a),(b) | | 20,939 | | 278,907 |
| Community Health Systems Inc (a) | | 29,922 | | 461,996 |
| Invitae Corp (a),(b) | | 46,039 | | 1,552,895 |
| MEDNAX Inc (a) | | 19,766 | | 595,945 |
| ModivCare Inc (a) | | 3,276 | | 557,149 |
| Neuronetics Inc (a) | | 5,866 | | 93,973 |
| Ontrak Inc (a),(b) | | 4,084 | | 132,648 |
| OPKO Health Inc (a) | | 154,678 | | 626,446 |
| Personalis Inc (a) | | 10,087 | | 255,201 |
| Surgery Partners Inc (a) | | 13,819 | | 920,622 |
| Teladoc Health Inc (a) | | 28,258 | | 4,699,023 |
| Tivity Health Inc (a) | | 11,347 | | 298,540 |
| Vapotherm Inc (a),(b) | | 5,958 | | 140,847 |
| | | | $ | 11,682,781 |
| |
| Pharmaceuticals — 14.99% | | | | |
| AcelRx Pharmaceuticals Inc (a) | | 27,460 | | 37,895 |
| Aclaris Therapeutics Inc (a) | | 11,959 | | 210,000 |
| Adamis Pharmaceuticals Corp (a) | | 32,384 | | 35,622 |
| AdaptHealth Corp (a) | | 26,525 | | 727,050 |
| Aerie Pharmaceuticals Inc (a) | | 10,831 | | 173,404 |
| Agile Therapeutics Inc (a) | | 20,228 | | 26,903 |
| Agios Pharmaceuticals Inc (a) | | 16,068 | | 885,507 |
| Akebia Therapeutics Inc (a) | | 35,437 | | 134,306 |
| Alector Inc (a) | | 18,373 | | 382,710 |
| Alkermes PLC (a) | | 36,761 | | 901,380 |
| Amneal Pharmaceuticals Inc (a) | | 34,096 | | 174,571 |
| Aquestive Therapeutics Inc (a) | | 8,360 | | 33,189 |
See accompanying notes.
66
| | | |
| Schedule of Investments |
| Principal Healthcare Innovators Index ETF |
| June 30, 2021 |
| |
| COMMON STOCKS (continued) | Shares Held | | Value |
| |
| Pharmaceuticals (continued) | | | |
| Arvinas Inc (a) | 10,979 | $ | 845,383 |
| Athenex Inc (a) | 21,545 | | 99,538 |
| Bioxcel Therapeutics Inc (a) | 5,673 | | 164,857 |
| Cassava Sciences Inc (a),(b) | 5,905 | | 504,523 |
| Chimerix Inc (a) | 19,780 | | 158,240 |
| Clovis Oncology Inc (a),(b) | 24,131 | | 139,960 |
| Corbus Pharmaceuticals Holdings Inc (a) | 28,842 | | 52,781 |
| CorMedix Inc (a),(b) | 7,418 | | 50,887 |
| Cytokinetics Inc (a) | 16,416 | | 324,873 |
| Elanco Animal Health Inc (a) | 110,152 | | 3,821,173 |
| Enanta Pharmaceuticals Inc (a) | 4,657 | | 204,955 |
| Endo International PLC (a) | 53,212 | | 249,032 |
| Evofem Biosciences Inc (a),(b) | 19,186 | | 21,680 |
| Flexion Therapeutics Inc (a) | 11,385 | | 93,699 |
| G1 Therapeutics Inc (a),(b) | 9,687 | | 212,533 |
| Gritstone bio Inc (a) | 11,301 | | 103,178 |
| Heat Biologics Inc (a) | 5,866 | | 39,478 |
| Heron Therapeutics Inc (a) | 21,099 | | 327,456 |
| Heska Corp (a) | 2,405 | | 552,501 |
| Intellia Therapeutics Inc (a) | 15,882 | | 2,571,455 |
| Jaguar Health Inc (a),(b) | 25,544 | | 40,359 |
| Jounce Therapeutics Inc (a) | 10,479 | | 71,257 |
| Kala Pharmaceuticals Inc (a),(b) | 14,210 | | 75,313 |
| KalVista Pharmaceuticals Inc (a) | 5,383 | | 128,977 |
| Kura Oncology Inc (a) | 15,285 | | 318,692 |
| Lipocine Inc (a) | 20,382 | | 28,535 |
| Madrigal Pharmaceuticals Inc (a) | 3,699 | | 360,320 |
| MannKind Corp (a),(b) | 57,055 | | 310,950 |
| Marinus Pharmaceuticals Inc (a),(b) | 8,230 | | 147,646 |
| MediciNova Inc (a),(b) | 11,238 | | 47,761 |
| Morphic Holding Inc (a) | 8,318 | | 477,370 |
| Novan Inc (a),(b) | 3,480 | | 35,009 |
| Ocugen Inc (a),(b) | 43,419 | | 348,655 |
| Ocular Therapeutix Inc (a) | 17,384 | | 246,505 |
| Odonate Therapeutics Inc (a) | 8,912 | | 31,103 |
| Option Care Health Inc (a) | 41,508 | | 907,780 |
| ORIC Pharmaceuticals Inc (a) | 8,458 | | 149,622 |
| Owens & Minor Inc | 16,969 | | 718,298 |
| Passage Bio Inc (a) | 12,216 | | 161,740 |
| Perrigo Co PLC | 31,988 | | 1,466,650 |
| PetIQ Inc (a) | 5,837 | | 225,308 |
| Protagonist Therapeutics Inc (a) | 9,931 | | 445,703 |
| Reata Pharmaceuticals Inc, Class A (a) | 7,173 | | 1,015,195 |
| Revance Therapeutics Inc (a) | 16,478 | | 488,408 |
| Rhythm Pharmaceuticals Inc (a) | 11,364 | | 222,507 |
| Sarepta Therapeutics Inc (a) | 18,496 | | 1,437,879 |
| Senseonics Holdings Inc (a),(b) | 87,237 | | 334,990 |
| Seres Therapeutics Inc (a) | 21,065 | | 502,400 |
| Spectrum Pharmaceuticals Inc (a) | 33,684 | | 126,315 |
| Syros Pharmaceuticals Inc (a) | 14,226 | | 77,532 |
| TFF Pharmaceuticals Inc (a) | 5,342 | | 51,337 |
| TherapeuticsMD Inc (a) | 89,531 | | 106,542 |
| Tonix Pharmaceuticals Holding Corp (a) | 74,776 | | 83,001 |
| Trevena Inc (a),(b) | 37,231 | | 62,920 |
| Tricida Inc (a) | 11,599 | | 50,108 |
| uniQure NV (a) | 10,269 | | 316,285 |
| Vaxcyte Inc (a) | 11,762 | | 264,763 |
| Xeris Pharmaceuticals Inc (a),(b) | 13,716 | | 55,824 |
| Zogenix Inc (a) | 12,853 | | 222,100 |
| | | $ | 26,422,378 |
| |
| Retail — 0.14% | | | |
| OptimizeRx Corp (a) | 3,880 | | 240,172 |
See accompanying notes.
67
| | | | |
| Schedule of Investments |
| Principal Healthcare Innovators Index ETF |
| June 30, 2021 |
| |
| COMMON STOCKS (continued) | Shares Held | | Value | |
| Software — 1.94% | | | | |
| 1Life Healthcare Inc (a) | 32,062 | $ | 1,059,970 | |
| Evolent Health Inc, Class A (a) | 19,875 | | 419,760 | |
| Health Catalyst Inc (a) | 10,167 | | 564,370 | |
| Hims & Hers Health Inc (a),(b) | 42,241 | | 460,004 | |
| Phreesia Inc (a) | 10,195 | | 624,954 | |
| Tabula Rasa HealthCare Inc (a) | 5,698 | | 284,900 | |
| | | $ | 3,413,958 | |
| TOTAL COMMON STOCKS | | $ | 175,986,387 | |
| INVESTMENT COMPANIES — 3.85% | Shares Held | | Value | |
| Money Market Funds — 3.85% | | | | |
| Principal Government Money Market Fund — Institutional Class 0.00% (a),(c),(d),(e) | 6,534,128 | $ | 6,534,128 | |
| State Street Institutional U.S. Government Money Market Fund — Institutional | | | | |
| Class 0.03% (e) | 255,508 | | 255,508 | |
| TOTAL INVESTMENT COMPANIES | | $ | 6,789,636 | |
| Total Investments | | $ | 182,776,023 | |
| Other Assets and Liabilities — (3.73)% | | | (6,578,661 | ) |
| Total Net Assets — 100.00% | | $ | 176,197,362 | |
| (a) | Non-income producing security. |
| (b) | Security or a portion of the security was on loan. At the end of the period, the value of these securities totaled $6,381,980 or 3.62% of net assets. |
| (c) | Security or a portion of the security was received as collateral for securities lending. At the end of the period, the value of these securities totaled $6,534,128 or 3.71% of net assets. |
| (d) | Affiliated Security. Security is either an affiliate (and registered under the Investment Company Act of 1940) or an affiliate as defined by the Investment Company Act of 1940 (controls 5.00% or more of the outstanding voting shares of the security). |
| | Please see Affiliated Securities sub-schedule for transactional information. |
| (e) | Current yield shown is as of period end. |
| | | | | | | | | | |
| Portfolio Summary (unaudited) | | | | | | | |
| Sector | | | | | Percent | | | | | |
| Consumer, Non-cyclical | | | | | 97.56 | % | | | | |
| Money Market Funds | | | | | 3.85 | % | | | | |
| Technology | | | | | 1.94 | % | | | | |
| Basic Materials | | | | | 0.19 | % | | | | |
| Consumer, Cyclical | | | | | 0.13 | % | | | | |
| Industrial | | | | | 0.06 | % | | | | |
| Other Assets and Liabilities | | | | | (3.73 | )% | | | | |
| TOTAL NET ASSETS | | | | | 100.00 | % | | | | |
| |
| | | | June 30, 2020 | | Purchases | | | Sales | | June 30, 2021 |
| Affiliated Securities | | | Value | | Cost | | | Proceeds | | Value |
| Principal Government Money | | | | | | | | | | |
| Market Fund — Institutional Class | | | | | | | | | | |
| 0.00 | % | $ | 4,074,103 | $ | 85,586,508 | | $ | 83,126,483 | $ | 6,534,128 |
| | | $ | 4,074,103 | $ | 85,586,508 | | $ | 83,126,483 | $ | 6,534,128 |
| |
| | | | | | | | | Realized Gain | | |
| | | | | | Realized | | | from | | Change in |
| | | | | | Gain/Loss on | | | Capital Gain | | Unrealized |
| | | | Income (a) | | Investments | | | Distributions | | Gain/Loss |
| Principal Government Money | | | | | | | | | | |
| Market Fund — Institutional Class | | | | | | | | | | |
| 0.00 | % | $ | — | $ | — | | $ | — | $ | — |
| | | $ | — | $ | — | | $ | — | $ | — |
| (a) | Amount excludes earnings from securities lending collateral. |
See accompanying notes.
68
| | | |
| Schedule of Investments |
| Principal International Adaptive Multi-Factor ETF |
| June 30, 2021 |
| |
| COMMON STOCKS — 99.28% | Shares Held | | Value |
| |
| Advertising — 0.38% | | | |
| Hakuhodo DY Holdings Inc | 2,300 | $ | 35,692 |
| Publicis Groupe SA | 1,273 | | 81,420 |
| WPP PLC | 4,429 | | 59,686 |
| | | $ | 176,798 |
| |
| Aerospace & Defense — 0.71% | | | |
| Airbus SE (a) | 572 | | 73,549 |
| BAE Systems PLC | 9,784 | | 70,649 |
| CAE Inc (a) | 1,519 | | 46,786 |
| Elbit Systems Ltd | 323 | | 41,810 |
| MTU Aero Engines AG | 113 | | 27,990 |
| Safran SA | 360 | | 49,910 |
| Thales SA | 247 | | 25,199 |
| | | $ | 335,893 |
| |
| Agriculture — 0.83% | | | |
| British American Tobacco PLC | 5,053 | | 195,715 |
| Imperial Brands PLC | 3,572 | | 76,934 |
| Japan Tobacco Inc | 4,500 | | 85,001 |
| Swedish Match AB | 4,179 | | 35,637 |
| | | $ | 393,287 |
| |
| Airlines — 0.12% | | | |
| Air Canada (a) | 969 | | 19,934 |
| Deutsche Lufthansa AG (a) | 1,578 | | 17,757 |
| Qantas Airways Ltd (a) | 5,094 | | 17,802 |
| | | $ | 55,493 |
| |
| Apparel — 1.80% | | | |
| Burberry Group PLC (a) | 893 | | 25,521 |
| Gildan Activewear Inc | 646 | | 23,837 |
| Hermes International | 89 | | 129,646 |
| Kering SA | 107 | | 93,507 |
| LVMH Moet Hennessy Louis Vuitton SE | 698 | | 547,327 |
| Puma SE | 228 | | 27,184 |
| | | $ | 847,022 |
| |
| Auto Manufacturers — 2.65% | | | |
| Bayerische Motoren Werke AG | 1,315 | | 131,312 |
| Daimler AG | 1,672 | | 149,288 |
| Ferrari NV | 227 | | 46,835 |
| Honda Motor Co Ltd | 4,100 | | 131,014 |
| Porsche Automobil Holding SE | 266 | | 28,500 |
| Renault SA (a) | 1,141 | | 46,115 |
| Stellantis NV | 2,509 | | 49,249 |
| Suzuki Motor Corp | 1,600 | | 67,704 |
| Toyota Motor Corp | 5,300 | | 463,234 |
| Volkswagen AG | 151 | | 49,561 |
| Volvo AB, Class B | 3,515 | | 84,568 |
| | | $ | 1,247,380 |
| |
| Auto Parts & Equipment — 0.70% | | | |
| Cie Generale des Etablissements Michelin SCA | 552 | | 88,035 |
| Continental AG (a) | 192 | | 28,226 |
| Faurecia SE | 761 | | 37,331 |
| Magna International Inc | 780 | | 72,217 |
| NGK Spark Plug Co Ltd | 2,000 | | 29,632 |
| Toyoda Gosei Co Ltd | 1,300 | | 32,004 |
| Valeo SA | 1,369 | | 41,183 |
| | | $ | 328,628 |
See accompanying notes.
69
| | | |
| Schedule of Investments |
| Principal International Adaptive Multi-Factor ETF |
| June 30, 2021 |
| |
| COMMON STOCKS (continued) | Shares Held | | Value |
| |
| Banks — 11.02% | | | |
| ABN AMRO Bank NV (a),(b) | 3,478 | $ | 42,032 |
| Australia & New Zealand Banking Group Ltd | 5,816 | | 122,782 |
| Banco Bilbao Vizcaya Argentaria SA | 16,662 | | 103,289 |
| Banco Santander SA | 17,937 | | 68,475 |
| Bank Hapoalim BM (a) | 4,284 | | 34,376 |
| Bank Leumi Le-Israel BM (a) | 5,090 | | 38,657 |
| Bank of East Asia Ltd/The | 7,800 | | 14,486 |
| Bank of Montreal | 2,205 | | 226,014 |
| Bank of Nova Scotia/The | 3,932 | | 255,726 |
| Banque Cantonale Vaudoise | 230 | | 20,657 |
| Barclays PLC | 39,824 | | 94,268 |
| BNP Paribas SA | 2,260 | | 141,681 |
| BOC Hong Kong Holdings Ltd | 18,500 | | 62,784 |
| CaixaBank SA | 18,242 | | 56,109 |
| Canadian Imperial Bank of Commerce | 1,159 | | 131,935 |
| Chiba Bank Ltd/The | 5,700 | | 34,325 |
| Commerzbank AG (a) | 7,354 | | 52,163 |
| Commonwealth Bank of Australia | 2,375 | | 177,882 |
| Concordia Financial Group Ltd | 9,600 | | 35,170 |
| Credit Agricole SA | 4,104 | | 57,491 |
| Credit Suisse Group AG | 7,068 | | 74,037 |
| Danske Bank A/S | 2,887 | | 50,800 |
| DBS Group Holdings Ltd | 7,100 | | 157,396 |
| Deutsche Bank AG (a) | 5,873 | | 76,506 |
| DNB ASA | 1,481 | | 32,268 |
| Erste Group Bank AG | 1,425 | | 52,279 |
| FinecoBank Banca Fineco SpA (a) | 3,382 | | 58,950 |
| Hang Seng Bank Ltd | 1,900 | | 37,954 |
| HSBC Holdings PLC | 3,649 | | 21,064 |
| ING Groep NV | 8,666 | | 114,471 |
| Intesa Sanpaolo SpA | 43,891 | | 121,236 |
| Israel Discount Bank Ltd, Class A (a) | 4,690 | | 22,327 |
| KBC Group NV | 419 | | 31,946 |
| Lloyds Banking Group PLC | 81,870 | | 52,877 |
| Macquarie Group Ltd | 515 | | 60,417 |
| Mediobanca Banca di Credito Finanziario SpA (a) | 2,014 | | 23,523 |
| Mitsubishi UFJ Financial Group Inc | 30,400 | | 164,211 |
| Mizrahi Tefahot Bank Ltd (a) | 1,655 | | 50,968 |
| Mizuho Financial Group Inc | 8,100 | | 115,746 |
| National Australia Bank Ltd | 6,631 | | 130,390 |
| National Bank of Canada | 1,635 | | 122,361 |
| Natixis SA | 4,182 | | 19,835 |
| Natwest Group PLC | 9,937 | | 27,932 |
| Nordea Bank Abp | 8,304 | | 92,432 |
| Oversea-Chinese Banking Corp Ltd | 10,600 | | 94,199 |
| Raiffeisen Bank International AG | 932 | | 21,108 |
| Royal Bank of Canada | 4,160 | | 421,470 |
| Shizuoka Bank Ltd/The | 5,100 | | 39,434 |
| Skandinaviska Enskilda Banken AB, Class A | 5,244 | | 67,740 |
| Societe Generale SA | 1,256 | | 37,024 |
| Standard Chartered PLC | 4,693 | | 29,927 |
| Sumitomo Mitsui Financial Group Inc | 4,100 | | 141,348 |
| Sumitomo Mitsui Trust Holdings Inc | 1,800 | | 57,162 |
| Svenska Handelsbanken AB, Class A | 6,234 | | 70,337 |
| Swedbank AB, Class A | 2,146 | | 39,931 |
| Toronto-Dominion Bank/The | 3,876 | | 271,626 |
| UBS Group AG | 12,867 | | 196,916 |
| UniCredit SpA | 3,420 | | 40,350 |
| United Overseas Bank Ltd | 2,300 | | 44,163 |
| Westpac Banking Corp | 7,201 | | 139,384 |
| | | $ | 5,194,347 |
See accompanying notes.
70
| | | |
| Schedule of Investments |
| Principal International Adaptive Multi-Factor ETF |
| June 30, 2021 |
| |
| COMMON STOCKS (continued) | Shares Held | | Value |
| |
| Beverages — 0.79% | | | |
| Asahi Group Holdings Ltd | 1,800 | $ | 84,106 |
| Carlsberg A/S, Class B | 227 | | 42,314 |
| Coca-Cola HBC AG | 1,272 | | 45,995 |
| Davide Campari-Milano NV | 2,431 | | 32,558 |
| Diageo PLC | 702 | | 33,609 |
| Endeavour Group Ltd (a) | 3,420 | | 16,133 |
| Heineken Holding NV | 343 | | 34,550 |
| Heineken NV | 113 | | 13,694 |
| JDE Peet's NV (a) | 665 | | 24,129 |
| Pernod Ricard SA | 76 | | 16,870 |
| Remy Cointreau SA | 132 | | 27,250 |
| | | $ | 371,208 |
| |
| Biotechnology — 0.44% | | | |
| Argenx SE (a) | 94 | | 28,433 |
| CSL Ltd | 552 | | 118,061 |
| Genmab A/S (a) | 94 | | 38,462 |
| H Lundbeck A/S | 626 | | 19,914 |
| | | $ | 204,870 |
| |
| Chemicals — 3.05% | | | |
| Air Liquide SA | 591 | | 103,477 |
| Air Water Inc | 1,900 | | 29,211 |
| Akzo Nobel NV | 932 | | 115,153 |
| Arkema SA | 437 | | 54,823 |
| BASF SE | 876 | | 69,012 |
| Brenntag SE | 1,006 | | 93,544 |
| Chr Hansen Holding A/S | 341 | | 30,776 |
| Clariant AG | 1,254 | | 24,938 |
| Covestro AG (b) | 798 | | 51,532 |
| Croda International PLC | 361 | | 36,794 |
| EMS-Chemie Holding AG | 12 | | 11,789 |
| Evonik Industries AG | 1,463 | | 49,059 |
| Givaudan SA | 15 | | 69,760 |
| ICL Group Ltd | 3,192 | | 21,648 |
| Johnson Matthey PLC | 1,046 | | 44,464 |
| Koninklijke DSM NV | 75 | | 13,998 |
| LANXESS AG | 857 | | 58,756 |
| Mitsubishi Gas Chemical Co Inc | 1,500 | | 31,811 |
| Mitsui Chemicals Inc | 1,500 | | 51,780 |
| Nippon Sanso Holdings Corp | 1,900 | | 38,942 |
| Nissan Chemical Corp | 700 | | 34,277 |
| Novozymes A/S, Class B | 515 | | 38,818 |
| Nutrien Ltd | 1,501 | | 90,949 |
| Shin-Etsu Chemical Co Ltd | 900 | | 150,520 |
| Solvay SA | 190 | | 24,151 |
| Symrise AG | 286 | | 39,847 |
| Yara International ASA | 1,084 | | 57,057 |
| | | $ | 1,436,886 |
| |
| Commercial Services — 2.52% | | | |
| Adecco Group AG | 838 | | 56,932 |
| Adyen NV (a),(b) | 39 | | 95,286 |
| Afterpay Ltd (a) | 341 | | 30,220 |
| Ashtead Group PLC | 1,178 | | 87,408 |
| Atlantia SpA (a) | 1,273 | | 23,049 |
| Brambles Ltd | 4,142 | | 35,536 |
| Bureau Veritas SA (a) | 247 | | 7,814 |
| Dai Nippon Printing Co Ltd | 1,900 | | 40,174 |
| Experian PLC | 1,481 | | 57,076 |
| Intertek Group PLC | 417 | | 31,899 |
| Nexi SpA (a),(b) | 1,178 | | 25,855 |
| Nihon M&A Center Inc | 1,800 | | 46,679 |
See accompanying notes.
71
| | | |
| Schedule of Investments |
| Principal International Adaptive Multi-Factor ETF |
| June 30, 2021 |
| |
| COMMON STOCKS (continued) | Shares Held | | Value |
| |
| Commercial Services (continued) | | | |
| Persol Holdings Co Ltd | 1,900 | $ | 37,540 |
| Randstad NV | 646 | | 49,407 |
| Recruit Holdings Co Ltd | 3,400 | | 167,406 |
| RELX PLC | 2,735 | | 72,602 |
| Rentokil Initial PLC | 4,903 | | 33,573 |
| Ritchie Bros Auctioneers Inc | 341 | | 20,216 |
| Secom Co Ltd | 900 | | 68,406 |
| Securitas AB, Class B | 2,851 | | 45,007 |
| SGS SA | 13 | | 40,099 |
| Sohgo Security Services Co Ltd | 700 | | 31,883 |
| Toppan Printing Co Ltd | 2,300 | | 36,955 |
| Transurban Group | 1,177 | | 12,561 |
| Worldline SA (a),(b) | 342 | | 32,012 |
| | | $ | 1,185,595 |
| |
| Computers — 2.05% | | | |
| Atos SE | 323 | | 19,648 |
| Bechtle AG | 208 | | 38,636 |
| Capgemini SE | 645 | | 123,899 |
| CGI Inc (a) | 857 | | 77,701 |
| Check Point Software Technologies Ltd (a) | 515 | | 59,807 |
| Computershare Ltd | 3,914 | | 49,607 |
| Fujitsu Ltd | 700 | | 131,059 |
| Itochu Techno-Solutions Corp | 1,100 | | 34,061 |
| Logitech International SA | 800 | | 96,925 |
| NEC Corp | 1,200 | | 61,785 |
| Nomura Research Institute Ltd | 1,900 | | 62,852 |
| NTT Data Corp | 3,700 | | 57,717 |
| Otsuka Corp | 800 | | 41,982 |
| SCSK Corp | 500 | | 29,794 |
| Teleperformance | 192 | | 77,929 |
| | | $ | 963,402 |
| |
| Construction Materials — 2.25% | | | |
| Cie de Saint-Gobain | 1,310 | | 86,272 |
| CRH PLC | 1,901 | | 95,800 |
| Daikin Industries Ltd | 600 | | 111,742 |
| Geberit AG | 126 | | 94,508 |
| HeidelbergCement AG | 590 | | 50,609 |
| Holcim Ltd | 1,558 | | 93,455 |
| Investment AB Latour | 1,311 | | 43,015 |
| James Hardie Industries PLC | 1,634 | | 55,475 |
| Kingspan Group PLC | 589 | | 55,621 |
| Lixil Corp | 1,600 | | 41,377 |
| Nibe Industrier AB | 5,378 | | 56,569 |
| Rinnai Corp | 300 | | 28,543 |
| ROCKWOOL International A/S | 88 | | 42,841 |
| Sika AG | 379 | | 123,910 |
| Taiheiyo Cement Corp | 1,400 | | 30,711 |
| Xinyi Glass Holdings Ltd | 12,000 | | 48,916 |
| | | $ | 1,059,364 |
| |
| Distribution/Wholesale — 1.60% | | | |
| Bunzl PLC | 2,507 | | 82,849 |
| Ferguson PLC | 990 | | 137,631 |
| ITOCHU Corp | 4,200 | | 120,978 |
| Mitsubishi Corp | 4,300 | | 117,201 |
| Mitsui & Co Ltd | 5,300 | | 119,291 |
| Sumitomo Corp | 4,900 | | 65,630 |
| Toromont Industries Ltd | 627 | | 54,627 |
| Toyota Tsusho Corp | 1,200 | | 56,708 |
| | | $ | 754,915 |
See accompanying notes.
72
| | | |
| Schedule of Investments |
| Principal International Adaptive Multi-Factor ETF |
| June 30, 2021 |
| |
| COMMON STOCKS (continued) | Shares Held | | Value |
| |
| Diversified Financial Services — 2.60% | | | |
| Acom Co Ltd | 7,600 | $ | 33,110 |
| Amundi SA (b) | 553 | | 48,753 |
| ASX Ltd | 571 | | 33,277 |
| Brookfield Asset Management Inc, Class A | 1,350 | | 68,872 |
| Daiwa Securities Group Inc | 9,400 | | 51,622 |
| Deutsche Boerse AG | 305 | | 53,235 |
| EQT AB | 1,369 | | 49,685 |
| Hargreaves Lansdown PLC | 949 | | 20,860 |
| Hong Kong Exchanges & Clearing Ltd | 2,300 | | 137,094 |
| IGM Financial Inc | 1,901 | | 67,109 |
| Japan Exchange Group Inc | 2,300 | | 51,136 |
| Julius Baer Group Ltd | 874 | | 57,036 |
| London Stock Exchange Group PLC | 381 | | 42,005 |
| Magellan Financial Group Ltd | 531 | | 21,448 |
| Nomura Holdings Inc | 13,300 | | 67,976 |
| Onex Corp | 436 | | 31,659 |
| ORIX Corp | 5,200 | | 87,739 |
| Partners Group Holding AG | 61 | | 92,398 |
| Schroders PLC | 1,006 | | 48,887 |
| Singapore Exchange Ltd | 3,700 | | 30,762 |
| St James's Place PLC | 2,622 | | 53,571 |
| Standard Life Aberdeen PLC | 6,158 | | 23,085 |
| TMX Group Ltd | 248 | | 26,197 |
| Tokyo Century Corp | 475 | | 25,525 |
| | | $ | 1,223,041 |
| |
| Electric — 3.35% | | | |
| AGL Energy Ltd | 4,067 | | 25,010 |
| Algonquin Power & Utilities Corp | 1,937 | | 28,861 |
| Atco Ltd, Class I | 1,292 | | 45,818 |
| AusNet Services Ltd | 16,683 | | 21,895 |
| Canadian Utilities Ltd, Class A | 227 | | 6,299 |
| Chubu Electric Power Co Inc | 3,900 | | 47,673 |
| CLP Holdings Ltd | 7,125 | | 70,476 |
| E.ON SE | 4,144 | | 47,929 |
| EDP - Energias de Portugal SA | 1,598 | | 8,470 |
| Electricite de France SA | 1,693 | | 23,126 |
| Elia Group SA | 228 | | 24,061 |
| Emera Inc | 721 | | 32,711 |
| Endesa SA | 2,032 | | 49,297 |
| Enel SpA | 25,668 | | 238,374 |
| Engie SA | 3,382 | | 46,334 |
| Fortis Inc | 950 | | 42,051 |
| Fortum OYJ | 3,118 | | 85,996 |
| HK Electric Investments & HK Electric Investments Ltd | 8,500 | | 8,616 |
| Hydro One Ltd (b) | 2,204 | | 53,269 |
| Iberdrola SA | 13,490 | | 164,437 |
| Kyushu Electric Power Co Inc | 3,900 | | 30,015 |
| Mercury NZ Ltd | 3,990 | | 18,603 |
| National Grid PLC | 1,310 | | 16,686 |
| Northland Power Inc | 2,148 | | 73,281 |
| Origin Energy Ltd | 6,899 | | 23,334 |
| Orsted A/S (b) | 247 | | 34,660 |
| Power Assets Holdings Ltd | 5,000 | | 30,685 |
| Red Electrica Corp SA | 2,926 | | 54,315 |
| RWE AG | 1,199 | | 43,448 |
| SSE PLC | 2,165 | | 44,938 |
| Terna SPA | 4,312 | | 32,130 |
| Tohoku Electric Power Co Inc | 3,900 | | 30,541 |
| Uniper SE | 836 | | 30,789 |
See accompanying notes.
73
| | | |
| Schedule of Investments |
| Principal International Adaptive Multi-Factor ETF |
| June 30, 2021 |
| |
| COMMON STOCKS (continued) | Shares Held | | Value |
| |
| Electric (continued) | | | |
| Verbund AG | 495 | $ | 45,576 |
| | | $ | 1,579,704 |
| |
| Electrical Components & Equipment — 0.84% | | | |
| ABB Ltd | 4,447 | | 150,869 |
| Brother Industries Ltd | 1,900 | | 37,916 |
| Legrand SA | 476 | | 50,380 |
| Prysmian SpA | 1,425 | | 51,079 |
| Schneider Electric SE | 666 | | 104,779 |
| | | $ | 395,023 |
| |
| Electronics — 1.59% | | | |
| Assa Abloy AB, Class B | 3,023 | | 91,063 |
| Azbil Corp | 900 | | 37,306 |
| Halma PLC | 970 | | 36,121 |
| Hoya Corp | 900 | | 119,330 |
| MINEBEA MITSUMI Inc | 2,100 | | 55,555 |
| Murata Manufacturing Co Ltd | 1,500 | | 114,524 |
| Nidec Corp | 1,100 | | 127,481 |
| Sartorius AG | 113 | | 58,822 |
| Shimadzu Corp | 1,297 | | 50,143 |
| Venture Corp Ltd | 1,900 | | 27,143 |
| Yokogawa Electric Corp | 1,900 | | 28,390 |
| | | $ | 745,878 |
| |
| Energy — Alternate Sources — 0.17% | | | |
| Ballard Power Systems Inc (a) | 949 | | 17,210 |
| Siemens Gamesa Renewable Energy SA (a) | 610 | | 20,369 |
| Vestas Wind Systems A/S | 1,139 | | 44,461 |
| | | $ | 82,040 |
| |
| Engineering & Construction — 1.28% | | | |
| ACS Actividades de Construccion y Servicios SA | 722 | | 19,340 |
| ACS Actividades de Construccion y Servicios SA – Rights (a) | 646 | | 904 |
| Bouygues SA | 591 | | 21,857 |
| CK Infrastructure Holdings Ltd | 8,000 | | 47,706 |
| Eiffage SA | 228 | | 23,196 |
| HOCHTIEF AG | 401 | | 30,792 |
| Infrastrutture Wireless Italiane SpA (b) | 2,187 | | 24,667 |
| Kajima Corp | 3,100 | | 39,261 |
| Keppel Corp Ltd | 1,800 | | 7,322 |
| Lendlease Corp Ltd | 2,263 | | 19,449 |
| Obayashi Corp | 5,000 | | 39,741 |
| Shimizu Corp | 5,300 | | 40,646 |
| Singapore Technologies Engineering Ltd | 15,300 | | 44,033 |
| Skanska AB, Class B | 2,659 | | 70,529 |
| Taisei Corp | 1,400 | | 45,871 |
| Vinci SA | 552 | | 58,901 |
| WSP Global Inc | 572 | | 66,770 |
| | | $ | 600,985 |
| |
| Entertainment — 0.69% | | | |
| Aristocrat Leisure Ltd | 2,033 | | 65,697 |
| Entain PLC (a) | 2,298 | | 55,487 |
| Evolution Gaming Group AB (b) | 436 | | 68,899 |
| Flutter Entertainment PLC (a) | 192 | | 34,764 |
| Genting Singapore Ltd | 9,500 | | 5,899 |
| La Francaise des Jeux SAEM (b) | 780 | | 45,856 |
| Tabcorp Holdings Ltd | 12,219 | | 47,468 |
| | | $ | 324,070 |
See accompanying notes.
74
| | | |
| Schedule of Investments |
| Principal International Adaptive Multi-Factor ETF |
| June 30, 2021 |
| |
| COMMON STOCKS (continued) | Shares Held | | Value |
| |
| Environmental Control — 0.13% | | | |
| GFL Environmental Inc | 648 | $ | 20,711 |
| Kurita Water Industries Ltd | 800 | | 38,382 |
| | | $ | 59,093 |
| |
| Food — 5.98% | | | |
| a2 Milk Co Ltd (a) | 7,125 | | 32,074 |
| Ajinomoto Co Inc | 2,500 | | 64,899 |
| Associated British Foods PLC | 819 | | 25,106 |
| Barry Callebaut AG | 14 | | 32,532 |
| Calbee Inc | 1,300 | | 29,980 |
| Carrefour SA | 1,826 | | 35,910 |
| Chocoladefabriken Lindt & Spruengli AG | 1 | | 9,949 |
| Coles Group Ltd | 3,248 | | 41,628 |
| Danone SA | 1,634 | | 115,030 |
| Empire Co Ltd | 1,541 | | 48,607 |
| Etablissements Franz Colruyt NV | 760 | | 42,499 |
| George Weston Ltd | 571 | | 54,424 |
| HelloFresh SE (a) | 609 | | 59,200 |
| ICA Gruppen AB | 987 | | 45,936 |
| J Sainsbury PLC | 8,703 | | 32,722 |
| Jeronimo Martins SGPS SA | 2,738 | | 49,932 |
| Kerry Group PLC, Class A | 322 | | 44,977 |
| Kesko Oyj, Class B | 2,488 | | 91,897 |
| Kobe Bussan Co Ltd | 1,400 | | 44,106 |
| Koninklijke Ahold Delhaize NV | 3,363 | | 99,971 |
| Loblaw Cos Ltd | 1,009 | | 62,098 |
| MEIJI Holdings Co Ltd | 700 | | 41,901 |
| Metro Inc | 1,293 | | 61,990 |
| Nestle SA | 7,183 | | 894,488 |
| NH Foods Ltd | 950 | | 36,941 |
| Nisshin Seifun Group Inc | 2,400 | | 35,105 |
| Nissin Foods Holdings Co Ltd | 600 | | 43,206 |
| Orkla ASA | 5,301 | | 53,994 |
| Saputo Inc | 1,671 | | 49,836 |
| Seven & i Holdings Co Ltd | 2,600 | | 123,968 |
| Tesco PLC | 15,258 | | 47,057 |
| Toyo Suisan Kaisha Ltd | 900 | | 34,633 |
| WH Group Ltd (b) | 56,500 | | 50,793 |
| Wilmar International Ltd | 19,000 | | 63,583 |
| Wm Morrison Supermarkets PLC | 20,104 | | 68,607 |
| Woolworths Group Ltd | 3,420 | | 97,797 |
| Yakult Honsha Co Ltd | 900 | | 50,956 |
| | | $ | 2,818,332 |
| |
| Forest Products & Paper — 0.71% | | | |
| Mondi PLC | 1,994 | | 52,435 |
| Oji Holdings Corp | 7,200 | | 41,348 |
| Smurfit Kappa Group PLC | 1,579 | | 85,658 |
| Stora Enso Oyj, Class R | 3,020 | | 55,093 |
| Svenska Cellulosa AB SCA, Class B | 1,788 | | 29,302 |
| UPM-Kymmene Oyj | 266 | | 10,062 |
| West Fraser Timber Co Ltd | 854 | | 61,308 |
| | | $ | 335,206 |
| |
| Gas — 0.57% | | | |
| Enagas SA | 1,312 | | 30,313 |
| Hong Kong & China Gas Co Ltd | 26,250 | | 40,773 |
| Naturgy Energy Group SA | 1,807 | | 46,453 |
| Osaka Gas Co Ltd | 2,500 | | 46,559 |
| Snam SpA | 10,508 | | 60,742 |
| Tokyo Gas Co Ltd | 2,400 | | 45,302 |
| | | $ | 270,142 |
See accompanying notes.
75
| | | |
| Schedule of Investments |
| Principal International Adaptive Multi-Factor ETF |
| June 30, 2021 |
| |
| COMMON STOCKS (continued) | Shares Held | | Value |
| |
| Hand/Machine Tools — 0.39% | | | |
| Makita Corp | 1,100 | $ | 51,784 |
| Schindler Holding AG | 207 | | 62,034 |
| Techtronic Industries Co Ltd | 4,000 | | 69,858 |
| | | $ | 183,676 |
| |
| Healthcare — Products — 1.02% | | | |
| Alcon Inc | 190 | | 13,303 |
| Ambu A/S | 417 | | 16,032 |
| Carl Zeiss Meditec AG | 116 | | 22,413 |
| Coloplast A/S, Class B | 247 | | 40,528 |
| Demant A/S (a) | 817 | | 45,988 |
| DiaSorin SpA | 97 | | 18,345 |
| EssilorLuxottica SA | 96 | | 17,717 |
| Fisher & Paykel Healthcare Corp Ltd | 1,082 | | 23,537 |
| GN Store Nord A/S | 552 | | 48,218 |
| Koninklijke Philips NV | 306 | | 15,163 |
| QIAGEN NV (a) | 647 | | 31,270 |
| Sartorius Stedim Biotech | 113 | | 53,448 |
| Siemens Healthineers AG (b) | 645 | | 39,525 |
| Sonova Holding AG | 95 | | 35,731 |
| Straumann Holding AG | 38 | | 60,578 |
| | | $ | 481,796 |
| |
| Healthcare — Services — 1.00% | | | |
| BioMerieux | 152 | | 17,663 |
| Eurofins Scientific SE (a) | 514 | | 58,754 |
| Fresenius Medical Care AG & Co KGaA | 874 | | 72,586 |
| Fresenius SE & Co KGaA | 1,557 | | 81,224 |
| Lonza Group AG | 113 | | 80,092 |
| Orpea SA (a) | 154 | | 19,584 |
| Ramsay Health Care Ltd | 626 | | 29,553 |
| Ryman Healthcare Ltd | 2,529 | | 23,211 |
| Sonic Healthcare Ltd | 3,134 | | 90,253 |
| | | $ | 472,920 |
| |
| Holding Companies — Diversified — 0.18% | | | |
| CK Hutchison Holdings Ltd | 6,000 | | 46,752 |
| Jardine Matheson Holdings Ltd | 391 | | 24,993 |
| Swire Pacific Ltd, Class A | 2,000 | | 13,562 |
| | | $ | 85,307 |
| |
| Home Builders — 0.57% | | | |
| Barratt Developments PLC | 2,336 | | 22,465 |
| Berkeley Group Holdings PLC | 379 | | 24,090 |
| Daiwa House Industry Co Ltd | 2,300 | | 69,044 |
| Iida Group Holdings Co Ltd | 1,600 | | 41,190 |
| Persimmon PLC | 1,272 | | 52,048 |
| Sekisui House Ltd | 3,000 | | 61,528 |
| | | $ | 270,365 |
| |
| Home Furnishings — 1.16% | | | |
| Electrolux AB, Series B | 2,263 | | 62,749 |
| Panasonic Corp | 7,700 | | 89,098 |
| Rational AG | 20 | | 18,118 |
| SEB SA | 363 | | 65,597 |
| Sony Group Corp | 3,200 | | 311,517 |
| | | $ | 547,079 |
| |
| Household Products — 1.54% | | | |
| Beiersdorf AG | 75 | | 9,049 |
| Essity AB, Class B | 2,260 | | 74,945 |
| Kao Corp | 1,600 | | 98,438 |
See accompanying notes.
76
| | | |
| Schedule of Investments |
| Principal International Adaptive Multi-Factor ETF |
| June 30, 2021 |
| |
| COMMON STOCKS (continued) | Shares Held | | Value |
| |
| Household Products (continued) | | | |
| L'Oreal SA | 303 | $ | 135,018 |
| Unicharm Corp | 1,700 | | 68,401 |
| Unilever PLC | 5,813 | | 340,180 |
| | | $ | 726,031 |
| |
| Household Products/Wares — 0.24% | | | |
| Henkel AG & Co KGaA | 325 | | 29,924 |
| Reckitt Benckiser Group PLC | 949 | | 83,977 |
| | | $ | 113,901 |
| |
| Insurance — 6.28% | | | |
| Admiral Group PLC | 1,750 | | 76,109 |
| Aegon NV | 5,075 | | 21,056 |
| Ageas SA | 1,235 | | 68,534 |
| AIA Group Ltd | 30,400 | | 377,832 |
| Allianz SE | 1,237 | | 308,462 |
| Assicurazioni Generali SpA | 3,913 | | 78,437 |
| Aviva PLC | 18,070 | | 101,460 |
| AXA SA | 4,142 | | 105,030 |
| Baloise Holding AG | 173 | | 26,981 |
| Brookfield Asset Management Reinsurance Partners Ltd (a) | 9 | | 476 |
| CNP Assurances | 3,324 | | 56,560 |
| Direct Line Insurance Group PLC | 6,993 | | 27,569 |
| Fairfax Financial Holdings Ltd | 114 | | 49,992 |
| Gjensidige Forsikring ASA | 1,196 | | 26,364 |
| Great-West Lifeco Inc | 2,698 | | 80,139 |
| Hannover Rueck SE | 189 | | 31,621 |
| iA Financial Corp Inc | 1,160 | | 63,156 |
| Intact Financial Corp | 551 | | 74,858 |
| Japan Post Insurance Co Ltd | 1,900 | | 35,128 |
| Legal & General Group PLC | 18,166 | | 64,732 |
| M&G PLC | 15,846 | | 50,174 |
| Manulife Financial Corp | 6,747 | | 132,806 |
| Medibank Pvt Ltd | 13,015 | | 30,843 |
| Muenchener Rueckversicherungs-Gesellschaft AG in Muenchen | 154 | | 42,173 |
| NN Group NV | 1,313 | | 61,933 |
| Phoenix Group Holdings PLC | 4,903 | | 45,876 |
| Power Corp of Canada | 3,420 | | 108,096 |
| Prudential PLC | 5,568 | | 105,790 |
| QBE Insurance Group Ltd | 3,535 | | 28,605 |
| Sampo Oyj, Class A | 1,655 | | 76,063 |
| SCOR SE (a) | 646 | | 20,544 |
| Sompo Holdings Inc | 1,700 | | 62,831 |
| Sun Life Financial Inc | 2,526 | | 130,253 |
| Suncorp Group Ltd | 3,174 | | 26,446 |
| Swiss Life Holding AG | 132 | | 64,142 |
| Swiss Re AG | 533 | | 48,090 |
| T&D Holdings Inc | 3,800 | | 49,118 |
| Tryg A/S | 2,244 | | 55,087 |
| Zurich Insurance Group AG | 360 | | 144,428 |
| | | $ | 2,957,794 |
| |
| Internet — 1.81% | | | |
| Adevinta ASA (a) | 1,121 | | 21,482 |
| Auto Trader Group PLC (a),(b) | 3,685 | | 32,287 |
| Delivery Hero SE (a),(b) | 208 | | 27,475 |
| Iliad SA | 229 | | 33,508 |
| M3 Inc | 1,100 | | 80,330 |
| Prosus NV | 1,026 | | 100,331 |
| Scout24 AG (b) | 94 | | 7,927 |
| SEEK Ltd | 949 | | 23,586 |
| Shopify Inc, Class A (a) | 268 | | 391,940 |
| Trend Micro Inc | 900 | | 47,149 |
See accompanying notes.
77
| | | |
| Schedule of Investments |
| Principal International Adaptive Multi-Factor ETF |
| June 30, 2021 |
| |
| COMMON STOCKS (continued) | Shares Held | | Value |
| |
| Internet (continued) | | | |
| United Internet AG | 496 | $ | 20,279 |
| Wix.com Ltd (a) | 95 | | 27,577 |
| ZOZO Inc | 1,100 | | 37,378 |
| | | $ | 851,249 |
| |
| Investment Companies — 1.13% | | | |
| Eurazeo SE | 229 | | 19,958 |
| EXOR NV | 284 | | 22,751 |
| Groupe Bruxelles Lambert SA | 323 | | 36,132 |
| Industrivarden AB | 1,179 | | 45,848 |
| Industrivarden AB, Class C | 762 | | 27,887 |
| Investor AB, Class B | 7,202 | | 165,994 |
| Kinnevik AB, Class B | 952 | | 38,111 |
| L E Lundbergforetagen AB, Class B | 113 | | 7,291 |
| Melrose Industries PLC | 22,685 | | 48,671 |
| Sofina SA | 75 | | 32,353 |
| Washington H Soul Pattinson & Co Ltd | 1,787 | | 45,204 |
| Wendel SE | 303 | | 40,742 |
| | | $ | 530,942 |
| |
| Iron & Steel — 0.66% | | | |
| ArcelorMittal SA | 2,223 | | 68,139 |
| BlueScope Steel Ltd | 1,386 | | 22,826 |
| Evraz PLC | 6,858 | | 56,161 |
| Fortescue Metals Group Ltd | 6,858 | | 120,041 |
| voestalpine AG | 1,104 | | 44,953 |
| | | $ | 312,120 |
| |
| Lodging — 0.18% | | | |
| City Developments Ltd | 3,900 | | 21,143 |
| Crown Resorts Ltd (a) | 2,108 | | 18,828 |
| InterContinental Hotels Group PLC (a) | 362 | | 24,086 |
| Whitbread PLC (a) | 512 | | 22,112 |
| | | $ | 86,169 |
| |
| Machinery — Construction & Mining — 0.87% | | | |
| Epiroc AB | 2,089 | | 40,996 |
| Epiroc AB, Class A | 2,737 | | 62,364 |
| Hitachi Ltd | 2,400 | | 137,417 |
| Mitsubishi Electric Corp | 6,500 | | 94,345 |
| Sandvik AB | 2,907 | | 74,254 |
| | | $ | 409,376 |
| |
| Machinery — Diversified — 1.88% | | | |
| Atlas Copco AB | 781 | | 41,066 |
| Atlas Copco AB, Class A | 1,008 | | 61,718 |
| CNH Industrial NV | 3,818 | | 63,041 |
| FANUC Corp | 500 | | 120,595 |
| GEA Group AG | 1,520 | | 61,568 |
| Hexagon AB, Class B | 6,117 | | 90,632 |
| Husqvarna AB | 4,448 | | 59,095 |
| Keyence Corp | 500 | | 252,352 |
| KION Group AG | 210 | | 22,381 |
| Kone Oyj, Class B | 588 | | 47,969 |
| Miura Co Ltd | 700 | | 30,339 |
| Spirax-Sarco Engineering PLC | 192 | | 36,160 |
| | | $ | 886,916 |
| |
| Media — 0.97% | | | |
| Bollore SA | 8,131 | | 43,579 |
| Informa PLC (a) | 3,362 | | 23,328 |
| Pearson PLC | 4,274 | | 49,071 |
See accompanying notes.
78
| | | |
| Schedule of Investments |
| Principal International Adaptive Multi-Factor ETF |
| June 30, 2021 |
| |
| COMMON STOCKS (continued) | Shares Held | | Value |
| |
| Media (continued) | | | |
| Quebecor Inc, Class B | 1,690 | $ | 45,072 |
| Schibsted ASA | 456 | | 18,992 |
| Schibsted ASA, Class A | 398 | | 19,211 |
| Shaw Communications Inc | 2,888 | | 83,663 |
| Thomson Reuters Corp | 401 | | 39,831 |
| Vivendi SE | 2,529 | | 84,955 |
| Wolters Kluwer NV | 495 | | 49,726 |
| | | $ | 457,428 |
| |
| Metal Fabrication & Hardware — 0.14% | | | |
| SKF AB, Class B | 1,844 | | 46,951 |
| Tenaris SA | 1,939 | | 21,134 |
| | | $ | 68,085 |
| |
| Mining — 3.84% | | | |
| Agnico Eagle Mines Ltd | 420 | | 25,398 |
| Anglo American PLC | 3,933 | | 156,279 |
| Antofagasta PLC | 968 | | 19,222 |
| B2Gold Corp | 8,303 | | 34,830 |
| Barrick Gold Corp | 4,199 | | 86,852 |
| BHP Group Ltd | 5,319 | | 193,745 |
| BHP Group PLC | 6,405 | | 188,719 |
| Boliden AB | 1,899 | | 73,003 |
| Cameco Corp | 1,331 | | 25,512 |
| Evolution Mining Ltd | 11,649 | | 39,313 |
| First Quantum Minerals Ltd | 1,199 | | 27,634 |
| Franco-Nevada Corp | 249 | | 36,135 |
| Fresnillo PLC | 3,023 | | 32,266 |
| Glencore PLC | 11,628 | | 49,775 |
| Kinross Gold Corp | 6,535 | | 41,437 |
| Kirkland Lake Gold Ltd | 1,273 | | 49,057 |
| Lundin Mining Corp | 1,920 | | 17,317 |
| Newcrest Mining Ltd | 2,774 | | 52,592 |
| Norsk Hydro ASA | 7,259 | | 46,319 |
| Northern Star Resources Ltd | 2,662 | | 19,524 |
| Pan American Silver Corp | 629 | | 17,963 |
| Rio Tinto Ltd | 1,370 | | 130,114 |
| Rio Tinto PLC | 3,117 | | 256,506 |
| South32 Ltd | 11,211 | | 24,635 |
| SSR Mining Inc | 2,412 | | 37,670 |
| Sumitomo Metal Mining Co Ltd | 1,300 | | 50,610 |
| Teck Resources Ltd, Class B | 1,122 | | 25,841 |
| Wheaton Precious Metals Corp | 705 | | 31,075 |
| Yamana Gold Inc | 4,465 | | 18,802 |
| | | $ | 1,808,145 |
| |
| Miscellaneous Manufacture — 0.76% | | | |
| Alfa Laval AB | 1,426 | | 50,371 |
| Alstom SA (a) | 476 | | 24,039 |
| Knorr-Bremse AG | 246 | | 28,294 |
| Siemens AG | 1,465 | | 232,114 |
| Smiths Group PLC | 1,082 | | 23,798 |
| | | $ | 358,616 |
| |
| Oil & Gas — 1.19% | | | |
| Canadian Natural Resources Ltd | 1,462 | | 53,073 |
| Cenovus Energy Inc | 3,250 | | 31,095 |
| DCC PLC | 610 | | 49,937 |
| Equinor ASA | 1,579 | | 33,410 |
| Imperial Oil Ltd | 856 | | 26,089 |
| Lundin Energy AB | 702 | | 24,838 |
| Neste OYJ | 590 | | 36,127 |
See accompanying notes.
79
| | | |
| Schedule of Investments |
| Principal International Adaptive Multi-Factor ETF |
| June 30, 2021 |
| |
| COMMON STOCKS (continued) | Shares Held | | Value |
| |
| Oil & Gas (continued) | | | |
| Oil Search Ltd | 7,297 | $ | 20,850 |
| OMV AG | 894 | | 50,851 |
| Parkland Corp | 685 | | 22,137 |
| Repsol SA | 2,528 | | 31,636 |
| Royal Dutch Shell PLC, Class A | 4,011 | | 80,274 |
| Royal Dutch Shell PLC, Class B | 3,763 | | 72,823 |
| Santos Ltd | 4,559 | | 24,241 |
| TotalEnergies SE | 114 | | 5,158 |
| | | $ | 562,539 |
| |
| Packaging & Containers — 0.16% | | | |
| CCL Industries Inc, Class B | 1,351 | | 74,405 |
| |
| Pharmaceuticals — 7.15% | | | |
| Alfresa Holdings Corp | 1,900 | | 28,373 |
| Amplifon SpA | 951 | | 46,955 |
| AstraZeneca PLC | 1,902 | | 228,453 |
| Bausch Health Cos Inc (a) | 1,653 | | 48,513 |
| Canopy Growth Corp (a) | 781 | | 18,889 |
| Chugai Pharmaceutical Co Ltd | 2,400 | | 95,097 |
| Daiichi Sankyo Co Ltd | 4,200 | | 90,525 |
| Eisai Co Ltd | 1,100 | | 108,173 |
| GlaxoSmithKline PLC | 10,887 | | 213,761 |
| Grifols SA | 1,921 | | 52,026 |
| Hikma Pharmaceuticals PLC | 1,484 | | 50,212 |
| Ipsen SA | 401 | | 41,710 |
| Medipal Holdings Corp | 1,900 | | 36,291 |
| Merck KGaA | 439 | | 84,172 |
| Nippon Shinyaku Co Ltd | 500 | | 39,651 |
| Novartis AG | 5,054 | | 460,582 |
| Novo Nordisk A/S, Class B | 2,357 | | 197,467 |
| Ono Pharmaceutical Co Ltd | 1,900 | | 42,397 |
| Orion Oyj, Class B | 591 | | 25,403 |
| Otsuka Holdings Co Ltd | 1,800 | | 74,644 |
| Recordati Industria Chimica e Farmaceutica SpA | 493 | | 28,177 |
| Roche Holding AG | 1,921 | | 728,724 |
| Sanofi | 2,413 | | 252,817 |
| Santen Pharmaceutical Co Ltd | 3,200 | | 44,070 |
| Shionogi & Co Ltd | 1,300 | | 67,765 |
| Sumitomo Dainippon Pharma Co Ltd | 2,375 | | 49,768 |
| Takeda Pharmaceutical Co Ltd | 4,000 | | 133,903 |
| Teva Pharmaceutical Industries Ltd (a) | 2,564 | | 25,384 |
| UCB SA | 534 | | 55,822 |
| | | $ | 3,369,724 |
| |
| Pipelines — 0.54% | | | |
| AltaGas Ltd | 3,590 | | 75,357 |
| APA Group | 3,951 | | 26,371 |
| Enbridge Inc | 647 | | 25,904 |
| Inter Pipeline Ltd | 1,500 | | 24,383 |
| Keyera Corp | 988 | | 26,549 |
| Koninklijke Vopak NV | 133 | | 6,040 |
| TC Energy Corp | 1,388 | | 68,683 |
| | | $ | 253,287 |
| |
| Private Equity — 0.06% | | | |
| 3i Group PLC | 1,712 | | 27,779 |
| |
| Real Estate — 1.78% | | | |
| Aroundtown SA | 3,135 | | 24,460 |
| CapitaLand Ltd | 2,000 | | 5,518 |
| CK Asset Holdings Ltd | 7,000 | | 48,324 |
| Daito Trust Construction Co Ltd | 400 | | 43,746 |
See accompanying notes.
80
| | | |
| Schedule of Investments |
| Principal International Adaptive Multi-Factor ETF |
| June 30, 2021 |
| |
| COMMON STOCKS (continued) | Shares Held | | Value |
| |
| Real Estate (continued) | | | |
| Deutsche Wohnen SE | 173 | $ | 10,581 |
| ESR Cayman Ltd (a),(b) | 6,600 | | 22,271 |
| Fastighets AB Balder, Class B (a) | 723 | | 45,366 |
| FirstService Corp | 287 | | 49,225 |
| Hang Lung Properties Ltd | 3,000 | | 7,287 |
| Henderson Land Development Co Ltd | 1,000 | | 4,740 |
| Hongkong Land Holdings Ltd | 1,789 | | 8,516 |
| Hulic Co Ltd | 3,200 | | 36,005 |
| LEG Immobilien SE | 227 | | 32,690 |
| Mitsubishi Estate Co Ltd | 4,500 | | 72,769 |
| Mitsui Fudosan Co Ltd | 3,800 | | 88,009 |
| New World Development Co Ltd | 1,000 | | 5,197 |
| Nomura Real Estate Holdings Inc | 1,400 | | 35,512 |
| REA Group Ltd | 343 | | 43,480 |
| Sino Land Co Ltd | 4,000 | | 6,306 |
| Sumitomo Realty & Development Co Ltd | 1,700 | | 60,750 |
| Sun Hung Kai Properties Ltd | 3,000 | | 44,705 |
| Swire Properties Ltd | 2,800 | | 8,348 |
| Swiss Prime Site AG | 287 | | 28,475 |
| Tokyu Fudosan Holdings Corp | 7,500 | | 45,097 |
| UOL Group Ltd | 1,500 | | 8,143 |
| Vonovia SE | 855 | | 55,273 |
| | | $ | 840,793 |
| |
| REITs — 0.90% | | | |
| Ascendas Real Estate Investment Trust | 2,100 | | 4,607 |
| Canadian Apartment Properties REIT | 570 | | 26,725 |
| CapitaLand Integrated Commercial Trust | 3,900 | | 6,062 |
| Dexus | 969 | | 7,754 |
| Goodman Group | 5,492 | | 87,193 |
| GPT Group/The | 6,213 | | 22,831 |
| Link REIT | 4,400 | | 42,644 |
| Mapletree Commercial Trust | 15,300 | | 24,576 |
| Mapletree Logistics Trust | 17,100 | | 26,069 |
| Orix JREIT Inc | 22 | | 42,339 |
| RioCan Real Estate Investment Trust | 1,142 | | 20,342 |
| Scentre Group | 12,008 | | 24,675 |
| Segro PLC | 2,755 | | 41,711 |
| Stockland | 6,556 | | 22,912 |
| Suntec Real Estate Investment Trust | 4,000 | | 4,343 |
| Vicinity Centres | 16,779 | | 19,441 |
| | | $ | 424,224 |
| |
| Retail — 2.93% | | | |
| Alimentation Couche-Tard Inc, Class B | 2,680 | | 98,479 |
| Canadian Tire Corp Ltd, Class A | 438 | | 69,311 |
| Cie Financiere Richemont SA | 551 | | 66,668 |
| Cosmos Pharmaceutical Corp | 200 | | 29,344 |
| Dollarama Inc | 760 | | 34,787 |
| Fast Retailing Co Ltd | 100 | | 75,278 |
| Hennes & Mauritz AB, Class B (a) | 1,291 | | 30,623 |
| JD Sports Fashion PLC | 5,224 | | 66,410 |
| Kingfisher PLC | 14,878 | | 75,017 |
| Marui Group Co Ltd | 2,100 | | 39,469 |
| McDonald's Holdings Co Japan Ltd | 800 | | 35,285 |
| Moncler SpA | 819 | | 55,413 |
| Next PLC (a) | 248 | | 26,951 |
| Nitori Holdings Co Ltd | 300 | | 53,090 |
| Pan Pacific International Holdings Corp | 2,300 | | 47,741 |
| Pandora A/S | 456 | | 61,297 |
| Restaurant Brands International Inc | 609 | | 39,239 |
| Shimamura Co Ltd | 300 | | 28,786 |
| Sundrug Co Ltd | 900 | | 28,597 |
See accompanying notes.
81
| | | |
| Schedule of Investments |
| Principal International Adaptive Multi-Factor ETF |
| June 30, 2021 |
| |
| COMMON STOCKS (continued) | Shares Held | | Value |
| |
| Retail (continued) | | | |
| Swatch Group AG/The | 855 | $ | 83,012 |
| Tsuruha Holdings Inc | 300 | | 34,862 |
| USS Co Ltd | 1,900 | | 33,145 |
| Welcia Holdings Co Ltd | 1,200 | | 39,210 |
| Wesfarmers Ltd | 2,908 | | 128,888 |
| Yamada Holdings Co Ltd | 7,500 | | 34,632 |
| Zalando SE (a),(b) | 532 | | 64,312 |
| | | $ | 1,379,846 |
| |
| Semiconductors — 2.29% | | | |
| ASM International NV | 172 | | 56,494 |
| ASML Holding NV | 1,063 | | 730,306 |
| Infineon Technologies AG | 1,386 | | 55,581 |
| STMicroelectronics NV | 1,806 | | 65,540 |
| Tokyo Electron Ltd | 400 | | 173,113 |
| | | $ | 1,081,034 |
| |
| Shipbuilding — 0.10% | | | |
| Wartsila OYJ Abp | 3,286 | | 48,763 |
| |
| Software — 1.62% | | | |
| BlackBerry Ltd (a) | 2,318 | | 28,330 |
| Constellation Software Inc | 58 | | 87,843 |
| Dassault Systemes SE | 227 | | 55,044 |
| Koei Tecmo Holdings Co Ltd | 700 | | 34,151 |
| Konami Holdings Corp | 600 | | 36,023 |
| Nemetschek SE | 267 | | 20,427 |
| Open Text Corp | 722 | | 36,665 |
| Oracle Corp Japan | 400 | | 30,604 |
| Sage Group PLC/The | 6,328 | | 59,892 |
| SAP SE | 1,387 | | 195,448 |
| TeamViewer AG (a),(b) | 474 | | 17,828 |
| Temenos AG | 153 | | 24,573 |
| TIS Inc | 1,900 | | 48,520 |
| WiseTech Global Ltd | 1,615 | | 38,673 |
| Xero Ltd (a) | 476 | | 48,941 |
| | | $ | 762,962 |
| |
| Telecommunications — 4.30% | | | |
| BCE Inc | 1,120 | | 55,232 |
| BT Group PLC (a) | 14,992 | | 40,233 |
| Deutsche Telekom AG | 7,849 | | 165,775 |
| Elisa OYJ | 514 | | 30,669 |
| Hikari Tsushin Inc | 200 | | 35,123 |
| HKT Trust & HKT Ltd | 19,000 | | 25,890 |
| KDDI Corp | 4,100 | | 127,877 |
| Koninklijke KPN NV | 24,946 | | 77,913 |
| Nice Ltd (a) | 152 | | 37,122 |
| Nippon Telegraph & Telephone Corp | 4,100 | | 106,823 |
| Orange SA | 6,668 | | 76,022 |
| PCCW Ltd | 39,000 | | 20,444 |
| Proximus SADP | 1,768 | | 34,150 |
| Rogers Communications Inc, Class B | 1,425 | | 75,756 |
| SES SA | 2,662 | | 20,334 |
| Singapore Telecommunications Ltd | 19,200 | | 32,697 |
| Softbank Corp | 9,400 | | 122,984 |
| SoftBank Group Corp | 3,900 | | 272,942 |
| Spark New Zealand Ltd | 9,122 | | 30,606 |
| Swisscom AG | 73 | | 41,674 |
| Tele2 AB, Class B | 3,742 | | 50,983 |
| Telecom Italia SpA/Milano | 179,343 | | 92,469 |
| Telefonaktiebolaget LM Ericsson, Class B | 10,165 | | 127,756 |
| Telefonica Deutschland Holding AG | 9,253 | | 24,412 |
See accompanying notes.
82
| | | |
| Schedule of Investments |
| Principal International Adaptive Multi-Factor ETF |
| June 30, 2021 |
| |
| COMMON STOCKS (continued) | Shares Held | | Value |
| |
| Telecommunications (continued) | | | |
| Telefonica SA | 7,827 | $ | 36,576 |
| Telenor ASA | 3,384 | | 57,028 |
| Telia Co AB | 1,901 | | 8,436 |
| Telstra Corp Ltd | 12,976 | | 36,590 |
| TELUS Corp | 2,643 | | 59,274 |
| TPG Telecom Ltd | 8,112 | | 38,083 |
| Vodafone Group PLC | 39,350 | | 66,049 |
| | | $ | 2,027,922 |
| |
| Textiles — 0.07% | | | |
| Teijin Ltd | 2,300 | | 35,050 |
| |
| Toys, Games & Hobbies — 0.37% | | | |
| Nintendo Co Ltd | 300 | | 174,499 |
| |
| Transportation — 2.24% | | | |
| AP Moller - Maersk A/S | 31 | | 86,110 |
| AP Moller - Maersk A/S, Class B | 35 | | 100,598 |
| Aurizon Holdings Ltd | 9,730 | | 27,145 |
| Canadian National Railway Co | 911 | | 96,119 |
| Canadian Pacific Railway Ltd | 1,692 | | 130,108 |
| Deutsche Post AG | 3,438 | | 233,834 |
| DSV PANALPINA A/S | 534 | | 124,533 |
| Kuehne + Nagel International AG | 210 | | 71,857 |
| MTR Corp Ltd | 1,500 | | 8,356 |
| Poste Italiane SpA (b) | 5,624 | | 74,356 |
| SG Holdings Co Ltd | 1,900 | | 49,820 |
| Yamato Holdings Co Ltd | 1,800 | | 51,199 |
| | | $ | 1,054,035 |
| |
| Water — 0.14% | | | |
| Severn Trent PLC | 211 | | 7,300 |
| Suez SA | 969 | | 23,037 |
| United Utilities Group PLC | 571 | | 7,697 |
| Veolia Environnement SA | 971 | | 29,325 |
| | | $ | 67,359 |
| TOTAL COMMON STOCKS | | $ | 46,780,738 |
| PREFERRED STOCKS — 0.35% | Shares Held | | Value |
| |
| Auto Manufacturers — 0.21% | | | |
| Volkswagen AG | | | |
| 2.84%, 09/29/2023 | 400 | $ | 100,172 |
| |
| Chemicals — 0.05% | | | |
| Fuchs Petrolub SE | | | |
| 1.88%, 07/09/2021 | 476 | | 23,152 |
| |
| Household Products/Wares — 0.09% | | | |
| Henkel AG & Co KGaA | | | |
| 1.98%, 08/07/2022 | 379 | | 40,015 |
| TOTAL PREFERRED STOCKS | | $ | 163,339 |
| INVESTMENT COMPANIES — 0.28% | Shares Held | | Value |
| |
| Money Market Fund — 0.28% | | | |
| State Street Institutional U.S. Government Money Market Fund — Institutional | | | |
| Class 0.03% (c) | 130,678 | $ | 130,678 |
| TOTAL INVESTMENT COMPANIES | | $ | 130,678 |
| Total Investments | | $ | 47,074,755 |
| Other Assets and Liabilities — 0.09% | | | 43,282 |
| |
| Total Net Assets — 100.00% | | $ | 47,118,037 |
See accompanying notes.
83
Schedule of Investments
Principal International Adaptive Multi-Factor ETF
June 30, 2021
| (a) | Non-income producing security. |
| (b) | Security exempt from registration under Rule 144A of the Securities Act of 1933. These securities may be resold in transactions exempt from registration, normally to qualified institutional buyers. At the end of the period, the value of these securities totaled $859,595 or 1.82% of net assets. |
| (c) | Current yield shown is as of period end. |
| | |
| Portfolio Summary (unaudited) |
|
| Location | Percent | |
| Japan | 21.29 | % |
| Canada | 12.28 | % |
| United Kingdom | 9.28 | % |
| Switzerland | 9.22 | % |
| France | 8.09 | % |
| Germany | 7.52 | % |
| Australia | 6.29 | % |
| Sweden | 4.48 | % |
| Netherlands | 4.26 | % |
| Hong Kong | 2.84 | % |
| Italy | 2.49 | % |
| Denmark | 2.37 | % |
| Spain | 1.56 | % |
| Singapore | 1.29 | % |
| Finland | 1.27 | % |
| Ireland | 1.02 | % |
| Norway | 0.78 | % |
| Israel | 0.76 | % |
| Belgium | 0.74 | % |
| Austria | 0.46 | % |
| Luxembourg | 0.41 | % |
| United States | 0.38 | % |
| New Zealand | 0.37 | % |
| Portugal | 0.12 | % |
| Isle Of Man | 0.12 | % |
| Jordan | 0.11 | % |
| Mexico | 0.07 | % |
| Chile | 0.04 | % |
| Other Assets and Liabilities | 0.09 | % |
| TOTAL NET ASSETS | 100.00 | % |
See accompanying notes.
84
| | | |
| Schedule of Investments |
| Principal International Multi-Factor ETF |
| June 30, 2021 |
| |
| COMMON STOCKS — 98.04% | Shares Held | | Value |
| |
| Advertising — 0.67% | | | |
| Dentsu Group Inc | 2,800 | $ | 100,185 |
| DKSH Holding AG | 2,284 | | 174,771 |
| Publicis Groupe SA | 1,802 | | 115,255 |
| Stroeer SE & Co KGaA | 1,348 | | 107,971 |
| WPP PLC | 8,721 | | 117,525 |
| | | $ | 615,707 |
| |
| Aerospace & Defense — 0.62% | | | |
| Airbus SE (a) | 2,633 | | 338,558 |
| BAE Systems PLC | 15,899 | | 114,804 |
| Rheinmetall AG | 1,086 | | 107,268 |
| Safran SA | 68 | | 9,427 |
| | | $ | 570,057 |
| |
| Agriculture — 0.72% | | | |
| British American Tobacco PLC | 11,645 | | 451,039 |
| Imperial Brands PLC | 5,382 | | 115,918 |
| Japan Tobacco Inc (b) | 4,800 | | 90,668 |
| | | $ | 657,625 |
| |
| Airlines — 0.05% | | | |
| Singapore Airlines Ltd (a) | 13,500 | | 48,691 |
| |
| Apparel — 0.85% | | | |
| adidas AG | 181 | | 67,369 |
| Kering SA | 30 | | 26,217 |
| LVMH Moet Hennessy Louis Vuitton SE | 879 | | 689,256 |
| | | $ | 782,842 |
| |
| Auto Manufacturers — 2.26% | | | |
| Bayerische Motoren Werke AG | 1,439 | | 152,389 |
| Daimler AG | 3,633 | | 324,380 |
| Honda Motor Co Ltd | 7,500 | | 239,660 |
| Porsche Automobil Holding SE | 2,971 | | 318,326 |
| Toyota Motor Corp | 9,400 | | 821,585 |
| Volvo AB, Class B (b) | 9,060 | | 217,975 |
| | | $ | 2,074,315 |
| |
| Auto Parts & Equipment — 1.18% | | | |
| Aisin Corp | 2,286 | | 97,741 |
| Brembo SpA | 8,839 | | 111,935 |
| Bridgestone Corp | 2,300 | | 104,654 |
| Cie Generale des Etablissements Michelin SCA | 737 | | 117,539 |
| Denso Corp | 2,400 | | 163,730 |
| Georg Fischer AG | 134 | | 198,846 |
| NGK Insulators Ltd | 5,000 | | 83,892 |
| Nokian Renkaat OYJ | 3,042 | | 122,820 |
| Toyota Industries Corp | 900 | | 77,852 |
| | | $ | 1,079,009 |
| |
| Banks — 11.58% | | | |
| Australia & New Zealand Banking Group Ltd | 12,260 | | 258,822 |
| Banca Mediolanum SpA | 11,660 | | 113,427 |
| Banco Bilbao Vizcaya Argentaria SA | 60,885 | | 377,432 |
| Banco Santander SA | 70,878 | | 270,578 |
| Bank Hapoalim BM (a) | 3,657 | | 29,344 |
| Bank Leumi Le-Israel BM (a) | 4,319 | | 32,802 |
| Bank of East Asia Ltd/The | 32,800 | | 60,917 |
| Bank of Montreal | 4,732 | | 485,034 |
| Bank of Nova Scotia/The | 7,979 | | 518,931 |
| Bankinter SA | 15,857 | | 79,704 |
| Barclays PLC | 60,137 | | 142,350 |
| BNP Paribas SA | 4,616 | | 289,380 |
See accompanying notes.
85
| | | |
| Schedule of Investments |
| Principal International Multi-Factor ETF |
| June 30, 2021 |
| |
| COMMON STOCKS (continued) | Shares Held | | Value |
| |
| Banks (continued) | | | |
| CaixaBank SA | 35,573 | $ | 109,417 |
| Canadian Imperial Bank of Commerce | 1,882 | | 214,238 |
| Commonwealth Bank of Australia | 7,582 | | 567,873 |
| Credit Agricole SA | 7,605 | | 106,534 |
| DBS Group Holdings Ltd | 15,600 | | 345,829 |
| Deutsche Bank AG (a) | 9,212 | | 120,002 |
| DNB ASA | 1,627 | | 35,449 |
| Erste Group Bank AG | 3,247 | | 119,123 |
| FinecoBank Banca Fineco SpA (a) | 6,727 | | 117,255 |
| Hang Seng Bank Ltd | 3,630 | | 72,513 |
| HSBC Holdings PLC | 44,603 | | 257,471 |
| ING Groep NV | 16,881 | | 222,985 |
| Intesa Sanpaolo SpA | 74,910 | | 206,917 |
| Japan Post Bank Co Ltd | 9,000 | | 75,584 |
| KBC Group NV | 1,513 | | 115,357 |
| Lloyds Banking Group PLC | 283,222 | | 182,923 |
| Macquarie Group Ltd | 49 | | 5,748 |
| Mediobanca Banca di Credito Finanziario SpA (a) | 9,928 | | 115,955 |
| Mitsubishi UFJ Financial Group Inc | 90,600 | | 489,393 |
| Mizrahi Tefahot Bank Ltd (a) | 1,268 | | 39,049 |
| Mizuho Financial Group Inc | 22,610 | | 323,087 |
| National Australia Bank Ltd | 14,190 | | 279,028 |
| National Bank of Canada | 1,879 | | 140,622 |
| Natwest Group PLC | 40,909 | | 114,990 |
| Nordea Bank Abp | 6,816 | | 75,869 |
| Oversea-Chinese Banking Corp Ltd | 37,300 | | 331,475 |
| Resona Holdings Inc | 20,700 | | 79,599 |
| Royal Bank of Canada | 7,966 | | 807,075 |
| Skandinaviska Enskilda Banken AB, Class A | 5,506 | | 71,124 |
| Standard Chartered PLC | 16,073 | | 102,498 |
| Sumitomo Mitsui Financial Group Inc | 10,900 | | 375,778 |
| Sumitomo Mitsui Trust Holdings Inc | 2,600 | | 82,567 |
| Svenska Handelsbanken AB, Class A | 6,181 | | 69,739 |
| Swedbank AB, Class A | 3,811 | | 70,911 |
| Toronto-Dominion Bank/The | 10,431 | | 730,995 |
| UBS Group AG | 27,968 | | 428,022 |
| United Overseas Bank Ltd | 2,800 | | 53,764 |
| Westpac Banking Corp | 15,767 | | 305,189 |
| | | $ | 10,620,668 |
| |
| Beverages — 1.12% | | | |
| Anheuser-Busch InBev SA | 1,777 | | 128,131 |
| Asahi Group Holdings Ltd | 2,300 | | 107,469 |
| Carlsberg A/S, Class B | 882 | | 164,410 |
| Coca-Cola HBC AG | 3,476 | | 125,690 |
| Diageo PLC | 4,628 | | 221,570 |
| Endeavour Group Ltd (a) | 5,320 | | 25,096 |
| Royal Unibrew A/S | 1,293 | | 164,696 |
| Suntory Beverage & Food Ltd (b) | 2,500 | | 94,064 |
| | | $ | 1,031,126 |
| |
| Biotechnology — 0.45% | | | |
| CSL Ltd | 1,950 | | 417,063 |
| |
| Chemicals — 3.24% | | | |
| Air Liquide SA | 2,034 | | 356,129 |
| Akzo Nobel NV | 988 | | 122,072 |
| Arkema SA | 909 | | 114,036 |
| Asahi Kasei Corp | 7,800 | | 85,692 |
| BASF SE | 3,709 | | 292,200 |
| Brenntag SE | 1,288 | | 119,767 |
| Covestro AG (c) | 1,635 | | 105,582 |
| Evonik Industries AG | 3,111 | | 104,321 |
See accompanying notes.
86
| | | | |
| Schedule of Investments |
| Principal International Multi-Factor ETF |
| June 30, 2021 |
| |
| COMMON STOCKS (continued) | | Shares Held | | Value |
| |
| Chemicals (continued) | | | | |
| ICL Group Ltd | | 5,647 | $ | 38,297 |
| Kansai Paint Co Ltd | | 3,200 | | 81,545 |
| LANXESS AG | | 1,491 | | 102,223 |
| Mitsubishi Gas Chemical Co Inc | | 3,400 | | 72,104 |
| Mitsui Chemicals Inc | | 2,800 | | 96,656 |
| Nippon Sanso Holdings Corp | | 4,800 | | 98,381 |
| Nissan Chemical Corp | | 1,900 | | 93,037 |
| Nitto Denko Corp | | 1,000 | | 74,621 |
| Novozymes A/S, Class B | | 1,175 | | 88,566 |
| Nutrien Ltd (b) | | 2,368 | | 143,482 |
| Shin-Etsu Chemical Co Ltd | | 1,300 | | 217,418 |
| Solvay SA | | 884 | | 112,367 |
| Sumitomo Chemical Co Ltd | | 17,000 | | 90,130 |
| Symrise AG | | 909 | | 126,647 |
| Tosoh Corp | | 4,800 | | 82,783 |
| Wacker Chemie AG | | 773 | | 119,202 |
| Yara International ASA | | 664 | | 34,950 |
| | | | $ | 2,972,208 |
| |
| Coal — 0.00% | | | | |
| Thungela Resources Ltd (a) | | 4 | | 11 |
| |
| Commercial Services — 2.28% | | | | |
| Adecco Group AG | | 2,602 | | 176,776 |
| Adyen NV (a),(c) | | 112 | | 273,643 |
| Ashtead Group PLC | | 1,855 | | 137,641 |
| Brambles Ltd | | 10,682 | | 91,645 |
| Bureau Veritas SA (a) | | 3,870 | | 122,431 |
| GMO Payment Gateway Inc | | 600 | | 78,149 |
| Intertek Group PLC | | 1,431 | | 109,467 |
| Randstad NV | | 1,566 | | 119,769 |
| Recruit Holdings Co Ltd | | 3,700 | | 182,177 |
| RELX PLC | | 8,376 | | 222,345 |
| Ritchie Bros Auctioneers Inc | | 2,179 | | 129,183 |
| Securitas AB, Class B | | 3,948 | | 62,324 |
| SGS SA | | 61 | | 188,159 |
| Sohgo Security Services Co Ltd | | 2,100 | | 95,648 |
| Worley Ltd | | 10,773 | | 96,627 |
| | | | $ | 2,085,984 |
| |
| Computers — 1.66% | | | | |
| Avast PLC (c) | | 3,031 | | 20,536 |
| Bechtle AG | | 589 | | 109,405 |
| Capgemini SE | | 649 | | 124,667 |
| CGI Inc (a) | | 1,534 | | 139,082 |
| Computershare Ltd | | 7,516 | | 95,259 |
| Fujitsu Ltd | | 600 | | 112,336 |
| Itochu Techno-Solutions Corp | | 2,800 | | 86,701 |
| Logitech International SA | | 1,725 | | 208,995 |
| Netcompany Group A/S (c) | | 1,423 | | 161,672 |
| NTT Data Corp | | 5,700 | | 88,916 |
| Obic Co Ltd | | 500 | | 93,209 |
| Otsuka Corp | | 2,100 | | 110,203 |
| SCSK Corp | | 200 | | 11,918 |
| Softwareone Holding AG | | 6,794 | | 160,442 |
| | | | $ | 1,523,341 |
| |
| Construction Materials — 2.07% | | | | |
| AGC Inc | | 2,300 | | 96,476 |
| Boral Ltd (a) | | 20,584 | | 113,462 |
| Buzzi Unicem SpA | | 4,237 | | 112,387 |
| Cie de Saint-Gobain | | 1,863 | | 122,691 |
| CRH PLC | | 3,290 | | 165,797 |
See accompanying notes.
87
| | | |
| Schedule of Investments |
| Principal International Multi-Factor ETF |
| June 30, 2021 |
| |
| COMMON STOCKS (continued) | Shares Held | | Value |
| |
| Construction Materials (continued) | | | |
| Daikin Industries Ltd | 1,100 | $ | 204,861 |
| Geberit AG | 278 | | 208,519 |
| HeidelbergCement AG | 1,215 | | 104,219 |
| Holcim Ltd | 2,986 | | 179,112 |
| Lixil Corp | 3,100 | | 80,168 |
| Nibe Industrier AB | 8,660 | | 91,092 |
| Rinnai Corp | 700 | | 66,601 |
| Sika AG | 567 | | 185,374 |
| TOTO Ltd | 1,700 | | 87,988 |
| Xinyi Glass Holdings Ltd | 20,000 | | 81,527 |
| | | $ | 1,900,274 |
| |
| Distribution/Wholesale — 2.03% | | | |
| Bunzl PLC | 3,454 | | 114,144 |
| Ferguson PLC | 925 | | 128,595 |
| ITOCHU Corp | 11,500 | | 331,248 |
| Jardine Cycle & Carriage Ltd | 3,200 | | 50,831 |
| Marubeni Corp | 10,700 | | 93,049 |
| Mitsubishi Corp | 5,900 | | 160,810 |
| Mitsui & Co Ltd | 15,200 | | 342,118 |
| Rexel SA | 5,555 | | 116,192 |
| Seven Group Holdings Ltd | 5,012 | | 76,490 |
| Sumitomo Corp | 6,100 | | 81,703 |
| Toromont Industries Ltd | 1,667 | | 145,237 |
| Toyota Tsusho Corp | 2,300 | | 108,691 |
| Travis Perkins PLC (a) | 4,648 | | 108,596 |
| | | $ | 1,857,704 |
| |
| Diversified Financial Services — 3.08% | | | |
| Acom Co Ltd | 19,100 | | 83,212 |
| Amundi SA (c) | 1,375 | | 121,221 |
| Brookfield Asset Management Inc, Class A | 6,494 | | 331,301 |
| Daiwa Securities Group Inc | 17,000 | | 93,359 |
| EQT AB | 2,042 | | 74,110 |
| Euronext NV (c) | 1,091 | | 118,628 |
| Hargreaves Lansdown PLC | 5,210 | | 114,519 |
| Hong Kong Exchanges & Clearing Ltd | 5,164 | | 307,806 |
| IGM Financial Inc | 4,188 | | 147,844 |
| Julius Baer Group Ltd | 2,741 | | 178,872 |
| Magellan Financial Group Ltd | 2,503 | | 101,102 |
| Nomura Holdings Inc | 16,800 | | 85,864 |
| Onex Corp | 2,052 | | 149,000 |
| ORIX Corp | 5,300 | | 89,427 |
| Partners Group Holding AG | 142 | | 215,091 |
| SBI Holdings Inc | 3,200 | | 75,697 |
| Schroders PLC | 2,293 | | 111,429 |
| Singapore Exchange Ltd | 7,600 | | 63,187 |
| St James's Place PLC | 6,301 | | 128,738 |
| Standard Life Aberdeen PLC | 27,692 | | 103,810 |
| TMX Group Ltd | 1,228 | | 129,715 |
| | | $ | 2,823,932 |
| |
| Electric — 2.11% | | | |
| A2A SpA | 60,487 | | 123,650 |
| AGL Energy Ltd | 11,711 | | 72,018 |
| BKW AG | 1,615 | | 168,089 |
| Chubu Electric Power Co Inc | 6,600 | | 80,677 |
| CLP Holdings Ltd | 7,006 | | 69,299 |
| Emera Inc | 2,870 | | 130,210 |
| Endesa SA | 4,161 | | 100,948 |
| Enel SpA | 28,871 | | 268,119 |
| Fortum OYJ | 4,126 | | 113,797 |
| Hera SpA | 28,726 | | 118,672 |
See accompanying notes.
88
| | | |
| Schedule of Investments |
| Principal International Multi-Factor ETF |
| June 30, 2021 |
| |
| COMMON STOCKS (continued) | Shares Held | | Value |
| |
| Electric (continued) | | | |
| Hydro One Ltd (c) | 5,478 | $ | 132,398 |
| Iberdrola SA | 23,710 | | 289,013 |
| Kansai Electric Power Co Inc/The | 8,200 | | 78,203 |
| Power Assets Holdings Ltd | 12,500 | | 76,713 |
| Red Electrica Corp SA | 6,216 | | 115,387 |
| | | $ | 1,937,193 |
| |
| Electrical Components & Equipment — 1.42% | | | |
| ABB Ltd | 13,932 | | 472,657 |
| Brother Industries Ltd | 3,700 | | 73,837 |
| Legrand SA | 1,186 | | 125,526 |
| Prysmian SpA | 3,389 | | 121,479 |
| Schneider Electric SE | 2,290 | | 360,275 |
| Signify NV (c) | 2,276 | | 143,952 |
| | | $ | 1,297,726 |
| |
| Electronics — 1.46% | | | |
| Assa Abloy AB, Class B | 2,336 | | 70,368 |
| Electrocomponents PLC | 8,087 | | 115,112 |
| Hirose Electric Co Ltd | 500 | | 73,136 |
| Hoya Corp | 1,700 | | 225,402 |
| Murata Manufacturing Co Ltd | 2,900 | | 221,412 |
| Nidec Corp | 2,300 | | 266,551 |
| Sartorius AG | 292 | | 151,999 |
| Spectris PLC | 2,415 | | 108,171 |
| Taiyo Yuden Co Ltd | 2,100 | | 103,776 |
| | | $ | 1,335,927 |
| |
| Energy — Alternate Sources — 0.00% | | | |
| Vestas Wind Systems A/S | 78 | | 3,045 |
| |
| Engineering & Construction — 1.11% | | | |
| Ackermans & van Haaren NV | 691 | | 116,676 |
| ACS Actividades de Construccion y Servicios SA | 3,325 | | 89,064 |
| ACS Actividades de Construccion y Servicios SA – Rights (a) | 3,091 | | 4,325 |
| Auckland International Airport Ltd (a) | 5,613 | | 28,524 |
| Bouygues SA | 2,744 | | 101,483 |
| CK Infrastructure Holdings Ltd | 12,500 | | 74,540 |
| HOCHTIEF AG | 1,229 | | 94,374 |
| Kajima Corp | 6,100 | | 77,255 |
| Obayashi Corp | 9,400 | | 74,713 |
| Singapore Technologies Engineering Ltd | 19,100 | | 54,969 |
| Taisei Corp | 2,400 | | 78,635 |
| Vinci SA | 592 | | 63,170 |
| WSP Global Inc | 1,341 | | 156,536 |
| | | $ | 1,014,264 |
| |
| Entertainment — 0.51% | | | |
| Aristocrat Leisure Ltd | 3,287 | | 106,220 |
| Entain PLC (a) | 5,291 | | 127,754 |
| La Francaise des Jeux SAEM (c) | 2,422 | | 142,388 |
| Tabcorp Holdings Ltd | 24,147 | | 93,805 |
| | | $ | 470,167 |
| |
| Environmental Control — 0.12% | | | |
| Kurita Water Industries Ltd | 2,200 | | 105,549 |
| |
| Food — 4.70% | | | |
| Ajinomoto Co Inc | 4,600 | | 119,415 |
| Axfood AB | 2,808 | | 77,664 |
| Coles Group Ltd | 7,060 | | 90,485 |
| Danone SA | 2,711 | | 190,849 |
| Emmi AG | 173 | | 177,441 |
See accompanying notes.
89
| | | |
| Schedule of Investments |
| Principal International Multi-Factor ETF |
| June 30, 2021 |
| |
| COMMON STOCKS (continued) | Shares Held | | Value |
| |
| Food (continued) | | | |
| Empire Co Ltd | 4,096 | $ | 129,198 |
| George Weston Ltd | 1,444 | | 137,632 |
| HelloFresh SE (a) | 1,477 | | 143,576 |
| J Sainsbury PLC | 33,106 | | 124,472 |
| Jeronimo Martins SGPS SA | 6,542 | | 119,305 |
| Kesko OYJ, Class B | 3,598 | | 132,896 |
| Koninklijke Ahold Delhaize NV | 3,955 | | 117,569 |
| Loblaw Cos Ltd | 2,284 | | 140,567 |
| MEIJI Holdings Co Ltd | 1,200 | | 71,830 |
| Metro Inc | 2,796 | | 134,048 |
| Nestle SA | 12,262 | | 1,526,968 |
| Nisshin Seifun Group Inc | 5,300 | | 77,524 |
| Nissin Foods Holdings Co Ltd | 1,200 | | 86,412 |
| Orkla ASA | 3,534 | | 35,996 |
| Saputo Inc | 4,244 | | 126,574 |
| Seven & i Holdings Co Ltd | 3,400 | | 162,112 |
| Toyo Suisan Kaisha Ltd | 2,300 | | 88,505 |
| Wilmar International Ltd | 13,700 | | 45,847 |
| Woolworths Group Ltd | 5,320 | | 152,129 |
| Yakult Honsha Co Ltd | 1,800 | | 101,913 |
| | | $ | 4,310,927 |
| |
| Forest Products & Paper — 0.45% | | | |
| Mondi PLC | 4,338 | | 114,074 |
| Nine Dragons Paper Holdings Ltd | 50,000 | | 64,140 |
| Smurfit Kappa Group PLC | 2,337 | | 126,778 |
| Stora Enso Oyj, Class R | 5,902 | | 107,669 |
| | | $ | 412,661 |
| |
| Gas — 0.50% | | | |
| Enagas SA | 5,070 | | 117,139 |
| Italgas SpA | 16,960 | | 110,848 |
| Naturgy Energy Group SA | 4,494 | | 115,528 |
| Snam SpA | 19,857 | | 114,784 |
| | | $ | 458,299 |
| |
| Hand/Machine Tools — 0.61% | | | |
| Disco Corp | 300 | | 91,678 |
| Fuji Electric Co Ltd | 2,300 | | 107,449 |
| Makita Corp | 2,200 | | 103,569 |
| Schindler Holding AG | 597 | | 182,600 |
| Techtronic Industries Co Ltd | 4,000 | | 69,858 |
| | | $ | 555,154 |
| |
| Healthcare — Products — 1.03% | | | |
| Alcon Inc | 2,102 | | 147,169 |
| Coloplast A/S, Class B | 903 | | 148,166 |
| ConvaTec Group PLC (c) | 40,940 | | 136,257 |
| DiaSorin SpA | 686 | | 129,741 |
| EssilorLuxottica SA | 202 | | 37,279 |
| Getinge AB | 2,419 | | 91,242 |
| Koninklijke Philips NV | 829 | | 41,079 |
| Lifco AB, Class B | 3,612 | | 84,411 |
| Sartorius Stedim Biotech | 265 | | 125,344 |
| | | $ | 940,688 |
| |
| Healthcare — Services — 0.55% | | | |
| Eurofins Scientific SE (a) | 1,149 | | 131,338 |
| Fresenius Medical Care AG & Co KGaA | 1,500 | | 124,575 |
| Fresenius SE & Co KGaA | 2,473 | | 129,009 |
| Lonza Group AG | 6 | | 4,252 |
| NMC Health PLC (a),(d) | 708 | | — |
See accompanying notes.
90
| | | |
| Schedule of Investments |
| Principal International Multi-Factor ETF |
| June 30, 2021 |
| |
| COMMON STOCKS (continued) | Shares Held | | Value |
| |
| Healthcare — Services (continued) | | | |
| PeptiDream Inc (a) | 400 | $ | 19,623 |
| Sonic Healthcare Ltd | 3,220 | | 92,730 |
| | | $ | 501,527 |
| |
| Holding Companies — Diversified — 0.16% | | | |
| CK Hutchison Holdings Ltd | 10,000 | | 77,921 |
| Swire Pacific Ltd, Class A | 10,500 | | 71,201 |
| | | $ | 149,122 |
| |
| Home Builders — 0.73% | | | |
| Barratt Developments PLC | 10,749 | | 103,370 |
| Daiwa House Industry Co Ltd | 3,000 | | 90,058 |
| Iida Group Holdings Co Ltd | 3,500 | | 90,103 |
| Open House Co Ltd | 2,200 | | 103,371 |
| Persimmon PLC | 2,732 | | 111,788 |
| Sekisui Chemical Co Ltd | 4,800 | | 82,049 |
| Sekisui House Ltd | 4,200 | | 86,140 |
| | | $ | 666,879 |
| |
| Home Furnishings — 1.25% | | | |
| De' Longhi SpA | 2,728 | | 118,844 |
| Electrolux AB, Series B | 2,421 | | 67,130 |
| Howden Joinery Group PLC | 11,577 | | 130,774 |
| Panasonic Corp | 10,500 | | 121,497 |
| SEB SA | 625 | | 112,943 |
| Sharp Corp | 5,200 | | 85,797 |
| Sony Group Corp | 5,200 | | 506,215 |
| | | $ | 1,143,200 |
| |
| Household Products — 1.49% | | | |
| Essity AB, Class B | 2,128 | | 70,568 |
| Kao Corp | 1,300 | | 79,981 |
| L'Oreal SA | 1,053 | | 469,222 |
| Unicharm Corp | 2,300 | | 92,542 |
| Unilever PLC | 11,225 | | 656,893 |
| | | $ | 1,369,206 |
| |
| Household Products/Wares — 0.28% | | | |
| Reckitt Benckiser Group PLC | 2,919 | | 258,301 |
| |
| Insurance — 5.84% | | | |
| Admiral Group PLC | 2,590 | | 112,641 |
| Ageas SA | 1,821 | | 101,053 |
| AIA Group Ltd | 47,707 | | 592,935 |
| Allianz SE | 2,323 | | 579,271 |
| ASR Nederland NV | 2,456 | | 94,909 |
| Assicurazioni Generali SpA | 5,502 | | 110,288 |
| Aviva PLC | 19,667 | | 110,426 |
| AXA SA | 8,970 | | 227,455 |
| Brookfield Asset Management Reinsurance Partners Ltd (a) | 45 | | 2,378 |
| CNP Assurances | 5,790 | | 98,520 |
| Direct Line Insurance Group PLC | 25,626 | | 101,028 |
| Fairfax Financial Holdings Ltd | 291 | | 127,612 |
| Gjensidige Forsikring ASA | 1,478 | | 32,581 |
| Great-West Lifeco Inc | 4,794 | | 142,397 |
| Hannover Rueck SE | 602 | | 100,720 |
| iA Financial Corp Inc | 2,345 | | 127,673 |
| Intact Financial Corp | 1,044 | | 141,836 |
| Japan Post Holdings Co Ltd | 9,600 | | 78,661 |
| Japan Post Insurance Co Ltd | 4,000 | | 73,955 |
| Legal & General Group PLC | 28,765 | | 102,501 |
| M&G PLC | 38,710 | | 122,570 |
| Manulife Financial Corp | 16,486 | | 324,507 |
See accompanying notes.
91
| | | |
| Schedule of Investments |
| Principal International Multi-Factor ETF |
| June 30, 2021 |
| |
| COMMON STOCKS (continued) | Shares Held | | Value |
| |
| Insurance (continued) | | | |
| Mapfre SA | 52,859 | $ | 111,723 |
| Medibank Pvt Ltd | 40,360 | | 95,647 |
| Muenchener Rueckversicherungs-Gesellschaft AG in Muenchen | 551 | | 150,891 |
| NN Group NV | 2,252 | | 106,225 |
| Phoenix Group Holdings PLC | 10,937 | | 102,334 |
| Power Corp of Canada (b) | 4,853 | | 153,389 |
| Prudential PLC | 2,343 | | 44,516 |
| Sompo Holdings Inc | 2,400 | | 88,702 |
| Sun Life Financial Inc | 2,528 | | 130,356 |
| Swiss Re AG | 1,786 | | 161,140 |
| T&D Holdings Inc | 6,600 | | 85,311 |
| Talanx AG (a) | 2,596 | | 106,137 |
| Tokio Marine Holdings Inc | 3,000 | | 137,936 |
| Tryg A/S | 5,743 | | 140,982 |
| Zurich Insurance Group AG | 585 | | 234,695 |
| | | $ | 5,355,901 |
| |
| Internet — 1.15% | | | |
| ASOS PLC (a) | 1,451 | | 99,555 |
| CyberAgent Inc | 1,642 | | 35,251 |
| Prosus NV | 1,845 | | 180,420 |
| Rakuten Inc | 4,800 | | 54,181 |
| Reply SpA | 76 | | 12,490 |
| SEEK Ltd | 3,963 | | 98,494 |
| Shopify Inc, Class A (a) | 289 | | 422,652 |
| Trend Micro Inc | 600 | | 31,433 |
| United Internet AG | 457 | | 18,684 |
| ZOZO Inc | 3,100 | | 105,338 |
| | | $ | 1,058,498 |
| |
| Investment Companies — 0.62% | | | |
| Aker ASA, Class A | 453 | | 33,409 |
| Industrivarden AB, Class C | 1,913 | | 70,010 |
| Investor AB, Class B | 12,130 | | 279,576 |
| Kinnevik AB, Class B | 2,342 | | 93,756 |
| Washington H Soul Pattinson & Co Ltd | 3,581 | | 90,584 |
| | | $ | 567,335 |
| |
| Iron & Steel — 0.49% | | | |
| ArcelorMittal SA | 3,813 | | 116,875 |
| Evraz PLC | 13,890 | | 113,747 |
| Fortescue Metals Group Ltd | 5,651 | | 98,914 |
| Mineral Resources Ltd | 2,970 | | 119,676 |
| | | $ | 449,212 |
| |
| Leisure Time — 0.21% | | | |
| Shimano Inc | 400 | | 94,874 |
| Yamaha Motor Co Ltd | 3,600 | | 97,862 |
| | | $ | 192,736 |
| |
| Machinery — Construction & Mining — 0.98% | | | |
| Epiroc AB, Class A | 3,174 | | 72,321 |
| Hitachi Ltd | 8,100 | | 463,784 |
| Metso Outotec OYJ | 9,876 | | 114,716 |
| Mitsubishi Electric Corp | 8,900 | | 129,180 |
| Weir Group PLC/The (a) | 4,518 | | 115,683 |
| | | $ | 895,684 |
| |
| Machinery — Diversified — 2.63% | | | |
| ANDRITZ AG | 2,449 | | 137,587 |
| Atlas Copco AB, Class A | 3,907 | | 239,220 |
| Bucher Industries AG | 344 | | 179,873 |
See accompanying notes.
92
| | | |
| Schedule of Investments |
| Principal International Multi-Factor ETF |
| June 30, 2021 |
| |
| COMMON STOCKS (continued) | Shares Held | | Value |
| |
| Machinery — Diversified (continued) | | | |
| FANUC Corp | 700 | $ | 168,833 |
| GEA Group AG | 2,685 | | 108,756 |
| Hexagon AB, Class B | 9,338 | | 138,355 |
| Husqvarna AB | 4,660 | | 61,911 |
| IMI PLC | 6,017 | | 143,161 |
| Interpump Group SpA | 2,186 | | 129,447 |
| Keyence Corp | 800 | | 403,763 |
| KION Group AG | 1,114 | | 118,725 |
| Kone OYJ, Class B | 1,979 | | 161,446 |
| Kubota Corp | 3,900 | | 78,881 |
| Nabtesco Corp | 1,902 | | 71,906 |
| Spirax-Sarco Engineering PLC | 706 | | 132,965 |
| Valmet Oyj | 3,026 | | 131,970 |
| | | $ | 2,406,799 |
| |
| Media — 0.76% | | | |
| Bollore SA | 22,797 | | 122,183 |
| ITV PLC (a) | 66,821 | | 116,050 |
| Pearson PLC | 10,404 | | 119,452 |
| Telenet Group Holding NV | 2,713 | | 102,106 |
| Vivendi SE (b) | 3,355 | | 112,702 |
| Wolters Kluwer NV | 1,264 | | 126,977 |
| | | $ | 699,470 |
| |
| Metal Fabrication & Hardware — 0.45% | | | |
| SFS Group AG | 1,415 | | 203,552 |
| VAT Group AG (c) | 626 | | 208,114 |
| | | $ | 411,666 |
| |
| Mining — 3.03% | | | |
| Anglo American PLC | 609 | | 24,199 |
| Antofagasta PLC | 4,752 | | 94,362 |
| Barrick Gold Corp | 7,767 | | 160,653 |
| BHP Group Ltd | 12,607 | | 459,211 |
| BHP Group PLC | 7,589 | | 223,605 |
| Boliden AB | 1,808 | | 69,505 |
| Evolution Mining Ltd | 27,698 | | 93,475 |
| Fresnillo PLC | 9,290 | | 99,157 |
| Glencore PLC | 43,111 | | 184,542 |
| Kinross Gold Corp | 19,161 | | 121,495 |
| Lundin Mining Corp | 12,402 | | 111,854 |
| Newcrest Mining Ltd | 4,625 | | 87,684 |
| Norsk Hydro ASA | 5,412 | | 34,533 |
| Northern Star Resources Ltd | 11,919 | | 87,420 |
| OZ Minerals Ltd | 4,950 | | 83,452 |
| Polymetal International PLC | 5,655 | | 121,602 |
| Rio Tinto Ltd | 1,022 | | 97,063 |
| Rio Tinto PLC | 6,551 | | 539,098 |
| Sumitomo Metal Mining Co Ltd | 2,200 | | 85,647 |
| | | $ | 2,778,557 |
| |
| Miscellaneous Manufacture — 1.20% | | | |
| Aalberts NV | 2,172 | | 116,719 |
| Alfa Laval AB | 2,221 | | 78,453 |
| Indutrade AB | 2,908 | | 74,415 |
| Knorr-Bremse AG | 882 | | 101,446 |
| Siemens AG | 3,196 | | 506,374 |
| Stadler Rail AG | 3,680 | | 161,797 |
| Trelleborg AB, Class B | 2,643 | | 61,364 |
| | | $ | 1,100,568 |
See accompanying notes.
93
| | | |
| Schedule of Investments |
| Principal International Multi-Factor ETF |
| June 30, 2021 |
| |
| COMMON STOCKS (continued) | Shares Held | | Value |
| |
| Office & Business Equipment — 0.24% | | | |
| FUJIFILM Holdings Corp | 1,700 | $ | 126,075 |
| Seiko Epson Corp | 5,500 | | 96,737 |
| | | $ | 222,812 |
| |
| Oil & Gas — 1.88% | | | |
| BP PLC | 37,283 | | 162,457 |
| Canadian Natural Resources Ltd | 4,386 | | 159,221 |
| ENEOS Holdings Inc | 19,500 | | 81,602 |
| Idemitsu Kosan Co Ltd | 3,300 | | 79,697 |
| Inpex Corp | 13,100 | | 97,753 |
| OMV AG | 2,169 | | 123,373 |
| Royal Dutch Shell PLC, Class A | 23,567 | | 471,660 |
| Rubis SCA | 2,326 | | 103,399 |
| TotalEnergies SE (b) | 9,793 | | 443,058 |
| | | $ | 1,722,220 |
| |
| Packaging & Containers — 0.62% | | | |
| CCL Industries Inc, Class B | 2,307 | | 127,056 |
| DS Smith PLC | 19,692 | | 113,836 |
| Huhtamaki OYJ | 2,432 | | 115,206 |
| SIG Combibloc Group AG | 7,830 | | 212,749 |
| | | $ | 568,847 |
| |
| Pharmaceuticals — 7.08% | | | |
| AstraZeneca PLC | 5,162 | | 620,018 |
| Bayer AG | 1,173 | | 71,227 |
| Chugai Pharmaceutical Co Ltd | 2,300 | | 91,135 |
| Daiichi Sankyo Co Ltd | 2,700 | | 58,195 |
| Dechra Pharmaceuticals PLC | 2,340 | | 141,453 |
| GlaxoSmithKline PLC | 20,064 | | 393,948 |
| Hikma Pharmaceuticals PLC | 3,529 | | 119,405 |
| Ipsen SA | 1,283 | | 133,450 |
| Merck KGaA | 1,741 | | 333,812 |
| Novartis AG | 10,517 | | 958,437 |
| Novo Nordisk A/S, Class B | 10,024 | | 839,802 |
| Ono Pharmaceutical Co Ltd | 3,300 | | 73,637 |
| Orion OYJ, Class B | 2,745 | | 117,989 |
| Otsuka Holdings Co Ltd | 2,200 | | 91,232 |
| Recordati Industria Chimica e Farmaceutica SpA | 2,048 | | 117,050 |
| Roche Holding AG | 3,711 | | 1,397,967 |
| Sanofi | 4,902 | | 513,597 |
| Shionogi & Co Ltd (b) | 1,700 | | 88,615 |
| Sumitomo Dainippon Pharma Co Ltd | 5,135 | | 107,604 |
| Takeda Pharmaceutical Co Ltd | 6,600 | | 220,941 |
| | | $ | 6,489,514 |
| |
| Pipelines — 0.76% | | | |
| Enbridge Inc | 8,696 | | 348,163 |
| Pembina Pipeline Corp | 4,418 | | 140,388 |
| TC Energy Corp | 4,150 | | 205,357 |
| | | $ | 693,908 |
| |
| Real Estate — 1.75% | | | |
| CapitaLand Ltd | 19,600 | | 54,076 |
| Castellum AB | 3,045 | | 77,494 |
| CK Asset Holdings Ltd | 12,516 | | 86,403 |
| Daito Trust Construction Co Ltd | 700 | | 76,556 |
| FirstService Corp | 859 | | 147,331 |
| Henderson Land Development Co Ltd | 17,000 | | 80,574 |
| Hongkong Land Holdings Ltd | 10,500 | | 49,980 |
| Hopson Development Holdings Ltd | 19,400 | | 88,951 |
| Hulic Co Ltd (b) | 7,700 | | 86,638 |
See accompanying notes.
94
| | | |
| Schedule of Investments |
| Principal International Multi-Factor ETF |
| June 30, 2021 |
| |
| COMMON STOCKS (continued) | Shares Held | | Value |
| |
| Real Estate (continued) | | | |
| Kojamo OYJ | 5,627 | $ | 128,574 |
| Mitsubishi Estate Co Ltd | 5,200 | | 84,088 |
| Mitsui Fudosan Co Ltd | 3,900 | | 90,325 |
| REA Group Ltd | 797 | | 101,031 |
| Sumitomo Realty & Development Co Ltd | 2,600 | | 92,911 |
| Sun Hung Kai Properties Ltd | 4,500 | | 67,057 |
| TAG Immobilien AG | 3,855 | | 122,322 |
| Wharf Holdings Ltd/The | 28,000 | | 106,745 |
| Wharf Real Estate Investment Co Ltd | 11,000 | | 63,966 |
| | | $ | 1,605,022 |
| |
| REITs — 1.06% | | | |
| Charter Hall Group | 8,774 | | 102,123 |
| Dexus | 11,592 | | 92,759 |
| GPT Group/The | 24,566 | | 90,274 |
| Japan Metropolitan Fund Invest | 86 | | 93,203 |
| Japan Real Estate Investment Corp | 16 | | 98,366 |
| Klepierre SA | 4,723 | | 121,694 |
| Mapletree Industrial Trust | 26,600 | | 55,981 |
| Orix JREIT Inc | 52 | | 100,073 |
| Stockland | 25,684 | | 89,760 |
| Warehouses De Pauw CVA | 3,332 | | 127,220 |
| | | $ | 971,453 |
| |
| Retail — 3.49% | | | |
| ABC-Mart Inc | 1,800 | | 103,209 |
| Alimentation Couche-Tard Inc, Class B | 10,107 | | 371,389 |
| B&M European Value Retail SA | 15,213 | | 120,625 |
| Canadian Tire Corp Ltd, Class A | 902 | | 142,737 |
| Cie Financiere Richemont SA | 2,331 | | 282,038 |
| Cosmos Pharmaceutical Corp | 500 | | 73,361 |
| Dollarama Inc | 2,886 | | 132,100 |
| Domino's Pizza Enterprises Ltd | 1,173 | | 106,012 |
| Fast Retailing Co Ltd | 200 | | 150,556 |
| Fielmann AG (a) | 1,377 | | 107,682 |
| Harvey Norman Holdings Ltd | 19,721 | | 81,048 |
| JB Hi-Fi Ltd | 2,185 | | 82,882 |
| Kingfisher PLC | 25,223 | | 127,178 |
| Lawson Inc | 2,000 | | 92,533 |
| Moncler SpA | 1,919 | | 129,837 |
| Next PLC (a) | 1,022 | | 111,063 |
| Nitori Holdings Co Ltd | 400 | | 70,786 |
| Pan Pacific International Holdings Corp | 3,500 | | 72,650 |
| Pandora A/S | 1,262 | | 169,642 |
| Sundrug Co Ltd | 2,500 | | 79,436 |
| USS Co Ltd | 4,700 | | 81,989 |
| Welcia Holdings Co Ltd | 2,600 | | 84,954 |
| Wesfarmers Ltd | 4,917 | | 217,931 |
| Yamada Holdings Co Ltd | 16,400 | | 75,730 |
| Zalando SE (a),(c) | 1,120 | | 135,394 |
| | | $ | 3,202,762 |
| |
| Semiconductors — 2.00% | | | |
| Advantest Corp | 900 | | 81,093 |
| ASML Holding NV | 1,415 | | 972,138 |
| BE Semiconductor Industries NV | 1,313 | | 111,380 |
| Infineon Technologies AG | 1,174 | | 47,080 |
| Melexis NV | 1,039 | | 107,861 |
| Renesas Electronics Corp (a) | 8,200 | | 88,647 |
| Rohm Co Ltd | 800 | | 73,955 |
| SUMCO Corp (b) | 3,800 | | 93,208 |
See accompanying notes.
95
| | | |
| Schedule of Investments |
| Principal International Multi-Factor ETF |
| June 30, 2021 |
| |
| COMMON STOCKS (continued) | Shares Held | | Value |
| |
| Semiconductors (continued) | | | |
| Tokyo Electron Ltd | 600 | $ | 259,670 |
| | | $ | 1,835,032 |
| |
| Shipbuilding — 0.17% | | | |
| Wartsila OYJ Abp | 10,510 | | 155,965 |
| |
| Software — 1.58% | | | |
| Constellation Software Inc | 94 | | 142,366 |
| Dassault Systemes SE | 649 | | 157,373 |
| Justsystems Corp | 100 | | 5,887 |
| Konami Holdings Corp | 1,600 | | 96,062 |
| Lightspeed POS Inc (a) | 377 | | 31,553 |
| Open Text Corp | 1,078 | | 54,744 |
| Sage Group PLC/The | 4,392 | | 41,568 |
| SAP SE | 5,823 | | 820,545 |
| TeamViewer AG (a),(c) | 684 | | 25,727 |
| Temenos AG | 305 | | 48,985 |
| TIS Inc | 900 | | 22,983 |
| | | $ | 1,447,793 |
| |
| Telecommunications — 4.23% | | | |
| BCE Inc | 3,799 | | 187,345 |
| BT Group PLC (a) | 51,864 | | 139,182 |
| Deutsche Telekom AG | 17,566 | | 371,004 |
| Elisa OYJ | 1,833 | | 109,370 |
| Hellenic Telecommunications Organization SA | 6,475 | | 108,640 |
| Hikari Tsushin Inc | 400 | | 70,246 |
| KDDI Corp | 12,100 | | 377,393 |
| Koninklijke KPN NV | 32,439 | | 101,316 |
| Nippon Telegraph & Telephone Corp | 11,400 | | 297,019 |
| Orange SA | 8,944 | | 101,970 |
| Proximus SADP | 5,057 | | 97,680 |
| Softbank Corp | 25,100 | | 328,393 |
| SoftBank Group Corp | 6,300 | | 440,906 |
| Spark New Zealand Ltd | 9,824 | | 32,962 |
| Swisscom AG | 336 | | 191,813 |
| Telecom Italia SpA/Milano | 203,546 | | 101,104 |
| Telefonaktiebolaget LM Ericsson, Class B | 14,035 | | 176,395 |
| Telefonica Deutschland Holding AG | 37,550 | | 99,068 |
| Telefonica SA | 24,594 | | 114,929 |
| Telekom Austria AG | 13,969 | | 119,259 |
| Telenor ASA | 1,968 | | 33,165 |
| Telstra Corp Ltd | 33,237 | | 93,722 |
| Vodafone Group PLC | 110,225 | | 185,012 |
| | | $ | 3,877,893 |
| |
| Toys, Games & Hobbies — 0.51% | | | |
| Nintendo Co Ltd | 800 | | 465,331 |
| |
| Transportation — 2.97% | | | |
| AP Moller - Maersk A/S, Class B | 58 | | 166,705 |
| Aurizon Holdings Ltd | 28,974 | | 80,832 |
| Canadian National Railway Co | 2,628 | | 277,280 |
| Canadian Pacific Railway Ltd | 5,102 | | 392,322 |
| Deutsche Post AG | 8,482 | | 576,900 |
| DSV PANALPINA A/S | 1,828 | | 426,303 |
| Kuehne + Nagel International AG | 636 | | 217,625 |
| Mainfreight Ltd | 633 | | 34,048 |
| Poste Italiane SpA (c) | 8,661 | | 114,508 |
| SG Holdings Co Ltd | 4,000 | | 104,883 |
| SITC International Holdings Co Ltd | 22,000 | | 91,946 |
| TFI International Inc | 1,704 | | 155,568 |
See accompanying notes.
96
| | | | |
| Schedule of Investments |
| Principal International Multi-Factor ETF |
| June 30, 2021 |
| |
| COMMON STOCKS (continued) | Shares Held | | Value | |
| Transportation (continued) | | | | |
| Yamato Holdings Co Ltd | 3,100 | $ | 88,177 | |
| | | $ | 2,727,097 | |
| TOTAL COMMON STOCKS | | $ | 89,892,467 | |
| PREFERRED STOCKS — 1.19% | Shares Held | | Value | |
| Auto Manufacturers — 0.69% | | | | |
| Volkswagen AG | | | | |
| 2.84%, 09/29/2023 | 2,516 | $ | 630,083 | |
| Chemicals — 0.12% | | | | |
| Fuchs Petrolub SE | | | | |
| 1.88%, 07/09/2021 | 2,301 | | 111,919 | |
| Household Products/Wares — 0.38% | | | | |
| Henkel AG & Co KGaA | | | | |
| 1.98%, 08/07/2022 | 3,299 | | 348,306 | |
| TOTAL PREFERRED STOCKS | | $ | 1,090,308 | |
| INVESTMENT COMPANIES — 1.91% | Shares Held | | Value | |
| Money Market Funds — 1.91% | | | | |
| Principal Government Money Market Fund — Institutional Class 0.00 (a),(e),(f),(g) | 1,088,545 | $ | 1,088,545 | |
| State Street Institutional U.S. Government Money Market Fund — Institutional | | | | |
| Class 0.03% (g) | 664,157 | | 664,157 | |
| TOTAL INVESTMENT COMPANIES | | $ | 1,752,702 | |
| Total Investments | | $ | 92,735,477 | |
| Other Assets and Liabilities — (1.14)% | | | (1,041,100 | ) |
| Total Net Assets — 100.00% | | $ | 91,694,377 | |
| (a) | Non-income producing security. |
| (b) | Security or a portion of the security was on loan. At the end of the period, the value of these securities totaled $1,023,397 or 1.12% of net assets. |
| (c) | Security exempt from registration under Rule 144A of the Securities Act of 1933. These securities may be resold in transactions exempt from registration, normally to qualified institutional buyers. At the end of the period, the value of these securities totaled $1,840,020 or 2.01% of net assets. |
| (d) | The value of these investments was determined using significant unobservable inputs, in good faith by the Advisor, under procedures established and periodically reviewed by the Board of Trustees. |
| (e) | Security or a portion of the security was received as collateral for securities lending. At the end of the period, the value of these securities totaled $1,088,545 or 1.19% of net assets. |
| (f) | Affiliated Security. Security is either an affiliate (and registered under the Investment Company Act of 1940) or an affiliate as defined by the Investment Company Act of 1940 (controls 5.00% or more of the outstanding voting shares of the security). |
| | Please see Affiliated Securities sub-schedule for transactional information. |
| (g) | Current yield shown is as of period end. |
See accompanying notes.
97
| | | | | | | | | |
| | | | Schedule of Investments | | | | |
| | | | Principal International Multi-Factor ETF | | |
| | | | June 30, 2021 | | | | |
| |
| Portfolio Summary (unaudited) | | | | | | |
| Location | | | | | Percent | | | | |
| Japan | | | | | 20.90 | % | | | |
| Canada | | | | | 11.21 | % | | | |
| Switzerland | | | | | 10.85 | % | | | |
| United Kingdom | | | | | 10.05 | % | | | |
| Germany | | | | | 9.40 | % | | | |
| France | | | | | 7.24 | % | | | |
| Australia | | | | | 6.34 | % | | | |
| Netherlands | | | | | 3.75 | % | | | |
| Sweden | | | | | 2.85 | % | | | |
| Italy | | | | | 2.83 | % | | | |
| Denmark | | | | | 2.70 | % | | | |
| Hong Kong | | | | | 2.46 | % | | | |
| Spain | | | | | 2.07 | % | | | |
| United States | | | | | 1.91 | % | | | |
| Finland | | | | | 1.73 | % | | | |
| Singapore | | | | | 1.21 | % | | | |
| Belgium | | | | | 1.10 | % | | | |
| Austria | | | | | 0.55 | % | | | |
| Ireland | | | | | 0.32 | % | | | |
| Luxembourg | | | | | 0.27 | % | | | |
| Norway | | | | | 0.26 | % | | | |
| Israel | | | | | 0.15 | % | | | |
| Isle Of Man | | | | | 0.14 | % | | | |
| Cyprus | | | | | 0.13 | % | | | |
| Jordan | | | | | 0.13 | % | | | |
| Portugal | | | | | 0.13 | % | | | |
| Greece | | | | | 0.12 | % | | | |
| Mexico | | | | | 0.11 | % | | | |
| New Zealand | | | | | 0.10 | % | | | |
| Chile | | | | | 0.10 | % | | | |
| Czech Republic | | | | | 0.03 | % | | | |
| Other Assets and Liabilities | | | | | (1.14 | )% | | | |
| TOTAL NET ASSETS | | | | | 100.00 | % | | | |
| |
| | | | June 30, 2020 | | Purchases | | Sales | | June 30, 2021 |
| Affiliated Securities | | | Value | | Cost | | Proceeds | | Value |
| Principal Government Money | | | | | | | | | |
| Market Fund — Institutional Class | | | | | | | | | |
| 0.00 | % | $ | 158,531 | $ | 8,436,989 | $ | 7,506,975 | $ | 1,088,545 |
| | | $ | 158,531 | $ | 8,436,989 | $ | 7,506,975 | $ | 1,088,545 |
| |
| | | | | | | | Realized Gain | | |
| | | | | | Realized | | from | | Change in |
| | | | | | Gain/Loss on | | Capital Gain | | Unrealized |
| | | | Income (a) | | Investments | | Distributions | | Gain/Loss |
| Principal Government Money | | | | | | | | | |
| Market Fund — Institutional Class | | | | | | | | | |
| 0.00 | % | $ | — | $ | — $ | | — | $ | — |
| | | $ | — | $ | — $ | | — | $ | — |
| (a) | Amount excludes earnings from securities lending collateral. |
See accompanying notes.
98
| | | | |
| Schedule of Investments |
| Principal Investment Grade Corporate Active ETF |
| June 30, 2021 |
| |
| | | Principal | | |
| BONDS — 97.65% | | Amount | | Value |
| |
| Advertising — 0.18% | | | | |
| Omnicom Group Inc | | | | |
| 2.60%, 08/01/2031 | $ | 850,000 | $ | 864,115 |
| |
| Aerospace & Defense — 3.75% | | | | |
| Boeing Co/The | | | | |
| 2.20%, 02/04/2026 | | 5,260,000 | | 5,310,276 |
| 2.70%, 02/01/2027 | | 2,954,000 | | 3,053,364 |
| 2.80%, 03/01/2024 | | 353,000 | | 368,203 |
| 3.25%, 02/01/2028 | | 1,364,000 | | 1,445,962 |
| 3.50%, 03/01/2039 | | 403,000 | | 403,856 |
| 4.88%, 05/01/2025 | | 388,000 | | 434,742 |
| 5.71%, 05/01/2040 | | 2,006,000 | | 2,583,493 |
| L3Harris Technologies Inc | | | | |
| 1.80%, 01/15/2031 | | 3,511,000 | | 3,404,600 |
| Raytheon Technologies Corp | | | | |
| 5.40%, 05/01/2035 | | 787,000 | | 1,038,518 |
| | | | $ | 18,043,014 |
| |
| Agriculture — 2.71% | | | | |
| Altria Group Inc | | | | |
| 2.35%, 05/06/2025 | | 1,116,000 | | 1,166,752 |
| 3.40%, 02/04/2041 | | 989,000 | | 942,954 |
| 5.80%, 02/14/2039 | | 398,000 | | 491,668 |
| 5.95%, 02/14/2049 | | 120,000 | | 153,447 |
| BAT Capital Corp | | | | |
| 2.26%, 03/25/2028 | | 2,918,000 | | 2,896,111 |
| 3.22%, 08/15/2024 | | 2,801,000 | | 2,975,109 |
| 3.56%, 08/15/2027 | | 2,781,000 | | 2,978,040 |
| Philip Morris International Inc | | | | |
| 0.88%, 05/01/2026 | | 1,332,000 | | 1,314,874 |
| Reynolds American Inc | | | | |
| 5.85%, 08/15/2045 | | 95,000 | | 116,323 |
| | | | $ | 13,035,278 |
| |
| Airlines — 2.27% | | | | |
| Continental Airlines 2012-1 Class A Pass Through Trust | | | | |
| 4.15%, 10/11/2025 | | 807,525 | | 857,788 |
| Delta Air Lines Inc / SkyMiles IP Ltd | | | | |
| 4.50%, 10/20/2025 (a) | | 3,432,331 | | 3,688,454 |
| 4.75%, 10/20/2028 (a) | | 666,156 | | 740,604 |
| JetBlue 2019-1 Class AA Pass Through Trust | | | | |
| 2.75%, 11/15/2033 | | 265,747 | | 272,899 |
| Southwest Airlines Co | | | | |
| 5.13%, 06/15/2027 | | 1,339,000 | | 1,575,295 |
| 5.25%, 05/04/2025 | | 1,737,000 | | 1,981,873 |
| United Airlines 2014-2 Class A Pass Through Trust | | | | |
| 3.75%, 03/03/2028 | | 588,954 | | 622,435 |
| United Airlines 2016-2 Class A Pass Through Trust | | | | |
| 3.10%, 04/07/2030 | | 907,631 | | 916,033 |
| United Airlines 2019-2 Class AA Pass Through Trust | | | | |
| 2.70%, 11/01/2033 | | 247,965 | | 248,518 |
| | | | $ | 10,903,899 |
| |
| Auto Manufacturers — 1.41% | | | | |
| General Motors Co | | | | |
| 5.00%, 10/01/2028 | | 3,001,000 | | 3,518,449 |
| 6.25%, 10/02/2043 | | 1,150,000 | | 1,587,567 |
| General Motors Financial Co Inc | | | | |
| 2.70%, 06/10/2031 | | 1,690,000 | | 1,696,075 |
| | | | $ | 6,802,091 |
See accompanying notes.
99
| | | | |
| Schedule of Investments |
| Principal Investment Grade Corporate Active ETF |
| June 30, 2021 |
| |
| | | Principal | | |
| BONDS (continued) | | Amount | | Value |
| |
| Banks — 20.75% | | | | |
| Australia & New Zealand Banking Group Ltd | | | | |
| (5-year Treasury Constant Maturity Rate + 1.70%), | | | | |
| 2.57%, 11/25/2035 (a),(b) | $ | 1,022,000 | $ | 992,750 |
| Banco Santander SA | | | | |
| 2.75%, 12/03/2030 | | 1,800,000 | | 1,783,112 |
| Bank of America Corp | | | | |
| 2.09%, 06/14/2029 (c) | | 2,532,000 | | 2,552,488 |
| 2.68%, 06/19/2041 (c) | | 851,000 | | 825,895 |
| 2.69%, 04/22/2032 (c) | | 597,000 | | 614,190 |
| 2.83%, 10/24/2051 (c) | | 3,363,000 | | 3,279,483 |
| (3-month USD LIBOR + 1.19%), | | | | |
| 2.88%, 10/22/2030 (b) | | 641,000 | | 675,223 |
| 4.25%, 10/22/2026 | | 4,773,000 | | 5,389,497 |
| Barclays PLC | | | | |
| 4.84%, 05/09/2028 | | 5,436,000 | | 6,111,067 |
| Citigroup Inc | | | | |
| 1.12%, 01/28/2027 (c) | | 4,038,000 | | 3,980,825 |
| (3-month USD LIBOR + 1.15%), | | | | |
| 3.52%, 10/27/2028 (b) | | 402,000 | | 440,225 |
| Commonwealth Bank of Australia | | | | |
| 3.31%, 03/11/2041 (a) | | 1,173,000 | | 1,194,281 |
| Credit Agricole SA | | | | |
| 2.81%, 01/11/2041 (a) | | 726,000 | | 688,832 |
| Credit Suisse Group AG | | | | |
| 1.31%, 02/02/2027 (a),(c) | | 3,136,000 | | 3,071,557 |
| 3.09%, 05/14/2032 (a),(c) | | 2,020,000 | | 2,080,311 |
| (5-year Treasury Constant Maturity Rate + 4.89%), | | | | |
| 5.25%, 02/11/2027 (a),(b),(d) | | 3,964,000 | | 4,191,930 |
| First Republic Bank | | | | |
| 4.63%, 02/13/2047 | | 3,239,000 | | 4,108,192 |
| Goldman Sachs Group Inc/The | | | | |
| 3.85%, 01/26/2027 | | 2,525,000 | | 2,782,330 |
| HSBC Holdings PLC | | | | |
| 1.59%, 05/24/2027 (c) | | 6,058,000 | | 6,069,677 |
| 2.80%, 05/24/2032 (c) | | 1,062,000 | | 1,089,877 |
| JPMorgan Chase & Co | | | | |
| 1.04%, 02/04/2027 (c) | | 6,767,000 | | 6,655,768 |
| 3.11%, 04/22/2041 (c) | | 112,000 | | 116,194 |
| 3.96%, 11/15/2048 | | 562,000 | | 659,498 |
| 5.50%, 10/15/2040 | | 757,000 | | 1,037,488 |
| Macquarie Bank Ltd | | | | |
| (5-year Treasury Constant Maturity Rate + 1.70%), | | | | |
| 3.05%, 03/03/2036 (a),(b) | | 1,329,000 | | 1,320,740 |
| Macquarie Group Ltd | | | | |
| 1.63%, 09/23/2027 (a),(c) | | 1,700,000 | | 1,687,091 |
| 2.69%, 06/23/2032 (a),(c) | | 1,464,000 | | 1,467,828 |
| Morgan Stanley | | | | |
| 1.59%, 05/04/2027 (c) | | 1,504,000 | | 1,514,641 |
| 2.80%, 01/25/2052 (c) | | 1,667,000 | | 1,634,324 |
| (3-month USD LIBOR + 1.34%), | | | | |
| 3.59%, 07/22/2028 (b) | | 3,560,000 | | 3,943,595 |
| 5.00%, 11/24/2025 | | 1,777,000 | | 2,048,661 |
| National Australia Bank Ltd | | | | |
| 2.33%, 08/21/2030 (a) | | 2,307,000 | | 2,239,084 |
| Natwest Group PLC | | | | |
| (5-year Treasury Constant Maturity Rate + 5.63%), | | | | |
| 6.00%, 12/29/2025 (b),(d) | | 2,530,000 | | 2,819,887 |
| Santander UK Group Holdings PLC | | | | |
| (1-year Treasury Constant Maturity Rate + 1.25%), | | | | |
| 1.53%, 08/21/2026 (b) | | 5,504,000 | | 5,513,401 |
See accompanying notes.
100
| | | | |
| Schedule of Investments |
| Principal Investment Grade Corporate Active ETF |
| June 30, 2021 |
| |
| | | Principal | | |
| BONDS (continued) | | Amount | | Value |
| |
| Banks (continued) | | | | |
| Standard Chartered PLC | | | | |
| (3-month USD LIBOR + 1.21%), | | | | |
| 2.82%, 01/30/2026 (a),(b) | $ | 2,212,000 | $ | 2,321,575 |
| (5-year Treasury Constant Maturity Rate + 2.30%), | | | | |
| 3.27%, 02/18/2036 (a),(b) | | 1,802,000 | | 1,807,501 |
| 6.00%, 07/26/2025 (a),(c),(d) | | 1,544,000 | | 1,692,687 |
| Wells Fargo & Co | | | | |
| 2.39%, 06/02/2028 (c) | | 4,644,000 | | 4,816,271 |
| 3.07%, 04/30/2041 (c) | | 440,000 | | 451,301 |
| 4.40%, 06/14/2046 | | 343,000 | | 413,457 |
| 4.90%, 11/17/2045 | | 2,241,000 | | 2,874,151 |
| Westpac Banking Corp | | | | |
| (5-year Treasury Constant Maturity Rate + 2.00%), | | | | |
| 4.11%, 07/24/2034 (b) | | 829,000 | | 910,980 |
| | | | $ | 99,867,865 |
| |
| Beverages — 1.74% | | | | |
| Anheuser-Busch Cos LLC / Anheuser-Busch InBev Worldwide Inc | | | | |
| 3.65%, 02/01/2026 | | 1,231,000 | | 1,359,251 |
| 4.90%, 02/01/2046 | | 1,578,000 | | 1,997,354 |
| Anheuser-Busch InBev Worldwide Inc | | | | |
| 4.38%, 04/15/2038 | | 3,271,000 | | 3,910,711 |
| 4.60%, 04/15/2048 | | 413,000 | | 504,208 |
| 5.45%, 01/23/2039 | | 348,000 | | 458,967 |
| Constellation Brands Inc | | | | |
| 2.88%, 05/01/2030 | | 147,000 | | 154,152 |
| | | | $ | 8,384,643 |
| |
| Biotechnology — 0.28% | | | | |
| Amgen Inc | | | | |
| 2.20%, 02/21/2027 | | 1,302,000 | | 1,351,882 |
| |
| Building Materials — 1.28% | | | | |
| Martin Marietta Materials Inc | | | | |
| 2.40%, 07/15/2031 | | 1,825,000 | | 1,826,448 |
| 2.50%, 03/15/2030 | | 2,089,000 | | 2,124,495 |
| Masco Corp | | | | |
| 1.50%, 02/15/2028 | | 2,281,000 | | 2,227,041 |
| | | | $ | 6,177,984 |
| |
| Chemicals — 0.58% | | | | |
| DuPont de Nemours Inc | | | | |
| 5.32%, 11/15/2038 | | 1,077,000 | | 1,424,341 |
| International Flavors & Fragrances Inc | | | | |
| 1.23%, 10/01/2025 (a) | | 601,000 | | 597,769 |
| 1.83%, 10/15/2027 (a) | | 773,000 | | 770,804 |
| | | | $ | 2,792,914 |
| |
| Commercial Services — 1.06% | | | | |
| CoStar Group Inc | | | | |
| 2.80%, 07/15/2030 (a) | | 5,019,000 | | 5,098,604 |
| |
| Computers — 0.45% | | | | |
| Apple Inc | | | | |
| 4.65%, 02/23/2046 | | 430,000 | | 570,578 |
| Dell International LLC / EMC Corp | | | | |
| 4.90%, 10/01/2026 | | 1,158,000 | | 1,336,429 |
| 8.35%, 07/15/2046 | | 152,000 | | 248,612 |
| | | | $ | 2,155,619 |
See accompanying notes.
101
| | | | |
| Schedule of Investments |
| Principal Investment Grade Corporate Active ETF |
| June 30, 2021 |
| |
| | | Principal | | |
| BONDS (continued) | | Amount | | Value |
| |
| Diversified Financial Services — 7.46% | | | | |
| AerCap Ireland Capital DAC / AerCap Global Aviation Trust | | | | |
| 3.15%, 02/15/2024 | $ | 5,836,000 | $ | 6,125,642 |
| Air Lease Corp | | | | |
| 2.88%, 01/15/2026 | | 1,170,000 | | 1,229,241 |
| 3.38%, 07/01/2025 | | 1,000 | | 1,074 |
| Ally Financial Inc | | | | |
| 4.63%, 03/30/2025 | | 869,000 | | 972,982 |
| 5.75%, 11/20/2025 | | 853,000 | | 979,379 |
| 5.80%, 05/01/2025 | | 702,000 | | 815,781 |
| 8.00%, 11/01/2031 | | 3,261,000 | | 4,686,214 |
| Aviation Capital Group LLC | | | | |
| 1.95%, 01/30/2026 (a) | | 3,463,000 | | 3,463,936 |
| Avolon Holdings Funding Ltd | | | | |
| 4.25%, 04/15/2026 (a) | | 2,400,000 | | 2,600,822 |
| 4.38%, 05/01/2026 (a) | | 980,000 | | 1,065,250 |
| 5.50%, 01/15/2026 (a) | | 900,000 | | 1,020,837 |
| Blackstone Holdings Finance Co LLC | | | | |
| 2.80%, 09/30/2050 (a) | | 969,000 | | 964,944 |
| Brookfield Finance Inc | | | | |
| 2.72%, 04/15/2031 | | 1,324,000 | | 1,362,968 |
| 3.45%, 04/15/2050 | | 699,000 | | 721,156 |
| 4.85%, 03/29/2029 | | 1,339,000 | | 1,576,625 |
| GE Capital Funding LLC | | | | |
| 4.40%, 05/15/2030 | | 812,000 | | 946,250 |
| GE Capital International Funding Co Unlimited Co | | | | |
| 4.42%, 11/15/2035 | | 5,427,000 | | 6,504,159 |
| Synchrony Financial | | | | |
| 3.95%, 12/01/2027 | | 762,000 | | 849,408 |
| | | | $ | 35,886,668 |
| |
| Electric — 6.95% | | | | |
| American Electric Power Co Inc | | | | |
| 1.00%, 11/01/2025 | | 1,774,000 | | 1,755,972 |
| CMS Energy Corp | | | | |
| 3.00%, 05/15/2026 | | 1,719,000 | | 1,838,219 |
| Commonwealth Edison Co | | | | |
| 3.13%, 03/15/2051 | | 1,183,000 | | 1,234,889 |
| 4.00%, 03/01/2049 | | 1,752,000 | | 2,099,967 |
| Dominion Energy Inc | | | | |
| 4.25%, 06/01/2028 | | 505,000 | | 579,748 |
| DTE Energy Co | | | | |
| 3.40%, 06/15/2029 | | 1,500,000 | | 1,637,161 |
| Duke Energy Florida LLC | | | | |
| 3.80%, 07/15/2028 | | 959,000 | | 1,086,763 |
| Duke Energy Ohio Inc | | | | |
| 4.30%, 02/01/2049 (e) | | 811,000 | | 1,001,671 |
| Entergy Corp | | | | |
| 1.90%, 06/15/2028 | | 933,000 | | 931,641 |
| Evergy Inc | | | | |
| 2.90%, 09/15/2029 | | 939,000 | | 995,074 |
| Georgia Power Co | | | | |
| 3.25%, 03/15/2051 | | 491,000 | | 494,884 |
| 3.70%, 01/30/2050 | | 120,000 | | 130,320 |
| MidAmerican Energy Co | | | | |
| 3.15%, 04/15/2050 | | 1,465,000 | | 1,564,734 |
| NextEra Energy Capital Holdings Inc | | | | |
| 2.75%, 11/01/2029 | | 1,857,000 | | 1,961,038 |
See accompanying notes.
102
| | | | |
| Schedule of Investments |
| Principal Investment Grade Corporate Active ETF |
| June 30, 2021 |
| |
| | | Principal | | |
| BONDS (continued) | | Amount | | Value |
| |
| Electric (continued) | | | | |
| NextEra Energy Capital Holdings Inc (continued) | | | | |
| 3.50%, 04/01/2029 | $ | 666,000 | $ | 735,540 |
| NRG Energy Inc | | | | |
| 2.00%, 12/02/2025 (a) | | 940,000 | | 953,511 |
| 2.45%, 12/02/2027 (a) | | 696,000 | | 700,476 |
| Pacific Gas and Electric Co | | | | |
| 1.75%, 06/16/2022 | | 1,061,000 | | 1,060,415 |
| Public Service Co of Colorado | | | | |
| 4.05%, 09/15/2049 | | 669,000 | | 820,678 |
| Southern California Edison Co | | | | |
| 4.88%, 03/01/2049 | | 1,114,000 | | 1,318,064 |
| Southern Co/The | | | | |
| 1.75%, 03/15/2028 | | 1,003,000 | | 990,060 |
| (3-month USD LIBOR + 3.63%), | | | | |
| 5.50%, 03/15/2057 (b) | | 2,413,000 | | 2,470,914 |
| Southern Power Co | | | | |
| 0.90%, 01/15/2026 | | 1,463,000 | | 1,435,552 |
| Tampa Electric Co | | | | |
| 3.63%, 06/15/2050 | | 418,000 | | 466,435 |
| Tucson Electric Power Co | | | | |
| 4.85%, 12/01/2048 | | 460,000 | | 591,590 |
| Virginia Electric & Power Co | | | | |
| 3.80%, 04/01/2028 | | 1,307,000 | | 1,475,416 |
| 4.60%, 12/01/2048 | | 759,000 | | 979,995 |
| WEC Energy Group Inc | | | | |
| 1.38%, 10/15/2027 | | 1,186,000 | | 1,158,379 |
| Xcel Energy Inc | | | | |
| 2.60%, 12/01/2029 | | 949,000 | | 986,029 |
| | | | $ | 33,455,135 |
| |
| Environmental Control — 0.31% | | | | |
| Waste Management Inc | | | | |
| 1.15%, 03/15/2028 | | 1,518,000 | | 1,470,774 |
| |
| Food — 1.14% | | | | |
| Hormel Foods Corp | | | | |
| 1.70%, 06/03/2028 | | 1,218,000 | | 1,224,911 |
| JBS USA LUX SA / JBS USA Finance Inc | | | | |
| 3.75%, 12/01/2031 (a) | | 1,145,000 | | 1,171,621 |
| Mars Inc | | | | |
| 2.38%, 07/16/2040 (a) | | 643,000 | | 618,925 |
| Sysco Corp | | | | |
| 6.60%, 04/01/2050 | | 1,592,000 | | 2,472,955 |
| | | | $ | 5,488,412 |
| |
| Gas — 1.29% | | | | |
| CenterPoint Energy Resources Corp | | | | |
| 1.75%, 10/01/2030 | | 2,140,000 | | 2,051,623 |
| NiSource Inc | | | | |
| 0.95%, 08/15/2025 | | 1,772,000 | | 1,757,263 |
| Piedmont Natural Gas Co Inc | | | | |
| 3.50%, 06/01/2029 | | 1,449,000 | | 1,595,159 |
| Southern California Gas Co | | | | |
| 2.55%, 02/01/2030 | | 793,000 | | 819,097 |
| | | | $ | 6,223,142 |
| |
| Healthcare — Products — 0.91% | | | | |
| Boston Scientific Corp | | | | |
| 2.65%, 06/01/2030 | | 4,206,000 | | 4,350,305 |
See accompanying notes.
103
| | | | |
| Schedule of Investments |
| Principal Investment Grade Corporate Active ETF |
| June 30, 2021 |
| |
| | | Principal | | |
| BONDS (continued) | | Amount | | Value |
| |
| Healthcare — Products (continued) | | | | |
| Medtronic Inc | | | | |
| 4.63%, 03/15/2045 | $ | 39,000 | $ | 51,160 |
| | | | $ | 4,401,465 |
| |
| Healthcare — Services — 0.52% | | | | |
| Centene Corp | | | | |
| 3.38%, 02/15/2030 | | 343,000 | | 358,545 |
| UnitedHealth Group Inc | | | | |
| 2.75%, 05/15/2040 | | 1,051,000 | | 1,064,353 |
| 3.25%, 05/15/2051 | | 995,000 | | 1,061,433 |
| | | | $ | 2,484,331 |
| |
| Home Builders — 0.79% | | | | |
| Lennar Corp | | | | |
| 4.75%, 05/30/2025 | | 3,370,000 | | 3,778,613 |
| |
| Insurance — 6.29% | | | | |
| AIA Group Ltd | | | | |
| 3.20%, 09/16/2040 (a) | | 1,378,000 | | 1,421,263 |
| American International Group Inc | | | | |
| 4.50%, 07/16/2044 | | 819,000 | | 994,054 |
| AmFam Holdings Inc | | | | |
| 3.83%, 03/11/2051 (a) | | 617,000 | | 662,368 |
| Arch Capital Group Ltd | | | | |
| 3.64%, 06/30/2050 | | 1,008,000 | | 1,084,343 |
| Arthur J Gallagher & Co | | | | |
| 2.50%, 05/20/2031 | | 1,365,000 | | 1,378,594 |
| Athene Global Funding | | | | |
| 1.45%, 01/08/2026 (a) | | 1,504,000 | | 1,505,022 |
| 2.50%, 03/24/2028 (a) | | 2,587,000 | | 2,651,579 |
| 2.55%, 11/19/2030 (a) | | 1,419,000 | | 1,426,836 |
| Athene Holding Ltd | | | | |
| 4.13%, 01/12/2028 | | 607,000 | | 676,972 |
| Equitable Financial Life Global Funding | | | | |
| 1.80%, 03/08/2028 (a) | | 2,958,000 | | 2,942,633 |
| F&G Global Funding | | | | |
| 1.75%, 06/30/2026 (a) | | 2,492,000 | | 2,502,254 |
| Markel Corp | | | | |
| 3.35%, 09/17/2029 | | 25,000 | | 27,448 |
| 4.30%, 11/01/2047 | | 1,591,000 | | 1,863,581 |
| Massachusetts Mutual Life Insurance Co | | | | |
| 3.38%, 04/15/2050 (a) | | 238,000 | | 248,433 |
| New York Life Insurance Co | | | | |
| 3.75%, 05/15/2050 (a) | | 1,420,000 | | 1,585,684 |
| Swiss Re Finance Luxembourg SA | | | | |
| (5-year Treasury Constant Maturity Rate + 3.58%), | | | | |
| 5.00%, 04/02/2049 (a),(b) | | 1,000,000 | | 1,137,250 |
| Willis North America Inc | | | | |
| 3.88%, 09/15/2049 | | 1,674,000 | | 1,880,486 |
| XLIT Ltd | | | | |
| 4.45%, 03/31/2025 | | 3,388,000 | | 3,801,139 |
| 5.50%, 03/31/2045 | | 1,837,000 | | 2,493,924 |
| | | | $ | 30,283,863 |
| |
| Internet — 2.16% | | | | |
| Amazon.com Inc | | | | |
| 2.10%, 05/12/2031 | | 1,910,000 | | 1,942,114 |
| 2.70%, 06/03/2060 | | 576,000 | | 551,692 |
| 3.10%, 05/12/2051 | | 732,000 | | 768,917 |
| eBay Inc | | | | |
| 3.65%, 05/10/2051 | | 1,320,000 | | 1,399,860 |
See accompanying notes.
104
| | | | |
| Schedule of Investments |
| Principal Investment Grade Corporate Active ETF |
| June 30, 2021 |
| |
| | | Principal | | |
| BONDS (continued) | | Amount | | Value |
| |
| Internet (continued) | | | | |
| Expedia Group Inc | | | | |
| 3.60%, 12/15/2023 | $ | 961,000 | $ | 1,021,316 |
| 3.80%, 02/15/2028 | | 2,199,000 | | 2,391,613 |
| 4.63%, 08/01/2027 | | 1,171,000 | | 1,323,400 |
| Netflix Inc | | | | |
| 4.88%, 04/15/2028 | | 856,000 | | 995,100 |
| | | | $ | 10,394,012 |
| |
| Iron & Steel — 0.24% | | | | |
| Nucor Corp | | | | |
| 2.70%, 06/01/2030 | | 218,000 | | 227,659 |
| Vale Overseas Ltd | | | | |
| 3.75%, 07/08/2030 | | 848,000 | | 902,866 |
| | | | $ | 1,130,525 |
| |
| Media — 4.43% | | | | |
| Charter Communications Operating LLC / Charter Communications Operating | | | | |
| Capital | | | | |
| 2.30%, 02/01/2032 | | 1,705,000 | | 1,639,224 |
| 3.70%, 04/01/2051 | | 1,621,000 | | 1,603,277 |
| 3.90%, 06/01/2052 | | 1,512,000 | | 1,539,528 |
| 4.80%, 03/01/2050 | | 428,000 | | 491,579 |
| Comcast Corp | | | | |
| 3.95%, 10/15/2025 | | 1,141,000 | | 1,278,468 |
| 3.97%, 11/01/2047 | | 2,623,000 | | 3,053,788 |
| 4.60%, 10/15/2038 | | 773,000 | | 958,058 |
| Discovery Communications LLC | | | | |
| 4.00%, 09/15/2055 | | 731,000 | | 773,695 |
| Fox Corp | | | | |
| 5.58%, 01/25/2049 | | 601,000 | | 811,283 |
| Time Warner Cable LLC | | | | |
| 5.50%, 09/01/2041 | | 1,228,000 | | 1,522,081 |
| 5.88%, 11/15/2040 | | 1,559,000 | | 2,016,643 |
| ViacomCBS Inc | | | | |
| 2.90%, 01/15/2027 | | 4,391,000 | | 4,662,113 |
| 5.25%, 04/01/2044 | | 762,000 | | 974,740 |
| | | | $ | 21,324,477 |
| |
| Mining — 1.16% | | | | |
| Newmont Corp | | | | |
| 2.25%, 10/01/2030 | | 2,153,000 | | 2,147,119 |
| Teck Resources Ltd | | | | |
| 3.90%, 07/15/2030 (e) | | 863,000 | | 929,870 |
| 5.40%, 02/01/2043 | | 2,058,000 | | 2,507,448 |
| | | | $ | 5,584,437 |
| |
| Miscellaneous Manufacture — 0.62% | | | | |
| General Electric Co | | | | |
| 3.45%, 05/01/2027 | | 2,164,000 | | 2,378,818 |
| Siemens Financieringsmaatschappij NV | | | | |
| 1.20%, 03/11/2026 (a) | | 617,000 | | 617,424 |
| | | | $ | 2,996,242 |
| |
| Oil & Gas — 2.80% | | | | |
| BP Capital Markets America Inc | | | | |
| 3.00%, 02/24/2050 | | 687,000 | | 663,646 |
| 3.59%, 04/14/2027 | | 1,574,000 | | 1,742,666 |
| 4.23%, 11/06/2028 | | 25,000 | | 28,990 |
| Canadian Natural Resources Ltd | | | | |
| 4.95%, 06/01/2047 | | 383,000 | | 476,035 |
See accompanying notes.
105
| | | | |
| Schedule of Investments |
| Principal Investment Grade Corporate Active ETF |
| June 30, 2021 |
| |
| | | Principal | | |
| BONDS (continued) | | Amount | | Value |
| |
| Oil & Gas (continued) | | | | |
| Chevron Corp | | | | |
| 2.00%, 05/11/2027 | $ | 1,444,000 | $ | 1,489,723 |
| Devon Energy Corp | | | | |
| 4.50%, 01/15/2030 (a) | | 1,548,000 | | 1,701,867 |
| Exxon Mobil Corp | | | | |
| 2.44%, 08/16/2029 | | 1,061,000 | | 1,110,622 |
| 3.00%, 08/16/2039 | | 1,095,000 | | 1,123,516 |
| Marathon Oil Corp | | | | |
| 4.40%, 07/15/2027 | | 1,652,000 | | 1,871,078 |
| 6.60%, 10/01/2037 | | 56,000 | | 74,453 |
| Occidental Petroleum Corp | | | | |
| 3.20%, 08/15/2026 | | 470,000 | | 473,525 |
| Pioneer Natural Resources Co | | | | |
| 0.75%, 01/15/2024 | | 1,019,000 | | 1,018,064 |
| Shell International Finance BV | | | | |
| 3.13%, 11/07/2049 | | 1,657,000 | | 1,713,641 |
| | | | $ | 13,487,826 |
| |
| Packaging & Containers — 0.75% | | | | |
| Berry Global Inc | | | | |
| 0.95%, 02/15/2024 (a) | | 2,638,000 | | 2,640,295 |
| WRKCo Inc | | | | |
| 3.00%, 06/15/2033 | | 940,000 | | 984,018 |
| | | | $ | 3,624,313 |
| |
| Pharmaceuticals — 5.27% | | | | |
| AbbVie Inc | | | | |
| 4.25%, 11/21/2049 | | 2,132,000 | | 2,555,233 |
| Bayer US Finance II LLC | | | | |
| 3.38%, 07/15/2024 (a) | | 303,000 | | 322,841 |
| 4.38%, 12/15/2028 (a) | | 2,921,000 | | 3,346,468 |
| Becton Dickinson and Co | | | | |
| 3.36%, 06/06/2024 | | 328,000 | | 351,416 |
| 3.70%, 06/06/2027 | | 1,444,000 | | 1,604,545 |
| 4.67%, 06/06/2047 | | 995,000 | | 1,239,574 |
| 4.69%, 12/15/2044 | | 1,563,000 | | 1,945,122 |
| Bristol-Myers Squibb Co | | | | |
| 4.13%, 06/15/2039 | | 1,504,000 | | 1,815,022 |
| 4.25%, 10/26/2049 | | 428,000 | | 540,059 |
| Cigna Corp | | | | |
| 4.38%, 10/15/2028 | | 2,754,000 | | 3,202,991 |
| 4.90%, 12/15/2048 | | 50,000 | | 64,392 |
| CVS Health Corp | | | | |
| 5.05%, 03/25/2048 | | 4,978,000 | | 6,465,803 |
| Viatris Inc | | | | |
| 2.30%, 06/22/2027 (a) | | 223,000 | | 227,626 |
| Zoetis Inc | | | | |
| 3.90%, 08/20/2028 | | 1,468,000 | | 1,669,057 |
| | | | $ | 25,350,149 |
| |
| Pipelines — 2.68% | | | | |
| Eastern Gas Transmission and Storage, Inc. | | | | |
| 3.00%, 11/15/2029 | | 222,000 | | 233,907 |
| Enbridge Inc | | | | |
| 2.50%, 08/01/2033 | | 1,564,000 | | 1,564,148 |
| Energy Transfer Operating LP | | | | |
| 3.75%, 05/15/2030 | | 2,997,000 | | 3,255,605 |
| 5.15%, 03/15/2045 | | 958,000 | | 1,107,991 |
| 6.25%, 04/15/2049 | | 373,000 | | 489,468 |
| Enterprise Products Operating LLC | | | | |
| 4.20%, 01/31/2050 | | 1,820,000 | | 2,099,192 |
See accompanying notes.
106
| | | | |
| Schedule of Investments |
| Principal Investment Grade Corporate Active ETF |
| June 30, 2021 |
| |
| | | Principal | | |
| BONDS (continued) | | Amount | | Value |
| |
| Pipelines (continued) | | | | |
| Kinder Morgan Inc | | | | |
| 3.60%, 02/15/2051 | $ | 994,000 | $ | 1,011,715 |
| MPLX LP | | | | |
| 4.00%, 03/15/2028 | | 70,000 | | 78,201 |
| 5.20%, 03/01/2047 | | 617,000 | | 759,659 |
| ONEOK Inc | | | | |
| 4.45%, 09/01/2049 | | 577,000 | | 637,721 |
| Sabine Pass Liquefaction LLC | | | | |
| 5.00%, 03/15/2027 | | 1,428,000 | | 1,648,971 |
| 5.75%, 05/15/2024 | | 9,000 | | 10,100 |
| | | | $ | 12,896,678 |
| |
| Private Equity — 0.30% | | | | |
| KKR Group Finance Co VIII LLC | | | | |
| 3.50%, 08/25/2050 (a) | | 1,369,000 | | 1,432,383 |
| |
| REITs — 3.53% | | | | |
| Alexandria Real Estate Equities Inc | | | | |
| 4.70%, 07/01/2030 | | 383,000 | | 455,661 |
| American Campus Communities Operating Partnership LP | | | | |
| 3.88%, 01/30/2031 | | 1,207,000 | | 1,339,543 |
| American Homes 4 Rent, Class A | | | | |
| 3.38%, 07/15/2051 | | 1,165,000 | | 1,152,262 |
| Crown Castle International Corp | | | | |
| 2.90%, 04/01/2041 | | 1,111,000 | | 1,080,698 |
| Healthcare Trust of America Holdings LP | | | | |
| 3.10%, 02/15/2030 | | 1,004,000 | | 1,066,325 |
| Prologis LP | | | | |
| 3.00%, 04/15/2050 | | 248,000 | | 252,540 |
| Regency Centers LP | | | | |
| 3.70%, 06/15/2030 | | 2,882,000 | | 3,188,073 |
| Simon Property Group LP | | | | |
| 1.75%, 02/01/2028 | | 1,216,000 | | 1,209,497 |
| Spirit Realty LP | | | | |
| 3.20%, 01/15/2027 (e) | | 4,214,000 | | 4,481,458 |
| 3.20%, 02/15/2031 | | 758,000 | | 789,980 |
| VEREIT Operating Partnership LP | | | | |
| 3.10%, 12/15/2029 | | 1,846,000 | | 1,970,603 |
| | | | $ | 16,986,640 |
| |
| Retail — 0.14% | | | | |
| Home Depot Inc/The | | | | |
| 3.30%, 04/15/2040 | | 616,000 | | 674,734 |
| |
| Semiconductors — 3.05% | | | | |
| Broadcom Inc | | | | |
| 1.95%, 02/15/2028 (a) | | 671,000 | | 670,713 |
| 3.15%, 11/15/2025 | | 482,000 | | 516,598 |
| 3.42%, 04/15/2033 (a) | | 2,502,000 | | 2,627,511 |
| KLA Corp | | | | |
| 3.30%, 03/01/2050 | | 645,000 | | 682,494 |
| Lam Research Corp | | | | |
| 3.75%, 03/15/2026 | | 1,023,000 | | 1,145,549 |
| 4.00%, 03/15/2029 | | 823,000 | | 954,932 |
| 4.88%, 03/15/2049 | | 45,000 | | 60,685 |
| Micron Technology Inc | | | | |
| 4.19%, 02/15/2027 | | 2,145,000 | | 2,419,515 |
| NVIDIA Corp | | | | |
| 3.50%, 04/01/2040 | | 2,084,000 | | 2,363,826 |
| 3.50%, 04/01/2050 | | 983,000 | | 1,109,706 |
| NXP BV / NXP Funding LLC / NXP USA Inc | | | | |
| 2.70%, 05/01/2025 (a) | | 100,000 | | 105,462 |
| 3.15%, 05/01/2027 (a) | | 1,056,000 | | 1,129,632 |
See accompanying notes.
107
| | | | |
| Schedule of Investments |
| Principal Investment Grade Corporate Active ETF |
| June 30, 2021 |
| |
| | | Principal | | |
| BONDS (continued) | | Amount | | Value |
| |
| Semiconductors (continued) | | | | |
| QUALCOMM Inc | | | | |
| 4.30%, 05/20/2047 | $ | 707,000 | $ | 892,627 |
| | | | $ | 14,679,250 |
| |
| Software — 3.04% | | | | |
| Activision Blizzard Inc | | | | |
| 4.50%, 06/15/2047 | | 1,200,000 | | 1,498,591 |
| Fidelity National Information Services Inc | | | | |
| 1.65%, 03/01/2028 | | 1,173,000 | | 1,166,352 |
| Fiserv Inc | | | | |
| 4.40%, 07/01/2049 | | 1,691,000 | | 2,039,621 |
| Oracle Corp | | | | |
| 2.80%, 04/01/2027 | | 1,777,000 | | 1,884,392 |
| 4.00%, 07/15/2046 | | 2,318,000 | | 2,513,576 |
| salesforce.com Inc | | | | |
| 3.70%, 04/11/2028 | | 1,429,000 | | 1,627,869 |
| VMware Inc | | | | |
| 4.50%, 05/15/2025 | | 3,496,000 | | 3,904,351 |
| | | | $ | 14,634,752 |
| |
| Telecommunications — 4.23% | | | | |
| AT&T Inc | | | | |
| 3.50%, 06/01/2041 | | 3,126,000 | | 3,247,184 |
| 3.50%, 09/15/2053 (a) | | 4,195,000 | | 4,214,593 |
| 3.55%, 09/15/2055 (a) | | 1,830,000 | | 1,836,136 |
| 4.50%, 03/09/2048 | | 973,000 | | 1,147,510 |
| T-Mobile USA Inc | | | | |
| 2.05%, 02/15/2028 | | 1,727,000 | | 1,753,198 |
| Verizon Communications Inc | | | | |
| 2.65%, 11/20/2040 | | 700,000 | | 673,622 |
| 3.55%, 03/22/2051 | | 5,851,000 | | 6,251,014 |
| 3.70%, 03/22/2061 | | 842,000 | | 901,831 |
| Vodafone Group PLC | | | | |
| (5-year Treasury Constant Maturity Rate + 2.45%), | | | | |
| 3.25%, 06/04/2081 (b) | | 341,000 | | 342,978 |
| | | | $ | 20,368,066 |
| |
| Transportation — 0.53% | | | | |
| Burlington Northern Santa Fe LLC | | | | |
| 4.38%, 09/01/2042 | | 408,000 | | 508,112 |
| FedEx Corp | | | | |
| 4.10%, 02/01/2045 | | 1,806,000 | | 2,062,207 |
| | | | $ | 2,570,319 |
| |
| Water — 0.60% | | | | |
| American Water Capital Corp | | | | |
| 2.30%, 06/01/2031 | | 1,020,000 | | 1,036,683 |
| Essential Utilities Inc | | | | |
| 2.40%, 05/01/2031 | | 1,840,000 | | 1,856,101 |
| | | | $ | 2,892,784 |
| TOTAL BONDS | | | $ | 469,977,898 |
| INVESTMENT COMPANIES — 2.26% | | Shares Held | | Value |
| |
| Money Market Funds — 2.26% | | | | |
| Principal Government Money Market Fund — Institutional Class 0.00% (f),(g),(h),(i) | | 2,138,163 | $ | 2,138,163 |
| State Street Institutional U.S. Government Money Market Fund — Institutional | | | | |
| Class 0.03% (i) | | 8,731,942 | | 8,731,942 |
| TOTAL INVESTMENT COMPANIES | | | $ | 10,870,105 |
See accompanying notes.
108
| | |
| Schedule of Investments |
| Principal Investment Grade Corporate Active ETF |
| June 30, 2021 |
| |
| | | Value |
| Total Investments | $ | 480,848,003 |
| Other Assets and Liabilities — 0.09% | | 423,259 |
| Total Net Assets — 100.00% | $ | 481,271,262 |
| (a) | Security exempt from registration under Rule 144A of the Securities Act of 1933. These securities may be resold in transactions exempt from registration, normally to qualified institutional buyers. At the end of the period, the value of these securities totaled $85,168,997 or 17.70% of net assets. |
| (b) | Rate shown is as of period end. The rate may be a variable or floating rate or a fixed rate which may convert to a variable or floating rate in the future. |
| (c) | Certain variable rate securities are not based on a published reference rate and spread but are determined by the issuer or agent and are based on current market conditions. These securities do not indicate a reference rate and spread in their description. Rate shown is the rate in effect as of period end. |
| (d) | Perpetual security. Perpetual securities pay an indefinite stream of interest, but they may be called by the issuer at an earlier date. Date shown, if any, reflects the next call date or final legal maturity date. Rate shown is as of period end. |
| (e) | Security or a portion of the security was on loan. At the end of the period, the value of these securities totaled $2,095,206 or 0.44% of net assets. |
| (f) | Non-income producing security. |
| (g) | Security or a portion of the security was received as collateral for securities lending. At the end of the period, the value of these securities totaled $2,138,163 or 0.44% of net assets. |
| (h) | Affiliated Security. Security is either an affiliate (and registered under the Investment Company Act of 1940) or an affiliate as defined by the Investment Company Act of 1940 (controls 5.00% or more of the outstanding voting shares of the security). |
| | Please see Affiliated Securities sub-schedule for transactional information. |
| (i) | Current yield shown is as of period end. |
| | | | | | | | | |
| Portfolio Summary (unaudited) | | | | | | | |
| Sector | | Percent | | | | | | |
| Financial | | 38.33 | % | | | | | |
| Consumer, Non-cyclical | | 13.63 | % | | | | | |
| Communications | | 11.00 | % | | | | | |
| Utilities | | | 8.84 | % | | | | | |
| Industrial | | | 7.25 | % | | | | | |
| Technology | | | 6.54 | % | | | | | |
| Energy | | | 5.48 | % | | | | | |
| Consumer, Cyclical | | | 4.60 | % | | | | | |
| Money Market Funds | | | 2.26 | % | | | | | |
| Basic Materials | | | 1.98 | % | | | | | |
| Other Assets and Liabilities | | | 0.09 | % | | | | | |
| TOTAL NET ASSETS | | 100.00 | % | | | | | |
| |
| Futures Contracts |
|
| | | | | | | | | Value and Unrealized | |
| Description and Expiration Date | Type | Contracts | Notional Amount | | | Appreciation/(Depreciation) | |
| U.S. 5 Year Notes; September 2021 | Short | 339 | $ | | 41,842,664 | | $ | 14,996 | |
| U.S. 10 Year Notes; September 2021 | Short | 102 | | | 13,515,000 | | | (67,633 | ) |
| U.S. Long Bond CBT; September 2021 | Short | 8 | | | 1,286,000 | | | (37,142 | ) |
| Total | | | | | | | $ | (89,779 | ) |
See accompanying notes.
109
| | | | | | | | | |
| | | | Schedule of Investments | | | | |
| | | | Principal Investment Grade Corporate Active ETF | | |
| | | | June 30, 2021 | | | | |
| |
| | | | June 30, 2020 | | Purchases | | Sales | | June 30, 2021 |
| Affiliated Securities | | | Value | | Cost | | Proceeds | | Value |
| Principal Government Money | | | | | | | | | |
| Market Fund — Institutional Class | | | | | | | | | |
| 0.00 | % | $ | 600,345 | $ | 13,108,660 | $ | 11,570,842 | $ | 2,138,163 |
| | | $ | 600,345 | $ | 13,108,660 | $ | 11,570,842 | $ | 2,138,163 |
| |
| | | | | | | | Realized Gain | | |
| | | | | | Realized | | from | | Change in |
| | | | | | Gain/Loss on | | Capital Gain | | Unrealized |
| | | | Income (a) | | Investments | | Distributions | | Gain/Loss |
| Principal Government Money | | | | | | | | | |
| Market Fund — Institutional Class | | | | | | | | | |
| 0.00 | % | $ | — | $ | — $ | | — | $ | — |
| | | $ | — | $ | — $ | | — | $ | — |
| (a) | Amount excludes earnings from securities lending collateral. |
See accompanying notes.
110
| | | | |
| Schedule of Investments |
| Principal Millennials Index ETF |
| June 30, 2021 |
| |
| COMMON STOCKS — 99.75% | | Shares Held | | Value |
| Apparel — 3.11% | | | | |
| Carter's Inc | | 2,428 | $ | 250,497 |
| Columbia Sportswear Co | | 2,044 | | 201,048 |
| Deckers Outdoor Corp (a) | | 652 | | 250,414 |
| Fila Holdings Corp | | 8,498 | | 439,181 |
| Hanesbrands Inc | | 10,980 | | 204,997 |
| SMCP SA (a),(b) | | 44,676 | | 323,939 |
| Urban Outfitters Inc (a) | | 47,034 | | 1,938,741 |
| Yue Yuen Industrial Holdings Ltd (a) | | 129,000 | | 318,666 |
| | | | $ | 3,927,483 |
| |
| Beverages — 1.35% | | | | |
| Brown-Forman Corp, Class B | | 6,263 | | 469,349 |
| Constellation Brands Inc, Class A | | 1,893 | | 442,754 |
| Monster Beverage Corp (a) | | 4,743 | | 433,273 |
| Treasury Wine Estates Ltd | | 40,864 | | 357,945 |
| | | | $ | 1,703,321 |
| |
| Building Materials — 0.51% | | | | |
| Fortune Brands Home & Security Inc | | 2,255 | | 224,621 |
| Masco Corp | | 7,211 | | 424,800 |
| | | | $ | 649,421 |
| |
| Commercial Services — 3.48% | | | | |
| Adyen NV (a),(b) | | 1,043 | | 2,548,297 |
| China Yuhua Education Corp Ltd (b) | | 408,000 | | 369,414 |
| Global Payments Inc | | 2,144 | | 402,086 |
| GMO Payment Gateway Inc | | 2,500 | | 325,622 |
| PayPal Holdings Inc (a) | | 1,778 | | 518,252 |
| PROG Holdings, Inc. | | 4,989 | | 240,121 |
| | | | $ | 4,403,792 |
| |
| Computers — 0.38% | | | | |
| Apple Inc | | 3,537 | | 484,427 |
| Diversified Financial Services — 4.73% | | | | |
| Discover Financial Services | | 24,738 | | 2,926,258 |
| LexinFintech Holdings Ltd ADR (a) | | 173,878 | | 2,130,005 |
| Rocket Cos Inc, Class A | | 9,354 | | 181,000 |
| XP Inc, Class A (a) | | 17,103 | | 744,836 |
| | | | $ | 5,982,099 |
| |
| Electronics — 0.56% | | | | |
| Garmin Ltd | | 4,885 | | 706,566 |
| Engineering & Construction — 0.20% | | | | |
| HomeServe PLC | | 19,442 | | 256,973 |
| Entertainment — 2.28% | | | | |
| CTS Eventim AG & Co KGaA (a) | | 30,185 | | 1,886,232 |
| DraftKings Inc, Class A (a) | | 19,013 | | 991,908 |
| | | | $ | 2,878,140 |
| |
| Food — 2.32% | | | | |
| Albertsons Cos Inc, Class A (c) | | 11,325 | | 222,650 |
| Kroger Co/The | | 65,314 | | 2,502,179 |
| Sprouts Farmers Market Inc (a) | | 8,114 | | 201,633 |
| | | | $ | 2,926,462 |
| |
| Home Builders — 0.52% | | | | |
| DR Horton Inc | | 4,845 | | 437,842 |
| Toll Brothers Inc | | 3,807 | | 220,083 |
| | | | $ | 657,925 |
See accompanying notes.
111
| | | | |
| Schedule of Investments |
| Principal Millennials Index ETF |
| June 30, 2021 |
| |
| COMMON STOCKS (continued) | | Shares Held | | Value |
| |
| Home Furnishings — 3.82% | | | | |
| Sleep Number Corp (a) | | 12,191 | $ | 1,340,400 |
| Sony Group Corp | | 33,400 | | 3,251,461 |
| Tempur Sealy International Inc | | 5,905 | | 231,417 |
| | | | $ | 4,823,278 |
| |
| Internet — 35.08% | | | | |
| AfreecaTV Co Ltd | | 37,838 | | 3,998,332 |
| Alibaba Group Holding Ltd ADR (a) | | 2,841 | | 644,282 |
| Alphabet Inc, Class C (a) | | 1,137 | | 2,849,686 |
| Amazon.com Inc (a) | | 141 | | 485,063 |
| ASOS PLC (a) | | 4,220 | | 289,541 |
| Baidu Inc (a) | | 2,960 | | 603,544 |
| eBay Inc | | 7,053 | | 495,191 |
| Expedia Group Inc (a) | | 6,774 | | 1,108,972 |
| Facebook Inc, Class A (a) | | 7,981 | | 2,775,074 |
| Farfetch Ltd, Class A (a) | | 32,808 | | 1,652,211 |
| IAC (a) | | 5,392 | | 831,285 |
| JOYY Inc | | 28,058 | | 1,850,986 |
| Kakao Corp | | 7,363 | | 1,065,728 |
| Kogan.com Ltd (c) | | 35,246 | | 306,091 |
| Momo Inc ADR | | 178,411 | | 2,731,472 |
| Naspers Ltd, Class N | | 9,778 | | 2,052,962 |
| NCSoft Corp | | 840 | | 611,641 |
| Netflix Inc (a) | | 828 | | 437,358 |
| Overstock.com Inc (a) | | 3,258 | | 300,388 |
| Pinduoduo Inc ADR (a) | | 17,468 | | 2,218,785 |
| Pinterest Inc, Class A (a) | | 21,002 | | 1,658,108 |
| Rakuten Inc | | 53,800 | | 607,275 |
| RealReal Inc/The (a) | | 9,544 | | 188,589 |
| Revolve Group Inc (a) | | 39,156 | | 2,697,848 |
| Roku Inc (a) | | 4,772 | | 2,191,541 |
| Shutterstock Inc | | 2,424 | | 237,964 |
| Snap Inc, Class A (a) | | 29,735 | | 2,026,143 |
| Temple & Webster Group Ltd (a) | | 46,476 | | 376,082 |
| Tencent Holdings Ltd | | 8,200 | | 616,772 |
| Tencent Music Entertainment Group ADR (a) | | 128,417 | | 1,987,895 |
| Trip.com Group Ltd ADR (a) | | 43,894 | | 1,556,481 |
| Vimeo Inc (a) | | 8,802 | | 431,298 |
| Wayfair Inc, Class A (a),(c) | | 5,557 | | 1,754,401 |
| Weibo Corp (a),(c) | | 6,384 | | 335,926 |
| ZOZO Inc | | 10,900 | | 370,381 |
| | | | $ | 44,345,296 |
| |
| Leisure Time — 1.57% | | | | |
| Camping World Holdings Inc, Class A | | 48,472 | | 1,986,867 |
| |
| Media — 6.77% | | | | |
| Comcast Corp, Class A | | 7,980 | | 455,019 |
| Fox Corp, Class B | | 6,183 | | 217,642 |
| Sirius XM Holdings Inc (c) | | 70,919 | | 463,810 |
| ViacomCBS Inc, Class B | | 52,144 | | 2,356,909 |
| Vivendi SE (c) | | 106,469 | | 3,576,539 |
| Walt Disney Co/The (a) | | 8,426 | | 1,481,038 |
| | | | $ | 8,550,957 |
| |
| Real Estate — 0.60% | | | | |
| REA Group Ltd | | 5,968 | | 756,528 |
| |
| REITs — 2.92% | | | | |
| American Homes 4 Rent, Class A | | 6,476 | | 251,592 |
| AvalonBay Communities Inc | | 2,341 | | 488,543 |
| Duke Realty Corp | | 10,302 | | 487,800 |
| EastGroup Properties Inc | | 1,508 | | 247,991 |
See accompanying notes.
112
| | | | |
| Schedule of Investments |
| Principal Millennials Index ETF |
| June 30, 2021 |
| |
| COMMON STOCKS (continued) | | Shares Held | | Value |
| |
| REITs (continued) | | | | |
| Essex Property Trust Inc | | 1,588 | $ | 476,416 |
| Invitation Homes Inc | | 13,500 | | 503,415 |
| Prologis Inc | | 4,075 | | 487,085 |
| Segro PLC | | 49,802 | | 754,013 |
| | | | $ | 3,696,855 |
| |
| Retail — 16.48% | | | | |
| Academy Sports & Outdoors Inc (a) | | 8,002 | | 330,003 |
| At Home Group Inc (a) | | 7,524 | | 277,184 |
| Bed Bath & Beyond Inc (a) | | 40,005 | | 1,331,767 |
| Dick's Sporting Goods Inc | | 2,835 | | 284,039 |
| Domino's Pizza Inc | | 1,174 | | 547,659 |
| Foot Locker Inc | | 3,840 | | 236,659 |
| Hennes & Mauritz AB, Class B (a) | | 103,542 | | 2,456,039 |
| Hibbett Inc (a) | | 3,134 | | 280,900 |
| Home Depot Inc/The | | 7,699 | | 2,455,134 |
| Industria de Diseno Textil SA | | 70,764 | | 2,492,919 |
| JD Sports Fashion PLC | | 28,313 | | 359,930 |
| Kingfisher PLC | | 73,352 | | 369,850 |
| L Brands Inc | | 6,983 | | 503,195 |
| Li Ning Co Ltd | | 98,771 | | 1,205,967 |
| Lowe's Cos Inc | | 2,270 | | 440,312 |
| Lululemon Athletica Inc (a) | | 1,407 | | 513,513 |
| Mr Price Group Ltd | | 24,567 | | 362,174 |
| Pandora A/S | | 2,998 | | 403,000 |
| Pets at Home Group PLC | | 56,531 | | 356,589 |
| Qurate Retail Inc, Series A | | 18,362 | | 240,359 |
| Signet Jewelers Ltd (a) | | 30,256 | | 2,444,382 |
| Truworths International Ltd | | 99,429 | | 401,615 |
| Williams-Sonoma Inc | | 2,411 | | 384,916 |
| Zalando SE (a),(b) | | 17,795 | | 2,151,188 |
| | | | $ | 20,829,293 |
| |
| Semiconductors — 0.51% | | | | |
| Samsung Electronics Co Ltd | | 9,010 | | 645,657 |
| |
| Software — 6.57% | | | | |
| Activision Blizzard Inc | | 25,278 | | 2,412,532 |
| Bilibili Inc ADR (a) | | 21,842 | | 2,661,229 |
| Electronic Arts Inc | | 3,190 | | 458,818 |
| Fiserv Inc (a) | | 3,628 | | 387,797 |
| Microsoft Corp | | 1,832 | | 496,289 |
| NetEase Inc ADR | | 6,239 | | 719,045 |
| Netmarble Corp (b) | | 2,843 | | 338,287 |
| Pearl Abyss Corp (a) | | 5,951 | | 400,027 |
| Take-Two Interactive Software Inc (a) | | 2,445 | | 432,814 |
| | | | $ | 8,306,838 |
| |
| Telecommunications — 1.77% | | | | |
| AT&T Inc | | 77,651 | | 2,234,796 |
| |
| Textiles — 0.34% | | | | |
| Mohawk Industries Inc (a) | | 2,244 | | 431,274 |
| |
| Toys, Games & Hobbies — 2.01% | | | | |
| Funko Inc, Class A (a) | | 89,603 | | 1,906,752 |
| Nintendo Co Ltd | | 1,100 | | 639,831 |
| | | | $ | 2,546,583 |
| |
| Transportation — 1.87% | | | | |
| Deutsche Post AG | | 11,735 | | 798,152 |
| FedEx Corp | | 1,519 | | 453,163 |
| United Parcel Service Inc, Class B | | 2,540 | | 528,244 |
| XPO Logistics Inc (a) | | 1,750 | | 244,807 |
See accompanying notes.
113
| | | | |
| Schedule of Investments |
| Principal Millennials Index ETF |
| June 30, 2021 |
| |
| COMMON STOCKS (continued) | Shares Held | | Value | |
| Transportation (continued) | | | | |
| Yamato Holdings Co Ltd | 11,700 | $ | 332,796 | |
| | | $ | 2,357,162 | |
| TOTAL COMMON STOCKS | | $ | 126,087,993 | |
| INVESTMENT COMPANIES — 4.05% | Shares Held | | Value | |
| Money Market Funds — 4.05% | | | | |
| Principal Government Money Market Fund — Institutional Class 0.00% (a),(d),(e),(f) | 4,595,808 | $ | 4,595,808 | |
| State Street Institutional U.S. Government Money Market Fund — Institutional | | | | |
| Class 0.03% (f) | 518,976 | | 518,976 | |
| TOTAL INVESTMENT COMPANIES | | $ | 5,114,784 | |
| Total Investments | | $ | 131,202,777 | |
| Other Assets and Liabilities — (3.80)% | | | (4,803,481 | ) |
| Total Net Assets — 100.00% | | $ | 126,399,296 | |
| (a) | Non-income producing security. |
| (b) | Security exempt from registration under Rule 144A of the Securities Act of 1933. These securities may be resold in transactions exempt from registration, normally to qualified institutional buyers. At the end of the period, the value of these securities totaled $5,731,125 or 4.53% of net assets. |
| (c) | Security or a portion of the security was on loan. At the end of the period, the value of these securities totaled $4,426,790 or 3.50% of net assets. |
| (d) | Security or a portion of the security was received as collateral for securities lending. At the end of the period, the value of these securities totaled $4,595,808 or 3.64% of net assets. |
| (e) | Affiliated Security. Security is either an affiliate (and registered under the Investment Company Act of 1940) or an affiliate as defined by the Investment Company Act of 1940 (controls 5.00% or more of the outstanding voting shares of the security). |
| | Please see Affiliated Securities sub-schedule for transactional information. |
| (f) | Current yield shown is as of period end. |
| | | | | | | | | | |
| Portfolio Summary (unaudited) | | | | | | | |
| Sector | | | | | Percent | | | | | |
| Communications | | | | | 43.62 | % | | | | |
| Consumer, Cyclical | | | | | 30.13 | % | | | | |
| Financial | | | | | 8.25 | % | | | | |
| Technology | | | | | 7.46 | % | | | | |
| Consumer, Non-cyclical | | | | | 7.15 | % | | | | |
| Money Market Funds | | | | | 4.05 | % | | | | |
| Industrial | | | | | 3.14 | % | | | | |
| Other Assets and Liabilities | | | | | (3.80 | )% | | | | |
| TOTAL NET ASSETS | | | | | 100.00 | % | | | | |
| |
| | | | June 30, 2020 | | Purchases | | | Sales | | June 30, 2021 |
| Affiliated Securities | | | Value | | Cost | | | Proceeds | | Value |
| Principal Government Money | | | | | | | | | | |
| Market Fund — Institutional Class | | | | | | | | | | |
| 0.00 | % | $ | 736,189 | $ | 26,812,284 | | $ | 22,952,665 | $ | 4,595,808 |
| | | $ | 736,189 | $ | 26,812,284 | | $ | 22,952,665 | $ | 4,595,808 |
| |
| | | | | | | | | Realized Gain | | |
| | | | | | Realized | | | from | | Change in |
| | | | | | Gain/Loss on | | | Capital Gain | | Unrealized |
| | | | Income (a) | | Investments | | | Distributions | | Gain/Loss |
| Principal Government Money | | | | | | | | | | |
| Market Fund — Institutional Class | | | | | | | | | | |
| 0.00 | % | $ | — | $ | — | | $ | — | $ | — |
| | | $ | — | $ | — | | $ | — | $ | — |
| (a) | Amount excludes earnings from securities lending collateral. |
See accompanying notes.
114
| | | | |
| Schedule of Investments |
| Principal Quality ETF |
| June 30, 2021 |
| |
| COMMON STOCKS — 99.67% | | Shares Held | | Value |
| |
| Aerospace & Defense — 1.78% | | | | |
| Lockheed Martin Corp | | 1,562 | $ | 590,983 |
| Northrop Grumman Corp | | 1,240 | | 450,653 |
| | | | $ | 1,041,636 |
| |
| Agriculture — 0.99% | | | | |
| Altria Group Inc | | 8,293 | | 395,410 |
| Philip Morris International Inc | | 1,844 | | 182,759 |
| | | | $ | 578,169 |
| |
| Beverages — 2.47% | | | | |
| Brown-Forman Corp, Class B | | 5,051 | | 378,522 |
| Coca-Cola Co/The | | 3,163 | | 171,150 |
| Keurig Dr Pepper Inc | | 5,076 | | 178,878 |
| Monster Beverage Corp (a) | | 5,887 | | 537,777 |
| PepsiCo Inc | | 1,191 | | 176,471 |
| | | | $ | 1,442,798 |
| |
| Biotechnology — 2.45% | | | | |
| Amgen Inc | | 686 | | 167,212 |
| Bio-Rad Laboratories Inc, Class A (a) | | 262 | | 168,804 |
| Regeneron Pharmaceuticals Inc (a) | | 802 | | 447,949 |
| Seagen Inc (a) | | 1,028 | | 162,301 |
| Vertex Pharmaceuticals Inc (a) | | 2,422 | | 488,348 |
| | | | $ | 1,434,614 |
| |
| Chemicals — 2.41% | | | | |
| FMC Corp | | 3,556 | | 384,759 |
| RPM International Inc | | 4,530 | | 401,720 |
| Sherwin-Williams Co/The | | 2,281 | | 621,459 |
| | | | $ | 1,407,938 |
| |
| Commercial Services — 6.18% | | | | |
| Automatic Data Processing Inc | | 882 | | 175,183 |
| Booz Allen Hamilton Holding Corp | | 6,683 | | 569,258 |
| Gartner Inc (a) | | 862 | | 208,776 |
| MarketAxess Holdings Inc | | 927 | | 429,748 |
| Moody's Corp | | 1,881 | | 681,618 |
| PayPal Holdings Inc (a) | | 595 | | 173,431 |
| Rollins Inc | | 10,902 | | 372,848 |
| S&P Global Inc | | 1,098 | | 450,674 |
| Verisk Analytics Inc | | 3,153 | | 550,892 |
| | | | $ | 3,612,428 |
| |
| Computers — 3.27% | | | | |
| Accenture PLC, Class A | | 2,061 | | 607,562 |
| Apple Inc | | 4,260 | | 583,450 |
| EPAM Systems Inc (a) | | 412 | | 210,515 |
| Fortinet Inc (a) | | 2,142 | | 510,203 |
| | | | $ | 1,911,730 |
| |
| Distribution/Wholesale — 2.53% | | | | |
| Fastenal Co | | 11,131 | | 578,812 |
| LKQ Corp (a) | | 3,933 | | 193,582 |
| Pool Corp | | 1,541 | | 706,795 |
| | | | $ | 1,479,189 |
| |
| Diversified Financial Services — 3.51% | | | | |
| BlackRock Inc | | 523 | | 457,609 |
| Intercontinental Exchange Inc | | 1,405 | | 166,774 |
| Mastercard Inc, Class A | | 438 | | 159,909 |
| Nasdaq Inc | | 2,614 | | 459,541 |
| T Rowe Price Group Inc | | 3,240 | | 641,423 |
See accompanying notes.
115
| | | |
| Schedule of Investments |
| Principal Quality ETF |
| June 30, 2021 |
| |
| COMMON STOCKS (continued) | Shares Held | | Value |
| |
| Diversified Financial Services (continued) | | | |
| Visa Inc, Class A | 728 | $ | 170,221 |
| | | $ | 2,055,477 |
| |
| Electric — 2.21% | | | |
| CMS Energy Corp | 6,684 | | 394,891 |
| Evergy Inc | 2,891 | | 174,703 |
| Eversource Energy | 1,951 | | 156,548 |
| Southern Co/The | 2,733 | | 165,374 |
| WEC Energy Group Inc | 4,482 | | 398,674 |
| | | $ | 1,290,190 |
| |
| Electrical Components & Equipment — 0.63% | | | |
| AMETEK Inc | 1,315 | | 175,553 |
| Generac Holdings Inc (a) | 467 | | 193,875 |
| | | $ | 369,428 |
| |
| Electronics — 4.59% | | | |
| Agilent Technologies Inc | 2,963 | | 437,961 |
| Amphenol Corp, Class A | 2,877 | | 196,816 |
| Garmin Ltd | 2,917 | | 421,915 |
| Honeywell International Inc | 767 | | 168,241 |
| Keysight Technologies Inc (a) | 1,096 | | 169,233 |
| Mettler-Toledo International Inc (a) | 462 | | 640,027 |
| Waters Corp (a) | 1,887 | | 652,166 |
| | | $ | 2,686,359 |
| |
| Engineering & Construction — 0.31% | | �� | |
| Jacobs Engineering Group Inc | 1,344 | | 179,316 |
| |
| Environmental Control — 0.33% | | | |
| Republic Services Inc | 1,738 | | 191,197 |
| |
| Food — 2.89% | | | |
| Campbell Soup Co | 3,406 | | 155,279 |
| General Mills Inc | 9,390 | | 572,133 |
| Hershey Co/The | 3,548 | | 617,991 |
| JM Smucker Co/The | 1,384 | | 179,325 |
| McCormick & Co Inc | 1,841 | | 162,597 |
| | | $ | 1,687,325 |
| |
| Healthcare — Products — 8.96% | | | |
| Abbott Laboratories | 3,019 | | 349,993 |
| Bio-Techne Corp | 430 | | 193,612 |
| Danaher Corp | 2,351 | | 630,914 |
| Edwards Lifesciences Corp (a) | 1,865 | | 193,158 |
| Hologic Inc (a) | 5,017 | | 334,734 |
| IDEXX Laboratories Inc (a) | 991 | | 625,866 |
| Masimo Corp (a) | 617 | | 149,592 |
| PerkinElmer Inc | 4,097 | | 632,618 |
| ResMed Inc | 2,679 | | 660,427 |
| STERIS PLC | 2,067 | | 426,422 |
| Thermo Fisher Scientific Inc | 1,146 | | 578,123 |
| West Pharmaceutical Services Inc | 1,291 | | 463,598 |
| | | $ | 5,239,057 |
| |
| Healthcare — Services — 3.58% | | | |
| Charles River Laboratories International Inc (a) | 1,265 | | 467,949 |
| Humana Inc | 411 | | 181,958 |
| Laboratory Corp of America Holdings (a) | 1,510 | | 416,533 |
| Quest Diagnostics Inc | 4,470 | | 589,906 |
| UnitedHealth Group Inc | 1,090 | | 436,480 |
| | | $ | 2,092,826 |
See accompanying notes.
116
| | | | |
| Schedule of Investments |
| Principal Quality ETF |
| June 30, 2021 |
| |
| COMMON STOCKS (continued) | | Shares Held | | Value |
| Home Builders — 0.63% | | | | |
| DR Horton Inc | | 2,018 | $ | 182,367 |
| Lennar Corp, Class A | | 1,867 | | 185,486 |
| | | | $ | 367,853 |
| |
| Household Products — 1.92% | | | | |
| Colgate-Palmolive Co | | 6,870 | | 558,875 |
| Procter & Gamble Co/The | | 4,182 | | 564,277 |
| | | | $ | 1,123,152 |
| |
| Household Products/Wares — 2.79% | | | | |
| Avery Dennison Corp | | 882 | | 185,432 |
| Church & Dwight Co Inc | | 6,560 | | 559,043 |
| Clorox Co/The | | 2,854 | | 513,463 |
| Kimberly-Clark Corp | | 2,815 | | 376,591 |
| | | | $ | 1,634,529 |
| |
| Housewares — 0.79% | | | | |
| Scotts Miracle-Gro Co/The | | 2,421 | | 464,638 |
| Insurance — 5.08% | | | | |
| Allstate Corp/The | | 1,452 | | 189,399 |
| Aon PLC | | 2,266 | | 541,030 |
| Arthur J Gallagher & Co | | 4,313 | | 604,165 |
| Brown & Brown Inc | | 7,878 | | 418,637 |
| Marsh & McLennan Cos Inc | | 4,482 | | 630,528 |
| Progressive Corp/The | | 6,010 | | 590,242 |
| | | | $ | 2,974,001 |
| |
| Internet — 2.69% | | | | |
| Alphabet Inc, Class A (a) | | 177 | | 432,197 |
| eBay Inc | | 9,155 | | 642,773 |
| Etsy Inc (a) | | 703 | | 144,705 |
| Netflix Inc (a) | | 672 | | 354,957 |
| | | | $ | 1,574,632 |
| |
| Machinery — Diversified — 1.70% | | | | |
| Graco Inc | | 5,214 | | 394,700 |
| IDEX Corp | | 793 | | 174,499 |
| Rockwell Automation Inc | | 1,489 | | 425,884 |
| | | | $ | 995,083 |
| |
| Media — 0.97% | | | | |
| FactSet Research Systems Inc | | 1,696 | | 569,195 |
| Miscellaneous Manufacture — 1.29% | | | | |
| 3M Co | | 2,948 | | 585,561 |
| Illinois Tool Works Inc | | 767 | | 171,471 |
| | | | $ | 757,032 |
| |
| Pharmaceuticals — 3.95% | | | | |
| AbbVie Inc | | 1,439 | | 162,089 |
| Becton Dickinson and Co | | 1,497 | | 364,055 |
| Cigna Corp | | 1,723 | | 408,472 |
| Eli Lilly & Co | | 1,762 | | 404,414 |
| Johnson & Johnson | | 3,260 | | 537,052 |
| Zoetis Inc | | 2,329 | | 434,033 |
| | | | $ | 2,310,115 |
| |
| REITs — 2.64% | | | | |
| Alexandria Real Estate Equities Inc | | 969 | | 176,300 |
| American Tower Corp | | 1,672 | | 451,674 |
| Crown Castle International Corp | | 2,324 | | 453,412 |
See accompanying notes.
117
| | | | |
| Schedule of Investments |
| Principal Quality ETF |
| June 30, 2021 |
| |
| COMMON STOCKS (continued) | | Shares Held | | Value |
| |
| REITs (continued) | | | | |
| Public Storage | | 1,543 | $ | 463,965 |
| | | | $ | 1,545,351 |
| |
| Retail — 8.98% | | | | |
| AutoZone Inc (a) | | 310 | | 462,588 |
| Costco Wholesale Corp | | 1,560 | | 617,245 |
| Dollar General Corp | | 2,733 | | 591,394 |
| Domino's Pizza Inc | | 444 | | 207,122 |
| Home Depot Inc/The | | 1,999 | | 637,461 |
| Lowe's Cos Inc | | 3,232 | | 626,911 |
| O'Reilly Automotive Inc (a) | | 1,157 | | 655,105 |
| Target Corp | | 2,814 | | 680,256 |
| Tractor Supply Co | | 3,250 | | 604,695 |
| Walmart Inc | | 1,190 | | 167,814 |
| | | | $ | 5,250,591 |
| |
| Semiconductors — 1.91% | | | | |
| KLA Corp | | 1,163 | | 377,056 |
| Monolithic Power Systems Inc | | 966 | | 360,753 |
| Teradyne Inc | | 2,811 | | 376,562 |
| | | | $ | 1,114,371 |
| |
| Software — 12.02% | | | | |
| Activision Blizzard Inc | | 3,780 | | 360,763 |
| Adobe Inc (a) | | 1,122 | | 657,088 |
| Akamai Technologies Inc (a) | | 1,642 | | 191,457 |
| Autodesk Inc (a) | | 565 | | 164,924 |
| Broadridge Financial Solutions Inc | | 3,625 | | 585,546 |
| Cerner Corp | | 7,473 | | 584,090 |
| Citrix Systems Inc | | 1,161 | | 136,150 |
| Fair Isaac Corp (a) | | 790 | | 397,117 |
| Intuit Inc | | 925 | | 453,407 |
| Jack Henry & Associates Inc | | 2,436 | | 398,310 |
| Microsoft Corp | | 2,221 | | 601,669 |
| Oracle Corp | | 8,007 | | 623,265 |
| Paychex Inc | | 3,972 | | 426,196 |
| PTC Inc (a) | | 1,133 | | 160,048 |
| Synopsys Inc (a) | | 2,107 | | 581,090 |
| Tyler Technologies Inc (a) | | 329 | | 148,830 |
| Veeva Systems Inc, Class A (a) | | 1,293 | | 402,058 |
| Zoom Video Communications Inc, Class A (a) | | 411 | | 159,069 |
| | | | $ | 7,031,077 |
| |
| Telecommunications — 0.73% | | | | |
| Cisco Systems Inc | | 8,047 | | 426,491 |
| |
| Transportation — 1.53% | | | | |
| Expeditors International of Washington Inc | | 5,623 | | 711,872 |
| Old Dominion Freight Line Inc | | 716 | | 181,721 |
| | | | $ | 893,593 |
| |
| Water — 0.96% | | | | |
| American Water Works Co Inc | | 2,548 | | 392,723 |
| Essential Utilities Inc | | 3,686 | | 168,450 |
| | | | $ | 561,173 |
| TOTAL COMMON STOCKS | | | $ | 58,292,554 |
See accompanying notes.
118
Schedule of Investments
Principal Quality ETF
June 30, 2021
| | | |
| INVESTMENT COMPANIES — 0.28% | Shares Held | | Value |
| Money Market Fund — 0.28% | | | |
| State Street Institutional U.S. Government Money Market Fund — Institutional | | | |
| Class 0.03% (b) | 164,623 | $ | 164,623 |
| TOTAL INVESTMENT COMPANIES | | $ | 164,623 |
| Total Investments | | $ | 58,457,177 |
| Other Assets and Liabilities — 0.05% | | | 28,450 |
| Total Net Assets — 100.00% | | $ | 58,485,627 |
| (a) | Non-income producing security. |
| (b) | Current yield shown is as of period end. |
| | | | | | | | | | | |
| Portfolio Summary (unaudited) | | | | | | | | |
| Sector | | | | | Percent | | | | | | |
| Consumer, Non-cyclical | | | | | 36.17 | % | | | | | |
| Technology | | | | | 17.20 | % | | | | | |
| Consumer, Cyclical | | | | | 12.93 | % | | | | | |
| Industrial | | | | | 12.16 | % | | | | | |
| Financial | | | | | 11.24 | % | | | | | |
| Communications | | | | | 4.39 | % | | | | | |
| Utilities | | | | | 3.17 | % | | | | | |
| Basic Materials | | | | | 2.41 | % | | | | | |
| Money Market Fund | | | | | 0.28 | % | | | | | |
| Other Assets and Liabilities | | | | | 0.05 | % | | | | | |
| TOTAL NET ASSETS | | | | | 100.00 | % | | | | | |
| |
| |
| | | | June 30, 2020 | | Purchases | | Sales | | June 30, 2021 |
| Affiliated Securities | | | Value | | Cost | | | | Proceeds | | Value |
| Principal Government Money | | | | | | | | | | | |
| Market Fund — Institutional Class | | | | | | | | | | | |
| 0.00 | % | $ | — | $ | 52,718 | $ | 52,718 | $ | — |
| | | $ | — | $ | 52,718 | $ | 52,718 | $ | — |
| |
| | | | | | | | | | Realized Gain | | |
| | | | | | Realized | | | | from | | Change in |
| | | | | | Gain/Loss on | | Capital Gain | | Unrealized |
| | | | Income (a) | | Investments | | Distributions | | Gain/Loss |
| Principal Government Money | | | | | | | | | | | |
| Market Fund — Institutional Class | | | | | | | | | | | |
| 0.00 | % | $ | — | | $ | | — | $ | — | $ | — |
| | | $ | — | | $ | | — | $ | — | $ | — |
| (a) | Amount excludes earnings from securities lending collateral. |
See accompanying notes.
119
| | | | |
| Schedule of Investments |
| Principal Spectrum Preferred Securities Active ETF |
| June 30, 2021 |
| |
| | | Principal | | |
| BONDS — 97.13% | | Amount | | Value |
| |
| Banks — 39.40% | | | | |
| Bank of America Corp | | | | |
| (3-month USD LIBOR + 3.90%), | | | | |
| 6.10%, 03/17/2025 (a),(b) | $ | 7,667,000 | $ | 8,609,044 |
| (3-month USD LIBOR + 4.55%), | | | | |
| 6.30%, 03/10/2026 (a),(b) | | 768,000 | | 886,203 |
| Bank of Montreal | | | | |
| (5-year Treasury Constant Maturity Rate + 2.98%), | | | | |
| 4.80%, 08/25/2024 (a),(b),(c) | | 3,275,000 | | 3,527,601 |
| Bank of New York Mellon Corp/The | | | | |
| (5-year Treasury Constant Maturity Rate + 3.35%), | | | | |
| 3.70%, 03/20/2026 (a),(b) | | 15,059,000 | | 15,680,184 |
| (5-year Treasury Constant Maturity Rate + 4.36%), | | | | |
| 4.70%, 09/20/2025 (a),(b) | | 736,000 | | 803,160 |
| Bank of Nova Scotia/The | | | | |
| (5-year Treasury Constant Maturity Rate + 4.55%), | | | | |
| 4.90%, 06/04/2025 (a),(b) | | 3,474,000 | | 3,812,715 |
| BNP Paribas SA | | | | |
| (3-month USD LIBOR + 1.29%), | | | | |
| 7.20%, 06/25/2037 (a),(b),(c),(d) | | 2,300,000 | | 2,455,250 |
| Citigroup Inc | | | | |
| (5-year Treasury Constant Maturity Rate + 3.42%), | | | | |
| 3.88%, 02/18/2026 (a),(b) | | 2,159,000 | | 2,204,879 |
| (5-year Treasury Constant Maturity Rate + 3.60%), | | | | |
| 4.00%, 12/10/2025 (a),(b) | | 9,239,000 | | 9,550,816 |
| (3-month USD LIBOR + 3.91%), | | | | |
| 5.95%, 05/15/2025 (a),(b) | | 3,830,000 | | 4,191,743 |
| Citizens Financial Group Inc | | | | |
| (5-year Treasury Constant Maturity Rate + 3.22%), | | | | |
| 4.00%, 10/06/2026 (a),(b) | | 2,528,000 | | 2,546,960 |
| (5-year Treasury Constant Maturity Rate + 5.31%), | | | | |
| 5.65%, 10/06/2025 (a),(b),(c) | | 3,057,000 | | 3,377,985 |
| (3-month USD LIBOR + 3.16%), | | | | |
| 6.38%, 04/06/2024 (a),(b),(c) | | 2,818,000 | | 2,994,125 |
| Comerica Inc | | | | |
| (5-year Treasury Constant Maturity Rate + 5.29%), | | | | |
| 5.63%, 07/01/2025 (a),(b) | | 605,000 | | 670,038 |
| Fifth Third Bancorp | | | | |
| (5-year Treasury Constant Maturity Rate + 4.22%), | | | | |
| 4.50%, 09/30/2025 (a),(b) | | 995,000 | | 1,079,575 |
| Goldman Sachs Group Inc/The | | | | |
| (5-year Treasury Constant Maturity Rate + 2.97%), | | | | |
| 3.80%, 05/10/2026 (a),(b) | | 1,352,000 | | 1,376,066 |
| (5-year Treasury Constant Maturity Rate + 3.62%), | | | | |
| 5.50%, 08/10/2024 (a),(b),(c) | | 5,750,000 | | 6,307,232 |
| HSBC Capital Funding Dollar 1 LP | | | | |
| (3-month USD LIBOR + 4.98%), | | | | |
| 10.18%, 06/30/2030 (a),(b) | | 5,553,000 | | 9,192,658 |
| Huntington Bancshares Inc | | | | |
| (7-year Treasury Constant Maturity Rate + 4.05%), | | | | |
| 4.45%, 10/15/2027 (a),(b) | | 2,125,000 | | 2,268,438 |
| (10-year Treasury Constant Maturity Rate + 4.95%), | | | | |
| 5.63%, 07/15/2030 (a),(b) | | 6,909,000 | | 8,023,076 |
| JPMorgan Chase & Co | | | | |
| (5-year Treasury Constant Maturity Rate + 2.85%), | | | | |
| 3.65%, 06/01/2026 (a),(b) | | 7,140,000 | | 7,149,996 |
| (3-month USD LIBOR + 3.30%), | | | | |
| 6.00%, 08/01/2023 (a),(b) | | 4,226,000 | | 4,492,766 |
| (3-month USD LIBOR + 3.78%), | | | | |
| 6.75%, 02/01/2024 (a),(b) | | 4,978,000 | | 5,519,855 |
| KeyCorp | | | | |
| (3-month USD LIBOR + 3.61%), | | | | |
| 5.00%, 09/15/2026 (a),(b) | | 1,154,000 | | 1,284,864 |
See accompanying notes.
120
| | | | |
| Schedule of Investments |
| Principal Spectrum Preferred Securities Active ETF |
| June 30, 2021 |
| |
| | | Principal | | |
| BONDS (continued) | | Amount | | Value |
| |
| Banks (continued) | | | | |
| Lloyds Bank PLC | | | | |
| (3-month USD LIBOR + 11.76%), | | | | |
| 12.00%, 12/16/2024 (a),(b),(c),(d) | $ | 4,269,000 | $ | 4,636,561 |
| SVB Financial Group | | | | |
| (5-year Treasury Constant Maturity Rate + 3.20%), | | | | |
| 4.00%, 05/15/2026 (a),(b) | | 2,252,000 | | 2,292,086 |
| (10-year Treasury Constant Maturity Rate + 3.06%), | | | | |
| 4.10%, 02/15/2031 (a),(b) | | 512,000 | | 519,357 |
| Truist Financial Corp | | | | |
| (5-year Treasury Constant Maturity Rate + 3.00%), | | | | |
| 4.80%, 09/01/2024 (a),(b) | | 7,667,000 | | 8,050,350 |
| (5-year Treasury Constant Maturity Rate + 4.61%), | | | | |
| 4.95%, 09/01/2025 (a),(b) | | 1,600,000 | | 1,757,600 |
| Wells Fargo & Co | | | | |
| (5-year Treasury Constant Maturity Rate + 3.45%), | | | | |
| 3.90%, 03/15/2026 (a),(b) | | 11,587,000 | | 11,996,021 |
| (3-month USD LIBOR + 3.99%), | | | | |
| 5.88%, 06/15/2025 (a),(b) | | 5,266,000 | | 5,897,446 |
| | | | $ | 143,154,650 |
| |
| Diversified Financial Services — 7.52% | | | | |
| Ally Financial Inc | | | | |
| (5-year Treasury Constant Maturity Rate + 3.87%), | | | | |
| 4.70%, 05/15/2026 (a),(b) | | 1,561,000 | | 1,616,728 |
| (7-year Treasury Constant Maturity Rate + 3.48%), | | | | |
| 4.70%, 05/15/2028 (a),(b) | | 1,012,000 | | 1,024,954 |
| Capital One Financial Corp | | | | |
| (5-year Treasury Constant Maturity Rate + 3.16%), | | | | |
| 3.95%, 09/01/2026 (a),(b) | | 4,048,000 | | 4,134,020 |
| Charles Schwab Corp/The | | | | |
| (5-year Treasury Constant Maturity Rate + 3.17%), | | | | |
| 4.00%, 06/01/2026 (a),(b) | | 8,065,000 | | 8,407,762 |
| (5-year Treasury Constant Maturity Rate + 4.97%), | | | | |
| 5.38%, 06/01/2025 (a),(b) | | 4,601,000 | | 5,085,485 |
| Discover Financial Services | | | | |
| (5-year Treasury Constant Maturity Rate + 5.78%), | | | | |
| 6.13%, 06/23/2025 (a),(b) | | 6,292,000 | | 7,060,882 |
| | | | $ | 27,329,831 |
| |
| Electric — 11.70% | | | | |
| CMS Energy Corp | | | | |
| (5-year Treasury Constant Maturity Rate + 2.90%), | | | | |
| 3.75%, 12/01/2050 (b) | | 3,331,000 | | 3,388,626 |
| (5-year Treasury Constant Maturity Rate + 4.12%), | | | | |
| 4.75%, 06/01/2050 (b) | | 2,957,000 | | 3,295,207 |
| Dominion Energy Inc | | | | |
| (5-year Treasury Constant Maturity Rate + 2.99%), | | | | |
| 4.65%, 12/15/2024 (a),(b) | | 13,679,000 | | 14,533,937 |
| Duke Energy Corp | | | | |
| (5-year Treasury Constant Maturity Rate + 3.39%), | | | | |
| 4.88%, 09/16/2024 (a),(b) | | 9,298,000 | | 9,879,125 |
| Emera Inc | | | | |
| (3-month USD LIBOR + 5.44%), | | | | |
| 6.75%, 06/15/2076 (b) | | 6,892,000 | | 8,072,255 |
| Southern Co/The | | | | |
| (5-year Treasury Constant Maturity Rate + 2.92%), | | | | |
| 3.75%, 09/15/2051 (b) | | 512,000 | | 515,277 |
| (5-year Treasury Constant Maturity Rate + 3.73%), | | | | |
| 4.00%, 01/15/2051 (b) | | 2,681,000 | | 2,835,158 |
| | | | $ | 42,519,585 |
See accompanying notes.
121
| | | | |
| Schedule of Investments |
| Principal Spectrum Preferred Securities Active ETF |
| June 30, 2021 |
| |
| | | Principal | | |
| BONDS (continued) | | Amount | | Value |
| |
| Gas — 1.77% | | | | |
| NiSource Inc | | | | |
| (5-year Treasury Constant Maturity Rate + 2.84%), | | | | |
| 5.65%, 06/15/2023 (a),(b) | $ | 6,027,000 | $ | 6,426,289 |
| |
| Hand/Machine Tools — 1.12% | | | | |
| Stanley Black & Decker Inc | | | | |
| (5-year Treasury Constant Maturity Rate + 2.66%), | | | | |
| 4.00%, 03/15/2060 (b) | | 3,830,000 | | 4,075,120 |
| |
| Insurance — 25.53% | | | | |
| Allstate Corp/The | | | | |
| (3-month USD LIBOR + 2.94%), | | | | |
| 5.75%, 08/15/2053 (b) | | 3,830,000 | | 4,169,913 |
| American International Group Inc | | | | |
| (3-month USD LIBOR + 2.87%), | | | | |
| 5.75%, 04/01/2048 (b) | | 1,600,000 | | 1,831,363 |
| Argentum Netherlands BV for Swiss Re Ltd | | | | |
| (3-month USD LIBOR + 3.78%), | | | | |
| 5.63%, 08/15/2052 (b) | | 5,600,000 | | 6,411,686 |
| Argentum Netherlands BV for Zurich Insurance Co Ltd | | | | |
| (5-year Treasury Constant Maturity Rate + 3.27%), | | | | |
| 5.13%, 06/01/2048 (b) | | 4,000,000 | | 4,595,000 |
| AXA SA | | | | |
| (3-month USD LIBOR + 2.26%), | | | | |
| 6.38%, 12/14/2036 (a),(b),(d) | | 5,091,000 | | 7,076,490 |
| Cloverie PLC for Zurich Insurance Co Ltd | | | | |
| (3-month USD LIBOR + 4.92%), | | | | |
| 5.63%, 06/24/2046 (b) | | 5,600,000 | | 6,482,112 |
| Equitable Holdings Inc | | | | |
| (5-year Treasury Constant Maturity Rate + 4.74%), | | | | |
| 4.95%, 09/15/2025 (a),(b) | | 3,172,000 | | 3,449,550 |
| M&G PLC | | | | |
| 6.50%, 10/20/2048 | | 2,200,000 | | 2,607,550 |
| Meiji Yasuda Life Insurance Co | | | | |
| (5-year Swap rate + 4.23%), | | | | |
| 5.20%, 10/20/2045 (b),(d) | | 3,830,000 | | 4,338,241 |
| MetLife Inc | | | | |
| (5-year Treasury Constant Maturity Rate + 3.58%), | | | | |
| 3.85%, 09/15/2025 (a),(b) | | 6,394,000 | | 6,721,692 |
| 9.25%, 04/08/2068 (d) | | 5,593,000 | | 8,481,584 |
| Nippon Life Insurance Co | | | | |
| (5-year Treasury Constant Maturity Rate + 2.65%), | | | | |
| 2.75%, 01/21/2051 (b),(d) | | 4,910,000 | | 4,811,800 |
| Prudential Financial Inc | | | | |
| (5-year Treasury Constant Maturity Rate + 3.04%), | | | | |
| 3.70%, 10/01/2050 (b) | | 7,347,000 | | 7,659,247 |
| (3-month USD LIBOR + 3.92%), | | | | |
| 5.63%, 06/15/2043 (b) | | 5,750,000 | | 6,170,628 |
| Sumitomo Life Insurance Co | | | | |
| (5-year Treasury Constant Maturity Rate + 2.75%), | | | | |
| 3.38%, 04/15/2081 (b),(d) | | 4,163,000 | | 4,289,972 |
| (3-month USD LIBOR + 4.44%), | | | | |
| 6.50%, 09/20/2073 (b),(d) | | 7,704,000 | | 8,532,180 |
| Voya Financial Inc | | | | |
| (5-year Treasury Constant Maturity Rate + 3.36%), | | | | |
| 6.13%, 09/15/2023 (a),(b),(c) | | 3,830,000 | | 4,136,400 |
| Zurich Finance Ireland Designated Activity Co | | | | |
| (5-year Treasury Constant Maturity Rate + 2.78%), | | | | |
| 3.00%, 04/19/2051 (b) | | 1,000,000 | | 989,644 |
| | | | $ | 92,755,052 |
See accompanying notes.
122
| | | | | |
| Schedule of Investments |
| Principal Spectrum Preferred Securities Active ETF |
| June 30, 2021 |
| |
| | | Principal | | | |
| BONDS (continued) | | Amount | | Value | |
| |
| Oil & Gas — 1.55% | | | | | |
| BP Capital Markets PLC | | | | | |
| (5-year Treasury Constant Maturity Rate + 4.04%), | | | | | |
| 4.38%, 06/22/2025 (a),(b) | $ | 5,289,000 | $ | 5,632,785 | |
| |
| Pipelines — 6.07% | | | | | |
| Enbridge Inc | | | | | |
| (5-year Treasury Constant Maturity Rate + 5.31%), | | | | | |
| 5.75%, 07/15/2080 (b) | | 2,220,000 | | 2,475,300 | |
| (3-month USD LIBOR + 3.89%), | | | | | |
| 6.00%, 01/15/2077 (b) | | 5,750,000 | | 6,376,443 | |
| Enterprise Products Operating LLC | | | | | |
| (3-month USD LIBOR + 3.03%), | | | | | |
| 5.25%, 08/16/2077 (b) | | 3,830,000 | | 4,015,656 | |
| Transcanada Trust | | | | | |
| (3-month USD LIBOR + 4.15%), | | | | | |
| 5.50%, 09/15/2079 (b) | | 8,428,000 | | 9,186,520 | |
| | | | $ | 22,053,919 | |
| |
| REITs — 0.96% | | | | | |
| Scentre Group Trust 2 | | | | | |
| (5-year Treasury Constant Maturity Rate + 4.38%), | | | | | |
| 4.75%, 09/24/2080 (b),(d) | | 847,000 | | 904,173 | |
| (5-year Treasury Constant Maturity Rate + 4.69%), | | | | | |
| 5.13%, 09/24/2080 (b),(d) | | 2,417,000 | | 2,577,126 | |
| | | | $ | 3,481,299 | |
| |
| Telecommunications — 1.51% | | | | | |
| Vodafone Group PLC | | | | | |
| (5-year Swap rate + 4.87%), | | | | | |
| 7.00%, 04/04/2079 (b) | | 4,516,000 | | 5,472,173 | |
| TOTAL BONDS | | | $ | 352,900,703 | |
| INVESTMENT COMPANIES — 4.72% | | Shares Held | | Value | |
| |
| Money Market Funds — 4.72% | | | | | |
| Principal Government Money Market Fund — Institutional Class 0.00% (e),(f),(g),(h) | | 10,355,640 | $ | 10,355,640 | |
| State Street Institutional U.S. Government Money Market Fund — Institutional | | | | | |
| Class 0.03% (h) | | 6,805,333 | | 6,805,333 | |
| TOTAL INVESTMENT COMPANIES | | | $ | 17,160,973 | |
| Total Investments | | | $ | 370,061,676 | |
| Other Assets and Liabilities — (1.85%) | | | | (6,728,542 | ) |
| |
| Total Net Assets — 100.00% | | | $ | 363,333,134 | |
| (a) | Perpetual security. Perpetual securities pay an indefinite stream of interest, but they may be called by the issuer at an earlier date. Date shown, if any, reflects the next call date or final legal maturity date. Rate shown is as of period end. |
| (b) | Rate shown is as of period end. The rate may be a variable or floating rate or a fixed rate which may convert to a variable or floating rate in the future. |
| (c) | Security or a portion of the security was on loan. At the end of the period, the value of these securities totaled $10,152,033 or 2.79% of net assets. |
| (d) | Security exempt from registration under Rule 144A of the Securities Act of 1933. These securities may be resold in transactions exempt from registration, normally to qualified institutional buyers. At the end of the period, the value of these securities totaled $48,103,377 or 13.24% of net assets. |
| (e) | Non-income producing security. |
| (f) | Security or a portion of the security was received as collateral for securities lending. At the end of the period, the value of these securities totaled $10,355,640 or 2.85% of net assets. |
| (g) | Affiliated Security. Security is either an affiliate (and registered under the Investment Company Act of 1940) or an affiliate as defined by the Investment Company Act of 1940 (controls 5.00% or more of the outstanding voting shares of the security). |
| | Please see Affiliated Securities sub-schedule for transactional information. |
| (h) | Current yield shown is as of period end. |
See accompanying notes.
123
| | | | | | | | | |
| | | | Schedule of Investments | | | | |
| Principal Spectrum Preferred Securities Active ETF | | |
| | | | June 30, 2021 | | | | |
| |
| Portfolio Summary (unaudited) | | | | | | |
| Sector | | | | | Percent | | | | |
| Financial | | | | | 73.41 | % | | | |
| Utilities | | | | | 13.47 | % | | | |
| Energy | | | | | 7.62 | % | | | |
| Money Market Funds | | | | | 4.72 | % | | | |
| Communications | | | | | 1.51 | % | | | |
| Industrial | | | | | 1.12 | % | | | |
| Other Assets and Liabilities | | | | | (1.85 | )% | | | |
| TOTAL NET ASSETS | | | | | 100.00 | % | | | |
| |
| | | | June 30, 2020 | | Purchases | | Sales | | June 30, 2021 |
| Affiliated Securities | | | Value | | Cost | | Proceeds | | Value |
| Principal Government Money | | | | | | | | | |
| Market Fund — Institutional Class | | | | | | | | | |
| 0.00 | % | $ | 2,865,310 | $ | 51,313,520 | $ | 43,823,190 | $ | 10,355,640 |
| | | $ | 2,865,310 | $ | 51,313,520 | $ | 43,823,190 | $ | 10,355,640 |
| |
| | | | | | | | Realized Gain | | |
| | | | | | Realized | | from | | Change in |
| | | | | | Gain/Loss on | | Capital Gain | | Unrealized |
| | | | Income (a) | | Investments | | Distributions | | Gain/Loss |
| Principal Government Money | | | | | | | | | |
| Market Fund — Institutional Class | | | | | | | | | |
| 0.00 | % | $ | — | $ | — $ | | — | $ | — |
| | | $ | — | $ | — $ | | — | $ | — |
| (a) | Amount excludes earnings from securities lending collateral. |
See accompanying notes.
124
| | | | |
| Schedule of Investments |
| Principal Spectrum Tax-Advantaged Dividend Active ETF |
| June 30, 2021 |
| |
| PREFERRED STOCKS — 13.69% | | Shares Held | | Value |
| |
| Banks — 5.33% | | | | |
| Associated Banc-Corp; Series F | | | | |
| 5.63%, 09/15/2025 (a) | | 1,890 | $ | 54,715 |
| Bank of America Corp; Series NN | | | | |
| 4.38%, 11/03/2025 (a) | | 4,000 | | 104,800 |
| Fulton Financial Corp; Series A | | | | |
| 5.13%, 01/15/2026 (a) | | 8,400 | | 225,372 |
| JPMorgan Chase & Co; Series DD | | | | |
| 5.75%, 12/01/2023 (a) | | 1,151 | | 32,516 |
| JPMorgan Chase & Co; Series EE | | | | |
| 6.00%, 03/01/2024 (a) | | 1,500 | | 43,245 |
| Morgan Stanley; Series I | | | | |
| (3-month USD LIBOR + 3.71%), | | | | |
| 6.38%, 10/15/2024 (a),(b) | | 15,550 | | 452,194 |
| Synovus Financial Corp; Series E | | | | |
| (5-year Treasury Constant Maturity Rate + 4.13%), | | | | |
| 5.88%, 07/01/2024 (a),(b) | | 10,500 | | 286,230 |
| US Bancorp; Series B | | | | |
| (3-month USD LIBOR + 0.60%), | | | | |
| 3.50%, 07/30/2021 (a),(b) | | 302 | | 7,520 |
| | | | $ | 1,206,592 |
| |
| Insurance — 4.11% | | | | |
| Allstate Corp/The; Series H | | | | |
| 5.10%, 10/15/2024 (a) | | 10,500 | | 295,470 |
| American International Group Inc; Series A | | | | |
| 5.85%, 03/15/2024 (a) | | 7,321 | | 209,673 |
| MetLife Inc; Series F | | | | |
| 4.75%, 03/15/2024 (a) | | 15,750 | | 425,093 |
| | | | $ | 930,236 |
| |
| Telecommunications — 4.25% | | | | |
| AT&T Inc; Series A | | | | |
| 5.00%, 12/12/2024 (a) | | 10,500 | | 287,700 |
| AT&T Inc; Series C | | | | |
| 4.75%, 02/18/2025 (a) | | 25,383 | | 674,934 |
| | | | $ | 962,634 |
| TOTAL PREFERRED STOCKS | | | $ | 3,099,462 |
| | | Principal | | |
| BONDS — 84.30% | | Amount | | Value |
| |
| Banks — 69.48% | | | | |
| Bank of America Corp | | | | |
| (3-month USD LIBOR + 3.90%), | | | | |
| 6.10%, 03/17/2025 (a),(b) | $ | 210,000 | $ | 235,803 |
| (3-month USD LIBOR + 4.55%), | | | | |
| 6.30%, 03/10/2026 (a),(b) | | 525,000 | | 605,803 |
| Bank of New York Mellon Corp/The | | | | |
| (5-year Treasury Constant Maturity Rate + 3.35%), | | | | |
| 3.70%, 03/20/2026 (a),(b) | | 210,000 | | 218,662 |
| (5-year Treasury Constant Maturity Rate + 4.36%), | | | | |
| 4.70%, 09/20/2025 (a),(b) | | 525,000 | | 572,906 |
| Bank of Nova Scotia/The | | | | |
| (5-year Treasury Constant Maturity Rate + 4.55%), | | | | |
| 4.90%, 06/04/2025 (a),(b) | | 525,000 | | 576,187 |
| Citigroup Inc | | | | |
| (5-year Treasury Constant Maturity Rate + 3.42%), | | | | |
| 3.88%, 02/18/2026 (a),(b) | | 210,000 | | 214,463 |
| Citizens Financial Group Inc | | | | |
| (5-year Treasury Constant Maturity Rate + 5.31%), | | | | |
| 5.65%, 10/06/2025 (a),(b) | | 525,000 | | 580,125 |
See accompanying notes.
125
| | | | |
| Schedule of Investments |
| Principal Spectrum Tax-Advantaged Dividend Active ETF |
| June 30, 2021 |
| |
| | | Principal | | |
| BONDS (continued) | | Amount | | Value |
| |
| Banks (continued) | | | | |
| Comerica Inc | | | | |
| (5-year Treasury Constant Maturity Rate + 5.29%), | | | | |
| 5.63%, 07/01/2025 (a),(b) | $ | 525,000 | $ | 581,437 |
| Credit Agricole SA | | | | |
| (5-year Swap rate + 4.90%), | | | | |
| 7.88%, 01/23/2024 (a),(b),(c) | | 787,000 | | 889,310 |
| Credit Suisse Group AG | | | | |
| (5-year Treasury Constant Maturity Rate + 4.82%), | | | | |
| 6.38%, 08/21/2026 (a),(b),(c),(d) | | 367,000 | | 409,069 |
| (5-year Swap rate + 5.11%), | | | | |
| 7.13%, 07/29/2022 (a),(b),(c) | | 500,000 | | 521,875 |
| Fifth Third Bancorp | | | | |
| (5-year Treasury Constant Maturity Rate + 4.22%), | | | | |
| 4.50%, 09/30/2025 (a),(b) | | 500,000 | | 542,500 |
| Goldman Sachs Group Inc/The | | | | |
| (5-year Treasury Constant Maturity Rate + 2.97%), | | | | |
| 3.80%, 05/10/2026 (a),(b) | | 400,000 | | 407,120 |
| HSBC Holdings PLC | | | | |
| (5-year Swap rate + 4.37%), | | | | |
| 6.38%, 03/30/2025 (a),(b),(c) | | 787,000 | | 877,348 |
| Huntington Bancshares Inc | | | | |
| (10-year Treasury Constant Maturity Rate + 4.95%), | | | | |
| 5.63%, 07/15/2030 (a),(b) | | 525,000 | | 609,656 |
| ING Groep NV | | | | |
| (5-year Treasury Constant Maturity Rate + 4.34%), | | | | |
| 5.75%, 11/16/2026 (a),(b),(c) | | 787,000 | | 871,681 |
| JPMorgan Chase & Co | | | | |
| (5-year Treasury Constant Maturity Rate + 2.85%), | | | | |
| 3.65%, 06/01/2026 (a),(b) | | 100,000 | | 100,140 |
| Lloyds Banking Group PLC | | | | |
| (5-year Swap rate + 4.50%), | | | | |
| 7.50%, 09/27/2025 (a),(b),(c) | | 787,000 | | 920,790 |
| M&T Bank Corp | | | | |
| (3-month USD LIBOR + 3.52%), | | | | |
| 5.13%, 11/01/2026 (a),(b) | | 225,000 | | 247,779 |
| Natwest Group PLC | | | | |
| (5-year Swap rate + 5.72%), | | | | |
| 8.00%, 08/10/2025 (a),(b),(c) | | 787,000 | | 930,683 |
| Nordea Bank Abp | | | | |
| (5-year Treasury Constant Maturity Rate + 4.11%), | | | | |
| 6.63%, 03/26/2026 (a),(b),(c),(d) | | 787,000 | | 902,595 |
| Societe Generale SA | | | | |
| (5-year Swap rate + 4.98%), | | | | |
| 7.88%, 12/18/2023 (a),(b),(c) | | 787,000 | | 879,724 |
| Standard Chartered PLC | | | | |
| (5-year Swap rate + 6.30%), | | | | |
| 7.50%, 04/02/2022 (a),(b),(c) | | 787,000 | | 819,842 |
| SVB Financial Group | | | | |
| (5-year Treasury Constant Maturity Rate + 3.20%), | | | | |
| 4.00%, 05/15/2026 (a),(b) | | 100,000 | | 101,780 |
| Truist Financial Corp | | | | |
| (5-year Treasury Constant Maturity Rate + 4.61%), | | | | |
| 4.95%, 09/01/2025 (a),(b) | | 525,000 | | 576,712 |
| UBS Group AG | | | | |
| (5-year Swap rate + 4.34%), | | | | |
| 7.00%, 01/31/2024 (a),(b),(c) | | 787,000 | | 866,684 |
| Wells Fargo & Co | | | | |
| (5-year Treasury Constant Maturity Rate + 3.45%), | | | | |
| 3.90%, 03/15/2026 (a),(b) | | 300,000 | | 310,590 |
| (3-month USD LIBOR + 3.99%), | | | | |
| 5.88%, 06/15/2025 (a),(b) | | 325,000 | | 363,971 |
| | | | $ | 15,735,235 |
See accompanying notes.
126
| | | | |
| Schedule of Investments |
| Principal Spectrum Tax-Advantaged Dividend Active ETF |
| June 30, 2021 |
| |
| | | Principal | | |
| BONDS (continued) | | Amount | | Value |
| |
| Diversified Financial Services — 7.46% | | | | |
| Ally Financial Inc | | | | |
| (5-year Treasury Constant Maturity Rate + 3.87%), | | | | |
| 4.70%, 05/15/2026 (a),(b) | $ | 200,000 | $ | 207,140 |
| Charles Schwab Corp/The | | | | |
| (5-year Treasury Constant Maturity Rate + 3.17%), | | | | |
| 4.00%, 06/01/2026 (a),(b) | | 300,000 | | 312,750 |
| (5-year Treasury Constant Maturity Rate + 4.97%), | | | | |
| 5.38%, 06/01/2025 (a),(b) | | 525,000 | | 580,282 |
| Discover Financial Services | | | | |
| (5-year Treasury Constant Maturity Rate + 5.78%), | | | | |
| 6.13%, 06/23/2025 (a),(b) | | 525,000 | | 589,155 |
| | | | $ | 1,689,327 |
| |
| Electric — 4.43% | | | | |
| Dominion Energy Inc | | | | |
| (5-year Treasury Constant Maturity Rate + 2.99%), | | | | |
| 4.65%, 12/15/2024 (a),(b) | | 420,000 | | 446,250 |
| Duke Energy Corp | | | | |
| (5-year Treasury Constant Maturity Rate + 3.39%), | | | | |
| 4.88%, 09/16/2024 (a),(b) | | 525,000 | | 557,813 |
| | | | $ | 1,004,063 |
| |
| Insurance — 2.93% | | | | |
| MetLife Inc | | | | |
| (5-year Treasury Constant Maturity Rate + 3.58%), | | | | |
| 3.85%, 09/15/2025 (a),(b) | | 200,000 | | 210,250 |
| Voya Financial Inc | | | | |
| (5-year Treasury Constant Maturity Rate + 3.36%), | | | | |
| 6.13%, 09/15/2023 (a),(b) | | 420,000 | | 453,600 |
| | | | $ | 663,850 |
| TOTAL BONDS | | | $ | 19,092,475 |
| INVESTMENT COMPANIES — 1.15% | | Shares Held | | Value |
| |
| Money Market Fund — 1.15% | | | | |
| State Street Institutional U.S. Government Money Market Fund — Institutional | | | | |
| Class 0.03% (e) | | 260,996 | $ | 260,996 |
| TOTAL INVESTMENT COMPANIES | | | $ | 260,996 |
| Total Investments | | | $ | 22,452,933 |
| Other Assets and Liabilities — 0.86% | | | | 194,498 |
| |
| Total Net Assets — 100.00% | | | $ | 22,647,431 |
| (a) | Perpetual security. Perpetual securities pay an indefinite stream of interest, but they may be called by the issuer at an earlier date. Date shown, if any, reflects the next call date or final legal maturity date. Rate shown is as of period end. |
| (b) | Rate shown is as of period end. The rate may be a variable or floating rate or a fixed rate which may convert to a variable or floating rate in the future. |
| (c) | Security is a contingent convertible security, ("CoCo"). CoCo's are hybrid debt securities that may convert to equity or have their principal written down upon occurrence of certain "triggers". At the end of the period, the value of these securities totaled $8,889,601 or 39.25% of net assets. |
| (d) | Security exempt from registration under Rule 144A of the Securities Act of 1933. These securities may be resold in transactions exempt from registration, normally to qualified institutional buyers. At the end of the period, the value of these securities totaled $1,311,664 or 5.79% of net assets. |
| (e) | Current yield shown is as of period end. |
See accompanying notes.
127
Schedule of Investments
Principal Spectrum Tax-Advantaged Dividend Active ETF
June 30, 2021
| | |
| Portfolio Summary (unaudited) |
|
| Sector | Percent | |
| Financial | 89.31 | % |
| Utilities | 4.43 | % |
| Communications | 4.25 | % |
| Money Market Fund | 1.15 | % |
| Other Assets and Liabilities | 0.86 | % |
| TOTAL NET ASSETS | 100.00 | % |
See accompanying notes.
128
| | | | |
| Schedule of Investments |
| Principal Ultra-Short Active Income ETF |
| June 30, 2021 |
| |
| | | Principal | | |
| BONDS — 95.34% | | Amount | | Value |
| |
| Asset-Backed Securities — 19.25% | | | | |
| AmeriCredit Automobile Receivables Trust 2021-1 | | | | |
| 0.28%, 06/18/2024 | $ | 250,000 | $ | 250,113 |
| CarMax Auto Owner Trust 2021-2 | | | | |
| 0.27%, 06/17/2024 | | 200,000 | | 200,066 |
| CPS Auto Receivables Trust 2020-A | | | | |
| 2.09%, 05/15/2023 (a) | | 7,296 | | 7,301 |
| CPS Auto Receivables Trust 2021-B | | | | |
| 0.37%, 03/17/2025 (a) | | 90,915 | | 90,936 |
| GreatAmerica Leasing Receivables Funding LLC | | | | |
| 0.27%, 06/15/2023 (a) | | 50,000 | | 50,003 |
| HPEFS Equipment Trust | | | | |
| 0.27%, 03/20/2031 (a) | | 100,000 | | 100,024 |
| MMAF Equipment Finance LLC 2021-A | | | | |
| 0.30%, 04/15/2024 (a) | | 100,000 | | 99,974 |
| Navient Private Education Loan Trust 2018-BA | | | | |
| 1.69%, 05/15/2069 (a) | | 147,340 | | 148,818 |
| Santander Drive Auto Receivables Trust 2020-2 | | | | |
| 0.62%, 05/15/2023 | | 10,054 | | 10,056 |
| Santander Drive Auto Receivables Trust 2020-3 | | | | |
| 0.46%, 09/15/2023 | | 75,887 | | 75,910 |
| Santander Drive Auto Receivables Trust 2021-1 | | | | |
| 0.29%, 11/15/2023 | | 42,030 | | 42,046 |
| SMB Private Education Loan Trust 2015-B | | | | |
| 1.27%, 07/15/2027 (a),(c) | | 78,455 | | 78,696 |
| Volvo Financial Equipment Master Owner Trust 2018-A | | | | |
| 0.59%, 07/17/2023 (a),(c) | | 325,000 | | 325,061 |
| Westlake Automobile Receivables Trust 2020-2A | | | | |
| 0.93%, 02/15/2024 (a) | | 136,882 | | 137,237 |
| World Omni Auto Receivables Trust 2021-A | | | | |
| 0.17%, 02/15/2024 | | 50,000 | | 50,002 |
| | | | $ | 1,666,243 |
| |
| Banks — 29.38% | | | | |
| Bank of New York Mellon Corp/The | | | | |
| 0.29%, 04/26/2024 (c) | | 250,000 | | 250,476 |
| Citigroup Inc | | | | |
| (3-month USD LIBOR + 1.43%), | | | | |
| 1.57%, 09/01/2023 (b) | | 250,000 | | 253,529 |
| Fifth Third Bancorp | | | | |
| 2.60%, 06/15/2022 | | 279,000 | | 284,780 |
| Goldman Sachs Group Inc/The | | | | |
| 0.58%, 11/17/2023 (c) | | 250,000 | | 250,147 |
| ING Bank NV | | | | |
| (3-month USD LIBOR + 0.88%), | | | | |
| 1.04%, 08/15/2021 (a),(b) | | 200,000 | | 200,203 |
| Morgan Stanley | | | | |
| 0.73%, 01/20/2023 (c) | | 200,000 | | 200,568 |
| MUFG Union Bank NA | | | | |
| 0.76%, 12/09/2022 (c) | | 300,000 | | 301,848 |
| Toronto-Dominion Bank | | | | |
| 0.26%, 01/06/2023 (c) | | 200,000 | | 200,145 |
| Truist Bank | | �� | | |
| 2.45%, 08/01/2022 | | 350,000 | | 357,570 |
| Wells Fargo & Co | | | | |
| (3-month USD LIBOR + 1.03%), | | | | |
| 1.20%, 07/26/2021 (b) | | 244,000 | | 244,172 |
| | | | $ | 2,543,438 |
See accompanying notes.
129
| | | | |
| Schedule of Investments |
| Principal Ultra-Short Active Income ETF |
| June 30, 2021 |
| |
| | | Principal | | |
| BONDS (continued) | | Amount | | Value |
| |
| Biotechnology — 2.89% | | | | |
| Gilead Sciences Inc | | | | |
| 0.75%, 09/29/2023 | $ | 250,000 | $ | 250,123 |
| |
| Chemicals — 2.36% | | | | |
| Westlake Chemical Corp | | | | |
| 3.60%, 07/15/2022 | | 200,000 | | 204,641 |
| |
| Electric — 8.14% | | | | |
| Dominion Energy Inc | | | | |
| (3-month USD LIBOR + 0.53%), | | | | |
| 0.65%, 09/15/2023 (b) | | 150,000 | | 150,108 |
| 2.72%, 08/15/2021 | | 250,000 | | 250,715 |
| DTE Energy Co | | | | |
| 2.60%, 06/15/2022 | | 200,000 | | 204,320 |
| Florida Power & Light Co | | | | |
| 0.28%, 05/10/2023 (c) | | 100,000 | | 99,943 |
| | | | $ | 705,086 |
| |
| Electronics — 2.89% | | | | |
| Honeywell International Inc | | | | |
| 0.48%, 08/19/2022 | | 250,000 | | 250,079 |
| |
| Food — 2.89% | | | | |
| Tyson Foods Inc | | | | |
| 2.25%, 08/23/2021 | | 250,000 | | 250,297 |
| |
| Insurance — 6.28% | | | | |
| Metropolitan Life Global Funding I | | | | |
| 0.90%, 06/08/2023 (a) | | 250,000 | | 252,460 |
| New York Life Global Funding | | | | |
| 1.70%, 09/14/2021 (a) | | 290,000 | | 290,900 |
| | | | $ | 543,360 |
| |
| Miscellaneous Manufacture — 2.91% | | | | |
| Siemens Financieringsmaatschappij NV | | | | |
| 0.48%, 03/11/2024 (a),(c) | | 250,000 | | 251,763 |
| |
| Oil & Gas — 4.81% | | | | |
| Suncor Energy Inc | | | | |
| 2.80%, 05/15/2023 | | 400,000 | | 416,008 |
| |
| Retail — 2.31% | | | | |
| McDonald's Corp | | | | |
| (3-month USD LIBOR + 0.43%), | | | | |
| 0.61%, 10/28/2021 (b) | | 200,000 | | 200,246 |
| |
| Software — 3.18% | | | | |
| Fidelity National Information Services Inc | | | | |
| 0.38%, 03/01/2023 | | 25,000 | | 24,968 |
| Oracle Corp | | | | |
| 1.90%, 09/15/2021 | | 250,000 | | 250,492 |
| | | | $ | 275,460 |
| |
| Telecommunications — 8.05% | | | | |
| AT&T Inc | | | | |
| 2.63%, 12/01/2022 | | 221,000 | | 226,775 |
| NTT Finance Corp | | | | |
| 0.37%, 03/03/2023 (a) | | 200,000 | | 200,034 |
| Sprint Spectrum Co LLC / Sprint Spectrum Co II LLC / Sprint Spectrum Co III | | | | |
| LLC | | | | |
| 3.36%, 03/20/2023 (a) | | 68,750 | | 69,130 |
See accompanying notes.
130
| | | | |
| Schedule of Investments |
| Principal Ultra-Short Active Income ETF |
| June 30, 2021 |
| |
| | | Principal | | |
| BONDS (continued) | | Amount | | Value |
| Telecommunications (continued) | | | | |
| Sprint Spectrum Co LLC / Sprint Spectrum Co II LLC / Sprint Spectrum Co III | | | | |
| LLC (continued) | | | | |
| 4.74%, 03/20/2025 (a) | $ | 187,500 | $ | 201,161 |
| | | | $ | 697,100 |
| TOTAL BONDS | | | $ | 8,253,844 |
| INVESTMENT COMPANIES — 4.43% | | Shares Held | | Value |
| Money Market Fund — 4.43% | | | | |
| State Street Institutional U.S. Government Money Market Fund — Institutional | | | | |
| Class 0.03% (d) | | 383,270 | $ | 383,270 |
| TOTAL INVESTMENT COMPANIES | | | $ | 383,270 |
| Total Investments | | | $ | 8,637,114 |
| Other Assets and Liabilities — 0.23% | | | | 19,905 |
| Total Net Assets — 100.00% | | | $ | 8,657,019 |
| (a) | Security exempt from registration under Rule 144A of the Securities Act of 1933. These securities may be resold in transactions exempt from registration, normally to qualified institutional buyers. At the end of the period, the value of these securities totaled $2,503,701 or 28.92% of net assets. |
| (b) | Rate shown is as of period end. The rate may be a variable or floating rate or a fixed rate which may convert to a variable or floating rate in the future. |
| (c) | Certain variable rate securities are not based on a published reference rate and spread but are determined by the issuer or agent and are based on current market conditions. These securities do not indicate a reference rate and spread in their description. Rate shown is the rate in effect as of period end. |
| (d) | Current yield shown is as of period end. |
| | | | | | | | | | |
| Portfolio Summary (unaudited) | | | | | | | |
| Sector | | | | | Percent | | | | | |
| Financial | | | | | 35.66 | % | | | | |
| Asset-Backed Securities | | | | | 19.25 | % | | | | |
| Utilities | | | | | 8.14 | % | | | | |
| Communications | | | | | 8.05 | % | | | | |
| Industrial | | | | | 5.80 | % | | | | |
| Consumer, Non-cyclical | | | | | 5.78 | % | | | | |
| Energy | | | | | 4.81 | % | | | | |
| Money Market Fund | | | | | 4.43 | % | | | | |
| Technology | | | | | 3.18 | % | | | | |
| Basic Materials | | | | | 2.36 | % | | | | |
| Consumer, Cyclical | | | | | 2.31 | % | | | | |
| Other Assets and Liabilities | | | | | 0.23 | % | | | | |
| TOTAL NET ASSETS | | | | | 100.00 | % | | | | |
| |
| | | | June 30, 2020 | | Purchases | | | Sales | | June 30, 2021 |
| Affiliated Securities | | | Value | | Cost | | | Proceeds | | Value |
| Principal Government Money | | | | | | | | | | |
| Market Fund — Institutional Class | | | | | | | | | | |
| 0.00 | % | $ | 11,413 | $ | 252,922 | | $ | 264,335 | $ | — |
| | | $ | 11,413 | $ | 252,922 | | $ | 264,335 | $ | — |
| |
| | | | | | | | | Realized Gain | | |
| | | | | | Realized | | | from | | Change in |
| | | | | | Gain/Loss on | | | Capital Gain | | Unrealized |
| | | | Income (a) | | Investments | | | Distributions | | Gain/Loss |
| Principal Government Money | | | | | | | | | | |
| Market Fund — Institutional Class | | | | | | | | | | |
| 0.00 | % | $ | — | $ | — | | $ | — | $ | — |
| | | $ | — | $ | — | | $ | — | $ | — |
| (a) | Amount excludes earnings from securities lending collateral. |
See accompanying notes.
131
| | | |
| Schedule of Investments |
| Principal U.S. Large-Cap Adaptive Multi-Factor ETF |
| June 30, 2021 |
| |
| COMMON STOCKS — 99.76% | Shares Held | | Value |
| |
| Advertising — 0.22% | | | |
| Interpublic Group of Cos Inc/The | 1,357 | $ | 44,089 |
| Omnicom Group Inc | 253 | | 20,237 |
| | | $ | 64,326 |
| |
| Aerospace & Defense — 1.27% | | | |
| Boeing Co/The (a) | 207 | | 49,589 |
| General Dynamics Corp | 321 | | 60,432 |
| Howmet Aerospace Inc (a) | 644 | | 22,199 |
| L3Harris Technologies Inc | 161 | | 34,800 |
| Lockheed Martin Corp | 230 | | 87,021 |
| Northrop Grumman Corp | 184 | | 66,871 |
| Teledyne Technologies Inc (a) | 69 | | 28,899 |
| TransDigm Group Inc (a) | 46 | | 29,775 |
| | | $ | 379,586 |
| |
| Agriculture — 0.53% | | | |
| Altria Group Inc | 1,748 | | 83,345 |
| Archer-Daniels-Midland Co | 966 | | 58,539 |
| Philip Morris International Inc | 161 | | 15,957 |
| | | $ | 157,841 |
| |
| Airlines — 0.36% | | | |
| Alaska Air Group Inc (a) | 299 | | 18,033 |
| American Airlines Group Inc (a) | 1,012 | | 21,465 |
| Delta Air Lines Inc (a) | 552 | | 23,879 |
| Southwest Airlines Co (a) | 437 | | 23,200 |
| United Airlines Holdings Inc (a) | 414 | | 21,648 |
| | | $ | 108,225 |
| |
| Apparel — 0.50% | | | |
| Hanesbrands Inc | 943 | | 17,606 |
| NIKE Inc, Class B | 138 | | 21,320 |
| PVH Corp (a) | 345 | | 37,118 |
| Ralph Lauren Corp | 161 | | 18,967 |
| Tapestry Inc (a) | 460 | | 20,001 |
| Under Armour Inc, Class A (a) | 828 | | 17,512 |
| Under Armour Inc, Class C (a) | 966 | | 17,939 |
| | | $ | 150,463 |
| |
| Auto Manufacturers — 2.21% | | | |
| Cummins Inc | 230 | | 56,076 |
| Ford Motor Co (a) | 4,886 | | 72,606 |
| General Motors Co (a) | 1,219 | | 72,128 |
| PACCAR Inc | 322 | | 28,739 |
| Tesla Inc (a) | 634 | | 430,930 |
| | | $ | 660,479 |
| |
| Auto Parts & Equipment — 0.32% | | | |
| Aptiv PLC (a) | 368 | | 57,898 |
| BorgWarner Inc | 782 | | 37,958 |
| | | $ | 95,856 |
| |
| Banks — 5.88% | | | |
| Bank of America Corp | 4,946 | | 203,923 |
| Bank of New York Mellon Corp/The | 552 | | 28,279 |
| Citigroup Inc | 1,541 | | 109,026 |
| Citizens Financial Group Inc | 506 | | 23,210 |
| Comerica Inc | 552 | | 39,380 |
| Fifth Third Bancorp | 644 | | 24,620 |
| First Republic Bank | 299 | | 55,964 |
| Goldman Sachs Group Inc/The | 392 | | 148,776 |
| Huntington Bancshares Inc | 2,806 | | 40,042 |
See accompanying notes.
132
| | | |
| Schedule of Investments |
| Principal U.S. Large-Cap Adaptive Multi-Factor ETF |
| June 30, 2021 |
| |
| COMMON STOCKS (continued) | Shares Held | | Value |
| |
| Banks (continued) | | | |
| JPMorgan Chase & Co | 2,508 | $ | 390,094 |
| KeyCorp | 2,116 | | 43,695 |
| M&T Bank Corp | 138 | | 20,053 |
| Morgan Stanley | 1,724 | | 158,073 |
| Northern Trust Corp | 368 | | 42,548 |
| PNC Financial Services Group Inc/The | 414 | | 78,975 |
| Regions Financial Corp | 2,139 | | 43,165 |
| State Street Corp | 299 | | 24,602 |
| SVB Financial Group (a) | 123 | | 68,441 |
| Truist Financial Corp | 1,842 | | 102,231 |
| US Bancorp | 1,265 | | 72,067 |
| Zions Bancorp NA | 713 | | 37,689 |
| | | $ | 1,754,853 |
| |
| Beverages — 0.98% | | | |
| Brown-Forman Corp, Class B | 276 | | 20,683 |
| Coca-Cola Co/The | 1,609 | | 87,063 |
| Constellation Brands Inc, Class A | 232 | | 54,262 |
| Molson Coors Beverage Co, Class B (a) | 368 | | 19,758 |
| Monster Beverage Corp (a) | 276 | | 25,213 |
| PepsiCo Inc | 575 | | 85,198 |
| | | $ | 292,177 |
| |
| Biotechnology — 1.29% | | | |
| Alexion Pharmaceuticals Inc (a) | 138 | | 25,352 |
| Amgen Inc | 460 | | 112,125 |
| Bio-Rad Laboratories Inc, Class A (a) | 55 | | 35,436 |
| Biogen Inc (a) | 100 | | 34,627 |
| Corteva Inc | 1,058 | | 46,922 |
| Gilead Sciences Inc | 161 | | 11,087 |
| Regeneron Pharmaceuticals Inc (a) | 115 | | 64,232 |
| Vertex Pharmaceuticals Inc (a) | 275 | | 55,448 |
| | | $ | 385,229 |
| |
| Building Materials — 1.03% | | | |
| Carrier Global Corp | 1,173 | | 57,008 |
| Fortune Brands Home & Security Inc | 552 | | 54,985 |
| Johnson Controls International PLC | 1,055 | | 72,405 |
| Martin Marietta Materials Inc | 115 | | 40,458 |
| Masco Corp | 644 | | 37,938 |
| Vulcan Materials Co | 252 | | 43,865 |
| | | $ | 306,659 |
| |
| Chemicals — 2.21% | | | |
| Air Products & Chemicals Inc | 137 | | 39,412 |
| Albemarle Corp | 138 | | 23,247 |
| Celanese Corp | 276 | | 41,842 |
| CF Industries Holdings Inc | 828 | | 42,601 |
| Dow Inc | 920 | | 58,218 |
| DuPont de Nemours Inc | 368 | | 28,487 |
| Eastman Chemical Co | 368 | | 42,964 |
| Ecolab Inc | 45 | | 9,269 |
| FMC Corp | 231 | | 24,994 |
| International Flavors & Fragrances Inc | 46 | | 6,872 |
| Linde PLC | 416 | | 120,266 |
| LyondellBasell Industries NV, Class A | 460 | | 47,320 |
| Mosaic Co/The | 1,173 | | 37,430 |
| PPG Industries Inc | 368 | | 62,475 |
| Sherwin-Williams Co/The | 267 | | 72,744 |
| | | $ | 658,141 |
See accompanying notes.
133
| | | |
| Schedule of Investments |
| Principal U.S. Large-Cap Adaptive Multi-Factor ETF |
| June 30, 2021 |
| |
| COMMON STOCKS (continued) | Shares Held | | Value |
| |
| Commercial Services — 2.56% | | | |
| Automatic Data Processing Inc | 230 | $ | 45,683 |
| Cintas Corp | 137 | | 52,334 |
| Equifax Inc | 91 | | 21,795 |
| FleetCor Technologies Inc (a) | 69 | | 17,668 |
| Gartner Inc (a) | 206 | | 49,893 |
| IHS Markit Ltd | 276 | | 31,094 |
| MarketAxess Holdings Inc | 32 | | 14,835 |
| Moody's Corp | 101 | | 36,599 |
| Nielsen Holdings PLC | 1,518 | | 37,449 |
| PayPal Holdings Inc (a) | 758 | | 220,942 |
| Quanta Services Inc | 605 | | 54,795 |
| Robert Half International Inc | 460 | | 40,926 |
| Rollins Inc | 529 | | 18,092 |
| S&P Global Inc | 122 | | 50,075 |
| United Rentals Inc (a) | 148 | | 47,214 |
| Verisk Analytics Inc | 138 | | 24,111 |
| | | $ | 763,505 |
| |
| Computers — 8.12% | | | |
| Accenture PLC, Class A | 704 | | 207,532 |
| Apple Inc | 12,973 | | 1,776,782 |
| Cognizant Technology Solutions Corp, Class A | 713 | | 49,382 |
| DXC Technology Co (a) | 1,196 | | 46,572 |
| Fortinet Inc (a) | 229 | | 54,546 |
| Hewlett Packard Enterprise Co | 1,403 | | 20,456 |
| HP Inc | 1,610 | | 48,606 |
| International Business Machines Corp | 437 | | 64,060 |
| Leidos Holdings Inc | 415 | | 41,956 |
| NetApp Inc | 552 | | 45,165 |
| Seagate Technology Holdings PLC | 483 | | 42,470 |
| Western Digital Corp (a) | 345 | | 24,554 |
| | | $ | 2,422,081 |
| |
| Distribution/Wholesale — 0.68% | | | |
| Copart Inc (a) | 207 | | 27,289 |
| Fastenal Co | 506 | | 26,312 |
| LKQ Corp (a) | 1,242 | | 61,131 |
| Pool Corp | 92 | | 42,197 |
| WW Grainger Inc | 102 | | 44,676 |
| | | $ | 201,605 |
| |
| Diversified Financial Services — 4.23% | | | |
| American Express Co | 298 | | 49,239 |
| Ameriprise Financial Inc | 206 | | 51,269 |
| BlackRock Inc | 123 | | 107,621 |
| Capital One Financial Corp | 483 | | 74,715 |
| Cboe Global Markets Inc | 230 | | 27,382 |
| Charles Schwab Corp/The | 1,219 | | 88,755 |
| CME Group Inc | 206 | | 43,812 |
| Discover Financial Services | 483 | | 57,134 |
| Franklin Resources Inc | 1,311 | | 41,939 |
| Intercontinental Exchange Inc | 322 | | 38,221 |
| Invesco Ltd | 1,472 | | 39,347 |
| Mastercard Inc, Class A | 423 | | 154,433 |
| Nasdaq Inc | 276 | | 48,521 |
| Raymond James Financial Inc | 460 | | 59,754 |
| Synchrony Financial | 1,104 | | 53,566 |
| T Rowe Price Group Inc | 483 | | 95,620 |
| Visa Inc, Class A | 898 | | 209,970 |
| Western Union Co/The | 897 | | 20,604 |
| | | $ | 1,261,902 |
See accompanying notes.
134
| | | |
| Schedule of Investments |
| Principal U.S. Large-Cap Adaptive Multi-Factor ETF |
| June 30, 2021 |
| |
| COMMON STOCKS (continued) | Shares Held | | Value |
| |
| Electric — 1.77% | | | |
| AES Corp/The | 782 | $ | 20,387 |
| Alliant Energy Corp | 368 | | 20,520 |
| Ameren Corp | 276 | | 22,091 |
| American Electric Power Co Inc | 345 | | 29,184 |
| CMS Energy Corp | 345 | | 20,383 |
| Consolidated Edison Inc | 69 | | 4,949 |
| Dominion Energy Inc | 115 | | 8,461 |
| DTE Energy Co | 345 | | 44,712 |
| Duke Energy Corp | 92 | | 9,082 |
| Edison International | 92 | | 5,319 |
| Entergy Corp | 253 | | 25,224 |
| Evergy Inc | 322 | | 19,458 |
| Eversource Energy | 299 | | 23,992 |
| Exelon Corp | 759 | | 33,631 |
| FirstEnergy Corp | 575 | | 21,396 |
| NextEra Energy Inc | 207 | | 15,169 |
| NRG Energy Inc | 506 | | 20,392 |
| Pinnacle West Capital Corp | 460 | | 37,706 |
| PPL Corp | 184 | | 5,146 |
| Public Service Enterprise Group Inc | 414 | | 24,732 |
| Sempra Energy | 230 | | 30,470 |
| Southern Co/The | 598 | | 36,185 |
| WEC Energy Group Inc | 276 | | 24,550 |
| Xcel Energy Inc | 391 | | 25,759 |
| | | $ | 528,898 |
| |
| Electrical Components & Equipment — 0.66% | | | |
| AMETEK Inc | 391 | | 52,198 |
| Emerson Electric Co | 968 | | 93,160 |
| Generac Holdings Inc (a) | 124 | | 51,479 |
| | | $ | 196,837 |
| |
| Electronics — 1.55% | | | |
| Agilent Technologies Inc | 437 | | 64,593 |
| Allegion PLC | 299 | | 41,651 |
| Amphenol Corp, Class A | 437 | | 29,895 |
| Fortive Corp | 391 | | 27,268 |
| Garmin Ltd | 343 | | 49,612 |
| Honeywell International Inc | 322 | | 70,631 |
| Keysight Technologies Inc (a) | 184 | | 28,411 |
| Mettler-Toledo International Inc (a) | 41 | | 56,799 |
| TE Connectivity Ltd | 207 | | 27,988 |
| Trimble Inc (a) | 483 | | 39,524 |
| Waters Corp (a) | 79 | | 27,303 |
| | | $ | 463,675 |
| |
| Energy — Alternate Sources — 0.08% | | | |
| Enphase Energy Inc (a) | 138 | | 25,341 |
| |
| Engineering & Construction — 0.22% | | | |
| Jacobs Engineering Group Inc | 483 | | 64,442 |
| |
| Entertainment — 0.21% | | | |
| Caesars Entertainment Inc (a) | 230 | | 23,863 |
| Live Nation Entertainment Inc (a) | 253 | | 22,160 |
| Penn National Gaming Inc (a) | 230 | | 17,593 |
| | | $ | 63,616 |
| |
| Environmental Control — 0.36% | | | |
| Pentair PLC | 690 | | 46,568 |
| Republic Services Inc | 230 | | 25,302 |
| Waste Management Inc | 253 | | 35,448 |
| | | $ | 107,318 |
See accompanying notes.
135
| | | |
| Schedule of Investments |
| Principal U.S. Large-Cap Adaptive Multi-Factor ETF |
| June 30, 2021 |
| |
| COMMON STOCKS (continued) | Shares Held | | Value |
| |
| Food — 1.50% | | | |
| Campbell Soup Co | 782 | $ | 35,651 |
| Conagra Brands Inc | 1,150 | | 41,837 |
| General Mills Inc | 920 | | 56,056 |
| Hershey Co/The | 299 | | 52,080 |
| Hormel Foods Corp | 115 | | 5,491 |
| JM Smucker Co/The | 322 | | 41,722 |
| Kellogg Co | 414 | | 26,633 |
| Kraft Heinz Co/The | 713 | | 29,076 |
| Kroger Co/The | 1,311 | | 50,224 |
| Lamb Weston Holdings Inc | 184 | | 14,841 |
| McCormick & Co Inc | 253 | | 22,345 |
| Mondelez International Inc, Class A | 805 | | 50,264 |
| Tyson Foods Inc, Class A | 276 | | 20,358 |
| | | $ | 446,578 |
| |
| Forest Products & Paper — 0.17% | | | |
| International Paper Co | 805 | | 49,355 |
| |
| Gas — 0.03% | | | |
| Atmos Energy Corp | 46 | | 4,421 |
| NiSource Inc | 184 | | 4,508 |
| | | $ | 8,929 |
| |
| Hand/Machine Tools — 0.42% | | | |
| Snap-on Inc | 246 | | 54,964 |
| Stanley Black & Decker Inc | 345 | | 70,721 |
| | | $ | 125,685 |
| |
| Healthcare — Products — 2.73% | | | |
| Abbott Laboratories | 735 | | 85,209 |
| ABIOMED Inc (a) | 115 | | 35,893 |
| Align Technology Inc (a) | 87 | | 53,157 |
| Baxter International Inc | 345 | | 27,772 |
| Boston Scientific Corp (a) | 207 | | 8,851 |
| Cooper Cos Inc/The | 54 | | 21,399 |
| Danaher Corp | 276 | | 74,067 |
| DENTSPLY SIRONA Inc | 322 | | 20,370 |
| Edwards Lifesciences Corp (a) | 368 | | 38,114 |
| Henry Schein Inc (a) | 253 | | 18,770 |
| Hologic Inc (a) | 529 | | 35,295 |
| IDEXX Laboratories Inc (a) | 97 | | 61,260 |
| Intuitive Surgical Inc (a) | 46 | | 42,303 |
| Medtronic PLC | 138 | | 17,130 |
| PerkinElmer Inc | 276 | | 42,617 |
| ResMed Inc | 137 | | 33,773 |
| STERIS PLC | 114 | | 23,518 |
| Stryker Corp | 175 | | 45,453 |
| Teleflex Inc | 52 | | 20,893 |
| Thermo Fisher Scientific Inc | 161 | | 81,220 |
| West Pharmaceutical Services Inc | 80 | | 28,728 |
| | | $ | 815,792 |
| |
| Healthcare — Services — 2.63% | | | |
| Anthem Inc | 200 | | 76,360 |
| Catalent Inc (a) | 345 | | 37,302 |
| Centene Corp (a) | 759 | | 55,354 |
| DaVita Inc (a) | 345 | | 41,548 |
| HCA Healthcare Inc | 437 | | 90,345 |
| Humana Inc | 147 | | 65,080 |
| IQVIA Holdings Inc (a) | 38 | | 9,208 |
| Laboratory Corp of America Holdings (a) | 184 | | 50,757 |
| Quest Diagnostics Inc | 322 | | 42,494 |
| UnitedHealth Group Inc | 697 | | 279,107 |
See accompanying notes.
136
| | | |
| Schedule of Investments |
| Principal U.S. Large-Cap Adaptive Multi-Factor ETF |
| June 30, 2021 |
| |
| COMMON STOCKS (continued) | Shares Held | | Value |
| |
| Healthcare — Services (continued) | | | |
| Universal Health Services Inc, Class B | 252 | $ | 36,900 |
| | | $ | 784,455 |
| |
| Home Builders — 0.86% | | | |
| DR Horton Inc | 738 | | 66,693 |
| Lennar Corp, Class A | 667 | | 66,267 |
| NVR Inc (a) | 13 | | 64,653 |
| PulteGroup Inc | 1,058 | | 57,735 |
| | | $ | 255,348 |
| |
| Home Furnishings — 0.31% | | | |
| Leggett & Platt Inc | 736 | | 38,132 |
| Whirlpool Corp | 253 | | 55,159 |
| | | $ | 93,291 |
| |
| Household Products — 1.21% | | | |
| Colgate-Palmolive Co | 897 | | 72,971 |
| Estee Lauder Cos Inc/The, Class A | 148 | | 47,076 |
| Procter & Gamble Co/The | 1,794 | | 242,064 |
| | | $ | 362,111 |
| |
| Household Products/Wares — 0.74% | | | |
| Avery Dennison Corp | 322 | | 67,698 |
| Church & Dwight Co Inc | 542 | | 46,189 |
| Clorox Co/The | 253 | | 45,517 |
| Kimberly-Clark Corp | 460 | | 61,539 |
| | | $ | 220,943 |
| |
| Housewares — 0.14% | | | |
| Newell Brands Inc | 1,472 | | 40,436 |
| |
| Insurance — 4.37% | | | |
| Aflac Inc | 851 | | 45,665 |
| Allstate Corp/The | 437 | | 57,002 |
| American International Group Inc | 575 | | 27,370 |
| Aon PLC | 276 | | 65,898 |
| Arthur J Gallagher & Co | 529 | | 74,102 |
| Assurant Inc | 161 | | 25,145 |
| Berkshire Hathaway Inc, Class B (a) | 1,165 | | 323,777 |
| Chubb Ltd | 437 | | 69,457 |
| Cincinnati Financial Corp | 184 | | 21,458 |
| Everest Re Group Ltd | 69 | | 17,389 |
| Globe Life Inc | 322 | | 30,670 |
| Hartford Financial Services Group Inc/The | 716 | | 44,371 |
| Lincoln National Corp | 621 | | 39,024 |
| Loews Corp | 736 | | 40,222 |
| Marsh & McLennan Cos Inc | 552 | | 77,655 |
| MetLife Inc | 920 | | 55,062 |
| Progressive Corp/The | 689 | | 67,667 |
| Prudential Financial Inc | 552 | | 56,563 |
| Travelers Cos Inc/The | 367 | | 54,944 |
| Unum Group | 1,288 | | 36,579 |
| Willis Towers Watson PLC | 221 | | 50,834 |
| WR Berkley Corp | 299 | | 22,255 |
| | | $ | 1,303,109 |
| |
| Internet — 11.51% | | | |
| Alphabet Inc, Class A (a) | 248 | | 605,564 |
| Alphabet Inc, Class C (a) | 237 | | 593,998 |
| Amazon.com Inc (a) | 352 | | 1,210,936 |
| Booking Holdings Inc (a) | 19 | | 41,574 |
| CDW Corp | 368 | | 64,271 |
| eBay Inc | 437 | | 30,682 |
See accompanying notes.
137
| | | |
| Schedule of Investments |
| Principal U.S. Large-Cap Adaptive Multi-Factor ETF |
| June 30, 2021 |
| |
| COMMON STOCKS (continued) | Shares Held | | Value |
| |
| Internet (continued) | | | |
| Etsy Inc (a) | 207 | $ | 42,609 |
| Expedia Group Inc (a) | 138 | | 22,592 |
| F5 Networks Inc (a) | 137 | | 25,572 |
| Facebook Inc, Class A (a) | 1,978 | | 687,770 |
| Netflix Inc (a) | 137 | | 72,365 |
| Twitter Inc (a) | 460 | | 31,653 |
| VeriSign Inc (a) | 23 | | 5,237 |
| | | $ | 3,434,823 |
| |
| Iron & Steel — 0.19% | | | |
| Nucor Corp | 600 | | 57,558 |
| |
| Leisure Time — 0.22% | | | |
| Carnival Corp (a) | 851 | | 22,432 |
| Norwegian Cruise Line Holdings Ltd (a) | 690 | | 20,293 |
| Royal Caribbean Cruises Ltd (a) | 253 | | 21,576 |
| | | $ | 64,301 |
| |
| Lodging — 0.31% | | | |
| Hilton Worldwide Holdings Inc (a) | 207 | | 24,968 |
| Marriott International Inc, Class A (a) | 184 | | 25,120 |
| MGM Resorts International | 529 | | 22,562 |
| Wynn Resorts Ltd (a) | 161 | | 19,690 |
| | | $ | 92,340 |
| |
| Machinery — Construction & Mining — 0.15% | | | |
| Caterpillar Inc | 207 | | 45,049 |
| |
| Machinery — Diversified — 1.04% | | | |
| Deere & Co | 361 | | 127,328 |
| Dover Corp | 184 | | 27,710 |
| IDEX Corp | 92 | | 20,245 |
| Ingersoll Rand Inc (a) | 437 | | 21,330 |
| Otis Worldwide Corp | 414 | | 33,853 |
| Rockwell Automation Inc | 199 | | 56,918 |
| Westinghouse Air Brake Technologies Corp | 230 | | 18,929 |
| Xylem Inc | 46 | | 5,518 |
| | | $ | 311,831 |
| |
| Media — 1.99% | | | |
| Charter Communications Inc, Class A (a) | 80 | | 57,716 |
| Comcast Corp, Class A | 1,910 | | 108,908 |
| Discovery Inc (a) | 1,196 | | 34,660 |
| Discovery Inc, Class A (a) | 966 | | 29,637 |
| DISH Network Corp, Class A (a) | 460 | | 19,228 |
| Fox Corp, Class A | 920 | | 34,160 |
| Fox Corp, Class B | 851 | | 29,955 |
| News Corp | 1,449 | | 35,283 |
| News Corp, Class A | 1,472 | | 37,934 |
| ViacomCBS Inc, Class B | 1,611 | | 72,817 |
| Walt Disney Co/The (a) | 760 | | 133,585 |
| | | $ | 593,883 |
| |
| Mining — 0.20% | | | |
| Freeport-McMoRan Inc | 851 | | 31,581 |
| Newmont Corp | 437 | | 27,697 |
| | | $ | 59,278 |
| |
| Miscellaneous Manufacture — 1.52% | | | |
| 3M Co | 506 | | 100,507 |
| AO Smith Corp | 575 | | 41,434 |
| Eaton Corp PLC | 297 | | 44,009 |
| General Electric Co | 7,017 | | 94,449 |
See accompanying notes.
138
| | | |
| Schedule of Investments |
| Principal U.S. Large-Cap Adaptive Multi-Factor ETF |
| June 30, 2021 |
| |
| COMMON STOCKS (continued) | Shares Held | | Value |
| |
| Miscellaneous Manufacture (continued) | | | |
| Illinois Tool Works Inc | 46 | $ | 10,284 |
| Parker-Hannifin Corp | 252 | | 77,392 |
| Textron Inc | 690 | | 47,451 |
| Trane Technologies PLC | 207 | | 38,117 |
| | | $ | 453,643 |
| |
| Office & Business Equipment — 0.16% | | | |
| Zebra Technologies Corp (a) | 91 | | 48,184 |
| |
| Oil & Gas — 0.98% | | | |
| APA Corp | 1,081 | | 23,382 |
| ConocoPhillips | 690 | | 42,021 |
| Devon Energy Corp | 966 | | 28,197 |
| Diamondback Energy Inc | 276 | | 25,914 |
| EOG Resources Inc | 391 | | 32,625 |
| Hess Corp | 322 | | 28,117 |
| Marathon Oil Corp | 1,863 | | 25,374 |
| Marathon Petroleum Corp | 483 | | 29,183 |
| Occidental Petroleum Corp | 920 | | 28,768 |
| Pioneer Natural Resources Co | 184 | | 29,904 |
| | | $ | 293,485 |
| |
| Oil & Gas Services — 0.43% | | | |
| Baker Hughes Co | 1,058 | | 24,196 |
| Halliburton Co | 2,231 | | 51,581 |
| NOV Inc (a) | 1,334 | | 20,437 |
| Schlumberger NV | 1,035 | | 33,130 |
| | | $ | 129,344 |
| |
| Packaging & Containers — 0.66% | | | |
| Amcor PLC | 3,680 | | 42,173 |
| Ball Corp | 276 | | 22,362 |
| Packaging Corp of America | 322 | | 43,605 |
| Sealed Air Corp | 782 | | 46,333 |
| Westrock Co | 782 | | 41,618 |
| | | $ | 196,091 |
| |
| Pharmaceuticals — 3.05% | | | |
| AbbVie Inc | 1,333 | | 150,149 |
| AmerisourceBergen Corp | 207 | | 23,699 |
| Becton Dickinson and Co | 161 | | 39,154 |
| Bristol-Myers Squibb Co | 230 | | 15,369 |
| Cardinal Health Inc | 621 | | 35,453 |
| Cigna Corp | 298 | | 70,647 |
| CVS Health Corp | 1,218 | | 101,630 |
| Johnson & Johnson | 1,473 | | 242,662 |
| McKesson Corp | 161 | | 30,790 |
| Merck & Co Inc | 1,059 | | 82,358 |
| Organon & Co (a) | 94 | | 2,844 |
| Perrigo Co PLC | 529 | | 24,255 |
| Pfizer Inc | 552 | | 21,616 |
| Viatris Inc | 1,541 | | 22,021 |
| Zoetis Inc | 253 | | 47,149 |
| | | $ | 909,796 |
| |
| Pipelines — 0.09% | | | |
| ONEOK Inc | 460 | | 25,594 |
| |
| Real Estate — 0.16% | | | |
| CBRE Group Inc, Class A (a) | 575 | | 49,295 |
| |
| REITs — 1.77% | | | |
| Alexandria Real Estate Equities Inc | 138 | | 25,108 |
| American Tower Corp | 207 | | 55,919 |
See accompanying notes.
139
| | | |
| Schedule of Investments |
| Principal U.S. Large-Cap Adaptive Multi-Factor ETF |
| June 30, 2021 |
| |
| COMMON STOCKS (continued) | Shares Held | | Value |
| |
| REITs (continued) | | | |
| AvalonBay Communities Inc | 25 | $ | 5,217 |
| Boston Properties Inc | 345 | | 39,534 |
| Crown Castle International Corp | 230 | | 44,873 |
| Digital Realty Trust Inc | 46 | | 6,921 |
| Duke Realty Corp | 115 | | 5,445 |
| Equinix Inc | 14 | | 11,236 |
| Extra Space Storage Inc | 161 | | 26,375 |
| Federal Realty Investment Trust | 184 | | 21,559 |
| Iron Mountain Inc | 897 | | 37,961 |
| Kimco Realty Corp | 1,909 | | 39,803 |
| Mid-America Apartment Communities Inc | 45 | | 7,579 |
| Prologis Inc | 92 | | 10,997 |
| Public Storage | 115 | | 34,579 |
| Realty Income Corp | 345 | | 23,025 |
| Regency Centers Corp | 322 | | 20,631 |
| SBA Communications Corp | 23 | | 7,330 |
| Simon Property Group Inc | 230 | | 30,010 |
| Ventas Inc | 414 | | 23,639 |
| Welltower Inc | 345 | | 28,670 |
| Weyerhaeuser Co | 644 | | 22,167 |
| | | $ | 528,578 |
| |
| Retail — 5.35% | | | |
| Advance Auto Parts Inc | 230 | | 47,182 |
| AutoZone Inc (a) | 36 | | 53,720 |
| Best Buy Co Inc | 575 | | 66,113 |
| CarMax Inc (a) | 345 | | 44,557 |
| Chipotle Mexican Grill Inc (a) | 25 | | 38,758 |
| Costco Wholesale Corp | 345 | | 136,506 |
| Darden Restaurants Inc | 161 | | 23,504 |
| Dollar General Corp | 299 | | 64,701 |
| Dollar Tree Inc (a) | 368 | | 36,616 |
| Domino's Pizza Inc | 109 | | 50,847 |
| Gap Inc/The | 575 | | 19,349 |
| Genuine Parts Co | 416 | | 52,612 |
| Home Depot Inc/The | 783 | | 249,691 |
| L Brands Inc | 621 | | 44,749 |
| Lowe's Cos Inc | 867 | | 168,172 |
| McDonald's Corp | 84 | | 19,403 |
| O'Reilly Automotive Inc (a) | 101 | | 57,187 |
| Starbucks Corp | 138 | | 15,430 |
| Target Corp | 667 | | 161,241 |
| Tractor Supply Co | 368 | | 68,470 |
| Walgreens Boots Alliance Inc | 483 | | 25,411 |
| Walmart Inc | 1,037 | | 146,238 |
| Yum! Brands Inc | 46 | | 5,291 |
| | | $ | 1,595,748 |
| |
| Savings & Loans — 0.12% | | | |
| People's United Financial Inc | 2,139 | | 36,663 |
| |
| Semiconductors — 5.32% | | | |
| Advanced Micro Devices Inc (a) | 437 | | 41,047 |
| Analog Devices Inc | 230 | | 39,597 |
| Applied Materials Inc | 690 | | 98,256 |
| Broadcom Inc | 307 | | 146,390 |
| Intel Corp | 2,530 | | 142,034 |
| IPG Photonics Corp (a) | 92 | | 19,391 |
| KLA Corp | 171 | | 55,440 |
| Lam Research Corp | 120 | | 78,084 |
| Maxim Integrated Products Inc | 322 | | 33,926 |
| Microchip Technology Inc | 322 | | 48,216 |
| Micron Technology Inc (a) | 483 | | 41,045 |
See accompanying notes.
140
| | | |
| Schedule of Investments |
| Principal U.S. Large-Cap Adaptive Multi-Factor ETF |
| June 30, 2021 |
| |
| COMMON STOCKS (continued) | Shares Held | | Value |
| |
| Semiconductors (continued) | | | |
| Monolithic Power Systems Inc | 101 | $ | 37,719 |
| NVIDIA Corp | 510 | | 408,051 |
| NXP Semiconductors NV | 161 | | 33,121 |
| Qorvo Inc (a) | 115 | | 22,500 |
| QUALCOMM Inc | 782 | | 111,771 |
| Skyworks Solutions Inc | 138 | | 26,462 |
| Teradyne Inc | 323 | | 43,269 |
| Texas Instruments Inc | 714 | | 137,302 |
| Xilinx Inc | 161 | | 23,287 |
| | | $ | 1,586,908 |
| |
| Shipbuilding — 0.11% | | | |
| Huntington Ingalls Industries Inc | 161 | | 33,931 |
| |
| Software — 8.68% | | | |
| Activision Blizzard Inc | 439 | | 41,898 |
| Adobe Inc (a) | 143 | | 83,747 |
| Akamai Technologies Inc (a) | 207 | | 24,136 |
| ANSYS Inc (a) | 54 | | 18,741 |
| Broadridge Financial Solutions Inc | 138 | | 22,291 |
| Cadence Design Systems Inc (a) | 345 | | 47,203 |
| Cerner Corp | 643 | | 50,257 |
| Citrix Systems Inc | 276 | | 32,367 |
| Electronic Arts Inc | 46 | | 6,616 |
| Fidelity National Information Services Inc | 69 | | 9,775 |
| Fiserv Inc (a) | 69 | | 7,375 |
| Intuit Inc | 132 | | 64,702 |
| Jack Henry & Associates Inc | 115 | | 18,804 |
| Microsoft Corp | 6,201 | | 1,679,851 |
| MSCI Inc | 46 | | 24,522 |
| Oracle Corp | 1,520 | | 118,317 |
| Paychex Inc | 276 | | 29,615 |
| Paycom Software Inc (a) | 101 | | 36,710 |
| PTC Inc (a) | 253 | | 35,739 |
| Roper Technologies Inc | 70 | | 32,914 |
| salesforce.com Inc (a) | 276 | | 67,419 |
| ServiceNow Inc (a) | 79 | | 43,414 |
| Synopsys Inc (a) | 206 | | 56,813 |
| Take-Two Interactive Software Inc (a) | 92 | | 16,286 |
| Tyler Technologies Inc (a) | 47 | | 21,261 |
| | | $ | 2,590,773 |
| |
| Telecommunications — 1.54% | | | |
| Arista Networks Inc (a) | 55 | | 19,927 |
| AT&T Inc | 3,059 | | 88,038 |
| Cisco Systems Inc | 3,104 | | 164,512 |
| Corning Inc | 575 | | 23,518 |
| Juniper Networks Inc | 920 | | 25,162 |
| Lumen Technologies Inc | 1,518 | | 20,630 |
| Motorola Solutions Inc | 45 | | 9,758 |
| T-Mobile US Inc (a) | 69 | | 9,993 |
| Verizon Communications Inc | 1,748 | | 97,940 |
| | | $ | 459,478 |
| |
| Textiles — 0.13% | | | |
| Mohawk Industries Inc (a) | 207 | | 39,783 |
| |
| Toys, Games & Hobbies — 0.07% | | | |
| Hasbro Inc | 207 | | 19,566 |
| |
| Transportation — 1.58% | | | |
| CH Robinson Worldwide Inc | 253 | | 23,698 |
| CSX Corp | 276 | | 8,854 |
| Expeditors International of Washington Inc | 391 | | 49,501 |
See accompanying notes.
141
| | | | |
| Schedule of Investments |
| Principal U.S. Large-Cap Adaptive Multi-Factor ETF |
| June 30, 2021 |
| |
| COMMON STOCKS (continued) | Shares Held | | Value | |
| Transportation (continued) | | | | |
| FedEx Corp | 358 | $ | 106,802 | |
| JB Hunt Transport Services Inc | 368 | | 59,966 | |
| Kansas City Southern | 147 | | 41,655 | |
| Norfolk Southern Corp | 161 | | 42,731 | |
| Old Dominion Freight Line Inc | 186 | | 47,207 | |
| Union Pacific Corp | 69 | | 15,175 | |
| United Parcel Service Inc, Class B | 368 | | 76,533 | |
| | | $ | 472,122 | |
| |
| Water — 0.08% | | | | |
| American Water Works Co Inc | 161 | | 24,815 | |
| TOTAL COMMON STOCKS | | $ | 29,771,947 | |
| INVESTMENT COMPANIES — 0.39% | Shares Held | | Value | |
| Money Market Fund — 0.39% | | | | |
| State Street Institutional U.S. Government Money Market Fund — Institutional | | | | |
| Class 0.03% (b) | 115,078 | $ | 115,078 | |
| TOTAL INVESTMENT COMPANIES | | $ | 115,078 | |
| Total Investments | | $ | 29,887,025 | |
| Other Assets and Liabilities — (0.15)% | | | (45,052 | ) |
| Total Net Assets — 100.00% | | $ | 29,841,973 | |
| (a) | Non-income producing security. |
| (b) | Current yield shown is as of period end. |
| | |
| Portfolio Summary (unaudited) |
|
| Sector | Percent | |
| Technology | 22.28 | % |
| Consumer, Non-cyclical | 17.22 | % |
| Financial | 16.53 | % |
| Communications | 15.25 | % |
| Consumer, Cyclical | 11.66 | % |
| Industrial | 10.58 | % |
| Basic Materials | 2.76 | % |
| Utilities | 1.89 | % |
| Energy | 1.59 | % |
| Money Market Fund | 0.39 | % |
| Other Assets and Liabilities | (0.15 | )% |
| TOTAL NET ASSETS | 100.00 | % |
See accompanying notes.
142
| | | | |
| Schedule of Investments |
| Principal U.S. Mega-Cap ETF |
| June 30, 2021 |
| |
| COMMON STOCKS — 99.75% | | Shares Held | | Value |
| Apparel — 2.35% | | | | |
| NIKE Inc, Class B | | 297,378 | $ | 45,941,927 |
| Auto Manufacturers — 1.10% | | | | |
| Tesla Inc (a) | | 31,712 | | 21,554,646 |
| Banks — 5.46% | | | | |
| Bank of America Corp | | 1,017,830 | | 41,965,131 |
| JPMorgan Chase & Co | | 259,595 | | 40,377,406 |
| Wells Fargo & Co | | 541,793 | | 24,537,805 |
| | | | $ | 106,880,342 |
| |
| Beverages — 5.16% | | | | |
| Coca-Cola Co/The | | 749,729 | | 40,567,836 |
| PepsiCo Inc | | 408,265 | | 60,492,625 |
| | | | $ | 101,060,461 |
| |
| Commercial Services — 1.30% | | | | |
| PayPal Holdings Inc (a) | | 87,113 | | 25,391,697 |
| Computers — 8.02% | | | | |
| Accenture PLC, Class A | | 142,527 | | 42,015,535 |
| Apple Inc | | 839,142 | | 114,928,888 |
| | | | $ | 156,944,423 |
| |
| Diversified Financial Services — 4.30% | | | | |
| Mastercard Inc, Class A | | 110,993 | | 40,522,435 |
| Visa Inc, Class A | | 186,644 | | 43,641,100 |
| | | | $ | 84,163,535 |
| |
| Healthcare — Products — 6.57% | | | | |
| Abbott Laboratories | | 328,314 | | 38,061,442 |
| Danaher Corp | | 175,574 | | 47,117,039 |
| Thermo Fisher Scientific Inc | | 86,254 | | 43,512,555 |
| | | | $ | 128,691,036 |
| |
| Healthcare — Services — 2.16% | | | | |
| UnitedHealth Group Inc | | 105,823 | | 42,375,762 |
| Household Products — 2.94% | | | | |
| Procter & Gamble Co/The | | 426,412 | | 57,535,771 |
| Insurance — 3.21% | | | | |
| Berkshire Hathaway Inc, Class B (a) | | 226,049 | | 62,823,538 |
| Internet — 8.10% | | | | |
| Alphabet Inc, Class A (a) | | 19,158 | | 46,779,813 |
| Amazon.com Inc (a) | | 12,726 | | 43,779,476 |
| Facebook Inc, Class A (a) | | 134,174 | | 46,653,642 |
| Netflix Inc (a) | | 40,558 | | 21,423,141 |
| | | | $ | 158,636,072 |
| |
| Media — 4.05% | | | | |
| Comcast Corp, Class A | | 730,334 | | 41,643,645 |
| Walt Disney Co/The (a) | | 214,167 | | 37,644,133 |
| | | | $ | 79,287,778 |
| |
| Oil & Gas — 3.24% | | | | |
| Chevron Corp | | 377,118 | | 39,499,339 |
| Exxon Mobil Corp | | 378,970 | | 23,905,428 |
| | | | $ | 63,404,767 |
| |
| Pharmaceuticals — 12.67% | | | | |
| AbbVie Inc | | 363,818 | | 40,980,460 |
| Eli Lilly & Co | | 113,949 | | 26,153,574 |
See accompanying notes.
143
| | | |
| Schedule of Investments |
| Principal U.S. Mega-Cap ETF |
| June 30, 2021 |
| |
| COMMON STOCKS (continued) | Shares Held | | Value |
| Pharmaceuticals (continued) | | | |
| Johnson & Johnson | 351,377 | $ | 57,885,847 |
| Merck & Co Inc | 779,079 | | 60,588,974 |
| Pfizer Inc | 1,593,959 | | 62,419,434 |
| | | $ | 248,028,289 |
| |
| Retail — 7.23% | | | |
| Home Depot Inc/The | 128,943 | | 41,118,633 |
| McDonald's Corp | 257,646 | | 59,513,650 |
| Walmart Inc | 290,939 | | 41,028,218 |
| | | $ | 141,660,501 |
| |
| Semiconductors — 5.73% | | | |
| Broadcom Inc | 45,635 | | 21,760,593 |
| Intel Corp | 330,339 | | 18,545,232 |
| NVIDIA Corp | 39,671 | | 31,740,767 |
| Texas Instruments Inc | 209,102 | | 40,210,315 |
| | | $ | 112,256,907 |
| |
| Software — 9.35% | | | |
| Adobe Inc (a) | 83,130 | | 48,684,253 |
| Microsoft Corp | 167,008 | | 45,242,467 |
| Oracle Corp | 561,297 | | 43,691,359 |
| salesforce.com Inc (a) | 186,521 | | 45,561,485 |
| | | $ | 183,179,564 |
| |
| Telecommunications — 6.81% | | | |
| AT&T Inc | 1,907,799 | | 54,906,455 |
| Cisco Systems Inc | 764,229 | | 40,504,137 |
| Verizon Communications Inc | 676,787 | | 37,920,376 |
| | | $ | 133,330,968 |
| TOTAL COMMON STOCKS | | $ | 1,953,147,984 |
| INVESTMENT COMPANIES — 0.21% | Shares Held | | Value |
| Money Market Fund — 0.21% | | | |
| State Street Institutional U.S. Government Money Market Fund — Institutional | | | |
| Class 0.03% (b) | 4,160,028 | $ | 4,160,028 |
| TOTAL INVESTMENT COMPANIES | | $ | 4,160,028 |
| Total Investments | | $ | 1,957,308,012 |
| Other Assets and Liabilities — 0.04% | | | 756,164 |
| Total Net Assets — 100.00% | | $ | 1,958,064,176 |
| (a) | Non-income producing security. |
| (b) | Current yield shown is as of period end. |
| | |
| Portfolio Summary (unaudited) |
|
| Sector | Percent | |
| Consumer, Non-cyclical | 30.80 | % |
| Technology | 23.10 | % |
| Communications | 18.96 | % |
| Financial | 12.97 | % |
| Consumer, Cyclical | 10.68 | % |
| Energy | 3.24 | % |
| Money Market Fund | 0.21 | % |
| Other Assets and Liabilities | 0.04 | % |
| TOTAL NET ASSETS | 100.00 | % |
See accompanying notes.
144
| | | |
| Schedule of Investments |
| Principal U.S. Small-Cap Adaptive Multi-Factor ETF |
| June 30, 2021 |
| |
| COMMON STOCKS — 99.70% | Shares Held | | Value |
| |
| Aerospace & Defense — 1.28% | | | |
| AAR Corp (a) | 319 | $ | 12,361 |
| Aerojet Rocketdyne Holdings Inc | 482 | | 23,276 |
| AeroVironment Inc (a) | 144 | | 14,422 |
| Barnes Group Inc | 210 | | 10,762 |
| Moog Inc, Class A | 100 | | 8,406 |
| National Presto Industries Inc | 50 | | 5,083 |
| Park Aerospace Corp | 95 | | 1,416 |
| Triumph Group Inc (a) | 290 | | 6,017 |
| | | $ | 81,743 |
| |
| Agriculture — 0.51% | | | |
| Fresh Del Monte Produce Inc | 240 | | 7,891 |
| Universal Corp | 145 | | 8,261 |
| Vector Group Ltd | 1,168 | | 16,515 |
| | | $ | 32,667 |
| |
| Airlines — 0.43% | | | |
| Allegiant Travel Co (a) | 40 | | 7,760 |
| Hawaiian Holdings Inc (a) | 225 | | 5,483 |
| SkyWest Inc (a) | 336 | | 14,472 |
| | | $ | 27,715 |
| |
| Apparel — 1.63% | | | |
| Crocs Inc (a) | 485 | | 56,512 |
| Fossil Group Inc (a) | 750 | | 10,710 |
| Kontoor Brands Inc | 291 | | 16,416 |
| Oxford Industries Inc | 70 | | 6,919 |
| Unifi Inc (a) | 150 | | 3,654 |
| Wolverine World Wide Inc | 305 | | 10,260 |
| | | $ | 104,471 |
| |
| Auto Manufacturers — 0.14% | | | |
| Wabash National Corp | 580 | | 9,280 |
| |
| Auto Parts & Equipment — 1.56% | | | |
| American Axle & Manufacturing Holdings Inc (a) | 1,222 | | 12,648 |
| Cooper-Standard Holdings Inc (a) | 140 | | 4,060 |
| Dorman Products Inc (a) | 105 | | 10,885 |
| Gentherm Inc (a) | 246 | | 17,478 |
| Goodyear Tire & Rubber Co/The (a) | 421 | | 7,220 |
| Meritor Inc (a) | 265 | | 6,206 |
| Methode Electronics Inc | 356 | | 17,519 |
| Motorcar Parts of America Inc (a) | 385 | | 8,640 |
| Standard Motor Products Inc | 270 | | 11,705 |
| Titan International Inc (a) | 405 | | 3,434 |
| | | $ | 99,795 |
| |
| Banks — 10.00% | | | |
| Allegiance Bancshares Inc | 275 | | 10,571 |
| Ameris Bancorp | 594 | | 30,074 |
| BancFirst Corp | 160 | | 9,989 |
| BankUnited Inc | 508 | | 21,686 |
| Banner Corp | 115 | | 6,234 |
| Cadence BanCorp | 375 | | 7,830 |
| Central Pacific Financial Corp | 355 | | 9,251 |
| City Holding Co | 176 | | 13,242 |
| Columbia Banking System Inc | 195 | | 7,519 |
| Community Bank System Inc | 180 | | 13,617 |
| Customers Bancorp Inc (a) | 502 | | 19,573 |
| CVB Financial Corp | 516 | | 10,624 |
| Dime Community Bancshares Inc | 335 | | 11,263 |
| Eagle Bancorp Inc | 253 | | 14,188 |
| FB Financial Corp | 323 | | 12,054 |
See accompanying notes.
145
| | | |
| Schedule of Investments |
| Principal U.S. Small-Cap Adaptive Multi-Factor ETF |
| June 30, 2021 |
| |
| COMMON STOCKS (continued) | Shares Held | | Value |
| |
| Banks (continued) | | | |
| First BanCorp | 2,096 | $ | 24,984 |
| First Bancorp/Southern Pines | 266 | | 10,882 |
| First Commonwealth Financial Corp | 867 | | 12,199 |
| First Financial Bancorp | 290 | | 6,853 |
| First Hawaiian Inc | 340 | | 9,636 |
| First Midwest Bancorp Inc | 340 | | 6,742 |
| Flagstar Bancorp Inc | 555 | | 23,460 |
| Hanmi Financial Corp | 450 | | 8,577 |
| Heritage Financial Corp | 230 | | 5,755 |
| Hilltop Holdings Inc | 749 | | 27,264 |
| HomeStreet Inc | 282 | | 11,489 |
| Hope Bancorp Inc | 954 | | 13,528 |
| Independent Bank Group Inc | 353 | | 26,313 |
| Meta Financial Group Inc | 416 | | 21,062 |
| National Bank Holdings Corp, Class A | 175 | | 6,604 |
| NBT Bancorp Inc | 404 | | 14,532 |
| OFG Bancorp | 450 | | 9,954 |
| Old National Bancorp | 1,147 | | 20,199 |
| Park National Corp | 65 | | 7,632 |
| Preferred Bank | 186 | | 11,768 |
| Renasant Corp | 230 | | 9,200 |
| Seacoast Banking Corp of Florida | 389 | | 13,284 |
| ServisFirst Bancshares Inc | 326 | | 22,161 |
| Simmons First National Corp, Class A | 750 | | 22,005 |
| Southside Bancshares Inc | 175 | | 6,690 |
| Tompkins Financial Corp | 160 | | 12,410 |
| Triumph Bancorp Inc (a) | 159 | | 11,806 |
| TrustCo Bank Corp | 297 | | 10,211 |
| United Community Banks Inc | 523 | | 16,741 |
| Veritex Holdings Inc | 385 | | 13,633 |
| Walker & Dunlop Inc | 170 | | 17,745 |
| Westamerica BanCorp | 125 | | 7,254 |
| | | $ | 640,288 |
| |
| Beverages — 0.69% | | | |
| Celsius Holdings Inc (a) | 105 | | 7,990 |
| Coca-Cola Consolidated Inc | 47 | | 18,900 |
| MGP Ingredients Inc | 100 | | 6,764 |
| National Beverage Corp | 219 | | 10,343 |
| | | $ | 43,997 |
| |
| Biotechnology — 0.55% | | | |
| Cara Therapeutics Inc (a) | 70 | | 999 |
| Innoviva Inc (a) | 1,003 | | 13,450 |
| Myriad Genetics Inc (a) | 245 | | 7,492 |
| NeoGenomics Inc (a) | 90 | | 4,065 |
| Vericel Corp (a) | 140 | | 7,350 |
| Xencor Inc (a) | 60 | | 2,070 |
| | | $ | 35,426 |
| |
| Chemicals — 2.26% | | | |
| AdvanSix Inc (a) | 378 | | 11,287 |
| American Vanguard Corp | 315 | | 5,516 |
| Balchem Corp | 115 | | 15,095 |
| Ferro Corp (a) | 115 | | 2,480 |
| GCP Applied Technologies Inc (a) | 310 | | 7,211 |
| Hawkins Inc | 320 | | 10,480 |
| HB Fuller Co | 493 | | 31,360 |
| Innospec Inc | 25 | | 2,265 |
| Koppers Holdings Inc (a) | 438 | | 14,169 |
| Kraton Corp (a) | 145 | | 4,682 |
| Quaker Chemical Corp | 50 | | 11,859 |
See accompanying notes.
146
| | | |
| Schedule of Investments |
| Principal U.S. Small-Cap Adaptive Multi-Factor ETF |
| June 30, 2021 |
| |
| COMMON STOCKS (continued) | Shares Held | | Value |
| |
| Chemicals (continued) | | | |
| Rayonier Advanced Materials Inc (a) | 1,010 | $ | 6,757 |
| Rogers Corp (a) | 15 | | 3,012 |
| Stepan Co | 155 | | 18,642 |
| | | $ | 144,815 |
| |
| Coal — 0.44% | | | |
| CONSOL Energy Inc (a) | 972 | | 17,953 |
| SunCoke Energy Inc | 1,405 | | 10,032 |
| | | $ | 27,985 |
| |
| Commercial Services — 4.58% | | | |
| Aaron's Co Inc/The | 215 | | 6,878 |
| ABM Industries Inc | 445 | | 19,736 |
| Alarm.com Holdings Inc (a) | 159 | | 13,467 |
| American Public Education Inc (a) | 280 | | 7,935 |
| AMN Healthcare Services Inc (a) | 307 | | 29,773 |
| CoreCivic Inc (a) | 690 | | 7,224 |
| CorVel Corp (a) | 107 | | 14,370 |
| Cross Country Healthcare Inc (a) | 708 | | 11,689 |
| Deluxe Corp | 160 | | 7,643 |
| EVERTEC Inc | 261 | | 11,393 |
| Forrester Research Inc (a) | 120 | | 5,496 |
| Green Dot Corp, Class A (a) | 255 | | 11,947 |
| Heidrick & Struggles International Inc | 40 | | 1,782 |
| Kelly Services Inc, Class A (a) | 225 | | 5,393 |
| Korn Ferry | 349 | | 25,320 |
| Medifast Inc | 84 | | 23,770 |
| Monro Inc | 140 | | 8,891 |
| Perdoceo Education Corp (a) | 590 | | 7,239 |
| R1 RCM Inc (a) | 828 | | 18,415 |
| Rent-A-Center Inc | 512 | | 27,172 |
| Resources Connection Inc | 700 | | 10,052 |
| Team Inc (a) | 460 | | 3,082 |
| TrueBlue Inc (a) | 305 | | 8,574 |
| Viad Corp (a) | 120 | | 5,982 |
| | | $ | 293,223 |
| |
| Computers — 1.74% | | | |
| 3D Systems Corp (a) | 396 | | 15,828 |
| Diebold Nixdorf Inc (a) | 380 | | 4,879 |
| ExlService Holdings Inc (a) | 128 | | 13,601 |
| Insight Enterprises Inc (a) | 332 | | 33,203 |
| Sykes Enterprises Inc (a) | 362 | | 19,440 |
| TTEC Holdings Inc | 154 | | 15,876 |
| Unisys Corp (a) | 330 | | 8,352 |
| | | $ | 111,179 |
| |
| Construction Materials — 3.27% | | | |
| AAON Inc | 155 | | 9,701 |
| American Woodmark Corp (a) | 195 | | 15,930 |
| Apogee Enterprises Inc | 447 | | 18,206 |
| Boise Cascade Co | 419 | | 24,449 |
| Gibraltar Industries Inc (a) | 226 | | 17,246 |
| Griffon Corp | 420 | | 10,765 |
| Patrick Industries Inc | 243 | | 17,739 |
| PGT Innovations Inc (a) | 742 | | 17,237 |
| SPX Corp (a) | 330 | | 20,156 |
| UFP Industries Inc | 519 | | 38,582 |
| US Concrete Inc (a) | 260 | | 19,188 |
| | | $ | 209,199 |
See accompanying notes.
147
| | | |
| Schedule of Investments |
| Principal U.S. Small-Cap Adaptive Multi-Factor ETF |
| June 30, 2021 |
| |
| COMMON STOCKS (continued) | Shares Held | | Value |
| |
| Distribution/Wholesale — 1.14% | | | |
| Core-Mark Holding Co Inc | 392 | $ | 17,644 |
| G-III Apparel Group Ltd (a) | 402 | | 13,210 |
| Resideo Technologies Inc (a) | 779 | | 23,370 |
| ScanSource Inc (a) | 180 | | 5,063 |
| Veritiv Corp (a) | 220 | | 13,512 |
| | | $ | 72,799 |
| |
| Diversified Financial Services — 3.04% | | | |
| B. Riley Financial Inc | 278 | | 20,989 |
| Brightsphere Investment Group Inc | 798 | | 18,697 |
| Encore Capital Group Inc (a) | 306 | | 14,501 |
| Enova International Inc (a) | 533 | | 18,234 |
| EZCORP Inc, Class A (a) | 1,125 | | 6,784 |
| Greenhill & Co Inc | 425 | | 6,613 |
| Mr Cooper Group Inc (a) | 720 | | 23,803 |
| Piper Sandler Cos | 136 | | 17,620 |
| PRA Group Inc (a) | 424 | | 16,311 |
| StoneX Group Inc (a) | 211 | | 12,802 |
| Virtus Investment Partners Inc | 60 | | 16,666 |
| WisdomTree Investments Inc | 730 | | 4,526 |
| World Acceptance Corp (a) | 106 | | 16,986 |
| | | $ | 194,532 |
| |
| Electric — 0.18% | | | |
| Avista Corp | 266 | | 11,350 |
| |
| Electrical Components & Equipment — 0.48% | | | |
| Encore Wire Corp | 207 | | 15,689 |
| Insteel Industries Inc | 315 | | 10,127 |
| Powell Industries Inc | 165 | | 5,107 |
| | | $ | 30,923 |
| |
| Electronics — 2.52% | | | |
| Advanced Energy Industries Inc | 199 | | 22,429 |
| Badger Meter Inc | 118 | | 11,578 |
| Bel Fuse Inc, Class B | 465 | | 6,696 |
| Benchmark Electronics Inc | 250 | | 7,115 |
| Brady Corp, Class A | 360 | | 20,175 |
| FARO Technologies Inc (a) | 25 | | 1,944 |
| Knowles Corp (a) | 105 | | 2,073 |
| Mesa Laboratories Inc | 8 | | 2,169 |
| OSI Systems Inc (a) | 158 | | 16,059 |
| Plexus Corp (a) | 214 | | 19,562 |
| Sanmina Corp (a) | 481 | | 18,740 |
| TTM Technologies Inc (a) | 565 | | 8,080 |
| Vicor Corp (a) | 95 | | 10,045 |
| Watts Water Technologies Inc, Class A | 100 | | 14,591 |
| | | $ | 161,256 |
| |
| Energy — Alternate Sources — 0.42% | | | |
| FutureFuel Corp | 105 | | 1,008 |
| Green Plains Inc (a) | 215 | | 7,228 |
| Renewable Energy Group Inc (a) | 295 | | 18,391 |
| | | $ | 26,627 |
| |
| Engineering & Construction — 1.63% | | | |
| Arcosa Inc | 340 | | 19,972 |
| Comfort Systems USA Inc | 369 | | 29,073 |
| Exponent Inc | 170 | | 15,166 |
| Granite Construction Inc | 369 | | 15,325 |
| MYR Group Inc (a) | 273 | | 24,821 |
| | | $ | 104,357 |
See accompanying notes.
148
| | | |
| Schedule of Investments |
| Principal U.S. Small-Cap Adaptive Multi-Factor ETF |
| June 30, 2021 |
| |
| COMMON STOCKS (continued) | Shares Held | | Value |
| |
| Entertainment — 0.08% | | | |
| Monarch Casino & Resort Inc (a) | 75 | $ | 4,963 |
| |
| Environmental Control — 0.13% | | | |
| Harsco Corp (a) | 330 | | 6,739 |
| US Ecology Inc (a) | 45 | | 1,688 |
| | | $ | 8,427 |
| |
| Food — 1.58% | | | |
| B&G Foods Inc | 564 | | 18,499 |
| Cal-Maine Foods Inc | 215 | | 7,785 |
| Calavo Growers Inc | 25 | | 1,585 |
| Chefs' Warehouse Inc/The (a) | 155 | | 4,934 |
| J & J Snack Foods Corp | 15 | | 2,616 |
| John B Sanfilippo & Son Inc | 125 | | 11,071 |
| Seneca Foods Corp, Class A (a) | 200 | | 10,216 |
| Simply Good Foods Co/The (a) | 341 | | 12,450 |
| SpartanNash Co | 480 | | 9,269 |
| United Natural Foods Inc (a) | 615 | | 22,743 |
| | | $ | 101,168 |
| |
| Forest Products & Paper — 0.62% | | | |
| Clearwater Paper Corp (a) | 265 | | 7,677 |
| Domtar Corp (a) | 209 | | 11,487 |
| Glatfelter Corp | 425 | | 5,937 |
| Neenah Inc | 30 | | 1,505 |
| Schweitzer-Mauduit International Inc | 318 | | 12,841 |
| | | $ | 39,447 |
| |
| Gas — 0.43% | | | |
| Chesapeake Utilities Corp | 75 | | 9,025 |
| Northwest Natural Holding Co | 145 | | 7,615 |
| South Jersey Industries Inc | 428 | | 11,098 |
| | | $ | 27,738 |
| |
| Hand/Machine Tools — 0.19% | | | |
| Franklin Electric Co Inc | 149 | | 12,012 |
| |
| Healthcare — Products — 1.72% | | | |
| AngioDynamics Inc (a) | 205 | | 5,562 |
| Cardiovascular Systems Inc (a) | 50 | | 2,132 |
| CONMED Corp | 25 | | 3,436 |
| Cutera Inc (a) | 150 | | 7,354 |
| Glaukos Corp (a) | 124 | | 10,519 |
| Hanger Inc (a) | 230 | | 5,814 |
| Integer Holdings Corp (a) | 30 | | 2,826 |
| Lantheus Holdings Inc (a) | 90 | | 2,488 |
| LeMaitre Vascular Inc | 115 | | 7,017 |
| Luminex Corp | 160 | | 5,888 |
| Meridian Bioscience Inc (a) | 740 | | 16,413 |
| Merit Medical Systems Inc (a) | 180 | | 11,639 |
| Natus Medical Inc (a) | 60 | | 1,559 |
| Omnicell Inc (a) | 140 | | 21,203 |
| Orthofix Medical Inc (a) | 35 | | 1,404 |
| Surmodics Inc (a) | 25 | | 1,356 |
| Zynex Inc (a) | 220 | | 3,417 |
| | | $ | 110,027 |
| |
| Healthcare — Services — 3.43% | | | |
| Addus HomeCare Corp (a) | 142 | | 12,388 |
| Community Health Systems Inc (a) | 1,210 | | 18,682 |
| Ensign Group Inc/The | 448 | | 38,828 |
| Fulgent Genetics Inc (a) | 226 | | 20,844 |
| Magellan Health Inc (a) | 110 | | 10,362 |
See accompanying notes.
149
| | | |
| Schedule of Investments |
| Principal U.S. Small-Cap Adaptive Multi-Factor ETF |
| June 30, 2021 |
| |
| COMMON STOCKS (continued) | Shares Held | | Value |
| |
| Healthcare — Services (continued) | | | |
| MEDNAX Inc (a) | 609 | $ | 18,361 |
| ModivCare Inc (a) | 160 | | 27,211 |
| Pennant Group Inc/The (a) | 245 | | 10,021 |
| RadNet Inc (a) | 250 | | 8,423 |
| Select Medical Holdings Corp | 877 | | 37,062 |
| Tivity Health Inc (a) | 440 | | 11,576 |
| US Physical Therapy Inc | 50 | | 5,794 |
| | | $ | 219,552 |
| |
| Home Builders — 3.02% | | | |
| Cavco Industries Inc (a) | 65 | | 14,442 |
| Century Communities Inc | 330 | | 21,958 |
| Installed Building Products Inc | 130 | | 15,907 |
| LCI Industries | 165 | | 21,684 |
| LGI Homes Inc (a) | 185 | | 29,959 |
| M/I Homes Inc (a) | 343 | | 20,124 |
| MDC Holdings Inc | 484 | | 24,491 |
| Meritage Homes Corp (a) | 320 | | 30,106 |
| Winnebago Industries Inc | 220 | | 14,951 |
| | | $ | 193,622 |
| |
| Home Furnishings — 1.17% | | | |
| Daktronics Inc (a) | 920 | | 6,063 |
| Ethan Allen Interiors Inc | 335 | | 9,246 |
| iRobot Corp (a) | 251 | | 23,441 |
| Sleep Number Corp (a) | 236 | | 25,948 |
| Universal Electronics Inc (a) | 205 | | 9,942 |
| | | $ | 74,640 |
| |
| Household Products — 0.52% | | | |
| Edgewell Personal Care Co | 452 | | 19,843 |
| elf Beauty Inc (a) | 426 | | 11,561 |
| Inter Parfums Inc | 25 | | 1,800 |
| | | $ | 33,204 |
| |
| Household Products/Wares — 0.86% | | | |
| Central Garden & Pet Co (a) | 193 | | 10,215 |
| Central Garden & Pet Co, Class A (a) | 334 | | 16,132 |
| Quanex Building Products Corp | 650 | | 16,146 |
| WD-40 Co | 50 | | 12,815 |
| | | $ | 55,308 |
| |
| Housewares — 0.18% | | | |
| Tupperware Brands Corp (a) | 480 | | 11,400 |
| |
| Insurance — 2.16% | | | |
| Ambac Financial Group Inc (a) | 90 | | 1,409 |
| American Equity Investment Life Holding Co | 547 | | 17,679 |
| AMERISAFE Inc | 110 | | 6,566 |
| Employers Holdings Inc | 333 | | 14,252 |
| HCI Group Inc | 85 | | 8,452 |
| Horace Mann Educators Corp | 389 | | 14,556 |
| James River Group Holdings Ltd | 40 | | 1,501 |
| NMI Holdings Inc, Class A (a) | 924 | | 20,772 |
| Safety Insurance Group Inc | 163 | | 12,760 |
| SiriusPoint Ltd (a) | 675 | | 6,797 |
| Stewart Information Services Corp | 263 | | 14,910 |
| Trupanion Inc (a) | 100 | | 11,510 |
| United Fire Group Inc | 45 | | 1,248 |
| Universal Insurance Holdings Inc | 430 | | 5,968 |
| | | $ | 138,380 |
See accompanying notes.
150
| | | |
| Schedule of Investments |
| Principal U.S. Small-Cap Adaptive Multi-Factor ETF |
| June 30, 2021 |
| |
| COMMON STOCKS (continued) | Shares Held | | Value |
| |
| Internet — 1.59% | | | |
| Cogent Communications Holdings Inc | 40 | $ | 3,076 |
| ePlus Inc (a) | 144 | | 12,483 |
| HealthStream Inc (a) | 245 | | 6,845 |
| Liquidity Services Inc (a) | 235 | | 5,981 |
| Perficient Inc (a) | 150 | | 12,063 |
| QuinStreet Inc (a) | 656 | | 12,189 |
| Shutterstock Inc | 153 | | 15,020 |
| Stamps.com Inc (a) | 104 | | 20,830 |
| TechTarget Inc (a) | 170 | | 13,173 |
| | | $ | 101,660 |
| |
| Iron & Steel — 0.35% | | | |
| Allegheny Technologies Inc (a) | 370 | | 7,715 |
| Carpenter Technology Corp | 369 | | 14,841 |
| | | $ | 22,556 |
| |
| Leisure Time — 0.48% | | | |
| Callaway Golf Co | 285 | | 9,613 |
| Vista Outdoor Inc (a) | 452 | | 20,919 |
| | | $ | 30,532 |
| |
| Machinery — Construction & Mining — 0.29% | | | |
| Astec Industries Inc | 293 | | 18,441 |
| |
| Machinery — Diversified — 2.01% | | | |
| Alamo Group Inc | 96 | | 14,657 |
| Albany International Corp, Class A | 120 | | 10,711 |
| Applied Industrial Technologies Inc | 258 | | 23,494 |
| Chart Industries Inc (a) | 174 | | 25,460 |
| CIRCOR International Inc (a) | 140 | | 4,564 |
| DXP Enterprises Inc (a) | 310 | | 10,323 |
| Ichor Holdings Ltd (a) | 210 | | 11,298 |
| Lindsay Corp | 50 | | 8,264 |
| SPX FLOW Inc | 176 | | 11,482 |
| Tennant Co | 105 | | 8,384 |
| | | $ | 128,637 |
| |
| Media — 1.10% | | | |
| AMC Networks Inc, Class A (a) | 373 | | 24,917 |
| EW Scripps Co/The Class A | 793 | | 16,169 |
| Gannett Co Inc (a) | 1,800 | | 9,882 |
| Meredith Corp (a) | 400 | | 17,376 |
| Scholastic Corp | 55 | | 2,084 |
| | | $ | 70,428 |
| |
| Metal Fabrication & Hardware — 0.82% | | | |
| AZZ Inc | 274 | | 14,188 |
| Mueller Industries Inc | 432 | | 18,710 |
| Olympic Steel Inc | 312 | | 9,169 |
| TimkenSteel Corp (a) | 760 | | 10,754 |
| | | $ | 52,821 |
| |
| Mining — 0.50% | | | |
| Arconic Corp (a) | 315 | | 11,220 |
| Century Aluminum Co (a) | 310 | | 3,996 |
| Kaiser Aluminum Corp | 67 | | 8,274 |
| Livent Corp (a) | 445 | | 8,615 |
| | | $ | 32,105 |
| |
| Miscellaneous Manufacture — 2.96% | | | |
| Enerpac Tool Group Corp | 75 | | 1,997 |
| EnPro Industries Inc | 108 | | 10,492 |
See accompanying notes.
151
| | | |
| Schedule of Investments |
| Principal U.S. Small-Cap Adaptive Multi-Factor ETF |
| June 30, 2021 |
| |
| COMMON STOCKS (continued) | Shares Held | | Value |
| |
| Miscellaneous Manufacture (continued) | | | |
| ESCO Technologies Inc | 100 | $ | 9,381 |
| Fabrinet (a) | 251 | | 24,063 |
| Federal Signal Corp | 464 | | 18,667 |
| Haynes International Inc | 160 | | 5,661 |
| Hillenbrand Inc | 699 | | 30,812 |
| John Bean Technologies Corp | 80 | | 11,410 |
| Lydall Inc (a) | 297 | | 17,974 |
| Materion Corp | 30 | | 2,260 |
| Myers Industries Inc | 520 | | 10,920 |
| Standex International Corp | 130 | | 12,338 |
| Sturm Ruger & Co Inc | 200 | | 17,996 |
| Trinseo SA | 264 | | 15,798 |
| | | $ | 189,769 |
| |
| Office & Business Equipment — 0.21% | | | |
| Pitney Bowes Inc | 1,556 | | 13,646 |
| |
| Office Furnishings — 0.26% | | | |
| HNI Corp | 236 | | 10,377 |
| Interface Inc | 415 | | 6,349 |
| | | $ | 16,726 |
| |
| Oil & Gas — 1.89% | | | |
| Bonanza Creek Energy Inc | 327 | | 15,392 |
| Callon Petroleum Co (a) | 185 | | 10,673 |
| Matador Resources Co | 359 | | 12,928 |
| Nabors Industries Ltd (a) | 117 | | 13,366 |
| Par Pacific Holdings Inc (a) | 315 | | 5,298 |
| Patterson-UTI Energy Inc | 875 | | 8,697 |
| PDC Energy Inc | 292 | | 13,371 |
| Penn Virginia Corp (a) | 681 | | 16,078 |
| Range Resources Corp (a) | 896 | | 15,017 |
| SM Energy Co | 405 | | 9,975 |
| | | $ | 120,795 |
| |
| Oil & Gas Services — 1.37% | | | |
| Archrock Inc | 600 | | 5,346 |
| Bristow Group Inc (a) | 386 | | 9,886 |
| Core Laboratories N.V. | 205 | | 7,985 |
| DMC Global Inc (a) | 95 | | 5,340 |
| Helix Energy Solutions Group Inc (a) | 2,280 | | 13,019 |
| NOW Inc (a) | 605 | | 5,741 |
| Oceaneering International Inc (a) | 1,112 | | 17,314 |
| Oil States International Inc (a) | 1,646 | | 12,921 |
| ProPetro Holding Corp (a) | 515 | | 4,717 |
| US Silica Holdings Inc (a) | 445 | | 5,144 |
| | | $ | 87,413 |
| |
| Packaging & Containers — 0.51% | | | |
| Matthews International Corp, Class A | 190 | | 6,832 |
| O-I Glass Inc (a) | 1,587 | | 25,916 |
| | | $ | 32,748 |
| |
| Pharmaceuticals — 2.44% | | | |
| Amphastar Pharmaceuticals Inc (a) | 85 | | 1,714 |
| Coherus Biosciences Inc (a) | 490 | | 6,777 |
| Collegium Pharmaceutical Inc (a) | 519 | | 12,269 |
| Corcept Therapeutics Inc (a) | 310 | | 6,820 |
| Covetrus Inc (a) | 290 | | 7,830 |
| Eagle Pharmaceuticals Inc (a) | 140 | | 5,992 |
| Enanta Pharmaceuticals Inc (a) | 35 | | 1,540 |
| Endo International PLC (a) | 1,070 | | 5,008 |
| Heska Corp (a) | 50 | | 11,487 |
See accompanying notes.
152
| | | |
| Schedule of Investments |
| Principal U.S. Small-Cap Adaptive Multi-Factor ETF |
| June 30, 2021 |
| |
| COMMON STOCKS (continued) | Shares Held | | Value |
| |
| Pharmaceuticals (continued) | | | |
| Lannett Co Inc (a) | 860 | $ | 4,016 |
| Owens & Minor Inc | 471 | | 19,937 |
| Pacira BioSciences Inc (a) | 177 | | 10,740 |
| Phibro Animal Health Corp, Class A | 415 | | 11,985 |
| Prestige Consumer Healthcare Inc (a) | 403 | | 20,996 |
| Supernus Pharmaceuticals Inc (a) | 410 | | 12,624 |
| USANA Health Sciences Inc (a) | 139 | | 14,238 |
| Vanda Pharmaceuticals Inc (a) | 100 | | 2,151 |
| | | $ | 156,124 |
| |
| Real Estate — 0.68% | | | |
| Marcus & Millichap Inc (a) | 45 | | 1,749 |
| RE/MAX Holdings Inc, Class A | 320 | | 10,666 |
| Realogy Holdings Corp (a) | 933 | | 16,999 |
| St Joe Co/The | 318 | | 14,186 |
| | | $ | 43,600 |
| |
| REITs — 5.50% | | | |
| Agree Realty Corp | 218 | | 15,367 |
| American Assets Trust Inc | 60 | | 2,237 |
| Apollo Commercial Real Estate Finance Inc | 455 | | 7,257 |
| Armada Hoffler Properties Inc | 395 | | 5,250 |
| ARMOUR Residential REIT Inc | 130 | | 1,485 |
| Brandywine Realty Trust | 831 | | 11,393 |
| Capstead Mortgage Corp | 230 | | 1,412 |
| CareTrust REIT Inc | 395 | | 9,176 |
| Centerspace | 25 | | 1,973 |
| Chatham Lodging Trust (a) | 340 | | 4,376 |
| Community Healthcare Trust Inc | 135 | | 6,407 |
| DiamondRock Hospitality Co (a) | 710 | | 6,887 |
| Diversified Healthcare Trust | 1,310 | | 5,476 |
| Easterly Government Properties Inc | 385 | | 8,116 |
| Essential Properties Realty Trust Inc | 682 | | 18,441 |
| Four Corners Property Trust Inc | 320 | | 8,835 |
| Franklin Street Properties Corp | 885 | | 4,655 |
| GEO Group Inc/The | 880 | | 6,266 |
| Getty Realty Corp | 220 | | 6,853 |
| Global Net Lease Inc | 110 | | 2,035 |
| Granite Point Mortgage Trust Inc | 365 | | 5,384 |
| Hersha Hospitality Trust (a) | 395 | | 4,250 |
| Independence Realty Trust Inc | 125 | | 2,279 |
| Industrial Logistics Properties Trust | 320 | | 8,365 |
| Innovative Industrial Properties Inc | 145 | | 27,698 |
| iStar Inc | 420 | | 8,707 |
| Kite Realty Group Trust | 315 | | 6,933 |
| KKR Real Estate Finance Trust Inc | 275 | | 5,948 |
| Lexington Realty Trust | 255 | | 3,047 |
| LTC Properties Inc | 190 | | 7,294 |
| Mack-Cali Realty Corp | 120 | | 2,058 |
| National Storage Affiliates Trust | 245 | | 12,387 |
| New York Mortgage Trust Inc | 1,420 | | 6,347 |
| NexPoint Residential Trust Inc | 35 | | 1,924 |
| Office Properties Income Trust | 295 | | 8,646 |
| PennyMac Mortgage Investment Trust | 873 | | 18,385 |
| Ready Capital Corp | 340 | | 5,396 |
| Redwood Trust Inc | 520 | | 6,276 |
| Retail Opportunity Investments Corp | 826 | | 14,587 |
| Retail Properties of America Inc, Class A | 675 | | 7,729 |
| RPT Realty | 415 | | 5,387 |
| Safehold Inc | 95 | | 7,457 |
| Saul Centers Inc | 95 | | 4,318 |
| SITE Centers Corp | 525 | | 7,906 |
| Summit Hotel Properties Inc (a) | 530 | | 4,945 |
See accompanying notes.
153
| | | |
| Schedule of Investments |
| Principal U.S. Small-Cap Adaptive Multi-Factor ETF |
| June 30, 2021 |
| |
| COMMON STOCKS (continued) | Shares Held | | Value |
| |
| REITs (continued) | | | |
| Tanger Factory Outlet Centers Inc | 370 | $ | 6,974 |
| Uniti Group Inc | 240 | | 2,542 |
| Universal Health Realty Income Trust | 90 | | 5,540 |
| Washington Real Estate Investment Trust | 100 | | 2,300 |
| Xenia Hotels & Resorts Inc (a) | 385 | | 7,211 |
| | | $ | 352,117 |
| |
| Retail — 10.78% | | | |
| Abercrombie & Fitch Co, Class A (a) | 427 | | 19,826 |
| America's Car-Mart Inc (a) | 115 | | 16,298 |
| Asbury Automotive Group Inc (a) | 157 | | 26,905 |
| Barnes & Noble Education Inc (a) | 510 | | 3,677 |
| Bed Bath & Beyond Inc (a) | 738 | | 24,568 |
| Big Lots Inc | 351 | | 23,169 |
| BJ's Restaurants Inc (a) | 100 | | 4,914 |
| Bloomin' Brands Inc (a) | 265 | | 7,192 |
| Boot Barn Holdings Inc (a) | 201 | | 16,894 |
| Brinker International Inc (a) | 282 | | 17,442 |
| Buckle Inc/The | 409 | | 20,348 |
| Caleres Inc | 471 | | 12,854 |
| Cheesecake Factory Inc/The (a) | 135 | | 7,314 |
| Chico's FAS Inc (a) | 1,370 | | 9,015 |
| Children's Place Inc/The (a) | 70 | | 6,514 |
| Chuy's Holdings Inc (a) | 110 | | 4,099 |
| Conn's Inc (a) | 474 | | 12,087 |
| Dave & Buster's Entertainment Inc (a) | 155 | | 6,293 |
| Designer Brands Inc (a) | 300 | | 4,965 |
| Dine Brands Global Inc (a) | 72 | | 6,426 |
| El Pollo Loco Holdings Inc (a) | 550 | | 10,059 |
| Fiesta Restaurant Group Inc (a) | 575 | | 7,722 |
| GameStop Corp, Class A (a) | 331 | | 70,880 |
| Genesco Inc (a) | 214 | | 13,628 |
| GMS Inc (a) | 483 | | 23,252 |
| Group 1 Automotive Inc | 160 | | 24,709 |
| Guess? Inc | 411 | | 10,850 |
| Haverty Furniture Cos Inc | 406 | | 17,361 |
| Hibbett Inc (a) | 240 | | 21,511 |
| La-Z-Boy Inc | 562 | | 20,816 |
| Lumber Liquidators Holdings Inc (a) | 405 | | 8,545 |
| Macy's Inc (a) | 792 | | 15,016 |
| MarineMax Inc (a) | 323 | | 15,743 |
| Movado Group Inc | 295 | | 9,284 |
| ODP Corp/The (a) | 386 | | 18,532 |
| PC Connection Inc | 140 | | 6,478 |
| PetMed Express Inc | 290 | | 9,236 |
| PriceSmart Inc | 199 | | 18,111 |
| Red Robin Gourmet Burgers Inc (a) | 130 | | 4,304 |
| Ruth's Hospitality Group Inc (a) | 195 | | 4,491 |
| Sally Beauty Holdings Inc (a) | 1,152 | | 25,425 |
| Shake Shack Inc, Class A (a) | 95 | | 10,167 |
| Shoe Carnival Inc | 156 | | 11,168 |
| Signet Jewelers Ltd (a) | 314 | | 25,368 |
| Sonic Automotive Inc, Class A | 230 | | 10,290 |
| Vera Bradley Inc (a) | 735 | | 9,107 |
| Zumiez Inc (a) | 361 | | 17,685 |
| | | $ | 690,538 |
| |
| Savings & Loans — 1.82% | | | |
| Axos Financial Inc (a) | 576 | | 26,721 |
| Banc of California Inc | 275 | | 4,823 |
| Brookline Bancorp Inc | 878 | | 13,126 |
| Capitol Federal Financial Inc | 160 | | 1,885 |
| Investors Bancorp Inc | 845 | | 12,050 |
See accompanying notes.
154
| | | |
| Schedule of Investments |
| Principal U.S. Small-Cap Adaptive Multi-Factor ETF |
| June 30, 2021 |
| |
| COMMON STOCKS (continued) | Shares Held | | Value |
| |
| Savings & Loans (continued) | | | |
| Northfield Bancorp Inc | 365 | $ | 5,986 |
| Northwest Bancshares Inc | 590 | | 8,047 |
| Pacific Premier Bancorp Inc | 500 | | 21,145 |
| Provident Financial Services Inc | 345 | | 7,897 |
| WSFS Financial Corp | 313 | | 14,583 |
| | | $ | 116,263 |
| |
| Semiconductors — 2.79% | | | |
| Arlo Technologies Inc (a) | 680 | | 4,604 |
| Axcelis Technologies Inc (a) | 130 | | 5,255 |
| Cohu Inc (a) | 160 | | 5,886 |
| CTS Corp | 412 | | 15,310 |
| Diodes Inc (a) | 40 | | 3,191 |
| DSP Group Inc (a) | 90 | | 1,332 |
| FormFactor Inc (a) | 427 | | 15,568 |
| Kulicke & Soffa Industries Inc | 403 | | 24,664 |
| MaxLinear Inc (a) | 210 | | 8,923 |
| Onto Innovation Inc (a) | 323 | | 23,592 |
| Photronics Inc (a) | 955 | | 12,615 |
| Power Integrations Inc | 200 | | 16,412 |
| Rambus Inc (a) | 120 | | 2,845 |
| SMART Global Holdings Inc (a) | 195 | | 9,298 |
| Ultra Clean Holdings Inc (a) | 442 | | 23,744 |
| Veeco Instruments Inc (a) | 240 | | 5,770 |
| | | $ | 179,009 |
| |
| Software — 2.66% | | | |
| Agilysys Inc (a) | 105 | | 5,971 |
| Allscripts Healthcare Solutions Inc (a) | 455 | | 8,422 |
| Bottomline Technologies de Inc (a) | 45 | | 1,669 |
| Computer Programs & Systems Inc | 195 | | 6,480 |
| CSG Systems International Inc | 324 | | 15,286 |
| Digi International Inc (a) | 495 | | 9,954 |
| Donnelley Financial Solutions Inc (a) | 373 | | 12,309 |
| Ebix Inc | 305 | | 10,339 |
| LivePerson Inc (a) | 175 | | 11,067 |
| ManTech International Corp, Class A | 217 | | 18,779 |
| MicroStrategy Inc, Class A (a) | 20 | | 13,290 |
| NextGen Healthcare Inc (a) | 305 | | 5,060 |
| Progress Software Corp | 195 | | 9,019 |
| Simulations Plus Inc | 70 | | 3,844 |
| SPS Commerce Inc (a) | 228 | | 22,766 |
| Xperi Holding Corp | 733 | | 16,302 |
| | | $ | 170,557 |
| |
| Telecommunications — 0.96% | | | |
| ADTRAN Inc | 90 | | 1,859 |
| ATN International Inc | 30 | | 1,365 |
| Cincinnati Bell Inc (a) | 105 | | 1,619 |
| Consolidated Communications Holdings Inc (a) | 1,354 | | 11,902 |
| Extreme Networks Inc (a) | 565 | | 6,305 |
| InterDigital Inc | 35 | | 2,556 |
| NETGEAR Inc (a) | 510 | | 19,543 |
| Plantronics Inc (a) | 150 | | 6,259 |
| Shenandoah Telecommunications Co | 50 | | 2,426 |
| Spok Holdings Inc | 115 | | 1,106 |
| Viavi Solutions Inc (a) | 200 | | 3,532 |
| Vonage Holdings Corp (a) | 215 | | 3,098 |
| | | $ | 61,570 |
| |
| Textiles — 0.37% | | | |
| UniFirst Corp | 101 | | 23,699 |
See accompanying notes.
155
| | | |
| Schedule of Investments |
| Principal U.S. Small-Cap Adaptive Multi-Factor ETF |
| June 30, 2021 |
| |
| COMMON STOCKS (continued) | Shares Held | | Value |
| Transportation — 2.24% | | | |
| ArcBest Corp | 290 | $ | 16,875 |
| Atlas Air Worldwide Holdings Inc (a) | 345 | | 23,498 |
| Dorian LPG Ltd (a) | 350 | | 4,942 |
| Echo Global Logistics Inc (a) | 546 | | 16,784 |
| Forward Air Corp | 30 | | 2,692 |
| Heartland Express Inc | 335 | | 5,738 |
| Hub Group Inc, Class A (a) | 166 | | 10,953 |
| Marten Transport Ltd | 385 | | 6,349 |
| Matson Inc | 399 | | 25,536 |
| Saia Inc (a) | 144 | | 30,167 |
| | | $ | 143,534 |
| |
| Trucking & Leasing — 0.19% | | | |
| Greenbrier Cos Inc/The | 275 | | 11,985 |
| Water — 0.35% | | | |
| American States Water Co | 145 | | 11,536 |
| California Water Service Group | 199 | | 11,053 |
| | | $ | 22,589 |
| TOTAL COMMON STOCKS | | $ | 6,383,377 |
| INVESTMENT COMPANIES — 0.25% | Shares Held | | Value |
| Money Market Fund — 0.25% | | | |
| State Street Institutional U.S. Government Money Market Fund — Institutional | | | |
| Class 0.03% (b) | 16,169 | $ | 16,169 |
| TOTAL INVESTMENT COMPANIES | | $ | 16,169 |
| Total Investments | | $ | 6,399,546 |
| Other Assets and Liabilities — 0.05% | | | 3,152 |
| Total Net Assets — 100.00% | | $ | 6,402,698 |
| (a) | Non-income producing security. |
| (b) | Current yield shown is as of period end. |
| | |
| Portfolio Summary (unaudited) |
|
| Sector | Percent | |
| Financial | 23.20 | % |
| Consumer, Cyclical | 21.24 | % |
| Industrial | 18.52 | % |
| Consumer, Non-cyclical | 16.88 | % |
| Technology | 7.41 | % |
| Energy | 4.11 | % |
| Basic Materials | 3.73 | % |
| Communications | 3.65 | % |
| Utilities | 0.96 | % |
| Money Market Fund | 0.25 | % |
| Other Assets and Liabilities | 0.05 | % |
| TOTAL NET ASSETS | 100.00 | % |
See accompanying notes.
156
| | | | |
| Schedule of Investments |
| Principal U.S. Small-Cap Multi-Factor ETF |
| June 30, 2021 |
| |
| COMMON STOCKS — 99.72% | | Shares Held | | Value |
| |
| Aerospace & Defense — 0.14% | | | | |
| Barnes Group Inc | | 45,253 | $ | 2,319,216 |
| |
| Agriculture — 0.13% | | | | |
| Andersons Inc/The | | 13,494 | | 411,972 |
| Turning Point Brands Inc | | 16,682 | | 763,535 |
| Vector Group Ltd | | 69,972 | | 989,404 |
| | | | $ | 2,164,911 |
| |
| Airlines — 0.04% | | | | |
| Mesa Air Group Inc (a) | | 69,184 | | 645,487 |
| |
| Apparel — 0.95% | | | | |
| Kontoor Brands Inc | | 51,908 | | 2,928,130 |
| Levi Strauss & Co, Class A | | 202,098 | | 5,602,157 |
| Oxford Industries Inc | | 10,919 | | 1,079,234 |
| Steven Madden Ltd | | 91,055 | | 3,984,567 |
| Wolverine World Wide Inc | | 56,768 | | 1,909,675 |
| | | | $ | 15,503,763 |
| |
| Auto Manufacturers — 0.08% | | | | |
| Wabash National Corp | | 79,603 | | 1,273,648 |
| |
| Auto Parts & Equipment — 0.94% | | | | |
| Dana Inc | | 145,214 | | 3,450,285 |
| Gentherm Inc (a) | | 22,968 | | 1,631,876 |
| Goodyear Tire & Rubber Co/The (a) | | 397,397 | | 6,815,358 |
| Methode Electronics Inc | | 36,894 | | 1,815,554 |
| Standard Motor Products Inc | | 35,697 | | 1,547,465 |
| | | | $ | 15,260,538 |
| |
| Banks — 8.99% | | | | |
| 1st Source Corp | | 22,586 | | 1,049,346 |
| Ameris Bancorp | | 110,382 | | 5,588,641 |
| Bancorp Inc/The (a) | | 94,597 | | 2,176,677 |
| BancorpSouth Bank | | 122,363 | | 3,466,544 |
| BankUnited Inc | | 140,365 | | 5,992,182 |
| Cathay General Bancorp | | 96,281 | | 3,789,620 |
| City Holding Co | | 22,698 | | 1,707,798 |
| Community Trust Bancorp Inc | | 22,859 | | 923,046 |
| Customers Bancorp Inc (a) | | 44,021 | | 1,716,379 |
| CVB Financial Corp | | 143,304 | | 2,950,629 |
| Dime Community Bancshares Inc | | 55,788 | | 1,875,593 |
| Eagle Bancorp Inc | | 33,478 | | 1,877,446 |
| Enterprise Financial Services Corp | | 31,946 | | 1,481,975 |
| FB Financial Corp | | 43,466 | | 1,622,151 |
| First Busey Corp | | 44,824 | | 1,105,360 |
| First Financial Bancorp | | 87,850 | | 2,075,896 |
| First Financial Corp | | 15,989 | | 652,671 |
| First Foundation Inc | | 44,446 | | 1,000,480 |
| First Merchants Corp | | 44,367 | | 1,848,773 |
| German American Bancorp Inc | | 15,497 | | 576,488 |
| Hanmi Financial Corp | | 42,873 | | 817,159 |
| Hilltop Holdings Inc | | 202,723 | | 7,379,117 |
| Home BancShares Inc | | 170,625 | | 4,211,025 |
| Hope Bancorp Inc | | 186,860 | | 2,649,675 |
| Horizon Bancorp Inc | | 32,214 | | 561,490 |
| Independent Bank Corp | | 26,751 | | 580,764 |
| Independent Bank Group Inc | | 55,598 | | 4,113,140 |
| Kearny Financial Corp | | 99,366 | | 1,187,424 |
| Lakeland Bancorp Inc | | 43,414 | | 758,877 |
| Lakeland Financial Corp | | 36,486 | | 2,248,997 |
| Merchants Bancorp | | 12,581 | | 493,678 |
| Meta Financial Group Inc | | 58,307 | | 2,952,083 |
| Metropolitan Bank Holding Corp (a) | | 13,688 | | 824,291 |
See accompanying notes.
157
| | | | |
| Schedule of Investments |
| Principal U.S. Small-Cap Multi-Factor ETF |
| June 30, 2021 |
| |
| COMMON STOCKS (continued) | | Shares Held | | Value |
| |
| Banks (continued) | | | | |
| Midland States Bancorp Inc | | 21,511 | $ | 565,094 |
| Origin Bancorp Inc | | 13,684 | | 581,023 |
| Preferred Bank | | 20,608 | | 1,303,868 |
| Premier Financial Corp | | 31,196 | | 886,278 |
| Sandy Spring Bancorp Inc | | 43,346 | | 1,912,859 |
| ServisFirst Bancshares Inc | | 51,047 | | 3,470,175 |
| Silvergate Capital Corp, Class A (a) | | 75,545 | | 8,560,759 |
| Simmons First National Corp, Class A | | 151,455 | | 4,443,690 |
| Stock Yards Bancorp Inc | | 18,777 | | 955,562 |
| Texas Capital Bancshares Inc (a) | | 151,118 | | 9,594,482 |
| Tompkins Financial Corp | | 10,252 | | 795,145 |
| TriCo Bancshares | | 19,895 | | 847,129 |
| Triumph Bancorp Inc (a) | | 32,105 | | 2,383,796 |
| UMB Financial Corp | | 51,571 | | 4,799,197 |
| United Community Banks Inc | | 126,893 | | 4,061,845 |
| Valley National Bancorp | | 677,086 | | 9,093,265 |
| Veritex Holdings Inc | | 78,657 | | 2,785,244 |
| Washington Trust Bancorp Inc | | 19,888 | | 1,021,249 |
| Webster Financial Corp | | 144,995 | | 7,734,033 |
| Wintrust Financial Corp | | 109,243 | | 8,262,048 |
| | | | $ | 146,312,156 |
| |
| Beverages — 0.05% | | | | |
| MGP Ingredients Inc | | 11,510 | | 778,536 |
| |
| Biotechnology — 2.38% | | | | |
| Agenus Inc (a) | | 411,860 | | 2,261,111 |
| Altimmune Inc (a),(b) | | 106,915 | | 1,053,113 |
| Avid Bioservices Inc (a) | | 62,869 | | 1,612,590 |
| Avidity Biosciences Inc (a) | | 39,569 | | 977,750 |
| Cara Therapeutics Inc (a) | | 56,757 | | 809,922 |
| Cardiff Oncology Inc (a),(b) | | 141,018 | | 937,770 |
| Celldex Therapeutics Inc (a) | | 74,731 | | 2,499,005 |
| Curis Inc (a),(b) | | 136,707 | | 1,103,225 |
| ImmunoGen Inc (a) | | 181,079 | | 1,193,311 |
| Innoviva Inc (a) | | 120,380 | | 1,614,296 |
| Intercept Pharmaceuticals Inc (a) | | 86,174 | | 1,720,895 |
| Lexicon Pharmaceuticals Inc (a) | | 165,957 | | 761,743 |
| Ligand Pharmaceuticals Inc (a) | | 47,567 | | 6,240,315 |
| Lineage Cell Therapeutics Inc (a),(b) | | 114,773 | | 327,103 |
| Myriad Genetics Inc (a) | | 88,249 | | 2,698,654 |
| Oncternal Therapeutics Inc (a),(b) | | 75,369 | | 358,003 |
| Organogenesis Holdings Inc (a) | | 42,242 | | 702,062 |
| Prothena Corp PLC (a) | | 17,197 | | 884,098 |
| Puma Biotechnology Inc (a) | | 44,894 | | 412,127 |
| Radius Health Inc (a) | | 44,697 | | 815,273 |
| Selecta Biosciences Inc (a) | | 137,914 | | 576,480 |
| Sesen Bio Inc (a) | | 448,671 | | 2,072,860 |
| Strongbridge Biopharma PLC (a) | | 93,756 | | 278,455 |
| Surface Oncology Inc (a) | | 152,090 | | 1,134,591 |
| Sutro Biopharma Inc (a) | | 57,425 | | 1,067,531 |
| TransMedics Group Inc (a) | | 32,726 | | 1,085,849 |
| Vericel Corp (a) | | 68,458 | | 3,594,045 |
| | | | $ | 38,792,177 |
| |
| Chemicals — 3.80% | | | | |
| AdvanSix Inc (a) | | 28,866 | | 861,939 |
| Cabot Corp | | 63,886 | | 3,637,030 |
| Chemours Co/The | | 221,106 | | 7,694,489 |
| Element Solutions Inc | | 380,385 | | 8,893,401 |
| HB Fuller Co | | 108,313 | | 6,889,790 |
| Ingevity Corp (a) | | 50,029 | | 4,070,359 |
| Koppers Holdings Inc (a) | | 25,601 | | 828,192 |
See accompanying notes.
158
| | | | |
| Schedule of Investments |
| Principal U.S. Small-Cap Multi-Factor ETF |
| June 30, 2021 |
| |
| COMMON STOCKS (continued) | | Shares Held | | Value |
| |
| Chemicals (continued) | | | | |
| Minerals Technologies Inc | | 26,200 | $ | 2,061,154 |
| Sensient Technologies Corp | | 66,924 | | 5,792,942 |
| Valvoline Inc | | 410,531 | | 13,325,836 |
| W R Grace & Co | | 111,924 | | 7,736,187 |
| | | | $ | 61,791,319 |
| |
| Coal — 0.04% | | | | |
| SunCoke Energy Inc | | 91,243 | �� | 651,475 |
| |
| Commercial Services — 4.39% | | | | |
| ABM Industries Inc | | 68,522 | | 3,038,951 |
| ASGN Inc (a) | | 44,825 | | 4,344,887 |
| CAI International Inc | | 27,584 | | 1,544,704 |
| Carriage Services Inc | | 20,767 | | 767,756 |
| Cass Information Systems Inc | | 21,274 | | 866,916 |
| CorVel Corp (a) | | 10,668 | | 1,432,712 |
| CRA International Inc | | 4,946 | | 423,378 |
| Deluxe Corp | | 52,968 | | 2,530,281 |
| EVERTEC Inc | | 119,171 | | 5,201,814 |
| Graham Holdings Co, Class B | | 4,902 | | 3,107,378 |
| H&R Block Inc | | 397,616 | | 9,336,024 |
| Hackett Group Inc/The | | 21,245 | | 382,835 |
| Herc Holdings Inc (a) | | 27,639 | | 3,097,503 |
| Insperity Inc | | 52,795 | | 4,771,084 |
| John Wiley & Sons Inc, Class A | | 58,262 | | 3,506,207 |
| Kforce Inc | | 28,352 | | 1,784,191 |
| Korn Ferry | | 62,840 | | 4,559,042 |
| Medifast Inc | | 11,600 | | 3,282,568 |
| Monro Inc | | 44,739 | | 2,841,374 |
| Progyny Inc (a) | | 82,574 | | 4,871,866 |
| Rent-A-Center Inc | | 69,730 | | 3,700,571 |
| Resources Connection Inc | | 44,373 | | 637,196 |
| Triton International Ltd | | 103,081 | | 5,395,260 |
| | | | $ | 71,424,498 |
| |
| Computers — 1.67% | | | | |
| Diebold Nixdorf Inc (a) | | 86,480 | | 1,110,403 |
| ExlService Holdings Inc (a) | | 41,607 | | 4,421,160 |
| Insight Enterprises Inc (a) | | 49,419 | | 4,942,394 |
| NCR Corp (a) | | 207,140 | | 9,447,655 |
| Rimini Street Inc (a) | | 36,448 | | 224,520 |
| Super Micro Computer Inc (a) | | 50,762 | | 1,785,807 |
| Sykes Enterprises Inc (a) | | 39,425 | | 2,117,123 |
| TTEC Holdings Inc | | 30,068 | | 3,099,710 |
| | | | $ | 27,148,772 |
| |
| Construction Materials — 1.64% | | | | |
| Apogee Enterprises Inc | | 38,739 | | 1,577,839 |
| Boise Cascade Co | | 44,365 | | 2,588,698 |
| Griffon Corp | | 42,489 | | 1,088,993 |
| Louisiana-Pacific Corp | | 192,985 | | 11,635,066 |
| Patrick Industries Inc | | 26,728 | | 1,951,144 |
| PGT Innovations Inc (a) | | 43,413 | | 1,008,484 |
| UFP Industries Inc | | 63,169 | | 4,695,983 |
| US Concrete Inc (a) | | 29,720 | | 2,193,336 |
| | | | $ | 26,739,543 |
| |
| Distribution/Wholesale — 1.34% | | | | |
| Avient Corp | | 86,242 | | 4,239,657 |
| Core-Mark Holding Co Inc | | 18,832 | | 847,628 |
| G-III Apparel Group Ltd (a) | | 60,615 | | 1,991,809 |
| H&E Equipment Services Inc | | 28,838 | | 959,440 |
| Resideo Technologies Inc (a) | | 138,686 | | 4,160,580 |
See accompanying notes.
159
| | | |
| Schedule of Investments |
| Principal U.S. Small-Cap Multi-Factor ETF |
| June 30, 2021 |
| |
| COMMON STOCKS (continued) | Shares Held | | Value |
| |
| Distribution/Wholesale (continued) | | | |
| Titan Machinery Inc (a) | 31,478 | $ | 973,930 |
| Veritiv Corp (a) | 18,753 | | 1,151,809 |
| WESCO International Inc (a) | 72,721 | | 7,477,173 |
| | | $ | 21,802,026 |
| |
| Diversified Financial Services — 4.10% | | | |
| Alliance Data Systems Corp | 95,568 | | 9,957,230 |
| B. Riley Financial Inc | 45,602 | | 3,442,951 |
| Brightsphere Investment Group Inc | 100,050 | | 2,344,171 |
| Cowen Inc, Class A | 85,169 | | 3,496,187 |
| Diamond Hill Investment Group Inc | 4,955 | | 829,021 |
| Enova International Inc (a) | 70,558 | | 2,413,789 |
| Evercore Inc, Class A | 81,293 | | 11,443,616 |
| Federated Hermes Inc | 164,331 | | 5,572,464 |
| Moelis & Co, Class A | 136,177 | | 7,747,110 |
| Mr Cooper Group Inc (a) | 232,342 | | 7,681,227 |
| Navient Corp | 434,084 | | 8,390,844 |
| Virtus Investment Partners Inc | 12,466 | | 3,462,681 |
| | | $ | 66,781,291 |
| |
| Electric — 1.96% | | | |
| Avista Corp | 95,874 | | 4,090,944 |
| Evoqua Water Technologies Corp (a) | 311,214 | | 10,512,809 |
| Hawaiian Electric Industries Inc | 149,392 | | 6,316,294 |
| IDACORP Inc | 98,437 | | 9,597,607 |
| Spark Energy Inc, Class A (b) | 41,242 | | 467,272 |
| Unitil Corp | 17,940 | | 950,282 |
| | | $ | 31,935,208 |
| |
| Electrical Components & Equipment — 0.98% | | | |
| Acuity Brands Inc | 63,806 | | 11,933,636 |
| Energizer Holdings Inc | 71,933 | | 3,091,681 |
| Insteel Industries Inc | 16,187 | | 520,412 |
| Powell Industries Inc | 11,898 | | 368,243 |
| | | $ | 15,913,972 |
| |
| Electronics — 3.15% | | | |
| Advanced Energy Industries Inc | 34,171 | | 3,851,413 |
| Atkore Inc (a) | 67,055 | | 4,760,905 |
| Avnet Inc | 189,927 | | 7,612,274 |
| Badger Meter Inc | 48,122 | | 4,721,731 |
| Benchmark Electronics Inc | 41,502 | | 1,181,147 |
| Comtech Telecommunications Corp | 46,306 | | 1,118,753 |
| Fluidigm Corp (a),(b) | 254,089 | | 1,565,188 |
| OSI Systems Inc (a) | 34,416 | | 3,498,042 |
| Sanmina Corp (a) | 76,613 | | 2,984,843 |
| SYNNEX Corp | 58,646 | | 7,140,737 |
| Vishay Intertechnology Inc | 197,456 | | 4,452,633 |
| Watts Water Technologies Inc, Class A | 57,082 | | 8,328,835 |
| | | $ | 51,216,501 |
| |
| Energy — Alternate Sources — 0.33% | | | |
| Alto Ingredients Inc (a) | 425,428 | | 2,599,365 |
| Green Plains Inc (a) | 84,344 | | 2,835,645 |
| | | $ | 5,435,010 |
| |
| Engineering & Construction — 0.84% | | | |
| Arcosa Inc | 37,478 | | 2,201,458 |
| Comfort Systems USA Inc | 40,480 | | 3,189,419 |
| Construction Partners Inc, Class A (a) | 64,387 | | 2,021,752 |
| Granite Construction Inc | 52,767 | | 2,191,414 |
| MYR Group Inc (a) | 20,647 | | 1,877,225 |
See accompanying notes.
160
| | | |
| Schedule of Investments |
| Principal U.S. Small-Cap Multi-Factor ETF |
| June 30, 2021 |
| |
| COMMON STOCKS (continued) | Shares Held | | Value |
| |
| Engineering & Construction (continued) | | | |
| Primoris Services Corp | 77,177 | $ | 2,271,319 |
| | | $ | 13,752,587 |
| |
| Entertainment — 0.09% | | | |
| Bally's Corp (a) | 27,031 | | 1,462,647 |
| |
| Environmental Control — 0.08% | | | |
| Energy Recovery Inc (a) | 55,994 | | 1,275,543 |
| |
| Food — 1.42% | | | |
| B&G Foods Inc (b) | 147,970 | | 4,853,416 |
| Hain Celestial Group Inc/The (a) | 82,107 | | 3,294,133 |
| Hostess Brands Inc (a) | 270,867 | | 4,385,337 |
| Ingles Markets Inc, Class A | 14,145 | | 824,229 |
| Natural Grocers by Vitamin Cottage Inc | 9,142 | | 98,185 |
| Seaboard Corp | 133 | | 514,541 |
| Simply Good Foods Co/The (a) | 67,769 | | 2,474,246 |
| SpartanNash Co | 40,999 | | 791,691 |
| Sprouts Farmers Market Inc (a) | 234,209 | | 5,820,093 |
| | | $ | 23,055,871 |
| |
| Food Service — 0.22% | | | |
| Healthcare Services Group Inc | 111,589 | | 3,522,865 |
| |
| Forest Products & Paper — 0.15% | | | |
| Neenah Inc | 20,543 | | 1,030,642 |
| Schweitzer-Mauduit International Inc | 33,172 | | 1,339,486 |
| | | $ | 2,370,128 |
| |
| Gas — 1.12% | | | |
| Chesapeake Utilities Corp | 19,981 | | 2,404,314 |
| South Jersey Industries Inc | 271,073 | | 7,028,923 |
| Southwest Gas Holdings Inc | 132,539 | | 8,772,756 |
| | | $ | 18,205,993 |
| |
| Hand/Machine Tools — 0.23% | | | |
| Franklin Electric Co Inc | 46,828 | | 3,775,273 |
| |
| Healthcare — Products — 3.49% | | | |
| Accelerate Diagnostics Inc (a) | 31,886 | | 257,001 |
| Accuray Inc (a) | 97,044 | | 438,639 |
| AngioDynamics Inc (a) | 41,931 | | 1,137,588 |
| Atrion Corp | 1,647 | | 1,022,672 |
| Avanos Medical Inc (a) | 42,241 | | 1,536,305 |
| AxoGen Inc (a) | 32,214 | | 696,145 |
| Axonics Inc (a) | 90,204 | | 5,719,836 |
| Castle Biosciences Inc (a) | 26,760 | | 1,962,311 |
| ClearPoint Neuro Inc (a) | 32,869 | | 627,469 |
| Co-Diagnostics Inc (a),(b) | 135,613 | | 1,118,807 |
| CONMED Corp | 58,071 | | 7,980,697 |
| Inogen Inc (a) | 22,845 | | 1,488,809 |
| Invacare Corp (a) | 42,150 | | 340,150 |
| LeMaitre Vascular Inc | 18,980 | | 1,158,160 |
| Meridian Bioscience Inc (a) | 59,799 | | 1,326,342 |
| Natus Medical Inc (a) | 28,352 | | 736,585 |
| NuVasive Inc (a) | 134,998 | | 9,150,164 |
| Orthofix Medical Inc (a) | 18,274 | | 732,970 |
| Patterson Cos Inc | 137,093 | | 4,166,256 |
| Quanterix Corp (a) | 33,557 | | 1,968,454 |
| Shockwave Medical Inc (a) | 35,906 | | 6,812,445 |
| SI-BONE Inc (a) | 40,306 | | 1,268,430 |
| Sientra Inc (a) | 70,560 | | 561,658 |
See accompanying notes.
161
| | | |
| Schedule of Investments |
| Principal U.S. Small-Cap Multi-Factor ETF |
| June 30, 2021 |
| |
| COMMON STOCKS (continued) | Shares Held | | Value |
| |
| Healthcare — Products (continued) | | | |
| Silk Road Medical Inc (a) | 55,344 | $ | 2,648,764 |
| T2 Biosystems Inc (a),(b) | 683,595 | | 813,478 |
| Varex Imaging Corp (a) | 42,726 | | 1,145,911 |
| | | $ | 56,816,046 |
| |
| Healthcare — Services — 1.78% | | | |
| Brookdale Senior Living Inc (a) | 161,793 | | 1,278,165 |
| Community Health Systems Inc (a) | 134,906 | | 2,082,949 |
| Ensign Group Inc/The | 41,086 | | 3,560,924 |
| MEDNAX Inc (a) | 99,402 | | 2,996,970 |
| ModivCare Inc (a) | 10,534 | | 1,791,517 |
| National HealthCare Corp | 4,933 | | 344,817 |
| Neuronetics Inc (a) | 36,902 | | 591,170 |
| OPKO Health Inc (a) | 793,402 | | 3,213,278 |
| Pennant Group Inc/The (a) | 15,136 | | 619,062 |
| Personalis Inc (a) | 106,540 | | 2,695,462 |
| Select Medical Holdings Corp | 72,860 | | 3,079,064 |
| Surgery Partners Inc (a) | 39,829 | | 2,653,408 |
| Tivity Health Inc (a) | 92,708 | | 2,439,147 |
| Triple-S Management Corp, Class B (a) | 14,136 | | 314,809 |
| US Physical Therapy Inc | 11,871 | | 1,375,493 |
| | | $ | 29,036,235 |
| |
| Home Builders — 0.86% | | | |
| Century Communities Inc | 40,732 | | 2,710,307 |
| Forestar Group Inc (a) | 38,918 | | 813,776 |
| Hovnanian Enterprises Inc, Class A (a) | 4,784 | | 508,491 |
| LCI Industries | 22,185 | | 2,915,553 |
| Taylor Morrison Home Corp, Class A (a) | 118,265 | | 3,124,561 |
| TRI Pointe Homes Inc (a) | 186,309 | | 3,992,602 |
| | | $ | 14,065,290 |
| |
| Home Furnishings — 1.53% | | | |
| Ethan Allen Interiors Inc | 47,307 | | 1,305,673 |
| iRobot Corp (a) | 63,016 | | 5,885,064 |
| Lovesac Co/The (a) | 28,221 | | 2,251,754 |
| Sleep Number Corp (a) | 45,370 | | 4,988,431 |
| Sonos Inc (a) | 284,446 | | 10,021,033 |
| Universal Electronics Inc (a) | 10,136 | | 491,596 |
| | | $ | 24,943,551 |
| |
| Household Products — 0.20% | | | |
| Edgewell Personal Care Co | 75,678 | | 3,322,264 |
| |
| Household Products/Wares — 0.45% | | | |
| ACCO Brands Corp | 51,340 | | 443,064 |
| Central Garden & Pet Co, Class A (a) | 35,688 | | 1,723,731 |
| Quanex Building Products Corp | 48,912 | | 1,214,974 |
| Spectrum Brands Holdings Inc | 45,732 | | 3,889,049 |
| | | $ | 7,270,818 |
| |
| Housewares — 0.13% | | | |
| Tupperware Brands Corp (a) | 89,621 | | 2,128,499 |
| |
| Insurance — 2.51% | | | |
| American National Group Inc | 11,256 | | 1,672,079 |
| CNO Financial Group Inc | 264,193 | | 6,240,239 |
| Enstar Group Ltd (a) | 10,855 | | 2,593,476 |
| Hanover Insurance Group Inc/The | 82,725 | | 11,220,819 |
| Mercury General Corp | 108,159 | | 7,024,927 |
| Radian Group Inc | 403,748 | | 8,983,393 |
| Stewart Information Services Corp | 54,241 | | 3,074,922 |
| | | $ | 40,809,855 |
See accompanying notes.
162
| | | |
| Schedule of Investments |
| Principal U.S. Small-Cap Multi-Factor ETF |
| June 30, 2021 |
| |
| COMMON STOCKS (continued) | Shares Held | | Value |
| |
| Internet — 1.36% | | | |
| Cargurus Inc (a) | 229,036 | $ | 6,007,614 |
| ChannelAdvisor Corp (a) | 34,802 | | 852,997 |
| HealthStream Inc (a) | 32,062 | | 895,812 |
| Perficient Inc (a) | 57,011 | | 4,584,825 |
| Revolve Group Inc (a) | 99,010 | | 6,821,789 |
| Shutterstock Inc | 30,344 | | 2,978,871 |
| | | $ | 22,141,908 |
| |
| Investment Companies — 0.04% | | | |
| Altus Midstream Co, Class A | 9,191 | | 620,484 |
| |
| Iron & Steel — 0.34% | | | |
| Commercial Metals Co | 181,894 | | 5,587,784 |
| |
| Leisure Time — 0.91% | | | |
| Acushnet Holdings Corp | 57,849 | | 2,857,740 |
| Camping World Holdings Inc, Class A | 127,402 | | 5,222,208 |
| OneWater Marine Inc, Class A | 9,366 | | 393,653 |
| Vista Outdoor Inc (a) | 135,331 | | 6,263,119 |
| | | $ | 14,736,720 |
| |
| Lodging — 0.02% | | | |
| Full House Resorts Inc (a) | 28,722 | | 285,497 |
| |
| Machinery — Construction & Mining — 0.30% | | | |
| Terex Corp | 101,158 | | 4,817,144 |
| |
| Machinery — Diversified — 2.25% | | | |
| Albany International Corp, Class A | 29,902 | | 2,669,053 |
| Altra Industrial Motion Corp | 66,974 | | 4,354,649 |
| Applied Industrial Technologies Inc | 33,808 | | 3,078,556 |
| Cactus Inc, Class A | 52,690 | | 1,934,777 |
| Crane Co | 75,923 | | 7,013,008 |
| Curtiss-Wright Corp | 51,780 | | 6,149,393 |
| Ichor Holdings Ltd (a) | 30,264 | | 1,628,203 |
| Kadant Inc | 11,121 | | 1,958,297 |
| Lindsay Corp | 17,796 | | 2,941,323 |
| Mueller Water Products Inc, Class A | 235,345 | | 3,393,675 |
| Tennant Co | 19,810 | | 1,581,828 |
| | | $ | 36,702,762 |
| |
| Media — 1.32% | | | |
| AMC Networks Inc, Class A (a) | 83,578 | | 5,583,010 |
| Audacy Inc (a) | 148,506 | | 640,061 |
| EW Scripps Co/The Class A | 55,855 | | 1,138,884 |
| Gray Television Inc | 103,202 | | 2,414,927 |
| Meredith Corp (a) | 36,103 | | 1,568,314 |
| Sinclair Broadcast Group Inc, Class A | 109,318 | | 3,631,544 |
| TEGNA Inc | 280,811 | | 5,268,014 |
| WideOpenWest Inc (a) | 61,537 | | 1,274,431 |
| | | $ | 21,519,185 |
| |
| Metal Fabrication & Hardware — 1.07% | | | |
| AZZ Inc | 38,701 | | 2,003,938 |
| Helios Technologies Inc | 21,925 | | 1,711,246 |
| Mueller Industries Inc | 55,503 | | 2,403,835 |
| Valmont Industries Inc | 37,092 | | 8,755,567 |
| Worthington Industries Inc | 41,118 | | 2,515,599 |
| | | $ | 17,390,185 |
| |
| Mining — 0.13% | | | |
| Kaiser Aluminum Corp | 16,649 | | 2,055,985 |
See accompanying notes.
163
| | | |
| Schedule of Investments |
| Principal U.S. Small-Cap Multi-Factor ETF |
| June 30, 2021 |
| |
| COMMON STOCKS (continued) | Shares Held | | Value |
| |
| Miscellaneous Manufacture — 0.87% | | | |
| EnPro Industries Inc | 21,040 | $ | 2,044,036 |
| Federal Signal Corp | 61,653 | | 2,480,300 |
| Hillenbrand Inc | 82,034 | | 3,616,059 |
| Myers Industries Inc | 32,681 | | 686,301 |
| Standex International Corp | 13,301 | | 1,262,398 |
| Trinseo SA | 68,671 | | 4,109,273 |
| | | $ | 14,198,367 |
| |
| Office & Business Equipment — 0.72% | | | |
| Pitney Bowes Inc | 162,091 | | 1,421,538 |
| Xerox Holding Corp | 441,525 | | 10,371,422 |
| | | $ | 11,792,960 |
| |
| Office Furnishings — 0.21% | | | |
| HNI Corp | 51,749 | | 2,275,403 |
| Interface Inc | 46,176 | | 706,493 |
| Kimball International Inc, Class B | 37,384 | | 491,600 |
| | | $ | 3,473,496 |
| |
| Oil & Gas — 2.61% | | | |
| Bonanza Creek Energy Inc | 28,556 | | 1,344,131 |
| Callon Petroleum Co (a) | 143,680 | | 8,288,899 |
| Cimarex Energy Co | 144,183 | | 10,446,058 |
| Matador Resources Co | 177,104 | | 6,377,515 |
| Par Pacific Holdings Inc (a) | 64,746 | | 1,089,028 |
| Patterson-UTI Energy Inc | 222,088 | | 2,207,555 |
| PDC Energy Inc | 99,970 | | 4,577,626 |
| Transocean Ltd (a) | 1,818,779 | | 8,220,881 |
| | | $ | 42,551,693 |
| |
| Oil & Gas Services — 0.82% | | | |
| Archrock Inc | 179,001 | | 1,594,899 |
| ChampionX Corp (a) | 162,004 | | 4,155,403 |
| Core Laboratories N.V. | 66,388 | | 2,585,813 |
| Helix Energy Solutions Group Inc (a) | 225,828 | | 1,289,478 |
| Oceaneering International Inc (a) | 104,036 | | 1,619,841 |
| ProPetro Holding Corp (a) | 101,133 | | 926,378 |
| Solaris Oilfield Infrastructure Inc, Class A | 45,883 | | 446,900 |
| TETRA Technologies Inc (a) | 166,472 | | 722,488 |
| | | $ | 13,341,200 |
| |
| Packaging & Containers — 0.78% | | | |
| Greif Inc, Class A | 40,282 | | 2,439,075 |
| Matthews International Corp, Class A | 21,418 | | 770,191 |
| O-I Glass Inc (a) | 237,193 | | 3,873,362 |
| Silgan Holdings Inc | 134,224 | | 5,570,296 |
| | | $ | 12,652,924 |
| |
| Pharmaceuticals — 6.19% | | | |
| Aclaris Therapeutics Inc (a) | 32,237 | | 566,082 |
| Adamas Pharmaceuticals Inc (a) | 63,641 | | 336,024 |
| AdaptHealth Corp (a) | 134,989 | | 3,700,049 |
| Agios Pharmaceuticals Inc (a) | 93,366 | | 5,145,400 |
| Akebia Therapeutics Inc (a) | 490,963 | | 1,860,750 |
| Alkermes PLC (a) | 204,572 | | 5,016,105 |
| Amneal Pharmaceuticals Inc (a) | 148,351 | | 759,557 |
| Anika Therapeutics Inc (a) | 16,193 | | 700,995 |
| Arvinas Inc (a) | 62,999 | | 4,850,923 |
| BioDelivery Sciences International Inc (a) | 170,455 | | 610,229 |
| Cassava Sciences Inc (a),(b) | 114,468 | | 9,780,146 |
| cbdMD Inc (a),(b) | 70,613 | | 204,778 |
| Clovis Oncology Inc (a),(b) | 614,705 | | 3,565,289 |
See accompanying notes.
164
| | | | |
| Schedule of Investments |
| Principal U.S. Small-Cap Multi-Factor ETF |
| June 30, 2021 |
| |
| COMMON STOCKS (continued) | | Shares Held | | Value |
| |
| Pharmaceuticals (continued) | | | | |
| Coherus Biosciences Inc (a) | | 189,276 | $ | 2,617,687 |
| Collegium Pharmaceutical Inc (a) | | 70,307 | | 1,662,058 |
| Eagle Pharmaceuticals Inc (a) | | 20,183 | | 863,832 |
| Endo International PLC (a) | | 377,840 | | 1,768,291 |
| Heat Biologics Inc (a) | | 126,702 | | 852,704 |
| Heska Corp (a) | | 11,088 | | 2,547,246 |
| Intellia Therapeutics Inc (a) | | 84,660 | | 13,707,301 |
| Ironwood Pharmaceuticals Inc (a) | | 311,553 | | 4,009,687 |
| Jaguar Health Inc (a),(b) | | 1,166,386 | | 1,842,890 |
| Jounce Therapeutics Inc (a) | | 37,277 | | 253,484 |
| Lannett Co Inc (a) | | 60,426 | | 282,189 |
| MannKind Corp (a),(b) | | 309,543 | | 1,687,009 |
| Novan Inc (a),(b) | | 65,404 | | 657,964 |
| Ocular Therapeutix Inc (a) | | 115,560 | | 1,638,641 |
| Owens & Minor Inc | | 84,539 | | 3,578,536 |
| Pacira BioSciences Inc (a) | | 77,930 | | 4,728,792 |
| Paratek Pharmaceuticals Inc (a) | | 56,067 | | 382,377 |
| PetIQ Inc (a) | | 44,325 | | 1,710,945 |
| Phibro Animal Health Corp, Class A | | 28,312 | | 817,651 |
| Premier Inc, Class A | | 176,148 | | 6,128,189 |
| Prestige Consumer Healthcare Inc (a) | | 123,844 | | 6,452,272 |
| Supernus Pharmaceuticals Inc (a) | | 86,628 | | 2,667,276 |
| USANA Health Sciences Inc (a) | | 10,627 | | 1,088,524 |
| Vanda Pharmaceuticals Inc (a) | | 66,539 | | 1,431,254 |
| Voyager Therapeutics Inc (a) | | 74,554 | | 307,908 |
| | | | $ | 100,781,034 |
| |
| Pipelines — 0.47% | | | | |
| Antero Midstream Corp | | 742,788 | | 7,717,567 |
| |
| Real Estate — 0.86% | | | | |
| Alexander & Baldwin Inc | | 103,827 | | 1,902,111 |
| Kennedy-Wilson Holdings Inc | | 173,957 | | 3,456,525 |
| RE/MAX Holdings Inc, Class A | | 21,353 | | 711,695 |
| Realogy Holdings Corp (a) | | 205,044 | | 3,735,902 |
| RMR Group Inc/The, Class A | | 14,972 | | 578,518 |
| St Joe Co/The | | 80,421 | | 3,587,581 |
| | | | $ | 13,972,332 |
| |
| REITs — 7.29% | | | | |
| Alexander's Inc | | 3,187 | | 853,957 |
| Ares Commercial Real Estate Corp | | 131,206 | | 1,927,416 |
| Brandywine Realty Trust | | 594,544 | | 8,151,198 |
| CareTrust REIT Inc | | 200,112 | | 4,648,602 |
| Corporate Office Properties Trust | | 349,420 | | 9,780,266 |
| CTO Realty Growth Inc | | 12,407 | | 664,023 |
| Essential Properties Realty Trust Inc | | 238,735 | | 6,455,394 |
| GEO Group Inc/The | | 823,142 | | 5,860,771 |
| Getty Realty Corp | | 77,812 | | 2,423,844 |
| Healthcare Realty Trust Inc | | 335,903 | | 10,144,271 |
| Industrial Logistics Properties Trust | | 117,537 | | 3,072,417 |
| KKR Real Estate Finance Trust Inc | | 151,296 | | 3,272,532 |
| LTC Properties Inc | | 91,958 | | 3,530,268 |
| Macerich Co/The | | 914,854 | | 16,696,085 |
| National Health Investors Inc | | 98,345 | | 6,594,032 |
| PotlatchDeltic Corp | | 127,903 | | 6,798,044 |
| Retail Value Inc | | 37,629 | | 818,431 |
| Sabra Health Care REIT Inc | | 577,812 | | 10,516,178 |
| Tanger Factory Outlet Centers Inc | | 619,394 | | 11,675,577 |
| UMH Properties Inc | | 55,468 | | 1,210,312 |
| Urban Edge Properties | | 189,329 | | 3,616,184 |
| | | | $ | 118,709,802 |
See accompanying notes.
165
| | | | |
| Schedule of Investments |
| Principal U.S. Small-Cap Multi-Factor ETF |
| June 30, 2021 |
| |
| COMMON STOCKS (continued) | | Shares Held | | Value |
| |
| Retail — 7.65% | | | | |
| American Eagle Outfitters Inc | | 366,057 | $ | 13,738,119 |
| Asbury Automotive Group Inc (a) | | 22,501 | | 3,855,996 |
| At Home Group Inc (a) | | 140,779 | | 5,186,298 |
| Bassett Furniture Industries Inc | | 7,424 | | 180,774 |
| Big 5 Sporting Goods Corp (b) | | 79,881 | | 2,051,344 |
| Big Lots Inc | | 98,749 | | 6,518,421 |
| BlueLinx Holdings Inc (a) | | 15,601 | | 784,418 |
| Buckle Inc/The | | 58,839 | | 2,927,240 |
| Caleres Inc | | 32,795 | | 894,976 |
| Chuy's Holdings Inc (a) | | 13,906 | | 518,138 |
| Citi Trends Inc (a) | | 19,200 | | 1,670,400 |
| Container Store Group Inc/The (a) | | 89,409 | | 1,165,893 |
| Dick's Sporting Goods Inc | | 140,631 | | 14,089,820 |
| Dillard's Inc, Class A | | 33,104 | | 5,987,852 |
| Duluth Holdings Inc, Class B (a) | | 22,087 | | 456,097 |
| Franchise Group Inc | | 22,339 | | 787,897 |
| GMS Inc (a) | | 44,554 | | 2,144,830 |
| Group 1 Automotive Inc | | 20,494 | | 3,164,888 |
| Haverty Furniture Cos Inc | | 24,744 | | 1,058,053 |
| Hibbett Inc (a) | | 46,782 | | 4,193,071 |
| Jack in the Box Inc | | 66,222 | | 7,379,780 |
| Kirkland's Inc (a),(b) | | 47,067 | | 1,076,893 |
| La-Z-Boy Inc | | 70,122 | | 2,597,319 |
| Lazydays Holdings Inc (a) | | 13,548 | | 298,056 |
| Lumber Liquidators Holdings Inc (a) | | 61,357 | | 1,294,633 |
| MarineMax Inc (a) | | 44,548 | | 2,171,270 |
| MSC Industrial Direct Co Inc, Class A | | 118,806 | | 10,660,462 |
| National Vision Holdings Inc (a) | | 110,739 | | 5,662,085 |
| Nu Skin Enterprises Inc, Class A | | 49,931 | | 2,828,591 |
| PC Connection Inc | | 12,101 | | 559,913 |
| PriceSmart Inc | | 26,820 | | 2,440,888 |
| Rush Enterprises Inc, Class A | | 35,923 | | 1,553,311 |
| Ruth's Hospitality Group Inc (a) | | 51,922 | | 1,195,764 |
| Sally Beauty Holdings Inc (a) | | 178,762 | | 3,945,277 |
| Signet Jewelers Ltd (a) | | 76,779 | | 6,202,975 |
| Sonic Automotive Inc, Class A | | 37,612 | | 1,682,761 |
| World Fuel Services Corp | | 51,945 | | 1,648,215 |
| | | | $ | 124,572,718 |
| |
| Savings & Loans — 2.06% | | | | |
| Axos Financial Inc (a) | | 83,674 | | 3,881,637 |
| Berkshire Hills Bancorp Inc | | 70,312 | | 1,927,252 |
| Flushing Financial Corp | | 39,604 | | 848,714 |
| Investors Bancorp Inc | | 729,452 | | 10,401,985 |
| Northfield Bancorp Inc | | 49,462 | | 811,177 |
| OceanFirst Financial Corp | | 81,869 | | 1,706,150 |
| Pacific Premier Bancorp Inc | | 128,169 | | 5,420,267 |
| Provident Financial Services Inc | | 89,550 | | 2,049,799 |
| WSFS Financial Corp | | 140,044 | | 6,524,650 |
| | | | $ | 33,571,631 |
| |
| Semiconductors — 1.63% | | | | |
| Amkor Technology Inc | | 172,264 | | 4,077,489 |
| CMC Material Inc | | 24,095 | | 3,632,080 |
| Cohu Inc (a) | | 83,894 | | 3,086,460 |
| CTS Corp | | 33,126 | | 1,230,962 |
| SMART Global Holdings Inc (a) | | 34,022 | | 1,622,169 |
| Synaptics Inc (a) | | 71,731 | | 11,159,909 |
| Veeco Instruments Inc (a) | | 71,540 | | 1,719,822 |
| | | | $ | 26,528,891 |
| |
| Software — 3.27% | | | | |
| Altair Engineering Inc, Class A (a) | | 42,696 | | 2,944,743 |
See accompanying notes.
166
| | | |
| Schedule of Investments |
| Principal U.S. Small-Cap Multi-Factor ETF |
| June 30, 2021 |
| |
| COMMON STOCKS (continued) | Shares Held | | Value |
| |
| Software (continued) | | | |
| American Software Inc, Class A | 28,545 | $ | 626,848 |
| Apollo Medical Holdings Inc (a) | 12,200 | | 766,282 |
| Blackbaud Inc (a) | 69,542 | | 5,324,831 |
| BM Technologies Inc (a) | 3,549 | | 44,150 |
| Castlight Health Inc, Class B (a) | 110,182 | | 289,779 |
| Cerence Inc (a) | 73,420 | | 7,834,648 |
| CommVault Systems Inc (a) | 69,755 | | 5,452,748 |
| Computer Programs & Systems Inc | 14,853 | | 493,565 |
| CSG Systems International Inc | 57,747 | | 2,724,503 |
| Donnelley Financial Solutions Inc (a) | 36,379 | | 1,200,507 |
| Ebix Inc | 48,922 | | 1,658,456 |
| Evolent Health Inc, Class A (a) | 83,061 | | 1,754,248 |
| Health Catalyst Inc (a) | 96,056 | | 5,332,069 |
| Inovalon Holdings Inc, Class A (a) | 82,848 | | 2,823,460 |
| NextGen Healthcare Inc (a) | 57,677 | | 956,861 |
| Phreesia Inc (a) | 61,770 | | 3,786,501 |
| Progress Software Corp | 62,886 | | 2,908,478 |
| QAD Inc, Class A | 8,157 | | 709,822 |
| Sciplay Corp, Class A (a) | 81,286 | | 1,377,798 |
| Simulations Plus Inc | 29,557 | | 1,622,975 |
| Xperi Holding Corp | 119,216 | | 2,651,364 |
| | | $ | 53,284,636 |
| |
| Telecommunications — 2.39% | | | |
| Cambium Networks Corp (a) | 27,286 | | 1,319,278 |
| Casa Systems Inc (a) | 68,273 | | 605,581 |
| Clearfield Inc (a) | 24,031 | | 899,961 |
| CommScope Holding Co Inc (a) | 431,737 | | 9,200,315 |
| Consolidated Communications Holdings Inc (a) | 60,869 | | 535,039 |
| EchoStar Corp, Class A (a) | 150,061 | | 3,644,982 |
| IDT Corp, Class B (a) | 15,852 | | 585,890 |
| InterDigital Inc | 65,210 | | 4,762,286 |
| Loral Space & Communications Inc | 25,394 | | 986,557 |
| NETGEAR Inc (a) | 77,958 | | 2,987,351 |
| Ribbon Communications Inc (a) | 107,026 | | 814,468 |
| Switch Inc, Class A | 334,474 | | 7,060,746 |
| Telephone & Data Systems Inc | 240,456 | | 5,448,733 |
| | | $ | 38,851,187 |
| |
| Toys, Games & Hobbies — 0.15% | | | |
| Funko Inc, Class A (a) | 111,784 | | 2,378,764 |
| |
| Transportation — 1.43% | | | |
| ArcBest Corp | 33,788 | | 1,966,124 |
| Atlas Air Worldwide Holdings Inc (a) | 93,898 | | 6,395,393 |
| Daseke Inc (a) | 49,349 | | 319,782 |
| Forward Air Corp | 36,659 | | 3,290,145 |
| International Seaways Inc | 26,467 | | 507,637 |
| Matson Inc | 50,797 | | 3,251,008 |
| Ryder System Inc | 96,247 | | 7,154,039 |
| US Xpress Enterprises Inc, Class A (a) | 41,170 | | 354,062 |
| | | $ | 23,238,190 |
| |
| Water — 0.38% | | | |
| California Water Service Group | 71,247 | | 3,957,058 |
| SJW Group | 35,766 | | 2,263,988 |
| | | $ | 6,221,046 |
| TOTAL COMMON STOCKS | | $ | 1,623,399,604 |
See accompanying notes.
167
| | | | |
| Schedule of Investments |
| Principal U.S. Small-Cap Multi-Factor ETF |
| June 30, 2021 |
| |
| INVESTMENT COMPANIES — 1.24% | Shares Held | | Value | |
| Money Market Funds — 1.24% | | | | |
| Principal Government Money Market Fund — Institutional Class 0.00% (a),(c),(d),(e) | 16,551,960 | $ | 16,551,960 | |
| State Street Institutional U.S. Government Money Market Fund — Institutional | | | | |
| Class 0.03% (e) | 3,663,799 | | 3,663,799 | |
| TOTAL INVESTMENT COMPANIES | | $ | 20,215,759 | |
| Total Investments | | $ | 1,643,615,363 | |
| Other Assets and Liabilities — (0.96)% | | | (15,612,064 | ) |
| Total Net Assets — 100.00% | | $ | 1,628,003,299 | |
| (a) | Non-income producing security. |
| (b) | Security or a portion of the security was on loan. At the end of the period, the value of these securities totaled $16,161,357 or 0.99% of net assets. |
| (c) | Security or a portion of the security was received as collateral for securities lending. At the end of the period, the value of these securities totaled $16,551,960 or 1.02% of net assets. |
| (d) | Affiliated Security. Security is either an affiliate (and registered under the Investment Company Act of 1940) or an affiliate as defined by the Investment Company Act of 1940 (controls 5.00% or more of the outstanding voting shares of the security). |
| | Please see Affiliated Securities sub-schedule for transactional information. |
| (e) | Current yield shown is as of period end. |
| | | | | | | | | | |
| Portfolio Summary (unaudited) | | | | | | | |
| Sector | | | | | Percent | | | | | |
| Financial | | | | | 25.85 | % | | | | |
| Consumer, Non-cyclical | | | | | 20.48 | % | | | | |
| Consumer, Cyclical | | | | | 15.11 | % | | | | |
| Industrial | | | | | 13.76 | % | | | | |
| Technology | | | | | 7.30 | % | | | | |
| Communications | | | | | 5.07 | % | | | | |
| Basic Materials | | | | | 4.41 | % | | | | |
| Energy | | | | | 4.28 | % | | | | |
| Utilities | | | | | 3.46 | % | | | | |
| Money Market Funds | | | | | 1.24 | % | | | | |
| Other Assets and Liabilities | | | | | (0.96 | )% | | | | |
| TOTAL NET ASSETS | | | | | 100.00 | % | | | | |
| |
| | | | June 30, 2020 | | Purchases | | | Sales | | June 30, 2021 |
| Affiliated Securities | | | Value | | Cost | | | Proceeds | | Value |
| Principal Government Money | | | | | | | | | | |
| Market Fund — Institutional Class | | | | | | | | | | |
| 0.00 | % | $ | 13,835,298 | $ | 211,907,367 | | $ | 209,190,705 | $ | 16,551,960 |
| | | $ | 13,835,298 | $ | 211,907,367 | | $ | 209,190,705 | $ | 16,551,960 |
| |
| | | | | | | | | Realized Gain | | |
| | | | | | Realized | | | from | | Change in |
| | | | | | Gain/Loss on | | | Capital Gain | | Unrealized |
| | | | Income (a) | | Investments | | | Distributions | | Gain/Loss |
| Principal Government Money | | | | | | | | | | |
| Market Fund — Institutional Class | | | | | | | | | | |
| 0.00 | % | $ | — | $ | — | | $ | — | $ | — |
| | | $ | — | $ | — | | $ | — | $ | — |
| (a) | Amount excludes earnings from securities lending collateral. |
See accompanying notes.
168
| | | | |
| Schedule of Investments |
| Principal Value ETF |
| June 30, 2021 |
| |
| COMMON STOCKS — 99.54% | | Shares Held | | Value |
| Advertising — 1.75% | | | | |
| Interpublic Group of Cos Inc/The | | 24,011 | $ | 780,117 |
| Aerospace & Defense — 3.56% | | | | |
| General Dynamics Corp | | 2,573 | | 484,393 |
| L3Harris Technologies Inc | | 1,424 | | 307,798 |
| Lockheed Martin Corp | | 1,210 | | 457,803 |
| Northrop Grumman Corp | | 920 | | 334,356 |
| | | | $ | 1,584,350 |
| |
| Agriculture — 2.94% | | | | |
| Altria Group Inc | | 27,402 | | 1,306,527 |
| Banks — 5.33% | | | | |
| Citigroup Inc | | 7,280 | | 515,060 |
| First Horizon Corp | | 41,990 | | 725,587 |
| Regions Financial Corp | | 26,982 | | 544,497 |
| State Street Corp | | 7,115 | | 585,422 |
| | | | $ | 2,370,566 |
| |
| Biotechnology — 0.98% | | | | |
| Amgen Inc | | 1,786 | | 435,337 |
| Building Materials — 1.10% | | | | |
| Fortune Brands Home & Security Inc | | 1,944 | | 193,642 |
| Masco Corp | | 2,691 | | 158,527 |
| Vulcan Materials Co | | 794 | | 138,211 |
| | | | $ | 490,380 |
| |
| Chemicals — 3.23% | | | | |
| Celanese Corp | | 1,985 | | 300,926 |
| Dow Inc | | 12,298 | | 778,218 |
| NewMarket Corp | | 729 | | 234,723 |
| Sherwin-Williams Co/The | | 455 | | 123,965 |
| | | | $ | 1,437,832 |
| |
| Commercial Services — 3.81% | | | | |
| Automatic Data Processing Inc | | 1,718 | | 341,229 |
| Booz Allen Hamilton Holding Corp | | 2,658 | | 226,408 |
| ManpowerGroup Inc | | 3,828 | | 455,188 |
| Quanta Services Inc | | 624 | | 56,516 |
| Robert Half International Inc | | 4,036 | | 359,083 |
| Service Corp International | | 4,795 | | 256,964 |
| | | | $ | 1,695,388 |
| |
| Computers — 3.12% | | | | |
| Apple Inc | | 728 | | 99,707 |
| Cognizant Technology Solutions Corp, Class A | | 2,110 | | 146,139 |
| Genpact Ltd | | 3,364 | | 152,826 |
| HP Inc | | 14,576 | | 440,049 |
| NetApp Inc | | 6,712 | | 549,176 |
| | | | $ | 1,387,897 |
| |
| Construction Materials — 0.96% | | | | |
| Lennox International Inc | | 583 | | 204,517 |
| Owens Corning | | 2,258 | | 221,058 |
| | | | $ | 425,575 |
| |
| Distribution/Wholesale — 1.05% | | | | |
| Fastenal Co | | 8,965 | | 466,180 |
| Diversified Financial Services — 7.65% | | | | |
| Ameriprise Financial Inc | | 1,375 | | 342,210 |
| Cboe Global Markets Inc | | 2,443 | | 290,839 |
| Jefferies Financial Group Inc | | 12,144 | | 415,325 |
See accompanying notes.
169
| | | |
| Schedule of Investments |
| Principal Value ETF |
| June 30, 2021 |
| |
| COMMON STOCKS (continued) | Shares Held | | Value |
| |
| Diversified Financial Services (continued) | | | |
| Raymond James Financial Inc | 1,908 | $ | 247,849 |
| Santander Consumer USA Holdings Inc | 17,477 | | 634,765 |
| Synchrony Financial | 9,454 | | 458,708 |
| T Rowe Price Group Inc | 2,156 | | 426,823 |
| Western Union Co/The | 25,585 | | 587,688 |
| | | $ | 3,404,207 |
| |
| Electric — 1.14% | | | |
| NRG Energy Inc | 12,581 | | 507,014 |
| |
| Electrical Components & Equipment — 0.22% | | | |
| AMETEK Inc | 730 | | 97,455 |
| |
| Electronics — 1.27% | | | |
| Allegion PLC | 1,461 | | 203,517 |
| Hubbell Inc | 1,924 | | 359,480 |
| | | $ | 562,997 |
| |
| Environmental Control — 0.16% | | | |
| Tetra Tech Inc | 590 | | 72,004 |
| |
| Food — 1.76% | | | |
| Kroger Co/The | 9,589 | | 367,355 |
| Tyson Foods Inc, Class A | 5,617 | | 414,310 |
| | | $ | 781,665 |
| |
| Gas — 1.48% | | | |
| UGI Corp | 14,209 | | 658,019 |
| |
| Hand/Machine Tools — 0.93% | | | |
| Snap-on Inc | 1,848 | | 412,899 |
| |
| Healthcare — Services — 1.94% | | | |
| Anthem Inc | 564 | | 215,335 |
| Humana Inc | 231 | | 102,268 |
| Quest Diagnostics Inc | 2,316 | | 305,643 |
| UnitedHealth Group Inc | 603 | | 241,465 |
| | | $ | 864,711 |
| |
| Home Builders — 2.07% | | | |
| DR Horton Inc | 1,970 | | 178,029 |
| Lennar Corp, Class A | 1,424 | | 141,474 |
| PulteGroup Inc | 3,705 | | 202,182 |
| Thor Industries Inc | 2,149 | | 242,837 |
| Toll Brothers Inc | 2,735 | | 158,110 |
| | | $ | 922,632 |
| |
| Home Furnishings — 1.00% | | | |
| Whirlpool Corp | 2,032 | | 443,017 |
| |
| Household Products/Wares — 0.69% | | | |
| Clorox Co/The | 1,714 | | 308,366 |
| |
| Housewares — 1.67% | | | |
| Newell Brands Inc | 27,057 | | 743,256 |
| |
| Insurance — 15.49% | | | |
| Aflac Inc | 7,587 | | 407,118 |
| Alleghany Corp (a) | 557 | | 371,558 |
| Allstate Corp/The | 2,658 | | 346,710 |
| American Financial Group Inc | 6,601 | | 823,277 |
| Assurant Inc | 2,194 | | 342,659 |
| Essent Group Ltd | 5,183 | | 232,976 |
| Fidelity National Financial Inc | 13,054 | | 567,327 |
| First American Financial Corp | 9,494 | | 591,951 |
| Hartford Financial Services Group Inc/The | 7,528 | | 466,510 |
See accompanying notes.
170
| | | |
| Schedule of Investments |
| Principal Value ETF |
| June 30, 2021 |
| |
| COMMON STOCKS (continued) | Shares Held | | Value |
| Insurance (continued) | | | |
| Old Republic International Corp | 31,906 | $ | 794,778 |
| Primerica Inc | 1,217 | | 186,371 |
| Progressive Corp/The | 4,497 | | 441,650 |
| Prudential Financial Inc | 9,391 | | 962,296 |
| Travelers Cos Inc/The | 2,383 | | 356,759 |
| | | $ | 6,891,940 |
| |
| Internet — 0.93% | | | |
| CDW Corp | 1,070 | | 186,876 |
| eBay Inc | 3,258 | | 228,744 |
| | | $ | 415,620 |
| |
| Iron & Steel — 0.77% | | | |
| Reliance Steel & Aluminum Co | 2,279 | | 343,901 |
| Leisure Time — 1.46% | | | |
| Brunswick Corp | 2,116 | | 210,796 |
| Polaris Inc | 3,193 | | 437,313 |
| | | $ | 648,109 |
| |
| Machinery — Construction & Mining — 0.54% | | | |
| Oshkosh Corp | 1,945 | | 242,425 |
| Machinery — Diversified — 0.20% | | | |
| AGCO Corp | 695 | | 90,614 |
| Media — 1.87% | | | |
| Fox Corp, Class A | 6,838 | | 253,895 |
| Nexstar Media Group Inc, Class A | 2,153 | | 318,386 |
| ViacomCBS Inc, Class B | 5,780 | | 261,256 |
| | | $ | 833,537 |
| |
| Mining — 0.66% | | | |
| Newmont Corp | 4,605 | | 291,865 |
| Miscellaneous Manufacture — 1.26% | | | |
| AO Smith Corp | 4,345 | | 313,101 |
| Carlisle Cos Inc | 1,300 | | 248,794 |
| | | $ | 561,895 |
| |
| Oil & Gas — 1.19% | | | |
| EOG Resources Inc | 6,359 | | 530,595 |
| Packaging & Containers — 1.10% | | | |
| Sealed Air Corp | 4,810 | | 284,992 |
| Silgan Holdings Inc | 4,973 | | 206,380 |
| | | $ | 491,372 |
| |
| Pharmaceuticals — 4.46% | | | |
| Bristol-Myers Squibb Co | 8,717 | | 582,470 |
| Cardinal Health Inc | 12,697 | | 724,872 |
| CVS Health Corp | 6,228 | | 519,664 |
| McKesson Corp | 814 | | 155,669 |
| | | $ | 1,982,675 |
| |
| Pipelines — 3.16% | | | |
| Equitrans Midstream Corp | 165,496 | | 1,408,371 |
| REITs — 3.40% | | | |
| Essex Property Trust Inc | 2,454 | | 736,224 |
| VICI Properties Inc | 24,990 | | 775,190 |
| | | $ | 1,511,414 |
See accompanying notes.
171
| | | |
| Schedule of Investments |
| Principal Value ETF |
| June 30, 2021 |
| |
| COMMON STOCKS (continued) | Shares Held | | Value |
| Retail — 6.78% | | | |
| Advance Auto Parts Inc | 568 | $ | 116,519 |
| Best Buy Co Inc | 3,171 | | 364,602 |
| Dollar General Corp | 505 | | 109,277 |
| Home Depot Inc/The | 1,258 | | 401,164 |
| Lowe's Cos Inc | 1,267 | | 245,760 |
| Qurate Retail Inc, Series A | 96,195 | | 1,259,192 |
| Tractor Supply Co | 965 | | 179,548 |
| Williams-Sonoma Inc | 2,128 | | 339,735 |
| | | $ | 3,015,797 |
| |
| Semiconductors — 3.20% | | | |
| Broadcom Inc | 939 | | 447,753 |
| Entegris Inc | 458 | | 56,320 |
| Intel Corp | 6,263 | | 351,605 |
| KLA Corp | 627 | | 203,280 |
| Texas Instruments Inc | 1,901 | | 365,562 |
| | | $ | 1,424,520 |
| |
| Shipbuilding — 0.96% | | | |
| Huntington Ingalls Industries Inc | 2,032 | | 428,244 |
| Software — 0.94% | | | |
| Cerner Corp | 2,023 | | 158,117 |
| Oracle Corp | 3,320 | | 258,429 |
| | | $ | 416,546 |
| |
| Telecommunications — 1.36% | | | |
| Juniper Networks Inc | 22,115 | | 604,845 |
| TOTAL COMMON STOCKS | | $ | 44,292,676 |
| INVESTMENT COMPANIES — 0.29% | Shares Held | | Value |
| Money Market Fund — 0.29% | | | |
| State Street Institutional U.S. Government Money Market Fund — Institutional | | | |
| Class 0.03% (b) | 129,538 | $ | 129,538 |
| TOTAL INVESTMENT COMPANIES | | $ | 129,538 |
| Total Investments | | $ | 44,422,214 |
| Other Assets and Liabilities — 0.17% | | | 76,122 |
| Total Net Assets — 100.00% | | $ | 44,498,336 |
| (a) | Non-income producing security. |
| (b) | Current yield shown is as of period end. |
| | |
| Portfolio Summary (unaudited) |
|
| Sector | Percent | |
| Financial | 31.86 | % |
| Consumer, Non-cyclical | 16.57 | % |
| Consumer, Cyclical | 14.02 | % |
| Industrial | 12.27 | % |
| Technology | 7.26 | % |
| Communications | 5.92 | % |
| Basic Materials | 4.66 | % |
| Energy | 4.36 | % |
| Utilities | 2.62 | % |
| Money Market Fund | 0.29 | % |
| Other Assets and Liabilities | 0.17 | % |
| TOTAL NET ASSETS | 100.00 | % |
See accompanying notes.
172
| | | | | | | | | |
| | | | Schedule of Investments | | | | |
| | | | Principal Value ETF | | | | |
| | | | June 30, 2021 | | | | |
| |
| | | | June 30, 2020 | | Purchases | | Sales | | June 30, 2021 |
| Affiliated Securities | | | Value | | Cost | | Proceeds | | Value |
| Principal Government Money | | | | | | | | | |
| Market Fund — Institutional Class | | | | | | | | | |
| 0.00 | % | $ | 982,112 | $ | 6,674,868 | $ | 7,656,980 | $ | — |
| | | $ | 982,112 | $ | 6,674,868 | $ | 7,656,980 | $ | — |
| |
| | | | | | | | Realized Gain | | |
| | | | | | Realized | | from | | Change in |
| | | | | | Gain/Loss on | | Capital Gain | | Unrealized |
| | | | Income (a) | | Investments | | Distributions | | Gain/Loss |
| Principal Government Money | | | | | | | | | |
| Market Fund — Institutional Class | | | | | | | | | |
| 0.00 | % | $ | — | $ | — | $ | — | $ | — |
| | | $ | — | $ | — | $ | — | $ | — |
| (a) | Amount excludes earnings from securities lending collateral. |
See accompanying notes.
173
| | | | | | | | | | | | | | | |
| Financial Highlights |
| Principal Exchange-Traded Funds |
|
| |
| |
| Principal Active Income ETF | | | | | | | | | | | | | | | |
| For a share outstanding: | | | | | | | | | | | | | | | |
| | | Year ended | | | Year ended | | | Year ended | | | Year ended | | | Year ended | |
| | | June 30, 2021 | | | June 30, 2020 | | | June 30, 2019 | | | June 30, 2018 | | | June 30, 2017 | |
| | | | | | | | | | | | | | | | |
| Net asset value, beginning of year (e) | $ | 18.07 | | $ | 19.96 | | $ | 20.14 | | $ | 20.66 | | $ | 19.56 | |
| |
| Investment Operations: (e) | | | | | | | | | | | | | | | |
| Net investment income (loss) (a) | | 0.77 | | | 0.94 | | | 0.96 | | | 0.89 | | | 0.98 | |
| Net realized and change in unrealized gain (loss) | | 2.82 | | | (1.86 | ) | | (0.01 | ) | | (0.25 | ) | | 1.11 | |
| Total from investment operations | | 3.59 | | | (0.92 | ) | | 0.95 | | | 0.64 | | | 2.09 | |
| |
| Dividends to Shareholders from: (e) | | | | | | | | | | | | | | | |
| Net investment income | | (0.81 | ) | | (0.97 | ) | | (0.96 | ) | | (0.94 | ) | | (0.99 | ) |
| Net realized gains | | — | | | — | | | (0.17 | ) | | (0.22 | ) | | — | |
| Total dividends to stockholders | | (0.81 | ) | | (0.97 | ) | | (1.13 | ) | | (1.16 | ) | | (0.99 | ) |
| |
| Net asset value, end of year (e) | $ | 20.85 | | $ | 18.07 | | $ | 19.96 | | $ | 20.14 | | $ | 20.66 | |
| Total return | | 20.25 | % | | (4.78 | )% | | 4.95 | % | | 3.10 | % | | 10.92 | % |
| |
| Ratios/Supplemental Data: | | | | | | | | | | | | | | | |
| Net assets, end of year (000s) | $ | 232,443 | | $ | 270,096 | | $ | 216,519 | | $ | 292,967 | | $ | 286,084 | |
| Ratio of expenses to average net assets | | 0.49 | % | | 0.49 | % | | 0.61 | % | | 0.65 | % (b) | | 0.77 | % (b) |
| Ratio of gross expenses to average net assets | | —% (c) | —% (c) | —% (c) | 0.68 | % | | 0.80 | % |
| Ratio of net investment income (loss) to average net | | | | | | | | | | | | | | | |
| assets | | 3.90 | % | | 4.89 | % | | 4.84 | % | | 4.34 | % | | 4.82 | % |
| Portfolio turnover rate (d) | | 19.5 | % | | 10.6 | % | | 17.9 | % | | 11.0 | % | | 30.7 | % |
| (a) | Calculated on average shares outstanding during the year. |
| (b) | Includes reimbursement from Advisor. |
| (c) | Ratio is not applicable as there was no reimbursement from Advisor in the year. |
| (d) | Portfolio turnover rate excludes in-kind transactions. |
| (e) | Reflects a 2 to 1 stock split effective after the close of trading on August 30, 2021, see 'Subsequent Events' in Notes to Financial Statements. |
| | |
See accompanying notes.
174
| | | | | | | | | | | | | | | | |
| Financial Highlights |
| Principal Exchange-Traded Funds |
|
| |
| |
| Principal Healthcare Innovators Index ETF | | | | | | | | | | | | | | | | |
| For a share outstanding: | | | | | | | | | | | | | | | | |
| | | Year ended | | | Year ended | | | Year ended | | | Year ended | | | Period ended | |
| | | June 30, 2021 | | | June 30, 2020 | | | June 30, 2019 | | | June 30, 2018 | | | June 30, 2017 (a) | |
| |
| Net asset value, beginning of period | $ | 44.34 | | | $ | 34.37 | | $ | 34.74 | | $ | 28.56 | | $ | 25.00 | |
| |
| Investment Operations: | | | | | �� | | | | | | | | | | | |
| Net investment income (loss) (b) | | (0.15 | ) | | | (0.10 | ) | | (0.13 | ) | | (0.12 | ) | | (0.08 | ) |
| Net realized and change in unrealized gain (loss) | | 16.79 | | | | 10.07 | | | (0.24 | ) | | 6.35 | | | 3.64 | |
| Total from investment operations | | 16.64 | | | | 9.97 | | | (0.37 | ) | | 6.23 | | | 3.56 | |
| |
| Dividends to Shareholders from: | | | | | | | | | | | | | | | | |
| Net realized gains | | (0.22 | ) | | | — | | | — | | | (0.05 | ) | | — | |
| Total dividends to stockholders | | (0.22 | ) | | | — | | | — | | | (0.05 | ) | | — | |
| |
| Net asset value, end of period | $ | 60.76 | | | $ | 44.34 | | $ | 34.37 | | $ | 34.74 | | $ | 28.56 | |
| Total return | | 37.51 | % | | | 29.01 | % | | (1.05 | )% | | 21.83 | % | | 14.24 | % (c) |
| |
| Ratios/Supplemental Data: | | | | | | | | | | | | | | | | |
| Net assets, end of period (000s) | $ | 176,197 | | $ | 95,338 | | $ | 56,713 | | $ | 52,104 | | $ | 7,140 | |
| Ratio of expenses to average net assets | | 0.42 | % | | | 0.42 | % | | 0.42 | % | | 0.42 | % | | 0.42 | % (d) |
| Ratio of net investment income (loss) to average net assets | (0.27 | )% | | | (0.29 | )% | | (0.39 | )% | | (0.38 | )% | | (0.32 | )% (d) |
| Portfolio turnover rate (e) | | 45.8 | % | | | 36.1 | % | | 34.5 | % | | 33.6 | % | | 18.2 | % (d) |
| (a) | Period from August 19, 2016, date operations commenced, through June 30, 2017. |
| (b) | Calculated on average shares outstanding during the period. |
| (c) | Total return amounts have not been annualized. |
| (d) | Computed on an annualized basis. |
| (e) | Portfolio turnover rate excludes in-kind transactions. |
See accompanying notes.
175
| | | |
| Financial Highlights |
| Principal Exchange-Traded Funds |
|
| |
| |
| Principal International Adaptive Multi-Factor ETF | | | |
| For a share outstanding: | | | |
| | | Period ended | |
| | | June 30, 2021 (a) | |
| |
| Net asset value, beginning of period | $ | 25.00 | |
| |
| Investment Operations: | | | |
| Net investment income (loss) (b) | | 0.07 | |
| Net realized and change in unrealized gain (loss) | | (0.27 | ) |
| Total from investment operations | | (0.20 | ) |
| |
| Net asset value, end of period | $ | 24.80 | |
| Total return (c) | | (0.80 | )% |
| |
| Ratios/Supplemental Data: | | | |
| Net assets, end of period (000s) | $ | 47,118 | |
| Ratio of expenses to average net assets (d) | | 0.24 | % |
| Ratio of net investment income (loss) to average net assets (d) | | 2.76 | % |
| Portfolio turnover rate (e) | | 1.5 | % |
| (a) | Period from May 26, 2021, date operations commenced, through June 30, 2021. |
| (b) | Calculated on average shares outstanding during the period. |
| (c) | Total return amounts have not been annualized. |
| (d) | Computed on an annualized basis. |
| (e) | Portfolio turnover rate excludes in-kind transactions. |
See accompanying notes.
176
| | | | | | |
| Financial Highlights |
| Principal Exchange-Traded Funds |
|
| |
| |
| Principal International Multi-Factor ETF (a) | | | | | | |
| For a share outstanding: | | | | | | |
| | | Year ended | | | Period ended | |
| | | June 30, 2021 | | | June 30, 2020 (b) | |
| |
| Net asset value, beginning of period | $ | 23.80 | | $ | 25.00 | |
| |
| Investment Operations: | | | | | | |
| Net investment income (loss) (c) | | 0.80 | | | 0.54 | |
| Net realized and change in unrealized gain (loss) | | 7.57 | | | (1.34 | ) |
| Total from investment operations | | 8.37 | | | (0.80 | ) |
| |
| Dividends to Shareholders from: | | | | | | |
| Net investment income | | (0.55 | ) | | (0.39 | ) |
| Net realized gains | | — | | | (0.01 | ) |
| Total dividends to stockholders | | (0.55 | ) | | (0.40 | ) |
| |
| Net asset value, end of period | $ | 31.62 | | $ | 23.80 | |
| Total return | | 35.54 | % | | (3.13 | )% (d) |
| |
| Ratios/Supplemental Data: | | | | | | |
| Net assets, end of period (000s) | $ | 91,694 | | $ | 16,661 | |
| Ratio of expenses to average net assets | | 0.25 | % | | 0.25 | % (e) |
| Ratio of net investment income (loss) to average net assets | | 2.78 | % | | 2.39 | % (e) |
| Portfolio turnover rate (f) | | 68.8 | % | | 56.1 | % |
| (a) | Effective September 30, 2020, Principal International Multi-Factor Core Index ETF changed its name to Principal International Multi-Factor ETF. |
| (b) | Period from July 23, 2019, date operations commenced, through June 30, 2020. |
| (c) | Calculated on average shares outstanding during the period. |
| (d) | Total return amounts have not been annualized. |
| (e) | Computed on an annualized basis. |
| (f) | Portfolio turnover rate excludes in-kind transactions. |
See accompanying notes.
177
| | | | | | | | | | | | |
| Financial Highlights |
| Principal Exchange-Traded Funds |
|
| |
| |
| Principal Investment Grade Corporate Active ETF | | | | | | | | | | | | |
| For a share outstanding: | | | | | | | | | | | | |
| | | Year ended | | | Year ended | | | Year ended | | | Period ended | |
| | | June 30, 2021 | | | June 30, 2020 | | | June 30, 2019 | | | June 30, 2018 (a) | |
| |
| Net asset value, beginning of period | $ | 26.67 | | $ | 26.20 | | $ | 24.59 | | $ | 25.00 | |
| |
| Investment Operations: | | | | | | | | | | | | |
| Net investment income (loss) (b) | | 0.62 | | | 0.88 | | | 0.95 | | | 0.19 | |
| Net realized and change in unrealized gain (loss) | | 0.69 | | | 1.39 | | | 1.66 | | | (0.52 | ) |
| Total from investment operations | | 1.31 | | | 2.27 | | | 2.61 | | | (0.33 | ) |
| |
| Dividends to Shareholders from: | | | | | | | | | | | | |
| Net investment income | | (0.79 | ) | | (0.95 | ) | | (0.98 | ) | | (0.08 | ) |
| Net realized gains | | (0.45 | ) | | (0.85 | ) | | (0.02 | ) | | — | |
| Total dividends to stockholders | | (1.24 | ) | | (1.80 | ) | | (1.00 | ) | | (0.08 | ) |
| |
| Net asset value, end of period | $ | 26.74 | | $ | 26.67 | | $ | 26.20 | | $ | 24.59 | |
| Total return | | 4.90 | % | | 8.98 | % | | 10.95 | % | | (1.32 | )% (c) |
| |
| Ratios/Supplemental Data: | | | | | | | | | | | | |
| Net assets, end of period (000s) | $ | 481,271 | | $ | 110,693 | | $ | 120,540 | | $ | 228,710 | |
| Ratio of expenses to average net assets | | 0.25 | % | | 0.26 | % | | 0.26 | % | | 0.26 | % (d) |
| Ratio of net investment income (loss) to average net assets | | 2.30 | % | | 3.37 | % | | 3.86 | % | | 3.83 | % (d) |
| Portfolio turnover rate (e) | | 67.8 | % | | 73.3 | % | | 92.8 | % | | 47.8 | % (d) |
| (a) | Period from April 18, 2018, date operations commenced, through June 30, 2018. |
| (b) | Calculated on average shares outstanding during the period. |
| (c) | Total return amounts have not been annualized. |
| (d) | Computed on an annualized basis. |
| (e) | Portfolio turnover rate excludes in-kind transactions. |
See accompanying notes.
178
| | | | | | | | | | | | | | | | |
| Financial Highlights |
| Principal Exchange-Traded Funds |
|
| |
| |
| Principal Millennials Index ETF | | | | | | | | | | | | | | | | |
| For a share outstanding: | | | | | | | | | | | | | | | | |
| | | Year ended | | | Year ended | | | Year ended | | | Year ended | | | Period ended | |
| | | June 30, 2021 | | | June 30, 2020 | | | June 30, 2019 | | | June 30, 2018 | | | June 30, 2017 (a) | |
| |
| Net asset value, beginning of period | $ | 42.85 | | | $ | 38.24 | | $ | 36.76 | | $ | 28.92 | | $ | 25.00 | |
| |
| Investment Operations: | | | | | | | | | | | | | | | | |
| Net investment income (loss) (b) | | 0.27 | | | | 0.34 | | | 0.17 | | | 0.23 | | | 0.17 | |
| Net realized and change in unrealized gain (loss) | | 23.81 | | | | 4.59 | | | 1.54 | | | 7.91 | | | 3.87 | |
| Total from investment operations | | 24.08 | | | | 4.93 | | | 1.71 | | | 8.14 | | | 4.04 | |
| |
| Dividends to Shareholders from: | | | | | | | | | | | | | | | | |
| Net investment income | | (0.40 | ) | | | (0.32 | ) | | (0.23 | ) | | (0.23 | ) | | (0.09 | ) |
| Net realized gains | | — | | | | — | | | — | | | (0.07 | ) | | (0.03 | ) |
| Total dividends to stockholders | | (0.40 | ) | | | (0.32 | ) | | (0.23 | ) | | (0.30 | ) | | (0.12 | ) |
| |
| Net asset value, end of period | $ | 66.53 | | | $ | 42.85 | | $ | 38.24 | | $ | 36.76 | | $ | 28.92 | |
| Total return | | 56.45 | % | | | 12.96 | % | | 4.70 | % | | 28.31 | % | | 16.23 | % (c) |
| |
| Ratios/Supplemental Data: | | | | | | | | | | | | | | | | |
| Net assets, end of period (000s) | $ | 126,399 | | $ | 25,708 | | $ | 21,031 | | $ | 20,217 | | $ | 7,230 | |
| Ratio of expenses to average net assets | | 0.45 | % | | | 0.45 | % | | 0.45 | % | | 0.45 | % | | 0.45 | % (d) |
| Ratio of expenses to average net assets excluding interest | | | | | | | | | | | | | | | | |
| expense | | —% (e) | | | | —% (e) | | | —% (e) | | | 0.45 | % | | —% (e) | |
| Ratio of net investment income (loss) to average net assets | | 0.46 | % | | | 0.88 | % | | 0.47 | % | | 0.66 | % | | 0.71 | % (d) |
| Portfolio turnover rate (f) | | 55.7 | % | | | 47.4 | % | | 32.9 | % | | 35.6 | % | | 5.1 | % (d) |
| (a) | Period from August 19, 2016, date operations commenced, through June 30, 2017. |
| (b) | Calculated on average shares outstanding during the period. |
| (c) | Total return amounts have not been annualized. |
| (d) | Computed on an annualized basis. |
| (e) | Ratio is not applicable as there was no interest expense in the period. |
| (f) | Portfolio turnover rate excludes in-kind transactions. |
See accompanying notes.
179
| | | | | | | | | | | | | | | |
| Financial Highlights |
| Principal Exchange-Traded Funds | | | | | | | | | | |
| |
| |
| Principal Quality ETF (a) | | | | | | | | | | | | | | | |
| For a share outstanding: | | | | | | | | | | | | | | | |
| | | Year ended | | | Year ended | | | Year ended | | | Year ended | | | Year ended | |
| | | June 30, 2021 | | June 30, 2020 | | June 30, 2019 | | | June 30, 2018 | | | June 30, 2017 | |
| |
| Net asset value, beginning of year | $ | 39.89 | | $ | 37.79 | | $ | 33.32 | | $ | 29.03 | | $ | 26.08 | |
| |
| Investment Operations: | | | | | | | | | | | | | | | |
| Net investment income (loss) (b) | | 0.57 | | | 0.51 | | | 0.46 | | | 0.39 | | | 0.34 | |
| Net realized and change in unrealized gain (loss) | | 13.22 | | | 1.00 | | | 4.48 | | | 4.20 | | | 3.06 | |
| Net realized gain due from reimbursement from Advisor | | — | | | 1.13 | (c) | | — | | | — | | | — | |
| Total from investment operations | | 13.79 | | | 2.64 | | | 4.94 | | | 4.59 | | | 3.40 | |
| |
| Dividends to Shareholders from: | | | | | | | | | | | | | | | |
| Net investment income | | (0.51 | ) | | (0.54 | ) | | (0.47 | ) | | (0.27 | ) | | (0.39 | ) |
| Net realized gains | | — | | | — | | | — | | | (0.03 | ) | | (0.06 | ) |
| Total dividends to stockholders | | (0.51 | ) | | (0.54 | ) | | (0.47 | ) | | (0.30 | ) | | (0.45 | ) |
| |
| Net asset value, end of year | $ | 53.17 | | $ | 39.89 | | $ | 37.79 | | $ | 33.32 | | $ | 29.03 | |
| Total return | | 34.83 | % | | 7.05% (c) | 15.03 | % | | 15.89 | % | | 13.23 | % |
| |
| Ratios/Supplemental Data: | | | | | | | | | | | | | | | |
| Net assets, end of year (000s) | $ | 58,486 | | $ | 17,951 | | $ | 20,786 | | $ | 21,655 | | $ | 7,257 | |
| Ratio of expenses to average net assets | | 0.15 | % | | 0.29% (d) | 0.29% (d) | 0.29% (d) | 0.40 | % |
| Ratio of gross expenses to average net assets | | —% (e) | | | 0.34 | % | | 0.40 | % | | 0.40 | % | | —% (e) | |
| Ratio of net investment income (loss) to average net assets | | 1.22 | % | | 1.32 | % | | 1.32 | % | | 1.22 | % | | 1.26 | % |
| Portfolio turnover rate (f) | | 45.1 | % | | 103.7 | % | | 40.4 | % | | 63.5 | % | | 2.0 | % |
| (a) | Effective September 30, 2020, Principal Price Setters Index ETF changed its name to Principal Quality ETF. |
| (b) | Calculated on average shares outstanding during the year. |
| (c) | During 2020, the Fund experienced a significant one-time gain as the result of a payment by the Advisor due to an operational error by a third party. If such payment had not been recognized, the total return amounts expressed herein would have been lower by 3.04%. |
| (d) | Includes reimbursement from Advisor. |
| (e) | Ratio is not applicable as there was no reimbursement from Advisor in the year. |
| (f) | Portfolio turnover rate excludes in-kind transactions. |
See accompanying notes.
180
| | | | | | | | | | | | | | |
| Financial Highlights |
| Principal Exchange-Traded Funds |
|
| |
| |
| Principal Spectrum Preferred Securities Active ETF | | | | | | | | | | | | | | |
| For a share outstanding: | | | | | | | | | | | | | | |
| | | Year ended | | | | Year ended | | | | Year ended | | | Period ended | |
| | | June 30, 2021 | | June 30, 2020 | | | | June 30, 2019 | | | June 30, 2018 (a) | |
| |
| Net asset value, beginning of period | $ | 19.31 | (b) | $ | | 19.36 | (b) | $ | | 18.89 | (b) | $ | 20.00 | (b) |
| |
| Investment Operations: | | | | | | | | | | | | | | |
| Net investment income (loss) (c) | | 0.70 | | | | 0.80 | (b) | | | 0.68 | (b) | | 0.94 | (b) |
| Net realized and change in unrealized gain (loss) | | 1.86 | | | | 0.08 | (b) | | | 0.77 | (b) | | (1.18 | ) (b) |
| Total from investment operations | | 2.56 | | | | 0.88 | (b) | | | 1.45 | (b) | | (0.24 | ) (b) |
| |
| Dividends to Shareholders from: | | | | | | | | | | | | | | |
| Net investment income | | (1.23 | ) | | | (0.93 | ) (b) | | | (0.98 | ) (b) | | (0.87 | ) (b) |
| Net realized gains | | — | | | | —(b) | | | | —(b) | | | (0.00) | (b),(d) |
| Total dividends to stockholders | | (1.23 | ) | | | (0.93 | ) (b) | | | (0.98 | ) (b) | | (0.87 | ) (b) |
| |
| Net asset value, end of period | $ | 20.64 | | $ | | 19.31 | (b) | $ | | 19.36 | (b) | $ | 18.89 | (b) |
| Total return | | 11.58 | % | | | 4.60 | % | | | 7.99 | % | | (1.28 | )% (e) |
| |
| Ratios/Supplemental Data: | | | | | | | | | | | | | | |
| Net assets, end of period (000s) | $ | 363,333 | | $ | | 139,995 | | $ | | 67,750 | | $ | 51,949 | |
| Ratio of expenses to average net assets | | 0.55 | % | | | 0.55 | % | | | 0.55 | % | | 0.55 | % (f) |
| Ratio of net investment income (loss) to average net assets | | 3.43 | % | | | 4.10 | % | | | 3.65 | % | | 4.93 | % (f) |
| Portfolio turnover rate (g) | | 12.6 | % | | | 41.9 | % | | | 27.6 | % | | 41.0 | % (f) |
| (a) | Period from July 7, 2017, date operations commenced, through June 30, 2018. |
| (b) | Reflects a 5 to 1 stock split effective after the close of trading on July 22, 2020; see Notes to Financial Statements. |
| (c) | Calculated on average shares outstanding during the period. |
| (d) | Reflects an amount rounding to less than one cent. |
| (e) | Total return amounts have not been annualized. |
| (f) | Computed on an annualized basis. |
| (g) | Portfolio turnover rate excludes in-kind transactions. |
See accompanying notes.
181
| | | | | | |
| Financial Highlights |
| Principal Exchange-Traded Funds |
|
| |
| |
| Principal Spectrum Tax-Advantaged Dividend Active ETF | | | | | | |
| For a share outstanding: | | | | | | |
| | | Year ended | | | Period ended | |
| | | June 30, 2021 | | | June 30, 2020 (a) | |
| |
| Net asset value, beginning of period | $ | 19.95 | | $ | 20.00 | |
| |
| Investment Operations: | | | | | | |
| Net investment income (loss) (b) | | 0.88 | | | 0.03 | |
| Net realized and change in unrealized gain (loss) | | 1.76 | | | (0.08 | ) |
| Total from investment operations | | 2.64 | | | (0.05 | ) |
| |
| Dividends to Shareholders from: | | | | | | |
| Net investment income | | (0.98 | ) | | — | |
| Net realized gains | | (0.04 | ) | | — | |
| Total dividends to stockholders | | (1.02 | ) | | — | |
| |
| Net asset value, end of period | $ | 21.57 | | $ | 19.95 | |
| Total return | | 13.42 | % | | (0.26 | )% (c) |
| |
| Ratios/Supplemental Data: | | | | | | |
| Net assets, end of period (000s) | $ | 22,647 | | $ | 19,948 | |
| Ratio of expenses to average net assets | | 0.60 | % | | 0.60 | % (d) |
| Ratio of net investment income (loss) to average net assets | | 4.15 | % | | 4.35 | % (d) |
| Portfolio turnover rate | | 15.5 | % | | 6.3 | % |
| (a) | Period from June 16, 2020, date operations commenced, through June 30, 2020. |
| (b) | Calculated on average shares outstanding during the period. |
| (c) | Total return amounts have not been annualized. |
| (d) | Computed on an annualized basis. |
See accompanying notes.
182
| | | | | | | | | |
| Financial Highlights |
| Principal Exchange-Traded Funds |
|
| |
| |
| Principal Ultra-Short Active Income ETF | | | | | | | | | |
| For a share outstanding: | | | | | | | | | |
| | | Year ended | | | Year ended | | | Period ended | |
| | | June 30, 2021 | | | June 30, 2020 | | | June 30, 2019 (a) | |
| |
| Net asset value, beginning of period | $ | 25.02 | | $ | 25.09 | | $ | 25.00 | |
| |
| Investment Operations: | | | | | | | | | |
| Net investment income (loss) (b) | | 0.18 | | | 0.55 | | | 0.12 | |
| Net realized and change in unrealized gain (loss) | | (0.04 | ) | | 0.07 | | | 0.04 | |
| Total from investment operations | | 0.14 | | | 0.62 | | | 0.16 | |
| |
| Dividends to Shareholders from: | | | | | | | | | |
| Net investment income | | (0.43 | ) | | (0.69 | ) | | (0.07 | ) |
| Total dividends to stockholders | | (0.43 | ) | | (0.69 | ) | | (0.07 | ) |
| |
| Net asset value, end of period | $ | 24.73 | | $ | 25.02 | | $ | 25.09 | |
| Total return | | 0.57 | % | | 2.54 | % | | 0.62 | % (c) |
| |
| Ratios/Supplemental Data: | | | | | | | | | |
| Net assets, end of period (000s) | $ | 8,657 | | $ | 12,509 | | $ | 12,543 | |
| Ratio of expenses to average net assets | | 0.18 | % | | 0.18 | % | | 0.18 | % (d) |
| Ratio of net investment income (loss) to average net assets | | 0.72 | % | | 2.19 | % | | 2.51 | % (d) |
| Portfolio turnover rate | | 88.1 | % | | 32.7 | % | | 0.0% (d),(e) | |
| (a) | Period from April 24, 2019, date operations commenced, through June 30, 2019. |
| (b) | Calculated on average shares outstanding during the period. |
| (c) | Total return amounts have not been annualized. |
| (d) | Computed on an annualized basis. |
| (e) | Portfolio turnover rate excludes in-kind transactions. |
See accompanying notes.
183
| | | |
| Financial Highlights |
| Principal Exchange-Traded Funds |
|
| |
| |
| Principal U.S. Large-Cap Adaptive Multi-Factor ETF | | | |
| For a share outstanding: | | | |
| | | Period ended | |
| | | June 30, 2021 (a) | |
| |
| Net asset value, beginning of period | $ | 25.00 | |
| |
| Investment Operations: | | | |
| Net investment income (loss) (b) | | 0.03 | |
| Net realized and change in unrealized gain (loss) | | 0.92 | |
| Total from investment operations | | 0.95 | |
| |
| Net asset value, end of period | $ | 25.95 | |
| Total return (c) | | 3.80 | % |
| |
| Ratios/Supplemental Data: | | | |
| Net assets, end of period (000s) | $ | 29,842 | |
| Ratio of expenses to average net assets (d) | | 0.15 | % |
| Ratio of net investment income (loss) to average net assets (d) | | 0.99 | % |
| Portfolio turnover rate (e) | | 0.4 | % |
| (a) | Period from May 19, 2021, date operations commenced, through June 30, 2021. |
| (b) | Calculated on average shares outstanding during the period. |
| (c) | Total return amounts have not been annualized. |
| (d) | Computed on an annualized basis. |
| (e) | Portfolio turnover rate excludes in-kind transactions. |
See accompanying notes.
184
| | | | | | | | | | | | |
| Financial Highlights |
| Principal Exchange-Traded Funds |
|
| |
| |
| Principal U.S. Mega-Cap ETF (a) | | | | | | | | | | | | |
| For a share outstanding: | | | | | | | | | | | | |
| | | Year ended | | | Year ended | | | Year ended | | | Period ended | |
| | | June 30, 2021 | | | June 30, 2020 | | | June 30, 2019 | | | June 30, 2018 (b) | |
| |
| Net asset value, beginning of period | $ | 30.04 | | $ | 29.07 | | $ | 26.02 | | $ | 25.00 | |
| |
| Investment Operations: | | | | | | | | | | | | |
| Net investment income (loss) (c) | | 0.59 | | | 0.60 | | | 0.63 | | | 0.38 | |
| Net realized and change in unrealized gain (loss) | | 9.60 | | | 1.00 | | | 3.04 | | | 0.80 | |
| Total from investment operations | | 10.19 | | | 1.60 | | | 3.67 | | | 1.18 | |
| |
| Dividends to Shareholders from: | | | | | | | | | | | | |
| Net investment income | | (0.55 | ) | | (0.63 | ) | | (0.62 | ) | | (0.16 | ) |
| Total dividends to stockholders | | (0.55 | ) | | (0.63 | ) | | (0.62 | ) | | (0.16 | ) |
| |
| Net asset value, end of period | $ | 39.68 | | $ | 30.04 | | $ | 29.07 | | $ | 26.02 | |
| Total return | | 34.25 | % | | 5.62 | % | | 14.32 | % | | 4.73 | % (d) |
| |
| Ratios/Supplemental Data: | | | | | | | | | | | | |
| Net assets, end of period (000s) | $ | 1,958,064 | | $ | 1,505,046 | | $ | 1,618,941 | | $ | 1,666,525 | |
| Ratio of expenses to average net assets (e) | | 0.12 | % | | 0.12 | % | | 0.12 | % | | 0.12 | % (f) |
| Ratio of gross expenses to average net assets | | 0.15 | % | | 0.15 | % | | 0.15 | % | | 0.15 | % (f) |
| Ratio of net investment income (loss) to average net assets | | 1.67 | % | | 2.05 | % | | 2.30 | % | | 2.02 | % (f) |
| Portfolio turnover rate (g) | | 42.9 | % | | 42.9 | % | | 27.0 | % | | 39.8 | % (f) |
| (a) | Effective September 30, 2020, Principal U.S. Mega-Cap Multi-Factor Index ETF changed its name to Principal U.S. Mega-Cap ETF. |
| (b) | Period from October 11, 2017, date operations commenced, through June 30, 2018. |
| (c) | Calculated on average shares outstanding during the period. |
| (d) | Total return amounts have not been annualized. |
| (e) | Includes reimbursement from Advisor. |
| (f) | Computed on an annualized basis. |
| (g) | Portfolio turnover rate excludes in-kind transactions. |
See accompanying notes.
185
| | | |
| Financial Highlights |
| Principal Exchange-Traded Funds |
|
| |
| |
| Principal U.S. Small-Cap Adaptive Multi-Factor ETF | | | |
| For a share outstanding: | | | |
| | | Period ended | |
| | | June 30, 2021 (a) | |
| |
| Net asset value, beginning of period | $ | 25.00 | |
| |
| Investment Operations: | | | |
| Net investment income (loss) (b) | | 0.03 | |
| Net realized and change in unrealized gain (loss) | | 0.58 | |
| Total from investment operations | | 0.61 | |
| |
| Net asset value, end of period | $ | 25.61 | |
| Total return (c) | | 2.44 | % |
| |
| Ratios/Supplemental Data: | | | |
| Net assets, end of period (000s) | $ | 6,403 | |
| Ratio of expenses to average net assets (d) | | 0.19 | % |
| Ratio of net investment income (loss) to average net assets (d) | | 0.96 | % |
| Portfolio turnover rate (e) | | 0.2 | % |
| (a) | Period from May 19, 2021, date operations commenced, through June 30, 2021. |
| (b) | Calculated on average shares outstanding during the period. |
| (c) | Total return amounts have not been annualized. |
| (d) | Computed on an annualized basis. |
| (e) | Portfolio turnover rate excludes in-kind transactions. |
See accompanying notes.
186
| | | | | | | | | | | | | | | | |
| Financial Highlights |
| Principal Exchange-Traded Funds |
|
| |
| |
| Principal U.S. Small-Cap Multi-Factor ETF (a) | | | | | | | | | | | | | | | | |
| For a share outstanding: | | | | | | | | | | | | | | | | |
| | | Year ended | | | Year ended | | | Year ended | | | Year ended | | | Period ended | |
| | June 30, 2021 | | | June 30, 2020 | | | June 30, 2019 | | | June 30, 2018 | | | June 30, 2017 (b) | |
| |
| Net asset value, beginning of period | $ | 27.36 | | | $ | 31.43 | | $ | 33.45 | | $ | 28.84 | | $ | 25.00 | |
| |
| Investment Operations: | | | | | | | | | | | | | | | | |
| Net investment income (loss) (c) | | 0.54 | | | | 0.45 | | | 0.40 | | | 0.29 | | | 0.26 | |
| Net realized and change in unrealized gain (loss) | | 19.51 | | | | (4.11 | ) | | (2.03 | ) | | 4.64 | | | 3.75 | |
| Total from investment operations | | 20.05 | | | | (3.66 | ) | | (1.63 | ) | | 4.93 | | | 4.01 | |
| |
| Dividends to Shareholders from: | | | | | | | | | | | | | | | | |
| Net investment income | | (0.49 | ) | | | (0.41 | ) | | (0.39 | ) | | (0.30 | ) | | (0.17 | ) |
| Net realized gains | | — | | | | — | | | — | | | (0.02 | ) | | — | |
| Total dividends to stockholders | | (0.49 | ) | | | (0.41 | ) | | (0.39 | ) | | (0.32 | ) | | (0.17 | ) |
| |
| Net asset value, end of period | $ | 46.92 | | | $ | 27.36 | | $ | 31.43 | | $ | 33.45 | | $ | 28.84 | |
| Total return | | 74.05 | % | | (11.71 | )% | | (4.84 | )% | | 17.14 | % | | 16.08 | % (d) |
| |
| Ratios/Supplemental Data: | | | | | | | | | | | | | | | | |
| Net assets, end of period (000s) | $ | 1,628,003 | | $ | 328,305 | | $ | 355,200 | | $ | 351,176 | | $ | 275,466 | |
| Ratio of expenses to average net assets | | 0.38 | % | | | 0.38 | % | | 0.38 | % | | 0.38 | % | | 0.38 | % (e) |
| Ratio of net investment income (loss) to average net assets | 1.39 | % | | | 1.54 | % | | 1.27 | % | | 0.94 | % | | 1.21 | % (e) |
| Portfolio turnover rate (f) | | 93.1 | % | | | 80.4 | % | | 81.9 | % | | 76.3 | % | | 44.7 | % (e) |
| (a) | Effective September 30, 2020, Principal U.S. Small-Cap Multi-Factor Index ETF changed its name to Principal U.S. Small-Cap Multi-Factor ETF. |
| (b) | Period from September 21, 2016, date operations commenced, through June 30, 2017. |
| (c) | Calculated on average shares outstanding during the period. |
| (d) | Total return amounts have not been annualized. |
| (e) | Computed on an annualized basis. |
| (f) | Portfolio turnover rate excludes in-kind transactions. |
See accompanying notes.
187
| | | | | | | | | | | | | | | |
| Financial Highlights |
| Principal Exchange-Traded Funds |
|
| |
| |
| Principal Value ETF (a) | | | | | | | | | | | | | | | |
| For a share outstanding: | | | | | | | | | | | | | | | |
| | Year ended | | | Year ended | | | Year ended | | | Year ended | | | Year ended | |
| | June 30, 2021 | | | June 30, 2020 | | | June 30, 2019 | | | June 30, 2018 | | | June 30, 2017 | |
| |
| Net asset value, beginning of year | $ | 27.75 | | $ | 31.99 | | $ | 32.49 | | $ | 29.16 | | $ | 24.65 | |
| |
| Investment Operations: | | | | | | | | | | | | | | | |
| Net investment income (loss) (b) | | 1.16 | | | 0.87 | | | 0.71 | | | 0.61 | | | 0.54 | |
| Net realized and change in unrealized gain (loss) | | 14.52 | | | (4.36 | ) | | (0.51 | ) | | 3.21 | | | 4.67 | |
| Total from investment operations | | 15.68 | | | (3.49 | ) | | 0.20 | | | 3.82 | | | 5.21 | |
| |
| Dividends to Shareholders from: | | | | | | | | | | | | | | | |
| Net investment income | | (1.05 | ) | | (0.75 | ) | | (0.70 | ) | | (0.47 | ) | | (0.67 | ) |
| Net realized gains | | — | | | — | | | — | | | (0.02 | ) | | (0.03 | ) |
| Total dividends to stockholders | | (1.05 | ) | | (0.75 | ) | | (0.70 | ) | | (0.49 | ) | | (0.70 | ) |
| |
| Net asset value, end of year | $ | 42.38 | | $ | 27.75 | | $ | 31.99 | | $ | 32.49 | | $ | 29.16 | |
| Total return | | 57.97 | % | | (11.09 | )% | | 0.68 | % | | 13.17 | % | | 21.42 | % |
| |
| Ratios/Supplemental Data: | | | | | | | | | | | | | | | |
| Net assets, end of year (000s) | $ | 44,498 | | $ | 31,907 | | $ | 14,395 | | $ | 14,622 | | $ | 7,290 | |
| Ratio of expenses to average net assets | | 0.15 | % | | 0.29 | % (c) | | 0.29 | % (c) | | 0.29 | % (c) | | 0.40 | % |
| Ratio of gross expenses to average net assets | | —% (d) | 0.32 | % | | 0.40 | % | | 0.40 | % | | —% (d) | |
| Ratio of net investment income (loss) to average net assets | | 3.31 | % | | 2.95 | % | | 2.26 | % | | 1.90 | % | | 1.98 | % |
| Portfolio turnover rate (e) | | 44.8 | % | | 47.6 | % | | 49.2 | % | | 55.5 | % | | 3.0 | % |
| (a) | Effective September 30, 2020, Principal Shareholder Yield Index ETF changed its name to Principal Value ETF. |
| (b) | Calculated on average shares outstanding during the year. |
| (c) | Includes reimbursement from Advisor. |
| (d) | Ratio is not applicable as there was no reimbursement from Advisor in the year. |
| (e) | Portfolio turnover rate excludes in-kind transactions. |
See accompanying notes.
188
Report of Independent Registered Public Accounting Firm
To the Shareholders and the Board of Trustees of Principal Exchange-Traded Funds
Opinion on the Financial Statements
We have audited the accompanying statements of assets and liabilities of Principal Exchange-Traded Funds (the “Trust”) (comprising Principal Active Income ETF, Principal Healthcare Innovators Index ETF, Principal International Adaptive Multi-Factor ETF, Principal International Multi-Factor ETF (formerly Principal International Multi-Factor Core Index ETF), Principal Investment Grade Corporate Active ETF, Principal Millennials Index ETF, Principal Quality ETF (formerly Principal Price Setters Index ETF), Principal Spectrum Preferred Securities Active ETF, Principal Spectrum Tax-Advantaged Dividend Active ETF, Principal Ultra-Short Active Income ETF, Principal U.S. Large-Cap Adaptive Multi-Factor ETF, Principal U.S. Mega-Cap ETF (formerly Principal U.S. Mega-Cap Multi-Factor Index ETF), Principal U.S. Small-Cap Adaptive Multi-Factor Index ETF, Principal U.S. Small-Cap Multi-Factor ETF (formerly Principal U.S. Small-Cap Multi-Factor Index ETF), and Principal Value ETF (formerly Principal Shareholder Yield Index ETF) (collectively referred to as the “Funds”)), including the schedules of investments, as of June 30, 2021, and the related statements of operations, changes in net assets, and the financial highlights for each of the periods indicated in the table below and the related notes (collectively referred to as the “financial statements”). In our opinion, the financial statements present fairly, in all material respects, the financial position of each of the Funds comprising the Principal Exchange-Traded Funds at June 30, 2021, the results of their operations, changes in net assets and financial highlights for each of the periods indicated in the table below, in conformity with U.S. generally accepted accounting principles.
| | | |
| | Statement of | Statements | |
| Funds comprising the Trust | operations | of changes | Financial highlights |
| | | in net assets | |
| Principal Active Income ETF | For the year | For each of | For each of the five |
| Principal Quality ETF | ended June | the two | years in the period |
| Principal Value ETF | 30, 2021 | years in the | ended June 30, 2021 |
| | | period | |
| | | ended June | |
| | | 30, 2021 | |
| Principal Healthcare Innovators Index ETF | For the year | For each of | For each of the four |
| Principal Millennials Index ETF | ended June | the two | years in the period |
| | 30, 2021 | years in the | ended June 30, 2021 |
| | | period | and the period from |
| | | ended June | August 19, 2016 (date |
| | | 30, 2021 | operations commenced) |
| | | | through June 30, 2017 |
| Principal U.S. Small-Cap Multi-Factor ETF | For the year | For each of | For each of the four |
| | ended June | the two | years in the period |
| | 30, 2021 | years in the | ended June 30, 2021 |
| | | period | and the period from |
| | | ended June | September 21, 2016 |
| | | 30, 2021 | (date operations |
| | | | commenced) through |
| | | | June 30, 2017 |
189
| | | |
| Funds comprising the Trust | Statement of | Statements | Financial highlights |
| | operations | of changes in | |
| | | net assets | |
| Principal Spectrum Preferred Securities | For the year | For each of | For each of the three |
| Active ETF | ended June | the two years | years in the period |
| | 30, 2021 | in the period | ended June 30, 2021 |
| | | ended June | and the period from |
| | | 30, 2021 | July 7, 2017 (date |
| | | | operations |
| | | | commenced) through |
| | | | June 30, 2018 |
| Principal U.S. Mega-Cap ETF | For the year | For each of | For each of the three |
| | ended June | the two years | years in the period |
| | 30, 2021 | in the period | ended June 30, 2021 |
| | | ended June | and the period from |
| | | 30, 2021 | October 11, 2017 (date |
| | | | operations |
| | | | commenced) through |
| | | | June 30, 2018 |
| Principal Investment Grade Corporate | For the year | For each of | For each of the three |
| Active ETF | ended June | the two years | years in the period |
| | 30, 2021 | in the period | ended June 30, 2021 |
| | | ended June | and the period from |
| | | 30, 2021 | April 18, 2018 (date |
| | | | operations |
| | | | commenced) through |
| | | | June 30, 2018 |
| Principal Ultra-Short Active Income ETF | For the year | For each of | For each of the two |
| | ended June | the two years | years in the period |
| | 30, 2021 | in the period | ended June 30, 2021 |
| | | ended June | and the period from |
| | | 30, 2021 | April 24, 2019 (date |
| | | | operations |
| | | | commenced) through |
| | | | June 30, 2019 |
| Principal International Multi-Factor ETF | For the year | For the year ended June 30, 2021 and |
| | ended June | the period from July 23, 2019 (date |
| | 30, 2021 | operations commenced) through June |
| | | 30, 2020 | |
| Principal Spectrum Tax-Advantaged | For the year | For year ended June 30, 2021 and the |
| Dividend Active ETF | ended June | period from June 16, 2020 (date |
| | 30, 2021 | operations commenced) through June |
| | | 30, 2020 | |
| Principal U.S. Large-Cap Adaptive Multi- | For the period from May 19, 2021 (date operations |
| Factor ETF | commenced) through June 30, 2021 |
| Principal U.S. Small-Cap Adaptive Multi- | | | |
| Factor ETF | | | |
| Principal International Adaptive Multi- | For the period from May 26, 2021 (date operations |
| Factor ETF | commenced) through June 30, 2021 |
190
Basis for Opinion
These financial statements are the responsibility of the Trust’s management. Our responsibility is to express an opinion on each of the Funds’ financial statements based on our audits. We are a public accounting firm registered with the Public Accounting Oversight Board (United States) (“PCAOB”) and are required to be independent with respect to the Trust in accordance with the U.S. federal securities laws and the applicable rules and regulations of the Securities and Exchange Commission and the PCAOB.
We conducted our audits in accordance with the standards of the PCAOB. Those standards require that we plan and perform the audit to obtain reasonable assurance about whether the financial statements are free of material misstatement, whether due to error or fraud. The Trust is not required to have, nor were we engaged to perform, an audit of the Trust’s internal control over financial reporting. As part of our audits we are required to obtain an understanding of internal control over financial reporting but not for the purpose of expressing an opinion on the effectiveness of the Trust’s internal control over financial reporting. Accordingly, we express no such opinion.
Our audits included performing procedures to assess the risks of material misstatement of the financial statements, whether due to error or fraud, and performing procedures that respond to those risks. Such procedures included examining, on a test basis, evidence regarding the amounts and disclosures in the financial statements. Our procedures included confirmation of securities owned as of June 30, 2021, by correspondence with the custodian and brokers or by other appropriate auditing procedures where replies from brokers were not received. Our audits also included evaluating the accounting principles used and significant estimates made by management, as well as evaluating the overall presentation of the financial statements. We believe that our audits provide a reasonable basis for our opinion.

We have served as the auditor of one or more Principal investment companies since 1969.
Minneapolis, MN
August 20, 2021, except as to Note 8, as to which the date is October 8, 2021.
191
Shareholder Expense Example
Principal Exchange-Traded Funds
June 30, 2021 (unaudited)
As a shareholder of Principal Exchange-Traded Funds, you incur two types of costs: (1) transaction costs, including brokerage commissions paid on purchases and sales of Fund shares and (2) ongoing costs, including management fees. This Example is intended to help you understand your ongoing costs (in dollars) of investing in Principal Exchange-Traded Funds and to compare these costs with the ongoing costs of investing in other exchange-traded funds.
The Examples are based on an investment of $1,000 invested at the beginning of the period and held for the entire period, January 1, 2021 through June 30, 2021, except as noted in the following table.
Actual Expenses
The first section of the table provides information about actual account values and actual expenses. You may use the information in this section, together with the amount you invested, to estimate the expenses that you paid over the period. Simply divide your account value by $1,000 (for example, an $8,600 account value divided by $1,000 = 8.6), then multiply the result by the number in the first section under the heading entitled "Expenses Paid During Period" to estimate the expenses you paid on your account during this period.
Hypothetical Example for Comparison Purposes
The second section of table provides information about hypothetical account values and hypothetical expenses based on the Fund's actual expense ratio and an assumed rate of return of 5% per year before expenses, which is not the Fund's actual return. The hypothetical account values and expenses may not be used to estimate the actual ending account balance or expenses you paid for the period. You may use this information to compare the ongoing costs of investing in the Fund. To do so, compare this 5% hypothetical example with the 5% hypothetical examples that appear in the shareholder reports of the other fund.
Please note that the expenses shown in the table are meant to highlight your ongoing costs only and do not reflect any transaction costs, such as contingent deferred sales charges, redemption fees or exchange fees. Therefore, the second section of the table is useful in comparing ongoing costs only, and will not help you determine the relative total costs of owning different fund. In addition, if these transaction costs were included, your costs would have been higher.
| | | | | | | | | |
| | | | | | Annualized | | | Expenses | |
| | | Beginning | | | Expense | Paid During | |
| | | Account | | Ending | Ratio | | | Period | |
| | | Value | | Account | January 1, | January 1, | |
| | | January 1, | | Value | 2021 to June | 2021 to June | |
| | | 2021 | | June 30, 2021 | 30, 2021 | 30, 2021 | (a) |
| Principal Active Income ETF | | | | | | | | | |
| Actual Fund Return | $ | 1,000 | $ | 1,064.20 | 0.49 | % | $ | 2.46 | |
| Hypothetical 5% Annual Return | | 1,000 | | 1,022.41 | 0.49 | | | 2.41 | |
| |
| Principal Healthcare Innovators Index ETF | | | | | | | | | |
| Actual Fund Return | | 1,000 | | 1,036.40 | 0.42 | | | 2.07 | |
| Hypothetical 5% Annual Return | | 1,000 | | 1,022.76 | 0.42 | | | 2.06 | |
| |
| Principal International Adaptive Multi-Factor ETF (b) | | | | | | | | | |
| Actual Fund Return | | 1,000 | | 992.00 | 0.24 | | | 0.22 | |
| Hypothetical 5% Annual Return | | 1,000 | | 1,004.57 | 0.24 | | | 1.14 | |
| |
| Principal International Multi Factor ETF | | | | | | | | | |
| Actual Fund Return | | 1,000 | | 1,115.60 | 0.25 | | | 1.31 | |
| Hypothetical 5% Annual Return | | 1,000 | | 1,023.55 | 0.25 | | | 1.25 | |
192
| | | | | | | | | |
| Shareholder Expense Example |
| Principal Exchange-Traded Funds |
| June 30, 2021 (unaudited) |
|
| |
| | | | | | Annualized | | | Expenses | |
| | | Beginning | | | Expense | Paid During | |
| | | Account | | Ending | Ratio | | | Period | |
| | | Value | | Account | January 1, | January 1, | |
| | | January 1, | | Value | 2021 to June | 2021 to June | |
| | | 2021 | | June 30, 2021 | 30, 2021 | 30, 2021 | (a) |
| Principal Investment Grade Corporate Active ETF | | | | | | | | | |
| Actual Fund Return | $ | 1,000 | $ | 988.60 | 0.24 | % | $ | 1.18 | |
| Hypothetical 5% Annual Return | | 1,000 | | 1,023.60 | 0.24 | | | 1.20 | |
| |
| Principal Millennials Index ETF | | | | | | | | | |
| Actual Fund Return | | 1,000 | | 1,150.00 | 0.45 | | | 2.35 | |
| Hypothetical 5% Annual Return | | 1,000 | | 1,022.61 | 0.45 | | | 2.21 | |
| |
| Principal Quality ETF | | | | | | | | | |
| Actual Fund Return | | 1,000 | | 1,127.60 | 0.15 | | | 0.79 | |
| Hypothetical 5% Annual Return | | 1,000 | | 1,024.05 | 0.15 | | | 0.75 | |
| |
| Principal Spectrum Preferred Securities Active ETF | | | | | | | | | |
| Actual Fund Return | | 1,000 | | 1,019.60 | 0.55 | | | 2.70 | |
| Hypothetical 5% Annual Return | | 1,000 | | 1,022.12 | 0.55 | | | 2.71 | |
| |
| Principal Spectrum Tax-Advantaged Dividend Active ETF | | | | | | | | |
| Actual Fund Return | | 1,000 | | 1,027.60 | 0.60 | | | 2.97 | |
| Hypothetical 5% Annual Return | | 1,000 | | 1,021.87 | 0.60 | | | 2.96 | |
| |
| Principal Ultra-Short Active Income ETF | | | | | | | | | |
| Actual Fund Return | | 1,000 | | 1,001.70 | 0.18 | | | 0.89 | |
| Hypothetical 5% Annual Return | | 1,000 | | 1,023.90 | 0.18 | | | 0.90 | |
| |
| Principal U.S. Large-Cap Adaptive Multi-Factor ETF (c) | | | | | | | | | |
| Actual Fund Return | | 1,000 | | 1,038.00 | 0.15 | | | 0.16 | |
| Hypothetical 5% Annual Return | | 1,000 | | 1,005.59 | 0.15 | | | 0.70 | |
| |
| Principal U.S. Mega-Cap ETF | | | | | | | | | |
| Actual Fund Return | | 1,000 | | 1,115.90 | 0.12 | | | 0.63 | |
| Hypothetical 5% Annual Return | | 1,000 | | 1,024.20 | 0.12 | | | 0.60 | |
| |
| Principal U.S. Small-Cap Adaptive Multi-Factor ETF (c) | | | | | | | | | |
| Actual Fund Return | | 1,000 | | 1,024.40 | 0.19 | | | 0.21 | |
| Hypothetical 5% Annual Return | | 1,000 | | 1,005.55 | 0.19 | | | 0.90 | |
| |
| Principal U.S. Small-Cap Multi-Factor ETF | | | | | | | | | |
| Actual Fund Return | | 1,000 | | 1,293.50 | 0.38 | | | 2.10 | |
| Hypothetical 5% Annual Return | | 1,000 | | 1,022.96 | 0.38 | | | 1.86 | |
| |
| Principal Value ETF | | | | | | | | | |
| Actual Fund Return | | 1,000 | | 1,254.50 | 0.15 | | | 0.84 | |
| Hypothetical 5% Annual Return | | 1,000 | | 1,024.05 | 0.15 | | | 0.75 | |
| (a) | Expenses are equal to a Fund’s annualized expense ratio multiplied by the average account value over the period, multiplied by 181/365. |
| (b) | Period from May 26, 2021, date operations commenced, through June 30, 2021. |
| (c) | Period from May 19, 2021, date operations commenced, through June 30, 2021. |
193
TRUSTEES AND OFFICERS
Under Delaware law, a Board of Trustees oversees the Trust. The Trustees have financial or other relevant experience and meet several times during the year to review contracts, Trust activities and the quality of services provided to the Trust. Each trustee also has the same position with Principal Funds, Inc. and Principal Variable Contracts Funds, Inc., and Principal Diversified Select Real Asset Fund which are also sponsored by Principal Life Insurance Company. Each trustee generally holds office for an indefinite term until the trustee reaches age age 72 (unless such mandatory retirement age is waived by the Board of Trustees). Trustees considered to be “interested persons” as defined in the Investment Company Act of 1940, as amended (the “1940 Act”), as shown below are considered to be interested because of an affiliation with the Manager and Principal Life Insurance Company.
| | | |
| The following Trustees are considered not to be “interested persons” as defined in the 1940 Act | |
| | | | Other |
| Name, | | Number of Portfolios | Directorships |
| Position Held with the Trust, | Principal Occupation(s) | in Fund Complex | Held by Trustee |
| Year of Birth | During past 5 years | Overseen by Trustee | During Past 5 Years |
| |
| Elizabeth Ballantine | Principal, EBA Associates | 126 | Durango Herald, Inc; |
| Trustee since 2014 | | | McClatchy Newspapers, Inc. |
| Chair, Nominating and Governance | | | |
| Committee | | | |
| 1948 | | | |
| |
| Leroy T. Barnes, Jr. | Retired. | 126 | McClatchy Newspapers, Inc.; |
| Trustee since 2014 | | | Frontier Communications, |
| Member, Audit Committee | | | Inc.; formerly, Herbalife Ltd. |
| Member, Nominating and Governance | | | |
| Committee | | | |
| 1951 | | | |
| | President, C.P. Damos | 126 | None |
| Craig Damos | Consulting LLC | | |
| Lead Independent Trustee since 2020 | | | |
| Trustee since 2014 | | | |
| Member, Nominating and Governance | | | |
| Committee | | | |
| Member, Executive Committee | | | |
| 1954 | | | |
| |
| Fritz S. Hirsch | Interim CEO, MAM USA: | 126 | MAM USA |
| Trustee since 2014 | February 2020 to October | | |
| Member, Operations Committee | 2020 | | |
| Chair, 15(c) Committee | | | |
| 1951 | | | |
| |
| Victor Hymes | Founder and Managing Member | 126 | Formerly, Montgomery Street |
| Trustee since 2020 | of Legato Capital Management, | | Income Securities Inc. |
| Member, Audit Committee | LLC | | |
| 1957 | | | |
| |
| John D. Kenney | Formerly, Legg Mason Global | 126 | Formerly: Legg Mason |
| Trustee since 2020 | Asset Management | | Investment Management |
| Member, Operations Committee | | | Affiliates: Brandywine |
| Member, 15(c) Committee | | | Global; Clarion Partners; |
| 1965 | | | ClearBridge Investments; |
| | | | Entrust Global; Legg Mason |
| | | | Poland; Martin Currie |
| | | | Investment Management; |
| | | | Permal Group (merged |
| | | | into Entrust); QS Investors; |
| | | | RARE Infrastructure; Royce |
| | | | and Associates; and Western |
| | | | Asset Management |
194
| | | |
| | | | Other |
| Name, | | Number of Portfolios | Directorships |
| Position Held with the Trust, | Principal Occupation(s) | in Fund Complex | Held by Trustee |
| Year of Birth | During past 5 years | Overseen by Trustee | During Past 5 Years |
| |
| Padelford (“Padel”) L. Lattimer | TBA Management Consulting | 126 | None |
| Trustee since 2020 | LLC | | |
| Member, Operations Committee | | | |
| Member, 15(c) Committee | | | |
| 1961 | | | |
| |
| Karen (“Karrie”) McMillan | Founder/Owner, Tyche | 126 | None |
| Trustee since 2014 | Consulting LLC Formerly, | | |
| Chair, Operations Committee | Managing Director, Patomak | | |
| 1961 | Global Partners, LLC. | | |
| |
| Elizabeth A. Nickels | Retired | 126 | SpartanNash; formerly: |
| Trustee since 2015 | | | Charlotte Russe; Follet |
| Chair, Audit Committee | | | Corporation; PetSmart; |
| Member, Nominating and Governance | | | Spectrum Health Systems |
| Committee | | | |
| 1962 | | | |
| |
| Mary M. (“Meg”) VanDeWeghe | CEO and President, Forte | 126 | Helmerich & Payne; |
| Trustee since 2018 | Consulting, Inc. | | Formerly: B/E Aerospace; |
| Member, Audit Committee | | | Brown Advisory; Denbury |
| Member, 15(c) Committee | | | Resources Inc.; Nalco (and its |
| 1959 | | | successor Ecolab); and WP |
| | | | Carey |
195
| | | | |
| The following Trustees are considered to be “interested persons” as defined in the 1940 Act, because of an affiliation with the |
| Manager and Principal Life. | | | | |
| |
| | | | Number of | Other |
| | | | Portfolios in | Directorships |
| Name, | | | Fund Complex | Held by Trustee |
| Position Held with the Trust, | Principal Occupation(s) | | Overseen | During Past 5 |
| Year of Birth | During past 5 years | | by Trustee | Years |
| Timothy M. Dunbar | President-Principal Global Asset Management | | 126 | None |
| Chair and Trustee since 2019 | (“PGAM”), Principal Global Investors, LLC | | | |
| Chair, Executive Committee | (“PGI”) (since 2018) | | | |
| 1957 | Director, PGI (2018-2020) | | | |
| | Division President, Principal Financial Services, | | | |
| | Inc. (“PFSI) and Principal Life Insurance | | | |
| | Company (“PLIC”) (2020–2021) | | | |
| | Executive Vice President and Chief Investment | | | |
| | Officer, PFSI and PLIC (2014-2018) | | | |
| | Director, Post Advisory Group, LLC (“Post”) | | | |
| | (2018-2020) | | | |
| | Chair and Executive Vice President, | | | |
| | RobustWealth, Inc. (2018-2020) | | | |
| |
| Patrick G. Halter | Chair, PGI (since 2018) | | 126 | None |
| Trustee since 2017 | Chief Executive Officer and President, PGI (since | | | |
| Member, Executive Committee | 2018) | | | |
| 1959 | Chief Operating Officer, PGI (2017-2018) | | | |
| Senior Executive Director – Real Estate, PGI and | | | |
| | PFSI (2014-2016) | | | |
| | Director, PGI (2003-2018) | | | |
| | Chair, CCIP, LLC (“CCIP”) since 2017 | | | |
| | Director, Origin Asset Management LLP (2018- | | | |
| | 2019) | | | |
| | President, PGAM, PFSI, and PLIC (since 2020) | | | |
| | Director, Post (since 2017) | | | |
| | Chair, Principal Real Estate Investors, LLC | | | |
| | (“Principal-REI”) (since 2004) | | | |
| | President and Chief Executive Officer, PGI, | | | |
| | Principal-REI | | | |
| | (since 2018) | | | |
| | Chief Executive Officer, Principal-REI (2005- | | | |
| | 2018) | | | |
| | Chair, Spectrum Asset Management, Inc. | | | |
Correspondence intended for each Trustee who is other than an Interested Trustee may be sent to 655 9th Street, Des Moines, IA
50392.
196
The following table presents officers of the Trust.
| |
| Name, Position Held with the Trust, | Principal Occupation(s) |
| Address, and Year of Birth | During past 5 years |
| |
| Kamal Bhatia | Director, PGI (since 2019) |
| President, Chief Executive Officer | President-Principal Funds, PGI (since 2019) |
| Des Moines, IA 50392 | Principal Executive Officer, OPC Private Capital (2017-2019) |
| 1972 | Senior Vice President, OppenheimerFunds (2011-2019) |
| | Director, Principal Funds Distributor, Inc. (“PFD”) (since 2019) |
| | Senior Executive Director and Chief Operating Officer, PFSI and PLIC (since 2020) |
| President, PFSI and PLIC (2019-2020) |
| | Director, Post (since 2020) |
| | Director, Principal-REI (since 2020) |
| | Chair and Executive Vice President, (Principal Shareholder Services, Inc. (“PSS’) |
| | (since 2019) |
| |
| Randy D. Bolin | Vice President and Associate General Counsel, PGI (since 2016) |
| Assistant Tax Counsel | Vice President and Associate General Counsel, PFSI (since 2013) |
| Des Moines, IA 50392 | Vice President and Associate General Counsel, PLIC (since 2013) |
| 1961 | |
| |
| Beth Graff | Director – Fund Accounting (since 2016) |
| Vice President and Assistant Controller | |
| Des Moines, IA 50392 | |
| 1968 | |
| |
| Gina L. Graham | Vice President and Treasurer, PGI (since 2016) |
| Treasurer | Vice President and Treasurer, PFD (since 2016) |
| Des Moines, IA 50392 | Vice President and Treasurer, PFSI (since 2016) |
| 1965 | Vice President and Treasurer, PLIC (since 2016) |
| | Vice President and Treasurer, Principal - REI (since 2017) |
| | Vice President and Treasurer, Principal Securities, Inc. (“PSI”) (since 2016) |
| | Vice President and Treasurer, PSS (since 2016) |
| | Vice President and Treasurer, RobustWealth, Inc. (since 2018) |
| |
| Megan Hoffmann | Director – Accounting, PLIC (since 2020) |
| Vice President and Controller | Assistant Director - Accounting (2017-2020) |
| Des Moines, IA 50392 | Prior thereto, Senior Accounting Analyst, PLIC |
| 1979 | |
| |
| Laura B. Latham | Counsel, PGI (since 2018) |
| Assistant Counsel and Assistant | Counsel, PLIC (since 2018) |
| Secretary | Prior thereto, Attorney in Private Practice |
| Des Moines, IA 50392 | |
| 1986 | |
| |
| |
| Diane K. Nelson | Chief Compliance Officer/AML Officer, PSS (since 2015) |
| AML Officer | |
| Des Moines, IA 50392 | |
| 1965 | |
| |
| |
| Tara Parks | Director - Accounting, PLIC (since 2019) |
| Vice President and Assistant Controller | Tax Manager – ALPS Fund Services (2011-2019) |
| Des Moines, IA 50392 | |
| 1983 | |
197
| |
| Name, Position Held with the Trust, | Principal Occupation(s) |
| Address, and Year of Birth | During past 5 years |
| |
| Sara L. Reece | Managing Director – Financial Analysis/Planning, PLIC (since 2021) |
| Vice President and Controller | Director - Accounting, PLIC (2015-2021) |
| Des Moines, IA 50392 | |
| 1975 | |
| |
| |
| Teri R. Root | Chief Compliance Officer – Funds, PGI (since 2018) |
| Chief Compliance Officer | Interim Chief Compliance Officer (2018) |
| Des Moines, IA 50392 | Deputy Chief Compliance Officer, PGI (2017-2018) |
| 1979 | Vice President and Chief Compliance Officer, PMC (2015–2017) |
| | Vice President, PSS (since 2015) |
| |
| Britney L. Schnathorst | Counsel, PGI (since 2018) |
| Assistant Counsel and Assistant | Counsel, PLIC (since 2013) |
| Secretary | |
| Des Moines, IA 50392 | |
| 1981 | |
| |
| Michael Scholten | Chief Financial Officer, PFD (since 2016) |
| Chief Financial Officer | Assistant Vice President and Actuary, PLIC (since 2021) |
| Des Moines, IA 50392 | Chief Financial Officer – Funds/Platforms, PLIC (since 2015) |
| 1979 | Chief Financial Officer, PSS (since 2015) |
| |
| |
| Adam U. Shaikh | Assistant General Counsel, PGI (since 2018) |
| Assistant Counsel | Counsel, PGI (2017-2018) |
| Des Moines, IA 50392 | Counsel, PLIC (since 2006) |
| 1972 | Counsel, PMC (2007-2017) |
| |
| John L. Sullivan | Counsel, PGI (since 2020) |
| Assistant Counsel and Assistant | Counsel, PLIC (since 2019) |
| Secretary | Prior thereto, Attorney in Private Practice |
| Des Moines, IA 50392 | |
| 1970 | |
| |
| Dan L. Westholm | Assistant Vice President-Treasury, PGI (since 2013) |
| Assistant Treasurer | Assistant Vice President-Treasury, PFD (since 2013) |
| Des Moines, IA 50392 | Assistant Vice President-Treasury, PLIC (since 2014) |
| 1966 | Assistant Vice President-Treasury, PSI (since 2013) |
| | Assistant Vice President-Treasury, PSS (since 2013) |
| |
| Beth C. Wilson | Director and Secretary – Funds, PLIC (since 2007) |
| Vice President and Secretary | |
| Des Moines, IA 50392 | |
| 1956 | |
198
| |
| Name, Position Held with the Trust, | Principal Occupation(s) |
| Address, and Year of Birth | During past 5 years |
| |
| |
| Clint L. Woods | Of Counsel (2017-2018) |
| Counsel, Vice President and Assistant | Vice President (2016-2017) |
| Secretary | Counsel (2015-2017) |
| Des Moines, IA 50392 | Vice President, Associate General Counsel and Secretary, PGI (since 2020) |
| 1961 | Vice President, Associate General Counsel, Governance Officer, and Assistant |
| | Corporate Secretary, PGI (2018-2020) |
| | Vice President, Associate General Counsel and Assistant |
| | Corporate Secretary, PFD (since 2019) |
| | Vice President, Associate General Counsel, Governance Officer and Assistant |
| | Corporate Secretary, PFSI (since 2015) |
| | Vice President, Associate General Counsel, Governance Officer and Assistant |
| | Corporate Secretary, PLIC (since 2015) |
| | Secretary, Post (since 2020) |
| | Vice President, Associate General Counsel, Governance Officer and Secretary, |
| | Principal-REI (since 2020) |
| | Vice President, Associate General Counsel, Governance Officer and Assistant |
| | Corporate Secretary, Principal-REI (2020) |
| | Vice President, Associate General Counsel and Assistant |
| | Corporate Secretary, PSI (since 2019) |
| | Vice President, Associate General Counsel and Assistant |
| | Corporate Secretary, PSS (since 2019) |
| | Vice President, Associate General Counsel and |
| | Assistant Secretary, RobustWealth, Inc. (since 2019) |
| Secretary, Spectrum (since 2020) |
| |
| Jared A.Yepsen | Counsel, PGI (2017-2019) |
| Assistant Tax Counsel | Counsel, PLIC (since 2015) |
| Des Moines, IA 50392 | |
| 1981 | |
199
The 15(c) Committee assists the Board in performing the annual review of the Trust’s advisory and sub-advisory agreements pursuant to Section 15(c) of the 1940 Act.
The Audit Committee selects the independent auditors for the Trust and oversees the activities of the independent auditors as well as the internal auditors. The committee also receives reports about accounting and financial matters affecting the Trust.
The Executive Committee is selected by the Board. It may exercise all the powers of the Board, with certain exceptions, when the Board is not in session. The Committee must report its actions to the Board.
The Nominating and Governance Committee selects and nominates all candidates who are not “interested persons” of the Trust for election to the Board. The committee also oversees the structure and efficiency of the Board of Trustees and the committees the Board establishes.
The Operations Committee oversees the provision of administrative and distribution services to the Trust, communications with the Trusts’ shareholders, and provides review and oversight of the Trusts’ operations.
Additional information about the Trust is available in the Prospectuses and the Statements of Additional Information dated November 1, 2021 and restated April 28, 2021. These documents may be obtained free of charge by writing Principal Exchange-Traded Funds, c/o ALPS Distributors, Inc., 1290 Broadway, Suite 1100, Denver, CO 80203 or telephoning 1-800-787-1621. The prospectuses may be viewed at www.PrincipalETFs.com.
PROXY VOTING POLICIES
A description of the policies and procedures the Trust uses to determine how to vote proxies relating to portfolio securities and the results of the proxy votes for the most recent twelve months ended June 30 may be obtained free of charge by telephoning 1-800-787-1621, or on the SEC website at www.sec.gov.
SCHEDULES OF INVESTMENTS
The Trust files complete schedules of investments with the Securities and Exchange Commission for the first and third quarters of each year as a part of Form N-PORT. The Trust’s Form N-PORT reports are available on the Commission’s website at www.sec.gov.
STATEMENT REGARDING LIQUIDITY RISK MANAGEMENT PROGRAM
The Board of Directors of Principal Funds, Inc. (the “Board”) met on March 9, 2021 to review the liquidity risk management program (the “Program”) applicable to all series of the Principal Exchange Traded Funds (each, a “Fund”), pursuant to Rule 22e-4 under the Investment Company Act of 1940, as amended (the “Liquidity Rule”) for the period from January 1, 2020 through December 31, 2020 (the “Reporting Period”). At the meeting, the committee designated by the Board to administer the Program, the Liquidity Risk Management Committee (the “Committee”), addressed the operation, adequacy and effectiveness of the Program, the operation of each Fund’s highly liquid investment minimum, where applicable, and any material changes made to the Program during the Reporting Period.
The Committee noted key factors it considered when assessing, managing and reviewing each Fund’s liquidity risk. Such factors included each Fund’s investment strategy and liquidity of portfolio investments during both normal and reasonably foreseeable stressed conditions , including (a) whether the Fund’s investment strategy is appropriate for an open-end fund, (b) the extent to which the strategy involves a relatively concentrated portfolio or large positions in particular issuers, and (c) the use of borrowings for investment purposes and use of leveraged derivatives and financial commitment obligations; short-term and long-term cash flow projections during both normal and reasonably foreseeable stressed conditions; holdings of cash and cash equivalents, as well as borrowing arrangements and other funding sources; and each Fund’s shareholder ownership concentration.
There were no material changes to the Program during the Reporting Period. The Committee concluded, based on the operation of the functions as described in the Report, that the Program is operating as intended and is effective in implementing the requirements of the Liquidity Rule.
200
BOARD CONSIDERATION OF INVESTMENT ADVISORY CONTRACTS
During the period covered by this report, the Board of Trustees of Principal Exchange-Traded Funds (“PETF”) approved: (1) a management agreement between PETF and Principal Global Investors, LLC (“PGI” or “Manager”) related to the addition of the PETF Principal International Adaptive Multi-Factor ETF, the Principal U.S. Large-Cap Adaptive Multi-Factor ETF, and the Principal U.S. Small-Cap Adaptive Multi-Factor; and (2) an amended management agreement between PETF and PGI related to the PETF Principal Active Income ETF.
Management Agreement for PETF Principal International Adaptive Multi-Factor ETF, Principal U.S. Large-Cap Adaptive Multi-Factor ETF, and the Principal U.S. Small-Cap Adaptive Multi-Factor ETF
On March 8, 2021, the Board considered, on behalf of the newly established Principal International Adaptive Multi-Factor ETF, Principal U.S. Large-Cap Adaptive Multi-Factor ETF, and the Principal U.S. Small-Cap Adaptive Multi-Factor ETF series of PETF (the “Fund”), the approval of a management agreement (the “Management Agreement”) between PETF, on behalf of each Fund, and Principal Global Investors, LLC (the “Manager”).
Based upon their review, the Board concluded that it was in the best interests of each Fund to approve the Management Agreement and, accordingly, recommended to the Board the approval of the Management Agreement. In reaching this conclusion, no single factor was determinative in the Board’s analysis, but rather the Board considered a variety of factors.
The Board considered, among other factors, that the Manager serves as the investment adviser to the existing series of PETF, that the Manager has had a long-term relationship with PETF, Principal Funds, Inc. and Principal Variable Contracts, Inc. (collectively with Principal Diversified Select Real Asset Fund, the “Principal Funds”), all of which are also overseen by the Trustees; and that the Manager has demonstrated a commitment to support the Principal Funds. The Board concluded that a long-term relationship with a capable and conscientious adviser is in the best interests of the Funds. The Board considered various factors, including the following, and made certain findings and conclusions with regard thereto, in approving the Management Agreement.
Nature, Quality and Extent of Services
The Board considered the nature, quality and extent of the services to be provided under the Management Agreement, including administrative services. The Board noted that, in connection with the 2020 annual renewal of the management agreements for the other Principal Funds, the Board had: (1) reviewed the services provided by the Manager to the other Principal Funds under their respective management agreements; (2) considered the experience and skills of senior management leading fund operations, the experience and skills of the personnel performing the functions under the management agreements and the resources made available to such personnel, the ability of the Manager to attract and retain high-quality personnel, and the organizational depth and stability of the Manager and concluded that appropriate resources were provided under the management agreements for the other Principal Funds; and (3) considered the compliance program established by the Manager for the Principal Funds and their respective series, as applicable, the
201
quality of that program and the level of compliance attained by the Principal Funds. Based upon all relevant factors, the Board concluded that the nature, quality and extent of the services to be provided by the Manager to the Funds under the Management Agreement are expected to be satisfactory.
Investment Performance
Because the Funds are newly created series, the Board did not review the performance of the Funds as no track records were available.
Fees, Economies of Scale and Profitability.
The Board considered the proposed management fee rate for each Fund. The Board noted that the Manager proposed a unitary management fee for each Fund. The Board also received information from the Manager, based upon data supplied by Broadridge Financial Solutions, Inc. (“Broadridge”), an independent provider of investment company data, comparing the proposed unitary management fee rate for each Fund to the total expense ratios of funds in a peer group selected by Broadridge. For each Fund, the Board also considered whether there are economies of scale with respect to the services to be provided to that Fund under the Management Agreement. The Board concluded that, although the proposed management fee schedules for the Funds do not include breakpoints, the management fee schedules are appropriate at currently anticipated asset levels.
In addition, in evaluating the proposed management fees, the Board considered the Manager’s statements regarding the expected asset levels that will be required for the Funds to break even. On the basis of the information provided, the Board concluded that the proposed management fee rates were reasonable.
Other Benefits
The Board also considered the character and amount of other incidental benefits to be received by the Manager. The Board noted the Manager’s statement that it intends to use Fund commissions to buy Section 28(e) eligible products and services consistent with its use of commissions for the other equity portfolios it currently manages, as well as the Manager’s statement that there would be no known fall-out benefits to the Manager in connection with its management of the Funds outside the use of soft dollars. The Board concluded that, on the basis of the information provided, the incidental benefits to be received by the Manager were appropriate.
Overall Conclusions
Based upon all of the information considered and the conclusions reached, the Board determined that the terms of the Management Agreement, including the fee rates payable thereunder, are fair and reasonable and that approval of the Management Agreement is in the best interests of each Fund.
202
Amended Management Agreement for PETF Principal Active Income ETF
On June 14, 2021, the Board considered, on behalf of the PETF Principal Active High Yield ETF (formerly PETF Principal Active Income ETF) (the “Fund”) the approval of an amended management agreement (the “Management Agreement”) between PETF, for the Fund, and Principal Global Investors, LLC (the “Manager”) in connection with a proposal to amend the Fund’s unitary management fee schedule to reduce the unitary management fee rate payable at all asset levels.
The Board reviewed materials received from the Manager regarding the proposed change in the Fund’s unitary management fee schedule. The Board considered the Manager’s representation that the change in the Fund’s unitary management fee schedule would not reduce the quality or quantity of the services the Manager provides to the Fund and that the Manager’s obligations under the Management Agreement would remain the same in all material respects. The Board also considered that the Manager was not proposing any material changes to the terms of the Management Agreement other than to the Fund’s unitary management fee schedule.
The Board considered that they had last approved the Management Agreement for the Fund during the annual contract renewal process that concluded at the Board of Trustees’ September 2020 meeting. They noted that during the annual contract renewal process, they had considered the nature, quality and extent of the services provided by the Manager under the Management Agreement and had concluded, based upon the information provided, that the terms of the Management Agreement were reasonable and that approval of the Management Agreement was in the best interests of the Fund. The Board also noted that the Manager was proposing the amended Management Agreement in connection with a proposal to change the Fund’s investment objective and name and concluded that the proposed terms of the amended Management Agreement were reasonable in light of those proposed changes.
Based upon all of the information considered, the Board concluded that it was in the best interests of the Fund to approve the amended Management Agreement and, accordingly, recommended to the Board of Trustees the approval of the amended Management Agreement.
203
Federal Income Tax Information
Principal Exchange-Traded Funds
June 30, 2021 (unaudited)
Long-Term Capital Gain Dividends. Certain funds distributed long-term capital gain dividends during the fiscal year ended June 30, 2021.
Details of designated long-term capital gain dividends for federal income tax purposes are shown in the Notes to Financial Statements. To the extent necessary to distribute such capital gains, certain funds may also utilize, and hereby designate, earnings and profits distributed to shareholders on redemptions of shares as part of the Dividends Paid Deduction.
Foreign Taxes Paid. The following funds elect under the Internal Revenue Code Section ("IRC") 853 to pass through foreign taxes paid to their shareholders.
The funds designated the following for federal income tax purposes for distributions made during the fiscal year ended June 30, 2021:
| | | |
| | Foreign Taxes | Foreign | |
| | Per Share | Source Income | |
| Principal International Adaptive Multi-Factor ETF | 0.0043 | 99.99 | % |
| Principal International Multi-Factor ETF | 0.0652 | 99.65 | % |
Dividends Received Deduction ("DRD"). For corporate shareholders, the funds designate the following as a percentage of taxable ordinary income distributions (dividend income and short-term gains, if any), or up to the maximum amount allowable, as DRD eligible for the calendar year ended December 31, 2020:
| | |
| | DRD | |
| Principal Active Income ETF | 17.16 | % |
| Principal Healthcare Innovators Index ETF | 2.38 | % |
| Principal International Adaptive Multi-Factor ETF | N/A | |
| Principal International Multi-Factor ETF | 0.00 | % |
| Principal Investment Grade Corporate Active ETF | 1.29 | % |
| Principal Millennials Index ETF | 52.49 | % |
| Principal Quality ETF | 98.38 | % |
| Principal Spectrum Preferred Securities Active ETF | 41.59 | % |
| Principal Spectrum Tax-Advantaged Dividend Active ETF | 42.14 | % |
| Principal U.S. Large-Cap Adaptive Multi-Factor ETF | N/A | |
| Principal U.S. Mega-Cap ETF | 100.00 | % |
| Principal U.S. Small-Cap Adaptive Multi-Factor ETF | N/A | |
| Principal U.S. Small-Cap Multi-Factor ETF | 95.34 | % |
| Principal Ultra-Short Active Income ETF | 0.00 | % |
| Principal Value ETF | 98.35 | % |
Qualified Dividend Income ("QDI"). Certain dividends paid by the funds may be subject to a maximum tax rate of 20%. The funds designate the following as a percentage of taxable ordinary income distributions (dividend income and short-term gains, if any), or up to the maximum amount allowable, as QDI eligible for the calendar year ended December 31, 2020:
| | |
| | QDI | |
| Principal Active Income ETF | 18.54 | % |
| Principal Healthcare Innovators Index ETF | 2.38 | % |
| Principal International Adaptive Multi-Factor ETF | N/A | |
| Principal International Multi-Factor ETF | 100.00 | % |
| Principal Investment Grade Corporate Active ETF | 3.51 | % |
| Principal Millennials Index ETF | 66.16 | % |
| Principal Quality ETF | 100.00 | % |
| Principal Spectrum Preferred Securities Active ETF | 56.69 | % |
| Principal Spectrum Tax-Advantaged Dividend Active ETF | 100.00 | % |
| Principal U.S. Large-Cap Adaptive Multi-Factor ETF | N/A | |
| Principal U.S. Mega-Cap ETF | 100.00 | % |
| Principal U.S. Small-Cap Adaptive Multi-Factor ETF | N/A | |
| Principal U.S. Small-Cap Multi-Factor ETF | 94.07 | % |
| Principal Ultra-Short Active Income ETF | 0.00 | % |
| Principal Value ETF | 100.00 | % |
204

ITEM 2 – CODE OF ETHICS
(a) The Registrant has adopted a code of ethics (the "Code of Ethics") that applies to its principal executive officer, principal financial officer, principal accounting officer or controller, or persons performing similar functions.
| (b) | Not applicable. |
| (c) | The Registrant has not amended, as described in Item 2(c) of Form N-CSR, its Code of Ethics during |
the period covered by the shareholder report presented in Item 1 hereto.
(d) The Registrant has not granted a waiver or an implicit waiver from a provision of its Code of Ethics during the period covered by the shareholder report presented in Item 1 hereto.
| (e) | Not applicable. |
| (f) | The Registrant's Code of Ethics is attached as an Exhibit in response to Item 13(a)(1). |
ITEM 3 – AUDIT COMMITTEE FINANCIAL EXPERT
The Registrant's Board has determined that Elizabeth Nickels, a member of the Registrant's Audit Committee, is an "audit committee financial expert" and "independent," as such terms are defined in this Item.
ITEM 4 – PRINCIPAL ACCOUNTANT FEES AND SERVICES
(a) Audit Fees. Ernst & Young is the principal accountant for the registrant. As such, Ernst & Young has audited the financial statements of the registrant and reviewed regulatory filings that include those financial statements. During the last two fiscal years, Ernst & Young has billed the following amounts for their professional services.
June 30, 2020 - $363,078 June 30, 2021 - $315,075
(b) Audit-Related Fees. Ernst & Young provided audit-related services to the registrant that are not included in response to item 4(a). Those services related to the review of Form N-1A. Ernst & Young has billed the following amounts for those services.
June 30, 2020 - $11,000 June 30, 2021 - $5,500
Ernst & Young billed no fees that registrant’s audit committee was required to pre-approve pursuant to paragraph (c)(7)(ii) of Rule 2-01 of Regulation S-X.
(c) Tax Fees. Ernst & Young reviews the federal income tax returns and federal excise tax returns of the registrant. In connection with this review, Ernst & Young reviews the calculation of the registrant’s dividend distributions that are included as deductions on the tax returns. Ernst & Young also provides services to identify passive foreign investment companies. Ernst & Young also provides services to understand and comply with tax laws in certain foreign countries. During the last two fiscal years, Ernst & Young has billed the following amounts for their professional tax services.
June 30, 2020 - $144,679
June 30, 2021 - $145,603
Ernst & Young billed no fees that registrant’s audit committee was required to pre-approve pursuant to paragraph (c)(7)(ii) of Rule 2-01 of Regulation S-X.
(d) All Other Fees. Ernst & Young has not billed the registrant for other products or services during the last two fiscal years.
Ernst & Young billed no fees that registrant’s audit committee was required to pre-approve pursuant to paragraph (c)(7)(ii) of Rule 2-01 of Regulation S-X.
(e) (1) Audit Committee Pre-Approval Policy. The audit committee of the registrant has adopted the following pre-approval policy:
The Principal Funds
Policy on Auditor Independence
The purpose of this policy is to ensure the independence of the Principal Funds' primary independent auditor. This policy is established by the Audit Committee (the "Committee") of the Boards of Directors of Principal Funds, Inc. and Principal Variable Contracts Funds, Inc. and the Boards of Trustees of Principal Exchange-Traded Funds and any registered closed-end management investment company that is operated as an interval fund and managed by Principal Global Investors, LLC1 (the “Funds”) (the “Boards of the Funds”) effective for all engagements of the primary independent auditor.
| 1. | The primary independent auditor, its subsidiaries and affiliates shall not provide Prohibited |
| | | to the Funds. For the purposes of this policy, Prohibited Services are: |
| | | Services that are subject to audit procedure during a financial statement audit; |
| | | Services where the auditor would act on behalf of management; |
| | | Services where the auditor is an advocate to the client's position in an adversarial proceeding; |
| | | Bookkeeping or other services related to the accounting records or financial statements of the Funds, its subsidiaries and affiliates; |
| | | Financial information systems design and implementation; |
| | | Appraisal or valuation services, fairness opinions, or contribution-in-kind reports; |
| | | Actuarial services; |
| | | Internal audit functions or human resources; |
| | | Broker or dealer, investment advisor, or investment banking services; |
| | | Legal services and expert services unrelated to the audit; |
| | | Tax planning services related to listed, confidential and aggressive transactions; |
| | | Personal tax planning services to individuals in a financial reporting oversight role with regard to the Funds (other than members of the Boards of the Funds who are not also officers of the Funds), including the immediate family members of such individuals; |
| | | Any other service that the Public Company Accounting Oversight Board (PCAOB) determines, by regulation, is impermissible. |
1 The first such interval fund is the Principal Diversified Select Real Asset Fund; Management, subject to Board approval, may create others, each of which would be formed as a separate trust.
| 2. | (A) All services the primary independent auditor, its subsidiaries and affiliates provide to the Funds, and (B) Audit services, including audits of annual financial statements, audits of acquired or divested businesses or review of regulatory filings, any independent auditor provides, shall be approved by the Committee in advance in accordance with the following procedure: |
Each quarter, Management will present to the Committee for pre-approval, a detailed description of each particular service, excluding tax services, for which pre-approval is sought and a range of fees for such service. The Committee may delegate pre-approval authority to one or more of its members provided such delegated member(s) shall present a report of any services approved to the full Committee at its next regularly scheduled meeting. The Committee Chairperson shall have pre-approval authority for changes to any range of fees applicable to services the Committee previously approved and for new services and the range of fees for such services that arise between regularly scheduled Committee meetings.
Similarly, the primary independent auditor will present to the Committee for pre-approval a written description of the nature and scope of all tax services not expressly prohibited, including the fee arrangements for such services, and the potential effects of such services on the audit firm’s independence.
In considering whether to pre-approve the primary independent auditor’s provision of non-audit services, the Committee will consider whether the services are compatible with the maintenance of such auditor's independence. The Committee will also consider whether the primary independent auditor is best positioned to provide the most effective and efficient service, for reasons such as its familiarity with the Funds' business, people, culture, accounting systems, risk profile and other factors, and whether the service might enhance the Funds' ability to manage or control risk or improve audit quality.
| 3. | The provisions of this policy shall apply to all audit and non-audit services provided directly to the Funds. Additionally, the provisions of this policy shall apply to non-audit services provided to Principal Global Investors, LLC (“PGI”) or an affiliate of PGI that provides ongoing services to the Funds if the engagement relates directly to the operations and financial reporting of the Funds. |
| 4. | Not less than annually, the primary independent auditor shall report to the Committee in writing all relationships that may reasonably be thought to bear on independence between the auditor and the Funds or persons in financial reporting oversight roles with respect to any services provided by the auditor, its subsidiaries or affiliates as of the date of the communication, pursuant to Rule 3526 of the PCAOB. The primary independent auditor shall discuss with the Committee the potential effects of such relationships on the independence of the auditor. In addition, the primary independent auditor shall affirm, in writing, that, as of the date of the communication, it is independent within the meaning of the federal securities laws and Rule 3520 of the PCAOB. |
| 5. | The Committee shall ensure that the lead (or coordinating) audit partners, as well as the reviewing audit partner, of the Funds' primary independent auditor are rotated at least every five years and subject upon rotation to a five year "time out" period. All other audit partners of the primary independent auditor, excluding partners who simply consult with others on the audit engagement regarding technical issues, shall rotate after seven years and be subject upon rotation to a two year "time out" period. |
| 6. | Neither the Funds nor PGI may hire or promote any former partner, principal, shareholder or professional employee (Former Employee) of the primary independent auditor into a financial reporting oversight role unless the Former Employee (1) has severed his/her economic interest in the independent audit firm, and (2) was not a member of the audit engagement team for the Funds during the one year period preceding the date that the audit procedures began for the fiscal period in which the Funds or PGI proposes to hire or promote the Former Employee. Neither the Funds nor PGI shall, without prior written consent of the primary independent auditor, hire or |
| | promote any Former Employee into a role not prohibited above if the Former Employee had provided any services to the Funds or PGI during the 12 months preceding the date of filing of the Funds' most recent annual report with the SEC. Upon termination of the primary independent auditor, the Funds or PGI shall not, without prior written consent of the former primary independent auditor, hire or promote any Former Employee for a period of up to 12 months from termination. |
| 7. | For persons recently promoted or hired into a financial reporting oversight role (other than members of the Boards of the Funds who are not also officers of the Funds), any personal tax planning services pursuant to an engagement that was in progress before the hiring or promotion and provided by the primary independent auditor must be completed on or before 180 days after the hiring or promotion. |
| 8. | The phrase "financial reporting oversight role" means a role in which a person is in a position to exercise influence over the contents of the financial statements or anyone who prepares them, such as a member of the board of directors or similar management or governing body, chief executive officer, president, chief operating officer, chief financial officer, counsel, controller, chief internal auditor, or any equivalent positions. |
(Adopted by the Audit Committee of the Boards of the Funds on March 10, 2020).
(End of policy)
(e) (2) Pre-Approval Waivers. There were no services provided to the registrant by Ernst & Young that were approved pursuant to paragraph (c)(7)(i)(C) of Rule 2-01 of Regulation S-X.
(f) Substantially all work in connection with the audit of the registrant’s financial statements was performed by full-time employees of Ernst & Young.
(g) The aggregate non-audit fees Ernst & Young billed to the registrant, the registrant's investment adviser (not including any sub-adviser whose role is primarily portfolio management and is subcontracted with or overseen by another investment adviser), and any entity controlling, controlled by or under common control with the adviser that provides ongoing services to the registrant for each of registrant's last two fiscal years were as follows.
June 30, 2020 - $155,679 June 30, 2021 - $151,103
(h) The registrant’s audit committee of the board of trustees has considered whether the provision of non-audit services that were rendered to the registrant’s investment adviser (not including any sub-adviser whose role is primarily portfolio management and is subcontracted with or overseen by another investment adviser), and any entity controlling, controlled by or under common control with the investment adviser that provides ongoing services to the registrant that were not pre-approved pursuant to paragraph (c)(7)(ii) of Rule 2-01 of Regulation S-X is compatible with maintaining the principal accountant’s independence.
ITEM 5 – AUDIT COMMITTEE OF LISTED REGISTRANTS
(a) The registrant has a separately-designated standing audit committee established in accordance with Section 3(a)(58)(A) of the Exchange Act. The members of the audit committee are Leroy Barnes, Victor Hymes, Elizabeth Nickels, and Meg VanDeWeghe.
ITEM 6 – SCHEDULE OF INVESTMENTS
Schedule of Investments is included as part of the Report to Shareholders filed under Item 1 of this form.
ITEM 7 – DISCLOSURE OF PROXY VOTING POLICIES AND PROCEDURES FOR CLOSED-END MANAGEMENT INVESTMENT COMPANIES
Not applicable.
ITEM 8 – PORTFOLIO MANAGERS OF CLOSED-END MANAGEMENT INVESTMENT COMPANIES
Not applicable.
ITEM 9 – PURCHASES OF EQUITY SECURITIES BY CLOSED-END MANAGEMENT INVESTMENT COMPANY AND AFFILIATED PURCHASERS
Not applicable.
ITEM 10 – SUBMISSION OF MATTERS TO A VOTE OF SECURITY HOLDERS
There have been no material changes to the procedures by which shareholders may recommend nominees to registrant’s board of trustees.
ITEM 11 – CONTROLS AND PROCEDURES a) The registrant's principal executive officer and principal financial officer have concluded that the registrant's disclosure controls and procedures (as defined in Rule 30a-3(c) under the Investment Company Act of 1940, as amended) are effective (such disclosure controls and procedures having been evaluated within 90 days of the date of this filing).
(b) There have been no changes in the registrant’s internal controls over financial reporting (as defined in Rule 30a-3(d) under the Act (17 CFR 270.30a-3(d)) that occurred during the period covered by this report that have materially affected, or are reasonably likely to materially affect, the registrant’s internal control over financial reporting.
ITEM 12 – DISCLOSURE OF SECURITIES LENDING ACTIVITIES FOR CLOSED-END MANAGEMENT INVESTMENT COMPANIES
Not applicable.
ITEM 13 – EXHIBITS
(a)(1) Code of Ethics required to be disclosed under Item 2 of Form N-CSR attached hereto as Exhibit 99.CODE ETH.
(a)(2) Certifications pursuant to Section 302 of the Sarbanes-Oxley Act of 2002 and Rule 30a-2(a) under the Investment Company Act of 1940 are attached hereto as Exhibit 99.CERT.
(b) Certification pursuant to Section 906 of the Sarbanes-Oxley Act of 2002 and Rule 30a-2(b) under the Investment Company Act of 1940 is attached hereto as Exhibit 99.906CERT.
SIGNATURES
Pursuant to the requirements of the Securities Exchange Act of 1934 and the Investment Company Act of 1940, the registrant has duly caused this report to be signed on its behalf by the undersigned, thereunto duly authorized.
| | |
| (Registrant) | Principal Exchange-Traded Funds |
| |
| By | /s/ Kamal Bhatia |
| Kamal Bhatia, President and CEO |
| Date | 10/6/2021 |
Pursuant to the requirements of the Securities Exchange Act of 1934 and the Investment Company Act of 1940, this report has been signed below by the following persons on behalf of the registrant and in the capacities and on the dates indicated.
By /s/ Kamal Bhatia
Kamal Bhatia, President and CEO
| |
| Date | 10/6/2021 |
| |
| By | /s/ Michael Scholten |
| | Michael Scholten, Chief Financial Officer |
| Date | 10/6/2021 |