UNITED STATES
SECURITIES AND EXCHANGE COMMISSION
Washington, DC 20549
FORM N-CSR
CERTIFIED SHAREHOLDER REPORT OF REGISTERED
MANAGEMENT INVESTMENT COMPANIES
Investment Company Act file number
811-23029
Principal Exchange-Traded Funds
(Exact name of registrant as specified in charter)
| 801 Grand Avenue, Des Moines, IA 50309 | |
| (Address of principal executive offices) | (Zip code) |
Principal Global Investors, LLC, 801 Grand Avenue, Des Moines, IA 50309 (Name and address of agent for service)
| Registrant’s telephone number, including area code: | 515-235-1719 | |
| Date of fiscal year end: | June 30, 2023 | |
| Date of reporting period: | June 30, 2023 | |
ITEM 1 – REPORT TO STOCKHOLDERS

| Table of Contents | |
| Economic & Financial Market Review | 1 |
| Important Fund Information | 3 |
| Principal Active High Yield ETF (unaudited) | 4 |
| Principal Healthcare Innovators ETF (unaudited) | 5 |
| Principal International Adaptive Multi-Factor ETF (unaudited) | 6 |
| Principal Investment Grade Corporate Active ETF (unaudited) | 7 |
| Principal Millennial Global Growth ETF (unaudited) | 8 |
| Principal Quality ETF (unaudited) | 9 |
| Principal Real Estate Active Opportunities ETF | 10 |
| Principal Spectrum Preferred Securities Active ETF (unaudited) | 11 |
| Principal Spectrum Tax-Advantaged Dividend Active ETF (unaudited) | 12 |
| Principal U.S. Large-Cap Adaptive Multi-Factor ETF (unaudited) | 13 |
| Principal U.S. Mega-Cap ETF (unaudited) | 14 |
| Principal U.S. Small-Cap Adaptive Multi-Factor ETF (unaudited) | 15 |
| Principal U.S. Small-Cap ETF (unaudited) | 16 |
| Principal Value ETF (unaudited) | 17 |
| Statements of Assets and Liabilities | 18 |
| Statements of Operations | 23 |
| Statements of Changes in Net Assets | 28 |
| Notes to Financial Statements | 42 |
| Table of Contents (Continued) | |
| Schedules of Investments | 59 |
| Financial Highlights (Includes Performance Information) | 159 |
| Report of Independent Registered Public Accounting Firm | 173 |
| Shareholder Expense Example | 175 |
| Supplemental Information | 177 |
Not FDIC or NCUA insured
May lose value • Not a deposit • No bank or credit union guarantee Not insured by any Federal government agency
Economic & Financial Market Review
Global economic growth continued to slow, but showed signs of resiliency as consumption activity remained strong in developed markets. Geopolitical disruptions, continued supply constraints, and wage pressures were among the key factors keeping global inflation elevated—which fell from 7.7% in June 2022 to 4.2% in May 2023, still well above central banks’ targets. Although headline and core inflation have likely peaked now that oil prices and goods inflation have rolled over, services inflation (a key component of the Consumer Price Index (CPI), and of particular focus for the Federal Reserve) remains very sticky.
Aggressive global central bank tightening paths weighed heavily on global financial conditions, with global policy rates rising by 223 basis points (bps) in the twelve months ending June 2023. In that span, the United States Federal Reserve (Fed) hiked interest rates seven times for a 350 bps total increase, before finally pausing at their June 2023 meeting. However, expectations are that the Fed will resume rate hikes in July as stubborn core inflation remains elevated.
Despite the challenges from hawkish monetary policy and a significant slowdown in manufacturing activities, U.S. jobs data remained strong. As such, U.S. real Gross Domestic Product (GDP) grew an average quarter-over-quarter annualized rate of 1.8% in the four quarters ending March 2023. However, economic activity continues to slow—the U.S. manufacturing Purchasing Manager’s Index (PMI) again reads below 50, as it has done since October 20221. Similarly, Global PMI has been below 50 for nine consecutive months and is showing no signs of bottoming out. Emerging markets PMI, on the other hand, continued its streak of six consecutive months above 50.
Despite recent signs of resiliency, global earnings growth flipped negative, with the MSCI All Country World Index (ACWI) trailing twelve months earnings per share (TTM EPS) falling by 15%. The MSCI World Index TTM EPS increased by 4%, much higher than the MSCI Emerging Market Index’s -61%. In developed markets, the MSCI Europe Index (17%) earnings grew at a faster pace than the MSCI U.S. Index (2%). Within the U.S., mid-cap stocks, represented by the S&P Mid-Cap 400 Index, delivered higher earnings growth (5%) than large-cap (3%) and small-cap (1%) stocks, represented by the S&P 500 Index and the S&P Small-Cap 600 Index, respectively. Value stocks, represented by the Russell 1000 Value Index, delivered higher earnings growth (5%) than growth stocks (0%), represented by the Russell 1000 Growth Index. Large tech, represented by NASDAQ 100 Index, delivered -11% earnings growth.
Global equities outperformed global bonds in the last twelve months, with the MSCI ACWI recording a 17% gain year-over-year, while the Bloomberg Global Aggregate Corporate Index gained 2%. Within equities, developed markets (MSCI World Index) outperformed emerging markets (MSCI Emerging Markets Index) by 17%, and the U.S. (MSCI U.S. Index) outperformed developed markets ex-U.S. (MSCI World ex-U.S. Index) by 2%. Among major markets, the MSCI China Index was the worst performer with a 17% loss. The NASDAQ 100 Index was the top outperformer with a 33% gain. The Bloomberg U.S. Treasury Index delivered a 2% loss as the U.S. 10-year Treasury yield rose from 3.01% to 3.84%. Global high yield bonds outperformed investment grade corporate bonds and global treasury bonds by 8% and 13% respectively. The DXY Index, a proxy for U.S. dollar strength, dropped 2%. Commodity prices, represented by the S&P GSCI Total Return Index, fell 14%, and Nymex crude oil dropped significantly from 105.8 to 70.6 USD/ barrel, as the demand-supply dynamic improved.
Looking forward, the reversal in ultra-loose global central bank policy has led to an almost unrecognizable global investment landscape. Unlike the golden era of the past decade, where low inflation and low interest rates were suppressing volatility and lifting asset prices, the higher interest rate environment is now uncovering market strains and raising volatility.
Unless otherwise stated, data sources are Bloomberg, FactSet, and Principal Asset Allocation. Data as of June 30, 2023.
1 In global PMI readings, a number above 50 means that manufacturing activity is expanding, and a number below 50 indicates contraction.
Index descriptions:
MSCI All Country World Index (ACWI) includes large and mid-cap stocks across developed and emerging market countries.
MSCI World Index captures large and mid-cap representation across 23 Developed Markets (DM) countries.
MSCI World ex-U.S. Index captures large and mid-cap representation across 22 of 23 Developed Markets (DM) countries-- excluding the United States.
MSCI Europe Index captures large and mid-cap representation across 15 Developed Markets (DM) countries in Europe.
MSCI Emerging Markets Index consists of large and mid-cap companies across 24 countries and represents 10% of the world market capitalization. The index covers approximately 85% of the free float-adjusted market capitalization in each of the 24 countries.
MSCI U.S. Index is designed to measure the performance of the large and mid-cap segments of the U.S. market.
NASDAQ 100 Index is a basket of the 100 largest, most actively traded U.S. companies listed on the NASDAQ stock exchange. The index includes companies from various industries except for the financial industry, like commercial and investment banks.
Russell 1000 Growth Index measures the performance of the large-cap growth segment of the U.S. equity universe.
Russell 1000 Value Index measures the performance of the large-cap value segment of the U.S. equity universe.
Bloomberg Global Aggregate Index is a flagship measure of global investment grade debt from 24 local currency markets. This multi-currency benchmark includes treasury, government-related, corporate, and securitized fixed-rate bonds from both developed and emerging markets issuers.
Bloomberg U.S. Treasury Index measures U.S. dollar-denominated, fixed-rate, nominal debt issued by the U.S. Treasury.
U.S. Dollar Index (USDX, DXY, DX) is an index (or measure) of the value of the United States dollar relative to a basket of foreign currencies, often referred to as a basket of U.S. trade partners' currencies.
Standard & Poor's 500 (S&P 500) Index is a market capitalization-weighted index of 500 widely held stocks often used as a proxy for the stock market.
1
Economic & Financial Market Review
S&P Mid-Cap 400 Index, more commonly known as the S&P 400, is a stock market index from S&P Dow Jones Indices. The index serves as a gauge for the U.S. mid-cap equities sector and is the most widely followed mid-cap index.
S&P Small-Cap 600 Index is a stock market index established by Standard & Poor's. It covers roughly the small-cap range of American stocks, using a capitalization-weighted index.
S&P GSCI Total Return Index is an index of 24 exchange-traded futures contracts that represent a large portion of the global commodities market.
2
Important Fund Information
The following information applies to all funds shown in the annual report:
The line graphs on the following pages illustrate the growth of a hypothetical $10,000 investment.
Investment results shown represent historical performance and do not guarantee future results. Your investment’s returns and principal values will fluctuate with changes in interest rates and other market conditions so the value, when redeemed, may be worth more or less than original costs. Current performance may be lower or higher than the performance shown. For more information, including the most recent month-end performance, call 1-800-787-1621 or online at www.principalam.com/etf.
* Performance is based on net asset value (NAV) and assumes reinvestment of all dividends and capital gains. Performance does not reflect the impact of federal, state, or municipal taxes. If it did, performance would be lower. Since inception returns less than one year are not annualized.
** Performance shown for the benchmark assumes reinvestment of all dividends and distributions. Indices are unmanaged, and individuals cannot invest directly in an index.
.
3
Principal Active High Yield ETF
Investment Advisor: Principal Global Investors, LLC

| Average Annual Total Returns*± as of June 30, 2023 | |||||||
| 1-Year | 5-Year | Since Inception | Inception Date | ||||
| Principal Active High Yield ETF | 10.15 | % | 3.42 | % | 4.13 | % | 7/8/15 |
| What contributed to or detracted from Fund performance during the fiscal year? | |||||||
The investment seeks to provide a high level of current income. The fund is an actively managed exchange-traded fund (“ETF”) that seeks to achieve its investment objective by investing, under normal circumstances, at least 80% of its net assets, plus any borrowings for investment purposes, in below-investment grade (commonly known as "junk" or “high yield”) fixed income securities, such as bonds and bank loans. It invests in U.S. treasury bills, bonds, and other obligations issued or guaranteed by the U.S. government or its agencies or instrumentalities, investment grade bank loans (also known as senior floating rate interests), and preferred securities.
Security selection positively impacted returns due to the outperformance from overweights to Global Aircraft Leasing Co, Ahern Rentals, United Airlines, and Triumph Group, underweights to CSC Holdings LLC. Sector allocation outperformed due to an underweight to communications, and an overweight to energy.
Underperformance came from overweights to Aruba Investments Inc, Mold-Rite / Valcour Packaging LLC, and Lions Gate Capital Holdings, underweights to Carnival Corporation, and Royal Caribbean Cruises. From a sector perspective, our underweight to capital goods and overweight to consumer cyclicals had a negative impact on performance.
±Prior to September 1, 2021, the objective and strategy of the Fund differed from its current objective and strategy. Accordingly, performance of the Fund for periods prior to September 1, 2021 may not be representative of the performance the Fund would have achieved had the Fund been following its current objective and strategy.
4
Principal Healthcare Innovators ETF
Investment Advisor: Principal Global Investors, LLC
| Average Annual Total Returns*± as of June 30, 2023 | |||||||
| 1-Year | 5-Year | Since Inception | Inception Date | ||||
| Principal Healthcare Innovators ETF | 11.49 | % | 0.98 | % | 5.68 | % | 8/19/16 |
| What contributed to or detracted from Fund performance during the fiscal year? |
The investment seeks long-term growth of capital. Under normal circumstances, the fund invests at least 80% of its net assets, plus any borrowings for investment purposes, in equity securities of companies in the healthcare sector. It invests significantly in early-stage companies within the healthcare equipment and supplies, pharmaceuticals, biotechnology, and life sciences industries that are not yet consistently profitable.
The Principal Healthcare Innovators ETF underperformed the Index during the year. The healthcare technology and healthcare equipment and supplies industries performed the best within the index. Prometheus Biosciences, Provention Bio, and TG Therapeutics outperformed within the index. Our positioning in Exact Sciences, Sarepta Therapeutics, and Prometheus Biosciences contributed to performance.
The insurance and electronic equipment instruments and components industries underperformed during the year. Babylon Holdings, Tricida, and Gelesis Holdings underperformed within the index. Our positioning in Illumina, Mirati Therapeutics, and Tandem Diabetes Care detracted from performance.
^Effective July 15, 2022, the Fund changed its primary broad-based index for performance comparison purposes to the Russell 2000 Healthcare Index in connection with the Fund's change to an actively managed Fund. Prior to that date, the Fund was passively managed to correspond to the Nasdaq US Health Care Innovators Index. The Nasdaq US Health Care Innovators Index was a custom index which ceased operations on December 1, 2022. Performance shown for the benchmark assumes reinvestment of all dividends and distributions. Indices are unmanaged, and individuals cannot invest directly in an index.
±Prior to July 15, 2022, the objective and strategy of the Fund differed from its current objective and strategy. Accordingly, performance of the Fund for periods prior to that date may not be representative of the performance the Fund would have achieved had the Fund been following its current objective and strategy.
5
Principal International Adaptive Multi-Factor ETF
Investment Advisor: Principal Global Investors, LLC
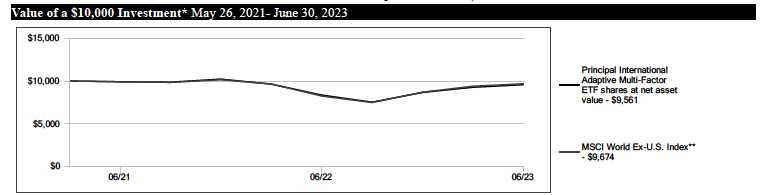
| Average Annual Total Returns* as of June 30, 2023 | |||||
| 1-Year | Since Inception | Inception Date | |||
| Principal International Adaptive Multi-Factor ETF | 14.50 | % | -2.12 | % | 5/26/21 |
| What contributed to or detracted from Fund performance during the fiscal year? |
The investment seeks long-term growth of capital. Under normal circumstances, the fund invests at least 40% of its net assets, plus any borrowings for investment purposes, in securities of foreign companies. It invests in securities regardless of market capitalization size (small, medium or large). For security selection and portfolio construction, Principal Global Investors, LLC ("PGI") uses a proprietary quantitative model. The model is designed to identify and rank equity securities in the MSCI World Ex-U.S. Index (the "index").
The Principal International Adaptive Multi-Factor ETF underperformed the index over the last 12 months. Ten of the eleven sectors within the index posted positive returns, led by information technology and consumer discretionary. UniCredit, Advantest, and Shopify outperformed within the index. Our positioning in Disco, Advantest, and Rheinmetall contributed to performance.
The real estate sector lagged during the year. Credit Suisse Group, Uniper, and Embracer Group underperformed within the index. Our positioning in Bezeq the Israel Telecommuncations Corp, WH Group, and Telefonica detracted from performance.
6
Principal Investment Grade Corporate Active ETF
Investment Advisor: Principal Global Investors, LLC

| Average Annual Total Returns* as of June 30, 2023 | |||||||
| 1-Year | 5-Year | Since Inception | Inception Date | ||||
| Principal Investment Grade Corporate Active ETF | 0.87 | % | 1.58 | % | 1.26 | % | 4/18/18 |
| What contributed to or detracted from Fund performance during the fiscal year? |
The investment seeks to provide current income and, as a secondary objective, capital appreciation. The fund is an actively managed exchange-traded fund ("ETF") that seeks to achieve its investment objective by investing, under normal circumstances, at least 80% of its net assets, plus any borrowings for investment purposes, in investment grade corporate bonds and other fixed income securities at the time of purchase. "Investment grade" securities are rated BBB- or higher by S&P Global Ratings ("S&P Global") or Baa3 or higher by Moody's Investors Service, Inc. ("Moody's") or, if unrated, of comparable quality in the opinion of those selecting such investments.
Sector allocations contributed positively to performance from overweight positions in Banking, Insurance, Communications, Finance Companies, and Transportation. Security selection within Transportation, Consumer Non-Cyclical, Capital Goods, Electric, and REITs were also positive contributors to performance.
Security selection negatively impacted returns due to the underperformance from positions in Credit Suisse and First Republic. For sector allocation, underweight positions in Consumer Cyclical, Energy, Technology, and Basic Industry contributed negatively to performance.
Duration was also a negative contributor.
7
Principal Millennial Global Growth ETF
Investment Advisor: Principal Global Investors, LLC

| Average Annual Total Returns*± as of June 30, 2023 | |||||||
| 1-Year | 5-Year | Since Inception | Inception Date | ||||
| Principal Millennial Global Growth ETF | 11.52 | % | 4.71 | % | 9.61 | % | 8/19/16 |
| What contributed to or detracted from Fund performance during the fiscal year? | |||||||
The investment seeks long-term growth of capital. Under normal circumstances, the fund primarily invests in equity securities, focusing on growth equity securities. Under normal circumstances, it invests at least 40% of its net assets in foreign and emerging market securities. The fund invests in equity securities of different market capitalizations (small, medium, or large). The fund will concentrate its investments (invest more than 25% of its assets) in one or more industries within the consumer discretionary sector and one or more industries within the communication services sector.
The Principal Millennial Global Growth ETF underperformed the Index during the year. Ten of the eleven sectors within the index posted positive returns, led by information technology and industrials. Zhongji Innolight, Posco, and Royal Caribbean Group outperformed within the index. Our positioning in Industria de Diseno Textil, Netflix, and Tencent Music Entertainment contributed to performance.
The real estate sector lagged during the year. SVB Financial Group, Signature Bank, and First Republic Bank underperformed within the index, while our positioning in Lufax Holding, Kuaishou Technology, and AT&T detracted from performance.
^Effective July 15, 2022 the fund changed its primary broad-based index to the MSCI ACWI NR USD Index in connection with the fund’s change to an actively managed fund. Prior to that date, the fund was passively managed to correspond to the Nasdaq Global Millennial Opportunity Index. The Nasdaq Global Millennial Opportunity Index was a custom index which ceased operations on December 1, 2022. Performance shown for the benchmark assumes reinvestment of all dividends and distributions. Indices are unmanaged, and individuals cannot invest directly in an index.
± Prior to July 15, 2022, the objective and strategy of the Fund differed from its current objective and strategy. Accordingly, performance of the Fund for periods prior to that date may not be representative of the performance the Fund would have achieved had the Fund been following its current objective and strategy.
8
Principal Quality ETF
Investment Advisor: Principal Global Investors, LLC

| Average Annual Total Returns* as of June 30, 2023 | |||||||
| 1-Year | 5-Year | Since Inception | Inception Date | ||||
| Principal Quality ETF | 19.69 | % | 12.56 | % | 13.25 | % | 3/21/16 |
| What contributed to or detracted from Fund performance during the fiscal year? | |||||||
The investment seeks long-term growth of capital. Under normal circumstances, the fund primarily invests in equity securities. For security selection and portfolio construction, Principal Global Investors, LLC (“PGI”) uses a proprietary quantitative model designed to identify equity securities in the S&P 500 Index or S&P 400 Index that exhibit higher quality, growth potential, and pricing power. The fund invested significantly in one or more industries within the healthcare sector.
The Principal Quality ETF outperformed the Index over the last twelve months. Nine of the eleven sectors in the index posted positive returns, led by information technology and industrials. Royal Caribbean Group, NVIDIA, and Netflix outperformed within the index. Our positioning in Regeneron Pharmaceuticals, IDEXX Laboratories, and Gilead Sciences contributed to performance.
The real estate and utility sectors lagged during the year. Signature Bank, SVB Financial Group, and First Republic Bank underperformed in the index, while our positioning in SVB Financial Group, Waters Corporation, and AbbVie detracted from performance.
9
Principal Real Estate Active Opportunities ETF
Investment Advisor: Principal Global Investors, LLC
Sub-Advisor: Principal Real Estate Investors, LLC

| Average Annual Total Returns* as of June 30, 2023 | |||||
| 1-Year | Since Inception | Inception Date | |||
| Principal Real Estate Active Opportunities ETF | -5.03 | % | -6.23 | % | 5/18/22 |
| What contributed to or detracted from Fund performance during the fiscal year? | |||||
The investment seeks total return. Under normal circumstances, the fund invests at least 80% of its net assets, plus any borrowings for investment purposes, in securities of companies principally engaged in the real estate industry at the time of purchase. It invests primarily in equity securities of U.S. companies, including those of small companies. The fund is non-diversified.
Fund performance benefited from investors displaying a preference for property types and stocks with greater economic sensitivity trading at lower valuation multiples. Thus, our overweight to gaming landlords and hotel and resort properties was beneficial. Gaming REITs were aided by healthy underlying casino growth and from inflation protection embedded in many leases. Similarly, hotel and resort owners experienced favorable demand trends, particularly from the leisure segment. Not owning office REITs was the largest contributor to fund performance, despite greater economic sensitivity and lower valuations, as the market remained concerned about work-from-home headwinds and the tightening of lending conditions, which are expected to hit office harder than others.
Avoidance of retail was a top detractor as the sector outperformed on signs of further fundamental recovery combined with lower valuation levels. Stock selection within industrial was also a detractor due the fund’s holdings having elevated exposure to Southern California on fears that market is slowing after years of outsized growth. An overweight to manufactured housing hurt performance due to expense pressures and unease regarding a recent acquisition made by one company that expanded its portfolio into the United Kingdom.
10
Principal Spectrum Preferred Securities Active ETF
Investment Advisor: Principal Global Investors, LLC
Sub-Advisor: Spectrum Asset Management, Inc.

| Average Annual Total Returns* as of June 30, 2023 | |||||||
| 1-Year | 5-Year | Since Inception | Inception Date | ||||
| Principal Spectrum Preferred Securities Active ETF | 2.68 | % | 2.37 | % | 1.76 | % | 7/10/17 |
| What contributed to or detracted from Fund performance during the fiscal year? | |||||||
The investment seeks to provide current income. Under normal circumstances, the fund invests at least 80% of its net assets, plus any borrowings for investment purposes, in preferred securities at the time of purchase. Examples of preferred securities include preferred stock, certain depositary receipts, and various types of junior subordinated debt (such debt generally includes the contractual ability to defer payment of interest without accelerating an immediate default event). It concentrates its investments (invests more than 25% of its net assets) in securities in one or more industries within the financial services sector.
In a rising rate environment (U.S. Treasury 2 year yield increased 195 basis points (bps) and the 10 year yield increased 82 bps) the Fund underperformed its ICE BofA U.S. Investment Grade Institutional Capital Securities Index (CIPS) benchmark (100% investment grade), because investment grade outperformed below investment grade paper, which represents mostly regional bank underperformance. Insurance hybrids, Limited Recourse Capital Notes (LRCNs) contributed to performance.
11
Principal Spectrum Tax-Advantaged Dividend Active ETF
Investment Advisor: Principal Global Investors, LLC
Sub-Advisor: Spectrum Asset Management, Inc.

| Average Annual Total Returns* as of June 30, 2023 | |||||
| 1-Year | Since Inception | Inception Date | |||
| Principal Spectrum Tax-Advantaged Dividend Active ETF | 0.65 | % | 0.66 | % | 6/16/20 |
| What contributed to or detracted from Fund performance during the fiscal year? | |||||
The investment seeks to provide current income. Under normal circumstances, the fund invests at least 80% of its net assets, plus any borrowings for investment purposes, in dividend-paying securities at the time of purchase. Such securities include, without limitation, preferred securities and capital securities of U.S. and non-U.S. issuers. The fund invests significantly in securities that, at the time of issuance, are eligible to pay dividends that qualify for favorable U.S. federal income tax treatment, such as dividends treated as “qualified dividend income” (“QDI”) and qualified dividends from real estate investment trusts (“REITS”).
In a rising rate environment (U.S. Treasury 2 year yield increased 195 basis points (bps) and the 10 year yield increased 82 bps) the top returning holdings were Canadian Banks-Additional Tier 1 capital (AT1), Limited Recourse Capital Notes (LRCNs) and $1000 par Preferred Stock issued by U.S. Banks.
The largest detractors were $25 par preferred stocks and U.S. Treasury futures.
12
Principal U.S. Large-Cap Adaptive Multi-Factor ETF
Investment Advisor: Principal Global Investors, LLC

| Average Annual Total Returns* as of June 30, 2023 | |||||
| 1-Year | Since Inception | Inception Date | |||
| Principal U.S. Large-Cap Adaptive Multi-Factor ETF | 16.28 | % | 4.05 | % | 5/19/21 |
| What contributed to or detracted from Fund performance during the fiscal year? | |||||
The investment seeks long-term growth of capital. Under normal circumstances, the fund invests at least 80% of its net assets, plus any borrowings for investment purposes, in equity securities of U.S. companies with large market capitalizations at the time of purchase. As a result, changes in the value of a single investment could cause greater fluctuations in its share price than would occur in a more diversified fund. The fund’s strategies may result in the active and frequent trading of its portfolio securities. It is non-diversified.
The Principal U.S. Large-Cap Adaptive Multi-Factor ETF underperformed the index over the last 12 months. Nine of the eleven sectors in the index posted positive returns, led by information technology and industrials. Royal Caribbean Group, NVIDIA, and Netflix outperformed within the index. Our positioning in PulteGroup, Regeneron Pharmaceuticals, and W.W. Grainger contributed to performance.
The real estate and utility sectors lagged during the year. Signature Bank, SVB Financial Group, and First Republic Bank underperformed in the index, while our positioning in First Republic Bank, Tyson Foods, and Advance Auto Parts detracted from performance.
13
Principal U.S. Mega-Cap ETF
Investment Advisor: Principal Global Investors, LLC

| Average Annual Total Returns* as of June 30, 2023 | |||||||
| 1-Year | 5-Year | Since Inception | Inception Date | ||||
| Principal U.S. Mega-Cap ETF | 21.39 | % | 13.05 | % | 12.22 | % | 10/11/17 |
| What contributed to or detracted from Fund performance during the fiscal year? | |||||||
The investment seeks long-term growth of capital. Under normal circumstances, the fund invests at least 80% of its net assets, plus any borrowings for investment purposes, in equity securities of U.S. companies with very large ("mega") market capitalizations at the time of purchase. For this fund, companies with mega capitalizations are those with market capitalizations in the top 50th percentile of the S&P 500 Index at the time of purchase.
The Principal U.S. Mega Cap ETF outperformed the Index over the last 12 months. Nine of the eleven sectors in the index posted positive returns, led by information technology and industrials. Royal Caribbean Group, NVIDIA, and Netflix outperformed within the index. Our positioning in NVIDIA, Meta Platforms, and Broadcom contributed to performance.
The real estate and utility sectors lagged during the year. Signature Bank, SVB Financial Group, and First Republic Bank underperformed in the index, while our positioning in Pfizer, Danaher, and UnitedHealth Group detracted from performance.
14
Principal U.S. Small-Cap Adaptive Multi-Factor ETF
Investment Advisor: Principal Global Investors, LLC
| Average Annual Total Returns* as of June 30, 2023 | |||||
| 1-Year | Since Inception | Inception Date | |||
| Principal U.S. Small-Cap Adaptive Multi-Factor ETF | 9.22 | % | -1.39 | % | 5/19/21 |
| What contributed to or detracted from Fund performance during the fiscal year? | |||||
The investment seeks long-term growth of capital. Under normal circumstances, the fund invests at least 80% of its net assets, plus any borrowings for investment purposes, in equity securities of U.S. companies with small market capitalizations at the time of purchase. For security selection and portfolio construction, Principal Global Investors, LLC ("PGI") uses a proprietary quantitative model. The fund’s strategies may result in the active and frequent trading of its portfolio securities.
The Principal U.S. Small-Cap Adaptive Multi-Factor ETF underperformed the index over the last 12 months. Six of the eleven sectors within the index posted positive returns, led by industrials and information technology. E.l.f. Beauty, Circor International, and Axcelis Technologies outperformed within the index. Our positioning in Olympic Steel, Green Brick Partners, and Comfort Systems contributed to performance.
The financials and real estate sectors lagged during the year. HomeStreet, Nektar Therapeutics, and Bed Bath and Beyond underperformed in the index, while our positioning in Genesco, Ameris Bancorp, and Mercer International detracted from performance.
15
Principal U.S. Small-Cap ETF
Investment Advisor: Principal Global Investors, LLC
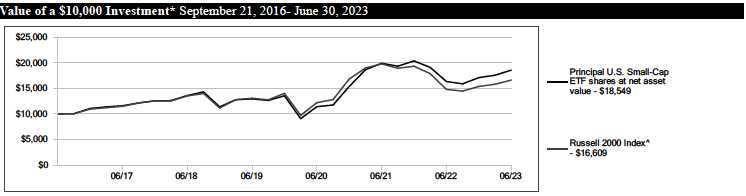
| Average Annual Total Returns*± as of June 30, 2023 | |||||||
| 1-Year | 5-Year | Since Inception | Inception Date | ||||
| Principal U.S. Small-Cap ETF | 13.59 | % | 6.41 | % | 9.55 | % | 9/21/16 |
| What contributed to or detracted from Fund performance during the fiscal year? | |||||||
The investment seeks long-term growth of capital. Under normal circumstances, the fund invests at least 80% of its net assets, plus any borrowings for investment purposes, in equity securities of U.S. companies with small market capitalizations at the time of purchase. For this fund, companies with small market capitalizations are those with market capitalizations within the range of companies comprising the Russell 2000 Index.
The Principal U.S. Small-Cap ETF outperformed the Index during the year. Seven of the eleven sectors within the index posted positive returns, led by industrial and energy. Applied Digital, Prometheus Biosciences, and Super Micro Computer outperformed within the index. Our positioning in Super Micro Computer, Axcelis Technologies, and Atlas Air Worldwide Holdings contributed to performance.
The financials and communication services sectors lagged during the year. Diebold Nixdorf, Starry Group, and Babylon Holdings underperformed in the index, while our positioning in Associated Banc-Corp, United Community Banks, and Spectrum Brands Holdings detracted from performance.
^Effective July 8, 2022, the Fund changed its primary broad-based index to the Russell 2000 Index in connection with the Fund's change to an actively managed Fund. Prior to that date, the Fund was passively managed to correspond to the Nasdaq US SmallCap Select Leaders Index. The Nasdaq US SmallCap Select Leaders Index was a custom index which ceased operations on December 1, 2022. Performance shown for the benchmark assumes reinvestment of all dividends and distributions. Indices are unmanaged, and individuals cannot invest directly in an index.
± Prior to July 8, 2022, the objective and strategy of the Fund differed from its current objective and strategy. Accordingly, performance of the Fund for periods prior to that date may not be representative of the performance the Fund would have achieved had the Fund been following its current objective and strategy.
16
Principal Value ETF
Investment Advisor: Principal Global Investors, LLC

| Average Annual Total Returns* as of June 30, 2023 | |||||||
| 1-Year | 5-Year | Since Inception | Inception Date | ||||
| Principal Value ETF | 10.45 | % | 8.08 | % | 9.98 | % | 3/21/16 |
| What contributed to or detracted from Fund performance during the fiscal year? | |||||||
The investment seeks long-term growth of capital. Under normal circumstances, the fund primarily invests in equity securities, focusing on value stocks. For security selection and portfolio construction, Principal Global Investors, LLC ("PGI") uses a proprietary quantitative model designed to identify equity securities of mid- to large-capitalization companies in the S&P 500 Index that exhibit higher degrees of shareholder yield (meaning how much money a company distributes to shareholders through dividends and share repurchases).
The Principal Value ETF underperformed the Index over the last twelve months. Nine of the eleven sectors in the index posted positive returns, led by information technology and industrials. Royal Caribbean Group, NVIDIA, and Netflix outperformed within the index. Our positioning in Cardinal Health, Ross Stores, and Omnicom Group contributed to performance.
The real estate and utility sectors lagged during the year. Signature Bank, SVB Financial Group, and First Republic Bank underperformed in the index, while our positioning in Zions Bancorporation, Organon, and Sealed Air detracted from performance.
17
| Statements of Assets and Liabilities | ||||||||||
| Principal Exchange-Traded Funds | ||||||||||
| June 30, 2023 | ||||||||||
| Principal | ||||||||||
| Principal | International | |||||||||
| Principal | Healthcare | Adaptive | ||||||||
| Active High | Innovators | Multi-Factor | ||||||||
| Yield ETF | ETF | ETF | ||||||||
| Investment in securities — at cost | $ | 111,143,837 | $ | 78,304,030 | $ | 15,504,589 | ||||
| Investment in affiliated funds — at cost | $ | 3,219,013 | $ | 1,429,219 | $ | — | ||||
| Foreign currency — at cost | $ | 2 | $ | — | $ | 9,549 | ||||
| Assets | ||||||||||
| Investment in securities — at value | $ | 103,948,260 | (a) | $ | 54,006,740 | (a) | $ | 15,571,957 | ||
| Investment in affiliated funds — at value | 3,219,013 | 1,429,219 | — | |||||||
| Foreign currency — at value | 2 | — | 9,570 | |||||||
| Cash | 8,953 | 6,570 | 30 | |||||||
| Receivables: | ||||||||||
| Dividends | 41,619 | 539 | 79,427 | |||||||
| Interest | 1,606,850 | — | — | |||||||
| Securities lending income | 3,205 | 9,313 | — | |||||||
| Investment securities sold | 5,869 | — | — | |||||||
| Total Assets | 108,833,771 | 55,452,381 | 15,660,984 | |||||||
| Liabilities | ||||||||||
| Accrued management and investment advisory fees | 33,060 | 19,125 | 3,060 | |||||||
| Payables: | ||||||||||
| Investment securities purchased | 487,641 | 6,692 | — | |||||||
| Collateral obligation on securities loaned — at value | 3,219,013 | 1,429,219 | — | |||||||
| Total Liabilities | 3,739,714 | 1,455,036 | 3,060 | |||||||
| Net Assets Applicable to Outstanding Shares | $ | 105,094,057 | $ | 53,997,345 | $ | 15,657,924 | ||||
| Net Assets Consist of: | ||||||||||
| Capital shares and additional paid-in-capital | $ | 128,387,124 | $ | 100,760,041 | $ | 24,545,834 | ||||
| Total distributable earnings (accumulated loss) | (23,293,067 | ) | (46,762,696 | ) | (8,887,910 | ) | ||||
| Total Net Assets | $ | 105,094,057 | $ | 53,997,345 | $ | 15,657,924 | ||||
| Net Asset Value Per Share: | ||||||||||
| Net assets | $ | 105,094,057 | $ | 53,997,345 | $ | 15,657,924 | ||||
| Shares issued and outstanding | 5,750,000 | 1,500,001 | 700,001 | |||||||
| Net asset value per share | $ | 18.28 | $ | 36.00 | $ | 22.37 | ||||
| (a) Includes fair market value of securities loaned, see 'Securities Lending' in Notes to Financial Statements. | ||||||||||
See accompanying notes.
18
| Statements of Assets and Liabilities | |||||||||
| Principal Exchange-Traded Funds | |||||||||
| June 30, 2023 | |||||||||
| Principal | |||||||||
| Investment | Principal | ||||||||
| Grade | Millennial | ||||||||
| Corporate | Global Growth | Principal | |||||||
| Active ETF | ETF (a) | Quality ETF | |||||||
| Investment in securities — at cost | $ | 49,258,885 | $ | 37,576,575 | $ | 32,981,210 | |||
| Investment in affiliated funds — at cost | $ | 384,880 | $ | 721,539 | $ | — | |||
| Assets | |||||||||
| Investment in securities — at value | $ | 46,660,338 | (b) | $ | 29,964,461 | (b) | $ | 36,681,051 | |
| Investment in affiliated funds — at value | 384,880 | 721,539 | — | ||||||
| Cash | 625 | — | — | ||||||
| Deposits with counterparty | 51,410 | — | — | ||||||
| Receivables: | |||||||||
| Dividends | 3,642 | 27,442 | 18,994 | ||||||
| Interest | 476,333 | — | — | ||||||
| Securities lending income | 362 | 865 | — | ||||||
| Total Assets | 47,577,590 | 30,714,307 | 36,700,045 | ||||||
| Liabilities | |||||||||
| Accrued management and investment advisory fees | 7,241 | 9,174 | 4,366 | ||||||
| Payables: | |||||||||
| Variation margin on financial derivative instruments | 11,273 | — | — | ||||||
| Collateral obligation on securities loaned — at value | 384,880 | 721,539 | — | ||||||
| Total Liabilities | 403,394 | 730,713 | 4,366 | ||||||
| Net Assets Applicable to Outstanding Shares | $ | 47,174,196 | $ | 29,983,594 | $ | 36,695,679 | |||
| Net Assets Consist of: | |||||||||
| Capital shares and additional paid-in-capital | $ | 67,690,851 | $ | 46,997,698 | $ | 45,577,128 | |||
| Total distributable earnings (accumulated loss) | (20,516,655 | ) | (17,014,104 | ) | (8,881,449 | ) | |||
| Total Net Assets | $ | 47,174,196 | $ | 29,983,594 | $ | 36,695,679 | |||
| Net Asset Value Per Share: | |||||||||
| Net assets | $ | 47,174,196 | $ | 29,983,594 | $ | 36,695,679 | |||
| Shares issued and outstanding | 2,300,001 | 700,001 | 650,001 | ||||||
| Net asset value per share | $ | 20.51 | $ | 42.83 | $ | 56.45 | |||
| (a) | Effective July 15, 2022, Principal Millennials ETF changed its name to Principal Millennial Global Growth ETF. |
| (b) | Includes fair market value of securities loaned, see 'Securities Lending' in Notes to Financial Statements. |
| See accompanying notes. |
19
| Statements of Assets and Liabilities | ||||||||||
| Principal Exchange-Traded Funds | ||||||||||
| June 30, 2023 | ||||||||||
| Principal | Principal | |||||||||
| Principal Real | Spectrum | Spectrum Tax- | ||||||||
| Estate Active | Preferred | Advantaged | ||||||||
| Opportunities | Securities | Dividend | ||||||||
| ETF | Active ETF | Active ETF | ||||||||
| Investment in securities — at cost | $ | 5,890,998 | $ | 610,666,167 | $ | 21,601,475 | ||||
| Investment in affiliated funds — at cost | $ | — | $ | 3,970,623 | $ | — | ||||
| Assets | ||||||||||
| Investment in securities — at value | $ | 5,419,779 | $ | 566,324,751 | (a) | $ | 19,869,012 | |||
| Investment in affiliated funds — at value | — | 3,970,623 | — | |||||||
| Cash | — | — | 6,165 | |||||||
| Deposits with counterparty | — | — | 25,397 | |||||||
| Receivables: | ||||||||||
| Dividends | 26,161 | 66,830 | 13,098 | |||||||
| Interest | — | 6,468,798 | 177,544 | |||||||
| Securities lending income | — | 5,858 | — | |||||||
| Fund shares sold | — | 3,373,271 | — | |||||||
| Total Assets | 5,445,940 | 580,210,131 | 20,091,216 | |||||||
| Liabilities | ||||||||||
| Accrued management and investment advisory fees | 2,852 | 253,279 | 9,867 | |||||||
| Collateral obligation on securities loaned — at value | — | 3,970,623 | — | |||||||
| Total Liabilities | 2,852 | 4,223,902 | 9,867 | |||||||
| Net Assets Applicable to Outstanding Shares | $ | 5,443,088 | $ | 575,986,229 | $ | 20,081,349 | ||||
| Net Assets Consist of: | ||||||||||
| Capital shares and additional paid-in-capital | $ | 5,934,393 | $ | 641,037,630 | $ | 23,199,790 | ||||
| Total distributable earnings (accumulated loss) | (491,305 | ) | (65,051,401 | ) | (3,118,441 | ) | ||||
| Total Net Assets | $ | 5,443,088 | $ | 575,986,229 | $ | 20,081,349 | ||||
| Net Asset Value Per Share: | ||||||||||
| Net assets | $ | 5,443,088 | $ | 575,986,229 | $ | 20,081,349 | ||||
| Shares issued and outstanding | 240,001 | 34,150,005 | 1,150,001 | |||||||
| Net asset value per share | $ | 22.68 | $ | 16.87 | $ | 17.46 | ||||
| (a) | Includes fair market value of securities loaned, see 'Securities Lending' in Notes to Financial Statements. |
| See accompanying notes. |
20
| Statements of Assets and Liabilities | ||||||||||
| Principal Exchange-Traded Funds | ||||||||||
| June 30, 2023 | ||||||||||
| Principal U.S. | Principal U.S. | |||||||||
| Large | -Cap | Small | -Cap | |||||||
| Adaptive | Adaptive | |||||||||
| Multi-Factor | Principal U.S. | Multi-Factor | ||||||||
| ETF | Mega-Cap ETF | ETF | ||||||||
| Investment in securities — at cost | $ | 6,717,747 | $ | 1,262,120,816 | $ | 5,527,304 | ||||
| Assets | ||||||||||
| Investment in securities — at value | $ | 6,567,559 | $ | 1,463,279,280 | $ | 5,855,807 | ||||
| Receivables: | ||||||||||
| Dividends | 4,704 | 721,718 | 5,566 | |||||||
| Investment securities sold | — | 2,178,418 | — | |||||||
| Expense reimbursement from Advisor | — | 35,260 | — | |||||||
| Total Assets | 6,572,263 | 1,466,214,676 | 5,861,373 | |||||||
| Liabilities | ||||||||||
| Accrued management and investment advisory fees | 787 | 176,299 | 898 | |||||||
| Fund shares redeemed | — | 2,184,856 | — | |||||||
| Total Liabilities | 787 | 2,361,155 | 898 | |||||||
| Net Assets Applicable to Outstanding Shares | $ | 6,571,476 | $ | 1,463,853,521 | $ | 5,860,475 | ||||
| Net Assets Consist of: | ||||||||||
| Capital shares and additional paid-in-capital | $ | 11,947,818 | $ | 1,351,049,602 | $ | 6,262,759 | ||||
| Total distributable earnings (accumulated loss) | (5,376,342 | ) | 112,803,919 | (402,284 | ) | |||||
| Total Net Assets | $ | 6,571,476 | $ | 1,463,853,521 | $ | 5,860,475 | ||||
| Net Asset Value Per Share: | ||||||||||
| Net assets | $ | 6,571,476 | $ | 1,463,853,521 | $ | 5,860,475 | ||||
| Shares issued and outstanding | 250,001 | 33,500,001 | 250,001 | |||||||
| Net asset value per share | $ | 26.29 | $ | 43.70 | $ | 23.44 | ||||
See accompanying notes.
21
| Statements of Assets and Liabilities | |||||||
| Principal Exchange-Traded Funds | |||||||
| June 30, 2023 | |||||||
| Principal U.S. | |||||||
| Small-Cap | Principal Value | ||||||
| ETF (a) | ETF | ||||||
| Investment in securities — at cost | $ | 195,420,307 | $ | 37,034,433 | |||
| Investment in affiliated funds — at cost | $ | 847,907 | $ | — | |||
| Assets | |||||||
| Investment in securities — at value | $ | 201,106,953 | (b) | $ | 37,269,306 | ||
| Investment in affiliated funds — at value | 847,907 | — | |||||
| Receivables: | |||||||
| Dividends | 157,681 | 75,158 | |||||
| Securities lending income | 271 | — | |||||
| Investment securities sold | 87,374 | — | |||||
| Total Assets | 202,200,186 | 37,344,464 | |||||
| Liabilities | |||||||
| Accrued management and investment advisory fees | 61,008 | 4,482 | |||||
| Collateral obligation on securities loaned — at value | 847,907 | — | |||||
| Total Liabilities | 908,915 | 4,482 | |||||
| Net Assets Applicable to Outstanding Shares | $ | 201,291,271 | $ | 37,339,982 | |||
| Net Assets Consist of: | |||||||
| Capital shares and additional paid-in-capital | $ | 374,832,931 | $ | 65,138,079 | |||
| Total distributable earnings (accumulated loss) | (173,541,660 | ) | (27,798,097 | ) | |||
| Total Net Assets | $ | 201,291,271 | $ | 37,339,982 | |||
| Net Asset Value Per Share: | |||||||
| Net assets | $ | 201,291,271 | $ | 37,339,982 | |||
| Shares issued and outstanding | 4,750,001 | 900,001 | |||||
| Net asset value per share | $ | 42.38 | $ | 41.49 | |||
| (a) | Effective June 30, 2023, Principal U.S. Small-Cap Multi-Factor ETF changed its name to Principal U.S. Small-Cap ETF. |
| (b) | Includes fair market value of securities loaned, see 'Securities Lending' in Notes to Financial Statements. |
See accompanying notes.
22
| Statements of Operations | |||||||||
| Principal Exchange-Traded Funds | |||||||||
| Year Ended June 30, 2023 | |||||||||
| Principal | |||||||||
| Principal | International | ||||||||
| Principal | Healthcare | Adaptive | |||||||
| Active High | Innovators | Multi-Factor | |||||||
| Yield ETF | ETF | ETF | |||||||
| Net Investment Income (Loss) | |||||||||
| Income: | |||||||||
| Dividend | $ | 258,291 | $ | 48,416 | $ | 528,511 | |||
| Withholding tax | — | — | (57,247 | ) | |||||
| Interest | 10,541,705 | — | — | ||||||
| Securities lending — net | 31,071 | 72,322 | — | ||||||
| Total Income | 10,831,067 | 120,738 | 471,264 | ||||||
| Expenses: | |||||||||
| Management and investment advisory fees | 680,077 | 239,432 | 32,003 | ||||||
| Total Expenses | 680,077 | 239,432 | 32,003 | ||||||
| Net Investment Income (Loss) | 10,150,990 | (118,694 | ) | 439,261 | |||||
| Net Realized and Unrealized Gain (Loss) | |||||||||
| Net realized gain (loss) from: | |||||||||
| Investment transactions | (3,137,089 | ) | (14,608,378 | ) | (2,029,487 | ) | |||
| In-kind redemptions | (10,906,862 | ) | 776,842 | (319,766 | ) | ||||
| Foreign currency transactions | — | — | (1,690 | ) | |||||
| Change in unrealized appreciation (depreciation) of: | |||||||||
| Investments | 25,524,711 | 19,829,648 | 3,768,280 | ||||||
| Foreign currency transactions | — | — | 3,326 | ||||||
| Net Realized and Unrealized Gain (Loss) | 11,480,760 | 5,998,112 | 1,420,663 | ||||||
| Net Increase (Decrease) in Net Assets Resulting from Operations | $ | 21,631,750 | $ | 5,879,418 | $ | 1,859,924 | |||
See accompanying notes.
23
| Statements of Operations | |||||||||
| Principal Exchange-Traded Funds | |||||||||
| Year Ended June 30, 2023 | |||||||||
| Principal | |||||||||
| Investment | Principal | ||||||||
| Grade | Millennial | ||||||||
| Corporate | Global Growth | Principal | |||||||
| Active ETF | ETF (a) | Quality ETF | |||||||
| Net Investment Income (Loss) | |||||||||
| Income: | |||||||||
| Dividend | $ | 126,440 | $ | 530,849 | $ | 438,574 | |||
| Withholding tax | — | (19,289 | ) | (357 | ) | ||||
| Interest | 3,107,058 | — | — | ||||||
| Securities lending — net | 2,581 | 19,157 | — | ||||||
| Total Income | 3,236,079 | 530,717 | 438,217 | ||||||
| Expenses: | |||||||||
| Management and investment advisory fees | 168,052 | 103,972 | 49,652 | ||||||
| Total Expenses | 168,052 | 103,972 | 49,652 | ||||||
| Net Investment Income (Loss) | 3,068,027 | 426,745 | 388,565 | ||||||
| Net Realized and Unrealized Gain (Loss) | |||||||||
| Net realized gain (loss) from: | |||||||||
| Investment transactions | (7,965,073 | ) | (567,457 | ) | (235,438 | ) | |||
| In-kind redemptions | (56,221,905 | ) | — | 1,588,878 | |||||
| Foreign currency transactions | — | (609 | ) | — | |||||
| Futures contracts | (256,390 | ) | — | — | |||||
| Change in unrealized appreciation (depreciation) of: | |||||||||
| Investments | 65,372,706 | 3,219,051 | 4,996,312 | ||||||
| Futures contracts | 15,608 | — | — | ||||||
| Foreign currency transactions | — | 459 | — | ||||||
| Net Realized and Unrealized Gain (Loss) | 944,946 | 2,651,444 | 6,349,752 | ||||||
| Net Increase (Decrease) in Net Assets Resulting from Operations | $ | 4,012,973 | $ | 3,078,189 | $ | 6,738,317 | |||
| (a) | Effective July 15, 2022, Principal Millennials ETF changed its name to Principal Millennial Global Growth ETF. |
See accompanying notes.
24
| Statements of Operations | |||||||||
| Principal Exchange-Traded Funds | |||||||||
| Year Ended June 30, 2023 | |||||||||
| Principal | Principal | ||||||||
| Principal Real | Spectrum | Spectrum Tax- | |||||||
| Estate Active | Preferred | Advantaged | |||||||
| Opportunities | Securities | Dividend | |||||||
| ETF | Active ETF | Active ETF | |||||||
| Net Investment Income (Loss) | |||||||||
| Income: | |||||||||
| Dividend | $ | 154,302 | $ | 413,191 | $ | 151,415 | |||
| Interest | — | 20,383,689 | 968,712 | ||||||
| Securities lending — net | — | 33,762 | — | ||||||
| Total Income | 154,302 | 20,830,642 | 1,120,127 | ||||||
| Expenses: | |||||||||
| Management and investment advisory fees | 33,703 | 2,405,683 | 124,264 | ||||||
| Total Expenses | 33,703 | 2,405,683 | 124,264 | ||||||
| Net Investment Income (Loss) | 120,599 | 18,424,959 | 995,863 | ||||||
| Net Realized and Unrealized Gain (Loss) | |||||||||
| Net realized gain (loss) from: | |||||||||
| Investment transactions | (55,825 | ) | (9,158,068 | ) | (1,012,497 | ) | |||
| In-kind redemptions | — | (4,305,378 | ) | — | |||||
| Written options | — | — | 17,563 | ||||||
| Change in unrealized appreciation (depreciation) of: | |||||||||
| Investments | (319,485 | ) | 8,786,436 | 141,114 | |||||
| Net Realized and Unrealized Gain (Loss) | (375,310 | ) | (4,677,010 | ) | (853,820 | ) | |||
| Net Increase (Decrease) in Net Assets Resulting from Operations | $ | (254,711 | ) | $ | 13,747,949 | $ | 142,043 | ||
See accompanying notes.
25
| Statements of Operations | |||||||||
| Principal Exchange-Traded Funds | |||||||||
| Year Ended June 30, 2023 | |||||||||
| Principal U.S. | Principal U.S. | ||||||||
| Large-Cap | Small | -Cap | |||||||
| Adaptive | Adaptive | ||||||||
| Multi-Factor | Principal U.S. | Multi-Factor | |||||||
| ETF | Mega-Cap ETF | ETF | |||||||
| Net Investment Income (Loss) | |||||||||
| Income: | |||||||||
| Dividend | $ | 107,626 | $ | 19,835,648 | $ | 105,127 | |||
| Withholding tax | (27 | ) | — | (146 | ) | ||||
| Total Income | 107,599 | 19,835,648 | 104,981 | ||||||
| Expenses: | |||||||||
| Management and investment advisory fees | 9,527 | 1,805,383 | 10,823 | ||||||
| Total Gross Expenses | 9,527 | 1,805,383 | 10,823 | ||||||
| Less: Reimbursement from Advisor | — | (361,077 | ) | — | |||||
| Total Net Expenses | 9,527 | 1,444,306 | 10,823 | ||||||
| Net Investment Income (Loss) | 98,072 | 18,391,342 | 94,158 | ||||||
| Net Realized and Unrealized Gain (Loss) | |||||||||
| Net realized gain (loss) from: | |||||||||
| Investment transactions | (736,561 | ) | (25,665,178 | ) | (356,638 | ) | |||
| In-kind redemptions | (1,310,311 | ) | 66,713,308 | — | |||||
| Change in unrealized appreciation (depreciation) of: | |||||||||
| Investments | 2,909,479 | 199,046,571 | 758,503 | ||||||
| Net Realized and Unrealized Gain (Loss) | 862,607 | 240,094,701 | 401,865 | ||||||
| Net Increase (Decrease) in Net Assets Resulting from Operations | $ | 960,679 | $ | 258,486,043 | $ | 496,023 | |||
See accompanying notes.
26
| Statements of Operations | |||||
| Principal Exchange-Traded Funds | |||||
| Year Ended June 30, 2023 | |||||
| Principal U.S. | |||||
| Small-Cap | Principal Value | ||||
| ETF (a) | ETF | ||||
| Net Investment Income (Loss) | |||||
| Income: | |||||
| Dividend | $ | 5,162,767 | $ | 1,738,882 | |
| Withholding tax | (6,899 | ) | — | ||
| Securities lending — net | 26,078 | — | |||
| Total Income | 5,181,946 | 1,738,882 | |||
| Expenses: | |||||
| Management and investment advisory fees | 1,120,109 | 107,261 | |||
| Total Expenses | 1,120,109 | 107,261 | |||
| Net Investment Income (Loss) | 4,061,837 | 1,631,621 | |||
| Net Realized and Unrealized Gain (Loss) | |||||
| Net realized gain (loss) from: | |||||
| Investment transactions | (31,208,231 | ) | 253,894 | ||
| In-kind redemptions | (32,348,507 | ) | 4,863,899 | ||
| Change in unrealized appreciation (depreciation) of: | |||||
| Investments | 112,599,822 | 5,432,725 | |||
| Net Realized and Unrealized Gain (Loss) | 49,043,084 | 10,550,518 | |||
| Net Increase (Decrease) in Net Assets Resulting from Operations | $ | 53,104,921 | $ | 12,182,139 | |
| (a) | Effective June 30, 2023, Principal U.S. Small-Cap Multi-Factor ETF changed its name to Principal U.S. Small-Cap ETF. |
See accompanying notes.
27
| Statement of Changes in Net Assets | ||||||
| Principal Exchange-Traded Funds | ||||||
| Principal Active High Yield ETF | ||||||
| Year ended | Year ended | |||||
| June 30, 2023 | June 30, 2022 | |||||
| Operations | ||||||
| Net investment income (loss) | $ | 10,150,990 | $ | 10,370,892 | ||
| Net realized gain (loss) | (14,043,951 | ) | 22,688,033 | |||
| Change in unrealized appreciation (depreciation) | 25,524,711 | (58,007,435 | ) | |||
| Net Increase (Decrease) in Net Assets Resulting from Operations | 21,631,750 | (24,948,510 | ) | |||
| Dividends and Distributions to Shareholders | ||||||
| From net investment income and net realized gain on investments | (11,723,824 | ) | (11,667,484 | ) | ||
| Total Dividends and Distributions | (11,723,824 | ) | (11,667,484 | ) | ||
| Capital Share Transactions | ||||||
| Net increase (decrease) in capital share transactions | (123,588,810 | ) | 22,948,323 | |||
| Total Increase (Decrease) in Net Assets | (113,680,884 | ) | (13,667,671 | ) | ||
| Net Assets | ||||||
| Beginning of year | 218,774,941 | 232,442,612 | ||||
| End of year | $ | 105,094,057 | $ | 218,774,941 | ||
| Capital Share Transactions | ||||||
| Dollars: | ||||||
| Sold | $ | 170,914,816 | $ | 102,653,195 | ||
| Redeemed | (294,503,626 | ) | (79,704,872 | ) | ||
| Net Increase (Decrease) | $ | (123,588,810 | ) | $ | 22,948,323 | |
| Shares: | ||||||
| Sold | 9,400,000 | 3,700,000 | ||||
| Redeemed | (16,000,000 | ) | (2,500,000 | ) | ||
| Net Increase (Decrease) | (6,600,000 | ) | 1,200,000 | |||
See accompanying notes.
28
| Statement of Changes in Net Assets | ||||||
| Principal Exchange-Traded Funds | ||||||
| Principal Healthcare Innovators ETF | ||||||
| Year ended | Year ended | |||||
| June 30, 2023 | June 30, 2022 | |||||
| Operations | ||||||
| Net investment income (loss) | $ | (118,694 | ) | $ | (293,184 | ) |
| Net realized gain (loss) | (13,831,536 | ) | 4,792,287 | |||
| Change in unrealized appreciation (depreciation) | 19,829,648 | (65,363,644 | ) | |||
| Net Increase (Decrease) in Net Assets Resulting from Operations | 5,879,418 | (60,864,541 | ) | |||
| Dividends and Distributions to Shareholders | ||||||
| From net investment income and net realized gain on investments | — | (861,124 | ) | |||
| Total Dividends and Distributions | — | (861,124 | ) | |||
| Capital Share Transactions | ||||||
| Net increase (decrease) in capital share transactions | (5,157,228 | ) | (61,196,542 | ) | ||
| Total Increase (Decrease) in Net Assets | 722,190 | (122,922,207 | ) | |||
| Net Assets | ||||||
| Beginning of year | 53,275,155 | 176,197,362 | ||||
| End of year | $ | 53,997,345 | $ | 53,275,155 | ||
| Capital Share Transactions | ||||||
| Dollars: | ||||||
| Sold | $ | 1,657,546 | $ | 2,777,910 | ||
| Redeemed | (6,814,774 | ) | (63,974,452 | ) | ||
| Net Increase (Decrease) | $ | (5,157,228 | ) | $ | (61,196,542 | ) |
| Shares: | ||||||
| Sold | 50,000 | 50,000 | ||||
| Redeemed | (200,000 | ) | (1,300,000 | ) | ||
| Net Increase (Decrease) | (150,000 | ) | (1,250,000 | ) | ||
See accompanying notes.
29
| Statement of Changes in Net Assets | ||||||
| Principal Exchange-Traded Funds | ||||||
| Principal International Adaptive Multi- | ||||||
| Factor ETF | ||||||
| Year ended | Year ended | |||||
| June 30, 2023 | June 30, 2022 | |||||
| Operations | ||||||
| Net investment income (loss) | $ | 439,261 | $ | 2,037,402 | ||
| Net realized gain (loss) | (2,350,943 | ) | (9,062,479 | ) | ||
| Change in unrealized appreciation (depreciation) | 3,771,606 | (2,677,086 | ) | |||
| Net Increase (Decrease) in Net Assets Resulting from Operations | 1,859,924 | (9,702,163 | ) | |||
| Dividends and Distributions to Shareholders | ||||||
| From net investment income and net realized gain on investments | (512,269 | ) | (1,862,278 | ) | ||
| Total Dividends and Distributions | (512,269 | ) | (1,862,278 | ) | ||
| Capital Share Transactions | ||||||
| Net increase (decrease) in capital share transactions | 108,803 | (21,352,130 | ) | |||
| Total Increase (Decrease) in Net Assets | 1,456,458 | (32,916,571 | ) | |||
| Net Assets | ||||||
| Beginning of year | 14,201,466 | 47,118,037 | ||||
| End of year | $ | 15,657,924 | $ | 14,201,466 | ||
| Capital Share Transactions | ||||||
| Dollars: | ||||||
| Sold | $ | 2,130,137 | $ | 133,715,469 | ||
| Redeemed | (2,021,334 | ) | (155,067,599 | ) | ||
| Net Increase (Decrease) | $ | 108,803 | $ | (21,352,130 | ) | |
| Shares: | ||||||
| Sold | 100,000 | 5,400,000 | ||||
| Redeemed | (100,000 | ) | (6,600,000 | ) | ||
| Net Increase (Decrease) | — | (1,200,000 | ) | |||
See accompanying notes.
30
| Statement of Changes in Net Assets | |||||||
| Principal Exchange-Traded Funds | |||||||
| Principal Investment Grade Corporate | |||||||
| Active ETF | |||||||
| Year ended | Year ended | ||||||
| June 30, 2023 | June 30, 2022 | ||||||
| Operations | |||||||
| Net investment income (loss) | $ | 3,068,027 | $ | 11,547,215 | |||
| Net realized gain (loss) | (64,443,368 | ) | (5,080,997 | ) | |||
| Change in unrealized appreciation (depreciation) | 65,388,314 | (76,159,657 | ) | ||||
| Net Increase (Decrease) in Net Assets Resulting from Operations | 4,012,973 | (69,693,439 | ) | ||||
| Dividends and Distributions to Shareholders | |||||||
| From net investment income and net realized gain on investments | (4,589,877 | ) | (15,584,122 | ) | |||
| Total Dividends and Distributions | (4,589,877 | ) | (15,584,122 | ) | |||
| Capital Share Transactions | |||||||
| Net increase (decrease) in capital share transactions | (321,275,205 | ) | (26,967,396 | ) | |||
| Total Increase (Decrease) in Net Assets | (321,852,109 | ) | (112,244,957 | ) | |||
| Net Assets | |||||||
| Beginning of year | 369,026,305 | 481,271,262 | |||||
| End of year | $ | 47,174,196 | $ | 369,026,305 | |||
| Capital Share Transactions | |||||||
| Dollars: | |||||||
| Sold | $ | 41,226,063 | $ | 37,903,794 | |||
| Redeemed | (362,501,268 | ) | (64,871,190 | ) | |||
| Net Increase (Decrease) | $ | (321,275,205 | ) | $ | (26,967,396 | ) | |
| Shares: | |||||||
| Sold | 1,950,000 | 1,500,000 | |||||
| Redeemed | (16,550,000 | ) | (2,600,000 | ) | |||
| Net Increase (Decrease) | (14,600,000 | ) | (1,100,000 | ) | |||
See accompanying notes.
31
| Statement of Changes in Net Assets | ||||||
| Principal Exchange-Traded Funds | ||||||
| Principal Millennial Global | ||||||
| Growth ETF (a) | ||||||
| Year ended | Year ended | |||||
| June 30, 2023 | June 30, 2022 | |||||
| Operations | ||||||
| Net investment income (loss) | $ | 426,745 | $ | 2,886,044 | ||
| Net realized gain (loss) | (568,066 | ) | (14,685,302 | ) | ||
| Change in unrealized appreciation (depreciation) | 3,219,510 | (22,104,977 | ) | |||
| Net Increase (Decrease) in Net Assets Resulting from Operations | 3,078,189 | (33,904,235 | ) | |||
| Dividends and Distributions to Shareholders | ||||||
| From net investment income and net realized gain on investments | (549,801 | ) | (2,817,266 | ) | ||
| Total Dividends and Distributions | (549,801 | ) | (2,817,266 | ) | ||
| Capital Share Transactions | ||||||
| Net increase (decrease) in capital share transactions | 3,848,155 | (66,070,744 | ) | |||
| Total Increase (Decrease) in Net Assets | 6,376,543 | (102,792,245 | ) | |||
| Net Assets | ||||||
| Beginning of year | 23,607,051 | 126,399,296 | ||||
| End of year | $ | 29,983,594 | $ | 23,607,051 | ||
| Capital Share Transactions | ||||||
| Dollars: | ||||||
| Sold | $ | 3,848,155 | $ | 45,979,391 | ||
| Redeemed | — | (112,050,135 | ) | |||
| Net Increase (Decrease) | $ | 3,848,155 | $ | (66,070,744 | ) | |
| Shares: | ||||||
| Sold | 100,000 | 800,000 | ||||
| Redeemed | — | (2,100,000 | ) | |||
| Net Increase (Decrease) | 100,000 | (1,300,000 | ) | |||
| (a) Effective July 15, 2022, Principal Millennials ETF changed its name to Principal Millennial Global Growth ETF. | ||||||
See accompanying notes.
32
| Statement of Changes in Net Assets | |||||||
| Principal Exchange-Traded Funds | |||||||
| Principal Quality ETF | |||||||
| Year ended | Year ended | ||||||
| June 30, 2023 | June 30, 2022 | ||||||
| Operations | |||||||
| Net investment income (loss) | $ | 388,565 | $ | 891,275 | |||
| Net realized gain (loss) | 1,353,440 | (5,551,421 | ) | ||||
| Change in unrealized appreciation (depreciation) | 4,996,312 | (3,671,471 | ) | ||||
| Net Increase (Decrease) in Net Assets Resulting from Operations | 6,738,317 | (8,331,617 | ) | ||||
| Dividends and Distributions to Shareholders | |||||||
| From net investment income and net realized gain on investments | (527,129 | ) | (811,956 | ) | |||
| Total Dividends and Distributions | (527,129 | ) | (811,956 | ) | |||
| Capital Share Transactions | |||||||
| Net increase (decrease) in capital share transactions | (15,004,459 | ) | (3,853,104 | ) | |||
| Total Increase (Decrease) in Net Assets | (8,793,271 | ) | (12,996,677 | ) | |||
| Net Assets | |||||||
| Beginning of year | 45,488,950 | 58,485,627 | |||||
| End of year | $ | 36,695,679 | $ | 45,488,950 | |||
| Capital Share Transactions | |||||||
| Dollars: | |||||||
| Sold | $ | 5,213,657 | $ | 144,698,544 | |||
| Redeemed | (20,218,116 | ) | (148,551,648 | ) | |||
| Net Increase (Decrease) | $ | (15,004,459 | ) | $ | (3,853,104 | ) | |
| Shares: | |||||||
| Sold | 100,000 | 2,600,000 | |||||
| Redeemed | (400,000 | ) | (2,750,000 | ) | |||
| Net Increase (Decrease) | (300,000 | ) | (150,000 | ) | |||
See accompanying notes.
33
| Statement of Changes in Net Assets | ||||||
| Principal Exchange-Traded Funds | ||||||
| Principal Real Estate Active | ||||||
| Opportunities ETF | ||||||
| Year ended | Period ended | |||||
| June 30, 2023 | June 30, 2022 (a) | |||||
| Operations | ||||||
| Net investment income (loss) | $ | 120,599 | $ | 21,660 | ||
| Net realized gain (loss) | (55,825 | ) | 22,299 | |||
| Change in unrealized appreciation (depreciation) | (319,485 | ) | (151,734 | ) | ||
| Net Increase (Decrease) in Net Assets Resulting from Operations | (254,711 | ) | (107,775 | ) | ||
| Dividends and Distributions to Shareholders | ||||||
| From net investment income and net realized gain on investments | (128,638 | ) | — | |||
| Total Dividends and Distributions | (128,638 | ) | — | |||
| Capital Share Transactions | ||||||
| Net increase (decrease) in capital share transactions | 436,840 | 5,497,372 | ||||
| Total Increase (Decrease) in Net Assets | 53,491 | 5,389,597 | ||||
| Net Assets | ||||||
| Beginning of period | 5,389,597 | — | ||||
| End of period | $ | 5,443,088 | $ | 5,389,597 | ||
| Capital Share Transactions | ||||||
| Dollars: | ||||||
| Sold | $ | 436,840 | $ | 5,497,372 | ||
| Redeemed | — | — | ||||
| Net Increase (Decrease) | $ | 436,840 | $ | 5,497,372 | ||
| Shares: | ||||||
| Sold | 20,000 | 220,001 | ||||
| Redeemed | — | — | ||||
| Net Increase (Decrease) | 20,000 | 220,001 | ||||
| (a) Period from May 18, 2022, date operations commenced, through June 30, 2022. | ||||||
See accompanying notes.
34
| Statement of Changes in Net Assets | ||||||
| Principal Exchange-Traded Funds | ||||||
| Principal Spectrum Preferred Securities | ||||||
| Active ETF | ||||||
| Year ended | Year ended | |||||
| June 30, 2023 | June 30, 2022 | |||||
| Operations | ||||||
| Net investment income (loss) | $ | 18,424,959 | $ | 12,966,742 | ||
| Net realized gain (loss) | (13,463,446 | ) | (1,783,750 | ) | ||
| Change in unrealized appreciation (depreciation) | 8,786,436 | (66,719,754 | ) | |||
| Net Increase (Decrease) in Net Assets Resulting from Operations | 13,747,949 | (55,536,762 | ) | |||
| Dividends and Distributions to Shareholders | ||||||
| From net investment income and net realized gain on investments | (20,075,762 | ) | (16,461,144 | ) | ||
| Total Dividends and Distributions | (20,075,762 | ) | (16,461,144 | ) | ||
| Capital Share Transactions | ||||||
| Net increase (decrease) in capital share transactions | 237,357,268 | 53,621,546 | ||||
| Total Increase (Decrease) in Net Assets | 231,029,455 | (18,376,360 | ) | |||
| Net Assets | ||||||
| Beginning of year | 344,956,774 | 363,333,134 | ||||
| End of year | $ | 575,986,229 | $ | 344,956,774 | ||
| Capital Share Transactions | ||||||
| Dollars: | ||||||
| Sold | $ | 317,487,703 | $ | 119,885,173 | ||
| Redeemed | (80,130,435 | ) | (66,263,627 | ) | ||
| Net Increase (Decrease) | $ | 237,357,268 | $ | 53,621,546 | ||
| Shares: | ||||||
| Sold | 18,650,000 | 5,950,000 | ||||
| Redeemed | (4,550,000 | ) | (3,500,000 | ) | ||
| Net Increase (Decrease) | 14,100,000 | 2,450,000 | ||||
See accompanying notes.
35
| Statement of Changes in Net Assets | ||||||
| Principal Exchange-Traded Funds | ||||||
| Principal Spectrum Tax-Advantaged | ||||||
| Dividend Active ETF | ||||||
| Year ended | Year ended | |||||
| June 30, 2023 | June 30, 2022 | |||||
| Operations | ||||||
| Net investment income (loss) | $ | 995,863 | $ | 942,323 | ||
| Net realized gain (loss) | (994,934 | ) | 28,895 | |||
| Change in unrealized appreciation (depreciation) | 141,114 | (3,438,648 | ) | |||
| Net Increase (Decrease) in Net Assets Resulting from Operations | 142,043 | (2,467,430 | ) | |||
| Dividends and Distributions to Shareholders | ||||||
| From net investment income and net realized gain on investments | (1,148,780 | ) | (1,220,956 | ) | ||
| Total Dividends and Distributions | (1,148,780 | ) | (1,220,956 | ) | ||
| Capital Share Transactions | ||||||
| Net increase (decrease) in capital share transactions | — | 2,129,041 | ||||
| Total Increase (Decrease) in Net Assets | (1,006,737 | ) | (1,559,345 | ) | ||
| Net Assets | ||||||
| Beginning of year | 21,088,086 | 22,647,431 | ||||
| End of year | $ | 20,081,349 | $ | 21,088,086 | ||
| Capital Share Transactions | ||||||
| Dollars: | ||||||
| Sold | $ | — | $ | 2,129,041 | ||
| Redeemed | — | — | ||||
| Net Increase (Decrease) | $ | — | $ | 2,129,041 | ||
| Shares: | ||||||
| Sold | — | 100,000 | ||||
| Redeemed | — | — | ||||
| Net Increase (Decrease) | — | 100,000 | ||||
See accompanying notes.
36
| Statement of Changes in Net Assets | ||||||
| Principal Exchange-Traded Funds | ||||||
| Principal U.S. Large-Cap Adaptive | ||||||
| Multi-Factor ETF | ||||||
| Year ended | Year ended | |||||
| June 30, 2023 | June 30, 2022 | |||||
| Operations | ||||||
| Net investment income (loss) | $ | 98,072 | $ | 1,150,353 | ||
| Net realized gain (loss) | (2,046,872 | ) | (3,811,836 | ) | ||
| Change in unrealized appreciation (depreciation) | 2,909,479 | (3,432,631 | ) | |||
| Net Increase (Decrease) in Net Assets Resulting from Operations | 960,679 | (6,094,114 | ) | |||
| Dividends and Distributions to Shareholders | ||||||
| From net investment income and net realized gain on investments | (237,483 | ) | (1,000,323 | ) | ||
| Total Dividends and Distributions | (237,483 | ) | (1,000,323 | ) | ||
| Capital Share Transactions | ||||||
| Net increase (decrease) in capital share transactions | (6,901,309 | ) | (9,997,947 | ) | ||
| Total Increase (Decrease) in Net Assets | (6,178,113 | ) | (17,092,384 | ) | ||
| Net Assets | ||||||
| Beginning of year | 12,749,589 | 29,841,973 | ||||
| End of year | $ | 6,571,476 | $ | 12,749,589 | ||
| Capital Share Transactions | ||||||
| Dollars: | ||||||
| Sold | $ | — | $ | 172,626,760 | ||
| Redeemed | (6,901,309 | ) | (182,624,707 | ) | ||
| Net Increase (Decrease) | $ | (6,901,309 | ) | $ | (9,997,947 | ) |
| Shares: | ||||||
| Sold | — | 6,400,000 | ||||
| Redeemed | (300,000 | ) | (7,000,000 | ) | ||
| Net Increase (Decrease) | (300,000 | ) | (600,000 | ) | ||
See accompanying notes.
37
| Statement of Changes in Net Assets | ||||||
| Principal Exchange-Traded Funds | ||||||
| Principal U.S. Mega-Cap ETF | ||||||
| Year ended | Year ended | |||||
| June 30, 2023 | June 30, 2022 | |||||
| Operations | ||||||
| Net investment income (loss) | $ | 18,391,342 | $ | 29,571,207 | ||
| Net realized gain (loss) | 41,048,130 | 318,629,005 | ||||
| Change in unrealized appreciation (depreciation) | 199,046,571 | (388,433,052 | ) | |||
| Net Increase (Decrease) in Net Assets Resulting from Operations | 258,486,043 | (40,232,840 | ) | |||
| Dividends and Distributions to Shareholders | ||||||
| From net investment income and net realized gain on investments | (19,885,169 | ) | (31,378,545 | ) | ||
| Total Dividends and Distributions | (19,885,169 | ) | (31,378,545 | ) | ||
| Capital Share Transactions | ||||||
| Net increase (decrease) in capital share transactions | (142,174,201 | ) | (519,025,943 | ) | ||
| Total Increase (Decrease) in Net Assets | 96,426,673 | (590,637,328 | ) | |||
| Net Assets | ||||||
| Beginning of year | 1,367,426,848 | 1,958,064,176 | ||||
| End of year | $ | 1,463,853,521 | $ | 1,367,426,848 | ||
| Capital Share Transactions | ||||||
| Dollars: | ||||||
| Sold | $ | 206,613,201 | $ | 564,035,727 | ||
| Redeemed | (348,787,402 | ) | (1,083,061,670 | ) | ||
| Net Increase (Decrease) | $ | (142,174,201 | ) | $ | (519,025,943 | ) |
| Shares: | ||||||
| Sold | 5,200,000 | 13,400,000 | ||||
| Redeemed | (9,050,000 | ) | (25,400,000 | ) | ||
| Net Increase (Decrease) | (3,850,000 | ) | (12,000,000 | ) | ||
See accompanying notes.
38
| Statement of Changes in Net Assets | ||||||
| Principal Exchange-Traded Funds | ||||||
| Principal U.S. Small-Cap Adaptive | ||||||
| Multi-Factor ETF | ||||||
| Year ended | Year ended | |||||
| June 30, 2023 | June 30, 2022 | |||||
| Operations | ||||||
| Net investment income (loss) | $ | 94,158 | $ | 96,711 | ||
| Net realized gain (loss) | (356,638 | ) | (365,590 | ) | ||
| Change in unrealized appreciation (depreciation) | 758,503 | (561,664 | ) | |||
| Net Increase (Decrease) in Net Assets Resulting from Operations | 496,023 | (830,543 | ) | |||
| Dividends and Distributions to Shareholders | ||||||
| From net investment income and net realized gain on investments | (98,793 | ) | (108,910 | ) | ||
| Total Dividends and Distributions | (98,793 | ) | (108,910 | ) | ||
| Capital Share Transactions | ||||||
| Net increase (decrease) in capital share transactions | — | — | ||||
| Total Increase (Decrease) in Net Assets | 397,230 | (939,453 | ) | |||
| Net Assets | ||||||
| Beginning of year | 5,463,245 | 6,402,698 | ||||
| End of year | $ | 5,860,475 | $ | 5,463,245 | ||
| Capital Share Transactions | ||||||
| Dollars: | ||||||
| Sold | $ | — | $ | — | ||
| Redeemed | — | — | ||||
| Net Increase (Decrease) | $ | — | $ | — | ||
| Shares: | ||||||
| Sold | — | — | ||||
| Redeemed | — | — | ||||
| Net Increase (Decrease) | — | — | ||||
See accompanying notes.
39
| Statement of Changes in Net Assets | ||||||
| Principal Exchange-Traded Funds | ||||||
| Principal U.S. Small-Cap ETF (a) | ||||||
| Year ended | Year ended | |||||
| June 30, 2023 | June 30, 2022 | |||||
| Operations | ||||||
| Net investment income (loss) | $ | 4,061,837 | $ | 15,920,622 | ||
| Net realized gain (loss) | (63,556,738 | ) | 179,835,384 | |||
| Change in unrealized appreciation (depreciation) | 112,599,822 | (330,521,307 | ) | |||
| Net Increase (Decrease) in Net Assets Resulting from Operations | 53,104,921 | (134,765,301 | ) | |||
| Dividends and Distributions to Shareholders | ||||||
| From net investment income and net realized gain on investments | (6,213,838 | ) | (17,721,353 | ) | ||
| Total Dividends and Distributions | (6,213,838 | ) | (17,721,353 | ) | ||
| Capital Share Transactions | ||||||
| Net increase (decrease) in capital share transactions | (461,864,330 | ) | (859,252,127 | ) | ||
| Total Increase (Decrease) in Net Assets | (414,973,247 | ) | (1,011,738,781 | ) | ||
| Net Assets | ||||||
| Beginning of year | 616,264,518 | 1,628,003,299 | ||||
| End of year | $ | 201,291,271 | $ | 616,264,518 | ||
| Capital Share Transactions | ||||||
| Dollars: | ||||||
| Sold | $ | 16,238,484 | $ | 472,542,832 | ||
| Redeemed | (478,102,814 | ) | (1,331,794,959 | ) | ||
| Net Increase (Decrease) | $ | (461,864,330 | ) | $ | (859,252,127 | ) |
| Shares: | ||||||
| Sold | 400,000 | 10,150,000 | ||||
| Redeemed | (11,850,000 | ) | (28,650,000 | ) | ||
| Net Increase (Decrease) | (11,450,000 | ) | (18,500,000 | ) | ||
| (a) Effective June 30, 2023, Principal U.S. Small-Cap Multi-Factor ETF changed its name to Principal U.S. Small-Cap ETF. | ||||||
See accompanying notes.
40
| Statement of Changes in Net Assets | |||||||
| Principal Exchange-Traded Funds | |||||||
| Principal Value ETF | |||||||
| Year ended | Year ended | ||||||
| June 30, 2023 | June 30, 2022 | ||||||
| Operations | |||||||
| Net investment income (loss) | $ | 1,631,621 | $ | 4,657,810 | |||
| Net realized gain (loss) | 5,117,793 | (17,125,428 | ) | ||||
| Change in unrealized appreciation (depreciation) | 5,432,725 | (7,994,936 | ) | ||||
| Net Increase (Decrease) in Net Assets Resulting from Operations | 12,182,139 | (20,462,554 | ) | ||||
| Dividends and Distributions to Shareholders | |||||||
| From net investment income and net realized gain on investments | (4,060,672 | ) | (2,251,380 | ) | |||
| Total Dividends and Distributions | (4,060,672 | ) | (2,251,380 | ) | |||
| Capital Share Transactions | |||||||
| Net increase (decrease) in capital share transactions | (186,656,742 | ) | 194,090,855 | ||||
| Total Increase (Decrease) in Net Assets | (178,535,275 | ) | 171,376,921 | ||||
| Net Assets | |||||||
| Beginning of year | 215,875,257 | 44,498,336 | |||||
| End of year | $ | 37,339,982 | $ | 215,875,257 | |||
| Capital Share Transactions | |||||||
| Dollars: | |||||||
| Sold | $ | 39,360,027 | $ | 371,175,106 | |||
| Redeemed | (226,016,769 | ) | (177,084,251 | ) | |||
| Net Increase (Decrease) | $ | (186,656,742 | ) | $ | 194,090,855 | ||
| Shares: | |||||||
| Sold | 1,000,000 | 8,700,000 | |||||
| Redeemed | (5,650,000 | ) | (4,200,000 | ) | |||
| Net Increase (Decrease) | (4,650,000 | ) | 4,500,000 | ||||
See accompanying notes.
41
Notes to Financial Statements Principal Exchange-Traded Funds June 30, 2023
1. Organization
The Principal Exchange-Traded Funds (the “Trust”) is a statutory trust organized under the laws of the State of Delaware in 2013 and is authorized to have multiple series or portfolios. The Trust is an open-end management investment company, registered under the Investment Company Act of 1940, as amended (the “1940 Act”). The Trust currently consists of fourteen series, Principal Active High Yield ETF, Principal Healthcare Innovators ETF, Principal International Adaptive Multi-Factor ETF, Principal Investment Grade Corporate Active ETF, Principal Millennial Global Growth ETF, Principal Quality ETF, Principal Real Estate Active Opportunities ETF, Principal Spectrum Preferred Securities Active ETF, Principal Spectrum Tax-Advantaged Dividend Active ETF, Principal U.S. Large-Cap Adaptive Multi-Factor ETF, Principal U.S. Mega-Cap ETF, Principal U.S. Small-Cap Adaptive Multi-Factor ETF, Principal U.S. Small-Cap ETF and Principal Value ETF (collectively, the “Funds” and individually, a “Fund”). The shares of the Funds are referred to herein as “Shares”.
Each of the Funds is an investment company and applies specialized accounting and reporting under Accounting Standards Codification Topic 946, Financial Services - Investment Companies. The Funds have not provided financial support and are not contractually required to provide financial support to any investee.
The Trust issues and redeems Shares at net asset value (“NAV”) only with Authorized Participants (“APs”) and only in aggregations of 50,000 Shares with the exception of Principal International Adaptive Multi-Factor ETF and Principal Real Estate Active Opportunities ETF which are issued and redeemed in aggregations of 100,000 shares and 20,000 shares, respectively (each a “Creation Unit” or multiples thereof “Creation Unit Aggregations”), which is subject to change. The Trust issues and redeems Creation Unit Aggregations in exchange for portfolio securities and/or cash, plus a fixed and/or variable transaction fee.
Shares trade on exchanges at market prices that may be below, at, or above NAV. Shares are listed on the respective exchanges as listed below:
| Fund | Exchange |
| Principal Active High Yield ETF | NYSE Arca |
| Principal Healthcare Innovators ETF | The Nasdaq Stock Market LLC |
| Principal International Adaptive Multi-Factor ETF | Cboe BZX Exchange, Inc. |
| Principal Investment Grade Corporate Active ETF | NYSE Arca |
| Principal Millennial Global Growth ETF | The Nasdaq Stock Market LLC |
| Principal Quality ETF | The Nasdaq Stock Market LLC |
| Principal Real Estate Active Opportunities ETF | NYSE Arca |
| Principal Spectrum Preferred Securities Active ETF | NYSE Arca |
| Principal Spectrum Tax-Advantaged Dividend Active ETF | NYSE Arca |
| Principal U.S. Large-Cap Adaptive Multi-Factor ETF | Cboe BZX Exchange, Inc. |
| Principal U.S. Mega-Cap ETF | The Nasdaq Stock Market LLC |
| Principal U.S. Small-Cap Adaptive Multi-Factor ETF | Cboe BZX Exchange, Inc. |
| Principal U.S. Small-Cap ETF | The Nasdaq Stock Market LLC |
| Principal Value ETF | The Nasdaq Stock Market LLC |
Effective September 1, 2021, Principal Active Income ETF changed its name to Principal Active High Yield ETF. In addition to the name change, the Board of Trustees authorized a 2 for 1 stock split effective after the close of trading on August 30, 2021. The stock split has been retroactively reflected on the Financial Highlights.
42
Notes to Financial Statements Principal Exchange-Traded Funds June 30, 2023
1. Organization (continued)
Effective October 29, 2021, the following Funds changed their names as shown below:
| Previous Name | New Name |
| Principal Healthcare Innovators Index ETF | Principal Healthcare Innovators ETF |
| Principal Millennials Index ETF | Principal Millennials ETF |
Principal Real Estate Active Opportunities ETF initial investment and commencement of operations was May 18, 2022.
Effective July 8, 2022 and July 15, 2022, Principal U.S. Small-Cap Multi-Factor ETF and Principal Healthcare Innovators ETF changed from passively managed funds to actively managed funds, respectively.
Effective July 15, 2022, Principal Millennials ETF changed its name to Principal Millennial Global Growth ETF and changed from passively managed fund to actively managed fund.
Effective June 30, 2023, Principal U.S. Small-Cap Multi-Factor ETF changed its name to Principal U.S. Small-Cap ETF.
2. Significant Accounting Policies
The preparation of financial statements in conformity with U.S. Generally Accepted Accounting Principles (“U.S. GAAP”) requires management to make estimates and assumptions that affect the reported amounts of assets and liabilities and disclosure of contingent assets and liabilities at the date of the financial statements and the reported amounts of revenues and expenses during the reporting period. Actual results could differ from those estimates. The following summarizes the significant accounting policies of the Funds:
Security Valuation. The Funds may invest in series of Principal Funds, Inc. and other investment funds, which may include money market funds and other registered open-end investment companies. Investments in registered open-end investment companies are valued at the respective fund's closing NAV per share on the day of valuation.
The Funds value securities for which market quotations are readily available at fair value, which is determined using the last reported sale price. If no sales are reported, as is regularly the case for some securities traded over-the-counter (“OTC”), securities are valued using the last reported bid price or an evaluated bid price provided by a pricing service. Pricing services use modeling techniques that incorporate security characteristics such as current quotations by broker/dealers, coupon, maturity, quality, type of issue, trading characteristics, other yield and risk factors and other market conditions to determine an evaluated bid price. When reliable market quotations are not considered to be readily available, which may be the case, for example, with respect to restricted securities, certain debt securities, preferred stocks, and foreign securities, the investments are valued at their fair value as determined in good faith by the Principal Global Investors, LLC (“the Advisor”) under procedures established and periodically reviewed by the Board of Trustees.
The value of foreign securities used in computing the NAV per share is generally determined as of the close of the foreign exchange where the security is principally traded. Events that occur after the close of the applicable foreign market or exchange but prior to the calculation of the Fund’s NAV are reflected in the Fund’s NAV and these securities are valued at fair value. Many factors, provided by independent pricing services, are reviewed in the course of making a good faith determination of a security's fair value including, but not limited to, price movements in American Depository Receipts (“ADRs”), futures contracts, industry indices, general indices, and foreign currencies.
To the extent the Funds invest in foreign securities listed on foreign exchanges which trade on days on which the Funds do not determine NAV, for example, weekends and other customary national U.S. holidays, the Fund’s NAV could be significantly affected on days when shares are not able to be issued or redeemed by APs.
43
Notes to Financial Statements
Principal Exchange-Traded Funds
June 30, 2023
2. Significant Accounting Policies (continued)
Certain securities issued by companies in emerging market countries may have more than one quoted valuation at any given point in time, sometimes referred to as a “local” price and a “premium” price. The premium price is often a negotiated price, which may not consistently represent a price at which a specific transaction can be effected. It is the policy of the Funds to value such securities at prices at which it is expected those shares may be sold, and the Advisor, or any sub-advisor, is authorized to make such determinations subject to such oversight by the Board of Trustees, as may occasionally be necessary.
Currency Translation. Foreign holdings are translated to U.S. dollars using the exchange rate at the daily close of the New York Stock Exchange. The identified cost of the Funds’ holdings is translated at approximate rates prevailing when acquired. Income and expense amounts are translated at approximate rates prevailing when received or paid, with daily accruals of such amounts reported at approximate rates prevailing at the date of valuation. Since the carrying amount of the foreign securities is determined based on the exchange rate and market values at the close of the period, it is not practicable to isolate that portion of the results of operations arising as a result of changes in the foreign exchange rates from the fluctuations arising from changes in the market prices of securities during the period.
Net realized foreign exchange gains or losses arise from sales of foreign currencies, currency gains or losses realized between trade and settlement dates on security transactions, and the difference between the amount of dividends, interest income, interest expense, and foreign withholding taxes recorded on the books and the U.S. dollar equivalent of the amounts actually received or paid. Net unrealized appreciation (depreciation) on translation of assets and liabilities in foreign currencies arise from changes in the exchange rate relating to assets and liabilities, other than investments in securities, purchased and held in non-U.S. denominated currencies.
The following Funds held securities denominated in foreign currencies that exceeded 5% of net assets of the respective Fund as of June 30, 2023:
| Principal International Adaptive Multi-Factor ETF | ||
| Australian Dollar | 6.51 | % |
| British Pound Sterling | 12.25 | % |
| Canadian Dollar | 10.03 | % |
| Euro | 31.20 | % |
| Japanese Yen | 20.27 | % |
| Swiss Franc | 7.17 | % |
| Principal Millennial Global Growth ETF | ||
| Euro | 13.96 | % |
Income and Investment Transactions. The Funds record investment transactions on a trade date basis. Trade date for senior floating rate interests purchased in the primary market is considered the date on which the loan allocations are determined. Trade date for senior floating rate interests purchased in the secondary market is the date on which the transaction is entered into. The identified cost basis has been used in determining the net realized gain or loss from investment transactions and unrealized appreciation or depreciation of investments. The Funds record dividend income on the ex-dividend date, except dividend income from foreign securities whereby the ex-dividend date has passed; such dividends are recorded as soon as the Funds are informed of the ex-dividend date. Interest income is recognized on an accrual basis. Payment in kind ("PIK") income is computed on the value of the securities received at the contractual rate specified in each loan agreement. Discounts and premiums on securities are accreted/amortized, respectively, on the level yield method over the expected lives of the respective securities. Callable debt securities purchased at a premium are amortized to the earliest call date and to the callable amount, if other than par.
Distributions from Real Estate Investment Trusts ("REITs") may be characterized as ordinary income, capital gain, or a return of capital to the Funds. The proper characterization of REIT distributions is generally not known until after the end of each calendar year. As such, estimates are used in reporting the character of income and distributions for financial statement purposes. Principal Real Estate Active Opportunities ETF receives substantial distributions from holdings in REITs.
44
Notes to Financial Statements
Principal Exchange-Traded Funds
June 30, 2023
2. Significant Accounting Policies (continued)
Capital Share Transactions. Capital shares are issued and redeemed by the Funds only in a Creation Unit or Creation Unit Aggregations. Except when aggregated into at least a Creation Unit, Shares are not redeemable.
The consideration for the purchase of a Creation Unit or Creation Unit Aggregations of a Fund generally consists of a basket of cash and/or securities that the Fund specifies each business day. To offset transfer and other transaction costs associated with the issuance and redemption of Creation Unit Aggregations, APs are subject to standard creation and redemption transaction fees.
Expenses. For all Funds, a unitary investment management and advisory fee is charged. The Advisor covers all operating expenses through the investment management and advisory fee with the exception of 12b-1 fees, brokerage commissions and other expenses connected to the execution of portfolio transactions, interest expense, taxes, acquired fund fees and expenses, litigation expenses and other extraordinary expenses, if applicable.
Dividends and Distributions to Shareholders. Dividends and distributions to shareholders of the Funds are recorded on the ex-dividend date. Dividends and distributions to shareholders from net investment income and net realized gain from investments and foreign currency transactions are determined in accordance with federal tax regulations, which may differ from U.S. GAAP. These differences are primarily due to differing treatments for amortization of premiums and discounts, futures contracts, net operating losses, sales of passive foreign investment companies, partnership investments, foreign currency transactions, losses deferred due to wash sales, tax straddles, mortgage-backed securities, certain preferred securities, redemptions-in-kind, REITs, utilization of earnings and profits distributed to shareholders on redemption of Shares, and limitations imposed by Sections 381-384 of the Internal Revenue Code (“IRC”). Permanent book and tax basis differences are reclassified within the capital accounts based on federal tax-basis treatment; temporary differences do not require reclassification. To the extent dividends and distributions exceed current and accumulated earnings and profits for federal income tax purposes, they are reported as return of capital distributions.
Federal Income Taxes. No provision for federal income taxes is considered necessary because the Funds each intend to qualify as a “regulated investment company” under the IRC and they intend to distribute each year substantially all of their net investment income and realized capital gains to shareholders.
Management evaluates tax positions taken or expected to be taken in the course of preparing the Funds' tax returns to determine whether it is “more likely than not” that each tax position would be sustained upon examination by a taxing authority based on the technical merits of their position. Tax positions not deemed to meet the “more likely than not” threshold would be recorded as a tax benefit or expense in the current year. The Funds recognize interest and penalties, if any, related to unrecognized tax positions as tax expense on the Statements of Operations. During the year ended June 30, 2023, the Funds did not record any such tax benefit or expense in the accompanying financial statements. The statute of limitations remains open for the last three years, once a return is filed. No examinations are in progress at this time.
Foreign Taxes. Certain Funds are subject to foreign income taxes imposed by certain countries in which they invest. Foreign income taxes are accrued by the Funds as a reduction of income. These amounts are shown as withholding tax on the Statements of Operations.
Recent Accounting Pronouncements. In March 2020, the Financial Accounting Standards Board (“FASB”) issued Accounting Standards Update (“ASU”) No. 2020-04, Reference Rate Reform (Topic 848); Facilitation of the Effects of Reference Rate Reform on Financial Reporting, which provides optional guidance for a limited period of time to ease the potential burden in accounting for (or recognizing the effects of) reference rate reform. The guidance is applicable to contracts referencing London Inter-Bank Offered Rate (“LIBOR”) or another reference rate that is expected to be discontinued due to reference rate reform. The ASU is effective as of March 12, 2020 and generally can be applied through December 31, 2022. In December 2022, the FASB issued ASU No. 2022-06 Reference Rate Reform (Topic 848): Deferral of the Sunset Date of Topic 848 which updates and clarifies ASU No. 2020-04. The amendments in this ASU defer the sunset date of Topic 848 from December 31, 2022, to December 31, 2024.
Management expects these ASUs will not have a material impact on the Funds' financial statements.
45
Notes to Financial Statements
Principal Exchange-Traded Funds
June 30, 2023
2. Significant Accounting Policies (continued)
In June 2022, the FASB issued ASU No. 2022-03, Fair Value Measurement (Topic 820); Fair Value Measurement of Equity Securities Subject to Contractual Sale Restrictions, which provides clarifying guidance that a contractual restriction on the sale of an equity security is not considered part of the unit of account of the equity security and, therefore, is not considered in measuring fair value. The ASU is effective for fiscal years beginning after December 15, 2023, and interim periods within those fiscal years. Management expects the ASU will not have a material impact on the Funds' financial statements.
Tracking Basket Structure. Principal Real Estate Active Opportunities ETF operates pursuant to an exemptive order from the Securities and Exchange Commission (“SEC”) and does not publicly disclose its complete portfolio holdings each business day. Instead, the Fund publishes each business day on its website a “Tracking Basket” which is designed to closely track the daily performance of the Fund but is not the Fund's actual portfolio. The Fund's Tracking Basket structure may affect the price at which shares of the Fund trade in the secondary market. Although the Tracking Basket is intended to provide investors with enough information to allow for an effective arbitrage mechanism that will keep the market price of the Fund at or close to the Fund's NAV, there is a risk that market prices will vary significantly from NAV.
3. Operating Policies
Contingent Convertible Securities (“CoCos”). As footnoted in the Schedules of Investments, certain of the Funds invest in contingent convertible securities. CoCos are hybrid debt securities that may convert into equity or have their principal written down upon the occurrence of certain “triggers”. Although a contingent convertible security's equity conversion and principal write-down features are tailored to the particular issuing banking institution and its regulatory requirements, triggers are generally linked to regulatory capital thresholds or regulatory actions calling into question such institution's continued viability as a going-concern. CoCos may have no stated maturity and fully discretionary coupons, which means coupon payments can be canceled at the issuing banking institution's discretion or at the request of the relevant regulatory authority without causing a default. To provide the appropriate regulatory capital treatment, CoCos are usually issued in the form of subordinated debt instruments that rank junior to the claims of holders of more senior obligations in the event of the issuer's liquidation. If CoCos are converted into equity securities due to a trigger event, holders will be further subordinated. The future value of CoCos is unpredictable and is influenced by many factors including, without limitation: the creditworthiness of the issuer and/or fluctuations in such issuer's applicable capital ratios; supply and demand for CoCos; general market conditions and available liquidity; and economic, financial and political events that affect the issuer, its particular market or the financial markets in general.
Due to these features, CoCos may have substantially greater risk than other securities in times of financial stress. Because of the uncertainty regarding whether a conversion event will occur, it may be difficult to predict when, if at all, a contingent convertible security will be converted to equity, and a fund may suffer losses as a result. If the trigger level is breached, the issuer's decision to write down, write off or convert a contingent convertible security may result in the fund's complete loss on an investment in CoCos with no chance of recovery even if the issuer remains in existence.
Cross Trades. The Funds may engage in cross trades. A cross trade is a purchase or sale transaction between affiliated portfolios executed directly or through an intermediary. Mutual funds and other managed portfolios may be considered affiliated if they have a common investment advisor, so a fund may be considered affiliated with any portfolio for which the fund's sub-advisor acts as an investment advisor. Such transactions are permissible provided that the conditions of Rule 17a-7 under the 1940 Act are satisfied. For the year ended June 30, 2023, the Funds did not engage in cross trades.
Deposits with Counterparty. Cash pledged as collateral is reflected as an asset on the Statements of Assets and Liabilities as deposits with counterparty. There are a variety of security types which require varying levels of pledged collateral. Customer account agreements govern cleared derivatives transactions such as futures contracts. Such transactions require posting of initial margin as determined by each relevant clearing agency which is segregated in an account at a futures commission merchant (“FCM”) registered with the Commodity Futures Trading Commission. As of June 30, 2023, deposits with counterparty for Principal Investment Grade Corporate Active ETF and Principal Spectrum Tax-Advantaged Dividend Active ETF were $51,410 and $25,397 respectively.
46
Notes to Financial Statements
Principal Exchange-Traded Funds
June 30, 2023
3. Operating Policies (continued)
Futures Contracts. The Funds are subject to equity price risk, interest rate risk, and foreign currency exchange rate risk in the normal course of pursuing its investment objectives. The Funds may enter into futures contracts to hedge against changes in, or to gain exposure to, change in the value of equities, interest rates and foreign currencies. Initial margin deposits are made by cash deposits or segregation of specific securities as may be required by the exchange on which the transaction was conducted. Pursuant to the contracts, typically a Fund agrees to receive from or pay to the broker, an amount of cash equal to the daily fluctuation in the value of the contract. Such receipts or payments are known as “variation margin” and are recorded by the Funds as variation margin receivable or payable on financial derivative instruments. For those contracts where daily variation margin payments are not received from or paid to the broker, the cumulative unrealized gains or losses are included in variation margin receivable or payable on financial derivative instruments. Futures contracts are marked to market daily at the closing settlement price or in the absence of such a price, the most recent quoted bid price. If there are no quotations available, the security is valued at the last available closing settlement price. During the period the futures contracts are open, daily changes in the fair value of the contracts are recognized as unrealized gains or losses. These unrealized gains or losses are included as a component of net unrealized appreciation (depreciation) of investments on the Statements of Assets and Liabilities. When the contracts are closed, the Funds recognize a realized gain or loss equal to the difference between the proceeds from, or cost of, the closing transaction and the Fund’s cost basis in the contract. There is minimal counterparty credit risk to the Funds because futures are exchange traded and the exchange’s clearinghouse, as counterparty to all exchange traded futures, guarantees the futures against default.
Long and short U.S. Treasury futures contracts are used to obtain interest rate exposure in order to manage duration of the Principal Investment Grade Corporate Active ETF. The notional values of the futures contracts will vary in accordance with changing duration of this Fund.
Illiquid Securities. Illiquid securities generally cannot be sold or disposed of in the ordinary course of business (within seven calendar days) at approximately the value at which each of the Funds has valued the investments. This may have an adverse effect on each of the Funds’ ability to dispose of particular illiquid securities at fair value and may limit each of the Funds’ ability to obtain accurate market quotations for purposes of valuing the securities.
Indemnification. In a normal course of business, the Funds enter into contracts that contain a variety of indemnifications. The Funds’ maximum exposure under these arrangements is unknown as this would involve potential future claims against the Funds that have not yet occurred. Based on management's experience, the risk of loss would be remote.
Restricted Securities. Certain of the Funds may invest in securities that are subject to legal or contractual restrictions on resale. These securities generally may be resold in transactions exempt from registration or to the public if the securities are registered. Disposal of these securities may involve time-consuming negotiations and expense, and prompt sale at an acceptable price may be difficult.
Securities Lending. As footnoted in the Schedules of Investments, certain of the Funds may lend portfolio securities to approved brokerage firms to earn additional income. The Funds receive collateral, in the form of cash, against the loaned securities. During the period of the loan, the borrower must maintain collateral in an amount not less than 102% of the market value of the domestic and foreign fixed income loaned securities and 105% of the market value of the foreign equity loaned securities. The market value of the loaned securities is determined at the close of business of the Funds and any additional required collateral is delivered to the Funds on the next business day. The transactions are accounted for as secured borrowings and the remaining contractual maturity is overnight and continuous for all securities. The cash collateral received is usually invested in a SEC-registered money market mutual fund and the Funds could realize a loss on such investments. Further, the Funds could experience a delay in recovering their securities and possible loss of income or value if the borrower fails to return them. Securities lending income, net of related fees, is shown on the Statements of Operations.
47
Notes to Financial Statements
Principal Exchange-Traded Funds
June 30, 2023
3. Operating Policies (continued)
Senior Floating Rate Interests. The Fund may invest in senior floating rate interests (bank loans). Senior floating rate interests hold the most senior position in the capital structure of a business entity (the “Borrower”), are typically secured by specific collateral and have a claim on the assets and/or stock of the Borrower that is senior to that held by subordinated debtholders and stockholders of the Borrower. Senior floating rate interests are typically structured and administered by a financial institution that acts as the agent of the lenders participating in the senior floating rate interest. Borrowers of senior floating rate interests are typically rated below investment grade, which means they are more likely to default than investment-grade loans. A default could lead to non-payment of income which would result in a reduction of income to the Fund and there can be no assurance that the liquidation of any collateral would satisfy the Borrower’s obligation in the event of non-payment of scheduled interest or principal payments, or that such collateral could be readily liquidated.
Senior floating rate interests pay interest at rates which are periodically reset by reference to a base lending rate plus a spread. These base lending rates are generally the prime rate offered by a designated U.S. bank, LIBOR, Secured Overnight Financing Rate (“SOFR”), or a similar reference rate.
Senior floating rate interests generally are subject to mandatory and/or optional prepayment. Because of these mandatory prepayment conditions and because there may be significant economic incentives for the Borrower to repay, prepayments of senior floating rate interests may occur. As a result, the actual remaining maturity of senior floating rate interests may be substantially less than stated maturities shown in the Schedule of Investments.
In connection with the senior floating rate interests, the Fund may also enter into unfunded loan commitments. All or a portion of the loan commitments may be unfunded. The Fund is obligated to fund these commitments at the Borrower’s discretion. Therefore, the Fund must have funds sufficient to cover its contractual obligation. Unfunded loan commitments are marked to market daily and the unrealized gain or loss is shown as a separate line item called unrealized gain or loss on unfunded commitments on the statements of assets and liabilities and included in the net change in unrealized appreciation/(depreciation) of investments on the statements of operations, as applicable. As of year end, the unfunded loan commitments are categorized as Level 2 within the disclosure hierarchy. As of June 30, 2023, there were no unfunded loan commitments.
Underlying Funds. An underlying fund may experience relatively large redemptions or purchases as the investee fund periodically reallocates or rebalances its assets. These transactions may accelerate the realization of taxable income if sales of portfolio securities result in gains and could increase transaction costs.
The Advisor is the advisor to Principal Funds, Inc., Principal Variable Contracts Funds, Inc. (affiliates of the Advisor) and other asset allocation programs. The Advisor is committed to minimizing the potential impact of underlying fund risk to the extent consistent with pursuing the investment objectives of the investee funds which it manages. Each may face conflicts of interest in fulfilling its responsibilities to all such funds.
As of June 30, 2023, series of Principal Funds, Inc. and Principal Variable Contracts Funds, Inc. owned the following percentages, in aggregate, of the outstanding Shares of the Funds listed below:
| Total Percentage of | ||
| Fund | Outstanding Shares Owned | |
| Principal Active High Yield ETF | 38.16 | % |
| Principal U.S. Mega-Cap ETF | 82.39 | |
| Principal U.S. Small-Cap ETF | 75.79 |
48
Notes to Financial Statements
Principal Exchange-Traded Funds
June 30, 2023
3. Operating Policies (continued)
U.S. Government Agencies or Government-Sponsored Enterprises. Certain of the Funds may invest in U.S. Government agencies or government-sponsored enterprises. U.S. Government securities are obligations of, and in certain cases, guaranteed by, the U.S. Government or its agencies. The U.S. Government does not guarantee the NAV of the Funds’ Shares. Some U.S. Government securities such as treasury bills, notes and bonds, and securities guaranteed by the Government National Mortgage Association (“GNMA”) are supported by the full faith and credit of the U.S. Government. Other securities, such as those of the Federal Home Loan Bank, are supported by the right of the issuer to borrow from the U.S. Department of the Treasury. Still other securities, such as those of the Federal National Mortgage Association (“FNMA”), are supported by the discretionary authority of the U.S. Government to purchase the agency’s obligations.
Government related guarantors (those not backed by the full faith and credit of the U.S. Government) include FNMA and Federal Home Loan Mortgage Corporation (“FHLMC”). FNMA is a government sponsored corporation, the common stock of which is owned entirely by private stockholders. FNMA purchases conventional residential mortgages from a list of approved seller/servicers which include state and federally chartered savings and loan associations, mutual savings banks, commercial banks, credit unions, and mortgage bankers. Pass-through securities issued by FNMA are guaranteed as to the timely payment of principal and interest by FNMA, but are not backed by the full faith and credit of the U.S. Government. FHLMC issues participation certificates, which are pass-through securities, each representing an undivided interest in a pool of residential mortgages. FHLMC guarantees the timely payment of interest and ultimate collection of principal, but participation certificates are not backed by the full faith and credit of the U.S. Government.
Derivatives. The following tables provide information about where on the Statements of Assets and Liabilities and Statements of Operations information about derivatives can be found:
| Asset Derivatives | Liability Derivatives | ||||||
| June 30, 2023 | June 30, 2023 | ||||||
| Statement of Assets and | Statement of Assets and | ||||||
| Derivatives not accounted for as hedging instruments | Liabilities Location | Fair Value | Liabilities Location | Fair Value | |||
| Principal Investment Grade Corporate Active ETF | |||||||
| Interest rate contracts | Receivables, Total | Payables, Total | |||||
| distributable earnings | distributable earnings | ||||||
| (accumulated loss) | $ | 57,804 | * | (accumulated loss) | $ | — | |
* Includes cumulative unrealized appreciation (depreciation) of futures contracts as shown in the Schedule of Investments. Only the portion of the unrealized appreciation (depreciation) not yet cash settled is shown in the Statements of Assets and Liabilities as variation margin.
| Net Realized Gain or | Net Change in Unrealized | |||||
| (Loss) on Derivatives | Appreciation | |||||
| Location of Gain or (Loss) on | Recognized in | (Depreciation) of | ||||
| Derivatives Recognized in | Statement of | Derivatives Recognized in | ||||
| Derivatives not accounted for as hedging instruments | Statement of Operations | Operations | Statement of Operations | |||
| Principal Investment Grade Corporate Active ETF | ||||||
| Interest rate contracts | Futures contracts | $ | (256,390 | ) | $ | 15,608 |
| Principal Spectrum Tax-Advantaged Dividend Active ETF | ||||||
| Investment | ||||||
| Equity contracts | transactions/Investments | $ | (24,950 | ) ** | $ | — |
| Written options | 17,563 | — | ||||
| ** Investment transactions includes purchased options and/or purchased swaptions. | ||||||
49
Notes to Financial Statements
Principal Exchange-Traded Funds
June 30, 2023
3. Operating Policies (continued)
The following table includes a summary of the monthly average outstanding notional by derivative instrument type for the year ended June 30, 2023:
| Average Notional or | |||
| Contract Type | Derivative Type | Number of Contracts | |
| Principal Investment Grade Corporate Active ETF | |||
| Interest rate contracts | Futures — Short | $ | 3,073,545 |
| Futures — Long | 2,794,646 | ||
| Principal Spectrum Tax-Advantaged Dividend Active ETF | |||
| Equity contracts | Purchased options | 25 | |
| Written options | 25 | ||
4. Fair Valuation
Fair value is defined as the price that the Funds would receive upon selling a security or transferring a liability in a timely transaction to an independent buyer in the principal or most advantageous market of the security at the measurement date. In determining fair value, the Funds may use one or more of the following approaches: market, income and/or cost. A hierarchy for inputs is used in measuring fair value that maximizes the use of observable inputs and minimizes the use of unobservable inputs by requiring that the most observable inputs be used when available.
Observable inputs are inputs that reflect the assumptions market participants would use in pricing the asset or liability developed based on market data obtained from sources independent of the Funds. Unobservable inputs are inputs that reflect the Fund’s own estimates about the estimates market participants would use in pricing the asset or liability developed based on the best information available in the circumstances.
The three-tier hierarchy of inputs is summarized in the three broad levels listed below.
Level 1 — Quoted prices are available in active markets for identical securities as of the reporting date. Investments which are generally included in this category include listed equities and listed derivatives.
Level 2 — Other significant observable inputs (including quoted prices for similar investments, interest rates, prepayment speeds, credit risk, etc.). Investments which are generally included in this category include certain corporate bonds, senior floating rate interests, OTC derivatives, mortgage-backed securities and municipal bonds.
Level 3 — Significant unobservable inputs (including the Funds' assumptions in determining the fair value of investments). Investments which are generally included in this category include certain corporate bonds and certain common stocks.
The availability of observable inputs can vary from security to security and is affected by a wide variety of factors, including, for example, the type of security, whether the security is new and not yet established in the market place, and other characteristics particular to the transaction. To the extent that valuation is based on models or inputs that are less observable or unobservable in the market, the determination of fair value requires more judgment. Accordingly, the degree of judgment exercised by the Funds in determining fair value is greatest for instruments categorized in Level 3.
In certain cases, the inputs used to measure fair value may fall into different levels of the fair value hierarchy. In such cases, for disclosure purposes, the level in the fair value hierarchy within which the fair value measurement in its entirety falls is determined based on the lowest level input that is significant to the fair value measurement in its entirety.
50
Notes to Financial Statements
Principal Exchange-Traded Funds
June 30, 2023
4. Fair Valuation (continued)
Fair value is a market based measure considered from the perspective of a market participant who holds the asset rather than an entity specific measure. Therefore, even when market assumptions are not readily available, the Funds’ own assumptions are set to reflect those that market participants would use in pricing the asset or liability at the measurement date. The Funds use prices and inputs that are current as of the measurement date, to the extent available.
Investments which are included in the Level 3 category may be valued using quoted prices from brokers and dealers participating in the market for these investments. These investments are classified as Level 3 investments due to the lack of market transparency and market corroboration to support these quoted prices.
Valuation models may be used as the pricing source for other investments classified as Level 3. Valuation models rely on one or more significant unobservable inputs such as prepayment rates, probability of default, or loss severity in the event of default. Significant increases in any of those inputs in isolation would result in a significantly lower fair value measurement.
The fair values of these entities are dependent on economic, political and other considerations. The values of the underlying investee entities may be affected by significant changes in the economic conditions, changes in government policies, and other factors (e.g., natural disasters, pandemics, accidents, conflicts, etc.).
The inputs or methodology used for valuing securities are not necessarily an indication of the risk associated with investing in those instruments.
During the period there were no significant purchases, sales, or transfers into or out of Level 3.
The following is a summary of the inputs used as of June 30, 2023, in valuing the Funds' securities carried at fair value:
| Level 2 — | ||||||||
| Other | Level 3 — | |||||||
| Level 1 — | Significant | Significant | ||||||
| Quoted | Observable | Unobservable | ||||||
| Fund | Prices | Inputs | Inputs | Totals (Level 1,2,3) | ||||
| Principal Active High Yield ETF | ||||||||
| Bonds* | $ | — $ | 88,157,015 | $ | — $ | 88,157,015 | ||
| Senior Floating Rate Interests* | — | 5,447,015 | — | 5,447,015 | ||||
| U.S. Government & Government Agency | ||||||||
| Obligations* | — | 3,013,816 | — | 3,013,816 | ||||
| Investment Companies | 10,549,427 | — | — | 10,549,427 | ||||
| Total investments in securities | $ | 10,549,427 | $ | 96,617,846 | $ | — $ | 107,167,273 | |
| Principal Healthcare Innovators ETF | ||||||||
| Common Stocks* | $ | 53,904,909 | $ | — $ | — $ | 53,904,909 | ||
| Investment Companies | 1,531,050 | — | — | 1,531,050 | ||||
| Total investments in securities | $ | 55,435,959 | $ | — $ | — $ | 55,435,959 | ||
| Principal International Adaptive Multi-Factor ETF | ||||||||
| Common Stocks* | ||||||||
| Basic Materials | $ | 993,620 | $ | — $ | — $ | 993,620 | ||
| Communications | 924,861 | — | — | 924,861 | ||||
| Consumer, Cyclical | 2,346,564 | — | — | 2,346,564 | ||||
| Consumer, Non-cyclical | 3,457,322 | — | — | 3,457,322 | ||||
| Diversified | 34,726 | — | — | 34,726 | ||||
| Energy | 979,436 | 1,714 | — | 981,150 | ||||
| Financial | 3,059,444 | — | — | 3,059,444 | ||||
| Industrial | 2,069,503 | — | — | 2,069,503 | ||||
| Technology | 1,013,077 | — | — | 1,013,077 | ||||
| Utilities | 557,374 | — | — | 557,374 | ||||
| Preferred Stocks* | 69,055 | — | — | 69,055 | ||||
| Investment Companies | 65,261 | — | — | 65,261 | ||||
| Total investments in securities | $ | 15,570,243 | $ | 1,714 | $ | — $ | 15,571,957 | |
51
| Notes to Financial Statements | ||||||||
| Principal Exchange-Traded Funds | ||||||||
| June 30, 2023 | ||||||||
| 4. Fair Valuation (continued) | ||||||||
| Level 2 — | ||||||||
| Other | Level 3 — | |||||||
| Level 1 — | Significant | Significant | ||||||
| Quoted | Observable | Unobservable | ||||||
| Fund | Prices | Inputs | Inputs | Totals (Level 1,2,3) | ||||
| Principal Investment Grade Corporate Active ETF | ||||||||
| Bonds* | $ | — $ | 45,098,417 | $ | — $ | 45,098,417 | ||
| U.S. Government & Government Agency | ||||||||
| Obligations* | — | 1,136,529 | — | 1,136,529 | ||||
| Investment Companies | 810,272 | — | — | 810,272 | ||||
| Total investments in securities | $ | 810,272 | $ | 46,234,946 | $ | — $ | 47,045,218 | |
| Derivative Assets | ||||||||
| Interest rate contracts | ||||||||
| Futures | $ | 57,804 | $ | — $ | — $ | 57,804 | ||
| Principal Millennial Global Growth ETF | ||||||||
| Common Stocks* | $ | 29,865,253 | $ | — $ | — $ | 29,865,253 | ||
| Investment Companies | 820,747 | — | — | 820,747 | ||||
| Total investments in securities | $ | 30,686,000 | $ | — $ | — $ | 30,686,000 | ||
| Principal Quality ETF | ||||||||
| Common Stocks* | $ | 36,549,939 | $ | — $ | — $ | 36,549,939 | ||
| Investment Companies | 131,112 | — | — | 131,112 | ||||
| Total investments in securities | $ | 36,681,051 | $ | — $ | — $ | 36,681,051 | ||
| Principal Real Estate Active Opportunities ETF | ||||||||
| Common Stocks* | $ | 5,380,676 | $ | — $ | — $ | 5,380,676 | ||
| Investment Companies | 39,103 | — | — | 39,103 | ||||
| Total investments in securities | $ | 5,419,779 | $ | — $ | — $ | 5,419,779 | ||
| Principal Spectrum Preferred Securities Active ETF | ||||||||
| Bonds* | $ | — $ | 554,413,194 | $ | — $ | 554,413,194 | ||
| Investment Companies | 15,882,180 | — | — | 15,882,180 | ||||
| Total investments in securities | $ | 15,882,180 | $ | 554,413,194 | $ | — $ | 570,295,374 | |
| Principal Spectrum Tax-Advantaged Dividend Active ETF | ||||||||
| Preferred Stocks* | $ | 2,158,738 | $ | — $ | — $ | 2,158,738 | ||
| Bonds* | — | 17,425,213 | — | 17,425,213 | ||||
| Investment Companies | 285,061 | — | — | 285,061 | ||||
| Total investments in securities | $ | 2,443,799 | $ | 17,425,213 | $ | — $ | 19,869,012 | |
| Principal U.S. Large-Cap Adaptive Multi-Factor ETF | ||||||||
| Common Stocks* | $ | 6,547,181 | $ | — $ | — $ | 6,547,181 | ||
| Investment Companies | 20,378 | — | — | 20,378 | ||||
| Total investments in securities | $ | 6,567,559 | $ | — $ | — $ | 6,567,559 | ||
| Principal U.S. Mega-Cap ETF | ||||||||
| Common Stocks* | $ | 1,459,447,660 | $ | — $ | — $ | 1,459,447,660 | ||
| Investment Companies | 3,831,620 | — | — | 3,831,620 | ||||
| Total investments in securities | $ | 1,463,279,280 | $ | — $ | — $ | 1,463,279,280 | ||
| Principal U.S. Small-Cap Adaptive Multi-Factor ETF | ||||||||
| Common Stocks* | $ | 5,835,923 | $ | — $ | — $ | 5,835,923 | ||
| Investment Companies | 19,884 | — | — | 19,884 | ||||
| Total investments in securities | $ | 5,855,807 | $ | — $ | — $ | 5,855,807 | ||
| Principal U.S. Small-Cap ETF | ||||||||
| Common Stocks* | $ | 200,549,508 | $ | — $ | — $ | 200,549,508 | ||
| Investment Companies | 1,405,352 | — | — | 1,405,352 | ||||
| Total investments in securities | $ | 201,954,860 | $ | — $ | — $ | 201,954,860 | ||
| Principal Value ETF | ||||||||
| Common Stocks* | $ | 37,108,797 | $ | — $ | — $ | 37,108,797 | ||
| Investment Companies | 160,509 | — | — | 160,509 | ||||
| Total investments in securities | $ | 37,269,306 | $ | — $ | — $ | 37,269,306 | ||
* For additional detail regarding sector and/or sub-industry classifications, please see the Schedules of Investments.
52
Notes to Financial Statements
Principal Exchange-Traded Funds
June 30, 2023
5. Management Agreement and Transactions with Affiliates
Management Services. The Funds have agreed to pay management and investment advisory fees to the Advisor computed at an annual percentage rate of each of the Funds' average daily net assets. A portion of the management fee is paid by the Advisor to the sub-advisor of the Funds, which is also an affiliate of the Advisor. The management fee schedule for the Funds is as follows:
| First | Next | Next | Over | |||||
| Fund | $500 Million | $500 Million | $500 Million | $1.5 Billion | ||||
| Principal Healthcare Innovators ETF | 0.42 | % | 0.40 | % | 0.38 | % | 0.37 | % |
| Fund | All Assets | |||||||
| Principal Active High Yield ETF | 0.39 | % | ||||||
| Principal International Adaptive Multi-Factor ETF | 0.24 | |||||||
| Principal Investment Grade Corporate Active ETF | 0.19 | |||||||
| Principal Millennial Global Growth ETF | 0.38 | |||||||
| Principal Quality ETF | 0.15 | |||||||
| Principal Real Estate Active Opportunities ETF | 0.65 | |||||||
| Principal Spectrum Preferred Securities Active ETF | 0.55 | |||||||
| Principal Spectrum Tax-Advantaged Dividend Active ETF | 0.60 | |||||||
| Principal U.S. Large-Cap Adaptive Multi-Factor ETF | 0.15 | |||||||
| Principal U.S. Mega-Cap ETF | 0.15 | |||||||
| Principal U.S. Small-Cap Adaptive Multi-Factor ETF | 0.19 | |||||||
| Principal U.S. Small-Cap ETF | 0.38 | |||||||
| Principal Value ETF | 0.15 | |||||||
Prior to November 1, 2022, the management fee for Principal Millennial Global Growth ETF was 0.45%, 0.43%, 0.41% and 0.40% for the first $500 million, next $500 million, next $500 million and over $1.5 billion, respectively.
The Advisor has contractually agreed to limit the expenses (excluding interest expense, expenses related to fund investments, acquired fund fees and expenses, tax reclaim recovery expenses, and other extraordinary expenses) for certain of the Funds. The reductions and reimbursements are in amounts that maintain total operating expenses at or below certain limits.
The limit is expressed as a percentage of average daily net assets attributable to each Fund on an annualized basis during the reporting period. The expenses borne by the Advisor are subject to reimbursement by the Fund through the fiscal year end, provided no reimbursement will be made if it would result in the Fund exceeding the total operating expense limit. Any amount outstanding at the end of the period are shown as an expense reimbursement from Advisor or expense reimbursement to Advisor on the Statements of Assets and Liabilities. The expense limit for Principal U.S. Mega-Cap ETF is 0.12% through October 31, 2023. No other Funds had expense limitation agreements in place during the year.
Affiliated Ownership. At June 30, 2023, Principal Financial Services, Inc. (an affiliate of the Advisor) owned Shares of the Funds as follows:
| Fund | Shares |
| Principal International Adaptive Multi-Factor ETF | 390,001 |
| Principal Real Estate Active Opportunities ETF | 199,204 |
| Principal Spectrum Tax-Advantaged Dividend Active ETF | 995,521 |
| Principal U.S. Large-Cap Adaptive Multi-Factor ETF | 198,571 |
| Principal U.S. Small-Cap Adaptive Multi-Factor ETF | 200,965 |
53
Notes to Financial Statements
Principal Exchange-Traded Funds
June 30, 2023
5. Management Agreement and Transactions with Affiliates (continued)
Affiliated Brokerage Commissions. With respect to Principal Spectrum Tax-Advantaged Dividend Active ETF, $387 of brokerage commissions were paid to SAMI Brokerage LLC, a member of the Principal Financial Group. The other Funds did not pay brokerage commissions to any member of the Principal Financial Group during the year ended June 30, 2023.
6. Investment Transactions
For the period ended June 30, 2023, the cost of investment securities purchased and proceeds from investment securities sold (not including short-term investments and in-kind transactions) by the Funds were as follows:
| Non-U.S. Government | U.S. Government | |||||||
| Fund | Purchases | Sales | Purchases | Sales | ||||
| Principal Active High Yield ETF | $ | 146,090,917 | $ | 56,178,970 | $ | 2,849,132 | $ | — |
| Principal Healthcare Innovators ETF | 31,597,130 | 31,681,702 | — | — | ||||
| Principal International Adaptive Multi-Factor ETF | 8,223,748 | 8,233,322 | — | — | ||||
| Principal Investment Grade Corporate Active ETF | 52,231,120 | 79,075,487 | 895,563 | 201,223 | ||||
| Principal Millennial Global Growth ETF | 525,983 | 506,357 | — | — | ||||
| Principal Quality ETF | 15,928,856 | 16,168,751 | — | — | ||||
| Principal Real Estate Active Opportunities ETF | 995,400 | 910,097 | — | — | ||||
| Principal Spectrum Preferred Securities Active ETF | 330,326,784 | 71,218,747 | — | — | ||||
| Principal Spectrum Tax-Advantaged Dividend Active ETF | 2,852,795 | 2,580,102 | — | — | ||||
| Principal U.S. Large-Cap Adaptive Multi-Factor ETF | 3,967,363 | 4,083,586 | — | — | ||||
| Principal U.S. Mega-Cap ETF | 349,536,126 | 356,871,190 | — | — | ||||
| Principal U.S. Small-Cap Adaptive Multi-Factor ETF | 5,227,617 | 5,199,030 | — | — | ||||
| Principal U.S. Small-Cap ETF | 217,158,992 | 218,953,235 | — | — | ||||
| Principal Value ETF | 1,312,218 | 13,363,878 | — | — | ||||
For the period ended June 30, 2023, in-kind transactions were as follows:
| Fund | Purchases | Sales | ||
| Principal Active High Yield ETF | $ | 44,301,186 | $ | 253,051,219 |
| Principal Healthcare Innovators ETF | 1,657,751 | 6,776,015 | ||
| Principal International Adaptive Multi-Factor ETF | 2,005,695 | 1,917,634 | ||
| Principal Investment Grade Corporate Active ETF | 34,809,897 | 314,840,964 | ||
| Principal Millennial Global Growth ETF | 3,696,638 | — | ||
| Principal Quality ETF | 5,204,078 | 20,087,911 | ||
| Principal Real Estate Active Opportunities ETF | 426,165 | — | ||
| Principal Spectrum Preferred Securities Active ETF | 25,521,110 | 49,540,164 | ||
| Principal U.S. Large-Cap Adaptive Multi-Factor ETF | — | 6,896,659 | ||
| Principal U.S. Mega-Cap ETF | 204,084,291 | 340,232,524 | ||
| Principal U.S. Small-Cap ETF | 16,169,563 | 475,886,930 | ||
| Principal Value ETF | 39,183,577 | 215,307,931 |
Unsettled in-kind purchases and sales at the end of the period are included in investment securities purchased and investment securities sold, respectively, on the Statements of Assets and Liabilities.
54
Notes to Financial Statements
Principal Exchange-Traded Funds
June 30, 2023
7. Federal Tax Information
Distributions to Shareholders. The federal income tax character of distributions paid for the periods ended June 30, 2023, and June 30, 2022 was as follows:
| Ordinary Income | Long-Term Capital Gain* | Section 1250 Gain** | ||||||||||
| Period ended | Period ended | Period ended | Period ended | Period ended | Period ended | |||||||
| Fund | June 30, 2023 | June 30, 2022 | June 30, 2023 | June 30, 2022 | June 30, 2023 | June 30, 2022 | ||||||
| Principal Active High Yield ETF | $ | 11,723,824 | $ | 11,667,484 | $ | — | $ | — | $ | — | $ | — |
| Principal Healthcare Innovators ETF | — | 861,124 | — | — | — | — | ||||||
| Principal International Adaptive | ||||||||||||
| Multi-Factor ETF | 512,269 | 1,862,278 | — | — | — | — | ||||||
| Principal Investment Grade | ||||||||||||
| Corporate Active ETF | 4,589,877 | 14,949,956 | — | 634,166 | — | — | ||||||
| Principal Millennial Global Growth | ||||||||||||
| ETF | 549,801 | 2,817,266 | — | — | — | — | ||||||
| Principal Quality ETF | 527,129 | 811,956 | — | — | — | — | ||||||
| Principal Real Estate Active | ||||||||||||
| Opportunities ETF | 125,835 | — | 1,790 | — | 1,013 | — | ||||||
| Principal Spectrum Preferred | ||||||||||||
| Securities Active ETF | 20,075,762 | 16,461,144 | — | — | — | — | ||||||
| Principal Spectrum Tax-Advantaged | ||||||||||||
| Dividend Active ETF | 1,148,780 | 1,190,472 | — | 30,484 | — | — | ||||||
| Principal U.S. Large-Cap Adaptive | ||||||||||||
| Multi-Factor ETF | 237,483 | 1,000,076 | — | 247 | — | — | ||||||
| Principal U.S. Mega-Cap ETF | 19,885,169 | 31,378,545 | — | — | — | — | ||||||
| Principal U.S. Small-Cap Adaptive | ||||||||||||
| Multi-Factor ETF | 98,793 | 108,590 | — | 320 | — | — | ||||||
| Principal U.S. Small-Cap ETF | 6,213,838 | 17,721,353 | — | — | — | — | ||||||
| Principal Value ETF | 4,060,672 | 2,251,380 | — | — | — | — | ||||||
* The Funds designate these distributions as long-term capital gain dividends per IRC Sec. 852(b)(3)(C) in the 20-percent group (which may be taxed at a 20-percent rate, a 15-percent rate or a 0-percent rate, depending on the shareholder’s taxable income).
** Unrecaptured Section 1250 gains are gains from the sale of depreciable property that are subject to a maximum tax rate of 25%.
Certain Funds may also utilize earnings and profits distributed to shareholders on redemptions of shares as part of the dividends paid deduction.
For U.S. federal income tax purposes, short-term capital gain distributions are considered ordinary income distributions.
55
Notes to Financial Statements
Principal Exchange-Traded Funds
June 30, 2023
7. Federal Tax Information (continued)
Distributable Earnings. As of June 30, 2023, the components of distributable earnings (accumulated loss) on a federal income tax basis were:
| Late Year | ||||||||||||||||
| Ordinary and | ||||||||||||||||
| UndistributedUndistributed Unrealized Post October | Other | |||||||||||||||
| Ordinary | Long-Term Appreciation/ Capital Loss Capital Loss | Temporary | ||||||||||||||
| Fund | Income | Capital Gains (Depreciation) Deferrals Carryforward Differences* | ||||||||||||||
| Principal Active High Yield ETF | $ | 656,023 | $ | — | $ | (7,931,831 | ) | $ | — | $ | (16,035,217 | ) | $ | (17,958 | ) | |
| Principal Healthcare Innovators ETF | — | — | (24,621,653 | ) | (22,787 | ) | (22,118,256 | ) | — | |||||||
| Principal International Adaptive Multi-Factor ETF | 221,804 | — | (23 | ) | — | (9,109,691 | ) | — | ||||||||
| Principal Investment Grade Corporate Active ETF | 193,559 | — | (2,771,882 | ) | — | (17,938,332 | ) | — | ||||||||
| Principal Millennial Global Growth ETF | 374,976 | — | (8,578,751 | ) | — | (8,810,329 | ) | — | ||||||||
| Principal Quality ETF | 83,653 | — | 3,696,087 | — | (12,661,189 | ) | — | |||||||||
| Principal Real Estate Active Opportunities ETF | 36,613 | — | (471,965 | ) | — | (55,953 | ) | — | ||||||||
| Principal Spectrum Preferred Securities Active ETF | 2,357,841 | — | (51,137,916 | ) | — | (16,867,569 | ) | (596,243 | ) | |||||||
| Principal Spectrum Tax-Advantaged Dividend Active ETF | 80,896 | — | (2,137,437 | ) | — | (1,079,880 | ) | (17,980 | ) | |||||||
| Principal U.S. Large-Cap Adaptive Multi-Factor ETF | 26,307 | — | (160,341 | ) | — | (5,242,308 | ) | — | ||||||||
| Principal U.S. Mega-Cap ETF | 5,163,903 | — | 200,801,873 | — | (93,161,857 | ) | — | |||||||||
| Principal U.S. Small-Cap Adaptive Multi-Factor ETF | 21,856 | — | 318,824 | — | (742,964 | ) | — | |||||||||
| Principal U.S. Small-Cap ETF | 461,676 | — | 5,555,223 | — | (179,558,559 | ) | — | |||||||||
| Principal Value ETF | 317,403 | — | 214,982 | — | (28,330,482 | ) | — | |||||||||
| * Represents book-to-tax accounting differences. | ||||||||||||||||
Capital Loss Carryforwards. For federal income tax purposes, capital loss carryforwards are losses that can be used to offset future capital gains of the Fund. As of June 30, 2023, the Funds had approximate net capital loss carryforwards as follows:
| No Expiration | No Expiration | Annual | ||||||
| Fund | Short-Term | Long-Term | Total | Limitations* | ||||
| Principal Active High Yield ETF | $ | 8,931,997 | $ | 7,103,220 | $ | 16,035,217 | $ 1,874,152** | |
| Principal Healthcare Innovators ETF | 7,798,727 | 14,319,529 | 22,118,256 | — | ||||
| Principal International Adaptive Multi-Factor ETF | 7,842,774 | 1,266,917 | 9,109,691 | 291,060 | ||||
| Principal Investment Grade Corporate Active ETF | 6,804,194 | 11,134,138 | 17,938,332 | 473,238 | ||||
| Principal Millennial Global Growth ETF | 6,794,042 | 2,016,287 | 8,810,329 | — | ||||
| Principal Quality ETF | 11,535,823 | 1,125,366 | 12,661,189 | — | ||||
| Principal Real Estate Active Opportunities ETF | 52,803 | 3,150 | 55,953 | — | ||||
| Principal Spectrum Preferred Securities Active ETF | 5,405,847 | 11,461,722 | 16,867,569 | — | ||||
| Principal Spectrum Tax-Advantaged Dividend Active ETF | 410,394 | 669,486 | 1,079,880 | — | ||||
| Principal U.S. Large-Cap Adaptive Multi-Factor ETF | 4,960,050 | 282,258 | 5,242,308 | 150,782 | ||||
| Principal U.S. Mega-Cap ETF | 80,544,792 | 12,617,065 | 93,161,857 | — | ||||
| Principal U.S. Small-Cap Adaptive Multi-Factor ETF | 577,048 | 165,916 | 742,964 | — | ||||
| Principal U.S. Small-Cap ETF | 136,509,426 | 43,049,133 | 179,558,559 | — | ||||
| Principal Value ETF | 26,205,033 | 2,125,449 | 28,330,482 | 230,798 | ||||
| * | In accordance with IRC Sections 381-384, a portion of certain Funds’ losses have been subjected to an annual limitation. |
| ** | Certain losses are subject to an annual limit of $1,874,152 and certain losses are subject to an additional annual limit of $6,296,672. |
56
Notes to Financial Statements
Principal Exchange-Traded Funds
June 30, 2023
7. Federal Tax Information (continued)
All of these capital losses were generated in taxable years beginning after the enactment date of the Regulated Investment Company Modernization Act of 2010 on December 22, 2010, and will be carried forward with no expiration and with the character of the loss retained.
For the year ended June 30, 2023, the Fund utilized capital loss carryforwards as follows:
| Short-Term | Long-Term | |||
| Fund | Utilized | Utilized | ||
| Principal Quality ETF | $ | 365,231 | $ | — |
| Principal Value ETF | 187,203 | 63,135 |
Late-Year Losses. A regulated investment company may elect to treat any portion of its qualified late-year loss as arising on the first day of the next taxable year. Qualified late-year losses are certain capital and ordinary losses which occur during the portion of the Fund’s taxable year subsequent to October 31 and December 31, respectively.
For the taxable year ended June 30, 2023, the Funds intend to defer late-year capital and ordinary losses as follows:
| Fund | Late Year Ordinary Loss | Post October Capital Loss | ||
| Principal Healthcare Innovators ETF | $ | 22,787 | $ | — |
Reclassification of Capital Accounts. The Funds may record reclassifications in their capital accounts. These reclassifications have no impact on the total net assets of the Funds. The reclassifications are a result of permanent differences between U.S. GAAP and tax accounting. Adjustments are made to reflect the impact these items have on current and future distributions to shareholders. Therefore, the source of the Funds’ distributions may be shown in the accompanying Statement of Changes in Net Assets as from net investment income and net realized gains on investments or from tax return of capital depending on the type of book and tax differences that exist. For the period ended June 30, 2023, the Funds recorded reclassifications as follows:
| Total | ||||||
| Distributable Earnings | ||||||
| Fund | (Accumulated Loss) | Paid In Capital | ||||
| Principal Active High Yield ETF | $ | 10,235,610 | $ | (10,235,610 | ) | |
| Principal Healthcare Innovators ETF | (657,096 | ) | 657,096 | |||
| Principal International Adaptive Multi-Factor ETF | 341,201 | (341,201 | ) | |||
| Principal Investment Grade Corporate Active ETF | 56,092,908 | (56,092,908 | ) | |||
| Principal Millennial Global Growth ETF | (1,497 | ) | 1,497 | |||
| Principal Quality ETF | (1,580,891 | ) | 1,580,891 | |||
| Principal Real Estate Active Opportunities ETF | (4 | ) | 4 | |||
| Principal Spectrum Preferred Securities Active ETF | 3,171,030 | (3,171,030 | ) | |||
| Principal Spectrum Tax-Advantaged Dividend Active ETF | (1 | ) | 1 | |||
| Principal U.S. Large-Cap Adaptive Multi-Factor ETF | 1,320,673 | (1,320,673 | ) | |||
| Principal U.S. Mega-Cap ETF | (66,233,347 | ) | 66,233,347 | |||
| Principal U.S. Small-Cap ETF | 31,829,343 | (31,829,343 | ) | |||
| Principal Value ETF | (4,887,348 | ) | 4,887,348 |
57
Notes to Financial Statements
Principal Exchange-Traded Funds
June 30, 2023
7. Federal Tax Information (continued)
Federal Income Tax Basis. As of June 30, 2023, the net federal income tax unrealized appreciation (depreciation) and federal tax cost of investments held by each Fund were as follows:
| Cost for | ||||||||||
| Net Unrealized | Federal | |||||||||
| Unrealized | Unrealized | Appreciation | Income Tax | |||||||
| Fund | Appreciation | Depreciation | (Depreciation) | Purposes | ||||||
| Principal Active High Yield ETF | $ | 69,282 | $ | (8,001,113 | ) | $ | (7,931,831 | ) | $ | 115,099,104 |
| Principal Healthcare Innovators ETF | 5,698,445 | (30,320,097 | ) | (24,621,652 | ) | 80,057,611 | ||||
| Principal International Adaptive Multi-Factor ETF | 1,229,198 | (1,229,240 | ) | (42 | ) | 15,571,999 | ||||
| Principal Investment Grade Corporate Active ETF | 91,177 | (2,863,059 | ) | (2,771,882 | ) | 49,874,904 | ||||
| Principal Millennial Global Growth ETF | 1,904,157 | (10,482,910 | ) | (8,578,753 | ) | 39,264,753 | ||||
| Principal Quality ETF | 4,648,653 | (952,566 | ) | 3,696,087 | 32,984,964 | |||||
| Principal Real Estate Active Opportunities ETF | 81,858 | (553,823 | ) | (471,965 | ) | 5,891,744 | ||||
| Principal Spectrum Preferred Securities Active ETF | 1,221,182 | (52,359,097 | ) | (51,137,915 | ) | 621,433,289 | ||||
| Principal Spectrum Tax-Advantaged Dividend Active ETF | 75,415 | (2,212,854 | ) | (2,137,439 | ) | 22,006,451 | ||||
| Principal U.S. Large-Cap Adaptive Multi-Factor ETF | 475,778 | (636,119 | ) | (160,341 | ) | 6,727,900 | ||||
| Principal U.S. Mega-Cap ETF | 229,402,393 | (28,600,520 | ) | 200,801,873 | 1,262,477,407 | |||||
| Principal U.S. Small-Cap Adaptive Multi-Factor ETF | 870,124 | (551,300 | ) | 318,824 | 5,536,983 | |||||
| Principal U.S. Small-Cap ETF | 25,665,607 | (20,110,384 | ) | 5,555,223 | 196,399,637 | |||||
| Principal Value ETF | 2,454,126 | (2,239,144 | ) | 214,982 | 37,054,324 |
8. Subsequent Events
Management has evaluated events or transactions that have occurred through the date the financial statements were issued that would merit recognition or disclosure in the financial statements. On July 27, 2023, the Board of Trustees approved a Plan of Liquidation and Termination (the “Plan”) for the Principal Millennial Global Growth ETF. Pursuant to the Plan, Principal Millennial Global Growth ETF will liquidate on or about October 20, 2023. There were no additional items requiring adjustment of the financial statements or additional disclosure.
58
| Schedule of Investments | ||||
| Principal Active High Yield ETF | ||||
| June 30, 2023 | ||||
| Principal | ||||
| BONDS — 83.88% | Amount | Value | ||
| Aerospace & Defense — 1.45% | ||||
| Bombardier, Inc. | ||||
| 7.50%, 02/01/2029 (a) | $ | 570,000 | $ | 563,357 |
| Triumph Group, Inc. | ||||
| 7.75%, 08/15/2025 (b) | 991,000 | 963,450 | ||
| $ | 1,526,807 | |||
| Airlines — 0.06% | ||||
| United Airlines 2016-1 Class B Pass-Through Trust | ||||
| 3.65%, 07/07/2027 | 73,186 | 67,367 | ||
| Auto Manufacturers — 1.74% | ||||
| Ford Motor Co. | ||||
| 3.25%, 02/12/2032 | 880,000 | 692,282 | ||
| Ford Motor Credit Co. LLC | ||||
| 3.38%, 11/13/2025 | 952,000 | 885,240 | ||
| 4.54%, 08/01/2026 | 263,000 | 247,219 | ||
| $ | 1,824,741 | |||
| Auto Parts & Equipment — 0.98% | ||||
| Dana, Inc. | ||||
| 4.25%, 09/01/2030 | 1,231,000 | 1,024,850 | ||
| Banks — 1.41% | ||||
| JPMorgan Chase & Co. | ||||
| (3-month Term Secured Overnight Financing Rate + 3.13%), | ||||
| 4.60%, 02/01/2025 (c),(d) | 1,587,000 | 1,479,878 | ||
| Chemicals — 3.67% | ||||
| Consolidated Energy Finance SA | ||||
| 5.63%, 10/15/2028 (a) | 1,142,000 | 970,928 | ||
| Kobe U.S. Midco 2, Inc. | ||||
| 9.25%, PIK 10.00%; 11/01/2026 (a),(e) | 1,234,000 | 814,440 | ||
| Olympus Water U.S. Holding Corp. | ||||
| 6.25%, 10/01/2029 (a),(b) | 1,931,000 | 1,396,695 | ||
| Tronox, Inc. | ||||
| 4.63%, 03/15/2029 (a) | 816,000 | 678,123 | ||
| $ | 3,860,186 | |||
| Commercial Services — 4.01% | ||||
| Albion Financing 1 SARL/Aggreko Holdings, Inc. | ||||
| 6.13%, 10/15/2026 (a) | 990,000 | 930,600 | ||
| Garda World Security Corp. | ||||
| 6.00%, 06/01/2029 (a) | 188,000 | 154,058 | ||
| 9.50%, 11/01/2027 (a) | 1,016,000 | 981,551 | ||
| WASH Multifamily Acquisition, Inc. | ||||
| 5.75%, 04/15/2026 (a) | 1,360,000 | 1,269,659 | ||
| ZipRecruiter, Inc. | ||||
| 5.00%, 01/15/2030 (a) | 1,033,000 | 879,548 | ||
| $ | 4,215,416 | |||
| Computers — 1.48% | ||||
| Seagate HDD Cayman | ||||
| 5.75%, 12/01/2034 | 630,000 | 558,779 | ||
| 9.63%, 12/01/2032 (a) | 907,486 | 1,001,354 | ||
| $ | 1,560,133 | |||
See accompanying notes.
59
| Schedule of Investments | ||||
| Principal Active High Yield ETF | ||||
| June 30, 2023 | ||||
| Principal | ||||
| BONDS (continued) | Amount | Value | ||
| Construction Materials — 1.43% | ||||
| Smyrna Ready Mix Concrete LLC | ||||
| 6.00%, 11/01/2028 (a) | $ | 1,588,000 | $ | 1,497,554 |
| Diversified Financial Services — 6.46% | ||||
| AerCap Holdings NV | ||||
| (5-year Treasury Constant Maturity Rate + 4.54%), | ||||
| 5.88%, 10/10/2079 (c) | 1,706,000 | 1,608,973 | ||
| Credit Acceptance Corp. | ||||
| 6.63%, 03/15/2026 (b) | 1,483,000 | 1,425,056 | ||
| Global Aircraft Leasing Co. Ltd. | ||||
| 6.50%, PIK 7.25%; 09/15/2024 (a),(e) | 1,524,242 | 1,395,215 | ||
| Macquarie Airfinance Holdings Ltd. | ||||
| 8.38%, 05/01/2028 | 963,000 | 976,424 | ||
| OneMain Finance Corp. | ||||
| 3.50%, 01/15/2027 | 130,000 | 111,532 | ||
| 4.00%, 09/15/2030 | 1,357,000 | 1,044,890 | ||
| 6.63%, 01/15/2028 | 244,000 | 230,158 | ||
| $ | 6,792,248 | |||
| Electric — 4.31% | ||||
| Clearway Energy Operating LLC | ||||
| 3.75%, 02/15/2031 (a) | 1,850,000 | 1,535,223 | ||
| GenOn Energy, Inc. | ||||
| 0.00%, 10/15/2020 (f),(g),(h) | 3,100,000 | — | ||
| NRG Energy, Inc. | ||||
| 3.88%, 02/15/2032 (a) | 1,500,000 | 1,155,728 | ||
| (5-year Treasury Constant Maturity Rate + 5.92%), | ||||
| 10.25%, 03/15/2028 (a),(c),(d) | 227,000 | 214,054 | ||
| Vistra Corp. | ||||
| (5-year Treasury Constant Maturity Rate + 5.74%), | ||||
| 7.00%, 12/15/2026 (a),(c),(d) | 697,000 | 608,133 | ||
| Vistra Operations Co. LLC | ||||
| 4.38%, 05/01/2029 (a) | 1,154,000 | 1,010,785 | ||
| $ | 4,523,923 | |||
| Electronics — 1.41% | ||||
| Sensata Technologies BV | ||||
| 4.00%, 04/15/2029 (a) | 153,000 | 136,213 | ||
| Sensata Technologies, Inc. | ||||
| 3.75%, 02/15/2031 (a) | 1,576,000 | 1,348,255 | ||
| $ | 1,484,468 | |||
| Entertainment — 7.47% | ||||
| Boyne USA, Inc. | ||||
| 4.75%, 05/15/2029 (a) | 1,811,000 | 1,631,998 | ||
| CCM Merger, Inc. | ||||
| 6.38%, 05/01/2026 (a) | 1,589,000 | 1,541,330 | ||
| CDI Escrow Issuer, Inc. | ||||
| 5.75%, 04/01/2030 (a) | 1,611,000 | 1,499,548 | ||
| Cinemark USA, Inc. | ||||
| 5.25%, 07/15/2028 (a) | 1,370,000 | 1,205,074 | ||
| International Game Technology PLC | ||||
| 5.25%, 01/15/2029 (a) | 1,032,000 | 977,562 | ||
| Lions Gate Capital Holdings LLC | ||||
| 5.50%, 04/15/2029 (a) | 1,376,000 | 996,499 | ||
| $ | 7,852,011 | |||
See accompanying notes.
60
| Schedule of Investments | ||||
| Principal Active High Yield ETF | ||||
| June 30, 2023 | ||||
| Principal | ||||
| BONDS (continued) | Amount | Value | ||
| Food — 3.14% | ||||
| Albertsons Cos., Inc./Safeway, Inc./New Albertsons LP/Albertsons LLC | ||||
| 3.50%, 03/15/2029 (a) | $ | 1,000,000 | $ | 865,640 |
| Chobani LLC/Chobani Finance Corp., Inc. | ||||
| 7.50%, 04/15/2025 (a) | 1,130,000 | 1,124,363 | ||
| Pilgrim's Pride Corp. | ||||
| 3.50%, 03/01/2032 | 1,469,000 | 1,161,392 | ||
| 4.25%, 04/15/2031 | 177,000 | 151,786 | ||
| $ | 3,303,181 | |||
| Forest Products & Paper — 0.51% | ||||
| Mercer International, Inc. | �� | |||
| 5.13%, 02/01/2029 | 683,000 | 531,520 | ||
| Healthcare — Services — 2.62% | ||||
| Acadia Healthcare Co., Inc. | ||||
| 5.00%, 04/15/2029 (a) | 1,574,000 | 1,451,387 | ||
| Tenet Healthcare Corp. | ||||
| 6.13%, 06/15/2030 | 1,325,000 | 1,306,052 | ||
| $ | 2,757,439 | |||
| Home Builders — 1.42% | ||||
| Forestar Group, Inc. | ||||
| 3.85%, 05/15/2026 (a) | 262,000 | 240,741 | ||
| 5.00%, 03/01/2028 (a) | 1,368,000 | 1,254,885 | ||
| $ | 1,495,626 | |||
| Insurance — 0.77% | ||||
| Acrisure LLC/Acrisure Finance, Inc. | ||||
| 4.25%, 02/15/2029 (a) | 181,000 | 156,239 | ||
| 7.00%, 11/15/2025 (a) | 675,000 | 653,458 | ||
| $ | 809,697 | |||
| Investment Companies — 0.84% | ||||
| Compass Group Diversified Holdings LLC | ||||
| 5.25%, 04/15/2029 (a) | 1,010,000 | 885,283 | ||
| Iron & Steel — 0.62% | ||||
| TMS International Corp. | ||||
| 6.25%, 04/15/2029 (a) | 775,000 | 651,000 | ||
| Leisure Time — 1.37% | ||||
| Life Time, Inc. | ||||
| 5.75%, 01/15/2026 (a) | 1,473,000 | 1,435,487 | ||
| Lodging — 1.62% | ||||
| Wynn Las Vegas LLC/Wynn Las Vegas Capital Corp. | ||||
| 5.25%, 05/15/2027 (a),(b) | 1,069,000 | 1,012,613 | ||
| Wynn Macau Ltd. | ||||
| 5.63%, 08/26/2028 (a) | 791,000 | 690,148 | ||
| $ | 1,702,761 | |||
| Media — 6.51% | ||||
| CCO Holdings LLC/CCO Holdings Capital Corp. | ||||
| 4.25%, 02/01/2031 (a) | 1,596,000 | 1,291,116 | ||
| 4.75%, 02/01/2032 (a) | 508,000 | 414,264 | ||
| Directv Financing LLC/Directv Financing Co.-Obligor, Inc. | ||||
| 5.88%, 08/15/2027 (a) | 1,576,000 | 1,427,281 | ||
See accompanying notes.
61
| Schedule of Investments | ||||
| Principal Active High Yield ETF | ||||
| June 30, 2023 | ||||
| Principal | ||||
| BONDS (continued) | Amount | Value | ||
| Media (continued) | ||||
| DISH DBS Corp. | ||||
| 5.13%, 06/01/2029 | $ | 178,000 | $ | 82,654 |
| 5.25%, 12/01/2026 (a) | 13,284 | 10,656 | ||
| 5.88%, 11/15/2024 | 481,000 | 420,691 | ||
| 7.38%, 07/01/2028 | 816,000 | 436,560 | ||
| DISH Network Corp. | ||||
| 11.75%, 11/15/2027 (a) | 672,000 | 655,812 | ||
| Scripps Escrow II, Inc. | ||||
| 5.38%, 01/15/2031 (a) | 504,000 | 355,218 | ||
| Sirius XM Radio, Inc. | ||||
| 3.13%, 09/01/2026 (a) | 1,362,000 | 1,219,326 | ||
| UPC Holding BV | ||||
| 5.50%, 01/15/2028 (a) | 599,000 | 522,906 | ||
| $ | 6,836,484 | |||
| Mining — 3.10% | ||||
| Copper Mountain Mining Corp. | ||||
| 8.00%, 04/09/2026 (a) | 989,734 | 999,631 | ||
| Novelis Corp. | ||||
| 3.88%, 08/15/2031 (a) | 922,000 | 758,448 | ||
| Taseko Mines Ltd. | ||||
| 7.00%, 02/15/2026 (a) | 1,644,000 | 1,498,409 | ||
| $ | 3,256,488 | |||
| Oil & Gas — 5.90% | ||||
| Aethon United BR LP/Aethon United Finance Corp. | ||||
| 8.25%, 02/15/2026 (a) | 1,350,000 | 1,326,375 | ||
| Antero Resources Corp. | ||||
| 7.63%, 02/01/2029 (a) | 1,039,000 | 1,054,184 | ||
| Apache Corp. | ||||
| 4.75%, 04/15/2043 | 80,000 | 58,800 | ||
| 5.10%, 09/01/2040 | 921,000 | 748,313 | ||
| 5.25%, 02/01/2042 | 42,000 | 33,075 | ||
| Ascent Resources Utica Holdings LLC/ARU Finance Corp. | ||||
| 7.00%, 11/01/2026 (a) | 486,000 | 470,287 | ||
| Comstock Resources, Inc. | ||||
| 5.88%, 01/15/2030 (a) | 599,000 | 520,034 | ||
| MEG Energy Corp. | ||||
| 7.13%, 02/01/2027 (a) | 948,000 | 963,247 | ||
| Southwestern Energy Co. | ||||
| 4.75%, 02/01/2032 | 1,167,000 | 1,028,520 | ||
| $ | 6,202,835 | |||
| Oil & Gas Services — 0.91% | ||||
| Archrock Partners LP/Archrock Partners Finance Corp. | ||||
| 6.25%, 04/01/2028 (a) | 1,023,000 | 960,454 | ||
| Packaging & Containers — 1.61% | ||||
| Clydesdale Acquisition Holdings, Inc. | ||||
| 6.63%, 04/15/2029 (a) | 153,000 | 145,916 | ||
| 8.75%, 04/15/2030 (a) | 578,000 | 510,214 | ||
| LABL, Inc. | ||||
| 5.88%, 11/01/2028 (a) | 293,000 | 266,478 | ||
| 8.25%, 11/01/2029 (a) | 473,000 | 395,546 | ||
| 9.50%, 11/01/2028 (a) | 368,000 | 374,398 | ||
| $ | 1,692,552 | |||
See accompanying notes.
62
| Schedule of Investments | ||||
| Principal Active High Yield ETF | ||||
| June 30, 2023 | ||||
| Principal | ||||
| BONDS (continued) | Amount | Value | ||
| Pharmaceuticals — 2.22% | ||||
| BellRing Brands, Inc. | ||||
| 7.00%, 03/15/2030 (a) | $ | 892,000 | $ | 897,575 |
| Jazz Securities DAC | ||||
| 4.38%, 01/15/2029 (a) | 1,612,000 | 1,438,210 | ||
| $ | 2,335,785 | |||
| Pipelines — 6.97% | ||||
| Antero Midstream Partners LP/Antero Midstream Finance Corp. | ||||
| 5.38%, 06/15/2029 (a) | 916,000 | 851,129 | ||
| 5.75%, 03/01/2027 (a) | 596,000 | 574,804 | ||
| CNX Midstream Partners LP | ||||
| 4.75%, 04/15/2030 (a) | 1,354,000 | 1,148,444 | ||
| Crestwood Midstream Partners LP/Crestwood Midstream Finance Corp. | ||||
| 5.63%, 05/01/2027 (a) | 1,471,000 | 1,394,508 | ||
| EnLink Midstream LLC | ||||
| 6.50%, 09/01/2030 (a) | 952,000 | 950,840 | ||
| Hess Midstream Operations LP | ||||
| 4.25%, 02/15/2030 (a) | 1,117,000 | 974,583 | ||
| Kinetik Holdings LP | ||||
| 5.88%, 06/15/2030 (a) | 1,501,000 | 1,426,686 | ||
| $ | 7,320,994 | |||
| REITs — 2.28% | ||||
| CBL & Associates LP | ||||
| 0.00%, 12/15/2026 (f),(g),(h) | 6,000,000 | — | ||
| HAT Holdings I LLC/HAT Holdings II LLC | ||||
| 3.38%, 06/15/2026 (a) | 864,000 | 774,354 | ||
| 3.75%, 09/15/2030 (a) | 197,000 | 154,554 | ||
| Ladder Capital Finance Holdings LLLP/Ladder Capital Finance Corp. | ||||
| 4.75%, 06/15/2029 (a) | 1,798,000 | 1,463,278 | ||
| $ | 2,392,186 | |||
| Retail — 4.52% | ||||
| Bath & Body Works, Inc. | ||||
| 5.25%, 02/01/2028 | 311,000 | 295,669 | ||
| 6.63%, 10/01/2030 (a) | 520,000 | 502,002 | ||
| 6.75%, 07/01/2036 | 275,000 | 247,423 | ||
| 9.38%, 07/01/2025 (a) | 30,000 | 31,845 | ||
| Dave & Buster's, Inc. | ||||
| 7.63%, 11/01/2025 (a) | 932,000 | 944,815 | ||
| Fertitta Entertainment LLC/Fertitta Entertainment Finance Co., Inc. | ||||
| 4.63%, 01/15/2029 (a) | 695,000 | 609,863 | ||
| 6.75%, 01/15/2030 (a) | 476,000 | 405,094 | ||
| LSF9 Atlantis Holdings LLC/Victra Finance Corp. | ||||
| 7.75%, 02/15/2026 (a) | 1,013,000 | 943,155 | ||
| Park River Holdings, Inc. | ||||
| 5.63%, 02/01/2029 (a) | 590,000 | 457,250 | ||
| Patrick Industries, Inc. | ||||
| 4.75%, 05/01/2029 (a) | 365,000 | 313,491 | ||
| $ | 4,750,607 | |||
| Transportation — 1.07% | ||||
| Watco Cos. LLC/Watco Finance Corp. | ||||
| 6.50%, 06/15/2027 (a) | 1,186,000 | 1,127,054 | ||
| TOTAL BONDS | $ | 88,157,015 | ||
See accompanying notes. 63
Schedule of Investments Principal Active High Yield ETF
June 30, 2023
| Principal | ||||||
| SENIOR FLOATING RATE INTERESTS — 5.18% | Amount | Value | ||||
| Airlines — 3.01% | ||||||
| AAdvantage Loyalty IP Ltd., 2021 Term Loan B | ||||||
| (3-month USD LIBOR + 4.75%), | ||||||
| 10.00%, 04/20/2028 | $ | 1,355,000 | $ | 1,382,100 | ||
| United Airlines, Inc., 2021 Term Loan B | ||||||
| (3-month USD LIBOR + 3.75%), | ||||||
| 9.29%, 04/21/2028 | 1,786,109 | 1,782,644 | ||||
| $ | 3,164,744 | |||||
| Forest Products & Paper — 1.25% | ||||||
| Spectrum Group Buyer, Inc., 2022 Term Loan B | ||||||
| (3-month Term Secured Overnight Financing Rate + 6.50%), | ||||||
| 11.32%, 05/19/2028 | 1,385,938 | 1,311,735 | ||||
| Healthcare — Products — 0.92% | ||||||
| Medline Borrower LP, USD Term Loan B | ||||||
| (1-month Term Secured Overnight Financing Rate + 3.25%), | ||||||
| 8.35%, 10/23/2028 | 982,513 | 970,536 | ||||
| TOTAL SENIOR FLOATING RATE INTERESTS | $ | 5,447,015 | ||||
| U.S. GOVERNMENT & GOVERNMENT AGENCY OBLIGATIONS — | Principal | |||||
| 2.87 | % | Amount | Value | |||
| U.S. Treasury - 2.87% | ||||||
| 3.38%, 05/15/2033 | $ | 1,570,400 | $ | 1,514,454 | ||
| 3.50%, 04/30/2028 | 1,543,000 | 1,499,362 | ||||
| TOTAL U.S. GOVERNMENT & GOVERNMENT AGENCY OBLIGATIONS | $ | 3,013,816 | ||||
| INVESTMENT COMPANIES — 10.04% | Shares Held | Value | ||||
| Money Market Funds — 10.04% | ||||||
| Principal Government Money Market Fund — Class R-6 5.01% (i),(j),(k) | 3,219,013 | $ | 3,219,013 | |||
| State Street Institutional U.S. Government Money Market Fund — Premier Class | ||||||
| 5.03 | % (k) | 7,330,414 | 7,330,414 | |||
| TOTAL INVESTMENT COMPANIES | $ | 10,549,427 | ||||
| Total Investments | $ | 107,167,273 | ||||
| Other Assets and Liabilities — (1.97)% | (2,073,216 | ) | ||||
| Total Net Assets — 100.00% | $ | 105,094,057 | ||||
Security exempt from registration under Rule 144A of the Securities Act of 1933. These securities may be resold in transactions exempt from registration, normally to qualified institutional buyers. At the end of the period, the value of these securities totaled $70,338,462 or 66.93% of net assets.
(b) Security or a portion of the security was on loan. At the end of the period, the value of these securities totaled $3,161,998 or 3.01% of net assets.
(c) Rate shown is as of period end. The rate may be a variable or floating rate or a fixed rate which may convert to a variable or floating rate in the future.
(d) Perpetual security. Perpetual securities pay an indefinite stream of interest, but they may be called by the issuer at an earlier date. Date shown, if any, reflects the next call date or final legal maturity date. Rate shown is as of period end.
(e) Payment in kind; the issuer has the option of paying additional securities in lieu of cash. (f) Non-income producing security.
(g) The value of these investments was determined using significant unobservable inputs, in good faith by the Advisor, under procedures established and periodically reviewed by the Board of Trustees.
(h) Security is defaulted.
(i) Affiliated Security. Security is either an affiliate (and registered under the Investment Company Act of 1940) or an affiliate as defined by the Investment Company Act of 1940 (controls 5.00% or more of the outstanding voting shares of the security).
Please see Affiliated Securities sub-schedule for transactional information.
(j) Security or a portion of the security was received as collateral for securities lending. At the end of the period, the value of these securities totaled $3,219,013 or 3.06% of net assets.
See accompanying notes. 64
| Schedule of Investments | ||||||||||||
| Principal Active High Yield ETF | ||||||||||||
| June 30, 2023 | ||||||||||||
| (k) 1-day yield shown as of period end. | ||||||||||||
| Portfolio Summary | ||||||||||||
| Sector | Percent | |||||||||||
| Consumer, Cyclical | 22.19 | % | ||||||||||
| Energy | 13.78 | % | ||||||||||
| Consumer, Non-cyclical | 12.92 | % | ||||||||||
| Financial | 11.76 | % | ||||||||||
| Money Market Funds | 10.04 | % | ||||||||||
| Basic Materials | 9.15 | % | ||||||||||
| Industrial | 6.97 | % | ||||||||||
| Communications | 6.51 | % | ||||||||||
| Utilities | 4.30 | % | ||||||||||
| Government | 2.87 | % | ||||||||||
| Technology | 1.48 | % | ||||||||||
| Other Assets and Liabilities | (1.97 | )% | ||||||||||
| TOTAL NET ASSETS | 100.00 | % | ||||||||||
| June 30, 2022 | Purchases | Sales | June 30, 2023 | |||||||||
| Affiliated Securities | Value | Cost | Proceeds | Value | ||||||||
| Principal Government Money | ||||||||||||
| Market Fund — Class R-6 5.01% | $ | — | $ | 24,624,583 | $ | 21,405,570 | $ | 3,219,013 | ||||
| Principal Government Money | ||||||||||||
| Market Fund — Institutional Class | ||||||||||||
| 4.90 | % | 5,781,485 | 33,322,007 | 39,103,492 | — | |||||||
| $ | 5,781,485 | $ | 57,946,590 | $ | 60,509,062 | $ | 3,219,013 | |||||
| Realized Gain | ||||||||||||
| Realized | from | Change in | ||||||||||
| Gain/(Loss) on | Capital Gain | Unrealized | ||||||||||
| Income (a) | Investments | Distributions | Gain/(Loss) | |||||||||
| Principal Government Money | ||||||||||||
| Market Fund — Class R-6 5.01% | $ | — | $ | — | $ | — | $ | — | ||||
| Principal Government Money | ||||||||||||
| Market Fund — Institutional Class | ||||||||||||
| 4.90 | % | — | — | — | — | |||||||
| $ | — | $ | — | $ | — | $ | — | |||||
| (a) Amount excludes earnings from securities lending collateral. | ||||||||||||
See accompanying notes.
65
| Schedule of Investments | ||||
| Principal Healthcare Innovators ETF | ||||
| June 30, 2023 | ||||
| COMMON STOCKS — 99.83% | Shares Held | Value | ||
| Biotechnology — 63.33% | ||||
| 2seventy bio, Inc. (a) | 9,209 | $ | 93,195 | |
| 4D Molecular Therapeutics, Inc. (a) | 5,187 | 93,729 | ||
| Aadi Bioscience, Inc. (a) | 6,306 | 43,133 | ||
| ACADIA Pharmaceuticals, Inc. (a) | 20,287 | 485,874 | ||
| Adicet Bio, Inc. (a),(b) | 9,296 | 22,589 | ||
| ADMA Biologics, Inc. (a) | 33,886 | 125,039 | ||
| Aerovate Therapeutics, Inc. (a) | 4,552 | 78,067 | ||
| Agenus, Inc. | 54,875 | 87,800 | ||
| Akero Therapeutics, Inc. (a) | 6,082 | 283,969 | ||
| Allogene Therapeutics, Inc. (a) | 22,132 | 109,996 | ||
| Allovir, Inc. (a),(b) | 18,369 | 62,455 | ||
| Alnylam Pharmaceuticals, Inc. (a) | 7,941 | 1,508,314 | ||
| Amicus Therapeutics, Inc. (a) | 35,514 | 446,056 | ||
| AnaptysBio, Inc. (a) | 4,672 | 95,028 | ||
| Anavex Life Sciences Corp. (a) | 12,666 | 102,975 | ||
| ANI Pharmaceuticals, Inc. (a) | 2,768 | 149,001 | ||
| Apellis Pharmaceuticals, Inc. (a) | 13,714 | 1,249,345 | ||
| Arbutus Biopharma Corp. (a),(b) | 27,510 | 63,273 | ||
| Arcellx, Inc. (a) | 6,289 | 198,858 | ||
| Arcturus Therapeutics Holdings, Inc. (a) | 4,130 | 118,448 | ||
| Arcus Biosciences, Inc. (a) | 9,929 | 201,658 | ||
| Arcutis Biotherapeutics, Inc. (a) | 8,866 | 84,493 | ||
| Arrowhead Pharmaceuticals, Inc. (a) | 13,520 | 482,123 | ||
| Atara Biotherapeutics, Inc. (a) | 19,887 | 32,018 | ||
| Atea Pharmaceuticals, Inc. (a) | 17,804 | 66,587 | ||
| Aurinia Pharmaceuticals, Inc. (a) | 19,264 | 186,476 | ||
| Avidity Biosciences, Inc. (a) | 9,998 | 110,878 | ||
| Axsome Therapeutics, Inc. (a),(b) | 5,452 | 391,781 | ||
| Beam Therapeutics, Inc. (a) | 9,339 | 298,194 | ||
| Bio-Rad Laboratories, Inc., Class A (a) | 3,463 | 1,312,893 | ||
| BioCryst Pharmaceuticals, Inc. (a) | 25,739 | 181,203 | ||
| Biohaven Ltd. (a) | 9,941 | 237,789 | ||
| Bluebird Bio, Inc. (a),(b) | 19,980 | 65,734 | ||
| Blueprint Medicines Corp. (a) | 7,558 | 477,666 | ||
| Bridgebio Pharma, Inc. (a) | 21,124 | 363,333 | ||
| C4 Therapeutics, Inc. (a) | 13,917 | 38,272 | ||
| Cara Therapeutics, Inc. (a) | 12,807 | 36,244 | ||
| Caribou Biosciences, Inc. (a) | 13,075 | 55,569 | ||
| Cassava Sciences, Inc. (a),(b) | 6,081 | 149,106 | ||
| Celldex Therapeutics, Inc. (a) | 6,274 | 212,877 | ||
| Cerevel Therapeutics Holdings, Inc. (a) | 19,266 | 612,466 | ||
| Chinook Therapeutics, Inc. (a) | 8,976 | 344,858 | ||
| Cogent Biosciences, Inc. (a) | 10,699 | 126,676 | ||
| Crinetics Pharmaceuticals, Inc. (a) | 7,883 | 142,052 | ||
| Cullinan Oncology, Inc. (a) | 7,509 | 80,797 | ||
| Cytokinetics, Inc. (a) | 11,810 | 385,242 | ||
| Day One Biopharmaceuticals, Inc. (a) | 10,450 | 124,773 | ||
| Deciphera Pharmaceuticals, Inc. (a) | 10,788 | 151,895 | ||
| Denali Therapeutics, Inc. (a) | 17,030 | 502,555 | ||
| Design Therapeutics, Inc. (a),(b) | 10,825 | 68,197 | ||
| DICE Therapeutics, Inc. (a) | 6,484 | 301,247 | ||
| Dyne Therapeutics, Inc. (a) | 9,093 | 102,296 | ||
| Edgewise Therapeutics, Inc. (a) | 11,541 | 89,443 | ||
| Editas Medicine, Inc. (a) | 11,548 | 95,040 | ||
| Emergent BioSolutions, Inc. (a) | 8,300 | 61,005 | ||
| EQRx, Inc. (a),(b) | 72,395 | 134,655 | ||
| Erasca, Inc. (a) | 26,815 | 74,009 | ||
| Esperion Therapeutics, Inc. (a) | 31,538 | 43,838 | ||
See accompanying notes.
66
| Schedule of Investments | ||||
| Principal Healthcare Innovators ETF | ||||
| June 30, 2023 | ||||
| COMMON STOCKS (continued) | Shares Held | Value | ||
| Biotechnology (continued) | ||||
| Evolus, Inc. (a) | 9,367 | $ | 68,098 | |
| Fate Therapeutics, Inc. (a) | 16,639 | 79,202 | ||
| FibroGen, Inc. (a) | 12,359 | 33,369 | ||
| Geron Corp. (a) | 69,932 | 224,482 | ||
| Gossamer Bio, Inc. (a) | 33,504 | 40,205 | ||
| Ideaya Biosciences, Inc. (a) | 7,558 | 177,613 | ||
| IGM Biosciences, Inc. (a),(b) | 5,721 | 52,805 | ||
| Illumina, Inc. (a) | 7,302 | 1,369,052 | ||
| ImmunityBio, Inc. (a) | 61,424 | 170,759 | ||
| ImmunoGen, Inc. (a) | 33,049 | 623,635 | ||
| Immunovant, Inc. (a) | 16,997 | 322,433 | ||
| Inhibrx, Inc. (a),(b) | 6,425 | 166,793 | ||
| Inovio Pharmaceuticals, Inc. (a) | 61,331 | 27,384 | ||
| Insmed, Inc. (a) | 17,434 | 367,857 | ||
| Intellia Therapeutics, Inc. (a) | 11,004 | 448,743 | ||
| Intercept Pharmaceuticals, Inc. (a) | 6,138 | 67,886 | ||
| Intra-Cellular Therapies, Inc. (a) | 11,532 | 730,206 | ||
| Ionis Pharmaceuticals, Inc. (a) | 17,391 | 713,553 | ||
| Iovance Biotherapeutics, Inc. (a) | 31,116 | 219,057 | ||
| IVERIC bio, Inc. (a) | 16,900 | 664,846 | ||
| Karuna Therapeutics, Inc. (a) | 4,480 | 971,488 | ||
| Karyopharm Therapeutics, Inc. (a) | 19,466 | 34,844 | ||
| Keros Therapeutics, Inc. (a) | 3,954 | 158,872 | ||
| Kezar Life Sciences, Inc. (a) | 19,058 | 46,692 | ||
| Kiniksa Pharmaceuticals Ltd., Class A (a) | 6,524 | 91,858 | ||
| Kodiak Sciences, Inc. (a) | 11,695 | 80,695 | ||
| Krystal Biotech, Inc. (a) | 3,341 | 392,233 | ||
| Kymera Therapeutics, Inc. (a) | 7,241 | 166,471 | ||
| Ligand Pharmaceuticals, Inc. (a) | 2,359 | 170,084 | ||
| Liquidia Corp. (a) | 12,024 | 94,388 | ||
| MacroGenics, Inc. (a) | 10,945 | 58,556 | ||
| Mersana Therapeutics, Inc. (a) | 18,957 | 62,369 | ||
| Mineralys Therapeutics, Inc. (a) | 6,779 | 115,582 | ||
| Mirati Therapeutics, Inc. (a) | 7,421 | 268,121 | ||
| Myriad Genetics, Inc. (a) | 10,723 | 248,559 | ||
| Nektar Therapeutics (a) | 53,034 | 30,505 | ||
| NGM Biopharmaceuticals, Inc. (a) | 15,993 | 41,422 | ||
| Nkarta, Inc. (a) | 11,294 | 24,734 | ||
| Novavax, Inc. (a),(b) | 13,343 | 99,138 | ||
| Nurix Therapeutics, Inc. (a) | 8,529 | 85,205 | ||
| Nuvalent, Inc., Class A (a) | 6,794 | 286,503 | ||
| Phathom Pharmaceuticals, Inc. (a),(b) | 7,853 | 112,455 | ||
| Point Biopharma Global, Inc. (a) | 15,861 | 143,701 | ||
| Praxis Precision Medicines, Inc. (a) | 31,771 | 36,537 | ||
| Precigen, Inc. (a),(b) | 50,980 | 58,627 | ||
| Prime Medicine, Inc. (a) | 13,358 | 195,695 | ||
| Prothena Corp. PLC (a) | 6,637 | 453,174 | ||
| PTC Therapeutics, Inc. (a) | 9,100 | 370,097 | ||
| RAPT Therapeutics, Inc. (a) | 5,447 | 101,859 | ||
| Recursion Pharmaceuticals, Inc., Class A (a) | 26,367 | 196,961 | ||
| REGENXBIO, Inc. (a) | 6,566 | 131,254 | ||
| Relay Therapeutics, Inc. (a) | 16,372 | 205,632 | ||
| Replimune Group, Inc. (a) | 8,258 | 191,751 | ||
| REVOLUTION Medicines, Inc. (a) | 13,358 | 357,326 | ||
| Rigel Pharmaceuticals, Inc. (a) | 42,877 | 55,311 | ||
| Rocket Pharmaceuticals, Inc. (a) | 10,783 | 214,258 | ||
| Sage Therapeutics, Inc. (a) | 7,547 | 354,860 | ||
| Sana Biotechnology, Inc. (a),(b) | 27,750 | 165,390 | ||
See accompanying notes.
67
| Schedule of Investments | ||||
| Principal Healthcare Innovators ETF | ||||
| June 30, 2023 | ||||
| COMMON STOCKS (continued) | Shares Held | Value | ||
| Biotechnology (continued) | ||||
| Sangamo Therapeutics, Inc. (a) | 35,574 | $ | 46,246 | |
| Sarepta Therapeutics, Inc. (a) | 10,510 | 1,203,605 | ||
| Scilex Holding Co. (a),(b) | 10,078 | 56,134 | ||
| Seagen, Inc. (a) | 8,155 | 1,569,511 | ||
| Seer, Inc. (a) | 13,925 | 59,460 | ||
| SpringWorks Therapeutics, Inc. (a) | 8,468 | 222,031 | ||
| Stoke Therapeutics, Inc. (a) | 8,460 | 89,930 | ||
| Sutro Biopharma, Inc. (a) | 12,597 | 58,576 | ||
| Syndax Pharmaceuticals, Inc. (a) | 9,308 | 194,816 | ||
| TG Therapeutics, Inc. (a) | 18,310 | 454,820 | ||
| Theravance Biopharma, Inc. (a),(b) | 10,325 | 106,864 | ||
| Theseus Pharmaceuticals, Inc. (a) | 8,532 | 79,604 | ||
| Travere Therapeutics, Inc. (a) | 9,845 | 151,219 | ||
| Twist Bioscience Corp. (a) | 8,709 | 178,186 | ||
| Ultragenyx Pharmaceutical, Inc. (a) | 8,842 | 407,881 | ||
| Ventyx Biosciences, Inc. (a) | 7,539 | 247,279 | ||
| Vera Therapeutics, Inc. (a),(b) | 9,301 | 149,281 | ||
| Veracyte, Inc. (a) | 9,632 | 245,327 | ||
| Vericel Corp. (a) | 6,441 | 241,988 | ||
| Verve Therapeutics, Inc. (a) | 8,896 | 166,800 | ||
| Vir Biotechnology, Inc. (a) | 16,626 | 407,836 | ||
| Viridian Therapeutics, Inc. (a) | 5,958 | 141,741 | ||
| Xencor, Inc. (a) | 7,979 | 199,236 | ||
| Zentalis Pharmaceuticals, Inc. (a) | 8,280 | 233,579 | ||
| $ | 34,196,217 | |||
| Chemicals — 0.07% | ||||
| Codexis, Inc. (a) | 13,853 | 38,788 | ||
| Healthcare — Products — 23.02% | ||||
| 10X Genomics, Inc., Class A (a) | 11,824 | 660,252 | ||
| Adaptive Biotechnologies Corp. (a) | 20,006 | 134,240 | ||
| Alphatec Holdings, Inc. (a) | 14,875 | 267,452 | ||
| AngioDynamics, Inc. (a) | 8,091 | 84,389 | ||
| Artivion, Inc. (a) | 6,895 | 118,525 | ||
| AtriCure, Inc. (a) | 6,099 | 301,047 | ||
| Axogen, Inc. (a) | 7,993 | 72,976 | ||
| Axonics, Inc. (a) | 6,285 | 317,204 | ||
| Azenta, Inc. (a) | 8,701 | 406,163 | ||
| BioLife Solutions, Inc. (a) | 6,627 | 146,457 | ||
| Bionano Genomics, Inc. (a) | 76,323 | 46,557 | ||
| Butterfly Network, Inc. (a),(b) | 31,271 | 71,923 | ||
| CareDx, Inc. (a) | 9,906 | 84,201 | ||
| Cerus Corp. (a) | 33,432 | 82,243 | ||
| Cutera, Inc. (a) | 3,462 | 52,380 | ||
| Exact Sciences Corp. (a) | 21,239 | 1,994,342 | ||
| Glaukos Corp. (a) | 6,146 | 437,657 | ||
| ICU Medical, Inc. (a) | 2,948 | 525,304 | ||
| Inari Medical, Inc. (a) | 6,731 | 391,340 | ||
| Inogen, Inc. (a) | 4,646 | 53,661 | ||
| Inspire Medical Systems, Inc. (a) | 3,502 | 1,136,889 | ||
| iRhythm Technologies, Inc. (a) | 3,717 | 387,757 | ||
| MaxCyte, Inc. (a) | 18,348 | 84,217 | ||
| MiMedx Group, Inc. (a) | 20,965 | 138,579 | ||
| NanoString Technologies, Inc. (a) | 8,034 | 32,538 | ||
| Natera, Inc. (a) | 13,686 | 665,961 | ||
| Nevro Corp. (a) | 5,003 | 127,176 | ||
| Novocure Ltd. (a) | 12,712 | 527,548 | ||
| OmniAb, Inc. (a) | 20,881 | 105,031 | ||
See accompanying notes.
68
| Schedule of Investments | ||||
| Principal Healthcare Innovators ETF | ||||
| June 30, 2023 | ||||
| COMMON STOCKS (continued) | Shares Held | Value | ||
| Healthcare — Products (continued) | ||||
| OmniAb, Inc., Earnout Shares (a) | 977 | $ | — | |
| OmniAb, Inc., Earnout Shares (a) | 977 | — | ||
| Orthofix Medical, Inc. (a) | 5,686 | 102,689 | ||
| OrthoPediatrics Corp. (a) | 3,260 | 142,951 | ||
| Pacific Biosciences of California, Inc. (a) | 31,332 | 416,716 | ||
| Paragon 28, Inc. (a) | 11,826 | 209,793 | ||
| PROCEPT BioRobotics Corp. (a) | 6,005 | 212,277 | ||
| Pulmonx Corp. (a) | 6,918 | 90,695 | ||
| Quanterix Corp. (a) | 6,565 | 148,041 | ||
| Quantum-Si, Inc. (a) | 30,788 | 55,110 | ||
| RxSight, Inc. (a) | 5,679 | 163,555 | ||
| SI-BONE, Inc. (a) | 5,373 | 144,964 | ||
| Silk Road Medical, Inc. (a) | 5,095 | 165,537 | ||
| SomaLogic, Inc. (a),(b) | 30,110 | 69,554 | ||
| Surmodics, Inc. (a) | 2,939 | 92,020 | ||
| Tactile Systems Technology, Inc. (a) | 4,325 | 107,822 | ||
| Tandem Diabetes Care, Inc. (a) | 8,576 | 210,455 | ||
| TransMedics Group, Inc. (a) | 4,066 | 341,463 | ||
| Treace Medical Concepts, Inc. (a) | 8,196 | 209,654 | ||
| ViewRay, Inc. (a) | 43,089 | 15,176 | ||
| Zimvie, Inc. (a) | 6,804 | 76,409 | ||
| $ | 12,428,890 | |||
| Healthcare — Services — 0.38% | ||||
| Inotiv, Inc. (a) | 7,668 | 36,576 | ||
| Nano-X Imaging Ltd. (a),(b) | 10,784 | 167,044 | ||
| $ | 203,620 | |||
| Pharmaceuticals — 12.52% | ||||
| AbCellera Biologics, Inc. (a) | 37,433 | 241,817 | ||
| Aclaris Therapeutics, Inc. (a) | 10,934 | 113,386 | ||
| Agios Pharmaceuticals, Inc. (a) | 7,698 | 218,007 | ||
| Alector, Inc. (a) | 13,994 | 84,104 | ||
| Alkermes PLC (a) | 20,083 | 628,598 | ||
| Amneal Pharmaceuticals, Inc. (a) | 36,400 | 112,840 | ||
| Amylyx Pharmaceuticals, Inc. (a) | 8,682 | 187,271 | ||
| Anika Therapeutics, Inc. (a) | 2,678 | 69,574 | ||
| Arvinas, Inc. (a) | 7,202 | 178,754 | ||
| Bioxcel Therapeutics, Inc. (a) | 4,849 | 32,294 | ||
| Coherus Biosciences, Inc. (a) | 12,280 | 52,436 | ||
| Collegium Pharmaceutical, Inc. (a) | 5,211 | 111,984 | ||
| Elanco Animal Health, Inc. (a) | 60,004 | 603,640 | ||
| Enanta Pharmaceuticals, Inc. (a) | 3,100 | 66,340 | ||
| Fulcrum Therapeutics, Inc. (a) | 17,062 | 56,305 | ||
| Heron Therapeutics, Inc. (a) | 23,433 | 27,182 | ||
| KalVista Pharmaceuticals, Inc. (a) | 7,222 | 64,998 | ||
| Kura Oncology, Inc. (a) | 10,580 | 111,936 | ||
| Lyell Immunopharma, Inc. (a),(b) | 41,516 | 132,021 | ||
| Madrigal Pharmaceuticals, Inc. (a) | 2,203 | 508,893 | ||
| MannKind Corp. (a) | 37,767 | 153,712 | ||
| Mirum Pharmaceuticals, Inc. (a) | 5,470 | 141,509 | ||
| Morphic Holding, Inc. (a) | 5,238 | 300,295 | ||
| Ocugen, Inc. (a) | 61,761 | 33,542 | ||
| Ocular Therapeutix, Inc. (a) | 13,032 | 67,245 | ||
| Perrigo Co. PLC | 16,490 | 559,836 | ||
| PMV Pharmaceuticals, Inc. (a) | 10,973 | 68,691 | ||
| Protagonist Therapeutics, Inc. (a) | 7,742 | 213,834 | ||
| Reata Pharmaceuticals, Inc., Class A (a) | 4,019 | 409,777 | ||
See accompanying notes.
69
Schedule of Investments Principal Healthcare Innovators ETF
June 30, 2023
| COMMON STOCKS (continued) | Shares Held | Value | ||
| Pharmaceuticals (continued) | ||||
| Revance Therapeutics, Inc. (a) | 10,640 | $ | 269,298 | |
| Senseonics Holdings, Inc. (a) | 96,865 | 73,918 | ||
| Seres Therapeutics, Inc. (a),(b) | 19,137 | 91,666 | ||
| SIGA Technologies, Inc. | 13,227 | 66,796 | ||
| Vaxcyte, Inc. (a) | 11,304 | 564,522 | ||
| Xeris Biopharma Holdings, Inc. (a) | 29,583 | 77,508 | ||
| Y-mAbs Therapeutics, Inc. (a) | 9,610 | 65,252 | ||
| $ | 6,759,781 | |||
| Software — 0.29% | ||||
| Outset Medical, Inc. (a) | 7,249 | 158,536 | ||
| Transportation — 0.22% | ||||
| CryoPort, Inc. (a) | 6,903 | 119,077 | ||
| TOTAL COMMON STOCKS | $ | 53,904,909 | ||
| INVESTMENT COMPANIES — 2.83% | Shares Held | Value | ||
| Money Market Funds — 2.83% | ||||
| Principal Government Money Market Fund — Class R-6 5.01% (c),(d),(e) | 1,429,219 | $ | 1,429,219 | |
| State Street Institutional U.S. Government Money Market Fund — Premier Class | ||||
| 5.03% (e) | 101,831 | 101,831 | ||
| TOTAL INVESTMENT COMPANIES | $ | 1,531,050 | ||
| Total Investments | $ | 55,435,959 | ||
| Other Assets and Liabilities — (2.66)% | (1,438,614 | ) | ||
| Total Net Assets — 100.00% | $ | 53,997,345 | ||
(a) Non-income producing security.
(b) Security or a portion of the security was on loan. At the end of the period, the value of these securities totaled $1,362,326 or 2.52% of net assets.
(c) Affiliated Security. Security is either an affiliate (and registered under the Investment Company Act of 1940) or an affiliate as defined by the Investment Company Act of 1940 (controls 5.00% or more of the outstanding voting shares of the security).
Please see Affiliated Securities sub-schedule for transactional information.
(d) Security or a portion of the security was received as collateral for securities lending. At the end of the period, the value of these securities totaled $1,429,219 or 2.65% of net assets.
(e) 1-day yield shown as of period end.
| Portfolio Summary | |||
| Sector | Percent | ||
| Consumer, Non-cyclical | 99.25 | % | |
| Money Market Funds | 2.83 | % | |
| Technology | 0.29 | % | |
| Industrial | 0.22 | % | |
| Basic Materials | 0.07 | % | |
| Other Assets and Liabilities | (2.66 | )% | |
| TOTAL NET ASSETS | 100.00 | % | |
See accompanying notes. 70
Schedule of Investments Principal Healthcare Innovators ETF
June 30, 2023
| June 30, 2022 | Purchases | Sales | June 30, 2023 | ||||||
| Affiliated Securities | Value | Cost | Proceeds | Value | |||||
| Principal Government Money | |||||||||
| Market Fund — Class R-6 5.01% | $ | — | $ | 11,779,546 | $ | 10,350,327 | $ | 1,429,219 | |
| Principal Government Money | |||||||||
| Market Fund — Institutional Class | |||||||||
| 4.90 | % | 1,097,187 | 11,867,549 | 12,964,736 | — | ||||
| $ | 1,097,187 | $ | 23,647,095 | $ | 23,315,063 | $ | 1,429,219 | ||
| Realized Gain | |||||||||
| Realized | from | Change in | |||||||
| Gain/(Loss) on | Capital Gain | Unrealized | |||||||
| Income (a) | Investments | Distributions | Gain/(Loss) | ||||||
| Principal Government Money | |||||||||
| Market Fund — Class R-6 5.01% | $ | — | $ | — | $ | — | $ | — | |
| Principal Government Money | |||||||||
| Market Fund — Institutional Class | |||||||||
| 4.90 | % | — | — | — | — | ||||
| $ | — | $ | — | $ | — | $ | — | ||
| (a) Amount excludes earnings from securities lending collateral. | |
| See accompanying notes. | 71 |
| Schedule of Investments | |||
| Principal International Adaptive Multi-Factor ETF | |||
| June 30, 2023 | |||
| COMMON STOCKS — 98.59% | Shares Held | Value | |
| Advertising — 0.51% | |||
| Dentsu Group, Inc. | 500 | $ | 16,331 |
| Hakuhodo DY Holdings, Inc. | 1,000 | 10,479 | |
| Publicis Groupe SA (a) | 383 | 30,718 | |
| WPP PLC | 2,183 | 22,828 | |
| $ | 80,356 | ||
| Aerospace & Defense — 1.24% | |||
| Airbus SE | 195 | 28,164 | |
| BAE Systems PLC | 4,150 | 48,858 | |
| Dassault Aviation SA | 99 | 19,812 | |
| Elbit Systems Ltd. | 12 | 2,499 | |
| MTU Aero Engines AG | 34 | 8,808 | |
| Rheinmetall AG | 59 | 16,147 | |
| Rolls-Royce Holdings PLC (a) | 10,552 | 20,242 | |
| Safran SA | 163 | 25,517 | |
| Singapore Technologies Engineering Ltd. | 800 | 2,177 | |
| Thales SA | 146 | 21,858 | |
| $ | 194,082 | ||
| Agriculture — 0.87% | |||
| British American Tobacco PLC | 1,661 | 55,015 | |
| Imperial Brands PLC | 1,525 | 33,670 | |
| Japan Tobacco, Inc. | 1,500 | 32,777 | |
| Wilmar International Ltd. | 5,100 | 14,330 | |
| $ | 135,792 | ||
| Airlines — 0.29% | |||
| Air Canada (a) | 517 | 9,753 | |
| Deutsche Lufthansa AG (a) | 1,309 | 13,397 | |
| Qantas Airways Ltd. (a) | 2,831 | 11,692 | |
| Singapore Airlines Ltd. | 2,000 | 10,574 | |
| $ | 45,416 | ||
| Apparel — 2.18% | |||
| Burberry Group PLC | 269 | 7,243 | |
| Gildan Activewear, Inc. | 457 | 14,734 | |
| Hermes International | 22 | 47,773 | |
| Kering SA | 57 | 31,447 | |
| LVMH Moet Hennessy Louis Vuitton SE | 247 | 232,601 | |
| Puma SE | 121 | 7,278 | |
| $ | 341,076 | ||
| Auto Manufacturers — 3.38% | |||
| Bayerische Motoren Werke AG | 461 | 56,602 | |
| Daimler Truck Holding AG | 540 | 19,445 | |
| Ferrari NV | 126 | 41,179 | |
| Honda Motor Co. Ltd. | 1,500 | 45,126 | |
| Isuzu Motors Ltd. | 1,200 | 14,470 | |
| Mazda Motor Corp. | 1,500 | 14,486 | |
| Mercedes-Benz Group AG | 570 | 45,822 | |
| Renault SA | 365 | 15,366 | |
| Stellantis NV | 2,747 | 48,230 | |
| Subaru Corp. | 1,200 | 22,479 | |
| Toyota Motor Corp. | 9,500 | 151,986 | |
| Volkswagen AG | 39 | 6,507 | |
| Volvo AB, Class A | 614 | 13,071 | |
| Volvo AB, Class B | 1,383 | 28,595 | |
See accompanying notes.
72
| Schedule of Investments | |||
| Principal International Adaptive Multi-Factor ETF | |||
| June 30, 2023 | |||
| COMMON STOCKS (continued) | Shares Held | Value | |
| Auto Manufacturers (continued) | |||
| Volvo Car AB, Class B (a) | 1,444 | $ | 5,733 |
| $ | 529,097 | ||
| Auto Parts & Equipment — 0.27% | |||
| Cie Generale des Etablissements Michelin SCA | 361 | 10,660 | |
| Continental AG | 92 | 6,937 | |
| NGK Insulators Ltd. | 900 | 10,691 | |
| Valeo SA | 634 | 13,580 | |
| $ | 41,868 | ||
| Banks — 10.09% | |||
| ABN AMRO Bank NV, GDR (b) | 862 | 13,385 | |
| AIB Group PLC | 3,373 | 14,170 | |
| ANZ Group Holdings Ltd. | 1,511 | 23,865 | |
| Banco Bilbao Vizcaya Argentaria SA | 7,231 | 55,486 | |
| Banco Santander SA | 12,017 | 44,387 | |
| Bank Hapoalim BM | 1,841 | 15,090 | |
| Bank Leumi Le-Israel BM | 2,070 | 15,408 | |
| Bank of Ireland Group PLC | 2,503 | 23,866 | |
| Bank of Montreal | 572 | 51,658 | |
| Bank of Nova Scotia | 581 | 29,069 | |
| Banque Cantonale Vaudoise | 152 | 16,048 | |
| Barclays PLC | 7,376 | 14,368 | |
| BNP Paribas SA | 787 | 49,568 | |
| BOC Hong Kong Holdings Ltd. | 3,500 | 10,697 | |
| CaixaBank SA | 4,936 | 20,397 | |
| Canadian Imperial Bank of Commerce | 506 | 21,604 | |
| Chiba Bank Ltd. | 2,100 | 12,718 | |
| Commerzbank AG | 1,612 | 17,854 | |
| Commonwealth Bank of Australia | 794 | 53,035 | |
| Concordia Financial Group Ltd. | 3,700 | 14,426 | |
| Credit Agricole SA | 1,920 | 22,778 | |
| Danske Bank A/S (a) | 426 | 10,364 | |
| DBS Group Holdings Ltd. | 1,600 | 37,279 | |
| Deutsche Bank AG | 1,094 | 11,482 | |
| DNB Bank ASA | 720 | 13,463 | |
| Erste Group Bank AG | 498 | 17,438 | |
| FinecoBank Banca Fineco SpA | 983 | 13,210 | |
| First International Bank Of Israel Ltd. | 290 | 11,282 | |
| Hang Seng Bank Ltd. | 695 | 9,889 | |
| HSBC Holdings PLC (a) | 17,912 | 141,426 | |
| ING Groep NV | 2,914 | 39,232 | |
| Intesa Sanpaolo SpA | 6,555 | 17,167 | |
| Israel Discount Bank Ltd., Class A | 2,678 | 13,294 | |
| KBC Group NV (a) | 280 | 19,530 | |
| Lloyds Banking Group PLC | 53,580 | 29,661 | |
| Macquarie Group Ltd. | 191 | 22,599 | |
| Mediobanca Banca di Credito Finanziario SpA | 1,643 | 19,650 | |
| Mitsubishi UFJ Financial Group, Inc. | 10,600 | 78,236 | |
| Mizrahi Tefahot Bank Ltd. | 397 | 13,207 | |
| Mizuho Financial Group, Inc. | 3,000 | 45,719 | |
| National Australia Bank Ltd. | 1,487 | 26,121 | |
| National Bank of Canada | 399 | 29,727 | |
| NatWest Group PLC | 2,880 | 8,808 | |
| Nordea Bank Abp | 1,352 | 14,704 | |
| Oversea-Chinese Banking Corp. Ltd. | 3,300 | 29,965 | |
| Royal Bank of Canada | 733 | 70,005 | |
| Skandinaviska Enskilda Banken AB, Class A | 1,766 | 19,510 | |
See accompanying notes.
73
| Schedule of Investments | |||
| Principal International Adaptive Multi-Factor ETF | |||
| June 30, 2023 | |||
| COMMON STOCKS (continued) | Shares Held | Value | |
| Banks (continued) | |||
| Societe Generale SA | 889 | $ | 23,088 |
| Standard Chartered PLC | 2,641 | 22,908 | |
| Sumitomo Mitsui Financial Group, Inc. | 1,200 | 51,220 | |
| Svenska Handelsbanken AB, Class A | 972 | 8,142 | |
| Swedbank AB, Class A | 1,063 | 17,923 | |
| Toronto-Dominion Bank | 797 | 49,399 | |
| UBS Group AG (a) | 2,350 | 47,509 | |
| UniCredit SpA | 783 | 18,169 | |
| United Overseas Bank Ltd. | 700 | 14,493 | |
| Westpac Banking Corp. | 1,720 | 24,451 | |
| $ | 1,580,147 | ||
| Beverages — 2.19% | |||
| Anheuser-Busch InBev SA | 410 | 23,188 | |
| Asahi Group Holdings Ltd. | 600 | 23,177 | |
| Budweiser Brewing Co. APAC Ltd. (b) | 1,900 | 4,898 | |
| Carlsberg AS, Class B | 73 | 11,667 | |
| Coca-Cola Europacific Partners PLC | 479 | 30,862 | |
| Coca-Cola HBC AG (a) | 558 | 16,618 | |
| Davide Campari-Milano NV | 1,258 | 17,420 | |
| Diageo PLC | 974 | 41,798 | |
| Endeavour Group Ltd. | 2,007 | 8,436 | |
| Heineken Holding NV | 202 | 17,557 | |
| Heineken NV | 390 | 40,080 | |
| JDE Peet's NV | 647 | 19,246 | |
| Kirin Holdings Co. Ltd. | 1,400 | 20,389 | |
| Pernod Ricard SA | 183 | 40,417 | |
| Remy Cointreau SA | 36 | 5,773 | |
| Suntory Beverage & Food Ltd. | 400 | 14,448 | |
| Treasury Wine Estates Ltd. | 946 | 7,077 | |
| $ | 343,051 | ||
| Biotechnology — 0.58% | |||
| Argenx SE (a) | 12 | 4,654 | |
| Argenx SE (a) | 24 | 9,307 | |
| Bachem Holding AG, Class B | 66 | 5,752 | |
| CSL Ltd. | 204 | 37,694 | |
| Genmab A/S (a) | 74 | 27,980 | |
| Swedish Orphan Biovitrum AB (a) | 316 | 6,165 | |
| $ | 91,552 | ||
| Chemicals — 2.53% | |||
| Air Liquide SA | 231 | 41,390 | |
| Arkema SA | 145 | 13,655 | |
| BASF SE | 690 | 33,483 | |
| Brenntag SE | 226 | 17,608 | |
| Chr Hansen Holding A/S | 90 | 6,247 | |
| Clariant AG (a) | 497 | 7,174 | |
| Croda International PLC | 104 | 7,431 | |
| EMS-Chemie Holding AG (a) | 3 | 2,269 | |
| Evonik Industries AG | 311 | 5,915 | |
| Givaudan SA | 5 | 16,563 | |
| ICL Group Ltd. | 1,923 | 10,428 | |
| Johnson Matthey PLC | 505 | 11,198 | |
| Nippon Sanso Holdings Corp. | 600 | 12,940 | |
| Nissan Chemical Corp. | 400 | 17,101 | |
| Nitto Denko Corp. | 300 | 22,101 | |
| Novozymes A/S, Class B | 150 | 6,988 | |
See accompanying notes.
74
| Schedule of Investments | |||
| Principal International Adaptive Multi-Factor ETF | |||
| June 30, 2023 | |||
| COMMON STOCKS (continued) | Shares Held | Value | |
| Chemicals (continued) | |||
| Nutrien Ltd. | 435 | $ | 25,681 |
| OCI NV (a) | 432 | 10,357 | |
| Shin-Etsu Chemical Co. Ltd. | 1,700 | 56,174 | |
| Solvay SA | 199 | 22,214 | |
| Sumitomo Chemical Co. Ltd. | 3,800 | 11,495 | |
| Symrise AG | 27 | 2,829 | |
| Tosoh Corp. | 900 | 10,597 | |
| Umicore SA | 441 | 12,314 | |
| Yara International ASA | 341 | 12,041 | |
| $ | 396,193 | ||
| Coal — 0.07% | |||
| Teck Resources Ltd., Class B | 271 | 11,403 | |
| Commercial Services — 2.53% | |||
| Adecco Group AG (a) | 191 | 6,238 | |
| Adyen NV (a),(b) | 9 | 15,574 | |
| Amadeus IT Group SA | 394 | 29,966 | |
| Ashtead Group PLC | 423 | 29,246 | |
| Brambles Ltd. | 2,124 | 20,389 | |
| Bureau Veritas SA | 82 | 2,248 | |
| Edenred | 357 | 23,895 | |
| Element Fleet Management Corp. | 1,211 | 18,447 | |
| Experian PLC | 412 | 15,791 | |
| IDP Education Ltd. | 353 | 5,197 | |
| Intertek Group PLC | 351 | 19,012 | |
| Persol Holdings Co. Ltd. | 600 | 10,765 | |
| Randstad NV | 222 | 11,703 | |
| RB Global, Inc. | 147 | 8,822 | |
| Recruit Holdings Co. Ltd. | 1,300 | 41,109 | |
| RELX PLC | 1,555 | 51,761 | |
| Rentokil Initial PLC | 1,437 | 11,224 | |
| Secom Co. Ltd. | 400 | 26,997 | |
| Securitas AB, Class B | 778 | 6,381 | |
| SGS SA | 25 | 2,362 | |
| TOPPAN, Inc. | 700 | 15,039 | |
| Transurban Group | 1,811 | 17,191 | |
| Worldline SA (a),(b) | 192 | 7,019 | |
| $ | 396,376 | ||
| Computers — 1.45% | |||
| Bechtle AG | 139 | 5,509 | |
| Capgemini SE | 145 | 27,460 | |
| CGI, Inc. (a) | 371 | 39,123 | |
| Check Point Software Technologies Ltd. (a) | 90 | 11,306 | |
| Computershare Ltd. | 544 | 8,472 | |
| Itochu Techno-Solutions Corp. | 400 | 10,079 | |
| Logitech International SA (a) | 138 | 8,209 | |
| NEC Corp. | 500 | 24,135 | |
| Nomura Research Institute Ltd. | 800 | 21,960 | |
| NTT Data Corp. | 1,200 | 16,691 | |
| Otsuka Corp. | 400 | 15,488 | |
| Ricoh Co. Ltd. | 1,700 | 14,403 | |
| SCSK Corp. | 700 | 10,961 | |
| Teleperformance | 76 | 12,726 | |
| $ | 226,522 | ||
See accompanying notes.
75
| Schedule of Investments | |||
| Principal International Adaptive Multi-Factor ETF | |||
| June 30, 2023 | |||
| COMMON STOCKS (continued) | Shares Held | Value | |
| Construction Materials — 1.85% | |||
| AGC, Inc. | 400 | $ | 14,312 |
| Cie de Saint-Gobain | 698 | 42,447 | |
| CRH PLC | 629 | 34,661 | |
| Daikin Industries Ltd. | 200 | 40,563 | |
| Geberit AG | 20 | 10,460 | |
| Heidelberg Materials AG | 222 | 18,217 | |
| Holcim AG (a) | 781 | 52,529 | |
| Investment AB Latour, Class B | 314 | 6,225 | |
| James Hardie Industries PLC, CDI (a) | 369 | 9,771 | |
| Kingspan Group PLC | 120 | 7,975 | |
| Nibe Industrier AB, Class B | 1,735 | 16,473 | |
| Sika AG | 59 | 16,855 | |
| West Fraser Timber Co. Ltd. | 102 | 8,763 | |
| Xinyi Glass Holdings Ltd. | 7,000 | 10,898 | |
| $ | 290,149 | ||
| Distribution/Wholesale — 1.91% | |||
| Bunzl PLC | 537 | 20,453 | |
| D'ieteren Group | 31 | 5,477 | |
| IMCD NV | 50 | 7,186 | |
| ITOCHU Corp. | 1,500 | 59,118 | |
| Marubeni Corp. | 2,000 | 33,820 | |
| Mitsubishi Corp. | 1,100 | 52,829 | |
| Mitsui & Co. Ltd. | 1,300 | 48,749 | |
| Sumitomo Corp. | 1,700 | 35,827 | |
| Toromont Industries Ltd. | 128 | 10,515 | |
| Toyota Tsusho Corp. | 500 | 24,738 | |
| $ | 298,712 | ||
| Diversified Financial Services — 1.51% | |||
| abrdn PLC | 2,329 | 6,454 | |
| AerCap Holdings NV (a) | 129 | 8,194 | |
| Amundi SA (b) | 200 | 11,796 | |
| ASX Ltd. | 53 | 2,224 | |
| Brookfield Asset Management Ltd., Class A | 287 | 9,368 | |
| Deutsche Boerse AG | 178 | 32,845 | |
| Euronext NV (b) | 188 | 12,781 | |
| Futu Holdings Ltd., ADR (a) | 230 | 9,140 | |
| IGM Financial, Inc. | 239 | 7,276 | |
| Julius Baer Group Ltd. | 255 | 16,051 | |
| London Stock Exchange Group PLC | 50 | 5,312 | |
| Mitsubishi HC Capital, Inc. | 2,600 | 15,397 | |
| Nomura Holdings, Inc. | 5,800 | 21,995 | |
| ORIX Corp. | 1,600 | 28,969 | |
| SBI Holdings, Inc. | 700 | 13,431 | |
| Schroders PLC | 1,214 | 6,742 | |
| Singapore Exchange Ltd. | 1,400 | 9,948 | |
| TMX Group Ltd. | 815 | 18,339 | |
| $ | 236,262 | ||
| Electric — 2.82% | |||
| BKW AG | 134 | 23,655 | |
| Brookfield Renewable Corp., Class A | 452 | 14,259 | |
| CLP Holdings Ltd. | 528 | 4,104 | |
| E.ON SE | 2,452 | 31,251 | |
| EDP - Energias de Portugal SA | 2,218 | 10,833 | |
| Elia Group SA | 64 | 8,122 | |
| Emera, Inc. | 287 | 11,820 | |
See accompanying notes.
76
| Schedule of Investments | |||
| Principal International Adaptive Multi-Factor ETF | |||
| June 30, 2023 | |||
| COMMON STOCKS (continued) | Shares Held | Value | |
| Electric (continued) | |||
| Endesa SA | 1,105 | $ | 23,693 |
| Enel SpA | 4,086 | 27,501 | |
| Engie SA | 1,922 | 31,937 | |
| Fortis, Inc. | 356 | 15,342 | |
| Hydro One Ltd. (b) | 614 | 17,543 | |
| Iberdrola SA | 4,887 | 63,726 | |
| Mercury NZ Ltd. | 1,870 | 7,460 | |
| Meridian Energy Ltd. | 2,425 | 8,334 | |
| National Grid PLC | 1,826 | 24,129 | |
| Northland Power, Inc. | 634 | 13,223 | |
| Origin Energy Ltd. | 2,814 | 15,765 | |
| Orsted AS (b) | 127 | 12,001 | |
| Power Assets Holdings Ltd. | 500 | 2,619 | |
| Redeia Corp. SA | 546 | 9,166 | |
| RWE AG | 691 | 30,063 | |
| SSE PLC | 686 | 16,039 | |
| Terna - Rete Elettrica Nazionale | 1,357 | 11,559 | |
| Verbund AG | 86 | 6,893 | |
| $ | 441,037 | ||
| Electrical Components & Equipment — 1.11% | |||
| ABB Ltd. | 1,354 | 53,219 | |
| Legrand SA | 310 | 30,715 | |
| Prysmian SpA | 603 | 25,188 | |
| Schneider Electric SE | 360 | 65,391 | |
| $ | 174,513 | ||
| Electronics — 0.90% | |||
| Assa Abloy AB, Class B | 499 | 11,983 | |
| Halma PLC | 293 | 8,473 | |
| Hirose Electric Co. Ltd. | 100 | 13,219 | |
| Hoya Corp. | 300 | 35,500 | |
| Ibiden Co. Ltd. | 300 | 16,841 | |
| Murata Manufacturing Co. Ltd. | 100 | 5,708 | |
| Shimadzu Corp. | 545 | 16,724 | |
| TDK Corp. | 700 | 27,006 | |
| Venture Corp. Ltd. | 573 | 6,233 | |
| $ | 141,687 | ||
| Energy — Alternate Sources — 0.15% | |||
| Corp. ACCIONA Energias Renovables SA | 335 | 11,193 | |
| Siemens Gamesa Renewable Energy SA (a) | 87 | 1,714 | |
| Vestas Wind Systems A/S (a) | 418 | 11,116 | |
| $ | 24,023 | ||
| Engineering & Construction — 1.69% | |||
| Acciona SA | 45 | 7,631 | |
| ACS Actividades de Construccion y Servicios SA | 517 | 18,149 | |
| Aena SME SA (b) | 52 | 8,398 | |
| Auckland International Airport Ltd. (a) | 1,593 | 8,359 | |
| Bouygues SA | 481 | 16,145 | |
| Cellnex Telecom SA (a),(b) | 279 | 11,261 | |
| CK Infrastructure Holdings Ltd. | 500 | 2,645 | |
| Eiffage SA | 238 | 24,823 | |
| Ferrovial SE | 396 | 12,518 | |
| Infrastrutture Wireless Italiane SpA (b) | 964 | 12,707 | |
| Kajima Corp. | 1,400 | 21,054 | |
| Keppel Corp. Ltd. | 3,900 | 19,350 | |
See accompanying notes.
77
| Schedule of Investments | |||
| Principal International Adaptive Multi-Factor ETF | |||
| June 30, 2023 | |||
| COMMON STOCKS (continued) | Shares Held | Value | |
| Engineering & Construction (continued) | |||
| Skanska AB, Class B | 411 | $ | 5,760 |
| Vinci SA | 631 | 73,247 | |
| WSP Global, Inc. | 172 | 22,724 | |
| $ | 264,771 | ||
| Entertainment — 0.94% | |||
| Aristocrat Leisure Ltd. | 476 | 12,258 | |
| Evolution AB (b) | 173 | 21,908 | |
| Flutter Entertainment PLC (a) | 149 | 29,957 | |
| Genting Singapore Ltd. | 10,000 | 6,951 | |
| La Francaise des Jeux SAEM (b) | 359 | 14,118 | |
| Lottery Corp. Ltd. | 2,538 | 8,673 | |
| Oriental Land Co. Ltd. | 900 | 34,935 | |
| Universal Music Group NV | 830 | 18,431 | |
| $ | 147,231 | ||
| Environmental Control — 0.07% | |||
| GFL Environmental, Inc. | 281 | 10,911 | |
| Food — 4.62% | |||
| Associated British Foods PLC | 695 | 17,574 | |
| Barry Callebaut AG | 5 | 9,647 | |
| Carrefour SA | 436 | 8,257 | |
| CK Hutchison Holdings Ltd. | 2,000 | 12,213 | |
| Coles Group Ltd. | 1,045 | 12,823 | |
| Danone SA | 332 | 20,338 | |
| Empire Co. Ltd., Class A | 616 | 17,498 | |
| George Weston Ltd. | 204 | 24,118 | |
| J Sainsbury PLC | 6,816 | 23,285 | |
| Jeronimo Martins SGPS SA | 736 | 20,271 | |
| Kerry Group PLC, Class A | 31 | 3,023 | |
| Kesko Oyj, Class B | 752 | 14,155 | |
| Koninklijke Ahold Delhaize NV | 1,467 | 50,041 | |
| Loblaw Cos. Ltd. | 253 | 23,162 | |
| Metro, Inc. (a) | 395 | 22,309 | |
| Mowi ASA | 841 | 13,336 | |
| Nestle SA | 2,465 | 296,334 | |
| Orkla ASA | 2,151 | 15,451 | |
| Salmar ASA | 146 | 5,888 | |
| Saputo, Inc. | 325 | 7,281 | |
| Seven & i Holdings Co. Ltd. | 900 | 38,702 | |
| Tesco PLC | 4,829 | 15,234 | |
| WH Group Ltd. (b) | 36,500 | 19,331 | |
| Woolworths Group Ltd. | 1,233 | 32,633 | |
| $ | 722,904 | ||
| Food Service — 0.46% | |||
| Compass Group PLC | 1,599 | 44,717 | |
| Sodexo SA (a) | 255 | 28,062 | |
| $ | 72,779 | ||
| Forest Products & Paper — 0.42% | |||
| Holmen AB, Class B | 311 | 11,171 | |
| Mondi PLC | 1,053 | 16,034 | |
| Oji Holdings Corp. | 3,500 | 13,040 | |
| Smurfit Kappa Group PLC | 434 | 14,459 | |
See accompanying notes.
78
| Schedule of Investments | |||
| Principal International Adaptive Multi-Factor ETF | |||
| June 30, 2023 | |||
| COMMON STOCKS (continued) | Shares Held | Value | |
| Forest Products & Paper (continued) | |||
| UPM-Kymmene Oyj | 366 | $ | 10,891 |
| $ | 65,595 | ||
| Gas — 0.57% | |||
| AltaGas Ltd. | 997 | 17,912 | |
| Canadian Utilities Ltd., Class A | 580 | 15,021 | |
| Enagas SA | 456 | 8,957 | |
| Hong Kong & China Gas Co. Ltd. | 3,250 | 2,808 | |
| Naturgy Energy Group SA | 503 | 14,962 | |
| Snam SpA | 2,060 | 10,760 | |
| Tokyo Gas Co. Ltd. | 900 | 19,604 | |
| $ | 90,024 | ||
| Hand/Machine Tools — 0.47% | |||
| Disco Corp. | 200 | 31,339 | |
| Fuji Electric Co. Ltd. | 400 | 17,436 | |
| Schindler Holding AG | 31 | 7,263 | |
| Schindler Holding AG | 28 | 6,288 | |
| Techtronic Industries Co. Ltd. | 1,000 | 10,866 | |
| $ | 73,192 | ||
| Healthcare — Products — 1.15% | |||
| Alcon, Inc. | 68 | 5,630 | |
| Carl Zeiss Meditec AG | 48 | 5,188 | |
| Cochlear Ltd. | 115 | 17,548 | |
| Coloplast A/S, Class B | 96 | 12,004 | |
| Demant A/S (a) | 175 | 7,399 | |
| DiaSorin SpA | 54 | 5,621 | |
| EBOS Group Ltd. | 487 | 10,984 | |
| EssilorLuxottica SA | 146 | 27,498 | |
| Fisher & Paykel Healthcare Corp. Ltd., Class C | 448 | 6,736 | |
| Lifco AB, Class B | 343 | 7,451 | |
| Olympus Corp. | 1,600 | 25,126 | |
| QIAGEN NV (a) | 230 | 10,325 | |
| Sartorius Stedim Biotech | 23 | 5,740 | |
| Siemens Healthineers AG (b) | 174 | 9,847 | |
| Smith & Nephew PLC | 197 | 3,172 | |
| Sonova Holding AG | 34 | 9,048 | |
| Straumann Holding AG | 69 | 11,190 | |
| $ | 180,507 | ||
| Healthcare — Services — 0.59% | |||
| BioMerieux | 129 | 13,530 | |
| Eurofins Scientific SE | 118 | 7,489 | |
| Fresenius Medical Care AG & Co. KGaA | 192 | 9,170 | |
| Fresenius SE & Co. KGaA | 318 | 8,804 | |
| Lonza Group AG | 29 | 17,282 | |
| Medibank Pvt Ltd. | 7,106 | 16,663 | |
| Ramsay Health Care Ltd. | 53 | 1,987 | |
| Sonic Healthcare Ltd. | 713 | 16,895 | |
| $ | 91,820 | ||
| Holding Companies — Diversified — 0.22% | |||
| Jardine Matheson Holdings Ltd. | 383 | 19,399 | |
| Swire Pacific Ltd., Class A | 2,000 | 15,327 | |
| $ | 34,726 | ||
See accompanying notes.
79
| Schedule of Investments | |||
| Principal International Adaptive Multi-Factor ETF | |||
| June 30, 2023 | |||
| COMMON STOCKS (continued) | Shares Held | Value | |
| Home Builders — 0.66% | |||
| Barratt Developments PLC | 1,216 | $ | 6,386 |
| Berkeley Group Holdings PLC | 118 | 5,879 | |
| Daiwa House Industry Co. Ltd. | 900 | 23,652 | |
| Iida Group Holdings Co. Ltd. | 700 | 11,769 | |
| Open House Group Co. Ltd. | 300 | 10,743 | |
| Persimmon PLC | 436 | 5,678 | |
| Sekisui Chemical Co. Ltd. | 900 | 12,923 | |
| Sekisui House Ltd. | 1,000 | 20,136 | |
| Taylor Wimpey PLC | 4,706 | 6,141 | |
| $ | 103,307 | ||
| Home Furnishings — 0.70% | |||
| Rational AG | 8 | 5,788 | |
| SEB SA | 56 | 5,784 | |
| Sony Group Corp. | 1,100 | 98,835 | |
| $ | 110,407 | ||
| Household Products — 1.64% | |||
| Beiersdorf AG | 86 | 11,379 | |
| Essity AB, Class B | 420 | 11,180 | |
| Haleon PLC | 3,602 | 14,741 | |
| L'Oreal SA | 182 | 84,821 | |
| Unilever PLC | 2,587 | 134,623 | |
| $ | 256,744 | ||
| Household Products/Wares — 0.34% | |||
| Henkel AG & Co. KGaA | 127 | 8,939 | |
| Reckitt Benckiser Group PLC | 598 | 44,899 | |
| $ | 53,838 | ||
| Insurance — 4.86% | |||
| Aegon NV | 1,743 | 8,806 | |
| Ageas SA | 220 | 8,909 | |
| AIA Group Ltd. | 10,600 | 107,001 | |
| Allianz SE | 305 | 70,956 | |
| Assicurazioni Generali SpA | 1,269 | 25,784 | |
| AXA SA | 1,568 | 46,240 | |
| Baloise Holding AG | 62 | 9,102 | |
| Fairfax Financial Holdings Ltd. | 32 | 23,969 | |
| Gjensidige Forsikring ASA | 92 | 1,472 | |
| Great-West Lifeco, Inc. | 953 | 27,675 | |
| Hannover Rueck SE | 149 | 31,599 | |
| iA Financial Corp., Inc. | 274 | 18,666 | |
| Insurance Australia Group Ltd. | 2,886 | 10,958 | |
| Intact Financial Corp. | 281 | 43,386 | |
| Japan Post Holdings Co. Ltd. | 3,100 | 22,268 | |
| Manulife Financial Corp. | 2,666 | 50,392 | |
| Muenchener Rueckversicherungs-Gesellschaft AG in Muenchen | 69 | 25,871 | |
| NN Group NV | 288 | 10,657 | |
| Phoenix Group Holdings PLC | 298 | 2,013 | |
| Power Corp. of Canada | 486 | 13,082 | |
| Prudential PLC | 1,166 | 16,415 | |
| QBE Insurance Group Ltd. | 1,862 | 19,437 | |
| Sampo Oyj, Class A | 787 | 35,313 | |
| Sun Life Financial, Inc. | 361 | 18,819 | |
| Suncorp Group Ltd. | 2,256 | 20,273 | |
| Swiss Life Holding AG | 23 | 13,439 | |
| Swiss Re AG | 306 | 30,783 | |
See accompanying notes.
80
| Schedule of Investments | |||
| Principal International Adaptive Multi-Factor ETF | |||
| June 30, 2023 | |||
| COMMON STOCKS (continued) | Shares Held | Value | |
| Insurance (continued) | |||
| Tokio Marine Holdings, Inc. | 1,600 | $ | 36,758 |
| Tryg A/S | 106 | 2,294 | |
| Zurich Insurance Group AG | 17 | 8,070 | |
| $ | 760,407 | ||
| Internet — 1.10% | |||
| Adevinta ASA (a) | 781 | 5,122 | |
| Auto Trader Group PLC (b) | 1,276 | 9,892 | |
| Delivery Hero SE (a),(b) | 183 | 8,068 | |
| Prosus NV (a) | 567 | 41,522 | |
| Scout24 SE (b) | 105 | 6,655 | |
| SEEK Ltd. | 406 | 5,874 | |
| Shopify, Inc., Class A (a) | 1,074 | 69,414 | |
| United Internet AG | 609 | 8,572 | |
| Wix.com Ltd. (a) | 61 | 4,773 | |
| ZOZO, Inc. | 600 | 12,354 | |
| $ | 172,246 | ||
| Investment Companies — 0.34% | |||
| EXOR NV | 30 | 2,674 | |
| Groupe Bruxelles Lambert NV | 29 | 2,283 | |
| Industrivarden AB, Class A | 209 | 5,790 | |
| Industrivarden AB, Class C | 215 | 5,924 | |
| Washington H Soul Pattinson & Co. Ltd. | 1,109 | 23,478 | |
| Wendel SE | 125 | 12,822 | |
| $ | 52,971 | ||
| Iron & Steel — 0.85% | |||
| ArcelorMittal SA | 327 | 8,896 | |
| BlueScope Steel Ltd. | 530 | 7,255 | |
| Fortescue Metals Group Ltd. | 2,495 | 36,864 | |
| JFE Holdings, Inc. | 1,400 | 19,890 | |
| Mineral Resources Ltd. | 279 | 13,276 | |
| Nippon Steel Corp. | 1,300 | 27,064 | |
| voestalpine AG (a) | 561 | 20,140 | |
| $ | 133,385 | ||
| Leisure Time — 0.38% | |||
| BRP, Inc. | 233 | 19,697 | |
| Shimano, Inc. | 100 | 16,605 | |
| Yamaha Motor Co. Ltd. | 800 | 22,853 | |
| $ | 59,155 | ||
| Lodging — 0.39% | |||
| Accor SA | 215 | 7,981 | |
| City Developments Ltd. | 2,300 | 11,429 | |
| Galaxy Entertainment Group Ltd. (a) | 1,000 | 6,342 | |
| InterContinental Hotels Group PLC | 161 | 11,111 | |
| Sands China Ltd. (a) | 2,000 | 6,815 | |
| Whitbread PLC | 418 | 17,975 | |
| $ | 61,653 | ||
| Machinery — Construction & Mining — 1.17% | |||
| Epiroc AB, Class A | 465 | 8,791 | |
| Epiroc AB, Class B | 428 | 6,917 | |
| Hitachi Construction Machinery Co. Ltd. | 700 | 19,541 | |
| Hitachi Ltd. | 900 | 55,486 | |
See accompanying notes.
81
| Schedule of Investments | |||
| Principal International Adaptive Multi-Factor ETF | |||
| June 30, 2023 | |||
| COMMON STOCKS (continued) | Shares Held | Value | |
| Machinery — Construction & Mining (continued) | |||
| Komatsu Ltd. | 1,300 | $ | 34,965 |
| Metso Oyj | 1,448 | 17,452 | |
| Mitsubishi Heavy Industries Ltd. | 500 | 23,254 | |
| Sandvik AB | 502 | 9,784 | |
| Siemens Energy AG (a) | 377 | 6,656 | |
| $ | 182,846 | ||
| Machinery — Diversified — 1.27% | |||
| Atlas Copco AB, Class A | 1,170 | 16,858 | |
| Atlas Copco AB, Class B | 1,877 | 23,364 | |
| CNH Industrial NV | 1,305 | 18,804 | |
| FANUC Corp. | 200 | 6,974 | |
| GEA Group AG | 358 | 14,966 | |
| Keyence Corp. | 200 | 94,043 | |
| Kone Oyj, Class B | 175 | 9,134 | |
| Spirax-Sarco Engineering PLC | 57 | 7,503 | |
| Wartsila OYJ Abp | 636 | 7,159 | |
| $ | 198,805 | ||
| Media — 0.72% | |||
| Bollore SE | 2,414 | 15,041 | |
| Informa PLC | 1,276 | 11,765 | |
| Pearson PLC | 1,508 | 15,743 | |
| Quebecor, Inc., Class B | 895 | 22,058 | |
| Thomson Reuters Corp. (a) | 106 | 14,316 | |
| Vivendi SE | 222 | 2,036 | |
| Wolters Kluwer NV | 255 | 32,361 | |
| $ | 113,320 | ||
| Metal Fabrication & Hardware — 0.24% | |||
| SKF AB, Class B | 366 | 6,366 | |
| Tenaris SA | 1,452 | 21,730 | |
| VAT Group AG (b) | 23 | 9,508 | |
| $ | 37,604 | ||
| Mining — 2.54% | |||
| Anglo American PLC | 506 | 14,350 | |
| Antofagasta PLC | 387 | 7,181 | |
| BHP Group Ltd. | 4,545 | 136,214 | |
| Boliden AB (a) | 426 | 12,306 | |
| First Quantum Minerals Ltd. | 445 | 10,527 | |
| Franco-Nevada Corp. | 117 | 16,675 | |
| Glencore PLC (a) | 7,413 | 41,847 | |
| IGO Ltd. | 803 | 8,131 | |
| Lundin Mining Corp. | 1,089 | 8,533 | |
| Norsk Hydro ASA | 2,259 | 13,427 | |
| Northern Star Resources Ltd. | 931 | 7,492 | |
| Pilbara Minerals Ltd. | 8,811 | 28,702 | |
| Rio Tinto Ltd. | 329 | 25,136 | |
| Rio Tinto PLC | 380 | 24,060 | |
| South32 Ltd. | 6,286 | 15,745 | |
| Sumitomo Metal Mining Co. Ltd. | 600 | 19,256 | |
| Wheaton Precious Metals Corp. | 205 | 8,865 | |
| $ | 398,447 | ||
| Miscellaneous Manufacturers — 0.63% | |||
| Alfa Laval AB | 210 | 7,652 | |
See accompanying notes.
82
| Schedule of Investments | |||
| Principal International Adaptive Multi-Factor ETF | |||
| June 30, 2023 | |||
| COMMON STOCKS (continued) | Shares Held | Value | |
| Miscellaneous Manufacturers (continued) | |||
| Alstom SA | 256 | $ | 7,632 |
| Indutrade AB | 337 | 7,590 | |
| Knorr-Bremse AG | 95 | 7,254 | |
| Orica Ltd. | 848 | 8,377 | |
| Siemens AG | 310 | 51,600 | |
| Smiths Group PLC | 428 | 8,936 | |
| $ | 99,041 | ||
| Office & Business Equipment — 0.11% | |||
| Seiko Epson Corp. | 1,100 | 17,069 | |
| Oil & Gas — 5.68% | |||
| Aker BP ASA | 623 | 14,615 | |
| Ampol Ltd. | 1,042 | 20,782 | |
| ARC Resources Ltd. | 1,318 | 30,125 | |
| BP PLC | 16,358 | 95,221 | |
| Canadian Natural Resources Ltd. | 807 | 45,371 | |
| Cenovus Energy, Inc. | 1,502 | 25,510 | |
| DCC PLC | 162 | 9,048 | |
| Eni SpA (a) | 3,221 | 46,332 | |
| Equinor ASA | 899 | 26,140 | |
| Galp Energia SGPS SA | 1,182 | 13,827 | |
| Idemitsu Kosan Co. Ltd. | 600 | 12,000 | |
| Imperial Oil Ltd. | 343 | 17,549 | |
| Inpex Corp. | 1,700 | 18,827 | |
| Neste Oyj | 213 | 8,195 | |
| OMV AG | 462 | 19,581 | |
| Parkland Corp. | 575 | 14,323 | |
| Repsol SA | 2,129 | 30,968 | |
| Santos Ltd. | 3,992 | 19,998 | |
| Shell PLC | 6,302 | 187,483 | |
| Suncor Energy, Inc. | 1,118 | 32,795 | |
| TotalEnergies SE | 2,232 | 127,989 | |
| Tourmaline Oil Corp. | 457 | 21,533 | |
| Woodside Energy Group Ltd. | 2,215 | 50,817 | |
| $ | 889,029 | ||
| Oil & Gas Services — 0.04% | |||
| Seatrium Ltd. (a) | 71,127 | 6,574 | |
| Packaging & Containers — 0.20% | |||
| CCL Industries, Inc., Class B | 508 | 24,971 | |
| Stora Enso Oyj, Class R | 550 | 6,377 | |
| $ | 31,348 | ||
| Pharmaceuticals — 7.57% | |||
| Amplifon SpA | 205 | 7,514 | |
| Astellas Pharma, Inc. | 100 | 1,489 | |
| AstraZeneca PLC | 1,383 | 198,053 | |
| Bayer AG | 698 | 38,593 | |
| Chugai Pharmaceutical Co. Ltd. | 1,000 | 28,317 | |
| Daiichi Sankyo Co. Ltd. | 1,600 | 50,452 | |
| GSK PLC | 3,224 | 56,864 | |
| Hikma Pharmaceuticals PLC | 395 | 9,484 | |
| Ipsen SA | 162 | 19,481 | |
| Merck KGaA | 62 | 10,253 | |
| Nippon Shinyaku Co. Ltd. | 300 | 12,213 | |
| Novartis AG | 1,004 | 100,955 | |
| Novo Nordisk A/S, Class B | 1,477 | 237,974 | |
See accompanying notes.
83
| Schedule of Investments | |||
| Principal International Adaptive Multi-Factor ETF | |||
| June 30, 2023 | |||
| COMMON STOCKS (continued) | Shares Held | Value | |
| Pharmaceuticals (continued) | |||
| Ono Pharmaceutical Co. Ltd. | 800 | $ | 14,448 |
| Orion Oyj, Class B | 317 | 13,152 | |
| Recordati Industria Chimica e Farmaceutica SpA | 200 | 9,548 | |
| Roche Holding AG | 629 | 192,203 | |
| Roche Holding AG | 33 | 10,825 | |
| Sanofi | 888 | 95,154 | |
| Shionogi & Co. Ltd. | 500 | 21,033 | |
| Takeda Pharmaceutical Co. Ltd. | 1,300 | 40,785 | |
| Teva Pharmaceutical Industries Ltd., ADR (a) | 1,765 | 13,290 | |
| UCB SA | 30 | 2,658 | |
| $ | 1,184,738 | ||
| Pipelines — 0.32% | |||
| APA Group | 1,454 | 9,386 | |
| Enbridge, Inc. | 245 | 9,106 | |
| Keyera Corp. | 99 | 2,283 | |
| Pembina Pipeline Corp. | 765 | 24,052 | |
| TC Energy Corp. | 131 | 5,294 | |
| $ | 50,121 | ||
| Private Equity — 0.51% | |||
| 3i Group PLC | 1,094 | 27,072 | |
| Brookfield Corp. | 553 | 18,618 | |
| Capitaland Investment Ltd. | 5,800 | 14,195 | |
| EQT AB | 368 | 7,077 | |
| Eurazeo SE | 181 | 12,729 | |
| $ | 79,691 | ||
| Real Estate — 1.16% | |||
| Aroundtown SA (a) | 3,471 | 4,003 | |
| CK Asset Holdings Ltd. | 2,000 | 11,077 | |
| Fastighets AB Balder, Classs B (a) | 3,090 | 11,277 | |
| FirstService Corp. | 111 | 17,095 | |
| Hang Lung Properties Ltd. | 3,000 | 4,632 | |
| Henderson Land Development Co. Ltd. | 1,000 | 2,973 | |
| Hongkong Land Holdings Ltd. | 516 | 2,012 | |
| Hulic Co. Ltd. | 1,600 | 13,650 | |
| LEG Immobilien SE (a) | 114 | 6,548 | |
| Mitsui Fudosan Co. Ltd. | 1,400 | 27,753 | |
| Nomura Real Estate Holdings, Inc. | 600 | 14,196 | |
| REA Group Ltd. | 74 | 7,051 | |
| Sagax AB, Class B | 299 | 5,905 | |
| Sino Land Co. Ltd. | 6,000 | 7,374 | |
| Sun Hung Kai Properties Ltd. | 1,000 | 12,596 | |
| Swire Properties Ltd. | 5,200 | 12,781 | |
| Swiss Prime Site AG | 26 | 2,256 | |
| UOL Group Ltd. | 2,800 | 13,292 | |
| Wharf Real Estate Investment Co. Ltd. | 1,000 | 4,996 | |
| $ | 181,467 | ||
| REITs — 1.08% | |||
| British Land Co. PLC | 2,793 | 10,741 | |
| Canadian Apartment Properties REIT | 70 | 2,687 | |
| CapitaLand Ascendas REIT | 7,600 | 15,285 | |
| CapitaLand Integrated Commercial Trust | 6,517 | 9,204 | |
| Dexus | 1,711 | 8,890 | |
| Gecina SA | 57 | 6,067 | |
| Goodman Group | 879 | 11,752 | |
See accompanying notes.
84
| Schedule of Investments | |||
| Principal International Adaptive Multi-Factor ETF | |||
| June 30, 2023 | |||
| COMMON STOCKS (continued) | Shares Held | Value | |
| REITs (continued) | |||
| GPT Group | 728 | $ | 2,008 |
| Klepierre SA (a) | 857 | 21,247 | |
| Land Securities Group PLC | 932 | 6,796 | |
| Link REIT | 1,540 | 8,549 | |
| Mapletree Logistics Trust | 6,200 | 7,427 | |
| Mapletree Pan Asia Commercial Trust | 6,100 | 7,307 | |
| Mirvac Group | 6,229 | 9,378 | |
| RioCan Real Estate Investment Trust | 144 | 2,096 | |
| Scentre Group | 1,313 | 2,318 | |
| Stockland | 6,329 | 16,991 | |
| Vicinity Ltd. | 6,239 | 7,668 | |
| Warehouses De Pauw CVA | 441 | 12,088 | |
| $ | 168,499 | ||
| Retail — 2.99% | |||
| Alimentation Couche-Tard, Inc. | 756 | 38,766 | |
| Canadian Tire Corp. Ltd., Class A | 129 | 17,637 | |
| Cie Financiere Richemont SA, Class A | 170 | 28,803 | |
| Dollarama, Inc. | 387 | 26,210 | |
| Fast Retailing Co. Ltd. | 200 | 50,896 | |
| H & M Hennes & Mauritz AB, Class B | 650 | 11,160 | |
| Industria de Diseno Textil SA | 931 | 36,024 | |
| Jardine Cycle & Carriage Ltd. | 900 | 23,159 | |
| JD Sports Fashion PLC | 9,607 | 17,813 | |
| Kingfisher PLC | 4,070 | 11,976 | |
| MatsukiyoCocokara & Co. | 300 | 16,793 | |
| Moncler SpA | 257 | 17,763 | |
| Next PLC | 286 | 25,062 | |
| Pan Pacific International Holdings Corp. | 900 | 16,048 | |
| Pandora A/S | 260 | 23,213 | |
| Reece Ltd. | 555 | 6,866 | |
| Restaurant Brands International, Inc. | 379 | 29,385 | |
| Swatch Group AG | 193 | 10,598 | |
| Swatch Group AG | 46 | 13,419 | |
| USS Co. Ltd. | 800 | 13,184 | |
| Welcia Holdings Co. Ltd. | 600 | 12,456 | |
| Wesfarmers Ltd. | 617 | 20,279 | |
| $ | 467,510 | ||
| Semiconductors — 3.41% | |||
| Advantest Corp. | 300 | 39,814 | |
| ASM International NV | 55 | 23,307 | |
| ASML Holding NV | 360 | 260,448 | |
| Hamamatsu Photonics KK | 300 | 14,608 | |
| Infineon Technologies AG | 992 | 40,901 | |
| Renesas Electronics Corp. (a) | 1,700 | 31,828 | |
| Rohm Co. Ltd. | 200 | 18,739 | |
| STMicroelectronics NV | 591 | 29,385 | |
| SUMCO Corp. | 1,100 | 15,460 | |
| Tokyo Electron Ltd. | 400 | 56,994 | |
| Tower Semiconductor Ltd. (a) | 48 | 1,770 | |
| $ | 533,254 | ||
| Shipbuilding — 0.09% | |||
| Kongsberg Gruppen ASA | 302 | 13,736 | |
| Software — 1.51% | |||
| Constellation Software, Inc. | 19 | 39,366 | |
See accompanying notes.
85
| Schedule of Investments | |||
| Principal International Adaptive Multi-Factor ETF | |||
| June 30, 2023 | |||
| COMMON STOCKS (continued) | Shares Held | Value | |
| Software (continued) | |||
| Dassault Systemes SE | 299 | $ | 13,255 |
| Descartes Systems Group, Inc. (a) | 200 | 16,021 | |
| Nemetschek SE | 100 | 7,490 | |
| Open Text Corp. | 267 | 11,105 | |
| Oracle Corp. Japan | 200 | 14,817 | |
| Sage Group PLC | 1,051 | 12,344 | |
| SAP SE | 558 | 76,197 | |
| Square Enix Holdings Co. Ltd. | 300 | 13,905 | |
| TIS, Inc. | 600 | 14,932 | |
| WiseTech Global Ltd. | 316 | 16,800 | |
| $ | 236,232 | ||
| Telecommunications — 3.57% | |||
| BCE, Inc. | 197 | 8,982 | |
| Bezeq The Israeli Telecommunication Corp. Ltd. | 9,694 | 11,837 | |
| BT Group PLC | 4,903 | 7,619 | |
| Deutsche Telekom AG | 3,588 | 78,211 | |
| Elisa Oyj | 277 | 14,793 | |
| Hikari Tsushin, Inc. | 100 | 14,276 | |
| HKT Trust & HKT Ltd. | 7,000 | 8,138 | |
| KDDI Corp. | 1,400 | 43,176 | |
| Koninklijke KPN NV | 5,323 | 18,988 | |
| Nice Ltd. (a) | 79 | 16,135 | |
| Nippon Telegraph & Telephone Corp. | 35,000 | 41,356 | |
| Nokia Oyj | 5,134 | 21,487 | |
| Orange SA (a) | 3,323 | 38,806 | |
| Rogers Communications, Inc., Class B | 53 | 2,418 | |
| Singapore Telecommunications Ltd. | 1,600 | 2,958 | |
| SoftBank Corp. | 3,500 | 37,354 | |
| SoftBank Group Corp. | 1,100 | 51,632 | |
| Spark New Zealand Ltd. | 7,430 | 23,209 | |
| Swisscom AG | 20 | 12,464 | |
| Tele2 AB, Class B | 911 | 7,528 | |
| Telecom Italia SpA (a) | 18,290 | 5,145 | |
| Telefonaktiebolaget LM Ericsson, Class B | 1,725 | 9,342 | |
| Telefonica Deutschland Holding AG | 4,435 | 12,471 | |
| Telefonica SA | 6,054 | 24,548 | |
| Telenor ASA | 832 | 8,434 | |
| Telia Co. AB | 857 | 1,879 | |
| Telstra Group Ltd. | 6,516 | 18,665 | |
| TELUS Corp. | 131 | 2,549 | |
| Vodafone Group PLC | 15,477 | 14,539 | |
| $ | 558,939 | ||
| Toys, Games & Hobbies — 0.44% | |||
| Bandai Namco Holdings, Inc. | 1,000 | 23,015 | |
| Nintendo Co. Ltd. | 1,000 | 45,338 | |
| $ | 68,353 | ||
| Transportation — 2.28% | |||
| AP Moller - Maersk A/S, Class A | 7 | 12,187 | |
| AP Moller - Maersk A/S, Class B | 7 | 12,285 | |
| Aurizon Holdings Ltd. | 3,688 | 9,630 | |
| Canadian National Railway Co. | 270 | 32,695 | |
| Canadian Pacific Kansas City Ltd. | 115 | 9,289 | |
| Deutsche Post AG | 763 | 37,242 | |
| DSV A/S | 237 | 49,772 | |
| Getlink SE | 587 | 9,980 | |
See accompanying notes.
86
| Schedule of Investments | ||||
| Principal International Adaptive Multi-Factor ETF | ||||
| June 30, 2023 | ||||
| COMMON STOCKS (continued) | Shares Held | Value | ||
| Transportation (continued) | ||||
| Kintetsu Group Holdings Co. Ltd. | 500 | $ | 17,270 | |
| Kuehne & Nagel International AG | 68 | 20,110 | ||
| Mitsui OSK Lines Ltd. | 800 | 19,161 | ||
| MTR Corp. Ltd. | 500 | 2,297 | ||
| NIPPON EXPRESS HOLDINGS, Inc. | 300 | 16,849 | ||
| Nippon Yusen KK | 900 | 19,897 | ||
| Poste Italiane SpA (b) | 2,253 | 24,378 | ||
| SG Holdings Co. Ltd. | 1,100 | 15,609 | ||
| SITC International Holdings Co. Ltd. | 6,000 | 10,949 | ||
| TFI International, Inc. | 200 | 22,786 | ||
| Yamato Holdings Co. Ltd. | 800 | 14,432 | ||
| $ | 356,818 | |||
| Water — 0.17% | ||||
| Severn Trent PLC | 70 | 2,281 | ||
| United Utilities Group PLC | 183 | 2,235 | ||
| Veolia Environnement SA | 690 | 21,797 | ||
| $ | 26,313 | |||
| TOTAL COMMON STOCKS | $ | 15,437,641 | ||
| PREFERRED STOCKS — 0.44% | Shares Held | Value | ||
| Auto Manufacturers — 0.29% | ||||
| Bayerische Motoren Werke AG | ||||
| 8.22 | % | 224 | $ | 25,469 |
| Porsche Automobil Holding SE | ||||
| 4.64 | % | 128 | 7,704 | |
| Volkswagen AG | ||||
| 22.62 | % | 89 | 11,940 | |
| $ | 45,113 | |||
| Electronics — 0.08% | ||||
| Sartorius AG | ||||
| 0.45 | % | 35 | 12,111 | |
| Household Products/Wares — 0.07% | ||||
| Henkel AG & Co. KGaA | ||||
| 2.52 | % | 148 | 11,831 | |
| TOTAL PREFERRED STOCKS | $ | 69,055 | ||
| INVESTMENT COMPANIES — 0.42% | Shares Held | Value | ||
| Money Market Fund — 0.42% | |||
| State Street Institutional U.S. Government Money Market Fund — Premier Class | |||
| 5.03% (c) | 65,261 | $ | 65,261 |
| TOTAL INVESTMENT COMPANIES | $ | 65,261 |
| Total Investments | $ | 15,571,957 |
| Other Assets and Liabilities — 0.55% | 85,967 | |
| Total Net Assets — 100.00% | $ | 15,657,924 |
(a) Non-income producing security.
(b) Security exempt from registration under Rule 144A of the Securities Act of 1933. These securities may be resold in transactions exempt from registration, normally to qualified institutional buyers. At the end of the period, the value of these securities totaled $251,068 or 1.60% of net assets.
(c) 1-day yield shown as of period end.
See accompanying notes.
87
Schedule of Investments
Principal International Adaptive Multi-Factor ETF
June 30, 2023
| Portfolio Summary | |||
| Location | Percent | ||
| Japan | 20.28 | % | |
| United Kingdom | 11.83 | % | |
| France | 10.92 | % | |
| Canada | 10.02 | % | |
| Switzerland | 7.69 | % | |
| Germany | 6.70 | % | |
| Australia | 6.52 | % | |
| Netherlands | 4.72 | % | |
| Denmark | 2.83 | % | |
| Spain | 2.69 | % | |
| Sweden | 2.32 | % | |
| Italy | 2.28 | % | |
| Hong Kong | 2.25 | % | |
| Singapore | 1.67 | % | |
| Finland | 1.10 | % | |
| Ireland | 1.09 | % | |
| Norway | 0.91 | % | |
| Israel | 0.90 | % | |
| Belgium | 0.75 | % | |
| United States | 0.51 | % | |
| Austria | 0.41 | % | |
| New Zealand | 0.35 | % | |
| Portugal | 0.29 | % | |
| Luxembourg | 0.27 | % | |
| Jordan | 0.06 | % | |
| Chile | 0.05 | % | |
| Mongolia | 0.04 | % | |
| Other Assets and Liabilities | 0.55 | % | |
| TOTAL NET ASSETS | 100.00 | % | |
See accompanying notes.
88
| Schedule of Investments | ||||
| Principal Investment Grade Corporate Active ETF | ||||
| June 30, 2023 | ||||
| Principal | ||||
| BONDS — 95.60% | Amount | Value | ||
| Aerospace & Defense — 3.43% | ||||
| Boeing Co. | ||||
| 3.25%, 02/01/2028 | $ | 420,000 | $ | 385,580 |
| 5.71%, 05/01/2040 | 363,000 | 362,095 | ||
| Lockheed Martin Corp. | ||||
| 5.70%, 11/15/2054 | 180,000 | 199,848 | ||
| Raytheon Technologies Corp. | ||||
| 4.13%, 11/16/2028 | 698,000 | 672,268 | ||
| $ | 1,619,791 | |||
| Airlines — 3.50% | ||||
| Delta Air Lines, Inc./SkyMiles IP Ltd. | ||||
| 4.75%, 10/20/2028 (a) | 647,262 | 628,290 | ||
| United Airlines 2016-2 Class A Pass-Through Trust | ||||
| 3.10%, 04/07/2030 | 1,211,415 | 1,025,421 | ||
| $ | 1,653,711 | |||
| Auto Manufacturers — 0.49% | ||||
| Mercedes-Benz Finance North America LLC | ||||
| 4.80%, 03/30/2028 (a) | 235,000 | 231,878 | ||
| Banks — 24.41% | ||||
| Bank of America Corp. | ||||
| (6-month Secured Overnight Financing Rate + 1.06%), | ||||
| 2.09%, 06/14/2029 (b) | 829,000 | 707,269 | ||
| (5-year Treasury Constant Maturity Rate + 1.20%), | ||||
| 2.48%, 09/21/2036 (b) | 736,000 | 563,063 | ||
| (6-month Secured Overnight Financing Rate + 1.88%), | ||||
| 2.83%, 10/24/2051 (b) | 406,000 | 266,571 | ||
| (6-month Secured Overnight Financing Rate + 1.99%), | ||||
| 6.20%, 11/10/2028 (b) | 418,000 | 429,641 | ||
| Bank of New York Mellon Corp. | ||||
| (6-month Secured Overnight Financing Rate + 1.61%), | ||||
| 4.97%, 04/26/2034 | 356,000 | 347,662 | ||
| Citigroup, Inc. | ||||
| (6-month Secured Overnight Financing Rate + 1.94%), | ||||
| 3.79%, 03/17/2033 (b) | 774,000 | 683,834 | ||
| (6-month Secured Overnight Financing Rate + 1.54%), | ||||
| 5.61%, 09/29/2026 (b) | 781,000 | 779,938 | ||
| (6-month Secured Overnight Financing Rate + 2.33%), | ||||
| 6.27%, 11/17/2033 (b) | 129,000 | 136,923 | ||
| Deutsche Bank AG | ||||
| (6-month U.S. International Swaps and Derivative Association + 2.55%), | ||||
| 4.88%, 12/01/2032 (b) | 548,000 | 462,725 | ||
| Goldman Sachs Group, Inc. | ||||
| (6-month Secured Overnight Financing Rate + 1.41%), | ||||
| 3.10%, 02/24/2033 (b) | 1,004,000 | 848,132 | ||
| JPMorgan Chase & Co. | ||||
| (3-month Term Secured Overnight Financing Rate + 0.70%), | ||||
| 1.04%, 02/04/2027 (b) | 1,007,000 | 896,782 | ||
| (6-month Secured Overnight Financing Rate + 2.08%), | ||||
| 4.91%, 07/25/2033 (b) | 455,000 | 444,614 | ||
| (6-month Secured Overnight Financing Rate + 1.85%), | ||||
| 5.35%, 06/01/2034 | 191,000 | 192,522 | ||
| Morgan Stanley | ||||
| (6-month Secured Overnight Financing Rate + 1.43%), | ||||
| 2.80%, 01/25/2052 (b) | 643,000 | 421,910 | ||
See accompanying notes.
89
| Schedule of Investments | ||||
| Principal Investment Grade Corporate Active ETF | ||||
| June 30, 2023 | ||||
| Principal | ||||
| BONDS (continued) | Amount | Value | ||
| Banks (continued) | ||||
| Morgan Stanley (continued) | ||||
| (3-month USD LIBOR + 1.34%), | ||||
| 3.59%, 07/22/2028 | $ | 364,000 | $ | 335,859 |
| 5.00%, 11/24/2025 | 318,000 | 312,616 | ||
| National Australia Bank Ltd. | ||||
| 2.33%, 08/21/2030 (a) | 1,061,000 | 826,877 | ||
| State Street Corp. | ||||
| (6-month Secured Overnight Financing Rate + 1.57%), | ||||
| 4.82%, 01/26/2034 (b) | 97,000 | 94,184 | ||
| (6-month Secured Overnight Financing Rate + 1.89%), | ||||
| 5.16%, 05/18/2034 | 220,000 | 218,683 | ||
| Truist Financial Corp. | ||||
| (6-month Secured Overnight Financing Rate + 1.63%), | ||||
| 5.90%, 10/28/2026 (b) | 210,000 | 208,155 | ||
| UBS Group AG | ||||
| (1-year Treasury Constant Maturity Rate + 1.75%), | ||||
| 4.75%, 05/12/2028 (a),(b) | 786,000 | 744,930 | ||
| Wells Fargo & Co. | ||||
| (6-month Secured Overnight Financing Rate + 2.10%), | ||||
| 2.39%, 06/02/2028 (b) | 1,098,000 | 978,462 | ||
| Westpac Banking Corp. | ||||
| (1-year Treasury Constant Maturity Rate + 2.68%), | ||||
| 5.41%, 08/10/2033 (b) | 646,000 | 612,028 | ||
| $ | 11,513,380 | |||
| Beverages — 3.89% | ||||
| Anheuser-Busch InBev Worldwide, Inc. | ||||
| 4.38%, 04/15/2038 | 549,000 | 508,306 | ||
| 4.90%, 01/23/2031 (c) | 456,000 | 463,652 | ||
| Constellation Brands, Inc. | ||||
| 4.75%, 05/09/2032 | 398,000 | 386,297 | ||
| PepsiCo, Inc. | ||||
| 4.20%, 07/18/2052 | 250,000 | 232,817 | ||
| 4.45%, 02/15/2033 (c) | 240,000 | 241,929 | ||
| $ | 1,833,001 | |||
| Biotechnology — 0.88% | ||||
| Amgen, Inc. | ||||
| 5.25%, 03/02/2030 | 166,000 | 166,331 | ||
| 5.60%, 03/02/2043 | 248,000 | 248,751 | ||
| $ | 415,082 | |||
| Commercial Services — 1.11% | ||||
| CoStar Group, Inc. | ||||
| 2.80%, 07/15/2030 (a) | 637,000 | 525,399 | ||
| Computers — 0.79% | ||||
| Apple, Inc. | ||||
| 3.95%, 08/08/2052 | 423,000 | 372,811 | ||
| Diversified Financial Services — 1.02% | ||||
| AerCap Ireland Capital DAC/AerCap Global Aviation Trust | ||||
| 3.00%, 10/29/2028 | 319,000 | 275,824 | ||
| 3.85%, 10/29/2041 | 790 | 600 | ||
| Blackstone Holdings Finance Co. LLC | ||||
| 2.85%, 08/05/2051 (a) | 354,342 | 203,559 | ||
| $ | 479,983 | |||
See accompanying notes.
90
| Schedule of Investments | ||||
| Principal Investment Grade Corporate Active ETF | ||||
| June 30, 2023 | ||||
| Principal | ||||
| BONDS (continued) | Amount | Value | ||
| Electric — 10.52% | ||||
| Commonwealth Edison Co. | ||||
| 4.00%, 03/01/2049 | $ | 461,000 | $ | 381,514 |
| Duke Energy Carolinas LLC | ||||
| 3.75%, 06/01/2045 | 356,000 | 280,041 | ||
| Entergy Louisiana LLC | ||||
| 4.95%, 01/15/2045 | 356,000 | 329,155 | ||
| FirstEnergy Corp. | ||||
| 5.10%, 07/15/2047 | 268,000 | 240,403 | ||
| Florida Power & Light Co. | ||||
| 3.95%, 03/01/2048 | 268,000 | 225,659 | ||
| Kentucky Utilities Co. | ||||
| 4.38%, 10/01/2045 | 235,000 | 197,273 | ||
| Louisville Gas & Electric Co. | ||||
| 5.45%, 04/15/2033 | 130,000 | 132,382 | ||
| MidAmerican Energy Co. | ||||
| 4.40%, 10/15/2044 | 356,000 | 310,656 | ||
| Monongahela Power Co. | ||||
| 3.55%, 05/15/2027 (a) | 284,000 | 266,268 | ||
| Northern States Power Co. | ||||
| 5.10%, 05/15/2053 | 203,000 | 199,833 | ||
| NRG Energy, Inc. | ||||
| 2.00%, 12/02/2025 (a) | 362,000 | 324,738 | ||
| Pacific Gas & Electric Co. | ||||
| 1.70%, 11/15/2023 | 554,000 | 544,482 | ||
| 2.95%, 03/01/2026 | 694,000 | 635,711 | ||
| WEC Energy Group, Inc. | ||||
| 1.38%, 10/15/2027 | 731,000 | 624,285 | ||
| 5.00%, 09/27/2025 | 271,000 | 268,467 | ||
| $ | 4,960,867 | |||
| Environmental Control — 1.57% | ||||
| Waste Connections, Inc. | ||||
| 4.20%, 01/15/2033 | 507,000 | 476,502 | ||
| Waste Management, Inc. | ||||
| 4.63%, 02/15/2030 | 268,000 | 264,040 | ||
| $ | 740,542 | |||
| Food — 2.51% | ||||
| JBS USA LUX SA/JBS USA Food Co./JBS USA Finance, Inc. | ||||
| 4.38%, 02/02/2052 (a) | 307,000 | 215,327 | ||
| Kraft Heinz Foods Co. | ||||
| 4.88%, 10/01/2049 | 369,000 | 336,700 | ||
| Mars, Inc. | ||||
| 2.38%, 07/16/2040 (a) | 321,000 | 220,463 | ||
| Pilgrim's Pride Corp. | ||||
| 3.50%, 03/01/2032 | 522,000 | 412,693 | ||
| Sysco Corp. | ||||
| 3.15%, 12/14/2051 | 736 | 510 | ||
| $ | 1,185,693 | |||
| Gas — 1.82% | ||||
| NiSource, Inc. | ||||
| 0.95%, 08/15/2025 | 883,000 | 805,239 | ||
| 5.25%, 03/30/2028 | 52,000 | 51,959 | ||
| $ | 857,198 | |||
See accompanying notes.
91
| Schedule of Investments | ||||
| Principal Investment Grade Corporate Active ETF | ||||
| June 30, 2023 | ||||
| Principal | ||||
| BONDS (continued) | Amount | Value | ||
| Healthcare — Products — 1.89% | ||||
| Abbott Laboratories | ||||
| 4.90%, 11/30/2046 | $ | 250,000 | $ | 252,407 |
| Boston Scientific Corp. | ||||
| 2.65%, 06/01/2030 | 735,000 | 640,384 | ||
| $ | 892,791 | |||
| Healthcare — Services — 2.33% | ||||
| Centene Corp. | ||||
| 2.45%, 07/15/2028 | 791,000 | 676,112 | ||
| UnitedHealth Group, Inc. | ||||
| 2.75%, 05/15/2040 | 372,000 | 276,348 | ||
| 5.88%, 02/15/2053 | 134,000 | 148,838 | ||
| $ | 1,101,298 | |||
| Insurance — 4.14% | ||||
| Arthur J Gallagher & Co. | ||||
| 2.40%, 11/09/2031 | 449,000 | 357,737 | ||
| 5.50%, 03/02/2033 | 186,000 | 186,244 | ||
| Chubb INA Holdings, Inc. | ||||
| 3.35%, 05/03/2026 | 371,000 | 356,437 | ||
| Corebridge Financial, Inc. | ||||
| 4.40%, 04/05/2052 | 244,000 | 191,827 | ||
| Everest Reinsurance Holdings, Inc. | ||||
| 3.13%, 10/15/2052 | 327,000 | 216,084 | ||
| Markel Group, Inc. | ||||
| 4.30%, 11/01/2047 | 324,000 | 260,984 | ||
| MetLife, Inc. | ||||
| 5.00%, 07/15/2052 | 177,000 | 166,207 | ||
| New York Life Insurance Co. | ||||
| 3.75%, 05/15/2050 (a) | 284,000 | 216,922 | ||
| $ | 1,952,442 | |||
| Internet — 2.15% | ||||
| Amazon.com, Inc. | ||||
| 4.55%, 12/01/2027 | 774,000 | 769,139 | ||
| Meta Platforms, Inc. | ||||
| 5.60%, 05/15/2053 | 121,000 | 124,269 | ||
| Netflix, Inc. | ||||
| 4.88%, 04/15/2028 | 65,000 | 64,283 | ||
| 5.88%, 11/15/2028 | 55,000 | 56,804 | ||
| $ | 1,014,495 | |||
| Media — 1.91% | ||||
| Charter Communications Operating LLC/Charter Communications Operating | ||||
| Capital | ||||
| 2.30%, 02/01/2032 | 465,000 | 352,005 | ||
| Comcast Corp. | ||||
| 3.97%, 11/01/2047 | 418,000 | 346,200 | ||
| 4.80%, 05/15/2033 | 203,000 | 200,855 | ||
| $ | 899,060 | |||
| Mining — 1.47% | ||||
| Yamana Gold, Inc. | ||||
| 2.63%, 08/15/2031 | 889,000 | 692,481 | ||
See accompanying notes.
92
| Schedule of Investments | ||||
| Principal Investment Grade Corporate Active ETF | ||||
| June 30, 2023 | ||||
| Principal | ||||
| BONDS (continued) | Amount | Value | ||
| Pharmaceuticals — 8.81% | ||||
| AbbVie, Inc. | ||||
| 3.20%, 11/21/2029 | $ | 374,000 | $ | 338,199 |
| 4.05%, 11/21/2039 | 550,000 | 478,864 | ||
| Astrazeneca Finance LLC | ||||
| 4.88%, 03/03/2033 | 127,000 | 128,823 | ||
| Bayer U.S. Finance II LLC | ||||
| 4.63%, 06/25/2038 (a) | 604,000 | 525,894 | ||
| Becton Dickinson & Co. | ||||
| 3.70%, 06/06/2027 | 964,000 | 916,548 | ||
| Bristol-Myers Squibb Co. | ||||
| 4.13%, 06/15/2039 | 268,000 | 244,347 | ||
| CVS Health Corp. | ||||
| 5.13%, 02/21/2030 | 240,000 | 238,343 | ||
| 5.30%, 06/01/2033 | 250,000 | 249,612 | ||
| Eli Lilly & Co. | ||||
| 4.70%, 02/27/2033 (c) | 186,000 | 188,438 | ||
| Pfizer Investment Enterprises Pte. Ltd. | ||||
| 5.11%, 05/19/2043 | 191,000 | 191,433 | ||
| Zoetis, Inc. | ||||
| 3.90%, 08/20/2028 | 684,000 | 656,270 | ||
| $ | 4,156,771 | |||
| Pipelines — 3.56% | ||||
| Energy Transfer LP | ||||
| 3.75%, 05/15/2030 | 469,000 | 423,182 | ||
| 5.15%, 03/15/2045 | 315,000 | 271,633 | ||
| Enterprise Products Operating LLC | ||||
| 3.13%, 07/31/2029 | 750,000 | 672,033 | ||
| Sabine Pass Liquefaction LLC | ||||
| 5.00%, 03/15/2027 | 320,000 | 314,972 | ||
| $ | 1,681,820 | |||
| REITs — 2.05% | ||||
| Invitation Homes Operating Partnership LP | ||||
| 2.00%, 08/15/2031 | 272,000 | 208,382 | ||
| Kimco Realty OP LLC | ||||
| 3.20%, 04/01/2032 | 512,000 | 423,903 | ||
| Realty Income Corp. | ||||
| 3.10%, 12/15/2029 | 70 | 62 | ||
| Spirit Realty LP | ||||
| 3.20%, 02/15/2031 | 408,000 | 333,194 | ||
| $ | 965,541 | |||
| Retail — 0.30% | ||||
| Walmart, Inc. | ||||
| 4.50%, 04/15/2053 | 146,000 | 142,390 | ||
| Semiconductors — 0.66% | ||||
| Broadcom, Inc. | ||||
| 4.11%, 09/15/2028 | 329,000 | 310,835 | ||
| Software — 5.11% | ||||
| Fiserv, Inc. | ||||
| 4.40%, 07/01/2049 | 322,000 | 272,081 | ||
| Microsoft Corp. | ||||
| 2.53%, 06/01/2050 | 500,000 | 345,873 | ||
| Oracle Corp. | ||||
| 2.80%, 04/01/2027 | 268,000 | 246,327 | ||
See accompanying notes.
93
Schedule of Investments
Principal Investment Grade Corporate Active ETF
June 30, 2023
| Principal | |||||
| BONDS (continued) | Amount | Value | |||
| Software (continued) | |||||
| Oracle Corp. (continued) | |||||
| 4.00%, 07/15/2046 | $ | 268,000 | $ | 205,988 | |
| 6.15%, 11/09/2029 | 141,000 | 146,861 | |||
| Take-Two Interactive Software, Inc. | |||||
| 4.00%, 04/14/2032 | 420,000 | 384,719 | |||
| VMware, Inc. | |||||
| 4.65%, 05/15/2027 | 831,000 | 807,395 | |||
| $ | 2,409,244 | ||||
| Telecommunications — 3.71% | |||||
| AT&T, Inc. | |||||
| 3.50%, 09/15/2053 | 882,000 | 624,381 | |||
| T-Mobile USA, Inc. | |||||
| 3.38%, 04/15/2029 | 1,247,000 | 1,126,101 | |||
| $ | 1,750,482 | ||||
| Transportation — 0.71% | |||||
| Penske Truck Leasing Co. LP/PTL Finance Corp. | |||||
| 6.20%, 06/15/2030 (a) | 54,000 | 54,282 | |||
| United Parcel Service, Inc. | |||||
| 4.88%, 03/03/2033 | 278,000 | 280,932 | |||
| $ | 335,214 | ||||
| Water — 0.86% | |||||
| Essential Utilities, Inc. | |||||
| 2.40%, 05/01/2031 | 498,000 | 404,217 | |||
| TOTAL BONDS | $ | 45,098,417 | |||
| U.S. GOVERNMENT & GOVERNMENT AGENCY OBLIGATIONS — | Principal | ||||
| 2.41 | % | Amount | Value | ||
| U.S. Treasury — 2.41% | |||||
| 4.13%, 11/15/2032 | $ | 1,112,200 | $ | 1,136,529 | |
| TOTAL U.S. GOVERNMENT & GOVERNMENT AGENCY OBLIGATIONS | $ | 1,136,529 | |||
| INVESTMENT COMPANIES — 1.72% | Shares Held | Value | |||
| Money Market Funds — 1.72% | |||||
| Principal Government Money Market Fund — Class R-6 5.01% (d),(e),(f) | 384,880 | $ | 384,880 | ||
| State Street Institutional U.S. Government Money Market Fund — Premier Class | |||||
| 5.03 | % (d) | 425,392 | 425,392 | ||
| TOTAL INVESTMENT COMPANIES | $ | 810,272 | |||
| Total Investments | $ | 47,045,218 | |||
| Other Assets and Liabilities — 0.27% | 128,978 | ||||
| Total Net Assets — 100.00% | $ | 47,174,196 | |||
(a) Security exempt from registration under Rule 144A of the Securities Act of 1933. These securities may be resold in transactions exempt from registration, normally to qualified institutional buyers. At the end of the period, the value of these securities totaled $4,984,827 or 10.57% of net assets.
(b) Rate shown is as of period end. The rate may be a variable or floating rate or a fixed rate which may convert to a variable or floating rate in the future.
(c) Security or a portion of the security was on loan. At the end of the period, the value of these securities totaled $379,101 or 0.80% of net assets.
(d) 1-day yield shown as of period end.
See accompanying notes. 94
Schedule of Investments
Principal Investment Grade Corporate Active ETF June 30, 2023
(e) Affiliated Security. Security is either an affiliate (and registered under the Investment Company Act of 1940) or an affiliate as defined by the Investment Company Act of 1940 (controls 5.00% or more of the outstanding voting shares of the security).
Please see Affiliated Securities sub-schedule for transactional information.
(f) Security or a portion of the security was received as collateral for securities lending. At the end of the period, the value of these securities totaled $384,880 or 0.82% of net assets.
| Portfolio Summary | ||||||||||||
| Sector | Percent | |||||||||||
| Financial | 31.61 | % | ||||||||||
| Consumer, Non-cyclical | 21.43 | % | ||||||||||
| Utilities | 13.19 | % | ||||||||||
| Communications | 7.77 | % | ||||||||||
| Technology | 6.56 | % | ||||||||||
| Industrial | 5.71 | % | ||||||||||
| Consumer, Cyclical | 4.30 | % | ||||||||||
| Energy | 3.56 | % | ||||||||||
| Government | 2.41 | % | ||||||||||
| Money Market Funds | 1.72 | % | ||||||||||
| Basic Materials | 1.47 | % | ||||||||||
| Other Assets and Liabilities | 0.27 | % | ||||||||||
| TOTAL NET ASSETS | 100.00 | % | ||||||||||
| June 30, 2022 | Purchases | Sales | June 30, 2023 | |||||||||
| Affiliated Securities | Value | Cost | Proceeds | Value | ||||||||
| Principal Government Money | ||||||||||||
| Market Fund — Class R-6 5.01% | $ | — | $ | 6,256,205 | $ | 5,871,325 | $ | 384,880 | ||||
| Principal Government Money | ||||||||||||
| Market Fund — Institutional Class | ||||||||||||
| 4.90 | % | 1,398,980 | 3,608,665 | 5,007,645 | — | |||||||
| $ | 1,398,980 | $ | 9,864,870 | $ | 10,878,970 | $ | 384,880 | |||||
| Realized Gain | ||||||||||||
| Realized | from | Change in | ||||||||||
| Gain/(Loss) on | Capital Gain | Unrealized | ||||||||||
| Income (a) | Investments | Distributions | Gain/(Loss) | |||||||||
| Principal Government Money | ||||||||||||
| Market Fund — Class R-6 5.01% | $ | — | $ | — | $ | — | $ | — | ||||
| Principal Government Money | ||||||||||||
| Market Fund — Institutional Class | ||||||||||||
| 4.90 | % | — | — | — | — | |||||||
| $ | — | $ | — | $ | — | $ | — | |||||
| (a) Amount excludes earnings from securities lending collateral. | ||||||||||||
| Futures Contracts | ||||||||||||
| Value and Unrealized | ||||||||||||
| Notional | Appreciation/ | |||||||||||
| Description and Expiration Date | Type | Contracts | Amount | (Depreciation) | ||||||||
| U.S. 10 Year CBT; September 2023 | Short | 15 | $ | 1,708,735 | $ | 24,750 | ||||||
| U.S. 10 Year Ultra; September 2023 | Short | 11 | 1,314,993 | 12,180 | ||||||||
| U.S. 5 Year CBT; September 2023 | Short | 5 | 543,006 | 7,537 | ||||||||
| U.S. Long Bond CBT; September 2023 | Long | 8 | 1,013,455 | 1,796 | ||||||||
| U.S. Ultra Bond CBT; September 2023 | Long | 10 | 1,350,647 | 11,541 | ||||||||
| Total | $ | 57,804 | ||||||||||
See accompanying notes. 95
| Schedule of Investments | |||
| Principal Millennial Global Growth ETF | |||
| June 30, 2023 | |||
| COMMON STOCKS — 99.60% | Shares Held | Value | |
| Apparel — 6.35% | |||
| adidas AG | 605 | $ | 117,366 |
| Carter's, Inc. | 690 | 50,094 | |
| Columbia Sportswear Co. | 702 | 54,222 | |
| Fila Holdings Corp. | 2,659 | 80,719 | |
| Gildan Activewear, Inc. | 1,788 | 57,645 | |
| Kering SA | 226 | 124,687 | |
| Levi Strauss & Co., Class A | 3,207 | 46,277 | |
| LVMH Moet Hennessy Louis Vuitton SE | 203 | 191,166 | |
| NIKE, Inc., Class B | 972 | 107,280 | |
| PVH Corp. | 826 | 70,185 | |
| Ralph Lauren Corp. | 559 | 68,925 | |
| SMCP SA (a),(b) | 9,031 | 78,640 | |
| Torrid Holdings, Inc. (a) | 10,459 | 29,390 | |
| Urban Outfitters, Inc. (a) | 23,618 | 782,464 | |
| VF Corp. | 2,296 | 43,831 | |
| $ | 1,902,891 | ||
| Beverages — 1.90% | |||
| Brown-Forman Corp., Class B | 1,978 | 132,091 | |
| Constellation Brands, Inc., Class A | 578 | 142,263 | |
| Fevertree Drinks PLC | 2,940 | 45,515 | |
| Monster Beverage Corp. (a) | 3,326 | 191,046 | |
| Treasury Wine Estates Ltd. | 7,978 | 59,682 | |
| $ | 570,597 | ||
| Commercial Services — 4.49% | |||
| Aaron's Co., Inc. | 3,155 | 44,612 | |
| Adyen NV (a),(b) | 287 | 496,632 | |
| Global Payments, Inc. | 961 | 94,678 | |
| GMO Payment Gateway, Inc. | 700 | 54,333 | |
| HYBE Co. Ltd. (a) | 2,529 | 540,290 | |
| Nuvei Corp. (a),(b) | 920 | 27,195 | |
| Paysafe Ltd. (a) | 1,706 | 17,214 | |
| PROG Holdings, Inc. (a) | 2,201 | 70,696 | |
| $ | 1,345,650 | ||
| Computers — 0.49% | |||
| Apple, Inc. | 757 | 146,835 | |
| Construction Materials — 1.17% | |||
| Fortune Brands Innovations, Inc. | 1,779 | 127,999 | |
| Masco Corp. | 2,599 | 149,131 | |
| Masterbrand, Inc. (a) | 1,779 | 20,690 | |
| Mohawk Industries, Inc. (a) | 510 | 52,611 | |
| $ | 350,431 | ||
| Diversified Financial Services — 7.72% | |||
| Coinbase Global, Inc., Class A (a) | 4,183 | 299,294 | |
| Discover Financial Services | 7,177 | 838,632 | |
| Futu Holdings Ltd., ADR (a),(c) | 13,301 | 528,582 | |
| LexinFintech Holdings Ltd., ADR (a) | 164,476 | 376,650 | |
| Lufax Holding Ltd., ADR | 76,244 | 109,029 | |
| Rocket Cos., Inc., Class A (a) | 5,699 | 51,063 | |
| XP, Inc., Class A (a) | 4,770 | 111,904 | |
| $ | 2,315,154 | ||
| Entertainment — 4.52% | |||
| CTS Eventim AG & Co. KGaA | 6,215 | 392,328 | |
See accompanying notes.
96
| Schedule of Investments | |||
| Principal Millennial Global Growth ETF | |||
| June 30, 2023 | |||
| COMMON STOCKS (continued) | Shares Held | Value | |
| Entertainment (continued) | |||
| DraftKings, Inc., Class A (a) | 3,258 | $ | 86,565 |
| Universal Music Group NV | 21,240 | 471,654 | |
| Warner Music Group Corp., Class A | 15,529 | 405,151 | |
| $ | 1,355,698 | ||
| Food — 2.69% | |||
| Albertsons Cos., Inc., Class A | 3,974 | 86,713 | |
| Kroger Co. | 13,786 | 647,942 | |
| Sprouts Farmers Market, Inc. (a) | 1,984 | 72,872 | |
| $ | 807,527 | ||
| Home Builders — 1.08% | |||
| DR Horton, Inc. | 1,796 | 218,555 | |
| Toll Brothers, Inc. | 1,348 | 106,587 | |
| $ | 325,142 | ||
| Home Furnishings — 2.32% | |||
| Arhaus, Inc. (a) | 7,447 | 77,672 | |
| Sleep Number Corp. (a) | 1,250 | 34,100 | |
| Sony Group Corp. | 5,500 | 494,179 | |
| Tempur Sealy International, Inc. | 2,269 | 90,919 | |
| $ | 696,870 | ||
| Internet — 29.62% | |||
| AfreecaTV Co. Ltd. | 5,288 | 293,767 | |
| Alphabet, Inc., Class C (a) | 5,663 | 685,053 | |
| D-MARKET Elektronik Hizmetler ve Ticaret A/S, ADR (a) | 30,559 | 51,339 | |
| eBay, Inc. | 2,307 | 103,100 | |
| Expedia Group, Inc. (a) | 2,681 | 293,274 | |
| Farfetch Ltd., Class A (a) | 4,590 | 27,724 | |
| Hello Group, Inc., ADR | 74,871 | 719,510 | |
| iQIYI, Inc., ADR (a) | 94,876 | 506,638 | |
| JD.com, Inc., ADR | 2,575 | 87,885 | |
| JOYY, Inc., ADR | 17,689 | 543,229 | |
| Kakao Corp. | 1,666 | 62,081 | |
| Kuaishou Technology (a),(b) | 60,600 | 414,131 | |
| Lulu's Fashion Lounge Holdings, Inc. (a) | 9,349 | 23,653 | |
| Match Group, Inc. (a) | 4,762 | 199,290 | |
| Meituan, Class B (a),(b) | 280 | 4,370 | |
| Meta Platforms, Inc., Class A (a) | 598 | 171,614 | |
| Naspers Ltd., Class N | 5,042 | 910,554 | |
| Netflix, Inc. (a) | 2,111 | 929,874 | |
| Pinterest, Inc., Class A (a) | 5,346 | 146,160 | |
| RealReal, Inc. (a),(c) | 8,731 | 19,383 | |
| Revolve Group, Inc. (a) | 10,855 | 178,022 | |
| Rightmove PLC | 8,326 | 55,323 | |
| Shutterstock, Inc. | 683 | 33,242 | |
| Snap, Inc., Class A (a) | 14,348 | 169,880 | |
| Temple & Webster Group Ltd. (a) | 13,808 | 54,085 | |
| Tencent Holdings Ltd. | 3,000 | 126,952 | |
| Tencent Music Entertainment Group, ADR (a) | 132,634 | 978,839 | |
| THG PLC (a),(c) | 57,270 | 59,277 | |
| Trip.com Group Ltd., ADR (a) | 24,834 | 869,190 | |
| Vipshop Holdings Ltd., ADR (a) | 7,706 | 127,149 | |
| Weibo Corp., ADR | 2,829 | 37,088 | |
| $ | 8,881,676 | ||
See accompanying notes.
97
| Schedule of Investments | |||
| Principal Millennial Global Growth ETF | |||
| June 30, 2023 | |||
| COMMON STOCKS (continued) | Shares Held | Value | |
| Leisure Time — 2.46% | |||
| Camping World Holdings, Inc., Class A | 21,223 | $ | 638,812 |
| Shimano, Inc. | 600 | 99,629 | |
| $ | 738,441 | ||
| Media — 3.83% | |||
| Comcast Corp., Class A | 2,826 | 117,420 | |
| Fox Corp., Class B | 3,618 | 115,378 | |
| Paramount Global, Class B | 13,875 | 220,751 | |
| Sirius XM Holdings, Inc. (c) | 20,006 | 90,627 | |
| Vivendi SE | 65,723 | 602,853 | |
| $ | 1,147,029 | ||
| Real Estate — 0.45% | |||
| REA Group Ltd. | 1,424 | 135,678 | |
| REITs — 2.97% | |||
| EastGroup Properties, Inc. | 645 | 111,972 | |
| Equity Residential | 1,458 | 96,184 | |
| Prologis, Inc. | 817 | 100,189 | |
| Rexford Industrial Realty, Inc. | 1,759 | 91,855 | |
| Segro PLC | 48,905 | 445,200 | |
| Warehouses De Pauw CVA | 1,594 | 43,693 | |
| $ | 889,093 | ||
| Retail — 16.68% | |||
| Academy Sports & Outdoors, Inc. | 1,559 | 84,264 | |
| American Eagle Outfitters, Inc. | 3,771 | 44,498 | |
| ANTA Sports Products Ltd. | 11,800 | 120,545 | |
| Bath & Body Works, Inc. | 2,743 | 102,862 | |
| Dick's Sporting Goods, Inc. | 614 | 81,165 | |
| Foot Locker, Inc. | 2,138 | 57,961 | |
| Frasers Group PLC (a) | 8,311 | 74,096 | |
| Goldwin, Inc. | 1,400 | 118,369 | |
| H & M Hennes & Mauritz AB, Class B | 10,709 | 183,869 | |
| Hibbett, Inc. | 1,388 | 50,370 | |
| Home Depot, Inc. | 2,629 | 816,673 | |
| Industria de Diseno Textil SA | 39,290 | 1,520,286 | |
| Kingfisher PLC | 20,632 | 60,711 | |
| Li Ning Co. Ltd. | 16,771 | 90,212 | |
| Lowe's Cos., Inc. | 658 | 148,511 | |
| Lululemon Athletica, Inc. (a) | 364 | 137,774 | |
| Next PLC | 1,844 | 161,590 | |
| Pandora A/S | 1,512 | 134,991 | |
| Petco Health & Wellness Co., Inc. (a) | 3,237 | 28,809 | |
| Qurate Retail, Inc., Series A (a) | 13,315 | 13,179 | |
| Ryohin Keikaku Co. Ltd. | 5,740 | 56,586 | |
| Signet Jewelers Ltd. | 8,929 | 582,706 | |
| Starbucks Corp. | 1,445 | 143,142 | |
| Truworths International Ltd. | 17,374 | 52,248 | |
| Victoria's Secret & Co. (a) | 1,233 | 21,491 | |
| Williams-Sonoma, Inc. | 907 | 113,502 | |
| $ | 5,000,410 | ||
| Semiconductors — 0.69% | |||
| NVIDIA Corp. | 491 | 207,703 | |
| Software — 4.80% | |||
| Bilibili, Inc., ADR (a),(c) | 16,834 | 254,193 | |
See accompanying notes.
98
| Schedule of Investments | ||||
| Principal Millennial Global Growth ETF | ||||
| June 30, 2023 | ||||
| COMMON STOCKS (continued) | Shares Held | Value | ||
| Software (continued) | ||||
| DouYu International Holdings Ltd., ADR (a) | 207,027 | $ | 217,378 | |
| Fidelity National Information Services, Inc. | 1,318 | 72,095 | ||
| Fiserv, Inc. (a) | 1,298 | 163,743 | ||
| HUYA, Inc., ADR (a) | 96,416 | 345,169 | ||
| Kakao Games Corp. (a) | 1,068 | 26,626 | ||
| Microsoft Corp. | 431 | 146,773 | ||
| NetEase, Inc., ADR | 1,620 | 156,638 | ||
| XD, Inc. (a) | 22,200 | 55,812 | ||
| $ | 1,438,427 | |||
| Telecommunications — 2.35% | ||||
| AT&T, Inc. | 44,099 | 703,379 | ||
| Toys, Games & Hobbies — 1.23% | ||||
| Funko, Inc., Class A (a) | 34,215 | 370,206 | ||
| Transportation — 1.79% | ||||
| Deutsche Post AG | 2,985 | 145,696 | ||
| FedEx Corp. | 573 | 142,047 | ||
| RXO, Inc. (a) | 869 | 19,700 | ||
| United Parcel Service, Inc., Class B | 619 | 110,956 | ||
| XPO, Inc. (a) | 869 | 51,271 | ||
| Yamato Holdings Co. Ltd. | 3,700 | 66,746 | ||
| $ | 536,416 | |||
| TOTAL COMMON STOCKS | $ | 29,865,253 | ||
| INVESTMENT COMPANIES — 2.74% | Shares Held | Value | ||
| Money Market Funds — 2.74% | ||||
| Principal Government Money Market Fund — Class R-6 5.01% (d),(e),(f) | 721,539 | $ | 721,539 | |
| State Street Institutional U.S. Government Money Market Fund — Premier Class | ||||
| 5.03% (f) | 99,208 | 99,208 | ||
| TOTAL INVESTMENT COMPANIES | $ | 820,747 | ||
| Total Investments | $ | 30,686,000 | ||
| Other Assets and Liabilities — (2.34)% | (702,406 | ) | ||
| Total Net Assets — 100.00% | $ | 29,983,594 | ||
(a) Non-income producing security.
(b) Security exempt from registration under Rule 144A of the Securities Act of 1933. These securities may be resold in transactions exempt from registration, normally to qualified institutional buyers. At the end of the period, the value of these securities totaled $1,020,968 or 3.41% of net assets.
(c) Security or a portion of the security was on loan. At the end of the period, the value of these securities totaled $713,807 or 2.38% of net assets.
(d) Affiliated Security. Security is either an affiliate (and registered under the Investment Company Act of 1940) or an affiliate as defined by the Investment Company Act of 1940 (controls 5.00% or more of the outstanding voting shares of the security).
Please see Affiliated Securities sub-schedule for transactional information.
(e) Security or a portion of the security was received as collateral for securities lending. At the end of the period, the value of these securities totaled $721,539 or 2.41% of net assets.
(f) 1-day yield shown as of period end.
See accompanying notes. 99
| Schedule of Investments | ||||||||||||
| Principal Millennial Global Growth ETF | ||||||||||||
| June 30, 2023 | ||||||||||||
| Portfolio Summary | ||||||||||||
| Location | Percent | |||||||||||
| United States | 50.28 | % | ||||||||||
| China | 18.67 | % | ||||||||||
| Spain | 5.07 | % | ||||||||||
| Republic Of Korea | 3.35 | % | ||||||||||
| France | 3.33 | % | ||||||||||
| Netherlands | 3.23 | % | ||||||||||
| South Africa | 3.21 | % | ||||||||||
| United Kingdom | 3.16 | % | ||||||||||
| Japan | 2.97 | % | ||||||||||
| Germany | 2.19 | % | ||||||||||
| Singapore | 1.81 | % | ||||||||||
| Hong Kong | 1.76 | % | ||||||||||
| Australia | 0.83 | % | ||||||||||
| Canada | 0.74 | % | ||||||||||
| Sweden | 0.61 | % | ||||||||||
| Denmark | 0.45 | % | ||||||||||
| Brazil | 0.37 | % | ||||||||||
| Turkey | 0.17 | % | ||||||||||
| Belgium | 0.14 | % | ||||||||||
| Other Assets and Liabilities | (2.34 | )% | ||||||||||
| TOTAL NET ASSETS | 100.00 | % | ||||||||||
| June 30, 2022 | Purchases | Sales | June 30, 2023 | |||||||||
| Affiliated Securities | Value | Cost | Proceeds | Value | ||||||||
| Principal Government Money | ||||||||||||
| Market Fund — Class R-6 5.01% | $ | — | $ | 9,711,941 | $ | 8,990,402 | $ | 721,539 | ||||
| Principal Government Money | ||||||||||||
| Market Fund — Institutional Class | ||||||||||||
| 4.90 | % | 988,500 | 8,567,796 | 9,556,296 | — | |||||||
| $ | 988,500 | $ | 18,279,737 | $ | 18,546,698 | $ | 721,539 | |||||
| Realized Gain | ||||||||||||
| Realized | from | Change in | ||||||||||
| Gain/(Loss) on | Capital Gain | Unrealized | ||||||||||
| Income (a) | Investments | Distributions | Gain/(Loss) | |||||||||
| Principal Government Money | ||||||||||||
| Market Fund — Class R-6 5.01% | $ | — | $ | — | $ | — | $ | — | ||||
| Principal Government Money | ||||||||||||
| Market Fund — Institutional Class | ||||||||||||
| 4.90 | % | — | — | — | — | |||||||
| $ | — | $ | — | $ | — | $ | — | |||||
| (a) Amount excludes earnings from securities lending collateral. | ||||||||||||
See accompanying notes.
100
| Schedule of Investments | ||||
| Principal Quality ETF | ||||
| June 30, 2023 | ||||
| COMMON STOCKS — 99.60% | Shares Held | Value | ||
| Beverages — 0.98% | ||||
| Keurig Dr Pepper, Inc. | 11,482 | $ | 359,042 | |
| Biotechnology — 1.29% | ||||
| Amgen, Inc. | 2,135 | 474,013 | ||
| Commercial Services — 1.99% | ||||
| Automatic Data Processing, Inc. | 2,153 | 473,208 | ||
| MarketAxess Holdings, Inc. | 988 | 258,283 | ||
| $ | 731,491 | |||
| Computers — 8.93% | ||||
| Accenture PLC, Class A | 2,101 | 648,326 | ||
| Apple, Inc. | 11,646 | 2,258,975 | ||
| Leidos Holdings, Inc. | 4,190 | 370,731 | ||
| $ | 3,278,032 | |||
| Construction Materials — 1.21% | ||||
| Trane Technologies PLC | 2,316 | 442,958 | ||
| Distribution/Wholesale — 3.56% | ||||
| LKQ Corp. | 7,041 | 410,279 | ||
| Pool Corp. | 1,123 | 420,721 | ||
| WW Grainger, Inc. | 602 | 474,731 | ||
| $ | 1,305,731 | |||
| Diversified Financial Services — 2.03% | ||||
| Mastercard, Inc., Class A | 1,894 | 744,910 | ||
| Electrical Components & Equipment — 2.57% | ||||
| AMETEK, Inc. | 2,948 | 477,223 | ||
| Emerson Electric Co. | 5,157 | 466,141 | ||
| $ | 943,364 | |||
| Electronics — 3.15% | ||||
| Agilent Technologies, Inc. | 3,050 | 366,762 | ||
| Keysight Technologies, Inc. (a) | 2,566 | 429,677 | ||
| Mettler-Toledo International, Inc. (a) | 275 | 360,701 | ||
| $ | 1,157,140 | |||
| Healthcare — Products — 9.50% | ||||
| Abbott Laboratories | 5,534 | 603,317 | ||
| Danaher Corp. | 2,169 | 520,560 | ||
| Edwards Lifesciences Corp. (a) | 5,209 | 491,365 | ||
| Stryker Corp. | 1,678 | 511,941 | ||
| Thermo Fisher Scientific, Inc. | 1,068 | 557,229 | ||
| Waters Corp. (a) | 1,299 | 346,235 | ||
| West Pharmaceutical Services, Inc. | 1,187 | 453,992 | ||
| $ | 3,484,639 | |||
| Healthcare — Services — 5.74% | ||||
| Charles River Laboratories International, Inc. (a) | 1,973 | 414,823 | ||
| Humana, Inc. | 872 | 389,897 | ||
| IQVIA Holdings, Inc. (a) | 2,128 | 478,311 | ||
| UnitedHealth Group, Inc. | 1,715 | 824,298 | ||
| $ | 2,107,329 | |||
| Home Builders — 2.82% | ||||
| DR Horton, Inc. | 4,117 | 500,998 | ||
See accompanying notes.
101
| Schedule of Investments | ||||
| Principal Quality ETF | ||||
| June 30, 2023 | ||||
| COMMON STOCKS (continued) | Shares Held | Value | ||
| Home Builders (continued) | ||||
| PulteGroup, Inc. | 6,843 | $ | 531,564 | |
| $ | 1,032,562 | |||
| Household Products/Wares — 1.08% | ||||
| Avery Dennison Corp. | 2,309 | 396,686 | ||
| Insurance — 4.31% | ||||
| Aon PLC, Class A | 1,455 | 502,266 | ||
| Arthur J Gallagher & Co. | 2,258 | 495,789 | ||
| Berkshire Hathaway, Inc., Class B (a) | 127 | 43,307 | ||
| Marsh & McLennan Cos., Inc. | 2,873 | 540,354 | ||
| $ | 1,581,716 | |||
| Internet — 4.50% | ||||
| Alphabet, Inc., Class A (a) | 1,113 | 133,226 | ||
| Alphabet, Inc., Class C (a) | 5,153 | 623,358 | ||
| Amazon.com, Inc. (a) | 3,908 | 509,447 | ||
| CDW Corp. | 2,106 | 386,451 | ||
| $ | 1,652,482 | |||
| Machinery — Diversified — 2.31% | ||||
| IDEX Corp. | 1,778 | 382,732 | ||
| Nordson Corp. | 1,871 | 464,345 | ||
| $ | 847,077 | |||
| Pharmaceuticals — 4.71% | ||||
| AbbVie, Inc. | 4,149 | 558,995 | ||
| Merck & Co., Inc. | 6,063 | 699,609 | ||
| Zoetis, Inc. | 2,719 | 468,239 | ||
| $ | 1,726,843 | |||
| Pipelines — 1.27% | ||||
| Williams Cos., Inc. | 14,315 | 467,099 | ||
| Retail — 4.68% | ||||
| Genuine Parts Co. | 2,403 | 406,660 | ||
| O'Reilly Automotive, Inc. (a) | 525 | 501,532 | ||
| Ulta Beauty, Inc. (a) | 782 | 368,005 | ||
| Yum! Brands, Inc. | 3,172 | 439,481 | ||
| $ | 1,715,678 | |||
| Semiconductors — 15.96% | ||||
| Analog Devices, Inc. | 2,500 | 487,025 | ||
| Applied Materials, Inc. | 3,864 | 558,503 | ||
| Broadcom, Inc. | 999 | 866,563 | ||
| Microchip Technology, Inc. | 5,139 | 460,403 | ||
| NVIDIA Corp. | 3,882 | 1,642,164 | ||
| NXP Semiconductors NV | 2,350 | 480,998 | ||
| ON Semiconductor Corp. (a) | 5,166 | 488,600 | ||
| QUALCOMM, Inc. | 4,160 | 495,206 | ||
| Skyworks Solutions, Inc. | 3,408 | 377,231 | ||
| $ | 5,856,693 | |||
| Software — 14.14% | ||||
| Adobe, Inc. (a) | 1,484 | 725,661 | ||
| Fiserv, Inc. (a) | 4,060 | 512,169 | ||
| Intuit, Inc. | 1,175 | 538,373 | ||
| Microsoft Corp. | 5,657 | 1,926,435 | ||
See accompanying notes.
102
| Schedule of Investments | ||||||||||
| Principal Quality ETF | ||||||||||
| June 30, 2023 | ||||||||||
| COMMON STOCKS (continued) | Shares Held | Value | ||||||||
| Software (continued) | ||||||||||
| MSCI, Inc. | 769 | $ | 360,884 | |||||||
| Salesforce, Inc. (a) | 2,988 | 631,245 | ||||||||
| Synopsys, Inc. (a) | 1,136 | 494,626 | ||||||||
| $ | 5,189,393 | |||||||||
| Telecommunications — 1.61% | ||||||||||
| Cisco Systems, Inc. | 11,429 | 591,337 | ||||||||
| Transportation — 1.26% | ||||||||||
| Norfolk Southern Corp. | 2,045 | 463,724 | ||||||||
| TOTAL COMMON STOCKS | $ | 36,549,939 | ||||||||
| INVESTMENT COMPANIES — 0.36% | Shares Held | Value | ||||||||
| Money Market Fund — 0.36% | ||||||||||
| State Street Institutional U.S. Government Money Market Fund — Premier Class | ||||||||||
| 5.03% (b) | 131,112 | $ | 131,112 | |||||||
| TOTAL INVESTMENT COMPANIES | $ | 131,112 | ||||||||
| Total Investments | $ | 36,681,051 | ||||||||
| Other Assets and Liabilities — 0.04% | 14,628 | |||||||||
| Total Net Assets — 100.00% | $ | 36,695,679 | ||||||||
| (a) | Non-income producing security. | |||||||||
| (b) | 1-day yield shown as of period end. | |||||||||
| Portfolio Summary | ||||||||||
| Sector | Percent | |||||||||
| Technology | 39.04 | % | ||||||||
| Consumer, Non-cyclical | 25.29 | % | ||||||||
| Consumer, Cyclical | 11.05 | % | ||||||||
| Industrial | 10.50 | % | ||||||||
| Financial | 6.34 | % | ||||||||
| Communications | 6.11 | % | ||||||||
| Energy | 1.27 | % | ||||||||
| Money Market Fund | 0.36 | % | ||||||||
| Other Assets and Liabilities | 0.04 | % | ||||||||
| TOTAL NET ASSETS | 100.00 | % | ||||||||
| June 30, 2022 | Purchases | Sales | June 30, 2023 | |||||||
| Affiliated Securities | Value | Cost | Proceeds | Value | ||||||
| Principal Government Money | ||||||||||
| Market Fund — Class R-6 5.01% | $ | — | $ | 59,105 | $ | 59,105 | $ | — | ||
| $ | — | $ | 59,105 | $ | 59,105 | $ | — | |||
| Realized Gain | ||||||||||
| Realized | from | Change in | ||||||||
| Gain/(Loss) on | Capital Gain | Unrealized | ||||||||
| Income (a) | Investments | Distributions | Gain/(Loss) | |||||||
| Principal Government Money | ||||||||||
| Market Fund — Class R-6 5.01% | $ | — | $ | — | $ | — | $ | — | ||
| $ | — | $ | — | $ | — | $ | — | |||
| (a) | Amount excludes earnings from securities lending collateral. | |||||||||
| See accompanying notes. | 103 | |||||||||
| Schedule of Investments | ||||
| Principal Real Estate Active Opportunities ETF | ||||
| June 30, 2023 | ||||
| COMMON STOCKS — 98.85% | Shares Held | Value | ||
| Entertainment — 2.04% | ||||
| Marriott Vacations Worldwide Corp. | 904 | $ | 110,939 | |
| REITs — 96.81% | ||||
| Alexandria Real Estate Equities, Inc. | 1,763 | 200,083 | ||
| American Homes 4 Rent, Class A | 7,293 | 258,537 | ||
| American Tower Corp. | 2,009 | 389,626 | ||
| Crown Castle, Inc. | 1,813 | 206,573 | ||
| CubeSmart | 3,578 | 159,794 | ||
| DiamondRock Hospitality Co. | 13,003 | 104,154 | ||
| Digital Realty Trust, Inc. | 2,396 | 272,833 | ||
| Equinix, Inc. | 211 | 165,411 | ||
| Equity LifeStyle Properties, Inc. | 3,709 | 248,095 | ||
| Extra Space Storage, Inc. | 2,299 | 342,206 | ||
| Gaming & Leisure Properties, Inc. | 3,651 | 176,927 | ||
| Invitation Homes, Inc. | 10,526 | 362,094 | ||
| National Health Investors, Inc. | 2,581 | 135,296 | ||
| Rexford Industrial Realty, Inc. | 7,169 | 374,365 | ||
| Sabra Health Care REIT, Inc. | 12,540 | 147,596 | ||
| SBA Communications Corp. | 846 | 196,069 | ||
| Sun Communities, Inc. | 2,503 | 326,541 | ||
| Terreno Realty Corp. | 3,241 | 194,784 | ||
| Ventas, Inc. | 8,544 | 403,875 | ||
| VICI Properties, Inc. | 10,886 | 342,147 | ||
| Welltower, Inc. | 3,248 | 262,731 | ||
| $ | 5,269,737 | |||
| TOTAL COMMON STOCKS | $ | 5,380,676 | ||
| INVESTMENT COMPANIES — 0.72% | Shares Held | Value | ||
| Money Market Fund — 0.72% | ||||
| State Street Institutional U.S. Government Money Market Fund — Premier Class | ||||
| 5.03% (a) | 39,103 | $ | 39,103 | |
| TOTAL INVESTMENT COMPANIES | $ | 39,103 | ||
| Total Investments | $ | 5,419,779 | ||
| Other Assets and Liabilities — 0.43% | 23,309 | |||
| Total Net Assets — 100.00% | $ | 5,443,088 | ||
| (a) 1-day yield shown as of period end. | ||||
| Portfolio Summary | ||||
| Sector | Percent | |||
| Financial | 96.81 | % | ||
| Consumer, Cyclical | 2.04 | % | ||
| Money Market Fund | 0.72 | % | ||
| Other Assets and Liabilities | 0.43 | % | ||
| TOTAL NET ASSETS | 100.00 | % | ||
| See accompanying notes. | 104 | |||
| Schedule of Investments | ||||
| Principal Spectrum Preferred Securities Active ETF | ||||
| June 30, 2023 | ||||
| Principal | ||||
| BONDS — 96.25% | Amount | Value | ||
| Banks — 47.98% | ||||
| Bank of America Corp. | ||||
| (5-year Treasury Constant Maturity Rate + 2.76%), | ||||
| 4.38%, 01/27/2027 (a),(b) | $ | 15,343,000 | $ | 13,083,743 |
| (5-year Treasury Constant Maturity Rate + 3.23%), | ||||
| 6.13%, 04/27/2027 (a),(b),(c) | 11,025,000 | 10,773,079 | ||
| Bank of Montreal | ||||
| (5-year Treasury Constant Maturity Rate + 2.98%), | ||||
| 4.80%, 08/25/2024 (a),(b) | 3,362,000 | 2,879,282 | ||
| Bank of New York Mellon Corp. | ||||
| (5-year Treasury Constant Maturity Rate + 3.35%), | ||||
| 3.70%, 03/20/2026 (a),(b) | 11,569,000 | 10,212,535 | ||
| (5-year Treasury Constant Maturity Rate + 2.63%), | ||||
| 3.75%, 12/20/2026 (a),(b) | 3,501,000 | 2,875,196 | ||
| Bank of Nova Scotia | ||||
| (5-year Treasury Constant Maturity Rate + 4.55%), | ||||
| 4.90%, 06/04/2025 (a),(b) | 4,923,000 | 4,647,657 | ||
| (5-year Treasury Constant Maturity Rate + 4.38%), | ||||
| 8.63%, 10/27/2082 (a) | 12,685,000 | 13,216,721 | ||
| Citigroup, Inc. | ||||
| (5-year Treasury Constant Maturity Rate + 3.42%), | ||||
| 3.88%, 02/18/2026 (a),(b) | 7,962,000 | 6,668,175 | ||
| (5-year Treasury Constant Maturity Rate + 3.60%), | ||||
| 4.00%, 12/10/2025 (a),(b) | 13,081,000 | 11,167,904 | ||
| (5-year Treasury Constant Maturity Rate + 3.20%), | ||||
| 7.38%, 05/15/2028 (a),(b) | 7,530,000 | 7,474,695 | ||
| Citizens Financial Group, Inc. | ||||
| (5-year Treasury Constant Maturity Rate + 3.22%), | ||||
| 4.00%, 10/06/2026 (a),(b) | 6,671,000 | 4,994,757 | ||
| (5-year Treasury Constant Maturity Rate + 5.31%), | ||||
| 5.65%, 10/06/2025 (a),(b) | 4,833,000 | 4,240,032 | ||
| Goldman Sachs Group, Inc. | ||||
| (5-year Treasury Constant Maturity Rate + 2.92%), | ||||
| 3.65%, 08/10/2026 (a),(b) | 2,001,000 | 1,546,773 | ||
| (5-year Treasury Constant Maturity Rate + 2.97%), | ||||
| 3.80%, 05/10/2026 (a),(b) | 1,415,000 | 1,132,354 | ||
| (5-year Treasury Constant Maturity Rate + 2.95%), | ||||
| 4.13%, 11/10/2026 (a),(b) | 8,563,000 | 7,158,325 | ||
| (5-year Treasury Constant Maturity Rate + 3.62%), | ||||
| 5.50%, 08/10/2024 (a),(b),(c) | 8,268,000 | 8,050,386 | ||
| HSBC Capital Funding Dollar 1 LP | ||||
| (3-month USD LIBOR + 4.98%), | ||||
| 10.18%, 06/30/2030 (a),(b) | 6,021,000 | 7,430,726 | ||
| Huntington Bancshares, Inc. | ||||
| (7-year Treasury Constant Maturity Rate + 4.05%), | ||||
| 4.45%, 10/15/2027 (a),(b) | 3,045,000 | 2,472,982 | ||
| (10-year Treasury Constant Maturity Rate + 4.95%), | ||||
| 5.63%, 07/15/2030 (a),(b) | 6,907,000 | 6,172,178 | ||
| JPMorgan Chase & Co. | ||||
| (5-year Treasury Constant Maturity Rate + 2.85%), | ||||
| 3.65%, 06/01/2026 (a),(b) | 18,063,000 | 15,898,149 | ||
| (3-month Term Secured Overnight Financing Rate + 4.04%), | ||||
| 6.75%, 02/01/2024 (a),(b) | 7,788,000 | 7,808,249 | ||
| M&T Bank Corp. | ||||
| (5-year Treasury Constant Maturity Rate + 2.68%), | ||||
| 3.50%, 09/01/2026 (a),(b) | 19,512,000 | 13,014,620 | ||
| (5-year Treasury Constant Maturity Rate + 3.17%), | ||||
| 5.00%, 08/01/2024 (a),(b) | 5,000,000 | 3,933,387 | ||
See accompanying notes.
105
| Schedule of Investments | ||||
| Principal Spectrum Preferred Securities Active ETF | ||||
| June 30, 2023 | ||||
| Principal | ||||
| BONDS (continued) | Amount | Value | ||
| Banks (continued) | ||||
| PNC Financial Services Group, Inc. | ||||
| (5-year Treasury Constant Maturity Rate + 2.60%), | ||||
| 3.40%, 09/15/2026 (a),(b) | $ | 7,196,000 | $ | 5,307,050 |
| (5-year Treasury Constant Maturity Rate + 3.24%), | ||||
| 6.20%, 09/15/2027 (a),(b),(c) | 13,480,000 | 12,565,382 | ||
| (7-year Treasury Constant Maturity Rate + 2.81%), | ||||
| 6.25%, 03/15/2030 (a),(b) | 10,290,000 | 9,237,847 | ||
| Toronto-Dominion Bank | ||||
| (5-year Treasury Constant Maturity Rate + 4.07%), | ||||
| 8.13%, 10/31/2082 (a) | 22,075,000 | 22,425,551 | ||
| Truist Financial Corp. | ||||
| (5-year Treasury Constant Maturity Rate + 3.00%), | ||||
| 4.80%, 09/01/2024 (a),(b) | 10,866,000 | 9,263,265 | ||
| (5-year Treasury Constant Maturity Rate + 4.61%), | ||||
| 4.95%, 09/01/2025 (a),(b) | 11,197,000 | 10,357,225 | ||
| U.S. Bancorp | ||||
| (5-year Treasury Constant Maturity Rate + 2.54%), | ||||
| 3.70%, 01/15/2027 (a),(b) | 19,577,000 | 14,524,176 | ||
| Wells Fargo & Co. | ||||
| (5-year Treasury Constant Maturity Rate + 3.45%), | ||||
| 3.90%, 03/15/2026 (a),(b) | 29,321,000 | 25,814,208 | ||
| $ | 276,346,609 | |||
| Diversified Financial Services — 11.29% | ||||
| American Express Co. | ||||
| (5-year Treasury Constant Maturity Rate + 2.85%), | ||||
| 3.55%, 09/15/2026 (a),(b) | 14,967,000 | 12,422,610 | ||
| Capital One Financial Corp. | ||||
| (5-year Treasury Constant Maturity Rate + 3.16%), | ||||
| 3.95%, 09/01/2026 (a),(b) | 17,736,000 | 13,168,980 | ||
| Charles Schwab Corp. | ||||
| (5-year Treasury Constant Maturity Rate + 3.17%), | ||||
| 4.00%, 06/01/2026 (a),(b) | 12,919,000 | 10,499,917 | ||
| (5-year Treasury Constant Maturity Rate + 4.97%), | ||||
| 5.38%, 06/01/2025 (a),(b) | 5,502,000 | 5,258,372 | ||
| Discover Financial Services | ||||
| (5-year Treasury Constant Maturity Rate + 5.78%), | ||||
| 6.13%, 06/23/2025 (a),(b) | 10,641,000 | 10,140,206 | ||
| Voya Financial, Inc. | ||||
| (5-year Treasury Constant Maturity Rate + 3.36%), | ||||
| 6.13%, 09/15/2023 (a),(b) | 13,990,000 | 13,526,035 | ||
| $ | 65,016,120 | |||
| Electric — 12.91% | ||||
| Algonquin Power & Utilities Corp. | ||||
| (5-year Treasury Constant Maturity Rate + 3.25%), | ||||
| 4.75%, 01/18/2082 (a) | 3,010,000 | 2,392,950 | ||
| American Electric Power Co., Inc. | ||||
| (5-year Treasury Constant Maturity Rate + 2.68%), | ||||
| 3.88%, 02/15/2062 (a) | 9,601,000 | 7,625,402 | ||
| CMS Energy Corp. | ||||
| (5-year Treasury Constant Maturity Rate + 4.12%), | ||||
| 4.75%, 06/01/2050 (a) | 2,484,000 | 2,135,569 | ||
| Dominion Energy, Inc. | ||||
| (5-year Treasury Constant Maturity Rate + 3.20%), | ||||
| 4.35%, 01/15/2027 (a),(b) | 1,185,000 | 995,544 | ||
See accompanying notes.
106
| Schedule of Investments | ||||
| Principal Spectrum Preferred Securities Active ETF | ||||
| June 30, 2023 | ||||
| Principal | ||||
| BONDS (continued) | Amount | Value | ||
| Electric (continued) | ||||
| Dominion Energy, Inc. (continued) | ||||
| (5-year Treasury Constant Maturity Rate + 2.99%), | ||||
| 4.65%, 12/15/2024 (a),(b) | $ | 11,434,000 | $ | 10,280,310 |
| Duke Energy Corp. | ||||
| (5-year Treasury Constant Maturity Rate + 2.32%), | ||||
| 3.25%, 01/15/2082 (a) | 11,847,000 | 8,796,713 | ||
| (5-year Treasury Constant Maturity Rate + 3.39%), | ||||
| 4.88%, 09/16/2024 (a),(b) | 14,322,000 | 13,754,849 | ||
| Emera, Inc. | ||||
| (3-month USD LIBOR + 5.44%), | ||||
| 6.75%, 06/15/2076 (a) | 6,287,000 | 6,079,403 | ||
| Enel SpA | ||||
| (5-year Swap rate + 5.88%), | ||||
| 8.75%, 09/24/2073 (a),(d) | 3,335,000 | 3,316,531 | ||
| NextEra Energy Capital Holdings, Inc. | ||||
| (5-year Treasury Constant Maturity Rate + 2.55%), | ||||
| 3.80%, 03/15/2082 (a) | 15,229,000 | 12,785,189 | ||
| Southern Co. | ||||
| (5-year Treasury Constant Maturity Rate + 3.73%), | ||||
| 4.00%, 01/15/2051 (a) | 6,694,000 | 6,190,745 | ||
| $ | 74,353,205 | |||
| Hand/Machine Tools — 0.50% | ||||
| Stanley Black & Decker, Inc. | ||||
| (5-year Treasury Constant Maturity Rate + 2.66%), | ||||
| 4.00%, 03/15/2060 (a) | 3,816,000 | 2,913,075 | ||
| Insurance — 14.89% | ||||
| Allstate Corp. | ||||
| (3-month USD LIBOR + 2.94%), | ||||
| 5.75%, 08/15/2053 (a) | 3,251,000 | 3,199,209 | ||
| American International Group, Inc. | ||||
| (3-month USD LIBOR + 2.87%), | ||||
| 5.75%, 04/01/2048 (a) | 1,292,000 | 1,255,553 | ||
| Argentum Netherlands BV for Swiss Re Ltd. | ||||
| (3-month USD LIBOR + 3.78%), | ||||
| 5.63%, 08/15/2052 (a) | 5,600,000 | 5,264,000 | ||
| Argentum Netherlands BV for Zurich Insurance Co. Ltd. | ||||
| (5-year Treasury Constant Maturity Rate + 3.27%), | ||||
| 5.13%, 06/01/2048 (a) | 4,000,000 | 3,791,088 | ||
| Cloverie PLC for Zurich Insurance Co. Ltd. | ||||
| (3-month USD LIBOR + 4.92%), | ||||
| 5.63%, 06/24/2046 (a) | 5,600,000 | 5,500,768 | ||
| Corebridge Financial, Inc. | ||||
| (5-year Treasury Constant Maturity Rate + 3.85%), | ||||
| 6.88%, 12/15/2052 | 7,921,000 | 7,592,199 | ||
| Equitable Holdings, Inc. | ||||
| (5-year Treasury Constant Maturity Rate + 4.74%), | ||||
| 4.95%, 09/15/2025 (a),(b) | 3,605,000 | 3,347,967 | ||
| Liberty Mutual Group, Inc. | ||||
| (5-year Treasury Constant Maturity Rate + 3.32%), | ||||
| 4.13%, 12/15/2051 (a),(d) | 2,832,000 | 2,225,386 | ||
| Meiji Yasuda Life Insurance Co. | ||||
| (5-year Swap rate + 4.23%), | ||||
| 5.20%, 10/20/2045 (a),(d) | 3,210,000 | 3,102,756 | ||
| MetLife, Inc. | ||||
| (5-year Treasury Constant Maturity Rate + 3.58%), | ||||
| 3.85%, 09/15/2025 (a),(b) | 12,376,000 | 11,435,176 | ||
See accompanying notes.
107
| Schedule of Investments | ||||
| Principal Spectrum Preferred Securities Active ETF | ||||
| June 30, 2023 | ||||
| Principal | ||||
| BONDS (continued) | Amount | Value | ||
| Insurance (continued) | ||||
| MetLife, Inc. (continued) | ||||
| 9.25%, 04/08/2068 (d) | $ | 1,988,000 | $ | 2,304,735 |
| Nippon Life Insurance Co. | ||||
| (5-year Treasury Constant Maturity Rate + 2.65%), | ||||
| 2.75%, 01/21/2051 (a),(d) | 4,583,000 | 3,768,935 | ||
| (5-year Treasury Constant Maturity Rate + 2.60%), | ||||
| 2.90%, 09/16/2051 (a),(d) | 2,509,000 | 2,048,911 | ||
| Prudential Financial, Inc. | ||||
| (5-year Treasury Constant Maturity Rate + 3.04%), | ||||
| 3.70%, 10/01/2050 (a) | 14,198,000 | 11,975,019 | ||
| (5-year Treasury Constant Maturity Rate + 3.16%), | ||||
| 5.13%, 03/01/2052 (a) | 4,634,000 | 4,183,900 | ||
| Sumitomo Life Insurance Co. | ||||
| (5-year Treasury Constant Maturity Rate + 2.75%), | ||||
| 3.38%, 04/15/2081 (a),(d) | 4,030,000 | 3,471,491 | ||
| (3-month USD LIBOR + 4.44%), | ||||
| 6.50%, 09/20/2073 (a),(d) | 6,711,000 | 6,651,076 | ||
| Zurich Finance Ireland Designated Activity Co. | ||||
| (5-year Treasury Constant Maturity Rate + 2.78%), | ||||
| 3.00%, 04/19/2051 (a) | 6,000,000 | 4,679,700 | ||
| $ | 85,797,869 | |||
| Oil & Gas — 1.44% | ||||
| BP Capital Markets PLC | ||||
| (5-year Treasury Constant Maturity Rate + 4.04%), | ||||
| 4.38%, 06/22/2025 (a),(b) | 5,982,000 | 5,738,233 | ||
| (5-year Treasury Constant Maturity Rate + 4.40%), | ||||
| 4.88%, 03/22/2030 (a),(b) | 2,790,000 | 2,536,110 | ||
| $ | 8,274,343 | |||
| Pipelines — 5.49% | ||||
| Enbridge, Inc. | ||||
| (5-year Treasury Constant Maturity Rate + 5.31%), | ||||
| 5.75%, 07/15/2080 (a) | 2,485,000 | 2,244,276 | ||
| (3-month USD LIBOR + 3.89%), | ||||
| 6.00%, 01/15/2077 (a) | 4,882,000 | 4,528,488 | ||
| (5-year Treasury Constant Maturity Rate + 4.41%), | ||||
| 7.63%, 01/15/2083 (a) | 5,749,000 | 5,777,004 | ||
| Enterprise Products Operating LLC | ||||
| (3-month Term Secured Overnight Financing Rate + 3.29%), | ||||
| 5.25%, 08/16/2077 (a) | 3,213,000 | 2,809,633 | ||
| Transcanada Trust | ||||
| (6-month Secured Overnight Financing Rate + 4.42%), | ||||
| 5.50%, 09/15/2079 (a) | 5,185,000 | 4,447,434 | ||
| (5-year Treasury Constant Maturity Rate + 3.99%), | ||||
| 5.60%, 03/07/2082 (a) | 14,054,000 | 11,843,165 | ||
| $ | 31,650,000 | |||
| REITs — 0.52% | ||||
| Scentre Group Trust 2 | ||||
| (5-year Treasury Constant Maturity Rate + 4.38%), | ||||
| 4.75%, 09/24/2080 (a),(d) | 1,210,000 | 1,083,252 | ||
| (5-year Treasury Constant Maturity Rate + 4.69%), | ||||
| 5.13%, 09/24/2080 (a),(d) | 2,249,000 | 1,898,094 | ||
| $ | 2,981,346 | |||
| See accompanying notes. | 108 | |||
| Schedule of Investments | ||||||
| Principal Spectrum Preferred Securities Active ETF | ||||||
| June 30, 2023 | ||||||
| Principal | ||||||
| BONDS (continued) | Amount | Value | ||||
| Telecommunications — 1.23% | ||||||
| Vodafone Group PLC | ||||||
| (5-year Treasury Constant Maturity Rate + 2.77%), | ||||||
| 4.13%, 06/04/2081 (a) | $ | 1,793,000 | $ | 1,422,746 | ||
| (5-year Swap rate + 4.87%), | ||||||
| 7.00%, 04/04/2079 (a) | 5,518,000 | 5,657,881 | ||||
| $ | 7,080,627 | |||||
| TOTAL BONDS | $ | 554,413,194 | ||||
| INVESTMENT COMPANIES — 2.76% | Shares Held | Value | ||||
| Money Market Funds — 2.76% | ||||||
| Principal Government Money Market Fund — Class R-6 5.01% (e),(f),(g) | 3,970,623 | $ | 3,970,623 | |||
| State Street Institutional U.S. Government Money Market Fund — Premier Class | ||||||
| 5.03% (e) | 11,911,557 | 11,911,557 | ||||
| TOTAL INVESTMENT COMPANIES | $ | 15,882,180 | ||||
| Total Investments | $ | 570,295,374 | ||||
| Other Assets and Liabilities — 0.99% | 5,690,855 | |||||
| Total Net Assets — 100.00% | $ | 575,986,229 | ||||
| (a) | Rate shown is as of period end. The rate may be a variable or floating rate or a fixed rate which may convert to a variable or | |||||
| floating rate in the future. | ||||||
| (b) | Perpetual security. Perpetual securities pay an indefinite stream of interest, but they may be called by the issuer at an earlier | |||||
| date. Date shown, if any, reflects the next call date or final legal maturity date. Rate shown is as of period end. | ||||||
| (c) | Security or a portion of the security was on loan. At the end of the period, the value of these securities totaled $3,886,213 or | |||||
| 0.67% of net assets. | ||||||
| (d) | Security exempt from registration under Rule 144A of the Securities Act of 1933. These securities may be resold in | |||||
| transactions exempt from registration, normally to qualified institutional buyers. At the end of the period, the value of these | ||||||
| securities totaled $29,871,167 or 5.19% of net assets. | ||||||
| (e) | 1-day yield shown as of period end. | |||||
| (f) | Affiliated Security. Security is either an affiliate (and registered under the Investment Company Act of 1940) or an affiliate | |||||
| as defined by the Investment Company Act of 1940 (controls 5.00% or more of the outstanding voting shares of the security). | ||||||
| Please see Affiliated Securities sub-schedule for transactional information. | ||||||
| (g) | Security or a portion of the security was received as collateral for securities lending. At the end of the period, the value of | |||||
| these securities totaled $3,970,623 or 0.69% of net assets. | ||||||
| Portfolio Summary | ||||||
| Sector | Percent | |||||
| Financial | 74.68 | % | ||||
| Utilities | 12.91 | % | ||||
| Energy | 6.93 | % | ||||
| Money Market Funds | 2.76 | % | ||||
| Communications | 1.23 | % | ||||
| Industrial | 0.50 | % | ||||
| Other Assets and Liabilities | 0.99 | % | ||||
| TOTAL NET ASSETS | 100.00 | % | ||||
| See accompanying notes. | 109 | |||||
| Schedule of Investments | |||||||||||
| Principal Spectrum Preferred Securities Active ETF | |||||||||||
| June 30, 2023 | |||||||||||
| June 30, 2022 | Purchases | Sales | June 30, 2023 | ||||||||
| Affiliated Securities | Value | Cost | Proceeds | Value | |||||||
| Principal Government Money | |||||||||||
| Market Fund — Class R-6 5.01% | $ | — | $ | 65,065,961 | $ | 61,095,338 | $ | 3,970,623 | |||
| Principal Government Money | |||||||||||
| Market Fund — Institutional Class | |||||||||||
| 4.90 | % | 2,707,203 | 11,373,540 | 14,080,743 | — | ||||||
| $ | 2,707,203 | $ | 76,439,501 | $ | 75,176,081 | $ | 3,970,623 | ||||
| Realized Gain | |||||||||||
| Realized | from | Change in | |||||||||
| Gain/(Loss) on | Capital Gain | Unrealized | |||||||||
| Income (a) | Investments | Distributions | Gain/(Loss) | ||||||||
| Principal Government Money | |||||||||||
| Market Fund — Class R-6 5.01% | $ | — | $ | — | $ | — | $ | — | |||
| Principal Government Money | |||||||||||
| Market Fund — Institutional Class | |||||||||||
| 4.90 | % | — | — | — | — | ||||||
| $ | — | $ | �� | $ | — | $ | — | ||||
| (a) Amount excludes earnings from securities lending collateral. | |||||||||||
See accompanying notes.
110
| Schedule of Investments | ||||
| Principal Spectrum Tax-Advantaged Dividend Active ETF | ||||
| June 30, 2023 | ||||
| PREFERRED STOCKS — 10.75% | Shares Held | Value | ||
| Banks — 3.83% | ||||
| Bank of America Corp.; Series NN | ||||
| 4.38%, 11/03/2025 (a) | 4,380 | $ | 83,483 | |
| Morgan Stanley; Series I | ||||
| (3-month USD LIBOR + 3.71%), | ||||
| 6.38%, 10/15/2024 (a) | 17,030 | 417,916 | ||
| Morgan Stanley; Series P | ||||
| 6.50%, 10/15/2027 (a) | 4,000 | 103,840 | ||
| State Street Corp.; Series D | ||||
| (3-month USD LIBOR + 3.11%), | ||||
| 5.90%, 03/15/2024 (a) | 6,410 | 163,070 | ||
| $ | 768,309 | |||
| Insurance — 4.04% | ||||
| Allstate Corp.; Series H | ||||
| 5.10%, 10/15/2024 (a) | 11,500 | 253,000 | ||
| American International Group, Inc.; Series A | ||||
| 5.85%, 03/15/2024 (a) | 8,019 | 193,178 | ||
| MetLife, Inc.; Series F | ||||
| 4.75%, 03/15/2025 (a) | 17,250 | 365,700 | ||
| $ | 811,878 | |||
| Telecommunications — 2.88% | ||||
| AT&T, Inc.; Series A | ||||
| 5.00%, 12/12/2024 (a) | 11,381 | 254,024 | ||
| AT&T, Inc.; Series C | ||||
| 4.75%, 02/18/2025 (a) | 15,395 | 324,527 | ||
| $ | 578,551 | |||
| TOTAL PREFERRED STOCKS | $ | 2,158,738 | ||
| Principal | ||||
| BONDS — 86.77% | Amount | Value | ||
| Banks — 69.23% | ||||
| Bank of America Corp. | ||||
| (3-month Term Secured Overnight Financing Rate + 4.81%), | ||||
| 6.30%, 03/10/2026 (a),(b) | $ | 575,000 | $ | 573,419 |
| Bank of New York Mellon Corp. | ||||
| (5-year Treasury Constant Maturity Rate + 3.35%), | ||||
| 3.70%, 03/20/2026 (a),(b) | 230,000 | 203,033 | ||
| (5-year Treasury Constant Maturity Rate + 4.36%), | ||||
| 4.70%, 09/20/2025 (a),(b) | 275,000 | 267,094 | ||
| Bank of Nova Scotia | ||||
| (5-year Treasury Constant Maturity Rate + 4.55%), | ||||
| 4.90%, 06/04/2025 (a),(b) | 575,000 | 542,840 | ||
| (5-year Treasury Constant Maturity Rate + 4.38%), | ||||
| 8.63%, 10/27/2082 (b) | 300,000 | 312,575 | ||
| BNP Paribas SA | ||||
| (5-year Treasury Constant Maturity Rate + 4.90%), | ||||
| 7.75%, 08/16/2029 (a),(b),(c),(d) | 200,000 | 193,580 | ||
| Citigroup, Inc. | ||||
| (5-year Treasury Constant Maturity Rate + 3.42%), | ||||
| 3.88%, 02/18/2026 (a),(b) | 655,000 | 548,562 | ||
| (5-year Treasury Constant Maturity Rate + 3.20%), | ||||
| 7.38%, 05/15/2028 (a),(b) | 200,000 | 198,531 | ||
| Citizens Financial Group, Inc. | ||||
| (5-year Treasury Constant Maturity Rate + 5.31%), | ||||
| 5.65%, 10/06/2025 (a),(b) | 575,000 | 504,452 | ||
See accompanying notes.
111
| Schedule of Investments | ||||
| Principal Spectrum Tax-Advantaged Dividend Active ETF | ||||
| June 30, 2023 | ||||
| Principal | ||||
| BONDS (continued) | Amount | Value | ||
| Banks (continued) | ||||
| Credit Agricole SA | ||||
| (5-year Swap Rate + 4.90%), | ||||
| 7.88%, 01/23/2024 (a),(b),(d) | $ | 861,000 | $ | 851,002 |
| Fifth Third Bancorp | ||||
| (5-year Treasury Constant Maturity Rate + 4.22%), | ||||
| 4.50%, 09/30/2025 (a),(b) | 548,000 | 483,284 | ||
| Goldman Sachs Group, Inc. | ||||
| (5-year Treasury Constant Maturity Rate + 2.97%), | ||||
| 3.80%, 05/10/2026 (a),(b) | 438,000 | 350,510 | ||
| HSBC Holdings PLC | ||||
| (6-month U.S. International Swaps and Derivative Association + 4.37%), | ||||
| 6.38%, 03/30/2025 (a),(b),(d) | 861,000 | 824,537 | ||
| Huntington Bancshares, Inc. | ||||
| (10-year Treasury Constant Maturity Rate + 4.95%), | ||||
| 5.63%, 07/15/2030 (a),(b) | 575,000 | 513,827 | ||
| ING Groep NV | ||||
| (5-year Treasury Constant Maturity Rate + 4.34%), | ||||
| 5.75%, 11/16/2026 (a),(b),(d) | 861,000 | 760,388 | ||
| JPMorgan Chase & Co. | ||||
| (5-year Treasury Constant Maturity Rate + 2.85%), | ||||
| 3.65%, 06/01/2026 (a),(b) | 110,000 | 96,817 | ||
| Lloyds Banking Group PLC | ||||
| (5-year Swap Rate + 4.50%), | ||||
| 7.50%, 09/27/2025 (a),(b),(d) | 861,000 | 805,164 | ||
| M&T Bank Corp. | ||||
| (5-year Treasury Constant Maturity Rate + 2.68%), | ||||
| 3.50%, 09/01/2026 (a),(b) | 300,000 | 200,102 | ||
| (3-month USD LIBOR + 3.52%), | ||||
| 5.13%, 11/01/2026 (a),(b) | 247,000 | 194,971 | ||
| NatWest Group PLC | ||||
| (5-year Swap Rate + 5.72%), | ||||
| 8.00%, 08/10/2025 (a),(b),(d) | 861,000 | 838,123 | ||
| Nordea Bank Abp | ||||
| (5-year Treasury Constant Maturity Rate + 4.11%), | ||||
| 6.63%, 03/26/2026 (a),(b),(c),(d) | 861,000 | 811,742 | ||
| PNC Financial Services Group, Inc. | ||||
| (5-year Treasury Constant Maturity Rate + 3.00%), | ||||
| 6.00%, 05/15/2027 (a),(b) | 400,000 | 360,000 | ||
| (5-year Treasury Constant Maturity Rate + 3.24%), | ||||
| 6.20%, 09/15/2027 (a),(b) | 100,000 | 93,215 | ||
| Societe Generale SA | ||||
| (5-year Swap rate + 4.98%), | ||||
| 7.88%, 12/18/2023 (a),(b),(d) | 824,000 | 805,810 | ||
| Toronto-Dominion Bank | ||||
| (5-year Treasury Constant Maturity Rate + 4.07%), | ||||
| 8.13%, 10/31/2082 (b) | 414,000 | 420,574 | ||
| Truist Financial Corp. | ||||
| (5-year Treasury Constant Maturity Rate + 3.00%), | ||||
| 4.80%, 09/01/2024 (a),(b) | 400,000 | 341,000 | ||
| (5-year Treasury Constant Maturity Rate + 4.61%), | ||||
| 4.95%, 09/01/2025 (a),(b) | 575,000 | 531,875 | ||
| U.S. Bancorp | ||||
| (5-year Treasury Constant Maturity Rate + 2.54%), | ||||
| 3.70%, 01/15/2027 (a),(b) | 209,000 | 155,057 | ||
| UBS Group AG | ||||
| (5-year Swap rate + 4.34%), | ||||
| 7.00%, 01/31/2024 (a),(b),(d) | 861,000 | 831,423 | ||
See accompanying notes.
112
| Schedule of Investments | |||||
| Principal Spectrum Tax-Advantaged Dividend Active ETF | |||||
| June 30, 2023 | |||||
| Principal | |||||
| BONDS (continued) | Amount | Value | |||
| Banks (continued) | |||||
| Wells Fargo & Co. | |||||
| (5-year Treasury Constant Maturity Rate + 3.45%), | |||||
| 3.90%, 03/15/2026 (a),(b) | $ | 328,000 | $ | 288,771 | |
| $ | 13,902,278 | ||||
| Diversified Financial Services — 11.72% | |||||
| American Express Co. | |||||
| (5-year Treasury Constant Maturity Rate + 2.85%), | |||||
| 3.55%, 09/15/2026 (a),(b) | 700,000 | 581,000 | |||
| Capital One Financial Corp. | |||||
| (5-year Treasury Constant Maturity Rate + 3.16%), | |||||
| 3.95%, 09/01/2026 (a),(b) | 209,000 | 155,182 | |||
| Charles Schwab Corp. | |||||
| (5-year Treasury Constant Maturity Rate + 3.17%), | |||||
| 4.00%, 06/01/2026 (a),(b) | 328,000 | 266,582 | |||
| (5-year Treasury Constant Maturity Rate + 4.97%), | |||||
| 5.38%, 06/01/2025 (a),(b) | 375,000 | 358,395 | |||
| Discover Financial Services | |||||
| (5-year Treasury Constant Maturity Rate + 5.78%), | |||||
| 6.13%, 06/23/2025 (a),(b) | 575,000 | 547,939 | |||
| Voya Financial, Inc. | |||||
| (5-year Treasury Constant Maturity Rate + 3.36%), | |||||
| 6.13%, 09/15/2023 (a),(b) | 460,000 | 444,745 | |||
| $ | 2,353,843 | ||||
| Electric — 4.81% | |||||
| Dominion Energy, Inc. | |||||
| (5-year Treasury Constant Maturity Rate + 2.99%), | |||||
| 4.65%, 12/15/2024 (a),(b) | 460,000 | 413,586 | |||
| Duke Energy Corp. | |||||
| (5-year Treasury Constant Maturity Rate + 3.39%), | |||||
| 4.88%, 09/16/2024 (a),(b) | 575,000 | 552,230 | |||
| $ | 965,816 | ||||
| Insurance — 1.01% | |||||
| MetLife, Inc. | |||||
| (5-year Treasury Constant Maturity Rate + 3.58%), | |||||
| 3.85%, 09/15/2025 (a),(b) | 220,000 | 203,276 | |||
| TOTAL BONDS | $ | 17,425,213 | |||
| INVESTMENT COMPANIES — 1.42% | Shares Held | Value | |||
| Money Market Fund — 1.42% | |||||
| State Street Institutional U.S. Government Money Market Fund — Premier Class | |||||
| 5.03% (e) | 285,061 | $ | 285,061 | ||
| TOTAL INVESTMENT COMPANIES | $ | 285,061 | |||
| Total Investments | $ | 19,869,012 | |||
| Other Assets and Liabilities — 1.06% | 212,337 | ||||
| Total Net Assets — 100.00% | $ | 20,081,349 | |||
| (a) | Perpetual security. Perpetual securities pay an indefinite stream of interest, but they may be called by the issuer at an earlier | ||||
| date. Date shown, if any, reflects the next call date or final legal maturity date. Rate shown is as of period end. | |||||
| (b) | Rate shown is as of period end. The rate may be a variable or floating rate or a fixed rate which may convert to a variable or | ||||
| floating rate in the future. | |||||
| See accompanying notes. | 113 | ||||
| Schedule of Investments | |||
| Principal Spectrum Tax-Advantaged Dividend Active ETF | |||
| June 30, 2023 | |||
| (c) | Security exempt from registration under Rule 144A of the Securities Act of 1933. These securities may be resold in | ||
| transactions exempt from registration, normally to qualified institutional buyers. At the end of the period, the value of these | |||
| securities totaled $1,005,322 or 5.01% of net assets. | |||
| (d) | Security is a contingent convertible security, ("CoCo"). CoCo's are hybrid debt securities that may convert to equity or have | ||
| their principal written down upon occurrence of certain "triggers". At the end of the period, the value of these securities | |||
| totaled $6,721,769 or 33.47% of net assets. | |||
| (e) | 1-day yield shown as of period end. | ||
| Portfolio Summary | |||
| Sector | Percent | ||
| Financial | 89.83 | % | |
| Utilities | 4.81 | % | |
| Communications | 2.88 | % | |
| Money Market Fund | 1.42 | % | |
| Other Assets and Liabilities | 1.06 | % | |
| TOTAL NET ASSETS | 100.00 | % | |
| See accompanying notes. | 114 | ||
| Schedule of Investments | |||
| Principal U.S. Large-Cap Adaptive Multi-Factor ETF | |||
| June 30, 2023 | |||
| COMMON STOCKS — 99.63% | Shares Held | Value | |
| Advertising — 0.39% | |||
| Interpublic Group of Cos., Inc. | 326 | $ | 12,577 |
| Omnicom Group, Inc. | 138 | 13,131 | |
| $ | 25,708 | ||
| Aerospace & Defense — 1.49% | |||
| Boeing Co. (a) | 43 | 9,080 | |
| General Dynamics Corp. | 57 | 12,264 | |
| Howmet Aerospace, Inc. | 111 | 5,501 | |
| L3Harris Technologies, Inc. | 8 | 1,566 | |
| Lockheed Martin Corp. | 59 | 27,162 | |
| Northrop Grumman Corp. | 45 | 20,511 | |
| Raytheon Technologies Corp. | 140 | 13,714 | |
| TransDigm Group, Inc. | 9 | 8,048 | |
| $ | 97,846 | ||
| Agriculture — 0.60% | |||
| Altria Group, Inc. | 206 | 9,332 | |
| Archer-Daniels-Midland Co. | 151 | 11,409 | |
| Bunge Ltd. | 42 | 3,963 | |
| Philip Morris International, Inc. | 151 | 14,741 | |
| $ | 39,445 | ||
| Airlines — 0.40% | |||
| American Airlines Group, Inc. (a) | 232 | 4,162 | |
| Delta Air Lines, Inc. (a) | 258 | 12,265 | |
| United Airlines Holdings, Inc. (a) | 182 | 9,987 | |
| $ | 26,414 | ||
| Apparel — 0.37% | |||
| NIKE, Inc., Class B | 91 | 10,044 | |
| Ralph Lauren Corp. | 57 | 7,028 | |
| Tapestry, Inc. | 176 | 7,533 | |
| $ | 24,605 | ||
| Auto Manufacturers — 2.52% | |||
| Cummins, Inc. | 65 | 15,935 | |
| General Motors Co. | 171 | 6,594 | |
| PACCAR, Inc. | 221 | 18,487 | |
| Tesla, Inc. (a) | 476 | 124,602 | |
| $ | 165,618 | ||
| Auto Parts & Equipment — 0.23% | |||
| Aptiv PLC (a) | 38 | 3,880 | |
| BorgWarner, Inc. | 232 | 11,347 | |
| $ | 15,227 | ||
| Banks — 3.46% | |||
| Bank of America Corp. | 489 | 14,029 | |
| Bank of New York Mellon Corp. | 218 | 9,705 | |
| Citigroup, Inc. | 187 | 8,609 | |
| Citizens Financial Group, Inc. | 131 | 3,416 | |
| Comerica, Inc. | 88 | 3,728 | |
| Fifth Third Bancorp | 165 | 4,325 | |
| Goldman Sachs Group, Inc. | 63 | 20,320 | |
| Huntington Bancshares, Inc. | 997 | 10,748 | |
| JPMorgan Chase & Co. | 520 | 75,629 | |
| KeyCorp | 329 | 3,040 | |
See accompanying notes.
115
| Schedule of Investments | |||
| Principal U.S. Large-Cap Adaptive Multi-Factor ETF | |||
| June 30, 2023 | |||
| COMMON STOCKS (continued) | Shares Held | Value | |
| Banks (continued) | |||
| M&T Bank Corp. | 38 | $ | 4,703 |
| Morgan Stanley | 231 | 19,727 | |
| Northern Trust Corp. | 51 | 3,781 | |
| PNC Financial Services Group, Inc. | 48 | 6,046 | |
| Regions Financial Corp. | 236 | 4,205 | |
| State Street Corp. | 120 | 8,782 | |
| Truist Financial Corp. | 172 | 5,220 | |
| U.S. Bancorp | 169 | 5,584 | |
| Wells Fargo & Co. | 292 | 12,463 | |
| Zions Bancorp NA | 126 | 3,384 | |
| $ | 227,444 | ||
| Beverages — 1.61% | |||
| Brown-Forman Corp., Class B | 62 | 4,140 | |
| Coca-Cola Co. | 573 | 34,506 | |
| Constellation Brands, Inc., Class A | 26 | 6,399 | |
| Keurig Dr Pepper, Inc. | 38 | 1,188 | |
| Molson Coors Beverage Co., Class B | 157 | 10,337 | |
| Monster Beverage Corp. (a) | 204 | 11,718 | |
| PepsiCo, Inc. | 203 | 37,600 | |
| $ | 105,888 | ||
| Biotechnology — 1.35% | |||
| Amgen, Inc. | 91 | 20,204 | |
| Biogen, Inc. (a) | 37 | 10,539 | |
| Corteva, Inc. | 114 | 6,532 | |
| Gilead Sciences, Inc. | 240 | 18,497 | |
| Incyte Corp. (a) | 64 | 3,984 | |
| Moderna, Inc. (a) | 39 | 4,739 | |
| Regeneron Pharmaceuticals, Inc. (a) | 9 | 6,467 | |
| Vertex Pharmaceuticals, Inc. (a) | 50 | 17,595 | |
| $ | 88,557 | ||
| Chemicals — 1.77% | |||
| Air Products & Chemicals, Inc. | 49 | 14,677 | |
| Albemarle Corp. | 56 | 12,493 | |
| Celanese Corp. | 38 | 4,400 | |
| CF Industries Holdings, Inc. | 102 | 7,081 | |
| Dow, Inc. | 130 | 6,924 | |
| DuPont de Nemours, Inc. | 84 | 6,001 | |
| Eastman Chemical Co. | 48 | 4,019 | |
| FMC Corp. | 63 | 6,573 | |
| Linde PLC | 77 | 29,343 | |
| LyondellBasell Industries NV, Class A | 109 | 10,009 | |
| Mosaic Co. | 97 | 3,395 | |
| PPG Industries, Inc. | 33 | 4,894 | |
| Sherwin-Williams Co. | 24 | 6,373 | |
| $ | 116,182 | ||
| Commercial Services — 1.95% | |||
| Automatic Data Processing, Inc. | 79 | 17,364 | |
| Cintas Corp. | 24 | 11,930 | |
| CoStar Group, Inc. (a) | 116 | 10,324 | |
| FleetCor Technologies, Inc. (a) | 36 | 9,039 | |
| Gartner, Inc. (a) | 28 | 9,809 | |
| MarketAxess Holdings, Inc. | 17 | 4,444 | |
| PayPal Holdings, Inc. (a) | 88 | 5,872 | |
| Quanta Services, Inc. | 55 | 10,805 | |
See accompanying notes.
116
| Schedule of Investments | |||
| Principal U.S. Large-Cap Adaptive Multi-Factor ETF | |||
| June 30, 2023 | |||
| COMMON STOCKS (continued) | Shares Held | Value | |
| Commercial Services (continued) | |||
| Robert Half International, Inc. | 86 | $ | 6,469 |
| Rollins, Inc. | 180 | 7,709 | |
| S&P Global, Inc. | 33 | 13,229 | |
| United Rentals, Inc. | 33 | 14,697 | |
| Verisk Analytics, Inc. | 29 | 6,555 | |
| $ | 128,246 | ||
| Computers — 9.17% | |||
| Accenture PLC, Class A | 88 | 27,155 | |
| Apple, Inc. | 2,627 | 509,559 | |
| Cognizant Technology Solutions Corp., Class A | 150 | 9,792 | |
| DXC Technology Co. (a) | 153 | 4,088 | |
| EPAM Systems, Inc. (a) | 24 | 5,394 | |
| Fortinet, Inc. (a) | 71 | 5,367 | |
| Hewlett Packard Enterprise Co. | 379 | 6,367 | |
| HP, Inc. | 166 | 5,098 | |
| International Business Machines Corp. | 92 | 12,311 | |
| Leidos Holdings, Inc. | 87 | 7,698 | |
| NetApp, Inc. | 81 | 6,188 | |
| Seagate Technology Holdings PLC | 63 | 3,898 | |
| $ | 602,915 | ||
| Construction Materials — 0.78% | |||
| Carrier Global Corp. | 319 | 15,858 | |
| Johnson Controls International PLC | 82 | 5,587 | |
| Martin Marietta Materials, Inc. | 10 | 4,617 | |
| Masco Corp. | 148 | 8,492 | |
| Trane Technologies PLC | 50 | 9,563 | |
| Vulcan Materials Co. | 31 | 6,989 | |
| $ | 51,106 | ||
| Distribution/Wholesale — 0.82% | |||
| Copart, Inc. (a) | 133 | 12,131 | |
| Fastenal Co. | 99 | 5,840 | |
| LKQ Corp. | 215 | 12,528 | |
| Pool Corp. | 21 | 7,867 | |
| WW Grainger, Inc. | 20 | 15,772 | |
| $ | 54,138 | ||
| Diversified Financial Services — 3.61% | |||
| American Express Co. | 100 | 17,420 | |
| Ameriprise Financial, Inc. | 32 | 10,629 | |
| BlackRock, Inc. | 24 | 16,587 | |
| Capital One Financial Corp. | 60 | 6,562 | |
| Cboe Global Markets, Inc. | 35 | 4,830 | |
| Charles Schwab Corp. | 122 | 6,915 | |
| CME Group, Inc. | 43 | 7,968 | |
| Discover Financial Services | 48 | 5,609 | |
| Franklin Resources, Inc. | 261 | 6,971 | |
| Intercontinental Exchange, Inc. | 71 | 8,029 | |
| Invesco Ltd. | 245 | 4,118 | |
| Mastercard, Inc., Class A | 129 | 50,736 | |
| Nasdaq, Inc. | 161 | 8,026 | |
| Raymond James Financial, Inc. | 84 | 8,717 | |
| Synchrony Financial | 261 | 8,853 | |
| T Rowe Price Group, Inc. | 43 | 4,817 | |
See accompanying notes.
117
| Schedule of Investments | |||
| Principal U.S. Large-Cap Adaptive Multi-Factor ETF | |||
| June 30, 2023 | |||
| COMMON STOCKS (continued) | Shares Held | Value | |
| Diversified Financial Services (continued) | |||
| Visa, Inc., Class A | 255 | $ | 60,557 |
| $ | 237,344 | ||
| Electric — 1.72% | |||
| AES Corp. | 154 | 3,192 | |
| Alliant Energy Corp. | 77 | 4,041 | |
| Ameren Corp. | 55 | 4,492 | |
| American Electric Power Co., Inc. | 75 | 6,315 | |
| CenterPoint Energy, Inc. | 39 | 1,137 | |
| CMS Energy Corp. | 72 | 4,230 | |
| Consolidated Edison, Inc. | 103 | 9,311 | |
| Constellation Energy Corp. | 53 | 4,852 | |
| Dominion Energy, Inc. | 30 | 1,554 | |
| DTE Energy Co. | 44 | 4,841 | |
| Duke Energy Corp. | 87 | 7,807 | |
| Edison International | 79 | 5,486 | |
| Entergy Corp. | 12 | 1,168 | |
| Evergy, Inc. | 18 | 1,052 | |
| Eversource Energy | 65 | 4,610 | |
| Exelon Corp. | 38 | 1,548 | |
| FirstEnergy Corp. | 133 | 5,171 | |
| NextEra Energy, Inc. | 46 | 3,413 | |
| NRG Energy, Inc. | 118 | 4,412 | |
| PG&E Corp. (a) | 336 | 5,806 | |
| Pinnacle West Capital Corp. | 54 | 4,399 | |
| PPL Corp. | 186 | 4,922 | |
| Public Service Enterprise Group, Inc. | 23 | 1,440 | |
| Sempra Energy | 12 | 1,747 | |
| Southern Co. | 31 | 2,178 | |
| WEC Energy Group, Inc. | 100 | 8,824 | |
| Xcel Energy, Inc. | 86 | 5,347 | |
| $ | 113,295 | ||
| Electrical Components & Equipment — 0.27% | |||
| AMETEK, Inc. | 68 | 11,008 | |
| Emerson Electric Co. | 78 | 7,050 | |
| $ | 18,058 | ||
| Electronics — 1.30% | |||
| Agilent Technologies, Inc. | 68 | 8,177 | |
| Allegion PLC | 95 | 11,402 | |
| Amphenol Corp., Class A | 146 | 12,402 | |
| Fortive Corp. | 79 | 5,907 | |
| Garmin Ltd. | 41 | 4,276 | |
| Honeywell International, Inc. | 68 | 14,110 | |
| Keysight Technologies, Inc. (a) | 49 | 8,205 | |
| Mettler-Toledo International, Inc. (a) | 6 | 7,870 | |
| TE Connectivity Ltd. | 92 | 12,895 | |
| $ | 85,244 | ||
| Energy — Alternate Sources — 0.10% | |||
| Enphase Energy, Inc. (a) | 17 | 2,847 | |
| First Solar, Inc. (a) | 18 | 3,422 | |
| $ | 6,269 | ||
| Engineering & Construction — 0.13% | |||
| Jacobs Solutions, Inc. | 71 | 8,441 | |
See accompanying notes.
118
| Schedule of Investments | |||
| Principal U.S. Large-Cap Adaptive Multi-Factor ETF | |||
| June 30, 2023 | |||
| COMMON STOCKS (continued) | Shares Held | Value | |
| Entertainment — 0.08% | |||
| Live Nation Entertainment, Inc. (a) | 58 | $ | 5,284 |
| Environmental Control — 0.34% | |||
| Pentair PLC | 133 | 8,592 | |
| Republic Services, Inc. | 38 | 5,821 | |
| Waste Management, Inc. | 46 | 7,977 | |
| $ | 22,390 | ||
| Food — 1.68% | |||
| Campbell Soup Co. | 151 | 6,902 | |
| Conagra Brands, Inc. | 129 | 4,350 | |
| General Mills, Inc. | 212 | 16,260 | |
| Hershey Co. | 42 | 10,487 | |
| Hormel Foods Corp. | 105 | 4,223 | |
| J M Smucker Co. | 31 | 4,578 | |
| Kellogg Co. | 180 | 12,132 | |
| Kraft Heinz Co. | 149 | 5,290 | |
| Kroger Co. | 211 | 9,917 | |
| Lamb Weston Holdings, Inc. | 74 | 8,506 | |
| McCormick & Co., Inc. | 16 | 1,396 | |
| Mondelez International, Inc., Class A | 148 | 10,795 | |
| Sysco Corp. | 144 | 10,685 | |
| Tyson Foods, Inc., Class A | 93 | 4,747 | |
| $ | 110,268 | ||
| Forest Products & Paper — 0.06% | |||
| International Paper Co. | 114 | 3,626 | |
| Gas — 0.18% | |||
| Atmos Energy Corp. | 69 | 8,028 | |
| NiSource, Inc. | 144 | 3,938 | |
| $ | 11,966 | ||
| Hand/Machine Tools — 0.21% | |||
| Snap-on, Inc. | 49 | 14,121 | |
| Healthcare — Products — 2.02% | |||
| Abbott Laboratories | 156 | 17,007 | |
| Bio-Techne Corp. | 40 | 3,265 | |
| Boston Scientific Corp. (a) | 174 | 9,412 | |
| Danaher Corp. | 44 | 10,560 | |
| Edwards Lifesciences Corp. (a) | 60 | 5,660 | |
| GE HealthCare Technologies, Inc. (a) | 116 | 9,424 | |
| Hologic, Inc. (a) | 115 | 9,311 | |
| IDEXX Laboratories, Inc. (a) | 19 | 9,542 | |
| Insulet Corp. (a) | 12 | 3,460 | |
| Medtronic PLC | 33 | 2,907 | |
| ResMed, Inc. | 26 | 5,681 | |
| Stryker Corp. | 53 | 16,170 | |
| Thermo Fisher Scientific, Inc. | 33 | 17,218 | |
| Waters Corp. (a) | 11 | 2,932 | |
| West Pharmaceutical Services, Inc. | 11 | 4,207 | |
| Zimmer Biomet Holdings, Inc. | 41 | 5,970 | |
| $ | 132,726 | ||
| Healthcare — Services — 2.94% | |||
| Catalent, Inc. (a) | 43 | 1,865 | |
| Centene Corp. (a) | 103 | 6,947 | |
| Charles River Laboratories International, Inc. (a) | 34 | 7,149 | |
See accompanying notes.
119
| Schedule of Investments | |||
| Principal U.S. Large-Cap Adaptive Multi-Factor ETF | |||
| June 30, 2023 | |||
| COMMON STOCKS (continued) | Shares Held | Value | |
| Healthcare — Services (continued) | |||
| DaVita, Inc. (a) | 47 | $ | 4,722 |
| Elevance Health, Inc. | 43 | 19,105 | |
| HCA Healthcare, Inc. | 53 | 16,084 | |
| Humana, Inc. | 40 | 17,885 | |
| IQVIA Holdings, Inc. (a) | 48 | 10,789 | |
| Laboratory Corp. of America Holdings | 26 | 6,275 | |
| Molina Healthcare, Inc. (a) | 31 | 9,338 | |
| Quest Diagnostics, Inc. | 38 | 5,341 | |
| UnitedHealth Group, Inc. | 165 | 79,306 | |
| Universal Health Services, Inc., Class B | 55 | 8,677 | |
| $ | 193,483 | ||
| Home Builders — 0.88% | |||
| DR Horton, Inc. | 134 | 16,307 | |
| Lennar Corp., Class A | 119 | 14,912 | |
| NVR, Inc. (a) | 2 | 12,701 | |
| PulteGroup, Inc. | 181 | 14,060 | |
| $ | 57,980 | ||
| Home Furnishings — 0.07% | |||
| Whirlpool Corp. | 29 | 4,315 | |
| Household Products — 0.80% | |||
| Colgate-Palmolive Co. | 182 | 14,021 | |
| Procter & Gamble Co. | 256 | 38,846 | |
| $ | 52,867 | ||
| Household Products/Wares — 0.52% | |||
| Avery Dennison Corp. | 70 | 12,026 | |
| Church & Dwight Co., Inc. | 53 | 5,312 | |
| Clorox Co. | 31 | 4,931 | |
| Kimberly-Clark Corp. | 87 | 12,011 | |
| $ | 34,280 | ||
| Insurance — 3.85% | |||
| Aflac, Inc. | 178 | 12,425 | |
| Allstate Corp. | 46 | 5,016 | |
| American International Group, Inc. | 110 | 6,329 | |
| Aon PLC, Class A | 44 | 15,189 | |
| Arch Capital Group Ltd. (a) | 129 | 9,656 | |
| Arthur J Gallagher & Co. | 58 | 12,735 | |
| Assurant, Inc. | 35 | 4,400 | |
| Berkshire Hathaway, Inc., Class B (a) | 189 | 64,449 | |
| Brown & Brown, Inc. | 143 | 9,844 | |
| Chubb Ltd. | 52 | 10,013 | |
| Everest Re Group Ltd. | 22 | 7,521 | |
| Globe Life, Inc. | 102 | 11,181 | |
| Hartford Financial Services Group, Inc. | 143 | 10,299 | |
| Lincoln National Corp. | 167 | 4,302 | |
| Loews Corp. | 90 | 5,344 | |
| Marsh & McLennan Cos., Inc. | 54 | 10,156 | |
| MetLife, Inc. | 123 | 6,953 | |
| Progressive Corp. | 121 | 16,017 | |
| Prudential Financial, Inc. | 63 | 5,558 | |
| Travelers Cos., Inc. | 71 | 12,330 | |
| W R Berkley Corp. | 132 | 7,862 | |
See accompanying notes.
120
| Schedule of Investments | |||
| Principal U.S. Large-Cap Adaptive Multi-Factor ETF | |||
| June 30, 2023 | |||
| COMMON STOCKS (continued) | Shares Held | Value | |
| Insurance (continued) | |||
| Willis Towers Watson PLC | 24 | $ | 5,652 |
| $ | 253,231 | ||
| Internet — 9.66% | |||
| Alphabet, Inc., Class A (a) | 1,054 | 126,164 | |
| Alphabet, Inc., Class C (a) | 920 | 111,292 | |
| Amazon.com, Inc. (a) | 1,577 | 205,578 | |
| Booking Holdings, Inc. (a) | 6 | 16,202 | |
| CDW Corp. | 70 | 12,845 | |
| Expedia Group, Inc. (a) | 48 | 5,251 | |
| F5, Inc. (a) | 26 | 3,803 | |
| Gen Digital, Inc. | 231 | 4,285 | |
| Meta Platforms, Inc., Class A (a) | 393 | 112,783 | |
| Netflix, Inc. (a) | 62 | 27,310 | |
| VeriSign, Inc. (a) | 40 | 9,039 | |
| $ | 634,552 | ||
| Iron & Steel — 0.41% | |||
| Nucor Corp. | 97 | 15,906 | |
| Steel Dynamics, Inc. | 102 | 11,111 | |
| $ | 27,017 | ||
| Leisure Time — 0.09% | |||
| Royal Caribbean Cruises Ltd. (a) | 55 | 5,706 | |
| Lodging — 0.60% | |||
| Hilton Worldwide Holdings, Inc. | 44 | 6,404 | |
| Las Vegas Sands Corp. (a) | 68 | 3,944 | |
| Marriott International, Inc., Class A | 98 | 18,002 | |
| MGM Resorts International (a) | 179 | 7,862 | |
| Wynn Resorts Ltd. | 30 | 3,168 | |
| $ | 39,380 | ||
| Machinery — Construction & Mining — 0.31% | |||
| Caterpillar, Inc. | 82 | 20,176 | |
| Machinery — Diversified — 1.24% | |||
| Deere & Co. | 64 | 25,932 | |
| Dover Corp. | 59 | 8,711 | |
| IDEX Corp. | 36 | 7,749 | |
| Ingersoll Rand, Inc. | 70 | 4,575 | |
| Nordson Corp. | 14 | 3,475 | |
| Otis Worldwide Corp. | 74 | 6,587 | |
| Rockwell Automation, Inc. | 30 | 9,884 | |
| Westinghouse Air Brake Technologies Corp. | 95 | 10,419 | |
| Xylem, Inc. | 36 | 4,054 | |
| $ | 81,386 | ||
| Media — 1.00% | |||
| Charter Communications, Inc., Class A (a) | 27 | 9,919 | |
| Comcast Corp., Class A | 410 | 17,036 | |
| DISH Network Corp., Class A (a) | 390 | 2,570 | |
| FactSet Research Systems, Inc. | 19 | 7,612 | |
| Fox Corp., Class A | 230 | 7,820 | |
| Fox Corp., Class B | 146 | 4,656 | |
| News Corp., Class A | 224 | 4,368 | |
| News Corp., Class B | 205 | 4,043 | |
| Paramount Global, Class B | 189 | 3,007 | |
See accompanying notes.
121
| Schedule of Investments | |||
| Principal U.S. Large-Cap Adaptive Multi-Factor ETF | |||
| June 30, 2023 | |||
| COMMON STOCKS (continued) | Shares Held | Value | |
| Media (continued) | |||
| Warner Bros Discovery, Inc. (a) | 354 | $ | 4,439 |
| $ | 65,470 | ||
| Mining — 0.10% | |||
| Freeport-McMoRan, Inc. | 163 | 6,520 | |
| Miscellaneous Manufacturers — 1.26% | |||
| 3M Co. | 128 | 12,812 | |
| A O Smith Corp. | 48 | 3,493 | |
| Eaton Corp. PLC | 48 | 9,653 | |
| General Electric Co. | 180 | 19,773 | |
| Illinois Tool Works, Inc. | 58 | 14,509 | |
| Parker-Hannifin Corp. | 16 | 6,241 | |
| Teledyne Technologies, Inc. (a) | 19 | 7,811 | |
| Textron, Inc. | 123 | 8,318 | |
| $ | 82,610 | ||
| Oil & Gas — 3.95% | |||
| APA Corp. | 114 | 3,895 | |
| Chevron Corp. | 270 | 42,485 | |
| ConocoPhillips | 191 | 19,790 | |
| Coterra Energy, Inc. | 319 | 8,071 | |
| Devon Energy Corp. | 106 | 5,124 | |
| Diamondback Energy, Inc. | 65 | 8,538 | |
| EOG Resources, Inc. | 114 | 13,046 | |
| EQT Corp. | 127 | 5,224 | |
| Exxon Mobil Corp. | 730 | 78,292 | |
| Hess Corp. | 37 | 5,030 | |
| Marathon Oil Corp. | 316 | 7,274 | |
| Marathon Petroleum Corp. | 137 | 15,974 | |
| Occidental Petroleum Corp. | 96 | 5,645 | |
| Phillips 66 | 161 | 15,356 | |
| Pioneer Natural Resources Co. | 55 | 11,395 | |
| Valero Energy Corp. | 124 | 14,545 | |
| $ | 259,684 | ||
| Oil & Gas Services — 0.18% | |||
| Halliburton Co. | 160 | 5,278 | |
| Schlumberger NV | 137 | 6,730 | |
| $ | 12,008 | ||
| Packaging & Containers — 0.43% | |||
| Amcor PLC | 1,095 | 10,928 | |
| Packaging Corp. of America | 60 | 7,930 | |
| Sealed Air Corp. | 147 | 5,880 | |
| Westrock Co. | 128 | 3,721 | |
| $ | 28,459 | ||
| Pharmaceuticals — 6.28% | |||
| AbbVie, Inc. | 369 | 49,715 | |
| AmerisourceBergen Corp. | 87 | 16,742 | |
| Becton Dickinson & Co. | 58 | 15,313 | |
| Bristol-Myers Squibb Co. | 356 | 22,766 | |
| Cardinal Health, Inc. | 130 | 12,294 | |
| Cigna Group | 64 | 17,959 | |
| CVS Health Corp. | 147 | 10,162 | |
| Dexcom, Inc. (a) | 83 | 10,666 | |
| Eli Lilly & Co. | 140 | 65,657 | |
See accompanying notes.
122
| Schedule of Investments | |||
| Principal U.S. Large-Cap Adaptive Multi-Factor ETF | |||
| June 30, 2023 | |||
| COMMON STOCKS (continued) | Shares Held | Value | |
| Pharmaceuticals (continued) | |||
| Henry Schein, Inc. (a) | 62 | $ | 5,028 |
| Johnson & Johnson | 308 | 50,980 | |
| McKesson Corp. | 51 | 21,793 | |
| Merck & Co., Inc. | 533 | 61,503 | |
| Organon & Co. | 163 | 3,392 | |
| Pfizer, Inc. | 848 | 31,105 | |
| Viatris, Inc. | 1,081 | 10,788 | |
| Zoetis, Inc. | 39 | 6,716 | |
| $ | 412,579 | ||
| Pipelines — 0.48% | |||
| Kinder Morgan, Inc. | 649 | 11,176 | |
| ONEOK, Inc. | 153 | 9,443 | |
| Targa Resources Corp. | 60 | 4,566 | |
| Williams Cos., Inc. | 193 | 6,297 | |
| $ | 31,482 | ||
| Real Estate — 0.08% | |||
| CBRE Group, Inc., Class A (a) | 65 | 5,246 | |
| REITs — 1.57% | |||
| AvalonBay Communities, Inc. | 30 | 5,678 | |
| Boston Properties, Inc. | 74 | 4,262 | |
| Camden Property Trust | 37 | 4,028 | |
| Crown Castle, Inc. | 41 | 4,672 | |
| Equinix, Inc. | 17 | 13,327 | |
| Equity Residential | 21 | 1,385 | |
| Extra Space Storage, Inc. | 22 | 3,275 | |
| Federal Realty Investment Trust | 10 | 968 | |
| Host Hotels & Resorts, Inc. | 259 | 4,359 | |
| Iron Mountain, Inc. | 131 | 7,443 | |
| Mid-America Apartment Communities, Inc. | 28 | 4,252 | |
| Prologis, Inc. | 69 | 8,461 | |
| Public Storage | 22 | 6,421 | |
| Realty Income Corp. | 102 | 6,099 | |
| Regency Centers Corp. | 64 | 3,953 | |
| SBA Communications Corp. | 14 | 3,245 | |
| Simon Property Group, Inc. | 92 | 10,624 | |
| VICI Properties, Inc. | 184 | 5,783 | |
| Weyerhaeuser Co. | 156 | 5,228 | |
| $ | 103,463 | ||
| Retail — 4.79% | |||
| Advance Auto Parts, Inc. | 34 | 2,390 | |
| AutoZone, Inc. (a) | 7 | 17,454 | |
| Bath & Body Works, Inc. | 100 | 3,750 | |
| Best Buy Co., Inc. | 56 | 4,589 | |
| CarMax, Inc. (a) | 64 | 5,357 | |
| Chipotle Mexican Grill, Inc. (a) | 6 | 12,834 | |
| Costco Wholesale Corp. | 37 | 19,920 | |
| Darden Restaurants, Inc. | 58 | 9,691 | |
| Dollar General Corp. | 57 | 9,677 | |
| Dollar Tree, Inc. (a) | 63 | 9,040 | |
| Genuine Parts Co. | 83 | 14,046 | |
| Home Depot, Inc. | 156 | 48,460 | |
| Lowe's Cos., Inc. | 50 | 11,285 | |
| McDonald's Corp. | 65 | 19,397 | |
| O'Reilly Automotive, Inc. (a) | 22 | 21,017 | |
See accompanying notes.
123
| Schedule of Investments | |||
| Principal U.S. Large-Cap Adaptive Multi-Factor ETF | |||
| June 30, 2023 | |||
| COMMON STOCKS (continued) | Shares Held | Value | |
| Retail (continued) | |||
| Ross Stores, Inc. | 58 | $ | 6,504 |
| Starbucks Corp. | 115 | 11,392 | |
| TJX Cos., Inc. | 127 | 10,768 | |
| Tractor Supply Co. | 39 | 8,623 | |
| Ulta Beauty, Inc. (a) | 27 | 12,706 | |
| Walmart, Inc. | 314 | 49,354 | |
| Yum! Brands, Inc. | 46 | 6,373 | |
| $ | 314,627 | ||
| Semiconductors — 6.63% | |||
| Analog Devices, Inc. | 79 | 15,390 | |
| Applied Materials, Inc. | 136 | 19,657 | |
| Broadcom, Inc. | 54 | 46,841 | |
| KLA Corp. | 44 | 21,341 | |
| Lam Research Corp. | 38 | 24,429 | |
| Microchip Technology, Inc. | 190 | 17,022 | |
| Micron Technology, Inc. | 112 | 7,068 | |
| Monolithic Power Systems, Inc. | 15 | 8,103 | |
| NVIDIA Corp. | 435 | 184,014 | |
| NXP Semiconductors NV | 87 | 17,807 | |
| ON Semiconductor Corp. (a) | 176 | 16,646 | |
| Qorvo, Inc. (a) | 39 | 3,979 | |
| QUALCOMM, Inc. | 165 | 19,642 | |
| Skyworks Solutions, Inc. | 66 | 7,306 | |
| Texas Instruments, Inc. | 146 | 26,283 | |
| $ | 435,528 | ||
| Shipbuilding — 0.14% | |||
| Huntington Ingalls Industries, Inc. | 39 | 8,876 | |
| Software — 9.21% | |||
| Activision Blizzard, Inc. (a) | 92 | 7,756 | |
| Adobe, Inc. (a) | 30 | 14,670 | |
| Akamai Technologies, Inc. (a) | 52 | 4,673 | |
| ANSYS, Inc. (a) | 25 | 8,257 | |
| Autodesk, Inc. (a) | 22 | 4,501 | |
| Broadridge Financial Solutions, Inc. | 31 | 5,134 | |
| Cadence Design Systems, Inc. (a) | 55 | 12,899 | |
| Ceridian HCM Holding, Inc. (a) | 47 | 3,148 | |
| Electronic Arts, Inc. | 43 | 5,577 | |
| Fair Isaac Corp. (a) | 5 | 4,046 | |
| Fiserv, Inc. (a) | 112 | 14,129 | |
| Intuit, Inc. | 20 | 9,164 | |
| Jack Henry & Associates, Inc. | 20 | 3,347 | |
| Microsoft Corp. | 1,315 | 447,810 | |
| MSCI, Inc. | 18 | 8,447 | |
| Oracle Corp. | 147 | 17,506 | |
| Paychex, Inc. | 51 | 5,705 | |
| Paycom Software, Inc. | 11 | 3,534 | |
| PTC, Inc. (a) | 35 | 4,980 | |
| Roper Technologies, Inc. | 15 | 7,212 | |
| Synopsys, Inc. (a) | 29 | 12,627 | |
| $ | 605,122 | ||
| Telecommunications — 1.77% | |||
| Arista Networks, Inc. (a) | 56 | 9,075 | |
| AT&T, Inc. | 690 | 11,006 | |
| Cisco Systems, Inc. | 912 | 47,187 | |
See accompanying notes.
124
| Schedule of Investments | |||||
| Principal U.S. Large-Cap Adaptive Multi-Factor ETF | |||||
| June 30, 2023 | |||||
| COMMON STOCKS (continued) | Shares Held | Value | |||
| Telecommunications (continued) | |||||
| Corning, Inc. | 38 | $ | 1,332 | ||
| Juniper Networks, Inc. | 30 | 940 | |||
| Motorola Solutions, Inc. | 41 | 12,024 | |||
| T-Mobile U.S., Inc. (a) | 67 | 9,306 | |||
| Verizon Communications, Inc. | 680 | 25,289 | |||
| $ | 116,159 | ||||
| Transportation — 1.70% | |||||
| CH Robinson Worldwide, Inc. | 82 | 7,737 | |||
| CSX Corp. | 485 | 16,538 | |||
| Expeditors International of Washington, Inc. | 103 | 12,476 | |||
| FedEx Corp. | 54 | 13,387 | |||
| JB Hunt Transport Services, Inc. | 42 | 7,603 | |||
| Norfolk Southern Corp. | 59 | 13,379 | |||
| Old Dominion Freight Line, Inc. | 24 | 8,874 | |||
| Union Pacific Corp. | 45 | 9,208 | |||
| United Parcel Service, Inc., Class B | 125 | 22,406 | |||
| $ | 111,608 | ||||
| Water — 0.08% | |||||
| American Water Works Co., Inc. | 35 | 4,996 | |||
| TOTAL COMMON STOCKS | $ | 6,547,181 | |||
| INVESTMENT COMPANIES — 0.31% | Shares Held | Value | |||
| Money Market Fund — 0.31% | |||||
| State Street Institutional U.S. Government Money Market Fund — Premier Class | |||||
| 5.03% (b) | 20,378 | $ | 20,378 | ||
| TOTAL INVESTMENT COMPANIES | $ | 20,378 | |||
| Total Investments | $ | 6,567,559 | |||
| Other Assets and Liabilities — 0.06% | 3,917 | ||||
| Total Net Assets — 100.00% | $ | 6,571,476 | |||
| (a) | Non-income producing security. | ||||
| (b) | 1-day yield shown as of period end. | ||||
| Portfolio Summary | |||||
| Sector | Percent | ||||
| Technology | 25.01 | % | |||
| Consumer, Non-cyclical | 19.76 | % | |||
| Communications | 12.81 | % | |||
| Financial | 12.58 | % | |||
| Consumer, Cyclical | 10.86 | % | |||
| Industrial | 9.59 | % | |||
| Energy | 4.71 | % | |||
| Basic Materials | 2.33 | % | |||
| Utilities | 1.98 | % | |||
| Money Market Fund | 0.31 | % | |||
| Other Assets and Liabilities | 0.06 | % | |||
| TOTAL NET ASSETS | 100.00 | % | |||
| See accompanying notes. | 125 | ||||
| Schedule of Investments | ||||
| Principal U.S. Mega-Cap ETF | ||||
| June 30, 2023 | ||||
| COMMON STOCKS — 99.70% | Shares Held | Value | ||
| Auto Manufacturers — 3.25% | ||||
| Tesla, Inc. (a) | 181,578 | $ | 47,531,673 | |
| Banks — 5.24% | ||||
| Bank of America Corp. | 1,003,513 | 28,790,788 | ||
| JPMorgan Chase & Co. | 213,284 | 31,020,025 | ||
| Wells Fargo & Co. | 397,381 | 16,960,221 | ||
| $ | 76,771,034 | |||
| Beverages — 3.04% | ||||
| Coca-Cola Co. | 467,993 | 28,182,539 | ||
| PepsiCo, Inc. | 88,388 | 16,371,225 | ||
| $ | 44,553,764 | |||
| Chemicals — 1.17% | ||||
| Linde PLC | 44,753 | 17,054,473 | ||
| Computers — 11.00% | ||||
| Accenture PLC, Class A | 156,898 | 48,415,585 | ||
| Apple, Inc. | 580,596 | 112,618,206 | ||
| $ | 161,033,791 | |||
| Diversified Financial Services — 6.11% | ||||
| Mastercard, Inc., Class A | 115,539 | 45,441,489 | ||
| Visa, Inc., Class A | 185,240 | 43,990,795 | ||
| $ | 89,432,284 | |||
| Electric — 1.05% | ||||
| NextEra Energy, Inc. | 207,471 | 15,394,348 | ||
| Healthcare — Products — 6.68% | ||||
| Abbott Laboratories | 268,448 | 29,266,201 | ||
| Danaher Corp. | 171,497 | 41,159,280 | ||
| Thermo Fisher Scientific, Inc. | 52,433 | 27,356,918 | ||
| $ | 97,782,399 | |||
| Healthcare — Services — 2.94% | ||||
| UnitedHealth Group, Inc. | 89,613 | 43,071,592 | ||
| Household Products — 1.99% | ||||
| Procter & Gamble Co. | 192,061 | 29,143,336 | ||
| Insurance — 1.18% | ||||
| Berkshire Hathaway, Inc., Class B (a) | 50,528 | 17,230,048 | ||
| Internet — 8.61% | ||||
| Alphabet, Inc., Class A (a) | 411,309 | 49,233,687 | ||
| Amazon.com, Inc. (a) | 280,244 | 36,532,608 | ||
| Meta Platforms, Inc., Class A (a) | 140,486 | 40,316,672 | ||
| $ | 126,082,967 | |||
| Media — 2.24% | ||||
| Comcast Corp., Class A | 434,234 | 18,042,423 | ||
| Walt Disney Co. (a) | 164,590 | 14,694,595 | ||
| $ | 32,737,018 | |||
| Oil & Gas — 4.64% | ||||
| Chevron Corp. | 177,241 | 27,888,871 | ||
| Exxon Mobil Corp. | 373,728 | 40,082,328 | ||
| $ | 67,971,199 | |||
See accompanying notes.
126
| Schedule of Investments | ||||||
| Principal U.S. Mega-Cap ETF | ||||||
| June 30, 2023 | ||||||
| COMMON STOCKS (continued) | Shares Held | Value | ||||
| Pharmaceuticals — 9.89% | ||||||
| AbbVie, Inc. | 184,563 | $ | 24,866,173 | |||
| Eli Lilly & Co. | 42,538 | 19,949,471 | ||||
| Johnson & Johnson | 183,830 | 30,427,542 | ||||
| Merck & Co., Inc. | 259,816 | 29,980,168 | ||||
| Pfizer, Inc. | 1,078,238 | 39,549,770 | ||||
| $ | 144,773,124 | |||||
| Retail — 7.57% | ||||||
| Costco Wholesale Corp. | 85,626 | 46,099,326 | ||||
| Home Depot, Inc. | 99,903 | 31,033,868 | ||||
| McDonald's Corp. | 56,115 | 16,745,277 | ||||
| Walmart, Inc. | 108,006 | 16,976,383 | ||||
| $ | 110,854,854 | |||||
| Semiconductors — 8.08% | ||||||
| Broadcom, Inc. | 47,361 | 41,082,352 | ||||
| NVIDIA Corp. | 110,285 | 46,652,761 | ||||
| Texas Instruments, Inc. | 169,331 | 30,482,967 | ||||
| $ | 118,218,080 | |||||
| Software — 12.77% | ||||||
| Adobe, Inc. (a) | 114,797 | 56,134,585 | ||||
| Microsoft Corp. | 290,590 | 98,957,519 | ||||
| Salesforce, Inc. (a) | 150,605 | 31,816,812 | ||||
| $ | 186,908,916 | |||||
| Telecommunications — 2.25% | ||||||
| Cisco Systems, Inc. | 635,925 | 32,902,760 | ||||
| TOTAL COMMON STOCKS | $ | 1,459,447,660 | ||||
| INVESTMENT COMPANIES — 0.26% | Shares Held | Value | ||||
| Money Market Fund — 0.26% | ||||||
| State Street Institutional U.S. Government Money Market Fund — Premier Class | ||||||
| 5.03% (b) | 3,831,620 | $ | 3,831,620 | |||
| TOTAL INVESTMENT COMPANIES | $ | 3,831,620 | ||||
| Total Investments | $ | 1,463,279,280 | ||||
| Other Assets and Liabilities — 0.04% | 574,241 | |||||
| Total Net Assets — 100.00% | $ | 1,463,853,521 | ||||
| (a) | Non-income producing security. | |||||
| (b) | 1-day yield shown as of period end. | |||||
| Portfolio Summary | ||||||
| Sector | Percent | |||||
| Technology | 31.84 | % | ||||
| Consumer, Non-cyclical | 24.55 | % | ||||
| Communications | 13.10 | % | ||||
| Financial | 12.53 | % | ||||
| Consumer, Cyclical | 10.82 | % | ||||
| Energy | 4.64 | % | ||||
| Basic Materials | 1.17 | % | ||||
| Utilities | 1.05 | % | ||||
| Money Market Fund | 0.26 | % | ||||
| Other Assets and Liabilities | 0.04 | % | ||||
| TOTAL NET ASSETS | 100.00 | % | ||||
| See accompanying notes. | 127 | |||||
| Schedule of Investments | |||
| Principal U.S. Small-Cap Adaptive Multi-Factor ETF | |||
| June 30, 2023 | |||
| COMMON STOCKS — 99.58% | Shares Held | Value | |
| Aerospace & Defense — 1.22% | |||
| AAR Corp. (a) | 265 | $ | 15,306 |
| Aerojet Rocketdyne Holdings, Inc. (a) | 261 | 14,321 | |
| Barnes Group, Inc. | 229 | 9,661 | |
| Moog, Inc., Class A | 195 | 21,144 | |
| National Presto Industries, Inc. | 69 | 5,051 | |
| Triumph Group, Inc. (a) | 464 | 5,740 | |
| $ | 71,223 | ||
| Agriculture — 0.56% | |||
| Andersons, Inc. | 274 | 12,645 | |
| Fresh Del Monte Produce, Inc. | 387 | 9,950 | |
| Universal Corp. | 35 | 1,748 | |
| Vector Group Ltd. | 669 | 8,570 | |
| $ | 32,913 | ||
| Airlines — 0.20% | |||
| SkyWest, Inc. (a) | 287 | 11,687 | |
| Apparel — 1.19% | |||
| Kontoor Brands, Inc. | 482 | 20,292 | |
| Oxford Industries, Inc. | 175 | 17,224 | |
| Steven Madden Ltd. | 762 | 24,910 | |
| Urban Outfitters, Inc. (a) | 226 | 7,487 | |
| $ | 69,913 | ||
| Auto Manufacturers — 0.30% | |||
| Wabash National Corp. | 674 | 17,281 | |
| Auto Parts & Equipment — 1.26% | |||
| American Axle & Manufacturing Holdings, Inc. (a) | 1,318 | 10,900 | |
| Dorman Products, Inc. (a) | 116 | 9,144 | |
| Methode Electronics, Inc. | 472 | 15,821 | |
| Standard Motor Products, Inc. | 405 | 15,196 | |
| Titan International, Inc. (a) | 795 | 9,127 | |
| XPEL, Inc. (a) | 163 | 13,728 | |
| $ | 73,916 | ||
| Banks — 8.80% | |||
| Ameris Bancorp | 633 | 21,655 | |
| Atlantic Union Bankshares Corp. | 540 | 14,013 | |
| BancFirst Corp. | 88 | 8,096 | |
| Bancorp, Inc. (a) | 201 | 6,563 | |
| BankUnited, Inc. | 301 | 6,487 | |
| Banner Corp. | 410 | 17,905 | |
| Central Pacific Financial Corp. | 520 | 8,169 | |
| City Holding Co. | 137 | 12,329 | |
| Community Bank System, Inc. | 202 | 9,470 | |
| Customers Bancorp, Inc. (a) | 458 | 13,859 | |
| CVB Financial Corp. | 825 | 10,956 | |
| Dime Community Bancshares, Inc. | 390 | 6,876 | |
| Eagle Bancorp, Inc. | 348 | 7,364 | |
| FB Financial Corp. | 386 | 10,827 | |
| First BanCorp | 1,443 | 17,634 | |
| First BanCorp | 375 | 11,156 | |
| First Commonwealth Financial Corp. | 1,016 | 12,852 | |
| First Financial Bancorp | 705 | 14,410 | |
| First Hawaiian, Inc. | 534 | 9,617 | |
| Hanmi Financial Corp. | 519 | 7,749 | |
See accompanying notes.
128
| Schedule of Investments | |||
| Principal U.S. Small-Cap Adaptive Multi-Factor ETF | |||
| June 30, 2023 | |||
| COMMON STOCKS (continued) | Shares Held | Value | |
| Banks (continued) | |||
| Heritage Financial Corp. | 678 | $ | 10,963 |
| Hilltop Holdings, Inc. | 453 | 14,251 | |
| HomeStreet, Inc. | 230 | 1,362 | |
| Hope Bancorp, Inc. | 1,231 | 10,365 | |
| Independent Bank Corp. | 305 | 13,576 | |
| Independent Bank Group, Inc. | 312 | 10,773 | |
| Lakeland Financial Corp. | 122 | 5,919 | |
| National Bank Holdings Corp., Class A | 231 | 6,708 | |
| NBT Bancorp, Inc. | 573 | 18,250 | |
| OFG Bancorp | 489 | 12,753 | |
| Park National Corp. | 67 | 6,855 | |
| Pathward Financial, Inc. | 116 | 5,378 | |
| Preferred Bank | 191 | 10,503 | |
| Renasant Corp. | 694 | 18,134 | |
| S&T Bancorp, Inc. | 560 | 15,226 | |
| Seacoast Banking Corp. of Florida | 269 | 5,945 | |
| ServisFirst Bancshares, Inc. | 142 | 5,811 | |
| Simmons First National Corp., Class A | 570 | 9,833 | |
| Southside Bancshares, Inc. | 343 | 8,973 | |
| Stellar Bancorp, Inc. | 254 | 5,814 | |
| Tompkins Financial Corp. | 237 | 13,201 | |
| Triumph Financial, Inc. (a) | 96 | 5,829 | |
| TrustCo Bank Corp. NY | 316 | 9,041 | |
| Trustmark Corp. | 562 | 11,870 | |
| United Community Banks, Inc. | 759 | 18,967 | |
| Veritex Holdings, Inc. | 525 | 9,413 | |
| Walker & Dunlop, Inc. | 203 | 16,055 | |
| Westamerica BanCorp | 148 | 5,668 | |
| $ | 515,423 | ||
| Beverages — 0.45% | |||
| MGP Ingredients, Inc. | 142 | 15,092 | |
| National Beverage Corp. (a) | 230 | 11,120 | |
| $ | 26,212 | ||
| Biotechnology — 1.24% | |||
| ANI Pharmaceuticals, Inc. (a) | 108 | 5,814 | |
| Certara, Inc. (a) | 322 | 5,864 | |
| Dynavax Technologies Corp. (a) | 1,079 | 13,941 | |
| Innoviva, Inc. (a) | 913 | 11,622 | |
| iTeos Therapeutics, Inc. (a) | 307 | 4,065 | |
| Ligand Pharmaceuticals, Inc. (a) | 72 | 5,191 | |
| NeoGenomics, Inc. (a) | 412 | 6,621 | |
| Vir Biotechnology, Inc. (a) | 576 | 14,129 | |
| Xencor, Inc. (a) | 218 | 5,443 | |
| $ | 72,690 | ||
| Chemicals — 2.68% | |||
| AdvanSix, Inc. | 322 | 11,264 | |
| American Vanguard Corp. | 640 | 11,437 | |
| Balchem Corp. | 110 | 14,829 | |
| Hawkins, Inc. | 136 | 6,486 | |
| HB Fuller Co. | 190 | 13,587 | |
| Innospec, Inc. | 176 | 17,677 | |
| Koppers Holdings, Inc. | 322 | 10,980 | |
| Livent Corp. (a) | 467 | 12,810 | |
| Mativ Holdings, Inc. | 523 | 7,908 | |
| Minerals Technologies, Inc. | 163 | 9,403 | |
See accompanying notes.
129
| Schedule of Investments | |||
| Principal U.S. Small-Cap Adaptive Multi-Factor ETF | |||
| June 30, 2023 | |||
| COMMON STOCKS (continued) | Shares Held | Value | |
| Chemicals (continued) | |||
| Quaker Chemical Corp. | 83 | $ | 16,177 |
| Rogers Corp. (a) | 54 | 8,744 | |
| Stepan Co. | 163 | 15,576 | |
| $ | 156,878 | ||
| Coal — 0.84% | |||
| CONSOL Energy, Inc. | 361 | 24,480 | |
| SunCoke Energy, Inc. | 1,245 | 9,798 | |
| Warrior Met Coal, Inc. | 376 | 14,645 | |
| $ | 48,923 | ||
| Commercial Services — 5.58% | |||
| Aaron's Co., Inc. | 445 | 6,292 | |
| ABM Industries, Inc. | 660 | 28,149 | |
| Adtalem Global Education, Inc. (a) | 380 | 13,049 | |
| Alarm.com Holdings, Inc. (a) | 198 | 10,233 | |
| AMN Healthcare Services, Inc. (a) | 242 | 26,407 | |
| CoreCivic, Inc. (a) | 1,157 | 10,887 | |
| CorVel Corp. (a) | 43 | 8,320 | |
| Cross Country Healthcare, Inc. (a) | 604 | 16,960 | |
| Deluxe Corp. | 316 | 5,524 | |
| EVERTEC, Inc. | 518 | 19,078 | |
| Forrester Research, Inc. (a) | 106 | 3,084 | |
| GEO Group, Inc. (a) | 1,904 | 13,633 | |
| Green Dot Corp., Class A (a) | 563 | 10,551 | |
| Healthcare Services Group, Inc. (a) | 368 | 5,494 | |
| Heidrick & Struggles International, Inc. | 288 | 7,623 | |
| Kelly Services, Inc., Class A | 85 | 1,497 | |
| Korn Ferry | 375 | 18,577 | |
| Matthews International Corp., Class A | 191 | 8,140 | |
| Medifast, Inc. | 109 | 10,045 | |
| Mister Car Wash, Inc. (a) | 472 | 4,555 | |
| Monro, Inc. | 292 | 11,864 | |
| Payoneer Global, Inc. (a) | 865 | 4,161 | |
| Perdoceo Education Corp. (a) | 874 | 10,724 | |
| PROG Holdings, Inc. (a) | 472 | 15,161 | |
| Resources Connection, Inc. | 722 | 11,343 | |
| Strategic Education, Inc. | 102 | 6,920 | |
| Stride, Inc. (a) | 479 | 17,833 | |
| TrueBlue, Inc. (a) | 347 | 6,145 | |
| Upbound Group, Inc. | 466 | 14,507 | |
| $ | 326,756 | ||
| Computers — 0.98% | |||
| Corsair Gaming, Inc. (a) | 250 | 4,435 | |
| Insight Enterprises, Inc. (a) | 266 | 38,926 | |
| NetScout Systems, Inc. (a) | 77 | 2,383 | |
| OneSpan, Inc. (a) | 238 | 3,532 | |
| TTEC Holdings, Inc. | 244 | 8,257 | |
| $ | 57,533 | ||
| Construction Materials — 2.91% | |||
| AAON, Inc. | 224 | 21,237 | |
| American Woodmark Corp. (a) | 285 | 21,766 | |
| Apogee Enterprises, Inc. | 282 | 13,387 | |
| Boise Cascade Co. | 298 | 26,924 | |
| Gibraltar Industries, Inc. (a) | 421 | 26,489 | |
| Griffon Corp. | 188 | 7,576 | |
See accompanying notes.
130
| Schedule of Investments | |||
| Principal U.S. Small-Cap Adaptive Multi-Factor ETF | |||
| June 30, 2023 | |||
| COMMON STOCKS (continued) | Shares Held | Value | |
| Construction Materials (continued) | |||
| Masterbrand, Inc. (a) | 1,382 | $ | 16,073 |
| PGT Innovations, Inc. (a) | 769 | 22,416 | |
| SPX Technologies, Inc. (a) | 173 | 14,700 | |
| $ | 170,568 | ||
| Distribution/Wholesale — 0.68% | |||
| G-III Apparel Group Ltd. (a) | 330 | 6,359 | |
| Resideo Technologies, Inc. (a) | 910 | 16,071 | |
| ScanSource, Inc. (a) | 361 | 10,671 | |
| Veritiv Corp. | 54 | 6,783 | |
| $ | 39,884 | ||
| Diversified Financial Services — 2.97% | |||
| Avantax, Inc. (a) | 257 | 5,752 | |
| Bread Financial Holdings, Inc. | 221 | 6,937 | |
| Brightsphere Investment Group, Inc. | 462 | 9,679 | |
| Encore Capital Group, Inc. (a) | 160 | 7,779 | |
| Enova International, Inc. (a) | 274 | 14,555 | |
| EZCORP, Inc., Class A (a) | 1,551 | 12,997 | |
| LendingTree, Inc. (a) | 160 | 3,538 | |
| Mr Cooper Group, Inc. (a) | 500 | 25,320 | |
| Piper Sandler Cos., | 64 | 8,273 | |
| PRA Group, Inc. (a) | 197 | 4,501 | |
| Radian Group, Inc. | 1,478 | 37,364 | |
| StoneX Group, Inc. (a) | 198 | 16,450 | |
| Virtus Investment Partners, Inc. | 35 | 6,911 | |
| WisdomTree, Inc. | 985 | 6,757 | |
| World Acceptance Corp. (a) | 55 | 7,371 | |
| $ | 174,184 | ||
| Electric — 0.91% | |||
| Avista Corp. | 280 | 10,996 | |
| Otter Tail Corp. | 412 | 32,531 | |
| Unitil Corp. | 192 | 9,736 | |
| $ | 53,263 | ||
| Electrical Components & Equipment — 0.75% | |||
| Encore Wire Corp. | 157 | 29,191 | |
| Insteel Industries, Inc. | 303 | 9,429 | |
| Powell Industries, Inc. | 90 | 5,453 | |
| $ | 44,073 | ||
| Electronics — 3.31% | |||
| Advanced Energy Industries, Inc. | 236 | 26,302 | |
| Badger Meter, Inc. | 188 | 27,741 | |
| Benchmark Electronics, Inc. | 670 | 17,306 | |
| Brady Corp., Class A | 338 | 16,079 | |
| Comtech Telecommunications Corp. | 299 | 2,733 | |
| CTS Corp. | 286 | 12,192 | |
| Itron, Inc. (a) | 142 | 10,238 | |
| OSI Systems, Inc. (a) | 137 | 16,143 | |
| Plexus Corp. (a) | 196 | 19,255 | |
| Sanmina Corp. (a) | 551 | 33,209 | |
| TTM Technologies, Inc. (a) | 907 | 12,607 | |
| $ | 193,805 | ||
See accompanying notes.
131
| Schedule of Investments | |||
| Principal U.S. Small-Cap Adaptive Multi-Factor ETF | |||
| June 30, 2023 | |||
| COMMON STOCKS (continued) | Shares Held | Value | |
| Energy — Alternate Sources — 0.32% | |||
| FutureFuel Corp. | 1,007 | $ | 8,912 |
| REX American Resources Corp. (a) | 280 | 9,747 | |
| $ | 18,659 | ||
| Engineering & Construction — 2.35% | |||
| Arcosa, Inc. | 322 | 24,398 | |
| Comfort Systems USA, Inc. | 301 | 49,424 | |
| Dycom Industries, Inc. (a) | 83 | 9,433 | |
| Frontdoor, Inc. (a) | 520 | 16,588 | |
| Granite Construction, Inc. | 208 | 8,274 | |
| MYR Group, Inc. (a) | 174 | 24,071 | |
| NV5 Global, Inc. (a) | 51 | 5,650 | |
| $ | 137,838 | ||
| Entertainment — 0.32% | |||
| Golden Entertainment, Inc. (a) | 130 | 5,434 | |
| Monarch Casino & Resort, Inc. | 85 | 5,988 | |
| Six Flags Entertainment Corp. (a) | 292 | 7,586 | |
| $ | 19,008 | ||
| Food — 2.13% | |||
| Cal-Maine Foods, Inc. | 392 | 17,640 | |
| Calavo Growers, Inc. | 310 | 8,996 | |
| Chefs' Warehouse, Inc. (a) | 197 | 7,045 | |
| Hostess Brands, Inc. (a) | 875 | 22,155 | |
| J & J Snack Foods Corp. | 65 | 10,293 | |
| John B Sanfilippo & Son, Inc. | 119 | 13,955 | |
| Seneca Foods Corp., Class A (a) | 102 | 3,333 | |
| Simply Good Foods Co. (a) | 306 | 11,197 | |
| SpartanNash Co. | 276 | 6,213 | |
| Tootsie Roll Industries, Inc. | 228 | 8,074 | |
| TreeHouse Foods, Inc. (a) | 208 | 10,479 | |
| United Natural Foods, Inc. (a) | 268 | 5,239 | |
| $ | 124,619 | ||
| Forest Products & Paper — 0.43% | |||
| Mercer International, Inc. | 934 | 7,537 | |
| Sylvamo Corp. | 432 | 17,475 | |
| $ | 25,012 | ||
| Gas — 0.37% | |||
| Chesapeake Utilities Corp. | 73 | 8,687 | |
| Northwest Natural Holding Co. | 301 | 12,958 | |
| $ | 21,645 | ||
| Hand/Machine Tools — 0.74% | |||
| Enerpac Tool Group Corp. | 294 | 7,938 | |
| Franklin Electric Co., Inc. | 249 | 25,622 | |
| Kennametal, Inc. | 353 | 10,022 | |
| $ | 43,582 | ||
| Healthcare — Products — 1.66% | |||
| Avanos Medical, Inc. (a) | 435 | 11,119 | |
| BioLife Solutions, Inc. (a) | 202 | 4,464 | |
| Embecta Corp. | 226 | 4,882 | |
| Glaukos Corp. (a) | 50 | 3,560 | |
| Integer Holdings Corp. (a) | 100 | 8,861 | |
See accompanying notes.
132
| Schedule of Investments | |||
| Principal U.S. Small-Cap Adaptive Multi-Factor ETF | |||
| June 30, 2023 | |||
| COMMON STOCKS (continued) | Shares Held | Value | |
| Healthcare — Products (continued) | |||
| LeMaitre Vascular, Inc. | 215 | $ | 14,465 |
| Merit Medical Systems, Inc. (a) | 347 | 29,023 | |
| NuVasive, Inc. (a) | 236 | 9,815 | |
| OraSure Technologies, Inc. (a) | 651 | 3,262 | |
| Varex Imaging Corp. (a) | 96 | 2,263 | |
| Zynex, Inc. (a) | 598 | 5,735 | |
| $ | 97,449 | ||
| Healthcare — Services — 1.74% | |||
| Addus HomeCare Corp. (a) | 135 | 12,515 | |
| Agiliti, Inc. (a) | 248 | 4,092 | |
| Community Health Systems, Inc. (a) | 1,013 | 4,457 | |
| Enhabit, Inc. (a) | 661 | 7,602 | |
| Ensign Group, Inc. | 181 | 17,278 | |
| Fulgent Genetics, Inc. (a) | 151 | 5,592 | |
| Pediatrix Medical Group, Inc. (a) | 405 | 5,755 | |
| RadNet, Inc. (a) | 218 | 7,111 | |
| Select Medical Holdings Corp. | 670 | 21,346 | |
| U.S. Physical Therapy, Inc. | 131 | 15,902 | |
| $ | 101,650 | ||
| Home Builders — 5.06% | |||
| Cavco Industries, Inc. (a) | 79 | 23,305 | |
| Century Communities, Inc. | 210 | 16,090 | |
| Green Brick Partners, Inc. (a) | 430 | 24,424 | |
| Installed Building Products, Inc. | 220 | 30,835 | |
| LCI Industries | 235 | 29,695 | |
| LGI Homes, Inc. (a) | 128 | 17,266 | |
| M/I Homes, Inc. (a) | 346 | 30,168 | |
| MDC Holdings, Inc. | 452 | 21,140 | |
| Meritage Homes Corp. | 321 | 45,669 | |
| Tri Pointe Homes, Inc. (a) | 1,061 | 34,864 | |
| Winnebago Industries, Inc. | 347 | 23,141 | |
| $ | 296,597 | ||
| Home Furnishings — 0.44% | |||
| Ethan Allen Interiors, Inc. | 523 | 14,790 | |
| iRobot Corp. (a) | 38 | 1,719 | |
| Sleep Number Corp. (a) | 164 | 4,474 | |
| Xperi, Inc. (a) | 364 | 4,787 | |
| $ | 25,770 | ||
| Household Products — 0.97% | |||
| Edgewell Personal Care Co. | 224 | 9,254 | |
| elf Beauty, Inc. (a) | 267 | 30,499 | |
| Inter Parfums, Inc. | 127 | 17,174 | |
| $ | 56,927 | ||
| Household Products/Wares — 1.00% | |||
| Central Garden & Pet Co. (a) | 228 | 8,840 | |
| Central Garden & Pet Co., Class A (a) | 373 | 13,600 | |
| Quanex Building Products Corp. | 643 | 17,264 | |
| WD-40 Co. | 100 | 18,865 | |
| $ | 58,569 | ||
| Insurance — 2.70% | |||
| Ambac Financial Group, Inc. (a) | 707 | 10,068 | |
See accompanying notes.
133
| Schedule of Investments | |||
| Principal U.S. Small-Cap Adaptive Multi-Factor ETF | |||
| June 30, 2023 | |||
| COMMON STOCKS (continued) | Shares Held | Value | |
| Insurance (continued) | |||
| American Equity Investment Life Holding Co. | 438 | $ | 22,824 |
| AMERISAFE, Inc. | 132 | 7,038 | |
| Assured Guaranty Ltd. | 59 | 3,292 | |
| Employers Holdings, Inc. | 163 | 6,098 | |
| Genworth Financial, Inc., Class A (a) | 3,844 | 19,220 | |
| Horace Mann Educators Corp. | 56 | 1,661 | |
| James River Group Holdings Ltd. | 526 | 9,605 | |
| Mercury General Corp. | 168 | 5,085 | |
| NMI Holdings, Inc., Class A (a) | 1,014 | 26,181 | |
| Palomar Holdings, Inc. (a) | 200 | 11,608 | |
| ProAssurance Corp. (a) | 89 | 1,343 | |
| Safety Insurance Group, Inc. | 23 | 1,650 | |
| SiriusPoint Ltd. (a) | 1,226 | 11,071 | |
| Stewart Information Services Corp. | 269 | 11,067 | |
| United Fire Group, Inc. | 155 | 3,512 | |
| Universal Insurance Holdings, Inc. | 463 | 7,144 | |
| $ | 158,467 | ||
| Internet — 1.22% | |||
| Cars.com, Inc. (a) | 280 | 5,550 | |
| Cogent Communications Holdings, Inc. | 173 | 11,641 | |
| ePlus, Inc. (a) | 274 | 15,426 | |
| HealthStream, Inc. | 356 | 8,743 | |
| Liquidity Services, Inc. (a) | 326 | 5,379 | |
| Perficient, Inc. (a) | 140 | 11,666 | |
| QuinStreet, Inc. (a) | 289 | 2,552 | |
| Shutterstock, Inc. | 83 | 4,040 | |
| TechTarget, Inc. (a) | 125 | 3,891 | |
| Yelp, Inc. (a) | 77 | 2,804 | |
| $ | 71,692 | ||
| Iron & Steel — 0.54% | |||
| ATI, Inc. (a) | 322 | 14,242 | |
| Carpenter Technology Corp. | 165 | 9,261 | |
| Haynes International, Inc. | 164 | 8,335 | |
| $ | 31,838 | ||
| Leisure Time — 0.15% | |||
| Vista Outdoor, Inc. (a) | 311 | 8,605 | |
| Lodging — 0.15% | |||
| Marcus Corp. | 591 | 8,765 | |
| Machinery — Construction & Mining — 0.09% | |||
| Astec Industries, Inc. | 119 | 5,407 | |
| Machinery — Diversified — 1.92% | |||
| Alamo Group, Inc. | 84 | 15,448 | |
| Albany International Corp., Class A | 124 | 11,567 | |
| Applied Industrial Technologies, Inc. | 220 | 31,863 | |
| CIRCOR International, Inc. (a) | 137 | 7,734 | |
| DXP Enterprises, Inc. (a) | 353 | 12,853 | |
| Ichor Holdings Ltd. (a) | 314 | 11,775 | |
| Lindsay Corp. | 54 | 6,444 | |
| Tennant Co. | 185 | 15,005 | |
| $ | 112,689 | ||
| Media — 0.53% | |||
| AMC Networks, Inc., Class A (a) | 282 | 3,370 | |
See accompanying notes.
134
| Schedule of Investments | |||
| Principal U.S. Small-Cap Adaptive Multi-Factor ETF | |||
| June 30, 2023 | |||
| COMMON STOCKS (continued) | Shares Held | Value | |
| Media (continued) | |||
| EW Scripps Co., Class A (a) | 928 | $ | 8,491 |
| Scholastic Corp. | 319 | 12,406 | |
| Thryv Holdings, Inc. (a) | 282 | 6,937 | |
| $ | 31,204 | ||
| Metal Fabrication & Hardware — 1.51% | |||
| AZZ, Inc. | 253 | 10,995 | |
| Mueller Industries, Inc. | 504 | 43,989 | |
| Olympic Steel, Inc. | 168 | 8,232 | |
| Standex International Corp. | 110 | 15,562 | |
| TimkenSteel Corp. (a) | 274 | 5,910 | |
| Tredegar Corp. | 586 | 3,909 | |
| $ | 88,597 | ||
| Mining — 0.15% | |||
| Arconic Corp. (a) | 303 | 8,963 | |
| Miscellaneous Manufacturers — 2.48% | |||
| EnPro Industries, Inc. | 24 | 3,205 | |
| ESCO Technologies, Inc. | 191 | 19,793 | |
| Fabrinet (a) | 223 | 28,963 | |
| Federal Signal Corp. | 402 | 25,740 | |
| Hillenbrand, Inc. | 257 | 13,179 | |
| John Bean Technologies Corp. | 207 | 25,109 | |
| Materion Corp. | 129 | 14,732 | |
| Myers Industries, Inc. | 657 | 12,766 | |
| Sturm Ruger & Co., Inc. | 29 | 1,536 | |
| $ | 145,023 | ||
| Office & Business Equipment — 0.15% | |||
| Pitney Bowes, Inc. | 2,493 | 8,825 | |
| Office Furnishings — 0.30% | |||
| HNI Corp. | 449 | 12,653 | |
| Interface, Inc. | 567 | 4,984 | |
| $ | 17,637 | ||
| Oil & Gas — 2.35% | |||
| Callon Petroleum Co. (a) | 398 | 13,958 | |
| Civitas Resources, Inc. | 292 | 20,256 | |
| Comstock Resources, Inc. | 938 | 10,881 | |
| CVR Energy, Inc. | 475 | 14,231 | |
| Nabors Industries Ltd. (a) | 50 | 4,651 | |
| Northern Oil & Gas, Inc. | 491 | 16,851 | |
| Par Pacific Holdings, Inc. (a) | 643 | 17,110 | |
| Patterson-UTI Energy, Inc. | 733 | 8,774 | |
| SM Energy Co. | 366 | 11,577 | |
| Talos Energy, Inc. (a) | 1,029 | 14,272 | |
| Vital Energy, Inc. (a) | 117 | 5,283 | |
| $ | 137,844 | ||
| Oil & Gas Services — 1.20% | |||
| Archrock, Inc. | 570 | 5,842 | |
| Bristow Group, Inc. (a) | 214 | 6,148 | |
| DMC Global, Inc. (a) | 393 | 6,980 | |
| Dril-Quip, Inc. (a) | 175 | 4,072 | |
| Helix Energy Solutions Group, Inc. (a) | 683 | 5,041 | |
| NexTier Oilfield Solutions, Inc. (a) | 786 | 7,027 | |
See accompanying notes.
135
| Schedule of Investments | |||
| Principal U.S. Small-Cap Adaptive Multi-Factor ETF | |||
| June 30, 2023 | |||
| COMMON STOCKS (continued) | Shares Held | Value | |
| Oil & Gas Services (continued) | |||
| NOW, Inc. (a) | 1,031 | $ | 10,681 |
| Oceaneering International, Inc. (a) | 371 | 6,938 | |
| Oil States International, Inc. (a) | 517 | 3,862 | |
| RPC, Inc. | 1,126 | 8,051 | |
| U.S. Silica Holdings, Inc. (a) | 457 | 5,543 | |
| $ | 70,185 | ||
| Packaging & Containers — 0.62% | |||
| Clearwater Paper Corp. (a) | 262 | 8,206 | |
| O-I Glass, Inc. (a) | 1,324 | 28,241 | |
| $ | 36,447 | ||
| Pharmaceuticals — 1.94% | |||
| AdaptHealth Corp. (a) | 358 | 4,357 | |
| Amphastar Pharmaceuticals, Inc. (a) | 193 | 11,092 | |
| Anika Therapeutics, Inc. (a) | 133 | 3,455 | |
| Catalyst Pharmaceuticals, Inc. (a) | 710 | 9,543 | |
| Collegium Pharmaceutical, Inc. (a) | 188 | 4,040 | |
| Corcept Therapeutics, Inc. (a) | 304 | 6,764 | |
| Eagle Pharmaceuticals, Inc. (a) | 153 | 2,974 | |
| Harmony Biosciences Holdings, Inc. (a) | 123 | 4,328 | |
| Ironwood Pharmaceuticals, Inc. (a) | 1,285 | 13,673 | |
| Owens & Minor, Inc. (a) | 431 | 8,206 | |
| Pacira BioSciences, Inc. (a) | 52 | 2,084 | |
| Phibro Animal Health Corp., Class A | 544 | 7,453 | |
| Prestige Consumer Healthcare, Inc. (a) | 324 | 19,255 | |
| Supernus Pharmaceuticals, Inc. (a) | 248 | 7,455 | |
| uniQure NV (a) | 226 | 2,590 | |
| USANA Health Sciences, Inc. (a) | 103 | 6,493 | |
| $ | 113,762 | ||
| Real Estate — 0.42% | |||
| Alexander & Baldwin, Inc. (a) | 100 | 1,858 | |
| Cushman & Wakefield PLC (a) | 668 | 5,464 | |
| Douglas Elliman, Inc. (a) | 1,378 | 3,058 | |
| Kennedy-Wilson Holdings, Inc. | 134 | 2,188 | |
| Marcus & Millichap, Inc. | 49 | 1,544 | |
| RE/MAX Holdings, Inc., Class A | 433 | 8,340 | |
| St. Joe Co. | 47 | 2,272 | |
| $ | 24,724 | ||
| REITs — 5.33% | |||
| Acadia Realty Trust | 133 | 1,914 | |
| American Assets Trust, Inc. | 89 | 1,709 | |
| Apollo Commercial Real Estate Finance, Inc. | 1,172 | 13,267 | |
| Armada Hoffler Properties, Inc. | 939 | 10,967 | |
| ARMOUR Residential REIT, Inc. | 1,193 | 6,359 | |
| Brandywine Realty Trust | 1,159 | 5,389 | |
| CareTrust REIT, Inc. | 461 | 9,155 | |
| Centerspace | 27 | 1,657 | |
| Chatham Lodging Trust | 131 | 1,226 | |
| Community Healthcare Trust, Inc. | 171 | 5,646 | |
| DiamondRock Hospitality Co. | 1,136 | 9,099 | |
| Easterly Government Properties, Inc. | 514 | 7,453 | |
| Ellington Financial, Inc. | 125 | 1,725 | |
| Elme Communities | 131 | 2,154 | |
| Essential Properties Realty Trust, Inc. | 921 | 21,680 | |
| Four Corners Property Trust, Inc. | 621 | 15,773 | |
See accompanying notes.
136
| Schedule of Investments | |||
| Principal U.S. Small-Cap Adaptive Multi-Factor ETF | |||
| June 30, 2023 | |||
| COMMON STOCKS (continued) | Shares Held | Value | |
| REITs (continued) | |||
| Franklin BSP Realty Trust, Inc. | 554 | $ | 7,845 |
| Getty Realty Corp. | 377 | 12,750 | |
| Global Net Lease, Inc. | 583 | 5,993 | |
| Hudson Pacific Properties, Inc. | 863 | 3,642 | |
| Innovative Industrial Properties, Inc. | 87 | 6,352 | |
| JBG SMITH Properties | 130 | 1,955 | |
| KKR Real Estate Finance Trust, Inc. | 127 | 1,546 | |
| LTC Properties, Inc. | 377 | 12,449 | |
| LXP Industrial Trust | 271 | 2,642 | |
| NexPoint Residential Trust, Inc. | 45 | 2,047 | |
| Office Properties Income Trust | 402 | 3,095 | |
| Orion Office REIT, Inc. | 201 | 1,329 | |
| PennyMac Mortgage Investment Trust | 139 | 1,874 | |
| Ready Capital Corp. | 1,167 | 13,164 | |
| Redwood Trust, Inc. | 205 | 1,306 | |
| Retail Opportunity Investments Corp. | 592 | 7,998 | |
| RPT Realty | 719 | 7,514 | |
| Safehold, Inc. | 140 | 3,322 | |
| Saul Centers, Inc. | 132 | 4,862 | |
| Service Properties Trust | 1,335 | 11,601 | |
| SITE Centers Corp. | 191 | 2,525 | |
| Summit Hotel Properties, Inc. | 750 | 4,882 | |
| Sunstone Hotel Investors, Inc. | 241 | 2,439 | |
| Tanger Factory Outlet Centers, Inc. | 473 | 10,439 | |
| Two Harbors Investment Corp. | 962 | 13,353 | |
| Uniti Group, Inc. | 1,504 | 6,948 | |
| Universal Health Realty Income Trust | 194 | 9,231 | |
| Urban Edge Properties | 143 | 2,206 | |
| Urstadt Biddle Properties, Inc., Class A | 513 | 10,906 | |
| Veris Residential, Inc. (a) | 485 | 7,784 | |
| Whitestone REIT | 537 | 5,209 | |
| Xenia Hotels & Resorts, Inc. | 657 | 8,088 | |
| $ | 312,469 | ||
| Retail — 8.46% | |||
| Abercrombie & Fitch Co., Class A (a) | 213 | 8,026 | |
| Academy Sports & Outdoors, Inc. | 589 | 31,835 | |
| America's Car-Mart, Inc. (a) | 111 | 11,076 | |
| American Eagle Outfitters, Inc. | 609 | 7,186 | |
| Asbury Automotive Group, Inc. (a) | 173 | 41,593 | |
| BJ's Restaurants, Inc. (a) | 147 | 4,675 | |
| Bloomin' Brands, Inc. | 703 | 18,904 | |
| Boot Barn Holdings, Inc. (a) | 93 | 7,876 | |
| Brinker International, Inc. (a) | 347 | 12,700 | |
| Buckle, Inc. | 320 | 11,072 | |
| Caleres, Inc. | 443 | 10,601 | |
| Cheesecake Factory, Inc. | 179 | 6,190 | |
| Chico's FAS, Inc. (a) | 1,703 | 9,111 | |
| Children's Place, Inc. (a) | 120 | 2,785 | |
| Chuy's Holdings, Inc. (a) | 160 | 6,531 | |
| Cracker Barrel Old Country Store, Inc. | 93 | 8,666 | |
| Dave & Buster's Entertainment, Inc. (a) | 336 | 14,972 | |
| Designer Brands, Inc., Class A | 513 | 5,181 | |
| Dine Brands Global, Inc. | 181 | 10,503 | |
| El Pollo Loco Holdings, Inc. | 429 | 3,762 | |
| Genesco, Inc. (a) | 224 | 5,609 | |
| GMS, Inc. (a) | 450 | 31,140 | |
| Group 1 Automotive, Inc. | 128 | 33,037 | |
See accompanying notes.
137
| Schedule of Investments | |||
| Principal U.S. Small-Cap Adaptive Multi-Factor ETF | |||
| June 30, 2023 | |||
| COMMON STOCKS (continued) | Shares Held | Value | |
| Retail (continued) | |||
| Guess?, Inc. | 330 | $ | 6,419 |
| Haverty Furniture Cos., Inc. | 411 | 12,420 | |
| Hibbett, Inc. | 228 | 8,274 | |
| Jack in the Box, Inc. | 84 | 8,193 | |
| La-Z-Boy, Inc. | 568 | 16,268 | |
| Leslie's, Inc. (a) | 534 | 5,014 | |
| MarineMax, Inc. (a) | 311 | 10,624 | |
| Movado Group, Inc. | 159 | 4,266 | |
| Nu Skin Enterprises, Inc., Class A | 55 | 1,826 | |
| ODP Corp. (a) | 342 | 16,012 | |
| Patrick Industries, Inc. | 295 | 23,600 | |
| PC Connection, Inc. | 190 | 8,569 | |
| PriceSmart, Inc. | 219 | 16,219 | |
| Sally Beauty Holdings, Inc. (a) | 838 | 10,349 | |
| Shoe Carnival, Inc. | 323 | 7,584 | |
| Signet Jewelers Ltd. | 135 | 8,810 | |
| Sonic Automotive, Inc., Class A | 191 | 9,105 | |
| World Kinect Corp. | 753 | 15,572 | |
| Zumiez, Inc. (a) | 233 | 3,882 | |
| $ | 496,037 | ||
| Savings & Loans — 2.26% | |||
| Axos Financial, Inc. (a) | 375 | 14,790 | |
| Banc of California, Inc. | 818 | 9,472 | |
| Berkshire Hills Bancorp, Inc. | 492 | 10,199 | |
| Brookline Bancorp, Inc. | 1,070 | 9,352 | |
| Capitol Federal Financial, Inc. | 213 | 1,314 | |
| Northfield Bancorp, Inc. | 1,089 | 11,957 | |
| Northwest Bancshares, Inc. | 1,081 | 11,459 | |
| Pacific Premier Bancorp, Inc. | 707 | 14,621 | |
| Provident Financial Services, Inc. | 699 | 11,422 | |
| Washington Federal, Inc. | 767 | 20,341 | |
| WSFS Financial Corp. | 470 | 17,728 | |
| $ | 132,655 | ||
| Semiconductors — 3.03% | |||
| Alpha & Omega Semiconductor Ltd. (a) | 180 | 5,904 | |
| Axcelis Technologies, Inc. (a) | 168 | 30,799 | |
| Cohu, Inc. (a) | 227 | 9,434 | |
| Diodes, Inc. (a) | 240 | 22,198 | |
| Kulicke & Soffa Industries, Inc. | 334 | 19,856 | |
| MaxLinear, Inc. (a) | 209 | 6,596 | |
| Onto Innovation, Inc. (a) | 125 | 14,559 | |
| Photronics, Inc. (a) | 616 | 15,887 | |
| Rambus, Inc. (a) | 364 | 23,358 | |
| Semtech Corp. (a) | 435 | 11,075 | |
| SMART Global Holdings, Inc. (a) | 317 | 9,196 | |
| Veeco Instruments, Inc. (a) | 346 | 8,885 | |
| $ | 177,747 | ||
| Software — 3.17% | |||
| Adeia, Inc. | 1,781 | 19,609 | |
| Agilysys, Inc. (a) | 74 | 5,079 | |
| Avid Technology, Inc. (a) | 153 | 3,901 | |
| Computer Programs & Systems, Inc. (a) | 311 | 7,679 | |
| Consensus Cloud Solutions, Inc. (a) | 146 | 4,526 | |
| CSG Systems International, Inc. | 147 | 7,753 | |
| Digi International, Inc. (a) | 371 | 14,614 | |
See accompanying notes.
138
| Schedule of Investments | |||
| Principal U.S. Small-Cap Adaptive Multi-Factor ETF | |||
| June 30, 2023 | |||
| COMMON STOCKS (continued) | Shares Held | Value | |
| Software (continued) | |||
| Digital Turbine, Inc. (a) | 484 | $ | 4,491 |
| Donnelley Financial Solutions, Inc. (a) | 262 | 11,929 | |
| DoubleVerify Holdings, Inc. (a) | 484 | 18,837 | |
| Ebix, Inc. | 575 | 14,490 | |
| NextGen Healthcare, Inc. (a) | 349 | 5,661 | |
| PDF Solutions, Inc. (a) | 128 | 5,773 | |
| Progress Software Corp. | 305 | 17,720 | |
| Simulations Plus, Inc. | 93 | 4,030 | |
| SPS Commerce, Inc. (a) | 117 | 22,471 | |
| Veradigm, Inc. (a) | 476 | 5,998 | |
| Verra Mobility Corp. (a) | 563 | 11,102 | |
| $ | 185,663 | ||
| Telecommunications — 1.03% | |||
| A10 Networks, Inc. | 104 | 1,517 | |
| ATN International, Inc. | 98 | 3,587 | |
| Clearfield, Inc. (a) | 84 | 3,977 | |
| Extreme Networks, Inc. (a) | 410 | 10,680 | |
| Harmonic, Inc. (a) | 418 | 6,759 | |
| InterDigital, Inc. | 183 | 17,669 | |
| Lumen Technologies, Inc. (a) | 3,203 | 7,239 | |
| NETGEAR, Inc. (a) | 75 | 1,062 | |
| Shenandoah Telecommunications Co. | 255 | 4,955 | |
| Viavi Solutions, Inc. (a) | 233 | 2,640 | |
| $ | 60,085 | ||
| Textiles — 0.16% | |||
| UniFirst Corp. | 60 | 9,301 | |
| Transportation — 2.29% | |||
| ArcBest Corp. | 162 | 16,006 | |
| Dorian LPG Ltd. | 205 | 5,258 | |
| Forward Air Corp. | 188 | 19,949 | |
| Heartland Express, Inc. | 958 | 15,721 | |
| Hub Group, Inc., Class A (a) | 336 | 26,987 | |
| Marten Transport Ltd. | 584 | 12,556 | |
| Matson, Inc. | 253 | 19,666 | |
| RXO, Inc. (a) | 808 | 18,317 | |
| $ | 134,460 | ||
| Water — 1.07% | |||
| American States Water Co. | 243 | 21,141 | |
| California Water Service Group | 365 | 18,845 | |
| Middlesex Water Co. | 96 | 7,743 | |
| SJW Group | 209 | 14,653 | |
| $ | 62,382 | ||
| TOTAL COMMON STOCKS | $ | 5,835,923 | |
See accompanying notes.
139
| Schedule of Investments | |||||
| Principal U.S. Small-Cap Adaptive Multi-Factor ETF | |||||
| June 30, 2023 | |||||
| INVESTMENT COMPANIES — 0.34% | Shares Held | Value | |||
| Money Market Fund — 0.34% | |||||
| State Street Institutional U.S. Government Money Market Fund — Premier Class | |||||
| 5.03% (b) | 19,884 | $ | 19,884 | ||
| TOTAL INVESTMENT COMPANIES | $ | 19,884 | |||
| Total Investments | $ | 5,855,807 | |||
| Other Assets and Liabilities — 0.08% | 4,668 | ||||
| Total Net Assets — 100.00% | $ | 5,860,475 | |||
| (a) | Non-income producing security. | ||||
| (b) | 1-day yield shown as of period end. | ||||
| Portfolio Summary | |||||
| Sector | Percent | ||||
| Financial | 22.49 | % | |||
| Industrial | 20.47 | % | |||
| Consumer, Cyclical | 18.41 | % | |||
| Consumer, Non-cyclical | 17.26 | % | |||
| Technology | 7.33 | % | |||
| Energy | 4.70 | % | |||
| Basic Materials | 3.80 | % | |||
| Communications | 2.78 | % | |||
| Utilities | 2.34 | % | |||
| Money Market Fund | 0.34 | % | |||
| Other Assets and Liabilities | 0.08 | % | |||
| TOTAL NET ASSETS | 100.00 | % | |||
| See accompanying notes. | 140 | ||||
| Schedule of Investments | ||||
| Principal U.S. Small-Cap ETF | ||||
| June 30, 2023 | ||||
| COMMON STOCKS — 99.63% | Shares Held | Value | ||
| Advertising — 0.03% | ||||
| Stagwell, Inc. (a) | 7,283 | $ | 52,510 | |
| Aerospace & Defense — 0.88% | ||||
| Aerojet Rocketdyne Holdings, Inc. (a) | 23,468 | 1,287,689 | ||
| Barnes Group, Inc. | 5,027 | 212,089 | ||
| Moog, Inc., Class A | 2,541 | 275,521 | ||
| $ | 1,775,299 | |||
| Agriculture — 0.07% | ||||
| Fresh Del Monte Produce, Inc. | 2,963 | 76,179 | ||
| Turning Point Brands, Inc. | 3,096 | 74,335 | ||
| $ | 150,514 | |||
| Apparel — 1.25% | ||||
| Crocs, Inc. (a) | 10,593 | 1,191,077 | ||
| Ermenegildo Zegna NV | 3,188 | 40,424 | ||
| Kontoor Brands, Inc. | 4,777 | 201,112 | ||
| Oxford Industries, Inc. | 1,782 | 175,384 | ||
| Steven Madden Ltd. | 8,842 | 289,045 | ||
| Urban Outfitters, Inc. (a) | 18,559 | 614,860 | ||
| $ | 2,511,902 | |||
| Auto Manufacturers — 0.17% | ||||
| Wabash National Corp. | 13,172 | 337,730 | ||
| Auto Parts & Equipment — 0.66% | ||||
| Dorman Products, Inc. (a) | 1,477 | 116,432 | ||
| Fox Factory Holding Corp. (a) | 2,115 | 229,499 | ||
| Methode Electronics, Inc. | 3,189 | 106,895 | ||
| Shyft Group, Inc. | 6,119 | 134,985 | ||
| Standard Motor Products, Inc. | 1,529 | 57,368 | ||
| Visteon Corp. (a) | 3,509 | 503,928 | ||
| XPEL, Inc. (a) | 2,069 | 174,251 | ||
| $ | 1,323,358 | |||
| Banks — 4.24% | ||||
| 1st Source Corp. | 1,746 | 73,210 | ||
| Amalgamated Financial Corp. | 5,870 | 94,448 | ||
| Ameris Bancorp | 12,707 | 434,707 | ||
| Associated Banc-Corp. | 62,508 | 1,014,505 | ||
| Atlantic Union Bankshares Corp. | 10,451 | 271,203 | ||
| Bancorp, Inc. (a) | 9,748 | 318,272 | ||
| Bank of NT Butterfield & Son Ltd. | 6,253 | 171,082 | ||
| Cadence Bank | 47,320 | 929,365 | ||
| Central Pacific Financial Corp. | 6,526 | 102,523 | ||
| City Holding Co. | 2,315 | 208,327 | ||
| Enterprise Financial Services Corp. | 5,232 | 204,571 | ||
| First BanCorp | 42,921 | 524,495 | ||
| First BanCorp/Southern Pines NC | 7,200 | 214,200 | ||
| First Bancshares, Inc. | 4,968 | 128,373 | ||
| First Financial Bancorp | 10,018 | 204,768 | ||
| First Foundation, Inc. | 12,524 | 49,720 | ||
| Heartland Financial USA, Inc. | 5,718 | 159,361 | ||
| Hilltop Holdings, Inc. | 11,984 | 377,017 | ||
| International Bancshares Corp. | 7,836 | 346,351 | ||
| NBT Bancorp, Inc. | 6,939 | 221,007 | ||
| Pathward Financial, Inc. | 8,176 | 379,039 | ||
| Peoples Bancorp, Inc. | 4,241 | 112,599 | ||
See accompanying notes.
141
| Schedule of Investments | ||||
| Principal U.S. Small-Cap ETF | ||||
| June 30, 2023 | ||||
| COMMON STOCKS (continued) | Shares Held | Value | ||
| Banks (continued) | ||||
| Preferred Bank | 2,964 | $ | 162,990 | |
| Premier Financial Corp. | 4,879 | 78,162 | ||
| Renasant Corp. | 7,165 | 187,221 | ||
| S&T Bancorp, Inc. | 5,275 | 143,427 | ||
| Tompkins Financial Corp. | 1,293 | 72,020 | ||
| Towne Bank | 6,224 | 144,646 | ||
| TriCo Bancshares | 2,684 | 89,109 | ||
| United Bankshares, Inc. | 16,364 | 485,520 | ||
| United Community Banks, Inc. | 19,962 | 498,850 | ||
| WesBanco, Inc. | 5,226 | 133,838 | ||
| $ | 8,534,926 | |||
| Beverages — 0.52% | ||||
| Coca-Cola Consolidated, Inc. | 659 | 419,137 | ||
| Duckhorn Portfolio, Inc. (a) | 7,906 | 102,541 | ||
| MGP Ingredients, Inc. | 2,291 | 243,487 | ||
| Primo Water Corp. | 15,274 | 191,536 | ||
| Vita Coco Co., Inc. (a) | 3,139 | 84,345 | ||
| $ | 1,041,046 | |||
| Biotechnology — 3.49% | ||||
| ACADIA Pharmaceuticals, Inc. (a) | 28,590 | 684,731 | ||
| ADMA Biologics, Inc. (a) | 47,123 | 173,884 | ||
| Amicus Therapeutics, Inc. (a) | 46,025 | 578,074 | ||
| Arcus Biosciences, Inc. (a) | 19,073 | 387,373 | ||
| Avid Bioservices, Inc. (a) | 4,712 | 65,827 | ||
| Bridgebio Pharma, Inc. (a) | 6,187 | 106,416 | ||
| Chinook Therapeutics, Inc. (a) | 9,266 | 356,000 | ||
| Cytek Biosciences, Inc. (a) | 15,712 | 134,180 | ||
| Dynavax Technologies Corp. (a) | 29,066 | 375,533 | ||
| Emergent BioSolutions, Inc. (a) | 15,378 | 113,028 | ||
| Halozyme Therapeutics, Inc. (a) | 32,120 | 1,158,568 | ||
| Innoviva, Inc. (a) | 13,439 | 171,078 | ||
| Intercept Pharmaceuticals, Inc. (a) | 18,610 | 205,827 | ||
| iTeos Therapeutics, Inc. (a) | 6,327 | 83,769 | ||
| Ligand Pharmaceuticals, Inc. (a) | 2,382 | 171,742 | ||
| Prothena Corp. PLC (a) | 8,963 | 611,994 | ||
| REGENXBIO, Inc. (a) | 8,738 | 174,673 | ||
| Rigel Pharmaceuticals, Inc. (a) | 36,601 | 47,215 | ||
| Syndax Pharmaceuticals, Inc. (a) | 16,794 | 351,498 | ||
| Veracyte, Inc. (a) | 14,638 | 372,830 | ||
| Vir Biotechnology, Inc. (a) | 20,203 | 495,580 | ||
| Xencor, Inc. (a) | 8,264 | 206,352 | ||
| $ | 7,026,172 | |||
| Chemicals — 1.10% | ||||
| AdvanSix, Inc. | 3,592 | 125,648 | ||
| American Vanguard Corp. | 3,218 | 57,506 | ||
| Balchem Corp. | 2,740 | 369,379 | ||
| Ingevity Corp. (a) | 7,118 | 413,983 | ||
| Innospec, Inc. | 2,557 | 256,825 | ||
| Intrepid Potash, Inc. (a) | 5,538 | 125,657 | ||
| Koppers Holdings, Inc. | 2,574 | 87,773 | ||
| Quaker Chemical Corp. | 2,212 | 431,119 | ||
| Tronox Holdings PLC | 27,295 | 346,920 | ||
| $ | 2,214,810 | |||
See accompanying notes.
142
| Schedule of Investments | ||||
| Principal U.S. Small-Cap ETF | ||||
| June 30, 2023 | ||||
| COMMON STOCKS (continued) | Shares Held | Value | ||
| Coal — 1.59% | ||||
| Alpha Metallurgical Resources, Inc. | 6,602 | $ | 1,085,105 | |
| Arch Resources, Inc. | 5,385 | 607,213 | ||
| CONSOL Energy, Inc. | 9,234 | 626,157 | ||
| Ramaco Resources, Inc., Class A | 10,922 | 92,182 | ||
| Ramaco Resources, Inc., Class B (a) | 2,184 | 23,176 | ||
| SunCoke Energy, Inc. | 22,651 | 178,263 | ||
| Warrior Met Coal, Inc. | 15,124 | 589,080 | ||
| $ | 3,201,176 | |||
| Commercial Services — 7.34% | ||||
| Adtalem Global Education, Inc. (a) | 2,896 | 99,449 | ||
| Alarm.com Holdings, Inc. (a) | 4,969 | 256,798 | ||
| AMN Healthcare Services, Inc. (a) | 16,143 | 1,761,524 | ||
| Barrett Business Services, Inc. | 1,556 | 135,683 | ||
| Brink's Co. | 4,228 | 286,785 | ||
| Carriage Services, Inc. | 1,404 | 45,588 | ||
| Cass Information Systems, Inc. | 1,759 | 68,214 | ||
| CBIZ, Inc. (a) | 4,782 | 254,785 | ||
| Chegg, Inc. (a) | 34,099 | 302,799 | ||
| CorVel Corp. (a) | 1,394 | 269,739 | ||
| CRA International, Inc. | 1,799 | 183,498 | ||
| Cross Country Healthcare, Inc. (a) | 14,679 | 412,186 | ||
| Ennis, Inc. | 3,109 | 63,361 | ||
| EVERTEC, Inc. | 10,610 | 390,766 | ||
| First Advantage Corp. (a) | 7,634 | 117,640 | ||
| GEO Group, Inc. (a) | 62,211 | 445,431 | ||
| Green Dot Corp., Class A (a) | 9,683 | 181,459 | ||
| Hackett Group, Inc. | 5,200 | 116,220 | ||
| Heidrick & Struggles International, Inc. | 2,832 | 74,963 | ||
| Herc Holdings, Inc. | 9,068 | 1,240,956 | ||
| Huron Consulting Group, Inc. (a) | 2,985 | 253,456 | ||
| I3 Verticals, Inc., Class A (a) | 4,597 | 105,087 | ||
| Insperity, Inc. | 4,225 | 502,606 | ||
| John Wiley & Sons, Inc., Class A | 5,513 | 187,607 | ||
| Kforce, Inc. | 3,520 | 220,563 | ||
| Korn Ferry | 6,420 | 318,047 | ||
| Matthews International Corp., Class A | 3,117 | 132,847 | ||
| Medifast, Inc. | 3,794 | 349,655 | ||
| Monro, Inc. | 3,474 | 141,149 | ||
| Payoneer Global, Inc. (a) | 72,346 | 347,984 | ||
| Perdoceo Education Corp. (a) | 5,388 | 66,111 | ||
| Progyny, Inc. (a) | 16,974 | 667,757 | ||
| R1 RCM, Inc. (a) | 42,039 | 775,620 | ||
| Repay Holdings Corp. (a) | 29,522 | 231,157 | ||
| Resources Connection, Inc. | 5,319 | 83,562 | ||
| SP Plus Corp. (a) | 2,364 | 92,456 | ||
| StoneCo Ltd., Class A (a) | 140,404 | 1,788,747 | ||
| Strategic Education, Inc. | 1,431 | 97,079 | ||
| Stride, Inc. (a) | 5,696 | 212,062 | ||
| Target Hospitality Corp. (a),(b) | 9,297 | 124,766 | ||
| Transcat, Inc. (a) | 1,480 | 126,259 | ||
| TriNet Group, Inc. (a) | 8,133 | 772,391 | ||
| V2X, Inc. (a) | 1,767 | 87,573 | ||
| ZipRecruiter, Inc., Class A (a) | 21,903 | 388,997 | ||
| $ | 14,781,382 | |||
| Computers — 3.44% | ||||
| ExlService Holdings, Inc. (a) | 4,391 | 663,304 | ||
See accompanying notes.
143
| Schedule of Investments | ||||
| Principal U.S. Small-Cap ETF | ||||
| June 30, 2023 | ||||
| COMMON STOCKS (continued) | Shares Held | Value | ||
| Computers (continued) | ||||
| Insight Enterprises, Inc. (a) | 5,193 | $ | 759,943 | |
| Integral Ad Science Holding Corp. (a) | 5,700 | 102,486 | ||
| Maximus, Inc. | 8,720 | 736,927 | ||
| Mitek Systems, Inc. (a) | 8,139 | 88,227 | ||
| Parsons Corp. (a) | 12,264 | 590,389 | ||
| Qualys, Inc. (a) | 6,557 | 846,968 | ||
| Super Micro Computer, Inc. (a) | 12,567 | 3,132,325 | ||
| $ | 6,920,569 | |||
| Construction Materials — 2.00% | ||||
| AAON, Inc. | 4,954 | 469,689 | ||
| American Woodmark Corp. (a) | 2,646 | 202,075 | ||
| Apogee Enterprises, Inc. | 2,579 | 122,425 | ||
| Boise Cascade Co. | 6,252 | 564,868 | ||
| Gibraltar Industries, Inc. (a) | 3,586 | 225,631 | ||
| JELD-WEN Holding, Inc. (a) | 11,682 | 204,902 | ||
| Masonite International Corp. (a) | 3,407 | 349,013 | ||
| Modine Manufacturing Co. (a) | 5,482 | 181,016 | ||
| PGT Innovations, Inc. (a) | 7,816 | 227,836 | ||
| Summit Materials, Inc., Class A (a) | 17,997 | 681,187 | ||
| UFP Industries, Inc. | 8,170 | 792,899 | ||
| $ | 4,021,541 | |||
| Distribution & Wholesale — 0.14% | ||||
| Rush Enterprises, Inc., Class A | 4,535 | 275,456 | ||
| Distribution/Wholesale — 0.24% | ||||
| G-III Apparel Group Ltd. (a) | 8,491 | 163,622 | ||
| ScanSource, Inc. (a) | 2,953 | 87,291 | ||
| Titan Machinery, Inc. (a) | 7,961 | 234,849 | ||
| $ | 485,762 | |||
| Diversified Financial Services — 5.10% | ||||
| AssetMark Financial Holdings, Inc. (a) | 2,910 | 86,311 | ||
| BGC Partners, Inc., Class A | 45,103 | 199,806 | ||
| Enact Holdings, Inc. | 3,745 | 94,112 | ||
| Enova International, Inc. (a) | 7,236 | 384,376 | ||
| EZCORP, Inc., Class A (a) | 16,286 | 136,477 | ||
| Federal Agricultural Mortgage Corp., Class C | 2,090 | 300,417 | ||
| Federated Hermes, Inc. | 21,001 | 752,886 | ||
| Focus Financial Partners, Inc., Class A (a) | 23,759 | 1,247,585 | ||
| Houlihan Lokey, Inc. | 12,276 | 1,206,854 | ||
| International Money Express, Inc. (a) | 9,595 | 235,365 | ||
| LendingTree, Inc. (a) | 7,573 | 167,439 | ||
| Moelis & Co., Class A | 20,384 | 924,211 | ||
| Nelnet, Inc., Class A | 1,251 | 120,696 | ||
| PennyMac Financial Services, Inc. | 11,133 | 782,761 | ||
| Perella Weinberg Partners | 9,393 | 78,244 | ||
| Piper Sandler Cos., | 3,362 | 434,572 | ||
| PJT Partners, Inc., Class A | 6,313 | 439,637 | ||
| Radian Group, Inc. | 41,440 | 1,047,603 | ||
| StepStone Group, Inc., Class A | 10,512 | 260,803 | ||
| StoneX Group, Inc. (a) | 3,542 | 294,269 | ||
| Victory Capital Holdings, Inc., Class A | 11,017 | 347,476 | ||
| Virtus Investment Partners, Inc. | 2,519 | 497,427 | ||
| World Acceptance Corp. (a) | 1,663 | 222,859 | ||
| $ | 10,262,186 | |||
See accompanying notes.
144
| Schedule of Investments | |||
| Principal U.S. Small-Cap ETF | |||
| June 30, 2023 | |||
| COMMON STOCKS (continued) | Shares Held | Value | |
| Electric — 1.73% | |||
| ALLETE, Inc. | 10,789 | $ | 625,438 |
| Otter Tail Corp. | 6,270 | 495,079 | |
| PNM Resources, Inc. | 23,090 | 1,041,359 | |
| Portland General Electric Co. | 25,224 | 1,181,240 | |
| Unitil Corp. | 2,611 | 132,404 | |
| $ | 3,475,520 | ||
| Electrical Components & Equipment — 1.14% | |||
| Belden, Inc. | 5,773 | 552,188 | |
| Encore Wire Corp. | 4,040 | 751,157 | |
| Energizer Holdings, Inc. | 8,688 | 291,743 | |
| Insteel Industries, Inc. | 2,660 | 82,779 | |
| Novanta, Inc. (a) | 2,668 | 491,179 | |
| Powell Industries, Inc. | 1,977 | 119,786 | |
| $ | 2,288,832 | ||
| Electronics — 2.68% | |||
| Advanced Energy Industries, Inc. | 4,076 | 454,270 | |
| Allied Motion Technologies, Inc. | 1,652 | 65,981 | |
| Atkore, Inc. (a) | 9,375 | 1,461,938 | |
| Badger Meter, Inc. | 2,581 | 380,852 | |
| Benchmark Electronics, Inc. | 5,484 | 141,652 | |
| Brady Corp., Class A | 4,727 | 224,863 | |
| CTS Corp. | 3,678 | 156,793 | |
| Knowles Corp. (a) | 16,082 | 290,441 | |
| Mesa Laboratories, Inc. | 1,065 | 136,853 | |
| Napco Security Technologies, Inc. | 7,173 | 248,544 | |
| OSI Systems, Inc. (a) | 2,107 | 248,268 | |
| Plexus Corp. (a) | 3,495 | 343,349 | |
| Sanmina Corp. (a) | 8,593 | 517,900 | |
| TTM Technologies, Inc. (a) | 12,337 | 171,484 | |
| Vishay Intertechnology, Inc. | 18,745 | 551,103 | |
| $ | 5,394,291 | ||
| Energy — Alternate Sources — 0.06% | |||
| Montauk Renewables, Inc. (a) | 10,525 | 78,306 | |
| REX American Resources Corp. (a) | 1,169 | 40,693 | |
| $ | 118,999 | ||
| Engineering & Construction — 1.93% | |||
| Arcosa, Inc. | 4,212 | 319,143 | |
| Comfort Systems USA, Inc. | 5,055 | 830,031 | |
| EMCOR Group, Inc. | 6,232 | 1,151,549 | |
| Exponent, Inc. | 3,916 | 365,441 | |
| Frontdoor, Inc. (a) | 9,119 | 290,896 | |
| MYR Group, Inc. (a) | 1,920 | 265,613 | |
| NV5 Global, Inc. (a) | 2,750 | 304,617 | |
| Sterling Infrastructure, Inc. (a) | 6,356 | 354,665 | |
| $ | 3,881,955 | ||
| Entertainment — 0.26% | |||
| Liberty Media Corp.-Liberty Braves, Class C (a) | 2,497 | 98,931 | |
| Monarch Casino & Resort, Inc. | 1,278 | 90,035 | |
| RCI Hospitality Holdings, Inc. | 1,114 | 84,653 | |
| Red Rock Resorts, Inc., Class A | 5,131 | 240,028 | |
| $ | 513,647 | ||
See accompanying notes.
145
| Schedule of Investments | ||||
| Principal U.S. Small-Cap ETF | ||||
| June 30, 2023 | ||||
| COMMON STOCKS (continued) | Shares Held | Value | ||
| Environmental Control — 0.14% | ||||
| Energy Recovery, Inc. (a) | 6,226 | $ | 174,017 | |
| Heritage-Crystal Clean, Inc. (a) | 3,012 | 113,823 | ||
| $ | 287,840 | |||
| Food — 1.10% | ||||
| Hostess Brands, Inc. (a) | 15,026 | 380,458 | ||
| Lancaster Colony Corp. | 2,685 | 539,927 | ||
| Simply Good Foods Co. (a) | 8,755 | 320,345 | ||
| Sprouts Farmers Market, Inc. (a) | 21,957 | 806,481 | ||
| Tootsie Roll Industries, Inc. | 1,978 | 70,041 | ||
| Weis Markets, Inc. | 1,420 | 91,178 | ||
| $ | 2,208,430 | |||
| Forest Products & Paper — 0.21% | ||||
| Sylvamo Corp. | 10,706 | 433,058 | ||
| Gas — 0.34% | ||||
| New Jersey Resources Corp. | 14,688 | 693,274 | ||
| Hand/Machine Tools — 0.37% | ||||
| Franklin Electric Co., Inc. | 3,282 | 337,718 | ||
| Kennametal, Inc. | 14,470 | 410,803 | ||
| $ | 748,521 | |||
| Healthcare — Products — 5.49% | ||||
| Alphatec Holdings, Inc. (a) | 15,843 | 284,857 | ||
| Avanos Medical, Inc. (a) | 4,427 | 113,154 | ||
| CONMED Corp. | 6,240 | 847,954 | ||
| Embecta Corp. | 10,689 | 230,882 | ||
| Haemonetics Corp. (a) | 6,921 | 589,254 | ||
| Integer Holdings Corp. (a) | 4,655 | 412,480 | ||
| Lantheus Holdings, Inc. (a) | 14,981 | 1,257,205 | ||
| LeMaitre Vascular, Inc. | 1,487 | 100,045 | ||
| LivaNova PLC (a) | 11,069 | 569,279 | ||
| Merit Medical Systems, Inc. (a) | 4,907 | 410,421 | ||
| Neogen Corp. (a) | 37,760 | 821,280 | ||
| NuVasive, Inc. (a) | 16,905 | 703,079 | ||
| OmniAb, Inc., Earnout Shares (a) | 1,130 | — | ||
| OmniAb, Inc., Earnout Shares (a) | 1,130 | — | ||
| Omnicell, Inc. (a) | 8,008 | 589,949 | ||
| OraSure Technologies, Inc. (a) | 10,178 | 50,992 | ||
| Orthofix Medical, Inc. (a) | 6,961 | 125,716 | ||
| Shockwave Medical, Inc. (a) | 6,174 | 1,762,121 | ||
| Silk Road Medical, Inc. (a) | 11,521 | 374,317 | ||
| STAAR Surgical Co. (a) | 12,824 | 674,158 | ||
| Tactile Systems Technology, Inc. (a) | 3,162 | 78,829 | ||
| TransMedics Group, Inc. (a) | 6,572 | 551,917 | ||
| UFP Technologies, Inc. (a) | 1,484 | 287,673 | ||
| Varex Imaging Corp. (a) | 5,122 | 120,725 | ||
| ViewRay, Inc. (a) | 22,901 | 8,066 | ||
| Zimvie, Inc. (a) | 3,569 | 40,080 | ||
| Zynex, Inc. (a),(b) | 4,298 | 41,218 | ||
| $ | 11,045,651 | |||
| Healthcare — Services — 2.22% | ||||
| Addus HomeCare Corp. (a) | 1,690 | 156,663 | ||
| Agiliti, Inc. (a) | 5,019 | 82,814 | ||
| Cano Health, Inc. (a),(b) | 61,678 | 85,732 | ||
See accompanying notes.
146
| Schedule of Investments | ||||
| Principal U.S. Small-Cap ETF | ||||
| June 30, 2023 | ||||
| COMMON STOCKS (continued) | Shares Held | Value | ||
| Healthcare — Services (continued) | ||||
| DocGo, Inc. (a) | 11,255 | $ | 105,459 | |
| Ensign Group, Inc. | 4,669 | 445,703 | ||
| Fulgent Genetics, Inc. (a) | 4,137 | 153,193 | ||
| HealthEquity, Inc. (a) | 14,811 | 935,167 | ||
| Medpace Holdings, Inc. (a) | 6,580 | 1,580,319 | ||
| ModivCare, Inc. (a) | 2,269 | 102,581 | ||
| Pediatrix Medical Group, Inc. (a) | 13,864 | 197,007 | ||
| RadNet, Inc. (a) | 3,337 | 108,853 | ||
| Select Medical Holdings Corp. | 9,706 | 309,233 | ||
| U.S. Physical Therapy, Inc. | 1,638 | 198,837 | ||
| $ | 4,461,561 | |||
| Home Builders — 2.52% | ||||
| Beazer Homes USA, Inc. (a) | 3,046 | 86,171 | ||
| Cavco Industries, Inc. (a) | 710 | 209,450 | ||
| Century Communities, Inc. | 3,258 | 249,628 | ||
| Green Brick Partners, Inc. (a) | 3,322 | 188,690 | ||
| Hovnanian Enterprises, Inc., Class A (a) | 982 | 97,424 | ||
| Installed Building Products, Inc. | 2,561 | 358,950 | ||
| KB Home | 16,083 | 831,652 | ||
| LGI Homes, Inc. (a) | 2,471 | 333,313 | ||
| M/I Homes, Inc. (a) | 3,203 | 279,269 | ||
| MDC Holdings, Inc. | 6,567 | 307,139 | ||
| Meritage Homes Corp. | 4,455 | 633,813 | ||
| Skyline Champion Corp. (a) | 4,186 | 273,974 | ||
| Taylor Morrison Home Corp. (a) | 9,703 | 473,215 | ||
| Tri Pointe Homes, Inc. (a) | 9,772 | 321,108 | ||
| Winnebago Industries, Inc. | 6,504 | 433,752 | ||
| $ | 5,077,548 | |||
| Home Furnishings — 0.19% | ||||
| Ethan Allen Interiors, Inc. | 3,410 | 96,435 | ||
| MillerKnoll, Inc. | 12,247 | 181,011 | ||
| Sleep Number Corp. (a) | 3,791 | 103,418 | ||
| $ | 380,864 | |||
| Household Products — 1.03% | ||||
| Edgewell Personal Care Co. | 6,034 | 249,264 | ||
| elf Beauty, Inc. (a) | 13,381 | 1,528,512 | ||
| Inter Parfums, Inc. | 2,185 | 295,478 | ||
| $ | 2,073,254 | |||
| Household Products/Wares — 0.49% | ||||
| ACCO Brands Corp. | 15,681 | 81,698 | ||
| Helen of Troy Ltd. (a) | 5,569 | 601,563 | ||
| WD-40 Co. | 1,614 | 304,481 | ||
| $ | 987,742 | |||
| Insurance — 3.86% | ||||
| Ambac Financial Group, Inc. (a) | 13,351 | 190,118 | ||
| American Equity Investment Life Holding Co. | 22,695 | 1,182,636 | ||
| CNO Financial Group, Inc. | 30,693 | 726,503 | ||
| Essent Group Ltd. | 17,111 | 800,795 | ||
| Jackson Financial, Inc., Class A | 35,809 | 1,096,114 | ||
| Kinsale Capital Group, Inc. | 4,462 | 1,669,680 | ||
| NMI Holdings, Inc., Class A (a) | 11,256 | 290,630 | ||
| Palomar Holdings, Inc. (a) | 4,094 | 237,616 | ||
See accompanying notes.
147
| Schedule of Investments | |||
| Principal U.S. Small-Cap ETF | |||
| June 30, 2023 | |||
| COMMON STOCKS (continued) | Shares Held | Value | |
| Insurance (continued) | |||
| RLI Corp. | 5,474 | $ | 747,037 |
| Selective Insurance Group, Inc. | 8,066 | 773,933 | |
| Universal Insurance Holdings, Inc. | 3,608 | 55,671 | |
| $ | 7,770,733 | ||
| Internet — 2.04% | |||
| 1-800-Flowers.com, Inc., Class A (a) | 4,390 | 34,242 | |
| Cargurus, Inc. (a) | 22,824 | 516,507 | |
| Cars.com, Inc. (a) | 8,171 | 161,949 | |
| Figs, Inc., Class A (a) | 49,459 | 409,026 | |
| HealthStream, Inc. | 1,865 | 45,804 | |
| Open Lending Corp., Class A (a) | 19,354 | 203,411 | |
| Perficient, Inc. (a) | 4,573 | 381,068 | |
| Q2 Holdings, Inc. (a) | 10,828 | 334,585 | |
| QuinStreet, Inc. (a) | 6,403 | 56,539 | |
| Revolve Group, Inc. (a),(b) | 14,484 | 237,538 | |
| Shutterstock, Inc. | 9,857 | 479,740 | |
| Squarespace, Inc., Class A (a) | 11,272 | 355,519 | |
| Yelp, Inc. (a) | 12,192 | 443,911 | |
| Ziff Davis, Inc. (a) | 6,474 | 453,568 | |
| $ | 4,113,407 | ||
| Iron & Steel — 0.77% | |||
| Commercial Metals Co. | 27,396 | 1,442,673 | |
| Haynes International, Inc. | 2,296 | 116,683 | |
| $ | 1,559,356 | ||
| Leisure Time — 0.19% | |||
| Acushnet Holdings Corp. | 3,980 | 217,626 | |
| Malibu Boats, Inc., Class A (a) | 1,388 | 81,420 | |
| MasterCraft Boat Holdings, Inc. (a) | 2,575 | 78,924 | |
| $ | 377,970 | ||
| Machinery — Construction & Mining — 0.67% | |||
| Terex Corp. | 22,543 | 1,348,748 | |
| Machinery — Diversified — 1.65% | |||
| Alamo Group, Inc. | 1,323 | 243,313 | |
| Albany International Corp., Class A | 3,727 | 347,654 | |
| Applied Industrial Technologies, Inc. | 5,325 | 771,220 | |
| CSW Industrials, Inc. | 1,816 | 301,801 | |
| GrafTech International Ltd. | 39,045 | 196,787 | |
| Kadant, Inc. | 1,603 | 356,026 | |
| Mueller Water Products, Inc., Class A | 18,564 | 301,294 | |
| Tennant Co. | 1,638 | 132,858 | |
| Thermon Group Holdings, Inc. (a) | 4,641 | 123,451 | |
| Watts Water Technologies, Inc., Class A | 3,002 | 551,557 | |
| $ | 3,325,961 | ||
| Media — 0.34% | |||
| AMC Networks, Inc., Class A (a) | 5,087 | 60,790 | |
| Gray Television, Inc. | 21,380 | 168,474 | |
| Liberty Latin America Ltd., Class C (a) | 27,673 | 238,541 | |
| Sinclair, Inc. | 15,496 | 214,155 | |
| $ | 681,960 | ||
| Metal Fabrication & Hardware — 1.24% | |||
| Mueller Industries, Inc. | 8,718 | 760,907 | |
See accompanying notes.
148
| Schedule of Investments | ||||
| Principal U.S. Small-Cap ETF | ||||
| June 30, 2023 | ||||
| COMMON STOCKS (continued) | Shares Held | Value | ||
| Metal Fabrication & Hardware (continued) | ||||
| Olympic Steel, Inc. | 3,232 | $ | 158,368 | |
| Proto Labs, Inc. (a) | 5,106 | 178,506 | ||
| RBC Bearings, Inc. (a) | 4,108 | 893,367 | ||
| Ryerson Holding Corp. | 6,801 | 295,027 | ||
| Standex International Corp. | 1,519 | 214,893 | ||
| $ | 2,501,068 | |||
| Mining — 0.18% | ||||
| Constellium SE (a) | 21,338 | 367,014 | ||
| Miscellaneous Manufacturers — 1.06% | ||||
| ESCO Technologies, Inc. | 2,043 | 211,716 | ||
| Fabrinet (a) | 4,499 | 584,330 | ||
| Federal Signal Corp. | 7,572 | 484,835 | ||
| Hillenbrand, Inc. | 7,505 | 384,857 | ||
| Materion Corp. | 2,797 | 319,417 | ||
| Smith & Wesson Brands, Inc. | 6,449 | 84,095 | ||
| Sturm Ruger & Co., Inc. | 1,378 | 72,979 | ||
| $ | 2,142,229 | |||
| Office & Business Equipment — 0.23% | ||||
| Xerox Holdings Corp. | 30,973 | 461,188 | ||
| Oil & Gas — 4.19% | ||||
| Berry Corp. | 9,030 | 62,126 | ||
| California Resources Corp. | 9,385 | 425,047 | ||
| Callon Petroleum Co. (a) | 16,849 | 590,895 | ||
| Chord Energy Corp. | 5,378 | 827,136 | ||
| Civitas Resources, Inc. | 6,708 | 465,334 | ||
| Comstock Resources, Inc. | 52,892 | 613,547 | ||
| CVR Energy, Inc. | 8,629 | 258,525 | ||
| Denbury, Inc. (a) | 6,062 | 522,908 | ||
| Magnolia Oil & Gas Corp., Class A | 20,100 | 420,090 | ||
| Matador Resources Co. | 15,970 | 835,550 | ||
| Par Pacific Holdings, Inc. (a) | 8,136 | 216,499 | ||
| PBF Energy, Inc., Class A | 29,087 | 1,190,822 | ||
| Permian Resources Corp. | 82,223 | 901,164 | ||
| Ring Energy, Inc. (a) | 31,645 | 54,113 | ||
| Sitio Royalties Corp., Class A | 8,430 | 221,456 | ||
| Talos Energy, Inc. (a) | 18,702 | 259,397 | ||
| Weatherford International PLC (a) | 8,480 | 563,242 | ||
| $ | 8,427,851 | |||
| Oil & Gas Services — 0.55% | ||||
| Archrock, Inc. | 10,146 | 103,997 | ||
| Aris Water Solutions, Inc., Class A | 9,325 | 96,234 | ||
| ChampionX Corp. | 19,536 | 606,397 | ||
| Expro Group Holdings NV (a) | 9,124 | 161,677 | ||
| Helix Energy Solutions Group, Inc. (a) | 19,828 | 146,331 | ||
| $ | 1,114,636 | |||
| Packaging & Containers — 0.44% | ||||
| Greif, Inc., Class A | 4,837 | 333,221 | ||
| O-I Glass, Inc. (a) | 25,475 | 543,382 | ||
| $ | 876,603 | |||
| Pharmaceuticals — 3.10% | ||||
| AbCellera Biologics, Inc. (a),(b) | 35,088 | 226,669 | ||
See accompanying notes.
149
| Schedule of Investments | ||||
| Principal U.S. Small-Cap ETF | ||||
| June 30, 2023 | ||||
| COMMON STOCKS (continued) | Shares Held | Value | ||
| Pharmaceuticals (continued) | ||||
| AdaptHealth Corp. (a) | 20,677 | $ | 251,639 | |
| Alector, Inc. (a) | 13,033 | 78,328 | ||
| Alkermes PLC (a) | 23,786 | 744,502 | ||
| Amphastar Pharmaceuticals, Inc. (a) | 4,002 | 229,995 | ||
| BellRing Brands, Inc. (a) | 14,517 | 531,322 | ||
| Catalyst Pharmaceuticals, Inc. (a) | 25,549 | 343,379 | ||
| Collegium Pharmaceutical, Inc. (a) | 7,848 | 168,654 | ||
| Corcept Therapeutics, Inc. (a) | 14,211 | 316,195 | ||
| Eagle Pharmaceuticals, Inc. (a) | 3,087 | 60,011 | ||
| Harmony Biosciences Holdings, Inc. (a) | 12,410 | 436,708 | ||
| Herbalife Ltd. (a) | 25,661 | 339,752 | ||
| Ironwood Pharmaceuticals, Inc. (a) | 38,705 | 411,821 | ||
| Option Care Health, Inc. (a) | 19,160 | 622,508 | ||
| Pacira BioSciences, Inc. (a) | 9,628 | 385,794 | ||
| PetIQ, Inc. (a) | 5,302 | 80,431 | ||
| Prestige Consumer Healthcare, Inc. (a) | 5,009 | 297,685 | ||
| Revance Therapeutics, Inc. (a) | 6,584 | 166,641 | ||
| Seres Therapeutics, Inc. (a) | 15,082 | 72,243 | ||
| SIGA Technologies, Inc. | 17,988 | 90,839 | ||
| Supernus Pharmaceuticals, Inc. (a) | 7,956 | 239,157 | ||
| USANA Health Sciences, Inc. (a) | 1,220 | 76,909 | ||
| Vanda Pharmaceuticals, Inc. (a) | 11,336 | 74,704 | ||
| $ | 6,245,886 | |||
| Pipelines — 0.05% | ||||
| Kinetik Holdings, Inc. | 2,826 | 99,306 | ||
| Real Estate — 0.63% | ||||
| Cushman & Wakefield PLC (a) | 81,620 | 667,652 | ||
| Marcus & Millichap, Inc. | 6,646 | 209,415 | ||
| McGrath RentCorp | 3,008 | 278,180 | ||
| RE/MAX Holdings, Inc., Class A | 5,513 | 106,180 | ||
| $ | 1,261,427 | |||
| REITs — 5.31% | ||||
| Agree Realty Corp. | 19,522 | 1,276,544 | ||
| American Assets Trust, Inc. | 17,004 | 326,477 | ||
| Broadstone Net Lease, Inc. | 33,002 | 509,551 | ||
| CareTrust REIT, Inc. | 20,677 | 410,645 | ||
| Community Healthcare Trust, Inc. | 4,772 | 157,571 | ||
| Easterly Government Properties, Inc. | 32,691 | 474,020 | ||
| Empire State Realty Trust, Inc., Class A | 49,521 | 370,912 | ||
| Essential Properties Realty Trust, Inc. | 29,083 | 684,614 | ||
| Four Corners Property Trust, Inc. | 14,128 | 358,851 | ||
| Getty Realty Corp. | 10,287 | 347,906 | ||
| Global Net Lease, Inc. | 24,199 | 248,766 | ||
| Industrial Logistics Properties Trust | 42,423 | 139,996 | ||
| Innovative Industrial Properties, Inc. | 12,276 | 896,271 | ||
| Office Properties Income Trust | 22,614 | 174,128 | ||
| Piedmont Office Realty Trust, Inc., Class A | 57,321 | 416,724 | ||
| PotlatchDeltic Corp. | 16,316 | 862,301 | ||
| STAG Industrial, Inc. | 37,656 | 1,351,097 | ||
| Tanger Factory Outlet Centers, Inc. | 29,714 | 655,788 | ||
| Terreno Realty Corp. | 15,355 | 922,835 | ||
| Universal Health Realty Income Trust | 2,123 | 101,012 | ||
| $ | 10,686,009 | |||
See accompanying notes.
150
| Schedule of Investments | ||||
| Principal U.S. Small-Cap ETF | ||||
| June 30, 2023 | ||||
| COMMON STOCKS (continued) | Shares Held | Value | ||
| Retail — 5.39% | ||||
| Academy Sports & Outdoors, Inc. | 13,844 | $ | 748,268 | |
| Asbury Automotive Group, Inc. (a) | 2,585 | 621,486 | ||
| Bloomin' Brands, Inc. | 16,632 | 447,234 | ||
| BlueLinx Holdings, Inc. (a) | 2,527 | 236,982 | ||
| Buckle, Inc. | 6,193 | 214,278 | ||
| Chuy's Holdings, Inc. (a) | 1,374 | 56,087 | ||
| Denny's Corp. (a) | 7,946 | 97,895 | ||
| Destination XL Group, Inc. (a) | 10,524 | 51,568 | ||
| Dillard's, Inc., Class A (b) | 1,800 | 587,304 | ||
| FirstCash Holdings, Inc. | 5,695 | 531,514 | ||
| Foot Locker, Inc. | 28,362 | 768,894 | ||
| Genesco, Inc. (a) | 2,646 | 66,256 | ||
| GMS, Inc. (a) | 5,248 | 363,162 | ||
| Group 1 Automotive, Inc. | 1,911 | 493,229 | ||
| Haverty Furniture Cos., Inc. | 1,802 | 54,456 | ||
| Hibbett, Inc. | 3,931 | 142,656 | ||
| Jack in the Box, Inc. | 3,820 | 372,565 | ||
| La-Z-Boy, Inc. | 4,184 | 119,830 | ||
| MarineMax, Inc. (a) | 6,555 | 223,919 | ||
| Movado Group, Inc. | 2,297 | 61,628 | ||
| Murphy USA, Inc. | 3,415 | 1,062,441 | ||
| National Vision Holdings, Inc. (a) | 10,172 | 247,078 | ||
| OneWater Marine, Inc., Class A (a) | 1,660 | 60,158 | ||
| Patrick Industries, Inc. | 2,043 | 163,440 | ||
| PriceSmart, Inc. | 1,789 | 132,493 | ||
| Sally Beauty Holdings, Inc. (a) | 15,091 | 186,374 | ||
| Shoe Carnival, Inc. | 4,501 | 105,683 | ||
| Sonic Automotive, Inc., Class A | 3,919 | 186,819 | ||
| Texas Roadhouse, Inc. | 9,347 | 1,049,481 | ||
| Wingstop, Inc. | 6,215 | 1,243,994 | ||
| Winmark Corp. | 180 | 59,845 | ||
| World Kinect Corp. | 4,542 | 93,928 | ||
| $ | 10,850,945 | |||
| Savings & Loans — 0.30% | ||||
| OceanFirst Financial Corp. | 8,232 | 128,584 | ||
| Washington Federal, Inc. | 17,817 | 472,507 | ||
| $ | 601,091 | |||
| Semiconductors — 4.11% | ||||
| Amkor Technology, Inc. | 23,899 | 710,995 | ||
| Axcelis Technologies, Inc. (a) | 10,054 | 1,843,200 | ||
| Cohu, Inc. (a) | 5,161 | 214,491 | ||
| Diodes, Inc. (a) | 4,320 | 399,557 | ||
| Kulicke & Soffa Industries, Inc. | 9,035 | 537,131 | ||
| MACOM Technology Solutions Holdings, Inc. (a) | 9,343 | 612,247 | ||
| MaxLinear, Inc. (a) | 10,821 | 341,511 | ||
| Onto Innovation, Inc. (a) | 4,483 | 522,135 | ||
| Photronics, Inc. (a) | 14,177 | 365,625 | ||
| Power Integrations, Inc. | 7,948 | 752,437 | ||
| Rambus, Inc. (a) | 18,107 | 1,161,926 | ||
| Semtech Corp. (a) | 28,442 | 724,133 | ||
| Vishay Precision Group, Inc. (a) | 2,108 | 78,312 | ||
| $ | 8,263,700 | |||
| Software — 3.41% | ||||
| 8x8, Inc. (a) | 25,237 | 106,753 | ||
| ACI Worldwide, Inc. (a) | 16,169 | 374,636 | ||
See accompanying notes.
151
| Schedule of Investments | ||||
| Principal U.S. Small-Cap ETF | ||||
| June 30, 2023 | ||||
| COMMON STOCKS (continued) | Shares Held | Value | ||
| Software (continued) | ||||
| Adeia, Inc. | 14,459 | $ | 159,194 | |
| Agilysys, Inc. (a) | 3,348 | 229,807 | ||
| Apollo Medical Holdings, Inc. (a) | 3,318 | 104,849 | ||
| Avid Technology, Inc. (a) | 4,963 | 126,556 | ||
| CommVault Systems, Inc. (a) | 6,755 | 490,548 | ||
| Computer Programs & Systems, Inc. (a) | 1,569 | 38,739 | ||
| Digi International, Inc. (a) | 6,597 | 259,856 | ||
| Donnelley Financial Solutions, Inc. (a) | 6,309 | 287,249 | ||
| Ebix, Inc. | 12,041 | 303,433 | ||
| EngageSmart, Inc. (a) | 9,481 | 180,992 | ||
| Envestnet, Inc. (a) | 9,859 | 585,132 | ||
| Everbridge, Inc. (a) | 9,186 | 247,103 | ||
| Health Catalyst, Inc. (a) | 12,352 | 154,400 | ||
| Model N, Inc. (a) | 9,279 | 328,105 | ||
| N-able, Inc. (a) | 7,242 | 104,357 | ||
| NextGen Healthcare, Inc. (a) | 7,795 | 126,435 | ||
| PDF Solutions, Inc. (a) | 3,359 | 151,491 | ||
| PowerSchool Holdings, Inc., Class A (a) | 15,000 | 287,100 | ||
| Privia Health Group, Inc. (a) | 13,341 | 348,334 | ||
| Progress Software Corp. | 7,384 | 429,010 | ||
| PubMatic, Inc., Class A (a) | 9,939 | 181,685 | ||
| Sapiens International Corp. NV | 3,674 | 97,728 | ||
| Simulations Plus, Inc. | 1,898 | 82,240 | ||
| SPS Commerce, Inc. (a) | 2,841 | 545,642 | ||
| Verra Mobility Corp. (a) | 27,357 | 539,480 | ||
| $ | 6,870,854 | |||
| Telecommunications — 1.75% | ||||
| A10 Networks, Inc. | 13,147 | 191,815 | ||
| CommScope Holding Co., Inc. (a) | 56,224 | 316,541 | ||
| EchoStar Corp., Class A (a) | 5,609 | 97,260 | ||
| Extreme Networks, Inc. (a) | 24,634 | 641,716 | ||
| IDT Corp., Class B (a) | 1,765 | 45,625 | ||
| InterDigital, Inc. | 7,372 | 711,767 | ||
| Iridium Communications, Inc. | 14,963 | 929,502 | ||
| U.S. Cellular Corp. (a) | 7,015 | 123,674 | ||
| Viavi Solutions, Inc. (a) | 40,746 | 461,652 | ||
| $ | 3,519,552 | |||
| Textiles — 0.14% | ||||
| UniFirst Corp. | 1,853 | 287,233 | ||
| Transportation — 3.03% | ||||
| Air Transport Services Group, Inc. (a) | 11,230 | 211,910 | ||
| ArcBest Corp. | 5,317 | 525,320 | ||
| Covenant Logistics Group, Inc. | 2,234 | 97,916 | ||
| Dorian LPG Ltd. | 7,250 | 185,963 | ||
| FLEX LNG Ltd. (a) | 4,513 | 137,782 | ||
| Forward Air Corp. | 3,658 | 388,150 | ||
| Heartland Express, Inc. | 5,157 | 84,626 | ||
| Hub Group, Inc., Class A (a) | 4,813 | 386,580 | ||
| International Seaways, Inc. | 7,803 | 298,387 | ||
| Marten Transport Ltd. | 6,168 | 132,612 | ||
| Matson, Inc. | 7,173 | 557,557 | ||
| Safe Bulkers, Inc. | 21,848 | 71,225 | ||
| Saia, Inc. (a) | 4,924 | 1,686,027 | ||
| Scorpio Tankers, Inc. | 16,705 | 788,977 | ||
See accompanying notes.
152
| Schedule of Investments | ||||
| Principal U.S. Small-Cap ETF | ||||
| June 30, 2023 | ||||
| COMMON STOCKS (continued) | Shares Held | Value | ||
| Transportation (continued) | ||||
| Werner Enterprises, Inc. | 12,562 | $ | 554,989 | |
| $ | 6,108,021 | |||
| Water — 0.84% | ||||
| American States Water Co. | 5,614 | 488,418 | ||
| Artesian Resources Corp., Class A | 1,748 | 82,540 | ||
| California Water Service Group | 6,898 | 356,144 | ||
| SJW Group | 11,016 | 772,332 | ||
| $ | 1,699,434 | |||
| TOTAL COMMON STOCKS | $ | 200,549,508 | ||
| INVESTMENT COMPANIES — 0.70% | Shares Held | Value | ||
| Money Market Funds — 0.70% | ||||
| Principal Government Money Market Fund — Class R-6 5.01% (c),(d),(e) | 847,907 | $ | 847,907 | |
| State Street Institutional U.S. Government Money Market Fund — Premier Class | ||||
| 5.03% (e) | 557,445 | 557,445 | ||
| TOTAL INVESTMENT COMPANIES | $ | 1,405,352 | ||
| Total Investments | $ | 201,954,860 | ||
| Other Assets and Liabilities — (0.33)% | (663,589 | ) | ||
| Total Net Assets — 100.00% | $ | 201,291,271 | ||
(a) Non-income producing security.
(b) Security or a portion of the security was on loan. At the end of the period, the value of these securities totaled $817,670 or 0.41% of net assets.
(c) Affiliated Security. Security is either an affiliate (and registered under the Investment Company Act of 1940) or an affiliate as defined by the Investment Company Act of 1940 (controls 5.00% or more of the outstanding voting shares of the security).
Please see Affiliated Securities sub-schedule for transactional information.
(d) Security or a portion of the security was received as collateral for securities lending. At the end of the period, the value of these securities totaled $847,907 or 0.42% of net assets.
(e) 1-day yield shown as of period end.
| Portfolio Summary | |||
| Sector | Percent | ||
| Consumer, Non-cyclical | 24.85 | % | |
| Financial | 19.43 | % | |
| Industrial | 17.29 | % | |
| Technology | 11.19 | % | |
| Consumer, Cyclical | 11.09 | % | |
| Energy | 6.44 | % | |
| Communications | 4.16 | % | |
| Utilities | 2.91 | % | |
| Basic Materials | 2.27 | % | |
| Money Market Funds | 0.70 | % | |
| Other Assets and Liabilities | (0.33 | )% | |
| TOTAL NET ASSETS | 100.00 | % | |
See accompanying notes. 153
| Schedule of Investments | |||||||||||
| Principal U.S. Small-Cap ETF | |||||||||||
| June 30, 2023 | |||||||||||
| June 30, 2022 | Purchases | Sales | June 30, 2023 | ||||||||
| Affiliated Securities | Value | Cost | Proceeds | Value | |||||||
| Principal Government Money | |||||||||||
| Market Fund — Class R-6 5.01% | $ | — | $ | 8,868,922 | $ | 8,021,015 | $ | 847,907 | |||
| Principal Government Money | |||||||||||
| Market Fund — Institutional Class | |||||||||||
| 4.90 | % | 5,359,834 | 17,843,390 | 23,203,224 | — | ||||||
| $ | 5,359,834 | $ | 26,712,312 | $ | 31,224,239 | $ | 847,907 | ||||
| Realized Gain | |||||||||||
| Realized | from | Change in | |||||||||
| Gain/(Loss) on | Capital Gain | Unrealized | |||||||||
| Income (a) | Investments | Distributions | Gain/(Loss) | ||||||||
| Principal Government Money | |||||||||||
| Market Fund — Class R-6 5.01% | $ | — | $ | — | $ | — | $ | — | |||
| Principal Government Money | |||||||||||
| Market Fund — Institutional Class | |||||||||||
| 4.90 | % | — | — | — | — | ||||||
| $ | — | $ | — | $ | — | $ | — | ||||
| (a) Amount excludes earnings from securities lending collateral. | |||||||||||
See accompanying notes.
154
| Schedule of Investments | ||||
| Principal Value ETF | ||||
| June 30, 2023 | ||||
| COMMON STOCKS — 99.38% | Shares Held | Value | ||
| Advertising — 1.45% | ||||
| Omnicom Group, Inc. | 5,681 | $ | 540,547 | |
| Aerospace & Defense — 2.57% | ||||
| Northrop Grumman Corp. | 926 | 422,071 | ||
| Raytheon Technologies Corp. | 5,498 | 538,584 | ||
| $ | 960,655 | |||
| Agriculture — 3.53% | ||||
| Altria Group, Inc. | 9,590 | 434,427 | ||
| Archer-Daniels-Midland Co. | 5,012 | 378,707 | ||
| Philip Morris International, Inc. | 5,171 | 504,793 | ||
| $ | 1,317,927 | |||
| Auto Parts & Equipment — 1.37% | ||||
| BorgWarner, Inc. | 10,486 | 512,870 | ||
| Banks — 5.86% | ||||
| Bank of America Corp. | 18,498 | 530,708 | ||
| M&T Bank Corp. | 2,316 | 286,628 | ||
| Northern Trust Corp. | 3,936 | 291,815 | ||
| PNC Financial Services Group, Inc. | 2,672 | 336,538 | ||
| Wells Fargo & Co. | 13,157 | 561,541 | ||
| Zions Bancorp NA | 6,740 | 181,036 | ||
| $ | 2,188,266 | |||
| Beverages — 3.95% | ||||
| Coca-Cola Co. | 10,004 | 602,441 | ||
| Constellation Brands, Inc., Class A | 1,686 | 414,975 | ||
| Molson Coors Beverage Co., Class B | 6,974 | 459,168 | ||
| $ | 1,476,584 | |||
| Biotechnology — 2.33% | ||||
| Amgen, Inc. | 2,063 | 458,027 | ||
| Corteva, Inc. | 7,186 | 411,758 | ||
| $ | 869,785 | |||
| Chemicals — 2.64% | ||||
| CF Industries Holdings, Inc. | 4,184 | 290,453 | ||
| Eastman Chemical Co. | 4,058 | 339,736 | ||
| FMC Corp. | 3,413 | 356,112 | ||
| $ | 986,301 | |||
| Computers — 8.50% | ||||
| Accenture PLC, Class A | 1,938 | 598,028 | ||
| Apple, Inc. | 9,143 | 1,773,468 | ||
| International Business Machines Corp. | 3,500 | 468,335 | ||
| Leidos Holdings, Inc. | 3,778 | 334,277 | ||
| $ | 3,174,108 | |||
| Construction Materials — 1.47% | ||||
| Johnson Controls International PLC | 8,039 | 547,777 | ||
| Diversified Financial Services — 4.60% | ||||
| American Express Co. | 3,058 | 532,704 | ||
| Franklin Resources, Inc. | 14,890 | 397,712 | ||
| Invesco Ltd. | 21,443 | 360,457 | ||
| Raymond James Financial, Inc. | 4,137 | 429,296 | ||
| $ | 1,720,169 | |||
See accompanying notes.
155
| Schedule of Investments | ||||
| Principal Value ETF | ||||
| June 30, 2023 | ||||
| COMMON STOCKS (continued) | Shares Held | Value | ||
| Electronics — 1.48% | ||||
| Honeywell International, Inc. | 2,658 | $ | 551,535 | |
| Food — 5.56% | ||||
| Conagra Brands, Inc. | 11,360 | 383,059 | ||
| General Mills, Inc. | 5,804 | 445,167 | ||
| Hershey Co. | 1,829 | 456,701 | ||
| J M Smucker Co. | 2,906 | 429,129 | ||
| Sysco Corp. | 4,868 | 361,206 | ||
| $ | 2,075,262 | |||
| Household Products/Wares — 1.24% | ||||
| Clorox Co. | 2,914 | 463,443 | ||
| Insurance — 4.48% | ||||
| Arthur J Gallagher & Co. | 2,520 | 553,316 | ||
| Assurant, Inc. | 2,077 | 261,121 | ||
| Cincinnati Financial Corp. | 3,162 | 307,726 | ||
| Marsh & McLennan Cos., Inc. | 2,928 | 550,698 | ||
| $ | 1,672,861 | |||
| Machinery — Construction & Mining — 1.56% | ||||
| Caterpillar, Inc. | 2,365 | 581,908 | ||
| Machinery — Diversified — 4.01% | ||||
| Deere & Co. | 1,362 | 551,869 | ||
| Dover Corp. | 3,093 | 456,681 | ||
| Otis Worldwide Corp. | 5,480 | 487,775 | ||
| $ | 1,496,325 | |||
| Media — 1.00% | ||||
| Fox Corp., Class A | 10,970 | 372,980 | ||
| Oil & Gas — 4.27% | ||||
| Chevron Corp. | 4,409 | 693,756 | ||
| Hess Corp. | 3,646 | 495,674 | ||
| Phillips 66 | 4,263 | 406,605 | ||
| $ | 1,596,035 | |||
| Oil & Gas Services — 1.44% | ||||
| Schlumberger NV | 10,923 | 536,538 | ||
| Packaging & Containers — 2.40% | ||||
| Amcor PLC | 30,665 | 306,037 | ||
| Packaging Corp. of America | 2,560 | 338,329 | ||
| Sealed Air Corp. | 6,272 | 250,880 | ||
| $ | 895,246 | |||
| Pharmaceuticals — 8.99% | ||||
| AmerisourceBergen Corp. | 2,585 | 497,432 | ||
| Becton Dickinson & Co. | 1,754 | 463,074 | ||
| Cardinal Health, Inc. | 7,072 | 668,799 | ||
| CVS Health Corp. | 5,250 | 362,932 | ||
| Johnson & Johnson | 4,885 | 808,565 | ||
| Organon & Co. | 10,537 | 219,275 | ||
| Viatris, Inc. | 33,797 | 337,294 | ||
| $ | 3,357,371 | |||
| Pipelines — 1.13% | ||||
| Williams Cos., Inc. | 12,908 | 421,188 | ||
See accompanying notes.
156
| Schedule of Investments | ||||
| Principal Value ETF | ||||
| June 30, 2023 | ||||
| COMMON STOCKS (continued) | Shares Held | Value | ||
| REITs — 8.06% | ||||
| Essex Property Trust, Inc. | 1,398 | $ | 327,551 | |
| Kimco Realty Corp. | 18,609 | 366,970 | ||
| Public Storage | 1,303 | 380,320 | ||
| Realty Income Corp. | 5,861 | 350,429 | ||
| Regency Centers Corp. | 6,072 | 375,067 | ||
| Simon Property Group, Inc. | 3,958 | 457,070 | ||
| Ventas, Inc. | 7,363 | 348,049 | ||
| VICI Properties, Inc. | 12,830 | 403,247 | ||
| $ | 3,008,703 | |||
| Retail — 5.32% | ||||
| Genuine Parts Co. | 2,833 | 479,429 | ||
| McDonald's Corp. | 2,276 | 679,181 | ||
| Ross Stores, Inc. | 4,979 | 558,295 | ||
| Walgreens Boots Alliance, Inc. | 9,440 | 268,946 | ||
| $ | 1,985,851 | |||
| Semiconductors — 1.59% | ||||
| Texas Instruments, Inc. | 3,298 | 593,706 | ||
| Shipbuilding — 1.06% | ||||
| Huntington Ingalls Industries, Inc. | 1,739 | 395,796 | ||
| Software — 4.62% | ||||
| Jack Henry & Associates, Inc. | 2,060 | 344,700 | ||
| Microsoft Corp. | 4,055 | 1,380,890 | ||
| $ | 1,725,590 | |||
| Telecommunications — 2.14% | ||||
| Corning, Inc. | 11,470 | 401,909 | ||
| Juniper Networks, Inc. | 12,660 | 396,638 | ||
| $ | 798,547 | |||
| Toys, Games & Hobbies — 0.76% | ||||
| Hasbro, Inc. | 4,399 | 284,923 | ||
| TOTAL COMMON STOCKS | $ | 37,108,797 | ||
| INVESTMENT COMPANIES — 0.43% | Shares Held | Value | ||
| Money Market Fund — 0.43% | ||||
| State Street Institutional U.S. Government Money Market Fund — Premier Class | ||||
| 5.03% (a) | 160,509 | $ | 160,509 | |
| TOTAL INVESTMENT COMPANIES | $ | 160,509 | ||
| Total Investments | $ | 37,269,306 | ||
| Other Assets and Liabilities — 0.19% | 70,676 | |||
| Total Net Assets — 100.00% | $ | 37,339,982 | ||
| (a) 1-day yield shown as of period end. | ||||
| See accompanying notes. | 157 | |||
| Schedule of Investments | |||||||||
| Principal Value ETF | |||||||||
| June 30, 2023 | |||||||||
| Portfolio Summary | |||||||||
| Sector | Percent | ||||||||
| Consumer, Non-cyclical | 25.60 | % | |||||||
| Financial | 23.00 | % | |||||||
| Technology | 14.71 | % | |||||||
| Industrial | 14.54 | % | |||||||
| Consumer, Cyclical | 7.46 | % | |||||||
| Energy | 6.84 | % | |||||||
| Communications | 4.59 | % | |||||||
| Basic Materials | 2.64 | % | |||||||
| Money Market Fund | 0.43 | % | |||||||
| Other Assets and Liabilities | 0.19 | % | |||||||
| TOTAL NET ASSETS | 100.00 | % | |||||||
| June 30, 2022 | Purchases | Sales | June 30, 2023 | ||||||
| Affiliated Securities | Value | Cost | Proceeds | Value | |||||
| Principal Government Money | |||||||||
| Market Fund — Class R-6 5.01% | $ | — | $ | 131,450 | $ | 131,450 | $ | — | |
| $ | — | $ | 131,450 | $ | 131,450 | $ | — | ||
| Realized Gain | |||||||||
| Realized | from | Change in | |||||||
| Gain/(Loss) on | Capital Gain | Unrealized | |||||||
| Income (a) | Investments | Distributions | Gain/(Loss) | ||||||
| Principal Government Money | |||||||||
| Market Fund — Class R-6 5.01% | $ | — | $ | — | $ | — | $ | — | |
| $ | — | $ | — | $ | — | $ | — | ||
| (a) Amount excludes earnings from securities lending collateral. | |||||||||
See accompanying notes.
158
| Financial Highlights | |||||||||||||||||
| Principal Exchange-Traded Funds | |||||||||||||||||
| Principal Active High Yield ETF | |||||||||||||||||
| For a share outstanding: | |||||||||||||||||
| Year ended | Year ended | Year ended | Year ended | Year ended | |||||||||||||
| June 30, 2023 | June 30, 2022 | June 30, 2021 | June 30, 2020 | June 30, 2019 | |||||||||||||
| Net asset value, beginning of year | $ | 17.71 | $ | 20.85 | (a) | $ | 18.07 | (a) | $ | 19.96 | (a) | $ | 20.14 | (a) | |||
| Investment Operations: | |||||||||||||||||
| Net investment income (loss) (b) | 1.05 | 0.90 | 0.77 | (a) | 0.94 | (a) | 0.96 | (a) | |||||||||
| Net realized and change in unrealized gain (loss) | 0.70 | (2.90 | ) | 2.82 | (a) | (1.86 | ) (a) | (0.01 | ) (a) | ||||||||
| Total from investment operations | 1.75 | (2.00 | ) | 3.59 | (a) | (0.92 | ) (a) | 0.95 | (a) | ||||||||
| Dividends to Shareholders from: | |||||||||||||||||
| Net investment income | (1.18 | ) | (1.14 | ) | (0.81 | ) (a) | (0.97 | ) (a) | (0.96 | ) (a) | |||||||
| Net realized gains | — | — | — | (a) | — | (a) | (0.17 | ) (a) | |||||||||
| Total dividends to stockholders | (1.18 | ) | (1.14 | ) | (0.81 | ) (a) | (0.97 | ) (a) | (1.13 | ) (a) | |||||||
| Net asset value, end of year | $ | 18.28 | $ | 17.71 | $ | 20.85 | (a) | $ | 18.07 | (a) | $ | 19.96 | (a) | ||||
| Total return | 10.15 | % | (10.65 | )% | 20.25 | % | (4.78 | )% | 4.95 | % | |||||||
| Ratios/Supplemental Data: | |||||||||||||||||
| Net assets, end of year (000s) | $ | 105,094 | $ | 218,775 | $ | 232,443 | $ | 270,096 | $ | 216,519 | |||||||
| Ratio of expenses to average net assets | 0.39 | % | 0.41 | % | 0.49 | % | 0.49 | % | 0.61 | % | |||||||
| Ratio of net investment income (loss) to average | |||||||||||||||||
| net assets | 5.84 | % | 4.46 | % | 3.90 | % | 4.89 | % | 4.84 | % | |||||||
| Portfolio turnover rate (c) | 34.5 | % | 110.5 | % | 19.5 | % | 10.6 | % | 17.9 | % | |||||||
(a) Reflects a 2 to 1 stock split effective after the close of trading on August 30, 2021, see Notes to Financial Statements. (b) Calculated on average shares outstanding during the year.
(c) Portfolio turnover rate excludes the value of portfolio securities received or delivered as a result of in-kind creations or redemptions of the Fund's Shares.
See accompanying notes.
159
| Financial Highlights | |||||||||||||||
| Principal Exchange-Traded Funds | |||||||||||||||
| Principal Healthcare Innovators ETF | |||||||||||||||
| For a share outstanding: | |||||||||||||||
| Year ended | Year ended | Year ended | Year ended | Year ended | |||||||||||
| June 30, 2023 | June 30, 2022 | June 30, 2021 | June 30, 2020 | June 30, 2019 | |||||||||||
| Net asset value, beginning of year | $ | 32.29 | $ | 60.76 | $ | 44.34 | $ | 34.37 | $ | 34.74 | |||||
| Investment Operations: | |||||||||||||||
| Net investment income (loss) (a) | (0.07 | ) | (0.14 | ) | (0.15 | ) | (0.10 | ) | (0.13 | ) | |||||
| Net realized and change in unrealized gain (loss) | 3.78 | (27.88 | ) | 16.79 | 10.07 | (0.24 | ) | ||||||||
| Total from investment operations | 3.71 | (28.02 | ) | 16.64 | 9.97 | (0.37 | ) | ||||||||
| Dividends to Shareholders from: | |||||||||||||||
| Net investment income | — | (0.45 | ) | — | — | — | |||||||||
| Net realized gains | — | — | (0.22 | ) | — | — | |||||||||
| Total dividends to stockholders | — | (0.45 | ) | (0.22 | ) | — | — | ||||||||
| Net asset value, end of year | $ | 36.00 | $ | 32.29 | $ | 60.76 | $ | 44.34 | $ | 34.37 | |||||
| Total return | 11.49 | % | (46.36 | )% | 37.51 | % | 29.01 | % | (1.05 | )% | |||||
| Ratios/Supplemental Data: | |||||||||||||||
| Net assets, end of year (000s) | $ | 53,997 | $ | 53,275 | $ | 176,197 | $ | 95,338 | $ | 56,713 | |||||
| Ratio of expenses to average net assets | 0.42 | % | 0.42 | % | 0.42 | % | 0.42 | % | 0.42 | % | |||||
| Ratio of net investment income (loss) to average | |||||||||||||||
| net assets | (0.21 | )% | (0.29 | )% | (0.27 | )% | (0.29 | )% | (0.39 | )% | |||||
| Portfolio turnover rate (b) | 56.6 | % | 46.2 | % | 45.8 | % | 36.1 | % | 34.5 | % | |||||
| (a) | Calculated on average shares outstanding during the year. |
| (b) | Portfolio turnover rate excludes the value of portfolio securities received or delivered as a result of in-kind creations or redemptions of the |
Fund's Shares.
- See accompanying notes.
160
| Financial Highlights | |||||||||
| Principal Exchange-Traded Funds | |||||||||
| Principal International Adaptive Multi-Factor ETF | |||||||||
| For a share outstanding: | |||||||||
| Year ended | Year ended | Period ended | |||||||
| June 30, 2023 | June 30, 2022 | June 30, 2021 (a) | |||||||
| Net asset value, beginning of period | $ | 20.29 | $ | 24.80 | $ | 25.00 | |||
| Investment Operations: | |||||||||
| Net investment income (loss) (b) | 0.69 | 0.59 | 0.07 | ||||||
| Net realized and change in unrealized gain (loss) | 2.15 | (4.42 | ) | (0.27 | ) | ||||
| Total from investment operations | 2.84 | (3.83 | ) | (0.20 | ) | ||||
| Dividends to Shareholders from: | |||||||||
| Net investment income | (0.76 | ) | (0.68 | ) | — | ||||
| Total dividends to stockholders | (0.76 | ) | (0.68 | ) | — | ||||
| Net asset value, end of period | $ | 22.37 | $ | 20.29 | $ | 24.80 | |||
| Total return | 14.50 | % | (15.82 | )% | (0.80 | )% (c) | |||
| Ratios/Supplemental Data: | |||||||||
| Net assets, end of period (000s) | $ | 15,658 | $ | 14,201 | $ | 47,118 | |||
| Ratio of expenses to average net assets | 0.24 | % | 0.24 | % | 0.24 | % (d) | |||
| Ratio of net investment income (loss) to average | |||||||||
| net assets | 3.29 | % | 2.41 | % | 2.76 | % (d) | |||
| Portfolio turnover rate (e) | 61.8 | % | 111.9 | % | 1.5 | % | |||
| (a) | Period from May 26, 2021, date operations commenced, through June 30, 2021. |
| (b) | Calculated on average shares outstanding during the period. |
| (c) | Total return amounts have not been annualized. |
| (d) | Computed on an annualized basis. |
| (e) | Portfolio turnover rate excludes the value of portfolio securities received or delivered as a result of in-kind creations or redemptions of the |
Fund's Shares.
- See accompanying notes.
161
| Financial Highlights | |||||||||||||||
| Principal Exchange-Traded Funds | |||||||||||||||
| Principal Investment Grade Corporate Active ETF | |||||||||||||||
| For a share outstanding: | |||||||||||||||
| Year ended | Year ended | Year ended | Year ended | Year ended | |||||||||||
| June 30, 2023 | June 30, 2022 | June 30, 2021 | June 30, 2020 | June 30, 2019 | |||||||||||
| Net asset value, beginning of year | $ | 21.84 | $ | 26.74 | $ | 26.67 | $ | 26.20 | $ | 24.59 | |||||
| Investment Operations: | |||||||||||||||
| Net investment income (loss) (a) | 0.76 | 0.65 | 0.62 | 0.88 | 0.95 | ||||||||||
| Net realized and change in unrealized gain (loss) | (0.60 | ) | (4.68 | ) | 0.69 | 1.39 | 1.66 | ||||||||
| Total from investment operations | 0.16 | (4.03 | ) | 1.31 | 2.27 | 2.61 | |||||||||
| Dividends to Shareholders from: | |||||||||||||||
| Net investment income | (1.49 | ) | (0.80 | ) | (0.79 | ) | (0.95 | ) | (0.98 | ) | |||||
| Net realized gains | — | (0.07 | ) | (0.45 | ) | (0.85 | ) | (0.02 | ) | ||||||
| Total dividends to stockholders | (1.49 | ) | (0.87 | ) | (1.24 | ) | (1.80 | ) | (1.00 | ) | |||||
| Net asset value, end of year | $ | 20.51 | $ | 21.84 | $ | 26.74 | $ | 26.67 | $ | 26.20 | |||||
| Total return | 0.87 | % | (15.47 | )% | 4.90 | % | 8.98 | % | 10.95 | % | |||||
| Ratios/Supplemental Data: | |||||||||||||||
| Net assets, end of year (000s) | $ | 47,174 | $ | 369,026 | $ | 481,271 | $ | 110,693 | $ | 120,540 | |||||
| Ratio of expenses to average net assets | 0.19 | % | 0.19 | % | 0.25 | % | 0.26 | % | 0.26 | % | |||||
| Ratio of net investment income (loss) to average | |||||||||||||||
| net assets | 3.52 | % | 2.58 | % | 2.30 | % | 3.37 | % | 3.86 | % | |||||
| Portfolio turnover rate (b) | 61.0 | % | 46.9 | % | 67.8 | % | 73.3 | % | 92.8 | % | |||||
| (a) | Calculated on average shares outstanding during the year. |
| (b) | Portfolio turnover rate excludes the value of portfolio securities received or delivered as a result of in-kind creations or redemptions of the |
Fund's Shares.
- See accompanying notes.
162
| Financial Highlights | |||||||||||||||
| Principal Exchange-Traded Funds | |||||||||||||||
| Principal Millennial Global Growth ETF (a) | |||||||||||||||
| For a share outstanding: | |||||||||||||||
| Year ended | Year ended | Year ended | Year ended | Year ended | |||||||||||
| June 30, 2023 | June 30, 2022 | June 30, 2021 | June 30, 2020 | June 30, 2019 | |||||||||||
| Net asset value, beginning of year | $ | 39.35 | $ | 66.53 | $ | 42.85 | $ | 38.24 | $ | 36.76 | |||||
| Investment Operations: | |||||||||||||||
| Net investment income (loss) (b) | 0.66 | 2.18 | 0.27 | 0.34 | 0.17 | ||||||||||
| Net realized and change in unrealized gain (loss) | 3.72 | (27.57 | ) | 23.81 | 4.59 | 1.54 | |||||||||
| Total from investment operations | 4.38 | (25.39 | ) | 24.08 | 4.93 | 1.71 | |||||||||
| Dividends to Shareholders from: | |||||||||||||||
| Net investment income | (0.90 | ) | (1.79 | ) | (0.40 | ) | (0.32 | ) | (0.23 | ) | |||||
| Total dividends to stockholders | (0.90 | ) | (1.79 | ) | (0.40 | ) | (0.32 | ) | (0.23 | ) | |||||
| Net asset value, end of year | $ | 42.83 | $ | 39.35 | $ | 66.53 | $ | 42.85 | $ | 38.24 | |||||
| Total return | 11.52 | % | (38.99 | )% | 56.45 | % | 12.96 | % | 4.70 | % | |||||
| Ratios/Supplemental Data: | |||||||||||||||
| Net assets, end of year (000s) | $ | 29,984 | $ | 23,607 | $ | 126,399 | $ | 25,708 | $ | 21,031 | |||||
| Ratio of expenses to average net assets | 0.40 | % | 0.45 | % | 0.45 | % | 0.45 | % | 0.45 | % | |||||
| Ratio of net investment income (loss) to average | |||||||||||||||
| net assets | 1.64 | % | 3.78 | % | 0.46 | % | 0.88 | % | 0.47 | % | |||||
| Portfolio turnover rate (c) | 2.0 | % | 28.4 | % | 55.7 | % | 47.4 | % | 32.9 | % | |||||
| (a) | Effective July 15, 2022, Principal Millennials ETF changed its name to Principal Millennial Global Growth ETF. |
| (b) | Calculated on average shares outstanding during the year. |
| (c) | Portfolio turnover rate excludes the value of portfolio securities received or delivered as a result of in-kind creations or redemptions of the |
Fund's Shares.
- See accompanying notes.
163
| Financial Highlights | ||||||||||||||||
| Principal Exchange-Traded Funds | ||||||||||||||||
| Principal Quality ETF | ||||||||||||||||
| For a share outstanding: | ||||||||||||||||
| Year ended | Year ended | Year ended | Year ended | Year ended | ||||||||||||
| June 30, 2023 | June 30, 2022 | June 30, 2021 | June 30, 2020 | June 30, 2019 | ||||||||||||
| Net asset value, beginning of year | $ | 47.88 | $ | 53.17 | $ | 39.89 | $ | 37.79 | $ | 33.32 | ||||||
| Investment Operations: | ||||||||||||||||
| Net investment income (loss) (a) | 0.60 | 0.61 | 0.57 | 0.51 | 0.46 | |||||||||||
| Net realized and change in unrealized gain (loss) | 8.71 | (5.36 | ) | 13.22 | 1.00 | 4.48 | ||||||||||
| Net realized gain due from reimbursement from | ||||||||||||||||
| Advisor | — | — | — | 1.13 | (b) | — | ||||||||||
| Total from investment operations | 9.31 | (4.75 | ) | 13.79 | 2.64 | 4.94 | ||||||||||
| Dividends to Shareholders from: | ||||||||||||||||
| Net investment income | (0.74 | ) | (0.54 | ) | (0.51 | ) | (0.54 | ) | (0.47 | ) | ||||||
| Total dividends to stockholders | (0.74 | ) | (0.54 | ) | (0.51 | ) | (0.54 | ) | (0.47 | ) | ||||||
| Net asset value, end of year | $ | 56.45 | $ | 47.88 | $ | 53.17 | $ | 39.89 | $ | 37.79 | ||||||
| Total return | 19.69 | % | (9.07 | )% | 34.83 | % | 7.05 | % (b) | 15.03 | % | ||||||
| Ratios/Supplemental Data: | ||||||||||||||||
| Net assets, end of year (000s) | $ | 36,696 | $ | 45,489 | $ | 58,486 | $ | 17,951 | $ | 20,786 | ||||||
| Ratio of expenses to average net assets | 0.15 | % | 0.15 | % | 0.15 | % | 0.29 | % (c) | 0.29 | % (c) | ||||||
| Ratio of gross expenses to average net assets | —% (d) | —% (d) | —% (d) | 0.34 | % | 0.40 | % | |||||||||
| Ratio of net investment income (loss) to average | ||||||||||||||||
| net assets | 1.18 | % | 1.11 | % | 1.22 | % | 1.32 | % | 1.32 | % | ||||||
| Portfolio turnover rate (e) | 47.7 | % | 96.0 | % | 45.1 | % | 103.7 | % | 40.4 | % | ||||||
| (a) | Calculated on average shares outstanding during the year. | |||||||||||||||
| (b) | During 2020, the Fund experienced a significant one-time gain as the result of a payment by the Advisor due to an operational error by a | |||||||||||||||
| third party. If such payment had not been recognized, the total return amounts expressed herein would have been lower by 3.04%. | ||||||||||||||||
| (c) | Includes reimbursement from Advisor. | |||||||||||||||
| (d) | Ratio is not applicable as there was no waiver during the year. | |||||||||||||||
| (e) | Portfolio turnover rate excludes the value of portfolio securities received or delivered as a result of in-kind creations or redemptions of the | |||||||||||||||
| Fund's Shares. | ||||||||||||||||
| See accompanying notes. | ||||||||||||||||
| 164 | ||||||||||||||||
| Financial Highlights | ||||||
| Principal Exchange-Traded Funds | ||||||
| Principal Real Estate Active Opportunities ETF | ||||||
| For a share outstanding: | ||||||
| Year ended | Period ended | |||||
| June 30, 2023 | June 30, 2022 (a) | |||||
| Net asset value, beginning of period | $ | 24.50 | $ | 25.00 | ||
| Investment Operations: | ||||||
| Net investment income (loss) (b) | 0.54 | 0.10 | ||||
| Net realized and change in unrealized gain (loss) | (1.78 | ) | (0.60 | ) | ||
| Total from investment operations | (1.24 | ) | (0.50 | ) | ||
| Dividends to Shareholders from: | ||||||
| Net investment income | (0.48 | ) | — | |||
| Net realized gains | (0.10 | ) | — | |||
| Total dividends to stockholders | (0.58 | ) | — | |||
| Net asset value, end of period | $ | 22.68 | $ | 24.50 | ||
| Total return | (5.03 | )% | (2.01 | )% (c) | ||
| Ratios/Supplemental Data: | ||||||
| Net assets, end of period (000s) | $ | 5,443 | $ | 5,390 | ||
| Ratio of expenses to average net assets | 0.65 | % | 0.65 | % (d) | ||
| Ratio of net investment income (loss) to average | ||||||
| net assets | 2.33 | % | 3.51 | % (d) | ||
| Portfolio turnover rate (e) | 17.6 | % | 16.2 | % | ||
| (a) | Period from May 18, 2022, date operations commenced, through June 30, 2022. |
| (b) | Calculated on average shares outstanding during the period. |
| (c) | Total return amounts have not been annualized. |
| (d) | Computed on an annualized basis. |
| (e) | Portfolio turnover rate excludes the value of portfolio securities received or delivered as a result of in-kind creations or redemptions of the |
Fund's Shares.
- See accompanying notes.
165
| Financial Highlights | ||||||||||||||||
| Principal Exchange-Traded Funds | ||||||||||||||||
| Principal Spectrum Preferred Securities Active ETF | ||||||||||||||||
| For a share outstanding: | ||||||||||||||||
| Year ended | Year ended | Year ended | Year ended | Year ended | ||||||||||||
| June 30, 2023 | June 30, 2022 | June 30, 2021 | June 30, 2020 | June 30, 2019 | ||||||||||||
| Net asset value, beginning of year | $ | 17.20 | $ | 20.64 | $ | 19.31 | (a) | $ | 19.36 | (a) | $ | 18.89 | (a) | |||
| Investment Operations: | ||||||||||||||||
| Net investment income (loss) (b) | 0.72 | 0.64 | 0.70 | 0.80 | (a) | 0.68 | (a) | |||||||||
| Net realized and change in unrealized gain (loss) | (0.25 | ) | (3.27 | ) | 1.86 | 0.08 | (a) | 0.77 | (a) | |||||||
| Total from investment operations | 0.47 | (2.63 | ) | 2.56 | 0.88 | (a) | 1.45 | (a) | ||||||||
| Dividends to Shareholders from: | ||||||||||||||||
| Net investment income | (0.80 | ) | (0.81 | ) | (1.23 | ) | (0.93 | ) (a) | (0.98 | ) (a) | ||||||
| Total dividends to stockholders | (0.80 | ) | (0.81 | ) | (1.23 | ) | (0.93 | ) (a) | (0.98 | ) (a) | ||||||
| Net asset value, end of year | $ | 16.87 | $ | 17.20 | $ | 20.64 | $ | 19.31 | (a) | $ | 19.36 | (a) | ||||
| Total return | 2.68 | % | (13.15 | )% | 11.58 | % | 4.60 | % | 7.99 | % | ||||||
| Ratios/Supplemental Data: | ||||||||||||||||
| Net assets, end of year (000s) | $ | 575,986 | $ | 344,957 | $ | 363,333 | $ | 139,995 | $ | 67,750 | ||||||
| Ratio of expenses to average net assets | 0.55 | % | 0.55 | % | 0.55 | % | 0.55 | % | 0.55 | % | ||||||
| Ratio of net investment income (loss) to average | ||||||||||||||||
| net assets | 4.21 | % | 3.24 | % | 3.43 | % | 4.10 | % | 3.65 | % | ||||||
| Portfolio turnover rate (c) | 16.7 | % | 9.2 | % | 12.6 | % | 41.9 | % | 27.6 | % | ||||||
| (a) | Reflects a 5 to 1 stock split effective after the close of trading on July 22, 2020, see Notes to Financial Statements. |
| (b) | Calculated on average shares outstanding during the year. |
| (c) | Portfolio turnover rate excludes the value of portfolio securities received or delivered as a result of in-kind creations or redemptions of the |
Fund's Shares.
- See accompanying notes.
166
| Financial Highlights | ||||||||||||
| Principal Exchange-Traded Funds | ||||||||||||
| Principal Spectrum Tax-Advantaged Dividend Active ETF | ||||||||||||
| For a share outstanding: | ||||||||||||
| Year ended | Year ended | Year ended | Period ended | |||||||||
| June 30, 2023 | June 30, 2022 | June 30, 2021 | June 30, 2020 (a) | |||||||||
| Net asset value, beginning of period | $ | 18.34 | $ | 21.57 | $ | 19.95 | $ | 20.00 | ||||
| Investment Operations: | ||||||||||||
| Net investment income (loss) (b) | 0.87 | 0.84 | 0.88 | 0.03 | ||||||||
| Net realized and change in unrealized gain (loss) | (0.75 | ) | (2.98 | ) | 1.76 | (0.08 | ) | |||||
| Total from investment operations | 0.12 | (2.14 | ) | 2.64 | (0.05 | ) | ||||||
| Dividends to Shareholders from: | ||||||||||||
| Net investment income | (1.00 | ) | (1.00 | ) | (0.98 | ) | — | |||||
| Net realized gains | — | (0.09 | ) | (0.04 | ) | — | ||||||
| Total dividends to stockholders | (1.00 | ) | (1.09 | ) | (1.02 | ) | — | |||||
| Net asset value, end of period | $ | 17.46 | $ | 18.34 | $ | 21.57 | $ | 19.95 | ||||
| Total return | 0.65 | % | (10.38 | )% | 13.42 | % | (0.26 | )% (c) | ||||
| Ratios/Supplemental Data: | ||||||||||||
| Net assets, end of period (000s) | $ | 20,081 | $ | 21,088 | $ | 22,647 | $ | 19,948 | ||||
| Ratio of expenses to average net assets | 0.60 | % | 0.60 | % | 0.60 | % | 0.60 | % (d) | ||||
| Ratio of net investment income (loss) to average | ||||||||||||
| net assets | 4.81 | % | 4.09 | % | 4.15 | % | 4.35 | % (d) | ||||
| Portfolio turnover rate (e) | 12.8 | % | 6.7 | % | 15.5 | % | 6.3 | % | ||||
| (a) | Period from June 16, 2020, date operations commenced, through June 30, 2020. |
| (b) | Calculated on average shares outstanding during the period. |
| (c) | Total return amounts have not been annualized. |
| (d) | Computed on an annualized basis. |
| (e) | Portfolio turnover rate excludes the value of portfolio securities received or delivered as a result of in-kind creations or redemptions of the |
Fund's Shares.
- See accompanying notes.
167
| Financial Highlights | |||||||||
| Principal Exchange-Traded Funds | |||||||||
| Principal U.S. Large-Cap Adaptive Multi-Factor ETF | |||||||||
| For a share outstanding: | |||||||||
| Year ended | Year ended | Period ended | |||||||
| June 30, 2023 | June 30, 2022 | June 30, 2021 (a) | |||||||
| Net asset value, beginning of period | $ | 23.18 | $ | 25.95 | $ | 25.00 | |||
| Investment Operations: | |||||||||
| Net investment income (loss) (b) | 0.37 | 0.32 | 0.03 | ||||||
| Net realized and change in unrealized gain (loss) | 3.33 | (2.85 | ) | 0.92 | |||||
| Total from investment operations | 3.70 | (2.53 | ) | 0.95 | |||||
| Dividends to Shareholders from: | |||||||||
| Net investment income | (0.59 | ) | (0.24 | ) | — | ||||
| Total dividends to stockholders | (0.59 | ) | (0.24 | ) | — | ||||
| Net asset value, end of period | $ | 26.29 | $ | 23.18 | $ | 25.95 | |||
| Total return | 16.28 | % | (9.89 | )% | 3.80 | % (c) | |||
| Ratios/Supplemental Data: | |||||||||
| Net assets, end of period (000s) | $ | 6,571 | $ | 12,750 | $ | 29,842 | |||
| Ratio of expenses to average net assets | 0.15 | % | 0.15 | % | 0.15 | % (d) | |||
| Ratio of net investment income (loss) to average | |||||||||
| net assets | 1.55 | % | 1.19 | % | 0.99 | % (d) | |||
| Portfolio turnover rate (e) | 59.3 | % | 106.6 | % | 0.4 | % | |||
| (a) | Period from May 19, 2021, date operations commenced, through June 30, 2021. |
| (b) | Calculated on average shares outstanding during the period. |
| (c) | Total return amounts have not been annualized. |
| (d) | Computed on an annualized basis. |
| (e) | Portfolio turnover rate excludes the value of portfolio securities received or delivered as a result of in-kind creations or redemptions of the |
Fund's Shares.
- See accompanying notes.
168
| Financial Highlights | ||||||||||||||||
| Principal Exchange-Traded Funds | ||||||||||||||||
| Principal U.S. Mega-Cap ETF | ||||||||||||||||
| For a share outstanding: | ||||||||||||||||
| Year ended | Year ended | Year ended | Year ended | Year ended | ||||||||||||
| June 30, 2023 | June 30, 2022 | June 30, 2021 | June 30, 2020 | June 30, 2019 | ||||||||||||
| Net asset value, beginning of year | $ | 36.61 | $ | 39.68 | $ | 30.04 | $ | 29.07 | $ | 26.02 | ||||||
| Investment Operations: | ||||||||||||||||
| Net investment income (loss) (a) | 0.59 | 0.68 | 0.59 | 0.60 | 0.63 | |||||||||||
| Net realized and change in unrealized gain (loss) | 7.13 | (3.05 | ) | 9.60 | 1.00 | 3.04 | ||||||||||
| Total from investment operations | 7.72 | (2.37 | ) | 10.19 | 1.60 | 3.67 | ||||||||||
| Dividends to Shareholders from: | ||||||||||||||||
| Net investment income | (0.63 | ) | (0.70 | ) | (0.55 | ) | (0.63 | ) | (0.62 | ) | ||||||
| Total dividends to stockholders | (0.63 | ) | (0.70 | ) | (0.55 | ) | (0.63 | ) | (0.62 | ) | ||||||
| Net asset value, end of year | $ | 43.70 | $ | 36.61 | $ | 39.68 | $ | 30.04 | $ | 29.07 | ||||||
| Total return | 21.39 | % | (6.18 | )% | 34.25 | % | 5.62 | % | 14.32 | % | ||||||
| Ratios/Supplemental Data: | ||||||||||||||||
| Net assets, end of year (000s) | $ | 1,463,854 | $ | 1,367,427 | $ | 1,958,064 | $ | 1,505,046 | $ | 1,618,941 | ||||||
| Ratio of expenses to average net assets (b) | 0.12 | % | 0.12 | % | 0.12 | % | 0.12 | % | 0.12 | % | ||||||
| Ratio of gross expenses to average net assets | 0.15 | % | 0.15 | % | 0.15 | % | 0.15 | % | 0.15 | % | ||||||
| Ratio of net investment income (loss) to average | ||||||||||||||||
| net assets | 1.53 | % | 1.65 | % | 1.67 | % | 2.05 | % | 2.30 | % | ||||||
| Portfolio turnover rate (c) | 28.8 | % | 41.1 | % | 42.9 | % | 42.9 | % | 27.0 | % | ||||||
| (a) | Calculated on average shares outstanding during the year. |
| (b) | Includes reimbursement from Advisor. |
| (c) | Portfolio turnover rate excludes the value of portfolio securities received or delivered as a result of in-kind creations or redemptions of the |
Fund's Shares.
- See accompanying notes.
169
| Financial Highlights | |||||||||
| Principal Exchange-Traded Funds | |||||||||
| Principal U.S. Small-Cap Adaptive Multi-Factor ETF | |||||||||
| For a share outstanding: | |||||||||
| Year ended | Year ended | Period ended | |||||||
| June 30, 2023 | June 30, 2022 | June 30, 2021 (a) | |||||||
| Net asset value, beginning of period | $ | 21.85 | $ | 25.61 | $ | 25.00 | |||
| Investment Operations: | |||||||||
| Net investment income (loss) (b) | 0.38 | 0.39 | 0.03 | ||||||
| Net realized and change in unrealized gain (loss) | 1.61 | (3.71 | ) | 0.58 | |||||
| Total from investment operations | 1.99 | (3.32 | ) | 0.61 | |||||
| Dividends to Shareholders from: | |||||||||
| Net investment income | (0.40 | ) | (0.31 | ) | — | ||||
| Net realized gains | — | (0.13 | ) | — | |||||
| Total dividends to stockholders | (0.40 | ) | (0.44 | ) | — | ||||
| Net asset value, end of period | $ | 23.44 | $ | 21.85 | $ | 25.61 | |||
| Total return | 9.22 | % | (13.25 | )% | 2.44 | % (c) | |||
| Ratios/Supplemental Data: | |||||||||
| Net assets, end of period (000s) | $ | 5,860 | $ | 5,463 | $ | 6,403 | |||
| Ratio of expenses to average net assets | 0.19 | % | 0.19 | % | 0.19 | % (d) | |||
| Ratio of net investment income (loss) to average | |||||||||
| net assets | 1.65 | % | 1.55 | % | 0.96 | % (d) | |||
| Portfolio turnover rate (e) | 91.5 | % | 128.4 | % | 0.2 | % | |||
| (a) | Period from May 19, 2021, date operations commenced, through June 30, 2021. |
| (b) | Calculated on average shares outstanding during the period. |
| (c) | Total return amounts have not been annualized. |
| (d) | Computed on an annualized basis. |
| (e) | Portfolio turnover rate excludes the value of portfolio securities received or delivered as a result of in-kind creations or redemptions of the |
Fund's Shares.
- See accompanying notes.
170
| Financial Highlights | ||||||||||||||||
| Principal Exchange-Traded Funds | ||||||||||||||||
| Principal U.S. Small-Cap ETF (a) | ||||||||||||||||
| For a share outstanding: | ||||||||||||||||
| Year ended | Year ended | Year ended | Year ended | Year ended | ||||||||||||
| June 30, 2023 | June 30, 2022 | June 30, 2021 | June 30, 2020 | June 30, 2019 | ||||||||||||
| Net asset value, beginning of year | $ | 38.04 | $ | 46.92 | $ | 27.36 | $ | 31.43 | $ | 33.45 | ||||||
| Investment Operations: | ||||||||||||||||
| Net investment income (loss) (b) | 0.56 | 0.62 | 0.54 | 0.45 | 0.40 | |||||||||||
| Net realized and change in unrealized gain (loss) | 4.53 | (8.90 | ) | 19.51 | (4.11 | ) | (2.03 | ) | ||||||||
| Total from investment operations | 5.09 | (8.28 | ) | 20.05 | (3.66 | ) | (1.63 | ) | ||||||||
| Dividends to Shareholders from: | ||||||||||||||||
| Net investment income | (0.75 | ) | (0.60 | ) | (0.49 | ) | (0.41 | ) | (0.39 | ) | ||||||
| Total dividends to stockholders | (0.75 | ) | (0.60 | ) | (0.49 | ) | (0.41 | ) | (0.39 | ) | ||||||
| Net asset value, end of year | $ | 42.38 | $ | 38.04 | $ | 46.92 | $ | 27.36 | $ | 31.43 | ||||||
| Total return | 13.59 | % | (17.88 | )% | 74.05 | % | (11.71 | )% | (4.84 | )% | ||||||
| Ratios/Supplemental Data: | ||||||||||||||||
| Net assets, end of year (000s) | $ | 201,291 | $ | 616,265 | $ | 1,628,003 | $ | 328,305 | $ | 355,200 | ||||||
| Ratio of expenses to average net assets | 0.38 | % | 0.38 | % | 0.38 | % | 0.38 | % | 0.38 | % | ||||||
| Ratio of net investment income (loss) to average | ||||||||||||||||
| net assets | 1.39 | % | 1.37 | % | 1.39 | % | 1.54 | % | 1.27 | % | ||||||
| Portfolio turnover rate (c) | 74.1 | % | 70.6 | % | 93.1 | % | 80.4 | % | 81.9 | % | ||||||
| (a) | Effective June 30, 2023, Principal U.S. Small-Cap Multi-Factor ETF changed its name to Principal U.S. Small-Cap ETF. |
| (b) | Calculated on average shares outstanding during the year. |
| (c) | Portfolio turnover rate excludes the value of portfolio securities received or delivered as a result of in-kind creations or redemptions of the |
Fund's Shares.
- See accompanying notes.
171
| Financial Highlights | ||||||||||||||||
| Principal Exchange-Traded Funds | ||||||||||||||||
| Principal Value ETF | ||||||||||||||||
| For a share outstanding: | ||||||||||||||||
| Year ended | Year ended | Year ended | Year ended | Year ended | ||||||||||||
| June 30, 2023 | June 30, 2022 | June 30, 2021 | June 30, 2020 | June 30, 2019 | ||||||||||||
| Net asset value, beginning of year | $ | 38.90 | $ | 42.38 | $ | 27.75 | $ | 31.99 | $ | 32.49 | ||||||
| Investment Operations: | ||||||||||||||||
| Net investment income (loss) (a) | 0.93 | 1.63 | 1.16 | 0.87 | 0.71 | |||||||||||
| Net realized and change in unrealized gain (loss) | 3.04 | (3.89 | ) | 14.52 | (4.36 | ) | (0.51 | ) | ||||||||
| Total from investment operations | 3.97 | (2.26 | ) | 15.68 | (3.49 | ) | 0.20 | |||||||||
| Dividends to Shareholders from: | ||||||||||||||||
| Net investment income | (1.38 | ) | (1.22 | ) | (1.05 | ) | (0.75 | ) | (0.70 | ) | ||||||
| Total dividends to stockholders | (1.38 | ) | (1.22 | ) | (1.05 | ) | (0.75 | ) | (0.70 | ) | ||||||
| Net asset value, end of year | $ | 41.49 | $ | 38.90 | $ | 42.38 | $ | 27.75 | $ | 31.99 | ||||||
| Total return | 10.45 | % | (5.58 | )% | 57.97 | % | (11.09 | )% | 0.68 | % | ||||||
| Ratios/Supplemental Data: | ||||||||||||||||
| Net assets, end of year (000s) | $ | 37,340 | $ | 215,875 | $ | 44,498 | $ | 31,907 | $ | 14,395 | ||||||
| Ratio of expenses to average net assets | 0.15 | % | 0.15 | % | 0.15 | % | 0.29 | % (b) | 0.29 | % (b) | ||||||
| Ratio of gross expenses to average net assets | —% (c) | —% (c) | —% (c) | 0.32 | % | 0.40 | % | |||||||||
| Ratio of net investment income (loss) to average | ||||||||||||||||
| net assets | 2.31 | % | 3.83 | % | 3.31 | % | 2.95 | % | 2.26 | % | ||||||
| Portfolio turnover rate (d) | 1.8 | % | 298.2 | % | 44.8 | % | 47.6 | % | 49.2 | % | ||||||
| (a) | Calculated on average shares outstanding during the year. |
| (b) | Includes reimbursement from Advisor. |
| (c) | Ratio is not applicable as there was no waiver during the year. |
| (d) | Portfolio turnover rate excludes the value of portfolio securities received or delivered as a result of in-kind creations or redemptions of the |
Fund's Shares.
See accompanying notes.
172
Report of Independent Registered Public Accounting Firm
To the Shareholders and the Board of Trustees of Principal Exchange-Traded Funds
Opinion on the Financial Statements
We have audited the accompanying statements of assets and liabilities of Principal Exchange-Traded Funds (the “Trust”) (comprising Principal Active High Yield ETF, Principal Healthcare Innovators ETF, Principal International Adaptive Multi-Factor ETF, Principal Investment Grade Corporate Active ETF, Principal Millennial Global Growth ETF (formerly Principal Millennials ETF), Principal Quality ETF, Principal Real Estate Active Opportunities ETF, Principal Spectrum Preferred Securities Active ETF, Principal Spectrum Tax-Advantaged Dividend Active ETF, Principal U.S. Large-Cap Adaptive Multi-Factor ETF, Principal U.S. Mega-Cap ETF, Principal U.S. Small-Cap Adaptive Multi-Factor ETF, Principal U.S. Small-Cap ETF (formerly Principal U.S. Small-Cap Multi-Factor ETF), and Principal Value ETF, (collectively referred to as the “Funds”)), including the schedules of investments, as of June 30, 2023, and the related statements of operations and changes in net assets, and the financial highlights for each of the periods indicated in the table below and the related notes (collectively referred to as the “financial statements”). In our opinion, the financial statements present fairly, in all material respects, the financial position of each of the Funds comprising the Principal Exchange-Traded Funds at June 30, 2023, the results of their operations, changes in net assets and financial highlights for each of the periods indicated in the table below, in conformity with U.S. generally accepted accounting principles.
| Statements of | Statements of | ||
| Funds comprising the Trust | operations | changes in | Financial highlights |
| net assets | |||
| Principal Active High Yield ETF | For the year | For each of | For each of the five |
| Principal Healthcare Innovators ETF | ended June 30, | the two years | years in the period |
| Principal Investment Grade Corporate | 2023 | in the period | ended June 30, 2023 |
| Active ETF | ended June 30, | ||
| Principal Millennial Global Growth ETF | 2023 | ||
| Principal Quality ETF | |||
| Principal Spectrum Preferred Securities | |||
| Active ETF | |||
| Principal U.S. Mega-Cap ETF | |||
| Principal U.S. Small-Cap ETF | |||
| Principal Value ETF | |||
| Principal Spectrum Tax-Advantaged | For the year | For each of | For each of the three |
| Dividend Active ETF | ended June 30, | the two years | years in the period |
| 2023 | in the period | ended June 30, 2023 | |
| ended June 30, | and the period from | ||
| 2023 | June 16, 2020 (date | ||
| operations | |||
| commenced) through | |||
| June 30, 2020 | |||
| Principal U.S. Large-Cap Adaptive Multi- | For the year | For each of | For each of the two |
| Factor ETF | ended June 30, | the two years | years in the period |
| Principal U.S. Small-Cap Adaptive Multi- | 2023 | in the period | ended June 30, 2023 |
| Factor ETF | ended June 30, | and the period from | |
| 2023 | May 19, 2021 (date | ||
| operations | |||
| commenced) through | |||
| June 30, 2021 |
173
| Funds comprising the Trust | Statements of | Statements of | ||
| operations | changes in | Financial highlights | ||
| net assets | ||||
| Principal International Adaptive Multi- | For the year | For each of | For each of the two | |
| Factor ETF | ended June 30, | the two years | years in the period | |
| 2023 | in the period | ended June 30, 2023 | ||
| ended June 30, | and the period from | |||
| 2023 | May 26, 2021 (date | |||
| operations | ||||
| commenced) through | ||||
| June 30, 2021 | ||||
| Principal Real Estate Active Opportunities | For the year | For the year ended June 30, 2023 and | ||
| ETF | ended June 30, | the period from May 18, 2022 (date | ||
| 2023 | operations commenced) through June | |||
| 30, 2022 | . | |||
Basis for Opinion
These financial statements are the responsibility of the Trust’s management. Our responsibility is to express an opinion on each of the Funds’ financial statements based on our audits. We are a public accounting firm registered with the Public Company Accounting Oversight Board (United States) (“PCAOB”) and are required to be independent with respect to the Trust in accordance with the U.S. federal securities laws and the applicable rules and regulations of the Securities and Exchange Commission and the PCAOB.
We conducted our audits in accordance with the standards of the PCAOB. Those standards require that we plan and perform the audit to obtain reasonable assurance about whether the financial statements are free of material misstatement, whether due to error or fraud. The Trust is not required to have, nor were we engaged to perform, an audit of the Trust’s internal control over financial reporting. As part of our audits, we are required to obtain an understanding of internal control over financial reporting but not for the purpose of expressing an opinion on the effectiveness of the Trust’s internal control over financial reporting. Accordingly, we express no such opinion.
Our audits included performing procedures to assess the risks of material misstatement of the financial statements, whether due to error or fraud, and performing procedures that respond to those risks. Such procedures included examining, on a test basis, evidence regarding the amounts and disclosures in the financial statements. Our procedures included confirmation of securities owned as of June 30, 2023, by correspondence with the custodian, brokers, and agent banks; when replies were not received from brokers and agent banks, we performed other auditing procedures. Our audits also included evaluating the accounting principles used and significant estimates made by management, as well as evaluating the overall presentation of the financial statements. We believe that our audits provide a reasonable basis for our opinion.

We have served as the auditor of one or more Principal investment companies since 1969.
Minneapolis, MN
August 21, 2023
174
Shareholder Expense Example
Principal Exchange-Traded Funds
June 30, 2023 (unaudited)
As a shareholder of Principal Exchange-Traded Funds, you incur two types of costs: (1) transaction costs, including brokerage commissions paid on purchases and sales of Fund shares and (2) ongoing costs, including management fees. This Example is intended to help you understand your ongoing costs (in dollars) of investing in Principal Exchange-Traded Funds and to compare these costs with the ongoing costs of investing in other exchange-traded funds.
The Examples are based on an investment of $1,000 invested at the beginning of the period and held for the entire period, January 1, 2023 through June 30, 2023, except as noted in the following table.
Actual Expenses
The first section of the table provides information about actual account values and actual expenses. You may use the information in this section, together with the amount you invested, to estimate the expenses that you paid over the period. Simply divide your account value by $1,000 (for example, an $8,600 account value divided by $1,000 = 8.6), then multiply the result by the number in the first section under the heading entitled "Expenses Paid During Period" to estimate the expenses you paid on your account during this period.
Hypothetical Example for Comparison Purposes
The second section of table provides information about hypothetical account values and hypothetical expenses based on the Fund's actual expense ratio and an assumed rate of return of 5% per year before expenses, which is not the Fund's actual return. The hypothetical account values and expenses may not be used to estimate the actual ending account balance or expenses you paid for the period. You may use this information to compare the ongoing costs of investing in the Fund. To do so, compare this 5% hypothetical example with the 5% hypothetical examples that appear in the shareholder reports of the other fund.
Please note that the expenses shown in the table are meant to highlight your ongoing costs only and do not reflect any transaction costs, such as contingent deferred sales charges, redemption fees or exchange fees. Therefore, the second section of the table is useful in comparing ongoing costs only, and will not help you determine the relative total costs of owning different fund. In addition, if these transaction costs were included, your costs would have been higher.
| Annualized | Expenses | ||||||||
| Expense | Paid During | ||||||||
| Beginning | Ending | Ratio | Period | ||||||
| Account | Account | January 1, | January 1, | ||||||
| Value | Value | 2023 | to | 2023 | to | ||||
| January 1, | June 30, | June 30, | June 30, | ||||||
| 2023 | 2023 | 2023 | 2023 | (a) | |||||
| Principal Active High Yield ETF | |||||||||
| Actual Fund Return | $ | 1,000 | $ | 1,053.70 | 0.39 | % | $ | 1.99 | |
| Hypothetical 5% Annual Return | $ | 1,000 | $ | 1,022.86 | 0.39 | % | $ | 1.96 | |
| Principal Healthcare Innovators ETF | |||||||||
| Actual Fund Return | $ | 1,000 | $ | 1,068.10 | 0.42 | % | $ | 2.15 | |
| Hypothetical 5% Annual Return | $ | 1,000 | $ | 1,022.71 | 0.42 | % | $ | 2.11 | |
| Principal International Adaptive Multi-Factor ETF | |||||||||
| Actual Fund Return | $ | 1,000 | $ | 1,104.10 | 0.24 | % | $ | 1.25 | |
| Hypothetical 5% Annual Return | $ | 1,000 | $ | 1,023.60 | 0.24 | % | $ | 1.20 | |
175
| Shareholder Expense Example | |||||||||
| Principal Exchange-Traded Funds | |||||||||
| June 30, 2023 (unaudited) | |||||||||
| Annualized | Expenses | ||||||||
| Expense | Paid During | ||||||||
| Beginning | Ending | Ratio | Period | ||||||
| Account | Account | January 1, | January 1, | ||||||
| Value | Value | 2023 | to | 2023 | to | ||||
| January 1, | June 30, | June 30, | June 30, | ||||||
| 2023 | 2023 | 2023 | 2023 | (a) | |||||
| Principal Investment Grade Corporate Active ETF | |||||||||
| Actual Fund Return | $ | 1,000 | $ | 1,024.30 | 0.19 | % | $ | 0.95 | |
| Hypothetical 5% Annual Return | $ | 1,000 | $ | 1,023.85 | 0.19 | % | $ | 0.95 | |
| Principal Millennial Global Growth ETF | |||||||||
| Actual Fund Return | $ | 1,000 | $ | 1,093.20 | 0.38 | % | $ | 1.97 | |
| Hypothetical 5% Annual Return | $ | 1,000 | $ | 1,022.91 | 0.38 | % | $ | 1.91 | |
| Principal Quality ETF | |||||||||
| Actual Fund Return | $ | 1,000 | $ | 1,136.80 | 0.15 | % | $ | 0.79 | |
| Hypothetical 5% Annual Return | $ | 1,000 | $ | 1,024.05 | 0.15 | % | $ | 0.75 | |
| Principal Real Estate Active Opportunities ETF | |||||||||
| Actual Fund Return | $ | 1,000 | $ | 1,021.70 | 0.65 | % | $ | 3.26 | |
| Hypothetical 5% Annual Return | $ | 1,000 | $ | 1,021.57 | 0.65 | % | $ | 3.26 | |
| Principal Spectrum Preferred Securities Active ETF | |||||||||
| Actual Fund Return | $ | 1,000 | $ | 1,007.20 | 0.55 | % | $ | 2.74 | |
| Hypothetical 5% Annual Return | $ | 1,000 | $ | 1,022.07 | 0.55 | % | $ | 2.76 | |
| Principal Spectrum Tax-Advantaged Dividend Active ETF | |||||||||
| Actual Fund Return | $ | 1,000 | $ | 996.70 | 0.60 | % | $ | 2.97 | |
| Hypothetical 5% Annual Return | $ | 1,000 | $ | 1,021.82 | 0.60 | % | $ | 3.01 | |
| Principal U.S. Large-Cap Adaptive Multi-Factor ETF | |||||||||
| Actual Fund Return | $ | 1,000 | $ | 1,152.80 | 0.15 | % | $ | 0.80 | |
| Hypothetical 5% Annual Return | $ | 1,000 | $ | 1,024.05 | 0.15 | % | $ | 0.75 | |
| Principal U.S. Mega-Cap ETF | |||||||||
| Actual Fund Return | $ | 1,000 | $ | 1,213.50 | 0.12 | % | $ | 0.66 | |
| Hypothetical 5% Annual Return | $ | 1,000 | $ | 1,024.20 | 0.12 | % | $ | 0.60 | |
| Principal U.S. Small-Cap Adaptive Multi-Factor ETF | |||||||||
| Actual Fund Return | $ | 1,000 | $ | 1,054.90 | 0.19 | % | $ | 0.97 | |
| Hypothetical 5% Annual Return | $ | 1,000 | $ | 1,023.85 | 0.19 | % | $ | 0.95 | |
| Principal U.S. Small-Cap ETF | |||||||||
| Actual Fund Return | $ | 1,000 | $ | 1,085.50 | 0.38 | % | $ | 1.96 | |
| Hypothetical 5% Annual Return | $ | 1,000 | $ | 1,022.91 | 0.38 | % | $ | 1.91 | |
| Principal Value ETF | |||||||||
| Actual Fund Return | $ | 1,000 | $ | 1,021.10 | 0.15 | % | $ | 0.75 | |
| Hypothetical 5% Annual Return | $ | 1,000 | $ | 1,024.05 | 0.15 | % | $ | 0.75 | |
| (a) Expenses are equal to a Fund's annualized expense ratio multiplied by the average account value over the period, | |||||||||
| multiplied by 181/365. | |||||||||
176
PRINCIPAL EXCHANGE-TRADED FUNDS
(unaudited)
Notification of Source of Distributions
Pursuant to Rule 19a-1 of the Investment Company Act of 1940
As noted in the table provided below, certain of the Principal Exchange-Traded Funds made distributions for the months of April 2023 and July 2023 for which a portion is estimated to be in excess of the Fund’s current and accumulated net income. As of these month ends, the estimated sources of these distributions were as follows:
| April 2023 | ||||||
| Fund | Net Income | Realized Gain | Capital Sources | |||
| Principal Millennial Global Growth ETF | 31.07 | % | 0.00 | % | 68.93 | % |
| July 2023 | ||||||
| Fund | Net Income | Realized Gain | Capital Sources | |||
| Principal International Adaptive Multi-Factor ETF | 85.20 | % | 0.00 | % | 14.80 | % |
| Principal Millennial Global Growth ETF | 7.65 | 0.00 | 92.35 | |||
The ultimate composition of these distributions may vary from the estimates provided above due to a variety of factors including future income and expenses, and realized gains and losses from the purchase and sale of securities.
Please note that this information is being provided to satisfy certain notice requirements under the Investment Company Act of 1940. Tax reporting information for shareholders of the Funds will not be available until the end of the Funds’ fiscal year.
As a result, shareholders should not use the information provided in this notice for tax reporting purposes.
177
FUND BOARD OF TRUSTEES AND OFFICERS
The Board of Trustees (the “Board”) has overall responsibility for overseeing the Fund’s operations in accordance with the Investment Act of 1940, as amended (the “1940 Act”), other applicable laws, and the Fund’s charter. Each member of the Board (“Board Member”) serves on the Boards of the following investment companies: Principal Funds, Inc., Principal Variable Contracts Funds, Inc., Principal Exchange-Traded Funds, and Principal Diversified Select Real Asset Fund which are collectively referred to as the “Fund Complex”. Board Members that are affiliated persons of any investment advisor, the principal distributor, or the principal underwriter of the Fund Complex are considered “interested persons” of the Fund (as defined in the 1940 Act) and are referred to as “Interested Board Members”. Board Members who are not Interested Board Members are referred to as “Independent Board Members”.
Each Board Member generally serves until the next annual meeting of shareholders or until such Board Member’s earlier death, resignation, or removal. Independent Board Members have a 72-year age limit and, for Independent Board Members elected on or after September 14, 2021, a 72-year age limit or a 15-year term limit, whichever occurs first. The Board may waive the age or term limits in the Board’s discretion. The Board elects officers to supervise the day-to-day operations of the Fund Complex. Officers serve at the pleasure of the Board, and each officer has the same position with each investment company in the Fund Complex.
INDEPENDENT BOARD MEMBERS
| Name, | Number of Portfolios | Other Directorships | |
| Position Held with the Fund Complex, | Principal Occupation(s) | in Fund Complex | Held by Board Member |
| Year of Birth | During past 5 years | Overseen by Board Member | During Past 5 Years |
| Leroy T. Barnes, Jr. | Retired | 130 | McClatchy Newspapers, Inc. (2000- |
| Board Member since 2012 | 2020); Frontier Communications, Inc. | ||
| Member, Audit Committee | (2005-2019) | ||
| 1951 | |||
| Craig Damos | President, C.P. Damos Consulting LLC (consulting | 130 | None |
| Lead Independent Board Member since 2020 | services) | ||
| Board Member since 2008 | |||
| Member, Nominating and Governance | |||
| Committee | |||
| Member, Operations Committee | |||
| Member, Executive Committee | |||
| 1954 | |||
| Katharin S. Dyer | Founder and Chief Executive Officer, PivotWise | 130 | Liquidity Services, Inc. (2020-present) |
| Board Member since 2023 | (consulting services) Global Partner, IBM | ||
| Member, Operations Committee | (technology company) from 2016-2018 | ||
| 1957 | |||
| Frances P. Grieb | Retired | 130 | First Interstate BancSystems, Inc. |
| Board Member since 2023 | (2022-present); Great Western Bancorp, | ||
| Member, Audit Committee | Inc. and Great Western Bank (2014-2022) | ||
| 1960 | |||
| Fritz S. Hirsch | Interim CEO, MAM USA (manufacturer of infant | 130 | MAM USA (2011-present) |
| Board Member since 2005 | and juvenile products) from February 2020 to | ||
| Member, Nominating and Governance | October 2020 | ||
| Committee | |||
| Member, 15(c) Committee | |||
| 1951 | |||
| Victor Hymes | Founder, CEO, CIO, Legato Capital Management, | 130 | None |
| Board Member since 2020 | LLC (investment management company) | ||
| Chair, Audit Committee | |||
| Member, Nominating and Governance | |||
| Committee | |||
| 1957 | |||
| Padelford L. Lattimer | Managing Partner, TBA Management Consulting | 130 | None |
| Board Member since 2020 | LLC (management consulting and staffing company) | ||
| Chair, Operations Committee | |||
| Member, 15(c) Committee | |||
| 1961 | |||
| Karen McMillan | Founder/Owner, Tyche Consulting LLC (consulting | 130 | None |
| Board Member since 2014 | services) | ||
| Member, Operations Committee | Managing Director, Patomak Global Partners, LLC | ||
| Chair, 15(c) Committee | (financial services consulting) from 2014-2021 | ||
| 1961 | |||
| 178 | |||
| Name, | Number of Portfolios | Other Directorships | |
| Position Held with the Fund Complex, | Principal Occupation(s) | in Fund Complex | Held by Board Member |
| Year of Birth | During past 5 years | Overseen by Board Member | During Past 5 Years |
| Elizabeth A. Nickels | Retired | 130 | SpartanNash (2000-2022) |
| Board Member since 2015 | |||
| Member, Audit Committee | |||
| Chair, Nominating and Governance Committee | |||
| 1962 | |||
| Mary M. VanDeWeghe | CEO and President, Forte Consulting, Inc. (financial | 130 | Helmerich & Payne (2019-present); |
| Board Member since 2018 | and management consulting) | Denbury Resources Inc. (2019-2020) | |
| Member, Audit Committee | |||
| Member, 15(c) Committee | |||
| 1959 | |||
| INTERESTED BOARD MEMBERS | |||
| Other | |||
| Name, | Number of Portfolios | Directorships | |
| Position Held with the Fund Complex, | Principal Occupation(s) | in Fund Complex | Held by Board Member |
| Year of Birth | During past 5 years | Overseen by Board Member | During Past 5 Years |
| Kamal Bhatia | Principal Global Investors, LLC (“PGI”) | 130 | None |
| Chair and Board Member since 2023 | Director since 2019 | ||
| Chief Executive Officer and President | President-Principal Funds since 2019 | ||
| since 2019 | |||
| Chair, Executive Committee | |||
| 1972 | |||
| Principal Funds Distributor, Inc. (“PFD”) | |||
| Director since 2019 | |||
| Principal Financial Group, Inc. (“PFGI”), Principal | |||
| Financial Services, Inc. (“PFSI”), and Principal Life | |||
| Insurance Company (“PLIC”) | |||
| Senior Executive Managing Director – Global | |||
| Head of Investments – Principal Asset Management | |||
| (“PAM”) since 2023 | |||
| Senior Executive Director and Chief Operating | |||
| Officer - PAM since 2023 | |||
| Senior Executive Director and Chief Operating | |||
| Officer - PGI (2020-2022) | |||
| President-Principal Funds (2019-2020) | |||
| Post Advisory Group, LLC (“Post”) | |||
| Director since 2020 | |||
| Principal Real Estate Investors, LLC (“PREI”) | |||
| Senior Executive Director and Chief Operating | |||
| Officer - PGI since 2022 | |||
| Director since 2020 | |||
| Principal Shareholder Services, Inc. (“PSS”) | |||
| Executive Vice President since 2019 | |||
| Director and Chair (2019-2022) | |||
| Spectrum Asset Management (“Spectrum”) | |||
| Director since 2021 | |||
| Origin Asset Management (“Origin”) | |||
| Additional Director since 2022 | |||
| OppenheimerFunds | |||
| Senior Vice President (2011-2019) | |||
| 179 | |||
| Other | |||||
| Name, | Number of Portfolios | Directorships | |||
| Position Held with the Fund Complex, | Principal Occupation(s) | in Fund Complex | Held by Board Member | ||
| Year of Birth | During past 5 years | Overseen by Board Member | During Past 5 Years | ||
| Patrick G. Halter | PGI | 130 | None | ||
| Board Member since 2017 | Chair since 2018 | ||||
| Member, Executive Committee | Chief Executive Officer and | ||||
| 1959 | President since 2018 | ||||
| Director since 2003 | |||||
| PFGI, PFSI, and PLIC | |||||
| President and Chief Executive Officer – PAM) since | |||||
| 2022 | |||||
| President – Principal Global Asset Management | |||||
| (“PGAM”) (2020-2022) | |||||
| Post | |||||
| Director since 2017 | |||||
| Chair (2017-2020) | |||||
| PREI | |||||
| President - PGAM since 2022 | |||||
| Director and Chair since 2004 | |||||
| Chief Executive Officer and | |||||
| President (2018-2021) | |||||
| Origin | |||||
| Director (2018-2019) | |||||
| Kenneth A. McCullum | PGI | 130 | |||
| Board Member since 2023 | Director since 2020 | ||||
| 1964 | |||||
| PFGI, PFSI, and PLIC | |||||
| Executive Vice President and Chief Risk Officer | |||||
| since 2023 | |||||
| Senior Vice President and Chief Risk Officer (2020- | |||||
| 2023 | ) | ||||
| Vice President and Chief Actuary (2015-2020) | |||||
| Principal Securities, Inc. (“PSI”) | |||||
| Director since 2020 | |||||
| PSS | |||||
| Director since 2020 | |||||
| Correspondence intended for each Board Member who is other than an Interested Board Member may be sent to 655 9th Street, Des Moines, | |||||
| IA 50392 | . | ||||
| 180 | |||||
| FUND COMPLEX OFFICERS | ||
| Name, | ||
| Position Held with the Fund Complex, | Principal Occupation(s) | |
| Address, and Year of Birth | During past 5 years | |
| Randy D. Bolin | Vice President/Associate General Counsel, PGI | |
| Assistant Tax Counsel | since 2016 | |
| Des Moines, IA 50392 | Vice President/Associate General Counsel, PFSI | |
| 1961 | since 2013 | |
| Vice President/Associate General Counsel, PLIC | ||
| since 2013 | ||
| George Djurasovic | Vice President/General Counsel PAM, PGI since | |
| General Counsel | 2022 | |
| Des Moines, IA 50392 | Vice President/General Counsel PAM, PFGI since | |
| 1971 | 2022 | |
| Vice President/General Counsel PAM, PFSI since | ||
| 2022 | ||
| Vice President/General Counsel PAM, PLIC since | ||
| 2022 | ||
| Global Chief Compliance Officer, Artisan Partners | ||
| Limited | ||
| Partnership (2013-2022) | ||
| Beth Graff | Director – Fund Accounting, PLIC since 2016 | |
| Vice President and Assistant Controller | ||
| Des Moines, IA 50392 | ||
| 1968 | ||
| Gina L. Graham | Vice President and Treasurer, PGI since 2016 | |
| Treasurer | Vice President and Treasurer, PFD since 2016 | |
| Des Moines, IA 50392 | Vice President and Treasurer, PFSI since 2016 | |
| 1965 | Vice President and Treasurer, Business Owner | |
| Ecosystem, Inc. (“BOE - formerly, RobustWealth, | ||
| Inc.”) since 2018 | ||
| Vice President and Treasurer, PFD since 2016 | ||
| Vice President and Treasurer, PFGI since 2016 | ||
| Vice President and Treasurer, PFSI since 2016 | ||
| Vice President and Treasurer, PLIC since 2016 | ||
| Vice President and Treasurer, PREI since 2017 | ||
| Vice President and Treasurer, PSI since 2016 | ||
| Vice President and Treasurer, PSS since 2016 | ||
| Megan Hoffmann | Director – Accounting, PLIC since 2020 | |
| Vice President and Controller | Assistant Director – Accounting, PLIC (2017-2020) | |
| Des Moines, IA 50392 | ||
| 1979 | ||
| Laura B. Latham | Assistant Counsel and Assistant Secretary – Fund | |
| Counsel and Assistant Secretary | Complex (2018-2023) | |
| Des Moines, IA 50392 | Counsel, PGI since 2018 | |
| 1986 | Counsel, PLIC since 2018 | |
| Diane K. Nelson | Chief Compliance Officer/AML Officer, PSS since | |
| AML Officer | 2015 | |
| Des Moines, IA 50392 | ||
| 1965 | ||
| Tara Parks | Director – Accounting, PLIC since 2019 | |
| Vice President and Assistant Controller | Tax Manager – ALPS Fund Services (2011-2019) | |
| Des Moines, IA 50392 | ||
| 1983 | ||
| Deanna Y. Pellack | Assistant Counsel and Assistant Secretary – Fund | |
| Counsel and Assistant Secretary | Complex (2022-2023) | |
| Des Moines, IA 50392 | Counsel, PLIC since 2022 | |
| 1987 | Vice President, The Northern Trust Company (2019- | |
| 2022 | ) | |
| Second Vice President, The Northern Trust | ||
| Company (2014-2019) | ||
181
| Name, | ||
| Position Held with the Fund Complex, | Principal Occupation(s) | |
| Address, and Year of Birth | During past 5 years | |
| Sara L. Reece | Vice President and Controller – Fund Complex | |
| Vice President and Chief Operating Officer | (2016-2021) | |
| Des Moines, IA 50392 | Managing Director – Global Funds Ops, PLIC since | |
| 1975 | 2021 | |
| Managing Director – Financial Analysis/ Planning, | ||
| PLIC (2021) | ||
| Director - Accounting, PLIC (2015-2021) | ||
| Teri R. Root | Interim Chief Compliance Officer – Fund Complex | |
| Chief Compliance Officer | (2018 | ) |
| Des Moines, IA 50392 | Vice President, PSS since 2015 | |
| 1979 | ||
| Michael Scholten | Chief Operations Officer, PFD since 2022 | |
| Chief Financial Officer | Chief Financial Officer – PFD (2016-2022) | |
| Des Moines, IA 50392 | Assistant Vice President and Actuary, PLIC since | |
| 1979 | 2021 | |
| Chief Financial Officer – Funds/Platforms, PLIC | ||
| since 2015 | ||
| Chief Financial Officer, PSS since 2015 | ||
| Adam U. Shaikh | Assistant Counsel – Fund Complex (2006-2023) | |
| Assistant General Counsel and Assistant | Assistant General Counsel, PGI since 2018 | |
| Secretary | Counsel, PLIC since 2006 | |
| Des Moines, IA 50392 | ||
| 1972 | ||
| John L. Sullivan | Assistant Counsel and Assistant Secretary – Fund | |
| Counsel and Assistant Secretary | Complex (2019-2023) | |
| Des Moines, IA 50392 | Counsel, PGI since 2020 | |
| 1970 | Counsel, PLIC since 2019 | |
| Prior thereto, Attorney in Private Practice | ||
| Dan L. Westholm | Assistant Vice President-Treasury, PGI since 2013 | |
| Assistant Treasurer | Assistant Vice President-Treasury, PFD since 2013 | |
| Des Moines, IA 50392 | Assistant Vice President-Treasury, PLIC since 2014 | |
| 1966 | Assistant Vice President-Treasury, PSI since 2013 | |
| Assistant Vice President-Treasury, PSS since 2013 | ||
| Beth C. Wilson | Director and Secretary – Funds, PLIC since 2007 | |
| Vice President and Secretary | ||
| Des Moines, IA 50392 | ||
| 1956 | ||
| Jared A. Yepsen | Counsel, PGI (2017-2019) | |
| Assistant Tax Counsel | Counsel, PLIC since 2015 | |
| Des Moines, IA 50392 | ||
| 1981 | ||
The 15(c) Committee’s primary purpose is to assist the Board in performing the annual review of the Fund’s advisory and sub-advisory agreements pursuant to Section 15(c) of the 1940 Act. The Committee is responsible for requesting and reviewing related materials.
The Audit Committee’s primary purpose is to assist the Board by serving as an independent and objective party to monitor the Fund Complex’s accounting policies, financial reporting and internal control system, as well as the work of the independent registered public accountants. The Audit Committee assists Board oversight of 1) the integrity of the Fund Complex’s financial statements; 2) the Fund Complex’s compliance with certain legal and regulatory requirements; 3) the independent registered public accountants’ qualifications and independence; and 4) the performance of the Fund Complex’s independent registered public accountants. The Audit Committee also provides an open avenue of communication among the independent registered public accountants, the Manager’s internal auditors, Fund Complex management, and the Board.
The Executive Committee’s primary purpose is to exercise certain powers of the Board when the Board is not in session. When the Board is not in session, the Committee may exercise all powers of the Board in the management of the Fund Complex's business except the power to 1) issue stock, except as permitted by law; 2) recommend to the shareholders any action that requires shareholder approval; 3) amend the bylaws; or 4) approve any merger or share exchange that does not require shareholder approval.
The Nominating and Governance Committee’s primary purpose is to oversee the structure and efficiency of the Board and the committees. The Committee is responsible for evaluating Board membership and functions, committee membership and functions, insurance coverage, and legal matters. The Committee's nominating functions include selecting and nominating Independent Board Member candidates for election
182
to the Board. Generally, the Committee requests nominee suggestions from Board Members and management. In addition, the Committee considers candidates recommended by shareholders of the Fund Complex. Recommendations should be submitted in writing to the Principal Funds Complex Secretary, in care of the Principal Funds Complex, 711 High Street, Des Moines, IA 50392. Such recommendations must include all information specified in the Committee’s charter and must conform with the procedures set forth in Appendix A thereto, which can be found at https://secure02.principal.com/publicvsupply/GetFile?fm=MM13013&ty=VOP&EXT=.VOP. Examples of such information include the nominee’s biographical information; relevant educational and professional background of the nominee; the number of shares of each Fund owned of record and beneficially by the nominee and by the recommending shareholder; any other information regarding the nominee that would be required to be disclosed in a proxy statement or other filing required to be made in connection with the solicitation of proxies for the election of board members; whether the nominee is an “interested person” of the Fund as defined in the 1940 Act; and the written consent of the nominee to be named as a nominee and serve as a board member if elected.
When evaluating a potential nominee for Independent Board Member, the Committee may consider, among other factors: educational background; relevant business and industry experience; whether the person is an "interested person" of the Fund as defined in the 1940 Act; and whether the person is willing to serve, and willing and able to commit the time necessary to attend meetings and perform the duties of an
Independent Board Member. In addition, the Committee may consider whether a candidate’s background, experience, skills and views would complement the background, experience, skills and views of other Board Members and would contribute to the diversity of the Board. The final decision is based on a combination of factors, including the strengths and the experience an individual may bring to the Board. The Board does not regularly use the services of professional search firms to identify or evaluate potential candidates or nominees.
The Operations Committee’s primary purpose is to review and oversee the provision of administrative and distribution services to the Fund Complex, communications with the Fund Complex’s shareholders, and the Fund Complex’s operations.
Additional information about the Fund is available in the Prospectuses date November 1, 2022 and as supplemented and the Statement of Additional Information dated November 1, 2022, as amended and restated July 10, 2023, and as supplemented. These documents may be obtained free of charge by writing Principal Exchange-Traded Funds, c/o ALPS Distributors, Inc., 1290 Broadway, Suite 1000, Denver, CO 80203 or telephoning 1-800-222-5852. The prospectus may be viewed at www.PrincipalAM.com/ETFprospectuses.
PROXY VOTING POLICIES
A description of the policies and procedures the Fund uses to determine how to vote proxies relating to portfolio securities and the results of the proxy votes for the most recent twelve months ended June 30 may be obtained free of charge by telephoning 1-800-222-5852, or on the SEC website at www.sec.gov.
SCHEDULES OF INVESTMENTS
The Fund files complete schedules of investments with the Securities and Exchange Commission for the first and third quarters of each fiscal year as an exhibit to its reports on Form N-PORT. The Fund’s Form N-PORT reports are available on the Commission’s website at www. sec.gov.
Traded Funds (the “Board”) met on March 15, 2023 to review the liquidity risk management program (the “Program”) applicable to all series of the Principal Exchange Traded Funds. (each, a “Fund”), pursuant to Rule 22e-4 under the Investment Company Act of 1940, as amended (the “Liquidity Rule”) for the period from December 31, 2021 through December 31, 2022 (the “Reporting Period”). At the meeting, the committee designated by the Board to administer the Program, the Liquidity Risk Management Committee (the “Committee”), addressed the operation, adequacy and effectiveness of the Program, the operation of each Fund’s highly liquid investment minimum, where applicable, and any material changes made to the Program during the Reporting Period.
STATEMENT REGARDING LIQUIDITY RISK MANAGEMENT PROGRAM
The Committee noted key factors it considered when assessing, managing and reviewing each Fund’s liquidity risk. Such factors included each Fund’s investment strategy and liquidity of portfolio investments during both normal and reasonably foreseeable stressed conditions, including (a) whether the Fund’s investment strategy is appropriate for an open-end fund, (b) the extent to which the strategy involves a relatively concentrated portfolio or large positions in particular issuers, (c) the use of in-kind creation baskets, and (d) the use of borrowings for investment purposes and use of leveraged derivatives and financial commitment obligations; short-term and long-term cash flow projections during both normal and reasonably foreseeable stressed conditions; holdings of cash and cash equivalents, as well as borrowing arrangements and other funding sources; and each Fund’s shareholder ownership concentration.
183
There were no material changes to the Program during the Reporting Period. The Committee concluded, based on the operation of the functions as described in the Report, that the Program is operating as intended and is effective in implementing the requirements of the Liquidity Rule.
184
| Joint Annual Meeting of Shareholders | ||
| Principal Exchange-Traded Funds | ||
| Held April 26, 2023 | ||
| 1. Election of thirteen Directors as members of the Board of Directors | ||
| For | Withheld | |
| Leroy T. Barnes | 62,976,789 | 337,800 |
| Craig Damos | 62,978,344 | 336,245 |
| Katharin S. Dyer | 62,993,406 | 321,133 |
| Frances P. Grieb | 62,997,362 | 317,177 |
| Fritz S. Hirsch | 62,972,955 | 341,634 |
| Victor L. Hymes | 62,989,824 | 324,765 |
| Padelford L. Lattimer | 62,985,764 | 328,775 |
| Karen McMillan | 62,992,508 | 322,081 |
| Elizabeth A. Nickels | 62,985,489 | 329,050 |
| Mary M. VanDeWeghe | 62,989,262 | 325,277 |
| Kamal Bhatia | 63,006,143 | 308,446 |
| Patrick G. Halter | 62,964,751 | 349,838 |
| Kenneth A. McCullum | 62,983,816 | 330,773 |
| 2. | Approval of the ability of Principal Global Investors, LLC to enter into and/or materially amend sub-advisory agreements with all sub-advisors, regardless of the degree of affiliation, as described in the proposal, on behalf of the Fund without obtaining shareholder approval |
| For | Against | Abstain | Broker Non-Vote | |
| Principal Active High Yield ETF | 2,288,820 | 50,971 | 1,403 | 745,281 |
| Principal Healthcare Innovators ETF | 964,756 | 3,717 | 1,105 | 318,174 |
| Principal Investment Grade Corporate Active ETF | 632,287 | 4,215 | 3,923 | 715,698 |
| Principal Millennial Global Growth ETF | 140,877 | 6,774 | 5,744 | 397,369 |
| Principal Quality ETF | 129,777 | 7,398 | 6,197 | 272,203 |
| Principal Spectrum Preferred Securities Active ETF | 14,875,650 | 276,737 | 117,617 | 7,235,786 |
| Principal U.S. Mega-Cap ETF | 24,595,197 | 19,566 | 10,063 | 2,499,294 |
| Principal U.S. Small-Cap ETF | 3,815,990 | 1,614 | 831 | 252,645 |
| Principal Value ETF | 308,262 | 3,545 | 4,632 | 350,458 |
185
Federal Income Tax Information Principal Exchange-Traded Funds June 30, 2023 (unaudited)
Long-Term Capital Gain Dividends. Certain funds distributed long-term capital gain dividends during the fiscal year ended June 30, 2023.
Details of designated long-term capital gain dividends for federal income tax purposes are shown in the Notes to Financial Statements. To the extent necessary to distribute such capital gains, certain funds may also utilize, and hereby designate, earnings and profits distributed to shareholders on redemptions of shares as part of the Dividends Paid Deduction.
Foreign Taxes Paid. The following funds elect under the Internal Revenue Code Section ("IRC") 853 to pass through foreign taxes paid to their shareholders.
The funds designated the following for federal income tax purposes for distributions made during the fiscal year ended June 30, 2023:
| Foreign Taxes | Foreign | ||
| Per Share | Source Income | ||
| Principal International Adaptive Multi-Factor ETF | 0.081108 | 99.67 | % |
Dividends Received Deduction ("DRD"). For corporate shareholders, the funds designate the following as a percentage of taxable ordinary income distributions (dividend income and short-term gains, if any), or up to the maximum amount allowable, as DRD eligible for the calendar year ended December 31, 2022:
| DRD | ||
| Principal Active High Yield ETF | 1.11 | % |
| Principal Healthcare Innovators ETF | 0.00 | % |
| Principal International Adaptive Multi-Factor ETF | 0.00 | % |
| Principal Investment Grade Corporate Active ETF | 0.00 | % |
| Principal Millennial Global Growth ETF | 82.05 | % |
| Principal Quality ETF | 98.30 | % |
| Principal Real Estate Active Opportunities ETF | 2.37 | % |
| Principal Spectrum Preferred Securities Active ETF | 60.97 | % |
| Principal Spectrum Tax-Advantaged Dividend Active ETF | 90.95 | % |
| Principal U.S. Large-Cap Adaptive Multi-Factor ETF | 99.04 | % |
| Principal U.S. Mega-Cap ETF | 100.00 | % |
| Principal U.S. Small-Cap Adaptive Multi-Factor ETF | 81.36 | % |
| Principal U.S. Small-Cap ETF | 96.07 | % |
| Principal Value ETF | 75.80 | % |
Qualified Dividend Income ("QDI"). Certain dividends paid by the funds may be subject to a maximum tax rate of 20%. The funds designate the following as a percentage of taxable ordinary income distributions (dividend income and short-term gains, if any), or up to the maximum amount allowable, as QDI eligible for the calendar year ended December 31, 2022:
| QDI | |||
| Principal Active High Yield ETF | 2.48 | % | |
| Principal Healthcare Innovators ETF | 0.00 | % | |
| Principal International Adaptive Multi-Factor ETF | 100.00 | % | |
| Principal Investment Grade Corporate Active ETF | 3.04 | % | |
| Principal Millennial Global Growth ETF | 100.00 | % | |
| Principal Quality ETF | 100.00 | % | |
| Principal Real Estate Active Opportunities ETF | 2.64 | % | |
| Principal Spectrum Preferred Securities Active ETF | 67.80 | % | |
| Principal Spectrum Tax-Advantaged Dividend Active ETF | 100.00 | % | |
| Principal U.S. Large-Cap Adaptive Multi-Factor ETF | 100.00 | % | |
| Principal U.S. Mega-Cap ETF | 100.00 | % | |
| Principal U.S. Small-Cap Adaptive Multi-Factor ETF | 83.63 | % | |
| Principal U.S. Small-Cap ETF | 100.00 | % | |
| Principal Value ETF | 78.00 | % | |
| 186 | |||
Section 163(j) Interest Dividends. The funds below intend to pass through Section 163(j) Interest Dividends as defined in Proposed Treasury Regulation §1.163(j)-1(b). The funds designate the following as a percentage of taxable ordinary income distributions (dividend income and short-term gains, if any), or up to the maximum amount allowable, as 163(j) eligible for the calendar year ended December 31, 2022:
| 163 | (j) | |
| Interest Dividends | ||
| Principal Active High Yield ETF | 91.21 | % |
| Principal Healthcare Innovators ETF | 0.00 | % |
| Principal International Adaptive Multi-Factor ETF | 0.37 | % |
| Principal Investment Grade Corporate Active ETF | 97.09 | % |
| Principal Millennial Global Growth ETF | 0.00 | % |
| Principal Quality ETF | 0.00 | % |
| Principal Real Estate Active Opportunities ETF | 0.00 | % |
| Principal Spectrum Preferred Securities Active ETF | 35.03 | % |
| Principal Spectrum Tax-Advantaged Dividend Active ETF | 0.38 | % |
| Principal U.S. Large-Cap Adaptive Multi-Factor ETF | 0.00 | % |
| Principal U.S. Mega-Cap ETF | 0.00 | % |
| Principal U.S. Small-Cap Adaptive Multi-Factor ETF | 0.00 | % |
| Principal U.S. Small-Cap ETF | 0.00 | % |
| Principal Value ETF | 0.00 | % |
In early 2023, if applicable, shareholders of record received the above information on DRD, QDI, and Section 163(j) for the distribution paid to them by the funds during the calendar year 2022 via Form 1099.
The funds will notify shareholders in early 2024 of amounts paid to them by the funds, if any, during the calendar year 2023.
This information is given to meet certain requirements of the Internal Revenue Code and should not be used by shareholders for preparing their income tax returns. For tax return preparation purposes, please refer to the information supplied with the 1099-DIV form you will receive from the fund's transfer agent.
The latest tax reporting supplement is available on Principal's Tax Center website. Website: https://www.principalfunds.com/individual-investor/customer-support/tax-center
Please consult your tax advisor if you have any questions.
187

ITEM 2 – CODE OF ETHICS
(a) The Registrant has adopted a code of ethics (the "Code of Ethics") that applies to its principal executive officer, principal financial officer, principal accounting officer or controller, or persons performing similar functions.
| (b) | Not applicable. |
| (c) | The Registrant has not amended, as described in Item 2(c) of Form N-CSR, its Code of Ethics during |
the period covered by the shareholder report presented in Item 1 hereto.
(d) The Registrant has not granted a waiver or an implicit waiver from a provision of its Code of Ethics during the period covered by the shareholder report presented in Item 1 hereto.
| (e) | Not applicable. |
| (f) | The Registrant's Code of Ethics is attached as an Exhibit in response to Item 13(a)(1). |
ITEM 3 – AUDIT COMMITTEE FINANCIAL EXPERT
The Registrant's Board has determined that Elizabeth Nickels, a member of the Registrant's Audit Committee, is an "audit committee financial expert" and "independent," as such terms are defined in this Item.
ITEM 4 – PRINCIPAL ACCOUNTANT FEES AND SERVICES
(a) Audit Fees. Ernst & Young is the principal accountant for the registrant. As such, Ernst & Young has audited the financial statements of the registrant and reviewed regulatory filings that include those financial statements. During the last two fiscal years, Ernst & Young has billed the following amounts for their professional services.
June 30, 2022 - $340,593
June 30, 2023 - $328,631
(b) Audit-Related Fees. Ernst & Young provided audit-related services to the registrant that are not included in response to item 4(a). Those services related to the review of Form N-1A. Ernst & Young has billed the following amounts for those services.
June 30, 2022 - $5,500
June 30, 2023 - $0
Ernst & Young billed no fees that registrant’s audit committee was required to pre-approve pursuant to paragraph (c)(7)(ii) of Rule 2-01 of Regulation S-X.
(c) Tax Fees. Ernst & Young reviews the federal income tax returns and federal excise tax returns of the registrant. In connection with this review, Ernst & Young reviews the calculation of the registrant’s dividend distributions that are included as deductions on the tax returns. Ernst & Young also provides services to identify passive foreign investment companies. Ernst & Young also provides services to understand and comply with tax laws in certain foreign countries. During the last two fiscal years, Ernst & Young has billed the following amounts for their professional tax services.
June 30, 2022 - $139,046
June 30, 2023 - $140,381
Ernst & Young billed no fees that registrant’s audit committee was required to pre-approve pursuant to paragraph (c)(7)(ii) of Rule 2-01 of Regulation S-X.
(d) All Other Fees. Ernst & Young has not billed the registrant for other products or services during the last two fiscal years.
Ernst & Young billed no fees that registrant’s audit committee was required to pre-approve pursuant to paragraph (c)(7)(ii) of Rule 2-01 of Regulation S-X.
(e) (1) Audit Committee Pre-Approval Policy. The audit committee of the registrant has adopted the following pre-approval policy:
The Principal Funds
Policy on Auditor Independence
The purpose of this policy is to ensure the independence of the Principal Funds' primary independent auditor. This policy is established by the Audit Committee (the "Committee") of the Boards of Directors of Principal Funds, Inc. and Principal Variable Contracts Funds, Inc. and the Boards of Trustees of Principal Exchange-Traded Funds and any registered closed-end management investment company that is operated as an interval fund and managed by Principal Global Investors, LLC1 (the “Funds”) (the “Boards of the Funds”) effective for all engagements of the primary independent auditor.
1. The primary independent auditor, its subsidiaries and affiliates shall not provide Prohibited Services to the Funds. For the purposes of this policy, Prohibited Services are:
• Services that are subject to audit procedure during a financial statement audit;
• Services where the auditor would act on behalf of management;
• Services where the auditor is an advocate to the client's position in an adversarial proceeding;
• Bookkeeping or other services related to the accounting records or financial statements of the Funds, its subsidiaries and affiliates;
• Financial information systems design and implementation;
• Appraisal or valuation services, fairness opinions, or contribution-in-kind reports;
• Actuarial services;
• Internal audit functions or human resources;
• Broker or dealer, investment advisor, or investment banking services;
• Legal services and expert services unrelated to the audit;
• Tax planning services related to listed, confidential and aggressive transactions;
• Personal tax planning services to individuals in a financial reporting oversight role with regard to the Funds (other than members of the Boards of the Funds who are not also officers of the Funds), including the immediate family members of such individuals;
• Any other service that the Public Company Accounting Oversight Board (PCAOB) determines, by regulation, is impermissible; and
• Any other service that the International Ethics Standards Board for Accountants (IESBA) determines, by regulation, is impermissible.
2. (A) All services the primary independent auditor, its subsidiaries and affiliates provide to the Funds, and (B) Audit services, including audits of annual financial statements, audits of acquired or divested businesses or review of regulatory filings, any independent auditor provides, shall be approved by the Committee in advance in accordance with the following procedure:
Each quarter, Management will present to the Committee for pre-approval and pre-concurrence a detailed description of each particular service, excluding tax services, for which pre-approval and pre-concurrence is sought, and the corresponding range of fees for such service. The Committee may delegate pre-approval and pre-concurrence authority to one or more of its members provided such delegated member(s) shall present a report of any services so pre-approved and pre-concurred to the full Committee at its next regularly scheduled meeting. The Committee Chairperson is presently so appointed pursuant to this policy, and shall have pre-approval and pre-concurrence authority for changes to any range of fees applicable to services the Committee previously approved and for new services and the range of fees for such services that arise between regularly scheduled Committee meetings.
Similarly, the primary independent auditor will present to the Committee for pre-approval and pre-concurrence a written description of the nature and scope of all tax services not expressly prohibited, including the fee arrangements for such services, and the potential effects of such services on the audit firm’s independence.
In considering whether to grant pre-approval and pre-concurrence with respect to the primary independent auditor’s provision of non-audit services, the Committee (or the delegated member(s), as applicable) will consider whether the services are compatible with the maintenance of such auditor's independence. The Committee (or the delegated member(s), as applicable) will also consider whether the primary independent auditor is best positioned to provide the most effective and efficient service, for reasons such as its familiarity with the Funds' business, people, culture, accounting systems, risk profile and other factors, and whether the service might enhance the Funds' ability to manage or control risk or improve audit quality.
3. The provisions of this policy shall apply to all audit and non-audit services provided directly to the Funds. Additionally, the provisions of this policy shall apply to non-audit services provided to Principal Global Investors, LLC (“PGI”) or an affiliate of PGI that provides ongoing services to the Funds if the engagement relates directly to the operations and financial reporting of the Funds as well as any controlled subsidiary.
4. Not less than annually, the primary independent auditor shall report to the Committee in writing all relationships that may reasonably be thought to bear on independence between the auditor and the Funds or persons in financial reporting oversight roles with respect to any services provided by the auditor, its subsidiaries or affiliates as of the date of the communication, pursuant to Rule 3526 of the PCAOB. The primary independent auditor shall discuss with the Committee the potential effects of such relationships on the independence of the auditor. In addition, the primary independent auditor shall affirm, in writing, that, as of the date of the communication, it is independent within the meaning of the federal securities laws and Rule 3520 of the PCAOB.
5. The Committee shall monitor that the lead (or coordinating) audit partners, as well as the reviewing audit partner, of the Funds' primary independent auditor are rotated at least every five years and subject upon rotation to a five year "time out" period. All other audit partners of the primary independent auditor, excluding partners who simply consult with others on the audit engagement regarding technical issues, shall rotate after seven years and be subject upon rotation to a two year "time out" period.
6. Neither the Funds nor PGI may hire or promote any former partner, principal, shareholder or professional employee (Former Employee) of the primary independent auditor into a financial reporting oversight role unless the Former Employee (1) has severed his/her economic interest
in the independent audit firm, and (2) was not a member of the audit engagement team for the Funds during the one year period preceding the date that the audit procedures began for the fiscal period in which the Funds or PGI proposes to hire or promote the Former Employee. Neither the Funds nor PGI shall, without prior written consent of the primary independent auditor, hire or promote any Former Employee into a role not prohibited above if the Former Employee had provided any services to the Funds or PGI during the 12 months preceding the date of filing of the Funds' most recent annual report with the SEC. Upon termination of the primary independent auditor, the Funds or PGI shall not, without prior written consent of the former primary independent auditor, hire or promote any Former Employee for a period of up to 12 months from termination.
7. For persons recently promoted or hired into a financial reporting oversight role (other than members of the Boards of the Funds who are not also officers or otherwise “interested persons” (as defined in the Investment Company Act of 1940) of the Funds), any personal tax planning services pursuant to an engagement that was in progress before the hiring or promotion and provided by the primary independent auditor must be completed on or before 180 days after the hiring or promotion.
8. The phrase "financial reporting oversight role" means a role in which a person is in a position to exercise influence over the contents of the financial statements or anyone who prepares them, such as a member of the board of directors or similar management or governing body, chief executive officer, president, chief operating officer, chief financial officer, counsel, controller, chief internal auditor, or any equivalent positions.
(Adopted by the Audit Committee of the Boards of the Funds on June 14, 2023).
1 The first such interval fund is the Principal Diversified Select Real Asset Fund; Management, subject to Board approval, may create others, each of which would be formed as a separate trust.
(End of policy)
(e) (2) Pre-Approval Waivers. There were no services, or 0%, provided by the registrant by Ernst & Young that were approved pursuant to paragraph (c)(7)(i)(C) of Rule 2-01 of Regulation S-X.
(f) Substantially all work in connection with the audit of the registrant’s financial statements was performed by full-time employees of Ernst & Young.
(g) The aggregate non-audit fees Ernst & Young billed to the registrant, the registrant's investment adviser (not including any sub-adviser whose role is primarily portfolio management and is subcontracted with or overseen by another investment adviser), and any entity controlling, controlled by or under common control with the adviser that provides ongoing services to the registrant for each of registrant's last two fiscal years were as follows.
June 30, 2022 - $274,210
June 30, 2023 - $376,590
(h) The registrant’s audit committee of the board of trustees has considered whether the provision of non-audit services that were rendered to the registrant’s investment adviser (not including any sub-adviser
whose role is primarily portfolio management and is subcontracted with or overseen by another investment adviser), and any entity controlling, controlled by or under common control with the investment adviser that provides ongoing services to the registrant that were not pre-approved pursuant to paragraph (c)(7)(ii) of Rule 2-01 of Regulation S-X is compatible with maintaining the principal accountant’s independence.
ITEM 5 – AUDIT COMMITTEE OF LISTED REGISTRANTS
(a) The registrant has a separately-designated standing audit committee established in accordance with Section 3(a)(58)(A) of the Exchange Act. The members of the audit committee are Leroy Barnes, Frances Grieb, Victor Hymes, Elizabeth Nickels, and Meg VanDeWeghe.
(b) Not applicable.
ITEM 6 – SCHEDULE OF INVESTMENTS
Schedule of Investments is included as part of the Report to Stockholders filed under Item 1 of this form.
ITEM 7 – DISCLOSURE OF PROXY VOTING POLICIES AND PROCEDURES FOR CLOSED-END MANAGEMENT INVESTMENT COMPANIES
Not applicable.
ITEM 8 – PORTFOLIO MANAGERS OF CLOSED-END MANAGEMENT INVESTMENT COMPANIES
Not applicable.
ITEM 9 – PURCHASES OF EQUITY SECURITIES BY CLOSED-END MANAGEMENT INVESTMENT COMPANY AND AFFILIATED PURCHASERS
Not applicable.
ITEM 10 – SUBMISSION OF MATTERS TO A VOTE OF SECURITY HOLDERS
None.
ITEM 11 – CONTROLS AND PROCEDURES a) The registrant's principal executive officer and principal financial officer have concluded that the registrant's disclosure controls and procedures (as defined in Rule 30a-3(c) under the Investment Company Act of 1940, as amended) are effective (such disclosure controls and procedures having been evaluated within 90 days of the date of this filing).
(b) There have been no changes in the registrant’s internal controls over financial reporting (as defined in Rule 30a-3(d) under the Act (17 CFR 270.30a-3(d)) that occurred during the period covered by this report that have materially affected, or are reasonably likely to materially affect, the registrant’s internal control over financial reporting.
ITEM 12 – DISCLOSURE OF SECURITIES LENDING ACTIVITIES FOR CLOSED-END MANAGEMENT INVESTMENT COMPANIES
Not applicable.
ITEM 13 – EXHIBITS
(a)(1) Code of Ethics required to be disclosed under Item 2 of Form N-CSR attached hereto as Exhibit 99.CODE ETH.
(a)(2) Certifications pursuant to Section 302 of the Sarbanes-Oxley Act of 2002 and Rule 30a-2(a) under the Investment Company Act of 1940 are attached hereto as Exhibit 99.CERT.
(b) Certification pursuant to Section 906 of the Sarbanes-Oxley Act of 2002 and Rule 30a-2(b) under the Investment Company Act of 1940 is attached hereto as Exhibit 99.906CERT.
SIGNATURES
Pursuant to the requirements of the Securities Exchange Act of 1934 and the Investment Company Act of 1940, the registrant has duly caused this report to be signed on its behalf by the undersigned, thereunto duly authorized.
| (Registrant) | Principal Exchange-Traded Funds | |
| By | /s/ Kamal Bhatia | |
| Kamal Bhatia, President and CEO | ||
| Date | 8/8/23 | |
Pursuant to the requirements of the Securities Exchange Act of 1934 and the Investment Company Act of 1940, this report has been signed below by the following persons on behalf of the registrant and in the capacities and on the dates indicated.
By /s/ Kamal Bhatia
Kamal Bhatia, President and CEO
| Date | 8/8/23 |
| By | /s/ Michael Scholten |
| Michael Scholten, Chief Financial Officer | |
| Date | 8/8/2023 |