As filed with the Securities and Exchange Commission on November 29, 2017
UNITED STATES
SECURITIES AND EXCHANGE COMMISSION
WASHINGTON, D.C. 20549
FORM N-CSR
CERTIFIED SHAREHOLDER REPORT OF REGISTERED MANAGEMENT
INVESTMENT COMPANIES
Investment Company Act file number 811-22842
FORUM FUNDS II
Three Canal Plaza, Suite 600
Portland, Maine 04101
Jessica Chase, Principal Executive Officer
Three Canal Plaza, Suite 600
Portland, Maine 04101
207-347-2000
Date of fiscal year end: September 30
Date of reporting period: October 1, 2016 – September 30, 2017
ITEM 1. REPORT TO STOCKHOLDERS.
![](https://capedge.com/proxy/N-CSR/0001435109-17-000808/baywoodfrontcover.jpg)
BAYWOOD VALUEPLUS FUND
A MESSAGE TO OUR SHAREHOLDERS (Unaudited)
SEPTEMBER 30, 2017
Dear Shareholder,
We are pleased to report our economic and financial market perspectives and the investment activities for the Baywood ValuePlus Fund (the "Fund") for the 12 months ended September, 2017. The Fund is a large-capitalization value fund that purchases primarily dividend-paying companies traded on U.S. exchanges and uses SKBA's Relative Dividend Yield (RDY) discipline as the initial valuation framework. We believe that RDY points out attractive investment opportunities, not simply among companies with above-average dividend yield, but just as importantly among stocks for which low expectations are already discounted into their valuations at the time of purchase. This provides the potential for attractive capital appreciation opportunities, while offering desirable downside protection.
Before we delve into fundamental aspects of the fund, there is one housekeeping item, albeit an important one, that should be addressed. SKBA Capital Management, advisor to the Baywood funds, has for years, in many aspects of our business, used benchmark information from one or more of the large index providers. Over the course of the last few years these index providers have looked for additional sources of revenues; as a result, they are now charging fees to reference their indexes which are exorbitant if not bordering on usury. This is by no means an isolated situation to SKBA Capital Management; it is an industrywide concern. A number of mutual fund advisors, many of which are larger than us, have raised similar complaints (http://www.barrons.com/articles/morningstar-announces-free-use-of-its-indexes-1478322642).
These complaints due to the sudden and significant increases in fees charged have resulted in initiatives to substitute benchmarks for alternatives which aim to accomplish the exact same goal. Perhaps the industry pushback is tied to the fact that an index is in some sense a commodity and as such it should be priced accordingly. We point you to a 2016 article in Pensions & Investments (http://www.pionline.com/article/20161102/ONLINE/161109998/the-rising-cost-of-benchmarking) written by Joe Mansueto, Chairman of Morningstar, itself an objective authority in the mutual fund industry. We also point the reader to Morningstar's Open Indexes Project (http://corporate1.morningstar.com/Morningstar-Global-Indexes/#) for further information on the initiative that has taken place in order to stem out of control price increases.
It has never been our goal to enrich anyone but our clients and fund shareholders. As such, we strive to keep our fees competitive with those of our peers and commissions as a function of portfolio turnover, to the extent that they also bear an impact, have also typically been lower than many of our peers.
Going forward, while we may discuss the Russell 1000 Value and other indexes from a historical context, it is our intention to move towards using some of Morningstar's open indexes. In the case of the domestic large value index, per the company's data, Morningstar Domestic Large Cap Value currently has a 0.99 correlation with the MSCI US Large Cap Value index, a 0.98 correlation with the Russell 1000 Value and a 0.97 correlation with the S&P 500 Value, a fine substitute in our humble opinion. We believe that in the very near future one of two things is likely to take place. Either 1. fund managers will shift indexes as we have done or 2. index providers will curtail if not reverse some of their recent price gauging practices. Now, onto the business of discussing our investments.
For the fiscal year ending September 30, the strategy outperformed the Russell 1000 Value. In 2017 we entered the ninth year of consecutive annual increases in the broad market as defined by the S&P 500—a record. Yet while averages have been making new highs, often led by a narrow subset of companies, entire economic sectors have been plumbing multi-year lows. Energy, basic materials, industrials and healthcare, sectors which in total make up nearly half of many indexes, have all experienced meaningful declines in the last three years or so. As fundamental investors, we are more interested in having some level of opportunity set than we are by the market averages. The last few years have proven to be fertile grounds for investors such as ourselves.
Over the last few years, we have maintained a cyclical bias by varying degrees. This bias began during the global financial crisis, was maintained through what was viewed as the burdensome regulatory regime and was maintained through the change in presidential administration. We took profits in companies like Home Depot and Whirlpool among others once we believed that their stock prices no longer reflected attractive risk-return economics and we added to positions like Boeing and basic materials when it was widely perceived that their problems would be structural. Always, we sought companies that were out-of-favor, with our expectation that their problems were temporary.
This investment practice had the effect of delivering characteristics that have proven to be consistent since the founding of the firm. ValuePlus outperformed our benchmarks in the 2007 through 2008 downturn, generally kept up during the up-swing, fell behind during the above-normal rates of return of 2012 through 2014 and outperformed during the more recent period of 2015 through the present. At times, monetary policy worked in our favor and at times it did not. In those times that monetary policy dis-favored our
1 |
BAYWOOD VALUEPLUS FUND
A MESSAGE TO OUR SHAREHOLDERS (Unaudited)
SEPTEMBER 30, 2017
sector positioning, it was due to equity bond proxies increasing due to factors outside of their fundamentals. The over 35 year old bond market rally resulted in valuations on certain sectors like consumer staples, utilities and REITs at decade highs—not our definition of "out-of-favor". So we generally stayed away. At times relative returns suffered and we were criticized.
Yet, criticism, while difficult, comes part and parcel with our discipline of investing in securities that are often reviled and generally neglected. We don't take such criticism lightly and yet we do take solace in the fact that it may inform us that we might be onto something.
During the year, we were underweight consumer discretionary and staples, financials, REITs, utilities and telecom companies. We were overweight energy, healthcare, information technology and basic materials. This positioning held generally constant this year with the exception of healthcare, a sector whose representation has increased meaningfully over the year was indeed reviled and mostly neglected. The worst performing benchmark sectors during the period were consumer staples and REITs; the best included basic materials, telecom, information technology and energy. With the exception of telecom, we are currently overweight all of the sectors that performed well in the year.
From a sector level perspective, the best areas to be invested in were financials; those alone contributed half of the index's total return for the year in question. Behind financials, basic materials, industrials and information technology also had noteworthy returns. In a year of strong absolute returns, very few industries were negative yet real estate and telecom either ended in the red or close to it. We are pleased to have mostly avoided those two areas while having meaningful weights in areas that generally performed well.
Our sector positioning did not always work to our advantage as some of our holdings declined. As a result, for the year, sector allocation, not security selection, was responsible for the majority of excess return. Beginning with the worst, while the index's consumer discretionary allocation generally increased around 13%, our holdings had a -27% contribution in aggregate. The best we can say looking at that figure is that our underweight position mitigated the impact; position sizing should not be taken lightly. From a fundamental standpoint, the declines have at times rendered those stocks more attractive than they were at the onset. The basic materials sector returned approximately 24% for the index; our exposure increased a modest 3%. Yet again, however, we remain attracted to our holdings. In a year of such strong absolute returns any level of cash will tend to have a negative impact. In a vehicle such as this, we must maintain some level of cash and while it is modest by most standards, it hindered overall returns somewhat; this will not always be the case.
Looking at sectors in which we were able to capture excess returns, our stock selection within consumer staples, energy, healthcare, industrials and utilities more than made up for the aforementioned shortfalls. Our absence of exposure to REITs also had a large beneficial impact.
LBrands and Mattel, the latter of which we exited, were among the largest detractors to performance during the period; rounding out the worst five were Mosaic, Qualcomm and Helmerich & Payne.
Outside of consumer discretionary issues which are experiencing an existential crisis, the theme of stocks "taking a breather" is one we have often experienced. Stock prices rarely increase or decrease in a linear fashion; instead they often move in fits and starts. As investors, we cannot let such short term volatility drive our decision making. As banks performed quite well late last year and lagged during this quarter, so too did energy companies perform strongly last year and lag earlier in 2017. We are not disturbed by this—it enables us to add to positions during what we feel is temporary weakness.
Boeing, Royal Philips, Abbvie, Novo Nordisk and Harris Corp were the largest contributors during the year. Yet again we find a repeatable pattern, this time in health care. In 2015, ValuePlus was underweight energy due to the lofty investor expectations that existed at the time. Our underweight position helped overall returns when those expectations proved too high later in the year. In 2016, however, the expectations were so pessimistic we were able to comfortably move from underweight to overweight, knowing we were picking up good companies at a discount. That shift, in addition to our underweight in health care, which was going through very similar circumstances that energy did the previous year, were among the decisions that resulted in the largest contributors to that year's performance. As it stands now, we remain overweight energy, and as expectations in health care have become nearly as pessimistic as those we witnessed in energy the previous year, we became overweight earlier this year; a decision which has resulted in the largest contributor to overall excess returns this year.
The energy and health care sectors are representative of the rolling bear markets that we have discussed on a number of occasions. These rolling bear markets continue to provide attractive opportunity sets. Whether market averages reach new highs is less
2 |
BAYWOOD VALUEPLUS FUND
A MESSAGE TO OUR SHAREHOLDERS (Unaudited)
SEPTEMBER 30, 2017
important to us as the ability to find companies currently reviled or neglected. The last few years have been an investor's candy store in that respect. Energy, basic materials, industrials, healthcare and consumer discretionary sectors have all experienced significant declines all while markets have made new highs. These have been our areas of focus; an effort well spent. We are likely to see similar declines in sectors that have so far defied valuation gravity and we look forward to spending time analyzing them when they do.
For more detailed information on SKBA Capital Management, LLC and our investment process and perspectives, visit our website at www.SKBA.com.
Current and future portfolio holdings are subject to change and risk.
The Morningstar category is used to compare fund performance to its peers. It is not possible to invest directly into an index or category. Past performance is no guarantee of future results.
Risk Considerations: Mutual fund investing involves risk, including the possible loss of principal. The Fund primarily invests in undervalued securities, which may not appreciate in value as anticipated by the Advisor or remain undervalued for longer than anticipated. The Fund may invest in American Depositary Receipts (ADRs), which involves risks relating to political, economic or regulatory conditions in foreign countries and may cause greater volatility and less liquidity. The Fund may also invest in convertible securities and preferred stock, which may be adversely affected as interest rates rise.
3 |
BAYWOOD VALUEPLUS FUND
PERFORMANCE CHART AND ANALYSIS (Unaudited)
SEPTEMBER 30, 2017
![](https://capedge.com/proxy/N-CSR/0001435109-17-000808/valplusinstgraph.jpg)
Performance data quoted represents past performance and is no guarantee of future results. Current performance may be lower or higher than the performance data quoted. Investment return and principal value will fluctuate so that shares, when redeemed, may be worth more or less than original cost. For the most recent month-end performance, please call (855) 409-2297. As stated in the Fund's prospectus, the annual operating expense ratios (gross) for Investor Shares and Institutional Shares are 9.43% and 14.43% , respectively. However, the Fund's advisor has contractually agreed to waive Fund expenses to limit Total Annual Fund Operating Expenses After Fee Waiver and/or Expense Reimbursment (excluding all taxes, interest, portfolio transaction expenses, acquired fund fees and expenses, proxy expenses and extraordinary expenses) to 0.95% and 0.70% for Investor Shares and Institutional Shares, respectively, through January 31, 2018 (the "Expense Cap"). The Advisor may be reimbursed by the Fund for fees waived and expenses reimbursed by the Advisor pursuant to the Expense Cap if such payment is approved by the Board, made within three years of the fee waiver or expense reimbursement, and does not cause the Total Annual Fund Operating Expenses After Fee Waiver and/or Expense Reimbursment of a class to exceed the lesser of (i) the then-current expense cap, or (ii) the expense cap in place at the time the fees/expenses were waived or reimbursed. The Expense Cap may only be raised or eliminated with the consent of the Board of Trustees. During the period, certain fees were waived and/or expenses reimbursed, otherwise returns would have been lower. The performance table and graph do not reflect the deduction of taxes that a shareholder would pay on Fund distributions or the redemption of Fund shares. Returns greater than one year are annualized.
![]() | Shares | Security Description | Value |
Common Stock - 92.4% | |||||||
Basic Materials - 5.4% | |||||||
500 | LyondellBasell Industries NV, Class A | $ | 49,525 | ||||
200 | Packaging Corp. of America | 22,936 | |||||
3,000 | Potash Corp. of Saskatchewan, Inc. | 57,720 | |||||
130,181 | |||||||
Capital Goods / Industrials - 6.8% | |||||||
500 | Eaton Corp. PLC | 38,395 | |||||
1,000 | Nielsen Holdings PLC | 41,450 | |||||
300 | Republic Services, Inc. | 19,818 | |||||
100 | Stanley Black & Decker, Inc. | 15,097 | |||||
200 | The Boeing Co. | 50,842 | |||||
165,602 | |||||||
Consumer Cyclicals - 0.9% | |||||||
500 | L Brands, Inc. | 20,805 | |||||
Consumer Discretionary - 1.2% | |||||||
700 | Coach, Inc. | 28,196 | |||||
Consumer Staples - 6.5% | |||||||
400 | PepsiCo, Inc. | 44,572 | |||||
400 | The Procter & Gamble Co. | 36,392 | |||||
1,000 | Wal-Mart Stores, Inc. | 78,140 | |||||
159,104 | |||||||
Energy - 14.7% | |||||||
900 | BP PLC, ADR | 34,587 | |||||
600 | Chevron Corp. | 70,500 | |||||
2,200 | ConocoPhillips | 110,110 | |||||
400 | Occidental Petroleum Corp. | 25,684 | |||||
1,000 | Schlumberger, Ltd. | 69,760 | |||||
600 | Valero Energy Corp. | 46,158 | |||||
356,799 | |||||||
Financials - 20.0% | |||||||
500 | BB&T Corp. | 23,470 | |||||
600 | BOK Financial Corp. | 53,448 | |||||
100 | Brighthouse Financial, Inc. (a) | 6,080 | |||||
340 | Chubb, Ltd. | 48,467 | |||||
900 | FNF Group | 42,714 | |||||
500 | JPMorgan Chase & Co. | 47,755 | |||||
400 | M&T Bank Corp. | 64,416 | |||||
1,200 | MetLife, Inc. | 62,340 | |||||
1,400 | Morgan Stanley | 67,438 | |||||
1,300 | U.S. Bancorp | 69,667 | |||||
485,795 | |||||||
Health Care - 18.4% | |||||||
500 | AbbVie, Inc. | 44,430 | |||||
300 | Amgen, Inc. | 55,935 | |||||
800 | AstraZeneca PLC, ADR | 27,104 | |||||
400 | Cardinal Health, Inc. | 26,768 | |||||
800 | Eli Lilly & Co. | 68,432 |
![]() | Shares | Security Description | Value |
700 | Gilead Sciences, Inc. | $ | 56,714 | ||||
700 | HealthSouth Corp. | 32,445 | |||||
2,200 | Koninklijke Philips NV, ADR | 90,640 | |||||
900 | Novo Nordisk A/S, ADR | 43,335 | |||||
445,803 | |||||||
Technology - 14.3% | |||||||
2,500 | Cisco Systems, Inc. | 84,075 | |||||
200 | Harris Corp. | 26,336 | |||||
2,300 | HP, Inc. | 45,908 | |||||
1,600 | Intel Corp. | 60,928 | |||||
300 | International Business Machines Corp. | 43,524 | |||||
600 | Microsoft Corp. | 44,694 | |||||
300 | QUALCOMM, Inc. | 15,552 | |||||
300 | Texas Instruments, Inc. | 26,892 | |||||
347,909 | |||||||
Telecommunications - 0.8% | |||||||
400 | Verizon Communications, Inc. | 19,796 | |||||
Transportation - 1.4% | |||||||
300 | Union Pacific Corp. | 34,791 | |||||
Utilities - 2.0% | |||||||
1,300 | Exelon Corp. | 48,971 | |||||
Total Common Stock (Cost $1,880,465) | 2,243,752 |
Money Market Fund - 7.4% | |||||||
180,260 | Federated Government Obligations Fund, Institutional Class, 0.89% (b) (Cost $180,260) | 180,260 | |||||
Total Investments - 99.8% (Cost $2,060,725) | $ | 2,424,012 |
Other Assets & Liabilities, Net – 0.2% | 3,841 | ||
Net Assets – 100.0% | $ | 2,427,853 |
ADR | American Depositary Receipt |
PLC | Public Limited Company |
(a) | Non-income producing security. |
(b) | Dividend yield changes daily to reflect current market conditions. Rate was the quoted yield as of September 30, 2017. |
The following is a summary of the inputs used to value the Fund's investments as of September 30, 2017.
The inputs or methodology used for valuing securities are not necessarily an indication of the risks associated with investing in those securities. For more information on valuation inputs, and their aggregation into the levels used in the table below, please refer to the Security Valuation section in Note 2 of the accompanying Notes to Financial Statements.
Valuation Inputs | Investments in Securities |
Level 1 - Quoted Prices | $ | 2,243,752 | ||
Level 2 - Other Significant Observable Inputs | 180,260 | |||
Level 3 - Significant Unobservable Inputs | - | |||
Total | $ | 2,424,012 |
The Level 1 value displayed in this table is Common Stock. The Level 2 value displayed in this table is a Money Market Fund. Refer to this Schedule of Investments for a further breakout of each security by industry.
The Fund utilizes the end of period methodology when determining transfers. There were no transfers among Level 1, Level 2 and Level 3 for the year ended September 30, 2017.
AFA
PORTFOLIO HOLDINGS | ||
% of Total Investments | ||
Basic Materials | 5.4 | % |
Capital Goods / Industrials | 6.8 | % |
Consumer Cyclicals | 0.9 | % |
Consumer Discretionary | 1.2 | % |
Consumer Staples | 6.6 | % |
Energy | 14.7 | % |
Financials | 20.0 | % |
Health Care | 18.4 | % |
Technology | 14.4 | % |
Telecommunications | 0.8 | % |
Transportation | 1.4 | % |
Utilities | 2.0 | % |
Money Market Fund | 7.4 | % |
100.0 | % |
AFA
These financial highlights reflect selected data for a share outstanding throughout each period. | |||||||||||||||||
For the Year Ended September 30, 2017 | For the Period Ended September 30, 2016(a) | For the Year Ended November 30, 2015 | December 2, 2013 (b) Through September 30, 2014 | ||||||||||||||
INVESTOR SHARES | |||||||||||||||||
NET ASSET VALUE, Beginning of Period | $ | 15.52 | $ | 16.90 | $ | 19.28 | $ | 17.47 | |||||||||
INVESTMENT OPERATIONS | |||||||||||||||||
Net investment income (c) | 0.33 | 0.26 | 0.34 | 0.36 | |||||||||||||
Net realized and unrealized gain (loss) | 2.02 | 0.93 | (1.06 | ) | 1.49 | ||||||||||||
Total from Investment Operations | 2.35 | 1.19 | (0.72 | ) | 1.85 | ||||||||||||
DISTRIBUTIONS TO SHAREHOLDERS FROM | |||||||||||||||||
Net investment income | (0.32 | ) | (2.20 | ) | (0.26 | ) | (0.04 | ) | |||||||||
Net realized gain | (0.27 | ) | (0.37 | ) | (1.40 | ) | — | ||||||||||
Total Distributions to Shareholders | (0.59 | ) | (2.57 | ) | (1.66 | ) | (0.04 | ) | |||||||||
NET ASSET VALUE, End of Period | $ | 17.28 | $ | 15.52 | $ | 16.90 | $ | 19.28 | |||||||||
TOTAL RETURN | 15.32 | % | 8.40 | %(d) | (3.86 | )% | 10.59 | %(d) | |||||||||
RATIOS/SUPPLEMENTARY DATA | |||||||||||||||||
Net Assets at End of Period (000's omitted) | $1,717 | $1,699 | $1,362 | $1,471 | |||||||||||||
Ratios to Average Net Assets: | |||||||||||||||||
Net investment income | 2.03 | % | 2.07 | %(e) | 1.97 | % | 1.98 | %(e) | |||||||||
Net expenses | 0.95 | % | 0.95 | %(e) | 0.95 | % | 0.95 | %(e) | |||||||||
Gross expenses (f) | 7.67 | % | 9.43 | %(e) | 5.80 | % | 4.54 | %(e) | |||||||||
PORTFOLIO TURNOVER RATE | 48 | % | 22 | %(d) | 32 | % | 35 | %(d) | |||||||||
�� | |||||||||||||||||
(a) | Effective March 24, 2016, the Fund changed its fiscal year end from November 30 to September 30. The information presented is for the period December 1, 2015 through September 30, 2016. | ||||||||||||||||
(b) | Commencement of operations. | ||||||||||||||||
(c) | Calculated based on average shares outstanding during each period. | ||||||||||||||||
(d) | Not annualized. | ||||||||||||||||
(e) | Annualized. | ||||||||||||||||
(f) | Reflects the expense ratio excluding any waivers and/or reimbursements. |
These financial highlights reflect selected data for a share outstanding throughout each period. | |||||||||||||||||||||||||||
For the Year Ended September 30, 2017 | For the Period Ended September 30, 2016(a) | For the Year Ended November 30, 2015 | December 2, 2013 (b) Through November 30, 2014 | ||||||||||||||||||||||||
INSTITUTIONAL SHARES | |||||||||||||||||||||||||||
NET ASSET VALUE, Beginning of Period | $ | 15.59 | $ | 17.00 | $ | 19.42 | $ | 17.56 | |||||||||||||||||||
INVESTMENT OPERATIONS | |||||||||||||||||||||||||||
Net investment income (c) | 0.38 | 0.29 | 0.39 | 0.41 | |||||||||||||||||||||||
Net realized and unrealized gain (loss) | 2.02 | 0.94 | (1.06 | ) | 1.50 | ||||||||||||||||||||||
Total from Investment Operations | 2.40 | 1.23 | (0.67 | ) | 1.91 | ||||||||||||||||||||||
DISTRIBUTIONS TO SHAREHOLDERS FROM | |||||||||||||||||||||||||||
Net investment income | (0.36 | ) | (2.27 | ) | (0.35 | ) | (0.05 | ) | |||||||||||||||||||
Net realized gain | (0.27 | ) | (0.37 | ) | (1.40 | ) | — | ||||||||||||||||||||
Total Distributions to Shareholders | (0.63 | ) | (2.64 | ) | (1.75 | ) | (0.05 | ) | |||||||||||||||||||
NET ASSET VALUE, End of Period | $ | 17.36 | $ | 15.59 | $ | 17.00 | $ | 19.42 | |||||||||||||||||||
TOTAL RETURN | 15.60 | % | 8.65 | %(d) | (3.58 | )% | 10.87 | %(d) | |||||||||||||||||||
RATIOS/SUPPLEMENTARY DATA | |||||||||||||||||||||||||||
Net Assets at End of Period (000's omitted) | $711 | $536 | $426 | $11,067 | |||||||||||||||||||||||
Ratios to Average Net Assets: | |||||||||||||||||||||||||||
Net investment income | 2.28 | % | 2.30 | %(e) | 2.23 | % | 2.26 | %(e) | |||||||||||||||||||
Net expenses | 0.70 | % | 0.70 | %(e) | 0.70 | % | 0.70 | %(e) | |||||||||||||||||||
Gross expenses (f) | 11.16 | % | 14.43 | %(e) | 2.09 | % | 2.50 | %(e) | |||||||||||||||||||
PORTFOLIO TURNOVER RATE | 48 | % | 22 | %(d) | 32 | % | 35 | %(d) | |||||||||||||||||||
(a) | Effective March 24, 2016, the Fund changed its fiscal year end from November 30 to September 30. The information presented is for the period December 1, 2015 through September 30, 2016. | ||||||||||||||||||||||||||
(b) | Commencement of operations. | ||||||||||||||||||||||||||
(c) | Calculated based on average shares outstanding during each period. | ||||||||||||||||||||||||||
(d) | Not annualized. | ||||||||||||||||||||||||||
(e) | Annualized. | ||||||||||||||||||||||||||
(f) | Reflects the expense ratio excluding any waivers and/or reimbursements. |
Dear Shareholder,
We are pleased to report our economic and financial market perspectives and the investment activities for the Baywood SociallyResponsible Fund (the "Fund") for the 12 months ended September, 2017. The Fund is a mid-to-large capitalization value-oriented portfolio of stock holdings selected from a universe of stocks created through the application of inclusionary and exclusionary social screens and assessments of the ESG profile of each company. Among these stocks, we further evaluate and assess each prospective holding's valuation and fundamental business attraction to determine the current portfolio holdings. In selecting investments, we consider social criteria such as an issuer's community relations, corporate governance, employee diversity, employee relations, environmental impact and sustainability, human rights record and product safety. Using both quantitative and qualitative data, we also evaluate an issuer's involvement in specific revenue generating activities to determine whether the issuer's involvement was meaningful or incidental with respect to that activity.
Before we delve into fundamental aspects of the fund, there is one housekeeping item, albeit an important one, that should be addressed. SKBA Capital Management, advisor to the Baywood funds, has for years, in many aspects of our business, used benchmark information from one or more of the large index providers. Over the course of the last few years these index providers have looked for additional sources of revenues; as a result, they are now charging fees to reference their indexes which are exorbitant if not bordering on usury. This is by no means an isolated situation to SKBA Capital Management; it is an industrywide concern. A number of mutual fund advisors, many of which are larger than us, have raised similar complaints (http://www.barrons.com/articles/morningstar-announces-free-use-of-its-indexes-1478322642).
These complaints due to the sudden and significant increases in fees charged have resulted in initiatives to substitute benchmarks for alternatives which aim to accomplish the exact same goal. Perhaps the industry pushback is tied to the fact that an index is in some sense a commodity and as such it should be priced accordingly. We point you to a 2016 article in Pensions & Investments (http://www.pionline.com/article/20161102/ONLINE/161109998/the-rising-cost-of-benchmarking) written by Joe Mansueto, Chairman of Morningstar, itself an objective authority in the mutual fund industry. We also point the reader to Morningstar's Open Indexes Project (http://corporate1.morningstar.com/Morningstar-Global-Indexes/#) for further information on the initiative that has taken place in order to stem out of control price increases.
It has never been our goal to enrich anyone but our clients and fund shareholders. As such, we strive to keep our fees competitive with those of our peers. Which is why one of the first actions taken, in regards to the fund, after we became advisers was to lower the fees. Commissions, as a function of portfolio turnover, to the extent that they also bear an impact, have also typically been lower than many of our peers.
Going forward, while we may discuss the Russell 1000 Value and other indexes from a historical context, it is our intention to move to using some of Morningstar's open indexes. In the case of the domestic large value index, per the company's data, Morningstar Domestic Large Cap Value currently has a 0.99 correlation with the MSCI US Large Cap Value index, a 0.98 correlation with the Russell 1000 Value and a 0.97 correlation with the S&P 500 Value, a fine substitute in our humble opinion. We believe that in the very near future one of two things is likely to take place. Either 1. fund managers will shift indexes as we have done or 2. index providers will curtail if not reverse some of their recent price gauging practices. Now, onto the business of discussing our investments.
The overall positioning of the portfolio has increased from a "sustainability" point-of-view over the last year. While we don't always agree with the way in which SRI rating agencies score companies, the socially responsible strategy has increased its overall score with the very popular rating agency Sustainalytics, which feeds into the Morningstar sustainability rankings. Only investing-by-the-score can lead to unintended consequences, and we do not endorse doing so. There are, however, some areas in which our applied judgment and active management of the available data set can lead to similar conclusions. Changes made resulted in the strategy attaining the highest level of sustainability ratings in its group earlier this year.
What further sets our strategy apart is that there are very few "VALUE" strategies in the Socially Responsible investing universe. It should be noted, however, that the performance of the strategy will generally not be highly correlated with most benchmarks as there are no good comparable indexes. Most Socially Responsible benchmarks tend to be growth oriented, the return patterns of which are different than that of value. While value benchmarks tend to have large weights in some of the largest companies, Exxon Mobil and Phillip Morris as examples, that aren't and shouldn't currently be a part of a Socially Responsible mandate. This important distinction sets us apart from our competitors, but also makes evaluating performance a difficult task. Fortunately for us we have been managing portfolios in the Socially Responsible space for over 25 years and are familiar with the constantly changing landscape. Our clients are often demanding, as they should be, and preferences have a tendency to shift dramatically among issues.
Our investment approach is to reward companies that are good stewards of capital, show consideration for all stakeholders and create sustainable business practices. This philosophy often positions us for most environments and preference shifts, but the fact that our performance doesn't always track an index generally requires some explanation. Benchmark issues aside, we are pleased to report the performance of the strategy over the last year has improved dramatically including outperforming our primary benchmark in the third quarter. We are also pleased that the strategy is in the top 10% of its sustainable universe, yet due to the many flaws in the rating process it is difficult to gauge how lasting this will be, although we believe it has the potential to remain near the top.
Over the last year ended September 2017, one sector, financials, stands out from the benchmark's performance. More than half of the benchmark's 15% return was from financials, a sector in which the fund was underweight modestly. Our modest underweight was offset by the stock selection within the sector so that the total effect was positive. The remainder of the stock selection effect was negative, however. Stock selection within consumer discretionary and energy accounted for the largest source of negative returns during the period. In energy, half of the negative stock selection effect was mitigated by the portfolio's underweight position. Within consumer discretionary, L Brands and Discovery Communications account for the shortfall.
L Brands, the parent of Victoria's Secret and Bath & Body Works declined after it continued to report negative same-store sales comparisons which were mostly due to the exit of certain lines of business. On the surface, it's easy to see the cause for the declines in the stock price. Nearly all of retail benefitted from years of expansion and over-building which can often hide the true health of the business. Most of these fail over time as the trendy nature of retail and the incentive to grow beyond their means (usually with debt) tends to get companies in trouble. This phenomenon has been accelerated by the increasingly important and disruptive e-commerce channel and a very large, aggressive, profitless competitor in Amazon. L Brands is different, however. It's run by a very conservative owner-operator and has not succumbed to the temptation to over-build. In this period of disruption it is highly unlikely that L Brands will suffer the same fate as many of its peers. It will eventually refresh its product lineup and move inventory to locations where demand exists but in the meantime it is being grouped together with companies that will likely eventually fail as the entire retail landscape is upended. In anticipation of what will likely be a noisy 3rd and 4th quarter reporting due to the massive disruptions caused by the hurricanes, we will welcome the opportunity to purchase more shares at depressed prices.
Discovery Communications underperformed in the quarter when it announced a merger with Scripps Network. This merger of equals will make it a stronger competitor as it leverages content from both companies to negotiate better terms on the networks. However, until the contracts are up for renewal the amount of debt issued to fund the deal has given Wall Street reason to pause. We continue to hold on to our position as we realize it may take the company some time to renegotiate its contracts with the networks and work off the debt, but we still believe the resulting company is one with better fundamentals than when we initiated our position and we will likely add on further weakness.
In addition to our underweight in energy, our underweight in consumer staples and real estate contributed nearly 200bp of positive relative contribution to performance. We will not pay for over-priced bond substitutes like consumer staples and real estate which has contributed greatly to returns over the past several years. Our decision to underweight these and other bond-proxies have been related to technical, not fundamental, factors driving up valuations to near historic highs. Yet one sector, the utility sector, which we have long admonished for high valuations and poor fundamentals, remains surprisingly resilient. However, one only needs to look at the packaged food companies within consumer staples for an example of how poor fundamentals can eventually catch up to valuations. During the most recently ended quarter the five largest packaged food stocks were down 7% when the overall market was up 3%. In our opinion the fundamentals of most utility stocks are nearly as bad as the food stocks, and yet valuations are even higher! While we don't know exactly when it will end, we do know there are much better opportunities for investment elsewhere.
In summary, over the last year and since becoming advisers a number of changes in the portfolio have resulted in lower fees, better performance and an improved sustainability profile. It is important to note, however, that nothing has changed about our investment philosophy or approach, only that there are times in which the marketplace rewards our style and times when it doesn't. Going forward we continue to see investment opportunities as more sectors come under pressure. In the near-term, the unfortunate natural disasters that have displaced thousands across North America, and our thoughts go out to those lives that have been displaced, will undoubtedly affect the level of economic activity in the quarters to come. Should any companies under our sentry be unduly punished or overly rewarded we will act accordingly and responsibly.
For more detailed information on SKBA Capital Management, LLC and our investment process and perspectives, visit our website at www.SKBA.com.
Current and future portfolio holdings are subject to change and risk.
The Russell 1000 Value Index, MSCI KLD 400 Social Index and the Morningstar Category is used to compare fund performance to its peers. It is not possible to invest directly into an index or category. Past performance is no guarantee of future results.
Risk Considerations: Mutual fund investing involves risk, including the possible loss of principal. Socially responsible investment criteria may limit the number of investment opportunities available to the Fund or it may invest a larger portion of its assets in certain sectors which could be more sensitive to market conditions, economic, regulatory and environmental developments. These factors could negatively impact the Fund's returns. The Fund primarily invests in undervalued securities, which may not appreciate in value as anticipated by the Advisor or remain undervalued for longer than anticipated. The Fund may invest in American Depositary Receipts (ADRs), which involves risks relating to political, economic or regulatory conditions in foreign countries and may cause greater volatility and less liquidity. The Fund may also invest in convertible securities and preferred stock, which may be adversely affected as interest rates rise.
The following charts reflect the change in the value of a hypothetical $10,000 investment in Investor Shares and $100,000 investment in Institutional Shares, including reinvested dividends and distributions, in Baywood SociallyResponsible Fund (the "Fund") compared with the performance of the primary benchmark, Morningstar Large Value Index and MSCI KLD 400 Social Index, over the past ten fiscal years. The Morningstar Large Value Index measures the performance of large-cap stocks with relatively low prices given anticipated per share earnings, book value, cash flow, sales and dividends. The MSCI KLD 400 Social Index is a capitalization weighted index of 400 US securities that provides exposure to companies with outstanding Environmental, Social and Governance ratings and excludes companies whose products have negative social or environmental impacts. The total return of both the MSCI KLD 400 Social Index and Russell 1000 Value Index include the reinvestment of dividends and income. The total return of the Fund includes operating expenses that reduce returns, while the total return of the MSCI KLD 400 Social Index and Russell 1000 Value Index do not include expenses. The Fund is professionally managed, while the MSCI KLD 400 Social Index and Russell 1000 Value Index are unmanaged and are not available for investment.
![](https://capedge.com/proxy/N-CSR/0001435109-17-000808/socrespinstgraph.jpg)
Performance data quoted represents past performance and is no guarantee of future results. Current performance may be lower or higher than the performance data quoted. Investment return and principal value will fluctuate so that shares, when redeemed, may be worth more or less than original cost. For the most recent month-end performance, please call (855) 409-2297. As stated in the Fund's prospectus, the annual operating expense ratios (gross) for Investor Shares and Institutional Shares are 1.79% and 0.94%, respectively. However, the Fund's advisor has contractually agreed to waive Fund expenses to limit Total Annual Fund Operating Expenses After Fee Waiver and/or Expense Reimbursement (excluding all taxes, interest, portfolio transaction expenses, acquired fund fees and expenses, proxy expenses and extraordinary expenses) to 1.14% and 0.89% for Investor Shares and Institutional Shares, respectively, through January 31, 2018 (the "Expense Cap"). The Advisor may be reimbursed by the Fund for fees waived and expenses reimbursed by the Advisor pursuant to the Expense Cap if such payment is approved by the Board, made within three years of the fee waiver or expense reimbursement, and does not cause the Total Annual Fund Operating Expenses After Fee Waiver and/or Expense Reimbursement of a class to exceed the lesser of (i) the then-current expense cap, or (ii) the expense cap in place at the time the fees/expenses were waived or reimbursed. The Expense Cap may only be raised or eliminated with the consent of the Board of Trustees. During the period, certain fees were waived and/or expenses reimbursed, otherwise returns would have been lower. The performance table and graph do not reflect the deduction of taxes that a shareholder would pay on Fund distributions or the redemption of Fund shares. Returns greater than one year are annualized.
![]() | Shares | Security Description | Value |
Common Stock - 93.1% | |||||||
Basic Materials - 2.8% | |||||||
4,300 | Potash Corp. of Saskatchewan, Inc. | $ | 82,732 | ||||
7,000 | The Mosaic Co. | 151,130 | |||||
233,862 | |||||||
Capital Goods / Industrials - 8.1% | |||||||
4,438 | Johnson Controls International PLC | 178,807 | |||||
3,900 | Nielsen Holdings PLC | 161,655 | |||||
2,700 | Pentair PLC | 183,492 | |||||
3,000 | Sensata Technologies Holding NV (a) | 144,210 | |||||
668,164 | |||||||
Consumer Cyclicals - 5.0% | |||||||
2,500 | L Brands, Inc. | 104,025 | |||||
800 | Lithia Motors, Inc., Class A | 96,248 | |||||
15,800 | TRI Pointe Group, Inc. (a) | 218,198 | |||||
418,471 | |||||||
Consumer Discretionary - 5.7% | |||||||
3,500 | AutoNation, Inc. (a) | 166,110 | |||||
9,300 | Discovery Communications, Inc., Class C (a) | 188,418 | |||||
3,700 | Lions Gate Entertainment Corp., Class B (a) | 117,623 | |||||
472,151 | |||||||
Consumer Staples - 3.2% | |||||||
1,300 | PepsiCo, Inc. | 144,859 | |||||
1,300 | The Procter & Gamble Co. | 118,274 | |||||
263,133 | |||||||
Energy - 7.5% | |||||||
6,700 | Cabot Oil & Gas Corp. | 179,225 | |||||
4,700 | Centennial Resource Development, Inc., Class A (a) | 84,459 | |||||
5,800 | Devon Energy Corp. | 212,918 | |||||
4,100 | National Oilwell Varco, Inc. | 146,493 | |||||
623,095 | |||||||
Financials - 23.0% | |||||||
6,100 | Air Lease Corp. | 259,982 | |||||
2,900 | American Express Co. | 262,334 | |||||
2,000 | American International Group, Inc. | 122,780 | |||||
13,300 | Bank of America Corp. | 337,022 | |||||
2,300 | BOK Financial Corp. | 204,884 | |||||
127 | Brighthouse Financial, Inc. (a) | 7,722 | |||||
5,750 | Brookfield Asset Management, Inc., Class A | 237,475 | |||||
1,800 | M&T Bank Corp. | 289,872 | |||||
1,400 | MetLife, Inc. | 72,730 | |||||
5,800 | Radian Group, Inc. | 108,402 | |||||
1,903,203 |
![]() | Shares | Security Description | Value |
Health Care - 19.1% | |||||||
1,500 | AbbVie, Inc. | $ | 133,290 | ||||
3,800 | AstraZeneca PLC, ADR | 128,744 | |||||
1,200 | Becton Dickinson and Co. | 235,140 | |||||
2,000 | Cardinal Health, Inc. | 133,840 | |||||
3,900 | HealthSouth Corp. | 180,765 | |||||
8,500 | Koninklijke Philips NV, ADR | 350,200 | |||||
700 | Laboratory Corp. of America Holdings (a) | 105,679 | |||||
1,900 | Medtronic PLC | 147,763 | |||||
3,400 | Novo Nordisk A/S, ADR | 163,710 | |||||
1,579,131 | |||||||
Technology - 15.2% | |||||||
7,800 | Cisco Systems, Inc. | 262,314 | |||||
5,500 | Corning, Inc. | 164,560 | |||||
8,500 | HP, Inc. | 169,660 | |||||
6,400 | Intel Corp. | 243,712 | |||||
900 | International Business Machines Corp. | 130,572 | |||||
1,600 | Microsoft Corp. | 119,184 | |||||
3,200 | QUALCOMM, Inc. | 165,888 | |||||
1,255,890 | |||||||
Transportation - 3.5% | |||||||
1,200 | Kansas City Southern | 130,416 | |||||
1,400 | Union Pacific Corp. | 162,358 | |||||
292,774 |
Total Common Stock (Cost $6,499,709) | 7,709,874 |
Money Market Fund - 6.9% | |||||||
566,099 | Morgan Stanley Institutional Liquidity Fund Government Portfolio, Institutional Class, 0.90%(b) (Cost $566,099) | 566,099 | |||||
Total Investments - 100.0% (Cost $7,065,808) | $ | 8,275,973 |
Other Assets & Liabilities, Net – 0.0% | 2,267 | ||
Net Assets – 100.0% | $ | 8,278,240 |
ADR | American Depositary Receipt |
PLC | Public Limited Company |
(a) | Non-income producing security. |
(b) | Dividend yield changes daily to reflect current market conditions. Rate was the quoted yield as of September 30, 2017. |
The following is a summary of the inputs used to value the Fund's investments as of September 30, 2017.
The inputs or methodology used for valuing securities are not necessarily an indication of the risks associated with investing in those securities. For more information on valuation inputs, and their aggregation into the levels used in the table below, please refer to the Security Valuation section in Note 2 of the accompanying Notes to Financial Statements.
Valuation Inputs | Investments in Securities |
Level 1 - Quoted Prices | $ | 7,709,874 | ||
Level 2 - Other Significant Observable Inputs | 566,099 | |||
Level 3 - Significant Unobservable Inputs | - | |||
Total | $ | 8,275,973 |
The Level 1 value displayed in this table is Common Stock. The Level 2 value displayed in this table is a Money Market Fund. Refer to this Schedule of Investments for a further breakout of each security by industry.
The Fund utilizes the end of period methodology when determining transfers. There were no transfers among Level Level 1, Level 2 and Level 3 for the year ended September 30, 2017.
usAFA
PORTFOLIO HOLDINGS | ||
% of Total Investments | ||
Basic Materials | 2.8 | % |
Capital Goods / Industrials | 8.1 | % |
Consumer Cyclicals | 5.1 | % |
Consumer Discretionary | 5.7 | % |
Consumer Staples | 3.2 | % |
Energy | 7.5 | % |
Financials | 23.0 | % |
Health Care | 19.1 | % |
Technology | 15.2 | % |
Transportation | 3.5 | % |
Money Market Fund | 6.8 | % |
100.0 | % |
AFA
ASSETS | ||||||
. | Investments, at value (Cost $7,065,808) | $ | 8,275,973 | |||
Cash | 1,271 | |||||
Receivables: | ||||||
Fund shares sold | 1,400 | |||||
Dividends | 8,617 | |||||
From investment advisor | 13,901 | |||||
Prepaid expenses | 4,922 | |||||
Total Assets | 8,306,084 | |||||
LIABILITIES | ||||||
Payables: | ||||||
Fund shares redeemed | 3 | |||||
Accrued Liabilities: | ||||||
Fund services fees | 5,362 | |||||
Other expenses | 22,479 | |||||
Total Liabilities | 27,844 | |||||
NET ASSETS | $ | 8,278,240 | ||||
COMPONENTS OF NET ASSETS | ||||||
Paid-in capital | $ | 7,371,357 | ||||
Undistributed net investment income | 1,691 | |||||
Accumulated net realized loss | (304,973 | ) | ||||
Net unrealized appreciation | 1,210,165 | |||||
NET ASSETS | $ | 8,278,240 | ||||
SHARES OF BENEFICIAL INTEREST AT NO PAR VALUE (UNLIMITED SHARES AUTHORIZED) | ||||||
Investor Shares | 251,110 | |||||
Institutional Shares | 472,707 | |||||
NET ASSET VALUE, OFFERING AND REDEMPTION PRICE PER SHARE | ||||||
Investor Shares (based on net assets of $2,874,448) | $ | 11.45 | ||||
Institutional Shares (based on net assets of $5,403,792) | $ | 11.43 |
INVESTMENT INCOME | |||||||
Dividend income (Net of foreign withholding taxes of $5,986) | . | $ | 202,021 | ||||
Total Investment Income | 202,021 | ||||||
Advisor | |||||||
EXPENSES | |||||||
Investment advisor fees | 79,891 | ||||||
Fund services fees | 73,923 | ||||||
Transfer agent fees: | |||||||
Investor Shares | 18,180 | ||||||
Institutional Shares | 18,180 | ||||||
Distribution fees: | |||||||
Investor Shares | 15,391 | ||||||
Custodian fees | 5,000 | ||||||
Registration fees: | |||||||
Investor Shares | 15,830 | ||||||
Institutional Shares | 15,830 | ||||||
Professional fees | 29,493 | ||||||
Trustees' fees and expenses | 2,561 | ||||||
Other expenses | 27,363 | ||||||
Total Expenses | 301,642 | ||||||
Fees waived and expenses reimbursed | (184,879 | ) | |||||
Net Expenses | 116,763 | ||||||
NET INVESTMENT INCOME | 85,258 | ||||||
NET REALIZED AND UNREALIZED GAIN (LOSS) | |||||||
Net realized gain on investments | 1,077,354 | ||||||
Net change in unrealized appreciation (depreciation) on investments | 408,585 | ||||||
NET REALIZED AND UNREALIZED GAIN | 1,485,939 | ||||||
INCREASE IN NET ASSETS RESULTING FROM OPERATIONS | $ | 1,571,197 | |||||
For the Year Ended September 30, 2017 | For the Year Ended September 30, 2016 | ||||||||||
OPERATIONS | |||||||||||
Net investment income | $ | 85,258 | $ | 675,355 | |||||||
Net realized gain (loss) | 1,077,354 | (1,239,017 | ) | ||||||||
Net change in unrealized appreciation (depreciation) | 408,585 | 15,453,930 | |||||||||
Increase in Net Assets Resulting from Operations | 1,571,197 | 14,890,268 | |||||||||
DISTRIBUTIONS TO SHAREHOLDERS FROM | |||||||||||
Net investment income: | |||||||||||
Investor Shares | (57,751 | ) | (539,156 | ) | |||||||
Institutional Shares | (72,531 | ) | (213,418 | ) | |||||||
Net realized gain: | |||||||||||
Investor Shares | - | (1,155,096 | ) | ||||||||
Institutional Shares | - | (750,918 | ) | ||||||||
Total Distributions to Shareholders | (130,282 | ) | (2,658,588 | ) | |||||||
CAPITAL SHARE TRANSACTIONS | |||||||||||
Sale of shares: | |||||||||||
Investor Shares | 451,332 | 1,397,425 | |||||||||
Institutional Shares | 285,008 | 8,353,879 | |||||||||
Reinvestment of distributions: | |||||||||||
Investor Shares | 56,463 | 1,686,621 | |||||||||
Institutional Shares | 72,083 | 944,207 | |||||||||
Redemption of shares: | |||||||||||
1 | Investor Shares | (8,327,460 | ) | (14,388,052 | ) | ||||||
2 | Institutional Shares | (1,145,359 | ) | (256,204,428 | ) | ||||||
Decrease in Net Assets from Capital Share Transactions | (8,607,933 | ) | (258,210,348 | ) | |||||||
Decrease in Net Assets | (7,167,018 | ) | (245,978,668 | ) | |||||||
NET ASSETS | |||||||||||
Beginning of Year | 15,445,258 | 261,423,926 | |||||||||
End of Year (Including line (a)) | $ | 8,278,240 | $ | 15,445,258 | |||||||
SHARE TRANSACTIONS | |||||||||||
Sale of shares: | |||||||||||
Investor Shares | 41,978 | 152,505 | |||||||||
Institutional Shares | 25,941 | 792,315 | |||||||||
Reinvestment of distributions: | |||||||||||
Investor Shares | 5,238 | 172,979 | |||||||||
Institutional Shares | 6,593 | 96,286 | |||||||||
Redemption of shares: | |||||||||||
Investor Shares | (771,560 | ) | (1,619,069 | ) | |||||||
Institutional Shares | (107,029 | ) | (23,760,340 | ) | |||||||
Decrease in Shares | (798,839 | ) | (24,165,324 | ) | |||||||
(a) | Undistributed net investment income | $ | 1,691 | $ | - |
These financial highlights reflect selected data for a share outstanding throughout each year. | |||||||||||||||||||||
For the Years Ended September 30, | |||||||||||||||||||||
2017 | 2016 | 2015 | 2014 | 2013 | |||||||||||||||||
INVESTOR SHARES | |||||||||||||||||||||
NET ASSET VALUE, Beginning of Year | $ | 10.14 | $ | 10.16 | $ | 11.42 | $ | 12.26 | $ | 10.04 | |||||||||||
INVESTMENT OPERATIONS | |||||||||||||||||||||
Net investment income (a) | 0.06 | 0.08 | 0.11 | 0.18 | 0.09 | ||||||||||||||||
Net realized and unrealized gain (loss) | 1.35 | 0.71 | (0.98 | ) | 1.15 | 2.22 | |||||||||||||||
Total from Investment Operations | 1.41 | 0.79 | (0.87 | ) | 1.33 | 2.31 | |||||||||||||||
DISTRIBUTIONS TO SHAREHOLDERS FROM | |||||||||||||||||||||
Net investment income | (0.10 | ) | (0.28 | ) | (0.10 | ) | (0.15 | ) | (0.09 | ) | |||||||||||
Net realized gain | — | (0.53 | ) | (0.29 | ) | (2.02 | ) | — | |||||||||||||
Total Distributions to Shareholders | (0.10 | ) | (0.81 | ) | (0.39 | ) | (2.17 | ) | (0.09 | ) | |||||||||||
NET ASSET VALUE, End of Year | $ | 11.45 | $ | 10.14 | $ | 10.16 | $ | 11.42 | $ | 12.26 | |||||||||||
TOTAL RETURN | 13.98 | % | 8.28 | % | (7.86 | )% | 12.11 | % | 23.12 | % | |||||||||||
RATIOS/SUPPLEMENTARY DATA | |||||||||||||||||||||
Net Assets at End of Year (000's omitted) | $2,874 | $9,890 | $23,045 | $26,763 | $31,387 | ||||||||||||||||
Ratios to Average Net Assets: | |||||||||||||||||||||
Net investment income | 0.60 | % | 0.77 | % | 0.99 | % | 1.55 | % | 0.81 | % | |||||||||||
Net expenses | 1.14 | % | 1.28 | % | 1.14 | % | 1.14 | % | 1.13 | % | |||||||||||
Gross expenses (b) | 2.64 | % | 1.84 | % | 1.37 | % | 1.46 | % | 1.38 | % | |||||||||||
PORTFOLIO TURNOVER RATE | 42 | % | 57 | % | 29 | % | 34 | % | 42 | % | |||||||||||
(a) | Calculated based on average shares outstanding during each year. | ||||||||||||||||||||
(b) | Reflects the expense ratio excluding any waivers and/or reimbursements. |
These financial highlights reflect selected data for a share outstanding throughout each year. | |||||||||||||||||||||
For the Years Ended September 30, | |||||||||||||||||||||
2017 | 2016 | 2015 | 2014 | 2013 | |||||||||||||||||
INSTITUTIONAL SHARES | |||||||||||||||||||||
NET ASSET VALUE, Beginning of Year | $ | 10.15 | $ | 10.18 | $ | 11.45 | $ | 12.28 | $ | 10.06 | |||||||||||
INVESTMENT OPERATIONS | |||||||||||||||||||||
Net investment income (a) | 0.10 | 0.14 | 0.14 | 0.19 | 0.12 | ||||||||||||||||
Net realized and unrealized gain (loss) | 1.33 | 0.66 | (0.99 | ) | 1.18 | 2.22 | |||||||||||||||
Total from Investment Operations | 1.43 | 0.80 | (0.85 | ) | 1.37 | 2.34 | |||||||||||||||
DISTRIBUTIONS TO SHAREHOLDERS FROM | |||||||||||||||||||||
Net investment income | (0.15 | ) | (0.30 | ) | (0.13 | ) | (0.18 | ) | (0.12 | ) | |||||||||||
Net realized gain | — | (0.53 | ) | (0.29 | ) | (2.02 | ) | — | |||||||||||||
Total Distributions to Shareholders | (0.15 | ) | (0.83 | ) | (0.42 | ) | (2.20 | ) | (0.12 | ) | |||||||||||
NET ASSET VALUE, End of Year | $ | 11.43 | $ | 10.15 | $ | 10.18 | $ | 11.45 | $ | 12.28 | |||||||||||
TOTAL RETURN | 14.18 | % | 8.40 | % | (7.70 | )% | 12.46 | % | 23.38 | % | |||||||||||
RATIOS/SUPPLEMENTARY DATA | |||||||||||||||||||||
Net Assets at End of Year (000's omitted) | $5,404 | $5,555 | $238,379 | $172,830 | $45,357 | ||||||||||||||||
Ratios to Average Net Assets: | |||||||||||||||||||||
Net investment income | 0.92 | % | 1.35 | % | 1.22 | % | 1.62 | % | 1.10 | % | |||||||||||
Net expenses | 0.89 | % | 0.89 | % | 0.89 | % | 0.89 | % | 0.87 | % | |||||||||||
Gross expenses (b) | 2.64 | % | 1.00 | % | 0.87 | %(c) | 0.96 | % | 0.87 | % | |||||||||||
PORTFOLIO TURNOVER RATE | 42 | % | 57 | % | 29 | % | 34 | % | 42 | % | |||||||||||
(a) | Calculated based on average shares outstanding during each year. | ||||||||||||||||||||
(b) | Reflects the expense ratio excluding any waivers and/or reimbursements. | ||||||||||||||||||||
(c) | Ratio includes waivers and previously waived investment advisory fees recovered. The impact of the recovered fees may cause a higher net expense ratio. |
Note 1. Organization
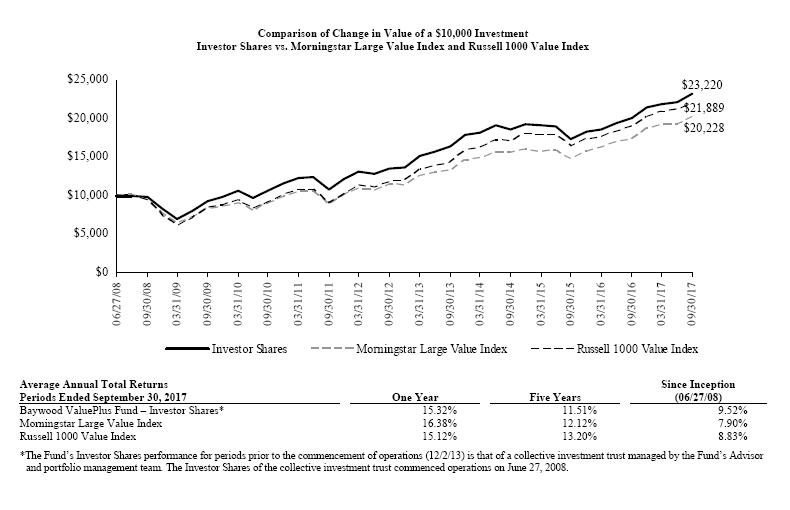
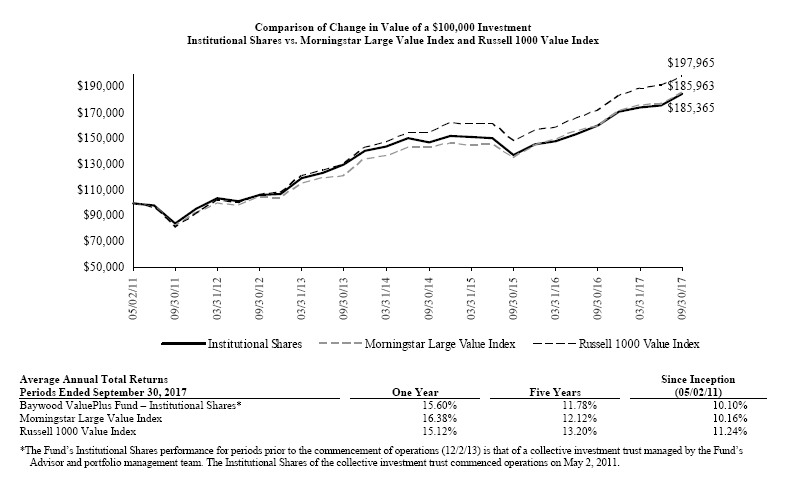
Baywood ValuePlus Fund and Baywood SociallyResponsible Fund (individually, a "Fund" and collectively, the "Funds") are diversified portfolios of Forum Funds II (the "Trust"). The Trust is a Delaware statutory trust that is registered as an open-end, management investment company under the Investment Company Act of 1940, as amended (the "Act"). Under its Trust Instrument, the Trust is authorized to issue an unlimited number of each Fund's shares of beneficial interest without par value. The Baywood ValuePlus Fund commenced operations on December 2, 2013, through a reorganization of a collective investment trust into the Baywood ValuePlus Fund. The collective investment trust was previously managed by the Baywood ValuePlus Fund's Advisor and portfolio management team. This collective investment trust was organized and commenced operations on June 27, 2008. The Baywood ValuePlus Fund currently offers two classes of shares: Investor Shares and Institutional Shares. The Baywood ValuePlus Fund seeks to achieve long-term capital appreciation by investing in undervalued equity securities.
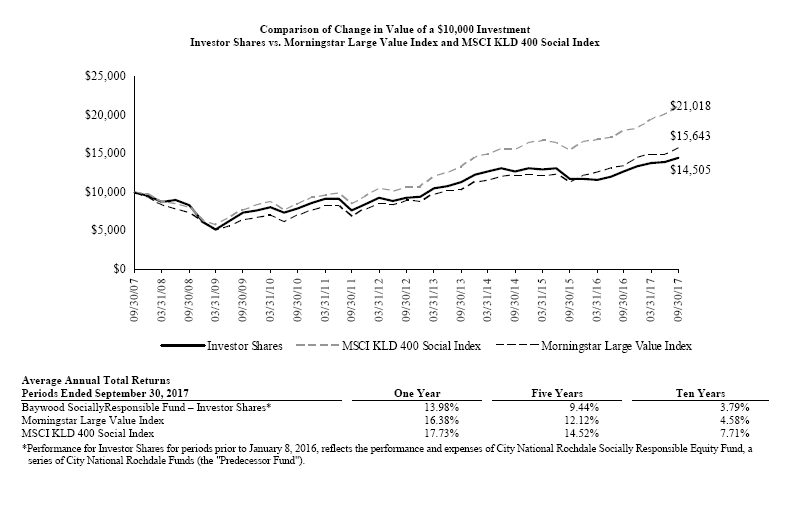
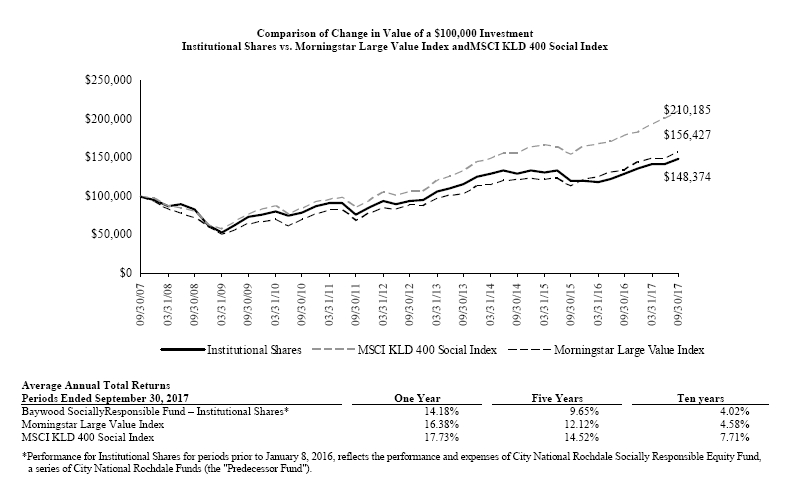
The Baywood SociallyResponsible Fund commenced operations on January 3, 2005. The Baywood SociallyResponsible Fund currently offers two classes of shares: Investor Shares and Institutional Shares. The Baywood SociallyResponsible Fund seeks to provide long-term capital growth.
On December 7, 2015, at a special meeting of shareholders of Baywood SociallyResponsible Fund, formerly City National Rochdale Socially Responsible Equity Fund, a series of City National Rochdale Funds (the "Predecessor Fund"), the shareholders approved a proposal to reorganize the Predecessor Fund into the Baywood SociallyResponsible Fund, a newly created series of the Forum Funds II. The Predecessor Fund was sub-advised by the Fund's Advisor, SKBA Capital Management, LLC, with the same portfolio managers as Baywood SociallyResponsible Fund. The Baywood SociallyResponsible Fund is managed in a manner that is in all material respects equivalent to the management of the Predecessor Fund, including the investment objective, strategies, guidelines and restrictions. The primary purpose of the reorganization was to move the Predecessor Fund to a newly created series of Forum Funds II. As a result of the reorganization, the Baywood SociallyResponsible Fund is now operating under the supervision of a different board of trustees. On January 8, 2016, the Baywood SociallyResponsible Fund acquired all of the assets, subject to liabilities, of the Predecessor Fund. The shares of the Predecessor Fund were, in effect, exchanged on a tax-free basis for Shares of the Baywood SociallyResponsible Fund with the same aggregate value. No commission or other transactional fees were imposed on shareholders in connection with the tax-free exchange of their shares.
Note 2. Summary of Significant Accounting Policies
The Funds are investment companies and follow accounting and reporting guidance under Financial Accounting Standards Board ("FASB") Accounting Standards Codification ("ASC") Topic 946, "Financial Services-Investment Companies". These financial statements are prepared in accordance with accounting principles generally accepted in the United States of America ("GAAP"), which require management to make estimates and assumptions that affect the reported amounts of assets and liabilities, the disclosure of contingent liabilities at the date of the financial statements, and the reported amounts of increases and decreases in net assets from operations during the fiscal year. Actual amounts could differ from those estimates. The following summarizes the significant accounting policies of each Fund:
Security Valuation – Securities are valued at market prices using the last quoted trade or official closing price from the principal exchange where the security is traded, as provided by independent pricing services on each Fund business day. In the absence of a last trade, securities are valued at the mean of the last bid and ask price provided by the pricing service. Shares of non-exchange-traded open-end mutual funds are valued at net asset value ("NAV"). Short-term investments that mature in 60 days or less may be valued at amortized cost.
Each Fund values its investments at fair value pursuant to procedures adopted by the Trust's Board of Trustees (the "Board") if (1) market quotations are not readily available or (2) the Advisor, as defined in Note 3, believes that the values available are unreliable. The Trust's Valuation Committee, as defined in each Fund's registration statement, performs certain functions as they relate to the administration and oversight of each Fund's valuation procedures. Under these procedures, the Valuation Committee convenes on a regular and ad hoc basis to review such investments and considers a number of factors, including valuation methodologies and significant unobservable inputs, when arriving at fair value.
The Valuation Committee may work with the Advisor to provide valuation inputs. In determining fair valuations, inputs may include market-based analytics that may consider related or comparable assets or liabilities, recent transactions, market multiples, book values and other relevant investment information. Advisor inputs may include an income-based approach in which the anticipated future cash flows of the investment are discounted in determining fair value. Discounts may also be applied based on the nature or duration of any restrictions on the disposition of the investments. The Valuation Committee performs regular reviews
of valuation methodologies, key inputs and assumptions, disposition analysis and market activity.
Fair valuation is based on subjective factors and, as a result, the fair value price of an investment may differ from the security's market price and may not be the price at which the asset may be sold. Fair valuation could result in a different NAV than a NAV determined by using market quotes.
GAAP has a three-tier fair value hierarchy. The basis of the tiers is dependent upon the various "inputs" used to determine the value of each Fund's investments. These inputs are summarized in the three broad levels listed below:
Level 1 — Quoted prices in active markets for identical assets and liabilities
Level 2 – Prices determined using significant other observable inputs (including quoted prices for similar securities, interest rates, prepayment speeds, credit risk, etc.). Short-term securities with maturities of sixty days or less are valued at amortized cost, which approximates market value, and are categorized as Level 2 in the hierarchy. Municipal securities, long-term U.S. government obligations and corporate debt securities are valued in accordance with the evaluated price supplied by the pricing service and generally categorized as Level 2 in the hierarchy. Other securities that are categorized as Level 2 in the hierarchy include, but are not limited to, warrants that do not trade on an exchange, securities valued at the mean between the last reported bid and ask quotation and international equity securities valued by an independent third party with adjustments for changes in value between the time of the securities respective local market closes and the close of the U.S. market.
Level 3 — Significant unobservable inputs (including each Fund's own assumptions in determining the fair value of investments)
The aggregate value by input level, as of September 30, 2017, for each Fund's investments is included at the end of each Fund's Schedule of Investments.
Security Transactions, Investment Income and Realized Gain and Loss – Investment transactions are accounted for on the trade date. Dividend income is recorded on the ex-dividend date. Foreign dividend income is recorded on the ex-dividend date or as soon as possible after determining the existence of a dividend declaration after exercising reasonable due diligence. Income and capital gains on some foreign securities may be subject to foreign withholding taxes, which are accrued as applicable. Interest income is recorded on an accrual basis. Premium is amortized and discount is accreted using the effective interest method. Identified cost of investments sold is used to determine the gain and loss for both financial statement and federal income tax purposes.
Distributions to Shareholders – Distributions to shareholders of net investment income, if any, are declared and paid at least annually. Distributions to shareholders of net capital gains, if any, are declared and paid at least annually. Distributions to shareholders are recorded on the ex-dividend date. Distributions are based on amounts calculated in accordance with applicable federal income tax regulations, which may differ from GAAP. These differences are due primarily to differing treatments of income and gain on various investment securities held by each Fund, timing differences and differing characterizations of distributions made by each Fund.
Federal Taxes – Each Fund intends to continue to qualify each year as a regulated investment company under Subchapter M of Chapter 1, Subtitle A, of the Internal Revenue Code of 1986, as amended ("Code"), and to distribute all of its taxable income to shareholders. In addition, by distributing in each calendar year substantially all of its net investment income and capital gains, if any, the Fund will not be subject to a federal excise tax. Therefore, no federal income or excise tax provision is required. Each Fund files a U.S. federal income and excise tax return as required. Each Fund's federal income tax returns are subject to examination by the Internal Revenue Service for a period of three fiscal years after they are filed. As of September 30, 2017, there are no uncertain tax positions that would require financial statement recognition, de-recognition or disclosure.
Income and Expense Allocation – The Trust accounts separately for the assets, liabilities and operations of each of its investment portfolios. Expenses that are directly attributable to more than one investment portfolio are allocated among the respective investment portfolios in an equitable manner.
The Fund's class-specific expenses are charged to the operations of that class of shares. Income and expenses (other than expenses attributable to a specific class) and realized and unrealized gains or losses on investments are allocated to each class of shares based on the class' respective net assets to the total net assets of each Fund.
Commitments and Contingencies – In the normal course of business, each Fund enters into contracts that provide general indemnifications by each Fund to the counterparty to the contract. Each Fund's maximum exposure under these arrangements is dependent on future claims that may be made against each Fund and, therefore, cannot be estimated; however, based on experience,
the risk of loss from such claims is considered remote.
Note 3. Fees and Expenses
Investment Advisor – SKBA Capital Management, LLC (the "Advisor") is the investment advisor to the Funds. Pursuant to an Investment Advisory Agreement, the Advisor receives an advisory fee at an annual rate of 0.50% and 0.70% of the average daily net assets of Baywood ValuePlus Fund and Baywood SociallyResponsible Fund, respectively.
Distribution – Foreside Fund Services, LLC serves as each Fund's distributor (the "Distributor"). The Funds have adopted a Distribution Plan (the "Plan") in accordance with Rule 12b-1 of the Act. Under the Plan, each Fund may pay the Distributor and/or any other entity as authorized by the Board a fee of up to 0.25% of each Fund's average daily net assets of Investor Shares for providing distribution and/or shareholder services to the Funds.
The Distributor is not affiliated with the Advisor or Atlantic Fund Administration, LLC (d/b/a Atlantic Fund Services) ("Atlantic") or their affiliates.
Other Service Providers – Atlantic provides fund accounting, fund administration, compliance and transfer agency services to each Fund. The fees related to these services are included in Fund services fees within the Statement of Operations. Atlantic also provides certain shareholder report production and EDGAR conversion and filing services. Pursuant to an Atlantic services agreement, each Fund pays Atlantic customary fees for its services. Atlantic provides a Principal Executive Officer, a Principal Financial Officer, a Chief Compliance Officer and an Anti-Money Laundering Officer to each Fund, as well as certain additional compliance support functions.
Trustees and Officers – The Trust pays each Independent Trustee an annual fee of $16,000 ($21,000 for the Chairman) for service to the Trust. The Independent Trustees and Chairman may receive additional fees for special Board meetings. The Independent Trustees are also reimbursed for all reasonable out-of-pocket expenses incurred in connection with their duties as Trustees, including travel and related expenses incurred in attending Board meetings. The amount of Independent Trustees' fees attributable to each Fund is disclosed in the Statements of Operations. Certain officers of the Trust are also officers or employees of the above named service providers, and during their terms of office received no compensation from each Fund.
Note 4. Expenses Reimbursed and Fees Waived
The Advisor has contractually agreed to waive its fee and/or reimburse certain expenses to limit total operating expenses (excluding all taxes, interest, portfolio transaction expenses, acquired fund fees and expenses, proxy expenses and extraordinary expenses) for Investor Shares to 0.95% and Institutional Shares to 0.70% through January 31, 2018, for Baywood ValuePlus Fund. The Advisor also has contractually agreed to waive its fees and/or reimburse certain expenses to limit total operating expenses (excluding all taxes, interest, portfolio transaction expenses, acquired fund fees and expenses, proxy expenses and extraordinary expenses) for Investor Shares to 1.14% and Institutional Shares to 0.89% through January 31, 2018, for Baywood SociallyResponsible Fund. Other Fund service providers have voluntarily agreed to waive and reimburse a portion of their fees. These voluntary fee waivers and reimbursements may be reduced or eliminated at any time. For the year ended September 30, 2017, fees waived and expenses reimbursed were as follows:
Investment Advisor Fees Waived | Investment Advisor Expenses Reimbursed | Other Waivers | Total Fees Waived and Expenses Reimbursed |
Baywood ValuePlus Fund | $ | 11,515 | $ | 121,849 | $ | 45,000 | $ | 178,364 | |||
Baywood SociallyResponsible Fund | 79,891 | 59,988 | 45,000 | 184,879 |
The Advisor may be reimbursed by the Funds for fees waived and expenses reimbursed by the Advisor pursuant to the expense cap if such payment is approved by the Board, and does not cause the Total Annual Fund Operating Expenses After Fee Waiver and/or Expense Reimbursement to exceed the lesser of (i) the then-current expense cap, or (ii) the expense cap in place at the time the fees/expenses were waived or reimbursed. As of September 30, 2017, $415,124 and $230,924 in the Baywood ValuePlus Fund and Baywood SociallyResponsible Fund, respectively, is subject to recapture by the Advisor. Other Waivers are not eligible for recoupment.
Note 5. Security Transactions
The cost of purchases and proceeds from sales of investment securities (including maturities), other than short-term investments
during the year ended September 30, 2017, were as follows:
![](https://capedge.com/proxy/N-CSR/0001435109-17-000808/image0.jpg)
Purchases | Sales | |||||
Baywood ValuePlus Fund | $ | 1,055,730 | $ | 1,234,811 | ||
Baywood SociallyResponsible Fund | 4,490,867 | 12,542,736 |
Note 6. Federal Income Tax
As of September 30, 2017, the cost of investments and the components of net unrealized appreciation were as follows:
Tax Cost of Investment | Gross Unrealized Appreciation | Gross Unrealized Depreciation | Net Unrealized Appreciation | |||||||||||||
Baywood ValuePlus Fund | $ | 2,063,377 | $ | 380,171 | $ | (19,536 | ) | $ | 360,635 | |||||||
Baywood SociallyResponsible Fund | 7,483,194 | 947,527 | (154,748 | ) | 792,779 |
Distributions paid during the fiscal years ended as noted were characterized for tax purposes as follows:
Ordinary Income | Long-Term Capital Gain | Total | ||||||||||
Baywood ValuePlus Fund | ||||||||||||
2017 | $ | 46,824 | $ | 38,818 | $ | 85,642 | ||||||
2016 | 222,678 | 61,442 | 284,120 | |||||||||
2015 | 229,854 | 2,129,193 | 2,359,047 | |||||||||
Baywood SociallyResponsible Fund | ||||||||||||
2017 | 130,282 | 71,027 | 201,309 | |||||||||
2016 | 752,147 | 1,906,441 | 2,658,588 |
Equalization debits included in the distributions were as follows:
Ordinary Income | Long-Term Capital Gain | Total | ||||||||||||||||
Baywood SociallyResponsible Fund | ||||||||||||||||||
2017 | $ | - | $ | 71,027 | $ | 71,027 |
As of September 30, 2017, distributable earnings (accumulated loss) on a tax basis were as follows:
Undistributed Ordinary Income | Undistributed Long-Term Gain | Unrealized Appreciation | Total |
Baywood ValuePlus Fund | $ | 40 | $ | 73,877 | $ | 360,635 | $ | 434,552 | |||||||||
Baywood SociallyResponsible Fund | 1,691 | 112,413 | 792,779 | 906,883 |
The difference between components of distributable earnings on a tax basis and the amounts reflected in the Statements of Assets and Liabilities are primarily due to wash sales and equity return of capital.
On the Statements of Assets and Liabilities, as a result of permanent book to tax differences, certain amounts have been reclassified for the year ended September 30, 2017. The following reclassifications were the result of partnerships, equalization, equity return of capital, prior year adjustments for real estate investment trusts, distribution reclassifications, and reclassification of income from a taxable corporate action and have no impact on the net assets of each Fund.
![]() | Undistributed Net Investment Income (Loss) | Accumulated Net Realized Gain (Loss) | Paid-in-Capital |
Baywood ValuePlus Fund | $ | (3,645 | ) | $ | 3,645 | $ | - | |||||
Baywood SociallyResponsible Fund | 46,715 | (25,176 | ) | (21,539 | ) |
Note 7. Subsequent Events
Subsequent events occurring after the date of this report through the date these financial statements were issued have been evaluated for potential impact, and each Fund has had no such events.
Investment Advisory Agreement Approval
At the September 14, 2017 Board meeting, the Board, including the Independent Trustees, considered the approval of the continuance of the investment advisory agreement between the Advisor and the Trust pertaining to the Funds (the "Advisory Agreement"). In preparation for the September meeting, the Board was presented with a range of information to assist in its deliberations. The Board requested and reviewed written responses from the Advisor to a letter circulated on the Board's behalf concerning the Advisor's personnel, operations, financial condition, performance, and services provided to the Funds by the Advisor. During its deliberations, the Board received an oral presentation from the Advisor and discussed the materials with the Advisor, independent legal counsel to the Independent Trustees ("Independent Legal Counsel"), and, as necessary, with the Trust's administrator, Atlantic Fund Services. The Independent Trustees also met in executive session with Independent Legal Counsel while deliberating.
At the September meeting, the Board reviewed, among other matters, the topics discussed below:
Nature, Extent and Quality of Services
Based on written materials received, a presentation from senior representatives of the Advisor and a discussion with the Advisor about the Advisor's personnel, operations and financial condition, the Board considered the quality of services provided by the Advisor under the Advisory Agreement. In this regard, the Board considered information regarding the experience, qualifications and professional background of the portfolio manager and other personnel at the Advisor with principal responsibility for the Funds, as well as the investment philosophy and decision-making process of those professionals and the capability and integrity of the Advisor's senior management and staff.
The Board considered also the adequacy of the Advisor's resources. The Board noted the Advisor's representation that the firm is financially stable and has the operational capability and necessary staffing and experience to continue providing quality investment advisory services to the Funds. Based on the presentation and the materials provided by the Advisor in connection with the Board's consideration of the renewal of the Advisory Agreement, the Board concluded that, overall, it was satisfied with the nature, extent and quality of services to be provided to the Fund under the Advisory Agreement.
Performance
In connection with a presentation by the Advisor regarding its approach to managing the Funds, the Board reviewed the performance of the Funds compared to their respective benchmarks. The Board observed that the ValuePlus Fund underperformed the Russell 1000 Value Index, the primary benchmark index for the ValuePlus Fund, for the one-, three- and five-year periods ended June 30, 2017. The Board also considered the ValuePlus Fund's performance relative to an independent peer group of funds identified by Broadridge Financial Solutions, Inc. ("Broadridge") believed to have characteristics similar to those of the Funds. Based on the information provided by Broadridge, the Board observed that the ValuePlus Fund underperformed the median of the Broadridge peers for the one-year period ended June 30, 2017, and outperformed the median of the Broadridge peers for three-year period ended June 30, 2017. The Board noted the Advisor's representation that the ValuePlus Fund's underperformance relative to its primary benchmark index and peers over the one-year period could be attributed, in part, to the ValuePlus Fund's overweight exposure in the energy sector during a period in which energy stocks underperformed the overall market . The Board noted the Advisor's representation that the ValuePlus Fund underperformed the benchmark over the three- and five-year periods as a result of such periods having been marked by high absolute returns, an environment in which the ValuePlus Fund's strategy tended to underperform.
The Board observed that the SociallyResponsible Fund had underperformed the MSCI KLD 400 Social Index, the primary benchmark index, for the one-, three-, five- and 10-year periods ended June 30, 2017. The Board noted the Advisor's representation that the primary benchmark index was not an ideal comparison because it is comprised of companies with growth oriented strategies, which outperformed value investing in general over the last five years. The Board observed that the SociallyResponsible Fund underperformed the median of its Broadridge peers for the one-, three-, and five-year periods ended June 30, 2017. The Board noted the Advisor's representation that the SociallyResponsible Fund's underperformance relative to the Broadridge peers could be attributed, in part, to the SociallyResponsible Fund having a different set of characteristics than the Broadridge peers due to the "socially responsible" criteria, which will cause the SociallyResponsible Fund to perform differently than peers that do not have such "socially responsible" constraints and conditions. The Board noted also the Advisor's representation that the Advisor had recently implemented a change in the investment strategy for the SociallyResponsible Fund, which provided additional flexibility in the management of the portfolio.
Based on the foregoing and other relevant factors, the Board concluded that the Advisor's management of each Fund could benefit each Fund and their respective shareholders.
Compensation
The Board evaluated the Advisor's compensation for providing advisory services to the Funds and analyzed comparative information on actual advisory fee rates and actual total expenses of the Funds' respective Broadridge peer groups. The Board noted that the Advisor's actual advisory fee rate and actual total expense ratio for each of the Funds was less than the median of their respective Broadridge peers. Based on the foregoing, the Board concluded that the Advisor's advisory fee rate charged to the Fund was reasonable.
Cost of Services and Profitability
The Board considered information provided by the Advisor regarding the costs of services and its profitability with respect to the Fund. In this regard, the Board considered the Advisor's resources devoted to the Fund, as well as the Advisor's discussion of costs and profitability. The Board noted the Advisor's representation that, as a result of the contractual expense limitation arrangement in place for the Funds, the Advisor was not earning any profit from its mutual fund operations but that the Advisor was willing to continue subsidizing the Funds in an effort to support growth initiatives. The Board noted that based on other applicable considerations, the Board concluded that the Advisor's costs of services and profits attributable to management of the Fund were reasonable in the context of all factors considered.
Economies of Scale
The Board evaluated whether the Funds would benefit from any economies of scale. In this respect, the Board noted the Advisor's representation that economies of scale could be experienced by shareholders of the Funds upon reaching significantly higher asset levels but that, in light of the Funds' current asset levels, breakpoints in the advisory fee were not believed by the Advisor to be appropriate at this time. Based on the foregoing information, the Board concluded that economies of scale were not a material factor in approving the Advisory Agreement.
Other Benefits
The Board noted the Advisor's representation that, aside from its contractual advisory fees, it does not benefit in a material way from its relationship with the Funds. Based on the foregoing representation, the Board concluded that other benefits received by the Advisor from its relationship with the Funds were not a material factor to consider in approving the continuation of the Advisory Agreement.
Conclusion
The Board did not identify any single factor as being of paramount importance, and different Trustees may have given different weight to different factors. The Board reviewed a memorandum from Fund counsel discussing the legal standards applicable to its consideration of the Advisory Agreement. Based on its review, including consideration of each of the factors referenced above, the Board determined, in the exercise of its reasonable business judgment, that the advisory arrangement, as outlined in the Advisory Agreement, was fair and reasonable in light of the services performed or to be performed, expenses incurred or to be incurred and such other matters as the Board considered relevant.
Proxy Voting Information
A description of the policies and procedures that each Fund uses to determine how to vote proxies relating to securities held in each Fund's portfolio is available, without charge and upon request, by calling (855) 409-2297 and on the U.S. Securities and Exchange Commission's (the "SEC") website at www.sec.gov. Each Fund's proxy voting record for the most recent twelve-month period ended June 30 is available, without charge and upon request, by calling (855) 409-2297 and on the SEC's website at www.sec.gov.
Availability of Quarterly Portfolio Schedules
Each Fund files its complete schedule of portfolio holdings with the SEC for the first and third quarters of each fiscal year on Form N-Q. These filings are available, without charge and upon request on the SEC's website at www.sec.gov or may be reviewed and copied at the SEC's Public Reference Room in Washington, DC. Information on the operation of the Public Reference Room may be obtained by calling (800) SEC-0330.
Shareholder Expense Example
As a shareholder of the Fund, you incur ongoing costs, including management fees, distribution (12b-1) fees (for Investor Shares only) and other Fund expenses. This example is intended to help you understand your ongoing costs (in dollars) of investing in the Fund and to compare these costs with the ongoing costs of investing in other mutual funds.
The example is based on an investment of $1,000 invested at the beginning of the period and held for the entire period from April 1, 2017 through September 30, 2017.
Actual Expenses – The first line under each share class of the table below provides information about actual account values and actual expenses. You may use the information in this line, together with the amount you invested, to estimate the expenses that you paid over the period. Simply divide your account value by $1,000 (for example, an $8,600 account value divided by $1,000 = 8.6), then multiply the result by the number in the first line under the heading entitled "Expenses Paid During Period" to estimate the expenses you paid on your account during the period.
Hypothetical Example for Comparison Purposes – The second line under each share class of the table below provides information about hypothetical account values and hypothetical expenses based on each Fund's actual expense ratio and an assumed rate of return of 5% per year before expenses, which is not each Fund's actual return. The hypothetical account values and expenses may not be used to estimate the actual ending account balance or expenses you paid for the period. You may use this information to compare the ongoing costs of investing in each Fund and other funds. To do so, compare this 5% hypothetical example with the 5% hypothetical examples that appear in the shareholder reports of other funds.
Please note that the expenses shown in the table are meant to highlight your ongoing costs only. Therefore, the second line of the table is useful in comparing ongoing costs only and will not help you determine the relative total costs of owning different funds.
Beginning | Ending | Expenses | Annualized | ||||||||
Account Value | Account Value | Paid During | Expense | ||||||||
April 1, 2017 | September 30, 2017 | Period* | Ratio* | ||||||||
Baywood ValuePlus Fund | |||||||||||
Investor Shares | |||||||||||
Actual | $ | 1,000.00 | $ | 1,060.27 | $ | 4.91 | 0.95 | % | |||
Hypothetical (5% return before expenses) | $ | 1,000.00 | $ | 1,020.31 | $ | 4.81 | 0.95 | % | |||
Institutional Shares | |||||||||||
Actual | $ | 1,000.00 | $ | 1,061.93 | $ | 3.62 | 0.70 | % | |||
Hypothetical (5% return before expenses) | $ | 1,000.00 | $ | 1,021.56 | $ | 3.55 | 0.70 | % |
Baywood SociallyResponsible Fund | |||||||||||
Investor Shares | |||||||||||
Actual | $ | 1,000.00 | $ | 1,049.01 | $ | 5.86 | 1.14 | % | |||
Hypothetical (5% return before expenses) | $ | 1,000.00 | $ | 1,019.35 | $ | 5.77 | 1.14 | % | |||
Institutional Shares | |||||||||||
Actual | $ | 1,000.00 | $ | 1,049.15 | $ | 4.57 | 0.89 | % | |||
Hypothetical (5% return before expenses) | $ | 1,000.00 | $ | 1,020.61 | $ | 4.51 | 0.89 | % | |||
* | Expenses are equal to each Fund's annualized expense ratio multiplied by the average account value over the period, multiplied by the number of days in the most recent fiscal half-year (183) divided by 365 to reflect the half-year period. |
Federal Tax Status of Dividends Declared during the Fiscal Year
For federal income tax purposes, dividends from short-term capital gains are classified as ordinary income. The Baywood ValuePlus Fund designates 100.00% of its income dividend distributed as qualifying for the corporate dividends-received deduction (DRD) and 100.00% for the qualified dividend rate (QDI) as defined in Section 1(h)(11) of the Internal Revenue Code. The Baywood SociallyResponsible Fund designates 100.00% of its income dividend distributed as DRD and 100.00% for QDI.
Trustees and Officers of the Trust
The Board is responsible for oversight of the management of the Trust's business affairs and of the exercise of all the Trust's powers except those reserved for the shareholders. The following table provides information about each Trustee and certain officers of the Trust. Each Trustee and officer holds office until the person resigns, is removed, or is replaced. Unless otherwise noted, the persons have held their principal occupations for more than five years. The address for all Trustees and officers is Three Canal Plaza, Suite 600, Portland, Maine 04101. Mr. Keffer and Mr. Hong are considered Interested Trustees due to their affiliation with Atlantic. Each Fund's Statement of Additional Information includes additional information about the Trustees and is available, without charge and upon request, by calling (855) 409-2297.
Name and Year of Birth | Position(s) with the Trust | Length of Time Served | Principal Occupation(s) During Past Five Years | Number of Series of Fund Complex¹ Overseen by Trustee | Other Directorships Held by Trustee |
Independent Trustees | |||||
David Tucker Born: 1958 | Chairman of the Board; Trustee; Chairman, Nominating Committee and Qualified Legal Compliance Committee | Since 2013 | Director, Blue Sky Experience (a charitable endeavor) since 2008; Senior Vice President & General Counsel, American Century Companies (an investment management firm) 1998-2008. | 45 | Trustee, Forum Funds, Forum ETF Trust and U.S. Global Investors Funds |
Mark D. Moyer Born: 1959 | Trustee; Chairman, Audit Committee | Since 2013 | Chief Financial Officer, Freedom House (a NGO advocating political freedom and democracy), since 2017; Independent Consultant providing interim CFO services, principally to non-profit organizations, 2011-2017; Chief Financial Officer, Institute of International Education (a NGO administering international educational exchange programs), 2008- 2011; Chief Financial Officer and Chief Restructuring Officer, Ziff Davis Media Inc. (an integrated media company) 2005- 2008; Adjunct Professor of Accounting, Fairfield University 2009-2012. | 24 | Trustee, Forum ETF Trust and U.S. Global Investors Funds |
Jennifer Brown-Strabley Born: 1964 | Trustee | Since 2013 | Principal, Portland Global Advisors 1996-2010. | 24 | Trustee, Forum ETF Trust and U.S. Global Investors Funds |
Interested Trustees | |||||
Stacey E. Hong Born: 1966 | Trustee | Since 2013 | President, Atlantic since 2008. | 24 | Trustee, U.S. Global Investors Funds |
John Y. Keffer2 Born: 1942 | Trustee | Since 2013 | Chairman, Atlantic since 2008; President, Forum Investment Advisors, LLC since 2011; President, Forum Foundation (a charitable organization) since 2005; President, Forum Trust, LLC (a non-depository trust company chartered in the State of Maine) since 1997. | 45 | Trustee, Forum Funds, Forum ETF Trust and U.S. Global Investors Funds; Director, Wintergreen Fund, Inc. |
Officers | |||||
Jessica Chase Born: 1970 | President; Principal Executive Officer | Since 2015 | Senior Vice President, Atlantic since 2008. | N/A | N/A |
Karen Shaw Born: 1972 | Treasurer; Principal Financial Officer | Since 2013 | Senior Vice President, Atlantic since 2008. | N/A | N/A |
Zachary Tackett Born: 1988 | Vice President; Secretary; Anti-Money Laundering Compliance Officer | Since 2014 | Counsel, Atlantic since 2014; Intern Associate, Coakley & Hyde, PLLC, 2010-2013. | N/A | N/A |
Michael J. McKeen Born: 1971 | Vice President | Since 2013 | Senior Vice President, Atlantic since 2008. | N/A | N/A |
Timothy Bowden Born: 1969 | Vice President | Since 2013 | Manager, Atlantic since 2008. | N/A | N/A |
Geoffrey Ney Born: 1975 | Vice President | Since 2013 | Manager, Atlantic since 2013; Senior Fund Accountant, Atlantic, 2008-2013. | N/A | N/A |
Todd Proulx Born: 1978 | Vice President | Since 2013 | Manager, Atlantic since 2013; Senior Fund Accountant, Atlantic, 2008-2013. | N/A | N/A |
Carlyn Edgar Born: 1963 | Chief Compliance Officer | Since 2013 | Senior Vice President, Atlantic since 2008. | N/A | N/A |
1The Fund Complex includes the Trust, Forum Funds, Forum ETF Trust and U.S. Global Investors Funds and is overseen by different Boards of Trustees. 2Atlantic is a subsidiary of Forum Holdings Corp. I, a Delaware corporation that is wholly owned by Mr. Keffer. |