UNITED STATES
SECURITIES AND EXCHANGE COMMISSION
Washington, D.C. 20549
FORM N-CSR
CERTIFIED SHAREHOLDER REPORT OF REGISTERED
MANAGEMENT INVESTMENT COMPANIES
Investment Company Act file number(s) 811-22845
Babson Capital Funds Trust
(Exact Name of Registrant as Specified in Charter)
550 South Tryon Street
Suite 3300
Charlotte, NC 28202
(Address of Principal Executive Offices)
Registrant’s telephone number, including area code: (704) 805-7200
Janice M. Bishop
Secretary and Chief Legal Officer
c/o Babson Capital Management LLC
Independence Wharf
470 Atlantic Avenue, Boston MA 02210
(Name and Address of Agent for Service)
Date of fiscal year end: June 30
Date of reporting period: June 30, 2015
| Item 1. | Reports to Stockholders. |

BABSON CAPITAL FUNDS TRUST
Annual Report
June 30, 2015


BCFT Service Providers
ADVISER
Babson Capital Management LLC
550 South Tryon Street
Suite 3300
Charlotte, NC 28202
SUB-ADVISER
Babson Capital Global Advisors Limited
61 Aldwych
London, UK
WC2B 4AE
COUNSEL TO THE TRUST
Ropes & Gray LLP
Prudential Tower
800 Boylston Street
Boston, MA 02110
INDEPENDENT REGISTERED PUBLIC ACCOUNTING FIRM
Deloitte & Touche LLP
200 Berkley Street
Boston, MA 02116
CUSTODIAN
State Street Bank & Trust
One Lincoln Street
Boston, MA 02111
TRANSFER AGENT AND REGISTRAR
State Street Bank & Trust
One Lincoln Street
Boston, MA 02111
FUND ADMINISTRATION/ACCOUNTING
State Street Bank & Trust
One Lincoln Street
Boston, MA 02111
FUND DISTRIBUTOR
ALPS Distributors, Inc.
1290 Broadway
Suite 1100
Denver, CO 80203
BLUE SKY ADMINISTRATION
Boston Financial Data Services
2000 Crown Colony Drive
Quincy, MA 02169
PROXY VOTING POLICIES & PROCEDURES
The Trustees of Babson Capital Funds Trust (the “Trust”) have delegated proxy voting responsibilities relating to the voting of securities held by the Trust to Babson Capital Management LLC (“Babson Capital”). A description of Babson Capital’s proxy voting policies and procedures is available (1) without charge, upon request, by calling, toll-free 1-877-766-0014; (2) on the Trust’s website at http://www.BabsonCapital.com; and (3) on the U.S. Securities and Exchange Commission’s (“SEC”) website at http://www.sec.gov.
FORM N-Q
The Trust will file its complete schedule of portfolio holdings with the SEC for the first and third quarters of each fiscal year on Form N-Q. This information is available (i) on the SEC’s website at http://www.sec.gov; and (ii) at the SEC’s Public Reference Room in Washington, DC (which information on their operation may be obtained by calling 1-800-SEC-0330). A complete schedule of portfolio holdings as of each quarter-end is available on the Trust’s website at http://www.BabsonCapital.com or upon request by calling, toll-free, 1-877-766-0014.

Anthony Sciacca
President
Babson Capital Funds Trust
Babson Capital Funds Trust
Babson Global Floating Rate Fund
Babson Global Credit Income Opportunities Fund
Dear Shareholder,
The first half of 2015 brought continued volatility to global markets as central-bank influence remained a driving force across developed and emerging economies. In June, European Central Bank President Mario Draghi warned investors that volatility would likely persist. Greece did not disappoint in this regard, coming perilously close to defaulting on its debt and renewing concerns about a potential exit from the euro. In Asia, weak economic growth from China roiled commodity markets, causing uncertainty across the energy, metals and mining sectors and raising the specter of lower inflation.
In the U.S., as the Federal Reserve (“Fed”) appears to be moving closer to normalizing monetary policy and raising interest rates for the first time in nearly 10 years, lower inflation would not be welcome news. At the July Federal Open Market Committee meeting, Fed Chair Janet Yellen noted continued improvements in the U.S. labor market and reaffirmed the Fed’s intention to raise rates in 2015. If employment data continues to improve and inflation moves toward the Fed’s stated goal of 2%, the likelihood of a September interest-rate hike will increase. If the decline in commodity prices affects the Fed’s inflation outlook, a 2015 interest-rate hike may not materialize.
Against this uncertain backdrop, we expect that volatility will continue to punctuate global markets as we move further into the second half of 2015. While this increasing volatility is presenting risks that must be monitored carefully, it is also – importantly – creating opportunities in global high yield and across credit markets more broadly. To capitalize on these opportunities, we are pleased to announce six new Babson mutual funds that will be available to investors in 2015 that will span investment grade credit, emerging market debt and global high yield. Two of these funds, Babson Active Short Duration Bond Fund and Babson Total Return Bond Fund, are already available for investment, with the remainder scheduled to launch later this year. These new funds present our investors with a broader set of opportunities across global credit markets and enable increased access to Babson’s robust fixed income platform.
As fundamental investors, we employ rigorous, bottom-up analysis across all of our credit strategies and on every company we invest in. We focus on our clients’ long-term goals, while also being mindful of the current macroeconomic environment. This disciplined, time-tested process has served our clients well through many investment cycles and in adverse market conditions.
On behalf of the entire Babson team, we value your continued partnership, and we look forward to helping you achieve your investment objectives.
Sincerely,

Anthony Sciacca
Cautionary Notice: Certain statements contained in this report may be “forward looking” statements. Investors are cautioned not to place undue reliance on forward-looking statements, which speak only as of the date in which they are made and reflect management’s current estimates, projections, expectations or beliefs, and which are subject to risks and uncertainties that may cause actual results to differ materially. These statements are subject to change at any time based upon economic, market or other conditions and may not be relied upon as investment advice or an indication of the Trust’s trading intent. References to specific securities are not recommendations of such securities, and may not be representative of the Trust’s current or future investments. We undertake no obligation to publicly update these forward looking statements, whether as a result of new information, future events, or otherwise.
ALPS Distributors, Inc. is the distributor for the Babson Capital mutual funds. Shares of the funds are offered by Babson Capital Securities LLC, an affiliated broker dealer of Babson Capital Management LLC. ALPS and Babson Capital Management are separate and unaffiliated. A prospectus can be obtained by calling 1.855.439.5459. Read the prospectus carefully before investing. Investors should carefully consider the investment objective, risks, charges and expenses of any mutual fund before investing. This and other important information is contained in the prospectus and summary prospectus.
Babson Global Floating Rate Fund 2015 Annual Report
Investment Objective
The investment objective of the Babson Global Floating Rate Fund (“Global Floating Rate Fund” or the “Fund”) is to seek a high level of current income. Preservation of capital is a secondary goal.
Portfolio Management Commentary
How did the Fund perform?
| | ● | | The Fund reported a net total rate of return for the annual reporting period from July 1, 2014 through June 30, 2015 of 1.28% and underperformed the Credit Suisse Global Loan Benchmark, which returned 2.42%.1 |
What factors influenced performance of the Fund?
| | ● | | For the annual reporting period, the Fund’s U.S. holdings in both senior secured loans and, to a lesser extent, high yield bonds were the primary detractors from performance relative to the Benchmark. The Fund’s European holdings, however, positively impacted Fund performance as a result of good credit selection within the senior secured loan asset class. European issuers represented eight out of the top ten contributors to Fund performance for this time period. |
| | ● | | U.S. senior secured loans and high yield bonds of commodity-related issuers faced significant selling pressure over the past twelve months. The Fund was negatively impacted by its exposure to these credits relative to the Benchmark. Seven of the Fund’s bottom ten contributors to its underperformance were commodity-related issuers. In our view, the underlying credit fundamentals for many of these issuers imply a higher value than current trading levels. We feel the selling was indiscriminate at times. While it is difficult to predict the price of commodities, we believe that most of these companies have sufficient liquidity and flexibility in their capital expenditure and operating budgets to withstand the volatility in commodity prices for longer than their current prices would suggest. |
Describe recent portfolio activity.
| | ● | | The number of holdings in the portfolio remained relatively unchanged over the year even as the Fund experienced an almost 50% increase in assets. Despite the Fund’s increased size, its positioning across geographies remained fairly consistent and the Fund continues to maintain significant positions in high conviction credits. |
| | ● | | The Fund remained overweight to European assets relative to the global senior secured loan market. Even with the overweight positioning, the Fund increased its exposure to U.S. assets over the past twelve months as prices widened more significantly than Europe which, in our opinion, positions the Fund to capture the best risk-adjusted returns from the market. |
| | ● | | Over the past twelve months, the Fund’s top three industry exposures have remained the same except for slight shifts in positioning with a decrease in the Healthcare, Education and Childcare sector by 0.5%, an increase to the Diversified / Conglomerate Service sector by 1.2% and a decrease to the non-bank related Finance sector by 4.4%. |
Describe portfolio positioning at period end.
| | ● | | The Fund finished the annual reporting period, June 30, 2015, with a 79.9% weighting to global senior secured loans. The remainder of the portfolio was invested in global high yield bonds (13.7%), primarily senior secured bonds. A portion of the Fund is invested in floating rate, high yield bonds (4.2%) predominantly issued by European companies, which increases the total floating rate exposure of the portfolio to 83.7%. |
| 1. | Total return describes the return to an investor based on the Class Y net expense ratio and includes the reinvestment of dividends and capital gains. Performance results reflect past performance and are no guarantee of future results. Current performance may be lower or higher than the performance data quoted. The net asset value (NAV) will fluctuate with market conditions. All returns 1-year or less are cumulative. The Credit Suisse Global Loan Benchmark is a market capitalization weighted average of the Credit Suisse Leveraged Loan Index and the Credit Suisse Western European Leveraged Loan Index. The Credit Suisse Leveraged Loan Index is designed to mirror the investable universe of the U.S. dollar-denominated leveraged loan market. The Credit Suisse Western European Leveraged Loan Index is designed to mirror the investable universe of the Western European leveraged loan market, with loans denominated in U.S. and Western European currencies. Indices are unmanaged. It is not possible to invest directly in an index. |
2
Babson Global Floating Rate Fund 2015 Annual Report
| | n | | The Fund remains well-diversified across a number of sectors based on Moody’s Industry Classification, with higher concentrations in Healthcare, Education and Childcare (10.4%), Diversified/Conglomerate Service (9.5%), and non-bank related Finance companies (8.2%) as of June 30, 2015. |
| | n | | As of June 30, 2015, the Fund had the following credit quality breakdown excluding cash and accrued income: 19.7% in Ba assets, 65.2% in single-B credits and a small exposure to Caa and below at 3.4%. Approximately 10.8% of the Fund’s assets are not publicly rated, primarily consisting of European issuers that we believe have a credit quality similar to that of other assets in the portfolio. Baa assets accounted for the remaining 1.0% of the portfolio assets. Over the course of the year, the single-B assets increased as the Fund’s exposure to Caa and below and not publicly rated assets decreased.2 |
| | n | | The top five countries in the portfolio at the end of the annual reporting period are the U.S. (63.2%), the United Kingdom (18.4%), Germany (7.6%), Canada (2.8%) and Switzerland (1.8%). Overall, the Fund has exposure to 17 different countries, and we continue to focus on building a well-diversified portfolio of global floating rate securities. |
Describe market and portfolio outlook.
| | n | | For the remainder of 2015, monetary policy will be a key theme capturing the attention of financial markets in the coming months as expectations have increased around an eventual interest rate hike by the Federal Reserve in the United States. In Europe, the European Central Bank’s quantitative easing program will still be monitored as well as any lagging headline risk from the Greece debt crisis. |
| | n | | Further, commodities will be closely watched as the market is looking for signs of stability across the energy and metals and mining sectors. Weak economic data from China has resulted in additional uncertainty surrounding any commodity related credits. |
| | n | | Excluding any potential commodity centric volatility and market instability from a potential Federal Reserve interest rate increase, we believe corporate fundamentals, such as balance sheet leverage and earnings growth, will continue to support global senior secured loan valuations in the near term and will most likely keep default rates below normal. This fundamental picture coupled with relatively attractive yields compared to other fixed income securities, we believe, should remain favorable for the global high yield market and the Fund. |
| 2. | Ratings shown are the highest rating given by one of the following national rating agencies: S&P or Moody’s. Additional information about ratings can be found at www.moodys.com and www.standardandpoors.com. Credit ratings are subject to change. AAA, AA, A, and BBB are investment grade ratings; BB, B, CCC/CC/C and D are below investment grade ratings. Bonds backed by U.S. Government or agency securities are given an implied rating equal to the rating of such securities. Holdings designated Not Publicly Rated are not rated by these national rating agencies. |
3
Babson Global Floating Rate Fund 2015 Annual Report
PORTFOLIO COMPOSITION (% OF ASSETS*)
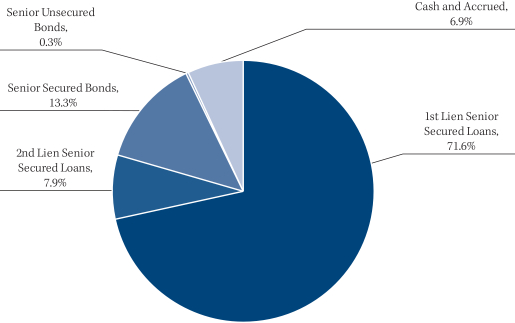
| * | The percentages shown above represent a percentage of the assets as of June 30, 2015. |
COUNTRY COMPOSITION (% OF ASSETS**)
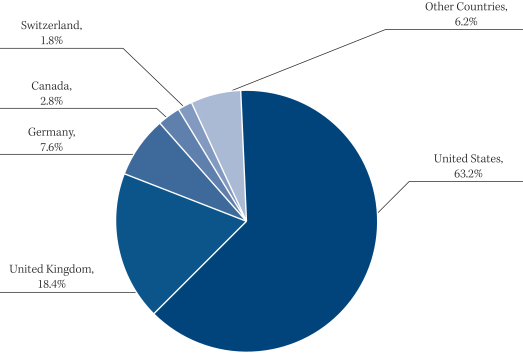
| ** | Percentage of assets are expressed by market value excluding cash and accrued income, and may vary over time. The percentages shown above represent a percentage of the assets as of June 30, 2015. |
4
Babson Global Credit Income Opportunities Fund 2015 Annual Report
Investment Objective
The investment objective of the Babson Global Credit Income Opportunities Fund (“Global Credit Income Opportunities Fund” or the “Fund”) is to seek an absolute return, primarily through current income and secondarily through capital appreciation.
Portfolio Management Commentary
How did the Fund perform?
| | n | | The Fund reported a net total rate of return for the annual reporting period from July 1, 2014 through June 30, 2015, of 0.05% and underperformed the 3 Month USD LIBOR + 500 basis points1 Benchmark, which retuned +5.38%.2 |
What factors influenced performance of the Fund?
| | n | | During the annual reporting period, the main contributors to performance were the Fund’s allocations to collateralized loan obligations (“CLOs”), European high yield bonds, and senior secured loans in the U.S. and Europe. European issuers represented five of the top ten contributors to Fund performance for this time period, while three CLO issuers also claimed spots on the top ten contributor list. |
| | n | | U.S. high yield bonds of commodity-related issuers faced significant selling pressure over the past twelve months. The Fund was negatively impacted by its exposure to these credits. Eight of the Fund’s bottom ten contributors to its performance were commodity-related issuers. In our view, the underlying credit fundamentals for many of these issuers imply a higher value than current trading levels. We feel the selling was indiscriminate at times. While it is difficult to predict the price of commodities, we believe that most of these companies have sufficient liquidity and flexibility in their capital expenditure and operating budgets to withstand the volatility in commodity prices for longer than their current prices would suggest. |
| | n | | The Fund’s special situation credits had a negative impact on performance during the annual reporting period; however, we believe these assets provide attractive current income to the portfolio and should contribute to the Fund’s performance in the future. |
Describe recent portfolio activity.
| | n | | The number of holdings in the portfolio has increased moderately over the year as the Fund grew slightly. Despite the increased number of holdings, the Fund’s positioning across geographies remained fairly consistent and the Fund continues to maintain significant positions in high conviction credits. |
| | n | | Over the course of the year, the Fund slightly trimmed its exposure to global high yield bonds and senior secured loans while increasing its exposure to CLOs in order to focus on what we believe to be a more attractive part of the below investment grade market from a risk-adjusted basis. |
| | n | | Over the past twelve months, the Fund’s top three industry exposures have remained the same except for slight shifts in positioning with an increase to its CLO position by 3.1%, a decrease in exposure to Oil and Gas companies by approximately 3.3% and an increase to the Healthcare, Education and Childcare sector by 1.3%. |
| 1. | A basis point is equal to 1/100th of 1% or 0.01%. |
| 2. | Total return describes the return to an investor based on the Class Y net expense ratio and includes the reinvestment of dividends and capital gains. Performance results reflect past performance and are no guarantee of future results. Current performance may be lower or higher than the performance data quoted. The net asset value (NAV) will fluctuate with market conditions. All returns 1-year or less are cumulative. The 3 Month USD LIBOR (London Interbank Offered Rate) is an average interest rate, determined by the British Bankers Association, that banks charge one another for the use of short-term money (3 months) in England’s Eurodollar market. The return shown includes 3 Month USD LIBOR plus 500 bps, or 5% per annum. LIBOR is unmanaged. It is not possible to invest directly in LIBOR. No assurance can be given that the Fund’s performance will exceed that of LIBOR by any given increment, or at all. |
5
Babson Global Credit Income Opportunities Fund 2015 Annual Report
| | n | | The Fund in April 2015 sold and purchased a put option on Markit’s North American High Yield CDX Index to help mitigate downside market risk. While the derivatives are a small portion of the overall Fund, they may be used to hedge the Fund when the manager believes the risk of significant market dislocations makes hedging attractive. 3 |
Describe portfolio positioning at period end.
| | n | | The Fund finished the annual reporting period, June 30, 2015, with an allocation of 46.5%, 28.3%, and 16.5% to global high yield bonds, global senior secured loans and CLOs, respectively. The remainder of the portfolio was invested in a few opportunistic special situation credits at 0.7%, derivatives at 0.3% and cash at 7.7%. A significant portion of the portfolio (50.2%) is senior secured in nature, which may mitigate principal loss in the event of a default. |
| | n | | The Fund remains well-diversified across a number of sectors based on Moody’s Industry Classification, with higher concentrations in CLOs (16.5%), Oil and Gas (7.8%), and Healthcare, Education and Childcare (7.3%) as of June 30, 2015. |
| | n | | As of June 30, 2015, the Fund had the following credit quality breakdown excluding cash and accrued income: 31.3% in Ba assets, 51.7% in single-B credits and a modest exposure to Caa and below at 11.4%. Approximately 5.1% of the Fund’s assets are not publicly rated, primarily consisting of European issuers that we believe have a credit quality similar to that of other assets in the portfolio. Baa and above assets accounted for the remaining 0.5% of the portfolio assets. Over the course of the year, the single-B assets increased as the Fund’s exposure to assets rated Caa and below and not publicly rated assets decreased.4 |
| | n | | The top five countries in the portfolio at the end of the annual reporting period are the U.S. (49.2%), the Cayman Islands (17.3%), the United Kingdom (13.8%), Germany (3.4%) and the Netherlands (3.1%). The Cayman Islands exposure related to the Fund’s CLO holdings is predominantly invested in U.S. senior secured loans. Overall, the Fund has exposure to 19 different countries, and we continue to focus on building a well-diversified portfolio of global high yield securities. |
Describe market and portfolio outlook.
| | n | | For the remainder of 2015, monetary policy will be a key theme capturing the attention of financial markets in the coming months as expectations have increased around an eventual interest rate hike by the Federal Reserve in the United States. In Europe, the European Central Bank’s quantitative easing program will still be monitored as well as any lagging headline risk from the Greece debt crisis. |
| | n | | Further, commodities will be closely watched as the market is looking for signs of stability across the energy and metals and mining sectors. Weak economic data from China has resulted in additional uncertainty surrounding any commodity related credits. |
| | n | | Excluding any potential commodity centric volatility and market instability from a potential Federal Reserve interest rate increase, we believe corporate fundamentals, such as balance sheet leverage and earnings growth, will continue to support global senior secured loan and high yield bond valuations in the near term and will most likely keep default rates below normal. This fundamental picture coupled with relatively attractive yields compared to other fixed income securities, we believe, should remain favorable for the global high yield market and the Fund. |
| 3. | Markit’s North American High Yield CDX Index is composed of 100 liquid North American entities with high yield credit ratings that trade in the credit default swap market. It is not possible to invest directly in an index. A put option gives the owner the right to sell a security at a specific price and date. |
| 4. | Ratings shown are the highest rating given by one of the following national rating agencies: S&P or Moody’s. Additional information about ratings can be found at www.moodys.com and www.standardandpoors.com. Credit ratings are subject to change. AAA, AA, A, and BBB are investment grade ratings; BB, B, CCC/CC/C and D are below investment grade ratings. Bonds backed by U.S. Government or agency securities are given an implied rating equal to the rating of such securities. Holdings designated Not Publicly Rated are not rated by these national rating agencies |
6
Babson Global Credit Income Opportunities Fund 2015 Annual Report
PORTFOLIO COMPOSITION (% OF ASSETS*)
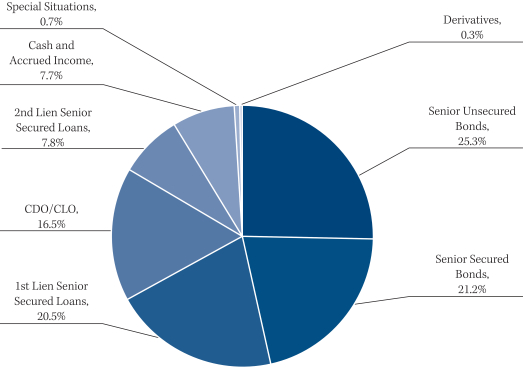
| * | The percentages shown above represent a percentage of the assets as of June 30, 2015. |
COUNTRY COMPOSITION (% OF ASSETS**)
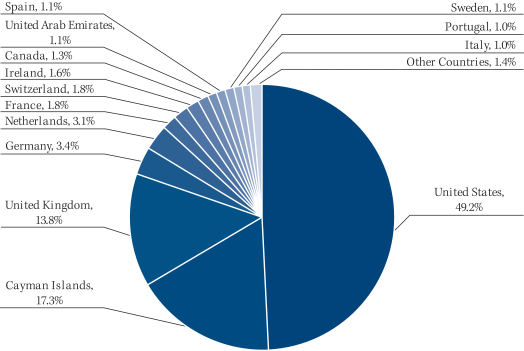
| ** | Percentage of assets are expressed by market value excluding cash and accrued income, and may vary over time. The percentages shown above represent a percentage of the assets as of June 30, 2015. |
7
Babson Capital Funds Trust 2015 Annual Report
SHAREHOLDER EXPENSES (UNAUDITED)
As a shareholder of Babson Global Floating Rate Fund or Babson Global Credit Income Opportunities Fund, you incur ongoing expenses, such as management fees, shareholder service fees, distribution fees and other fund expenses. The following table is intended to help you understand your ongoing expenses (in dollars and cents) of investing in the Funds and to compare these expenses with the ongoing expenses of investing in other funds.
The table is based on an investment of $1,000 invested at the beginning of the period and held for the entire period from January 1, 2015 to June 30, 2015.
Actual Expenses
The first line in the table below provides information about the actual account values and actual expenses. You may use the information in this line, together with the amount you invested, to estimate the expenses that you paid over the period. Simply divide your account value by $1,000 (for example, an $8,600 account value divided by $1,000 = 8.6), then multiply the result by the number in the first line for the Fund under the heading entitled “Operating Expenses Incurred” to estimate the expenses you paid on your account during this period.
Hypothetical Example for Comparison Purposes
The second line in the table below provides information about the hypothetical account values and hypothetical expenses based on the Fund’s actual expense ratio and an assumed rate of return of 5% per year before expenses, which is not the Fund’s actual return. The hypothetical account value and expenses may not be used to estimate the actual ending account balance or expenses you paid for the period. You may use this information to compare the ongoing costs of investing in your Fund and other funds. To do so, compare this 5% hypothetical example with the 5% hypothetical examples that appear in the shareholder reports of the other funds.
Babson Global Floating Rate Fund
| | | | | | | | | | | | | | | | | | | | |
| | | EXPENSE
RATIO | | | BEGINNING
AMOUNT | | | ENDING
VALUE | | | AVERAGE
VALUE | | | OPERATING
EXPENSE
INCURRED* | |
Class A | | | | | | | | | | | | | | | | | | | | |
Actual | | | 1.05 | % | | $ | 1,000.00 | | | $ | 1,028.00 | | | $ | 1,014.00 | | | $ | 5.28 | |
Hypothetical | | | 1.05 | % | | | 1,000.00 | | | | 1,019.60 | | | | 1,009.80 | | | | 5.26 | |
| | | | | |
Class C | | | | | | | | | | | | | | | | | | | | |
Actual | | | 1.80 | % | | | 1,000.00 | | | | 1,025.30 | | | | 1,012.65 | | | | 9.04 | |
Hypothetical | | | 1.80 | % | | | 1,000.00 | | | | 1,015.90 | | | | 1,007.95 | | | | 9.00 | |
| | | | | |
Class I | | | | | | | | | | | | | | | | | | | | |
Actual | | | 0.75 | % | | | 1,000.00 | | | | 1,030.60 | | | | 1,015.30 | | | | 3.78 | |
Hypothetical | | | 0.75 | % | | | 1,000.00 | | | | 1,021.10 | | | | 1,010.55 | | | | 3.76 | |
| | | | | |
Class Y | | | | | | | | | | | | | | | | | | | | |
Actual | | | 0.75 | % | | | 1,000.00 | | | | 1,030.00 | | | | 1,015.00 | | | | 3.77 | |
Hypothetical | | | 0.75 | % | | | 1,000.00 | | | | 1,021.10 | | | | 1,010.55 | | | | 3.76 | |
| * | For each Class of the Fund, net expenses are equal to the annualized expense ratio net of any expenses waived or reimbursed by the advisor for such class multiplied by the average account value over the period, multiplied by 181/365. |
8
Babson Capital Funds Trust 2015 Annual Report
SHAREHOLDER EXPENSES (UNAUDITED) (CONTINUED)
Babson Global Credit Income Opportunities Fund
| | | | | | | | | | | | | | | | | | | | |
| | | EXPENSE
RATIO | | | BEGINNING
AMOUNT | | | ENDING
VALUE | | | AVERAGE
VALUE | | | OPERATING
EXPENSE
INCURRED* | |
Class A | | | | | | | | | | | | | | | | | | | | |
Actual | | | 1.20 | % | | $ | 1,000.00 | | | $ | 1,039.90 | | | $ | 1,019.95 | | | $ | 6.07 | |
Hypothetical | | | 1.20 | % | | | 1,000.00 | | | | 1,018.80 | | | | 1,009.40 | | | | 6.01 | |
| | | | | |
Class C | | | | | | | | | | | | | | | | | | | | |
Actual | | | 1.95 | % | | | 1,000.00 | | | | 1,036.10 | | | | 1,018.05 | | | | 9.84 | |
Hypothetical | | | 1.95 | % | | | 1,000.00 | | | | 1,015.10 | | | | 1,007.55 | | | | 9.74 | |
| | | | | |
Class I | | | | | | | | | | | | | | | | | | | | |
Actual | | | 0.95 | % | | | 1,000.00 | | | | 1,041.20 | | | | 1,020.60 | | | | 4.81 | |
Hypothetical | | | 0.95 | % | | | 1,000.00 | | | | 1,020.10 | | | | 1,010.05 | | | | 4.76 | |
| | | | | |
Class Y | | | | | | | | | | | | | | | | | | | | |
Actual | | | 0.95 | % | | | 1,000.00 | | | | 1,041.20 | | | | 1,020.60 | | | | 4.81 | |
Hypothetical | | | 0.95 | % | | | 1,000.00 | | | | 1,020.10 | | | | 1,010.05 | | | | 4.76 | |
| * | For each Class of the Fund, net expenses are equal to the annualized expense ratio net of any expenses waived or reimbursed by the advisor for such class multiplied by the average account value over the period, multiplied by 181/365. |
9
Babson Capital Funds Trust 2015 Annual Report
FINANCIAL REPORT
10
Babson Capital Funds Trust 2015 Annual Report
STATEMENTS OF ASSETS AND LIABILITIES
June 30, 2015
| | | | | | | | |
| | | BABSON GLOBAL
FLOATING RATE FUND | | | BABSON GLOBAL
CREDIT INCOME
OPPORTUNITIES FUND | |
| | |
| Assets | | | | | | | | |
| Investments, at fair value (cost $183,779,073 and $87,211,696, respectively) | | $ | 178,945,642 | | | $ | 83,439,026 | |
| Foreign currency, at value (cost $187,148 and $828,874, respectively) | | | 188,172 | | | | 827,846 | |
| Receivable for investments sold | | | 7,522,395 | | | | 1,321,634 | |
| Receivable for Fund shares sold | | | 439,981 | | | | 548,379 | |
| Interest receivable | | | 1,060,641 | | | | 1,077,097 | |
| Receivable from adviser (see Note 3) | | | – | | | | 10,439 | |
| Foreign tax reclaims receivable | | | – | | | | 499 | |
| Unrealized appreciation on forward foreign currency exchange contracts | | | 153,124 | | | | 98,939 | |
| Prepaid expenses | | | 14,479 | | | | 14,362 | |
| | | | | | | | |
Total assets | | | 188,324,434 | | | | 87,338,221 | |
| | | | | | | | |
| | |
| Liabilities | | | | | | | | |
| Payable for investments purchased | | | 21,215,008 | | | | 4,798,806 | |
| Payable for Fund shares repurchased | | | 188,148 | | | | 59,294 | |
| Investment advisory fee payable (see Note 3) | | | 6,682 | | | | – | |
| Directors’ fees payable | | | 25,191 | | | | 22,457 | |
| Distribution fees payable | | | 4,510 | | | | 4,953 | |
| Dividends payable | | | 30,800 | | | | 8,138 | |
| Written options, at fair value (premiums of $382,000) | | | – | | | | 319,477 | |
| Unrealized depreciation on forward foreign currency exchange contracts | | | 523,194 | | | | 242,571 | |
| Unrealized depreciation on unfunded loan commitments | | | 4,592 | | | | 4,592 | |
| Accrued expenses and other liabilities | | | 167,172 | | | | 145,304 | |
| | | | | | | | |
Total liabilities | | | 22,165,297 | | | | 5,605,592 | |
| | | | | | | | |
Total net assets | | $ | 166,159,137 | | | $ | 81,732,629 | |
| | | | | | | | |
| | |
| Composition of net assets | | | | | | | | |
| Shares of beneficial interest outstanding (par value $0.00001 per share), unlimited number of shares authorized | | $ | 173 | | | $ | 86 | |
| Additional paid-in capital | | | 172,113,692 | | | | 86,777,920 | |
| Undistributed net investment income | | | 385,459 | | | | 832,841 | |
| Accumulated net realized loss | | | (1,236,004 | ) | | | (2,089,794 | ) |
| Net unrealized depreciation | | | (5,104,183 | ) | | | (3,788,424 | ) |
| | | | | | | | |
Total net assets | | $ | 166,159,137 | | | $ | 81,732,629 | |
| | | | | | | | |
See accompanying Notes to Financial Statements.
11
Babson Capital Funds Trust 2015 Annual Report
STATEMENTS OF ASSETS AND LIABILITIES (CONTINUED)
June 30, 2015
| | | | | | | | |
| | | BABSON GLOBAL
FLOATING RATE FUND | | | BABSON GLOBAL
CREDIT INCOME
OPPORTUNITIES FUND | |
| | |
| Class A | | | | | | | | |
| Net assets applicable to outstanding shares | | $ | 5,153,390 | | | $ | 12,718,453 | |
| | | | | | | | |
| Shares of beneficial interest outstanding | | | 536,621 | | | | 1,337,125 | |
| | | | | | | | |
| Net asset value per share outstanding | | $ | 9.60 | | | $ | 9.51 | |
| | | | | | | | |
| Maximum offering price per share outstanding (Net asset value plus sales charge of 3.00% and 3.75%, respectively) | | $ | 9.90 | | | $ | 9.88 | |
| | | | | | | | |
| | |
| Class C | | | | | | | | |
| Net assets applicable to outstanding shares | | $ | 5,461,107 | | | $ | 3,579,214 | |
| | | | | | | | |
| Shares of beneficial interest outstanding | | | 570,658 | | | | 376,719 | |
| | | | | | | | |
| Net asset value per share outstanding | | $ | 9.57 | | | $ | 9.50 | |
| | | | | | | | |
| | |
| Class I | | | | | | | | |
| Net assets applicable to outstanding shares | | $ | 25,885,261 | | | $ | 26,428,486 | |
| | | | | | | | |
| Shares of beneficial interest outstanding | | | 2,690,564 | | | | 2,778,924 | |
| | | | | | | | |
| Net asset value per share outstanding | | $ | 9.62 | | | $ | 9.51 | |
| | | | | | | | |
| | |
| Class Y | | | | | | | | |
| Net assets applicable to outstanding shares | | $ | 129,659,379 | | | $ | 39,006,476 | |
| | | | | | | | |
| Shares of beneficial interest outstanding | | | 13,480,746 | | | | 4,101,804 | |
| | | | | | | | |
| Net asset value per share outstanding | | $ | 9.62 | | | $ | 9.51 | |
| | | | | | | | |
See accompanying Notes to Financial Statements.
12
Babson Capital Funds Trust 2015 Annual Report
STATEMENTS OF OPERATIONS
For the Year Ended June 30, 2015
| | | | | | | | |
| | | BABSON GLOBAL
FLOATING RATE FUND | | | BABSON GLOBAL
CREDIT INCOME
OPPORTUNITIES FUND | |
| | |
| Investment Income | | | | | | | | |
Interest income | | $ | 6,512,192 | | | $ | 5,117,388 | |
Other income | | | 4,314 | | | | 1,892 | |
| | | | | | | | |
Total investment income | | | 6,516,506 | | | | 5,119,280 | |
| | | | | | | | |
| | |
| Operating Expenses | | | | | | | | |
Advisory fees | | | 788,308 | | | | 578,488 | |
12b-1 distribution and servicing plan | | | | | | | | |
Class A | | | 26,347 | | | | 35,043 | |
Class C | | | 32,479 | | | | 18,556 | |
Administrator fees | | | 167,393 | | | | 114,506 | |
Custody fees | | | 141,692 | | | | 100,173 | |
Professional fees | | | 134,906 | | | | 134,906 | |
Transfer agent fees | | | 126,095 | | | | 132,698 | |
Directors’ fees | | | 104,974 | | | | 89,727 | |
Registration fees | | | 62,198 | | | | 62,773 | |
Printing and mailing expenses | | | 28,787 | | | | 28,787 | |
Other operating expenses | | | 30,462 | | | | 25,347 | |
| | | | | | | | |
Total operating expenses | | | 1,643,641 | | | | 1,321,004 | |
Reimbursement of expenses | | | | | | | | |
Class A | | | (72,972 | ) | | | (109,328 | ) |
Class C | | | (42,980 | ) | | | (39,700 | ) |
Class I | | | (172,893 | ) | | | (163,439 | ) |
Class Y | | | (379,508 | ) | | | (222,205 | ) |
| | | | | | | | |
Net operating expenses | | | 975,288 | | | | 786,332 | |
| | | | | | | | |
Net investment income | | | 5,541,218 | | | | 4,332,948 | |
| | | | | | | | |
| | |
| Realized and Unrealized Gains (Losses) on Investments | | | | | | | | |
Net realized loss on investments | | | (3,012,607 | ) | | | (3,177,577 | ) |
Net realized gain on forward foreign currency exchange contracts | | | 5,210,733 | | | | 3,726,491 | |
Net realized loss on foreign currency and translation | | | (639,717 | ) | | | (96,926 | ) |
| | | | | | | | |
Net realized gain | | | 1,558,409 | | | | 451,988 | |
| | | | | | | | |
Net change in unrealized depreciation on investments | | | (5,833,597 | ) | | | (5,178,072 | ) |
Net change in unrealized depreciation on unfunded loan commitments | | | (4,592 | ) | | | (4,592 | ) |
Net change in unrealized appreciation (depreciation) on forward foreign currency exchange contracts | | | (35,901 | ) | | | 72,833 | |
Net change in unrealized appreciation on foreign currency and translation | | | 53,872 | | | | 76,427 | |
Net change in unrealized appreciation on written option contracts | | | – | | | | 62,523 | |
| | | | | | | | |
Net change in unrealized depreciation | | | (5,820,218 | ) | | | (4,970,881 | ) |
| | | | | | | | |
Net realized and unrealized losses on investments | | | (4,261,809 | ) | | | (4,518,893 | ) |
| | | | | | | | |
Net increase (decrease) in net assets resulting from operations | | $ | 1,279,409 | | | $ | (185,945 | ) |
| | | | | | | | |
See accompanying Notes to Financial Statements.
13
Babson Capital Funds Trust 2015 Annual Report
STATEMENTS OF CHANGES IN NET ASSETS
| | | | | | | | | | | | | | | | |
| | | BABSON GLOBAL
FLOATING RATE FUND | | | BABSON GLOBAL
CREDIT INCOME
OPPORTUNITIES FUND | |
| | | FOR THE YEAR
ENDED
JUNE 30, 2015 | | | PERIOD FROM
SEPTEMBER 16, 2013
THROUGH
JUNE 30, 2014 (1) | | | FOR THE YEAR
ENDED
JUNE 30, 2015 | | | PERIOD FROM
SEPTEMBER 16, 2013
THROUGH
JUNE 30, 2014 (1) | |
| | | | |
| Operations | | | | | | | | | | | | | | | | |
Net investment income | | $ | 5,541,218 | | | $ | 2,203,083 | | | $ | 4,332,948 | | | $ | 2,096,689 | |
Net realized gain (loss) on investments | | | 1,558,409 | | | | (139,670 | ) | | | 451,988 | | | | 541,842 | |
Net change in unrealized appreciation (depreciation) on investments | | | (5,820,218 | ) | | | 716,035 | | | | (4,970,881 | ) | | | 1,182,457 | |
| | | | | | | | | | | | | | | | |
Net increase (decrease) in net assets from operations | | | 1,279,409 | | | | 2,779,448 | | | | (185,945 | ) | | | 3,820,988 | |
| | | | | | | | | | | | | | | | |
| | | | |
| Dividends to Common Shareholders | | | | | | | | | | | | | | | | |
Net investment income | | | | | | | | | | | | | | | | |
Class A | | | (805,770 | ) | | | (140,982 | ) | | | (1,114,861 | ) | | | (36,805 | ) |
| | | | | | | | | | | | | | | | |
Class C | | | (199,251 | ) | | | (26,146 | ) | | | (136,768 | ) | | | (10,571 | ) |
| | | | | | | | | | | | | | | | |
Class I | | | (2,251,195 | ) | | | (610,026 | ) | | | (2,110,134 | ) | | | (734,939 | ) |
| | | | | | | | | | | | | | | | |
Class Y | | | (4,937,396 | ) | | | (1,014,718 | ) | | | (2,778,042 | ) | | | (790,102 | ) |
| | | | | | | | | | | | | | | | |
Net realized gain | | | | | | | | | | | | | | | | |
Class A | | | (11,345 | ) | | | – | | | | (186,020 | ) | | | – | |
| | | | | | | | | | | | | | | | |
Class C | | | (2,779 | ) | | | – | | | | (25,871 | ) | | | – | |
| | | | | | | | | | | | | | | | |
Class I | | | (27,574 | ) | | | – | | | | (340,131 | ) | | | – | |
| | | | | | | | | | | | | | | | |
Class Y | | | (49,009 | ) | | | – | | | | (416,997 | ) | | | – | |
| | | | | | | | | | | | | | | | |
Total dividends to common shareholders | | | (8,284,319 | ) | | | (1,791,872 | ) | | | (7,108,824 | ) | | | (1,572,417 | ) |
| | | | | | | | | | | | | | | | |
| | | | |
| Capital Share Transactions | | | | | | | | | | | | | | | | |
Net proceeds from sale of shares | | | 103,090,790 | | | | 114,172,093 | | | | 42,681,717 | | | | 60,160,874 | |
Net Asset Value of shares issued to shareholders in payment of distributions declared | | | 8,079,411 | | | | 1,770,684 | | | | 6,926,691 | | | | 1,559,384 | |
Cost of shares redeemed | | | (52,643,055 | ) | | | (2,298,911 | ) | | | (24,420,068 | ) | | | (143,371 | ) |
Redemption fees | | | 5,459 | | | | – | | | | 13,600 | | | | – | |
| | | | | | | | | | | | | | | | |
Net increase in net assets resulting from capital stock transactions | | | 58,532,605 | | | | 113,643,866 | | | | 25,201,940 | | | | 61,576,887 | |
| | | | | | | | | | | | | | | | |
Total increase in net assets | | | 51,527,695 | | | | 114,631,442 | | | | 17,907,171 | | | | 63,825,458 | |
| | | | | | | | | | | | | | | | |
| | | | |
| Net Assets | | | | | | | | | | | | | | | | |
Beginning of year | | | 114,631,442 | | | | – | | | | 63,825,458 | | | | – | |
| | | | | | | | | | | | | | | | |
End of year (includes undistributed net investment income of $385,459, $334,169, $832,841 and $216,465, respectively) | | $ | 166,159,137 | | | $ | 114,631,442 | | | $ | 81,732,629 | | | $ | 63,825,458 | |
| | | | | | | | | | | | | | | | |
| (1) | | Fund commenced operations on September 16, 2013. |
See accompanying Notes to Financial Statements.
14
Babson Global Floating Rate Fund 2015 Annual Report
FINANCIAL HIGHLIGHTS
| | | | | | | | |
| | | CLASS A | |
| | | FOR THE YEAR
ENDED
JUNE 30, 2015 | | | PERIOD FROM
SEPTEMBER 16, 2013
THROUGH
JUNE 30, 2014 (1) | |
| | |
| Per Common Share Data | | | | | | | | |
Net asset value, beginning of year | | $ | 10.20 | | | $ | 10.00 | |
Income from investment operations: | | | | | | | | |
Net investment income (2) | | | 0.44 | | | | 0.30 | |
Net realized and unrealized gain (loss) on investments | | | (0.35 | ) | | | 0.08 | |
| | | | | | | | |
Total increase from investment operations | | | 0.09 | | | | 0.38 | |
| | | | | | | | |
Less dividends and distributions: | | | | | | | | |
From net investment income | | | (0.68 | ) | | | (0.18 | ) |
From net realized gain | | | (0.01 | ) | | | – | |
| | | | | | | | |
Total dividends and distributions | | | (0.69 | ) | | | (0.18 | ) |
| | | | | | | | |
Redemption fees | | | 0.00 | (3) | | | – | |
| | | | | | | | |
Net asset value, at end of year | | $ | 9.60 | | | $ | 10.20 | |
| | | | | | | | |
Total investment return (4) | | | 0.95 | % | | | 3.81 | %(5) |
| | | | | | | | |
| | |
| Supplemental Data and Ratios | | | | | | | | |
Net assets, end of year (000’s) | | $ | 5,153 | | | $ | 12,464 | |
Ratio of total expenses (before reductions and reimbursements) to average net assets (6) | | | 1.74 | % | | | 2.27 | %(7) |
Ratio of net expenses to average net assets | | | 1.05 | % | | | 1.05 | %(7) |
Ratio of net investment income to average net assets | | | 4.44 | % | | | 3.76 | %(7) |
Portfolio turnover rate | | | 63.17 | % | | | 49.51 | %(5) |
| (1) | | Fund commenced operations on September 16, 2013. |
| (2) | | Calculated using average shares outstanding. |
| (3) | | Amount rounds to less than $.01 per share. |
| (4) | | Total investment return calculation does not consider the effects of sales loads and assumes the reinvestment of dividends at actual prices pursuant to the Fund’s dividend reinvestment plan. |
| (6) | | The Adviser has agreed to waive and/or reimburse certain fees and/or expense so that, on an annualized basis, such expenses incurred will not exceed 1.05% as a percentage of average daily net assets. |
| (7) | | Annualized for periods less than one full year. |
See accompanying Notes to Financial Statements.
15
Babson Global Floating Rate Fund 2015 Annual Report
FINANCIAL HIGHLIGHTS (CONTINUED)
| | | | | | | | |
| | | CLASS C | |
| | | FOR THE YEAR
ENDED
JUNE 30, 2015 | | | PERIOD FROM
SEPTEMBER 16, 2013
THROUGH
JUNE 30, 2014 (1) | |
| | |
| Per Common Share Data | | | | | | | | |
Net asset value, beginning of year | | $ | 10.16 | | | $ | 10.00 | |
Income from investment operations: | | | | | | | | |
Net investment income (2) | | | 0.35 | | | | 0.24 | |
Net realized and unrealized gain (loss) on investments | | | (0.33 | ) | | | 0.07 | |
| | | | | | | | |
Total increase from investment operations | | | 0.02 | | | | 0.31 | |
| | | | | | | | |
Less dividends and distributions: | | | | | | | | |
From net investment income | | | (0.60 | ) | | | (0.15 | ) |
From net realized gain | | | (0.01 | ) | | | – | |
| | | | | | | | |
Total dividends and distributions | | | (0.61 | ) | | | (0.15 | ) |
| | | | | | | | |
Redemption fees | | | 0.00 | (3) | | | – | |
| | | | | | | | |
Net asset value, at end of year | | $ | 9.57 | | | $ | 10.16 | |
| | | | | | | | |
Total investment return (4) | | | 0.30 | % | | | 3.15 | %(5) |
| | | | | | | | |
| | |
| Supplemental Data and Ratios | | | | | | | | |
Net assets, end of year (000’s) | | $ | 5,461 | | | $ | 2,396 | |
Ratio of total expenses (before reductions and reimbursements) to average net assets (6) | | | 3.12 | % | | | 4.97 | %(7) |
Ratio of net expenses to average net assets | | | 1.80 | % | | | 1.80 | %(7) |
Ratio of net investment income to average net assets | | | 3.60 | % | | | 3.07 | %(7) |
Portfolio turnover rate | | | 63.17 | % | | | 49.51 | %(5) |
| (1) | | Fund commenced operations on September 16, 2013. |
| (2) | | Calculated using average shares outstanding. |
| (3) | | Amount rounds to less than $.01 per share. |
| (4) | | Total investment return calculation does not consider the effects of sales loads and assumes the reinvestment of dividends at actual prices pursuant to the Fund’s dividend reinvestment plan. |
| (6) | | The Adviser has agreed to waive and/or reimburse certain fees and/or expense so that, on an annualized basis, such expenses incurred will not exceed 1.80% as a percentage of average daily net assets. |
| (7) | | Annualized for periods less than one full year. |
See accompanying Notes to Financial Statements.
16
Babson Global Floating Rate Fund 2015 Annual Report
FINANCIAL HIGHLIGHTS (CONTINUED)
| | | | | | | | |
| | | CLASS I | |
| | | FOR THE YEAR
ENDED
JUNE 30, 2015 | | | PERIOD FROM
SEPTEMBER 16, 2013
THROUGH
JUNE 30, 2014 (1) | |
| | |
| Per Common Share Data | | | | | | | | |
Net asset value, beginning of year | | $ | 10.21 | | | $ | 10.00 | |
Income from investment operations: | | | | | | | | |
Net investment income (2) | | | 0.46 | | | | 0.30 | |
Net realized and unrealized gain (loss) on investments | | | (0.34 | ) | | | 0.10 | |
| | | | | | | | |
Total increase from investment operations | | | 0.12 | | | | 0.40 | |
| | | | | | | | |
Less dividends and distributions: | | | | | | | | |
From net investment income | | | (0.70 | ) | | | (0.19 | ) |
From net realized gain | | | (0.01 | ) | | | – | |
| | | | | | | | |
Total dividends and distributions | | | (0.71 | ) | | | (0.19 | ) |
| | | | | | | | |
Redemption fees | | | 0.00 | (3) | | | – | |
| | | | | | | | |
Net asset value, at end of year | | $ | 9.62 | | | $ | 10.21 | |
| | | | | | | | |
Total investment return (4) | | | 1.34 | % | | | 4.04 | %(5) |
| | | | | | | | |
| | |
| Supplemental Data and Ratios | | | | | | | | |
Net assets, end of year (000’s) | | $ | 25,885 | | | $ | 32,772 | |
Ratio of total expenses (before reductions and reimbursements) to average net assets (6) | | | 1.31 | % | | | 1.52 | %(7) |
Ratio of net expenses to average net assets | | | 0.75 | % | | | 0.75 | %(7) |
Ratio of net investment income to average net assets | | | 4.69 | % | | | 3.72 | %(7) |
Portfolio turnover rate | | | 63.17 | % | | | 49.51 | %(5) |
| (1) | | Fund commenced operations on September 16, 2013. |
| (2) | | Calculated using average shares outstanding. |
| (3) | | Amount rounds to less than $.01 per share. |
| (4) | | Total investment return calculation assumes the reinvestment of dividends at actual prices pursuant to the Fund’s dividend reinvestment plan. |
| (6) | | The Adviser has agreed to waive and/or reimburse certain fees and/or expense so that, on an annualized basis, such expenses incurred will not exceed .75% as a percentage of average daily net assets. |
| (7) | | Annualized for periods less than one full year. |
See accompanying Notes to Financial Statements.
17
Babson Global Floating Rate Fund 2015 Annual Report
FINANCIAL HIGHLIGHTS (CONTINUED)
| | | | | | | | |
| | | CLASS Y | |
| | | FOR THE YEAR
ENDED
JUNE 30, 2015 | | | PERIOD FROM
SEPTEMBER 16, 2013
THROUGH
JUNE 30, 2014 (1) | |
| | |
| Per Common Share Data | | | | | | | | |
Net asset value, beginning of year | | $ | 10.21 | | | $ | 10.00 | |
Income from investment operations: | | | | | | | | |
Net investment income (2) | | | 0.45 | | | | 0.30 | |
Net realized and unrealized gain (loss) on investments | | | (0.33 | ) | | | 0.10 | |
| | | | | | | | |
Total increase from investment operations | | | 0.12 | | | | 0.40 | |
| | | | | | | | |
Less dividends and distributions: | | | | | | | | |
From net investment income | | | (0.70 | ) | | | (0.19 | ) |
From net realized gain | | | (0.01 | ) | | | – | |
| | | | | | | | |
Total dividends and distributions | | | (0.71 | ) | | | (0.19 | ) |
| | | | | | | | |
Redemption fees | | | 0.00 | (3) | | | – | |
| | | | | | | | |
Net asset value, at end of year | | $ | 9.62 | | | $ | 10.21 | |
| | | | | | | | |
Total investment return (4) | | | 1.28 | % | | | 4.04 | %(5) |
| | | | | | | | |
| | |
| Supplemental Data and Ratios | | | | | | | | |
Net assets, end of year (000’s) | | $ | 129,659 | | | $ | 66,999 | |
Ratio of total expenses (before reductions and reimbursements) to average net assets (6) | | | 1.25 | % | | | 1.53 | %(7) |
Ratio of net expenses to average net assets | | | 0.75 | % | | | 0.75 | %(7) |
Ratio of net investment income to average net assets | | | 4.58 | % | | | 3.80 | %(7) |
Portfolio turnover rate | | | 63.17 | % | | | 49.51 | %(5) |
| (1) | | Fund commenced operations on September 16, 2013. |
| (2) | | Calculated using average shares outstanding. |
| (3) | | Amount rounds to less than $.01 per share. |
| (4) | | Total investment return calculation assumes the reinvestment of dividends at actual prices pursuant to the Fund’s dividend reinvestment plan. |
| (6) | | The Adviser has agreed to waive and/or reimburse certain fees and/or expense so that, on an annualized basis, such expenses incurred will not exceed .75% as a percentage of average daily net assets. |
| (7) | | Annualized for periods less than one full year. |
See accompanying Notes to Financial Statements.
18
Babson Global Credit Income Opportunities Fund 2015 Annual Report
FINANCIAL HIGHLIGHTS (CONTINUED)
| | | | | | | | |
| | | CLASS A | |
| | | FOR THE YEAR
ENDED
JUNE 30, 2015 | | | PERIOD FROM
SEPTEMBER 16, 2013
THROUGH
JUNE 30, 2014 (1) | |
| | |
| Per Common Share Data | | | | | | | | |
Net asset value, beginning of year | | $ | 10.45 | | | $ | 10.00 | |
Income from investment operations: | | | | | | | | |
Net investment income (2) | | | 0.54 | | | | 0.40 | |
Net realized and unrealized gain (loss) on investments | | | (0.57 | ) | | | 0.33 | |
| | | | | | | | |
Total increase (decrease) from investment operations | | | (0.03 | ) | | | 0.73 | |
| | | | | | | | |
Less dividends and distributions: | | | | | | | | |
From net investment income | | | (0.78 | ) | | | (0.28 | ) |
From net realized gain | | | (0.13 | ) | | | – | |
| | | | | | | | |
Total dividends and distributions | | | (0.91 | ) | | | (0.28 | ) |
| | | | | | | | |
Redemption fees | | | 0.00 | (3) | | | – | |
| | | | | | | | |
Net asset value, at end of year | | $ | 9.51 | | | $ | 10.45 | |
| | | | | | | | |
Total investment return (4) | | | (0.11 | )% | | | 7.30 | %(5) |
| | | | | | | | |
| | |
| Supplemental Data and Ratios | | | | | | | | |
Net assets, end of year (000’s) | | $ | 12,718 | | | $ | 2,591 | |
Ratio of total expenses (before reductions and reimbursements) to average net assets (6) | | | 1.98 | % | | | 3.95 | %(7) |
Ratio of net expenses to average net assets | | | 1.20 | % | | | 1.20 | %(7) |
Ratio of net investment income to average net assets | | | 5.46 | % | | | 4.88 | %(7) |
Portfolio turnover rate | | | 84.65 | % | | | 99.72 | %(5) |
| (1) | | Fund commenced operations on September 16, 2013. |
| (2) | | Calculated using average shares outstanding. |
| (3) | | Amount rounds to less than $.01 per share. |
| (4) | | Total investment return calculation does not consider the effects of sales loads and assumes the reinvestment of dividends at actual prices pursuant to the Fund’s dividend reinvestment plan. |
| (6) | | The Adviser has agreed to waive and/or reimburse certain fees and/or expense so that, on an annualized basis, such expenses incurred will not exceed 1.20% as a percentage of average daily net assets. |
| (7) | | Annualized for periods less than one full year. |
See accompanying Notes to Financial Statements.
19
Babson Global Credit Income Opportunities Fund 2015 Annual Report
FINANCIAL HIGHLIGHTS (CONTINUED)
| | | | | | | | |
| | | CLASS C | |
| | | FOR THE YEAR
ENDED
JUNE 30, 2015 | | | PERIOD FROM
SEPTEMBER 16, 2013
THROUGH
JUNE 30, 2014 (1) | |
| | |
| Per Common Share Data | | | | | | | | |
Net asset value, beginning of year | | $ | 10.45 | | | $ | 10.00 | |
Income from investment operations: | | | | | | | | |
Net investment income (2) | | | 0.47 | | | | 0.35 | |
Net realized and unrealized gain (loss) on investments | | | (0.58 | ) | | | 0.32 | |
| | | | | | | | |
Total increase (decrease) from investment operations | | | (0.11 | ) | | | 0.67 | |
| | | | | | | | |
Less dividends and distributions: | | | | | | | | |
From net investment income | | | (0.71 | ) | | | (0.22 | ) |
From net realized gain | | | (0.13 | ) | | | – | |
| | | | | | | | |
Total dividends and distributions | | | (0.84 | ) | | | (0.22 | ) |
| | | | | | | | |
Redemption fees | | | 0.00 | (3) | | | – | |
| | | | | | | | |
Net asset value, at end of year | | $ | 9.50 | | | $ | 10.45 | |
| | | | | | | | |
Total investment return (4) | | | (0.93 | )% | | | 6.75 | %(5) |
| | | | | | | | |
| | |
| Supplemental Data and Ratios | | | | | | | | |
Net assets, end of year (000’s) | | $ | 3,579 | | | $ | 944 | |
Ratio of total expenses (before reductions and reimbursements) to average net assets (6) | | | 4.09 | % | | | 10.50 | %(7) |
Ratio of net expenses to average net assets | | | 1.95 | % | | | 1.95 | %(7) |
Ratio of net investment income to average net assets | | | 4.79 | % | | | 4.39 | %(7) |
Portfolio turnover rate | | | 84.65 | % | | | 99.72 | %(5) |
| (1) | | Fund commenced operations on September 16, 2013. |
| (2) | | Calculated using average shares outstanding. |
| (3) | | Amount rounds to less than $.01 per share. |
| (4) | | Total investment return calculation does not consider the effects of sales loads and assumes the reinvestment of dividends at actual prices pursuant to the Fund’s dividend reinvestment plan. |
| (6) | | The Adviser has agreed to waive and/or reimburse certain fees and/or expense so that, on an annualized basis, such expenses incurred will not exceed 1.95% as a percentage of average daily net assets. |
| (7) | | Annualized for periods less than one full year. |
See accompanying Notes to Financial Statements.
20
Babson Global Credit Income Opportunities Fund 2015 Annual Report
FINANCIAL HIGHLIGHTS (CONTINUED)
| | | | | | | | |
| | | CLASS I | |
| | | FOR THE YEAR
ENDED
JUNE 30, 2015 | | | PERIOD FROM
SEPTEMBER 16, 2013
THROUGH
JUNE 30, 2014 (1) | |
| | |
| Per Common Share Data | | | | | | | | |
Net asset value, beginning of year | | $ | 10.46 | | | $ | 10.00 | |
Income from investment operations: | | | | | | | | |
Net investment income (2) | | | 0.56 | | | | 0.41 | |
Net realized and unrealized gain (loss) on investments | | | (0.58 | ) | | | 0.35 | |
| | | | | | | | |
Total increase (decrease) from investment operations | | | (0.02 | ) | | | 0.76 | |
| | | | | | | | |
Less dividends and distributions: | | | | | | | | |
From net investment income | | | (0.80 | ) | | | (0.30 | ) |
From net realized gain | | | (0.13 | ) | | | – | |
| | | | | | | | |
Total dividends and distributions | | | (0.93 | ) | | | (0.30 | ) |
| | | | | | | | |
Redemption fees | | | 0.00 | (3) | | | – | |
| | | | | | | | |
Net asset value, at end of year | | $ | 9.51 | | | $ | 10.46 | |
| | | | | | | | |
Total investment return (4) | | | 0.05 | % | | | 7.59 | %(5) |
| | | | | | | | |
| | |
| Supplemental Data and Ratios | | | | | | | | |
Net assets, end of year (000’s) | | $ | 26,428 | | | $ | 26,406 | |
Ratio of total expenses (before reductions and reimbursements) to average net assets (6) | | | 1.58 | % | | | 1.83 | %(7) |
Ratio of net expenses to average net assets | | | 0.95 | % | | | 0.95 | %(7) |
Ratio of net investment income to average net assets | | | 5.69 | % | | | 5.02 | %(7) |
Portfolio turnover rate | | | 84.65 | % | | | 99.72 | %(5) |
| (1) | | Fund commenced operations on September 16, 2013. |
| (2) | | Calculated using average shares outstanding. |
| (3) | | Amount rounds to less than $.01 per share. |
| (4) | | Total investment return calculation assumes the reinvestment of dividends at actual prices pursuant to the Fund’s dividend reinvestment plan. |
| (6) | | The Adviser has agreed to waive and/or reimburse certain fees and/or expense so that, on an annualized basis, such expenses incurred will not exceed .95% as a percentage of average daily net assets. |
| (7) | | Annualized for periods less than one full year. |
See accompanying Notes to Financial Statements.
21
Babson Global Credit Income Opportunities Fund 2015 Annual Report
FINANCIAL HIGHLIGHTS (CONTINUED)
| | | | | | | | |
| | | CLASS Y | |
| | | FOR THE YEAR
ENDED
JUNE 30, 2015 | | | PERIOD FROM
SEPTEMBER 16, 2013
THROUGH
JUNE 30, 2014 (1) | |
| | |
| Per Common Share Data | | | | | | | | |
Net asset value, beginning of year | | $ | 10.46 | | | $ | 10.00 | |
Income from investment operations: | | | | | | | | |
Net investment income (2) | | | 0.56 | | | | 0.41 | |
Net realized and unrealized gain (loss) on investments | | | (0.58 | ) | | | 0.35 | |
| | | | | | | | |
Total increase (decrease) from investment operations | | | (0.02 | ) | | | 0.76 | |
| | | | | | | | |
Less dividends and distributions: | | | | | | | | |
From net investment income | | | (0.80 | ) | | | (0.30 | ) |
From net realized gain | | | (0.13 | ) | | | – | |
| | | | | | | | |
Total dividends and distributions | | | (0.93 | ) | | | (0.30 | ) |
| | | | | | | | |
Redemption fees | | | 0.00 | (3) | | | – | |
| | | | | | | | |
Net asset value, at end of year | | $ | 9.51 | | | $ | 10.46 | |
| | | | | | | | |
Total investment return (4) | | | 0.05 | % | | | 7.59 | %(5) |
| | | | | | | | |
| | |
| Supplemental Data and Ratios | | | | | | | | |
Net assets, end of year (000’s) | | $ | 39,006 | | | $ | 33,885 | |
Ratio of total expenses (before reductions and reimbursements) to average net assets (6) | | | 1.58 | % | | | 1.84 | %(7) |
Ratio of net expenses to average net assets | | | 0.95 | % | | | 0.95 | %(7) |
Ratio of net investment income to average net assets | | | 5.67 | % | | | 5.04 | %(7) |
Portfolio turnover rate | | | 84.65 | % | | | 99.72 | %(5) |
| (1) | | Fund commenced operations on September 16, 2013. |
| (2) | | Calculated using average shares outstanding. |
| (3) | | Amount rounds to less than $.01 per share. |
| (4) | | Total investment return calculation assumes the reinvestment of dividends at actual prices pursuant to the Fund’s dividend reinvestment plan. |
| (6) | | The Adviser has agreed to waive and/or reimburse certain fees and/or expense so that, on an annualized basis, such expenses incurred will not exceed .95% as a percentage of average daily net assets. |
| (7) | | Annualized for periods less than one full year. |
See accompanying Notes to Financial Statements.
22
Babson Global Floating Rate Fund 2015 Annual Report
SCHEDULE OF INVESTMENTS
June 30, 2015
| | | | | | | | | | | | | | | | | | | | |
| | | EFFECTIVE
INTEREST RATE | | | DUE DATE | | | PRINCIPAL ‡‡ | | | COST | | | FAIR
VALUE | |
Fixed Income — 93.6%*: | |
|
Bank Loans — 79.9%*§: | |
|
Automobile — 2.3%*: | |
Gates Global, Inc. | | | 4.25 | % | | | 7/5/2021 | | | | 1,493,731 | | | | $1,488,312 | | | | $1,469,458 | |
RAC Finance (Holdings) Ltd.+ | | | 5.03 | | | | 12/17/2021 | | | | 995,000 | | | | 1,487,022 | | | | 1,561,439 | |
RAC Finance (Holdings) Ltd.+ | | | 8.25 | | | | 12/17/2022 | | | | 500,000 | | | | 791,316 | | | | 790,048 | |
| | | | | | | | | | | | | | | | | | | | |
Total Automobile | | | | 2,988,731 | | | | 3,766,650 | | | | 3,820,945 | |
| | | | | | | | | | | | | | | | | | | | |
|
Beverage, Food and Tobacco — 1.7%*: | |
1011778 B.C. Unlimited Liability Co.+ | | | 3.75 | | | | 12/10/2021 | | | | 956,012 | | | | 953,644 | | | | 954,683 | |
Acosta Holdco, Inc. | | | 4.25 | | | | 9/26/2021 | | | | 406,859 | | | | 406,859 | | | | 405,207 | |
Del Monte Foods, Inc. | | | 4.25 | | | | 2/18/2021 | | | | 246,875 | | | | 245,879 | | | | 234,944 | |
Deoleo SA+ | | | 4.50 | | | | 6/11/2021 | | | | 500,000 | | | | 676,961 | | | | 541,098 | |
JBS USA Holdings, Inc. | | | 3.75 | | | | 9/18/2020 | | | | 491,250 | | | | 492,191 | | | | 489,614 | |
Telepizza SA+ | | | 7.00 | | | | 10/20/2020 | | | | 250,000 | | | | 315,291 | | | | 277,609 | |
| | | | | | | | | | | | | | | | | | | | |
Total Beverage, Food and Tobacco | | | | 2,850,996 | | | | 3,090,825 | | | | 2,903,155 | |
| | | | | | | | | | | | | | | | | | | | |
|
Broadcasting and Entertainment — 4.8%*: | |
All3Media International+ | | | 5.25 | | | | 6/30/2021 | | | | 1,500,000 | | | | 2,301,024 | | | | 2,337,525 | |
All3Media International+ | | | 8.25 | | | | 6/30/2022 | | | | 500,000 | | | | 671,306 | | | | 548,133 | |
Charter Communications Operating LLC | | | 3.00 | | | | 1/3/2021 | | | | 492,462 | | | | 491,478 | | | | 485,957 | |
Cumulus Media Holdings, Inc. | | | 4.25 | | | | 12/23/2020 | | | | 1,352,647 | | | | 1,338,028 | | | | 1,283,324 | |
Learfield Communications, Inc. | | | 4.50 | | | | 10/9/2020 | | | | 413,325 | | | | 412,906 | | | | 412,808 | |
Telecommunications Management LLC | | | 4.75 | | | | 4/30/2020 | | | | 13,378 | | | | 13,377 | | | | 13,311 | |
Univision Communications, Inc. | | | 4.00 | | | | 3/1/2020 | | | | 1,496,060 | | | | 1,496,059 | | | | 1,482,700 | |
Yankee Cable Acquisition LLC | | | 4.25 | | | | 3/1/2020 | | | | 1,486,294 | | | | 1,493,736 | | | | 1,486,294 | |
| | | | | | | | | | | | | | | | | | | | |
Total Broadcasting and Entertainment | | | | 7,254,166 | | | | 8,217,914 | | | | 8,050,052 | |
| | | | | | | | | | | | | | | | | | | | |
|
Buildings and Real Estate — 0.7%*: | |
Alison Bidco Sarl+ | | | 5.50 | | | | 8/29/2021 | | | | 295,028 | | | | 292,418 | | | | 285,440 | |
DTZ US Borrower LLC | | | 5.50 | | | | 11/4/2021 | | | | 315,331 | | | | 310,910 | | | | 316,318 | |
Jeld-Wen, Inc. | | | 5.25 | | | | 10/15/2021 | | | | 507,482 | | | | 502,905 | | | | 508,436 | |
| | | | | | | | | | | | | | | | | | | | |
Total Buildings and Real Estate | | | | 1,117,841 | | | | 1,106,233 | | | | 1,110,194 | |
| | | | | | | | | | | | | | | | | | | | |
|
Cargo Transport — 0.6%*: | |
Direct ChassisLink, Inc.¤ | | | 8.25 | | | | 11/12/2019 | | | | 492,857 | | | | 487,415 | | | | 483,000 | |
Direct ChassisLink, Inc. (Add-On Facility)¤ | | | 8.25 | | | | 11/12/2019 | | | | 503,175 | | | | 503,175 | | | | 493,111 | |
| | | | | | | | | | | | | | | | | | | | |
Total Cargo Transport | | | | 996,032 | | | | 990,590 | | | | 976,111 | |
| | | | | | | | | | | | | | | | | | | | |
|
Chemicals, Plastics and Rubber — 6.8%*: | |
Chromaflo Technologies Corp. | | | 4.50 | | | | 12/2/2019 | | | | 1,215,245 | | | | 1,213,118 | | | | 1,205,122 | |
Colouroz Investment 1 GmbH+ | | | 4.50 | | | | 9/7/2021 | | | | 641,644 | | | | 635,899 | | | | 641,644 | |
Ineos Finance PLC+ | | | 4.25 | | | | 3/31/2022 | | | | 1,496,249 | | | | 1,678,570 | | | | 1,645,390 | |
Methanol Holdings (Trinidad) Ltd. | | | 4.25 | | | | 6/2/2022 | | | | 1,135,461 | | | | 1,124,106 | | | | 1,124,106 | |
OXEA Finance & Cy S.C.A.+ | | | 4.50 | | | | 1/15/2020 | | | | 500,000 | | | | 527,613 | | | | 542,285 | |
OXEA Finance LLC+ | | | 4.25 | | | | 1/15/2020 | | | | 355,927 | | | | 349,033 | | | | 342,875 | |
See accompanying Notes to Financial Statements.
23
Babson Global Floating Rate Fund 2015 Annual Report
SCHEDULE OF INVESTMENTS (CONTINUED)
June 30, 2015
| | | | | | | | | | | | | | | | | | | | |
| | | EFFECTIVE
INTEREST RATE | | | DUE DATE | | | PRINCIPAL ‡‡ | | | COST | | | FAIR
VALUE | |
Bank Loans (Continued) | |
|
Chemicals, Plastics and Rubber (Continued) | |
Styrolution Group GmbH+ | | | 6.50 | % | | | 11/7/2019 | | | | 597,000 | | | $ | 734,695 | | | $ | 668,267 | |
Univar, Inc. | | | 4.50 | | | | 6/30/2022 | | | | 2,079,426 | | | | 2,069,029 | | | | 2,076,183 | |
Univar, Inc. | | | 5.00 | | | | 6/30/2017 | | | | 1,583,000 | | | | 1,581,824 | | | | 1,580,910 | |
Vantage Specialty Chemicals, Inc. | | | 5.00 | | | | 2/10/2019 | | | | 1,446,367 | | | | 1,433,685 | | | | 1,417,440 | |
| | | | | | | | | | | | | | | | | | | | |
Total Chemicals, Plastics and Rubber | | | | 11,050,319 | | | | 11,347,572 | | | | 11,244,222 | |
| | | | | | | | | | | | | | | | | | | | |
|
Containers, Packaging and Glass — 4.4%*: | |
BWAY Holding Co., Inc. | | | 5.50 | | | | 8/14/2020 | | | | 232,238 | | | | 230,245 | | | | 232,238 | |
CD&R Millennium Holdco 6 Sarl+ | | | 4.50 | | | | 7/31/2021 | | | | 1,572,310 | | | | 1,572,380 | | | | 1,567,404 | |
Chesapeake Corp. | | | 4.25 | | | | 9/30/2020 | | | | 1,138,233 | | | | 1,137,862 | | | | 1,132,064 | |
Consolidated Container Co. LLC | | | 5.00 | | | | 7/3/2019 | | | | 1,496,154 | | | | 1,494,170 | | | | 1,461,249 | |
Consolidated Container Co. LLC | | | 7.75 | | | | 1/3/2020 | | | | 188,280 | | | | 185,199 | | | | 175,100 | |
Coveris | | | 4.50 | | | | 5/8/2019 | | | | 492,500 | | | | 677,167 | | | | 549,063 | |
Coveris | | | 4.50 | | | | 5/8/2019 | | | | 309,131 | | | | 308,034 | | | | 309,387 | |
Hilex Poly Co. LLC | | | 6.00 | | | | 12/5/2021 | | | | 404,843 | | | | 401,072 | | | | 407,037 | |
Onex Wizard Acquisition Co. I Sarl+ | | | 4.25 | | | | 3/13/2022 | | | | 553,612 | | | | 626,914 | | | | 617,139 | |
Onex Wizard US Acquisition, Inc.+ | | | 4.25 | | | | 3/13/2022 | | | | 445,069 | | | | 442,934 | | | | 444,290 | |
Tekni-Plex, Inc. | | | 4.50 | | | | 6/1/2022 | | | | 373,750 | | | | 371,898 | | | | 373,377 | |
| | | | | | | | | | | | | | | | | | | | |
Total Containers, Packaging and Glass | | | | 7,206,120 | | | | 7,447,875 | | | | 7,268,348 | |
| | | | | | | | | | | | | | | | | | | | |
|
Diversified Natural Resources, Precious Metals and Minerals — 0.3%*: | |
Cemex Espana S.A.+ | | | 4.78 | | | | 2/14/2017 | | | | 97,200 | | | | 103,433 | | | | 107,867 | |
Cemex SAB de CV+ | | | 4.78 | | | | 2/14/2017 | | | | 441,850 | | | | 441,297 | | | | 440,745 | |
| | | | | | | | | | | | | | | | | | | | |
Total Diversified Natural Resources, Precious Metals and Minerals | | | | | | | | | | | 539,050 | | | | 544,730 | | | | 548,612 | |
| | | | | | | | | | | | | | | | | | | | |
|
Diversified/Conglomerate Manufacturing — 1.7%*: | |
Capital Safety North America Holdings, Inc. | | | 3.75 | | | | 3/29/2021 | | | | 344,257 | | | | 343,898 | | | | 343,251 | |
Capital Safety North America Holdings, Inc. | | | 6.50 | | | | 3/28/2022 | | | | 251,661 | | | | 251,392 | | | | 253,549 | |
Information Resources, Inc. | | | 4.75 | | | | 9/30/2020 | | | | 156,647 | | | | 156,055 | | | | 157,105 | |
Pelican Products, Inc. | | | 5.25 | | | | 4/10/2020 | | | | 994,962 | | | | 992,632 | | | | 989,371 | |
Quality Home Brands Holdings LLC | | | 7.75 | | | | 5/25/2018 | | | | 259,718 | | | | 257,990 | | | | 260,042 | |
STS Operating, Inc. | | | 4.75 | | | | 2/12/2021 | | | | 312,931 | | | | 313,224 | | | | 311,366 | |
West Corp. | | | 2.53 | | | | 7/1/2019 | | | | 495,181 | | | | 479,727 | | | | 480,325 | |
| | | | | | | | | | | | | | | | | | | | |
Total Diversified/Conglomerate Manufacturing | | | | | | | | | | | 2,815,357 | | | | 2,794,918 | | | | 2,795,009 | |
| | | | | | | | | | | | | | | | | | | | |
|
Diversified/Conglomerate Service — 8.1%*: | |
Aquilex Holdings LLC | | | 5.00 | | | | 12/31/2020 | | | | 197,140 | | | | 196,749 | | | | 196,647 | |
Atrium Innovations, Inc.+ | | | 4.25 | | | | 2/13/2021 | | | | 827,738 | | | | 826,451 | | | | 802,906 | |
Brock Holdings III, Inc. | | | 6.00 | | | | 3/16/2017 | | | | 1,595,585 | | | | 1,571,455 | | | | 1,585,613 | |
EIG Investors Corp. | | | 5.00 | | | | 11/9/2019 | | | | 827,183 | | | | 827,978 | | | | 823,047 | |
Garda World Security Corp.+ | | | 4.00 | | | | 11/6/2020 | | | | 1,169,214 | | | | 1,162,059 | | | | 1,164,338 | |
Go Daddy Operating Co. LLC | | | 4.25 | | | | 5/13/2021 | | | | 862,427 | | | | 859,106 | | | | 862,565 | |
MH Sub I LLC | | | 4.75 | | | | 7/8/2021 | | | | 586,811 | | | | 583,899 | | | | 585,162 | |
See accompanying Notes to Financial Statements.
24
Babson Global Floating Rate Fund 2015 Annual Report
SCHEDULE OF INVESTMENTS (CONTINUED)
June 30, 2015
| | | | | | | | | | | | | | | | | | | | |
| | | EFFECTIVE
INTEREST RATE | | | DUE DATE | | | PRINCIPAL ‡‡ | | | COST | | | FAIR
VALUE | |
Bank Loans (Continued) | |
|
Diversified/Conglomerate Service (Continued) | |
MH Sub I LLC | | | 8.50 | % | | | 7/8/2022 | | | | 400,000 | | | $ | 396,478 | | | $ | 394,000 | |
MPH Acquisition Holdings LLC | | | 3.75 | | | | 3/31/2021 | | | | 749,302 | | | | 747,732 | | | | 744,215 | |
Northgate Information Solutions Ltd.+ | | | 4.28 | | | | 3/18/2018 | | | | 507,622 | | | | 680,154 | | | | 547,999 | |
Northgate Information Solutions Ltd.+ | | | 4.78 | | | | 3/18/2018 | | | | 503,801 | | | | 675,369 | | | | 543,875 | |
Power Team Services LLC | | | 8.25 | | | | 11/6/2020 | | | | 500,000 | | | | 496,132 | | | | 492,500 | |
RP Crown Parent LLC | | | 6.00 | | | | 12/21/2018 | | | | 548,203 | | | | 549,858 | | | | 525,935 | |
RP Crown Parent LLC | | | 11.25 | | | | 12/20/2019 | | | | 678,571 | | | | 690,366 | | | | 621,741 | |
Sabre, Inc. | | | 4.00 | | | | 2/19/2019 | | | | 738,728 | | | | 734,430 | | | | 737,575 | |
SkillSoft Corp. | | | 5.75 | | | | 4/28/2021 | | | | 945,084 | | | | 939,631 | | | | 916,731 | |
Triple Point Technology, Inc. | | | 5.25 | | | | 7/10/2020 | | | | 341,331 | | | | 316,095 | | | | 306,345 | |
Triple Point Technology, Inc.†† | | | 9.25 | | | | 7/10/2021 | | | | 145,677 | | | | 136,543 | | | | 122,368 | |
Vogue International, Inc. | | | 5.75 | | | | 2/14/2020 | | | | 1,440,373 | | | | 1,452,180 | | | | 1,442,174 | |
| | | | | | | | | | | | | | | | | | | | |
Total Diversified/Conglomerate Service | | | | 13,564,790 | | | | 13,842,665 | | | | 13,415,736 | |
| | | | | | | | | | | | | | | | | | | | |
|
Ecological — 2.5%*: | |
Biffa Waste Services Ltd.+ | | | 5.68 | | | | 1/30/2018 | | | | 2,000,000 | | | | 3,170,356 | | | | 3,065,069 | |
Emerald 3 Ltd.+ | | | 8.00 | | | | 5/31/2022 | | | | 390,426 | | | | 386,999 | | | | 389,450 | |
PHS Group PLC+ | | | 6.00 | | | | 4/17/2020 | | | | 500,000 | | | | 769,929 | | | | 761,074 | |
| | | | | | | | | | | | | | | | | | | | |
Total Ecological | | | | 2,890,426 | | | | 4,327,284 | | | | 4,215,593 | |
| | | | | | | | | | | | | | | | | | | | |
|
Electronics — 2.6%*: | |
CDW LLC | | | 3.25 | | | | 4/29/2020 | | | | 1,196,940 | | | | 1,191,136 | | | | 1,186,024 | |
Freescale Semiconductor, Inc. | | | 4.25 | | | | 2/28/2020 | | | | 736,263 | | | | 736,263 | | | | 736,469 | |
Kronos, Inc. | | | 4.50 | | | | 10/30/2019 | | | | 196,597 | | | | 195,522 | | | | 196,401 | |
Magic Newco LLC+ | | | 5.00 | | | | 12/12/2018 | | | | 95,132 | | | | 95,132 | | | | 95,156 | |
Renaissance Learning, Inc. | | | 4.50 | | | | 4/9/2021 | | | | 1,493,700 | | | | 1,473,169 | | | | 1,473,788 | |
SS&C Technologies, Inc. | | | 4.00 | | | | 6/23/2022 | | | | 104,284 | | | | 103,763 | | | | 104,220 | |
SS&C Technologies, Inc. | | | 4.00 | | | | 6/23/2022 | | | | 462,921 | | | | 460,607 | | | | 462,634 | |
| | | | | | | | | | | | | | | | | | | | |
Total Electronics | | | | 4,285,837 | | | | 4,255,592 | | | | 4,254,692 | |
| | | | | | | | | | | | | | | | | | | | |
|
Finance — 5.5%*: | |
AssuredPartners Capital, Inc. | | | 5.00 | | | | 3/31/2021 | | | | 305,536 | | | | 304,273 | | | | 305,347 | |
AssuredPartners Capital, Inc. | | | 7.75 | | | | 4/2/2022 | | | | 136,522 | | | | 135,363 | | | | 134,303 | |
Confie Seguros Holdings II Co. | | | 5.75 | | | | 11/9/2018 | | | | 534,085 | | | | 532,263 | | | | 533,861 | |
Cunningham Lindsey US, Inc. | | | 5.00 | | | | 12/10/2019 | | | | 488,697 | | | | 486,942 | | | | 477,701 | |
Cunningham Lindsey US, Inc. | | | 9.25 | | | | 6/10/2020 | | | | 748,546 | | | | 750,073 | | | | 712,990 | |
Eze Castle Software, Inc. | | | 4.00 | | | | 4/6/2020 | | | | 971,818 | | | | 966,843 | | | | 966,958 | |
First Data Corp. | | | 4.03 | | | | 6/23/2022 | | | | 806,874 | | | | 802,840 | | | | 802,840 | |
Intertrust Group Holding B.V.+ | | | 8.00 | | | | 4/16/2022 | | | | 192,451 | | | | 191,220 | | | | 191,392 | |
Intertrust Group Holding B.V.+ | | | 8.00 | | | | 4/16/2022 | | | | 500,000 | | | | 680,712 | | | | 556,031 | |
Moneygram International, Inc. | | | 4.25 | | | | 3/27/2020 | | | | 1,083,758 | | | | 1,010,598 | | | | 1,028,671 | |
National Financial Partners Corp. | | | 4.50 | | | | 7/1/2020 | | | | 131,865 | | | | 131,865 | | | | 131,495 | |
P2 Newco Acquisition, Inc. | | | 5.50 | | | | 10/22/2020 | | | | 402,751 | | | | 399,680 | | | | 403,254 | |
P2 Newco Acquisition, Inc. | | | 9.50 | | | | 10/22/2021 | | | | 500,000 | | | | 496,038 | | | | 497,500 | |
SAM Finance Lux Sarl+ | | | 5.00 | | | | 12/17/2020 | | | | 343,568 | | | | 554,751 | | | | 538,287 | |
See accompanying Notes to Financial Statements.
25
Babson Global Floating Rate Fund 2015 Annual Report
SCHEDULE OF INVESTMENTS (CONTINUED)
June 30, 2015
| | | | | | | | | | | | | | | | | | | | |
| | | EFFECTIVE
INTEREST RATE | | | DUE DATE | | | PRINCIPAL ‡‡ | | | COST | | | FAIR
VALUE | |
Bank Loans (Continued) | |
|
Finance (Continued) | |
Sedgwick, Inc. | | | 3.75 | % | | | 3/1/2021 | | | | 493,750 | | | $ | 492,748 | | | $ | 485,460 | |
Sedgwick, Inc. | | | 6.75 | | | | 2/28/2022 | | | | 561,418 | | | | 560,813 | | | | 550,016 | |
VFH Parent LLC | | | 5.25 | | | | 11/6/2019 | | | | 648,329 | | | | 644,402 | | | | 649,950 | |
Wall Street Systems Delaware, Inc. | | | 4.50 | | | | 4/30/2021 | | | | 248,399 | | | | 247,362 | | | | 247,935 | |
| | | | | | | | | | | | | | | | | | | | |
Total Finance | | | | 9,098,367 | | | | 9,388,786 | | | | 9,213,991 | |
| | | | | | | | | | | | | | | | | | | | |
|
Healthcare, Education and Childcare — 8.9%*: | |
Accellent, Inc. | | | 4.50 | | | | 3/12/2021 | | | | 1,537,578 | | | | 1,535,443 | | | | 1,526,692 | |
ADMI Corp. | | | 5.50 | | | | 4/30/2022 | | | | 1,500,000 | | | | 1,511,068 | | | | 1,503,750 | |
Britax US Holdings, Inc. | | | 4.50 | | | | 10/15/2020 | | | | 432,963 | | | | 431,316 | | | | 338,434 | |
CareCore National LLC | | | 5.50 | | | | 3/5/2021 | | | | 679,619 | | | | 679,200 | | | | 680,754 | |
Drumm Investors LLC | | | 6.75 | | | | 5/4/2018 | | | | 869,028 | | | | 863,021 | | | | 877,180 | |
Endo Luxembourg Finance Co. I Sarl | | | 3.75 | | | | 6/11/2022 | | | | 540,680 | | | | 539,328 | | | | 541,697 | |
Heartland Dental LLC | | | 5.50 | | | | 12/21/2018 | | | | 386,125 | | | | 384,790 | | | | 385,159 | |
Kindred Healthcare, Inc. | | | 4.25 | | | | 4/9/2021 | | | | 700,787 | | | | 695,741 | | | | 700,612 | |
Ortho-Clinical Diagnostics, Inc. | | | 4.75 | | | | 6/30/2021 | | | | 1,046,342 | | | | 1,037,380 | | | | 1,024,673 | |
PharMedium Healthcare Corp. | | | 4.25 | | | | 1/28/2021 | | | | 1,092,879 | | | | 1,090,711 | | | | 1,081,043 | |
PRA Holdings, Inc. | | | 4.50 | | | | 9/23/2020 | | | | 680,303 | | | | 675,197 | | | | 680,303 | |
Rodenstock GmbH+ | | | 4.78 | | | | 5/31/2019 | | | | 1,500,000 | | | | 1,763,719 | | | | 1,649,281 | |
RPI Finance Trust | | | 3.50 | | | | 11/9/2020 | | | | 599,806 | | | | 599,806 | | | | 600,178 | |
Synarc-Biocore Holdings LLC | | | 5.50 | | | | 3/10/2021 | | | | 493,750 | | | | 489,713 | | | | 481,406 | |
Synarc-Biocore Holdings LLC | | | 9.25 | | | | 3/10/2022 | | | | 500,000 | | | | 495,798 | | | | 455,000 | |
Tecomet, Inc. | | | 5.75 | | | | 12/5/2021 | | | | 975,782 | | | | 945,813 | | | | 959,925 | |
Tunstall Group Holdings Ltd.+ | | | 5.28 | | | | 10/16/2020 | | | | 500,000 | | | | 793,369 | | | | 663,853 | |
Valeant Pharmaceuticals International | | | 4.00 | | | | 4/1/2022 | | | | 593,681 | | | | 590,796 | | | | 592,689 | |
| | | | | | | | | | | | | | | | | | | | |
Total Healthcare, Education and Childcare | | | | | | | | | | | 14,629,323 | | | | 15,122,209 | | | | 14,742,629 | |
| | | | | | | | | | | | | | | | | | | | |
|
Home and Office Furnishings, Housewares, and Durable Consumer Products — 1.3%*: | |
HMK Intermediate Holdings LLC | | | 5.00 | | | | 3/30/2019 | | | | 476,795 | | | | 476,209 | | | | 474,411 | |
Leslie’s Poolmart, Inc. | | | 4.25 | | | | 10/16/2019 | | | | 539,942 | | | | 539,942 | | | | 540,071 | |
WMF AG+ | | | 4.78 | | | | 9/22/2021 | | | | 1,000,000 | | | | 1,086,819 | | | | 1,110,201 | |
| | | | | | | | | | | | | | | | | | | | |
Total Home and Office Furnishings, Housewares, and Durable Consumer Products | | | | | | | | | | | 2,016,737 | | | | 2,102,970 | | | | 2,124,683 | |
| | | | | | | | | | | | | | | | | | | | |
|
Hotels, Motels, Inns and Gaming — 0.5%*: | |
Cyan Blue Holdco 3 Ltd.+ | | | 6.50 | | | | 2/25/2022 | | | | 500,000 | | | | 731,588 | | | | 783,904 | |
| | | | | | | | | | | | | | | | | | | | |
|
Insurance — 1.8%*: | |
AmWINS Group LLC | | | 5.25 | | | | 9/6/2019 | | | | 151,371 | | | | 151,097 | | | | 152,582 | |
Asurion LLC | | | 5.00 | | | | 5/24/2019 | | | | 967,980 | | | | 967,303 | | | | 969,597 | |
Hub International Ltd. | | | 4.00 | | | | 10/2/2020 | | | | 1,730,041 | | | | 1,723,376 | | | | 1,715,992 | |
York Risk Services Holding Corp. | | | 4.75 | | | | 10/1/2021 | | | | 192,678 | | | | 191,372 | | | | 188,343 | |
| | | | | | | | | | | | | | | | | | | | |
Total Insurance | | | | 3,042,070 | | | | 3,033,148 | | | | 3,026,514 | |
| | | | | | | | | | | | | | | | | | | | |
See accompanying Notes to Financial Statements.
26
Babson Global Floating Rate Fund 2015 Annual Report
SCHEDULE OF INVESTMENTS (CONTINUED)
June 30, 2015
| | | | | | | | | | | | | | | | | | | | |
| | | EFFECTIVE
INTEREST RATE | | | DUE DATE | | | PRINCIPAL ‡‡ | | | COST | | | FAIR
VALUE | |
Bank Loans (Continued) | |
|
Leisure, Amusement, Entertainment — 3.2%*: | |
AP NMT Acquisition B.V.+ | | | 7.00 | % | | | 8/13/2021 | | | | 540,400 | | | $ | 650,891 | | | $ | 600,458 | |
Delta 2 (Lux) Sarl+ | | | 4.75 | | | | 7/30/2021 | | | | 1,587,247 | | | | 1,582,406 | | | | 1,576,756 | |
Delta 2 (Lux) Sarl+ | | | 7.75 | | | | 7/31/2022 | | | | 437,500 | | | | 436,731 | | | | 436,406 | |
SeaWorld Parks & Entertainment, Inc. | | | 3.00 | | | | 5/14/2020 | | | | 647,432 | | | | 622,921 | | | | 622,507 | |
SeaWorld Parks & Entertainment, Inc. | | | 4.00 | | | | 5/14/2020 | | | | 1,112,596 | | | | 1,113,359 | | | | 1,107,378 | |
WMG Acquisition Corp. | | | 3.75 | | | | 7/1/2020 | | | | 994,937 | | | | 977,937 | | | | 978,928 | |
| | | | | | | | | | | | | | | | | | | | |
Total Leisure, Amusement, Entertainment | | | | 5,320,112 | | | | 5,384,245 | | | | 5,322,433 | |
| | | | | | | | | | | | | | | | | | | | |
|
Machinery Non-Agriculture, Non-Construction, Non-Electronic — 4.3%*: | |
Doncasters Finance US LLC | | | 4.50 | | | | 4/9/2020 | | | | 962,057 | | | | 960,121 | | | | 960,258 | |
Gardner Denver, Inc. | | | 4.25 | | | | 7/30/2020 | | | | 1,292,671 | | | | 1,262,408 | | | | 1,259,100 | |
Husky Injection Molding Systems Ltd.+ | | | 4.25 | | | | 6/30/2021 | | | | 943,171 | | | | 942,338 | | | | 937,474 | |
Husky Injection Molding Systems Ltd.+ | | | 7.25 | | | | 6/30/2022 | | | | 450,443 | | | | 431,161 | | | | 444,249 | |
Intelligrated, Inc. | | | 4.50 | | | | 7/30/2018 | | | | 1,109,949 | | | | 1,100,391 | | | | 1,107,174 | |
Schenck Measuring and Process Technologies+ | | | 3.78 | | | | 4/28/2017 | | | | 2,000,000 | | | | 1,923,771 | | | | 1,975,000 | |
Silver II US Holdings LLC | | | 4.00 | | | | 12/13/2019 | | | | 445,480 | | | | 441,087 | | | | 429,220 | |
TCH-2 Holding LLC | | | 5.50 | | | | 5/6/2021 | | | | 108,172 | | | | 107,263 | | | | 107,767 | |
| | | | | | | | | | | | | | | | | | | | |
Total Machinery Non-Agriculture, Non-Construction, Non-Electronic | | | | | | | | | | | 7,311,943 | | | | 7,168,540 | | | | 7,220,242 | |
| | | | | | | | | | | | | | | | | | | | |
|
Mining, Steel, Iron and Non-Precious Metals — 2.3%*: | |
Arch Coal, Inc. | | | 6.25 | | | | 5/16/2018 | | | | 1,987,254 | | | | 1,701,461 | | | | 1,352,585 | |
Boomerang Tube LLC††~ | | | 11.00 | | | | 10/11/2017 | | | | 249,123 | | | | 245,561 | | | | 125,807 | |
H.C. Starck GmbH+ | | | 3.03 | | | | 5/30/2016 | | | | 500,000 | | | | 492,500 | | | | 497,500 | |
H.C. Starck GmbH+ | | | 3.03 | | | | 5/30/2016 | | | | 500,000 | | | | 679,250 | | | | 553,010 | |
Metal Services LLC | | | 6.00 | | | | 6/30/2017 | | | | 105,283 | | | | 105,284 | | | | 105,107 | |
Murray Energy Corp. | | | 7.50 | | | | 4/16/2020 | | | | 750,000 | | | | 728,179 | | | | 693,630 | |
Peabody Energy Corp. | | | 4.25 | | | | 9/24/2020 | | | | 623,551 | | | | 561,694 | | | | 523,066 | |
| | | | | | | | | | | | | | | | | | | | |
Total Mining, Steel, Iron and Non-Precious Metals | | | | | | | | | | | 4,715,211 | | | | 4,513,929 | | | | 3,850,705 | |
| | | | | | | | | | | | | | | | | | | | |
|
Oil and Gas — 4.9%*: | |
Caelus Energy Alaska O3 LLC | | | 8.75 | | | | 4/15/2020 | | | | 1,692,308 | | | | 1,518,379 | | | | 1,370,769 | |
CITGO Holding, Inc. | | | 9.50 | | | | 5/12/2018 | | | | 1,073,131 | | | | 1,054,991 | | | | 1,075,277 | |
Drillships Financing Holding, Inc. | | | 6.00 | | | | 3/31/2021 | | | | 1,500,000 | | | | 1,278,240 | | | | 1,219,995 | |
Drillships Ocean Ventures, Inc. | | | 5.50 | | | | 7/25/2021 | | | | 253,325 | | | | 251,118 | | | | 215,010 | |
Fieldwood Energy LLC | | | 8.38 | | | | 9/30/2020 | | | | 1,725,000 | | | | 1,391,284 | | | | 1,317,469 | |
Floatel International Ltd. | | | 6.00 | | | | 6/27/2020 | | | | 406,468 | | | | 403,039 | | | | 321,110 | |
Paragon Offshore Finance Co.+ | | | 3.75 | | | | 7/18/2021 | | | | 548,627 | | | | 441,258 | | | | 397,755 | |
Sabine Oil & Gas LLC~ | | | 8.75 | | | | 12/31/2018 | | | | 700,000 | | | | 708,817 | | | | 239,169 | |
Seadrill Partners Finco LLC | | | 4.00 | | | | 2/21/2021 | | | | 932,636 | | | | 926,259 | | | | 702,396 | |
Southcross Holdings Borrower LP | | | 6.00 | | | | 8/4/2021 | | | | 145,959 | | | | 145,319 | | | | 141,580 | |
Templar Energy LLC | | | 8.50 | | | | 11/25/2020 | | | | 750,000 | | | | 561,094 | | | | 550,500 | |
TPF II Power LLC | | | 5.50 | | | | 10/2/2021 | | | | 521,067 | | | | 517,557 | | | | 525,256 | |
| | | | | | | | | | | | | | | | | | | | |
Total Oil and Gas | | | | 10,248,521 | | | | 9,197,355 | | | | 8,076,286 | |
| | | | | | | | | | | | | | | | | | | | |
See accompanying Notes to Financial Statements.
27
Babson Global Floating Rate Fund 2015 Annual Report
SCHEDULE OF INVESTMENTS (CONTINUED)
June 30, 2015
| | | | | | | | | | | | | | | | | | | | |
| | | EFFECTIVE
INTEREST RATE | | | DUE DATE | | | PRINCIPAL ‡‡ | | | COST | | | FAIR
VALUE | |
Bank Loans (Continued) | |
|
Personal and Non-Durable Consumer Products Mfg. Only — 0.2%*: | |
Berlin Packaging LLC | | | 4.50 | % | | | 10/1/2021 | | | | 336,937 | | | $ | 335,429 | | | $ | 336,833 | |
| | | | | | | | | | | | | | | | | | | | |
|
Personal Transportation — 0.2%*: | |
Travelport Finance (Luxembourg) Sarl | | | 5.75 | | | | 9/2/2021 | | | | 319,245 | | | | 315,714 | | | | 319,587 | |
| | | | | | | | | | | | | | | | | | | | |
|
Personal, Food and Miscellaneous — 0.1%*: | |
Redtop Acquisitions Ltd.+ | | | 8.25 | | | | 6/3/2021 | | | | 156,777 | | | | 155,224 | | | | 156,973 | |
| | | | | | | | | | | | | | | | | | | | |
|
Printing and Publishing — 2.7%*: | |
Cengage Learning Acquisitions, Inc. | | | 7.00 | | | | 3/31/2020 | | | | 1,097,730 | | | | 1,092,485 | | | | 1,097,730 | |
Eden Bidco Ltd.+ | | | 6.00 | | | | 4/28/2022 | | | | 550,000 | | | | 576,192 | | | | 608,569 | |
EMI Music Publishing Ltd. | | | 3.75 | | | | 6/29/2018 | | | | 242,664 | | | | 242,664 | | | | 242,118 | |
Houghton Mifflin Harcourt Publishing Co. | | | 4.00 | | | | 5/31/2021 | | | | 1,368,236 | | | | 1,366,406 | | | | 1,361,394 | |
R.H. Donnelley, Inc. | | | 9.75 | | | | 12/31/2016 | | | | 103,399 | | | | 82,095 | | | | 51,010 | |
Springer Science+Business Media Deutschland GmbH+ | | | 4.75 | | | | 8/14/2020 | | | | 909,272 | | | | 911,304 | | | | 907,572 | |
SuperMedia, Inc. | | | 11.60 | | | | 12/30/2016 | | | | 262,823 | | | | 228,657 | | | | 155,723 | |
| | | | | | | | | | | | | | | | | | | | |
Total Printing and Publishing | | | | 4,534,124 | | | | 4,499,803 | | | | 4,424,116 | |
| | | | | | | | | | | | | | | | | | | | |
|
Retail Stores — 4.2%*: | |
Advantage Sales & Marketing, Inc. | | | 4.25 | | | | 7/23/2021 | | | | 993,984 | | | | 990,653 | | | | 988,457 | |
BJ’s Wholesale Club, Inc. | | | 4.50 | | | | 9/26/2019 | | | | 134,413 | | | | 133,926 | | | | 134,153 | |
Burlington Coat Factory Warehouse Corp. | | | 4.25 | | | | 8/13/2021 | | | | 429,744 | | | | 427,861 | | | | 429,405 | |
Dollar Tree, Inc. | | | 3.50 | | | | 3/9/2022 | | | | 382,829 | | | | 382,825 | | | | 382,511 | |
Douglas Holding AG+ | | | 5.00 | | | | 6/26/2022 | | | | 800,000 | | | | 889,172 | | | | 887,420 | |
FleetPride Corp. | | | 5.25 | | | | 11/19/2019 | | | | 1,481,709 | | | | 1,466,698 | | | | 1,468,122 | |
J. Crew Group, Inc. | | | 4.00 | | | | 3/5/2021 | | | | 1,227,891 | | | | 1,163,664 | | | | 1,056,833 | |
Maxeda DIY B.V.+ | | | 5.28 | | | | 6/29/2017 | | | | 500,000 | | | | 556,683 | | | | 529,932 | |
Staples, Inc. | | | 3.50 | | | | 4/7/2021 | | | | 431,902 | | | | 429,742 | | | | 430,913 | |
Talbots, Inc. (The) | | | 5.50 | | | | 3/19/2020 | | | | 741,241 | | | | 730,208 | | | | 722,710 | |
| | | | | | | | | | | | | | | | | | | | |
Total Retail Stores | | | | 7,123,713 | | | | 7,171,432 | | | | 7,030,456 | |
| | | | | | | | | | | | | | | | | | | | |
|
Telecommunications — 2.6%*: | |
Altice Financing SA+ | | | 5.50 | | | | 7/2/2019 | | | | 261,641 | | | | 263,676 | | | | 263,537 | |
Carros Finance Luxembourg Sarl | | | 4.50 | | | | 9/30/2021 | | | | 291,518 | | | | 290,862 | | | | 291,518 | |
Eircom Finco Sarl+ | | | 4.78 | | | | 9/30/2019 | | | | 988,319 | | | | 1,322,736 | | | | 1,078,215 | |
ION Trading Technologies Ltd. | | | 1.00 | | | | 6/16/2021 | | | | 1,140,458 | | | | 1,129,054 | | | | 1,129,054 | |
ION Trading Technologies Sarl+ | | | 7.25 | | | | 6/10/2022 | | | | 842,143 | | | | 836,513 | | | | 840,037 | |
Numericable US LLC+ | | | 4.50 | | | | 5/21/2020 | | | | 665,852 | | | | 660,407 | | | | 667,277 | |
| | | | | | | | | | | | | | | | | | | | |
Total Telecommunications | | | | 4,189,931 | | | | 4,503,248 | | | | 4,269,638 | |
| | | | | | | | | | | | | | | | | | | | |
|
Textiles and Leather — 0.4%*: | |
Fullbeauty Brands, Inc. | | | 4.75 | | | | 3/18/2021 | | | | 741,508 | | | | 737,936 | | | | 738,727 | |
| | | | | | | | | | | | | | | | | | | | |
See accompanying Notes to Financial Statements.
28
Babson Global Floating Rate Fund 2015 Annual Report
SCHEDULE OF INVESTMENTS (CONTINUED)
June 30, 2015
| | | | | | | | | | | | | | | | | | | | |
| | | EFFECTIVE
INTEREST RATE | | | DUE DATE | | | PRINCIPAL ‡‡ | | | COST | | | FAIR
VALUE | |
Bank Loans (Continued) | |
|
Utilities — 0.3%*: | |
Bayonne Energy Center LLC | | | 5.00 | % | | | 8/19/2021 | | | | 49,292 | | | $ | 49,075 | | | $ | 49,292 | |
Calpine Construction Finance Co. LP | | | 3.00 | | | | 5/3/2020 | | | | 492,462 | | | | 486,761 | | | | 482,204 | |
| | | | | | | | | | | | | | | | | | | | |
Total Utilities | | | | 541,754 | | | | 535,836 | | | | 531,496 | |
| | | | | | | | | | | | | | | | | | | | |
| | | | | | | | | | | | | | | | | | | | |
Total Bank Loans | | | | | | | | | | | 132,385,938 | | | | 136,630,240 | | | | 132,771,882 | |
| | | | | | | | | | | | | | | | | | | | |
|
Corporate Bonds — 13.7%*: | |
|
Automobile — 0.1%*: | |
Grupo Antolin Dutch B.V.+ | | | 5.13 | | | | 6/30/2022 | | | | 200,000 | | | | 226,590 | | | | 226,497 | |
| | | | | | | | | | | | | | | | | | | | |
|
Banking — 0.1%*: | |
Lock AS+ | | | 7.00 | | | | 8/15/2021 | | | | 100,000 | | | | 134,225 | | | | 117,617 | |
| | | | | | | | | | | | | | | | | | | | |
|
Beverage, Food and Tobacco — 1.0%*: | |
1011778 B.C. Unlimited Liability Co.+^ | | | 4.63 | | | | 1/15/2022 | | | | 121,000 | | | | 121,000 | | | | 119,185 | |
EWOS Holding AS+ | | | 6.51 | # | | | 11/1/2020 | | | | 1,000,000 | | | | 166,715 | | | | 126,268 | |
Findus Bondco SA+ | | | 9.13 | | | | 7/1/2018 | | | | 100,000 | | | | 139,419 | | | | 116,781 | |
Iglo Foods Bondco PLC+ | | | 4.49 | # | | | 6/15/2020 | | | | 1,000,000 | | | | 1,116,476 | | | | 1,114,848 | |
Twinkle Pizza PLC+ | | | 6.63 | | | | 8/1/2021 | | | | 100,000 | | | | 169,730 | | | | 162,184 | |
| | | | | | | | | | | | | | | | | | | | |
Total Beverage, Food and Tobacco | | | | 2,321,000 | | | | 1,713,340 | | | | 1,639,266 | |
| | | | | | | | | | | | | | | | | | | | |
| | |
Broadcasting and Entertainment — 0.1%*: | | | | | | | | | |
Univision Communications, Inc.^ | | | 5.13 | | | | 2/15/2025 | | | | 149,000 | | | | 151,017 | | | | 143,815 | |
| | | | | | | | | | | | | | | | | | | | |
| | |
Buildings and Real Estate — 0.1%*: | | | | | | | | | |
Paroc Group Oy+ | | | 5.24 | # | | | 5/15/2020 | | | | 100,000 | | | | 137,565 | | | | 105,799 | |
Paroc Group Oy+ | | | 6.25 | | | | 5/15/2020 | | | | 100,000 | | | | 137,565 | | | | 109,557 | |
| | | | | | | | | | | | | | | | | | | | |
Total Buildings and Real Estate | | | | 200,000 | | | | 275,130 | | | | 215,356 | |
| | | | | | | | | | | | | | | | | | | | |
| | |
Cargo Transport — 0.4%*: | | | | | | | | | |
Florida East Coast Holdings Corp.^ | | | 6.75 | | | | 5/1/2019 | | | | 550,000 | | | | 542,425 | | | | 551,375 | |
WFS Global Holding SAS+ | | | 9.50 | | | | 7/15/2022 | | | | 100,000 | | | | 113,435 | | | | 112,600 | |
| | | | | | | | | | | | | | | | | | | | |
Total Cargo Transport | | | | 650,000 | | | | 655,860 | | | | 663,975 | |
| | | | | | | | | | | | | | | | | | | | |
| | |
Chemicals, Plastics and Rubber — 0.4%*: | | | | | | | | | |
Ineos Finance PLC+ | | | 4.00 | | | | 5/1/2023 | | | | 150,000 | | | | 162,382 | | | | 158,879 | |
Pinnacle Operating Corp.^ | | | 9.00 | | | | 11/15/2020 | | | | 500,000 | | | | 533,754 | | | | 496,250 | |
| | | | | | | | | | | | | | | | | | | | |
Total Chemicals, Plastics and Rubber | | | | 650,000 | | | | 696,136 | | | | 655,129 | |
| | | | | | | | | | | | | | | | | | | | |
| | |
Containers, Packaging and Glass — 0.3%*: | | | | | | | | | |
Innovia Group Finance PLC+ | | | 4.99 | # | | | 3/31/2020 | | | | 500,000 | | | | 684,986 | | | | 552,965 | |
| | | | | | | | | | | | | | | | | | | | |
| | |
Diversified/Conglomerate Manufacturing — 0.3%*: | | | | | | | | | |
Appvion, Inc.^ | | | 9.00 | | | | 6/1/2020 | | | | 460,000 | | | | 467,776 | | | | 289,800 | |
Galapagos SA+ | | | 4.74 | # | | | 6/15/2021 | | | | 200,000 | | | | 272,630 | | | | 220,740 | |
| | | | | | | | | | | | | | | | | | | | |
Total Diversified/Conglomerate Manufacturing | | | | | | | | | | | 660,000 | | | | 740,406 | | | | 510,540 | |
| | | | | | | | | | | | | | | | | | | | |
See accompanying Notes to Financial Statements.
29
Babson Global Floating Rate Fund 2015 Annual Report
SCHEDULE OF INVESTMENTS (CONTINUED)
June 30, 2015
| | | | | | | | | | | | | | | | | | | | |
| | | EFFECTIVE
INTEREST RATE | | | DUE DATE | | | PRINCIPAL ‡‡ | | | COST | | | FAIR
VALUE | |
Corporate Bonds (Continued) | |
| | |
Diversified/Conglomerate Service — 1.4%*: | | | | | | | | | |
Carlson Travel Holdings, Inc. PIK^ | | | 7.50 | % | | | 8/15/2019 | | | | 470,000 | | | $ | 475,196 | | | $ | 477,050 | |
Sabre GLBL, Inc.^ | | | 5.38 | | | | 4/15/2023 | | | | 1,061,000 | | | | 1,082,049 | | | | 1,045,085 | |
United Rentals North America, Inc. | | | 4.63 | | | | 7/15/2023 | | | | 176,000 | | | | 176,000 | | | | 172,586 | |
Verisure Holding AB+ | | | 8.75 | | | | 9/1/2018 | | | | 500,000 | | | | 580,755 | | | | 588,083 | |
| | | | | | | | | | | | | | | | | | | | |
Total Diversified/Conglomerate Service | | | | 2,207,000 | | | | 2,314,000 | | | | 2,282,804 | |
| | | | | | | | | | | | | | | | | | | | |
| | |
Finance — 2.7%*: | | | | | | | | | |
Equiniti Newco 2 PLC+ | | | 6.32 | # | | | 12/15/2018 | | | | 750,000 | | | | 1,211,979 | | | | 1,154,869 | |
Equiniti Newco 2 PLC+ | | | 7.13 | | | | 12/15/2018 | | | | 550,000 | | | | 868,440 | | | | 868,508 | |
Galaxy Bidco Ltd.+ | | | 5.57 | # | | | 11/15/2019 | | | | 100,000 | | | | 161,051 | | | | 155,554 | |
Lowell Group Financing PLC+ | | | 5.88 | | | | 4/1/2019 | | | | 100,000 | | | | 166,730 | | | | 152,443 | |
Marlin Intermediate Holdings PLC+ | | | 10.50 | | | | 8/1/2020 | | | | 500,000 | | | | 838,625 | | | | 867,094 | |
Travelex Financing PLC+ | | | 6.57 | # | | | 8/1/2018 | | | | 700,000 | | | | 1,121,314 | | | | 1,094,375 | |
Travelex Financing PLC+ | | | 8.00 | | | | 8/1/2018 | | | | 100,000 | | | | 158,548 | | | | 163,423 | |
| | | | | | | | | | | | | | | | | | | | |
Total Finance | | | | 2,800,000 | | | | 4,526,687 | | | | 4,456,266 | |
| | | | | | | | | | | | | | | | | | | | |
| | |
Grocery — 0.1%*: | | | | | | | | | |
Premier Foods Finance PLC+ | | | 5.57 | # | | | 3/16/2020 | | | | 100,000 | | | | 167,370 | | | | 146,833 | |
| | | | | | | | | | | | | | | | | | | | |
| | |
Healthcare, Education and Childcare — 1.5%*: | | | | | | | | | |
Care UK Health & Social Care PLC+ | | | 5.57 | # | | | 7/15/2019 | | | | 800,000 | | | | 1,161,107 | | | | 1,219,290 | |
Tenet Healthcare Corp.^ | | | 3.79 | # | | | 6/15/2020 | | | | 819,000 | | | | 814,936 | | | | 826,166 | |
Unilabs Subholding AB+ | | | 7.26 | # | | | 7/15/2018 | | | | 400,000 | | | | 550,402 | | | | 445,940 | |
| | | | | | | | | | | | | | | | | | | | |
Total Healthcare, Education and Childcare | | | | 2,019,000 | | | | 2,526,445 | | | | 2,491,396 | |
| | | | | | | | | | | | | | | | | | | | |
| | |
Hotels, Motels, Inns and Gaming — 0.5%*: | | | | | | | | | |
Gala Group Finance PLC+ | | | 8.88 | | | | 9/1/2018 | | | | 450,000 | | | | 711,992 | | | | 740,648 | |
| | | | | | | | | | | | | | | | | | | | |
| | |
Insurance — 0.9%*: | | | | | | | | | |
Hastings Insurance Group Finance PLC+ | | | 6.57 | # | | | 10/21/2019 | | | | 150,000 | | | | 238,061 | | | | 235,572 | |
Hastings Insurance Group Finance PLC+ | | | 8.00 | | | | 10/21/2020 | | | | 500,000 | | | | 824,102 | | | | 832,616 | |
TIG Finco PLC+ | | | 8.50 | # | | | 3/2/2020 | | | | 46,609 | | | | 68,205 | | | | 76,896 | |
TIG Finco PLC+^ | | | 8.75 | | | | 4/2/2020 | | | | 207,453 | | | | 308,378 | | | | 322,701 | |
| | | | | | | | | | | | | | | | | | | | |
Total Insurance | | | | 904,062 | | | | 1,438,746 | | | | 1,467,785 | |
| | | | | | | | | | | | | | | | | | | | |
|
Leisure, Amusement, Entertainment — 0.3%*: | |
Vougeot Bidco PLC+ | | | 5.26 | # | | | 7/15/2020 | | | | 100,000 | | | | 135,168 | | | | 111,206 | |
WMG Acquisition Corp. | | | 6.25 | | | | 1/15/2021 | | | | 387,000 | | | | 468,087 | | | | 437,919 | |
| | | | | | | | | | | | | | | | | | | | |
Total Leisure, Amusement, Entertainment | | | | 487,000 | | | | 603,255 | | | | 549,125 | |
| | | | | | | | | | | | | | | | | | | | |
|
Oil and Gas — 0.6%*: | |
Halcon Resources Corp.^ | | | 8.63 | | | | 2/1/2020 | | | | 144,000 | | | | 144,000 | | | | 142,200 | |
Sabine Pass Liquefaction LLC^ | | | 5.63 | | | | 3/1/2025 | | | | 495,000 | | | | 495,000 | | | | 490,050 | |
Shelf Drilling Holdings Ltd.+^ | | | 8.63 | | | | 11/1/2018 | | | | 438,000 | | | | 361,149 | | | | 389,820 | |
| | | | | | | | | | | | | | | | | | | | |
Total Oil and Gas | | | | 1,077,000 | | | | 1,000,149 | | | | 1,022,070 | |
| | | | | | | | | | | | | | | | | | | | |
See accompanying Notes to Financial Statements.
30
Babson Global Floating Rate Fund 2015 Annual Report
SCHEDULE OF INVESTMENTS (CONTINUED)
June 30, 2015
| | | | | | | | | | | | | | | | | | | | |
| | | EFFECTIVE
INTEREST RATE | | | DUE DATE | | | PRINCIPAL ‡‡ | | | COST | | | FAIR
VALUE | |
Corporate Bonds (Continued) | |
|
Personal Transportation — 0.1%*: | |
AA Bond Co. Ltd.+ | | | 5.50 | % | | | 7/31/2043 | | | | 150,000 | | | $ | 223,140 | | | $ | 234,273 | |
| | | | | | | | | | | | | | | | | | | | |
| | | |
Personal, Food and Miscellaneous — 0.5%*: | | | | | | | | | | | | | |
Brakes Capital+ | | | 4.99 | # | | | 12/15/2018 | | | | 100,000 | | | | 136,645 | | | | 111,296 | |
Brakes Capital+ | | | 7.13 | | | | 12/15/2018 | | | | 300,000 | | | | 514,604 | | | | 483,178 | |
Financiere Quick SAS+ | | | 4.76 | # | | | 4/15/2019 | | | | 200,000 | | | | 275,616 | | | | 193,984 | |
TeamSystem Holding SpA+ | | | 7.38 | | | | 5/15/2020 | | | | 100,000 | | | | 132,587 | | | | 118,118 | |
| | | | | | | | | | | | | | | | | | | | |
Total Personal, Food and Miscellaneous | | | | 700,000 | | | | 1,059,452 | | | | 906,576 | |
| | | | | | | | | | | | | | | | | | | | |
|
Retail Stores — 1.6%*: | |
Boing Group Financing PLC+ | | | 6.63 | | | | 7/15/2019 | | | | 350,000 | | | | 396,245 | | | | 377,703 | |
Brighthouse Group PLC+ | | | 7.88 | | | | 5/15/2018 | | | | 150,000 | | | | 243,460 | | | | 230,974 | |
HD Supply, Inc.^ | | | 5.25 | | | | 12/15/2021 | | | | 1,000,000 | | | | 1,025,911 | | | | 1,013,750 | |
House of Fraser Funding PLC+ | | | 8.88 | | | | 8/15/2018 | | | | 500,000 | | | | 798,609 | | | | 819,485 | |
HSS Financing PLC+ | | | 6.75 | | | | 8/1/2019 | | | | 65,774 | | | | 108,872 | | | | 107,998 | |
Takko Luxembourg 2 S.C.A.+ | | | 9.88 | | | | 4/15/2019 | | | | 100,000 | | | | 132,433 | | | | 51,395 | |
| | | | | | | | | | | | | | | | | | | | |
Total Retail Stores | | | | 2,165,774 | | | | 2,705,530 | | | | 2,601,305 | |
| | | | | | | | | | | | | | | | | | | | |
|
Telecommunications — 0.7%*: | |
Numericable-SFR+ | | | 5.38 | | | | 5/15/2022 | | | | 100,000 | | | | 138,295 | | | | 113,157 | |
Numericable-SFR+ | | | 5.63 | | | | 5/15/2024 | | | | 100,000 | | | | 138,165 | | | | 112,321 | |
Numericable-SFR+^ | | | 6.00 | | | | 5/15/2022 | | | | 646,000 | | | | 645,234 | | | | 636,714 | |
Wind Acquisition Finance SA+ | | | 4.00 | | | | 7/15/2020 | | | | 150,000 | | | | 161,192 | | | | 166,809 | |
Wind Acquisition Finance SA+ | | | 4.15 | # | | | 7/15/2020 | | | | 150,000 | | | | 159,292 | | | | 166,743 | |
| | | | | | | | | | | | | | | | | | | | |
Total Telecommunications | | | | | | | | | | | 1,146,000 | | | | 1,242,178 | | | | 1,195,744 | |
| | | | | | | | | | | | | | | | | | | | |
Total Corporate Bonds | | | | | | | | | | | 19,635,836 | | | | 23,796,634 | | | | 22,819,985 | |
| | | | | | | | | | | | | | | | | | | | |
Total Fixed Income | | | | | | | | | | | 152,021,774 | | | | 160,426,874 | | | | 155,591,867 | |
| | | | | | | | | | | | | | | | | | | | |
|
Short-Term Investments — 14.1%*: | |
|
Bank Deposit — 14.0%*: | |
State Street Bank & Trust Co. Euro Time Deposit | | | 0.01 | | | | 7/1/2015 | | | | 23,274,995 | | | | 23,274,995 | | | | 23,274,995 | |
| | | | | | | | | | | | | | | | | | | | |
|
Bank Loan — 0.1%*§: | |
|
Mining, Steel, Iron and Non-Precious Metals — 0.1%*: | |
Boomerang Tube LLC¤ | | | 11.28 | | | | 10/7/2015 | | | | 78,780 | | | | 77,204 | | | | 78,780 | |
| | | | | | | | | | | | | | | | | | | | |
Total Short-Term Investments | | | | | | | | | | | 23,353,775 | | | | 23,352,199 | | | | 23,353,775 | |
| | | | | | | | | | | | | | | | | | | | |
Total Investments | | | | | | | | | | | 175,375,549 | | | | 183,779,073 | | | | 178,945,642 | |
| | | | | | | | | | | | | | | | | | | | |
| | | | | |
Other assets and liabilities — (7.7%)* | | | | | | | | | | | | | | | | | | | (12,786,505 | ) |
| | | | | |
Net Assets — 100.0% | | | | | | | | | | | | | | | | | | | $166,159,137 | |
| | | | | | | | | | | | | | | | | | | | |
See accompanying Notes to Financial Statements.
31
Babson Global Floating Rate Fund 2015 Annual Report
SCHEDULE OF INVESTMENTS (CONTINUED)
June 30, 2015
| ‡‡ | Unless otherwise indicated, all principal amounts are denominated in United States Dollars. |
| * | Calculated as a percentage of net assets applicable to common shareholders. |
Distributions of investments by country of risk (excluding temporary cash investments) as a percentage of total investments in securities, is as follows:
| | | | | | |
| | United States | | | 63.2% | |
| | United Kingdom | | | 18.4% | |
| | Germany | | | 7.6% | |
| | Canada | | | 2.8% | |
| | Switzerland | | | 1.8% | |
| | Netherlands | | | 1.2% | |
| | France | | | 1.2% | |
| | Spain | | | 1.0% | |
| | Other (Individually less than 1%) | | | 2.8% | |
| | | | | | |
| | Total | | | 100.0% | |
| | | | | | |
| ^ | Security acquired in a transaction exempt from registration under Rule 144A of the Securities Act of 1933. These securities may only be resold in transactions exempt from registration, normally to qualified institutional buyers. |
| § | Bank loans are exempt from registration under the Securities Act of 1933, as amended, but contain certain restrictions on resale and cannot be sold publicly. These loans pay interest at rates which adjust periodically. The interest rates shown for bank loans are the current interest rates at June 30, 2015. Bank loans are also subject to mandatory and/or optional prepayment which cannot be predicted. As a result, the remaining maturity may be substantially less than the stated maturity shown. |
| ¤ | For fair value measurement disclosure purposes, security is categorized as Level 3 (see Note 2). |
| # | Variable rate security. The interest rate shown is the rate in effect at June 30, 2015. |
A summary of outstanding derivatives at June 30, 2015 is as follows:
Forward Foreign Currency Exchange Contracts to Buy
| | | | | | | | | | | | | | | | | | | | | | |
EXPIRATION
DATE | | COUNTERPARTY | | LOCAL
CURRENCY | | | VALUE IN USD | | | IN
EXCHANGE
FOR USD | | | NET UNREALIZED
DEPRECIATION | |
| 07/14/15 | | Morgan Stanley | | | EUR | | | | 1,500,000 | | | | 1,672,544 | | | | 1,687,479 | | | $ | (14,935 | ) |
See accompanying Notes to Financial Statements.
32
Babson Global Floating Rate Fund 2015 Annual Report
SCHEDULE OF INVESTMENTS (CONTINUED)
June 30, 2015
Forward Foreign Currency Exchange Contracts to Sell
| | | | | | | | | | | | | | | | | | | | | | |
EXPIRATION
DATE | | COUNTERPARTY | | LOCAL
CURRENCY | | | VALUE IN USD | | | IN
EXCHANGE
FOR USD | | | NET UNREALIZED
APPRECIATION
(DEPRECIATION) | |
| 07/14/15 | | Morgan Stanley | | | EUR | | | | 17,509,486 | | | | 19,523,594 | | | | 19,676,718 | | | $ | 153,124 | |
| 07/14/15 | | Morgan Stanley | | | GBP | | | | 11,930,996 | | | | 18,745,001 | | | | 18,237,334 | | | | (507,667 | ) |
| 07/14/15 | | Morgan Stanley | | | NOK | | | | 1,019,018 | | | | 129,934 | | | | 129,342 | | | | (592 | ) |
| | | | | | | | | | | | | | | | | | | | | | |
Net unrealized depreciation on forward foreign exchange contracts to sell | | | | | | | $ | (355,135 | ) |
| | | | | | | | | | | | | | | | | | | | | | |
Currency Legend
| | | | |
| EUR | | – | | Euro |
| GBP | | – | | British Pound Sterling |
| NOK | | – | | Norwegian Krona |
See accompanying Notes to Financial Statements.
33
Babson Global Credit Income Opportunities Fund 2015 Annual Report
SCHEDULE OF INVESTMENTS
June 30, 2015
| | | | | | | | | | | | | | | | | | | | |
| | | EFFECTIVE
INTEREST RATE | | | DUE DATE | | | PRINCIPAL ‡‡ | | | COST | | | FAIR
VALUE | |
Fixed Income — 91.9%*: | |
|
Asset-Backed Securities — 16.5%*: | |
|
CDO/CLO — 16.5%*: | |
Apidos CLO XII^ | | | 5.15 | #% | | | 4/15/2025 | | | | 500,000 | | | | $448,151 | | | | $414,870 | |
Apidos CLO XV^ | | | 5.76 | # | | | 10/20/2025 | | | | 500,000 | | | | 462,554 | | | | 425,939 | |
Atlas Senior Loan Fund Ltd.^ | | | 5.45 | # | | | 10/15/2026 | | | | 800,000 | | | | 731,231 | | | | 747,276 | |
Avery Point CLO Ltd. 2014-1 AE^ | | | 4.88 | # | | | 4/25/2026 | | | | 500,000 | | | | 461,217 | | | | 441,101 | |
BlueMountain CLO Ltd.^ | | | Zero Coupon | | | | 4/30/2026 | | | | 250,000 | | | | 238,762 | | | | 200,149 | |
Carlyle Global Market Strategies CLO 2013-3 Ltd.^ | | | 4.85 | # | | | 7/15/2025 | | | | 500,000 | | | | 457,710 | | | | 457,341 | |
Carlyle Global Market Strategies CLO 2013-4 Ltd.^ | | | 4.75 | # | | | 10/15/2025 | | | | 500,000 | | | | 462,990 | | | | 457,222 | |
Carlyle Global Market Strategies CLO 2013-4 Ltd.^ | | | 5.45 | # | | | 10/15/2025 | | | | 500,000 | | | | 455,271 | | | | 423,363 | |
Carlyle Global Market Strategies CLO 2014-1 Ltd.^ | | | 4.72 | # | | | 4/17/2025 | | | | 500,000 | | | | 447,087 | | | | 453,308 | |
Dryden XXXI Senior Loan Fund^ | | | 4.51 | # | | | 4/18/2026 | | | | 1,000,000 | | | | 891,308 | | | | 883,819 | |
Dryden XXXI Senior Loan Fund^ | | | 5.61 | # | | | 4/18/2026 | | | | 500,000 | | | | 461,311 | | | | 412,069 | |
Eaton Vance CLO 2013-1 Ltd.^ | | | 5.26 | # | | | 11/13/2024 | | | | 500,000 | | | | 465,238 | | | | 466,605 | |
GoldenTree Loan Opportunities VII Ltd.^ | | | 5.51 | # | | | 4/25/2025 | | | | 500,000 | | | | 466,866 | | | | 433,377 | |
LCM XIII LP^ | | | 5.11 | # | | | 1/19/2023 | | | | 750,000 | | | | 702,854 | | | | 706,815 | |
LCM XV LP^ | | | 4.71 | # | | | 8/25/2024 | | | | 500,000 | | | | 467,184 | | | | 451,859 | |
LCM XVII LP^ | | | 5.02 | # | | | 10/15/2026 | | | | 500,000 | | | | 450,940 | | | | 457,177 | |
Newhaven CLO Ltd.+^ | | | 5.19 | # | | | 11/15/2028 | | | | 500,000 | | | | 619,360 | | | | 537,954 | |
Oak Hill Credit Partners X Ltd.^ | | | Zero Coupon | | | | 7/20/2026 | | | | 500,000 | | | | 449,138 | | | | 384,808 | |
OHA Credit Partners IX Ltd.^ | | | 5.28 | # | | | 10/20/2025 | | | | 500,000 | | | | 468,255 | | | | 472,566 | |
Pinnacle Park CLO Ltd.^ | | | 5.20 | # | | | 4/15/2026 | | | | 500,000 | | | | 469,792 | | | | 465,909 | |
Seneca Park CLO Ltd.^ | | | 4.96 | # | | | 7/17/2026 | | | | 1,020,000 | | | | 927,562 | | | | 935,585 | |
Silver Spring CLO Ltd.^ | | | 5.16 | # | | | 10/15/2026 | | | | 1,000,000 | | | | 904,874 | | | | 861,314 | |
Tryon Park CLO Ltd.^ | | | 4.65 | # | | | 7/15/2025 | | | | 500,000 | | | | 463,736 | | | | 456,584 | |
Voya CLO 2013-2 Ltd.^ | | | 5.76 | # | | | 4/25/2025 | | | | 500,000 | | | | 466,449 | | | | 429,757 | |
Voya CLO 2013-3 Ltd.^ | | | 4.76 | # | | | 1/18/2026 | | | | 750,000 | | | | 675,717 | | | | 675,579 | |
Voya CLO 2014-3 Ltd.^ | | | 5.28 | # | | | 7/25/2026 | | | | 500,000 | | | | 457,168 | | | | 462,406 | |
| | | | | | | | | | | | | | | | | | | | |
Total CDO/CLO | | | | 15,070,000 | | | | 13,972,725 | | | | 13,514,752 | |
| | | | | | | | | | | | | | | | | | | | |
| | | | | | | | | | | | | | | | | | | | |
Total Asset-Backed Securities | | | | 15,070,000 | | | | 13,972,725 | | | | 13,514,752 | |
| | | | | | | | | | | | | | | | | | | | |
|
Bank Loans — 28.9%*§: | |
|
Automobile — 1.0%*: | |
RAC Finance (Holdings) Ltd.+ | | | 8.25 | | | | 12/17/2022 | | | | 500,000 | | | | 791,319 | | | | 790,048 | |
| | | | | | | | | | | | | | | | | | | | |
|
Beverage, Food and Tobacco — 1.0%*: | |
Deoleo SA+ | | | 4.50 | | | | 6/11/2021 | | | | 500,000 | | | | 552,606 | | | | 541,098 | |
Telepizza SA+ | | | 7.00 | | | | 10/20/2020 | | | | 250,000 | | | | 315,291 | | | | 277,608 | |
| | | | | | | | | | | | | | | | | | | | |
Total Beverage, Food and Tobacco | | | | 750,000 | | | | 867,897 | | | | 818,706 | |
| | | | | | | | | | | | | | | | | | | | |
See accompanying Notes to Financial Statements.
34
Babson Global Credit Income Opportunities Fund 2015 Annual Report
SCHEDULE OF INVESTMENTS (CONTINUED)
June 30, 2015
| | | | | | | | | | | | | | | | | | | | |
| | | EFFECTIVE
INTEREST RATE | | | DUE DATE | | | PRINCIPAL ‡‡ | | | COST | | | FAIR
VALUE | |
Bank Loans (Continued) | |
|
Broadcasting and Entertainment — 0.9%*: | |
All3Media International+ | | | 5.25 | % | | | 6/30/2021 | | | | 500,000 | | | | $834,051 | | | | $779,175 | |
| | | | | | | | | | | | | | | | | | | | |
|
Buildings and Real Estate — 0.4%*: | |
Alison Bidco Sarl+ | | | 5.50 | | | | 8/29/2021 | | | | 147,514 | | | | 146,209 | | | | 142,720 | |
Jeld-Wen, Inc. | | | 5.25 | | | | 10/15/2021 | | | | 218,418 | | | | 216,448 | | | | 218,828 | |
| | | | | | | | | | | | | | | | | | | | |
Total Buildings and Real Estate | | | | 365,932 | | | | 362,657 | | | | 361,548 | |
| | | | | | | | | | | | | | | | | | | | |
|
Cargo Transport — 0.9%*: | |
Direct ChassisLink, Inc.¤ | | | 8.25 | | | | 11/12/2019 | | | | 492,857 | | | | 487,416 | | | | 483,000 | |
Direct ChassisLink, Inc. (Add-On Facility)¤ | | | 8.25 | | | | 11/12/2019 | | | | 251,587 | | | | 251,587 | | | | 246,555 | |
| | | | | | | | | | | | | | | | | | | | |
Total Cargo Transport | | | | 744,444 | | | | 739,003 | | | | 729,555 | |
| | | | | | | | | | | | | | | | | | | | |
|
Chemicals, Plastics and Rubber — 1.3%*: | |
Methanol Holdings (Trinidad) Ltd. | | | 4.25 | | | | 6/2/2022 | | | | 352,490 | | | | 348,965 | | | | 348,965 | |
Styrolution Group GmbH+ | | | 6.50 | | | | 11/7/2019 | | | | 497,500 | | | | 612,246 | | | | 556,890 | |
Univar, Inc. | | | 4.50 | | | | 6/30/2022 | | | | 150,675 | | | | 149,922 | | | | 150,440 | |
| | | | | | | | | | | | | | | | | | | | |
Total Chemicals, Plastics and Rubber | | | | 1,000,665 | | | | 1,111,133 | | | | 1,056,295 | |
| | | | | | | | | | | | | | | | | | | | |
|
Containers, Packaging and Glass — 1.3%*: | |
Consolidated Container Co. LLC | | | 7.75 | | | | 1/3/2020 | | | | 94,140 | | | | 92,599 | | | | 87,550 | |
Coveris | | | 4.50 | | | | 5/8/2019 | | | | 492,500 | | | | 677,167 | | | | 549,063 | |
Hilex Poly Co. LLC | | | 6.00 | | | | 12/5/2021 | | | | 191,958 | | | | 190,183 | | | | 192,999 | |
Onex Wizard US Acquisition, Inc.+ | | | 4.25 | | | | 3/13/2022 | | | | 210,395 | | | | 209,386 | | | | 210,027 | |
| | | | | | | | | | | | | | | | | | | | |
Total Containers, Packaging and Glass | | | | 988,993 | | | | 1,169,335 | | | | 1,039,639 | |
| | | | | | | | | | | | | | | | | | | | |
|
Diversified/Conglomerate Manufacturing — 1.3%*: | |
Capital Safety North America Holdings, Inc. | | | 3.75 | | | | 3/29/2021 | | | | 485,750 | | | | 484,103 | | | | 484,332 | |
Capital Safety North America Holdings, Inc. | | | 6.50 | | | | 3/28/2022 | | | | 125,831 | | | | 125,696 | | | | 126,774 | |
Quality Home Brands Holdings LLC | | | 7.75 | | | | 5/25/2018 | | | | 129,859 | | | | 128,995 | | | | 130,021 | |
West Corp. | | | 2.53 | | | | 7/1/2019 | | | | 366,003 | | | | 354,581 | | | | 355,023 | |
| | | | | | | | | | | | | | | | | | | | |
Total Diversified/Conglomerate Manufacturing | | | | 1,107,443 | | | | 1,093,375 | | | | 1,096,150 | |
| | | | | | | | | | | | | | | | | | | | |
|
Diversified/Conglomerate Service — 2.7%*: | |
Aquilex Holdings LLC | | | 5.00 | | | | 12/31/2020 | | | | 98,570 | | | | 98,374 | | | | 98,324 | |
Atrium Innovations, Inc.+ | | | 4.25 | | | | 2/13/2021 | | | | 464,051 | | | | 462,647 | | | | 450,129 | |
MH Sub I LLC | | | 4.75 | | | | 7/8/2021 | | | | 182,552 | | | | 181,646 | | | | 182,039 | |
MH Sub I LLC | | | 8.50 | | | | 7/8/2022 | | | | 150,000 | | | | 148,679 | | | | 147,750 | |
Power Team Services LLC | | | 8.25 | | | | 11/6/2020 | | | | 300,000 | | | | 298,816 | | | | 295,500 | |
RP Crown Parent LLC | | | 6.00 | | | | 12/21/2018 | | | | 548,203 | | | | 549,858 | | | | 525,934 | |
RP Crown Parent LLC | | | 11.25 | | | | 12/20/2019 | | | | 178,571 | | | | 183,005 | | | | 163,616 | |
Triple Point Technology, Inc. | | | 5.25 | | | | 7/10/2020 | | | | 341,331 | | | | 316,095 | | | | 306,345 | |
Triple Point Technology, Inc.†† | | | 9.25 | | | | 7/10/2021 | | | | 50,846 | | | | 47,339 | | | | 42,710 | |
| | | | | | | | | | | | | | | | | | | | |
Total Diversified/Conglomerate Service | | | | 2,314,124 | | | | 2,286,459 | | | | 2,212,347 | |
| | | | | | | | | | | | | | | | | | | | |
See accompanying Notes to Financial Statements.
35
Babson Global Credit Income Opportunities Fund 2015 Annual Report
SCHEDULE OF INVESTMENTS (CONTINUED)
June 30, 2015
| | | | | | | | | | | | | | | | | | | | |
| | | EFFECTIVE
INTEREST RATE | | | DUE DATE | | | PRINCIPAL ‡‡ | | | COST | | | FAIR
VALUE | |
Bank Loans (Continued) | |
|
Ecological — 0.2%*: | |
Emerald 3 Ltd.+ | | | 8.00 | % | | | 5/31/2022 | | | | 196,488 | | | | $194,751 | | | | $195,997 | |
| | | | | | | | | | | | | | | | | | | | |
|
Electronics — 0.2%*: | |
SS&C Technologies, Inc. | | | 4.00 | | | | 6/23/2022 | | | | 31,918 | | | | 31,759 | | | | 31,899 | |
SS&C Technologies, Inc. | | | 4.00 | | | | 6/23/2022 | | | | 141,686 | | | | 140,977 | | | | 141,598 | |
| | | | | | | | | | | | | | | | | | | | |
Total Electronics | | | | 173,604 | | | | 172,736 | | | | 173,497 | |
| | | | | | | | | | | | | | | | | | | | |
|
Finance — 2.3%*: | |
AssuredPartners Capital, Inc. | | | 7.75 | | | | 4/2/2022 | | | | 68,261 | | | | 67,681 | | | | 67,151 | |
Confie Seguros Holdings II Co. | | | 5.75 | | | | 11/9/2018 | | | | 224,949 | | | | 224,205 | | | | 224,854 | |
First Data Corp. | | | 3.94 | | | | 6/23/2022 | | | | 246,959 | | | | 245,725 | | | | 245,725 | |
Intertrust Group Holding B.V.+ | | | 8.00 | | | | 4/16/2022 | | | | 96,225 | | | | 95,607 | | | | 95,696 | |
Moneygram International, Inc. | | | 4.25 | | | | 3/27/2020 | | | | 639,168 | | | | 602,919 | | | | 606,679 | |
P2 Newco Acquisition, Inc. | | | 9.50 | | | | 10/22/2021 | | | | 103,373 | | | | 102,554 | | | | 102,856 | |
Sedgwick, Inc. | | | 3.75 | | | | 3/1/2021 | | | | 294,918 | | | | 294,320 | | | | 289,967 | |
VFH Parent LLC | | | 5.25 | | | | 11/6/2019 | | | | 213,434 | | | | 212,547 | | | | 213,968 | |
| | | | | | | | | | | | | | | | | | | | |
Total Finance | | | | 1,887,287 | | | | 1,845,558 | | | | 1,846,896 | |
| | | | | | | | | | | | | | | | | | | | |
|
Healthcare, Education and Childcare — 1.8%*: | |
Endo Luxembourg Finance Co. I Sarl | | | 3.75 | | | | 6/11/2022 | | | | 164,854 | | | | 164,442 | | | | 165,164 | |
RPI Finance Trust | | | 3.50 | | | | 11/9/2020 | | | | 227,537 | | | | 227,537 | | | | 227,678 | |
Synarc-Biocore Holdings LLC | | | 5.50 | | | | 3/10/2021 | | | | 395,870 | | | | 392,633 | | | | 385,973 | |
Synarc-Biocore Holdings LLC | | | 9.25 | | | | 3/10/2022 | | | | 500,000 | | | | 495,798 | | | | 455,000 | |
Tecomet, Inc. | | | 5.75 | | | | 12/5/2021 | | | | 208,807 | | | | 202,982 | | | | 205,414 | |
| | | | | | | | | | | | | | | | | | | | |
Total Healthcare, Education and Childcare | | | | | | | | | | | 1,497,068 | | | | 1,483,392 | | | | 1,439,229 | |
| | | | | | | | | | | | | | | | | | | | |
| | |
Leisure, Amusement, Entertainment — 0.9%*: | | | | | | | | | |
AP NMT Acquisition B.V.+ | | | 7.00 | | | | 8/13/2021 | | | | 403,285 | | | | 490,083 | | | | 448,105 | |
AP NMT Acquisition B.V.+ | | | 10.00 | | | | 8/13/2022 | | | | 300,000 | | | | 278,490 | | | | 287,625 | |
| | | | | | | | | | | | | | | | | | | | |
Total Leisure, Amusement, Entertainment | | | | | | | | | | | 703,285 | | | | 768,573 | | | | 735,730 | |
| | | | | | | | | | | | | | | | | | | | |
| | |
Machinery Non-Agriculture, Non-Construction, Non-Electronic — 0.9%*: | | | | | | | | | |
Gardner Denver, Inc. | | | 4.25 | | | | 7/30/2020 | | | | 496,212 | | | | 487,902 | | | | 483,326 | |
Husky Injection Molding Systems Ltd.+ | | | 7.25 | | | | 6/30/2022 | | | | 217,593 | | | | 213,066 | | | | 214,601 | |
TCH-2 Holding LLC | | | 5.50 | | | | 5/6/2021 | | | | 54,086 | | | | 53,631 | | | | 53,883 | |
| | | | | | | | | | | | | | | | | | | | |
Total Machinery Non-Agriculture, Non-Construction, Non-Electronic | | | | | | | | | | | 767,891 | | | | 754,599 | | | | 751,810 | |
| | | | | | | | | | | | | | | | | | | | |
| | |
Mining, Steel, Iron and Non-Precious Metals — 1.0%*: | | | | | | | | | |
Arch Coal, Inc. | | | 6.25 | | | | 5/16/2018 | | | | 742,364 | | | | 733,523 | | | | 505,275 | |
Boomerang Tube LLC††~ | | | 11.00 | | | | 10/11/2017 | | | | 249,123 | | | | 245,561 | | | | 125,807 | |
Murray Energy Corp. | | | 7.50 | | | | 4/16/2020 | | | | 199,844 | | | | 194,029 | | | | 184,824 | |
| | | | | | | | | | | | | | | | | | | | |
Total Mining, Steel, Iron and Non-Precious Metals | | | | | | | | | | | 1,191,331 | | | | 1,173,113 | | | | 815,906 | |
| | | | | | | | | | | | | | | | | | | | |
See accompanying Notes to Financial Statements.
36
Babson Global Credit Income Opportunities Fund 2015 Annual Report
SCHEDULE OF INVESTMENTS (CONTINUED)
June 30, 2015
| | | | | | | | | | | | | | | | | | | | |
| | | EFFECTIVE
INTEREST RATE | | | DUE DATE | | | PRINCIPAL ‡‡ | | | COST | | | FAIR
VALUE | |
Bank Loans (Continued) | |
| | |
Oil and Gas — 3.3%*: | | | | | | | | | |
American Energy—Marcellus LLC | | | 8.50 | % | | | 8/4/2021 | | | | 60,369 | | | | $59,578 | | | | $32,398 | |
Caelus Energy Alaska O3 LLC | | | 8.75 | | | | 4/15/2020 | | | | 846,154 | | | | 755,361 | | | | 685,385 | |
CITGO Holding, Inc. | | | 9.50 | | | | 5/12/2018 | | | | 138,565 | | | | 131,183 | | | | 138,843 | |
Drillships Ocean Ventures, Inc. | | | 5.50 | | | | 7/25/2021 | | | | 126,663 | | | | 125,559 | | | | 107,505 | |
Fieldwood Energy LLC | | | 8.38 | | | | 9/30/2020 | | | | 1,124,231 | | | | 825,259 | | | | 858,631 | |
Floatel International Ltd. | | | 6.00 | | | | 6/27/2020 | | | | 203,234 | | | | 201,520 | | | | 160,555 | |
Jonah Energy LLC | | | 7.50 | | | | 5/12/2021 | | | | 173,566 | | | | 171,379 | | | | 164,020 | |
Paragon Offshore Finance Co.+ | | | 3.75 | | | | 7/18/2021 | | | | 482,303 | | | | 375,222 | | | | 349,670 | |
Seadrill Partners Finco LLC | | | 4.00 | | | | 2/21/2021 | | | | 129,018 | | | | 102,383 | | | | 97,167 | |
Southcross Holdings Borrower LP | | | 6.00 | | | | 8/4/2021 | | | | 72,979 | | | | 72,660 | | | | 70,790 | |
| | | | | | | | | | | | | | | | | | | | |
Total Oil and Gas | | | | | | | | | | | 3,357,082 | | | | 2,820,104 | | | | 2,664,964 | |
| | | | | | | | | | | | | | | | | | | | |
| | |
Printing and Publishing — 1.7%*: | | | | | | | | | |
Cengage Learning Acquisitions, Inc. | | | 7.00 | | | | 3/31/2020 | | | | 548,865 | | | | 546,243 | | | | 548,865 | |
Eden Bidco Ltd.+ | | | 6.00 | | | | 4/28/2022 | | | | 500,000 | | | | 523,810 | | | | 553,244 | |
Houghton Mifflin Harcourt Publishing Co. | | | 4.00 | | | | 5/31/2021 | | | | 132,829 | | | | 132,169 | | | | 132,165 | |
R.H. Donnelley, Inc. | | | 9.75 | | | | 12/31/2016 | | | | 103,399 | | | | 82,095 | | | | 51,010 | |
SuperMedia, Inc. | | | 11.60 | | | | 12/30/2016 | | | | 225,663 | | | | 196,485 | | | | 133,705 | |
| | | | | | | | | | | | | | | | | | | | |
Total Printing and Publishing | | | | | | | | | | | 1,510,756 | | | | 1,480,802 | | | | 1,418,989 | |
| | | | | | | | | | | | | | | | | | | | |
| | |
Retail Stores — 2.0%*: | | | | | | | | | |
Bass Pro Group LLC | | | 4.00 | | | | 6/5/2020 | | | | 179,357 | | | | 178,911 | | | | 179,166 | |
J. Crew Group, Inc. | | | 4.00 | | | | 3/5/2021 | | | | 498,741 | | | | 468,144 | | | | 429,261 | |
Maxeda DIY B.V.+ | | | 5.28 | | | | 6/29/2017 | | | | 500,000 | | | | 556,683 | | | | 529,932 | |
Maxeda DIY B.V.+ | | | 8.50 | | | | 6/30/2018 | | | | 602,231 | | | | 724,213 | | | | 369,268 | |
Staples, Inc. | | | 3.50 | | | | 4/7/2021 | | | | 163,843 | | | | 163,023 | | | | 163,468 | |
| | | | | | | | | | | | | | | | | | | | |
Total Retail Stores | | | | | | | | | | | 1,944,172 | | | | 2,090,974 | | | | 1,671,095 | |
| | | | | | | | | | | | | | | | | | | | |
| | |
Telecommunications — 3.3%*: | | | | | | | | | |
Altice Financing SA+ | | | 5.50 | | | | 7/2/2019 | | | | 759,115 | | | | 760,003 | | | | 764,619 | |
Eircom Finco Sarl+ | | | 4.78 | | | | 9/30/2019 | | | | 494,160 | | | | 657,581 | | | | 539,107 | |
ION Trading Technologies Ltd. | | | 1.00 | | | | 6/16/2021 | | | | 349,059 | | | | 345,569 | | | | 345,569 | |
ION Trading Technologies Sarl+ | | | 7.25 | | | | 6/10/2022 | | | | 894,762 | | | | 888,780 | | | | 892,525 | |
SBA Senior Finance II LLC | | | 3.25 | | | | 6/1/2022 | | | | 137,594 | | | | 136,221 | | | | 135,961 | |
| | | | | | | | | | | | | | | | | | | | |
Total Telecommunications | | | | | | | | | | | 2,634,690 | | | | 2,788,154 | | | | 2,677,781 | |
| | | | | | | | | | | | | | | | | | | | |
|
Utilities — 0.5%*: | |
Texas Competitive Electric Holdings Co. LLC | | | 4.67 | | | | 10/10/2017 | | | | 650,000 | | | | 533,851 | | | | 372,645 | |
| | | | | | | | | | | | | | | | | | | | |
Total Bank Loans | | | | | | | | | | | 24,785,255 | | | | 25,361,836 | | | | 23,648,002 | |
| | | | | | | | | | | | | | | | | | | | |
| | | | | |
Corporate Bonds — 46.5%*: | | | | | | | | | | | | | | | | | | | | |
|
Aerospace and Defense — 0.9%*: | |
CPI International, Inc. | | | 8.75 | | | | 2/15/2018 | | | | 387,000 | | | | 396,756 | | | | 395,707 | |
TransDigm, Inc. | | | 6.50 | | | | 7/15/2024 | | | | 315,000 | | | | 315,000 | | | | 311,063 | |
| | | | | | | | | | | | | | | | | | | | |
Total Aerospace and Defense | | | | | | | | | | | 702,000 | | | | 711,756 | | | | 706,770 | |
| | | | | | | | | | | | | | | | | | | | |
See accompanying Notes to Financial Statements.
37
Babson Global Credit Income Opportunities Fund 2015 Annual Report
SCHEDULE OF INVESTMENTS (CONTINUED)
June 30, 2015
| | | | | | | | | | | | | | | | | | | | |
| | | EFFECTIVE
INTEREST RATE | | | DUE DATE | | | PRINCIPAL ‡‡ | | | COST | | | FAIR
VALUE | |
Corporate Bonds (Continued) | |
|
Automobile — 3.1%*: | |
Allied Specialty Vehicles, Inc.^ | | | 8.50 | % | | | 11/1/2019 | | | | 1,000,000 | | | | $1,028,015 | | | | $1,040,000 | |
International Automotive Components Group SA^ | | | 9.13 | | | | 6/1/2018 | | | | 940,000 | | | | 963,841 | | | | 958,800 | |
JB Poindexter & Co., Inc.^ | | | 9.00 | | | | 4/1/2022 | | | | 500,000 | | | | 524,251 | | | | 535,000 | |
| | | | | | | | | | | | | | | | | | | | |
Total Automobile | | | | | | | | | | | 2,440,000 | | | | 2,516,107 | | | | 2,533,800 | |
| | | | | | | | | | | | | | | | | | | | |
|
Banking — 0.4%*: | |
Lock AS+ | | | 7.00 | | | | 8/15/2021 | | | | 250,000 | | | | 335,562 | | | | 294,041 | |
| | | | | | | | | | | | | | | | | | | | |
|
Beverage, Food and Tobacco — 1.2%*: | |
Dean Foods Co.^ | | | 6.50 | | | | 3/15/2023 | | | | 291,000 | | | | 291,000 | | | | 296,820 | |
EWOS Holding AS+ | | | 6.75 | | | | 11/1/2020 | | | | 200,000 | | | | 273,839 | | | | 221,298 | |
Findus Bondco SA+ | | | 9.13 | | | | 7/1/2018 | | | | 200,000 | | | | 291,224 | | | | 233,561 | |
Twinkle Pizza PLC+ | | | 6.63 | | | | 8/1/2021 | | | | 150,000 | | | | 254,595 | | | | 243,276 | |
| | | | | | | | | | | | | | | | | | | | |
Total Beverage, Food and Tobacco | | | | | | | | | | | 841,000 | | | | 1,110,658 | | | | 994,955 | |
| | | | | | | | | | | | | | | | | | | | |
|
Broadcasting and Entertainment — 3.3%*: | |
Harron Communications LP/Harron Finance Corp.^ | | | 9.13 | | | | 4/1/2020 | | | | 500,000 | | | | 541,099 | | | | 540,625 | |
RCN Telecom Services LLC/RCN Capital Corp.^ | | | 8.50 | | | | 8/15/2020 | | | | 775,000 | | | | 777,921 | | | | 811,813 | |
Sirius XM Radio, Inc.^ | | | 5.38 | | | | 4/15/2025 | | | | 959,000 | | | | 959,000 | | | | 925,435 | |
Unitymedia GmbH+ | | | 3.75 | | | | 1/15/2027 | | | | 300,000 | | | | 335,460 | | | | 322,749 | |
Unitymedia Hessen GmbH & Co. KG/Unitymedia NRW GmbH+ | | | 6.25 | | | | 1/15/2029 | | | | 100,000 | | | | 133,825 | | | | 125,281 | |
| | | | | | | | | | | | | | | | | | | | |
Total Broadcasting and Entertainment | | | | | | | | | | | 2,634,000 | | | | 2,747,305 | | | | 2,725,903 | |
| | | | | | | | | | | | | | | | | | | | |
|
Buildings and Real Estate — 1.5%*: | |
Deutsche Raststaetten Gruppe IV GmbH+ | | | 6.75 | | | | 12/30/2020 | | | | 100,000 | | | | 135,605 | | | | 119,289 | |
Keystone Financing PLC+ | | | 9.50 | | | | 10/15/2019 | | | | 350,000 | | | | 563,603 | | | | 576,747 | |
Paroc Group Oy+ | | | 5.24 | # | | | 5/15/2020 | | | | 100,000 | | | | 137,565 | | | | 105,799 | |
Paroc Group Oy+ | | | 6.25 | | | | 5/15/2020 | | | | 100,000 | | | | 137,565 | | | | 109,556 | |
Roofing Supply Group LLC/Roofing Supply Finance, Inc.^ | | | 10.00 | | | | 6/1/2020 | | | | 271,000 | | | | 290,623 | | | | 277,098 | |
| | | | | | | | | | | | | | | | | | | | |
Total Buildings and Real Estate | | | | | | | | | | | 921,000 | | | | 1,264,961 | | | | 1,188,489 | |
| | | | | | | | | | | | | | | | | | | | |
|
Cargo Transport — 1.9%*: | |
Kenan Advantage Group, Inc. (The)^ | | | 8.38 | | | | 12/15/2018 | | | | 1,000,000 | | | | 1,037,765 | | | | 1,041,250 | |
Moto Finance PLC+ | | | 6.38 | | | | 9/1/2020 | | | | 200,000 | | | | 301,036 | | | | 320,535 | |
WFS Global Holding SAS+ | | | 9.50 | | | | 7/15/2022 | | | | 150,000 | | | | 170,153 | | | | 168,900 | |
| | | | | | | | | | | | | | | | | | | | |
Total Cargo Transport | | | | | | | | | | | 1,350,000 | | | | 1,508,954 | | | | 1,530,685 | |
| | | | | | | | | | | | | | | | | | | | |
|
Chemicals, Plastics and Rubber — 2.4%*: | |
A. Schulman, Inc.^ | | | 6.88 | | | | 6/1/2023 | | | | 257,000 | | | | 257,000 | | | | 262,140 | |
Ineos Finance PLC+ | | | 4.00 | | | | 5/1/2023 | | | | 400,000 | | | | 433,020 | | | | 423,679 | |
See accompanying Notes to Financial Statements.
38
Babson Global Credit Income Opportunities Fund 2015 Annual Report
SCHEDULE OF INVESTMENTS (CONTINUED)
June 30, 2015
| | | | | | | | | | | | | | | | | | | | |
| | | EFFECTIVE
INTEREST RATE | | | DUE DATE | | | PRINCIPAL ‡‡ | | | COST | | | FAIR
VALUE | |
Corporate Bonds (Continued) | |
|
Chemicals, Plastics and Rubber (Continued) | |
Monitchem HoldCo 3 SA+ | | | 5.25 | % | | | 6/15/2021 | | | | 150,000 | | | | $183,938 | | | | $168,080 | |
OMNOVA Solutions, Inc. | | | 7.88 | | | | 11/1/2018 | | | | 500,000 | | | | 513,853 | | | | 500,000 | |
Pinnacle Operating Corp.^ | | | 9.00 | | | | 11/15/2020 | | | | 600,000 | | | | 615,682 | | | | 595,500 | |
| | | | | | | | | | | | | | | | | | | | |
Total Chemicals, Plastics and Rubber | | | | | | | | | | | 1,907,000 | | | | 2,003,493 | | | | 1,949,399 | |
| | | | | | | | | | | | | | | | | | | | |
| | |
Containers, Packaging and Glass — 3.3%*: | | | | | | | | | |
Ardagh Finance Holdings SA PIK^ | | | 8.63 | | | | 6/15/2019 | | | | 359,323 | | | | 356,604 | | | | 371,899 | |
Coveris Holdings SA^ | | | 7.88 | | | | 11/1/2019 | | | | 900,000 | | | | 903,112 | | | | 895,500 | |
Innovia Group Finance PLC+ | | | 4.99 | # | | | 3/31/2020 | | | | 100,000 | | | | 136,098 | | | | 110,593 | |
Mustang Merger Corp.^ | | | 8.50 | | | | 8/15/2021 | | | | 750,000 | | | | 746,116 | | | | 761,250 | |
ProGroup AG+ | | | 5.13 | | | | 5/1/2022 | | | | 100,000 | | | | 108,255 | | | | 113,715 | |
SIG Combibloc Holdings SCA+ | | | 7.75 | | | | 2/15/2023 | | | | 400,000 | | | | 459,340 | | | | 464,090 | |
| | | | | | | | | | | | | | | | | | | | |
Total Containers, Packaging and Glass | | | | | | | | | | | 2,609,323 | | | | 2,709,525 | | | | 2,717,047 | |
| | | | | | | | | | | | | | | | | | | | |
| | |
Diversified Natural Resources, Precious Metals and Minerals — 0.1%*: | | | | | | | | | |
Cemex SAB de CV+ | | | 4.38 | | | | 3/5/2023 | | | | 100,000 | | | | 111,980 | | | | 107,165 | |
| | | | | | | | | | | | | | | | | | | | |
| | |
Diversified/Conglomerate Manufacturing — 1.5%*: | | | | | | | | | |
Appvion, Inc.^ | | | 9.00 | | | | 6/1/2020 | | | | 500,000 | | | | 512,945 | | | | 315,000 | |
CTP Transportation Products LLC/CTP Finance, Inc.^ | | | 8.25 | | | | 12/15/2019 | | | | 448,000 | | | | 458,465 | | | | 463,680 | |
Galapagos SA+ | | | 5.38 | | | | 6/15/2021 | | | | 175,000 | | | | 219,269 | | | | 195,512 | |
West Corp.^ | | | 5.38 | | | | 7/15/2022 | | | | 250,000 | | | | 238,217 | | | | 233,750 | |
| | | | | | | | | | | | | | | | | | | | |
Total Diversified/Conglomerate Manufacturing | | | | | | | | 1,373,000 | | | | 1,428,896 | | | | 1,207,942 | |
| | | | | | | | | | | | | | | | | | | | |
| | |
Diversified/Conglomerate Service — 1.3%*: | | | | | | | | | |
Carlson Travel Holdings, Inc. PIK^ | | | 7.50 | | | | 8/15/2019 | | | | 665,000 | | | | 674,250 | | | | 674,975 | |
Zachry Holdings, Inc.^ | | | 7.50 | | | | 2/1/2020 | | | | 391,000 | | | | 392,460 | | | | 389,045 | |
| | | | | | | | | | | | | | | | | | | | |
Total Diversified/Conglomerate Service | | | | | | | | | | | 1,056,000 | | | | 1,066,710 | | | | 1,064,020 | |
| | | | | | | | | | | | | | | | | | | | |
| | |
Electronics — 0.2%*: | | | | | | | | | |
SS&C Technologies Holdings, Inc.^ | | | 5.88 | | | | 7/15/2023 | | | | 166,000 | | | | 166,000 | | | | 167,660 | |
| | | | | | | | | | | | | | | | | | | | |
| | |
Finance — 2.4%*: | | | | | | | | | |
Arrow Global Finance PLC+ | | | 5.24 | # | | | 11/1/2021 | | | | 100,000 | | | | 123,118 | | | | 112,265 | |
Cabot Financial Luxembourg SA+ | | | 10.38 | | | | 10/1/2019 | | | | 100,000 | | | | 173,823 | | | | 170,984 | |
Equiniti Newco 2 PLC+ | | | 7.13 | | | | 12/15/2018 | | | | 200,000 | | | | 314,474 | | | | 315,821 | |
Galaxy Bidco Ltd.+ | | | 6.38 | | | | 11/15/2020 | | | | 100,000 | | | | 161,665 | | | | 157,321 | |
Galaxy Finco Ltd.+ | | | 7.88 | | | | 11/15/2021 | | | | 100,000 | | | | 165,396 | | | | 155,213 | |
Lowell Group Financing PLC+ | | | 5.88 | | | | 4/1/2019 | | | | 100,000 | | | | 166,730 | | | | 152,443 | |
National Financial Partners Corp.^ | | | 9.00 | | | | 7/15/2021 | | | | 279,000 | | | | 277,628 | | | | 275,513 | |
TMF Group Holding B.V.+ | | | 9.88 | | | | 12/1/2019 | | | | 500,000 | | | | 717,174 | | | | 595,374 | |
| | | | | | | | | | | | | | | | | | | | |
Total Finance | | | | | | | | | | | 1,479,000 | | | | 2,100,008 | | | | 1,934,934 | |
| | | | | | | | | | | | | | | | | | | | |
See accompanying Notes to Financial Statements.
39
Babson Global Credit Income Opportunities Fund 2015 Annual Report
SCHEDULE OF INVESTMENTS (CONTINUED)
June 30, 2015
| | | | | | | | | | | | | | | | | | | | |
| | | EFFECTIVE
INTEREST RATE | | | DUE DATE | | | PRINCIPAL ‡‡ | | | COST | | | FAIR
VALUE | |
Corporate Bonds (Continued) | |
| | |
Grocery — 0.4%*: | | | | | | | | | |
Premier Foods PLC+ | | | 6.50 | % | | | 3/15/2021 | | | | 200,000 | | | | $339,387 | | | | $295,709 | |
| | | | | | | | | | | | | | | | | | | | |
| | |
Healthcare, Education and Childcare — 5.5%*: | | | | | | | | | |
Alere, Inc.^ | | | 6.38 | | | | 7/1/2023 | | | | 490,000 | | | | 490,000 | | | | 498,575 | |
BioScrip, Inc. | | | 8.88 | | | | 2/15/2021 | | | | 410,000 | | | | 423,779 | | | | 348,500 | |
Care UK Health & Social Care PLC+ | | | 5.57 | # | | | 7/15/2019 | | | | 100,000 | | | | 152,699 | | | | 152,411 | |
Cerberus Nightingale 1 Sarl+ | | | 8.25 | | | | 2/1/2020 | | | | 300,000 | | | | 342,042 | | | | 339,472 | |
HomeVi SAS+ | | | 6.88 | | | | 8/15/2021 | | | | 250,000 | | | | 334,500 | | | | 291,673 | |
Priory Group No. 3 PLC+ | | | 8.88 | | | | 2/15/2019 | | | | 500,000 | | | | 806,718 | | | | 813,122 | |
Surgical Care Affiliates, Inc.^ | | | 6.00 | | | | 4/1/2023 | | | | 406,000 | | | | 406,000 | | | | 406,000 | |
Tenet Healthcare Corp.^ | | | 3.79 | # | | | 6/15/2020 | | | | 750,000 | | | | 746,278 | | | | 756,562 | |
Tenet Healthcare Corp.^ | | | 6.75 | | | | 6/15/2023 | | | | 294,000 | | | | 292,536 | | | | 299,880 | |
Unilabs Subholding AB+ | | | 8.50 | | | | 7/15/2018 | | | | 200,000 | | | | 284,664 | | | | 231,220 | |
VRX Escrow Corp.^ | | | 6.13 | | | | 4/15/2025 | | | | 339,000 | | | | 339,000 | | | | 348,746 | |
| | | | | | | | | | | | | | | | | | | | |
Total Healthcare, Education and Childcare | | | | 4,039,000 | | | | 4,618,216 | | | | 4,486,161 | |
| | | | | | | | | | | | | | | | | | | | |
|
Hotels, Motels, Inns and Gaming — 0.2%*: | |
Gala Electric Casinos PLC+ | | | 11.50 | | | | 6/1/2019 | | | | 100,000 | | | | 176,735 | | | | 167,102 | |
| | | | | | | | | | | | | | | | | | | | |
|
Insurance — 0.7%*: | |
Hastings Insurance Group Finance PLC+ | | | 8.00 | | | | 10/21/2020 | | | | 100,000 | | | | 159,915 | | | | 166,523 | |
TIG Finco PLC+ | | | 8.50 | # | | | 3/2/2020 | | | | 15,734 | | | | 25,272 | | | | 25,958 | |
TIG Finco PLC+^ | | | 8.75 | | | | 4/2/2020 | | | | 266,163 | | | | 409,278 | | | | 414,027 | |
| | | | | | | | | | | | | | | | | | | | |
Total Insurance | | | | 381,897 | | | | 594,465 | | | | 606,508 | |
| | | | | | | | | | | | | | | | | | | | |
|
Leisure, Amusement, Entertainment — 2.7%*: | |
Allegiant Travel Co. | | | 5.50 | | | | 7/15/2019 | | | | 700,000 | | | | 718,326 | | | | 705,250 | |
Dometic Group AB PIK+ | | | 9.50 | | | | 6/26/2019 | | | | 500,000 | | | | 679,476 | | | | 560,212 | |
Interval Acquisition Corp.^ | | | 5.63 | | | | 4/15/2023 | | | | 459,000 | | | | 459,000 | | | | 464,738 | |
Vougeot Bidco PLC+ | | | 7.88 | | | | 7/15/2020 | | | | 300,000 | | | | 510,665 | | | | 499,676 | |
| | | | | | | | | | | | | | | | | | | | |
Total Leisure, Amusement, Entertainment | | | | 1,959,000 | | | | 2,367,467 | | | | 2,229,876 | |
| | | | | | | | | | | | | | | | | | | | |
|
Machinery Non-Agriculture, Non-Construction, Non-Electronic — 1.1%*: | |
KraussMaffei Group GmbH+ | | | 8.75 | | | | 12/15/2020 | | | | 90,000 | | | | 129,685 | | | | 107,360 | |
Xerium Technologies, Inc. | | | 8.88 | | | | 6/15/2018 | | | | 720,000 | | | | 737,219 | | | | 745,200 | |
| | | | | | | | | | | | | | | | | | | | |
Total Machinery Non-Agriculture, Non-Construction, Non-Electronic | | | | 810,000 | | | | 866,904 | | | | 852,560 | |
| | | | | | | | | | | | | | | | | | | | |
|
Mining, Steel, Iron and Non-Precious Metals — 0.5%*: | |
Constellium NV | | | 7.00 | | | | 1/15/2023 | | | | 250,000 | | | | 307,212 | | | | 278,713 | |
Paprec Holding+ | | | 5.25 | | | | 4/1/2022 | | | | 100,000 | | | | 108,105 | | | | 113,993 | |
| | | | | | | | | | | | | | | | | | | | |
Total Mining, Steel, Iron and Non-Precious Metals | | | | 350,000 | | | | 415,317 | | | | 392,706 | |
| | | | | | | | | | | | | | | | | | | | |
|
Oil and Gas — 4.5%*: | |
Baytex Energy Corp.+^ | | | 5.63 | | | | 6/1/2024 | | | | 350,000 | | | | 286,996 | | | | 324,625 | |
California Resources Corp. | | | 6.00 | | | | 11/15/2024 | | | | 400,000 | | | | 400,000 | | | | 344,000 | |
See accompanying Notes to Financial Statements.
40
Babson Global Credit Income Opportunities Fund 2015 Annual Report
SCHEDULE OF INVESTMENTS (CONTINUED)
June 30, 2015
| | | | | | | | | | | | | | | | | | | | |
| | | EFFECTIVE
INTEREST RATE | | | DUE DATE | | | PRINCIPAL ‡‡ | | | COST | | | FAIR
VALUE | |
Corporate Bonds (Continued) | |
|
Oil and Gas (Continued) | |
Calumet Specialty Products Partners LP/Calumet Finance Corp. | | | 6.50 | % | | | 4/15/2021 | | | | 500,000 | | | | $500,000 | | | | $492,500 | |
Citgo Holding, Inc.^ | | | 10.75 | | | | 2/15/2020 | | | | 350,000 | | | | 338,439 | | | | 357,875 | |
Halcon Resources Corp.^ | | | 8.63 | | | | 2/1/2020 | | | | 331,000 | | | | 331,000 | | | | 326,863 | |
Kosmos Energy Ltd.^ | | | 7.88 | | | | 8/1/2021 | | | | 571,000 | | | | 526,550 | | | | 552,442 | |
Millennium Offshore Services Superholdings LLC+^ | | | 9.50 | | | | 2/15/2018 | | | | 500,000 | | | | 516,870 | | | | 467,500 | |
Seventy Seven Energy, Inc. | | | 6.50 | | | | 7/15/2022 | | | | 440,000 | | | | 440,000 | | | | 281,600 | |
Shelf Drilling Holdings Ltd.+^ | | | 8.63 | | | | 11/1/2018 | | | | 439,000 | | | | 361,973 | | | | 390,710 | |
Welltec A/S+^ | | | 8.00 | | | | 2/1/2019 | | | | 174,000 | | | | 145,412 | | | | 166,170 | |
| | | | | | | | | | | | | | | | | | | | |
Total Oil and Gas | | | | 4,055,000 | | | | 3,847,240 | | | | 3,704,285 | |
| | | | | | | | | | | | | | | | | | | | |
|
Personal Transportation — 0.3%*: | |
AA Bond Co. Ltd.+ | | | 5.50 | | | | 7/31/2043 | | | | 150,000 | | | | 223,140 | | | | 234,273 | |
| | | | | | | | | | | | | | | | | | | | |
|
Personal, Food and Miscellaneous — 1.5%*: | |
Brakes Capital+ | | | 7.13 | | | | 12/15/2018 | | | | 500,000 | | | | 842,431 | | | | 805,297 | |
TeamSystem Holding SpA+ | | | 7.38 | | | | 5/15/2020 | | | | 350,000 | | | | 476,299 | | | | 413,414 | |
| | | | | | | | | | | | | | | | | | | | |
Total Personal, Food and Miscellaneous | | | | 850,000 | | | | 1,318,730 | | | | 1,218,711 | |
| | | | | | | | | | | | | | | | | | | | |
|
Printing and Publishing — 0.3%*: | |
CEB, Inc.^ | | | 5.63 | | | | 6/15/2023 | | | | 273,000 | | | | 273,000 | | | | 274,365 | |
| | | | | | | | | | | | | | | | | | | | |
|
Retail Stores — 2.7%*: | |
Boing Group Financing PLC+ | | | 6.63 | | | | 7/15/2019 | | | | 200,000 | | | | 272,200 | | | | 215,830 | |
Brighthouse Group PLC+ | | | 7.88 | | | | 5/15/2018 | | | | 150,000 | | | | 243,459 | | | | 230,974 | |
Family Tree Escrow LLC^ | | | 5.25 | | | | 3/1/2020 | | | | 50,000 | | | | 51,406 | | | | 52,312 | |
Family Tree Escrow LLC^ | | | 5.75 | | | | 3/1/2023 | | | | 700,000 | | | | 722,747 | | | | 731,500 | |
HSS Financing PLC+ | | | 6.75 | | | | 8/1/2019 | | | | 65,774 | | | | 108,872 | | | | 107,998 | |
Kirk Beauty Zero GmbH+ | | | 6.25 | | | | 7/15/2022 | | | | 550,000 | | | | 614,378 | | | | 604,767 | |
Pendragon PLC+ | | | 6.88 | | | | 5/1/2020 | | | | 100,000 | | | | 171,016 | | | | 165,613 | |
Takko Luxembourg 2 S.C.A.+ | | | 9.88 | | | | 4/15/2019 | | | | 200,000 | | | | 258,634 | | | | 102,789 | |
| | | | | | | | | | | | | | | | | | | | |
Total Retail Stores | | | | 2,015,774 | | | | 2,442,712 | | | | 2,211,783 | |
| | | | | | | | | | | | | | | | | | | | |
| | | | | |
Telecommunications — 2.6%*: | | | | | | | | | | | | | | | | | | | | |
Altice US Finance I Corp.^ | | | 5.38 | | | | 7/15/2023 | | | | 341,000 | | | | 341,000 | | | | 332,475 | |
CCO Holdings LLC/CCO Holdings Capital Corp.^ | | | 5.88 | | | | 5/1/2027 | | | | 391,000 | | | | 391,000 | | | | 381,714 | |
CommScope Technologies Finance LLC^ | | | 6.00 | | | | 6/15/2025 | | | | 338,000 | | | | 338,000 | | | | 336,732 | |
eircom Finance Ltd.+ | | | 9.25 | | | | 5/15/2020 | | | | 100,000 | | | | 147,539 | | | | 120,961 | |
Numericable-SFR+ | | | 5.63 | | | | 5/15/2024 | | | | 100,000 | | | | 138,165 | | | | 112,321 | |
Numericable-SFR+^ | | | 6.00 | | | | 5/15/2022 | | | | 315,000 | | | | 315,000 | | | | 310,472 | |
UPC Holding B.V.+ | | | 6.75 | | | | 3/15/2023 | | | | 200,000 | | | | 213,359 | | | | 231,831 | |
Wind Acquisition Finance SA+ | | | 4.00 | | | | 7/15/2020 | | | | 200,000 | | | | 243,426 | | | | 222,412 | |
See accompanying Notes to Financial Statements.
41
Babson Global Credit Income Opportunities Fund 2015 Annual Report
SCHEDULE OF INVESTMENTS (CONTINUED)
June 30, 2015
| | | | | | | | | | | | | | | | | | | | |
| | | EFFECTIVE
INTEREST RATE | | | DUE DATE | | | PRINCIPAL ‡‡ | | | COST | | | FAIR
VALUE | |
Corporate Bonds (Continued) | |
|
Telecommunications (Continued) | |
Wind Acquisition Finance SA+ | | | 4.01 | #% | | | 7/15/2020 | | | | 100,000 | | | | $135,965 | | | | $110,649 | |
| | | | | | | | | | | | | | | | | | | | |
Total Telecommunications | | | | 2,085,000 | | | | 2,263,454 | | | | 2,159,567 | |
| | | | | | | | | | | | | | | | | | | | |
Total Corporate Bonds | | | | 35,096,994 | | | | 39,528,682 | | | | 37,956,416 | |
| | | | | | | | | | | | | | | | | | | | |
Total Fixed Income | | | | 74,952,249 | | | | 78,863,243 | | | | 75,119,170 | |
| | | | | | | | | | | | | | | | | | | | |
| | | | | |
| | | STRIKE
PRICE | | | EXPIRATION
DATE | | | NOTIONAL | | | COST | | | FAIR
VALUE | |
Purchased Options — 0.7%*: | |
|
Put Options — 0.7%*: | |
OTC—Markit CDX.NA.HY.24 Swaption with Credit Suisse International | | | $105.00 | | | | 09/16/2015 | | | | 20,000,000 | | | | 446,000 | | | | 415,368 | |
OTC—Markit CDX.NA.HY.24 Swaption with JPMorgan Chase Bank, N.A. | | | 105.00 | | | | 09/16/2015 | | | | 10,000,000 | | | | 172,000 | | | | 172,459 | |
| | | | | | | | | | | | | | | | | | | | |
Total Purchased Options | | | | 30,000,000 | | | | 618,000 | | | | 587,827 | |
| | | | | | | | | | | | | | | | | | | | |
| | | | | |
| | | EFFECTIVE
INTEREST RATE | | | DUE DATE | | | PRINCIPAL ‡‡ | | | COST | | | FAIR
VALUE | |
Short-Term Investments — 9.5%*: | |
|
Bank Deposit — 9.4%*: | |
State Street Bank & Trust Co. Euro Time Deposit | | | 0.01 | % | | | 7/1/2015 | | | | 7,653,249 | | | | 7,653,249 | | | | 7,653,249 | |
| | | | | | | | | | | | | | | | | | | | |
|
Bank Loan — 0.1%*§: | |
|
Mining, Steel, Iron and Non-Precious Metals — 0.1%*: | |
Boomerang Tube LLC¤ | | | 11.28 | | | | 10/7/2015 | | | | 78,780 | | | | 77,204 | | | | 78,780 | |
| | | | | | | | | | | | | | | | | | | | |
Total Short-Term Investments | | | | 7,732,029 | | | | 7,730,453 | | | | 7,732,029 | |
| | | | | | | | | | | | | | | | | | | | |
Total Investments | | | | 112,684,278 | | | | 87,211,696 | | | | 83,439,026 | |
| | | | | | | | | | | | | | | | | | | | |
| | | | | |
Other assets and liabilities — (2.1%)* | | | | | | | | | | | | | | | | | | | (1,706,397 | ) |
| | | | | |
Net Assets — 100.0% | | | | | | | | | | | | | | | | | | | $81,732,629 | |
| | | | | | | | | | | | | | | | | | | | |
| ‡‡ | Unless otherwise indicated, all principal amounts are denominated in United States Dollars. |
| * | Calculated as a percentage of net assets applicable to common shareholders. |
See accompanying Notes to Financial Statements.
42
Babson Global Credit Income Opportunities Fund 2015 Annual Report
SCHEDULE OF INVESTMENTS (CONTINUED)
June 30, 2015
Distributions of investments by country of risk (excluding temporary cash investments) as a percentage of total investments in securities, is as follows:
| | | | | | |
| | United States | | | 49.2% | |
| | Cayman Islands | | | 17.3% | |
| | United Kingdom | | | 13.8% | |
| | Germany | | | 3.4% | |
| | Netherlands | | | 3.1% | |
| | France | | | 1.8% | |
| | Switzerland | | | 1.8% | |
| | Ireland | | | 1.6% | |
| | Canada | | | 1.3% | |
| | United Arab Emirates | | | 1.1% | |
| | Spain | | | 1.1% | |
| | Sweden | | | 1.1% | |
| | Portugal | | | 1.0% | |
| | Italy | | | 1.0% | |
| Other (Individually less than 1%) | | | 1.4% | |
| | | | | | |
| | Total | | | 100.0% | |
| | | | | | |
| ^ | Security acquired in a transaction exempt from registration under Rule 144A of the Securities Act of 1933. These securities may only be resold in transactions exempt from registration, normally to qualified institutional buyers. |
| § | Bank loans are exempt from registration under the Securities Act of 1933, as amended, but contain certain restrictions on resale and cannot be sold publicly. These loans pay interest at rates which adjust periodically. The interest rates shown for bank loans are the current interest rates at June 30, 2015. Bank loans are also subject to mandatory and/or optional prepayment which cannot be predicted. As a result, the remaining maturity may be substantially less than the stated maturity shown. |
| ¤ | For fair value measurement disclosure purposes, security is categorized as Level 3 (see Note 2). |
| # | Variable rate security. The interest rate shown is the rate in effect at June 30, 2015. |
A summary of outstanding derivatives at June 30, 2015 is as follows:
Forward Foreign Currency Exchange Contracts to Buy
| | | | | | | | | | | | | | | | | | | | | | |
EXPIRATION
DATE | | COUNTERPARTY | | LOCAL
CURRENCY | | | VALUE IN USD | | | IN
EXCHANGE
FOR USD | | | NET
UNREALIZED
DEPRECIATION | |
| 07/14/15 | | Morgan Stanley | | | EUR | | | | 540,000 | | | | 602,116 | | | | 607,260 | | | $ | (5,144 | ) |
| 07/14/15 | | Morgan Stanley | | | GBP | | | | 500,000 | | | | 785,559 | | | | 786,918 | | | | (1,359 | ) |
| | | | | | | | | | | | | | | | | | | | | | |
Net unrealized depreciation on forward foreign exchange contracts to buy | | | | | | | $ | (6,503 | ) |
| | | | | | | | | | | | | | | | | | | | | | |
See accompanying Notes to Financial Statements.
43
Babson Global Credit Income Opportunities Fund 2015 Annual Report
SCHEDULE OF INVESTMENTS (CONTINUED)
June 30, 2015
Forward Foreign Currency Exchange Contracts to Sell
| | | | | | | | | | | | | | | | | | | | | | |
EXPIRATION
DATE | | COUNTERPARTY | | LOCAL
CURRENCY | | | VALUE IN USD | | | IN
EXCHANGE
FOR USD | | | NET UNREALIZED
APPRECIATION
(DEPRECIATION) | |
| 07/14/15 | | Morgan Stanley | | | CHF | | | | 230,728 | | | | 246,885 | | | | 247,564 | | | $ | 679 | |
| 07/14/15 | | Morgan Stanley | | | EUR | | | | 11,320,994 | | | | 12,623,243 | | | | 12,721,503 | | | | 98,260 | |
| 07/14/15 | | Morgan Stanley | | | GBP | | | | 5,547,959 | | | | 8,716,498 | | | | 8,480,430 | | | | (236,068 | ) |
| | | | | | | | | | | | | | | | | | | | | | |
Net unrealized depreciation on forward foreign exchange contracts to sell | | | | | | | $ | (137,129 | ) |
| | | | | | | | | | | | | | | | | | | | | | |
Currency Legend
| | | | |
| CHF | | – | | Swiss Franc |
| EUR | | – | | Euro |
| GBP | | – | | British Pound Sterling |
Written Options
| | | | | | | | | | | | | | | | | | | | |
| TYPE OF CONTRACT | | EXPIRATION
DATE | | STRIKE
PRICE | | | COUNTERPARTY | | NUMBER OF
CONTRACTS/
NOTIONAL
AMOUNTS | | | PREMIUMS
RECEIVED | | | VALUE AT
JUNE 30,
2015 | |
Put—Markit CDX.NA.HY.24 Swaption | | 09/16/15 | | $ | 102.25 | | | Credit Suisse International | | | 20,000,000 | | | $ | 278,000 | | | $ | (225,997 | ) |
Put—Markit CDX.NA.HY.24 Swaption | | 09/16/15 | | | 102.25 | | | JPMorgan Chase Bank, N.A. | | | 10,000,000 | | | | 104,000 | | | | (93,480 | ) |
| | | | | | | | | | | | | | | | | | | | |
| | | | | | | | | | | | | | $ | 382,000 | | | $ | (319,477 | ) |
| | | | | | | | | | | | | | | | | | | | |
See accompanying Notes to Financial Statements.
44
Babson Capital Funds Trust 2015 Annual Report
NOTES TO THE FINANCIAL STATEMENTS
June 30, 2015
Babson Capital Funds Trust (the “Trust”) was organized as a business trust under the laws of the Commonwealth of Massachusetts on May 3, 2013 and commenced operations on September 16, 2013. The Trust is registered under the Investment Company Act of 1940, as amended (the “1940 Act”), as an open-end management investment company. As of June 30, 2015, the Trust currently consists of two non-diversified funds (separately, a “Fund” and collectively, the “Funds”): Babson Global Floating Rate Fund (“Global Floating Rate Fund”) and Babson Global Credit Income Opportunities Fund (“Global Credit Income Opportunities Fund”).
Babson Capital Management LLC (the “Adviser”), a wholly-owned indirect subsidiary of Massachusetts Mutual Life Insurance Company, is a registered investment adviser under the Investment Advisers Act of 1940, as amended, and serves as investment adviser to the Funds.
Babson Capital Global Advisors Limited (the “Sub-Adviser”), an indirect wholly-owned subsidiary of the Adviser, serves as a sub-adviser with respect to the Funds’ European investments.
The primary investment objective of the Global Floating Rate Fund is to seek a high level of current income. The Fund seeks preservation of capital as a secondary investment objective. The primary investment objective of the Global Credit Income Opportunities Fund is to seek an absolute return, primarily through current income and secondarily through capital appreciation.
There can be no assurance that the Funds will achieve their investment objectives. The Funds will seek to take advantage of inefficiencies between geographies, primarily the North American and European high yield bond, loan and other debt markets. Under normal market conditions, the Global Floating Rate Fund will invest at least 80% of its net assets (including the amount of any borrowings for investment purposes) in income-producing floating rate debt securities, consisting of floating rate loans, bonds and notes, issued primarily by North American and Western European companies that are, at the time of purchase, rated below investment grade (below Baa3 by Moody’s Investors Service, Inc. (“Moody’s”) or below BBB- by either Standard & Poor’s Rating Services, a division of the McGraw-Hill Company, Inc. (“S&P”) or Fitch, Inc. (“Fitch”)) or unrated but judged by the Adviser or Sub-Adviser to be of comparable quality. Under normal market conditions, the Global
Credit Income Opportunities Fund will invest at least 80% of its net assets (including the amount of any borrowings for investment purposes) in debt instruments, consisting of loans, bonds and notes, based in U.S. and non-U.S. markets, as well as over-the-counter and exchange-traded derivatives. Investments may be issued or guaranteed by governments and their agencies, corporations, financial institutions and supranational organizations that the Funds believe have the potential to provide a high total return over time. A significant portion of the Funds’ investments in debt instruments will be denominated in a currency other than the U.S. dollar. Although the investments in non-U.S. dollar denominated assets may be on a currency hedged or unhedged basis, the Funds expect that, under current market conditions, they will seek to hedge substantially all of their exposure to foreign currencies.
Each Fund has four classes of shares: Class A, C, I, and Y, each with different expenses and dividends. A front-end sales charge is normally added to the net asset value (“NAV”) for Class A shares. There is no front-end sales charge in the case of Class C, I, and Y shares. There may be a contingent deferred sales charge (“CDSC”) in certain cases as follows: Class A shares purchased without an initial sales charge and redeemed within the first year of purchase (subject to certain exceptions as set forth in each Fund’s prospectus) and Class C shares redeemed within the first year of purchase. All classes of shares have equal voting rights, with the exception of matters that relate solely to one class.
| 2. | Significant Accounting Policies |
The following is a summary of significant accounting policies followed consistently by the Funds in the preparation of their financial statements in conformity with accounting principles generally accepted in the United States of America (“U.S. GAAP”).
| | A. | Valuation of Investments |
The Funds’ investments in fixed income securities are generally valued using the prices provided directly by independent third party services or provided directly from one or more broker dealers or market makers, each in accordance with the valuation policies and procedures approved by the Funds’ Board of Trustees (the “Board”).
The pricing services may use valuation models or matrix pricing, which consider yield or prices with respect to comparable bond quotations from bond dealers or by reference to other securities that are considered
45
Babson Capital Funds Trust 2015 Annual Report
NOTES TO THE FINANCIAL STATEMENTS (CONTINUED)
June 30, 2015
comparable in such characteristics as credit rating, interest rates and maturity date to determine the current value. The Funds’ investments in bank loans are normally valued at the bid quotation obtained from dealers in loans by an independent pricing service in accordance with the Funds’ valuation policies and procedures approved by the Board. Short-term securities with remaining maturities of 60 days or less may be valued at amortized cost, which approximates fair value. Over-the-counter (“OTC”) options are valued by an independent pricing service using a mathematical model, which incorporates a number of market data factors, such as the trades and prices of the underlying instruments.
A Valuation Committee, made up of officers of the Trust and employees of the Adviser, is responsible for determining, in accordance with the Funds’ valuation policies and procedures approved by the Board; (1) whether market quotations are readily available for investments held by the Fund; and (2) the fair value of investments held by the Fund for which market quotations are not readily available or are deemed not reliable by the Adviser. In certain cases, authorized pricing service vendors may not provide prices for a security held by the Funds, or the price provided by such pricing service vendor is deemed unreliable by the Adviser. In such cases, the Funds may use market maker quotations provided by an established market maker for that security (i.e., broker quotes) to value the security if the Adviser has experience obtaining quotations from the market maker and the Adviser determines that quotations obtained from the market maker in the past have generally been reliable (or, if the Adviser has no such experience with respect to a market maker, it determines based on other information available to it that quotations to be obtained by it from the market maker are reasonably likely to be reliable). In any such case, the Adviser will review any market quotations so obtained in light of other information in its possession for their general reliability.
Bond investments are valued on the basis of last available bid prices or current market quotations provided by dealers or pricing services. Bank loan positions are valued at the bid price from one or more brokers or dealers as obtained from a pricing service. In determining the value of a particular investment, pricing services may use certain information with respect to transactions in such investments, quotations from dealers, pricing matrixes, market transactions in comparable investments, various relationships observed in the market between
investments and calculated yield measures. Asset-backed and mortgage-backed securities are valued by independent pricing services using models that consider estimated cash flows of each tranche of the security, establish a benchmark yield and develop an estimated tranche-specific spread to the benchmark yield based on the unique attributes of the tranche.
Bank loans in which the Funds may invest have similar risks to lower-rated fixed income securities. Changes in the financial condition of the borrower or economic conditions or other circumstances may reduce the capacity of the borrower to make principal and interest payments on such instruments and may lead to defaults. Senior secured bank loans are supported by collateral; however, the value of the collateral may be insufficient to cover the amount owed to the Funds. By relying on a third party to administer a loan, the Funds are subject to the risk that the third party will fail to perform its obligations. The loans in which the Funds will invest are largely floating rate instruments; therefore, the interest rate risk generally is lower than for fixed-rate debt obligations. However, from the perspective of the borrower, an increase in interest rates may adversely affect the borrower’s financial condition. Due to the unique and customized nature of loan agreements evidencing loans and the private syndication thereof, loans are not as easily purchased or sold as publicly traded securities. Although the range of investors in loans has broadened in recent years, there can be no assurance that future levels of supply and demand in loan trading will provide the degree of liquidity which currently exists in the market. In addition, the terms of the loans may restrict their transferability without borrower consent. These factors may have an adverse effect on the market price and the Funds’ ability to dispose of particular portfolio investments. A less liquid secondary market also may make it more difficult for the Funds to obtain precise valuations of the high yield loans in its portfolio.
The Funds may invest in collateralized debt obligations (“CDOs”), which include collateralized bond obligations (“CBOs”) and collateralized loan obligations (“CLOs”). CBOs and CLOs are types of asset-backed securities. A CDO is an entity that is backed by a diversified pool of debt securities (CBOs) or syndicated bank loans (CLOs). The cash flows of the CDO can be split into multiple segments, called “tranches,” which will vary in risk profile and yield. The riskiest segment is the subordinated or “equity” tranche. This tranche bears the greatest risk of defaults from the underlying assets in the CDO and
46
Babson Capital Funds Trust 2015 Annual Report
NOTES TO THE FINANCIAL STATEMENTS (CONTINUED)
June 30, 2015
serves to protect the other, more senior, tranches from default in all but the most severe circumstances. Since it is shielded from defaults by the more junior tranches, a “senior” tranche will typically have higher credit ratings and lower yields than their underlying securities, and often receive investment grade ratings from one or more of the nationally recognized rating agencies. Despite the protection from the more junior tranches, senior tranches can experience substantial losses due to actual defaults, increased sensitivity to future defaults and the disappearance of one or more protecting tranches as a result of changes in the credit profile of the underlying pool of assets.
Fair value is defined as the price that the Funds would receive upon selling an investment in a timely transaction to an independent buyer in the principal or most advantageous market of the investment. A three-tier hierarchy is utilized to maximize the use of observable market data and minimize the use of unobservable inputs and to establish classification of fair value measurements for disclosure purposes. Inputs refer broadly to the assumptions that market participants would use in pricing the asset or liability, including assumptions about risk. For example, market participants would consider the risk inherent in a particular valuation technique used to measure fair value, such as a pricing model, and/or the risk inherent in the inputs to the valuation technique. Inputs may be observable or unobservable. Observable inputs are inputs that reflect the assumptions market participants would use in pricing the asset or liability and are developed based on market data obtained from sources independent of the reporting entity. Unobservable inputs are inputs that reflect the reporting entity’s own assumptions about the assumptions market
participants would use in pricing the asset or liability and are developed based on the best information available in the circumstances. The three-tier hierarchy of inputs is summarized in the three broad levels listed below.
Level 1 – quoted prices in active markets for identical securities
Level 2 – other significant observable inputs (including quoted prices for similar securities, interest rates, prepayment speeds, credit risk, etc.)
Level 3 – significant unobservable inputs (including the Funds’ own assumptions in determining the fair value of investments)
The availability of observable inputs can vary from security to security and is affected by a wide variety of factors, including, for example, the type of security, whether the security is new and not yet established in the marketplace, the liquidity of markets, and other characteristics particular to the security. To the extent that valuation is based on models or inputs that are less observable or unobservable in the market, the determination of fair value requires more judgment. Accordingly, the degree of judgment exercised in determining fair value is greatest for instruments categorized in level 3.
The inputs used to measure fair value may fall into different levels of the fair value hierarchy. In such cases, for disclosure purposes, the level in the fair value hierarchy within which the fair value measurement falls in its entirety is determined based on the lowest level input that is significant to the fair value measurement in its entirety.
47
Babson Capital Funds Trust 2015 Annual Report
NOTES TO THE FINANCIAL STATEMENTS (CONTINUED)
June 30, 2015
The following is a summary of the inputs used as of June 30, 2015 in valuing the Funds’ investments:
| | | | | | | | | | | | | | | | |
| DESCRIPTION | | LEVEL 1 | | | LEVEL 2 | | | LEVEL 3 | | | TOTAL INVESTMENTS | |
| | | | |
Assets:* | | | | | | | | | | | | | | | | |
| Fixed Income: | | | | | | | | | | | | | | | | |
Bank Loans | | $ | – | | | $ | 131,795,771 | | | $ | 976,111 | | | $ | 132,771,882 | |
Corporate Bonds | | | – | | | | 22,819,985 | | | | – | | | | 22,819,985 | |
| | | | | | | | | | | | | | | | |
| Total Fixed Income | | | – | | | | 154,615,756 | | | | 976,111 | | | | 155,591,867 | |
| | | | | | | | | | | | | | | | |
| Short-Term Investments: | | | | | | | | | | | | | | | | |
Bank Deposit | | | – | | | | 23,274,995 | | | | – | | | | 23,274,995 | |
Bank Loan | | | – | | | | – | | | | 78,780 | | | | 78,780 | |
| | | | | | | | | | | | | | | | |
| Total Short-Term Investments | | | – | | | | 23,274,995 | | | | 78,780 | | | | 23,353,775 | |
| | | | | | | | | | | | | | | | |
| Derivative Securities: | | | | | | | | | | | | | | | | |
Forward Foreign Currency Exchange Contracts | | | – | | | | 153,124 | | | | – | | | | 153,124 | |
| | | | | | | | | | | | | | | | |
| Total | | $ | – | | | $ | 178,043,875 | | | $ | 1,054,891 | | | $ | 179,098,766 | |
| | | | | | | | | | | | | | | | |
| Liabilities:* | | | | | | | | | | | | | | | | |
| Derivative Securities: | | | | | | | | | | | | | | | | |
Forward Foreign Currency Exchange Contracts | | | – | | | | (523,194 | ) | | | – | | | | (523,194 | ) |
| | | | | | | | | | | | | | | | |
| | | | |
Total Investments | | $ | – | | | $ | 177,520,681 | | | $ | 1,054,891 | | | $ | 178,575,572 | |
| | | | | | | | | | | | | | | | |
| | * | There were no transfers between levels during the year ended June 30, 2015. |
The following is a reconciliation of investments with unobservable inputs (Level 3) that were used in determining fair value:
| | | | | | | | | | | | | | | | | | | | | | | | | | | | | | | | | | | | |
INVESTMENTS IN SECURITIES | | BALANCE AS
OF
JULY 1,
2014 | | | REALIZED
GAIN (LOSS) | | | CHANGE IN UNREALIZED
APPRECIATION
(DEPRECIATION) | | | NET
TRANSFERS
IN (OUT)
OF LEVEL 3 | | | ACCRUED PREMIUMS/
DISCOUNTS | | | PURCHASES | | | SALES | | | BALANCE AS OF
JUNE 30,
2015 | | | CHANGE IN UNREALIZED
APPRECIATION
(DEPRECIATION)
FROM
INVESTMENTS
HELD AT
JUNE 30,
2015 | |
| Fixed Income | | | | | | | | | | | | | | | | | | | | | | | | | | | | | | | | | | | | |
Bank Loans | | $ | 497,619 | | | $ | 57 | | | $ | (19,651 | ) | | $ | – | | | $ | 1,249 | | | $ | 585,462 | | | $ | (9,845 | ) | | $ | 1,054,891 | | | $ | (19,651 | ) |
| | | | | | | | | | | | | | | | | | | | | | | | | | | | | | | | | | | | |
| Total | | $ | 497,619 | | | $ | 57 | | | $ | (19,651 | ) | | $ | – | | | $ | 1,249 | | | $ | 585,462 | | | $ | (9,845 | ) | | $ | 1,054,891 | | | $ | (19,651 | ) |
| | | | | | | | | | | | | | | | | | | | | | | | | | | | | | | | | | | | |
48
Babson Capital Funds Trust 2015 Annual Report
NOTES TO THE FINANCIAL STATEMENTS (CONTINUED)
June 30, 2015
| | Global | Credit Income Opportunities Fund |
| | | | | | | | | | | | | | | | |
| DESCRIPTION | | LEVEL 1 | | | LEVEL 2 | | | LEVEL 3 | | | TOTAL INVESTMENTS | |
| Assets:* | | | | | | | | | | | | | | | | |
| Fixed Income: | | | | | | | | | | | | | | | | |
Asset-Backed Securities | | $ | – | | | $ | 13,514,752 | | | $ | – | | | $ | 13,514,752 | |
Bank Loans | | | – | | | | 22,918,447 | | | | 729,555 | | | | 23,648,002 | |
Corporate Bonds | | | – | | | | 37,956,416 | | | | – | | | | 37,956,416 | |
| | | | | | | | | | | | | | | | |
| Total Fixed Income | | | – | | | | 74,389,615 | | | | 729,555 | | | | 75,119,170 | |
| | | | | | | | | | | | | | | | |
| Purchased Options: | | | | | | | | | | | | | | | | |
Put Options | | | – | | | | 587,827 | | | | – | | | | 587,827 | |
| | | | | | | | | | | | | | | | |
| Total Purchased Options | | | – | | | | 587,827 | | | | – | | | | 587,827 | |
| | | | | | | | | | | | | | | | |
| Short-Term Investments: | | | | | | | | | | | | | | | | |
Bank Deposit | | | – | | | | 7,653,249 | | | | – | | | | 7,653,249 | |
Bank Loan | | | – | | | | – | | | | 78,780 | | | | 78,780 | |
| | | | | | | | | | | | | | | | |
| Total Short-Term Investments | | | – | | | | 7,653,249 | | | | 78,780 | | | | 7,732,029 | |
| | | | | | | | | | | | | | | | |
| Derivative Securities: | | | | | | | | | | | | | | | | |
Forward Foreign Currency Exchange Contracts | | | – | | | | 98,939 | | | | – | | | | 98,939 | |
| | | | | | | | | | | | | | | | |
| Total | | $ | – | | | $ | 82,729,630 | | | $ | 808,335 | | | $ | 83,537,965 | |
| | | | | | | | | | | | | | | | |
| Liabilities:* | | | | | | | | | | | | | | | | |
| Derivative Securities: | | | | | | | | | | | | | | | | |
Forward Foreign Currency Exchange Contracts | | | – | | | | (242,571 | ) | | | – | | | | (242,571 | ) |
Written Options | | | – | | | | (319,477 | ) | | | – | | | | (319,477 | ) |
| | | | | | | | | | | | | | | | |
| Total Derivative Securities | | | – | | | | (562,048 | ) | | | – | | | | (562,048 | ) |
| | | | | | | | | | | | | | | | |
| | | | |
Total Investments | | $ | – | | | $ | 82,167,582 | | | $ | 808,335 | | | $ | 82,975,917 | |
| | | | | | | | | | | | | | | | |
| | * | There were no transfers between levels during the year ended June 30, 2015. |
The following is a reconciliation of investments with unobservable inputs (Level 3) that were used in determining fair value:
| | | | | | | | | | | | | | | | | | | | | | | | | | | | | | | | | | | | |
INVESTMENTS IN SECURITIES | | BALANCE AS
OF
JULY 1,
2014 | | | REALIZED
GAIN (LOSS) | | | CHANGE IN
UNREALIZED
APPRECIATION
(DEPRECIATION) | | | NET
TRANSFERS
IN (OUT)
OF LEVEL 3 | | | ACCRUED PREMIUMS/
DISCOUNTS | | | PURCHASES | | | SALES | | | BALANCE AS OF
JUNE 30,
2015 | | | CHANGE IN
UNREALIZED
APPRECIATION
(DEPRECIATION)
FROM
INVESTMENTS
HELD AT
JUNE 30,
2015 | |
| Fixed Income | | | | | | | | | | | | | | | | | | | | | | | | | | | | | | | | | | | | |
Bank Loans | | $ | 497,619 | | | $ | 57 | | | $ | (14,619 | ) | | $ | – | | | $ | 1,248 | | | $ | 331,333 | | | $ | (7,303 | ) | | $ | 808,335 | | | $ | (14,619 | ) |
| | | | | | | | | | | | | | | | | | | | | | | | | | | | | | | | | | | | |
| Total | | $ | 497,619 | | | $ | 57 | | | $ | (14,619 | ) | | $ | – | | | $ | 1,248 | | | $ | 331,333 | | | $ | (7,303 | ) | | $ | 808,335 | | | $ | (14,619 | ) |
| | | | | | | | | | | | | | | | | | | | | | | | | | | | | | | | | | | | |
49
Babson Capital Funds Trust 2015 Annual Report
NOTES TO THE FINANCIAL STATEMENTS (CONTINUED)
June 30, 2015
| | B. | Forward Commitments and When-Issued Delayed Delivery Securities |
The Funds may purchase securities on a when-issued basis and may purchase or sell securities on a forward commitment basis. Settlement of such transactions normally occurs within a month or more after the purchase or sale commitment is made. The Funds may purchase securities under such conditions with the intention of actually acquiring them, but may enter into a separate agreement to sell the securities before the settlement date. Since the value of securities purchased may fluctuate prior to settlement, the Funds may be required to pay more at settlement than the security is worth. In addition, the Funds are not entitled to any of the interest earned prior to settlement. When purchasing a security on a delayed delivery basis, the Funds assume the rights and risks of ownership of the security, including the risk of price and yield fluctuations. In the event of default by the counterparty, the Funds’ maximum amount of loss is the unrealized appreciation of unsettled when-issued transactions, which is shown in the Schedule of Investments.
| | C. | Cash and Short-Term Investments |
Cash and cash equivalents consist principally of short-term investments that are readily convertible into cash and have original maturities of three months or less. At June 30, 2015, all cash and cash equivalents are held by the custodian.
| | D. | Investment Transactions, Related Investment Income and Expenses |
Investment transactions are accounted for on a trade date basis. Interest income is recorded on the accrual basis, including the amortization of premiums and accretion of discounts on bonds held using the yield-to-maturity method.
Realized gains and losses on investment transactions and unrealized appreciation and depreciation of investments are reported for financial statement and Federal income tax purposes on the identified cost method.
Expenses are recorded on the accrual basis as incurred.
Redemptions of Fund shares held for 60 days or less may be assessed a 1% short-term trading fee and recorded as paid-in capital.
The preparation of financial statements in conformity with U.S. GAAP requires management to make estimates and assumptions that affect the reported amounts of assets and liabilities at the date of the financial statements and the reported amounts of revenues and expenses during the reporting period. Actual results could differ from these estimates.
| | G. | Federal Income Taxation |
The Funds have elected to be taxed as a Regulated Investment Company (“RIC”) under sub-chapter M of the U.S. Internal Revenue Code of 1986, as amended, and intend to maintain this qualification and to distribute substantially all of their net taxable income to their shareholders. As of June 30, 2015, the Funds had no uncertain tax positions that would require financial statement recognition, de-recognition, or disclosure. The Funds file a U.S. federal income tax return annually after their fiscal year-end, which is subject to examination by the Internal Revenue Service for a period of three years from the date of the filings.
| | H. | Dividends and Distributions |
For the period July 1, 2014 through December 31, 2014, the Funds declared and paid dividends monthly from net investment income. Per the Funds’ prospectuses, effective January 1, 2015, each Fund declares a dividend daily based on the Adviser’s projections of the Funds’ estimated net investment income and distributes such dividend monthly. To the extent that these distributions exceed net investment income, they may be classified as return of capital. The Funds also pay a distribution at least annually from their net realized capital gains, if any. Dividends and distributions are recorded on the ex-dividend date. All common shares have equal dividend and other distribution rights. A notice disclosing the source(s) of a distribution will be provided if payment is made from any source other than net investment income. Any such notice would be provided only for informational purposes in order to comply with the requirements of Section 19(a) of the 1940 Act and not for tax reporting purposes. The tax composition of the Funds’ distributions for each calendar year is reported on Internal Revenue Service Form 1099-DIV.
Dividends from net investment income and distributions from realized gains from investment transactions have been determined in accordance with Federal income tax regulations and may differ from net investment income
50
Babson Capital Funds Trust 2015 Annual Report
NOTES TO THE FINANCIAL STATEMENTS (CONTINUED)
June 30, 2015
and realized gains recorded by the Funds for financial reporting purposes. These differences, which could be temporary or permanent in nature may result in reclassification of distributions; however, net investment income, net realized gains and losses, and net assets are not affected.
The Funds may invest in bank loans, which usually take the form of loan participations and assignments. Loan participations and assignments are agreements to make money available to U.S. or foreign corporations, partnerships or other business entities (the “Borrower”) in a specified amount, at a specified rate and within a specified time. A loan is typically originated, negotiated and structured by a U.S. or foreign bank, insurance company or other financial institution (the “Agent”) for a group of loan investors (“Loan Investors”). The Agent typically administers and enforces the loan on behalf of the other Loan Investors in the syndicate and may hold any collateral on behalf of the Loan Investors. Such loan participations and assignments are typically senior, secured and collateralized in nature. The Funds record an investment when the Borrower withdraws money and records interest as earned. These loans pay interest at rates which are periodically reset by reference to a base lending rate plus a spread. These base lending rates are generally the prime rate offered by a designated U.S. bank or London InterBank Offered Rate (“LIBOR”).
The loans in which the Funds invest may be subject to some restrictions on resale. For example, the Funds may be contractually obligated to receive approval from the Agent and/or Borrower prior to the sale of these investments. The Funds generally have no right to enforce compliance with the terms of the loan agreement with the Borrower. As a result, the Funds assume the credit risk of the Borrower, the selling participant and any other persons interpositioned between the Funds and the Borrower (“Intermediate Participants”). In the event that the Borrower, selling participant or Intermediate Participants become insolvent or enter into bankruptcy, the Funds may incur certain costs and delays in realizing payment or may suffer a loss of principal and/or interest.
Unfunded commitments represent the remaining obligation of the Funds to the Borrower. At any point in time, up to the maturity date of the issue, the Borrower may demand the unfunded portion. Until demanded by the Borrower, unfunded commitments are not
recognized as an asset on the Statements of Assets and Liabilities. Unrealized appreciation/depreciation on unfunded commitments presented on the Statements of Assets and Liabilities represents mark to market of the unfunded portion of the Funds’ bank loans. As of June 30, 2015, the Global Floating Rate Fund and Global Credit Income Opportunities Fund each had one unfunded loan commitment which amounted to $500,000 of par and had cost and fair value of $557,747 and $553,155, respectively.
The following is a description of the derivative instruments that the Funds utilize as part of their investment strategy, including the primary underlying risk exposures related to the instrument.
Forward Foreign Currency Exchange Contracts – The Funds are subject to foreign currency exchange rate risk in the normal course of pursuing their investment objectives. The Funds may use forward foreign currency exchange contracts to hedge against changes in the value of foreign currencies. The Funds may enter into forward foreign currency exchange contracts obligating the Funds to deliver or receive a currency at a specified future date. Forward contracts are valued daily and unrealized appreciation or depreciation is recorded daily as the difference between the contract exchange rate and the closing forward rate applied to the face amount of the contract. A realized gain or loss is recorded at the time the forward contract expires. Credit risk may arise as a result of the failure of the counterparty to comply with the terms of the contract. The Funds consider the creditworthiness of each counterparty to a contract in evaluating potential credit risk quarterly. The Funds are also subject to credit risk with respect to the counterparties to derivative contracts that are not cleared through a central counterparty but instead are traded over-the-counter between two counterparties. If a counterparty to an over-the-counter derivative becomes bankrupt or otherwise fails to perform its obligations under a derivative contract due to financial difficulties, the Funds may experience significant delays in obtaining any recovery under the derivative contract in a bankruptcy or other reorganization proceeding. The Funds may obtain only a limited recovery or may obtain no recovery in such circumstances. The counterparty risk for cleared derivatives is generally lower than for uncleared over-the-counter derivative transactions since generally a clearing organization becomes substituted for
51
Babson Capital Funds Trust 2015 Annual Report
NOTES TO THE FINANCIAL STATEMENTS (CONTINUED)
June 30, 2015
each counterparty to a cleared derivative contract and, in effect, guarantees the parties’ performance under the contract as each party to a trade looks only to the clearing house for performance of financial obligations. However, there can be no assurance that the clearing house, or its members, will satisfy its obligations to the Funds. In addition, in the event of a bankruptcy of a clearing house, the Funds could experience a loss of the funds deposited with such clearing house as margin and of any profits on its open positions. The counterparty risk to the Funds is limited to the net unrealized gain, if any, on the contract.
The use of forward foreign currency exchange contracts does not eliminate fluctuations in the underlying prices of the Funds’ investment securities; however, it does establish a rate of exchange that can be achieved in the future. The use of forward foreign currency exchange contracts involves the risk that anticipated currency movements will not be accurately predicted. A forward foreign currency exchange contract would limit the risk of loss due to a decline in the value of a particular currency; however, it would also limit any potential gain that might result should the value of the currency increase instead of decrease. These contracts may involve market risk in excess of the amount of receivable or payable reflected on the Statement of Assets and Liabilities.
The Funds may purchase call or put options. When a Fund purchases an option, the premium paid by the Fund is recorded as an asset and is subsequently adjusted to the current fair value of the option purchased. Purchasing call options tends to increase the Fund’s exposure to the underlying instrument. Purchasing put options tends to decrease the Fund’s exposure to the underlying instrument. Premiums paid for purchasing options that expire are treated as realized losses. Premiums paid for purchasing options that are exercised or closed are added to the amounts paid or offset against the proceeds on the underlying security to determine the realized gain or loss. The risks associated with purchasing put and call options are potential loss of the premium paid and, in the instances of over-the-counter derivatives, the failure of the counterparty to honor its obligation under the contract.
The Funds may enter into swap options (“swaptions”). A swaption is an option to enter into a pre-defined swap agreement by some specified date in the future. The writer of the swaption becomes the counterparty to the
swap if the buyer exercises. The interest rate swaption agreement will specify whether the buyer of the swaption will be a fixed rate receiver or a fixed rate buyer. Depending on the terms of the particular option agreement, a Fund generally will incur a greater degree of risk when the Fund writes a swaption than the Fund will incur when it purchases a swaption. When a Fund purchases a swaption, the Fund’s risk of loss is limited to the amount of the premium it has paid should it decide to let the swaption expire unexercised.
When a Fund writes a covered call or a put option, an amount equal to the premium received by the Fund is included in the Fund’s Statement of Assets and Liabilities as an asset and as an equivalent liability. The amount of the liability is subsequently marked-to-market to reflect the current market value of the option written. The Fund receives a premium on the sale of a call option but gives up the opportunity to profit from any increase in stock value above the exercise price of the option, and when a Fund writes a put option, it is exposed to a decline in the price of the underlying security.
Whether an option which a Fund has written expires on its stipulated expiration date or a Fund enters into a closing purchase transaction, the Fund realizes a gain (or loss, if the cost of a closing purchase transaction exceeds the premium received when the option was sold) without regard to any unrealized gain or loss on the underlying security, and the liability related to such option is extinguished. If a call option which a Fund has written is exercised, the Fund realizes a capital gain or loss from the sale of the underlying security, and the cost basis of the lots sold are decreased by the premium originally received. When a put option which a Fund has written is exercised, the amount of the premium originally received will reduce the cost of the security which the Fund purchases upon exercise of the option. Realized gains (losses) on purchased options are included in net realized gain (loss) from investments.
The Funds’ use of written options involves, to varying degrees, elements of market risk in excess of the amount recognized in the Statements of Assets and Liabilities. The face or contract amounts of these instruments reflect the extent of the Funds’ exposure to market risk. The risks may be caused by an imperfect correlation between movements in the price of the instrument and the price of the underlying securities, currencies and interest rates.
52
Babson Capital Funds Trust 2015 Annual Report
NOTES TO THE FINANCIAL STATEMENTS (CONTINUED)
June 30, 2015
Transactions in written option contracts for the Global Credit Income Opportunities Fund for the year ended June 30, 2015 are as follows:
| | | | | | | | |
| | | NUMBER OF
CONTRACTS/ NOTIONAL AMOUNT | | | PREMIUMS
RECEIVED | |
Options outstanding at June 30, 2014 | | | – | | | $ | – | |
Options written | | | 30,000,000 | | | | 382,000 | |
Options terminated in closing purchase transactions | | | – | | | | – | |
Options expired | | | – | | | | – | |
| | | | | | | | |
Options outstanding at June 30, 2015 | | | 30,000,000 | | | $ | 382,000 | |
| | | | | | | | |
During the year ended June 30, 2015, the Funds’ direct investment in derivatives consisted of forward foreign currency exchange contracts, purchased options, and written options.
The following is a summary of the fair value of derivative instruments held directly by the Funds as of June 30, 2015:
Global Floating Rate Fund
| | | | | | |
ASSET
DERIVATIVES | | STATEMENTS OF ASSETS
AND LIABILITIES
LOCATION | | FOREIGN
EXCHANGE
CONTRACTS
RISK | |
Forward Foreign Currency Exchange Contracts | | Unrealized appreciation
on forward foreign
currency exchange
contracts | | $ | 153,124 | |
| | | | | | |
Total | | | | $ | 153,124 | |
| | | | | | |
| | |
LIABILITY
DERIVATIVES | | STATEMENTS OF ASSETS
AND LIABILITIES
LOCATION | | FOREIGN
EXCHANGE
CONTRACTS
RISK | |
Forward Foreign Currency Exchange Contracts | | Unrealized depreciation
on forward foreign
currency exchange
contracts | | $ | 523,194 | |
| | | | | | |
Total | | | | $ | 523,194 | |
| | | | | | |
53
Babson Capital Funds Trust 2015 Annual Report
NOTES TO THE FINANCIAL STATEMENTS (CONTINUED)
June 30, 2015
Global Credit Income Opportunities Fund
| | | | | | | | | | | | | | |
ASSET
DERIVATIVES | | STATEMENTS OF ASSETS
AND LIABILITIES
LOCATION | | FOREIGN
EXCHANGE
CONTRACTS
RISK | | | CREDIT
RISK | | | TOTAL | |
Forward Foreign Currency Exchange Contracts | | Unrealized appreciation
on forward foreign
currency exchange
contracts | | $ | 98,939 | | | $ | – | | | $ | 98,939 | |
Purchased Options | | Investments, at fair
value | | | – | | | | 587,827 | | | | 587,827 | |
| | | | | | | | | | | | | | |
Total | | | | $ | 98,939 | | | $ | 587,827 | | | $ | 686,766 | |
| | | | | | | | | | | | | | |
| | | | |
LIABILITY
DERIVATIVES | | STATEMENTS OF ASSETS
AND LIABILITIES
LOCATION | | FOREIGN
EXCHANGE
CONTRACTS
RISK | | | CREDIT
RISK | | | TOTAL | |
Forward Foreign Currency Exchange Contracts | | Unrealized depreciation
on forward foreign
currency exchange
contracts | | $ | 242,571 | | | $ | – | | | $ | 242,571 | |
Written Options | | Written options, at fair
value | | | – | | | | 319,477 | | | | 319,477 | |
| | | | | | | | | | | | | | |
Total | | | | $ | 242,571 | | | $ | 319,477 | | | $ | 562,048 | |
| | | | | | | | | | | | | | |
Amount of Realized Gain/(Loss) on Derivatives:
Global Floating Rate Fund
| | | | |
| | | FOREIGN
EXCHANGE
CONTRACTS
RISK | |
Forward Foreign Currency Exchange Contracts | | $ | 5,210,733 | |
| | | | |
Total | | $ | 5,210,733 | |
| | | | |
Global Credit Income Opportunities Fund
| | | | | | | | | | | | |
| | | FOREIGN
EXCHANGE
CONTRACTS
RISK | | | CREDIT
RISK | | | TOTAL | |
Forward Foreign Currency Exchange Contracts | | $ | 3,726,491 | | | $ | – | | | $ | 3,726,491 | |
Purchased Options | | | – | | | | (75,183 | ) | | | (75,183 | ) |
| | | | | | | | | | | | |
Total | | $ | 3,726,491 | | | $ | (75,183 | ) | | $ | 3,651,308 | |
| | | | | | | | | | | | |
54
Babson Capital Funds Trust 2015 Annual Report
NOTES TO THE FINANCIAL STATEMENTS (CONTINUED)
June 30, 2015
Change in Unrealized Appreciation/(Depreciation) on Derivatives:
Global Floating Rate Fund
| | | | |
| | | FOREIGN
EXCHANGE
CONTRACTS
RISK | |
Forward Foreign Currency Exchange Contracts | | $ | (35,901 | ) |
| | | | |
Total | | $ | (35,901 | ) |
| | | | |
Global Floating Rate Fund
| | | | |
NUMBER OF CONTRACTS,
NOTIONAL AMOUNTS OF
SHARES/UNITS | | FOREIGN
EXCHANGE
CONTRACTS
RISK | |
Forward Foreign Currency Exchange Contracts(1) | | | 37,338,297 | |
| | | | |
Total | | | 37,338,297 | |
| | | | |
| | (1) | Volume of derivative activity is based on an average of month-end notional amounts outstanding during the period. |
Global Credit Income Opportunities Fund
| | | | | | | | | | | | |
| | | FOREIGN
EXCHANGE
CONTRACTS
RISK | | | CREDIT
RISK | | | TOTAL | |
Forward Foreign Currency Exchange Contracts | | $ | 72,833 | | | $ | – | | | $ | 72,833 | |
Purchased Options | | | – | | | | (40,866 | ) | | | (40,866 | ) |
Written Options | | | – | | | | 62,523 | | | | 62,523 | |
| | | | | | | | | | | | |
Total | | $ | 72,833 | | | $ | 21,657 | | | $ | 94,490 | |
| | | | | | | | | | | | |
Global Credit Income Opportunities Fund
| | | | | | | | | | | | |
NUMBER OF CONTRACTS,
NOTIONAL AMOUNTS OF
SHARES/UNITS | | FOREIGN
EXCHANGE CONTRACTS
RISK | | | CREDIT RISK | | | TOTAL | |
Forward Foreign Currency Exchange Contracts(1) | | | 26,141,491 | | | | – | | | | 26,141,491 | |
Purchased Options(1) | | | – | | | | 15,461,538 | | | | 15,461,538 | |
Written Options(1) | | | – | | | | (6,923,077 | ) | | | (6,923,077 | ) |
| | | | | | | | | | | | |
Total | | | 26,141,491 | | | | 8,538,461 | | | | 34,679,952 | |
| | | | | | | | | | | | |
| | (1) | Volume of derivative activity is based on an average of month-end notional amounts outstanding during the period. |
| | K. | Disclosures about Offsetting Assets and Liabilities |
The Financial Accounting Standards Board (“FASB”) issued Accounting Standards Update No. 2011-11 “Disclosures about Offsetting Assets and Liabilities” (“ASU 2011-11”). These disclosure requirements are intended to help better assess the effect or potential effect of offsetting
arrangements on a fund’s financial position. In addition, FASB issued Accounting Standards Update No. 2013-01 “Clarifying the Scope of Offsetting Assets and Liabilities” (“ASU 2013-01”), specifying which transactions are subject to disclosures about offsetting.
55
Babson Capital Funds Trust 2015 Annual Report
NOTES TO THE FINANCIAL STATEMENTS (CONTINUED)
June 30, 2015
The following tables illustrate gross and net information about recognized assets eligible for offset in the Statement of Assets and Liabilities; and disclose such amounts subject to an enforceable master netting agreement or similar agreement, by counterparty. A master netting agreement is an agreement between two counterparties who have multiple contracts with each other that provides for the net settlement of all contracts, as well as cash collateral, through a single payment in the event of default on or termination of any one contract:
Global Floating Rate Fund
| | | | | | | | | | | | |
| DESCRIPTION | | GROSS AMOUNTS OF
RECOGNIZED ASSETS | | | GROSS AMOUNTS OFFSET
IN THE STATEMENTS OF
ASSETS AND LIABILITIES | | | NET AMOUNTS OF
ASSETS PRESENTED
IN THE STATEMENTS OF
ASSETS AND LIABILITIES | |
Forward Foreign Currency Exchange Contracts | | $ | 153,124 | | | $ | – | | | $ | 153,124 | |
| | | | | | | | | | | | |
Total | | $ | 153,124 | | | $ | – | | | $ | 153,124 | |
| | | | | | | | | | | | |
| | | | | | | | | | | | | | | | |
| | | | | | GROSS AMOUNTS NOT OFFSET IN THE
STATEMENTS OF ASSETS AND LIABILITIES | | | | | | | |
| COUNTERPARTY | | NET AMOUNTS OF ASSETS
PRESENTED IN THE STATEMENTS
OF ASSETS AND LIABILITIES | | | FINANCIAL
INSTRUMENT (a) | | | CASH
COLLATERAL
RECEIVED (a) | | | NET
AMOUNT (b) | |
Morgan Stanley | | $ | 153,124 | | | $ | (153,124 | ) | | $ | – | | | $ | – | |
| | | | | | | | | | | | | | | | |
Total | | $ | 153,124 | | | $ | (153,124 | ) | | $ | – | | | $ | – | |
| | | | | | | | | | | | | | | | |
| | (a) | Collateral disclosed is limited to an amount not to exceed 100% of the net amount of assets presented in the Statements of Assets and Liabilities, for each respective counterparty. |
| | (b) | Net Amount represents the amount that is subject to loss in the event of a counterparty failure as of June 30, 2015. |
| | | | | | | | | | | | |
| DESCRIPTION | | GROSS AMOUNTS OF
RECOGNIZED LIABILITIES | | | GROSS AMOUNTS OFFSET
IN THE STATEMENTS OF
ASSETS AND LIABILITIES | | | NET AMOUNTS OF
LIABILITIES PRESENTED
IN THE STATEMENTS OF
ASSETS AND LIABILITIES | |
Forward Foreign Currency Exchange Contracts | | $ | 523,194 | | | $ | – | | | $ | 523,194 | |
| | | | | | | | | | | | |
Total | | $ | 523,194 | | | $ | – | | | $ | 523,194 | |
| | | | | | | | | | | | |
| | | | | | | | | | | | | | | | |
| | | | | | GROSS AMOUNTS NOT OFFSET IN THE
STATEMENTS OF ASSETS AND LIABILITIES | | | | | | | |
| COUNTERPARTY | | NET AMOUNTS OF LIABILITIES
PRESENTED IN THE STATEMENTS
OF ASSETS AND LIABILITIES | | | FINANCIAL
INSTRUMENT (a) | | | CASH
COLLATERAL
PLEDGED (a) | | | NET
AMOUNT (b) | |
Morgan Stanley | | $ | 523,194 | | | $ | (153,124 | ) | | $ | – | | | $ | 370,070 | |
| | | | | | | | | | | | | | | | |
Total | | $ | 523,194 | | | $ | (153,124 | ) | | $ | – | | | $ | 370,070 | |
| | | | | | | | | | | | | | | | |
| | (a) | Collateral disclosed is limited to an amount not to exceed 100% of the net amount of assets presented in the Statements of Assets and Liabilities, for each respective counterparty. |
| | (b) | Net Amount represents the amount that is subject to loss in the event of a counterparty failure as of June 30, 2015. |
56
Babson Capital Funds Trust 2015 Annual Report
NOTES TO THE FINANCIAL STATEMENTS (CONTINUED)
June 30, 2015
Global Credit Income Opportunities Fund
| | | | | | | | | | | | |
| DESCRIPTION | | GROSS AMOUNTS OF
RECOGNIZED ASSETS | | | GROSS AMOUNTS OFFSET
IN THE STATEMENTS OF
ASSETS AND LIABILITIES | | | NET AMOUNTS OF
ASSETS PRESENTED
IN THE STATEMENTS OF
ASSETS AND LIABILITIES | |
Forward Foreign Currency Exchange Contracts | | $ | 98,939 | | | $ | – | | | $ | 98,939 | |
Purchased Options | | | 587,827 | | | | – | | | | 587,827 | |
| | | | | | | | | | | | |
Total | | $ | 686,766 | | | $ | – | | | $ | 686,766 | |
| | | | | | | | | | | | |
| | | | | | | | | | | | | | | | |
| | | | | | GROSS AMOUNTS NOT OFFSET IN THE
STATEMENTS OF ASSETS AND LIABILITIES | | | | | | | |
| COUNTERPARTY | | NET AMOUNTS OF ASSETS
PRESENTED IN THE STATEMENTS
OF ASSETS AND LIABILITIES | | | FINANCIAL
INSTRUMENT (a) | | | CASH
COLLATERAL
RECEIVED (a) | | | NET
AMOUNT (b) | |
Credit Suisse International | | $ | 415,368 | | | $ | (225,997 | ) | | $ | – | | | $ | 189,371 | |
JPMorgan Chase Bank, N.A. | | | 172,459 | | | | (93,480 | ) | | | – | | | | 78,979 | |
Morgan Stanley | | | 98,939 | | | | (98,939 | ) | | | – | | | | – | |
| | | | | | | | | | | | | | | | |
Total | | $ | 686,766 | | | $ | (418,416 | ) | | $ | – | | | $ | 268,350 | |
| | | | | | | | | | | | | | | | |
| | (a) | Collateral disclosed is limited to an amount not to exceed 100% of the net amount of assets presented in the Statements of Assets and Liabilities, for each respective counterparty. |
| | (b) | Net Amount represents the amount that is subject to loss in the event of a counterparty failure as of June 30, 2015. |
| | | | | | | | | | | | |
| DESCRIPTION | | GROSS AMOUNTS OF
RECOGNIZED LIABILITIES | | | GROSS AMOUNTS OFFSET
IN THE STATEMENTS OF
ASSETS AND LIABILITIES | | | NET AMOUNTS OF
LIABILITIES PRESENTED
IN THE STATEMENTS OF
ASSETS AND LIABILITIES | |
Forward Foreign Currency Exchange Contracts | | $ | 242,571 | | | $ | – | | | $ | 242,571 | |
Written Options | | | 319,477 | | | | – | | | | 319,477 | |
| | | | | | | | | | | | |
Total | | $ | 562,048 | | | $ | – | | | $ | 562,048 | |
| | | | | | | | | | | | |
57
Babson Capital Funds Trust 2015 Annual Report
NOTES TO THE FINANCIAL STATEMENTS (CONTINUED)
June 30, 2015
| | | | | | | | | | | | | | | | |
| | | | | | GROSS AMOUNTS NOT OFFSET IN THE
STATEMENTS OF ASSETS AND LIABILITIES | | | | | | | |
| COUNTERPARTY | | NET AMOUNTS OF LIABILITIES
PRESENTED IN THE STATEMENTS
OF ASSETS AND LIABILITIES | | | FINANCIAL
INSTRUMENT (a) | | | CASH
COLLATERAL
PLEDGED (a) | | | NET
AMOUNT (b) | |
Credit Suisse International | | $ | 225,997 | | | $ | (225,997 | ) | | $ | – | | | $ | – | |
JPMorgan Chase Bank, N.A. | | | 93,480 | | | | (93,480 | ) | | | – | | | | – | |
Morgan Stanley | | | 242,571 | | | | (98,939 | ) | | | – | | | | 143,632 | |
| | | | | | | | | | | | | | | | |
Total | | $ | 562,048 | | | $ | (418,416 | ) | | $ | – | | | $ | 143,632 | |
| | | | | | | | | | | | | | | | |
| | (a) | Collateral disclosed is limited to an amount not to exceed 100% of the net amount of assets presented in the Statements of Assets and Liabilities, for each respective counterparty. |
| | (b) | Net Amount represents the amount that is subject to loss in the event of a counterparty failure as of June 30, 2015. |
Investing in securities of foreign companies and foreign governments involves special risks and considerations not typically associated with investing in U.S. companies and the U.S. government. These risks include valuation of currencies and adverse political and economic developments. Moreover, securities of many foreign companies, foreign governments, and their markets may be less liquid and their prices more volatile than those of securities of comparable U.S. companies and the U.S. government.
| | M. | Foreign Currency Translation |
The books and records of the Funds are maintained in U.S. dollars. Foreign currency transactions are translated into U.S. dollars on the following basis: (i) market value of investment securities, assets and liabilities at the daily rates of exchange, and (ii) purchases and sales of investment securities, dividend and interest income and certain expenses at the rates of exchange prevailing on the respective dates of such transactions. For financial reporting purposes, the Funds do not isolate changes in the exchange rate of investment securities from the fluctuations arising from changes in the market prices of securities. However, for Federal income tax purposes, the
Funds do isolate and treat as ordinary income the effect of changes in foreign exchange rates on realized gain or loss from the sale of investment securities and payables and receivables arising from trade-date and settlement-date differences.
The Funds seek to manage counterparty credit risk by entering into agreements only with counterparties the Adviser believes have the financial resources to honor their obligations. The Adviser monitors the financial stability of the Funds’ counterparties.
The Funds have entered into an Investment Management Agreement (the “Agreement”) with the Adviser. Pursuant to the Agreement, the Global Floating Rate Fund agrees to pay the Adviser a fee payable at the end of each calendar month, at an annual rate of 0.65% of the Fund’s average daily net assets during such month. The Global Credit Income Opportunities Fund agrees to pay the Adviser a fee payable at the end of each calendar month, at an annual rate of 0.75% of the Fund’s average daily net assets during such month.
58
Babson Capital Funds Trust 2015 Annual Report
NOTES TO THE FINANCIAL STATEMENTS (CONTINUED)
June 30, 2015
The Adviser has contractually agreed to waive and/or reimburse a portion of its fees and/or reimburse expenses (excluding 12b-1 fees, interest expenses, taxes, fees incurred in acquiring and disposing of securities and extraordinary expenses) such that total net annual operating expenses for each class do not exceed the following rates:
| | | | | | | | | | | | | | | | |
| | | CLASS A | | | CLASS C | | | CLASS I | | | CLASS Y | |
Global Floating Rate Fund | | | 1.05 | % | | | 1.80 | % | | | 0.75 | % | | | 0.75 | % |
Global Credit Income Opportunities Fund | | | 1.20 | % | | | 1.95 | % | | | 0.95 | % | | | 0.95 | % |
Pursuant to the expense waiver/reimbursement agreement, the Adviser is entitled to be reimbursed for any fees the Adviser waives and Fund expenses that the Adviser reimburses for a period of three years following such fee waivers and expense reimbursements, to the extent that such reimbursement of the Adviser by a Fund will not cause the Fund to exceed any applicable expense limitation that is in place for the Fund.
The contractual management fee waiver and expense reimbursement agreements between the Funds and the Adviser will remain in effect until November 1, 2016 and may be terminated only upon the approval of the Funds’ Board of Trustees.
Subject to the supervision of the Adviser and the Board, the Sub-Adviser manages the investment and reinvestment of a portion of the assets of the Funds, as allocated from time to time to the Sub-Adviser. The Adviser (not the Funds) will pay a portion of the fees it receives to the Sub-Adviser in return for its services.
| 4. | 12b-1 Distribution and Service Plan |
ALPS Distributors, Inc. (the “Distributor”) is the Distributor of the Funds’ shares as of June 30, 2015.
The Funds have adopted a Distribution and Shareholder Services Plan (the “Plan”), pursuant to Rule 12b-1 under the 1940 Act. Under the Plan, each Fund’s Class A and Class C shares may compensate certain financial institutions, including the Distributor, for certain distribution and shareholder servicing activities. The Funds’ Class A shares may expend an aggregate amount, on an annual basis, not to exceed 0.25% of the value of the average daily net assets of a Fund attributable to
Class A shares and 1.00% of the value of the average daily net assets of a Fund attributable to Class C shares. The Plan provides that the distribution and service fees are payable to the Distributor regardless of the amounts actually expended by the Distributor for distribution of the Funds’ shares and service activities.
Under its terms, the Funds’ Plan shall remain in effect from year to year, provided such continuance is approved annually by a vote of a majority of the Boards’ members and a majority of those Boards’ members who are not “interested persons” of the Funds and who have no direct or indirect financial interest in the operation of the Plan or in any agreement related to the Plan.
| 5. | Sales Charges and Commissions |
For the year ended June 30, 2015, the amount of sales charges retained by the Distributor on sales of Class A and Class C shares of the Funds were as follows:
| | | | |
| | | CLASS C | |
Global Floating Rate Fund | | $ | 27,409 | |
Global Credit Income Opportunities Fund | | | 20,691 | |
For the year ended June 30, 2015, the Distributor received the following commissions on sales of shares of the Funds, after concessions were paid to authorized dealers:
| | | | | | | | |
| | | DISTRIBUTOR
COMMISSIONS | | | DEALERS’
CONCESSIONS | |
Global Floating Rate Fund | | $ | 2,988 | | | $ | 42,363 | |
Global Credit Income Opportunities Fund | | | 18,168 | | | | 102,312 | |
| 6. | Administrator, Custody, and Transfer Agent Fees |
The Funds have engaged State Street Bank and Trust (“SSB”) to serve as the Funds’ administrator, custodian, fund accountant, and transfer agent. For each of these services, the Funds have agreed to pay SSB a fee payable at the end of each calendar month pursuant to fee agreements between SSB and the Funds. For the year ended June 30, 2015, the aggregate effective fee for these services was at an annual rate of 0.36% and 0.45% of Global Floating Rate Fund and Global Credit Income Opportunities Fund’s average daily managed assets, respectively.
59
Babson Capital Funds Trust 2015 Annual Report
NOTES TO THE FINANCIAL STATEMENTS (CONTINUED)
June 30, 2015
It is the Funds’ intention to qualify as a RIC under subchapter M of the Internal Revenue Code and distribute all of its taxable income. Accordingly, no provision for Federal income taxes is required in the financial statements.
The tax character of dividends paid to shareholders during the tax period ended June 30, 2014 was as follows:
| | | | | | | | | | | | |
| | | ORDINARY
INCOME | | | RETURN
OF CAPITAL | | | TOTAL
DISTRIBUTIONS
PAID | |
Global Floating Rate Fund | | $ | 1,730,080 | | | $ | 61,792 | | | $ | 1,791,872 | |
Global Credit Income Opportunities Fund | | | 1,572,417 | | | | – | | | | 1,572,417 | |
The tax character of dividends paid to shareholders during the year ended June 30, 2015 was as follows:
| | | | | | | | | | | | |
| | | ORDINARY
INCOME | | | NET
LONG-TERM
CAPITAL
GAINS | | | TOTAL
DISTRIBUTIONS
PAID | |
Global Floating Rate Fund | | $ | 8,284,319 | | | $ | – | | | $ | 8,284,319 | |
Global Credit Income Opportunities Fund | | | 7,108,559 | | | | 265 | | | | 7,108,824 | |
As of June 30, 2015, the components of distributable earnings on a tax-basis were as follows:
| | | | | | | | | | | | | | | | | | | | |
| | | UNDISTRIBUTED
ORDINARY
INCOME | | | CAPITAL LOSS
CARRYFORWARDS | | | OTHER
TEMPORARY
DIFFERENCES | | | UNREALIZED
APPRECIATION
(DEPRECIATION) | | | TOTAL
DISTRIBUTABLE
EARNINGS | |
Global Floating Rate Fund | | $ | 45,559 | | | $ | (1,215,117 | ) | | $ | (30,800 | ) | | $ | (4,754,370 | ) | | $ | (5,954,728 | ) |
Global Credit Income Opportunities Fund | | | 697,347 | | | | (2,073,127 | ) | | | (8,138 | ) | | | (3,661,459 | ) | | | (5,045,377 | ) |
In accordance with the Regulated Investment Company Modernization Act of 2010, the Funds will carryforward capital losses incurred in taxable years beginning after December 22, 2010 (“post-enactment losses”) indefinitely. Post-enactment losses will also retain their character as either short-term or long-term and be utilized before any pre-enactment losses.
On June 30, 2015, the Global Floating Rate Fund had capital loss carryforwards available to be offset against future net capital gains through the indicated expiration dates as follows:
| | | | | | | | | | | | | | | | | | |
| | | EXPIRING JUNE 30, | |
| | | 2016 | | 2017 | | | 2018 | | | 2019 | | | UNLIMITED | |
| | $ – | | $ | – | | | $ | – | | | $ | – | | | $ | 100 | |
Under current tax rules, regulated investment companies can elect to treat certain late-year ordinary losses incurred and post-October capital losses (capital losses realized after October 31) as arising on the first day of the following taxable year. As of June 30, 2015, Global Floating Rate Fund and Global Credit Income Opportunities Fund have elected to defer current year post-October losses of $1,215,017 and $2,073,127, respectively.
60
Babson Capital Funds Trust 2015 Annual Report
NOTES TO THE FINANCIAL STATEMENTS (CONTINUED)
June 30, 2015
As of June 30, 2015, the aggregate unrealized security gains and losses based on cost for U.S. federal income tax purposes were as follows:
| | | | | | | | | | | | | | | | |
| | | COST OF
INVESTMENTS | | | GROSS
UNREALIZED
APPRECIATION | | | GROSS
UNREALIZED
DEPRECIATION | | | NET
UNREALIZED
APPRECIATION
(DEPRECIATION) | |
Global Floating Rate Fund | | $ | 183,799,960 | | | $ | 783,725 | | | $ | (5,638,043 | ) | | $ | (4,854,318 | ) |
Global Credit Income Opportunities Fund | | | 87,228,363 | | | | 567,939 | | | | (4,357,276 | ) | | | (3,789,337 | ) |
The difference between book-basis and tax-basis unrealized gains (losses) is attributable to wash sales.
Permanent items identified during the year ended June 30, 2015 have been reclassified among the components of net assets based on their tax basis treatment as follows:
| | | | | | | | |
| | | UNDISTRIBUTED
NET
INVESTMENT
INCOME | | | ACCUMULATED
NET REALIZED
GAIN (LOSS) | |
Global Floating Rate Fund | | $ | 2,703,684 | | | $ | (2,703,684 | ) |
Global Credit Income Opportunities Fund | | | 2,423,233 | | | | (2,423,233 | ) |
The permanent differences are primarily attributable to foreign currency gains (losses) and the tax treatment of certain distributions.
| 8. | Investment Transactions |
Purchases and sales of securities (excluding short-term debt securities) for the year ended June 30, 2015 were as follows:
| | | | | | | | |
| | | PURCHASES | | | SALES | |
Global Floating Rate Fund | | $ | 124,382,078 | | | $ | 73,185,705 | |
Global Credit Income Opportunities Fund | | | 84,486,687 | | | | 61,007,687 | |
61
Babson Capital Funds Trust 2015 Annual Report
NOTES TO THE FINANCIAL STATEMENTS (CONTINUED)
June 30, 2015
Transactions in common stock for the year ended June 30, 2015 were as follows:
Global Floating Rate Fund
| | | | | | | | | | | | | | | | |
| | | FOR THE YEAR
ENDED JUNE 30, 2015 | | | PERIOD FROM
SEPTEMBER 16, 2013
THROUGH
JUNE 30, 2014 (1) | |
| CLASS A | | SHARES | | | AMOUNT | | | SHARES | | | AMOUNT | |
Shares sold | | | 1,046,486 | | | $ | 10,379,529 | | | | 1,222,507 | | | $ | 12,481,232 | |
Shares sold through reinvestments of distributions | | | 83,026 | | | | 807,940 | | | | 13,651 | | | | 139,125 | |
Shares redeemed | | | (1,815,123 | ) | | | (17,653,590 | ) | | | (13,926 | ) | | | (142,258 | ) |
Redemption fees(2) | | | – | | | | 676 | | | | – | | | | – | |
| | | | | | | | | | | | | | | | |
Net increase (decrease) | | | (685,611 | ) | | $ | (6,465,445 | ) | | | 1,222,232 | | | $ | 12,478,099 | |
| | | | | | | | | | | | | | | | |
CLASS C | | | | | | | | | | | | | | | | |
Shares sold | | | 335,871 | | | $ | 3,264,612 | | | | 233,502 | | | $ | 2,379,349 | |
Shares sold through reinvestments of distributions | | | 19,258 | | | | 185,848 | | | | 2,446 | | | | 24,864 | |
Shares redeemed | | | (20,267 | ) | | | (195,905 | ) | | | (152 | ) | | | (1,544 | ) |
Redemption fees(2) | | | – | | | | 169 | | | | – | | | | – | |
| | | | | | | | | | | | | | | | |
Net increase | | | 334,862 | | | $ | 3,254,724 | | | | 235,796 | | | $ | 2,402,669 | |
| | | | | | | | | | | | | | | | |
CLASS I | | | | | | | | | | | | | | | | |
Shares sold | | | – | | | $ | – | | | | 3,150,134 | | | $ | 31,550,060 | |
Shares sold through reinvestments of distributions | | | 234,264 | | | | 2,279,655 | | | | 59,739 | | | | 610,026 | |
Shares redeemed | | | (753,573 | ) | | | (7,271,983 | ) | | | – | | | | – | |
Redemption fees(2) | | | – | | | | 1,694 | | | | – | | | | – | |
| | | | | | | | | | | | | | | | |
Net increase (decrease) | | | (519,309 | ) | | $ | (4,990,634 | ) | | | 3,209,873 | | | $ | 32,160,086 | |
| | | | | | | | | | | | | | | | |
CLASS Y | | | | | | | | | | | | | | | | |
Shares sold | | | 9,236,912 | | | $ | 89,446,649 | | | | 6,676,274 | | | $ | 67,761,452 | |
Shares sold through reinvestments of distributions | | | 493,939 | | | | 4,805,968 | | | | 97,618 | | | | 996,669 | |
Shares redeemed | | | (2,813,208 | ) | | | (27,521,577 | ) | | | (210,789 | ) | | | (2,155,109 | ) |
Redemption fees(2) | | | – | | | | 2,920 | | | | – | | | | – | |
| | | | | | | | | | | | | | | | |
Net increase | | | 6,917,643 | | | $ | 66,733,960 | | | | 6,563,103 | | | $ | 66,603,012 | |
| | | | | | | | | | | | | | | | |
| | (1) | Fund commenced operations on September 16, 2013. |
| | (2) | On May 7, 2015, the Funds’ Board of Trustees voted to remove redemption fees from future transactions. |
62
Babson Capital Funds Trust 2015 Annual Report
NOTES TO THE FINANCIAL STATEMENTS (CONTINUED)
June 30, 2015
Global Credit Income Opportunities Fund
| | | | | | | | | | | | | | | | |
| | | FOR THE YEAR
ENDED JUNE 30, 2015 | | | PERIOD FROM
SEPTEMBER 16, 2013
THROUGH
JUNE 30, 2014 (1) | |
| CLASS A | | SHARES | | | AMOUNT | | | SHARES | | | AMOUNT | |
Shares sold | | | 2,316,931 | | | $ | 23,545,838 | | | | 250,892 | | | $ | 2,588,194 | |
Shares sold through reinvestments of distributions | | | 127,930 | | | | 1,237,474 | | | | 3,520 | | | | 36,805 | |
Shares redeemed | | | (1,355,520 | ) | | | (13,184,266 | ) | | | (6,628 | ) | | | (69,594 | ) |
Redemption fees(2) | | | – | | | | 2,624 | | | | – | | | | – | |
| | | | | | | | | | | | | | | | |
Net increase | | | 1,089,341 | | | $ | 11,601,670 | | | | 247,784 | | | $ | 2,555,405 | |
| | | | | | | | | | | | | | | | |
CLASS C | | | | | | | | | | | | | | | | |
Shares sold | | | 285,284 | | | $ | 2,802,118 | | | | 89,635 | | | $ | 933,045 | |
Shares sold through reinvestments of distributions | | | 13,552 | | | | 130,085 | | | | 900 | | | | 9,400 | |
Shares redeemed | | | (12,493 | ) | | | (121,540 | ) | | | (159 | ) | | | (1,661 | ) |
Redemption fees(2) | | | – | | | | 343 | | | | – | | | | – | |
| | | | | | | | | | | | | | | | |
Net increase | | | 286,343 | | | $ | 2,811,006 | | | | 90,376 | | | $ | 940,784 | |
| | | | | | | | | | | | | | | | |
CLASS I | | | | | | | | | | | | | | | | |
Shares sold | | | – | | | $ | – | | | | 2,455,000 | | | $ | 24,550,000 | |
Shares sold through reinvestments of distributions | | | 253,647 | | | | 2,450,842 | | | | 70,277 | | | | 734,939 | |
Shares redeemed | | | – | | | | – | | | | – | | | | – | |
Redemption fees(2) | | | – | | | | 4,679 | | | | – | | | | – | |
| | | | | | | | | | | | | | | | |
Net increase | | | 253,647 | | | $ | 2,455,521 | | | | 2,525,277 | | | $ | 25,284,939 | |
| | | | | | | | | | | | | | | | |
CLASS Y | | | | | | | | | | | | | | | | |
Shares sold | | | 1,654,908 | | | $ | 16,333,761 | | | | 3,172,809 | | | $ | 32,089,635 | |
Shares sold through reinvestments of distributions | | | 321,379 | | | | 3,108,290 | | | | 74,417 | | | | 778,240 | |
Shares redeemed | | | (1,114,834 | ) | | | (11,114,262 | ) | | | (6,875 | ) | | | (72,116 | ) |
Redemption fees(2) | | | – | | | | 5,954 | | | | – | | | | – | |
| | | | | | | | | | | | | | | | |
Net increase | | | 861,453 | | | $ | 8,333,743 | | | | 3,240,351 | | | $ | 32,795,759 | |
| | | | | | | | | | | | | | | | |
| | (1) | Fund commenced operations on September 16, 2013. |
| | (2) | On May 7, 2015, the Funds’ Board of Trustees voted to remove redemption fees from future transactions. |
During the year ended June 30, 2015, the Trust (the “Borrower”) entered into a Credit Agreement (the “Credit Agreement”) with State Street Bank and Trust Company (the “Bank”). The Credit Agreement provides for a revolving credit facility of $20,000,000 (the “Facility Amount”) to be utilized for temporary or emergency purposes to fund shareholder redemptions or for other short-term liquidity purposes. Per the Credit Agreement, outstanding principal on the loan shall bear interest at a variable rate per annum equal to the higher of (a) the
Federal Funds Rate as in effect on the day of the borrowing plus 1.25% and (b) the Overnight LIBOR rate as in effect on the day of the borrowing plus 1.25%. In addition, the Borrower shall pay to the Bank a commitment fee at the rate of 0.125% per annum on the daily unused portion of the Facility Amount. As of June 30, 2015, there were no loans outstanding pursuant to the Credit Agreement.
Effective July 22, 2015, the Facility Amount increased from $20,000,000 to $40,000,000.
63
Babson Capital Funds Trust 2015 Annual Report
REPORT OF INDEPENDENT REGISTERED PUBLIC ACCOUNTING FIRM
To the Board of Trustees of Babson Capital Funds Trust and Shareholders of
Babson Global Floating Rate Fund and Babson Global Credit Income Opportunities:
We have audited the accompanying statements of assets and liabilities, including the schedules of investments, of Babson Capital Funds Trust, comprising Babson Global Floating Rate Fund and Babson Global Credit Income Opportunities Fund (collectively, the “Funds”) as of June 30, 2015, and the related statements of operations for the year then ended, the statements of changes in net assets and the financial highlights for the year then ended and for the period September 16, 2013 (commencement of operations) through June 30, 2014. These financial statements and financial highlights are the responsibility of the Funds’ management. Our responsibility is to express an opinion on these financial statements and financial highlights based on our audits.
We conducted our audits in accordance with the standards of the Public Company Accounting Oversight Board (United States). Those standards require that we plan and perform the audit to obtain reasonable assurance about whether the financial statements and financial highlights are free of material misstatement. The Funds are not required to have, nor were we engaged to perform, an audit of their internal control over financial reporting. Our audits included consideration of internal control over financial reporting as a basis for designing audit procedures that are appropriate in the circumstances, but not for the purpose of expressing an opinion on the effectiveness of the Funds’ internal control over financial reporting. Accordingly, we express no such opinion. An audit also includes examining, on a test basis, evidence supporting the amounts and disclosures in the financial statements, assessing the accounting principles used and significant estimates made by management, as well as evaluating the overall financial statement presentation. Our procedures included confirmation of securities owned as of June 30, 2015, by correspondence with the custodian, brokers, and agent banks; where replies were not received from brokers and agent banks, we performed other auditing procedures. We believe that our audits provide a reasonable basis for our opinion.
In our opinion, the financial statements and financial highlights referred to above present fairly, in all material respects, the financial position of each of the Funds as of June 30, 2015, the results of their operations for the year then ended, and the statements of changes in net assets and the financial highlights for the year then ended and for the period September 16, 2013 (commencement of operations) through June 30, 2014, in conformity with accounting principles generally accepted in the United States of America.
Deloitte & Touche LLP
Boston, Massachusetts
August 25, 2015
64
Babson Capital Funds Trust 2015 Annual Report
INTERESTED TRUSTEE
| | | | | | | | | | |
| NAME (AGE), ADDRESS | | POSITION(S)
WITH THE TRUST | | OFFICE
TERM
AND
LENGTH
OF TIME
SERVED | | PRINCIPAL OCCUPATIONS
DURING PAST 5 YEARS | | PORTFOLIOS
OVERSEEN
IN FUND
COMPLEX | | OTHER DIRECTORSHIPS HELD BY
DIRECTOR |
Thomas M. Finke (51) 550 South Tryon Street Suite 3300 Charlotte, NC 28202 | | Trustee | | Trustee since 2013 | | Chairman and Chief Executive Officer (since 2008), Member of the Board of Managers (since 2006), President (2007-2008), Managing Director (2002-2008), Babson Capital; Chief Investment Officer and Executive Vice President (2008-2011), Massachusetts Mutual Life Insurance Company. | | 3 | | Trustee (since 2013), Babson Capital Global Short Duration High Yield Fund (closed-end investment company advised by Babson Capital); Chairman (2012-2015), Director (since 2008), Babson Capital Management (UK) Limited (investment advisory firm); Chairman and Director (2012-2015), Babson Capital Global Advisors Limited (investment advisory firm); Director (since 2008), Babson Capital Guernsey Limited (holding company); Vice Chairman and Manager (since 2011), MM Asset Management Holding LLC (holding company); Manager (since 2011), Wood Creek Capital Management, LLC (investment advisory firm); Chairman and Director (since 2007), Cornerstone Real Estate Advisers LLC (real estate advisory firm); Director (since 2004), Jefferies Finance LLC (finance company); Manager (2007-2015), Credit Strategies Management LLC (general partner of an investment fund); Manager (since 2005), Loan Strategies Management, LLC (general partner of an investment fund); Manager (since 2005), Jefferies Finance CP Funding LLC (investment company); Manager (2004-2012), Class C Member LLC (equity holding company); Chairman, Chief Executive Officer and Director (2009-2011), MassMutual Capital Partners, LLC (investment company); Director (2007-2011), Scottish Re Group Limited (reinsurance specialist). |
65
Babson Capital Funds Trust 2015 Annual Report
INDEPENDENT TRUSTEES (CONTINUED)
| | | | | | | | | | |
| NAME (AGE), ADDRESS | | POSITION(S) WITH THE TRUST | | OFFICE TERM AND LENGTH OF TIME SERVED | | PRINCIPAL OCCUPATIONS DURING PAST 5 YEARS | | PORTFOLIOS OVERSEEN IN FUND COMPLEX | | OTHER DIRECTORSHIPS HELD BY DIRECTOR |
Thomas W. Bunn (61) 550 South Tryon Street Suite 3300 Charlotte, NC 28202 | | Trustee | | Trustee since 2013 | | Retired (since 2009); Vice Chairman (2002-2009), Head of National Banking (2006-2009), Head of Corporate and Investment Banking (2002-2006), KeyCorp (commercial and investment banking firm). | | 3 | | Trustee (since 2013), Babson Capital Global Short Duration High Yield Fund (closed-end investment company advised by Babson Capital); Director (since 2010), SquareTwo Financial (asset recovery and management firm); Director (since 2010), Southern Weaving Co. (webbing and sleeving design and manufacturing company); Trustee (since 2010), Wake Forest University Board of Trustees; Member (since 1998), Babcock School of Business Board of Visitors; Senior Operating Advisor (since 2010), Sound Harbor Partners (investment management firm); Director (since 2009), Nature Conservancy of North Carolina; Director (2009-2014), Kiawah Island Conservancy; Director (2007-2009), Victory Asset Management (mutual fund complex). |
| | | | | |
Rodney J. Dillman (63) 550 South Tryon Street Suite 3300 Charlotte, NC 28202 | | Trustee, Chairman | | Trustee since 2013 | | Retired (since 2012); Deputy General Counsel (2011-2012), Senior Vice President (2008-2012), Vice President (2000-2008), Massachusetts Mutual Life Insurance Company; Member of the Board of Directors and President (2008-2011), MassMutual International LLC; General Counsel (2006-2008), Babson Capital. | | 3 | | Trustee (since 2012), Babson Capital Global Short Duration High Yield Fund (closed-end investment company advised by Babson Capital); Director (2008-2011), Compania de Seguros CorpVida S.A. (insurance company); Director (2009-2011), MassMutual Europe S.A. (insurance company); Director (2009-2010), Yingda Taihe Life Insurance Co.; Director (2008-2011), MassMutual Asia Limited (insurance company); Director (2008-2011), MassMutual Life Insurance Company; Director (2008-2010), MassMutual Mercuries Life Insurance Company; Director (2005-2010), The MassMutual Trust Company. |
| | | | | |
Bernard A. Harris, Jr. (58) 550 South Tryon Street Suite 3300 Charlotte, NC 28202 | | Trustee | | Trustee since 2013 | | Chief Executive Officer and Managing Partner (since 2002), Vesalius Ventures, Inc.; Director and President (since 1998), The Space Agency; President (since 1999), The Harris Foundation; Clinical Scientist, Flight Surgeon and Astronaut (1986-1996), NASA. | | 3 | | Trustee (since 2012), Babson Capital Global Short Duration High Yield Fund (closed-end investment company advised by Babson Capital); Trustee (since 2011), Salient Midstream & MLP Fund and Salient MLP & Energy Infrastructure Fund; Trustee (since 2010), Salient Absolute Return Fund; Director (since 2009), Monebo Technologies Inc. (medical technology design company); Director (since 2008), US Physical Therapy (USPH: NYSE); Director (since 2012), E-Cardio, Inc. (provides services for cardiac monitoring). |
66
Babson Capital Funds Trust 2015 Annual Report
INDEPENDENT TRUSTEES (CONTINUED)
| | | | | | | | | | |
| NAME (AGE), ADDRESS | | POSITION(S) WITH THE TRUST | | OFFICE TERM AND LENGTH OF TIME SERVED | | PRINCIPAL OCCUPATIONS DURING PAST 5 YEARS | | PORTFOLIOS OVERSEEN IN FUND COMPLEX | | OTHER DIRECTORSHIPS HELD BY DIRECTOR |
Thomas W. Okel (52) 550 South Tryon Street Suite 3300 Charlotte, NC 28202 | | Trustee | | Trustee since 2013 | | Executive Director (since 2011), Catawba Lands Conservancy; Global Head of Syndicated Capital Markets (1998-2010), Bank of America Merrill Lynch. | | 3 | | Trustee (since 2012), Babson Capital Global Short Duration High Yield Fund (closed-end investment company advised by Babson Capital). |
| | | | | |
Martin A. Sumichrast (48) 550 South Tryon Street Suite 3300 Charlotte, NC 28202 | | Trustee | | Trustee since 2013 | | Vice Chairman and Prinicipal (since 2013), Siskey Capital, LLC (merchant banking); Managing Director (2012-2013), Washington Capital, LLC (family office); Managing Director (2009-2012), Lomond International (business advisory firm). | | 3 | | Trustee (since 2012), Babson Capital Global Short Duration High Yield Fund (closed-end investment company advised by Babson Capital); Director (since 2014), Kure Corp. (retail); Director (since 2014), Jadeveon Clowney Help-InTime Foundation; Director (since 2015), Social Realty, Inc. (digital platform technology and management software company for internet advertising); Chairman and Director (since 2015), Level Beauty Group Inc. (a retail/e-commerce beauty investment/management company). |
67
Babson Capital Funds Trust 2015 Annual Report
OFFICERS OF THE TRUST
| | | | | | |
| NAME (AGE), ADDRESS | | POSITION(S) WITH THE TRUST | | OFFICE TERM* AND
LENGTH OF TIME
SERVED | | PRINCIPAL OCCUPATION(S) DURING PAST 5 YEARS |
Anthony J. Sciacca (44) 550 South Tryon Street Charlotte, NC 28202 | | President | | Since 2013 | | Head of Babson Capital Strategic Investors (since 2014), Head of Global Business Development Group (since 2008), Managing Director (since 2006), Babson Capital. |
| | | |
Russell D. Morrison (49) 550 South Tryon Street Charlotte, NC 28202 | | Senior Vice President | | Since 2013 | | Vice Chairman (since 2014), Member of the Board of Managers (since 2014), Head of Global Fixed Income Group (since 2012), Head of Global High Yield Investments Group (since 2010); Co-Head U.S. Loan Team (2006-2009), Managing Director (since 2002), Babson Capital; Chairman and Director (since 2015), Babson Capital Management (UK) Limited (investment advisory firm); Chairman and Director (since 2015), Babson Capital Global Advisors Limited (investment advisory firm); President (since 2012), Babson Capital Global Short Duration High Yield Fund (closed-end investment company advised by Babson Capital). |
| | | |
Patrick Hoefling (34) 550 South Tryon Street Charlotte, NC 28202 | | Chief Financial Officer | | Since 2013 | | Treasurer (since 2015), Managing Director (since 2015), Director (2008-2015), Babson Capital; Chief Financial Officer (since 2012), Babson Capital Global Short Duration High Yield Fund (closed-end investment company advised by Babson Capital); Manager (2005-2008), Deloitte and Touche. |
| | | |
Andrew Lennon (39) 550 South Tryon Street Charlotte, NC 28202 | | Treasurer | | Since 2013 | | Managing Director (since 2010), Director (2005-2009), Babson Capital; Treasurer (since 2013), Babson Capital Global Short Duration High Yield Fund (closed-end investment company advised by Babson Capital). |
| | | |
Paul J. Thompson (42) 550 South Tryon Street Charlotte, NC 28202 | | Vice President | | Since 2013 | | Chief Financial Officer (since 2015), Chief Operating Officer and Head of Global Investment Services (since 2010), Head of Operations and Portfolio/Client Services (2002-2010), Managing Director (since 2008), Babson Capital. |
| | | |
Paul Gehrig (46) 550 South Tryon Street Charlotte, NC 28202 | | Vice President | | Since 2013 | | Managing Director (since 2008), Babson Capital. |
| | | |
Brian W. Pope (35) 550 South Tryon Street Charlotte, NC 28202 | | Vice President | | Since 2013 | | Director (since 2009), Babson Capital |
| | | |
Duncan Robertson (46) 550 South Tryon Street Charlotte, NC 28202 | | Vice President | | Since 2014 | | Managing Director (since 2008), Babson Capital. |
68
Babson Capital Funds Trust 2015 Annual Report
OFFICERS OF THE TRUST (CONTINUED)
| | | | | | |
| NAME (AGE), ADDRESS | | POSITION(S) WITH THE TRUST | | OFFICE TERM* AND
LENGTH OF TIME
SERVED | | PRINCIPAL OCCUPATION(S) DURING PAST 5 YEARS |
Melissa LaGrant (42) 550 South Tryon Street Charlotte, NC 28202 | | Chief Compliance Officer | | Since 2013 | | Managing Director (since 2005), Babson Capital; Chief Compliance Officer (since 2013), Babson Capital Finance LLC; Chief Compliance Officer (since 2006), Babson Capital Corporate Investors and Babson Capital Participation Investors (closed-end investment companies advised by Babson Capital); Chief Compliance Officer (since 2012), Babson Capital Global Short Duration High Yield Fund (closed-end investment company advised by Babson Capital). |
| | | |
Janice M. Bishop (49) 550 South Tryon Street Charlotte, NC 28202 | | Secretary and Chief Legal Officer | | Since 2013 | | Senior Counsel and Managing Director (since 2014), Counsel (2007-2014), Babson Capital; Associate Secretary (since 2008), Babson Capital Corporate Investors and Babson Capital Participation Investors (closed-end investment companies advised by Babson Capital); Secretary and Chief Legal Officer (since 2012), Babson Capital Global Short Duration High Yield Fund (closed-end investment company advised by Babson Capital). |
| | | |
Michelle Manha (41) 550 South Tryon Street Charlotte, NC 28202 | | Assistant Secretary | | Since 2013 | | Associate General Counsel and Managing Director (since 2014), Counsel (2008-2014), Babson Capital; Assistant Secretary (since 2012), Babson Capital Global Short Duration High Yield Fund, (closed-end investment company advised by Babson Capital). |
69
Babson Capital Funds Trust 2015 Annual Report

JOINT PRIVACY NOTICE OF BABSON CAPITAL MANAGEMENT LLC AND
BABSON CAPITAL FUNDS TRUST
This privacy notice is being provided by the following entities: Babson Capital Management LLC; Babson Capital Securities LLC; Babson Capital Management (Japan) KK; Babson Capital Cornerstone Asia Ltd.; Babson Capital Funds Trust; Babson Capital Global Short Duration High Yield Fund; Babson Capital Corporate Investors and Babson Capital Participation Investors (together, for purposes of this privacy notice, “Babson Capital”).
When you use Babson Capital you entrust us not only with your hard-earned assets but also with your personal and financial data. We consider your data to be private and confidential, and protecting its confidentiality is important to us. Our policies and procedures regarding your personal information are summarized below.
We may collect non-public personal information about you from:
| | n | | Applications or other forms, interviews, or by other means; |
| | n | | Consumer or other reporting agencies, government agencies, employers or others; |
| | n | | Your transactions with us, our affiliates, or others; and |
We may share the financial information we collect with our financial service affiliates, such as insurance companies, investment companies and securities broker-dealers. Additionally, so that we may continue to offer you products and services that best meet your investment needs and to effect transactions that you request or authorize, we may disclose the information we collect, as described above, to companies that perform administrative or marketing services on our behalf, such as transfer agents, custodian banks, service providers or printers and mailers that assist us in the distribution of investor materials or that provide operational support to Babson Capital. These companies are required to protect this information and will use this information only for the services for which we hire them, and are not permitted to use or share this information for any other purpose. Some of these companies may perform such services in jurisdictions other than the United States. We may share some or all of the information we collect with other financial institutions with whom we jointly market products. This may be done only if it is permitted by the state in which you live. Some disclosures may be limited to your name, contact and transaction information with us or our affiliates.
Any disclosures will be only to the extent permitted by federal and state law. Certain disclosures may require us to get an “opt-in” or “opt-out” from you. If this is required, we will do so before information is shared. Otherwise, we do not share any personal information about our customers or former customers unless authorized by the customer or as permitted by law.
We restrict access to personal information about you to those employees who need to know that information to provide products and services to you. We maintain physical, electronic and procedural safeguards that comply with legal standards to guard your personal information. As an added measure, we do not include personal or account information in non-secure e-mails that we send you via the Internet without your prior consent. We advise you not to send such information to us in non-secure e-mails.
This notice describes the privacy policies of Babson Capital, and applies to all accounts you presently have, or may open in the future, with Babson Capital using your social security number or federal taxpayer identification number. As mandated by various regulators, including rules issued by the Securities and Exchange Commission, we will be sending you this notice annually, as long as you remain a customer of Babson Capital.
Babson Capital Securities LLC is a member of the Financial Industry Regulatory Authority (FINRA) and the Securities Investor Protection Corporation (SIPC). Investors may obtain information about SIPC including the SIPC brochure by contacting SIPC online at www.sipc.org or calling (202) 371-8300. Investors may obtain information about FINRA including the FINRA Investor Brochure by contacting FINRA online at www.finra.org or by calling (800) 289-9999.
June 2015
70

Babson Capital Funds Trust
ANNUAL REPORT
June 30, 2015

The Registrant adopted a Code of Ethics for Principal Executive and Senior Financial Officers (the “Code”) on July 29, 2013, which is available on the Registrant’s website at www.babsoncapital.com/funds/mutual-funds. During the period covered by this Form N-CSR, there were no amendments to, or waivers from, the Code.
| Item 3. | Audit Committee Financial Expert. |
The Registrant’s Board of Trustees has determined that Dr. Bernard A. Harris, Jr., Mr. Thomas W. Okel and Mr. Martin A. Sumichrast, constituting all the members of the Registrant’s Audit Committee, are audit committee financial experts. Dr. Harris, Mr. Okel and Mr. Sumichrast are “independent” for purposes of this Item 3 as required by applicable regulation.
| Item 4. | Principal Accountant Fees and Services. |
The Registrant has engaged its principal accountant, Deloitte & Touche LLP (“Deloitte”), to perform audit services, audit-related services, tax services and other services. The following tables detail the aggregate fees billed or expected to be billed for each of the last two fiscal years by Deloitte.
Fees Billed to the Registrant:
| | | | | | | | |
| | | Year Ended
June 30,
2015 | | | Year Ended
June 30,
2014 | |
Audit Fees | | $ | 130,850 | | | $ | 123,750 | |
Audit-Related Fees | | $ | 0 | | | $ | 0 | |
Tax Fees | | $ | 54,000 | | | $ | 18,000 | |
All Other Fees | | $ | 0 | | | $ | 0 | |
| | | | | | | | |
Total Fees | | $ | 184,850 | | | $ | 141,750 | |
| | | | | | | | |
Non-Audit Fees Billed to Babson Capital and MassMutual:
| | | | | | | | |
| | | Year Ended
June 30,
2015 | | | Year Ended
June 30,
2014 | |
Audit Fees | | $ | 3,396,868 | | | $ | 2,982,385 | |
Audit-Related Fees | | $ | 0 | | | $ | 0 | |
Tax Fees | | $ | 1,687,113 | | | $ | 1,994,907 | |
All Other Fees | | $ | 2,031,819 | | | $ | 4,880,709 | |
| | | | | | | | |
Total Fees | | $ | 7,115,800 | | | $ | 9,858,001 | |
| | | | | | | | |
The category “Audit Fees” refers to performing an audit of the Registrant’s, Babson Capital Management LLC’s (“Babson Capital”) or Massachusetts Mutual Life Insurance Company’s (“MassMutual”) annual financial statements or services that are normally provided by the principal accountant in connection with statutory and regulatory filings or engagements. The category “Audit-Related Fees” reflects fees billed by Deloitte for various non-audit and non-tax services rendered to the Registrant, Babson Capital, and MassMutual. Preparation of Federal, state and local income tax and tax compliance work are representative of the fees reported in the “Tax Fees” category. The category “All Other Fees” represents fees billed by Deloitte for consulting rendered to the Registrant, Babson Capital, and MassMutual.
The Sarbanes-Oxley Act of 2002 and its implementing regulations allow the Registrant’s Audit Committee to establish a pre-approval policy for certain services rendered by the Registrant’s principal accountant, Deloitte. During the fiscal year ended June 30, 2015, the Registrant’s Audit Committee approved all of the services rendered to the Registrant by Deloitte and did not rely on such a pre-approval policy for any such services.
The Audit Committee has also reviewed the aggregate fees billed for professional services rendered by Deloitte for the years ended June 30, 2014 and June 30, 2015 for the Registrant and for the non-audit services provided to Babson Capital, and Babson Capital’s parent, MassMutual. As part of this review, the Audit Committee considered whether the provision of such non-audit services was compatible with maintaining the principal accountant’s independence.
The June 30, 2014 fees billed represent final 2014 amounts, which may differ from the preliminary figures available as of the filing date of the Registrant’s 2014 Annual Form N-CSR and includes, among other things, fees for services that may not have been billed as of the filing date of the Registrant’s 2014 Annual Form N-CSR, but are now properly included in the June 30, 2014 fees billed to the Registrant, Babson Capital and MassMutual.
| Item 5. | Audit Committee of Listed Registrants. |
Not applicable.
| Item 6. | Schedule of Investments. |
| (a) | The Registrant’s Consolidated Schedule of Investments as of the close of the reporting period is included in the Report to Stockholders filed under Item 1 of this form. |
| Item 7. | Disclosure of Proxy Voting Policies and Procedures for Closed-End Management Investment Companies. |
Not applicable.
| Item 8. | Portfolio Managers of Closed-End Investment Management Companies. |
Not applicable.
| Item 9. | Purchases of Equity Securities by Closed-End Management Investment Company and Affiliated Purchasers. |
Not applicable.
| Item 10. | Submission of Matters to a Vote of Security Holders. |
There have been no material changes to procedures by which the shareholders may recommend nominees to the Registrant’s Board of Trustees.
| Item 11. | Controls and Procedures. |
| (a) | The Registrant’s principal executive officer and principal financial officer, or persons performing similar functions, have concluded that the Registrant’s disclosure controls and procedures as defined in Rule 30a-3(c) under the Investment Company Act of 1940, as amended (the “1940 Act”), are effective as of the date within 90 days of the filing date of this report based on the evaluation of these controls and procedures required by Rule 30a-3(b) under the 1940 Act and Rules 13a-15(b) or 15d-15(b) under the Securities Exchange Act of 1934, as amended. |
| (b) | There were no changes in the Registrant’s internal control over financial reporting (as defined in Rule 30a-3(d) under the 1940 Act) that occurred during the second fiscal quarter of the period covered by this report that have materially affected or are reasonably likely to materially affect, the Registrant’s internal control over financial reporting. |
| | |
| (a)(1) | | The Registrant has posted its Code of Ethics on its website at www.babsoncapital.com/funds/mutual-funds. |
| |
| (a)(2) | | Certifications pursuant to Rule 30a-2(a) under the 1940 Act are attached hereto. |
| |
| | Exhibit 99.1 Cert |
| | Exhibit 99.2 Cert |
| |
| (a)(3) | | Not applicable. |
| |
| (b) | | Certification pursuant to Rule 30a-2(b) under the 1940 Act is attached hereto. |
| |
| | Exhibit 99.906 Cert |
SIGNATURES
Pursuant to the requirements of the Securities Exchange Act of 1934 and the Investment Company Act of 1940, the Registrant has duly caused this report to be signed on its behalf by the undersigned, thereunto duly authorized.
| | |
| (Registrant) | | Babson Capital Funds Trust |
| | |
| By (Signature and Title) | | /s/ Anthony J. Sciacca |
| | Anthony J. Sciacca, President (Principal Executive Officer) |
Date September 4, 2015
Pursuant to the requirements of the Securities Exchange Act of 1934 and the Investment Company Act of 1940, this report has been signed below by the following persons on behalf of the Registrant and in the capacities and on the dates indicated.
| | |
| By (Signature and Title) | | /s/ Anthony J. Sciacca |
| | Anthony J. Sciacca, President (Principal Executive Officer) |
Date September 4, 2015
| | |
| By (Signature and Title) | | /s/ Patrick Hoefling |
| | Patrick Hoefling, Chief Financial Officer (Principal Financial Officer) |
Date September 4, 2015