UNITED STATES
SECURITIES AND EXCHANGE COMMISSION
Washington, D.C. 20549
FORM N-CSR
CERTIFIED SHAREHOLDER REPORT OF REGISTERED
MANAGEMENT INVESTMENT COMPANIES
Investment Company Act file number(s) 811-22845
Barings Funds Trust
(Exact Name of Registrant as Specified in Charter)
300 South Tryon Street
Suite 2500
Charlotte, NC 28202
(Address of Principal Executive Offices)
Registrant’s telephone number, including area code: (704) 805-7200
Janice M. Bishop
Vice President, Secretary and Chief Legal Officer
c/o Barings LLC
Independence Wharf
470 Atlantic Avenue
Boston MA 02210
(Name and Address of Agent for Service)
Date of fiscal year end: June 30
Date of reporting period: June 30, 2018
| Item 1. | Reports to Stockholders. |
The Annual Report to Shareholders is attached hereto.


BARINGS FUNDS TRUST
Annual Report
June 30, 2018

BFT Service Providers
ADVISER
Barings LLC
300 South Tryon Street
Suite 2500
Charlotte, NC 28202
SUB-ADVISER
Barings Global Advisers Limited
61 Aldwych
London, UK
WC2B4AE
COUNSEL TO THE TRUST
Ropes & Gray LLP
Prudential Tower
800 Boylston Street
Boston, MA 02110
INDEPENDENT REGISTERED PUBLIC ACCOUNTING FIRM
Deloitte & Touche LLP
30 Rockefeller Plaza
New York, NY
10112-0015
CUSTODIAN
State Street Bank & Trust Company
One Lincoln Street
Boston, MA 02111
TRANSFER AGENT AND REGISTRAR
ALPS Fund Services, Inc.
1290 Broadway
Suite 1100
Denver, CO 80203
FUND ADMINISTRATION / ACCOUNTING
State Street Bank & Trust Company
One Lincoln Street
Boston, MA 02111
FUND DISTRIBUTOR
ALPS Distributors, Inc.
1290 Broadway
Suite 1100
Denver, CO 80203
BLUE SKY ADMINISTRATION
DST Asset Manager Solutions, Inc.
2000 Crown Colony Drive
Quincy, MA 02169
PROXY VOTING POLICIES & PROCEDURES
The Trustees of Barings Funds Trust (the “Trust”) have delegated proxy voting responsibilities relating to the voting of securities held by the Trust to Barings LLC (“Barings”). A description of Barings’ proxy voting policies and procedures is available (1) without charge, upon request, by calling, toll-free 1-877-766-0014; (2) on the Trust’s website at http://www.Barings.com; and (3) on the U.S. Securities and Exchange Commission’s (“SEC”) website at http://www.sec.gov.
FORM N-Q
The Trust will file its complete schedule of portfolio holdings with the SEC for the first and third quarters of each fiscal year on Form N-Q. This information is available (1) on the SEC’s website at http://www.sec.gov; and (2) at the SEC’s Public Reference Room in Washington, DC (which information on their operation may be obtained by calling 1-800-SEC-0330). A complete schedule of portfolio holdings as of each quarter-end is available on the Trust’s website at http://www.Barings.com or upon request by calling, toll-free, 1-877-766-0014.

Duncan Robertson
President
Barings Funds Trust
Barings Funds Trust
Barings Global Floating Rate Fund
Barings Global Credit Income Opportunities Fund
Barings Active Short Duration Bond Fund
Barings Total Return Bond Fund
Barings Emerging Markets Debt Blended Total Return Fund
Barings Emerging Markets Local Currency Debt Fund
Barings Global High Yield Fund
Barings U.S. High Yield Fund
Dear Shareholder,
Thank you, as always, for your continued trust and partnership. In the first half of the year, political tensions were back in the forefront, with trade war rhetoric dominating headlines and the rise of populist parties across Europe and Mexico contributing to widespread uncertainty. Global monetary policy continues to diverge – while macro volatility has kept aggressive interest rate behavior at bay in Europe, U.S. markets increased their expectations for a fourth rate hike this year. Global growth has been mixed, with the U.S. continuing at a healthy pace but Europe appearing to slow. Across emerging markets, escalating trade tensions, widespread political turmoil and a strengthening U.S. dollar proved challenging.
The abundance of political and other headlines has certainly kept investors on their toes. Nonetheless, the global economy and capital markets held up relatively well in the first half of the year. On the positive side, the International Monetary Fund maintained its global growth forecasts for 2018 and 2019, and global unemployment continued to fall. Across the fixed income markets, corporate fundamentals appear healthy and defaults remain near historical lows. From a bottom-up, fundamental research perspective, our investment teams continue to find a generally supportive environment for corporate and sovereign issuers, and believe there is value to be found across both developed and emerging markets.
That said, looking ahead to the remainder of 2018, we see a number of potential headwinds on the horizon and believe investors must be particularly mindful of risks. Late in the credit and economic cycle – almost a decade past the last recession – monetary policy missteps are more likely. At the same time, while inflation has remained relatively subdued in the years following the financial crisis, an unexpected increase in the near- to medium-term could pose a risk to markets. We believe that political risk will likely remain very topical in the months ahead, particularly as tensions between the U.S. and China continue to escalate and the U.S. moves toward midterm elections. In the U.K., Brexit negotiations will likely remain in the headlines, which could introduce additional volatility into the markets.
At Barings, we continue to focus on helping you, our shareholders, uncover value opportunities and achieve strong, through-the-cycle risk-adjusted returns. Our consistent, repeatable investment process and emphasis on active management is built upon decades of experience conducting rigorous, fundamental analysis on every investment we consider. The broad capabilities and expertise of our large, global teams allow us to provide innovative solutions across the quality, yield and liquidity spectrum, and we aim to evolve and adapt so that we may continue to meet your needs in the future.
On behalf of the entire Barings team, we thank you for your partnership and trust, and we look forward to helping you achieve your investment objectives.
Sincerely,

Duncan Robertson
President
Risks
Investing in the Funds involves risk, including the risk that you may receive little or no return on your investment or that you may lose part or even all of your investment. Fixed income investing is subject to interest rate risks. Bond prices and other fixed income product prices generally fall when interest rates rise. Duration measures the price sensitivity of a bond or a portfolio to changes in interest rates. The Funds may invest in high yield loans and bonds, commonly referred to as “junk bonds”, including distressed securities, which are subject to greater credit risk (the risk that an issuer will not make timely payments of principal and interest) and market risk (the risk that the value of the Fund’s investments may fall, sometimes rapidly or unpredictably, as a result of increasing interest rates or otherwise); loans and derivative securities, which may carry market, credit and liquidity risk (the risk that the Fund’s investments may be difficult to sell at an advantageous time or price); foreign securities, which are subject to additional risks, including political and economic risks. The Funds may also invest in mortgage and asset-backed securities, which may be sensitive to changes in interest rates, subject to early repayment risk, and their value may fluctuate in response to the market’s perception of issuer creditworthiness; while generally supported by some form of government or private guarantee, there is no assurance that private guarantors will meet their obligations. Although these securities tend to provide higher yields than higher rated securities, there is a greater risk that a Fund’s share price will decline.
Cautionary Notice: Certain statements contained in this report may be “forward looking” statements. Investors are cautioned not to place undue reliance on forward-looking statements, which speak only as of the date in which they are made and reflect management’s current estimates, projections, expectations or beliefs, and which are subject to risks and uncertainties that may cause actual results to differ materially. These statements are subject to change at any time based upon economic, market or other conditions and may not be relied upon as investment advice or an indication of the Trust’s trading intent. References to specific securities are not recommendations of such securities, and may not be representative of the Trust’s current or future investments. We undertake no obligation to publicly update these forward-looking statements, whether as a result of new information, future events, or otherwise.
Investors should carefully consider the investment objective, risks, charges and expenses of any mutual fund before investing. This and other important information is contained in the prospectus. A prospectus, which contains this and other information, can be obtained by calling 1.855.439.5459. Read the prospectus carefully before investing.
ALPS Distributors, Inc. is the distributor for the Barings mutual funds. ALPS and Barings are separate and unaffiliated.
Barings Global Floating Rate Fund 2018 Annual Report
Investment Objective
Barings Global Floating Rate Fund (“Global Floating Rate Fund” or the “Fund”) seeks a high level of current income. Preservation of capital is a secondary goal.
Portfolio Management Commentary
How did the Fund perform?
| | ∎ | | The Fund reported a net total rate of return for the fiscal year ended June 30, 2018 of 4.27%, underperforming the Credit Suisse Global Loan Benchmark (the “Benchmark”), which returned 4.65%.1 |
What factors influenced performance of the Fund?
| | ∎ | | During the fiscal year ended June 30, 2018, the global loan markets had positive returns in ten of twelve months and defaults were below historical averages. |
| | ∎ | | The Fund’s slight overweight to European loans was a minor detractor that was more than made up for by credit selection. |
| | ∎ | | The Fund’s North American assets outperformed the European assets. |
| | ∎ | | The Fund’s average allocation of approximately 9% to senior secured bonds was a detractor from Fund performance, as the senior secured bond holdings had a return below the global loan market return. |
| | ∎ | | During the period, the Fund was overweight the lower segments (the B and CCC categories) of the market, which outperformed, and underweight the BB category. |
| | ∎ | | With the exception of consumer durables, telecommunications and automotive, every sector generated positive returns. The two sectors that contributed the most to performance versus the Benchmark were the energy and metals & minerals sectors, while the two sectors that detracted the most from performance versus the Benchmark were the information technology and consumer durables sectors. |
Describe recent portfolio activity.
| | ∎ | | During most of the period, the Fund’s geographic exposure to North America and Europe was essentially unchanged. Beginning in March 2018, the Fund increased its exposure to European loans and reduced exposure to North American loans, as in early 2018 European loans started to look more attractive. |
| | ∎ | | During the fiscal year, the Fund’s three largest sectors were healthcare, education & childcare, diversified/conglomerate services and chemicals, plastics & rubber. The two sectors that decreased the most during the period were the diversified/conglomerate services and containers, packaging & glass sectors, while the two sectors that increased the most were the leisure, amusement & entertainment and retail stores sectors. |
| | ∎ | | By ratings category, the Fund increased exposure to the B category and reduced exposure to the BB and CCC categories. |
Describe portfolio positioning at period end.
| | ∎ | | As of June 30, 2018, the Fund had an 84.3% weighting to global senior secured loans, 9.2% to global senior secured high yield bonds and 5.0% to cash. |
| 1. | Total return describes the return to an investor of Class Y shares and includes the reinvestment of dividends and capital gains. Past performance is no guarantee of future results and investment returns and the net asset value (NAV) of shares of the Fund will fluctuate so that shares, when redeemed, may be worth more or less than their original cost. Current performance may be higher or lower than performance quoted. Call 1.855.439.5459 or visit barings.com for current month end performance. All returns 1-year or less are cumulative. The Credit Suisse Global Loan Benchmark is a market capitalization weighted average of the Credit Suisse Leveraged Loan Index and the Credit Suisse Western European Leveraged Loan Index. The Credit Suisse Leveraged Loan Index is designed to mirror the investable universe of the U.S. dollar-denominated leveraged loan market. The Credit Suisse Western European Leveraged Loan Index is designed to mirror the investable universe of the Western European leveraged loan market, with loans denominated in U.S. and Western European currencies. Indices are unmanaged. It is not possible to invest directly in an index. |
2
Barings Global Floating Rate Fund 2018 Annual Report
| | ∎ | | From an industry perspective, the Fund remains well diversified across a number of sectors, with concentrations in healthcare, education & childcare (12.3%), diversified/conglomerate services (10.34%) and chemicals, plastics & rubber (5.87%) as of June 30, 2018. |
| | ∎ | | As of June 30, 2018, the Fund had the following credit quality breakdown: 1.2% in BBB assets, 22.9% in BB assets, 58.5% in B assets and 5.4% in CCC and below assets. Approximately 7.2% of the Fund’s assets are not publicly rated. Cash and accrued income accounted for the remaining 5.0% of the portfolio assets.2 |
| | ∎ | | The top five countries in the portfolio at the end of the reporting period were the U.S. (65.2%), the U.K. (9.7%), Germany (6.4%), the Netherlands (3.6%) and France (3.5%). Overall, the Fund has exposure to 17 different countries, and we continue to focus on building a well-diversified portfolio of global floating rate securities. |
Describe market and portfolio outlook.
| | ∎ | | We believe that the market continues to show positive economic growth driven by stable corporate earnings, low rates and supportive central bank policies. Currently, growth appears synchronized across the U.S. and Europe; however, in our view, there may be potential for this momentum to slow. |
| | ∎ | | We currently see better relative-value opportunities in the European market versus the U.S. market, which has seen generally higher yields with lower durations.3 |
| | ∎ | | First-quarter earnings results were similar to recent quarters, with continued revenue and EBITDA (earnings before interest, taxes, depreciation and amortization) growth alongside modest leverage. In addition, interest coverage remains at or near all-time highs. Given these healthy interest coverage levels, we believe high yield issuers have ample cushion to withstand future interest rate increases. |
| | ∎ | | Defaults across the global markets are below historical averages and we believe will likely remain low in the near-term. Broadly speaking, we believe spreads are fairly compensating investors for the potential default risk in the market. |
| 2. | Ratings shown are the highest rating given by one of the following national rating agencies: S&P, Moody’s or Fitch. Additional information about ratings can be found, respectively, at www.standardandpoors.com, www.moodys.com and www.fitchratings.com. Credit ratings are subject to change. AAA, AA, A, and BBB are investment grade ratings categories used by S&P and Fitch; BB, B, CCC/CC/C and D are below investment grade ratings categories used by S&P and Fitch. Aaa, Aa, A and Baa are investment grade ratings categories used by Moody’s; Ba, B, Caa/Ca and C are below investment grade ratings categories used by Moody’s. Ratings categories may include gradations within each category. Bonds backed by U.S. Government or agency securities are given an implied rating equal to the rating of such securities. Holdings designated Not Publicly Rated are not rated by these national rating agencies. |
| 3. | Duration is a measure of the sensitivity of the price – the value of principal – of a fixed-income investment to a change in interest rates. Duration is expressed as a number of years. Bond prices are said to have an inverse relationship with interest rates. Therefore, rising interest rates indicate bond prices are likely to fall, while declining interest rates indicate bond prices are likely to rise. |
3
Barings Global Floating Rate Fund 2018 Annual Report
PORTFOLIO COMPOSITION (% OF ASSETS*)
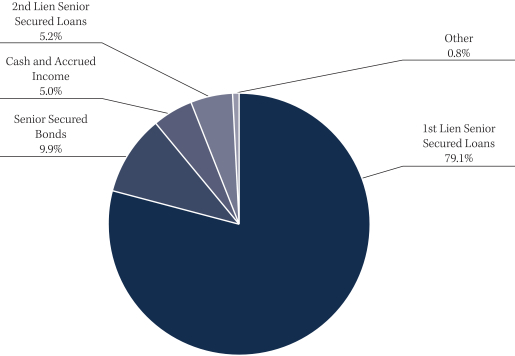
| * | The percentages shown above represent a percentage of the assets as of June 30, 2018. |
COUNTRY COMPOSITION (% OF ASSETS**)
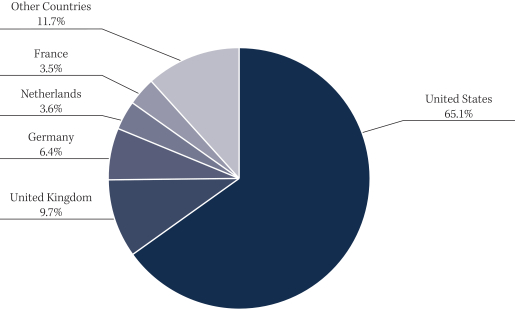
| ** | Percentage of assets are expressed by market value excluding cash and accrued income, and may vary over time. The percentages shown above represent a percentage of the assets as of June 30, 2018. |
4
Barings Global Floating Rate Fund 2018 Annual Report
| | | | | | | | | | | | | | | | |
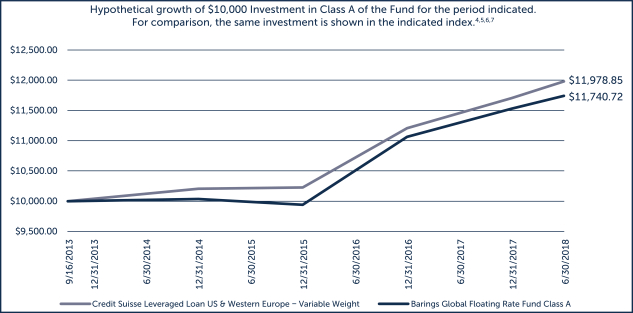
| % AVERAGE ANNUAL TOTAL RETURNS 5,7,8 | | INCEPTION DATE | | | ONE YEAR | | | THREE YEARS | | | INCEPTION TO DATE | |
Class A With Load | | | 09/16/2013 | | | | 0.88 | % | | | 3.35 | % | | | 3.09 | % |
Class A No Load | | | 09/16/2013 | | | | 4.00 | % | | | 4.41 | % | | | 3.75 | % |
Class C With Load | | | 09/16/2013 | | | | 2.24 | % | | | 3.63 | % | | | 2.99 | % |
Class C No Load | | | 09/16/2013 | | | | 3.24 | % | | | 3.63 | % | | | 2.99 | % |
Class I With Load | | | 09/16/2013 | | | | 4.28 | % | | | 4.68 | % | | | 4.05 | % |
Class I No Load | | | 09/16/2013 | | | | 4.28 | % | | | 4.68 | % | | | 4.05 | % |
Class Y With Load | | | 09/16/2013 | | | | 4.27 | % | | | 4.67 | % | | | 4.03 | % |
Class Y No Load | | | 09/16/2013 | | | | 4.27 | % | | | 4.67 | % | | | 4.03 | % |
Performance shown is historical and does not guarantee future results. Current performance may be lower or higher. Because share price, principal value, and return will vary, you may have a gain or loss when you sell Fund shares. For current month-end performance information, call 1.855.439.5459. Performance includes the reinvestment of dividends and capital gains. Performance less than one year is cumulative; all other performance is annualized.
| 4. | Inception date: 9/16/2013 |
| 5. | Class A performance with the sales charges includes the maximum 3.00% sales charge. |
| 6. | Benchmark A: Credit Suisse Global Loan. The benchmark is a market capitalization weighted average of the Credit Suisse Leveraged Loan Index and the Credit Suisse Western European Leveraged Loan Index. Indices are unmanaged. It is not possible to invest directly in an index. |
| 7. | Line graph and table do not reflect the deduction of taxes that a shareholder would pay. |
| 8. | Class C performance with the sales charges includes the 1.00% contingent deferred sales charge (CDSC) for returns of one year or less. |
5
Barings Global Credit Income Opportunities Fund 2018 Annual Report
Investment Objective
Barings Global Credit Income Opportunities Fund (“Global Credit Income Opportunities Fund” or the “Fund”) seeks an absolute return, primarily through current income and secondarily through capital appreciation.
Portfolio Management Commentary
How did the Fund perform?
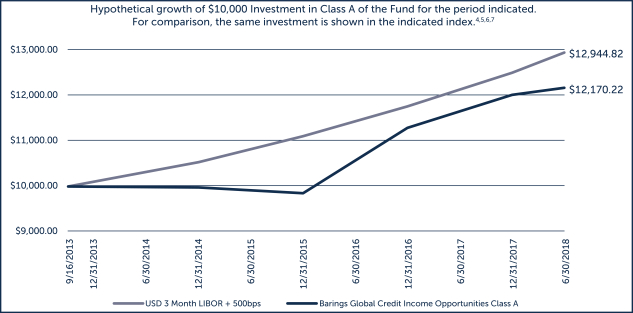
| | ∎ | | The Fund reported a net total rate of return for the fiscal year ended June 30, 2018 of 3.48%, underperforming the 3-Month USD LIBOR + 500 basis points1 benchmark (the “Benchmark”), which returned 6.84%.2 |
What factors influenced performance of the Fund?
| | ∎ | | During the period, the global loan market outperformed the global high yield bond market. Although both markets had positive returns as defaults remained below historical averages, both markets underperformed the Fund’s Benchmark. |
| | ∎ | | Collateralized loan obligations (“CLOs”) were the top performing asset class in the Fund’s portfolio, followed by special situations, loans and bonds. Loans were the largest contributor to Fund performance. |
| | ∎ | | The Fund’s North American assets outperformed the European assets, and were the largest contributor to Fund performance. |
| | ∎ | | The Fund’s B-rated assets were the largest contributor to Fund performance, followed by CCC-rated and BB-rated assets. |
| | ∎ | | The Fund’s allocations to the broadcasting and consumer durables sectors detracted the most from Fund performance, while the energy and healthcare sectors contributed the most to Fund performance. |
Describe recent portfolio activity.
| | ∎ | | During the period, the Fund increased its exposure to Europe and reduced its exposure to North America. For the first seven months of the period, the Fund increased its exposure to North America, and then starting in January 2018, the Fund increased European assets and reduced North American assets. |
| | ∎ | | The Fund reduced its exposure to bonds for the first seven months of the period, but increased the bond allocation in the latter part of the period. Over the full period, the Fund’s allocations to loans increased, bonds decreased and CLOs remained essentially unchanged. |
| | ∎ | | The Fund increased its exposure to the BBB, BB and CCC and below categories, and reduced its exposure to the B and not publicly rated categories. |
| | ∎ | | During the period, the Fund reduced its exposure to the finance sector, which is no longer in the Fund’s top three sector exposures. The Fund’s allocations to the oil & gas, diversified/conglomerate services and healthcare, education & childcare sectors represent the Fund’s top three sectors. During the period, the Fund decreased its exposure to the containers, packaging & glass and diversified/conglomerate manufacturing sectors, while increasing its exposure to the electronics and beverages, food & tobacco sectors. |
| 1. | A unit that is equal to 1/100th of 1% or 0.01%. |
| 2. | Total return describes the return to an investor of Class Y shares and includes the reinvestment of dividends and capital gains. Past performance is no guarantee of future results and investment returns and the net asset value (NAV) of shares of the Fund will fluctuate so that shares, when redeemed, may be worth more or less than their original cost. Current performance may be higher or lower than performance quoted. Call 1.855.439.5459 or visit barings.com for current month end performance. All returns 1-year or less are cumulative. The 3-Month USD LIBOR (London Interbank Offered Rate) is an average interest rate, determined by the Intercontinental Exchange, that banks charge one another for the use of short-term money (3 months) in England’s Eurodollar market. The return shown includes 3-Month USD LIBOR plus 500 bps, or 5% per annum. LIBOR is unmanaged. It is not possible to invest directly in LIBOR. No assurance can be given that the Fund’s performance will exceed that of LIBOR by any given increment, or at all. |
6
Barings Global Credit Income Opportunities Fund 2018 Annual Report
Describe portfolio positioning at period end.
| | ∎ | | As of June 30, 2018, the Fund had allocations of 60.1%, 20.2% and 14.8% to global high yield bonds, global senior secured loans and CLOs, respectively. The remainder of the portfolio was invested in a few opportunistic special situation credits at 0.3%, equities at 0.8% and cash/other at 3.8%. A significant portion of the portfolio (approximately 60.4%) is senior secured in nature (includes CLOs backed by secured loans), which can potentially mitigate principal loss in the event that default rates increase. |
| | ∎ | | From an industry perspective, the Fund remains well diversified across a number of sectors, with concentrations in oil & gas (9.1%), diversified/conglomerate services (8.7%) and healthcare, education & childcare (8.1%) as of June 30, 2018. |
| | ∎ | | As of June 30, 2018, the Fund had the following credit quality breakdown: 1.0% in BBB assets, 32.0% in BB assets, 43.0% in B assets and 10.5% in CCC and below assets. Approximately 4.7% of the Fund’s assets are not publicly rated.3 |
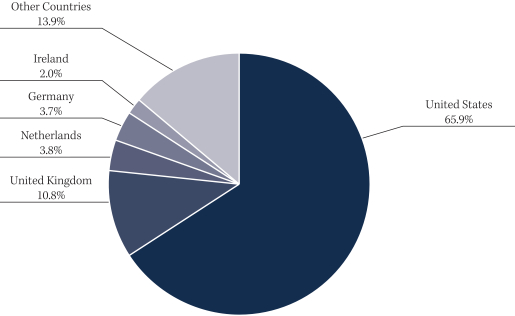
| | ∎ | | The top five countries in the portfolio at the end of the reporting period are the U.S. (65.9%), the U.K. (10.8%), the Netherlands (3.8%), Germany (3.7%) and Ireland (2.0%). The Cayman Islands exposure related to the Fund’s CLO holdings is included in the U.S. Overall, the Fund has exposure to 16 different countries, and we continue to focus on building a well-diversified portfolio of global high yield securities. |
Describe market and portfolio outlook.
| | ∎ | | We believe that the market continues to show positive economic growth driven by stable corporate earnings, low rates and supportive central bank policies. Currently, growth appears synchronized across the U.S. and Europe; however, we believe that there may be potential for this momentum to slow. |
| | ∎ | | We currently see better relative value opportunities in the European market versus the U.S. market, which has seen generally higher yields with lower durations. |
| | ∎ | | First-quarter earnings results were similar to recent quarters, with continued revenue and EBITDA growth alongside modest leverage. In addition, interest coverage remains at or near all-time highs. Given these healthy interest coverage levels, we believe high yield issuers have ample cushion to withstand future interest rate increases. |
| | ∎ | | Defaults across the global markets are below historical averages and we believe will likely remain low in the near term. Broadly speaking, we believe spreads are fairly compensating investors for the potential default risk in the market. |
| 3. | Ratings shown are the highest rating given by one of the following national rating agencies: S&P, Moody’s or Fitch. Additional information about ratings can be found, respectively, at www.standardandpoors.com, www.moodys.com and www.fitchratings.com. Credit ratings are subject to change. AAA, AA, A, and BBB are investment grade ratings categories used by S&P and Fitch; BB, B, CCC/CC/C and D are below investment grade ratings categories used by S&P and Fitch. Aaa, Aa, A and Baa are investment grade ratings categories used by Moody’s; Ba, B, Caa/Ca and C are below investment grade ratings categories used by Moody’s. Ratings categories may include gradations within each category. Bonds backed by U.S. Government or agency securities are given an implied rating equal to the rating of such securities. Holdings designated Not Publicly Rated are not rated by these national rating agencies. |
7
Barings Global Credit Income Opportunities Fund 2018 Annual Report
PORTFOLIO COMPOSITION (% OF ASSETS*)
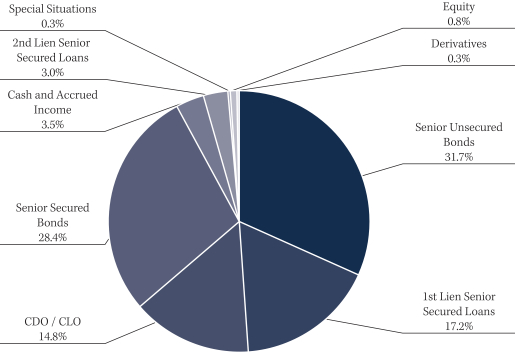
| * | The percentages shown above represent a percentage of the assets as of June 30, 2018. |
COUNTRY COMPOSITION (% OF ASSETS**)
| ** | Percentage of assets are expressed by market value excluding cash and accrued income, and may vary over time. The percentages shown above represent a percentage of the assets as of June 30, 2018. |
8
Barings Global Credit Income Opportunities Fund 2018 Annual Report
| | | | | | | | | | | | | | | | |
| % AVERAGE ANNUAL TOTAL RETURNS 5,7,8 | | INCEPTION DATE | | | ONE YEAR | | | THREE YEARS | | | INCEPTION TO DATE | |
Class A With Load | | | 09/16/2013 | | | | -0.89 | % | | | 4.05 | % | | | 4.07 | % |
Class A No Load | | | 09/16/2013 | | | | 3.24 | % | | | 5.47 | % | | | 4.90 | % |
Class C With Load | | | 09/16/2013 | | | | 1.48 | % | | | 4.68 | % | | | 4.12 | % |
Class C No Load | | | 09/16/2013 | | | | 2.47 | % | | | 4.68 | % | | | 4.12 | % |
Class I With Load | | | 09/16/2013 | | | | 3.49 | % | | | 5.73 | % | | | 5.16 | % |
Class I No Load | | | 09/16/2013 | | | | 3.49 | % | | | 5.73 | % | | | 5.16 | % |
Class Y With Load | | | 09/16/2013 | | | | 3.48 | % | | | 5.72 | % | | | 5.16 | % |
Class Y No Load | | | 09/16/2013 | | | | 3.48 | % | | | 5.72 | % | | | 5.16 | % |
Performance shown is historical and does not guarantee future results. Current performance may be lower or higher. Because share price, principal value, and return will vary, you may have a gain or loss when you sell Fund shares. For current month-end performance information, call 1.855.439.5459. Performance includes the reinvestment of dividends and capital gains. Performance less than one year is cumulative; all other performance is annualized
| 4. | Inception date: 9/16/2013 |
| 5. | Class A performance with the sales charges includes the maximum 3.00% sales charge. |
| 6. | Benchmark: 3-Month USD LIBOR + 500 basis points. |
| 7. | Line graph and table do not reflect the deduction of taxes that a shareholder would pay. |
| 8. | Class C performance with the sales charges includes the 1.00% contingent deferred sales charge (CDSC) for returns of one year or less. |
9
Barings Active Short Duration Bond Fund 2018 Annual Report
Investment Objective
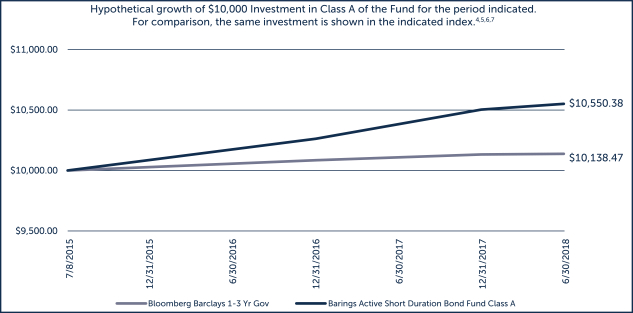
Barings Active Short Duration Bond Fund (“Active Short Duration Bond Fund” or the “Fund”) seeks to achieve a high total rate of return, primarily from current income while minimizing fluctuations in capital values by investing primarily in a diversified portfolio of short-term investment grade fixed income securities.
Portfolio Management Commentary
How did the Fund perform?
| | ∎ | | The Fund reported a net total rate of return for the fiscal year ended June 30, 2018 of 1.35%, outperforming the Bloomberg Barclays U.S. 1-3 Year Government Bond Index (the “Benchmark”), which returned -0.03%.1 |
What factors influenced performance of the Fund?
| | ∎ | | Duration positioning positively contributed to performance relative to the Benchmark. The Fund uses Treasury bonds and futures to help manage duration. During the period, in accordance with our duration management process, the Fund lengthened duration from 1.0 to 2.0 years to end the fiscal year. |
| | ∎ | | The Fund’s allocation to corporate credit contributed positively to Fund performance. Despite recent widening in corporate spreads, tightening during the period – specifically in the fourth quarter of 2017 and first quarter of 2018 – benefited sector returns on a year-over-year basis. Over the period, allocations to the banking and capital goods sectors contributed the most to Fund performance, while allocations to the paper & packaging and gas pipelines sectors contributed the least. |
| | ∎ | | Asset-backed securities (ABS) was the primary contributor to Fund performance within the securitized sector. Allocations to government-guaranteed Federal Family Education Loan Program (FFELP) student loans, consumer loan and railroad ABS collateral were the largest contributing subsectors. |
| | ∎ | | Downside derivative mitigation, such as using investment grade CDX index credit default swaps2 (a swap where the seller compensates the buyer in the event of a default) to partially hedge longer duration ABS exposures, CMBX to gain exposure to the commercial mortgage-backed securities (CMBS) sector and a payer/receiver swaption pair to hedge against possible rising volatility detracted from Fund performance during the period. |
Describe recent portfolio activity.
| | ∎ | | The Fund ended the period with a duration position of 2.0 years, as the basis between the two and three year remains flat. |
| | ∎ | | The Fund marginally increased the allocation to non-agency residential mortgage-backed securities (RMBS) given the high-quality, high-carry and short-duration profile of the sector in a flat yield curve environment. |
| 1. | Total return describes the return to an investor of Class Y shares and includes the reinvestment of dividends and capital gains. Past performance is no guarantee of future results and investment returns and the net asset value (NAV) of shares of the Fund will fluctuate so that shares, when redeemed, may be worth more or less than their original cost. Current performance may be higher or lower than performance quoted. Call 1.855.439.5459 or visit barings.com for current month end performance. All returns 1-year or less are cumulative. The Bloomberg Barclays U.S. 1-3 Year Government Bond Index is comprised of the U.S. Treasury and U.S. Agency Indices. The U.S. Government Index includes Treasuries (public obligations of the U.S. Treasury) and U.S. agency debentures (publicly issued debt of U.S. Government agencies, quasi-federal corporations, and corporate or foreign debt guaranteed by the U.S. Government) that have remaining maturities of more than one year and up to but not including 3 years. Indices are unmanaged. It is not possible to invest directly in an index. |
| 2. | Barings Active Short Duration Bond Fund currently holds long CMBX positions, which cover approximately 30 companies within each position. |
10
Barings Active Short Duration Bond Fund 2018 Annual Report
Describe portfolio positioning at period end.
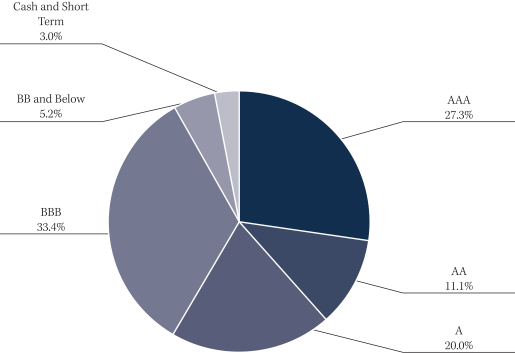
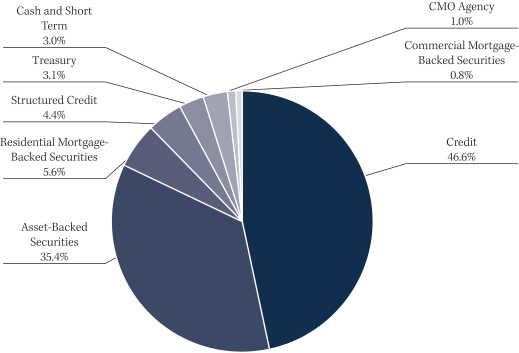
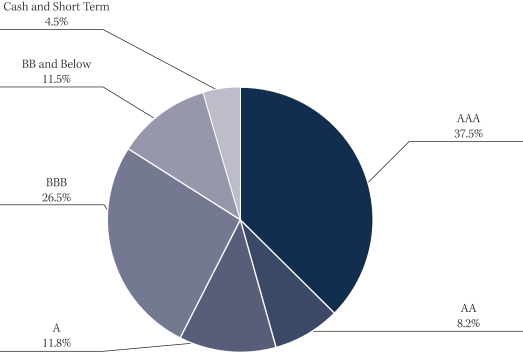
| | ∎ | | The Fund continues to be well diversified across corporates, securitized and governments. The corporate allocation is at approximately 51.2%, with 46.6% in investment grade corporates, 4.2% in BB-rated and crossover high yield and 0.4% in U.S. dollar-denominated emerging markets.3 U.S. money centers and regional banks represent the largest corporate allocation to the Fund, followed by diversified industrials. In our view, insurance still offers attractive income opportunities with decent fundamentals. |
| | ∎ | | The securitized ABS allocation was 35.4% at the end of the period. Student loans represent the largest allocation, followed by automotive loan collateral. Further ABS subsectors consist of consumer loans, timeshares, and railroad, in addition to others. The Fund maintains an active position in CMBS, based on our analysis of technicals and commercial real estate fundamentals. CMBS allocations have been in shorter-maturity deals, with a bias toward new issue as well as selective seasoned issues. |
| | ∎ | | The Fund reduced the allocation to agency collateralized mortgage obligations (CMOs) to help shorten overall Fund duration during the period. The allocation was slightly less than 1.0% at the end of the period. |
Describe market and portfolio outlook.
| | ∎ | | While the U.S. Treasury curve has flattened over the year, the short end of the curve has steepened as the Federal Reserve has been active in raising interest rates. Accordingly, the Fund lengthened duration to 2.0 years, up from 1.0 year at the start of the period. The Fund will continue to manage duration in accordance with our management process. |
| | ∎ | | The Fund expects to continue to maintain a lower allocation in both Treasury and agency securities, with an active allocation to corporate bonds. Credit fundamentals in investment grade credit are on solid footing in our view, supported by constructive global economic data. The Fund expects to continue to reinvest within the sector, favoring financials and pipeline sectors with an underweight to M&A-prone sectors such as technology and pharmaceuticals. |
| | ∎ | | Throughout 2017, the primary factors that we used to assess the health and value of the investment grade corporate market were unambiguously positive, in our view. Early in 2018, two factors – monetary policy and technicals – began to weaken, driven by a deteriorating global growth picture and the possibility of a full-fledged trade war. However, we believe spread levels and fundamentals continue to improve. We expect these fundamental positives and macro negatives will lead to a much more balanced investing environment. |
| | ∎ | | The Fund expects to continue to selectively reinvest and add exposure to ABS, such as private student loans, FFELP, timeshares, consumer loans and subprime autos, with selective positioning in aviation, containers and franchise receivables, as opportunities arise. |
| 3. | Ratings shown are the highest rating given by one of the following national rating agencies: S&P, Moody’s or Fitch. Additional information about ratings can be found, respectively, at www.standardandpoors.com, www.moodys.com and www.fitchratings.com. Credit ratings are subject to change. AAA, AA, A, and BBB are investment grade ratings categories used by S&P and Fitch; BB, B, CCC/CC/C and D are below investment grade ratings categories used by S&P and Fitch. Aaa, Aa, A and Baa are investment grade ratings categories used by Moody’s; Ba, B, Caa/Ca and C are below investment grade ratings categories used by Moody’s. Ratings categories may include gradations within each category. Bonds backed by U.S. Government or agency securities are given an implied rating equal to the rating of such securities. Holdings designated Not Publicly Rated are not rated by these national rating agencies. |
11
Barings Active Short Duration Bond Fund 2018 Annual Report
CREDIT QUALITY BREAKDOWN (% OF ASSETS*)
| * | The percentages shown above represent a percentage of the assets as of June 30, 2018. |
PORTFOLIO COMPOSITION (% OF ASSETS*)
| * | The percentages shown above represent a percentage of the assets as of June 30, 2018. |
12
Barings Active Short Duration Bond Fund 2018 Annual Report
| | | | | | | | | | | | |
| % AVERAGE ANNUAL TOTAL RETURNS 5,7,8 | | INCEPTION DATE | | | ONE YEAR | | | INCEPTION TO DATE | |
Class A With Load | | | 07/08/2015 | | | | 1.10 | % | | | 1.47 | % |
Class A No Load | | | 07/08/2015 | | | | 1.10 | % | | | 1.47 | % |
Class C With Load | | | 07/08/2015 | | | | 0.35 | % | | | 1.22 | % |
Class C No Load | | | 07/08/2015 | | | | 0.84 | % | | | 1.22 | % |
Class I With Load | | | 07/08/2015 | | | | 1.39 | % | | | 1.73 | % |
Class I No Load | | | 07/08/2015 | | | | 1.39 | % | | | 1.73 | % |
Class Y With Load | | | 07/08/2015 | | | | 1.35 | % | | | 1.71 | % |
Class Y No Load | | | 07/08/2015 | | | | 1.35 | % | | | 1.71 | % |
Performance shown is historical and does not guarantee future results. Current performance may be lower or higher. Because share price, principal value, and return will vary, you may have a gain or loss when you sell Fund shares. For current month-end performance information, call 1.855.439.5459. Performance includes the reinvestment of dividends and capital gains. Performance less than one year is cumulative; all other performance is annualized.
| 4. | Inception date: 7/8/2015 |
| 5. | Class A performance with the sales charges includes the maximum 3.00% sales charge. |
| 6. | Benchmark A: Bloomberg Barclays U.S. 1-3 Year Government Bond Index. Indices are unmanaged. It is not possible to invest directly in an index. |
| 7. | Line graph and table do not reflect the deduction of taxes that a shareholder would pay. |
| 8. | Class C performance with the sales charges includes the 1.00% contingent deferred sales charge (CDSC) for returns of one year or less. |
13
Barings Total Return Bond Fund 2018 Annual Report
Investment Objective
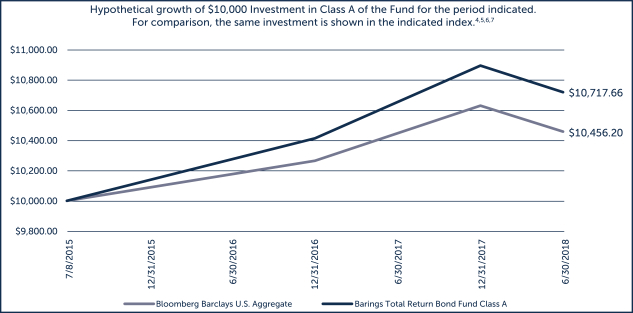
Barings Total Return Bond Fund (“Total Return Bond Fund” or the “Fund”) seeks a superior total rate of return by investing in fixed income instruments.
Portfolio Management Commentary
How did the Fund perform?
| | ∎ | | The Fund reported a net total rate of return for the fiscal year ended June 30, 2018 of 0.13%, outperforming the Bloomberg Barclays U.S. Aggregate Index (the “Benchmark”), which returned -0.40%.1 |
What factors influenced performance of the Fund?
| | ∎ | | An underweight to U.S. Treasuries relative to the Benchmark positively contributed to Fund performance. |
| | ∎ | | Investment grade corporate credit was a positive contributor to performance, as spread tightening in the fourth quarter of 2017 and first quarter of 2018 offset recent widening. The banking, industrials and gas pipeline sectors were the primary contributors to Fund performance. Holdings in the telecom and utility sectors were the primary detractors from Fund performance. |
| | ∎ | | The Fund has a 4.4% allocation to short weighted average life, AAA-rated collateralized loan obligation (CLO) structured product.2 This out-of-index allocation detracted from the Fund’s performance relative to the Benchmark. |
| | ∎ | | The Fund’s allocation to taxable municipal bonds did not detract from Fund performance during the period. |
| | ∎ | | Asset-backed securities (ABS) contributed to Fund performance largely due to holdings in private and government-guaranteed Federal Family Education Loan Program (FFELP) student loans, as this sector performed well during the reporting period. Selective positioning to commercial ABS sectors also contributed positively to performance. |
| | ∎ | | Downside derivative mitigation, such as using investment grade CDX index credit default swaps3 (a swap where the seller compensates the buyer in the event of a default) to partially hedge longer duration ABS exposures, and a payer/receiver swaption pair to hedge against possible rising volatility detracted from Fund performance during the period. |
| | ∎ | | Security selection in high yield credit, an out-of-index allocation, contributed positively to Fund performance over the period. |
| 1. | Total return describes the return to an investor of Class Y shares and includes the reinvestment of dividends and capital gains. Past performance is no guarantee of future results and investment returns and the net asset value (NAV) of shares of the Fund will fluctuate so that shares, when redeemed, may be worth more or less than their original cost. Current performance may be higher or lower than performance quoted. Call 1.855.439.5459 or visit barings.com for current month end performance. All returns 1-year or less are cumulative. The Bloomberg Barclays U.S. Aggregate Index represents securities that are SEC-registered, taxable, and dollar denominated. The index covers the U.S. investment grade fixed rate bond market, with index components for government and corporate securities, mortgage pass-through securities, and asset-backed securities. These major sectors are subdivided into more specific indices that are calculated and reported on a regular basis. Indices are unmanaged. It is not possible to invest directly in an index. |
| 2. | Ratings shown are the highest rating given by one of the following national rating agencies: S&P, Moody’s or Fitch. Additional information about ratings can be found, respectively, at www.standardandpoors.com, www.moodys.com and www.fitchratings.com. Credit ratings are subject to change. AAA, AA, A, and BBB are investment grade ratings categories used by S&P and Fitch; BB, B, CCC/CC/C and D are below investment grade ratings categories used by S&P and Fitch. Aaa, Aa, A and Baa are investment grade ratings categories used by Moody’s; Ba, B, Caa/Ca and C are below investment grade ratings categories used by Moody’s. Ratings categories may include gradations within each category. Bonds backed by U.S. Government or agency securities are given an implied rating equal to the rating of such securities. Holdings designated Not Publicly Rated are not rated by these national rating agencies. |
| 3. | Barings Total Return Bond Fund currently holds long CMBX positions, which cover approximately 30 companies within each position. |
14
Barings Total Return Bond Fund 2018 Annual Report
Describe recent portfolio activity.
| | ∎ | | The Fund maintained an active allocation to ABS, with recent purchases in both private and public student loans. |
| | ∎ | | The Fund marginally increased its exposure to higher coupon 30-year collateral Federal National Mortgage Association (FNMA) agency mortgage-backed securities (MBS) due to attractive carry profile and relative value versus discount coupons. The Fund remains underweight to agency MBS relative to the Benchmark. |
Describe portfolio positioning at period end.
| | ∎ | | As of June 30, 2018, the Fund was duration and curve neutral relative to the Benchmark. |
| | ∎ | | The Fund’s largest overweight relative to the Benchmark was the ABS allocation, which represents 19% of the Fund. The allocation to ABS comprised FFELP student loans, private student loans, a modest allocation to traditional automotive loan collateral and compelling commercial collateral such as whole business franchise receivables, shipping containers and loan servicers, in addition to other subsectors. |
| | ∎ | | As of June 30, 2018, corporate credit represented approximately 42.3% of the Fund (versus 30.1% for the Benchmark); of that amount, investment grade corporates made up approximately 28.4%, high yield corporates made up 11.2% and U.S. dollar-denominated emerging markets made up almost 2.7%. The energy sector was the Fund’s largest overweight position by 3.4%, as we believe yields are attractive. The technology sector represented the Fund’s largest underweight position by 0.60%. |
| | ∎ | | The Fund’s allocation to agency MBS was underweight by 6.2% relative to the Benchmark. |
| | ∎ | | The Fund maintained a 4.4% allocation to structured credit, represented by short weighted average life, AAA-rated CLOs. |
| | ∎ | | The Fund maintained a currency overlay strategy, which is 5% of the Fund on a notional basis to help lower tracking error. |
Describe market and portfolio outlook.
| | ∎ | | Throughout 2017, the primary factors that we used to assess the health and value of the investment grade corporate market were unambiguously positive, in our view. Early in 2018, two factors – monetary policy and technicals – began to weaken, driven by a deteriorating global growth picture and the possibility of a full-fledged trade war. However, spread levels and fundamentals continue to improve, in our view. We expect these fundamental positives and macro negatives will lead to a much more balanced investing environment. |
| | ∎ | | The intermediate to long end of the U.S. Treasury curve has flattened over the period, unlike the short end of the curve, which has steepened as the U.S. Federal Reserve has been active in raising interest rates. |
| | ∎ | | The Fund remains overweight in spread sectors, such as corporates and structured products, relative to liquid products, such as governments and agencies, and seeks to add alpha, or return in excess to the Benchmark, by investing in under-covered sectors where we believe we have competitive advantages, such as commercial ABS, CLOs and emerging market corporates. |
| | ∎ | | We believe that credit fundamentals in investment grade credit are on solid footing, supported by constructive global economic data. The Fund expects to continue to reinvest within the sector, favoring financials and pipeline sectors with an underweight to M&A-prone sectors such as technology and pharmaceuticals. |
| | ∎ | | The Fund expects to continue to invest in high quality, shorter-duration securitized bonds in private student loans, timeshares, consumer loans, FFELP and subprime autos. We advocate selectivity in sectors such as aviation, containers and franchise receivables. |
15
Barings Total Return Bond Fund 2018 Annual Report
CREDIT QUALITY BREAKDOWN (% OF ASSETS*)
| * | The percentages shown above represent a percentage of the assets as of June 30, 2018. |
PORTFOLIO COMPOSITION (% OF ASSETS*)
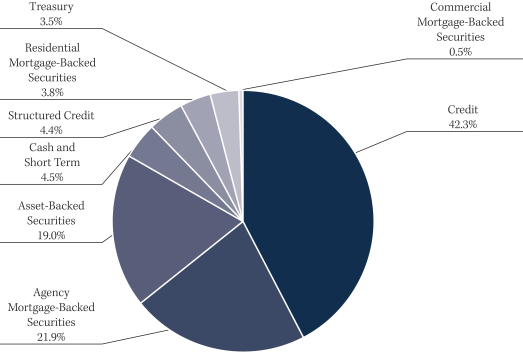
| * | The percentages shown above represent a percentage of the assets as of June 30, 2018. |
16
Barings Total Return Bond Fund 2018 Annual Report
| | | | | | | | | | | | |
| % AVERAGE ANNUAL TOTAL RETURNS 5,7,8 | | INCEPTION DATE | | | ONE YEAR | | | INCEPTION TO DATE | |
Class A With Load | | | 07/08/2015 | | | | -4.12 | % | | | 0.66 | % |
Class A No Load | | | 07/08/2015 | | | | -0.12 | % | | | 2.05 | % |
Class C With Load | | | 07/08/2015 | | | | -1.84 | % | | | 1.29 | % |
Class C No Load | | | 07/08/2015 | | | | -0.87 | % | | | 1.29 | % |
Class I With Load | | | 07/08/2015 | | | | 0.13 | % | | | 2.30 | % |
Class I No Load | | | 07/08/2015 | | | | 0.13 | % | | | 2.30 | % |
Class Y With Load | | | 07/08/2015 | | | | 0.13 | % | | | 2.30 | % |
Class Y No Load | | | 07/08/2015 | | | | 0.13 | % | | | 2.30 | % |
Performance shown is historical and does not guarantee future results. Current performance may be lower or higher. Because share price, principal value, and return will vary, you may have a gain or loss when you sell Fund shares. For current month-end performance information, call 1.855.439.5459. Performance includes the reinvestment of dividends and capital gains. Performance less than one year is cumulative; all other performance is annualized.
| 4. | Inception date: 7/8/2015 |
| 5. | Class A performance with the sales charges includes the maximum 4.00% sales charge. |
| 6. | Benchmark: Bloomberg Barclays U.S. Aggregate. The benchmark includes domestic, taxable, dollar-denominated securities. The index covers U.S. investment-grade fixed rate bond market, with index components for government and corporate securities, mortgage pass-through securities, and asset-backed securities. It is not possible to invest directly in an index. |
| 7. | Line graph and table do not reflect the deduction of taxes that a shareholder would pay. |
| 8. | Class C performance with the sales charges includes the 1.00% contingent deferred sales charge (CDSC) for returns of one year or less. |
17
Barings Emerging Markets Debt Blended Total Return Fund 2018 Annual Report
Investment Objective
Barings Emerging Markets Debt Blended Total Return Fund (“EMD Blended Total Return Fund” or the “Fund”) seeks to achieve maximum total return, consistent with preservation of capital and prudent investment management, through high current income generation and, where appropriate, capital appreciation.
Portfolio Management Commentary
How did the Fund perform?
| | ∎ | | The Fund reported a net total rate of return for the fiscal year ended June 30, 2018 of -1.94%.1 |
| | ∎ | | Each of the Fund’s three sub-strategies – EM corporates, EM sovereign and EM local – underperformed during the period. Although hard currency emerging markets started trending negatively during the first quarter of 2018 due to higher U.S. Treasury rates, local debt maintained a positive trajectory until early April 2018 when markets began a period of unpredictability. From April through June, all three EM debt indices fell. |
What factors influenced performance of the Fund?
| | ∎ | | Although the U.S. Congress passed its tax reform in late 2017 – generating expectations of further growth and fiscal stimulus in the U.S. – the U.S. dollar fell during the first quarter of 2018, only to sharply reverse course during the second quarter of 2018, leading to the worst quarter for EM currencies since 2015 (-8.3%). The combination of a more assertive U.S. Federal Reserve (Fed), President Trump’s trade protectionism policies aimed at foes and allies alike, and the announcement of a terminal date for the European Central Bank (ECB)’s quantitative easing program all put downward pressure on EM assets. Flows have remained supportive in 2018, with $19.6 billion ($68.1 billion in the last twelve months) of positive flows across EM corporate, sovereign and local. Most developed market central banks remained dovish, including the ECB, Bank of England and Bank of Japan; however, the Fed increased the short-term rates and commodities were higher during the period. |
| | ∎ | | For the annual reporting period, the Fund’s positioning in Hungary, South Africa, Israel, Belarus and currency positioning in Japan, Kazakhstan and Thailand contributed to Fund performance. However, the Fund’s positions in Argentina, Brazil and Eastern European currencies detracted from Fund performance. |
Describe recent portfolio activity.
| | ∎ | | As a result of spread widening during the second quarter of 2018, the Fund increased its exposure to short duration EM corporates to capture the higher yields on companies we believe to have strong potential. The Fund has maintained its exposure to local rates on overall moderate growth, low inflation and high rates in select EM local markets, based on our expectations that local rates will fall over the next 12 months in countries that are well managed and where inflation is falling. |
Describe portfolio positioning at period end.
| | ∎ | | The Fund finished the reporting period ended June 30, 2018 with a 43% exposure to emerging markets local debt and currencies, 32% exposure to sovereign hard currency, 29% exposure to corporate bonds and a 6.97% cash position. |
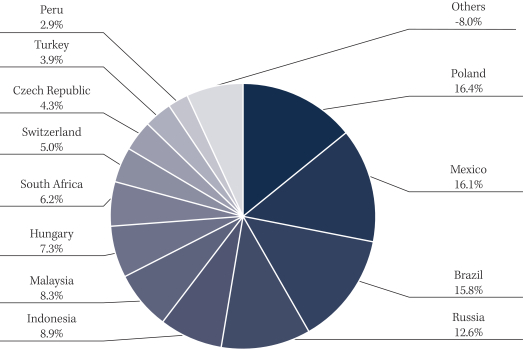
| | ∎ | | The top five countries in the portfolio at the end of the reporting period were Mexico (14.9%), Brazil (14.4%), South Africa (11.9%), Russia (10.3%) and Colombia (7.1%). The top five corporate issuers were Perobras (2.8%), Future Land Holdings (2.7%), Lila Chile Holding (2.1%), Firstrand Bank (1.9%) and CIFI Holdings (1.9%). Overall, the Fund had exposure to 26 countries, 19 corporates and 22 different currencies. |
| 1. | Total return describes the return to an investor of Class Y shares and includes the reinvestment of dividends and capital gains. Past performance is no guarantee of future results and investment returns and the net asset value (NAV) of shares of the Fund will fluctuate so that shares, when redeemed, may be worth more or less than their original cost. Current performance may be higher or lower than performance quoted. Call 1.855.439.5459 or visit barings.com for current month end performance. All returns 1-year or less are cumulative. |
18
Barings Emerging Markets Debt Blended Total Return Fund 2018 Annual Report
Describe market and portfolio outlook.
| | ∎ | | We believe that developed market fiscal policies, other than the U.S., are likely to remain expansionary for the next 12 months, providing support for global growth, which we expect to benefit emerging markets. |
| | ∎ | | Given current energy prices, we believe that energy importers are likely to experience higher inflation, although we expect inflation to be manageable over the next several years. Due to reduced inflationary pressures, we expect to see lower overall interest rates in countries with floating currencies and credible central bank policies, where nominal yields offer significant compensation for risk. |
| | ∎ | | We believe that EM corporate debt will perform well over the second half of 2018 given the favorable macro trends, meaningful steps to strengthen balance sheets and deleverage, stable commodity prices and improving sovereign stories across Europe and Latin America. |
| | ∎ | | EM corporate fundamentals appear to be improving and we believe they will likely continue to benefit from an increasingly stable macroeconomic environment. |
| | ∎ | | Technicals remain favorable, and over the next year, we do not expect to see sharp reversals in fund flows, which remain supportive. We expect net financing to stay subdued as a result of continued liability management among EM corporates and tighter restrictions out of China. We also expect cash flows from amortizations and coupons to remain robust in the coming years. |
19
Barings Emerging Markets Debt Blended Total Return Fund 2018 Annual Report
PORTFOLIO COMPOSITION (% OF ASSETS*)
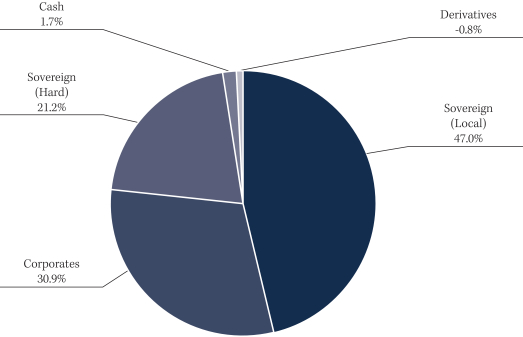
| * | The percentages shown above represent a percentage of the assets as of June 30, 2018. |
REGIONAL COMPOSITION (% OF ASSETS**)
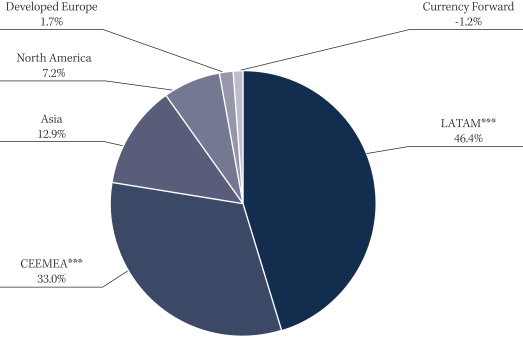
| ** | Percentage of assets are expressed by market value excluding cash and accrued income, and may vary over time. The percentages shown above represent a percentage of the assets as of June 30, 2018. |
| *** | CEEMEA: Central Europe, Eastern Europe, Middle East and Africa. |
| | LATAM: Latin America (includes countries in Central and South America). |
20
Barings Emerging Markets Debt Blended Total Return Fund 2018 Annual Report
| | | | | | | | | | | | |
| % AVERAGE ANNUAL TOTAL RETURNS 3,5,6 | | INCEPTION DATE | | | ONE YEAR | | | INCEPTION TO DATE | |
Class A With Load | | | 10/21/2015 | | | | -6.12 | % | | | 2.84 | % |
Class A No Load | | | 10/21/2015 | | | | -2.21 | % | | | 4.41 | % |
Class C With Load | | | 10/21/2015 | | | | -3.80 | % | | | 3.66 | % |
Class C No Load | | | 10/21/2015 | | | | -2.90 | % | | | 3.66 | % |
Class I With Load | | | 10/21/2015 | | | | -1.94 | % | | | 4.68 | % |
Class I No Load | | | 10/21/2015 | | | | -1.94 | % | | | 4.68 | % |
Class Y With Load | | | 10/21/2015 | | | | -1.94 | % | | | 4.68 | % |
Class Y No Load | | | 10/21/2015 | | | | -1.94 | % | | | 4.68 | % |
Performance shown is historical and does not guarantee future results. Current performance may be lower or higher. Because share price, principal value, and return will vary, you may have a gain or loss when you sell Fund shares. For current month-end performance information, call 1.855.439.5459. Performance includes the reinvestment of dividends and capital gains. Performance less than one year is cumulative; all other performance is annualized.
| 2. | Inception date: 10/21/2015 |
| 3. | Class A performance with the sales charges includes the maximum 4.00% sales charge. |
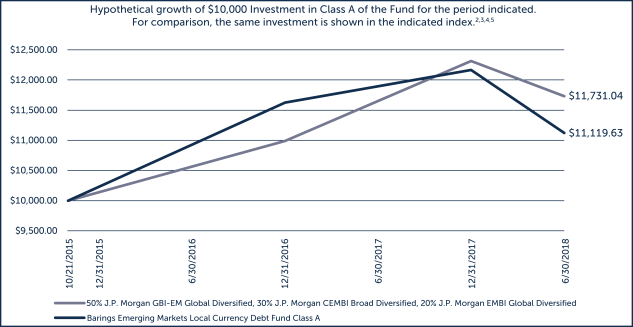
| 4. | Benchmark is a blend of 50% JPMorgan Government Bond Index – Emerging Markets Global Diversified (GBI-EMGD), 30% JPMorgan EMBI Global Diversified and 20% JPMorgan CEMBI Broad Diversified. |
| 5. | Line graph and table do not reflect the deduction of taxes that a shareholder would pay. |
| 6. | Class C performance with the sales charges includes the 1.00% contingent deferred sales charge (CDSC) for returns of one year or less. |
21
Barings Emerging Markets Local Currency Debt Fund 2018 Annual Report
Investment Objective
Barings Emerging Markets Local Currency Debt Fund (“EM Local Currency Debt Fund” or the “Fund”) seeks long-term total return through investment in a diversified portfolio of emerging markets local currency-denominated debt securities.
Portfolio Management Commentary
How did the Fund perform?
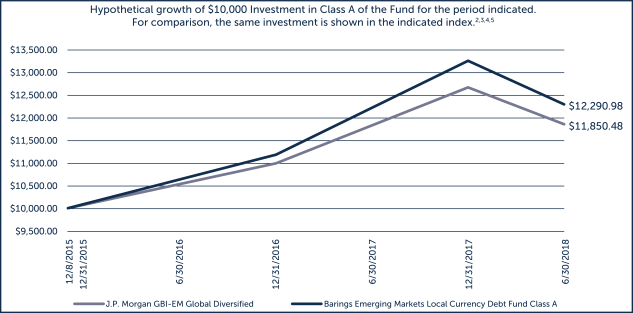
| | ∎ | | The Fund reported a net total rate of return for the fiscal year ended June 30, 2018 of -2.94%, underperforming the J.P. Morgan Government Bond Index Emerging Markets Global Diversified (the “Benchmark”), which returned -2.33%.1 |
What factors influenced performance of the Fund?
| | ∎ | | For the annual reporting period, the Fund’s positioning in Turkey, Hungary, South Africa and Colombia outperformed the Benchmark. The Fund’s overall positioning in Argentina, Brazil, Indonesia and the Polish zloty detracted from performance. |
| | ∎ | | The Fund’s performance trailed the Benchmark during the reporting period as a result of its currency positioning, which was the main detractor from Fund performance. Despite higher commodity prices and improving balance of payments for many EM countries, the U.S. dollar materially strengthened during the second quarter of 2018, sending many currencies to their lowest levels in years. The Fund’s EM local rates positions performed well versus the Benchmark, due in part to moderate growth, strong global trade and low inflation across many local markets. |
Describe recent portfolio activity.
| | ∎ | | The Fund increased its rates exposure to the Philippines, Russia, Colombia and Peru, while reducing exposure to South Africa, Argentina, Turkey and Czech Republic. The Fund also increased its exposure to the Brazilian real, Russian ruble and Polish zloty, while paring back exposure to the Israeli shekel, Thai bhat, Colombian peso, Argentinian peso and Turkish lira. The Fund remains overweight in Eastern European currencies in countries that are experiencing healthy growth and where we expect the currencies to continue appreciating versus the euro. |
Describe portfolio positioning at period end.
| | ∎ | | The Fund finished the annual reporting period ended June 30, 2018 with an 87.5% exposure to emerging market bonds and a 12.5% cash position. The Fund had a duration of 1.9 years greater than the Benchmark and 111% exposure to EM currencies, while underweight 11% to developed market currencies. |
| | ∎ | | The top five countries in the portfolio at the end of the annual reporting period (+/- years duration versus the Benchmark) were Brazil (+.96 years) South Africa (+.57 years), Russia (+.57 year), Mexico (+.55 years) and Colombia (+.45 years). Overall, the Fund had exposure to 20 different countries and 26 different currencies. |
Describe market and portfolio outlook.
| | ∎ | | We remain optimistic that some emerging markets headwinds are in the process of becoming tailwinds for many economies. |
| | ∎ | | We believe that EM countries continue to make meaningful adjustments to their current accounts to accommodate lower commodity revenues and continue to diversify and compete for export market share. |
| 1. | Total return describes the return to an investor of Class Y shares and includes the reinvestment of dividends and capital gains. Past performance is no guarantee of future results and investment returns and the net asset value (NAV) of shares of the Fund will fluctuate so that shares, when redeemed, may be worth more or less than their original cost. Current performance may be higher or lower than performance quoted. Call 1.855.439.5459 or visit barings.com for current month end performance. All returns 1-year or less are cumulative. J.P. Morgan GBI-EM Global Diversified consists of regularly traded, fixed-rate, domestic currency government bonds which international investors can readily access. The maximum weight to any country in the index is capped at 10%. The performance of the index does not reflect the deduction of expenses associated with a fund, such as investment management fees. By contrast, the performance of the Fund reflects the deduction of the fund expenses, including sales charges if applicable. Indices are unmanaged. It is not possible to invest directly in an index. |
22
Barings Emerging Markets Local Currency Debt Fund 2018 Annual Report
| | ∎ | | Global inflation may rise, although we expect it to be manageable over the next several years. Due to reduced inflationary pressures, we expect to see lower overall interest rates in countries with floating currencies and credible central bank policies, where nominal yields offer significant compensation for risk. |
| | ∎ | | The portfolio continues to add to constructive positioning on select Eastern European and Latin American currencies, less so on Asian currencies, while maintaining a watchful eye on commodity prices and the escalating trade war between the U.S. and China. |
| | ∎ | | The portfolio continues to be positioned in select rates where inflation is falling along with narrowing current account deficits. Although the U.S. is experiencing strong growth and higher inflation, most other countries are still in a period of disinflation, and we expect this to be favorable for EM local debt and the Fund. |
23
Barings Emerging Markets Local Currency Debt Fund 2018 Annual Report
COUNTRY COMPOSITION (% OF ASSETS*)
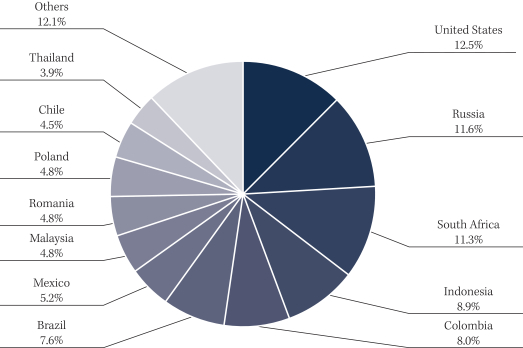
| * | Percentage of assets are expressed by market value excluding cash and accrued income, and may vary over time. The percentages shows above represent a percentage of the assets as of June 30, 2018. |
CURRENCY COMPOSITION (% OF ASSETS*)
| * | Percentage of assets are expressed by market value excluding cash and accrued income, and may vary over time. The percentages shows above represent a percentage of the assets as of June 30, 2018. |
24
Barings Emerging Markets Local Currency Debt Fund 2018 Annual Report
CONTRIBUTION TO DURATION (IN YEARS**)
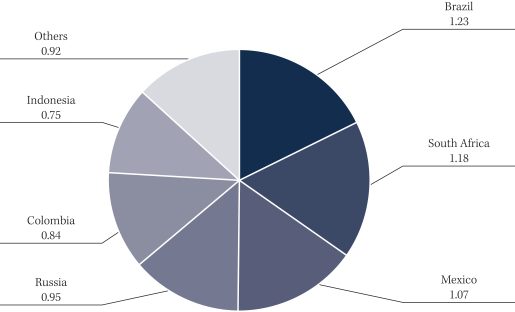
| ** | The values shown above represent the contribution to duration, in years, of the assets as of June 30, 2018. |
25
Barings Emerging Markets Local Currency Debt Fund 2018 Annual Report
| | | | | | | | | | | | |
| % AVERAGE ANNUAL TOTAL RETURNS 3,5,6 | | INCEPTION DATE | | | ONE YEAR | | | INCEPTION TO DATE | |
Class A With Load | | | 12/8/2015 | | | | -7.03 | % | | | 5.49 | % |
Class A No Load | | | 12/8/2015 | | | | -3.16 | % | | | 7.19 | % |
Class C With Load | | | 12/8/2015 | | | | -4.79 | % | | | 6.41 | % |
Class C No Load | | | 12/8/2015 | | | | -3.88 | % | | | 6.41 | % |
Class I With Load | | | 12/8/2015 | | | | -2.94 | % | | | 7.44 | % |
Class I No Load | | | 12/8/2015 | | | | -2.94 | % | | | 7.44 | % |
Class Y With Load | | | 12/8/2015 | | | | -2.93 | % | | | 7.45 | % |
Class Y No Load | | | 12/8/2015 | | | | -2.93 | % | | | 7.45 | % |
Performance shown is historical and does not guarantee future results. Current performance may be lower or higher. Because share price, principal value, and return will vary, you may have a gain or loss when you sell Fund shares. For current month-end performance information, call 1.855.439.5459. Performance includes the reinvestment of dividends and capital gains. Performance less than one year is cumulative; all other performance is annualized.
| 2. | Inception date: 12/08/2015 |
| 3. | Class A performance with the sales charges includes the maximum 4.00% sales charge. |
| 4. | Benchmark: JPMorgan Government Bond Index—Emerging Markets Global Diversified (GBI-EMGD) |
| 5. | Line graph and table do not reflect the deduction of taxes that a shareholder would pay. |
| 6. | Class C performance with the sales charges includes the 1.00% contingent deferred sales charge (CDSC) for returns of one year or less. |
26
Barings Global High Yield Fund 2018 Annual Report
Investment Objective
Barings Global High Yield Fund (“Global High Yield Fund” or the “Fund”) seeks to provide high current income generation and, where appropriate, capital appreciation.
Portfolio Management Commentary
How did the Fund perform?
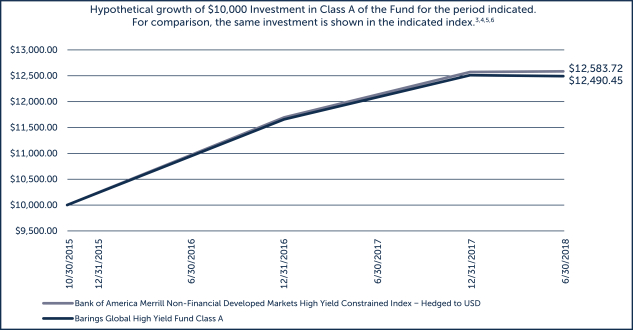
| | ∎ | | The Fund reported a net total rate of return for the fiscal year ended June 30, 2018 of 2.05%, underperforming the Bank of America Merrill Lynch Non-Financial Developed Markets High Yield Constrained Index (the “Benchmark”), which returned 2.60%.1 |
What factors influenced performance of the Fund?
| | ∎ | | The global high yield market finished the fiscal year with positive performance driven by stable to improving corporate fundamentals, moderate global economic growth and subdued inflationary pressures. |
| | ∎ | | The market was generally in risk-on mode as the lower end of the ratings spectrum outperformed less risky assets. As a result, the Fund’s overweight position in CCC-rated assets and an underweight allocation to BB-rated holdings relative to the Benchmark were the primary contributors to relative performance. Prudent credit selection across BB-rated assets and B-rated holdings was also a contributor to the Fund’s relative performance while credit selection within the CCC-rated category was the notable detractor. |
| | ∎ | | Performance across industries was fairly mixed during the period. Credit selection was the primary contributor to the Fund’s performance, whereas allocations to specific industry categories, compared to the Benchmark, did not have a material impact on performance. The containers, packaging & glass and the leisure, amusement & entertainment sectors contributed to Fund performance, while an overweight position in the leisure, amusement & entertainment sector detracted from Fund performance. The diversified & conglomerate manufacturing and the oil & gas sectors were the largest detractors from Fund performance, driven by certain idiosyncratic credit events. |
| | ∎ | | Across geographies, credit selection within the European market was a key contributor to Fund performance during the year while Europe also outperformed the U.S. across the broader market. The Fund was relatively aligned with the Benchmark from an allocation perspective and, as such, geographic allocations did not contribute meaningfully to performance during the year. |
Describe recent portfolio activity.
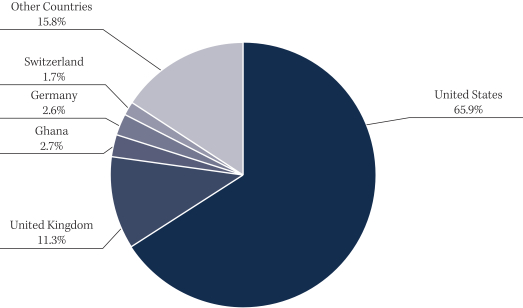
| | ∎ | | For much of the fiscal year, the Fund’s target weighting between U.S. and Europe was unchanged. In early 2018, however, the Fund began to shift allocation slightly in favor of Europe due to better relative value opportunities. As of June 30, 2018, 65.9% of the Fund is held in U.S. issuers (down approximately 2.5% from June 30, 2017), while European assets ended the period at 23.4% of the Fund by market value. We expect this shift to continue over the coming months as we believe that European assets remain more attractive relative to U.S. assets. The remaining 10.7% represents investments in other countries, cash and accrued income. |
| 1. | Total return describes the return to an investor of Class Y shares and includes the reinvestment of dividends and capital gains. Past performance is no guarantee of future results and investment returns and the net asset value (NAV) of shares of the Fund will fluctuate so that shares, when redeemed, may be worth more or less than their original cost. Current performance may be higher or lower than performance quoted. Call 1.855.439.5459 or visit barings.com for current month end performance. All returns 1-year or less are cumulative. The Bank of America Merrill Lynch Non-Financial Developed Markets High Yield Constrained Index contains all securities in the Bank of America Merrill Lynch Global High Yield Index that are non-financials and from developed markets countries, but caps issuer exposure at 2%. Developed markets is defined as an FX-G10 member, a Western European nation, or a territory of the U.S. or a Western European nation. Indices are unmanaged. It is not possible to invest directly in an index. |
27
Barings Global High Yield Fund 2018 Annual Report
| | ∎ | | The lower end of the ratings spectrum has outperformed the broader market over the past year and as such the Fund’s allocation to CCC-rated assets has increased while the Fund’s allocation to B-rated assets has decreased. The allocation to BB-rated assets has remained relatively in line during the period while holdings designated as not publicly rated by S&P, Moody’s or Fitch2 have decreased by 0.5% to 0.9% of market value. Cash and accrued income ended the period at 5.6% of the Fund. |
| | ∎ | | Oil & gas remained the top sector during the time period (the Fund increased its allocation to the sector by approximately 4%) as commodity prices have continued to improve and corporate fundamentals in the sector have remained generally stable. The healthcare, education & childcare sector was the second largest sector by market value with minimal change from the prior year-end. Meanwhile, the Fund’s allocation to the telecommunications sector was reduced by approximately 3% with a focus on opportunities primarily in the wireless subsector that we believe represent better relative value. |
Describe portfolio positioning at period end.
| | ∎ | | On a traded basis, the Fund held approximately 62% in senior unsecured bonds and approximately 30% in senior unsecured bonds. The remaining portion was held in first lien senior secured loans (2%), second lien senior secured loans (1%) and cash and accrued income (5%). |
| | ∎ | | The Fund remained broadly diversified across Moody’s sectors, with the oil & gas sector representing the largest portion of the portfolio at 18.0%, followed by healthcare, education & childcare at 7.1% and the mining, steel, iron & non-precious metals sector at 6.7%. |
| | ∎ | | At the end of the fiscal year, the Fund had the following credit quality weighting breakdown: 3.9% in BBB, 27.4% in BB, 45.1% in B, 17.1% in CCC and below and 5.6% in cash and accrued income. A small portion of the portfolio (0.9%) is not publicly rated by S&P, Moody’s or Fitch.2 |
| | ∎ | | The top five countries in the portfolio, as of June 30, 2018, are the U.S. (65.9%), the U.K. (11.3%), Ghana (2.7%), Germany (2.6%) and Switzerland (1.7%). Overall, the Fund had exposure to 15 countries and supports our focus on building a well-diversified portfolio of global high yield bonds. |
Describe market and portfolio outlook.
| | ∎ | | We believe that the global high yield market continues to show positive economic growth driven by stable corporate earnings, low rates and supportive central bank policies. Currently, growth appears synchronized across the U.S. and Europe, however, there may be potential for this momentum to slow. |
| | ∎ | | We currently see better relative value opportunities in the European market, which has seen generally higher yields with lower durations, versus the U.S. market. |
| | ∎ | | First-quarter earnings results reported by high yield issuers were similar to recent quarters, with continued revenue and EBITDA growth alongside modest leverage. In addition, interest coverage remains at or near all-time highs. Given these healthy interest coverage levels, we believe high yield issuers are generally well positioned to withstand future interest rate increases. |
| | ∎ | | Defaults across the global high yield market are below historical averages and we believe will likely remain low in the near term. Broadly speaking, we believe high yield spreads are fairly compensating investors for the potential default risk in the market. |
| 2. | Ratings shown are the highest rating given by one of the following national rating agencies: S&P, Moody’s or Fitch. Additional information about ratings can be found, respectively, at www.standardandpoors.com, www.moodys.com and www.fitchratings.com. Credit ratings are subject to change. AAA, AA, A, and BBB are investment grade ratings categories used by S&P and Fitch; BB, B, CCC/CC/C and D are below investment grade ratings categories used by S&P and Fitch. Aaa, Aa, A and Baa are investment grade ratings categories used by Moody’s; Ba, B, Caa/Ca and C are below investment grade ratings categories used by Moody’s. Ratings categories may include gradations within each category. Bonds backed by U.S. Government or agency securities are given an implied rating equal to the rating of such securities. Holdings designated Not Publicly Rated are not rated by these national rating agencies. |
28
Barings Global High Yield Fund 2018 Annual Report
CREDIT QUALITY COMPOSITION (% OF ASSETS*)
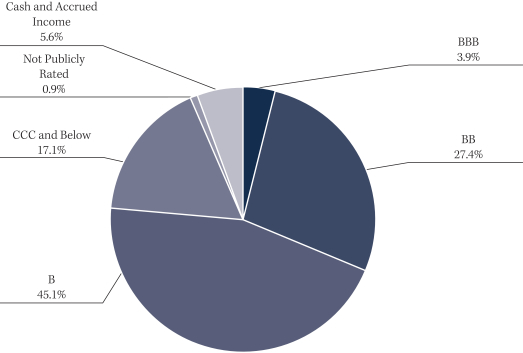
| * | The percentages shown above represent a percentage of the assets as of June 30, 2018. |
COUNTRY COMPOSITION (% OF ASSETS**)
| ** | Percentage of assets are expressed by market value excluding cash and accrued income, and may vary over time. The percentages shown above represent a percentage of the assets as of June 30, 2018. |
29
Barings Global High Yield Fund 2018 Annual Report
| | | | | | | | | | | | |
| % AVERAGE ANNUAL TOTAL RETURNS 4,6,7 | | INCEPTION DATE | | | ONE YEAR | | | INCEPTION TO DATE | |
Class A With Load | | | 10/30/2015 | | | | -2.28 | % | | | 6.05 | % |
Class A No Load | | | 10/30/2015 | | | | 1.79 | % | | | 7.69 | % |
Class C With Load | | | 10/30/2015 | | | | 0.10 | % | | | 6.89 | % |
Class C No Load | | | 10/30/2015 | | | | 1.04 | % | | | 6.89 | % |
Class I With Load | | | 10/30/2015 | | | | 2.05 | % | | | 7.96 | % |
Class I No Load | | | 10/30/2015 | | | | 2.05 | % | | | 7.96 | % |
Class Y With Load | | | 10/30/2015 | | | | 2.05 | % | | | 7.96 | % |
Class Y No Load | | | 10/30/2015 | | | | 2.05 | % | | | 7.96 | % |
Performance shown is historical and does not guarantee future results. Current performance may be lower or higher. Because share price, principal value, and return will vary, you may have a gain or loss when you sell Fund shares. For current month-end performance information, call 1.855.439.5459. Performance includes the reinvestment of dividends and capital gains. Performance less than one year is cumulative; all other performance is annualized.
| 3. | Inception date: 10/30/2015 |
| 4. | Class A performance with the sales charges includes the maximum 4.00% sales charge. |
| 5. | Benchmark: BofA Merrill Lynch Non-Fin. Developed Markets High Yield Constrained Index. The benchmark contains all securities in The BofA Merrill Lynch Global High Yield Index that are non-financials and from developed markets countries, but caps issuer exposure at 2%. Developed markets is defined as an FX-G10 member, a Western European nation, or a territory of the U.S. or a Western European nation. Indices are unmanaged. It is not possible to invest directly in an index. |
| 6. | Line graph and table do not reflect the deduction of taxes that a shareholder would pay. |
| 7. | Class C performance with the sales charges includes the 1.00% contingent deferred sales charge (CDSC) for returns of one year or less. |
30
Barings U.S. High Yield Fund 2018 Annual Report
Investment Objective
Barings U.S. High Yield Fund (“U.S. High Yield Fund” or the “Fund”) seeks to achieve a high level of total return, with an emphasis on current income, by investing primarily in high yield debt and related securities.
Portfolio Management Commentary
How did the Fund perform?
| | ∎ | | The Fund reported a net total rate of return for the fiscal year ended June 30, 2018 of 1.61%, underperforming the Bloomberg Barclays U.S. Corporate High Yield Index (the “Benchmark”), which returned 2.62%.1 |
What factors influenced performance of the Fund?
| | ∎ | | The U.S. high yield market finished the fiscal year with positive performance driven by stable to improving corporate fundamentals, moderate global economic growth and subdued inflationary pressures. |
| | ∎ | | The market was generally in risk-on mode as the lower end of the ratings spectrum outperformed less risky assets. As a result, the Fund’s overweight position in CCC-rated holdings and an underweight allocation to BB-rated assets relative to the Benchmark were the primary contributors to Fund performance. Credit selection within the BB-rated and B-rated categories was also a driver of Fund performance; however, weakness within a few specific securities in the CCC-rated category detracted from Fund performance during the period. |
| | ∎ | | Performance across industries was fairly mixed during the period. Credit selection within the containers, packaging, & glass and automotive sectors contributed to Fund performance. The diversified/conglomerate manufacturing and the oil & gas sectors were the largest detractors from Fund performance, driven by certain idiosyncratic credit events. |
Describe recent portfolio activity.
| | ∎ | | The Fund’s allocation across ratings categories remains more heavily focused on the lower end of the ratings spectrum where we continue to see more attractive risk reward versus higher rated holdings. During the period, the Fund’s exposure to CCC-rated and BB-rated credits increased while B-rated holdings decreased. |
| | ∎ | | Oil & gas remained the largest sector by market value during the period, although the Fund’s allocation to the sector decreased slightly. The Fund’s allocation to the mining, steel, iron, & non-precious metals sector increased by 4.5% during the period to become the second largest sector. We selectively reduced the Fund’s exposure to securities in the telecommunications sector, with a focus on opportunities primarily in the wireless subsector that we believe represent better relative value. |
Describe portfolio positioning at period end.
| | ∎ | | On a traded basis, the Fund finished the period ending June 30, 2018 with an 89.5% weighting to high yield bonds. The remaining balance of the portfolio was invested in senior secured loans at 2.6%, equity at 0.4%, and cash and accrued income at 7.5%. |
| | ∎ | | The Fund remains diversified across a number of Moody’s-based industries, with higher concentrations in oil & gas (16.1%), mining, steel, iron & non-precious metals (9.4%) and telecommunications (8.9%) as of June 30, 2018. |
| 1. | Total return describes the return to an investor of Class Y shares and includes the reinvestment of dividends and capital gains. Past performance is no guarantee of future results and investment returns and the net asset value (NAV) of shares of the Fund will fluctuate so that shares, when redeemed, may be worth more or less than their original cost. Current performance may be higher or lower than performance quoted. Call 1.855.439.5459 or visit barings.com for current month end performance. All returns 1-year or less are cumulative. The Bloomberg Barclays U.S. Corporate High Yield Index covers the universe of fixed-rate, non-investment grade debt focusing on corporate USD denominated and non-convertible debt. Indices are unmanaged. It is not possible to invest directly in an index. |
31
Barings U.S. High Yield Fund 2018 Annual Report
| | ∎ | | As of June 30, 2018, the Fund had the following credit quality weighting breakdown: 4.4% in BBB, 33.5% in BB, 36.7% in B, 15.7% in CCC and below, and cash and accrued income at 7.5%. A small portion of the portfolio (2.2%) is not publicly rated by S&P, Moody’s or Fitch.2 |
Describe market and portfolio outlook.
| | ∎ | | We believe that the U.S. high yield market continues to show positive economic growth driven by stable corporate earnings, low rates and supportive central bank policies. |
| | ∎ | | First-quarter earnings results reported by high yield issuers were similar to recent quarters with continued revenue and EBITDA growth alongside modest leverage. In addition, interest coverage remains at or near all-time highs. Given these healthy interest coverage levels, we believe high yield issuers are generally well-positioned to withstand future interest rate increases. |
| | ∎ | | Defaults across the U.S. high yield market are below historical averages and we believe will likely remain low in the near-term. Broadly speaking, we believe high yield spreads are fairly compensating investors for the potential default risk in the market. |
| 2. | Ratings shown are the highest rating given by one of the following national rating agencies: S&P, Moody’s or Fitch. Additional information about ratings can be found, respectively, at www.standardandpoors.com, www.moodys.com and www.fitchratings.com. Credit ratings are subject to change. AAA, AA, A, and BBB are investment grade ratings categories used by S&P and Fitch; BB, B, CCC/CC/C and D are below investment grade ratings categories used by S&P and Fitch. Aaa, Aa, A and Baa are investment grade ratings categories used by Moody’s; Ba, B, Caa/Ca and C are below investment grade ratings categories used by Moody’s. Ratings categories may include gradations within each category. Bonds backed by U.S. Government or agency securities are given an implied rating equal to the rating of such securities. Holdings designated Not Publicly Rated are not rated by these national rating agencies. |
32
Barings U.S. High Yield Fund 2018 Annual Report
CREDIT QUALITY COMPOSITION (% OF ASSETS*)
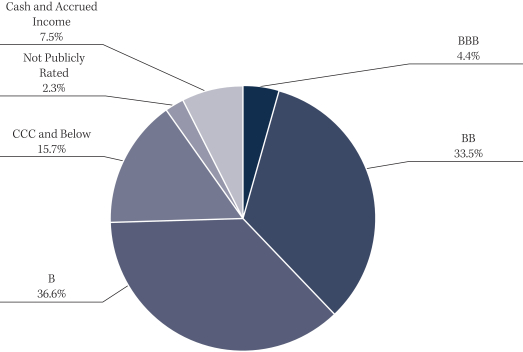
| * | The percentages shown above represent a percentage of the assets as of June 30, 2018. |
COUNTRY COMPOSITION (% OF ASSETS**)
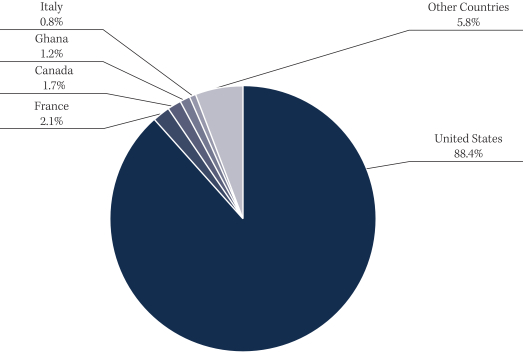
| ** | Percentage of assets are expressed by market value excluding cash and accrued income, and may vary over time. The percentages shown above represent a percentage of the assets as of June 30, 2018. |
33
Barings U.S. High Yield Fund 2018 Annual Report
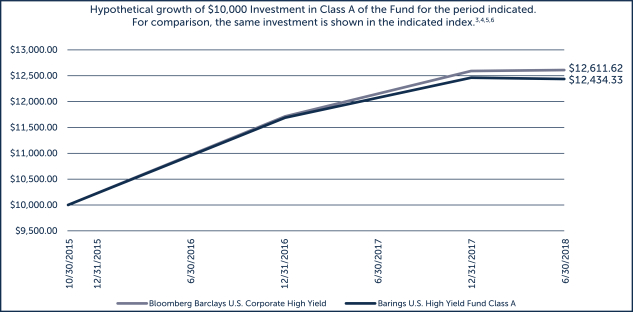
| | | | | | | | | | | | |
| % AVERAGE ANNUAL TOTAL RETURNS 4,6,7 | | INCEPTION DATE | | | ONE YEAR | | | INCEPTION TO DATE | |
Class A With Load | | | 10/30/2015 | | | | -2.74 | % | | | 5.69 | % |
Class A No Load | | | 10/30/2015 | | | | 1.32 | % | | | 7.32 | % |
Class C With Load | | | 10/30/2015 | | | | -0.32 | % | | | 6.53 | % |
Class C No Load | | | 10/30/2015 | | | | 0.61 | % | | | 6.53 | % |
Class I With Load | | | 10/30/2015 | | | | 1.61 | % | | | 7.59 | % |
Class I No Load | | | 10/30/2015 | | | | 1.61 | % | | | 7.59 | % |
Class Y With Load | | | 10/30/2015 | | | | 1.61 | % | | | 7.58 | % |
Class Y No Load | | | 10/30/2015 | | | | 1.61 | % | | | 7.58 | % |
Performance shown is historical and does not guarantee future results. Current performance may be lower or higher. Because share price, principal value, and return will vary, you may have a gain or loss when you sell Fund shares. For current month-end performance information, call 1.855.439.5459. Performance includes the reinvestment of dividends and capital gains. Performance less than one year is cumulative; all other performance is annualized.
| 3. | Inception date: 10/30/2015 |
| 4. | Class A performance with the sales charges includes the maximum 4.00% sales charge. |
| 5. | Benchmark: Bloomberg Barclays U.S. Corporate High Yield Index. The benchmark covers the universe of fixed-rate, non-investment grade debt focusing on corporate USD denominated and non-convertible debt. It is not possible to invest directly in an index. |
| 6. | Line graph and table do not reflect the deduction of taxes that a shareholder would pay. |
| 7. | Class C performance with the sales charges includes the 1.00% contingent deferred sales charge (CDSC) for returns of one year or less. |
34
Barings Funds Trust 2018 Annual Report
SHAREHOLDER EXPENSES (UNAUDITED)
As a shareholder of Barings Global Floating Rate Fund, Barings Global Credit Income Opportunities Fund, Barings Active Short Duration Bond Fund, Barings Total Return Bond Fund, Barings Emerging Markets Debt Blended Total Return Fund, Barings Emerging Markets Local Currency Debt Fund, Barings Global High Yield Fund or Barings U.S. High Yield Fund you incur ongoing expenses, such as management fees, shareholder service fees, distribution fees and other fund expenses. The following table is intended to help you understand your ongoing expenses (in dollars and cents) of investing in the Funds and to compare these expenses with the ongoing expenses of investing in other funds.
The table is based on an investment of $1,000 invested at the beginning of the period and held for the entire period from January 1, 2018 to June 30, 2018.
Actual Expenses
The first line in the table below provides information about the actual account values and actual expenses. You may use the information in this line, together with the amount you invested, to estimate the expenses that you paid over the period. Simply divide your account value by $1,000 (for example, an $8,600 account value divided by $1,000 = 8.6), then multiply the result by the number in the first line for the Fund under the heading entitled “Operating Expense Incurred” to estimate the expenses you paid on your account during this period.
Hypothetical Example for Comparison Purposes
The second line in the table below provides information about the hypothetical account values and hypothetical expenses based on the Fund’s actual expense ratio and an assumed rate of return of 5% per year before expenses, which is not the Fund’s actual return. The hypothetical account value and expenses may not be used to estimate the actual ending account balance or expenses you paid for the period. You may use this information to compare the ongoing costs of investing in your Fund and other funds. To do so, compare this 5% hypothetical example with the 5% hypothetical examples that appear in the shareholder reports of the other funds.
Barings Global Floating Rate Fund
| | | | | | | | | | | | | | | | | | | | |
| | | EXPENSE
RATIO | | | BEGINNING
AMOUNT | | | ENDING
VALUE | | | AVERAGE
VALUE | | | OPERATING
EXPENSE
INCURRED* | |
Class A | | | | | | | | | | | | | | | | | | | | |
Actual | | | 0.92 | % | | $ | 1,000.00 | | | $ | 1,018.40 | | | $ | 1,009.20 | | | $ | 4.60 | |
Hypothetical | | | 0.92 | % | | | 1,000.00 | | | | 1,020.20 | | | | 1,010.10 | | | | 4.61 | |
| | | | | |
Class C | | | | | | | | | | | | | | | | | | | | |
Actual | | | 1.68 | % | | | 1,000.00 | | | | 1,014.70 | | | | 1,007.35 | | | | 8.39 | |
Hypothetical | | | 1.68 | % | | | 1,000.00 | | | | 1,016.50 | | | | 1,008.25 | | | | 8.40 | |
| | | | | |
Class I | | | | | | | | | | | | | | | | | | | | |
Actual | | | 0.64 | % | | | 1,000.00 | | | | 1,019.80 | | | | 1,009.90 | | | | 3.21 | |
Hypothetical | | | 0.64 | % | | | 1,000.00 | | | | 1,021.60 | | | | 1,010.80 | | | | 3.21 | |
| | | | | |
Class Y | | | | | | | | | | | | | | | | | | | | |
Actual | | | 0.72 | % | | | 1,000.00 | | | | 1,019.70 | | | | 1,009.85 | | | | 3.61 | |
Hypothetical | | | 0.72 | % | | | 1,000.00 | | | | 1,021.20 | | | | 1,010.60 | | | | 3.61 | |
| * | For each Class of the Fund, net expenses are equal to the annualized expense ratio net of any expenses waived or reimbursed by the advisor for such class multiplied by the average account value over the period, multiplied by 181/365. |
35
Barings Funds Trust 2018 Annual Report
SHAREHOLDER EXPENSES (UNAUDITED) (CONTINUED)
Barings Global Credit Income Opportunities Fund
| | | | | | | | | | | | | | | | | | | | |
| | | EXPENSE
RATIO | | | BEGINNING
AMOUNT | | | ENDING
VALUE | | | AVERAGE
VALUE | | | OPERATING
EXPENSE
INCURRED* | |
Class A | | | | | | | | | | | | | | | | | | | | |
Actual | | | 1.20 | % | | $ | 1,000.00 | | | $ | 1,012.60 | | | $ | 1,006.30 | | | $ | 5.99 | |
Hypothetical | | | 1.20 | % | | | 1,000.00 | | | | 1,018.80 | | | | 1,009.40 | | | | 6.01 | |
| | | | | |
Class C | | | | | | | | | | | | | | | | | | | | |
Actual | | | 1.95 | % | | | 1,000.00 | | | | 1,008.80 | | | | 1,004.40 | | | | 9.71 | |
Hypothetical | | | 1.95 | % | | | 1,000.00 | | | | 1,015.10 | | | | 1,007.55 | | | | 9.74 | |
| | | | | |
Class I | | | | | | | | | | | | | | | | | | | | |
Actual | | | 0.95 | % | | | 1,000.00 | | | | 1,013.80 | | | | 1,006.90 | | | | 4.74 | |
Hypothetical | | | 0.95 | % | | | 1,000.00 | | | | 1,020.10 | | | | 1,010.05 | | | | 4.76 | |
| | | | | |
Class Y | | | | | | | | | | | | | | | | | | | | |
Actual | | | 0.95 | % | | | 1,000.00 | | | | 1,013.70 | | | | 1,006.85 | | | | 4.74 | |
Hypothetical | | | 0.95 | % | | | 1,000.00 | | | | 1,020.10 | | | | 1,010.05 | | | | 4.76 | |
| * | For each Class of the Fund, net expenses are equal to the annualized expense ratio net of any expenses waived or reimbursed by the advisor for such class multiplied by the average account value over the period, multiplied by 181/365. |
Barings Active Short Duration Bond Fund
| | | | | | | | | | | | | | | | | | | | |
| | | EXPENSE
RATIO | | | BEGINNING
AMOUNT | | | ENDING
VALUE | | | AVERAGE
VALUE | | | OPERATING
EXPENSE
INCURRED* | |
Class A | | | | | | | | | | | | | | | | | | | | |
Actual | | | 0.65 | % | | $ | 1,000.00 | | | $ | 1,004.30 | | | $ | 1,002.15 | | | $ | 3.23 | |
Hypothetical | | | 0.65 | % | | | 1,000.00 | | | | 1,021.60 | | | | 1,010.80 | | | | 3.26 | |
| | | | | |
Class C | | | | | | | | | | | | | | | | | | | | |
Actual | | | 0.90 | % | | | 1,000.00 | | | | 1,003.00 | | | | 1,001.50 | | | | 4.47 | |
Hypothetical | | | 0.90 | % | | | 1,000.00 | | | | 1,020.30 | | | | 1,010.15 | | | | 4.51 | |
| | | | | |
Class I | | | | | | | | | | | | | | | | | | | | |
Actual | | | 0.40 | % | | | 1,000.00 | | | | 1,005.60 | | | | 1,002.80 | | | | 1.99 | |
Hypothetical | | | 0.40 | % | | | 1,000.00 | | | | 1,022.80 | | | | 1,011.40 | | | | 2.01 | |
| | | | | |
Class Y | | | | | | | | | | | | | | | | | | | | |
Actual | | | 0.40 | % | | | 1,000.00 | | | | 1,005.50 | | | | 1,002.75 | | | | 1.99 | |
Hypothetical | | | 0.40 | % | | | 1,000.00 | | | | 1,022.80 | | | | 1,011.40 | | | | 2.01 | |
| * | For each Class of the Fund, net expenses are equal to the annualized expense ratio net of any expenses waived or reimbursed by the advisor for such class multiplied by the average account value over the period, multiplied by 181/365. |
36
Barings Funds Trust 2018 Annual Report
SHAREHOLDER EXPENSES (UNAUDITED) (CONTINUED)
Barings Total Return Bond Fund
| | | | | | | | | | | | | | | | | | | | |
| | | EXPENSE
RATIO** | | | BEGINNING
AMOUNT | | | ENDING
VALUE | | | AVERAGE
VALUE | | | OPERATING
EXPENSE
INCURRED* | |
Class A | | | | | | | | | | | | | | | | | | | | |
Actual | | | 0.80 | % | | $ | 1,000.00 | | | $ | 983.90 | | | $ | 991.95 | | | $ | 3.94 | |
Hypothetical | | | 0.80 | % | | | 1,000.00 | | | | 1,020.80 | | | | 1,010.40 | | | | 4.01 | |
| | | | | |
Class C | | | | | | | | | | | | | | | | | | | | |
Actual | | | 1.55 | % | | | 1,000.00 | | | | 980.30 | | | | 990.15 | | | | 7.61 | |
Hypothetical | | | 1.55 | % | | | 1,000.00 | | | | 1,017.10 | | | | 1,008.55 | | | | 7.75 | |
| | | | | |
Class I | | | | | | | | | | | | | | | | | | | | |
Actual | | | 0.55 | % | | | 1,000.00 | | | | 985.10 | | | | 992.55 | | | | 2.71 | |
Hypothetical | | | 0.55 | % | | | 1,000.00 | | | | 1,022.10 | | | | 1,011.05 | | | | 2.76 | |
| | | | | |
Class Y | | | | | | | | | | | | | | | | | | | | |
Actual | | | 0.55 | % | | | 1,000.00 | | | | 985.10 | | | | 992.55 | | | | 2.71 | |
Hypothetical | | | 0.55 | % | | | 1,000.00 | | | | 1,022.10 | | | | 1,011.05 | | | | 2.76 | |
| * | For each Class of the Fund, net expenses are equal to the annualized expense ratio net of any expenses waived or reimbursed by the advisor for such class multiplied by the average account value over the period, multiplied by 181/365. |
| ** | Expense ratios (as disclosed in the table) do not include the expenses of any underlying funds in which the Fund invests. The annualized expense ratios, as stated in the fee table of the Prospectus, may differ from the expense ratios disclosed in this report. |
Barings Emerging Markets Debt Blended Total Return Fund
| | | | | | | | | | | | | | | | | | | | |
| | | EXPENSE
RATIO | | | BEGINNING
AMOUNT | | | ENDING
VALUE | | | AVERAGE
VALUE | | | OPERATING
EXPENSE
INCURRED* | |
Class A | | | | | | | | | | | | | | | | | | | | |
Actual | | | 1.09 | % | | $ | 1,000.00 | | | $ | 934.40 | | | $ | 967.20 | | | $ | 5.23 | |
Hypothetical | | | 1.09 | % | | | 1,000.00 | | | | 1,019.40 | | | | 1,009.70 | | | | 5.46 | |
| | | | | |
Class C | | | | | | | | | | | | | | | | | | | | |
Actual | | | 1.83 | % | | | 1,000.00 | | | | 931.00 | | | | 965.50 | | | | 8.76 | |
Hypothetical | | | 1.83 | % | | | 1,000.00 | | | | 1,015.70 | | | | 1,007.85 | | | | 9.15 | |
| | | | | |
Class I | | | | | | | | | | | | | | | | | | | | |
Actual | | | 0.78 | % | | | 1,000.00 | | | | 935.60 | | | | 967.80 | | | | 3.74 | |
Hypothetical | | | 0.78 | % | | | 1,000.00 | | | | 1,020.90 | | | | 1,010.45 | | | | 3.91 | |
| | | | | |
Class Y | | | | | | | | | | | | | | | | | | | | |
Actual | | | 0.78 | % | | | 1,000.00 | | | | 935.60 | | | | 967.80 | | | | 3.74 | |
Hypothetical | | | 0.78 | % | | | 1,000.00 | | | | 1,020.90 | | | | 1,010.45 | | | | 3.91 | |
| * | For each Class of the Fund, net expenses are equal to the annualized expense ratio net of any expenses waived or reimbursed by the advisor for such class multiplied by the average account value over the period, multiplied by 181/365. |
37
Barings Funds Trust 2018 Annual Report
SHAREHOLDER EXPENSES (UNAUDITED) (CONTINUED)
Barings Emerging Markets Local Currency Debt Fund
| | | | | | | | | | | | | | | | | | | | |
| | | EXPENSE
RATIO | | | BEGINNING
AMOUNT | | | ENDING
VALUE | | | AVERAGE
VALUE | | | OPERATING
EXPENSE
INCURRED* | |
Class A | | | | | | | | | | | | | | | | | | | | |
Actual | | | 1.15 | % | | $ | 1,000.00 | | | $ | 927.80 | | | $ | 963.90 | | | $ | 5.50 | |
Hypothetical | | | 1.15 | % | | | 1,000.00 | | | | 1,019.10 | | | | 1,009.55 | | | | 5.76 | |
| | | | | |
Class C | | | | | | | | | | | | | | | | | | | | |
Actual | | | 1.98 | % | | | 1,000.00 | | | | 924.30 | | | | 962.15 | | | | 9.45 | |
Hypothetical | | | 1.98 | % | | | 1,000.00 | | | | 1,015.00 | | | | 1,007.50 | | | | 9.89 | |
| | | | | |
Class I | | | | | | | | | | | | | | | | | | | | |
Actual | | | 0.90 | % | | | 1,000.00 | | | | 928.90 | | | | 964.45 | | | | 4.30 | |
Hypothetical | | | 0.90 | % | | | 1,000.00 | | | | 1,020.30 | | | | 1,010.15 | | | | 4.51 | |
| | | | | |
Class Y | | | | | | | | | | | | | | | | | | | | |
Actual | | | 0.88 | % | | | 1,000.00 | | | | 928.90 | | | | 964.45 | | | | 4.21 | |
Hypothetical | | | 0.88 | % | | | 1,000.00 | | | | 1,020.40 | | | | 1,010.20 | | | | 4.41 | |
| * | For each Class of the Fund, net expenses are equal to the annualized expense ratio net of any expenses waived or reimbursed by the advisor for such class multiplied by the average account value over the period, multiplied by 181/365. |
Barings Global High Yield Fund
| | | | | | | | | | | | | | | | | | | | |
| | | EXPENSE
RATIO | | | BEGINNING
AMOUNT | | | ENDING
VALUE | | | AVERAGE
VALUE | | | OPERATING
EXPENSE
INCURRED* | |
Class A | | | | | | | | | | | | | | | | | | | | |
Actual | | | 1.05 | % | | $ | 1,000.00 | | | $ | 998.60 | | | $ | 999.30 | | | $ | 5.20 | |
Hypothetical | | | 1.05 | % | | | 1,000.00 | | | | 1,019.60 | | | | 1,009.80 | | | | 5.26 | |
| | | | | |
Class C | | | | | | | | | | | | | | | | | | | | |
Actual | | | 1.80 | % | | | 1,000.00 | | | | 994.90 | | | | 997.45 | | | | 8.90 | |
Hypothetical | | | 1.80 | % | | | 1,000.00 | | | | 1,015.90 | | | | 1,007.95 | | | | 9.00 | |
| | | | | |
Class I | | | | | | | | | | | | | | | | | | | | |
Actual | | | 0.80 | % | | | 1,000.00 | | | | 999.90 | | | | 999.95 | | | | 3.97 | |
Hypothetical | | | 0.80 | % | | | 1,000.00 | | | | 1,020.80 | | | | 1,010.40 | | | | 4.01 | |
| | | | | |
Class Y | | | | | | | | | | | | | | | | | | | | |
Actual | | | 0.80 | % | | | 1,000.00 | | | | 999.90 | | | | 999.95 | | | | 3.97 | |
Hypothetical | | | 0.80 | % | | | 1,000.00 | | | | 1,020.80 | | | | 1,010.40 | | | | 4.01 | |
| * | For each Class of the Fund, net expenses are equal to the annualized expense ratio net of any expenses waived or reimbursed by the advisor for such class multiplied by the average account value over the period, multiplied by 181/365. |
38
Barings Funds Trust 2018 Annual Report
SHAREHOLDER EXPENSES (UNAUDITED) (CONTINUED)
Barings U.S. High Yield Fund
| | | | | | | | | | | | | | | | | | | | |
| | | EXPENSE
RATIO | | | BEGINNING
AMOUNT | | | ENDING
VALUE | | | AVERAGE
VALUE | | | OPERATING
EXPENSE
INCURRED* | |
Class A | | | | | | | | | | | | | | | | | | | | |
Actual | | | 1.00 | % | | $ | 1,000.00 | | | $ | 997.80 | | | $ | 998.90 | | | $ | 4.95 | |
Hypothetical | | | 1.00 | % | | | 1,000.00 | | | | 1,019.80 | | | | 1,009.90 | | | | 5.01 | |
| | | | | |
Class C | | | | | | | | | | | | | | | | | | | | |
Actual | | | 1.75 | % | | | 1,000.00 | | | | 994.10 | | | | 997.05 | | | | 8.65 | |
Hypothetical | | | 1.75 | % | | | 1,000.00 | | | | 1,016.10 | | | | 1,008.05 | | | | 8.75 | |
| | | | | |
Class I | | | | | | | | | | | | | | | | | | | | |
Actual | | | 0.75 | % | | | 1,000.00 | | | | 999.00 | | | | 999.50 | | | | 3.72 | |
Hypothetical | | | 0.75 | % | | | 1,000.00 | | | | 1,021.10 | | | | 1,010.55 | | | | 3.76 | |
| | | | | |
Class Y | | | | | | | | | | | | | | | | | | | | |
Actual | | | 0.75 | % | | | 1,000.00 | | | | 999.00 | | | | 999.50 | | | | 3.72 | |
Hypothetical | | | 0.75 | % | | | 1,000.00 | | | | 1,021.10 | | | | 1,010.55 | | | | 3.76 | |
| * | For each Class of the Fund, net expenses are equal to the annualized expense ratio net of any expenses waived or reimbursed by the advisor for such class multiplied by the average account value over the period, multiplied by 181/365. |
39
Barings Funds Trust 2018 Annual Report
FINANCIAL REPORT
40
Barings Funds Trust 2018 Annual Report
STATEMENTS OF ASSETS AND LIABILITIES
June 30, 2018
| | | | | | | | | | | | | | | | |
| | | BARINGS GLOBAL
FLOATING RATE FUND | | | BARINGS GLOBAL
CREDIT INCOME
OPPORTUNITIES FUND | | | BARINGS ACTIVE
SHORT DURATION
BOND FUND | | | BARINGS
TOTAL RETURN
BOND FUND | |
| | | | |
| Assets | | | | | | | | | | | | | | | | |
| Investments, at fair value (cost $290,646,501, $239,021,691, $437,488,228 and $27,827,836, respectively) | | $ | 287,743,930 | | | $ | 234,123,460 | | | $ | 433,034,032 | | | $ | 27,464,150 | |
| Investments in affiliates, at fair value (cost $2,613,198) | | | — | | | | — | | | | — | | | | 2,635,105 | |
| Cash | | | 248,171 | | | | 39,209 | | | | 20,950 | | | | — | |
| Foreign currency, at value (cost $236,747, $1,052,725, $0 and $7, respectively) | | | 237,027 | | | | 1,054,323 | | | | — | | | | 7 | |
| Receivable for investments sold | | | 6,016,506 | | | | 1,981,562 | | | | 492,372 | | | | 677,613 | |
| Receivable for Fund shares sold | | | 589,860 | | | | 10,087,625 | | | | 1,687,295 | | | | 75,000 | |
| Interest receivable | | | 1,447,932 | | | | 2,574,066 | | | | 2,671,972 | | | | 181,429 | |
| Receivable from adviser (see Note 3) | | | — | | | | — | | | | 105,512 | | | | 20,253 | |
| Foreign tax reclaims receivable | | | — | | | | 3,778 | | | | — | | | | — | |
| Unrealized appreciation on forward foreign currency exchange contracts | | | 635,460 | | | | 817,834 | | | | — | | | | 20,403 | |
| Prepaid expenses | | | 33,489 | | | | 60,883 | | | | 2,426 | | | | 17,605 | |
| | | | | | | | | | | | | | | | |
Total assets | | | 296,952,375 | | | | 250,742,740 | | | | 438,014,559 | | | | 31,091,565 | |
| | | | | | | | | | | | | | | | |
| | | | |
| Liabilities | | | | | | | | | | | | | | | | |
| Payable for investments purchased | | | 650,681 | | | | 3,290,339 | | | | 940,972 | | | | 68,464 | |
| Payable for TBA and when-issued securities purchased | | | 41,890,414 | | | | 13,918,476 | | | | 1,550,000 | | | | 1,563,550 | |
| Payable for Fund shares repurchased | | | 551,922 | | | | 211,163 | | | | 541,431 | | | | 1,299 | |
| Swap contracts, at fair value (up-front net premiums received of $0, $0, $20,886 and $5,031, respectively) | | | — | | | | — | | | | 53,944 | | | | 13,486 | |
| Payable for variation margin on open futures contracts | | | — | | | | — | | | | 8,561 | | | | 1,699 | |
| Investment advisory fee payable (see Note 3) | | | 83,780 | | | | 75,100 | | | | — | | | | — | |
| Cash collateral Due to Broker | | | 655,000 | | | | 1,242,947 | | | | 3,720,000 | | | | 380,000 | |
| Distribution fees payable | | | 17,802 | | | | 17,797 | | | | 36,305 | | | | 203 | |
| Dividends payable | | | 113,373 | | | | 296,479 | | | | 122,980 | | | | 68,486 | |
| Unrealized depreciation on forward foreign currency exchange contracts | | | 6,085 | | | | 2,076 | | | | — | | | | 43,379 | |
| Unrealized depreciation on unfunded loan commitments | | | 9,990 | | | | 14,782 | | | | — | | | | — | |
| Accrued expenses and other liabilities | | | 186,124 | | | | 174,504 | | | | 256,166 | | | | 64,762 | |
| | | | | | | | | | | | | | | | |
Total liabilities | | | 44,165,171 | | | | 19,243,663 | | | | 7,230,359 | | | | 2,205,328 | |
| | | | | | | | | | | | | | | | |
Total net assets | | $ | 252,787,204 | | | $ | 231,499,077 | | | $ | 430,784,200 | | | $ | 28,886,237 | |
| | | | | | | | | | | | | | | | |
See accompanying Notes to the Financial Statements.
41
Barings Funds Trust 2018 Annual Report
STATEMENTS OF ASSETS AND LIABILITIES (CONTINUED)
June 30, 2018
| | | | | | | | | | | | | | | | |
| | | BARINGS GLOBAL
FLOATING RATE FUND | | | BARINGS GLOBAL
CREDIT INCOME
OPPORTUNITIES FUND | | | BARINGS ACTIVE
SHORT DURATION
BOND FUND | | | BARINGS
TOTAL RETURN
BOND FUND | |
| | | | |
| Composition of net assets | | | | | | | | | | | | | | | | |
| Shares of beneficial interest outstanding (par value $0.00001 per share), unlimited number of shares authorized | | $ | 266 | | | $ | 249 | | | $ | 436 | | | $ | 30 | |
| Additional paid-in capital | | | 257,602,876 | | | | 236,857,497 | | | | 434,654,353 | | | | 29,584,773 | |
| Undistributed net investment loss | | | (113,373 | ) | | | (305,679 | ) | | | (10,364 | ) | | | (60,031 | ) |
| Accumulated net realized gain (loss) | | | (2,445,913 | ) | | | (951,705 | ) | | | 1,015,106 | | | | (340,336 | ) |
| Net unrealized depreciation | | | (2,256,652 | ) | | | (4,101,285 | ) | | | (4,875,331 | ) | | | (298,199 | ) |
| | | | | | | | | | | | | | | | |
Total net assets | | $ | 252,787,204 | | | $ | 231,499,077 | | | $ | 430,784,200 | | | $ | 28,886,237 | |
| | | | | | | | | | | | | | | | |
| | | | |
| Class A | | | | | | | | | | | | | | | | |
| Net assets applicable to outstanding shares | | $ | 53,371,328 | | | $ | 60,506,724 | | | $ | 177,020,488 | | | $ | 206,750 | |
| | | | | | | | | | | | | | | | |
| Shares of beneficial interest outstanding | | | 5,627,110 | | | | 6,493,380 | | | | 17,916,765 | | | | 21,163 | |
| | | | | | | | | | | | | | | | |
| Net asset value per share outstanding | | $ | 9.48 | | | $ | 9.32 | | | $ | 9.88 | | | $ | 9.77 | |
| | | | | | | | | | | | | | | | |
| Maximum offering price per share outstanding (Net asset value plus sales charge of 3.00%, 4.00%, 0.00% and 4.00%, respectively) | | $ | 9.77 | | | $ | 9.71 | | | $ | 9.88 | | | $ | 10.18 | |
| | | | | | | | | | | | | | | | |
| | | | |
| Class C | | | | | | | | | | | | | | | | |
| Net assets applicable to outstanding shares | | $ | 8,310,603 | | | $ | 8,841,661 | | | $ | 1,139,147 | | | $ | 195,975 | |
| | | | | | | | | | | | | | | | |
| Shares of beneficial interest outstanding | | | 879,403 | | | | 950,025 | | | | 115,383 | | | | 20,061 | |
| | | | | | | | | | | | | | | | |
| Net asset value per share outstanding | | $ | 9.45 | | | $ | 9.31 | | | $ | 9.87 | | | $ | 9.77 | |
| | | | | | | | | | | | | | | | |
| | | | |
| Class I | | | | | | | | | | | | | | | | |
| Net assets applicable to outstanding shares | | $ | 18,369,575 | | | $ | 21,788,260 | | | $ | 299,577 | | | $ | 12,069,580 | |
| | | | | | | | | | | | | | | | |
| Shares of beneficial interest outstanding | | | 1,932,979 | | | | 2,338,856 | | | | 30,319 | | | | 1,235,482 | |
| | | | | | | | | | | | | | | | |
| Net asset value per share outstanding | | $ | 9.50 | | | $ | 9.32 | | | $ | 9.88 | | | $ | 9.77 | |
| | | | | | | | | | | | | | | | |
| | | | |
| Class Y | | | | | | | | | | | | | | | | |
| Net assets applicable to outstanding shares | | $ | 172,735,698 | | | $ | 140,362,432 | | | $ | 252,324,988 | | | $ | 16,413,932 | |
| | | | | | | | | | | | | | | | |
| Shares of beneficial interest outstanding | | | 18,183,091 | | | | 15,068,639 | | | | 25,557,578 | | | | 1,680,121 | |
| | | | | | | | | | | | | | | | |
| Net asset value per share outstanding | | $ | 9.50 | | | $ | 9.31 | | | $ | 9.87 | | | $ | 9.77 | |
| | | | | | | | | | | | | | | | |
See accompanying Notes to the Financial Statements.
42
Barings Funds Trust 2018 Annual Report
STATEMENTS OF ASSETS AND LIABILITIES
June 30, 2018
| | | | | | | | | | | | | | | | |
| | | BARINGS EMERGING
MARKETS DEBT
BLENDED TOTAL
RETURN FUND | | | BARINGS EMERGING
MARKETS LOCAL
CURRENCY DEBT
FUND | | | BARINGS GLOBAL
HIGH YIELD
FUND | | | BARINGS U.S.
HIGH YIELD
FUND | |
| | | | |
| Assets | | | | | | | | | | | | | | | | |
| Investments, at fair value (cost $49,778,556, $19,240,870, $26,115,605 and $58,017,024, respectively) | | $ | 45,863,780 | | | $ | 18,243,585 | | | $ | 25,279,847 | | | $ | 57,263,157 | |
| Cash | | | 500 | | | | — | | | | — | | | | — | |
| Cash collateral held at Broker | | | 1,870,000 | | | | 896,082 | | | | — | | | | — | |
| Foreign currency, at value (cost $92,630, $3,392, $0 and $0, respectively) | | | 93,272 | | | | 3,098 | | | | — | | | | — | |
| Receivable for investments sold | | | 280,000 | | | | 43,843 | | | | 117,839 | | | | — | |
| Receivable for Fund shares sold | | | — | | | | — | | | | 12 | | | | 3,874 | |
| Interest receivable | | | 878,582 | | | | 339,929 | | | | 422,315 | | | | 893,270 | |
| Receivable from adviser (see Note 3) | | | 28,851 | | | | 33,209 | | | | 9,428 | | | | — | |
| Cash collateral held at broker on open future contracts | | | 29,039 | | | | — | | | | — | | | | — | |
| Swap contracts, at fair value | | | 179,432 | | | | 60,900 | | | | — | | | | — | |
| Foreign tax reclaims receivable | | | — | | | | 4,024 | | | | 1,809 | | | | 297 | |
| Unrealized appreciation on forward foreign currency exchange contracts | | | 2,214,203 | | | | 691,437 | | | | 46,798 | | | | — | |
| Prepaid expenses | | | 17,275 | | | | 17,333 | | | | 17,325 | | | | 17,456 | |
| | | | | | | | | | | | | | | | |
Total assets | | | 51,454,934 | | | | 20,333,440 | | | | 25,895,373 | | | | 58,178,054 | |
| | | | | | | | | | | | | | | | |
| | | | |
| Liabilities | | | | | | | | | | | | | | | | |
| Payable for investments purchased | | | 633,479 | | | | 140,000 | | | | — | | | | — | |
| Payable for TBA and when-issued securities purchased | | | — | | | | — | | | | 763,060 | | | | 984,290 | |
| Payable for Fund shares repurchased | | | 1,222 | | | | 537 | | | | 2,447 | | | | 54 | |
| Due to custodian | | | — | | | | — | | | | 116,595 | | | | — | |
| Payable for variation margin on open swap contracts | | | — | | | | 2,791 | | | | — | | | | — | |
| Investment advisory fee payable (see Note 3) | | | — | | | | — | | | | — | | | | 3,447 | |
| Cash collateral Due to Broker | | | 1,140,000 | | | | 290,000 | | | | — | | | | — | |
| Distribution fees payable | | | 351 | | | | 140 | | | | 187 | | | | 555 | |
| Dividends payable | | | 205,647 | | | | 45,292 | | | | 123,018 | | | | 119,470 | |
| Unrealized depreciation on forward foreign currency exchange contracts | | | 2,771,591 | | | | 1,261,719 | | | | 900 | | | | — | |
| Accrued expenses and other liabilities | | | 87,832 | | | | 73,747 | | | | 63,393 | | | | 62,961 | |
| | | | | | | | | | | | | | | | |
Total liabilities | | | 4,840,122 | | | | 1,814,226 | | | | 1,069,600 | | | | 1,170,777 | |
| | | | | | | | | | | | | | | | |
Total net assets | | $ | 46,614,812 | | | $ | 18,519,214 | | | $ | 24,825,773 | | | $ | 57,007,277 | |
| | | | | | | | | | | | | | | | |
See accompanying Notes to the Financial Statements.
43
Barings Funds Trust 2018 Annual Report
STATEMENTS OF ASSETS AND LIABILITIES (CONTINUED)
June 30, 2018
| | | | | | | | | | | | | | | | |
| | | BARINGS EMERGING
MARKETS DEBT
BLENDED TOTAL
RETURN FUND | | | BARINGS EMERGING
MARKETS LOCAL
CURRENCY DEBT
FUND | | | BARINGS GLOBAL
HIGH YIELD
FUND | | | BARINGS U.S.
HIGH YIELD
FUND | |
| | | | |
| Composition of net assets | | | | | | | | | | | | | | | | |
| Shares of beneficial interest outstanding (par value $0.00001 per share), unlimited number of shares authorized | | $ | 49 | | | $ | 19 | | | $ | 25 | | | $ | 58 | |
| Additional paid-in capital | | | 51,014,152 | | | | 20,051,291 | | | | 25,424,683 | | | | 57,838,791 | |
| Undistributed (distributions in excess of) net investment income | | | 123,614 | | | | (206,237 | ) | | | (440 | ) | | | (536 | ) |
| Accumulated net realized gain (loss) | | | (67,734 | ) | | | 222,011 | | | | 194,670 | | | | (77,169 | ) |
| Net unrealized depreciation | | | (4,455,269 | ) | | | (1,547,870 | ) | | | (793,165 | ) | | | (753,867 | ) |
| | | | | | | | | | | | | | | | |
Total net assets | | $ | 46,614,812 | | | $ | 18,519,214 | | | $ | 24,825,773 | | | $ | 57,007,277 | |
| | | | | | | | | | | | | | | | |
| | | | |
| Class A | | | | | | | | | | | | | | | | |
| Net assets applicable to outstanding shares | | $ | 566,170 | | | $ | 282,910 | | | $ | 106,000 | | | $ | 2,917,514 | |
| | | | | | | | | | | | | | | | |
| Shares of beneficial interest outstanding | | | 59,541 | | | | 28,939 | | | | 10,836 | | | | 296,984 | |
| | | | | | | | | | | | | | | | |
| Net asset value per share outstanding | | $ | 9.51 | | | $ | 9.78 | | | $ | 9.78 | | | $ | 9.82 | |
| | | | | | | | | | | | | | | | |
| Maximum offering price per share outstanding (Net asset value plus sales charge of 4.00%) | | $ | 9.91 | | | $ | 10.19 | | | $ | 10.19 | | | $ | 10.23 | |
| | | | | | | | | | | | | | | | |
| | | | |
| Class C | | | | | | | | | | | | | | | | |
| Net assets applicable to outstanding shares | | $ | 277,230 | | | $ | 97,749 | | | $ | 197,478 | | | $ | 98,225 | |
| | | | | | | | | | | | | | | | |
| Shares of beneficial interest outstanding | | | 29,148 | | | | 10,000 | | | | 20,186 | | | | 10,000 | |
| | | | | | | | | | | | | | | | |
| Net asset value per share outstanding | | $ | 9.51 | | | $ | 9.77 | | | $ | 9.78 | | | $ | 9.82 | |
| | | | | | | | | | | | | | | | |
| | | | |
| Class I | | | | | | | | | | | | | | | | |
| Net assets applicable to outstanding shares | | $ | 22,649,740 | | | $ | 6,921,449 | | | $ | 12,129,548 | | | $ | 14,815,948 | |
| | | | | | | | | | | | | | | | |
| Shares of beneficial interest outstanding | | | 2,381,296 | | | | 708,165 | | | | 1,240,000 | | | | 1,508,341 | |
| | | | | | | | | | | | | | | | |
| Net asset value per share outstanding | | $ | 9.51 | | | $ | 9.77 | | | $ | 9.78 | | | $ | 9.82 | |
| | | | | | | | | | | | | | | | |
| | | | |
| Class Y | | | | | | | | | | | | | | | | |
| Net assets applicable to outstanding shares | | $ | 23,121,672 | | | $ | 11,217,106 | | | $ | 12,392,747 | | | $ | 39,175,590 | |
| | | | | | | | | | | | | | | | |
| Shares of beneficial interest outstanding | | | 2,430,781 | | | | 1,147,519 | | | | 1,266,907 | | | | 3,988,801 | |
| | | | | | | | | | | | | | | | |
| Net asset value per share outstanding | | $ | 9.51 | | | $ | 9.78 | | | $ | 9.78 | | | $ | 9.82 | |
| | | | | | | | | | | | | | | | |
See accompanying Notes to the Financial Statements.
44
Barings Funds Trust 2018 Annual Report
STATEMENTS OF OPERATIONS
For the Year Ended June 30, 2018
| | | | | | | | | | | | | | | | |
| | | BARINGS GLOBAL
FLOATING RATE FUND | | | BARINGS GLOBAL
CREDIT INCOME
OPPORTUNITIES FUND | | | BARINGS ACTIVE
SHORT DURATION
BOND FUND | | | BARINGS
TOTAL RETURN
BOND FUND | |
| | | | |
| Investment Income | | | | | | | | | | | | | | | | |
Interest income | | $ | 11,256,953 | | | $ | 11,415,570 | | | $ | 11,291,253 | | | $ | 913,532 | |
Dividends | | | — | | | | — | | | | — | | | | 498 | |
Dividends from affiliated securities | | | — | | | | — | | | | — | | | | 161,230 | |
Other income | | | 186,798 | | | | 46,134 | | | | 5,418 | | | | — | |
| | | | | | | | | | | | | | | | |
Total investment income | | | 11,443,751 | | | | 11,461,704 | | | | 11,296,671 | | | | 1,075,260 | |
| | | | | | | | | | | | | | | | |
| | | | |
| Operating Expenses | | | | | | | | | | | | | | | | |
Advisory fees | | | 1,352,275 | | | | 1,346,860 | | | | 1,412,898 | | | | 122,954 | |
12b-1 distribution and servicing plan | | | | | | | | | | | | | | | | |
Class A | | | 128,770 | | | | 89,859 | | | | 392,256 | | | | 534 | |
Class C | | | 80,399 | | | | 77,776 | | | | 4,430 | | | | 2,003 | |
Administrator fees | | | 234,817 | | | | 204,184 | | | | 449,980 | | | | 51,292 | |
Custody fees | | | 169,936 | | | | 151,970 | | | | 343,146 | | | | 54,940 | |
Professional fees | | | 84,614 | | | | 87,154 | | | | 120,714 | | | | 44,240 | |
Transfer agent fees | | | 32,759 | | | | 57,881 | | | | 73,714 | | | | 26,502 | |
Directors’ fees | | | 70,603 | | | | 62,775 | | | | 116,253 | | | | 29,563 | |
Registration fees | | | 76,471 | | | | 59,708 | | | | 168,080 | | | | 59,043 | |
Printing and mailing expenses | | | 51,695 | | | | 41,969 | | | | 72,259 | | | | 12,879 | |
Interest expense | | | — | | | | — | | | | 322 | | | | 25 | |
Other operating expenses | | | 42,270 | | | | 35,469 | | | | 73,983 | | | | 12,267 | |
| | | | | | | | | | | | | | | | |
Total operating expenses | | | 2,324,609 | | | | 2,215,605 | | | | 3,228,035 | | | | 416,242 | |
Reimbursement of expenses | | | | | | | | | | | | | | | | |
Class A | | | (158,427 | ) | | | (66,401 | ) | | | (461,180 | ) | | | (6,248 | ) |
Class C | | | (31,185 | ) | | | (19,931 | ) | | | (9,305 | ) | | | (6,105 | ) |
Class I | | | (64,781 | ) | | | (40,624 | ) | | | (7,254 | ) | | | (92,656 | ) |
Class Y | | | (386,868 | ) | | | (214,990 | ) | | | (738,757 | ) | | | (139,614 | ) |
| | | | | | | | | | | | | | | | |
Net operating expenses | | | 1,683,348 | | | | 1,873,659 | | | | 2,011,539 | | | | 171,619 | |
| | | | | | | | | | | | | | | | |
Net investment income | | | 9,760,403 | | | | 9,588,045 | | | | 9,285,132 | | | | 903,641 | |
| | | | | | | | | | | | | | | | |
See accompanying Notes to the Financial Statements.
45
Barings Funds Trust 2018 Annual Report
STATEMENTS OF OPERATIONS (CONTINUED)
For the Year Ended June 30, 2018
| | | | | | | | | | | | | | | | |
| | | BARINGS GLOBAL
FLOATING RATE FUND | | | BARINGS GLOBAL
CREDIT INCOME
OPPORTUNITIES FUND | | | BARINGS ACTIVE
SHORT DURATION
BOND FUND | | | BARINGS
TOTAL RETURN
BOND FUND | |
| | | | |
| Realized and Unrealized Gains (Losses) on Investments | | | | | | | | | | | | | | | | |
Net realized gain (loss) on investments | | $ | (1,646,076 | ) | | $ | 1,082,547 | | | $ | (485,401 | ) | | $ | (21,155 | ) |
Net realized gain (loss) on forward foreign currency exchange contracts | | | (820,659 | ) | | | (963,704 | ) | | | — | | | | 11,939 | |
Net realized gain (loss) on foreign currency and translation | | | 609,791 | | | | 826,053 | | | | — | | | | (667 | ) |
Net realized gain (loss) on futures contracts | | | — | | | | — | | | | 1,893,658 | | | | (163,053 | ) |
Net realized gain (loss) on swap contracts | | | — | | | | — | | | | (11,819 | ) | | | (1,808 | ) |
Capital gain distributions received from underlying fund | | | — | | | | — | | | | — | | | | 75,839 | |
Net realized gain (loss) on purchased options | | | — | | | | (266,936 | ) | | | (95,458 | ) | | | (19,770 | ) |
| | | | | | | | | | | | | | | | |
Net realized gain (loss) | | | (1,856,944 | ) | | | 677,960 | | | | 1,300,980 | | | | (118,675 | ) |
| | | | | | | | | | | | | | | | |
Net change in unrealized depreciation on investments | | | (645,939 | ) | | | (5,741,631 | ) | | | (5,339,791 | ) | | | (620,450 | ) |
Net change in unrealized appreciation (depreciation) on unfunded loan commitments | | | (14,990 | ) | | | (18,833 | ) | | | — | | | | — | |
Net change in unrealized appreciation (depreciation) on forward foreign currency exchange contracts | | | 936,893 | | | | 1,076,045 | | | | — | | | | (25,222 | ) |
Net change in unrealized appreciation (depreciation) on foreign currency and translation | | | 86,925 | | | | (1,490 | ) | | | — | | | | — | |
Change in net unrealized appreciation (depreciation) on affiliates | | | — | | | | — | | | | — | | | | (197,471 | ) |
Net change in unrealized appreciation (depreciation) on futures contracts | | | — | | | | — | | | | (638,459 | ) | | | 70,710 | |
Net change in unrealized appreciation (depreciation) on swap contracts | | | — | | | | — | | | | 14,762 | | | | 3,338 | |
Net change in unrealized appreciation (depreciation) on purchased option contracts | | | — | | | | 176,828 | | | | 39,457 | | | | 18,599 | |
| | | | | | | | | | | | | | | | |
Net change in unrealized appreciation (depreciation) | | | 362,889 | | | | (4,509,081 | ) | | | (5,924,031 | ) | | | (750,496 | ) |
| | | | | | | | | | | | | | | | |
Net realized and unrealized gains (losses) on investments | | | (1,494,055 | ) | | | (3,831,121 | ) | | | (4,623,051 | ) | | | (869,171 | ) |
| | | | | | | | | | | | | | | | |
Net increase in net assets resulting from operations | | $ | 8,266,348 | | | $ | 5,756,924 | | | $ | 4,662,081 | | | $ | 34,470 | |
| | | | | | | | | | | | | | | | |
See accompanying Notes to the Financial Statements.
46
Barings Funds Trust 2018 Annual Report
STATEMENTS OF OPERATIONS
For the Year Ended June 30, 2018
| | | | | | | | | | | | | | | | |
| | | BARINGS EMERGING
MARKETS DEBT
BLENDED TOTAL
RETURN FUND | | | BARINGS EMERGING
MARKETS LOCAL
CURRENCY DEBT
FUND | | | BARINGS GLOBAL
HIGH YIELD
FUND | | | BARINGS U.S.
HIGH YIELD
FUND | |
| | | | |
| Investment Income | | | | | | | | | | | | | | | | |
Interest income (net of withholding tax of $27,301, $24,203, $0 and $0, respectively) | | $ | 1,415,401 | | | $ | 864,257 | | | $ | 1,867,193 | | | $ | 2,528,895 | |
| | | | | | | | | | | | | | | | |
Total investment income | | | 1,415,401 | | | | 864,257 | | | | 1,867,193 | | | | 2,528,895 | |
| | | | | | | | | | | | | | | | |
| | | | |
| Operating Expenses | | | | | | | | | | | | | | | | |
Advisory fees | | | 172,999 | | | | 108,895 | | | | 161,392 | | | | 202,338 | |
12b-1 distribution and servicing plan | | | | | | | | | | | | | | | | |
Class A | | | 1,374 | | | | 686 | | | | 273 | | | | 5,895 | |
Class C | | | 2,437 | | | | 1,084 | | | | 2,295 | | | | 1,127 | |
Administrator fees | | | 40,616 | | | | 33,995 | | | | 47,112 | | | | 53,631 | |
Custody fees | | | 55,329 | | | | 51,018 | | | | 37,656 | | | | 40,862 | |
Professional fees | | | 58,805 | | | | 57,929 | | | | 43,617 | | | | 39,761 | |
Transfer agent fees | | | 26,248 | | | | 19,009 | | | | 21,113 | | | | 19,089 | |
Directors’ fees | | | 26,887 | | | | 25,588 | | | | 28,582 | | | | 30,007 | |
Registration fees | | | 63,408 | | | | 59,930 | | | | 58,634 | | | | 61,772 | |
Printing and mailing expenses | | | 9,146 | | | | 7,706 | | | | 12,519 | | | | 13,363 | |
Interest expense | | | 15 | | | | — | | | | — | | | | — | |
Other operating expenses | | | 9,380 | | | | 8,966 | | | | 11,581 | | | | 12,594 | |
| | | | | | | | | | | | | | | | |
Total operating expenses | | | 466,644 | | | | 374,806 | | | | 424,774 | | | | 480,439 | |
Reimbursement of expenses | | | | | | | | | | | | | | | | |
Class A | | | (13,877 | ) | | | (9,210 | ) | | | (6,011 | ) | | | (16,671 | ) |
Class C | | | (9,750 | ) | | | (6,701 | ) | | | (6,890 | ) | | | (5,276 | ) |
Class I | | | (124,706 | ) | | | (91,260 | ) | | | (92,799 | ) | | | (80,869 | ) |
Class Y | | | (128,628 | ) | | | (143,818 | ) | | | (101,318 | ) | | | (94,685 | ) |
| | | | | | | | | | | | | | | | |
Net operating expenses | | | 189,683 | | | | 123,817 | | | | 217,756 | | | | 282,938 | |
| | | | | | | | | | | | | | | | |
Net investment income | | | 1,225,718 | | | | 740,440 | | | | 1,649,437 | | | | 2,245,957 | |
| | | | | | | | | | | | | | | | |
See accompanying Notes to the Financial Statements.
47
Barings Funds Trust 2018 Annual Report
STATEMENTS OF OPERATIONS (CONTINUED)
For the Year Ended June 30, 2018
| | | | | | | | | | | | | | | | |
| | | BARINGS EMERGING
MARKETS DEBT
BLENDED TOTAL
RETURN FUND | | | BARINGS EMERGING
MARKETS LOCAL
CURRENCY DEBT
FUND | | | BARINGS GLOBAL
HIGH YIELD
FUND | | | BARINGS U.S.
HIGH YIELD
FUND | |
| | | | |
| Realized and Unrealized Gains (Losses) on Investments | | | | | | | | | | | | | | | | |
Net realized gain (loss) on investments | | $ | 298,462 | (1) | | $ | (41,973 | )(2) | | $ | 567,832 | | | $ | 150,989 | |
Net realized gain (loss) on forward foreign currency exchange contracts | | | (166,348 | ) | | | 231,609 | | | | (123,373 | ) | | | — | |
Net realized gain (loss) on foreign currency and translation | | | 22,867 | | | | (46,616 | ) | | | (41,657 | ) | | | — | |
Net realized gain (loss) on futures contracts | | | 12,675 | | | | — | | | | — | | | | — | |
Net realized gain on swap contracts | | | 64,575 | | | | 21,491 | | | | — | | | | — | |
| | | | | | | | | | | | | | | | |
Net realized gain (loss) | | | 232,231 | | | | 164,511 | | | | 402,802 | | | | 150,989 | |
| | | | | | | | | | | | | | | | |
Net change in unrealized depreciation on investments | | | (4,373,296 | )(3) | | | (1,296,546 | )(4) | | | (1,589,302 | ) | | | (1,764,583 | ) |
Net change in unrealized appreciation (depreciation) on unfunded loan commitments | | | — | | | | — | | | | (735 | ) | | | (489 | ) |
Net change in unrealized appreciation (depreciation) on forward foreign currency exchange contracts | | | (537,334 | ) | | | (623,053 | ) | | | 124,681 | | | | — | |
Net change in unrealized appreciation (depreciation) on foreign currency and translation | | | (20,289 | ) | | | (15,168 | ) | | | (7,399 | ) | | | — | |
Net change in unrealized appreciation (depreciation) on futures contracts | | | (38,239 | ) | | | — | | | | — | | | | — | |
Net change in unrealized appreciation (depreciation) on swap contracts | | | 53,630 | | | | 7,670 | | | | — | | | | — | |
| | | | | | | | | | | | | | | | |
Net change in unrealized appreciation (depreciation) | | | (4,915,528 | ) | | | (1,927,097 | ) | | | (1,472,755 | ) | | | (1,765,072 | ) |
| | | | | | | | | | | | | | | | |
Net realized and unrealized gains (losses) on investments | | | (4,683,297 | ) | | | (1,762,586 | ) | | | (1,069,953 | ) | | | (1,614,083 | ) |
| | | | | | | | | | | | | | | | |
Net increase (decrease) in net assets resulting from operations | | $ | (3,457,579 | ) | | $ | (1,022,146 | ) | | $ | 579,484 | | | $ | 631,874 | |
| | | | | | | | | | | | | | | | |
| (1) | | Net of realized foreign capital gains taxes of $1,650. |
| (2) | | Net of realized foreign capital gains taxes of $751. |
| (3) | | Net of change in unrealized appreciation (depreciation) of foreign capital gains taxes of $(1,594). |
| (4) | | Net of change in unrealized appreciation (depreciation) of foreign capital gains taxes of $2,872. |
See accompanying Notes to the Financial Statements.
48
Barings Funds Trust 2018 Annual Report
STATEMENTS OF CHANGES IN NET ASSETS
| | | | | | | | | | | | | | | | |
| | | BARINGS GLOBAL
FLOATING RATE FUND | | | BARINGS GLOBAL
CREDIT INCOME
OPPORTUNITIES FUND | |
| | | FOR THE YEAR
ENDED
JUNE 30, 2018 | | | FOR THE YEAR
ENDED
JUNE 30, 2017 | | | FOR THE YEAR
ENDED
JUNE 30, 2018 | | | FOR THE YEAR
ENDED
JUNE 30, 2017 | |
| | | | |
| Operations | | | | | | | | | | | | | | | | |
Net investment income | | $ | 9,760,403 | | | $ | 8,278,260 | | | $ | 9,588,045 | | | $ | 7,530,510 | |
Net realized gain (loss) on investments | | | (1,856,944 | ) | | | (233,299 | ) | | | 677,960 | | | | 1,210,122 | |
Net change in unrealized appreciation (depreciation) on investments | | | 362,889 | | | | 7,195,702 | | | | (4,509,081 | ) | | | 7,282,710 | |
| | | | | | | | | | | | | | | | |
Net increase in net assets resulting from operations | | | 8,266,348 | | | | 15,240,663 | | | | 5,756,924 | | | | 16,023,342 | |
| | | | | | | | | | | | | | | | |
| | | | |
| Dividends to Common Shareholders | | | | | | | | | | | | | | | | |
Net investment income | | | | | | | | | | | | | | | | |
Class A | | | (2,063,485 | ) | | | (938,252 | ) | | | (1,756,888 | ) | | | (998,532 | ) |
| | | | | | | | | | | | | | | | |
Class C | | | (270,057 | ) | | | (185,364 | ) | | | (327,000 | ) | | | (215,973 | ) |
| | | | | | | | | | | | | | | | |
Class I | | | (854,559 | ) | | | (672,463 | ) | | | (1,145,985 | ) | | | (1,381,435 | ) |
| | | | | | | | | | | | | | | | |
Class Y | | | (5,403,280 | ) | | | (3,901,578 | ) | | | (5,859,509 | ) | | | (4,128,774 | ) |
| | | | | | | | | | | | | | | | |
Return of Capital | | | | | | | | | | | | | | | | |
Class A | | | (279,765 | ) | | | (539,887 | ) | | | (100,036 | ) | | | (128,650 | ) |
| | | | | | | | | | | | | | | | |
Class C | | | (35,709 | ) | | | (92,940 | ) | | | (17,976 | ) | | | (27,208 | ) |
| | | | | | | | | | | | | | | | |
Class I | | | (107,589 | ) | | | (292,699 | ) | | | (57,195 | ) | | | (142,739 | ) |
| | | | | | | | | | | | | | | | |
Class Y | | | (748,240 | ) | | | (1,654,649 | ) | | | (321,100 | ) | | | (507,018 | ) |
| | | | | | | | | | | | | | | | |
Total dividends to common shareholders | | | (9,762,684 | ) | | | (8,277,832 | ) | | | (9,585,689 | ) | | | (7,530,329 | ) |
| | | | | | | | | | | | | | | | |
| | | | |
| Capital Share Transactions | | | | | | | | | | | | | | | | |
Net proceeds from sale of shares | | | 112,207,247 | | | | 148,677,637 | | | | 121,425,079 | | | | 80,293,147 | |
Net Asset Value of shares issued to shareholders in payment of distributions declared | | | 8,983,366 | | | | 6,768,827 | | | | 6,045,876 | | | | 3,419,184 | |
Cost of shares redeemed | | | (62,757,889 | ) | | | (133,201,507 | ) | | | (43,918,289 | ) | | | (39,350,864 | ) |
| | | | | | | | | | | | | | | | |
Net increase in net assets resulting from capital stock transactions | | | 58,432,724 | | | | 22,244,957 | | | | 83,552,666 | | | | 44,361,467 | |
| | | | | | | | | | | | | | | | |
Total increase in net assets | | | 56,936,388 | | | | 29,207,788 | | | | 79,723,901 | | | | 52,854,480 | |
| | | | | | | | | | | | | | | | |
| | | | |
| Net Assets | | | | | | | | | | | | | | | | |
Beginning of year | | | 195,850,816 | | | | 166,643,028 | | | | 151,775,176 | | | | 98,920,696 | |
| | | | | | | | | | | | | | | | |
End of year (includes undistributed net investment income of $(113,373), $(1,302,641), $(305,680) and $(1,244,900), respectively) | | $ | 252,787,204 | | | $ | 195,850,816 | | | $ | 231,499,077 | | | $ | 151,775,176 | |
| | | | | | | | | | | | | | | | |
See accompanying Notes to the Financial Statements.
49
Barings Funds Trust 2018 Annual Report
STATEMENTS OF CHANGES IN NET ASSETS
| | | | | | | | | | | | | | | | |
| | | BARINGS ACTIVE
SHORT DURATION
BOND FUND | | | BARINGS TOTAL
RETURN BOND
FUND | |
| | | FOR THE YEAR
ENDED
JUNE 30, 2018 | | | FOR THE YEAR
ENDED
JUNE 30, 2017 | | | FOR THE YEAR
ENDED
JUNE 30, 2018 | | | FOR THE YEAR
ENDED
JUNE 30, 2017 | |
| | | | |
| Operations | | | | | | | | | | | | | | | | |
Net investment income | | $ | 9,285,132 | | | $ | 4,633,575 | | | $ | 903,641 | | | $ | 758,446 | |
Net realized gain (loss) on investments | | | 1,300,980 | | | | 1,189,095 | | | | (118,675 | ) | | | (33,874 | ) |
Net change in unrealized appreciation (depreciation) on investments | | | (5,924,031 | ) | | | 172,123 | | | | (750,496 | ) | | | (149,825 | ) |
| | | | | | | | | | | | | | | | |
Net increase in net assets resulting from operations | | | 4,662,081 | | | | 5,994,793 | | | | 34,470 | | | | 574,747 | |
| | | | | | | | | | | | | | | | |
| | | | |
| Dividends to Common Shareholders | | | | | | | | | | | | | | | | |
Net investment income | | | | | | | | | | | | | | | | |
Class A | | | (3,385,234 | ) | | | (1,605,272 | ) | | | (6,279 | ) | | | (5,751 | ) |
| | | | | | | | | | | | | | | | |
Class C | | | (17,041 | ) | | | (5,353 | ) | | | (4,440 | ) | | | (3,785 | ) |
| | | | | | | | | | | | | | | | |
Class I | | | (6,510 | ) | | | (11,257 | ) | | | (392,338 | ) | | | (357,307 | ) |
| | | | | | | | | | | | | | | | |
Class Y | | | (5,887,689 | ) | | | (3,057,128 | ) | | | (573,463 | ) | | | (433,167 | ) |
| | | | | | | | | | | | | | | | |
Net realized gain | | | | | | | | | | | | | | | | |
Class A | | | (490,289 | ) | | | (38,267 | ) | | | — | | | | — | |
| | | | | | | | | | | | | | | | |
Class C | | | (2,454 | ) | | | (114 | ) | | | — | | | | — | |
| | | | | | | | | | | | | | | | |
Class I | | | (910 | ) | | | (42 | ) | | | — | | | | — | |
| | | | | | | | | | | | | | | | |
Class Y | | | (776,810 | ) | | | (63,403 | ) | | | — | | | | — | |
| | | | | | | | | | | | | | | | |
Return of Capital | | | | | | | | | | | | | | | | |
Class A | | | — | | | | — | | | | (217 | ) | | | — | |
| | | | | | | | | | | | | | | | |
Class C | | | — | | | | — | | | | (153 | ) | | | — | |
| | | | | | | | | | | | | | | | |
Class I | | | — | | | | — | | | | (13,609 | ) | | | — | |
| | | | | | | | | | | | | | | | |
Class Y | | | — | | | | — | | | | (19,524 | ) | | | — | |
| | | | | | | | | | | | | | | | |
Total dividends to common shareholders | | | (10,566,937 | ) | | | (4,780,836 | ) | | | (1,010,023 | ) | | | (800,010 | ) |
| | | | | | | | | | | | | | | | |
| | | | |
| Capital Share Transactions | | | | | | | | | | | | | | | | |
Net proceeds from sale of shares | | | 354,038,993 | | | | 317,789,229 | | | | 2,983,984 | | | | 5,001,298 | |
Net Asset Value of shares issued to shareholders in payment of distributions declared | | | 9,474,859 | | | | 4,101,768 | | | | 183,911 | | | | 75,328 | |
Cost of shares redeemed | | | (250,813,003 | ) | | | (154,981,250 | ) | | | (3,661,938 | ) | | | (503,539 | ) |
| | | | | | | | | | | | | | | | |
Net increase (decrease) in net assets resulting from capital stock transactions | | | 112,700,849 | | | | 166,909,747 | | | | (494,043 | ) | | | 4,573,087 | |
| | | | | | | | | | | | | | | | |
Total increase (decrease) in net assets | | | 106,795,993 | | | | 168,123,704 | | | | (1,469,596 | ) | | | 4,347,824 | |
| | | | | | | | | | | | | | | | |
| | | | |
| Net Assets | | | | | | | | | | | | | | | | |
Beginning of year | | | 323,988,207 | | | | 155,864,503 | | | | 30,355,833 | | | | 26,008,009 | |
| | | | | | | | | | | | | | | | |
End of year (includes undistributed net investment income of $(10,364), $(12,296), $(60,031) and $(46,905), respectively) | | $ | 430,784,200 | | | $ | 323,988,207 | | | $ | 28,886,237 | | | $ | 30,355,833 | |
| | | | | | | | | | | | | | | | |
See accompanying Notes to the Financial Statements.
50
Barings Funds Trust 2018 Annual Report
STATEMENTS OF CHANGES IN NET ASSETS
| | | | | | | | | | | | | | | | |
| | | BARINGS EMERGING
MARKETS DEBT
BLENDED TOTAL
RETURN FUND | | | BARINGS EMERGING
MARKETS LOCAL
CURRENCY DEBT
FUND | |
| | | FOR THE YEAR
ENDED
JUNE 30, 2018 | | | FOR THE YEAR
ENDED
JUNE 30, 2017 | | | FOR THE YEAR
ENDED
JUNE 30, 2018 | | | FOR THE YEAR
ENDED
JUNE 30, 2017 | |
| | | | |
| Operations | | | | | | | | | | | | | | | | |
Net investment income | | $ | 1,225,718 | | | $ | 448,168 | | | $ | 740,440 | | | $ | 138,071 | |
Net realized gain on investments | | | 232,231 | | | | 415,231 | | | | 164,511 | | | | 211,313 | |
Net change in unrealized appreciation (depreciation) on investments | | | (4,915,528 | ) | | | 312,882 | | | | (1,927,097 | ) | | | 123,019 | |
| | | | | | | | | | | | | | | | |
Net increase (decrease) in net assets from operations | | | (3,457,579 | ) | | | 1,176,281 | | | | (1,022,146 | ) | | | 472,403 | |
| | | | | | | | | | | | | | | | |
| | | | |
| Dividends to Common Shareholders | | | | | | | | | | | | | | | | |
Net investment income | | | | | | | | | | | | | | | | |
Class A | | | (29,114 | ) | | | (10,093 | ) | | | (13,626 | ) | | | (9,790 | ) |
| | | | | | | | | | | | | | | | |
Class C | | | (10,947 | ) | | | (8,789 | ) | | | (4,519 | ) | | | (9,013 | ) |
| | | | | | | | | | | | | | | | |
Class I | | | (556,464 | ) | | | (254,319 | ) | | | (288,701 | ) | | | (241,257 | ) |
| | | | | | | | | | | | | | | | |
Class Y | | | (570,211 | ) | | | (256,813 | ) | | | (472,975 | ) | | | (241,252 | ) |
| | | | | | | | | | | | | | | | |
Net realized gain | | | | | | | | | | | | | | | | |
Class A | | | (17,857 | ) | | | — | | | | (2,395 | ) | | | (1,816 | ) |
| | | | | | | | | | | | | | | | |
Class C | | | (6,611 | ) | | | — | | | | (774 | ) | | | (1,816 | ) |
| | | | | | | | | | | | | | | | |
Class I | | | (144,527 | ) | | | — | | | | (18,576 | ) | | | (43,584 | ) |
| | | | | | | | | | | | | | | | |
Class Y | | | (152,234 | ) | | | — | | | | (49,187 | ) | | | (43,584 | ) |
| | | | | | | | | | | | | | | | |
Total dividends to common shareholders | | | (1,487,965 | ) | | | (530,014 | ) | | | (850,753 | ) | | | (592,112 | ) |
| | | | | | | | | | | | | | | | |
| | | | |
| Capital Share Transactions | | | | | | | | | | | | | | | | |
Net proceeds from sale of shares | | | 41,179,347 | | | | 539,240 | | | | 15,638,704 | | | | — | |
Net Asset Value of shares issued to shareholders in payment of distributions declared | | | 43,749 | | | | 2,427 | | | | 224,528 | | | | — | |
Cost of shares redeemed | | | (498,234 | ) | | | (255,428 | ) | | | (811,922 | ) | | | — | |
| | | | | | | | | | | | | | | | |
Net increase in net assets resulting from capital stock transactions | | | 40,724,862 | | | | 286,239 | | | | 15,051,310 | | | | — | |
| | | | | | | | | | | | | | | | |
Total increase (decrease) in net assets | | | 35,779,318 | | | | 932,506 | | | | 13,178,411 | | | | (119,709 | ) |
| | | | | | | | | | | | | | | | |
| | | | |
| Net Assets | | | | | | | | | | | | | | | | |
Beginning of year | | | 10,835,494 | | | | 9,902,988 | | | | 5,340,803 | | | | 5,460,512 | |
| | | | | | | | | | | | | | | | |
End of year (includes undistributed net investment income of $123,614, $(50,942), $(206,237) and $(44,971), respectively) | | $ | 46,614,812 | | | $ | 10,835,494 | | | $ | 18,519,214 | | | $ | 5,340,803 | |
| | | | | | | | | | | | | | | | |
See accompanying Notes to the Financial Statements.
51
Barings Funds Trust 2018 Annual Report
STATEMENTS OF CHANGES IN NET ASSETS
| | | | | | | | | | | | | | | | |
| | | BARINGS GLOBAL
HIGH YIELD FUND | | | BARINGS U.S.
HIGH YIELD FUND | |
| | | FOR THE YEAR
ENDED
JUNE 30, 2018 | | | FOR THE YEAR
ENDED
JUNE 30, 2017 | | | FOR THE YEAR
ENDED
JUNE 30, 2018 | | | FOR THE YEAR
ENDED
JUNE 30, 2017 | |
| | | | |
| Operations | | | | | | | | | | | | | | | | |
Net investment income | | $ | 1,649,437 | | | $ | 1,737,828 | | | $ | 2,245,957 | | | $ | 2,048,058 | |
Net realized gain on investments | | | 402,802 | | | | 1,098,745 | | | | 150,989 | | | | 1,008,031 | |
Net change in unrealized appreciation (depreciation) on investments | | | (1,472,755 | ) | | | 892,695 | | | | (1,765,072 | ) | | | 829,782 | |
| | | | | | | | | | | | | | | | |
Net increase in net assets resulting from operations | | | 579,484 | | | | 3,729,268 | | | | 631,874 | | | | 3,885,871 | |
| | | | | | | | | | | | | | | | |
| | | | |
| Dividends to Common Shareholders | | | | | | | | | | | | | | | | |
Net investment income | | | | | | | | | | | | | | | | |
Class A | | | (6,439 | ) | | | (6,644 | ) | | | (139,147 | ) | | | (123,272 | ) |
| | | | | | | | | | | | | | | | |
Class C | | | (11,793 | ) | | | (10,538 | ) | | | (5,823 | ) | | | (6,069 | ) |
| | | | | | | | | | | | | | | | |
Class I | | | (775,770 | ) | | | (829,764 | ) | | | (944,699 | ) | | | (1,005,037 | ) |
| | | | | | | | | | | | | | | | |
Class Y | | | (855,423 | ) | | | (890,882 | ) | | | (1,156,409 | ) | | | (913,775 | ) |
| | | | | | | | | | | | | | | | |
Net realized gain | | | | | | | | | | | | | | | | |
Class A | | | (2,627 | ) | | | (3,987 | ) | | | (70,872 | ) | | | (24,333 | ) |
| | | | | | | | | | | | | | | | |
Class C | | | (5,847 | ) | | | (7,212 | ) | | | (3,383 | ) | | | (1,951 | ) |
| | | | | | | | | | | | | | | | |
Class I | | | (305,536 | ) | | | (474,176 | ) | | | (449,823 | ) | | | (274,369 | ) |
| | | | | | | | | | | | | | | | |
Class Y | | | (336,250 | ) | | | (517,180 | ) | | | (446,525 | ) | | | (253,823 | ) |
| | | | | | | | | | | | | | | | |
Total dividends to common shareholders | | | (2,299,685 | ) | | | (2,740,383 | ) | | | (3,216,681 | ) | | | (2,602,629 | ) |
| | | | | | | | | | | | | | | | |
| | | | |
| Capital Share Transactions | | | | | | | | | | | | | | | | |
Net proceeds from sale of shares | | | 3,560,120 | | | | 1,640,235 | | | | 29,139,508 | | | | 7,082,995 | |
Net Asset Value of shares issued to shareholders in payment of distributions declared | | | 116,325 | | | | 111,913 | | | | 882,238 | | | | 428,741 | |
Cost of shares redeemed | | | (4,970,047 | ) | | | (172,600 | ) | | | (3,532,281 | ) | | | (3,537,611 | ) |
| | | | | | | | | | | | | | | | |
Net increase (decrease) in net assets resulting from capital stock transactions | | | (1,293,602 | ) | | | 1,579,548 | | | | 26,489,465 | | | | 3,974,125 | |
| | | | | | | | | | | | | | | | |
Total increase (decrease) in net assets | | | (3,013,803 | ) | | | 2,568,433 | | | | 23,904,658 | | | | 5,257,367 | |
| | | | | | | | | | | | | | | | |
| | | | |
| Net Assets | | | | | | | | | | | | | | | | |
Beginning of year | | | 27,839,576 | | | | 25,271,143 | | | | 33,102,619 | | | | 27,845,252 | |
| | | | | | | | | | | | | | | | |
End of year (includes undistributed net investment income of $(440), $(134,955), $(536) and $(95), respectively) | | $ | 24,825,773 | | | $ | 27,839,576 | | | $ | 57,007,277 | | | $ | 33,102,619 | |
| | | | | | | | | | | | | | | | |
See accompanying Notes to the Financial Statements.
52
Barings Global Floating Rate Fund 2018 Annual Report
FINANCIAL HIGHLIGHTS
| | | | | | | | | | | | | | | | | | | | |
| | | CLASS A | |
| | | FOR THE
YEAR
ENDED
JUNE 30,
2018 | | | FOR THE
YEAR
ENDED
JUNE 30,
2017 | | | FOR THE
YEAR
ENDED
JUNE 30,
2016 | | | FOR THE
YEAR
ENDED
JUNE 30,
2015 | | | PERIOD FROM
SEPTEMBER 16,
2013
THROUGH
JUNE 30,
2014 (1) | |
| | | | | |
| Per Common Share Data | | | | | | | | | | | | | | | | | | | | |
Net asset value, beginning of year | | $ | 9.54 | | | $ | 9.13 | | | $ | 9.60 | | | $ | 10.20 | | | $ | 10.00 | |
Income from investment operations: | | | | | | | | | | | | | | | | | | | | |
Net investment income (2) | | | 0.43 | | | | 0.43 | | | | 0.44 | | | | 0.44 | | | | 0.30 | |
Net realized and unrealized gain (loss) on investments | | | (0.06 | ) | | | 0.42 | | | | (0.45 | ) | | | (0.35 | ) | | | 0.08 | |
| | | | | | | | | | | | | | | | | | | | |
Total increase (decrease) from investment operations | | | 0.37 | | | | 0.85 | | | | (0.01 | ) | | | 0.09 | | | | 0.38 | |
| | | | | | | | | | | | | | | | | | | | |
Less dividends and distributions: | | | | | | | | | | | | | | | | | | | | |
From net investment income | | | (0.38 | ) | | | (0.31 | ) | | | (0.46 | ) | | | (0.68 | ) | | | (0.18 | ) |
From net realized gain | | | – | | | | – | | | | – | | | | (0.01 | ) | | | – | |
From return of capital | | | (0.05 | ) | | | (0.13 | ) | | | – | | | | – | | | | – | |
| | | | | | | | | | | | | | | | | | | | |
Total dividends and distributions | | | (0.43 | ) | | | (0.44 | ) | | | (0.46 | ) | | | (0.69 | ) | | | (0.18 | ) |
| | | | | | | | | | | | | | | | | | | | |
Redemption fees | | | – | | | | – | | | | – | | | | 0.00 | (3) | | | – | |
| | | | | | | | | | | | | | | | | | | | |
Net asset value, at end of year | | $ | 9.48 | | | $ | 9.54 | | | $ | 9.13 | | | $ | 9.60 | | | $ | 10.20 | |
| | | | | | | | | | | | | | | | | | | | |
Total investment return (4) | | | 4.00 | % | | | 9.47 | % | | | (0.04 | )% | | | 0.95 | % | | | 3.81 | %(5) |
| | | | | | | | | | | | | | | | | | | | |
| Supplemental Data and Ratios | | | | | | | | | | | | | | | | | | | | |
Net assets, end of year (000’s) | | $ | 53,371 | | | $ | 45,363 | | | $ | 13,980 | | | $ | 5,153 | | | $ | 12,464 | |
Ratio of total expenses (before reductions and reimbursements) to average net assets | | | 1.26 | % | | | 1.37 | % | | | 1.72 | % | | | 1.74 | % | | | 2.27 | %(6) |
Ratio of net expenses to average net assets (7) | | | 0.96 | %(10) | | | 0.99 | %(8) | | | 1.05 | %(9) | | | 1.05 | %(9) | | | 1.05 | %(6)(9) |
Ratio of net investment income to average net assets | | | 4.55 | % | | | 4.52 | % | | | 4.74 | % | | | 4.44 | % | | | 3.76 | %(6) |
Portfolio turnover rate | | | 57.74 | % | | | 47.06 | % | | | 62.99 | % | | | 63.17 | % | | | 49.51 | %(5) |
| (1) | | Fund commenced operations on September 16, 2013. |
| (2) | | Calculated using average shares outstanding. |
| (3) | | Amount rounds to less than $.01 per share. |
| (4) | | Total investment return calculation does not consider the effects of sales loads and assumes the reinvestment of dividends at actual prices pursuant to the Fund’s dividend reinvestment plan. |
| (6) | | Annualized for periods less than one full year. |
| (7) | | The Adviser has agreed to waive and/or reimburse certain fees and/or expense so that, on an annualized basis, such expenses incurred will not exceed 1.00% as a percentage of average daily net assets. |
| (8) | | Net expenses reflect a one-time voluntary reimbursement to the Fund during the period in connection with a change to the fee waiver and/or expense reimbursement agreement. |
| (9) | | Net expenses reflect a previous fee waiver and/or expense reimbursement agreement. |
| (10) | | Net expenses reflect a voluntary expense reimbursement to prevent a negative yield. |
See accompanying Notes to the Financial Statements.
53
Barings Global Floating Rate Fund 2018 Annual Report
FINANCIAL HIGHLIGHTS (CONTINUED)
| | | | | | | | | | | | | | | | | | | | |
| | | CLASS C | |
| | | FOR THE
YEAR
ENDED
JUNE 30,
2018 | | | FOR THE
YEAR
ENDED
JUNE 30,
2017 | | | FOR THE
YEAR
ENDED
JUNE 30,
2016 | | | FOR THE
YEAR
ENDED
JUNE 30,
2015 | | | PERIOD FROM
SEPTEMBER 16,
2013
THROUGH
JUNE 30,
2014 (1) | |
| | | | | |
| Per Common Share Data | | | | | | | | | | | | | | | | | | | | |
Net asset value, beginning of year | | $ | 9.51 | | | $ | 9.10 | | | $ | 9.57 | | | $ | 10.16 | | | $ | 10.00 | |
Income from investment operations: | | | | | | | | | | | | | | | | | | | | |
Net investment income (2) | | | 0.36 | | | | 0.37 | | | | 0.37 | | | | 0.35 | | | | 0.24 | |
Net realized and unrealized gain (loss) on investments | | | (0.06 | ) | | | 0.41 | | | | (0.45 | ) | | | (0.33 | ) | | | 0.07 | |
| | | | | | | | | | | | | | | | | | | | |
Total increase (decrease) from investment operations | | | 0.30 | | | | 0.78 | | | | (0.08 | ) | | | 0.02 | | | | 0.31 | |
| | | | | | | | | | | | | | | | | | | | |
Less dividends and distributions: | | | | | | | | | | | | | | | | | | | | |
From net investment income | | | (0.32 | ) | | | (0.26 | ) | | | (0.39 | ) | | | (0.60 | ) | | | (0.15 | ) |
From net realized gain | | | – | | | | – | | | | – | | | | (0.01 | ) | | | – | |
From return of capital | | | (0.04 | ) | | | (0.11 | ) | | | – | | | | – | | | | – | |
| | | | | | | | | | | | | | | | | | | | |
Total dividends and distributions | | | (0.36 | ) | | | (0.37 | ) | | | (0.39 | ) | | | (0.61 | ) | | | (0.15 | ) |
| | | | | | | | | | | | | | | | | | | | |
Redemption fees | | | – | | | | – | | | | – | | | | 0.00 | (3) | | | – | |
| | | | | | | | | | | | | | | | | | | | |
Net asset value, at end of year | | $ | 9.45 | | | $ | 9.51 | | | $ | 9.10 | | | $ | 9.57 | | | $ | 10.16 | |
| | | | | | | | | | | | | | | | | | | | |
Total investment return (4) | | | 3.24 | % | | | 8.68 | % | | | (0.81 | )% | | | 0.30 | % | | | 3.15 | %(5) |
| | | | | | | | | | | | | | | | | | | | |
| Supplemental Data and Ratios | | | | | | | | | | | | | | | | | | | | |
Net assets, end of year (000’s) | | $ | 8,311 | | | $ | 8,018 | | | $ | 6,803 | | | $ | 5,461 | | | $ | 2,396 | |
Ratio of total expenses (before reductions and reimbursements) to average net assets | | | 2.09 | % | | | 2.24 | % | | | 2.50 | % | | | 3.12 | % | | | 4.97 | %(6) |
Ratio of net expenses to average net assets (7) | | | 1.70 | %(10) | | | 1.71 | %(8) | | | 1.80 | %(9) | | | 1.80 | %(9) | | | 1.80 | %(6)(9) |
Ratio of net investment income to average net assets | | | 3.80 | % | | | 3.91 | % | | | 4.04 | % | | | 3.60 | % | | | 3.07 | %(6) |
Portfolio turnover rate | | | 57.74 | % | | | 47.06 | % | | | 62.99 | % | | | 63.17 | % | | | 49.51 | %(5) |
| (1) | | Fund commenced operations on September 16, 2013. |
| (2) | | Calculated using average shares outstanding. |
| (3) | | Amount rounds to less than $.01 per share. |
| (4) | | Total investment return calculation does not consider the effects of sales loads and assumes the reinvestment of dividends at actual prices pursuant to the Fund’s dividend reinvestment plan. |
| (6) | | Annualized for periods less than one full year. |
| (7) | | The Adviser has agreed to waive and/or reimburse certain fees and/or expense so that, on an annualized basis, such expenses incurred will not exceed 1.75% as a percentage of average daily net assets. |
| (8) | | Net expenses reflect a one-time voluntary reimbursement to the Fund during the period in connection with a change to the fee waiver and/or expense reimbursement agreement. |
| (9) | | Net expenses reflect a previous fee waiver and/or expense reimbursement agreement. |
| (10) | | Net expenses reflect a voluntary expense reimbursement to prevent a negative yield. |
See accompanying Notes to the Financial Statements.
54
Barings Global Floating Rate Fund 2018 Annual Report
FINANCIAL HIGHLIGHTS (CONTINUED)
| | | | | | | | | | | | | | | | | | | | |
| | | CLASS I | |
| | | FOR THE
YEAR
ENDED
JUNE 30,
2018 | | | FOR THE
YEAR
ENDED
JUNE 30,
2017 | | | FOR THE
YEAR
ENDED
JUNE 30,
2016 | | | FOR THE
YEAR
ENDED
JUNE 30,
2015 | | | PERIOD FROM
SEPTEMBER 16,
2013
THROUGH
JUNE 30,
2014 (1) | |
| | | | | |
| Per Common Share Data | | | | | | | | | | | | | | | | | | | | |
Net asset value, beginning of year | | $ | 9.56 | | | $ | 9.15 | | | $ | 9.62 | | | $ | 10.21 | | | $ | 10.00 | |
Income from investment operations: | | | | | | | | | | | | | | | | | | | | |
Net investment income (2) | | | 0.46 | | | | 0.47 | | | | 0.47 | | | | 0.46 | | | | 0.30 | |
Net realized and unrealized gain (loss) on investments | | | (0.06 | ) | | | 0.40 | | | | (0.45 | ) | | | (0.34 | ) | | | 0.10 | |
| | | | | | | | | | | | | | | | | | | | |
Total increase from investment operations | | | 0.40 | | | | 0.87 | | | | 0.02 | | | | 0.12 | | | | 0.40 | |
| | | | | | | | | | | | | | | | | | | | |
Less dividends and distributions: | | | | | | | | | | | | | | | | | | | | |
From net investment income | | | (0.41 | ) | | | (0.32 | ) | | | (0.49 | ) | | | (0.70 | ) | | | (0.19 | ) |
From net realized gain | | | – | | | | – | | | | – | | | | (0.01 | ) | | | – | |
From return of capital | | | (0.05 | ) | | | (0.14 | ) | | | – | | | | – | | | | – | |
| | | | | | | | | | | | | | | | | | | | |
Total dividends and distributions | | | (0.46 | ) | | | (0.46 | ) | | | (0.49 | ) | | | (0.71 | ) | | | (0.19 | ) |
| | | | | | | | | | | | | | | | | | | | |
Redemption fees | | | – | | | | – | | | | – | | | | 0.00 | (3) | | | – | |
| | | | | | | | | | | | | | | | | | | | |
Net asset value, at end of year | | $ | 9.50 | | | $ | 9.56 | | | $ | 9.15 | | | $ | 9.62 | | | $ | 10.21 | |
| | | | | | | | | | | | | | | | | | | | |
Total investment return (4) | | | 4.28 | % | | | 9.74 | % | | | 0.25 | % | | | 1.34 | % | | | 4.04 | %(5) |
| | | | | | | | | | | | | | | | | | | | |
| Supplemental Data and Ratios | | | | | | | | | | | | | | | | | | | | |
Net assets, end of year (000’s) | | $ | 18,370 | | | $ | 19,733 | | | $ | 19,903 | | | $ | 25,885 | | | $ | 32,772 | |
Ratio of total expenses (before reductions and reimbursements) to average net assets | | | 1.03 | % | | | 1.16 | % | | | 1.29 | % | | | 1.31 | % | | | 1.52 | %(6) |
Ratio of net expenses to average net assets (7) | | | 0.71 | %(8) | | | 0.75 | % | | | 0.75 | % | | | 0.75 | % | | | 0.75 | %(6) |
Ratio of net investment income to average net assets | | | 4.78 | % | | | 4.90 | % | | | 5.07 | % | | | 4.69 | % | | | 3.72 | %(6) |
Portfolio turnover rate | | | 57.74 | % | | | 47.06 | % | | | 62.99 | % | | | 63.17 | % | | | 49.51 | %(5) |
| (1) | | Fund commenced operations on September 16, 2013. |
| (2) | | Calculated using average shares outstanding. |
| (3) | | Amount rounds to less than $.01 per share. |
| (4) | | Total investment return calculation assumes the reinvestment of dividends at actual prices pursuant to the Fund’s dividend reinvestment plan. |
| (6) | | Annualized for periods less than one full year. |
| (7) | | The Adviser has agreed to waive and/or reimburse certain fees and/or expense so that, on an annualized basis, such expenses incurred will not exceed .75% as a percentage of average daily net assets. |
| (8) | | Net expenses reflect a voluntary expense reimbursement to prevent a negative yield. |
See accompanying Notes to the Financial Statements.
55
Barings Global Floating Rate Fund 2018 Annual Report
FINANCIAL HIGHLIGHTS (CONTINUED)
| | | | | | | | | | | | | | | | | | | | |
| | | CLASS Y | |
| | | FOR THE
YEAR
ENDED
JUNE 30,
2018 | | | FOR THE
YEAR
ENDED
JUNE 30,
2017 | | | FOR THE
YEAR
ENDED
JUNE 30,
2016 | | | FOR THE
YEAR
ENDED
JUNE 30,
2015 | | | PERIOD FROM
SEPTEMBER 16,
2013
THROUGH
JUNE 30,
2014 (1) | |
| | | | | |
| Per Common Share Data | | | | | | | | | | | | | | | | | | | | |
Net asset value, beginning of year | | $ | 9.56 | | | $ | 9.15 | | | $ | 9.62 | | | $ | 10.21 | | | $ | 10.00 | |
Income from investment operations: | | | | | | | | | | | | | | | | | | | | |
Net investment income (2) | | | 0.46 | | | | 0.47 | | | | 0.47 | | | | 0.45 | | | | 0.30 | |
Net realized and unrealized gain (loss) on investments | | | (0.06 | ) | | | 0.40 | | | | (0.45 | ) | | | (0.33 | ) | | | 0.10 | |
| | | | | | | | | | | | | | | | | | | | |
Total increase from investment operations | | | 0.40 | | | | 0.87 | | | | 0.02 | | | | 0.12 | | | | 0.40 | |
| | | | | | | | | | | | | | | | | | | | |
Less dividends and distributions: | | | | | | | | | | | | | | | | | | | | |
From net investment income | | | (0.41 | ) | | | (0.32 | ) | | | (0.49 | ) | | | (0.70 | ) | | | (0.19 | ) |
From net realized gain | | | – | | | | – | | | | – | | | | (0.01 | ) | | | – | |
From return of capital | | | (0.05 | ) | | | (0.14 | ) | | | – | | | | – | | | | – | |
| | | | | | | | | | | | | | | | | | | | |
Total dividends and distributions | | | (0.46 | ) | | | (0.46 | ) | | | (0.49 | ) | | | (0.71 | ) | | | (0.19 | ) |
| | | | | | | | | | | | | | | | | | | | |
Redemption fees | | | – | | | | – | | | | – | | | | 0.00 | (3) | | | – | |
| | | | | | | | | | | | | | | | | | | | |
Net asset value, at end of year | | $ | 9.50 | | | $ | 9.56 | | | $ | 9.15 | | | $ | 9.62 | | | $ | 10.21 | |
| | | | | | | | | | | | | | | | | | | | |
Total investment return (4) | | | 4.27 | % | | | 9.73 | % | | | 0.22 | % | | | 1.28 | % | | | 4.04 | %(5) |
| | | | | | | | | | | | | | | | | | | | |
| Supplemental Data and Ratios | | | | | | | | | | | | | | | | | | | | |
Net assets, end of year (000’s) | | $ | 172,736 | | | $ | 122,736 | | | $ | 125,957 | | | $ | 129,659 | | | $ | 66,999 | |
Ratio of total expenses (before reductions and reimbursements) to average net assets | | | 1.01 | % | | | 1.14 | % | | | 1.27 | % | | | 1.25 | % | | | 1.53 | %(6) |
Ratio of net expenses to average net assets (7) | | | 0.71 | %(8) | | | 0.75 | % | | | 0.75 | % | | | 0.75 | % | | | 0.75 | %(6) |
Ratio of net investment income to average net assets | | | 4.79 | % | | | 4.90 | % | | | 5.08 | % | | | 4.58 | % | | | 3.80 | %(6) |
Portfolio turnover rate | | | 57.74 | % | | | 47.06 | % | | | 62.99 | % | | | 63.17 | % | | | 49.51 | %(5) |
| (1) | | Fund commenced operations on September 16, 2013. |
| (2) | | Calculated using average shares outstanding. |
| (3) | | Amount rounds to less than $.01 per share. |
| (4) | | Total investment return calculation assumes the reinvestment of dividends at actual prices pursuant to the Fund’s dividend reinvestment plan. |
| (6) | | Annualized for periods less than one full year. |
| (7) | | The Adviser has agreed to waive and/or reimburse certain fees and/or expense so that, on an annualized basis, such expenses incurred will not exceed .75% as a percentage of average daily net assets. |
| (8) | | Net expenses reflect a voluntary expense reimbursement to prevent a negative yield. |
See accompanying Notes to the Financial Statements.
56
Barings Global Credit Income Opportunities Fund 2018 Annual Report
FINANCIAL HIGHLIGHTS (CONTINUED)
| | | | | | | | | | | | | | | | | | | | |
| | | CLASS A | |
| | | FOR THE
YEAR
ENDED
JUNE 30,
2018 | | | FOR THE
YEAR
ENDED
JUNE 30,
2017 | | | FOR THE
YEAR
ENDED
JUNE 30,
2016 | | | FOR THE
YEAR
ENDED
JUNE 30,
2015 | | | PERIOD FROM
SEPTEMBER 16,
2013
THROUGH
JUNE 30,
2014 (1) | |
| | | | | |
| Per Common Share Data | | | | | | | | | | | | | | | | | | | | |
Net asset value, beginning of year | | $ | 9.51 | | | $ | 8.80 | | | $ | 9.51 | | | $ | 10.45 | | | $ | 10.00 | |
Income from investment operations: | | | | | | | | | | | | | | | | | | | | |
Net investment income (2) | | | 0.49 | | | | 0.55 | | | | 0.56 | | | | 0.54 | | | | 0.40 | |
Net realized and unrealized gain (loss) on investments | | | (0.19 | ) | | | 0.71 | | | | (0.66 | ) | | | (0.57 | ) | | | 0.33 | |
| | | | | | | | | | | | | | | | | | | | |
Total increase (decrease) from investment operations | | | 0.30 | | | | 1.26 | | | | (0.10 | ) | | | (0.03 | ) | | | 0.73 | |
| | | | | | | | | | | | | | | | | | | | |
Less dividends and distributions: | | | | | | | | | | | | | | | | | | | | |
From net investment income | | | (0.47 | ) | | | (0.50 | ) | | | (0.61 | ) | | | (0.78 | ) | | | (0.28 | ) |
From net realized gain | | | – | | | | – | | | | – | | | | (0.13 | ) | | | – | |
From return of capital | | | (0.02 | ) | | | (0.05 | ) | | | – | | | | – | | | | – | |
| | | | | | | | | | | | | | | | | | | | |
Total dividends and distributions | | | (0.49 | ) | | | (0.55 | ) | | | (0.61 | ) | | | (0.91 | ) | | | (0.28 | ) |
| | | | | | | | | | | | | | | | | | | | |
Redemption fees | | | – | | | | – | | | | – | | | | 0.00 | (3) | | | – | |
| | | | | | | | | | | | | | | | | | | | |
Net asset value, at end of year | | $ | 9.32 | | | $ | 9.51 | | | $ | 8.80 | | | $ | 9.51 | | | $ | 10.45 | |
| | | | | | | | | | | | | | | | | | | | |
Total investment return (4) | | | 3.24 | % | | | 14.61 | % | | | (0.84 | )% | | | (0.11 | )% | | | 7.30 | %(5) |
| | | | | | | | | | | | | | | | | | | | |
| Supplemental Data and Ratios | | | | | | | | | | | | | | | | | | | | |
Net assets, end of year (000’s) | | $ | 60,507 | | | $ | 26,904 | | | $ | 12,340 | | | $ | 12,718 | | | $ | 2,591 | |
Ratio of total expenses (before reductions and reimbursements) to average net assets | | | 1.38 | % | | | 1.56 | % | | | 1.90 | % | | | 1.98 | % | | | 3.95 | %(6) |
Ratio of net expenses to average net assets (7) | | | 1.20 | % | | | 1.20 | % | | | 1.20 | % | | | 1.20 | % | | | 1.20 | %(6) |
Ratio of net investment income to average net assets | | | 5.17 | % | | | 5.83 | % | | | 6.28 | % | | | 5.46 | % | | | 4.88 | %(6) |
Portfolio turnover rate | | | 52.29 | % | | | 48.69 | % | | | 58.08 | % | | | 84.65 | % | | | 99.72 | %(5) |
| (1) | | Fund commenced operations on September 16, 2013. |
| (2) | | Calculated using average shares outstanding. |
| (3) | | Amount rounds to less than $.01 per share. |
| (4) | | Total investment return calculation does not consider the effects of sales loads and assumes the reinvestment of dividends at actual prices pursuant to the Fund’s dividend reinvestment plan. |
| (6) | | Annualized for periods less than one full year. |
| (7) | | The Adviser has agreed to waive and/or reimburse certain fees and/or expense so that, on an annualized basis, such expenses incurred will not exceed 1.20% as a percentage of average daily net assets. |
See accompanying Notes to the Financial Statements.
57
Barings Global Credit Income Opportunities Fund 2018 Annual Report
FINANCIAL HIGHLIGHTS (CONTINUED)
| | | | | | | | | | | | | | | | | | | | |
| | | CLASS C | |
| | | FOR THE
YEAR
ENDED
JUNE 30,
2018 | | | FOR THE
YEAR
ENDED
JUNE 30,
2017 | | | FOR THE
YEAR
ENDED
JUNE 30,
2016 | | | FOR THE
YEAR
ENDED
JUNE 30,
2015 | | | PERIOD FROM
SEPTEMBER 16,
2013
THROUGH
JUNE 30,
2014 (1) | |
| | | | | |
| Per Common Share Data | | | | | | | | | | | | | | | | | | | | |
Net asset value, beginning of year | | $ | 9.50 | | | $ | 8.79 | | | $ | 9.50 | | | $ | 10.45 | | | $ | 10.00 | |
Income from investment operations: | | | | | | | | | | | | | | | | | | | | |
Net investment income (2) | | | 0.42 | | | | 0.48 | | | | 0.49 | | | | 0.47 | | | | 0.35 | |
Net realized and unrealized gain (loss) on investments | | | (0.19 | ) | | | 0.71 | | | | (0.65 | ) | | | (0.58 | ) | | | 0.32 | |
| | | | | | | | | | | | | | | | | | | | |
Total increase (decrease) from investment operations | | | 0.23 | | | | 1.19 | | | | (0.16 | ) | | | (0.11 | ) | | | 0.67 | |
| | | | | | | | | | | | | | | | | | | | |
Less dividends and distributions: | | | | | | | | | | | | | | | | | | | | |
From net investment income | | | (0.40 | ) | | | (0.43 | ) | | | (0.55 | ) | | | (0.71 | ) | | | (0.22 | ) |
From net realized gain | | | – | | | | – | | | | – | | | | (0.13 | ) | | | – | |
From return of capital | | | (0.02 | ) | | | (0.05 | ) | | | – | | | | – | | | | – | |
| | | | | | | | | | | | | | | | | | | | |
Total dividends and distributions | | | (0.42 | ) | | | (0.48 | ) | | | (0.55 | ) | | | (0.84 | ) | | | (0.22 | ) |
| | | | | | | | | | | | | | | | | | | | |
Redemption fees | | | – | | | | – | | | | – | | | | 0.00 | (3) | | | – | |
| | | | | | | | | | | | | | | | | | | | |
Net asset value, at end of year | | $ | 9.31 | | | $ | 9.50 | | | $ | 8.79 | | | $ | 9.50 | | | $ | 10.45 | |
| | | | | | | | | | | | | | | | | | | | |
Total investment return (4) | | | 2.47 | % | | | 13.75 | % | | | (1.59 | )% | | | (0.93 | )% | | | 6.75 | %(5) |
| | | | | | | | | | | | | | | | | | | | |
| Supplemental Data and Ratios | | | | | | | | | | | | | | | | | | | | |
Net assets, end of year (000’s) | | $ | 8,842 | | | $ | 6,628 | | | $ | 3,578 | | | $ | 3,579 | | | $ | 944 | |
Ratio of total expenses (before reductions and reimbursements) to average net assets | | | 2.21 | % | | | 2.39 | % | | | 2.91 | % | | | 4.09 | % | | | 10.50 | %(6) |
Ratio of net expenses to average net assets (7) | | | 1.95 | % | | | 1.95 | % | | | 1.95 | % | | | 1.95 | % | | | 1.95 | %(6) |
Ratio of net investment income to average net assets | | | 4.44 | % | | | 5.12 | % | | | 5.50 | % | | | 4.79 | % | | | 4.39 | %(6) |
Portfolio turnover rate | | | 52.29 | % | | | 48.69 | % | | | 58.08 | % | | | 84.65 | % | | | 99.72 | %(5) |
| (1) | | Fund commenced operations on September 16, 2013. |
| (2) | | Calculated using average shares outstanding. |
| (3) | | Amount rounds to less than $.01 per share. |
| (4) | | Total investment return calculation does not consider the effects of sales loads and assumes the reinvestment of dividends at actual prices pursuant to the Fund’s dividend reinvestment plan. |
| (6) | | Annualized for periods less than one full year. |
| (7) | | The Adviser has agreed to waive and/or reimburse certain fees and/or expense so that, on an annualized basis, such expenses incurred will not exceed 1.95% as a percentage of average daily net assets. |
See accompanying Notes to the Financial Statements.
58
Barings Global Credit Income Opportunities Fund 2018 Annual Report
FINANCIAL HIGHLIGHTS (CONTINUED)
| | | | | | | | | | | | | | | | | | | | |
| | | CLASS I | |
| | | FOR THE
YEAR
ENDED
JUNE 30,
2018 | | | FOR THE
YEAR
ENDED
JUNE 30,
2017 | | | FOR THE
YEAR
ENDED
JUNE 30,
2016 | | | FOR THE
YEAR
ENDED
JUNE 30,
2015 | | | PERIOD FROM
SEPTEMBER 16,
2013
THROUGH
JUNE 30,
2014 (1) | |
| | | | | |
| Per Common Share Data | | | | | | | | | | | | | | | | | | | | |
Net asset value, beginning of year | | $ | 9.50 | | | $ | 8.80 | | | $ | 9.51 | | | $ | 10.46 | | | $ | 10.00 | |
Income from investment operations: | | | | | | | | | | | | | | | | | | | | |
Net investment income (2) | | | 0.51 | | | | 0.58 | | | | 0.58 | | | | 0.56 | | | | 0.41 | |
Net realized and unrealized gain (loss) on investments | | | (0.18 | ) | | | 0.70 | | | | (0.65 | ) | | | (0.58 | ) | | | 0.35 | |
| | | | | | | | | | | | | | | | | | | | |
Total increase (decrease) from investment operations | | | 0.33 | | | | 1.28 | | | | (0.07 | ) | | | (0.02 | ) | | | 0.76 | |
| | | | | | | | | | | | | | | | | | | | |
Less dividends and distributions: | | | | | | | | | | | | | | | | | | | | |
From net investment income | | | (0.49 | ) | | | (0.52 | ) | | | (0.64 | ) | | | (0.80 | ) | | | (0.30 | ) |
From net realized gain | | | – | | | | – | | | | – | | | | (0.13 | ) | | | – | |
From return of capital | | | (0.02 | ) | | | (0.06 | ) | | | – | | | | – | | | | – | |
| | | | | | | | | | | | | | | | | | | | |
Total dividends and distributions | | | (0.51 | ) | | | (0.58 | ) | | | (0.64 | ) | | | (0.93 | ) | | | (0.30 | ) |
| | | | | | | | | | | | | | | | | | | | |
Redemption fees | | | – | | | | – | | | | – | | | | 0.00 | (3) | | | – | |
| | | | | | | | | | | | | | | | | | | | |
Net asset value, at end of year | | $ | 9.32 | | | $ | 9.50 | | | $ | 8.80 | | | $ | 9.51 | | | $ | 10.46 | |
| | | | | | | | | | | | | | | | | | | | |
Total investment return (4) | | | 3.49 | % | | | 14.90 | % | | | (0.61 | )% | | | 0.05 | % | | | 7.59 | %(5) |
| | | | | | | | | | | | | | | | | | | | |
| Supplemental Data and Ratios | | | | | | | | | | | | | | | | | | | | |
Net assets, end of year (000’s) | | $ | 21,788 | | | $ | 22,228 | | | $ | 24,689 | | | $ | 26,428 | | | $ | 26,406 | |
Ratio of total expenses (before reductions and reimbursements) to average net assets | | | 1.13 | % | | | 1.27 | % | | | 1.54 | % | | | 1.58 | % | | | 1.83 | %(6) |
Ratio of net expenses to average net assets (7) | | | 0.95 | % | | | 0.95 | % | | | 0.95 | % | | | 0.95 | % | | | 0.95 | %(6) |
Ratio of net investment income to average net assets | | | 5.45 | % | | | 6.22 | % | | | 6.54 | % | | | 5.69 | % | | | 5.02 | %(6) |
Portfolio turnover rate | | | 52.29 | % | | | 48.69 | % | | | 58.08 | % | | | 84.65 | % | | | 99.72 | %(5) |
| (1) | | Fund commenced operations on September 16, 2013. |
| (2) | | Calculated using average shares outstanding. |
| (3) | | Amount rounds to less than $.01 per share. |
| (4) | | Total investment return calculation assumes the reinvestment of dividends at actual prices pursuant to the Fund’s dividend reinvestment plan. |
| (6) | | Annualized for periods less than one full year. |
| (7) | | The Adviser has agreed to waive and/or reimburse certain fees and/or expense so that, on an annualized basis, such expenses incurred will not exceed .95% as a percentage of average daily net assets. |
See accompanying Notes to the Financial Statements.
59
Barings Global Credit Income Opportunities Fund 2018 Annual Report
FINANCIAL HIGHLIGHTS (CONTINUED)
| | | | | | | | | | | | | | | | | | | | |
| | | CLASS Y | |
| | | FOR THE
YEAR
ENDED
JUNE 30,
2018 | | | FOR THE
YEAR
ENDED
JUNE 30,
2017 | | | FOR THE
YEAR
ENDED
JUNE 30,
2016 | | | FOR THE
YEAR
ENDED
JUNE 30,
2015 | | | PERIOD FROM
SEPTEMBER 16,
2013
THROUGH
JUNE 30,
2014 (1) | |
| | | | | |
| Per Common Share Data | | | | | | | | | | | | | | | | | | | | |
Net asset value, beginning of year | | $ | 9.50 | | | $ | 8.80 | | | $ | 9.51 | | | $ | 10.46 | | | $ | 10.00 | |
Income from investment operations: | | | | | | | | | | | | | | | | | | | | |
Net investment income (2) | | | 0.51 | | | | 0.57 | | | | 0.59 | | | | 0.56 | | | | 0.41 | |
Net realized and unrealized gain (loss) on investments | | | (0.19 | ) | | | 0.71 | | | | (0.66 | ) | | | (0.58 | ) | | | 0.35 | |
| | | | | | | | | | | | | | | | | | | | |
Total increase (decrease) from investment operations | | | 0.32 | | | | 1.28 | | | | (0.07 | ) | | | (0.02 | ) | | | 0.76 | |
| | | | | | | | | | | | | | | | | | | | |
Less dividends and distributions: | | | | | | | | | | | | | | | | | | | | |
From net investment income | | | (0.49 | ) | | | (0.52 | ) | | | (0.64 | ) | | | (0.80 | ) | | | (0.30 | ) |
From net realized gain | | | – | | | | – | | | | – | | | | (0.13 | ) | | | – | |
From return of capital | | | (0.02 | ) | | | (0.06 | ) | | | – | | | | – | | | | – | |
| | | | | | | | | | | | | | | | | | | | |
Total dividends and distributions | | | (0.51 | ) | | | (0.58 | ) | | | (0.64 | ) | | | (0.93 | ) | | | (0.30 | ) |
| | | | | | | | | | | | | | | | | | | | |
Redemption fees | | | – | | | | – | | | | – | | | | 0.00 | (3) | | | – | |
| | | | | | | | | | | | | | | | | | | | |
Net asset value, at end of year | | $ | 9.31 | | | $ | 9.50 | | | $ | 8.80 | | | $ | 9.51 | | | $ | 10.46 | |
| | | | | | | | | | | | | | | | | | | | |
Total investment return (4) | | | 3.48 | % | | | 14.90 | % | | | (0.61 | )% | | | 0.05 | % | | | 7.59 | %(5) |
| | | | | | | | | | | | | | | | | | | | |
| Supplemental Data and Ratios | | | | | | | | | | | | | | | | | | | | |
Net assets, end of year (000’s) | | $ | 140,362 | | | $ | 96,014 | | | $ | 58,312 | | | $ | 39,006 | | | $ | 33,885 | |
Ratio of total expenses (before reductions and reimbursements) to average net assets | | | 1.14 | % | | | 1.28 | % | | | 1.55 | % | | | 1.58 | % | | | 1.84 | %(6) |
Ratio of net expenses to average net assets (7) | | | 0.95 | % | | | 0.95 | % | | | 0.95 | % | | | 0.95 | % | | | 0.95 | %(6) |
Ratio of net investment income to average net assets | | | 5.43 | % | | | 6.14 | % | | | 6.56 | % | | | 5.67 | % | | | 5.04 | %(6) |
Portfolio turnover rate | | | 52.29 | % | | | 48.69 | % | | | 58.08 | % | | | 84.65 | % | | | 99.72 | %(5) |
| (1) | | Fund commenced operations on September 16, 2013. |
| (2) | | Calculated using average shares outstanding. |
| (3) | | Amount rounds to less than $.01 per share. |
| (4) | | Total investment return calculation assumes the reinvestment of dividends at actual prices pursuant to the Fund’s dividend reinvestment plan. |
| (6) | | Annualized for periods less than one full year. |
| (7) | | The Adviser has agreed to waive and/or reimburse certain fees and/or expense so that, on an annualized basis, such expenses incurred will not exceed .95% as a percentage of average daily net assets. |
See accompanying Notes to the Financial Statements.
60
Barings Active Short Duration Bond Fund 2018 Annual Report
FINANCIAL HIGHLIGHTS (CONTINUED)
| | | | | | | | | | | | |
| | | CLASS A | |
| | | FOR THE YEAR
ENDED
JUNE 30, 2018 | | | FOR THE YEAR
ENDED
JUNE 30, 2017 | | | PERIOD FROM
JULY 8, 2015
THROUGH
JUNE 30, 2016 (1) | |
| | | |
| Per Common Share Data | | | | | | | | | | | | |
Net asset value, beginning of year | | $ | 10.01 | | | $ | 9.98 | | | $ | 10.00 | |
Income from investment operations: | | | | | | | | | | | | |
Net investment income (2) | | | 0.21 | | | | 0.17 | | | | 0.15 | |
Net realized and unrealized gain (loss) on investments | | | (0.10 | ) | | | 0.03 | | | | (0.03 | )(3) |
| | | | | | | | | | | | |
Total increase from investment operations | | | 0.11 | | | | 0.20 | | | | 0.12 | |
| | | | | | | | | | | | |
Less dividends and distributions: | | | | | | | | | | | | |
From net investment income | | | (0.21 | ) | | | (0.17 | ) | | | (0.14 | ) |
From net realized gain | | | (0.03 | ) | | | (0.00 | )(4) | | | – | |
| | | | | | | | | | | | |
Total dividends and distributions | | | (0.24 | ) | | | (0.17 | ) | | | (0.14 | ) |
| | | | | | | | | | | | |
Net asset value, at end of year | | $ | 9.88 | | | $ | 10.01 | | | $ | 9.98 | |
| | | | | | | | | | | | |
Total investment return (5) | | | 1.10 | % | | | 2.12 | % | | | 1.17 | %(6) |
| | | | | | | | | | | | |
| | | |
| Supplemental Data and Ratios | | | | | | | | | | | | |
Net assets, end of year (000’s) | | $ | 177,020 | | | $ | 119,189 | | | $ | 39,992 | |
Ratio of total expenses (before reductions and reimbursements) to average net assets | | | 0.94 | % | | | 1.06 | % | | | 1.18 | %(7) |
Ratio of net expenses to average net assets (8) | | | 0.65 | % | | | 0.65 | % | | | 0.65 | %(7) |
Ratio of net investment income to average net assets | | | 2.15 | % | | | 1.72 | % | | | 1.51 | %(7) |
Portfolio turnover rate | | | 53.33 | % | | | 88.52 | % | | | 218.67 | %(6) |
| (1) | | Fund commenced operations on July 8, 2015. |
| (2) | | Calculated using average shares outstanding. |
| (3) | | The per share amount varies from the net realized and unrealized gain/loss for the period because of the timing of sales of fund shares and the per share amount of realized and unrealized gains and losses at such time. |
| (4) | | Amount rounds to less than $.01 per share. |
| (5) | | Total investment return calculation assumes the reinvestment of dividends at actual prices pursuant to the Fund’s dividend reinvestment plan. |
| (7) | | Annualized for periods less than one full year. |
| (8) | | The Adviser has agreed to waive and/or reimburse certain fees and/or expense so that, on an annualized basis, such expenses incurred will not exceed .65% as a percentage of average daily net assets. |
See accompanying Notes to the Financial Statements.
61
Barings Active Short Duration Bond Fund 2018 Annual Report
FINANCIAL HIGHLIGHTS (CONTINUED)
| | | | | | | | | | | | |
| | | CLASS C | |
| | | FOR THE YEAR
ENDED
JUNE 30, 2018 | | | FOR THE YEAR
ENDED
JUNE 30, 2017 | | | PERIOD FROM
JULY 8, 2015
THROUGH
JUNE 30, 2016 (1) | |
| | | |
| Per Common Share Data | | | | | | | | | | | | |
Net asset value, beginning of year | | $ | 10.01 | | | $ | 9.97 | | | $ | 10.00 | |
Income from investment operations: | | | | | | | | | | | | |
Net investment income (2) | | | 0.19 | | | | 0.19 | | | | 0.07 | |
Net realized and unrealized gain (loss) on investments | | | (0.11 | ) | | | 0.05 | | | | (0.03 | )(3) |
| | | | | | | | | | | | |
Total increase from investment operations | | | 0.08 | | | | 0.24 | | | | 0.04 | |
| | | | | | | | | | | | |
Less dividends and distributions: | | | | | | | | | | | | |
From net investment income | | | (0.19 | ) | | | (0.20 | ) | | | (0.07 | ) |
From net realized gain | | | (0.03 | ) | | | (0.00 | )(4) | | | – | |
| | | | | | | | | | | | |
Total dividends and distributions | | | (0.22 | ) | | | (0.20 | ) | | | (0.07 | ) |
| | | | | | | | | | | | |
Net asset value, at end of year | | $ | 9.87 | | | $ | 10.01 | | | $ | 9.97 | |
| | | | | | | | | | | | |
Total investment return (5) | | | 0.84 | % | | | 2.41 | % | | | 0.39 | %(6) |
| | | | | | | | | | | | |
| | | |
| Supplemental Data and Ratios | | | | | | | | | | | | |
Net assets, end of year (000’s) | | $ | 1,139 | | | $ | 236 | | | $ | 257 | |
Ratio of total expenses (before reductions and reimbursements) to average net assets | | | 1.95 | % | | | 3.09 | %(8) | | | 5.44 | %(7)(9) |
Ratio of net expenses to average net assets (10) | | | 0.90 | % | | | 0.40 | %(8) | | | 1.40 | %(7)(9) |
Ratio of net investment income to average net assets | | | 1.92 | % | | | 1.94 | %(8) | | | 0.71 | %(7)(9) |
Portfolio turnover rate | | | 53.33 | % | | | 88.52 | % | | | 218.67 | %(6) |
| (1) | | Fund commenced operations on July 8, 2015. |
| (2) | | Calculated using average shares outstanding. |
| (3) | | The per share amount varies from the net realized and unrealized gain/loss for the period because of the timing of sales of fund shares and the per share amount of realized and unrealized gains and losses at such time. |
| (4) | | Amount rounds to less than $.01 per share. |
| (5) | | Total investment return calculation assumes the reinvestment of dividends at actual prices pursuant to the Fund’s dividend reinvestment plan. |
| (7) | | Annualized for periods less than one full year. |
| (8) | | Expenses shown reflect a reimbursement to the Fund during the period for an overaccrual of 12b-1 fees made during and prior to the period. |
| (9) | | Expenses shown reflect an overaccrual of 12b-1 fees for the period of $1,478 or 0.50% of average net assets over the period. Subsequent to the period, the Fund was reimbursed for the overaccrued amount. |
| (10) | | The Adviser has agreed to waive and/or reimburse certain fees and/or expense so that, on an annualized basis, such expenses incurred will not exceed 0.90% as a percentage of average daily net assets. |
See accompanying Notes to the Financial Statements.
62
Barings Active Short Duration Bond Fund 2018 Annual Report
FINANCIAL HIGHLIGHTS (CONTINUED)
| | | | | | | | | | | | |
| | | CLASS I | |
| | | FOR THE YEAR
ENDED
JUNE 30, 2018 | | | FOR THE YEAR
ENDED
JUNE 30, 2017 | | | PERIOD FROM
JULY 8, 2015
THROUGH
JUNE 30, 2016 (1) | |
| | | |
| Per Common Share Data | | | | | | | | | | | | |
Net asset value, beginning of year | | $ | 10.01 | | | $ | 9.97 | | | $ | 10.00 | |
Income from investment operations: | | | | | | | | | | | | |
Net investment income (2) | | | 0.24 | | | | 0.18 | | | | 0.16 | |
Net realized and unrealized gain (loss) on investments | | | (0.10 | ) | | | 0.06 | | | | (0.03 | )(3) |
| | | | | | | | | | | | |
Total increase from investment operations | | | 0.14 | | | | 0.24 | | | | 0.13 | |
| | | | | | | | | | | | |
Less dividends and distributions: | | | | | | | | | | | | |
From net investment income | | | (0.24 | ) | | | (0.20 | ) | | | (0.16 | ) |
From net realized gain (4) | | | (0.03 | ) | | | (0.00 | )(4) | | | – | |
| | | | | | | | | | | | |
Total dividends and distributions | | | (0.27 | ) | | | (0.20 | ) | | | (0.16 | ) |
| | | | | | | | | | | | |
Net asset value, at end of year | | $ | 9.88 | | | $ | 10.01 | | | $ | 9.97 | |
| | | | | | | | | | | | |
Total investment return (5) | | | 1.39 | % | | | 2.44 | % | | | 1.35 | %(6) |
| | | | | | | | | | | | |
| | | |
| Supplemental Data and Ratios | | | | | | | | | | | | |
Net assets, end of year (000’s) | | $ | 300 | | | $ | 100 | | | $ | 5,971 | |
Ratio of total expenses (before reductions and reimbursements) to average net assets | | | 3.07 | % | | | 1.67 | % | | | 0.96 | %(7) |
Ratio of net expenses to average net assets (8) | | | 0.40 | % | | | 0.40 | % | | | 0.44 | %(7) |
Ratio of net investment income to average net assets | | | 2.39 | % | | | 1.84 | % | | | 1.67 | %(7) |
Portfolio turnover rate | | | 53.33 | % | | | 88.52 | % | | | 218.67 | %(6) |
| (1) | | Fund commenced operations on July 8, 2015. |
| (2) | | Calculated using average shares outstanding. |
| (3) | | The per share amount varies from the net realized and unrealized gain/loss for the period because of the timing of sales of fund shares and the per share amount of realized and unrealized gains and losses at such time. |
| (4) | | Amount rounds to less than $.01 per share. |
| (5) | | Total investment return calculation assumes the reinvestment of dividends at actual prices pursuant to the Fund’s dividend reinvestment plan. |
| (7) | | Annualized for periods less than one full year. |
| (8) | | The Adviser has agreed to waive and/or reimburse certain fees and/or expense so that, on an annualized basis, such expenses incurred will not exceed .40% as a percentage of average daily net assets. |
See accompanying Notes to the Financial Statements.
63
Barings Active Short Duration Bond Fund 2018 Annual Report
FINANCIAL HIGHLIGHTS (CONTINUED)
| | | | | | | | | | | | |
| | | CLASS Y | |
| | | FOR THE YEAR
ENDED
JUNE 30, 2018 | | | FOR THE YEAR
ENDED
JUNE 30, 2017 | | | PERIOD FROM
JULY 8, 2015
THROUGH
JUNE 30, 2016 (1) | |
| | | |
| Per Common Share Data | | | | | | | | | | | | |
Net asset value, beginning of year | | $ | 10.01 | | | $ | 9.97 | | | $ | 10.00 | |
Income from investment operations: | | | | | | | | | | | | |
Net investment income (2) | | | 0.24 | | | | 0.20 | | | | 0.17 | |
Net realized and unrealized gain (loss) on investments | | | (0.11 | ) | | | 0.04 | | | | (0.04 | )(3) |
| | | | | | | | | | | | |
Total increase from investment operations | | | 0.13 | | | | 0.24 | | | | 0.13 | |
| | | | | | | | | | | | |
Less dividends and distributions: | | | | | | | | | | | | |
From net investment income | | | (0.24 | ) | | | (0.20 | ) | | | (0.16 | ) |
From net realized gain | | | (0.03 | ) | | | (0.00 | )(4) | | | – | |
| | | | | | | | | | | | |
Total dividends and distributions | | | (0.27 | ) | | | (0.20 | ) | | | (0.16 | ) |
| | | | | | | | | | | | |
Net asset value, at end of year | | $ | 9.87 | | | $ | 10.01 | | | $ | 9.97 | |
| | | | | | | | | | | | |
Total investment return (5) | | | 1.35 | % | | | 2.38 | % | | | 1.36 | %(6) |
| | | | | | | | | | | | |
| | | |
| Supplemental Data and Ratios | | | | | | | | | | | | |
Net assets, end of year (000’s) | | $ | 252,325 | | | $ | 204,464 | | | $ | 109,645 | |
Ratio of total expenses (before reductions and reimbursements) to average net assets | | | 0.70 | % | | | 0.82 | % | | | 0.87 | %(7) |
Ratio of net expenses to average net assets (8) | | | 0.40 | % | | | 0.40 | % | | | 0.41 | %(7) |
Ratio of net investment income to average net assets | | | 2.39 | % | | | 1.97 | % | | | 1.73 | %(7) |
Portfolio turnover rate | | | 53.33 | % | | | 88.52 | % | | | 218.67 | %(6) |
| (1) | | Fund commenced operations on July 8, 2015. |
| (2) | | Calculated using average shares outstanding. |
| (3) | | The per share amount varies from the net realized and unrealized gain/loss for the period because of the timing of sales of fund shares and the per share amount of realized and unrealized gains and losses at such time. |
| (4) | | Amount rounds to less than $.01 per share. |
| (5) | | Total investment return calculation assumes the reinvestment of dividends at actual prices pursuant to the Fund’s dividend reinvestment plan. |
| (7) | | Annualized for periods less than one full year. |
| (8) | | The Adviser has agreed to waive and/or reimburse certain fees and/or expense so that, on an annualized basis, such expenses incurred will not exceed .40% as a percentage of average daily net assets. |
See accompanying Notes to the Financial Statements.
64
Barings Total Return Bond Fund 2018 Annual Report
FINANCIAL HIGHLIGHTS (CONTINUED)
| | | | | | | | | | | | |
| | | CLASS A | |
| | | FOR THE YEAR
ENDED
JUNE 30, 2018 | | | FOR THE YEAR
ENDED
JUNE 30, 2017 | | | PERIOD FROM
JULY 8, 2015
THROUGH
JUNE 30, 2016 (1) | |
| | | |
| Per Common Share Data | | | | | | | | | | | | |
Net asset value, beginning of year | | $ | 10.08 | | | $ | 10.18 | | | $ | 10.00 | |
Income from investment operations: | | | | | | | | | | | | |
Net investment income (2) | | | 0.27 | | | | 0.25 | | | | 0.25 | |
Net realized and unrealized gain (loss) on investments | | | (0.28 | ) | | | (0.09 | ) | | | 0.20 | |
| | | | | | | | | | | | |
Total increase (decrease) from investment operations | | | (0.01 | ) | | | 0.16 | | | | 0.45 | |
| | | | | | | | | | | | |
Less dividends and distributions: | | | | | | | | | | | | |
From net investment income | | | (0.29 | ) | | | (0.26 | ) | | | (0.25 | ) |
From net realized gain | | | — | | | | — | | | | (0.02 | ) |
From return of capital | | | (0.01 | ) | | | — | | | | — | |
| | | | | | | | | | | | |
Total dividends and distributions | | | (0.30 | ) | | | (0.26 | ) | | | (0.27 | ) |
| | | | | | | | | | | | |
Net asset value, at end of year | | $ | 9.77 | | | $ | 10.08 | | | $ | 10.18 | |
| | | | | | | | | | | | |
Total investment return (3) | | | (0.12 | )% | | | 1.65 | % | | | 4.63 | %(4) |
| | | | | | | | | | | | |
| | | |
| Supplemental Data and Ratios | | | | | | | | | | | | |
Net assets, end of year (000’s) | | $ | 207 | | | $ | 218 | | | $ | 211 | |
Ratio of total expenses (before reductions and reimbursements) to average net assets | | | 3.72 | % | | | 3.52 | % | | | 5.60 | %(5) |
Ratio of net expenses to average net assets (6)(7) | | | 0.80 | % | | | 0.80 | % | | | 0.80 | %(5) |
Ratio of net investment income to average net assets | | | 2.70 | % | | | 2.49 | % | | | 2.52 | %(5) |
Portfolio turnover rate | | | 172.39 | % | | | 242.55 | % | | | 434.37 | %(4) |
| (1) | | Fund commenced operations on July 8, 2015. |
| (2) | | Calculated using average shares outstanding. |
| (3) | | Total investment return calculation does not consider the effects of sales loads and assumes the reinvestment of dividends at actual prices pursuant to the Fund’s dividend reinvestment plan. |
| (5) | | Annualized for periods less than one full year. |
| (6) | | The Adviser has agreed to waive and/or reimburse certain fees and/or expense so that, on an annualized basis, such expenses incurred will not exceed .80% as a percentage of average daily net assets. |
| (7) | | Ratio of net expenses to average net assets does not include expenses of the underlying fund in which the Fund invests. |
See accompanying Notes to the Financial Statements.
65
Barings Total Return Bond Fund 2018 Annual Report
FINANCIAL HIGHLIGHTS (CONTINUED)
| | | | | | | | | | | | |
| | | CLASS C | |
| | | FOR THE YEAR
ENDED
JUNE 30, 2018 | | | FOR THE YEAR
ENDED
JUNE 30, 2017 | | | PERIOD FROM
JULY 8, 2015
THROUGH
JUNE 30, 2016 (1) | |
| | | |
| Per Common Share Data | | | | | | | | | | | | |
Net asset value, beginning of year | | $ | 10.08 | | | $ | 10.18 | | | $ | 10.00 | |
Income from investment operations: | | | | | | | | | | | | |
Net investment income (2) | | | 0.19 | | | | 0.17 | | | | 0.17 | |
Net realized and unrealized gain (loss) on investments | | | (0.27 | ) | | | (0.08 | ) | | | 0.21 | |
| | | | | | | | | | | | |
Total increase (decrease) from investment operations | | | (0.08 | ) | | | 0.09 | | | | 0.38 | |
| | | | | | | | | | | | |
Less dividends and distributions: | | | | | | | | | | | | |
From net investment income | | | (0.22 | ) | | | (0.19 | ) | | | (0.18 | ) |
From net realized gain | | | — | | | | — | | | | (0.02 | ) |
From return of capital | | | (0.01 | ) | | | — | | | | — | |
| | | | | | | | | | | | |
Total dividends and distributions | | | (0.23 | ) | | | (0.19 | ) | | | (0.20 | ) |
| | | | | | | | | | | | |
Net asset value, at end of year | | $ | 9.77 | | | $ | 10.08 | | | $ | 10.18 | |
| | | | | | | | | | | | |
Total investment return (3) | | | (0.87 | )% | | | 0.89 | % | | | 3.87 | %(4) |
| | | | | | | | | | | | |
| | | |
| Supplemental Data and Ratios | | | | | | | | | | | | |
Net assets, end of year (000’s) | | $ | 196 | | | $ | 202 | | | $ | 204 | |
Ratio of total expenses (before reductions and reimbursements) to average net assets | | | 4.60 | % | | | 4.41 | % | | | 6.38 | %(5) |
Ratio of net expenses to average net assets (6)(7) | | | 1.55 | % | | | 1.55 | % | | | 1.55 | %(5) |
Ratio of net investment income to average net assets | | | 1.95 | % | | | 1.74 | % | | | 1.77 | %(5) |
Portfolio turnover rate | | | 172.39 | % | | | 242.55 | % | | | 434.37 | %(4) |
| (1) | | Fund commenced operations on July 8, 2015. |
| (2) | | Calculated using average shares outstanding. |
| (3) | | Total investment return calculation does not consider the effects of sales loads and assumes the reinvestment of dividends at actual prices pursuant to the Fund’s dividend reinvestment plan. |
| (5) | | Annualized for periods less than one full year. |
| (6) | | The Adviser has agreed to waive and/or reimburse certain fees and/or expense so that, on an annualized basis, such expenses incurred will not exceed 1.55% as a percentage of average daily net assets. |
| (7) | | Ratio of net expenses to average net assets does not include expenses of the underlying fund in which the Fund invests. |
See accompanying Notes to the Financial Statements.
66
Barings Total Return Bond Fund 2018 Annual Report
FINANCIAL HIGHLIGHTS (CONTINUED)
| | | | | | | | | | | | |
| | | CLASS I | |
| | | FOR THE YEAR
ENDED
JUNE 30, 2018 | | | FOR THE YEAR
ENDED
JUNE 30, 2017 | | | PERIOD FROM
JULY 8, 2015
THROUGH
JUNE 30, 2016 (1) | |
| | | |
| Per Common Share Data | | | | | | | | | | | | |
Net asset value, beginning of year | | $ | 10.08 | | | $ | 10.18 | | | $ | 10.00 | |
Income from investment operations: | | | | | | | | | | | | |
Net investment income (2) | | | 0.29 | | | | 0.28 | | | | 0.27 | |
Net realized and unrealized gain (loss) on investments | | | (0.27 | ) | | | (0.09 | ) | | | 0.20 | |
| | | | | | | | | | | | |
Total increase from investment operations | | | 0.02 | | | | 0.19 | | | | 0.47 | |
| | | | | | | | | | | | |
Less dividends and distributions: | | | | | | | | | | | | |
From net investment income | | | (0.32 | ) | | | (0.29 | ) | | | (0.27 | ) |
From net realized gain | | | — | | | | — | | | | (0.02 | ) |
From return of capital | | | (0.01 | ) | | | — | | | | — | |
| | | | | | | | | | | | |
Total dividends and distributions | | | (0.33 | ) | | | (0.29 | ) | | | (0.29 | ) |
| | | | | | | | | | | | |
Net asset value, at end of year | | $ | 9.77 | | | $ | 10.08 | | | $ | 10.18 | |
| | | | | | | | | | | | |
Total investment return (3) | | | 0.13 | % | | | 1.90 | % | | | 4.89 | %(4) |
| | | | | | | | | | | | |
| | | |
| Supplemental Data and Ratios | | | | | | | | | | | | |
Net assets, end of year (000’s) | | $ | 12,070 | | | $ | 12,457 | | | $ | 12,582 | |
Ratio of total expenses (before reductions and reimbursements) to average net assets | | | 1.30 | % | | | 1.36 | % | | | 1.37 | %(5) |
Ratio of net expenses to average net assets (6)(7) | | | 0.55 | % | | | 0.55 | % | | | 0.55 | %(5) |
Ratio of net investment income to average net assets | | | 2.94 | % | | | 2.74 | % | | | 2.77 | %(5) |
Portfolio turnover rate | | | 172.39 | % | | | 242.55 | % | | | 434.37 | %(4) |
| (1) | | Fund commenced operations on July 8, 2015. |
| (2) | | Calculated using average shares outstanding. |
| (3) | | Total investment return calculation assumes the reinvestment of dividends at actual prices pursuant to the Fund’s dividend reinvestment plan. |
| (5) | | Annualized for periods less than one full year. |
| (6) | | The Adviser has agreed to waive and/or reimburse certain fees and/or expense so that, on an annualized basis, such expenses incurred will not exceed .55% as a percentage of average daily net assets. |
| (7) | | Ratio of net expenses to average net assets does not include expenses of the underlying fund in which the Fund invests. |
See accompanying Notes to the Financial Statements.
67
Barings Total Return Bond Fund 2018 Annual Report
FINANCIAL HIGHLIGHTS (CONTINUED)
| | | | | | | | | | | | |
| | | CLASS Y | |
| | | FOR THE YEAR
ENDED
JUNE 30, 2018 | | | FOR THE YEAR
ENDED
JUNE 30, 2017 | | | PERIOD FROM
JULY 8, 2015
THROUGH
JUNE 30, 2016 (1) | |
| | | |
| Per Common Share Data | | | | | | | | | | | | |
Net asset value, beginning of year | | $ | 10.08 | | | $ | 10.18 | | | $ | 10.00 | |
Income from investment operations: | | | | | | | | | | | | |
Net investment income (2) | | | 0.29 | | | | 0.27 | | | | 0.27 | |
Net realized and unrealized gain (loss) on investments | | | (0.27 | ) | | | (0.08 | ) | | | 0.20 | |
| | | | | | | | | | | | |
Total increase from investment operations | | | 0.02 | | | | 0.19 | | | | 0.47 | |
| | | | | | | | | | | | |
Less dividends and distributions: | | | | | | | | | | | | |
From net investment income | | | (0.32 | ) | | | (0.29 | ) | | | (0.27 | ) |
From net realized gain | | | — | | | | — | | | | (0.02 | ) |
From return of capital | | | (0.01 | ) | | | — | | | | — | |
| | | | | | | | | | | | |
Total dividends and distributions | | | (0.33 | ) | | | (0.29 | ) | | | (0.29 | ) |
| | | | | | | | | | | | |
Net asset value, at end of year | | $ | 9.77 | | | $ | 10.08 | | | $ | 10.18 | |
| | | | | | | | | | | | |
Total investment return (3) | | | 0.13 | % | | | 1.90 | % | | | 4.89 | %(4) |
| | | | | | | | | | | | |
| | | |
| Supplemental Data and Ratios | | | | | | | | | | | | |
Net assets, end of year (000’s) | | $ | 16,414 | | | $ | 17,478 | | | $ | 13,011 | |
Ratio of total expenses (before reductions and reimbursements) to average net assets | | | 1.33 | % | | | 1.36 | % | | | 1.36 | %(5) |
Ratio of net expenses to average net assets (6)(7) | | | 0.55 | % | | | 0.55 | % | | | 0.55 | %(5) |
Ratio of net investment income to average net assets | | | 2.95 | % | | | 2.72 | % | | | 2.77 | %(5) |
Portfolio turnover rate | | | 172.39 | % | | | 242.55 | % | | | 434.37 | %(4) |
| (1) | | Fund commenced operations on July 8, 2015. |
| (2) | | Calculated using average shares outstanding. |
| (3) | | Total investment return calculation assumes the reinvestment of dividends at actual prices pursuant to the Fund’s dividend reinvestment plan. |
| (5) | | Annualized for periods less than one full year. |
| (6) | | The Adviser has agreed to waive and/or reimburse certain fees and/or expense so that, on an annualized basis, such expenses incurred will not exceed .55% as a percentage of average daily net assets. |
| (7) | | Ratio of net expenses to average net assets does not include expenses of the underlying fund in which the Fund invests. |
See accompanying Notes to the Financial Statements.
68
Barings Emerging Markets Debt Blended Total Return Fund 2018 Annual Report
FINANCIAL HIGHLIGHTS (CONTINUED)
| | | | | | | | | | | | |
| | | CLASS A | |
| | | FOR THE YEAR
ENDED
JUNE 30, 2018 | | | FOR THE YEAR
ENDED
JUNE 30, 2017 | | | PERIOD FROM
OCTOBER 21, 2015
THROUGH
JUNE 30, 2016 (1) | |
| | | |
| Per Common Share Data | | | | | | | | | | | | |
Net asset value, beginning of year | | $ | 10.55 | | | $ | 9.90 | | | $ | 10.00 | |
Income from investment operations: | | | | | | | | | | | | |
Net investment income (2) | | | 0.45 | | | | 0.42 | | | | 0.43 | |
Net realized and unrealized gain (loss) on investments | | | (0.64 | ) | | | 0.73 | | | | (0.19 | ) |
| | | | | | | | | | | | |
Total increase (decrease) from investment operations | | | (0.19 | ) | | | 1.15 | | | | 0.24 | |
| | | | | | | | | | | | |
Less dividends and distributions: | | | | | | | | | | | | |
From net investment income | | | (0.55 | ) | | | (0.50 | ) | | | (0.34 | ) |
From net realized gain | | | (0.30 | ) | | | – | | | | (0.00 | )(3) |
| | | | | | | | | | | | |
Total dividends and distributions | | | (0.85 | ) | | | (0.50 | ) | | | (0.34 | ) |
| | | | | | | | | | | | |
Net asset value, at end of year | | $ | 9.51 | | | $ | 10.55 | | | $ | 9.90 | |
| | | | | | | | | | | | |
Total investment return (4) | | | (2.21 | )% | | | 11.94 | % | | | 2.62 | %(5) |
| | | | | | | | | | | | |
| | | |
| Supplemental Data and Ratios | | | | | | | | | | | | |
Net assets, end of year (000’s) | | $ | 566 | | | $ | 211 | | | $ | 198 | |
Ratio of total expenses (before reductions and reimbursements) to average net assets | | | 3.63 | % | | | 5.77 | % | | | 6.82 | %(6) |
Ratio of net expenses to average net assets (7) | | | 1.11 | %(8) | | | 1.15 | %(8) | | | 1.16 | %(6) |
Ratio of net investment income to average net assets | | | 4.33 | % | | | 4.17 | % | | | 6.52 | %(6) |
Portfolio turnover rate | | | 51.95 | % | | | 55.66 | % | | | 83.26 | %(5) |
| (1) | | Fund commenced operations on October 21, 2015. |
| (2) | | Calculated using average shares outstanding. |
| (3) | | Amount rounds to less than $.01 per share. |
| (4) | | Total investment return calculation does not consider the effects of sales loads and assumes the reinvestment of dividends at actual prices pursuant to the Fund’s dividend reinvestment plan. |
| (6) | | Annualized for periods less than one full year. |
| (7) | | The Adviser has agreed to waive and/or reimburse certain fees and/or expense so that, on an annualized basis, such expenses incurred will not exceed 1.20% as a percentage of average daily net assets. |
| (8) | | Net expenses reflect a voluntary expense reimbursement to prevent a negative yield. |
See accompanying Notes to the Financial Statements.
69
Barings Emerging Markets Debt Blended Total Return Fund 2018 Annual Report
FINANCIAL HIGHLIGHTS (CONTINUED)
| | | | | | | | | | | | |
| | | CLASS C | |
| | | FOR THE YEAR
ENDED
JUNE 30, 2018 | | | FOR THE YEAR
ENDED
JUNE 30, 2017 | | | PERIOD FROM
OCTOBER 21, 2015
THROUGH
JUNE 30, 2016 (1) | |
| | | |
| Per Common Share Data | | | | | | | | | | | | |
Net asset value, beginning of year | | $ | 10.55 | | | $ | 9.90 | | | $ | 10.00 | |
Income from investment operations: | | | | | | | | | | | | |
Net investment income (2) | | | 0.48 | | | | 0.35 | | | | 0.38 | |
Net realized and unrealized gain (loss) on investments | | | (0.74 | ) | | | 0.73 | | | | (0.19 | ) |
| | | | | | | | | | | | |
Total increase (decrease) from investment operations | | | (0.26 | ) | | | 1.08 | | | | 0.19 | |
| | | | | | | | | | | | |
Less dividends and distributions: | | | | | | | | | | | | |
From net investment income | | | (0.48 | ) | | | (0.43 | ) | | | (0.29 | ) |
From net realized gain | | | (0.30 | ) | | | – | | | | (0.00 | )(3) |
| | | | | | | | | | | | |
Total dividends and distributions | | | (0.78 | ) | | | (0.43 | ) | | | (0.29 | ) |
| | | | | | | | | | | | |
Net asset value, at end of year | | $ | 9.51 | | | $ | 10.55 | | | $ | 9.90 | |
| | | | | | | | | | | | |
Total investment return (4) | | | (2.90 | )% | | | 11.11 | % | | | 2.10 | %(5) |
| | | | | | | | | | | | |
| | | |
| Supplemental Data and Ratios | | | | | | | | | | | | |
Net assets, end of year (000’s) | | $ | 277 | | | $ | 222 | | | $ | 198 | |
Ratio of total expenses (before reductions and reimbursements) to average net assets | | | 5.85 | % | | | 6.47 | % | | | 7.57 | %(6) |
Ratio of net expenses to average net assets (7) | | | 1.85 | %(8) | | | 1.89 | %(8) | | | 1.90 | %(6) |
Ratio of net investment income to average net assets | | | 4.63 | % | | | 3.44 | % | | | 5.79 | %(6) |
Portfolio turnover rate | | | 51.95 | % | | | 55.66 | % | | | 83.26 | %(5) |
| (1) | | Fund commenced operations on October 21, 2015. |
| (2) | | Calculated using average shares outstanding. |
| (3) | | Amount rounds to less than $.01 per share. |
| (4) | | Total investment return calculation does not consider the effects of sales loads and assumes the reinvestment of dividends at actual prices pursuant to the Fund’s dividend reinvestment plan. |
| (6) | | Annualized for periods less than one full year. |
| (7) | | The Adviser has agreed to waive and/or reimburse certain fees and/or expense so that, on an annualized basis, such expenses incurred will not exceed 1.95% as a percentage of average daily net assets. |
| (8) | | Net expenses reflect a voluntary expense reimbursement to prevent a negative yield. |
See accompanying Notes to the Financial Statements.
70
Barings Emerging Markets Debt Blended Total Return Fund 2018 Annual Report
FINANCIAL HIGHLIGHTS (CONTINUED)
| | | | | | | | | | | | |
| | | CLASS I | |
| | | FOR THE YEAR
ENDED
JUNE 30, 2018 | | | FOR THE YEAR
ENDED
JUNE 30, 2017 | | | PERIOD FROM
OCTOBER 21, 2015
THROUGH
JUNE 30, 2016 (1) | |
| | | |
| Per Common Share Data | | | | | | | | | | | | |
Net asset value, beginning of year | | $ | 10.55 | | | $ | 9.90 | | | $ | 10.00 | |
Income from investment operations: | | | | | | | | | | | | |
Net investment income (2) | | | 0.54 | | | | 0.45 | | | | 0.45 | |
Net realized and unrealized gain (loss) on investments | | | (0.70 | ) | | | 0.73 | | | | (0.19 | ) |
| | | | | | | | | | | | |
Total increase (decrease) from investment operations | | | (0.16 | ) | | | 1.18 | | | | 0.26 | |
| | | | | | | | | | | | |
Less dividends and distributions: | | | | | | | | | | | | |
From net investment income | | | (0.58 | ) | | | (0.53 | ) | | | (0.36 | ) |
From net realized gain | | | (0.30 | ) | | | – | | | | (0.00 | )(3) |
| | | | | | | | | | | | |
Total dividends and distributions | | | (0.88 | ) | | | (0.53 | ) | | | (0.36 | ) |
| | | | | | | | | | | | |
Net asset value, at end of year | | $ | 9.51 | | | $ | 10.55 | | | $ | 9.90 | |
| | | | | | | | | | | | |
Total investment return (4) | | | (1.94 | )% | | | 12.22 | % | | | 2.79 | %(5) |
| | | | | | | | | | | | |
| | | |
| Supplemental Data and Ratios | | | | | | | | | | | | |
Net assets, end of year (000’s) | | $ | 22,650 | | | $ | 5,063 | | | $ | 4,753 | |
Ratio of total expenses (before reductions and reimbursements) to average net assets | | | 1.94 | % | | | 2.76 | % | | | 2.58 | %(6) |
Ratio of net expenses to average net assets (7) | | | 0.80 | %(8) | | | 0.90 | %(8) | | | 0.92 | %(6) |
Ratio of net investment income to average net assets | | | 5.31 | % | | | 4.42 | % | | | 6.77 | %(6) |
Portfolio turnover rate | | | 51.95 | % | | | 55.66 | % | | | 83.26 | %(5) |
| (1) | | Fund commenced operations on October 21, 2015. |
| (2) | | Calculated using average shares outstanding. |
| (3) | | Amount rounds to less than $.01 per share. |
| (4) | | Total investment return calculation assumes the reinvestment of dividends at actual prices pursuant to the Fund’s dividend reinvestment plan. |
| (6) | | Annualized for periods less than one full year. |
| (7) | | The Adviser has agreed to waive and/or reimburse certain fees and/or expense so that, on an annualized basis, such expenses incurred will not exceed .95% as a percentage of average daily net assets. |
| (8) | | Net expenses reflect a voluntary expense reimbursement to prevent a negative yield. |
See accompanying Notes to the Financial Statements.
71
B arings Emerging Markets Debt Blended Total Return Fund 2018 Annual Report
FINANCIAL HIGHLIGHTS (CONTINUED)
| | | | | | | | | | | | |
| | | CLASS Y | |
| | | FOR THE YEAR
ENDED
JUNE 30, 2018 | | | FOR THE YEAR
ENDED
JUNE 30, 2017 | | | PERIOD FROM
OCTOBER 21, 2015
THROUGH
JUNE 30, 2016 (1) | |
| | | |
| Per Common Share Data | | | | | | | | | | | | |
Net asset value, beginning of year | | $ | 10.55 | | | $ | 9.90 | | | $ | 10.00 | |
Income from investment operations: | | | | | | | | | | | | |
Net investment income (2) | | | 0.55 | | | | 0.45 | | | | 0.45 | |
Net realized and unrealized gain (loss) on investments | | | (0.71 | ) | | | 0.73 | | | | (0.19 | ) |
| | | | | | | | | | | | |
Total increase (decrease) from investment operations | | | (0.16 | ) | | | 1.18 | | | | 0.26 | |
| | | | | | | | | | | | |
Less dividends and distributions: | | | | | | | | | | | | |
From net investment income | | | (0.58 | ) | | | (0.53 | ) | | | (0.36 | ) |
From net realized gain | | | (0.30 | ) | | | – | | | | (0.00 | )(3) |
| | | | | | | | | | | | |
Total dividends and distributions | | | (0.88 | ) | | | (0.53 | ) | | | (0.36 | ) |
| | | | | | | | | | | | |
Net asset value, at end of year | | $ | 9.51 | | | $ | 10.55 | | | $ | 9.90 | |
| | | | | | | | | | | | |
Total investment return (4) | | | (1.94 | )% | | | 12.22 | % | | | 2.79 | %(5) |
| | | | | | | | | | | | |
| | | |
| Supplemental Data and Ratios | | | | | | | | | | | | |
Net assets, end of year (000’s) | | $ | 23,122 | | | $ | 5,340 | | | $ | 4,754 | |
Ratio of total expenses (before reductions and reimbursements) to average net assets | | | 1.95 | % | | | 2.77 | % | | | 2.58 | %(6) |
Ratio of net expenses to average net assets (7) | | | 0.80 | %(8) | | | 0.90 | %(8) | | | 0.92 | %(6) |
Ratio of net investment income to average net assets | | | 5.38 | % | | | 4.43 | % | | | 6.77 | %(6) |
Portfolio turnover rate | | | 51.95 | % | | | 55.66 | % | | | 83.26 | %(5) |
| (1) | | Fund commenced operations on October 21, 2015. |
| (2) | | Calculated using average shares outstanding. |
| (3) | | Amount rounds to less than $.01 per share. |
| (4) | | Total investment return calculation assumes the reinvestment of dividends at actual prices pursuant to the Fund’s dividend reinvestment plan. |
| (6) | | Annualized for periods less than one full year. |
| (7) | | The Adviser has agreed to waive and/or reimburse certain fees and/or expense so that, on an annualized basis, such expenses incurred will not exceed .95% as a percentage of average daily net assets. |
| (8) | | Net expenses reflect a voluntary expense reimbursement to prevent a negative yield. |
See accompanying Notes to the Financial Statements.
72
Barings Emerging Markets Local Currency Debt Fund 2018 Annual Report
FINANCIAL HIGHLIGHTS (CONTINUED)
| | | | | | | | | | | | |
| | | CLASS A | |
| | | FOR THE YEAR
ENDED
JUNE 30, 2018 | | | FOR THE YEAR
ENDED
JUNE 30, 2017 | | | PERIOD FROM
DECEMBER 8, 2015
THROUGH
JUNE 30, 2016 (1) | |
| | | |
| Per Common Share Data | | | | | | | | | | | | |
Net asset value, beginning of year | | $ | 10.68 | | | $ | 10.92 | | | $ | 10.00 | |
Income from investment operations: | | | | | | | | | | | | |
Net investment income (2) | | | 0.43 | | | | 0.25 | | | | 0.50 | |
Net realized and unrealized gain (loss) on investments | | | (0.72 | ) | | | 0.67 | | | | 0.73 | |
| | | | | | | | | | | | |
Total increase (decrease) from investment operations | | | (0.29 | ) | | | 0.92 | | | | 1.23 | |
| | | | | | | | | | | | |
Less dividends and distributions: | | | | | | | | | | | | |
From net investment income | | | (0.53 | ) | | | (0.98 | ) | | | (0.31 | ) |
From net realized gain | | | (0.08 | ) | | | (0.18 | ) | | | – | |
| | | | | | | | | | | | |
Total dividends and distributions | | | (0.61 | ) | | | (1.16 | ) | | | (0.31 | ) |
| | | | | | | | | | | | |
Net asset value, at end of year | | $ | 9.78 | | | $ | 10.68 | | | $ | 10.92 | |
| | | | | | | | | | | | |
Total investment return (3) | | | (3.16 | )% | | | 9.57 | % | | | 12.58 | %(4) |
| | | | | | | | | | | | |
| | | |
| Supplemental Data and Ratios | | | | | | | | | | | | |
Net assets, end of year (000’s) | | $ | 283 | | | $ | 107 | | | $ | 109 | |
Ratio of total expenses (before reductions and reimbursements) to average net assets | | | 4.45 | % | | | 8.41 | % | | | 8.55 | %(5) |
Ratio of net expenses to average net assets (6) | | | 1.09 | %(7) | | | 1.06 | %(7) | | | 1.08 | %(5) |
Ratio of net investment income to average net assets | | | 3.95 | % | | | 2.41 | % | | | 8.82 | %(5) |
Portfolio turnover rate | | | 55.87 | % | | | 67.23 | % | | | 37.68 | %(4) |
| (1) | | Fund commenced operations on December 8, 2015. |
| (2) | | Calculated using average shares outstanding. |
| (3) | | Total investment return calculation does not consider the effects of sales loads and assumes the reinvestment of dividends at actual prices pursuant to the Fund’s dividend reinvestment plan. |
| (5) | | Annualized for periods less than one full year. |
| (6) | | The Adviser has agreed to waive and/or reimburse certain fees and/or expense so that, on an annualized basis, such expenses incurred will not exceed 1.20% as a percentage of average daily net assets. |
| (7) | | Net expenses reflect a voluntary expense reimbursement to prevent a negative yield. |
See accompanying Notes to the Financial Statements.
73
Barings Emerging Markets Local Currency Debt Fund 2018 Annual Report
FINANCIAL HIGHLIGHTS (CONTINUED)
| | | | | | | | | | | | |
| | | CLASS C | |
| | | FOR THE YEAR
ENDED
JUNE 30, 2018 | | | FOR THE YEAR
ENDED
JUNE 30, 2017 | | | PERIOD FROM
DECEMBER 8, 2015
THROUGH
JUNE 30, 2016 (1) | |
| | | |
| Per Common Share Data | | | | | | | | | | | | |
Net asset value, beginning of year | | $ | 10.68 | | | $ | 10.92 | | | $ | 10.00 | |
Income from investment operations: | | | | | | | | | | | | |
Net investment income (2) | | | 0.43 | | | | 0.18 | | | | 0.46 | |
Net realized and unrealized gain (loss) on investments | | | (0.81 | ) | | | 0.66 | | | | 0.73 | |
| | | | | | | | | | | | |
Total increase (decrease) from investment operations | | | (0.38 | ) | | | 0.84 | | | | 1.19 | |
| | | | | | | | | | | | |
Less dividends and distributions: | | | | | | | | | | | | |
From net investment income | | | (0.45 | ) | | | (0.90 | ) | | | (0.27 | ) |
From net realized gain | | | (0.08 | ) | | | (0.18 | ) | | | – | |
| | | | | | | | | | | | |
Total dividends and distributions | | | (0.53 | ) | | | (1.08 | ) | | | (0.27 | ) |
| | | | | | | | | | | | |
Net asset value, at end of year | | $ | 9.77 | | | $ | 10.68 | | | $ | 10.92 | |
| | | | | | | | | | | | |
Total investment return (3) | | | (3.88 | )% | | | 8.77 | % | | | 12.13 | %(4) |
| | | | | | | | | | | | |
| | | |
| Supplemental Data and Ratios | | | | | | | | | | | | |
Net assets, end of year (000’s) | | $ | 98 | | | $ | 107 | | | $ | 109 | |
Ratio of total expenses (before reductions and reimbursements) to average net assets | | | 8.00 | % | | | 9.17 | % | | | 9.30 | %(5) |
Ratio of net expenses to average net assets (6) | | | 1.82 | %(7) | | | 1.80 | %(7) | | | 1.81 | %(5) |
Ratio of net investment income to average net assets | | | 4.01 | % | | | 1.67 | % | | | 8.09 | %(5) |
Portfolio turnover rate | | | 55.87 | % | | | 67.23 | % | | | 37.68 | %(4) |
| (1) | | Fund commenced operations on December 8, 2015. |
| (2) | | Calculated using average shares outstanding. |
| (3) | | Total investment return calculation does not consider the effects of sales loads and assumes the reinvestment of dividends at actual prices pursuant to the Fund’s dividend reinvestment plan. |
| (5) | | Annualized for periods less than one full year. |
| (6) | | The Adviser has agreed to waive and/or reimburse certain fees and/or expense so that, on an annualized basis, such expenses incurred will not exceed 1.95% as a percentage of average daily net assets. |
| (7) | | Net expenses reflect a voluntary expense reimbursement to prevent a negative yield. |
See accompanying Notes to the Financial Statements.
74
Barings Emerging Markets Local Currency Debt Fund 2018 Annual Report
FINANCIAL HIGHLIGHTS (CONTINUED)
| | | | | | | | | | | | |
| | | CLASS I | |
| | | FOR THE YEAR
ENDED
JUNE 30, 2018 | | | FOR THE YEAR
ENDED
JUNE 30, 2017 | | | PERIOD FROM
DECEMBER 8, 2015
THROUGH
JUNE 30, 2016 (1) | |
| | | |
| Per Common Share Data | | | | | | | | | | | | |
Net asset value, beginning of year | | $ | 10.68 | | | $ | 10.92 | | | $ | 10.00 | |
Income from investment operations: | | | | | | | | | | | | |
Net investment income (2) | | | 0.56 | | | | 0.28 | | | | 0.52 | |
Net realized and unrealized gain (loss) on investments | | | (0.83 | ) | | | 0.67 | | | | 0.73 | |
| | | | | | | | | | | | |
Total increase (decrease) from investment operations | | | (0.27 | ) | | | 0.95 | | | | 1.25 | |
| | | | | | | | | | | | |
Less dividends and distributions: | | | | | | | | | | | | |
From net investment income | | | (0.56 | ) | | | (1.01 | ) | | | (0.33 | ) |
From net realized gain | | | (0.08 | ) | | | (0.18 | ) | | | – | |
| | | | | | | | | | | | |
Total dividends and distributions | | | (0.64 | ) | | | (1.19 | ) | | | (0.33 | ) |
| | | | | | | | | | | | |
Net asset value, at end of year | | $ | 9.77 | | | $ | 10.68 | | | $ | 10.92 | |
| | | | | | | | | | | | |
Total investment return (3) | | | (2.94 | )% | | | 9.84 | % | | | 12.73 | %(4) |
| | | | | | | | | | | | |
| | | |
| Supplemental Data and Ratios | | | | | | | | | | | | |
Net assets, end of year (000’s) | | $ | 6,921 | | | $ | 2,564 | | | $ | 2,621 | |
Ratio of total expenses (before reductions and reimbursements) to average net assets | | | 2.56 | % | | | 4.32 | % | | | 4.03 | %(5) |
Ratio of net expenses to average net assets (6) | | | 0.84 | %(7) | | | 0.81 | %(7) | | | 0.84 | %(5) |
Ratio of net investment income to average net assets | | | 5.13 | % | | | 2.65 | % | | | 9.07 | %(5) |
Portfolio turnover rate | | | 55.87 | % | | | 67.23 | % | | | 37.68 | %(4) |
| (1) | | Fund commenced operations on December 8, 2015. |
| (2) | | Calculated using average shares outstanding. |
| (3) | | Total investment return calculation assumes the reinvestment of dividends at actual prices pursuant to the Fund’s dividend reinvestment plan. |
| (5) | | Annualized for periods less than one full year. |
| (6) | | The Adviser has agreed to waive and/or reimburse certain fees and/or expense so that, on an annualized basis, such expenses incurred will not exceed 0.95% as a percentage of average daily net assets. |
| (7) | | Net expenses reflect a voluntary expense reimbursement to prevent a negative yield. |
See accompanying Notes to the Financial Statements.
75
Barings Emerging Markets Local Currency Debt Fund 2018 Annual Report
FINANCIAL HIGHLIGHTS (CONTINUED)
| | | | | | | | | | | | |
| | | CLASS Y | |
| | | FOR THE YEAR
ENDED
JUNE 30, 2018 | | | FOR THE YEAR
ENDED
JUNE 30, 2017 | | | PERIOD FROM
DECEMBER 8, 2015
THROUGH
JUNE 30, 2016 (1) | |
| | | |
| Per Common Share Data | | | | | | | | | | | | |
Net asset value, beginning of year | | $ | 10.68 | | | $ | 10.92 | | | $ | 10.00 | |
Income from investment operations: | | | | | | | | | | | | |
Net investment income (2) | | | 0.56 | | | | 0.28 | | | | 0.52 | |
Net realized and unrealized gain (loss) on investments | | | (0.82 | ) | | | 0.67 | | | | 0.73 | |
| | | | | | | | | | | | |
Total increase (decrease) from investment operations | | | (0.26 | ) | | | 0.95 | | | | 1.25 | |
| | | | | | | | | | | | |
Less dividends and distributions: | | | | | | | | | | | | |
From net investment income | | | (0.56 | ) | | | (1.01 | ) | | | (0.33 | ) |
From net realized gain | | | (0.08 | ) | | | (0.18 | ) | | | – | |
| | | | | | | | | | | | |
Total dividends and distributions | | | (0.64 | ) | | | (1.19 | ) | | | (0.33 | ) |
| | | | | | | | | | | | |
Net asset value, at end of year | | $ | 9.78 | | | $ | 10.68 | | | $ | 10.92 | |
| | | | | | | | | | | | |
Total investment return (3) | | | (2.93 | )% | | | 9.84 | % | | | 12.73 | %(4) |
| | | | | | | | | | | | |
| | | |
| Supplemental Data and Ratios | | | | | | | | | | | | |
Net assets, end of year (000’s) | | $ | 11,217 | | | $ | 2,564 | | | $ | 2,621 | |
Ratio of total expenses (before reductions and reimbursements) to average net assets | | | 2.47 | % | | | 4.32 | % | | | 4.03 | %(5) |
Ratio of net expenses to average net assets (6) | | | 0.84 | %(7) | | | 0.81 | %(7) | | | 0.84 | %(5) |
Ratio of net investment income to average net assets | | | 5.13 | % | | | 2.65 | % | | | 9.07 | %(5) |
Portfolio turnover rate | | | 55.87 | % | | | 67.23 | % | | | 37.68 | %(4) |
| (1) | | Fund commenced operations on December 8, 2015. |
| (2) | | Calculated using average shares outstanding. |
| (3) | | Total investment return calculation assumes the reinvestment of dividends at actual prices pursuant to the Fund’s dividend reinvestment plan. |
| (5) | | Annualized for periods less than one full year. |
| (6) | | The Adviser has agreed to waive and/or reimburse certain fees and/or expense so that, on an annualized basis, such expenses incurred will not exceed 0.95% as a percentage of average daily net assets. |
| (7) | | Net expenses reflect a voluntary expense reimbursement to prevent a negative yield. |
See accompanying Notes to the Financial Statements.
76
Barings Global High Yield Fund 2018 Annual Report
FINANCIAL HIGHLIGHTS (CONTINUED)
| | | | | | | | | | | | |
| | | CLASS A | |
| | | FOR THE YEAR
ENDED
JUNE 30, 2018 | | | FOR THE YEAR
ENDED
JUNE 30, 2017 | | | PERIOD FROM
OCTOBER 30, 2015
THROUGH
JUNE 30, 2016 (1) | |
| | | |
| Per Common Share Data | | | | | | | | | | | | |
Net asset value, beginning of year | | $ | 10.44 | | | $ | 10.05 | | | $ | 10.00 | |
Income from investment operations: | | | | | | | | | | | | |
Net investment income (2) | | | 0.60 | | | | 0.64 | | | | 0.38 | |
Net realized and unrealized gain (loss) on investments | | | (0.41 | ) | | | 0.77 | | | | 0.05 | |
| | | | | | | | | | | | |
Total increase from investment operations | | | 0.19 | | | | 1.41 | | | | 0.43 | |
| | | | | | | | | | | | |
Less dividends and distributions: | | | | | | | | | | | | |
From net investment income | | | (0.60 | ) | | | (0.64 | ) | | | (0.38 | ) |
From net realized gain | | | (0.25 | ) | | | (0.38 | ) | | | – | |
| | | | | | | | | | | | |
Total dividends and distributions | | | (0.85 | ) | | | (1.02 | ) | | | (0.38 | ) |
| | | | | | | | | | | | |
Net asset value, at end of year | | $ | 9.78 | | | $ | 10.44 | | | $ | 10.05 | |
| | | | | | | | | | | | |
Total investment return (3) | | | 1.79 | % | | | 14.61 | % | | | 4.45 | %(4) |
| | | | | | | | | | | | |
| | | |
| Supplemental Data and Ratios | | | | | | | | | | | | |
Net assets, end of year (000’s) | | $ | 106 | | | $ | 111 | | | $ | 101 | |
Ratio of total expenses (before reductions and reimbursements) to average net assets | | | 6.55 | % | | | 6.27 | % | | | 7.14 | %(5) |
Ratio of net expenses to average net assets (6) | | | 1.05 | % | | | 1.05 | % | | | 1.04 | %(5) |
Ratio of net investment income to average net assets | | | 5.89 | % | | | 6.20 | % | | | 5.83 | %(5) |
Portfolio turnover rate | | | 65.26 | % | | | 87.34 | % | | | 83.24 | %(4) |
| (1) | | Fund commenced operations on October 30, 2015. |
| (2) | | Calculated using average shares outstanding. |
| (3) | | Total investment return calculation does not consider the effects of sales loads and assumes the reinvestment of dividends at actual prices pursuant to the Fund’s dividend reinvestment plan. |
| (5) | | Annualized for periods less than one full year. |
| (6) | | The Adviser has agreed to waive and/or reimburse certain fees and/or expense so that, on an annualized basis, such expenses incurred will not exceed 1.05% as a percentage of average daily net assets. |
See accompanying Notes to the Financial Statements.
77
B arings Global High Yield Fund 2018 Annual Report
FINANCIAL HIGHLIGHTS (CONTINUED)
| | | | | | | | | | | | |
| | | CLASS C | |
| | | FOR THE YEAR
ENDED
JUNE 30, 2018 | | | FOR THE YEAR
ENDED
JUNE 30, 2017 | | | PERIOD FROM
OCTOBER 30, 2015
THROUGH
JUNE 30, 2016 (1) | |
| | | |
| Per Common Share Data | | | | | | | | | | | | |
Net asset value, beginning of year | | $ | 10.44 | | | $ | 10.05 | | | $ | 10.00 | |
Income from investment operations: | | | | | | | | | | | | |
Net investment income (2) | | | 0.52 | | | | 0.56 | | | | 0.33 | |
Net realized and unrealized gain (loss) on investments | | | (0.41 | ) | | | 0.77 | | | | 0.05 | |
| | | | | | | | | | | | |
Total increase from investment operations | | | 0.11 | | | | 1.33 | | | | 0.38 | |
| | | | | | | | | | | | |
Less dividends and distributions: | | | | | | | | | | | | |
From net investment income | | | (0.52 | ) | | | (0.56 | ) | | | (0.33 | ) |
From net realized gain | | | (0.25 | ) | | | (0.38 | ) | | | – | |
| | | | | | | | | | | | |
Total dividends and distributions | | | (0.77 | ) | | | (0.94 | ) | | | (0.33 | ) |
| | | | | | | | | | | | |
Net asset value, at end of year | | $ | 9.78 | | | $ | 10.44 | | | $ | 10.05 | |
| | | | | | | | | | | | |
Total investment return (3) | | | 1.04 | % | | | 13.75 | % | | | 3.94 | %(4) |
| | | | | | | | | | | | |
| | | |
| Supplemental Data and Ratios | | | | | | | | | | | | |
Net assets, end of year (000’s) | | $ | 197 | | | $ | 247 | | | $ | 101 | |
Ratio of total expenses (before reductions and reimbursements) to average net assets | | | 4.80 | % | | | 4.94 | % | | | 7.89 | %(5) |
Ratio of net expenses to average net assets (6) | | | 1.80 | % | | | 1.80 | % | | | 1.78 | %(5) |
Ratio of net investment income to average net assets | | | 5.14 | % | | | 5.40 | % | | | 5.09 | %(5) |
Portfolio turnover rate | | | 65.26 | % | | | 87.34 | % | | | 83.24 | %(4) |
| (1) | | Fund commenced operations on October 30, 2015. |
| (2) | | Calculated using average shares outstanding. |
| (3) | | Total investment return calculation does not consider the effects of sales loads and assumes the reinvestment of dividends at actual prices pursuant to the Fund’s dividend reinvestment plan. |
| (5) | | Annualized for periods less than one full year. |
| (6) | | The Adviser has agreed to waive and/or reimburse certain fees and/or expense so that, on an annualized basis, such expenses incurred will not exceed 1.80% as a percentage of average daily net assets. |
See accompanying Notes to the Financial Statements.
78
B arings Global High Yield Fund 2018 Annual Report
FINANCIAL HIGHLIGHTS (CONTINUED)
| | | | | | | | | | | | |
| | | CLASS I | |
| | | FOR THE YEAR
ENDED
JUNE 30, 2018 | | | FOR THE YEAR
ENDED
JUNE 30, 2017 | | | PERIOD FROM
OCTOBER 30, 2015
THROUGH
JUNE 30, 2016 (1) | |
| | | |
| Per Common Share Data | | | | | | | | | | | | |
Net asset value, beginning of year | | $ | 10.44 | | | $ | 10.05 | | | $ | 10.00 | |
Income from investment operations: | | | | | | | | | | | | |
Net investment income (2) | | | 0.63 | | | | 0.67 | | | | 0.39 | |
Net realized and unrealized gain (loss) on investments | | | (0.41 | ) | | | 0.77 | | | | 0.05 | |
| | | | | | | | | | | | |
Total increase from investment operations | | | 0.22 | | | | 1.44 | | | | 0.44 | |
| | | | | | | | | | | | |
Less dividends and distributions: | | | | | | | | | | | | |
From net investment income | | | (0.63 | ) | | | (0.67 | ) | | | (0.39 | ) |
From net realized gain | | | (0.25 | ) | | | (0.38 | ) | | | – | |
| | | | | | | | | | | | |
Total dividends and distributions | | | (0.88 | ) | | | (1.05 | ) | | | (0.39 | ) |
| | | | | | | | | | | | |
Net asset value, at end of year | | $ | 9.78 | | | $ | 10.44 | | | $ | 10.05 | |
| | | | | | | | | | | | |
Total investment return (3) | | | 2.05 | % | | | 14.90 | % | | | 4.62 | %(4) |
| | | | | | | | | | | | |
| | | |
| Supplemental Data and Ratios | | | | | | | | | | | | |
Net assets, end of year (000’s) | | $ | 12,130 | | | $ | 12,947 | | | $ | 12,466 | |
Ratio of total expenses (before reductions and reimbursements) to average net assets | | | 1.53 | % | | | 1.53 | % | | | 1.51 | %(5) |
Ratio of net expenses to average net assets (6) | | | 0.80 | % | | | 0.80 | % | | | 0.79 | %(5) |
Ratio of net investment income to average net assets | | | 6.14 | % | | | 6.46 | % | | | 6.08 | %(5) |
Portfolio turnover rate | | | 65.26 | % | | | 87.34 | % | | | 83.24 | %(4) |
| (1) | | Fund commenced operations on October 30, 2015. |
| (2) | | Calculated using average shares outstanding. |
| (3) | | Total investment return calculation assumes the reinvestment of dividends at actual prices pursuant to the Fund’s dividend reinvestment plan. |
| (5) | | Annualized for periods less than one full year. |
| (6) | | The Adviser has agreed to waive and/or reimburse certain fees and/or expense so that, on an annualized basis, such expenses incurred will not exceed .80% as a percentage of average daily net assets. |
See accompanying Notes to the Financial Statements.
79
Barings Global High Yield Fund 2018 Annual Report
FINANCIAL HIGHLIGHTS (CONTINUED)
| | | | | | | | | | | | |
| | | CLASS Y | |
| | | FOR THE YEAR
ENDED
JUNE 30, 2018 | | | FOR THE YEAR
ENDED
JUNE 30, 2017 | | | PERIOD FROM
OCTOBER 30, 2015
THROUGH
JUNE 30, 2016 (1) | |
| | | |
| Per Common Share Data | | | | | | | | | | | | |
Net asset value, beginning of year | | $ | 10.44 | | | $ | 10.05 | | | $ | 10.00 | |
Income from investment operations: | | | | | | | | | | | | |
Net investment income (2) | | | 0.63 | | | | 0.67 | | | | 0.39 | |
Net realized and unrealized gain (loss) on investments | | | (0.41 | ) | | | 0.77 | | | | 0.05 | |
| | | | | | | | | | | | |
Total increase from investment operations | | | 0.22 | | | | 1.44 | | | | 0.44 | |
| | | | | | | | | | | | |
Less dividends and distributions: | | | | | | | | | | | | |
From net investment income | | | (0.63 | ) | | | (0.67 | ) | | | (0.39 | ) |
From net realized gain | | | (0.25 | ) | | | (0.38 | ) | | | – | |
| | | | | | | | | | | | |
Total dividends and distributions | | | (0.88 | ) | | | (1.05 | ) | | | (0.39 | ) |
| | | | | | | | | | | | |
Net asset value, at end of year | | $ | 9.78 | | | $ | 10.44 | | | $ | 10.05 | |
| | | | | | | | | | | | |
Total investment return (3) | | | 2.05 | % | | | 14.90 | % | | | 4.62 | %(4) |
| | | | | | | | | | | | |
| | | |
| Supplemental Data and Ratios | | | | | | | | | | | | |
Net assets, end of year (000’s) | | $ | 12,393 | | | $ | 14,535 | | | $ | 12,604 | |
Ratio of total expenses (before reductions and reimbursements) to average net assets | | | 1.53 | % | | | 1.53 | % | | | 1.51 | %(5) |
Ratio of net expenses to average net assets (6) | | | 0.80 | % | | | 0.80 | % | | | 0.79 | %(5) |
Ratio of net investment income to average net assets | | | 6.14 | % | | | 6.45 | % | | | 6.08 | %(5) |
Portfolio turnover rate | | | 65.26 | % | | | 87.34 | % | | | 83.24 | %(4) |
| (1) | | Fund commenced operations on October 30, 2015. |
| (2) | | Calculated using average shares outstanding. |
| (3) | | Total investment return calculation assumes the reinvestment of dividends at actual prices pursuant to the Fund’s dividend reinvestment plan. |
| (5) | | Annualized for periods less than one full year. |
| (6) | | The Adviser has agreed to waive and/or reimburse certain fees and/or expense so that, on an annualized basis, such expenses incurred will not exceed .80% as a percentage of average daily net assets. |
See accompanying Notes to the Financial Statements.
80
Barings U.S. High Yield Fund 2018 Annual Report
FINANCIAL HIGHLIGHTS (CONTINUED)
| | | | | | | | | | | | |
| | | CLASS A | |
| | | FOR THE YEAR
ENDED
JUNE 30, 2018 | | | FOR THE YEAR
ENDED
JUNE 30, 2017 | | | PERIOD FROM
OCTOBER 30, 2015
THROUGH
JUNE 30, 2016 (1) | |
| | | |
| Per Common Share Data | | | | | | | | | | | | |
Net asset value, beginning of year | | $ | 10.59 | | | $ | 10.14 | | | $ | 10.00 | |
Income from investment operations: | | | | | | | | | | | | |
Net investment income (2) | | | 0.61 | | | | 0.65 | | | | 0.39 | |
Net realized and unrealized gain (loss) on investments | | | (0.47 | ) | | | 0.65 | | | | 0.13 | |
| | | | | | | | | | | | |
Total increase from investment operations | | | 0.14 | | | | 1.30 | | | | 0.52 | |
| | | | | | | | | | | | |
Less dividends and distributions: | | | | | | | | | | | | |
From net investment income | | | (0.61 | ) | | | (0.66 | ) | | | (0.38 | ) |
From net realized gain | | | (0.30 | ) | | | (0.19 | ) | | | – | |
| | | | | | | | | | | | |
Total dividends and distributions | | | (0.91 | ) | | | (0.85 | ) | | | (0.38 | ) |
| | | | | | | | | | | | |
Net asset value, at end of year | | $ | 9.82 | | | $ | 10.59 | | | $ | 10.14 | |
| | | | | | | | | | | | |
Total investment return (3) | | | 1.32 | % | | | 13.13 | % | | | 5.36 | %(4) |
| | | | | | | | | | | | |
| | | |
| Supplemental Data and Ratios | | | | | | | | | | | | |
Net assets, end of year (000’s) | | $ | 2,918 | | | $ | 2,633 | | | $ | 206 | |
Ratio of total expenses (before reductions and reimbursements) to average net assets | | | 1.71 | % | | | 1.82 | % | | | 5.47 | %(5) |
Ratio of net expenses to average net assets (6) | | | 1.00 | % | | | 1.00 | % | | | 0.99 | %(5) |
Ratio of net investment income to average net assets | | | 5.92 | % | | | 6.21 | % | | | 5.93 | %(5) |
Portfolio turnover rate | | | 43.75 | % | | | 71.57 | % | | | 77.52 | %(4) |
| (1) | | Fund commenced operations on October 30, 2015. |
| (2) | | Calculated using average shares outstanding. |
| (3) | | Total investment return calculation does not consider the effects of sales loads and assumes the reinvestment of dividends at actual prices pursuant to the Fund’s dividend reinvestment plan. |
| (5) | | Annualized for periods less than one full year. |
| (6) | | The Adviser has agreed to waive and/or reimburse certain fees and/or expense so that, on an annualized basis, such expenses incurred will not exceed 1.00% as a percentage of average daily net assets. |
See accompanying Notes to the Financial Statements.
81
B arings U.S. High Yield Fund 2018 Annual Report
FINANCIAL HIGHLIGHTS (CONTINUED)
| | | | | | | | | | | | |
| | | CLASS C | |
| | | FOR THE YEAR
ENDED
JUNE 30, 2018 | | | FOR THE YEAR
ENDED
JUNE 30, 2017 | | | PERIOD FROM
OCTOBER 30, 2015
THROUGH
JUNE 30, 2016 (1) | |
| | | |
| Per Common Share Data | | | | | | | | | | | | |
Net asset value, beginning of year | | $ | 10.59 | | | $ | 10.14 | | | $ | 10.00 | |
Income from investment operations: | | | | | | | | | | | | |
Net investment income (2) | | | 0.53 | | | | 0.58 | | | | 0.33 | |
Net realized and unrealized gain (loss) on investments | | | (0.47 | ) | | | 0.64 | | | | 0.14 | |
| | | | | | | | | | | | |
Total increase from investment operations | | | 0.06 | | | | 1.22 | | | | 0.47 | |
| | | | | | | | | | | | |
Less dividends and distributions: | | | | | | | | | | | | |
From net investment income | | | (0.53 | ) | | | (0.58 | ) | | | (0.33 | ) |
From net realized gain | | | (0.30 | ) | | | (0.19 | ) | | | – | |
| | | | | | | | | | | | |
Total dividends and distributions | | | (0.83 | ) | | | (0.77 | ) | | | (0.33 | ) |
| | | | | | | | | | | | |
Net asset value, at end of year | | $ | 9.82 | | | $ | 10.59 | | | $ | 10.14 | |
| | | | | | | | | | | | |
Total investment return (3) | | | 0.61 | % | | | 12.24 | % | | | 4.85 | %(4) |
| | | | | | | | | | | | |
| | | |
| Supplemental Data and Ratios | | | | | | | | | | | | |
Net assets, end of year (000’s) | | $ | 98 | | | $ | 118 | | | $ | 101 | |
Ratio of total expenses (before reductions and reimbursements) to average net assets | | | 6.43 | % | | | 6.18 | % | | | 7.30 | %(5) |
Ratio of net expenses to average net assets (6) | | | 1.75 | % | | | 1.75 | % | | | 1.73 | %(5) |
Ratio of net investment income to average net assets | | | 5.17 | % | | | 5.50 | % | | | 5.08 | %(5) |
Portfolio turnover rate | | | 43.75 | % | | | 71.57 | % | | | 77.52 | %(4) |
| (1) | | Fund commenced operations on October 30, 2015. |
| (2) | | Calculated using average shares outstanding. |
| (3) | | Total investment return calculation does not consider the effects of sales loads and assumes the reinvestment of dividends at actual prices pursuant to the Fund’s dividend reinvestment plan. |
| (5) | | Annualized for periods less than one full year. |
| (6) | | The Adviser has agreed to waive and/or reimburse certain fees and/or expense so that, on an annualized basis, such expenses incurred will not exceed 1.75% as a percentage of average daily net assets. |
See accompanying Notes to the Financial Statements.
82
B arings U.S. High Yield Fund 2018 Annual Report
FINANCIAL HIGHLIGHTS (CONTINUED)
| | | | | | | | | | | | |
| | | CLASS I | |
| | | FOR THE YEAR
ENDED
JUNE 30, 2018 | | | FOR THE YEAR
ENDED
JUNE 30, 2017 | | | PERIOD FROM
OCTOBER 30, 2015
THROUGH
JUNE 30, 2016 (1) | |
| | | |
| Per Common Share Data | | | | | | | | | | | | |
Net asset value, beginning of year | | $ | 10.59 | | | $ | 10.14 | | | $ | 10.00 | |
Income from investment operations: | | | | | | | | | | | | |
Net investment income (2) | | | 0.63 | | | | 0.68 | | | | 0.40 | |
Net realized and unrealized gain (loss) on investments | | | (0.47 | ) | | | 0.64 | | | | 0.13 | |
| | | | | | | | | | | | |
Total increase from investment operations | | | 0.16 | | | | 1.32 | | | | 0.53 | |
| | | | | | | | | | | | |
Less dividends and distributions: | | | | | | | | | | | | |
From net investment income | | | (0.63 | ) | | | (0.68 | ) | | | (0.39 | ) |
From net realized gain | | | (0.30 | ) | | | (0.19 | ) | | | – | |
| | | | | | | | | | | | |
Total dividends and distributions | | | (0.93 | ) | | | (0.87 | ) | | | (0.39 | ) |
| | | | | | | | | | | | |
Net asset value, at end of year | | $ | 9.82 | | | $ | 10.59 | | | $ | 10.14 | |
| | | | | | | | | | | | |
Total investment return (3) | | | 1.61 | % | | | 13.36 | % | | | 5.53 | %(4) |
| | | | | | | | | | | | |
| | | |
| Supplemental Data and Ratios | | | | | | | | | | | | |
Net assets, end of year (000’s) | | $ | 14,816 | | | $ | 15,720 | | | $ | 14,863 | |
Ratio of total expenses (before reductions and reimbursements) to average net assets | | | 1.28 | % | | | 1.36 | % | | | 1.38 | %(5) |
Ratio of net expenses to average net assets (6) | | | 0.75 | % | | | 0.75 | % | | | 0.74 | %(5) |
Ratio of net investment income to average net assets | | | 6.16 | % | | | 6.50 | % | | | 6.11 | %(5) |
Portfolio turnover rate | | | 43.75 | % | | | 71.57 | % | | | 77.52 | %(4) |
| (1) | | Fund commenced operations on October 30, 2015. |
| (2) | | Calculated using average shares outstanding. |
| (3) | | Total investment return calculation assumes the reinvestment of dividends at actual prices pursuant to the Fund’s dividend reinvestment plan. |
| (5) | | Annualized for periods less than one full year. |
| (6) | | The Adviser has agreed to waive and/or reimburse certain fees and/or expense so that, on an annualized basis, such expenses incurred will not exceed .75% as a percentage of average daily net assets. |
See accompanying Notes to the Financial Statements.
83
B arings U.S. High Yield Fund 2018 Annual Report
FINANCIAL HIGHLIGHTS (CONTINUED)
| | | | | | | | | | | | |
| | | CLASS Y | |
| | | FOR THE YEAR
ENDED
JUNE 30, 2018 | | | FOR THE YEAR
ENDED
JUNE 30, 2017 | | | PERIOD FROM
OCTOBER 30, 2015
THROUGH
JUNE 30, 2016 (1) | |
| | | |
| Per Common Share Data | | | | | | | | | | | | |
Net asset value, beginning of year | | $ | 10.58 | | | $ | 10.14 | | | $ | 10.00 | |
Income from investment operations: | | | | | | | | | | | | |
Net investment income (2) | | | 0.62 | | | | 0.68 | | | | 0.39 | |
Net realized and unrealized gain (loss) on investments | | | (0.45 | ) | | | 0.63 | | | | 0.14 | |
| | | | | | | | | | | | |
Total increase from investment operations | | | 0.17 | | | | 1.31 | | | | 0.53 | |
| | | | | | | | | | | | |
Less dividends and distributions: | | | | | | | | | | | | |
From net investment income | | | (0.63 | ) | | | (0.68 | ) | | | (0.39 | ) |
From net realized gain | | | (0.30 | ) | | | (0.19 | ) | | | – | |
| | | | | | | | | | | | |
Total dividends and distributions | | | (0.93 | ) | | | (0.87 | ) | | | (0.39 | ) |
| | | | | | | | | | | | |
Net asset value, at end of year | | $ | 9.82 | | | $ | 10.58 | | | $ | 10.14 | |
| | | | | | | | | | | | |
Total investment return (3) | | | 1.61 | % | | | 13.35 | % | | | 5.52 | %(4) |
| | | | | | | | | | | | |
| | | |
| Supplemental Data and Ratios | | | | | | | | | | | | |
Net assets, end of year (000’s) | | $ | 39,176 | | | $ | 14,631 | | | $ | 12,675 | |
Ratio of total expenses (before reductions and reimbursements) to average net assets | | | 1.25 | % | | | 1.36 | % | | | 1.42 | %(5) |
Ratio of net expenses to average net assets (6) | | | 0.75 | % | | | 0.75 | % | | | 0.74 | %(5) |
Ratio of net investment income to average net assets | | | 6.09 | % | | | 6.50 | % | | | 6.06 | %(5) |
Portfolio turnover rate | | | 43.75 | % | | | 71.57 | % | | | 77.52 | %(4) |
| (1) | | Fund commenced operations on October 30, 2015. |
| (2) | | Calculated using average shares outstanding. |
| (3) | | Total investment return calculation assumes the reinvestment of dividends at actual prices pursuant to the Fund’s dividend reinvestment plan. |
| (5) | | Annualized for periods less than one full year. |
| (6) | | The Adviser has agreed to waive and/or reimburse certain fees and/or expense so that, on an annualized basis, such expenses incurred will not exceed .75% as a percentage of average daily net assets. |
See accompanying Notes to the Financial Statements.
84
Barings Global Floating Rate Fund 2018 Annual Report
SCHEDULE OF INVESTMENTS
June 30, 2018
| | | | | | | | | | | | | | | | | | | | |
| | | | | | | | | SHARES | | | COST | | | FAIR
VALUE | |
Equities — 0.8%*: | | | | | | | | | | | | | | | | | | | | |
| | | | | |
Common Stocks — 0.7%*: | | | | | | | | | | | | | | | | | | | | |
| | | | | |
Healthcare, Education and Childcare — 0.0%*: | | | | | | | | | | | | | | | | | | | | |
Tunstall Group Holdings Ltd.+¤ | | | | | | | | | | | 469 | | | | $— | | | | $— | |
Tunstall Group Holdings Ltd.+¤ | | | | | | | | | | | 310 | | | | — | | | | — | |
| | | | | | | | | | | | | | | | | | | | |
Total Healthcare, Education and Childcare | | | | | | | | | | | 779 | | | | — | | | | — | |
| | | | | | | | | | | | | | | | | | | | |
| | | | |
Mining, Steel, Iron and Non-Precious Metals — 0.0%*: | | | | | | | | | | | | | | | | | |
Boomerang Tube LLC¤ | | | | | | | | | | | 2,007 | | | | — | | | | — | |
| | | | | | | | | | | | | | | | | | | | |
| | | | | |
Oil and Gas — 0.7%*: | | | | | | | | | | | | | | | | | | | | |
Fieldwood Energy LLC | | | | | | | | | | | 6,469 | | | | 226,415 | | | | 317,389 | |
Fieldwood Energy LLC | | | | | | | | | | | 26,365 | | | | 568,599 | | | | 1,324,841 | |
Sabine Oil & Gas LLC¤ | | | | | | | | | | | 387 | | | | 22,597 | | | | 19,350 | |
Sabine Oil & Gas LLC Warrants¤ | | | | | | | | | | | 1,230 | | | | 5,523 | | | | 7,380 | |
Sabine Oil & Gas LLC Warrants¤ | | | | | | | | | | | 219 | | | | 596 | | | | 1,095 | |
Southcross Energy Holdings LP¤ | | | | | | | | | | | 22 | | | | — | | | | — | |
Southcross Energy Partners LP | | | | | | | | | | | 22 | | | | 5,500 | | | | 4,895 | |
Templar Energy LLC¤ | | | | | | | | | | | 8,762 | | | | 50,647 | | | | 7,010 | |
Templar Energy LLC¤ | | | | | | | | | | | 6,069 | | | | 60,686 | | | | 39,446 | |
| | | | | | | | | | | | | | | | | | | | |
Total Oil and Gas | | | | | | | | | | | 49,545 | | | | 940,563 | | | | 1,721,406 | |
| | | | | | | | | | | | | | | | | | | | |
Total Common Stocks | | | | | | | | | | | 52,331 | | | | 940,563 | | | | 1,721,406 | |
| | | | | | | | | | | | | | | | | | | | |
Preferred Stock — 0.1%*: | | | | | | | | | | | | | | | | | | | | |
| | | | | |
Farming and Agriculture — 0.1%*: | | | | | | | | | | | | | | | | | | | | |
Pinnacle Agriculture Holdings A 2¤ | | | | | | | | | | | 259,648 | | | | 173,407 | | | | 238,876 | |
| | | | | | | | | | | | | | | | | | | | |
Total Equities | | | | | | | | | | | 311,979 | | | | 1,113,970 | | | | 1,960,282 | |
| | | | | | | | | | | | | | | | | | | | |
| | | | | |
| | | EFFECTIVE
INTEREST RATE | | | DUE DATE | | | PRINCIPAL ‡‡ | | | COST | | | FAIR
VALUE | |
Fixed Income — 94.9%*: | | | | | | | | | | | | | | | | | | | | |
| | | | | |
Bank Loans — 84.9%*§: | | | | | | | | | | | | | | | | | | | | |
| | | | | |
Aerospace and Defense — 0.2%*: | | | | | | | | | | | | | | | | | | | | |
Doncasters Finance US LLC, 3M LIBOR + 3.500% | | | 5.83 | % | | | 4/9/2020 | | | | 446,565 | | | | 434,571 | | | | 430,796 | |
| | | | | | | | | | | | | | | | | | | | |
| | | | | |
Automobile — 0.6%*: | | | | | | | | | | | | | | | | | | | | |
DexKo Global, Inc., 2M LIBOR + 3.500% | | | 5.59 | | | | 7/24/2024 | | | | 309,073 | | | | 311,509 | | | | 309,268 | |
NN, Inc., 1M LIBOR + 3.750% | | | 5.84 | | | | 10/19/2022 | | | | 1,334,566 | | | | 1,337,952 | | | | 1,331,229 | |
| | | | | | | | | | | | | | | | | | | | |
Total Automobile | | | | | | | | | | | 1,643,639 | | | | 1,649,461 | | | | 1,640,497 | |
| | | | | | | | | | | | | | | | | | | | |
| | | | | |
Beverage, Food and Tobacco — 3.4%*: | | | | | | | | | | | | | | | | | | | | |
Amphora Finance Ltd., 3M LIBOR + 4.750%+ | | | 5.42 | | | | 5/29/2025 | | | | 500,000 | | | | 660,382 | | | | 655,131 | |
CTI Foods Holding Co. LLC, 1M LIBOR + 3.500% | | | 5.60 | | | | 6/29/2020 | | | | 1,371,857 | | | | 1,366,810 | | | | 1,177,506 | |
Deoleo, S.A., EURIBOR + 3.500%+ | | | 4.50 | | | | 6/11/2021 | | | | 500,000 | | | | 589,199 | | | | 435,981 | |
See accompanying Notes to the Financial Statements.
85
Barings Global Floating Rate Fund 2018 Annual Report
SCHEDULE OF INVESTMENTS (CONTINUED)
June 30, 2018
| | | | | | | | | | | | | | | | | | | | |
| | | EFFECTIVE
INTEREST RATE | | | DUE DATE | | | PRINCIPAL ‡‡ | | | COST | | | FAIR
VALUE | |
Bank Loans (Continued) | | | | | | | | | | | | | | | | | | | | |
| | | | | |
Beverage, Food and Tobacco (Continued) | | | | | | | | | | | | | | | | | | | | |
IRB Holding Corp., 1M LIBOR + 3.250% | | | 5.27 | % | | | 2/5/2025 | | | | 1,871,169 | | | | $1,885,756 | | | | $1,872,722 | |
JBS USA, LLC, 3M LIBOR + 2.500% | | | 4.83 | | | | 10/30/2022 | | | | 1,933,563 | | | | 1,928,470 | | | | 1,917,128 | |
Labeyrie Fine Foods SAS, EURIBOR + 4.250%+ | | | 4.25 | | | | 5/23/2023 | | | | 500,000 | | | | 553,676 | | | | 583,690 | |
Refresco Group B.V., EURIBOR + 3.250%+ | | | 3.25 | | | | 3/28/2025 | | | | 500,000 | | | | 584,887 | | | | 575,994 | |
Refresco Group B.V., EURIBOR + 3.250%+ | | | 5.59 | | | | 3/28/2025 | | | | 159,042 | | | | 158,272 | | | | 158,843 | |
Sigma Bidco B.V., EURIBOR + 3.500%+ | | | 3.50 | | | | 3/6/2025 | | | | 1,000,000 | | | | 1,146,191 | | | | 1,142,984 | |
| | | | | | | | | | | | | | | | | | | | |
Total Beverage, Food and Tobacco | | | | | | | | | | | 8,335,631 | | | | 8,873,643 | | | | 8,519,979 | |
| | | | | | | | | | | | | | | | | | | | |
| | | | | |
Broadcasting and Entertainment — 3.9%*: | | | | | | | | | | | | | | | | | | | | |
All3Media International, 6M LIBOR + 4.250%+ | | | 5.25 | | | | 6/30/2021 | | | | 1,500,000 | | | | 2,305,013 | | | | 1,972,202 | |
AP NMT Acquisition B.V., EURIBOR +
6.000%+ | | | 7.00 | | | | 8/13/2021 | | | | 524,065 | | | | 638,462 | | | | 612,309 | |
AP NMT Acquisition B.V., 3M LIBOR +
5.750%+ | | | 8.06 | | | | 8/13/2021 | | | | 2,083,840 | | | | 2,041,515 | | | | 2,079,068 | |
AP NMT Acquisition B.V., 3M LIBOR +
9.000%+ | | | 11.31 | | | | 8/13/2022 | | | | 182,721 | | | | 162,803 | | | | 182,415 | |
DLG Acquisitions Ltd., EURIBOR + 7.250%+ | | | 8.25 | | | | 6/30/2022 | | | | 500,000 | | | | 673,427 | | | | 584,630 | |
Imagina Media Audiovisual, S.L., EURIBOR + 4.500%+ | | | 4.50 | | | | 5/30/2025 | | | | 500,000 | | | | 566,989 | | | | 572,222 | |
Imagina Media Audiovisual, S.L., EURIBOR + 7.500%+ | | | 7.50 | | | | 10/31/2025 | | | | 500,000 | | | | 536,406 | | | | 538,648 | |
Intelsat Jackson Holdings S.A., 3M LIBOR + 3.750% | | | 5.85 | | | | 11/27/2023 | | | | 750,000 | | | | 747,782 | | | | 747,533 | |
Technicolor S.A., EURIBOR + 3.000%+ | | | 3.00 | | | | 12/6/2023 | | | | 500,000 | | | | 538,572 | | | | 549,158 | |
Univision Communications, Inc., 1M LIBOR + 2.750% | | | 4.84 | | | | 3/15/2024 | | | | 1,991,867 | | | | 1,973,028 | | | | 1,922,989 | |
| | | | | | | | | | | | | | | | | | | | |
Total Broadcasting and Entertainment | | | | | | | | | | | 9,032,493 | | | | 10,183,997 | | | | 9,761,174 | |
| | | | | | | | | | | | | | | | | | | | |
| | | | | |
Buildings and Real Estate — 1.9%*: | | | | | | | | | | | | | | | | | | | | |
Core & Main L.P., 6M LIBOR + 3.000% | | | 5.25 | | | | 8/1/2024 | | | | 1,492,500 | | | | 1,503,681 | | | | 1,490,634 | |
Quikrete Holdings, Inc., 1M LIBOR + 2.750% | | | 4.84 | | | | 11/15/2023 | | | | 1,451,381 | | | | 1,451,511 | | | | 1,443,515 | |
SRS Distribution Inc., 3M LIBOR + 3.250% | | | 5.58 | | | | 5/23/2025 | | | | 1,953,395 | | | | 1,947,294 | | | | 1,922,473 | |
| | | | | | | | | | | | | | | | | | | | |
Total Buildings and Real Estate | | | | | | | | | | | 4,897,276 | | | | 4,902,486 | | | | 4,856,622 | |
| | | | | | | | | | | | | | | | | | | | |
| | | | | |
Cargo Transport — 0.2%*: | | | | | | | | | | | | | | | | | | | | |
Kenan Advantage Group, Inc., 1M LIBOR + 3.000% | | | 5.09 | | | | 7/31/2022 | | | | 449,923 | | | | 451,784 | | | | 448,798 | |
| | | | | | | | | | | | | | | | | | | | |
Total Cargo Transport | | | | | | | | | | | 449,923 | | | | 451,784 | | | | 448,798 | |
| | | | | | | | | | | | | | | | | | | | |
| | | | | |
Chemicals, Plastics and Rubber — 5.7%*: | | | | | | | | | | | | | | | | | | | | |
Albaugh LLC, 1M LIBOR + 3.500% | | | 5.59 | | | | 12/23/2024 | | | | 698,222 | | | | 702,529 | | | | 700,408 | |
Allnex (Luxembourg) & Cy S.C.A., EURIBOR + 3.250%+ | | | 3.25 | | | | 9/13/2023 | | | | 687,745 | | | | 778,537 | | | | 789,383 | |
Allnex (Luxembourg) & Cy S.C.A., 3M LIBOR + 3.250% | | | 5.57 | | | | 9/13/2023 | | | | 420,252 | | | | 418,682 | | | | 418,151 | |
Allnex USA, Inc., 3M LIBOR + 3.250% | | | 5.57 | | | | 9/13/2023 | | | | 316,614 | | | | 315,431 | | | | 315,031 | |
See accompanying Notes to the Financial Statements.
86
Barings Global Floating Rate Fund 2018 Annual Report
SCHEDULE OF INVESTMENTS (CONTINUED)
June 30, 2018
| | | | | | | | | | | | | | | | | | | | |
| | | EFFECTIVE
INTEREST RATE | | | DUE DATE | | | PRINCIPAL ‡‡ | | | COST | | | FAIR
VALUE | |
Bank Loans (Continued) | | | | | | | | | | | | | | | | | | | | |
| | | | | |
Chemicals, Plastics and Rubber (Continued) | | | | | | | | | | | | | | | | | | | | |
Alpha 3 B.V., 3M LIBOR + 3.000% | | | 5.33 | % | | | 1/31/2024 | | | | 1,576,791 | | | | $1,586,382 | | | | $1,567,598 | |
Archroma Finance Sarl, EURIBOR + 4.000%+ | | | 4.00 | | | | 8/11/2024 | | | | 1,000,000 | | | | 1,152,060 | | | | 1,153,202 | |
Associated Asphalt Partners LLC, 1M LIBOR + 5.250% | | | 7.34 | | | | 4/5/2024 | | | | 292,338 | | | | 291,139 | | | | 284,787 | |
Colouroz Investment 1 GmbH, EURIBOR + 3.0000%+ | | | 3.75 | | | | 9/7/2021 | | | | 22,342 | | | | 26,354 | | | | 24,982 | |
Colouroz Investment 1 GmbH, EURIBOR + 3.0000%+ | | | 5.03 | | | | 9/7/2021 | | | | 307,327 | | | | 362,517 | | | | 343,643 | |
Diversey, EURIBOR + 3.2500% | | | 3.25 | | | | 9/6/2024 | | | | 497,500 | | | | 587,920 | | | | 569,117 | |
Flint Group GmbH, LIBOR + 3.000%+ | | | 3.75 | | | | 9/7/2021 | | | | 264,212 | | | | 311,660 | | | | 295,433 | |
Flint Group GmbH, 3M LIBOR + 3.000%+ | | | 5.36 | | | | 9/7/2021 | | | | 88,273 | | | | 87,865 | | | | 81,211 | |
Flint Group US LLC, 3M LIBOR + 3.000%+ | | | 5.36 | | | | 9/7/2021 | | | | 533,976 | | | | 531,514 | | | | 491,258 | |
GrafTech Finance, Inc., 3M LIBOR + 3.500% | | | 5.84 | | | | 2/12/2025 | | | | 1,931,365 | | | | 1,927,052 | | | | 1,918,097 | |
Ineos US Finance LLC, EURIBOR + 2.000%+ | | | 2.50 | | | | 3/31/2024 | | | | 498,747 | | | | 590,991 | | | | 575,366 | |
MacDermid, Inc., EURIBOR + 2.500% | | | 3.25 | | | | 6/7/2020 | | | | 412,929 | | | | 485,509 | | | | 481,317 | |
Novacap S.A., EURIBOR + 3.500%+ | | | 3.50 | | | | 6/22/2023 | | | | 1,000,000 | | | | 1,132,039 | | | | 1,146,394 | |
Pinnacle Operating Corp., 1M LIBOR + 7.250% | | | 9.34 | | | | 11/15/2021 | | | | 715,986 | | | | 676,449 | | | | 657,812 | |
Solenis International, LP, 3M LIBOR + 4.000% | | | 6.34 | | | | 6/16/2025 | | | | 641,354 | | | | 634,940 | | | | 639,333 | |
Solenis International, LP, 3M LIBOR + 8.500% | | | 10.68 | | | | 6/1/2026 | | | | 376,263 | | | | 364,982 | | | | 369,208 | |
Tronox Blocked Borrower LLC, 3M LIBOR + 3.000% | | | 5.09 | | | | 9/22/2024 | | | | 480,423 | | | | 478,269 | | | | 479,943 | |
Tronox Finance LLC, 3M LIBOR + 3.000% | | | 5.09 | | | | 9/22/2024 | | | | 1,108,669 | | | | 1,103,699 | | | | 1,107,561 | |
| | | | | | | | | | | | | | | | | | | | |
Total Chemicals, Plastics and Rubber | | | | | | | | | | | 13,871,328 | | | | 14,546,520 | | | | 14,409,235 | |
| | | | | | | | | | | | | | | | | | | | |
| | | | | |
Containers, Packaging and Glass — 2.9%*: | | | | | | | | | | | | | | | | | | | | |
Albea Beauty Holdings S.A, EURIBOR + 4.000%+ | | | 5.44 | | | | 4/22/2024 | | | | 620,735 | | | | 619,986 | | | | 616,856 | |
BWAY Holding Co., 1M LIBOR + 3.250% | | | 5.59 | | | | 4/3/2024 | | | | 1,485,000 | | | | 1,478,799 | | | | 1,475,956 | |
Coveris Holdings S.A., EURIBOR + 4.000% | | | 6.50 | | | | 6/29/2022 | | | | 595,325 | | | | 694,027 | | | | 694,226 | |
Flex Acquisition Co., Inc., 3M LIBOR + 3.000% | | | 5.31 | | | | 12/29/2023 | | | | 1,583,940 | | | | 1,599,667 | | | | 1,575,767 | |
Horizon Holdings III S.A.S., EURIBOR + 2.750%+ | | | 2.75 | | | | 10/29/2022 | | | | 1,390,909 | | | | 1,661,893 | | | | 1,588,666 | |
ProAmpac PG Borrower LLC, 1M LIBOR + 3.500% | | | 5.61 | | | | 11/18/2023 | | | | 738,750 | | | | 741,628 | | | | 733,904 | |
ProAmpac PG Borrower LLC, 3M LIBOR + 8.500% | | | 10.58 | | | | 11/18/2024 | | | | 750,000 | | | | 741,006 | | | | 757,035 | |
| | | | | | | | | | | | | | | | | | | | |
Total Containers, Packaging and Glass | | | | | | | | | | | 7,164,659 | | | | 7,537,006 | | | | 7,442,410 | |
| | | | | | | | | | | | | | | | | | | | |
| | | | |
Diversified/Conglomerate Manufacturing — 2.3%*: | | | | | | | | | | | | | | | | | |
LTI Holdings, Inc., 1M LIBOR + 4.750% | | | 6.85 | | | | 5/16/2024 | | | | 815,670 | | | | 808,477 | | | | 813,631 | |
Misys Europe SA, EURIBOR + 3.250%+ | | | 4.25 | | | | 6/13/2024 | | | | 496,250 | | | | 538,123 | | | | 574,630 | |
PCF GmbH, EURIBOR + 3.250%+ | | | 4.00 | | | | 8/1/2024 | | | | 500,000 | | | | 525,197 | | | | 584,507 | |
Project Alpha Intermediate Holding, Inc., 3M LIBOR + 3.500% | | | 5.99 | | | | 4/26/2024 | | | | 589,151 | | | | 586,690 | | | | 585,469 | |
See accompanying Notes to the Financial Statements.
87
Barings Global Floating Rate Fund 2018 Annual Report
SCHEDULE OF INVESTMENTS (CONTINUED)
June 30, 2018
| | | | | | | | | | | | | | | | | | | | |
| | | EFFECTIVE
INTEREST RATE | | | DUE DATE | | | PRINCIPAL ‡‡ | | | COST | | | FAIR
VALUE | |
Bank Loans (Continued) | | | | | | | | | | | | | | | | | | | | |
| | | | |
Diversified/Conglomerate Manufacturing (Continued) | | | | | | | | | | | | | | | | | |
Triple Point Technology, Inc., 3M LIBOR + 4.250% | | | 6.34 | % | | | 7/10/2020 | | | | 942,485 | | | | $915,586 | | | | $841,168 | |
Wilsonart LLC, 3M LIBOR + 3.250% | | | 5.59 | | | | 12/19/2023 | | | | 606,400 | | | | 606,960 | | | | 604,581 | |
Xella International GmbH, EURIBOR +
3.500%+ | | | 3.50 | | | | 4/11/2024 | | | | 1,500,000 | | | | 1,830,487 | | | | 1,737,476 | |
| | | | | | | | | | | | | | | | | | | | |
Total Diversified/Conglomerate Manufacturing | | | | | | | | 5,449,956 | | | | 5,811,520 | | | | 5,741,462 | |
| | | | | | | | | | | | | | | | | | | | |
| | | | | |
Diversified/Conglomerate Service — 9.5%*: | | | | | | | | | | | | | | | | | | | | |
Almonde, Inc., 3M LIBOR + 3.500%+ | | | 5.81 | | | | 6/13/2024 | | | | 555,719 | | | | 553,355 | | | | 545,377 | |
Almonde, Inc., 3M LIBOR + 7.250%+ | | | 9.56 | | | | 6/13/2025 | | | | 752,587 | | | | 765,739 | | | | 723,658 | |
EAB Global, Inc., LIBOR + 3.750% | | | 6.25 | | | | 11/15/2024 | | | | 755,206 | | | | 751,757 | | | | 742,934 | |
GTCR Valor Cos., Inc., 3M LIBOR + 3.250% | | | 5.58 | | | | 6/16/2023 | | | | 451,649 | | | | 450,687 | | | | 450,294 | |
Hyland Software, Inc., 1M LIBOR + 3.250% | | | 5.34 | | | | 7/1/2022 | | | | 989,975 | | | | 998,110 | | | | 991,004 | |
I-Logic Technologies Bidco Ltd., 1M LIBOR + 4.000% | | | 6.09 | | | | 12/23/2024 | | | | 1,490,233 | | | | 1,488,405 | | | | 1,486,507 | |
Infor (US), Inc., EURIBOR + 2.250% | | | 3.25 | | | | 2/1/2022 | | | | 495,013 | | | | 587,001 | | | | 573,948 | |
Infor (US), Inc., 3M LIBOR + 2.750% | | | 4.84 | | | | 2/1/2022 | | | | 1,481,250 | | | | 1,482,145 | | | | 1,472,733 | |
Informatica LLC, 1M LIBOR + 3.250% | | | 5.34 | | | | 8/5/2022 | | | | 1,395,889 | | | | 1,399,298 | | | | 1,396,643 | |
Kronos, Inc., 3M LIBOR + 3.500% | | | 5.36 | | | | 11/1/2023 | | | | 1,591,043 | | | | 1,594,645 | | | | 1,586,779 | |
MH Sub I LLC, 3M LIBOR + 3.750% | | | 5.84 | | | | 9/13/2024 | | | | 2,066,882 | | | | 2,067,067 | | | | 2,064,877 | |
Project Leopard Holdings, Inc., 1M LIBOR + 4.000% | | | 6.09 | | | | 7/7/2023 | | | | 1,499,069 | | | | 1,506,887 | | | | 1,497,196 | |
Red Ventures LLC, 1M LIBOR + 4.000% | | | 6.09 | | | | 11/8/2024 | | | | 2,014,347 | | | | 2,023,810 | | | | 2,022,324 | |
TierPoint LLC, 1M LIBOR + 3.750% | | | 5.85 | | | | 5/6/2024 | | | | 265,171 | | | | 264,061 | | | | 257,383 | |
TMF Group Holding B.V., EURIBOR + 3.250%+ | | | 3.25 | | | | 11/30/2024 | | | | 1,000,000 | | | | 1,176,503 | | | | 1,148,099 | |
Travelport Finance (Luxembourg) S.a.r.l., 3M LIBOR + 2.500% | | | 4.83 | | | | 3/17/2025 | | | | 1,917,646 | | | | 1,910,507 | | | | 1,909,017 | |
Verisure Holding AB, EURIBOR + 3.000%+ | | | 3.00 | | | | 10/20/2022 | | | | 1,200,000 | | | | 1,357,165 | | | | 1,370,880 | |
Vertafore, Inc., 1M LIBOR + 3.250% | | | 5.59 | | | | 5/30/2025 | | | | 1,000,000 | | | | 995,000 | | | | 993,130 | |
Vertafore, Inc., 1M LIBOR + 7.250% | | | 9.59 | | | | 5/30/2026 | | | | 1,000,000 | | | | 990,000 | | | | 991,250 | |
VF Holding Corp., 1M LIBOR + 3.250% | | | 5.34 | | | | 6/30/2023 | | | | 1,719,991 | | | | 1,723,652 | | | | 1,708,381 | |
| | | | | | | | | | | | | | | | | | | | |
Total Diversified/Conglomerate Service | | | | | | | | | | | 23,641,670 | | | | 24,085,794 | | | | 23,932,414 | |
| | | | | | | | | | | | | | | | | | | | |
| | | | | |
Ecological — 0.5%*: | | | | | | | | | | | | | | | | | | | | |
Emerald 3 Ltd., 3M LIBOR + 7.000% | | | 9.33 | | | | 5/31/2022 | | | | 390,426 | | | | 388,486 | | | | 381,317 | |
Emerald US, Inc., 3M LIBOR + 4.000% | | | 6.33 | | | | 5/9/2021 | | | | 594,978 | | | | 564,704 | | | | 593,490 | |
PHS Group Ltd., 1M LIBOR + 5.250%+ | | | 7.35 | | | | 12/20/2021 | | | | 264,450 | | | | 326,992 | | | | 348,572 | |
| | | | | | | | | | | | | | | | | | | | |
Total Ecological | | | | | | | | | | | 1,249,854 | | | | 1,280,182 | | | | 1,323,379 | |
| | | | | | | | | | | | | | | | | | | | |
| | | | | |
Electronics — 3.6%*: | | | | | | | | | | | | | | | | | | | | |
EXC Holdings III Corp., 3M LIBOR + 3.500% | | | 5.83 | | | | 12/2/2024 | | | | 494,328 | | | | 499,703 | | | | 494,021 | |
ION Trading Technologies S.a.r.l., EURIBOR + 2.750% | | | 3.75 | | | | 11/21/2024 | | | | 497,500 | | | | 584,689 | | | | 572,510 | |
ION Trading Technologies S.a.r.l., EURIBOR + 3.250% | | | 4.25 | | | | 11/30/2024 | | | | 400,000 | | | | 458,356 | | | | 458,945 | |
See accompanying Notes to the Financial Statements.
88
Barings Global Floating Rate Fund 2018 Annual Report
SCHEDULE OF INVESTMENTS (CONTINUED)
June 30, 2018
| | | | | | | | | | | | | | | | | | | | |
| | | EFFECTIVE
INTEREST RATE | | | DUE DATE | | | PRINCIPAL ‡‡ | | | COST | | | FAIR
VALUE | |
Bank Loans (Continued) | | | | | | | | | | | | | | | | | | | | |
| | | | | |
Electronics (Continued) | | | | | | | | | | | | | | | | | | | | |
ION Trading Technologies S.a.r.l., 1M LIBOR + 4.000% | | | 6.34 | % | | | 11/21/2024 | | | | 725,993 | | | | $707,843 | | | | $718,733 | |
Omnitracs, Inc., 1M LIBOR + 2.750% | | | 5.09 | | | | 3/16/2025 | | | | 1,528,827 | | | | 1,522,551 | | | | 1,508,769 | |
RP Crown Parent LLC, 1M LIBOR + 3.000% | | | 4.84 | | | | 10/12/2023 | | | | 1,751,341 | | | | 1,747,565 | | | | 1,736,017 | |
Veritas Bermuda Ltd., EURIBOR + 4.500% | | | 5.50 | | | | 1/27/2023 | | | | 790,000 | | | | 880,772 | | | | 839,532 | |
Veritas Bermuda Ltd., 3M LIBOR + 4.500% | | | 6.65 | | | | 1/27/2023 | | | | 1,283,750 | | | | 1,279,777 | | | | 1,173,348 | |
Wall Street Systems Delaware, Inc., EURIBOR + 3.000% | | | 4.00 | | | | 11/21/2024 | | | | 497,500 | | | | 584,689 | | | | 581,887 | |
Wall Street Systems Delaware, Inc., 1M LIBOR + 3.000% | | | 5.09 | | | | 11/21/2024 | | | | 1,156,963 | | | | 1,156,963 | | | | 1,139,608 | |
| | | | | | | | | | | | | | | | | | | | |
Total Electronics | | | | | | | | | | | 9,126,202 | | | | 9,422,908 | | | | 9,223,370 | |
| | | | | | | | | | | | | | | | | | | | |
| | | | | |
Farming and Agriculture — 0.6%*: | | | | | | | | | | | | | | | | | | | | |
Dole Food Co. Inc., 1M LIBOR + 2.750% | | | 4.83 | | | | 4/6/2024 | | | | 1,448,934 | | | | 1,455,985 | | | | 1,440,400 | |
| | | | | | | | | | | | | | | | | | | | |
| | | | | |
Finance — 3.0%*: | | | | | | | | | | | | | | | | | | | | |
Edelman Financial Group, The, 3M LIBOR + 3.250% | | | 5.59 | | | | 6/25/2025 | | | | 653,967 | | | | 650,698 | | | | 652,744 | |
Edelman Financial Group, The, 3M LIBOR + 6.750% | | | 9.09 | | | | 6/8/2026 | | | | 337,346 | | | | 335,659 | | | | 339,245 | |
Focus Financial Partners LLC, 3M LIBOR + 2.750% | | | 4.84 | | | | 6/18/2024 | | | | 1,949,708 | | | | 1,959,060 | | | | 1,948,090 | |
NAB Holdings LLC, 3M LIBOR + 3.000% | | | 5.33 | | | | 6/28/2024 | | | | 995,000 | | | | 996,729 | | | | 988,164 | |
Nets Holding A/S, EURIBOR + 3.250%+ | | | 3.25 | | | | 2/6/2025 | | | | 440,972 | | | | 522,706 | | | | 505,456 | |
NFP Corp., 1M LIBOR + 3.000% | | | 5.09 | | | | 1/8/2024 | | | | 1,528,448 | | | | 1,546,108 | | | | 1,516,985 | |
Tempo Acquisition LLC, 1M LIBOR + 3.000% | | | 5.09 | | | | 5/1/2024 | | | | 1,620,829 | | | | 1,620,392 | | | | 1,612,724 | |
| | | | | | | | | | | | | | | | | | | | |
Total Finance | | | | | | | | | | | 7,526,270 | | | | 7,631,352 | | | | 7,563,408 | |
| | | | | | | | | | | | | | | | | | | | |
| | | | | |
Healthcare, Education and Childcare — 11.7%*: | | | | | | | | | | | | | | | | | | | | |
Aenova Holding GmbH, EURIBOR + 4.000%+ | | | 5.00 | | | | 9/29/2020 | | | | 500,000 | | | | 575,325 | | | | 566,383 | |
Amedes Holding AG, EURIBOR + 4.750%+ | | | 4.75 | | | | 8/19/2022 | | | | 500,000 | | | | 577,946 | | | | 578,867 | |
Amneal Pharmaceuticals LLC, 3M LIBOR + 3.500% | | | 5.63 | | | | 5/4/2025 | | | | 1,487,267 | | | | 1,489,168 | | | | 1,483,087 | |
Arbor Pharmaceuticals, Inc., 3M LIBOR + 5.000% | | | 7.49 | | | | 7/5/2023 | | | | 1,546,101 | | | | 1,534,162 | | | | 1,549,967 | |
Cerba Healthcare S.A.S., EURIBOR + 3.000%+ | | | 3.00 | | | | 4/20/2024 | | | | 1,000,000 | | | | 1,172,595 | | | | 1,133,350 | |
CEVA Sante Animale, EURIBOR + 3.000%+ | | | 3.00 | | | | 6/30/2021 | | | | 1,000,000 | | | | 1,155,622 | | | | 1,150,073 | |
Cheplapharm Arzneimittel GmbH, EURIBOR + 4.500%+ | | | 4.50 | | | | 6/30/2025 | | | | 500,000 | | | | 575,019 | | | | 575,141 | |
Domus Vi SA, EURIBOR + 3.250%+ | | | 3.25 | | | | 10/11/2024 | | | | 500,000 | | | | 592,175 | | | | 574,231 | |
Endo Luxembourg Finance Co. I S.a r.l., 1M LIBOR + 4.250% | | | 6.38 | | | | 4/29/2024 | | | | 1,543,736 | | | | 1,538,983 | | | | 1,539,876 | |
Greatbatch Ltd., 1M LIBOR + 3.250% | | | 5.30 | | | | 10/27/2022 | | | | 1,188,711 | | | | 1,198,194 | | | | 1,189,983 | |
Horizon Pharma, Inc., 1M LIBOR + 3.250% | | | 5.38 | | | | 3/29/2024 | | | | 967,220 | | | | 972,700 | | | | 964,802 | |
Indivior Finance S.a.r.l., 3M LIBOR + 4.500% | | | 6.86 | | | | 12/18/2022 | | | | 497,500 | | | | 495,265 | | | | 494,391 | |
Jaguar Holding Co. II, 1M LIBOR + 2.500% | | | 4.59 | | | | 8/18/2022 | | | | 1,491,192 | | | | 1,495,432 | | | | 1,482,439 | |
Kindred Healthcare, Inc., 3M LIBOR + 3.500% | | | 5.88 | | | | 4/9/2021 | | | | 1,651,736 | | | | 1,623,333 | | | | 1,649,671 | |
See accompanying Notes to the Financial Statements.
89
Barings Global Floating Rate Fund 2018 Annual Report
SCHEDULE OF INVESTMENTS (CONTINUED)
June 30, 2018
| | | | | | | | | | | | | | | | | | | | |
| | | EFFECTIVE
INTEREST RATE | | | DUE DATE | | | PRINCIPAL ‡‡ | | | COST | | | FAIR
VALUE | |
Bank Loans (Continued) | | | | | | | | | | | | | | | | | | | | |
| | | | |
Healthcare, Education and Childcare (Continued) | | | | | | | | | | | | | | | | | |
Lifescan Global Corp., 1M LIBOR + 6.0000% | | | 8.34 | % | | | 5/23/2025 | | | | 400,000 | | | | $388,000 | | | | $387,000 | |
Mallinckrodt International Finance S.A., 3M LIBOR + 2.750% | | | 5.09 | | | | 9/24/2024 | | | | 1,089,782 | | | | 1,089,782 | | | | 1,066,625 | |
Nidda Healthcare Holding AG, EURIBOR + 3.500%+ | | | 3.50 | | | | 8/21/2024 | | | | 1,000,000 | | | | 1,152,060 | | | | 1,142,132 | |
Nidda Healthcare Holding AG, GBP + 4.500%+ | | | 4.51 | | | | 8/21/2024 | | | | 500,000 | | | | 679,950 | | | | 645,266 | |
Ortho-Clinical Diagnostics SA, 3M LIBOR + 3.250% | | | 5.34 | | | | 6/30/2025 | | | | 1,984,616 | | | | 1,985,600 | | | | 1,975,943 | |
Press Ganey Holdings, Inc., 1M LIBOR + 2.750% | | | 4.84 | | | | 10/23/2023 | | | | 1,231,250 | | | | 1,237,792 | | | | 1,228,172 | |
Press Ganey Holdings, Inc., 1M LIBOR + 6.500% | | | 8.59 | | | | 10/21/2024 | | | | 369,106 | | | | 373,143 | | | | 373,719 | |
Radiology Partners Holdings, LLC, 1M LIBOR + 4.2500% | | | 6.59 | | | | 6/21/2025 | | | | 1,387,034 | | | | 1,373,164 | | | | 1,373,164 | |
Riemser Pharma GmbH, EURIBOR + 5.500%+ | | | 5.50 | | | | 6/29/2023 | | | | 500,000 | | | | 543,452 | | | | 576,969 | |
Rodenstock GmbH, EURIBOR + 5.250%+ | | | 5.25 | | | | 6/30/2021 | | | | 1,500,000 | | | | 1,741,305 | | | | 1,690,390 | |
Team Health Holdings, Inc., 1M LIBOR + 2.750% | | | 4.84 | | | | 2/6/2024 | | | | 1,987,425 | | | | 1,934,044 | | | | 1,907,927 | |
Tunstall Group Holdings Ltd., 3M LIBOR + 5.000% (PIK 3.000%) + | | | 8.72 | | | | 10/16/2020 | | | | 515,832 | | | | 817,936 | | | | 679,919 | |
Valeant Pharmaceuticals International, Inc., 1M LIBOR + 3.000% | | | 4.98 | | | | 6/1/2025 | | | | 1,507,610 | | | | 1,504,690 | | | | 1,501,489 | |
| | | | | | | | | | | | | | | | | | | | |
Total Healthcare, Education and Childcare | | | | | | | | | | | 28,346,118 | | | | 29,816,837 | | | | 29,480,976 | |
| | | | | | | | | | | | | | | | | | | | |
|
Home and Office Furnishings, Housewares, and Durable Consumer Products — 2.2%*: | |
Hayward Industries, Inc., LIBOR + 3.50% | | | 5.59 | | | | 8/5/2024 | | | | 992,500 | | | | 999,174 | | | | 993,125 | |
Keter Group B.V., EURIBOR + 4.250%+ | | | 5.25 | | | | 10/31/2023 | | | | 500,000 | | | | 546,977 | | | | 568,678 | |
Serta Simmons Bedding LLC, 3M LIBOR + 3.500% | | | 5.75 | | | | 11/8/2023 | | | | 1,708,660 | | | | 1,702,033 | | | | 1,452,361 | |
Serta Simmons Bedding LLC, 1M LIBOR + 8.000% | | | 10.33 | | | | 11/8/2024 | | | | 474,667 | | | | 468,970 | | | | 317,434 | |
SIWF Holdings Inc., 1M LIBOR + 4.250% | | | 6.32 | | | | 3/17/2025 | | | | 1,486,626 | | | | 1,491,779 | | | | 1,492,201 | |
Visual Comfort Generation Brands Holdings, Inc., 1M LIBOR + 8.000% | | | 10.09 | | | | 2/28/2025 | | | | 800,000 | | | | 796,480 | | | | 802,000 | |
| | | | | | | | | | | | | | | | | | | | |
Total Home and Office Furnishings, Housewares, and Durable Consumer Products | | | | | | | | | | | 5,962,453 | | | | 6,005,413 | | | | 5,625,799 | |
| | | | | | | | | | | | | | | | | | | | |
|
Hotels, Motels, Inns and Gaming — 3.5%*: | |
Caesars Resort Collection LLC, 1M LIBOR + 2.750% | | | 4.84 | | | | 12/22/2024 | | | | 1,992,494 | | | | 1,992,681 | | | | 1,984,703 | |
Compass IV Ltd., 3M LIBOR + 4.500%+ | | | 4.50 | | | | 4/30/2025 | | | | 500,000 | | | | 598,059 | | | | 581,226 | |
Compass IV Ltd., EURIBOR + 8.000%+ | | | 9.00 | | | | 4/30/2026 | | | | 500,000 | | | | 585,977 | | | | 571,247 | |
Cyan Blue Holdco 3 Ltd., LIBOR - GBP + 4.000%+ | | | 4.66 | | | | 8/23/2024 | | | | 460,049 | | | | 595,403 | | | | 605,730 | |
Financiere Sun S.A.S., EURIBOR + 3.250%+ | | | 3.25 | | | | 3/14/2023 | | | | 338,983 | | | | 404,625 | | | | 392,472 | |
HNVR Holdco Ltd., EURIBOR + 3.250%+ | | | 3.25 | | | | 9/12/2023 | | | | 492,449 | | | | 545,137 | | | | 566,456 | |
See accompanying Notes to the Financial Statements.
90
Barings Global Floating Rate Fund 2018 Annual Report
SCHEDULE OF INVESTMENTS (CONTINUED)
June 30, 2018
| | | | | | | | | | | | | | | | | | | | |
| | | EFFECTIVE
INTEREST RATE | | | DUE DATE | | | PRINCIPAL ‡‡ | | | COST | | | FAIR
VALUE | |
Bank Loans (Continued) | | | | | | | | | | | | | | | | | | | | |
| | | | | |
Hotels, Motels, Inns and Gaming (Continued) | | | | | | | | | | | | | | | | | | | | |
Stars Group Holdings B.V. (The), 3M LIBOR + 3.500%+ | | | 2.34 | % | | | 7/28/2025 | | | | 1,500,000 | | | | $1,492,500 | | | | $1,500,000 | |
Stars Group Holdings B.V. (The), 3M LIBOR + 3.000%+ | | | 5.09 | | | | 4/6/2025 | | | | 1,496,250 | | | | 1,492,617 | | | | 1,493,257 | |
Tackle S.a.r.l., EURIBOR + 3.250%+ | | | 3.25 | | | | 8/8/2022 | | | | 1,000,000 | | | | 1,116,850 | | | | 1,153,039 | |
| | | | | | | | | | | | | | | | | | | | |
Total Hotels, Motels, Inns and Gaming | | | | | | | | | | | 8,280,225 | | | | 8,823,849 | | | | 8,848,130 | |
| | | | | | | | | | | | | | | | | | | | |
|
Insurance — 5.1%*: | |
Alliant Holdings I, Inc., 1M LIBOR + 3.000% | | | 5.05 | | | | 5/9/2025 | | | | 1,811,098 | | | | 1,819,969 | | | | 1,797,515 | |
AmWINS Group, Inc., 1M LIBOR + 2.750% | | | 4.82 | | | | 1/25/2024 | | | | 1,481,203 | | | | 1,484,252 | | | | 1,473,590 | |
AssuredPartners, Inc., 1M LIBOR + 3.250% | | | 5.34 | | | | 10/22/2024 | | | | 1,795,794 | | | | 1,807,638 | | | | 1,785,701 | |
Asurion LLC, 1M LIBOR + 2.750% | | | 4.84 | | | | 11/3/2023 | | | | 1,556,089 | | | | 1,563,408 | | | | 1,552,198 | |
Genex Holding Inc., 3M LIBOR + 3.250% | | | 5.28 | | | | 2/14/2025 | | | | 2,059,888 | | | | 2,060,372 | | | | 2,037,579 | |
Hub International Ltd., 2M LIBOR + 3.000% | | | 2.00 | | | | 4/25/2025 | | | | 2,000,000 | | | | 1,995,114 | | | | 1,986,760 | |
Sedgwick Claims Management Services, Inc., 1M LIBOR + 5.750% | | | 7.89 | | | | 2/28/2022 | | | | 743,236 | | | | 744,722 | | | | 745,563 | |
York Risk Services Holding Corp., 1M LIBOR + 3.750% | | | 5.84 | | | | 10/1/2021 | | | | 1,650,217 | | | | 1,626,652 | | | | 1,597,757 | |
| | | | | | | | | | | | | | | | | | | | |
Total Insurance | | | | | | | | | | | 13,097,525 | | | | 13,102,127 | | | | 12,976,663 | |
| | | | | | | | | | | | | | | | | | | | |
|
Leisure, Amusement, Entertainment — 4.0%*: | |
Columbus Capital B.V., EURIBOR + 4.750%+ | | | 4.75 | | | | 6/30/2024 | | | | 500,000 | | | | 571,078 | | | | 575,142 | |
Crown Finance US, Inc., 1M LIBOR + 2.500% | | | 4.59 | | | | 2/28/2025 | | | | 997,500 | | | | 998,717 | | | | 989,311 | |
Delta 2 (LUX) S.a.r.l., 1M LIBOR + 2.500%+ | | | 4.59 | | | | 2/1/2024 | | | | 1,394,967 | | | | 1,399,517 | | | | 1,374,921 | |
Dorna Sports, S.L., EURIBOR + 3.000%+ | | | 3.00 | | | | 4/12/2024 | | | | 500,000 | | | | 540,275 | | | | 574,826 | |
International Park Holdings B.V., EURIBOR + 3.500%+ | | | 3.50 | | | | 6/13/2024 | | | | 500,000 | | | | 580,850 | | | | 579,001 | |
Metro-Goldwyn-Mayer Inc., 3M LIBOR + 2.340% | | | 2.34 | | | | 6/26/2026 | | | | 2,000,000 | | | | 1,980,000 | | | | 1,980,000 | |
SeaWorld Parks & Entertainment, Inc., 3M LIBOR + 3.000% | | | 5.09 | | | | 3/31/2024 | | | | 2,072,785 | | | | 2,062,384 | | | | 2,055,394 | |
William Morris Endeavor Entertainment, LLC, 2M LIBOR + 2.750% | | | 4.93 | | | | 5/10/2025 | | | | 1,924,382 | | | | 1,919,076 | | | | 1,907,543 | |
| | | | | | | | | | | | | | | | | | | | |
Total Leisure, Amusement, Entertainment | | | | | | | | | | | 9,889,634 | | | | 10,051,897 | | | | 10,036,138 | |
| | | | | | | | | | | | | | | | | | | | |
|
Machinery Non-Agriculture, Non-Construction, Non-Electronic — 2.1%*: | |
Alison Bidco S.a.r.l., 1M LIBOR + 4.500%+ | | | 6.86 | | | | 8/29/2021 | | | | 286,110 | | | | 284,812 | | | | 280,388 | |
Apex Tool Group LLC, 1M LIBOR + 3.750% | | | 5.84 | | | | 2/1/2022 | | | | 1,711,921 | | | | 1,708,848 | | | | 1,710,312 | |
Gardner Denver, Inc., 3M LIBOR + 2.750% | | | 4.84 | | | | 7/30/2024 | | | | 1,256,745 | | | | 1,253,996 | | | | 1,256,280 | |
Titan Acquisition Ltd., 1M LIBOR + 3.000%+ | | | 5.09 | | | | 3/28/2025 | | | | 1,995,900 | | | | 1,993,617 | | | | 1,963,227 | |
| | | | | | | | | | | | | | | | | | | | |
Total Machinery Non-Agriculture, Non-Construction, Non-Electronic | | | | | | | | | | | 5,250,676 | | | | 5,241,273 | | | | 5,210,207 | |
| | | | | | | | | | | | | | | | | | | | |
|
Mining, Steel, Iron and Non-Precious Metals — 2.8%*: | |
Big River Steel LLC, 3M LIBOR + 5.000% | | | 7.33 | | | | 8/23/2023 | | | | 1,126,808 | | | | 1,136,480 | | | | 1,140,195 | |
Boomerang Tube LLC¤†† | | | 15.00 | *** | | | 2/1/2019 | | | | 32,825 | | | | 32,858 | | | | 32,825 | |
See accompanying Notes to the Financial Statements.
91
Barings Global Floating Rate Fund 2018 Annual Report
SCHEDULE OF INVESTMENTS (CONTINUED)
June 30, 2018
| | | | | | | | | | | | | | | | | | | | |
| | | EFFECTIVE
INTEREST RATE | | | DUE DATE | | | PRINCIPAL ‡‡ | | | COST | | | FAIR
VALUE | |
Bank Loans (Continued) | | | | | | | | | | | | | | | | | | | | |
| | | | |
Mining, Steel, Iron and Non-Precious Metals (Continued) | | | | | | | | | | | | | | | | | |
Boomerang Tube LLC, 1M LIBOR + 15.000%¤†† | | | 17.09 | % | | | 2/1/2019 | | | | 121,563 | | | | 121,563 | | | | $121,563 | |
Boomerang Tube LLC, 1M LIBOR + 17.500%¤†† | | | 19.59 | | | | 2/1/2021 | | | | 105,223 | | | | $105,223 | | | | 5,261 | |
Boomerang Tube LLC¤†† | | | 20.00 | *** | | | 2/1/2019 | | | | 46,501 | | | | 45,368 | | | | 46,501 | |
Coronado Coal LLC, LIBOR + 6.500% | | | 8.83 | | | | 3/14/2025 | | | | 809,187 | | | | 785,590 | | | | 814,244 | |
Covia Holdings Corp., 3M LIBOR + 3.750% | | | 6.05 | | | | 6/1/2025 | | | | 1,475,193 | | | | 1,475,193 | | | | 1,474,279 | |
Murray Energy Corp., 3M LIBOR + 7.250% | | | 9.34 | | | | 4/16/2020 | | | | 1,386,791 | | | | 1,321,095 | | | | 1,304,249 | |
U.S. Silica Co., 1M LIBOR + 4.000% | | | 6.13 | | | | 5/1/2025 | | | | 2,168,785 | | | | 2,192,644 | | | | 2,165,531 | |
| | | | | | | | | | | | | | | | | | | | |
Total Mining, Steel, Iron and Non-Precious Metals | | | | | | | | | | | 7,272,876 | | | | 7,216,014 | | | | 7,104,648 | |
| | | | | | | | | | | | | | | | | | | | |
|
Oil and Gas — 3.1%*: | |
Caelus Energy Alaska O3 LLC, 3M LIBOR + 7.500% | | | 9.83 | | | | 4/15/2020 | | | | 1,499,143 | | | | 1,435,301 | | | | 1,371,716 | |
Fieldwood Energy LLC, 1M LIBOR + 7.250% | | | 9.34 | | | | 4/11/2023 | | | | 864,968 | | | | 337,501 | | | | 835,412 | |
Floatel International, Ltd., 3M LIBOR + 5.000% | | | 7.33 | | | | 6/27/2020 | | | | 393,837 | | | | 392,512 | | | | 338,699 | |
Gulf Finance LLC, 3M LIBOR + 5.250% | | | 7.59 | | | | 8/25/2023 | | | | 939,721 | | | | 918,909 | | | | 808,940 | |
KCA Deutag Alpha Ltd., LIBOR + 6.750%+ | | | 9.08 | | | | 3/31/2023 | | | | 500,000 | | | | 497,509 | | | | 497,375 | |
Seadrill Partners Finco LLC, 3M LIBOR + 6.000% | | | 8.33 | | | | 2/21/2021 | | | | 2,180,480 | | | | 1,617,002 | | | | 1,949,415 | |
Southcross Holdings Borrower LP, 1M LIBOR + 5.500% (3.500% PIK) | | | 9.00 | | | | 4/13/2023 | | | | 21,747 | | | | 21,747 | | | | 20,660 | |
UTEX Industries, Inc., 1M LIBOR + 4.000% | | | 6.09 | | | | 5/22/2021 | | | | 977,848 | | | | 882,422 | | | | 967,258 | |
UTEX Industries, Inc., 1M LIBOR + 7.250% | | | 9.35 | | | | 5/22/2022 | | | | 1,000,000 | | | | 671,588 | | | | 978,330 | |
| | | | | | | | | | | | | | | | | | | | |
Total Oil and Gas | | | | | | | | | | | 8,377,744 | | | | 6,774,491 | | | | 7,767,805 | |
| | | | | | | | | | | | | | | | | | | | |
|
Personal, Food and Miscellaneous — 0.2%*: | |
Capri Finance LLC, 3M LIBOR + 3.250%+ | | | 5.61 | | | | 10/4/2024 | | | | 500,000 | | | | 498,750 | | | | 495,315 | |
| | | | | | | | | | | | | | | | | | | | |
|
Printing and Publishing — 2.1%*: | |
Ascend Learning LLC, 1M LIBOR + 3.000% | | | 5.09 | | | | 7/12/2024 | | | | 697,598 | | | | 700,037 | | | | 694,982 | |
Getty Images, Inc., 3M LIBOR + 3.500% | | | 5.59 | | | | 10/18/2019 | | | | 2,101,881 | | | | 2,033,437 | | | | 2,026,570 | |
Springer Science+Business Media Deutschland GmbH, 2M LIBOR + 3.500%+ | | | 5.59 | | | | 8/15/2022 | | | | 1,667,010 | | | | 1,671,582 | | | | 1,663,543 | |
Springer Science+Business Media Deutschland GmbH, EURIBOR + 3.2500%+ | | | 3.75 | | | | 8/15/2022 | | | | 748,092 | | | | 869,733 | | | | 868,660 | |
| | | | | | | | | | | | | | | | | | | | |
Total Printing and Publishing | | | | | | | | | | | 5,214,581 | | | | 5,274,789 | | | | 5,253,755 | |
| | | | | | | | | | | | | | | | | | | | |
|
Retail Stores — 4.2%*: | |
24 Hour Fitness Worldwide, Inc., 1M LIBOR + 3.500% | | | 5.59 | | | | 5/24/2025 | | | | 1,525,857 | | | | 1,528,722 | | | | 1,523,568 | |
Ascena Retail Group, Inc., 1M LIBOR + 4.500% | | | 6.63 | | | | 8/21/2022 | | | | 1,043,624 | | | | 898,127 | | | | 929,348 | |
EG Finco Ltd., LIBOR + 4.000%+ | | | 6.33 | | | | 2/7/2025 | | | | 1,102,865 | | | | 1,097,495 | | | | 1,092,112 | |
EG Group Ltd., EURIBOR + 4.000%+ | | | 2.00 | | | | 2/6/2025 | | | | 168,196 | | | | 203,871 | | | | 193,881 | |
See accompanying Notes to the Financial Statements.
92
Barings Global Floating Rate Fund 2018 Annual Report
SCHEDULE OF INVESTMENTS (CONTINUED)
June 30, 2018
| | | | | | | | | | | | | | | | | | | | |
| | | EFFECTIVE
INTEREST RATE | | | DUE DATE | | | PRINCIPAL ‡‡ | | | COST | | | FAIR
VALUE | |
Bank Loans (Continued) | | | | | | | | | | | | | | | | | | | | |
| | | | | |
Retail Stores (Continued) | | | | | | | | | | | | | | | | | | | | |
EG Group Ltd., EURIBOR + 4.000%+ | | | 4.00 | % | | | 2/6/2025 | | | | 661,949 | | | | $801,356 | | | | $764,220 | |
EG Group Ltd., 3M LIBOR + 4.000%+ | | | 6.34 | | | | 2/6/2025 | | | | 224,494 | | | | 223,956 | | | | 222,305 | |
Eyemart Express LLC, 1M LIBOR + 3.000% | | | 5.06 | | | | 8/4/2024 | | | | 1,576,129 | | | | 1,582,147 | | | | 1,573,182 | |
Kirk Beauty One GmbH, EURIBOR + 3.500%+ | | | 3.50 | | | | 8/12/2022 | | | | 1,250,001 | | | | 1,548,597 | | | | 1,316,899 | |
Staples, Inc., 3M LIBOR + 4.000% | | | 6.36 | | | | 9/12/2024 | | | | 2,241,250 | | | | 2,225,192 | | | | 2,209,738 | |
Talbots, Inc., 1M LIBOR + 4.500% | | | 6.59 | | | | 3/19/2020 | | | | 317,290 | | | | 306,928 | | | | 311,937 | |
Thom Europe S.A.S, EURIBOR + 4.500%+ | | | 4.50 | | | | 8/7/2024 | | | | 500,000 | | | | 575,710 | | | | 578,791 | |
| | | | | | | | | | | | | | | | | | | | |
Total Retail Stores | | | | | | | | | | | 10,611,655 | | | | 10,992,101 | | | | 10,715,981 | |
| | | | | | | | | | | | | | | | | | | | |
|
Telecommunications — 5.0%*: | |
BMC Software Finance, Inc., 1M LIBOR + 4.250% | | | 6.59 | | | | 6/26/2025 | | | | 1,000,000 | | | | 990,000 | | | | 993,750 | |
CDS Holdco III B.V., EURIBOR + 4.250%+ | | | 3.75 | | | | 12/31/2024 | | | | 500,000 | | | | 577,220 | | | | 576,531 | |
Digicel International Finance Ltd., 3M LIBOR + 3.250%+ | | | 5.61 | | | | 5/28/2024 | | | | 424,880 | | | | 428,234 | | | | 405,229 | |
Eircom Finco S.a.r.l., EURIBOR + 3.250%+ | | | 3.25 | | | | 4/19/2024 | | | | 1,000,000 | | | | 1,154,955 | | | | 1,155,211 | |
GTT Communications, Inc., 3M LIBOR + 2.750% | | | 4.88 | | | | 4/25/2025 | | | | 2,010,909 | | | | 2,000,912 | | | | 1,979,237 | |
Sprint Communications, Inc., 1M LIBOR + 2.500% | | | 4.63 | | | | 2/2/2024 | | | | 1,484,962 | | | | 1,491,400 | | | | 1,476,914 | |
Syniverse Holdings, Inc., 1M LIBOR + 5.000% | | | 7.05 | | | | 3/9/2023 | | | | 1,577,245 | | | | 1,582,855 | | | | 1,573,964 | |
Syniverse Holdings, Inc., 1M LIBOR + 9.000% | | | 11.05 | | | | 3/11/2024 | | | | 425,482 | | | | 419,412 | | | | 422,159 | |
TDC A/S, 1M LIBOR + 3.500%+ | | | 3.50 | | | | 6/30/2025 | | | | 800,000 | | | | 939,798 | | | | 922,366 | |
Virgin Media Investment Holdings Ltd., LIBOR - GBP + 3.250%+ | | | 3.76 | | | | 11/15/2027 | | | | 1,250,000 | | | | 1,725,580 | | | | 1,629,694 | |
Ziggo Secured Finance B.V., EURIBOR + 3.000%+ | | | 3.00 | | | | 4/15/2025 | | | | 1,000,000 | | | | 1,153,446 | | | | 1,146,733 | |
Ziggo Secured Finance Partnership, 1M LIBOR + 2.500%+ | | | 4.57 | | | | 4/15/2025 | | | | 500,000 | | | | 501,134 | | | | 494,065 | |
| | | | | | | | | | | | | | | | | | | | |
Total Telecommunications | | | | | | | | | | | 11,973,478 | | | | 12,964,946 | | | | 12,775,853 | |
| | | | | | | | | | | | | | | | | | | | |
|
Utilities — 0.6%*: | |
Helix Gen Funding LLC, 3M LIBOR + 3.750% | | | 5.84 | | | | 6/2/2024 | | | | 504,038 | | | | 503,981 | | | | 504,562 | |
Vistra Operations Co. LLC, 1M LIBOR + 3.250% | | | 4.34 | | | | 12/14/2023 | | | | 1,073,350 | | | | 1,081,984 | | | | 1,067,318 | |
| | | | | | | | | | | | | | | | | | | | |
Total Utilities | | | | | | | | | | | 1,577,388 | | | | 1,585,965 | | | | 1,571,880 | |
| | | | | | | | | | | | | | | | | | | | |
Total Bank Loans | | | | | | | | | | | 210,638,753 | | | | 216,615,661 | | | | 214,597,094 | |
| | | | | | | | | | | | | | | | | | | | |
|
Corporate Bonds — 10.0%*: | |
|
Automobile — 0.4%*: | |
AA Bond Co. Ltd.+ | | | 5.50 | | | | 7/31/2022 | | | | 700,000 | | | | 938,160 | | | | 842,529 | |
RAC Bond Co. PLC+ | | | 5.00 | | | | 11/6/2022 | | | | 100,000 | | | | 128,880 | | | | 124,481 | |
| | | | | | | | | | | | | | | | | | | | |
Total Automobile | | | | | | | | | | | 800,000 | | | | 1,067,040 | | | | 967,010 | |
| | | | | | | | | | | | | | | | | | | | |
See accompanying Notes to the Financial Statements.
93
Barings Global Floating Rate Fund 2018 Annual Report
SCHEDULE OF INVESTMENTS (CONTINUED)
June 30, 2018
| | | | | | | | | | | | | | | | | | | | |
| | | EFFECTIVE
INTEREST RATE | | | DUE DATE | | | PRINCIPAL ‡‡ | | | COST | | | FAIR
VALUE | |
Corporate Bonds (Continued) | | | | | | | | | | | | | | | | | | | | |
|
Beverage, Food and Tobacco — 0.1%*: | |
Burger King, Inc.+^ | | | 5.00 | % | | | 10/15/2025 | | | | 327,000 | | | | $327,000 | | | | $309,407 | |
| | | | | | | | | | | | | | | | | | | | |
|
Broadcasting and Entertainment — 0.1%*: | |
Entertainment One Ltd.+ | | | 6.88 | | | | 12/15/2022 | | | | 100,000 | | | | 150,201 | | | | 137,914 | |
VTR Finance BV+^ | | | 6.88 | | | | 1/15/2024 | | | | 211,000 | | | | 213,799 | | | | 211,992 | |
| | | | | | | | | | | | | | | | | | | | |
Total Broadcasting and Entertainment | | | | | | | | | | | 311,000 | | | | 364,000 | | | | 349,906 | |
| | | | | | | | | | | | | | | | | | | | |
|
Buildings and Real Estate — 0.3%*: | |
Miller Homes Group Holdings PLC, 3M GBP LIBOR + 5.250%+ | | | 6.04 | # | | | 10/15/2023 | | | | 500,000 | | | | 666,402 | | | | 658,226 | |
| | | | | | | | | | | | | | | | | | | | |
|
Cargo Transport — 0.4%*: | |
Deck Chassis Acquisition, Inc.^ | | | 10.00 | | | | 6/15/2023 | | | | 841,000 | | | | 883,824 | | | | 891,460 | |
WFS Global Holding SAS+ | | | 9.50 | | | | 7/15/2022 | | | | 100,000 | | | | 113,435 | | | | 122,421 | |
| | | | | | | | | | | | | | | | | | | | |
Total Cargo Transport | | | | | | | | | | | 941,000 | | | | 997,259 | | | | 1,013,881 | |
| | | | | | | | | | | | | | | | | | | | |
|
Chemicals, Plastics and Rubber — 0.2%*: | |
Monitchem HoldCo 3 SA, 3 mo. EURIBOR + 4.750%+ | | | 4.43 | # | | | 6/15/2021 | | | | 150,000 | | | | 174,855 | | | | 173,314 | |
Pinnacle Operating Corp.^ | | | 9.00 | | | | 5/15/2023 | | | | 378,294 | | | | 461,200 | | | | 355,597 | |
| | | | | | | | | | | | | | | | | | | | |
Total Chemicals, Plastics and Rubber | | | | | | | | | | | 528,294 | | | | 636,055 | | | | 528,911 | |
| | | | | | | | | | | | | | | | | | | | |
|
Containers, Packaging and Glass — 0.5%*: | |
Ardagh Packaging Finance PLC/Ardagh Holdings USA, Inc.+^ | | | 4.63 | | | | 5/15/2023 | | | | 500,000 | | | | 502,271 | | | | 494,375 | |
BWAY Holding Co. | | | 4.75 | | | | 4/15/2024 | | | | 350,000 | | | | 404,810 | | | | 406,216 | |
BWAY Holding Co.^ | | | 5.50 | | | | 4/15/2024 | | | | 300,000 | | | | 300,000 | | | | 292,500 | |
Reynolds Group Issuer, Inc./Reynolds Group Issuer LLC/Reynolds Group Issuer Lu^ | | | 5.13 | | | | 7/15/2023 | | | | 178,000 | | | | 178,000 | | | | 175,775 | |
| | | | | | | | | | | | | | | | | | | | |
Total Containers, Packaging and Glass | | | | | | | | | | | 1,328,000 | | | | 1,385,081 | | | | 1,368,866 | |
| | | | | | | | | | | | | | | | | | | | |
|
Diversified/Conglomerate Manufacturing — 0.1%*: | |
Appvion, Inc.^~ | | | 9.00 | # | | | 6/1/2020 | | | | 460,000 | | | | 463,417 | | | | 2,588 | |
Galapagos S.A., 3 mo. EURIBOR + 4.750%+ | | | 4.43 | # | | | 6/15/2021 | | | | 200,000 | | | | 272,630 | | | | 207,868 | |
| | | | | | | | | | | | | | | | | | | | |
Total Diversified/Conglomerate Manufacturing | | | | | | | | | | | 660,000 | | | | 736,047 | | | | 210,456 | |
| | | | | | | | | | | | | | | | | | | | |
|
Diversified/Conglomerate Service — 0.9%*: | |
Algeco Global Finance PLC, 3 mo. EURIBOR + 6.250%+ | | | 5.92 | # | | | 2/15/2023 | | | | 150,000 | | | | 182,089 | | | | 175,380 | |
Algeco Global Finance PLC+ | | | 6.50 | | | | 2/15/2023 | | | | 200,000 | | | | 242,598 | | | | 237,437 | |
Carlson Travel, Inc., 3 mo. EURIBOR + 4.750% | | | 4.75 | # | | | 6/15/2023 | | | | 600,000 | | | | 692,423 | | | | 683,163 | |
Prime Security Services Borrower LLC/Prime Finance, Inc.^ | | | 9.25 | | | | 5/15/2023 | | | | 220,000 | | | | 220,000 | | | | 234,234 | |
Sabre GLBL, Inc.^ | | | 5.38 | | | | 4/15/2023 | | | | 561,000 | | | | 568,791 | | | | 566,610 | |
See accompanying Notes to the Financial Statements.
94
Barings Global Floating Rate Fund 2018 Annual Report
SCHEDULE OF INVESTMENTS (CONTINUED)
June 30, 2018
| | | | | | | | | | | | | | | | | | | | |
| | | EFFECTIVE
INTEREST RATE | | | DUE DATE | | | PRINCIPAL ‡‡ | | | COST | | | FAIR
VALUE | |
Corporate Bonds (Continued) | | | | | | | | | | | | | | | | | | | | |
| | | | | |
Diversified/Conglomerate Service (Continued) | | | | | | | | | | | | | | | | | | | | |
TeamSystem SpA, 3 mo. EURIBOR + 4.000%+ | | | 4.00 | #% | | | 4/15/2023 | | | | 400,000 | | | | $492,740 | | | | $465,649 | |
| | | | | | | | | | | | | | | | | | | | |
Total Diversified/Conglomerate Service | | | | | | | | | | | 2,131,000 | | | | 2,398,641 | | | | 2,362,473 | |
| | | | | | | | | | | | | | | | | | | | |
|
Electronics — 0.4%*: | |
First Data Corp.^ | | | 5.00 | | | | 1/15/2024 | | | | 179,000 | | | | 178,159 | | | | 177,658 | |
Veritas US, Inc./Veritas Bermuda Ltd.^ | | | 7.50 | | | | 2/1/2023 | | | | 817,000 | | | | 865,333 | | | | 765,937 | |
| | | | | | | | | | | | | | | | | | | | |
Total Electronics | | | | | | | | | | | 996,000 | | | | 1,043,492 | | | | 943,595 | |
| | | | | | | | | | | | | | | | | | | | |
|
Finance — 1.7%*: | |
Arrow Global Finance PLC, 3 mo. EURIBOR + 3.750%+ | | | 3.75 | # | | | 3/1/2026 | | | | 400,000 | | | | 496,520 | | | | 449,883 | |
Cabot Financial Luxembourg SA+ | | | 7.50 | | | | 10/1/2023 | | | | 300,000 | | | | 429,095 | | | | 402,854 | |
Galaxy Bidco Ltd., 3M GBP LIBOR + 4.500%+ | | | 5.14 | # | | | 11/15/2020 | | | | 100,000 | | | | 139,788 | | | | 130,061 | |
Garfunkelux Holdco 3 S.A.+ | | | 8.50 | | | | 11/1/2022 | | | | 250,000 | | | | 386,377 | | | | 320,139 | |
Garfunkelux Holdco 3 SA, 3 mo. EURIBOR + 4.500%+ | | | 4.50 | # | | | 9/1/2023 | | | | 1,100,000 | | | | 1,323,253 | | | | 1,145,845 | |
Jerrold Finco PLC+ | | | 6.13 | | | | 1/15/2024 | | | | 100,000 | | | | 124,555 | | | | 132,643 | |
Jerrold Finco PLC+ | | | 6.25 | | | | 9/15/2021 | | | | 500,000 | | | | 696,832 | | | | 676,207 | |
Nexi Capital SpA, 3 mo. EURIBOR + 3.625%+ | | | 3.63 | # | | | 5/1/2023 | | | | 850,000 | | | | 1,008,417 | | | | 977,741 | |
| | | | | | | | | | | | | | | | | | | | |
Total Finance | | | | | | | | | | | 3,600,000 | | | | 4,604,837 | | | | 4,235,373 | |
| | | | | | | | | | | | | | | | | | | | |
|
Healthcare, Education and Childcare — 0.7%*: | |
HCA, Inc. | | | 5.25 | | | | 6/15/2026 | | | | 82,000 | | | | 82,000 | | | | 81,442 | |
IDH Finance PLC+ | | | 6.25 | | | | 8/15/2022 | | | | 100,000 | | | | 131,025 | | | | 120,207 | |
Synlab Bondco PLC+ | | | 6.25 | | | | 7/1/2022 | | | | 1,000,000 | | | | 1,243,226 | | | | 1,199,915 | |
Tenet Healthcare Corp.^ | | | 4.63 | | | | 7/15/2024 | | | | 255,000 | | | | 254,026 | | | | 241,536 | |
Valeant Pharmaceuticals International, Inc.^ | | | 5.50 | | | | 11/1/2025 | | | | 165,000 | | | | 165,000 | | | | 162,608 | |
| | | | | | | | | | | | | | | | | | | | |
Total Healthcare, Education and Childcare | | | | | | | | | | | 1,602,000 | | | | 1,875,277 | | | | 1,805,708 | |
| | | | | | | | | | | | | | | | | | | | |
|
Home and Office Furnishings, Housewares, and Durable Consumer Products — 0.2%*: | |
LSF9 Balta Issuer SARL+ | | | 7.75 | | | | 9/15/2022 | | | | 324,000 | | | | 407,548 | | | | 394,811 | |
| | | | | | | | | | | | | | | | | | | | |
|
Hotels, Motels, Inns and Gaming — 0.2%*: | |
TVL Finance PLC, 3M GBP LIBOR + 4.875%+ | | | 5.52 | # | | | 5/15/2023 | | | | 100,000 | | | | 130,880 | | | | 129,594 | |
TVL Finance PLC+ | | | 8.50 | | | | 5/15/2023 | | | | 280,000 | | | | 390,237 | | | | 385,974 | |
| | | | | | | | | | | | | | | | | | | | |
Total Hotels, Motels, Inns and Gaming | | | | | | | | | | | 380,000 | | | | 521,117 | | | | 515,568 | |
| | | | | | | | | | | | | | | | | | | | |
|
Leisure, Amusement, Entertainment — 0.3%*: | |
CPUK Finance Ltd.+ | | | 4.88 | | | | 2/28/2025 | | | | 100,000 | | | | 134,070 | | | | 132,292 | |
Perform Group Financing PLC+ | | | 8.50 | | | | 11/15/2020 | | | | 250,000 | | | | 349,108 | | | | 334,966 | |
Vue International Bidco PLC, 3 mo. EURIBOR + 5.250%+ | | | 4.92 | # | | | 7/15/2020 | | | | 100,000 | | | | 134,429 | | | | 116,826 | |
WMG Acquisition Corp.^ | | | 5.00 | | | | 8/1/2023 | | | | 63,000 | | | | 63,000 | | | | 62,685 | |
| | | | | | | | | | | | | | | | | | | | |
Total Leisure, Amusement, Entertainment | | | | | | | | | | | 513,000 | | | | 680,607 | | | | 646,769 | |
| | | | | | | | | | | | | | | | | | | | |
See accompanying Notes to the Financial Statements.
95
Barings Global Floating Rate Fund 2018 Annual Report
SCHEDULE OF INVESTMENTS (CONTINUED)
June 30, 2018
| | | | | | | | | | | | | | | | | | | | |
| | | EFFECTIVE
INTEREST RATE | | | DUE DATE | | | PRINCIPAL ‡‡ | | | COST | | | FAIR
VALUE | |
Corporate Bonds (Continued) | | | | | | | | | | | | | | | | | | | | |
|
Oil and Gas — 1.3%*: | |
Citgo Holding, Inc.^ | | | 10.75 | % | | | 2/15/2020 | | | | 1,500,000 | | | | $1,490,422 | | | | $1,595,625 | |
EP Energy LLC/Everest Acquisition Finance, Inc.^ | | | 8.00 | | | | 2/15/2025 | | | | 713,000 | | | | 620,595 | | | | 552,575 | |
Kosmos Energy Ltd.+^ | | | 7.88 | | | | 8/1/2021 | | | | 150,000 | | | | 146,200 | | | | 152,438 | |
Sanchez Energy Corp.^ | | | 7.25 | | | | 2/15/2023 | | | | 1,136,000 | | | | 1,125,329 | | | | 1,124,640 | |
| | | | | | | | | | | | | | | | | | | | |
Total Oil and Gas | | | | | | | | | | | 3,499,000 | | | | 3,382,546 | | | | 3,425,278 | |
| | | | | | | | | | | | | | | | | | | | |
|
Personal Transportation — 0.6%*: | |
Hertz Corp. (The)^ | | | 7.63 | | | | 6/1/2022 | | | | 1,051,000 | | | | 1,048,949 | | | | 1,008,960 | |
Naviera Armas SA, 3 mo. EURIBOR +
4.250%+ | | | 4.25 | # | | | 11/15/2024 | | | | 250,000 | | | | 296,803 | | | | 286,523 | |
Naviera Armas SA, 3 mo. EURIBOR +
6.500%+ | | | 6.50 | # | | | 7/31/2023 | | | | 250,000 | | | | 297,865 | | | | 292,387 | |
| | | | | | | | | | | | | | | | | | | | |
Total Personal Transportation | | | | | | | | | | | 1,551,000 | | | | 1,643,617 | | | | 1,587,870 | |
| | | | | | | | | | | | | | | | | | | | |
|
Retail Stores — 0.5%*: | |
House of Fraser Funding PLC, 3M GBP LIBOR + 5.750%+ | | | 6.38 | # | | | 9/15/2020 | | | | 300,000 | | | | 465,807 | | | | 286,769 | |
HSS Financing PLC+ | | | 6.75 | | | | 8/1/2019 | | | | 68,000 | | | | 112,557 | | | | 89,339 | |
Jewel UK Bondco PLC+ | | | 8.50 | | | | 4/15/2023 | | | | 100,000 | | | | 142,450 | | | | 131,224 | |
Marcolin SpA, 3 mo. EURIBOR + 4.125%+ | | | 4.13 | # | | | 2/15/2023 | | | | 300,000 | | | | 338,783 | | | | 347,310 | |
Maxeda DIY Holding B.V.+ | | | 6.13 | | | | 7/15/2022 | | | | 100,000 | | | | 114,070 | | | | 106,124 | |
Takko Luxembourg 2 SCA+ | | | 5.38 | | | | 11/15/2023 | | | | 100,000 | | | | 116,475 | | | | 105,277 | |
Travelex Financing PLC+ | | | 8.00 | | | | 5/15/2022 | | | | 100,000 | | | | 108,750 | | | | 113,750 | |
| | | | | | | | | | | | | | | | | | | | |
Total Retail Stores | | | | | | | | | | | 1,068,000 | | | | 1,398,892 | | | | 1,179,793 | |
| | | | | | | | | | | | | | | | | | | | |
|
Telecommunications — 0.7%*: | |
Hughes Satellite Systems Corp. | | | 5.25 | | | | 8/1/2026 | | | | 1,388,000 | | | | 1,396,867 | | | | 1,301,250 | |
Ziggo Secured Finance B.V.+ | | | 4.25 | | | | 1/15/2027 | | | | 350,000 | | | | 390,407 | | | | 403,178 | |
| | | | | | | | | | | | | | | | | | | | |
Total Telecommunications | | | | | | | | | | | 1,738,000 | | | | 1,787,274 | | | | 1,704,428 | |
| | | | | | | | | | | | | | | | | | | | |
|
Utilities — 0.4%*: | |
Viridian Group Finance Co. PLC+ | | | 4.75 | | | | 9/15/2024 | | | | 865,000 | | | | 1,068,739 | | | | 1,052,826 | |
| | | | | | | | | | | | | | | | | | | | |
Total Corporate Bonds | | | | | | | | | | | 23,662,294 | | | | 26,991,471 | | | | 25,261,155 | |
| | | | | | | | | | | | | | | | | | | | |
Total Fixed Income | | | | | | | | | | | 234,301,047 | | | | 243,607,132 | | | | 239,858,249 | |
| | | | | | | | | | | | | | | | | | | | |
|
Short-Term Investments — 18.1%*: | |
|
Bank Deposit — 18.1%*: | |
State Street Bank & Trust Co. Euro Time Deposit | | | 0.28 | | | | 7/2/2018 | | | | 45,925,399 | | | | 45,925,399 | | | | 45,925,399 | |
| | | | | | | | | | | | | | | | | | | | |
Total Investments | | | | | | | | | | | 280,538,425 | | | | 290,646,501 | | | | 287,743,930 | |
| | | | | | | | | | | | | | | | | | | | |
| | | | | |
Other assets and liabilities — (13.8%)* | | | | | | | | | | | | | | | | | | | (34,956,726 | ) |
| | | | | | | | | | | | | | | | | | | | |
| | | | | |
Net Assets — 100.0% | | | | | | | | | | | | | | | | | | | $252,787,204 | |
| | | | | | | | | | | | | | | | | | | | |
See accompanying Notes to the Financial Statements.
96
Barings Global Floating Rate Fund 2018 Annual Report
SCHEDULE OF INVESTMENTS (CONTINUED)
June 30, 2018
| ‡‡ | Unless otherwise indicated, all principal amounts are denominated in United States Dollars. |
| * | Calculated as a percentage of net assets applicable to common shareholders. |
Distributions of investments by country of risk (excluding temporary cash investments) as a percentage of total investments in securities, is as follows:
| | | | | | |
| | United States | | | 68.6% | |
| | United Kingdom | | | 10.1% | |
| | Germany | | | 6.7% | |
| | Netherlands | | | 3.8% | |
| | France | | | 3.7% | |
| | Spain | | | 1.6% | |
| | Ireland | | | 1.1% | |
| | Other (Individually less than 1%) | | | 4.4% | |
| | | | | | |
| | Total | | | 100.0% | |
| | | | | | |
| ^ | Security acquired in a transaction exempt from registration under Rule 144A of the Securities Act of 1933. These securities may only be resold in transactions exempt from registration, normally to qualified institutional buyers. |
| § | Bank loans are exempt from registration under the Securities Act of 1933, as amended, but contain certain restrictions on resale and cannot be sold publicly. These loans pay interest at rates which adjust periodically. The interest rates shown for bank loans are the current interest rates at June 30, 2018. Bank loans are also subject to mandatory and/or optional prepayment which cannot be predicted. As a result, the remaining maturity may be substantially less than the stated maturity shown. |
| ¤ | For fair value measurement disclosure purposes, security is categorized as Level 3 (See Note 2). |
| # | Variable rate security. The interest rate shown is the rate in effect at June 30, 2018. |
A summary of outstanding derivatives at June 30, 2018 is as follows:
Forward Foreign Currency Exchange Contracts to Buy
| | | | | | | | | | | | | | | | | | | | | | |
EXPIRATION
DATE | | COUNTERPARTY | | LOCAL
CURRENCY | | | VALUE IN USD | | | IN
EXCHANGE
FOR USD | | | NET UNREALIZED
APPRECIATION
(DEPRECIATION) | |
| 7/2/18 | | Morgan Stanley & Co. | | | EUR | | | | 168,196 | | | $ | 196,419 | | | $ | 194,920 | | | $ | 1,499 | |
| 7/12/18 | | Morgan Stanley & Co. | | | GBP | | | | 792,834 | | | | 1,046,757 | | | | 1,052,325 | | | | (5,568 | ) |
| | | | | | | | | | | | | | | | | | | | | | |
Net unrealized depreciation on forward foreign currency exchange contracts to buy | | | $ | (4,069 | ) |
| | | | | | | | | | | | | | | | | | | | | | |
See accompanying Notes to the Financial Statements.
97
Barings Global Floating Rate Fund 2018 Annual Report
SCHEDULE OF INVESTMENTS (CONTINUED)
June 30, 2018
Forward Foreign Currency Exchange Contracts to Sell
| | | | | | | | | | | | | | | | | | | | | | |
EXPIRATION
DATE | | COUNTERPARTY | | LOCAL
CURRENCY | | | VALUE IN USD | | | IN
EXCHANGE
FOR USD | | | NET UNREALIZED
APPRECIATION
(DEPRECIATION) | |
| 7/12/18 | | Credit Suisse International | | | EUR | | | | 29,377,068 | | | $ | 34,328,296 | | | $ | 34,770,551 | | | $ | 442,255 | |
| 7/12/18 | | Morgan Stanley & Co. | | | EUR | | | | 1,055,358 | | | | 1,233,229 | | | | 1,232,712 | | | | (517 | ) |
| 7/12/18 | | Morgan Stanley & Co. | | | GBP | | | | 9,153,045 | | | | 12,084,509 | | | | 12,276,215 | | | | 191,706 | |
| | | | | | | | | | | | | | | | | | | | | | |
Net unrealized appreciation on forward foreign currency exchange contracts to sell | | | $ | 633,444 | |
| | | | | | | | | | | | | | | | | | | | | | |
Currency Legend
| | | | |
| EUR | | – | | Euro |
| GBP | | – | | British Pound Sterling |
See accompanying Notes to the Financial Statements.
98
Barings Global Credit Income Opportunities Fund 2018 Annual Report
SCHEDULE OF INVESTMENTS
June 30, 2018
| | | | | | | | | | | | | | | | | | | | |
| | | | | | | | | SHARES | | | COST | | | FAIR
VALUE | |
Equities — 0.8%*: | | | | | | | | | | | | | | | | | | | | |
| | | | | |
Common Stocks — 0.7%*: | | | | | | | | | | | | | | | | | | | | |
| | | | | |
Healthcare, Education and Childcare — 0.1%*: | | | | | | | | | | | | | | | | | | | | |
MModal, Inc. | | | | | | | | | | | 4,725 | | | | $131,922 | | | | $153,563 | |
Tunstall Group Holdings Ltd.+¤ | | | | | | | | | | | 396 | | | | — | | | | — | |
Tunstall Group Holdings Ltd.+¤ | | | | | | | | | | | 261 | | | | — | | | | — | |
| | | | | | | | | | | | | | | | | | | | |
Total Healthcare, Education and Childcare | | | | | | | | | | | 5,382 | | | | 131,922 | | | | 153,563 | |
| | | | | | | | | | | | | | | | | | | | |
| | | | |
Mining, Steel, Iron and Non-Precious Metals — 0.0%*: | | | | | | | | | | | | | | | | | |
Boomerang Tube LLC¤ | | | | | | | | | | | 2,007 | | | | — | | | | — | |
| | | | | | | | | | | | | | | | | | | | |
| | | | | |
Oil and Gas — 0.4%*: | | | | | | | | | | | | | | | | | | | | |
Fieldwood Energy LLC | | | | | | | | | | | 3,698 | | | | 129,430 | | | | 181,435 | |
Fieldwood Energy LLC | | | | | | | | | | | 15,071 | | | | 325,033 | | | | 757,318 | |
Southcross Energy Holdings LP¤ | | | | | | | | | | | 11 | | | | — | | | | — | |
Southcross Energy Partners LP | | | | | | | | | | | 11 | | | | 2,750 | | | | 2,447 | |
| | | | | | | | | | | | | | | | | | | | |
Total Oil and Gas | | | | | | | | | | | 18,791 | | | | 457,213 | | | | 941,200 | |
| | | | | | | | | | | | | | | | | | | | |
| | | | | |
Retail Stores — 0.2%*: | | | | | | | | | | | | | | | | | | | | |
Maxeda DIY B.V.+¤ | | | | | | | | | | | 10,446 | | | | — | | | | 110,131 | |
Maxeda DIY B.V.+¤ | | | | | | | | | | | 18,859,871 | | | | 373,738 | | | | 440,491 | |
| | | | | | | | | | | | | | | | | | | | |
Total Retail Stores | | | | | | | | | | | 18,870,317 | | | | 373,738 | | | | 550,622 | |
| | | | | | | | | | | | | | | | | | | | |
| | | | | | | | | | | | | | | | | | | | |
Total Common Stocks | | | | | | | | | | | 18,896,497 | | | | 962,873 | | | | 1,645,385 | |
| | | | | | | | | | | | | | | | | | | | |
| | | | | |
Preferred Stock — 0.1%*: | | | | | | | | | | | | | | | | | | | | |
| | | | | |
Farming and Agriculture — 0.1%*: | | | | | | | | | | | | | | | | | | | | |
Pinnacle Agriculture Holdings A 2¤ | | | | | | | | | | | 311,577 | | | | 202,152 | | | | 286,651 | |
| | | | | | | | | | | | | | | | | | | | |
Total Equities | | | | | | | | | | | 19,208,074 | | | | 1,165,025 | | | | 1,932,036 | |
| | | | | | | | | | | | | | | | | | | | |
| | | | | |
| | | EFFECTIVE
INTEREST RATE | | | DUE DATE | | | PRINCIPAL ‡‡ | | | COST | | | FAIR
VALUE | |
Fixed Income — 91.8%*: | | | | | | | | | | | | | | | | | | | | |
| | | | | |
Asset-Backed Securities — 14.3%*: | | | | | | | | | | | | | | | | | | | | |
| | | | | |
CDO/CLO — 14.3%*: | | | | | | | | | | | | | | | | | | | | |
AIMCO CLO Series 2015-AA ER, 3M USD LIBOR + 5.200%^ | | | 7.55 | #% | | | 1/15/2028 | | | | 500,000 | | | | 500,000 | | | | 497,293 | |
Alinea CLO 2018-1 Ltd., 3M LIBOR + 6.000%^¤ | | | 8.34 | # | | | 7/20/2031 | | | | 1,250,000 | | | | 1,250,000 | | | | 1,250,000 | |
ALME Loan Funding III Designated Activity Co. 3A ERV, 3M EURIBOR + 5.400%+^ | | | 5.40 | # | | | 4/15/2030 | | | | 500,000 | | | | 522,465 | | | | 586,377 | |
ALME Loan Funding IV BV 4A ER, 3M EURIBOR + 4.670%+^ | | | 4.67 | # | | | 1/15/2032 | | | | 1,000,000 | | | | 1,142,718 | | | | 1,129,079 | |
Anchorage Capital CLO Ltd. 2015-6A ER, 3M USD LIBOR + 6.350%^ | | | 8.70 | # | | | 7/15/2030 | | | | 500,000 | | | | 513,545 | | | | 507,541 | |
Apidos CLO 2017-27A D, 3M USD LIBOR + 6.400%^ | | | 8.75 | # | | | 7/17/2030 | | | | 700,000 | | | | 700,000 | | | | 710,963 | |
See accompanying Notes to the Financial Statements.
99
Barings Global Credit Income Opportunities Fund 2018 Annual Report
SCHEDULE OF INVESTMENTS (CONTINUED)
June 30, 2018
| | | | | | | | | | | | | | | | | | | | |
| | | EFFECTIVE
INTEREST RATE | | | DUE DATE | | | PRINCIPAL ‡‡ | | | COST | | | FAIR
VALUE | |
| | | | | |
Asset-Backed Securities (Continued) | | | | | | | | | | | | | | | | | | | | |
| | | | | |
CDO/CLO (Continued) | | | | | | | | | | | | | | | | | | | | |
Ares XLVIII CLO, 3M LIBOR + 5.200%^¤ | | | 7.54 | #% | | | 7/20/2030 | | | | 800,000 | | | | $800,000 | | | | $800,000 | |
Atlas Senior Loan Fund X Ltd., 3M USD LIBOR + 5.700%^ | | | 8.05 | # | | | 1/15/2031 | | | | 500,000 | | | | 500,000 | | | | 489,053 | |
Atlas Senior Loan Fund XI Ltd., 3M LIBOR + 5.7500%^¤ | | | 8.09 | # | | | 7/26/2031 | | | | 1,900,000 | | | | 1,900,000 | | | | 1,900,000 | |
Atrium IX 9A ER, 3M USD LIBOR + 6.450%^ | | | 8.77 | # | | | 5/28/2030 | | | | 500,000 | | | | 500,000 | | | | 508,173 | |
Avoca CLO XIV Designated Activity Co. 14X FR, 3M EURIBOR + 6.350%+ | | | 6.35 | # | | | 1/12/2031 | | | | 500,000 | | | | 558,800 | | | | 560,285 | |
BlueMountain CLO Ltd. 2014-1A^ | | | Zero Coupon | | | | 4/30/2026 | | | | 250,000 | | | | 241,795 | | | | 116,617 | |
Cadogan Square CLO XI DAC, 3M USD LIBOR +
4.860%+¤ | | | 4.86 | # | | | 2/15/2031 | | | | 1,000,000 | | | | 1,130,535 | | | | 1,132,766 | |
Cairn CLO B.V. 2013-3A E, 6M EURIBOR + 4.900%+^ | | | 4.90 | # | | | 10/20/2028 | | | | 1,000,000 | | | | 1,036,401 | | | | 1,155,215 | |
Carbone CLO Ltd. 2017-1A D, 3M USD LIBOR + 5.900%^ | | | 8.26 | # | | | 1/20/2031 | | | | 500,000 | | | | 500,000 | | | | 502,124 | |
Carlyle Global Market Strategies CLO Ltd. 2015-1A E1, 3M USD LIBOR + 5.300%^ | | | 7.66 | # | | | 4/20/2027 | | | | 500,000 | | | | 449,971 | | | | 500,070 | |
CBAM Ltd. 2017-3A E, 3M USD LIBOR + 6.500%^ | | | 8.85 | # | | | 10/17/2029 | | | | 750,000 | | | | 750,000 | | | | 757,843 | |
CIFC Funding 2018-III Ltd., 3M LIBOR + 5.500%^¤ | | | 7.84 | # | | | 7/18/2031 | | | | 1,500,000 | | | | 1,500,000 | | | | 1,500,000 | |
CIFC Funding Ltd. 2017-1A E, 3M USD LIBOR + 6.350%^ | | | 8.71 | # | | | 4/23/2029 | | | | 750,000 | | | | 746,800 | | | | 758,873 | |
CIFC Funding Ltd. 2017-5A D, 3M USD LIBOR + 6.100%^ | | | 8.45 | # | | | 11/16/2030 | | | | 500,000 | | | | 500,000 | | | | 506,188 | |
Cordatus 3X CLO plc+ | | | 4.86 | | | | 8/15/2032 | | | | 1,000,000 | | | | 1,156,187 | | | | 1,124,977 | |
Dryden 42 Senior Loan Fund 2016-42A E, 3M USD LIBOR + 7.250%^ | | | 9.60 | # | | | 7/15/2027 | | | | 500,000 | | | | 511,961 | | | | 500,879 | |
Dryden 45 Senior Loan Fund 2016-45A E, 3M USD LIBOR + 6.850%^ | | | 9.20 | # | | | 7/15/2027 | | | | 500,000 | | | | 481,848 | | | | 504,774 | |
Dryden 58 CLO Ltd., 3M LIBOR + 5.350%^¤ | | | 7.69 | # | | | 7/17/2031 | | | | 600,000 | | | | 600,000 | | | | 600,000 | |
Eaton Vance CLO Ltd. 2013-1A DR, 3M USD LIBOR + 7.600%^ | | | 9.95 | # | | | 1/15/2028 | | | | 500,000 | | | | 488,363 | | | | 511,375 | |
Galaxy XXI CLO Ltd., 3M USD LIBOR + 5.250%^ | | | 7.61 | # | | | 4/20/2031 | | | | 500,000 | | | | 500,000 | | | | 487,959 | |
Galaxy XXIV CLO Ltd. 2017-24A E, 3M USD LIBOR + 5.500%^ | | | 7.48 | # | | | 1/15/2031 | | | | 700,000 | | | | 700,000 | | | | 695,183 | |
KKR CLO Ltd. 22, 3M LIBOR + 6.000%^ | | | 8.34 | # | | | 7/20/2031 | | | | 1,000,000 | | | | 1,000,000 | | | | 1,000,000 | |
KKR Financial CLO Ltd. 2018 E, 3M USD LIBOR +
6.450%^ | | | 8.81 | # | | | 7/18/2030 | | | | 800,000 | | | | 784,482 | | | | 811,150 | |
LCM XIII LP 2013-A ER, 3M USD LIBOR + 7.300%^ | | | 9.66 | # | | | 7/19/2027 | | | | 750,000 | | | | 723,660 | | | | 765,312 | |
LCM XV LP 2015-A ER, 3M USD LIBOR + 6.500%^ | | | 8.86 | # | | | 7/20/2030 | | | | 500,000 | | | | 500,000 | | | | 507,790 | |
Madison Park Funding XIII Ltd. 2014-13A^ | | | Zero Coupon | | | | 4/19/2030 | | | | 500,000 | | | | 416,158 | | | | 399,889 | |
See accompanying Notes to the Financial Statements.
100
Barings Global Credit Income Opportunities Fund 2018 Annual Report
SCHEDULE OF INVESTMENTS (CONTINUED)
June 30, 2018
| | | | | | | | | | | | | | | | | | | | |
| | | EFFECTIVE
INTEREST RATE | | | DUE DATE | | | PRINCIPAL ‡‡ | | | COST | | | FAIR
VALUE | |
| | | | | |
Asset-Backed Securities (Continued) | | | | | | | | | | | | | | | | | | | | |
| | | | | |
CDO/CLO (Continued) | | | | | | | | | | | | | | | | | | | | |
Madison Park Funding XX Ltd., 3M LIBOR + 5.300%^¤ | | | 7.64 | #% | | | 7/27/2030 | | | | 1,400,000 | | | | $1,400,000 | | | | $1,400,000 | |
Madison Park Funding XXVII Ltd., 3M USD LIBOR + 5.200%^ | | | 7.05 | # | | | 4/20/2030 | | | | 500,000 | | | | 500,000 | | | | 491,264 | |
Madison Park Funding XXVIII Ltd., 3M LIBOR +
7.600%^¤ | | | 9.94 | # | | | 7/15/2030 | | | | 500,000 | | | | 495,391 | | | | 495,388 | |
Magnetite VII Ltd.^ | | | Zero Coupon | | | | 1/15/2028 | | | | 2,000,000 | | | | 1,445,867 | | | | 1,455,068 | |
Neuberger Berman Loan Advisers CLO 28 Ltd., 3M USD LIBOR + 5.600%^ | | | 7.92 | # | | | 4/20/2030 | | | | 500,000 | | | | 500,000 | | | | 499,935 | |
Oak Hill Credit Partners X Ltd. 2014-10A^ | | | Zero Coupon | | | | 7/20/2026 | | | | 500,000 | | | | 462,368 | | | | 243,234 | |
Steele Creek CLO Ltd. 2017-1A E, 3M USD LIBOR + 6.200%^ | | | 8.54 | # | | | 1/15/2030 | | | | 500,000 | | | | 500,000 | | | | 502,473 | |
TCI-Symphony CLO Ltd. 2017-1A E, 3M USD LIBOR + 6.450%^ | | | 8.80 | # | | | 7/15/2030 | | | | 1,000,000 | | | | 990,372 | | | | 1,016,091 | |
THL Credit Wind River CLO Ltd. 2017-4A E, 3M USD LIBOR + 5.800%^ | | | 8.13 | # | | | 11/20/2030 | | | | 500,000 | | | | 500,000 | | | | 501,273 | |
Voya CLO Ltd. 2015-2A E, 3M USD LIBOR + 5.300%^ | | | 7.66 | # | | | 7/23/2027 | | | | 500,000 | | | | 484,809 | | | | 498,584 | |
Wellfleet CLO 2018-1 Ltd., 3M USD LIBOR + 5.600%^¤ | | | 7.84 | # | | | 7/17/2031 | | | | 1,150,000 | | | | 1,150,000 | | | | 1,150,000 | |
Wellfleet CLO Ltd. 2017-3A D, 3M USD LIBOR + 5.550%^ | | | 7.28 | # | | | 1/17/2031 | | | | 1,000,000 | | | | 1,000,000 | | | | 998,414 | |
| | | | | | | | | | | | | | | | | | | | |
Total CDO/CLO | | | | | | | | | | | 33,300,000 | | | | 33,034,496 | | | | 33,029,472 | |
| | | | | | | | | | | | | | | | | | | | |
| | | | | | | | | | | | | | | | | | | | |
Total Asset-Backed Securities | | | | | | | | | | | 33,300,000 | | | | 33,034,496 | | | | 33,029,472 | |
| | | | | | | | | | | | | | | | | | | | |
| | | | | |
Bank Loans — 30.4%*§: | | | | | | | | | | | | | | | | | | | | |
| | | | | |
Beverage, Food and Tobacco — 1.3%*: | | | | | | | | | | | | | | | | | | | | |
Deoleo S.A., EURIBOR + 3.500%+ | | | 4.50 | | | | 6/11/2021 | | | | 500,000 | | | | 559,279 | | | | 408,730 | |
IRB Holding Corp., 1M LIBOR + 3.250% | | | 5.27 | | | | 2/5/2025 | | | | 1,625,171 | | | | 1,644,541 | | | | 1,626,520 | |
JBS USA, LLC, 3M LIBOR + 2.500% | | | 4.83 | | | | 10/30/2022 | | | | 404,837 | | | | 403,445 | | | | 401,396 | |
Refresco Group B.V., EURIBOR + 3.250%+ | | | 3.25 | | | | 3/28/2025 | | | | 500,000 | | | | 584,887 | | | | 575,994 | |
| | | | | | | | | | | | | | | | | | | | |
Total Beverage, Food and Tobacco | | | | | | | | | | | 3,030,008 | | | | 3,192,152 | | | | 3,012,640 | |
| | | | | | | | | | | | | | | | | | | | |
| | | | | |
Broadcasting and Entertainment — 2.1%*: | | | | | | | | | | | | | | | | | | | | |
All3Media International, 6M LIBOR + 4.250%+ | | | 5.25 | | | | 6/30/2021 | | | | 500,000 | | | | 835,516 | | | | 657,401 | |
AP NMT Acquisition B.V., EURIBOR + 6.000%+ | | | 7.00 | | | | 8/13/2021 | | | | 391,095 | | | | 481,142 | | | | 456,949 | |
AP NMT Acquisition B.V., 3M LIBOR + 5.750%+ | | | 8.06 | | | | 8/13/2021 | | | | 1,187,454 | | | | 1,159,079 | | | | 1,184,735 | |
AP NMT Acquisition B.V., 3M LIBOR + 9.000%+ | | | 11.31 | | | | 8/13/2022 | | | | 300,000 | | | | 287,557 | | | | 299,499 | |
Intelsat Jackson Holdings S.A., 3M LIBOR + 3.750% | | | 5.85 | | | | 11/27/2023 | | | | 250,000 | | | | 249,261 | | | | 249,177 | |
See accompanying Notes to the Financial Statements.
101
Barings Global Credit Income Opportunities Fund 2018 Annual Report
SCHEDULE OF INVESTMENTS (CONTINUED)
June 30, 2018
| | | | | | | | | | | | | | | | | | | | |
| | | EFFECTIVE
INTEREST RATE | | | DUE DATE | | | PRINCIPAL ‡‡ | | | COST | | | FAIR
VALUE | |
| | | | | |
Bank Loans (Continued) | | | | | | | | | | | | | | | | | | | | |
| | | | | |
Broadcasting and Entertainment (Continued) | | | | | | | | | | | | | | | | | | | | |
Univision Communications, Inc., 1M LIBOR + 2.750% | | | 4.84 | % | | | 3/15/2024 | | | | 1,994,564 | | | | $1,972,451 | | | | $1,925,592 | |
| | | | | | | | | | | | | | | | | | | | |
Total Broadcasting and Entertainment | | | | | | | | | | | 4,623,113 | | | | 4,985,006 | | | | 4,773,353 | |
| | | | | | | | | | | | | | | | | | | | |
| | | | | |
Buildings and Real Estate — 0.1%*: | | | | | | | | | | | | | | | | | | | | |
SRS Distribution Inc., 3M LIBOR + 3.250% | | | 5.58 | | | | 5/23/2025 | | | | 365,308 | | | | 364,405 | | | | 359,526 | |
| | | | | | | | | | | | | | | | | | | | |
| | | | | |
Chemicals, Plastics and Rubber — 1.2%*: | | | | | | | | | | | | | | | | | | | | |
Colouroz Investment 1 GmbH, EURIBOR + 3.0000%+ | | | 3.75 | | | | 9/7/2021 | | | | 1,351,980 | | | | 1,581,318 | | | | 1,511,741 | |
Diversey, EURIBOR + 3.2500%+ | | | 3.25 | | | | 9/6/2024 | | | | 497,500 | | | | 587,921 | | | | 569,117 | |
Flint Group GmbH, LIBOR + 3.000%+ | | | 3.75 | | | | 9/7/2021 | | | | 286,230 | | | | 338,179 | | | | 320,054 | |
Solenis International, LP, 3M LIBOR + 4.000% | | | 6.33 | | | | 6/6/2025 | | | | 248,605 | | | | 246,119 | | | | 247,822 | |
Solenis International, LP, 3M LIBOR + 8.500% | | | 10.68 | | | | 6/1/2026 | | | | 158,282 | | | | 153,537 | | | | 155,314 | |
| | | | | | | | | | | | | | | | | | | | |
Total Chemicals, Plastics and Rubber | | | | | | | | | | | 2,542,597 | | | | 2,907,074 | | | | 2,804,048 | |
| | | | | | | | | | | | | | | | | | | | |
| | | | | |
Containers, Packaging and Glass — 0.9%*: | | | | | | | | | | | | | | | | | | | | |
Albea Beauty Holdings S.A, EURIBOR + 4.000%+ | | | 5.44 | | | | 4/22/2024 | | | | 206,419 | | | | 206,170 | | | | 205,129 | |
BWAY Holding Co., 1M LIBOR + 3.250% | | | 5.59 | | | | 4/3/2024 | | | | 1,336,067 | | | | 1,335,499 | | | | 1,327,930 | |
ProAmpac PG Borrower LLC, 3M LIBOR + 8.500% | | | 10.58 | | | | 11/18/2024 | | | | 500,000 | | | | 494,004 | | | | 504,690 | |
| | | | | | | | | | | | | | | | | | | | |
Total Containers, Packaging and Glass | | | | | | | | | | | 2,042,486 | | | | 2,035,673 | | | | 2,037,749 | |
| | | | | | | | | | | | | | | | | | | | |
| | | | |
Diversified/Conglomerate Manufacturing — 1.3%*: | | | | | | | | | | | | | | | | | |
LTI Holdings, Inc., 1M LIBOR + 4.750% | | | 6.84 | | | | 5/16/2024 | | | | 754,999 | | | | 750,734 | | | | 753,112 | |
Project Alpha Intermediate Holding, Inc., 3M LIBOR + 3.500% | | | 5.99 | | | | 4/26/2024 | | | | 1,179,870 | | | | 1,176,993 | | | | 1,172,495 | |
Triple Point Technology, Inc., 3M LIBOR + 4.250% | | | 6.34 | | | | 7/10/2020 | | | | 575,931 | | | | 558,672 | | | | 514,019 | |
Xella International GmbH, EURIBOR +
3.500%+ | | | 3.50 | | | | 4/11/2024 | | | | 500,000 | | | | 588,325 | | | | 579,159 | |
| | | | | | | | | | | | | | | | | | | | |
Total Diversified/Conglomerate Manufacturing | | | | | | | | | | | 3,010,800 | | | | 3,074,724 | | | | 3,018,785 | |
| | | | | | | | | | | | | | | | | | | | |
| | | | | |
Diversified/Conglomerate Service — 3.7%*: | | | | | | | | | | | | | | | | | | | | |
Almonde, Inc., 3M LIBOR + 3.500%+ | | | 5.81 | | | | 6/13/2024 | | | | 1,415,940 | | | | 1,419,251 | | | | 1,389,590 | |
EAB (Avatar Purchaser), 1M LIBOR + 3.750% | | | 6.25 | | | | 11/15/2024 | | | | 245,147 | | | | 244,027 | | | | 241,163 | |
GTCR Valor Cos., Inc., 3M LIBOR + 3.250% | | | 5.58 | | | | 6/16/2023 | | | | 1,097,877 | | | | 1,108,362 | | | | 1,094,583 | |
MH Sub I LLC, 3M LIBOR + 3.750% | | | 5.84 | | | | 9/13/2024 | | | | 698,241 | | | | 699,936 | | | | 697,564 | |
MH Sub I, LLC, 3M LIBOR + 7.500% | | | 9.59 | | | | 9/15/2025 | | | | 650,000 | | | | 646,339 | | | | 654,063 | |
Project Leopard Holdings, Inc., 1M LIBOR + 4.000% | | | 6.09 | | | | 7/7/2023 | | | | 525,448 | | | | 527,141 | | | | 524,791 | |
Verisure Holding AB, EURIBOR + 3.000%+ | | | 3.00 | | | | 10/20/2022 | | | | 500,000 | | | | 589,696 | | | | 571,200 | |
Vertafore, Inc., 1M LIBOR + 3.250% | | | 5.59 | | | | 5/30/2025 | | | | 1,000,000 | | | | 995,000 | | | | 993,130 | |
See accompanying Notes to the Financial Statements.
102
Barings Global Credit Income Opportunities Fund 2018 Annual Report
SCHEDULE OF INVESTMENTS (CONTINUED)
June 30, 2018
| | | | | | | | | | | | | | | | | | | | |
| | | EFFECTIVE
INTEREST RATE | | | DUE DATE | | | PRINCIPAL ‡‡ | | | COST | | | FAIR
VALUE | |
| | | | | |
Bank Loans (Continued) | | | | | | | | | | | | | | | | | | | | |
| | | | | |
Diversified/Conglomerate Service (Continued) | | | | | | | | | | | | | | | | | | | | |
Vertafore, Inc., 1M LIBOR + 7.250% | | | 9.59 | % | | | 5/30/2026 | | | | 879,452 | | | | $870,657 | | | | $871,757 | |
VF Holding Corp., 1M LIBOR + 3.250% | | | 5.34 | | | | 6/30/2023 | | | | 1,474,489 | | | | 1,480,013 | | | | 1,464,536 | |
| | | | | | | | | | | | | | | | | | | | |
Total Diversified/Conglomerate Service | | | | | | | | | | | 8,486,594 | | | | 8,580,422 | | | | 8,502,377 | |
| | | | | | | | | | | | | | | | | | | | |
| | | | | |
Ecological — 0.1%*: | | | | | | | | | | | | | | | | | | | | |
Emerald 3 Ltd., 3M LIBOR + 7.000% | | | 9.33 | | | | 5/31/2022 | | | | 196,488 | | | | 195,504 | | | | 191,904 | |
GFL Environmental Inc., 3M LIBOR + 2.750%+ | | | 5.08 | | | | 5/30/2025 | | | | 118,686 | | | | 118,391 | | | | 117,796 | |
| | | | | | | | | | | | | | | | | | | | |
Total Ecological | | | | | | | | | | | 315,174 | | | | 313,895 | | | | 309,700 | |
| | | | | | | | | | | | | | | | | | | | |
| | | | | |
Electronics — 1.3%*: | | | | | | | | | | | | | | | | | | | | |
ION Trading Technologies S.a.r.l., 1M LIBOR + 4.000% | | | 6.34 | | | | 11/21/2024 | | | | 286,390 | | | | 279,230 | | | | 283,526 | |
Omnitracs, Inc., 1M LIBOR + 2.750% | | | 5.09 | | | | 3/16/2025 | | | | 1,500,000 | | | | 1,503,650 | | | | 1,480,320 | |
RP Crown Parent LLC, 1M LIBOR + 3.000% | | | 4.84 | | | | 10/12/2023 | | | | 732,149 | | | | 729,380 | | | | 725,742 | |
Veritas Bermuda Ltd., 3M LIBOR + 4.500% | | | 6.65 | | | | 1/27/2023 | | | | 560,065 | | | | 558,332 | | | | 511,900 | |
| | | | | | | | | | | | | | | | | | | | |
Total Electronics | | | | | | | | | | | 3,078,604 | | | | 3,070,592 | | | | 3,001,488 | |
| | | | | | | | | | | | | | | | | | | | |
| | | | | |
Finance — 1.4%*: | | | | | | | | | | | | | | | | | | | | |
Edelman Financial Group, The, 3M LIBOR + 3.250% | | | 5.59 | | | | 6/26/2025 | | | | 251,921 | | | | 250,662 | | | | 251,450 | |
Focus Financial Partners LLC, 3M LIBOR + 2.750% | | | 4.84 | | | | 7/3/2024 | | | | 1,488,750 | | | | 1,496,545 | | | | 1,487,514 | |
Tempo Acquisition LLC, 1M LIBOR + 3.000% | | | 5.09 | | | | 5/1/2024 | | | | 1,514,590 | | | | 1,518,836 | | | | 1,507,017 | |
| | | | | | | | | | | | | | | | | | | | |
Total Finance | | | | | | | | | | | 3,255,261 | | | | 3,266,043 | | | | 3,245,981 | |
| | | | | | | | | | | | | | | | | | | | |
| | | | | |
Healthcare, Education and Childcare — 3.9%*: | | | | | | | | | | | | | | | | | | | | |
Aenova Holding GmbH, EURIBOR + 4.000%+ | | | 5.00 | | | | 9/29/2020 | | | | 499,999 | | | | 575,325 | | | | 566,383 | |
Amneal Pharmaceuticals LLC, 3M LIBOR + 3.500% | | | 5.63 | | | | 5/4/2025 | | | | 245,228 | | | | 244,027 | | | | 244,539 | |
Cerba Healthcare S.A.S., EURIBOR + 3.000%+ | | | 3.00 | | | | 4/20/2024 | | | | 1,000,000 | | | | 1,177,140 | | | | 1,133,350 | |
Endo Luxembourg Finance Co. I S.a r.l., 1M LIBOR + 4.250%+ | | | 6.38 | | | | 4/29/2024 | | | | 1,171,020 | | | | 1,174,975 | | | | 1,168,092 | |
Horizon Pharma, Inc., 1M LIBOR + 3.250% | | | 5.38 | | | | 3/29/2024 | | | | 967,220 | | | | 972,701 | | | | 964,802 | |
Lifescan Global Corp., 1M LIBOR + 6.0000% | | | 8.34 | | | | 9/28/2024 | | | | 189,398 | | | | 183,716 | | | | 183,242 | |
MModal, Inc., 1M LIBOR + 4.750% | | | 7.27 | | | | 1/31/2020 | | | | 559,543 | | | | 550,234 | | | | 555,000 | |
Ortho-Clinical Diagnostics SA, 3M LIBOR + 3.250% | | | 5.34 | | | | 5/30/2025 | | | | 1,231,819 | | | | 1,232,429 | | | | 1,226,436 | |
Parexel International Corp., 1M LIBOR + 2.7500% | | | 4.84 | | | | 9/27/2024 | | | | 992,500 | | | | 998,271 | | | | 986,297 | |
Radiology Partners Holdings, LLC, 1M LIBOR + 4.2500% | | | 6.59 | | | | 6/21/2025 | | | | 470,278 | | | | 465,575 | | | | 465,575 | |
Rodenstock GmbH, EURIBOR + 5.250%+ | | | 5.25 | | | | 6/30/2021 | | | | 500,000 | | | | 580,435 | | | | 563,463 | |
Tunstall Group Holdings Ltd., 1M LIBOR + 4.500%+ | | | 7.50 | | | | 10/16/2020 | | | | 503,750 | | | | 591,019 | | | | 587,544 | |
See accompanying Notes to the Financial Statements.
103
Barings Global Credit Income Opportunities Fund 2018 Annual Report
SCHEDULE OF INVESTMENTS (CONTINUED)
June 30, 2018
| | | | | | | | | | | | | | | | | | | | |
| | | EFFECTIVE
INTEREST RATE | | | DUE DATE | | | PRINCIPAL ‡‡ | | | COST | | | FAIR
VALUE | |
| | | | | |
Bank Loans (Continued) | | | | | | | | | | | | | | | | | | | | |
| | | | |
Healthcare, Education and Childcare (Continued) | | | | | | | | | | | | | | | | | |
Valeant Pharmaceuticals International, Inc., 1M LIBOR + 3.000% | | | 4.98 | % | | | 6/1/2025 | | | | 500,000 | | | | $497,525 | | | | $497,970 | |
| | | | | | | | | | | | | | | | | | | | |
Total Healthcare, Education and Childcare | | | | | | | | | | | 8,830,755 | | | | 9,243,372 | | | | 9,142,693 | |
| | | | | | | | | | | | | | | | | | | | |
| | |
Home and Office Furnishings, Housewares, and Durable Consumer Products — 1.7%*: | | | | | | | | | |
Hayward Industries, Inc., LIBOR + 3.50% | | | 5.59 | | | | 8/5/2024 | | | | 992,500 | | | | 999,174 | | | | 993,125 | |
Keter Group B.V., EURIBOR + 4.250%+ | | | 5.25 | | | | 10/31/2023 | | | | 500,000 | | | | 546,977 | | | | 568,678 | |
Serta Simmons Bedding LLC, 3M LIBOR + 3.500% | | | 5.75 | | | | 11/8/2023 | | | | 1,225,667 | | | | 1,224,794 | | | | 1,041,817 | |
Serta Simmons Bedding LLC, 1M LIBOR + 8.000% | | | 10.33 | | | | 11/8/2024 | | | | 474,667 | | | | 468,970 | | | | 317,433 | |
SIWF Holdings Inc., 1M LIBOR + 4.250% | | | 6.32 | | | | 5/17/2025 | | | | 190,611 | | | | 188,712 | | | | 191,326 | |
Visual Comfort Generation Brands Holdings, Inc., 1M LIBOR + 8.000% | | | 10.09 | | | | 2/28/2025 | | | | 800,000 | | | | 796,480 | | | | 802,000 | |
| | | | | | | | | | | | | | | | | | | | |
Total Home and Office Furnishings, Housewares, and Durable Consumer Products | | | | | | | | | | | 4,183,445 | | | | 4,225,107 | | | | 3,914,379 | |
| | | | | | | | | | | | | | | | | | | | |
| | | | | |
Hotels, Motels, Inns and Gaming — 1.3%*: | | | | | | | | | | | | | | | | | | | | |
Compass IV Ltd., 3M LIBOR + 4.500%+ | | | 4.50 | | | | 4/30/2025 | | | | 500,000 | | | | 598,059 | | | | 581,226 | |
HNVR Holdco Ltd., EURIBOR + 3.250%+ | | | 3.25 | | | | 9/12/2023 | | | | 500,000 | | | | 555,625 | | | | 573,682 | |
Stars Group Holdings B.V. (The), 3M LIBOR + 3.500%+ | | | 2.34 | | | | 7/28/2025 | | | | 708,761 | | | | 705,217 | | | | 708,761 | |
Stars Group Holdings B.V. (The), 3M LIBOR + 3.000%+ | | | 5.09 | | | | 4/6/2025 | | | | 521,982 | | | | 520,714 | | | | 520,938 | |
Tackle S.a.r.l., EURIBOR + 3.250%+ | | | 3.25 | | | | 8/8/2022 | | | | 600,000 | | | | 705,195 | | | | 691,823 | |
| | | | | | | | | | | | | | | | | | | | |
Total Hotels, Motels, Inns and Gaming | | | | | | | | | | | 2,830,743 | | | | 3,084,810 | | | | 3,076,430 | |
| | | | | | | | | | | | | | | | | | | | |
| | | | | |
Insurance — 1.2%*: | | | | | | | | | | | | | | | | | | | | |
AssuredPartners, Inc., 1M LIBOR + 3.250% | | | 5.34 | | | | 10/22/2024 | | | | 992,513 | | | | 996,885 | | | | 986,934 | |
Hub International Ltd., 2M LIBOR + 3.000% | | | 5.36 | | | | 4/25/2025 | | | | 1,311,679 | | | | 1,308,474 | | | | 1,302,996 | |
York Risk Services Holding Corp., 1M LIBOR + 3.750% | | | 5.84 | | | | 10/1/2021 | | | | 438,136 | | | | 430,711 | | | | 424,208 | |
| | | | | | | | | | | | | | | | | | | | |
Total Insurance | | | | | | | | | | | 2,742,328 | | | | 2,736,070 | | | | 2,714,138 | |
| | | | | | | | | | | | | | | | | | | | |
| | | | | |
Leisure, Amusement, Entertainment — 0.8%*: | | | | | | | | | | | | | | | | | | | | |
Delta 2 (LUX) S.a.r.l., 1M LIBOR + 2.500%+ | | | 4.59 | | | | 2/1/2024 | | | | 509,619 | | | | 511,281 | | | | 502,296 | |
Dorna Sports, S.L., 1M LIBOR + 3.250%+ | | | 5.58 | | | | 4/12/2024 | | | | 500,000 | | | | 500,000 | | | | 495,000 | |
Metro-Goldwyn-Mayer Inc. | | | 2.34 | | | | 6/26/2026 | | | | 893,847 | | | | 884,908 | | | | 884,908 | |
| | | | | | | | | | | | | | | | | | | | |
Total Leisure, Amusement, Entertainment | | | | | | | | | | | 1,903,466 | | | | 1,896,189 | | | | 1,882,204 | |
| | | | | | | | | | | | | | | | | | | | |
| | | |
Machinery Non-Agriculture, Non-Construction, Non-Electronic — 0.8%*: | | | | | | | | | | | | | |
Alison Bidco S.a.r.l., 1M LIBOR + 4.500%+ | | | 6.86 | | | | 8/29/2021 | | | | 143,055 | | | | 142,406 | | | | 140,194 | |
Apex Tool Group LLC, 1M LIBOR + 3.750% | | | 5.84 | | | | 2/1/2022 | | | | 185,812 | | | | 184,962 | | | | 185,637 | |
Titan Acquisition Ltd., 1M LIBOR + 3.000%+ | | | 5.09 | | | | 3/28/2025 | | | | 1,496,250 | | | | 1,498,077 | | | | 1,471,756 | |
| | | | | | | | | | | | | | | | | | | | |
Total Machinery Non-Agriculture, Non-Construction, Non-Electronic | | | | | | | | | | | 1,825,117 | | | | 1,825,445 | | | | 1,797,587 | |
| | | | | | | | | | | | | | | | | | | | |
See accompanying Notes to the Financial Statements.
104
Barings Global Credit Income Opportunities Fund 2018 Annual Report
SCHEDULE OF INVESTMENTS (CONTINUED)
June 30, 2018
| | | | | | | | | | | | | | | | | | | | |
| | | EFFECTIVE
INTEREST RATE | | | DUE DATE | | | PRINCIPAL ‡‡ | | | COST | | | FAIR
VALUE | |
| | | | | |
Bank Loans (Continued) | | | | | | | | | | | | | | | | | | | | |
| | | | |
Mining, Steel, Iron and Non-Precious Metals — 1.1%*: | | | | | | | | | | | | | | | | | |
Big River Steel LLC, 3M LIBOR + 5.000% | | | 7.33 | % | | | 8/23/2023 | | | | 118,507 | | | | $120,047 | | | | $119,915 | |
Boomerang Tube LLC††¤ | | | 15.00 | *** | | | 2/1/2019 | | | | 75,898 | | | | 75,966 | | | | 75,898 | |
Boomerang Tube LLC, 1M LIBOR + 15.000%††¤ | | | 17.09 | | | | 2/1/2019 | | | | 121,563 | | | | 121,563 | | | | 121,563 | |
Boomerang Tube LLC, 1M LIBOR + 17.500%††¤ | | | 19.59 | | | | 2/1/2021 | | | | 105,223 | | | | 105,222 | | | | 5,261 | |
Boomerang Tube LLC††¤ | | | 20.00 | *** | | | 2/1/2019 | | | | 46,501 | | | | 45,368 | | | | 46,501 | |
Boomerang Tube LLC, 1M LIBOR + 18.000%††¤ | | | 20.09 | | | | 9/1/2018 | | | | 27,866 | | | | 27,866 | | | | 27,866 | |
Coronado Coal LLC, LIBOR + 6.500% | | | 8.83 | | | | 3/14/2025 | | | | 272,904 | | | | 264,946 | | | | 274,610 | |
Covia Holdings Corp., 3M LIBOR + 3.750% | | | 6.05 | | | | 6/1/2025 | | | | 1,398,358 | | | | 1,398,358 | | | | 1,397,491 | |
Murray Energy Corp., 3M LIBOR + 7.250% | | | 9.34 | | | | 4/16/2020 | | | | 578,624 | | | | 524,969 | | | | 544,184 | |
| | | | | | | | | | | | | | | | | | | | |
Total Mining, Steel, Iron and Non-Precious Metals | | | | | | | | | | | 2,745,444 | | | | 2,684,305 | | | | 2,613,289 | |
| | | | | | | | | | | | | | | | | | | | |
| | | | | |
Oil and Gas — 2.4%*: | | | | | | | | | | | | | | | | | | | | |
Caelus Energy Alaska O3 LLC, 3M LIBOR + 7.500% | | | 9.83 | | | | 4/15/2020 | | | | 682,707 | | | | 649,758 | | | | 624,677 | |
Fieldwood Energy LLC, 1M LIBOR + 5.250% | | | 7.34 | | | | 4/11/2022 | | | | 649,368 | | | | 577,359 | | | | 649,693 | |
Fieldwood Energy LLC, 1M LIBOR + 7.250% | | | 9.34 | | | | 4/11/2023 | | | | 885,631 | | | | 281,357 | | | | 855,369 | |
Floatel International, Ltd., 3M LIBOR + 5.000% | | | 7.33 | | | | 6/27/2020 | | | | 196,918 | | | | 196,256 | | | | 169,350 | |
Gulf Finance LLC, 3M LIBOR + 5.250% | | | 7.59 | | | | 8/25/2023 | | | | 939,204 | | | | 922,370 | | | | 808,495 | |
KCA Deutag Alpha Ltd., LIBOR + 6.750%+ | | | 9.08 | | | | 3/31/2023 | | | | 500,000 | | | | 497,524 | | | | 497,375 | |
Seadrill Partners Finco LLC, 3M LIBOR + 6.000% | | | 8.33 | | | | 2/21/2021 | | | | 248,556 | | | | 195,735 | | | | 222,216 | |
Southcross Holdings Borrower LP, 1M LIBOR + 5.500% (3.500% PIK) | | | 9.00 | | | | 4/13/2023 | | | | 10,874 | | | | 10,874 | | | | 10,330 | |
Summit Midstream Partners Holdings LLC, 1M LIBOR + 6.000% | | | 8.09 | | | | 5/13/2022 | | | | 96,593 | | | | 95,866 | | | | 97,619 | |
UTEX Industries, Inc., 1M LIBOR + 4.000% | | | 6.09 | | | | 5/22/2021 | | | | 1,251,702 | | | | 1,129,525 | | | | 1,238,146 | |
UTEX Industries, Inc., 1M LIBOR + 7.250% | | | 9.34 | | | | 5/22/2022 | | | | 355,555 | | | | 327,334 | | | | 347,851 | |
| | | | | | | | | | | | | | | | | | | | |
Total Oil and Gas | | | | | | | | | | | 5,817,108 | | | | 4,883,958 | | | | 5,521,121 | |
| | | | | | | | | | | | | | | | | | | | |
| | | | | |
Printing and Publishing — 0.8%*: | | | | | | | | | | | | | | | | | | | | |
Getty Images, Inc., 3M LIBOR + 3.500% | | | 5.59 | | | | 10/18/2019 | | | | 1,495,821 | | | | 1,458,062 | | | | 1,442,225 | |
Springer Science+Business Media Deutschland GmbH, 2M LIBOR + 3.500%+ | | | 5.59 | | | | 8/15/2022 | | | | 397,364 | | | | 398,454 | | | | 396,538 | |
| | | | | | | | | | | | | | | | | | | | |
Total Printing and Publishing | | | | | | | | | | | 1,893,185 | | | | 1,856,516 | | | | 1,838,763 | |
| | | | | | | | | | | | | | | | | | | | |
| | | | | |
Retail Stores — 0.6%*: | | | | | | | | | | | | | | | | | | | | |
EG Finco Ltd., LIBOR + 4.000%+ | | | 6.33 | | | | 2/7/2025 | | | | 366,747 | | | | 364,961 | | | | 363,171 | |
EG Group Ltd., EURIBOR + 4.000%+ | | | 4.00 | | | | 2/6/2025 | | | | 330,975 | | | | 409,462 | | | | 382,110 | |
See accompanying Notes to the Financial Statements.
105
Barings Global Credit Income Opportunities Fund 2018 Annual Report
SCHEDULE OF INVESTMENTS (CONTINUED)
June 30, 2018
| | | | | | | | | | | | | | | | | | | | |
| | | EFFECTIVE
INTEREST RATE | | | DUE DATE | | | PRINCIPAL ‡‡ | | | COST | | | FAIR
VALUE | |
| | | | | |
Bank Loans (Continued) | | | | | | | | | | | | | | | | | | | | |
| | | | | |
Retail Stores (Continued) | | | | | | | | | | | | | | | | | | | | |
Thom Europe S.A.S, EURIBOR + 4.500%+ | | | 4.50 | % | | | 8/7/2024 | | | | 500,000 | | | | $575,710 | | | | $578,791 | |
| | | | | | | | | | | | | | | | | | | | |
Total Retail Stores | | | | | | | | | | | 1,197,722 | | | | 1,350,133 | | | | 1,324,072 | |
| | | | | | | | | | | | | | | | | | | | |
| | | | | |
Telecommunications — 1.1%*: | | | | | | | | | | | | | | | | | | | | |
BMC Software Finance, Inc., 1M LIBOR + 4.250% | | | 6.59 | | | | 6/26/2025 | | | | 664,411 | | | | 657,767 | | | | 660,259 | |
Syniverse Holdings, Inc., 1M LIBOR + 5.000% | | | 7.05 | | | | 3/9/2023 | | | | 199,578 | | | | 197,699 | | | | 199,163 | |
Syniverse Holdings, Inc., 1M LIBOR + 9.000% | | | 11.05 | | | | 3/11/2024 | | | | 153,729 | | | | 151,536 | | | | 152,528 | |
TDC A/S, 1M LIBOR + 3.500%+ | | | 3.50 | | | | 6/30/2025 | | | | 500,000 | | | | 587,374 | | | | 576,479 | |
Virgin Media Investment Holdings Ltd., LIBOR — GBP + 3.250%+ | | | 3.76 | | | | 11/15/2027 | | | | 750,000 | | | | 1,062,468 | | | | 977,816 | |
| | | | | | | | | | | | | | | | | | | | |
Total Telecommunications | | | | | | | | | | | 2,267,718 | | | | 2,656,844 | | | | 2,566,245 | |
| | | | | | | | | | | | | | | | | | | | |
| | | | | |
Utilities — 1.3%*: | | | | | | | | | | | | | | | | | | | | |
Calpine Corp., LIBOR + 2.500% | | | 4.84 | | | | 1/15/2024 | | | | 992,327 | | | | 992,327 | | | | 989,946 | |
EFS Cogen Holdings I LLC, 3M LIBOR + 3.250% | | | 5.59 | | | | 6/28/2023 | | | | 1,094,739 | | | | 1,089,817 | | | | 1,092,517 | |
Vistra Energy Corp., 1M LIBOR + 2.000% | | | 4.07 | | | | 12/31/2025 | | | | 877,447 | | | | 876,354 | | | | 871,111 | |
| | | | | | | | | | | | | | | | | | | | |
Total Utilities | | | | | | | | | | | 2,964,513 | | | | 2,958,498 | | | | 2,953,574 | |
| | | | | | | | | | | | | | | | | | | | |
| | | | | | | | | �� | | | | | | | | | | | |
Total Bank Loans | | | | | | | | | | | 69,951,489 | | | | 71,191,233 | | | | 70,410,142 | |
| | | | | | | | | | | | | | | | | | | | |
Corporate Bonds — 47.1%*: | | | | | | | | | | | | | | | | | | | | |
| | | | | |
Aerospace and Defense — 1.6%*: | | | | | | | | | | | | | | | | | | | | |
Park Aerospace Holdings Ltd.^ | | | 4.50 | | | | 3/15/2023 | | | | 584,000 | | | | 584,000 | | | | 554,683 | |
Swissport Financing Sarl+ | | | 9.75 | | | | 12/15/2022 | | | | 300,000 | | | | 390,780 | | | | 376,153 | |
TransDigm, Inc. | | | 6.38 | | | | 6/15/2026 | | | | 1,077,000 | | | | 1,082,998 | | | | 1,068,922 | |
TransDigm, Inc. | | | 6.50 | | | | 5/15/2025 | | | | 203,000 | | | | 205,647 | | | | 205,284 | |
Triumph Group, Inc. | | | 5.25 | | | | 6/1/2022 | | | | 875,000 | | | | 872,324 | | | | 842,188 | |
Triumph Group, Inc. | | | 7.75 | | | | 8/15/2025 | | | | 750,000 | | | | 802,547 | | | | 742,500 | |
| | | | | | | | | | | | | | | | | | | | |
Total Aerospace and Defense | | | | | | | | | | | 3,789,000 | | | | 3,938,296 | | | | 3,789,730 | |
| | | | | | | | | | | | | | | | | | | | |
| | | | | |
Automobile — 1.2%*: | | | | | | | | | | | | | | | | | | | | |
AA Bond Co. Ltd.+ | | | 5.50 | | | | 7/31/2022 | | | | 1,100,000 | | | | 1,418,453 | | | | 1,323,974 | |
Gates Global LLC/Gates Global Co.^ | | | 6.00 | | | | 7/15/2022 | | | | 477,000 | | | | 397,911 | | | | 482,962 | |
RAC Bond Co. PLC+ | | | 5.00 | | | | 11/6/2022 | | | | 600,000 | | | | 796,230 | | | | 746,890 | |
Wabash National Corp.^ | | | 5.50 | | | | 10/1/2025 | | | | 182,000 | | | | 182,000 | | | | 174,720 | |
| | | | | | | | | | | | | | | | | | | | |
Total Automobile | | | | | | | | | | | 2,359,000 | | | | 2,794,594 | | | | 2,728,546 | |
| | | | | | | | | | | | | | | | | | | | |
| | | | | |
Beverage, Food and Tobacco — 2.1%*: | | | | | | | | | | | | | | | | | | | | |
Boparan Finance PLC+ | | | 5.50 | | | | 7/15/2021 | | | | 1,300,000 | | | | 1,697,581 | | | | 1,484,917 | |
IRB Holding Corp.^ | | | 6.75 | | | | 2/15/2026 | | | | 1,000,000 | | | | 982,974 | | | | 955,000 | |
JBS USA LUX SA/JBS USA Finance, Inc.^ | | | 5.88 | | | | 7/15/2024 | | | | 700,000 | | | | 715,426 | | | | 668,507 | |
JBS USA LUX SA/JBS USA Finance, Inc.^ | | | 6.75 | | | | 2/15/2028 | | | | 500,000 | | | | 500,000 | | | | 472,350 | |
Pilgrim’s Pride Corp.^ | | | 5.75 | | | | 3/15/2025 | | | | 355,000 | | | | 357,186 | | | | 340,800 | |
See accompanying Notes to the Financial Statements.
106
Barings Global Credit Income Opportunities Fund 2018 Annual Report
SCHEDULE OF INVESTMENTS (CONTINUED)
June 30, 2018
| | | | | | | | | | | | | | | | | | | | |
| | | EFFECTIVE
INTEREST RATE | | | DUE DATE | | | PRINCIPAL ‡‡ | | | COST | | | FAIR
VALUE | |
| | | | | |
Corporate Bonds (Continued) | | | | | | | | | | | | | | | | | | | | |
| | | | | |
Beverage, Food and Tobacco (Continued) | | | | | | | | | | | | | | | | | | | | |
Pilgrim’s Pride Corp.^ | | | 5.88 | % | | | 9/30/2027 | | | | 312,000 | | | | $303,633 | | | | $289,380 | |
Sunshine Mid BV+ | | | 6.50 | | | | 5/15/2026 | | | | 600,000 | | | | 726,330 | | | | 663,614 | |
| | | | | | | | | | | | | | | | | | | | |
Total Beverage, Food and Tobacco | | | | | | | | | | | 4,767,000 | | | | 5,283,130 | | | | 4,874,568 | |
| | | | | | | | | | | | | | | | | | | | |
| | | | | |
Broadcasting and Entertainment — 2.3%*: | | | | | | | | | | | | | | | | | | | | |
Arqiva Broadcast Finance plc+ | | | 9.50 | | | | 3/31/2020 | | | | 500,000 | | | | 742,875 | | | | 682,839 | |
CCO Holdings LLC/CCO Holdings Capital Corp.^ | | | 5.00 | | | | 2/1/2028 | | | | 1,750,000 | | | | 1,742,899 | | | | 1,601,250 | |
Clear Channel Worldwide Holdings, Inc. | | | 7.63 | | | | 3/15/2020 | | | | 918,000 | | | | 921,192 | | | | 912,529 | |
CSC Holdings LLC^ | | | 5.38 | | | | 2/1/2028 | | | | 335,000 | | | | 335,000 | | | | 309,875 | |
DISH DBS Corp. | | | 7.75 | | | | 7/1/2026 | | | | 691,000 | | | | 695,422 | | | | 605,489 | |
Netflix, Inc.^ | | | 5.88 | | | | 11/15/2028 | | | | 959,000 | | | | 959,000 | | | | 968,302 | |
VTR Finance BV+^ | | | 6.88 | | | | 1/15/2024 | | | | 250,000 | | | | 244,821 | | | | 251,175 | |
| | | | | | | | | | | | | | | | | | | | |
Total Broadcasting and Entertainment | | | | | | | | | | | 5,403,000 | | | | 5,641,209 | | | | 5,331,459 | |
| | | | | | | | | | | | | | | | | | | | |
| | | | | |
Buildings and Real Estate — 0.7%*: | | | | | | | | | | | | | | | | | | | | |
Miller Homes Group Holdings PLC, 3M GBP LIBOR + 5.250%+ | | | 6.04 | # | | | 10/15/2023 | | | | 400,000 | | | | 538,437 | | | | 526,580 | |
Standard Industries, Inc.^ | | | 4.75 | | | | 1/15/2028 | | | | 885,000 | | | | 885,000 | | | | 811,988 | |
William Lyon Homes, Inc. | | | 7.00 | | | | 8/15/2022 | | | | 295,000 | | | | 298,831 | | | | 300,531 | |
| | | | | | | | | | | | | | | | | | | | |
Total Buildings and Real Estate | | | | | | | | | | | 1,580,000 | | | | 1,722,268 | | | | 1,639,099 | |
| | | | | | | | | | | | | | | | | | | | |
| | | | | |
Cargo Transport+ — 1.3%*: | | | | | | | | | | | | | | | | | | | | |
CMA CGM SA | | | 7.75 | | | | 1/15/2021 | | | | 400,000 | | | | 488,083 | | | | 458,740 | |
Deck Chassis Acquisition, Inc.^ | | | 10.00 | | | | 6/15/2023 | | | | 1,080,000 | | | | 1,115,632 | | | | 1,144,800 | |
Kenan Advantage Group, Inc.^ | | | 7.88 | | | | 7/31/2023 | | | | 1,367,000 | | | | 1,367,000 | | | | 1,394,340 | |
| | | | | | | | | | | | | | | | | | | | |
Total Cargo Transport | | | | | | | | | | | 2,847,000 | | | | 2,970,715 | | | | 2,997,880 | |
| | | | | | | | | | | | | | | | | | | | |
| | | | | |
Chemicals, Plastics and Rubber — 1.4%*: | | | | | | | | | | | | | | | | | | | | |
Consolidated Energy Finance SA^ | | | 6.88 | | | | 6/15/2025 | | | | 940,000 | | | | 962,408 | | | | 964,675 | |
Diversey | | | 5.63 | | | | 8/15/2025 | | | | 100,000 | | | | 105,791 | | | | 104,658 | |
Kraton Polymers LLC / Kraton Polymers Capital Corp.^ | | | 7.00 | | | | 4/15/2025 | | | | 240,000 | | | | 249,360 | | | | 248,400 | |
Monitchem HoldCo 2 SA+ | | | 6.88 | | | | 6/15/2022 | | | | 650,000 | | | | 722,280 | | | | 664,847 | |
Nufarm Australia Ltd. / Nufarm Americas, Inc.^ | | | 5.75 | | | | 4/30/2026 | | | | 703,000 | | | | 703,000 | | | | 681,910 | |
Pinnacle Operating Corp.^ | | | 9.00 | | | | 5/15/2023 | | | | 453,953 | | | | 544,178 | | | | 426,716 | |
Platform Specialty Products Corp.^ | | | 5.88 | | | | 12/1/2025 | | | | 180,000 | | | | 180,000 | | | | 175,950 | |
| | | | | | | | | | | | | | | | | | | | |
Total Chemicals, Plastics and Rubber | | | | | | | | | | | 3,266,953 | | | | 3,467,017 | | | | 3,267,156 | |
| | | | | | | | | | | | | | | | | | | | |
| | | | | |
Containers, Packaging and Glass — 0.7%*: | | | | | | | | | | | | | | | | | | | | |
BWAY Holding Co. | | | 4.75 | | | | 4/15/2024 | | | | 700,000 | | | | 809,620 | | | | 812,433 | |
SIG Combibloc Holdings SCA+ | | | 7.75 | | | | 2/15/2023 | | | | 650,000 | | | | 831,858 | | | | 785,637 | |
| | | | | | | | | | | | | | | | | | | | |
Total Containers, Packaging and Glass | | | | | | | | | | | 1,350,000 | | | | 1,641,478 | | | | 1,598,070 | |
| | | | | | | | | | | | | | | | | | | | |
See accompanying Notes to the Financial Statements.
107
Barings Global Credit Income Opportunities Fund 2018 Annual Report
SCHEDULE OF INVESTMENTS (CONTINUED)
June 30, 2018
| | | | | | | | | | | | | | | | | | | | |
| | | EFFECTIVE
INTEREST RATE | | | DUE DATE | | | PRINCIPAL ‡‡ | | | COST | | | FAIR
VALUE | |
| | | | | |
Corporate Bonds (Continued) | | | | | | | | | | | | | | | | | | | | |
| | | |
Diversified Natural Resources, Precious Metals and Minerals — 0.2%*: | | | | | | | | | | | | | |
Parker Drilling Co. | | | 6.75 | % | | | 7/15/2022 | | | | 750,000 | | | | $684,388 | | | | $547,500 | |
| | | | | | | | | | | | | | | | | | | | |
| | | | |
Diversified/Conglomerate Manufacturing — 1.4%*: | | | | | | | | | | | | | | | | | |
Appvion, Inc.^~ | | | 9.00 | | | | 6/1/2020 | | | | 500,000 | | | | 505,672 | | | | 2,812 | |
Energizer Gamma Acquisition BV | | | 4.63 | | | | 7/15/2026 | | | | 500,000 | | | | 580,650 | | | | 588,198 | |
EnPro Industries, Inc. | | | 5.88 | | | | 9/15/2022 | | | | 400,000 | | | | 402,711 | | | | 408,000 | |
Griffon Corp. | | | 5.25 | | | | 3/1/2022 | | | | 1,800,000 | | | | 1,786,639 | | | | 1,751,220 | |
StoneMor Partners LP/Cornerstone Family Services of West Virginia Subsidiary | | | 7.88 | | | | 6/1/2021 | | | | 494,000 | | | | 503,669 | | | | 486,590 | |
| | | | | | | | | | | | | | | | | | | | |
Total Diversified/Conglomerate Manufacturing | | | | | | | | | | | 3,694,000 | | | | 3,779,341 | | | | 3,236,820 | |
| | | | | | | | | | | | | | | | | | | | |
| | | | | |
Diversified/Conglomerate Service — 4.7%*: | | | | | | | | | | | | | | | | | | | | |
Algeco Global Finance PLC+ | | | 6.50 | | | | 2/15/2023 | | | | 700,000 | | | | 850,200 | | | | 831,030 | |
Carlson Travel, Inc.^ | | | 6.75 | | | | 12/15/2023 | | | | 1,438,000 | | | | 1,458,516 | | | | 1,409,240 | |
Carlson Travel, Inc.^ | | | 9.50 | | | | 12/15/2024 | | | | 277,000 | | | | 277,000 | | | | 250,685 | |
Iron Mountain UK PLC | | | 3.88 | | | | 11/15/2025 | | | | 450,000 | | | | 597,667 | | | | 561,877 | |
La Financiere Atalian SASU+ | | | 6.63 | | | | 5/15/2025 | | | | 600,000 | | | | 835,110 | | | | 760,176 | |
Nuance Communications, Inc. | | | 5.63 | | | | 12/15/2026 | | | | 1,000,000 | | | | 991,734 | | | | 977,510 | |
Prime Security Services Borrower LLC/Prime Finance, Inc.^ | | | 9.25 | | | | 5/15/2023 | | | | 3,000,000 | | | | 3,216,997 | | | | 3,194,100 | |
ServiceMaster Co. LLC (The)^ | | | 5.13 | | | | 11/15/2024 | | | | 627,000 | | | | 627,000 | | | | 608,190 | |
Verisure Midholding AB+ | | | 5.75 | | | | 12/1/2023 | | | | 1,950,000 | | | | 2,285,391 | | | | 2,206,981 | |
| | | | | | | | | | | | | | | | | | | | |
Total Diversified/Conglomerate Service | | | | | | | | | | | 10,042,000 | | | | 11,139,615 | | | | 10,799,789 | |
| | | | | | | | | | | | | | | | | | | | |
| | | | | |
Electronics — 2.3%*: | | | | | | | | | | | | | | | | | | | | |
Solera LLC/Solera Finance, Inc.^ | | | 10.50 | | | | 3/1/2024 | | | | 376,000 | | | | 421,411 | | | | 417,597 | |
TIBCO Software, Inc.^ | | | 11.38 | | | | 12/1/2021 | | | | 2,881,000 | | | | 3,128,043 | | | | 3,111,480 | |
Veritas US, Inc./Veritas Bermuda Ltd.^ | | | 7.50 | | | | 2/1/2023 | | | | 817,000 | | | | 865,332 | | | | 765,937 | |
Veritas US, Inc./Veritas Bermuda Ltd.^ | | | 10.50 | | | | 2/1/2024 | | | | 1,289,000 | | | | 1,350,105 | | | | 1,056,980 | |
| | | | | | | | | | | | | | | | | | | | |
Total Electronics | | | | | | | | | | | 5,363,000 | | | | 5,764,891 | | | | 5,351,994 | |
| | | | | | | | | | | | | | | | | | | | |
| | | | | |
Finance — 5.0%*: | | | | | | | | | | | | | | | | | | | | |
Arrow Global Finance PLC+ | | | 5.13 | | | | 9/15/2024 | | | | 500,000 | | | | 691,637 | | | | 610,384 | |
Cabot Financial Luxembourg SA+ | | | 7.50 | | | | 10/1/2023 | | | | 650,000 | | | | 907,330 | | | | 872,850 | |
Galaxy Bidco Ltd.+ | | | 6.38 | % | | | 11/15/2020 | | | | 350,000 | | | | 499,613 | | | | 459,880 | |
Galaxy Finco Ltd.+ | | | 7.88 | | | | 11/15/2021 | | | | 700,000 | | | | 1,008,098 | | | | 910,439 | |
Garfunkelux Holdco 2 SA+ | | | 11.00 | | | | 11/1/2023 | | | | 800,000 | | | | 1,129,875 | | | | 1,016,208 | |
Garfunkelux Holdco 3 S.A.+ | | | 8.50 | | | | 11/1/2022 | | | | 850,000 | | | | 1,166,229 | | | | 1,088,471 | |
Icahn Enterprises LP/Icahn Enterprises Finance Corp. | | | 6.25 | | | | 2/1/2022 | | | | 300,000 | | | | 307,877 | | | | 306,000 | |
Icahn Enterprises LP/Icahn Enterprises Finance Corp. | | | 6.38 | | | | 12/15/2025 | | | | 381,000 | | | | 381,000 | | | | 381,476 | |
Icahn Enterprises LP/Icahn Enterprises Finance Corp. | | | 6.75 | | | | 2/1/2024 | | | | 1,250,000 | | | | 1,250,000 | | | | 1,259,375 | |
See accompanying Notes to the Financial Statements.
108
Barings Global Credit Income Opportunities Fund 2018 Annual Report
SCHEDULE OF INVESTMENTS (CONTINUED)
June 30, 2018
| | | | | | | | | | | | | | | | | | | | |
| | | EFFECTIVE
INTEREST RATE | | | DUE DATE | | | PRINCIPAL ‡‡ | | | COST | | | FAIR
VALUE | |
| | | | | |
Corporate Bonds (Continued) | | | | | | | | | | | | | | | | | | | | |
| | | | | |
Finance (Continued) | | | | | | | | | | | | | | | | | | | | |
Jerrold Finco PLC+ | | | 6.13 | % | | | 1/15/2024 | | | | 450,000 | | | | $560,298 | | | | $596,895 | |
LPL Holdings, Inc.^ | | | 5.75 | | | | 9/15/2025 | | | | 1,282,000 | | | | 1,302,391 | | | | 1,246,745 | |
Nexi Capital SpA+ | | | 4.13 | | | | 11/1/2023 | | | | 700,000 | | | | 795,452 | | | | 801,111 | |
Park Aerospace Holdings Ltd.+^ | | | 5.25 | | | | 8/15/2022 | | | | 1,000,000 | | | | 998,114 | | | | 990,010 | |
VFH Parent LLC/Orchestra Co-Issuer, Inc.^ | | | 6.75 | | | | 6/15/2022 | | | | 921,000 | | | | 963,926 | | | | 950,942 | |
| | | | | | | | | | | | | | | | | | | | |
Total Finance | | | | | | | | | | | 10,134,000 | | | | 11,961,839 | | | | 11,490,786 | |
| | | | | | | | | | | | | | | | | | | | |
| | |
Grocery — 0.1%*: | | | | | | | | | |
C&S Group Enterprises LLC^ | | | 5.38 | | | | 7/15/2022 | | | | 270,000 | | | | 262,854 | | | | 264,600 | |
| | | | | | | | | | | | | | | | | | | | |
| | | | | |
Healthcare, Education and Childcare — 3.8%*: | | | | | | | | | | | | | | | | | | | | |
Avantor, Inc.^ | | | 6.00 | | | | 10/1/2024 | | | | 424,000 | | | | 424,000 | | | | 419,421 | |
Avantor, Inc.^ | | | 9.00 | | | | 10/1/2025 | | | | 1,000,000 | | | | 1,022,248 | | | | 1,007,700 | |
Cognita Financing PLC+ | | | 7.75 | | | | 8/15/2021 | | | | 500,000 | | | | 723,888 | | | | 669,774 | |
CTC BondCo GmbH+ | | | 5.25 | | | | 12/15/2025 | | | | 400,000 | | | | 480,823 | | | | 444,876 | |
IDH Finance PLC+ | | | 6.25 | | | | 8/15/2022 | | | | 400,000 | | | | 503,286 | | | | 480,828 | |
Ortho-Clinical Diagnostics, Inc./Ortho-Clinical Diagnostics SA^ | | | 6.63 | | | | 5/15/2022 | | | | 735,000 | | | | 697,360 | | | | 718,462 | |
Synlab Unsecured Bondco PLC+ | | | 8.25 | | | | 7/1/2023 | | | | 750,000 | | | | 938,301 | | | | 922,664 | |
Tenet Healthcare Corp.^ | | | 4.63 | | | | 7/15/2024 | | | | 465,000 | | | | 465,000 | | | | 440,448 | |
Tenet Healthcare Corp. | | | 8.13 | | | | 4/1/2022 | | | | 500,000 | | | | 529,127 | | | | 522,760 | |
Teva Pharmaceutical Finance Netherlands III BV | | | 6.00 | | | | 4/15/2024 | | | | 729,000 | | | | 724,056 | | | | 721,948 | |
Unilabs Subholding AB+ | | | 5.75 | | | | 5/15/2025 | | | | 500,000 | | | | 605,268 | | | | 555,245 | |
Valeant Pharmaceuticals International^ | | | 8.50 | | | | 1/31/2027 | | | | 210,000 | | | | 210,000 | | | | 212,625 | |
Valeant Pharmaceuticals International, Inc. | | | 4.50 | | | | 5/15/2023 | | | | 100,000 | | | | 93,569 | | | | 110,296 | |
Valeant Pharmaceuticals International, Inc.^ | | | 5.50 | | | | 11/1/2025 | | | | 184,000 | | | | 184,000 | | | | 181,332 | |
Valeant Pharmaceuticals International, Inc.^ | | | 6.13 | | | | 4/15/2025 | | | | 1,325,000 | | | | 1,132,336 | | | | 1,220,656 | |
Valeant Pharmaceuticals International, Inc.^ | | | 9.00 | | | | 12/15/2025 | | | | 177,000 | | | | 174,657 | | | | 183,407 | |
| | | | | | | | | | | | | | | | | | | | |
Total Healthcare, Education and Childcare | | | | | | | | | | | 8,399,000 | | | | 8,907,919 | | | | 8,812,442 | |
| | | | | | | | | | | | | | | | | | | | |
| | |
Home and Office Furnishings, Housewares, and Durable Consumer Products — 0.1%*: | | | | | | | | | |
LSF9 Balta Issuer SARL+ | | | 7.75 | | | | 9/15/2022 | | | | 162,000 | | | | 210,538 | | | | 197,406 | |
| | | | | | | | | | | | | | | | | | | | |
| | | | | |
Hotels, Motels, Inns and Gaming — 0.8%*: | | | | | | | | | | | | | | | | | | | | |
TVL Finance PLC+ | | | 8.50 | | | | 5/15/2023 | | | | 480,000 | | | | 676,755 | | | | 661,670 | |
Wynn Las Vegas LLC / Wynn Las Vegas Capital Corp.^ | | | 5.50 | | | | 3/1/2025 | | | | 1,250,000 | | | | 1,240,930 | | | | 1,228,125 | |
| | | | | | | | | | | | | | | | | | | | |
Total Hotels, Motels, Inns and Gaming | | | | | | | | | | | 1,730,000 | | | | 1,917,685 | | | | 1,889,795 | |
| | | | | | | | | | | | | | | | | | | | |
| | |
Insurance — 0.7%*: | | | | | | | | | |
Acrisure LLC/Acrisure Finance, Inc.^ | | | 7.00 | | | | 11/15/2025 | | | | 500,000 | | | | 477,924 | | | | 455,000 | |
HUB International Ltd.^ | | | 7.00 | | | | 5/1/2026 | | | | 1,000,000 | | | | 1,000,000 | | | | 987,500 | |
USIS Merger Sub, Inc.^ | | | 6.88 | | | | 5/1/2025 | | | | 146,000 | | | | 146,000 | | | | 145,270 | |
| | | | | | | | | | | | | | | | | | | | |
Total Insurance | | | | | | | | | | | 1,646,000 | | | | 1,623,924 | | | | 1,587,770 | |
| | | | | | | | | | | | | | | | | | | | |
See accompanying Notes to the Financial Statements.
109
Barings Global Credit Income Opportunities Fund 2018 Annual Report
SCHEDULE OF INVESTMENTS (CONTINUED)
June 30, 2018
| | | | | | | | | | | | | | | | | | | | |
| | | EFFECTIVE
INTEREST RATE | | | DUE DATE | | | PRINCIPAL ‡‡ | | | COST | | | FAIR
VALUE | |
| | | | | |
Corporate Bonds (Continued) | | | | | | | | | | | | | | | | | | | | |
| | |
Leisure, Amusement, Entertainment — 1.5%*: | | | | | | | | | |
Allegiant Travel Co. | | | 5.50 | % | | | 7/15/2019 | | | | 800,000 | | | | $811,630 | | | | $804,000 | |
AMC Entertainment Holdings, Inc. | | | 6.38 | | | | 11/15/2024 | | | | 750,000 | | | | 967,487 | | | | 1,001,196 | |
Interval Acquisition Corp. | | | 5.63 | | | | 4/15/2023 | | | | 459,000 | | | | 459,000 | | | | 462,727 | |
Perform Group Financing PLC+ | | | 8.50 | | | | 11/15/2020 | | | | 850,000 | | | | 1,170,859 | | | | 1,138,884 | |
| | | | | | | | | | | | | | | | | | | | |
Total Leisure, Amusement, Entertainment | | | | | | | | | | | 2,859,000 | | | | 3,408,976 | | | | 3,406,807 | |
| | | | | | | | | | | | | | | | | | | | |
| | |
Machinery Non-Agriculture, Non-Construction, Non-Electronic — 0.5%*: | | | | | | | | | |
Apex Tool Group LLC/BC Mountain Finance, Inc.^ | | | 9.00 | | | | 2/15/2023 | | | | 622,000 | | | | 618,672 | | | | 601,785 | |
Xerium Technologies, Inc. | | | 9.50 | | | | 8/15/2021 | | | | 500,000 | | | | 496,855 | | | | 527,500 | |
| | | | | | | | | | | | | | | | | | | | |
Total Machinery Non-Agriculture, Non-Construction, Non-Electronic | | | | | | | | | | | 1,122,000 | | | | 1,115,527 | | | | 1,129,285 | |
| | | | | | | | | | | | | | | | | | | | |
| | |
Mining, Steel, Iron and Non-Precious Metals — 2.6%*: | | | | | | | | | |
Allegheny Technologies, Inc. | | | 5.95 | | | | 1/15/2021 | | | | 1,000,000 | | | | 1,001,792 | | | | 1,005,000 | |
First Quantum Minerals Ltd.+^ | | | 6.50 | | | | 3/1/2024 | | | | 1,000,000 | | | | 1,000,000 | | | | 965,000 | |
First Quantum Minerals Ltd.+^ | | | 7.00 | | | | 2/15/2021 | | | | 1,000,000 | | | | 1,008,129 | | | | 1,001,393 | |
First Quantum Minerals Ltd.+^ | | | 7.50 | | | | 4/1/2025 | | | | 500,000 | | | | 492,606 | | | | 493,450 | |
Northwest Acquisitions ULC/Dominion Finco, Inc.+^ | | | 7.13 | | | | 11/1/2022 | | | | 1,500,000 | | | | 1,536,152 | | | | 1,496,250 | |
SunCoke Energy Partners LP/SunCoke Energy Partners Finance Corp.^ | | | 7.50 | | | | 6/15/2025 | | | | 654,000 | | | | 645,284 | | | | 665,445 | |
Warrior Met Coal, Inc.^ | | | 8.00 | | | | 11/1/2024 | | | | 340,000 | | | | 349,392 | | | | 351,050 | |
| | | | | | | | | | | | | | | | | | | | |
Total Mining, Steel, Iron and Non-Precious Metals | | | | | | | | | | | 5,994,000 | | | | 6,033,355 | | | | 5,977,588 | |
| | | | | | | | | | | | | | | | | | | | |
| | |
Oil and Gas — 6.0%*: | | | | | | | | | |
Chesapeake Energy Corp.^ | | | 8.00 | | | | 12/15/2022 | | | | 756,000 | | | | 779,909 | | | | 793,573 | |
Citgo Holding, Inc.^ | | | 10.75 | | | | 2/15/2020 | | | | 1,350,000 | | | | 1,400,920 | | | | 1,436,062 | |
EP Energy LLC/Everest Acquisition Finance, Inc.^ | | | 7.75 | | | | 5/15/2026 | | | | 744,000 | | | | 744,000 | | | | 760,740 | |
EP Energy LLC/Everest Acquisition Finance, Inc.^ | | | 8.00 | | | | 2/15/2025 | | | | 1,343,000 | | | | 1,298,538 | | | | 1,040,825 | |
Ferrellgas LP/Ferrellgas Finance Corp. | | | 6.75 | | | | 1/15/2022 | | | | 1,000,000 | | | | 1,008,304 | | | | 905,000 | |
Ferrellgas Partners LP/Ferrellgas Partners Finance Corp. | | | 8.63 | | | | 6/15/2020 | | | | 284,000 | | | | 276,980 | | | | 273,350 | |
Genesis Energy LP/Genesis Energy Finance Corp. | | | 6.00 | | | | 5/15/2023 | | | | 1,000,000 | | | | 985,074 | | | | 981,250 | |
Genesis Energy LP/Genesis Energy Finance Corp. | | | 6.75 | | | | 8/1/2022 | | | | 500,000 | | | | 485,984 | | | | 505,000 | |
Jonah Energy LLC/Jonah Energy Finance Corp.^ | | | 7.25 | | | | 10/15/2025 | | | | 1,121,000 | | | | 1,105,129 | | | | 905,207 | |
Jupiter Resources, Inc.+^ | | | 8.50 | | | | 10/1/2022 | | | | 1,450,000 | | | | 1,258,028 | | | | 594,500 | |
KCA Deutag UK Finance PLC+^ | | | 9.63 | | | | 4/1/2023 | | | | 250,000 | | | | 250,000 | | | | 253,438 | |
KCA Deutag UK Finance PLC+^ | | | 9.88 | | | | 4/1/2022 | | | | 300,000 | | | | 311,131 | | | | 310,047 | |
See accompanying Notes to the Financial Statements.
110
Barings Global Credit Income Opportunities Fund 2018 Annual Report
SCHEDULE OF INVESTMENTS (CONTINUED)
June 30, 2018
| | | | | | | | | | | | | | | | | | | | |
| | | EFFECTIVE
INTEREST RATE | | | DUE DATE | | | PRINCIPAL ‡‡ | | | COST | | | FAIR
VALUE | |
| | | | | |
Corporate Bonds (Continued) | | | | | | | | | | | | | | | | | | | | |
| | |
Oil and Gas (Continued) | | | | | | | | | |
Kosmos Energy Ltd. | | | 7.88 | % | | | 8/1/2021 | | | | 1,177,000 | | | | $1,146,693 | | | | $1,196,127 | |
PBF Holding Co. LLC/PBF Finance Corp. | | | 7.25 | | | | 6/15/2025 | | | | 1,100,000 | | | | 1,139,731 | | | | 1,156,375 | |
QEP Resources, Inc. | | | 5.63 | | | | 3/1/2026 | | | | 1,230,000 | | | | 1,187,270 | | | | 1,177,725 | |
Welltec A/S+^ | | | 9.50 | | | | 12/1/2022 | | | | 1,637,000 | | | | 1,637,994 | | | | 1,645,185 | |
| | | | | | | | | | | | | | | | | | | | |
Total Oil and Gas | | | | | | | | | | | 15,242,000 | | | | 15,015,685 | | | | 13,934,404 | |
| | | | | | | | | | | | | | | | | | | | |
| | |
Personal and Non-Durable Consumer Products Mfg. Only — 0.3%*: | | | | | | | | | |
Prestige Brands, Inc.^ | | | 6.38 | | | | 3/1/2024 | | | | 271,000 | | | | 274,873 | | | | 268,290 | |
Samsonite Finco Sarl | | | 3.50 | | | | 5/15/2026 | | | | 425,000 | | | | 459,063 | | | | 472,120 | |
| | | | | | | | | | | | | | | | | | | | |
Total Personal and Non-Durable Consumer Products Mfg. Only | | | | | | | | | | | 696,000 | | | | 733,936 | | | | 740,410 | |
| | | | | | | | | | | | | | | | | | | | |
| | |
Personal, Food and Miscellaneous — 0.7%*: | | | | | | | | | |
Ocado Group PLC+ | | | 4.00 | | | | 6/15/2024 | | | | 350,000 | | | | 449,120 | | | | 462,004 | |
Simmons Foods, Inc.^ | | | 5.75 | | | | 11/1/2024 | | | | 1,208,000 | | | | 1,025,703 | | | | 1,047,940 | |
| | | | | | | | | | | | | | | | | | | | |
Total Personal, Food and Miscellaneous | | | | | | | | | | | 1,558,000 | | | | 1,474,823 | | | | 1,509,944 | |
| | | | | | | | | | | | | | | | | | | | |
| | |
Retail Stores — 1.9%*: | | | | | | | | | |
CBR Fashion Finance BV+ | | | 5.13 | | | | 10/1/2022 | | | | 650,000 | | | | 700,178 | | | | 648,181 | |
House of Fraser Funding PLC, 3M GBP LIBOR + 5.750%+ | | | 6.38 | # | | | 9/15/2020 | | | | 150,000 | | | | 232,904 | | | | 143,384 | |
HSS Financing PLC+ | | | 6.75 | | | | 8/1/2019 | | | | 442,000 | | | | 623,442 | | | | 580,705 | |
Jewel UK Bondco PLC+ | | | 8.50 | | | | 4/15/2023 | | | | 300,000 | | | | 427,350 | | | | 393,673 | |
Maxeda DIY Holding B.V.+ | | | 6.13 | | | | 7/15/2022 | | | | 400,000 | | | | 474,460 | | | | 424,495 | |
Penske Automotive Group, Inc. | | | 5.50 | | | | 5/15/2026 | | | | 1,250,000 | | | | 1,246,586 | | | | 1,225,000 | |
Takko Luxembourg 2 SCA, 3M USD LIBOR + 5.375%+ | | | 5.38 | # | | | 11/15/2023 | | | | 450,000 | | | | 511,675 | | | | 480,149 | |
Travelex Financing PLC+ | | | 8.00 | | | | 5/15/2022 | | | | 500,000 | | | | 569,102 | | | | 568,751 | |
| | | | | | | | | | | | | | | | | | | | |
Total Retail Stores | | | | | | | | | | | 4,142,000 | | | | 4,785,697 | | | | 4,464,338 | |
| | | | | | | | | | | | | | | | | | | | |
| | |
Telecommunications — 2.6%*: | | | | | | | | | |
Cablevision Systems Corp. | | | 5.88 | | | | 9/15/2022 | | | | 689,000 | | | | 688,699 | | | | 683,832 | |
CCO Holdings LLC/CCO Holdings Capital Corp.^ | | | 5.88 | | | | 5/1/2027 | | | | 500,000 | | | | 506,940 | | | | 488,125 | |
CenturyLink, Inc. | | | 6.75 | | | | 12/1/2023 | | | | 1,000,000 | | | | 1,000,000 | | | | 1,005,000 | |
Cequel Communications Holdings I LLC/Cequel Capital Corp.^ | | | 7.50 | | | | 4/1/2028 | | | | 386,000 | | | | 386,000 | | | | 390,709 | |
InterXion Holding NV+ | | | 4.75 | | | | 6/15/2025 | | | | 350,000 | | | | 411,828 | | | | 410,201 | |
TDC A/S+ | | | 5.63 | | | | 2/23/2023 | | | | 1,200,000 | | | | 1,721,619 | | | | 1,676,458 | |
Telecom Italia SpA/Milano+ | | | 3.63 | | | | 5/25/2026 | | | | 600,000 | | | | 756,680 | | | | 737,061 | |
Virgin Media Receivables Financing Notes II DAC+ | | | 5.75 | | | | 4/15/2023 | | | | 500,000 | | | | 688,765 | | | | 668,784 | |
| | | | | | | | | | | | | | | | | | | | |
Total Telecommunications | | | | | | | | | | | 5,225,000 | | | | 6,160,531 | | | | 6,060,170 | |
| | | | | | | | | | | | | | | | | | | | |
See accompanying Notes to the Financial Statements.
111
Barings Global Credit Income Opportunities Fund 2018 Annual Report
SCHEDULE OF INVESTMENTS (CONTINUED)
June 30, 2018
| | | | | | | | | | | | | | | | | | | | |
| | | EFFECTIVE
INTEREST RATE | | | DUE DATE | | | PRINCIPAL ‡‡ | | | COST | | | FAIR
VALUE | |
| | | | | |
Corporate Bonds (Continued) | | | | | | | | | | | | | | | | | | | | |
| | |
Textiles and Leather — 0.2%*: | | | | | | | | | |
Eagle Intermediate Global Holding BV/Ruyi US Finance LLC+ | | | 5.38 | % | | | 5/1/2023 | | | | 350,000 | | | | $410,529 | | | | $405,583 | |
| | | | | | | | | | | | | | | | | | | | |
| | | | | |
Utilities — 0.4%*: | | | | | | | | | | | | | | | | | | | | |
Nordex SE+ | | | 6.50 | | | | 2/1/2023 | | | | 250,000 | | | | 310,488 | | | | 272,267 | |
Viridian Group Finance Co. PLC+ | | | 4.75 | | | | 9/15/2024 | | | | 600,000 | | | | 797,453 | | | | 730,284 | |
| | | | | | | | | | | | | | | | | | | | |
Total Utilities | | | | | | | | | | | 850,000 | | | | 1,107,941 | | | | 1,002,551 | |
| | | | | | | | | | | | | | | | | | | | |
Total Corporate Bonds | | | | | | | | | | | 105,589,953 | | | | 113,958,702 | | | | 109,036,490 | |
| | | | | | | | | | | | | | | | | | | | |
Total Fixed Income | | | | | | | | | | | 208,841,442 | | | | 218,184,431 | | | | 212,476,104 | |
| | | | | | | | | | | | | | | | | | | | |
| | | | | | | | | | | | | | | | | | | | | | | | | | | | | | |
| | | | | | | | |
| COUNTERPARTY | | | | STRIKE
PRICE | | | EXPIRATION
DATE | | | CONTRACTS | | | NOTIONAL | | | COST | | | UNREALIZED
VALUE | | | FAIR
VALUE | |
| | | | | |
Purchased Option — 0.3%*: | | | | | | | | | | | | | | | | | | | | | |
| | | | | | |
Put Option Purchased — 0.3%*: | | | | | | | | | | | | | | | | | | | | | | | | | |
S&P 500 Index | | Morgan Stanley & Co. | | | $2,450.00 | | | | 6/21/2019 | | | | 95 | | | | 25,824,515 | | | | $733,920 | | | | $43,085 | | | | $777,005 | |
| | | | | | | | | | | | | | | | | | | | | | | | | | | | | | |
| | | | | | | | | | | | | | | | | | | | |
| | | | | |
| | | EFFECTIVE
INTEREST RATE | | | DUE DATE | | | PRINCIPAL ‡‡ | | | COST | | | FAIR
VALUE | |
| | | |
Short-Term Investments — 8.2%*: | | | | | | | | | | | | | |
| | | | |
Bank Deposit — 8.2%*: | | | | | | | | | | | | | | | | | |
State Street Bank & Trust Co. Euro Time Deposit | | | 0.28 | % | | | 7/2/2018 | | | | 18,938,315 | | | | 18,938,315 | | | | 18,938,315 | |
| | | | | | | | | | | | | | | | | | | | |
Total Investments | | | | | | | | | | | 272,812,346 | | | | 239,021,691 | | | | 234,123,460 | |
| | | | | | | | | | | | | | | | | | | | |
| | | | | |
Other assets and liabilities – (1.1%)* | | | | | | | | | | | | | | | | | | | (2,624,383 | ) |
| | | | | | | | | | | | | | | | | | | | |
| | | | | |
Net Assets – 100.0% | | | | | | | | | | | | | | | | | | | $231,499,077 | |
| | | | | | | | | | | | | | | | | | | | |
| ‡‡ | Unless otherwise indicated, all principal amounts are denominated in United States Dollars. |
| * | Calculated as a percentage of net assets applicable to common shareholders. |
Distributions of investments by country of risk (excluding temporary cash investments) as a percentage of total investments in securities, is as follows:
| | | | | | |
| | United States | | | 68.2% | |
| | United Kingdom | | | 11.1% | |
| | Netherlands | | | 3.9% | |
| | Germany | | | 3.8% | |
| | Ireland | | | 2.2% | |
See accompanying Notes to the Financial Statements.
112
Barings Global Credit Income Opportunities Fund 2018 Annual Report
SCHEDULE OF INVESTMENTS (CONTINUED)
June 30, 2018
| | | | | | |
| | France | | | 1.9% | |
| | Denmark | | | 1.8% | |
| | Canada | | | 1.7% | |
| | Sweden | | | 1.3% | |
| | Other (Individually less than 1%) | | | 4.1% | |
| | | | | | |
| | Total | | | 100.0% | |
| | | | | | |
| ^ | Security acquired in a transaction exempt from registration under Rule 144A of the Securities Act of 1933. These securities may only be resold in transactions exempt from registration, normally to qualified institutional buyers. |
| § | Bank loans are exempt from registration under the Securities Act of 1933, as amended, but contain certain restrictions on resale and cannot be sold publicly. These loans pay interest at rates which adjust periodically. The interest rates shown for bank loans are the current interest rates at June 30, 2018. Bank loans are also subject to mandatory and/or optional prepayment which cannot be predicted. As a result, the remaining maturity may be substantially less than the stated maturity shown. |
| ¤ | For fair value measurement disclosure purposes, security is categorized as Level 3 (See Note 2). |
| # | Variable rate security. The interest rate shown is the rate in effect at June 30, 2018. |
A summary of outstanding derivatives at June 30, 2018 is as follows:
Forward Foreign Currency Exchange Contracts to Buy
| | | | | | | | | | | | | | | | | | | | | | |
EXPIRATION
DATE | | COUNTERPARTY | | LOCAL
CURRENCY | | | VALUE IN USD | | | IN
EXCHANGE
FOR USD | | | NET UNREALIZED
APPRECIATION | |
| 7/2/18 | | Bank of America N.A. | | | EUR | | | | 1,178,029 | | | $ | 1,375,702 | | | $ | 1,374,419 | | | $ | 1,283 | |
| | | | | | | | | | | | | | | | | | | | | | |
Net unrealized appreciation on forward foreign currency exchange contracts to buy | | | $ | 1,283 | |
| | | | | | | | | | | | | | | | | | | | | | |
Forward Foreign Currency Exchange Contracts to Sell
| | | | | | | | | | | | | | | | | | | | | | |
EXPIRATION
DATE | | COUNTERPARTY | | LOCAL
CURRENCY | | | VALUE IN USD | | | IN
EXCHANGE
FOR USD | | | NET UNREALIZED
APPRECIATION
(DEPRECIATION) | |
| 7/12/18 | | Goldman Sachs & Co. | | | EUR | | | | 22,188,407 | | | $ | 25,928,053 | | | $ | 26,266,999 | | | $ | 338,946 | |
| 7/12/18 | | JPMorgan Chase Bank N.A. | | | EUR | | | | 731,460 | | | | 854,740 | | | | 860,399 | | | | 5,659 | |
| 7/12/18 | | Bank of America N.A. | | | EUR | | | | 1,528,029 | | | | 1,785,564 | | | | 1,783,488 | | | | (2,076 | ) |
| 7/12/18 | | JPMorgan Chase Bank N.A. | | | GBP | | | | 614,149 | | | | 810,844 | | | | 824,620 | | | | 13,776 | |
| 7/12/18 | | Bank of America N.A. | | | GBP | | | | 95,005 | | | | 125,432 | | | | 127,325 | | | | 1,893 | |
| 7/12/18 | | Citibank N.A. | | | GBP | | | | 17,061,987 | | | | 22,526,464 | | | | 22,982,741 | | | | 456,277 | |
| | | | | | | | | | | | | | | | | | | | | | |
Net unrealized appreciation on forward foreign currency exchange contracts to sell | | | $ | 814,475 | |
| | | | | | | | | | | | | | | | | | | | | | |
Currency Legend
| | | | |
| EUR | | – | | Euro |
| GBP | | – | | British Pound Sterling |
See accompanying Notes to the Financial Statements.
113
Barings Active Short Duration Bond Fund 2018 Annual Report
SCHEDULE OF INVESTMENTS
June 30, 2018
| | | | | | | | | | | | | | | | | | | | |
| | | EFFECTIVE
INTEREST RATE | | | DUE DATE | | | PRINCIPAL ‡‡ | | | COST | | | FAIR VALUE | |
Fixed Income — 95.3%*: | | | | | | | | | | | | | | | | | | | | |
| | | | | |
Asset-Backed Securities — 41.1%*: | | | | | | | | | | | | | | | | | | | | |
| | | | | |
CDO/CLO — 4.4%*: | | | | | | | | | | | | | | | | | | | | |
AIMCO CLO 2014-AA AR, 3M USD LIBOR + 1.100%^ | | | 3.46 | #% | | | 7/20/2026 | | | | 1,200,000 | | | | $1,200,000 | | | | $1,200,131 | |
ALM VII Ltd. 2012-7A A1R, 3M USD LIBOR + 1.480%^ | | | 3.83 | # | | | 10/15/2028 | | | | 390,000 | | | | 390,000 | | | | 392,488 | |
Apidos CLO XXV 2016-25A A1, 3M USD LIBOR + 1.460%^ | | | 3.82 | # | | | 10/20/2028 | | | | 470,000 | | | | 470,000 | | | | 470,454 | |
Avery Point III CLO Ltd. 2013-3A AR, 3M USD LIBOR + 1.120%^ | | | 3.48 | # | | | 1/18/2025 | | | | 651,790 | | | | 651,790 | | | | 651,854 | |
BlueMountain CLO Ltd. 2015-2A A1, 3M USD LIBOR + 1.430%^ | | | 3.79 | # | | | 7/18/2027 | | | | 500,000 | | | | 493,643 | | | | 500,019 | |
Denali Capital CLO Ltd. 2013 1A A1LR, 3M USD LIBOR + 1.050%^ | | | 3.41 | # | | | 10/26/2027 | | | | 2,420,000 | | | | 2,420,000 | | | | 2,421,551 | |
Galaxy XX CLO Ltd., 3M USD LIBOR + 1.000%^ | | | 3.36 | # | | | 4/20/2031 | | | | 1,200,000 | | | | 1,200,000 | | | | 1,194,798 | |
Hertz Vehicle Financing LLC 2018-3^ | | | 4.37 | | | | 7/25/2024 | | | | 620,000 | | | | 621,548 | | | | 619,772 | |
LCM XXIII Ltd. 23A A1, 3M USD LIBOR + 1.400%^ | | | 3.76 | # | | | 10/20/2029 | | | | 610,000 | | | | 610,000 | | | | 612,798 | |
Madison Park Funding XIV Ltd. 2014-14A A1R, 3M USD LIBOR + 1.120%^ | | | 3.48 | # | | | 7/20/2026 | | | | 290,000 | | | | 290,000 | | | | 290,042 | |
Madison Park Funding XXII Ltd. 2016-22A A, 3M USD LIBOR + 1.480%^ | | | 3.84 | # | | | 10/25/2029 | | | | 350,000 | | | | 350,000 | | | | 351,499 | |
Magnetite XI Ltd. 2014-11A A1R, 3M USD LIBOR + 1.120%^ | | | 3.48 | # | | | 1/18/2027 | | | | 890,000 | | | | 890,000 | | | | 890,097 | |
Neuberger Berman CLO XX Ltd. 2015-20A BR, 3M USD LIBOR + 1.250%^ | | | 3.60 | # | | | 1/15/2028 | | | | 2,000,000 | | | | 2,000,000 | | | | 1,990,064 | |
OCP CLO Ltd. 2015-8A A2AR, 3M USD LIBOR + 1.450%^ | | | 3.80 | # | | | 4/17/2027 | | | | 900,000 | | | | 900,000 | | | | 896,045 | |
OHA Loan Funding Ltd. 2015-1A AR, 3M USD LIBOR + 1.410%^ | | | 3.75 | # | | | 8/15/2029 | | | | 840,000 | | | | 840,000 | | | | 844,322 | |
Race Point VIII CLO Ltd. 2013-8A AR, 3M USD LIBOR + 1.340%^ | | | 3.67 | # | | | 2/20/2030 | | | | 1,320,000 | | | | 1,320,000 | | | | 1,327,215 | |
RR 3 Ltd. Series 2018-3 A A1R2, 3M USD LIBOR + 1.090%^ | | | 3.44 | # | | | 1/15/2030 | | | | 570,000 | | | | 570,000 | | | | 571,293 | |
Seneca Park CLO Ltd. 2014-1A AR, 3M USD LIBOR + 1.120%^ | | | 3.47 | # | | | 7/17/2026 | | | | 360,000 | | | | 360,000 | | | | 360,035 | |
Symphony CLO XV Ltd. 2014-15A AR, 3M USD LIBOR + 1.180%^ | | | 3.53 | # | | | 10/17/2026 | | | | 1,100,000 | | | | 1,100,000 | | | | 1,100,135 | |
TCI-Symphony CLO Ltd. 2016-1A A, 3M USD LIBOR + 1.480%^ | | | 3.82 | # | | | 10/13/2029 | | | | 320,000 | | | | 320,000 | | | | 321,140 | |
Treman Park CLO Ltd. 2015-1A AR, 3M USD LIBOR + 1.370%^ | | | 3.73 | # | | | 4/20/2027 | | | | 970,000 | | | | 970,000 | | | | 970,297 | |
VMC Finance 2018-FL1 LLC, 1M USD LIBOR + 0.820%^ | | | 2.89 | # | | | 4/15/2035 | | | | 926,861 | | | | 926,861 | | | | 927,240 | |
| | | | | | | | | | | | | | | | | | | | |
Total CDO/CLO | | | | | | | | | | | 18,898,651 | | | | 18,893,842 | | | | 18,903,289 | |
| | | | | | | | | | | | | | | | | | | | |
See accompanying Notes to the Financial Statements.
114
Barings Active Short Duration Bond Fund 2018 Annual Report
SCHEDULE OF INVESTMENTS (CONTINUED)
June 30, 2018
| | | | | | | | | | | | | | | | | | | | |
| | | EFFECTIVE
INTEREST RATE | | | DUE DATE | | | PRINCIPAL ‡‡ | | | COST | | | FAIR VALUE | |
Asset-Backed Securities (Continued) | | | | | | | | | | | | | | | | | | | | |
| | | | | |
Other Asset-Backed Securities — 36.7%*: | | | | | | | | | | | | | | | | | | | | |
321 Henderson Receivables II LLC 2006-3A A1, 1M USD LIBOR + 0.200%^ | | | 2.27 | # % | | | 9/15/2041 | | | | 129,482 | | | $ | 125,821 | | | $ | 123,043 | |
Access Group, Inc. 2015-1 A, 1M USD LIBOR + 0.700%^ | | | 2.79 | # | | | 7/25/2056 | | | | 126,362 | | | | 123,634 | | | | 126,187 | |
Access Group, Inc. 2015-1 B, 1M USD LIBOR + 1.500%^ | | | 3.59 | # | | | 7/25/2058 | | | | 100,000 | | | | 86,557 | | | | 89,553 | |
AccessLex Institute 2002-A A2, 28 Day ARS¤ | | | 1.96 | # | | | 9/25/2037 | �� | | | 550,000 | | | | 508,218 | | | | 546,700 | |
AccessLex Institute 2004-A A3, 28 day ARS | | | 1.70 | # | | | 7/1/2039 | | | | 1,400,000 | | | | 1,374,551 | | | | 1,372,497 | |
AccessLex Institute 2005-1 A3, 3M USD LIBOR + 0.150% | | | 2.48 | # | | | 6/22/2022 | | | | 20,708 | | | | 20,506 | | | | 20,706 | |
Accredited Mortgage Loan Trust 2004-04 A2D, 1M USD LIBOR + 0.700% | | | 2.79 | # | | | 1/25/2035 | | | | 509,926 | | | | 500,250 | | | | 504,565 | |
American Credit Acceptance Receivables Trust 2017-1 B^ | | | 2.39 | | | | 2/16/2021 | | | | 454,548 | | | | 454,518 | | | | 453,956 | |
American Credit Acceptance Receivables Trust 2017-4 C^ | | | 2.94 | | | | 1/10/2024 | | | | 1,790,000 | | | | 1,789,941 | | | | 1,778,734 | |
AmeriCredit Automobile Receivables Trust 2014-1 D | | | 2.54 | | | | 6/8/2020 | | | | 310,000 | | | | 309,792 | | | | 309,955 | |
Arbys Funding LLC 2015-1A A2^ | | | 4.97 | | | | 10/30/2045 | | | | 78,000 | | | | 78,000 | | | | 78,112 | |
Argent Securities, Inc. Asset-Backed Pass-Through Certificates 2004-W10 M1, 1M USD LIBOR + 0.900% | | | 2.99 | # | | | 10/25/2034 | | | | 274,742 | | | | 250,480 | | | | 272,963 | |
ARI Fleet Lease Trust 2016-A A3^ | | | 2.11 | | | | 7/15/2024 | | | | 200,000 | | | | 199,971 | | | | 198,807 | |
Asset Backed Securities Corp. Home Equity Loan Trust 2005-HE1 M1, 1M USD LIBOR + 0.750% | | | 2.84 | # | | | 3/25/2035 | | | | 296,403 | | | | 294,702 | | | | 294,772 | |
Avant Loans Funding Trust 2018-A^ | | | 3.09 | | | | 6/15/2021 | | | | 720,000 | | | | 719,982 | | | | 719,596 | |
BCC Funding XIV LLC^ | | | 2.20 | | | | 2/20/2019 | | | | 2,508,324 | | | | 2,508,324 | | | | 2,507,105 | |
BlueVirgo Trust 2015-1A^ | | | 3.00 | | | | 12/15/2022 | | | | 97,973 | | | | 97,685 | | | | 97,966 | |
BRE Grand Islander Timeshare Issuer LLC 2017-1A A^ | | | 2.94 | | | | 5/25/2029 | | | | 248,032 | | | | 247,975 | | | | 241,887 | |
BRE Grand Islander Timeshare Issuer LLC 2017-1A B^ | | | 3.24 | | | | 5/25/2029 | | | | 204,262 | | | | 204,235 | | | | 198,258 | |
Capital Automotive LLC 2017-1A A1^ | | | 3.87 | | | | 4/15/2047 | | | | 306,383 | | | | 306,296 | | | | 305,778 | |
Castlelake Aircraft Securitization Trust 2018-1^ | | | 4.13 | | | | 6/15/2043 | | | | 600,000 | | | | 599,548 | | | | 602,760 | |
Cazenovia Creek Funding I LLC 2015-1A A^ | | | 2.00 | | | | 12/10/2023 | | | | 40,125 | | | | 39,809 | | | | 39,809 | |
Centex Home Equity Loan Trust 2006-A AV4, 1M USD LIBOR + 0.250% | | | 2.34 | # | | | 6/25/2036 | | | | 132,391 | | | | 129,400 | | | | 132,612 | |
Chase Education Loan Trust, 3M USD LIBOR + 0.220% | | | 2.56 | # | | | 6/28/2040 | | | | 797,663 | | | | 753,132 | | | | 752,869 | |
Citigroup Mortgage Loan Trust Asset Backed Pass-Through Certificates 2005-OPT3 M2, 1M USD LIBOR + 0.675% | | | 2.77 | # | | | 5/25/2035 | | | | 78,215 | | | | 78,028 | | | | 78,263 | |
CLI Funding V LLC 2013-1A^ | | | 2.83 | | | | 3/18/2028 | | | | 46,700 | | | | 46,502 | | | | 45,801 | |
CLI Funding V LLC 2013-2A^ | | | 3.22 | | | | 6/18/2028 | | | | 932,191 | | | | 922,314 | | | | 919,129 | |
See accompanying Notes to the Financial Statements.
115
Barings Active Short Duration Bond Fund 2018 Annual Report
SCHEDULE OF INVESTMENTS (CONTINUED)
June 30, 2018
| | | | | | | | | | | | | | | | | | | | |
| | | EFFECTIVE
INTEREST RATE | | | DUE DATE | | | PRINCIPAL ‡‡ | | | COST | | | FAIR VALUE | |
Asset-Backed Securities (Continued) | | | | | | | | | | | | | | | | | | | | |
| | | | | |
Other Asset-Backed Securities (Continued) | | | | | | | | | | | | | | | | | | | | |
CLI Funding V LLC 2014-1A A^ | | | 3.29 | % | | | 6/18/2029 | | | | 782,180 | | | $ | 778,320 | | | $ | 769,726 | |
CLI Funding VI LLC 2017-1A A^ | | | 3.62 | | | | 5/18/2042 | | | | 1,758,706 | | | | 1,762,310 | | | | 1,733,828 | |
College Ave Student Loans LLC 2018-A, 1M USD LIBOR + 1.200%^ | | | 3.29 | # | | | 12/26/2047 | | | | 460,334 | | | | 460,334 | | | | 460,240 | |
College Loan Corp. Trust I 2005-2 B, 3M USD LIBOR + 0.490% | | | 2.84 | # | | | 1/15/2037 | | | | 179,552 | | | | 158,860 | | | | 168,372 | |
Commonbond Student Loan Trust 2016-B A1^ | | | 2.73 | | | | 10/25/2040 | | | | 1,520,484 | | | | 1,526,587 | | | | 1,483,050 | |
Commonbond Student Loan Trust 2017-A-GS^ | | | 5.28 | | | | 5/25/2041 | | | | 651,676 | | | | 651,597 | | | | 652,365 | |
Commonbond Student Loan Trust 2018-A-GS^ | | | 3.82 | | | | 2/25/2044 | | | | 440,000 | | | | 439,901 | | | | 437,982 | |
CPS Auto Receivables Trust 2015-C B^ | | | 2.55 | | | | 2/18/2020 | | | | 23,842 | | | | 23,840 | | | | 23,839 | |
CPS Auto Receivables Trust 2016-C A^ | | | 1.62 | | | | 1/15/2020 | | | | 10,186 | | | | 10,186 | | | | 10,182 | |
CPS Auto Receivables Trust 2016-C B^ | | | 2.48 | | | | 9/15/2020 | | | | 180,000 | | | | 179,990 | | | | 179,700 | |
CPS Auto Receivables Trust 2018-A^ | | | 2.16 | | | | 5/17/2021 | | | | 281,152 | | | | 281,148 | | | | 280,123 | |
CPS Auto Trust 2017-A B^ | | | 2.68 | | | | 5/17/2021 | | | | 1,200,000 | | | | 1,200,000 | | | | 1,196,569 | |
Credit Suisse ABS Repackaging Trust 2013-A B^ | | | 2.50 | | | | 1/25/2030 | | | | 46,459 | | | | 44,424 | | | | 43,214 | |
DB Master Finance LLC 2015-1A A2II^ | | | 3.98 | | | | 2/20/2045 | | | | 1,161,000 | | | | 1,169,440 | | | | 1,162,949 | |
Diamond Resorts Owner Trust 2013-2 A^ | | | 2.27 | | | | 5/20/2026 | | | | 332,009 | | | | 329,820 | | | | 331,648 | |
Diamond Resorts Owner Trust 2015-1 A^ | | | 2.73 | | | | 7/20/2027 | | | | 17,505 | | | | 17,503 | | | | 17,471 | |
Diamond Resorts Owner Trust 2015-2 A^ | | | 2.99 | | | | 5/22/2028 | | | | 68,257 | | | | 68,942 | | | | 67,778 | |
Diamond Resorts Owner Trust 2015-2 B^ | | | 3.54 | | | | 5/22/2028 | | | | 24,821 | | | | 24,820 | | | | 24,570 | |
Diamond Resorts Owner Trust 2016-1 A^ | | | 3.08 | | | | 11/20/2028 | | | | 477,046 | | | | 477,046 | | | | 465,889 | |
Domino’s Pizza Master Issuer LLC^ | | | 4.12 | | | | 7/25/2048 | | | | 660,000 | | | | 660,000 | | | | 677,343 | |
DRB Prime Student Loan Trust 2015-A A2^ | | | 3.06 | | | | 7/25/2031 | | | | 54,325 | | | | 53,694 | | | | 53,971 | |
DRB Prime Student Loan Trust 2015-B A2^ | | | 3.17 | | | | 7/25/2031 | | | | 154,152 | | | | 153,602 | | | | 153,553 | |
DRB Prime Student Loan Trust 2015-B A3^ | | | 2.54 | | | | 4/27/2026 | | | | 19,667 | | | | 19,666 | | | | 19,378 | |
DRB Prime Student Loan Trust 2015-D A1, 1M USD LIBOR + 1.700%^ | | | 3.79 | # | | | 1/25/2040 | | | | 167,726 | | | | 165,628 | | | | 170,999 | |
DRB Prime Student Loan Trust 2015-D A2^ | | | 3.20 | | | | 1/25/2040 | | | | 656,206 | | | | 655,545 | | | | 655,903 | |
DRB Prime Student Loan Trust 2016-A A1, 1M USD LIBOR + 2.000%^ | | | 4.09 | # | | | 4/25/2040 | | | | 867,460 | | | | 887,687 | | | | 891,635 | |
DRB Prime Student Loan Trust 2016-B A2^ | | | 2.89 | | | | 6/25/2040 | | | | 179,708 | | | | 179,657 | | | | 175,852 | |
DRB Prime Student Loan Trust 2016-R A1, 1M USD LIBOR + 1.900%^¤ | | | 3.99 | # | | | 10/25/2044 | | | | 897,715 | | | | 897,715 | | | | 911,181 | |
Drive Auto Receivables Trust 2015-AA C^ | | | 3.06 | | | | 5/17/2021 | | | | 121,212 | | | | 122,150 | | | | 121,364 | |
Drive Auto Receivables Trust 2017-1 C | | | 2.84 | | | | 4/15/2022 | | | | 350,000 | | | | 349,960 | | | | 349,469 | |
Drive Auto Receivables Trust 2017-2 C | | | 2.75 | | | | 9/15/2023 | | | | 200,000 | | | | 199,992 | | | | 199,568 | |
Drive Auto Receivables Trust 2018-2 | | | 3.22 | | | | 4/15/2022 | | | | 380,000 | | | | 379,951 | | | | 380,145 | |
Drug Royalty Corp Inc. 2012-1 A1, 3M USD LIBOR + 5.250%^ | | | 6.13 | # | | | 7/15/2024 | | | | 20,590 | | | | 20,977 | | | | 20,713 | |
DT Auto Owner Trust 2018-1^ | | | 2.59 | | | | 5/17/2021 | | | | 1,682,052 | | | | 1,682,025 | | | | 1,679,438 | |
DT Auto Owner Trust 2018-1^ | | | 3.04 | | | | 1/18/2022 | | | | 570,000 | | | | 569,955 | | | | 568,027 | |
Earnest Student Loan Program LLC 2016-B A1, 1M USD LIBOR + 2.050%^ | | | 4.14 | # | | | 2/26/2035 | | | | 160,448 | | | | 160,448 | | | | 166,633 | |
Earnest Student Loan Program LLC 2016-C A2^ | | | 2.68 | | | | 7/25/2035 | | | | 297,572 | | | | 295,947 | | | | 286,413 | |
Earnest Student Loan Program LLC 2016-D A2^ | | | 2.72 | | | | 1/25/2041 | | | | 328,690 | | | | 328,592 | | | | 323,604 | |
See accompanying Notes to the Financial Statements.
116
Barings Active Short Duration Bond Fund 2018 Annual Report
SCHEDULE OF INVESTMENTS (CONTINUED)
June 30, 2018
| | | | | | | | | | | | | | | | | | | | |
| | | EFFECTIVE
INTEREST RATE | | | DUE DATE | | | PRINCIPAL ‡‡ | | | COST | | | FAIR VALUE | |
Asset-Backed Securities (Continued) | | | | | | | | | | | | | | | | | | | | |
| | | | | |
Other Asset-Backed Securities (Continued) | | | | | | | | | | | | | | | | | | | | |
ECMC Group Student Loan Trust 2016-1A A, 1M USD LIBOR + 1.350%^ | | | 3.44 | # % | | | 7/26/2066 | | | | 446,238 | | | $ | 446,238 | | | $ | 453,528 | |
ECMC Group Student Loan Trust 2017-1A A, 1M USD LIBOR + 1.200%^ | | | 3.29 | # | | | 12/27/2066 | | | | 1,266,328 | | | | 1,266,328 | | | | 1,287,447 | |
ECMC Group Student Loan Trust 2018-1, 1M USD LIBOR + 0.750%^ | | | 2.84 | # | | | 2/27/2068 | | | | 1,638,224 | | | | 1,638,224 | | | | 1,640,272 | |
EdLinc Student Loan Funding Trust 2017-A A, 1M USD LIBOR - 1.150%^ | | | 3.35 | # | | | 12/1/2047 | | | | 1,777,609 | | | | 1,765,368 | | | | 1,767,107 | |
Education Loan Asset-Backed Trust I 2013-1 A1, 1M USD LIBOR + 0.800%^ | | | 2.89 | # | | | 6/25/2026 | | | | 393,050 | | | | 388,857 | | | | 393,215 | |
Elara HGV Timeshare Issuer LLC 2014-A B^ | | | 3.02 | **# | | | 2/25/2027 | | | | 23,633 | | | | 23,460 | | | | 23,275 | |
Elara HGV Timeshare Issuer LLC 2016-A A^ | | | 2.73 | | | | 4/25/2028 | | | | 1,521,180 | | | | 1,492,502 | | | | 1,488,484 | |
Elara HGV Timeshare Issuer LLC 2017-A A^ | | | 2.69 | | | | 3/25/2030 | | | | 468,247 | | | | 468,207 | | | | 458,143 | |
Element Rail Leasing II LLC 2015-1A A1+^ | | | 2.71 | | | | 2/19/2045 | | | | 339,016 | | | | 336,114 | | | | 334,548 | |
Element Rail Leasing II LLC 2015-1A A1+^ | | | 3.97 | | | | 3/19/2046 | | | | 117,618 | | | | 117,618 | | | | 118,633 | |
Element Rail Leasing II LLC 2016-1A A2+^ | | | 5.05 | | | | 3/19/2046 | | | | 800,000 | | | | 813,080 | | | | 833,218 | |
ELFI Graduate Loan Program LLC 2018-A, 1M USD LIBOR + 0.750%^ | | | 2.84 | # | | | 8/25/2042 | | | | 1,294,673 | | | | 1,294,673 | | | | 1,294,676 | |
ELFI Graduate Loan Program LLC 2018-A^ | | | 4.00 | | | | 8/25/2042 | | | | 460,000 | | | | 450,992 | | | | 447,908 | |
Entergy New Orleans Storm Recovery Funding I LLC 2015-1 A | | | 2.67 | | | | 6/1/2027 | | | | 130,110 | | | | 130,085 | | | | 127,181 | |
Enterprise Fleet Financing LLC 2016-1 A2^ | | | 1.83 | | | | 9/20/2021 | | | | 146,439 | | | | 146,427 | | | | 146,167 | |
Enterprise Fleet Financing LLC 2017-1 A3^ | | | 2.60 | | | | 7/20/2022 | | | | 240,000 | | | | 239,955 | | | | 238,042 | |
Exeter Automobile Receivables Trust 2015-2A C^ | | | 3.90 | | | | 3/15/2021 | | | | 800,000 | | | | 807,642 | | | | 806,453 | |
Exeter Automobile Receivables Trust 2016-3A B^ | | | 2.84 | | | | 8/16/2021 | | | | 240,000 | | | | 239,971 | | | | 239,763 | |
Exeter Automobile Receivables Trust 2017-1A B^ | | | 3.00 | | | | 12/15/2021 | | | | 430,000 | | | | 429,930 | | | | 429,746 | |
Exeter Automobile Receivables Trust 2018-1^ | | | 2.75 | | | | 4/15/2022 | | | | 480,000 | | | | 480,000 | | | | 475,761 | |
First Franklin Mortgage Loan Trust 2004-FFH4 M5, 1M USD LIBOR + 1.575% | | | 3.67 | # | | | 1/25/2035 | | | | 250,800 | | | | 251,910 | | | | 250,989 | |
First Investors Auto Owner Trust 2016-2A B^ | | | 2.21 | | | | 7/15/2022 | | | | 520,000 | | | | 519,980 | | | | 512,419 | |
First Investors Auto Owner Trust 2017-3A B^ | | | 2.72 | | | | 4/17/2023 | | | | 560,000 | | | | 559,963 | | | | 549,945 | |
First Investors Auto Owner Trust 2018-1^ | | | 3.22 | | | | 1/17/2023 | | | | 540,000 | | | | 539,952 | | | | 539,951 | |
Flagship Credit Auto Trust 2015-2 A^ | | | 1.98 | | | | 10/15/2020 | | | | 9,655 | | | | 9,654 | | | | 9,644 | |
Flagship Credit Auto Trust 2015-3 A^ | | | 2.38 | | | | 10/15/2020 | | | | 101,283 | | | | 101,520 | | | | 101,158 | |
Flagship Credit Auto Trust 2016-1 A^ | | | 2.77 | | | | 12/15/2020 | | | | 91,904 | | | | 91,787 | | | | 91,929 | |
Flagship Credit Auto Trust 2016-3 B^ | | | 2.43 | | | | 6/15/2021 | | | | 310,000 | | | | 309,982 | | | | 308,104 | |
Flagship Credit Auto Trust 2016-4 B^ | | | 2.41 | | | | 10/15/2021 | | | | 1,940,000 | | | | 1,941,078 | | | | 1,925,754 | |
Flagship Credit Auto Trust 2016-4 C^ | | | 2.71 | | | | 11/15/2022 | | | | 410,000 | | | | 409,983 | | | | 405,763 | |
Flagship Credit Auto Trust 2017-1 B^ | | | 2.83 | | | | 3/15/2023 | | | | 895,000 | | | | 894,978 | | | | 891,625 | |
Flagship Credit Auto Trust 2017-4 C^ | | | 2.92 | | | | 11/15/2023 | | | | 1,140,000 | | | | 1,139,048 | | | | 1,118,425 | |
Flagship Credit Auto Trust 2018-1^ | | | 3.13 | | | | 1/17/2023 | | | | 2,250,000 | | | | 2,249,554 | | | | 2,234,809 | |
Flagship Credit Auto Trust 2018-2^ | | | 2.97 | | | | 10/17/2022 | | | | 916,894 | | | | 916,894 | | | | 915,861 | |
See accompanying Notes to the Financial Statements.
117
Barings Active Short Duration Bond Fund 2018 Annual Report
SCHEDULE OF INVESTMENTS (CONTINUED)
June 30, 2018
| | | | | | | | | | | | | | | | | | | | |
| | | EFFECTIVE
INTEREST RATE | | | DUE DATE | | | PRINCIPAL ‡‡ | | | COST | | | FAIR VALUE | |
Asset-Backed Securities (Continued) | | | | | | | | | | | | | | | | | | | | |
| | | | | |
Other Asset-Backed Securities (Continued) | | | | | | | | | | | | | | | | | | | | |
FRS I LLC 2013-1A A1^ | | | 1.80 | % | | | 4/15/2043 | | | | 13,866 | | | $ | 13,731 | | | $ | 13,777 | |
Global SC Finance II SRL 2014-1A A1+^ | | | 3.19 | | | | 7/17/2029 | | | | 188,583 | | | | 188,547 | | | | 185,300 | |
Goal Capital Funding Trust 2010-1 A, 3M USD LIBOR + 0.700%^ | | | 3.03 | # | | | 8/25/2048 | | | | 175,769 | | | | 168,831 | | | | 175,589 | |
Goal Structured Solution Trust 2015-1 B, 1M USD LIBOR + 1.500%^ | | | 3.59 | # | | | 9/25/2043 | | | | 100,000 | | | | 76,517 | | | | 98,173 | |
Goodgreen 2018-1^ | | | 3.93 | | | | 10/15/2053 | | | | 1,153,900 | | | | 1,153,781 | | | | 1,159,275 | |
Goodgreen Trust 2016-1 A^ | | | 3.23 | | | | 10/15/2052 | | | | 507,760 | | | | 507,513 | | | | 492,288 | |
Hero Funding 2017-3A A1^ | | | 3.19 | | | | 9/20/2048 | | | | 791,795 | | | | 791,530 | | | | 765,648 | |
HERO FUNDING 2018-1^ | | | 4.67 | | | | 9/20/2048 | | | | 944,032 | | | | 967,585 | | | | 972,169 | |
HERO Funding Trust 2015-1A A^ | | | 3.84 | | | | 9/21/2040 | | | | 808,817 | | | | 823,344 | | | | 828,523 | |
HERO Funding Trust 2016-4A A1^ | | | 3.57 | | | | 9/20/2047 | | | | 347,237 | | | | 347,102 | | | | 346,321 | |
HERO Funding Trust 2017-2A A1^ | | | 3.28 | | | | 9/20/2048 | | | | 123,842 | | | | 123,826 | | | | 122,272 | |
HERO Funding Trust 2017-2A A2^ | | | 4.07 | | | | 9/20/2048 | | | | 97,304 | | | | 99,688 | | | | 98,642 | |
Hertz Vehicle Financing II LP^ | | | 3.29 | | | | 2/25/2024 | | | | 2,830,000 | | | | 2,766,860 | | | | 2,771,336 | |
Hertz Vehicle Financing II LP^ | | | 3.60 | | | | 2/25/2024 | | | | 1,320,000 | | | | 1,319,554 | | | | 1,283,122 | |
Higher Education Funding I 2004-1 B1, 28 day ARS^ | | | 3.41 | | | | 1/1/2044 | | | | 950,000 | | | | 829,766 | | | | 892,662 | |
Hilton Grand Vacations Trust 2013-A A^ | | | 2.28 | | | | 1/25/2026 | | | | 40,480 | | | | 39,974 | | | | 40,197 | |
Hilton Grand Vacations Trust 2017-AA B^ | | | 2.96 | **# | | | 12/26/2028 | | | | 295,080 | | | | 295,068 | | | | 286,808 | |
Laurel Road Prime Student Loan Trust 2017-B CFX^ | | | 3.61 | | | | 8/25/2042 | | | | 452,635 | | | | 452,566 | | | | 434,318 | |
Laurel Road Prime Student Loan Trust 2017-C B^ | | | 2.95 | | | | 11/25/2042 | | | | 590,000 | | | | 589,773 | | | | 567,876 | |
Lendmark Funding Trust 2017-1A^ | | | 2.83 | | | | 12/22/2025 | | | | 570,000 | | | | 569,011 | | | | 565,045 | |
Lendmark Funding Trust 2017-2A A^ | | | 2.80 | | | | 5/20/2026 | | | | 679,964 | | | | 679,939 | | | | 671,088 | |
Lendmark Funding Trust 2018-1^ | | | 3.81 | | | | 12/21/2026 | | | | 630,000 | | | | 629,966 | | | | 631,712 | |
Mariner Finance Issuance Trust 2017-AA A^ | | | 3.62 | | | | 2/20/2029 | | | | 480,000 | | | | 479,914 | | | | 481,516 | |
Mariner Finance Issuance Trust 2017-BA B^ | | | 2.92 | | | | 12/20/2029 | | | | 2,100,000 | | | | 2,099,794 | | | | 2,069,559 | |
Marlette Funding Trust 2016-1A A^ | | | 3.06 | | | | 1/17/2023 | | | | 46,233 | | | | 46,270 | | | | 46,250 | |
Marlette Funding Trust 2017-1A A^ | | | 2.83 | | | | 3/15/2024 | | | | 654,929 | | | | 656,465 | | | | 654,579 | |
Marlette Funding Trust 2017-2A A^ | | | 2.39 | | | | 7/15/2024 | | | | 213,858 | | | | 213,857 | | | | 213,408 | |
Marlette Funding Trust 2017-3A A^ | | | 2.36 | | | | 12/15/2024 | | | | 302,668 | | | | 302,653 | | | | 301,455 | |
Marlette Funding Trust 2018-1^ | | | 2.61 | | | | 3/15/2028 | | | | 1,857,679 | | | | 1,857,593 | | | | 1,852,429 | |
Marlette Funding Trust 2018-2^ | | | 3.06 | | | | 7/17/2028 | | | | 570,000 | | | | 570,000 | | | | 569,999 | |
Mosaic Solar Loan Trust 2018-2-GS^ | | | 4.20 | | | | 2/20/2044 | | | | 670,000 | | | | 669,891 | | | | 669,891 | |
Mosaic Solar Loans LLC 2017-1A A^ | | | 4.45 | | | | 6/20/2042 | | | | 101,942 | | | | 101,914 | | | | 104,060 | |
Mosaic Solar Loans LLC 2017-2A D^ | | | Zero Coupon | | | | 9/20/2042 | | | | 890,000 | | | | 793,100 | | | | 809,866 | |
MVW Owner Trust 2013-1A A^ | | | 2.15 | | | | 4/22/2030 | | | | 276,965 | | | | 274,975 | | | | 271,761 | |
MVW Owner Trust 2015-1A A^ | | | 2.52 | | | | 12/20/2032 | | | | 34,273 | | | | 34,271 | | | | 33,501 | |
MVW Owner Trust 2016-1A A^ | | | 2.25 | | | | 12/20/2033 | | | | 1,563,361 | | | | 1,550,294 | | | | 1,521,406 | |
MVW Owner Trust 2017-1A A^ | | | 2.42 | | | | 12/20/2034 | | | | 103,287 | | | | 103,272 | | | | 100,651 | |
Nations Equipment Finance Funding III LLC 2016-1A A^ | | | 3.61 | | | | 2/20/2021 | | | | 38,804 | | | | 38,804 | | | | 38,819 | |
See accompanying Notes to the Financial Statements.
118
Barings Active Short Duration Bond Fund 2018 Annual Report
SCHEDULE OF INVESTMENTS (CONTINUED)
June 30, 2018
| | | | | | | | | | | | | | | | | | | | |
| | | EFFECTIVE
INTEREST RATE | | | DUE DATE | | | PRINCIPAL ‡‡ | | | COST | | | FAIR VALUE | |
Asset-Backed Securities (Continued) | | | | | | | | | | | | | | | | | | | | |
| | | | | |
Other Asset-Backed Securities (Continued) | | | | | | | | | | | | | | | | | | | | |
Navient Private Education Loan Trust 2018-B, 1M USD LIBOR + 0.720%^ | | | 2.79 | # % | | | 12/15/2059 | | | | 320,000 | | | $ | 320,000 | | | $ | 319,982 | |
Navient Student Loan Trust 2015-1 B, 1M USD LIBOR + 1.500% | | | 3.59 | # | | | 7/25/2052 | | | | 1,100,000 | | | | 1,094,546 | | | | 1,136,988 | |
Navient Student Loan Trust 2015-2 A3, 1M USD LIBOR + 0.570% | | | 2.66 | # | | | 11/26/2040 | | | | 500,000 | | | | 492,793 | | | | 500,000 | |
Navient Student Loan Trust 2016-5A A, 1M USD LIBOR + 1.250%^ | | | 3.34 | # | | | 6/25/2065 | | | | 987,266 | | | | 991,519 | | | | 1,013,100 | |
Navient Student Loan Trust 2016-6 A3, 1M USD LIBOR + 1.300%^ | | | 3.39 | # | | | 3/25/2066 | | | | 550,000 | | | | 550,000 | | | | 570,326 | |
Navient Student Loan Trust 2017-1A A3, 1M USD LIBOR + 1.150%^ | | | 3.24 | # | | | 7/26/2066 | | | | 1,000,000 | | | | 1,000,000 | | | | 1,024,291 | |
Navient Student Loan Trust 2017-5A A, 1M USD LIBOR + 0.800%^ | | | 2.89 | # | | | 7/26/2066 | | | | 577,347 | | | | 576,687 | | | | 582,673 | |
Navient Student Loan Trust 2018-1A A3, 1M USD LIBOR + 0.720%^ | | | 2.81 | # | | | 3/25/2067 | | | | 1,600,000 | | | | 1,600,000 | | | | 1,604,978 | |
Navient Student Loan Trust 2018-2, 1M USD LIBOR + 0.750%^ | | | 2.84 | # | | | 3/25/2067 | | | | 1,360,000 | | | | 1,360,000 | | | | 1,357,670 | |
Navient Student Loan Trust 2018-3, 1M USD LIBOR + 0.800%^ | | | 2.89 | # | | | 3/25/2067 | | | | 1,600,000 | | | | 1,600,000 | | | | 1,600,000 | |
Navistar Financial Dealer Note Master Owner Trust II 2016-1 A, 1M LIBOR + 1.350%^ | | | 3.44 | # | | | 9/27/2021 | | | | 550,000 | | | | 550,000 | | | | 551,360 | |
Nelnet Private Education Loan Trust 2016-A A1A, 1M USD LIBOR + 1.750%^ | | | 3.65 | # | | | 12/26/2040 | | | | 267,151 | | | | 267,151 | | | | 267,639 | |
Nelnet Private Education Loan Trust 2016-A A1B^ | | | 3.60 | | | | 12/26/2040 | | | | 192,362 | | | | 191,132 | | | | 185,692 | |
Nelnet Student Loan Trust 2006-2 B, 3M USD LIBOR + 0.200% | | | 2.56 | # | | | 1/25/2038 | | | | 1,080,866 | | | | 1,015,526 | | | | 1,010,869 | |
Nelnet Student Loan Trust 2014-6A A, 1M USD LIBOR + 0.650%^ | | | 2.74 | # | | | 11/25/2052 | | | | 334,062 | | | | 323,793 | | | | 335,345 | |
Nelnet Student Loan Trust 2018-1A, 1M USD LIBOR + 0.760%^ | | | 2.85 | # | | | 5/25/2066 | | | | 1,390,000 | | | | 1,390,000 | | | | 1,389,998 | |
New Residential Advance Receivables Trust Advance Receivables Backed Notes 2016-T2 AT2^ | | | 2.58 | | | | 10/15/2049 | | | | 1,950,000 | | | | 1,950,000 | | | | 1,931,780 | |
NextGear Floorplan Master Owner Trust 2015-2A A^ | | | 2.38 | | | | 10/15/2020 | | | | 100,000 | | | | 99,996 | | | | 99,917 | |
NextGear Floorplan Master Owner Trust 2016-1A A1, 1M LIBOR + 1.700%^ | | | 3.77 | # | | | 4/15/2021 | | | | 490,000 | | | | 490,000 | | | | 495,245 | |
NextGear Floorplan Master Owner Trust 2016-2A A2^ | | | 2.19 | | | | 9/15/2021 | | | | 762,000 | | | | 760,142 | | | | 754,691 | |
Northstar Education Finance, Inc. 2005-1 A5, 3M USD LIBOR + 0.750% | | | 3.11 | # | | | 10/30/2045 | | | | 188,658 | | | | 180,827 | | | | 187,224 | |
NorthStar Student Loan Trust III 2016-1 A, 1M USD LIBOR + 1.250%^ | | | 3.34 | # | | | 5/27/2036 | | | | 209,424 | | | | 200,597 | | | | 209,243 | |
See accompanying Notes to the Financial Statements.
119
Barings Active Short Duration Bond Fund 2018 Annual Report
SCHEDULE OF INVESTMENTS (CONTINUED)
June 30, 2018
| | | | | | | | | | | | | | | | | | | | |
| | | EFFECTIVE
INTEREST RATE | | | DUE DATE | | | PRINCIPAL ‡‡ | | | COST | | | FAIR VALUE | |
Asset-Backed Securities (Continued) | | | | | | | | | | | | | | | | | | | | |
| | | | | |
Other Asset-Backed Securities (Continued) | | | | | | | | | | | | | | | | | | | | |
NovaStar Mortgage Funding Trust 2004-4 M5, 1M LIBOR + 1.725% | | | 3.82 | # % | | | 3/25/2035 | | | | 486,909 | | | $ | 486,789 | | | $ | 496,413 | |
NP SPE II LLC 2017-1A A1^ | | | 3.37 | | | | 10/21/2047 | | | | 430,800 | | | | 430,800 | | | | 421,420 | |
NRZ Advance Receivables Trust 2016-T4 AT4^ | | | 3.11 | | | | 12/15/2050 | | | | 900,000 | | | | 900,000 | | | | 899,133 | |
OneMain Direct Auto Receivables Trust 2017-2A A^ | | | 2.31 | | | | 12/14/2021 | | | | 1,130,000 | | | | 1,129,884 | | | | 1,121,657 | |
Orange Lake Timeshare Trust 2016-A A^ | | | 2.61 | | | | 3/8/2029 | | | | 188,448 | | | | 188,429 | | | | 181,153 | |
Orange Lake Timeshare Trust 2016-A B^ | | | 2.91 | | | | 3/8/2029 | | | | 593,054 | | | | 584,690 | | | | 581,628 | |
Oscar US Funding Trust II 2015 1A A3+^ | | | 1.86 | | | | 10/15/2019 | | | | 71,946 | | | | 71,849 | | | | 71,888 | |
Oscar US Funding Trust II 2015 1A A4+^ | | | 2.44 | | | | 6/15/2022 | | | | 270,000 | | | | 264,611 | | | | 268,990 | |
Oscar US Funding Trust IV 2016 1A A2B, 1M USD LIBOR + 1.700%+^ | | | 3.62 | # | | | 7/15/2020 | | | | 23,016 | | | | 23,016 | | | | 23,098 | |
Oscar US Funding Trust IV 2016-1A A2A+^ | | | 2.53 | | | | 7/15/2020 | | | | 57,540 | | | | 57,630 | | | | 57,512 | |
Oscar US Funding Trust V 2016-2A A2A+^ | | | 2.31 | | | | 11/15/2019 | | | | 80,825 | | | | 80,820 | | | | 80,688 | |
Oscar US Funding Trust VI LLC 2017-1A A3+^ | | | 2.82 | | | | 6/10/2021 | | | | 370,000 | | | | 369,952 | | | | 368,404 | |
Oscar US Funding Trust VI LLC 2017-1A A4+^ | | | 3.30 | | | | 5/10/2024 | | | | 500,000 | | | | 501,787 | | | | 498,553 | |
OSCAR US Funding Trust VIII LLC+^ | | | 2.91 | | | | 4/12/2021 | | | | 620,000 | | | | 619,954 | | | | 618,090 | |
Oxford Finance Funding LLC 2016-1A A^ | | | 3.97 | | | | 6/17/2024 | | | | 170,000 | | | | 170,000 | | | | 169,243 | |
PHEAA Student Loan Trust 2016-2A A, 1M USD LIBOR + 0.950%^ | | | 3.04 | # | | | 11/25/2065 | | | | 621,261 | | | | 621,261 | | | | 629,211 | |
Popular ABS Mortgage Pass-Through Trust 2006-B A3, 1M USD LIBOR + 0.280% | | | 2.37 | # | | | 5/25/2036 | | | | 64,702 | | | | 62,254 | | | | 64,644 | |
Prestige Auto Receivables Trust 2015-1 B^ | | | 2.04 | | | | 4/15/2021 | | | | 32,394 | | | | 32,465 | | | | 32,388 | |
Santander Drive Auto Receivables Trust 2014-4 D | | | 3.10 | | | | 11/16/2020 | | | | 540,000 | | | | 543,670 | | | | 541,002 | |
Santander Drive Auto Receivables Trust 2016-1 B | | | 2.47 | | | | 12/15/2020 | | | | 168,668 | | | | 168,664 | | | | 168,644 | |
Santander Drive Auto Receivables Trust 2016-1 D | | | 4.02 | | | | 4/15/2022 | | | | 430,000 | | | | 437,342 | | | | 435,430 | |
SBA Tower Trust^ | | | 2.88 | | | | 7/9/2021 | | | | 880,000 | | | | 875,644 | | | | 854,801 | |
SBA Tower Trust^ | | | 3.17 | | | | 4/11/2022 | | | | 630,000 | | | | 630,853 | | | | 613,623 | |
SBA Tower Trust 2014-1A C^ | | | 2.90 | | | | 10/15/2044 | | | | 590,000 | | | | 591,503 | | | | 586,261 | |
Sierra Timeshare 2014-1 Receivables Funding LLC^ | | | 2.42 | | | | 3/20/2030 | | | | 1,019,471 | | | | 1,016,353 | | | | 1,016,533 | |
Sierra Timeshare 2014-3 Receivables Funding LLC^ | | | 2.80 | | | | 10/20/2031 | | | | 634,531 | | | | 631,805 | | | | 631,588 | |
Sierra Timeshare 2015-1 Receivables Funding LLC^ | | | 3.05 | | | | 3/22/2032 | | | | 719,168 | | | | 716,518 | | | | 715,120 | |
Sierra Timeshare 2015-2 Receivables Funding LLC^ | | | 2.43 | | | | 6/20/2032 | | | | 563,946 | | | | 559,098 | | | | 557,584 | |
Sierra Timeshare 2016-2 Receivables Funding LLC^ | | | 2.78 | | | | 7/20/2033 | | | | 487,896 | | | | 483,394 | | | | 482,139 | |
Sierra Timeshare Receivables Funding LLC 2014-1A A^ | | | 2.07 | | | | 3/20/2030 | | | | 330,910 | | | | 323,945 | | | | 330,148 | |
See accompanying Notes to the Financial Statements.
120
Barings Active Short Duration Bond Fund 2018 Annual Report
SCHEDULE OF INVESTMENTS (CONTINUED)
June 30, 2018
| | | | | | | | | | | | | | | | | | | | |
| | | EFFECTIVE
INTEREST RATE | | | DUE DATE | | | PRINCIPAL ‡‡ | | | COST | | | FAIR VALUE | |
Asset-Backed Securities (Continued) | | | | | | | | | | | | | | | | | | | | |
| | | | | |
Other Asset-Backed Securities (Continued) | | | | | | | | | | | | | | | | | | | | |
Sierra Timeshare Receivables Funding LLC 2014-2A A^ | | | 2.05 | % | | | 6/20/2031 | | | | 44,430 | | | $ | 43,977 | | | $ | 44,232 | |
Sierra Timeshare Receivables Funding LLC 2014-3A A^ | | | 2.30 | | | | 10/20/2031 | | | | 174,496 | | | | 173,532 | | | | 173,371 | |
Sierra Timeshare Receivables Funding LLC 2015 3A B^ | | | 3.08 | | | | 9/20/2032 | | | | 24,585 | | | | 24,585 | | | | 24,408 | |
Sierra Timeshare Receivables Funding LLC 2015-1A A^ | | | 2.40 | | | | 3/22/2032 | | | | 131,248 | | | | 129,758 | | | | 128,821 | |
Sierra Timeshare Receivables Funding LLC 2015-2A B^ | | | 3.02 | | | | 6/20/2032 | | | | 1,087,610 | | | | 1,082,686 | | | | 1,081,141 | |
Sierra Timeshare Receivables Funding LLC 2015-3A A^ | | | 2.58 | | | | 9/20/2032 | | | | 24,585 | | | | 24,581 | | | | 24,197 | |
Sierra Timeshare Receivables Funding LLC 2017-1A A^ | | | 2.91 | | | | 3/20/2034 | | | | 708,048 | | | | 710,618 | | | | 702,106 | |
SLC Private Student Loan Trust 2006-A C, 3M USD LIBOR + 0.450% | | | 2.80 | # | | | 7/15/2036 | | | | 350,000 | | | | 311,634 | | | | 336,645 | |
SLC Student Loan Trust 2005-1 B, 3M USD LIBOR + 0.200% | | | 2.54 | # | | | 2/15/2045 | | | | 435,640 | | | | 381,473 | | | | 403,683 | |
SLC Student Loan Trust 2006-2 B, 3M USD LIBOR + 0.230% | | | 2.57 | # | | | 12/15/2039 | | | | 1,939,345 | | | | 1,799,942 | | | | 1,824,437 | |
SLC Student Loan Trust 2006-2 B, 3M USD LIBOR + 0.230% | | | 2.59 | # | | | 1/25/2041 | | | | 799,358 | | | | 750,774 | | | | 760,144 | |
SLM Student Loan Trust 2003-14, 3M USD LIBOR + 0.600%^ | | | 2.96 | # | | | 10/25/2065 | | | | 4,450,000 | | | | 4,434,739 | | | | 4,398,728 | |
SLM Student Loan Trust 2003-14 A6, 3M USD LIBOR + 0.300% | | | 2.66 | # | | | 7/25/2025 | | | | 40,000 | | | | 38,710 | | | | 39,903 | |
SLM Student Loan Trust 2003-4 B, 3M USD LIBOR + 0.650% | | | 2.99 | # | | | 6/15/2038 | | | | 115,058 | | | | 105,788 | | | | 110,456 | |
SLM Student Loan Trust 2004-10, 3M USD LIBOR + 0.600%^ | | | 2.96 | # | | | 10/25/2029 | | | | 1,100,000 | | | | 1,100,000 | | | | 1,104,813 | |
SLM Student Loan Trust 2004-3A A6A, 3M USD LIBOR + 0.550%^ | | | 2.91 | # | | | 10/25/2064 | | | | 1,550,000 | | | | 1,522,283 | | | | 1,541,578 | |
SLM Student Loan Trust 2005-4 B, 3M USD LIBOR + 0.180% | | | 2.54 | # | | | 7/25/2055 | | | | 382,441 | | | | 319,872 | | | | 364,025 | |
SLM Student Loan Trust 2005-6 B, 3M USD LIBOR + 0.290% | | | 2.65 | # | | | 1/25/2044 | | | | 1,618,704 | | | | 1,505,270 | | | | 1,512,829 | |
SLM Student Loan Trust 2005-7, 3M USD LIBOR + 0.750% | | | 3.11 | # | | | 1/25/2040 | | | | 1,400,000 | | | | 1,395,236 | | | | 1,394,750 | |
SLM Student Loan Trust 2005-9, 3M USD LIBOR + 0.300% | | | 2.66 | # | | | 1/25/2041 | | | | 932,506 | | | | 889,670 | | | | 890,247 | |
SLM Student Loan Trust 2005-9, 3 mo. Euribor + 0.600% | | | 2.96 | # | | | 1/25/2041 | | | | 1,280,000 | | | | 1,264,179 | | | | 1,272,479 | |
SLM Student Loan Trust 2006-10, 3M USD LIBOR + 0.150% | | | 2.51 | # | | | 3/25/2044 | | | | 1,800,000 | | | | 1,735,062 | | | | 1,736,132 | |
See accompanying Notes to the Financial Statements.
121
Barings Active Short Duration Bond Fund 2018 Annual Report
SCHEDULE OF INVESTMENTS (CONTINUED)
June 30, 2018
| | | | | | | | | | | | | | | | | | | | |
| | | EFFECTIVE
INTEREST RATE | | | DUE DATE | | | PRINCIPAL ‡‡ | | | COST | | | FAIR VALUE | |
Asset-Backed Securities (Continued) | | | | | | | | | | | | | | | | | | | | |
| | | | | |
Other Asset-Backed Securities (Continued) | | | | | | | | | | | | | | | | | | | | |
SLM Student Loan Trust 2006-10, 3M USD LIBOR + 0.220% | | | 2.58 | # % | | | 3/25/2044 | | | | 1,436,601 | | | $ | 1,355,416 | | | $ | 1,355,562 | |
SLM Student Loan Trust 2006-2, 3M USD LIBOR + 0.170% | | | 2.53 | # | | | 1/25/2041 | | | | 1,250,000 | | | | 1,218,486 | | | | 1,220,635 | |
SLM Student Loan Trust 2006-5 B, 3M USD LIBOR + 0.210% | | | 2.57 | # | | | 10/25/2040 | | | | 642,000 | | | | 569,345 | | | | 608,290 | |
SLM Student Loan Trust 2006-7 B, 3M USD LIBOR + 0.200% | | | 2.56 | # | | | 1/27/2042 | | | | 624,291 | | | | 578,783 | | | | 593,904 | |
SLM Student Loan Trust 2006-9 A5, 3M USD LIBOR + 0.100% | | | 2.46 | # | | | 1/26/2026 | | | | 85,055 | | | | 83,114 | | | | 84,926 | |
SLM Student Loan Trust 2007-1 A6, 3M USD LIBOR + 0.140% | | | 2.50 | # | | | 1/27/2042 | | | | 200,000 | | | | 192,094 | | | | 192,879 | |
SMB Private Education Loan Trust 2014-A A2B, 1M USD LIBOR + 1.150%^ | | | 3.22 | # | | | 5/15/2026 | | | | 584,591 | | | | 588,613 | | | | 590,160 | |
SMB Private Education Loan Trust 2015-A A2B, 1M USD LIBOR + 1.000%^ | | | 3.07 | # | | | 6/15/2027 | | | | 84,272 | | | | 82,933 | | | | 84,976 | |
SMB Private Education Loan Trust 2015-A A3, 1M USD LIBOR + 1.500%^ | | | 3.57 | # | | | 2/17/2032 | | | | 900,000 | | | | 920,088 | | | | 922,681 | |
SMB Private Education Loan Trust 2015-C A3, 1M USD LIBOR + 1.950%^ | | | 4.02 | # | | | 8/16/2032 | | | | 700,000 | | | | 730,223 | | | | 732,109 | |
SMB Private Education Loan Trust 2016-B A2B, 1M USD LIBOR + 1.450%^ | | | 3.52 | # | | | 2/17/2032 | | | | 124,069 | | | | 124,069 | | | | 126,684 | |
SMB Private Education Loan Trust 2016-C A2B, 1M USD LIBOR + 1.100%^ | | | 3.17 | # | | | 9/15/2034 | | | | 280,000 | | | | 280,000 | | | | 283,846 | |
SMB Private Education Loan Trust 2017-B A2B, 1M USD LIBOR + 0.750%^ | | | 2.82 | # | | | 10/15/2035 | | | | 670,000 | | | | 670,000 | | | | 671,956 | |
SMB Private Education Loan Trust 2018-B, 1M USD LIBOR + 0.720%^ | | | 2.80 | # | | | 1/15/2037 | | | | 1,050,000 | | | | 1,050,000 | | | | 1,049,773 | |
SoFi Consumer Loan Program LLC 2016-1A A^ | | | 3.26 | | | | 8/25/2025 | | | | 544,021 | | | | 545,822 | | | | 542,835 | |
SoFi Consumer Loan Program LLC 2016-2A A^ | | | 3.09 | | | | 10/27/2025 | | | | 200,427 | | | | 200,401 | | | | 200,091 | |
SoFi Consumer Loan Program LLC 2016-3 A^ | | | 3.05 | | | | 12/26/2025 | | | | 183,774 | | | | 183,771 | | | | 183,207 | |
SoFi Consumer Loan Program LLC 2016-5 A^ | | | 3.06 | | | | 9/25/2028 | | | | 1,059,739 | | | | 1,056,551 | | | | 1,055,383 | |
SoFi Consumer Loan Program LLC 2017-2 A^ | | | 3.28 | | | | 2/25/2026 | | | | 468,042 | | | | 467,364 | | | | 467,624 | |
SoFi Consumer Loan Program LLC 2017-3 A^ | | | 2.77 | | | | 5/25/2026 | | | | 709,807 | | | | 709,807 | | | | 704,208 | |
SoFi Consumer Loan Program Trust 2015-1 A^ | | | 3.28 | | | | 9/15/2023 | | | | 362,326 | | | | 362,495 | | | | 362,887 | |
Sofi Professional Loan Program 2018-A LLC^¤ | | | Zero Coupon | | | | 2/25/2042 | | | | 1,372,500 | | | | 991,656 | | | | 985,730 | |
Sofi Professional Loan Program 2018-B Trust^¤ | | | Zero Coupon | | | | 8/26/2047 | | | | 1,265,700 | | | | 687,529 | | | | 721,196 | |
SoFi Professional Loan Program LLC 2015-A RC^¤ | | | Zero Coupon | | | | 3/25/2033 | | | | 300 | | | | 844,125 | | | | 442,500 | |
SoFi Professional Loan Program LLC 2015-C A2^ | | | 2.51 | | | | 8/25/2033 | | | | 36,418 | | | | 36,245 | | | | 35,795 | |
SoFi Professional Loan Program LLC 2016 A A1, 1M USD LIBOR + 1.750%^ | | | 3.84 | # | | | 8/25/2036 | | | | 138,507 | | | | 137,328 | | | | 142,734 | |
See accompanying Notes to the Financial Statements.
122
Barings Active Short Duration Bond Fund 2018 Annual Report
SCHEDULE OF INVESTMENTS (CONTINUED)
June 30, 2018
| | | | | | | | | | | | | | | | | | | | |
| | | EFFECTIVE
INTEREST RATE | | | DUE DATE | | | PRINCIPAL ‡‡ | | | COST | | | FAIR VALUE | |
Asset-Backed Securities (Continued) | | | | | | | | | | | | | | | | | | | | |
| | | | | |
Other Asset-Backed Securities (Continued) | | | | | | | | | | | | | | | | | | | | |
SoFi Professional Loan Program LLC 2016-B A1, 1M USD LIBOR + 1.200%^ | | | 3.29 | # % | | | 6/25/2033 | | | | 480,937 | | | $ | 486,423 | | | $ | 487,723 | |
SoFi Professional Loan Program LLC 2016-D A1, 1M USD LIBOR + 0.950%^ | | | 3.04 | # | | | 1/25/2039 | | | | 101,868 | | | | 101,868 | | | | 102,577 | |
SoFi Professional Loan Program LLC 2016-E A2B^ | | | 2.49 | | | | 1/25/2036 | | | | 330,000 | | | | 329,385 | | | | 322,195 | |
SoFi Professional Loan Program LLC 2017-D R1^¤ | | | Zero Coupon | | | | 9/25/2040 | | | | 1,233,700 | | | | 714,350 | | | | 740,220 | |
SpringCastle America Funding LLC 2016-AA A^ | | | 3.05 | | | | 4/25/2029 | | | | 410,059 | | | | 410,045 | | | | 408,543 | |
Springleaf Funding Trust 2016-AA A^ | | | 2.90 | | | | 11/15/2029 | | | | 1,560,000 | | | | 1,559,784 | | | | 1,551,962 | |
SPS Servicer Advance Receivable 2016-T1 AT1^ | | | 2.53 | | | | 11/16/2048 | | | | 1,040,000 | | | | 1,039,912 | | | | 1,044,763 | |
SVO VOI Mortgage LLC 2012-AA A^ | | | 2.00 | | | | 9/20/2029 | | | | 267,556 | | | | 264,228 | | | | 263,083 | |
Taco Bell Funding LLC 2016-1A A2I^ | | | 3.83 | | | | 5/25/2046 | | | | 2,245,800 | | | | 2,263,388 | | | | 2,248,783 | |
TAL Advantage LLC 2017-1A A | | | 4.50 | | | | 4/20/2042 | | | | 638,576 | | | | 646,109 | | | | 651,193 | |
Tesla Auto Lease Trust 2018-A^ | | | 2.32 | | | | 12/20/2019 | | | | 423,130 | | | | 423,123 | | | | 421,838 | |
Tesla Auto Lease Trust 2018-A^ | | | 2.75 | | | | 2/20/2020 | | | | 275,000 | | | | 274,982 | | | | 273,964 | |
TLF National Tax Lien Trust 2017-1^ | | | 3.09 | | | | 12/15/2029 | | | | 1,043,845 | | | | 1,043,809 | | | | 1,043,183 | |
TPG Real Estate Finance 2018-FL-1 Issuer Ltd., 1M USD LIBOR + 0.750%^ | | | 2.82 | # | | | 2/15/2035 | | | | 680,000 | | | | 680,000 | | | | 679,996 | |
Trafigura Securitisation Finance PLC 2017-1, 1M USD LIBOR + 1.700%+^ | | | 3.77 | # | | | 12/15/2020 | | | | 900,000 | | | | 902,576 | | | | 901,628 | |
Trinity Rail Leasing LP^ | | | 3.82 | | | | 6/17/2048 | | | | 1,000,000 | | | | 999,632 | | | | 999,632 | |
TRIP Rail Master Funding LLC 2011-1A A2^ | | | 6.02 | | | | 7/15/2041 | | | | 1,249,401 | | | | 1,332,939 | | | | 1,316,939 | |
TRIP Rail Master Funding LLC 2014-1A A2^ | | | 4.09 | | | | 4/15/2044 | | | | 700,000 | | | | 713,771 | | | | 694,913 | |
TRIP Rail Master Funding LLC 2017-1A A1^ | | | 2.71 | | | | 8/15/2047 | | | | 209,395 | | | | 209,392 | | | | 206,425 | |
VSE VOI Mortgage LLC 2016-A A^ | | | 2.54 | | | | 7/20/2033 | | | | 476,214 | | | | 476,169 | | | | 465,475 | |
Wachovia Student Loan Trust 2005-1 B, 3M USD LIBOR + 0.300% | | | 2.66 | # | | | 10/25/2040 | | | | 718,127 | | | | 659,037 | | | | 663,970 | |
Welk Resorts LLC 2017-AA B^ | | | 3.41 | | | | 6/15/2033 | | | | 330,170 | | | | 330,117 | | | | 322,359 | |
Westgate Resorts LLC 2015-2A A^ | | | 3.20 | | | | 7/20/2028 | | | | 143,173 | | | | 143,016 | | | | 143,110 | |
Westgate Resorts LLC 2017-1A A^ | | | 3.05 | | | | 12/20/2030 | | | | 389,815 | | | | 389,815 | | | | 386,177 | |
Westgate Resorts LLC 2018-1^ | | | 3.38 | | | | 12/20/2031 | | | | 762,327 | | | | 761,001 | | | | 760,905 | |
| | | | | | | | | | | | | | | | | | | | |
Total Other Asset-Backed Securities | | | | | | | | | | | 160,482,334 | | | | 158,443,110 | | | | 158,107,550 | |
| | | | | | | | | | | | | | | | | | | | |
| | | | | | | | | | | | | | | | | | | | |
Total Asset-Backed Securities | | | | | | | | | | | 179,380,985 | | | | 177,336,952 | | | | 177,010,839 | |
| | | | | | | | | | | | | | | | | | | | |
Corporate Bonds — 46.0%*: | | | | | | | | | | | | | | | | | | | | |
| | | | | |
Advertising — 0.2%*: | | | | | | | | | | | | | | | | | | | | |
S&P Global, Inc. | | | 3.30 | | | | 8/14/2020 | | | | 700,000 | | | | 716,485 | | | | 700,751 | |
| | | | | | | | | | | | | | | | | | | | |
| | | | | |
Aerospace/Defense — 0.5%*: | | | | | | | | | | | | | | | | | | | | |
Harris Corp. | | | 2.70 | | | | 4/27/2020 | | | | 2,140,000 | | | | 2,135,457 | | | | 2,121,054 | |
| | | | | | | | | | | | | | | | | | | | |
See accompanying Notes to the Financial Statements.
123
Barings Active Short Duration Bond Fund 2018 Annual Report
SCHEDULE OF INVESTMENTS (CONTINUED)
June 30, 2018
| | | | | | | | | | | | | | | | | | | | |
| | | EFFECTIVE
INTEREST RATE | | | DUE DATE | | | PRINCIPAL ‡‡ | | | COST | | | FAIR VALUE | |
Corporate Bonds (Continued) | | | | | | | | | | | | | | | | | | | | |
| | | | | |
Agriculture — 1.0%*: | | | | | | | | | | | | | | | | | | | | |
Bunge Ltd. Finance Corp. | | | 3.00 | % | | | 9/25/2022 | | | | 1,040,000 | | | $ | 1,035,101 | | | $ | 1,001,339 | |
Bunge Ltd. Finance Corp. | | | 3.50 | | | | 11/24/2020 | | | | 1,220,000 | | | | 1,242,080 | | | | 1,219,284 | |
Imperial Brands Finance PLC+^ | | | 2.05 | | | | 7/20/2018 | | | | 335,000 | | | | 334,969 | | | | 334,934 | |
Imperial Brands Finance PLC+^ | | | 2.95 | | | | 7/21/2020 | | | | 1,747,000 | | | | 1,768,050 | | | | 1,728,994 | |
| | | | | | | | | | | | | | | | | | | | |
Total Agriculture | | | | | | | | | | | 4,342,000 | | | | 4,380,200 | | | | 4,284,551 | |
| | | | | | | | | | | | | | | | | | | | |
| | | | | |
Airlines — 0.4%*: | | | | | | | | | | | | | | | | | | | | |
Delta Air Lines, Inc. | | | 3.63 | | | | 3/15/2022 | | | | 1,700,000 | | | | 1,710,023 | | | | 1,680,815 | |
| | | | | | | | | | | | | | | | | | | | |
| | | | | |
Auto Manufacturers — 1.6%*: | | | | | | | | | | | | | | | | | | | | |
Ford Motor Credit Co. LLC, 3M USD LIBOR + 0.810% | | | 2.83 | # | | | 4/5/2021 | | | | 1,135,000 | | | | 1,135,000 | | | | 1,138,957 | |
Ford Motor Credit Co. LLC, 3M USD LIBOR +1.235% | | | 3.59 | # | | | 2/15/2023 | | | | 985,000 | | | | 985,000 | | | | 991,065 | |
General Motors Financial Co., Inc. | | | 3.25 | | | | 1/5/2023 | | | | 2,590,000 | | | | 2,544,070 | | | | 2,509,892 | |
Hyundai Capital America^ | | | 2.00 | | | | 7/1/2019 | | | | 70,000 | | | | 69,983 | | | | 69,089 | |
Hyundai Capital America^ | | | 2.40 | | | | 10/30/2018 | | | | 150,000 | | | | 150,009 | | | | 149,779 | |
Hyundai Capital America^ | | | 2.55 | | | | 2/6/2019 | | | | 1,138,000 | | | | 1,140,493 | | | | 1,133,798 | |
Hyundai Capital America^ | | | 3.00 | | | | 10/30/2020 | | | | 480,000 | | | | 484,271 | | | | 473,409 | |
Nissan Motor Acceptance Corp.+^ | | | 1.90 | | | | 9/14/2021 | | | | 670,000 | | | | 666,410 | | | | 637,618 | |
| | | | | | | | | | | | | | | | | | | | |
Total Auto Manufacturers | | | | | | | | | | | 7,218,000 | | | | 7,175,236 | | | | 7,103,607 | |
| | | | | | | | | | | | | | | | | | | | |
| | | | | |
Auto Parts&Equipment — 0.5%*: | | | | | | | | | | | | | | | | | | | | |
Lear Corp. | | | 5.25 | | | | 1/15/2025 | | | | 300,000 | | | | 320,972 | | | | 308,536 | |
Lear Corp. | | | 5.38 | | | | 3/15/2024 | | | | 1,660,000 | | | | 1,762,082 | | | | 1,721,850 | |
| | | | | | | | | | | | | | | | | | | | |
Total Auto Parts&Equipment | | | | | | | | | | | 1,960,000 | | | | 2,083,054 | | | | 2,030,386 | |
| | | | | | | | | | | | | | | | | | | | |
| | | | | |
Beverages — 0.6%*: | | | | | | | | | | | | | | | | | | | | |
Anheuser-Busch InBev Finance, Inc.+ | | | 2.65 | | | | 2/1/2021 | | | | 373,000 | | | | 377,203 | | | | 367,859 | |
Anheuser-Busch InBev Worldwide, Inc.+ | | | 3.50 | | | | 1/12/2024 | | | | 761,000 | | | | 756,708 | | | | 756,301 | |
Maple Escrow Subsidiary, Inc.^ | | | 4.06 | | | | 5/25/2023 | | | | 1,305,000 | | | | 1,305,000 | | | | 1,308,182 | |
Molson Coors Brewing Co. | | | 2.10 | | | | 7/15/2021 | | | | 325,000 | | | | 323,182 | | | | 311,652 | |
| | | | | | | | | | | | | | | | | | | | |
Total Beverages | | | | | | | | | | | 2,764,000 | | | | 2,762,093 | | | | 2,743,994 | |
| | | | | | | | | | | | | | | | | | | | |
| | | | | |
Biotechnology — 0.4%*: | | | | | | | | | | | | | | | | | | | | |
Celgene Corp. | | | 3.25 | | | | 2/20/2023 | | | | 804,000 | | | | 784,377 | | | | 785,392 | |
Celgene Corp. | | | 3.55 | | | | 8/15/2022 | | | | 475,000 | | | | 487,028 | | | | 471,386 | |
Celgene Corp. | | | 4.00 | | | | 8/15/2023 | | | | 619,000 | | | | 632,556 | | | | 624,257 | |
| | | | | | | | | | | | | | | | | | | | |
Total Biotechnology | | | | | | | | | | | 1,898,000 | | | | 1,903,961 | | | | 1,881,035 | |
| | | | | | | | | | | | | | | | | | | | |
| | | | | |
Chemicals — 1.7%*: | | | | | | | | | | | | | | | | | | | | |
CF Industries, Inc. | | | 7.13 | | | | 5/1/2020 | | | | 151,000 | | | | 162,334 | | | | 159,494 | |
Incitec Pivot Finance LLC+^ | | | 6.00 | | | | 12/10/2019 | | | | 1,443,000 | | | | 1,508,201 | | | | 1,491,938 | |
LyondellBasell Industries NV | | | 5.00 | | | | 4/15/2019 | | | | 945,000 | | | | 963,510 | | | | 954,343 | |
LyondellBasell Industries NV | | | 6.00 | | | | 11/15/2021 | | | | 985,000 | | | | 1,088,255 | | | | 1,054,159 | |
See accompanying Notes to the Financial Statements.
124
Barings Active Short Duration Bond Fund 2018 Annual Report
SCHEDULE OF INVESTMENTS (CONTINUED)
June 30, 2018
| | | | | | | | | | | | | | | | | | | | |
| | | EFFECTIVE
INTEREST RATE | | | DUE DATE | | | PRINCIPAL ‡‡ | | | COST | | | FAIR VALUE | |
Corporate Bonds (Continued) | | | | | | | | | | | | | | | | | | | | |
| | | | | |
Chemicals (Continued) | | | | | | | | | | | | | | | | | | | | |
RPM International, Inc. | | | 3.45 | % | | | 11/15/2022 | | | | 380,000 | | | $ | 391,248 | | | $ | 374,347 | |
RPM International, Inc. | | | 6.13 | | | | 10/15/2019 | | | | 1,205,000 | | | | 1,259,433 | | | | 1,246,260 | |
Sherwin-Williams Co. (The) | | | 2.75 | | | | 6/1/2022 | | | | 1,245,000 | | | | 1,245,820 | | | | 1,206,399 | |
Syngenta Finance NV+^ | | | 3.70 | | | | 4/24/2020 | | | | 790,000 | | | | 790,000 | | | | 787,131 | |
| | | | | | | | | | | | | | | | | | | | |
Total Chemicals | | | | | | | | | | | 7,144,000 | | | | 7,408,801 | | | | 7,274,071 | |
| | | | | | | | | | | | | | | | | | | | |
| | | | | |
Commercial Banks — 7.5%*: | | | | | | | | | | | | | | | | | | | | |
Banco Santander SA+ | | | 3.50 | | | | 4/11/2022 | | | | 2,400,000 | | | | 2,412,357 | | | | 2,341,045 | |
Bancolombia SA+ | | | 5.95 | | | | 6/3/2021 | | | | 315,000 | | | | 335,156 | | | | 331,676 | |
Bank of America Corp. | | | 2.82 | **# | | | 7/21/2023 | | | | 4,320,000 | | | | 4,292,223 | | | | 4,177,123 | |
Barclays PLC, 3M USD LIBOR + 1.380%+ | | | 3.71 | # | | | 5/16/2024 | | | | 885,000 | | | | 885,000 | | | | 877,699 | |
Citigroup, Inc. | | | 3.14 | **# | | | 1/24/2023 | | | | 2,140,000 | | | | 2,127,883 | | | | 2,096,596 | |
Compass Bank | | | 5.50 | | | | 4/1/2020 | | | | 2,403,000 | | | | 2,488,267 | | | | 2,472,209 | |
Discover Bank | | | 3.35 | | | | 2/6/2023 | | | | 1,667,000 | | | | 1,667,136 | | | | 1,624,487 | |
Discover Bank | | | 4.20 | | | | 8/8/2023 | | | | 635,000 | | | | 653,269 | | | | 640,731 | |
First Horizon National Corp. | | | 3.50 | | | | 12/15/2020 | | | | 1,870,000 | | | | 1,882,773 | | | | 1,876,249 | |
Goldman Sachs Group, Inc. (The) | | | 2.88 | | | | 2/25/2021 | | | | 3,285,000 | | | | 3,319,837 | | | | 3,242,270 | |
Goldman Sachs Group, Inc. (The) | | | 3.20 | | | | 2/23/2023 | | | | 980,000 | | | | 979,178 | | | | 954,954 | |
JPMorgan Chase & Co. | | | 4.50 | | | | 1/24/2022 | | | | 2,045,000 | | | | 2,161,084 | | | | 2,115,373 | |
Macquarie Bank Ltd.+^ | | | 2.85 | | | | 1/15/2021 | | | | 130,000 | | | | 132,538 | | | | 128,032 | |
Mitsubishi UFJ Financial Group, Inc.+ | | | 2.67 | | | | 7/25/2022 | | | | 2,345,000 | | | | 2,290,042 | | | | 2,263,327 | |
Morgan Stanley MTN | | | 3.75 | | | | 2/25/2023 | | | | 2,365,000 | | | | 2,437,739 | | | | 2,367,681 | |
Regions Financial Corp. | | | 3.20 | | | | 2/8/2021 | | | | 1,940,000 | | | | 1,976,330 | | | | 1,929,954 | |
Sumitomo Mitsui Financial Group, Inc.+ | | | 2.06 | | | | 7/14/2021 | | | | 682,000 | | | | 677,505 | | | | 654,033 | |
Sumitomo Mitsui Financial Group, Inc.+ | | | 2.85 | | | | 1/11/2022 | | | | 580,000 | | | | 584,070 | | | | 566,490 | |
SVB Financial Group | | | 5.38 | | | | 9/15/2020 | | | | 200,000 | | | | 210,898 | | | | 208,490 | |
Synchrony Bank | | | 3.00 | | | | 6/15/2022 | | | | 1,380,000 | | | | 1,357,509 | | | | 1,328,927 | |
Turkiye Garanti Bankasi AS+^ | | | 4.75 | | | | 10/17/2019 | | | | 325,000 | | | | 329,699 | | | | 322,049 | |
| | | | | | | | | | | | | | | | | | | | |
Total Commercial Banks | | | | | | | | | | | 32,892,000 | | | | 33,200,493 | | | | 32,519,395 | |
| | | | | | | | | | | | | | | | | | | | |
| | | | | |
Construction Materials — 1.2%*: | | | | | | | | | | | | | | | | | | | | |
Holcim US Finance Sarl & Cie SCS+^ | | | 6.00 | | | | 12/30/2019 | | | | 1,990,000 | | | | 2,090,327 | | | | 2,062,433 | |
Martin Marietta Materials, Inc., 3M USD LIBOR + 0.500% | | | 2.82 | # | | | 12/20/2019 | | | | 445,000 | | | | 445,000 | | | | 445,734 | |
Martin Marietta Materials, Inc., 3M USD LIBOR + 0.650% | | | 2.98 | # | | | 5/22/2020 | | | | 530,000 | | | | 530,000 | | | | 531,295 | |
Masco Corp. | | | 3.50 | | | | 4/1/2021 | | | | 590,000 | | | | 594,878 | | | | 589,226 | |
Masco Corp. | | | 7.13 | | | | 3/15/2020 | | | | 124,000 | | | | 133,622 | | | | 131,343 | |
Standard Industries, Inc.^ | | | 5.50 | | | | 2/15/2023 | | | | 1,385,000 | | | | 1,423,051 | | | | 1,398,850 | |
| | | | | | | | | | | | | | | | | | | | |
Total Construction Materials | | | | | | | | | | | 5,064,000 | | | | 5,216,878 | | | | 5,158,881 | |
| | | | | | | | | | | | | | | | | | | | |
| | | | | |
Diversified Financial Services — 3.1%*: | | | | | | | | | | | | | | | | | | | | |
AerCap Ireland Capital Ltd./AerCap Global Aviation Trust+ | | | 3.95 | | | | 2/1/2022 | | | | 1,530,000 | | | | 1,563,789 | | | | 1,520,974 | |
See accompanying Notes to the Financial Statements.
125
Barings Active Short Duration Bond Fund 2018 Annual Report
SCHEDULE OF INVESTMENTS (CONTINUED)
June 30, 2018
| | | | | | | | | | | | | | | | | | | | |
| | | EFFECTIVE
INTEREST RATE | | | DUE DATE | | | PRINCIPAL ‡‡ | | | COST | | | FAIR VALUE | |
Corporate Bonds (Continued) | | | | | | | | | | | | | | | | | | | | |
| | | | | |
Diversified Financial Services (Continued) | | | | | | | | | | | | | | | | | | | | |
AerCap Ireland Capital Ltd./AerCap Global Aviation Trust+ | | | 4.50 | % | | | 5/15/2021 | | | | 300,000 | | | $ | 313,918 | | | $ | 305,663 | |
Aircastle Ltd. | | | 5.00 | | | | 4/1/2023 | | | | 2,471,000 | | | | 2,633,449 | | | | 2,480,266 | |
Ally Financial, Inc. | | | 4.75 | | | | 9/10/2018 | | | | 2,581,000 | | | | 2,590,697 | | | | 2,585,839 | |
Athene Global Funding^ | | | 4.00 | | | | 1/25/2022 | | | | 2,551,000 | | | | 2,587,518 | | | | 2,569,286 | |
Genpact Luxembourg Sarl^ | | | 3.70 | | | | 4/1/2022 | | | | 1,575,000 | | | | 1,578,309 | | | | 1,538,626 | |
Lazard Group LLC | | | 4.25 | | | | 11/14/2020 | | | | 2,173,000 | | | | 2,246,851 | | | | 2,215,538 | |
| | | | | | | | | | | | | | | | | | | | |
Total Diversified Financial Services | | | | | | | | | | | 13,181,000 | | | | 13,514,531 | | | | 13,216,192 | |
| | | | | | | | | | | | | | | | | | | | |
| | | | | |
Electric — 1.7%*: | | | | | | | | | | | | | | | | | | | | |
Ameren Corp. | | | 2.70 | | | | 11/15/2020 | | | | 760,000 | | | | 766,517 | | | | 751,601 | |
Duke Energy Corp. | | | 1.80 | | | | 9/1/2021 | | | | 780,000 | | | | 764,964 | | | | 746,618 | |
EDP Finance BV+^ | | | 4.13 | | | | 1/15/2020 | | | | 981,000 | | | | 1,002,864 | | | | 989,025 | |
Enel Finance International NV+^ | | | 2.88 | | | | 5/25/2022 | | | | 1,050,000 | | | | 1,047,505 | | | | 1,000,468 | |
Entergy Corp. | | | 4.00 | | | | 7/15/2022 | | | | 750,000 | | | | 776,741 | | | | 760,445 | |
Entergy Texas, Inc. | | | 2.55 | | | | 6/1/2021 | | | | 460,000 | | | | 459,923 | | | | 449,738 | |
Entergy Texas, Inc. | | | 7.13 | | | | 2/1/2019 | | | | 934,000 | | | | 961,010 | | | | 955,509 | |
Israel Electric Corp. Ltd.+^ | | | 7.25 | | | | 1/15/2019 | | | | 607,000 | | | | 621,176 | | | | 618,685 | |
Puget Energy, Inc. | | | 6.00 | | | | 9/1/2021 | | | | 675,000 | | | | 741,666 | | | | 721,903 | |
Puget Energy, Inc. | | | 6.50 | | | | 12/15/2020 | | | | 321,000 | | | | 350,338 | | | | 343,760 | |
| | | | | | | | | | | | | | | | | | | | |
Total Electric | | | | | | | | | | | 7,318,000 | | | | 7,492,704 | | | | 7,337,752 | |
| | | | | | | | | | | | | | | | | | | | |
| | | | | |
Electronics — 0.2%*: | | | | | | | | | | | | | | | | | | | | |
FLIR Systems, Inc. | | | 3.13 | | | | 6/15/2021 | | | | 480,000 | | | | 486,886 | | | | 474,740 | |
Tech Data Corp. | | | 3.70 | | | | 2/15/2022 | | | | 260,000 | | | | 259,709 | | | | 254,297 | |
| | | | | | | | | | | | | | | | | | | | |
Total Electronics | | | | | | | | | | | 740,000 | | | | 746,595 | | | | 729,037 | |
| | | | | | | | | | | | | | | | | | | | |
| | | | | |
Food — 0.9%*: | | | | | | | | | | | | | | | | | | | | |
Danone SA+^ | | | 2.08 | | | | 11/2/2021 | | | | 2,110,000 | | | | 2,097,406 | | | | 2,017,111 | |
JBS Investments GmbH^ | | | 7.75 | | | | 10/28/2020 | | | | 415,000 | | | | 432,066 | | | | 422,262 | |
Mondelez International Holdings Netherlands B.V.^ | | | 2.00 | | | | 10/28/2021 | | | | 1,419,000 | | | | 1,386,755 | | | | 1,353,809 | |
| | | | | | | | | | | | | | | | | | | | |
Total Food | | | | | | | | | | | 3,944,000 | | | | 3,916,227 | | | | 3,793,182 | |
| | | | | | | | | | | | | | | | | | | | |
| | | | | |
Healthcare-Products — 1.5%*: | | | | | | | | | | | | | | | | | | | | |
Abbott Laboratories | | | 2.90 | | | | 11/30/2021 | | | | 1,460,000 | | | | 1,465,009 | | | | 1,437,040 | |
Abbott Laboratories | | | 3.25 | | | | 4/15/2023 | | | | 275,000 | | | | 271,087 | | | | 271,140 | |
Becton Dickinson and Co., 3M USD LIBOR + 0.875% | | | 3.21 | # | | | 12/29/2020 | | | | 2,135,000 | | | | 2,136,607 | | | | 2,138,488 | |
Boston Scientific Corp. | | | 2.85 | | | | 5/15/2020 | | | | 350,000 | | | | 351,993 | | | | 347,396 | |
CVS Health Corp. | | | 2.13 | | | | 6/1/2021 | | | | 1,815,000 | | | | 1,801,121 | | | | 1,744,745 | |
CVS Health Corp. | | | 3.70 | | | | 3/9/2023 | | | | 620,000 | | | | 614,760 | | | | 616,856 | |
| | | | | | | | | | | | | | | | | | | | |
Total Healthcare-Products | | | | | | | | | | | 6,655,000 | | | | 6,640,577 | | | | 6,555,665 | |
| | | | | | | | | | | | | | | | | | | | |
See accompanying Notes to the Financial Statements.
126
Barings Active Short Duration Bond Fund 2018 Annual Report
SCHEDULE OF INVESTMENTS (CONTINUED)
June 30, 2018
| | | | | | | | | | | | | | | | | | | | |
| | | EFFECTIVE
INTEREST RATE | | | DUE DATE | | | PRINCIPAL ‡‡ | | | COST | | | FAIR VALUE | |
Corporate Bonds (Continued) | | | | | | | | | | | | | | | | | | | | |
| | | | | |
Healthcare-Services — 1.2%*: | | | | | | | | | | | | | | | | | | | | |
Cigna Corp. | | | 4.00 | % | | | 2/15/2022 | | | | 942,000 | | | $ | 984,178 | | | $ | 955,164 | |
Cigna Corp. | | | 4.50 | | | | 3/15/2021 | | | | 1,170,000 | | | | 1,228,019 | | | | 1,194,740 | |
HCA, Inc. | | | 3.75 | | | | 3/15/2019 | | | | 2,160,000 | | | | 2,175,962 | | | | 2,168,100 | |
Laboratory Corp. of America Holdings | | | 2.63 | | | | 2/1/2020 | | | | 710,000 | | | | 711,440 | | | | 704,339 | |
| | | | | | | | | | | | | | | | | | | | |
Total Healthcare-Services | | | | | | | | | | | 4,982,000 | | | | 5,099,599 | | | | 5,022,343 | |
| | | | | | | | | | | | | | | | | | | | |
| | | | | |
Home Builders — 0.5%*: | | | | | | | | | | | | | | | | | | | | |
Lennar Corp. | | | 4.50 | | | | 6/15/2019 | | | | 150,000 | | | | 151,156 | | | | 150,375 | |
Lennar Corp. | | | 4.50 | | | | 11/15/2019 | | | | 1,090,000 | | | | 1,108,333 | | | | 1,096,813 | |
Lennar Corp. | | | 4.75 | | | | 4/1/2021 | | | | 900,000 | | | | 930,386 | | | | 912,825 | |
| | | | | | | | | | | | | | | | | | | | |
Total Home Builders | | | | | | | | | | | 2,140,000 | | | | 2,189,875 | | | | 2,160,013 | |
| | | | | | | | | | | | | | | | | | | | |
| | | | | |
Insurance — 3.1%*: | | | | | | | | | | | | | | | | | | | | |
American International Group, Inc. | | | 3.30 | | | | 3/1/2021 | | | | 1,125,000 | | | | 1,132,933 | | | | 1,124,205 | |
AmTrust Financial Services, Inc. | | | 6.13 | | | | 8/15/2023 | | | | 780,000 | | | | 775,753 | | | | 751,725 | |
CNA Financial Corp. | | | 5.75 | | | | 8/15/2021 | | | | 941,000 | | | | 1,010,794 | | | | 998,088 | |
Enstar Group Ltd.+ | | | 4.50 | | | | 3/10/2022 | | | | 950,000 | | | | 960,014 | | | | 946,967 | |
Jackson National Life Global Funding^ | | | 2.50 | | | | 6/27/2022 | | | | 1,925,000 | | | | 1,921,248 | | | | 1,855,750 | |
Lincoln National Corp. | | | 4.00 | | | | 9/1/2023 | | | | 222,000 | | | | 229,139 | | | | 223,822 | |
Lincoln National Corp. | | | 4.20 | | | | 3/15/2022 | | | | 725,000 | | | | 764,714 | | | | 742,978 | |
Lincoln National Corp. | | | 6.25 | | | | 2/15/2020 | | | | 400,000 | | | | 420,865 | | | | 419,283 | |
Nuveen FIinance LLC^ | | | 2.95 | | | | 11/1/2019 | | | | 2,070,000 | | | | 2,088,259 | | | | 2,061,925 | |
Reinsurance Group of America, Inc. | | | 5.00 | | | | 6/1/2021 | | | | 1,429,000 | | | | 1,513,227 | | | | 1,480,953 | |
Trinity Acquisition PLC | | | 3.50 | | | | 9/15/2021 | | | | 1,316,000 | | | | 1,328,309 | | | | 1,305,241 | |
Willis Towers Watson PLC | | | 5.75 | | | | 3/15/2021 | | | | 370,000 | | | | 392,548 | | | | 390,071 | |
XLIT Ltd. | | | 5.75 | | | | 10/1/2021 | | | | 925,000 | | | | 1,011,576 | | | | 986,958 | |
| | | | | | | | | | | | | | | | | | | | |
Total Insurance | | | | | | | | | | | 13,178,000 | | | | 13,549,379 | | | | 13,287,966 | |
| | | | | | | | | | | | | | | | | | | | |
| | | | | |
Internet — 0.5%*: | | | | | | | | | | | | | | | | | | | | |
Expedia, Inc. | | | 5.95 | | | | 8/15/2020 | | | | 746,000 | | | | 797,357 | | | | 783,180 | |
Expedia, Inc. | | | 7.46 | | | | 8/15/2018 | | | | 1,249,000 | | | | 1,257,012 | | | | 1,255,058 | |
| | | | | | | | | | | | | | | | | | | | |
Total Internet | | | | | | | | | | | 1,995,000 | | | | 2,054,369 | | | | 2,038,238 | |
| | | | | | | | | | | | | | | | | | | | |
| | | | | |
Investment Company Security — 0.7%*: | | | | | | | | | | | | | | | | | | | | |
Ares Capital Corp. | | | 3.63 | | | | 1/19/2022 | | | | 420,000 | | | | 423,213 | | | | 409,580 | |
Ares Capital Corp. | | | 3.88 | | | | 1/15/2020 | | | | 607,000 | | | | 615,537 | | | | 608,984 | |
Ares Capital Corp. | | | 4.88 | | | | 11/30/2018 | | | | 200,000 | | | | 201,342 | | | | 201,429 | |
FS Investment Corp. | | | 4.00 | | | | 7/15/2019 | | | | 853,000 | | | | 856,473 | | | | 853,817 | |
TCP Capital Corp. | | | 4.13 | | | | 8/11/2022 | | | | 1,140,000 | | | | 1,135,863 | | | | 1,088,176 | |
| | | | | | | | | | | | | | | | | | | | |
Total Investment Company Security | | | | | | | | | | | 3,220,000 | | | | 3,232,428 | | | | 3,161,986 | |
| | | | | | | | | | | | | | | | | | | | |
| | | | | |
IT Services — 0.9%*: | | | | | | | | | | | | | | | | | | | | |
Dell International LLC/EMC Corp.^ | | | 3.48 | | | | 6/1/2019 | | | | 405,000 | | | | 405,790 | | | | 406,020 | |
Dell International LLC/EMC Corp.^ | | | 4.42 | | | | 6/15/2021 | | | | 1,180,000 | | | | 1,216,429 | | | | 1,197,255 | |
See accompanying Notes to the Financial Statements.
127
Barings Active Short Duration Bond Fund 2018 Annual Report
SCHEDULE OF INVESTMENTS (CONTINUED)
June 30, 2018
| | | | | | | | | | | | | | | | | | | | |
| | | EFFECTIVE
INTEREST RATE | | | DUE DATE | | | PRINCIPAL ‡‡ | | | COST | | | FAIR VALUE | |
Corporate Bonds (Continued) | | | | | | | | | | | | | | | | | | | | |
| | | | | |
IT Services (Continued) | | | | | | | | | | | | | | | | | | | | |
DXC Technology Co. | | | 2.88 | % | | | 3/27/2020 | | | | 270,000 | | | $ | 269,505 | | | $ | 268,066 | |
Leidos Holdings, Inc. | | | 4.45 | | | | 12/1/2020 | | | | 1,975,000 | | | | 2,019,252 | | | | 1,989,812 | |
| | | | | | | | | | | | | | | | | | | | |
Total IT Services | | | | | | | | | | | 3,830,000 | | | | 3,910,976 | | | | 3,861,153 | |
| | | | | | | | | | | | | | | | | | | | |
| | | | | |
Leisure Time — 0.3%*: | | | | | | | | | | | | | | | | | | | | |
Brunswick Corp.^ | | | 4.63 | | | | 5/15/2021 | | | | 1,476,000 | | | | 1,497,999 | | | | 1,476,063 | |
| | | | | | | | | | | | | | | | | | | | |
| | | | | |
Lodging — 0.4%*: | | | | | | | | | | | | | | | | | | | | |
Marriott International, Inc. | | | 2.30 | | | | 1/15/2022 | | | | 300,000 | | | | 299,198 | | | | 287,729 | |
Marriott International, Inc. | | | 2.88 | | | | 3/1/2021 | | | | 1,345,000 | | | | 1,360,174 | | | | 1,326,326 | |
| | | | | | | | | | | | | | | | | | | | |
Total Lodging | | | | | | | | | | | 1,645,000 | | | | 1,659,372 | | | | 1,614,055 | |
| | | | | | | | | | | | | | | | | | | | |
| | | | | |
Machinery-Diversified — 0.6%*: | | | | | | | | | | | | | | | | | | | | |
CNH Industrial Capital LLC | | | 3.38 | | | | 7/15/2019 | | | | 945,000 | | | | 950,331 | | | | 945,756 | |
CNH Industrial Capital LLC | | | 3.88 | | | | 10/15/2021 | | | | 1,110,000 | | | | 1,124,983 | | | | 1,104,450 | |
CNH Industrial NV+ | | | 4.50 | | | | 8/15/2023 | | | | 450,000 | | | | 460,260 | | | | 452,430 | |
| | | | | | | | | | | | | | | | | | | | |
Total Machinery-Diversified | | | | | | | | | | | 2,505,000 | | | | 2,535,574 | | | | 2,502,636 | |
| | | | | | | | | | | | | | | | | | | | |
| | | | | |
Media — 0.9%*: | | | | | | | | | | | | | | | | | | | | |
Charter Communications Operating LLC/Charter Communications Operating Capital | | | 3.58 | | | | 7/23/2020 | | | | 1,130,000 | | | | 1,143,705 | | | | 1,128,565 | |
Discovery Communications LLC | | | 2.95 | | | | 3/20/2023 | | | | 545,000 | | | | 544,404 | | | | 521,199 | |
Sirius XM Radio, Inc.^ | | | 3.88 | | | | 8/1/2022 | | | | 2,188,000 | | | | 2,216,054 | | | | 2,111,420 | |
Viacom, Inc. | | | 2.75 | | | | 12/15/2019 | | | | 118,000 | | | | 119,395 | | | | 116,930 | |
| | | | | | | | | | | | | | | | | | | | |
Total Media | | | | | | | | | | | 3,981,000 | | | | 4,023,558 | | | | 3,878,114 | |
| | | | | | | | | | | | | | | | | | | | |
| | | | | |
Mining — 1.6%*: | | | | | | | | | | | | | | | | | | | | |
Anglo American Capital PLC+^ | | | 3.75 | | | | 4/10/2022 | | | | 1,350,000 | | | | 1,366,384 | | | | 1,340,293 | |
Glencore Finance Canada Ltd.+^ | | | 4.25 | | | | 10/25/2022 | | | | 484,000 | | | | 506,488 | | | | 489,464 | |
Glencore Funding LLC+^ | | | 3.00 | | | | 10/27/2022 | | | | 730,000 | | | | 728,115 | | | | 699,640 | |
Glencore Funding LLC+^ | | | 4.13 | | | | 5/30/2023 | | | | 980,000 | | | | 975,499 | | | | 977,854 | |
Kinross Gold Corp. | | | 5.13 | | | | 9/1/2021 | | | | 990,000 | | | | 1,042,780 | | | | 1,015,691 | |
Kinross Gold Corp.+ | | | 5.95 | | | | 3/15/2024 | | | | 1,070,000 | | | | 1,109,861 | | | | 1,096,750 | |
Newcrest Finance Pty Ltd.+^ | | | 4.20 | | | | 10/1/2022 | | | | 1,145,000 | | | | 1,200,701 | | | | 1,146,272 | |
| | | | | | | | | | | | | | | | | | | | |
Total Mining | | | | | | | | | | | 6,749,000 | | | | 6,929,828 | | | | 6,765,964 | |
| | | | | | | | | | | | | | | | | | | | |
| | | | | |
Office/Business Equip — 0.6%*: | | | | | | | | | | | | | | | | | | | | |
Pitney Bowes, Inc. | | | 3.63 | | | | 10/1/2021 | | | | 2,765,000 | | | | 2,744,333 | | | | 2,599,238 | |
| | | | | | | | | | | | | | | | | | | | |
| | | | | |
Oil and Gas — 0.6%*: | | | | | | | | | | | | | | | | | | | | |
Antero Resources Corp. | | | 5.38 | | | | 11/1/2021 | | | | 480,000 | | | | 489,867 | | | | 486,000 | |
Continental Resources, Inc. | | | 5.00 | | | | 9/15/2022 | | | | 1,260,000 | | | | 1,280,498 | | | | 1,276,648 | |
EQT Corp. | | | 3.00 | | | | 10/1/2022 | | | | 1,045,000 | | | | 1,042,063 | | | | 1,006,598 | |
| | | | | | | | | | | | | | | | | | | | |
Total Oil and Gas | | | | | | | | | | | 2,785,000 | | | | 2,812,428 | | | | 2,769,246 | |
| | | | | | | | | | | | | | | | | | | | |
See accompanying Notes to the Financial Statements.
128
Barings Active Short Duration Bond Fund 2018 Annual Report
SCHEDULE OF INVESTMENTS (CONTINUED)
June 30, 2018
| | | | | | | | | | | | | | | | | | | | |
| | | EFFECTIVE
INTEREST RATE | | | DUE DATE | | | PRINCIPAL ‡‡ | | | COST | | | FAIR VALUE | |
Corporate Bonds (Continued) | | | | | | | | | | | | | | | | | | | | |
| | | | | |
Packaging and Containers — 0.5%*: | | | | | | | | | | | | | | | | | | | | |
Graphic Packaging International, Inc. | | | 4.75 | % | | | 4/15/2021 | | | | 2,096,000 | | | $ | 2,178,977 | | | $ | 2,116,960 | |
| | | | | | | | | | | | | | | | | | | | |
| | | | | |
Pharmaceuticals — 2.2%*: | | | | | | | | | | | | | | | | | | | | |
AbbVie, Inc. | | | 2.30 | | | | 5/14/2021 | | | | 150,000 | | | | 149,140 | | | | 145,759 | |
Bayer US Finance II LLC, 3M USD LIBOR + 1.010%^ | | | 3.35 | # | | | 12/15/2023 | | | | 1,795,000 | | | | 1,795,000 | | | | 1,794,907 | |
Cardinal Health, Inc., 3M USD LIBOR + 0.770% | | | 3.11 | # | | | 6/15/2022 | | | | 2,145,000 | | | | 2,155,406 | | | | 2,142,855 | |
Express Scripts Holding Co. | | | 3.30 | | | | 2/25/2021 | | | | 1,590,000 | | | | 1,609,824 | | | | 1,584,169 | |
Express Scripts Holding Co. | | | 4.75 | | | | 11/15/2021 | | | | 950,000 | | | | 1,010,415 | | | | 980,121 | |
Shire Acquisitions Investments Ireland DAC | | | 2.40 | | | | 9/23/2021 | | | | 630,000 | | | | 625,528 | | | | 603,139 | |
Teva Pharmaceutical Finance Netherlands III B.V. | | | 2.20 | | | | 7/21/2021 | | | | 2,390,000 | | | | 2,337,502 | | | | 2,216,814 | |
| | | | | | | | | | | | | | | | | | | | |
Total Pharmaceuticals | | | | | | | | | | | 9,650,000 | | | | 9,682,815 | | | | 9,467,764 | |
| | | | | | | | | | | | | | | | | | | | |
| | | | | |
Pipelines — 1.4%*: | | | | | | | | | | | | | | | | | | | | |
Andeavor Logistics LP/Tesoro Logistics Finance Corp. | | | 3.50 | | | | 12/1/2022 | | | | 290,000 | | | | 289,199 | | | | 283,352 | |
Energy Transfer Partners LP | | | 4.20 | | | | 9/15/2023 | | | | 2,125,000 | | | | 2,124,537 | | | | 2,123,957 | |
EQT Midstream Partners LP | | | 4.75 | | | | 7/15/2023 | | | | 1,250,000 | | | | 1,247,021 | | | | 1,247,986 | |
Williams Cos., Inc. (The) | | | 3.70 | | | | 1/15/2023 | | | | 2,320,000 | | | | 2,268,442 | | | | 2,244,600 | |
| | | | | | | | | | | | | | | | | | | | |
Total Pipelines | | | | | | | | | | | 5,985,000 | | | | 5,929,199 | | | | 5,899,895 | |
| | | | | | | | | | | | | | | | | | | | |
| | | | | |
Real Estate Investment Trusts — 1.3%*: | | | | | | | | | | | | | | | | | | | | |
American Tower Corp. | | | 2.25 | | | | 1/15/2022 | | | | 330,000 | | | | 329,681 | | | | 315,492 | |
American Tower Corp. | | | 3.00 | | | | 6/15/2023 | | | | 1,400,000 | | | | 1,396,038 | | | | 1,342,433 | |
American Tower Corp. | | | 3.30 | | | | 2/15/2021 | | | | 530,000 | | | | 535,303 | | | | 529,426 | |
Crown Castle International Corp. | | | 3.40 | | | | 2/15/2021 | | | | 1,272,000 | | | | 1,293,442 | | | | 1,270,510 | |
Digital Realty Trust LP | | | 3.40 | | | | 10/1/2020 | | | | 385,000 | | | | 387,376 | | | | 384,865 | |
Healthcare Trust of America Holdings LP | | | 2.95 | | | | 7/1/2022 | | | | 370,000 | | | | 369,816 | | | | 358,014 | |
Simon Property Group LP | | | 2.35 | | | | 1/30/2022 | | | | 955,000 | | | | 950,813 | | | | 920,801 | |
Weyerhaeuser Co. | | | 7.38 | | | | 10/1/2019 | | | | 315,000 | | | | 331,710 | | | | 330,997 | |
| | | | | | | | | | | | | | | | | | | | |
Total REITS | | | | | | | | | | | 5,557,000 | | | | 5,594,179 | | | | 5,452,538 | |
| | | | | | | | | | | | | | | | | | | | |
| | | | | |
Retail — 0.7%*: | | | | | | | | | | | | | | | | | | | | |
AutoNation, Inc. | | | 3.35 | | | | 1/15/2021 | | | | 1,365,000 | | | | 1,377,413 | | | | 1,356,060 | |
Dollar Tree, Inc. | | | 3.70 | | | | 5/15/2023 | | | | 1,070,000 | | | | 1,062,644 | | | | 1,060,397 | |
QVC, Inc. | | | 3.13 | | | | 4/1/2019 | | | | 857,000 | | | | 862,790 | | | | 856,006 | |
| | | | | | | | | | | | | | | | | | | | |
Total Retail | | | | | | | | | | | 3,292,000 | | | | 3,302,847 | | | | 3,272,463 | |
| | | | | | | | | | | | | | | | | | | | |
| | | | | |
Semiconductors — 0.9%*: | | | | | | | | | | | | | | | | | | | | |
Broadcom Corp./Broadcom Cayman Finance Ltd. | | | 3.00 | | | | 1/15/2022 | | | | 1,785,000 | | | | 1,780,844 | | | | 1,736,199 | |
Microchip Technology, Inc.^ | | | 3.92 | | | | 6/1/2021 | | | | 835,000 | | | | 835,000 | | | | 836,387 | |
NXP BV/NXP Funding LLC^ | | | 4.13 | | | | 6/1/2021 | | | | 1,270,000 | | | | 1,295,811 | | | | 1,266,825 | |
| | | | | | | | | | | | | | | | | | | | |
Total Semiconductors | | | | | | | | | | | 3,890,000 | | | | 3,911,655 | | | | 3,839,411 | |
| | | | | | | | | | | | | | | | | | | | |
See accompanying Notes to the Financial Statements.
129
Barings Active Short Duration Bond Fund 2018 Annual Report
SCHEDULE OF INVESTMENTS (CONTINUED)
June 30, 2018
| | | | | | | | | | | | | | | | | | | | |
| | | EFFECTIVE
INTEREST RATE | | | DUE DATE | | | PRINCIPAL ‡‡ | | | COST | | | FAIR VALUE | |
Corporate Bonds (Continued) | | | | | | | | | | | | | | | | | | | | |
| | | | | |
Telecommunications — 1.6%*: | | | | | | | | | | | | | | | | | | | | |
Hughes Satellite Systems Corp. | | | 6.50 | % | | | 6/15/2019 | | | | 1,932,000 | | | $ | 2,001,430 | | | $ | 1,977,305 | |
Sprint Communications, Inc. | | | 9.25 | | | | 4/15/2022 | | | | 1,005,000 | | | | 1,194,756 | | | | 1,130,625 | |
Telefonaktiebolaget LM Ericsson+ | | | 4.13 | | | | 5/15/2022 | | | | 3,220,000 | | | | 3,242,530 | | | | 3,171,985 | |
Verizon Communications, Inc. | | | 2.95 | | | | 3/15/2022 | | | | 760,000 | | | | 770,026 | | | | 745,909 | |
| | | | | | | | | | | | | | | | | | | | |
Total Telecommunications | | | | | | | | | | | 6,917,000 | | | | 7,208,742 | | | | 7,025,824 | |
| | | | | | | | | | | | | | | | | | | | |
| | | | | |
Transportation — 0.8%*: | | | | | | | | | | | | | | | | | | | | |
Penske Truck Leasing Co. LP/PTL Finance Corp.^ | | | 2.50 | | | | 6/15/2019 | | | | 285,000 | | | | 283,686 | | | | 283,424 | |
Penske Truck Leasing Co. LP/PTL Finance Corp.^ | | | 2.70 | | | | 3/14/2023 | | | | 410,000 | | | | 402,506 | | | | 389,358 | |
Penske Truck Leasing Co. LP/PTL Finance Corp.^ | | | 3.05 | | | | 1/9/2020 | | | | 590,000 | | | | 594,833 | | | | 587,222 | |
Penske Truck Leasing Co. LP/PTL Finance Corp.^ | | | 3.20 | | | | 7/15/2020 | | | | 135,000 | | | | 134,959 | | | | 134,667 | |
Penske Truck Leasing Co. LP/PTL Finance Corp.^ | | | 3.30 | | | | 4/1/2021 | | | | 240,000 | | | | 244,619 | | | | 238,123 | |
Penske Truck Leasing Co. LP/PTL Finance Corp.^ | | | 3.38 | | | | 2/1/2022 | | | | 80,000 | | | | 81,054 | | | | 78,852 | |
Penske Truck Leasing Co. LP/PTL Finance Corp.^ | | | 4.88 | | | | 7/11/2022 | | | | 490,000 | | | | 528,687 | | | | 509,481 | |
Ryder System, Inc. MTN | | | 2.25 | | | | 9/1/2021 | | | | 635,000 | | | | 631,605 | | | | 613,263 | |
Ryder System, Inc. MTN | | | 2.45 | | | | 9/3/2019 | | | | 200,000 | | | | 201,621 | | | | 198,727 | |
Ryder System, Inc. MTN | | | 2.55 | | | | 6/1/2019 | | | | 185,000 | | | | 184,881 | | | | 184,321 | |
Ryder System, Inc. MTN | | | 2.88 | | | | 9/1/2020 | | | | 310,000 | | | | 310,363 | | | | 306,599 | |
| | | | | | | | | | | | | | | | | | | | |
Total Transportation | | | | | | | | | | | 3,560,000 | | | | 3,598,814 | | | | 3,524,037 | |
| | | | | | | | | | | | | | | | | | | | |
| | | | | |
Trucking and Leasing — 1.3%*: | | | | | | | | | | | | | | | | | | | | |
Aviation Capital Group LLC^ | | | 2.88 | | | | 9/17/2018 | | | | 1,465,000 | | | | 1,466,543 | | | | 1,465,274 | |
Aviation Capital Group LLC^ | | | 2.88 | | | | 1/20/2022 | | | | 750,000 | | | | 746,813 | | | | 725,420 | |
Aviation Capital Group LLC^ | | | 6.75 | | | | 4/6/2021 | | | | 200,000 | | | | 212,938 | | | | 216,042 | |
DAE Funding LLC+^ | | | 4.00 | | | | 8/1/2020 | | | | 276,000 | | | | 276,000 | | | | 272,895 | |
GATX Corp. | | | 2.50 | | | | 7/30/2019 | | | | 250,000 | | | | 251,139 | | | | 248,376 | |
GATX Corp. | | | 2.60 | | | | 3/30/2020 | | | | 685,000 | | | | 681,259 | | | | 676,671 | |
Park Aerospace Holdings Ltd.+^ | | | 5.25 | | | | 8/15/2022 | | | | 2,230,000 | | | | 2,294,202 | | | | 2,207,722 | |
| | | | | | | | | | | | | | | | | | | | |
Total Trucking and Leasing | | | | | | | | | | | 5,856,000 | | | | 5,928,894 | | | | 5,812,400 | |
| | | | | | | | | | | | | | | | | | | | |
| | | | | |
Venture Capital — 0.4%*: | | | | | | | | | | | | | | | | | | | | |
Hercules Capital, Inc. | | | 4.63 | | | | 10/23/2022 | | | | 1,725,000 | | | | 1,716,678 | | | | 1,722,487 | |
| | | | | | | | | | | | | | | | | | | | |
Total Corporate Bonds | | | | | | | | | | | 199,439,000 | | | | 202,295,833 | | | | 198,401,162 | |
| | | | | | | | | | | | | | | | | | | | |
| | |
Mortgage-Backed Securities — 5.0%*: | | | | | | | | | |
COMM Mortgage Trust 2014-UBS2 B | | | 4.70 | | | | 3/10/2047 | | | | 600,000 | | | | 643,352 | | | | 617,413 | |
Deephaven Residential Mortgage Trust 2018-1^ | | | 3.03 | #@ | | | 12/25/2057 | | | | 1,103,397 | | | | 1,103,380 | | | | 1,085,124 | |
Deephaven Residential Mortgage Trust 2018-2^ | | | 3.68 | #@ | | | 4/25/2058 | | | | 1,745,344 | | | | 1,745,326 | | | | 1,754,423 | |
See accompanying Notes to the Financial Statements.
130
Barings Active Short Duration Bond Fund 2018 Annual Report
SCHEDULE OF INVESTMENTS (CONTINUED)
June 30, 2018
| | | | | | | | | | | | | | | | | | | | |
| | | EFFECTIVE
INTEREST RATE | | | DUE DATE | | | PRINCIPAL ‡‡ | | | COST | | | FAIR VALUE | |
Mortgage-Backed Securities (Continued) | | | | | | | | | | | | | | | | | | | | |
JP Morgan Chase Commercial Mortgage Securities Corp., 1M USD LIBOR + 1.000%^ | | | 3.00 | # % | | | 6/15/2032 | | | | 1,550,000 | | | $ | 1,550,000 | | | $ | 1,550,444 | |
JP Morgan Mortgage Trust 2017-6 A5^ | | | 3.50 | #@ | | | 12/25/2048 | | | | 1,053,688 | | | | 1,067,552 | | | | 1,042,442 | |
JP Morgan Mortgage Trust 2018-1^ | | | 3.50 | #@ | | | 6/25/2048 | | | | 769,871 | | | | 776,197 | | | | 761,177 | |
JP Morgan Mortgage Trust 2018-3^ | | | 3.50 | #@ | | | 9/25/2048 | | | | 1,191,316 | | | | 1,187,611 | | | | 1,174,131 | |
JP Morgan Mortgage Trust 2018-4^ | | | 3.50 | #@ | | | 10/25/2048 | | | | 1,026,841 | | | | 1,021,784 | | | | 1,015,293 | |
JPMorgan Chase Commercial Mortgage Securities Trust 2007-CIBC18 AM | | | 5.47 | #@ | | | 6/12/2047 | | | | 200,713 | | | | 205,496 | | | | 200,511 | |
New Residential Mortgage Loan Trust 2016-4A A1^ | | | 3.75 | #@ | | | 11/25/2056 | | | | 423,657 | | | | 436,246 | | | | 424,733 | |
PNMAC GMSR Issuer Trust 2018-GT1, 1M USD LIBOR + 2.850%^ | | | 4.94 | # | | | 2/25/2023 | | | | 470,000 | | | | 470,000 | | | | 472,832 | |
PSMC Trust^ | | | 3.50 | #@ | | | 2/25/2048 | | | | 1,226,504 | | | | 1,224,980 | | | | 1,212,607 | |
PSMC Trust 2018-2^ | | | 3.50 | #@ | | | 6/25/2048 | | | | 1,093,629 | | | | 1,075,723 | | | | 1,076,002 | |
RETL 2018-RVP, 1M USD LIBOR + 1.100%^ | | | 3.17 | # | | | 3/15/2033 | | | | 1,224,204 | | | | 1,224,204 | | | | 1,229,442 | |
Sequoia Mortgage Trust 2015-1^ | | | 2.50 | #@ | | | 1/25/2045 | | | | 916,467 | | | | 902,217 | | | | 891,455 | |
Sequoia Mortgage Trust 2018-3^ | | | 3.50 | #@ | | | 3/25/2048 | | | | 1,398,187 | | | | 1,396,016 | | | | 1,382,382 | |
Sequoia Mortgage Trust 2018-5^ | | | 3.50 | #@ | | | 5/25/2048 | | | | 1,038,577 | | | | 1,027,093 | | | | 1,026,852 | |
Sequoia Mortgage Trust 2018-CH1^ | | | 4.00 | #@ | | | 2/25/2048 | | | | 1,010,532 | | | | 1,028,253 | | | | 1,021,637 | |
Sequoia Mortgage Trust 2018-CH2^ | | | 4.00 | #@ | | | 6/25/2048 | | | | 1,805,920 | | | | 1,824,554 | | | | 1,827,097 | |
Shellpoint Co-Originator Trust 2016-1 2A3^ | | | 3.00 | #@ | | | 10/25/2031 | | | | 845,044 | | | | 853,473 | | | | 824,882 | |
TIAA Bank Mortgage Loan Trust 2018-2^¤ | | | 3.50 | #@ | | | 7/25/2048 | | | | 570,000 | | | | 564,479 | | | | 564,478 | |
Velocity Commercial Capital Loan Trust 2016-2 AFX | | | 3.00 | #@ | | | 10/25/2046 | | | | 317,455 | | | | 317,455 | | | | 316,031 | |
| | | | | | | | | | | | | | | | | | | | |
Total Mortgage-Backed Securities | | | | | | | | | | | 21,581,346 | | | | 21,645,391 | | | | 21,471,388 | |
| | | | | | | | | | | | | | | | | | | | |
| | |
U.S. Treasury & Government Agencies — 3.2%*: | | | | | | | | | |
Federal Home Loan Mortgage Corp., 1M LIBOR + 0.450% | | | 2.52 | # | | | 9/15/2042 | | | | 326,748 | | | | 325,154 | | | | 329,616 | |
Federal Home Loan Mortgage Corp., 1M LIBOR + 0.480% | | | 2.55 | # | | | 10/15/2040 | | | | 366,809 | | | | 366,470 | | | | 370,084 | |
Federal Home Loan Mortgage Corp. | | | 3.00 | | | | 5/15/2039 | | | | 527,898 | | | | 532,544 | | | | 521,743 | |
Federal Home Loan Mortgage Corp. | | | 3.00 | | | | 8/15/2040 | | | | 828,220 | | | | 840,434 | | | | 819,786 | |
Federal Home Loan Mortgage Corp. | | | 3.00 | | | | 3/15/2041 | | | | 705,416 | | | | 714,846 | | | | 698,517 | |
Federal National Mortgage Association | | | 3.00 | | | | 4/25/2040 | | | | 1,108,858 | | | | 1,121,638 | | | | 1,094,021 | |
Federal National Mortgage Association | | | 3.00 | | | | 1/25/2041 | | | | 559,210 | | | | 566,298 | | | | 554,299 | |
U.S. Treasury Bonds(1) | | | 8.00 | | | | 11/15/2021 | | | | 1,880,000 | | | | 2,199,992 | | | | 2,202,170 | |
U.S. Treasury Bonds | | | 8.13 | | | | 8/15/2019 | | | | 1,900,000 | | | | 2,021,520 | | | | 2,018,750 | |
U.S. Treasury Bonds | | | 8.75 | | | | 5/15/2020 | | | | 1,900,000 | | | | 2,119,367 | | | | 2,117,090 | |
U.S. Treasury Bonds | | | 9.00 | | | | 11/15/2018 | | | | 2,200,000 | | | | 2,259,006 | | | | 2,254,570 | |
U.S. Treasury Note | | | 1.63 | | | | 3/15/2020 | | | | 700,000 | | | | 701,853 | | | | 689,610 | |
| | | | | | | | | | | | | | | | | | | | |
Total U.S. Treasury & Government Agencies | | | | | | | | | | | 13,003,159 | | | | 13,769,122 | | | | 13,670,256 | |
| | | | | | | | | | | | | | | | | | | | |
| | | | | | | | | | | | | | | | | | | | |
Total Fixed Income | | | | | | | | | | | 413,404,490 | | | | 415,047,298 | | | | 410,553,645 | |
| | | | | | | | | | | | | | | | | | | | |
See accompanying Notes to the Financial Statements.
131
Barings Active Short Duration Bond Fund 2018 Annual Report
SCHEDULE OF INVESTMENTS (CONTINUED)
June 30, 2018
| | | | | | | | | | | | | | | | | | | | | | | | | | | | | | |
| | | COUNTERPARTY | | STRIKE
PRICE | | | EXPIRATION
DATE | | | CONTRACTS | | | NOTIONAL | | | COST | | | UNREALIZED
VALUE | | | FAIR
VALUE | |
Purchased Options — 0.9%*: | | | | | | | | | | | | | | | | | | | | | | | | | | | | |
| | | | | | |
Call Options Purchased — 0.3%*: | | | | | | | | | | | | | | | | | | | | | | | | | |
OTC — BCM Swaption | | JPMorgan Chase Bank N.A. | | | $2.44 | | | | 12/13/2032 | | | | 11,190,000 | | | | 11,190,000 | | | | $561,458 | | | | $(92,253 | ) | | | $469,205 | |
OTC — BCM Swaption | | JPMorgan Chase Bank N.A. | | | 2.61 | | | | 1/31/2033 | | | | 14,590,000 | | | | 14,590,000 | | | | 698,861 | | | | (17,460 | ) | | | 681,401 | |
| | | | | | | | | | | | | | | | | | | | | | | | | | | | | | |
Total Call Options Purchased | | | | 25,780,000 | | | | 25,780,000 | | | | 1,260,319 | | | | (109,713 | ) | | | 1,150,606 | |
| | | | | | | | | | | | | | | | | | | | | | | | | | | | | | |
| | | | | | |
Put Options Purchased — 0.6%*: | | | | | | | | | | | | | | | | | | | | | | | | | |
OTC — BCM Swaption | | JPMorgan Chase Bank N.A. | | | 2.94 | | | | 12/13/2032 | | | | 22,790,000 | | | | 22,790,000 | | | | 1,143,488 | | | | 98,550 | | | | 1,242,038 | |
OTC — BCM Swaption | | JPMorgan Chase Bank N.A. | | | 3.11 | | | | 1/31/2033 | | | | 29,090,000 | | | | 29,090,000 | | | | 1,390,502 | | | | 50,620 | | | | 1,441,122 | |
| | | | | | | | | | | | | | | | | | | | | | | | | | | | | | |
Total Put Options 51,880,000 | | | | 51,880,000 | | | | 2,533,990 | | | | 149,170 | | | | 2,683,160 | |
| | | | | | | | | | | | | | | | | | | | | | | | | | | | | | |
| | | | | | | | | | | | | | | | | | | | |
| | | EFFECTIVE
INTEREST RATE | | | DUE DATE | | | PRINCIPAL ‡‡ | | | COST | | | FAIR
VALUE | |
Short-Term Investments — 4.3%*: | | | | | | | | | | | | | | | | | | | | |
| | | | | |
Bank Deposit — 0.1%*: | | | | | | | | | | | | | | | | | | | | |
State Street Bank & Trust Co. Euro Time Deposit | | | 0.28 | % | | | 7/2/2018 | | | | 658,740 | | | | 658,740 | | | | 658,740 | |
| | | | | | | | | | | | | | | | | | | | |
| | | | | |
Commercial Paper — 4.2%*: | | | | | | | | | | | | | | | | | | | | |
| | | | |
Electrical Components and Equipment — 0.9%*: | | | | | | | | | | | | | | | | | |
Molex Electronics Technologies | | | Zero Coupon | | | | 7/9/2018 | | | | 3,750,000 | | | | 3,748,008 | | | | 3,748,008 | |
| | | | | | | | | | | | | | | | | | | | |
| | | | | |
Food — 0.9%*: | | | | | | | | | | | | | | | | | | | | |
JM Smucker Co | | | Zero Coupon | | | | 7/3/2018 | | | | 4,000,000 | | | | 3,999,504 | | | | 3,999,504 | |
| | | | | | | | | | | | | | | | | | | | |
| | | | | |
Retail — 1.0%*: | | | | | | | | | | | | | | | | | | | | |
ERAC USA Finance LLC | | | Zero Coupon | | | | 7/23/2018 | | | | 4,250,000 | | | | 4,243,767 | | | | 4,243,767 | |
| | | | | | | | | | | | | | | | | | | | |
| | | | | |
Software & Service — 0.6%*: | | | | | | | | | | | | | | | | | | | | |
Hewlett Packard Enterprise Co. | | | Zero Coupon | | | | 7/11/2018 | | | | 2,500,000 | | | | 2,498,375 | | | | 2,498,375 | |
| | | | | | | | | | | | | | | | | | | | |
| | | | | |
Telecommunications — 0.8%*: | | | | | | | | | | | | | | | | | | | | |
Rogers Communications+ | | | Zero Coupon | | | | 7/9/2018 | | | | 3,500,000 | | | | 3,498,227 | | | | 3,498,227 | |
| | | | | | | | | | | | | | | | | | | | |
Total Commercial Paper | | | | | | | | | | | 18,000,000 | | | | 17,987,881 | | | | 17,987,881 | |
| | | | | | | | | | | | | | | | | | | | |
Total Short-Term Investments | | | | | | | | | | | 18,658,740 | | | | 18,646,621 | | | | 18,646,621 | |
| | | | | | | | | | | | | | | | | | | | |
Total Investments | | | | | | | | | | | 509,723,230 | | | | 437,488,228 | | | | 433,034,032 | |
| | | | | | | | | | | | | | | | | | | | |
| | | | | |
Other assets and liabilities — (0.5%)* | | | | | | | | | | | | | | | | | | | (2,249,832 | ) |
| | | | | | | | | | | | | | | | | | | | |
| | | | | |
Net Assets — 100.0% | | | | | | | | | | | | | | | | | | | $430,784,200 | |
| | | | | | | | | | | | | | | | | | | | |
See accompanying Notes to the Financial Statements.
132
Barings Active Short Duration Bond Fund 2018 Annual Report
SCHEDULE OF INVESTMENTS (CONTINUED)
June 30, 2018
| (1) | All or a portion of this security is held for futures collateral. |
| ‡‡ | Unless otherwise indicated, all principal amounts are denominated in United States Dollars. |
| * | Calculated as a percentage of net assets applicable to common shareholders. |
Distributions of investments by country of risk (excluding temporary cash investments) as a percentage of total investments in securities, is as follows:
| | | | | | |
| | United States | | | 89.8% | |
| | Canada | | | 1.4% | |
| | Japan | | | 1.3% | |
| | United Kingdom | | | 1.1% | |
| | Ireland | | | 1.1% | |
| | Switzerland | | | 1.0% | |
| | Other (Individually less than 1%) | | | 4.3% | |
| | | | | | |
| | Total | | | 100.0% | |
| | | | | | |
| ^ | Security acquired in a transaction exempt from registration under Rule 144A of the Securities Act of 1933. These securities may only be resold in transactions exempt from registration, normally to qualified institutional buyers. |
| ¤ | For fair value measurement disclosure purposes, security is categorized as Level 3 (See Note 2). |
| # | Variable rate security. The interest rate shown is the rate in effect at June 30, 2018. |
| ** | Variable Rate is Fixed to Float: Rate remains fixed until designated future date. |
| @ | Effective interest rate for this security is the coupon rate at issue based on the underlying loans. |
A summary of outstanding derivatives at June 30, 2018 is as follows:
Futures
| | | | | | | | | | | | | | | | | | | | | | | | |
| TYPE | | EXPIRATION
DATE | | | CONTRACTS | | | NOTIONAL
AMOUNT | | | POSITION | | | FAIR VALUE | | | UNREALIZED
APPRECIATION | |
Long Futures | | | | | | | | | | | | | | | | | | | | | | | | |
U.S. 10-Year Treasury Note | | | 09/19/18 | | | | 223 | | | | 26,576,063 | | | | Long | | | $ | 26,801,813 | | | $ | 225,750 | |
U.S. 2-Year Treasury Note | | | 09/28/18 | | | | 822 | | | | 173,912,553 | | | | Long | | | | 174,122,719 | | | | 210,166 | |
| | | | | | | | | | | | | | | | | | | | | | | | |
Total Long Futures | | | | | | | | | | | | | | | | | | | | | | $ | 435,916 | |
| | | | | | | | | | | | | | | | | | | | | | | | |
| | | | | | |
| TYPE | | EXPIRATION
DATE | | | CONTRACTS | | | NOTIONAL
AMOUNT | | | POSITION | | | FAIR VALUE | | | UNREALIZED
DEPRECIATION | |
Short Futures | | | | | | | | | | | | | | | | | | | | | | | | |
U.S. 10-Year Ultra Bond | | | 09/19/18 | | | | 104 | | | | 13,130,661 | | | | Short | | | $ | 13,336,375 | | | $ | (205,714 | ) |
U.S. 5-Year Treasury Note | | | 09/28/18 | | | | 730 | | | | 82,322,268 | | | | Short | | | | 82,940,547 | | | | (618,279 | ) |
| | | | | | | | | | | | | | | | | | | | | | | | |
Total Short Futures | | | | | | | | | | | | | | | | | | | | | | $ | (823,993 | ) |
| | | | | | | | | | | | | | | | | | | | | | | | |
See accompanying Notes to the Financial Statements.
133
Barings Active Short Duration Bond Fund 2018 Annual Report
SCHEDULE OF INVESTMENTS (CONTINUED)
June 30, 2018
OTC Credit Default Swaps – Sell Protection(1),(2)
| | | | | | | | | | | | | | | | | | | | | | | | | | | | | | | | | | |
REFERENCE
OBLIGATION | | FIXED-DEAL
RECEIVED
RATE | | | PAYMENT
FREQUENCY | | | MATURITY
DATE | | | COUNTERPARTY | | ORIGINAL
NOTIONAL
AMOUNT | | | CURRENT
NOTIONAL
AMOUNT(3) | | | UPFRONT
PREMIUMS
PAID/
(RECEIVED) | | | FAIR
VALUE(4) | | | UNREALIZED
DEPRECIATION | |
| CMBX.NA.BBB-.6† | | | 3.00 | % | | | 1M | | | | 11/17/2045 | | | JPMorgan Chase
Bank N.A. | | | 230,000 | | | | 230,000 | | | $ | 515 | | | $ | (23,860 | ) | | $ | (24,375 | ) |
| CMBX.NA.BBB-.6† | | | 3.00 | % | | | 1M | | | | 5/11/2063 | | | Goldman Sachs
& Co. | | | 290,000 | | | | 290,000 | | | | (21,401 | ) | | | (30,084 | ) | | | (8,683 | ) |
| | | | | | | | | | | | | | | | | | | | | | | | | | | | | | | | | | |
| Total OTC Credit Default Swaps | | | | | | | | | | $ | (20,886 | ) | | $ | (53,944 | ) | | $ | (33,058 | ) |
| | | | | | | | | | | | | | | | | | | | | | | | | | | | | | | | | | |
| (1) | If the Fund is a seller of protection and a credit event occurs, as defined under the terms of that particular swap agreement, the Fund will either (i) pay to the buyer of protection an amount equal to the notional amount of the swap and take delivery of the referenced obligation or underlying securities comprising the referenced index or (ii) pay a net settlement amount in the form of cash or securities equal to the notional amount of the swap less the recovery value of the referenced obligation or underlying securities comprising the referenced index. |
| (2) | Represents an investment grade index of single name credit default swaps (CDS). All of the companies underlying the single name CDS within the index are rated investment grade or higher. Rating represents a weighted average of the credit ratings of all the companies underlying the single name CDS within the index. |
| (3) | The maximum potential amount the Portfolio could be required to make as a seller of credit protection or receive as a buyer of credit event as defined under the terms of that particular swap agreement. |
| (4) | The quoted market prices and resulting values for credit default swap agreements on asset-backed securities and credit indices serve as an indicator of the current status of the payment/performance risk and represent the expected amount paid or received for the credit derivative if the amount of the swap agreement was closed/sold as of the period end. Increasing market values, in absolute terms when compared to the notional amount of the swap, represent a deterioration of the referenced entity’s credit soundness and a greater likelihood or risk of default or other credit event occurring as defined under the terms of the agreements. |
See accompanying Notes to the Financial Statements.
134
Barings Total Return Bond Fund 2018 Annual Report
SCHEDULE OF INVESTMENTS
June 30, 2018
| | | | | | | | | | | | | | | | | | | | |
| | | EFFECTIVE
INTEREST RATE | | | DUE DATE | | | PRINCIPAL ‡‡ | | | COST | | | FAIR
VALUE | |
Fixed Income — 84.6%*: | | | | | | | | | | | | | | | | | | | | |
| | | | | |
Asset-Backed Securities — 26.8%*: | | | | | | | | | | | | | | | | | | | | |
| | | | | |
CDO/CLO — 4.3%*: | | | | | | | | | | | | | | | | | | | | |
ALM VII Ltd. 2012-7A A1R, 3M USD LIBOR + 1.480%^ | | | 3.83 | #% | | | 10/15/2028 | | | | 250,000 | | | | $250,000 | | | | $251,595 | |
LCM XXIII Ltd. 23A A1, 3M USD LIBOR + 1.400%^ | | | 3.76 | # | | | 10/20/2029 | | | | 250,000 | | | | 250,000 | | | | 251,147 | |
Madison Park Funding XIV Ltd. 2014-14A A1R, 3M USD LIBOR + 1.120%^ | | | 3.48 | # | | | 7/20/2026 | | | | 250,000 | | | | 250,000 | | | | 250,036 | |
Marble Point CLO XI Ltd. 2017-2A A, 3M USD LIBOR + 1.180%^ | | | 3.54 | # | | | 12/18/2030 | | | | 250,000 | | | | 250,000 | | | | 250,111 | |
RR 3 Ltd. Series 2018-3 A A1R2, 3M USD LIBOR + 1.090%^ | | | 3.44 | # | | | 1/15/2030 | | | | 250,000 | | | | 250,000 | | | | 250,567 | |
| | | | | | | | | | | | | | | | | | | | |
Total CDO/CLO | | | | | | | | | | | 1,250,000 | | | | 1,250,000 | | | | 1,253,456 | |
| | | | | | | | | | | | | | | | | | | | |
| | | | | |
Other Asset-Backed Securities — 22.5%*: | | | | | | | | | | | | | | | | | | | | |
Access Group, Inc. 2006-1 B, 3M USD LIBOR + 0.450% | | | 2.78 | # | | | 8/25/2037 | | | | 84,705 | | | | 74,464 | | | | 81,216 | |
Access Group, Inc. 2015-1 A, 1M USD LIBOR + 0.700%^ | | | 2.79 | # | | | 7/25/2056 | | | | 54,940 | | | | 53,754 | | | | 54,864 | |
Access Group, Inc. 2015-1 B, 1M USD LIBOR + 1.500%^ | | | 3.59 | # | | | 7/25/2058 | | | | 100,000 | | | | 86,557 | | | | 89,553 | |
AccessLex Institute 2004-1 B, 3M USD LIBOR + 0.570% | | | 2.90 | # | | | 9/22/2037 | | | | 58,933 | | | | 56,596 | | | | 56,612 | |
AccessLex Institute 2004-A A3, 28 day ARS | | | 3.15 | # | | | 7/1/2039 | | | | 149,706 | | | | 146,942 | | | | 146,765 | |
Arbys Funding LLC 2015-1A A2^ | | | 4.97 | | | | 10/30/2045 | | | | 39,000 | | | | 39,000 | | | | 39,056 | |
Argent Securities, Inc. Asset-Backed Pass-Through Certificates 2004-W10 M1, 1M USD LIBOR + 0.900% | | | 2.99 | # | | | 10/25/2034 | | | | 49,454 | | | | 45,086 | | | | 49,133 | |
Asset Backed Securities Corp. Home Equity Loan Trust 2005-HE1 M1, 1M USD LIBOR + 0.750% | | | 2.84 | # | | | 3/25/2035 | | | | 51,548 | | | | 51,253 | | | | 51,265 | |
CLI Funding V LLC 2013-2A^ | | | 3.22 | | | | 6/18/2028 | | | | 46,493 | | | | 46,001 | | | | 45,842 | |
CLI Funding VI LLC 2016-1A A^ | | | 4.21 | | | | 2/18/2041 | | | | 62,640 | | | | 62,634 | | | | 60,954 | |
College Avenue Student Loans LLC 2017, 1M USD LIBOR + 1.650%^ | | | 3.74 | # | | | 11/26/2046 | | | | 94,382 | | | | 95,875 | | | | 96,333 | |
College Loan Corp. Trust I 2005-2 B, 3M USD LIBOR + 0.490% | | | 2.84 | # | | | 1/15/2037 | | | | 94,265 | | | | 83,401 | | | | 88,395 | |
College Loan Corp. Trust I 2017-1 B2, 28 day ARS¤ | | | 3.38 | # | | | 1/25/2047 | | | | 45,000 | | | | 38,507 | | | | 38,700 | |
Credit Suisse ABS Repackaging Trust 2013-A B^ | | | 2.50 | | | | 1/25/2030 | | | | 40,651 | | | | 38,723 | | | | 37,813 | |
CWABS Asset-Backed Certificates Trust 2005-4 MV5, 1M USD LIBOR + 0.670% | | | 3.10 | # | | | 10/25/2035 | | | | 60,000 | | | | 54,151 | | | | 58,965 | |
DB Master Finance LLC 2015-1A A2II^ | | | 3.98 | | | | 2/20/2045 | | | | 48,375 | | | | 49,345 | | | | 48,456 | |
Diamond Resorts Owner Trust 2013-2 A^ | | | 2.27 | | | | 5/20/2026 | | | | 24,195 | | | | 24,062 | | | | 24,169 | |
Diamond Resorts Owner Trust 2015-1 A^ | | | 2.73 | | | | 7/20/2027 | | | | 17,505 | | | | 17,503 | | | | 17,471 | |
Diamond Resorts Owner Trust 2016-1 B^ | | | 3.37 | | | | 11/20/2028 | | | | 49,350 | | | | 49,342 | | | | 47,984 | |
Domino’s Pizza Master Issuer LLC 2015-1A A2II^ | | | 4.47 | | | | 10/25/2045 | | | | 58,800 | | | | 58,800 | | | | 60,172 | |
See accompanying Notes to the Financial Statements.
135
Barings Total Return Bond Fund 2018 Annual Report
SCHEDULE OF INVESTMENTS (CONTINUED)
June 30, 2018
| | | | | | | | | | | | | | | | | | | | |
| | | EFFECTIVE
INTEREST RATE | | | DUE DATE | | | PRINCIPAL ‡‡ | | | COST | | | FAIR
VALUE | |
Asset-Backed Securities (Continued) | | | | | | | | | | | | | | | | | | | | |
| | | | | |
Other Asset-Backed Securities (Continued) | | | | | | | | | | | | | | | | | | | | |
DRB Prime Student Loan Trust 2015-B A1, 1M USD LIBOR + 1.900%^ | | | 3.99 | # % | | | 10/27/2031 | | | | 34,610 | | | $ | 34,550 | | | $ | 35,659 | |
DRB Prime Student Loan Trust 2016-R A1, 1M USD LIBOR + 1.900%¤ | | | 3.99 | # | | | 10/25/2044 | | | | 61,911 | | | | 61,911 | | | | 62,840 | |
DRB Prime Student Loan Trust 2016-R A2¤ | | | 3.07 | | | | 10/25/2044 | | | | 61,911 | | | | 61,900 | | | | 62,221 | |
Drug Royalty Corp Inc. 2012-1 A1, 3M USD LIBOR + 5.250% | | | 6.13 | # | | | 7/15/2024 | | | | 9,359 | | | | 9,568 | | | | 9,415 | |
Earnest Student Loan Program LLC 2016-C A1, 1M USD LIBOR + 1.850%^ | | | 3.94 | # | | | 10/27/2036 | | | | 37,914 | | | | 37,914 | | | | 38,470 | |
ECMC Group Student Loan Trust 2016-1A A, 1M USD LIBOR + 1.350%^ | | | 3.44 | # | | | 7/26/2066 | | | | 69,725 | | | | 69,725 | | | | 70,864 | |
EdLinc Student Loan Funding Trust 2017-A A, 1M USD LIBOR - 1.150%^ | | | 3.35 | # | | | 12/1/2047 | | | | 91,160 | | | | 90,532 | | | | 90,621 | |
Element Rail Leasing II LLC 2015-1A A1 | | | 2.71 | | | | 2/19/2045 | | | | 52,156 | | | | 50,445 | | | | 51,469 | |
Entergy New Orleans Storm Recovery Funding I LLC 2015-1 A | | | 2.67 | | | | 6/1/2027 | | | | 72,283 | | | | 72,270 | | | | 70,656 | |
First Franklin Mortgage Loan Trust 2004-FFH4 M6, 1M USD LIBOR + 1.725% | | | 3.82 | # | | | 1/25/2035 | | | | 50,000 | | | | 49,820 | | | | 51,610 | |
Flagship Credit Auto Trust 2016-4 C^ | | | 2.71 | | | | 11/15/2022 | | | | 40,000 | | | | 39,998 | | | | 39,587 | |
Flagship Credit Auto Trust 2017-4 C^ | | | 2.92 | | | | 11/15/2023 | | | | 100,000 | | | | 99,829 | | | | 98,107 | |
Goodgreen Trust 2017-1A A^ | | | 3.74 | | | | 10/15/2052 | | | | 87,420 | | | | 87,380 | | | | 87,591 | |
Helios Issuer LLC 2017-1A A^ | | | 4.94 | | | | 9/20/2049 | | | | 95,079 | | | | 95,035 | | | | 96,551 | |
HERO Funding Trust 2015-1A A^ | | | 3.84 | | | | 9/21/2040 | | | | 90,992 | | | | 92,626 | | | | 93,209 | |
Hilton Grand Vacations Trust 2013-A A^ | | | 2.28 | | | | 1/25/2026 | | | | 60,290 | | | | 60,167 | | | | 59,868 | |
J.G. Wentworth XXXV LLC 2015-2A A^ | | | 3.87 | | | | 3/15/2058 | | | | 45,827 | | | | 45,792 | | | | 45,950 | |
Mariner Finance Issuance Trust 2017-AA A^ | | | 3.62 | | | | 2/20/2029 | | | | 100,000 | | | | 99,982 | | | | 100,316 | |
Marlette Funding Trust 2016-1A A^ | | | 3.06 | | | | 1/17/2023 | | | | 4,020 | | | | 4,024 | | | | 4,022 | |
Marlette Funding Trust 2017-2A B^ | | | 3.19 | | | | 7/15/2024 | | | | 100,000 | | | | 99,993 | | | | 99,493 | |
Montana Higher Education Student Assistance Corp. 2012-1 A3, 1M USD LIBOR + 1.050% | | | 3.13 | # | | | 7/20/2043 | | | | 150,000 | | | | 145,247 | | | | 150,745 | |
Navient Student Loan Trust 2017-1A A3, 1M USD LIBOR + 1.150%^ | | | 3.24 | # | | | 7/26/2066 | | | | 120,000 | | | | 120,000 | | | | 122,915 | |
Navient Student Loan Trust 2018-1A A3, 1M USD LIBOR + 0.720%^ | | | 2.81 | # | | | 3/25/2067 | | | | 100,000 | | | | 100,000 | | | | 100,311 | |
Navient Student Loan Trust 2018-1B, 1M USD LIBOR + 1.200%^ | | | 3.29 | # | | | 3/25/2067 | | | | 100,000 | | | | 100,623 | | | | 100,000 | |
Nelnet Private Education Loan Trust 2016-A A1B^ | | | 3.60 | | | | 12/26/2040 | | | | 53,434 | | | | 53,092 | | | | 51,581 | |
Nelnet Student Loan Trust 2006-2 B, 3M USD LIBOR + 0.200% | | | 2.56 | # | | | 1/25/2038 | | | | 79,088 | | | | 74,307 | | | | 73,966 | |
New Residential Advance Receivables Trust Advance Receivables Backed Notes 2016-T2 AT2^ | | | 2.58 | | | | 10/15/2049 | | | | 250,000 | | | | 250,000 | | | | 247,664 | |
Northstar Education Finance, Inc. 2005-1 A5, 3M USD LIBOR + 0.750% | | | 3.11 | # | | | 10/30/2045 | | | | 23,830 | | | | 22,841 | | | | 23,649 | |
NovaStar Mortgage Funding Trust 2004-4 M5, 1M LIBOR + 1.725% | | | 3.82 | # | | | 3/25/2035 | | | | 81,151 | | | | 81,131 | | | | 82,735 | |
See accompanying Notes to the Financial Statements.
136
Barings Total Return Bond Fund 2018 Annual Report
SCHEDULE OF INVESTMENTS (CONTINUED)
June 30, 2018
| | | | | | | | | | | | | | | | | | | | |
| | | EFFECTIVE
INTEREST RATE | | | DUE DATE | | | PRINCIPAL ‡‡ | | | COST | | | FAIR
VALUE | |
Asset-Backed Securities (Continued) | | | | | | | | | | | | | | | | | | | | |
| | | | | |
Other Asset-Backed Securities (Continued) | | | | | | | | | | | | | | | | | | | | |
NRZ Advance Receivables Trust 2016-T4 AT4^ | | | 3.11 | % | | | 12/15/2050 | | | | 100,000 | | | $ | 100,000 | | | $ | 99,904 | |
NRZ Advance Receivables Trust Advance Receivables Backed 2016-T3 AT3^ | | | 2.83 | | | | 10/16/2051 | | | | 230,000 | | | | 230,000 | | | | 224,391 | |
OSCAR US Funding Trust V 2016-2A A4^ | | | 2.99 | | | | 12/15/2023 | | | | 130,000 | | | | 129,269 | | | | 129,098 | |
Oscar US Funding Trust VI LLC 2017-1A A4^ | | | 3.30 | | | | 5/10/2024 | | | | 30,000 | | | | 29,994 | | | | 29,913 | |
Popular ABS Mortgage Pass-Through Trust 2006-B A3, 1M USD LIBOR + 0.280% | | | 2.37 | # | | | 5/25/2036 | | | | 31,427 | | | | 30,238 | | | | 31,399 | |
Sierra Timeshare Receivables Funding LLC 2015-2A B^ | | | 3.02 | | | | 6/20/2032 | | | | 20,141 | | | | 20,137 | | | | 20,021 | |
SLC Private Student Loan Trust 2006-A C, 3M USD LIBOR + 0.450% | | | 2.80 | # | | | 7/15/2036 | | | | 140,000 | | | | 125,554 | | | | 134,658 | |
SLC Student Loan Trust 2005-1 B, 3M USD LIBOR + 0.200% | | | 2.54 | # | | | 2/15/2045 | | | | 91,969 | | | | 79,261 | | | | 85,222 | |
SLM Student Loan Trust 2002-7 A11, 28 day ARS | | | 4.46 | # | | | 3/15/2028 | | | | 50,000 | | | | 49,471 | | | | 50,003 | |
SLM Student Loan Trust 2002-7 B, 28 day ARS | | | 5.46 | # | | | 12/15/2039 | | | | 80,000 | | | | 80,060 | | | | 79,808 | |
SLM Student Loan Trust 2003-2 A9, 28 day ARS | | | 5.47 | # | | | 9/15/2028 | | | | 100,000 | | | | 99,778 | | | | 99,999 | |
SLM Student Loan Trust 2003-4 B, 3M USD LIBOR + 0.650% | | | 2.99 | # | | | 6/15/2038 | | | | 65,199 | | | | 59,947 | | | | 62,592 | |
SLM Student Loan Trust 2005-4 B, 3M USD LIBOR + 0.180% | | | 2.54 | # | | | 7/25/2055 | | | | 108,404 | | | | 93,222 | | | | 103,184 | |
SLM Student Loan Trust 2005-6 B, 3M USD LIBOR + 0.290% | | | 2.65 | # | | | 1/25/2044 | | | | 123,305 | | | | 114,373 | | | | 115,240 | |
SLM Student Loan Trust 2006-10, 3M USD LIBOR + 0.150% | | | 2.51 | # | | | 3/25/2044 | | | | 100,000 | | | | 96,334 | | | | 96,452 | |
SLM Student Loan Trust 2006-10, 3M USD LIBOR + 0.220% | | | 2.58 | # | | | 3/25/2044 | | | | 62,461 | | | | 58,992 | | | | 58,937 | |
SLM Student Loan Trust 2006-4 B, 3M USD LIBOR + 0.200% | | | 2.56 | # | | | 1/25/2070 | | | | 58,833 | | | | 55,098 | | | | 56,258 | |
SLM Student Loan Trust 2006-5 B, 3M USD LIBOR + 0.210% | | | 2.57 | # | | | 10/25/2040 | | | | 116,304 | | | | 102,219 | | | | 110,197 | |
SLM Student Loan Trust 2006-7 B, 3M USD LIBOR + 0.200% | | | 2.56 | # | | | 1/27/2042 | | | | 56,754 | | | | 53,514 | | | | 53,991 | |
SLM Student Loan Trust 2007-1 A6, 3M USD LIBOR + 0.140% | | | 2.50 | # | | | 1/27/2042 | | | | 100,000 | | | | 96,047 | | | | 96,440 | |
SMB Private Education Loan Trust 2017-A B^ | | | 3.50 | | | | 6/17/2041 | | | | 130,000 | | | | 126,099 | | | | 120,755 | |
SoFi Professional Loan Program LLC 2017-A C^ | | | 4.43 | | | | 3/26/2040 | | | | 100,000 | | | | 99,486 | | | | 98,211 | |
SoFi Professional Loan Program LLC 2017-D BFX^ | | | 3.61 | | | | 9/25/2040 | | | | 100,000 | | | | 99,949 | | | | 97,899 | |
South Carolina Student Loan Corp. 2014-1 B, 1M USD LIBOR + 1.500% | | | 3.48 | # | | | 8/1/2035 | | | | 100,000 | | | | 98,546 | | | | 97,632 | |
SPS Servicer Advance Receivables Trust Advance Receivables Backed Notes 2016-T2 AT2^ | | | 2.75 | | | | 11/15/2049 | | | | 100,000 | | | | 99,986 | | | | 100,911 | |
Taco Bell Funding LLC 2016-1A A23^ | | | 4.97 | | | | 5/25/2046 | | | | 68,950 | | | | 69,560 | | | | 71,019 | |
Taco Bell Funding LLC 2016-1A A2I^ | | | 3.83 | | | | 5/25/2046 | | | | 78,800 | | | | 79,040 | | | | 78,905 | |
Textainer Marine Containers V Ltd. 2017-1A A | | | 3.72 | | | | 5/20/2042 | | | | 89,499 | | | | 89,496 | | | | 89,082 | |
TRIP Rail Master Funding LLC 2011-1A A2^ | | | 6.02 | | | | 7/15/2041 | | | | 99,952 | | | | 107,859 | | | | 105,355 | |
See accompanying Notes to the Financial Statements.
137
Barings Total Return Bond Fund 2018 Annual Report
SCHEDULE OF INVESTMENTS (CONTINUED)
June 30, 2018
| | | | | | | | | | | | | | | | | | | | |
| | | EFFECTIVE
INTEREST RATE | | | DUE DATE | | | PRINCIPAL ‡‡ | | | COST | | | FAIR
VALUE | |
Asset-Backed Securities (Continued) | | | | | | | | | | | | | | | | | | | | |
| | | | | |
Other Asset-Backed Securities (Continued) | | | | | | | | | | | | | | | | | | | | |
TRIP Rail Master Funding LLC 2014-1A A2^ | | | 4.09 | % | | | 4/15/2044 | | | | 100,000 | | | $ | 101,967 | | | $ | 99,273 | |
Triton Container Finance IV LLC 2017-2A A^ | | | 3.62 | | | | 8/20/2042 | | | | 129,522 | | | | 129,507 | | | | 128,293 | |
Triton Container Finance VI LLC 2017-1A A^ | | | 3.52 | | | | 6/20/2042 | | | | 90,308 | | | | 90,292 | | | | 89,725 | |
Wachovia Student Loan Trust 2005-1 B, 3M USD LIBOR + 0.300% | | | 2.66 | # | | | 10/25/2040 | | | | 71,813 | | | | 65,904 | | | | 66,397 | |
Welk Resorts LLC 2017-AA B^ | | | 3.41 | | | | 6/15/2033 | | | | 88,582 | | | | 88,623 | | | | 86,487 | |
| | | | | | | | | | | | | | | | | | | | |
Total Other Asset-Backed Securities | | | | | | | | | | | 6,594,325 | | | | 6,432,520 | | | | 6,483,454 | |
| | | | | | | | | | | | | | | | | | | | |
| | | | | | | | | | | | | | | | | | | | |
Total Asset-Backed Securities | | | | | | | | | | | 7,844,325 | | | | 7,682,520 | | | | 7,736,910 | |
| | | | | | | | | | | | | | | | | | | | |
Corporate Bonds — 32.0%*: | | | | | | | | | | | | | | | | | | | | |
| | | | | |
Advertising — 0.1%*: | | | | | | | | | | | | | | | | | | | | |
WPP Finance 2010+ | | | 5.63 | | | | 11/15/2043 | | | | 35,000 | | | | 38,096 | | | | 36,637 | |
| | | | | | | | | | | | | | | | | | | | |
| | | | | |
Aerospace/Defense — 0.1%*: | | | | | | | | | | | | | | | | | | | | |
United Technologies Corp. | | | 5.70 | | | | 4/15/2040 | | | | 25,000 | | | | 31,201 | | | | 28,481 | |
| | | | | | | | | | | | | | | | | | | | |
| | | | | |
Agriculture — 0.3%*: | | | | | | | | | | | | | | | | | | | | |
Bunge Ltd. Finance Corp. | | | 3.25 | | | | 8/15/2026 | | | | 25,000 | | | | 24,980 | | | | 22,818 | |
Bunge Ltd. Finance Corp. | | | 3.50 | | | | 11/24/2020 | | | | 5,000 | | | | 4,998 | | | | 4,997 | |
Reynolds American, Inc. | | | 4.45 | | | | 6/12/2025 | | | | 30,000 | | | | 30,501 | | | | 30,192 | |
Reynolds American, Inc. | | | 5.85 | | | | 8/15/2045 | | | | 25,000 | | | | 30,253 | | | | 27,293 | |
| | | | | | | | | | | | | | | | | | | | |
Total Agriculture | | | | | | | | | | | 85,000 | | | | 90,732 | | | | 85,300 | |
| | | | | | | | | | | | | | | | | | | | |
| | | | | |
Airlines — 0.1%*: | | | | | | | | | | | | | | | | | | | | |
United Airlines 2018-1 Class B Pass Through Trust | | | 4.60 | | | | 3/1/2026 | | | | 15,000 | | | | 15,000 | | | | 14,982 | |
WestJet Airlines Ltd. | | | 3.50 | | | | 6/16/2021 | | | | 14,000 | | | | 13,988 | | | | 13,856 | |
| | | | | | | | | | | | | | | | | | | | |
Total Airlines | | | | | | | | | | | 29,000 | | | | 28,988 | | | | 28,838 | |
| | | | | | | | | | | | | | | | | | | | |
| | | | | |
Auto Manufacturers — 0.8%*: | | | | | | | | | | | | | | | | | | | | |
Ford Motor Co. | | | 7.45 | | | | 7/16/2031 | | | | 10,000 | | | | 12,391 | | | | 11,750 | |
General Motors Co. | | | 4.20 | | | | 10/1/2027 | | | | 30,000 | | | | 29,959 | | | | 28,737 | |
General Motors Co. | | | 5.15 | | | | 4/1/2038 | | | | 20,000 | | | | 19,988 | | | | 19,034 | |
General Motors Co. | | | 5.20 | | | | 4/1/2045 | | | | 35,000 | | | | 34,594 | | | | 32,131 | |
General Motors Financial Co., Inc. | | | 3.50 | | | | 11/7/2024 | | | | 50,000 | | | | 49,932 | | | | 47,610 | |
General Motors Financial Co., Inc. | | | 4.15 | | | | 6/19/2023 | | | | 35,000 | | | | 34,948 | | | | 34,992 | |
General Motors Financial Co., Inc. | | | 4.30 | | | | 7/13/2025 | | | | 50,000 | | | | 49,730 | | | | 49,053 | |
| | | | | | | | | | | | | | | | | | | | |
Total Auto Manufacturers | | | | | | | | | | | 230,000 | | | | 231,542 | | | | 223,307 | |
| | | | | | | | | | | | | | | | | | | | |
| | | | | |
Beverages — 0.5%*: | | | | | | | | | | | | | | | | | | | | |
Anheuser-Busch InBev Worldwide, Inc.+ | | | 4.60 | | | | 4/15/2048 | | | | 45,000 | | | | 44,746 | | | | 44,336 | |
Anheuser-Busch InBev Worldwide, Inc.+ | | | 8.20 | | | | 1/15/2039 | | | | 35,000 | | | | 51,458 | | | | 50,037 | |
Molson Coors Brewing Co. | | | 4.20 | | | | 7/15/2046 | | | | 36,000 | | | | 33,082 | | | | 32,321 | |
Molson Coors Brewing Co. | | | 5.00 | | | | 5/1/2042 | | | | 5,000 | | | | 5,031 | | | | 5,071 | |
| | | | | | | | | | | | | | | | | | | | |
Total Beverages | | | | | | | | | | | 121,000 | | | | 134,317 | | | | 131,765 | |
| | | | | | | | | | | | | | | | | | | | |
See accompanying Notes to the Financial Statements.
138
Barings Total Return Bond Fund 2018 Annual Report
SCHEDULE OF INVESTMENTS (CONTINUED)
June 30, 2018
| | | | | | | | | | | | | | | | | | | | |
| | | EFFECTIVE
INTEREST RATE | | | DUE DATE | | | PRINCIPAL ‡‡ | | | COST | | | FAIR
VALUE | |
Corporate Bonds (Continued) | | | | | | | | | | | | | | | | | | | | |
| | | | | |
Biotechnology — 0.3%*: | | | | | | | | | | | | | | | | | | | | |
Amgen, Inc. | | | 5.15 | % | | | 11/15/2041 | | | | 10,000 | | | $ | 10,405 | | | $ | 10,633 | |
Celgene Corp. | | | 3.45 | | | | 11/15/2027 | | | | 45,000 | | | | 44,935 | | | | 41,377 | |
Celgene Corp. | | | 4.63 | | | | 5/15/2044 | | | | 25,000 | | | | 26,860 | | | | 23,205 | |
| | | | | | | | | | | | | | | | | | | | |
Total Biotechnology | | | | | | | | | | | 80,000 | | | | 82,200 | | | | 75,215 | |
| | | | | | | | | | | | | | | | | | | | |
| | | | | |
Chemicals — 0.7%*: | | | | | | | | | | | | | | | | | | | | |
Incitec Pivot Finance LLC | | | 6.00 | | | | 12/10/2019 | | | | 30,000 | | | | 31,471 | | | | 31,017 | |
LYB International Finance B.V.+ | | | 5.25 | | | | 7/15/2043 | | | | 35,000 | | | | 35,968 | | | | 36,330 | |
Monsanto Co. | | | 4.40 | | | | 7/15/2044 | | | | 15,000 | | | | 14,299 | | | | 13,898 | |
Mosaic Co. (The) | | | 4.05 | | | | 11/15/2027 | | | | 44,000 | | | | 43,171 | | | | 42,048 | |
RPM International, Inc. | | | 3.75 | | | | 3/15/2027 | | | | 15,000 | | | | 14,981 | | | | 14,299 | |
Sherwin-Williams Co. (The) | | | 4.50 | | | | 6/1/2047 | | | | 15,000 | | | | 14,899 | | | | 14,316 | |
Yara International ASA | | | 4.75 | | | | 6/1/2028 | | | | 50,000 | | | | 49,875 | | | | 50,264 | |
| | | | | | | | | | | | | | | | | | | | |
Total Chemicals | | | | | | | | | | | 204,000 | | | | 204,664 | | | | 202,172 | |
| | | | | | | | | | | | | | | | | | | | |
| | | | | |
Commercial Banks — 4.0%*: | | | | | | | | | | | | | | | | | | | | |
Associated Banc-Corp | | | 4.25 | | | | 1/15/2025 | | | | 70,000 | | | | 70,016 | | | | 70,360 | |
Bank of America Corp. | | | 4.18 | | | | 11/25/2027 | | | | 65,000 | | | | 65,000 | | | | 63,303 | |
Bank of America Corp., 3M USD LIBOR + 1.814% | | | 4.24 | # | | | 4/24/2038 | | | | 30,000 | | | | 30,000 | | | | 29,141 | |
Bank of America Corp. | | | 4.75 | | | | 4/21/2045 | | | | 45,000 | | | | 46,740 | | | | 45,308 | |
Bank of Montreal+ | | | 3.80 | | | | 12/15/2032 | | | | 40,000 | | | | 40,000 | | | | 37,053 | |
Bank of Nova Scotia (The)+ | | | 4.50 | | | | 12/16/2025 | | | | 30,000 | | | | 30,326 | | | | 29,912 | |
Bank of Nova Scotia (The)+ | | | 4.65 | | | | 4/12/2066 | | | | 80,000 | | | | 80,300 | | | | 72,400 | |
Citigroup, Inc. | | | 3.88 | | | | 3/26/2025 | | | | 60,000 | | | | 58,737 | | | | 58,192 | |
Citigroup, Inc. | | | 4.60 | | | | 3/9/2026 | | | | 45,000 | | | | 44,928 | | | | 44,935 | |
Fulton Financial Corp. | | | 3.60 | | | | 3/16/2022 | | | | 35,000 | | | | 34,898 | | | | 34,351 | |
Goldman Sachs Group, Inc. (The) | | | 3.81 | | | | 4/23/2029 | | | | 40,000 | | | | 40,000 | | | | 38,046 | |
Goldman Sachs Group, Inc. (The) | | | 5.15 | | | | 5/22/2045 | | | | 70,000 | | | | 67,824 | | | | 69,666 | |
Goldman Sachs Group, Inc. (The) | | | 5.95 | | | | 1/15/2027 | | | | 32,000 | | | | 35,303 | | | | 34,664 | |
HSBC Holdings plc+ | | | 4.25 | | | | 3/14/2024 | | | | 200,000 | | | | 201,780 | | | | 198,980 | |
Huntington Bancshares, Inc. | | | 5.70 | | | | 7/15/2066 | | | | 80,000 | | | | 80,000 | | | | 79,160 | |
JPMorgan Chase & Co. | | | 3.63 | | | | 12/1/2027 | | | | 30,000 | | | | 29,954 | | | | 28,206 | |
JPMorgan Chase & Co. | | | 4.95 | | | | 6/1/2045 | | | | 40,000 | | | | 39,326 | | | | 40,711 | |
Morgan Stanley | | | 4.35 | | | | 9/8/2026 | | | | 60,000 | | | | 59,848 | | | | 59,181 | |
Valley National Bancorp | | | 5.13 | | | | 9/27/2023 | | | | 75,000 | | | | 79,571 | | | | 78,323 | |
Wells Fargo & Co. | | | 5.38 | | | | 11/2/2043 | | | | 29,000 | | | | 34,271 | | | | 30,282 | |
Wells Fargo & Co. | | | 5.61 | | | | 1/15/2044 | | | | 15,000 | | | | 18,279 | | | | 16,138 | |
| | | | | | | | | | | | | | | | | | | | |
Total Commercial Banks | | | | | | | | | | | 1,171,000 | | | | 1,187,101 | | | | 1,158,312 | |
| | | | | | | | | | | | | | | | | | | | |
| | | | | |
Commercial Services — 0.2%*: | | | | | | | | | | | | | | | | | | | | |
ERAC USA Finance LLC^ | | | 4.20 | | | | 11/1/2046 | | | | 70,000 | | | | 69,482 | | | | 63,119 | |
| | | | | | | | | | | | | | | | | | | | |
| | | | | |
Construction Materials — 0.2%*: | | | | | | | | | | | | | | | | | | | | |
Standard Industries, Inc.^ | | | 5.00 | | | | 2/15/2027 | | | | 70,000 | | | | 70,000 | | | | 64,925 | |
| | | | | | | | | | | | | | | | | | | | |
See accompanying Notes to the Financial Statements.
139
Barings Total Return Bond Fund 2018 Annual Report
SCHEDULE OF INVESTMENTS (CONTINUED)
June 30, 2018
| | | | | | | | | | | | | | | | | | | | |
| | | EFFECTIVE
INTEREST RATE | | | DUE DATE | | | PRINCIPAL ‡‡ | | | COST | | | FAIR
VALUE | |
Corporate Bonds (Continued) | | | | | | | | | | | | | | | | | | | | |
| | | | | |
Distribution/Wholesale — 0.2%*: | | | | | | | | | | | | | | | | | | | | |
Ingram Micro, Inc. | | | 5.45 | % | | | 12/15/2024 | | | | 45,000 | | | $ | 46,005 | | | $ | 44,548 | |
| | | | | | | | | | | | | | | | | | | | |
| | | | | |
Diversified Financial Services — 3.4%*: | | | | | | | | | | | | | | | | | | | | |
AerCap Ireland Capital DAC/AerCap Global Aviation Trust+ | | | 3.50 | | | | 5/26/2022 | | | | 150,000 | | | | 149,879 | | | | 146,722 | |
AerCap Ireland Capital DAC/AerCap Global Aviation Trust+ | | | 3.50 | | | | 1/15/2025 | | | | 160,000 | | | | 159,172 | | | | 150,094 | |
Affiliated Managers Group, Inc. | | | 4.25 | | | | 2/15/2024 | | | | 50,000 | | | | 51,078 | | | | 50,867 | |
Aircastle Ltd. | | | 4.13 | | | | 5/1/2024 | | | | 30,000 | | | | 28,875 | | | | 28,728 | |
Brookfield Finance, Inc.+ | | | 4.25 | | | | 6/2/2026 | | | | 60,000 | | | | 59,522 | | | | 59,056 | |
Discover Financial Services, Inc. | | | 3.75 | | | | 3/4/2025 | | | | 30,000 | | | | 29,098 | | | | 28,645 | |
Discover Financial Services, Inc. | | | 4.10 | | | | 2/9/2027 | | | | 65,000 | | | | 65,415 | | | | 62,347 | |
Discover Financial Services, Inc. | | | 5.50 | | | | 12/29/2049 | | | | 160,000 | | | | 160,000 | | | | 156,200 | |
Genpact Luxembourg Sarl | | | 3.70 | | | | 4/1/2022 | | | | 65,000 | | | | 65,120 | | | | 63,499 | |
High Street Funding Trust I^ | | | 4.11 | | | | 2/15/2028 | | | | 150,000 | | | | 150,000 | | | | 147,245 | |
Lazard Group LLC | | | 3.63 | | | | 3/1/2027 | | | | 30,000 | | | | 29,888 | | | | 28,109 | |
Legg Mason, Inc. | | | 5.63 | | | | 1/15/2044 | | | | 35,000 | | | | 36,279 | | | | 36,417 | |
Neuberger Berman Group LLC/Neuberger Berman Finance Corp.^ | | | 4.50 | | | | 3/15/2027 | | | | 25,000 | | | | 24,822 | | | | 24,783 | |
| | | | | | | | | | | | | | | | | | | | |
Total Diversified Financial Services | | | | | | | | | | | 1,010,000 | | | | 1,009,148 | | | | 982,712 | |
| | | | | | | | | | | | | | | | | | | | |
| | | | | |
Electric — 1.1%*: | | | | | | | | | | | | | | | | | | | | |
Appalachian Power Co. | | | 6.70 | | | | 8/15/2037 | | | | 30,000 | | | | 37,170 | | | | 38,934 | |
Cleveland Electric Illuminating Co. (The)^ | | | 3.50 | | | | 4/1/2028 | | | | 25,000 | | | | 24,930 | | | | 23,709 | |
Duke Energy Corp. | | | 3.75 | | | | 9/1/2046 | | | | 40,000 | | | | 39,521 | | | | 35,232 | |
Indianapolis Power & Light Co.^ | | | 4.05 | | | | 5/1/2046 | | | | 45,000 | | | | 44,711 | | | | 43,881 | |
IPALCO Enterprises, Inc. | | | 3.45 | | | | 7/15/2020 | | | | 50,000 | | | | 50,171 | | | | 49,784 | |
IPALCO Enterprises, Inc. | | | 3.70 | | | | 9/1/2024 | | | | 25,000 | | | | 24,978 | | | | 24,241 | |
Oncor Electric Delivery Co. LLC | | | 5.25 | | | | 9/30/2040 | | | | 40,000 | | | | 48,615 | | | | 46,341 | |
Puget Sound Energy, Inc. | | | 4.30 | | | | 5/20/2045 | | | | 30,000 | | | | 30,640 | | | | 30,724 | |
Southwestern Public Service Co. | | | 6.00 | | | | 10/1/2036 | | | | 30,000 | | | | 35,323 | | | | 35,948 | |
| | | | | | | | | | | | | | | | | | | | |
Total Electric | | | | | | | | | | | 315,000 | | | | 336,059 | | | | 328,794 | |
| | | | | | | | | | | | | | | | | | | | |
| | | | | |
Electronics — 0.2%*: | | | | | | | | | | | | | | | | | | | | |
Arrow Electronics, Inc. | | | 3.25 | | | | 9/8/2024 | | | | 25,000 | | | | 24,863 | | | | 23,370 | |
Arrow Electronics, Inc. | | | 3.88 | | | | 1/12/2028 | | | | 25,000 | | | | 24,902 | | | | 23,428 | |
| | | | | | | | | | | | | | | | | | | | |
Total Electronics | | | | | | | | | | | 50,000 | | | | 49,765 | | | | 46,798 | |
| | | | | | | | | | | | | | | | | | | | |
| | | | | |
Food — 0.1%*: | | | | | | | | | | | | | | | | | | | | |
Kraft Heinz Foods Co. | | | 3.00 | | | | 6/1/2026 | | | | 45,000 | | | | 44,042 | | | | 40,524 | |
| | | | | | | | | | | | | | | | | | | | |
| | | | | |
Gas — 0.2%*: | | | | | | | | | | | | | | | | | | | | |
NiSource Finance Corp. | | | 4.80 | | | | 2/15/2044 | | | | 50,000 | | | | 55,861 | | | | 51,913 | |
| | | | | | | | | | | | | | | | | | | | |
See accompanying Notes to the Financial Statements.
140
Barings Total Return Bond Fund 2018 Annual Report
SCHEDULE OF INVESTMENTS (CONTINUED)
June 30, 2018
| | | | | | | | | | | | | | | | | | | | |
| | | EFFECTIVE
INTEREST RATE | | | DUE DATE | | | PRINCIPAL ‡‡ | | | COST | | | FAIR
VALUE | |
Corporate Bonds (Continued) | | | | | | | | | | | | | | | | | | | | |
| | | | | |
Healthcare-Products — 0.4%*: | | | | | | | | | | | | | | | | | | | | |
Abbott Laboratories | | | 4.90 | % | | | 11/30/2046 | | | | 15,000 | | | $ | 14,886 | | | $ | 16,148 | |
Becton Dickinson and Co. | | | 3.36 | | | | 6/6/2024 | | | | 40,000 | | | | 40,000 | | | | 38,423 | |
Becton Dickinson and Co. | | | 3.70 | | | | 6/6/2027 | | | | 40,000 | | | | 40,000 | | | | 37,864 | |
Becton Dickinson and Co. | | | 4.69 | | | | 12/15/2044 | | | | 25,000 | | | | 25,930 | | | | 24,232 | |
| | | | | | | | | | | | | | | | | | | | |
Total Healthcare-Products | | | | | | | | | | | 120,000 | | | | 120,816 | | | | 116,667 | |
| | | | | | | | | | | | | | | | | | | | |
| | | | | |
Healthcare-Services — 0.6%*: | | | | | | | | | | | | | | | | | | | | |
Humana, Inc. | | | 3.95 | | | | 3/15/2027 | | | | 40,000 | | | | 39,956 | | | | 39,335 | |
Humana, Inc. | | | 4.80 | | | | 3/15/2047 | | | | 20,000 | | | | 19,982 | | | | 20,546 | |
IHC Health Services, Inc. | | | 4.13 | | | | 5/15/2048 | | | | 100,000 | | | | 100,667 | | | | 99,635 | |
| | | | | | | | | | | | | | | | | | | | |
Total Healthcare-Services | | | | | | | | | | | 160,000 | | | | 160,605 | | | | 159,516 | |
| | | | | | | | | | | | | | | | | | | | |
| | | | | |
Household Products/Wares — 0.0%*: | | | | | | | | | | | | | | | | | | | | |
Church & Dwight Co., Inc. | | | 3.15 | | | | 8/1/2027 | | | | 15,000 | | | | 14,986 | | | | 13,918 | |
| | | | | | | | | | | | | | | | | | | | |
| | | | | |
Housewares — 0.1%*: | | | | | | | | | | | | | | | | | | | | |
Toro Co. (The) | | | 7.80 | | | | 6/15/2027 | | | | 25,000 | | | | 31,001 | | | | 29,997 | |
| | | | | | | | | | | | | | | | | | | | |
| | | | | |
Insurance — 2.8%*: | | | | | | | | | | | | | | | | | | | | |
Allstate Corp. (The), 3M USD LIBOR + 2.938% | | | 5.75 | # | | | 8/15/2053 | | | | 110,000 | | | | 116,428 | | | | 113,025 | |
American International Group, Inc. | | | 3.90 | | | | 4/1/2026 | | | | 20,000 | | | | 19,992 | | | | 19,355 | |
American International Group, Inc. | | | 4.20 | | | | 4/1/2028 | | | | 30,000 | | | | 29,890 | | | | 29,351 | |
American International Group, Inc. | | | 4.50 | | | | 7/16/2044 | | | | 25,000 | | | | 25,665 | | | | 23,281 | |
American International Group, Inc. | | | 4.75 | | | | 4/1/2048 | | | | 15,000 | | | | 14,912 | | | | 14,458 | |
American International Group, Inc. | | | 5.75 | | | | 4/1/2048 | | | | 30,000 | | | | 30,000 | | | | 29,550 | |
AmTrust Financial Services, Inc. | | | 6.13 | | | | 8/15/2023 | | | | 75,000 | | | | 74,592 | | | | 72,281 | |
Arch Capital Group US, Inc. | | | 5.14 | | | | 11/1/2043 | | | | 25,000 | | | | 25,300 | | | | 26,430 | |
Athene Holding Ltd. | | | 4.13 | | | | 1/12/2028 | | | | 117,000 | | | | 114,165 | | | | 107,893 | |
AXIS Specialty Finance PLC+ | | | 4.00 | | | | 12/6/2027 | | | | 60,000 | | | | 59,019 | | | | 56,612 | |
CNA Financial Corp. | | | 3.45 | | | | 8/15/2027 | | | | 25,000 | | | | 24,947 | | | | 23,249 | |
Enstar Group Ltd.+ | | | 4.50 | | | | 3/10/2022 | | | | 20,000 | | | | 20,000 | | | | 19,936 | |
Progressive Corp. (The) | | | 5.38 | | | | 9/15/2066 | | | | 75,000 | | | | 75,000 | | | | 74,625 | |
Trinity Acquisition PLC+ | | | 4.40 | | | | 3/15/2026 | | | | 55,000 | | | | 56,425 | | | | 54,461 | |
Unum Group | | | 3.88 | | | | 11/5/2025 | | | | 25,000 | | | | 24,998 | | | | 24,280 | |
XLIT Ltd.+ | | | 4.45 | | | | 3/31/2025 | | | | 85,000 | | | | 87,818 | | | | 83,630 | |
XLIT Ltd.+ | | | 5.50 | | | | 3/31/2045 | | | | 30,000 | | | | 28,801 | | | | 31,145 | |
| | | | | | | | | | | | | | | | | | | | |
Total Insurance | | | | | | | | | | | 822,000 | | | | 827,952 | | | | 803,562 | |
| | | | | | | | | | | | | | | | | | | | |
| | |
Internet — 0.5%*: | | | | | | | | | |
Amazon.com, Inc. | | | 4.05 | | | | 8/22/2047 | | | | 45,000 | | | | 44,673 | | | | 44,082 | |
Expedia, Inc. | | | 5.00 | | | | 2/15/2026 | | | | 40,000 | | | | 39,852 | | | | 40,744 | |
Expedia, Inc. | | | 7.46 | | | | 8/15/2018 | | | | 45,000 | | | | 45,276 | | | | 45,218 | |
| | | | | | | | | | | | | | | | | | | | |
Total Internet | | | | | | | | | | | 130,000 | | | | 129,801 | | | | 130,044 | |
| | | | | | | | | | | | | | | | | | | | |
See accompanying Notes to the Financial Statements.
141
Barings Total Return Bond Fund 2018 Annual Report
SCHEDULE OF INVESTMENTS (CONTINUED)
June 30, 2018
| | | | | | | | | | | | | | | | | | | | |
| | | EFFECTIVE
INTEREST RATE | | | DUE DATE | | | PRINCIPAL ‡‡ | | | COST | | | FAIR
VALUE | |
Corporate Bonds (Continued) | | | | | | | | | | | | | | | | | | | | |
| | |
Investment Company Security — 1.1%*: | | | | | | | | | |
Ares Capital Corp. | | | 3.50 | % | | | 2/10/2023 | | | | 75,000 | | | $ | 74,950 | | | $ | 71,486 | |
Ares Capital Corp. | | | 3.88 | | | | 1/15/2020 | | | | 85,000 | | | | 85,995 | | | | 85,278 | |
FS Investment Corp. | | | 4.00 | | | | 7/15/2019 | | | | 75,000 | | | | 75,436 | | | | 75,072 | |
TCP Capital Corp. | | | 4.13 | | | | 8/11/2022 | | | | 75,000 | | | | 74,755 | | | | 71,591 | |
| | | | | | | | | | | | | | | | | | | | |
Total Investment Company Security | | | | | | | | | | | 310,000 | | | | 311,136 | | | | 303,427 | |
| | | | | | | | | | | | | | | | | | | | |
| | |
Iron/Steel — 0.5%*: | | | | | | | | | |
Vale Overseas Ltd.+ | | | 5.88 | | | | 6/10/2021 | | | | 125,000 | | | | 134,494 | | | | 132,031 | |
Vale Overseas Ltd.+ | | | 6.88 | | | | 11/21/2036 | | | | 15,000 | | | | 14,988 | | | | 16,841 | |
| | | | | | | | | | | | | | | | | | | | |
Total Iron/Steel | | | | | | | | | | | 140,000 | | | | 149,482 | | | | 148,872 | |
| | | | | | | | | | | | | | | | | | | | |
| | |
IT Services — 0.4%*: | | | | | | | | | |
Dell International LLC / EMC Corp.^ | | | 8.35 | | | | 7/15/2046 | | | | 45,000 | | | | 57,771 | | | | 54,194 | |
Leidos Holdings, Inc. | | | 4.45 | | | | 12/1/2020 | | | | 75,000 | | | | 76,072 | | | | 75,563 | |
| | | | | | | | | | | | | | | | | | | | |
Total IT Services | | | | | | | | | | | 120,000 | | | | 133,843 | | | | 129,757 | |
| | | | | | | | | | | | | | | | | | | | |
| | |
Machinery-Diversified — 0.3%*: | | | | | | | | | |
CNH Industrial NV+ | | | 4.50 | | | | 8/15/2023 | | | | 90,000 | | | | 92,052 | | | | 90,486 | |
| | | | | | | | | | | | | | | | | | | | |
| | |
Media — 0.5%*: | | | | | | | | | |
Charter Communications Operating LLC/Charter Communications Operating Capital | | | 4.46 | | | | 7/23/2022 | | | | 22,000 | | | | 22,403 | | | | 22,270 | |
Comcast Corp. | | | 3.40 | | | | 7/15/2046 | | | | 20,000 | | | | 19,832 | | | | 16,218 | |
Discovery Communications LLC | | | 4.88 | | | | 4/1/2043 | | | | 25,000 | | | | 22,830 | | | | 23,179 | |
Discovery Communications LLC | | | 5.00 | | | | 9/20/2037 | | | | 25,000 | | | | 24,975 | | | | 24,071 | |
Time Warner Cable LLC | | | 4.50 | | | | 9/15/2042 | | | | 60,000 | | | | 49,613 | | | | 49,299 | |
| | | | | | | | | | | | | | | | | | | | |
Total Media | | | | | | | | | | | 152,000 | | | | 139,653 | | | | 135,037 | |
| | | | | | | | | | | | | | | | | | | | |
| | |
Mining — 0.5%*: | | | | | | | | | |
Glencore Finance Canada Ltd. | | | 5.55 | | | | 10/25/2042 | | | | 22,000 | | | | 22,081 | | | | 22,001 | |
Glencore Funding LLC^ | | | 3.00 | | | | 10/27/2022 | | | | 20,000 | | | | 19,926 | | | | 19,168 | |
Glencore Funding LLC^ | | | 3.88 | | | | 10/27/2027 | | | | 25,000 | | | | 24,799 | | | | 23,102 | |
Glencore Funding LLC^ | | | 4.00 | | | | 4/16/2025 | | | | 50,000 | | | | 49,942 | | | | 48,113 | |
Glencore Funding LLC^ | | | 4.63 | | | | 4/29/2024 | | | | 25,000 | | | | 25,967 | | | | 25,135 | |
| | | | | | | | | | | | | | | | | | | | |
Total Mining | | | | | | | | | | | 142,000 | | | | 142,715 | | | | 137,519 | |
| | | | | | | | | | | | | | | | | | | | |
| | |
Miscellaneous Manufacturing — 0.2%*: | | | | | | | | | |
General Electric Co. | | | 4.13 | | | | 10/9/2042 | | | | 25,000 | | | | 22,837 | | | | 23,219 | |
General Electric Co. MTN | | | 6.88 | | | | 1/10/2039 | | | | 35,000 | | | | 46,264 | | | | 44,322 | |
| | | | | | | | | | | | | | | | | | | | |
Total Miscellaneous Manufacturing | | | | | | | | | | | 60,000 | | | | 69,101 | | | | 67,541 | |
| | | | | | | | | | | | | | | | | | | | |
| | |
Office/Business Equip — 0.4%*: | | | | | | | | | |
Pitney Bowes, Inc. | | | 3.63 | | | | 9/15/2020 | | | | 20,000 | | | | 19,965 | | | | 19,500 | |
Pitney Bowes, Inc. | | | 3.63 | | | | 10/1/2021 | | | | 115,000 | | | | 114,788 | | | | 108,106 | |
| | | | | | | | | | | | | | | | | | | | |
Total Office/Business Equip | | | | | | | | | | | 135,000 | | | | 134,753 | | | | 127,606 | |
| | | | | | | | | | | | | | | | | | | | |
See accompanying Notes to the Financial Statements.
142
Barings Total Return Bond Fund 2018 Annual Report
SCHEDULE OF INVESTMENTS (CONTINUED)
June 30, 2018
| | | | | | | | | | | | | | | | | | | | |
| | | EFFECTIVE
INTEREST RATE | | | DUE DATE | | | PRINCIPAL ‡‡ | | | COST | | | FAIR
VALUE | |
Corporate Bonds (Continued) | | | | | | | | | | | | | | | | | | | | |
| | |
Oil and Gas — 2.5%*: | | | | | | | | | |
Anadarko Petroleum Corp. | | | 5.55 | % | | | 3/15/2026 | | | | 20,000 | | | $ | 19,949 | | | $ | 21,434 | |
Andeavor | | | 4.50 | | | | 4/1/2048 | | | | 15,000 | | | | 14,788 | | | | 13,670 | |
Cenovus Energy, Inc.+ | | | 3.00 | | | | 8/15/2022 | | | | 30,000 | | | | 29,721 | | | | 28,736 | |
Cenovus Energy, Inc.+ | | | 4.25 | | | | 4/15/2027 | | | | 50,000 | | | | 49,844 | | | | 48,160 | |
Cenovus Energy, Inc.+ | | | 6.75 | | | | 11/15/2039 | | | | 25,000 | | | | 28,656 | | | | 27,454 | |
Continental Resources, Inc. | | | 4.50 | | | | 4/15/2023 | | | | 40,000 | | | | 40,555 | | | | 40,591 | |
Encana Corp.+ | | | 6.50 | | | | 2/1/2038 | | | | 40,000 | | | | 46,316 | | | | 46,984 | |
EQT Corp. | | | 3.90 | | | | 10/1/2027 | | | | 105,000 | | | | 104,604 | | | | 97,920 | |
Helmerich & Payne International Drilling Co. | | | 4.65 | | | | 3/15/2025 | | | | 25,000 | | | | 26,380 | | | | 25,813 | |
Marathon Petroleum Corp. | | | 6.50 | | | | 3/1/2041 | | | | 30,000 | | | | 33,211 | | | | 34,937 | |
Nabors Industries, Inc. | | | 5.50 | | | | 1/15/2023 | | | | 35,000 | | | | 35,858 | | | | 33,688 | |
Newfield Exploration Co. | | | 5.38 | | | | 1/1/2026 | | | | 140,000 | | | | 139,887 | | | | 143,150 | |
Patterson-UTI Energy, Inc.^ | | | 3.95 | | | | 2/1/2028 | | | | 10,000 | | | | 9,993 | | | | 9,353 | |
PBF Holding Co. LLC/PBF Finance Corp. | | | 7.00 | | | | 11/15/2023 | | | | 25,000 | | | | 25,494 | | | | 25,875 | |
Petroleos Mexicanos+ | | | 3.50 | | | | 1/30/2023 | | | | 20,000 | | | | 19,603 | | | | 18,933 | |
Petroleos Mexicanos+ | | | 4.63 | | | | 9/21/2023 | | | | 10,000 | | | | 10,226 | | | | 9,810 | |
Petroleos Mexicanos | | | 5.35 | | | | 2/12/2028 | | | | 30,000 | | | | 30,000 | | | | 28,404 | |
Petroleos Mexicanos+ | | | 5.50 | | | | 1/21/2021 | | | | 55,000 | | | | 57,484 | | | | 56,622 | |
Petroleos Mexicanos+ | | | 6.50 | | | | 3/13/2027 | | | | 15,000 | | | | 14,879 | | | | 15,381 | |
Rowan Cos., Inc. | | | 4.88 | | | | 6/1/2022 | | | | 8,000 | | | | 7,989 | | | | 7,560 | |
| | | | | | | | | | | | | | | | | | | | |
Total Oil and Gas | | | | | | | | | | | 728,000 | | | | 745,437 | | | | 734,475 | |
| | | | | | | | | | | | | | | | | | | | |
| | |
Oil and Gas Services — 0.3%*: | | | | | | | | | |
National Oilwell Varco, Inc. | | | 3.95 | | | | 12/1/2042 | | | | 37,000 | | | | 30,576 | | | | 31,210 | |
SESI LLC | | | 7.13 | | | | 12/15/2021 | | | | 32,000 | | | | 33,123 | | | | 32,560 | |
Weatherford International Ltd. | | | 5.95 | | | | 4/15/2042 | | | | 30,000 | | | | 25,259 | | | | 22,425 | |
| | | | | | | | | | | | | | | | | | | | |
Total Oil and Gas Services | | | | | | | | | | | 99,000 | | | | 88,958 | | | | 86,195 | |
| | | | | | | | | | | | | | | | | | | | |
| | |
Packaging and Containers — 0.0%*: | | | | | | | | | |
Brambles USA, Inc.^ | | | 4.13 | | | | 10/23/2025 | | | | 10,000 | | | | 9,981 | | | | 9,983 | |
| | | | | | | | | | | | | | | | | | | | |
| | |
Pharmaceuticals — 1.6%*: | | | | | | | | | |
AbbVie, Inc. | | | 4.70 | | | | 5/14/2045 | | | | 30,000 | | | | 29,339 | | | | 29,675 | |
CVS Health Corp. | | | 4.30 | | | | 3/25/2028 | | | | 27,000 | | | | 26,630 | | | | 26,633 | |
CVS Health Corp. | | | 5.05 | | | | 3/25/2048 | | | | 40,000 | | | | 39,773 | | | | 40,708 | |
CVS Pass-Through Trust^ | | | 5.93 | | | | 1/10/2034 | | | | 28,950 | | | | 32,840 | | | | 31,140 | |
Express Scripts Holding Co. | | | 4.50 | | | | 2/25/2026 | | | | 30,000 | | | | 30,842 | | | | 29,782 | |
Express Scripts Holding Co. | | | 4.80 | | | | 7/15/2046 | | | | 30,000 | | | | 30,184 | | | | 28,528 | |
McKesson Corp. | | | 6.00 | | | | 3/1/2041 | | | | 50,000 | | | | 55,652 | | | | 58,279 | |
Mylan NV | | | 5.25 | | | | 6/15/2046 | | | | 40,000 | | | | 39,994 | | | | 38,963 | |
Shire Acquisitions Investments Ireland DAC+ | | | 2.88 | | | | 9/23/2023 | | | | 60,000 | | | | 59,994 | | | | 56,448 | |
Teva Pharmaceutical Finance Netherlands III B.V.+ | | | 1.70 | | | | 7/19/2019 | | | | 25,000 | | | | 24,669 | | | | 24,428 | |
Teva Pharmaceutical Finance Netherlands III B.V.+ | | | 2.20 | | | | 7/21/2021 | | | | 99,000 | | | | 94,200 | | | | 91,826 | |
Teva Pharmaceutical Finance Netherlands III B.V.+ | | | 4.10 | | | | 10/1/2046 | | | | 10,000 | | | | 9,919 | | | | 7,148 | |
| | | | | | | | | | | | | | | | | | | | |
Total Pharmaceuticals | | | | | | | | | | | 469,950 | | | | 474,036 | | | | 463,558 | |
| | | | | | | | | | | | | | | | | | | | |
See accompanying Notes to the Financial Statements.
143
Barings Total Return Bond Fund 2018 Annual Report
SCHEDULE OF INVESTMENTS (CONTINUED)
June 30, 2018
| | | | | | | | | | | | | | | | | | | | |
| | | EFFECTIVE
INTEREST RATE | | | DUE DATE | | | PRINCIPAL ‡‡ | | | COST | | | FAIR
VALUE | |
Corporate Bonds (Continued) | | | | | | | | | | | | | | | | | | | | |
| | |
Pipelines — 3.4%*: | | | | | | | | | |
Andeavor Logistics LP | | | 6.88 | **# % | | | 2/15/2066 | | | | 50,000 | | | $ | 50,125 | | | $ | 49,500 | |
Andeavor Logistics LP/Tesoro Logistics Finance Corp. | | | 3.50 | | | | 12/1/2022 | | | | 10,000 | | | | 9,972 | | | | 9,771 | |
Energy Transfer LP | | | 4.20 | | | | 4/15/2027 | | | | 25,000 | | | | 24,953 | | | | 23,557 | |
Energy Transfer LP | | | 4.75 | | | | 1/15/2026 | | | | 30,000 | | | | 29,852 | | | | 29,745 | |
Energy Transfer LP | | | 6.13 | | | | 12/15/2045 | | | | 25,000 | | | | 27,413 | | | | 24,986 | |
Energy Transfer Partners LP | | | 6.25 | | | | 2/15/2066 | | | | 60,000 | | | | 60,000 | | | | 55,575 | |
EnLink Midstream Partners LP | | | 2.70 | | | | 4/1/2019 | | | | 30,000 | | | | 30,015 | | | | 29,708 | |
EnLink Midstream Partners LP | | | 4.15 | | | | 6/1/2025 | | | | 25,000 | | | | 25,094 | | | | 23,105 | |
EnLink Midstream Partners LP | | | 4.85 | | | | 7/15/2026 | | | | 19,000 | | | | 19,383 | | | | 18,004 | |
Enterprise Products Operating LLC | | | 5.38 | | | | 2/15/2078 | | | | 30,000 | | | | 30,000 | | | | 27,348 | |
EQT Midstream Partners LP | | | 4.75 | | | | 7/15/2023 | | | | 70,000 | | | | 69,833 | | | | 69,887 | |
Kinder Morgan Energy Partners LP MTN | | | 6.95 | | | | 1/15/2038 | | | | 30,000 | | | | 31,943 | | | | 34,192 | |
Kinder Morgan, Inc.^ | | | 5.63 | | | | 11/15/2023 | | | | 50,000 | | | | 54,709 | | | | 53,243 | |
MPLX LP | | | 4.00 | | | | 2/15/2025 | | | | 77,000 | | | | 75,793 | | | | 75,282 | |
MPLX LP | | | 4.50 | | | | 4/15/2038 | | | | 30,000 | | | | 29,648 | | | | 27,709 | |
MPLX LP | | | 4.88 | | | | 6/1/2025 | | | | 23,000 | | | | 23,791 | | | | 23,648 | |
MPLX LP | | | 5.20 | | | | 3/1/2047 | | | | 5,000 | | | | 4,966 | | | | 4,968 | |
MPLX LP | | | 5.50 | | | | 2/15/2023 | | | | 20,000 | | | | 20,699 | | | | 20,378 | |
Phillips 66 Partners LP | | | 3.75 | | | | 3/1/2028 | | | | 20,000 | | | | 19,928 | | | | 18,692 | |
Phillips 66 Partners LP | | | 4.68 | | | | 2/15/2045 | | | | 2,000 | | | | 2,001 | | | | 1,875 | |
Phillips 66 Partners LP | | | 4.90 | | | | 10/1/2046 | | | | 15,000 | | | | 14,898 | | | | 14,378 | |
Plains All American Pipeline LP/PAA Finance Corp. | | | 4.50 | | | | 12/15/2026 | | | | 80,000 | | | | 80,014 | | | | 78,310 | |
Plains All American Pipeline LP/PAA Finance Corp. | | | 4.70 | | | | 6/15/2044 | | | | 40,000 | | | | 36,221 | | | | 35,144 | |
Sabine Pass Liquefaction LLC | | | 4.20 | | | | 3/15/2028 | | | | 75,000 | | | | 74,934 | | | | 72,608 | |
Sabine Pass Liquefaction LLC | | | 5.63 | | | | 3/1/2025 | | | | 25,000 | | | | 27,326 | | | | 26,592 | |
Sunoco Logistics Partners Operations LP | | | 4.00 | | | | 10/1/2027 | | | | 20,000 | | | | 19,853 | | | | 18,694 | |
Sunoco Logistics Partners Operations LP | | | 5.30 | | | | 4/1/2044 | | | | 25,000 | | | | 24,670 | | | | 22,661 | |
Western Gas Partners LP | | | 4.00 | | | | 7/1/2022 | | | | 75,000 | | | | 76,728 | | | | 74,121 | |
Western Gas Partners LP | | | 4.50 | | | | 3/1/2028 | | | | 15,000 | | | | 14,918 | | | | 14,435 | |
| | | | | | | | | | | | | | | | | | | | |
Total Pipelines | | | | | | | | | | | 1,001,000 | | | | 1,009,680 | | | | 978,116 | |
| | | | | | | | | | | | | | | | | | | | |
| | |
Real Estate Investment Trusts — 0.8%*: | | | | | | | | | |
Crown Castle International Corp. | | | 3.20 | | | | 9/1/2024 | | | | 40,000 | | | | 39,902 | | | | 37,751 | |
Crown Castle International Corp. | | | 4.00 | | | | 3/1/2027 | | | | 20,000 | | | | 19,925 | | | | 19,253 | |
Crown Castle International Corp. | | | 4.75 | | | | 5/15/2047 | | | | 10,000 | | | | 9,922 | | | | 9,427 | |
CubeSmart LP | | | 3.13 | | | | 9/1/2026 | | | | 45,000 | | | | 44,813 | | | | 41,387 | |
Healthcare Trust of America Holdings LP | | | 3.75 | | | | 7/1/2027 | | | | 35,000 | | | | 34,838 | | | | 33,209 | |
Host Hotels & Resorts LP | | | 3.88 | | | | 4/1/2024 | | | | 40,000 | | | | 39,858 | | | | 38,997 | |
Kimco Realty Corp. | | | 3.30 | | | | 2/1/2025 | | | | 25,000 | | | | 24,965 | | | | 23,685 | |
Mid-America Apartments LP | | | 3.60 | | | | 6/1/2027 | | | | 25,000 | | | | 24,905 | | | | 23,961 | |
Weingarten Realty Investors | | | 3.25 | | | | 8/15/2026 | | | | 10,000 | | | | 9,929 | | | | 9,215 | |
| | | | | | | | | | | | | | | | | | | | |
Total REITS | | | | | | | | | | | 250,000 | | | | 249,057 | | | | 236,885 | |
| | | | | | | | | | | | | | | | | | | | |
See accompanying Notes to the Financial Statements.
144
Barings Total Return Bond Fund 2018 Annual Report
SCHEDULE OF INVESTMENTS (CONTINUED)
June 30, 2018
| | | | | | | | | | | | | | | | | | | | |
| | | EFFECTIVE
INTEREST RATE | | | DUE DATE | | | PRINCIPAL ‡‡ | | | COST | | | FAIR
VALUE | |
Corporate Bonds (Continued) | | | | | | | | | | | | | | | | | | | | |
| | |
Retail — 0.8%*: | | | | | | | | | |
Dollar Tree, Inc. | | | 4.20 | % | | | 5/15/2028 | | | | 45,000 | | | $ | 44,883 | | | $ | 43,437 | |
El Puerto de Liverpool SAB de CV | | | 3.95 | | | | 10/2/2024 | | | | 200,000 | | | | 199,283 | | | | 188,120 | |
| | | | | | | | | | | | | | | | | | | | |
Total Retail | | | | | | | | | | | 245,000 | | | | 244,166 | | | | 231,557 | |
| | | | | | | | | | | | | | | | | | | | |
| | |
Semiconductors — 0.3%*: | | | | | | | | | |
Marvell Technology Group Ltd.+ | | | 4.20 | | | | 6/22/2023 | | | | 40,000 | | | | 39,918 | | | | 39,994 | |
Microchip Technology, Inc.^ | | | 3.92 | | | | 6/1/2021 | | | | 50,000 | | | | 50,000 | | | | 50,083 | |
| | | | | | | | | | | | | | | | | | | | |
Total Semiconductors | | | | | | | | | | | 90,000 | | | | 89,918 | | | | 90,077 | |
| | | | | | | | | | | | | | | | | | | | |
| | |
Telecommunications — 0.8%*: | | | | | | | | | |
AT&T, Inc. | | | 3.80 | | | | 3/1/2024 | | | | 35,000 | | | | 34,982 | | | | 34,325 | |
AT&T, Inc. | | | 4.75 | | | | 5/15/2046 | | | | 30,000 | | | | 28,201 | | | | 26,798 | |
AT&T, Inc. | | | 5.25 | | | | 3/1/2037 | | | | 15,000 | | | | 14,932 | | | | 14,753 | |
Telefonaktiebolaget LM Ericsson+ | | | 4.13 | | | | 5/15/2022 | | | | 55,000 | | | | 56,420 | | | | 54,180 | |
Verizon Communications, Inc. | | | 4.86 | | | | 8/21/2046 | | | | 25,000 | | | | 25,427 | | | | 23,889 | |
Verizon Communications, Inc. | | | 6.55 | | | | 9/15/2043 | | | | 56,000 | | | | 69,578 | | | | 66,295 | |
| | | | | | | | | | | | | | | | | | | | |
Total Telecommunications | | | | | | | | | | | 216,000 | | | | 229,540 | | | | 220,240 | |
| | | | | | | | | | | | | | | | | | | | |
| | |
Transportation — 0.2%*: | | | | | | | | | |
PT Penske Truck Leasing Co. LP / L Finance Corp.^ | | | 3.90 | | | | 2/1/2024 | | | | 70,000 | | | | 69,860 | | | | 69,235 | |
| | | | | | | | | | | | | | | | | | | | |
| | | | | |
Venture Capital — 0.5%*: | | | | | | | | | | | | | | | | | | | | |
Hercules Capital, Inc. | | | 4.63 | | | | 10/23/2022 | | | | 150,000 | | | | 149,276 | | | | 149,781 | |
| | | | | | | | | | | | | | | | | | | | |
Total Corporate Bonds | | | | | | | | | | | 9,384,950 | | | | 9,527,008 | | | | 9,257,411 | |
| | | | | | | | | | | | | | | | | | | | |
| | |
Foreign Government — 0.8%*: | | | | | | | | | |
| | | | | |
Colombia — 0.4%*: | | | | | | | | | | | | | | | | | | | | |
Colombia Government International Bond+ | | | 6.13 | | | | 1/18/2041 | | | | 100,000 | | | | 115,293 | | | | 111,600 | |
| | | | | | | | | | | | | | | | | | | | |
| | | | | |
Mexico — 0.4%*: | | | | | | | | | | | | | | | | | | | | |
Mexico Government International Bond+ | | | 4.75 | | | | 3/8/2044 | | | | 68,000 | | | | 69,461 | | | | 63,682 | |
Mexico Government International Bond+ | | | 5.55 | | | | 1/21/2045 | | | | 60,000 | | | | 64,544 | | | | 62,790 | |
| | | | | | | | | | | | | | | | | | | | |
Total Mexico | | | | 128,000 | | | | 134,005 | | | | 126,472 | |
| | | | | | | | | | | | | | | | | | | | |
| | | | | | | | | | | | | | | | | | | | |
Total Foreign Government | | | | | | | | | | | 228,000 | | | | 249,298 | | | | 238,072 | |
| | | | | | | | | | | | | | | | | | | | |
| | | | | |
Mortgage-Backed Securities — 0.9%*: | | | | | | | | | | | | | | | | | | | | |
Aventura Mall Trust 2018 D | | | 4.11 | # | | | 7/5/2040 | | | | 70,000 | | | | 68,621 | | | | 68,647 | |
GS Mortgage Securities Trust 2015-GC32 B | | | 4.55 | #@ | | | 7/10/2048 | | | | 100,000 | | | | 102,771 | | | | 101,008 | |
JPMorgan Mortgage Trust 2017-1 A11^ | | | 3.50 | #@ | | | 1/25/2047 | | | | 89,008 | | | | 88,602 | | | | 86,402 | |
| | | | | | | | | | | | | | | | | | | | |
Total Mortgage-Backed Securities | | | | 259,008 | | | | 259,994 | | | | 256,057 | |
| | | | | | | | | | | | | | | | | | | | |
| | |
U.S. Treasury & Government Agencies — 24.1%*: | | | | | | | | | |
Federal Home Loan Mortgage Corp. | | | 3.50 | | | | 11/1/2042 | | | | 15,663 | | | | 15,678 | | | | 15,667 | |
Federal Home Loan Mortgage Corp. | | | 3.50 | | | | 7/1/2046 | | | | 47,188 | | | | 49,838 | | | | 47,144 | |
Federal Home Loan Mortgage Corp. | | | 3.50 | | | | 11/1/2046 | | | | 68,111 | | | | 71,871 | | | | 67,989 | |
See accompanying Notes to the Financial Statements.
145
Barings Total Return Bond Fund 2018 Annual Report
SCHEDULE OF INVESTMENTS (CONTINUED)
June 30, 2018
| | | | | | | | | | | | | | | | | | | | |
| | | EFFECTIVE
INTEREST RATE | | | DUE DATE | | | PRINCIPAL ‡‡ | | | COST | | | FAIR
VALUE | |
U.S. Treasury & Government Agencies (Continued) | | | | | | | | | | | | | | | | | | | | |
Federal Home Loan Mortgage Corp. | | | 3.50 | % | | | 11/1/2047 | | | | 97,403 | | | $ | 100,320 | | | $ | 96,957 | |
Federal Home Loan Mortgage Corp. | | | 3.50 | | | | 12/1/2047 | | | | 775,782 | | | | 796,978 | | | | 772,225 | |
Federal Home Loan Mortgage Corp. | | | 3.50 | | | | 1/1/2048 | | | | 187,145 | | | | 188,654 | | | | 186,282 | |
Federal Home Loan Mortgage Corp. | | | 3.50 | | | | 2/1/2048 | | | | 148,140 | | | | 147,887 | | | | 147,658 | |
Federal Home Loan Mortgage Corp. | | | 4.00 | | | | 4/1/2047 | | | | 67,398 | | | | 71,729 | | | | 69,146 | |
Federal Home Loan Mortgage Corp. | | | 4.00 | | | | 12/1/2047 | | | | 820,488 | | | | 861,958 | | | | 837,171 | |
Federal Home Loan Mortgage Corp. | | | 4.00 | | | | 2/1/2048 | | | | 49,027 | | | | 49,906 | | | | 50,028 | |
Federal Home Loan Mortgage Corp. | | | 4.50 | | | | 8/1/2040 | | | | 14,414 | | | | 15,787 | | | | 15,160 | |
Federal Home Loan Mortgage Corp. | | | 4.50 | | | | 10/1/2040 | | | | 20,937 | | | | 22,819 | | | | 22,019 | |
Federal Home Loan Mortgage Corp. | | | 4.50 | | | | 10/1/2041 | | | | 23,032 | | | | 25,104 | | | | 24,217 | |
Federal Home Loan Mortgage Corp. | | | 4.50 | | | | 9/1/2043 | | | | 16,352 | | | | 17,881 | | | | 17,197 | |
Federal Home Loan Mortgage Corp. | | | 4.50 | | | | 5/1/2047 | | | | 23,341 | | | | 25,114 | | | | 24,303 | |
Federal Home Loan Mortgage Corp. | | | 4.50 | | | | 6/1/2047 | | | | 269,063 | | | | 289,579 | | | | 280,157 | |
Federal National Mortgage Association | | | 3.50 | | | | 12/1/2028 | | | | 42,764 | | | | 45,177 | | | | 43,450 | |
Federal National Mortgage Association | | | 3.50 | | | | 2/1/2041 | | | | 46,696 | | | | 47,186 | | | | 47,005 | |
Federal National Mortgage Association | | | 3.50 | | | | 2/1/2043 | | | | 189,781 | | | | 189,426 | | | | 189,692 | |
Federal National Mortgage Association | | | 3.50 | | | | 1/1/2044 | | | | 49,106 | | | | 49,160 | | | | 49,083 | |
Federal National Mortgage Association | | | 3.50 | | | | 1/1/2048 | | | | 582,862 | | | | 599,103 | | | | 581,119 | |
Federal National Mortgage Association | | | 3.50 | | | | 2/1/2048 | | | | 147,487 | | | | 146,272 | | | | 145,884 | |
Federal National Mortgage Association | | | 4.00 | | | | 8/1/2047 | | | | 137,480 | | | | 144,770 | | | | 140,342 | |
Federal National Mortgage Association | | | 4.00 | | | | 10/1/2047 | | | | 119,668 | | | | 126,185 | | | | 122,169 | |
Federal National Mortgage Association | | | 4.00 | | | | 4/1/2048 | | | | 99,492 | | | | 102,109 | | | | 101,633 | |
Federal National Mortgage Association | | | 4.00 | | | | 7/1/2048 | | | | 175,000 | | | | 178,404 | | | | 178,716 | |
Federal National Mortgage Association | | | 4.00 | | | | 5/1/2056 | | | | 159,761 | | | | 167,322 | | | | 163,903 | |
Federal National Mortgage Association | | | 4.00 | | | | 6/1/2056 | | | | 142,767 | | | | 151,307 | | | | 146,464 | |
Federal National Mortgage Association | | | 4.50 | | | | 3/1/2041 | | | | 15,861 | | | | 17,383 | | | | 16,688 | |
Federal National Mortgage Association | | | 4.50 | | | | 6/1/2048 | | | | 80,000 | | | | 83,375 | | | | 83,524 | |
Federal National Mortgage Association | | | 5.00 | | | | 6/1/2040 | | | | 10,067 | | | | 11,164 | | | | 10,795 | |
Federal National Mortgage Association | | | 5.00 | | | | 7/1/2040 | | | | 73,578 | | | | 81,256 | | | | 78,878 | |
Federal National Mortgage Association | | | 5.00 | | | | 2/1/2044 | | | | 29,599 | | | | 32,793 | | | | 31,699 | |
Federal National Mortgage Association TBA | | | 4.50 | | | | 7/1/2048 | | | | 125,000 | | | | 129,941 | | | | 130,157 | |
Government National Mortgage Association | | | 3.50 | | | | 5/20/2043 | | | | 19,772 | | | | 19,888 | | | | 19,853 | |
Government National Mortgage Association | | | 3.50 | | | | 9/20/2047 | | | | 73,959 | | | | 76,886 | | | | 74,267 | |
Government National Mortgage Association | | | 3.50 | | | | 10/20/2047 | | | | 96,431 | | | | 100,480 | | | | 96,889 | |
Government National Mortgage Association | | | 3.50 | | | | 11/20/2047 | | | | 98,249 | | | | 102,137 | | | | 98,761 | |
Government National Mortgage Association | | | 3.50 | | | | 12/15/2047 | | | | 24,593 | | | | 25,483 | | | | 24,694 | |
Government National Mortgage Association | | | 3.50 | | | | 12/20/2047 | | | | 98,703 | | | | 102,017 | | | | 99,172 | |
Government National Mortgage Association | | | 3.50 | | | | 1/15/2048 | | | | 103,193 | | | | 105,228 | | | | 103,723 | |
Government National Mortgage Association | | | 3.50 | | | | 1/20/2048 | | | | 284,509 | | | | 293,299 | | | | 285,836 | |
Government National Mortgage Association | | | 3.50 | | | | 2/15/2048 | | | | 99,378 | | | | 100,173 | | | | 99,785 | |
Government National Mortgage Association | | | 3.50 | | | | 2/20/2048 | | | | 49,693 | | | | 50,010 | | | | 49,900 | |
Government National Mortgage Association | | | 3.50 | | | | 7/1/2048 | | | | 100,000 | | | | 99,828 | | | | 100,385 | |
Government National Mortgage Association | | | 4.00 | | | | 10/20/2047 | | | | 24,025 | | | | 25,433 | | | | 24,819 | |
Government National Mortgage Association | | | 4.00 | | | | 2/20/2048 | | | | 49,281 | | | | 50,899 | | | | 50,612 | |
Government National Mortgage Association TBA | | | 4.00 | | | | 7/1/2048 | | | | 250,000 | | | | 255,234 | | | | 256,230 | |
U.S. Treasury Bond | | | 2.50 | | | | 5/15/2046 | | | | 80,000 | | | | 72,174 | | | | 72,694 | |
See accompanying Notes to the Financial Statements.
146
Barings Total Return Bond Fund 2018 Annual Report
SCHEDULE OF INVESTMENTS (CONTINUED)
June 30, 2018
| | | | | | | | | | | | | | | | | | | | |
| | | EFFECTIVE
INTEREST RATE | | | DUE DATE | | | PRINCIPAL ‡‡ | | | COST | | | FAIR
VALUE | |
U.S. Treasury & Government Agencies (Continued) | | | | | | | | | | | | | | | | | | | | |
U.S. Treasury Bond(1) | | | 3.50 | % | | | 2/15/2039 | | | | 175,000 | | | $ | 188,077 | | | $ | 190,654 | |
U.S. Treasury Notes | | | 2.00 | | | | 5/31/2021 | | | | 270,000 | | | | 265,240 | | | | 265,328 | |
U.S. Treasury Notes | | | 2.75 | | | | 2/15/2028 | | | | 110,000 | | | | 108,374 | | | | 109,059 | |
| | | | | | | | | | | | | | | | | | | | |
Total U.S. Treasury & Government Agencies | | | | | | | | | | | 6,877,239 | | | | 7,094,296 | | | | 6,957,182 | |
| | | | | | | | | | | | | | | | | | | | |
| | | | | | | | | | | | | | | | | | | | |
Total Fixed Income | | | | | | | | | | | 24,593,522 | | | | 24,813,116 | | | | 24,445,632 | |
| | | | | | | | | | | | | | | | | | | | |
| | | | | | | | | SHARES | | | COST | | | FAIR
VALUE | |
Mutual Fund — 9.1%*: | | | | | | | | | | | | | | | | | | | | |
Barings U.S. High Yield Fund | | | | | | | | | | | 268,341 | | | | 2,613,198 | | | | 2,635,105 | |
| | | | | | | | | | | | | | | | | | | | |
| | | | | | | | | | | | | | | | | | | | | | | | | | | | | | |
| | | COUNTERPARTY | | STRIKE
PRICE | | | EXPIRATION
DATE | | | CONTRACTS | | | NOTIONAL | | | COST | | | UNREALIZED
VALUE | | | FAIR
VALUE | |
Purchased Options — 1.4%*: | |
|
Call Options Purchased — 0.4%*: | |
OTC—BCM Swaption | | JPMorgan Chase
Bank N.A. | | | $2.44 | | | | 12/13/2032 | | | | 1,270,000 | | | | 1,270,000 | | | | 63,722 | | | | (10,470 | ) | | | 53,252 | |
OTC—BCM Swaption | | JPMorgan Chase
Bank N.A. | | | 2.61 | | | | 1/31/2033 | | | | 1,370,000 | | | | 1,370,000 | | | | 65,623 | | | | (1,640 | ) | | | 63,984 | |
| | | | | | | | | | | | | | | | | | | | | | | | | | | | | | |
Total Call Options Purchased | | | | | | | | | | | 2,640,000 | | | | 2,640,000 | | | | 129,345 | | | | (12,110 | ) | | | 117,236 | |
| | | | | | | | | | | | | | | | | | | | | | | | | | | | | | |
|
Put Options Purchased — 1.0%*: | |
OTC—BCM Swaption | | JPMorgan Chase
Bank N.A. | | | 2.94 | | | | 12/13/2032 | | | | 2,580,000 | | | | 2,580,000 | | | | 129,452 | | | | 11,156 | | | | 140,608 | |
OTC—BCM Swaption | | JPMorgan Chase
Bank N.A. | | | 3.11 | | | | 1/31/2033 | | | | 2,730,000 | | | | 2,730,000 | | | | 130,494 | | | | 4,751 | | | | 135,245 | |
| | | | | | | | | | | | | | | | | | | | | | | | | | | | | | |
Total Put Options | | | | | | | | | | | 5,310,000 | | | | 5,310,000 | | | | 259,946 | | | | 15,907 | | | | 275,853 | |
| | | | | | | | | | | | | | | | | | | | | | | | | | | | | | |
| | | | | | | | | | | | | | | | | | | | |
| | | EFFECTIVE
INTEREST RATE | | | DUE DATE | | | PRINCIPAL ‡‡ | | | COST | | | FAIR
VALUE | |
Short-Term Investments — 9.1%*: | |
|
Bank Deposit — 3.9%*: | |
State Street Bank & Trust Co. Euro Time Deposit | | | 0.28 | % | | | 7/2/2018 | | | | 1,126,545 | | | | 1,126,545 | | | | 1,126,545 | |
| | | | | | | | | | | | | | | | | | | | |
|
Commercial Paper — 5.2%*: | |
|
Chemicals — 1.7%*: | |
Avery Dennison Corp. | | | Zero Coupon | | | | 7/2/2018 | | | | 250,000 | | | | 249,985 | | | | 249,985 | |
Nutrien Ltd.+ | | | Zero Coupon | | | | 7/12/2018 | | | | 250,000 | | | | 249,821 | | | | 249,821 | |
| | | | | | | | | | | | | | | | | | | | |
Total Chemicals | | | | | | | | | | | 500,000 | | | | 499,806 | | | | 499,806 | |
| | | | | | | | | | | | | | | | | | | | |
See accompanying Notes to the Financial Statements.
147
Barings Total Return Bond Fund 2018 Annual Report
SCHEDULE OF INVESTMENTS (CONTINUED)
June 30, 2018
| | | | | | | | | | | | | | | | | | | | |
| | | EFFECTIVE
INTEREST RATE | | | DUE DATE | | | PRINCIPAL ‡‡ | | | COST | | | FAIR
VALUE | |
Short-Term Investments (Continued) | |
|
Electrical Components and Equipment — 0.9%*: | |
Molex Electronics Technologies | | | Zero Coupon | | | | 7/9/2018 | | | | 250,000 | | | | $249,867 | | | | $249,867 | |
| | | | | | | | | | | | | | | | | | | | |
|
Medical Equipment and Devices Manufacturing — 0.9%*: | |
Dentsply Sirona .,Inc. | | | Zero Coupon | | | | 7/9/2018 | | | | 250,000 | | | | 249,867 | | | | 249,867 | |
| | | | | | | | | | | | | | | | | | | | |
|
Pipelines — 0.9%*: | |
Transcanada Pipelines Ltd.+ | | | Zero Coupon | | | | 7/17/2018 | | | | 250,000 | | | | 249,711 | | | | 249,711 | |
| | | | | | | | | | | | | | | | | | | | |
|
Retail — 0.8%*: | |
ERAC USA Finance LLC | | | Zero Coupon | | | | 7/23/2018 | | | | 250,000 | | | | 249,633 | | | | 249,633 | |
| | | | | | | | | | | | | | | | | | | | |
Total Commercial Paper | | | | | | | | | | | 1,500,000 | | | | 1,498,884 | | | | 1,498,884 | |
| | | | | | | | | | | | | | | | | | | | |
Total Short-Term Investments | | | | | | | | | | | 2,626,545 | | | | 2,625,429 | | | | 2,625,429 | |
| | | | | | | | | | | | | | | | | | | | |
Total Investments | | | | | | | | | | | 35,438,408 | | | | 30,441,034 | | | | 30,099,255 | |
| | | | | | | | | | | | | | | | | | | | |
| |
Other assets and liabilities — (4.2%)* | | | | (1,213,018 | ) |
| | | | | | | | | | | | | | | | | | | | |
| |
Net Assets — 100.0% | | | | $28,886,237 | |
| | | | | | | | | | | | | | | | | | | | |
| TBA | To Be Announced: Securities purchased on a forward commitment basis with an approximate principal amount and maturity date. The actual principal amount and maturity date will be determined upon settlement. |
| (1) | All or a portion of this security is held for futures collateral. |
Unless otherwise indicated, all principal amounts are denominated in United States Dollars.
| * | Calculated as a percentage of net assets applicable to common shareholders. |
Distributions of investments by country of risk (excluding temporary cash investments) as a percentage of total investments in securities, is as follows:
| | | | | | |
| | United States | | | 89.2% | |
| | Canada | | | 3.3% | |
| | Netherlands | | | 1.6% | |
| | Mexico | | | 1.6% | |
| | United Kingdom | | | 1.5% | |
| | Other (Individually less than 1%) | | | 2.8% | |
| | | | | | |
| | Total | | | 100.0% | |
| | | | | | |
| ^ | Security acquired in a transaction exempt from registration under Rule 144A of the Securities Act of 1933. These securities may only be resold in transactions exempt from registration, normally to qualified institutional buyers. |
| ¤ | For fair value measurement disclosure purposes, security is categorized as Level 3 (See Note 2). |
| # | Variable rate security. The interest rate shown is the rate in effect at June 30, 2018. |
| ** | Variable Rate is Fixed to Float: Rate remains fixed until designated future date. |
| @ | Effective interest rate for this security is the coupon rate at issue based on the underlying loans. |
See accompanying Notes to the Financial Statements.
148
Barings Total Return Bond Fund 2018 Annual Report
SCHEDULE OF INVESTMENTS (CONTINUED)
June 30, 2018
Affiliate Table
| | | | | | | | | | | | | | | | | | | | | | | | | | | | | | | | | | | | | | |
| | | NUMBER
OF
SHARES
HELD AT
6/30/17 | | | VALUE AT
6/30/17 | | | COST
OF
PURCHASES | | | PROCEEDS
FROM
SHARES
SOLD | | | REALIZED
GAIN
(LOSS) | | CHANGE IN
UNREALIZED
APPRECIATION/
DEPRECIATION | | | NUMBER OF
SHARES
HELD
AT 6/30/18 | | | VALUE AT
6/30/18 | | | DIVIDEND
INCOME | | | CAPITAL
GAIN
DISTRIBUTIONS | |
| Barings U.S. High Yield Fund | | | 245,051 | | | | $2,595,086 | | | | $237,490 | | | | $– | | | $– | | | $(197,471) | | | | 268,341 | | | | $2,635,105 | | | | $161,230 | | | | $75,839 | |
A summary of outstanding derivatives at June 30, 2018 is as follows:
Cross Currency Forward Foreign Currency Exchange Contracts
| | | | | | | | | | | | | | | | |
EXPIRATION
DATE | | DELIVER/RECEIVE | | COUNTERPARTY | | CONTRACT
AMOUNT
PURCHASED | | | CONTRACT
AMOUNT
SOLD | | | NET UNREALIZED
APPRECIATION
(DEPRECIATION) | |
| 7/17/18 | | CZK/EUR | | JPMorgan Chase Bank N.A. | | | 12,165 | | | | 312,931 | | | $ | 135 | |
| 7/17/18 | | EUR/CZK | | Barclays Bank plc | | | 312,931 | | | | 12,330 | | | | (329 | ) |
| 7/17/18 | | EUR/HUF | | Goldman Sachs & Co. | | | 3,449,000 | | | | 11,060 | | | | (688 | ) |
| 7/17/18 | | EUR/HUF | | Citibank N.A. | | | 313,796 | | | | 1,000 | | | | (55 | ) |
| 7/17/18 | | EUR/PLN | | Goldman Sachs & Co. | | | 245,792 | | | | 58,353 | | | | (2,580 | ) |
| 7/17/18 | | EUR/PLN | | JPMorgan Chase Bank N.A. | | | 141,933 | | | | 33,000 | | | | (676 | ) |
| 7/17/18 | | EUR/PLN | | Citibank N.A. | | | 8,650 | | | | 2,000 | | | | (28 | ) |
| 7/17/18 | | HUF/EUR | | Bank of America N.A. | | | 11,659 | | | | 3,762,796 | | | | 274 | |
| | | | | | | | | | | | | | | | |
Net unrealized depreciation on cross currency forward foreign currency exchange contracts | | | $ | (3,947 | ) |
| | | | | | | | | | | | | | | | |
Forward Foreign Currency Exchange Contracts to Buy
| | | | | | | | | | | | | | | | | | | | | | |
EXPIRATION
DATE | | COUNTERPARTY | | LOCAL
CURRENCY | | | VALUE IN USD | | | IN
EXCHANGE
FOR USD | | | NET UNREALIZED
APPRECIATION
(DEPRECIATION) | |
| 2/12/19 | | Bank of America N.A. | | | ARS | | | | 433,440 | | | $ | 12,414 | | | $ | 18,000 | | | | $ (5,586 | ) |
| 2/12/19 | | JPMorgan Chase Bank N.A. | | | ARS | | | | 445,360 | | | | 12,755 | | | | 19,000 | | | | (6,245 | ) |
| 7/24/18 | | Citibank N.A. | | | AUD | | | | 18,940 | | | | 14,017 | | | | 14,709 | | | | (692 | ) |
| 7/10/18 | | JPMorgan Chase Bank N.A. | | | BRL | | | | 58,752 | | | | 15,146 | | | | 17,338 | | | | (2,192 | ) |
| 7/10/18 | | Bank of America N.A. | | | BRL | | | | 73,660 | | | | 18,989 | | | | 20,000 | | | | (1,011 | ) |
| 7/10/18 | | Goldman Sachs & Co. | | | BRL | | | | 131,922 | | | | 34,009 | | | | 36,000 | | | | (1,991 | ) |
| 7/10/18 | | Citibank N.A. | | | BRL | | | | 3,767 | | | | 971 | | | | 1,000 | | | | (29 | ) |
| 7/17/18 | | JPMorgan Chase Bank N.A. | | | CHF | | | | 71,254 | | | | 72,036 | | | | 72,000 | | | | 36 | |
| 7/10/18 | | JPMorgan Chase Bank N.A. | | | CLP | | | | 8,011,900 | | | | 12,262 | | | | 13,000 | | | | (738 | ) |
| 7/17/18 | | Goldman Sachs & Co. | | | EGP | | | | 271,518 | | | | 15,109 | | | | 15,018 | | | | 91 | |
| 7/17/18 | | Goldman Sachs & Co. | | | EUR | | | | 83,970 | | | | 98,158 | | | | 104,725 | | | | (6,567 | ) |
| 7/17/18 | | JPMorgan Chase Bank N.A. | | | EUR | | | | 34,035 | | | | 39,785 | | | | 40,941 | | | | (1,156 | ) |
| 7/17/18 | | JPMorgan Chase Bank N.A. | | | GHS | | | | 66,600 | | | | 13,841 | | | | 14,605 | | | | (764 | ) |
| 7/17/18 | | Goldman Sachs & Co. | | | ILS | | | | 53,245 | | | | 14,569 | | | | 14,885 | | | | (316 | ) |
| 7/24/18 | | JPMorgan Chase Bank N.A. | | | INR | | | | 1,414,770 | | | | 20,607 | | | | 21,075 | | | | (468 | ) |
| 7/10/18 | | Citibank N.A. | | | MXN | | | | 1,405,868 | | | | 70,709 | | | | 75,901 | | | | (5,192 | ) |
| 7/10/18 | | Goldman Sachs & Co. | | | MXN | | | | 59,938 | | | | 3,015 | | | | 3,000 | | | | 15 | |
| 7/24/18 | | Barclays Bank plc | | | MYR | | | | 150,234 | | | | 37,202 | | | | 38,533 | | | | (1,331 | ) |
See accompanying Notes to the Financial Statements.
149
Barings Total Return Bond Fund 2018 Annual Report
SCHEDULE OF INVESTMENTS (CONTINUED)
June 30, 2018
| | | | | | | | | | | | | | | | | | | | | | |
EXPIRATION
DATE | | COUNTERPARTY | | LOCAL
CURRENCY | | | VALUE IN USD | | | IN
EXCHANGE
FOR USD | | | NET UNREALIZED
APPRECIATION
(DEPRECIATION) | |
| 7/17/18 | | JPMorgan Chase Bank N.A. | | | NGN | | | | 7,701,000 | | | $ | 21,703 | | | $ | 21,021 | | | $ | 682 | |
| 7/24/18 | | Citibank N.A. | | | NZD | | | | 20,459 | | | | 13,857 | | | | 14,407 | | | | (550 | ) |
| 2/1/19 | | Bank of America N.A. | | | PEN | | | | 93,380 | | | | 28,232 | | | | 28,695 | | | | (463 | ) |
| 7/17/18 | | Bank of America N.A. | | | RUB | | | | 2,296,129 | | | | 36,506 | | | | 36,255 | | | | 251 | |
| 7/17/18 | | JPMorgan Chase Bank N.A. | | | RUB | | | | 1,141,920 | | | | 18,156 | | | | 18,000 | | | | 156 | |
| 7/17/18 | | JPMorgan Chase Bank N.A. | | | SEK | | | | 116,584 | | | | 13,030 | | | | 14,137 | | | | (1,107 | ) |
| 7/17/18 | | Citibank N.A. | | | SEK | | | | 8,677 | | | | 970 | | | | 1,000 | | | | (30 | ) |
| 7/17/18 | | Goldman Sachs & Co. | | | TRY | | | | 91,018 | | | | 19,688 | | | | 21,392 | | | | (1,704 | ) |
| 7/17/18 | | JPMorgan Chase Bank N.A. | | | TRY | | | | 65,366 | | | | 14,139 | | | | 14,092 | | | | 47 | |
| | | | | | | | | | | | | | | | | | | | | | |
Net unrealized depreciation on forward foreign currency exchange contracts to buy | | | $ | (36,854 | ) |
| | | | | | | | | | | | | | | | | | | | | | |
Forward Foreign Currency Exchange Contracts to Sell
| | | | | | | | | | | | | | | | | | | | | | |
EXPIRATION
DATE | | COUNTERPARTY | | LOCAL
CURRENCY | | | VALUE IN USD | | | IN
EXCHANGE
FOR USD | | | NET UNREALIZED
APPRECIATION
(DEPRECIATION) | |
| 2/12/19 | | JPMorgan Chase Bank N.A. | | | ARS | | | | 439,400 | | | $ | 12,585 | | | $ | 17,654 | | | $ | 5,069 | |
| 2/12/19 | | Bank of America N.A. | | | ARS | | | | 439,400 | | | | 12,584 | | | | 12,816 | | | | 232 | |
| 7/24/18 | | JPMorgan Chase Bank N.A. | | | AUD | | | | 18,940 | | | | 14,017 | | | | 14,165 | | | | 148 | |
| 7/10/18 | | Bank of America N.A. | | | CLP | | | | 8,751,593 | | | | 13,395 | | | | 14,444 | | | | 1,049 | |
| 7/10/18 | | Citibank N.A. | | | CLP | | | | 8,751,593 | | | | 13,394 | | | | 14,542 | | | | 1,148 | |
| 7/24/18 | | Bank of America N.A. | | | CNH | | | | 235,349 | | | | 35,457 | | | | 37,353 | | | | 1,896 | |
| 7/10/18 | | JPMorgan Chase Bank N.A. | | | COP | | | | 104,540,400 | | | | 35,655 | | | | 36,000 | | | | 345 | |
| 7/17/18 | | JPMorgan Chase Bank N.A. | | | EGP | | | | 271,519 | | | | 15,108 | | | | 15,046 | | | | (62 | ) |
| 7/17/18 | | Barclays Bank plc | | | EUR | | | | 23,527 | | | | 27,503 | | | | 27,819 | | | | 316 | |
| 7/17/18 | | JPMorgan Chase Bank N.A. | | | EUR | | | | 105,102 | | | | 122,860 | | | | 124,654 | | | | 1,794 | |
| 7/17/18 | | Barclays Bank plc | | | ILS | | | | 53,245 | | | | 14,569 | | | | 15,251 | | | | 682 | |
| 7/24/18 | | Barclays Bank plc | | | INR | | | | 943,320 | | | | 13,740 | | | | 14,000 | | | | 260 | |
| 7/24/18 | | JPMorgan Chase Bank N.A. | | | INR | | | | 1,414,770 | | | | 20,608 | | | | 21,335 | | | | 727 | |
| 7/17/18 | | JPMorgan Chase Bank N.A. | | | NGN | | | | 7,701,000 | | | | 21,703 | | | | 21,013 | | | | (690 | ) |
| 7/24/18 | | JPMorgan Chase Bank N.A. | | | NZD | | | | 20,459 | | | | 13,857 | | | | 14,996 | | | | 1,139 | |
| 2/1/19 | | Barclays Bank plc | | | PEN | | | | 93,380 | | | | 28,232 | | | | 28,587 | | | | 355 | |
| 7/24/18 | | Citibank N.A. | | | THB | | | | 2,352,960 | | | | 71,057 | | | | 72,000 | | | | 943 | |
| 7/17/18 | | JPMorgan Chase Bank N.A. | | | TRY | | | | 91,018 | | | | 19,688 | | | | 21,281 | | | | 1,593 | |
| 7/17/18 | | Citibank N.A. | | | TRY | | | | 65,366 | | | | 14,139 | | | | 14,000 | | | | (139 | ) |
| 7/17/18 | | Bank of America N.A. | | | ZAR | | | | 178,367 | | | | 12,980 | | | | 14,000 | | | | 1,020 | |
| | | | | | | | | | | | | | | | | | | | | | |
Net unrealized appreciation on forward foreign currency exchange contracts to sell | | | $ | 17,825 | |
| | | | | | | | | | | | | | | | | | | | | | |
Currency Legend
| | | | |
| ARS | | – | | Argentine Peso |
| AUD | | – | | Australian Dollar |
| BRL | | – | | Brazilian Real |
| CHF | | – | | Swiss Franc |
See accompanying Notes to the Financial Statements.
150
Barings Total Return Bond Fund 2018 Annual Report
SCHEDULE OF INVESTMENTS (CONTINUED)
June 30, 2018
| | | | |
| CLP | | – | | Chilean Peso |
| CNH | | – | | Chinese Yuan Renminbi |
| COP | | – | | Colombian Peso |
| CZK | | – | | Czech Koruna |
| EGP | | – | | Egyptian Pound |
| EUR | | – | | Euro |
| GHS | | – | | Ghana Cedi |
| HUF | | – | | Hungarian Forint |
| ILS | | – | | Israeli Shekel |
| INR | | – | | Indian Rupee |
| MXN | | – | | Mexican Peso |
| MYR | | – | | Malaysian Ringgit |
| NGN | | – | | Nigeria Naira |
| NZD | | – | | New Zealand Dollar |
| PEN | | – | | Peruvian Nouveau Sol |
| PLN | | – | | Polish Zloty |
| RUB | | – | | Russian Ruble |
| SEK | | – | | Swedish Krona |
| THB | | – | | Thai Baht |
| TRY | | – | | Turkish New Lira |
| ZAR | | – | | South African Rand |
Futures
| | | | | | | | | | | | | | | | | | | | | | |
| TYPE | | EXPIRATION
DATE | | CONTRACTS | | | NOTIONAL
AMOUNT | | | POSITION | | | FAIR VALUE | | | UNREALIZED
APPRECIATION | |
Long Futures | |
U.S. 10-Year Ultra Bond | | 09/19/18 | | | 1 | | | | 126,374 | | | | Long | | | $ | 128,234 | | | $ | 1,860 | |
U.S. 2-Year Treasury Note | | 09/28/18 | | | 19 | | | | 4,016,309 | | | | Long | | | | 4,024,734 | | | | 8,425 | |
U.S. 5-Year Treasury Note | | 09/28/18 | | | 14 | | | | 1,579,700 | | | | Long | | | | 1,590,640 | | | | 10,940 | |
U.S. Ultra Bond | | 09/19/18 | | | 11 | | | | 1,686,873 | | | | Long | | | | 1,755,188 | | | | 68,315 | |
| | | | | | | | | | | | | | | | | | | | | | |
Total Long Futures | | | $ | 89,540 | |
| | | | | | | | | | | | | | | | | | | | | | |
| | | | | | |
| TYPE | | EXPIRATION
DATE | | CONTRACTS | | | NOTIONAL
AMOUNT | | | POSITION | | | FAIR VALUE | | | UNREALIZED
DEPRECIATION | |
Short Future | |
U.S. Long Bond | | 09/19/18 | | | 4 | | | | (565,470 | ) | | | Short | | | $ | (580,000 | ) | | $ | (14,530 | ) |
| | | | | | | | | | | | | | | | | | | | | | |
OTC Credit Default Swaps – Sell Protection(1),(2)
| | | | | | | | | | | | | | | | | | | | | | | | | | | | | | | | |
REFERENCE
OBLIGATION | | FIXED-DEAL
RECEIVED
RATE | | | PAYMENT
FREQUENCY | | MATURITY
DATE | | | COUNTERPARTY | | ORIGINAL
NOTIONAL
AMOUNT | | | CURRENT
NOTIONAL
AMOUNT(3) | | | UPFRONT
PREMIUMS
PAID/
(RECEIVED) | | | FAIR
VALUE(4) | | | UNREALIZED
DEPRECIATION | |
| CMBX.NA.BBB-.6† | | | 3.00 | % | | 1M | | | 11/17/2045 | | | JPMorgan Chase
Bank N.A. | | | 60,000 | | | | 60,000 | | | $ | 135 | | | $ | (6,224 | ) | | $ | (6,359 | ) |
| CMBX.NA.BBB-.6† | | | 3.00 | % | | 1M | | | 5/11/2063 | | | Goldman
Sachs & Co. | | | 70,000 | | | | 70,000 | | | | (5,166 | ) | | | (7,262 | ) | | | (2,096 | ) |
| | | | | | | | | | | | | | | | | | | | | | | | | | | | | | | | |
Total OTC Credit Default Swaps | | | $ | (5,031 | ) | | $ | (13,486 | ) | | $ | (8,455 | ) |
| | | | | | | | | | | | | | | | | | | | | | | | | | | | | | | | |
See accompanying Notes to the Financial Statements.
151
Barings Total Return Bond Fund 2018 Annual Report
SCHEDULE OF INVESTMENTS (CONTINUED)
June 30, 2018
| (1) | If the Fund is a seller of protection and a credit event occurs, as defined under the terms of that particular swap agreement, the Fund will either (i) pay to the buyer of protection an amount equal to the notional amount of the swap and take delivery of the referenced obligation or underlying securities comprising the referenced index or (ii) pay a net settlement amount in the form of cash or securities equal to the notional amount of the swap less the recovery value of the referenced obligation or underlying securities comprising the referenced index. |
| (2) | Represents an investment grade index of single name credit default swaps (CDS). All of the companies underlying the single name CDS within the index are rated investment grade or higher. Rating represents a weighted average of the credit ratings of all the companies underlying the single name CDS within the index. |
| (3) | The maximum potential amount the Portfolio could be required to make as a seller of credit protection or receive as a buyer of credit event as defined under the terms of that particular swap agreement. |
| (4) | The quoted market prices and resulting values for credit default swap agreements on asset-backed securities and credit indices serve as an indicator of the current status of the payment/performance risk and represent the expected amount paid or received for the credit derivative if the amount of the swap agreement was closed/sold as of the period end. Increasing market values, in absolute terms when compared to the notional amount of the swap, represent a deterioration of the referenced entity’s credit soundness and a greater likelihood or risk of default or other credit event occurring as defined under the terms of the agreements. |
See accompanying Notes to the Financial Statements.
152
Barings Emerging Markets Debt Blended Total Return Fund 2018 Annual Report
SCHEDULE OF INVESTMENTS
June 30, 2018
| | | | | | | | | | | | | | | | | | | | |
| | | EFFECTIVE
INTEREST RATE | | | DUE DATE | | | PRINCIPAL ‡‡ | | | COST | | | FAIR
VALUE | |
Fixed Income — 92.5%*: | | | | | | | | | | | | | | | | | | | | |
| | | | | |
Corporate Bonds — 28.9%*: | | | | | | | | | | | | | | | | | | | | |
| | | | | |
Chemicals — 1.8%*: | | | | | | | | | | | | | | | | | | | | |
Grupo Idesa SA de CV+^ | | | 7.88 | % | | | 12/18/2020 | | | | 500,000 | | | | $479,387 | | | | $385,000 | |
Petkim Petrokimya Holding AS^+ | | | 5.88 | | | | 1/26/2023 | | | | 500,000 | | | | 462,870 | | | | 453,750 | |
| | | | | | | | | | | | | | | | | | | | |
Total Chemicals | | | | | | | | | | | 1,000,000 | | | | 942,257 | | | | 838,750 | |
| | | | | | | | | | | | | | | | | | | | |
| | | | | |
Commercial Banks — 6.1%*: | | | | | | | | | | | | | | | | | | | | |
Alfa Bank AO Via Alfa Bond Issuance plc,
5 year USD Swap + 6.660%+ | | | 8.00 | # | | | 2/3/2066 | | | | 400,000 | | | | 415,364 | | | | 392,500 | |
Banco Mercantil del Norte SA, 10 year CMT + 5.353%+ | | | 7.63 | # | | | 10/6/2065 | | | | 300,000 | | | | 326,848 | | | | 294,810 | |
Banco Mercantil del Norte SA, 10 year CMT + 5.353%+^ | | | 7.63 | # | | | 12/6/2065 | | | | 200,000 | | | | 219,196 | | | | 196,540 | |
FirstRand Bank Ltd.+ | | | 6.25 | **# | | | 4/23/2028 | | | | 900,000 | | | | 895,313 | | | | 893,250 | |
Itau Unibanco Holding SA+ | | | 6.13 | **# | | | 6/12/2066 | | | | 300,000 | | | | 301,500 | | | | 280,500 | |
Itau Unibanco Holding SA+^ | | | 6.13 | **# | | | 12/31/2099 | | | | 200,000 | | | | 200,000 | | | | 187,000 | |
Turkiye Is Bankasi AS^+ | | | 5.50 | | | | 4/21/2019 | | | | 600,000 | | | | 597,338 | | | | 595,500 | |
| | | | | | | | | | | | | | | | | | | | |
Total Commercial Banks | | | | | | | | | | | 2,900,000 | | | | 2,955,559 | | | | 2,840,100 | |
| | | | | | | | | | | | | | | | | | | | |
| | | | | |
Electric — 1.0%*: | | | | | | | | | | | | | | | | | | | | |
Pampa Energia SA+^ | | | 7.38 | | | | 7/21/2023 | | | | 500,000 | | | | 529,989 | | | | 476,250 | |
| | | | | | | | | | | | | | | | | | | | |
| | | | | |
Energy-Alternate Sources — 0.8%*: | | | | | | | | | | | | | | | | | | | | |
Rio Energy SA / UGEN SA / UENSA SA+^ | | | 6.88 | | | | 2/1/2025 | | | | 450,000 | | | | 445,261 | | | | 376,875 | |
| | | | | | | | | | | | | | | | | | | | |
| | | | | |
Food — 1.1%*: | | | | | | | | | | | | | | | | | | | | |
Marfrig Holdings Europe BV+^ | | | 8.00 | | | | 6/8/2023 | | | | 500,000 | | | | 510,940 | | | | 506,250 | |
| | | | | | | | | | | | | | | | | | | | |
| | | | | |
Gas — 0.9%*: | | | | | | | | | | | | | | | | | | | | |
Fermaca Enterprises S de RL de CV+^ | | | 6.38 | | | | 3/30/2038 | | | | 411,907 | | | | 444,640 | | | | 421,174 | |
| | | | | | | | | | | | | | | | | | | | |
| | | | | |
Holding Companies-Diverse — 1.0%*: | | | | | | | | | | | | | | | | | | | | |
KOC Holding AS^+ | | | 3.50 | | | | 4/24/2020 | | | | 500,000 | | | | 481,738 | | | | 480,000 | |
| | | | | | | | | | | | | | | | | | | | |
| | | | | |
Iron/Steel — 1.0%*: | | | | | | | | | | | | | | | | | | | | |
CSN Resources SA+^ | | | 7.63 | | | | 2/13/2023 | | | | 500,000 | | | | 490,271 | | | | 446,250 | |
| | | | | | | | | | | | | | | | | | | | |
| | | | | |
Media — 3.8%*: | | | | | | | | | | | | | | | | | | | | |
Altice Financing SA+^ | | | 6.63 | | | | 2/15/2023 | | | | 800,000 | | | | 793,712 | | | | 788,400 | |
VTR Finance BV+^ | | | 6.88 | | | | 1/15/2024 | | | | 1,000,000 | | | | 1,043,470 | | | | 1,004,700 | |
| | | | | | | | | | | | | | | | | | | | |
Total Media | | | | | | | | | | | 1,800,000 | | | | 1,837,182 | | | | 1,793,100 | |
| | | | | | | | | | | | | | | | | | | | |
| | | | | |
Mining — 1.6%*: | | | | | | | | | | | | | | | | | | | | |
Petra Diamonds US Treasury plc+^ | | | 7.25 | | | | 5/1/2022 | | | | 800,000 | | | | 805,168 | | | | 756,800 | |
| | | | | | | | | | | | | | | | | | | | |
| | | | | |
Oil and Gas — 3.1%*: | | | | | | | | | | | | | | | | | | | | |
Petrobras Global Finance BV+ | | | 8.75 | | | | 5/23/2026 | | | | 1,325,000 | | | | 1,549,401 | | | | 1,434,313 | |
| | | | | | | | | | | | | | | | | | | | |
See accompanying Notes to the Financial Statements.
153
Barings Emerging Markets Debt Blended Total Return Fund 2018 Annual Report
SCHEDULE OF INVESTMENTS (CONTINUED)
June 30, 2018
| | | | | | | | | | | | | | | | | | | | |
| | | EFFECTIVE
INTEREST RATE | | | DUE DATE | | | PRINCIPAL ‡‡ | | | COST | | | FAIR
VALUE | |
Corporate Bonds (Continued) | | | | | | | | | | | | | | | | | | | | |
| | | | | |
Real Estate — 5.6%*: | | | | | | | | | | | | | | | | | | | | |
CIFI Holdings Group Co. Ltd.+ | | | 5.38 | **#% | | | 2/28/2021 | | | | 250,000 | | | $ | 235,877 | | | $ | 229,063 | |
CIFI Holdings Group Co. Ltd.+ | | | 6.88 | | | | 4/23/2021 | | | | 630,000 | | | | 630,000 | | | | 623,700 | |
New Metro Global Ltd.+ | | | 6.50 | | | | 4/23/2021 | | | | 1,250,000 | | | | 1,229,047 | | | | 1,212,550 | |
Powerlong Real Estate Holdings Ltd.+ | | | 5.95 | | | | 7/19/2020 | | | | 300,000 | | | | 296,508 | | | | 285,750 | |
Yuzhou Properties Co. Ltd.+ | | | 6.38 | | | | 3/6/2021 | | | | 250,000 | | | | 249,771 | | | | 241,904 | |
| | | | | | | | | | | | | | | | | | | | |
Total Real Estate | | | | | | | | | | | 2,680,000 | | | | 2,641,203 | | | | 2,592,967 | |
| | | | | | | | | | | | | | | | | | | | |
| | | | | |
Retail — 1.1%*: | | | | | | | | | | | | | | | | | | | | |
Eurotorg LLC Via Bonitron DAC+^ | | | 8.75 | | | | 10/30/2022 | | | | 500,000 | | | | 507,224 | | | | 498,060 | |
| | | | | | | | | | | | | | | | | | | | |
Total Corporate Bonds | | | | | | | | | | | 13,866,907 | | | | 14,140,833 | | | | 13,460,889 | |
| | | | | | | | | | | | | | | | | | | | |
Foreign Government — 63.6%*: | | | | | | | | | | | | | | | | | | | | |
| | | | | |
Argentina — 2.7%*: | | | | | | | | | | | | | | | | | | | | |
Argentine Bonos del Tesoro+ | | | 15.50 | | | | 10/17/2026 | | | | 617,000 | | | | 33,255 | | | | 18,936 | |
Argentine Republic Government International Bond+ | | | 5.25 | | | | 1/15/2028 | | | | 350,000 | | | | 418,054 | | | | 348,953 | |
Argentine Republic Government International Bond+ | | | 7.82 | | | | 12/31/2033 | | | | 288,982 | | | | 397,172 | | | | 332,411 | |
Provincia de Cordoba+^ | | | 7.13 | | | | 6/10/2021 | | | | 580,000 | | | | 596,477 | | | | 559,700 | |
| | | | | | | | | | | | | | | | | | | | |
Total Argentina | | | | | | | | | | | 1,835,982 | | | | 1,444,958 | | | | 1,260,000 | |
| | | | | | | | | | | | | | | | | | | | |
| | | | | |
Armenia — 2.1%*: | | | | | | | | | | | | | | | | | | | | |
Republic of Armenia International Bond+^ | | | 7.15 | | | | 3/26/2025 | | | | 920,000 | | | | 1,000,589 | | | | 962,550 | |
| | | | | | | | | | | | | | | | | | | | |
| | | | | |
Brazil — 8.2%*: | | | | | | | | | | | | | | | | | | | | |
Brazil Notas do Tesouro Nacional Serie B+ | | | 6.00 | | | | 8/15/2050 | | | | 4,750,000 | | | | 4,892,155 | | | | 3,843,603 | |
| | | | | | | | | | | | | | | | | | | | |
| | | | | |
Colombia — 5.7%*: | | | | | | | | | | | | | | | | | | | | |
Colombian TES+ | | | 4.75 | | | | 4/4/2035 | | | | 683,739,301 | | | | 255,312 | | | | 265,623 | |
Colombian TES+ | | | 7.75 | | | | 9/18/2030 | | | | 6,605,000,000 | | | | 2,419,145 | | | | 2,407,189 | |
| | | | | | | | | | | | | | | | | | | | |
Total Colombia | | | | | | | | | | | 7,288,739,301 | | | | 2,674,457 | | | | 2,672,812 | |
| | | | | | | | | | | | | | | | | | | | |
| | | | | |
Croatia — 1.4%*: | | | | | | | | | | | | | | | | | | | | |
Croatia Government International Bond+ | | | 2.70 | | | | 6/15/2028 | | | | 350,000 | | | | 405,016 | | | | 405,664 | |
Croatia Government International Bond+ | | | 2.75 | | | | 1/27/2030 | | | | 200,000 | | | | 230,771 | | | | 228,889 | |
| | | | | | | | | | | | | | | | | | | | |
Total Croatia | | | | | | | | | | | 550,000 | | | | 635,787 | | | | 634,553 | |
| | | | | | | | | | | | | | | | | | | | |
| | | | | |
Dominican Republic — 1.4%*: | | | | | | | | | | | | | | | | | | | | |
Dominican Republic International Bond+^ | | | 8.63 | | | | 4/20/2027 | | | | 570,000 | | | | 675,579 | | | | 644,100 | |
| | | | | | | | | | | | | | | | | | | | |
| | | | | |
El Salvador — 2.4%*: | | | | | | | | | | | | | | | | | | | | |
El Salvador Government International Bond+^ | | | 7.38 | | | | 12/1/2019 | | | | 200,000 | | | | 202,627 | | | | 205,177 | |
El Salvador Government International Bond+^ | | | 8.63 | | | | 2/28/2029 | | | | 850,000 | | | | 993,784 | | | | 913,389 | |
| | | | | | | | | | | | | | | | | | | | |
Total El Salvador | | | | | | | | | | | 1,050,000 | | | | 1,196,411 | | | | 1,118,566 | |
| | | | | | | | | | | | | | | | | | | | |
See accompanying Notes to the Financial Statements.
154
Barings Emerging Markets Debt Blended Total Return Fund 2018 Annual Report
SCHEDULE OF INVESTMENTS (CONTINUED)
June 30, 2018
| | | | | | | | | | | | | | | | | | | | |
| | | EFFECTIVE
INTEREST RATE | | | DUE DATE | | | PRINCIPAL ‡‡ | | | COST | | | FAIR
VALUE | |
Foreign Government (Continued) | | | | | | | | | | | | | | | | | | | | |
| | | | | |
Ghana — 3.7%*: | | | | | | | | | | | | | | | | | | | | |
Ghana Government Bond+ | | | 16.50 | % | | | 2/6/2023 | | | | 3,500,000 | | | $ | 811,251 | | | $ | 694,219 | |
Ghana Government Bond+ | | | 18.25 | | | | 7/25/2022 | | | | 408,000 | | | | 92,778 | | | | 85,187 | |
Ghana Government Bond+ | | | 21.50 | | | | 3/9/2020 | | | | 480,000 | | | | 113,391 | | | | 104,703 | |
Ghana Government International Bond+^ | | | 10.75 | | | | 10/14/2030 | | | | 700,000 | | | | 873,903 | | | | 847,000 | |
| | | | | | | | | | | | | | | | | | | | |
Total Ghana | | | | | | | | | | | 5,088,000 | | | | 1,891,323 | | | | 1,731,109 | |
| | | | | | | | | | | | | | | | | | | | |
| | | | | |
Indonesia — 3.0%*: | | | | | | | | | | | | | | | | | | | | |
Indonesia Government International Bond+ | | | 1.75 | | | | 4/24/2025 | | | | 410,000 | | | | 506,384 | | | | 466,828 | |
Indonesia Treasury Bond+ | | | 8.38 | | | | 3/15/2034 | | | | 13,640,000,000 | | | | 1,041,249 | | | | 949,708 | |
| | | | | | | | | | | | | | | | | | | | |
Total Indonesia | | | | | | | | | | | 13,640,410,000 | | | | 1,547,633 | | | | 1,416,536 | |
| | | | | | | | | | | | | | | | | | | | |
| | | | | |
Malaysia — 2.1%*: | | | | | | | | | | | | | | | | | | | | |
Malaysia Government Bond+ | | | 4.13 | | | | 4/15/2032 | | | | 1,165,000 | | | | 261,865 | | | | 269,771 | |
Malaysia Government Bond+ | | | 4.94 | | | | 9/30/2043 | | | | 2,830,000 | | | | 741,334 | | | | 694,455 | |
| | | | | | | | | | | | | | | | | | | | |
Total Malaysia | | | | | | | | | | | 3,995,000 | | | | 1,003,199 | | | | 964,226 | |
| | | | | | | | | | | | | | | | | | | | |
| | | | | |
Mexico — 10.0%*: | | | | | | | | | | | | | | | | | | | | |
Mexican Bonos+ | | | 7.75 | | | | 11/13/2042 | | | | 62,700,000 | | | | 3,390,759 | | | | 3,190,934 | |
Mexico Government International Bond+ | | | 5.75 | | | | 10/12/2110 | | | | 1,500,000 | | | | 1,492,868 | | | | 1,481,250 | |
| | | | | | | | | | | | | | | | | | | | |
Total Mexico | | | | | | | | | | | 64,200,000 | | | | 4,883,627 | | | | 4,672,184 | |
| | | | | | | | | | | | | | | | | | | | |
| | | | | |
Paraguay — 1.3%*: | | | | | | | | | | | | | | | | | | | | |
Paraguay Government International Bond+^ | | | 5.60 | | | | 3/13/2048 | | | | 600,000 | | | | 600,000 | | | | 587,250 | |
| | | | | | | | | | | | | | | | | | | | |
| | | | | |
Peru — 1.1%*: | | | | | | | | | | | | | | | | | | | | |
Peru Government Bond+ | | | 6.85 | | | | 2/12/2042 | | | | 1,665,000 | | | | 571,763 | | | | 536,435 | |
| | | | | | | | | | | | | | | | | | | | |
| | | | | |
Russia — 8.2%*: | | | | | | | | | | | | | | | | | | | | |
Russian Federal Bond — OFZ+ | | | 7.70 | | | | 3/23/2033 | | | | 12,440,000 | | | | 226,395 | | | | 198,729 | |
Russian Federal Bond — OFZ+ | | | 8.50 | | | | 9/17/2031 | | | | 190,560,000 | | | | 3,712,878 | | | | 3,243,582 | |
Russian Foreign Bond — Eurobond+^ | | | 4.38 | | | | 3/21/2029 | | | | 400,000 | | | | 391,620 | | | | 387,000 | |
| | | | | | | | | | | | | | | | | | | | |
Total Russia | | | | | | | | | | | 203,400,000 | | | | 4,330,893 | | | | 3,829,311 | |
| | | | | | | | | | | | | | | | | | | | |
| | | | | |
Senegal — 0.7%*: | | | | | | | | | | | | | | | | | | | | |
Senegal Government International Bond+^ | | | 4.75 | | | | 3/13/2028 | | | | 300,000 | | | | 372,120 | | | | 325,816 | |
| | | | | | | | | | | | | | | | | | | | |
| | | | | |
South Africa — 8.2%*: | | | | | | | | | | | | | | | | | | | | |
South Africa Government Bond+ | | | 6.50 | | | | 2/28/2041 | | | | 68,200,000 | | | | 4,228,503 | | | | 3,541,230 | |
South Africa Government Bond+ | | | 8.75 | | | | 2/28/2048 | | | | 4,000,000 | | | | 249,486 | | | | 265,182 | |
| | | | | | | | | | | | | | | | | | | | |
Total South Africa | | | | | | | | | | | 72,200,000 | | | | 4,477,989 | | | | 3,806,412 | |
| | | | | | | | | | | | | | | | | | | | |
See accompanying Notes to the Financial Statements.
155
Barings Emerging Markets Debt Blended Total Return Fund 2018 Annual Report
SCHEDULE OF INVESTMENTS (CONTINUED)
June 30, 2018
| | | | | | | | | | | | | | | | | | | | |
| | | EFFECTIVE
INTEREST RATE | | | DUE DATE | | | PRINCIPAL ‡‡ | | | COST | | | FAIR
VALUE | |
Foreign Government (Continued) | | | | | | | | | | | | | | | | | | | | |
| | | | | |
Ukrainian — 1.4%*: | | | | | | | | | | | | | | | | | | | | |
Ukraine Government International Bond+^ | | | 7.75 | % | | | 9/1/2020 | | | | 325,000 | | | $ | 340,804 | | | $ | 321,344 | |
Ukraine Government International Bond+^ | | | 7.75 | | | | 9/1/2021 | | | | 325,000 | | | | 341,827 | | | | 319,475 | |
| | | | | | | | | | | | | | | | | | | | |
Total Ukrainian | | | | | | | | | | | 650,000 | | | | 682,631 | | | | 640,819 | |
| | | | | | | | | | | | | | | | | | | | |
Total Foreign Government | | | | | | | | | | | 21,290,923,283 | | | | 32,881,114 | | | | 29,646,282 | |
| | | | | | | | | | | | | | | | | | | | |
Total Fixed Income | | | | | | | | | | | 21,304,790,190 | | | | 47,021,947 | | | | 43,107,171 | |
| | | | | | | | | | | | | | | | | | | | |
Short-Term Investments — 5.9%*: | | | | | | | | | | | | | | | | | | | | |
| | | | | |
Bank Deposit — 5.9%*: | | | | | | | | | | | | | | | | | | | | |
State Street Bank & Trust Co. Euro Time Deposit | | | 0.28 | | | | 7/2/2018 | | | | 2,756,609 | | | | 2,756,609 | | | | 2,756,609 | |
| | | | | | | | | | | | | | | | | | | | |
Total Investments | | | | | | | | | | | 21,307,546,799 | | | | 49,778,556 | | | | 45,863,780 | |
| | | | | | | | | | | | | | | | | | | | |
| | | | | |
Other assets and liabilities – 1.6%* | | | | | | | | | | | | | | | | | | | 751,032 | |
| | | | | | | | | | | | | | | | | | | | |
| | | | | |
Net Assets – 100.0% | | | | | | | | | | | | | | | | | | | $46,614,812 | |
| | | | | | | | | | | | | | | | | | | | |
| ‡‡ | Unless otherwise indicated, all principal amounts are denominated in United States Dollars. |
| * | Calculated as a percentage of net assets applicable to common shareholders. |
Distributions of investments by country of risk (excluding temporary cash investments) as a percentage of total investments in securities, is as follows:
| | | | | | |
| | Brazil | | | 14.5% | |
| | Mexico | | | 13.8% | |
| | South Africa | | | 10.6% | |
| | Russia | | | 8.9% | |
| | Colombia | | | 6.2% | |
| | Argentina | | | 4.9% | |
| | Ghana | | | 4.0% | |
| | Turkey | | | 3.5% | |
| | Indonesia | | | 3.3% | |
| | Ivory Coast | | | 3.2% | |
| | China | | | 2.8% | |
| | El Salvador | | | 2.6% | |
| | Chile | | | 2.3% | |
| | Malaysia | | | 2.2% | |
| | Armenia | | | 2.2% | |
| | Saudi Arabia | | | 2.1% | |
| | Portugal | | | 1.8% | |
| | Dominican Republic | | | 1.5% | |
| | Ukrainian | | | 1.5% | |
| | Croatia | | | 1.5% | |
| | Paraguay | | | 1.4% | |
| | Peru | | | 1.2% | |
| | Belarus | | | 1.2% | |
| | Belize | | | 1.1% | |
| | Other (Individually less than 1%) | | | 1.7% | |
| | | | | | |
| | Total | | | 100.0% | |
| | | | | | |
See accompanying Notes to the Financial Statements.
156
Barings Emerging Markets Debt Blended Total Return Fund 2018 Annual Report
SCHEDULE OF INVESTMENTS (CONTINUED)
June 30, 2018
| ^ | Security acquired in a transaction exempt from registration under Rule 144A of the Securities Act of 1933. These securities may only be resold in transactions exempt from registration, normally to qualified institutional buyers. |
| # | Variable rate security. The interest rate shown is the rate in effect at June 30, 2018. |
| ** | Variable Rate is Fixed to Float: Rate remains fixed until designated future date. |
A summary of outstanding derivatives at June 30, 2018 is as follows:
Cross Currency Forward Foreign Currency Exchange Contracts
| | | | | | | | | | | | | | | | |
EXPIRATION
DATE | | DELIVER/RECEIVE | | COUNTERPARTY | | CONTRACT
AMOUNT
PURCHASED | | | CONTRACT
AMOUNT
SOLD | | | NET UNREALIZED
APPRECIATION
(DEPRECIATION) | |
| 7/17/18 | | CZK/EUR | | JPMorgan Chase Bank N.A. | | | 871,685 | | | | 22,423,425 | | | $ | 9,694 | |
| 7/17/18 | | EUR/CZK | | Barclays Bank plc | | | 22,423,425 | | | | 883,525 | | | | (23,534 | ) |
| 7/17/18 | | EUR/HUF | | Goldman Sachs & Co. | | | 143,591,929 | | | | 460,474 | | | | (28,643 | ) |
| 7/17/18 | | EUR/PLN | | Citibank N.A. | | | 1,946,336 | | | | 450,000 | | | | (6,315 | ) |
| 7/17/18 | | EUR/PLN | | JPMorgan Chase Bank N.A. | | | 8,950,381 | | | | 2,081,000 | | | | (42,645 | ) |
| 7/17/18 | | EUR/PLN | | Goldman Sachs & Co. | | | 17,414,991 | | | | 4,134,466 | | | | (182,816 | ) |
| 7/17/18 | | EUR/RSD | | JPMorgan Chase Bank N.A. | | | 104,074,680 | | | | 873,055 | | | | 8,586 | |
| 7/17/18 | | HUF/EUR | | Bank of America N.A. | | | 892,000 | | | | 287,855,625 | | | | 21,062 | |
| | | | | | | | | | | | | | | | |
Net unrealized depreciation on cross currency forward foreign currency exchange contracts | | | $ | (244,611 | ) |
| | | | | | | | | | | | | | | | |
Forward Foreign Currency Exchange Contracts to Buy
| | | | | | | | | | | | | | | | | | | | | | |
EXPIRATION
DATE | | COUNTERPARTY | | LOCAL CURRENCY | | | VALUE IN USD | | | IN
EXCHANGE
FOR USD | | | NET UNREALIZED
APPRECIATION
(DEPRECIATION) | |
| 2/12/19 | | State Street Bank & Trust Co. | | | ARS | | | | 48,501,050 | | | $ | 1,389,074 | | | $ | 2,015,000 | | | $ | (625,926 | ) |
| 2/12/19 | | Bank of America N.A. | | | ARS | | | | 6,742,400 | | | | 193,103 | | | | 280,000 | | | | (86,897 | ) |
| 7/24/18 | | Citibank N.A. | | | AUD | | | | 1,296,030 | | | | 959,182 | | | | 1,006,514 | | | | (47,332 | ) |
| 7/10/18 | | Citibank N.A. | | | BRL | | | | 561,283 | | | | 144,698 | | | | 149,000 | | | | (4,302 | ) |
| 7/10/18 | | Goldman Sachs & Co. | | | BRL | | | | 9,666,951 | | | | 2,492,125 | | | | 2,638,000 | | | | (145,875 | ) |
| 7/10/18 | | Bank of America N.A. | | | BRL | | | | 858,139 | | | | 221,227 | | | | 233,000 | | | | (11,773 | ) |
| 7/17/18 | | JPMorgan Chase Bank N.A. | | | CHF | | | | 2,371,515 | | | | 2,397,519 | | | | 2,404,000 | | | | (6,481 | ) |
| 7/10/18 | | Barclays Bank plc | | | CLP | | | | 35,378,000 | | | | 54,146 | | | | 56,000 | | | | (1,854 | ) |
| 7/10/18 | | JPMorgan Chase Bank N.A. | | | CLP | | | | 612,602,200 | | | | 937,588 | | | | 994,000 | | | | (56,412 | ) |
| 7/24/18 | | Citibank N.A. | | | CNH | | | | 1,105,054 | | | | 166,482 | | | | 172,000 | | | | (5,518 | ) |
| 7/17/18 | | Goldman Sachs & Co. | | | EGP | | | | 18,551,781 | | | | 1,032,293 | | | | 1,026,094 | | | | 6,199 | |
| 7/17/18 | | JPMorgan Chase Bank N.A. | | | EUR | | | | 2,075,305 | | | | 2,425,964 | | | | 2,498,744 | | | | (72,780 | ) |
| 7/17/18 | | Bank of America N.A. | | | EUR | | | | 212,408 | | | | 248,298 | | | | 258,000 | | | | (9,702 | ) |
| 7/17/18 | | Goldman Sachs & Co. | | | EUR | | | | 6,720,325 | | | | 7,855,839 | | | | 8,381,429 | | | | (525,590 | ) |
| 7/17/18 | | Barclays Bank plc | | | HUF | | | | 127,109,790 | | | | 451,138 | | | | 508,601 | | | | (57,463 | ) |
| 7/17/18 | | Goldman Sachs & Co. | | | ILS | | | | 3,423,310 | | | | 936,698 | | | | 957,034 | | | | (20,336 | ) |
| 7/24/18 | | JPMorgan Chase Bank N.A. | | | INR | | | | 100,047,973 | | | | 1,457,275 | | | | 1,490,362 | | | | (33,087 | ) |
| 7/17/18 | | JPMorgan Chase Bank N.A. | | | MAD | | | | 23,480,042 | | | | 2,473,480 | | | | 2,556,046 | | | | (82,566 | ) |
| 7/10/18 | | Citibank N.A. | | | MXN | | | | 32,227,624 | | | | 1,620,900 | | | | 1,739,914 | | | | (119,014 | ) |
| 7/24/18 | | Barclays Bank plc | | | MYR | | | | 6,063,295 | | | | 1,501,435 | | | | 1,555,154 | | | | (53,719 | ) |
| 7/17/18 | | JPMorgan Chase Bank N.A. | | | NGN | | | | 919,299,682 | | | | 2,539,502 | | | | 2,509,348 | | | | 30,154 | |
See accompanying Notes to the Financial Statements.
157
Barings Emerging Markets Debt Blended Total Return Fund 2018 Annual Report
SCHEDULE OF INVESTMENTS (CONTINUED)
June 30, 2018
| | | | | | | | | | | | | | | | | | | | | | |
EXPIRATION
DATE | | COUNTERPARTY | | LOCAL
CURRENCY | | | VALUE IN USD | | | IN
EXCHANGE
FOR USD | | | NET UNREALIZED
APPRECIATION
(DEPRECIATION) | |
| 7/24/18 | | Citibank N.A. | | | NZD | | | | 1,528,635 | | | $ | 1,035,356 | | | $ | 1,076,456 | | | $ | (41,100 | ) |
| 2/1/19 | | Bank of America N.A. | | | PEN | | | | 888,720 | | | | 268,692 | | | | 273,099 | | | | (4,407 | ) |
| 2/1/19 | | State Street Bank & Trust Co. | | | PEN | | | | 3,222,868 | | | | 974,389 | | | | 979,000 | | | | (4,611 | ) |
| 7/17/18 | | Citibank N.A. | | | RUB | | | | 8,553,505 | | | | 135,994 | | | | 136,139 | | | | (145 | ) |
| 7/17/18 | | JPMorgan Chase Bank N.A. | | | RUB | | | | 125,801,520 | | | | 2,000,152 | | | | 1,983,000 | | | | 17,152 | |
| 7/17/18 | | Bank of America N.A. | | | RUB | | | | 14,260,600 | | | | 226,733 | | | | 226,000 | | | | 733 | |
| 7/17/18 | | JPMorgan Chase Bank N.A. | | | SEK | | | | 8,864,950 | | | | 990,769 | | | | 1,074,906 | | | | (84,137 | ) |
| 7/17/18 | | Goldman Sachs & Co. | | | TRY | | | | 6,142,947 | | | | 1,328,789 | | | | 1,443,820 | | | | (115,031 | ) |
| 7/17/18 | | Barclays Bank plc | | | ZAR | | | | 30,702,878 | | | | 2,234,275 | | | | 2,458,000 | | | | (223,725 | ) |
| | | | | | | | | | | | | | | | | | | | | | |
Net unrealized depreciation on forward foreign currency exchange contracts to buy | | | $ | (2,385,545 | ) |
| | | | | | | | | | | | | | | | | | | | | | |
Forward Foreign Currency Exchange Contracts to Sell
| | | | | | | | | | | | | | | | | | | | | | |
EXPIRATION
DATE | | COUNTERPARTY | | LOCAL
CURRENCY | | | VALUE IN USD | | | IN
EXCHANGE
FOR USD | | | NET UNREALIZED
APPRECIATION
(DEPRECIATION) | |
| 2/12/19 | | Bank of America N.A. | | | ARS | | | | 27,621,725 | | | $ | 791,088 | | | $ | 805,650 | | | $ | 14,562 | |
| 2/12/19 | | JPMorgan Chase Bank N.A. | | | ARS | | | | 27,621,725 | | | | 791,088 | | | | 1,109,752 | | | | 318,664 | |
| 7/24/18 | | JPMorgan Chase Bank N.A. | | | AUD | | | | 1,296,030 | | | | 959,182 | | | | 969,329 | | | | 10,147 | |
| 7/10/18 | | JPMorgan Chase Bank N.A. | | | BRL | | | | 8,649,354 | | | | 2,229,789 | | | | 2,297,000 | | | | 67,211 | |
| 7/10/18 | | Goldman Sachs & Co. | | | BRL | | | | 69,012 | | | | 17,791 | | | | 20,384 | | | | 2,593 | |
| 7/17/18 | | JPMorgan Chase Bank N.A. | | | CHF | | | | 49,221 | | | | 49,761 | | | | 50,000 | | | | 239 | |
| 7/10/18 | | Citibank N.A. | | | CLP | | | | 622,169,543 | | | | 952,231 | | | | 1,033,830 | | | | 81,599 | |
| 7/10/18 | | Bank of America N.A. | | | CLP | | | | 622,169,543 | | | | 952,231 | | | | 1,026,835 | | | | 74,604 | |
| 7/24/18 | | Bank of America N.A. | | | CNH | | | | 16,461,850 | | | | 2,480,059 | | | | 2,612,708 | | | | 132,649 | |
| 7/10/18 | | JPMorgan Chase Bank N.A. | | | COP | | | | 6,998,399,000 | | | | 2,386,935 | | | | 2,410,000 | | | | 23,065 | |
| 7/10/18 | | Citibank N.A. | | | COP | | | | 7,999,776,526 | | | | 2,728,473 | | | | 2,849,786 | | | | 121,313 | |
| 7/17/18 | | JPMorgan Chase Bank N.A. | | | EGP | | | | 18,551,781 | | | | 1,032,293 | | | | 1,028,084 | | | | (4,209 | ) |
| 7/17/18 | | JPMorgan Chase Bank N.A. | | | EUR | | | | 6,999,047 | | | | 8,181,656 | | | | 8,300,000 | | | | 118,344 | |
| 7/17/18 | | Barclays Bank plc | | | EUR | | | | 2,406,143 | | | | 2,812,703 | | | | 2,845,000 | | | | 32,297 | |
| 7/24/18 | | Bank of America N.A. | | | IDR | | | | 273,900,000 | | | | 19,123 | | | | 19,748 | | | | 625 | |
| 7/17/18 | | Barclays Bank plc | | | ILS | | | | 3,423,310 | | | | 936,698 | | | | 980,568 | | | | 43,870 | |
| 7/24/18 | | Barclays Bank plc | | | INR | | | | 64,011,000 | | | | 932,369 | | | | 950,000 | | | | 17,631 | |
| 7/24/18 | | JPMorgan Chase Bank N.A. | | | INR | | | | 100,047,973 | | | | 1,457,275 | | | | 1,508,713 | | | | 51,438 | |
| 7/17/18 | | JPMorgan Chase Bank N.A. | | | MAD | | | | 23,480,042 | | | | 2,473,479 | | | | 2,510,241 | | | | 36,762 | |
| 7/17/18 | | JPMorgan Chase Bank N.A. | | | NGN | | | | 919,299,682 | | | | 2,539,502 | | | | 2,508,321 | | | | (31,181 | ) |
| 7/24/18 | | JPMorgan Chase Bank N.A. | | | NZD | | | | 1,528,635 | | | | 1,035,356 | | | | 1,120,487 | | | | 85,131 | |
| 2/1/19 | | Barclays Bank plc | | | PEN | | | | 4,111,588 | | | | 1,243,082 | | | | 1,258,714 | | | | 15,632 | |
| 7/17/18 | | Bank of America N.A. | | | RUB | | | | 59,554,985 | | | | 946,881 | | | | 934,416 | | | | (12,465 | ) |
| 7/24/18 | | Citibank N.A. | | | THB | | | | 152,223,440 | | | | 4,596,992 | | | | 4,658,000 | | | | 61,008 | |
| 7/17/18 | | JPMorgan Chase Bank N.A. | | | TRY | | | | 6,142,947 | | | | 1,328,789 | | | | 1,436,275 | | | | 107,486 | |
| 7/17/18 | | Bank of America N.A. | | | ZAR | | | | 29,354,112 | | | | 2,136,124 | | | | 2,304,000 | | | | 167,876 | |
| 7/17/18 | | JPMorgan Chase Bank N.A. | | | ZAR | | | | 56,097,300 | | | | 4,082,249 | | | | 4,618,126 | | | | 535,877 | |
| | | | | | | | | | | | | | | | | | | | | | |
Net unrealized appreciation on forward foreign currency exchange contracts to sell | | | $ | 2,072,768 | |
| | | | | | | | | | | | | | | | | | | | | | |
See accompanying Notes to the Financial Statements.
158
Barings Emerging Markets Debt Blended Total Return Fund 2018 Annual Report
SCHEDULE OF INVESTMENTS (CONTINUED)
June 30, 2018
|
| CURRENCY LEGEND |
| ARS – Argentine Peso |
| AUD – Australian Dollar |
| BRL – Brazilian Real |
| CHF – Swiss Franc |
| CLP – Chilean Peso |
| CNH – Chinese Yuan Renminbi |
| COP – Colombian Peso |
| CZK – Czech Koruna |
| EGP – Egyptian Pound |
| EUR – Euro |
| HUF – Hungarian Forint |
| IDR – Indonesian Rupiah |
| ILS – Israeli Shekel |
| INR – Indian Rupee |
| MAD – Moroccan Diram |
| MXN – Mexican Peso |
| MYR – Malaysian Ringgit |
| NGN – Nigeria Naira |
| NZD – New Zealand Dollar |
| PEN – Peruvian Nouveau Sol |
| PLN – Polish Zloty |
| RSD – Serbian Dinar. |
| RUB – Russian Ruble |
| SEK – Swedish Krona |
| THB – Thai Baht |
| TRY – Turkish New Lira |
| ZAR – South African Rand |
| | | | | | | | | | | | | | | | | | | | | | |
| Futures | |
| TYPE | | EXPIRATION
DATE | | | CONTRACTS | | | NOTIONAL
AMOUNT | | | POSITION | | FAIR
VALUE | | | UNREALIZED
DEPRECIATION | |
Short Future | |
U.S. Ultra Bond | | | 09/19/18 | | | | 8 | | | | (1,233,926 | ) | | Short | | $ | (1,276,500 | ) | | $ | (42,574 | ) |
| | | | | | | | | | | | | | | | | | | | | | |
See accompanying Notes to the Financial Statements.
159
Barings Emerging Markets Debt Blended Total Return Fund 2018 Annual Report
SCHEDULE OF INVESTMENTS (CONTINUED)
June 30, 2018
OTC Cross Currency Swaps
| | | | | | | | | | | | | | | | | | | | | | | | | | | | | | | | | | |
NOTIONAL
AMOUNT | | FUND
PAYS | | | PAY/
RECEIVE
PAYMENT
FREQUENCY | | MATURITY
DATE | | | COUNTERPARTY
| | | NOTIONAL
AMOUNT | | | FUND
RECEIVES | | | UPFRONT
PREMIUMS
PAID/
(RECEIVED) | | | FAIR
VALUE | | | UNREALIZED
APPRECIATION
(DEPRECIATION) | |
$300,000 EUR | | | 4.75 | % | | 1Y/6M | | | 03/13/2028 | | |
| Bank of
America
N.A.
|
| | $ | 372,150 USD | | | | 7.43 | % | | $ | 30 | | | $ | 26,967 | | | $ | 26,937 | |
288,982 EUR | | | 7.82 | % | | 1Y/6M | | | 12/31/2033 | | |
| Citibank
N.A.
|
| | | 355,737 USD | | | | 10.98 | % | | | 66,685 | | | | 17,335 | | | | (49,350 | ) |
410,000 EUR | | | 1.75 | % | | 1Y/6M | | | 04/24/2025 | | |
| Citibank
N.A.
|
| | | 507,170 USD | | | | 4.48 | % | | | (102 | ) | | | 32,730 | | | | 32,832 | |
200,000 EUR | | | 2.75 | % | | 1Y/6M | | | 01/27/2030 | | |
| Citibank
N.A.
|
| | | 235,400 USD | | | | 4.89 | % | | | (10 | ) | | | (3,107 | ) | | | (3,097 | ) |
350,000 EUR | | | 2.70 | % | | 1Y/6M | | | 06/15/2028 | | |
| Citibank
N.A.
|
| | | 411,740 USD | | | | 5.34 | % | | | (246 | ) | | | 5,866 | | | | 6,112 | |
200,000 EUR | | | 5.30 | % | | 1Y/6M | | | 01/15/2028 | | |
| Citibank
N.A.
|
| | | 233,200 USD | | | | 7.85 | % | | | (40 | ) | | | (6,164 | ) | | | (6,124 | ) |
150,000 EUR | | | 5.25 | % | | 1Y/6M | | | 01/15/2028 | | |
| Citibank
N.A.
|
| | | 184,200 USD | | | | 7.93 | % | | | 270 | | | | 10,686 | | | | 10,416 | |
| | | | | | | | | | | | | | | | | | | | | | | | | | | | | | | | | | |
Total OTC Cross Currency Swaps | | | | | | | | | | | | | | | $ | 66,587 | | | $ | 84,313 | | | $ | 17,726 | |
| | | | | | | | | | | | | | | | | | | | | | | | | | | | | | | | | | |
OTC – Interest Rate Swaps
| | | | | | | | | | | | | | | | |
| DESCRIPTION | | NOTIONAL
AMOUNT | | | UNREALIZED
APPRECIATION
(DEPRECIATION) | | | VALUE | |
Agreement with Bank of America N.A. dated 5/30/18 receiving a fixed rate of 11.31% paying the notional amount multiplied by the BRL-CDI rate. Expiring 1/4/27 | | | BRL | | | | 2,873,876 | | | $ | (18,391 | ) | | $ | (18,391 | ) |
Agreement with Bank of America N.A. dated 02/14/18 paying a fixed rate of 0.96% receiving the notional amount multiplied by the ILS-TELBOR rate. Expiring 2/14/23 | | | ILS | | | | 2,700,000 | | | | 3,981 | | | | 3,981 | |
Agreement with Bank of America N.A. dated 2/6/18 paying a fixed rate of 0.885 receiving the notional amount multiplied by the ILS-TELBOR rate. Expiring 2/6/23 | | | ILS | | | | 350,000 | | | | 816 | | | | 816 | |
Agreement with Bank of America N.A. dated 06/27/18 receiving a fixed rate of 9.35% paying the notional amount multiplied by the BRL-CDI rate. Expiring 1/4/21 | | | BRL | | | | 3,994,027 | | | | 3,020 | | | | 3,020 | |
Agreement with Bank of America N.A. dated 06/06/18 receiving a fixed rate of 12.06% paying the notional amount multiplied by the BRL-CDI rate. Expiring 1/4/27 | | | BRL | | | | 981,513 | | | | 10,692 | | | | 10,692 | |
Agreement with Bank of America N.A. dated 5/18/17 paying a fixed rate of 1.22% receiving the notional amount multiplied by the HUF-BUBOR rate. Expiring 5/18/22 | | | HUF | | | | 308,000,000 | | | | 22,987 | | | | 22,987 | |
Agreement with Bank of America N.A. dated 1/1217 receiving a fixed rate of 8.09% paying the notional amount multiplied by the ZAR-JIBAR rate. Expiring 1/12/27 | | | ZAR | | | | 4,300,000 | | | | (1,942 | ) | | | (1,942 | ) |
Agreement with BNP Paribas N.A. dated 03/14/18 paying a fixed rate of 0.855% receiving the notional amount multiplied by the ILS-TELBOR rate. Expiring 3/14/23 | | | ILS | | | | 19,730,000 | | | | 59,807 | | | | 59,807 | |
See accompanying Notes to the Financial Statements.
160
Barings Emerging Markets Debt Blended Total Return Fund 2018 Annual Report
SCHEDULE OF INVESTMENTS (CONTINUED)
June 30, 2018
| | | | | | | | | | | | | | | | |
| DESCRIPTION | | NOTIONAL
AMOUNT | | | UNREALIZED
APPRECIATION
(DEPRECIATION) | | | VALUE | |
Agreement with BNP Paribas N.A. dated 03/14/18 paying a fixed rate of 1.00% receiving the notional amount multiplied by the HUF-BUBOR rate. Expiring 3/14/23 | | | HUF | | | | 518,600,000 | | | $ | 71,569 | | | $ | 71,569 | |
Agreement with JPMorgan Chase Bank N.A. dated 5/19/17 paying a fixed rate of 0.43% receiving the notional amount multiplied by the ILS-TELBOR rate. Expiring 5/19/20 | | | ILS | | | | 6,500,000 | | | | (414 | ) | | | (414 | ) |
Agreement with JPMorgan Chase Bank N.A. dated 5/23/18 receiving a fixed rate of 7.9% paying the notional amount multiplied by the ZAR-JIBAR rate. Expiring 5/23/28 | | | ZAR | | | | 14,250,000 | | | | (27,026 | ) | | | (27,026 | ) |
Agreement with JPMorgan Chase Bank N.A. dated 1/12/17 receiving a fixed rate of 7.45% paying the notional amount multiplied by the ZAR-JIBAR rate. Expiring 1/12/20 | | | ZAR | | | | 4,460,000 | | | | 1,066 | | | | 1,066 | |
| | | | | | | | | | | | | | | | |
Total OTC Interest Rate Swaps | | | | | | | | | | $ | 126,165 | | | $ | 126,165 | |
| | | | | | | | | | | | | | | | |
OTC Credit Default Swaps – Sell Protection (1)
| | | | | | | | | | | | | | | | | | | | | | | | | | | | | | | | |
REFERENCE
OBLIGATION | | FIXED-DEAL
RECEIVED
RATE | | PAYMENT
FREQUENCY | | | MATURITY
DATE | | | COUNTERPARTY | | ORIGINAL
NOTIONAL
AMOUNT | | | CURRENT
NOTIONAL
AMOUNT (2) | | | UPFRONT
PREMIUMS
PAID/
(RECEIVED) | | | FAIR
VALUE (3) | | | UNREALIZED
APPRECIATION
(DEPRECIATION) | |
Colombia Government International Bond | | 1.00% | | | 3M | | | | 6/20/2023 | | | BNP Paribas S.A. | | | 100,000 | | | | 100,000 | | | $ | (103 | ) | | $ | (1,089 | ) | | $ | (986 | ) |
Colombia Government International Bond | | 1.00% | | | 3M | | | | 6/20/2023 | | | Bank of America
N.A. | | | 400,000 | | | | 400,000 | | | | 610 | | | | (4,355 | ) | | | (4,965 | ) |
Indonesia Government International Bond | | 1.00% | | | 3M | | | | 6/20/2023 | | | BNP Paribas S.A. | | | 200,000 | | | | 200,000 | | | | 569 | | | | (3,174 | ) | | | (3,743 | ) |
Indonesia Government International Bond | | 1.00% | | | 3M | | | | 6/20/2023 | | | BNP Paribas S.A. | | | 800,000 | | | | 800,000 | | | | 152 | | | | (12,695 | ) | | | (12,847 | ) |
Malaysia Government International Bond | | 1.00% | | | 3M | | | | 6/20/2023 | | | BNP Paribas S.A. | | | 100,000 | | | | 100,000 | | | | 1,560 | | | | (287 | ) | | | (1,847 | ) |
Malaysia Government International Bond | | 1.00% | | | 3M | | | | 6/20/2023 | | | BNP Paribas S.A. | | | 400,000 | | | | 400,000 | | | | 5,273 | | | | (1,148 | ) | | | (6,421 | ) |
Mexico Government International Bond | | 1.00% | | | 3M | | | | 6/20/2023 | | | BNP Paribas S.A. | | | 200,000 | | | | 200,000 | | | | (1,676 | ) | | | (3,078 | ) | | | (1,402 | ) |
Mexico Government International Bond | | 1.00% | | | 3M | | | | 6/20/2023 | | | Bank of America
N.A. | | | 800,000 | | | | 800,000 | | | | 126 | | | | (12,312 | ) | | | (12,438 | ) |
Panama Government International Bond | | 1.00% | | | 3M | | | | 6/20/2023 | | | Bank of America
N.A. | | | 200,000 | | | | 200,000 | | | | 3,124 | | | | 2,288 | | | | (836 | ) |
Panama Government International Bond | | 1.00% | | | 3M | | | | 6/20/2023 | | | Barclays Bank plc | | | 800,000 | | | | 800,000 | | | | 14,492 | | | | 9,150 | | | | (5,342 | ) |
See accompanying Notes to the Financial Statements.
161
Barings Emerging Markets Debt Blended Total Return Fund 2018 Annual Report
SCHEDULE OF INVESTMENTS (CONTINUED)
June 30, 2018
| | | | | | | | | | | | | | | | | | | | | | | | | | | | | | | | | | |
REFERENCE
OBLIGATION | | FIXED-DEAL
RECEIVED
RATE | | PAYMENT
FREQUENCY | | | MATURITY
DATE | | | COUNTERPARTY | | | ORIGINAL
NOTIONAL
AMOUNT | | | CURRENT
NOTIONAL
AMOUNT (2) | | | UPFRONT
PREMIUMS
PAID/
(RECEIVED) | | | FAIR
VALUE (3) | | | UNREALIZED
APPRECIATION
(DEPRECIATION) | |
Peruvian Government International Bond | | 1.00% | | | 3M | | | | 6/20/2023 | | | | BNP Paribas S.A. | | | | 800,000 | | | | 800,000 | | | $ | 10,401 | | | $ | 3,881 | | | $ | (6,520 | ) |
Peruvian Government International Bond | | 1.00% | | | 3M | | | | 6/20/2023 | | | | BNP Paribas S.A. | | | | 200,000 | | | | 200,000 | | | | 2,281 | | | | 970 | | | | (1,311 | ) |
Russian Government International Bond | | 1.00% | | | 3M | | | | 6/20/2023 | | |
| Bank of America
N.A. |
| | | 100,000 | | | | 100,000 | | | | (1,019 | ) | | | (1,840 | ) | | | (821 | ) |
Russian Government International Bond | | 1.00% | | | 3M | | | | 6/20/2023 | | |
| Bank of America
N.A. |
| | | 400,000 | | | | 400,000 | | | | (8,345 | ) | | | (7,359 | ) | | | 986 | |
| | | | | | | | | | | | | | | | | | | | | | | | | | | | | | | | | | |
Total OTC Credit Default Swaps | | | | | | | | | | | | | | | | | | | $ | 27,445 | | | $ | (31,048 | ) | | $ | (58,493 | ) |
| | | | | | | | | | | | | | | | | | | | | | | | | | | | | | | | | | |
| (1) | | If the Fund is a seller of protection and a credit event occurs, as defined under the terms of that particular swap agreement, the Fund will either (i) pay to the buyer of protection an amount equal to the notional amount of the swap and take delivery of the referenced obligation or underlying securities comprising the referenced index or (ii) pay a net settlement amount in the form of cash or securities equal to the notional amount of the swap less the recovery value of the referenced obligation or underlying securities comprising the referenced index. |
| (2) | | The maximum potential amount the Portfolio could be required to make as a seller of credit protection or receive as a buyer of credit event as defined under the terms of that particular swap agreement. |
| (3) | | The quoted market prices and resulting values for credit default swap agreements on asset-backed securities and credit indices serve as an indicator of the current status of the payment/performance risk and represent the expected amount paid or received for the credit derivative if the amount of the swap agreement was closed/sold as of the period end. Increasing market values, in absolute terms when compared to the notional amount of the swap, represent a deterioration of the referenced entity’s credit soundness and a greater likelihood or risk of default or other credit event occurring as defined under the terms of the agreements. |
Abbreviation Legend
See accompanying Notes to the Financial Statements.
162
Barings Emerging Markets Local Currency Debt Fund 2018 Annual Report
SCHEDULE OF INVESTMENTS
June 30, 2018
| | | | | | | | | | | | | | | | | | | | |
| | | EFFECTIVE
INTEREST RATE | | | DUE DATE | | | PRINCIPAL ‡‡ | | | COST | | | FAIR
VALUE | |
Fixed Income — 86.0%*: | | | | | | | | | | | | | | | | | | | | |
| | | | | |
Foreign Government — 86.0%*: | | | | | | | | | | | | | | | | | | | | |
| | | | | |
Argentina — 0.7%*: | | | | | | | | | | | | | | | | | | | | |
Argentine Bonos del Tesoro+ | | | 15.50 | % | | | 10/17/2026 | | | | 4,039,000 | | | | $210,327 | | | | $124,277 | |
| | | | | | | | | | | | | | | | | | | | |
| | | | | |
Brazil — 7.5%*: | | | | | | | | | | | | | | | | | | | | |
Brazil Notas do Tesouro Nacional Serie B+ | | | 6.00 | | | | 8/15/2050 | | | | 1,712,000 | | | | 1,702,933 | | | | 1,395,748 | |
| | | | | | | | | | | | | | | | | | | | |
| | | | | |
Chile — 4.4%*: | | | | | | | | | | | | | | | | | | | | |
Bonos de la Tesoreria de la Republica en pesos+ | | | 4.50 | | | | 3/1/2021 | | | | 485,000,000 | | | | 783,898 | | | | 760,243 | |
Chile Government International Bond+ | | | 5.50 | | | | 8/5/2020 | | | | 32,300,000 | | | | 47,439 | | | | 51,497 | |
| | | | | | | | | | | | | | | | | | | | |
Total Chile | | | | | | | | | | | 517,300,000 | | | | 831,337 | | | | 811,740 | |
| | | | | | | | | | | | | | | | | | | | |
| | | | | |
Colombia — 7.8%*: | | | | | | | | | | | | | | | | | | | | |
Colombian TES+ | | | 3.00 | | | | 3/25/2033 | | | | 694,362,004 | | | | 221,681 | | | | 220,132 | |
Colombian TES+ | | | 4.75 | | | | 4/4/2035 | | | | 2,067,540,594 | | | | 799,259 | | | | 801,585 | |
Colombian TES+ | | | 7.75 | | | | 9/18/2030 | | | | 1,148,000,000 | | | | 380,201 | | | | 417,542 | |
| | | | | | | | | | | | | | | | | | | | |
Total Colombia | | | | | | | | | | | 3,909,902,598 | | | | 1,401,141 | | | | 1,439,259 | |
| | | | | | | | | | | | | | | | | | | | |
| | | | | |
El Salvador — 0.9%*: | | | | | | | | | | | | | | | | | | | | |
El Salvador Government International Bond+^ | | | 8.25 | | | | 4/10/2032 | | | | 159,000 | | | | 176,442 | | | | 164,565 | |
El Salvador Government International Bond+^ | | | 8.63 | | | | 2/28/2029 | | | | 10,000 | | | | 10,691 | | | | 10,746 | |
| | | | | | | | | | | | | | | | | | | | |
Total El Salvador | | | | | | | | | | | 169,000 | | | | 187,133 | | | | 175,311 | |
| | | | | | | | | | | | | | | | | | | | |
| | | | | |
Ghana — 1.8%*: | | | | | | | | | | | | | | | | | | | | |
Ghana Government Bond+ | | | 16.50 | | | | 2/6/2023 | | | | 240,000 | | | | 55,530 | | | | 47,597 | |
Ghana Government Bond+ | | | 18.25 | | | | 7/25/2022 | | | | 785,000 | | | | 178,921 | | | | 163,876 | |
Ghana Government Bond+ | | | 21.50 | | | | 3/9/2020 | | | | 330,000 | | | | 78,134 | | | | 71,973 | |
Ghana Government Bond+ | | | 24.75 | | | | 3/1/2021 | | | | 100,000 | | | | 26,625 | | | | 23,551 | |
Ghana Government Bond+ | | | 24.75 | | | | 7/19/2021 | | | | 110,000 | | | | 28,378 | | | | 26,318 | |
| | | | | | | | | | | | | | | | | | | | |
Total Ghana | | | | | | | | | | | 1,565,000 | | | | 367,588 | | | | 333,315 | |
| | | | | | | | | | | | | | | | | | | | |
| | | | | |
Hungary — 0.3%*: | | | | | | | | | | | | | | | | | | | | |
Hungary Government Bond+ | | | 5.50 | | | | 12/20/2018 | | | | 14,750,000 | | | | 57,057 | | | | 53,585 | |
| | | | | | | | | | | | | | | | | | | | |
| | | | | |
Indonesia — 8.7%*: | | | | | | | | | | | | | | | | | | | | |
Indonesia Treasury Bond+ | | | 8.25 | | | | 5/15/2036 | | | | 2,120,000,000 | | | | 168,624 | | | | 146,277 | |
Indonesia Treasury Bond+ | | | 8.38 | | | | 3/15/2034 | | | | 20,909,000,000 | | | | 1,639,462 | | | | 1,455,824 | |
| | | | | | | | | | | | | | | | | | | | |
Total Indonesia | | | | | | | | | | | 23,029,000,000 | | | | 1,808,086 | | | | 1,602,101 | |
| | | | | | | | | | | | | | | | | | | | |
| | | | | |
Malaysia — 4.7%*: | | | | | | | | | | | | | | | | | | | | |
Malaysia Government Bond+ | | | 4.74 | | | | 3/15/2046 | | | | 2,995,000 | | | | 718,869 | | | | 716,560 | |
Malaysia Government Bond+ | | | 4.94 | | | | 9/30/2043 | | | | 653,000 | | | | 157,109 | | | | 160,240 | |
| | | | | | | | | | | | | | | | | | | | |
Total Malaysia | | | | | | | | | | | 3,648,000 | | | | 875,978 | | | | 876,800 | |
| | | | | | | | | | | | | | | | | | | | |
See accompanying Notes to the Financial Statements.
163
Barings Emerging Markets Local Currency Debt Fund 2018 Annual Report
SCHEDULE OF INVESTMENTS (CONTINUED)
June 30, 2018
| | | | | | | | | | | | | | | | | | | | |
| | | EFFECTIVE
INTEREST RATE | | | DUE DATE | | | PRINCIPAL ‡‡ | | | COST | | | FAIR
VALUE | |
Foreign Government (Continued) | | | | | | | | | | | | | | | | | | | | |
| | | | | |
Mexico — 5.0%*: | | | | | | | | | | | | | | | | | | | | |
Mexican Bonos+ | | | 7.75 | % | | | 11/13/2042 | | | | 17,990,000 | | | $ | 993,171 | | | $ | 925,074 | |
| | | | | | | | | | | | | | | | | | | | |
| | | | | |
Nigeria — 1.3%*: | | | | | | | | | | | | | | | | | | | | |
Nigeria Treasury Bill+ | | | Zero Coupon | | | | 7/5/2018 | | | | 90,550,000 | | | | 251,264 | | | | 249,377 | |
| | | | | | | | | | | | | | | | | | | | |
| | | | | |
Peru — 2.8%*: | | | | | | | | | | | | | | | | | | | | |
Peru Government Bond+ | | | 6.85 | | | | 2/12/2042 | | | | 1,070,000 | | | | 351,507 | | | | 345,736 | |
Peru Government Bond+ | | | 8.20 | | | | 8/12/2026 | | | | 500,000 | | | | 180,744 | | | | 181,569 | |
| | | | | | | | | | | | | | | | | | | | |
Total Peru | | | | | | | | | | | 1,570,000 | | | | 532,251 | | | | 527,305 | |
| | | | | | | | | | | | | | | | | | | | |
| | | | | |
Philippines — 2.6%*: | | | | | | | | | | | | | | | | | | | | |
Philippine Government Bond+ | | | 5.75 | | | | 8/16/2037 | | | | 50,000 | | | | 888 | | | | 843 | |
Philippine Government Bond+ | | | 6.13 | | | | 10/24/2037 | | | | 2,910,000 | | | | 53,794 | | | | 49,648 | |
Philippine Government Bond+ | | | 6.25 | | | | 3/22/2028 | | | | 14,750,000 | | | | 283,814 | | | | 270,978 | |
Philippine Government Bond+ | | | 6.50 | | | | 2/22/2038 | | | | 8,600,000 | | | | 159,841 | | | | 154,236 | |
Philippine Government Bond+ | | | 7.63 | | | | 9/29/2036 | | | | 90,000 | | | | 1,907 | | | | 1,855 | |
Philippine Government Bond+ | | | 8.13 | | | | 12/16/2035 | | | | 90,000 | | | | 1,974 | | | | 1,850 | |
| | | | | | | | | | | | | | | | | | | | |
Total Philippines | | | | | | | | | | | 26,490,000 | | | | 502,218 | | | | 479,410 | |
| | | | | | | | | | | | | | | | | | | | |
|
Poland — 4.7%*: | |
Poland Government Bond+ | | | 2.50 | | | | 7/25/2018 | | | | 3,225,000 | | | | 886,823 | | | | 861,571 | |
| | | | | | | | | | | | | | | | | | | | |
|
Romania — 4.6%*: | |
Romania Government Bond+ | | | 5.60 | | | | 11/28/2018 | | | | 2,510,000 | | | | 644,043 | | | | 633,099 | |
Romania Government Bond+ | | | 5.80 | | | | 7/26/2027 | | | | 860,000 | | | | 248,184 | | | | 223,730 | |
| | | | | | | | | | | | | | | | | | | | |
Total Romania | | | | | | | | | | | 3,370,000 | | | | 892,227 | | | | 856,829 | |
| | | | | | | | | | | | | | | | | | | | |
|
Russia — 11.4%*: | |
Russian Federal Bond — OFZ+ | | | 7.70 | | | | 3/23/2033 | | | | 50,717,000 | | | | 864,281 | | | | 811,480 | |
Russian Federal Bond — OFZ+ | | | 8.50 | | | | 9/17/2031 | | | | 75,713,000 | | | | 1,424,496 | | | | 1,290,765 | |
| | | | | | | | | | | | | | | | | | | | |
Total Russia | | | | | | | | | | | 126,430,000 | | | | 2,288,777 | | | | 2,102,245 | |
| | | | | | | | | | | | | | | | | | | | |
|
Serbia — 2.1%*: | |
Serbia Treasury Bond+ | | | 5.75 | | | | 7/21/2023 | | | | 20,120,000 | | | | 205,650 | | | | 213,537 | |
Serbia Treasury Bonds+ | | | 5.88 | | | | 2/8/2028 | | | | 17,300,000 | | | | 188,698 | | | | 183,951 | |
| | | | | | | | | | | | | | | | | | | | |
Total Serbia | | | | | | | | | | | 37,420,000 | | | | 394,348 | | | | 397,488 | |
| | | | | | | | | | | | | | | | | | | | |
|
South Africa — 10.9%*: | |
South Africa Government Bond+ | | | 6.50 | | | | 2/28/2041 | | | | 28,300,000 | | | | 1,501,009 | | | | 1,470,661 | |
South Africa Government Bond+ | | | 8.75 | | | | 2/28/2048 | | | | 8,200,000 | | | | 522,280 | | | | 544,070 | |
| | | | | | | | | | | | | | | | | | | | |
Total South Africa | | | | | | | | | | | 36,500,000 | | | | 2,023,289 | | | | 2,014,731 | |
| | | | | | | | | | | | | | | | | | | | |
|
Thailand — 3.8%*: | |
Thailand Government Bond+ | | | 3.88 | | | | 6/13/2019 | | | | 23,050,000 | | | | 728,148 | | | | 710,645 | |
| | | | | | | | | | | | | | | | | | | | |
Total Foreign Government | | | | | | | | | | | 27,848,680,598 | | | | 16,934,096 | | | | 15,936,811 | |
| | | | | | | | | | | | | | | | | | | | |
Total Fixed Income | | | | | | | | | | | 27,848,680,598 | | | | 16,934,096 | | | | 15,936,811 | |
| | | | | | | | | | | | | | | | | | | | |
See accompanying Notes to the Financial Statements.
164
Barings Emerging Markets Local Currency Debt Fund 2018 Annual Report
SCHEDULE OF INVESTMENTS (CONTINUED)
June 30, 2018
| | | | | | | | | | | | | | | | | | | | |
| | | EFFECTIVE
INTEREST RATE | | | DUE DATE | | | PRINCIPAL ‡‡ | | | COST | | | FAIR VALUE | |
Short-Term Investments — 12.5%*: | |
|
Bank Deposit — 12.5%*: | |
State Street Bank & Trust Co. Euro Time Deposit | | | 0.28 | % | | | 7/2/2018 | | | | 2,306,774 | | | $ | 2,306,774 | | | $ | 2,306,774 | |
| | | | | | | | | | | | | | | | | | | | |
Total Investments | | | | | | | | | | | 27,850,987,372 | | | | 19,240,870 | | | | 18,243,585 | |
| | | | | | | | | | | | | | | | | | | | |
| |
Other assets and liabilities — 1.5%* | | | | 275,629 | |
| | | | | | | | | | | | | | | | | | | | |
| |
Net Assets — 100.0% | | | | $18,519,214 | |
| | | | | | | | | | | | | | | | | | | | |
| ‡‡ | Unless otherwise indicated, all principal amounts are denominated in United States Dollars. |
| * | Calculated as a percentage of net assets applicable to common shareholders. |
Distributions of investments by country of risk (excluding temporary cash investments) as a percentage of total investments in securities, is as follows:
| | | | | | |
| | Russia | | | 13.2% | |
| | South Africa | | | 12.6% | |
| | Indonesia | | | 10.0% | |
| | Colombia | | | 9.0% | |
| | Brazil | | | 8.8% | |
| | Mexico | | | 5.8% | |
| | Malaysia | | | 5.5% | |
| | Poland | | | 5.4% | |
| | Romania | | | 5.4% | |
| | Chile | | | 5.1% | |
| | Thailand | | | 4.5% | |
| | Peru | | | 3.3% | |
| | Philippines | | | 3.0% | |
| | Serbia | | | 2.5% | |
| | Ghana | | | 2.1% | |
| | Nigeria | | | 1.6% | |
| | El Salvador | | | 1.1% | |
| | Other (Individually less than 1%) | | | 1.1% | |
| | | | | | |
| | Total | | | 100.0% | |
| | | | | | |
| ^ | Security acquired in a transaction exempt from registration under Rule 144A of the Securities Act of 1933. These securities may only be resold in transactions exempt from registration, normally to qualified institutional buyers. |
A summary of outstanding derivatives at June 30, 2018 is as follows:
Cross Currency Forward Foreign Currency Exchange Contracts
| | | | | | | | | | | | | | | | |
EXPIRATION
DATE | | DELIVER/RECEIVE | | COUNTERPARTY | | CONTRACT
AMOUNT
PURCHASED | | | CONTRACT
AMOUNT
SOLD | | | NET UNREALIZED
APPRECIATION
(DEPRECIATION) | |
| 7/17/18 | | CZK/EUR | | Goldman Sachs & Co. | | | 406,000 | | | | 10,446,786 | | | $ | 5,340 | |
| 7/17/18 | | EUR/CZK | | Citibank N.A. | | | 1,859,128 | | | | 72,000 | | | | (655 | ) |
See accompanying Notes to the Financial Statements.
165
Barings Emerging Markets Local Currency Debt Fund 2018 Annual Report
SCHEDULE OF INVESTMENTS (CONTINUED)
June 30, 2018
| | | | | | | | | | | | | | | | |
EXPIRATION
DATE | | DELIVER/RECEIVE | | COUNTERPARTY | | CONTRACT
AMOUNT
PURCHASED | | | CONTRACT
AMOUNT
SOLD | | | NET UNREALIZED
APPRECIATION
(DEPRECIATION) | |
| 7/17/18 | | EUR/CZK | | Barclays Bank plc | | | 26,069,998 | | | | 1,027,207 | | | $ | (29,725 | ) |
| 7/17/18 | | EUR/HUF | | Citibank N.A. | | | 16,302,189 | | | | 51,000 | | | | (1,724 | ) |
| 7/17/18 | | EUR/HUF | | Goldman Sachs & Co. | | | 194,234,141 | | | | 622,875 | | | | (38,336 | ) |
| 7/17/18 | | EUR/PLN | | Goldman Sachs & Co. | | | 5,068,870 | | | | 1,202,029 | | | | (50,693 | ) |
| 7/17/18 | | EUR/PLN | | JPMorgan Chase Bank N.A. | | | 1,109,658 | | | | 258,000 | | | | (5,086 | ) |
| 7/17/18 | | EUR/RON | | Barclays Bank plc | | | 850,319 | | | | 181,518 | | | | 594 | |
| 7/17/18 | | EUR/RSD | | JPMorgan Chase Bank N.A. | | | 28,510,064 | | | | 239,163 | | | | 2,412 | |
| 7/17/18 | | RON/EUR | | Citibank N.A. | | | 89,000 | | | | 416,759 | | | | (251 | ) |
| | | | | | | | | | | | | | | | |
Net unrealized depreciation on cross currency forward foreign currency exchange contracts | | | $ | (118,124 | ) |
| | | | | | | | | | | | | | | | |
Forward Foreign Currency Exchange Contracts to Buy
| | | | | | | | | | | | | | | | | | | | | | |
EXPIRATION
DATE | | COUNTERPARTY | | LOCAL
CURRENCY | | | VALUE IN USD | | | IN
EXCHANGE
FOR USD | | | NET UNREALIZED
APPRECIATION
(DEPRECIATION) | |
| 2/12/19 | | Goldman Sachs & Co. | | | ARS | | | | 3,877,500 | | | $ | 112,303 | | | $ | 165,000 | | | $ | (52,697 | ) |
| 2/12/19 | | JPMorgan Chase Bank N.A. | | | ARS | | | | 2,601,840 | | | | 75,356 | | | | 111,000 | | | | (35,644 | ) |
| 2/12/19 | | Bank of America N.A. | | | ARS | | | | 8,428,000 | | | | 244,097 | | | | 350,000 | | | | (105,903 | ) |
| 7/24/18 | | Citibank N.A. | | | AUD | | | | 525,272 | | | | 388,119 | | | | 407,933 | | | | (19,814 | ) |
| 7/10/18 | | JPMorgan Chase Bank N.A. | | | BRL | | | | 2,520,405 | | | | 654,523 | | | | 743,767 | | | | (89,244 | ) |
| 7/10/18 | | Citibank N.A. | | | BRL | | | | 565,050 | | | | 146,738 | | | | 150,000 | | | | (3,262 | ) |
| 7/10/18 | | Goldman Sachs & Co. | | | BRL | | | | 1,333,878 | | | | 346,394 | | | | 364,000 | | | | (17,606 | ) |
| 7/10/18 | | Bank of America N.A. | | | BRL | | | | 1,082,802 | | | | 281,193 | | | | 294,000 | | | | (12,807 | ) |
| 7/10/18 | | Barclays Bank plc | | | BRL | | | | 315,945 | | | | 82,048 | | | | 90,000 | | | | (7,952 | ) |
| 7/17/18 | | Bank of America N.A. | | | CHF | | | | 17,631 | | | | 17,777 | | | | 18,000 | | | | (223 | ) |
| 7/17/18 | | JPMorgan Chase Bank N.A. | | | CHF | | | | 925,399 | | | | 933,044 | | | | 935,000 | | | | (1,956 | ) |
| 7/10/18 | | Barclays Bank plc | | | CLP | | | | 15,793,750 | | | | 24,260 | | | | 25,000 | | | | (740 | ) |
| 7/10/18 | | JPMorgan Chase Bank N.A. | | | CLP | | | | 246,520,000 | | | | 378,665 | | | | 400,000 | | | | (21,335 | ) |
| 7/17/18 | | JPMorgan Chase Bank N.A. | | | EGP | | | | 686,698 | | | | 38,211 | | | | 38,000 | | | | 211 | |
| 7/17/18 | | Goldman Sachs & Co. | | | EGP | | | | 6,809,958 | | | | 378,932 | | | | 376,656 | | | | 2,276 | |
| 7/17/18 | | Bank of America N.A. | | | EUR | | | | 58,913 | | | | 68,853 | | | | 69,000 | | | | (147 | ) |
| 7/17/18 | | JPMorgan Chase Bank N.A. | | | EUR | | | | 257,130 | | | | 300,513 | | | | 309,600 | | | | (9,087 | ) |
| 7/17/18 | | Goldman Sachs & Co. | | | EUR | | | | 2,387,397 | | | | 2,790,193 | | | | 2,977,505 | | | | (187,312 | ) |
| 7/17/18 | | Barclays Bank plc | | | HUF | | | | 142,782,692 | | | | 506,951 | | | | 571,313 | | | | (64,362 | ) |
| 7/24/18 | | Bank of America N.A. | | | IDR | | | | 3,321,454,040 | | | | 231,812 | | | | 239,471 | | | | (7,659 | ) |
| 7/17/18 | | Goldman Sachs & Co. | | | ILS | | | | 1,394,609 | | | | 381,358 | | | | 389,882 | | | | (8,524 | ) |
| 7/24/18 | | JPMorgan Chase Bank N.A. | | | INR | | | | 27,321,910 | | | | 397,865 | | | | 407,000 | | | | (9,135 | ) |
| 7/17/18 | | JPMorgan Chase Bank N.A. | | | MAD | | | | 3,816,177 | | | | 401,976 | | | | 415,431 | | | | (13,455 | ) |
| 7/10/18 | | Citibank N.A. | | | MXN | | | | 38,838,965 | | | | 1,973,750 | | | | 2,096,849 | | | | (123,099 | ) |
| 7/10/18 | | Goldman Sachs & Co. | | | MXN | | | | 1,581,136 | | | | 80,352 | | | | 79,000 | | | | 1,352 | |
| 10/10/18 | | Barclays Bank plc | | | MXN | | | | 861,770 | | | | 43,174 | | | | 42,639 | | | | 535 | |
| 7/24/18 | | Barclays Bank plc | | | MYR | | | | 2,978,169 | | | | 737,087 | | | | 763,861 | | | | (26,774 | ) |
| 7/17/18 | | JPMorgan Chase Bank N.A. | | | NGN | | | | 75,087,102 | | | | 207,423 | | | | 204,960 | | | | 2,463 | |
| 7/24/18 | | Citibank N.A. | | | NZD | | | | 564,524 | | | | 382,214 | | | | 397,534 | | | | (15,320 | ) |
See accompanying Notes to the Financial Statements.
166
Barings Emerging Markets Local Currency Debt Fund 2018 Annual Report
SCHEDULE OF INVESTMENTS (CONTINUED)
June 30, 2018
| | | | | | | | | | | | | | | | | | | | | | |
EXPIRATION
DATE | | COUNTERPARTY | | LOCAL
CURRENCY | | | VALUE IN USD | | | IN
EXCHANGE
FOR USD | | | NET UNREALIZED
APPRECIATION
(DEPRECIATION) | |
| 2/1/19 | | Bank of America N.A. | | | PEN | | | | 1,852,947 | | | $ | 561,884 | | | $ | 569,736 | | | $ | (7,852 | ) |
| 7/17/18 | | Bank of America N.A. | | | PLN | | | | 1,815,126 | | | | 484,908 | | | | 537,772 | | | | (52,864 | ) |
| 7/17/18 | | JPMorgan Chase Bank N.A. | | | RUB | | | | 6,985,599 | | | | 111,244 | | | | 108,467 | | | | 2,777 | |
| 7/17/18 | | Bank of America N.A. | | | RUB | | | | 26,312,700 | | | | 419,023 | | | | 417,000 | | | | 2,023 | |
| 7/17/18 | | JPMorgan Chase Bank N.A. | | | SEK | | | | 3,352,797 | | | | 375,167 | | | | 406,539 | | | | (31,372 | ) |
| 7/24/18 | | BNP Paribas S.A. | | | THB | | | | 1,086,773 | | | | 32,819 | | | | 34,000 | | | | (1,181 | ) |
| 7/24/18 | | Citibank N.A. | | | THB | | | | 48,951,866 | | | | 1,478,296 | | | | 1,572,447 | | | | (94,151 | ) |
| 7/17/18 | | Citibank N.A. | | | TRY | | | | 721,685 | | | | 156,539 | | | | 155,181 | | | | 1,358 | |
| 7/17/18 | | JPMorgan Chase Bank N.A. | | | TRY | | | | 992,111 | | | | 215,196 | | | | 213,373 | | | | 1,823 | |
| 7/17/18 | | Goldman Sachs & Co. | | | TRY | | | | 5,689,875 | | | | 1,234,175 | | | | 1,304,708 | | | | (70,533 | ) |
| 7/17/18 | | Barclays Bank plc | | | ZAR | | | | 4,609,179 | | | | 335,689 | | | | 369,000 | | | | (33,311 | ) |
| | | | | | | | | | | | | | | | | | | | | | |
Net unrealized depreciation on forward foreign currency exchange contracts to buy | | | $ | (1,110,503 | ) |
| | | | | | | | | | | | | | | | | | | | | | |
Forward Foreign Currency Exchange Contracts to Sell
| | | | | | | | | | | | | | | | | | | | | | |
EXPIRATION
DATE | | COUNTERPARTY | | LOCAL
CURRENCY | | | VALUE IN USD | | | IN
EXCHANGE
FOR USD | | | NET UNREALIZED
APPRECIATION
(DEPRECIATION) | |
| 2/12/19 | | JPMorgan Chase Bank N.A. | | | ARS | | | | 7,453,670 | | | $ | 215,878 | | | $ | 299,464 | | | $ | 83,586 | |
| 2/12/19 | | Bank of America N.A. | | | ARS | | | | 7,453,670 | | | | 215,878 | | | | 217,403 | | | | 1,525 | |
| 7/24/18 | | JPMorgan Chase Bank N.A. | | | AUD | | | | 525,272 | | | | 388,120 | | | | 392,863 | | | | 4,743 | |
| 7/17/18 | | JPMorgan Chase Bank N.A. | | | CHF | | | | 26,579 | | | | 26,799 | | | | 27,000 | | | | 201 | |
| 7/10/18 | | Bank of America N.A. | | | CLP | | | | 362,981,209 | | | | 557,555 | | | | 599,068 | | | | 41,513 | |
| 7/10/18 | | Citibank N.A. | | | CLP | | | | 362,981,209 | | | | 557,554 | | | | 603,149 | | | | 45,595 | |
| 7/24/18 | | Bank of America N.A. | | | CNH | | | | 5,278,152 | | | | 795,929 | | | | 837,711 | | | | 41,782 | |
| 7/24/18 | | BNP Paribas S.A. | | | CNH | | | | 102,778 | | | | 15,499 | | | | 16,000 | | | | 501 | |
| 7/10/18 | | Goldman Sachs & Co. | | | COP | | | | 31,801,550 | | | | 10,824 | | | | 11,000 | | | | 176 | |
| 7/10/18 | | JPMorgan Chase Bank N.A. | | | COP | | | | 2,691,915,300 | | | | 916,268 | | | | 927,000 | | | | 10,732 | |
| 7/10/18 | | Citibank N.A. | | | COP | | | | 29,960,940 | | | | 10,198 | | | | 10,673 | | | | 475 | |
| 7/17/18 | | JPMorgan Chase Bank N.A. | | | EGP | | | | 7,496,656 | | | | 417,143 | | | | 415,442 | | | | (1,701 | ) |
| 7/17/18 | | Barclays Bank plc | | | EUR | | | | 177,806 | | | | 207,805 | | | | 210,236 | | | | 2,431 | |
| 7/17/18 | | JPMorgan Chase Bank N.A. | | | EUR | | | | 1,515,157 | | | | 1,770,790 | | | | 1,794,691 | | | | 23,901 | |
| 7/17/18 | | Citibank N.A. | | | EUR | | | | 147,872 | | | | 172,820 | | | | 173,152 | | | | 332 | |
| 7/24/18 | | Bank of America N.A. | | | IDR | | | | 3,321,454,040 | | | | 231,812 | | | | 238,696 | | | | 6,884 | |
| 7/17/18 | | Barclays Bank plc | | | ILS | | | | 1,394,609 | | | | 381,358 | | | | 399,470 | | | | 18,112 | |
| 7/24/18 | | JPMorgan Chase Bank N.A. | | | INR | | | | 41,044,591 | | | | 597,697 | | | | 618,948 | | | | 21,251 | |
| 7/24/18 | | Barclays Bank plc | | | INR | | | | 11,724,120 | | | | 170,728 | | | | 174,000 | | | | 3,272 | |
| 7/17/18 | | JPMorgan Chase Bank N.A. | | | MAD | | | | 3,816,177 | | | | 401,976 | | | | 407,986 | | | | 6,010 | |
| 7/3/18 | | Barclays Bank plc | | | MXN | | | | 861,770 | | | | 43,843 | | | | 43,296 | | | | (547 | ) |
| 7/24/18 | | Barclays Bank plc | | | MYR | | | | 419,407 | | | | 103,802 | | | | 106,000 | | | | 2,198 | |
| 7/17/18 | | JPMorgan Chase Bank N.A. | | | NGN | | | | 75,087,102 | | | | 207,423 | | | | 204,876 | | | | (2,547 | ) |
| 7/24/18 | | JPMorgan Chase Bank N.A. | | | NZD | | | | 564,524 | | | | 382,214 | | | | 413,795 | | | | 31,581 | |
| 2/1/19 | | Barclays Bank plc | | | PEN | | | | 1,852,947 | | | | 561,884 | | | | 567,257 | | | | 5,373 | |
| 7/24/18 | | JPMorgan Chase Bank N.A. | | | PHP | | | | 13,329,920 | | | | 249,277 | | | | 253,613 | | | | 4,336 | |
See accompanying Notes to the Financial Statements.
167
Barings Emerging Markets Local Currency Debt Fund 2018 Annual Report
SCHEDULE OF INVESTMENTS (CONTINUED)
June 30, 2018
| | | | | | | | | | | | | | | | | | | | | | |
EXPIRATION
DATE | | COUNTERPARTY | | LOCAL
CURRENCY | | | VALUE IN USD | | | IN
EXCHANGE
FOR USD | | | NET UNREALIZED
APPRECIATION
(DEPRECIATION) | |
| 7/24/18 | | Bank of America N.A. | | | PHP | | | | 10,346,840 | | | $ | 193,492 | | | $ | 196,000 | | | $ | 2,508 | |
| 7/17/18 | | JPMorgan Chase Bank N.A. | | | RON | | | | 2,252,618 | | | | 563,572 | | | | 599,627 | | | | 36,055 | |
| 7/17/18 | | JPMorgan Chase Bank N.A. | | | RSD | | | | 28,843,487 | | | | 285,223 | | | | 301,694 | | | | 16,471 | |
| 7/17/18 | | Bank of America N.A. | | | RUB | | | | 21,862,947 | | | | 348,162 | | | | 343,029 | | | | (5,133 | ) |
| 7/24/18 | | JPMorgan Chase Bank N.A. | | | THB | | | | 17,279,794 | | | | 521,832 | | | | 539,959 | | | | 18,127 | |
| 7/24/18 | | Citibank N.A. | | | THB | | | | 39,902,280 | | | | 1,205,008 | | | | 1,221,000 | | | | 15,992 | |
| 7/17/18 | | JPMorgan Chase Bank N.A. | | | TRY | | | | 4,123,869 | | | | 894,497 | | | | 967,523 | | | | 73,026 | |
| 7/17/18 | | Barclays Bank plc | | | ZAR | | | | 202,965 | | | | 14,782 | | | | 16,000 | | | | 1,218 | |
| 7/17/18 | | Bank of America N.A. | | | ZAR | | | | 4,777,688 | | | | 347,962 | | | | 375,000 | | | | 27,038 | |
| 7/17/18 | | JPMorgan Chase Bank N.A. | | | ZAR | | | | 12,780,873 | | | | 930,838 | | | | 1,052,166 | | | | 121,328 | |
| | | | | | | | | | | | | | | | | | | | | | |
Net unrealized appreciation on forward foreign currency exchange contracts to sell | | | $ | 658,345 | |
| | | | | | | | | | | | | | | | | | | | | | |
Currency Legend
| | | | |
| ARS | | – | | Argentine Peso |
| AUD | | – | | Australian Dollar |
| BRL | | – | | Brazilian Real |
| CHF | | – | | Swiss Franc |
| CLP | | – | | Chilean Peso |
| CNH | | – | | Chinese Yuan Renminbi |
| COP | | – | | Colombian Peso |
| CZK | | – | | Czech Koruna |
| EGP | | – | | Egyptian Pound |
| EUR | | – | | Euro |
| HUF | | – | | Hungarian Forint |
| IDR | | – | | Indonesian Rupiah |
| ILS | | – | | Israeli Shekel |
| INR | | – | | Indian Rupee |
| MAD | | – | | Moroccan Diram |
| MXN | | – | | Mexican Peso |
| MYR | | – | | Malaysian Ringgit |
| NGN | | – | | Nigeria Naira |
| NZD | | – | | New Zealand Dollar |
| PEN | | – | | Peruvian Nouveau Sol |
| PHP | | – | | Philippines Peso |
| PLN | | – | | Polish Zloty |
| RON | | – | | Romanian New Leu |
| RSD | | – | | Serbian Dinar. |
| RUB | | – | | Russian Ruble |
| SEK | | – | | Swedish Krona |
| THB | | – | | Thai Baht |
| TRY | | – | | Turkish New Lira |
| ZAR | | – | | South African Rand |
See accompanying Notes to the Financial Statements.
168
Barings Emerging Markets Local Currency Debt Fund 2018 Annual Report
SCHEDULE OF INVESTMENTS (CONTINUED)
June 30, 2018
OTC – Interest Rate Swaps
| | | | | | | | | | | | | | | | |
| DESCRIPTION | | NOTIONAL
AMOUNT | | | UNREALIZED
APPRECIATION
(DEPRECIATION) | | | VALUE | |
Agreement with Bank of America N.A. dated 12/9/15 receiving a fixed rate of 8.68% paying the notional amount multiplied by the ZAR-JIBAR rate. Expiring 12/9/25 | | | ZAR | | | | 8,000,000 | | | $ | 19,186 | | | $ | 19,186 | |
Agreement with Bank of America N.A. dated 2/14/18 paying a fixed rate of 0.96% receiving the notional amount multiplied by the ILS-TELBOR rate. Expiring 2/14/23 | | | ILS | | | | 5,900,000 | | | | 8,694 | | | | 8,694 | |
Agreement with Bank of America N.A. dated 2/6/18 paying a fixed rate of 0.885% receiving the notional amount multiplied by the ILS-TELBOR rate. Expiring 2/6/23 | | | ILS | | | | 700,000 | | | | 1,631 | | | | 1,631 | |
Agreement with Bank of America N.A. dated 12/21/17 paying a fixed rate of 1.73% receiving the notional amount multiplied by the HUF-BUBOR rate. Expiring 12/21/27 | | | HUF | | | | 67,700,000 | | | | 23,757 | | | | 23,757 | |
Agreement with Bank of America N.A. dated 11/24/17 paying a fixed rate of 1.84% receiving the notional amount multiplied by the HUF-BUBOR rate. Expiring 11/24/27 | | | HUF | | | | 76,800,000 | | | | 24,003 | | | | 24,003 | |
Agreement with Bank of America N.A. dated 5/18/17 paying a fixed rate of 1.22% receiving the notional amount multiplied by the HUF-BUBOR rate. Expiring 5/18/22 | | | HUF | | | | 92,000,000 | | | | 6,869 | | | | 6,869 | |
Agreement with Bank of America N.A. dated 06/27/18 receiving a fixed rate of 9.355% paying the notional amount multiplied by the BRL-CDI rate. Expiring 01/24/21 | | | BRL | | | | 1,597,611 | | | | 1,217 | | | | 1,217 | |
Agreement with Bank of America N.A. dated 06/06/18 receiving a fixed rate of 12.06% paying the notional amount multiplied by the BRL-CDI rate. Expiring 01/04/27 | | | BRL | | | | 415,255 | | | | 4,557 | | | | 4,557 | |
Agreement with Bank of America N.A. dated 05/30/18 receiving a fixed rate of 11.31% paying the notional amount multiplied by the BRL-CDI rate. Expiring 01/04/27 | | | BRL | | | | 1,117,619 | | | | (7,205 | ) | | | (7,205 | ) |
Agreement with JPMorgan Chase Bank N.A. dated 12/9/15 receiving a fixed rate of 6.35% paying the notional amount multiplied by the MXN-TIIE rate. Expiring 11/27/25 | | | MXN | | | | 4,750,000 | | | | (21,701 | ) | | | (21,701 | ) |
Agreement with JPMorgan Chase Bank N.A. dated 5/19/17 paying a fixed rate of 0.43% receiving the notional amount multiplied by the ILS-TELBOR rate. Expiring 5/19/20 | | | ILS | | | | 1,700,000 | | | | (108 | ) | | | (108 | ) |
| | | | | | | | | | | | | | | | |
Total OTC Interest Rate Swaps | | | | | | | | | | $ | 60,900 | | | $ | 60,900 | |
| | | | | | | | | | | | | | | | |
See accompanying Notes to the Financial Statements.
169
Barings Emerging Markets Local Currency Debt Fund 2018 Annual Report
SCHEDULE OF INVESTMENTS (CONTINUED)
June 30, 2018
Centrally Cleared Interest Rate Swaps
| | | | | | | | | | | | | | | | | | | | | | | | | | |
FLOATING RATE
REFERENCE | | PAY/RECEIVE
FLOATING
RATE | | FIXED
RATE | | | MATURITY
DATE | | | PAY/RECEIVE
PAYMENT
FREQUENCY | | | NOTIONAL
AMOUNT | | | CLEARED
EXCHANGE | | | UNREALIZED
APPRECIATION
DEPRECIATION | |
| MXN-TIIE Rate | | Pay | | | 7.77 | % | | | 4/5/27 | | | | 1M/1M | | | | 14,700,000 | | | | CME | | | | (6,995 | ) |
| MXN-TIIE Rate | | Pay | | | 7.73 | % | | | 12/8/27 | | | | 28D/28D | | | | 18,100,000 | | | | CME | | | | (17,546 | ) |
| | | | | | | | | | | | | | | | | | | | | | | | | | |
Total Centrally Cleared Interest Rate Swaps | | | $ | (24,541 | ) |
| | | | | | | | | | | | | | | | | | | | | | | | | | |
Abbreviation Legend
See accompanying Notes to the Financial Statements.
170
Barings Global High Yield Fund 2018 Annual Report
SCHEDULE OF INVESTMENTS
June 30, 2018
| | | | | | | | | | | | | | | | | | | | |
| | | EFFECTIVE
INTEREST RATE | | | DUE DATE | | | PRINCIPAL ‡‡ | | | COST | | | FAIR
VALUE | |
Fixed Income — 97.7%*: | | | | | | | | | | | | | | | | | | | | |
| | | | | |
Bank Loans — 3.3%*§: | | | | | | | | | | | | | | | | | | | | |
| | | | | |
Oil and Gas — 2.5%*: | | | | | | | | | | | | | | | | | | | | |
Fieldwood Energy LLC, 1M LIBOR + 5.250% | | | 7.34 | % | | | 4/11/2022 | | | | 300,000 | | | | $304,500 | | | | $300,150 | |
Caelus Energy Alaska O3 LLC, 3M LIBOR + 7.500% | | | 9.83 | | | | 4/15/2020 | | | | 250,000 | | | | 225,000 | | | | 228,750 | |
Gulf Finance LLC, 3M LIBOR + 5.250% | | | 7.59 | | | | 8/25/2023 | | | | 100,854 | | | | 100,122 | | | | 86,818 | |
| | | | | | | | | | | | | | | | | | | | |
Total Oil and Gas | | | | | | | | | | | 650,854 | | �� | | 629,622 | | | | 615,718 | |
| | | | | | | | | | | | | | | | | | | | |
| | | | | |
Printing and Publishing — 0.8%*: | | | | | | | | | | | | | | | | | | | | |
Getty Images, Inc., 3M LIBOR + 3.500% | | | 5.59 | | | | 10/18/2019 | | | | 199,458 | | | | 192,971 | | | | 192,311 | |
| | | | | | | | | | | | | | | | | | | | |
Total Bank Loans | | | | | | | | | | | 850,312 | | | | 822,593 | | | | 808,029 | |
| | | | | | | | | | | | | | | | | | | | |
| | | | | |
Corporate Bonds — 94.4%*: | | | | | | | | | | | | | | | | | | | | |
| | | | | |
Aerospace and Defense — 2.4%*: | | | | | | | | | | | | | | | | | | | | |
Swissport Financing Sarl+ | | | 9.75 | | | | 12/15/2022 | | | | 100,000 | | | | 131,180 | | | | 125,384 | |
Triumph Group, Inc. | | | 4.88 | | | | 4/1/2021 | | | | 38,000 | | | | 36,934 | | | | 36,575 | |
Triumph Group, Inc. | | | 7.75 | | | | 8/15/2025 | | | | 250,000 | | | | 250,000 | | | | 247,500 | |
VistaJet Malta Finance PLC / VistaJet Co. Finance LLC^ | | | 7.75 | | | | 6/1/2020 | | | | 200,000 | | | | 199,756 | | | | 198,000 | |
| | | | | | | | | | | | | | | | | | | | |
Total Aerospace and Defense | | | | | | | | | | | 588,000 | | | | 617,870 | | | | 607,459 | |
| | | | | | | | | | | | | | | | | | | | |
| | | | | |
Automobile — 2.3%*: | | | | | | | | | | | | | | | | | | | | |
AA Bond Co. Ltd.+ | | | 5.50 | | | | 7/31/2022 | | | | 200,000 | | | | 276,805 | | | | 240,722 | |
JB Poindexter & Co., Inc.^ | | | 7.13 | | | | 4/15/2026 | | | | 202,000 | | | | 202,000 | | | | 207,050 | |
RAC Bond Co. PLC+ | | | 5.00 | | | | 11/6/2022 | | | | 100,000 | | | | 128,880 | | | | 124,482 | |
| | | | | | | | | | | | | | | | | | | | |
Total Automobile | | | | | | | | | | | 502,000 | | | | 607,685 | | | | 572,254 | |
| | | | | | | | | | | | | | | | | | | | |
| | | | | |
Beverage, Food and Tobacco — 3.9%*: | | | | | | | | | | | | | | | | | | | | |
Boparan Finance PLC+ | | | 5.50 | | | | 7/15/2021 | | | | 150,000 | | | | 189,742 | | | | 171,337 | |
JBS USA LUX SA/JBS USA Finance, Inc.^ | | | 5.88 | | | | 7/15/2024 | | | | 137,000 | | | | 140,377 | | | | 130,836 | |
JBS USA LUX SA/JBS USA Finance, Inc.^ | | | 6.75 | | | | 2/15/2028 | | | | 250,000 | | | | 250,000 | | | | 236,175 | |
KeHE Distributors LLC/KeHE Finance Corp.^ | | | 7.63 | | | | 8/15/2021 | | | | 150,000 | | | | 151,115 | | | | 145,875 | |
Pilgrim’s Pride Corp.^ | | | 5.88 | | | | 9/30/2027 | | | | 200,000 | | | | 200,000 | | | | 185,500 | |
Sunshine Mid BV+ | | | 6.50 | | | | 5/15/2026 | | | | 100,000 | | | | 121,055 | | | | 110,602 | |
| | | | | | | | | | | | | | | | | | | | |
Total Beverage, Food and Tobacco | | | | | | | | | | | 987,000 | | | | 1,052,289 | | | | 980,325 | |
| | | | | | | | | | | | | | | | | | | | |
| | | | | |
Broadcasting and Entertainment — 6.8%*: | | | | | | | | | | | | | | | | | | | | |
CCO Holdings LLC/CCO Holdings Capital Corp.^ | | | 5.00 | | | | 2/1/2028 | | | | 275,000 | | | | 275,094 | | | | 251,625 | |
CCO Holdings LLC/CCO Holdings Capital Corp.^ | | | 5.75 | | | | 2/15/2026 | | | | 275,000 | | | | 274,320 | | | | 270,187 | |
Clear Channel Worldwide Holdings, Inc. | | | 7.63 | | | | 3/15/2020 | | | | 241,000 | | | | 240,236 | | | | 239,256 | |
CSC Holdings LLC^ | | | 5.38 | | | | 2/1/2028 | | | | 250,000 | | | | 250,000 | | | | 231,250 | |
DISH DBS Corp. | | | 7.75 | | | | 7/1/2026 | | | | 192,000 | | | | 192,000 | | | | 168,240 | |
Netflix, Inc.^ | | | 5.88 | | | | 11/15/2028 | | | | 200,000 | | | | 200,000 | | | | 201,940 | |
See accompanying Notes to the Financial Statements.
171
Barings Global High Yield Fund 2018 Annual Report
SCHEDULE OF INVESTMENTS (CONTINUED)
June 30, 2018
| | | | | | | | | | | | | | | | | | | | |
| | | EFFECTIVE
INTEREST RATE | | | DUE DATE | | | PRINCIPAL ‡‡ | | | COST | | | FAIR
VALUE | |
Corporate Bonds (Continued) | | | | | | | | | | | | | | | | | | | | |
| | | | | |
Broadcasting and Entertainment (Continued) | | | | | | | | | | | | | | | | | | | | |
Sirius XM Radio, Inc.^ | | | 5.00 | % | | | 8/1/2027 | | | | 229,000 | | | $ | 229,000 | | | $ | 214,401 | |
Unitymedia Hessen GmbH & Co. KG/Unitymedia NRW GmbH+ | | | 6.25 | | | | 1/15/2029 | | | | 90,000 | | | | 105,360 | | | | 117,599 | |
| | | | | | | | | | | | | | | | | | | | |
Total Broadcasting and Entertainment | | | | | | | | | | | 1,752,000 | | | | 1,766,010 | | | | 1,694,498 | |
| | | | | | | | | | | | | | | | | | | | |
| | | | | |
Buildings and Real Estate — 2.1%*: | | | | | | | | | | | | | | | | | | | | |
RPG Byty sro+ | | | 3.38 | | | | 10/15/2024 | | | | 150,000 | | | | 176,165 | | | | 174,294 | |
Standard Industries, Inc.^ | | | 4.75 | | | | 1/15/2028 | | | | 250,000 | | | | 250,000 | | | | 229,375 | |
William Lyon Homes, Inc.^ | | | 6.00 | | | | 9/1/2023 | | | | 123,000 | | | | 123,000 | | | | 121,427 | |
| | | | | | | | | | | | | | | | | | | | |
Total Buildings and Real Estate | | | | | | | | | | | 523,000 | | | | 549,165 | | | | 525,096 | |
| | | | | | | | | | | | | | | | | | | | |
|
Cargo Transport — 4.9%*: | |
American Airlines Group, Inc.^ | | | 5.50 | | | | 10/1/2019 | | | | 265,000 | | | | 267,311 | | | | 267,650 | |
Deck Chassis Acquisition, Inc.^ | | | 10.00 | | | | 6/15/2023 | | | | 387,000 | | | | 393,253 | | | | 410,220 | |
Kenan Advantage Group, Inc.^ | | | 7.88 | | | | 7/31/2023 | | | | 400,000 | | | | 410,331 | | | | 408,000 | |
WFS Global Holding SAS+ | | | 9.50 | | | | 7/15/2022 | | | | 100,000 | | | | 110,938 | | | | 122,421 | |
| | | | | | | | | | | | | | | | | | | | |
Total Cargo Transport | | | | | | | | | | | 1,152,000 | | | | 1,181,833 | | | | 1,208,291 | |
| | | | | | | | | | | | | | | | | | | | |
|
Chemicals, Plastics and Rubber — 3.6%*: | |
Consolidated Energy Finance SA^ | | | 6.88 | | | | 6/15/2025 | | | | 300,000 | | | | 298,654 | | | | 307,875 | |
Huntsman International LLC | | | 4.25 | | | | 4/1/2025 | | | | 100,000 | | | | 129,362 | | | | 132,749 | |
INEOS Group Holdings SA+ | | | 5.38 | | | | 8/1/2024 | | | | 100,000 | | | | 110,349 | | | | 121,914 | |
LBC Tank Terminals Holding Netherlands BV^ | | | 6.88 | | | | 5/15/2023 | | | | 215,000 | | | | 209,000 | | | | 217,150 | |
Monitchem HoldCo 2 SA+ | | | 6.88 | | | | 6/15/2022 | | | | 100,000 | | | | 99,298 | | | | 102,284 | |
| | | | | | | | | | | | | | | | | | | | |
Total Chemicals, Plastics and Rubber | | | | | | | | | | | 815,000 | | | | 846,663 | | | | 881,972 | |
| | | | | | | | | | | | | | | | | | | | |
|
Containers, Packaging and Glass — 1.7%*: | |
BWAY Holding Co. | | | 4.75 | | | | 4/15/2024 | | | | 100,000 | | | | 115,660 | | | | 116,062 | |
SIG Combibloc Holdings SCA+ | | | 7.75 | | | | 2/15/2023 | | | | 250,000 | | | | 291,997 | | | | 302,168 | |
| | | | | | | | | | | | | | | | | | | | |
Total Containers, Packaging and Glass | | | | | | | | | | | 350,000 | | | | 407,657 | | | | 418,230 | |
| | | | | | | | | | | | | | | | | | | | |
|
Diversified/Conglomerate Manufacturing — 0.5%*: | |
Appvion, Inc.^~ | | | 9.00 | | | | 6/1/2020 | | | | 327,000 | | | | 231,191 | | | | 1,839 | |
Energizer Gamma Acquisition BV | | | 4.63 | | | | 7/15/2026 | | | | 100,000 | | | | 116,130 | | | | 117,640 | |
| | | | | | | | | | | | | | | | | | | | |
Total Diversified/Conglomerate Manufacturing | | | | | | | | | | | 427,000 | | | | 347,321 | | | | 119,479 | |
| | | | | | | | | | | | | | | | | | | | |
|
Diversified/Conglomerate Service — 5.6%*: | |
Algeco Global Finance PLC+ | | | 6.50 | | | | 2/15/2023 | | | | 100,000 | | | | 121,299 | | | | 118,719 | |
Carlson Travel, Inc.^ | | | 9.50 | | | | 12/15/2024 | | | | 280,000 | | | | 280,000 | | | | 253,400 | |
Hertz Holdings Netherlands BV | | | 5.50 | | | | 3/30/2023 | | | | 100,000 | | | | 123,070 | | | | 113,044 | |
Iron Mountain UK PLC | | | 3.88 | | | | 11/15/2025 | | | | 100,000 | | | | 132,815 | | | | 124,862 | |
Prime Security Services Borrower LLC/Prime Finance, Inc.^ | | | 9.25 | | | | 5/15/2023 | | | | 353,000 | | | | 363,936 | | | | 375,839 | |
See accompanying Notes to the Financial Statements.
172
Barings Global High Yield Fund 2018 Annual Report
SCHEDULE OF INVESTMENTS (CONTINUED)
June 30, 2018
| | | | | | | | | | | | | | | | | | | | |
| | | EFFECTIVE
INTEREST RATE | | | DUE DATE | | | PRINCIPAL ‡‡ | | | COST | | | FAIR
VALUE | |
Corporate Bonds (Continued) | | | | | | | | | | | | | | | | | | | | |
| | | | | |
Diversified/Conglomerate Service (Continued) | | | | | | | | | | | | | | | | | | | | |
Verisure Midholding AB+ | | | 5.75 | % | | | 12/1/2023 | | | | 150,000 | | | $ | 176,873 | | | $ | 169,768 | |
Zachry Holdings, Inc.^ | | | 7.50 | | | | 2/1/2020 | | | | 250,000 | | | | 251,278 | | | | 247,187 | |
| | | | | | | | | | | | | | | | | | | | |
Total Diversified/Conglomerate Service | | | | | | | | | | | 1,333,000 | | | | 1,449,271 | | | | 1,402,819 | |
| | | | | | | | | | | | | | | | | | | | |
|
Electronics — 3.0%*: | |
j2 Cloud Services LLC/j2 Global Co-Obligor, Inc.^ | | | 6.00 | | | | 7/15/2025 | | | | 95,000 | | | | 95,000 | | | | 96,188 | |
TIBCO Software, Inc.^ | | | 11.38 | | | | 12/1/2021 | | | | 439,000 | | | | 472,658 | | | | 474,120 | |
Veritas US, Inc./Veritas Bermuda Ltd.^ | | | 10.50 | | | | 2/1/2024 | | | | 200,000 | | | | 214,855 | | | | 164,000 | |
| | | | | | | | | | | | | | | | | | | | |
Total Electronics | | | | | | | | | | | 734,000 | | | | 782,513 | | | | 734,308 | |
| | | | | | | | | | | | | | | | | | | | |
|
Finance — 6.8%*: | |
Cabot Financial Luxembourg SA+ | | | 7.50 | | | | 10/1/2023 | | | | 100,000 | | | | 134,851 | | | | 134,285 | |
Galaxy Finco Ltd.+ | | | 7.88 | | | | 11/15/2021 | | | | 250,000 | | | | 380,956 | | | | 325,157 | |
Garfunkelux Holdco 3 S.A.+ | | | 8.50 | | | | 11/1/2022 | | | | 300,000 | | | | 447,461 | | | | 384,166 | |
Jerrold Finco PLC+ | | | 6.13 | | | | 1/15/2024 | | | | 100,000 | | | | 124,555 | | | | 132,643 | |
LPL Holdings, Inc.^ | | | 5.75 | | | | 9/15/2025 | | | | 300,000 | | | | 300,000 | | | | 291,750 | |
Nexi Capital SpA+ | | | 4.13 | | | | 11/1/2023 | | | | 100,000 | | | | 119,575 | | | | 114,444 | |
Park Aerospace Holdings Ltd.+^ | | | 5.25 | | | | 8/15/2022 | | | | 47,000 | | | | 46,919 | | | | 46,531 | |
VFH Parent LLC/Orchestra Co-Issuer, Inc.^ | | | 6.75 | | | | 6/15/2022 | | | | 244,000 | | | | 250,406 | | | | 251,932 | |
| | | | | | | | | | | | | | | | | | | | |
Total Finance | | | | | | | | | | | 1,441,000 | | | | 1,804,723 | | | | 1,680,908 | |
| | | | | | | | | | | | | | | | | | | | |
| | | | | |
Healthcare, Education and Childcare — 7.3%*: | | | | | | | | | | | | | | | | | | | | |
Avantor, Inc.^ | | | 9.00 | | | | 10/1/2025 | | | | 220,000 | | | | 220,000 | | | | 221,694 | |
Cognita Financing PLC+ | | | 7.75 | | | | 8/15/2021 | | | | 100,000 | | | | 133,881 | | | | 133,955 | |
CTC BondCo GmbH+ | | | 5.25 | | | | 12/15/2025 | | | | 100,000 | | | | 117,432 | | | | 111,219 | |
HCA, Inc. | | | 5.38 | | | | 2/1/2025 | | | | 200,000 | | | | 202,660 | | | | 196,940 | |
IDH Finance PLC+ | | | 6.25 | | | | 8/15/2022 | | | | 100,000 | | | | 131,025 | | | | 120,207 | |
Nidda Healthcare Holding GmbH+ | | | 3.50 | | | | 9/30/2024 | | | | 100,000 | | | | 111,456 | | | | 110,065 | |
Ortho-Clinical Diagnostics, Inc./Ortho-Clinical Diagnostics SA^ | | | 6.63 | | | | 5/15/2022 | | | | 220,000 | | | | 210,374 | | | | 215,050 | |
Synlab Unsecured Bondco PLC+ | | | 8.25 | | | | 7/1/2023 | | | | 100,000 | | | | 131,659 | | | | 123,022 | |
Valeant Pharmaceuticals International, Inc.^ | | | 5.50 | | | | 3/1/2023 | | | | 101,000 | | | | 78,472 | | | | 93,930 | |
Valeant Pharmaceuticals International, Inc.^ | | | 5.88 | | | | 5/15/2023 | | | | 42,000 | | | | 35,629 | | | | 39,454 | |
Valeant Pharmaceuticals International, Inc.^ | | | 6.13 | | | | 4/15/2025 | | | | 224,000 | | | | 198,190 | | | | 206,360 | |
Valeant Pharmaceuticals International, Inc.^ | | | 6.50 | | | | 3/15/2022 | | | | 118,000 | | | | 118,000 | | | | 122,130 | |
Valeant Pharmaceuticals International, Inc.^ | | | 7.00 | | | | 3/15/2024 | | | | 125,000 | | | | 125,000 | | | | 131,056 | |
| | | | | | | | | | | | | | | | | | | | |
Total Healthcare, Education and Childcare | | | | | | | | | | | 1,750,000 | | | | 1,813,778 | | | | 1,825,082 | |
| | | | | | | | | | | | | | | | | | | | |
| | |
Home and Office Furnishings, Housewares, and Durable Consumer Products — 0.6%*: | | | | | | | | | |
LSF9 Balta Issuer SARL+ | | | 7.75 | | | | 9/15/2022 | | | | 121,500 | | | | 152,217 | | | | 148,054 | |
| | | | | | | | | | | | | | | | | | | | |
| | | | | |
Hotels, Motels, Inns and Gaming — 1.9%*: | | | | | | | | | | | | | | | | | | | | |
Boyne USA, Inc.^ | | | 7.25 | | | | 5/1/2025 | | | | 125,000 | | | | 125,000 | | | | 130,312 | |
TVL Finance PLC+ | | | 8.50 | | | | 5/15/2023 | | | | 160,000 | | | | 224,837 | | | | 220,557 | |
See accompanying Notes to the Financial Statements.
173
Barings Global High Yield Fund 2018 Annual Report
SCHEDULE OF INVESTMENTS (CONTINUED)
June 30, 2018
| | | | | | | | | | | | | | | | | | | | |
| | | EFFECTIVE
INTEREST RATE | | | DUE DATE | | | PRINCIPAL ‡‡ | | | COST | | | FAIR
VALUE | |
Corporate Bonds (Continued) | | | | | | | | | | | | | | | | | | | | |
| | | | | |
Hotels, Motels, Inns and Gaming (Continued) | | | | | | | | | | | | | | | | | | | | |
Wynn Las Vegas LLC/Wynn Las Vegas Capital Corp.^ | | | 5.25 | % | | | 5/15/2027 | | | | 125,000 | | | $ | 125,000 | | | $ | 116,875 | |
| | | | | | | | | | | | | | | | | | | | |
Total Hotels, Motels, Inns and Gaming | | | | | | | | | | | 410,000 | | | | 474,837 | | | | 467,744 | |
| | | | | | | | | | | | | | | | | | | | |
| | | | | |
Insurance — 0.9%*: | | | | | | | | | | | | | | | | | | | | |
Acrisure LLC/Acrisure Finance, Inc.^ | | | 7.00 | | | | 11/15/2025 | | | | 250,000 | | | | 250,000 | | | | 227,500 | |
| | | | | | | | | | | | | | | | | | | | |
| | | | | |
Leisure, Amusement, Entertainment — 4.6%*: | | | | | | | | | | | | | | | | | | | | |
Allegiant Travel Co. | | | 5.50 | | | | 7/15/2019 | | | | 200,000 | | | | 202,908 | | | | 201,000 | |
AMC Entertainment Holdings, Inc. | | | 6.38 | | | | 11/15/2024 | | | | 200,000 | | | | 254,565 | | | | 266,986 | |
Brunswick Corp. | | | 7.13 | | | | 8/1/2027 | | | | 317,000 | | | | 333,765 | | | | 370,020 | |
Perform Group Financing PLC+ | | | 8.50 | | | | 11/15/2020 | | | | 100,000 | | | | 150,387 | | | | 133,986 | |
WMG Acquisition Corp.^ | | | 5.00 | | | | 8/1/2023 | | | | 160,000 | | | | 160,000 | | | | 159,200 | |
| | | | | | | | | | | | | | | | | | | | |
Total Leisure, Amusement, Entertainment | | | | | | | | | | | 977,000 | | | | 1,101,625 | | | | 1,131,192 | |
| | | | | | | | | | | | | | | | | | | | |
| | |
Machinery Non-Agriculture, Non-Construction, Non-Electronic — 1.0%*: | | | | | | | | | |
Apex Tool Group LLC/BC Mountain Finance, Inc.^ | | | 9.00 | | | | 2/15/2023 | | | | 250,000 | | | | 250,000 | | | | 241,875 | |
| | | | | | | | | | | | | | | | | | | | |
| | | | |
Mining, Steel, Iron and Non-Precious Metals — 6.9%*: | | | | | | | | | | | | | | | | | |
Alliance Resource Operating Partners LP/Alliance Resource Finance Corp.^ | | | 7.50 | | | | 5/1/2025 | | | | 215,000 | | | | 215,000 | | | | 228,975 | |
ArcelorMittal | | | 6.75 | | | | 3/1/2041 | | | | 165,000 | | | | 191,986 | | | | 186,272 | |
First Quantum Minerals Ltd.+^ | | | 6.88 | | | | 3/1/2026 | | | | 229,000 | | | | 229,000 | | | | 219,267 | |
Hecla Mining Co. | | | 6.88 | | | | 5/1/2021 | | | | 250,000 | | | | 227,659 | | | | 252,647 | |
Kinross Gold Corp.+ | | | 5.95 | | | | 3/15/2024 | | | | 127,000 | | | | 131,535 | | | | 130,175 | |
Kinross Gold Corp. | | | 6.88 | | | | 9/1/2041 | | | | 82,000 | | | | 81,601 | | | | 84,050 | |
Northwest Acquisitions ULC/Dominion Finco, Inc.+^ | | | 7.13 | | | | 11/1/2022 | | | | 107,000 | | | | 106,638 | | | | 106,733 | |
SunCoke Energy Partners LP/SunCoke Energy Partners Finance Corp.^ | | | 7.50 | | | | 6/15/2025 | | | | 250,000 | | | | 246,668 | | | | 254,375 | |
Warrior Met Coal, Inc.^ | | | 8.00 | | | | 11/1/2024 | | | | 240,000 | | | | 240,000 | | | | 247,800 | |
| | | | | | | | | | | | | | | | | | | | |
Total Mining, Steel, Iron and Non-Precious Metals | | | | | | | | | | | 1,665,000 | | | | 1,670,087 | | | | 1,710,294 | |
| | | | | | | | | | | | | | | | | | | | |
| | | | | |
Oil and Gas — 16.2%*: | | | | | | | | | | | | | | | | | | | | |
CGG Holding US, Inc.+ | | | 7.88 | | | | 5/1/2023 | | | | 150,000 | | | | 185,580 | | | | 184,475 | |
Chesapeake Energy Corp. | | | 8.00 | | | | 1/15/2025 | | | | 200,000 | | | | 197,469 | | | | 203,690 | |
Chesapeake Energy Corp. | | | 8.00 | | | | 6/15/2027 | | | | 17,000 | | | | 17,000 | | | | 17,298 | |
Citgo Holding, Inc.^ | | | 10.75 | | | | 2/15/2020 | | | | 341,000 | | | | 343,221 | | | | 362,739 | |
Energy Transfer Equity LP | | | 4.25 | | | | 3/15/2023 | | | | 250,000 | | | | 250,000 | | | | 241,252 | |
EP Energy LLC/Everest Acquisition Finance, Inc.^ | | | 8.00 | | | | 2/15/2025 | | | | 314,000 | | | | 314,000 | | | | 243,350 | |
EP Energy LLC/Everest Acquisition Finance, Inc.^ | | | 9.38 | | | | 5/1/2024 | | | | 58,000 | | | | 52,246 | | | | 47,560 | |
See accompanying Notes to the Financial Statements.
174
Barings Global High Yield Fund 2018 Annual Report
SCHEDULE OF INVESTMENTS (CONTINUED)
June 30, 2018
| | | | | | | | | | | | | | | | | | | | |
| | | EFFECTIVE
INTEREST RATE | | | DUE DATE | | | PRINCIPAL ‡‡ | | | COST | | | FAIR
VALUE | |
Corporate Bonds (Continued) | | | | | | | | | | | | | | | | | | | | |
| | | | | |
Oil and Gas (Continued) | | | | | | | | | | | | | | | | | | | | |
Ferrellgas Partners LP/Ferrellgas Partners Finance Corp. | | | 8.63 | % | | | 6/15/2020 | | | | 500,000 | | | $ | 494,682 | | | $ | 481,250 | |
Genesis Energy LP/Genesis Energy Finance Corp. | | | 6.50 | | | | 10/1/2025 | | | | 300,000 | | | | 300,000 | | | | 288,000 | |
Jonah Energy LLC/Jonah Energy Finance Corp.^ | | | 7.25 | | | | 10/15/2025 | | | | 250,000 | | | | 250,000 | | | | 201,875 | |
Jupiter Resources, Inc.+^ | | | 8.50 | | | | 10/1/2022 | | | | 405,000 | | | | 338,790 | | | | 166,050 | |
KCA Deutag UK Finance PLC+^ | | | 9.63 | | | | 4/1/2023 | | | | 200,000 | | | | 206,270 | | | | 202,750 | |
Kosmos Energy Ltd.+^ | | | 7.88 | | | | 8/1/2021 | | | | 450,000 | | | | 434,445 | | | | 457,312 | |
Neptune Energy Bondco PLC^ | | | 6.63 | | | | 5/15/2025 | | | | 200,000 | | | | 200,246 | | | | 194,750 | |
QEP Resources, Inc. | | | 5.63 | | | | 3/1/2026 | | | | 125,000 | | | | 120,079 | | | | 119,688 | |
Sunoco LP/Sunoco Finance Corp.^ | | | 5.50 | | | | 2/15/2026 | | | | 100,000 | | | | 100,000 | | | | 94,750 | |
Transocean, Inc. | | | 6.80 | | | | 3/15/2038 | | | | 42,000 | | | | 33,718 | | | | 34,125 | |
Transocean, Inc. | | | 9.35 | | | | 12/15/2041 | | | | 32,000 | | | | 29,785 | | | | 31,840 | |
Tullow Oil PLC+^ | | | 6.25 | | | | 4/15/2022 | | | | 250,000 | | | | 211,304 | | | | 242,500 | |
Welltec A/S+^ | | | 9.50 | | | | 12/1/2022 | | | | 200,000 | | | | 198,237 | | | | 201,000 | |
| | | | | | | | | | | | | | | | | | | | |
Total Oil and Gas | | | | | | | | | | | 4,384,000 | | | | 4,277,072 | | | | 4,016,254 | |
| | | | | | | | | | | | | | | | | | | | |
| | | |
Personal and Non-Durable Consumer Products Mfg. Only — 0.4%*: | | | | | | | | | | | | | |
Samsonite Finco Sarl | | | 3.50 | | | | 5/15/2026 | | | | 100,000 | | | | 109,108 | | | | 111,087 | |
| | | | | | | | | | | | | | | | | | | | |
| | | | | |
Personal Transportation — 0.6%*: | | | | | | | | | | | | | | | | | | | | |
Hertz Corp. (The)^ | | | 7.63 | | | | 6/1/2022 | | | | 150,000 | | | | 150,000 | | | | 144,000 | |
| | | | | | | | | | | | | | | | | | | | |
| | | | | |
Personal, Food and Miscellaneous — 0.5%*: | | | | | | | | | | | | | | | | | | | | |
Ocado Group PLC+ | | | 4.00 | | | | 6/15/2024 | | | | 100,000 | | | | 128,106 | | | | 132,001 | |
| | | | | | | | | | | | | | | | | | | | |
| | | | | |
Retail Stores — 2.2%*: | | | | | | | | | | | | | | | | | | | | |
HSS Financing PLC+ | | | 6.75 | | | | 8/1/2019 | | | | 68,000 | | | | 98,098 | | | | 89,339 | |
Maxeda DIY Holding B.V.+ | | | 6.13 | | | | 7/15/2022 | | | | 100,000 | | | | 114,070 | | | | 106,124 | |
Penske Automotive Group, Inc. | | | 5.50 | | | | 5/15/2026 | | | | 250,000 | | | | 250,000 | | | | 245,000 | |
Travelex Financing PLC+ | | | 8.00 | | | | 5/15/2022 | | | | 100,000 | | | | 108,750 | | | | 113,750 | |
| | | | | | | | | | | | | | | | | | | | |
Total Retail Stores | | | | | | | | | | | 518,000 | | | | 570,918 | | | | 554,213 | |
| | | | | | | | | | | | | | | | | | | | |
| | | | | |
Telecommunications — 6.3%*: | | | | | | | | | | | | | | | | | | | | |
Cequel Communications Holdings I LLC/Cequel Capital Corp.^ | | | 7.50 | | | | 4/1/2028 | | | | 250,000 | | | | 250,000 | | | | 253,050 | |
Frontier Communications Corp. | | | 7.13 | | | | 3/15/2019 | | | | 250,000 | | | | 252,996 | | | | 251,875 | |
Sprint Communications, Inc. | | | 7.00 | | | | 8/15/2020 | | | | 75,000 | | | | 74,470 | | | | 77,625 | |
Sprint Corp. | | | 7.63 | | | | 3/1/2026 | | | | 125,000 | | | | 125,000 | | | | 127,500 | |
Sprint Corp. | | | 7.88 | | | | 9/15/2023 | | | | 452,000 | | | | 438,073 | | | | 468,667 | |
Telecom Italia SpA/Milano+ | | | 5.88 | | | | 5/19/2023 | | | | 100,000 | | | | 149,643 | | | | 145,235 | |
Virgin Media Receivables Financing Notes I DAC+ | | | 5.50 | | | | 9/15/2024 | | | | 100,000 | | | | 134,719 | | | | 129,823 | |
Ziggo Bond Finance BV+ | | | 4.63 | | | | 1/15/2025 | | | | 100,000 | | | | 103,942 | | | | 115,186 | |
| | | | | | | | | | | | | | | | | | | | |
Total Telecommunications | | | | | | | | | | | 1,452,000 | | | | 1,528,843 | | | | 1,568,961 | |
| | | | | | | | | | | | | | | | | | | | |
See accompanying Notes to the Financial Statements.
175
Barings Global High Yield Fund 2018 Annual Report
SCHEDULE OF INVESTMENTS (CONTINUED)
June 30, 2018
| | | | | | | | | | | | | | | | | | | | |
| | | EFFECTIVE
INTEREST RATE | | | DUE DATE | | | PRINCIPAL ‡‡ | | | COST | | | FAIR
VALUE | |
Corporate Bonds (Continued) | | | | | | | | | | | | | | | | | | | | |
| | | | | |
Utilities — 1.4%*: | | | | | | | | | | | | | | | | | | | | |
Nordex SE+ | | | 6.50 | % | | | 2/1/2023 | | | | 100,000 | | | $ | 124,195 | | | $ | 108,907 | |
Viridian Group Finance Co PLC+ | | | 4.00 | | | | 9/15/2025 | | | | 100,000 | | | | 118,264 | | | | 108,339 | |
Viridian Group Finance Co. PLC+ | | | 4.75 | | | | 9/15/2024 | | | | 100,000 | | | | 132,000 | | | | 121,714 | |
| | | | | | | | | | | | | | | | | | | | |
Total Utilities | | | | | | | | | | | 300,000 | | | | 374,459 | | | | 338,960 | |
| | | | | | | | | | | | | | | | | | | | |
Total Corporate Bonds | | | | | | | | | | | 23,031,500 | | | | 24,264,050 | | | | 23,442,856 | |
| | | | | | | | | | | | | | | | | | | | |
Total Fixed Income | | | | | | | | | | | 23,881,812 | | | | 25,086,643 | | | | 24,250,885 | |
| | | | | | | | | | | | | | | | | | | | |
| | | | | |
Short-Term Investments — 4.1%*: | | | | | | | | | | | | | | | | | | | | |
| | | | | |
Bank Deposit — 4.1%*: | | | | | | | | | | | | | | | | | | | | |
State Street Bank & Trust Co. Euro Time Deposit | | | 0.28 | | | | 7/2/2018 | | | | 1,028,962 | | | | 1,028,962 | | | | 1,028,962 | |
| | | | | | | | | | | | | | | | | | | | |
Total Investments | | | | | | | | | | | 24,910,774 | | | | 26,115,605 | | | | 25,279,847 | |
| | | | | | | | | | | | | | | | | | | | |
| | | | | |
Other assets and liabilities — (1.8%)* | | | | | | | | | | | | | | | | | | | (454,074 | ) |
| | | | | | | | | | | | | | | | | | | | |
| | | | | |
Net Assets — 100.0% | | | | | | | | | | | | | | | | | | | $24,825,773 | |
| | | | | | | | | | | | | | | | | | | | |
| ‡‡ | Unless otherwise indicated, all principal amounts are denominated in United States Dollars. |
| * | Calculated as a percentage of net assets applicable to common shareholders. |
Distributions of investments by country of risk (excluding temporary cash investments) as a percentage of total investments in securities, is as follows:
| | | | | | |
| | United States | | | 69.8% | |
| | United Kingdom | | | 12.0% | |
| | Ghana | | | 2.9% | |
| | Germany | | | 2.8% | |
| | Switzerland | | | 1.8% | |
| | France | | | 1.7% | |
| | Canada | | | 1.6% | |
| | Netherlands | | | 1.4% | |
| | Ireland | | | 1.1% | |
| | Italy | | | 1.1% | |
| | Other (Individually less than 1%) | | | 3.8% | |
| | | | | | |
| | | | | | |
| | Total | | | 100.0% | |
| | | | | | |
| ^ | Security acquired in a transaction exempt from registration under Rule 144A of the Securities Act of 1933. These securities may only be resold in transactions exempt from registration, normally to qualified institutional buyers. |
| § | Bank loans are exempt from registration under the Securities Act of 1933, as amended, but contain certain restrictions on resale and cannot be sold publicly. These loans pay interest at rates which adjust periodically. The interest rates shown for bank loans are the current interest rates at June 30, 2018. Bank loans are also subject to mandatory and/or optional prepayment which cannot be predicted. As a result, the remaining maturity may be substantially less than the stated maturity shown. |
See accompanying Notes to the Financial Statements.
176
Barings Global High Yield Fund 2018 Annual Report
SCHEDULE OF INVESTMENTS (CONTINUED)
June 30, 2018
A summary of outstanding derivatives at June 30, 2018 is as follows:
Forward Foreign Currency Exchange Contracts to Buy
| | | | | | | | | | | | | | | | | | | | | | |
EXPIRATION
DATE | | COUNTERPARTY | | LOCAL
CURRENCY | | | VALUE IN USD | | | IN
EXCHANGE
FOR USD | | | NET UNREALIZED
APPRECIATION
(DEPRECIATION) | |
| 7/11/18 | | Bank of America N.A. | | | EUR | | | | 100,907 | | | | 117,905 | | | | 117,005 | | | $ | 900 | |
| 7/11/18 | | BNP Paribas S.A. | | | GBP | | | | 2,000 | | | | 2,641 | | | | 2,648 | | | | (7 | ) |
| | | | | | | | | | | | | | | | | | | | | | |
Net unrealized appreciation on forward foreign currency exchange contracts to buy | | | $ | 893 | |
| | | | | | | | | | | | | | | | | | | | | | |
Forward Foreign Currency Exchange Contracts to Sell
| | | | | | | | | | | | | | | | | | | | | | |
EXPIRATION
DATE | | COUNTERPARTY | | LOCAL
CURRENCY | | | VALUE IN USD | | | IN
EXCHANGE
FOR USD | | | NET UNREALIZED
APPRECIATION
(DEPRECIATION) | |
| 7/11/18 | | BNP Paribas S.A. | | | EUR | | | | 85,220 | | | | 99,576 | | | | 100,550 | | | $ | 974 | |
| 7/11/18 | | Bank of America N.A. | | | EUR | | | | 506,649 | | | | 591,997 | | | | 591,104 | | | | (893 | ) |
| 7/11/18 | | Goldman Sachs & Co. | | | EUR | | | | 2,290,782 | | | | 2,676,676 | | | | 2,681,794 | | | | 5,118 | |
| 7/11/18 | | JPMorgan Chase Bank N.A. | | | GBP | | | | 2,445,864 | | | | 3,229,057 | | | | 3,268,863 | | | | 39,806 | |
| | | | | | | | | | | | | | | | | | | | | | |
Net unrealized appreciation on forward foreign currency exchange contracts to sell | | | $ | 45,005 | |
| | | | | | | | | | | | | | | | | | | | | | |
Currency Legend
| | | | |
| EUR | | – | | Euro |
| GBP | | – | | British Pound Sterling |
See accompanying Notes to the Financial Statements.
177
Barings U.S. High Yield Fund 2018 Annual Report
SCHEDULE OF INVESTMENTS
June 30, 2018
| | | | | | | | | | | | | | | | | | | | |
| | | | | | | | | SHARES | | | COST | | | FAIR
VALUE | |
Equities — 0.4%*: | | | | | | | | | | | | | | | | | | | | |
| | | | | |
Common Stocks — 0.4%*: | | | | | | | | | | | | | | | | | | | | |
| | | | | |
Oil and Gas — 0.4%*: | | | | | | | | | | | | | | | | | | | | |
Fieldwood Energy LLC | | | | | | | | | | | 1,006 | | | | $35,210 | | | | $49,357 | |
Fieldwood Energy LLC | | | | | | | | | | | 4,100 | | | | 88,421 | | | | 206,025 | |
| | | | | | | | | | | | | | | | | | | | |
Total Oil and Gas | | | | | | | | | | | 5,106 | | | | 123,631 | | | | 255,382 | |
| | | | | | | | | | | | | | | | | | | | |
Total Common Stocks | | | | | | | | | | | 5,106 | | | | 123,631 | | | | 255,382 | |
| | | | | | | | | | | | | | | | | | | | |
Total Equities | | | | | | | | | | | 5,106 | | | | 123,631 | | | | 255,382 | |
| | | | | | | | | | | | | | | | | | | | |
| | | | | |
| | | EFFECTIVE
INTEREST RATE | | | DUE DATE | | | PRINCIPAL ‡‡ | | | COST | | | FAIR
VALUE | |
Fixed Income — 93.9%*: | | | | | | | | | | | | | | | | | | | | |
| | | | | |
Bank Loans — 2.6%*§: | | | | | | | | | | | | | | | | | | | | |
| | | | | |
Broadcasting and Entertainment — 0.5%*: | | | | | | | | | | | | | | | | | | | | |
AP NMT Acquisition B.V., 3M LIBOR + 5.750%+ | | | 8.06 | % | | | 8/13/2021 | | | | 299,223 | | | | 299,247 | | | | 298,538 | |
| | | | | | | | | | | | | | | | | | | | |
| | | | | |
Buildings and Real Estate — 0.1%*: | | | | | | | | | | | | | | | | | | | | |
GYP Holdings III Corp., 1M LIBOR + 2.750% | | | 4.84 | | | | 6/1/2025 | | | | 30,632 | | | | 30,632 | | | | 30,377 | |
| | | | | | | | | | | | | | | | | | | | |
| | | | | |
Diversified/Conglomerate Service — 0.1%*: | | | | | | | | | | | | | | | | | | | | |
SonicWALL, Inc., 3M LIBOR + 7.500% | | | 9.83 | | | | 5/18/2026 | | | | 51,897 | | | | 51,380 | | | | 51,378 | |
| | | | | | | | | | | | | | | | | | | | |
| | | | | |
Electronics — 0.1%*: | | | | | | | | | | | | | | | | | | | | |
Renaissance Holding Corp., 3M LIBOR + 7.000% | | | 9.33 | | | | 5/26/2026 | | | | 68,963 | | | | 67,594 | | | | 68,445 | |
| | | | | | | | | | | | | | | | | | | | |
| | | | | |
Oil and Gas — 1.5%*: | | | | | | | | | | | | | | | | | | | | |
Caelus Energy Alaska O3 LLC, 3M LIBOR + 7.500% | | | 9.83 | | | | 4/15/2020 | | | | 550,000 | | | | 495,000 | | | | 503,250 | |
Fieldwood Energy LLC, 1M LIBOR + 5.250% | | | 7.34 | | | | 4/11/2022 | | | | 172,215 | | | | 153,118 | | | | 172,301 | |
Fieldwood Energy LLC, 1M LIBOR + 7.250% | | | 9.34 | | | | 4/11/2023 | | | | 91,996 | | | | 27,598 | | | | 88,852 | |
Gulf Finance LLC, 3M LIBOR + 5.250% | | | 7.59 | | | | 8/25/2023 | | | | 100,854 | | | | 100,122 | | | | 86,819 | |
| | | | | | | | | | | | | | | | | | | | |
Total Oil and Gas | | | | | | | | | | | 915,065 | | | | 775,838 | | | | 851,222 | |
| | | | | | | | | | | | | | | | | | | | |
| | | | | |
Printing and Publishing — 0.3%*: | | | | | | | | | | | | | | | | | | | | |
Getty Images, Inc., 3M LIBOR + 3.500% | | | 5.59 | | | | 10/18/2019 | | | | 199,457 | | | | 192,971 | | | | 192,311 | |
| | | | | | | | | | | | | | | | | | | | |
Total Bank Loans | | | | | | | | | | | 1,565,237 | | | | 1,417,662 | | | | 1,492,271 | |
| | | | | | | | | | | | | | | | | | | | |
| | | | | |
Corporate Bonds — 91.3%*: | | | | | | | | | | | | | | | | | | | | |
| | | | | |
Aerospace and Defense — 3.4%*: | | | | | | | | | | | | | | | | | | | | |
TransDigm UK Holdings PLC^ | | | 6.88 | | | | 5/15/2026 | | | | 500,000 | | | | 496,253 | | | | 506,875 | |
TransDigm, Inc. | | | 6.38 | | | | 6/15/2026 | | | | 307,000 | | | | 304,587 | | | | 304,697 | |
Triumph Group, Inc. | | | 4.88 | | | | 4/1/2021 | | | | 43,000 | | | | 41,794 | | | | 41,388 | |
Triumph Group, Inc. | | | 7.75 | | | | 8/15/2025 | | | | 555,000 | | | | 561,758 | | | | 549,450 | |
VistaJet Malta Finance PLC / VistaJet Co. Finance LLC^ | | | 7.75 | | | | 6/1/2020 | | | | 550,000 | | | | 542,246 | | | | 544,500 | |
| | | | | | | | | | | | | | | | | | | | |
Total Aerospace and Defense | | | | | | | | | | | 1,955,000 | | | | 1,946,638 | | | | 1,946,910 | |
| | | | | | | | | | | | | | | | | | | | |
See accompanying Notes to the Financial Statements.
178
Barings U.S. High Yield Fund 2018 Annual Report
SCHEDULE OF INVESTMENTS (CONTINUED)
June 30, 2018
| | | | | | | | | | | | | | | | | | | | |
| | | EFFECTIVE
INTEREST RATE | | | DUE DATE | | | PRINCIPAL ‡‡ | | | COST | | | FAIR
VALUE | |
Corporate Bonds (Continued) | | | | | | | | | | | | | | | | | | | | |
| | | | | |
Automobile — 1.2%*: | | | | | | | | | | | | | | | | | | | | |
Allison Transmission, Inc.^ | | | 4.75 | % | | | 10/1/2027 | | | | 247,000 | | | | $247,000 | | | | $230,327 | |
Allison Transmission, Inc.^ | | | 5.00 | | | | 10/1/2024 | | | | 176,000 | | | | 176,000 | | | | 173,140 | |
Gates Global LLC/Gates Global Co.^ | | | 6.00 | | | | 7/15/2022 | | | | 12,000 | | | | 10,010 | | | | 12,150 | |
JB Poindexter & Co., Inc.^ | | | 7.13 | | | | 4/15/2026 | | | | 202,000 | | | | 202,000 | | | | 207,050 | |
Wabash National Corp.^ | | | 5.50 | | | | 10/1/2025 | | | | 79,000 | | | | 79,000 | | | | 75,840 | |
| | | | | | | | | | | | | | | | | | | | |
Total Automobile | | | | | | | | | | | 716,000 | | | | 714,010 | | | | 698,507 | |
| | | | | | | | | | | | | | | | | | | | |
| | | | | |
Beverage, Food and Tobacco — 1.9%*: | | | | | | | | | | | | | | | | | | | | |
Carrols Restaurant Group, Inc. | | | 8.00 | | | | 5/1/2022 | | | | 260,000 | | | | 270,214 | | | | 270,400 | |
JBS USA LUX SA/JBS USA Finance, Inc.^ | | | 5.88 | | | | 7/15/2024 | | | | 165,000 | | | | 169,070 | | | | 157,577 | |
JBS USA LUX SA/JBS USA Finance, Inc.^ | | | 6.75 | | | | 2/15/2028 | | | | 250,000 | | | | 250,000 | | | | 236,175 | |
KeHE Distributors LLC/KeHE Finance Corp.^ | | | 7.63 | | | | 8/15/2021 | | | | 203,000 | | | | 201,106 | | | | 197,418 | |
Pilgrim’s Pride Corp.^ | | | 5.88 | | | | 9/30/2027 | | | | 225,000 | | | | 225,000 | | | | 208,687 | |
| | | | | | | | | | | | | | | | | | | | |
Total Beverage, Food and Tobacco | | | | | | | | | | | 1,103,000 | | | | 1,115,390 | | | | 1,070,257 | |
| | | | | | | | | | | | | | | | | | | | |
| | | | | |
Broadcasting and Entertainment — 7.4%*: | | | | | | | | | | | | | | | | | | | | |
Block Communications, Inc.^ | | | 6.88 | | | | 2/15/2025 | | | | 434,000 | | | | 434,000 | | | | 432,915 | |
CCO Holdings LLC/CCO Holdings Capital Corp.^ | | | 5.00 | | | | 2/1/2028 | | | | 274,000 | | | | 255,832 | | | | 250,710 | |
CCO Holdings LLC/CCO Holdings Capital Corp.^ | | | 5.75 | | | | 2/15/2026 | | | | 1,200,000 | | | | 1,197,272 | | | | 1,179,000 | |
Clear Channel Worldwide Holdings, Inc. | | | 7.63 | | | | 3/15/2020 | | | | 271,000 | | | | 268,901 | | | | 269,039 | |
CSC Holdings LLC^ | | | 5.38 | | | | 2/1/2028 | | | | 250,000 | | | | 250,000 | | | | 231,250 | |
DISH DBS Corp. | | | 7.75 | | | | 7/1/2026 | | | | 480,000 | | | | 460,718 | | | | 420,600 | |
Intelsat Jackson Holdings SA | | | 7.25 | | | | 10/15/2020 | | | | 121,000 | | | | 120,852 | | | | 120,395 | |
Intelsat Jackson Holdings SA | | | 7.50 | | | | 4/1/2021 | | | | 364,000 | | | | 363,849 | | | | 361,270 | |
Netflix, Inc.^ | | | 5.88 | | | | 11/15/2028 | | | | 600,000 | | | | 597,547 | | | | 605,820 | |
Sirius XM Radio, Inc.^ | | | 5.00 | | | | 8/1/2027 | | | | 350,000 | | | | 350,000 | | | | 327,687 | |
| | | | | | | | | | | | | | | | | | | | |
Total Broadcasting and Entertainment | | | | | | | | | | | 4,344,000 | | | | 4,298,971 | | | | 4,198,686 | |
| | | | | | | | | | | | | | | | | | | | |
| | | | | |
Buildings and Real Estate — 3.4%*: | | | | | | | | | | | | | | | | | | | | |
Brookfield Residential Properties, Inc.^ | | | 6.50 | | | | 12/15/2020 | | | | 250,000 | | | | 249,673 | | | | 253,125 | |
Century Communities, Inc. | | | 5.88 | | | | 7/15/2025 | | | | 250,000 | | | | 249,720 | | | | 236,250 | |
M/I Homes, Inc. | | | 5.63 | | | | 8/1/2025 | | | | 550,000 | | | | 531,035 | | | | 514,250 | |
M/I Homes, Inc. | | | 6.75 | | | | 1/15/2021 | | | | 250,000 | | | | 250,000 | | | | 257,760 | |
MPT Operating Partnership LP/MPT Finance Corp. | | | 5.00 | | | | 10/15/2027 | | | | 300,000 | | | | 300,000 | | | | 286,500 | |
Standard Industries, Inc.^ | | | 4.75 | | | | 1/15/2028 | | | | 300,000 | | | | 300,000 | | | | 275,250 | |
William Lyon Homes, Inc.^ | | | 6.00 | | | | 9/1/2023 | | | | 123,000 | | | | 123,000 | | | | 121,427 | |
| | | | | | | | | | | | | | | | | | | | |
Total Buildings and Real Estate | | | | | | | | | | | 2,023,000 | | | | 2,003,428 | | | | 1,944,562 | |
| | | | | | | | | | | | | | | | | | | | |
| | | | | |
Cargo Transport — 3.6%*: | | | | | | | | | | | | | | | | | | | | |
American Airlines Group, Inc.^ | | | 4.63 | | | | 3/1/2020 | | | | 250,000 | | | | 249,487 | | | | 248,750 | |
American Airlines Group, Inc.^ | | | 5.50 | | | | 10/1/2019 | | | | 532,000 | | | | 540,395 | | | | 537,320 | |
Deck Chassis Acquisition, Inc.^ | | | 10.00 | | | | 6/15/2023 | | | | 520,000 | | | | 532,118 | | | | 551,200 | |
Kenan Advantage Group, Inc.^ | | | 7.88 | | | | 7/31/2023 | | | | 700,000 | | | | 717,625 | | | | 714,000 | |
| | | | | | | | | | | | | | | | | | | | |
Total Cargo Transport | | | | | | | | | | | 2,002,000 | | | | 2,039,625 | | | | 2,051,270 | |
| | | | | | | | | | | | | | | | | | | | |
See accompanying Notes to the Financial Statements.
179
Barings U.S. High Yield Fund 2018 Annual Report
SCHEDULE OF INVESTMENTS (CONTINUED)
June 30, 2018
| | | | | | | | | | | | | | | | | | | | |
| | | EFFECTIVE
INTEREST RATE | | | DUE DATE | | | PRINCIPAL ‡‡ | | | COST | | | FAIR
VALUE | |
Corporate Bonds (Continued) | | | | | | | | | | | | | | | | | | | | |
| | | | | |
Chemicals, Plastics and Rubber — 2.2%*: | | | | | | | | | | | | | | | | | | | | |
Chemours Co. (The) | | | 5.38 | % | | | 5/15/2027 | | | | 156,000 | | | $ | 154,647 | | | $ | 150,930 | |
Chemours Co. (The) | | | 7.00 | | | | 5/15/2025 | | | | 254,000 | | | | 257,409 | | | | 272,415 | |
Consolidated Energy Finance SA^ | | | 6.88 | | | | 6/15/2025 | | | | 300,000 | | | | 298,654 | | | | 307,875 | |
LBC Tank Terminals Holding Netherlands BV^ | | | 6.88 | | | | 5/15/2023 | | | | 250,000 | | | | 243,023 | | | | 252,500 | |
Platform Specialty Products Corp.^ | | | 5.88 | | | | 12/1/2025 | | | | 250,000 | | | | 248,148 | | | | 244,375 | |
| | | | | | | | | | | | | | | | | | | | |
Total Chemicals, Plastics and Rubber | | | | | | | | | | | 1,210,000 | | | | 1,201,881 | | | | 1,228,095 | |
| | | | | | | | | | | | | | | | | | | | |
| | | | | |
Containers, Packaging and Glass — 0.2%*: | | | | | | | | | | | | | | | | | | | | |
Crown Americas LLC/Crown Americas Capital Corp.^ | | | 4.75 | | | | 2/1/2026 | | | | 135,000 | | | | 135,000 | | | | 128,250 | |
| | | | | | | | | | | | | | | | | | | | |
| | | |
Diversified/Conglomerate Manufacturing — 2.0%*: | | | | | | | | | | | | | |
Appvion, Inc.^~ | | | 9.00 | | | | 6/1/2020 | | | | 366,000 | | | | 258,814 | | | | 2,059 | |
EnPro Industries, Inc. | | | 5.88 | | | | 9/15/2022 | | | | 220,000 | | | | 221,447 | | | | 224,400 | |
Griffon Corp. | | | 5.25 | | | | 3/1/2022 | | | | 700,000 | | | | 699,179 | | | | 681,030 | |
StoneMor Partners LP/Cornerstone Family Services of West Virginia Subsidiary | | | 7.88 | | | | 6/1/2021 | | | | 124,000 | | | | 126,699 | | | | 122,140 | |
Teleflex, Inc. | | | 4.63 | | | | 11/15/2027 | | | | 119,000 | | | | 119,000 | | | | 112,455 | |
| | | | | | | | | | | | | | | | | | | | |
Total Diversified/Conglomerate Manufacturing | | | | | | | | | | | 1,529,000 | | | | 1,425,139 | | | | 1,142,084 | |
| | | | | | | | | | | | | | | | | | | | |
| | | | | |
Diversified/Conglomerate Service — 5.1%*: | | | | | | | | | | | | | | | | | | | | |
Carlson Travel, Inc.^ | | | 6.75 | | | | 12/15/2023 | | | | 250,000 | | | | 254,891 | | | | 245,000 | |
Carlson Travel, Inc.^ | | | 9.50 | | | | 12/15/2024 | | | | 350,000 | | | | 331,752 | | | | 316,750 | |
KAR Auction Services, Inc.^ | | | 5.13 | | | | 6/1/2025 | | | | 300,000 | | | | 300,000 | | | | 286,500 | |
Prime Security Services Borrower LLC/Prime Finance, Inc.^ | | | 9.25 | | | | 5/15/2023 | | | | 1,237,000 | | | | 1,307,936 | | | | 1,317,034 | |
United Rentals North America, Inc. | | | 4.63 | | | | 10/15/2025 | | | | 125,000 | | | | 125,000 | | | | 119,062 | |
United Rentals North America, Inc. | | | 4.88 | | | | 1/15/2028 | | | | 125,000 | | | | 125,294 | | | | 115,744 | |
Waste Pro USA, Inc.^ | | | 5.50 | | | | 2/15/2026 | | | | 59,000 | | | | 59,000 | | | | 56,714 | |
Zachry Holdings, Inc.^ | | | 7.50 | | | | 2/1/2020 | | | | 436,000 | | | | 435,656 | | | | 431,095 | |
| | | | | | | | | | | | | | | | | | | | |
Total Diversified/Conglomerate Service | | | | | | | | | | | 2,882,000 | | | | 2,939,529 | | | | 2,887,899 | |
| | | | | | | | | | | | | | | | | | | | |
| | | | | |
Electronics — 4.2%*: | | | | | | | | | | | | | | | | | | | | |
Dell, Inc. | | | 6.50 | | | | 4/15/2038 | | | | 126,000 | | | | 129,099 | | | | 118,755 | |
RP Crown Parent LLC^ | | | 7.38 | | | | 10/15/2024 | | | | 96,000 | | | | 96,000 | | | | 98,851 | |
Symantec Corp. | | | 4.20 | | | | 9/15/2020 | | | | 551,000 | | | | 550,343 | | | | 552,602 | |
TIBCO Software, Inc.^ | | | 11.38 | | | | 12/1/2021 | | | | 1,383,000 | | | | 1,497,807 | | | | 1,493,640 | |
Veritas US, Inc./Veritas Bermuda Ltd.^ | | | 10.50 | | | | 2/1/2024 | | | | 165,000 | | | | 172,417 | | | | 135,300 | |
| | | | | | | | | | | | | | | | | | | | |
Total Electronics | | | | | | | | | | | 2,321,000 | | | | 2,445,666 | | | | 2,399,148 | |
| | | | | | | | | | | | | | | | | | | | |
| | | | | |
Finance — 5.1%*: | | | | | | | | | | | | | | | | | | | | |
Aircastle Ltd. | | | 5.00 | | | | 4/1/2023 | | | | 271,000 | | | | 271,876 | | | | 272,016 | |
Alliance Data Systems Corp.^ | | | 5.88 | | | | 11/1/2021 | | | | 550,000 | | | | 561,297 | | | | 561,000 | |
Energizer Gamma Acquisition, Inc.^ | | | 6.38 | | | | 7/15/2026 | | | | 120,000 | | | | 120,000 | | | | 122,025 | |
Icahn Enterprises LP/Icahn Enterprises Finance Corp. | | | 6.25 | | | | 2/1/2022 | | | | 135,000 | | | | 138,545 | | | | 137,700 | |
See accompanying Notes to the Financial Statements.
180
Barings U.S. High Yield Fund 2018 Annual Report
SCHEDULE OF INVESTMENTS (CONTINUED)
June 30, 2018
| | | | | | | | | | | | | | | | | | | | |
| | | EFFECTIVE
INTEREST RATE | | | DUE DATE | | | PRINCIPAL ‡‡ | | | COST | | | FAIR
VALUE | |
Corporate Bonds (Continued) | | | | | | | | | | | | | | | | | | | | |
| | | | | |
Finance (Continued) | | | | | | | | | | | | | | | | | | | | |
Icahn Enterprises LP/Icahn Enterprises Finance Corp. | | | 6.38 | % | | | 12/15/2025 | | | | 415,000 | | | $ | 416,475 | | | $ | 415,519 | |
LPL Holdings, Inc.^ | | | 5.75 | | | | 9/15/2025 | | | | 575,000 | | | | 568,544 | | | | 559,187 | |
Park Aerospace Holdings Ltd.+^ | | | 5.25 | | | | 8/15/2022 | | | | 59,000 | | | | 58,893 | | | | 58,411 | |
Tempo Acquisition LLC/Tempo Acquisition Finance Corp.^ | | | 6.75 | | | | 6/1/2025 | | | | 210,000 | | | | 210,000 | | | | 201,600 | |
VFH Parent LLC/Orchestra Co-Issuer, Inc.^ | | | 6.75 | | | | 6/15/2022 | | | | 557,000 | | | | 568,942 | | | | 575,108 | |
| | | | | | | | | | | | | | | | | | | | |
Total Finance | | | | | | | | | | | 2,892,000 | | | | 2,914,572 | | | | 2,902,566 | |
| | | | | | | | | | | | | | | | | | | | |
| | | | | |
Grocery — 1.2%*: | | | | | | | | | | | | | | | | | | | | |
C&S Group Enterprises LLC^ | | | 5.38 | | | | 7/15/2022 | | | | 174,000 | | | | 172,147 | | | | 170,520 | |
Post Holdings, Inc.^ | | | 5.50 | | | | 3/1/2025 | | | | 300,000 | | | | 292,957 | | | | 292,875 | |
Post Holdings, Inc.^ | | | 5.75 | | | | 3/1/2027 | | | | 200,000 | | | | 200,000 | | | | 194,000 | |
| | | | | | | | | | | | | | | | | | | | |
Total Grocery | | | | | | | | | | | 674,000 | | | | 665,104 | | | | 657,395 | |
| | | | | | | | | | | | | | | | | | | | |
| | | | | |
Healthcare, Education and Childcare — 7.6%*: | | | | | | | | | | | | | | | | | | | | |
Avantor, Inc.^ | | | 9.00 | | | | 10/1/2025 | | | | 600,000 | | | | 602,867 | | | | 604,620 | |
Catalent Pharma Solutions, Inc.^ | | | 4.88 | | | | 1/15/2026 | | | | 227,000 | | | | 227,000 | | | | 217,986 | |
Endo Ltd./Endo Finance LLC/Endo Finco, Inc.^ | | | 6.00 | | | | 2/1/2025 | | | | 200,000 | | | | 182,149 | | | | 156,000 | |
HCA, Inc. | | | 5.38 | | | | 2/1/2025 | | | | 375,000 | | | | 379,988 | | | | 369,263 | |
inVentiv Group Holdings, Inc./inVentiv Health, Inc./inVentiv Health Clinical, Inc.^ | | | 7.50 | | | | 10/1/2024 | | | | 94,000 | | | | 94,000 | | | | 98,935 | |
Ortho-Clinical Diagnostics, Inc./Ortho-Clinical Diagnostics SA^ | | | 6.63 | | | | 5/15/2022 | | | | 1,065,000 | | | | 1,047,066 | | | | 1,041,037 | |
Teva Pharmaceutical Finance Netherlands III BV | | | 6.00 | | | | 4/15/2024 | | | | 300,000 | | | | 296,326 | | | | 297,098 | |
Valeant Pharmaceuticals International^ | | | 9.25 | | | | 4/1/2026 | | | | 775,000 | | | | 789,286 | | | | 805,031 | |
Valeant Pharmaceuticals International , Inc.^ | | | 5.50 | | | | 3/1/2023 | | | | 118,000 | | | | 91,680 | | | | 109,740 | |
Valeant Pharmaceuticals International, Inc.^ | | | 5.88 | | | | 5/15/2023 | | | | 50,000 | | | | 42,415 | | | | 46,969 | |
Valeant Pharmaceuticals International, Inc.^ | | | 6.13 | | | | 4/15/2025 | | | | 391,000 | | | | 346,535 | | | | 360,209 | |
Valeant Pharmaceuticals International, Inc.^ | | | 6.50 | | | | 3/15/2022 | | | | 118,000 | | | | 118,000 | | | | 122,130 | |
Valeant Pharmaceuticals International, Inc.^ | | | 7.00 | | | | 3/15/2024 | | | | 125,000 | | | | 125,000 | | | | 131,056 | |
| | | | | | | | | | | | | | | | | | | | |
Total Healthcare, Education and Childcare | | | | | | | | | | | 4,438,000 | | | | 4,342,312 | | | | 4,360,074 | |
| | | | | | | | | | | | | | | | | | | | |
| | |
Home and Office Furnishings, Housewares, and Durable Consumer Products — 0.6%*: | | | | | | | | | |
Louisiana-Pacific Corp. | | | 4.88 | | | | 9/15/2024 | | | | 250,000 | | | | 250,000 | | | | 245,625 | |
Mattel, Inc.^ | | | 6.75 | | | | 12/31/2025 | | | | 78,000 | | | | 78,000 | | | | 75,952 | |
| | | | | | | | | | | | | | | | | | | | |
Total Home and Office Furnishings, Housewares, and Durable Consumer Products | | | | | | | | | | | 328,000 | | | | 328,000 | | | | 321,577 | |
| | | | | | | | | | | | | | | | | | | | |
| | | | | |
Hotels, Motels, Inns and Gaming — 0.4%*: | | | | | | | | | | | | | | | | | | | | |
Boyne USA, Inc.^ | | | 7.25 | | | | 5/1/2025 | | | | 125,000 | | | | 125,000 | | | | 130,312 | |
Wynn Las Vegas LLC/Wynn Las Vegas Capital Corp.^ | | | 5.25 | | | | 5/15/2027 | | | | 125,000 | | | | 125,000 | | | | 116,875 | |
| | | | | | | | | | | | | | | | | | | | |
Total Hotels, Motels, Inns and Gaming | | | | | | | | | | | 250,000 | | | | 250,000 | | | | 247,187 | |
| | | | | | | | | | | | | | | | | | | | |
See accompanying Notes to the Financial Statements.
181
Barings U.S. High Yield Fund 2018 Annual Report
SCHEDULE OF INVESTMENTS (CONTINUED)
June 30, 2018
| | | | | | | | | | | | | | | | | | | | |
| | | EFFECTIVE
INTEREST RATE | | | DUE DATE | | | PRINCIPAL ‡‡ | | | COST | | | FAIR
VALUE | |
Corporate Bonds (Continued) | | | | | | | | | | | | | | | | | | | | |
| | | | | |
Insurance — 2.5%*: | | | | | | | | | | | | | | | | | | | | |
Acrisure LLC/Acrisure Finance, Inc.^ | | | 7.00 | % | | | 11/15/2025 | | | | 500,000 | | | $ | 485,335 | | | $ | 455,000 | |
Amwins Group, Inc.^ | | | 7.75 | | | | 7/1/2026 | | | | 200,000 | | | | 200,000 | | | | 203,000 | |
AssuredPartners, Inc.^ | | | 7.00 | | | | 8/15/2025 | | | | 339,000 | | | | 335,931 | | | | 326,288 | |
HUB International Ltd.^ | | | 7.00 | | | | 5/1/2026 | | | | 250,000 | | | | 250,000 | | | | 246,875 | |
York Risk Services Holding Corp.^ | | | 8.50 | | | | 10/1/2022 | | | | 220,000 | | | | 203,590 | | | | 201,874 | |
| | | | | | | | | | | | | | | | | | | | |
Total Insurance | | | | | | | | | | | 1,509,000 | | | | 1,474,856 | | | | 1,433,037 | |
| | | | | | | | | | | | | | | | | | | | |
| | | | | |
Leisure, Amusement, Entertainment — 3.2%*: | | | | | | | | | | | | | | | | | | | | |
Allegiant Travel Co. | | | 5.50 | | | | 7/15/2019 | | | | 1,000,000 | | | | 1,015,369 | | | | 1,005,000 | |
Brunswick Corp. | | | 7.13 | | | | 8/1/2027 | | | | 567,000 | | | | 599,570 | | | | 661,834 | |
WMG Acquisition Corp.^ | | | 5.00 | | | | 8/1/2023 | | | | 160,000 | | | | 160,000 | | | | 159,200 | |
| | | | | | | | | | | | | | | | | | | | |
Total Leisure, Amusement, Entertainment | | | | | | | | | | | 1,727,000 | | | | 1,774,939 | | | | 1,826,034 | |
| | | | | | | | | | | | | | | | | | | | |
| | | |
Machinery Non-Agriculture, Non-Construction, Non-Electronic — 0.6%*: | | | | | | | | | | | | | |
Apex Tool Group LLC/BC Mountain Finance, Inc.^ | | | 9.00 | | | | 2/15/2023 | | | | 380,000 | | | | 372,054 | | | | 367,650 | |
| | | | | | | | | | | | | | | | | | | | |
| | | | |
Mining, Steel, Iron and Non-Precious Metals — 9.6%*: | | | | | | | | | | | | | | | | | |
Alcoa Nederland Holding BV^ | | | 6.13 | | | | 5/15/2028 | | | | 421,000 | | | | 421,000 | | | | 423,631 | |
Allegheny Technologies, Inc. | | | 5.95 | | | | 1/15/2021 | | | | 309,000 | | | | 309,910 | | | | 310,545 | |
Alliance Resource Operating Partners LP/Alliance Resource Finance Corp.^ | | | 7.50 | | | | 5/1/2025 | | | | 328,000 | | | | 332,419 | | | | 349,320 | |
ArcelorMittal | | | 6.75 | | | | 3/1/2041 | | | | 197,000 | | | | 229,223 | | | | 222,397 | |
First Quantum Minerals Ltd.+^ | | | 6.88 | | | | 3/1/2026 | | | | 229,000 | | | | 229,000 | | | | 219,268 | |
First Quantum Minerals Ltd.+^ | | | 7.00 | | | | 2/15/2021 | | | | 600,000 | | | | 605,878 | | | | 600,836 | |
Hecla Mining Co. | | | 6.88 | | | | 5/1/2021 | | | | 250,000 | | | | 227,659 | | | | 252,648 | |
Kinross Gold Corp.+ | | | 5.95 | | | | 3/15/2024 | | | | 152,000 | | | | 157,453 | | | | 155,800 | |
Kinross Gold Corp. | | | 6.88 | | | | 9/1/2041 | | | | 99,000 | | | | 98,519 | | | | 101,475 | |
Kissner Holdings LP / Kissner Milling Co. Ltd. / BSC Holding, Inc. / Kissner USA^ | | | 8.38 | | | | 12/1/2022 | | | | 400,000 | | | | 410,336 | | | | 409,000 | |
New Gold, Inc.^ | | | 6.25 | | | | 11/15/2022 | | | | 400,000 | | | | 408,815 | | | | 404,000 | |
Northwest Acquisitions ULC/Dominion Finco, Inc.+^ | | | 7.13 | | | | 11/1/2022 | | | | 893,000 | | | | 907,236 | | | | 890,767 | |
SunCoke Energy Partners LP/SunCoke Energy Partners Finance Corp.^ | | | 7.50 | | | | 6/15/2025 | | | | 550,000 | | | | 557,735 | | | | 559,625 | |
Warrior Met Coal, Inc.^ | | | 8.00 | | | | 11/1/2024 | | | | 540,000 | | | | 548,858 | | | | 557,550 | |
| | | | | | | | | | | | | | | | | | | | |
Total Mining, Steel, Iron and Non-Precious Metals | | | | | | | | | | | 5,368,000 | | | | 5,444,041 | | | | 5,456,862 | |
| | | | | | | | | | | | | | | | | | | | |
| | | | | |
Oil and Gas — 14.5%*: | | | | | | | | | | | | | | | | | | | | |
Chesapeake Energy Corp. | | | 8.00 | | | | 1/15/2025 | | | | 522,000 | | | | 516,389 | | | | 531,631 | |
Citgo Holding, Inc.^ | | | 10.75 | | | | 2/15/2020 | | | | 762,000 | | | | 791,815 | | | | 810,577 | |
CVR Refining LLC/Coffeyville Finance, Inc. | | | 6.50 | | | | 11/1/2022 | | | | 331,000 | | | | 340,635 | | | | 337,620 | |
Energy Transfer Equity LP | | | 4.25 | | | | 3/15/2023 | | | | 250,000 | | | | 250,000 | | | | 241,253 | |
EP Energy LLC/Everest Acquisition Finance, Inc.^ | | | 7.75 | | | | 5/15/2026 | | | | 350,000 | | | | 350,000 | | | | 357,875 | |
EP Energy LLC/Everest Acquisition Finance, Inc.^ | | | 8.00 | | | | 2/15/2025 | | | | 248,000 | | | | 248,000 | | | | 192,200 | |
See accompanying Notes to the Financial Statements.
182
Barings U.S. High Yield Fund 2018 Annual Report
SCHEDULE OF INVESTMENTS (CONTINUED)
June 30, 2018
| | | | | | | | | | | | | | | | | | | | |
| | | EFFECTIVE
INTEREST RATE | | | DUE DATE | | | PRINCIPAL ‡‡ | | | COST | | | FAIR
VALUE | |
Corporate Bonds (Continued) | | | | | | | | | | | | | | | | | | | | |
| | | | | |
Oil and Gas (Continued) | | | | | | | | | | | | | | | | | | | | |
EP Energy LLC/Everest Acquisition Finance, Inc.^ | | | 9.38 | % | | | 5/1/2024 | | | | 65,000 | | | $ | 58,552 | | | $ | 53,300 | |
Ferrellgas LP/Ferrellgas Finance Corp. | | | 6.75 | | | | 1/15/2022 | | | | 100,000 | | | | 100,830 | | | | 90,500 | |
Ferrellgas Partners LP/Ferrellgas Partners Finance Corp. | | | 8.63 | | | | 6/15/2020 | | | | 600,000 | | | | 595,596 | | | | 577,500 | |
Genesis Energy LP/Genesis Energy Finance Corp. | | | 6.00 | | | | 5/15/2023 | | | | 100,000 | | | | 98,507 | | | | 98,125 | |
Genesis Energy LP/Genesis Energy Finance Corp. | | | 6.75 | | | | 8/1/2022 | | | | 250,000 | | | | 246,250 | | | | 252,500 | |
Jonah Energy LLC/Jonah Energy Finance Corp.^ | | | 7.25 | | | | 10/15/2025 | | | | 348,000 | | | | 348,956 | | | | 281,010 | |
Jupiter Resources, Inc.+^ | | | 8.50 | | | | 10/1/2022 | | | | 479,000 | | | | 402,814 | | | | 196,390 | |
KCA Deutag UK Finance PLC+^ | | | 9.63 | | | | 4/1/2023 | | | | 270,000 | | | | 278,289 | | | | 273,712 | |
Kosmos Energy Ltd. | | | 7.88 | | | | 8/1/2021 | | | | 1,027,000 | | | | 1,023,413 | | | | 1,043,689 | |
NGPL PipeCo LLC^ | | | 4.38 | | | | 8/15/2022 | | | | 56,000 | | | | 56,000 | | | | 55,440 | |
PBF Holding Co. LLC/PBF Finance Corp. | | | 7.25 | | | | 6/15/2025 | | | | 550,000 | | | | 558,371 | | | | 578,187 | |
QEP Resources, Inc. | | | 5.63 | | | | 3/1/2026 | | | | 550,000 | | | | 528,350 | | | | 526,625 | |
SM Energy Co. | | | 6.50 | | | | 1/1/2023 | | | | 227,000 | | | | 181,552 | | | | 229,270 | |
Suburban Propane Partners LP/Suburban Energy Finance Corp. | | | 5.88 | | | | 3/1/2027 | | | | 300,000 | | | | 300,000 | | | | 280,500 | |
Sunoco LP/Sunoco Finance Corp.^ | | | 4.88 | | | | 1/15/2023 | | | | 60,000 | | | | 60,000 | | | | 57,600 | |
Sunoco LP/Sunoco Finance Corp.^ | | | 5.88 | | | | 3/15/2028 | | | | 43,000 | | | | 43,000 | | | | 40,542 | |
Transocean Guardian Ltd.^ | | | 5.88 | | | | 1/15/2024 | | | | 171,000 | | | | 169,290 | | | | 170,359 | |
Transocean, Inc. | | | 6.80 | | | | 3/15/2038 | | | | 120,000 | | | | 100,392 | | | | 97,500 | |
Transocean, Inc. | | | 9.35 | | | | 12/15/2041 | | | | 38,000 | | | | 35,370 | | | | 37,810 | |
Weatherford International LLC^ | | | 9.88 | | | | 3/1/2025 | | | | 300,000 | | | | 300,740 | | | | 301,500 | |
Welltec A/S+^ | | | 9.50 | | | | 12/1/2022 | | | | 550,000 | | | | 554,383 | | | | 552,750 | |
| | | | | | | | | | | | | | | | | | | | |
Total Oil and Gas | | | | | | | | | | | 8,667,000 | | | | 8,537,494 | | | | 8,265,965 | |
| | | | | | | | | | | | | | | | | | | | |
| | | | | |
Personal Transportation — 1.1%*: | | | | | | | | | | | | | | | | | | | | |
Hertz Corp. (The)^ | | | 7.63 | | | | 6/1/2022 | | | | 450,000 | | | | 453,862 | | | | 432,000 | |
Watco Cos. LLC/Watco Finance Corp.^ | | | 6.38 | | | | 4/1/2023 | | | | 173,000 | | | | 173,301 | | | | 175,811 | |
| | | | | | | | | | | | | | | | | | | | |
Total Personal Transportation | | | | | | | | | | | 623,000 | | | | 627,163 | | | | 607,811 | |
| | | | | | | | | | | | | | | | | | | | |
| | | | | |
Personal, Food and Miscellaneous — 0.3%*: | | | | | | | | | | | | | | | | | | | | |
Simmons Foods, Inc.^ | | | 5.75 | | | | 11/1/2024 | | | | 193,000 | | | | 163,875 | | | | 167,428 | |
| | | | | | | | | | | | | | | | | | | | |
| | | | | |
Retail Stores — 0.4%*: | | | | | | | | | | | | | | | | | | | | |
Penske Automotive Group, Inc. | | | 5.50 | | | | 5/15/2026 | | | | 250,000 | | | | 250,000 | | | | 245,000 | |
| | | | | | | | | | | | | | | | | | | | |
| | | | | |
Telecommunications — 9.1%*: | | | | | | | | | | | | | | | | | | | | |
Altice Financing SA+^ | | | 6.63 | | | | 2/15/2023 | | | | 250,000 | | | | 251,202 | | | | 246,375 | |
Altice Luxembourg SA+^ | | | 7.63 | | | | 2/15/2025 | | | | 225,000 | | | | 238,501 | | | | 207,000 | |
Cablevision Systems Corp. | | | 5.88 | | | | 9/15/2022 | | | | 400,000 | | | | 394,658 | | | | 397,000 | |
CenturyLink, Inc. | | | 6.75 | | | | 12/1/2023 | | | | 280,000 | | | | 280,687 | | | | 281,400 | |
See accompanying Notes to the Financial Statements.
183
Barings U.S. High Yield Fund 2018 Annual Report
SCHEDULE OF INVESTMENTS (CONTINUED)
June 30, 2018
| | | | | | | | | | | | | | | | | | | | |
| | | EFFECTIVE
INTEREST RATE | | | DUE DATE | | | PRINCIPAL ‡‡ | | | COST | | | FAIR VALUE | |
Corporate Bonds (Continued) | | | | | | | | | | | | | | | | | | | | |
| | | | | |
Telecommunications (Continued) | | | | | | | | | | | | | | | | | | | | |
Cequel Communications Holdings I LLC/Cequel Capital Corp.^ | | | 7.50 | % | | | 4/1/2028 | | | | 250,000 | | | $ | 250,000 | | | $ | 253,050 | |
CommScope Technologies LLC^ | | | 5.00 | | | | 3/15/2027 | | | | 600,000 | | | | 572,074 | | | | 564,750 | |
Frontier Communications Corp. | | | 7.13 | | | | 3/15/2019 | | | | 550,000 | | | | 556,592 | | | | 554,125 | |
Hughes Satellite Systems Corp. | | | 6.63 | | | | 8/1/2026 | | | | 550,000 | | | | 549,142 | | | | 508,750 | |
Sprint Capital Corp. | | | 6.88 | | | | 11/15/2028 | | | | 700,000 | | | | 706,986 | | | | 670,250 | |
Sprint Communications, Inc. | | | 7.00 | | | | 8/15/2020 | | | | 75,000 | | | | 74,471 | | | | 77,625 | |
Sprint Corp. | | | 7.63 | | | | 3/1/2026 | | | | 125,000 | | | | 125,000 | | | | 127,500 | |
Sprint Corp. | | | 7.88 | | | | 9/15/2023 | | | | 489,000 | | | | 475,273 | | | | 507,032 | |
T-Mobile USA, Inc. | | | 4.50 | | | | 2/1/2026 | | | | 96,000 | | | | 96,000 | | | | 89,640 | |
T-Mobile USA, Inc. | | | 4.75 | | | | 2/1/2028 | | | | 155,000 | | | | 155,000 | | | | 143,569 | |
T-Mobile USA, Inc. | | | 5.38 | | | | 4/15/2027 | | | | 200,000 | | | | 200,000 | | | | 194,500 | |
Telecom Italia SpA+^ | | | 5.30 | | | | 5/30/2024 | | | | 250,000 | | | | 261,805 | | | | 246,562 | |
Ziggo BV+^ | | | 5.50 | | | | 1/15/2027 | | | | 140,000 | | | | 133,555 | | | | 130,774 | |
| | | | | | | | | | | | | | | | | | | | |
Total Telecommunications | | | | | | | | | | | 5,335,000 | | | | 5,320,946 | | | | 5,199,902 | |
| | | | | | | | | | | | | | | | | | | | |
| | | | | |
Utilities — 0.5%*: | | | | | | | | | | | | | | | | | | | | |
NRG Energy, Inc. | | | 7.25 | | | | 5/15/2026 | | | | 250,000 | | | | 250,000 | | | | 266,250 | |
| | | | | | | | | | | | | | | | | | | | |
Total Corporate Bonds | | | | | | | | | | | 53,104,000 | | | | 52,980,633 | | | | 52,020,406 | |
| | | | | | | | | | | | | | | | | | | | |
Total Fixed Income | | | | | | | | | | | 54,669,237 | | | | 54,398,295 | | | | 53,512,677 | |
| | | | | | | | | | | | | | | | | | | | |
| | | | | |
Short-Term Investments — 6.1%*: | | | | | | | | | | | | | | | | | | | | |
| | | | | |
Bank Deposit — 6.1%*: | | | | | | | | | | | | | | | | | | | | |
State Street Bank & Trust Co. Euro Time Deposit | | | 0.28 | | | | 7/2/2018 | | | | 3,495,098 | | | | 3,495,098 | | | | 3,495,098 | |
| | | | | | | | | | | | | | | | | | | | |
Total Investments | | | | | | | | | | | 58,169,441 | | | | 58,017,024 | | | | 57,263,157 | |
| | | | | | | | | | | | | | | | | | | | |
| | | | | |
Other assets and liabilities — (0.4%)* | | | | | | | | | | | | | | | | | | | (255,880 | ) |
| | | | | | | | | | | | | | | | | | | | |
| | | | | |
Net Assets — 100.0% | | | | | | | | | | | | | | | | | | | $57,007,277 | |
| | | | | | | | | | | | | | | | | | | | |
| ‡‡ | Unless otherwise indicated, all principal amounts are denominated in United States Dollars. |
| * | Calculated as a percentage of net assets applicable to common shareholders. |
See accompanying Notes to the Financial Statements.
184
Barings U.S. High Yield Fund 2018 Annual Report
SCHEDULE OF INVESTMENTS (CONTINUED)
June 30, 2018
Distributions of investments by country of risk (excluding temporary cash investments) as a percentage of total investments in securities, is as follows:
| | | | | | |
| | United States | | | 90.5% | |
| | Canada | | | 2.3% | |
| | Ghana | | | 2.0% | |
| | Zambia | | | 1.5% | |
| | Denmark | | | 1.0% | |
| | Other (Individually less than 1%) | | | 2.7% | |
| | | | | | |
| | Total | | | 100.0% | |
| | | | | | |
| ^ | Security acquired in a transaction exempt from registration under Rule 144A of the Securities Act of 1933. These securities may only be resold in transactions exempt from registration, normally to qualified institutional buyers. |
| § | Bank loans are exempt from registration under the Securities Act of 1933, as amended, but contain certain restrictions on resale and cannot be sold publicly. These loans pay interest at rates which adjust periodically. The interest rates shown for bank loans are the current interest rates at June 30, 2018. Bank loans are also subject to mandatory and/or optional prepayment which cannot be predicted. As a result, the remaining maturity may be substantially less than the stated maturity shown. |
See accompanying Notes to the Financial Statements.
185
Barings Funds Trust 2018 Annual Report
NOTES TO THE FINANCIAL STATEMENTS
June 30, 2018
Barings Funds Trust (the “Trust”) was organized as a business trust under the laws of the Commonwealth of Massachusetts on May 3, 2013 and commenced operations on September 16, 2013. The Trust is registered under the Investment Company Act of 1940, as amended (the “1940 Act”), as an open-end management investment company. As of June 30, 2018, the Trust consists of eight funds (separately, a “Fund” and collectively, the “Funds”): Barings Global Floating Rate Fund (“Global Floating Rate Fund”), Barings Global Credit Income Opportunities Fund (“Global Credit Income Opportunities Fund”), Barings Active Short Duration Bond Fund (“Active Short Duration Bond Fund”), Barings Total Return Bond Fund (“Total Return Bond Fund”), Barings Emerging Markets Debt Blended Total Return Fund (“Emerging Markets Debt Blended Total Return Fund”), Barings Emerging Markets Local Currency Debt Fund (“Emerging Markets Local Currency Debt Fund”), Barings Global High Yield Fund (“Global High Yield Fund”) and Barings U.S. High Yield Fund (“U.S. High Yield Fund”). Each Fund, other than Global Floating Rate Fund, Global Credit Income Opportunities Fund, Active Short Duration Bond Fund and Total Return Bond Fund, is a “non-diversified” investment company. Active Short Duration Bond Fund and Total Return Bond Fund commenced operations on July 8, 2015. Emerging Markets Debt Blended Total Return Fund commenced operations on October 21, 2015. Emerging Markets Local Currency Debt Fund commenced operations on December 8, 2015. Global High Yield Fund and U.S. High Yield Fund commenced operations on October 30, 2015.
Barings LLC (the “Adviser”), a wholly-owned indirect subsidiary of Massachusetts Mutual Life Insurance Company, is a registered investment adviser under the Investment Advisers Act of 1940 , as amended (the “Advisers Act”), and serves as investment adviser to the Funds.
Barings Global Advisers Limited (“BGA”), an indirect wholly-owned subsidiary of the Adviser, is a registered investment adviser under the Advisers Act and serves as a sub-adviser with respect to the Global Floating Rate Fund, Global Credit Income Opportunities Fund, Emerging Markets Debt Blended Total Return Fund and Global High Yield Fund European investments.
The primary investment objective of the Global Floating Rate Fund is to seek a high level of current income. The Global Floating Rate Fund seeks preservation of capital as
a secondary investment objective. The investment objective of the Global Credit Income Opportunities Fund is to seek an absolute return, primarily through current income and secondarily through capital appreciation. The investment objective of the Active Short Duration Bond Fund is to seek to achieve a high total rate of return primarily from current income while minimizing fluctuations in capital values by investing primarily in a diversified portfolio of short-term investment grade fixed income securities. The investment objective of the Total Return Bond Fund is to seek a superior total rate of return by investing in fixed income instruments. The investment objective of the Emerging Markets Debt Blended Total Return Fund is to seek to achieve maximum total return, consistent with preservation of capital and prudent investment management, through high current income generation and, where appropriate, capital appreciation. The investment objective of the Emerging Markets Local Currency Debt Fund is to seek long-term total return through investment in a diversified portfolio of emerging markets local currency denominated debt securities. The investment objective of the Global High Yield Fund is to seek to provide high current income generation and, where appropriate, capital appreciation. The investment objective of the U.S. High Yield Fund is to seek to achieve a high level of total return, with an emphasis on current income, by investing primarily in high yield debt and related securities.
There can be no assurance that the Funds will achieve their investment objectives. Under normal market conditions, the Global Floating Rate Fund invests at least 80% of its net assets (including the amount of any borrowings for investment purposes) in income producing floating rate debt securities, consisting of floating rate loans, bonds and notes, issued primarily by North American and Western European companies that are primarily, at the time of purchase, rated below-investment grade (below Baa3 by Moody’s Investors Service, Inc. (“Moody’s”) or below BBB- by either Standard & Poor’s Rating Services, a division of the McGraw-Hill Company, Inc. (“S&P”) or Fitch, Inc. (“Fitch”)) or, if unrated, determined by the Adviser or BGA to be of comparable quality. Under normal market conditions, the Global Credit Income Opportunities Fund invests at least 80% of its net assets (including the amount of any borrowings for investment purposes) in debt instruments, consisting of loans, bonds and notes. Investments may be based in U.S. and non-U.S. markets, as well as over-the-counter and exchange traded derivatives.
186
Barings Funds Trust 2018 Annual Report
NOTES TO THE FINANCIAL STATEMENTS (CONTINUED)
June 30, 2018
Investments may be issued or guaranteed by governments and their agencies, corporations, financial institutions and supranational organizations that the Adviser believes have the potential to provide a high total return over time. A significant portion of the Global Floating Rate Fund and Global Credit Income Opportunities Fund’s investments in debt instruments will be denominated in a currency other than the U.S. dollar. Although the investments in non-U.S. dollar denominated assets may be on a currency hedged or unhedged basis, the Global Floating Rate Fund and Global Credit Income Opportunities Fund expect that, under current market conditions, they will seek to hedge substantially all of their exposure to foreign currencies. Under normal market conditions, the Active Short Duration Bond Fund invests at least 80% of its net assets (including the amount of any borrowings for investment purposes) in investment grade fixed income securities (rated Baa3 or higher by Moody’s or BBB- or higher by S&P or Fitch or if unrated, determined to be of comparable quality by the Adviser). These typically include U.S. dollar-denominated corporate obligations, securities issued or guaranteed by the U.S. government or its agencies or instrumentalities, U.S. and foreign issuer dollar-denominated bonds including, but not limited to, corporate obligations, government and agency issues, private placement bonds, securities subject to resale pursuant to Rule 144A, mortgage-backed, and other asset-backed securities. Under normal market conditions, the Total Return Bond Fund invests at least 80% of its net assets (including the amount of any borrowings for investment purposes) in fixed income securities. These typically include: U.S. dollar denominated corporate obligations and bank loans, securities issued or guaranteed by the U.S. government or its agencies or instrumentalities, U.S. and foreign issuer dollar denominated bonds including, but not limited to, corporate obligations, government and agency issues, private placement bonds, securities subject to resale pursuant to Rule 144A, convertible bonds, mortgage-backed, and other asset-backed securities. Under normal market conditions, the Emerging Markets Debt Blended Total Return Fund will invest at least 80% of its net assets (including the amount of any borrowings for investment purposes) in (i) securities denominated in currencies of the emerging market countries, (ii) fixed income securities or debt instruments issued by emerging market entities or sovereign nations, and/or (iii) debt instruments denominated in or based on the currencies, interest rates, or issues of emerging
market countries. Emerging market countries are defined to include any country that did not become a member of the Organization for Economic Cooperation and Development (O.E.C.D.) prior to 1975 and Turkey. Certain emerging market countries are referred to as “frontier” market countries. The Emerging Markets Debt Blended Total Return Fund will likely focus its investments in Asia, Africa, the Middle East, Latin America and the developing countries of Europe. Under normal market conditions, the Emerging Markets Local Currency Debt Fund invests at least 80% of its net assets (including the amount of any borrowings for investment purposes) in local currency-denominated debt instruments issued by emerging markets governments, and their quasi sovereign agencies (including supranational and sub-national government issuers). The Adviser will select the Fund’s country and currency composition based on its evaluation of relative interest rates, inflation rates, exchange rates, monetary and fiscal policies, trade and current account balances, legal and political developments, and any other specific factors the Adviser believes to be relevant. The Emerging Markets Local Currency Debt Fund will likely focus its investments in Asia, Africa, the Middle East, Latin America and the developing countries of Europe. Under normal conditions, the Global High Yield Fund will invest at least 80% of its net assets (including the amount of any borrowing for investment purposes) in below investment grade (“high yield”) fixed and floating rate corporate debt securities including bonds, notes and other fixed and floating rate income securities issued primarily by North American and Western European companies. For this purpose, debt instruments issued by issuers based in the Channel Islands, Cayman Islands and Bermuda will be considered North American and Western European companies. Such debt securities may be secured or unsecured, and, either senior or subordinated. Secured debt means that collateral has been pledged as security against default, while investors in senior debt instruments are legally entitled to be repaid ahead of investors in subordinated (i.e. non-senior) instruments issued by the same corporation. Derivative instruments that provide exposure to such high yield debt securities or have similar economic characteristics may be used to satisfy the Fund’s 80% policy. The Adviser expects that such instruments will primarily, at the time of purchase, be rated below investment grade (commonly referred to as “junk bonds”) by at least one credit rating agency (below Baa3 by Moody’s or below BBB- by either S&P or Fitch) or, if unrated, determined by the Adviser or BGA, to be of
187
Barings Funds Trust 2018 Annual Report
NOTES TO THE FINANCIAL STATEMENTS (CONTINUED)
June 30, 2018
comparable quality. The Global High Yield Fund may invest in high yield securities of any rating, including securities that are in default at the time of purchase. Under normal circumstances, the U.S. High Yield Fund invests at least 80% of its net assets (including the amount of any borrowings for investment purposes) in lower rated fixed income securities (rated below Baa3 by Moody’s or BBB- by either S&P or Fitch (using the lower rating) or, if unrated, determined by the Adviser to be of comparable quality), and at least 80% of its net assets (including the amount of any borrowings for investment purposes) in securities of U.S. issuers. The U.S. High Yield Fund may also invest in convertible securities, preferred stocks, warrants, bank loans, and other fixed income securities, including Rule 144A securities, of both U.S. and foreign issuers. Currently, the Adviser does not expect that the U.S. High Yield Fund will invest more than 20% of its total assets in bank loans. The U.S. High Yield Fund may invest up to 15% of its total assets in securities that are not denominated in U.S. dollars including, but not limited to, corporate bonds, government and agency issues, Rule 144A securities, convertible securities, bank loans, mortgage-backed, and asset-backed securities.
Each Fund has four classes of shares: Class A, C, I, and Y, each with different expenses and dividends. With the exception of Active Short Duration Bond Fund, which has no sales charge on any class, a front-end sales charge is normally added to the net asset value (“NAV”) for Class A shares. There is no front-end sales charge in the case of Class C, I, and Y shares. There may be a contingent deferred sales charge (“CDSC”) in certain cases as follows: 1) Effective January 15, 2018, Class A Shares purchased without an initial sales charge in accounts aggregating $500,000 or more are subject to a 1.00% contingent deferred sales charge (CDSC) if the shares are tendered and accepted for repurchase within 18 months of purchase (or within 12 months for shares purchased prior to January 15, 2018). The 18-month period (or 12-month period for shares purchased prior to January 15, 2018) begins on the day on which the purchase was made; and 2) Class C shares redeemed within the first year of purchase. All classes of shares have equal voting rights, with the exception of matters that relate solely to one class.
| 2. | Significant Accounting Policies |
The Trust is an investment company and follows accounting and reporting guidance in Financial Accounting Standards Board (“FASB”) Accounting Standards Codification Topic 946 (“ASC 946”).
The following is a summary of significant accounting policies followed consistently by the Funds in the preparation of their financial statements in conformity with accounting principles generally accepted in the United States of America (“U.S. GAAP”).
| | A. | Valuation of Investments |
The Funds’ investments in fixed income securities are generally valued using the prices provided directly by independent third party services or provided directly from one or more broker dealers or market makers, each in accordance with the valuation policies and procedures approved by the Funds’ Board of Trustees (the “Board”).
The pricing services may use valuation models or matrix pricing, which consider yield or prices with respect to comparable bond quotations from bond dealers or by reference to other securities that are considered comparable in such characteristics as credit rating, interest rates and maturity date to determine the current value. The Funds’ investments in bank loans are normally valued at the bid quotation obtained from dealers in loans by an independent pricing service in accordance with the Funds’ valuation policies and procedures approved by the Board. Short-term securities with remaining maturities of 60 days or less may be valued at amortized cost, which approximates fair value. Derivative financial instruments, such as futures contracts or options contracts that are traded on a national securities exchange, are stated at the last reported sale or settlement price on the day of valuation. Futures traded on inactive markets are valued using broker quotations. OTC derivative financial instruments, such as foreign currency contracts, options contracts, or swaps agreements, derive their value from underlying asset prices, indices, reference rates, and other inputs or a combination of these factors. These contracts are normally valued on the basis of an independent pricing service providers or broker dealer quotations. Depending on the derivative type and the terms of the derivative, the value of the derivative financial instruments is assigned by independent pricing service providers using a series of techniques, which may include pricing models. The pricing models use inputs that are observed from actively quoted markets such as issuer details, indices, spreads, interest rates, curves, volatilities, dividends and exchange rates.
The assets and liabilities shown in the Statements of Assets and Liabilities related to investments purchased for “to-be-announced” (“TBA”) or when-issued securities
188
Barings Funds Trust 2018 Annual Report
NOTES TO THE FINANCIAL STATEMENTS (CONTINUED)
June 30, 2018
approximate fair value and are determined using Level 2 inputs, as of June 30, 2018. The assets and liabilities shown in the Statements of Assets and Liabilities related to cash collateral held at broker for futures contracts are determined using Level 1 inputs as of June 30, 2018.
A Valuation Committee, made up of officers of the Trust and employees of the Adviser, is responsible for determining, in accordance with the Funds’ valuation policies and procedures approved by the Board; (1) whether market quotations are readily available for investments held by the Fund; and (2) the fair value of investments held by the Fund for which market quotations are not readily available or are deemed not reliable by the Adviser. In certain cases, authorized pricing service vendors may not provide prices for a security held by the Funds, or the price provided by such pricing service vendor is deemed unreliable by the Adviser. In such cases, the Funds may use market maker quotations provided by an established market maker for that security (i.e., broker quotes) to value the security if the Adviser has experience obtaining quotations from the market maker and the Adviser determines that quotations obtained from the market maker in the past have generally been reliable (or, if the Adviser has no such experience with respect to a market maker, it determines based on other information available to it that quotations to be obtained by it from the market maker are reasonably likely to be reliable). In any such case, the Adviser will review any market quotations so obtained in light of other information in its possession for their general reliability.
Bond investments are valued on the basis of last available bid prices or current market quotations provided by dealers or pricing services. Bank loan positions are valued at the bid price from one or more brokers or dealers as obtained from a pricing service. In determining the value of a particular investment, pricing services may use certain information with respect to transactions in such investments, quotations from dealers, pricing matrixes, market transactions in comparable investments, various relationships observed in the market between investments and calculated yield measures. Asset-backed and mortgage-backed securities are valued by independent pricing services using models that consider estimated cash flows of each tranche of the security, establish a benchmark yield and develop an estimated tranche-specific spread to the benchmark yield based on the unique attributes of the tranche.
Bank loans in which the Funds may invest have similar risks to lower-rated fixed income securities. Changes in
the financial condition of the borrower or economic conditions or other circumstances may reduce the capacity of the borrower to make principal and interest payments on such instruments and may lead to defaults. Senior secured bank loans are supported by collateral; however, the value of the collateral may be insufficient to cover the amount owed to the Funds. By relying on a third party to administer a loan, the Funds are subject to the risk that the third party will fail to perform its obligations. The loans in which the Funds will invest are largely floating rate instruments; therefore, the interest rate risk generally is lower than for fixed-rate debt obligations. However, from the perspective of the borrower, an increase in interest rates may adversely affect the borrower’s financial condition. Due to the unique and customized nature of loan agreements evidencing loans and the private syndication thereof, loans are not as easily purchased or sold as publicly traded securities. Although the range of investors in loans has broadened in recent years, there can be no assurance that future levels of supply and demand in loan trading will provide the degree of liquidity which currently exists in the market. In addition, the terms of the loans may restrict their transferability without borrower consent. These factors may have an adverse effect on the market price and the Funds’ ability to dispose of particular portfolio investments. A less liquid secondary market also may make it more difficult for the Funds to obtain precise valuations of the high yield loans in its portfolio.
The Funds may invest in collateralized debt obligations (“CDOs”), which include collateralized bond obligations (“CBOs”) and collateralized loan obligations (“CLOs”). CBOs and CLOs are types of asset-backed securities. A CDO is an entity that is backed by a diversified pool of debt securities (CBOs) or syndicated bank loans (CLOs). The cash flows of the CDO can be split into multiple segments, called “tranches,” which will vary in risk profile and yield. The riskiest segment is the subordinated or “equity” tranche. This tranche bears the greatest risk of defaults from the underlying assets in the CDO and serves to protect the other, more senior, tranches from default in all but the most severe circumstances. Since it is shielded from defaults by the more junior tranches, a “senior” tranche will typically have higher credit ratings and lower yields than their underlying securities, and often receive investment grade ratings from one or more of the nationally recognized rating agencies. Despite the protection from the more junior tranches, senior tranches can experience substantial losses due to actual defaults, increased sensitivity to future defaults and the
189
Barings Funds Trust 2018 Annual Report
NOTES TO THE FINANCIAL STATEMENTS (CONTINUED)
June 30, 2018
disappearance of one or more protecting tranches as a result of changes in the credit profile of the underlying pool of assets.
Fair value is defined as the price that the Funds would receive upon selling an investment in a timely transaction to an independent buyer in the principal or most advantageous market of the investment. A three-tier hierarchy is utilized to maximize the use of observable market data and minimize the use of unobservable inputs and to establish classification of fair value measurements for disclosure purposes. Inputs refer broadly to the assumptions that market participants would use in pricing the asset or liability, including assumptions about risk. For example, market participants would consider the risk inherent in a particular valuation technique used to measure fair value, such as a pricing model, and/or the risk inherent in the inputs to the valuation technique. Inputs may be observable or unobservable. Observable inputs are inputs that reflect the assumptions market participants would use in pricing the asset or liability and are developed based on market data obtained from sources independent of the reporting entity. Unobservable inputs are inputs that reflect the reporting entity’s own assumptions about the assumptions market participants would use in pricing the asset or liability and are developed based on the best information available in the circumstances. The three-tier hierarchy of inputs is summarized in the three broad levels listed below.
Level 1 – quoted prices in active markets for identical securities
Level 2 – other significant observable inputs (including quoted prices for similar securities, interest rates, prepayment speeds, credit risk, etc.)
Level 3 – significant unobservable inputs (including the Funds’ own assumptions in determining the fair value of investments)
The availability of observable inputs can vary from security to security and is affected by a wide variety of factors, including, for example, the type of security, whether the security is new and not yet established in the marketplace, the liquidity of markets, and other characteristics particular to the security. To the extent that valuation is based on models or inputs that are less observable or unobservable in the market, the determination of fair value requires more judgment. Accordingly, the degree of judgment exercised in determining fair value is greatest for instruments categorized in level 3.
The inputs used to measure fair value may fall into different levels of the fair value hierarchy. In such cases, for disclosure purposes, the level in the fair value hierarchy within which the fair value measurement falls in its entirety is determined based on the lowest level input that is significant to the fair value measurement in its entirety.
The following is a summary of the inputs used as of June 30, 2018 in valuing the Funds’ investments:
Global Floating Rate Fund
| | | | | | | | | | | | | | | | |
| DESCRIPTION | | LEVEL 1 | | | LEVEL 2 | | | LEVEL 3 | | | TOTAL INVESTMENTS | |
| | | | |
Assets:* | | | | | | | | | | | | | | | | |
| Equities: | | | | | | | | | | | | | | | | |
Common Stocks | | $ | 317,389 | | | $ | 1,329,736 | | | $ | 74,281 | | | $ | 1,721,406 | |
Preferred Stock | | | – | | | | – | | | | 238,876 | | | | 238,876 | |
| | | | | | | | | | | | | | | | |
| Total Equities | | | 317,389 | | | | 1,329,736 | | | | 313,157 | | | | 1,960,282 | |
| | | | | | | | | | | | | | | | |
| Fixed Income: | | | | | | | | | | | | | | | | |
Bank Loans | | | – | | | | 214,390,944 | | | | 206,150 | | | | 214,597,094 | |
Corporate Bonds | | | – | | | | 25,261,155 | | | | – | | | | 25,261,155 | |
| | | | | | | | | | | | | | | | |
| Total Fixed Income | | | – | | | | 239,652,099 | | | | 206,150 | | | | 239,858,249 | |
| | | | | | | | | | | | | | | | |
| Short-Term Investments: | | | | | | | | | | | | | | | | |
Bank Deposit | | | – | | | | 45,925,399 | | | | – | | | | 45,925,399 | |
| Derivative Securities: | | | | | | | | | | | | | | | | |
Forward Foreign Currency Exchange Contracts | | | – | | | | 635,460 | | | | – | | | | 635,460 | |
| | | | | | | | | | | | | | | | |
| Total | | $ | 317,389 | | | $ | 287,542,694 | | | $ | 519,307 | | | $ | 288,379,390 | |
| | | | | | | | | | | | | | | | |
190
Barings Funds Trust 2018 Annual Report
NOTES TO THE FINANCIAL STATEMENTS (CONTINUED)
June 30, 2018
| | | | | | | | | | | | | | | | |
| DESCRIPTION | | LEVEL 1 | | | LEVEL 2 | | | LEVEL 3 | | | TOTAL INVESTMENTS | |
| | | | |
Liabilities:* | | | | | | | | | | | | | | | | |
| Derivative Securities: | | | | | | | | | | | | | | | | |
Forward Foreign Currency Exchange Contracts | | $ | – | | | $ | (6,085 | ) | | $ | – | | | $ | (6,085 | ) |
| | | | | | | | | | | | | | | | |
| | | | |
Total Investments | | $ | 317,389 | | | $ | 287,536,609 | | | $ | 519,307 | | | $ | 288,373,305 | |
| | | | | | | | | | | | | | | | |
| | * | There were no transfers between levels during the year ended June 30, 2018. |
The following table is a summary of quantitative information about significant unobservable valuation inputs for Level 3 fair value measurement for investments held as of June 30, 2018:
| | | | | | | | |
| TYPE OF ASSETS | | FAIR VALUE AS OF
JUNE 30, 2018 | | | VALUATION
TECHNIQUE(S) | | UNOBSERVABLE INPUT |
| | | |
Equities | | | | | | | | |
| | | |
Tunstall Group Holdings Ltd | | $ | – | | | Zero Value | | Valued at zero without primary asset attached |
| | | |
Tunstall Group Holdings Ltd | | $ | – | | | Zero Value | | Valued at zero without primary asset attached |
| | | |
Boomerang Tube LLC | | $ | – | | | Discounted Cash Flow | | Average Enterprise Valuation Multiple: 5 year projection, 5.5x; EBITDA: $42.5 million; 15% discount rate |
| | | |
Sabine Oil & Gas LLC | | $ | 19,350 | | | Broker Quote | | $50.00: Price source depth of 1 |
| | | |
Sabine Oil & Gas LLC Warrants | | $ | 7,380 | | | Broker Quote | | $6.00: Price source depth of 1 |
| | | |
Sabine Oil & Gas LLC Warrants | | $ | 1,095 | | | Broker Quote | | $5.00: Price source depth of 1 |
| | | |
Southcross Energy Holdings LP | | $ | – | | | Zero Value | | Valued at zero without primary asset attached |
| | | |
Templar Energy LLC | | $ | 7,010 | | | Broker Quote | | $0.80: Price source depth of 1 |
| | | |
Templar Energy LLC | | $ | 39,446 | | | Broker Quote | | $6.50: Price source depth of 1 |
| | | |
Pinnacle Agriculture Holdings A 2 | | $ | 238,876 | | | Broker Quote | | $0.92: Price source depth of 1 |
| | | |
Bank Loans | | | | | | | | |
| | | |
Boomerang Tube LLC | | $ | 32,825 | | | Discounted Cash Flow | | Average Enterprise Valuation Multiple: 5 year projection, 5.5x; EBITDA: $42.5 million; 15% discount rate |
| | | |
Boomerang Tube LLC | | $ | 121,563 | | | Discounted Cash Flow | | Average Enterprise Valuation Multiple: 5 year projection, 5.5x; EBITDA: $42.5 million; 15% discount rate |
| | | |
Boomerang Tube LLC | | $ | 5,261 | | | Discounted Cash Flow | | Average Enterprise Valuation Multiple: 5 year projection, 5.5x; EBITDA: $42.5 million; 15% discount rate |
| | | |
Boomerang Tube LLC | | $ | 46,501 | | | Discounted Cash Flow | | Average Enterprise Valuation Multiple: 5 year projection, 5.5x; EBITDA: $42.5 million; 15% discount rate |
Although the Fund believes the valuation methods described above are appropriate, the use of different methodologies or assumptions to determine fair value could result in different estimates of fair value at the reporting date.
191
Barings Funds Trust 2018 Annual Report
NOTES TO THE FINANCIAL STATEMENTS (CONTINUED)
June 30, 2018
The following is a reconciliation of investments with unobservable inputs (Level 3) that were used in determining fair value:
| | | | | | | | | | | | | | | | | | | | | | | | | | | | | | | | | | | | |
INVESTMENTS
IN SECURITIES | | BALANCE AS
OF
JULY 1,
2017 | | | REALIZED
GAIN
(LOSS) | | | CHANGE IN
UNREALIZED
APPRECIATION
(DEPRECIATION) | | | NET
TRANSFERS
IN (OUT) OF
LEVEL 3 | | | ACCRUED PREMIUMS/
DISCOUNTS | | | PURCHASES | | | SALES | | | BALANCE AS OF
JUNE 30,
2018 | | | CHANGE IN
UNREALIZED
APPRECIATION
(DEPRECIATION)
FROM
INVESTMENTS
HELD AT
JUNE 30,
2018 | |
| | | | | | | | | |
Equities | | | | | | | | | | | | | | | | | | | | | | | | | | | | | | | | | | | | |
Common Stock | | $ | 117,235 | | | $ | – | | | $ | (56,094 | ) | | $ | – | | | $ | – | | | $ | 4,665 | | | $ | – | | | $ | 65,806 | | | $ | (56,094 | ) |
Preferred Stock | | $ | 218,582 | | | $ | – | | | $ | 17,826 | | | $ | – | | | $ | – | | | $ | 2,468 | | | $ | – | | | $ | 238,876 | | | $ | 17,826 | |
Warrants | | $ | 10,286 | | | $ | – | | | $ | (1,811 | ) | | $ | – | | | $ | – | | | $ | – | | | $ | – | | | $ | 8,475 | | | $ | (1,811 | ) |
| | | | | | | | | | | | | | | | | | | | | | | | | | | | | | | | | | | | |
| | | | | | | | | |
Fixed Income | | | | | | | | | | | | | | | | | | | | | | | | | | | | | | | | | | | | |
Bank Loans | | $ | 179,744 | | | $ | – | | | $ | (19,442 | ) | | $ | – | | | $ | 692 | | | $ | 45,156 | | | $ | – | | | $ | 206,150 | | | $ | (19,442 | ) |
| | | | | | | | | | | | | | | | | | | | | | | | | | | | | | | | | | | | |
Total | | $ | 525,847 | | | $ | – | | | $ | (59,521 | ) | | $ | – | | | $ | 692 | | | $ | 52,289 | | | $ | – | | | $ | 519,307 | | | $ | (59,521 | ) |
| | | | | | | | | | | | | | | | | | | | | | | | | | | | | | | | | | | | |
Global Credit Income Opportunities Fund
| | | | | | | | | | | | | | | | |
| DESCRIPTION | | LEVEL 1 | | | LEVEL 2 | | | LEVEL 3 | | | TOTAL INVESTMENTS | |
| | | | |
Assets:* | | | | | | | | | | | | | | | | |
| Equities: | | | | | | | | | | | | | | | | |
Common Stocks | | $ | 181,435 | | | $ | 913,328 | | | $ | 550,622 | | | $ | 1,645,385 | |
Preferred Stock | | | – | | | | – | | | | 286,651 | | | | 286,651 | |
| | | | | | | | | | | | | | | | |
Total Equities | | | 181,435 | | | | 913,328 | | | | 837,273 | | | | 1,932,036 | |
| | | | | | | | | | | | | | | | |
| Fixed Income: | | | | | | | | | | | | | | | | |
Asset-Backed Securities | | | – | | | | 22,801,318 | | | | 10,228,154 | | | | 33,029,472 | |
Bank Loans | | | – | | | | 70,133,053 | | | | 277,089 | | | | 70,410,142 | |
Corporate Bonds | | | – | | | | 109,036,490 | | | | – | | | | 109,036,490 | |
| | | | | | | | | | | | | | | | |
| Total Fixed Income | | | – | | | | 201,970,861 | | | | 10,505,243 | | | | 212,476,104 | |
| | | | | | | | | | | | | | | | |
| Purchased Option: | | | | | | | | | | | | | | | | |
Put Option Purchased | | | – | | | | 777,005 | | | | – | | | | 777,005 | |
| Short-Term Investments: | | | | | | | | | | | | | | | | |
Bank Deposit | | | – | | | | 18,938,315 | | | | – | | | | 18,938,315 | |
| Derivative Securities: | | | | | | | | | | | | | | | | |
Forward Foreign Currency Exchange Contracts | | | – | | | | 817,834 | | | | – | | | | 817,834 | |
| | | | | | | | | | | | | | | | |
Total | | $ | 181,435 | | | $ | 223,417,343 | | | $ | 11,342,516 | | | $ | 234,941,294 | |
| | | | | | | | | | | | | | | | |
| | | | |
Liabilities:* | | | | | | | | | | | | | | | | |
| Derivative Securities: | | | | | | | | | | | | | | | | |
Forward Foreign Currency Exchange Contracts | | | – | | | | (2,076 | ) | | | – | | | | (2,076 | ) |
| | | | | | | | | | | | | | | | |
| Total Investments | | $ | 181,435 | | | $ | 223,415,267 | | | $ | 11,342,516 | | | $ | 234,939,218 | |
| | | | | | | | | | | | | | | | |
| | * | There were no transfers between levels during the year ended June 30, 2018. |
192
Barings Funds Trust 2018 Annual Report
NOTES TO THE FINANCIAL STATEMENTS (CONTINUED)
June 30, 2018
The following table is a summary of quantitative information about significant unobservable valuation inputs for Level 3 fair value measurement for investments held as of June 30, 2018:
| | | | | | | | |
| TYPE OF ASSETS | | FAIR VALUE AS OF
JUNE 30, 2018 | | | VALUATION
TECHNIQUE(S) | | UNOBSERVABLE INPUT |
| | | |
Equities | | | | | | | | |
| | | |
Tunstall Group Holdings LTD | | $ | – | | | Zero Value | | Valued at zero without primary asset attached |
| | | |
Tunstall Group Holdings LTD | | $ | – | | | Zero Value | | Valued at zero without primary asset attached |
| | | |
Boomerang Tube LLC | | $ | – | | | Discounted Cash Flow | | Average Enterprise Valuation Multiple: 5 year projection, 5.5x; EBITDA: $42.5 million; 15% discount rate |
| | | |
Southcross Energy Holdings LP | | $ | – | | | Zero value | | Valued at zero without primary asset attached |
| | | |
Maxeda DIY B.V. | | $ | 110,131 | | | Market Comparables | | LTM EBITDA €93m; Net leverage €453m; Average Comparable Valuation: 7.35X |
| | | |
Maxeda DIY B.V. | | $ | 440,491 | | | Market Comparables | | LTM EBITDA €93m; Net leverage €453m; Average Comparable Valuation: 7.35X |
| | | |
Pinnacle Agriculture Holdings A 2 | | $ | 286,651 | | | Broker Quote | | $0.92: Price source depth of 1 |
| | | |
Asset-Backed Securities | | | | | | | | |
| | | |
Alinea CLO Ltd | | $ | 1,250,000 | | | Broker Quote | | $100.00: Price source depth of 1 |
| | | |
Ares CLO LTD | | $ | 800,000 | | | Broker Quote | | $100.00: Price source depth of 1 |
| | | |
Atlas Senior Loan Funding Ltd | | $ | 1,900,000 | | | Broker Quote | | $100.00: Price source depth of 1 |
| | | |
Cadogan Square CLC | | $ | 1,132,766 | | | Broker Quote | | $113.28: Price source depth of 1 |
| | | |
CIFC Funding LTD | | $ | 1,500,000 | | | Broker Quote | | $100.00: Price source depth of 1 |
| | | |
Dryden Senior Loan Funding | | $ | 600,000 | | | Broker Quote | | $100.00: Price source depth of 1 |
| | | |
Madison Park Funding Ltd | | $ | 1,400,000 | | | Broker Quote | | $100.00: Price source depth of 1 |
| | | |
Madison Park Funding Ltd | | $ | 495,388 | | | Broker Quote | | $99.08: Price source depth of 1 |
| | | |
Wellfleet CLO Ltd | | $ | 1,150,000 | | | Broker Quote | | $100.00: Price source depth of 1 |
| | | |
Bank Loans | | | | | | | | |
| | | |
Boomerang Tube LLC | | $ | 75,898 | | | Discounted Cash Flow | | Average Enterprise Valuation Multiple: 5 year projection, 5.5x; EBITDA: $42.5 million; 15% discount rate |
| | | |
Boomerang Tube LLC | | $ | 121,563 | | | Discounted Cash Flow | | Average Enterprise Valuation Multiple: 5 year projection, 5.5x; EBITDA: $42.5 million; 15% discount rate |
| | | |
Boomerang Tube LLC | | $ | 5,261 | | | Discounted Cash Flow | | Average Enterprise Valuation Multiple: 5 year projection, 5.5x; EBITDA: $42.5 million; 15% discount rate |
| | | |
Boomerang Tube LLC | | $ | 46,501 | | | Discounted Cash Flow | | Average Enterprise Valuation Multiple: 5 year projection, 5.5x; EBITDA: $42.5 million; 15% discount rate |
| | | |
Boomerang Tube LLC | | $ | 27,866 | | | Discounted Cash Flow | | Average Enterprise Valuation Multiple: 5 year projection, 5.5x; EBITDA: $42.5 million; 15% discount rate |
Although the Fund believes the valuation methods described above are appropriate, the use of different methodologies or assumptions to determine fair value could result in different estimates of fair value at the reporting date.
193
Barings Funds Trust 2018 Annual Report
NOTES TO THE FINANCIAL STATEMENTS (CONTINUED)
June 30, 2018
The following is a reconciliation of investments with unobservable inputs (Level 3) that were used in determining fair value:
| | | | | | | | | | | | | | | | | | | | | | | | | | | | | | | | | | | | |
INVESTMENTS IN SECURITIES | | BALANCE
AS OF
JULY 1,
2017 | | | REALIZED
GAIN (LOSS) | | | CHANGE IN
UNREALIZED
APPRECIATION
(DEPRECIATION) | | | NET
TRANSFERS
IN (OUT)
OF LEVEL 3 | | | ACCRUED PREMIUMS/
DISCOUNTS | | | PURCHASES | | | SALES | | | BALANCE AS OF
JUNE 30,
2018 | | | CHANGE IN
UNREALIZED
APPRECIATION
(DEPRECIATION)
FROM
INVESTMENTS
HELD AT
JUNE 30
2018 | |
| | | | | | | | | |
Equities | | | | | | | | | | | | | | | | | | | | | | | | | | | | | | | | | | | | |
Common Stock | | $ | 538,528 | | | $ | – | | | $ | 12,094 | | | $ | – | | | $ | – | | | $ | – | | | $ | – | | | $ | 550,622 | | | $ | 12,094 | |
Preferred Stock | | $ | 262,298 | | | $ | – | | | $ | 21,474 | | | $ | – | | | $ | – | | | $ | 2,879 | | | $ | – | | | $ | 286,651 | | | $ | 21,474 | |
| | | | | | | | | | | | | | | | | | | | | | | | | | | | | | | | | | | | |
| | | | | | | | | |
Fixed Income | | | | | | | | | | | | | | | | | | | | | | | | | | | | | | | | | | | | |
Asset-Backed Securities | | $ | – | | | $ | – | | | $ | 2,229 | | | $ | – | | | $ | 2 | | | $ | 10,225,923 | | | $ | – | | | $ | 10,228,154 | | | $ | 2,229 | |
Bank Loans | | $ | 1,618,268 | | | $ | – | | | $ | (19,476 | ) | | $ | – | | | $ | 677 | | | $ | 64,784 | | | $ | (1,387,164 | ) | | $ | 277,089 | | | $ | (19,476 | ) |
| | | | | | | | | | | | | | | | | | | | | | | | | | | | | | | | | | | | |
Total | | $ | 2,419,094 | | | $ | – | | | $ | 16,321 | | | $ | – | | | $ | 679 | | | $ | 10,293,586 | | | $ | (1,387,164 | ) | | $ | 11,342,516 | | | $ | 16,321 | |
| | | | | | | | | | | | | | | | | | | | | | | | | | | | | | | | | | | | |
Active Short Duration Bond Fund
| | | | | | | | | | | | | | | | |
| DESCRIPTION | | LEVEL 1 | | | LEVEL 2 | | | LEVEL 3 | | | TOTAL INVESTMENTS | |
| | | | |
Assets:* | | | | | | | | | | | | | | | | |
| Fixed Income: | | | | | | | | | | | | | | | | |
Asset-Backed Securities | | $ | – | | | $ | 172,663,312 | | | $ | 4,347,527 | | | $ | 177,010,839 | |
Corporate Bonds | | | – | | | | 198,401,162 | | | | – | | | | 198,401,162 | |
Mortgage-Backed Securities | | | – | | | | 20,906,910 | | | | 564,478 | | | | 21,471,388 | |
U.S. Treasury & Government Agencies | | | – | | | | 13,670,256 | | | | – | | | | 13,670,256 | |
| | | | | | | | | | | | | | | | |
| Total Fixed Income | | | – | | | | 405,641,640 | | | | 4,912,005 | | | | 410,553,645 | |
| | | | | | | | | | | | | | | | |
| | | | |
Purchased Options: | | | | | | | | | | | | | | | | |
Call Options Purchased | | | – | | | | 1,150,606 | | | | – | | | | 1,150,606 | |
Put Options Purchased | | | – | | | | 2,683,160 | | | | – | | | | 2,683,160 | |
| | | | | | | | | | | | | | | | |
| Total Purchased Options | | | – | | | | 3,833,766 | | | | – | | | | 3,833,766 | |
| | | | | | | | | | | | | | | | |
| | | | |
Short-Term Investments: | | | | | | | | | | | | | | | | |
Bank Deposit | | | – | | | | 658,740 | | | | – | | | | 658,740 | |
Commercial Paper | | | – | | | | 17,987,881 | | | | – | | | | 17,987,881 | |
| | | | | | | | | | | | | | | | |
| Total Short-Term Investments | | | – | | | | 18,646,621 | | | | – | | | | 18,646,621 | |
| | | | | | | | | | | | | | | | |
| | | | |
Derivative Securities: | | | | | | | | | | | | | | | | |
Futures** | | | 435,916 | | | | – | | | | – | | | | 435,916 | |
| | | | | | | | | | | | | | | | |
| Total | | $ | 435,916 | | | $ | 428,122,027 | | | $ | 4,912,005 | | | $ | 433,469,948 | |
| | | | | | | | | | | | | | | | |
194
Barings Funds Trust 2018 Annual Report
NOTES TO THE FINANCIAL STATEMENTS (CONTINUED)
June 30, 2018
| | | | | | | | | | | | | | | | |
| DESCRIPTION | | LEVEL 1 | | | LEVEL 2 | | | LEVEL 3 | | | TOTAL INVESTMENTS | |
| | | | |
Liabilities:* | | | | | | | | | | | | | | | | |
| Derivative Securities: | | | | | | | | | | | | | | | | |
Futures** | | $ | (823,993 | ) | | $ | – | | | $ | – | | | $ | (823,993 | ) |
OTC – Credit Default Swaps | | | – | | | | (53,944 | ) | | | – | | | | (53,944 | ) |
| | | | | | | | | | | | | | | | |
| Total Derivative Securities | | | (823,993 | ) | | | (53,944 | ) | | | – | | | | (877,937 | ) |
| | | | | | | | | | | | | | | | |
| Total Investments | | $ | (388,077 | ) | | $ | 428,068,083 | | | $ | 4,912,005 | | | $ | 432,592,011 | |
| | | | | | | | | | | | | | | | |
| | * | There were no transfers between levels 1 and 2 during the year ended June 30, 2018. |
| | ** | Centrally Cleared Swaps and Futures are valued at unrealized appreciation/depreciation. Only current day’s variation margin, if any, is reported on the Statement of Assets and Liabilities. |
The following table is a summary of quantitative information about significant unobservable valuation inputs for Level 3 fair value measurement for investments held as of June 30, 2018:
| | | | | | | | |
| TYPE OF ASSETS | | FAIR VALUE AS OF
JUNE 30, 2018 | | | VALUATION
TECHNIQUE(S) | | UNOBSERVABLE INPUT |
| | | |
Asset-Backed Securities | | | | | | | | |
| | | |
AccessLex Institute 2002-A A2 | | $ | 546,700 | | | Broker Quote | | $99.40: Price source depth of 1 |
| | | |
DRB Prime Student Loan Trust 2016-R A1 | | $ | 911,181 | | | Broker Quote | | $101.50: Price source depth of 1 |
| | | |
SoFi Professional Loan Program 2018-A | | $ | 985,730 | | | Broker Quote | | $71.82: Price source depth of 1 |
| | | |
SoFi Professional Loan Program 2018-B Trust | | $ | 721,196 | | | Discounted Cash Flow | | Prepay CPR 15%; Default CDR 0.3 ramp 24 0.5; Severity 80%; 6-month recovery lag |
| | | |
SoFi Consumer Loan Program LLC 2015-A RC | | $ | 442,500 | | | Broker Quote | | $147,500: Price source depth of 1 |
| | | |
SoFi Professional Loan Program 2017-D R1 | | $ | 740,220 | | | Broker Quote | | $60.00: Price source depth of 1 |
| | | |
Mortgage-Backed Securities | | | | | | | | |
| | | |
TIAA Bank Mortgage Loan Trust 2018-2 | | $ | 564,478 | | | Broker Quote | | $99.03: Price source depth of 1 |
Although the Fund believes the valuation methods described above are appropriate, the use of different methodologies or assumptions to determine fair value could result in different estimates of fair value at the reporting date.
The following is a reconciliation of investments with unobservable inputs (Level 3) that were used in determining fair value:
| | | | | | | | | | | | | | | | | | | | | | | | | | | | | | | | | | | | |
INVESTMENTS IN SECURITIES | | BALANCE
AS OF
JULY 1,
2017 | | | REALIZED
GAIN (LOSS) | | | CHANGE IN
UNREALIZED
APPRECIATION
(DEPRECIATION) | | | NET
TRANSFERS
IN (OUT)
OF
LEVEL 3 | | | ACCRUED PREMIUMS/
DISCOUNTS | | | PURCHASES | | | SALES | | | BALANCE
AS OF
JUNE 30,
2018 | | | CHANGE IN
UNREALIZED
APPRECIATION
(DEPRECIATION)
FROM
INVESTMENTS
HELD AT
JUNE 30,
2018 | |
| | | | | | | | | |
Asset–Backed
Securities | | $ | 5,241,812 | | | $ | 15,438 | | | $ | (276,268 | ) | | $ | (2,394,587 | ) | | $ | 28,396 | | | $ | 2,367,232 | | | $ | (634,496 | ) | | $ | 4,347,527 | | | $ | (276,268 | ) |
| | | | | | | | | | | | | | | | | | | | | | | | | | | | | | | | | | | | |
| | | | | | | | | |
Mortgage–Backed Securities | | $ | – | | | $ | – | | | $ | (1 | ) | | $ | – | | | $ | 1 | | | $ | 564,478 | | | $ | – | | | $ | 564,478 | | | $ | (1 | ) |
| | | | | | | | | | | | | | | | | | | | | | | | | | | | | | | | | | | | |
Total | | $ | 5,241,812 | | | $ | 15,438 | | | $ | (276,269 | ) | | $ | (2,394,587 | ) | | $ | 28,397 | | | $ | 2,931,710 | | | $ | (634,496 | ) | | $ | 4,912,005 | | | $ | (276,269 | ) |
| | | | | | | | | | | | | | | | | | | | | | | | | | | | | | | | | | | | |
195
Barings Funds Trust 2018 Annual Report
NOTES TO THE FINANCIAL STATEMENTS (CONTINUED)
June 30, 2018
Total Return Bond Fund
| | | | | | | | | | | | | | | | |
| DESCRIPTION | | LEVEL 1 | | | LEVEL 2 | | | LEVEL 3 | | | TOTAL INVESTMENTS | |
| | | | |
Assets:* | | | | | | | | | | | | | | | | |
| Fixed Income: | | | | | | | | | | | | | | | | |
Asset-Backed Securities | | $ | – | | | $ | 7,573,149 | | | $ | 163,761 | | | $ | 7,736,910 | |
Corporate Bonds | | | – | | | | 9,257,411 | | | | – | | | | 9,257,411 | |
Foreign Government | | | – | | | | 238,072 | | | | – | | | | 238,072 | |
Mortgage-Backed Securities | | | – | | | | 256,057 | | | | – | | | | 256,057 | |
U.S. Treasury & Government Agencies | | | – | | | | 6,957,182 | | | | – | | | | 6,957,182 | |
| | | | | | | | | | | | | | | | |
| Total Fixed Income | | | – | | | | 24,281,871 | | | | 163,761 | | | | 24,445,632 | |
| | | | | | | | | | | | | | | | |
| | | | |
Mutual Fund: | | | | | | | | | | | | | | | | |
Mutual Fund | | | 2,635,105 | | | | – | | | | – | | | | 2,635,105 | |
| Purchased Options: | | | | | | | | | | | | | | | | |
Call Options Purchased | | | – | | | | 117,236 | | | | – | | | | 117,236 | |
Put Options Purchased | | | – | | | | 275,853 | | | | – | | | | 275,853 | |
| | | | | | | | | | | | | | | | |
| Total Purchased Options | | | – | | | | 393,089 | | | | – | | | | 393,089 | |
| | | | | | | | | | | | | | | | |
| | | | |
Short-Term Investments: | | | | | | | | | | | | | | | | |
Bank Deposit | | | – | | | | 1,126,545 | | | | – | | | | 1,126,545 | |
Commercial Paper | | | – | | | | 1,498,884 | | | | – | | | | 1,498,884 | |
| | | | | | | | | | | | | | | | |
| Total Short-Term Investments | | | – | | | | 2,625,429 | | | | – | | | | 2,625,429 | |
| | | | | | | | | | | | | | | | |
| | | | |
Derivative Securities: | | | | | | | | | | | | | | | | |
Forward Foreign Currency Exchange Contracts | | | – | | | | 20,403 | | | | – | | | | 20,403 | |
Futures** | | | 89,540 | | | | – | | | | – | | | | 89,540 | |
| | | | | | | | | | | | | | | | |
| Total Derivative Securities | | | 89,540 | | | | 20,403 | | | | – | | | | 109,943 | |
| | | | | | | | | | | | | | | | |
| Total | | $ | 2,724,645 | | | $ | 27,320,792 | | | $ | 163,761 | | | $ | 30,209,198 | |
| | | | | | | | | | | | | | | | |
| | | | |
Liabilities:* | | | | | | | | | | | | | | | | |
| Derivative Securities: | | | | | | | | | | | | | | | | |
Forward Foreign Currency Exchange Contracts | | | – | | | | (43,379 | ) | | | – | | | | (43,379 | ) |
Futures** | | | (14,530 | ) | | | – | | | | – | | | | (14,530 | ) |
OTC – Credit Default Swaps | | | – | | | | (13,486 | ) | | | – | | | | (13,486 | ) |
| | | | | | | | | | | | | | | | |
| Total Derivative Securities | | | (14,530 | ) | | | (56,865 | ) | | | – | | | | (71,395 | ) |
| | | | | | | | | | | | | | | | |
| Total Investments | | $ | 2,710,115 | | | $ | 27,263,927 | | | $ | 163,761 | | | $ | 30,137,803 | |
| | | | | | | | | | | | | | | | |
| | * | There were no transfers between levels 1 and 2 during the year ended June 30, 2018. |
| | ** | Centrally Cleared Swaps and Futures are valued at unrealized appreciation/depreciation. Only current day’s variation margin, if any, is reported on the Statement of Assets and Liabilities. |
196
Barings Funds Trust 2018 Annual Report
NOTES TO THE FINANCIAL STATEMENTS (CONTINUED)
June 30, 2018
The following table is a summary of quantitative information about significant unobservable valuation inputs for Level 3 fair value measurement for investments held as of June 30, 2018:
| | | | | | | | |
| TYPE OF ASSETS | | FAIR VALUE AS OF
JUNE 30, 2018 | | | VALUATION
TECHNIQUE(S) | | UNOBSERVABLE INPUT |
| | | |
Asset-Backed Securities | | | | | | | | |
| | | |
College Loan Corp. Trust 2017-1 B2 | | $ | 38,700 | | | Broker Quote | | $86.00: Price source depth of 1 |
| | | |
DRB Prime Student Loan Trust 2016-R A1 | | $ | 62,840 | | | Broker Quote | | $101.50: Price source depth of 1 |
| | | |
DRB Prime Student Loan Trust 2016-R A2 | | $ | 62,221 | | | Broker Quote | | $100.50: Price source depth of 1 |
Although the Fund believes the valuation methods described above are appropriate, the use of different methodologies or assumptions to determine fair value could result in different estimates of fair value at the reporting date.
The following is a reconciliation of investments with unobservable inputs (Level 3) that were used in determining fair value:
| | | | | | | | | | | | | | | | | | | | | | | | | | | | | | | | | | | | |
INVESTMENTS IN SECURITIES | | BALANCE
AS OF
JULY 1,
2017 | | | REALIZED
GAIN (LOSS) | | | CHANGE IN
UNREALIZED
APPRECIATION
(DEPRECIATION) | | | NET
TRANSFERS
IN (OUT)
OF
LEVEL 3 | | | ACCRUED PREMIUMS/
DISCOUNTS | | | PURCHASES | | | SALES | | | BALANCE AS OF
JUNE 30,
2018 | | | CHANGE IN
UNREALIZED
APPRECIATION
(DEPRECIATION)
FROM
INVESTMENTS
HELD AT
JUNE 30,
2018 | |
| | | | | | | | | |
Asset Backed Securities | | $ | 410,163 | | | $ | 6 | | | $ | 781 | | | $ | (225,364 | ) | | $ | 144 | | | $ | 38,363 | | | $ | (60,332 | ) | | $ | 163,761 | | | $ | 781 | |
| | | | | | | | | | | | | | | | | | | | | | | | | | | | | | | | | | | | |
Total | | $ | 410,163 | | | $ | 6 | | | $ | 781 | | | $ | (225,364 | ) | | $ | 144 | | | $ | 38,363 | | | $ | (60,332 | ) | | $ | 163,761 | | | $ | 781 | |
| | | | | | | | | | | | | | | | | | | | | | | | | | | | | | | | | | | | |
Emerging Markets Debt Blended Total Return Fund
| | | | | | | | | | | | | | | | |
| DESCRIPTION | | LEVEL 1 | | | LEVEL 2 | | | LEVEL 3 | | | TOTAL INVESTMENTS | |
| | | | |
Assets:* | | | | | | | | | | | | | | | | |
| Fixed Income: | | | | | | | | | | | | | | | | |
Corporate Bonds | | $ | – | | | $ | 13,460,889 | | | $ | – | | | $ | 13,460,889 | |
Foreign Government | | | – | | | | 29,646,282 | | | | – | | | | 29,646,282 | |
| | | | | | | | | | | | | | | | |
| Total Fixed Income | | | – | | | | 43,107,171 | | | | – | | | | 43,107,171 | |
| | | | | | | | | | | | | | | | |
| | | | |
Short-Term Investments: | | | | | | | | | | | | | | | | |
Bank Deposit | | | – | | | | 2,756,609 | | | | – | | | | 2,756,609 | |
| Derivative Securities: | | | | | | | | | | | | | | | | |
Forward Foreign Currency Exchange Contracts | | | – | | | | 2,214,203 | | | | – | | | | 2,214,203 | |
OTC – Credit Default Swaps | | | – | | | | 16,289 | | | | – | | | | 16,289 | |
OTC – Cross Currency Swaps | | | – | | | | 93,584 | | | | – | | | | 93,584 | |
OTC – Interest Rate Swaps | | | – | | | | 173,938 | | | | – | | | | 173,938 | |
| | | | | | | | | | | | | | | | |
| Total Derivative Securities | | | – | | | | 2,498,014 | | | | – | | | | 2,498,014 | |
| | | | | | | | | | | | | | | | |
| Total | | $ | – | | | $ | 48,361,794 | | | $ | – | | | $ | 48,361,794 | |
| | | | | | | | | | | | | | | | |
197
Barings Funds Trust 2018 Annual Report
NOTES TO THE FINANCIAL STATEMENTS (CONTINUED)
June 30, 2018
| | | | | | | | | | | | | | | | |
| DESCRIPTION | | LEVEL 1 | | | LEVEL 2 | | | LEVEL 3 | | | TOTAL INVESTMENTS | |
| | | | |
Liabilities:* | | | | | | | | | | | | | | | | |
| Derivative Securities: | | | | | | | | | | | | | | | | |
Forward Foreign Currency Exchange Contracts | | $ | – | | | $ | (2,771,591 | ) | | $ | – | | | $ | (2,771,591 | ) |
Futures** | | | (42,574 | ) | | | – | | | | – | | | | (42,574 | ) |
OTC – Credit Default Swaps | | | – | | | | (47,337 | ) | | | – | | | | (47,337 | ) |
OTC – Cross Currency Swaps | | | – | | | | (9,271 | ) | | | – | | | | (9,271 | ) |
OTC – Interest Rate Swaps | | | – | | | | (47,773 | ) | | | – | | | | (47,773 | ) |
| | | | | | | | | | | | | | | | |
| Total Derivative Securities | | | (42,574 | ) | | | (2,875,972 | ) | | | – | | | | (2,918,546 | ) |
| | | | | | | | | | | | | | | | |
| Total Investments | | $ | (42,574 | ) | | $ | 45,485,822 | | | $ | – | | | $ | 45,443,248 | |
| | | | | | | | | | | | | | | | |
| | * | There were no transfers between levels during the year ended June 30, 2018. |
| | ** | Centrally Cleared Swaps and Futures are valued at unrealized appreciation/depreciation. Only current day’s variation margin, if any, is reported on the Statement of Assets and Liabilities. |
Emerging Markets Local Currency Debt Fund
| | | | | | | | | | | | | | | | |
| DESCRIPTION | | LEVEL 1 | | | LEVEL 2 | | | LEVEL 3 | | | TOTAL INVESTMENTS | |
| | | | |
Assets:* | | | | | | | | | | | | | | | | |
| Fixed Income: | | | | | | | | | | | | | | | | |
Foreign Government | | $ | – | | | $ | 15,936,811 | | | $ | – | | | $ | 15,936,811 | |
| | | | | | | | | | | | | | | | |
| Total Fixed Income | | | – | | | | 15,936,811 | | | | – | | | | 15,936,811 | |
| | | | | | | | | | | | | | | | |
| | | | |
Short-Term Investments: | | | | | | | | | | | | | | | | |
Bank Deposit | | | – | | | | 2,306,774 | | | | – | | | | 2,306,774 | |
| Derivative Securities: | | | | | | | | | | | | | | | | |
Forward Foreign Currency Exchange Contracts | | | – | | | | 691,437 | | | | – | | | | 691,437 | |
OTC – Interest Rate Swaps | | | – | | | | 89,914 | | | | – | | | | 89,914 | |
| | | | | | | | | | | | | | | | |
| Total Derivative Securities | | | – | | | | 781,351 | | | | – | | | | 781,351 | |
| | | | | | | | | | | | | | | | |
| Total | | $ | – | | | $ | 19,024,936 | | | $ | – | | | $ | 19,024,936 | |
| | | | | | | | | | | | | | | | |
| | | | |
Liabilities:* | | | | | | | | | | | | | | | | |
| Derivative Securities: | | | | | | | | | | | | | | | | |
Centrally Cleared Interest Rate Swaps | | | – | | | | (24,541 | ) | | | – | | | | (24,541 | ) |
Forward Foreign Currency Exchange Contracts | | | – | | | | (1,261,719 | ) | | | – | | | | (1,261,719 | ) |
OTC – Interest Rate Swaps | | | – | | | | (29,014 | ) | | | – | | | | (29,014 | ) |
| | | | | | | | | | | | | | | | |
| Total Derivative Securities | | | – | | | | (1,315,274 | ) | | | – | | | | (1,315,274 | ) |
| | | | | | | | | | | | | | | | |
| Total Investments | | $ | – | | | $ | 17,709,662 | | | $ | – | | | $ | 17,709,662 | |
| | | | | | | | | | | | | | | | |
| | * | There were no transfers between levels during the year ended June 30, 2018. |
198
Barings Funds Trust 2018 Annual Report
NOTES TO THE FINANCIAL STATEMENTS (CONTINUED)
June 30, 2018
Global High Yield Fund
| | | | | | | | | | | | | | | | |
| DESCRIPTION | | LEVEL 1 | | | LEVEL 2 | | | LEVEL 3 | | | TOTAL INVESTMENTS | |
| | | | |
Assets:* | | | | | | | | | | | | | | | | |
| Fixed Income: | | | | | | | | | | | | | | | | |
Bank Loans | | $ | – | | | $ | 808,029 | | | $ | – | | | $ | 808,029 | |
Corporate Bonds | | | – | | | | 23,442,856 | | | | – | | | | 23,442,856 | |
| | | | | | | | | | | | | | | | |
| Total Fixed Income | | | – | | | | 24,250,885 | | | | – | | | | 24,250,885 | |
| | | | | | | | | | | | | | | | |
| | | | |
Short-Term Investments: | | | | | �� | | | | | | | | | | | |
Bank Deposit | | | – | | | | 1,028,962 | | | | – | | | | 1,028,962 | |
| Derivative Securities: | | | | | | | | | | | | | | | | |
Forward Foreign Currency Exchange Contracts | | | – | | | | 46,798 | | | | – | | | | 46,798 | |
| | | | | | | | | | | | | | | | |
| Total | | $ | – | | | $ | 25,326,645 | | | $ | – | | | $ | 25,326,645 | |
| | | | | | | | | | | | | | | | |
| | | | |
Liabilities:* | | | | | | | | | | | | | | | | |
| Derivative Securities: | | | | | | | | | | | | | | | | |
Forward Foreign Currency Exchange Contracts | | | – | | | | (900 | ) | | | – | | | | (900 | ) |
| | | | | | | | | | | | | | | | |
| Total Investments | | $ | – | | | $ | 25,325,745 | | | $ | – | | | $ | 25,325,745 | |
| | | | | | | | | | | | | | | | |
| | * | There were no transfers between levels during the year ended June 30, 2018. |
The following is a reconciliation of investments with unobservable inputs (Level 3) that were used in determining fair value:
| | | | | | | | | | | | | | | | | | | | | | | | | | | | | | | | | | | | |
INVESTMENTS IN SECURITIES | | BALANCE
AS OF
JULY 1,
2017 | | | REALIZED
GAIN (LOSS) | | | CHANGE IN UNREALIZED
APPRECIATION
(DEPRECIATION) | | | NET
TRANSFERS
IN (OUT)
OF LEVEL 3 | | | ACCRUED PREMIUMS/
DISCOUNTS | | | PURCHASES | | | SALES | | | BALANCE AS OF
JUNE 30,
2018 | | | CHANGE IN UNREALIZED
APPRECIATION
(DEPRECIATION)
FROM
INVESTMENTS
HELD AT
JUNE 30,
2018 | |
| | | | | | | | | |
Fixed Income | | | | | | | | | | | | | | | | | | | | | | | | | | | | | | | | | | | | |
Bank Loans | | $ | 255,372 | | | $ | – | | | $ | – | | | $ | – | | | $ | – | | | $ | – | | | $ | (255,372 | ) | | $ | – | | | $ | – | |
U.S. High Yield Fund
| | | | | | | | | | | | | | | | |
| DESCRIPTION | | LEVEL 1 | | | LEVEL 2 | | | LEVEL 3 | | | TOTAL INVESTMENTS | |
| | | | |
Assets:* | | | | | | | | | | | | | | | | |
| Equities: | | | | | | | | | | | | | | | | |
Common Stocks | | $ | 49,357 | | | $ | 206,025 | | | $ | – | | | $ | 255,382 | |
| | | | | | | | | | | | | | | | |
| Total Equities | | | 49,357 | | | | 206,025 | | | | – | | | | 255,382 | |
| | | | | | | | | | | | | | | | |
| | | | |
Fixed Income: | | | | | | | | | | | | | | | | |
Bank Loans | | | – | | | | 1,492,271 | | | | – | | | | 1,492,271 | |
Corporate Bonds | | | – | | | | 52,020,406 | | | | – | | | | 52,020,406 | |
| | | | | | | | | | | | | | | | |
Total Fixed Income | | | – | | | | 53,512,677 | | | | – | | | | 53,512,677 | |
| | | | | | | | | | | | | | | | |
199
Barings Funds Trust 2018 Annual Report
NOTES TO THE FINANCIAL STATEMENTS (CONTINUED)
June 30, 2018
| | | | | | | | | | | | | | | | |
| DESCRIPTION | | LEVEL 1 | | | LEVEL 2 | | | LEVEL 3 | | | TOTAL INVESTMENTS | |
| | | | |
Short-Term Investments: | | | | | | | | | | | | | | | | |
Bank Deposit | | $ | – | | | $ | 3,495,098 | | | $ | – | | | $ | 3,495,098 | |
| | | | | | | | | | | | | | | | |
Total | | $ | 49,357 | | | $ | 57,213,800 | | | $ | – | | | $ | 57,263,157 | |
| | | | | | | | | | | | | | | | |
Total Investments | | $ | 49,357 | | | $ | 57,213,800 | | | $ | – | | | $ | 57,263,157 | |
| | | | | | | | | | | | | | | | |
| | * | There were no transfers between levels during the year ended June 30, 2018. |
The following is a reconciliation of investments with unobservable inputs (Level 3) that were used in determining fair value:
| | | | | | | | | | | | | | | | | | | | | | | | | | | | | | | | | | | | |
INVESTMENTS
IN SECURITIES | | BALANCE
AS OF
JULY 1,
2017 | | | REALIZED
GAIN (LOSS) | | | CHANGE IN
UNREALIZED
APPRECIATION
(DEPRECIATION) | | | NET
TRANSFERS
IN (OUT)
OF LEVEL 3 | | | ACCRUED PREMIUMS/
DISCOUNTS | | | PURCHASES | | | SALES | | | BALANCE AS OF
JUNE 30,
2018 | | | CHANGE IN UNREALIZED
APPRECIATION
(DEPRECIATION)
FROM
INVESTMENTS
HELD AT
JUNE 30,
2018 | |
| | | | | | | | | |
Fixed Income | | | | | | | | | | | | | | | | | | | | | | | | | | | | | | | | | | | | |
Bank Loans | | $ | 255,643 | | | $ | – | | | $ | – | | | $ | – | | | $ | – | | | $ | – | | | $ | (255,643 | ) | | $ | – | | | $ | – | |
| | B. | When-Issued, Delayed-Delivery, Forward Commitment, and To-Be-Announced Transactions |
The Funds may enter into when-issued, delayed-delivery, forward commitment, or TBA transactions (collectively, the “Forward Transactions”) in order to lock in the purchase price of the underlying security, or in order to adjust the interest rate exposure of the Fund’s existing portfolio. In Forward Transactions, a Fund commits to purchase or sell particular securities, with payment and delivery to take place at a future date. In the case of TBA purchase commitments, the unit price and the estimated principal amount are established when the Fund enters into a commitment, with the actual principal amount being within a specified range of the estimate. Although a Fund does not typically pay for the securities in these types of transactions until they are delivered, it immediately assumes the risks of ownership, including the risk of price fluctuation. As a result, each of these types of transactions may create investment leverage in a Fund’s portfolio and increase the volatility of the Fund. If a Fund’s counterparty fails to deliver a security purchased in a Forward Transaction, there may be a loss, and the Fund may have missed an opportunity to make an alternative investment.
These securities are valued on the basis of valuations furnished by a pricing service, selected pursuant to
procedures approved by the Trustees, which determines valuations taking into account appropriate factors such as institutional-size trading in similar groups of securities, yield, quality, coupon rate, maturity, type of issue, trading characteristics, and other market data. Securities for which no market quotation is available are valued at fair value in accordance with procedures approved by the Trustees. The Funds record on a daily basis the unrealized appreciation (depreciation) based upon changes in the values of these securities. When a Forward Transaction is closed, the Funds record a realized gain or loss equal to the difference between the value of the transaction at the time it was opened and the value of the transaction at the time it was closed.
| | C. | Cash and Short-Term Investments |
Cash and cash equivalents consist principally of short-term investments that are readily convertible into cash and have original maturities of three months or less. At June 30, 2018, all cash and cash equivalents are held by the custodian.
| | D. | Investment Transactions, Related Investment Income and Expenses |
Investment transactions are accounted for on a trade date basis. Interest income is recorded on the accrual basis, including the amortization of premiums and
200
Barings Funds Trust 2018 Annual Report
NOTES TO THE FINANCIAL STATEMENTS (CONTINUED)
June 30, 2018
accretion of discounts on bonds held using the yield-to-maturity method. Interest income from securitized investments in which the Fund(s) has/have a beneficial interest, such as the “equity” security class of a CLO vehicle (typically in the form of income or subordinated notes), are recorded upon receipt. The accrual of interest income related to these types of securities is periodically reviewed and adjustments are made as necessary. These cash inflows are regularly reviewed to ensure these payments are not materially different from what would be required by GAAP reporting. Adjustments would be made if needed to address any changes.
Realized gains and losses on investment transactions and unrealized appreciation and depreciation of investments are reported for financial statement and Federal income tax purposes on the identified cost method.
Expenses are recorded on the accrual basis as incurred.
The Funds do not have redemption fees.
The preparation of financial statements in conformity with U.S. GAAP requires management to make estimates and assumptions that affect the reported amounts of assets and liabilities at the date of the financial statements and the reported amounts of revenues and expenses during the reporting period. Actual results could differ from these estimates.
| | G. | Federal Income Taxation |
The Funds have elected to be taxed as a Regulated Investment Company (“RIC”) under sub-chapter M of the U.S. Internal Revenue Code of 1986, as amended, and intend to maintain this qualification and to distribute substantially all of their net taxable income to their shareholders. As of June 30, 2018, the Funds had no uncertain tax positions that would require financial statement recognition, de-recognition, or disclosure. The Funds file a U.S. federal income tax return annually after their fiscal year-end, which is subject to examination by the Internal Revenue Service for a period of three years from the date of the filings.
| | H. | Dividends and Distributions |
Each Fund declares a dividend daily based on the Adviser’s projections of the Funds’ estimated net investment income and distributes such dividend
monthly. To the extent that these distributions exceed net investment income, they may be classified as return of capital. The Funds also pay a distribution at least annually from their net realized capital gains, if any. Dividends and distributions are recorded on the ex-dividend date. All common shares have equal dividend and other distribution rights. A notice disclosing the source(s) of a distribution will be provided if payment is made from any source other than net investment income. Any such notice would be provided only for informational purposes in order to comply with the requirements of Section 19(a) of the 1940 Act and not for tax reporting purposes. The tax composition of the Funds’ distributions for each calendar year is reported on Internal Revenue Service Form 1099-DIV.
Dividends from net investment income and distributions from realized gains from investment transactions have been determined in accordance with Federal income tax regulations and may differ from net investment income and realized gains recorded by the Funds for financial reporting purposes. These differences, which could be temporary or permanent in nature may result in reclassification of distributions; however, net investment income, net realized gains and losses, and net assets are not affected.
The Funds may invest in bank loans, which usually take the form of loan participations and assignments. Loan participations and assignments are agreements to make money available to U.S. or foreign corporations, partnerships or other business entities (the “Borrower”) in a specified amount, at a specified rate and within a specified time. A loan is typically originated, negotiated and structured by a U.S. or foreign bank, insurance company or other financial institution (the “Agent”) for a group of loan investors (“Loan Investors”). The Agent typically administers and enforces the loan on behalf of the other Loan Investors in the syndicate and may hold any collateral on behalf of the Loan Investors. Such loan participations and assignments are typically senior, secured and collateralized in nature. The Funds record an investment when the Borrower withdraws money and records interest as earned. These loans pay interest at rates which are periodically reset by reference to a base lending rate plus a spread. These base lending rates are generally the prime rate offered by a designated U.S. bank or London InterBank Offered Rate (“LIBOR”).
201
Barings Funds Trust 2018 Annual Report
NOTES TO THE FINANCIAL STATEMENTS (CONTINUED)
June 30, 2018
The loans in which the Funds invest may be subject to some restrictions on resale. For example, the Funds may be contractually obligated to receive approval from the Agent and/or Borrower prior to the sale of these investments. The Funds generally have no right to enforce compliance with the terms of the loan agreement with the Borrower. As a result, the Funds assume the credit risk of the Borrower, the selling participant and any other persons interpositioned between the Funds and the Borrower (“Intermediate Participants”). In the event that the Borrower, selling participant or Intermediate Participants become insolvent or enter into bankruptcy, the Funds may incur certain costs and delays in realizing payment or may suffer a loss of principal and/or interest.
Unfunded commitments represent the remaining obligation of the Funds to the Borrower. At any point in time, up to the maturity date of the issue, the Borrower may demand the unfunded portion. Until demanded by the Borrower, unfunded commitments are not recognized as an asset on the Statements of Assets and Liabilities. Unrealized appreciation/depreciation on unfunded commitments presented on the Statements of Assets and Liabilities represents mark to market of the unfunded portion of the Funds’ bank loans. As of June 30, 2018, the following Funds had unfunded loan commitments:
| | | | | | |
| FUND | | SECURITY | | PAR AMOUNT | |
Global Floating Rate Fund | | EG Group, Limited, 2/6/25 | | | 168,197 | |
Global Credit Income Opportunities Fund | | EG Group, Limited, 2/6/25 | | | 168,197 | |
Global Credit Income Opportunities Fund | | GFL Environmental, 5/30/25 | | | 14,744 | |
The following is a description of the derivative instruments that the Funds utilize as part of their investment strategy, including the primary underlying risk exposures related to the instrument.
The Funds are subject to foreign currency exchange rate risk in the normal course of pursuing their investment objectives. The Funds may use forward foreign currency exchange contracts to hedge against changes in the value of foreign currencies. The Funds may enter into forward foreign currency exchange contracts obligating the Funds to deliver or receive a currency at a specified future date. Forward contracts are valued daily and unrealized appreciation or depreciation is recorded daily as the
difference between the contract exchange rate and the closing forward rate applied to the face amount of the contract. A realized gain or loss is recorded at the time the forward contract expires. Credit risk may arise as a result of the failure of the counterparty to comply with the terms of the contract. The Funds consider the creditworthiness of each counterparty to a contract in evaluating potential credit risk quarterly. The Funds are also subject to credit risk with respect to the counterparties to derivative contracts that are not cleared through a central counterparty but instead are traded over-the-counter between two counterparties. If a counterparty to an over-the-counter derivative becomes bankrupt or otherwise fails to perform its obligations under a derivative contract due to financial difficulties, the Funds may experience significant delays in obtaining any recovery under the derivative contract in a bankruptcy or other reorganization proceeding. The Funds may obtain only a limited recovery or may obtain no recovery in such circumstances. The counterparty risk for cleared derivatives is generally lower than for uncleared over-the-counter derivative transactions since generally a clearing organization becomes substituted for each counterparty to a cleared derivative contract and, in effect, guarantees the parties’ performance under the contract as each party to a trade looks only to the clearing house for performance of financial obligations. However, there can be no assurance that the clearing house, or its members, will satisfy its obligations to the Funds. In addition, in the event of a bankruptcy of a clearing house, the Funds could experience a loss of the funds deposited with such clearing house as margin and of any profits on its open positions. The counterparty risk to the Funds is limited to the net unrealized gain, if any, on the contract.
The use of forward foreign currency exchange contracts does not eliminate fluctuations in the underlying prices of the Funds’ investment securities; however, it does establish a rate of exchange that can be achieved in the future. The use of forward foreign currency exchange contracts involves the risk that anticipated currency movements will not be accurately predicted. A forward foreign currency exchange contract would limit the risk of loss due to a decline in the value of a particular currency; however, it would also limit any potential gain that might result should the value of the currency increase instead of decrease. These contracts may involve market risk in excess of the amount of receivable or payable reflected on the Statement of Assets and Liabilities.
202
Barings Funds Trust 2018 Annual Report
NOTES TO THE FINANCIAL STATEMENTS (CONTINUED)
June 30, 2018
The Funds may purchase and sell futures contracts to enhance returns, to attempt to hedge some of its investment risk, or as a substitute position in lieu of holding the underlying asset on which the instrument is based. At the time of entering into a futures transaction, an investor is required to deposit and maintain a specified amount of cash or eligible securities called “initial margin.” Subsequent payments made or received by a Fund called “variation margin” are made on a daily basis as the market price of the futures contract fluctuates. Each Fund will record an unrealized gain (loss) based on the amount of variation margin. When a contract is closed, a realized gain (loss) is recorded equal to the difference between the opening and closing value of the contract.
The Funds may purchase call or put options. When a Fund purchases an option, the premium paid by the Fund is recorded as an asset and is subsequently adjusted to the current fair value of the option purchased. Purchasing call options tends to increase the Fund’s exposure to the underlying instrument. Purchasing put options tends to decrease the Fund’s exposure to the underlying instrument. Premiums paid for purchasing options that expire are treated as realized losses. Premiums paid for purchasing options that are exercised or closed are added to the amounts paid or offset against the proceeds on the underlying security to determine the realized gain or loss. The risks associated with purchasing put and call options are potential loss of the premium paid and, in the instances of over-the-counter derivatives, the failure of the counterparty to honor its obligation under the contract.
The Funds may enter into swap options (“swaptions”). A swaption is an option to enter into a pre-defined swap agreement by some specified date in the future. The writer of the swaption becomes the counterparty to the swap if the buyer exercises. The interest rate swaption agreement will specify whether the buyer of the swaption will be a fixed rate receiver or a fixed rate buyer. Depending on the terms of the particular option agreement, a Fund generally will incur a greater degree of risk when the Fund writes a swaption than the Fund will incur when it purchases a swaption. When a Fund purchases a swaption, the Fund’s risk of loss is limited to the amount of the premium it has paid should it decide to let the swaption expire unexercised.
When a Fund writes a covered call or a put option, an amount equal to the premium received by the Fund is
included in the Fund’s Statement of Assets and Liabilities as an asset and as an equivalent liability. The amount of the liability is subsequently marked-to-market to reflect the current market value of the option written. The Fund receives a premium on the sale of a call option but gives up the opportunity to profit from any increase in stock value above the exercise price of the option, and when a Fund writes a put option, it is exposed to a decline in the price of the underlying security.
Whether an option which a Fund has written expires on its stipulated expiration date or a Fund enters into a closing purchase transaction, the Fund realizes a gain (or loss, if the cost of a closing purchase transaction exceeds the premium received when the option was sold) without regard to any unrealized gain or loss on the underlying security, and the liability related to such option is extinguished. If a call option which a Fund has written is exercised, the Fund realizes a capital gain or loss from the sale of the underlying security, and the cost basis of the lots sold are decreased by the premium originally received. When a put option which a Fund has written is exercised, the amount of the premium originally received will reduce the cost of the security which the Fund purchases upon exercise of the option. Realized gains (losses) on purchased options are included in net realized gain (loss) from investments.
The Funds’ use of written options involves, to varying degrees, elements of market risk in excess of the amount recognized in the Statements of Assets and Liabilities. The face or contract amounts of these instruments reflect the extent of the Funds’ exposure to market risk. The risks may be caused by an imperfect correlation between movements in the price of the instrument and the price of the underlying securities, currencies and interest rates.
The Funds may enter into credit default swap contracts. As a seller of a credit default swap contract (“seller of protection”), a Fund is required to pay the notional amount or other agreed-upon value of a referenced debt obligation to the counterparty (or central clearing party in the case of centrally cleared swaps) in the event of a default by or other credit event involving the referenced issuer, obligation or index. In return, a Fund receives from the counterparty (or central clearing party in the case of centrally cleared swaps) a periodic stream of payments over the term of the contract.
As a purchaser of a credit default swap contract (“buyer of protection”), a Fund would receive the notional amount or other agreed upon value of a referenced debt
203
Barings Funds Trust 2018 Annual Report
NOTES TO THE FINANCIAL STATEMENTS (CONTINUED)
June 30, 2018
obligation from the counterparty (or central clearing party in the case of centrally cleared swaps) in the event of default by or other credit event involving the referenced issuer, obligation or index. In return, a Fund would make periodic payments to the counterparty (or central clearing party in the case of centrally cleared swaps) over the term of the contracts, provided no event of default has occurred.
These credit default swaps may have as a reference obligation corporate or sovereign issuers or credit indices. These credit indices are comprised of a basket of securities representing a particular sector of the market. During the period, Active Short Duration Bond Fund and Total Return Bond Fund entered into credit default swaps based on a CMBX index, which is comprised of commercial mortgage-backed securities and a CDX index, which is comprised of North American and Emerging Market companies.
Credit default swaps are fair valued based upon quotations from counterparties, brokers or market-makers and the change in value, if any, is recorded as an unrealized appreciation or depreciation. For a credit default swap sold by a Fund, payment of the agreed-upon amount made by a Fund in the event of default of the referenced debt obligation is recorded as the cost of the referenced debt obligation purchased/received. For a credit default swap purchased by a Fund, the agreed-upon amount received by a Fund in the event of default of the referenced debt obligation is recorded as proceeds from sale/delivery of the referenced debt obligation and the resulting gain or loss realized on the referenced debt obligation is recorded as such by a Fund.
Any upfront payments made or received upon entering a credit default swap contract would be amortized or accreted over the life of the swap and recorded as realized gains or losses. Collateral, in the form of cash or securities, may be required to be held in segregated accounts with the custodian bank or broker in accordance with the swap agreement. The value and credit rating of each credit default swap where a Fund is the seller of protection, are both measures of the current payment/performance risk of the swap. As the value of the swap changes as a positive or negative percentage of the total notional amount, the payment/performance risk may decrease or increase, respectively. The maximum potential amount of future payments (undiscounted) that a Fund as a seller of protection could be required to make under a credit default swap agreement would be an
amount equal to the notional amount of the agreement. These potential amounts would be partially offset by any recovery values of the respective referenced obligations, upfront payments received upon entering into the agreement, or net amounts received from the settlement of buy protection credit default swap agreements entered into by a Fund for the same referenced entity or entities. For centrally cleared swaps, the daily change in valuation is recorded as a receivable or payable for variation margin and settled in cash with the central clearing party daily.
Interest rate swaps involve the exchange by a Fund with another party of their respective commitments to receive or pay interest (e.g., an exchange of fixed rate payments for floating rate payments) with respect to a notional amount of principal. When a Fund enters into an interest rate swap, it typically agrees to make payments to its counterparty (or central clearing party in the case of centrally cleared interest rate swaps) based on a specified long- or short-term interest rate, and will receive payments from its counterparty (or central clearing party in the case of centrally cleared interest rate swaps) based on another interest rate. Other forms of interest rate swap agreements include interest rate caps, under which, in return for a specified payment stream, one party agrees to make payments to the other to the extent that interest rates exceed a specified rate, or “cap”; interest rate floors, under which, in return for a specified payment stream, one party agrees to make payments to the other to the extent that interest rates fall below a specified rate, or “floor”; and interest rate collars, under which a party sells a cap and purchases a floor or vice versa in an attempt to protect itself against interest rate movements exceeding given minimum or maximum levels. A Fund may enter into an interest rate swap in order, for example, to hedge against the effect of interest rate changes on the value of specific securities in its portfolio, or to adjust the interest rate sensitivity (duration) or the credit exposure of its portfolio overall, or otherwise as a substitute for a direct investment in debt securities.
Entering into swap agreements involves counterparty and market risk. Such risks involve the possibility that there will be no liquid market for these agreements, that the counterparty to the agreements may default on its obligation to perform or disagree as to the meaning of the contractual terms in the agreements, that there may be unfavorable changes in interest rates, and, in the case of credit default swaps, that the Adviser does not correctly predict the creditworthiness of the issuers of
204
Barings Funds Trust 2018 Annual Report
NOTES TO THE FINANCIAL STATEMENTS (CONTINUED)
June 30, 2018
the reference obligation on which the credit default swap is based. In the case of centrally cleared swaps, counterparty risk is believed to be minimal due to protections provided by the central clearing party.
During the period ended June 30, 2018, the Funds’ direct investment in derivatives consisted of forward foreign currency exchange contracts, futures contracts, credit default swaps, interest rate swaps and purchased options.
The following is a summary of the fair value of derivative instruments held directly by the Funds as of June 30, 2018:
Global Floating Rate Fund
| | | | | | | | |
ASSET
DERIVATIVES | | STATEMENTS OF ASSETS
AND LIABILITIES
LOCATION | | | FOREIGN
EXCHANGE
CONTRACTS RISK | |
Forward Foreign Currency Exchange Contracts | |
| Unrealized appreciation
on forward
foreign currency
exchange contracts |
| | $ | 635,460 | |
| | | | | | | | |
Total | | | | | | $ | 635,460 | |
| | | | | | | | |
| | | | | | | | |
LIABILITY
DERIVATIVES | | STATEMENTS OF ASSETS
AND LIABILITIES
LOCATION | | | FOREIGN
EXCHANGE
CONTRACTS RISK | |
Forward Foreign Currency Exchange Contracts | |
| Unrealized depreciation
on forward foreign
currency exchange
contracts |
| | $ | (6,085 | ) |
| | | | | | | | |
Total | | | | | | $ | (6,085 | ) |
| | | | | | | | |
Global Credit Income Opportunities Fund
| | | | | | | | | | | | | | | | | | | | |
ASSET
DERIVATIVES | | STATEMENTS OF ASSETS
AND LIABILITIES
LOCATION | | | FOREIGN
EXCHANGE
CONTRACTS RISK | | | INTEREST RATE
RISK | | | EQUITY | | | TOTAL | |
Forward Foreign Currency Exchange Contracts | |
| Unrealized appreciation on
forward foreign currency
exchange contracts |
| | $ | 817,834 | | | $ | – | | | $ | – | | | $ | 817,834 | |
Purchased Options | | | Investments, at fair value | | | | – | | | | | | | | 777,005 | | | | 777,005 | |
| | | | | | | | | | | | | | | | | | | | |
Total | | | | | | $ | 817,834 | | | $ | – | | | $ | 777,005 | | | $ | 1,594,839 | |
| | | | | | | | | | | | | | | | | | | | |
205
Barings Funds Trust 2018 Annual Report
NOTES TO THE FINANCIAL STATEMENTS (CONTINUED)
June 30, 2018
| | | | | | | | | | | | | | | | | | | | |
| | | | | |
LIABILITY
DERIVATIVES | | STATEMENTS OF ASSETS
AND LIABILITIES
LOCATION | | | FOREIGN
EXCHANGE
CONTRACTS RISK | | | INTEREST RATE
RISK | | | EQUITY | | | TOTAL | |
Forward Foreign Currency Exchange Contracts | |
| Unrealized depreciation on
forward foreign currency
exchange contracts |
| | $ | (2,076 | ) | | $ | – | | | | $ | | | $ | (2,076 | ) |
| | | | | | | | | | | | | | | | | | | | |
Total | | | | | | $ | (2,076 | ) | | $ | – | | | | $ | | | $ | (2,076 | ) |
| | | | | | | | | | | | | | | | | | | | |
Active Short Duration Bond Fund
| | | | | | | | | | | | | | |
ASSET
DERIVATIVES | | STATEMENTS OF ASSETS
AND LIABILITIES
LOCATION | | INTEREST RATE
RISK | | | CREDIT
RISK | | | TOTAL | |
Futures Contracts | | Includes cumulative unrealized appreciation/ depreciation of futures contracts as reported in the Schedule of Investments. Only current day’s variation margin is reported within the Statements of Assets and Liabilities. | | $ | 435,916 | | | $ | – | | | $ | 435,916 | |
Purchased Options | | Investments, at fair value | | | 3,833,766 | | | | – | | | | 3,833,766 | |
| | | | | | | | | | | | | | |
Total | | | | $ | 4,269,682 | | | $ | – | | | $ | 4,269,682 | |
| | | | | | | | | | | | | | |
| | | | |
LIABILITY
DERIVATIVES | | STATEMENTS OF ASSETS
AND LIABILITIES
LOCATION | | INTEREST RATE
RISK | | | CREDIT
RISK | | | TOTAL | |
Futures Contracts | | Includes cumulative unrealized appreciation/ depreciation of futures contracts as reported in the Schedule of Investments. Only current day’s variation margin is reported within the Statements of Assets and Liabilities. | | $ | (823,993 | ) | | $ | – | | | $ | (823,993 | ) |
OTC – Swaps Contracts | | Swap contracts, at fair value | | | – | | | | (53,944 | ) | | | (53,944 | ) |
| | | | | | | | | | | | | | |
Total | | | | $ | (823,993 | ) | | $ | (53,944 | ) | | $ | (877,937 | ) |
| | | | | | | | | | | | | | |
Total Return Bond Fund
| | | | | | | | | | | | | | | | | | |
ASSET
DERIVATIVES | | STATEMENTS OF ASSETS
AND LIABILITIES
LOCATION | | FOREIGN
EXCHANGE
CONTRACTS RISK | | | INTEREST RATE
RISK | | | CREDIT
RISK | | | TOTAL | |
Forward Foreign Currency Exchange Contracts | | Unrealized appreciation on forward foreign currency exchange contracts | | $ | 20,403 | | | $ | – | | | $ | – | | | $ | 20,403 | |
Futures Contracts | | Includes cumulative unrealized appreciation/ depreciation of futures contracts as reported in the Schedule of Investments. Only current day’s variation margin is reported within the Statements of Assets and Liabilities. | | | – | | | | 89,540 | | | | – | | | | 89,540 | |
Purchased Options | | Investments, at fair value | | | — | | | | 393,089 | | | | — | | | | 393,089 | |
| | | | | | | | | | | | | | | | | | |
Total | | | | $ | 20,403 | | | $ | 482,629 | | | $ | | | | $ | 503,032 | |
| | | | | | | | | | | | | | | | | | |
206
Barings Funds Trust 2018 Annual Report
NOTES TO THE FINANCIAL STATEMENTS (CONTINUED)
June 30, 2018
| | | | | | | | | | | | | | | | | | |
LIABILITY
DERIVATIVES | | STATEMENTS OF ASSETS
AND LIABILITIES
LOCATION | | FOREIGN
EXCHANGE
CONTRACTS RISK | | | INTEREST RATE
RISK | | | CREDIT
RISK | | | TOTAL | |
Forward Foreign Currency Exchange Contracts | | Unrealized depreciation on forward foreign currency exchange contracts | | $ | (43,379 | ) | | $ | – | | | $ | | | | $ | (43,379 | ) |
Futures Contracts | | Includes cumulative unrealized appreciation/ depreciation of futures contracts as reported in the Schedule of Investments. Only current day’s variation margin is reported within the Statements of Assets and Liabilities. | | | – | | | | (14,530 | ) | | | – | | | | (14,530 | ) |
OTC – Swaps Contracts | | Swap contracts, at fair value | | | – | | | | – | | | | (13,486 | ) | | | (13,486 | ) |
| | | | | | | | | | | | | | | | | | |
Total | | | | $ | (43,379 | ) | | $ | (14,530 | ) | | $ | (13,486 | ) | | $ | (71,395 | ) |
| | | | | | | | | | | | | | | | | | |
Emerging Markets Debt Blended Total Return Fund
| | | | | | | | | | | | | | | | | | |
ASSET
DERIVATIVES | | STATEMENTS OF ASSETS
AND LIABILITIES
LOCATION | | FOREIGN
EXCHANGE
CONTRACTS RISK | | | INTEREST RATE
RISK | | | CREDIT
RISK | | | TOTAL | |
Forward Foreign Currency Exchange Contracts | | Unrealized appreciation on forward foreign currency exchange contracts | | $ | 2,214,203 | | | $ | – | | | $ | – | | | $ | 2,214,203 | |
OTC – Swaps Contracts | | Swap contracts, at fair value | | | 93,584 | | | | 173,938 | | | | 16,289 | | | | 283,811 | |
| | | | | | | | | | | | | | | | | | |
Total | | | | $ | 2,307,787 | | | $ | 173,938 | | | $ | 16,289 | | | $ | 2,498,014 | |
| | | | | | | | | | | | | | | | | | |
| | | | | | | | | | | | | | | | | | |
LIABILITY
DERIVATIVES | | STATEMENTS OF ASSETS
AND LIABILITIES
LOCATION | | FOREIGN
EXCHANGE
CONTRACTS RISK | | | INTEREST RATE
RISK | | | CREDIT
RISK | | | TOTAL | |
Forward Foreign Currency Exchange Contracts | | Unrealized depreciation on forward foreign
currency exchange contracts | | $ | (2,771,591) | | | $ | – | | | $ | | | | $ | (2,771,591 | ) |
Futures Contracts | | Includes cumulative unrealized appreciation/ depreciation of futures contracts as reported in the Schedule of Investments. Only current day’s variation margin is reported within the Statements of Assets and Liabilities. | | | – | | | | (42,574 | ) | | | – | | | | (42,574 | ) |
OTC – Swaps Contracts | | Swap contracts, at fair value | | | (9,271) | | | | (47,773 | ) | | | (47,337 | ) | | | (104,381 | ) |
| | | | | | | | | | | | | | | | | | |
Total | | | | $ | (2,780,862 | ) | | $ | (90,347 | ) | | $ | (47,337 | ) | | $ | (2,918,546 | ) |
| | | | | | | | | | | | | | | | | | |
207
Barings Funds Trust 2018 Annual Report
NOTES TO THE FINANCIAL STATEMENTS (CONTINUED)
June 30, 2018
Emerging Markets Local Currency Debt Fund
| | | | | | | | | | | | | | |
ASSET
DERIVATIVES | | STATEMENTS OF ASSETS
AND LIABILITIES
LOCATION | | FOREIGN
EXCHANGE
CONTRACTS RISK | | | INTEREST RATE
RISK | | | TOTAL | |
Forward Foreign Currency Exchange Contracts | | Unrealized appreciation on forward foreign currency exchange contracts | | $ | 691,437 | | | $ | – | | | $ | 691,437 | |
OTC – Swaps Contracts | | Swap contracts, at fair value | | | | | | | 89,914 | | | | 89,914 | |
| | | | | | | | | | | | | | |
Total | | | | $ | 691,437 | | | $ | 89,914 | | | $ | 781,351 | |
| | | | | | | | | | | | | | |
| | | | |
LIABILITY
DERIVATIVES | | STATEMENTS OF ASSETS
AND LIABILITIES
LOCATION | | FOREIGN
EXCHANGE
CONTRACTS RISK | | | INTEREST RATE
RISK | | | TOTAL | |
Forward Foreign Currency Exchange Contracts | | Unrealized depreciation on forward foreign currency exchange contracts | | $ | (1,261,719 | ) | | $ | – | | | $ | (1,261,719 | ) |
OTC – Swaps Contracts | | Swap contracts, at fair value | | | | | | | (29,014 | ) | | | (29,014 | ) |
Centrally Cleared Credit Default Swaps Contracts | | Includes cumulative unrealized appreciation/ depreciation of swap contracts as reported in thein the Schedule of Investments. Only current day’s variation margin is reported within the Statements of Assets and Liabilities. | | | | | | | (24,541 | ) | | | (24,541 | ) |
| | | | | | | | | | | | | | |
Total | | | | $ | (1,261,719 | ) | | $ | (53,555 | ) | | $ | (1,315,274 | ) |
| | | | | | | | | | | | | | |
Global High Yield Fund
| | | | | | | | |
ASSET
DERIVATIVES | | STATEMENTS OF ASSETS
AND LIABILITIES
LOCATION | | | FOREIGN
EXCHANGE
CONTRACTS RISK | |
Forward Foreign Currency Exchange
Contracts | |
| Unrealized appreciation
on forward foreign
currency exchange
contracts |
| | $ | 46,798 | |
| | | | | | | | |
Total | | | | | | $ | 46,798 | |
| | | | | | | | |
| | |
LIABILITY
DERIVATIVES | | STATEMENTS OF ASSETS
AND LIABILITIES
LOCATION | | | FOREIGN
EXCHANGE
CONTRACTS RISK | |
Forward Foreign Currency Exchange
Contracts | |
| Unrealized depreciation
on forward foreign
currency exchange
contracts |
| | $ | (900 | ) |
| | | | | | | | |
Total | | | | | | $ | (900 | ) |
| | | | | | | | |
208
Barings Funds Trust 2018 Annual Report
NOTES TO THE FINANCIAL STATEMENTS (CONTINUED)
June 30, 2018
Amount of Realized Gain/(Loss) on Derivatives:
Global Floating Rate Fund
| | | | |
| | | FOREIGN
EXCHANGE
CONTRACTS RISK | |
Forward Foreign Currency Exchange Contracts | | $ | (820,659 | ) |
| | | | |
Total | | $ | (820,659 | ) |
| | | | |
Global Credit Income Opportunities Fund
| | | | | | | | | | | | | | | | |
| | | FOREIGN
EXCHANGE
CONTRACTS RISK | | | INTEREST RATE
RISK | | | EQUITY | | | TOTAL | |
Forward Foreign Currency Exchange Contracts | | $ | (963,704 | ) | | $ | – | | | $ | – | | | $ | (963,704 | ) |
Purchased Options | | | – | | | | (94,770 | ) | | | (172,166 | ) | | | (266,936 | ) |
| | | | | | | | | | | | | | | | |
Total | | $ | (963,704 | ) | | $ | (94,770 | ) | | $ | (172,166 | ) | | $ | (1,230,640 | ) |
| | | | | | | | | | | | | | | | |
Active Short Duration Bond Fund
| | | | | | | | | | | | |
| | | INTEREST RATE
RISK | | | CREDIT
RISK | | | TOTAL | |
Futures Contracts | | $ | 1,893,658 | | | $ | – | | | $ | 1,893,658 | |
Purchased Options | | | (95,458 | ) | | | – | | | | (95,458 | ) |
Swaps Contracts | | | – | | | | (11,819 | ) | | | (11,819 | ) |
| | | | | | | | | | | | |
Total | | $ | 1,798,200 | | | $ | (11,819 | ) | | $ | 1,786,381 | |
| | | | | | | | | | | | |
Total Return Bond Fund
| | | | | | | | | | | | | | | | |
| | | FOREIGN
EXCHANGE
CONTRACTS RISK | | | INTEREST RATE
RISK | | | CREDIT
RISK | | | TOTAL | |
Forward Foreign Currency Exchange Contracts | | $ | 11,939 | | | $ | – | | | $ | – | | | $ | 11,939 | |
Futures Contracts | | | – | | | | (163,053 | ) | | | – | | | | (163,053 | ) |
Purchased Options | | | – | | | | (19,770 | ) | | | – | | | | (19,770 | ) |
Swaps Contracts | | | – | | | | – | | | | (1,808 | ) | | | (1,808 | ) |
| | | | | | | | | | | | | | | | |
Total | | $ | 11,939 | | | $ | (182,823 | ) | | $ | (1,808 | ) | | $ | (172,692 | ) |
| | | | | | | | | | | | | | | | |
Emerging Markets Debt Blended Total Return Fund
| | | | | | | | | | | | | | | | |
| | | FOREIGN
EXCHANGE
CONTRACTS RISK | | | INTEREST RATE
RISK | | | CREDIT
RISK | | | TOTAL | |
Forward Foreign Currency Exchange Contracts | | $ | (166,348 | ) | | $ | – | | | $ | – | | | $ | (166,348 | ) |
Futures Contracts | | | – | | | | 12,675 | | | | – | | | | 12,675 | |
Swaps Contracts | | | (3,324 | ) | | | 5,311 | | | | 62,588 | | | | 64,575 | |
| | | | | | | | | | | | | | | | |
Total | | $ | (169,672 | ) | | $ | 17,986 | | | $ | 62,588 | | | $ | (89,098 | ) |
| | | | | | | | | | | | | | | | |
209
Barings Funds Trust 2018 Annual Report
NOTES TO THE FINANCIAL STATEMENTS (CONTINUED)
June 30, 2018
Emerging Markets Local Currency Debt Fund
| | | | | | | | | | | | |
| | | FOREIGN
EXCHANGE
CONTRACTS RISK | | | INTEREST RATE
RISK | | | TOTAL | |
Forward Foreign Currency Exchange Contracts | | $ | 231,609 | | | $ | – | | | $ | 231,609 | |
Swaps Contracts | | | – | | | | 21,491 | | | | 21,491 | |
| | | | | | | | | | | | |
Total | | $ | 231,609 | | | $ | 21,491 | | | $ | 253,100 | |
| | | | | | | | | | | | |
Global High Yield Fund
| | | | |
| | | FOREIGN
EXCHANGE
CONTRACTS RISK | |
Forward Foreign Currency Exchange Contracts | | $ | (123,373 | ) |
| | | | |
Total | | $ | (123,373 | ) |
| | | | |
Change in Unrealized Appreciation/(Depreciation) on Derivatives:
Global Floating Rate Fund
| | | | |
| | | FOREIGN
EXCHANGE
CONTRACTS RISK | |
Forward Foreign Currency Exchange Contracts | | $ | 936,893 | |
| | | | |
Total | | $ | 936,893 | |
| | | | |
Global Credit Income Opportunities Fund
| | | | | | | | | | | | | | | | |
| | | FOREIGN
EXCHANGE
CONTRACTS RISK | | | INTEREST RATE
RISK | | | EQUITY | | | TOTAL | |
Forward Foreign Currency Exchange Contracts | | $ | 1,076,045 | | | $ | | | | $ | – | | | $ | 1,076,045 | |
Purchased Options | | | – | | | | – | | | | 176,828 | | | | 176,828 | |
| | | | | | | | | | | | | | | | |
Total | | $ | 1,076,045 | | | $ | – | | | $ | 176,828 | | | $ | 1,252,873 | |
| | | | | | | | | | | | | | | | |
Active Short Duration Bond Fund
| | | | | | | | | | | | |
| | | INTEREST RATE
RISK | | | CREDIT
RISK | | | TOTAL | |
Futures Contracts | | $ | (638,459 | ) | | $ | – | | | $ | (638,459 | ) |
Purchased Options | | | 39,457 | | | | – | | | | 39,457 | |
Swaps Contracts | | | – | | | | 14,762 | | | | 14,762 | |
| | | | | | | | | | | | |
Total | | $ | (599,002 | ) | | $ | 14,762 | | | $ | (584,240 | ) |
| | | | | | | | | | | | |
210
Barings Funds Trust 2018 Annual Report
NOTES TO THE FINANCIAL STATEMENTS (CONTINUED)
June 30, 2018
Total Return Bond Fund
| | | | | | | | | | | | | | | | |
| | | FOREIGN
EXCHANGE
CONTRACTS RISK | | | INTEREST RATE
RISK | | | CREDIT
RISK | | | TOTAL | |
Forward Foreign Currency Exchange Contracts | | $ | (25,222 | ) | | $ | – | | | $ | – | | | $ | (25,222 | ) |
Futures Contracts | | | – | | | | 70,710 | | | | – | | | | 70,710 | |
Purchased Options | | | – | | | | 18,599 | | | | – | | | | 18,599 | |
Swaps Contracts | | | – | | | | – | | | | 3,338 | | | | 3,338 | |
| | | | | | | | | | | | | | | | |
Total | | $ | (25,222 | ) | | $ | 89,309 | | | $ | 3,338 | | | $ | 67,425 | |
| | | | | | | | | | | | | | | | |
Emerging Markets Debt Blended Total Return Fund
| | | | | | | | | | | | | | | | |
| | | FOREIGN
EXCHANGE
CONTRACTS RISK | | | INTEREST
RATE
RISK | | | CREDIT
RISK | | | TOTAL | |
Forward Foreign Currency Exchange Contracts | | $ | (537,334 | ) | | $ | | | | $ | – | | | $ | (537,334 | ) |
Futures Contracts | | | – | | | | (38,239 | ) | | | – | | | | (38,239 | ) |
Swaps Contracts | | | 19,670 | | | | 99,848 | | | | (65,888 | ) | | | 53,630 | |
| | | | | | | | | | | | | | | | |
Total | | $ | (517,664 | ) | | $ | 61,609 | | | $ | (65,888 | ) | | $ | (521,943 | ) |
| | | | | | | | | | | | | | | | |
Emerging Markets Local Currency Debt Fund
| | | | | | | | | | | | |
| | | FOREIGN
EXCHANGE
CONTRACTS RISK | | | INTEREST
RATE
RISK | | | TOTAL | |
Forward Foreign Currency Exchange Contracts | | $ | (623,053 | ) | | $ | – | | | $ | (623,053 | ) |
Swaps Contracts | | | – | | | | 7,670 | | | | 7,670 | |
| | | | | | | | | | | | |
Total | | $ | (623,053 | ) | | $ | 7,670 | | | $ | (615,383 | ) |
| | | | | | | | | | | | |
Global High Yield Fund
| | | | |
| | | FOREIGN
EXCHANGE
CONTRACTS RISK | |
Forward Foreign Currency Exchange Contracts | | $ | 124,681 | |
| | | | |
Total | | $ | 124,681 | |
| | | | |
Global Floating Rate Fund
| | | | |
NUMBER OF CONTRACTS,
NOTIONAL AMOUNTS OF
SHARES/UNITS | | FOREIGN
EXCHANGE
CONTRACTS RISK | |
Forward Foreign Currency Exchange Contracts(1) | | $ | 35,779,683 | |
| | (1) Volume | of derivative activity is based on an average of month-end notional amounts outstanding during the period. |
211
Barings Funds Trust 2018 Annual Report
NOTES TO THE FINANCIAL STATEMENTS (CONTINUED)
June 30, 2018
Global Credit Income Opportunities Fund
| | | | | | | | | | | | | | | | |
NUMBER OF CONTRACTS,
NOTIONAL AMOUNTS OF
SHARES/UNITS | | FOREIGN
EXCHANGE
CONTRACTS RISK | | | INTEREST RATE
RISK | | | EQUITY | | | TOTAL | |
Forward Foreign Currency Exchange Contracts(1) | | $ | 35,062,659 | | | $ | – | | | $ | – | | | $ | 35,062,659 | |
Purchased Options(1) | | $ | – | | | $ | 3,000,000 | | | $ | 4,323 | | | $ | 3,004,323 | |
| | (1) Volume | of derivative activity is based on an average of month-end notional amounts outstanding during the period. |
Active Short Duration Bond Fund
| | | | | | | | | | | | |
NUMBER OF CONTRACTS,
NOTIONAL AMOUNTS OF
SHARES/UNITS | | INTEREST RATE
RISK | | | CREDIT
RISK | | | TOTAL | |
Futures Contracts(1) | | | 1,725 | | | | – | | | | 1,725 | |
Purchased Options(2) | | $ | 42,279,077 | | | $ | – | | | $ | 42,279,077 | |
OTC – Swaps Contracts(2) | | $ | – | | | $ | 1,066,154 | | | $ | 1,066,154 | |
| | (1) Volume | of derivative activity is based on an average of month-end contracts outstanding during the period. |
| | (2) Volume | of derivative activity is based on an average of month-end notional amounts outstanding during the period. |
Total Return Bond Fund
| | | | | | | | | | | | | | | | |
NUMBER OF CONTRACTS,
NOTIONAL AMOUNTS OF
SHARES/UNITS | | FOREIGN
EXCHANGE
CONTRACTS RISK | | | INTEREST RATE
RISK | | | CREDIT
RISK | | | TOTAL | |
Forward Foreign Currency Exchange Contracts(1) | | $ | 1,040,015 | | | $ | – | | | $ | – | | | $ | 1,040,015 | |
Futures Contracts(2) | | | – | | | | 42 | | | | – | | | | 42 | |
Purchased Options(1) | | $ | – | | | $ | 4,697,846 | | | $ | – | | | $ | 4,697,846 | |
OTC – Swaps Contracts(1) | | $ | – | | | $ | – | | | $ | 221,538 | | | $ | 221,538 | |
| | (1) Volume | of derivative activity is based on an average of month-end notional amounts outstanding during the period. |
| | (2) Volume | of derivative activity is based on an average of month-end contracts outstanding during the period. |
Emerging Markets Debt Blended Total Return Fund
| | | | | | | | | | | | | | | | |
NUMBER OF CONTRACTS,
NOTIONAL AMOUNTS OF
SHARES/UNITS | | FOREIGN
EXCHANGE
CONTRACTS RISK | | | INTEREST RATE
RISK | | | CREDIT
RISK | | | TOTAL | |
Forward Foreign Currency Exchange Contracts(1) | | $ | 37,383,490 | | | $ | – | | | $ | – | | | $ | 37,383,490 | |
Futures Contracts(2)
| | | – | | | | 4 | | | | | | | | 4 | |
OTC – Swaps Contracts(1) | | $ | 784,689 | | | $ | 526,274,048 | | | $ | 2,184,615 | | | $ | 529,243,352 | |
| | (1) Volume | of derivative activity is based on an average of month-end notional amounts outstanding during the period. |
| | (2) Volume | of derivative activity is based on an average of month-end contracts outstanding during the period. |
212
Barings Funds Trust 2018 Annual Report
NOTES TO THE FINANCIAL STATEMENTS (CONTINUED)
June 30, 2018
Emerging Markets Local Currency Debt Fund
| | | | | | | | | | | | |
NUMBER OF CONTRACTS,
NOTIONAL AMOUNTS OF
SHARES/UNITS | | FOREIGN
EXCHANGE
CONTRACTS RISK | | | INTEREST RATE
RISK | | | TOTAL | |
Forward Foreign Currency Exchange Contracts(1) | | $ | 23,473,328 | | | $ | – | | | $ | 23,473,328 | |
OTC – Swaps Contracts(1) | | $ | – | | | $ | 24,446,154 | | | $ | 24,446,154 | |
| | (1) | Volume of derivative activity is based on an average of month-end notional amounts outstanding during the period. |
Global High Yield Fund
| | | | |
NUMBER OF CONTRACTS,
NOTIONAL AMOUNTS OF
SHARES/UNITS | | FOREIGN
EXCHANGE
CONTRACTS RISK | |
Forward Foreign Currency Exchange Contracts(1) | | $ | 6,565,800 | |
| | (1) | Volume of derivative activity is based on an average of month-end notional amounts outstanding during the period. |
| | K. | Disclosures about Offsetting Assets and Liabilities |
The Financial Accounting Standards Board (“FASB”) issued Accounting Standards Update No. 2011-11 “Disclosures about Offsetting Assets and Liabilities” (“ASU 2011-11”). These disclosure requirements are intended to help better assess the effect or potential effect of offsetting arrangements on a Fund’s financial position. In addition, FASB issued Accounting Standards Update No. 2013-01 “Clarifying the Scope of Offsetting Assets and Liabilities” (“ASU 2013-01”), specifying which transactions are subject to disclosures about offsetting. In order to better define its contractual rights and to secure rights that will help the Fund mitigate its counterparty risk, the Fund may enter into an International Swaps and Derivatives Association, Inc. Master Agreement (“ISDA Master Agreement”) or similar agreement with its counterparties. An ISDA Master Agreement is a bilateral agreement between the Fund and a counterparty that governs certain OTC derivatives and typically contains, among other things, collateral posting terms and netting provisions in the event of a default and/or termination event. Under an ISDA Master Agreement, the Fund may, under certain circumstances, offset with the counterparty certain derivative financial instruments’ payables and/or receivables with collateral held and/or posted and create one single net payment. The provisions of the ISDA Master Agreement typically permit a single net payment in the event of default including the bankruptcy or insolvency of the counterparty. Bankruptcy or insolvency laws of a particular jurisdiction may restrict or prohibit the right of offset in bankruptcy, insolvency or other events. In addition, certain ISDA Master Agreements allow counterparties to terminate derivative contracts prior to maturity in the event the Fund’s net assets decline by a stated percentage or the Fund fails to meet the terms of its ISDA Master Agreements. The result would cause the Fund to accelerate payment of any net liability owed to the counterparty.
For derivatives traded under an ISDA Master Agreement, the collateral requirements are typically calculated by netting the mark to market amount for each transaction under such agreement and comparing that amount to the value of any collateral currently pledged by the Funds and the counterparty.
Cash collateral that has been pledged to cover obligations of the Funds and cash collateral received from the counterparty, if any, is reported separately on the Statement of Assets and Liabilities as cash collateral held at broker or cash collateral due to broker, respectively. Non-cash collateral pledged by or received by the Funds, if any, is noted in the Schedule of Investments. Generally, the amount of collateral due from or to a party has to exceed a minimum transfer amount threshold before a transfer is required, which is determined each day at the close of business of the Funds, typically based on changes in market values for each transaction under an ISDA Master Agreement and netted into one amount for such agreement and any additional required collateral is delivered to/pledged by the Funds on the next business day. Typically, the Funds and counterparties are not permitted to sell, re-pledge or use the collateral they receive. To the extent amounts due to the Funds from their counterparties are not fully collateralized, contractually or
213
Barings Funds Trust 2018 Annual Report
NOTES TO THE FINANCIAL STATEMENTS (CONTINUED)
June 30, 2018
otherwise, the Funds bear the risk of loss from counterparty non-performance. The Funds attempt to mitigate counterparty risk by entering into agreements only with counterparties that they believe have the financial resources to honor their obligations and by monitoring the financial stability of those counterparties.
The following tables illustrate gross and net information about recognized assets eligible for offset in the Statement of Assets and Liabilities, and disclose such amounts subject to an enforceable master netting agreement or similar agreement, by counterparty. A master netting agreement is an agreement between two counterparties who have multiple contracts with each other that provides for the net settlement of all contracts, as well as cash collateral, through a single payment in the event of default on or termination of any one contract:
Global Floating Rate Fund
| | | | | | | | | | | | | | | | |
| DESCRIPTION | | | | | GROSS AMOUNTS OF
RECOGNIZED ASSETS | | | GROSS AMOUNTS OFFSET
IN THE STATEMENTS OF
ASSETS AND LIABILITIES | | | NET AMOUNTS OF
ASSETS PRESENTED
IN THE STATEMENTS OF
ASSETS AND LIABILITIES | |
Forward Foreign Currency Exchange Contracts | | | | | | $ | 635,460 | | | $ | – | | | $ | 635,460 | |
| | | | | | | | | | | | | | | | |
Total | | | | | | $ | 635,460 | | | $ | – | | | $ | 635,460 | |
| | | | | | | | | | | | | | | | |
| | | | | | | | | | | | | | | | |
| | | | | | GROSS AMOUNTS NOT OFFSET IN THE
STATEMENTS OF ASSETS AND LIABILITIES | | | | | | | |
| COUNTERPARTY | | NET AMOUNTS OF ASSETS
PRESENTED IN THE STATEMENTS
OF ASSETS AND LIABILITIES | | | FINANCIAL
INSTRUMENT | | | CASH
COLLATERAL
RECEIVED (a) | | | NET
AMOUNT (b) | |
Credit Suisse International | | $ | 442,255 | | | $ | – | | | $ | (442,255 | ) | | $ | – | |
Morgan Stanley & Co. | | | 193,205 | | | | (6,085 | ) | | | – | | | | 187,120 | |
| | | | | | | | | | | | | | | | |
Total | | $ | 635,460 | | | $ | (6,085 | ) | | $ | (442,255 | ) | | $ | 187,120 | |
| | | | | | | | | | | | | | | | |
| | (a) | Collateral disclosed is limited to an amount not to exceed 100% of the net amount of assets presented in the Statements of Assets and Liabilities, for each respective counterparty. |
| | (b) | Net Amount represents the amount that is subject to loss in the event of a counterparty failure as of June 30, 2018. |
| | | | | | | | | | | | | | |
| DESCRIPTION | | | | GROSS AMOUNTS OF
RECOGNIZED LIABILITIES | | | GROSS AMOUNTS OFFSET
IN THE STATEMENTS OF
ASSETS AND LIABILITIES | | | NET AMOUNTS OF
LIABILITIES PRESENTED
IN THE STATEMENTS OF
ASSETS AND LIABILITIES | |
Forward Foreign Currency Exchange
Contracts | | | | $ | 6,085 | | | $ | – | | | $ | 6,085 | |
| | | | | | | | | | | | | | |
Total | | | | $ | 6,085 | | | $ | – | | | $ | 6,085 | |
| | | | | | | | | | | | | | |
214
Barings Funds Trust 2018 Annual Report
NOTES TO THE FINANCIAL STATEMENTS (CONTINUED)
June 30, 2018
| | | | | | | | | | | | | | | | |
| | | | | | GROSS AMOUNTS NOT OFFSET IN THE
STATEMENTS OF ASSETS AND LIABILITIES | | | | | | | |
| COUNTERPARTY | | NET AMOUNTS OF LIABILITIES
PRESENTED IN THE STATEMENTS
OF ASSETS AND LIABILITIES | | | FINANCIAL
INSTRUMENT | | | CASH
COLLATERAL
PLEDGED (a) | | | NET
AMOUNT (b) | |
Morgan
Stanley & Co. | | $ | 6,085 | | | $ | (6,085 | ) | | $ | – | | | $ | – | |
| | | | | | | | | | | | | | | | |
Total | | $ | 6,085 | | | $ | (6,085 | ) | | $ | – | | | $ | – | |
| | | | | | | | | | | | | | | | |
| | (a) | Collateral disclosed is limited to an amount not to exceed 100% of the net amount of assets presented in the Statements of Assets and Liabilities, for each respective counterparty. |
| | (b) | Net Amount represents the amount that is subject to loss in the event of a counterparty failure as of June 30, 2018. |
Global Credit Income Opportunities Fund
| | | | | | | | | | | | |
| DESCRIPTION | | GROSS AMOUNTS OF
RECOGNIZED ASSETS | | | GROSS AMOUNTS OFFSET
IN THE STATEMENTS OF
ASSETS AND LIABILITIES | | | NET AMOUNTS OF
ASSETS PRESENTED
IN THE STATEMENTS OF
ASSETS AND LIABILITIES | |
Forward Foreign Currency Exchange Contracts | | $ | 817,834 | | | $ | – | | | $ | 817,834 | |
Purchased Options | | | 777,005 | | | | – | | | | 777,005 | |
| | | | | | | | | | | | |
Total | | $ | 1,594,839 | | | $ | – | | | $ | 1,594,839 | |
| | | | | | | | | | | | |
| | | | | | | | | | | | | | | | |
| | | | | | GROSS AMOUNTS NOT OFFSET IN THE
STATEMENTS OF ASSETS AND LIABILITIES | | | | | | | |
| COUNTERPARTY | | NET AMOUNTS OF ASSETS
PRESENTED IN THE STATEMENTS
OF ASSETS AND LIABILITIES | | | FINANCIAL
INSTRUMENT | | | CASH
COLLATERAL
RECEIVED (a) | | | NET
AMOUNT (b) | |
Bank of America N.A. | | $ | 3,176 | | | $ | (2,076 | ) | | $ | – | | | $ | 1,100 | |
Citibank N.A. | | | 456,277 | | | | – | | | | (456,277 | ) | | | – | |
Goldman Sachs & Co. | | | 338,946 | | | | – | | | | (338,946 | ) | | | – | |
JPMorgan Chase Bank N.A. | | | 19,435 | | | | – | | | | (10,000 | ) | | | 9,435 | |
Morgan Stanley & Co. | | | 777,005 | | | | – | | | | – | | | | 777,005 | |
| | | | | | | | | | | | | | | | |
Total | | | $1,594,839 | | | $ | (2,076 | ) | | $ | (805,223 | ) | | $ | 787,540 | |
| | | | | | | | | | | | | | | | |
| | (a) | Collateral disclosed is limited to an amount not to exceed 100% of the net amount of assets presented in the Statements of Assets and Liabilities, for each respective counterparty. |
| | (b) | Net Amount represents the amount that is subject to loss in the event of a counterparty failure as of June 30, 2018. |
215
Barings Funds Trust 2018 Annual Report
NOTES TO THE FINANCIAL STATEMENTS (CONTINUED)
June 30, 2018
| | | | | | | | | | | | |
| DESCRIPTION | | GROSS AMOUNTS OF
RECOGNIZED LIABILITIES | | | GROSS AMOUNTS OFFSET
IN THE STATEMENTS OF
ASSETS AND LIABILITIES | | | NET AMOUNTS OF
LIABILITIES PRESENTED
IN THE STATEMENTS OF
ASSETS AND LIABILITIES | |
Forward Foreign Currency Exchange Contracts | | $ | 2,076 | | | $ | – | | | $ | 2,076 | |
| | | | | | | | | | | | |
Total | | $ | 2,076 | | | $ | – | | | $ | 2,076 | |
| | | | | | | | | | | | |
| | | | | | | | | | | | | | | | |
| | | | | | GROSS AMOUNTS NOT OFFSET IN THE
STATEMENTS OF ASSETS AND LIABILITIES | | | | | | | |
| COUNTERPARTY | | NET AMOUNTS OF LIABILITIES
PRESENTED IN THE STATEMENTS
OF ASSETS AND LIABILITIES | | | FINANCIAL
INSTRUMENT | | | CASH
COLLATERAL
PLEDGED (a) | | | NET
AMOUNT (b) | |
Bank of America N.A. | | $ | 2,076 | | | $ | (2,076 | ) | | $ | – | | | $ | – | |
| | | | | | | | | | | | | | | | |
Total | | $ | 2,076 | | | $ | (2,076 | ) | | $ | – | | | $ | – | |
| | | | | | | | | | | | | | | | |
| | (a) | Collateral disclosed is limited to an amount not to exceed 100% of the net amount of assets presented in the Statements of Assets and Liabilities, for each respective counterparty. |
| | (b) | Net Amount represents the amount that is subject to loss in the event of a counterparty failure as of June 30, 2018. |
Active Short Duration Bond Fund
| | | | | | | | | | | | |
| DESCRIPTION | | GROSS AMOUNTS OF
RECOGNIZED ASSETS | | | GROSS AMOUNTS OFFSET
IN THE STATEMENTS OF
ASSETS AND LIABILITIES | | | NET AMOUNTS OF
ASSETS PRESENTED
IN THE STATEMENTS OF
ASSETS AND LIABILITIES | |
Purchased Options | | $ | 3,833,766 | | | $ | – | | | $ | 3,833,766 | |
| | | | | | | | | | | | |
Total | | $ | 3,833,766 | | | $ | – | | | $ | 3,833,766 | |
| | | | | | | | | | | | |
| | | | | | | | | | | | | | | | |
| | | | | | GROSS AMOUNTS NOT OFFSET IN THE
STATEMENTS OF ASSETS AND LIABILITIES | | | | | | | |
| COUNTERPARTY | | NET AMOUNTS OF ASSETS
PRESENTED IN THE STATEMENTS
OF ASSETS AND LIABILITIES | | | FINANCIAL
INSTRUMENT | | | CASH
COLLATERAL
RECEIVED (a) | | | NET
AMOUNT (b) | |
JPMorgan Chase Bank N.A. | | $ | 3,833,766 | | | $ | (24,375 | ) | | $ | (3,720,000 | ) | | $ | 89,391 | |
| | | | | | | | | | | | | | | | |
Total | | $ | 3,833,766 | | | $ | (24,375 | ) | | $ | (3,720,000 | ) | | $ | 89,391 | |
| | | | | | | | | | | | | | | | |
| | (a) | Collateral disclosed is limited to an amount not to exceed 100% of the net amount of assets presented in the Statements of Assets and Liabilities, for each respective counterparty. |
| | (b) | Net Amount represents the amount that is subject to loss in the event of a counterparty failure as of June 30, 2018. |
216
Barings Funds Trust 2018 Annual Report
NOTES TO THE FINANCIAL STATEMENTS (CONTINUED)
June 30, 2018
| | | | | | | | | | | | |
| DESCRIPTION | | GROSS AMOUNTS OF
RECOGNIZED LIABILITIES | | | GROSS AMOUNTS OFFSET
IN THE STATEMENTS OF
ASSETS AND LIABILITIES | | | NET AMOUNTS OF
LIABILITIES PRESENTED
IN THE STATEMENTS OF
ASSETS AND LIABILITIES | |
Swap Contracts | | $ | 33,058 | | | $ | – | | | $ | 33,058 | |
| | | | | | | | | | | | |
Total | | $ | 33,058 | | | $ | – | | | $ | 33,058 | |
| | | | | | | | | | | | |
| | | | | | | | | | | | | | | | |
| | | | | | GROSS AMOUNTS NOT OFFSET IN THE
STATEMENTS OF ASSETS AND LIABILITIES | | | | | | | |
| COUNTERPARTY | | NET AMOUNTS OF LIABILITIES
PRESENTED IN THE STATEMENTS
OF ASSETS AND LIABILITIES | | | FINANCIAL
INSTRUMENT | | | CASH
COLLATERAL
PLEDGED (a) | | | NET
AMOUNT (b) | |
Goldman Sachs & Co. | | $ | 8,683 | | | $ | – | | | $ | – | | | $ | 8,683 | |
JPMorgan Chase Bank N.A. | | | 24,375 | | | | (24,375 | ) | | | – | | | | – | |
| | | | | | | | | | | | | | | | |
Total | | $ | 33,058 | | | $ | (24,375 | ) | | $ | – | | | $ | 8,683 | |
| | | | | | | | | | | | | | | | |
| | (a) | Collateral disclosed is limited to an amount not to exceed 100% of the net amount of assets presented in the Statements of Assets and Liabilities, for each respective counterparty. |
| | (b) | Net Amount represents the amount that is subject to loss in the event of a counterparty failure as of June 30, 2018. |
Total Return Bond Fund
| | | | | | | | | | | | |
| DESCRIPTION | | GROSS AMOUNTS OF
RECOGNIZED ASSETS | | | GROSS AMOUNTS OFFSET
IN THE STATEMENTS OF
ASSETS AND LIABILITIES | | | NET AMOUNTS OF
ASSETS PRESENTED
IN THE STATEMENTS OF
ASSETS AND LIABILITIES | |
Forward Foreign Currency Exchange Contracts | | $ | 20,403 | | | $ | – | | | $ | 20,403 | |
Purchased Options | | | 393,089 | | | | – | | | | 393,089 | |
| | | | | | | | | | | | |
Total | | $ | 413,492 | | | $ | – | | | $ | 413,492 | |
| | | | | | | | | | | | |
| | | | | | | | | | | | | | | | |
| | | | | | GROSS AMOUNTS NOT OFFSET IN THE
STATEMENTS OF ASSETS AND LIABILITIES | | | | | | | |
| COUNTERPARTY | | NET AMOUNTS OF ASSETS
PRESENTED IN THE STATEMENTS
OF ASSETS AND LIABILITIES | | | FINANCIAL
INSTRUMENT | | | CASH
COLLATERAL
RECEIVED (a) | | | NET
AMOUNT (b) | |
Bank of America N.A. | | $ | 4,722 | | | $ | (4,722 | ) | | $ | – | | | $ | – | |
Barclays Bank plc | | | 1,613 | | | | (1,613 | ) | | | – | | | | – | |
Citibank N.A. | | | 2,091 | | | | (2,091 | ) | | | – | | | | – | |
Goldman Sachs & Co. | | | 106 | | | | (106 | ) | | | – | | | | – | |
JPMorgan Chase Bank N.A. | | | 404,960 | | | | (20,457 | ) | | | (380,000 | ) | | | 4,503 | |
| | | | | | | | | | | | | | | | |
Total | | $ | 413,492 | | | $ | (28,989 | ) | | $ | (380,000 | ) | | $ | 4,503 | |
| | | | | | | | | | | | | | | | |
| | (a) | Collateral disclosed is limited to an amount not to exceed 100% of the net amount of assets presented in the Statements of Assets and Liabilities, for each respective counterparty. |
| | (b) | Net Amount represents the amount that is subject to loss in the event of a counterparty failure as of June 30, 2018. |
217
Barings Funds Trust 2018 Annual Report
NOTES TO THE FINANCIAL STATEMENTS (CONTINUED)
June 30, 2018
| | | | | | | | | | | | |
| DESCRIPTION | | GROSS AMOUNTS OF
RECOGNIZED LIABILITIES | | | GROSS AMOUNTS OFFSET
IN THE STATEMENTS OF
ASSETS AND LIABILITIES | | | NET AMOUNTS OF
LIABILITIES PRESENTED
IN THE STATEMENTS OF
ASSETS AND LIABILITIES | |
Forward Foreign Currency Exchange Contracts | | $ | 43,379 | | | $ | — | | | $ | 43,379 | |
Swap Contracts | | | 8,455 | | | | — | | | | 8,455 | |
| | | | | | | | | | | | |
Total | | $ | 51,834 | | | $ | — | | | $ | 51,834 | |
| | | | | | | | | | | | |
| | | | | | | | | | | | | | | | |
| | | | | | GROSS AMOUNTS NOT OFFSET IN THE
STATEMENTS OF ASSETS AND LIABILITIES | | | | | | | |
| COUNTERPARTY | | NET AMOUNTS OF LIABILITIES
PRESENTED IN THE STATEMENTS
OF ASSETS AND LIABILITIES | | | FINANCIAL
INSTRUMENT | | | CASH
COLLATERAL
PLEDGED (a) | | | NET
AMOUNT (b) | |
Bank of America N.A. | | $ | 7,060 | | | $ | (4,722 | ) | | $ | — | | | $ | 2,338 | |
Barclays Bank plc | | | 1,660 | | | | (1,613 | ) | | | — | | | | 47 | |
Citibank N.A. | | | 6,715 | | | | (2,091 | ) | | | — | | | | 4,624 | |
Goldman Sachs & Co. | | | 15,942 | | | | (106 | ) | | | — | | | | 15,836 | |
JPMorgan Chase Bank N.A. | | | 20,457 | | | | (20,457 | ) | | | — | | | | — | |
| | | | | | | | | | | | | | | | |
Total | | $ | 51,834 | | | $ | (28,989 | ) | | $ | — | | | $ | 22,845 | |
| | | | | | | | | | | | | | | | |
| | (a) | Collateral disclosed is limited to an amount not to exceed 100% of the net amount of assets presented in the Statements of Assets and Liabilities, for each respective counterparty. |
| | (b) | Net Amount represents the amount that is subject to loss in the event of a counterparty failure as of June 30, 2018. |
Emerging Markets Debt Blended Total Return Fund
| | | | | | | | | | | | |
| DESCRIPTION | | GROSS AMOUNTS OF
RECOGNIZED ASSETS | | | GROSS AMOUNTS OFFSET
IN THE STATEMENTS OF
ASSETS AND LIABILITIES | | | NET AMOUNTS OF
ASSETS PRESENTED
IN THE STATEMENTS OF
ASSETS AND LIABILITIES | |
Forward Foreign Currency Exchange Contracts | | $ | 2,214,203 | | | $ | — | | | $ | 2,214,203 | |
Swap Contracts | | | 251,221 | | | | — | | | | 251,221 | |
| | | | | | | | | | | | |
Total | | $ | 2,465,424 | | | $ | — | | | $ | 2,465,424 | |
| | | | | | | | | | | | |
| | | | | | | | | | | | | | | | |
| | | | | | GROSS AMOUNTS NOT OFFSET IN THE
STATEMENTS OF ASSETS AND LIABILITIES | | | | | | | |
| COUNTERPARTY | | NET AMOUNTS OF ASSETS
PRESENTED IN THE STATEMENTS
OF ASSETS AND LIABILITIES | | | FINANCIAL
INSTRUMENT | | | CASH
COLLATERAL
RECEIVED (a) | | | NET
AMOUNT (b) | |
Bank of America N.A. | | $ | 481,530 | | | $ | (164,637 | ) | | $ | (280,000 | ) | | $ | 36,893 | |
Barclays Bank plc | | | 109,430 | | | | (109,430 | ) | | | — | | | | — | |
BNP Paribas S.A. | | | 131,376 | | | | (35,077 | ) | | | — | | | | 96,299 | |
Citibank N.A. | | | 313,280 | | | | (282,297 | ) | | | — | | | | 30,983 | |
218
Barings Funds Trust 2018 Annual Report
NOTES TO THE FINANCIAL STATEMENTS (CONTINUED)
June 30, 2018
| | | | | | | | | | | | | | | | |
| | | | | | GROSS AMOUNTS NOT OFFSET IN THE
STATEMENTS OF ASSETS AND LIABILITIES | | | | | | | |
| COUNTERPARTY | | NET AMOUNTS OF ASSETS
PRESENTED IN THE STATEMENTS
OF ASSETS AND LIABILITIES | | | FINANCIAL
INSTRUMENT | | | CASH
COLLATERAL
RECEIVED (a) | | | NET
AMOUNT (b) | |
Goldman Sachs & Co. | | $ | 8,792 | | | $ | (8,792 | ) | | $ | — | | | $ | — | |
JPMorgan Chase Bank N.A. | | | 1,421,016 | | | | (440,938 | ) | | | (860,000 | ) | | | 120,078 | |
| | | | | | | | | | | | | | | | |
Total | | $ | 2,465,424 | | | $ | (1,041,171 | ) | | $ | (1,140,000 | ) | | $ | 284,253 | |
| | | | | | | | | | | | | | | | |
| | (a) | Collateral disclosed is limited to an amount not to exceed 100% of the net amount of assets presented in the Statements of Assets and Liabilities, for each respective counterparty. |
| | (b) | Net Amount represents the amount that is subject to loss in the event of a counterparty failure as of June 30, 2018. |
| | | | | | | | | | | | | | | | |
| DESCRIPTION | | | | | GROSS AMOUNTS OF
RECOGNIZED LIABILITIES | | | GROSS AMOUNTS OFFSET
IN THE STATEMENTS OF
ASSETS AND LIABILITIES | | | NET AMOUNTS OF
LIABILITIES PRESENTED
IN THE STATEMENTS OF
ASSETS AND LIABILITIES | |
Forward Foreign Currency Exchange Contracts | | | | | | $ | 2,771,591 | | | $ | — | | | $ | 2,771,591 | |
Swap Contracts | | | | | | | 165,823 | | | | — | | | | 165,823 | |
| | | | | | | | | | | | | | | | |
Total | | | | | | $ | 2,937,414 | | | $ | — | | | $ | 2,937,414 | |
| | | | | | | | | | | | | | | | |
| | | | | | | | | | | | | | | | |
| | | | | | GROSS AMOUNTS NOT OFFSET IN THE
STATEMENTS OF ASSETS AND LIABILITIES | | | | | | | |
| COUNTERPARTY | | NET AMOUNTS OF LIABILITIES
PRESENTED IN THE STATEMENTS
OF ASSETS AND LIABILITIES | | | FINANCIAL
INSTRUMENT | | | CASH
COLLATERAL
PLEDGED (a) | | | NET
AMOUNT (b) | |
Bank of America N.A. | | $ | 164,637 | | | $ | (164,637 | ) | | $ | — | | | $ | — | |
Barclays Bank plc | | | 365,637 | | | | (109,430 | ) | | | (220,000 | ) | | | 36,207 | |
BNP Paribas S.A. | | | 35,077 | | | | (35,077 | ) | | | — | | | | — | |
Citibank N.A. | | | 282,297 | | | | (282,297 | ) | | | — | | | | — | |
Goldman Sachs & Co. | | | 1,018,291 | | | | (8,792 | ) | | | (1,009,499 | ) | | | — | |
JPMorgan Chase Bank N.A. | | | 440,938 | | | | (440,938 | ) | | | — | | | | — | |
State Street Bank & Trust Co. | | | 630,537 | | | | — | | | | (570,000 | ) | | | 60,537 | |
| | | | | | | | | | | | | | | | |
Total | | $ | 2,937,414 | | | $ | (1,041,171 | ) | | $ | (1,799,499 | ) | | $ | 96,744 | |
| | | | | | | | | | | | | | | | |
| | (a) | Collateral disclosed is limited to an amount not to exceed 100% of the net amount of assets presented in the Statements of Assets and Liabilities, for each respective counterparty. |
| | (b) | Net Amount represents the amount that is subject to loss in the event of a counterparty failure as of June 30, 2018. |
219
Barings Funds Trust 2018 Annual Report
NOTES TO THE FINANCIAL STATEMENTS (CONTINUED)
June 30, 2018
Emerging Markets Local Currency Debt Fund
| | | | | | | | | | | | |
| DESCRIPTION | | GROSS AMOUNTS OF
RECOGNIZED ASSETS | | | GROSS AMOUNTS OFFSET
IN THE STATEMENTS OF
ASSETS AND LIABILITIES | | | NET AMOUNTS OF
ASSETS PRESENTED
IN THE STATEMENTS OF
ASSETS AND LIABILITIES | |
Forward Foreign Currency Exchange Contracts | | $ | 691,437 | | | $ | — | | | $ | 691,437 | |
Swap Contracts | | | 89,914 | | | | — | | | | 89,914 | |
| | | | | | | | | | | | |
Total | | $ | 781,351 | | | $ | — | | | $ | 781,351 | |
| | | | | | | | | | | | |
| | | | | | | | | | | | | | | | |
| | | | | | GROSS AMOUNTS NOT OFFSET IN THE
STATEMENTS OF ASSETS AND LIABILITIES | | | | | | | |
| COUNTERPARTY | | NET AMOUNTS OF ASSETS
PRESENTED IN THE STATEMENTS
OF ASSETS AND LIABILITIES | | | FINANCIAL
INSTRUMENT | | | CASH
COLLATERAL
RECEIVED (a) | | | NET
AMOUNT (b) | |
Bank of America N.A. | | $ | 213,187 | | | $ | (199,793 | ) | | $ | — | | | $ | 13,394 | |
Barclays Bank plc | | | 33,733 | | | | (33,733 | ) | | | — | | | | — | |
BNP Paribas S.A. | | | 502 | | | | (502 | ) | | | — | | | | — | |
Citibank N.A. | | | 63,752 | | | | (63,752 | ) | | | — | | | | — | |
Goldman Sachs & Co. | | | 9,143 | | | | (9,143 | ) | | | — | | | | — | |
JPMorgan Chase Bank N.A. | | | 461,034 | | | | (242,371 | ) | | | (218,663 | ) | | | — | |
| | | | | | | | | | | | | | | | |
Total | | $ | 781,351 | | | $ | (549,294 | ) | | $ | (218,663 | ) | | $ | 13,394 | |
| | | | | | | | | | | | | | | | |
| | (a) | Collateral disclosed is limited to an amount not to exceed 100% of the net amount of assets presented in the Statements of Assets and Liabilities, for each respective counterparty. |
| | (b) | Net Amount represents the amount that is subject to loss in the event of a counterparty failure as of June 30, 2018. |
| | | | | | | | | | | | |
| DESCRIPTION | | GROSS AMOUNTS OF
RECOGNIZED LIABILITIES | | | GROSS AMOUNTS OFFSET
IN THE STATEMENTS OF
ASSETS AND LIABILITIES | | | NET AMOUNTS OF
LIABILITIES PRESENTED
IN THE STATEMENTS OF
ASSETS AND LIABILITIES | |
Forward Foreign Currency Exchange Contracts | | $ | 1,261,719 | | | $ | – | | | $ | 1,261,719 | |
Swap Contracts | | | 29,014 | | | | – | | | | 29,014 | |
| | | | | | | | | | | | |
Total | | $ | 1,290,733 | | | $ | – | | | $ | 1,290,733 | |
| | | | | | | | | | | | |
| | | | | | | | | | | | | | | | |
| | | | | | GROSS AMOUNTS NOT OFFSET IN THE
STATEMENTS OF ASSETS AND LIABILITIES | | | | | | | |
| COUNTERPARTY | | NET AMOUNTS OF LIABILITIES
PRESENTED IN THE STATEMENTS
OF ASSETS AND LIABILITIES | | | FINANCIAL
INSTRUMENT | | | CASH
COLLATERAL
PLEDGED (a) | | | NET
AMOUNT (b) | |
Bank of America N.A. | | $ | 199,793 | | | $ | (199,793 | ) | | $ | – | | | $ | – | |
Barclays Bank plc | | | 163,411 | | | | (33,733 | ) | | | (129,678 | ) | | | – | |
BNP Paribas S.A. | | | 1,181 | | | | (502 | ) | | | – | | | | 679 | |
220
Barings Funds Trust 2018 Annual Report
NOTES TO THE FINANCIAL STATEMENTS (CONTINUED)
June 30, 2018
| | | | | | | | | | | | | | | | |
| | | | | | GROSS AMOUNTS NOT OFFSET IN THE
STATEMENTS OF ASSETS AND LIABILITIES | | | | | | | |
| COUNTERPARTY | | NET AMOUNTS OF LIABILITIES
PRESENTED IN THE STATEMENTS
OF ASSETS AND LIABILITIES | | | FINANCIAL
INSTRUMENT | | | CASH
COLLATERAL
PLEDGED (a) | | | NET
AMOUNT (b) | |
Citibank N.A. | | $ | 258,275 | | | $ | (63,752 | ) | | $ | (194,523 | ) | | $ | – | |
Goldman Sachs & Co. | | | 425,702 | | | | (9,143 | ) | | | (410,000 | ) | | | 6,559 | |
JPMorgan Chase Bank N.A. | | | 242,371 | | | | (242,371 | ) | | | – | | | | – | |
| | | | | | | | | | | | | | | | |
Total | | $ | 1,290,733 | | | $ | (549,294 | ) | | $ | (734,201 | ) | | $ | 7,238 | |
| | | | | | | | | | | | | | | | |
| | (a) | Collateral disclosed is limited to an amount not to exceed 100% of the net amount of assets presented in the Statements of Assets and Liabilities, for each respective counterparty. |
| | (b) | Net Amount represents the amount that is subject to loss in the event of a counterparty failure as of June 30, 2018. |
Global High Yield Fund
| | | | | | | | | | | | |
| DESCRIPTION | | GROSS AMOUNTS OF
RECOGNIZED ASSETS | | | GROSS AMOUNTS OFFSET
IN THE STATEMENTS OF
ASSETS AND LIABILITIES | | | NET AMOUNTS OF
ASSETS PRESENTED
IN THE STATEMENTS OF
ASSETS AND LIABILITIES | |
Forward Foreign Currency Exchange Contracts | | $ | 46,798 | | | $ | – | | | $ | 46,798 | |
| | | | | | | | | | | | |
Total | | $ | 46,798 | | | $ | – | | | $ | 46,798 | |
| | | | | | | | | | | | |
| | | | | | | | | | | | | | | | |
| | | | | | GROSS AMOUNTS NOT OFFSET IN THE
STATEMENTS OF ASSETS AND LIABILITIES | | | | | | | |
| COUNTERPARTY | | NET AMOUNTS OF ASSETS
PRESENTED IN THE STATEMENTS
OF ASSETS AND LIABILITIES | | | FINANCIAL
INSTRUMENT | | | CASH
COLLATERAL
RECEIVED (a) | | | NET
AMOUNT (b) | |
Bank of America N.A. | | $ | 900 | | | $ | (893 | ) | | $ | – | | | $ | 7 | |
BNP Paribas S.A. | | | 974 | | | | (7 | ) | | | – | | | | 967 | |
Goldman Sachs & Co. | | | 5,118 | | | | – | | | | – | | | | 5,118 | |
JPMorgan Chase Bank N.A. | | | 39,806 | | | | – | | | | – | | | | 39,806 | |
| | | | | | | | | | | | | | | | |
Total | | $ | 46,798 | | | $ | (900 | ) | | $ | – | | | $ | 45,898 | |
| | | | | | | | | | | | | | | | |
| | (a) | Collateral disclosed is limited to an amount not to exceed 100% of the net amount of assets presented in the Statements of Assets and Liabilities, for each respective counterparty. |
| | (b) | Net Amount represents the amount that is subject to loss in the event of a counterparty failure as of June 30, 2018. |
221
Barings Funds Trust 2018 Annual Report
NOTES TO THE FINANCIAL STATEMENTS (CONTINUED)
June 30, 2018
| | | | | | | | | | | | |
| DESCRIPTION | | GROSS AMOUNTS OF
RECOGNIZED LIABILITIES | | | GROSS AMOUNTS OFFSET
IN THE STATEMENTS OF
ASSETS AND LIABILITIES | | | NET AMOUNTS OF
LIABILITIES PRESENTED
IN THE STATEMENTS OF
ASSETS AND LIABILITIES | |
Forward Foreign Currency Exchange Contracts | | $ | 900 | | | $ | – | | | $ | 900 | |
| | | | | | | | | | | | |
Total | | $ | 900 | | | $ | – | | | $ | 900 | |
| | | | | | | | | | | | |
| | | | | | | | | | | | | | | | |
| | | | | | GROSS AMOUNTS NOT OFFSET IN THE
STATEMENTS OF ASSETS AND LIABILITIES | | | | | | | |
| COUNTERPARTY | | NET AMOUNTS OF LIABILITIES
PRESENTED IN THE STATEMENTS
OF ASSETS AND LIABILITIES | | | FINANCIAL
INSTRUMENT | | | CASH
COLLATERAL
PLEDGED (a) | | | NET
AMOUNT (b) | |
Bank of America N.A. | | $ | 893 | | | $ | (893 | ) | | $ | – | | | $ | – | |
BNP Paribas S.A. | | | 7 | | | | (7 | ) | | | – | | | | – | |
| | | | | | | | | | | | | | | | |
Total | | $ | 900 | | | $ | (900 | ) | | $ | – | | | $ | – | |
| | | | | | | | | | | | | | | | |
| | (a) | Collateral disclosed is limited to an amount not to exceed 100% of the net amount of assets presented in the Statements of Assets and Liabilities, for each respective counterparty. |
| | (b) | Net Amount represents the amount that is subject to loss in the event of a counterparty failure as of June 30, 2018. |
Investing in securities of foreign companies and foreign governments involves special risks and considerations not typically associated with investing in U.S. companies and the U.S. government. These risks include valuation of currencies and adverse political and economic developments. Moreover, securities of many foreign companies, foreign governments, and their markets may be less liquid and their prices more volatile than those of securities of comparable U.S. companies and the U.S. government.
| | M. | Foreign Currency Translation |
The books and records of the Funds are maintained in U.S. dollars. Foreign currency transactions are translated into U.S. dollars on the following basis: (i) market value of investment securities, assets and liabilities at the daily rates of exchange, and (ii) purchases and sales of investment securities, dividend and interest income and certain expenses at the rates of exchange prevailing on the respective dates of such transactions. For financial reporting purposes, the Funds do not isolate changes in the exchange rate of investment securities from the fluctuations arising from changes in the market prices of securities. However, for Federal income tax purposes, the Funds do isolate and treat as ordinary income the effect
of changes in foreign exchange rates on realized gain or loss from the sale of investment securities and payables and receivables arising from trade-date and settlement-date differences.
The Funds seek to manage counterparty credit risk by entering into agreements only with counterparties the Adviser believes have the financial resources to honor their obligations. The Adviser monitors the financial stability of the Funds’ counterparties.
The Funds have entered into an Investment Management Agreement (the “Agreement”) with the Adviser. Pursuant to the Agreement, the Funds have agreed to pay the Adviser a fee payable at the end of each calendar month as set forth below:
| | |
Global Floating Rate Fund | | 0.65% of average daily net assets |
Global Credit Income Opportunities Fund | | 0.75% of average daily
net assets |
Active Short Duration Bond Fund | | 0.35% of average daily
net assets |
Total Return Bond Fund | | 0.40% of average daily
net assets |
222
Barings Funds Trust 2018 Annual Report
NOTES TO THE FINANCIAL STATEMENTS (CONTINUED)
June 30, 2018
| | |
Emerging Markets Debt Blended Total Return Fund | | 0.75% of average daily
net assets |
Emerging Markets Local Currency Debt Fund | | 0.75% of average daily
net assets |
Global High Yield Fund | | 0.60% of average daily
net assets |
U.S. High Yield Fund | | 0.55% of average daily
net assets |
The Adviser has contractually agreed to waive and/or reimburse a portion of its fees and/or reimburse expenses (excluding distribution and service (12b-1) fees, interest expenses, taxes, acquired fund fees and expenses, fees incurred in acquiring and disposing of securities and extraordinary expenses) such that total net annual operating expenses (including 12b-1 fees) for each class do not exceed the following rates (as a percentage of average daily net assets allocated to each such class):
| | | | | | | | | | | | | | | | |
| | | CLASS A | | | CLASS C | | | CLASS I | | | CLASS Y | |
Global Floating Rate Fund | | | 1.00 | % | | | 1.75 | % | | | 0.75 | % | | | 0.75 | % |
Global Credit Income Opportunities Fund | | | 1.20 | % | | | 1.95 | % | | | 0.95 | % | | | 0.95 | % |
Active Short Duration Bond Fund | | | 0.65 | % | | | 0.90 | % | | | 0.40 | % | | | 0.40 | % |
Total Return Bond Fund | | | 0.80 | % | | | 1.55 | % | | | 0.55 | % | | | 0.55 | % |
Emerging Markets Debt Blended Total Return Fund | | | 1.20 | % | | | 1.95 | % | | | 0.95 | % | | | 0.95 | % |
Emerging Markets Local Currency Debt Fund | | | 1.20 | % | | | 1.95 | % | | | 0.95 | % | | | 0.95 | % |
Global High Yield Fund | | | 1.05 | % | | | 1.80 | % | | | 0.80 | % | | | 0.80 | % |
U.S. High Yield Fund | | | 1.00 | % | | | 1.75 | % | | | 0.75 | % | | | 0.75 | % |
Pursuant to the expense waiver/reimbursement agreement, the Adviser is entitled to be reimbursed for any fees the Adviser waives and Fund expenses that the Adviser reimburses for a period of three years following such fee waivers and expense reimbursements, to the extent that such reimbursement of the Adviser by a Fund will not cause the Fund to exceed any applicable expense limitation that is in place for the Fund.
The contractual management fee waiver and expense reimbursement agreements between the Funds and the Adviser will remain in effect until November 1, 2018 and may be terminated only upon the approval of the Funds’ Board of Trustees.
Subject to the supervision of the Adviser and the Board, BGA manages the investment and reinvestment of a portion of the assets of the Global Floating Rate Fund, Global Credit Income Opportunities Fund, Emerging Markets Debt Blended Total Return Fund and Global High Yield Fund, as allocated from time to time to BGA. As compensation for its services, the Adviser (not the Funds) pays to BGA sub-advisory fees equal to the below percentages of the advisory fee paid to the Adviser by the applicable Fund, net of any fee waivers and/or expense reimbursements:
| | | | |
Global Floating Rate Fund | | | 0.35 | % |
Global Credit Income Opportunities Fund | | | 0.35 | % |
Emerging Markets Debt Blended Total Return Fund | | | 0.50 | % |
Global High Yield Fund | | | 0.35 | % |
The Adviser or its affiliates voluntarily agreed to waive certain fees for the Global Floating Rate Fund, the Active Short Duration Bond Fund, the Total Return Bond Fund, the Emerging Markets Debt Blended Total Return Fund and the Emerging Markets Local Currency Debt Fund in order to maintain a minimum net investment income of not less than $0. Such arrangements may be discontinued by the Adviser at any time. For the year ended June 30, 2018, the amount of the waivers were $86,141, $211, $5, $33,274 and $15,885, respectively.
| 4. | 12b-1 Distribution and Service Plan |
ALPS Distributors, Inc. (the “Distributor”) is the Distributor of the Funds’ shares as of June 30, 2018.
The Funds have adopted a Distribution and Shareholder Services Plan (the “Plan”), pursuant to Rule 12b-1 under the 1940 Act. Under the Plan, each Fund’s Class A and Class C shares may compensate certain financial institutions, including the Distributor, for certain distribution and shareholder servicing activities. The Funds’ Class A shares may expend an aggregate amount, on an annual basis, not to exceed 0.25% of the value of the average daily net assets of a Fund attributable to Class A shares and 1.00% (0.50% for Active Short Duration Bond Fund) of the value of the average daily net assets of a Fund attributable to Class C shares. The Plan provides that the distribution and service fees are payable to the Distributor regardless of the amounts actually expended
223
Barings Funds Trust 2018 Annual Report
NOTES TO THE FINANCIAL STATEMENTS (CONTINUED)
June 30, 2018
by the Distributor for distribution of the Funds’ shares and service activities.
Under its terms, the Funds’ Plan shall remain in effect from year to year, provided such continuance is approved annually by a vote of a majority of the Board’s members and a majority of the Board’s members who are not “interested persons” of the Funds and who have no direct or indirect financial interest in the operation of the Plan or in any agreement related to the Plan.
| 5. | Sales Charges and Commissions |
For the year ended June 30, 2018, the amount of sales charges retained by the Distributor on sales of Class A and Class C shares of the Funds were as follows:
| | | | |
| | | CLASS C | |
Global Floating Rate Fund | | $ | 300 | |
Global Credit Income Opportunities Fund | | | 7 | |
Barings Emerging Markets Debt Blended Total Return Fund | | | 98 | |
For the year ended June 30, 2018, the Distributor received the following commissions on sales of shares of the Funds, after concessions were paid to authorized dealers:
| | | | | | | | |
| | | DISTRIBUTOR
COMMISSIONS | | | DEALERS’
CONCESSIONS | |
Global Floating Rate Fund | | $ | 5,556 | | | $ | 116,748 | |
Global Credit Income Opportunities Fund | | | 10,839 | | | | 204,939 | |
Active Short Duration Bond Fund | | | – | | | | 4,557 | |
Emerging Markets Debt Blended Total Return Fund | | | 888 | | | | 7,351 | |
| 6. | Administrator, Custody, and Transfer Agent Fees |
The Funds have engaged State Street Bank and Trust (“SSB”) to serve as the Funds’ administrator, custodian, and fund accountant. For these services, the Funds have agreed to pay SSB fees payable at the end of each
calendar month pursuant to an agreement between SSB and the Funds. For the year ended June 30, 2018, the aggregate effective fee for the services performed by SSB was at the following annual rate of each Fund’s average daily managed assets:
| | | | |
Aggregate Administrator, Custodian and Fund Accountant Fee to SSB: | | | | |
Global Floating Rate Fund | | | 0.19 | % |
Global Credit Income Opportunities Fund | | | 0.20 | % |
Active Short Duration Bond Fund | | | 0.20 | % |
Total Return Bond Fund | | | 0.35 | % |
Emerging Markets Debt Blended Total Return Fund | | | 0.42 | % |
Emerging Markets Local Currency Debt Fund | | | 0.59 | % |
Global High Yield Fund | | | 0.32 | % |
U.S. High Yield Fund | | | 0.26 | % |
The Funds have engaged ALPS Fund Services, Inc. (“ALPS”) to serve as the Funds’ transfer agent. For these services, the Funds have agreed to pay ALPS fees payable at the end of each calendar month pursuant to an agreement between ALPS and the Funds. For the year ended June 30, 2018, the effective fee for the services performed by ALPS was at the following annual rate of each Fund’s average daily managed assets:
Transfer Agency Fee to ALPS:
| | | | |
Global Floating Rate Fund | | | 0.02 | % |
Global Credit Income Opportunities Fund | | | 0.03 | % |
Active Short Duration Bond Fund | | | 0.02 | % |
Total Return Bond Fund | | | 0.09 | % |
Emerging Markets Debt Blended Total Return Fund | | | 0.11 | % |
Emerging Markets Local Currency Debt Fund | | | 0.13 | % |
Global High Yield Fund | | | 0.08 | % |
U.S. High Yield Fund | | | 0.05 | % |
It is the Funds’ intention to qualify as a RIC under subchapter M of the Internal Revenue Code and distribute all of its taxable income. Accordingly, no provision for Federal income taxes is required in the financial statements.
224
Barings Funds Trust 2018 Annual Report
NOTES TO THE FINANCIAL STATEMENTS (CONTINUED)
June 30, 2018
The tax character of dividends paid to shareholders during the year ended June 30, 2018 was as follows:
| | | | | | | | | | | | | | | | |
| | | ORDINARY
INCOME | | | NET
LONG-TERM
CAPITAL
GAINS | | | RETURN OF
CAPITAL | | | TOTAL
DISTRIBUTIONS
PAID | |
Global Floating Rate Fund | | $ | 8,591,381 | | | $ | – | | | $ | 1,171,303 | | | $ | 9,762,684 | |
Global Credit Income Opportunities Fund | | | 9,089,382 | | | | – | | | | 496,307 | | | | 9,585,689 | |
Active Short Duration Bond Fund | | | 9,664,909 | | | | 902,028 | | | | – | | | | 10,566,937 | |
Total Return Bond Fund | | | 976,520 | | | | – | | | | 33,503 | | | | 1,010,023 | |
Emerging Markets Debt Blended Total Return Fund | | | 1,342,816 | | | | 145,149 | | | | – | | | | 1,487,965 | |
Emerging Markets Local Currency Debt Fund | | | 787,706 | | | | 63,047 | | | | – | | | | 850,753 | |
Global High Yield Fund | | | 2,242,682 | | | | 57,003 | | | | – | | | | 2,299,685 | |
U.S. High Yield Fund | | | 2,968,418 | | | | 248,263 | | | | – | | | | 3,216,681 | |
The tax character of dividends paid to shareholders during the tax year ended June 30, 2017 was as follows:
| | | | | | | | | | | | | | | | |
| | | ORDINARY
INCOME | | | NET
LONG-TERM
CAPITAL
GAINS | | | RETURN OF
CAPITAL | | | TOTAL
DISTRIBUTIONS
PAID | |
Global Floating Rate Fund | | $ | 5,697,657 | | | $ | – | | | $ | 2,580,175 | | | $ | 8,277,832 | |
Global Credit Income Opportunities Fund | | | 6,724,714 | | | | – | | | | 805,615 | | | | 7,530,329 | |
Active Short Duration Bond Fund | | | 4,705,679 | | | | 75,157 | | | | – | | | | 4,780,836 | |
Total Return Bond Fund | | | 800,010 | | | | – | | | | – | | | | 800,010 | |
Emerging Markets Debt Blended Total Return Fund | | | 530,014 | | | | – | | | | – | | | | 530,014 | |
Emerging Markets Local Currency Debt Fund | | | 559,981 | | | | 32,131 | | | | – | | | | 592,112 | |
Global High Yield Fund | | | 2,356,560 | | | | 383,823 | | | | – | | | | 2,740,383 | |
U.S. High Yield Fund | | | 2,602,629 | | | | – | | | | – | | | | 2,602,629 | |
As of June 30, 2018, the components of distributable earnings on a tax-basis were as follows:
| | | | | | | | | | | | | | | | | | | | | | | | |
| | | UNDISTRIBUTED
ORDINARY
INCOME | | | UNDISTRIBUTED
LONG-TERM
CAPITAL GAINS | | | LATE YEAR
ORDINARY AND
POST OCT CAPITAL
LOSS DEFERRALS | | | CAPITAL LOSS
CARRY FORWARDS | | | UNREALIZED
DEPRECIATION | | | TOTAL
DISTRIBUTABLE
EARNINGS | |
Global Floating Rate Fund | | $ | – | | | $ | – | | | $ | – | | | $ | (1,502,281 | ) | | $ | (3,200,284 | ) | | $ | (4,702,565 | ) |
Global Credit Income Opportunities Fund | | | – | | | | – | | | | – | | | | (56,730 | ) | | | (5,005,462 | ) | | | (5,062,192 | ) |
Active Short Duration Bond Fund | | | 240,435 | | | | 481,875 | | | | – | | | | – | | | | (4,469,919 | ) | | | (3,747,609 | ) |
Total Return Bond Fund | | | – | | | | – | | | | (163,970 | ) | | | (111,117 | ) | | | (354,994 | ) | | | (630,081 | ) |
Emerging Markets Debt Blended Total Return Fund | | | 288,494 | | | | – | | | | (266,300 | ) | | | – | | | | (4,215,935 | ) | | | (4,193,741 | ) |
Emerging Markets Local Currency Debt Fund | | | – | | | | – | | | | (360,711 | ) | | | – | | | | (1,126,093 | ) | | | (1,486,804 | ) |
Global High Yield Fund | | | 122,578 | | | | 240,568 | | | | – | | | | – | | | | (839,063 | ) | | | (475,917 | ) |
U.S. High Yield Fund | | | 118,934 | | | | – | | | | (69,914 | ) | | | – | | | | (761,122 | ) | | | (712,102 | ) |
In accordance with the Regulated Investment Company Modernization Act of 2010, the Funds will carryforward
capital losses incurred in taxable years beginning after December 22, 2010 (“post-enactment losses”)
225
Barings Funds Trust 2018 Annual Report
NOTES TO THE FINANCIAL STATEMENTS (CONTINUED)
June 30, 2018
indefinitely. Post-enactment losses will also retain their character as either short-term or long-term and be utilized before any pre-enactment losses.
On June 30, 2018, the following funds had capital loss carryforwards available to be offset against future net capital gains as follows:
| | | | | | | | |
| | | UNLIMITED -
SHORT TERM | | | UNLIMITED -
LONG TERM | |
Global Floating Rate Fund | | $ | 215,686 | | | $ | 1,286,595 | |
Global Credit Income Opportunities Fund | | | — | | | | 56,730 | |
Total Return Bond Fund | | | 111,117 | | | | — | |
Under current tax rules, regulated investment companies can elect to treat certain late-year ordinary losses
incurred and post-October capital losses (capital losses realized after October 31) as arising on the first day of the following taxable year. As of June 30, 2018, Emerging Markets Local Currency Debt Fund has elected to defer late-year ordinary losses incurred of $160,945. As of June 30, 2018, Total Return Bond Fund, Emerging Markets Debt Blended Total Return Fund, Emerging Markets Local Currency Debt Fund and U.S. High Yield Fund have elected to defer current year post-October losses of $163,970, $266,300, $199,766, and $69,914, respectively.
Global Credit Income Opportunities Fund utilized $1,349,346 of capital loss carryforwards during the year ended June 30, 2018.
As of June 30, 2018, the aggregate unrealized security gains and losses based on cost for U.S. federal income tax purposes were as follows:
| | | | | | | | | | | | | | | | |
| | | COST OF
INVESTMENTS | | | GROSS
UNREALIZED
APPRECIATION | | | GROSS
UNREALIZED
DEPRECIATION | | | NET
UNREALIZED
DEPRECIATION | |
Global Floating Rate Fund | | $ | 290,960,758 | | | $ | 2,966,121 | | | $ | (6,182,949 | ) | | $ | (3,216,828 | ) |
Global Credit Income Opportunities Fund | | | 239,068,308 | | | | 2,920,677 | | | | (7,865,524 | ) | | | (4,944,847 | ) |
Active Short Duration Bond Fund | | | 437,503,951 | | | | 1,095,713 | | | | (5,565,632 | ) | | | (4,469,919 | ) |
Total Return Bond Fund | | | 30,447,294 | | | | 170,652 | | | | (518,691 | ) | | | (348,039 | ) |
Emerging Markets Debt Blended Total Return Fund | | | 49,778,627 | | | | 47,145 | | | | (3,961,992 | ) | | | (3,914,847 | ) |
Emerging Markets Local Currency Debt Fund | | | 19,246,036 | | | | 79,958 | | | | (1,082,409 | ) | | | (1,002,451 | ) |
Global High Yield Fund | | | 26,115,605 | | | | 425,153 | | | | (1,260,911 | ) | | | (835,758 | ) |
U.S. High Yield Fund | | | 58,024,279 | | | | 745,360 | | | | (1,506,482 | ) | | | (761,122 | ) |
The difference between book-basis and tax-basis unrealized gains (losses) is attributable to wash sales.
Permanent items identified during the year ended June 30, 2018 have been reclassified among the components of net assets based on their tax basis treatment as follows:
| | | | | | | | |
| | | UNDISTRIBUTED
NET
INVESTMENT
INCOME | | | ACCUMULATED
NET REALIZED
GAIN (LOSS) | |
Global Floating Rate Fund | | $ | 20,246 | | | $ | (20,246 | ) |
Global Credit Income Opportunities Fund | | | 440,558 | | | | (440,558 | ) |
Active Short Duration Bond Fund | | | 13,274 | | | | (13,274 | ) |
Total Return Bond Fund | | | 59,753 | | | | (59,753 | ) |
| | | | | | | | |
| | | UNDISTRIBUTED
NET
INVESTMENT
INCOME | | | ACCUMULATED
NET REALIZED
GAIN (LOSS) | |
Emerging Markets Debt Blended Total Return Fund | | $ | 115,574 | | | $ | (115,574 | ) |
Emerging Markets Local Currency Debt Fund | | | (147,725 | ) | | | 147,725 | |
Global High Yield Fund | | | 134,503 | | | | (134,503 | ) |
U.S. High Yield Fund | | | (320 | ) | | | 320 | |
The permanent differences are primarily attributable to foreign currency gains (losses) partnership basis adjustments, swap income reclasses and the tax treatment of certain distributions.
226
Barings Funds Trust 2018 Annual Report
NOTES TO THE FINANCIAL STATEMENTS (CONTINUED)
June 30, 2018
| 8. | Investment Transactions |
Purchases and sales of securities (excluding short-term debt securities) for the year ended June 30, 2018 were as follows:
| | | | | | | | | | | | | | | | |
| | | PURCHASES | | | SALES | | | GOVERNMENT
PURCHASES | | | GOVERNMENT
SALES | |
Global Floating Rate Fund | | $ | 176,234,550 | | | $ | 113,958,993 | | | $ | – | | | $ | – | |
Global Credit Income Opportunities Fund | | | 165,217,547 | | | | 88,722,152 | | | | – | | | | – | |
Active Short Duration Bond Fund | | | 287,880,742 | | | | 185,006,432 | | | | 15,396,838 | | | | 50,676,889 | |
Total Return Bond Fund | | | 51,073,264 | | | | 52,044,346 | | | | 41,757,701 | | | | 42,971,374 | |
Emerging Markets Debt Blended Total Return Fund | | | 47,248,266 | | | | 10,918,099 | | | | – | | | | – | |
Emerging Markets Local Currency Debt Fund | | | 18,470,783 | | | | 6,556,206 | | | | – | | | | – | |
Global High Yield Fund | | | 17,107,639 | | | | 19,243,798 | | | | – | | | | – | |
U.S. High Yield Fund | | | 38,389,029 | | | | 15,262,912 | | | | – | | | | – | |
Transactions in common stock for the year ended June 30, 2018 were as follows:
Global Floating Rate Fund
| | | | | | | | | | | | | | | | |
| | | FOR THE
YEAR ENDED
JUNE 30, 2018 | | | FOR THE
YEAR ENDED
JUNE 30, 2017 | |
| CLASS A | | SHARES | | | AMOUNT | | | SHARES | | | AMOUNT | |
Shares sold | | | 1,667,532 | | | $ | 15,918,813 | | | | 3,829,613 | | | $ | 36,363,931 | |
Shares sold through reinvestments of distributions | | | 243,001 | | | | 2,317,457 | | | | 146,369 | | | | 1,393,229 | |
Shares redeemed | | | (1,036,759 | ) | | | (9,887,519 | ) | | | (753,451 | ) | | | (7,217,797 | ) |
| | | | | | | | | | | | | | | | |
Net increase | | | 873,774 | | | $ | 8,348,751 | | | | 3,222,531 | | | $ | 30,539,363 | |
| | | | | | | | | | | | | | | | |
CLASS C | | | | | | | | | | | | | | | | |
Shares sold | | | 185,281 | | | $ | 1,760,750 | | | | 282,492 | | | $ | 2,668,145 | |
Shares sold through reinvestments of distributions | | | 29,111 | | | | 276,669 | | | | 28,770 | | | | 272,104 | |
Shares redeemed | | | (178,196 | ) | | | (1,693,674 | ) | | | (215,649 | ) | | | (2,030,225 | ) |
| | | | | | | | | | | | | | | | |
Net increase | | | 36,196 | | | $ | 343,745 | | | | 95,613 | | | $ | 910,024 | |
| | | | | | | | | | | | | | | | |
CLASS I | | | | | | | | | | | | | | | | |
Shares sold | | | 575,961 | | | $ | 5,511,861 | | | | 2,214,829 | | | $ | 21,195,710 | |
Shares sold through reinvestments of distributions | | | 100,453 | | | | 960,046 | | | | 51,957 | | | | 499,056 | |
Shares redeemed | | | (807,441 | ) | | | (7,709,995 | ) | | | (2,378,284 | ) | | | (22,670,813 | ) |
| | | | | | | | | | | | | | | | |
Net decrease | | | (131,027 | ) | | $ | (1,238,088 | ) | | | (111,498 | ) | | $ | (976,047 | ) |
| | | | | | | | | | | | | | | | |
CLASS Y | | | | | | | | | | | | | | | | |
Shares sold | | | 9,320,803 | | | $ | 89,015,823 | | | | 9,291,951 | | | $ | 88,449,851 | |
Shares sold through reinvestments of distributions | | | 568,316 | | | | 5,429,194 | | | | 484,693 | | | | 4,604,438 | |
Shares redeemed | | | (4,547,811 | ) | | | (43,466,701 | ) | | | (10,706,795 | ) | | | (101,282,672 | ) |
| | | | | | | | | | | | | | | | |
Net increase (decrease) | | | 5,341,308 | | | $ | 50,978,316 | | | | (930,151 | ) | | $ | (8,228,383 | ) |
| | | | | | | | | | | | | | | | |
227
Barings Funds Trust 2018 Annual Report
NOTES TO THE FINANCIAL STATEMENTS (CONTINUED)
June 30, 2018
Global Credit Income Opportunities Fund
| | | | | | | | | | | | | | | | |
| | | FOR THE
YEAR ENDED
JUNE 30, 2018 | | | FOR THE
YEAR ENDED
JUNE 30, 2017 | |
| CLASS A | | SHARES | | | AMOUNT | | | SHARES | | | AMOUNT | |
Shares sold | | | 4,878,668 | | | $ | 45,886,717 | | | | 2,302,114 | | | $ | 21,436,358 | |
Shares sold through reinvestments of distributions | | | 185,198 | | | | 1,746,315 | | | | 106,536 | | | | 999,227 | |
Shares redeemed | | | (1,400,679 | ) | | | (13,240,661 | ) | | | (980,824 | ) | | | (9,084,434 | ) |
| | | | | | | | | | | | | | | | |
Net increase | | | 3,663,187 | | | $ | 34,392,371 | | | | 1,427,826 | | | $ | 13,351,151 | |
| | | | | | | | | | | | | | | | |
CLASS C | | | | | | | | | | | | | | | | |
Shares sold | | | 371,526 | | | $ | 3,505,551 | | | | 419,598 | | | $ | 3,942,417 | |
Shares sold through reinvestments of distributions | | | 30,456 | | | | 286,954 | | | | 21,444 | | | | 200,486 | |
Shares redeemed | | | (150,027 | ) | | | (1,414,034 | ) | | | (150,039 | ) | | | (1,403,298 | ) |
| | | | | | | | | | | | | | | | |
Net increase | | | 251,955 | | | $ | 2,378,471 | | | | 291,003 | | | $ | 2,739,605 | |
| | | | | | | | | | | | | | | | |
CLASS I | | | | | | | | | | | | | | | | |
Shares sold | | | – | | | $ | – | | | | 3,073 | | | $ | 26,732 | |
Shares sold through reinvestments of distributions | | | 93 | | | | 876 | | | | 98 | | | | 913 | |
Shares redeemed | | | – | | | | – | | | | (470,459 | ) | | | (4,473,652 | ) |
| | | | | | | | | | | | | | | | |
Net increase (decrease) | | | 93 | | | $ | 876 | | | | (467,288 | ) | | $ | (4,446,007 | ) |
| | | | | | | | | | | | | | | | |
CLASS Y | | | | | | | | | | | | | | | | |
Shares sold | | | 7,646,098 | | | $ | 72,032,811 | | | | 5,823,585 | | | $ | 54,887,640 | |
Shares sold through reinvestments of distributions | | | 425,660 | | | | 4,011,731 | | | | 236,560 | | | | 2,218,558 | |
Shares redeemed | | | (3,105,523 | ) | | | (29,263,594 | ) | | | (2,585,294 | ) | | | (24,389,480 | ) |
| | | | | | | | | | | | | | | | |
Net increase | | | 4,966,235 | | | $ | 46,780,948 | | | | 3,474,851 | | | $ | 32,716,718 | |
| | | | | | | | | | | | | | | | |
Active Short Duration Bond Fund
| | | | | | | | | | | | | | | | |
| | | FOR THE
YEAR ENDED
JUNE 30, 2018 | | | FOR THE
YEAR ENDED
JUNE 30, 2017 | |
| CLASS A | | SHARES | | | AMOUNT | | | SHARES | | | AMOUNT | |
Shares sold | | | 14,618,622 | | | $ | 145,642,052 | | | | 15,421,798 | | | $ | 153,874,328 | |
Shares sold through reinvestments of distributions | | | 386,954 | | | | 3,845,964 | | | | 162,991 | | | | 1,626,866 | |
Shares redeemed | | | (8,990,871 | ) | | | (89,385,833 | ) | | | (7,690,111 | ) | | | (76,746,051 | ) |
| | | | | | | | | | | | | | | | |
Net increase | | | 6,014,705 | | | $ | 60,102,183 | | | | 7,894,678 | | | $ | 78,755,143 | |
| | | | | | | | | | | | | | | | |
CLASS C | | | | | | | | | | | | | | | | |
Shares sold | | | 103,284 | | | $ | 1,031,298 | | | | 2,805 | | | $ | 28,000 | |
Shares sold through reinvestments of distributions | | | 1,963 | | | | 19,485 | | | | 543 | | | | 5,417 | |
Shares redeemed | | | (13,404 | ) | | | (133,445 | ) | | | (5,554 | ) | | | (55,396 | ) |
| | | | | | | | | | | | | | | | |
Net increase (decrease) | | | 91,843 | | | $ | 917,338 | | | | (2,206 | ) | | $ | (21,979 | ) |
| | | | | | | | | | | | | | | | |
CLASS I | | | | | | | | | | | | | | | | |
Shares sold | | | 20,309 | | | $ | 203,500 | | | | 10,010 | | | $ | 100,000 | |
Shares sold through reinvestments of distributions | | | – | | | | – | | | | – | | | | – | |
Shares redeemed | | | – | | | | – | | | | (598,837 | ) | | | (5,976,390 | ) |
| | | | | | | | | | | | | | | | |
Net increase (decrease) | | | 20,309 | | | $ | 203,500 | | | | (588,827 | ) | | $ | (5,876,390 | ) |
| | | | | | | | | | | | | | | | |
228
Barings Funds Trust 2018 Annual Report
NOTES TO THE FINANCIAL STATEMENTS (CONTINUED)
June 30, 2018
| | | | | | | | | | | | | | | | |
| | | FOR THE
YEAR ENDED
JUNE 30, 2018 | | | FOR THE
YEAR ENDED
JUNE 30, 2017 | |
| CLASS Y | | SHARES | | | AMOUNT | | | SHARES | | | AMOUNT | |
Shares sold | | | 20,820,040 | | | $ | 207,162,143 | | | | 16,431,103 | | | $ | 163,786,901 | |
Shares sold through reinvestments of distributions | | | 564,556 | | | | 5,609,410 | | | | 247,545 | | | | 2,469,485 | |
Shares redeemed | | | (16,257,695 | ) | | | (161,293,725 | ) | | | (7,243,098 | ) | | | (72,203,413 | ) |
| | | | | | | | | | | | | | | | |
Net increase | | | 5,126,901 | | | $ | 51,477,828 | | | | 9,435,550 | | | $ | 94,052,973 | |
| | | | | | | | | | | | | | | | |
Total Return Bond Fund
| | | | | | | | | | | | | | | | |
| | | FOR THE
YEAR ENDED
JUNE 30, 2018 | | | FOR THE
YEAR ENDED
JUNE 30, 2017 | |
| CLASS A | | SHARES | | | AMOUNT | | | SHARES | | | AMOUNT | |
Shares sold | | | – | | | $ | – | | | | 1,859 | | | $ | 19,007 | |
Shares sold through reinvestments of distributions | | | 40 | | | | 398 | | | | 45 | | | | 449 | |
Shares redeemed | | | (495 | ) | | | (4,965 | ) | | | (995 | ) | | | (9,908 | ) |
| | | | | | | | | | | | | | | | |
Net increase (decrease) | | | (455 | ) | | $ | (4,567 | ) | | | 909 | | | $ | 9,548 | |
| | | | | | | | | | | | | | | | |
CLASS C | | | | | | | | | | | | | | | | |
Shares sold | | | – | | | $ | – | | | | – | | | $ | – | |
Shares sold through reinvestments of distributions | | | – | | | | – | | | | – | | | | – | |
Shares redeemed | | | – | | | | – | | | | – | | | | – | |
| | | | | | | | | | | | | | | | |
Net increase | | | – | | | $ | – | | | | – | | | $ | – | |
| | | | | | | | | | | | | | | | |
CLASS I | | | | | | | | | | | | | | | | |
Shares sold | | | – | | | $ | – | | | | – | | | $ | – | |
Shares sold through reinvestments of distributions | | | – | | | | – | | | | – | | | | – | |
Shares redeemed | | | – | | | | – | | | | – | | | | – | |
| | | | | | | | | | | | | | | | |
Net increase | | | – | | | $ | – | | | | – | | | $ | – | |
| | | | | | | | | | | | | | | | |
CLASS Y | | | | | | | | | | | | | | | | |
Shares sold | | | 297,499 | | | $ | 2,983,984 | | | | 497,579 | | | $ | 4,982,291 | |
Shares sold through reinvestments of distributions | | | 18,366 | | | | 183,513 | | | | 7,463 | | | | 74,879 | |
Shares redeemed | | | (369,123 | ) | | | (3,656,973 | ) | | | (49,321 | ) | | | (493,631 | ) |
| | | | | | | | | | | | | | | | |
Net increase (decrease) | | | (53,258 | ) | | $ | (489,476 | ) | | | 455,721 | | | $ | 4,563,539 | |
| | | | | | | | | | | | | | | | |
Emerging Markets Debt Blended Total Return Fund
| | | | | | | | | | | | | | | | |
| | | FOR THE
YEAR ENDED
JUNE 30, 2018 | | | FOR THE
YEAR ENDED
JUNE 30, 2017 | |
| CLASS A | | SHARES | | | AMOUNT | | | SHARES | | | AMOUNT | |
Shares sold | | | 41,516 | | | $ | 444,647 | | | | – | | | $ | – | |
Shares sold through reinvestments of distributions | | | 2,054 | | | | 21,425 | | | | – | | | | – | |
Shares redeemed | | | (4,035 | ) | | | (40,621 | ) | | | – | | | | – | |
| | | | | | | | | | | | | | | | |
Net increase | | | 39,535 | | | $ | 425,451 | | | | – | | | $ | – | |
| | | | | | | | | | | | | | | | |
229
Barings Funds Trust 2018 Annual Report
NOTES TO THE FINANCIAL STATEMENTS (CONTINUED)
June 30, 2018
| | | | | | | | | | | | | | | | |
| | | FOR THE
YEAR ENDED
JUNE 30, 2018 | | | FOR THE
YEAR ENDED
JUNE 30, 2017 | |
| CLASS C | | SHARES | | | AMOUNT | | | SHARES | | | AMOUNT | |
Shares sold | | | 10,058 | | | $ | 105,120 | | | | 981 | | | $ | 9,740 | |
Shares sold through reinvestments of distributions | | | 193 | | | | 1,964 | | | | 20 | | | | 208 | |
Shares redeemed | | | (2,108 | ) | | | (20,978 | ) | | | (2 | ) | | | (17 | ) |
| | | | | | | | | | | | | | | | |
Net increase | | | 8,143 | | | $ | 86,106 | | | | 999 | | | $ | 9,931 | |
| | | | | | | | | | | | | | | | |
CLASS I | | | | | | | | | | | | | | | | |
Shares sold | | | 1,901,140 | | | $ | 20,000,000 | | | | – | | | $ | – | |
Shares sold through reinvestments of distributions | | | – | | | | – | | | | – | | | | – | |
Shares redeemed | | | – | | | | – | | | | – | | | | – | |
| | | | | | | | | | | | | | | | |
Net increase | | | 1,901,140 | | | $ | 20,000,000 | | | | – | | | $ | – | |
| | | | | | | | | | | | | | | | |
CLASS Y | | | | | | | | | | | | | | | | |
Shares sold | | | 1,964,043 | | | $ | 20,629,580 | | | | 50,328 | | | $ | 529,500 | |
Shares sold through reinvestments of distributions | | | 1,949 | | | | 20,360 | | | | 212 | | | | 2,219 | |
Shares redeemed | | | (41,536 | ) | | | (436,635 | ) | | | (24,371 | ) | | | (255,411 | ) |
| | | | | | | | | | | | | | | | |
Net increase | | | 1,924,456 | | | $ | 20,213,305 | | | | 26,169 | | | $ | 276,308 | |
| | | | | | | | | | | | | | | | |
Emerging Markets Local Currency Debt Fund
| | | | | | | | | | | | | | | | |
| | | FOR THE
YEAR ENDED
JUNE 30, 2018 | | | FOR THE
YEAR ENDED
JUNE 30, 2017 | |
| CLASS A | | SHARES | | | AMOUNT | | | SHARES | | | AMOUNT | |
Shares sold | | | 22,629 | | | $ | 249,981 | | | | – | | | $ | – | |
Shares sold through reinvestments of distributions | | | 921 | | | | 9,935 | | | | – | | | | – | |
Shares redeemed | | | (4,611 | ) | | | (49,914 | ) | | | – | | | | – | |
| | | | | | | | | | | | | | | | |
Net increase | | | 18,939 | | | $ | 210,002 | | | | | | | $ | | |
| | | | | | | | | | | | | | | | |
CLASS C | | | | | | | | | | | | | | | | |
Shares sold | | | – | | | $ | – | | | | – | | | $ | – | |
Shares sold through reinvestments of distributions | | | – | | | | – | | | | – | | | | – | |
Shares redeemed | | | – | | | | – | | | | – | | | | – | |
| | | | | | | | | | | | | | | | |
Net increase | | | – | | | $ | – | | | | – | | | $ | – | |
| | | | | | | | | | | | | | | | |
CLASS I | | | | | | | | | | | | | | | | |
Shares sold | | | 468,165 | | | $ | 5,000,000 | | | | – | | | $ | – | |
Shares sold through reinvestments of distributions | | | – | | | | – | | | | – | | | | – | |
Shares redeemed | | | – | | | | – | | | | – | | | | – | |
| | | | | | | | | | | | | | | | |
Net increase | | | 468,165 | | | $ | 5,000,000 | | | | – | | | $ | – | |
| | | | | | | | | | | | | | | | |
CLASS Y | | | | | | | | | | | | | | | | |
Shares sold | | | 957,538 | | | $ | 10,388,723 | | | | – | | | $ | – | |
Shares sold through reinvestments of distributions | | | 19,876 | | | | 214,593 | | | | – | | | | – | |
Shares redeemed | | | (69,895 | ) | | | (762,008 | ) | | | – | | | | – | |
| | | | | | | | | | | | | | | | |
Net increase | | | 907,519 | | | $ | 9,841,308 | | | | – | | | $ | – | |
| | | | | | | | | | | | | | | | |
230
Barings Funds Trust 2018 Annual Report
NOTES TO THE FINANCIAL STATEMENTS (CONTINUED)
June 30, 2018
Global High Yield Fund
| | | | | | | | | | | | | | | | |
| | | FOR THE
YEAR ENDED
JUNE 30, 2018 | | | FOR THE
YEAR ENDED
JUNE 30, 2017 | |
| CLASS A | | SHARES | | | AMOUNT | | | SHARES | | | AMOUNT | |
Shares sold | | | 127 | | | $ | 1,278 | | | | 1,210 | | | $ | 12,543 | |
Shares sold through reinvestments of distributions | | | 59 | | | | 602 | | | | 34 | | | | 351 | |
Shares redeemed | | | – | | | | – | | | | (594 | ) | | | (6,118 | ) |
| | | | | | | | | | | | | | | | |
Net increase | | | 186 | | | $ | 1,880 | | | | 650 | | | $ | 6,776 | |
| | | | | | | | | | | | | | | | |
CLASS C | | | | | | | | | | | | | | | | |
Shares sold | | | – | | | $ | – | | | | 13,247 | | | $ | 137,325 | |
Shares sold through reinvestments of distributions | | | 976 | | | | 9,925 | | | | 803 | | | | 8,287 | |
Shares redeemed | | | (4,423 | ) | | | (44,337 | ) | | | (417 | ) | | | (4,337 | ) |
| | | | | | | | | | | | | | | | |
Net increase (decrease) | | | (3,447 | ) | | $ | (34,412 | ) | | | 13,633 | | | $ | 141,275 | |
| | | | | | | | | | | | | | | | |
CLASS I | | | | | | | | | | | | | | | | |
Shares sold | | | – | | | $ | – | | | | – | | | $ | – | |
Shares sold through reinvestments of distributions | | | – | | | | – | | | | – | | | | – | |
Shares redeemed | | | – | | | | – | | | | – | | | | – | |
| | | | | | | | | | | | | | | | |
Net increase | | | – | | | $ | – | | | | – | | | $ | – | |
| | | | | | | | | | | | | | | | |
CLASS Y | | | | | | | | | | | | | | | | |
Shares sold | | | 350,327 | | | $ | 3,558,842 | | | | 143,843 | | | $ | 1,490,367 | |
Shares sold through reinvestments of distributions | | | 10,313 | | | | 105,798 | | | | 10,017 | | | | 103,275 | |
Shares redeemed | | | (485,834 | ) | | | (4,925,710 | ) | | | (15,575 | ) | | | (162,145 | ) |
| | | | | | | | | | | | | | | | |
Net increase (decrease) | | | (125,194 | ) | | $ | (1,261,070 | ) | | | 138,285 | | | $ | 1,431,497 | |
| | | | | | | | | | | | | | | | |
U.S. High Yield Fund
| | | | | | | | | | | | | | | | |
| | | FOR THE
YEAR ENDED
JUNE 30, 2018 | | | FOR THE
YEAR ENDED
JUNE 30, 2017 | |
| CLASS A | | SHARES | | | AMOUNT | | | SHARES | | | AMOUNT | |
Shares sold | | | 311,531 | | | $ | 3,152,721 | | | | 548,169 | | | $ | 5,757,935 | |
Shares sold through reinvestments of distributions | | | 19,367 | | | | 197,966 | | | | 12,725 | | | | 133,626 | |
Shares redeemed | | | (282,527 | ) | | | (2,883,028 | ) | | | (332,596 | ) | | | (3,522,759 | ) |
| | | | | | | | | | | | | | | | |
Net increase | | | 48,371 | | | $ | 467,659 | | | | 228,298 | | | $ | 2,368,802 | |
| | | | | | | | | | | | | | | | |
CLASS C | | | | | | | | | | | | | | | | |
Shares sold | | | – | | | $ | – | | | | 1,155 | | | $ | 12,126 | |
Shares sold through reinvestments of distributions | | | 88 | | | | 900 | | | | 37 | | | | 390 | |
Shares redeemed | | | (1,277 | ) | | | (12,651 | ) | | | (3 | ) | | | (32 | ) |
| | | | | | | | | | | | | | | | |
Net increase (decrease) | | | (1,189 | ) | | $ | (11,751 | ) | | | 1,189 | | | $ | 12,484 | |
| | | | | | | | | | | | | | | | |
CLASS I | | | | | | | | | | | | | | | | |
Shares sold | | | – | | | $ | – | | | | – | | | $ | – | |
Shares sold through reinvestments of distributions | | | 23,290 | | | | 237,490 | | | | 19,404 | | | | 203,243 | |
Shares redeemed | | | – | | | | – | | | | – | | | | – | |
| | | | | | | | | | | | | | | | |
Net increase | | | 23,290 | | | $ | 237,490 | | | | 19,404 | | | $ | 203,243 | |
| | | | | | | | | | | | | | | | |
231
Barings Funds Trust 2018 Annual Report
NOTES TO THE FINANCIAL STATEMENTS (CONTINUED)
June 30, 2018
| | | | | | | | | | | | | | | | |
| | | FOR THE
YEAR ENDED
JUNE 30, 2018 | | | FOR THE
YEAR ENDED
JUNE 30, 2017 | |
| CLASS Y | | SHARES | | | AMOUNT | | | SHARES | | | AMOUNT | |
Shares sold | | | 2,624,846 | | | $ | 25,986,787 | | | | 125,106 | | | $ | 1,312,934 | |
Shares sold through reinvestments of distributions | | | 44,607 | | | | 445,882 | | | | 8,719 | | | | 91,482 | |
Shares redeemed | | | (62,945 | ) | | | (636,602 | ) | | | (1,412 | ) | | | (14,820 | ) |
| | | | | | | | | | | | | | | | |
Net increase | | | 2,606,508 | | | $ | 25,796,067 | | | | 132,413 | | | $ | 1,389,596 | |
| | | | | | | | | | | | | | | | |
The Trust (the “Borrower”) has entered into a Credit Agreement (the “Credit Agreement”) with State Street Bank and Trust Company (the “Bank”). The Credit Agreement provides for a revolving credit facility of $40,000,000 (the “Facility Amount”) to be utilized for temporary or emergency purposes to fund shareholder redemptions or for other short-term liquidity purposes. Per the Credit Agreement, outstanding principal on the loan shall bear interest at a variable rate per annum equal to the higher of (a) the Federal Funds Rate as in effect on the day of the borrowing plus 1.25% and (b) the one month LIBOR rate as in effect on the day of the borrowing plus 1.25%. In addition, the Borrower shall pay to the Bank a commitment fee at the rate of 0.25% per annum on the daily unused portion of the Facility Amount. As of June 30, 2018, there were no loans outstanding pursuant to the Credit Agreement. Effective July 18, 2018, the Facility Amount increased from $40,000,000 to $61,000,000.
On August 2, 2018, the Independent Trustees of the Trust approved a sub advisory agreement with Baring
International Investment Limited (“BIIL”) for the Global Floating Rate Fund, Credit Income Opportunities Fund, Emerging Markets Debt Blended Total Return Fund and Global High Yield Fund. BIIL replaces Barings Global Advisers Limited (“BGA”), another indirect wholly-owned subsidiary of Barings that also is registered as an investment adviser with the SEC and the Financial Conduct Authority in the United Kingdom. This change was recommended based on Barings’ consolidation of corporate entities, but involves no change in the actual control or management of the Funds because the same personnel will continue to perform the services they previously had performed for the Funds, though through BIIL, rather than BGA.
Effective August 2, 2018, Daniel McGee was elected by the Board of Trustees as President.
Management has considered the circumstances under which the Funds should recognize or make disclosures regarding events or transactions occurring subsequent to June 30, 2018 through the date the financial statements were issued. Adjustments or additional disclosures, if any, have been included in these financial statements.
232
Barings Funds Trust 2018 Annual Report
REPORT OF INDEPENDENT REGISTERED PUBLIC ACCOUNTING FIRM
To the Board of Trustees of Barings Funds Trust and Shareholders of Barings Global Floating Rate Fund, Barings Global Credit Income Opportunities Fund, Barings Active Short Duration Bond Fund, Barings Total Return Bond Fund, Barings Emerging Markets Debt Blended Total Return Fund, Barings Emerging Markets Local Currency Debt Fund, Barings Global High Yield Fund, and Barings U.S. High Yield Fund (collectively, the “Funds”):
Opinion on the Financial Statements and Financial Highlights
We have audited the accompanying statements of assets and liabilities of Barings Funds Trust comprising the Barings Global Floating Rate Fund, Barings Global Credit Income Opportunities Fund, Barings Active Short Duration Bond Fund, Barings Total Return Bond Fund, Barings Emerging Markets Debt Blended Total Return Fund, Barings Emerging Markets Local Currency Debt Fund, Barings Global High Yield Fund, and Barings U.S. High Yield Fund (the “Funds”), including the schedules of investments, as of June 30, 2018; the related statements of operations for the year then ended, the statements of changes in net assets for each of the two years in the period then ended, and the financial highlights for the periods indicated in the table below for the Funds; and the related notes. In our opinion, the financial statements and financial highlights present fairly, in all material respects, the financial position of each of the funds listed above constituting Barings Funds Trust as of June 30, 2018, and the results of their operations for the year then ended, the changes in their net assets for each of the two years in the period then ended, and the financial highlights for the periods listed in the table below, in conformity with accounting principles generally accepted in the United States of America.
| | |
INDIVIDUAL FUND COMPRISING THE
BARINGS FUNDS TRUST | | FINANCIAL HIGHLIGHTS |
Barings Global Floating Rate Fund Barings Global Credit Income Opportunities Fund | | For the years ended June 30, 2018, 2017, 2016, 2015, and the period from September 16, 2013 (commencement of operations) through June 30, 2014 |
| |
Barings Active Short Duration Bond Fund Barings Total Return Bond Fund | | For the years ended June 30, 2018, 2017, and the period from July 8, 2015 (commencement of operations) through June 30, 2016 |
| |
Barings Emerging Markets Debt Blended Total Return Fund | | For the years ended June 30, 2018, 2017, and the period from October 21, 2015 (commencement of operations) through June 30, 2016 |
| |
Barings Emerging Markets Local Currency Debt Fund | | For the years ended June 30, 2018, 2017, and the period from December 8, 2015 (commencement of operations) through June 30, 2016 |
| |
Barings Global High Yield Fund Barings U.S. High Yield Fund | | For the years ended June 30, 2018, 2017, and the period from October 30, 2015 (commencement of operations) through June 30, 2016 |
233
Barings Funds Trust 2018 Annual Report
REPORT OF INDEPENDENT REGISTERED PUBLIC ACCOUNTING FIRM (CONTINUED)
Basis for Opinion
These financial statements and financial highlights are the responsibility of the Funds’ management. Our responsibility is to express an opinion on the Funds’ financial statements and financial highlights based on our audits. We are a public accounting firm registered with the Public Company Accounting Oversight Board (United States) (PCAOB) and are required to be independent with respect to the Funds in accordance with the U.S. federal securities laws and the applicable rules and regulations of the Securities and Exchange Commission and the PCAOB.
We conducted our audits in accordance with the standards of the PCAOB. Those standards require that we plan and perform the audit to obtain reasonable assurance about whether the financial statements and financial highlights are free of material misstatement, whether due to error or fraud. The Funds are not required to have, nor were we engaged to perform, an audit of their internal control over financial reporting. As part of our audits we are required to obtain an understanding of internal control over financial reporting but not for the purpose of expressing an opinion on the effectiveness of the Funds’ internal control over financial reporting. Accordingly, we express no such opinion.
Our audits included performing procedures to assess the risks of material misstatement of the financial statements and financial highlights, whether due to error or fraud, and performing procedures that respond to those risks. Such procedures included examining, on a test basis, evidence regarding the amounts and disclosures in the financial statements and financial highlights. Our audits also included evaluating the accounting principles used and significant estimates made by management, as well as evaluating the overall presentation of the financial statements and financial highlights. Our procedures included confirmation of securities owned as of June 30, 2018, by correspondence with the custodian, brokers and agent banks; when replies were not received from brokers or agent banks, we performed other auditing procedures. We believe that our audits provide a reasonable basis for our opinion.
DELOITTE & TOUCHE LLP
New York, New York
August 27, 2018
We have served as the auditor of one or more Barings LLC investment companies since 2013.
234
Barings Funds Trust 2018 Annual Report
FEDERAL TAX INFORMATION (UNAUDITED)
The following Funds designate long-term capital gain distributions as listed below:
| | | | |
| FUND | | LONG-TERM CAPITAL GAIN DISTRIBUTIONS | |
| |
Barings Active Short Duration Bond Fund | | $ | 902,028 | |
| |
Barings Emerging Markets Debt Blended Total Return Fund | | $ | 145,149 | |
| |
Barings Emerging Markets Local Currency Debt Fund | | $ | 63,047 | |
| |
Barings Global High Yield Fund | | $ | 57,003 | |
| |
Barings U.S. High Yield Fund | | $ | 248,263 | |
The following Funds paid foreign taxes during the year ended June 30, 2018 that are available as income tax credits:
| | | | |
| FUND | | FOREIGN TAX CREDIT | |
| |
Barings Emerging Markets Debt Blended Total Return Fund | | $ | 7,883 | |
| |
Barings Emerging Markets Local Currency Debt Fund | | $ | 18,635 | |
The following Funds generated net foreign source income during the year ended June 30, 2018 as listed below:
| | | | |
| FUND | | FOREIGN SOURCE INCOME | |
| |
Barings Emerging Markets Debt Blended Total Return Fund | | $ | 1,357,470 | |
| |
Barings Emerging Markets Local Currency Debt Fund | | $ | 821,703 | |
235
Barings Funds Trust 2018 Annual Report
INTERESTED TRUSTEE
| Information | about Trustees and Officers |
Information pertaining to the Trustees and officers of the Trust is set forth below.
The Statement of Additional Information includes additional information about Trustees and is available, without charge, upon request by calling the Funds at 1-855-439-5459 or on the Funds’ website at http://www.barings.com/funds/mutual-funds.
| | | | | | | | | | |
| NAME (AGE), ADDRESS | | POSITION(S)
WITH THE
TRUST | | OFFICE
TERM
AND
LENGTH
OF TIME
SERVED | | PRINCIPAL OCCUPATIONS
DURING PAST 5 YEARS | | PORTFOLIOS
OVERSEEN
IN FUND
COMPLEX | | OTHER DIRECTORSHIPS HELD BY
DIRECTOR |
Thomas M. Finke (54) 300 South Tryon Street Suite 2500 Charlotte, NC 28202 | | Trustee | | Trustee since July 2013 | | Chairman and Chief Executive Officer (since 2008), Member of the Board of Managers (since 2006), President (2007-2008), Managing Director (2002-2008), Barings; Chief Investment Officer and Executive Vice President (2008-2011), Massachusetts Mutual Life Insurance Company. | | 9 | | Trustee (since 2013), Barings Global Short Duration High Yield Fund (closed-end investment company advised by Barings); Chairman (2012-2015), Director (since 2008), Barings (U.K.) Limited (investment advisory firm); Director (since 2008), Barings Guernsey Limited (holding company); Vice Chairman and Manager (since 2011), MM Asset Management Holding LLC (holding company); Director (since 2004), Jefferies Finance LLC (finance company); Manager (since 2005), Loan Strategies Management, LLC (general partner of an investment fund); Manager (since 2005), Jefferies Finance CP Funding LLC (investment company); Chairman and Director (2012-2015), Barings Global Advisers Limited (investment advisory firm); Manager (2011-2016), Wood Creek Capital Management, LLC (investment advisory firm); Chairman and Manager (2007-2016), Barings Real Estate Advisers LLC (real estate advisory firm); Manager (2007-2015), Credit Strategies Management LLC (general partner of an investment fund). |
236
Barings Funds Trust 2018 Annual Report
INDEPENDENT TRUSTEES
| | | | | | | | | | |
| NAME (AGE), ADDRESS | | POSITION(S)
WITH THE
TRUST | | OFFICE
TERM
AND
LENGTH
OF TIME
SERVED | | PRINCIPAL OCCUPATIONS DURING
PAST 5 YEARS | | PORTFOLIOS
OVERSEEN
IN FUND
COMPLEX | | OTHER DIRECTORSHIPS HELD BY
DIRECTOR |
Rodney J. Dillman (65) 300 South Tryon Street Suite 2500 Charlotte, NC 28202 | | Trustee, Chairman | | Trustee since July 2013 | | Retired (since 2012); Deputy General Counsel (2011-2012), Senior Vice President (2008-2012), Vice President (2000-2008), Massachusetts Mutual Life Insurance Company; Member of the Board of Directors and President (2008-2011), MassMutual International LLC; General Counsel (2006-2008), Babson Capital Management LLC (currently known as Barings LLC). | | 9 | | Trustee (since 2012), Barings Global Short Duration High Yield Fund (closed-end investment company advised by Barings); Director (2016-2017), Social Reality, Inc. (digital platform technology and management software company for internet advertising). |
| | | | | |
Bernard A. Harris, Jr. (62) 300 South Tryon Street Suite 2500 Charlotte, NC 28202 | | Trustee | | Trustee since July 2013 | | Chief Executive Officer (since 2018), Director (since 2008), The National Math and Science Initiative; Director; Chief Executive Officer and Managing Partner (since 2002), Vesalius Ventures, Inc.; Director and President (since 1998), The Space Agency; President (since 1999), The Harris Foundation; Clinical Scientist, Flight Surgeon and Astronaut (1986-1996), NASA. | | 9 | | Trustee (since 2012), Barings Global Short Duration High Yield Fund (closed-end investment company advised by Barings); Director (since 2016), AIMIS, Inc. (American Institute of Minimally Invasive Surgery, an educator of advanced surgical techniques for women’s health specialists); Trustee (since 2015), Forward Funds (open-end investment company); Director (since 2012), E-Cardio, Inc. (provides services for cardiac monitoring); Trustee (since 2012), Salient Midstream & MLP Fund (closed-end investment company); Trustee (since 2012), Salient MF Trust (open-end investment company); Trustee (since 2009), Salient Private Access Funds (investment companies); Director (since 2009), Monebo Technologies Inc. (medical technology design company); Director (since 2009), The Endowment Fund; Director (since 2005), U.S. Physical Therapy, Inc. (NYSE: USPH). |
| | | | | |
Thomas W. Okel (55) 300 South Tryon Street Suite 2500 Charlotte, NC 28202 | | Trustee | | Trustee since July 2013 | | Executive Director (since 2011), Catawba Lands Conservancy; Global Head of Syndicated Capital Markets (1998-2010), Bank of America Merrill Lynch | | 9 | | Trustee (since 2012), Barings Global Short Duration High Yield Fund (closed-end investment company advised by Barings); Director (since 2018), Barings BDC, Inc. (business development company advised by Barings); Trustee (since 2015), Horizon Funds (mutual fund complex). |
237
Barings Funds Trust 2018 Annual Report
INDEPENDENT TRUSTEES (CONTINUED)
| | | | | | | | | | |
| NAME (AGE), ADDRESS | | POSITION(S)
WITH THE
TRUST | | OFFICE
TERM
AND
LENGTH
OF TIME
SERVED | | PRINCIPAL OCCUPATIONS
DURING PAST 5 YEARS | | PORTFOLIOS
OVERSEEN
IN FUND
COMPLEX | | OTHER DIRECTORSHIPS HELD BY
DIRECTOR |
| | | | | |
Cynthia R. Plouché (61) 300 South Tryon Street Suite 2500 Charlotte, NC 28202 | | Trustee | | Trustee since August 2017 | | Assessor (2014-2018), Moraine Township (property assessment); Senior Portfolio Manager (2006-2012), Williams Capital Management, LLC (asset management). | | 9 | | Trustee (since August 2017), Barings Global Short Duration High Yield Fund (closed-end investment company advised by Barings); Trustee (since 2014), Northern Trust Funds (mutual fund complex); Trustee (2001-2017), AXA VIP Trust (mutual fund complex). |
| | | | | |
Martin A. Sumichrast (51) 300 South Tryon Street Suite 2500 Charlotte, NC 28202 | | Trustee | | Trustee since July 2013 | | Chairman and Chief Executive Officer (since 2016), Director (since 2015), Level Brands, Inc. (NYSE: LEBV; licensing and brand management firm); Managing Partner and Principal (since 2013), Stone Street Partners, LLC (merchant banking); Managing Director (since 2012), Washington Capital, LLC (family office). | | 9 | | Trustee (since 2012), Barings Global Short Duration High Yield Fund (closed-end investment company advised by Barings); Chairman and Director (2014-2017), Kure Corp. (retail); Director (2014-2017), Jadeveon Clowney Help-In-Time Foundation; Director (2015-2017), Social Reality, Inc. (digital platform technology and management software company for internet advertising). |
238
Barings Funds Trust 2018 Annual Report
OFFICERS OF THE TRUST
| | | | | | |
| NAME (AGE), ADDRESS | | POSITION(S) WITH
THE TRUST | | OFFICE TERM* AND
LENGTH OF TIME
SERVED | | PRINCIPAL OCCUPATION(S)
DURING PAST 5 YEARS |
Duncan Robertson (48) 300 South Tryon Street Charlotte, NC 28202 | | President | | July 2016 to August 2018 | | Vice President (2014-2016), Barings Funds Trust; Head of Global Business Development Group (since 2016), Managing Director (since 2008), Barings; President (since 2016), Barings Securities LLC (registered broker-dealer). |
| | | |
Dan McGee (48) 300 South Tryon Street Charlotte, NC 28202 | | President | | Since August 2018 | | Managing Director (since 2013), Barings; Managing Director (1992-2013), Principal Financial Group. |
| | | |
Carlene Pollock (50) 300 South Tryon Street Charlotte, NC 28202 | | Chief Financial Officer | | Since January 2016 | | Assistant Treasurer (2015-2016), Barings Funds; Chief Financial Officer (since 2016), Assistant Treasurer (2015-2016), Barings Global Short Duration High Yield Fund (closed-end investment company advised by Barings); Director (since 2015), Barings; Director (2013-2015), Corrum Capital Management (investment adviser); Vice President (2008-2013), Bank of New York Mellon (third party administrator). |
| | | |
Lesley Mastandrea (41) 300 South Tryon Street Charlotte, NC 28202 | | Treasurer | | Since October 2016 | | Managing Director (since 2014), Director (2007-2014), Associate Director (2006-2007), Barings; Treasurer (since 2016), Barings Global Short Duration High Yield Fund (closed-end investment company advised by Barings). |
| | | |
Paul Thompson (46) 300 South Tryon Street Charlotte, NC 28202 | | Vice President | | Since July 2013 | | Chief Financial Officer (since 2015), Chief Operating Officer (since 2010) and Head of Global Investment Services (since 2010), Head of Operations and Portfolio/Client Services (2002-2010), Managing Director (since 2008), Barings. |
| | | |
Melissa LaGrant (44) 300 South Tryon Street Charlotte, NC 28202 | | Chief Compliance Officer | | Since July 2013 | | Managing Director (since 2005), Barings; Chief Compliance Officer (since 2013), Barings Finance LLC; Chief Compliance Officer (since 2006), Barings Corporate Investors and Barings Participation Investors (closed-end investment companies advised by Barings); Chief Compliance Officer (since 2012), Barings Global Short Duration High Yield Fund (closed-end investment company advised by Barings); Chief Compliance Officer (since 2018), Barings BDC, Inc. (business development company advised by Barings). |
| | | |
Janice M. Bishop (53) 300 South Tryon Street Charlotte, NC 28202 | | Vice President, Secretary and Chief Legal Officer | | Since July 2013 | | Senior Counsel and Managing Director (since 2014), Counsel (2007-2014), Barings; Vice President, Secretary and Chief Legal Officer (since 2015), Associate Secretary (2008-2015), Barings Corporate Investors and Barings Participation Investors (closed-end investment companies advised by Barings); Vice President, Secretary and Chief Legal Officer (since 2012), Barings Global Short Duration High Yield Fund (closed-end investment company advised by Barings); Vice President and Secretary (since 2015), Assistant Secretary (2008-2015), CI Subsidiary Trust and PI Subsidiary Trust; Secretary and Chief Legal Officer (since 2018), Barings BDC, Inc. (business development company advised by Barings). |
239
Barings Funds Trust 2018 Annual Report
OFFICERS OF THE TRUST (CONTINUED)
| | | | | | |
| NAME (AGE), ADDRESS | | POSITION(S) WITH
THE TRUST | | OFFICE TERM* AND
LENGTH OF TIME
SERVED | | PRINCIPAL OCCUPATION(S)
DURING PAST 5 YEARS |
| | | |
Michelle Manha (45) 300 South Tryon Street Charlotte, NC 28202 | | Assistant Secretary | | Since July 2013 | | Deputy General Counsel (since 2018), Associate General Counsel (2014-2018), Managing Director (since 2014), Counsel (2008-2014), Barings; Assistant Secretary (since 2012), Barings Global Short Duration High Yield Fund (closed-end investment company advised by Barings). |
| | | |
Kristin Goodchild (32) 300 South Tryon Street Charlotte, NC 28202 | | Assistant Secretary | | Since July 2015 | | Counsel (since 2016), Senior Paralegal (2013-2016), Paralegal (2008-2012), Barings; Assistant Secretary (since 2015), Barings Global Short Duration High Yield Fund (closed-end investment company advised by Barings); Associate Secretary (since 2015), Barings Corporate Investors and Barings Participation Investors (closed-end investment companies advised by Barings); Assistant Secretary (since 2015), CI Subsidiary Trust and PI Subsidiary Trust; Assistant Secretary (since 2018), Barings BDC, Inc. (business development company advised by Barings). |
240
Barings Funds Trust 2018 Annual Report

JOINT PRIVACY NOTICE OF BARINGS LLC AND
BARINGS FUNDS TRUST
This privacy notice is being provided on behalf of Barings LLC and its affiliates: Barings Securities LLC; Barings Australia Pty Ltd; Barings Advisers (Japan) KK; Barings Investment Advisers (Hong Kong) Limited; Barings Funds Trust; Barings Global Short Duration High Yield Fund; Barings Corporate Investors and Barings Participation Investors (together, for purposes of this privacy notice, “Barings”).
When you use Barings you entrust us not only with your hard-earned assets but also with your personal and financial data. We consider your data to be private and confidential, and protecting its confidentiality is important to us. Our policies and procedures regarding your personal information are summarized below.
We may collect non-public personal information about you from:
| | ∎ | | Applications or other forms, interviews, or by other means; |
| | ∎ | | Consumer or other reporting agencies, government agencies, employers or others; |
| | ∎ | | Your transactions with us, our affiliates, or others; and |
We may share the financial information we collect with our financial service affiliates, such as insurance companies, investment companies and securities broker-dealers. Additionally, so that we may continue to offer you products and services that best meet your investment needs and to effect transactions that you request or authorize, we may disclose the information we collect, as described above, to companies that perform administrative or marketing services on our behalf, such as transfer agents, custodian banks, service providers or printers and mailers that assist us in the distribution of investor materials or that provide operational support to Barings. These companies are required to protect this information and will use this information only for the services for which we hire them, and are not permitted to use or share this information for any other purpose. Some of these companies may perform such services in jurisdictions other than the United States. We may share some or all of the information we collect with other financial institutions with whom we jointly market products. This may be done only if it is permitted by the state in which you live. Some disclosures may be limited to your name, contact and transaction information with us or our affiliates.
Any disclosures will be only to the extent permitted by federal and state law. Certain disclosures may require us to get an “opt-in” or “opt-out” from you. If this is required, we will do so before information is shared. Otherwise, we do not share any personal information about our customers or former customers unless authorized by the customer or as permitted by law.
We restrict access to personal information about you to those employees who need to know that information to provide products and services to you. We maintain physical, electronic and procedural safeguards that comply with legal standards to guard your personal information. As an added measure, we do not include personal or account information in non-secure e-mails that we send you via the Internet without your prior consent. We advise you not to send such information to us in non-secure e-mails.
This joint notice describes the privacy policies of Barings, the Funds and Barings Securities LLC. It applies to all Barings and the Funds accounts you presently have, or may open in the future, using your social security number or federal taxpayer identification number – whether or not you remain a shareholder of our Funds or as an advisory client of Barings. As mandated by rules issued by the Securities and Exchange Commission, we will be sending you this notice annually, as long as you own shares in the Funds or have an account with Barings.
Barings Securities LLC is a member of the Financial Industry Regulatory Authority (FINRA) and the Securities Investor Protection Corporation (SIPC). Investors may obtain information about SIPC including the SIPC brochure by contacting SIPC online at www.sipc.org or calling (202)-371-8300. Investors may obtain information about FINRA including the FINRA Investor Brochure by contacting FINRA online at www.finra.org or by calling (800) 289-9999.
August 2018
241
BARINGS FUNDS TRUST
ANNUAL REPORT
June 30, 2018

The Registrant adopted a Code of Ethics for Principal Executive and Senior Financial Officers (the “Code”) on July 29, 2013, which is available on the Registrant’s website at www.barings.com/assets/user/media/Open-End-Fund-Code-of-Ethics.pdf. During the period covered by this Form N-CSR, there were no amendments to, or waivers from, the Code.
| Item 3. | Audit Committee Financial Expert. |
The Registrant’s Board of Trustees has determined that Dr. Bernard A. Harris, Jr., Mr. Thomas W. Okel and Mr. Martin A. Sumichrast, constituting all the members of the Registrant’s Audit Committee, are audit committee financial experts. Dr. Harris, Mr. Okel and Mr. Sumichrast are “independent” for purposes of this Item 3 as required by applicable regulation.
| Item 4. | Principal Accountant Fees and Services. |
The Registrant has engaged its principal accountant, Deloitte & Touche LLP (“Deloitte”), to perform audit services, audit-related services, tax services and other services. The following tables detail the aggregate fees billed or expected to be billed for each of the last two fiscal years by Deloitte.
Fees Billed to the Registrant:
| | | | | | | | |
| | | Year Ended
June 30
2018 | | | Year Ended
June 30,
2017 | |
Audit Fees | | $ | 357,560 | | | $ | 325,700 | |
Audit-Related Fees | | $ | 0 | | | $ | 0 | |
Tax Fees | | $ | 96,800 | | | $ | 94,300 | |
All Other Fees | | $ | 0 | | | $ | 0 | |
| | | | | | | | |
Total Fees | | $ | 454,360 | | | $ | 420,000 | |
Non-Audit Fees Billed to Barings and MassMutual:
| | | | | | | | |
| | | Year Ended
June 30,
2018 | | | Year Ended
June 30,
2017 | |
Audit Fees | | $ | 4,256,259 | | | $ | 5,066,751 | |
Audit-Related Fees | | $ | 0 | | | $ | 0 | |
Tax Fees | | $ | 2,714,717 | | | $ | 2,898,725 | |
All Other Fees | | $ | 12,453,397 | | | $ | 15,342,278 | |
| | | | | | | | |
Total Fees | | $ | 19,424,372 | | | $ | 23,307,754 | |
The category “Audit Fees” refers to performing an audit of the Registrant’s, Barings LLC’s (“Barings”) or Massachusetts Mutual Life Insurance Company’s (“MassMutual”) annual financial statements or services that are normally provided by the principal accountant in connection with statutory and regulatory filings or engagements. The category “Audit-Related Fees” reflects fees billed by Deloitte for various non-audit and non-tax services rendered to the Registrant, Barings, and MassMutual. Preparation of Federal, state and local income tax and tax compliance work are representative of the fees reported in the “Tax Fees” category. The category “All Other Fees” represents fees billed by Deloitte for consulting rendered to the Registrant, Barings, and MassMutual.
The Sarbanes-Oxley Act of 2002 and its implementing regulations allow the Registrant’s Audit Committee to establish a pre-approval policy for certain services rendered by the Registrant’s principal accountant, Deloitte. During the fiscal year ended June 30, 2018, the Registrant’s Audit Committee approved all of the services rendered to the Registrant by Deloitte and did not rely on such a pre-approval policy for any such services.
The Audit Committee has also reviewed the aggregate fees billed for professional services rendered by Deloitte for the years ended June 30, 2017 and June 30, 2018 for the Registrant and for the non-audit services provided to Barings, and Barings’ parent, MassMutual. As part of this review, the Audit Committee considered whether the provision of such non-audit services was compatible with maintaining the principal accountant’s independence.
| Item 5. | Audit Committee of Listed Registrants. |
Not applicable.
| Item 6. | Schedule of Investments. |
| (a) | The Registrant’s Consolidated Schedule of Investments as of the close of the reporting period is included in the Report to Shareholders filed under Item 1 of this form. |
| Item 7. | Disclosure of Proxy Voting Policies and Procedures for Closed-End Management Investment Companies. |
Not applicable.
| Item 8. | Portfolio Managers of Closed-End Investment Management Companies. |
Not applicable.
| Item 9. | Purchases of Equity Securities by Closed-End Management Investment Company and Affiliated Purchasers. |
Not applicable.
| Item 10. | Submission of Matters to a Vote of Security Holders. |
There have been no material changes to procedures by which the shareholders may recommend nominees to the Registrant’s Board of Trustees.
| Item 11. | Controls and Procedures. |
| (a) | The Registrant’s principal executive officer and principal financial officer, or persons performing similar functions, have concluded that the Registrant’s disclosure controls and procedures as defined in Rule 30a-3(c) under the Investment Company Act of 1940, as amended (the “1940 Act”), are effective as of the date within 90 days of the filing date of this report based on the evaluation of these controls and procedures required by Rule 30a-3(b) under the 1940 Act and Rules 13a-15(b) or 15d-15(b) under the Securities Exchange Act of 1934, as amended. |
| (b) | There were no changes in the Registrant’s internal control over financial reporting (as defined in Rule 30a-3(d) under the 1940 Act) that occurred during the second fiscal quarter of the period covered by this report that have materially affected, or are reasonably likely to materially affect, the Registrant’s internal control over financial reporting. |
| Item 12. | Disclosure of Securities Lending Activities for Closed-End Management Investment Companies. |
| (a)(1) | The Registrant has posted its Code of Ethics on its website at www.barings.com/assets/user/media/Open-End-Fund-Code-of-Ethics.pdf. |
| (a)(2) | Certifications pursuant to Rule 30a-2(a) under the 1940 Act are attached hereto. |
Exhibit 99.1 Cert
Exhibit 99.2 Cert
| (b) | Certification pursuant to Rule 30a-2(b) under the 1940 Act is attached hereto. |
Exhibit 99.906 Cert
SIGNATURES
Pursuant to the requirements of the Securities Exchange Act of 1934 and the Investment Company Act of 1940, the Registrant has duly caused this report to be signed on its behalf by the undersigned, thereunto duly authorized.
| | |
| (Registrant) | | Barings Funds Trust |
| | |
| By (Signature and Title) | | /s/ Duncan Robertson |
| | Duncan Robertson, President (Principal Executive Officer) |
Date September 7, 2018
Pursuant to the requirements of the Securities Exchange Act of 1934 and the Investment Company Act of 1940, this report has been signed below by the following persons on behalf of the Registrant and in the capacities and on the dates indicated.
| | |
| By (Signature and Title) | | /s/ Duncan Robertson |
| | Duncan Robertson, President (Principal Executive Officer) |
Date September 7, 2018
| | |
| By (Signature and Title) | | /s/ Carlene Pollock |
| | Carlene Pollock, Chief Financial Officer (Principal Financial Officer) |
Date September 7, 2018