UNITED STATES
SECURITIES AND EXCHANGE COMMISSION
Washington, D.C. 20549
FORMN-CSR
CERTIFIED SHAREHOLDER REPORT OF REGISTERED
MANAGEMENT INVESTMENT COMPANIES
Investment Company Act file number(s)811-22845
Barings Funds Trust
(Exact Name of Registrant as Specified in Charter)
300 South Tryon Street
Suite 2500
Charlotte, NC 28202
(Address of Principal Executive Offices)
Registrant’s telephone number, including area code: (704)805-7200
Janice M. Bishop
Secretary and Chief Legal Officer
c/o Barings LLC
Independence Wharf
470 Atlantic Avenue
Boston MA 02210
(Name and Address of Agent for Service)
Date of fiscal year end: June 30
Date of reporting period: June 30, 2019
| Item 1. | Reports to Stockholders. |
The Annual Report to Shareholders is attached hereto.


BARINGS FUNDS TRUST
Beginning on January 1, 2021, as permitted by regulations adopted by the U.S. Securities and Exchange Commission, paper copies of the Fund’s annual and semi-annual shareholder reports will no longer be sent by mail, unless you specifically request paper copies of the reports. Instead, the reports will be made available on the Funds’ website http://www.barings.com/, and you will be notified by mail each time a report is posted and provided with a website link to access the report.
If you already elected to receive shareholder reports electronically, you will not be affected by this change and you need not take any action. You may elect to receive shareholder reports and other communications from the Funds electronically anytime by contacting your financial intermediary (such as a broker-dealer or bank) or, if you are a direct investor, by calling 1-877-766-0014.
Beginning on January 1, 2019, you may elect to receive all future reports in paper free of charge. If you invest through a financial intermediary, you can contact your financial intermediary to request that you continue to receive paper copies of your shareholder reports. If you invest directly with the Fund, you can call1-877-766-0014 to inform the Fund that you wish to continue receiving paper copies of your shareholder reports. Your election to receive reports in paper will apply to all funds held in your account if you invest through your financial intermediary or all funds held with the fund complex if you invest directly with the Fund.
Annual Report
June 30, 2019

BFT Service Providers
ADVISER
Barings LLC
300 South Tryon Street
Suite 2500
Charlotte, NC 28202
SUB-ADVISER
Barings International Investments Limited
20 Old Bailey
London, UK
EC4M 7BF
COUNSEL TO THE TRUST
Ropes & Gray LLP
Prudential Tower
800 Boylston Street
Boston, MA 02110
INDEPENDENT REGISTERED PUBLIC ACCOUNTING FIRM
Deloitte & Touche LLP
30 Rockefeller Plaza
New York, NY
10112-0015
CUSTODIAN
State Street Bank & Trust Company
One Lincoln Street
Boston, MA 02111
TRANSFER AGENT AND REGISTRAR
ALPS Fund Services, Inc.
1290 Broadway
Suite 1100
Denver, CO 80203
FUND ADMINISTRATION / ACCOUNTING
State Street Bank & Trust Company
One Lincoln Street
Boston, MA 02111
FUND DISTRIBUTOR
ALPS Distributors, Inc.
1290 Broadway
Suite 1100
Denver, CO 80203
BLUE SKY ADMINISTRATION
DST Asset Manager Solutions, Inc.
2000 Crown Colony Drive
Quincy, MA 02169
PROXY VOTING POLICIES & PROCEDURES
The Trustees of Barings Funds Trust (the “Trust”) have delegated proxy voting responsibilities relating to the voting of securities held by the Trust to Barings LLC (“Barings”). A description of Barings’ proxy voting policies and procedures is available (1) without charge, upon request, by calling, toll-free 1-877-766-0014; (2) on the Trust’s website at http://www.Barings.com; and (3) on the U.S. Securities and Exchange Commission’s (“SEC”) website at http://www.sec.gov.
QUARTERLY PORTFOLIO HOLDINGS
The funds in the Trust file their complete schedules of portfolio holdings with the SEC for the first and third quarters of each fiscal year as an attachment to Form N-PORT. The funds’ Form N-PORT are available on the SEC’s website at http://www.sec.gov. A complete schedule of portfolio holdings as of each quarter-end is available on the Trust’s website at http://www.Barings.com or upon request by calling, toll-free, 1-877-766-0014.

Daniel McGee
President
Barings Funds Trust
Barings Funds Trust
Barings Global Floating Rate Fund
Barings Global Credit Income Opportunities Fund
Barings Active Short Duration Bond Fund
Barings Diversified Income Fund
Barings Emerging Markets Debt Blended Total Return Fund
Barings Global Emerging Markets Equity Fund
Barings Global High Yield Fund
Barings U.S. High Yield Fund
Dear Shareholder,
Thank you, as always, for your continued trust and partnership. The first half of the year certainly kept investors on their toes, as political tensions escalated and trade wars continued to dominate headlines. Amid growing uncertainty, global monetary policy turned markedly dovish. But the news is not all bad – while the economy is slowing, it is – notably – still growing. Further, in 2019 to date, the U.S. has experienced a recovery in productivity, along with decent wage growth, low unemployment and still-strong consumer spending. Across the fixed income markets, we believe that corporate fundamentals appear stable, and defaults generally remain low. From a bottom-up, fundamental research perspective, our investment teams believe there is still value to be found across both developed and emerging markets.
Despite the uptick in market volatility, our funds have continued to perform well and add value, with five out of seven established funds (institutional share class) having been awarded four stars or more by Morningstar as of June 30, 2019. Seven of our eight funds now have a 3-year track record, and two have reached their 5-year marks.
As we look ahead to the remainder of 2019 – and move through the later stages of an elongated credit cycle – the possibility of a recession is weighing on many investors’ minds. Looking across the markets today, we think it is important to keep in mind that there are a number of key signals to monitor when it comes to the health of the economy. Further, while downturns do come, and we are undoubtedly closer to one today than we were three or five years ago, we do not expect the next recession to be as severe or long-lasting as the 2007-2008 financial crisis. As such, our primary focus at Barings continues to be on bottom-up security selection across all asset classes.
Throughout the ups and downs of economic cycles, and through periods of volatility and risk, we remain committed to delivering you, our shareholders, with strong, through-the-cycle, risk-adjusted returns. Our mutual fund platform offers a wide range of institutional-quality investment strategies across fixed income and equity, and through a dedicated focus on rigorous, fundamental analysis, aims to provide innovative solutions to meet investors’ evolving needs.
On behalf of the entire Barings team, we thank you for your partnership and trust, and we look forward to helping you achieve your investment objectives.
Sincerely,

Daniel McGee
President
The statements and opinions expressed are those of the author as of the date of this report. All information is historical and not indicative of future results and subject to change. This information is not a recommendation to buy or sell any security.
Barings Global Floating Rate Fund 2019 Annual Report
Investment Objective
Barings Global Floating Rate Fund (“Global Floating Rate Fund” or the “Fund”) seeks a high level of current income. Preservation of capital is a secondary goal.
Portfolio Management Commentary
How did the Fund perform?
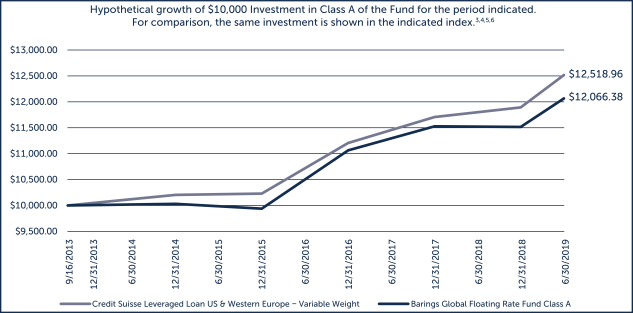
| | ∎ | | The Fund reported a net total rate of return for the annual reporting period from July 1, 2018 through June 30, 2019 of +3.03%, underperforming the Credit Suisse Global Loan Benchmark (the Benchmark), which returned +4.51%.1,6 |
What factors influenced performance of the Fund?
| | ∎ | | An elevated amount of net outflows from U.S. bank loan retail funds during the final two months of the year weighed heavily on performance in the global loan markets. This market technical resulted in greater volatility in the North American market than in Europe, for both the decline at the end of 2018 and a sharp rebound at the beginning of 2019. |
| | ∎ | | From a regional perspective, Fund’s the allocations between the North American and European markets did not have a material impact on performance, although underperformance by some of the Fund’s holdings in the North American market was the primary driver of the Fund’s underperformance during the period. |
| | ∎ | | The Fund’s underperformance in the energy sector (based on the Benchmark’s Credit Suisse industry sectors) was the top detractor from performance relative to the Benchmark during the quarter, followed by underperformance in the food/tobacco and consumer durables sectors. Outperformance by the Fund’s holdings in the information technology sector provided a partial offset to the sectors that underperformed. |
| | ∎ | | With a healthy return during the reporting period, the Fund’s modest allocation to cash, which averaged 5.5%, was a detractor from performance comparisons. |
| | ∎ | | From a ratings category perspective, loans rated BB in the market modestly outperformed loans rated single-B, and therefore the Fund’s overweight position to single-B-rated loans was a slight detractor to performance during the period. |
Describe recent portfolio activity.
| | ∎ | | At the beginning of the fiscal year period, the Fund shifted exposure from the North American market to Europe, as we believed that market was offering attractive relative value at that time. Toward the end of 2018 and the beginning of 2019, the Fund started to shift exposure back to the North American market, seeking to take advantage of some of the discounted levels available in the market following the volatility in the fourth quarter. From a regional perspective, the Fund has not made shifts between the two regions in recent months. |
| | ∎ | | Over the fiscal year, there were no changes in the Fund’s top three industry exposures based on Moody’s industries. The Fund’s three largest sectors were health care, education and child care, diversified/conglomerate services, and chemicals, plastics and rubber. The Fund has decreased some of its top industry exposure in the healthcare, education and child care sector. |
| 1. | Total return describes the return to an investor of Class Y shares and includes the reinvestment of dividends and capital gains.Past performance is no guarantee of future results and investment returns and the net asset value (NAV) of shares of the Fund will fluctuate so that shares, when redeemed, may be worth more or less than their original cost. Current performance may be higher or lower than performance quoted. Call 1.855.439.5459 or visit barings.com for current month end performance. All returns 1-year or less are cumulative. |
| 6. | Benchmark A: The Credit Suisse Global Loan Benchmark is a market capitalization weighted average of the Credit Suisse Leveraged Loan Index and the Credit Suisse Western European Leveraged Loan Index. The Credit Suisse Leveraged Loan Index is designed to mirror the investable universe of the U.S. dollar-denominated leveraged loan market. The Credit Suisse Western European Leveraged Loan Index is designed to mirror the investable universe of the Western European leveraged loan market, with loans denominated in U.S. and Western European currencies. Indices are unmanaged. It is not possible to invest directly in an index. |
2
Barings Global Floating Rate Fund 2019 Annual Report
| | ∎ | | By ratings category, the Fund increased exposure to the BB category with a slight bias toward higher quality loans. The Fund’s non-publicly rated exposure has decreased as more of the Fund’s holdings are publicly rated. |
Describe portfolio positioning at period end.
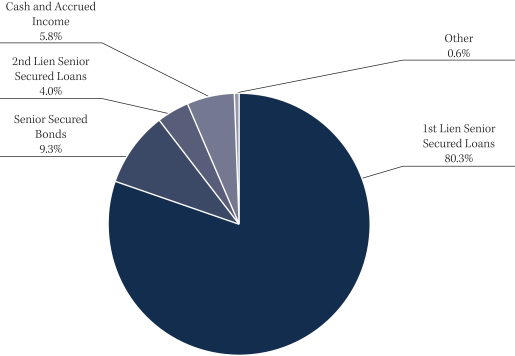
| | ∎ | | The Fund finished the twelve-month reporting period, ending June 30, 2019, with 84.3% allocated to global senior secured loans, 9.3% to global senior secured high yield bonds and 5.8% to cash. A minor position in equity and other holdings accounted for 0.6% of Fund holdings by market value. |
| | ∎ | | From an industry perspective (based on Moody’s industries), the Fund remains well diversified across a number of sectors, with concentrations in health care, education and child care (10.4%), diversified/conglomerate services (10.2%), and chemicals, plastics and rubber (7.2%), as of June 30, 2019. |
| | ∎ | | As of June 30, 2019, the Fund had the following credit quality breakdown: 2.0% in BBB assets, 25.7% in BB assets, 58.2% in single-B assets, and 5.2% in CCC and below assets. Approximately 3.2% of the Fund’s assets are non-publicly rated. Cash and accrued income accounted for the remaining 5.8% of the portfolio assets.2 |
| | ∎ | | The top five countries in the portfolio at the end of the reporting period were the U.S. (61.0%), the U.K. (11.6%), Germany (7.9%), the Netherlands (3.4%) and France (3.0%). Overall, the Fund has exposure to 17 different countries, and we continue to focus on building a well-diversified portfolio of global floating rate securities. |
Describe market and portfolio outlook.
| | ∎ | | In our view, corporate fundamentals overall remain relatively healthy. Growth appears to be slowing but measured, and we believe most companies have capital structures in place that can withstand and adjust to a slowdown. We believe that defaults are stable in the current market, and we do not expect to see a material or widespread increase in the near term. |
| | ∎ | | As will always be the case, there continues to be individual companies or segments of the market that face headwinds. Having said that, overall expectations are that there will not be a material increase in corporate defaults in the near term, and we believe that trading levels are compensating investors for a higher level of defaults than what corporate fundamentals suggest. |
| | ∎ | | We currently see better relative value opportunities in the North American market relative to the European market, although that can change as we saw during the last fiscal year period. |
| 2. | Ratings shown are the highest rating given by one of the following national rating agencies: S&P, Moody’s or Fitch. Additional information about ratings can be found, respectively, at www.standardandpoors.com, www.moodys.com and www.fitchratings.com. Credit ratings are subject to change. AAA, AA, single-A, and BBB are investment grade ratings categories used by S&P and Fitch; BB, single-B, CCC/CC/C and single-D are below investment grade ratings categories used by S&P and Fitch. Aaa, Aa, single-A and Baa are investment grade ratings categories used by Moody’s; Ba, B, Caa/Ca and single-C are below investment grade ratings categories used by Moody’s. Ratings categories may include gradations within each category. Bonds backed by U.S. Government or agency securities are given an implied rating equal to the rating of such securities. Holdings designated Not Publicly Rated are not rated by these national rating agencies. |
3
Barings Global Floating Rate Fund 2019 Annual Report
PORTFOLIO COMPOSITION(% OF ASSETS*)
COUNTRY COMPOSITION(% OF ASSETS**)
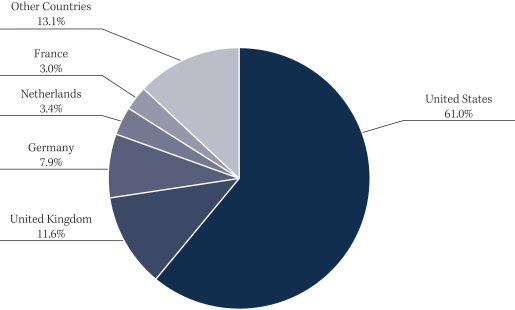
| ** | Percentage of assets are expressed by market value excluding cash and accrued income, and may vary over time. As of June 30, 2019. |
4
Barings Global Floating Rate Fund 2019 Annual Report
| | | | | | | | | | | | | | | | |
| % AVERAGE ANNUAL TOTAL RETURNS5,7,8 | | INCEPTION DATE | | | ONE YEAR | | | THREE YEARS | | | INCEPTION TO DATE | |
Class A With Load | | | 09/16/2013 | | | | -0.31 | % | | | 4.31 | % | | | 3.04 | % |
Class A No Load | | | 09/16/2013 | | | | 2.77 | % | | | 5.38 | % | | | 3.58 | % |
Class C With Load | | | 09/16/2013 | | | | 1.04 | % | | | 4.61 | % | | | 2.82 | % |
Class C No Load | | | 09/16/2013 | | | | 2.02 | % | | | 4.61 | % | | | 2.82 | % |
Class I With Load | | | 09/16/2013 | | | | 3.04 | % | | | 5.64 | % | | | 3.88 | % |
Class I No Load | | | 09/16/2013 | | | | 3.04 | % | | | 5.64 | % | | | 3.88 | % |
Class Y With Load | | | 09/16/2013 | | | | 3.03 | % | | | 5.64 | % | | | 3.86 | % |
Class Y No Load | | | 09/16/2013 | | | | 3.03 | % | | | 5.64 | % | | | 3.86 | % |
| 3. | Duration is a measure of the sensitivity of the price – the value of principal – of a fixed-income investment to a change in interest rates. Duration is expressed as a number of years. Bond prices are said to have an inverse relationship with interest rates. Therefore, rising interest rates indicate bond prices are likely to fall, while declining interest rates indicate bond prices are likely to rise. |
| 4. | Inception date: September 16, 2013. |
| 5. | Class A performance with the sales charges includes the maximum 3.00% sales charge. |
| 6. | Benchmark A: The Credit Suisse Global Loan Benchmark is a market capitalization weighted average of the Credit Suisse Leveraged Loan Index and the Credit Suisse Western European Leveraged Loan Index. The Credit Suisse Leveraged Loan Index is designed to mirror the investable universe of the U.S. dollar-denominated leveraged loan market. The Credit Suisse Western European Leveraged Loan Index is designed to mirror the investable universe of the Western European leveraged loan market, with loans denominated in U.S. and Western European currencies. Indices are unmanaged. It is not possible to invest directly in an index. |
| 7. | Line graph and table do not reflect the deduction of taxes that a shareholder would pay. |
| 8. | Class C performance with the sales charges includes the 1.00% contingent deferred sales charge (CDSC) for returns of one year or less. |
5
Barings Global Credit Income Opportunities Fund 2019 Annual Report
Investment Objective
Barings Global Credit Income Opportunities Fund (“Global Credit Income Opportunities Fund” or the “Fund”) seeks an absolute return, primarily through current income and secondarily through capital appreciation.
Portfolio Management Commentary
How did the Fund perform?
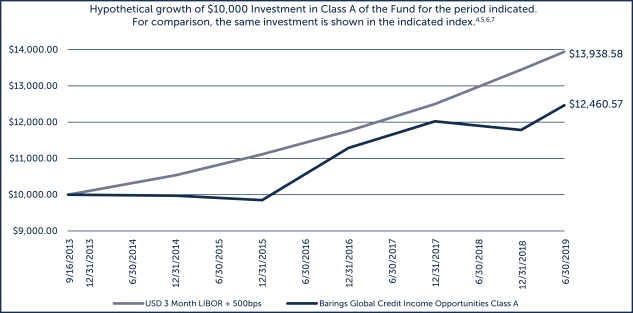
| | ∎ | | The Fund reported a net total rate of return for the annual reporting period from July 1, 2018 through June 30, 2019 of +2.64%, and underperformed the 3-Month USD London Inter-Bank Offered Rate (LIBOR) plus 500 basis points1 (the Benchmark), which returned +7.67%.2,6 |
What factors influenced performance of the Fund?
| | ∎ | | Volatility increased toward the end of 2018 across below investment grade asset classes. The decline was greater in North American markets and, given that those markets are larger than the European markets, weighed on the Fund’s performance. In addition, high yield bonds rebounded more sharply than senior secured loans to start 2019, which affected Fund performance. |
| | ∎ | | For the Fund’s holdings, high yield bonds were the top performing asset class during the period, followed by senior secured loans and collateralized loan obligations (CLOs). |
| | ∎ | | From a regional perspective, the Fund’s holdings in the European market outperformed the North American holdings. |
| | ∎ | | From a ratings category perspective, BB-rated credits in the high yield bond and senior secured loan markets performed strongly. The Fund’s BB-rated holdings outperformed the single-B-rated holdings during the fiscal year period; however, a higher weighting to single-B holdings relative to BB affected performance results. |
Describe recent portfolio activity.
| | ∎ | | In regard to the Fund’s core asset classes, early in the period the Fund increased exposure to the European markets over North America. |
| | ∎ | | As a result of the volatility that began in the high yield bond markets in October 2018, the Fund shifted exposure from senior secured loans to high yield bonds. Then, in December 2018 and the beginning of 2019, as volatility increased in the senior secured loan markets, and in North America in particular, the Fund shifted exposure from North American high yield bonds to North American loans. |
| | ∎ | | Later during the reporting period, the Fund continued to shift exposure from high yield bonds to senior secured loans. At the end of the fiscal year, the Fund made a modest shift from North American high yield bonds to European high yield bonds. |
| | ∎ | | In regard to the opportunistic asset classes, the Fund reduced some of its exposure to CLOs to allow flexibility to allocate to the asset class at a more attractive entry point later. |
| | ∎ | | In general, as these portfolios build over time, the Fund intends to deploy cash into asset classes which we believe offers the best relative value at that time, and will shift exposure between asset classes as relative value opportunities change. |
| 1. | A unit that is equal to 1/100th of 1% or 0.01%. |
| 2. | Total return describes the return to an investor of Class Y shares and includes the reinvestment of dividends and capital gains.Past performance is no guarantee of future results and investment returns and the net asset value (NAV) of shares of the Fund will fluctuate so that shares, when redeemed, may be worth more or less than their original cost. Current performance may be higher or lower than performance quoted. Call 1.855.439.5459 or visit barings.com for current month end performance. All returns 1-year or less are cumulative. |
| 6. | Benchmark: 3-Month USD LIBOR plus 500 bps. The 3-Month USD LIBOR (London Interbank Offered Rate) is an average interest rate, determined by the Intercontinental Exchange, that banks charge one another for the use of short-term money (three months) in England’s Euro dollar market. The return shown includes 3-Month USD LIBOR plus 500 bps, or 5% per annum. LIBOR is unmanaged. It is not possible to invest directly in LIBOR. No assurance can be given that the Fund’s performance will exceed that of LIBOR by any given increment, or at all. |
6
Barings Global Credit Income Opportunities Fund 2019 Annual Report
| | ∎ | | By ratings category, the Fund decreased exposure to CCC-rated holdings. |
| | ∎ | | From an industry sector perspective, the most notable change has been a decrease in the Fund’s exposure to the oil and gas sector. |
Describe portfolio positioning at period end.
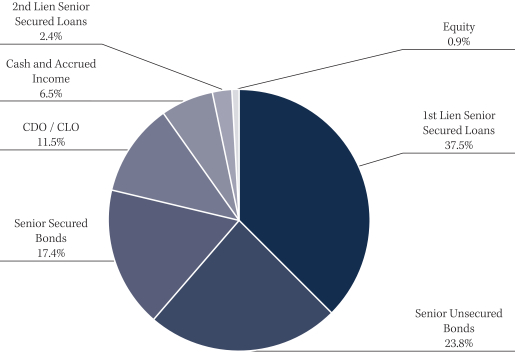
| | ∎ | | The Fund finished the annual reporting period, ended June 30, 2019, with an allocation of 41.2%, 40.0% and 11.5% to global high yield bonds, global senior secured loans and CLOs, respectively. The remainder of the portfolio was invested in equities at 0.9%, and cash/other at 6.5%. A significant portion of the portfolio (approximately 68.8%) was senior secured in nature (including CLOs backed by secured loans), which can potentially mitigate principal loss in the event that default rates increase. |
| | ∎ | | From an industry perspective, the Fund was well diversified across a number of sectors, with concentrations in health care, education and child care (9.4%), diversified/conglomerate services (8.3%), and broadcasting and entertainment (6.1%) as of June 30, 2019. |
| | ∎ | | As of June 30, 2019, the Fund had the following credit quality breakdown: 1.8% in BBB assets, 33.4% in BB assets, 45.3% in single-B assets, and 9.9% in CCC and below assets. Approximately 3.1% of the Fund’s assets are not publicly rated. Cash and accrued income accounted for the remaining 6.5% of the portfolio assets.3 |
| | ∎ | | The top five countries in the portfolio at the end of the reporting period were the U.S. (58.4%), the U.K. (12.0%), Germany (6.1%), the Netherlands (3.4%) and Ireland (2.5%). The Cayman Islands exposure related to the Fund’s CLO holdings was included in the U.S. Overall, the Fund had exposure to 17 different countries, and we continue to focus on building a well-diversified portfolio of global high yield securities. |
Describe market and portfolio outlook.
| | ∎ | | In our view, corporate fundamentals overall remain relatively healthy. Growth appears to be slowing but measured, and we believe most companies have capital structures in place that can withstand and adjust to a slowdown. Defaults appear to be stable in the current market, and we do not expect to see a material or widespread increase in the near term. |
| | ∎ | | As will always be the case, there continues to be individual companies or segments of the market that face headwinds. Having said that, market expectations are that there will not be a material increase in corporate defaults in the near term, and we believe that trading levels are compensating investors for a higher level of defaults than what corporate fundamentals suggest. |
| | ∎ | | We currently see better relative value opportunities in the North American market relative to the European market, although that can change as we saw during the last fiscal year period. Additionally, in this market we currently have a bias towards being in the senior and secured portion of the capital structure. |
| 3. | Ratings shown are the highest rating given by one of the following national rating agencies: S&P, Moody’s or Fitch. Additional information about ratings can be found, respectively, at www.standardandpoors.com, www.moodys.com and www.fitchratings.com. Credit ratings are subject to change. AAA, AA, single-A, and BBB are investment grade ratings categories used by S&P and Fitch; BB, single-B, CCC/CC/C and single-D are below investment grade ratings categories used by S&P and Fitch. Aaa, Aa, single-A and Baa are investment grade ratings categories used by Moody’s; Ba, single-B, Caa/Ca and single-C are below investment grade ratings categories used by Moody’s. Ratings categories may include gradations within each category. Bonds backed by U.S. Government or agency securities are given an implied rating equal to the rating of such securities. Holdings designated “Not Publicly Rated” are not rated by these national rating agencies. |
7
Barings Global Credit Income Opportunities Fund 2019 Annual Report
PORTFOLIO COMPOSITION(% OF ASSETS*)
COUNTRY COMPOSITION(% OF ASSETS**)
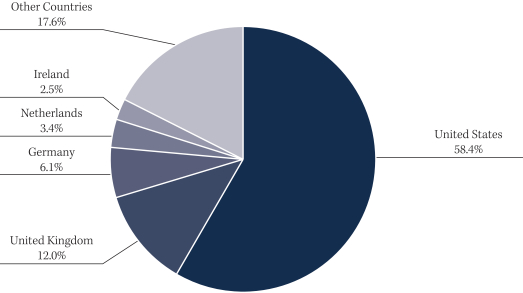
| ** | Percentage of assets are expressed by market value excluding cash and accrued income, and may vary over time. As of June 30, 2019. |
8
Barings Global Credit Income Opportunities Fund 2019 Annual Report
| | | | | | | | | | | | | | | | |
| % AVERAGE ANNUAL TOTAL RETURNS5,7,8 | | INCEPTION DATE | | | ONE YEAR | | | THREE YEARS | | | INCEPTION TO DATE | |
Class A With Load | | | 09/16/2013 | | | | -1.71 | % | | | 5.16 | % | | | 3.78 | % |
Class A No Load | | | 09/16/2013 | | | | 2.39 | % | | | 6.60 | % | | | 4.46 | % |
Class C With Load | | | 09/16/2013 | | | | 0.67 | % | | | 5.81 | % | | | 3.68 | % |
Class C No Load | | | 09/16/2013 | | | | 1.63 | % | | | 5.81 | % | | | 3.68 | % |
Class I With Load | | | 09/16/2013 | | | | 2.65 | % | | | 6.87 | % | | | 4.72 | % |
Class I No Load | | | 09/16/2013 | | | | 2.65 | % | | | 6.87 | % | | | 4.72 | % |
Class Y With Load | | | 09/16/2013 | | | | 2.64 | % | | | 6.87 | % | | | 4.72 | % |
Class Y No Load | | | 09/16/2013 | | | | 2.64 | % | | | 6.87 | % | | | 4.72 | % |
| 4. | Inception date: September 16, 2013. |
| 5. | Class A performance with the sales charges includes the maximum 4.00% sales charge. |
| 6. | Benchmark: 3-Month USD LIBOR plus 500 bps. The 3-Month USD LIBOR (London Interbank Offered Rate) is an average interest rate, determined by the Intercontinental Exchange, that banks charge one another for the use of short-term money (three months) in England’s Euro dollar market. The return shown includes 3-Month USD LIBOR plus 500 bps, or 5% per annum. LIBOR is unmanaged. It is not possible to invest directly in LIBOR. No assurance can be given that the Fund’s performance will exceed that of LIBOR by any given increment, or at all. |
| 7. | Line graph and table do not reflect the deduction of taxes that a shareholder would pay. |
| 8. | Class C performance with the sales charges includes the 1.00% contingent deferred sales charge (CDSC) for returns of one year or less. |
9
Barings Active Short Duration Bond Fund 2019 Annual Report
Investment Objective
Barings Active Short Duration Bond Fund (“Active Short Duration Bond Fund” or the “Fund”) seeks to achieve a high total rate of return, primarily from current income while minimizing fluctuations in capital values by investing primarily in a diversified portfolio of short-term investment grade fixed income securities.
Portfolio Management Commentary
How did the Fund perform?
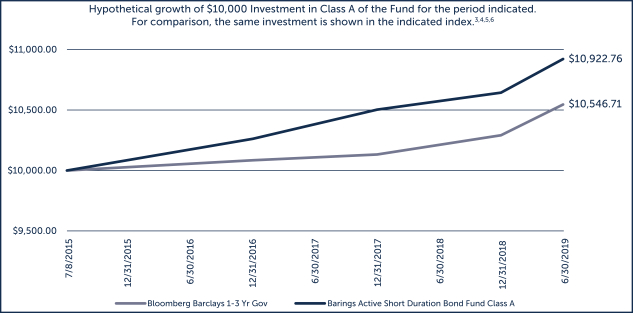
| | ∎ | | The Fund reported a net total rate of return for the period from July 1, 2018 through June 30, 2019 of +3.78%, underperforming the Bloomberg Barclays U.S. 1-3 Year Government Bond Index (the Benchmark), which returned 4.02%.1,5 |
What factors influenced performance of the Fund?
| | ∎ | | A shorter duration position contributed negatively to performance relative to the Benchmark as rates declined. The Fund uses Treasury bonds and futures to help manage duration. The front end of the Treasury yield curve remains inverted between three months and three years. Markets are now anticipating that the next rate move will likely be a decrease in the Federal Funds Rate, which is in stark contrast with the sentiment in the second half of 2018, when further tightening was expected. The Fund ended the period with a 0.37 year duration in accordance with our rules-based duration management process. |
| | ∎ | | We continue to favor securitized credit over corporate credit, emphasizing structure over unsecured positions. The Fund’s allocation to consumer asset-backed securities (ABS) was a positive contributor to performance. Student loans were the primary contributor within the securitized sector. We continue to find that federal family education loan program (FFELP) student loans offer good value trading, with a spread of 70 basis points (bps) over the London Inter-Bank Offered Rate (LIBOR) – with an explicit government guarantee and strong technical created by the discontinuation of the FFELP program in 2010. |
| | ∎ | | The Fund’s allocation to investment grade credit contributed positively to performance. Corporate spreads tightened over the recent six-month period, which was a contrast from the widening experienced during a volatile fourth quarter in 2018. Allocations to banking, leasing, and diversified telecom were the top performing industry positions. |
| | ∎ | | The Fund’s small position in high quality collateralized loan obligation (CLO) tranches was also a positive contributor. The Fund is invested in AAA-rated and select AA-rated tranches. We continue to like the structural subordination offered by CLOs, and favor high quality managers.2 |
| 1. | Total return describes the return to an investor of Class Y shares and includes the reinvestment of dividends and capital gains.Past performance is no guarantee of future results, and investment returns and the net asset value (NAV) of shares of the Fund will fluctuate so that shares, when redeemed, may be worth more or less than their original cost. Current performance may be higher or lower than performance quoted. Call 1.855.439.5459 or visit barings.com for current month-end performance.All returns one-year or less are cumulative. |
| 2. | Ratings shown are the highest ratings given by one of the following national rating agencies: S&P, Moody’s or Fitch. Additional information about ratings can be found, respectively, at www.standardandpoors.com, www.moodys.com and www.fitchratings.com. Credit ratings are subject to change. AAA, AA, single-A and BBB are investment grade ratings categories used by S&P and Fitch. BB, single-B, CCC/CC/C and single-D are below investment grade ratings categories used by S&P and Fitch. Aaa, Aa, single-A and Baa are investment grade ratings categories used by Moody’s. Ba, single-B, Caa/Ca and single-C are below investment grade ratings categories used by Moody’s. Ratings categories may include gradations within each category. Bonds backed by U.S. government or agency securities are given an implied rating equal to the rating of such securities. Holdings designated Not Publicly Rated are not rated by these national rating agencies. |
| 5. | Benchmark: The Bloomberg Barclays U.S. 1-3 Year Government Bond Index is comprised of the U.S. Treasury Index and U.S. Agency Index. The U.S. Government Index includes Treasuries (public obligations of the U.S. Treasury) and U.S. agency debentures (publicly issued debt of U.S. government agencies, quasi-federal corporations, and corporate or foreign debt guaranteed by the U.S. government) that have remaining maturities of more than one year, and up to but not including three years. Indexes are unmanaged. It is not possible to invest directly in an index. |
10
Barings Active Short Duration Bond Fund 2019 Annual Report
Describe recent portfolio activity.
| | ∎ | | The Fund ended the period with a duration position of 0.37 years, as the basis between three-month and one-year remains inverted. |
| | ∎ | | The Fund marginally reduced lower quality BBB-rated corporate bond exposure and added to several consumer asset-backed securities (ABS) and commercial mortgage-backed securities (CMBS) deals, favoring the structures these deals provide, and viewing positive technicals and fundamentals in these areas. |
Describe portfolio positioning at period end.
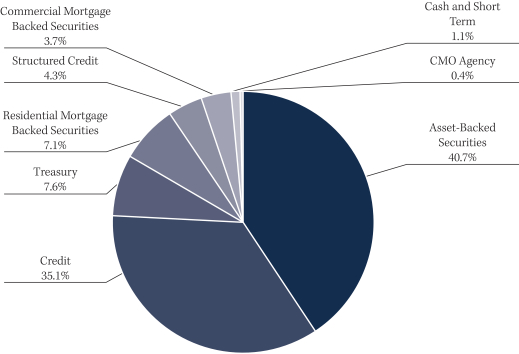
| | ∎ | | The Fund continues to be well diversified across corporate, securitized and government sectors. The securitized ABS allocation was 40.7% at the end of the period. Student loans represented the largest allocation, followed by automotive loan collateral. Further commercial ABS sub-sectors include timeshare, consumer loan, aircraft leasing and whole business receivables deals. The Fund has maintained an active position in CMBS, given strong technicals and still-supportive fundamentals. Allocations were in broadly syndicated deals with a diverse investor base, providing strong liquidity profiles. |
| | ∎ | | At the end of the period, the corporate allocation was at approximately 35.1%, with 32.9% in investment grade corporates, 1.4% in BB-rated and crossover high yield, and 0.8% in U.S. dollar denominated emerging markets. Banks/brokers and food/beverage/tobacco represent the Fund’s largest corporate allocations, followed by chemicals and independent finance. |
| | ∎ | | High quality AAA and AA quality CLO tranches represented a combined 4.3% allocation for the Fund. |
Describe market and portfolio outlook.
| | ∎ | | Investors remain largely on the defensive. A continuation of dovish comments from U.S. Federal Reserve (Fed) Chair Jerome Powell, prior to the second quarter’s coined “Powell Pivot,” led to positive sentiment among high grade investors globally. But the reaction was short-lived, and investors went back on the defensive amid growing uncertainty around a number of macro events. We believe that a Fed on pause, or even ready to cut rates, should translate into a supportive environment for high quality credit, as investors begin to venture more toward risk assets. But rallying Treasury rates are putting an upward technical on corporate spreads, as the yield curve continues to flatten. |
| | ∎ | | In our view, corporate spreads may not tighten with the same velocity that they had at the end of the second quarter, but the odds that spreads continue to tighten are much higher than they were. Given the current level of spreads, we believe that investors will likely balk at some additional tightening, but probably not until it reaches 10 to 15 bps tighter. Spread widening is still a potential, but as long as investors do not foresee a recession in the next 12 months, we believe that it should be limited. |
| | ∎ | | Within securitized sectors, increased rate volatility and macro concerns have weighed negatively on recent spread performance. Rate sensitive sectors were most impacted by spread widening. These sectors – which widened between 15 and 25 bps – included franchise receivables, containers and aviation. The team is anticipating an increase in “non-traditional” ABS issuance in sectors such as consumer and marketplace loans, aircraft receivables, whole business, fleet leases, container, solar and cell tower deals. Macro volatility has increased, but we expect technicals to improve and remain favorable. |
11
Barings Active Short Duration Bond Fund 2019 Annual Report
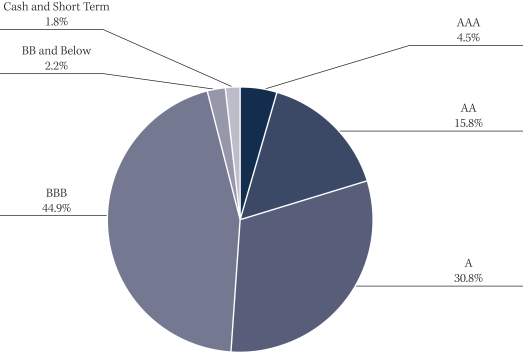
CREDIT QUALITY BREAKDOWN(% OF ASSETS*)
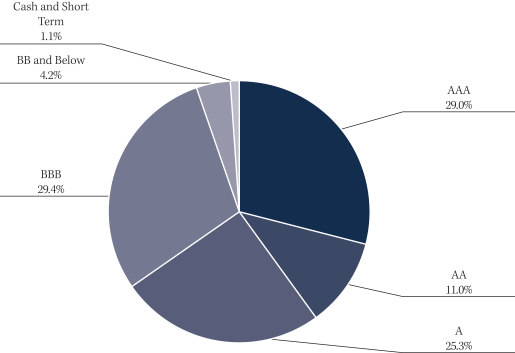
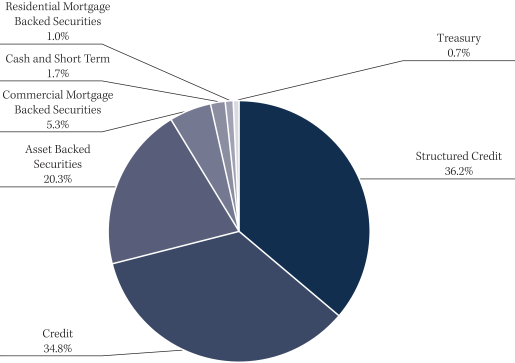
PORTFOLIO COMPOSITION(% OF ASSETS*)
12
Barings Active Short Duration Bond Fund 2019 Annual Report
| | | | | | | | | | | | | | | | |
| % AVERAGE ANNUAL TOTAL RETURNS 3,4,6,7 | | INCEPTION DATE | | | ONE YEAR | | | THREE YEARS | | | INCEPTION TO DATE | |
Class A With Load | | | 07/08/2015 | | | | 3.52 | % | | | 2.24 | % | | | 1.98 | % |
Class A No Load | | | 07/08/2015 | | | | 3.52 | % | | | 2.24 | % | | | 1.98 | % |
Class C With Load | | | 07/08/2015 | | | | 2.73 | % | | | 2.16 | % | | | 1.72 | % |
Class C No Load | | | 07/08/2015 | | | | 3.23 | % | | | 2.16 | % | | | 1.72 | % |
Class I With Load | | | 07/08/2015 | | | | 3.78 | % | | | 2.53 | % | | | 2.25 | % |
Class I No Load | | | 07/08/2015 | | | | 3.78 | % | | | 2.53 | % | | | 2.25 | % |
Class Y With Load | | | 07/08/2015 | | | | 3.78 | % | | | 2.50 | % | | | 2.23 | % |
Class Y No Load | | | 07/08/2015 | | | | 3.78 | % | | | 2.50 | % | | | 2.23 | % |
| 3. | Inception date: July 8, 2015. |
| 4. | Class A performance, the class does not have a sales charge. |
| 5. | Benchmark: The Bloomberg Barclays U.S. 1-3 Year Government Bond Index is comprised of the U.S. Treasury Index and U.S. Agency Index. The U.S. Government Index includes Treasuries (public obligations of the U.S. Treasury) and U.S. agency debentures (publicly issued debt of U.S. government agencies, quasi-federal corporations, and corporate or foreign debt guaranteed by the U.S. government) that have remaining maturities of more than one year, and up to but not including three years. Indexes are unmanaged. It is not possible to invest directly in an index. |
| 6. | Line graph and table do not reflect the deduction of taxes that a shareholder would pay. |
| 7. | Class C performance with the sales charges includes the 1.00% contingent deferred sales charge (CDSC) for returns of one year or less. |
13
Barings Diversified Income Fund 2019 Annual Report
Investment Objective
The Barings Diversified Income Fund (f/k/a the Barings Total Return Bond Fund) seeks to provide a total return comprised of current income and capital appreciation.
Portfolio Management Commentary
How did the Fund perform?
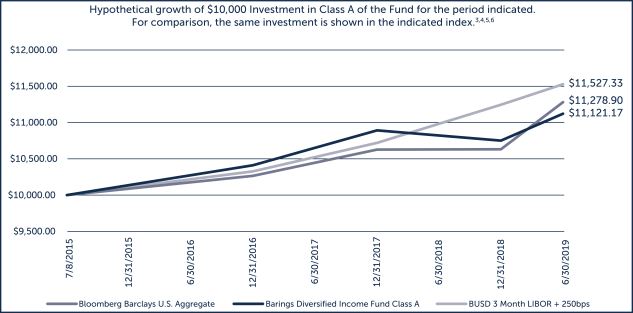
| | ∎ | | The Fund reported a net total rate of return for the reporting period from July 1, 2018 through June 30, 2019 of +4.01%, underperforming the Bloomberg Barclays U.S. Aggregate Index, which returned +7.87%. The Fund was benchmarked to the Bloomberg Barclays U.S. Aggregate Index prior to March 1, 2019 when it changed its strategy and its benchmark to 3-Month LIBOR plus 250 (“New Benchmark”). The Fund is not managed relative to the benchmark, however, the comparison is provided to show how the Fund’s returns compare with those of a broad measure of market performance. Since the strategy change, the Fund overperformed the New Benchmark, which returned 1.65%. |
What factors influenced performance of the Fund?
| | ∎ | | High quality collateralized loan obligation (CLO) positioning in AA to BBB rated tranches contributed positively to performance. This has proven to be a positive allocation for Fund performance, as spreads have largely grown tighter since the beginning of the year. |
| | ∎ | | We continue to favor securitized credit over corporate credit, emphasizing structure over unsecured positions. The Fund’s allocation to consumer asset-backed securities (ABS) was a positive contributor to performance. Student loans were the primary contributor within the securitized sector. We find that federal family education loan program (FFELP) student loans offer good value, trading with a spread of 70 basis points (bps)1 over the London Inter-Bank Offered Rate (LIBOR)2 – with an explicit government guarantee and strong technical created by the discontinuation of the FFELP program in 2010. |
| | ∎ | | Investment grade corporate credit across both developed and emerging market geographies was a positive contributor to performance. Developed market corporate spreads tightened over the recent six-month period, which was a contrast from the widening experienced during a volatile fourth quarter in 2018. Emerging market corporate spreads followed a similar path over the period, with spreads compressing despite growing macro uncertainties, which also contributed to the positive performance. Banking, gas pipelines and retail stores were the strongest performing industries over the period. |
Describe recent portfolio activity.
| | ∎ | | Effective March 1, 2019, the Barings Total Return Bond Fund changed its name and strategy to the Barings Diversified Income Fund. The Fund converted its asset composition consistent with the new strategy during the two-month period between March and May. |
| | ∎ | | Based on the conversion of the Fund, the portfolio allocations were shifted in accordance with target weights established by the Barings Allocation Committee. |
| | ∎ | | Recent allocation changes include decreases to developed market investment grade credit and high quality CLO tranches, and increases to securitized credit and BBB-rated emerging market corporate debt. |
| | ∎ | | The Fund ended the period with a duration position of 0.51 years, as the basis between three-month and one-year remains inverted. |
| 1 | A unit that is equal to 1/100th of 1% or 0.01%. |
| 2 | LIBOR (London Interbank Offered Rate) is a benchmark interest rate at which major global banks lend to one another in the international interbank market for short-term loans. |
14
Barings Diversified Income Fund 2019 Annual Report
Describe portfolio positioning at period end.
| | ∎ | | High quality CLO tranches represented the Fund’s largest allocation, at 36.2%. We continue to favor the total return potential and structural subordination of CLOs, and favor AA to BBB quality tranches. |
| | ∎ | | The securitized ABS allocation was 20.3% at the end of the period. Student loans (both FFELP and private) represented the largest allocation, followed by aircraft lease collateral. Further commercial ABS sub-sectors included shipping container, rental car and equipment leasing deals. The Fund maintained a small (5.3%) position in commercial mortgage-backed securities (CMBS), given strong technicals and still-supportive fundamentals. This was a tactical trade that the Fund put on earlier in the quarter, as we expected new issue supply to slow and cause spreads to compress. We then began to sell down the CMBS positions in the Fund, capturing total return before new issue started to come to market, causing spreads to once again widen out on increased new supply. |
| | ∎ | | Emerging market hard currency positioning was 12.1% at the end of the period. The Fund continues to favor BBB quality positioning in this area, given the spread differential between emerging and developed market issues, leading to an attractive yield pickup. The Fund has maintained a lower spread duration3 and favoring short-dated bonds. |
| | ∎ | | Investment grade corporates represent a 15.4% allocation. The Fund has favored BBB-rated positions in less cyclical industries such as consumer products, food/beverage/tobacco and lodging/gaming/leisure, while maintaining a short spread duration. |
Describe market and portfolio outlook.
| | ∎ | | Investors remain largely on the defensive. A continuation of dovish comments from U.S Federal Reserve (Fed) Chair Jerome Powell, prior to the second quarter’s coined “Powell Pivot,” led to positive sentiment among high grade investors globally. But the reaction was short-lived, and investors went back on the defensive amid growing uncertainty around a number of macro events. We believe that a Fed on pause, or even ready to cut rates, should translate into a supportive environment for high quality credit, as investors begin to venture more toward risk assets. But rallying Treasury rates are putting an upward technical on corporate spreads, as the yield curve continues to flatten. |
| | ∎ | | Within securitized sectors, increased rate volatility and macro concerns have weighed negatively on recent spread performance. Rate sensitive sectors were most impacted by spread widening. These sectors – which widened 15 to 25 bps – included franchise receivables, containers and aviation. The team is anticipating an increase in “non-traditional” ABS issuance, in sectors such as consumer and marketplace loans, aircraft receivables, whole business, fleet leases, container, solar and cell tower deals. Macro volatility has increased, but we expect technicals to improve and remain favorable. |
| | ∎ | | In our view, corporate spreads may not tighten with the same velocity that they had at the end of the second quarter, but the odds that spreads continue to tighten are much higher than they were. Given the current level of spreads, we believe that investors will likely balk at some additional tightening, but probably not until it reaches 10 to 15 bps tighter. Spread widening is still a potential, but as long as investors do not foresee a recession in the next 12 months, we believe that any spread widening should be limited. |
| 3 | Duration is a measure of the sensitivity of the price – the value of principal – of a fixed-income investment to a change in interest rates. Duration is expressed as a number of years. Bond prices are said to have an inverse relationship with interest rates. Therefore, rising interest rates indicate bond prices are likely to fall, while declining interest rates indicate bond prices are likely to rise. |
15
Barings Diversified Income Fund 2019 Annual Report
CREDIT QUALITY BREAKDOWN(% OF ASSETS*)
PORTFOLIO COMPOSITION(% OF ASSETS*)
16
Barings Diversified Income Fund 2019 Annual Report
| | | | | | | | | | | | | | | | |
| % AVERAGE ANNUAL TOTAL RETURNS 3,4,6,7 | | INCEPTION DATE | | | ONE YEAR | | | THREE YEARS | | | INCEPTION TO DATE | |
Class A With Load | | | 07/08/2015 | | | | -0.38 | % | | | 0.38 | % | | | 1.43 | % |
Class A No Load | | | 07/08/2015 | | | | 3.77 | % | | | 1.75 | % | | | 2.48 | % |
Class C With Load | | | 07/08/2015 | | | | 1.99 | % | | | 0.99 | % | | | 1.71 | % |
Class C No Load | | | 07/08/2015 | | | | 2.99 | % | | | 0.99 | % | | | 1.71 | % |
Class I With Load | | | 07/08/2015 | | | | 4.01 | % | | | 2.00 | % | | | 2.73 | % |
Class I No Load | | | 07/08/2015 | | | | 4.01 | % | | | 2.00 | % | | | 2.73 | % |
Class Y With Load | | | 07/08/2015 | | | | 4.01 | % | | | 2.00 | % | | | 2.73 | % |
Class Y No Load | | | 07/08/2015 | | | | 4.01 | % | | | 2.00 | % | | | 2.73 | % |
| 1. | Total return describes the return to an investor of Class Y shares and includes the reinvestment of dividends and capital gains.Past performance is no guarantee of future results, and investment returns and the net asset value (NAV) of shares of the Fund will fluctuate so that shares, when redeemed, may be worth more or less than their original cost. Current performance may be higher or lower than performance quoted. Call 1.855.439.5459 or visit barings.com for current month-end performance. All returns one-year or less are cumulative. |
| 2. | Ratings shown are the highest ratings given by one of the following national rating agencies: S&P, Moody’s or Fitch. Additional information about ratings can be found, respectively, at www.standardandpoors.com, www.moodys.com and www.fitchratings.com. Credit ratings are subject to change. AAA, AA, single-A and BBB are investment grade ratings categories used by S&P and Fitch. BB, single-B, CCC/CC/C and single-D are below investment grade ratings categories used by S&P and Fitch. Aaa, Aa, single-A and Baa are investment grade ratings categories used by Moody’s. Ba, single-B, Caa/Ca and single-C are below investment grade ratings categories used by Moody’s. Ratings categories may include gradations within each category. Bonds backed by U.S. government or agency securities are given an implied rating equal to the rating of such securities. Holdings designated Not Publicly Rated are not rated by these national rating agencies. |
| 3. | Inception date: July 8, 2015. Diversified Income strategy change effective March 1, 2019. |
| 4. | Class A performance with the sales charges includes the maximum 4.00% sales charge. |
| 5. | The Fund’s benchmark was changed on March 1, 2019, in connection with the change to the Fund’s name and investment strategy because Barings believes that the new benchmark is more appropriate to the Fund’s current strategy. Benchmark Prior to Strategy Change Effective March 1, 2019: Bloomberg Barclays U.S. Aggregate. The benchmark includes domestic, taxable, dollar-denominated securities. The index covers U.S. investment grade fixed rate bond market, with index components for government and corporate securities, mortgage pass-through securities and asset-backed securities. It is not possible to invest directly in an index. |
| 1. | New Benchmark: 3-Month USD LIBOR plus 250 bps. The 3-Month USD LIBOR (London Interbank Offered Rate) is an average interest rate, determined by the Intercontinental Exchange, that banks charge one another for the use of short-term money (three months) in England’s Euro dollar market. The return shown includes 3-Month USD LIBOR plus 250 bps, or 2.5% per annum. LIBOR is unmanaged. It is not possible to invest directly in LIBOR. No assurance can be given that the Fund’s performance will exceed that of LIBOR by any given increment, or at all. |
| 6. | Line graph and table do not reflect the deduction of taxes that a shareholder would pay. |
| 7. | Class C performance with the sales charges includes the 1.00% contingent deferred sales charge (CDSC) for returns of one year or less. |
17
Barings Emerging Markets Debt Blended Total Return Fund 2019 Annual Report
Investment Objective
Barings Emerging Markets Debt Blended Total Return Fund (“EMD Blended Total Return Fund” or the “Fund”) seeks to achieve maximum total return, consistent with preservation of capital and prudent investment management, through high current income generation and, where appropriate, capital appreciation.
Portfolio Management Commentary
How did the Fund perform?
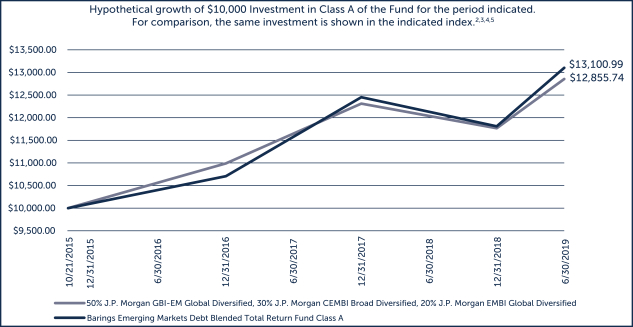
| | ∎ | | The Fund reported a net total rate of return for the period from July 1, 2018 through June 30, 2019 of +12.86%.1The net total rate of return for the Fund’s performance benchmark (a blend of 50% JPMorgan Government Bond Index – Emerging Markets Global Diversified (GBI-EMGD), 30% JPMorgan EMBI Global Diversified and 20% JPMorgan CEMBI Broad Diversified) was +10.13%. The Fund is not managed relative to the benchmark; however, the comparison is provided to show how the Fund’s returns compare with those of a broad measure of market performance. |
| | ∎ | | Each of the Fund’s three sub-strategies – emerging markets (EM) corporates, EM sovereign and EM local – generated positive performance over the period. This occurred as U.S. Treasury rates rallied 96 basis points (bps) over the past 12 months, alongside a dovish U.S. Federal Reserve (Fed) and European Central Bank (ECB), revisiting levels last seen in December 2016. |
What factors influenced performance of the Fund?
| | ∎ | | The Fund’s positioning, and active allocations across countries and credits, were additive to performance. The dovish shift in monetary policy expectations produced a bullish sentiment for external debt. EM local rallied as inflation across EM countries continued to be suppressed alongside low growth – leading central banks to continue their accommodative measures in the hopes of stimulating growth. EM currencies were stronger toward the end of June, despite lower commodity prices – led by the Russian Ruble, Thai Bhat, Czech Koruna and Argentine Peso, which rallied on the back of greater financial stability, positive political developments and rising consumer confidence. The U.S. and China continued their trade war, then called a temporary truce during the G-20 Summit, where Russia and Saudi Arabia additionally called to extend OPEC production cuts into 2020 as demand slows. EM debt flows have been strong in the first half of 2019, with $45.1 billion of positive flows during the year, mostly from hard currency, after just $0.13 billion in net flows for the second half of 2018. |
| | ∎ | | For the 12-month reporting period ending June 30, 2019, the Fund’s positioning in Brazil, Mexico, Ukraine and Turkey contributed positively to Fund performance. However, the Fund’s positions in Hungary, Russia and Thailand detracted from performance. |
Describe recent portfolio activity.
| | ∎ | | The Fund has recently increased its exposure to EM corporates to capture the higher yields on companies we believe to have strong potential. The Fund also increased exposure to EM sovereign hard currency assets, as spreads were overcompensating for defaults. The Fund decreased its exposure to local rates, but maintained its positioning on overall moderate growth, low inflation and high rates in select EM local markets – with the expectation that local rates will fall over the next 12 months in countries that are well managed and have falling inflation. |
Describe portfolio positioning at period end.
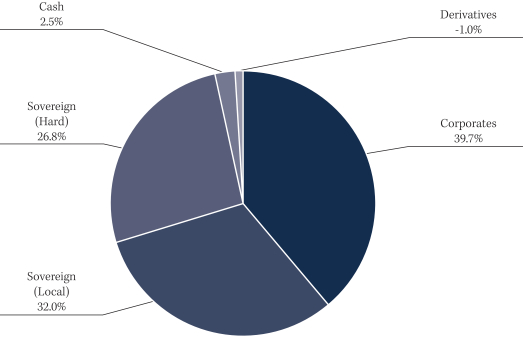
| | ∎ | | The Fund finished the reporting period, ended June 30, 2019, with a 40% exposure to EM corporate bonds, 32% to local debt and currencies, 30% to sovereign hard currencies (inclusive of Credit Default Swaps), and a 2.5% cash position. |
| 1. | Total return describes the return to an investor of Class Y shares and includes the reinvestment of dividends and capital gains.Past performance is no guarantee of future results, and investment returns and the net asset value (NAV) of shares of the Fund will fluctuate so that shares, when redeemed, may be worth more or less than their original cost. Current performance may be higher or lower than performance quoted. Call 1.855.439.5459 or visit barings.com for current month-end performance.All returns one-year or less are cumulative. |
18
Barings Emerging Markets Debt Blended Total Return Fund 2019 Annual Report
| | ∎ | | The top five countries in the portfolio at the end of the reporting period were Mexico (17.0%), Brazil (9.1%), Ukraine (8.5%), Turkey (6.6%) and Ghana (6.3%). The top five corporate issuers were MHP (2.6%), TBC Bank (2.6%), Turkiye Sinai Kalkinma Bankasi (2.4%), Petra Diamonds (2.1%) and Turkie Halk Bankasi (1.7%). Overall, the Fund had exposure to 31 countries, 31 corporates and 27 different currencies. |
Describe market and portfolio outlook.
| | ∎ | | We continue to have a constructive view on EM debt, as we believe valuations remain attractive on a fundamental basis. Generally, EMs do well during periods of central bank dovishness and positive economic growth. Although European growth is softening, we have not seen the type of sharp and sudden changes that are likely to derail economic growth across EMs. However, risks persist surrounding the ongoing trade negotiations between the U.S. and China, Persian Gulf tensions and other geopolitical events, interest rate moves and currency fluctuations. |
| | ∎ | | We continue to favor hard currency assets, as sovereign and corporate bonds are most attractive in the current environment, benefiting from lower rate expectations and healthy economic growth. We believe local rates will remain attractive, as governments continue to follow consolidation programs while trying to stimulate their economies. On a regional level, in our view, Latin America continues to provide some of the most attractive investment opportunities on a risk/return perspective, and we also find value in certain Eastern European hard currency high yield issuers. Overall, we favor countries that have the flexibility to adjust to an uncertain future in commodity process, core interest rates and developed market growth. Investors need to be selective, especially with respect to currencies without a tailwind for potential appreciation. |
19
Barings Emerging Markets Debt Blended Total Return Fund 2019 Annual Report
PORTFOLIO COMPOSITION(% OF ASSETS*)
REGIONAL COMPOSITION(% OF ASSETS**)
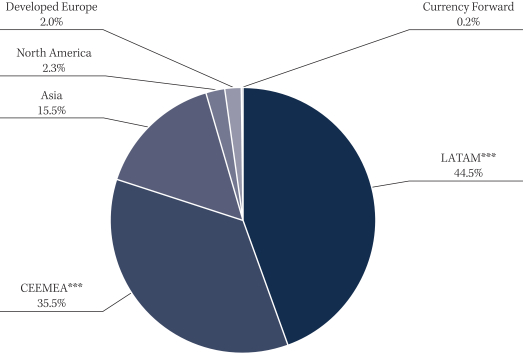
| ** | The percentages shown above are expressed by market value, excluding cash and accrued income, and may vary over time. As of June 30, 2019. |
| *** | CEEMEA: Central Europe, Eastern Europe, Middle East and Africa. |
| | LATAM: Latin America (includes countries in Central and South America). |
20
Barings Emerging Markets Debt Blended Total Return Fund 2019 Annual Report
| | | | | | | | | | | | | | | | |
| % AVERAGE ANNUAL TOTAL RETURNS 2,3,5,6 | | INCEPTION DATE | | | ONE YEAR | | | THREE YEARS | | | INCEPTION TO DATE | |
Class A With Load | | | 10/21/2015 | | | | 8.08 | % | | | 5.77 | % | | | 5.39 | % |
Class A No Load | | | 10/21/2015 | | | | 12.59 | % | | | 7.21 | % | | | 6.56 | % |
Class C With Load | | | 10/21/2015 | | | | 10.78 | % | | | 6.44 | % | | | 5.80 | % |
Class C No Load | | | 10/21/2015 | | | | 11.78 | % | | | 6.44 | % | | | 5.80 | % |
Class I With Load | | | 10/21/2015 | | | | 12.86 | % | | | 7.49 | % | | | 6.83 | % |
Class I No Load | | | 10/21/2015 | | | | 12.86 | % | | | 7.49 | % | | | 6.83 | % |
Class Y With Load | | | 10/21/2015 | | | | 12.86 | % | | | 7.49 | % | | | 6.84 | % |
Class Y No Load | | | 10/21/2015 | | | | 12.86 | % | | | 7.49 | % | | | 6.84 | % |
| 2. | Inception date: October 21, 2015. |
| 3. | Class A performance with the sales charges includes the maximum 4.00% sales charge. |
| 4. | Benchmark is a blend of 50% JPMorgan Government Bond Index – Emerging Markets Global Diversified (GBI-EMGD), 30% JPMorgan EMBI Global Diversified and 20% JPMorgan CEMBI Broad Diversified. JPMorgan GBIEM Global Diversified – Comprehensive index consisting of local emerging markets sovereign bonds. JPMorgan EMBI Global Diversified – Comprehensive index consisting of USD-denominated emerging markets sovereign bonds. JPMorgan CEMBI Broad Diversified – Comprehensive index consisting of USD-denominated emerging markets corporate bonds. |
| 5. | Line graph and table do not reflect the deduction of taxes that a shareholder would pay. |
| 6. | Class C performance with the sales charges includes the 1.00% contingent deferred sales charge (CDSC) for returns of one year or less. |
21
Barings Global Emerging Markets Equity Fund 2019 Annual Report
Investment Objective
Barings Global Emerging Markets Equity Fund (the “Fund”) seeks to achieve long-term capital growth.
Portfolio Management Commentary
How did the Fund perform?
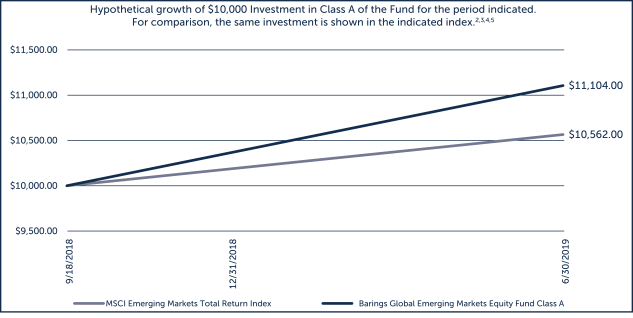
| | ∎ | | The Fund reported a net rate of return for the period from its inception, September 17, 2018, through June 30, 2019 of 11.26%, outperforming the MSCI Emerging Markets Index (the Benchmark), which returned 5.62%.1,4 |
What factors influenced performance of the Fund?
| | ∎ | | During the period, the Fund outperformed its Benchmark, primarily due to stock selection. |
| | ∎ | | Contributors to relative Fund performance included the following: |
| | ∎ | | HDFC Bank, an Indian bank, outperformed on the back of earnings that demonstrated improving margins and strong growth momentum. |
| | ∎ | | Anglo American, a global mining company based in South Africa, performed well in the stronger commodity price environment, supported further by the company’s continued focus on value creation and increasing balance sheet strength. |
| | ∎ | | Rumo,a Brazilian logistics company, performed in response to expectations that U.S.-China trade tensions would increase the level of Brazilian soybean exports, a dynamic that would help support Rumo’s volumes going forward. |
| | ∎ | | Detractors to relative Fund performance included the following: |
| | ∎ | | Brilliance China Automotive,a Chinese automobile manufacturer that operates a joint venture with BMW, was negatively impacted by the announcement that BMW will increase its stake in the joint venture to 75%, leading to concern among investors that minority interests will be negatively impacted. |
| | ∎ | | Angang Steel, a Chinese Steel manufacturer, faced headwinds as market prices reflected concerns relating to a slowing of the Chinese economy and demand for steel. |
| | ∎ | | Samsonite,a Chinese Luggage manufacturer, underperformed as markets processed the near-term uncertainty created by trade tensions. |
Describe recent portfolio activity.
| | ∎ | | Q4 2018: The Fund initiated a position in Chinese luggage manufacturer Samsonite, and exited its positon in Chinese automobile manufacturer Brilliance China Automotive, following the announcement that BMW will increase its stake in the joint venture to 75%, leading to concern among investors that minority interests will be negatively impacted. |
| | ∎ | | Q1 2019: Over the course of the quarter, the Fund initiated a position in a leading Indian IT services company, Infosys, and a Russian energy producer, Novatek. |
| | ∎ | | Q2 2019: The Fund exited its position in a Brazilian cosmetics manufacturer, Natura, as the company reached its price target. |
| 1. | Total return describes the return to an investor of Class Y shares and includes the reinvestment of dividends and capital gains.Past performance is no guarantee of future results, and investment returns and the net asset value (NAV) of shares of the Fund will fluctuate so that shares, when redeemed, may be worth more or less than their original cost. Current performance may be higher or lower than performance quoted. Call 1.855.439.5459 or visit barings.com for current month-end performance. All returns one-year or less are cumulative. The performance comparator is MSCI Emerging Markets Total Return Index with net dividends. |
| 4. | Benchmark: MSCI Emerging Markets Total Return Index with net dividends designed to measure the equity market performance of the emerging markets. Indices are unmanaged. It is not possible to invest directly in an index. |
22
Barings Global Emerging Markets Equity Fund 2019 Annual Report
| | ∎ | | As medium- to long-term investors, we would expect the average annual turnover rate of the strategy to be20-40%. The turnover for the Fund for the period from inception to June 30, 2019 was 7.1%, reflecting the relative attractiveness of the existing holdings relative to the overall emerging market (EM) opportunity set. Given the strong outperformance of the Fund’s holdings year-to-date (YTD), we believe it is reasonable to assume that turnover will likely trend upward over the next 12 months. |
Describe portfolio positioning at period end.
| | ∎ | | The Fund’s positioning at the end of the period reflected our bottom-up investment process – where we aim to identify companies with sustainable business franchises, and with future growth potential that is not fully reflected in the current share price. As a result, our active country and sector positioning relative to the Benchmark was not driven by a deliberate top-down strategy, but was a by-product of our bottom-up stock selection process. |
| | ∎ | | Relative to the Benchmark, the largest active country position was in China and the largest active sector exposure was to financials, where in each case we continue to identify many companies that we believe have strong medium-term growth prospects and are attractively valued. |
| | ∎ | | Despite the large active position in both cases, we believe that the performance of these companies will be influenced by company-specific factors (i.e. that these companies will be largely in control of their own destiny), rather than by correlation to their respective country or sector. As bottom-up investors, we always seek these types of companies. |
| | ∎ | | As of the end of the reporting period, the top five country weightings in the Fund, on an absolute basis, were China (36.4%), India (11.8%), Korea (10.2%), Taiwan (8.9%) and Brazil (6.4%). The Fund had exposure to 11 different countries, and in line with our investment process, we continue to seek out bottom-up investment opportunities where we believe the future earnings potential is not fully reflected in the current share price. |
Describe market and portfolio outlook.
| | ∎ | | We believe that confirmation that trade talks between China and the U.S. will resume, and that the ban on exports to Huawei will be temporarily lifted, is a near-term positive development for EM equities. However, with details lacking, it is unclear if any of the key areas of contention have been resolved. While our view remains that it is in both parties’ interest to resolve their differences, we are also mindful that there will likely be some more bumps on the road to a sustainable resolution, and so some continued volatility in markets should be expected. |
| | ∎ | | Once a resolution is achieved, we believe that investors are likely to focus back on the outlook for corporate profits in EM and the relative valuation versus developed market (DM) equities. Slowing economic growth and rising trade tensions have erased consensus forecast growth in EM corporate earnings for 2019. In our view, this may well prove too pessimistic given that monetary and fiscal policy across EM (and DM) is turning more accommodative. We believe that a return to double digit growth in corporate earnings next year and beyond seems reasonable, given the policy response, while a successful trade resolution would provide further upside to earnings forecasts. |
| | ∎ | | Meanwhile, the relative valuation of EM equities relative to DM equities remains very depressed, suggesting investors do not believe the earnings forecasts for EM are achievable. In our opinion, this makes EM equities a very compelling investment opportunity over the next year and beyond. |
23
Barings Global Emerging Markets Equity Fund 2019 Annual Report
| | | | | | | | |
| % AVERAGE ANNUAL TOTAL RETURNS 2,3,5,6 | | INCEPTION DATE | | | INCEPTION TO DATE | |
Class A With Load | | | 9/17/2018 | | | | 11.04 | % |
Class A No Load | | | 9/17/2018 | | | | 11.04 | % |
Class C With Load | | | 9/17/2018 | | | | 10.39 | % |
Class C No Load | | | 9/17/2018 | | | | 10.39 | % |
Class I With Load | | | 9/17/2018 | | | | 11.26 | % |
Class I No Load | | | 9/17/2018 | | | | 11.26 | % |
Class Y With Load | | | 9/17/2018 | | | | 11.26 | % |
Class Y No Load | | | 9/17/2018 | | | | 11.26 | % |
| 2. | Inception date: September 17, 2018. A fund’s performance for very short time periods may not be indicative of future performance |
| 3. | Class A performance with the sales charges includes the maximum 4.00% sales charge. |
| 4. | Benchmark: MSCI Emerging Markets Total Return Index with net dividends designed to measure the equity market performance of the emerging markets. Indices are unmanaged. It is not possible to invest directly in an index. |
| 5. | Line graph and table do not reflect the deduction of taxes that a shareholder would pay. |
| 6. | Class C performance with the sales charges includes the 1.00% contingent deferred sales charge (CDSC) for returns of one year or less. |
24
Barings Global High Yield Fund 2019 Annual Report
Investment Objective
Barings Global High Yield Fund (“Global High Yield Fund” or the “Fund”) seeks to provide high current income generation and, where appropriate, capital appreciation.
Portfolio Management Commentary
How did the Fund perform?
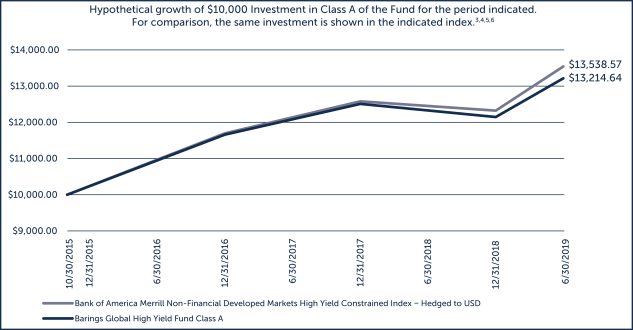
| | ∎ | | The Fund reported a net total rate of return for the reporting period from July 1, 2018 through June 30, 2019 of +6.12%, and underperformed the Bank of America Merrill Lynch Non-Financial Developed Markets High Yield Constrained Index (the Benchmark), which returned +7.59%.1,5 |
What factors influenced performance of the Fund?
| | ∎ | | During the one-year period, the global high yield bond market saw strong positive performance despite significant volatility in the fourth quarter of 2018. After ending the calendar year negative, the high yield market rebound was swift and broad, driven by continued economic stability, dovish sentiment from central banks and persistently low inflation. |
| | ∎ | | In general, demand for lower quality paper remained truncated while BB-rated credits outperformed single-B and CCC-rated high yield bonds. As a result, the Fund’s underweight allocation to BB-rated holdings, and overweight allocation to the lower-rated categories relative to the Benchmark, were performance detractors. Security selection across rating categories with a significant portfolio weight was a positive contributor to Fund performance relative to the Benchmark. |
| | ∎ | | From an industry perspective, the Fund remained overweight in the oil and gas sector, which underperformed during the one-year period, resulting in a drag to relative performance. Additionally, credit selection in the space was a significant detractor. Health care, education and child care was also a notable laggard as a result of specific credits held in the Fund. |
| | ∎ | | Across geographies, the notable lag to performance relative to the Benchmark was credit selection in the U.S. Alternatively, credit selection in Europe contributed positively to relative performance. As it relates to the Fund’s regional weightings, an overweight allocation to Europe and underweight position in the U.S. detracted from performance versus the Benchmark as the U.S. market outperformed the European market during the period. |
Describe recent portfolio activity.
| | ∎ | | The Fund continues to favor the single-B-rated subset of the global high yield bond market because we believe it has superior relative value characteristics and a generally lower duration profile. However, the Fund’s exposure to single-B and CCC-rated holdings was moderately reduced as the market remained notably risk-averse after the fourth quarter volatility. The Fund increased its exposure to BB-rated holdings, which saw significant spread tightening during the course of the one-year period. |
| | ∎ | | Across industries, the Fund’s allocation to the oil and gas industry was reduced during the period, as the industry still continues to display higher volatility in tandem with crude oil prices. The sector remains the largest industry sector in the Fund by market value. The telecommunications sector was increased, along with the health care, education and child care sector. |
| 1. | Total return describes the return to an investor of Class Y shares and includes the reinvestment of dividends and capital gains.Past performance is no guarantee of future results, and investment returns and the net asset value (NAV) of shares of the Fund will fluctuate so that shares, when redeemed, may be worth more or less than their original cost. Current performance may be higher or lower than performance quoted. Call 1.855.439.5459 or visit barings.com for current month-end performance. All returns one-year or less are cumulative. |
| 5. | Benchmark: BofA Merrill Lynch Non-Fin. Developed Markets High Yield Constrained Index. The benchmark contains all securities in The BofA Merrill Lynch Global High Yield Index that are non-financials and from developed markets countries, but caps issuer exposure at 2%. Developed markets is defined as an FX-G10 member (10 most widely traded currencies), a Western European nation, or a territory of the U.S. or a Western European nation. Indexes are unmanaged. It is not possible to invest directly in an index. |
25
Barings Global High Yield Fund 2019 Annual Report
| | ∎ | | The high yield market rally in the U.S. has outperformed the European market through the first half of 2019. The Fund increased its weighting to U.S. issuers during the period, while reducing European exposure. |
Describe portfolio positioning at period end.
| | ∎ | | The Fund finished the one-year period with a 33.4% weighting to senior secured high yield bonds, and a 54.8% weighting to senior unsecured high yield bonds. The balance of the portfolio was invested in senior secured loans (7.5%), and cash and accrued income (4.0%). A minor position in equity holdings acquired through bond restructurings accounted for 0.3% of Fund holdings by market value. |
| | ∎ | | From an industry perspective, the Fund remains diversified across a number of Moody’s-based industries, with higher concentrations in oil and gas (12.9%), telecommunications (10.0%), and health care, education and child care (9.3%), as of June 30, 2019. |
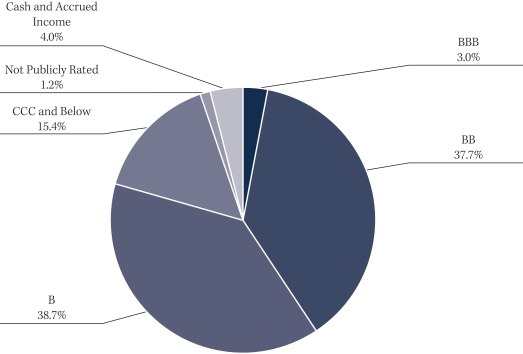
| | ∎ | | In terms of portfolio credit quality at the end of the period, the Fund had the following weighting breakdown: 3.0% in BBB, 37.7% in BB, 38.7% in single-B, 15.4% in CCC and below, and 4.0% in cash and accrued income. A small portion of the portfolio (1.2%) is designated as non-publicly rated, and is not rated by S&P, Moody’s or Fitch.2 |
| | ∎ | | The top five countries in the portfolio as of June 30, 2019 were the U.S. (60.0%), the U.K. (15.1%), Germany (4.6%), France (2.7%) and Canada (2.4%). Overall, the Fund has exposure to 16 countries, and supports our focus on building a well-diversified portfolio of global high yield bonds. |
Describe market and portfolio outlook.
| | ∎ | | We believe that corporate fundamentals for high yield borrowers remain relatively healthy overall. As will always be the case, there continues to be individual companies or segments of the market that face headwinds. |
| | ∎ | | Market expectations are that there will not be a material increase in corporate defaults in the near term, and we believe that the recent volatility and trading levels are compensating investors for a higher level of defaults than what corporate fundamentals suggest. |
| | ∎ | | Additionally, while commentary and action by central banks can influence investor sentiment and result in movements of retail fund flows or trading levels, we believe that the central banks may continue to be willing to take steps to support growth, which can be supportive for high yield borrowers and investors. |
| 2. | Ratings shown are the highest ratings given by one of the following national rating agencies: S&P, Moody’s or Fitch. Additional information about ratings can be found, respectively, at www.standardandpoors.com, www.moodys.com and www.fitchratings.com. Credit ratings are subject to change. AAA, AA, single-A and BBB are investment grade ratings categories used by S&P and Fitch. BB, single-B, CCC/CC/C and single-D are below investment grade ratings categories used by S&P and Fitch. Aaa, Aa, single-A and Baa are investment grade ratings categories used by Moody’s. Ba, single-B, Caa/Ca and single-C are below investment grade ratings categories used by Moody’s. Ratings categories may include gradations within each category. Bonds backed by U.S. government or agency securities are given an implied rating equal to the rating of such securities. Holdings designated Not Publicly Rated are not rated by these national rating agencies. |
26
Barings Global High Yield Fund 2019 Annual Report
CREDIT QUALITY COMPOSITION(% OF ASSETS*)
COUNTRY COMPOSITION(% OF ASSETS**)
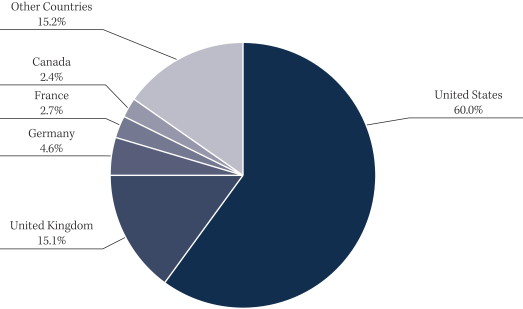
| ** | The percentages shown above are expressed by market value excluding cash and accrued income, may vary over time. As of June 30, 2019. |
27
Barings Global High Yield Fund 2019 Annual Report
| | | | | | | | | | | | | | | | |
| % AVERAGE ANNUAL TOTAL RETURNS 4,6,7 | | INCEPTION DATE | | | ONE YEAR | | | THREE YEARS | | | INCEPTION TO DATE | |
Class A With Load | | | 10/30/2015 | | | | 1.56 | % | | | 5.82 | % | | | 5.98 | % |
Class A No Load | | | 10/30/2015 | | | | 5.79 | % | | | 7.27 | % | | | 7.17 | % |
Class C With Load | | | 10/30/2015 | | | | 4.15 | % | | | 6.51 | % | | | 6.41 | % |
Class C No Load | | | 10/30/2015 | | | | 5.13 | % | | | 6.51 | % | | | 6.41 | % |
Class I With Load | | | 10/30/2015 | | | | 6.13 | % | | | 7.56 | % | | | 7.45 | % |
Class I No Load | | | 10/30/2015 | | | | 6.13 | % | | | 7.56 | % | | | 7.45 | % |
Class Y With Load | | | 10/30/2015 | | | | 6.12 | % | | | 7.56 | % | | | 7.45 | % |
Class Y No Load | | | 10/30/2015 | | | | 6.12 | % | | | 7.56 | % | | | 7.45 | % |
| 3. | Inception date: October 30, 2015. |
| 4. | Class A performance with the sales charges includes the maximum 4.00% sales charge. |
| 5. | Benchmark: BofA Merrill Lynch Non-Fin. Developed Markets High Yield Constrained Index. The benchmark contains all securities in The BofA Merrill Lynch Global High Yield Index that are non-financials and from developed markets countries, but caps issuer exposure at 2%. Developed markets is defined as an FX-G10 member (10 most widely traded currencies), a Western European nation, or a territory of the U.S. or a Western European nation. Indexes are unmanaged. It is not possible to invest directly in an index. |
| 6. | Line graph and table do not reflect the deduction of taxes that a shareholder would pay. |
| 7. | Class C performance with the sales charges includes the 1.00% contingent deferred sales charge (CDSC) for returns of one year or less. |
28
Barings U.S. High Yield Fund 2019 Annual Report
Investment Objective
Barings U.S. High Yield Fund (“U.S. High Yield Fund” or the “Fund”) seeks to achieve a high level of total return, with an emphasis on current income, by investing primarily in high yield debt and related securities.
Portfolio Management Commentary
How did the Fund perform?
| | ∎ | | The Fund reported a net total rate of return for the reporting period from July 1, 2018 through June 30, 2019 of +6.09%, underperforming the Bloomberg Barclays U.S. Corporate High Yield Index (the Benchmark), which returned +7.48%.1, 5 |
What factors influenced performance of the Fund?
| | ∎ | | During the one-year period, the U.S. high yield bond market saw strong positive performance despite significant volatility in the fourth quarter of 2018. After ending the calendar year negative, the high yield market rebound was swift and broad, driven by continued economic stability, dovish sentiment from central banks and persistently low inflation. |
| | ∎ | | In general, demand for lower quality paper remained truncated while BB-rated credits outperformed single-B and CCC-rated high yield bonds. As a result, the Fund’s underweight allocation to BB-rated holdings, and overweight allocation to the lower-rated categories relative to the Benchmark, were performance detractors. Security selection across single-B and CCC-rated credits was a positive contributor to Fund performance versus the Benchmark, while security selection in BB-rated holdings lagged. |
| | ∎ | | From an industry perspective, the Fund’s holdings within the telecommunications sector were positive contributors to performance versus the Index. The mining, steel, iron and non-precious metals sector was the largest detractor from performance as a result of credit selection and an overweight allocation. |
Describe recent portfolio activity.
| | ∎ | | The Fund modestly reduced its overweight allocation to single-B and CCC-rated holdings over the course of the one-year period, through both selective sales and attrition of holdings that had been called or matured. The Fund increased its weighting in BB and BBB-rated holdings, which have outperformed in the first half of the year, given the risk-averse sentiment of high yield investors and attractive relative value characteristics. |
| | ∎ | | Across industries, the Fund’s allocation to the oil and gas industry was reduced during the period, as the industry still continues to display higher volatility in tandem with crude oil prices. The sector remains the largest industry sector in the Fund by market value. The Fund’s exposure to the telecommunications sector was increased, along with the broadcasting and entertainment sector, and the health care, education and child care sector. |
Describe portfolio positioning at period end.
| | ∎ | | On a traded basis, the Fund finished June 30, 2019 with a 15.6% weighting to senior secured high yield bonds, and a 73.1% weighting to senior unsecured bonds. The remaining balance of the portfolio was invested in senior secured loans (8.0%), and cash, accrued and other holdings (3.3%). |
| | ∎ | | From a sector perspective, the Fund remains well diversified across a number of Moody’s-based industries, with higher concentrations in oil and gas (11.8%), telecommunications (10.6%), and broadcasting and entertainment (9.4%), as of June 30, 2019. |
| 1. | Total return describes the return to an investor of Class Y shares and includes the reinvestment of dividends and capital gains.Past performance is no guarantee of future results, and investment returns and the net asset value (NAV) of shares of the Fund will fluctuate so that shares, when redeemed, may be worth more or less than their original cost. Current performance may be higher or lower than performance quoted. Call 1.855.439.5459 or visit barings.com for current month-end performance. All returns one-year or less are cumulative. |
| 5. | Benchmark: Bloomberg Barclays U.S. Corporate High Yield Index. The benchmark covers the universe of fixed-rate, non-investment grade debt focusing on corporate USD denominated and non-convertible debt. It is not possible to invest directly in an index. |
29
Barings U.S. High Yield Fund 2019 Annual Report
| | ∎ | | In terms of portfolio credit quality, the Fund had the following weighting breakdown: 6.3% in BBB, 41.0% in BB, 34.4% in single-B, 13.9% in CCC and below, and 2.8% in cash and accrued income. The Fund’s weighting in Not Publicly Rated holdings finished the period at 1.6%.2 |
Describe market and portfolio outlook.
| | ∎ | | In our view, corporate fundamentals for high yield borrowers remain relatively healthy overall. As will always be the case, there continue to be individual companies or segments of the market that face headwinds. |
| | ∎ | | Overall, corporate defaults are not expected to increase materially in the near term, and we believe that the recent volatility and trading levels are compensating investors for a higher level of defaults than what corporate fundamentals suggest. |
| | ∎ | | Additionally, while commentary and action by central banks can influence investor sentiment and result in movements of retail fund flows or trading levels, we believe that the central banks appear to be willing to continue to take steps to support growth, which can be supportive for high yield borrowers and investors. |
| 2. | Ratings shown are the highest ratings given by one of the following national rating agencies: S&P, Moody’s or Fitch. Additional information about ratings can be found, respectively, at www.standardandpoors.com, www.moodys.com and www.fitchratings.com. Credit ratings are subject to change. AAA, AA, single-A and BBB are investment grade ratings categories used by S&P and Fitch. BB, single-B, CCC/CC/C and single-D are below investment grade ratings categories used by S&P and Fitch. Aaa, Aa, single-A and Baa are investment grade ratings categories used by Moody’s. Ba, single-B, Caa/Ca and single-C are below investment grade ratings categories used by Moody’s. Ratings categories may include gradations within each category. Bonds backed by U.S. government or agency securities are given an implied rating equal to the rating of such securities. Holdings designated Not Publicly Rated are not rated by these national rating agencies. |
30
Barings U.S. High Yield Fund 2019 Annual Report
CREDIT QUALITY COMPOSITION(% OF ASSETS*)
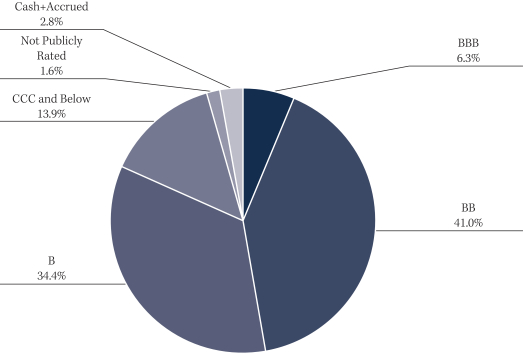
COUNTRY COMPOSITION(% OF ASSETS**)
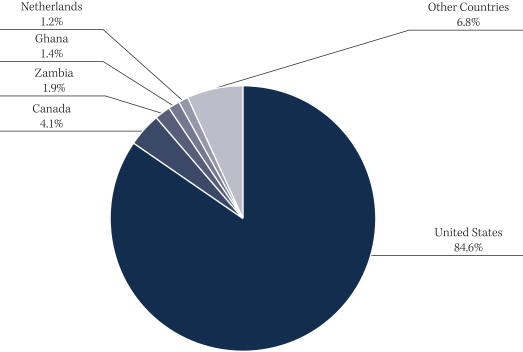
| ** | The percentages of assets are expressed by market value excluding cash and accrued income, and may vary over time. As of June 30, 2019. |
31
Barings U.S. High Yield Fund 2019 Annual Report
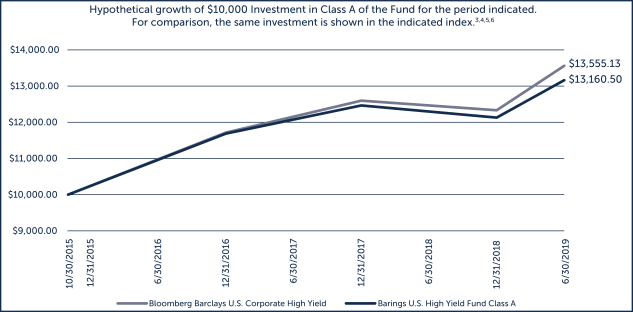
| | | | | | | | | | | | | | | | |
| % AVERAGE ANNUAL TOTAL RETURNS 4,6,7 | | INCEPTION DATE | | | ONE YEAR | | | THREE YEARS | | | INCEPTION TO DATE | |
Class A With Load | | | 10/30/2015 | | | | 1.61 | % | | | 5.21 | % | | | 5.74 | % |
Class A No Load | | | 10/30/2015 | | | | 5.84 | % | | | 6.65 | % | | | 6.92 | % |
Class C With Load | | | 10/30/2015 | | | | 4.03 | % | | | 5.85 | % | | | 6.12 | % |
Class C No Load | | | 10/30/2015 | | | | 5.03 | % | | | 5.85 | % | | | 6.12 | % |
Class I With Load | | | 10/30/2015 | | | | 6.07 | % | | | 6.90 | % | | | 7.17 | % |
Class I No Load | | | 10/30/2015 | | | | 6.07 | % | | | 6.90 | % | | | 7.17 | % |
Class Y With Load | | | 10/30/2015 | | | | 6.09 | % | | | 6.91 | % | | | 7.17 | % |
Class Y No Load | | | 10/30/2015 | | | | 6.09 | % | | | 6.91 | % | | | 7.17 | % |
| 3. | Inception date: October 30, 2015. |
| 4. | Class A performance with the sales charges includes the maximum 4.00% sales charge. |
| 5. | Benchmark: Bloomberg Barclays U.S. Corporate High Yield Index. The benchmark covers the universe of fixed-rate, non-investment grade debt focusing on corporate USD denominated and non-convertible debt. It is not possible to invest directly in an index. |
| 6. | Line graph and table do not reflect the deduction of taxes that a shareholder would pay. |
| 7. | Class C performance with the sales charges includes the 1.00% contingent deferred sales charge (CDSC) for returns of one year or less. |
32
Barings Funds Trust 2019 Annual Report
SHAREHOLDER EXPENSES(UNAUDITED)
As a shareholder of Barings Global Floating Rate Fund, Barings Global Credit Income Opportunities Fund, Barings Active Short Duration Bond Fund, Barings Diversified Income Fund (formerly Barings Total Return Bond Fund), Barings Emerging Markets Debt Blended Total Return Fund, Barings Global Emerging Markets Equity Fund, Barings Global High Yield Fund or Barings U.S. High Yield Fund you incur ongoing expenses, such as management fees, shareholder service fees, distribution fees and other fund expenses. The following table is intended to help you understand your ongoing expenses (in dollars and cents) of investing in the Funds and to compare these expenses with the ongoing expenses of investing in other funds.
The table is based on an investment of $1,000 invested at the beginning of the period and held for the entire period from January 1, 2019 to June 30, 2019.
Actual Expenses
The first line in the table below provides information about the actual account values and actual expenses. You may use the information in this line, together with the amount you invested, to estimate the expenses that you paid over the period. Simply divide your account value by $1,000 (for example, an $8,600 account value divided by $1,000 = 8.6), then multiply the result by the number in the first line for the Fund under the heading entitled “Operating Expense Incurred” to estimate the expenses you paid on your account during this period.
Hypothetical Example for Comparison Purposes
The second line in the table below provides information about the hypothetical account values and hypothetical expenses based on the Fund’s actual expense ratio and an assumed rate of return of 5% per year before expenses, which is not the Fund’s actual return. The hypothetical account value and expenses may not be used to estimate the actual ending account balance or expenses you paid for the period. You may use this information to compare the ongoing costs of investing in your Fund and other funds. To do so, compare this 5% hypothetical example with the 5% hypothetical examples that appear in the shareholder reports of the other funds.
Barings Global Floating Rate Fund
| | | | | | | | | | | | | | | | | | | | |
| | | EXPENSE
RATIO | | | BEGINNING
AMOUNT | | | ENDING
VALUE | | | AVERAGE
VALUE | | | OPERATING
EXPENSE
INCURRED* | |
Class A | | | | | | | | | | | | | | | | | | | | |
Actual | | | 1.00 | % | | $ | 1,000.00 | | | $ | 1,047.80 | | | $ | 1,023.90 | | | $ | 5.08 | |
Hypothetical | | | 1.00 | % | | | 1,000.00 | | | | 1,019.80 | | | | 1,009.90 | | | | 5.01 | |
| | | | | |
Class C | | | | | | | | | | | | | | | | | | | | |
Actual | | | 1.74 | % | | | 1,000.00 | | | | 1,044.00 | | | | 1,022.00 | | | | 8.82 | |
Hypothetical | | | 1.74 | % | | | 1,000.00 | | | | 1,016.20 | | | | 1,008.10 | | | | 8.70 | |
| | | | | |
Class I | | | | | | | | | | | | | | | | | | | | |
Actual | | | 0.75 | % | | | 1,000.00 | | | | 1,049.10 | | | | 1,024.55 | | | | 3.81 | |
Hypothetical | | | 0.75 | % | | | 1,000.00 | | | | 1,021.10 | | | | 1,010.55 | | | | 3.76 | |
| | | | | |
Class Y | | | | | | | | | | | | | | | | | | | | |
Actual | | | 0.75 | % | | | 1,000.00 | | | | 1,049.10 | | | | 1,024.55 | | | | 3.81 | |
Hypothetical | | | 0.75 | % | | | 1,000.00 | | | | 1,021.10 | | | | 1,010.55 | | | | 3.76 | |
| * | For each Class of the Fund, net expenses are equal to the annualized expense ratio net of any expenses waived or reimbursed by the adviser for such class multiplied by the average account value over the period, multiplied by 181/365. |
33
Barings Funds Trust 2019 Annual Report
SHAREHOLDER EXPENSES(UNAUDITED) (CONTINUED)
Barings Global Credit Income Opportunities Fund
| | | | | | | | | | | | | | | | | | | | |
| | | EXPENSE
RATIO | | | BEGINNING
AMOUNT | | | ENDING
VALUE | | | AVERAGE
VALUE | | | OPERATING
EXPENSE
INCURRED* | |
Class A | | | | | | | | | | | | | | | | | | | | |
Actual | | | 1.20 | % | | $ | 1,000.00 | | | $ | 1,057.70 | | | $ | 1,028.85 | | | $ | 6.12 | |
Hypothetical | | | 1.20 | % | | | 1,000.00 | | | | 1,018.80 | | | | 1,009.40 | | | | 6.01 | |
| | | | | |
Class C | | | | | | | | | | | | | | | | | | | | |
Actual | | | 1.95 | % | | | 1,000.00 | | | | 1,053.80 | | | | 1,026.90 | | | | 9.93 | |
Hypothetical | | | 1.95 | % | | | 1,000.00 | | | | 1,015.10 | | | | 1,007.55 | | | | 9.74 | |
| | | | | |
Class I | | | | | | | | | | | | | | | | | | | | |
Actual | | | 0.95 | % | | | 1,000.00 | | | | 1,059.00 | | | | 1,029.50 | | | | 4.85 | |
Hypothetical | | | 0.95 | % | | | 1,000.00 | | | | 1,020.10 | | | | 1,010.05 | | | | 4.76 | |
| | | | | |
Class Y | | | | | | | | | | | | | | | | | | | | |
Actual | | | 0.95 | % | | | 1,000.00 | | | | 1,059.00 | | | | 1,029.50 | | | | 4.85 | |
Hypothetical | | | 0.95 | % | | | 1,000.00 | | | | 1,020.10 | | | | 1,010.05 | | | | 4.76 | |
| * | For each Class of the Fund, net expenses are equal to the annualized expense ratio net of any expenses waived or reimbursed by the adviser for such class multiplied by the average account value over the period, multiplied by 181/365. |
Barings Active Short Duration Bond Fund
| | | | | | | | | | | | | | | | | | | | |
| | | EXPENSE
RATIO | | | BEGINNING
AMOUNT | | | ENDING
VALUE | | | AVERAGE
VALUE | | | OPERATING
EXPENSE
INCURRED* | |
Class A | | | | | | | | | | | | | | | | | | | | |
Actual | | | 0.65 | % | | $ | 1,000.00 | | | $ | 1,047.80 | | | $ | 1,023.90 | | | $ | 3.30 | |
Hypothetical | | | 0.65 | % | | | 1,000.00 | | | | 1,021.60 | | | | 1,010.80 | | | | 3.26 | |
| | | | | |
Class C | | | | | | | | | | | | | | | | | | | | |
Actual | | | 0.90 | % | | | 1,000.00 | | | | 1,044.00 | | | | 1,022.00 | | | | 4.56 | |
Hypothetical | | | 0.90 | % | | | 1,000.00 | | | | 1,020.30 | | | | 1,010.15 | | | | 4.51 | |
| | | | | |
Class I | | | | | | | | | | | | | | | | | | | | |
Actual | | | 0.40 | % | | | 1,000.00 | | | | 1,049.10 | | | | 1,024.55 | | | | 2.03 | |
Hypothetical | | | 0.40 | % | | | 1,000.00 | | | | 1,022.80 | | | | 1,011.40 | | | | 2.01 | |
| | | | | |
Class Y | | | | | | | | | | | | | | | | | | | | |
Actual | | | 0.40 | % | | | 1,000.00 | | | | 1,049.10 | | | | 1,024.55 | | | | 2.03 | |
Hypothetical | | | 0.40 | % | | | 1,000.00 | | | | 1,022.80 | | | | 1,011.40 | | | | 2.01 | |
| * | For each Class of the Fund, net expenses are equal to the annualized expense ratio net of any expenses waived or reimbursed by the adviser for such class multiplied by the average account value over the period, multiplied by 181/365. |
34
Barings Funds Trust 2019 Annual Report
SHAREHOLDER EXPENSES(UNAUDITED) (CONTINUED)
Barings Diversified Income Fund (formerly Barings Total Return Bond Fund)
| | | | | | | | | | | | | | | | | | | | |
| | | EXPENSE
RATIO** | | | BEGINNING
AMOUNT | | | ENDING
VALUE | | | AVERAGE
VALUE | | | OPERATING
EXPENSE
INCURRED* | |
Class A | | | | | | | | | | | | | | | | | | | | |
Actual | | | 0.78 | % | | $ | 1,000.00 | | | $ | 1,034.60 | | | $ | 1,017.30 | | | $ | 3.93 | |
Hypothetical | | | 0.78 | % | | | 1,000.00 | | | | 1,020.90 | | | | 1,010.45 | | | | 3.91 | |
| | | | | |
Class C | | | | | | | | | | | | | | | | | | | | |
Actual | | | 1.52 | % | | | 1,000.00 | | | | 1,030.80 | | | | 1,015.40 | | | | 7.65 | |
Hypothetical | | | 1.52 | % | | | 1,000.00 | | | | 1,017.30 | | | | 1,008.65 | | | | 7.60 | |
| | | | | |
Class I | | | | | | | | | | | | | | | | | | | | |
Actual | | | 0.55 | % | | | 1,000.00 | | | | 1,035.80 | | | | 1,017.90 | | | | 2.78 | |
Hypothetical | | | 0.55 | % | | | 1,000.00 | | | | 1,022.10 | | | | 1,011.05 | | | | 2.76 | |
| | | | | |
Class Y | | | | | | | | | | | | | | | | | | | | |
Actual | | | 0.55 | % | | | 1,000.00 | | | | 1,035.80 | | | | 1,017.90 | | | | 2.78 | |
Hypothetical | | | 0.55 | % | | | 1,000.00 | | | | 1,022.10 | | | | 1,011.05 | | | | 2.76 | |
| * | For each Class of the Fund, net expenses are equal to the annualized expense ratio net of any expenses waived or reimbursed by the adviser for such class multiplied by the average account value over the period, multiplied by 181/365. |
| ** | Expense ratios (as disclosed in the table) do not include the expenses of any underlying funds in which the Fund invests. The annualized expense ratios, as stated in the fee table of the Prospectus, may differ from the expense ratios disclosed in this report. |
Barings Emerging Markets Debt Blended Total Return Fund
| | | | | | | | | | | | | | | | | | | | |
| | | EXPENSE
RATIO | | | BEGINNING
AMOUNT | | | ENDING
VALUE | | | AVERAGE
VALUE | | | OPERATING
EXPENSE
INCURRED* | |
Class A | | | | | | | | | | | | | | | | | | | | |
Actual | | | 0.85 | % | | $ | 1,000.00 | | | $ | 1,109.30 | | | $ | 1,054.65 | | | $ | 4.45 | |
Hypothetical | | | 0.85 | % | | | 1,000.00 | | | | 1,020.60 | | | | 1,010.30 | | | | 4.26 | |
| | | | | |
Class C | | | | | | | | | | | | | | | | | | | | |
Actual | | | 1.58 | % | | | 1,000.00 | | | | 1,105.30 | | | | 1,052.65 | | | | 8.25 | |
Hypothetical | | | 1.58 | % | | | 1,000.00 | | | | 1,017.00 | | | | 1,008.50 | | | | 7.90 | |
| | | | | |
Class I | | | | | | | | | | | | | | | | | | | | |
Actual | | | 0.61 | % | | | 1,000.00 | | | | 1,110.60 | | | | 1,055.30 | | | | 3.19 | |
Hypothetical | | | 0.61 | % | | | 1,000.00 | | | | 1,021.80 | | | | 1,010.90 | | | | 3.06 | |
| | | | | |
Class Y | | | | | | | | | | | | | | | | | | | | |
Actual | | | 0.60 | % | | | 1,000.00 | | | | 1,110.60 | | | | 1,055.30 | | | | 3.14 | |
Hypothetical | | | 0.60 | % | | | 1,000.00 | | | | 1,021.80 | | | | 1,010.90 | | | | 3.01 | |
| * | For each Class of the Fund, net expenses are equal to the annualized expense ratio net of any expenses waived or reimbursed by the adviser for such class multiplied by the average account value over the period, multiplied by 181/365. |
35
Barings Funds Trust 2019 Annual Report
SHAREHOLDER EXPENSES(UNAUDITED) (CONTINUED)
��
Barings Global Emerging Markets Equity Fund
| | | | | | | | | | | | | | | | | | | | |
| | | EXPENSE
RATIO** | | | BEGINNING
AMOUNT | | | ENDING
VALUE | | | AVERAGE
VALUE | | | OPERATING
EXPENSE
INCURRED* | |
Class A | | | | | | | | | | | | | | | | | | | | |
Actual | | | 1.45 | % | | $ | 1,000.00 | | | $ | 1,152.40 | | | $ | 1,076.20 | | | $ | 7.74 | |
Hypothetical | | | 1.45 | % | | | 1,000.00 | | | | 1,017.60 | | | | 1,008.80 | | | | 7.25 | |
| | | | | |
Class C | | | | | | | | | | | | | | | | | | | | |
Actual | | | 2.20 | % | | | 1,000.00 | | | | 1,148.10 | | | | 1,074.05 | | | | 11.72 | |
Hypothetical | | | 2.20 | % | | | 1,000.00 | | | | 1,013.90 | | | | 1,006.95 | | | | 10.99 | |
| | | | | |
Class I | | | | | | | | | | | | | | | | | | | | |
Actual | | | 1.20 | % | | | 1,000.00 | | | | 1,153.80 | | | | 1,076.90 | | | | 6.41 | |
Hypothetical | | | 1.20 | % | | | 1,000.00 | | | | 1,018.80 | | | | 1,009.40 | | | | 6.01 | |
| | | | | |
Class Y | | | | | | | | | | | | | | | | | | | | |
Actual | | | 1.20 | % | | | 1,000.00 | | | | 1,153.80 | | | | 1,076.90 | | | | 6.41 | |
Hypothetical | | | 1.20 | % | | | 1,000.00 | | | | 1,018.80 | | | | 1,009.40 | | | | 6.01 | |
| * | For each Class of the Fund, net expenses are equal to the annualized expense ratio net of any expenses waived or reimbursed by the adviser for such class multiplied by the average account value over the period, multiplied by 181/365. |
| ** | Expense ratios (as disclosed in the table) do not include the expenses of any underlying funds in which the Fund invests. The annualized expense ratios, as stated in the fee table of the Prospectus, may differ from the expense ratios disclosed in this report. |
Barings Global High Yield Fund
| | | | | | | | | | | | | | | | | | | | |
| | | EXPENSE
RATIO | | | BEGINNING
AMOUNT | | | ENDING
VALUE | | | AVERAGE
VALUE | | | OPERATING
EXPENSE
INCURRED* | |
Class A | | | | | | | | | | | | | | | | | | | | |
Actual | | | 1.05 | % | | $ | 1,000.00 | | | $ | 1,088.50 | | | $ | 1,044.25 | | | $ | 5.44 | |
Hypothetical | | | 1.05 | % | | | 1,000.00 | | | | 1,019.60 | | | | 1,009.80 | | | | 5.26 | |
| | | | | |
Class C | | | | | | | | | | | | | | | | | | | | |
Actual | | | 1.80 | % | | | 1,000.00 | | | | 1,085.20 | | | | 1,042.60 | | | | 9.31 | |
Hypothetical | | | 1.80 | % | | | 1,000.00 | | | | 1,015.90 | | | | 1,007.95 | | | | 9.00 | |
| | | | | |
Class I | | | | | | | | | | | | | | | | | | | | |
Actual | | | 0.80 | % | | | 1,000.00 | | | | 1,090.20 | | | | 1,045.10 | | | | 4.15 | |
Hypothetical | | | 0.80 | % | | | 1,000.00 | | | | 1,020.80 | | | | 1,010.40 | | | | 4.01 | |
| | | | | |
Class Y | | | | | | | | | | | | | | | | | | | | |
Actual | | | 0.80 | % | | | 1,000.00 | | | | 1,090.20 | | | | 1,045.10 | | | | 4.15 | |
Hypothetical | | | 0.80 | % | | | 1,000.00 | | | | 1,020.80 | | | | 1,010.40 | | | | 4.01 | |
| * | For each Class of the Fund, net expenses are equal to the annualized expense ratio net of any expenses waived or reimbursed by the adviser for such class multiplied by the average account value over the period, multiplied by 181/365. |
36
Barings Funds Trust 2019 Annual Report
SHAREHOLDER EXPENSES(UNAUDITED) (CONTINUED)
Barings U.S. High Yield Fund
| | | | | | | | | | | | | | | | | | | | |
| | | EXPENSE
RATIO | | | BEGINNING
AMOUNT | | | ENDING
VALUE | | | AVERAGE
VALUE | | | OPERATING
EXPENSE
INCURRED* | |
Class A | | | | | | | | | | | | | | | | | | | | |
Actual | | | 1.00 | % | | $ | 1,000.00 | | | $ | 1,085.60 | | | $ | 1,042.80 | | | $ | 5.17 | |
Hypothetical | | | 1.00 | % | | | 1,000.00 | | | | 1,019.80 | | | | 1,009.90 | | | | 5.01 | |
| | | | | |
Class C | | | | | | | | | | | | | | | | | | | | |
Actual | | | 1.75 | % | | | 1,000.00 | | | | 1,081.70 | | | | 1,040.85 | | | | 9.03 | |
Hypothetical | | | 1.75 | % | | | 1,000.00 | | | | 1,016.10 | | | | 1,008.05 | | | | 8.75 | |
| | | | | |
Class I | | | | | | | | | | | | | | | | | | | | |
Actual | | | 0.75 | % | | | 1,000.00 | | | | 1,087.00 | | | | 1,043.50 | | | | 3.88 | |
Hypothetical | | | 0.75 | % | | | 1,000.00 | | | | 1,021.10 | | | | 1,010.55 | | | | 3.76 | |
| | | | | |
Class Y | | | | | | | | | | | | | | | | | | | | |
Actual | | | 0.75 | % | | | 1,000.00 | | | | 1,087.10 | | | | 1,043.55 | | | | 3.88 | |
Hypothetical | | | 0.75 | % | | | 1,000.00 | | | | 1,021.10 | | | | 1,010.55 | | | | 3.76 | |
| * | For each Class of the Fund, net expenses are equal to the annualized expense ratio net of any expenses waived or reimbursed by the adviser for such class multiplied by the average account value over the period, multiplied by 181/365. |
37
Barings Funds Trust 2019 Annual Report
FINANCIAL REPORT
38
Barings Funds Trust 2019 Annual Report
STATEMENTS OF ASSETS AND LIABILITIES
June 30, 2019
| | | | | | | | | | | | | | | | |
| | | BARINGS GLOBAL
FLOATING RATE FUND | | | BARINGS GLOBAL
CREDIT INCOME
OPPORTUNITIES FUND | | | BARINGS ACTIVE
SHORT DURATION
BOND FUND | | | BARINGS
DIVERSIFIED
INCOME FUND
(FORMERLY
BARINGS TOTAL
RETURN
BOND FUND) | |
| | | | |
| Assets | | | | | | | | | | | | | | | | |
| Investments, at fair value (cost $270,767,809, $209,414,498, $718,127,283 and $42,697,609, respectively) | | $ | 259,120,620 | | | $ | 198,644,529 | | | $ | 726,655,084 | | | $ | 43,163,759 | |
| Cash | | | 23,412,904 | | | | 15,491,071 | | | | – | | | | 443,417 | |
| Foreign currency, at value (cost $1,140,691, $3,391,489, $0 and $4,508, respectively) | | | 1,140,328 | | | | 3,406,864 | | | | – | | | | 4,526 | |
| Receivable for investments sold | | | 1,320,562 | | | | 1,873,135 | | | | 714,729 | | | | 424,278 | |
| Receivable for Fund shares sold | | | 399,213 | | | | 95,380 | | | | 3,999,152 | | | | 12,709 | |
| Interest receivable | | | 1,716,708 | | | | 2,258,609 | | | | 4,151,048 | | | | 315,970 | |
| Cash collateral held at broker on open options contracts | | | – | | | | 344,141 | | | | – | | | | – | |
| Receivable from adviser (see Note 3) | | | – | | | | – | | | | – | | | | 33,595 | |
| Receivable for variation margin on open centrally cleared swap contracts | | | – | | | | – | | | | 1,146 | | | | – | |
| Foreign tax reclaims receivable | | | – | | | | 183 | | | | 4,386 | | | | – | |
| Unrealized appreciation on forward foreign currency exchange contracts | | | 81,048 | | | | 94,580 | | | | – | | | | 4,206 | |
| Prepaid expenses | | | 10,385 | | | | 3,784 | | | | 61,845 | | | | 26,730 | |
| | | | | | | | | | | | | | | | |
Total assets | | | 287,201,768 | | | | 222,212,276 | | | | 735,587,390 | | | | 44,429,190 | |
| | | | | | | | | | | | | | | | |
|
| Liabilities | |
| Payable for investments purchased | | | 573,288 | | | | – | | | | 11,234,008 | | | | 414,119 | |
| Payable for TBA and when-issued securities purchased | | | 11,617,735 | | | | 8,462,516 | | | | – | | | | 1,299,990 | |
| Payable for Fund shares repurchased | | | 580,678 | | | | 480,405 | | | | 974,377 | | | | 8,270 | |
| Due to custodian | | | – | | | | – | | | | 2,860,144 | | | | – | |
| Swap contracts, at fair value (upfront net premiums received of $0, $0, $20,428 and $4,921, respectively) | | | – | | | | – | | | | 52,074 | | | | 13,018 | |
| Payable for variation margin on open futures contracts | | | – | | | | – | | | | 43,936 | | | | 3,012 | |
| Investment advisory fee payable (see Note 3) | | | 133,778 | | | | 252,786 | | | | 106,748 | | | | – | |
| Cash collateral Due to Broker | | | – | | | | – | | | | 3,740,000 | | | | – | |
| Distribution fees payable | | | 16,049 | | | | 17,416 | | | | 27,618 | | | | 212 | |
| Shareholder service fees payable | | | 17,323 | | | | 10,181 | | | | 45,635 | | | | 1,534 | |
| Dividends payable | | | 234,824 | | | | 214,593 | | | | 332,059 | | | | 74,667 | |
| Unrealized depreciation on forward foreign currency exchange contracts | | | 102,331 | | | | 52,933 | | | | – | | | | 24,128 | |
| Accrued expenses and other liabilities | | | 289,209 | | | | 230,727 | | | | 437,514 | | | | 91,413 | |
| | | | | | | | | | | | | | | | |
Total liabilities | | | 13,565,215 | | | | 9,721,557 | | | | 19,854,113 | | | | 1,930,363 | |
| | | | | | | | | | | | | | | | |
Total net assets | | $ | 273,636,553 | | | $ | 212,490,719 | | | $ | 715,733,277 | | | $ | 42,498,827 | |
| | | | | | | | | | | | | | | | |
See accompanying Notes to the Financial Statements.
39
Barings Funds Trust 2019 Annual Report
STATEMENTS OF ASSETS AND LIABILITIES(CONTINUED)
June 30, 2019
| | | | | | | | | | | | | | | | |
| | | BARINGS GLOBAL
FLOATING RATE FUND | | | BARINGS GLOBAL
CREDIT INCOME
OPPORTUNITIES FUND | | | BARINGS ACTIVE
SHORT DURATION
BOND FUND | | | BARINGS
DIVERSIFIED
INCOME FUND
(FORMERLY
BARINGS TOTAL
RETURN
BOND FUND) | |
|
| Composition of net assets | |
| Shares of beneficial interest outstanding (par value $0.00001 per share), unlimited number of shares authorized | | $ | 295 | | | $ | 238 | | | $ | 721 | | | $ | 43 | |
| Additionalpaid-in capital | | | 286,476,042 | | | | 227,944,181 | | | | 715,296,111 | | | | 42,985,466 | |
| Total distributable earnings (accumulated loss) | | | (12,839,784 | ) | | | (15,453,700 | ) | | | 436,445 | | | | (486,682 | ) |
| | | | | | | | | | | | | | | | |
Total net assets (1) | | $ | 273,636,553 | | | $ | 212,490,719 | | | $ | 715,733,277 | | | $ | 42,498,827 | |
| | | | | | | | | | | | | | | | |
|
| Class A | |
| Net assets applicable to outstanding shares | | $ | 45,213,173 | | | $ | 51,205,142 | | | $ | 135,981,353 | | | $ | 246,636 | |
| | | | | | | | | | | | | | | | |
| Shares of beneficial interest outstanding | | | 4,884,613 | | | | 5,734,302 | | | | 13,684,621 | | | | 25,117 | |
| | | | | | | | | | | | | | | | |
| Net asset value per share outstanding | | $ | 9.26 | | | $ | 8.93 | | | $ | 9.94 | | | $ | 9.82 | |
| | | | | | | | | | | | | | | | |
| Maximum offering price per share outstanding (Net asset value plus sales charge of 3.00%, 4.00%, 0.00% and 4.00%, respectively) | | $ | 9.55 | | | $ | 9.30 | | | $ | 9.94 | | | $ | 10.23 | |
| | | | | | | | | | | | | | | | |
|
| Class C | |
| Net assets applicable to outstanding shares | | $ | 8,005,318 | | | $ | 8,462,099 | | | $ | 1,178,163 | | | $ | 196,955 | |
| | | | | | | | | | | | | | | | |
| Shares of beneficial interest outstanding | | | 868,043 | | | | 948,798 | | | | 118,691 | | | | 20,061 | |
| | | | | | | | | | | | | | | | |
| Net asset value per share outstanding | | $ | 9.22 | | | $ | 8.92 | | | $ | 9.93 | | | $ | 9.82 | |
| | | | | | | | | | | | | | | | |
|
| Class I | |
| Net assets applicable to outstanding shares | | $ | 32,531,155 | | | $ | 23,202,780 | | | $ | 301,309 | | | $ | 12,129,886 | |
| | | | | | | | | | | | | | | | |
| Shares of beneficial interest outstanding | | | 3,507,292 | | | | 2,598,960 | | | | 30,319 | | | | 1,235,482 | |
| | | | | | | | | | | | | | | | |
| Net asset value per share outstanding | | $ | 9.28 | | | $ | 8.93 | | | $ | 9.94 | | | $ | 9.82 | |
| | | | | | | | | | | | | | | | |
|
| Class Y | |
| Net assets applicable to outstanding shares | | $ | 187,886,907 | | | $ | 129,620,698 | | | $ | 578,272,452 | | | $ | 29,925,350 | |
| | | | | | | | | | | | | | | | |
| Shares of beneficial interest outstanding | | | 20,266,113 | | | | 14,520,972 | | | | 58,234,564 | | | | 3,047,815 | |
| | | | | | | | | | | | | | | | |
| Net asset value per share outstanding | | $ | 9.27 | | | $ | 8.93 | | | $ | 9.93 | | | $ | 9.82 | |
| | | | | | | | | | | | | | | | |
| (1) | | The SEC eliminated the requirement to disclose total distributable earnings by each of its components as previously disclosed as the previous presentation did not provide insight into the tax implications of distributions. |
See accompanying Notes to the Financial Statements.
40
Barings Funds Trust 2019 Annual Report
STATEMENTS OF ASSETS AND LIABILITIES
June 30, 2019
| | | | | | | | | | | | | | | | |
| | | BARINGS EMERGING
MARKETS DEBT
BLENDED TOTAL
RETURN FUND | | | BARINGS GLOBAL
EMERGING MARKETS
EQUITY FUND | | | BARINGS GLOBAL
HIGH YIELD
FUND | | | BARINGS U.S.
HIGH YIELD
FUND | |
| | | | |
| Assets | | | | | | | | | | | | | | | | |
| Investments, at fair value (cost $47,825,492, $9,384,191, $27,788,536 and $50,143,523, respectively) | | $ | 49,033,090 | | | $ | 10,360,716 | | | $ | 26,696,680 | | | $ | 49,530,379 | |
| Cash | | | 987,092 | | | | 769,912 | | | | 2,432,974 | | | | 1,805,851 | |
| Foreign currency, at value (cost $499,264, $5,531, $17,928 and $0, respectively) | | | 494,846 | | | | 5,533 | | | | 17,898 | | | | – | |
| Receivable for investments sold | | | – | | | | – | | | | 118,520 | | | | 48,179 | |
| Receivable for Fund shares sold | | | – | | | | – | | | | 7 | | | | 5,481 | |
| Interest receivable | | | 841,699 | | | | 67,344 | | | | 400,890 | | | | 762,004 | |
| Receivable from adviser (see Note 3) | | | 35,610 | | | | 3,178 | | | | 6,549 | | | | – | |
| Cash collateral held at broker on open swap contracts | | | 950,000 | | | | – | | | | – | | | | – | |
| Receivable for variation margin on open centrally cleared swap contracts | | | 4,187 | | | | – | | | | – | | | | – | |
| Cash collateral held at broker on open future contracts | | | 30,360 | | | | – | | | | – | | | | – | |
| Receivable for variation margin on open futures contracts | | | 249 | | | | – | | | | – | | | | – | |
| Foreign tax reclaims receivable | | | – | | | | 648 | | | | 650 | | | | 297 | |
| Unrealized appreciation on forward foreign currency exchange contracts | | | 592,913 | | | | – | | | | 883 | | | | – | |
| Prepaid expenses | | | 23,059 | | | | 3,213 | | | | 21,887 | | | | 23,551 | |
| | | | | | | | | | | | | | | | |
Total assets | | | 52,993,105 | | | | 11,210,544 | | | | 29,696,938 | | | | 52,175,742 | |
| | | | | | | | | | | | | | | | |
|
| Liabilities | |
| Payable for investments purchased | | | – | | | | – | | | | 920,421 | | | | – | |
| Payable for TBA and when-issued securities purchased | | | 1,435,254 | | | | – | | | | 1,179,937 | | | | 1,159,247 | |
| Payable for Fund shares repurchased | | | – | | | | – | | | | 1,877 | | | | 15,321 | |
| Swap contracts, at fair value (upfront net premiums received of $11,325, $0, $0 and $0, respectively) | | | 263,000 | | | | – | | | | – | | | | – | |
| Investment advisory fee payable (see Note 3) | | | – | | | | – | | | | – | | | | 14,468 | |
| Directors’ fees payable | | | – | | | | 8,503 | | | | – | | | | – | |
| Distribution fees payable | | | 292 | | | | 109 | | | | 329 | | | | 778 | |
| Shareholder service fees payable | | | 157 | | | | – | | | | 180 | | | | 641 | |
| Dividends payable | | | 227,982 | | | | – | | | | 121,146 | | | | 125,278 | |
| Unrealized depreciation on forward foreign currency exchange contracts | | | 510,556 | | | | – | | | | 77,016 | | | | – | |
| Accrued expenses and other liabilities | | | 121,831 | | | | 77,089 | | | | 82,377 | | | | 90,945 | |
| | | | | | | | | | | | | | | | |
Total liabilities | | | 2,559,072 | | | | 85,701 | | | | 2,383,283 | | | | 1,406,678 | |
| | | | | | | | | | | | | | | | |
Total net assets | | $ | 50,434,033 | | | $ | 11,124,843 | | | $ | 27,313,655 | | | $ | 50,769,064 | |
| | | | | | | | | | | | | | | | |
See accompanying Notes to the Financial Statements.
41
Barings Funds Trust 2019 Annual Report
STATEMENTS OF ASSETS AND LIABILITIES(CONTINUED)
June 30, 2019
| | | | | | | | | | | | | | | | |
| | | BARINGS EMERGING
MARKETS DEBT
BLENDED TOTAL
RETURN FUND | | | BARINGS GLOBAL
EMERGING MARKETS
EQUITY FUND | | | BARINGS GLOBAL
HIGH YIELD
FUND | | | BARINGS U.S.
HIGH YIELD
FUND | |
|
| Composition of net assets | |
| Shares of beneficial interest outstanding (par value $0.00001 per share), unlimited number of shares authorized | | $ | 50 | | | $ | 10 | | | $ | 29 | | | $ | 52 | |
| Additionalpaid-in capital | | | 51,825,161 | | | | 9,999,742 | | | | 28,537,937 | | | | 51,926,098 | |
| Total distributable earnings (accumulated loss) | | | (1,391,178 | ) | | | 1,125,091 | | | | (1,224,311 | ) | | | (1,157,086 | ) |
| | | | | | | | | | | | | | | | |
Total net assets(1) | | $ | 50,434,033 | | | $ | 11,124,843 | | | $ | 27,313,655 | | | $ | 50,769,064 | |
| | | | | | | | | | | | | | | | |
|
| Class A | |
| Net assets applicable to outstanding shares | | $ | 404,806 | | | $ | 111,042 | | | $ | 2,302,408 | | | $ | 3,840,335 | |
| | | | | | | | | | | | | | | | |
| Shares of beneficial interest outstanding | | | 40,230 | | | | 10,000 | | | | 242,028 | | | | 392,237 | |
| | | | | | | | | | | | | | | | |
| Net asset value per share outstanding | | $ | 10.06 | | | $ | 11.10 | | | $ | 9.51 | | | $ | 9.79 | |
| | | | | | | | | | | | | | | | |
| Maximum offering price per share outstanding (Net asset value plus sales charge of 4.00%) | | $ | 10.48 | | | $ | 11.56 | | | $ | 9.91 | | | $ | 10.20 | |
| | | | | | | | | | | | | | | | |
|
| Class C | |
| Net assets applicable to outstanding shares | | $ | 261,015 | | | $ | 110,391 | | | $ | 242,001 | | | $ | 97,874 | |
| | | | | | | | | | | | | | | | |
| Shares of beneficial interest outstanding | | | 25,936 | | | | 10,000 | | | | 25,409 | | | | 10,000 | |
| | | | | | | | | | | | | | | | |
| Net asset value per share outstanding | | $ | 10.06 | | | $ | 11.04 | | | $ | 9.52 | | | $ | 9.79 | |
| | | | | | | | | | | | | | | | |
|
| Class I | |
| Net assets applicable to outstanding shares | | $ | 23,963,547 | | | $ | 5,451,705 | | | $ | 11,803,153 | | | $ | 12,135,495 | |
| | | | | | | | | | | | | | | | |
| Shares of beneficial interest outstanding | | | 2,381,296 | | | | 490,000 | | | | 1,240,000 | | | | 1,240,000 | |
| | | | | | | | | | | | | | | | |
| Net asset value per share outstanding | | $ | 10.06 | | | $ | 11.13 | | | $ | 9.52 | | | $ | 9.79 | |
| | | | | | | | | | | | | | | | |
|
| Class Y | |
| Net assets applicable to outstanding shares | | $ | 25,804,665 | | | $ | 5,451,705 | | | $ | 12,966,093 | | | $ | 34,695,360 | |
| | | | | | | | | | | | | | | | |
| Shares of beneficial interest outstanding | | | 2,564,100 | | | | 490,000 | | | | 1,362,223 | | | | 3,545,159 | |
| | | | | | | | | | | | | | | | |
| Net asset value per share outstanding | | $ | 10.06 | | | $ | 11.13 | | | $ | 9.52 | | | $ | 9.79 | |
| | | | | | | | | | | | | | | | |
| (1) | | The SEC eliminated the requirement to disclose total distributable earnings by each of its components as previously disclosed as the previous presentation did not provide insight into the tax implications of distributions. |
See accompanying Notes to the Financial Statements.
42
Barings Funds Trust 2019 Annual Report
STATEMENTS OF OPERATIONS
For the Year Ended June 30, 2019
| | | | | | | | | | | | | | | | |
| | | BARINGS GLOBAL
FLOATING RATE FUND | | | BARINGS GLOBAL
CREDIT INCOME
OPPORTUNITIES FUND | | | BARINGS ACTIVE
SHORT DURATION
BOND FUND | | | BARINGS
DIVERSIFIED
INCOME FUND
(FORMERLY
BARINGS
TOTAL RETURN
BOND FUND) | |
| | | | |
| Investment Income | | | | | | | | | | | | | | | | |
Interest income (net of withholding tax of $0, $2,640, $1,677 and $0, respectively) | | $ | 16,622,284 | | | $ | 14,461,104 | | | $ | 18,217,367 | | | $ | 1,171,344 | |
Dividends | | | 27,407 | | | | 5,823 | | | | – | | | | 113,115 | |
Other income | | | 45,753 | | | | 8,385 | | | | 176 | | | | – | |
| | | | | | | | | | | | | | | | |
Total investment income | | | 16,695,444 | | | | 14,475,312 | | | | 18,217,543 | | | | 1,284,459 | |
| | | | | | | | | | | | | | | | �� |
|
| Operating Expenses | |
Advisory fees | | | 1,891,720 | | | | 1,629,494 | | | | 1,853,894 | | | | 129,161 | |
12b-1 distribution and servicing plan | | | | | | | | | | | | | | | | |
Class A | | | 127,532 | | | | 137,618 | | | | 375,816 | | | | 605 | |
Class C | | | 86,592 | | | | 87,742 | | | | 6,091 | | | | 1,953 | |
Shareholder service fee | | | | | | | | | | | | | | | | |
Class A | | | 34,551 | | | | 14,551 | | | | 99,504 | | | | 30 | |
Class C | | | 4,864 | | | | 5,129 | | | | 796 | | | | – | |
Class Y | | | 46,414 | | | | 37,438 | | | | 131,307 | | | | 3,910 | |
Administrator fees | | | 213,311 | | | | 162,773 | | | | 323,700 | | | | 48,759 | |
Custody fees | | | 197,553 | | | | 156,019 | | | | 323,453 | | | | 46,537 | |
Professional fees | | | 111,994 | | | | 102,394 | | | | 111,821 | | | | 67,680 | |
Transfer agent fees | | | 55,406 | | | | 49,356 | | | | 92,656 | | | | 20,742 | |
Directors’ fees | | | 83,964 | | | | 69,566 | | | | 125,169 | | | | 32,247 | |
Registration fees | | | 87,684 | | | | 121,798 | | | | 80,914 | | | | 54,328 | |
Printing and mailing expenses | | | 36,823 | | | | 36,921 | | | | 55,106 | | | | 13,521 | |
Other operating expenses | | | 58,521 | | | | 45,867 | | | | 91,372 | | | | 11,113 | |
| | | | | | | | | | | | | | | | |
Total operating expenses | | | 3,036,929 | | | | 2,656,666 | | | | 3,671,599 | | | | 430,586 | |
Waiver/Reimbursement of expenses | | | | | | | | | | | | | | | | |
Class A | | | (128,483 | ) | | | (89,384 | ) | | | (376,122 | ) | | | (6,715 | ) |
Class C | | | (26,525 | ) | | | (22,950 | ) | | | (9,787 | ) | | | (6,281 | ) |
Class I | | | (60,287 | ) | | | (28,410 | ) | | | (7,317 | ) | | | (89,056 | ) |
Class Y | | | (425,661 | ) | | | (226,537 | ) | | | (778,908 | ) | | | (148,836 | ) |
| | | | | | | | | | | | | | | | |
Net operating expenses | | | 2,395,973 | | | | 2,289,385 | | | | 2,499,465 | | | | 179,698 | |
| | | | | | | | | | | | | | | | |
Net investment income | | | 14,299,471 | | | | 12,185,927 | | | | 15,718,078 | | | | 1,104,761 | |
| | | | | | | | | | | | | | | | |
See accompanying Notes to the Financial Statements.
43
Barings Funds Trust 2019 Annual Report
STATEMENTS OF OPERATIONS(CONTINUED)
For the Year Ended June 30, 2019
| | | | | | | | | | | | | | | | |
| | | BARINGS GLOBAL
FLOATING RATE FUND | | | BARINGS GLOBAL
CREDIT INCOME
OPPORTUNITIES FUND | | | BARINGS ACTIVE
SHORT DURATION
BOND FUND | | | BARINGS
DIVERSIFIED
INCOME FUND
(FORMERLY
BARINGS
TOTAL RETURN
BOND FUND) | |
| | | | |
| Realized and Unrealized Gains (Losses) on Investments | | | | | | | | | | | | | | | | |
Net realized loss on investments | | $ | (2,823,177 | ) | | $ | (5,383,341 | ) | | $ | (493,214 | ) | | $ | (105,354 | ) |
Net realized gain (loss) on forward foreign currency exchange contracts | | | 4,813,881 | | | | 3,669,530 | | | | – | | | | (10,209 | ) |
Net realized gain on foreign currency and translation | | | 754,531 | | | | 843,756 | | | | – | | | | 15,840 | |
Net realized gain (loss) on futures contracts | | | – | | | | – | | | | (4,665,303 | ) | | | (258,075 | ) |
Net realized gain on swap contracts | | | – | | | | – | | | | 135,318 | | | | 13,397 | |
Net realized gain (loss) on purchased options | | | – | | | | (511,938 | ) | | | – | | | | 3,709 | |
| | | | | | | | | | | | | | | | |
Net realized gain (loss) | | | 2,745,235 | | | | (1,381,993 | ) | | | (5,023,199 | ) | | | (340,692 | ) |
| | | | | | | | | | | | | | | | |
Net change in unrealized appreciation (depreciation) on investments | | | (8,744,618 | ) | | | (5,721,015 | ) | | | 12,975,830 | | | | 833,633 | |
Net change in unrealized appreciation on unfunded loan commitments | | | 9,990 | | | | 14,782 | | | | – | | | | – | |
Net change in unrealized appreciation (depreciation) on forward foreign currency exchange contracts | | | (650,658 | ) | | | (774,111 | ) | | | – | | | | 3,054 | |
Net change in unrealized appreciation (depreciation) on foreign currency and translation | | | (42,540 | ) | | | 744 | | | | – | | | | 55 | |
Change in net unrealized appreciation (depreciation) on affiliates | | | – | | | | – | | | | – | | | | (21,907 | ) |
Net change in unrealized appreciation (depreciation) on futures contracts | | | – | | | | – | | | | (3,081,643 | ) | | | (259,179 | ) |
Net change in unrealized appreciation (depreciation) on swap contracts | | | – | | | | – | | | | (11,999 | ) | | | 358 | |
Net change in unrealized appreciation (depreciation) on purchased option contracts | | | – | | | | (150,723 | ) | | | 6,168 | | | | (3,797 | ) |
| | | | | | | | | | | | | | | | |
Net change in unrealized appreciation (depreciation) | | | (9,427,826 | ) | | | (6,630,323 | ) | | | 9,888,356 | | | | 552,217 | |
| | | | | | | | | | | | | | | | |
Net realized and unrealized gains (losses) on investments | | | (6,682,591 | ) | | | (8,012,316 | ) | | | 4,865,157 | | | | 211,525 | |
| | | | | | | | | | | | | | | | |
Net increase in net assets resulting from operations | | $ | 7,616,880 | | | $ | 4,173,611 | | | $ | 20,583,235 | | | $ | 1,316,286 | |
| | | | | | | | | | | | | | | | |
See accompanying Notes to the Financial Statements.
44
Barings Funds Trust 2019 Annual Report
STATEMENTS OF OPERATIONS
For the Year Ended June 30, 2019
| | | | | | | | | | | | | | | | |
| | | BARINGS EMERGING
MARKETS DEBT
BLENDED TOTAL
RETURN FUND | | | BARINGS GLOBAL
EMERGING MARKETS
EQUITY FUND 1 | | | BARINGS GLOBAL
HIGH YIELD
FUND | | | BARINGS U.S.
HIGH YIELD
FUND | |
|
| Investment Income | |
Interest income (net of withholding tax of $11,047, $0, $3,547 and $0, respectively) | | $ | 3,212,202 | | | $ | 2,317 | | | $ | 1,779,162 | | | $ | 3,720,788 | |
Dividends | | | – | | | | 174,041 | | | | – | | | | – | |
Other income | | | 70,000 | | | | – | | | | 4,630 | | | | 6,696 | |
| | | | | | | | | | | | | | | | |
Total investment income | | | 3,282,202 | | | | 176,358 | | | | 1,783,792 | | | | 3,727,484 | |
| | | | | | | | | | | | | | | | |
| | | | |
| Operating Expenses | | | | | | | | | | | | | | | | |
Advisory fees | | | 356,504 | | | | 72,836 | | | | 148,382 | | | | 291,977 | |
12b-1 distribution and servicing plan | | | | | | | | | | | | | | | | |
Class A | | | 1,205 | | | | 202 | | | | 571 | | | | 5,147 | |
Class C | | | 2,665 | | | | 806 | | | | 1,997 | | | | 973 | |
Shareholder service fee | | | | | | | | | | | | | | | | |
Class A | | | 330 | | | | – | | | | 92 | | | | 1,931 | |
Class C | | | 56 | | | | – | | | | 75 | | | | – | |
Class Y | | | 255 | | | | – | | | | 385 | | | | 1,036 | |
Administrator fees | | | 64,566 | | | | 33,628 | | | | 46,611 | | | | 63,809 | |
Custody fees | | | 68,971 | | | | 9,297 | | | | 25,127 | | | | 47,212 | |
Professional fees | | | 61,977 | | | | 65,257 | | | | 51,510 | | | | 48,887 | |
Transfer agent fees | | | 28,147 | | | | 14,000 | | | | 22,099 | | | | 20,089 | |
Directors’ fees | | | 35,487 | | | | 22,500 | | | | 31,067 | | | | 36,731 | |
Registration fees | | | 52,934 | | | | 4,554 | | | | 52,976 | | | | 53,033 | |
Printing and mailing expenses | | | 15,316 | | | | 16,474 | | | | 12,358 | | | | 13,625 | |
Other operating expenses | | | 14,726 | | | | 6,253 | | | | 10,658 | | | | 15,614 | |
| | | | | | | | | | | | | | | | |
Total operating expenses | | | 703,139 | | | | 245,807 | | | | 403,908 | | | | 600,064 | |
Waiver/Reimbursement of expenses | | | | | | | | | | | | | | | | |
Class A | | | (10,434 | ) | | | (4,836 | ) | | | (7,075 | ) | | | (13,118 | ) |
Class C | | | (8,821 | ) | | | (4,831 | ) | | | (7,031 | ) | | | (5,247 | ) |
Class I | | | (163,253 | ) | | | (69,009 | ) | | | (92,171 | ) | | | (50,100 | ) |
Class Y | | | (172,417 | ) | | | (69,009 | ) | | | (97,139 | ) | | | (127,329 | ) |
| | | | | | | | | | | | | | | | |
Net operating expenses | | | 348,214 | | | | 98,122 | | | | 200,492 | | | | 404,270 | |
| | | | | | | | | | | | | | | | |
Net investment income | | | 2,933,988 | | | | 78,236 | | | | 1,583,300 | | | | 3,323,214 | |
| | | | | | | | | | | | | | | | |
See accompanying Notes to the Financial Statements.
45
Barings Funds Trust 2019 Annual Report
STATEMENTS OF OPERATIONS(CONTINUED)
For the Year Ended June 30, 2019
| | | | | | | | | | | | | | | | |
| | | BARINGS EMERGING
MARKETS DEBT
BLENDED TOTAL
RETURN FUND | | | BARINGS GLOBAL
EMERGING MARKETS
EQUITY FUND 1 | | | BARINGS GLOBAL
HIGH YIELD
FUND | | | BARINGS U.S.
HIGH YIELD
FUND | |
| | | | |
| Realized and Unrealized Gains (Losses) on Investments | | | | | | | | | | | | | | | | |
Net realized gain (loss) on investments | | $ | (2,070,916 | ) 2 | | $ | 76,264 | | | $ | (249,836 | ) | | $ | (467,591 | ) |
Net realized gain (loss) on forward foreign currency exchange contracts | | | (626,857 | ) | | | – | | | | 484,537 | | | | – | |
Net realized gain (loss) on foreign currency and translation | | | (118,308 | ) | | | (6,295 | ) | | | 52,604 | | | | – | |
Net realized gain (loss) on futures contracts | | | (90,314 | ) | | | – | | | | – | | | | – | |
Net realized gain on swap contracts | | | 672,109 | | | | – | | | | – | | | | – | |
Net realized gain (loss) on purchased options | | | 18,025 | | | | – | | | | – | | | | – | |
| | | | | | | | | | | | | | | | |
Net realized gain (loss) | | | (2,216,261 | ) | | | 69,969 | | | | 287,305 | | | | (467,591 | ) |
| | | | | | | | | | | | | | | | |
Net change in unrealized appreciation (depreciation) on investments | | | 5,159,506 | 3 | | | 976,525 | | | | (256,098 | ) | | | 140,723 | |
Net change in unrealized appreciation (depreciation) on forward foreign currency exchange contracts | | | 639,745 | | | | – | | | | (122,031 | ) | | | – | |
Net change in unrealized appreciation on foreign currency and translation | | | 14,159 | | | | 113 | | | | 1,604 | | | | – | |
Net change in unrealized appreciation (depreciation) on futures contracts | | | (29,220 | ) | | | – | | | | – | | | | – | |
Net change in unrealized appreciation (depreciation) on swap contracts | | | (639,038 | ) | | | – | | | | – | | | | – | |
Net change in unrealized appreciation (depreciation) on purchased option contracts | | | (37,731 | ) | | | – | | | | – | | | | – | |
| | | | | | | | | | | | | | | | |
Net change in unrealized appreciation (depreciation) | | | 5,107,421 | | | | 976,638 | | | | (376,525 | ) | | | 140,723 | |
| | | | | | | | | | | | | | | | |
Net realized and unrealized gains (losses) on investments | | | 2,891,160 | | | | 1,046,607 | | | | (89,220 | ) | | | (326,868 | ) |
| | | | | | | | | | | | | | | | |
Net increase in net assets resulting from operations | | $ | 5,825,148 | | | $ | 1,124,843 | | | $ | 1,494,080 | | | $ | 2,996,346 | |
| | | | | | | | | | | | | | | | |
| (1) | | Fund commenced operations on September 17, 2018. |
| (2) | | Includes realized foreign capital gains taxes of $988. |
| (3) | | Net of change in unrealized appreciation (depreciation) of foreign capital gains taxes of $(599). |
See accompanying Notes to the Financial Statements.
46
Barings Funds Trust 2019 Annual Report
STATEMENTS OF CHANGES IN NET ASSETS
| | | | | | | | | | | | | | | | |
| | | BARINGS GLOBAL
FLOATING RATE FUND | | | BARINGS GLOBAL
CREDIT INCOME
OPPORTUNITIES FUND | |
| | | FOR THE
YEAR ENDED
JUNE 30, 2019 | | | FOR THE
YEAR ENDED
JUNE 30, 2018 | | | FOR THE
YEAR ENDED
JUNE 30, 2019 | | | FOR THE
YEAR ENDED
JUNE 30, 2018 | |
| | | | |
| Operations | | | | | | | | | | | | | | | | |
Net investment income | | $ | 14,299,471 | | | $ | 9,760,403 | | | $ | 12,185,927 | | | $ | 9,588,045 | |
Net realized gain (loss) on investments | | | 2,745,235 | | | | (1,856,944 | ) | | | (1,381,993 | ) | | | 677,960 | |
Net change in unrealized appreciation (depreciation) on investments | | | (9,427,826 | ) | | | 362,889 | | | | (6,630,323 | ) | | | (4,509,081 | ) |
| | | | | | | | | | | | | | | | |
Net increase in net assets resulting from operations | | | 7,616,880 | | | | 8,266,348 | | | | 4,173,611 | | | | 5,756,924 | |
| | | | | | | | | | | | | | | | |
| | | | |
| Dividends and distributions | | | | | | | | | | | | | | | | |
Class A | | | (2,631,234 | ) | | | (2,063,485 | ) | | | (3,633,155 | ) | | | (1,756,888 | ) |
| | | | | | | | | | | | | | | | |
Class C | | | (385,566 | ) | | | (270,057 | ) | | | (505,418 | ) | | | (327,000 | ) |
| | | | | | | | | | | | | | | | |
Class I | | | (1,747,985 | ) | | | (854,559 | ) | | | (1,282,074 | ) | | | (1,145,985 | ) |
| | | | | | | | | | | | | | | | |
Class Y | | | (10,875,941 | ) | | | (5,403,280 | ) | | | (8,847,995 | ) | | | (5,859,509 | ) |
| | | | | | | | | | | | | | | | |
Total Dividends and distributions (1)(2) | | | (15,640,726 | ) | | | (8,591,381 | ) | | | (14,268,642 | ) | | | (9,089,382 | ) |
| | | | | | | | | | | | | | | | |
|
| Return of capital | |
Class A | | | – | | | | (279,765 | ) | | | (63,546 | ) | | | (100,036 | ) |
| | | | | | | | | | | | | | | | |
Class C | | | – | | | | (35,709 | ) | | | (9,510 | ) | | | (17,976 | ) |
| | | | | | | | | | | | | | | | |
Class I | | | – | | | | (107,589 | ) | | | (25,629 | ) | | | (57,195 | ) |
| | | | | | | | | | | | | | | | |
Class Y | | | – | | | | (748,240 | ) | | | (165,268 | ) | | | (321,100 | ) |
| | | | | | | | | | | | | | | | |
Total Return of capital | | | – | | | | (1,171,303 | ) | | | (263,953 | ) | | | (496,307 | ) |
| | | | | | | | | | | | | | | | |
|
| Capital Share Transactions | |
Net proceeds from sale of shares | | | 181,096,638 | | | | 112,207,247 | | | | 92,707,830 | | | | 121,425,079 | |
Net Asset Value of shares issued to shareholders in payment of distributions declared | | | 12,277,586 | | | | 8,983,366 | | | | 10,875,940 | | | | 6,045,876 | |
Cost of shares redeemed | | | (164,501,029 | ) | | | (62,757,889 | ) | | | (112,233,144 | ) | | | (43,918,289 | ) |
| | | | | | | | | | | | | | | | |
Net increase (decrease) in net assets resulting from capital stock transactions | | | 28,873,195 | | | | 58,432,724 | | | | (8,649,374 | ) | | | 83,552,666 | |
| | | | | | | | | | | | | | | | |
Total increase (decrease) in net assets | | | 20,849,349 | | | | 56,936,388 | | | | (19,008,358 | ) | | | 79,723,901 | |
| | | | | | | | | | | | | | | | |
|
| Net Assets | |
Beginning of year | | | 252,787,204 | | | | 195,850,816 | | | | 231,499,077 | | | | 151,775,176 | |
| | | | | | | | | | | | | | | | |
End of year | | $ | 273,636,553 | | | $ | 252,787,204 | | | $ | 212,490,719 | | | $ | 231,499,077 | |
| | | | | | | | | | | | | | | | |
| (1) | | The SEC eliminated the requirement to disclose distributions to shareholders from net investment income and from net realized gains in November 2018. Included in Barings Global Floating Rate Fund’s total distributions for net investment income and net realized gains, respectively, as of the year ended June 30, 2018 was $(2,063,485) and $0 for Class A, $(270,057) and $0 for Class C, $(854,559) and $0 for Class I and $(5,403,280) and $0 for Class Y. The undistributed net investment income (loss) was $(113,373) as of the year ended June 30, 2018. |
| (2) | | The SEC eliminated the requirement to disclose distributions to shareholders from net investment income and from net realized gains in November 2018. Included in Barings Global Credit Income Opportunities Fund’s total distributions for net investment income and net realized gains, respectively, as of the year ended June 30, 2018 was $(1,756,888) and $0 for Class A, $(327,000) and $0 for Class C, $(1,145,985) and $0 for Class I and $(5,859,509) and $0 for Class Y. The undistributed net investment income (loss) was $(305,680) as of the year ended June 30, 2018. |
See accompanying Notes to the Financial Statements.
47
Barings Funds Trust 2019 Annual Report
STATEMENTS OF CHANGES IN NET ASSETS
| | | | | | | | | | | | | | | | |
| | | BARINGS ACTIVE
SHORT DURATION
BOND FUND | | | BARINGS DIVERSIFIED INCOME
FUND (FORMERLY BARINGS
TOTAL RETURN BOND FUND) | |
| | | FOR THE
YEAR ENDED
JUNE 30, 2019 | | | FOR THE
YEAR ENDED
JUNE 30, 2018 | | | FOR THE
YEAR ENDED
JUNE 30, 2019 | | | FOR THE
YEAR ENDED
JUNE 30, 2018 | |
| | | | |
| Operations | | | | | | | | | | | | | | | | |
Net investment income | | $ | 15,718,078 | | | $ | 9,285,132 | | | $ | 1,104,761 | | | $ | 903,641 | |
Net realized gain (loss) on investments | | | (5,023,199 | ) | | | 1,300,980 | | | | (340,692 | ) | | | (118,675 | ) |
Net change in unrealized appreciation (depreciation) on investments | | | 9,888,356 | | | | (5,924,031 | ) | | | 552,217 | | | | (750,496 | ) |
| | | | | | | | | | | | | | | | |
Net increase in net assets resulting from operations | | | 20,583,235 | | | | 4,662,081 | | | | 1,316,286 | | | | 34,470 | |
| | | | | | | | | | | | | | | | |
| | | | |
| Dividends and distributions | | | | | | | | | | | | | | | | |
Class A | | | (4,327,284 | ) | | | (3,875,523 | ) | | | (7,516 | ) | | | (6,279 | ) |
| | | | | | | | | | | | | | | | |
Class C | | | (31,974 | ) | | | (19,495 | ) | | | (4,785 | ) | | | (4,440 | ) |
| | | | | | | | | | | | | | | | |
Class I | | | (9,407 | ) | | | (7,420 | ) | | | (413,758 | ) | | | (392,338 | ) |
| | | | | | | | | | | | | | | | |
Class Y | | | (11,907,536 | ) | | | (6,664,499 | ) | | | (678,343 | ) | | | (573,463 | ) |
| | | | | | | | | | | | | | | | |
Total Dividends and distributions (1)(2) | | | (16,276,201 | ) | | | (10,566,937 | ) | | | (1,104,402 | ) | | | (976,520 | ) |
| | | | | | | | | | | | | | | | |
|
| Return of capital | |
Class A | | | – | | | | – | | | | – | | | | (217 | ) |
| | | | | | | | | | | | | | | | |
Class C | | | – | | | | – | | | | – | | | | (153 | ) |
| | | | | | | | | | | | | | | | |
Class I | | | – | | | | – | | | | – | | | | (13,609 | ) |
| | | | | | | | | | | | | | | | |
Class Y | | | – | | | | – | | | | – | | | | (19,524 | ) |
| | | | | | | | | | | | | | | | |
Total Return of capital | | | – | | | | – | | | | – | | | | (33,503 | ) |
| | | | | | | | | | | | | | | | |
|
| Capital Share Transactions | |
Net proceeds from sale of shares | | | 531,527,546 | | | | 354,038,993 | | | | 16,053,424 | | | | 2,983,984 | |
Net Asset Value of shares issued to shareholders in payment of distributions declared | | | 13,533,610 | | | | 9,474,859 | | | | 262,817 | | | | 183,911 | |
Cost of shares redeemed | | | (264,419,113 | ) | | | (250,813,003 | ) | | | (2,915,535 | ) | | | (3,661,938 | ) |
| | | | | | | | | | | | | | | | |
Net increase (decrease) in net assets resulting from capital stock transactions | | | 280,642,043 | | | | 112,700,849 | | | | 13,400,706 | | | | (494,043 | ) |
| | | | | | | | | | | | | | | | |
Total increase (decrease) in net assets | | | 284,949,077 | | | | 106,795,993 | | | | 13,612,590 | | | | (1,469,596 | ) |
| | | | | | | | | | | | | | | | |
|
| Net Assets | |
Beginning of year | | | 430,784,200 | | | | 323,988,207 | | | | 28,886,237 | | | | 30,355,833 | |
| | | | | | | | | | | | | | | | |
End of year | | $ | 715,733,277 | | | $ | 430,784,200 | | | $ | 42,498,827 | | | $ | 28,886,237 | |
| | | | | | | | | | | | | | | | |
| (1) | | The SEC eliminated the requirement to disclose distributions to shareholders from net investment income and from net realized gains in November 2018. Included in Barings Active Short Duration Fund’s total distributions for net investment income and net realized gains, respectively, as of the year ended June 30, 2018 was $(3,385,234) and $(490,289) for Class A, $(17,041) and $(2,454) for Class C, $(6,510) and $(910) for Class I and $(5,887,689) and $(776,810) for Class Y. The undistributed net investment income (loss) was $(10,364) as of the year ended June 30, 2018. |
| (2) | | The SEC eliminated the requirement to disclose distributions to shareholders from net investment income and from net realized gains in November 2018. Included in Barings Diversified Income Fund’s total distributions for net investment income and net realized gains, respectively, as of the year ended June 30, 2018 was $(6,279) and $0 for Class A, $(4,440) and $0 for Class C, $(392,338) and $0 for Class I and $(573,463) and $0 for Class Y. The undistributed net investment income (loss) was $(60,031) as of the year ended June 30, 2018. |
See accompanying Notes to the Financial Statements.
48
Barings Funds Trust 2019 Annual Report
STATEMENTS OF CHANGES IN NET ASSETS
| | | | | | | | | | | | |
| | | BARINGS EMERGING
MARKETS DEBT
BLENDED TOTAL
RETURN FUND | | | BARINGS GLOBAL
EMERGING MARKETS
EQUITY FUND | |
| | | FOR THE
YEAR ENDED
JUNE 30, 2019 | | | FOR THE
YEAR ENDED
JUNE 30, 2018 | | | PERIOD FROM
SEPTEMBER 17, 2018
TO
JUNE 30, 2019 (1) | |
| | | |
| Operations | | | | | | | | | | | | |
Net investment income | | $ | 2,933,988 | | | $ | 1,225,718 | | | $ | 78,236 | |
Net realized gain (loss) on investments | | | (2,216,261 | ) | | | 232,231 | | | | 69,969 | |
Net change in unrealized appreciation (depreciation) on investments | | | 5,107,421 | | | | (4,915,528 | ) | | | 976,638 | |
| | | | | | | | | | | | |
Net increase (decrease) in net assets from operations | | | 5,825,148 | | | | (3,457,579 | ) | | | 1,124,843 | |
| | | | | | | | | | | | |
| | | |
| Dividends and distributions | | | | | | | | | | | | |
Class A | | | (27,569 | ) | | | (46,971 | ) | | | – | |
| | | | | | | | | | | | |
Class C | | | (13,395 | ) | | | (17,558 | ) | | | – | |
| | | | | | | | | | | | |
Class I | | | (1,355,443 | ) | | | (700,991 | ) | | | – | |
| | | | | | | | | | | | |
Class Y | | | (1,420,530 | ) | | | (722,445 | ) | | | – | |
| | | | | | | | | | | | |
Total Dividends and distributions (2) | | | (2,816,937 | ) | | | (1,487,965 | ) | | | – | |
| | | | | | | | | | | | |
|
| |
Class A | | | (2,043 | ) | | | – | | | | – | |
| | | | | | | | | | | | |
Class C | | | (1,174 | ) | | | – | | | | – | |
| | | | | | | | | | | | |
Class I | | | (126,191 | ) | | | – | | | | – | |
| | | | | | | | | | | | |
Class Y | | | (133,784 | ) | | | – | | | | – | |
| | | | | | | | | | | | |
Total Return of capital | | | (263,192 | ) | | | – | | | | – | |
| | | | | | | | | | | | |
|
| Capital Share Transactions | |
Net proceeds from sale of shares | | | 1,762,308 | | | | 41,179,347 | | | | 10,000,000 | |
Net Asset Value of shares issued to shareholders in payment of distributions declared | | | 64,652 | | | | 43,749 | | | | – | |
Cost of shares redeemed | | | (752,758 | ) | | | (498,234 | ) | | | – | |
| | | | | | | | | | | | |
Net increase in net assets resulting from capital stock transactions | | | 1,074,202 | | | | 40,724,862 | | | | 10,000,000 | |
| | | | | | | | | | | | |
Total increase in net assets | | | 3,819,221 | | | | 35,779,318 | | | | 11,124,843 | |
| | | | | | | | | | | | |
|
| Net Assets | |
Beginning of year | | | 46,614,812 | | | | 10,835,494 | | | | – | |
| | | | | | | | | | | | |
End of year | | $ | 50,434,033 | | | $ | 46,614,812 | | | $ | 11,124,843 | |
| | | | | | | | | | | | |
| (1) | | Fund commenced operations on September 17, 2018. |
| (2) | | The SEC eliminated the requirement to disclose distributions to shareholders from net investment income and from net realized gains in November 2018. Included in Barings Emerging Markets Debt Blended Total Return Fund’s total distributions for net investment income and net realized gains, respectively, as of the year ended June 30, 2018 was $(29,114) and $(17,857) for Class A, $(10,947) and $(6,611) for Class C, $(556,464) and $(144,527) for Class I and $(570,211) and $(152,234) for Class Y. The undistributed net investment income was $123,614 as of the year ended June 30, 2018. |
See accompanying Notes to the Financial Statements.
49
Barings Funds Trust 2019 Annual Report
STATEMENTS OF CHANGES IN NET ASSETS
| | | | | | | | | | | | | | | | |
| | | BARINGS GLOBAL
HIGH YIELD FUND | | | BARINGS U.S.
HIGH YIELD FUND | |
| | | FOR THE
YEAR ENDED
JUNE 30, 2019 | | | FOR THE
YEAR ENDED
JUNE 30, 2018 | | | FOR THE
YEAR ENDED
JUNE 30, 2019 | | | FOR THE
YEAR ENDED
JUNE 30, 2018 | |
| | | | |
| Operations | | | | | | | | | | | | | | | | |
Net investment income | | $ | 1,583,300 | | | $ | 1,649,437 | | | $ | 3,323,214 | | | $ | 2,245,957 | |
Net realized gain (loss) on investments | | | 287,305 | | | | 402,802 | | | | (467,591 | ) | | | 150,989 | |
Net change in unrealized appreciation (depreciation) on investments | | | (376,525 | ) | | | (1,472,755 | ) | | | 140,723 | | | | (1,765,072 | ) |
| | | | | | | | | | | | | | | | |
Net increase in net assets resulting from operations | | | 1,494,080 | | | | 579,484 | | | | 2,996,346 | | | | 631,874 | |
| | | | | | | | | | | | | | | | |
| | | | |
| Dividends and distributions | | | | | | | | | | | | | | | | |
Class A | | | (17,780 | ) | | | (9,066 | ) | | | (123,204 | ) | | | (210,019 | ) |
| | | | | | | | | | | | | | | | |
Class C | | | (15,389 | ) | | | (17,640 | ) | | | (5,130 | ) | | | (9,206 | ) |
| | | | | | | | | | | | | | | | |
Class I | | | (1,021,950 | ) | | | (1,081,306 | ) | | | (869,451 | ) | | | (1,394,522 | ) |
| | | | | | | | | | | | | | | | |
Class Y | | | (1,064,337 | ) | | | (1,191,673 | ) | | | (2,324,075 | ) | | | (1,602,934 | ) |
| | | | | | | | | | | | | | | | |
Total Dividends and distributions (1)(2) | | | (2,119,456 | ) | | | (2,299,685 | ) | | | (3,321,860 | ) | | | (3,216,681 | ) |
| | | | | | | | | | | | | | | | |
|
| Capital Share Transactions | |
Net proceeds from sale of shares | | | 6,816,400 | | | | 3,560,120 | | | | 8,045,852 | | | | 29,139,508 | |
Net Asset Value of shares issued to shareholders in payment of distributions declared | | | 47,989 | | | | 116,325 | | | | 1,787,969 | | | | 882,238 | |
Cost of shares redeemed | | | (3,751,131 | ) | | | (4,970,047 | ) | | | (15,746,520 | ) | | | (3,532,281 | ) |
| | | | | | | | | | | | | | | | |
Net increase (decrease) in net assets resulting from capital stock transactions | | | 3,113,258 | | | | (1,293,602 | ) | | | (5,912,699 | ) | | | 26,489,465 | |
| | | | | | | | | | | | | | | | |
Total increase (decrease) in net assets | | | 2,487,882 | | | | (3,013,803 | ) | | | (6,238,213 | ) | | | 23,904,658 | |
| | | | | | | | | | | | | | | | |
|
| Net Assets | |
Beginning of year | | | 24,825,773 | | | | 27,839,576 | | | | 57,007,277 | | | | 33,102,619 | |
| | | | | | | | | | | | | | | | |
End of year | | $ | 27,313,655 | | | $ | 24,825,773 | | | $ | 50,769,064 | | | $ | 57,007,277 | |
| | | | | | | | | | | | | | | | |
| (1) | | The SEC eliminated the requirement to disclose distributions to shareholders from net investment income and from net realized gains in November 2018. Included in Barings Global High Yield Fund’s total distributions for net investment income and net realized gains, respectively, as of the year ended June 30, 2018 was $(6,439) and $(2,627) for Class A, $(11,793) and $(5,847) for Class C, $(775,770) and $(305,536) for Class I and $(855,423) and $(336,250) for Class Y. The undistributed net investment income (loss) was $(440) as of the year ended June 30, 2018. |
| (2) | | The SEC eliminated the requirement to disclose distributions to shareholders from net investment income and from net realized gains in November 2018. Included in Barings U.S. High Yield Fund’s total distributions for net investment income and net realized gains, respectively, as of the year ended June 30, 2018 was $(139,147) and $(70,872) for Class A, $(5,823) and $(3,383) for Class C, $(944,699) and $(449,823) for Class I and $(1,156,409) and $(446,525) for Class Y. The undistributed net investment income (loss) was $(536) as of the year ended June 30, 2018. |
See accompanying Notes to the Financial Statements.
50
Barings Global Floating Rate Fund 2019 Annual Report
FINANCIAL HIGHLIGHTS
| | | | | | | | | | | | | | | | | | | | |
| | | CLASS A | |
| | | FOR THE
YEAR
ENDED
JUNE 30,
2019 | | | FOR THE
YEAR
ENDED
JUNE 30,
2018 | | | FOR THE
YEAR
ENDED
JUNE 30,
2017 | | | FOR THE
YEAR
ENDED
JUNE 30,
2016 | | | FOR THE
YEAR
ENDED
JUNE 30,
2015 | |
|
| Per Common Share Data | |
Net asset value, beginning of year | | $ | 9.48 | | | $ | 9.54 | | | $ | 9.13 | | | $ | 9.60 | | | $ | 10.20 | |
Income from investment operations: | |
Net investment income (1) | | | 0.44 | | | | 0.43 | | | | 0.43 | | | | 0.44 | | | | 0.44 | |
Net realized and unrealized gain (loss) on investments | | | (0.18 | ) | | | (0.06 | ) | | | 0.42 | | | | (0.45 | ) | | | (0.35 | ) |
| | | | | | | | | | | | | | | | | | | | |
Total increase (decrease) from investment operations | | | 0.26 | | | | 0.37 | | | | 0.85 | | | | (0.01 | ) | | | 0.09 | |
| | | | | | | | | | | | | | | | | | | | |
Less dividends and distributions: | |
From net investment income | | | (0.44 | ) | | | (0.38 | ) | | | (0.31 | ) | | | (0.46 | ) | | | (0.68 | ) |
From net realized gain | | | (0.04 | ) | | | – | | | | – | | | | – | | | | (0.01 | ) |
From return of capital | | | – | | | | (0.05 | ) | | | (0.13 | ) | | | – | | | | – | |
| | | | | | | | | | | | | | | | | | | | |
Total dividends and distributions | | | (0.48 | ) | | | (0.43 | ) | | | (0.44 | ) | | | (0.46 | ) | | | (0.69 | ) |
| | | | | | | | | | | | | | | | | | | | |
Redemption fees | | | – | | | | – | | | | – | | | | – | | | | 0.00 | (2) |
| | | | | | | | | | | | | | | | | | | | |
Net asset value, at end of year | | $ | 9.26 | | | $ | 9.48 | | | $ | 9.54 | | | $ | 9.13 | | | $ | 9.60 | |
| | | | | | | | | | | | | | | | | | | | |
Total investment return (3) | | | 2.77 | % | | | 4.00 | % | | | 9.47 | % | | | (0.04 | )% | | | 0.95 | % |
| | | | | | | | | | | | | | | | | | | | |
|
| Supplemental Data and Ratios | |
Net assets, end of year (000’s) | | $ | 45,213 | | | $ | 53,371 | | | $ | 45,363 | | | $ | 13,980 | | | $ | 5,153 | |
Ratio of total expenses (before reductions and reimbursements) to average net assets | | | 1.25 | % | | | 1.26 | % | | | 1.37 | % | | | 1.72 | % | | | 1.74 | % |
Ratio of net expenses to average net assets (4) | | | 1.00 | % | | | 0.96 | %(5) | | | 0.99 | %(6) | | | 1.05 | %(7) | | | 1.05 | %(7) |
Ratio of net investment income to average net assets | | | 4.72 | % | | | 4.55 | % | | | 4.52 | % | | | 4.74 | % | | | 4.44 | % |
Portfolio turnover rate | | | 46.51 | % | | | 57.74 | % | | | 47.06 | % | | | 62.99 | % | | | 63.17 | % |
| (1) | | Calculated using average shares outstanding. |
| (2) | | Amount rounds to less than $.01 per share. |
| (3) | | Total investment return calculation does not consider the effects of sales loads and assumes the reinvestment of dividends at actual prices pursuant to the Fund’s dividend reinvestment plan. |
| (4) | | The Adviser has agreed to waive and/or reimburse certain fees and/or expense so that, on an annualized basis, such expenses incurred will not exceed 1.00% as a percentage of average daily net assets. |
| (5) | | Net expenses reflect a voluntary expense reimbursement to prevent a negative yield. |
| (6) | | Net expenses reflect aone-time voluntary reimbursement to the Fund during the period in connection with a change to the fee waiver and/or expense reimbursement agreement. |
| (7) | | Net expenses reflect a previous fee waiver and/or expense reimbursement agreement. |
See accompanying Notes to the Financial Statements.
51
Barings Global Floating Rate Fund 2019 Annual Report
FINANCIAL HIGHLIGHTS(CONTINUED)
| | | | | | | | | | | | | | | | | | | | |
| | | CLASS C | |
| | | FOR THE
YEAR
ENDED
JUNE 30,
2019 | | | FOR THE
YEAR
ENDED
JUNE 30,
2018 | | | FOR THE
YEAR
ENDED
JUNE 30,
2017 | | | FOR THE
YEAR
ENDED
JUNE 30,
2016 | | | FOR THE
YEAR
ENDED
JUNE 30,
2015 | |
|
| Per Common Share Data | |
Net asset value, beginning of year | | $ | 9.45 | | | $ | 9.51 | | | $ | 9.10 | | | $ | 9.57 | | | $ | 10.16 | |
Income from investment operations: | |
Net investment income (1) | | | 0.37 | | | | 0.36 | | | | 0.37 | | | | 0.37 | | | | 0.35 | |
Net realized and unrealized gain (loss) on investments | | | (0.19 | ) | | | (0.06 | ) | | | 0.41 | | | | (0.45 | ) | | | (0.33 | ) |
| | | | | | | | | | | | | | | | | | | | |
Total increase (decrease) from investment operations | | | 0.18 | | | | 0.30 | | | | 0.78 | | | | (0.08 | ) | | | 0.02 | |
| | | | | | | | | | | | | | | | | | | | |
Less dividends and distributions: | |
From net investment income | | | (0.37 | ) | | | (0.32 | ) | | | (0.26 | ) | | | (0.39 | ) | | | (0.60 | ) |
From net realized gain | | | (0.04 | ) | | | – | | | | – | | | | – | | | | (0.01 | ) |
From return of capital | | | – | | | | (0.04 | ) | | | (0.11 | ) | | | – | | | | – | |
| | | | | | | | | | | | | | | | | | | | |
Total dividends and distributions | | | (0.41 | ) | | | (0.36 | ) | | | (0.37 | ) | | | (0.39 | ) | | | (0.61 | ) |
| | | | | | | | | | | | | | | | | | | | |
Redemption fees | | | – | | | | – | | | | – | | | | – | | | | 0.00 | (2) |
| | | | | | | | | | | | | | | | | | | | |
Net asset value, at end of year | | $ | 9.22 | | | $ | 9.45 | | | $ | 9.51 | | | $ | 9.10 | | | $ | 9.57 | |
| | | | | | | | | | | | | | | | | | | | |
Total investment return (3) | | | 2.02 | % | | | 3.24 | % | | | 8.68 | % | | | (0.81 | )% | | | 0.30 | % |
| | | | | | | | | | | | | | | | | | | | |
|
| Supplemental Data and Ratios | |
Net assets, end of year (000’s) | | $ | 8,005 | | | $ | 8,311 | | | $ | 8,018 | | | $ | 6,803 | | | $ | 5,461 | |
Ratio of total expenses (before reductions and reimbursements) to average net assets | | | 2.05 | % | | | 2.09 | % | | | 2.24 | % | | | 2.50 | % | | | 3.12 | % |
Ratio of net expenses to average net assets (4) | | | 1.74 | %(5) | | | 1.70 | %(5) | | | 1.71 | %(6) | | | 1.80 | %(7) | | | 1.80 | %(7) |
Ratio of net investment income to average net assets | | | 4.00 | % | | | 3.80 | % | | | 3.91 | % | | | 4.04 | % | | | 3.60 | % |
Portfolio turnover rate | | | 46.51 | % | | | 57.74 | % | | | 47.06 | % | | | 62.99 | % | | | 63.17 | % |
| (1) | | Calculated using average shares outstanding. |
| (2) | | Amount rounds to less than $.01 per share. |
| (3) | | Total investment return calculation does not consider the effects of sales loads and assumes the reinvestment of dividends at actual prices pursuant to the Fund’s dividend reinvestment plan. |
| (4) | | The Adviser has agreed to waive and/or reimburse certain fees and/or expense so that, on an annualized basis, such expenses incurred will not exceed 1.75% as a percentage of average daily net assets. |
| (5) | | Net expenses reflect a voluntary expense reimbursement to prevent a negative yield. |
| (6) | | Net expenses reflect aone-time voluntary reimbursement to the Fund during the period in connection with a change to the fee waiver and/or expense reimbursement agreement. |
| (7) | | Net expenses reflect a previous fee waiver and/or expense reimbursement agreement. |
See accompanying Notes to the Financial Statements.
52
Barings Global Floating Rate Fund 2019 Annual Report
FINANCIAL HIGHLIGHTS(CONTINUED)
| | | | | | | | | | | | | | | | | | | | |
| | | CLASS I | |
| | | FOR THE
YEAR
ENDED
JUNE 30,
2019 | | | FOR THE
YEAR
ENDED
JUNE 30,
2018 | | | FOR THE
YEAR
ENDED
JUNE 30,
2017 | | | FOR THE
YEAR
ENDED
JUNE 30,
2016 | | | FOR THE
YEAR
ENDED
JUNE 30,
2015 | |
| | | | | |
| Per Common Share Data | | | | | | | | | | | | | | | | | | | | |
Net asset value, beginning of year | | $ | 9.50 | | | $ | 9.56 | | | $ | 9.15 | | | $ | 9.62 | | | $ | 10.21 | |
Income from investment operations: | | | | | | | | | | | | | | | | | | | | |
Net investment income (1) | | | 0.47 | | | | 0.46 | | | | 0.47 | | | | 0.47 | | | | 0.46 | |
Net realized and unrealized gain (loss) on investments | | | (0.18 | ) | | | (0.06 | ) | | | 0.40 | | | | (0.45 | ) | | | (0.34 | ) |
| | | | | | | | | | | | | | | | | | | | |
Total increase from investment operations | | | 0.29 | | | | 0.40 | | | | 0.87 | | | | 0.02 | | | | 0.12 | |
| | | | | | | | | | | | | | | | | | | | |
Less dividends and distributions: | | | | | | | | | | | | | | | | | | | | |
From net investment income | | | (0.47 | ) | | | (0.41 | ) | | | (0.32 | ) | | | (0.49 | ) | | | (0.70 | ) |
From net realized gain | | | (0.04 | ) | | | – | | | | – | | | | – | | | | (0.01 | ) |
From return of capital | | | – | | | | (0.05 | ) | | | (0.14 | ) | | | – | | | | – | |
| | | | | | | | | | | | | | | | | | | | |
Total dividends and distributions | | | (0.51 | ) | | | (0.46 | ) | | | (0.46 | ) | | | (0.49 | ) | | | (0.71 | ) |
| | | | | | | | | | | | | | | | | | | | |
Redemption fees | | | – | | | | – | | | | – | | | | – | | | | 0.00 | (2) |
| | | | | | | | | | | | | | | | | | | | |
Net asset value, at end of year | | $ | 9.28 | | | $ | 9.50 | | | $ | 9.56 | | | $ | 9.15 | | | $ | 9.62 | |
| | | | | | | | | | | | | | | | | | | | |
Total investment return (3) | | | 3.04 | % | | | 4.28 | % | | | 9.74 | % | | | 0.25 | % | | | 1.34 | % |
| | | | | | | | | | | | | | | | | | | | |
| | | | | |
| Supplemental Data and Ratios | | | | | | | | | | | | | | | | | | | | |
Net assets, end of year (000’s) | | $ | 32,531 | | | $ | 18,370 | | | $ | 19,733 | | | $ | 19,903 | | | $ | 25,885 | |
Ratio of total expenses (before reductions and reimbursements) to average net assets | | | 0.94 | % | | | 1.03 | % | | | 1.16 | % | | | 1.29 | % | | | 1.31 | % |
Ratio of net expenses to average net assets (4) | | | 0.75 | % | | | 0.71 | %(5) | | | 0.75 | % | | | 0.75 | % | | | 0.75 | % |
Ratio of net investment income to average net assets | | | 5.01 | % | | | 4.78 | % | | | 4.90 | % | | | 5.07 | % | | | 4.69 | % |
Portfolio turnover rate | | | 46.51 | % | | | 57.74 | % | | | 47.06 | % | | | 62.99 | % | | | 63.17 | % |
| (1) | | Calculated using average shares outstanding. |
| (2) | | Amount rounds to less than $.01 per share. |
| (3) | | Total investment return calculation assumes the reinvestment of dividends at actual prices pursuant to the Fund’s dividend reinvestment plan. |
| (4) | | The Adviser has agreed to waive and/or reimburse certain fees and/or expense so that, on an annualized basis, such expenses incurred will not exceed 0.75% as a percentage of average daily net assets. |
| (5) | | Net expenses reflect a voluntary expense reimbursement to prevent a negative yield. |
See accompanying Notes to the Financial Statements.
53
Barings Global Floating Rate Fund 2019 Annual Report
FINANCIAL HIGHLIGHTS(CONTINUED)
| | | | | | | | | | | | | | | | | | | | |
| | | CLASS Y | |
| | | FOR THE
YEAR
ENDED
JUNE 30,
2019 | | | FOR THE
YEAR
ENDED
JUNE 30,
2018 | | | FOR THE
YEAR
ENDED
JUNE 30,
2017 | | | FOR THE
YEAR
ENDED
JUNE 30,
2016 | | | FOR THE
YEAR
ENDED
JUNE 30,
2015 | |
| | | | | |
| Per Common Share Data | | | | | | | | | | | | | | | | | | | | |
Net asset value, beginning of year | | $ | 9.50 | | | $ | 9.56 | | | $ | 9.15 | | | $ | 9.62 | | | $ | 10.21 | |
Income from investment operations: | | | | | | | | | | | | | | | | | | | | |
Net investment income (1) | | | 0.47 | | | | 0.46 | | | | 0.47 | | | | 0.47 | | | | 0.45 | |
Net realized and unrealized gain (loss) on investments | | | (0.19 | ) | | | (0.06 | ) | | | 0.40 | | | | (0.45 | ) | | | (0.33 | ) |
| | | | | | | | | | | | | | | | | | | | |
Total increase from investment operations | | | 0.28 | | | | 0.40 | | | | 0.87 | | | | 0.02 | | | | 0.12 | |
| | | | | | | | | | | | | | | | | | | | |
Less dividends and distributions: | | | | | | | | | | | | | | | | | | | | |
From net investment income | | | (0.47 | ) | | | (0.41 | ) | | | (0.32 | ) | | | (0.49 | ) | | | (0.70 | ) |
From net realized gain | | | (0.04 | ) | | | – | | | | – | | | | – | | | | (0.01 | ) |
From return of capital | | | – | | | | (0.05 | ) | | | (0.14 | ) | | | – | | | | – | |
| | | | | | | | | | | | | | | | | | | | |
Total dividends and distributions | | | (0.51 | ) | | | (0.46 | ) | | | (0.46 | ) | | | (0.49 | ) | | | (0.71 | ) |
| | | | | | | | | | | | | | | | | | | | |
Redemption fees | | | – | | | | – | | | | – | | | | – | | | | 0.00 | (2) |
| | | | | | | | | | | | | | | | | | | | |
Net asset value, at end of year | | $ | 9.27 | | | $ | 9.50 | | | $ | 9.56 | | | $ | 9.15 | | | $ | 9.62 | |
| | | | | | | | | | | | | | | | | | | | |
Total investment return (3) | | | 3.03 | % | | | 4.27 | % | | | 9.73 | % | | | 0.22 | % | | | 1.28 | % |
| | | | | | | | | | | | | | | | | | | | |
| | | | | |
| Supplemental Data and Ratios | | | | | | | | | | | | | | | | | | | | |
Net assets, end of year (000’s) | | $ | 187,887 | | | $ | 172,736 | | | $ | 122,736 | | | $ | 125,957 | | | $ | 129,659 | |
Ratio of total expenses (before reductions and reimbursements) to average net assets | | | 0.96 | % | | | 1.01 | % | | | 1.14 | % | | | 1.27 | % | | | 1.25 | % |
Ratio of net expenses to average net assets (4) | | | 0.75 | % | | | 0.71 | %(5) | | | 0.75 | % | | | 0.75 | % | | | 0.75 | % |
Ratio of net investment income to average net assets | | | 4.99 | % | | | 4.79 | % | | | 4.90 | % | | | 5.08 | % | | | 4.58 | % |
Portfolio turnover rate | | | 46.51 | % | | | 57.74 | % | | | 47.06 | % | | | 62.99 | % | | | 63.17 | % |
| (1) | | Calculated using average shares outstanding. |
| (2) | | Amount rounds to less than $.01 per share. |
| (3) | | Total investment return calculation assumes the reinvestment of dividends at actual prices pursuant to the Fund’s dividend reinvestment plan. |
| (4) | | The Adviser has agreed to waive and/or reimburse certain fees and/or expense so that, on an annualized basis, such expenses incurred will not exceed 0.75% as a percentage of average daily net assets. |
| (5) | | Net expenses reflect a voluntary expense reimbursement to prevent a negative yield. |
See accompanying Notes to the Financial Statements.
54
Barings Global Credit Income Opportunities Fund 2019 Annual Report
FINANCIAL HIGHLIGHTS
| | | | | | | | | | | | | | | | | | | | |
| | | CLASS A | |
| | | FOR THE
YEAR
ENDED
JUNE 30,
2019 | | | FOR THE
YEAR
ENDED
JUNE 30,
2018 | | | FOR THE
YEAR
ENDED
JUNE 30,
2017 | | | FOR THE
YEAR
ENDED
JUNE 30,
2016 | | | FOR THE
YEAR
ENDED
JUNE 30,
2015 | |
| | | | | |
| Per Common Share Data | | | | | | | | | | | | | | | | | | | | |
Net asset value, beginning of year | | $ | 9.32 | | | $ | 9.51 | | | $ | 8.80 | | | $ | 9.51 | | | $ | 10.45 | |
Income from investment operations: | | | | | | | | | | | | | | | | | | | | |
Net investment income (1) | | | 0.50 | | | | 0.49 | | | | 0.55 | | | | 0.56 | | | | 0.54 | |
Net realized and unrealized gain (loss) on investments | | | (0.30 | ) | | | (0.19 | ) | | | 0.71 | | | | (0.66 | ) | | | (0.57 | ) |
| | | | | | | | | | | | | | | | | | | | |
Total increase (decrease) from investment operations | | | 0.20 | | | | 0.30 | | | | 1.26 | | | | (0.10 | ) | | | (0.03 | ) |
| | | | | | | | | | | | | | | | | | | | |
Less dividends and distributions: | | | | | | | | | | | | | | | | | | | | |
From net investment income | | | (0.48 | ) | | | (0.47 | ) | | | (0.50 | ) | | | (0.61 | ) | | | (0.78 | ) |
From net realized gain | | | (0.10 | ) | | | – | | | | – | | | | – | | | | (0.13 | ) |
From return of capital | | | (0.01 | ) | | | (0.02 | ) | | | (0.05 | ) | | | – | | | | – | �� |
| | | | | | | | | | | | | | | | | | | | |
Total dividends and distributions | | | (0.59 | ) | | | (0.49 | ) | | | (0.55 | ) | | | (0.61 | ) | | | (0.91 | ) |
| | | | | | | | | | | | | | | | | | | | |
Redemption fees | | | – | | | | – | | | | – | | | | – | | | | 0.00 | (2) |
| | | | | | | | | | | | | | | | | | | | |
Net asset value, at end of year | | $ | 8.93 | | | $ | 9.32 | | | $ | 9.51 | | | $ | 8.80 | | | $ | 9.51 | |
| | | | | | | | | | | | | | | | | | | | |
Total investment return (3) | | | 2.39 | % | | | 3.24 | % | | | 14.61 | % | | | (0.84 | )% | | | (0.11 | )% |
| | | | | | | | | | | | | | | | | | | | |
| | | | | |
| Supplemental Data and Ratios | | | | | | | | | | | | | | | | | | | | |
Net assets, end of year (000’s) | | $ | 51,205 | | | $ | 60,507 | | | $ | 26,904 | | | $ | 12,340 | | | $ | 12,718 | |
Ratio of total expenses (before reductions and reimbursements) to average net assets | | | 1.36 | % | | | 1.38 | % | | | 1.56 | % | | | 1.90 | % | | | 1.98 | % |
Ratio of net expenses to average net assets (4) | | | 1.20 | % | | | 1.20 | % | | | 1.20 | % | | | 1.20 | % | | | 1.20 | % |
Ratio of net investment income to average net assets | | | 5.46 | % | | | 5.17 | % | | | 5.83 | % | | | 6.28 | % | | | 5.46 | % |
Portfolio turnover rate | | | 58.78 | % | | | 52.29 | % | | | 48.69 | % | | | 58.08 | % | | | 84.65 | % |
| (1) | | Calculated using average shares outstanding. |
| (2) | | Amount rounds to less than $.01 per share. |
| (3) | | Total investment return calculation does not consider the effects of sales loads and assumes the reinvestment of dividends at actual prices pursuant to the Fund’s dividend reinvestment plan. |
| (4) | | The Adviser has agreed to waive and/or reimburse certain fees and/or expense so that, on an annualized basis, such expenses incurred will not exceed 1.20% as a percentage of average daily net assets. |
See accompanying Notes to the Financial Statements.
55
Barings Global Credit Income Opportunities Fund 2019 Annual Report
FINANCIAL HIGHLIGHTS(CONTINUED)
| | | | | | | | | | | | | | | | | | | | |
| | | CLASS C | |
| | | FOR THE
YEAR
ENDED
JUNE 30,
2019 | | | FOR THE
YEAR
ENDED
JUNE 30,
2018 | | | FOR THE
YEAR
ENDED
JUNE 30,
2017 | | | FOR THE
YEAR
ENDED
JUNE 30,
2016 | | | FOR THE
YEAR
ENDED
JUNE 30,
2015 | |
| | | | | |
| Per Common Share Data | | | | | | | | | | | | | | | | | | | | |
Net asset value, beginning of year | | $ | 9.31 | | | $ | 9.50 | | | $ | 8.79 | | | $ | 9.50 | | | $ | 10.45 | |
Income from investment operations: | | | | | | | | | | | | | | | | | | | | |
Net investment income(1) | | | 0.43 | | | | 0.42 | | | | 0.48 | | | | 0.49 | | | | 0.47 | |
Net realized and unrealized gain (loss) on investments | | | (0.29 | ) | | | (0.19 | ) | | | 0.71 | | | | (0.65 | ) | | | (0.58 | ) |
| | | | | | | | | | | | | | | | | | | | |
Total increase (decrease) from investment operations | | | 0.14 | | | | 0.23 | | | | 1.19 | | | | (0.16 | ) | | | (0.11 | ) |
| | | | | | | | | | | | | | | | | | | | |
Less dividends and distributions: | | | | | | | | | | | | | | | | | | | | |
From net investment income | | | (0.42 | ) | | | (0.40 | ) | | | (0.43 | ) | | | (0.55 | ) | | | (0.71 | ) |
From net realized gain | | | (0.10 | ) | | | – | | | | – | | | | – | | | | (0.13 | ) |
From return of capital | | | (0.01 | ) | | | (0.02 | ) | | | (0.05 | ) | | | – | | | | – | |
| | | | | | | | | | | | | | | | | | | | |
Total dividends and distributions | | | (0.53 | ) | | | (0.42 | ) | | | (0.48 | ) | | | (0.55 | ) | | | (0.84 | ) |
| | | | | | | | | | | | | | | | | | | | |
Redemption fees | | | – | | | | – | | | | – | | | | – | | | | 0.00 | (2) |
| | | | | | | | | | | | | | | | | | | | |
Net asset value, at end of year | | $ | 8.92 | | | $ | 9.31 | | | $ | 9.50 | | | $ | 8.79 | | | $ | 9.50 | |
| | | | | | | | | | | | | | | | | | | | |
Total investment return(3) | | | 1.63 | % | | | 2.47 | % | | | 13.75 | % | | | (1.59 | )% | | | (0.93 | )% |
| | | | | | | | | | | | | | | | | | | | |
| | | | | |
| Supplemental Data and Ratios | | | | | | | | | | | | | | | | | | | | |
Net assets, end of year (000’s) | | $ | 8,462 | | | $ | 8,842 | | | $ | 6,628 | | | $ | 3,578 | | | $ | 3,579 | |
Ratio of total expenses (before reductions and reimbursements) to average net assets | | | 2.21 | % | | | 2.21 | % | | | 2.39 | % | | | 2.91 | % | | | 4.09 | % |
Ratio of net expenses to average net assets(4) | | | 1.95 | % | | | 1.95 | % | | | 1.95 | % | | | 1.95 | % | | | 1.95 | % |
Ratio of net investment income to average net assets | | | 4.73 | % | | | 4.44 | % | | | 5.12 | % | | | 5.50 | % | | | 4.79 | % |
Portfolio turnover rate | | | 58.78 | % | | | 52.29 | % | | | 48.69 | % | | | 58.08 | % | | | 84.65 | % |
| (1) | | Calculated using average shares outstanding. |
| (2) | | Amount rounds to less than $.01 per share. |
| (3) | | Total investment return calculation assumes the reinvestment of dividends at actual prices pursuant to the Fund’s dividend reinvestment plan. |
| (4) | | The Adviser has agreed to waive and/or reimburse certain fees and/or expense so that, on an annualized basis, such expenses incurred will not exceed 1.95% as a percentage of average daily net assets. |
See accompanying Notes to the Financial Statements.
56
Barings Global Credit Income Opportunities Fund 2019 Annual Report
FINANCIAL HIGHLIGHTS(CONTINUED)
| | | | | | | | | | | | | | | | | | | | |
| | | CLASS I | |
| | | FOR THE
YEAR
ENDED
JUNE 30,
2019 | | | FOR THE
YEAR
ENDED
JUNE 30,
2018 | | | FOR THE
YEAR
ENDED
JUNE 30,
2017 | | | FOR THE
YEAR
ENDED
JUNE 30,
2016 | | | FOR THE
YEAR
ENDED
JUNE 30,
2015 | |
| | | | | |
| Per Common Share Data | | | | | | | | | | | | | | | | | | | | |
Net asset value, beginning of year | | $ | 9.32 | | | $ | 9.50 | | | $ | 8.80 | | | $ | 9.51 | | | $ | 10.46 | |
Income from investment operations: | | | | | | | | | | | | | | | | | | | | |
Net investment income (1) | | | 0.52 | | | | 0.51 | | | | 0.58 | | | | 0.58 | | | | 0.56 | |
Net realized and unrealized gain (loss) on investments | | | (0.29 | ) | | | (0.18 | ) | | | 0.70 | | | | (0.65 | ) | | | (0.58 | ) |
| | | | | | | | | | | | | | | | | | | | |
Total increase (decrease) from investment operations | | | 0.23 | | | | 0.33 | | | | 1.28 | | | | (0.07 | ) | | | (0.02 | ) |
| | | | | | | | | | | | | | | | | | | | |
Less dividends and distributions: | | | | | | | | | | | | | | | | | | | | |
From net investment income | | | (0.51 | ) | | | (0.49 | ) | | | (0.52 | ) | | | (0.64 | ) | | | (0.80 | ) |
From net realized gain | | | (0.10 | ) | | | – | | | | – | | | | – | | | | (0.13 | ) |
From return of capital | | | (0.01 | ) | | | (0.02 | ) | | | (0.06 | ) | | | – | | | | – | |
| | | | | | | | | | | | | | | | | | | | |
Total dividends and distributions | | | (0.62 | ) | | | (0.51 | ) | | | (0.58 | ) | | | (0.64 | ) | | | (0.93 | ) |
| | | | | | | | | | | | | | | | | | | | |
Redemption fees | | | – | | | | – | | | | – | | | | – | | | | 0.00 | (2) |
| | | | | | | | | | | | | | | | | | | | |
Net asset value, at end of year | | $ | 8.93 | | | $ | 9.32 | | | $ | 9.50 | | | $ | 8.80 | | | $ | 9.51 | |
| | | | | | | | | | | | | | | | | | | | |
Total investment return (3) | | | 2.65 | % | | | 3.49 | % | | | 14.90 | % | | | (0.61 | )% | | | 0.05 | % |
| | | | | | | | | | | | | | | | | | | | |
| | | | | |
| Supplemental Data and Ratios | | | | | | | | | | | | | | | | | | | | |
Net assets, end of year (000’s) | | $ | 23,203 | | | $ | 21,788 | | | $ | 22,228 | | | $ | 24,689 | | | $ | 26,428 | |
Ratio of total expenses (before reductions and reimbursements) to average net assets | | | 1.09 | % | | | 1.13 | % | | | 1.27 | % | | | 1.54 | % | | | 1.58 | % |
Ratio of net expenses to average net assets (4) | | | 0.95 | % | | | 0.95 | % | | | 0.95 | % | | | 0.95 | % | | | 0.95 | % |
Ratio of net investment income to average net assets | | | 5.69 | % | | | 5.45 | % | | | 6.22 | % | | | 6.54 | % | | | 5.69 | % |
Portfolio turnover rate | | | 58.78 | % | | | 52.29 | % | | | 48.69 | % | | | 58.08 | % | | | 84.65 | % |
| (1) | | Calculated using average shares outstanding. |
| (2) | | Amount rounds to less than $.01 per share. |
| (3) | | Total investment return calculation assumes the reinvestment of dividends at actual prices pursuant to the Fund’s dividend reinvestment plan. |
| (4) | | The Adviser has agreed to waive and/or reimburse certain fees and/or expense so that, on an annualized basis, such expenses incurred will not exceed 0.95% as a percentage of average daily net assets. |
See accompanying Notes to the Financial Statements.
57
Barings Global Credit Income Opportunities Fund 2019 Annual Report
FINANCIAL HIGHLIGHTS(CONTINUED)
| | | | | | | | | | | | | | | | | | | | |
| | | CLASS Y | |
| | | FOR THE
YEAR
ENDED
JUNE 30,
2019 | | | FOR THE
YEAR
ENDED
JUNE 30,
2018 | | | FOR THE
YEAR
ENDED
JUNE 30,
2017 | | | FOR THE
YEAR
ENDED
JUNE 30,
2016 | | | FOR THE
YEAR
ENDED
JUNE 30,
2015 | |
| | | | | |
| Per Common Share Data | | | | | | | | | | | | | | | | | | | | |
Net asset value, beginning of year | | $ | 9.31 | | | $ | 9.50 | | | $ | 8.80 | | | $ | 9.51 | | | $ | 10.46 | |
Income from investment operations: | | | | | | | | | | | | | | | | | | | | |
Net investment income (1) | | | 0.52 | | | | 0.51 | | | | 0.57 | | | | 0.59 | | | | 0.56 | |
Net realized and unrealized gain (loss) on investments | | | (0.28 | ) | | | (0.19 | ) | | | 0.71 | | | | (0.66 | ) | | | (0.58 | ) |
| | | | | | | | | | | | | | | | | | | | |
Total increase (decrease) from investment operations | | | 0.24 | | | | 0.32 | | | | 1.28 | | | | (0.07 | ) | | | (0.02 | ) |
| | | | | | | | | | | | | | | | | | | | |
Less dividends and distributions: | | | | | | | | | | | | | | | | | | | | |
From net investment income | | | (0.51 | ) | | | (0.49 | ) | | | (0.52 | ) | | | (0.64 | ) | | | (0.80 | ) |
From net realized gain | | | (0.10 | ) | | | – | | | | – | | | | – | | | | (0.13 | ) |
From return of capital | | | (0.01 | ) | | | (0.02 | ) | | | (0.06 | ) | | | – | | | | – | |
| | | | | | | | | | | | | | | | | | | | |
Total dividends and distributions | | | (0.62 | ) | | | (0.51 | ) | | | (0.58 | ) | | | (0.64 | ) | | | (0.93 | ) |
| | | | | | | | | | | | | | | | | | | | |
Redemption fees | | | – | | | | – | | | | – | | | | – | | | | 0.00 | (2) |
| | | | | | | | | | | | | | | | | | | | |
Net asset value, at end of year | | $ | 8.93 | | | $ | 9.31 | | | $ | 9.50 | | | $ | 8.80 | | | $ | 9.51 | |
| | | | | | | | | | | | | | | | | | | | |
Total investment return (3) | | | 2.64 | % | | | 3.48 | % | | | 14.90 | % | | | (0.61 | )% | | | 0.05 | % |
| | | | | | | | | | | | | | | | | | | | |
| | | | | |
| Supplemental Data and Ratios | | | | | | | | | | | | | | | | | | | | |
Net assets, end of year (000’s) | | $ | 129,621 | | | $ | 140,362 | | | $ | 96,014 | | | $ | 58,312 | | | $ | 39,006 | |
Ratio of total expenses (before reductions and reimbursements) to average net assets | | | 1.12 | % | | | 1.14 | % | | | 1.28 | % | | | 1.55 | % | | | 1.58 | % |
Ratio of net expenses to average net assets (4) | | | 0.95 | % | | | 0.95 | % | | | 0.95 | % | | | 0.95 | % | | | 0.95 | % |
Ratio of net investment income to average net assets | | | 5.71 | % | | | 5.43 | % | | | 6.14 | % | | | 6.56 | % | | | 5.67 | % |
Portfolio turnover rate | | | 58.78 | % | | | 52.29 | % | | | 48.69 | % | | | 58.08 | % | | | 84.65 | % |
| (1) | | Calculated using average shares outstanding. |
| (2) | | Amount rounds to less than $.01 per share. |
| (3) | | Total investment return calculation assumes the reinvestment of dividends at actual prices pursuant to the Fund’s dividend reinvestment plan. |
| (4) | | The Adviser has agreed to waive and/or reimburse certain fees and/or expense so that, on an annualized basis, such expenses incurred will not exceed 0.95% as a percentage of average daily net assets. |
See accompanying Notes to the Financial Statements.
58
Barings Active Short Duration Bond Fund 2019 Annual Report
FINANCIAL HIGHLIGHTS
| | | | | | | | | | | | | | | | |
| | | CLASS A | |
| | | FOR THE
YEAR
ENDED
JUNE 30,
2019 | | | FOR THE
YEAR
ENDED
JUNE 30,
2018 | | | FOR THE
YEAR
ENDED
JUNE 30,
2017 | | | PERIOD FROM
JULY 8, 2015
THROUGH
JUNE 30,
2016 (1) | |
| | | | |
| Per Common Share Data | | | | | | | | | | | | | | | | |
Net asset value, beginning of year | | $ | 9.88 | | | $ | 10.01 | | | $ | 9.98 | | | $ | 10.00 | |
Income from investment operations: | | | | | | | | | | | | | | | | |
Net investment income (2) | | | 0.27 | | | | 0.21 | | | | 0.17 | | | | 0.15 | |
Net realized and unrealized gain (loss) on investments | | | 0.08 | | | | (0.10 | ) | | | 0.03 | | | | (0.03 | )(3) |
| | | | | | | | | | | | | | | | |
Total increase from investment operations | | | 0.35 | | | | 0.11 | | | | 0.20 | | | | 0.12 | |
| | | | | | | | | | | | | | | | |
Less dividends and distributions: | | | | | | | | | | | | | | | | |
From net investment income | | | (0.27 | ) | | | (0.21 | ) | | | (0.17 | ) | | | (0.14 | ) |
From net realized gain | | | (0.02 | ) | | | (0.03 | ) | | | (0.00 | )(4) | | | – | |
| | | | | | | | | | | | | | | | |
Total dividends and distributions | | | (0.29 | ) | | | (0.24 | ) | | | (0.17 | ) | | | (0.14 | ) |
| | | | | | | | | | | | | | | | |
Net asset value, at end of year | | $ | 9.94 | | | $ | 9.88 | | | $ | 10.01 | | | $ | 9.98 | |
| | | | | | | | | | | | | | | | |
Total investment return (5) | | | 3.52 | % | | | 1.10 | % | | | 2.12 | % | | | 1.17 | %(6) |
| | | | | | | | | | | | | | | | |
| | | | |
| Supplemental Data and Ratios | | | | | | | | | | | | | | | | |
Net assets, end of year (000’s) | | $ | 135,981 | | | $ | 177,020 | | | $ | 119,189 | | | $ | 39,992 | |
Ratio of total expenses (before reductions and reimbursements) to average net assets | | | 0.90 | % | | | 0.94 | % | | | 1.06 | % | | | 1.18 | %(7) |
Ratio of net expenses to average net assets (8) | | | 0.65 | % | | | 0.65 | % | | | 0.65 | % | | | 0.65 | %(7) |
Ratio of net investment income to average net assets | | | 2.75 | % | | | 2.15 | % | | | 1.72 | % | | | 1.51 | %(7) |
Portfolio turnover rate | | | 43.15 | % | | | 53.33 | % | | | 88.52 | % | | | 218.67 | %(6) |
| (1) | | Fund commenced operations on July 8, 2015. |
| (2) | | Calculated using average shares outstanding. |
| (3) | | The per share amount varies from the net realized and unrealized gain/loss for the period because of the timing of sales of fund shares and the per share amount of realized and unrealized gains and losses at such time. |
| (4) | | Amount rounds to less than $.01 per share. |
| (5) | | Total investment return calculation assumes the reinvestment of dividends at actual prices pursuant to the Fund’s dividend reinvestment plan. |
| (7) | | Annualized for periods less than one full year. |
| (8) | | The Adviser has agreed to waive and/or reimburse certain fees and/or expense so that, on an annualized basis, such expenses incurred will not exceed 0.65% as a percentage of average daily net assets. |
See accompanying Notes to the Financial Statements.
59
Barings Active Short Duration Bond Fund 2019 Annual Report
FINANCIAL HIGHLIGHTS(CONTINUED)
| | | | | | | | | | | | | | | | |
| | | CLASS C | |
| | | FOR THE
YEAR
ENDED
JUNE 30,
2019 | | | FOR THE
YEAR
ENDED
JUNE 30,
2018 | | | FOR THE
YEAR
ENDED
JUNE 30,
2017 | | | PERIOD FROM
JULY 8, 2015
THROUGH
JUNE 30,
2016 (1) | |
| | | | |
| Per Common Share Data | | | | | | | | | | | | | | | | |
Net asset value, beginning of year | | $ | 9.87 | | | $ | 10.01 | | | $ | 9.97 | | | $ | 10.00 | |
Income from investment operations: | | | | | | | | | | | | | | | | |
Net investment income (2) | | | 0.25 | | | | 0.19 | | | | 0.19 | | | | 0.07 | |
Net realized and unrealized gain (loss) on investments | | | 0.08 | | | | (0.11 | ) | | | 0.05 | | | | (0.03 | )(3) |
| | | | | | | | | | | | | | | | |
Total increase from investment operations | | | 0.33 | | | | 0.08 | | | | 0.24 | | | | 0.04 | |
| | | | | | | | | | | | | | | | |
Less dividends and distributions: | | | | | | | | | | | | | | | | |
From net investment income | | | (0.25 | ) | | | (0.19 | ) | | | (0.20 | ) | | | (0.07 | ) |
From net realized gain | | | (0.02 | ) | | | (0.03 | ) | | | (0.00 | )(4) | | | – | |
| | | | | | | | | | | | | | | | |
Total dividends and distributions | | | (0.27 | ) | | | (0.22 | ) | | | (0.20 | ) | | | (0.07 | ) |
| | | | | | | | | | | | | | | | |
Net asset value, at end of year | | $ | 9.93 | | | $ | 9.87 | | | $ | 10.01 | | | $ | 9.97 | |
| | | | | | | | | | | | | | | | |
Total investment return (5) | | | 3.23 | % | | | 0.84 | % | | | 2.41 | % | | | 0.39 | %(6) |
| | | | | | | | | | | | | | | | |
| | | | |
| Supplemental Data and Ratios | | | | | | | | | | | | | | | | |
Net assets, end of year (000’s) | | $ | 1,178 | | | $ | 1,139 | | | $ | 236 | | | $ | 257 | |
Ratio of total expenses (before reductions and reimbursements) to average net assets | | | 1.70 | % | | | 1.95 | % | | | 3.09 | %(7) | | | 5.44 | %(8)(9) |
Ratio of net expenses to average net assets (10) | | | 0.90 | % | | | 0.90 | % | | | 0.40 | %(7) | | | 1.40 | %(8)(9) |
Ratio of net investment income to average net assets | | | 2.51 | % | | | 1.92 | % | | | 1.94 | %(7) | | | 0.71 | %(8)(9) |
Portfolio turnover rate | | | 43.15 | % | | | 53.33 | % | | | 88.52 | % | | | 218.67 | %(6) |
| (1) | | Fund commenced operations on July 8, 2015. |
| (2) | | Calculated using average shares outstanding. |
| (3) | | The per share amount varies from the net realized and unrealized gain/loss for the period because of the timing of sales of fund shares and the per share amount of realized and unrealized gains and losses at such time. |
| (4) | | Amount rounds to less than $.01 per share. |
| (5) | | Total investment return calculation assumes the reinvestment of dividends at actual prices pursuant to the Fund’s dividend reinvestment plan. |
| (7) | | Expenses shown reflect a reimbursement to the Fund during the period for an overaccrual of12b-1 fees made during and prior to the period. |
| (8) | | Annualized for periods less than one full year. |
| (9) | | Expenses shown reflect an overaccrual of12b-1 fees for the period of $1,478 or 0.50% of average net assets over the period. Subsequent to the period, the Fund was reimbursed for the overaccrued amount. |
| (10) | | The Adviser has agreed to waive and/or reimburse certain fees and/or expense so that, on an annualized basis, such expenses incurred will not exceed 0.90% as a percentage of average daily net assets. |
See accompanying Notes to the Financial Statements.
60
Barings Active Short Duration Bond Fund 2019 Annual Report
FINANCIAL HIGHLIGHTS(CONTINUED)
| | | | | | | | | | | | | | | | |
| | | CLASS I | |
| | | FOR THE
YEAR
ENDED
JUNE 30,
2019 | | | FOR THE
YEAR
ENDED
JUNE 30,
2018 | | | FOR THE
YEAR
ENDED
JUNE 30,
2017 | | | PERIOD FROM
JULY 8, 2015
THROUGH
JUNE 30,
2016 (1) | |
| | | | |
| Per Common Share Data | | | | | | | | | | | | | | | | |
Net asset value, beginning of year | | $ | 9.88 | | | $ | 10.01 | | | $ | 9.97 | | | $ | 10.00 | |
Income from investment operations: | | | | | | | | | | | | | | | | |
Net investment income (2) | | | 0.30 | | | | 0.24 | | | | 0.18 | | | | 0.16 | |
Net realized and unrealized gain (loss) on investments | | | 0.08 | | | | (0.10 | ) | | | 0.06 | | | | (0.03 | )(3) |
| | | | | | | | | | | | | | | | |
Total increase from investment operations | | | 0.38 | | | | 0.14 | | | | 0.24 | | | | 0.13 | |
| | | | | | | | | | | | | | | | |
Less dividends and distributions: | | | | | | | | | | | | | | | | |
From net investment income | | | (0.30 | ) | | | (0.24 | ) | | | (0.20 | ) | | | (0.16 | ) |
From net realized gain | | | (0.02 | ) | | | (0.03 | ) | | | (0.00 | )(4) | | | – | |
| | | | | | | | | | | | | | | | |
Total dividends and distributions | | | (0.32 | ) | | | (0.27 | ) | | | (0.20 | ) | | | (0.16 | ) |
| | | | | | | | | | | | | | | | |
Net asset value, at end of year | | $ | 9.94 | | | $ | 9.88 | | | $ | 10.01 | | | $ | 9.97 | |
| | | | | | | | | | | | | | | | |
Total investment return (5) | | | 3.78 | % | | | 1.39 | % | | | 2.44 | % | | | 1.35 | %(6) |
| | | | | | | | | | | | | | | | |
| | | | |
| Supplemental Data and Ratios | | | | | | | | | | | | | | | | |
Net assets, end of year (000’s) | | $ | 301 | | | $ | 300 | | | $ | 100 | | | $ | 5,971 | |
Ratio of total expenses (before reductions and reimbursements) to average net assets | | | 2.84 | % | | | 3.07 | % | | | 1.67 | % | | | 0.96 | %(7) |
Ratio of net expenses to average net assets (8) | | | 0.40 | % | | | 0.40 | % | | | 0.40 | % | | | 0.44 | %(7) |
Ratio of net investment income to average net assets | | | 3.01 | % | | | 2.39 | % | | | 1.84 | % | | | 1.67 | %(7) |
Portfolio turnover rate | | | 43.15 | % | | | 53.33 | % | | | 88.52 | % | | | 218.67 | %(6) |
| (1) | | Fund commenced operations on July 8, 2015. |
| (2) | | Calculated using average shares outstanding. |
| (3) | | The per share amount varies from the net realized and unrealized gain/loss for the period because of the timing of sales of fund shares and the per share amount of realized and unrealized gains and losses at such time. |
| (4) | | Amount rounds to less than $.01 per share. |
| (5) | | Total investment return calculation assumes the reinvestment of dividends at actual prices pursuant to the Fund’s dividend reinvestment plan. |
| (7) | | Annualized for periods less than one full year. |
| (8) | | The Adviser has agreed to waive and/or reimburse certain fees and/or expense so that, on an annualized basis, such expenses incurred will not exceed 0.40% as a percentage of average daily net assets. |
See accompanying Notes to the Financial Statements.
61
Barings Active Short Duration Bond Fund 2019 Annual Report
FINANCIAL HIGHLIGHTS(CONTINUED)
| | | | | | | | | | | | | | | | |
| | | CLASS Y | |
| | | FOR THE
YEAR
ENDED
JUNE 30,
2019 | | | FOR THE
YEAR
ENDED
JUNE 30,
2018 | | | FOR THE
YEAR
ENDED
JUNE 30,
2017 | | | PERIOD FROM
JULY 8, 2015
THROUGH
JUNE 30,
2016 (1) | |
| | | | |
| Per Common Share Data | | | | | | | | | | | | | | | | |
Net asset value, beginning of year | | $ | 9.87 | | | $ | 10.01 | | | $ | 9.97 | | | $ | 10.00 | |
Income from investment operations: | | | | | | | | | | | | | | | | |
Net investment income (2) | | | 0.30 | | | | 0.24 | | | | 0.20 | | | | 0.17 | |
Net realized and unrealized gain (loss) on investments | | | 0.07 | | | | (0.11 | ) | | | 0.04 | | | | (0.04 | )(3) |
| | | | | | | | | | | | | | | | |
Total increase from investment operations | | | 0.37 | | | | 0.13 | | | | 0.24 | | | | 0.13 | |
| | | | | | | | | | | | | | | | |
Less dividends and distributions: | | | | | | | | | | | | | | | | |
From net investment income | | | (0.29 | ) | | | (0.24 | ) | | | (0.20 | ) | | | (0.16 | ) |
From net realized gain | | | (0.02 | ) | | | (0.03 | ) | | | (0.00 | )(4) | | | – | |
| | | | | | | | | | | | | | | | |
Total dividends and distributions | | | (0.31 | ) | | | (0.27 | ) | | | (0.20 | ) | | | (0.16 | ) |
| | | | | | | | | | | | | | | | |
Net asset value, at end of year | | $ | 9.93 | | | $ | 9.87 | | | $ | 10.01 | | | $ | 9.97 | |
| | | | | | | | | | | | | | | | |
Total investment return (5) | | | 3.78 | % | | | 1.35 | % | | | 2.38 | % | | | 1.36 | %(6) |
| | | | | | | | | | | | | | | | |
| | | | |
| Supplemental Data and Ratios | | | | | | | | | | | | | | | | |
Net assets, end of year (000’s) | | $ | 578,272 | | | $ | 252,325 | | | $ | 204,464 | | | $ | 109,645 | |
Ratio of total expenses (before reductions and reimbursements) to average net assets | | | 0.61 | % | | | 0.70 | % | | | 0.82 | % | | | 0.87 | %(7) |
Ratio of net expenses to average net assets (8) | | | 0.40 | % | | | 0.40 | % | | | 0.40 | % | | | 0.41 | %(7) |
Ratio of net investment income to average net assets | | | 3.06 | % | | | 2.39 | % | | | 1.97 | % | | | 1.73 | %(7) |
Portfolio turnover rate | | | 43.15 | % | | | 53.33 | % | | | 88.52 | % | | | 218.67 | %(6) |
| (1) | | Fund commenced operations on July 8, 2015. |
| (2) | | Calculated using average shares outstanding. |
| (3) | | The per share amount varies from the net realized and unrealized gain/loss for the period because of the timing of sales of fund shares and the per share amount of realized and unrealized gains and losses at such time. |
| (4) | | Amount rounds to less than $.01 per share. |
| (5) | | Total investment return calculation assumes the reinvestment of dividends at actual prices pursuant to the Fund’s dividend reinvestment plan. |
| (7) | | Annualized for periods less than one full year. |
| (8) | | The Adviser has agreed to waive and/or reimburse certain fees and/or expense so that, on an annualized basis, such expenses incurred will not exceed 0.40% as a percentage of average daily net assets. |
See accompanying Notes to the Financial Statements.
62
Barings Diversified Income Fund (formerly Barings Total Return Bond Fund) 2019 Annual Report
FINANCIAL HIGHLIGHTS
| | | | | | | | | | | | | | | | |
| | | CLASS A | |
| | | FOR THE
YEAR
ENDED
JUNE 30,
2019 | | | FOR THE
YEAR
ENDED
JUNE 30,
2018 | | | FOR THE
YEAR
ENDED
JUNE 30,
2017 | | | PERIOD FROM
JULY 8, 2015
THROUGH
JUNE 30,
2016 (1) | |
| | | | |
| Per Common Share Data | | | | | | | | | | | | | | | | |
Net asset value, beginning of year | | $ | 9.77 | | | $ | 10.08 | | | $ | 10.18 | | | $ | 10.00 | |
Income from investment operations: | | | | | | | | | | | | | | | | |
Net investment income (2) | | | 0.30 | | | | 0.27 | | | | 0.25 | | | | 0.25 | |
Net realized and unrealized gain (loss) on investments | | | 0.06 | | | | (0.28 | ) | | | (0.09 | ) | | | 0.20 | |
| | | | | | | | | | | | | | | | |
Total increase (decrease) from investment operations | | | 0.36 | | | | (0.01 | ) | | | 0.16 | | | | 0.45 | |
| | | | | | | | | | | | | | | | |
Less dividends and distributions: | | | | | | | | | | | | | | | | |
From net investment income | | | (0.31 | ) | | | (0.29 | ) | | | (0.26 | ) | | | (0.25 | ) |
From net realized gain | | | – | | | | – | | | | – | | | | (0.02 | ) |
From return of capital | | | – | | | | (0.01 | ) | | | – | | | | – | |
| | | | | | | | | | | | | | | | |
Total dividends and distributions | | | (0.31 | ) | | | (0.30 | ) | | | (0.26 | ) | | | (0.27 | ) |
| | | | | | | | | | | | | | | | |
Net asset value, at end of year | | $ | 9.82 | | | $ | 9.77 | | | $ | 10.08 | | | $ | 10.18 | |
| | | | | | | | | | | | | | | | |
Total investment return (3) | | | 3.77 | % | | | (0.12 | )% | | | 1.65 | % | | | 4.63 | %(4) |
| | | | | | | | | | | | | | | | |
| | | | |
| Supplemental Data and Ratios | | | | | | | | | | | | | | | | |
Net assets, end of year (000’s) | | $ | 247 | | | $ | 207 | | | $ | 218 | | | $ | 211 | |
Ratio of total expenses (before reductions and reimbursements) to average net assets | | | 3.57 | % | | | 3.72 | % | | | 3.52 | % | | | 5.60 | %(5) |
Ratio of net expenses to average net assets (6)(7) | | | 0.79 | %(8) | | | 0.80 | % | | | 0.80 | % | | | 0.80 | %(5) |
Ratio of net investment income to average net assets | | | 3.11 | % | | | 2.70 | % | | | 2.49 | % | | | 2.52 | %(5) |
Portfolio turnover rate | | | 192.64 | % | | | 172.39 | % | | | 242.55 | % | | | 434.37 | %(4) |
| (1) | | Fund commenced operations on July 8, 2015. |
| (2) | | Calculated using average shares outstanding. |
| (3) | | Total investment return calculation does not consider the effects of sales loads and assumes the reinvestment of dividends at actual prices pursuant to the Fund’s dividend reinvestment plan. |
| (5) | | Annualized for periods less than one full year. |
| (6) | | The Adviser has agreed to waive and/or reimburse certain fees and/or expense so that, on an annualized basis, such expenses incurred will not exceed 0.80% as a percentage of average daily net assets. |
| (7) | | Ratio of net expenses to average net assets does not include expenses of the underlying fund in which the Fund invests. |
| (8) | | Net expenses reflect a voluntary expense reimbursement to prevent a negative yield. |
See accompanying Notes to the Financial Statements.
63
Barings Diversified Income Fund (formerly Barings Total Return Bond Fund) 2019 Annual Report
FINANCIAL HIGHLIGHTS(CONTINUED)
| | | | | | | | | | | | | | | | |
| | | CLASS C | |
| | | FOR THE
YEAR
ENDED
JUNE 30,
2019 | | | FOR THE
YEAR
ENDED
JUNE 30,
2018 | | | FOR THE
YEAR
ENDED
JUNE 30,
2017 | | | PERIOD FROM
JULY 8, 2015
THROUGH
JUNE 30,
2016 (1) | |
| | | | |
| Per Common Share Data | | | | | | | | | | | | | | | | |
Net asset value, beginning of year | | $ | 9.77 | | | $ | 10.08 | | | $ | 10.18 | | | $ | 10.00 | |
Income from investment operations: | | | | | | | | | | | | | | | | |
Net investment income (2) | | | 0.24 | | | | 0.19 | | | | 0.17 | | | | 0.17 | |
Net realized and unrealized gain (loss) on investments | | | 0.05 | | | | (0.27 | ) | | | (0.08 | ) | | | 0.21 | |
| | | | | | | | | | | | | | | | |
Total increase (decrease) from investment operations | | | 0.29 | | | | (0.08 | ) | | | 0.09 | | | | 0.38 | |
| | | | | | | | | | | | | | | | |
Less dividends and distributions: | | | | | | | | | | | | | | | | |
From net investment income | | | (0.24 | ) | | | (0.22 | ) | | | (0.19 | ) | | | (0.18 | ) |
From net realized gain | | | – | | | | – | | | | – | | | | (0.02 | ) |
From return of capital | | | – | | | | (0.01 | ) | | | – | | | | – | |
| | | | | | | | | | | | | | | | |
Total dividends and distributions | | | (0.24 | ) | | | (0.23 | ) | | | (0.19 | ) | | | (0.20 | ) |
| | | | | | | | | | | | | | | | |
Net asset value, at end of year | | $ | 9.82 | | | $ | 9.77 | | | $ | 10.08 | | | $ | 10.18 | |
| | | | | | | | | | | | | | | | |
Total investment return (3) | | | 2.99 | % | | | (0.87 | )% | | | 0.89 | % | | | 3.87 | %(4) |
| | | | | | | | | | | | | | | | |
| | | | |
| Supplemental Data and Ratios | | | | | | | | | | | | | | | | |
Net assets, end of year (000’s) | | $ | 197 | | | $ | 196 | | | $ | 202 | | | $ | 204 | |
Ratio of total expenses (before reductions and reimbursements) to average net assets | | | 4.75 | % | | | 4.60 | % | | | 4.41 | % | | | 6.38 | %(5) |
Ratio of net expenses to average net assets (6)(7) | | | 1.54 | %(8) | | | 1.55 | % | | | 1.55 | % | | | 1.55 | %(5) |
Ratio of net investment income to average net assets | | | 2.45 | % | | | 1.95 | % | | | 1.74 | % | | | 1.77 | %(5) |
Portfolio turnover rate | | | 192.64 | % | | | 172.39 | % | | | 242.55 | % | | | 434.37 | %(4) |
| (1) | | Fund commenced operations on July 8, 2015. |
| (2) | | Calculated using average shares outstanding. |
| (3) | | Total investment return calculation does not consider the effects of sales loads and assumes the reinvestment of dividends at actual prices pursuant to the Fund’s dividend reinvestment plan. |
| (5) | | Annualized for periods less than one full year. |
| (6) | | The Adviser has agreed to waive and/or reimburse certain fees and/or expense so that, on an annualized basis, such expenses incurred will not exceed 1.55% as a percentage of average daily net assets. |
| (7) | | Ratio of net expenses to average net assets does not include expenses of the underlying fund in which the Fund invests. |
| (8) | | Net expenses reflect a voluntary expense reimbursement to prevent a negative yield. |
See accompanying Notes to the Financial Statements.
64
Barings Diversified Income Fund (formerly Barings Total Return Bond Fund) 2019 Annual Report
FINANCIAL HIGHLIGHTS(CONTINUED)
| | | | | | | | | | | | | | | | |
| | | CLASS I | |
| | | FOR THE
YEAR
ENDED
JUNE 30,
2019 | | | FOR THE
YEAR
ENDED
JUNE 30,
2018 | | | FOR THE
YEAR
ENDED
JUNE 30,
2017 | | | PERIOD FROM
JULY 8, 2015
THROUGH
JUNE 30,
2016 (1) | |
| | | | |
| Per Common Share Data | | | | | | | | | | | | | | | | |
Net asset value, beginning of year | | $ | 9.77 | | | $ | 10.08 | | | $ | 10.18 | | | $ | 10.00 | |
Income from investment operations: | | | | | | | | | | | | | | | | |
Net investment income (2) | | | 0.33 | | | | 0.29 | | | | 0.28 | | | | 0.27 | |
Net realized and unrealized gain (loss) on investments | | | 0.05 | | | | (0.27 | ) | | | (0.09 | ) | | | 0.20 | |
| | | | | | | | | | | | | | | | |
Total increase from investment operations | | | 0.38 | | | | 0.02 | | | | 0.19 | | | | 0.47 | |
| | | | | | | | | | | | | | | | |
Less dividends and distributions: | | | | | | | | | | | | | | | | |
From net investment income | | | (0.33 | ) | | | (0.32 | ) | | | (0.29 | ) | | | (0.27 | ) |
From net realized gain | | | – | | | | – | | | | – | | | | (0.02 | ) |
From return of capital | | | – | | | | (0.01 | ) | | | – | | | | – | |
| | | | | | | | | | | | | | | | |
Total dividends and distributions | | | (0.33 | ) | | | (0.33 | ) | | | (0.29 | ) | | | (0.29 | ) |
| | | | | | | | | | | | | | | | |
Net asset value, at end of year | | $ | 9.82 | | | $ | 9.77 | | | $ | 10.08 | | | $ | 10.18 | |
| | | | | | | | | | | | | | | | |
Total investment return (3) | | | 4.01 | % | | | 0.13 | % | | | 1.90 | % | | | 4.89 | %(4) |
| | | | | | | | | | | | | | | | |
| | | | |
| Supplemental Data and Ratios | | | | | | | | | | | | | | | | |
Net assets, end of year (000’s) | | $ | 12,130 | | | $ | 12,070 | | | $ | 12,457 | | | $ | 12,582 | |
Ratio of total expenses (before reductions and reimbursements) to average net assets | | | 1.29 | % | | | 1.30 | % | | | 1.36 | % | | | 1.37 | %(5) |
Ratio of net expenses to average net assets (6)(7) | | | 0.55 | %(8) | | | 0.55 | % | | | 0.55 | % | | | 0.55 | %(5) |
Ratio of net investment income to average net assets | | | 3.44 | % | | | 2.94 | % | | | 2.74 | % | | | 2.77 | %(5) |
Portfolio turnover rate | | | 192.64 | % | | | 172.39 | % | | | 242.55 | % | | | 434.37 | %(4) |
| (1) | | Fund commenced operations on July 8, 2015. |
| (2) | | Calculated using average shares outstanding. |
| (3) | | Total investment return calculation assumes the reinvestment of dividends at actual prices pursuant to the Fund’s dividend reinvestment plan. |
| (5) | | Annualized for periods less than one full year. |
| (6) | | The Adviser has agreed to waive and/or reimburse certain fees and/or expense so that, on an annualized basis, such expenses incurred will not exceed 0.55% as a percentage of average daily net assets. |
| (7) | | Ratio of net expenses to average net assets does not include expenses of the underlying fund in which the Fund invests. |
| (8) | | Net expenses reflect a voluntary expense reimbursement to prevent a negative yield. |
See accompanying Notes to the Financial Statements.
65
Barings Diversified Income Fund (formerly Barings Total Return Bond Fund) 2019 Annual Report
FINANCIAL HIGHLIGHTS(CONTINUED)
| | | | | | | | | | | | | | | | |
| | | CLASS Y | |
| | | FOR THE
YEAR
ENDED
JUNE 30,
2019 | | | FOR THE
YEAR
ENDED
JUNE 30,
2018 | | | FOR THE
YEAR
ENDED
JUNE 30,
2017 | | | PERIOD FROM
JULY 8, 2015
THROUGH
JUNE 30,
2016 (1) | |
| | | | |
| Per Common Share Data | | | | | | | | | | | | | | | | |
Net asset value, beginning of year | | $ | 9.77 | | | $ | 10.08 | | | $ | 10.18 | | | $ | 10.00 | |
Income from investment operations: | | | | | | | | | | | | | | | | |
Net investment income (2) | | | 0.33 | | | | 0.29 | | | | 0.27 | | | | 0.27 | |
Net realized and unrealized gain (loss) on investments | | | 0.05 | | | | (0.27 | ) | | | (0.08 | ) | | | 0.20 | |
| | | | | | | | | | | | | | | | |
Total increase from investment operations | | | 0.38 | | | | 0.02 | | | | 0.19 | | | | 0.47 | |
| | | | | | | | | | | | | | | | |
Less dividends and distributions: | | | | | | | | | | | | | | | | |
From net investment income | | | (0.33 | ) | | | (0.32 | ) | | | (0.29 | ) | | | (0.27 | ) |
From net realized gain | | | – | | | | – | | | | – | | | | (0.02 | ) |
From return of capital | | | – | | | | (0.01 | ) | | | – | | | | – | |
| | | | | | | | | | | | | | | | |
Total dividends and distributions | | | (0.33 | ) | | | (0.33 | ) | | | (0.29 | ) | | | (0.29 | ) |
| | | | | | | | | | | | | | | | |
Net asset value, at end of year | | $ | 9.82 | | | $ | 9.77 | | | $ | 10.08 | | | $ | 10.18 | |
| | | | | | | | | | | | | | | | |
Total investment return (3) | | | 4.01 | % | | | 0.13 | % | | | 1.90 | % | | | 4.89 | %(4) |
| | | | | | | | | | | | | | | | |
| | | | |
| Supplemental Data and Ratios | | | | | | | | | | | | | | | | |
Net assets, end of year (000’s) | | $ | 29,925 | | | $ | 16,414 | | | $ | 17,478 | | | $ | 13,011 | |
Ratio of total expenses (before reductions and reimbursements) to average net assets | | | 1.30 | % | | | 1.33 | % | | | 1.36 | % | | | 1.36 | %(5) |
Ratio of net expenses to average net assets (6)(7) | | | 0.55 | %(8) | | | 0.55 | % | | | 0.55 | % | | | 0.55 | %(5) |
Ratio of net investment income to average net assets | | | 3.42 | % | | | 2.95 | % | | | 2.72 | % | | | 2.77 | %(5) |
Portfolio turnover rate | | | 192.64 | % | | | 172.39 | % | | | 242.55 | % | | | 434.37 | %(4) |
| (1) | | Fund commenced operations on July 8, 2015. |
| (2) | | Calculated using average shares outstanding. |
| (3) | | Total investment return calculation assumes the reinvestment of dividends at actual prices pursuant to the Fund’s dividend reinvestment plan. |
| (5) | | Annualized for periods less than one full year. |
| (6) | | The Adviser has agreed to waive and/or reimburse certain fees and/or expense so that, on an annualized basis, such expenses incurred will not exceed 0.55% as a percentage of average daily net assets. |
| (7) | | Ratio of net expenses to average net assets does not include expenses of the underlying fund in which the Fund invests. |
| (8) | | Net expenses reflect a voluntary expense reimbursement to prevent a negative yield. |
See accompanying Notes to the Financial Statements.
66
Barings Emerging Markets Debt Blended Total Return Fund 2019 Annual Report
FINANCIAL HIGHLIGHTS
| | | | | | | | | | | | | | | | |
| | | CLASS A | |
| | | FOR THE
YEAR
ENDED
JUNE 30,
2019 | | | FOR THE
YEAR
ENDED
JUNE 30,
2018 | | | FOR THE
YEAR
ENDED
JUNE 30,
2017 | | | PERIOD FROM
OCTOBER 21, 2015
THROUGH
JUNE 30,
2016 (1) | |
| | | | |
| Per Common Share Data | | | | | | | | | | | | | | | | |
Net asset value, beginning of year | | $ | 9.51 | | | $ | 10.55 | | | $ | 9.90 | | | $ | 10.00 | |
Income from investment operations: | | | | | | | | | | | | | | | | |
Net investment income (2) | | | 0.55 | | | | 0.45 | | | | 0.42 | | | | 0.43 | |
Net realized and unrealized gain (loss) on investments | | | 0.60 | | | | (0.64 | ) | | | 0.73 | | | | (0.19 | ) |
| | | | | | | | | | | | | | | | |
Total increase (decrease) from investment operations | | | 1.15 | | | | (0.19 | ) | | | 1.15 | | | | 0.24 | |
| | | | | | | | | | | | | | | | |
Less dividends and distributions: | | | | | | | | | | | | | | | | |
From net investment income | | | (0.55 | ) | | | (0.55 | ) | | | (0.50 | ) | | | (0.34 | ) |
From net realized gain | | | – | | | | (0.30 | ) | | | – | | | | (0.00 | )(3) |
From return of capital | | | (0.05 | ) | | | – | | | | – | | | | – | |
| | | | | | | | | | | | | | | | |
Total dividends and distributions | | | (0.60 | ) | | | (0.85 | ) | | | (0.50 | ) | | | (0.34 | ) |
| | | | | | | | | | | | | | | | |
Net asset value, at end of year | | $ | 10.06 | | | $ | 9.51 | | | $ | 10.55 | | | $ | 9.90 | |
| | | | | | | | | | | | | | | | |
Total investment return (4) | | | 12.59 | % | | | (2.21 | )% | | | 11.94 | % | | | 2.62 | %(5) |
| | | | | | | | | | | | | | | | |
| | | | |
| Supplemental Data and Ratios | | | | | | | | | | | | | | | | |
Net assets, end of year (000’s) | | $ | 405 | | | $ | 566 | | | $ | 211 | | | $ | 198 | |
Ratio of total expenses (before reductions and reimbursements) to average net assets | | | 3.19 | % | | | 3.63 | % | | | 5.77 | % | | | 6.82 | %(6) |
Ratio of net expenses to average net assets (7) | | | 1.02 | %(8) | | | 1.11 | %(8) | | | 1.15 | %(8) | | | 1.16 | %(6) |
Ratio of net investment income to average net assets | | | 5.74 | % | | | 4.33 | % | | | 4.17 | % | | | 6.52 | %(6) |
Portfolio turnover rate | | | 89.98 | % | | | 51.95 | % | | | 55.66 | % | | | 83.26 | %(5) |
| (1) | | Fund commenced operations on October 21, 2015. |
| (2) | | Calculated using average shares outstanding. |
| (3) | | Amount rounds to less than $.01 per share. |
| (4) | | Total investment return calculation does not consider the effects of sales loads and assumes the reinvestment of dividends at actual prices pursuant to the Fund’s dividend reinvestment plan. |
| (6) | | Annualized for periods less than one full year. |
| (7) | | The Adviser has agreed to waive and/or reimburse certain fees and/or expense so that, on an annualized basis, such expenses incurred will not exceed 1.20% as a percentage of average daily net assets. |
| (8) | | Net expenses reflect a voluntary expense reimbursement to prevent a negative yield. |
See accompanying Notes to the Financial Statements.
67
Barings Emerging Markets Debt Blended Total Return Fund 2019 Annual Report
FINANCIAL HIGHLIGHTS(CONTINUED)
| | | | | | | | | | | | | | | | |
| | | CLASS C | |
| | | FOR THE
YEAR
ENDED
JUNE 30,
2019 | | | FOR THE
YEAR
ENDED
JUNE 30,
2018 | | | FOR THE
YEAR
ENDED
JUNE 30,
2017 | | | PERIOD FROM
OCTOBER 21, 2015
THROUGH
JUNE 30,
2016 (1) | |
| | | | |
| Per Common Share Data | | | | | | | | | | | | | | | | |
Net asset value, beginning of year | | $ | 9.51 | | | $ | 10.55 | | | $ | 9.90 | | | $ | 10.00 | |
Income from investment operations: | | | | | | | | | | | | | | | | |
Net investment income (2) | | | 0.49 | | | | 0.48 | | | | 0.35 | | | | 0.38 | |
Net realized and unrealized gain (loss) on investments | | | 0.59 | | | | (0.74 | ) | | | 0.73 | | | | (0.19 | ) |
| | | | | | | | | | | | | | | | |
Total increase (decrease) from investment operations | | | 1.08 | | | | (0.26 | ) | | | 1.08 | | | | 0.19 | |
| | | | | | | | | | | | | | | | |
Less dividends and distributions: | | | | | | | | | | | | | | | | |
From net investment income | | | (0.48 | ) | | | (0.48 | ) | | | (0.43 | ) | | | (0.29 | ) |
From net realized gain | | | – | | | | (0.30 | ) | | | – | | | | (0.00 | )(3) |
From return of capital | | | (0.05 | ) | | | – | | | | – | | | | – | |
| | | | | | | | | | | | | | | | |
Total dividends and distributions | | | (0.53 | ) | | | (0.78 | ) | | | (0.43 | ) | | | (0.29 | ) |
| | | | | | | | | | | | | | | | |
Net asset value, at end of year | | $ | 10.06 | | | $ | 9.51 | | | $ | 10.55 | | | $ | 9.90 | |
| | | | | | | | | | | | | | | | |
Total investment return (4) | | | 11.78 | % | | | (2.90 | )% | | | 11.11 | % | | | 2.10 | %(5) |
| | | | | | | | | | | | | | | | |
| | | | |
| Supplemental Data and Ratios | | | | | | | | | | | | | | | | |
Net assets, end of year (000’s) | | $ | 261 | | | $ | 277 | | | $ | 222 | | | $ | 198 | |
Ratio of total expenses (before reductions and reimbursements) to average net assets | | | 5.02 | % | | | 5.85 | % | | | 6.47 | % | | | 7.57 | %(6) |
Ratio of net expenses to average net assets (7) | | | 1.71 | %(8) | | | 1.85 | %(8) | | | 1.89 | %(8) | | | 1.90 | %(6) |
Ratio of net investment income to average net assets | | | 5.14 | % | | | 4.63 | % | | | 3.44 | % | | | 5.79 | %(6) |
Portfolio turnover rate | | | 89.98 | % | | | 51.95 | % | | | 55.66 | % | | | 83.26 | %(5) |
| (1) | | Fund commenced operations on October 21, 2015. |
| (2) | | Calculated using average shares outstanding. |
| (3) | | Amount rounds to less than $.01 per share. |
| (4) | | Total investment return calculation does not consider the effects of sales loads and assumes the reinvestment of dividends at actual prices pursuant to the Fund’s dividend reinvestment plan. |
| (6) | | Annualized for periods less than one full year. |
| (7) | | The Adviser has agreed to waive and/or reimburse certain fees and/or expense so that, on an annualized basis, such expenses incurred will not exceed 1.95% as a percentage of average daily net assets. |
| (8) | | Net expenses reflect a voluntary expense reimbursement to prevent a negative yield. |
See accompanying Notes to the Financial Statements.
68
Barings Emerging Markets Debt Blended Total Return Fund 2019 Annual Report
FINANCIAL HIGHLIGHTS(CONTINUED)
| | | | | | | | | | | | | | | | |
| | | CLASS I | |
| | | FOR THE
YEAR
ENDED
JUNE 30,
2019 | | | FOR THE
YEAR
ENDED
JUNE 30,
2018 | | | FOR THE
YEAR
ENDED
JUNE 30,
2017 | | | PERIOD FROM
OCTOBER 21, 2015
THROUGH
JUNE 30,
2016 (1) | |
| | | | |
| Per Common Share Data | | | | | | | | | | | | | | | | |
Net asset value, beginning of year | | $ | 9.51 | | | $ | 10.55 | | | $ | 9.90 | | | $ | 10.00 | |
Income from investment operations: | | | | | | | | | | | | | | | | |
Net investment income (2) | | | 0.59 | | | | 0.54 | | | | 0.45 | | | | 0.45 | |
Net realized and unrealized gain (loss) on investments | | | 0.58 | | | | (0.70 | ) | | | 0.73 | | | | (0.19 | ) |
| | | | | | | | | | | | | | | | |
Total increase (decrease) from investment operations | | | 1.17 | | | | (0.16 | ) | | | 1.18 | | | | 0.26 | |
| | | | | | | | | | | | | | | | |
Less dividends and distributions: | | | | | | | | | | | | | | | | |
From net investment income | | | (0.57 | ) | | | (0.58 | ) | | | (0.53 | ) | | | (0.36 | ) |
From net realized gain | | | – | | | | (0.30 | ) | | | – | | | | (0.00 | )(3) |
From return of capital | | | (0.05 | ) | | | – | | | | – | | | | – | |
| | | | | | | | | | | | | | | | |
Total dividends and distributions | | | (0.62 | ) | | | (0.88 | ) | | | (0.53 | ) | | | (0.36 | ) |
| | | | | | | | | | | | | | | | |
Net asset value, at end of year | | $ | 10.06 | | | $ | 9.51 | | | $ | 10.55 | | | $ | 9.90 | |
| | | | | | | | | | | | | | | | |
Total investment return (4) | | | 12.86 | % | | | (1.94 | )% | | | 12.22 | % | | | 2.79 | %(5) |
| | | | | | | | | | | | | | | | |
| | | | |
| Supplemental Data and Ratios | | | | | | | | | | | | | | | | |
Net assets, end of year (000’s) | | $ | 23,964 | | | $ | 22,650 | | | $ | 5,063 | | | $ | 4,753 | |
Ratio of total expenses (before reductions and reimbursements) to average net assets | | | 1.44 | % | | | 1.94 | % | | | 2.76 | % | | | 2.58 | %(6) |
Ratio of net expenses to average net assets (7) | | | 0.73 | %(8) | | | 0.80 | %(8) | | | 0.90 | %(8) | | | 0.92 | %(6) |
Ratio of net investment income to average net assets | | | 6.18 | % | | | 5.31 | % | | | 4.42 | % | | | 6.77 | %(6) |
Portfolio turnover rate | | | 89.98 | % | | | 51.95 | % | | | 55.66 | % | | | 83.26 | %(5) |
| (1) | | Fund commenced operations on October 21, 2015. |
| (2) | | Calculated using average shares outstanding. |
| (3) | | Amount rounds to less than $.01 per share. |
| (4) | | Total investment return calculation assumes the reinvestment of dividends at actual prices pursuant to the Fund’s dividend reinvestment plan. |
| (6) | | Annualized for periods less than one full year. |
| (7) | | The Adviser has agreed to waive and/or reimburse certain fees and/or expense so that, on an annualized basis, such expenses incurred will not exceed 0.95% as a percentage of average daily net assets. |
| (8) | | Net expenses reflect a voluntary expense reimbursement to prevent a negative yield. |
See accompanying Notes to the Financial Statements.
69
Barings Emerging Markets Debt Blended Total Return Fund 2019 Annual Report
FINANCIAL HIGHLIGHTS(CONTINUED)
| | | | | | | | | | | | | | | | |
| | | CLASS Y | |
| | | FOR THE
YEAR
ENDED
JUNE 30,
2019 | | | FOR THE
YEAR
ENDED
JUNE 30,
2018 | | | FOR THE
YEAR
ENDED
JUNE 30,
2017 | | | PERIOD FROM
OCTOBER 21, 2015
THROUGH
JUNE 30,
2016 (1) | |
| | | | |
| Per Common Share Data | | | | | | | | | | | | | | | | |
Net asset value, beginning of year | | $ | 9.51 | | | $ | 10.55 | | | $ | 9.90 | | | $ | 10.00 | |
Income from investment operations: | | | | | | | | | | | | | | | | |
Net investment income (2) | | | 0.59 | | | | 0.55 | | | | 0.45 | | | | 0.45 | |
Net realized and unrealized gain (loss) on investments | | | 0.58 | | | | (0.71 | ) | | | 0.73 | | | | (0.19 | ) |
| | | | | | | | | | | | | | | | |
Total increase (decrease) from investment operations | | | 1.17 | | | | (0.16 | ) | | | 1.18 | | | | 0.26 | |
| | | | | | | | | | | | | | | | |
Less dividends and distributions: | | | | | | | | | | | | | | | | |
From net investment income | | | (0.57 | ) | | | (0.58 | ) | | | (0.53 | ) | | | (0.36 | ) |
From net realized gain | | | – | | | | (0.30 | ) | | | – | | | | (0.00 | )(3) |
From return of capital | | | (0.05 | ) | | | – | | | | – | | | | – | |
| | | | | | | | | | | | | | | | |
Total dividends and distributions | | | (0.62 | ) | | | (0.88 | ) | | | (0.53 | ) | | | (0.36 | ) |
| | | | | | | | | | | | | | | | |
Net asset value, at end of year | | $ | 10.06 | | | $ | 9.51 | | | $ | 10.55 | | | $ | 9.90 | |
| | | | | | | | | | | | | | | | |
Total investment return (4) | | | 12.86 | % | | | (1.94 | )% | | | 12.22 | % | | | 2.79 | %(5) |
| | | | | | | | | | | | | | | | |
| | | | |
| Supplemental Data and Ratios | | | | | | | | | | | | | | | | |
Net assets, end of year (000’s) | | $ | 25,805 | | | $ | 23,122 | | | $ | 5,340 | | | $ | 4,754 | |
Ratio of total expenses (before reductions and reimbursements) to average net assets | | | 1.44 | % | | | 1.95 | % | | | 2.77 | % | | | 2.58 | %(6) |
Ratio of net expenses to average net assets (7) | | | 0.72 | %(8) | | | 0.80 | %(8) | | | 0.90 | %(8) | | | 0.92 | %(6) |
Ratio of net investment income to average net assets | | | 6.19 | % | | | 5.38 | % | | | 4.43 | % | | | 6.77 | %(6) |
Portfolio turnover rate | | | 89.98 | % | | | 51.95 | % | | | 55.66 | % | | | 83.26 | %(5) |
| (1) | | Fund commenced operations on October 21, 2015. |
| (2) | | Calculated using average shares outstanding. |
| (3) | | Amount rounds to less than $.01 per share. |
| (4) | | Total investment return calculation assumes the reinvestment of dividends at actual prices pursuant to the Fund’s dividend reinvestment plan. |
| (6) | | Annualized for periods less than one full year. |
| (7) | | The Adviser has agreed to waive and/or reimburse certain fees and/or expense so that, on an annualized basis, such expenses incurred will not exceed 0.95% as a percentage of average daily net assets. |
| (8) | | Net expenses reflect a voluntary expense reimbursement to prevent a negative yield. |
See accompanying Notes to the Financial Statements.
70
Barings Global Emerging Markets Equity Fund 2019 Annual Report
FINANCIAL HIGHLIGHTS
| | | | |
| | | CLASS A | |
| | | PERIOD FROM
SEPTEMBER 17, 2018
THROUGH
JUNE 30, 2019 (1) | |
| |
| Per Common Share Data | | | | |
Net asset value, beginning of year | | $ | 10.00 | |
Income from investment operations: | | | | |
Net investment income (2) | | | 0.06 | |
Net realized and unrealized gain on investments | | | 1.04 | |
| | | | |
Total increase from investment operations | | | 1.10 | |
| | | | |
Net asset value, at end of year | | $ | 11.10 | |
| | | | |
Total investment return (3) | | | 11.04 | %(4) |
| | | | |
| |
| Supplemental Data and Ratios | | | | |
Net assets, end of year (000’s) | | $ | 111 | |
Ratio of total expenses (before reductions and reimbursements) to average net assets | | | 7.43 | %(5) |
Ratio of net expenses to average net assets (6) | | | 1.45 | %(5) |
Ratio of net investment income to average net assets | | | 0.73 | %(5) |
Portfolio turnover rate | | | 7.48 | %(4) |
| (1) | | Fund commenced operations on September 17, 2018. |
| (2) | | Calculated using average shares outstanding. |
| (3) | | Total investment return calculation does not consider the effects of sales loads and assumes the reinvestment of dividends at actual prices pursuant to the Fund’s dividend reinvestment plan. |
| (5) | | Annualized for periods less than one full year. |
| (6) | | The Adviser has agreed to waive and/or reimburse certain fees and/or expense so that, on an annualized basis, such expenses incurred will not exceed 1.45% as a percentage of average daily net assets. |
See accompanying Notes to the Financial Statements.
71
Barings Global Emerging Markets Equity Fund 2019 Annual Report
FINANCIAL HIGHLIGHTS(CONTINUED)
| | | | |
| | | CLASS C | |
| | | PERIOD FROM
SEPTEMBER 17, 2018
THROUGH
JUNE 30, 2019 (1) | |
| |
| Per Common Share Data | | | | |
Net asset value, beginning of year | | $ | 10.00 | |
Income from investment operations: | | | | |
Net investment income (2) | | | 0.00 | (3) |
Net realized and unrealized gain on investments | | | 1.04 | |
| | | | |
Total increase from investment operations | | | 1.04 | |
| | | | |
Net asset value, at end of year | | $ | 11.04 | |
| | | | |
Total investment return (4) | | | 10.39 | %(5) |
| | | | |
| |
| Supplemental Data and Ratios | | | | |
Net assets, end of year (000’s) | | $ | 110 | |
Ratio of total expenses (before reductions and reimbursements) to average net assets | | | 8.19 | %(6) |
Ratio of net expenses to average net assets (7) | | | 2.20 | %(6) |
Ratio of net investment loss to average net assets | | | (0.03 | )%(6) |
Portfolio turnover rate | | | 7.48 | %(5) |
| (1) | | Fund commenced operations on September 17, 2018. |
| (2) | | Calculated using average shares outstanding. |
| (3) | | Amount rounds to less than $0.01 per share. |
| (4) | | Total investment return calculation does not consider the effects of sales loads and assumes the reinvestment of dividends at actual prices pursuant to the Fund’s dividend reinvestment plan. |
| (6) | | Annualized for periods less than one full year. |
| (7) | | The Adviser has agreed to waive and/or reimburse certain fees and/or expense so that, on an annualized basis, such expenses incurred will not exceed 2.20% as a percentage of average daily net assets. |
See accompanying Notes to the Financial Statements.
72
Barings Global Emerging Markets Equity Fund 2019 Annual Report
FINANCIAL HIGHLIGHTS(CONTINUED)
| | | | |
| | | CLASS I | |
| | | PERIOD FROM
SEPTEMBER 17, 2018
THROUGH
JUNE 30, 2019 (1) | |
| |
| Per Common Share Data | | | | |
Net asset value, beginning of year | | $ | 10.00 | |
Income from investment operations: | | | | |
Net investment income (2) | | | 0.08 | |
Net realized and unrealized gain on investments | | | 1.05 | |
| | | | |
Total increase from investment operations | | | 1.13 | |
| | | | |
Net asset value, at end of year | | $ | 11.13 | |
| | | | |
Total investment return (3) | | | 11.26 | %(4) |
| | | | |
| |
| Supplemental Data and Ratios | | | | |
Net assets, end of year (000’s) | | $ | 5,452 | |
Ratio of total expenses (before reductions and reimbursements) to average net assets | | | 2.94 | %(5) |
Ratio of net expenses to average net assets (6) | | | 1.20 | %(5) |
Ratio of net investment income to average net assets | | | 0.98 | %(5) |
Portfolio turnover rate | | | 7.48 | %(4) |
| (1) | | Fund commenced operations on September 17, 2018. |
| (2) | | Calculated using average shares outstanding. |
| (3) | | Total investment return calculation assumes the reinvestment of dividends at actual prices pursuant to the Fund’s dividend reinvestment plan. |
| (5) | | Annualized for periods less than one full year. |
| (6) | | The Adviser has agreed to waive and/or reimburse certain fees and/or expense so that, on an annualized basis, such expenses incurred will not exceed 1.20% as a percentage of average daily net assets. |
See accompanying Notes to the Financial Statements.
73
Barings Global Emerging Markets Equity Fund 2019 Annual Report
FINANCIAL HIGHLIGHTS(CONTINUED)
| | | | |
| | | CLASS Y | |
| | | PERIOD FROM
SEPTEMBER 17, 2018
THROUGH
JUNE 30, 2019 (1) | |
| |
| Per Common Share Data | | | | |
Net asset value, beginning of year | | $ | 10.00 | |
Income from investment operations: | | | | |
Net investment income (2) | | | 0.08 | |
Net realized and unrealized gain on investments | | | 1.05 | |
| | | | |
Total increase from investment operations | | | 1.13 | |
| | | | |
Net asset value, at end of year | | $ | 11.13 | |
| | | | |
Total investment return (3) | | | 11.26 | %(4) |
| | | | |
| |
| Supplemental Data and Ratios | | | | |
Net assets, end of year (000’s) | | $ | 5,452 | |
Ratio of total expenses (before reductions and reimbursements) to average net assets | | | 2.94 | %(5) |
Ratio of net expenses to average net assets (6) | | | 1.20 | %(5) |
Ratio of net investment income to average net assets | | | 0.98 | %(5) |
Portfolio turnover rate | | | 7.48 | %(4) |
| (1) | | Fund commenced operations on September 17, 2018. |
| (2) | | Calculated using average shares outstanding. |
| (3) | | Total investment return calculation assumes the reinvestment of dividends at actual prices pursuant to the Fund’s dividend reinvestment plan. |
| (5) | | Annualized for periods less than one full year. |
| (6) | | The Adviser has agreed to waive and/or reimburse certain fees and/or expense so that, on an annualized basis, such expenses incurred will not exceed 1.20% as a percentage of average daily net assets. |
See accompanying Notes to the Financial Statements.
74
Barings Global High Yield Fund 2019 Annual Report
FINANCIAL HIGHLIGHTS
| | | | | | | | | | | | | | | | |
| | | CLASS A | |
| | | FOR THE
YEAR
ENDED
JUNE 30,
2019 | | | FOR THE
YEAR
ENDED
JUNE 30,
2018 | | | FOR THE
YEAR
ENDED
JUNE 30,
2017 | | | PERIOD FROM
OCTOBER 30, 2015
THROUGH
JUNE 30,
2016 (1) | |
| | | | |
| Per Common Share Data | | | | | | | | | | | | | | | | |
Net asset value, beginning of year | | $ | 9.78 | | | $ | 10.44 | | | $ | 10.05 | | | $ | 10.00 | |
Income from investment operations: | | | | | | | | | | | | | | | | |
Net investment income (2) | | | 0.58 | | | | 0.60 | | | | 0.64 | | | | 0.38 | |
Net realized and unrealized gain (loss) on investments | | | (0.05 | ) | | | (0.41 | ) | | | 0.77 | | | | 0.05 | |
| | | | | | | | | | | | | | | | |
Total increase from investment operations | | | 0.53 | | | | 0.19 | | | | 1.41 | | | | 0.43 | |
| | | | | | | | | | | | | | | | |
Less dividends and distributions: | | | | | | | | | | | | | | | | |
From net investment income | | | (0.59 | ) | | | (0.60 | ) | | | (0.64 | ) | | | (0.38 | ) |
From net realized gain | | | (0.21 | ) | | | (0.25 | ) | | | (0.38 | ) | | | – | |
| | | | | | | | | | | | | | | | |
Total dividends and distributions | | | (0.80 | ) | | | (0.85 | ) | | | (1.02 | ) | | | (0.38 | ) |
| | | | | | | | | | | | | | | | |
Net asset value, at end of year | | $ | 9.51 | | | $ | 9.78 | | | $ | 10.44 | | | $ | 10.05 | |
| | | | | | | | | | | | | | | | |
Total investment return (3) | | | 5.79 | % | | | 1.79 | % | | | 14.61 | % | | | 4.45 | %(4) |
| | | | | | | | | | | | | | | | |
| | | | |
| Supplemental Data and Ratios | | | | | | | | | | | | | | | | |
Net assets, end of year (000’s) | | $ | 2,302 | | | $ | 106 | | | $ | 111 | | | $ | 101 | |
Ratio of total expenses (before reductions and reimbursements) to average net assets | | | 4.15 | % | | | 6.55 | % | | | 6.27 | % | | | 7.14 | %(5) |
Ratio of net expenses to average net assets (6) | | | 1.05 | % | | | 1.05 | % | | | 1.05 | % | | | 1.04 | %(5) |
Ratio of net investment income to average net assets | | | 6.08 | % | | | 5.89 | % | | | 6.20 | % | | | 5.83 | %(5) |
Portfolio turnover rate | | | 67.53 | % | | | 65.26 | % | | | 87.34 | % | | | 83.24 | %(4) |
| (1) | | Fund commenced operations on October 30, 2015. |
| (2) | | Calculated using average shares outstanding. |
| (3) | | Total investment return calculation does not consider the effects of sales loads and assumes the reinvestment of dividends at actual prices pursuant to the Fund’s dividend reinvestment plan. |
| (5) | | Annualized for periods less than one full year. |
| (6) | | The Adviser has agreed to waive and/or reimburse certain fees and/or expense so that, on an annualized basis, such expenses incurred will not exceed 1.05% as a percentage of average daily net assets. |
See accompanying Notes to the Financial Statements.
75
Barings Global High Yield Fund 2019 Annual Report
FINANCIAL HIGHLIGHTS(CONTINUED)
| | | | | | | | | | | | | | | | |
| | | CLASS C | |
| | | FOR THE
YEAR
ENDED
JUNE 30,
2019 | | | FOR THE
YEAR
ENDED
JUNE 30,
2018 | | | FOR THE
YEAR
ENDED
JUNE 30,
2017 | | | PERIOD FROM
OCTOBER 30, 2015
THROUGH
JUNE 30,
2016 (1) | |
| | | | |
| Per Common Share Data | | | | | | | | | | | | | | | | |
Net asset value, beginning of year | | $ | 9.78 | | | $ | 10.44 | | | $ | 10.05 | | | $ | 10.00 | |
Income from investment operations: | | | | | | | | | | | | | | | | |
Net investment income (2) | | | 0.52 | | | | 0.52 | | | | 0.56 | | | | 0.33 | |
Net realized and unrealized gain (loss) on investments | | | (0.05 | ) | | | (0.41 | ) | | | 0.77 | | | | 0.05 | |
| | | | | | | | | | | | | | | | |
Total increase from investment operations | | | 0.47 | | | | 0.11 | | | | 1.33 | | | | 0.38 | |
| | | | | | | | | | | | | | | | |
Less dividends and distributions: | | | | | | | | | | | | | | | | |
From net investment income | | | (0.52 | ) | | | (0.52 | ) | | | (0.56 | ) | | | (0.33 | ) |
From net realized gain | | | (0.21 | ) | | | (0.25 | ) | | | (0.38 | ) | | | – | |
| | | | | | | | | | | | | | | | |
Total dividends and distributions | | | (0.73 | ) | | | (0.77 | ) | | | (0.94 | ) | | | (0.33 | ) |
| | | | | | | | | | | | | | | | |
Net asset value, at end of year | | $ | 9.52 | | | $ | 9.78 | | | $ | 10.44 | | | $ | 10.05 | |
| | | | | | | | | | | | | | | | |
Total investment return (3) | | | 5.13 | % | | | 1.04 | % | | | 13.75 | % | | | 3.94 | %(4) |
| | | | | | | | | | | | | | | | |
| | | | |
| Supplemental Data and Ratios | | | | | | | | | | | | | | | | |
Net assets, end of year (000’s) | | $ | 242 | | | $ | 197 | | | $ | 247 | | | $ | 101 | |
Ratio of total expenses (before reductions and reimbursements) to average net assets | | | 5.32 | % | | | 4.80 | % | | | 4.94 | % | | | 7.89 | %(5) |
Ratio of net expenses to average net assets (6) | | | 1.80 | % | | | 1.80 | % | | | 1.80 | % | | | 1.78 | %(5) |
Ratio of net investment income to average net assets | | | 5.40 | % | | | 5.14 | % | | | 5.40 | % | | | 5.09 | %(5) |
Portfolio turnover rate | | | 67.53 | % | | | 65.26 | % | | | 87.34 | % | | | 83.24 | %(4) |
| (1) | | Fund commenced operations on October 30, 2015. |
| (2) | | Calculated using average shares outstanding. |
| (3) | | Total investment return calculation does not consider the effects of sales loads and assumes the reinvestment of dividends at actual prices pursuant to the Fund’s dividend reinvestment plan. |
| (5) | | Annualized for periods less than one full year. |
| (6) | | The Adviser has agreed to waive and/or reimburse certain fees and/or expense so that, on an annualized basis, such expenses incurred will not exceed 1.80% as a percentage of average daily net assets. |
See accompanying Notes to the Financial Statements.
76
Barings Global High Yield Fund 2019 Annual Report
FINANCIAL HIGHLIGHTS(CONTINUED)
| | | | | | | | | | | | | | | | |
| | | CLASS I | |
| | | FOR THE
YEAR
ENDED
JUNE 30,
2019 | | | FOR THE
YEAR
ENDED
JUNE 30,
2018 | | | FOR THE
YEAR
ENDED
JUNE 30,
2017 | | | PERIOD FROM
OCTOBER 30, 2015
THROUGH
JUNE 30,
2016 (1) | |
| | | | |
| Per Common Share Data | | | | | | | | | | | | | | | | |
Net asset value, beginning of year | | $ | 9.78 | | | $ | 10.44 | | | $ | 10.05 | | | $ | 10.00 | |
Income from investment operations: | | | | | | | | | | | | | | | | |
Net investment income (2) | | | 0.61 | | | | 0.63 | | | | 0.67 | | | | 0.39 | |
Net realized and unrealized gain (loss) on investments | | | (0.05 | ) | | | (0.41 | ) | | | 0.77 | | | | 0.05 | |
| | | | | | | | | | | | | | | | |
Total increase from investment operations | | | 0.56 | | | | 0.22 | | | | 1.44 | | | | 0.44 | |
| | | | | | | | | | | | | | | | |
Less dividends and distributions: | | | | | | | | | | | | | | | | |
From net investment income | | | (0.61 | ) | | | (0.63 | ) | | | (0.67 | ) | | | (0.39 | ) |
From net realized gain | | | (0.21 | ) | | | (0.25 | ) | | | (0.38 | ) | | | – | |
| | | | | | | | | | | | | | | | |
Total dividends and distributions | | | (0.82 | ) | | | (0.88 | ) | | | (1.05 | ) | | | (0.39 | ) |
| | | | | | | | | | | | | | | | |
Net asset value, at end of year | | $ | 9.52 | | | $ | 9.78 | | | $ | 10.44 | | | $ | 10.05 | |
| | | | | | | | | | | | | | | | |
Total investment return (3) | | | 6.13 | % | | | 2.05 | % | | | 14.90 | % | | | 4.62 | %(4) |
| | | | | | | | | | | | | | | | |
| | | | |
| Supplemental Data and Ratios | | | | | | | | | | | | | | | | |
Net assets, end of year (000’s) | | $ | 11,803 | | | $ | 12,130 | | | $ | 12,947 | | | $ | 12,466 | |
Ratio of total expenses (before reductions and reimbursements) to average net assets | | | 1.58 | % | | | 1.53 | % | | | 1.53 | % | | | 1.51 | %(5) |
Ratio of net expenses to average net assets (6) | | | 0.80 | % | | | 0.80 | % | | | 0.80 | % | | | 0.79 | %(5) |
Ratio of net investment income to average net assets | | | 6.41 | % | | | 6.14 | % | | | 6.46 | % | | | 6.08 | %(5) |
Portfolio turnover rate | | | 67.53 | % | | | 65.26 | % | | | 87.34 | % | | | 83.24 | %(4) |
| (1) | | Fund commenced operations on October 30, 2015. |
| (2) | | Calculated using average shares outstanding. |
| (3) | | Total investment return calculation assumes the reinvestment of dividends at actual prices pursuant to the Fund’s dividend reinvestment plan. |
| (5) | | Annualized for periods less than one full year. |
| (6) | | The Adviser has agreed to waive and/or reimburse certain fees and/or expense so that, on an annualized basis, such expenses incurred will not exceed 0.80% as a percentage of average daily net assets. |
See accompanying Notes to the Financial Statements.
77
Barings Global High Yield Fund 2019 Annual Report
FINANCIAL HIGHLIGHTS(CONTINUED)
| | | | | | | | | | | | | | | | |
| | | CLASS Y | |
| | | FOR THE
YEAR
ENDED
JUNE 30,
2019 | | | FOR THE
YEAR
ENDED
JUNE 30,
2018 | | | FOR THE
YEAR
ENDED
JUNE 30,
2017 | | | PERIOD FROM
OCTOBER 30, 2015
THROUGH
JUNE 30,
2016 (1) | |
| | | | |
| Per Common Share Data | | | | | | | | | | | | | | | | |
Net asset value, beginning of year | | $ | 9.78 | | | $ | 10.44 | | | $ | 10.05 | | | $ | 10.00 | |
Income from investment operations: | | | | | | | | | | | | | | | | |
Net investment income (2) | | | 0.61 | | | | 0.63 | | | | 0.67 | | | | 0.39 | |
Net realized and unrealized gain (loss) on investments | | | (0.05 | ) | | | (0.41 | ) | | | 0.77 | | | | 0.05 | |
| | | | | | | | | | | | | | | | |
Total increase from investment operations | | | 0.56 | | | | 0.22 | | | | 1.44 | | | | 0.44 | |
| | | | | | | | | | | | | | | | |
Less dividends and distributions: | | | | | | | | | | | | | | | | |
From net investment income | | | (0.61 | ) | | | (0.63 | ) | | | (0.67 | ) | | | (0.39 | ) |
From net realized gain | | | (0.21 | ) | | | (0.25 | ) | | | (0.38 | ) | | | – | |
| | | | | | | | | | | | | | | | |
Total dividends and distributions | | | (0.82 | ) | | | (0.88 | ) | | | (1.05 | ) | | | (0.39 | ) |
| | | | | | | | | | | | | | | | |
Net asset value, at end of year | | $ | 9.52 | | | $ | 9.78 | | | $ | 10.44 | | | $ | 10.05 | |
| | | | | | | | | | | | | | | | |
Total investment return (3) | | | 6.12 | % | | | 2.05 | % | | | 14.90 | % | | | 4.62 | %(4) |
| | | | | | | | | | | | | | | | |
| | | | |
| Supplemental Data and Ratios | | | | | | | | | | | | | | | | |
Net assets, end of year (000’s) | | $ | 12,966 | | | $ | 12,393 | | | $ | 14,535 | | | $ | 12,604 | |
Ratio of total expenses (before reductions and reimbursements) to average net assets | | | 1.58 | % | | | 1.53 | % | | | 1.53 | % | | | 1.51 | %(5) |
Ratio of net expenses to average net assets (6) | | | 0.80 | % | | | 0.80 | % | | | 0.80 | % | | | 0.79 | %(5) |
Ratio of net investment income to average net assets | | | 6.41 | % | | | 6.14 | % | | | 6.45 | % | | | 6.08 | %(5) |
Portfolio turnover rate | | | 67.53 | % | | | 65.26 | % | | | 87.34 | % | | | 83.24 | %(4) |
| (1) | | Fund commenced operations on October 30, 2015. |
| (2) | | Calculated using average shares outstanding. |
| (3) | | Total investment return calculation assumes the reinvestment of dividends at actual prices pursuant to the Fund’s dividend reinvestment plan. |
| (5) | | Annualized for periods less than one full year. |
| (6) | | The Adviser has agreed to waive and/or reimburse certain fees and/or expense so that, on an annualized basis, such expenses incurred will not exceed 0.80% as a percentage of average daily net assets. |
See accompanying Notes to the Financial Statements.
78
Barings U.S. High Yield Fund 2019 Annual Report
FINANCIAL HIGHLIGHTS
| | | | | | | | | | | | | | | | |
| | | CLASS A | |
| | | FOR THE
YEAR
ENDED
JUNE 30,
2019 | | | FOR THE
YEAR
ENDED
JUNE 30,
2018 | | | FOR THE
YEAR
ENDED
JUNE 30,
2017 | | | PERIOD FROM
OCTOBER 30, 2015
THROUGH
JUNE 30,
2016 (1) | |
| | | | |
| Per Common Share Data | | | | | | | | | | | | | | | | |
Net asset value, beginning of year | | $ | 9.82 | | | $ | 10.59 | | | $ | 10.14 | | | $ | 10.00 | |
Income from investment operations: | | | | | | | | | | | | | | | | |
Net investment income (2) | | | 0.58 | | | | 0.61 | | | | 0.65 | | | | 0.39 | |
Net realized and unrealized gain (loss) on investments | | | (0.02 | ) | | | (0.47 | ) | | | 0.65 | | | | 0.13 | |
| | | | | | | | | | | | | | | | |
Total increase from investment operations | | | 0.56 | | | | 0.14 | | | | 1.30 | | | | 0.52 | |
| | | | | | | | | | | | | | | | |
Less dividends and distributions: | | | | | | | | | | | | | | | | |
From net investment income | | | (0.59 | ) | | | (0.61 | ) | | | (0.66 | ) | | | (0.38 | ) |
From net realized gain | | | – | | | | (0.30 | ) | | | (0.19 | ) | | | – | |
| | | | | | | | | | | | | | | | |
Total dividends and distributions | | | (0.59 | ) | | | (0.91 | ) | | | (0.85 | ) | | | (0.38 | ) |
| | | | | | | | | | | | | | | | |
Net asset value, at end of year | | $ | 9.79 | | | $ | 9.82 | | | $ | 10.59 | | | $ | 10.14 | |
| | | | | | | | | | | | | | | | |
Total investment return (3) | | | 5.84 | % | | | 1.32 | % | | | 13.13 | % | | | 5.36 | %(4) |
| | | | | | | | | | | | | | | | |
| | | | |
| Supplemental Data and Ratios | | | | | | | | | | | | | | | | |
Net assets, end of year (000’s) | | $ | 3,840 | | | $ | 2,918 | | | $ | 2,633 | | | $ | 206 | |
Ratio of total expenses (before reductions and reimbursements) to average net assets | | | 1.64 | % | | | 1.71 | % | | | 1.82 | % | | | 5.47 | %(5) |
Ratio of net expenses to average net assets (6) | | | 1.00 | % | | | 1.00 | % | | | 1.00 | % | | | 0.99 | %(5) |
Ratio of net investment income to average net assets | | | 5.99 | % | | | 5.92 | % | | | 6.21 | % | | | 5.93 | %(5) |
Portfolio turnover rate | | | 55.98 | % | | | 43.75 | % | | | 71.57 | % | | | 77.52 | %(4) |
| (1) | | Fund commenced operations on October 30, 2015. |
| (2) | | Calculated using average shares outstanding. |
| (3) | | Total investment return calculation does not consider the effects of sales loads and assumes the reinvestment of dividends at actual prices pursuant to the Fund’s dividend reinvestment plan. |
| (5) | | Annualized for periods less than one full year. |
| (6) | | The Adviser has agreed to waive and/or reimburse certain fees and/or expense so that, on an annualized basis, such expenses incurred will not exceed 1.00% as a percentage of average daily net assets. |
See accompanying Notes to the Financial Statements.
79
Barings U.S. High Yield Fund 2019 Annual Report
FINANCIAL HIGHLIGHTS(CONTINUED)
| | | | | | | | | | | | | | | | |
| | | CLASS C | |
| | | FOR THE
YEAR
ENDED
JUNE 30,
2019 | | | FOR THE
YEAR
ENDED
JUNE 30,
2018 | | | FOR THE
YEAR
ENDED
JUNE 30,
2017 | | | PERIOD FROM
OCTOBER 30, 2015
THROUGH
JUNE 30,
2016 (1) | |
| | | | |
| Per Common Share Data | | | | | | | | | | | | | | | | |
Net asset value, beginning of year | | $ | 9.82 | | | $ | 10.59 | | | $ | 10.14 | | | $ | 10.00 | |
Income from investment operations: | | | | | | | | | | | | | | | | |
Net investment income (2) | | | 0.51 | | | | 0.53 | | | | 0.58 | | | | 0.33 | |
Net realized and unrealized gain (loss) on investments | | | (0.03 | ) | | | (0.47 | ) | | | 0.64 | | | | 0.14 | |
| | | | | | | | | | | | | | | | |
Total increase from investment operations | | | 0.48 | | | | 0.06 | | | | 1.22 | | | | 0.47 | |
| | | | | | | | | | | | | | | | |
Less dividends and distributions: | | | | | | | | | | | | | | | | |
From net investment income | | | (0.51 | ) | | | (0.53 | ) | | | (0.58 | ) | | | (0.33 | ) |
From net realized gain | | | – | | | | (0.30 | ) | | | (0.19 | ) | | | – | |
| | | | | | | | | | | | | | | | |
Total dividends and distributions | | | (0.51 | ) | | | (0.83 | ) | | | (0.77 | ) | | | (0.33 | ) |
| | | | | | | | | | | | | | | | |
Net asset value, at end of year | | $ | 9.79 | | | $ | 9.82 | | | $ | 10.59 | | | $ | 10.14 | |
| | | | | | | | | | | | | | | | |
Total investment return (3) | | | 5.03 | % | | | 0.61 | % | | | 12.24 | % | | | 4.85 | %(4) |
| | | | | | | | | | | | | | | | |
| | | | |
| Supplemental Data and Ratios | | | | | | | | | | | | | | | | |
Net assets, end of year (000’s) | | $ | 98 | | | $ | 98 | | | $ | 118 | | | $ | 101 | |
Ratio of total expenses (before reductions and reimbursements) to average net assets | | | 7.14 | % | | | 6.43 | % | | | 6.18 | % | | | 7.30 | %(5) |
Ratio of net expenses to average net assets (6) | | | 1.75 | % | | | 1.75 | % | | | 1.75 | % | | | 1.73 | %(5) |
Ratio of net investment income to average net assets | | | 5.27 | % | | | 5.17 | % | | | 5.50 | % | | | 5.08 | %(5) |
Portfolio turnover rate | | | 55.98 | % | | | 43.75 | % | | | 71.57 | % | | | 77.52 | %(4) |
| (1) | | Fund commenced operations on October 30, 2015. |
| (2) | | Calculated using average shares outstanding. |
| (3) | | Total investment return calculation does not consider the effects of sales loads and assumes the reinvestment of dividends at actual prices pursuant to the Fund’s dividend reinvestment plan. |
| (5) | | Annualized for periods less than one full year. |
| (6) | | The Adviser has agreed to waive and/or reimburse certain fees and/or expense so that, on an annualized basis, such expenses incurred will not exceed 1.75% as a percentage of average daily net assets. |
See accompanying Notes to the Financial Statements.
80
Barings U.S. High Yield Fund 2019 Annual Report
FINANCIAL HIGHLIGHTS(CONTINUED)
| | | | | | | | | | | | | | | | |
| | | CLASS I | |
| | | FOR THE
YEAR
ENDED
JUNE 30,
2019 | | | FOR THE
YEAR
ENDED
JUNE 30,
2018 | | | FOR THE
YEAR
ENDED
JUNE 30,
2017 | | | PERIOD FROM
OCTOBER 30, 2015
THROUGH
JUNE 30,
2016 (1) | |
| | | | |
| Per Common Share Data | | | | | | | | | | | | | | | | |
Net asset value, beginning of year | | $ | 9.82 | | | $ | 10.59 | | | $ | 10.14 | | | $ | 10.00 | |
Income from investment operations: | | | | | | | | | | | | | | | | |
Net investment income (2) | | | 0.61 | | | | 0.63 | | | | 0.68 | | | | 0.40 | |
Net realized and unrealized gain (loss) on investments | | | (0.03 | ) | | | (0.47 | ) | | | 0.64 | | | | 0.13 | |
| | | | | | | | | | | | | | | | |
Total increase from investment operations | | | 0.58 | | | | 0.16 | | | | 1.32 | | | | 0.53 | |
| | | | | | | | | | | | | | | | |
Less dividends and distributions: | | | | | | | | | | | | | | | | |
From net investment income | | | (0.61 | ) | | | (0.63 | ) | | | (0.68 | ) | | | (0.39 | ) |
From net realized gain | | | – | | | | (0.30 | ) | | | (0.19 | ) | | | – | |
| | | | | | | | | | | | | | | | |
Total dividends and distributions | | | (0.61 | ) | | | (0.93 | ) | | | (0.87 | ) | | | (0.39 | ) |
| | | | | | | | | | | | | | | | |
Net asset value, at end of year | | $ | 9.79 | | | $ | 9.82 | | | $ | 10.59 | | | $ | 10.14 | |
| | | | | | | | | | | | | | | | |
Total investment return (3) | | | 6.07 | % | | | 1.61 | % | | | 13.36 | % | | | 5.53 | %(4) |
| | | | | | | | | | | | | | | | |
| | | | |
| Supplemental Data and Ratios | | | | | | | | | | | | | | | | |
Net assets, end of year (000’s) | | $ | 12,135 | | | $ | 14,816 | | | $ | 15,720 | | | $ | 14,863 | |
Ratio of total expenses (before reductions and reimbursements) to average net assets | | | 1.11 | % | | | 1.28 | % | | | 1.36 | % | | | 1.38 | %(5) |
Ratio of net expenses to average net assets (6) | | | 0.75 | % | | | 0.75 | % | | | 0.75 | % | | | 0.74 | %(5) |
Ratio of net investment income to average net assets | | | 6.28 | % | | | 6.16 | % | | | 6.50 | % | | | 6.11 | %(5) |
Portfolio turnover rate | | | 55.98 | % | | | 43.75 | % | | | 71.57 | % | | | 77.52 | %(4) |
| (1) | | Fund commenced operations on October 30, 2015. |
| (2) | | Calculated using average shares outstanding. |
| (3) | | Total investment return calculation assumes the reinvestment of dividends at actual prices pursuant to the Fund’s dividend reinvestment plan. |
| (5) | | Annualized for periods less than one full year. |
| (6) | | The Adviser has agreed to waive and/or reimburse certain fees and/or expense so that, on an annualized basis, such expenses incurred will not exceed 0.75% as a percentage of average daily net assets. |
See accompanying Notes to the Financial Statements.
81
Barings U.S. High Yield Fund 2019 Annual Report
FINANCIAL HIGHLIGHTS(CONTINUED)
| | | | | | | | | | | | | | | | |
| | | CLASS Y | |
| | | FOR THE
YEAR
ENDED
JUNE 30,
2019 | | | FOR THE
YEAR
ENDED
JUNE 30,
2018 | | | FOR THE
YEAR
ENDED
JUNE 30,
2017 | | | PERIOD FROM
OCTOBER 30, 2015
THROUGH
JUNE 30,
2016 (1) | |
| | | | |
| Per Common Share Data | | | | | | | | | | | | | | | | |
Net asset value, beginning of year | | $ | 9.82 | | | $ | 10.58 | | | $ | 10.14 | | | $ | 10.00 | |
Income from investment operations: | | | | | | | | | | | | | | | | |
Net investment income (2) | | | 0.61 | | | | 0.62 | | | | 0.68 | | | | 0.39 | |
Net realized and unrealized gain (loss) on investments | | | (0.03 | ) | | | (0.45 | ) | | | 0.63 | | | | 0.14 | |
| | | | | | | | | | | | | | | | |
Total increase from investment operations | | | 0.58 | | | | 0.17 | | | | 1.31 | | | | 0.53 | |
| | | | | | | | | | | | | | | | |
Less dividends and distributions: | | | | | | | | | | | | | | | | |
From net investment income | | | (0.61 | ) | | | (0.63 | ) | | | (0.68 | ) | | | (0.39 | ) |
From net realized gain | | | – | | | | (0.30 | ) | | | (0.19 | ) | | | – | |
| | | | | | | | | | | | | | | | |
Total dividends and distributions | | | (0.61 | ) | | | (0.93 | ) | | | (0.87 | ) | | | (0.39 | ) |
| | | | | | | | | | | | | | | | |
Net asset value, at end of year | | $ | 9.79 | | | $ | 9.82 | | | $ | 10.58 | | | $ | 10.14 | |
| | | | | | | | | | | | | | | | |
Total investment return (3) | | | 6.09 | % | | | 1.61 | % | | | 13.35 | % | | | 5.52 | %(4) |
| | | | | | | | | | | | | | | | |
| | | | |
| Supplemental Data and Ratios | | | | | | | | | | | | | | | | |
Net assets, end of year (000’s) | | $ | 34,695 | | | $ | 39,176 | | | $ | 14,631 | | | $ | 12,675 | |
Ratio of total expenses (before reductions and reimbursements) to average net assets | | | 1.09 | % | | | 1.25 | % | | | 1.36 | % | | | 1.42 | %(5) |
Ratio of net expenses to average net assets (6) | | | 0.75 | % | | | 0.75 | % | | | 0.75 | % | | | 0.74 | %(5) |
Ratio of net investment income to average net assets | | | 6.27 | % | | | 6.09 | % | | | 6.50 | % | | | 6.06 | %(5) |
Portfolio turnover rate | | | 55.98 | % | | | 43.75 | % | | | 71.57 | % | | | 77.52 | %(4) |
| (1) | | Fund commenced operations on October 30, 2015. |
| (2) | | Calculated using average shares outstanding. |
| (3) | | Total investment return calculation assumes the reinvestment of dividends at actual prices pursuant to the Fund’s dividend reinvestment plan. |
| (5) | | Annualized for periods less than one full year. |
| (6) | | The Adviser has agreed to waive and/or reimburse certain fees and/or expense so that, on an annualized basis, such expenses incurred will not exceed 0.75% as a percentage of average daily net assets. |
See accompanying Notes to the Financial Statements.
82
Barings Global Floating Rate Fund 2019 Annual Report
SCHEDULE OF INVESTMENTS
June 30, 2019
| | | | | | | | | | | | | | | | | | | | |
| | | | | | | | | SHARES | | | COST | | | FAIR
VALUE | |
Equities — 0.6%*: | |
|
Common Stocks — 0.6%*: | |
|
Beverage, Food and Tobacco — 0.2%*: | |
CTI Foods Holding Co. LLC¤ | | | | | | | | | | | 4,657 | | | | $495,155 | | | | $512,659 | |
| | | | | | | | | | | | | | | | | | | | |
|
Healthcare, Education and Childcare — 0.0%*: | |
Tunstall Group Holdings Ltd.+¤ | | | | | | | | | | | 469 | | | | – | | | | – | |
Tunstall Group Holdings Ltd.+¤ | | | | | | | | | | | 310 | | | | – | | | | – | |
| | | | | | | | | | | | | | | | | | | | |
Total Healthcare, Education and Childcare | | | | | | | | | | | 779 | | | | – | | | | – | |
| | | | | | | | | | | | | | | | | | | | |
|
Mining, Steel, Iron andNon-Precious Metals — 0.1%*: | |
Boomerang Tube LLC¤ | | | | | | | | | | | 1,769 | | | | 171,860 | | | | 147,959 | |
| | | | | | | | | | | | | | | | | | | | |
|
Oil and Gas — 0.3%*: | |
Fieldwood Energy LLC | | | | | | | | | | | 6,469 | | | | 226,415 | | | | 194,070 | |
Fieldwood Energy LLC | | | | | | | | | | | 26,365 | | | | 568,599 | | | | 790,950 | |
Sabine Oil & Gas LLC | | | | | | | | | | | 394 | | | | 22,597 | | | | 11,032 | |
Southcross Energy Holdings LP | | | | | | | | | | | 22 | | | | – | | | | – | |
Southcross Energy Partners LP | | | | | | | | | | | 22 | | | | 5,500 | | | | 11,550 | |
Templar Energy LLC¤ | | | | | | | | | | | 8,762 | | | | 50,647 | | | | 3,286 | |
Templar Energy LLC¤†† | | | | | | | | | | | 6,069 | | | | 60,686 | | | | 13,654 | |
| | | | | | | | | | | | | | | | | | | | |
Total Oil and Gas | | | | | | | | | | | 48,103 | | | | 934,444 | | | | 1,024,542 | |
| | | | | | | | | | | | | | | | | | | | |
| | | | | | | | | | | | | | | | | | | | |
Total Common Stocks | | | | | | | | | | | 55,308 | | | | 1,601,459 | | | | 1,685,160 | |
| | | | | | | | | | | | | | | | | | | | |
| | | | | |
| | | EFFECTIVE
INTEREST RATE | | | | | | SHARES | | | COST | | | FAIR
VALUE | |
Preferred Stock — 0.0%*: | |
|
Farming and Agriculture — 0.0%*: | |
Pinnacle Agriculture Holdings A 2¤†† | | | 2.32 | % | | | | | | | 259,648 | | | | 173,408 | | | | 23,368 | |
| | | | | | | | | | | | | | | | | | | | |
| | | | | |
| | | | | | | | | SHARES | | | COST | | | FAIR
VALUE | |
| WARRANTS — 0.0%*: | | | | | | | | | | | | | | | | | | | | |
|
Diversified/Conglomerate Manufacturing — 0.0%*: | |
Appvion Holdings Corp. (exp. June 13, 2023)†† | | | | | | | | | | | 449 | | | | – | | | | 225 | |
Appvion Holdings Corp. (exp. June 13, 2023)†† | | | | | | | | | | | 449 | | | | – | | | | 56 | |
| | | | | | | | | | | | | | | | | | | | |
Total Diversified/Conglomerate Manufacturing | | | | | | | | | | | 898 | | | | – | | | | 281 | |
| | | | | | | | | | | | | | | | | | | | |
|
Oil and Gas — 0.0%*: | |
Sabine Oil & Gas LLC Warrants†† | | | | | | | | | | | 1,320 | | | | 5,523 | | | | 3,960 | |
Sabine Oil & Gas LLC Warrants†† | | | | | | | | | | | 258 | | | | 595 | | | | 645 | |
| | | | | | | | | | | | | | | | | | | | |
Total Oil and Gas | | | | | | | | | | | 1,578 | | | | 6,118 | | | | 4,605 | |
| | | | | | | | | | | | | | | | | | | | |
Total Warrants | | | | | | | | | | | 2,476 | | | | 6,118 | | | | 4,886 | |
| | | | | | | | | | | | | | | | | | | | |
Total Equities | | | | | | | | | | | 317,432 | | | | 1,780,985 | | | | 1,713,414 | |
| | | | | | | | | | | | | | | | | | | | |
See accompanying Notes to the Financial Statements.
83
Barings Global Floating Rate Fund 2019 Annual Report
SCHEDULE OF INVESTMENTS (CONTINUED)
June 30, 2019
| | | | | | | | | | | | | | | | | | | | |
| | | EFFECTIVE
INTEREST RATE | | | DUE DATE | | | PRINCIPAL ‡‡ | | | COST | | | FAIR
VALUE | |
Fixed Income — 94.1%*: | |
|
Bank Loans — 84.6%*§: | |
|
Aerospace and Defense — 0.2%*: | |
TransDigm, Inc., 1M LIBOR + 2.500% | | | 4.83 | % | | | 5/30/2025 | | | | 497,481 | | | | $485,404 | | | | $485,457 | |
| | | | | | | | | | | | | | | | | | | | |
|
Automobile — 2.3%*: | |
Adient US LLC, 1M LIBOR + 4.2500% | | | 6.87 | | | | 5/6/2024 | | | | 139,824 | | | | 139,141 | | | | 136,067 | |
Belron Finance US LLC, 3M LIBOR + 2.500%+ | | | 5.04 | | | | 11/13/2025 | | | | 289,608 | | | | 288,945 | | | | 289,246 | |
Brooks Automation, Inc., 3M LIBOR + 3.000% | | | 5.50 | | | | 10/4/2024 | | | | 1,994,987 | | | | 1,976,265 | | | | 1,990,000 | |
DexKo Global, Inc., 2M LIBOR + 3.500%†† | | | 5.90 | | | | 7/24/2024 | | | | 306,541 | | | | 308,558 | | | | 305,008 | |
NN, Inc., 1M LIBOR + 3.750% | | | 6.15 | | | | 10/19/2022 | | | | 1,329,385 | | | | 1,331,977 | | | | 1,306,121 | |
Panther BF Aggregator 2 L P, 1M LIBOR + 3.5000% | | | 5.90 | | | | 4/30/2026 | | | | 1,148,148 | | | | 1,139,029 | | | | 1,138,825 | |
US Farathane LLC, 3M LIBOR + 3.500% | | | 5.90 | | | | 12/23/2021 | | | | 1,181,196 | | | | 1,185,707 | | | | 1,133,948 | |
| | | | | | | | | | | | | | | | | | | | |
Total Automobile | | | | | | | | | | | 6,389,689 | | | | 6,369,622 | | | | 6,299,215 | |
| | | | | | | | | | | | | | | | | | | | |
|
Beverage, Food and Tobacco — 2.5%*: | |
Amphora Finance Ltd., 3M LIBOR + 4.750%+ | | | 5.47 | | | | 5/31/2025 | | | | 500,000 | | | | 661,278 | | | | 631,800 | |
CTI Foods Holding Co, LLC | | | 10.58 | | | | 5/3/2024 | | | | 197,652 | | | | 197,652 | | | | 187,770 | |
CTI Foods Holding Co, LLC | | | 9.58 | | | | 5/3/2024 | | | | 310,804 | | | | 304,788 | | | | 310,804 | |
Deoleo, S.A., EURIBOR + 3.500%+†† | | | 4.50 | | | | 6/11/2021 | | | | 500,000 | | | | 597,749 | | | | 218,892 | |
IRB Holding Corp., 1M LIBOR + 3.250% | | | 5.64 | | | | 2/5/2025 | | | | 2,582,543 | | | | 2,593,292 | | | | 2,547,446 | |
Labeyrie Fine Foods SAS, EURIBOR + 4.250%+ | | | 4.25 | | | | 5/23/2023 | | | | 500,000 | | | | 553,839 | | | | 565,946 | |
Refresco Group B.V., EURIBOR + 3.250%+ | | | 5.77 | | | | 3/28/2025 | | | | 157,452 | | | | 156,803 | | | | 156,664 | |
Refresco Group B.V., EURIBOR + 3.250%+ | | | 3.25 | | | | 3/28/2025 | | | | 500,000 | | | | 581,371 | | | | 564,644 | |
Sigma Bidco B.V., EURIBOR + 3.500%+ | | | 3.50 | | | | 7/2/2025 | | | | 1,000,000 | | | | 1,148,336 | | | | 1,112,459 | |
Sigma Bidco B.V., LIBOR + 4.000%+ | | | 4.85 | | | | 7/2/2025 | | | | 500,000 | | | | 644,981 | | | | 616,243 | |
| | | | | | | | | | | | | | | | | | | | |
Total Beverage, Food and Tobacco | | | | | | | | | | | 6,748,451 | | | | 7,440,089 | | | | 6,912,668 | |
| | | | | | | | | | | | | | | | | | | | |
|
Broadcasting and Entertainment — 6.0%*: | |
AP NMT Acquisition B.V., EURIBOR + 6.000%+ | | | 7.00 | | | | 8/13/2021 | | | | 518,620 | | | | 634,226 | | | | 589,169 | |
AP NMT Acquisition B.V., 3M LIBOR + 5.750%+ | | | 8.35 | | | | 8/13/2021 | | | | 2,062,190 | | | | 2,033,506 | | | | 2,044,146 | |
AP NMT Acquisition B.V., 3M LIBOR + 9.000%+ | | | 11.60 | | | | 8/13/2022 | | | | 2,182,721 | | | | 2,169,839 | | | | 2,157,248 | |
Charter Communications Operating, LLC, 3M LIBOR + 2.000% | | | 4.33 | | | | 4/30/2025 | | | | 1,989,899 | | | | 1,982,620 | | | | 1,986,914 | |
CSC Holdings, LLC, 1M LIBOR + 2.250% | | | 4.64 | | | | 7/15/2025 | | | | 1,174,457 | | | | 1,159,525 | | | | 1,154,268 | |
CSC Holdings, LLC, 1M LIBOR + 3.000% | | | 5.39 | | | | 4/15/2027 | | | | 944,680 | | | | 935,609 | | | | 944,916 | |
E.W. Scripps Co. (The), LIBOR + 2.750% | | | 5.15 | | | | 5/1/2026 | | | | 997,500 | | | | 992,566 | | | | 994,587 | |
iHeartCommunications, Inc., LIBOR + 4.000% | | | 6.58 | | | | 4/30/2026 | | | | 2,000,000 | | | | 2,005,000 | | | | 2,001,880 | |
Imagina Media Audiovisual, S.L., EURIBOR + 4.500%+ | | | 4.50 | | | | 6/26/2025 | | | | 500,000 | | | | 569,216 | | | | 569,023 | |
Imagina Media Audiovisual, S.L., EURIBOR + 7.500%+ | | | 7.50 | | | | 12/28/2025 | | | | 500,000 | | | | 542,806 | | | | 568,550 | |
Intelsat Jackson Holdings S.A., 1M LIBOR + 3.750% | | | 6.15 | | | | 11/27/2023 | | | | 1,500,000 | | | | 1,492,163 | | | | 1,483,125 | |
See accompanying Notes to the Financial Statements.
84
Barings Global Floating Rate Fund 2019 Annual Report
SCHEDULE OF INVESTMENTS (CONTINUED)
June 30, 2019
| | | | | | | | | | | | | | | | | | | | |
| | | EFFECTIVE
INTEREST RATE | | | DUE DATE | | | PRINCIPAL ‡‡ | | | COST | | | FAIR
VALUE | |
Bank Loans(Continued) | |
|
Broadcasting and Entertainment(Continued) | |
Technicolor S.A., EURIBOR + 3.000%+†† | | | 3.00 | % | | | 12/6/2023 | | | | 500,000 | | | $ | 538,791 | | | $ | 506,578 | |
Univision Communications, Inc., 1M LIBOR + 2.750% | | | 5.15 | | | | 3/15/2024 | | | | 1,426,718 | | | | 1,413,716 | | | | 1,356,723 | |
| | | | | | | | | | | | | | | | | | | | |
Total Broadcasting and Entertainment | | | | | | | | | | | 16,296,785 | | | | 16,469,583 | | | | 16,357,127 | |
| | | | | | | | | | | | | | | | | | | | |
|
Buildings and Real Estate — 2.7%*: | |
Core & Main L.P., 6M LIBOR + 3.000% | | | 5.52 | | | | 8/1/2024 | | | | 1,477,500 | | | | 1,486,761 | | | | 1,472,417 | |
GYP Holdings III Corp., 1M LIBOR + 2.750% | | | 5.15 | | | | 6/1/2025 | | | | 1,984,963 | | | | 1,980,552 | | | | 1,930,793 | |
LSF10 Impala Investments S.a r.l., EURIBOR + 4.750%+ | | | 4.75 | | | | 10/10/2025 | | | | 500,000 | | | | 574,228 | | | | 569,261 | |
Quikrete Holdings, Inc., 1M LIBOR + 2.750% | | | 5.15 | | | | 11/15/2023 | | | | 1,000,000 | | | | 1,000,906 | | | | 981,390 | |
SRS Distribution, Inc., 3M LIBOR + 3.250% | | | 5.65 | | | | 5/23/2025 | | | | 2,434,994 | | | | 2,420,960 | | | | 2,332,018 | |
| | | | | | | | | | | | | | | | | | | | |
Total Buildings and Real Estate | | | | | | | | | | | 7,397,457 | | | | 7,463,407 | | | | 7,285,879 | |
| | | | | | | | | | | | | | | | | | | | |
|
Cargo Transport — 1.0%*: | |
American Airlines, Inc., 1M LIBOR + 2.000% | | | 4.40 | | | | 4/28/2023 | | | | 989,796 | | | | 974,142 | | | | 975,197 | |
Kenan Advantage Group, Inc., 1M LIBOR + 3.000% | | | 5.40 | | | | 7/31/2022 | | | | 1,929,888 | | | | 1,932,754 | | | | 1,859,930 | |
| | | | | | | | | | | | | | | | | | | | |
Total Cargo Transport | | | | | | | | | | | 2,919,684 | | | | 2,906,896 | | | | 2,835,127 | |
| | | | | | | | | | | | | | | | | | | | |
|
Chemicals, Plastics and Rubber — 7.0%*: | |
Allnex (Luxembourg) & Cy S.C.A., EURIBOR + 3.250%+ | | | 3.25 | | | | 9/13/2023 | | | | 680,725 | | | | 771,148 | | | | 762,682 | |
Allnex (Luxembourg) & Cy S.C.A., 3M LIBOR + 3.250%+ | | | 5.77 | | | | 9/13/2023 | | | | 361,636 | | | | 360,544 | | | | 353,727 | |
Allnex USA, Inc., 3M LIBOR + 3.250%+ | | | 5.77 | | | | 9/13/2023 | | | | 272,452 | | | | 271,630 | | | | 266,494 | |
Archroma Finance Sarl, EURIBOR + 3.750%+ | | | 3.75 | | | | 8/11/2024 | | | | 1,000,000 | | | | 1,153,137 | | | | 1,141,364 | |
Associated Asphalt Partners LLC, 1M LIBOR + 5.250% | | | 7.65 | | | | 4/5/2024 | | | | 288,960 | | | | 287,974 | | | | 280,773 | |
Axalta Coating Systems US Holdings Inc., 3M LIBOR + 1.750% | | | 4.08 | | | | 6/1/2024 | | | | 147,753 | | | | 145,331 | | | | 145,860 | |
Colouroz Investment 1 GmbH, EURIBOR + 3.0000%+ | | | 3.75 | | | | 9/7/2021 | | | | 326,245 | | | | 386,086 | | | | 324,601 | |
Consolidated Energy Finance, S.A., 1M LIBOR + 2.500% | | | 4.90 | | | | 5/7/2025 | | | | 1,492,462 | | | | 1,442,718 | | | | 1,451,420 | |
Diamond B.V., EURIBOR + 3.2500% | | | 3.25 | | | | 9/6/2024 | | | | 987,475 | | | | 1,152,627 | | | | 1,028,818 | |
Flint Group GmbH, EURIBOR + 3.000%+ | | | 3.75 | | | | 9/7/2021 | | | | 757,710 | | | | 868,174 | | | | 753,894 | |
Flint Group GmbH, 3M LIBOR + 3.000%+ | | | 5.58 | | | | 9/7/2021 | | | | 526,801 | | | | 507,700 | | | | 435,928 | |
Flint Group US LLC, 3M LIBOR + 3.000%+ | | | 5.58 | | | | 9/7/2021 | | | | 3,060,391 | | | | 2,950,099 | | | | 2,532,473 | |
GrafTech Finance, Inc., 1M LIBOR + 3.500% | | | 5.90 | | | | 2/12/2025 | | | | 1,775,783 | | | | 1,773,424 | | | | 1,740,267 | |
Ineos US Finance LLC, EURIBOR + 2.000%+ | | | 2.50 | | | | 3/31/2024 | | | | 1,484,931 | | | | 1,713,504 | | | | 1,679,600 | |
Momentive Performance Materials, Inc., LIBOR + 3.250% | | | 5.59 | | | | 5/19/2024 | | | | 411,108 | | | | 409,089 | | | | 406,997 | |
Novacap S.A., EURIBOR + 3.500%+ | | | 3.50 | | | | 6/22/2023 | | | | 1,000,000 | | | | 1,134,981 | | | | 1,097,779 | |
See accompanying Notes to the Financial Statements.
85
Barings Global Floating Rate Fund 2019 Annual Report
SCHEDULE OF INVESTMENTS (CONTINUED)
June 30, 2019
| | | | | | | | | | | | | | | | | | | | |
| | | EFFECTIVE
INTEREST RATE | | | DUE DATE | | | PRINCIPAL ‡‡ | | | COST | | | FAIR
VALUE | |
Bank Loans(Continued) | |
|
Chemicals, Plastics and Rubber (Continued) | |
Pinnacle Operating Corp., 1M LIBOR +5.500% | | | 4.83 | % | | | 11/15/2021 | | | | 728,758 | | | $ | 700,925 | | | $ | 539,281 | |
Platform Specialty Products Corp., 1M LIBOR + 2.250% | | | 4.65 | | | | 1/30/2026 | | | | 663,060 | | | | 662,279 | | | | 660,368 | |
Polar US Borrower, LLC, 3M LIBOR + 4.750% | | | 7.34 | | | | 10/15/2025 | | | | 834,231 | | | | 834,231 | | | | 822,760 | |
Solenis Holdings LLC, 3M LIBOR + 4.000% | | | 6.52 | | | | 6/26/2025 | | | | 634,940 | | | | 629,464 | | | | 626,210 | |
Starfruit Finco B.V, EURIBOR + 3.750%+ | | | 3.75 | | | | 10/1/2025 | | | | 500,000 | | | | 588,925 | | | | 570,176 | |
Tronox Finance LLC, 3M LIBOR + 3.000% | | | 5.37 | | | | 9/22/2024 | | | | 1,428,497 | | | | 1,425,849 | | | | 1,412,941 | |
| | | | | | | | | | | | | | | | | | | | |
Total Chemicals, Plastics and Rubber | | | | | | | | | | | 19,363,918 | | | | 20,169,839 | | | | 19,034,413 | |
| | | | | | | | | | | | | | | | | | | | |
|
Commercial Services — 1.4%*: | |
Masmovil Holdphone SA, LIBOR + 3.250%+ | | | 3.25 | | | | 5/31/2026 | | | | 500,000 | | | | 557,623 | | | | 567,446 | |
Syniverse Holdings, Inc., 1M LIBOR + 5.000% | | | 7.40 | | | | 3/9/2023 | | | | 1,561,433 | | | | 1,565,964 | | | | 1,432,615 | |
Syniverse Holdings, Inc., 1M LIBOR + 9.000% | | | 11.40 | | | | 3/11/2024 | | | | 425,482 | | | | 420,477 | | | | 309,751 | |
Virgin Media Investment Holdings Ltd., LIBOR - GBP + 3.250%+ | | | 3.98 | | | | 11/15/2027 | | | | 1,250,000 | | | | 1,725,687 | | | | 1,574,547 | |
| | | | | | | | | | | | | | | | | | | | |
Total Commercial Services | | | | | | | | | | | 3,736,915 | | | | 4,269,751 | | | | 3,884,359 | |
| | | | | | | | | | | | | | | | | | | | |
|
Containers, Packaging and Glass — 3.8%*: | |
Albea Beauty Holdings S.A., 1M LIBOR + 3.000%+ | | | 5.52 | | | | 4/22/2024 | | | | 614,512 | | | | 613,898 | | | | 599,918 | |
Berry Global, Inc., LIBOR + 2.500% | | | 4.82 | | | | 5/22/2026 | | | | 1,500,000 | | | | 1,496,250 | | | | 1,488,915 | |
BWAY Holding Co., 1M LIBOR + 3.250% | | | 5.85 | | | | 4/3/2024 | | | | 2,459,899 | | | | 2,454,852 | | | | 2,372,769 | |
Flex Acquisition Co., Inc., 3M LIBOR + 3.000% | | | 5.44 | | | | 12/29/2023 | | | | 1,554,316 | | | | 1,566,943 | | | | 1,474,657 | |
ProAmpac PG Borrower LLC, 1M LIBOR + 3.500% | | | 5.99 | | | | 11/18/2023 | | | | 731,250 | | | | 733,570 | | | | 700,633 | |
ProAmpac PG Borrower LLC, 3M LIBOR + 8.500% | | | 11.02 | | | | 11/18/2024 | | | | 750,000 | | | | 742,414 | | | | 709,687 | |
Reynolds Group Holdings, Inc., 1M LIBOR + 2.750% | | | 5.15 | | | | 2/5/2023 | | | | 1,979,696 | | | | 1,987,826 | | | | 1,963,264 | |
Roy Bidco ApS, EURIBOR + 3.250%+ | | | 3.50 | | | | 8/23/2024 | | | | 1,000,000 | | | | 1,153,882 | | | | 1,121,181 | |
| | | | | | | | | | | | | | | | | | | | |
Total Containers, Packaging and Glass | | | | | | | | | | | 10,589,673 | | | | 10,749,635 | | | | 10,431,024 | |
| | | | | | | | | | | | | | | | | | | | |
|
Diversified/Conglomerate Manufacturing — 3.4%*: | |
Amer Sports Oyj, EURIBOR + 4.500%+ | | | 4.50 | | | | 3/1/2026 | | | | 500,000 | | | | 562,758 | | | | 568,726 | |
LTI Holdings, Inc., 1M LIBOR + 3.500% | | | 5.90 | | | | 9/6/2025 | | | | 1,433,096 | | | | 1,435,117 | | | | 1,353,388 | |
PCF GmbH, EURIBOR + 5.000%+†† | | | 5.00 | | | | 8/1/2024 | | | | 500,000 | | | | 526,014 | | | | 552,562 | |
Project Alpha Intermediate Holding, Inc., 3M LIBOR + 3.500% | | | 6.37 | | | | 4/26/2024 | | | | 1,573,099 | | | | 1,574,366 | | | | 1,521,974 | |
SGB-SMIT Management GmbH, 1M LIBOR + 5.000%+ | | | 5.00 | | | | 7/18/2024 | | | | 500,000 | | | | 485,665 | | | | 473,790 | |
Triple Point Technology, Inc., 3M LIBOR + 4.250% | | | 6.58 | | | | 7/10/2020 | | | | 928,634 | | | | 915,202 | | | | 885,294 | |
Wilsonart LLC, 3M LIBOR + 3.250% | | | 5.58 | | | | 12/19/2023 | | | | 600,275 | | | | 600,728 | | | | 585,418 | |
See accompanying Notes to the Financial Statements.
86
Barings Global Floating Rate Fund 2019 Annual Report
SCHEDULE OF INVESTMENTS (CONTINUED)
June 30, 2019
| | | | | | | | | | | | | | | | | | | | |
| | | EFFECTIVE
INTEREST RATE | | | DUE DATE | | | PRINCIPAL ‡‡ | | | COST | | | FAIR
VALUE | |
Bank Loans(Continued) | |
|
Diversified/Conglomerate Manufacturing (Continued) | |
Winebow Group, Inc. (The), 1M LIBOR + 3.750% | | | 6.15 | % | | | 7/1/2021 | | | | 1,737,898 | | | $ | 1,653,872 | | | $ | 1,555,419 | |
Xella International GmbH, EURIBOR + 4.000%+ | | | 3.75 | | | | 4/11/2024 | | | | 1,500,000 | | | | 1,830,247 | | | | 1,687,263 | |
| | | | | | | | | | | | | | | | | | | | |
Total Diversified/Conglomerate Manufacturing | | | | | | | | | | | 9,273,002 | | | | 9,583,969 | | | | 9,183,834 | |
| | | | | | | | | | | | | | | | | | | | |
|
Diversified/Conglomerate Service — 9.3%*: | |
Allied Universal Holdco LLC, LIBOR + 4.250%†† | | | 6.57 | | | | 6/27/2026 | | | | 529,422 | | | | 524,128 | | | | 526,775 | |
Almonde, Inc., 3M LIBOR + 7.250%+ | | | 9.65 | | | | 6/13/2025 | | | | 752,587 | | | | 763,848 | | | | 745,219 | |
Almonde, Inc., 3M LIBOR + 3.500%+ | | | 5.90 | | | | 6/13/2024 | | | | 2,729,510 | | | | 2,683,624 | | | | 2,655,977 | |
Canyon Valor Cos., Inc., 3M LIBOR + 2.750% | | | 5.08 | | | | 6/16/2023 | | | | 442,340 | | | | 441,587 | | | | 439,243 | |
Capri Finance LLC, 3M LIBOR + 3.250%+ | | | 5.83 | | | | 11/1/2024 | | | | 494,990 | | | | 493,940 | | | | 484,348 | |
EAB Global, Inc., LIBOR + 3.750% | | | 6.38 | | | | 11/15/2024 | | | | 747,635 | | | | 744,756 | | | | 740,159 | |
Financial & Risk US Holdings, Inc., 1M LIBOR + 3.750% | | | 6.15 | | | | 10/1/2025 | | | | 1,492,500 | | | | 1,440,018 | | | | 1,446,322 | |
Hyland Software, Inc., 1M LIBOR + 3.500% | | | 5.65 | | | | 7/1/2024 | | | | 980,063 | | | | 984,206 | | | | 972,712 | |
I-Logic Technologies Bidco Ltd., 1M LIBOR + 3.250%+ | | | 5.58 | | | | 12/21/2024 | | | | 1,008,009 | | | | 1,012,424 | | | | 976,509 | |
Infor (US), Inc., 3M LIBOR + 2.750% | | | 5.08 | | | | 2/1/2022 | | | | 1,953,858 | | | | 2,044,933 | | | | 2,015,476 | |
Informatica LLC, 1M LIBOR + 3.250% | | | 5.65 | | | | 8/5/2022 | | | | 1,381,821 | | | | 1,384,372 | | | | 1,382,401 | |
Kronos, Inc., 3M LIBOR + 3.500% | | | 5.58 | | | | 11/1/2023 | | | | 1,567,615 | | | | 1,570,500 | | | | 1,563,507 | |
LegalZoom.com, Inc., 1M LIBOR + 4.500% | | | 6.90 | | | | 11/23/2024 | | | | 582,580 | | | | 577,299 | | | | 582,947 | |
MH Sub I LLC, 3M LIBOR + 3.750% | | | 6.15 | | | | 9/13/2024 | | | | 1,041,058 | | | | 1,047,848 | | | | 1,021,538 | |
Project Leopard Holdings, Inc., 1M LIBOR + 4.500% | | | 6.70 | | | | 7/7/2023 | | | | 1,484,003 | | | | 1,490,224 | | | | 1,479,062 | |
Red Ventures, LLC, 1M LIBOR + 3.000%†† | | | 5.40 | | | | 11/8/2024 | | | | 1,325,211 | | | | 1,318,236 | | | | 1,320,427 | |
Sabre GLBL Inc., 1M LIBOR + 2.000% | | | 4.40 | | | | 2/22/2024 | | | | 148,632 | | | | 146,915 | | | | 148,198 | |
TMF Group Holding B.V., EURIBOR + 3.250%+ | | | 3.25 | | | | 5/5/2025 | | | | 500,000 | | | | 584,613 | | | | 529,701 | |
Verisure Holding AB, EURIBOR + 3.000%+ | | | 3.00 | | | | 10/21/2022 | | | | 2,700,000 | | | | 3,095,122 | | | | 3,038,640 | |
Verisure Holding AB, EURIBOR + 3.500%+ | | | 3.50 | | | | 10/22/2022 | | | | 500,000 | | | | 566,875 | | | | 568,357 | |
Vertafore, Inc., 1M LIBOR + 3.250% | | | 5.65 | | | | 7/2/2025 | | | | 1,990,000 | | | | 1,989,114 | | | | 1,909,564 | |
Vertafore, Inc., 1M LIBOR + 7.250% | | | 9.65 | | | | 7/2/2026 | | | | 1,000,000 | | | | 991,194 | | | | 970,420 | |
| | | | | | | | | | | | | | | | | | | | |
Total Diversified/Conglomerate Service | | | | | | | | | | | 25,351,834 | | | | 25,895,776 | | | | 25,517,502 | |
| | | | | | | | | | | | | | | | | | | | |
|
Ecological — 0.7%*: | |
Emerald 3 Ltd., 3M LIBOR + 7.000% | | | 9.40 | | | | 5/31/2022 | | | | 390,426 | | | | 388,981 | | | | 389,450 | |
Emerald US, Inc., 3M LIBOR + 4.000% | | | 6.40 | | | | 5/14/2021 | | | | 529,428 | | | | 511,917 | | | | 528,242 | |
PHS Group Ltd., 1M LIBOR + 5.250%+ | | | 6.25 | | | | 12/20/2021 | | | | 714,228 | | | | 915,783 | | | | 906,354 | |
| | | | | | | | | | | | | | | | | | | | |
Total Ecological | | | | | | | | | | | 1,634,082 | | | | 1,816,681 | | | | 1,824,046 | |
| | | | | | | | | | | | | | | | | | | | |
See accompanying Notes to the Financial Statements.
87
Barings Global Floating Rate Fund 2019 Annual Report
SCHEDULE OF INVESTMENTS (CONTINUED)
June 30, 2019
| | | | | | | | | | | | | | | | | | | | |
| | | EFFECTIVE
INTEREST RATE | | | DUE DATE | | | PRINCIPAL ‡‡ | | | COST | | | FAIR
VALUE | |
Bank Loans(Continued) | |
|
Electronics — 5.5%*: | |
EXC Holdings III Corp., 3M LIBOR + 3.500% | | | 5.83 | % | | | 11/30/2024 | | | | 489,713 | | | $ | 494,251 | | | $ | 487,876 | |
II-VI, Inc., LIBOR + 3.500% | | | 5.82 | | | | 6/28/2026 | | | | 568,912 | | | | 563,223 | | | | 560,025 | |
ION Trading Technologies Sarl, 3M LIBOR + 4.000% | | | 6.33 | | | | 11/21/2024 | | | | 1,705,205 | | | | 1,687,611 | | | | 1,649,479 | |
ION Trading Technologies Sarl, EURIBOR + 3.250% | | | 4.25 | | | | 11/21/2024 | | | | 1,381,750 | | | | 1,564,591 | | | | 1,527,540 | |
Omnitracs, Inc., 3M LIBOR + 2.750% | | | 5.10 | | | | 3/21/2025 | | | | 2,998,539 | | | | 2,990,461 | | | | 2,949,813 | |
Renaissance Holding Corp., 1M LIBOR + 3.250% | | | 5.73 | | | | 5/31/2025 | | | | 741,259 | | | | 741,259 | | | | 717,784 | |
RP Crown Parent LLC, 1M LIBOR + 2.750% | | | 5.15 | | | | 10/12/2023 | | | | 1,733,561 | | | | 1,730,554 | | | | 1,723,264 | |
Sophia LP, LIBOR + 3.250% | | | 5.58 | | | | 9/30/2022 | | | | 1,443,023 | | | | 1,449,143 | | | | 1,438,333 | |
SS&C Technologies Holdings Europe S.A.R.L., 1M LIBOR + 2.500% | | | 4.65 | | | | 4/16/2025 | | | | 19,246 | | | | 18,838 | | | | 19,160 | |
SS&C Technologies Inc., 1M LIBOR + 2.500% | | | 4.65 | | | | 4/16/2025 | | | | 28,064 | | | | 27,460 | | | | 27,938 | |
SS&C Technologies Inc., 1M LIBOR + 2.250% | | | 4.65 | | | | 4/16/2025 | | | | 477,432 | | | | 476,349 | | | | 475,508 | |
Veritas Bermuda Ltd., 3M LIBOR + 4.500% | | | 6.89 | | | | 1/27/2023 | | | | 1,270,750 | | | | 1,267,676 | | | | 1,154,006 | |
Veritas Bermuda Ltd., EURIBOR + 4.500% | | | 5.50 | | | | 1/27/2023 | | | | 782,000 | | | | 871,852 | | | | 816,777 | |
Wall Street Systems Delaware, Inc., 1M LIBOR + 3.000% | | | 5.33 | | | | 11/21/2024 | | | | 1,055,112 | | | | 1,055,112 | | | | 1,020,821 | |
Wall Street Systems Delaware, Inc., EURIBOR + 3.000% | | | 2.66 | | | | 11/21/2024 | | | | 492,053 | | | | 578,423 | | | | 556,369 | |
| | | | | | | | | | | | | | | | | | | | |
Total Electronics | | | | | | | | | | | 15,186,619 | | | | 15,516,803 | | | | 15,124,693 | |
| | | | | | | | | | | | | | | | | | | | |
|
Farming and Agriculture — 0.9%*: | |
Dole Food Co. Inc., 1M LIBOR + 2.750% | | | 5.15 | | | | 4/6/2024 | | | | 2,386,141 | | | | 2,394,374 | | | | 2,327,227 | |
| | | | | | | | | | | | | | | | | | | | |
|
Finance — 2.4%*: | |
Evergood 4 ApS, EURIBOR + 3.750%+ | | | 3.75 | | | | 2/6/2025 | | | | 500,000 | | | | 566,218 | | | | 570,034 | |
NAB Holdings LLC, 3M LIBOR + 3.000% | | | 5.33 | | | | 6/28/2024 | | | | 985,025 | | | | 986,452 | | | | 971,067 | |
Nets Holding A/S, EURIBOR + 3.000%+ | | | 3.25 | | | | 2/6/2025 | | | | 440,972 | | | | 522,706 | | | | 497,042 | |
NFP Corp., 1M LIBOR + 3.000% | | | 5.40 | | | | 1/6/2024 | | | | 2,502,779 | | | | 2,518,139 | | | | 2,430,423 | |
Tempo Acquisition LLC, 1M LIBOR + 3.000% | | | 5.40 | | | | 5/1/2024 | | | | 2,098,153 | | | | 2,102,843 | | | | 2,088,103 | |
| | | | | | | | | | | | | | | | | | | | |
Total Finance | | | | | | | | | | | 6,526,929 | | | | 6,696,358 | | | | 6,556,669 | |
| | | | | | | | | | | | | | | | | | | | |
|
Healthcare, Education and Childcare — 9.8%*: | |
Advanz Pharma Corp., LIBOR + 5.500%+ | | | 7.91 | | | | 9/6/2024 | | | | 2,314,750 | | | | 2,281,124 | | | | 2,219,267 | |
Advanz Pharma Corp., EURIBOR + 5.250%+ | | | 6.25 | | | | 9/6/2024 | | | | 492,500 | | | | 570,627 | | | | 552,848 | |
Aenova Holding GmbH, EURIBOR + 4.000%+ | | | 5.00 | | | | 9/29/2020 | | | | 2,000,000 | | | | 2,303,815 | | | | 2,261,874 | |
Arbor Pharmaceuticals, Inc., 3M LIBOR + 5.000% | | | 7.33 | | | | 7/5/2023 | | | | 1,475,365 | | | | 1,468,254 | | | | 1,370,865 | |
Auris Luxembourg III Sarl, LIBOR + 3.750% | | | 6.15 | | | | 2/27/2026 | | | | 997,500 | | | | 992,717 | | | | 997,999 | |
Avantor, Inc., 1M LIBOR +3.750% | | | 5.40 | | | | 11/21/2024 | | | | 766,409 | | | | 775,595 | | | | 769,283 | |
Aveanna Healthcare, LLC, 1M LIBOR + 5.500% | | | 7.90 | | | | 3/18/2024 | | | | 1,290,079 | | | | 1,275,362 | | | | 1,242,772 | |
See accompanying Notes to the Financial Statements.
88
Barings Global Floating Rate Fund 2019 Annual Report
SCHEDULE OF INVESTMENTS (CONTINUED)
June 30, 2019
| | | | | | | | | | | | | | | | | | | | |
| | | EFFECTIVE
INTEREST RATE | | | DUE DATE | | | PRINCIPAL ‡‡ | | | COST | | | FAIR
VALUE | |
Bank Loans(Continued) | |
|
Healthcare, Education and Childcare (Continued) | |
Catalent Pharma Solutions, Inc., LIBOR + 2.250% | | | 4.65 | % | | | 5/17/2026 | | | | 355,676 | | | $ | 354,798 | | | $ | 355,381 | |
Cerba Healthcare S.A.S., EURIBOR + 3.000%+ | | | 3.00 | | | | 4/20/2024 | | | | 1,000,000 | | | | 1,172,822 | | | | 1,124,023 | |
Endo Luxembourg Finance Co. I S.a r.l., 1M LIBOR + 4.250% | | | 6.65 | | | | 4/27/2024 | | | | 2,518,041 | | | | 2,521,707 | | | | 2,358,574 | |
Financiere Mendel SAS, EURIBOR + 4.750%+ | | | 4.75 | | | | 3/31/2026 | | | | 500,000 | | | | 552,640 | | | | 572,359 | |
Horizon Pharma, Inc., LIBOR + 2.500% | | | 4.94 | | | | 5/22/2026 | | | | 612,505 | | | | 612,318 | | | | 611,102 | |
Indivior Finance Sarl, 3M LIBOR + 4.500% | | | 7.09 | | | | 12/31/2022 | | | | 798,066 | | | | 789,991 | | | | 715,602 | |
Lifescan Global Corp., 3M LIBOR + 6.000% | | | 8.66 | | | | 9/28/2024 | | | | 386,000 | | | | 375,820 | | | | 367,665 | |
Mallinckrodt International Finance S.A., 3M LIBOR + 2.750% | | | 5.08 | | | | 9/24/2024 | | | | 1,247,838 | | | | 1,242,326 | | | | 1,119,411 | |
Nidda Healthcare Holding AG, EURIBOR + 3.500%+ | | | 3.50 | | | | 8/21/2024 | | | | 1,000,000 | | | | 1,152,944 | | | | 1,133,223 | |
Nidda Healthcare Holding AG, GBP + 4.500%+ | | | 5.30 | | | | 8/21/2024 | | | | 500,000 | | | | 678,300 | | | | 636,791 | |
Ortho-Clinical Diagnostics SA, 3M LIBOR + 3.250% | | | 5.68 | | | | 6/30/2025 | | | | 1,442,576 | | | | 1,443,189 | | | | 1,385,479 | |
Press Ganey Holdings, Inc., 1M LIBOR + 2.750% | | | 5.15 | | | | 10/23/2023 | | | | 1,218,750 | | | | 1,224,008 | | | | 1,217,227 | |
Radiology Partners Holdings, LLC, LIBOR + 4.750% | | | 7.36 | | | | 7/9/2025 | | | | 316,014 | | | | 314,434 | | | | 315,028 | |
Riemser Pharma GmbH, EURIBOR + 5.500%+ | | | 5.50 | | | | 6/29/2023 | | | | 442,831 | | | | 485,036 | | | | 501,025 | |
Rodenstock GmbH, LIBOR + 5.250%+ | | | 5.25 | | | | 6/30/2026 | | | | 500,000 | | | | 555,411 | | | | 558,743 | |
Team Health Holdings, Inc., 1M LIBOR + 2.750% | | | 5.15 | | | | 2/6/2024 | | | | 1,967,299 | | | | 1,923,824 | | | | 1,738,600 | |
Tunstall Group Holdings Ltd., 3M LIBOR + 5.000%+ | | | 4.41 | | | | 10/16/2020 | | | | 515,926 | | | | 814,301 | | | | 653,018 | |
Unilabs Holding AB, EURIBOR + 3.000%+ | | | 3.00 | | | | 4/19/2024 | | | | 500,000 | | | | 572,577 | | | | 558,856 | |
Valeant Pharmaceuticals International, Inc., 1M LIBOR + 3.000% | | | 5.41 | | | | 5/31/2025 | | | | 902,475 | | | | 907,607 | | | | 901,915 | |
Verscend Holding Corp., 1M LIBOR + 4.500% | | | 6.90 | | | | 8/27/2025 | | | | 630,278 | | | | 626,102 | | | | 629,887 | |
| | | | | | | | | | | | | | | | | | | | |
Total Healthcare, Education and Childcare | | | | | | | | | | | 26,690,878 | | | | 27,987,649 | | | | 26,868,817 | |
| | | | | | | | | | | | | | | | | | | | |
|
Home and Office Furnishings, Housewares, and Durable Consumer Products — 0.9%*: | |
Serta Simmons Bedding LLC, 3M LIBOR + 3.500% | | | 5.91 | | | | 11/8/2023 | | | | 1,691,357 | | | | 1,686,021 | | | | 1,088,811 | |
Serta Simmons Bedding LLC, 1M LIBOR + 8.000% | | | 10.39 | | | | 11/8/2024 | | | | 724,667 | | | | 669,965 | | | | 317,404 | |
SIWF Holdings Inc., 1M LIBOR + 4.250% | | | 6.65 | | | | 6/15/2025 | | | | 992,481 | | | | 1,000,997 | | | | 982,557 | |
| | | | | | | | | | | | | | | | | | | | |
Total Home and Office Furnishings, Housewares, and Durable Consumer Products | | | | | | | | | | | 3,408,505 | | | | 3,356,983 | | | | 2,388,772 | |
| | | | | | | | | | | | | | | | | | | | |
See accompanying Notes to the Financial Statements.
89
Barings Global Floating Rate Fund 2019 Annual Report
SCHEDULE OF INVESTMENTS (CONTINUED)
June 30, 2019
| | | | | | | | | | | | | | | | | | | | |
| | | EFFECTIVE
INTEREST RATE | | | DUE DATE | | | PRINCIPAL ‡‡ | | | COST | | | FAIR
VALUE | |
Bank Loans(Continued) | |
|
Hotels, Motels, Inns and Gaming — 2.6%*: | |
Caesars Resort Collection LLC, 1M LIBOR + 2.750% | | | 5.15 | % | | | 12/23/2024 | | | | 1,243,604 | | | $ | 1,240,872 | | | $ | 1,221,580 | |
Compass IV Ltd., EURIBOR + 4.500%+ | | | 4.50 | | | | 4/30/2025 | | | | 500,000 | | | | 598,578 | | | | 571,393 | |
Compass IV Ltd., EURIBOR + 8.000%+ | | | 9.00 | | | | 4/30/2026 | | | | 500,000 | | | | 587,816 | | | | 559,550 | |
Financiere Sun S.A.S., EURIBOR + 3.000%+†† | | | 3.00 | | | | 3/14/2023 | | | | 338,983 | | | | 404,369 | | | | 384,687 | |
Las Vegas Sands LLC, 1M LIBOR + 1.750% | | | 4.15 | | | | 3/27/2025 | | | | 154,409 | | | | 151,850 | | | | 153,128 | |
Penn National Gaming, Inc., 1M LIBOR + 2.250% | | | 4.65 | | | | 10/15/2025 | | | | 2,015,868 | | | | 2,010,981 | | | | 2,006,736 | |
Richmond UK Bidco Ltd., GBP LIBOR + 4.250%+ | | | 4.97 | | | | 3/3/2024 | | | | 482,094 | | | | 607,938 | | | | 590,501 | |
Rouge Beachhouse B.V., EURIBOR + 4.250%+ | | | 4.25 | | | | 9/4/2025 | | | | 500,000 | | | | 586,575 | | | | 572,342 | |
Tackle Sarl, EURIBOR +3.500%+ | | | 3.25 | | | | 8/8/2022 | | | | 1,000,000 | | | | 1,117,524 | | | | 1,130,152 | |
| | | | | | | | | | | | | | | | | | | | |
Total Hotels, Motels, Inns and Gaming | | | | | | | | | | | 6,734,958 | | | | 7,306,503 | | | | 7,190,069 | |
| | | | | | | | | | | | | | | | | | | | |
|
Insurance — 3.7%*: | |
Alliant Holdings I, Inc., 1M LIBOR + 2.750% | | | 5.40 | | | | 5/9/2025 | | | | 2,782,987 | | | | 2,793,806 | | | | 2,699,804 | |
AssuredPartners, Inc., 1M LIBOR + 3.250% | | | 5.90 | | | | 10/22/2024 | | | | 1,775,922 | | | | 1,785,815 | | | | 1,755,943 | |
Asurion LLC, 1M LIBOR + 3.000% | | | 5.40 | | | | 11/3/2023 | | | | 1,539,979 | | | | 1,545,867 | | | | 1,536,129 | |
Confie Seguros Holding II Co., 3M LIBOR + 8.500% | | | 11.02 | | | | 11/2/2025 | | | | 1,633,627 | | | | 1,603,955 | | | | 1,565,831 | |
Hub International Ltd., 2M LIBOR + 2.750% | | | 5.59 | | | | 4/25/2025 | | | | 1,980,000 | | | | 1,975,872 | | | | 1,928,916 | |
York Risk Services Holding Corp., 1M LIBOR + 3.750% | | | 6.15 | | | | 10/1/2021 | | | | 690,637 | | | | 683,476 | | | | 651,070 | |
| | | | | | | | | | | | | | | | | | | | |
Total Insurance | | | | | | | | | | | 10,403,152 | | | | 10,388,791 | | | | 10,137,693 | |
| | | | | | | | | | | | | | | | | | | | |
|
Leisure, Amusement, Entertainment — 5.8%*: | |
Columbus Capital B.V., EURIBOR + 4.750%+ | | | 4.75 | | | | 6/30/2024 | | | | 500,000 | | | | 570,275 | | | | 567,601 | |
Crown Finance US, Inc., 1M LIBOR + 2.500% | | | 4.65 | | | | 2/28/2025 | | | | 1,756,880 | | | | 1,735,259 | | | | 1,726,679 | |
Delta 2 (LUX) Sarl, 1M LIBOR + 2.500%+ | | | 4.90 | | | | 2/1/2024 | | | | 1,394,967 | | | | 1,398,703 | | | | 1,360,790 | |
Dorna Sports, S.L., EURIBOR +2.750%+ | | | 2.75 | | | | 4/12/2024 | | | | 978,282 | | | | 1,093,131 | | | | 1,098,088 | |
Eldorado Resorts LLC, LIBOR + 2.500% | | | 4.69 | | | | 4/17/2024 | | | | 642,001 | | | | 637,232 | | | | 638,990 | |
International Park Holdings B.V., EURIBOR + 3.500%+ | | | 3.50 | | | | 6/13/2024 | | | | 500,000 | | | | 580,575 | | | | 561,443 | |
Metro-Goldwyn-Mayer, Inc., 1M LIBOR + 4.500% | | | 6.91 | | | | 7/3/2026 | | | | 2,000,000 | | | | 1,982,346 | | | | 1,932,500 | |
SeaWorld Parks & Entertainment, Inc., 3M LIBOR + 3.000% | | | 5.40 | | | | 3/31/2024 | | | | 2,546,731 | | | | 2,538,268 | | | | 2,535,806 | |
Vacalians Group, EURIBOR + 4.000%+ | | | 4.00 | | | | 10/31/2025 | | | | 500,000 | | | | 564,631 | | | | 567,367 | |
Vougeot Bidco PLC, EURIBOR + 5.500%+ | | | 5.50 | | | | 7/18/2023 | | | | 1,000,000 | | | | 1,163,932 | | | | 1,133,780 | |
Vue International Bidco PLC, LIBOR + 4.750%+ | | | 4.75 | | | | 6/30/2026 | | | | 500,000 | | | | 558,668 | | | | 569,971 | |
William Morris Endeavor Entertainment, LLC, 2M LIBOR + 2.750% | | | 5.16 | | | | 5/18/2025 | | | | 1,827,425 | | | | 1,823,058 | | | | 1,760,414 | |
See accompanying Notes to the Financial Statements.
90
Barings Global Floating Rate Fund 2019 Annual Report
SCHEDULE OF INVESTMENTS (CONTINUED)
June 30, 2019
| | | | | | | | | | | | | | | | | | | | |
| | | EFFECTIVE
INTEREST RATE | | | DUE DATE | | | PRINCIPAL ‡‡ | | | COST | | | FAIR
VALUE | |
Bank Loans(Continued) | |
|
Leisure, Amusement, Entertainment (Continued) | |
WMG Acquisition Corp., LIBOR + 2.125% | | | 4.53 | % | | | 11/1/2023 | | | | 1,500,000 | | | $ | 1,498,387 | | | $ | 1,478,250 | |
| | | | | | | | | | | | | | | | | | | | |
Total Leisure, Amusement, Entertainment | | | | | | | | | | | 15,646,286 | | | | 16,144,465 | | | | 15,931,679 | |
| | | | | | | | | | | | | | | | | | | | |
|
MachineryNon-Agriculture,Non-Construction,Non-Electronic — 1.7%*: | |
Alison Bidco Sarl, 1M LIBOR + 4.500%+ | | | 7.08 | | | | 8/29/2021 | | | | 246,044 | | | | 245,280 | | | | 221,850 | |
Alison Bidco Sarl, EURIBOR + 4.500%+ | | | 5.50 | | | | 8/30/2021 | | | | 859,950 | | | | 995,924 | | | | 939,957 | |
Apex Tool Group LLC, 1M LIBOR + 3.750% | | | 6.15 | | | | 2/1/2022 | | | | 1,668,581 | | | | 1,666,507 | | | | 1,600,453 | |
Titan Acquisition Ltd., 1M LIBOR + 3.000%+ | | | 5.40 | | | | 3/28/2025 | | | | 1,975,891 | | | | 1,973,988 | | | | 1,884,230 | |
| | | | | | | | | | | | | | | | | | | | |
Total MachineryNon-Agriculture,Non-Construction,Non-Electronic | | | | | | | | | | | 4,750,466 | | | | 4,881,699 | | | | 4,646,490 | |
| | | | | | | | | | | | | | | | | | | | |
|
Mining, Steel, Iron andNon-Precious Metals — 0.5%*: | |
Big River Steel LLC, 3M LIBOR + 5.000% | | | 7.33 | | | | 8/23/2023 | | | | 619,243 | | | | 626,147 | | | | 620,791 | |
Boomerang Tube, LLC, 3M LIBOR + 3.000%¤†† | | | 7.40 | | | | 10/31/2021 | | | | 62,044 | | | | 62,044 | | | | 62,044 | |
US Silica Co., 1M LIBOR + 4.000% | | | 6.44 | | | | 5/1/2025 | | | | 873,676 | | | | 882,915 | | | | 819,071 | |
| | | | | | | | | | | | | | | | | | | | |
Total Mining, Steel, Iron andNon-Precious Metals | | | | | | | | | | | 1,554,963 | | | | 1,571,106 | | | | 1,501,906 | |
| | | | | | | | | | | | | | | | | | | | |
|
Oil and Gas — 1.4%*: | |
Fieldwood Energy LLC, 1M LIBOR + 7.250% | | | 9.65 | | | | 4/11/2023 | | | | 864,968 | | | | 447,831 | | | | 717,924 | |
Gulf Finance LLC, 3M LIBOR + 5.250% | | | 7.65 | | | | 8/25/2023 | | | | 1,639,934 | | | | 1,522,695 | | | | 1,335,857 | |
KCA Deutag Alpha Ltd., 3M LIBOR + 6.750%+ | | | 9.08 | | | | 2/28/2023 | | | | 495,000 | | | | 493,062 | | | | 370,364 | |
Seadrill Partners Finco LLC, 3M LIBOR + 6.000% | | | 8.33 | | | | 2/21/2021 | | | | 1,813,994 | | | | 1,470,655 | | | | 1,292,471 | |
| | | | | | | | | | | | | | | | | | | | |
Total Oil and Gas | | | | | | | | | | | 4,813,896 | | | | 3,934,243 | | | | 3,716,616 | |
| | | | | | | | | | | | | | | | | | | | |
|
Personal andNon-Durable Consumer Products Mfg. Only — 0.6%*: | |
Coty Inc., 1M LIBOR + 2.250% | | | 4.67 | | | | 4/7/2025 | | | | 992,481 | | | | 955,159 | | | | 967,669 | |
Party City Holdings Inc., 1M LIBOR + 2.500% | | | 4.91 | | | | 8/19/2022 | | | | 815,187 | | | | 809,922 | | | | 808,926 | |
| | | | | | | | | | | | | | | | | | | | |
Total Personal andNon-Durable Consumer Products Mfg. Only | | | | | | | | | | | 1,807,668 | | | | 1,765,081 | | | | 1,776,595 | |
| | | | | | | | | | | | | | | | | | | | |
|
Personal Transportation — 0.7%*: | |
Hertz Corp., (The), 3M LIBOR + 2.7500% | | | 5.16 | | | | 6/30/2023 | | | | 1,979,221 | | | | 1,945,668 | | | | 1,969,938 | |
| | | | | | | | | | | | | | | | | | | | |
|
Printing and Publishing — 0.7%*: | |
Springer Nature Deutschland GmbH, EURIBOR + 3.250%+ | | | 3.75 | | | | 8/24/2022 | | | | 1,715,134 | | | | 1,953,452 | | | | 1,948,505 | |
| | | | | | | | | | | | | | | | | | | | |
|
Retail Stores — 3.9%*: | |
24 Hour Fitness Worldwide, Inc., 1M LIBOR + 3.500% | | | 5.90 | | | | 5/30/2025 | | | | 2,500,598 | | | | 2,510,917 | | | | 2,488,545 | |
Bass Pro Group, LLC, 1M LIBOR + 5.000% | | | 7.40 | | | | 9/25/2024 | | | | 994,937 | | | | 979,975 | | | | 948,712 | |
See accompanying Notes to the Financial Statements.
91
Barings Global Floating Rate Fund 2019 Annual Report
SCHEDULE OF INVESTMENTS (CONTINUED)
June 30, 2019
| | | | | | | | | | | | | | | | | | | | |
| | | EFFECTIVE
INTEREST RATE | | | DUE DATE | | | PRINCIPAL ‡‡ | | | COST | | | FAIR
VALUE | |
Bank Loans(Continued) | |
|
Retail Stores (Continued) | |
EG Finco Ltd., 3M LIBOR + 4.000%+ | | | 6.33 | % | | | 2/6/2025 | | | | 1,091,814 | | | $ | 1,087,302 | | | $ | 1,072,248 | |
EG Group Ltd., EURIBOR + 4.000%+ | | | 4.00 | | | | 1/31/2025 | | | | 1,485,425 | | | | 1,742,605 | | | | 1,669,129 | |
EG Group Ltd., 3M LIBOR + 4.000%+ | | | 6.33 | | | | 2/7/2025 | | | | 222,244 | | | | 221,791 | | | | 218,261 | |
Eyemart Express LLC, 1M LIBOR + 3.000% | | | 5.44 | | | | 8/2/2024 | | | | 992,424 | | | | 996,243 | | | | 982,083 | |
Harbor Freight Tools USA, Inc., 1M LIBOR + 2.500% | | | 4.90 | | | | 8/18/2023 | | | | 499,578 | | | | 494,255 | | | | 485,760 | |
Kirk Beauty One GmbH, EURIBOR + 3.500%+ | | | 3.50 | | | | 8/13/2022 | | | | 2,250,000 | | | | 2,555,815 | | | | 2,152,318 | |
Thom Europe S.A.S, EURIBOR + 4.250%+ | | | 4.25 | | | | 8/7/2024 | | | | 500,000 | | | | 576,557 | | | | 566,776 | |
| | | | | | | | | | | | | | | | | | | | |
Total Retail Stores | | | | | | | | | | | 10,537,020 | | | | 11,165,460 | | | | 10,583,832 | |
| | | | | | | | | | | | | | | | | | | | |
|
Telecommunications — 3.2%*: | |
Banff Merger Sub, Inc., 3M LIBOR + 4.250% | | | 6.58 | | | | 10/2/2025 | | | | 995,000 | | | | 986,098 | | | | 940,583 | |
CommScope, Inc., 1M LIBOR + 3.250% | | | 5.65 | | | | 4/6/2026 | | | | 1,507,464 | | | | 1,500,133 | | | | 1,501,434 | |
Digicel International Finance Ltd., 3M LIBOR + 3.250%+ | | | 5.78 | | | | 5/25/2024 | | | | 420,600 | | | | 423,358 | | | | 363,819 | |
Eircom Finco Sarl+ | | | 3.00 | | | | 5/14/2026 | | | | 1,000,000 | | | | 1,092,307 | | | | 1,137,419 | |
GTT Communications, Inc., 1M LIBOR + 2.750% | | | 5.15 | | | | 5/31/2025 | | | | 1,990,800 | | | | 1,982,333 | | | | 1,779,278 | |
Sprint Communications, Inc., 1M LIBOR + 2.500% | | | 4.94 | | | | 2/3/2024 | | | | 2,954,735 | | | | 2,963,118 | | | | 2,906,720 | |
| | | | | | | | | | | | | | | | | | | | |
Total Telecommunications | | | | | | | | | | | 8,868,599 | | | | 8,947,347 | | | | 8,629,253 | |
| | | | | | | | | | | | | | | | | | | | |
| | | | | | | | | | | | | | | | | | | | |
Total Bank Loans | | | | | | | | | | | 233,209,406 | | | | 239,576,634 | | | | 231,349,405 | |
| | | | | | | | | | | | | | | | | | | | |
Corporate Bonds — 9.5%*: | |
|
Automobile — 0.4%*: | |
AA Bond Co. Ltd.+ | | | 5.50 | | | | 7/31/2022 | | | | 700,000 | | | | 937,651 | | | | 755,620 | |
Panther BF Aggregator 2 LP/Panther Finance Co., Inc. | | | 4.38 | | | | 5/15/2026 | | | | 100,000 | | | | 113,415 | | | | 117,406 | |
RAC Bond Co. PLC+ | | | 5.00 | | | | 11/6/2022 | | | | 200,000 | | | | 252,272 | | | | 227,533 | |
| | | | | | | | | | | | | | | | | | | | |
Total Automobile | | | | | | | | | | | 1,000,000 | | | | 1,303,338 | | | | 1,100,559 | |
| | | | | | | | | | | | | | | | | | | | |
|
Beverage, Food and Tobacco — 0.1%*: | |
Restaurant Brands+^ | | | 5.00 | | | | 10/15/2025 | | | | 327,000 | | | | 327,000 | | | | 329,551 | |
| | | | | | | | | | | | | | | | | | | | |
|
Broadcasting and Entertainment — 0.4%*: | |
Entertainment One Ltd.+ | | | 4.63 | | | | 7/15/2026 | | | | 100,000 | | | | 125,820 | | | | 130,551 | |
Tele Columbus AG+ | | | 3.88 | | | | 5/2/2025 | | | | 800,000 | | | | 855,748 | | | | 846,285 | |
VTR Finance BV+^ | | | 6.88 | | | | 1/15/2024 | | | | 200,000 | | | | 202,242 | | | | 207,000 | |
| | | | | | | | | | | | | | | | | | | | |
Total Broadcasting and Entertainment | | | | | | | | | | | 1,100,000 | | | | 1,183,810 | | | | 1,183,836 | |
| | | | | | | | | | | | | | | | | | | | |
See accompanying Notes to the Financial Statements.
92
Barings Global Floating Rate Fund 2019 Annual Report
SCHEDULE OF INVESTMENTS (CONTINUED)
June 30, 2019
| | | | | | | | | | | | | | | | | | | | |
| | | EFFECTIVE
INTEREST RATE | | | DUE DATE | | | PRINCIPAL ‡‡ | | | COST | | | FAIR
VALUE | |
Corporate Bonds(Continued) | |
|
Chemicals, Plastics and Rubber — 0.2%*: | |
Monitchem HoldCo 3 SA, 3 mo. EURIBOR + 4.750%+ | | | 4.43 | # % | | | 6/15/2021 | | | | 250,000 | | | $ | 289,303 | | | $ | 284,275 | |
Monitchem HoldCo 3 SA+ | | | 5.25 | | | | 6/15/2021 | | | | 200,000 | | | | 228,915 | | | | 227,659 | |
Pinnacle Operating Corp.^ | | | 9.00 | | | | 5/15/2023 | | | | 378,294 | | | | 444,762 | | | | 124,837 | |
| | | | | | | | | | | | | | | | | | | | |
Total Chemicals, Plastics and Rubber | | | | | | | | | | | 828,294 | | | | 962,980 | | | | 636,771 | |
| | | | | | | | | | | | | | | | | | | | |
|
Containers, Packaging and Glass — 0.1%*: | |
BWAY Holding Co.^ | | | 5.50 | | | | 4/15/2024 | | | | 207,000 | | | | 207,000 | | | | 207,103 | |
Reynolds Group Issuer, Inc./Reynolds Group Issuer LLC/Reynolds Group Issuer Lu^ | | | 5.13 | | | | 7/15/2023 | | | | 178,000 | | | | 178,000 | | | | 181,338 | |
| | | | | | | | | | | | | | | | | | | | |
Total Containers, Packaging and Glass | | | | | | | | | | | 385,000 | | | | 385,000 | | | | 388,441 | |
| | | | | | | | | | | | | | | | | | | | |
|
Diversified/Conglomerate Manufacturing — 0.2%*: | |
Appvion ESC, 3M EURIBOR + 4.125%^¤ | | | 9.00 | # | | | 6/1/2020 | | | | 460,000 | | | | 461,698 | | | | – | |
Fabric BC SpA, 3M EURIBOR + 4.125%+ | | | 4.13 | # | | | 11/30/2024 | | | | 250,000 | | | | 284,680 | | | | 284,275 | |
Galapagos S.A., 3 mo. EURIBOR + 4.750%+†† | | | 4.43 | # | | | 6/15/2021 | | | | 200,000 | | | | 272,630 | | | | 221,735 | |
| | | | | | | | | | | | | | | | | | | | |
Total Diversified/Conglomerate Manufacturing | | | | | | | | | | | 910,000 | | | | 1,019,008 | | | | 506,010 | |
| | | | | | | | | | | | | | | | | | | | |
|
Diversified/Conglomerate Service — 1.0%*: | |
ADT LLC/Prime Finance, Inc.^ | | | 9.25 | | | | 5/15/2023 | | | | 78,000 | | | | 78,000 | | | | 81,915 | |
Algeco Global Finance PLC, 3 mo. EURIBOR + 6.250%+ | | | 6.25 | # | | | 2/15/2023 | | | | 150,000 | | | | 182,704 | | | | 172,271 | |
Algeco Global Finance PLC+ | | | 6.50 | | | | 2/15/2023 | | | | 450,000 | | | | 548,280 | | | | 533,928 | |
Carlson Travel, Inc., 3 mo. EURIBOR + 4.750% | | | 4.75 | # | | | 6/15/2023 | | | | 1,200,000 | | | | 1,370,064 | | | | 1,364,998 | |
TeamSystem SpA, 3 mo. EURIBOR + 4.000%+ | | | 4.00 | # | | | 4/15/2023 | | | | 400,000 | | | | 492,740 | | | | 455,295 | |
| | | | | | | | | | | | | | | | | | | | |
Total Diversified/Conglomerate Service | | | | | | | | | | | 2,278,000 | | | | 2,671,788 | | | | 2,608,407 | |
| | | | | | | | | | | | | | | | | | | | |
|
Electronics — 0.3%*: | |
First Data Corp.^ | | | 5.00 | | | | 1/15/2024 | | | | 179,000 | | | | 178,293 | | | | 183,386 | |
Veritas US, Inc./Veritas Bermuda Ltd.^ | | | 7.50 | | | | 2/1/2023 | | | | 817,000 | | | | 855,879 | | | | 763,895 | |
| | | | | | | | | | | | | | | | | | | | |
Total Electronics | | | | | | | | | | | 996,000 | | | | 1,034,172 | | | | 947,281 | |
| | | | | | | | | | | | | | | | | | | | |
|
Finance — 2.2%*: | |
Arrow Global Finance PLC, 3 mo. EURIBOR + 3.750%+ | | | 3.75 | # | | | 3/1/2026 | | | | 400,000 | | | | 496,520 | | | | 445,962 | |
Arrow Global Finance PLC+ | | | 5.13 | | | | 9/15/2024 | | | | 1,000,000 | | | | 1,234,339 | | | | 1,246,138 | |
Cabot Financial Luxembourg SA+ | | | 7.50 | | | | 10/1/2023 | | | | 300,000 | | | | 424,835 | | | | 393,367 | |
Galaxy Bidco Ltd., 3M GBP LIBOR + 4.500%+ | | | 5.31 | # | | | 11/15/2020 | | | | 300,000 | | | | 399,129 | | | | 375,841 | |
Galaxy Bidco Ltd.+ | | | 6.38 | | | | 11/15/2020 | | | | 500,000 | | | | 638,553 | | | | 632,117 | |
Garfunkelux Holdco 3 S.A., 3M EURIBOR + 4.500%+ | | | 4.50 | # | | | 9/1/2023 | | | | 1,100,000 | | | | 1,327,506 | | | | 1,044,116 | |
Garfunkelux Holdco 3 S.A.+ | | | 8.50 | | | | 11/1/2022 | | | | 1,050,000 | | | | 1,398,085 | | | | 1,196,102 | |
Jerrold Finco PLC+ | | | 6.13 | | | | 1/15/2024 | | | | 100,000 | | | | 124,555 | | | | 128,951 | |
See accompanying Notes to the Financial Statements.
93
Barings Global Floating Rate Fund 2019 Annual Report
SCHEDULE OF INVESTMENTS (CONTINUED)
June 30, 2019
| | | | | | | | | | | | | | | | | | | | |
| | | EFFECTIVE
INTEREST RATE | | | DUE DATE | | | PRINCIPAL ‡‡ | | | COST | | | FAIR
VALUE | |
Corporate Bonds(Continued) | |
|
Finance (Continued) | |
Jerrold Finco PLC+ | | | 6.25 | % | | | 9/15/2021 | | | | 500,000 | | | $ | 690,896 | | | $ | 646,880 | |
| | | | | | | | | | | | | | | | | | | | |
Total Finance | | | | | | | | | | | 5,250,000 | | | | 6,734,418 | | | | 6,109,474 | |
| | | | | | | | | | | | | | | | | | | | |
|
Healthcare, Education and Childcare — 0.6%*: | |
Rossini Sarl, EURIBOR + 6.25%+ | | | 6.25 | # | | | 10/30/2025 | | | | 750,000 | | | | 875,155 | | | | 875,937 | |
Synlab Bondco PLC+ | | | 6.25 | | | | 7/1/2022 | | | | 500,000 | | | | 606,432 | | | | 577,647 | |
Tenet Healthcare Corp. | | | 4.63 | | | | 7/15/2024 | | | | 255,000 | | | | 254,169 | | | | 258,187 | |
| | | | | | | | | | | | | | | | | | | | |
Total Healthcare, Education and Childcare | | | | | | | | | | | 1,505,000 | | | | 1,735,756 | | | | 1,711,771 | |
| | | | | | | | | | | | | | | | | | | | |
|
Home and Office Furnishings, Housewares, and Durable Consumer Products — 0.2%*: | |
Balta+ | | | 7.75 | | | | 9/15/2022 | | | | 445,500 | | | | 550,119 | | | | 503,341 | |
| | | | | | | | | | | | | | | | | | | | |
|
Hotels, Motels, Inns and Gaming — 0.4%*: | |
Travelodge+ | | | 8.50 | | | | 5/15/2023 | | | | 280,000 | | | | 387,457 | | | | 371,324 | |
TVL Finance PLC, 3M GBP LIBOR + 4.875%+ | | | 5.68 | # | | | 5/15/2023 | | | | 100,000 | | | | 131,117 | | | | 126,355 | |
TVL Finance PLC, 3M LIBOR + 5.370%+†† | | | 6.14 | # | | | 7/15/2025 | | | | 450,000 | | | | 568,620 | | | | 568,620 | |
| | | | | | | | | | | | | | | | | | | | |
Total Hotels, Motels, Inns and Gaming | | | | | | | | | | | 830,000 | | | | 1,087,194 | | | | 1,066,299 | |
| | | | | | | | | | | | | | | | | | | | |
|
Leisure, Amusement, Entertainment — 0.5%*: | |
Center Parks.+ | | | 4.88 | | | | 8/28/2025 | | | | 600,000 | | | | 791,721 | | | | 762,151 | |
Perform Group Financing PLC+ | | | 8.50 | | | | 11/15/2020 | | | | 250,000 | | | | 346,510 | | | | 321,297 | |
Vue International Bidco PLC, 3M EURIBOR + 5.250%+ | | | 4.94 | # | | | 7/15/2020 | | | | 100,000 | | | | 134,154 | | | | 113,653 | |
WMG Acquisition Corp.^ | | | 5.00 | | | | 8/1/2023 | | | | 63,000 | | | | 63,000 | | | | 64,260 | |
| | | | | | | | | | | | | | | | | | | | |
Total Leisure, Amusement, Entertainment | | | | | | | | | | | 1,013,000 | | | | 1,335,385 | | | | 1,261,361 | |
| | | | | | | | | | | | | | | | | | | | |
|
MachineryNon-Agriculture,Non-Construction,Non-Electronic — 0.4%*: | |
Novafives SAS+ | | | 5.00 | | | | 6/15/2025 | | | | 1,000,000 | | | | 1,091,704 | | | | 1,083,838 | |
| | | | | | | | | | | | | | | | | | | | |
|
Oil and Gas — 0.9%*: | |
Citgo Holding, Inc.^ | | | 10.75 | | | | 2/15/2020 | | | | 1,500,000 | | | | 1,496,126 | | | | 1,552,500 | |
EP Energy LLC/Everest Acquisition Finance, Inc.^ | | | 8.00 | | | | 2/15/2025 | | | | 713,000 | | | | 630,776 | | | | 155,077 | |
KCA Deutag UK Finance PLC+^ | | | 9.88 | | | | 4/1/2022 | | | | 1,000,000 | | | | 1,014,762 | | | | 737,500 | |
| | | | | | | | | | | | | | | | | | | | |
Total Oil and Gas | | | | | | | | | | | 3,213,000 | | | | 3,141,664 | | | | 2,445,077 | |
| | | | | | | | | | | | | | | | | | | | |
|
Personal Transportation — 0.2%*: | |
Naviera Armas S.A., 3M EURIBOR + 6.500%+ | | | 6.50 | # | | | 7/31/2023 | | | | 250,000 | | | | 296,567 | | | | 217,470 | |
Naviera Armas SA, 3 mo. EURIBOR + 4.250%+ | | | 4.25 | # | | | 11/15/2024 | | | | 250,000 | | | | 296,705 | | | | 198,993 | |
| | | | | | | | | | | | | | | | | | | | |
Total Personal Transportation | | | | | | | | | | | 500,000 | | | | 593,272 | | | | 416,463 | |
| | | | | | | | | | | | | | | | | | | | |
|
Retail Stores — 0.8%*: | |
CBR Fashion Finance BV+ | | | 5.13 | | | | 10/1/2022 | | | | 200,000 | | | | 204,047 | | | | 226,783 | |
eG Global Finance PLC+ | | | 4.38 | | | | 2/7/2025 | | | | 250,000 | | | | 279,337 | | | | 282,996 | |
House of Fraser Funding PLC, 3M GBP LIBOR + 5.750%+†† | | | 6.54 | # | | | 9/15/2020 | | | | 300,000 | | | | 432,945 | | | | 9,525 | |
See accompanying Notes to the Financial Statements.
94
Barings Global Floating Rate Fund 2019 Annual Report
SCHEDULE OF INVESTMENTS (CONTINUED)
June 30, 2019
| | | | | | | | | | | | | | | | | | | | |
| | | EFFECTIVE
INTEREST RATE | | | DUE DATE | | | PRINCIPAL ‡‡ | | | COST | | | FAIR
VALUE | |
Corporate Bonds(Continued) | |
|
Retail Stores (Continued) | |
Marcolin SpA, 3 mo. EURIBOR + 4.125%+ | | | 4.13 | # % | | | 2/15/2023 | | | | 300,000 | | | $ | 338,980 | | | $ | 341,089 | |
Maxeda DIY Holding B.V.+ | | | 6.13 | | | | 7/15/2022 | | | | 100,000 | | | | 114,070 | | | | 112,630 | |
Takko Luxembourg 2 SCA+ | | | 5.38 | | | | 11/15/2023 | | | | 1,200,000 | | | | 1,306,555 | | | | 1,146,197 | |
Travelex Financing PLC+ | | | 8.00 | | | | 5/15/2022 | | | | 100,000 | | | | 108,750 | | | | 113,316 | |
| | | | | | | | | | | | | | | | | | | | |
Total Retail Stores | | | | | | | | | | | 2,450,000 | | | | 2,784,684 | | | | 2,232,536 | |
| | | | | | | | | | | | | | | | | | | | |
|
Telecommunications — 0.2%*: | |
Ziggo B.V.+ | | | 4.25 | | | | 1/15/2027 | | | | 350,000 | | | | 390,408 | | | | 421,864 | |
| | | | | | | | | | | | | | | | | | | | |
|
Utilities — 0.4%*: | |
Viridian Group Finance Co. PLC/Viridian Power & Energy+ | | | 4.75 | | | | 9/15/2024 | | | | 865,000 | | | | 1,078,490 | | | | 1,104,921 | |
| | | | | | | | | | | | | | | | | | | | |
Total Corporate Bonds | | | | | | | | | | | 25,245,794 | | | | 29,410,190 | | | | 26,057,801 | |
| | | | | | | | | | | | | | | | | | | | |
Total Fixed Income | | | | | | | | | | | 258,455,200 | | | | 268,986,824 | | | | 257,407,206 | |
| | | | | | | | | | | | | | | | | | | | |
Total Investments | | | | | | | | | | | 258,772,632 | | | | 270,767,809 | | | | 259,120,620 | |
| | | | | | | | | | | | | | | | | | | | |
| |
Other assets and liabilities – 5.3%* | | | | 14,515,933 | |
| | | | | | | | | | | | | | | | | | | | |
| |
Net Assets – 100.0% | | | | $273,636,553 | |
| | | | | | | | | | | | | | | | | | | | |
| ‡‡ | Unless otherwise indicated, all principal amounts are denominated in United States Dollars. |
| * | Calculated as a percentage of net assets applicable to common shareholders. |
Distributions of investments by country of risk (excluding temporary cash investments) as a percentage of total investments in securities, is as follows:
| | | | | | |
| | United States | | | 64.3% | |
| | United Kingdom | | | 12.4% | |
| | Germany | | | 8.4% | |
| | Netherlands | | | 3.7% | |
| | France | | | 3.2% | |
| | Spain | | | 1.5% | |
| | Sweden | | | 1.4% | |
| | Other (Individually less than 1%) | | | 5.1% | |
| | | | | | |
| | Total | | | 100.0% | |
| | | | | | |
| ^ | Security acquired in a transaction exempt from registration under Rule 144A of the Securities Act of 1933. These securities may only be resold in transactions exempt from registration, normally to qualified institutional buyers. |
| § | Bank loans are exempt from registration under the Securities Act of 1933, as amended, but contain certain restrictions on resale and cannot be sold publicly. These loans pay interest at rates which adjust periodically. The interest rates shown for bank loans are the current interest rates at June 30, 2019. Bank loans are also subject to mandatory and/or optional prepayment which cannot be predicted. As a result, the remaining maturity may be substantially less than the stated maturity shown. |
See accompanying Notes to the Financial Statements.
95
Barings Global Floating Rate Fund 2019 Annual Report
SCHEDULE OF INVESTMENTS (CONTINUED)
June 30, 2019
| ¤ | For fair value measurement disclosure purposes, security is categorized as Level 3 (See Note 2). |
| # | Variable rate security. The interest rate shown is the rate in effect at June 30, 2019. |
A summary of outstanding derivatives at June 30, 2019 is as follows:
Forward Foreign Currency Exchange Contracts to Buy
| | | | | | | | | | | | | | | | | | | | | | |
EXPIRATION
DATE | | COUNTERPARTY | | LOCAL
CURRENCY | | | VALUE IN USD | | | IN
EXCHANGE
FOR USD | | | NET UNREALIZED
APPRECIATION
(DEPRECIATION) | |
| 7/12/19 | | Credit Suisse International | | | EUR | | | | 3,048,076 | | | $ | 3,468,892 | | | $ | 3,471,489 | | | $ | (2,597 | ) |
| 7/12/19 | | Morgan Stanley & Co. | | | GBP | | | | 1,723,863 | | | | 2,190,339 | | | | 2,200,828 | | | | (10,489 | ) |
| | | | | | | | | | | | | | | | | | | | | | |
Net unrealized depreciation on forward foreign currency exchange contracts to buy | | | $ | (13,086 | ) |
| | | | | | | | | | | | | | | | | | | | | | |
Forward Foreign Currency Exchange Contracts to Sell
| | | | | | | | | | | | | | | | | | | | | | |
EXPIRATION
DATE | | COUNTERPARTY | | LOCAL
CURRENCY | | | VALUE IN USD | | | IN
EXCHANGE
FOR USD | | | NET UNREALIZED
APPRECIATION
(DEPRECIATION) | |
| 7/12/19 | | Morgan Stanley & Co. | | | EUR | | | | 56,822,991 | | | $ | 64,667,955 | | | $ | 64,578,710 | | | $ | (89,245 | ) |
| 7/12/19 | | Morgan Stanley & Co. | | | GBP | | | | 12,839,369 | | | | 16,313,691 | | | | 16,394,739 | | | | 81,048 | |
| | | | | | | | | | | | | | | | | | | | | | |
Net unrealized depreciation on forward foreign currency exchange contracts to sell | | | $ | (8,197 | ) |
| | | | | | | | | | | | | | | | | | | | | | |
Currency Legend
| | | | |
| EUR | | – | | Euro |
| GBP | | – | | British Pound Sterling |
See accompanying Notes to the Financial Statements.
96
Barings Global Credit Income Opportunities Fund 2019 Annual Report
SCHEDULE OF INVESTMENTS
June 30, 2019
| | | | | | | | | | | | | | | | | | | | |
| | | | | | | | | SHARES | | | COST | | | FAIR
VALUE | |
Equities — 0.8%*: | |
|
Common Stocks — 0.8%*: | |
|
Retail Stores — 0.3%*: | |
Maxeda DIY B.V.+¤ | | | | | | | | | | | 18,859,871 | | | | $373,737 | | | | $428,911 | |
Maxeda DIY B.V.+¤ | | | | | | | | | | | 10,446 | | | | – | | | | 107,236 | |
| | | | | | | | | | | | | | | | | | | | |
Total Retail Stores | | | | | | | | | | | 18,870,317 | | | | 373,737 | | | | 536,147 | |
| | | | | | | | | | | | | | | | | | | | |
|
Mining, Steel, Iron andNon-Precious Metals — 0.1%*: | |
Boomerang Tube LLC¤ | | | | | | | | | | | 1,769 | | | | 171,860 | | | | 147,959 | |
| | | | | | | | | | | | | | | | | | | | |
|
Oil and Gas — 0.4%*: | |
Fieldwood Energy LLC | | | | | | | | | | | 3,698 | | | | 129,430 | | | | 110,940 | |
Fieldwood Energy LLC | | | | | | | | | | | 15,071 | | | | 325,034 | | | | 452,130 | |
Jupiter Resources, Inc.+ | | | | | | | | | | | 120,272 | | | | 581,286 | | | | 315,714 | |
Southcross Energy Holdings LP | | | | | | | | | | | 11 | | | | – | | | | – | |
Southcross Energy Partners LP | | | | | | | | | | | 11 | | | | 2,750 | | | | 5,775 | |
| | | | | | | | | | | | | | | | | | | | |
Total Oil and Gas | | | | | | | | | | | 139,063 | | | | 1,038,500 | | | | 884,559 | |
| | | | | | | | | | | | | | | | | | | | |
|
Healthcare, Education and Childcare — 0.0%*: | |
MModal, Inc. | | | | | | | | | | | 4,725 | | | | 10,631 | | | | 9,450 | |
Tunstall Group Holdings Ltd.+¤ | | | | | | | | | | | 396 | | | | – | | | | – | |
Tunstall Group Holdings Ltd.+¤ | | | | | | | | | | | 261 | | | | – | | | | – | |
| | | | | | | | | | | | | | | | | | | | |
Total Healthcare, Education and Childcare | | | | | | | | | | | 5,382 | | | | 10,631 | | | | 9,450 | |
| | | | | | | | | | | | | | | | | | | | |
|
Diversified/Conglomerate Service — 0.0%*: | |
Innovation Group¤+ | | | | | | | | | | | 403,550 | | | | – | | | | 1 | |
| | | | | | | | | | | | | | | | | | | | |
Total Common Stocks | | | | | | | | | | | 19,420,081 | | | | 1,594,728 | | | | 1,578,116 | |
| | | | | | | | | | | | | | | | | | | | |
| | | | | |
| | | EFFECTIVE
INTEREST RATE | | | | | | SHARES | | | COST | | | FAIR
VALUE | |
Preferred Stock — 0.0%*: | |
|
Farming and Agriculture — 0.0%*: | |
Pinnacle Agriculture Holdings A 2¤†† | | | 2.32 | % | | | | | | | 311,577 | | | | 202,152 | | | | 28,042 | |
| | | | | | | | | | | | | | | | | | | | |
| | | | | |
| | | | | | | | | SHARES | | | COST | | | FAIR
VALUE | |
| WARRANTS — 0.0%*: | | | | | | | | | | | | | | | | | | | | |
|
Diversified/Conglomerate Manufacturing — 0.0%*: | |
Appvion Holdings Corp. (exp. June 13, 2023)¤†† | | | | | | | | | | | 488 | | | | – | | | | 244 | |
Appvion Holdings Corp. (exp. June 13, 2023)¤†† | | | | | | | | | | | 488 | | | | – | | | | 61 | |
| | | | | | | | | | | | | | | | | | | | |
Total Diversified/Conglomerate Manufacturing | | | | | | | | | | | 976 | | | | – | | | | 305 | |
| | | | | | | | | | | | | | | | | | | | |
Total Warrants | | | | | | | | | | | 976 | | | | – | | | | 305 | |
| | | | | | | | | | | | | | | | | | | | |
Total Equities | | | | | | | | | | | 19,732,634 | | | | 1,796,880 | | | | 1,606,463 | |
| | | | | | | | | | | | | | | | | | | | |
See accompanying Notes to the Financial Statements.
97
Barings Global Credit Income Opportunities Fund 2019 Annual Report
SCHEDULE OF INVESTMENTS (CONTINUED)
June 30, 2019
| | | | | | | | | | | | | | | | | | | | |
| | | EFFECTIVE
INTEREST RATE | | | DUE DATE | | | PRINCIPAL ‡‡ | | | COST | | | FAIR
VALUE | |
Fixed Income — 92.6%**: | |
|
Asset-Backed Securities — 11.2%**: | |
|
CDO/CLO — 11.2%*: | |
Alinea CLO2018-1 Ltd., 3M LIBOR + 6.000%^ | | | 8.59 | #% | | | 7/20/2031 | | | | 1,250,000 | | | | $1,250,000 | | | | $1,173,799 | |
ALME Loan Funding III Designated Activity Co. 3A ERV, 3M EURIBOR + 5.400%+^ | | | 5.40 | # | | | 4/15/2030 | | | | 500,000 | | | | 523,143 | | | | 563,243 | |
ALME Loan Funding IV BV 4A ER, 3M EURIBOR + 4.670%+^ | | | 4.67 | # | | | 1/15/2032 | | | | 1,000,000 | | | | 1,144,494 | | | | 1,075,377 | |
Anchorage Capital CLO Ltd.2015-6A ER, 3M USD LIBOR + 6.350%^ | | | 8.95 | # | | | 7/15/2030 | | | | 500,000 | | | | 512,786 | | | | 482,561 | |
Apidos CLO XXIV, 3M USD LIBOR + 5.800%^ | | | 8.39 | # | | | 10/20/2030 | | | | 1,000,000 | | | | 1,000,000 | | | | 952,132 | |
Ares XLVIII CLO, 3M LIBOR + 5.200%^ | | | 7.79 | # | | | 7/20/2030 | | | | 800,000 | | | | 800,000 | | | | 727,034 | |
Atlas Senior Loan Fund XI Ltd., 3M LIBOR + 5.7500%^ | | | 8.34 | # | | | 7/26/2031 | | | | 1,900,000 | | | | 1,900,000 | | | | 1,759,328 | |
Avoca CLO XIV Designated Activity Co. 14X FR, 3M EURIBOR + 6.350%+ | | | 6.35 | # | | | 1/12/2031 | | | | 500,000 | | | | 560,349 | | | | 509,089 | |
Blackrock European CLO VII DAC 7X E, 3M USD LIBOR + 5.170%+ | | | 5.17 | # | | | 10/15/2031 | | | | 725,000 | | | | 802,087 | | | | 782,962 | |
BlueMountain CLO Ltd.2014-1A^¤ | | | Zero Coupon | | | | 4/30/2026 | | | | 250,000 | | | | 242,827 | | | | – | |
Carbone CLO Ltd.2017-1A D, 3M USD LIBOR + 5.900%^ | | | 8.49 | # | | | 1/20/2031 | | | | 500,000 | | | | 500,000 | | | | 470,392 | |
CBAM Ltd.2017-3A E, 3M USD LIBOR + 6.500%^ | | | 9.09 | # | | | 10/17/2029 | | | | 750,000 | | | | 750,000 | | | | 728,551 | |
CIFC Funding2018-III Ltd., 3M LIBOR + 5.500%^ | | | 8.10 | # | | | 7/18/2031 | | | | 1,500,000 | | | | 1,499,999 | | | | 1,373,655 | |
CIFC Funding2019-III Ltd., 3M LIBOR + 6.800%^ | | | 9.32 | # | | | 7/16/2032 | | | | 750,000 | | | | 727,574 | | | | 734,950 | |
CIFC Funding Ltd.2017-5A D, 3M USD LIBOR + 6.100%^ | | | 8.69 | # | | | 11/16/2030 | | | | 500,000 | | | | 500,000 | | | | 477,048 | |
Cordatus 3X CLO plc, 3M EURIBOR+ 4.860%+ | | | 4.86 | # | | | 8/15/2032 | | | | 1,000,000 | | | | 1,157,180 | | | | 1,072,490 | |
Galaxy XXIV CLO Ltd.2017-24A E, 3M USD LIBOR + 5.500%^ | | | 8.10 | # | | | 1/15/2031 | | | | 700,000 | | | | 700,000 | | | | 647,293 | |
Madison Park Funding XIII Ltd.2014-13A^ | | | Zero Coupon | | | | 4/19/2030 | | | | 500,000 | | | | 422,677 | | | | 337,709 | |
Madison Park Funding XXVII Ltd., 3M USD LIBOR + 5.200%^ | | | 7.59 | # | | | 4/20/2030 | | | | 500,000 | | | | 500,000 | | | | 459,653 | |
Madison Park Funding XXVIII Ltd., 3M LIBOR + 7.600%^ | | | 10.20 | # | | | 7/15/2030 | | | | 500,000 | | | | 495,656 | | | | 457,855 | |
Magnetite CLO LTD., 3M LIBOR + 6.750%^ | | | 9.27 | # | | | 4/15/2031 | | | | 500,000 | | | | 500,000 | | | | 500,922 | |
Magnetite VII Ltd.^ | | | Zero Coupon | | | | 1/15/2028 | | | | 2,000,000 | | | | 1,495,849 | | | | 1,406,771 | |
Neuberger Berman Loan Advisers CLO 28 Ltd., 3M USD LIBOR + 5.600%^ | | | 8.19 | # | | | 4/20/2030 | | | | 500,000 | | | | 500,000 | | | | 469,318 | |
Oak Hill Credit Partners X Ltd.2014-10A^ | | | Zero Coupon | | | | 12/12/2030 | | | | 1,000,000 | | | | 721,764 | | | | 445,871 | |
RRE 2 Loan Management DAC, 3M EURIBOR + 5.800%+ | | | 5.80 | # | | | 1/15/2032 | | | | 1,000,000 | | | | 1,078,106 | | | | 1,097,069 | |
Steele Creek CLO Ltd.2017-1A E, 3M USD LIBOR + 6.200%^ | | | 8.80 | # | | | 1/15/2030 | | | | 500,000 | | | | 500,000 | | | | 478,625 | |
See accompanying Notes to the Financial Statements.
98
Barings Global Credit Income Opportunities Fund 2019 Annual Report
SCHEDULE OF INVESTMENTS (CONTINUED)
June 30, 2019
| | | | | | | | | | | | | | | | | | | | |
| | | EFFECTIVE
INTEREST RATE | | | DUE DATE | | | PRINCIPAL ‡‡ | | | COST | | | FAIR
VALUE | |
Asset-Backed Securities(Continued) | |
|
CDO/CLO (Continued) | |
Steele Creek CLO Ltd.2018-2A E, 3M USD LIBOR + 6.200%^ | | | 8.72 | # % | | | 8/18/2031 | | | | 850,000 | | | $ | 850,000 | | | $ | 785,426 | |
THL Credit Wind River CLO Ltd.2017-4A E, 3M USD LIBOR + 5.800%^ | | | 8.32 | # | | | 11/20/2030 | | | | 500,000 | | | | 500,000 | | | | 473,823 | |
THL Credit Wind River CLO Ltd.2018-2A E, 3M USD LIBOR + 5.750%^ | | | 8.35 | # | | | 7/15/2030 | | | | 1,450,000 | | | | 1,450,000 | | | | 1,336,313 | |
Wellfleet CLO2018-1 Ltd., 3M USD LIBOR + 5.500%^ | | | 8.09 | # | | | 7/17/2031 | | | | 1,150,000 | | | | 1,150,000 | | | | 1,019,917 | |
Wellfleet CLO Ltd.2017-3A D, 3M USD LIBOR + 5.550%^ | | | 8.14 | # | | | 1/17/2031 | | | | 1,000,000 | | | | 1,000,000 | | | | 898,919 | |
| | | | | | | | | | | | | | | | | | | | |
Total CDO/CLO | | | | | | | | | | | 26,075,000 | | | | 25,734,491 | | | | 23,698,095 | |
| | | | | | | | | | | | | | | | | | | | |
| | | | | | | | | | | | | | | | | | | | |
Total Asset-Backed Securities | | | | | | | | | | | 26,075,000 | | | | 25,734,491 | | | | 23,698,095 | |
| | | | | | | | | | | | | | | | | | | | |
Bank Loans — 40.1%*§: | |
|
Aerospace and Defense — 0.5%*: | |
TransDigm, Inc., 1M LIBOR + 2.500% | | | 4.83 | | | | 5/30/2025 | | | | 994,962 | | | | 970,808 | | | | 970,914 | |
| | | | | | | | | | | | | | | | | | | | |
|
Automobile — 0.5%*: | |
Panther BF Aggregator 2 L P, 1M LIBOR + 3.5000%+ | | | 5.90 | | | | 4/30/2026 | | | | 1,138,679 | | | | 1,129,417 | | | | 1,129,433 | |
| | | | | | | | | | | | | | | | | | | | |
|
Automobiles — 0.2%*: | |
IAA, Inc., LIBOR + 2.250% | | | 4.57 | | | | 5/22/2026 | | | | 452,258 | | | | 451,127 | | | | 453,388 | |
| | | | | | | | | | | | | | | | | | | | |
|
Beverage, Food and Tobacco — 0.9%*: | |
Deoleo S.A., EURIBOR + 3.500%+†† | | | 4.50 | | | | 6/11/2021 | | | | 500,000 | | | | 561,839 | | | | 224,577 | |
IRB Holding Corp., 1M LIBOR + 3.250% | | | 5.64 | | | | 2/5/2025 | | | | 1,819,790 | | | | 1,835,780 | | | | 1,795,060 | |
| | | | | | | | | | | | | | | | | | | | |
Total Beverage, Food and Tobacco | | | | | | | | | | | 2,319,790 | | | | 2,397,619 | | | | 2,019,637 | |
| | | | | | | | | | | | | | | | | | | | |
|
Broadcasting and Entertainment — 4.6%*: | |
AP NMT Acquisition B.V., EURIBOR + 6.000%+ | | | 7.00 | | | | 8/13/2021 | | | | 387,032 | | | | 478,094 | | | | 439,680 | |
AP NMT Acquisition B.V., 3M LIBOR + 5.750%+ | | | 8.35 | | | | 8/13/2021 | | | | 1,175,117 | | | | 1,156,336 | | | | 1,164,835 | |
AP NMT Acquisition B.V., 3M LIBOR + 9.000%+ | | | 11.60 | | | | 8/13/2022 | | | | 739,566 | | | | 729,068 | | | | 730,935 | |
Charter Communications Operating, LLC, 3M LIBOR + 2.000% | | | 4.33 | | | | 4/30/2025 | | | | 1,492,424 | | | | 1,486,965 | | | | 1,490,186 | |
CSC Holdings, LLC, 1M LIBOR + 3.000% | | | 5.39 | | | | 4/15/2027 | | | | 1,280,059 | | | | 1,273,732 | | | | 1,280,379 | |
E.W. Scripps Co. (The), LIBOR + 2.750% | | | 5.15 | | | | 5/1/2026 | | | | 439,062 | | | | 436,890 | | | | 437,780 | |
iHeartCommunications, Inc., LIBOR + 4.000% | | | 6.58 | | | | 5/1/2026 | | | | 2,000,000 | | | | 2,005,000 | | | | 2,001,880 | |
Intelsat Jackson Holdings S.A., 1M LIBOR + 3.750% | | | 6.15 | | | | 11/27/2023 | | | | 1,000,000 | | | | 990,831 | | | | 988,750 | |
Univision Communications, Inc., 1M LIBOR + 2.750% | | | 5.15 | | | | 3/15/2024 | | | | 1,429,327 | | | | 1,416,301 | | | | 1,359,204 | |
| | | | | | | | | | | | | | | | | | | | |
Total Broadcasting and Entertainment | | | | | | | | | | | 9,942,587 | | | | 9,973,217 | | | | 9,893,629 | |
| | | | | | | | | | | | | | | | | | | | |
See accompanying Notes to the Financial Statements.
99
Barings Global Credit Income Opportunities Fund 2019 Annual Report
SCHEDULE OF INVESTMENTS (CONTINUED)
June 30, 2019
| | | | | | | | | | | | | | | | | | | | |
| | | EFFECTIVE
INTEREST RATE | | | DUE DATE | | | PRINCIPAL ‡‡ | | | COST | | | FAIR
VALUE | |
Bank Loans(Continued) | |
|
Buildings and Real Estate — 0.7%*: | |
LSF10 Impala Investments S.a r.l., EURIBOR + 4.750%+ | | | 4.75 | % | | | 10/10/2025 | | | | 500,000 | | | $ | 574,228 | | | $ | 569,261 | |
SRS Distribution, Inc., 3M LIBOR + 3.250% | | | 5.65 | | | | 5/23/2025 | | | | 861,312 | | | | 848,025 | | | | 824,887 | |
| | | | | | | | | | | | | | | | | | | | |
Total Buildings and Real Estate | | | | | | | | | | | 1,361,312 | | | | 1,422,253 | | | | 1,394,148 | |
| | | | | | | | | | | | | | | | | | | | |
|
Cargo Transport — 1.1%*: | |
American Airlines, Inc., 1M LIBOR + 2.000% | | | 4.39 | | | | 12/14/2023 | | | | 1,000,000 | | | | 985,369 | | | | 983,750 | |
American Airlines, Inc., 1M LIBOR + 2.000% | | | 4.40 | | | | 4/28/2023 | | | | 1,489,796 | | | | 1,470,300 | | | | 1,467,821 | |
| | | | | | | | | | | | | | | | | | | | |
Total Cargo Transport | | | | | | | | | | | 2,489,796 | | | | 2,455,669 | | | | 2,451,571 | |
| | | | | | | | | | | | | | | | | | | | |
|
Chemicals, Plastics and Rubber — 1.6%*: | |
Colouroz Investment 1 GmbH, EURIBOR + 3.0000%+ | | | 3.75 | | | | 9/7/2021 | | | | 1,337,934 | | | | 1,576,740 | | | | 1,331,195 | |
Flint Group GmbH, EURIBOR + 3.000%+ | | | 3.75 | | | | 9/7/2021 | | | | 283,312 | | | | 335,819 | | | | 281,884 | |
Momentive Performance Materials, Inc., LIBOR + 3.250% | | | 5.59 | | | | 5/19/2024 | | | | 135,449 | | | | 134,784 | | | | 134,095 | |
Novacap S.A., EURIBOR + 3.500%+ | | | 3.50 | | | | 6/22/2023 | | | | 500,000 | | | | 577,134 | | | | 548,890 | |
Platform Specialty Products Corp., 1M LIBOR + 2.250% | | | 4.65 | | | | 1/30/2026 | | | | 200,162 | | | | 199,926 | | | | 199,349 | |
Solenis Holdings LLC, 3M LIBOR + 4.000% | | | 6.52 | | | | 6/26/2025 | | | | 246,119 | | | | 243,997 | | | | 242,735 | |
Solenis Holdings LLC, 3M LIBOR + 8.500% | | | 11.02 | | | | 6/26/2026 | | | | 68,282 | | | | 66,279 | | | | 66,973 | |
Starfruit Finco B.V, 1M LIBOR + 3.250%+ | | | 5.67 | | | | 10/1/2025 | | | | 513,444 | | | | 511,137 | | | | 504,674 | |
| | | | | | | | | | | | | | | | | | | | |
Total Chemicals, Plastics and Rubber | | | | | | | | | | | 3,284,702 | | | | 3,645,816 | | | | 3,309,795 | |
| | | | | | | | | | | | | | | | | | | | |
|
Commercial Services — 1.4%*: | |
Go Daddy Operating Company, LLC, LIBOR + 2.250% | | | 4.40 | | | | 2/15/2024 | | | | 1,126,130 | | | | 1,122,079 | | | | 1,125,849 | |
Masmovil Holdphone SA, LIBOR + 3.250%+ | | | 3.25 | | | | 5/13/2026 | | | | 500,000 | | | | 557,622 | | | | 567,447 | |
Syniverse Holdings, Inc., 1M LIBOR + 5.000% | | | 7.40 | | | | 3/9/2023 | | | | 197,577 | | | | 196,114 | | | | 181,277 | |
Syniverse Holdings, Inc., 1M LIBOR + 9.000% | | | 11.40 | | | | 3/11/2024 | | | | 153,729 | | | | 151,921 | | | | 111,915 | |
Virgin Media Investment Holdings Ltd., LIBOR - GBP + 3.250%+ | | | 3.98 | | | | 11/15/2027 | | | | 750,000 | | | | 1,062,532 | | | | 944,728 | |
| | | | | | | | | | | | | | | | | | | | |
Total Commercial Services | | | | | | | | | | | 2,727,436 | | | | 3,090,268 | | | | 2,931,216 | |
| | | | | | | | | | | | | | | | | | | | |
|
Containers, Packaging and Glass — 1.7%*: | |
Albea Beauty Holdings S.A., 1M LIBOR + 3.000%+ | | | 5.52 | | | | 4/22/2024 | | | | 204,350 | | | | 204,146 | | | | 199,497 | |
Berry Global, Inc., LIBOR + 2.500% | | | 4.82 | | | | 5/15/2026 | | | | 1,600,777 | | | | 1,598,025 | | | | 1,588,947 | |
BWAY Holding Co., 1M LIBOR + 3.250% | | | 5.85 | | | | 4/3/2024 | | | | 1,322,571 | | | | 1,322,148 | | | | 1,275,726 | |
ProAmpac PG Borrower LLC, 3M LIBOR + 8.500% | | | 11.02 | | | | 11/18/2024 | | | | 500,000 | | | | 494,943 | | | | 473,125 | |
| | | | | | | | | | | | | | | | | | | | |
Total Containers, Packaging and Glass | | | | | | | | | | | 3,627,698 | | | | 3,619,262 | | | | 3,537,295 | |
| | | | | | | | | | | | | | | | | | | | |
|
Diversified/Conglomerate Manufacturing — 1.0%*: | |
LTI Holdings, Inc., 1M LIBOR + 3.500% | | | 5.90 | | | | 9/6/2025 | | | | 1,004,817 | | | | 989,997 | | | | 948,929 | |
See accompanying Notes to the Financial Statements.
100
Barings Global Credit Income Opportunities Fund 2019 Annual Report
SCHEDULE OF INVESTMENTS (CONTINUED)
June 30, 2019
| | | | | | | | | | | | | | | | | | | | |
| | | EFFECTIVE
INTEREST RATE | | | DUE DATE | | | PRINCIPAL ‡‡ | | | COST | | | FAIR
VALUE | |
Bank Loans(Continued) | |
|
Diversified/Conglomerate Manufacturing (Continued) | |
Triple Point Technology, Inc., 3M LIBOR + 4.250% | | | 6.58 | % | | | 7/10/2020 | | | | 567,467 | | | $ | 558,845 | | | $ | 540,983 | |
Xella International GmbH, EURIBOR + 4.000%+ | | | 3.75 | | | | 4/11/2024 | | | | 500,000 | | | | 588,325 | | | | 562,421 | |
| | | | | | | | | | | | | | | | | | | | |
Total Diversified/Conglomerate Manufacturing | | | | | | | | | | | 2,072,284 | | | | 2,137,167 | | | | 2,052,333 | |
| | | | | | | | | | | | | | | | | | | | |
|
Diversified/Conglomerate Service — 5.0%*: | |
Allied Universal Holdco LLC, LIBOR + 4.250%†† | | | 6.57 | | | | 6/26/2026 | | | | 179,860 | | | | 178,061 | | | | 178,961 | |
Almonde, Inc., 3M LIBOR + 3.500%+ | | | 5.90 | | | | 6/13/2024 | | | | 1,331,835 | | | | 1,334,888 | | | | 1,295,955 | |
EAB (Avatar Purchaser), 1M LIBOR + 3.750% | | | 6.38 | | | | 11/15/2024 | | | | 242,689 | | | | 241,755 | | | | 240,262 | |
Financial & Risk US Holdings, Inc., 1M LIBOR + 3.750% | | | 6.15 | | | | 10/1/2025 | | | | 1,492,500 | | | | 1,439,500 | | | | 1,446,322 | |
Hyland Software, Inc., 1M LIBOR + 3.500% | | | 5.65 | | | | 7/1/2024 | | | | 994,988 | | | | 984,478 | | | | 987,525 | |
Innovation Group plc (The), LIBOR + 5.000%¤+†† | | | 5.94 | | | | 4/9/2024 | | | | 56,983 | | | | 74,565 | | | | 72,366 | |
Innovation Group plc (The), LIBOR + 6.000%+,¤,†† | | | 6.00 | | | | 4/9/2023 | | | | 232,625 | | | | 261,727 | | | | 264,519 | |
Innovation Group PLC (The), LIBOR + 8.000%¤+†† | | | 8.77 | | | | 4/9/2024 | | | | 133,938 | | | | 42,417 | | | | 35,210 | |
Kronos, Inc., 3M LIBOR + 3.500% | | | 5.58 | | | | 11/1/2023 | | | | 2,000,000 | | | | 1,981,411 | | | | 1,994,760 | |
TMF Group Holding B.V., LIBOR + 6.875%+ | | | 6.88 | | | | 5/4/2026 | | | | 500,000 | | | | 535,697 | | | | 531,594 | |
Ultimate Software Group Inc(The), LIBOR + 3.750% | | | 6.08 | | | | 5/3/2026 | | | | 247,000 | | | | 246,396 | | | | 247,309 | |
Verisure Holding AB, EURIBOR + 3.000%+ | | | 3.00 | | | | 10/21/2022 | | | | 1,000,000 | | | | 1,165,587 | | | | 1,125,422 | |
Vertafore, Inc., 1M LIBOR + 3.250% | | | 5.65 | | | | 7/2/2025 | | | | 1,491,764 | | | | 1,474,413 | | | | 1,431,467 | |
Vertafore, Inc., 1M LIBOR + 7.250% | | | 9.65 | | | | 7/2/2026 | | | | 879,452 | | | | 871,708 | | | | 853,437 | |
| | | | | | | | | | | | | | | | | | | | |
Total Diversified/Conglomerate Service | | | | | | | | | | | 10,783,634 | | | | 10,832,603 | | | | 10,705,109 | |
| | | | | | | | | | | | | | | | | | | | |
|
Ecological — 0.4%*: | |
Emerald 3 Ltd., 3M LIBOR + 7.000% | | | 9.40 | | | | 5/31/2022 | | | | 196,488 | | | | 195,756 | | | | 195,997 | |
GFL Environmental Inc., 1M LIBOR + 3.000%+ | | | 5.40 | | | | 5/31/2025 | | | | 132,132 | | | | 131,882 | | | | 129,867 | |
PHS Group Ltd., 1M LIBOR + 5.250%+ | | | 6.25 | | | | 12/20/2021 | | | | 467,152 | | | | 608,138 | | | | 592,814 | |
| | | | | | | | | | | | | | | | | | | | |
Total Ecological | | | | | | | | | | | 795,772 | | | | 935,776 | | | | 918,678 | |
| | | | | | | | | | | | | | | | | | | | |
|
Electronics — 2.7%*: | |
II-VI, Inc., LIBOR + 3.500% | | | 5.82 | | | | 6/28/2026 | | | | 596,932 | | | | 591,984 | | | | 587,608 | |
ION Trading Technologies Sarl, EURIBOR + 3.250% | | | 4.25 | | | | 11/21/2024 | | | | 1,090,342 | | | | 1,252,860 | | | | 1,205,386 | |
ION Trading Technologies Sarl, 3M LIBOR + 4.000% | | | 6.33 | | | | 11/21/2024 | | | | 282,941 | | | | 276,794 | | | | 273,694 | |
Omnitracs, Inc., 3M LIBOR + 2.750% | | | 5.10 | | | | 3/21/2025 | | | | 1,485,000 | | | | 1,488,076 | | | | 1,460,869 | |
Renaissance Holding Corp., 1M LIBOR + 3.250% | | | 5.73 | | | | 5/31/2025 | | | | 990,000 | | | | 990,000 | | | | 958,647 | |
RP Crown Parent LLC, 1M LIBOR + 2.750% | | | 5.15 | | | | 10/12/2023 | | | | 724,716 | | | | 722,493 | | | | 720,411 | |
See accompanying Notes to the Financial Statements.
101
Barings Global Credit Income Opportunities Fund 2019 Annual Report
SCHEDULE OF INVESTMENTS (CONTINUED)
June 30, 2019
| | | | | | | | | | | | | | | | | | | | |
| | | EFFECTIVE
INTEREST RATE | | | DUE DATE | | | PRINCIPAL ‡‡ | | | COST | | | FAIR
VALUE | |
Bank Loans(Continued) | |
|
Electronics (Continued) | |
Veritas Bermuda Ltd., 3M LIBOR + 4.500% | | | 6.89 | % | | | 1/27/2023 | | | | 554,394 | | | $ | 553,053 | | | $ | 503,461 | |
| | | | | | | | | | | | | | | | | | | | |
Total Electronics | | | | | | | | | | | 5,724,325 | | | | 5,875,260 | | | | 5,710,076 | |
| | | | | | | | | | | | | | | | | | | | |
|
Finance — 1.1%*: | |
NFP Corp., 1M LIBOR + 3.000% | | | 5.40 | | | | 1/6/2024 | | | | 952,737 | | | | 921,455 | | | | 925,194 | |
Tempo Acquisition LLC, 1M LIBOR + 3.000% | | | 5.40 | | | | 5/1/2024 | | | | 1,499,291 | | | | 1,502,863 | | | | 1,492,109 | |
| | | | | | | | | | | | | | | | | | | | |
Total Finance | | | | | | | | | | | 2,452,028 | | | | 2,424,318 | | | | 2,417,303 | |
| | | | | | | | | | | | | | | | | | | | |
|
Healthcare, Education and Childcare — 4.8%*: | |
Advanz Pharma Corp., LIBOR + 5.500%+ | | | 7.91 | | | | 9/6/2024 | | | | 1,822,250 | | | | 1,802,406 | | | | 1,747,082 | |
Aenova Holding GmbH, EURIBOR + 4.000%+ | | | 5.00 | | | | 9/29/2020 | | | | 1,000,000 | | | | 1,162,193 | | | | 1,130,936 | |
Aveanna Healthcare, LLC, 1M LIBOR + 5.500% | | | 7.90 | | | | 3/18/2024 | | | | 146,071 | | | | 140,334 | | | | 140,715 | |
Catalent Pharma Solutions, Inc., LIBOR + 2.250% | | | 4.65 | | | | 5/17/2026 | | | | 119,526 | | | | 119,231 | | | | 119,426 | |
Change Healthcare Holdings, Inc., 1M LIBOR + 2.750% | | | 5.15 | | | | 3/1/2024 | | | | 1,496,094 | | | | 1,487,895 | | | | 1,483,571 | |
Endo Luxembourg Finance Co. I S.a r.l., 1M LIBOR + 4.250% | | | 6.65 | | | | 4/27/2024 | | | | 662,989 | | | | 665,608 | | | | 621,002 | |
Financiere Mendel SAS, EURIBOR + 4.750%+ | | | 4.75 | | | | 3/31/2026 | | | | 500,000 | | | | 552,640 | | | | 572,359 | |
Lifescan Global Corp., 3M LIBOR + 6.000% | | | 8.66 | | | | 9/28/2024 | | | | 182,769 | | | | 177,949 | | | | 174,088 | |
Ortho-Clinical Diagnostics SA, 3M LIBOR + 3.250% | | | 5.68 | | | | 6/30/2025 | | | | 1,201,023 | | | | 1,201,534 | | | | 1,153,487 | |
Parexel International Corp., 1M LIBOR + 2.7500% | | | 5.15 | | | | 9/29/2024 | | | | 1,408,223 | | | | 1,399,904 | | | | 1,347,120 | |
Radiology Partners Holdings, LLC, LIBOR + 4.750% | | | 7.36 | | | | 7/9/2025 | | | | 100,864 | | | | 100,359 | | | | 100,549 | |
Rodenstock GmbH, LIBOR + 5.250%+ | | | 5.25 | | | | 6/30/2026 | | | | 500,000 | | | | 555,411 | | | | 558,743 | |
Tunstall Group Holdings Ltd., 1M LIBOR + 4.500%+ | | | 7.50 | | | | 10/16/2020 | | | | 500,313 | | | | 587,594 | | | | 567,661 | |
Valeant Pharmaceuticals International, Inc., 1M LIBOR + 3.000% | | | 5.41 | | | | 5/31/2025 | | | | 453,601 | | | | 451,679 | | | | 453,320 | |
| | | | | | | | | | | | | | | | | | | | |
Total Healthcare, Education and Childcare | | | | | | | | | | | 10,093,723 | | | | 10,404,737 | | | | 10,170,059 | |
| | | | | | | | | | | | | | | | | | | | |
|
Home and Office Furnishings, Housewares, and Durable Consumer Products — 0.5%*: | |
Serta Simmons Bedding LLC, 3M LIBOR + 3.500% | | | 5.91 | | | | 11/8/2023 | | | | 1,213,255 | | | | 1,212,584 | | | | 781,033 | |
Serta Simmons Bedding LLC, 1M LIBOR + 8.000% | | | 10.39 | | | | 11/8/2024 | | | | 474,667 | | | | 469,865 | | | | 207,904 | |
| | | | | | | | | | | | | | | | | | | | |
Total Home and Office Furnishings, Housewares, and Durable Consumer Products | | | | | | | | | | | 1,687,922 | | | | 1,682,449 | | | | 988,937 | |
| | | | | | | | | | | | | | | | | | | | |
See accompanying Notes to the Financial Statements.
102
Barings Global Credit Income Opportunities Fund 2019 Annual Report
SCHEDULE OF INVESTMENTS (CONTINUED)
June 30, 2019
| | | | | | | | | | | | | | | | | | | | |
| | | EFFECTIVE
INTEREST RATE | | | DUE DATE | | | PRINCIPAL ‡‡ | | | COST | | | FAIR
VALUE | |
Bank Loans(Continued) | |
|
Hotels, Motels, Inns and Gaming — 1.0%*: | |
Caesars Resort Collection LLC, 1M LIBOR + 2.750% | | | 5.15 | % | | | 12/23/2024 | | | | 1,492,424 | | | $ | 1,481,530 | | | $ | 1,465,993 | |
Compass IV Ltd., EURIBOR + 4.500%+ | | | 4.50 | | | | 4/30/2025 | | | | 500,000 | | | | 598,578 | | | | 571,393 | |
| | | | | | | | | | | | | | | | | | | | |
Total Hotels, Motels, Inns and Gaming | | | | | | | | | | | 1,992,424 | | | | 2,080,108 | | | | 2,037,386 | |
| | | | | | | | | | | | | | | | | | | | |
|
Insurance — 1.8%*: | |
AssuredPartners, Inc., 1M LIBOR + 3.250% | | | 5.90 | | | | 10/22/2024 | | | | 981,530 | | | | 985,168 | | | | 970,488 | |
Confie Seguros Holding II Co., 3M LIBOR + 8.500% | | | 11.02 | | | | 10/31/2025 | | | | 464,527 | | | | 455,237 | | | | 445,250 | |
Hub International Ltd., 2M LIBOR + 2.750% | | | 2.00 | | | | 4/25/2025 | | | | 1,298,562 | | | | 1,295,855 | | | | 1,265,059 | |
Sedgwick Claims Management Services, Inc., 1M LIBOR + 3.250% | | | 5.65 | | | | 12/31/2025 | | | | 995,000 | | | | 973,944 | | | | 979,896 | |
York Risk Services Holding Corp., 1M LIBOR + 3.750% | | | 6.15 | | | | 10/1/2021 | | | | 183,366 | | | | 181,303 | | | | 172,860 | |
| | | | | | | | | | | | | | | | | | | | |
Total Insurance | | | | | | | | | | | 3,922,985 | | | | 3,891,507 | | | | 3,833,553 | |
| | | | | | | | | | | | | | | | | | | | |
|
Leisure, Amusement, Entertainment — 1.8%*: | |
Crown Finance US, Inc., 1M LIBOR + 2.500% | | | 4.65 | | | | 2/28/2025 | | | | 1,242,448 | | | | 1,214,938 | | | | 1,221,090 | |
Dorna Sports, S.L., 1M LIBOR + 3.000%+ | | | 5.20 | | | | 4/12/2024 | | | | 400,000 | | | | 400,000 | | | | 388,200 | |
Eldorado Resorts LLC, LIBOR + 2.500% | | | 4.69 | | | | 4/17/2024 | | | | 856,001 | | | | 849,643 | | | | 851,987 | |
Metro-Goldwyn-Mayer, Inc., 1M LIBOR + 4.500% | | | 6.91 | | | | 7/3/2026 | | | | 893,847 | | | | 885,957 | | | | 863,680 | |
Vue International Bidco PLC, LIBOR + 4.750%+ | | | 4.75 | | | | 6/30/2026 | | | | 500,000 | | | | 558,667 | | | | 569,971 | |
| | | | | | | | | | | | | | | | | | | | |
Total Leisure, Amusement, Entertainment | | | | | | | | | | | 3,892,296 | | | | 3,909,205 | | | | 3,894,928 | |
| | | | | | | | | | | | | | | | | | | | |
|
MachineryNon-Agriculture,Non-Construction,Non-Electronic — 1.0%*: | |
Alison Bidco Sarl, 1M LIBOR + 4.500%+ | | | 7.08 | | | | 8/29/2021 | | | | 640,344 | | | | 616,960 | | | | 577,379 | |
Apex Tool Group LLC, 1M LIBOR + 3.750% | | | 6.15 | | | | 2/1/2022 | | | | 181,107 | | | | 180,510 | | | | 173,713 | |
Titan Acquisition Ltd., 1M LIBOR + 3.000%+ | | | 5.40 | | | | 3/28/2025 | | | | 1,481,250 | | | | 1,482,791 | | | | 1,412,535 | |
| | | | | | | | | | | | | | | | | | | | |
Total MachineryNon-Agriculture,Non-Construction,Non-Electronic | | | | | | | | | | | 2,302,701 | | | | 2,280,261 | | | | 2,163,627 | |
| | | | | | | | | | | | | | | | | | | | |
|
Mining, Steel, Iron andNon-Precious Metals — 0.1%*: | |
Boomerang Tube, LLC, 3M LIBOR + 3.000%¤†† | | | 7.40 | | | | 10/31/2021 | | | | 124,368 | | | | 124,368 | | | | 124,368 | |
| | | | | | | | | | | | | | | | | | | | |
|
Oil and Gas — 1.4%*: | |
Fieldwood Energy LLC, 1M LIBOR + 5.250% | | | 7.65 | | | | 4/11/2022 | | | | 649,368 | | | | 596,405 | | | | 600,055 | |
Fieldwood Energy LLC, 1M LIBOR + 7.250% | | | 9.65 | | | | 4/11/2022 | | | | 885,631 | | | | 407,752 | | | | 735,074 | |
Gulf Finance LLC, 3M LIBOR + 5.250% | | | 7.65 | | | | 8/25/2023 | | | | 1,284,651 | | | | 1,220,917 | | | | 1,046,451 | |
KCA Deutag Alpha Ltd., 3M LIBOR + 6.750%+ | | | 9.08 | | | | 2/28/2023 | | | | 495,000 | | | | 493,075 | | | | 370,364 | |
Seadrill Partners Finco LLC, 3M LIBOR + 6.000% | | | 8.33 | | | | 2/21/2021 | | | | 235,121 | | | | 203,067 | | | | 167,523 | |
| | | | | | | | | | | | | | | | | | | | |
Total Oil and Gas | | | | | | | | | | | 3,549,771 | | | | 2,921,216 | | | | 2,919,467 | |
| | | | | | | | | | | | | | | | | | | | |
See accompanying Notes to the Financial Statements.
103
Barings Global Credit Income Opportunities Fund 2019 Annual Report
SCHEDULE OF INVESTMENTS (CONTINUED)
June 30, 2019
| | | | | | | | | | | | | | | | | | | | |
| | | EFFECTIVE
INTEREST RATE | | | DUE DATE | | | PRINCIPAL ‡‡ | | | COST | | | FAIR
VALUE | |
Bank Loans(Continued) | |
|
Personal andNon-Durable Consumer Products Mfg. Only — 0.5%*: | |
Coty Inc., 1M LIBOR + 2.250% | | | 4.67 | % | | | 4/7/2025 | | | | 1,190,977 | | | $ | 1,146,191 | | | $ | 1,161,203 | |
| | | | | | | | | | | | | | | | | | | | |
|
Retail Stores — 1.6%*: | |
Bass Pro Group, LLC, 1M LIBOR + 5.000% | | | 7.40 | | | | 9/25/2024 | | | | 994,937 | | | | 989,051 | | | | 948,712 | |
EG Finco Ltd., 3M LIBOR + 4.000%+ | | | 6.33 | | | | 2/7/2025 | | | | 363,072 | | | | 361,571 | | | | 356,566 | |
EG Group Ltd., EURIBOR + 4.000%+ | | | 4.00 | | | | 2/6/2025 | | | | 494,593 | | | | 591,324 | | | | 555,760 | |
Kirk Beauty One GmbH, EURIBOR + 3.500%+ | | | 3.25 | | | | 8/12/2022 | | | | 500,000 | | | | 516,229 | | | | 467,632 | |
Kirk Beauty One GmbH, EURIBOR + 3.500%+ | | | 3.50 | | | | 8/13/2022 | | | | 499,999 | | | | 513,137 | | | | 478,292 | |
Thom Europe S.A.S, EURIBOR + 4.250%+ | | | 4.25 | | | | 8/7/2024 | | | | 500,000 | | | | 576,557 | | | | 566,776 | |
| | | | | | | | | | | | | | | | | | | | |
Total Retail Stores | | | | | | | | | | | 3,352,601 | | | | 3,547,869 | | | | 3,373,738 | |
| | | | | | | | | | | | | | | | | | | | |
|
Telecommunications — 0.9%*: | |
Banff Merger Sub, Inc., 3M LIBOR + 4.250% | | | 6.58 | | | | 10/2/2025 | | | | 997,494 | | | | 967,160 | | | | 942,941 | |
CommScope, Inc., 1M LIBOR + 3.250% | | | 5.65 | | | | 4/6/2026 | | | | 1,000,000 | | | | 1,000,000 | | | | 996,000 | |
| | | | | | | | | | | | | | | | | | | | |
Total Telecommunications | | | | | | | | | | | 1,997,494 | | | | 1,967,160 | | | | 1,938,941 | |
| | | | | | | | | | | | | | | | | | | | |
|
Utilities — 1.3%*: | |
Calpine Corp., LIBOR + 2.500% | | | 4.83 | | | | 1/16/2024 | | | | 1,479,507 | | | | 1,475,404 | | | | 1,470,659 | |
EFS Cogen Holdings I LLC, 3M LIBOR + 3.250% | | | 5.58 | | | | 6/28/2023 | | | | 447,800 | | | | 447,568 | | | | 445,700 | |
Vistra Energy Corp., 1M LIBOR + 2.000% | | | 4.40 | | | | 12/31/2025 | | | | 813,832 | | | | 812,953 | | | | 812,514 | |
| | | | | | | | | | | | | | | | | | | | |
Total Utilities | | | | | | | | | | | 2,741,139 | | | | 2,735,925 | | | | 2,728,873 | |
| | | | | | | | | | | | | | | | | | | | |
| | | | | | | | | | | | | | | | | | | | |
Total Bank Loans | | | | | | | | | | | 87,015,664 | | | | 88,051,576 | | | | 85,229,605 | |
| | | | | | | | | | | | | | | | | | | | |
Corporate Bonds — 41.3%**: | |
|
Aerospace and Defense — 1.2%*: | |
TransDigm, Inc.^ | | | 6.25 | | | | 3/15/2026 | | | | 954,000 | | | | 954,000 | | | | 1,004,085 | |
Triumph Group, Inc. | | | 5.25 | | | | 6/1/2022 | | | | 875,000 | | | | 872,955 | | | | 857,500 | |
Triumph Group, Inc. | | | 7.75 | | | | 8/15/2025 | | | | 750,000 | | | | 796,535 | | | | 725,625 | |
| | | | | | | | | | | | | | | | | | | | |
Total Aerospace and Defense | | | | | | | | | | | 2,579,000 | | | | 2,623,490 | | | | 2,587,210 | |
| | | | | | | | | | | | | | | | | | | | |
|
Automobile — 1.9%*: | |
AA Bond Co. Ltd.+ | | | 5.50 | | | | 7/31/2022 | | | | 1,300,000 | | | | 1,653,502 | | | | 1,403,294 | |
Garrett LX I Sarl/Garrett Borrowing LLC+ | | | 5.13 | | | | 10/15/2026 | | | | 1,150,000 | | | | 1,255,712 | | | | 1,257,320 | |
Gates Global LLC/Gates Global Co.^ | | | 6.00 | | | | 7/15/2022 | | | | 477,000 | | | | 414,381 | | | | 477,298 | |
Panther BF Aggregator 2 LP/Panther Finance Co., Inc. | | | 4.38 | | | | 5/15/2026 | | | | 200,000 | | | | 226,830 | | | | 234,811 | |
RAC Bond Co. PLC+ | | | 5.00 | | | | 11/6/2022 | | | | 600,000 | | | | 796,572 | | | | 682,600 | |
| | | | | | | | | | | | | | | | | | | | |
Total Automobile | | | | | | | | | | | 3,727,000 | | | | 4,346,997 | | | | 4,055,323 | |
| | | | | | | | | | | | | | | | | | | | |
|
Automobiles — 0.1%*: | |
Aston Martin Capital Holdings Ltd.+ | | | 5.75 | | | | 4/15/2022 | | | | 110,000 | | | | 134,655 | | | | 136,901 | |
| | | | | | | | | | | | | | | | | | | | |
See accompanying Notes to the Financial Statements.
104
Barings Global Credit Income Opportunities Fund 2019 Annual Report
SCHEDULE OF INVESTMENTS (CONTINUED)
June 30, 2019
| | | | | | | | | | | | | | | | | | | | |
| | | EFFECTIVE
INTEREST RATE | | | DUE DATE | | | PRINCIPAL ‡‡ | | | COST | | | FAIR
VALUE | |
Corporate Bonds(Continued) | |
|
Beverage, Food and Tobacco — 1.7%*: | |
Boparan Finance PLC+ | | | 4.38 | % | | | 7/15/2021 | | | | 250,000 | | | $ | 220,748 | | | $ | 158,330 | |
Boparan Finance PLC+ | | | 5.50 | | | | 7/15/2021 | | | | 1,300,000 | | | | 1,721,169 | | | | 907,763 | |
JBS USA LUX SA/JBS USA Finance, Inc.^ | | | 5.75 | | | | 6/15/2025 | | | | 344,000 | | | | 349,877 | | | | 357,760 | |
JBS USA LUX SA/JBS USA Finance, Inc.^ | | | 5.88 | | | | 7/15/2024 | | | | 651,000 | | | | 663,202 | | | | 669,716 | |
JBS USA LUX SA/JBS USA Finance, Inc.^ | | | 6.75 | | | | 2/15/2028 | | | | 500,000 | | | | 500,000 | | | | 543,125 | |
Sunshine Mid BV+ | | | 6.50 | | | | 5/15/2026 | | | | 850,000 | | | | 1,012,951 | | | | 1,002,017 | |
| | | | | | | | | | | | | | | | | | | | |
Total Beverage, Food and Tobacco | | | | | | | | | | | 3,895,000 | | | | 4,467,947 | | | | 3,638,711 | |
| | | | | | | | | | | | | | | | | | | | |
|
Broadcasting and Entertainment — 1.5%*: | |
CSC Holdings LLC^ | | | 7.50 | | | | 4/1/2028 | | | | 386,000 | | | | 386,000 | | | | 423,751 | |
Entertainment One Ltd.+ | | | 4.63 | | | | 7/15/2026 | | | | 450,000 | | | | 566,190 | | | | 587,478 | |
Intelsat Jackson Holdings SA^ | | | 8.50 | | | | 10/15/2024 | | | | 500,000 | | | | 500,000 | | | | 495,000 | |
Intelsat Jackson Holdings SA^ | | | 9.75 | | | | 7/15/2025 | | | | 436,000 | | | | 458,044 | | | | 444,720 | |
Tele Columbus AG+ | | | 3.88 | | | | 5/2/2025 | | | | 900,000 | | | | 956,718 | | | | 952,071 | |
VTR Finance BV+^ | | | 6.88 | | | | 1/15/2024 | | | | 224,000 | | | | 220,067 | | | | 231,840 | |
| | | | | | | | | | | | | | | | | | | | |
Total Broadcasting and Entertainment | | | | | | | | | | | 2,896,000 | | | | 3,087,019 | | | | 3,134,860 | |
| | | | | | | | | | | | | | | | | | | | |
|
Buildings and Real Estate — 0.2%*: | |
Realogy Group LLC/RealogyCo-Issuer Corp.^ | | | 9.38 | | | | 4/1/2027 | | | | 500,000 | | | | 489,343 | | | | 438,125 | |
| | | | | | | | | | | | | | | | | | | | |
|
Cargo Transport — 1.6%*: | |
Kenan Advantage Group, Inc.^ | | | 7.88 | | | | 7/31/2023 | | | | 1,367,000 | | | | 1,367,000 | | | | 1,230,300 | |
XPO Logistics, Inc.^ | | | 6.13 | | | | 9/1/2023 | | | | 520,000 | | | | 514,788 | | | | 538,850 | |
XPO Logistics, Inc.^ | | | 6.75 | | | | 8/15/2024 | | | | 1,466,000 | | | | 1,467,774 | | | | 1,563,123 | |
| | | | | | | | | | | | | | | | | | | | |
Total Cargo Transport | | | | | | | | | | | 3,353,000 | | | | 3,349,562 | | | | 3,332,273 | |
| | | | | | | | | | | | | | | | | | | | |
|
Chemicals, Plastics and Rubber — 1.0%*: | |
Consolidated Energy Finance SA^ | | | 6.88 | | | | 6/15/2025 | | | | 874,000 | | | | 893,981 | | | | 895,116 | |
Diversey | | | 5.63 | | | | 8/15/2025 | | | | 300,000 | | | | 315,567 | | | | 283,138 | |
Monitchem HoldCo 2 SA+ | | | 6.88 | | | | 6/15/2022 | | | | 200,000 | | | | 231,193 | | | | 227,420 | |
Monitchem HoldCo 3 SA+ | | | 5.25 | | | | 6/15/2021 | | | | 500,000 | | | | 559,597 | | | | 569,147 | |
Pinnacle Operating Corp.^ | | | 9.00 | | | | 5/15/2023 | | | | 453,953 | | | | 526,484 | | | | 149,804 | |
| | | | | | | | | | | | | | | | | | | | |
Total Chemicals, Plastics and Rubber | | | | | | | | | | | 2,327,953 | | | | 2,526,822 | | | | 2,124,625 | |
| | | | | | | | | | | | | | | | | | | | |
|
Commercial Services — 2.3%*: | |
Altice Finco S.A.+ | | | 9.00 | | | | 6/15/2023 | | | | 500,000 | | | | 593,855 | | | | 591,201 | |
Altice Luxembourg SA^+ | | | 7.75 | | | | 5/15/2022 | | | | 200,000 | | | | 202,344 | | | | 203,250 | |
CommScope, Inc.^ | | | 5.50 | | | | 3/1/2024 | | | | 290,000 | | | | 290,000 | | | | 297,613 | |
TDC A/S+ | | | 6.88 | | | | 2/23/2023 | | | | 600,000 | | | | 848,860 | | | | 865,788 | |
Telecom Italia SpA/Milano+ | | | 3.63 | | | | 5/25/2026 | | | | 1,250,000 | | | | 1,484,498 | | | | 1,499,551 | |
Wind Tre SpA, 3M EURIBOR + 2.750%+ | | | 2.75 | # | | | 1/20/2024 | | | | 350,000 | | | | 370,036 | | | | 392,502 | |
Wind Tre SpA+ | | | 3.13 | | | | 1/20/2025 | | | | 400,000 | | | | 448,203 | | | | 453,521 | |
Ziggo Bond Co. BV^+ | | | 5.88 | | | | 1/15/2025 | | | | 500,000 | | | | 497,582 | | | | 505,210 | |
| | | | | | | | | | | | | | | | | | | | |
Total Commercial Services | | | | | | | | | | | 4,090,000 | | | | 4,735,378 | | | | 4,808,636 | |
| | | | | | | | | | | | | | | | | | | | |
See accompanying Notes to the Financial Statements.
105
Barings Global Credit Income Opportunities Fund 2019 Annual Report
SCHEDULE OF INVESTMENTS (CONTINUED)
June 30, 2019
| | | | | | | | | | | | | | | | | | | | |
| | | EFFECTIVE
INTEREST RATE | | | DUE DATE | | | PRINCIPAL ‡‡ | | | COST | | | FAIR
VALUE | |
Corporate Bonds(Continued) | |
|
Containers, Packaging and Glass — 1.2%*: | |
Ardagh Packaging Finance PLC/Ardagh Holdings USA, Inc.+^ | | | 4.63 | % | | | 5/15/2023 | | | | 803,000 | | | $ | 793,126 | | | $ | 816,049 | |
Ardagh Packaging Finance PLC/Ardagh Holdings USA, Inc.+^ | | | 7.25 | | | | 5/15/2024 | | | | 300,000 | | | | 308,702 | | | | 316,125 | |
BWAY Holding Co. | | | 4.75 | | | | 4/15/2024 | | | | 950,000 | | | | 1,094,812 | | | | 1,110,816 | |
BWAY Holding Co.^ | | | 7.25 | | | | 4/15/2025 | | | | 383,000 | | | | 366,311 | | | | 369,595 | |
| | | | | | | | | | | | | | | | | | | | |
Total Containers, Packaging and Glass | | | | | | | | | | | 2,436,000 | | | | 2,562,951 | | | | 2,612,585 | |
| | | | | | | | | | | | | | | | | | | | |
|
Diversified/Conglomerate Manufacturing — 0.1%*: | |
Appvion ESC, 3M EURIBOR + 4.125%¤ | | | 9.00 | # | | | 6/1/2020 | | | | 500,000 | | | | 502,816 | | | | – | |
Fabric BC SpA, 3M EURIBOR + 4.125%+ | | | 4.13 | # | | | 11/30/2024 | | | | 150,000 | | | | 170,485 | | | | 170,565 | |
| | | | | | | | | | | | | | | | | | | | |
Total Diversified/Conglomerate Manufacturing | | | | | | | | | | | 650,000 | | | | 673,301 | | | | 170,565 | |
| | | | | | | | | | | | | | | | | | | | |
|
Diversified/Conglomerate Service — 2.8%*: | |
Algeco Global Finance PLC+ | | | 6.50 | | | | 2/15/2023 | | | | 750,000 | | | | 902,389 | | | | 889,880 | |
Carlson Travel, Inc.^ | | | 6.75 | | | | 12/15/2023 | | | | 1,337,000 | | | | 1,354,219 | | | | 1,353,713 | |
EIG Investors Corp. | | | 10.88 | | | | 2/1/2024 | | | | 665,000 | | | | 703,247 | | | | 704,900 | |
Iron Mountain UK PLC | | | 3.88 | | | | 11/15/2025 | | | | 450,000 | | | | 597,668 | | | | 566,240 | |
Verisure Midholding AB+ | | | 5.75 | | | | 12/1/2023 | | | | 2,050,000 | | | | 2,399,824 | | | | 2,409,780 | |
| | | | | | | | | | | | | | | | | | | | |
Total Diversified/Conglomerate Service | | | | | | | | | | | 5,252,000 | | | | 5,957,347 | | | | 5,924,513 | |
| | | | | | | | | | | | | | | | | | | | |
|
Electronics — 1.9%*: | |
TIBCO Software, Inc.^ | | | 11.38 | | | | 12/1/2021 | | | | 1,881,000 | | | | 1,999,437 | | | | 1,998,562 | |
Veritas US, Inc./Veritas Bermuda Ltd.^ | | | 7.50 | | | | 2/1/2023 | | | | 817,000 | | | | 855,879 | | | | 763,895 | |
Veritas US, Inc./Veritas Bermuda Ltd.^ | | | 10.50 | | | | 2/1/2024 | | | | 1,419,000 | | | | 1,455,644 | | | | 1,216,793 | |
| | | | | | | | | | | | | | | | | | | | |
Total Electronics | | | | | | | | | | | 4,117,000 | | | | 4,310,960 | | | | 3,979,250 | |
| | | | | | | | | | | | | | | | | | | | |
|
Finance — 4.3%*: | |
Arrow Global Finance PLC+ | | | 5.13 | | | | 9/15/2024 | | | | 300,000 | | | | 408,861 | | | | 373,841 | |
Cabot Financial Luxembourg SA+ | | | 7.50 | | | | 10/1/2023 | | | | 650,000 | | | | 900,476 | | | | 852,295 | |
Galaxy Bidco Ltd., 3M GBP LIBOR + 4.500%+ | | | 5.31 | # | | | 11/15/2020 | | | | 250,000 | | | | 327,140 | | | | 313,201 | |
Galaxy Bidco Ltd.+ | | | 6.38 | | | | 11/15/2020 | | | | 650,000 | | | | 886,901 | | | | 821,753 | |
Galaxy Finco Ltd.+ | | | 7.88 | | | | 11/15/2021 | | | | 1,000,000 | | | | 1,393,984 | | | | 1,247,090 | |
Garfunkelux Holdco 2 SA+ | | | 11.00 | | | | 11/1/2023 | | | | 250,000 | | | | 345,968 | | | | 261,384 | |
Garfunkelux Holdco 3 S.A., 3M EURIBOR + 4.500%+ | | | 4.50 | # | | | 9/1/2023 | | | | 200,000 | | | | 213,113 | | | | 189,839 | |
Garfunkelux Holdco 3 S.A.+ | | | 8.50 | | | | 11/1/2022 | | | | 1,400,000 | | | | 1,842,223 | | | | 1,594,802 | |
Icahn Enterprises LP/Icahn Enterprises Finance Corp. | | | 6.75 | | | | 2/1/2024 | | | | 1,162,000 | | | | 1,162,000 | | | | 1,207,028 | |
Jerrold Finco PLC+ | | | 6.13 | | | | 1/15/2024 | | | | 650,000 | | | | 822,588 | | | | 838,179 | |
Nexi Capital SpA+ | | | 4.13 | | | | 11/1/2023 | | | | 425,000 | | | | 484,394 | | | | 500,405 | |
Virto Financial, Inc.^ | | | 6.75 | | | | 6/15/2022 | | | | 921,000 | | | | 953,917 | | | | 954,313 | |
| | | | | | | | | | | | | | | | | | | | |
Total Finance | | | | | | | | | | | 7,858,000 | | | | 9,741,565 | | | | 9,154,130 | |
| | | | | | | | | | | | | | | | | | | | |
See accompanying Notes to the Financial Statements.
106
Barings Global Credit Income Opportunities Fund 2019 Annual Report
SCHEDULE OF INVESTMENTS (CONTINUED)
June 30, 2019
| | | | | | | | | | | | | | | | | | | | |
| | | EFFECTIVE
INTEREST RATE | | | DUE DATE | | | PRINCIPAL ‡‡ | | | COST | | | FAIR
VALUE | |
Corporate Bonds(Continued) | |
|
Healthcare, Education and Childcare — 4.6%*: | |
Advanz Pharma Corp.+ | | | 8.00 | % | | | 9/6/2024 | | | | 500,000 | | | $ | 474,606 | | | $ | 486,250 | |
Bausch Health Americas., Inc.^ | | | 8.50 | | | | 1/31/2027 | | | | 415,000 | | | | 421,938 | | | | 456,301 | |
Bausch Health Companies, Inc.^ | | | 5.50 | | | | 11/1/2025 | | | | 184,000 | | | | 184,000 | | | | 191,820 | |
Bausch Health Cos., Inc.^ | | | 6.13 | | | | 4/15/2025 | | | | 1,232,000 | | | | 1,069,544 | | | | 1,258,143 | |
Bausch Health Cos., Inc.^ | | | 9.00 | | | | 12/15/2025 | | | | 165,000 | | | | 163,030 | | | | 184,354 | |
Constantin Investissement 3 SASU+ | | | 5.38 | | | | 4/15/2025 | | | | 125,000 | | | | 141,829 | | | | 142,848 | |
Cream Tech+ | | | 5.25 | | | | 12/15/2025 | | | | 650,000 | | | | 760,635 | | | | 752,008 | |
Endo Pharmaceutical^ | | | 7.50 | | | | 4/1/2027 | | | | 708,000 | | | | 708,000 | | | | 695,610 | |
Envision Healthcare Corp.^ | | | 8.75 | | | | 10/15/2026 | | | | 1,492,000 | | | | 1,430,649 | | | | 1,040,670 | |
Nidda BondCo GmbH+ | | | 7.25 | | | | 9/30/2025 | | | | 500,000 | | | | 591,277 | | | | 596,010 | |
Ortho-Clinical Diagnostics, Inc./Ortho-Clinical Diagnostics SA^ | | | 6.63 | | | | 5/15/2022 | | | | 985,000 | | | | 940,780 | | | | 940,675 | |
Recordati+ | | | 6.75 | | | | 10/30/2025 | | | | 300,000 | | | | 349,925 | | | | 370,491 | |
Rossini Sarl, EURIBOR + 6.25%+ | | | 6.25 | # | | | 10/30/2025 | | | | 250,000 | | | | 291,718 | | | | 291,979 | |
Synlab Unsecured Bondco PLC+ | | | 8.25 | | | | 7/1/2023 | | | | 750,000 | | | | 928,438 | | | | 889,770 | |
Tenet Healthcare Corp.^ | | | 6.25 | | | | 2/1/2027 | | | | 382,000 | | | | 382,000 | | | | 395,370 | |
Teva Pharmaceutical Finance Netherlands III BV+ | | | 6.00 | | | | 4/15/2024 | | | | 678,000 | | | | 673,792 | | | | 639,439 | |
Unilabs Subholding AB+ | | | 5.75 | | | | 5/15/2025 | | | | 400,000 | | | | 479,078 | | | | 462,800 | |
| | | | | | | | | | | | | | | | | | | | |
Total Healthcare, Education and Childcare | | | | | | | | | | | 9,716,000 | | | | 9,991,239 | | | | 9,794,538 | |
| | | | | | | | | | | | | | | | | | | | |
|
Home and Office Furnishings, Housewares, and Durable Consumer Products — 0.4%*: | |
Balta+ | | | 7.75 | | | | 9/15/2022 | | | | 769,500 | | | | 931,088 | | | | 869,407 | |
| | | | | | | | | | | | | | | | | | | | |
|
Hotels, Motels, Inns and Gaming — 1.7%*: | |
Marriott Ownership Resorts, Inc./LG LLC | | | 5.63 | | | | 4/15/2023 | | | | 459,000 | | | | 463,815 | | | | 465,885 | |
Travelodge+ | | | 8.50 | | | | 5/15/2023 | | | | 480,000 | | | | 672,575 | | | | 636,555 | |
TVL Finance PLC, 3M LIBOR + 5.370%+†† | | | 6.14 | # | | | 7/15/2025 | | | | 400,000 | | | | 505,440 | | | | 505,440 | |
Wynn Las Vegas LLC/Wynn Las Vegas Capital Corp.^ | | | 5.50 | | | | 3/1/2025 | | | | 1,890,000 | | | | 1,868,482 | | | | 1,951,992 | |
| | | | | | | | | | | | | | | | | | | | |
Total Hotels, Motels, Inns and Gaming | | | | | | | | | | | 3,229,000 | | | | 3,510,312 | | | | 3,559,872 | |
| | | | | | | | | | | | | | | | | | | | |
|
Insurance — 0.4%*: | |
Acrisure LLC/Acrisure Finance, Inc.^†† | | | 7.00 | | | | 11/15/2025 | | | | 500,000 | | | | 480,241 | | | | 451,250 | |
Acrisure LLC/Acrisure Finance, Inc.^†† | | | 8.13 | | | | 2/15/2024 | | | | 271,000 | | | | 271,000 | | | | 279,808 | |
USI, Inc.^ | | | 6.88 | | | | 5/1/2025 | | | | 127,000 | | | | 127,000 | | | | 125,730 | |
| | | | | | | | | | | | | | | | | | | | |
Total Insurance | | | | | | | | | | | 898,000 | | | | 878,241 | | | | 856,788 | |
| | | | | | | | | | | | | | | | | | | | |
|
Leisure, Amusement, Entertainment — 2.5%*: | |
AMC Entertainment Holdings, Inc. | | | 6.38 | | | | 11/15/2024 | | | | 1,300,000 | | | | 1,687,160 | | | | 1,606,227 | |
Center Parks.+ | | | 4.88 | | | | 8/28/2025 | | | | 500,000 | | | | 651,329 | | | | 635,126 | |
Perform Group Financing PLC+ | | | 8.50 | | | | 11/15/2020 | | | | 850,000 | | | | 1,162,607 | | | | 1,092,410 | |
Thomas Cook Group PLC+ | | | 6.25 | | | | 6/15/2022 | | | | 1,400,000 | | | | 1,282,295 | | | | 597,710 | |
Vue International Bidco PLC, 3M EURIBOR + 5.250%+ | | | 4.94 | # | | | 7/15/2020 | | | | 200,000 | | | | 225,054 | | | | 227,306 | |
See accompanying Notes to the Financial Statements.
107
Barings Global Credit Income Opportunities Fund 2019 Annual Report
SCHEDULE OF INVESTMENTS (CONTINUED)
June 30, 2019
| | | | | | | | | | | | | | | | | | | | |
| | | EFFECTIVE
INTEREST RATE | | | DUE DATE | | | PRINCIPAL ‡‡ | | | COST | | | FAIR
VALUE | |
Corporate Bonds(Continued) | |
|
Leisure, Amusement, Entertainment (Continued) | |
Vue International Bidco PLC+ | | | 7.88 | % | | | 7/15/2020 | | | | 900,000 | | | $ | 1,168,728 | | | $ | 1,143,000 | |
| | | | | | | | | | | | | | | | | | | | |
Total Leisure, Amusement, Entertainment | | | | | | | | | | | 5,150,000 | | | | 6,177,173 | | | | 5,301,779 | |
| | | | | | | | | | | | | | | | | | | | |
|
MachineryNon-Agriculture,Non-Construction,Non-Electronic — 0.5%*: | |
Apex Tool Group LLC/BC Mountain Finance, Inc.^ | | | 9.00 | | | | 2/15/2023 | | | | 578,000 | | | | 575,271 | | | | 515,865 | |
Novafives SAS+ | | | 5.00 | | | | 6/15/2025 | | | | 550,000 | | | | 589,362 | | | | 596,111 | |
| | | | | | | | | | | | | | | | | | | | |
Total MachineryNon-Agriculture,Non-Construction,Non-Electronic | | | | | | | | | | | 1,128,000 | | | | 1,164,633 | | | | 1,111,976 | |
| | | | | | | | | | | | | | | | | | | | |
|
Mining, Steel, Iron andNon-Precious Metals — 2.4%*: | |
First Quantum Minerals Ltd.+^ | | | 6.50 | | | | 3/1/2024 | | | | 1,606,000 | | | | 1,555,548 | | | | 1,501,610 | |
First Quantum Minerals Ltd.+^ | | | 7.00 | | | | 2/15/2021 | | | | 268,000 | | | | 269,391 | | | | 273,360 | |
First Quantum Minerals Ltd.+^ | | | 7.50 | | | | 4/1/2025 | | | | 859,000 | | | | 826,684 | | | | 818,197 | |
Northwest Acquisitions ULC/Dominion Finco, Inc.+^ | | | 7.13 | | | | 11/1/2022 | | | | 1,500,000 | | | | 1,528,671 | | | | 1,035,000 | |
SunCoke Energy Partners LP/SunCoke Energy Partners Finance Corp.^ | | | 7.50 | | | | 6/15/2025 | | | | 608,000 | | | | 600,815 | | | | 593,560 | |
Warrior Met Coal, Inc.^ | | | 8.00 | | | | 11/1/2024 | | | | 840,000 | | | | 851,134 | | | | 875,700 | |
| | | | | | | | | | | | | | | | | | | | |
Total Mining, Steel, Iron andNon-Precious Metals | | | | | | | | | | | 5,681,000 | | | | 5,632,243 | | | | 5,097,427 | |
| | | | | | | | | | | | | | | | | | | | |
|
Oil and Gas — 3.1%*: | |
Calumet Specialty Products Partners LP/Calumet Finance Corp. | | | 6.50 | | | | 4/15/2021 | | | | 500,000 | | | | 482,008 | | | | 497,500 | |
Citgo Holding, Inc.^ | | | 10.75 | | | | 2/15/2020 | | | | 2,363,000 | | | | 2,408,589 | | | | 2,445,705 | |
Ferrellgas Partners LP/Ferrellgas Partners Finance Corp. | | | 8.63 | | | | 6/15/2020 | | | | 264,000 | | | | 260,655 | | | | 194,040 | |
Hilcorp Energy I LP/Hilcorp Finance Co.^ | | | 6.25 | | | | 11/1/2028 | | | | 1,000,000 | | | | 1,000,000 | | | | 1,005,000 | |
Jonah Energy LLC/Jonah Energy Finance Corp.^ | | | 7.25 | | | | 10/15/2025 | | | | 1,121,000 | | | | 1,106,740 | | | | 535,277 | |
KCA Deutag UK Finance PLC+^ | | | 9.63 | | | | 4/1/2023 | | | | 250,000 | | | | 250,000 | | | | 181,875 | |
KCA Deutag UK Finance PLC+^ | | | 9.88 | | | | 4/1/2022 | | | | 600,000 | | | | 617,501 | | | | 442,500 | |
Laredo Petroleum, Inc. | | | 5.63 | | | | 1/15/2022 | | | | 341,000 | | | | 321,002 | | | | 316,278 | |
PBF Holding Co. LLC/PBF Finance Corp. | | | 7.25 | | | | 6/15/2025 | | | | 1,022,000 | | | | 1,054,741 | | | | 1,070,545 | |
| | | | | | | | | | | | | | | | | | | | |
Total Oil and Gas | | | | 7,461,000 | | | | 7,501,236 | | | | 6,688,720 | |
| | | | | | | | | | | | | | | | | | | | |
|
Personal Transportation — 0.1%*: | |
Naviera Armas S.A., 3M EURIBOR + 6.500%+ | | | 6.50 | # | | | 7/31/2023 | | | | 250,000 | | | | 290,685 | | | | 217,470 | |
| | | | | | | | | | | | | | | | | | | | |
|
Personal, Food and Miscellaneous — 0.3%*: | |
Ocado Group PLC+ | | | 4.00 | | | | 6/15/2024 | | | | 540,000 | | | | 696,906 | | | | 708,986 | |
| | | | | | | | | | | | | | | | | | | | |
See accompanying Notes to the Financial Statements.
108
Barings Global Credit Income Opportunities Fund 2019 Annual Report
SCHEDULE OF INVESTMENTS (CONTINUED)
June 30, 2019
| | | | | | | | | | | | | | | | | | | | |
| | | EFFECTIVE
INTEREST RATE | | | DUE DATE | | | PRINCIPAL ‡‡ | | | COST | | | FAIR
VALUE | |
Corporate Bonds(Continued) | |
|
Retail Stores — 1.0%*: | |
CBR Fashion Finance BV+ | | | 5.13 | % | | | 10/1/2022 | | | | 450,000 | | | $ | 479,533 | | | $ | 510,262 | |
eG Global Finance PLC+ | | | 4.38 | | | | 2/7/2025 | | | | 200,000 | | | | 223,470 | | | | 226,397 | |
House of Fraser Funding PLC, 3M GBP LIBOR + 5.750%+†† | | | 6.54 | # | | | 9/15/2020 | | | | 150,000 | | | | 216,472 | | | | 4,762 | |
Takko Luxembourg 2 SCA+ | | | 5.38 | # | | | 11/15/2023 | | | | 550,000 | | | | 616,006 | | | | 522,557 | |
Travelex Financing PLC+ | | | 8.00 | | | | 5/15/2022 | | | | 750,000 | | | | 847,233 | | | | 849,874 | |
| | | | | | | | | | | | | | | | | | | | |
Total Retail Stores | | | | 2,100,000 | | | | 2,382,714 | | | | 2,113,852 | |
| | | | | | | | | | | | | |
|
Telecommunications — 1.0%*: | |
Sprint Capital Corp. | | | 6.88 | | | | 11/15/2028 | | | | 800,000 | | | | 784,431 | | | | 822,240 | |
Sprint Corp. | | | 7.63 | | | | 3/1/2026 | | | | 1,250,000 | | | | 1,290,343 | | | | 1,332,500 | |
| | | | | | | | | | | | | | | | | | | | |
Total Telecommunications | | | | 2,050,000 | | | | 2,074,774 | | | | 2,154,740 | |
| | | | | | | | | | | | | |
|
Utilities — 1.5%*: | |
Nordex SE+ | | | 6.50 | | | | 2/1/2023 | | | | 750,000 | | | | 855,116 | | | | 861,306 | |
Techem Verwaltungsgesellschaft 674 mbH+ | | | 6.00 | | | | 7/30/2026 | | | | 1,350,000 | | | | 1,549,050 | | | | 1,628,664 | |
Viridian Group Finance Co. PLC/Viridian Power & Energy+ | | | 4.75 | | | | 9/15/2024 | | | | 600,000 | | | | 800,451 | | | | 766,419 | |
| | | | | | | | | | | | | | | | | | | | |
Total Utilities | | | | | | | | | | | 2,700,000 | | | | 3,204,617 | | | | 3,256,389 | |
| | | | | | | | | | | | | |
Total Corporate Bonds | | | | 85,463,453 | | | | 93,443,198 | | | | 87,829,651 | |
| | | | | | | | | | | | | |
Total Fixed Income | | | | 198,554,117 | | | | 207,229,265 | | | | 196,757,351 | |
| | | | | | | | | | | | | |
| | | | | | | | | | | | | | | | | | | | | | | | | | | | |
| | | STRIKE
PRICE | | | EXPIRATION
DATE | | | CONTRACTS | | | NOTIONAL | | | COST | | | UNREALIZED
VALUE | | | FAIR VALUE | |
Purchased Options — 0.1%*: | |
|
Put Options Purchased — 0.1%*: | |
Euro Stoxx 50 Index+ | | | $3,150.00 | | | | 12/20/2019 | | | | 296 | | | | 10,282,122 | | | | 268,409 | | | | (88,674 | ) | | | 179,735 | |
S&P 500 Index | | | 2,650.00 | | | | 12/20/2019 | | | | 22 | | | | 6,471,872 | | | | 119,944 | | | | (18,964 | ) | | | 100,980 | |
| | | | | | | | | | | | | | | | | | | | | | | | | | | | |
Total Put Options | | | | | | | | | | | 318 | | | | 16,753,994 | | | | 388,353 | | | | (107,638 | ) | | | 280,715 | |
| | | | | | | | | | | | | | | | | | | | | | | | | | | | |
Total Investments | | | | 235,040,745 | | | | 209,414,498 | | | | | | | | 198,644,529 | |
| | | | | | | | | | | | | | | | | |
| |
Other assets and liabilities – 6.5%* | | | | 13,846,190 | |
| | | | | | | | | | | | | | | | | | | | | | | | | | | | |
| |
Net Assets – 100.0% | | | | $212,490,719 | |
| | | | | | | | | | | | | | | | | | | | | | | | | | | | |
| ‡‡ | Unless otherwise indicated, all principal amounts are denominated in United States Dollars. |
| * | Calculated as a percentage of net assets applicable to common shareholders. |
See accompanying Notes to the Financial Statements.
109
Barings Global Credit Income Opportunities Fund 2019 Annual Report
SCHEDULE OF INVESTMENTS (CONTINUED)
June 30, 2019
Distributions of investments by country of risk (excluding temporary cash investments) as a percentage of total investments in securities, is as follows:
| | | | | | |
| | United States | | | 62.6% | |
| | United Kingdom | | | 13.1% | |
| | Germany | | | 6.3% | |
| | Netherlands | | | 3.7% | |
| | Ireland | | | 2.7% | |
| | France | | | 2.2% | |
| | Italy | | | 1.8% | |
| | Sweden | | | 1.8% | |
| | Canada | | | 1.5% | |
| | Other (Individually less than 1%) | | | 4.3% | |
| | | | | | |
| | Total | | | 100.0% | |
| | | | | | |
| ^ | Security acquired in a transaction exempt from registration under Rule 144A of the Securities Act of 1933. These securities may only be resold in transactions exempt from registration, normally to qualified institutional buyers. |
| § | Bank loans are exempt from registration under the Securities Act of 1933, as amended, but contain certain restrictions on resale and cannot be sold publicly. These loans pay interest at rates which adjust periodically. The interest rates shown for bank loans are the current interest rates at June 30, 2019. Bank loans are also subject to mandatory and/or optional prepayment which cannot be predicted. As a result, the remaining maturity may be substantially less than the stated maturity shown. |
| ¤ | For fair value measurement disclosure purposes, security is categorized as Level 3 (See Note 2). |
| # | Variable rate security. The interest rate shown is the rate in effect at June 30, 2019. |
Forward Foreign Currency Exchange Contracts to Sell
| | | | | | | | | | | | | | | | | | | | | | |
EXPIRATION
DATE | | COUNTERPARTY | | LOCAL
CURRENCY | | | VALUE IN USD | | | IN
EXCHANGE
FOR USD | | | NET UNREALIZED
APPRECIATION
(DEPRECIATION) | |
| 7/12/19 | | Citibank N.A. | | | EUR | | | | 39,467,460 | | | $ | 44,916,325 | | | $ | 44,863,392 | | | $ | (52,933 | ) |
| 7/12/19 | | Citibank N.A. | | | GBP | | | | 16,577,896 | | | | 21,063,860 | | | | 21,158,440 | | | | 94,580 | |
| | | | | | | | | | | | | | | | | | | | | | |
Net unrealized appreciation on forward foreign currency exchange contracts to sell | | | $ | 41,647 | |
| | | | | | | | | | | | | | | | | | | | | | |
See accompanying Notes to the Financial Statements.
110
Barings Active Short Duration Bond Fund 2019 Annual Report
SCHEDULE OF INVESTMENTS
June 30, 2019
| | | | | | | | | | | | | | | | | | | | |
| | | EFFECTIVE
INTEREST RATE | | | DUE DATE | | | PRINCIPAL ‡‡ | | | COST | | | FAIR
VALUE | |
Fixed Income — 97.5%*: | |
|
Asset-Backed Securities — 46.1%*: | |
|
CDO/CLO — 4.8%*: | |
Ares XXXIV CLO Ltd., 3M USD LIBOR + 1.500%^ | | | 4.08 | #% | | | 7/29/2026 | | | | 1,500,000 | | | | $1,498,546 | | | | $1,498,187 | |
Avant Loans Funding Trust2019-A^ | | | 3.48 | | | | 7/15/2022 | | | | 2,239,211 | | | | 2,239,081 | | | | 2,248,815 | |
Bain Capital Credit CLO2017-1, 3M USD LIBOR + 1.250%^ | | | 3.84 | # | | | 7/20/2030 | | | | 900,000 | | | | 896,861 | | | | 900,092 | |
BlueMountain CLO2013-1 Ltd., 3M USD LIBOR + 1.230%^ | | | 3.79 | # | | | 1/20/2029 | | | | 2,500,000 | | | | 2,500,000 | | | | 2,502,680 | |
Denali Capital CLO Ltd. 2013 1A A1LR, 3M USD LIBOR + 1.050%^ | | | 3.64 | # | | | 10/26/2027 | | | | 2,420,000 | | | | 2,420,000 | | | | 2,416,525 | |
Elmwood CLO II Ltd., 3M USD LIBOR + 1.450%^ | | | 4.00 | # | | | 4/20/2031 | | | | 1,650,000 | | | | 1,650,000 | | | | 1,649,888 | |
FCI Funding2019-1 LLC^ | | | 3.63 | | | | 2/18/2031 | | | | 747,679 | | | | 747,553 | | | | 753,542 | |
Galaxy XX CLO Ltd., 3M USD LIBOR + 1.000%^ | | | 3.59 | # | | | 4/20/2031 | | | | 1,200,000 | | | | 1,200,000 | | | | 1,187,555 | |
Hertz Vehicle Financing LLC2018-3^ | | | 4.37 | | | | 7/25/2024 | | | | 620,000 | | | | 621,320 | | | | 647,297 | |
LCM Ltd. Partnership 07/27, 3M USD LIBOR + 1.750%^ | | | 4.35 | # | | | 7/15/2027 | | | | 2,000,000 | | | | 2,000,000 | | | | 2,005,108 | |
LCM XXIII Ltd. 23A A1, 3M USD LIBOR + 1.400%^ | | | 3.99 | # | | | 10/20/2029 | | | | 610,000 | | | | 610,000 | | | | 612,179 | |
Madison Park Funding Ltd. | | | 4.27 | | | | 1/22/2028 | | | | 1,500,000 | | | | 1,500,000 | | | | 1,499,977 | |
Madison Park Funding XXII Ltd.2016-22A A, 3M USD LIBOR + 1.480%^ | | | 4.06 | # | | | 10/25/2029 | | | | 350,000 | | | | 350,000 | | | | 350,675 | |
Madison Park Funding XXVI Ltd., 3M USD LIBOR + 1.200%^ | | | 3.78 | # | | | 7/29/2030 | | | | 2,000,000 | | | | 1,997,065 | | | | 1,999,616 | |
Neuberger Berman CLO XX Ltd.2015-20A BR, 3M USD LIBOR + 1.250%^ | | | 3.85 | # | | | 1/15/2028 | | | | 2,000,000 | | | | 2,000,000 | | | | 1,969,696 | |
OCP CLO Ltd.2015-8A A2AR, 3M USD LIBOR + 1.450%^ | | | 4.04 | # | | | 4/17/2027 | | | | 900,000 | | | | 900,000 | | | | 898,973 | |
Palmer Square CLO2015-1 Ltd., 3M USD LIBOR + 1.650%^ | | | 4.06 | # | | | 5/21/2029 | | | | 700,000 | | | | 700,000 | | | | 699,994 | |
Riserva Clo Ltd., 3M USD LIBOR + 1.700%^ | | | 4.04 | # | | | 10/18/2028 | | | | 2,750,000 | | | | 2,750,000 | | | | 2,750,000 | |
RR 3 Ltd. Series2018-3 A A1R2, 3M USD LIBOR + 1.090%^ | | | 3.69 | # | | | 1/15/2030 | | | | 570,000 | | | | 570,000 | | | | 565,852 | |
Salem Fields CLO Ltd.2016-2, 3M USD LIBOR + 1.150%^ | | | 3.73 | # | | | 10/25/2028 | | | | 2,000,000 | | | | 1,996,380 | | | | 2,000,028 | |
Structured Asset Securities Corp. Mortgage Loan Trust 2006-GEL1, 1M USD LIBOR + 0.800%^ | | | 3.20 | # | | | 11/25/2035 | | | | 3,060,000 | | | | 3,070,905 | | | | 2,984,893 | |
TCI-Symphony CLO Ltd.2016-1A A, 3M USD LIBOR + 1.480%^ | | | 4.08 | # | | | 10/13/2029 | | | | 320,000 | | | | 320,000 | | | | 320,857 | |
Treman Park CLO Ltd.2015-1A ARR, 3M USD LIBOR + 1.070%^ | | | 3.66 | # | | | 10/20/2028 | | | | 1,170,000 | | | | 1,170,000 | | | | 1,170,002 | |
See accompanying Notes to the Financial Statements.
111
Barings Active Short Duration Bond Fund 2019 Annual Report
SCHEDULE OF INVESTMENTS (CONTINUED)
June 30, 2019
| | | | | | | | | | | | | | | | | | | | |
| | | EFFECTIVE
INTEREST RATE | | | DUE DATE | | | PRINCIPAL ‡‡ | | | COST | | | FAIR
VALUE | |
Asset-Backed Securities(Continued) | |
|
CDO/CLO (Continued) | |
VMC Finance2018-FL1 LLC, 1M USD LIBOR + 0.820%^ | | | 3.21 | # % | | | 3/15/2035 | | | | 476,822 | | | $ | 476,822 | | | $ | 477,502 | |
| | | | | | | | | | | | | | | | | | | | |
Total CDO/CLO | | | | | | | | | | | 34,183,712 | | | | 34,184,533 | | | | 34,109,933 | |
| | | | | | | | | | | | | | | | | | | | |
|
Other Asset-Backed Securities — 41.3%*: | |
321 Henderson Receivables II LLC2006-3A A1, 1M USD LIBOR + 0.200%^ | | | 2.59 | # | | | 9/15/2041 | | | | 116,104 | | | | 112,897 | | | | 111,394 | |
AASET2017-1 Trust^ | | | 3.97 | | | | 5/16/2042 | | | | 2,352,341 | | | | 2,346,075 | | | | 2,379,315 | |
AASET US Ltd.2018-2 A^ | | | 4.45 | | | | 11/18/2038 | | | | 1,825,545 | | | | 1,837,273 | | | | 1,865,360 | |
Access Group, Inc.2015-1 A, 1M USD LIBOR + 0.700%^ | | | 3.10 | # | | | 7/25/2056 | | | | 150,621 | | | | 147,809 | | | | 148,546 | |
Access Group, Inc.2015-1 B, 1M USD LIBOR + 1.500%^ | | | 3.90 | # | | | 7/25/2058 | | | | 100,000 | | | | 86,679 | | | | 92,616 | |
AccessLex Institute2002-A A2, 28 Day ARS | | | 3.02 | # | | | 9/25/2037 | | | | 700,000 | | | | 672,979 | | | | 696,104 | |
AccessLex Institute2004-A A3, 28 Day ARS | | | 4.56 | # | | | 7/1/2039 | | | | 1,100,000 | | | | 1,080,672 | | | | 1,084,603 | |
Accredited Mortgage Loan Trust2004-04 A2D, 1M USD LIBOR + 0.700% | | | 3.10 | # | | | 1/25/2035 | | | | 464,715 | | | | 456,246 | | | | 465,626 | |
Adams Outdoor Advertising LP^ | | | 4.81 | | | | 11/15/2048 | | | | 1,150,313 | | | | 1,165,286 | | | | 1,223,893 | |
American Credit Acceptance Receivables Trust2017-4 C^ | | | 2.94 | | | | 1/10/2024 | | | | 1,790,000 | | | | 1,789,951 | | | | 1,790,849 | |
American Credit Acceptance Receivables Trust2019-1^ | | | 3.50 | | | | 4/14/2025 | | | | 2,650,000 | | | | 2,649,534 | | | | 2,700,154 | |
Arbys Funding LLC2015-1A A2^ | | | 4.97 | | | | 10/30/2045 | | | | 77,200 | | | | 77,200 | | | | 81,488 | |
Argent Securities, Inc. Asset-Backed Pass-Through Certificates2004-W10 M1, 1M USD LIBOR + 0.900% | | | 3.30 | # | | | 10/25/2034 | | | | 233,380 | | | | 213,655 | | | | 232,751 | |
ARI Fleet Lease Trust2016-A A3^ | | | 2.11 | | | | 7/15/2024 | | | | 104,221 | | | | 104,208 | | | | 104,261 | |
Ascentium Equipment Receivables2019-1^ | | | 3.47 | | | | 5/12/2025 | | | | 683,000 | | | | 682,780 | | | | 696,784 | |
Ascentium Equipment Receivables2019-1^ | | | 4.31 | | | | 4/12/2027 | | | | 430,000 | | | | 438,806 | | | | 439,979 | |
Ascentium Equipment Receivables Trust2018-2 B^ | | | 3.76 | | | | 5/10/2024 | | | | 1,418,000 | | | | 1,417,977 | | | | 1,476,899 | |
Ascentium Equipment Receivables Trust2018-2 B^ | | | 5.18 | | | | 7/10/2026 | | | | 2,723,000 | | | | 2,733,040 | | | | 2,828,449 | |
Avant Loans Funding Trust2018-A^ | | | 3.09 | | | | 6/15/2021 | | | | 91,042 | | | | 91,041 | | | | 91,037 | |
Avis Budget Rental Car Funding AESOP LLC^ | | | 3.55 | | | | 9/22/2025 | | | | 3,234,000 | | | | 3,233,319 | | | | 3,336,149 | |
Avis Budget Rental Car Funding AESOP LLC^ | | | 3.70 | | | | 3/20/2023 | | | | 344,000 | | | | 343,988 | | | | 352,656 | |
Avis Budget Rental Car Funding AESOP LLC^ | | | 4.53 | | | | 3/20/2023 | | | | 738,000 | | | | 739,170 | | | | 750,494 | |
Bank of The West Auto Trust2019-1^ | | | 2.90 | | | | 4/15/2025 | | | | 1,062,000 | | | | 1,061,744 | | | | 1,064,646 | |
BlueVirgo Trust2015-1A^ | | | 3.00 | | | | 12/15/2022 | | | | 11,842 | | | | 11,814 | | | | 11,842 | |
BRE Grand Islander Timeshare Issuer2019-A LLC^ | | | 3.78 | | | | 9/26/2033 | | | | 1,317,405 | | | | 1,317,358 | | | | 1,341,439 | |
BRE Grand Islander Timeshare Issuer LLC2017-1A A^ | | | 2.94 | | | | 5/25/2029 | | | | 181,871 | | | | 181,832 | | | | 183,111 | |
BRE Grand Islander Timeshare Issuer LLC2017-1A B^ | | | 3.24 | | | | 5/25/2029 | | | | 149,776 | | | | 149,758 | | | | 149,746 | |
See accompanying Notes to the Financial Statements.
112
Barings Active Short Duration Bond Fund 2019 Annual Report
SCHEDULE OF INVESTMENTS (CONTINUED)
June 30, 2019
| | | | | | | | | | | | | | | | | | | | |
| | | EFFECTIVE
INTEREST RATE | | | DUE DATE | | | PRINCIPAL ‡‡ | | | COST | | | FAIR
VALUE | |
Asset-Backed Securities(Continued) | |
|
Other Asset-Backed Securities (Continued) | |
CAL Funding III Ltd.^ | | | 4.34 | % | | | 9/25/2043 | | | | 536,500 | | | $ | 536,441 | | | $ | 548,060 | |
Canadian Pacer Auto Receivables Trust2018-2+^ | | | 3.63 | | | | 1/19/2024 | | | | 470,000 | | | | 469,980 | | | | 486,956 | |
Capital Automotive LLC2017-1A A1^ | | | 3.87 | | | | 4/15/2047 | | | | 303,283 | | | | 303,199 | | | | 308,923 | |
Carmax Auto Owner Trust2019-2 | | | 3.41 | | | | 10/15/2025 | | | | 615,000 | | | | 614,963 | | | | 628,071 | |
Castlelake Aircraft Securitiza Clast2019-1A | | | 3.97 | | | | 4/15/2039 | | | | 925,004 | | | | 925,004 | | | | 926,566 | |
Castlelake Aircraft Securitiza Clast2019-1A | | | 5.10 | | | | 4/15/2039 | | | | 935,840 | | | | 945,168 | | | | 940,615 | |
Castlelake Aircraft Securitization Trust2018-1^ | | | 4.13 | | | | 6/15/2043 | | | | 2,172,799 | | | | 2,173,945 | | | | 2,190,803 | |
Cazenovia Creek Funding I LLC2015-1A A^ | | | 2.00 | | | | 12/10/2023 | | | | 7,393 | | | | 7,345 | | | | 7,381 | |
Centex Home Equity Loan Trust2006-A AV4, 1M USD LIBOR + 0.250% | | | 2.65 | # | | | 6/25/2036 | | | | 75,643 | | | | 73,997 | | | | 75,207 | |
Chase Education Loan Trust, 3M USD LIBOR + 0.220% | | | 2.55 | # | | | 6/28/2040 | | | | 693,987 | | | | 656,564 | | | | 657,355 | |
CIT Education Loan Trust2007-1, 3M USD LIBOR + 0.090%^ | | | 2.44 | # | | | 3/25/2042 | | | | 1,415,760 | | | | 1,353,452 | | | | 1,348,194 | |
CLI Funding V LLC^ | | | 3.38 | | | | 10/18/2029 | | | | 2,166,794 | | | | 2,159,933 | | | | 2,193,325 | |
CLI Funding V LLC2013-1A^ | | | 2.83 | | | | 3/18/2028 | | | | 1,708,500 | | | | 1,677,947 | | | | 1,709,510 | |
CLI Funding V LLC2013-2A^ | | | 3.22 | | | | 6/18/2028 | | | | 809,285 | | | | 801,448 | | | | 816,305 | |
CLI Funding V LLC2014-1A A^ | | | 3.29 | | | | 6/18/2029 | | | | 658,804 | | | | 655,800 | | | | 658,831 | |
CLI Funding VI LLC^ | | | 3.71 | | | | 5/18/2044 | | | | 1,113,180 | | | | 1,113,180 | | | | 1,127,503 | |
CLI Funding VI LLC2017-1A A^ | | | 3.62 | | | | 5/18/2042 | | | | 1,550,372 | | | | 1,553,463 | | | | 1,575,879 | |
College Ave Student Loans LLC2018-A, 1M USD LIBOR + 1.200%^ | | | 3.60 | # | | | 12/26/2047 | | | | 1,026,327 | | | | 1,026,327 | | | | 1,023,165 | |
College Avenue Student Loans LLC^ | | | 3.81 | | | | 12/28/2048 | | | | 1,351,000 | | | | 1,350,873 | | | | 1,350,873 | |
College Loan Corp. Trust I2005-2 B, 3M USD LIBOR + 0.490% | | | 3.09 | # | | | 1/15/2037 | | | | 156,168 | | | | 138,815 | | | | 144,384 | |
Commonbond Student Loan Trust2016-B A1^ | | | 2.73 | | | | 10/25/2040 | | | | 1,117,628 | | | | 1,121,966 | | | | 1,119,011 | |
Commonbond Student Loan Trust2017-A-GS^ | | | 3.47 | | | | 5/25/2041 | | | | 1,456,697 | | | | 1,436,576 | | | | 1,474,286 | |
Commonbond Student Loan Trust2017-A-GS^ | | | 5.28 | | | | 5/25/2041 | | | | 194,368 | | | | 194,345 | | | | 204,627 | |
Commonbond Student Loan Trust2018-A-GS^ | | | 3.82 | | | | 2/25/2044 | | | | 391,036 | | | | 390,951 | | | | 396,158 | |
Commonbond Student Loan Trust2018-BGS^ | | | 4.12 | | | | 9/25/2045 | | | | 430,000 | | | | 429,944 | | | | 436,821 | |
Commonbond Student Loan Trust2018-C-GS^ | | | 4.35 | | | | 2/25/2046 | | | | 439,000 | | | | 438,958 | | | | 444,531 | |
CPS Auto Receivables Trust2018-A^ | | | 2.16 | | | | 5/17/2021 | | | | 58,871 | | | | 58,871 | | | | 58,838 | |
CPS Auto Receivables Trust2019-A^ | | | 3.18 | | | | 6/15/2022 | | | | 757,453 | | | | 757,424 | | | | 761,357 | |
CPS Auto Trust^ | | | 3.43 | | | | 7/15/2022 | | | | 440,000 | | | | 439,963 | | | | 443,367 | |
Credit Suisse ABS Repackaging Trust2013-A B^ | | | 2.50 | | | | 1/25/2030 | | | | 36,833 | | | | 35,339 | | | | 35,761 | |
DB Master Finance LLC^ | | | 3.79 | | | | 5/20/2049 | | | | 947,000 | | | | 947,000 | | | | 984,648 | |
DB Master Finance LLC^ | | | 4.02 | | | | 5/20/2049 | | | | 1,119,000 | | | | 1,119,000 | | | | 1,154,190 | |
DB Master Finance LLC^ | | | 4.03 | | | | 11/20/2047 | | | | 985,000 | | | | 952,474 | | | | 1,014,480 | |
Diamond Resorts Owner Trust2016-1 A^ | | | 3.08 | | | | 11/20/2028 | | | | 320,570 | | | | 320,570 | | | | 322,465 | |
Diamond Resorts Owner Trust2018-1^ | | | 3.70 | | | | 1/21/2031 | | | | 472,837 | | | | 472,837 | | | | 478,571 | |
Domino’s Pizza Master Issuer LLC^ | | | 4.12 | | | | 7/25/2048 | | | | 653,400 | | | | 653,400 | | | | 670,897 | |
Domino’s Pizza Master Issuer LLC2017-1 A^ | | | 3.08 | | | | 7/25/2047 | | | | 3,640,163 | | | | 3,573,859 | | | | 3,626,624 | |
DRB Prime Student Loan Trust2015-A A2^ | | | 3.06 | | | | 7/25/2031 | | | | 38,251 | | | | 37,835 | | | | 38,850 | |
See accompanying Notes to the Financial Statements.
113
Barings Active Short Duration Bond Fund 2019 Annual Report
SCHEDULE OF INVESTMENTS (CONTINUED)
June 30, 2019
| | | | | | | | | | | | | | | | | | | | |
| | | EFFECTIVE
INTEREST RATE | | | DUE DATE | | | PRINCIPAL ‡‡ | | | COST | | | FAIR
VALUE | |
Asset-Backed Securities(Continued) | |
|
Other Asset-Backed Securities (Continued) | |
DRB Prime Student Loan Trust2015-B A3^ | | | 2.54 | % | | | 4/27/2026 | | | | 4,365 | | | $ | 4,365 | | | $ | 4,365 | |
DRB Prime Student Loan Trust2015-D A1, 1M USD LIBOR + 1.700%^ | | | 4.18 | # | | | 1/25/2040 | | | | 87,458 | | | | 86,384 | | | | 88,337 | |
DRB Prime Student Loan Trust2015-D A2^ | | | 3.20 | | | | 1/25/2040 | | | | 484,504 | | | | 484,032 | | | | 490,323 | |
DRB Prime Student Loan Trust2016-A A1, 1M USD LIBOR + 2.000%^ | | | 4.40 | # | | | 4/25/2040 | | | | 375,496 | | | | 383,912 | | | | 381,897 | |
DRB Prime Student Loan Trust2016-R A1, 1M USD LIBOR + 1.900%^ | | | 4.30 | # | | | 10/25/2044 | | | | 605,021 | | | | 605,021 | | | | 610,956 | |
DRB Prime Student Loan Trust2016-R A2^¤ | | | 3.07 | | | | 10/25/2044 | | | | 1,752,473 | | | | 1,749,353 | | | | 1,754,321 | |
Drive Auto Receivables Trust | | | 3.66 | | | | 11/15/2024 | | | | 450,000 | | | | 449,930 | | | | 455,936 | |
Drive Auto Receivables Trust2017-1 C | | | 2.84 | | | | 4/15/2022 | | | | 178,283 | | | | 178,268 | | | | 178,430 | |
Drive Auto Receivables Trust2017-2 C | | | 2.75 | | | | 9/15/2023 | | | | 112,367 | | | | 112,363 | | | | 112,439 | |
Drive Auto Receivables Trust2018-2 | | | 3.22 | | | | 4/15/2022 | | | | 339,753 | | | | 339,720 | | | | 340,327 | |
Drive Auto Receivables Trust2018-5 A2B, 1M USD LIBOR + 0.320% | | | 2.71 | # | | | 7/15/2021 | | | | 410,845 | | | | 410,541 | | | | 410,709 | |
Drive Auto Receivables Trust2019-1 | | | 3.78 | | | | 4/15/2025 | | | | 2,625,000 | | | | 2,624,819 | | | | 2,679,507 | |
DT Auto Owner Trust2018-1^ | | | 2.59 | | | | 5/17/2021 | | | | 109,479 | | | | 109,478 | | | | 109,478 | |
DT Auto Owner Trust2018-1^ | | | 3.04 | | | | 1/18/2022 | | | | 570,000 | | | | 569,967 | | | | 570,901 | |
DT Auto Owner Trust2019-1^ | | | 3.61 | | | | 11/15/2024 | | | | 1,460,000 | | | | 1,459,856 | | | | 1,484,333 | |
Earnest Student Loan Program2017-A LLC^ | | | 3.59 | | | | 1/25/2041 | | | | 796,076 | | | | 791,316 | | | | 808,275 | |
Earnest Student Loan Program LLC2016-C A2^ | | | 2.68 | | | | 7/25/2035 | | | | 200,359 | | | | 199,316 | | | | 200,527 | |
Earnest Student Loan Program LLC2016-D A2^ | | | 2.72 | | | | 1/25/2041 | | | | 219,474 | | | | 219,410 | | | | 219,457 | |
ECMC Group Student Loan Trust2016-1A A, 1M USD LIBOR + 1.350%^ | | | 3.75 | # | | | 7/26/2066 | | | | 390,375 | | | | 390,375 | | | | 393,512 | |
ECMC Group Student Loan Trust2017-1A A, 1M USD LIBOR + 1.200%^ | | | 3.60 | # | | | 12/27/2066 | | | | 1,133,686 | | | | 1,133,686 | | | | 1,138,545 | |
ECMC Group Student Loan Trust2018-1, 1M USD LIBOR + 0.750%^ | | | 3.15 | # | | | 2/27/2068 | | | | 1,295,723 | | | | 1,295,722 | | | | 1,287,927 | |
ECMC Group Student Loan Trust2018-2, 1M USD LIBOR + 0.800%^ | | | 3.20 | # | | | 9/25/2068 | | | | 1,031,514 | | | | 1,030,224 | | | | 1,019,631 | |
EdLinc Student Loan Funding Trust2017-A A, Prime — 1.150%^ | | | 4.35 | # | | | 12/1/2047 | | | | 1,405,400 | | | | 1,395,894 | | | | 1,412,260 | |
Education Loan Asset-Backed Trust I2013-1 A1, 1M USD LIBOR + 0.800%^ | | | 3.20 | # | | | 6/25/2026 | | | | 219,680 | | | | 217,561 | | | | 219,842 | |
Educational Funding of the South, Inc., 3M USD LIBOR + 0.650% | | | 3.23 | # | | | 4/25/2035 | | | | 1,305,294 | | | | 1,297,874 | | | | 1,296,208 | |
EDvestinU Private Education Loan Issue No 1 LLC^ | | | 3.58 | # | | | 11/25/2038 | | | | 1,945,209 | | | | 1,944,871 | | | | 2,004,610 | |
Elara HGV Timeshare Issuer2016-A LLC^ | | | 3.22 | | | | 4/25/2028 | | | | 743,428 | | | | 736,507 | | | | 746,761 | |
Elara HGV Timeshare Issuer LLC2014-A B^ | | | 3.02 | #** | | | 2/25/2027 | | | | 15,273 | | | | 15,172 | | | | 15,261 | |
Elara HGV Timeshare Issuer LLC2016-A A^ | | | 2.73 | | | | 4/25/2028 | | | | 1,078,166 | | | | 1,059,646 | | | | 1,075,929 | |
Elara HGV Timeshare Issuer LLC2017-A A^ | | | 2.69 | | | | 3/25/2030 | | | | 317,497 | | | | 317,472 | | | | 319,377 | |
ELFI Graduate Loan Program LLC2018-A, 1M USD LIBOR + 0.750%^ | | | 3.15 | # | | | 8/25/2042 | | | | 1,646,750 | | | | 1,645,667 | | | | 1,641,612 | |
See accompanying Notes to the Financial Statements.
114
Barings Active Short Duration Bond Fund 2019 Annual Report
SCHEDULE OF INVESTMENTS (CONTINUED)
June 30, 2019
| | | | | | | | | | | | | | | | | | | | |
| | | EFFECTIVE
INTEREST RATE | | | DUE DATE | | | PRINCIPAL ‡‡ | | | COST | | | FAIR
VALUE | |
Asset-Backed Securities(Continued) | |
|
Other Asset-Backed Securities (Continued) | |
ELFI Graduate Loan Program LLC2018-A^ | | | 4.00 | % | | | 8/25/2042 | | | | 460,000 | | | $ | 451,214 | | | $ | 472,612 | |
Enterprise Fleet Financing LLC2017-1 A3^ | | | 2.60 | | | | 7/20/2022 | | | | 240,000 | | | | 239,965 | | | | 240,576 | |
Exeter Automobile Receivables Trust2015-2A C^ | | | 3.90 | | | | 3/15/2021 | | | | 281,585 | | | | 283,307 | | | | 282,243 | |
Exeter Automobile Receivables Trust2016-3A B^ | | | 2.84 | | | | 8/16/2021 | | | | 108,996 | | | | 108,987 | | | | 109,040 | |
Exeter Automobile Receivables Trust2017-1A B^ | | | 3.00 | | | | 12/15/2021 | | | | 249,393 | | | | 249,364 | | | | 249,652 | |
Exeter Automobile Receivables Trust2018-1^ | | | 2.75 | | | | 4/15/2022 | | | | 468,121 | | | | 468,121 | | | | 468,388 | |
Exeter Automobile Receivables Trust2018-3^ | | | 2.90 | | | | 1/18/2022 | | | | 436,643 | | | | 436,622 | | | | 437,089 | |
Exeter Automobile Receivables Trust2019-1A B^ | | | 3.45 | | | | 2/15/2023 | | | | 935,000 | | | | 934,970 | | | | 945,980 | |
First Franklin Mortgage Loan Trust 2004-FFH4 M5, 1M USD LIBOR + 1.575% | | | 3.98 | # | | | 1/25/2035 | | | | 178,739 | | | | 179,455 | | | | 179,278 | |
First Investors Auto Owner Trust2016-2A B^ | | | 2.21 | | | | 7/15/2022 | | | | 520,000 | | | | 519,985 | | | | 518,167 | |
First Investors Auto Owner Trust2017-3A B^ | | | 2.72 | | | | 4/17/2023 | | | | 560,000 | | | | 559,971 | | | | 562,305 | |
First Investors Auto Owner Trust2018-1^ | | | 3.22 | | | | 1/17/2023 | | | | 540,000 | | | | 539,962 | | | | 544,165 | |
Flagship Credit Auto Trust2016-3 B^ | | | 2.43 | | | | 6/15/2021 | | | | 117,523 | | | | 117,519 | | | | 117,487 | |
Flagship Credit Auto Trust2016-4 B^ | | | 2.41 | | | | 10/15/2021 | | | | 1,426,723 | | | | 1,427,281 | | | | 1,426,003 | |
Flagship Credit Auto Trust2016-4 C^ | | | 2.71 | | | | 11/15/2022 | | | | 410,000 | | | | 409,987 | | | | 410,912 | |
Flagship Credit Auto Trust2017-1 B^ | | | 2.83 | | | | 3/15/2023 | | | | 786,647 | | | | 786,631 | | | | 786,994 | |
Flagship Credit Auto Trust2017-4 C^ | | | 2.92 | | | | 11/15/2023 | | | | 1,140,000 | | | | 1,139,213 | | | | 1,139,093 | |
Flagship Credit Auto Trust2018-1^ | | | 3.13 | | | | 1/17/2023 | | | | 2,250,000 | | | | 2,249,647 | | | | 2,265,478 | |
Flagship Credit Auto Trust2018-2^ | | | 2.97 | | | | 10/17/2022 | | | | 505,752 | | | | 505,752 | | | | 508,087 | |
Flagship Credit Auto Trust2019-1^ | | | 3.60 | | | | 2/18/2025 | | | | 2,175,000 | | | | 2,176,663 | | | | 2,232,772 | |
Global SC Finance II SRL2014-1A A1+^ | | | 3.19 | | | | 7/17/2029 | | | | 157,583 | | | | 157,555 | | | | 157,665 | |
GLS Auto Receivables Trust2018-3 A^ | | | 3.35 | | | | 8/15/2022 | | | | 402,356 | | | | 402,349 | | | | 404,523 | |
Goal Capital Funding Trust2010-1 A, 3M USD LIBOR + 0.700%^ | | | 3.22 | # | | | 8/25/2048 | | | | 142,526 | | | | 137,010 | | | | 143,019 | |
Goal Structured Solution Trust2015-1 B, 1M USD LIBOR + 1.500%^ | | | 3.90 | # | | | 9/25/2043 | | | | 100,000 | | | | 76,917 | | | | 98,457 | |
Goodgreen Trust2016-1 A^ | | | 3.23 | | | | 10/15/2052 | | | | 872,411 | | | | 862,162 | | | | 889,160 | |
Goodgreen Trust2018-1^ | | | 3.93 | # | | | 10/15/2053 | | | | 3,782,292 | | | | 3,825,187 | | | | 3,943,508 | |
Goodgreen Trust2019-1^ | | | 3.86 | | | | 10/15/2054 | | | | 2,935,361 | | | | 2,935,886 | | | | 3,064,127 | |
HERO Funding Trust2015-1A A^ | | | 3.84 | | | | 9/21/2040 | | | | 617,483 | | | | 628,247 | | | | 639,914 | |
HERO Funding Trust2016-4A A1^ | | | 3.57 | | | | 9/20/2047 | | | | 268,250 | | | | 268,148 | | | | 278,553 | |
HERO Funding Trust2017-2A A1^ | | | 3.28 | | | | 9/20/2048 | | | | 100,977 | | | | 100,965 | | | | 102,068 | |
HERO Funding Trust2017-2A A2^ | | | 4.07 | | | | 9/20/2048 | | | | 79,339 | | | | 81,249 | | | | 82,540 | |
HERO Funding Trust2017-3A A1^ | | | 3.19 | | | | 9/20/2048 | | | | 677,123 | | | | 676,901 | | | | 688,434 | |
HERO Funding Trust2018-1^ | | | 4.67 | | | | 9/20/2048 | | | | 1,069,074 | | | | 1,090,772 | | | | 1,126,107 | |
Hertz Fleet Lease Funding LP^ | | | 3.44 | | | | 1/10/2033 | | | | 2,625,000 | | | | 2,624,579 | | | | 2,654,846 | |
Hertz Vehicle Financing II LP^ | | | 3.29 | | | | 7/25/2022 | | | | 1,000,000 | | | | 987,994 | | | | 1,007,553 | |
Hertz Vehicle Financing II LP^ | | | 3.29 | | | | 2/25/2024 | | | | 2,830,000 | | | | 2,777,090 | | | | 2,881,215 | |
Hertz Vehicle Financing II LP^ | | | 3.52 | | | | 3/25/2021 | | | | 900,000 | | | | 896,866 | | | | 905,063 | |
Hertz Vehicle Financing II LP^ | | | 3.56 | | | | 10/25/2021 | | | | 2,300,000 | | | | 2,284,459 | | | | 2,318,953 | |
See accompanying Notes to the Financial Statements.
115
Barings Active Short Duration Bond Fund 2019 Annual Report
SCHEDULE OF INVESTMENTS (CONTINUED)
June 30, 2019
| | | | | | | | | | | | | | | | | | | | |
| | | EFFECTIVE
INTEREST RATE | | | DUE DATE | | | PRINCIPAL ‡‡ | | | COST | | | FAIR
VALUE | |
Asset-Backed Securities(Continued) | |
|
Other Asset-Backed Securities (Continued) | |
Hertz Vehicle Financing II LP^ | | | 3.60 | % | | | 2/25/2024 | | | | 1,320,000 | | | $ | 1,319,627 | | | $ | 1,345,695 | |
Higher Education Funding I2004-1 B1, 28 Day ARS^ | | | 3.88 | # | | | 1/1/2044 | | | | 950,000 | | | | 834,169 | | | | 891,151 | |
Hilton Grand Vacations Trust2013-A A^ | | | 2.28 | | | | 1/25/2026 | | | | 23,447 | | | | 23,189 | | | | 23,431 | |
Hilton Grand Vacations Trust2017-AA B^ | | | 2.96 | #** | | | 12/26/2028 | | | | 211,575 | | | | 211,567 | | | | 212,123 | |
Hilton Grand Vacations Trust2018-A^ | | | 3.54 | | | | 2/25/2032 | | | | 350,260 | | | | 350,252 | | | | 361,080 | |
Horizon Aircraft Finance I Ltd.2018-1 A^ | | | 4.46 | | | | 12/15/2038 | | | | 475,406 | | | | 475,396 | | | | 492,876 | |
KDAC Aviation Finance Ltd.^ | | | 4.21 | | | | 12/15/2042 | | | | 1,540,702 | | | | 1,536,415 | | | | 1,579,011 | |
KREF Ltd.2018-FL1 AS, 1M USD LIBOR + 1.350%^ | | | 3.74 | # | | | 6/15/2036 | | | | 2,380,000 | | | | 2,380,000 | | | | 2,381,095 | |
Laurel Road Prime Student Loan Trust2017-B CFX^ | | | 3.61 | | | | 8/25/2042 | | | | 364,448 | | | | 364,394 | | | | 363,973 | |
Laurel Road Prime Student Loan Trust2017-C B^ | | | 2.95 | | | | 11/25/2042 | | | | 418,103 | | | | 417,947 | | | | 414,625 | |
Lendmark Funding Trust2017-1A^ | | | 2.83 | | | | 12/22/2025 | | | | 553,249 | | | | 552,409 | | | | 551,740 | |
Lendmark Funding Trust2017-2A A^ | | | 2.80 | | | | 5/20/2026 | | | | 680,000 | | | | 679,948 | | | | 679,826 | |
Lendmark Funding Trust2018-1^ | | | 3.81 | | | | 12/21/2026 | | | | 630,000 | | | | 629,969 | | | | 645,955 | |
Mariner Finance Issuance Trust2017-AA A^ | | | 3.62 | | | | 2/20/2029 | | | | 282,892 | | | | 282,845 | | | | 283,708 | |
Mariner Finance Issuance Trust2017-BA B^ | | | 2.92 | | | | 12/20/2029 | | | | 3,360,000 | | | | 3,345,087 | | | | 3,363,847 | |
Mariner Finance Issuance Trust2018-A^ | | | 4.20 | | | | 11/20/2030 | | | | 1,848,000 | | | | 1,847,870 | | | | 1,898,512 | |
Marlette Funding Trust2017-3A A^ | | | 2.36 | | | | 12/15/2024 | | | | 33,097 | | | | 33,095 | | | | 33,086 | |
Marlette Funding Trust2018-1^ | | | 2.61 | | | | 3/15/2028 | | | | 437,870 | | | | 437,852 | | | | 437,595 | |
Marlette Funding Trust2018-2^ | | | 3.06 | | | | 7/17/2028 | | | | 197,170 | | | | 197,170 | | | | 197,388 | |
Marlette Funding Trust2018-3^ | | | 3.20 | | | | 9/15/2028 | | | | 584,195 | | | | 584,149 | | | | 586,178 | |
Marlette Funding Trust2019-1^ | | | 3.44 | | | | 4/16/2029 | | | | 880,254 | | | | 880,233 | | | | 887,850 | |
Marlette Funding Trust2019-2^ | | | 3.13 | | | | 7/16/2029 | | | | 1,289,000 | | | | 1,288,875 | | | | 1,296,214 | |
Marlette Funding Trust2019-2^ | | | 3.53 | | | | 7/16/2029 | | | | 976,000 | | | | 975,812 | | | | 990,303 | |
Mosaic Solar Loan Trust2018-2-GS^ | | | 4.20 | | | | 2/22/2044 | | | | 553,161 | | | | 553,074 | | | | 568,698 | |
Mosaic Solar Loans LLC2017-1A A^ | | | 4.45 | | | | 6/20/2042 | | | | 82,043 | | | | 82,020 | | | | 85,307 | |
MVW Owner Trust2013-1A A^ | | | 2.15 | | | | 4/22/2030 | | | | 179,710 | | | | 178,515 | | | | 179,057 | |
MVW Owner Trust2015-1A A^ | | | 2.52 | | | | 12/20/2032 | | | | 23,301 | | | | 23,300 | | | | 23,260 | |
MVW Owner Trust2017-1A A^ | | | 2.42 | | | | 12/20/2034 | | | | 66,657 | | | | 66,647 | | | | 66,740 | |
Navient Private Education Loan Trust2017-A, 1M USD LIBOR - 0.900%^ | | | 3.29 | # | | | 12/16/2058 | | | | 1,125,000 | | | | 1,125,000 | | | | 1,129,780 | |
Navient Private Education Loan Trust2018-B, 1M USD LIBOR + 0.720%^ | | | 3.11 | # | | | 12/15/2059 | | | | 320,000 | | | | 320,000 | | | | 316,969 | |
Navient Private Education Refi Loan Trust2019-A^ | | | 3.42 | | | | 1/15/2043 | | | | 595,000 | | | | 594,738 | | | | 616,082 | |
Navient Student Loan Trust2015-1 B, 1M USD LIBOR + 1.500% | | | 3.90 | # | | | 7/25/2052 | | | | 1,100,000 | | | | 1,094,658 | | | | 1,113,947 | |
Navient Student Loan Trust2015-2 A3, 1M USD LIBOR + 0.570% | | | 2.97 | # | | | 11/26/2040 | | | | 500,000 | | | | 492,967 | | | | 494,859 | |
Navient Student Loan Trust2016-5A A, 1M USD LIBOR + 1.250%^ | | | 3.65 | # | | | 6/25/2065 | | | | 861,983 | | | | 865,599 | | | | 871,670 | |
See accompanying Notes to the Financial Statements.
116
Barings Active Short Duration Bond Fund 2019 Annual Report
SCHEDULE OF INVESTMENTS (CONTINUED)
June 30, 2019
| | | | | | | | | | | | | | | | | | | | |
| | | EFFECTIVE
INTEREST RATE | | | DUE DATE | | | PRINCIPAL ‡‡ | | | COST | | | FAIR
VALUE | |
Asset-Backed Securities(Continued) | |
|
Other Asset-Backed Securities (Continued) | |
Navient Student Loan Trust2016-6 A3, 1M USD LIBOR + 1.300%^ | | | 3.70 | # % | | | 3/25/2066 | | | | 550,000 | | | $ | 550,000 | | | $ | 559,485 | |
Navient Student Loan Trust2017-1A A3, 1M USD LIBOR + 1.150%^ | | | 3.55 | # | | | 7/26/2066 | | | | 1,000,000 | | | | 1,000,000 | | | | 1,010,228 | |
Navient Student Loan Trust2017-5A A, 1M USD LIBOR + 0.800%^ | | | 3.20 | # | | | 7/26/2066 | | | | 473,401 | | | | 472,886 | | | | 470,019 | |
Navient Student Loan Trust2018-1A A3, 1M USD LIBOR + 0.720%^ | | | 3.12 | # | | | 3/25/2067 | | | | 1,600,000 | | | | 1,600,000 | | | | 1,595,038 | |
Navient Student Loan Trust2018-2, 1M USD LIBOR + 0.750%^ | | | 3.15 | # | | | 3/25/2067 | | | | 1,360,000 | | | | 1,360,000 | | | | 1,346,346 | |
Navient Student Loan Trust2018-3, 1M USD LIBOR + 0.800%^ | | | 3.20 | # | | | 3/25/2067 | | | | 1,600,000 | | | | 1,600,000 | | | | 1,584,599 | |
Navient Student Loan Trust2019-2, 1M USD LIBOR + 1.000%^ | | | 3.40 | # | | | 2/27/2068 | | | | 2,516,000 | | | | 2,516,000 | | | | 2,524,783 | |
Navient Student Loan Trust2019-B, 1M USD LIBOR - 0.980%^ | | | 3.37 | # | | | 12/15/2059 | | | | 3,000,000 | | | | 3,000,000 | | | | 2,987,794 | |
Navistar Financial Dealer Note Master Owner Trust II, 1M USD LIBOR + 0.950%^ | | | 3.35 | # | | | 5/28/2024 | | | | 1,108,000 | | | | 1,108,000 | | | | 1,108,277 | |
Navistar Financial Dealer Note Master Owner Trust II, 1M USD LIBOR + 1.050%^ | | | 3.45 | # | | | 9/25/2023 | | | | 300,000 | | | | 300,000 | | | | 300,693 | |
Navistar Financial Dealer Note Master Owner Trust II, 1M USD LIBOR + 1.450%^ | | | 3.83 | # | | | 5/28/2024 | | | | 1,018,000 | | | | 1,018,000 | | | | 1,018,096 | |
Navistar Financial Dealer Note Master Owner Trust II, 1M USD LIBOR + 1.550%^ | | | 3.95 | # | | | 9/25/2023 | | | | 520,000 | | | | 520,000 | | | | 521,041 | |
Nelnet Private Education Loan Trust2016-A A1A, 1M USD LIBOR + 1.750%^ | | | 4.15 | # | | | 12/26/2040 | | | | 188,541 | | | | 188,541 | | | | 189,219 | |
Nelnet Private Education Loan Trust2016-A A1B^ | | | 3.60 | | | | 12/26/2040 | | | | 135,767 | | | | 134,924 | | | | 136,295 | |
Nelnet Student Loan Trust2005-1, 3M USD LIBOR + 0.110% | | | 2.69 | # | | | 10/25/2033 | | | | 372,353 | | | | 370,248 | | | | 367,647 | |
Nelnet Student Loan Trust2005-2, 3M USD LIBOR + 0.100% | | | 2.44 | # | | | 3/23/2037 | | | | 384,600 | | | | 382,114 | | | | 379,318 | |
Nelnet Student Loan Trust2006-2 B, 3M USD LIBOR + 0.200% | | | 2.78 | # | | | 1/25/2038 | | | | 1,229,226 | | | | 1,155,401 | | | | 1,180,553 | |
Nelnet Student Loan Trust2006-3, 3M USD LIBOR + 0.250% | | | 2.60 | # | | | 6/25/2041 | | | | 1,798,477 | | | | 1,679,727 | | | | 1,668,099 | |
Nelnet Student Loan Trust2007-2, 28 Day ARS^ | | | 3.71 | # | | | 6/25/2035 | | | | 2,000,000 | | | | 1,973,618 | | | | 1,986,814 | |
Nelnet Student Loan Trust2012-4, 1M USD LIBOR + 1.000%^ | | | 3.40 | # | | | 7/26/2049 | | | | 900,000 | | | | 868,108 | | | | 861,826 | |
Nelnet Student Loan Trust2014-6A A, 1M USD LIBOR + 0.650%^ | | | 3.05 | # | | | 11/25/2052 | | | | 2,413,574 | | | | 2,385,865 | | | | 2,379,458 | |
Nelnet Student Loan Trust2018-1A, 1M USD LIBOR + 0.760%^ | | | 3.16 | # | | | 5/25/2066 | | | | 3,190,000 | | | | 3,174,692 | | | | 3,155,257 | |
See accompanying Notes to the Financial Statements.
117
Barings Active Short Duration Bond Fund 2019 Annual Report
SCHEDULE OF INVESTMENTS (CONTINUED)
June 30, 2019
| | | | | | | | | | | | | | | | | | | | |
| | | EFFECTIVE
INTEREST RATE | | | DUE DATE | | | PRINCIPAL ‡‡ | | | COST | | | FAIR
VALUE | |
Asset-Backed Securities(Continued) | |
|
Other Asset-Backed Securities (Continued) | |
Nelnet Student Loan Trust2018-3, 1M USD LIBOR + 0.750%^ | | | 3.24 | # % | | | 9/27/2066 | | | | 1,300,000 | | | $ | 1,300,000 | | | $ | 1,277,453 | |
Nelnet Student Loan Trust2019-2, 1M USD LIBOR + 0.900%^ | | | 3.30 | # | | | 6/27/2067 | | | | 1,142,443 | | | | 1,142,443 | | | | 1,138,305 | |
New Residential Advance Receivables Trust Advance Receivables Backed Notes^ | | | 4.00 | | | | 2/15/2051 | | | | 3,550,000 | | | | 3,563,849 | | | | 3,581,138 | |
New Residential Advance Receivables Trust Advance Receivables Backed Notes2017-T1 AT1^ | | | 3.21 | | | | 2/15/2051 | | | | 1,080,000 | | | | 1,067,825 | | | | 1,091,929 | |
NextGear Floorplan Master Owner Trust2016-2A A2^ | | | 2.19 | | | | 9/15/2021 | | | | 762,000 | | | | 760,706 | | | | 761,049 | |
NorthStar Student Loan Trust III2016-1 A, 1M USD LIBOR + 1.250%^ | | | 3.65 | # | | | 5/27/2036 | | | | 145,760 | | | | 139,828 | | | | 146,929 | |
NovaStar Mortgage Funding Trust2004-4 M5, 1M USD LIBOR + 1.725% | | | 4.13 | # | | | 3/25/2035 | | | | 337,521 | | | | 337,463 | | | | 337,685 | |
NP Ferrum LLC 2015 1A A1+ | | | 5.05 | | | | 3/19/2046 | | | | 800,000 | | | | 812,854 | | | | 850,621 | |
NP SPE II LLC2017-1A A1^ | | | 3.37 | | | | 10/21/2047 | | | | 380,119 | | | | 380,119 | | | | 389,046 | |
NRZ Advance Receivables Trust2016-T4 AT4^ | | | 3.11 | | | | 12/15/2050 | | | | 900,000 | | | | 900,000 | | | | 907,337 | |
OneMain Direct Auto Receivables Trust2017-2A A^ | | | 2.31 | | | | 12/14/2021 | | | | 499,394 | | | | 499,357 | | | | 498,719 | |
Orange Lake Timeshare Trust2016-A A^ | | | 2.61 | | | | 3/8/2029 | | | | 1,097,712 | | | | 1,076,880 | | | | 1,115,892 | |
Orange Lake Timeshare Trust2016-A B^ | | | 2.91 | | | | 3/8/2029 | | | | 444,904 | | | | 439,132 | | | | 454,947 | |
Orange Lake Timeshare Trust2019-A^ | | | 4.93 | | | | 4/9/2038 | | | | 2,842,757 | | | | 2,842,171 | | | | 2,855,808 | |
Oscar US Funding Trust II 2015 1A A4^+ | | | 2.44 | | | | 6/15/2022 | | | | 76,289 | | | | 75,134 | | | | 76,244 | |
Oscar US Funding Trust IX LLC+^ | | | 3.63 | | | | 9/10/2025 | | | | 480,000 | | | | 479,903 | | | | 499,672 | |
Oscar US Funding Trust VI LLC2017-1A A3+^ | | | 2.82 | | | | 6/10/2021 | | | | 288,356 | | | | 288,331 | | | | 288,621 | |
Oscar US Funding Trust VIII LLC+^ | | | 2.91 | | | | 4/12/2021 | | | | 275,658 | | | | 275,638 | | | | 275,853 | |
Oscar US Funding X LLC^+ | | | 3.27 | | | | 5/11/2026 | | | | 2,240,000 | | | | 2,239,633 | | | | 2,303,721 | |
Oxford Finance Funding LLC2016-1A A^ | | | 3.97 | | | | 6/17/2024 | | | | 94,594 | | | | 94,594 | | | | 95,422 | |
PHEAA Student Loan Trust2016-2A A, 1M USD LIBOR + 0.950%^ | | | 3.35 | # | | | 11/25/2065 | | | | 508,290 | | | | 508,290 | | | | 506,641 | |
Pioneer Aircraft Finance Ltd.^+ | | | 3.97 | | | | 6/15/2044 | | | | 1,036,000 | | | | 1,036,000 | | | | 1,052,356 | |
Popular ABS Mortgage Pass-Through Trust2006-B A3, 1M USD LIBOR + 0.280% | | | 2.68 | # | | | 5/25/2036 | | | | 40,685 | | | | 39,204 | | | | 40,403 | |
Santander Drive Auto Receivables Trust2016-1 D | | | 4.02 | | | | 4/15/2022 | | | | 430,000 | | | | 435,499 | | | | 435,140 | |
SBA Tower Trust^ | | | 2.88 | | | | 7/9/2021 | | | | 880,000 | | | | 875,746 | | | | 881,595 | |
SBA Tower Trust^ | | | 3.17 | | | | 4/11/2022 | | | | 630,000 | | | | 630,835 | | | | 639,999 | |
SBA Tower Trust^ | | | 3.87 | | | | 10/15/2049 | | | | 1,300,000 | | | | 1,305,042 | | | | 1,342,362 | |
SBA Tower Trust2014-1A C^ | | | 2.90 | | | | 10/15/2044 | | | | 590,000 | | | | 591,465 | | | | 589,992 | |
Securitized Equipment Receivables | | | 3.76 | | | | 10/11/2024 | | | | 550,000 | | | | 549,990 | | | | 551,032 | |
Securitized Equipment Receivables | | | 4.20 | | | | 10/11/2024 | | | | 610,000 | | | | 609,966 | | | | 612,760 | |
See accompanying Notes to the Financial Statements.
118
Barings Active Short Duration Bond Fund 2019 Annual Report
SCHEDULE OF INVESTMENTS (CONTINUED)
June 30, 2019
| | | | | | | | | | | | | | | | | | | | |
| | | EFFECTIVE
INTEREST RATE | | | DUE DATE | | | PRINCIPAL ‡‡ | | | COST | | | FAIR
VALUE | |
Asset-Backed Securities(Continued) | |
|
Other Asset-Backed Securities (Continued) | |
Sierra Receivables Funding Co LLC2017-1A A^ | | | 2.91 | % | | | 3/20/2034 | | | | 471,475 | | | $ | 472,847 | | | $ | 475,994 | |
Sierra Receivables Funding Co LLC2018-1AB | | | 4.24 | | | | 4/20/2035 | | | | 2,236,286 | | | | 2,262,425 | | | | 2,286,783 | |
Sierra Timeshare2014-3 Receivables Funding LLC^ | | | 2.80 | | | | 10/20/2031 | | | | 418,994 | | | | 417,307 | | | | 418,846 | |
Sierra Timeshare2015-1 Receivables Funding LLC^ | | | 3.05 | | | | 3/22/2032 | | | | 461,627 | | | | 460,027 | | | | 462,003 | |
Sierra Timeshare2015-2 Receivables Funding LLC^ | | | 2.43 | | | | 6/20/2032 | | | | 370,154 | | | | 367,164 | | | | 369,438 | |
Sierra Timeshare2016-2 Receivables Funding LLC^ | | | 2.78 | | | | 7/20/2033 | | | | 306,093 | | | | 303,421 | | | | 305,541 | |
Sierra Timeshare2018-2 Receivables Funding LLC^ | | | 3.94 | | | | 6/20/2035 | | | | 384,604 | | | | 384,502 | | | | 389,839 | |
Sierra Timeshare2018-3 Receivables Funding LLC^ | | | 5.20 | | | | 9/20/2035 | | | | 679,773 | | | | 686,733 | | | | 688,063 | |
Sierra Timeshare2019-1 Receivables Funding LLC^ | | | 3.77 | | | | 1/20/2036 | | | | 1,694,836 | | | | 1,703,223 | | | | 1,734,581 | |
Sierra Timeshare2019-1 Receivables Funding LLC^ | | | 4.75 | | | | 1/20/2036 | | | | 2,251,090 | | | | 2,254,147 | | | | 2,302,350 | |
Sierra Timeshare Receivables Funding LLC2014-3A A^ | | | 2.30 | | | | 10/20/2031 | | | | 115,223 | | | | 114,628 | | | | 115,147 | |
Sierra Timeshare Receivables Funding LLC 2015 3A B^ | | | 3.08 | | | | 9/20/2032 | | | | 43,385 | | | | 43,118 | | | | 43,593 | |
Sierra Timeshare Receivables Funding LLC2015-1A A^ | | | 2.40 | | | | 3/22/2032 | | | | 84,247 | | | | 83,350 | | | | 84,003 | |
Sierra Timeshare Receivables Funding LLC2015-2A B^ | | | 3.02 | | | | 6/20/2032 | | | | 713,868 | | | | 710,825 | | | | 711,307 | |
Sierra Timeshare Receivables Funding LLC2015-3A A^ | | | 2.58 | | | | 9/20/2032 | | | | 16,068 | | | | 16,066 | | | | 16,051 | |
SLC Student Loan Trust2005-1 B, 3M USD LIBOR + 0.200% | | | 2.72 | # | | | 2/15/2045 | | | | 659,696 | | | | 594,804 | | | | 621,781 | |
SLC Student Loan Trust2006-1, 3M USD LIBOR + 0.210% | | | 2.62 | # | | | 3/15/2055 | | | | 2,302,524 | | | | 2,142,886 | | | | 2,130,006 | |
SLC Student Loan Trust2006-2 B, 3M USD LIBOR + 0.230% | | | 2.64 | # | | | 12/15/2039 | | | | 1,731,479 | | | | 1,611,237 | | | | 1,620,873 | |
SLC Student Loan Trust2006-2 B, 3M USD LIBOR + 0.230% | | | 2.81 | # | | | 1/25/2041 | | | | 754,616 | | | | 710,095 | | | | 696,939 | |
SLM Student Loan Trust2003-11, 3M USD LIBOR + 0.650% | | | 3.06 | # | | | 12/15/2038 | | | | 976,187 | | | | 928,084 | | | | 925,217 | |
SLM Student Loan Trust2003-14, 3M USD LIBOR + 0.600%^ | | | 3.18 | # | | | 10/25/2065 | | | | 2,700,000 | | | | 2,691,854 | | | | 2,673,278 | |
SLM Student Loan Trust2003-14 A6, 3M USD LIBOR + 0.300% | | | 2.88 | # | | | 7/25/2025 | | | | 34,193 | | | | 33,236 | | | | 34,032 | |
SLM Student Loan Trust2003-4 B, 3M USD LIBOR + 0.650% | | | 3.06 | # | | | 6/15/2038 | | | | 377,465 | | | | 360,914 | | | | 353,108 | |
See accompanying Notes to the Financial Statements.
119
Barings Active Short Duration Bond Fund 2019 Annual Report
SCHEDULE OF INVESTMENTS (CONTINUED)
June 30, 2019
| | | | | | | | | | | | | | | | | | | | |
| | | EFFECTIVE
INTEREST RATE | | | DUE DATE | | | PRINCIPAL ‡‡ | | | COST | | | FAIR
VALUE | |
Asset-Backed Securities(Continued) | |
|
Other Asset-Backed Securities (Continued) | |
SLM Student Loan Trust2004-1, 3M USD LIBOR + 0.500% | | | 3.08 | # % | | | 7/25/2039 | | | | 541,855 | | | $ | 515,216 | | | $ | 513,232 | |
SLM Student Loan Trust2004-3A A6A, 3M USD LIBOR + 0.550%^ | | | 3.13 | # | | | 10/25/2064 | | | | 1,550,000 | | | | 1,522,784 | | | | 1,520,108 | |
SLM Student Loan Trust2004-8, 3M USD LIBOR + 0.460% | | | 3.04 | # | | | 1/25/2040 | | | | 1,132,673 | | | | 1,073,184 | | | | 1,070,468 | |
SLM Student Loan Trust2005-4, 3M USD LIBOR + 0.170% | | | 2.75 | # | | | 7/25/2040 | | | | 1,750,000 | | | | 1,662,763 | | | | 1,651,579 | |
SLM Student Loan Trust2005-4 B, 3M USD LIBOR + 0.180% | | | 2.76 | # | | | 7/25/2055 | | | | 719,748 | | | | 642,091 | | | | 673,486 | |
SLM Student Loan Trust2005-5, 3M USD LIBOR + 0.250% | | | 2.83 | # | | | 10/25/2040 | | | | 1,452,929 | | | | 1,362,765 | | | | 1,358,817 | |
SLM Student Loan Trust2005-6 B, 3M USD LIBOR + 0.290% | | | 2.87 | # | | | 1/25/2044 | | | | 2,127,264 | | | | 1,985,152 | | | | 1,988,709 | |
SLM Student Loan Trust2005-7, 3M USD LIBOR + 0.750% | | | 3.33 | # | | | 1/25/2040 | | | | 1,400,000 | | | | 1,395,614 | | | | 1,382,013 | |
SLM Student Loan Trust2005-9, 3M USD LIBOR + 0.300% | | | 2.88 | # | | | 1/25/2041 | | | | 834,751 | | | | 797,549 | | | | 788,025 | |
SLM Student Loan Trust2005-9, 3M EURIBOR + 0.600% | | | 3.18 | # | | | 1/25/2041 | | | | 1,243,226 | | | | 1,228,475 | | | | 1,226,287 | |
SLM Student Loan Trust2006-10 A6, 3M USD LIBOR + 0.150% | | | 2.73 | # | | | 3/25/2044 | | | | 2,800,000 | | | | 2,700,568 | | | | 2,702,237 | |
SLM Student Loan Trust2006-10 B, 3M USD LIBOR + 0.220% | | | 2.80 | # | | | 3/25/2044 | | | | 1,237,375 | | | | 1,169,183 | | | | 1,164,143 | |
SLM Student Loan Trust2006-2¤ | | | Zero Coupon | | | | 1/25/2041 | | | | 3,956 | | | | 1,621,960 | | | | 1,938,440 | |
SLM Student Loan Trust2006-2, 3M USD LIBOR + 0.170% | | | 2.75 | # | | | 1/25/2041 | | | | 1,150,454 | | | | 1,122,431 | | | | 1,110,432 | |
SLM Student Loan Trust2006-5 B, 3M USD LIBOR + 0.210% | | | 2.79 | # | | | 10/25/2040 | | | | 569,504 | | | | 506,899 | | | | 530,671 | |
SLM Student Loan Trust2006-7 B, 3M USD LIBOR + 0.200% | | | 2.78 | # | | | 1/27/2042 | | | | 551,975 | | | | 512,887 | | | | 507,637 | |
SLM Student Loan Trust2006-8, 3M USD LIBOR + 0.230% | | | 2.81 | # | | | 1/25/2041 | | | | 930,479 | | | | 867,424 | | | | 863,130 | |
SLM Student Loan Trust2006-9 A5, 3M USD LIBOR + 0.100% | | | 2.68 | # | | | 1/26/2026 | | | | 46,511 | | | | 45,569 | | | | 46,441 | |
SLM Student Loan Trust2007-1 A6, 3M USD LIBOR + 0.140% | | | 2.72 | # | | | 1/27/2042 | | | | 200,000 | | | | 192,328 | | | | 190,869 | |
SMB Private Education Loan Trust2014-A^ | | | 4.00 | | | | 9/15/2042 | | | | 1,250,000 | | | | 1,271,721 | | | | 1,311,103 | |
SMB Private Education Loan Trust2014-A A2B, 1M USD LIBOR + 1.150%^ | | | 3.54 | # | | | 5/15/2026 | | | | 359,354 | | | | 361,459 | | | | 361,389 | |
SMB Private Education Loan Trust2015-A A2B, 1M USD LIBOR + 1.000%^ | | | 3.39 | # | | | 6/15/2027 | | | | 57,242 | | | | 56,412 | | | | 57,341 | |
SMB Private Education Loan Trust2015-A A3, 1M USD LIBOR + 1.500%^ | | | 3.89 | # | | | 2/17/2032 | | | | 900,000 | | | | 918,693 | | | | 912,880 | |
See accompanying Notes to the Financial Statements.
120
Barings Active Short Duration Bond Fund 2019 Annual Report
SCHEDULE OF INVESTMENTS (CONTINUED)
June 30, 2019
| | | | | | | | | | | | | | | | | | | | |
| | | EFFECTIVE
INTEREST RATE | | | DUE DATE | | | PRINCIPAL ‡‡ | | | COST | | | FAIR
VALUE | |
Asset-Backed Securities(Continued) | |
|
Other Asset-Backed Securities (Continued) | |
SMB Private Education Loan Trust2015-C^ | | | 4.50 | % | | | 9/17/2046 | | | | 1,710,000 | | | $ | 1,754,527 | | | $ | 1,845,019 | |
SMB Private Education Loan Trust2015-C A3, 1M USD LIBOR + 1.950%^ | | | 4.34 | # | | | 8/16/2032 | | | | 700,000 | | | | 728,471 | | | | 716,309 | |
SMB Private Education Loan Trust2016-B A2B, 1M USD LIBOR + 1.450%^ | | | 3.84 | # | | | 2/17/2032 | | | | 92,621 | | | | 92,621 | | | | 93,663 | |
SMB Private Education Loan Trust2016-C A2B, 1M USD LIBOR + 1.100%^ | | | 3.49 | # | | | 9/15/2034 | | | | 222,887 | | | | 222,887 | | | | 223,856 | |
SMB Private Education Loan Trust2017-B A2B, 1M USD LIBOR + 0.750%^ | | | 3.14 | # | | | 10/15/2035 | | | | 670,000 | | | | 670,000 | | | | 668,743 | |
SMB Private Education Loan Trust2018-B, 1M USD LIBOR + 0.720%^ | | | 3.11 | # | | | 1/15/2037 | | | | 2,800,000 | | | | 2,783,615 | | | | 2,778,574 | |
SMB Private Education Loan Trust2018-C, 1M USD LIBOR + 0.75%^ | | | 3.14 | # | | | 11/15/2035 | | | | 1,800,000 | | | | 1,790,938 | | | | 1,792,837 | |
SMB Private Education Loan Trust2019-A, 1M USD LIBOR + 0.75%^ | | | 3.26 | # | | | 7/15/2036 | | | | 1,715,000 | | | | 1,715,000 | | | | 1,707,845 | |
SMB Private Education Loan Trust2019-B, 1M USD LIBOR + 1.000%^ | | | 3.39 | # | | | 6/15/2037 | | | | 1,800,000 | | | | 1,800,000 | | | | 1,800,158 | |
SoFi Alternative Trust2019-C^¤ | | | Zero Coupon | | | | 1/25/2045 | | | | 4,460,000 | | | | 4,617,317 | | | | 4,617,317 | |
SoFi Consumer Loan Program2018-3 Trust^ | | | 3.20 | | | | 8/25/2027 | | | | 269,628 | | | | 269,628 | | | | 270,502 | |
SoFi Consumer Loan Program LLC2016-1A A^ | | | 3.26 | | | | 8/25/2025 | | | | 328,246 | | | | 329,195 | | | | 331,209 | |
SoFi Consumer Loan Program LLC2016-2A A^ | | | 3.09 | | | | 10/27/2025 | | | | 87,940 | | | | 87,930 | | | | 88,162 | |
SoFi Consumer Loan Program LLC2016-3 A^ | | | 3.05 | | | | 12/26/2025 | | | | 87,473 | | | | 87,471 | | | | 87,862 | |
SoFi Consumer Loan Program LLC2016-5 A^ | | | 3.06 | | | | 9/25/2028 | | | | 534,999 | | | | 533,526 | | | | 538,463 | |
SoFi Consumer Loan Program LLC2017-2 A^ | | | 3.28 | | | | 2/25/2026 | | | | 248,117 | | | | 247,799 | | | | 249,809 | |
SoFi Consumer Loan Program LLC2017-3 A^ | | | 2.77 | | | | 5/25/2026 | | | | 399,603 | | | | 399,603 | | | | 400,160 | |
SoFi Consumer Loan Program Trust2019-3^ | | | 3.89 | | | | 5/25/2028 | | | | 2,566,000 | | | | 2,565,259 | | | | 2,598,419 | |
SoFi Consumer Loan Program Trust2015-1 A^ | | | 3.28 | | | | 9/15/2023 | | | | 15,342 | | | | 15,348 | | | | 15,345 | |
SoFi Professional Loan Program2018-A LLC^¤ | | | Zero Coupon | | | | 2/25/2042 | | | | 1,372,500 | | | | 1,005,379 | | | | 1,059,158 | |
SoFi Professional Loan Program2018-B Trust^¤ | | | Zero Coupon | | | | 8/26/2047 | | | | 1,265,700 | | | | 702,045 | | | | 743,203 | |
SoFi Professional Loan Program2018-D Trust^¤ | | | Zero Coupon | | | | 2/25/2048 | | | | 1,887,200 | | | | 668,720 | | | | 650,140 | |
SoFi Professional Loan Program2019-A LLC^¤ | | | Zero Coupon | | | | 6/15/2048 | | | | 3,522,900 | | | | 1,046,902 | | | | 1,017,931 | |
SoFi Professional Loan Program2019-A LLC^ | | | 4.11 | | | | 6/15/2048 | | | | 870,000 | | | | 876,628 | | | | 922,140 | |
See accompanying Notes to the Financial Statements.
121
Barings Active Short Duration Bond Fund 2019 Annual Report
SCHEDULE OF INVESTMENTS (CONTINUED)
June 30, 2019
| | | | | | | | | | | | | | | | | | | | |
| | | EFFECTIVE
INTEREST RATE | | | DUE DATE | | | PRINCIPAL ‡‡ | | | COST | | | FAIR
VALUE | |
Asset-Backed Securities(Continued) | |
|
Other Asset-Backed Securities (Continued) | |
SoFi Professional Loan Program LLC2015-A RC^¤ | | | Zero Coupon | | | | 3/25/2033 | | | | 300 | | | $ | 844,125 | | | $ | 266,625 | |
SoFi Professional Loan Program LLC2015-C A2^ | | | 2.51 | % | | | 8/25/2033 | | | | 24,949 | | | | 24,837 | | | | 25,009 | |
SoFi Professional Loan Program LLC 2016 A A1, 1M USD LIBOR + 1.750%^ | | | 4.15 | # | | | 8/25/2036 | | | | 78,211 | | | | 77,568 | | | | 79,510 | |
SoFi Professional Loan Program LLC2016-B A1, 1M USD LIBOR + 1.200%^ | | | 3.60 | # | | | 6/25/2033 | | | | 269,100 | | | | 271,970 | | | | 271,929 | |
SoFi Professional Loan Program LLC2016-D A1, 1M USD LIBOR + 0.950%^ | | | 3.35 | # | | | 1/25/2039 | | | | 52,505 | | | | 52,505 | | | | 52,608 | |
SoFi Professional Loan Program LLC2017-D R1^ | | | Zero Coupon | | | | 9/25/2040 | | | | 1,233,700 | | | | 732,123 | | | | 707,416 | |
Spirit Master Funding LLC^ | | | 3.50 | | | | 1/20/2045 | | | | 2,989,685 | | | | 2,988,054 | | | | 2,987,159 | |
Springleaf Funding Trust2016-AA A^ | | | 2.90 | | | | 11/15/2029 | | | | 828,794 | | | | 828,687 | | | | 829,618 | |
Store Master FundingI-VII A3^ | | | 4.40 | | | | 10/20/2048 | | | | 1,893,667 | | | | 1,913,336 | | | | 1,996,129 | |
Taco Bell Funding LLC2016-1A A23^ | | | 4.97 | | | | 5/25/2046 | | | | 1,200,500 | | | | 1,240,455 | | | | 1,243,174 | |
Taco Bell Funding LLC2018-1A A2I^ | | | 4.32 | | | | 11/25/2048 | | | | 2,119,350 | | | | 2,119,350 | | | | 2,195,572 | |
TAL Advantage LLC2017-1A A^ | | | 4.50 | | | | 4/20/2042 | | | | 562,925 | | | | 569,404 | | | | 573,644 | |
TAL Advantage V LLC^ | | | 3.33 | | | | 5/20/2039 | | | | 1,224,265 | | | | 1,216,435 | | | | 1,232,955 | |
Tesla Auto Lease Trust2018-A^ | | | 2.32 | | | | 12/20/2019 | | | | 106,020 | | | | 106,020 | | | | 105,975 | |
Tesla Auto Lease Trust2018-A^ | | | 2.75 | | | | 2/20/2020 | | | | 275,000 | | | | 274,993 | | | | 274,957 | |
Tesla Auto Lease Trust2018-B A^ | | | 3.71 | | | | 8/20/2021 | | | | 440,341 | | | | 440,315 | | | | 446,836 | |
Textainer Marine Containers VII Ltd.+^ | | | 4.11 | | | | 7/20/2043 | | | | 700,500 | | | | 692,392 | | | | 707,798 | |
TLF National Tax Lien Trust2017-1^ | | | 3.09 | | | | 12/15/2029 | | | | 2,160,954 | | | | 2,148,918 | | | | 2,159,333 | |
TPG Real Estate Finance2018-FL-1 Issuer Ltd., 1M USD LIBOR + 0.750%^ | | | 3.14 | # | | | 2/15/2035 | | | | 426,188 | | | | 425,543 | | | | 426,325 | |
Trafigura Securitisation Finance PLC2017-1, 1M USD LIBOR + 1.700%+^ | | | 4.17 | # | | | 12/15/2020 | | | | 900,000 | | | | 901,551 | | | | 905,225 | |
Trafigura Securitisation Finance plc2018-1, 1M USD LIBOR + 0.730%+^ | | | 3.12 | # | | | 3/15/2022 | | | | 1,820,000 | | | | 1,813,844 | | | | 1,809,799 | |
Trafigura Securitisation Finance plc2018-1+^ | | | 4.29 | | | | 3/15/2022 | | | | 1,800,000 | | | | 1,799,905 | | | | 1,843,461 | |
Trinity Rail Leasing 2019 LLC^ | | | 3.82 | | | | 4/17/2049 | | | | 2,272,622 | | | | 2,271,489 | | | | 2,334,255 | |
Trinity Rail Leasing LP^ | | | 3.82 | | | | 6/17/2048 | | | | 899,819 | | | | 899,494 | | | | 940,780 | |
TRIP Rail Master Funding LLC2011-1A A2^ | | | 6.02 | | | | 7/15/2041 | | | | 1,248,118 | | | | 1,329,718 | | | | 1,320,118 | |
TRIP Rail Master Funding LLC2017-1A A1^ | | | 2.71 | | | | 8/15/2047 | | | | 158,279 | | | | 158,277 | | | | 158,176 | |
Triton Container Finance V LLC^ | | | 3.95 | | | | 3/20/2043 | | | | 306,250 | | | | 306,048 | | | | 316,499 | |
Upstart Securitization Trust2019-1 A | | | 3.45 | | | | 4/20/2026 | | | | 849,699 | | | | 849,669 | | | | 852,417 | |
VSE2018-A Voi Mortgage LLC^ | | | 4.02 | | | | 2/20/2036 | | | | 370,635 | | | | 370,588 | | | | 380,387 | |
VSE VOI Mortgage LLC2016-A A^ | | | 2.54 | | | | 7/20/2033 | | | | 329,926 | | | | 329,897 | | | | 329,608 | |
Wachovia Student Loan Trust2005-1 B, 3M USD LIBOR + 0.300% | | | 2.88 | # | | | 10/25/2040 | | | | 627,975 | | | | 577,790 | | | | 576,955 | |
Welk Resorts LLC2017-AA B^ | | | 3.41 | | | | 6/15/2033 | | | | 250,571 | | | | 250,533 | | | | 250,690 | |
Westgate Resorts LLC2015-2A A^ | | | 3.20 | | | | 7/20/2028 | | | | 64,823 | | | | 64,758 | | | | 64,726 | |
Westgate Resorts LLC2017-1A A^ | | | 3.05 | | | | 12/20/2030 | | | | 271,262 | | | | 271,262 | | | | 271,913 | |
Westgate Resorts LLC2018-1^ | | | 3.38 | | | | 12/20/2031 | | | | 567,532 | | | | 566,604 | | | | 573,564 | |
See accompanying Notes to the Financial Statements.
122
Barings Active Short Duration Bond Fund 2019 Annual Report
SCHEDULE OF INVESTMENTS (CONTINUED)
June 30, 2019
| | | | | | | | | | | | | | | | | | | | |
| | | EFFECTIVE
INTEREST RATE | | | DUE DATE | | | PRINCIPAL ‡‡ | | | COST | | | FAIR
VALUE | |
Asset-Backed Securities(Continued) | |
|
Other Asset-Backed Securities (Continued) | |
Willis Engine Structured Trust IV^ | | | 4.75 | % | | | 9/15/2043 | | | | 1,188,393 | | | $ | 1,204,982 | | | $ | 1,240,677 | |
Wingstop Funding2018-1 LLC^ | | | 4.97 | | | | 12/5/2048 | | | | 1,097,250 | | | | 1,113,047 | | | | 1,146,439 | |
| | | | | | | | | | | | | | | | | | | | |
Total Other Asset-Backed Securities | | | | | | | | | | | 297,139,354 | | | | 292,564,045 | | | | 295,594,080 | |
| | | | | | | | | | | | | | | | | | | | |
| | | | | | | | | | | | | | | | | | | | |
Total Asset-Backed Securities | | | | | | | | | | | 331,323,066 | | | | 326,748,578 | | | | 329,704,013 | |
| | | | | | | | | | | | | | | | | | | | |
Corporate Bonds — 34.6%*: | |
|
Advertising — 0.1%*: | |
Interpublic Group of Cos., Inc. (The) | | | 3.75 | | | | 10/1/2021 | | | | 820,000 | | | | 822,685 | | | | 841,491 | |
| | | | | | | | | | | | | | | | | | | | |
|
Aerospace/Defense — 0.3%*: | |
Harris Corp. | | | 2.70 | | | | 4/27/2020 | | | | 2,288,000 | | | | 2,285,216 | | | | 2,290,347 | |
| | | | | | | | | | | | | | | | | | | | |
|
Agriculture — 1.4%*: | |
BAT Capital Corp.+ | | | 3.22 | | | | 8/15/2024 | | | | 1,200,000 | | | | 1,182,723 | | | | 1,207,881 | |
Bunge Ltd. Finance Corp. | | | 3.00 | | | | 9/25/2022 | | | | 1,840,000 | | | | 1,819,058 | | | | 1,848,746 | |
Bunge Ltd. Finance Corp. | | | 3.50 | | | | 11/24/2020 | | | | 1,520,000 | | | | 1,532,219 | | | | 1,534,168 | |
Imperial Brands Finance PLC+^ | | | 2.95 | | | | 7/21/2020 | | | | 1,829,000 | | | | 1,820,680 | | | | 1,833,941 | |
Imperial Brands Finance plc^+ | | | 3.50 | | | | 2/11/2023 | | | | 1,347,000 | | | | 1,352,219 | | | | 1,372,007 | |
Reynolds American, Inc. | | | 4.00 | | | | 6/12/2022 | | | | 2,170,000 | | | | 2,182,342 | | | | 2,252,968 | |
| | | | | | | | | | | | | | | | | | | | |
Total Agriculture | | | | | | | | | | | 9,906,000 | | | | 9,889,241 | | | | 10,049,711 | |
| | | | | | | | | | | | | | | | | | | | |
|
Auto Manufacturers — 0.9%*: | |
Ford Motor Credit Co. LLC, 3M USD LIBOR + 0.810% | | | 3.41 | # | | | 4/5/2021 | | | | 1,135,000 | | | | 1,135,000 | | | | 1,120,102 | |
Ford Motor Credit Co. LLC, 3M USD LIBOR + 1.235% | | | 3.75 | # | | | 2/15/2023 | | | | 985,000 | | | | 985,000 | | | | 955,968 | |
Ford Motor Credit Co. LLC | | | 5.09 | | | | 1/7/2021 | | | | 350,000 | | | | 350,387 | | | | 360,657 | |
General Motors Financial Co., Inc. | | | 3.25 | | | | 1/5/2023 | | | | 3,440,000 | | | | 3,370,536 | | | | 3,452,487 | |
Nissan Motor Acceptance Corp.+^ | | | 1.90 | | | | 9/14/2021 | | | | 670,000 | | | | 667,500 | | | | 657,741 | |
| | | | | | | | | | | | | | | | | | | | |
Total Auto Manufacturers | | | | | | | | | | | 6,580,000 | | | | 6,508,423 | | | | 6,546,955 | |
| | | | | | | | | | | | | | | | | | | | |
|
Auto Parts&Equipment — 0.0%*: | |
Lear Corp. | | | 5.25 | | | | 1/15/2025 | | | | 300,000 | | | | 318,107 | | | | 310,819 | |
| | | | | | | | | | | | | | | | | | | | |
|
Beverages — 1.1%*: | |
Anheuser-Busch InBev Worldwide, Inc.+ | | | 3.50 | | | | 1/12/2024 | | | | 3,860,000 | | | | 3,822,812 | | | | 4,031,708 | |
Keurig Dr Pepper, Inc. | | | 4.06 | | | | 5/25/2023 | | | | 2,555,000 | | | | 2,573,827 | | | | 2,682,436 | |
Molson Coors Brewing Co. | | | 2.10 | | | | 7/15/2021 | | | | 325,000 | | | | 323,766 | | | | 322,834 | |
Molson Coors Brewing Co. | | | 3.50 | | | | 5/1/2022 | | | | 1,089,000 | | | | 1,081,095 | | | | 1,117,998 | |
| | | | | | | | | | | | | | | | | | | | |
Total Beverages | | | | | | | | | | | 7,829,000 | | | | 7,801,500 | | | | 8,154,976 | |
| | | | | | | | | | | | | | | | | | | | |
|
Biotechnology — 0.1%*: | |
Celgene Corp. | | | 4.00 | | | | 8/15/2023 | | | | 569,000 | | | | 578,221 | | | | 601,308 | |
| | | | | | | | | | | | | | | | | | | | |
See accompanying Notes to the Financial Statements.
123
Barings Active Short Duration Bond Fund 2019 Annual Report
SCHEDULE OF INVESTMENTS (CONTINUED)
June 30, 2019
| | | | | | | | | | | | | | | | | | | | |
| | | EFFECTIVE
INTEREST RATE | | | DUE DATE | | | PRINCIPAL ‡‡ | | | COST | | | FAIR
VALUE | |
Corporate Bonds(Continued) | |
|
Chemicals — 1.9%*: | |
CF Industries, Inc. | | | 7.13 | % | | | 5/1/2020 | | | | 151,000 | | | $ | 156,226 | | | $ | 155,907 | |
DowDuPont, Inc. | | | 4.21 | | | | 11/15/2023 | | | | 1,745,000 | | | | 1,804,412 | | | | 1,867,905 | |
Huntsman International LLC | | | 5.13 | | | | 11/15/2022 | | | | 3,780,000 | | | | 3,866,466 | | | | 3,996,514 | |
Incitec Pivot Finance LLC+^ | | | 6.00 | | | | 12/10/2019 | | | | 1,443,000 | | | | 1,463,267 | | | | 1,462,141 | |
RPM International, Inc. | | | 3.45 | | | | 11/15/2022 | | | | 1,155,000 | | | | 1,162,232 | | | | 1,176,073 | |
RPM International, Inc. | | | 6.13 | | | | 10/15/2019 | | | | 1,205,000 | | | | 1,217,353 | | | | 1,216,600 | |
Sherwin-Williams Co. (The) | | | 2.75 | | | | 6/1/2022 | | | | 1,845,000 | | | | 1,836,938 | | | | 1,863,933 | |
Syngenta Finance NV+^ | | | 3.70 | | | | 4/24/2020 | | | | 1,390,000 | | | | 1,387,766 | | | | 1,399,731 | |
Syngenta Finance NV+^ | | | 3.93 | | | | 4/23/2021 | | | | 500,000 | | | | 501,520 | | | | 509,073 | |
| | | | | | | | | | | | | | | | | | | | |
Total Chemicals | | | | | | | | | | | 13,214,000 | | | | 13,396,180 | | | | 13,647,877 | |
| | | | | | | | | | | | | | | | | | | | |
|
Commercial Banks — 6.7%*: | |
Banco Santander SA+ | | | 3.50 | | | | 4/11/2022 | | | | 2,400,000 | | | | 2,409,215 | | | | 2,462,033 | |
Bank of America Corp. | | | 2.82 | #** | | | 7/21/2023 | | | | 8,645,000 | | | | 8,540,052 | | | | 8,731,414 | |
Barclays PLC, 3M USD LIBOR + 1.380%+ | | | 3.90 | # | | | 5/16/2024 | | | | 1,235,000 | | | | 1,227,994 | | | | 1,216,802 | |
Citigroup, Inc. | | | 3.14 | #** | | | 1/24/2023 | | | | 3,940,000 | | | | 3,916,331 | | | | 4,007,350 | |
Discover Bank | | | 3.35 | | | | 2/6/2023 | | | | 1,917,000 | | | | 1,911,425 | | | | 1,961,828 | |
Discover Bank | | | 4.20 | | | | 8/8/2023 | | | | 1,935,000 | | | | 1,982,054 | | | | 2,053,429 | |
First Horizon National Corp. | | | 3.50 | | | | 12/15/2020 | | | | 2,170,000 | | | | 2,177,352 | | | | 2,196,014 | |
Goldman Sachs Group, Inc. (The) | | | 3.20 | | | | 2/23/2023 | | | | 8,595,000 | | | | 8,492,442 | | | | 8,796,070 | |
JPMorgan Chase & Co. | | | 4.50 | | | | 1/24/2022 | | | | 3,745,000 | | | | 3,885,097 | | | | 3,946,232 | |
Macquarie Bank Ltd.+^ | | | 2.85 | | | | 1/15/2021 | | | | 130,000 | | | | 131,554 | | | | 130,779 | |
Mitsubishi UFJ Financial Group, Inc.+ | | | 2.67 | | | | 7/25/2022 | | | | 3,295,000 | | | | 3,236,928 | | | | 3,304,132 | |
Morgan Stanley MTN | | | 3.75 | | | | 2/25/2023 | | | | 4,500,000 | | | | 4,579,008 | | | | 4,700,780 | |
Sumitomo Mitsui Financial Group, Inc.+ | | | 2.06 | | | | 7/14/2021 | | | | 682,000 | | | | 678,950 | | | | 679,183 | |
Sumitomo Mitsui Financial Group, Inc.+ | | | 2.85 | | | | 1/11/2022 | | | | 580,000 | | | | 582,951 | | | | 586,394 | |
Sumitomo Mitsui Financial Group, Inc.+ | | | 3.75 | | | | 7/19/2023 | | | | 900,000 | | | | 910,337 | | | | 945,012 | |
SVB Financial Group | | | 5.38 | | | | 9/15/2020 | | | | 200,000 | | | | 206,040 | | | | 206,727 | |
Synchrony Bank | | | 3.00 | | | | 6/15/2022 | | | | 1,680,000 | | | | 1,624,527 | | | | 1,692,504 | |
| | | | | | | | | | | | | | | | | | | | |
Total Commercial Banks | | | | | | | | | | | 46,549,000 | | | | 46,492,257 | | | | 47,616,683 | |
| | | | | | | | | | | | | | | | | | | | |
|
Construction Materials — 0.8%*: | |
Holcim US Finance Sarl & Cie SCS+^ | | | 6.00 | | | | 12/30/2019 | | | | 1,990,000 | | | | 2,023,740 | | | | 2,017,381 | |
Martin Marietta Materials, Inc., 3M USD LIBOR + 0.500% | | | 2.89 | # | | | 12/20/2019 | | | | 445,000 | | | | 445,000 | | | | 444,993 | |
Martin Marietta Materials, Inc., 3M USD LIBOR + 0.650% | | | 3.17 | # | | | 5/22/2020 | | | | 530,000 | | | | 530,000 | | | | 530,019 | |
Masco Corp. | | | 3.50 | | | | 4/1/2021 | | | | 590,000 | | | | 593,152 | | | | 598,769 | |
Masco Corp. | | | 7.13 | | | | 3/15/2020 | | | | 124,000 | | | | 128,030 | | | | 127,562 | |
Standard Industries, Inc.^ | | | 5.50 | | | | 2/15/2023 | | | | 2,060,000 | | | | 2,097,527 | | | | 2,116,650 | |
| | | | | | | | | | | | | | | | | | | | |
Total Construction Materials | | | | | | | | | | | 5,739,000 | | | | 5,817,449 | | | | 5,835,374 | |
| | | | | | | | | | | | | | | | | | | | |
|
Diversified Financial Services — 2.5%*: | |
AerCap Ireland Capital DAC/AerCap Global Aviation Trust+ | | | 3.50 | | | | 5/26/2022 | | | | 500,000 | | | | 500,147 | | | | 509,266 | |
See accompanying Notes to the Financial Statements.
124
Barings Active Short Duration Bond Fund 2019 Annual Report
SCHEDULE OF INVESTMENTS (CONTINUED)
June 30, 2019
| | | | | | | | | | | | | | | | | | | | |
| | | EFFECTIVE
INTEREST RATE | | | DUE DATE | | | PRINCIPAL ‡‡ | | | COST | | | FAIR
VALUE | |
Corporate Bonds(Continued) | |
|
Diversified Financial Services (Continued) | |
AerCap Ireland Capital Ltd./AerCap Global Aviation Trust+ | | | 3.95 | % | | | 2/1/2022 | | | | 3,030,000 | | | $ | 3,041,712 | | | $ | 3,117,411 | |
AerCap Ireland Capital Ltd./AerCap Global Aviation Trust+ | | | 4.50 | | | | 5/15/2021 | | | | 300,000 | | | | 309,197 | | | | 309,361 | |
Aircastle Ltd. | | | 5.00 | | | | 4/1/2023 | | | | 3,721,000 | | | | 3,872,113 | | �� | | 3,936,784 | |
Ameriprise Financial, Inc. | | | 3.00 | | | | 3/22/2022 | | | | 495,000 | | | | 493,795 | | | | 504,084 | |
Ameriprise Financial, Inc. | | | 3.70 | | | | 10/15/2024 | | | | 450,000 | | | | 455,713 | | | | 477,142 | |
Ameriprise Financial, Inc. | | | 4.00 | | | | 10/15/2023 | | | | 294,000 | | | | 302,934 | | | | 312,767 | |
Antares Holdings LP^ | | | 6.00 | | | | 8/15/2023 | | | | 1,260,000 | | | | 1,259,945 | | | | 1,280,696 | |
Athene Global Funding^ | | | 4.00 | | | | 1/25/2022 | | | | 3,883,000 | | | | 3,926,679 | | | | 4,017,144 | |
Brookfield Finance LLC+ | | | 4.00 | | | | 4/1/2024 | | | | 1,805,000 | | | | 1,860,841 | | | | 1,897,106 | |
Genpact Luxembourg Sarl+ | | | 3.70 | | | | 4/1/2022 | | | | 1,575,000 | | | | 1,577,466 | | | | 1,587,201 | |
| | | | | | | | | | | | | | | | | | | | |
Total Diversified Financial Services | | | | | | | | | | | 17,313,000 | | | | 17,600,542 | | | | 17,948,962 | |
| | | | | | | | | | | | | | | | | | | | |
|
Electric — 0.8%*: | |
Ameren Corp. | | | 2.70 | | | | 11/15/2020 | | | | 760,000 | | | | 763,809 | | | | 762,474 | |
EDP Finance BV+^ | | | 4.13 | | | | 1/15/2020 | | | | 981,000 | | | | 988,751 | | | | 983,158 | |
Enel Finance International NV+^ | | | 2.88 | | | | 5/25/2022 | | | | 1,050,000 | | | | 1,048,118 | | | | 1,058,317 | |
Entergy Corp. | | | 4.00 | | | | 7/15/2022 | | | | 750,000 | | | | 770,421 | | | | 780,244 | |
Entergy Texas, Inc. | | | 2.55 | | | | 6/1/2021 | | | | 460,000 | | | | 459,948 | | | | 459,488 | |
Puget Energy, Inc. | | | 6.00 | | | | 9/1/2021 | | | | 1,275,000 | | | | 1,350,688 | | | | 1,362,817 | |
Puget Energy, Inc. | | | 6.50 | | | | 12/15/2020 | | | | 321,000 | | | | 338,619 | | | | 338,731 | |
| | | | | | | | | | | | | | | | | | | | |
Total Electric | | | | | | | | | | | 5,597,000 | | | | 5,720,354 | | | | 5,745,229 | |
| | | | | | | | | | | | | | | | | | | | |
|
Electronics — 0.1%*: | |
FLIR Systems, Inc. | | | 3.13 | | | | 6/15/2021 | | | | 480,000 | | | | 484,610 | | | | 484,693 | |
Tech Data Corp. | | | 3.70 | | | | 2/15/2022 | | | | 260,000 | | | | 259,785 | | | | 264,466 | |
| | | | | | | | | | | | | | | | | | | | |
Total Electronics | | | | | | | | | | | 740,000 | | | | 744,395 | | | | 749,159 | |
| | | | | | | | | | | | | | | | | | | | |
|
Food — 0.3%*: | |
McCormick & Co., Inc. | | | 2.70 | | | | 8/15/2022 | | | | 1,980,000 | | | | 1,928,830 | | | | 1,998,154 | |
| | | | | | | | | | | | | | | | | | | | |
|
Healthcare-Products — 0.7%*: | |
Becton Dickinson and Co., 3M USD LIBOR + 0.875% | | | 3.21 | # | | | 12/29/2020 | | | | 1,826,000 | | | | 1,825,145 | | | | 1,826,270 | |
CVS Health Corp. | | | 2.13 | | | | 6/1/2021 | | | | 1,815,000 | | | | 1,805,752 | | | | 1,802,955 | |
CVS Health Corp. | | | 3.70 | | | | 3/9/2023 | | | | 1,170,000 | | | | 1,164,525 | | | | 1,209,951 | |
| | | | | | | | | | | | | | | | | | | | |
Total Healthcare-Products | | | | | | | | | | | 4,811,000 | | | | 4,795,422 | | | | 4,839,176 | |
| | | | | | | | | | | | | | | | | | | | |
|
Healthcare-Services — 0.1%*: | |
Cigna Corp. | | | 4.00 | | | | 2/15/2022 | | | | 942,000 | | | | 972,937 | | | | 973,655 | |
| | | | | | | | | | | | | | | | | | | | |
|
Home Builders — 0.4%*: | |
Lennar Corp. | | | 4.50 | | | | 11/15/2019 | | | | 1,090,000 | | | | 1,095,043 | | | | 1,094,087 | |
Lennar Corp. | | | 4.75 | | | | 4/1/2021 | | | | 1,600,000 | | | | 1,623,612 | | | | 1,642,000 | |
| | | | | | | | | | | | | | | | | | | | |
Total Home Builders | | | | | | | | | | | 2,690,000 | | | | 2,718,655 | | | | 2,736,087 | |
| | | | | | | | | | | | | | | | | | | | |
See accompanying Notes to the Financial Statements.
125
Barings Active Short Duration Bond Fund 2019 Annual Report
SCHEDULE OF INVESTMENTS (CONTINUED)
June 30, 2019
| | | | | | | | | | | | | | | | | | | | |
| | | EFFECTIVE
INTEREST RATE | | | DUE DATE | | | PRINCIPAL ‡‡ | | | COST | | | FAIR
VALUE | |
Corporate Bonds(Continued) | |
|
Household Products/Wares — 0.4%*: | |
Church & Dwight Co., Inc. | | | 2.88 | % | | | 10/1/2022 | | | | 2,940,000 | | | $ | 2,901,216 | | | $ | 2,979,378 | |
| | | | | | | | | | | | | | | | | | | | |
|
Housewares — 0.3%*: | |
Newell Brands, Inc. | | | 3.85 | | | | 4/1/2023 | | | | 2,040,000 | | | | 2,036,407 | | | | 2,069,954 | |
| | | | | | | | | | | | | | | | | | | | |
|
Insurance — 1.7%*: | |
American International Group, Inc. | | | 3.30 | | | | 3/1/2021 | | | | 102,000 | | | | 102,960 | | | | 103,376 | |
AmTrust Financial Services, Inc. | | | 6.13 | | | | 8/15/2023 | | | | 780,000 | | | | 776,481 | | | | 767,325 | |
CNA Financial Corp. | | | 5.75 | | | | 8/15/2021 | | | | 1,191,000 | | | | 1,253,386 | | | | 1,273,255 | |
Enstar Group Ltd.+ | | | 4.50 | | | | 3/10/2022 | | | | 1,720,000 | | | | 1,731,016 | | | | 1,761,807 | |
Jackson National Life Global Funding^ | | | 2.50 | | | | 6/27/2022 | | | | 2,475,000 | | | | 2,463,230 | | | | 2,484,944 | |
Lincoln National Corp. | | | 4.00 | | | | 9/1/2023 | | | | 472,000 | | | | 480,278 | | | | 499,337 | |
Lincoln National Corp. | | | 4.20 | | | | 3/15/2022 | | | | 725,000 | | | | 754,374 | | | | 758,853 | |
Lincoln National Corp. | | | 6.25 | | | | 2/15/2020 | | | | 400,000 | | | | 408,131 | | | | 408,746 | |
Reinsurance Group of America, Inc. | | | 5.00 | | | | 6/1/2021 | | | | 1,429,000 | | | | 1,485,136 | | | | 1,497,406 | |
Trinity Acquisition PLC | | | 3.50 | | | | 9/15/2021 | | | | 2,316,000 | | | | 2,319,329 | | | | 2,356,762 | |
Willis Towers Watson PLC | | | 5.75 | | | | 3/15/2021 | | | | 370,000 | | | | 384,449 | | | | 388,564 | |
| | | | | | | | | | | | | | | | | | | | |
Total Insurance | | | | | | | | | | | 11,980,000 | | | | 12,158,770 | | | | 12,300,375 | |
| | | | | | | | | | | | | | | | | | | | |
|
Investment Company Security — 0.5%*: | |
Ares Capital Corp. | | | 3.88 | | | | 1/15/2020 | | | | 1,207,000 | | | | 1,213,102 | | | | 1,212,173 | |
FS KKR Capital Corp. | | | 4.00 | | | | 7/15/2019 | | | | 853,000 | | | | 853,131 | | | | 853,157 | |
TCP Capital Corp. | | | 4.13 | | | | 8/11/2022 | | | | 1,140,000 | | | | 1,136,804 | | | | 1,148,866 | |
| | | | | | | | | | | | | | | | | | | | |
Total Investment Company Security | | | | | | | | | | | 3,200,000 | | | | 3,203,037 | | | | 3,214,196 | |
| | | | | | | | | | | | | | | | | | | | |
|
IT Services — 0.6%*: | |
Dell International LLC/EMC Corp.^ | | | 4.00 | | | | 7/15/2024 | | | | 629,000 | | | | 642,775 | | | | 645,455 | |
Dell International LLC/EMC Corp.^ | | | 4.42 | | | | 6/15/2021 | | | | 1,227,000 | | | | 1,243,553 | | | | 1,264,350 | |
Leidos Holdings, Inc. | | | 4.45 | | | | 12/1/2020 | | | | 2,275,000 | | | | 2,304,507 | | | | 2,315,814 | |
| | | | | | | | | | | | | | | | | | | | |
Total IT Services | | | | | | | | | | | 4,131,000 | | | | 4,190,835 | | | | 4,225,619 | |
| | | | | | | | | | | | | | | | | | | | |
|
Lodging — 0.2%*: | |
Marriott International, Inc. | | | 2.30 | | | | 1/15/2022 | | | | 300,000 | | | | 299,418 | | | | 299,010 | |
Marriott International, Inc. | | | 2.88 | | | | 3/1/2021 | | | | 1,345,000 | | | | 1,354,590 | | | | 1,353,946 | |
| | | | | | | | | | | | | | | | | | | | |
Total Lodging | | | | | | | | | | | 1,645,000 | | | | 1,654,008 | | | | 1,652,956 | |
| | | | | | | | | | | | | | | | | | | | |
|
Machinery-Diversified — 0.9%*: | |
CNH Industrial Capital LLC | | | 3.38 | | | | 7/15/2019 | | | | 945,000 | | | | 945,200 | | | | 945,219 | |
CNH Industrial Capital LLC | | | 3.88 | | | | 10/15/2021 | | | | 1,110,000 | | | | 1,120,573 | | | | 1,131,645 | |
CNH Industrial NV+ | | | 4.50 | | | | 8/15/2023 | | | | 900,000 | | | | 912,252 | | | | 943,830 | |
Wabtec Corp. | | | 4.40 | | | | 3/15/2024 | | | | 3,325,000 | | | | 3,304,492 | | | | 3,520,230 | |
| | | | | | | | | | | | | | | | | | | | |
Total Machinery-Diversified | | | | | | | | | | | 6,280,000 | | | | 6,282,517 | | | | 6,540,924 | |
| | | | | | | | | | | | | | | | | | | | |
|
Media — 0.9%*: | |
Charter Communications Operating LLC/Charter Communications Operating Capital | | | 3.58 | | | | 7/23/2020 | | | | 1,130,000 | | | | 1,137,143 | | | | 1,140,130 | |
See accompanying Notes to the Financial Statements.
126
Barings Active Short Duration Bond Fund 2019 Annual Report
SCHEDULE OF INVESTMENTS (CONTINUED)
June 30, 2019
| | | | | | | | | | | | | | | | | | | | |
| | | EFFECTIVE
INTEREST RATE | | | DUE DATE | | | PRINCIPAL ‡‡ | | | COST | | | FAIR
VALUE | |
Corporate Bonds(Continued) | |
|
Media (Continued) | |
Discovery Communications LLC | | | 2.95 | % | | | 3/20/2023 | | | | 1,445,000 | | | $ | 1,416,502 | | | $ | 1,458,173 | |
Sirius XM Radio, Inc.^ | | | 3.88 | | | | 8/1/2022 | | | | 3,698,000 | | | | 3,694,591 | | | | 3,707,245 | |
| | | | | | | | | | | | | | | | | | | | |
Total Media | | | | | | | | | | | 6,273,000 | | | | 6,248,236 | | | | 6,305,548 | |
| | | | | | | | | | | | | | | | | | | | |
|
Mining — 1.0%*: | |
Glencore Finance Canada Ltd.+^ | | | 4.25 | | | | 10/25/2022 | | | | 484,000 | | | | 501,536 | | | | 506,091 | |
Glencore Funding LLC+^ | | | 3.00 | | | | 10/27/2022 | | | | 730,000 | | | | 728,530 | | | | 734,234 | |
Glencore Funding LLC+^ | | | 4.13 | | | | 5/30/2023 | | | | 980,000 | | | | 976,342 | | | | 1,018,877 | |
Kinross Gold Corp. | | | 5.13 | | | | 9/1/2021 | | | | 990,000 | | | | 1,026,710 | | | | 1,019,700 | |
Kinross Gold Corp.+ | | | 5.95 | | | | 3/15/2024 | | | | 2,170,000 | | | | 2,234,173 | | | | 2,371,115 | |
Newcrest Finance Pty Ltd.+^ | | | 4.20 | | | | 10/1/2022 | | | | 1,645,000 | | | | 1,689,628 | | | | 1,718,507 | |
| | | | | | | | | | | | | | | | | | | | |
Total Mining | | | | | | | | | | | 6,999,000 | | | | 7,156,919 | | | | 7,368,524 | |
| | | | | | | | | | | | | | | | | | | | |
|
Office/Business Equip — 0.2%*: | |
Pitney Bowes, Inc. | | | 3.88 | | | | 9/15/2020 | | | | 350,000 | | | | 346,222 | | | | 349,464 | |
Pitney Bowes, Inc. | | | 3.88 | | | | 10/1/2021 | | | | 1,065,000 | | | | 1,055,892 | | | | 1,043,700 | |
| | | | | | | | | | | | | | | | | | | | |
Total Office/Business Equip | | | | | | | | | | | 1,415,000 | | | | 1,402,114 | | | | 1,393,164 | |
| | | | | | | | | | | | | | | | | | | | |
|
Oil and Gas — 0.6%*: | |
Antero Resources Corp. | | | 5.38 | | | | 11/1/2021 | | | | 480,000 | | | | 487,065 | | | | 474,000 | |
Continental Resources, Inc. | | | 5.00 | | | | 9/15/2022 | | | | 1,438,000 | | | | 1,450,062 | | | | 1,449,800 | |
EQT Corp. | | | 3.00 | | | | 10/1/2022 | | | | 2,195,000 | | | | 2,155,587 | | | | 2,177,973 | |
| | | | | | | | | | | | | | | | | | | | |
Total Oil and Gas | | | | | | | | | | | 4,113,000 | | | | 4,092,714 | | | | 4,101,773 | |
| | | | | | | | | | | | | | | | | | | | |
|
Packaging and Containers — 0.4%*: | |
Graphic Packaging International, Inc. | | | 4.75 | | | | 4/15/2021 | | | | 2,696,000 | | | | 2,754,890 | | | | 2,743,180 | |
| | | | | | | | | | | | | | | | | | | | |
|
Pharmaceuticals — 2.0%*: | |
AbbVie, Inc. | | | 2.30 | | | | 5/14/2021 | | | | 150,000 | | | | 149,433 | | | | 149,093 | |
Bayer US Finance II LLC, 3M USD LIBOR + 1.010%^ | | | 3.42 | # | | | 12/15/2023 | | | | 3,085,000 | | | | 3,046,641 | | | | 3,029,382 | |
Cardinal Health, Inc., 3M USD LIBOR + 0.770% | | | 3.18 | # | | | 6/15/2022 | | | | 2,995,000 | | | | 2,994,685 | | | | 3,003,026 | |
Express Scripts Holding Co. | | | 3.30 | | | | 2/25/2021 | | | | 1,590,000 | | | | 1,602,490 | | | | 1,611,110 | |
Express Scripts Holding Co. | | | 4.75 | | | | 11/15/2021 | | | | 950,000 | | | | 993,061 | | | | 997,460 | |
Shire Acquisitions Investments Ireland DAC | | | 2.40 | | | | 9/23/2021 | | | | 630,000 | | | | 626,870 | | | | 629,226 | |
Shire Acquisitions Investments Ireland DAC | | | 2.88 | | | | 9/23/2023 | | | | 1,070,000 | | | | 1,025,101 | | | | 1,080,460 | |
Teva Pharmaceutical Finance Netherlands III B.V.+ | | | 2.20 | | | | 7/21/2021 | | | | 3,890,000 | | | | 3,780,084 | | | | 3,690,637 | |
| | | | | | | | | | | | | | | | | | | | |
Total Pharmaceuticals | | | | | | | | | | | 14,360,000 | | | | 14,218,365 | | | | 14,190,394 | |
| | | | | | | | | | | | | | | | | | | | |
|
Pipelines — 0.8%*: | |
Energy Transfer Partners LP | | | 4.20 | | | | 9/15/2023 | | | | 3,475,000 | | | | 3,487,367 | | | | 3,643,188 | |
EnLink Midstream Partners LP | | | 4.40 | | | | 4/1/2024 | | | | 1,720,000 | | | | 1,718,394 | | | | 1,739,316 | |
| | | | | | | | | | | | | | | | | | | | |
Total Pipelines | | | | | | | | | | | 5,195,000 | | | | 5,205,761 | | | | 5,382,504 | |
| | | | | | | | | | | | | | | | | | | | |
See accompanying Notes to the Financial Statements.
127
Barings Active Short Duration Bond Fund 2019 Annual Report
SCHEDULE OF INVESTMENTS (CONTINUED)
June 30, 2019
| | | | | | | | | | | | | | | | | | | | |
| | | EFFECTIVE
INTEREST RATE | | | DUE DATE | | | PRINCIPAL ‡‡ | | | COST | | | FAIR
VALUE | |
Corporate Bonds(Continued) | |
|
Real Estate Investment Trusts — 1.1%*: | |
American Tower Corp. | | | 2.25 | % | | | 1/15/2022 | | | | 330,000 | | | $ | 329,768 | | | $ | 328,223 | |
American Tower Corp. | | | 3.00 | | | | 6/15/2023 | | | | 2,750,000 | | | | 2,723,873 | | | | 2,776,673 | |
American Tower Corp. | | | 3.30 | | | | 2/15/2021 | | | | 530,000 | | | | 533,325 | | | | 536,585 | |
Crown Castle International Corp. | | | 3.40 | | | | 2/15/2021 | | | | 1,672,000 | | | | 1,685,065 | | | | 1,694,840 | |
Healthcare Trust of America Holdings LP | | | 2.95 | | | | 7/1/2022 | | | | 708,000 | | | | 702,788 | | | | 713,044 | |
VEREIT Operating Partnership LP | | | 4.60 | | | | 2/6/2024 | | | | 1,940,000 | | | | 2,027,633 | | | | 2,060,016 | |
| | | | | | | | | | | | | | | | | | | | |
Total REITS | | | | | | | | | | | 7,930,000 | | | | 8,002,452 | | | | 8,109,381 | |
| | | | | | | | | | | | | | | | | | | | |
|
Retail — 1.6%*: | |
Advance Auto Parts, Inc. | | | 4.50 | | | | 12/1/2023 | | | | 1,187,000 | | | | 1,213,792 | | | | 1,273,654 | |
Dollar Tree, Inc. | | | 3.70 | | | | 5/15/2023 | | | | 3,820,000 | | | | 3,776,324 | | | | 3,944,161 | |
O’Reilly Automotive, Inc. | | | 3.80 | | | | 9/1/2022 | | | | 284,000 | | | | 284,582 | | | | 294,930 | |
O’Reilly Automotive, Inc. | | | 3.85 | | | | 6/15/2023 | | | | 2,389,000 | | | | 2,397,796 | | | | 2,502,754 | |
QVC, Inc. | | | 4.38 | | | | 3/15/2023 | | | | 3,260,000 | | | | 3,203,643 | | | | 3,309,113 | |
| | | | | | | | | | | | | | | | | | | | |
Total Retail | | | | | | | | | | | 10,940,000 | | | | 10,876,137 | | | | 11,324,612 | |
| | | | | | | | | | | | | | | | | | | | |
|
Semiconductors — 0.7%*: | |
Broadcom Corp./Broadcom Cayman Finance Ltd. | | | 3.00 | | | | 1/15/2022 | | | | 1,785,000 | | | | 1,781,964 | | | | 1,789,638 | |
Microchip Technology, Inc. | | | 3.92 | | | | 6/1/2021 | | | | 1,435,000 | | | | 1,435,980 | | | | 1,460,752 | |
NXP BV/NXP Funding LLC^ | | | 4.13 | | | | 6/1/2021 | | | | 1,670,000 | | | | 1,686,266 | | | | 1,708,577 | |
| | | | | | | | | | | | | | | | | | | | |
Total Semiconductors | | | | | | | | | | | 4,890,000 | | | | 4,904,210 | | | | 4,958,967 | |
| | | | | | | | | | | | | | | | | | | | |
|
Telecommunications — 0.6%*: | |
Sprint Communications, Inc. | | | 9.25 | | | | 4/15/2022 | | | | 1,005,000 | | | | 1,147,293 | | | | 1,160,775 | |
Telefonaktiebolaget LM Ericsson+ | | | 4.13 | | | | 5/15/2022 | | | | 2,740,000 | | | | 2,738,017 | | | | 2,831,379 | |
| | | | | | | | | | | | | | | | | | | | |
Total Telecommunications | | | | | | | | | | | 3,745,000 | | | | 3,885,310 | | | | 3,992,154 | |
| | | | | | | | | | | | | | | | | | | | |
|
Transportation — 0.9%*: | |
Penske Truck Leasing Co. LP/PTL Finance Corp.^ | | | 2.70 | | | | 3/14/2023 | | | | 410,000 | | | | 404,010 | | | | 409,831 | |
Penske Truck Leasing Co. LP/PTL Finance Corp.^ | | | 3.30 | | | | 4/1/2021 | | | | 240,000 | | | | 242,973 | | | | 242,970 | |
Penske Truck Leasing Co. LP/PTL Finance Corp.^ | | | 3.38 | | | | 2/1/2022 | | | | 830,000 | | | | 833,897 | | | | 846,134 | |
Penske Truck Leasing Co. LP/PTL Finance Corp.^ | | | 4.88 | | | | 7/11/2022 | | | | 2,040,000 | | | | 2,109,482 | | | | 2,168,595 | |
Ryder System, Inc. | | | 2.50 | | | | 9/1/2022 | | | | 26,000 | | | | 25,138 | | | | 26,050 | |
Ryder System, Inc. | | | 3.40 | | | | 3/1/2023 | | | | 330,000 | | | | 326,652 | | | | 339,045 | |
Ryder System, Inc. | | | 3.75 | | | | 6/9/2023 | | | | 1,235,000 | | | | 1,234,188 | | | | 1,285,184 | |
Ryder System, Inc. | | | 3.88 | | | | 12/1/2023 | | | | 392,000 | | | | 402,386 | | | | 411,046 | |
Ryder System, Inc. MTN | | | 2.25 | | | | 9/1/2021 | | | | 635,000 | | | | 632,645 | | | | 632,979 | |
| | | | | | | | | | | | | | | | | | | | |
Total Transportation | | | | | | | | | | | 6,138,000 | | | | 6,211,371 | | | | 6,361,834 | |
| | | | | | | | | | | | | | | | | | | | |
See accompanying Notes to the Financial Statements.
128
Barings Active Short Duration Bond Fund 2019 Annual Report
SCHEDULE OF INVESTMENTS (CONTINUED)
June 30, 2019
| | | | | | | | | | | | | | | | | | | | |
| | | EFFECTIVE
INTEREST RATE | | | DUE DATE | | | PRINCIPAL ‡‡ | | | COST | | | FAIR
VALUE | |
Corporate Bonds(Continued) | |
|
Trucking and Leasing — 0.8%*: | |
DAE Funding LLC+^ | | | 4.00 | % | | | 8/1/2020 | | | | 276,000 | | | $ | 276,000 | | | $ | 276,000 | |
GATX Corp. | | | 2.50 | | | | 7/30/2019 | | | | 250,000 | | | | 250,085 | | | | 249,981 | |
GATX Corp. | | | 2.60 | | | | 3/30/2020 | | | | 685,000 | | | | 683,372 | | | | 684,381 | |
Park Aerospace Holdings Ltd.+^ | | | 5.25 | | | | 8/15/2022 | | | | 4,535,000 | | | | 4,646,871 | | | | 4,788,053 | |
| | | | | | | | | | | | | | | | | | | | |
Total Trucking and Leasing | | | | | | | | | | | 5,746,000 | | | | 5,856,328 | | | | 5,998,415 | |
| | | | | | | | | | | | | | | | | | | | |
|
Venture Capital — 0.2%*: | |
Hercules Capital, Inc. | | | 4.63 | | | | 10/23/2022 | | | | 1,625,000 | | | | 1,618,841 | | | | 1,598,616 | |
| | | | | | | | | | | | | | | | | | | | |
Total Corporate Bonds | | | | | | | | | | | 242,148,000 | | | | 243,250,852 | | | | 247,698,431 | |
| | | | | | | | | | | | | | | | | | | | |
Mortgage-Backed Securities — 9.2%*: | |
Angel Oak Mortgage Trust2019-3^ | | | 3.24 | #@ | | | 5/25/2059 | | | | 3,900,000 | | | | 3,899,955 | | | | 3,919,810 | |
Angel Oak Mortgage Trust LLC^ | | | 3.90 | #@ | | | 11/25/2047 | | | | 2,250,000 | | | | 2,250,000 | | | | 2,284,633 | |
BAMLL Commercial Mortgage Securities Trust 2018-DSNY, 1M USD LIBOR + 1.350%^ | | | 3.74 | # | | | 9/15/2034 | | | | 270,000 | | | | 270,000 | | | | 267,474 | |
BHMS, 1M USD LIBOR + 1.500%^ | | | 3.89 | # | | | 7/15/2035 | | | | 1,800,000 | | | | 1,800,000 | | | | 1,799,976 | |
BHMS 2018-ATLS, 1M USD LIBOR + 1.250%^ | | | 3.64 | # | | | 7/15/2035 | | | | 2,750,000 | | | | 2,747,282 | | | | 2,750,824 | |
BX Commercial Mortgage Trust2018-IND, 1M USD LIBOR + 1.700%^ | | | 4.09 | # | | | 11/15/2035 | | | | 3,021,100 | | | | 3,031,131 | | | | 3,036,209 | |
CAMB Commercial Mortgage Trust 2019-LIFE, 1M USD LIBOR + 2.150%^ | | | 4.54 | # | | | 12/15/2037 | | | | 1,499,283 | | | | 1,499,283 | | | | 1,512,434 | |
COMM 2015-CCRE22 Mortgage Trust | | | 3.93 | #@ | | | 3/10/2048 | | | | 1,650,000 | | | | 1,640,280 | | | | 1,709,621 | |
COMM2015-DC1 Mortgage Trust | | | 3.72 | | | | 2/10/2048 | | | | 1,700,000 | | | | 1,680,719 | | | | 1,766,354 | |
COMM2015-DC1 Mortgage Trust | | | 4.04 | #@ | | | 2/10/2048 | | | | 1,087,775 | | | | 1,110,990 | | | | 1,127,292 | |
COMM Mortgage Trust 2014-UBS2 B | | | 4.70 | | | | 3/10/2047 | | | | 600,000 | | | | 642,562 | | | | 638,464 | |
Connecticut Avenue Securities Trust2019-R03, 1M USD LIBOR + 2.150%^ | | | 4.55 | # | | | 9/25/2031 | | | | 240,000 | | | | 240,000 | | | | 241,255 | |
Credit Suisse Mortgage Capital Certificates 2019-ICE4, 1M USD LIBOR + 1.600%^ | | | 3.99 | # | | | 5/15/2036 | | | | 960,000 | | | | 960,000 | | | | 962,704 | |
Deephave Residential Mortgage Trust2019-2^ | | | 3.92 | #@ | | | 4/25/2059 | | | | 672,000 | | | | 672,000 | | | | 687,102 | |
Deephaven Residential Mortgage Trust2018-1^ | | | 2.98 | #@ | | | 12/26/2057 | | | | 705,757 | | | | 697,436 | | | | 707,561 | |
Deephaven Residential Mortgage Trust2018-1^ | | | 3.03 | #@ | | | 12/26/2057 | | | | 603,608 | | | | 603,599 | | | | 603,512 | |
Deephaven Residential Mortgage Trust2018-2^ | | | 3.68 | #@ | | | 4/25/2058 | | | | 1,117,829 | | | | 1,117,817 | | | | 1,136,152 | |
Deephaven Residential Mortgage Trust2018-3^ | | | 3.96 | #@ | | | 8/25/2058 | | | | 1,189,387 | | | | 1,187,844 | | | | 1,203,600 | |
Deephaven Residential Mortgage Trust2018-4^ | | | 4.29 | #@ | | | 10/25/2058 | �� | | | 1,665,425 | | | | 1,665,425 | | | | 1,689,500 | |
GS Mortgage Securities Trust2016-GS2 | | | 4.68 | # | | | 5/10/2049 | | | | 1,000,000 | | | | 1,051,050 | | | | 1,076,405 | |
GS Mortgage Securities Trust2016-GS3 | | | 3.14 | | | | 10/10/2049 | | | | 1,000,000 | | | | 949,036 | | | | 1,009,839 | |
See accompanying Notes to the Financial Statements.
129
Barings Active Short Duration Bond Fund 2019 Annual Report
SCHEDULE OF INVESTMENTS (CONTINUED)
June 30, 2019
| | | | | | | | | | | | | | | | | | | | |
| | | EFFECTIVE
INTEREST RATE | | | DUE DATE | | | PRINCIPAL ‡‡ | | | COST | | | FAIR
VALUE | |
Mortgage-Backed Securities(Continued) | |
JP Morgan Chase Commercial Mortgage Securities Trust 2013-LC11 | | | 3.96 | #@ % | | | 4/15/2046 | | | | 1,015,000 | | | $ | 1,002,572 | | | $ | 1,033,760 | |
JP Morgan Chase Commercial Mortgage Securities Trust2018-LAQ, 1M USD LIBOR + 1.000%^ | | | 3.39 | # | | | 6/15/2032 | | | | 3,926,206 | | | | 3,917,451 | | | | 3,929,794 | |
JP Morgan Mortgage Trust2017-6 A5^ | | | 3.50 | #@ | | | 12/25/2048 | | | | 925,641 | | | | 937,590 | | | | 941,226 | |
JP Morgan Mortgage Trust2018-1^ | | | 3.50 | #@ | | | 6/25/2048 | | | | 683,102 | | | | 688,606 | | | | 692,898 | |
JP Morgan Mortgage Trust2018-3^ | | | 3.50 | #@ | | | 9/25/2048 | | | | 1,056,360 | | | | 1,053,137 | | | | 1,068,191 | |
JP Morgan Mortgage Trust2018-4^ | | | 3.50 | #@ | | | 10/25/2048 | | | | 2,287,193 | | | | 2,270,478 | | | | 2,320,086 | |
KNDL 2019-KNSQ Mortgage Trust, 1M USD LIBOR + 1.800%^ | | | 4.19 | # | | | 5/15/2036 | | | | 865,000 | | | | 865,000 | | | | 864,991 | |
Morgan Stanley Bank of America Merrill Lynch Trust2013-C7 | | | 3.77 | | | | 2/15/2046 | | | | 1,340,000 | | | | 1,371,720 | | | | 1,379,576 | |
Morgan Stanley Capital I Trust 2012-STAR^ | | | 4.06 | | | | 8/5/2034 | | | | 1,300,000 | | | | 1,300,498 | | | | 1,334,624 | |
MSCG Trust 2018-SELF, 1M USD LIBOR + 1.180%^ | | | 3.57 | # | | | 10/15/2037 | | | | 165,000 | | | | 165,000 | | | | 165,103 | |
New Residential Mortgage Loan Trust2016-4A A1^ | | | 3.75 | #@ | | | 11/25/2056 | | | | 357,175 | | | | 367,658 | | | | 368,439 | |
New Residential Mortgage Loan Trust2019-A1^ | | | 3.60 | #@ | | | 4/25/2049 | | | | 776,551 | | | | 776,551 | | | | 794,237 | |
New Residential Mortgage Loan Trust2019-A3^ | | | 3.75 | #@ | | | 4/25/2049 | | | | 2,653,852 | | | | 2,653,852 | | | | 2,714,085 | |
New Residential Mortgage Loan Trust 2019-NQM1^ | | | 3.93 | #@ | | | 1/25/2049 | | | | 2,889,598 | | | | 2,889,740 | | | | 2,950,981 | |
PNMAC GMSR Issuer Trust2018-GT1, 1M USD LIBOR + 2.850%^ | | | 5.34 | # | | | 2/25/2023 | | | | 470,000 | | | | 470,000 | | | | 470,752 | |
PSMC Trust^ | | | 3.50 | #@ | | | 2/25/2048 | | | | 1,098,527 | | | | 1,097,188 | | | | 1,115,321 | |
PSMC Trust2018-2^ | | | 3.50 | #@ | | | 6/25/2048 | | | | 1,008,604 | | | | 992,403 | | | | 1,024,629 | |
Sequoia Mortgage Trust2015-1^ | | | 2.50 | #@ | | | 1/25/2045 | | | | 719,838 | | | | 708,943 | | | | 721,591 | |
Sequoia Mortgage Trust2018-3^ | | | 3.50 | #@ | | | 3/25/2048 | | | | 1,221,274 | | | | 1,219,415 | | | | 1,238,782 | |
Sequoia Mortgage Trust2018-5^ | | | 3.50 | #@ | | | 5/25/2048 | | | | 906,223 | | | | 896,394 | | | | 921,074 | |
Sequoia Mortgage Trust2018-6^ | | | 4.00 | #@ | | | 7/25/2048 | | | | 2,242,877 | | | | 2,269,310 | | | | 2,294,408 | |
Sequoia Mortgage Trust2018-7^ | | | 4.00 | #@ | | | 9/25/2048 | | | | 610,120 | | | | 613,124 | | | | 624,127 | |
Sequoia Mortgage Trust2018-CH1^ | | | 4.00 | #@ | | | 2/25/2048 | | | | 758,402 | | | | 771,459 | | | | 775,837 | |
Sequoia Mortgage Trust2018-CH2^ | | | 4.00 | #@ | | | 6/25/2048 | | | | 1,318,681 | | | | 1,332,045 | | | | 1,337,207 | |
Sequoia Mortgage Trust2018-CH3^ | | | 4.00 | #@ | | | 8/25/2048 | | | | 884,490 | | | | 892,006 | | | | 905,769 | |
Sequoia Mortgage Trust2019-1^ | | | 4.00 | #@ | | | 2/25/2049 | | | | 784,659 | | | | 791,956 | | | | 802,671 | |
ShellpointCo-Originator Trust2016-1 2A3^ | | | 3.00 | #@ | | | 10/25/2031 | | | | 694,333 | | | | 700,827 | | | | 698,147 | |
TIAA Bank Mortgage Loan Trust2018-2^ | | | 3.50 | #@ | | | 7/25/2048 | | | | 496,424 | | | | 491,707 | | | | 503,530 | |
Velocity Commercial Capital Loan Trust2016-2 AFX | | | 3.00 | #@ | | | 10/25/2046 | | | | 183,959 | | | | 183,959 | | | | 185,133 | |
Wells Fargo Mortgage Backed Securities2019-1 Trust^ | | | 4.00 | #@ | | | 11/25/2048 | | | | 1,746,762 | | | | 1,759,532 | | | | 1,788,570 | |
| | | | | | | | | | | | | | | | | | | | |
Total Mortgage-Backed Securities | | | | | | | | | | | 65,068,015 | | | | 65,166,530 | | | | 66,096,260 | |
| | | | | | | | | | | | | | | | | | | | |
See accompanying Notes to the Financial Statements.
130
Barings Active Short Duration Bond Fund 2019 Annual Report
SCHEDULE OF INVESTMENTS (CONTINUED)
June 30, 2019
| | | | | | | | | | | | | | | | | | | | |
| | | EFFECTIVE
INTEREST RATE | | | DUE DATE | | | PRINCIPAL ‡‡ | | | COST | | | FAIR
VALUE | |
U.S. Treasury & Government Agencies — 7.6%*: | |
Federal Home Loan Mortgage Corp., 1M USD LIBOR + 0.480% | | | 2.87 | # % | | | 10/15/2040 | | | | 315,294 | | | $ | 315,030 | | | $ | 316,162 | |
Federal Home Loan Mortgage Corp. | | | 3.00 | | | | 5/15/2039 | | | | 473,179 | | | | 477,197 | | | | 478,469 | |
Federal Home Loan Mortgage Corp. | | | 3.00 | | | | 8/15/2040 | | | | 729,689 | | | | 740,099 | | | | 746,109 | |
Federal Home Loan Mortgage Corp. | | | 3.00 | | | | 3/15/2041 | | | | 602,071 | | | | 609,867 | | | | 611,167 | |
Federal National Mortgage Association | | | 3.00 | | | | 4/25/2040 | | | | 973,215 | | | | 984,059 | | | | 992,372 | |
Federal National Mortgage Association | | | 3.00 | | | | 1/25/2041 | | | | 484,535 | | | | 490,482 | | | | 490,494 | |
Federal National Mortgage Association, 1M USD LIBOR + 0.680% | | | 3.08 | # | | | 10/25/2030 | | | | 766,052 | | | | 766,201 | | | | 765,621 | |
U.S. Treasury Bonds | | | 8.00 | | | | 11/15/2021 | | | | 13,000,000 | | | | 14,869,060 | | | | 14,865,195 | |
U.S. Treasury Bonds | | | 8.75 | | | | 5/15/2020 | | | | 33,000,000 | | | | 34,801,623 | | | | 34,937,461 | |
| | | | | | | | | | | | | | | | | | | | |
Total U.S. Treasury & Government Agencies | | | | | | | | 50,344,035 | | | | 54,053,618 | | | | 54,203,050 | |
| | | | | | | | | | | | | | | | | | | | |
| | | | | | | | | | | | | | | | | | | | |
Total Fixed Income | | | | | | | | | | | 688,883,116 | | | | 689,219,578 | | | | 697,701,754 | |
| | | | | | | | | | | | | | | | | | | | |
| | | | | | | | | | | | | | | | | | | | | | | | | | | | | | |
COUNTERPARTY | | STRIKE
PRICE | | | EXPIRATION
DATE | | | CONTRACTS | | | NOTIONAL | | | COST | | | UNREALIZED
VALUE | | | FAIR
VALUE | |
Purchased Options — 0.5%*: | |
|
Call Options Purchased — 0.2%*: | |
OTC — BCM Swaption | | JPMorgan Chase Bank N.A. | | | $2.44 | | | | 12/13/2032 | | | | 11,190,000 | | | | 11,190,000 | | | | 561,458 | | | | 117,078 | | | | 678,536 | |
OTC — BCM Swaption | | JPMorgan Chase Bank N.A. | | | 2.61 | | | | 1/31/2033 | | | | 14,590,000 | | | | 14,590,000 | | | | 698,861 | | | | 286,866 | | | | 985,727 | |
| | | | | | | | | | | | | | | | | | | | | | | | | | | | | | |
Total Call Options Purchased | | | | | | | | 25,780,000 | | | | 25,780,000 | | | | 1,260,319 | | | | 403,944 | | | | 1,664,263 | |
| | | | | | | | | | | | | | | | | | | | | | | | | | | | | | |
|
Put Options Purchased — 0.3%*: | |
OTC — BCM Swaption | | JPMorgan Chase Bank N.A. | | | 2.94 | | | | 12/13/2032 | | | | 22,790,000 | | | | 22,790,000 | | | | 1,143,488 | | | | (135,697 | ) | | | 1,007,791 | |
OTC — BCM Swaption | | JPMorgan Chase Bank N.A. | | | 3.11 | | | | 1/31/2033 | | | | 29,090,000 | | | | 29,090,000 | | | | 1,390,502 | | | | (222,622 | ) | | | 1,167,880 | |
| | | | | | | | | | | | | | | | | | | | | | | | | | | | | | |
Total Put Options | | | | | | | | 51,880,000 | | | | 51,880,000 | | | | 2,533,990 | | | | (358,319 | ) | | | 2,175,671 | |
| | | | | | | | | | | | | | | | | | | | | | | | | | | | | | |
| | | | | | | | | | | | | | | | | | | | |
| | | EFFECTIVE
INTEREST RATE | | | DUE DATE | | | PRINCIPAL ‡‡ | | | COST | | | FAIR
VALUE | |
Short-Term Investments — 3.5%*: | |
|
Commercial Paper — 3.5%*: | |
|
Chemicals — 0.4%*: | |
DowDuPont, Inc. | | | 2.74 | % | | | 8/5/2019 | | | | 2,600,000 | | | | 2,593,200 | | | | 2,593,200 | |
| | | | | | | | | | | | | | | | | | | | |
|
Diversified Financial Services* — 0.6%*: | |
CRH America Finance Inc.+ | | | 2.80 | | | | 8/1/2019 | | | | 1,600,000 | | | | 1,596,211 | | | | 1,596,211 | |
General Electric Co. | | | 2.82 | | | | 8/16/2019 | | | | 2,600,000 | | | | 2,590,831 | | | | 2,590,831 | |
| | | | | | | | | | | | | | | | | | | | |
Total Diversified Financial Services | | | | | | | | | | | 4,200,000 | | | | 4,187,042 | | | | 4,187,042 | |
| | | | | | | | | | | | | | | | | | | | |
See accompanying Notes to the Financial Statements.
131
Barings Active Short Duration Bond Fund 2019 Annual Report
SCHEDULE OF INVESTMENTS (CONTINUED)
June 30, 2019
| | | | | | | | | | | | | | | | | | | | |
| | | EFFECTIVE
INTEREST RATE | | | DUE DATE | | | PRINCIPAL ‡‡ | | | COST | | | FAIR
VALUE | |
Short-Term Investments(Continued) | |
|
Lodging — 0.7%*: | |
Marriott International, Inc. | | | 2.63 | % | | | 8/14/2019 | | | | 5,000,000 | | | $ | 4,984,233 | | | $ | 4,984,233 | |
| | | | | | | | | | | | | | | | | | | | |
|
Media — 0.9%*: | |
Cox Enterprises, Inc. | | | 2.57 | | | | 7/1/2019 | | | | 6,800,000 | | | | 6,800,000 | | | | 6,800,000 | |
| | | | | | | | | | | | | | | | | | | | |
|
Oil and Gas — 0.3%*: | |
FMC Technologies, Inc. | | | 2.67 | | | | 7/15/2019 | | | | 2,000,000 | | | | 1,997,955 | | | | 1,997,955 | |
| | | | | | | | | | | | | | | | | | | | |
|
Utilities — 0.6%*: | |
Mondelez International, Inc. | | | 2.66 | | | | 7/10/2019 | | | | 1,000,000 | | | | 999,345 | | | | 999,345 | |
VW Credit Inc. | | | 2.70 | | | | 7/25/2019 | | | | 1,570,000 | | | | 1,567,226 | | | | 1,567,226 | |
VW Credit Inc. | | | 2.71 | | | | 10/15/2019 | | | | 2,000,000 | | | | 1,984,395 | | | | 1,984,395 | |
| | | | | | | | | | | | | | | | | | | | |
Total Utilities | | | | | | | | | | | 4,570,000 | | | | 4,550,966 | | | | 4,550,966 | |
| | | | | | | | | | | | | | | | | | | | |
Total Commercial Paper | | | | | | | | | | | 25,170,000 | | | | 25,113,396 | | | | 25,113,396 | |
| | | | | | | | | | | | | | | | | | | | |
Total Short-Term Investments | | | | | | | | | | | 25,170,000 | | | | 25,113,396 | | | | 25,113,396 | |
| | | | | | | | | | | | | | | | | | | | |
Total Investments | | | | | | | | | | | 791,713,116 | | | | 718,127,283 | | | | 726,655,084 | |
| | | | | | | | | | | | | | | | | | | | |
| |
Other assets and liabilities – (1.5%)* | | | | (10,921,807 | ) |
| | | | | | | | | | | | | | | | | | | | |
| |
Net Assets – 100.0% | | | | $715,733,277 | |
| | | | | | | | | | | | | | | | | | | | |
| ‡‡ | Unless otherwise indicated, all principal amounts are denominated in United States Dollars. |
| * | Calculated as a percentage of net assets applicable to common shareholders. |
Distributions of investments by country of risk (excluding temporary cash investments) as a percentage of total investments in securities, is as follows:
| | | | | | |
| | United States | | | 91.3% | |
| | Ireland | | | 1.9% | |
| | Japan | | | 1.3% | |
| | Netherlands | | | 1.0% | |
| | Other (Individually less than 1%) | | | 4.5% | |
| | | | | | |
| | Total | | | 100.0% | |
| | | | | | |
| ^ | Security acquired in a transaction exempt from registration under Rule 144A of the Securities Act of 1933. These securities may only be resold in transactions exempt from registration, normally to qualified institutional buyers. |
| ¤ | For fair value measurement disclosure purposes, security is categorized as Level 3 (See Note 2). |
| # | Variable rate security. The interest rate shown is the rate in effect at June 30, 2019. |
| @ | Effective interest rate for this security is the coupon rate at issue based on the underlying loans. |
| ** | Variable Rate is Fixed to Float: Rate remains fixed until designated future date. |
See accompanying Notes to the Financial Statements.
132
Barings Active Short Duration Bond Fund 2019 Annual Report
SCHEDULE OF INVESTMENTS (CONTINUED)
June 30, 2019
A summary of outstanding derivatives at June 30, 2019 is as follows:
Futures
| | | | | | | | | | | | | | | | | | | | | | |
| TYPE | | EXPIRATION
DATE | | CONTRACTS | | | NOTIONAL
AMOUNT | | | POSITION | | | FAIR VALUE | | | UNREALIZED
DEPRECIATION | |
Short Futures | |
90 Day Euro Futures | | 09/16/19 | | | 7 | | | | (1,704,037 | ) | | | Short | | | | $ (1,714,913) | | | $ | (10,876 | ) |
90 Day Euro Futures | | 12/16/19 | | | 8 | | | | (1,946,870 | ) | | | Short | | | | (1,961,800) | | | | (14,930 | ) |
90 Day Euro Futures | | 03/16/20 | | | 6 | | | | (1,461,278 | ) | | | Short | | | | (1,474,350) | | | | (13,072 | ) |
90 Day Euro Futures | | 06/15/20 | | | 6 | | | | (1,462,140 | ) | | | Short | | | | (1,475,700) | | | | (13,560 | ) |
90 Day Euro Futures | | 09/14/20 | | | 6 | | | | (1,462,778 | ) | | | Short | | | | (1,476,675) | | | | (13,897 | ) |
90 Day Euro Futures | | 12/14/20 | | | 5 | | | | (1,218,919 | ) | | | Short | | | | (1,230,563) | | | | (11,644 | ) |
90 Day Euro Futures | | 03/15/21 | | | 5 | | | | (1,219,356 | ) | | | Short | | | | (1,230,874) | | | | (11,518 | ) |
90 Day Euro Futures | | 09/13/21 | | | 9 | | | | (2,195,179 | ) | | | Short | | | | (2,214,450) | | | | (19,271 | ) |
90 Day Euro Futures | | 03/14/22 | | | 8 | | | | (1,950,670 | ) | | | Short | | | | (1,967,200) | | | | (16,530 | ) |
90 Day Euro Futures | | 09/19/22 | | | 7 | | | | (1,706,137 | ) | | | Short | | | | (1,719,988) | | | | (13,851 | ) |
90 Day Euro Futures | | 03/13/23 | | | 6 | | | | (1,461,503 | ) | | | Short | | | | (1,473,300) | | | | (11,797 | ) |
90 Day Euro Futures | | 12/18/23 | | | 8 | | | | (1,946,870 | ) | | | Short | | | | (1,961,900) | | | | (15,030 | ) |
90 Day Euro Futures | | 12/16/24 | | | 22 | | | | (5,347,293 | ) | | | Short | | | | (5,386,150) | | | | (38,857 | ) |
U.S.10-Year Ultra Bond | | 09/19/19 | | | 74 | | | | (9,948,755 | ) | | | Short | | | | (10,221,250) | | | | (272,495 | ) |
U.S.2-Year Treasury Note | | 09/30/19 | | | 752 | | | | (160,710,054 | ) | | | Short | | | | (161,815,125) | | | | (1,105,071 | ) |
U.S.5-Year Treasury Note | | 09/30/19 | | | 1,280 | | | | (149,352,679 | ) | | | Short | | | | (151,240,000) | | | | (1,887,321 | ) |
| | | | | | | | | | | | | | | | | | | | | | |
Total Short Futures | | | $ | (3,469,720 | ) |
| | | | | | | | | | | | | | | | | | | | | | |
Centrally Cleared Interest Rate Swaps
| | | | | | | | | | | | | | | | | | | | | | | | | | |
FLOATING RATE
REFERENCE | | PAY/
RECEIVE
FLOATING
RATE | | FIXED
RATE | | | MATURITY
DATE | | | PAY/
RECEIVE
PAYMENT
FREQUENCY | | | NOTIONAL
AMOUNT | | | CLEARED
EXCHANGE | | | UNREALIZED
DEPRECIATION | |
3M LIBOR | | Receive | | | 2.50 | % | | | 6/13/2043 | | | | 1Y/6M | | | | 2,300,000 | | | | CME | | | | (13,411 | ) |
| | | | | | | | | | | | | | | | | | | | | | | | | | |
OTC Credit Default Swaps – Sell Protection(1) (2)
| | | | | | | | | | | | | | | | | | | | | | | | | | | | | | | | | | |
REFERENCE
OBLIGATION | | FIXED-DEAL
RECEIVED
RATE | | | PAYMENT
FREQUENCY | | | MATURITY
DATE | | | COUNTERPARTY | | ORIGINAL
NOTIONAL
AMOUNT | | | CURRENT
NOTIONAL
AMOUNT (3) | | | UPFRONT
PREMIUMS
PAID/
(RECEIVED) | | | FAIR
VALUE (4) | | | UNREALIZED
DEPRECIATION | |
| CMBX.NA.BBB-.6† | | | 3.00 | % | | | 1M | | | | 11/17/2045 | | | JPMorgan Chase Bank N.A. | | | 230,000 | | | | 230,000 | | | $ | 496 | | | $ | (23,033 | ) | | $ | (23,529 | ) |
| CMBX.NA.BBB-.6†+ | | | 3.00 | % | | | 1M | | | | 5/11/2063 | | | Goldman Sachs & Co. | | | 290,000 | | | | 290,000 | | | | (20,924 | ) | | | (29,041 | ) | | | (8,117 | ) |
| | | | | | | | | | | | | | | | | | | | | | | | | | | | | | | | | | |
Total OTC Credit Default Swaps | | | | | | | | | | | | | | | | | | (20,428 | ) | | | (52,074 | ) | | | (31,646 | ) |
| | | | | | | | | | | | | | | | | | | | | | | | | | | | | | | | | | |
| (1) | If the Fund is a seller of protection and a credit event occurs, as defined under the terms of that particular swap agreement, the Fund will either (i) pay to the buyer of protection an amount equal to the notional amount of the swap |
See accompanying Notes to the Financial Statements.
133
Barings Active Short Duration Bond Fund 2019 Annual Report
SCHEDULE OF INVESTMENTS (CONTINUED)
June 30, 2019
| | and take delivery of the referenced obligation or underlying securities comprising the referenced index or (ii) pay a net settlement amount in the form of cash or securities equal to the notional amount of the swap less the recovery value of the referenced obligation or underlying securities comprising the referenced index. |
| (2) | Represents an investment grade index of single name credit default swaps (CDS). All of the companies underlying the single name CDS within the index are rated investment grade or higher. Rating represents a weighted average of the credit ratings of all the companies underlying the single name CDS within the index. |
| (3) | The maximum potential amount the Portfolio could be required to make as a seller of credit protection or receive as a buyer of credit event as defined under the terms of that particular swap agreement. |
| (4) | The quoted market prices and resulting values for credit default swap agreements on asset-backed securities and credit indices serve as an indicator of the current status of the payment/performance risk and represent the expected amount paid or received for the credit derivative if the amount of the swap agreement was closed/sold as of the period end. Increasing market values, in absolute terms when compared to the notional amount of the swap, represent a deterioration of the referenced entity’s credit soundness and a greater likelihood or risk of default or other credit event occurring as defined under the terms of the agreements. |
| † | Payment is based on a percentage of the index. Reference entities are a number of individual issuers comprising the index. |
Abbreviation Legend
See accompanying Notes to the Financial Statements.
134
Barings Diversified Income Fund (formerly Barings Total Return Bond Fund) 2019 Annual Report
SCHEDULE OF INVESTMENTS
June 30, 2019
| | | | | | | | | | | | | | | | | | | | |
| | | EFFECTIVE
INTEREST RATE | | | DUE DATE | | | PRINCIPAL ‡‡ | | | COST | | | FAIR
VALUE | |
Fixed Income — 97.8%*: | |
|
Asset-Backed Securities — 56.4%*: | |
|
CDO/CLO — 37.4%*: | |
AIMCO CLO 10 Ltd., 3M USD LIBOR + 3.550%^ | | | 5.88 | #% | | | 7/22/2032 | | | | 500,000 | | | | $500,000 | | | | $499,999 | |
Allegro CLO X Ltd., 3M USD LIBOR + 2.750%^ | | | 5.25 | # | | | 4/20/2032 | | | | 500,000 | | | | 500,000 | | | | 499,971 | |
Allegro CLO X Ltd., 3M USD LIBOR + 3.800%^ | | | 6.30 | # | | | 4/20/2032 | | | | 500,000 | | | | 500,000 | | | | 499,959 | |
Anchorage Capital CLO Ltd., 3M USD LIBOR + 2.850%^ | | | 5.17 | # | | | 7/15/2032 | | | | 500,000 | | | | 500,000 | | | | 499,999 | |
Ares CLO Ltd.2019-53A C, 3M USD LIBOR + 2.650%^ | | | 5.17 | # | | | 4/24/2031 | | | | 500,000 | | | | 500,000 | | | | 499,949 | |
Avery Point VII CLO Ltd., 3M USD LIBOR + 3.600%^ | | | 5.91 | # | | | 1/15/2028 | | | | 500,000 | | | | 500,000 | | | | 500,000 | |
Bain Capital Credit CLO Ltd.2017-2, 3M USD LIBOR + 2.500%^ | | | 5.08 | # | | | 7/25/2030 | | | | 750,000 | | | | 750,000 | | | | 749,952 | |
Ballyrock CLO2016-1 Ltd., 3M USD LIBOR + 3.500%^ | | | 6.10 | # | | | 10/15/2028 | | | | 500,000 | | | | 500,000 | | | | 500,634 | |
Ballyrock CLO Ltd.2019-1, 3M USD LIBOR + 3.700%^ | | | 6.02 | # | | | 7/15/2032 | | | | 500,000 | | | | 500,000 | | | | 499,999 | |
Carlyle US Clo2017-2 Ltd., 3M USD LIBOR + 2.400%^ | | | 4.99 | # | | | 7/20/2031 | | | | 500,000 | | | | 496,694 | | | | 500,001 | |
CBAM Ltd.2019-10, 3M USD LIBOR + 2.050%^ | | | 4.63 | # | | | 4/20/2032 | | | | 500,000 | | | | 500,000 | | | | 499,945 | |
CBAM Ltd.2019-10, 3M USD LIBOR + 2.750%^ | | | 5.33 | # | | | 4/20/2032 | | | | 500,000 | | | | 500,000 | | | | 500,190 | |
Crestline Denali CLO XIV Ltd., 3M USD LIBOR + 1.800%^ | | | 4.39 | # | | | 10/23/2031 | | | | 250,000 | | | | 250,000 | | | | 246,648 | |
Dryden 50 Senior Loan Fund, 3M USD LIBOR + 2.250%^ | | | 4.85 | # | | | 7/15/2030 | | | | 500,000 | | | | 495,183 | | | | 498,392 | |
Eaton Vance CLO Ltd.2019-1, 3M USD LIBOR + 1.950%^ | | | 4.47 | # | | | 4/15/2031 | | | | 500,000 | | | | 500,000 | | | | 499,963 | |
Eaton Vance CLO Ltd.2019-1, 3M USD LIBOR + 3.750%^ | | | 6.27 | # | | | 4/15/2031 | | | | 300,000 | | | | 300,000 | | | | 300,835 | |
Elmwood CLO II Ltd., 3M USD LIBOR + 2.900%^ | | | 5.45 | # | | | 4/20/2031 | | | | 750,000 | | | | 750,000 | | | | 751,877 | |
Highbridge Loan Management Ltd.12-2018, 3M USD LIBOR + 1.850%^ | | | 4.45 | # | | | 7/18/2031 | | | | 500,000 | | | | 479,124 | | | | 484,748 | |
Horizon Aircraft Finance I Ltd.^ | | | 5.27 | | | | 12/15/2038 | | | | 239,288 | | | | 242,315 | | | | 244,952 | |
Horizon Aircraft Finance II Ltd.^¤ | | | 4.70 | | | | 7/15/2039 | | | | 300,000 | | | | 299,990 | | | | 299,990 | |
Kayne CLO 4 Ltd., 3M USD LIBOR + 2.100%^ | | | 4.68 | # | | | 4/25/2032 | | | | 500,000 | | | | 500,000 | | | | 499,936 | |
KKR Financial CLO Ltd. 25 B1, 3M USD LIBOR + 2.000%^ | | | 4.53 | # | | | 4/15/2032 | | | | 500,000 | | | | 500,000 | | | | 499,962 | |
KKR Financial CLO Ltd. 25 C, 3M USD LIBOR + 2.750%^ | | | 5.28 | # | | | 4/15/2032 | | | | 500,000 | | | | 500,000 | | | | 500,471 | |
KREF Ltd.2018-FL1, 1M USD LIBOR + 2.550%^ | | | 4.94 | # | | | 6/15/2036 | | | | 420,000 | | | | 423,347 | | | | 420,283 | |
Madison Park Funding Ltd. 2019 34A D, 3M USD LIBOR + 3.700%^ | | | 6.28 | # | | | 4/25/2031 | | | | 500,000 | | | | 500,000 | | | | 501,641 | |
Neuberger Berman Loan Advisers CLO 31 Ltd., 3M USD LIBOR + 1.950%^ | | | 4.47 | # | | | 4/20/2031 | | | | 625,000 | | | | 625,000 | | | | 624,960 | |
Octagon Investment Partners 42 Ltd., 3M USD LIBOR + 1.950%^ | | | 4.47 | # | | | 4/15/2031 | | | | 500,000 | | | | 500,000 | | | | 499,961 | |
See accompanying Notes to the Financial Statements.
135
Barings Diversified Income Fund (formerly Barings Total Return Bond Fund) 2019 Annual Report
SCHEDULE OF INVESTMENTS (CONTINUED)
June 30, 2019
| | | | | | | | | | | | | | | | | | | | |
| | | EFFECTIVE
INTEREST RATE | | | DUE DATE | | | PRINCIPAL ‡‡ | | | COST | | | FAIR
VALUE | |
Asset-Backed Securities(Continued) | |
|
CDO/CLO (Continued) | |
OHA Credit Funding 2 Ltd., 3M USD LIBOR + 4.000%^ | | | 6.59 | # % | | | 4/21/2031 | | | | 500,000 | | | $ | 500,149 | | | $ | 500,718 | |
OHA Credit Partners XV Ltd., 3M USD LIBOR + 1.370%^ | | | 3.96 | # | | | 1/20/2030 | | | | 500,000 | | | | 488,840 | | | | 491,336 | |
Riserva CLO Ltd., 3M USD LIBOR + 3.450%^¤ | | | 5.79 | # | | | 10/18/2028 | | | | 500,000 | | | | 500,000 | | | | 500,000 | |
Rockford Tower CLO Ltd.2018-2, 3M USD LIBOR + 1.800%^ | | | 4.39 | # | | | 10/20/2031 | | | | 272,500 | | | | 270,481 | | | | 270,331 | |
TICP CLO VI Ltd.2016-2, 3M USD LIBOR + 3.300%^ | | | 5.69 | # | | | 1/15/2029 | | | | 500,000 | | | | 500,000 | | | | 499,512 | |
Verde CLO, 3M USD LIBOR + 1.900%^ | | | 4.48 | # | | | 4/15/2032 | | | | 500,000 | | | | 500,000 | | | | 499,947 | |
| | | | | | | | | | | | | | | | | | | | |
Total CDO/CLO | | | | | | | | | | | 15,906,788 | | | | 15,871,123 | | | | 15,887,061 | |
| | | | | | | | | | | | | | | | | | | | |
|
Other Asset-Backed Securities — 19.0%*: | |
Aaset2019-1 Trust^ | | | 3.84 | | | | 5/15/2039 | | | | 325,000 | | | | 325,000 | | | | 324,999 | |
Access Group, Inc.2015-1 B, 1M USD LIBOR + 1.500%^ | | | 3.90 | # | | | 7/25/2058 | | | | 100,000 | | | | 86,679 | | | | 92,616 | |
AccessLex Institute2004-1 B, 3M USD LIBOR + 0.570% | | | 2.91 | # | | | 9/22/2037 | | | | 52,200 | | | | 50,215 | | | | 50,124 | |
AccessLex Institute2004-A A3, 28 Day ARS | | | 4.56 | # | | | 7/1/2039 | | | | 100,000 | | | | 98,192 | | | | 98,600 | |
AccessLex Institute2006-1 B, 3M USD LIBOR + 0.450% | | | 2.97 | # | | | 8/25/2037 | | | | 74,807 | | | | 66,092 | | | | 72,032 | |
Adams Outdoor Advertising LP^ | | | 4.81 | | | | 11/15/2048 | | | | 198,330 | | | | 205,828 | | | | 211,016 | |
Arbys Funding LLC2015-1A A2^ | | | 4.97 | | | | 10/30/2045 | | | | 38,600 | | | | 38,600 | | | | 40,744 | |
Ascentium Equipment Receivables2019-1^ | | | 4.31 | | | | 4/12/2027 | | | | 220,000 | | | | 219,959 | | | | 225,105 | |
Ascentium Equipment Receivables Trust2018-2 B^ | | | 5.18 | | | | 7/10/2026 | | | | 81,000 | | | | 80,973 | | | | 84,137 | |
Blackbird Capital Aircraft Lease Securitization Ltd.2016-1^ | | | 5.68 | | | | 12/16/2041 | | | | 212,240 | | | | 220,088 | | | | 222,369 | |
Castlelake Aircraft Securitiza Clast2019-1A | | | 5.10 | | | | 4/15/2039 | | | | 295,528 | | | | 298,474 | | | | 297,036 | |
CLI Funding VI LLC^ | | | 4.64 | | | | 5/18/2044 | | | | 198,077 | | | | 198,045 | | | | 202,544 | |
College Avenue Student Loans LLC 2017, 1M USD LIBOR + 1.650%^ | | | 4.05 | # | | | 11/26/2046 | | | | 81,320 | | | | 82,563 | | | | 82,408 | |
College Loan Corp. Trust I2005-2 B, 3M USD LIBOR + 0.490% | | | 3.09 | # | | | 1/15/2037 | | | | 81,988 | | | | 72,878 | | | | 75,802 | |
College Loan Corp. Trust I2017-1 B2, 28 day ARS | | | 2.19 | # | | | 1/25/2047 | | | | 45,000 | | | | 38,717 | | | | 40,303 | |
Credit Suisse ABS Repackaging Trust2013-A B^ | | | 2.50 | | | | 1/25/2030 | | | | 32,229 | | | | 30,812 | | | | 31,291 | |
EdLinc Student Loan Funding Trust2017-A A, Prime - 1.150%^ | | | 4.35 | # | | | 12/1/2047 | | | | 72,072 | | | | 71,584 | | | | 72,424 | |
EDvestinU Private Education Loan Issue No 1 LLC^ | | | 4.49 | | | | 11/25/2043 | | | | 277,000 | | | | 276,805 | | | | 290,408 | |
Hertz Vehicle Financing II LP^ | | | 5.31 | | | | 10/25/2023 | | | | 310,000 | | | | 319,741 | | | | 326,024 | |
Labrador Aviation Finance Ltd.2016-1A^ | | | 4.30 | | | | 1/15/2042 | | | | 212,240 | | | | 212,824 | | | | 218,675 | |
See accompanying Notes to the Financial Statements.
136
Barings Diversified Income Fund (formerly Barings Total Return Bond Fund) 2019 Annual Report
SCHEDULE OF INVESTMENTS (CONTINUED)
June 30, 2019
| | | | | | | | | | | | | | | | | | | | |
| | | EFFECTIVE
INTEREST RATE | | | DUE DATE | | | PRINCIPAL ‡‡ | | | COST | | | FAIR
VALUE | |
Asset-Backed Securities(Continued) | |
|
Other Asset-Backed Securities (Continued) | |
Navient Student Loan Trust2015-2, 1M USD LIBOR + 1.500% | | | 3.90 | # % | | | 8/25/2050 | | | | 200,000 | | | $ | 198,563 | | | $ | 199,239 | |
Navient Student Loan Trust2018-1B, 1M USD LIBOR + 1.200%^ | | | 3.60 | # | | | 3/25/2067 | | | | 100,000 | | | | 95,818 | | | | 98,962 | |
Nelnet Private Education Loan Trust2016-A A1B^ | | | 3.60 | | | | 12/26/2040 | | | | 37,713 | | | | 37,479 | | | | 37,860 | |
Nelnet Student Loan Trust2006-2 B, 3M USD LIBOR + 0.200% | | | 2.78 | # | | | 1/25/2038 | | | | 226,563 | | | | 212,397 | | | | 217,592 | |
Nelnet Student Loan Trust2006-3, 3M USD LIBOR + 0.250% | | | 2.60 | # | | | 6/25/2041 | | | | 134,886 | | | | 125,979 | | | | 125,107 | |
Nelnet Student Loan Trust2015-3, 1M USD LIBOR + 1.500%^ | | | 3.90 | # | | | 6/25/2054 | | | | 375,000 | | | | 371,747 | | | | 368,204 | |
Pioneer Aircraft Finance Ltd.^+ | | | 4.95 | | | | 6/15/2044 | | | | 330,000 | | | | 329,988 | | | | 335,199 | |
SLC Student Loan Trust2005-1 B, 3M USD LIBOR + 0.200% | | | 2.72 | # | | | 2/15/2045 | | | | 81,923 | | | | 70,854 | | | | 77,215 | |
SLM Student Loan Trust2002-7 A11, 28 day ARS | | | 2.24 | # | | | 3/15/2028 | | | | 50,000 | | | | 49,518 | | | | 49,997 | |
SLM Student Loan Trust2002-7 B, 28 day ARS | | | 5.67 | # | | | 12/15/2039 | | | | 80,000 | | | | 80,058 | | | | 80,000 | |
SLM Student Loan Trust2003-14, 3M USD LIBOR + 0.550% | | | 3.13 | # | | | 10/25/2065 | | | | 188,562 | | | | 179,185 | | | | 178,327 | |
SLM Student Loan Trust2003-2 A9, 28 day ARS | | | 3.63 | # | | | 9/15/2028 | | | | 100,000 | | | | 99,796 | | | | 100,000 | |
SLM Student Loan Trust2003-4 B, 3M USD LIBOR + 0.650% | | | 3.06 | # | | | 6/15/2038 | | | | 57,294 | | | | 52,841 | | | | 53,597 | |
SLM Student Loan Trust2004-1, 3M USD LIBOR + 0.500% | | | 3.08 | # | | | 7/25/2039 | | | | 176,605 | | | | 163,375 | | | | 167,275 | |
SLM Student Loan Trust2005-4 B, 3M USD LIBOR + 0.180% | | | 2.76 | # | | | 7/25/2055 | | | | 96,456 | | | | 83,121 | | | | 90,256 | |
SLM Student Loan Trust2005-6 B, 3M USD LIBOR + 0.290% | | | 2.87 | # | | | 1/25/2044 | | | | 110,233 | | | | 102,441 | | | | 103,053 | |
SLM Student Loan Trust2006-10 B, 3M USD LIBOR + 0.220% | | | 2.80 | # | | | 3/25/2044 | | | | 634,827 | | | | 591,870 | | | | 597,256 | |
SLM Student Loan Trust2006-4 B, 3M USD LIBOR + 0.200% | | | 2.78 | # | | | 1/25/2070 | | | | 136,695 | | | | 127,894 | | | | 127,214 | |
SLM Student Loan Trust2006-5 B, 3M USD LIBOR + 0.210% | | | 2.79 | # | | | 10/25/2040 | | | | 103,171 | | | | 91,033 | | | | 96,136 | |
SLM Student Loan Trust2006-7 B, 3M USD LIBOR + 0.200% | | | 2.78 | # | | | 1/27/2042 | | | | 50,180 | | | | 47,400 | | | | 46,149 | |
SLM Student Loan Trust2013-6, 1M USD LIBOR + 1.500% | | | 3.90 | # | | | 7/26/2083 | | | | 100,000 | | | | 100,000 | | | | 94,770 | |
SLM Student Loan Trust2014-2, 1M USD LIBOR + 1.500% | | | 3.90 | # | | | 1/25/2072 | | | | 100,000 | | | | 100,125 | | | | 99,537 | |
SoFi Consumer Loan Program Trust2019-3^ | | | 3.89 | | | | 5/25/2028 | | | | 200,000 | | | | 199,942 | | | | 202,527 | |
SoFi Professional Loan Program LLC2017-A C^ | | | 4.43 | | | | 3/26/2040 | | | | 100,000 | | | | 99,500 | | | | 105,518 | |
South Carolina Student Loan Corp.2014-1 B, 1M USD LIBOR + 1.500% | | | 3.94 | # | | | 8/1/2035 | | | | 100,000 | | | | 98,597 | | | | 100,786 | |
Store Master FundingI-VII^ | | | 4.74 | | | | 10/20/2048 | | | | 229,233 | | | | 236,075 | | | | 249,252 | |
See accompanying Notes to the Financial Statements.
137
Barings Diversified Income Fund (formerly Barings Total Return Bond Fund) 2019 Annual Report
SCHEDULE OF INVESTMENTS (CONTINUED)
June 30, 2019
| | | | | | | | | | | | | | | | | | | | |
| | | EFFECTIVE
INTEREST RATE | | | DUE DATE | | | PRINCIPAL ‡‡ | | | COST | | | FAIR
VALUE | |
Asset-Backed Securities(Continued) | |
|
Other Asset-Backed Securities(Continued) | |
Taco Bell Funding LLC^ | | | 4.94 | % | | | 11/25/2048 | | | | 39,800 | | | $ | 39,800 | | | $ | 42,375 | |
Taco Bell Funding LLC2016-1A A23^ | | | 4.97 | | | | 5/25/2046 | | | | 68,600 | | | | 69,197 | | | | 71,039 | |
Textainer Marine Containers VII Ltd.^ | | | 5.28 | | | | 4/20/2044 | | | | 197,333 | | | | 197,256 | | | | 203,235 | |
TRIP Rail Master Funding LLC2011-1A A2^ | | | 6.02 | | | | 7/15/2041 | | | | 99,849 | | | | 107,571 | | | | 105,610 | |
Triton Container Finance IV LLC2017-2A A^ | | | 3.62 | | | | 8/20/2042 | | | | 116,532 | | | | 116,519 | | | | 117,909 | |
Wachovia Student Loan Trust2005-1 B, 3M USD LIBOR + 0.300% | | | 2.88 | # | | | 10/25/2040 | | | | 62,798 | | | | 57,779 | | | | 57,695 | |
Willis Engine Structured Trust IV^ | | | 4.75 | | | | 9/15/2043 | | | | 386,469 | | | | 395,329 | | | | 403,472 | |
| | | | | | | | | | | | | | | | | | | | |
Total Other Asset-Backed Securities | | | | | | | | | | | 8,078,353 | | | | 7,923,116 | | | | 8,061,020 | |
| | | | | | | | | | | | | | | | | | | | |
| | | | | | | | | | | | | | | | | | | | |
Total Asset-Backed Securities | | | | | | | | | | | 23,985,141 | | | | 23,794,239 | | | | 23,948,081 | |
| | | | | | | | | | | | | | | | | | | | |
Corporate Bonds — 34.4%*: | |
|
Chemicals — 0.6%*: | |
OCP SA^+ | | | 4.50 | | | | 10/22/2025 | | | | 250,000 | | | | 247,587 | | | | 255,922 | |
| | | | | | | | | | | | | | | | | | | | |
|
Commercial Banks — 5.3%*: | |
ADCB Finance Cayman Ltd.+ | | | 4.50 | | | | 3/6/2023 | | | | 400,000 | | | | 413,161 | | | | 419,000 | |
Bank of China Hong Kong Ltd.^+ | | | 5.90 | | | | 3/14/2067 | | | | 200,000 | | | | 206,679 | | | | 213,043 | |
BBVA Bancomer SA^+ | | | 6.75 | | | | 9/30/2022 | | | | 250,000 | | | | 270,131 | | | | 272,075 | |
Goldman Sachs Group, Inc. (The) | | | 5.75 | | | | 1/24/2022 | | | | 205,000 | | | | 217,969 | | | | 221,561 | |
Morgan Stanley | | | 4.10 | | | | 5/22/2023 | | | | 865,000 | | | | 881,345 | | | | 910,554 | |
Vnesheconombank Via VEB Finance plc^+ | | | 5.94 | | | | 11/21/2023 | | | | 200,000 | | | | 213,446 | | | | 211,750 | |
| | | | | | | | | | | | | | | | | | | | |
Total Commercial Banks | | | | | | | | | | | 2,120,000 | | | | 2,202,731 | | | | 2,247,983 | |
| | | | | | | | | | | | | | | | | | | | |
|
Diversified Financial Services — 5.8%*: | |
AerCap Ireland Capital DAC / AerCap Global Aviation Trust+ | | | 4.88 | | | | 1/16/2024 | | | | 580,000 | | | | 605,208 | | | | 622,807 | |
Capital One Financial Corp. | | | 4.75 | | | | 7/15/2021 | | | | 740,000 | | | | 763,954 | | | | 773,555 | |
Power Finance Corp. Ltd.+ | | | 3.75 | | | | 6/18/2024 | | | | 250,000 | | | | 248,634 | | | | 251,834 | |
REC Ltd.^+ | | | 5.25 | | | | 11/13/2023 | | | | 300,000 | | | | 314,242 | | | | 319,505 | |
Shinhan Financial Group Co. Ltd.+ | | | 5.88 | | | | 7/23/2022 | | | | 200,000 | | | | 204,345 | | | | 211,937 | |
SPARC EM SPC Panama Metro Line 2 SP+ | | | Zero Coupon | | | | 12/5/2022 | | | | 320,311 | | | | 300,639 | | | | 303,098 | |
| | | | | | | | | | | | | | | | | | | | |
Total Diversified Financial Services | | | | | | | | | | | 2,390,311 | | | | 2,437,022 | | | | 2,482,736 | |
| | | | | | | | | | | | | | | | | | | | |
|
Electric — 0.6%*: | |
Tabreed Sukuk Spc Ltd.+ | | | 5.50 | | | | 10/31/2025 | | | | 250,000 | | | | 269,535 | | | | 270,547 | |
| | | | | | | | | | | | | | | | | | | | |
|
Engineering&Construction — 0.6%*: | |
Dianjian International Finance Ltd.+ | | | 4.60 | ** | | | 7/19/2167 | | | | 250,000 | | | | 246,251 | | | | 255,740 | |
| | | | | | | | | | | | | | | | | | | | |
|
Insurance — 0.7%*: | |
Hanwha Life Insurance Co. Ltd.+ | | | 4.70 | | | | 4/23/2048 | | | | 300,000 | | | | 296,852 | | | | 295,974 | |
| | | | | | | | | | | | | | | | | | | | |
See accompanying Notes to the Financial Statements.
138
Barings Diversified Income Fund (formerly Barings Total Return Bond Fund) 2019 Annual Report
SCHEDULE OF INVESTMENTS (CONTINUED)
June 30, 2019
| | | | | | | | | | | | | | | | | | | | |
| | | EFFECTIVE
INTEREST RATE | | | DUE DATE | | | PRINCIPAL ‡‡ | | | COST | | | FAIR
VALUE | |
Corporate Bonds(Continued) | |
|
Iron/Steel — 0.8%*: | |
MMK International Capital DAC^+ | | | 4.38 | % | | | 6/13/2024 | | | | 325,000 | | | $ | 325,000 | | | $ | 329,212 | |
| | | | | | | | | | | | | | | | | | | | |
|
Mining — 1.8%*: | |
Gold Fields Orogen Holdings BVI Ltd.^+ | | | 5.13 | | | | 5/15/2024 | | | | 200,000 | | | | 200,000 | | | | 208,625 | |
MMC Norilsk Nickel OJSC Via MMC Finance DAC^+ | | | 4.10 | | | | 4/11/2023 | | | | 200,000 | | | | 196,239 | | | | 202,250 | |
Volcan Cia Minera SAA^+ | | | 5.38 | | | | 2/2/2022 | | | | 350,000 | | | | 362,386 | | | | 363,125 | |
| | | | | | | | | | | | | | | | | | | | |
Total Mining | | | | | | | | | | | 750,000 | | | | 758,625 | | | | 774,000 | |
| | | | | | | | | | | | | | | | | | | | |
|
Miscellaneous Manufacturing — 1.8%*: | |
General Electric Co. | | | 5.30 | | | | 2/11/2021 | | | | 730,000 | | | | 749,143 | | | | 756,324 | |
| | | | | | | | | | | | | | | | | | | | |
|
Multi-National — 2.2%*: | |
Africa Finance Corp.^+ | | | 4.38 | | | | 4/17/2026 | | | | 260,000 | | | | 258,117 | | | | 268,330 | |
Black Sea Trade & Development Bank+ | | | 3.50 | | | | 6/25/2024 | | | | 200,000 | | | | 199,087 | | | | 201,458 | |
Eastern & Southern African Trade & Development Bank+ | | | 4.88 | | | | 5/23/2024 | | | | 200,000 | | | | 198,927 | | | | 205,374 | |
Eastern & Southern African Trade & Development Bank+ | | | 5.38 | | | | 3/14/2022 | | | | 250,000 | | | | 256,665 | | | | 259,231 | |
| | | | | | | | | | | | | | | | | | | | |
Total Multi-National | | | | | | | | | | | 910,000 | | | | 912,796 | | | | 934,393 | |
| | | | | | | | | | | | | | | | | | | | |
|
Oil and Gas — 1.6%*: | |
Gazprom OAO Via Gaz Capital SA+ | | | 2.95 | | | | 1/24/2024 | | | | 250,000 | | | | 291,519 | | | | 304,880 | |
Helmerich & Payne, Inc. | | | 4.65 | | | | 3/15/2025 | | | | 25,000 | | | | 25,360 | | | | 26,467 | |
Petroleos Mexicanos+ | | | 8.25 | | | | 6/2/2022 | | | | 250,000 | | | | 359,829 | | | | 347,339 | |
| | | | | | | | | | | | | | | | | | | | |
Total Oil and Gas | | | | | | | | | | | 525,000 | | | | 676,708 | | | | 678,686 | |
| | | | | | | | | | | | | | | | | | | | |
|
Pharmaceuticals — 2.2%*: | |
CVS Health Corp. | | | 3.35 | | | | 3/9/2021 | | | | 905,000 | | | | 907,503 | | | | 917,572 | |
| | | | | | | | | | | | | | | | | | | | |
|
Pipelines — 1.0%*: | |
Energy Transfer Operating LP | | | 7.50 | | | | 10/15/2020 | | | | 37,000 | | | | 38,889 | | | | 39,246 | |
KazTransGas JSC^+ | | | 4.38 | | | | 9/26/2027 | | | | 400,000 | | | | 405,941 | | | | 408,380 | |
| | | | | | | | | | | | | | | | | | | | |
Total Pipelines | | | | | | | | | | | 437,000 | | | | 444,830 | | | | 447,626 | |
| | | | | | | | | | | | | | | | | | | | |
|
Real Estate — 2.6%*: | |
NE Property BV+ | | | 2.63 | | | | 5/22/2023 | | | | 260,000 | | | | 286,007 | | | | 302,617 | |
NE Property BV+ | | | 3.75 | | | | 2/26/2021 | | | | 300,000 | | | | 344,834 | | | | 354,073 | |
Powerlong Real Estate Holdings Ltd.+ | | | 5.95 | | | | 7/19/2020 | | | | 200,000 | | | | 197,862 | | | | 199,000 | |
Shimao Property Holdings Ltd. | | | 6.38 | | | | 10/15/2021 | | | | 250,000 | | | | 259,928 | | | | 261,250 | |
| | | | | | | | | | | | | | | | | | | | |
Total Real Estate | | | | | | | | | | | 1,010,000 | | | | 1,088,631 | | | | 1,116,940 | |
| | | | | | | | | | | | | | | | | | | | |
|
Retail — 2.0%*: | |
Dollar Tree, Inc. | | | 3.70 | | | | 5/15/2023 | | | | 620,000 | | | | 634,853 | | | | 640,152 | |
El Puerto de Liverpool SAB de CV+^ | | | 3.95 | | | | 10/2/2024 | | | | 200,000 | | | | 199,386 | | | | 201,002 | |
| | | | | | | | | | | | | | | | | | | | |
Total Retail | | | | | | | | | | | 820,000 | | | | 834,239 | | | | 841,154 | |
| | | | | | | | | | | | | | | | | | | | |
See accompanying Notes to the Financial Statements.
139
Barings Diversified Income Fund (formerly Barings Total Return Bond Fund) 2019 Annual Report
SCHEDULE OF INVESTMENTS (CONTINUED)
June 30, 2019
| | | | | | | | | | | | | | | | | | | | |
| | | EFFECTIVE
INTEREST RATE | | | DUE DATE | | | PRINCIPAL ‡‡ | | | COST | | | FAIR
VALUE | |
Corporate Bonds(Continued) | |
|
Telecommunications — 3.2%*: | |
AT&T, Inc. | | | 3.00 | % | | | 6/30/2022 | | | | 855,000 | | | $ | 849,602 | | | $ | 869,973 | |
Bharti Airtel International Netherlands BV^+ | | | 5.35 | | | | 5/20/2024 | | | | 450,000 | | | | 466,260 | | | | 476,523 | |
| | | | | | | | | | | | | | | | | | | | |
Total Telecommunications | | | | | | | | | | | 1,305,000 | | | | 1,315,862 | | | | 1,346,496 | |
| | | | | | | | | | | | | | | | | | | | |
|
Trucking and Leasing — 1.6%*: | |
Park Aerospace Holdings Ltd.^+ | | | 5.25 | | | | 8/15/2022 | | | | 650,000 | | | | 682,762 | | | | 686,270 | |
| | | | | | | | | | | | | | | | | | | | |
Total Corporate Bonds | | | | | | | | | | | 13,927,311 | | | | 14,396,077 | | | | 14,637,575 | |
| | | | | | | | | | | | | | | | | | | | |
Mortgage-Backed Securities — 6.3%*: | |
BANK 2017-BNK4 | | | 4.37 | | | | 5/15/2050 | | | | 400,000 | | | | 411,889 | | | | 419,495 | |
BANK 2017-BNK4 | | | 4.67 | | | | 4/15/2052 | | | | 196,000 | | | | 201,822 | | | | 211,571 | |
BBCMS 2018-CHRS Mortgage Trust^ | | | 4.41 | | | | 8/5/2038 | | | | 100,000 | | | | 97,744 | | | | 106,046 | |
BHMS, 1M USD LIBOR + 1.500%^ | | | 3.89 | # | | | 7/15/2035 | | | | 100,000 | | | | 100,000 | | | | 99,999 | |
COMM 2014-LC17 Mortgage Trust | | | 4.70 | | | | 10/10/2047 | | | | 400,000 | | | | 410,423 | | | | 414,840 | |
COMM 2014-UBS5 Mortgage Trust | | | 4.76 | | | | 9/10/2047 | | | | 195,000 | | | | 197,739 | | | | 201,676 | |
Connecticut Avenue Securities Trust2019-R02, 1M USD LIBOR + 2.300%^ | | | 4.70 | # | | | 8/25/2031 | | | | 230,000 | | | | 229,945 | | | | 232,243 | |
Connecticut Avenue Securities Trust2019-R03, 1M USD LIBOR + 2.150%^ | | | 4.55 | # | | | 9/25/2031 | | | | 200,000 | | | | 200,000 | | | | 201,046 | |
GS Mortgage Securities Corp. II^ | | | 3.00 | | | | 7/10/2051 | | | | 165,000 | | | | 138,374 | | | | 147,492 | |
GS Mortgage Securities Trust2016-GS2 | | | 4.68 | | | | 5/10/2049 | | | | 200,000 | | | | 207,130 | | | | 215,281 | |
J.P. Morgan Chase Commercial Mortgage Securities Trust2019-OSB^ | | | 3.78 | | | | 6/5/2039 | | | | 213,000 | | | | 211,293 | | | | 215,590 | |
Wells Fargo Commercial Mortgage Trust 2015-NXS3 | | | 4.64 | | | | 9/15/2057 | | | | 200,000 | | | | 200,998 | | | | 210,761 | |
| | | | | | | | | | | | | | | | | | | | |
Total Mortgage-Backed Securities | | | | | | | 2,599,000 | | | | 2,607,357 | | | | 2,676,040 | |
| | | | | | | | | | | | | | | | |
U.S. Treasury & Government Agencies — 0.7%*: | |
U.S. Treasury Notes | | | 2.75 | | | | 11/30/2020 | | | | 300,000 | | | | 301,623 | | | | 303,750 | |
| | | | | | | | | | | | | | | | | | | | |
Total Fixed Income | | | | | | | 40,811,452 | | | | 41,099,296 | | | | 41,565,446 | |
| | | | | | | | | | | | | | | | |
Short-Term Investments — 3.8%*: | | | | |
|
Commercial Paper — 3.8%*: | |
|
Agriculture — 1.0%*: | |
BAT International Finance PLC+ | | | 2.91 | | | | 7/9/2019 | | | | 400,000 | | | | 399,747 | | | | 399,747 | |
| | | | | | | | | | | | | | | | | | | | |
|
Construction Materials — 0.9%*: | |
Fortive Corp. | | | 2.68 | | | | 7/10/2019 | | | | 400,000 | | | | 399,736 | | | | 399,736 | |
| | | | | | | | | | | | | | | | | | | | |
|
Electric — 0.9%*: | |
Entergy Corp. | | | 2.83 | | | | 8/8/2019 | | | | 400,000 | | | | 398,830 | | | | 398,830 | |
| | | | | | | | | | | | | | | | | | | | |
See accompanying Notes to the Financial Statements.
140
Barings Diversified Income Fund (formerly Barings Total Return Bond Fund) 2019 Annual Report
SCHEDULE OF INVESTMENTS (CONTINUED)
June 30, 2019
| | | | | | | | | | | | | | | | | | | | |
| | | EFFECTIVE
INTEREST RATE | | | DUE
DATE | | | PRINCIPAL ‡‡ | | | COST | | | FAIR
VALUE | |
Short-Term Investments(Continued) | |
|
Oil and Gas — 1.0%*: | |
Enbridge, Inc. | | | 2.86 | % | | | 7/1/2019 | | | | 400,000 | | | $ | 400,000 | | | $ | 400,000 | |
| | | | | | | | | | | | | | | | | | | | |
Total Commercial Paper | | | | | | | 1,600,000 | | | | 1,598,313 | | | | 1,598,313 | |
| | | | | | | | | | | | | | | | |
Total Short-Term Investments | | | | | | | 1,600,000 | | | | 1,598,313 | | | | 1,598,313 | |
| | | | | | | | | | | | | | | | |
Total Investments | | | | | | | 42,411,452 | | | | 42,697,609 | | | | 43,163,759 | |
| | | | | | | | | | | | | | | | |
| | |
Other assets and liabilities — (1.6%)* | | | | | | | (664,932 | ) |
| | | | | | | | | | | | | | | | | | | | |
| | |
Net Assets — 100.0% | | | | | | | $42,498,827 | |
| | | | | | | | | | | | | | | | | | | | |
| ‡‡ | Unless otherwise indicated, all principal amounts are denominated in United States Dollars. |
| * | Calculated as a percentage of net assets applicable to common shareholders. |
| | Distributions of investments by country of risk (excluding temporary cash investments) as a percentage of total investments in securities, is as follows: |
| | | | | | |
| | United States | | | 76.4% | |
| | Cayman Islands | | | 4.5% | |
| | Niger | | | 2.6% | |
| | Ireland | | | 2.4% | |
| | Ivory Coast | | | 2.3% | |
| | Mexico | | | 1.9% | |
| | Russia | | | 1.7% | |
| | Iran | | | 1.4% | |
| | India | | | 1.3% | |
| | Slovakia | | | 1.2% | |
| | Other (Individually less than 1%) | | | 4.3% | |
| | | | | | |
| | Total | | | 100.0% | |
| | | | | | |
| ^ | Security acquired in a transaction exempt from registration under Rule 144A of the Securities Act of 1933. These securities may only be resold in transactions exempt from registration, normally to qualified institutional buyers. |
| ¤ | For fair value measurement disclosure purposes, security is categorized as Level 3 (See Note 2). |
| # | Variable rate security. The interest rate shown is the rate in effect at June 30, 2019. |
| ** | Variable Rate is Fixed to Float: Rate remains fixed until designated future date. |
See accompanying Notes to the Financial Statements.
141
Barings Diversified Income Fund (formerly Barings Total Return Bond Fund) 2019 Annual Report
SCHEDULE OF INVESTMENTS (CONTINUED)
June 30, 2019
Affiliate Table
| | | | | | | | | | | | | | | | | | | | | | | | | | | | | | | | | | | | | | |
| | | NUMBER
OF
SHARES
HELD AT
6/30/18 | | VALUE AT
6/30/18 | | | COST
OF
PURCHASES | | | PROCEEDS
FROM
SHARES
SOLD | | | REALIZED
GAIN
(LOSS) | | | CHANGE IN
UNREALIZED
APPRECIATION/
DEPRECIATION | | | NUMBER
OF
SHARES
HELD AT
6/30/19 | | | VALUE AT
6/30/19 | | | DIVIDEND
INCOME | | | CAPITAL
GAIN
DISTRIBUTIONS | |
Barings U.S. High Yield Fund | | 268,341 | | $ | 2,635,105 | | | $ | 110,810 | | | $ | (2,719,379 | ) | | $ | (4,629 | ) | | $ | (21,907 | ) | | | — | | | $ | — | | | $ | 113,100 | | | $ | — | |
A summary of outstanding derivatives at June 30, 2019 is as follows:
Forward Foreign Currency Exchange Contracts to Buy
| | | | | | | | | | | | | | | | | | | | | | |
EXPIRATION
DATE | | COUNTERPARTY | | LOCAL
CURRENCY | | | VALUE IN USD | | | IN
EXCHANGE
FOR USD | | | NET UNREALIZED
APPRECIATION
(DEPRECIATION) | |
| 10/29/19 | | JPMorgan Chase Bank N.A. | | | ARS | | | | 571,814 | | | $ | 11,319 | | | $ | 11,064 | | | $ | 255 | |
| 10/29/19 | | Bank of America N.A. | | | ARS | | | | 571,815 | | | | 11,320 | | | | 11,264 | | | | 56 | |
| 10/29/19 | | BNP Paribas S.A. | | | ARS | | | | 2,551,033 | | | | 50,498 | | | | 48,158 | | | | 2,340 | |
| 7/5/19 | | Barclays Bank plc | | | EUR | | | | 841,179 | | | | 956,750 | | | | 957,923 | | | | (1,173 | ) |
| 7/5/19 | | Barclays Bank plc | | | GBP | | | | 301,887 | | | | 383,441 | | | | 383,884 | | | | (443 | ) |
| | | | | | | | | | | | | | | | | | | | | | |
Net unrealized appreciation on forward foreign currency exchange contracts to buy | | | $ | 1,035 | |
| | | | | |
Forward Foreign Currency Exchange Contracts to Sell
| | | | | | | | | | | | | | | | | | | | | | |
EXPIRATION
DATE | | COUNTERPARTY | | LOCAL
CURRENCY | | | VALUE IN USD | | | IN
EXCHANGE
FOR USD | | | NET UNREALIZED
APPRECIATION
(DEPRECIATION) | |
| 10/29/19 | | JPMorgan Chase Bank N.A. | | | ARS | | | | 571,814 | | | $ | 11,319 | | | $ | 11,064 | | | $ | (255 | ) |
| 10/29/19 | | Bank of America N.A. | | | ARS | | | | 571,815 | | | | 11,319 | | | | 11,264 | | | | (55 | ) |
| 10/29/19 | | BNP Paribas S.A. | | | ARS | | | | 2,551,033 | | | | 50,498 | | | | 48,158 | | | | (2,340 | ) |
| 7/5/19 | | Barclays Bank plc | | | EUR | | | | 841,179 | | | | 956,750 | | | | 939,458 | | | | (17,292 | ) |
| 8/6/19 | | Barclays Bank plc | | | EUR | | | | 853,464 | | | | 973,258 | | | | 974,443 | | | | 1,185 | |
| 7/5/19 | | Barclays Bank plc | | | GBP | | | | 301,887 | | | | 383,441 | | | | 380,871 | | | | (2,570 | ) |
| 8/6/19 | | Barclays Bank plc | | | GBP | | | | 277,484 | | | | 352,998 | | | | 353,368 | | | | 370 | |
| | | | | | | | | | | | | | | | | | | | | | |
Net unrealized depreciation on forward foreign currency exchange contracts to sell | | | $ | (20,957 | ) |
| | | | | |
Currency Legend
| | | | |
| ARS | | – | | Argentine Peso |
| CRC | | – | | Costa Rican Colon |
| EUR | | – | | Euro |
| GBP | | – | | British Pound Sterling |
| KES | | – | | Kenyan Shilling |
| RON | | – | | Romanian New Leu |
See accompanying Notes to the Financial Statements.
142
Barings Diversified Income Fund (formerly Barings Total Return Bond Fund) 2019 Annual Report
SCHEDULE OF INVESTMENTS (CONTINUED)
June 30, 2019
Futures
| | | | | | | | | | | | | | | | | | | | | | |
| TYPE | | EXPIRATION
DATE | | CONTRACTS | | | NOTIONAL
AMOUNT | | | POSITION | | | FAIR VALUE | | | UNREALIZED
DEPRECIATION | |
Short Futures | |
Euro-BOBL Future | | 09/06/19 | | | 3 | | | | (461,180 | ) | | | Short | | | | $ (458,615) | | | $ | (2,565 | ) |
Euro-SCHATZ Future | | 09/06/19 | | | 3 | | | | (383,812 | ) | | | Short | | | | (383,038) | | | | (774 | ) |
U.S.2-Year Treasury Note | | 09/30/19 | | | 6 | | | | (1,300,234 | ) | | | Short | | | | (1,291,078) | | | | (9,156 | ) |
U.S.5-Year Treasury Note | | 09/30/19 | | | 83 | | | | (9,927,090 | ) | | | Short | | | | (9,806,969) | | | | (120,121 | ) |
U.S.10-Year Ultra Bond | | 09/19/19 | | | 14 | | | | (1,985,303 | ) | | | Short | | | | (1,933,750) | | | | (51,553 | ) |
| | | | | | | | | | | | | | | | | | | | | | |
Total Short Futures | | | $ | (184,169 | ) |
| | | | | | | | | | | | | | | | | | | | | | |
OTC Credit Default Swaps – Sell Protection(1) (2)
| | | | | | | | | | | | | | | | | | | | | | | | | | | | | | | | | | |
REFERENCE
OBLIGATION | | FIXED-DEAL
RECEIVED
RATE | | | PAYMENT
FREQUENCY | | | MATURITY
DATE | | | COUNTERPARTY | | ORIGINAL
NOTIONAL
AMOUNT | | | CURRENT
NOTIONAL
AMOUNT (3) | | | UPFRONT
PREMIUMS
PAID/
(RECEIVED) | | | FAIR
VALUE (4) | | | UNREALIZED
DEPRECIATION | |
| CMBX.NA.BBB-.6† | | | 3.00 | % | | | 1M | | | | 11/17/2045 | | | JPMorgan Chase Bank N.A. | | | 60,000 | | | | 60,000 | | | $ | 130 | | | $ | (6,008 | ) | | $ | (6,138 | ) |
| CMBX.NA.BBB-.6† | | | 3.00 | % | | | 1M | | | | 5/11/2063 | | | Goldman Sachs & Co. | | | 70,000 | | | | 70,000 | | | | (5,051 | ) | | | (7,010 | ) | | | (1,959 | ) |
| | | | | | | | | | | | | | | | | | | | | | | | | | | | | | | | | | |
Total OTC Credit Default Swaps | | | | | | | | | | | | | | | | | | (4,921 | ) | | | (13,018 | ) | | | (8,097 | ) |
| | | | | | | | | | | | | | | | | | | | | | | | | | | | | | | | | | |
| (1) | If the Fund is a seller of protection and a credit event occurs, as defined under the terms of that particular swap agreement, the Fund will either (i) pay to the buyer of protection an amount equal to the notional amount of the swap and take delivery of the referenced obligation or underlying securities comprising the referenced index or (ii) pay a net settlement amount in the form of cash or securities equal to the notional amount of the swap less the recovery value of the referenced obligation or underlying securities comprising the referenced index. |
| (2) | Represents an investment grade index of single name credit default swaps (CDS). All of the companies underlying the single name CDS within the index are rated investment grade or higher. Rating represents a weighted average of the credit ratings of all the companies underlying the single name CDS within the index. |
| (3) | The maximum potential amount the Portfolio could be required to make as a seller of credit protection or receive as a buyer of credit event as defined under the terms of that particular swap agreement. |
| (4) | The quoted market prices and resulting values for credit default swap agreements on asset-backed securities and credit indices serve as an indicator of the current status of the payment/performance risk and represent the expected amount paid or received for the credit derivative if the amount of the swap agreement was closed/sold as of the period end. Increasing market values, in absolute terms when compared to the notional amount of the swap, represent a deterioration of the referenced entity’s credit soundness and a greater likelihood or risk of default or other credit event occurring as defined under the terms of the agreements. |
| † | Payment is based on a percentage of the index. Reference entities are a number of individual issuers comprising the index. |
Abbreviation Legend
See accompanying Notes to the Financial Statements.
143
Barings Emerging Markets Debt Blended Total Return Fund 2019 Annual Report
SCHEDULE OF INVESTMENTS
June 30, 2019
| | | | | | | | | | | | | | | | | | | | |
| | | EFFECTIVE
INTEREST RATE | | | DUE DATE | | | PRINCIPAL ‡‡ | | | COST | | | FAIR
VALUE | |
Fixed Income — 97.2%*: | |
|
Corporate Bonds — 39.3%*: | |
|
Agriculture — 2.6%*: | |
MHP SE+^ | | | 7.75 | % | | | 5/10/2024 | | | | 1,250,000 | | | | $1,248,255 | | | | $1,327,050 | |
| | | | | | | | | | | | | | | | | | | | |
|
Chemicals — 2.8%*: | |
Consolidated Energy Finance SA+^ | | | 6.88 | | | | 6/15/2025 | | | | 170,000 | | | | 175,428 | | | | 174,107 | |
Grupo Idesa SA de CV+^ | | | 7.88 | | | | 12/18/2020 | | | | 1,000,000 | | | | 938,443 | | | | 748,750 | |
Petkim Petrokimya Holding AS+^ | | | 5.88 | | | | 1/26/2023 | | | | 500,000 | | | | 469,929 | | | | 483,750 | |
| | | | | | | | | | | | | | | | | | | | |
Total Chemicals | | | | | | | | | | | 1,670,000 | | | | 1,583,800 | | | | 1,406,607 | |
| | | | | | | | | | | | | | | | | | | | |
|
Commercial Banks — 12.0%*: | |
Alfa Bank AO Via Alfa Bond Issuance plc, 5 year USD Swap + 6.660%+ | | | 8.00 | # | | | 12/29/2049 | | | | 400,000 | | | | 415,240 | | | | 409,864 | |
Banco Mercantil del Norte SA, 10 year CMT + 5.470%+^ | | | 7.50 | #b | | | 1/1/1900 | | | | 315,000 | | | | 315,000 | | | | 318,386 | |
Banco Mercantil del Norte SA, 10 year CMT + 5.353% | | | 7.63 | | | | 1/1/1900 | | | | 500,000 | | | | 546,032 | | | | 513,750 | |
Itau Unibanco Holding SA | | | 6.13 | # | | | 6/12/2066 | | | | 500,000 | | | | 501,499 | | | | 508,675 | |
Standard Bank Group Ltd., 5 year USD Swap + 3.754%+ | | | 5.95 | # | | | 5/31/2029 | | | | 397,000 | | | | 397,000 | | | | 412,880 | |
TBC Bank JSC^+ | | | 5.75 | | | | 6/19/2024 | | | | 675,000 | | | | 667,846 | | | | 671,625 | |
TBC Bank JSC+ | | | 10.78 | ** | | | 12/31/2099 | | | | 645,000 | | | | 645,000 | | | | 645,000 | |
Turkiye Halk Bankasi AS+^ | | | 3.88 | | | | 2/5/2020 | | | | 300,000 | | | | 290,974 | | | | 292,799 | |
Turkiye Halk Bankasi AS+^ | | | 4.75 | | | | 2/11/2021 | | | | 600,000 | | | | 559,169 | | | | 550,687 | |
Turkiye Is Bankasi AS+^ | | | 5.00 | | | | 6/25/2021 | | | | 500,000 | | | | 473,144 | | | | 486,325 | |
Turkiye Sinai Kalkinma Bankasi AS+ | | | 4.88 | | | | 5/18/2021 | | | | 750,000 | | | | 703,324 | | | | 720,000 | |
Turkiye Sinai Kalkinma Bankasi AS+ | | | 5.13 | | | | 4/22/2020 | | | | 500,000 | | | | 488,837 | | | | 496,590 | |
| | | | | | | | | | | | | | | | | | | | |
Total Commercial Banks | | | | | | | | | | | 6,082,000 | | | | 6,003,065 | | | | 6,026,581 | |
| | | | | | | | | | | | | | | | | | | | |
|
Energy-Alternate Sources — 0.8%*: | |
Adani Green Energy UP Ltd./Prayatna Developers Pvt Ltd./Parampujya Solar Energ^+ | | | 6.25 | | | | 12/10/2024 | | | | 397,000 | | | | 397,000 | | | | 405,361 | |
| | | | | | | | | | | | | | | | | | | | |
|
Food — 2.0%*: | |
MARB BondCo plc^+ | | | 6.88 | | | | 1/19/2025 | | | | 500,000 | | | | 512,195 | | | | 521,615 | |
Minerva Luxembourg SA+^ | | | 5.88 | | | | 1/19/2028 | | | | 500,000 | | | | 465,781 | | | | 500,000 | |
| | | | | | | | | | | | | | | | | | | | |
Total Food | | | | | | | | | | | 1,000,000 | | | | 977,976 | | | | 1,021,615 | |
| | | | | | | | | | | | | | | | | | | | |
|
Iron/Steel — 1.6%*: | |
CSN Resources SA+^ | | | 7.63 | | | | 2/13/2023 | | | | 750,000 | | | | 743,939 | | | | 791,250 | |
| | | | | | | | | | | | | | | | | | | | |
|
Mining — 2.1%*: | |
Petra Diamonds US Treasury plc+^ | | | 7.25 | | | | 5/1/2022 | | | | 1,050,000 | | | | 1,048,058 | | | | 1,039,500 | |
| | | | | | | | | | | | | | | | | | | | |
|
Oil and Gas — 3.8%*: | |
Kosmos Energy Ltd.^+ | | | 7.13 | | | | 4/4/2026 | | | | 755,000 | | | | 755,000 | | | | 760,663 | |
See accompanying Notes to the Financial Statements.
144
Barings Emerging Markets Debt Blended Total Return Fund 2019 Annual Report
SCHEDULE OF INVESTMENTS (CONTINUED)
June 30, 2019
| | | | | | | | | | | | | | | | | | | | |
| | | EFFECTIVE
INTEREST RATE | | | DUE DATE | | | PRINCIPAL ‡‡ | | | COST | | | FAIR
VALUE | |
Corporate Bonds(Continued) | |
|
Oil and Gas (Continued) | |
Petroleos Mexicanos+ | | | 6.75 | % | | | 9/21/2047 | | | | 750,000 | | | $ | 704,685 | | | $ | 667,875 | |
Tullow Oil plc+^ | | | 7.00 | | | | 3/1/2025 | | | | 500,000 | | | | 492,865 | | | | 508,125 | |
| | | | | | | | | | | | | | | | | | | | |
Total Oil and Gas | | | | | | | | | | | 2,005,000 | | | | 1,952,550 | | | | 1,936,663 | |
| | | | | | | | | | | | | | | | | | | | |
|
Real Estate — 4.9%*: | |
Kaisa Group Holdings Ltd.+ | | | 11.25 | | | | 4/9/2022 | | | | 750,000 | | | | 766,297 | | | | 773,592 | |
New Metro Global Ltd.+ | | | 6.50 | | | | 4/23/2021 | | | | 500,000 | | | | 491,493 | | | | 505,035 | |
Powerlong Real Estate Holdings Ltd.+ | | | 5.95 | | | | 7/19/2020 | | | | 300,000 | | | | 298,155 | | | | 298,500 | |
Sunac China Holdings Ltd.+ | | | 7.95 | | | | 10/11/2023 | | | | 630,000 | | | | 625,456 | | | | 633,345 | |
Yuzhou Properties Co. Ltd.+ | | | 6.38 | | | | 3/6/2021 | | | | 250,000 | | | | 249,852 | | | | 251,381 | |
| | | | | | | | | | | | | | | | | | | | |
Total Real Estate | | | | | | | | | | | 2,430,000 | | | | 2,431,253 | | | | 2,461,853 | |
| | | | | | | | | | | | | | | | | | | | |
|
Retail — 1.6%*: | |
Eurotorg LLC Via Bonitron DAC+^ | | | 8.75 | | | | 10/30/2022 | | | | 750,000 | | | | 757,668 | | | | 791,250 | |
| | | | | | | | | | | | | | | | | | | | |
|
Telecommunications — 3.6%*: | |
Axtel SAB de CV^+ | | | 6.38 | | | | 11/14/2024 | | | | 500,000 | | | | 501,742 | | | | 509,844 | |
IHS Netherlands Holdco BV+^ | | | 9.50 | | | | 10/27/2021 | | | | 550,000 | | | | 556,652 | | | | 570,669 | |
Oztel Holdings SPC Ltd.^+ | | | 6.63 | | | | 4/24/2028 | | | | 500,000 | | | | 492,262 | | | | 491,250 | |
Turk Telekomunikasyon AS+^ | | | 6.88 | | | | 2/28/2025 | | | | 250,000 | | | | 248,559 | | | | 251,451 | |
| | | | | | | | | | | | | | | | | | | | |
Total Telecommunications | | | | | | | | | | | 1,800,000 | | | | 1,799,215 | | | | 1,823,214 | |
| | | | | | | | | | | | | | | | | | | | |
|
Water — 1.5%*: | |
Aegea Finance Sarl+^ | | | 5.75 | | | | 10/10/2024 | | | | 750,000 | | | | 715,572 | | | | 774,609 | |
| | | | | | | | | | | | | | | | | | | | |
Total Corporate Bonds | | | | | | | | | | | 19,934,000 | | | | 19,658,351 | | | | 19,805,553 | |
| | | | | | | | | | | | | | | | | | | | |
|
Foreign Government — 57.9%*: | |
|
Albania — 1.0%*: | |
Albania Government International Bond+^ | | | 3.50 | | | | 10/9/2025 | | | | 400,000 | | | | 460,779 | | | | 481,562 | |
| | | | | | | | | | | | | | | | | | | | |
|
Angola — 1.0%*: | |
Angolan Government International Bond+^ | | | 8.25 | | | | 5/9/2028 | | | | 480,000 | | | | 496,414 | | | | 513,600 | |
| | | | | | | | | | | | | | | | | | | | |
|
Argentina — 3.6%*: | |
Argentine Republic Government International Bond+ | | | 5.00 | | | | 1/15/2027 | | | | 100,000 | | | | 84,429 | | | | 82,973 | |
Argentine Republic Government International Bond+ | | | 8.28 | | | | 12/31/2033 | | | | 1,065,549 | | | | 857,441 | | | | 888,402 | |
Provincia de Buenos Aires+ | | | 4.00 | | | | 5/1/2020 | | | | 299,988 | | | | 335,305 | | | | 331,629 | |
Provincia de Cordoba+^ | | | 7.13 | | | | 6/10/2021 | | | | 580,000 | | | | 591,169 | | | | 498,800 | |
| | | | | | | | | | | | | | | | | | | | |
Total Argentina | | | | | | | | | | | 2,045,537 | | | | 1,868,344 | | | | 1,801,804 | |
| | | | | | | | | | | | | | | | | | | | |
|
Brazil — 5.2%*: | |
Brazil Notas do Tesouro Nacional Serie B+ | | | 6.00 | | | | 8/15/2050 | | | | 2,240,000 | | | | 2,213,659 | | | | 2,609,957 | |
| | | | | | | | | | | | | | | | | | | | |
See accompanying Notes to the Financial Statements.
145
Barings Emerging Markets Debt Blended Total Return Fund 2019 Annual Report
SCHEDULE OF INVESTMENTS (CONTINUED)
June 30, 2019
| | | | | | | | | | | | | | | | | | | | |
| | | EFFECTIVE
INTEREST RATE | | | DUE DATE | | | PRINCIPAL ‡‡ | | | COST | | | FAIR
VALUE | |
Corporate Bonds(Continued) | |
|
Colombia — 2.9%*: | |
Colombian TES+ | | | 7.50 | % | | | 8/26/2026 | | | | 1,350,000,000 | | | $ | 448,592 | | | $ | 464,739 | |
Colombian TES+ | | | 10.00 | | | | 7/24/2024 | | | | 2,688,600,000 | | | | 1,037,234 | | | | 1,011,168 | |
| | | | | | | | | | | | | | | | | | | | |
Total Colombia | | | | | | | | | | | 4,038,600,000 | | | | 1,485,826 | | | | 1,475,907 | |
| | | | | | | | | | | | | | | | | | | | |
|
Dominican Republic — 1.4%*: | |
Dominican Republic International Bond+^ | | | 8.63 | | | | 4/20/2027 | | | | 570,000 | | | | 666,119 | | | | 680,443 | |
| | | | | | | | | | | | | | | | | | | | |
|
Ecuador — 1.0%*: | |
Ecuador Government International Bond+^ | | | 9.65 | | | | 12/13/2026 | | | | 480,000 | | | | 491,207 | | | | 520,650 | |
| | | | | | | | | | | | | | | | | | | | |
|
Egypt — 4.2%*: | |
Egypt Government International Bond^+ | | | 6.38 | | | | 4/11/2031 | | | | 1,000,000 | | | | 1,122,349 | | | | 1,156,999 | |
Egypt Treasury Bills+ | | | Zero Coupon | | | | 7/2/2019 | | | | 10,550,000 | | | | 590,821 | | | | 630,827 | |
Egypt Treasury Bills+ | | | Zero Coupon | | | | 7/16/2019 | | | | 5,275,000 | | | | 293,170 | | | | 314,151 | |
| | | | | | | | | | | | | | | | | | | | |
Total Egypt | | | | | | | | | | | 16,825,000 | | | | 2,006,340 | | | | 2,101,977 | |
| | | | | | | | | | | | | | | | | | | | |
|
El Salvador — 3.6%*: | |
El Salvador Government International Bond+^ | | | 7.38 | | | | 12/1/2019 | | | | 200,000 | | | | 200,798 | | | | 202,000 | |
El Salvador Government International Bond+^ | | | 8.25 | | | | 4/10/2032 | | | | 600,000 | | | | 642,969 | | | | 661,500 | |
El Salvador Government International Bond+^ | | | 8.63 | | | | 2/28/2029 | | | | 850,000 | | | | 984,025 | | | | 969,000 | |
| | | | | | | | | | | | | | | | | | | | |
Total El Salvador | | | | | | | | | | | 1,650,000 | | | | 1,827,792 | | | | 1,832,500 | |
| | | | | | | | | | | | | | | | | | | | |
|
Ghana — 3.9%*: | |
Ghana Government Bond+^ | | | 10.75 | | | | 10/14/2030 | | | | 700,000 | | | | 864,601 | | | | 887,250 | |
Ghana Government Bond+ | | | 16.50 | | | | 2/6/2023 | | | | 3,500,000 | | | | 807,630 | | | | 594,009 | |
Ghana Government Bond+ | | | 17.60 | | | | 11/28/2022 | | | | 155,000 | | | | 26,007 | | | | 27,189 | |
Ghana Government Bond+ | | | 18.25 | | | | 7/25/2022 | | | | 1,173,000 | | | | 224,514 | | | | 210,081 | |
Ghana Government Bond+ | | | 21.50 | | | | 3/9/2020 | | | | 480,000 | | | | 111,186 | | | | 90,355 | |
Ghana Government Bond+ | | | 24.75 | | | | 3/1/2021 | | | | 155,000 | | | | 30,271 | | | | 30,829 | |
Ghana Government Bond+ | | | 24.75 | | | | 7/19/2021 | | | | 546,000 | | | | 110,872 | | | | 109,885 | |
| | | | | | | | | | | | | | | | | | | | |
Total Ghana | | | | | | | | | | | 6,709,000 | | | | 2,175,081 | | | | 1,949,598 | |
| | | | | | | | | | | | | | | | | | | | |
|
Greece — 0.9%*: | |
Hellenic Republic Government Bond+^ | | | 3.88 | | | | 3/12/2029 | | | | 375,000 | | | | 427,268 | | | | 478,085 | |
| | | | | | | | | | | | | | | | | | | | |
|
Guam — 0.4%*: | |
Guatemala Government Bond^+ | | | 6.13 | | | | 6/1/2050 | | | | 200,000 | | | | 196,635 | | | | 210,375 | |
| | | | | | | | | | | | | | | | | | | | |
|
Honduras — 1.1%*: | |
Honduras Government International Bond^+ | | | 6.25 | | | | 1/19/2027 | | | | 500,000 | | | | 522,340 | | | | 538,125 | |
| | | | | | | | | | | | | | | | | | | | |
See accompanying Notes to the Financial Statements.
146
Barings Emerging Markets Debt Blended Total Return Fund 2019 Annual Report
SCHEDULE OF INVESTMENTS (CONTINUED)
June 30, 2019
| | | | | | | | | | | | | | | | | | | | |
| | | EFFECTIVE
INTEREST RATE | | | DUE DATE | | | PRINCIPAL ‡‡ | | | COST | | | FAIR
VALUE | |
Corporate Bonds(Continued) | |
|
Indonesia — 3.0%*: | |
Indonesia Treasury Bond+ | | | 7.00 | % | | | 5/15/2027 | | | | 3,578,000,000 | | | $ | 239,160 | | | $ | 249,213 | |
Indonesia Treasury Bond+ | | | 8.25 | | | | 5/15/2036 | | | | 3,300,000,000 | | | | 240,475 | | | | 244,098 | |
Indonesia Treasury Bond+ | | | 8.38 | | | | 3/15/2034 | | | | 13,640,000,000 | | | | 1,039,512 | | | | 1,023,423 | |
| | | | | | | | | | | | | | | | | | | | |
Total Indonesia | | | | | | | | | | | 20,518,000,000 | | | | 1,519,147 | | | | 1,516,734 | |
| | | | | | | | | | | | | | | | | | | | |
|
Ivory Coast — 0.9%*: | |
Ivory Coast Government International Bond+^ | | | 5.25 | | | | 3/22/2030 | | | | 420,000 | | | | 453,812 | | | | 466,227 | |
| | | | | | | | | | | | | | | | | | | | |
|
Malaysia — 3.0%*: | |
Malaysia Government Bond+ | | | 3.96 | | | | 9/15/2025 | | | | 1,978,000 | | | | 476,653 | | | | 488,689 | |
Malaysia Government Bond+ | | | 4.92 | | | | 7/6/2048 | | | | 3,800,000 | | | | 991,673 | | | | 1,005,946 | |
| | | | | | | | | | | | | | | | | | | | |
Total Malaysia | | | | | | | | | | | 5,778,000 | | | | 1,468,326 | | | | 1,494,635 | |
| | | | | | | | | | | | | | | | | | | | |
|
Mexico — 11.5%*: | |
Mexican Bonos+ | | | 7.75 | | | | 11/13/2042 | | | | 60,400,000 | | | | 2,915,411 | | | | 3,111,956 | |
Mexican Bonos+ | | | 8.00 | | | | 11/7/2047 | | | | 41,000,000 | | | | 1,872,358 | | | | 2,163,978 | |
Mexico Government International Bond+ | | | 5.75 | | | | 10/12/2110 | | | | 500,000 | | | | 504,497 | | | | 546,250 | |
| | | | | | | | | | | | | | | | | | | | |
Total Mexico | | | | | | | | | | | 101,900,000 | | | | 5,292,266 | | | | 5,822,184 | |
| | | | | | | | | | | | | | | | | | | | |
|
Peru — 2.9%*: | |
Peru Government Bond+ | | | 6.85 | | | | 2/12/2042 | | | | 2,809,000 | | | | 982,347 | | | | 991,660 | |
Peru Government Bond+ | | | 8.20 | | | | 8/12/2026 | | | | 1,300,000 | | | | 465,097 | | | | 489,111 | |
| | | | | | | | | | | | | | | | | | | | |
Total Peru | | | | | | | | | | | 4,109,000 | | | | 1,447,444 | | | | 1,480,771 | |
| | | | | | | | | | | | | | | | | | | | |
|
Senegal — 0.7%*: | |
Senegal Government International Bond+^ | | | 4.75 | | | | 3/13/2028 | | | | 300,000 | | | | 372,120 | | | | 341,770 | |
| | | | | | | | | | | | | | | | | | | | |
|
Ukraine — 5.7%*: | |
Ukraine Government International Bond^+ | | | 6.75 | | | | 6/20/2026 | | | | 595,000 | | | | 670,833 | | | | 716,612 | |
Ukraine Government International Bond+^ | | | 7.75 | | | | 9/1/2020 | | | | 625,000 | | | | 635,575 | | | | 645,703 | |
Ukraine Government International Bond+^ | | | 7.75 | | | | 9/1/2021 | | | | 325,000 | | | | 336,845 | | | | 339,787 | |
Ukraine Government International Bond+^ | | | 8.99 | | | | 2/1/2024 | | | | 600,000 | | | | 597,734 | | | | 653,400 | |
Ukraine Government International Bond+^ | | | 9.75 | | | | 11/1/2028 | | | | 480,000 | | | | 484,473 | | | | 542,100 | |
| | | | | | | | | | | | | | | | | | | | |
Total Ukraine | | | | 2,625,000 | | | | 2,725,460 | | | | 2,897,602 | |
| | | | | | | | | | | | | |
Total Foreign Government | | | | 24,704,206,537 | | | | 28,116,379 | | | | 29,214,506 | |
| | | | | | | | | | | | | |
Total Fixed Income | | | | 24,724,140,537 | | | | 47,774,730 | | | | 49,020,059 | |
| | | | | | | | | | | | | |
See accompanying Notes to the Financial Statements.
147
Barings Emerging Markets Debt Blended Total Return Fund 2019 Annual Report
SCHEDULE OF INVESTMENTS (CONTINUED)
June 30, 2019
| | | | | | | | | | | | | | | | | | | | | | | | | | | | | | |
| | | | | | | |
| COUNTERPARTY | | STRIKE
PRICE | | | EXPIRATION
DATE | | | CONTRACTS | | | NOTIONAL | | | COST | | | UNREALIZED
VALUE | | | FAIR
VALUE | |
Purchased Option — 0.0%**: | |
|
Put Option Purchased — 0.0%*: | |
EUR Put/
USD Call | | Bank of America N.A. | | | $1.13 | | | | 8/5/2019 | | | | 4,000,000 | | | | 4,000,000 | | | | $50,762 | | | | (37,731 | ) | | | $13,031 | |
| | | | | | | | | | | | | | | | | | | | | | | | | | | | | | |
Total Investments | | | | 24,728,140,537 | | | | 47,825,492 | | | | 49,033,090 | |
| | | | | | | | | | | | | |
| |
Other assets and liabilities — 2.8%* | | | | 1,400,943 | |
| | | | | |
| |
Net Assets — 100.0% | | | | $50,434,033 | |
| | | | | |
| b | Security is perpetual in nature and has no stated maturity. |
| ‡‡ | Unless otherwise indicated, all principal amounts are denominated in United States Dollars. |
| * | Calculated as a percentage of net assets applicable to common shareholders. |
| | Distributions of investments by country of risk (excluding temporary cash investments) as a percentage of total investments in securities, is as follows: |
| | | | | | |
| | Mexico | | | 17.5% | |
| | Brazil | | | 10.6% | |
| | Ukraine | | | 9.6% | |
| | Turkey | | | 6.7% | |
| | Ghana | | | 6.6% | |
| | China | | | 5.0% | |
| | Egypt | | | 4.3% | |
| | El Salvador | | | 3.7% | |
| | Argentina | | | 3.7% | |
| | Indonesia | | | 3.1% | |
| | Malaysia | | | 3.0% | |
| | United States | | | 3.0% | |
| | Peru | | | 3.0% | |
| | Colombia | | | 3.0% | |
| | South Africa | | | 2.1% | |
| | Belarus | | | 1.6% | |
| | Dominican Republic | | | 1.4% | |
| | Nigeria | | | 1.2% | |
| | Honduras | | | 1.1% | |
| | United Kingdom | | | 1.1% | |
| | Ecuador | | | 1.1% | |
| | Angola | | | 1.0% | |
| | Albania | | | 1.0% | |
| | Greece | | | 1.0% | |
| | Ivory Coast | | | 1.0% | |
| | Other (Individually less than 1%) | | | 3.6% | |
| | | | | | |
| | Total | | | 100.0% | |
| | | | | | |
See accompanying Notes to the Financial Statements.
148
Barings Emerging Markets Debt Blended Total Return Fund 2019 Annual Report
SCHEDULE OF INVESTMENTS (CONTINUED)
June 30, 2019
| ^ | Security acquired in a transaction exempt from registration under Rule 144A of the Securities Act of 1933. These securities may only be resold in transactions exempt from registration, normally to qualified institutional buyers. |
| # | Variable rate security. The interest rate shown is the rate in effect at June 30, 2019. |
| ** | Variable Rate is Fixed to Float: Rate remains fixed until designated future date. |
A summary of outstanding derivatives at June 30, 2019 is as follows:
Cross Currency Forward Foreign Currency Exchange Contracts
| | | | | | | | | | | | | | | | |
EXPIRATION
DATE | | DELIVER/
RECEIVE | | COUNTERPARTY | | CONTRACT
AMOUNT
PURCHASED | | | CONTRACT
AMOUNT
SOLD | | | NET UNREALIZED
APPRECIATION
(DEPRECIATION) | |
| 7/16/19 | | EUR/CZK | | Citibank N.A. | | | 22,106,795 | | | | 859,234 | | | $ | 10,720 | |
| 7/16/19 | | EUR/CZK | | JPMorgan Chase Bank N.A. | | | 6,134,804 | | | | 241,000 | | | | 65 | |
| 7/16/19 | | EUR/HUF | | Citibank N.A. | | | 310,648,655 | | | | 962,000 | | | | (782 | ) |
| 7/16/19 | | EUR/PLN | | Barclays Bank plc | | | 13,912,601 | | | | 3,231,985 | | | | 48,347 | |
| 7/16/19 | | EUR/PLN | | Citibank N.A. | | | 399,564 | | | | 94,000 | | | | 47 | |
| 7/16/19 | | HUF/EUR | | Barclays Bank plc | | | 677,833 | | | | 218,328,600 | | | | 2,513 | |
| 7/16/19 | | HUF/EUR | | Bank of America N.A. | | | 64,000 | | | | 20,730,080 | | | | (171 | ) |
| | | | | | | | | | | | | | | | |
Net unrealized appreciation on cross currency forward foreign currency exchange contracts | | | $ | 60,739 | |
| | | | | |
Forward Foreign Currency Exchange Contracts to Buy
| | | | | | | | | | | | | | | | | | | | | | |
EXPIRATION
DATE | | COUNTERPARTY | | LOCAL CURRENCY | | | VALUE IN USD | | | IN
EXCHANGE
FOR USD | | | NET UNREALIZED
APPRECIATION
(DEPRECIATION) | |
| 10/29/19 | | BNP Paribas S.A. | | | ARS | | | | 86,840,864 | | | $ | 1,719,020 | | | $ | 1,635,000 | | | $ | 84,020 | |
| 10/29/19 | | Bank of America N.A. | | | ARS | | | | 37,505,807 | | | | 742,429 | | | | 719,609 | | | | 22,820 | |
| 10/29/19 | | Goldman Sachs & Co. | | | ARS | | | | 5,353,250 | | | | 105,968 | | | | 95,000 | | | | 10,968 | |
| 10/29/19 | | JPMorgan Chase Bank N.A. | | | ARS | | | | 47,192,207 | | | | 934,172 | | | | 846,008 | | | | 88,164 | |
| 10/29/19 | | Barclays Bank plc | | | ARS | | | | 15,375,358 | | | | 304,356 | | | | 307,000 | | | | (2,644 | ) |
| 7/23/19 | | Bank of America N.A. | | | AUD | | | | 2,809,573 | | | | 1,973,922 | | | | 2,017,654 | | | | (43,732 | ) |
| 7/23/19 | | Goldman Sachs & Co. | | | AUD | | | | 72,703 | | | | 51,079 | | | | 51,000 | | | | 79 | |
| 7/9/19 | | Barclays Bank plc | | | BRL | | | | 5,016,374 | | | | 1,305,531 | | | | 1,296,254 | | | | 9,277 | |
| 7/9/19 | | Goldman Sachs & Co. | | | BRL | | | | 425,628 | | | | 110,771 | | | | 108,000 | | | | 2,771 | |
| 7/9/19 | | JPMorgan Chase Bank N.A. | | | BRL | | | | 7,896,538 | | | | 2,055,106 | | | | 2,063,807 | | | | (8,701 | ) |
| 7/9/19 | | Citibank N.A. | | | CLP | | | | 617,079,870 | | | | 910,725 | | | | 891,000 | | | | 19,725 | |
| 7/23/19 | | JPMorgan Chase Bank N.A. | | | CNH | | | | 8,019,080 | | | | 1,167,146 | | | | 1,160,000 | | | | 7,146 | |
| 7/9/19 | | Goldman Sachs & Co. | | | COP | | | | 1,598,771,328 | | | | 497,394 | | | | 500,476 | | | | (3,082 | ) |
| 7/16/19 | | Bank of America N.A. | | | EUR | | | | 4,818,765 | | | | 5,485,839 | | | | 5,465,625 | | | | 20,214 | |
| 7/16/19 | | JPMorgan Chase Bank N.A. | | | EUR | | | | 190,362 | | | | 216,714 | | | | 212,978 | | | | 3,736 | |
| 7/16/19 | | Citibank N.A. | | | EUR | | | | 1,294,272 | | | | 1,473,441 | | | | 1,475,727 | | | | (2,286 | ) |
| 7/16/19 | | JPMorgan Chase Bank N.A. | | | GBP | | | | 751,690 | | | | 955,287 | | | | 945,132 | | | | 10,155 | |
See accompanying Notes to the Financial Statements.
149
Barings Emerging Markets Debt Blended Total Return Fund 2019 Annual Report
SCHEDULE OF INVESTMENTS (CONTINUED)
June 30, 2019
| | | | | | | | | | | | | | | | | | | | | | |
EXPIRATION
DATE | | COUNTERPARTY | | LOCAL
CURRENCY | | | VALUE IN USD | | | IN
EXCHANGE
FOR USD | | | NET UNREALIZED
APPRECIATION
(DEPRECIATION) | |
| 7/23/19 | | Barclays Bank plc | | | MYR | | | | 6,329,559 | | | $ | 1,531,731 | | | $ | 1,524,150 | | | $ | 7,581 | |
| 7/23/19 | | Bank of America N.A. | | | NZD | | | | 692,216 | | | | 465,257 | | | | 455,000 | | | | 10,257 | |
| 7/9/19 | | Barclays Bank plc | | | PEN | | | | 979,760 | | | | 297,469 | | | | 296,000 | | | | 1,469 | |
| 7/23/19 | | JPMorgan Chase Bank N.A. | | | PHP | | | | 74,477,250 | | | | 1,452,385 | | | | 1,422,000 | | | | 30,385 | |
| 7/3/19 | | Bank of America N.A. | | | RUB | | | | 3,023,020 | | | | 47,799 | | | | 47,888 | | | | (89 | ) |
| 7/16/19 | | Bank of America N.A. | | | RUB | | | | 61,138,850 | | | | 965,184 | | | | 937,743 | | | | 27,441 | |
| 7/16/19 | | Barclays Bank plc | | | RUB | | | | 10,286,195 | | | | 162,386 | | | | 158,000 | | | | 4,386 | |
| 7/16/19 | | Barclays Bank plc | | | SEK | | | | 8,294,060 | | | | 894,120 | | | | 899,231 | | | | (5,111 | ) |
| 7/16/19 | | Bank of America N.A. | | | SEK | | | | 838,555 | | | | 90,398 | | | | 89,000 | | | | 1,398 | |
| | | | | | | | | | | | | | | | | | | | | | |
Net unrealized appreciation on forward foreign currency exchange contracts to buy | | | $ | 296,347 | |
| | | | | |
Forward Foreign Currency Exchange Contracts to Sell
| | | | | | | | | | | | | | | | | | | | | | |
EXPIRATION
DATE | | COUNTERPARTY | | LOCAL
CURRENCY | | | VALUE IN USD | | | IN
EXCHANGE
FOR USD | | | NET UNREALIZED
APPRECIATION
(DEPRECIATION) | |
| 7/9/19 | | Citibank N.A. | | | BRL | | | | 11,284,812 | | | $ | 2,936,918 | | | $ | 2,898,000 | | | $ | (38,918 | ) |
| 7/16/19 | | Citibank N.A. | | | CHF | | | | 989,121 | | | | 1,014,589 | | | | 993,000 | | | | (21,589 | ) |
| 7/9/19 | | Barclays Bank plc | | | CLP | | | | 1,287,233,350 | | | | 1,899,779 | | | | 1,937,000 | | | | 37,221 | |
| 8/6/19 | | Bank of America N.A. | | | CLP | | | | 362,813,600 | | | | 535,673 | | | | 508,000 | | | | (27,673 | ) |
| 8/6/19 | | Citibank N.A. | | | CLP | | | | 701,259,720 | | | | 1,035,370 | | | | 1,002,000 | | | | (33,370 | ) |
| 7/23/19 | | Goldman Sachs & Co. | | | CNH | | | | 16,394,844 | | | | 2,386,206 | | | | 2,441,707 | | | | 55,501 | |
| 7/9/19 | | Citibank N.A. | | | COP | | | | 4,327,313,825 | | | | 1,346,271 | | | | 1,375,466 | | | | 29,195 | |
| 7/9/19 | | Barclays Bank plc | | | COP | | | | 673,075,800 | | | | 209,401 | | | | 213,675 | | | | 4,274 | |
| 7/9/19 | | Goldman Sachs & Co. | | | COP | | | | 1,654,077,700 | | | | 514,600 | | | | 514,000 | | | | (600 | ) |
| 7/16/19 | | Citibank N.A. | | | GBP | | | | 751,690 | | | | 955,286 | | | | 986,886 | | | | 31,600 | |
| 7/23/19 | | Citibank N.A. | | | IDR | | | | 31,485,936,572 | | | | 2,224,080 | | | | 2,203,200 | | | | (20,880 | ) |
| 8/20/19 | | Citibank N.A. | | | IDR | | | | 3,435,762,000 | | | | 241,788 | | | | 240,937 | | | | (851 | ) |
| 8/20/19 | | Barclays Bank plc | | | IDR | | | | 1,179,654,100 | | | | 83,017 | | | | 83,000 | | | | (17 | ) |
| 7/16/19 | | Citibank N.A. | | | ILS | | | | 3,536,048 | | | | 991,662 | | | | 993,809 | | | | 2,147 | |
| 8/13/19 | | Bank of America N.A. | | | ILS | | | | 5,385,310 | | | | 1,512,867 | | | | 1,498,000 | | | | (14,867 | ) |
| 7/23/19 | | Barclays Bank plc | | | INR | | | | 105,122,099 | | | | 1,520,255 | | | | 1,491,894 | | | | (28,361 | ) |
| 7/23/19 | | Bank of America N.A. | | | JPY | | | | 105,007,138 | | | | 975,554 | | | | 969,000 | | | | (6,554 | ) |
| 7/9/19 | | Citibank N.A. | | | MXN | | | | 75,656,220 | | | | 3,937,239 | | | | 3,882,713 | | | | (54,526 | ) |
| 8/6/19 | | Citibank N.A. | | | MXN | | | | 25,033,119 | | | | 1,296,795 | | | | 1,295,000 | | | | (1,795 | ) |
| 7/23/19 | | Morgan Stanley & Co. | | | MYR | | | | 4,203,353 | | | | 1,017,197 | | | | 1,015,180 | | | | (2,017 | ) |
| 7/23/19 | | Barclays Bank plc | | | NZD | | | | 1,427,290 | | | | 959,319 | | | | 967,100 | | | | 7,781 | |
| 7/9/19 | | Citibank N.A. | | | PEN | | | | 2,238,415 | | | | 679,615 | | | | 675,340 | | | | (4,275 | ) |
| 8/6/19 | | Goldman Sachs & Co. | | | PEN | | | | 3,590,873 | | | | 1,088,871 | | | | 1,080,412 | | | | (8,459 | ) |
| 7/23/19 | | Bank of America N.A. | | | PHP | | | | 126,255,750 | | | | 2,462,120 | | | | 2,418,322 | | | | (43,798 | ) |
| 7/16/19 | | Citibank N.A. | | | RUB | | | | 17,329,545 | | | | 273,577 | | | | 269,000 | | | | (4,577 | ) |
| 7/16/19 | | Bank of America N.A. | | | RUB | | | | 5,808,438 | | | | 91,696 | | | | 92,000 | | | | 304 | |
| 7/23/19 | | Citibank N.A. | | | SGD | | | | 1,308,376 | | | | 967,408 | | | | 968,614 | | | | 1,206 | |
| 8/20/19 | | JPMorgan Chase Bank N.A. | | | SGD | | | | 1,320,232 | | | | 976,571 | | | | 966,000 | | | | (10,571 | ) |
See accompanying Notes to the Financial Statements.
150
Barings Emerging Markets Debt Blended Total Return Fund 2019 Annual Report
SCHEDULE OF INVESTMENTS (CONTINUED)
June 30, 2019
| | | | | | | | | | | | | | | | | | | | | | |
EXPIRATION
DATE | | COUNTERPARTY | | LOCAL
CURRENCY | | | VALUE IN USD | | | IN
EXCHANGE
FOR USD | | | NET UNREALIZED
APPRECIATION
(DEPRECIATION) | |
| 8/20/19 | | Citibank N.A. | | | SGD | | | | 106,818 | | | $ | 79,013 | | | $ | 79,000 | | | $ | (13 | ) |
| 7/23/19 | | Citibank N.A. | | | THB | | | | 31,006,544 | | | | 1,011,509 | | | | 975,567 | | | | (35,942 | ) |
| 7/23/19 | | JPMorgan Chase Bank N.A. | | | THB | | | | 46,440,145 | | | | 1,514,991 | | | | 1,483,000 | | | | (31,991 | ) |
| 7/16/19 | | Bank of America N.A. | | | ZAR | | | | 27,588,691 | | | | 1,955,324 | | | | 1,937,000 | | | | (18,324 | ) |
| 8/13/19 | | Bank of America N.A. | | | ZAR | | | | 14,539,446 | | | | 1,026,917 | | | | 999,000 | | | | (27,917 | ) |
| 8/13/19 | | Barclays Bank plc | | | ZAR | | | | 29,620,276 | | | | 2,092,073 | | | | 2,086,000 | | | | (6,073 | ) |
| | | | | | | | | | | | | | | | | | | | | | |
Net unrealized depreciation on forward foreign currency exchange contracts to sell | | | $ | (274,729 | ) |
| | | | | | | | | | | | | | | | | | | | | | |
Currency Legend
| | | | |
| ARS | | – | | Argentine Peso |
| AUD | | – | | Australian Dollar |
| BRL | | – | | Brazilian Real |
| CHF | | – | | Swiss Franc |
| CLP | | – | | Chilean Peso |
| CNH | | – | | Chinese Yuan Renminbi |
| COP | | – | | Colombian Peso |
| CZK | | – | | Czech Koruna |
| EUR | | – | | Euro |
| GBP | | – | | British Pound Sterling |
| HUF | | – | | Hungarian Forint |
| IDR | | – | | Indonesian Rupiah |
| ILS | | – | | Israeli Shekel |
| INR | | – | | Indian Rupee |
| JPY | | – | | Japanese Yen |
| MXN | | – | | Mexican Peso |
| MYR | | – | | Malaysian Ringgit |
| NZD | | – | | New Zealand Dollar |
| PEN | | – | | Peruvian Nuevo Sol |
| PHP | | – | | Philippines Peso |
| PLN | | – | | Polish Zloty |
| RUB | | – | | Russian Ruble |
| SEK | | – | | Swedish Krona |
| SGD | | – | | Singapore Dollar |
| THB | | – | | Thai Baht |
| ZAR | | – | | South African Rand |
FUTURES
| | | | | | | | | | | | | | | | | | | | | | |
| TYPE | | EXPIRATION
DATE | | CONTRACTS | | | NOTIONAL
AMOUNT | | | POSITION | | | FAIR VALUE | | | UNREALIZED
DEPRECIATION | |
Short Future | |
U.S. Ultra Bond | | 09/19/19 | | | 8 | | | | (1,348,706 | ) | | | Short | | | $ | (1,420,500 | ) | | $ | (71,794 | ) |
| | | | | | | | | | | | | | | | | | | | | | |
See accompanying Notes to the Financial Statements.
151
Barings Emerging Markets Debt Blended Total Return Fund 2019 Annual Report
SCHEDULE OF INVESTMENTS (CONTINUED)
June 30, 2019
Centrally Cleared Interest Rate Swaps
| | | | | | | | | | | | | | | | | | | | | | | | | | |
FLOATING
RATE
REFERENCE | | PAY/RECEIVE
FLOATING
RATE | | FIXED
RATE | | | MATURITY
DATE | | | PAY/RECEIVE
PAYMENT
FREQUENCY | | | NOTIONAL
AMOUNT | | | CLEARED
EXCHANGE | | | UNREALIZED
APPRECIATION
DEPRECIATION | |
HUF-BUBOR Rate | | Receive | | | 1.85 | % | | | 6/25/29 | | | | 1Y/6M | | | | 1,335,000,000 | | | | LCH | | | $ | 24,683 | |
PLN-WIBOR Rate | | Receive | | | 1.87 | % | | | 6/25/24 | | | | 1Y/6M | | | | 12,500,000 | | | | LCH | | | | 850 | |
HUF-BUBOR Rate | | Receive | | | 1.32 | % | | | 12/17/21 | | | | 1Y/6M | | | | 2,241,000,000 | | | | LCH | | | | (170,163 | ) |
HUF-BUBOR Rate | | Receive | | | 2.27 | % | | | 5/27/29 | | | | 1Y/6M | | | | 142,000,000 | | | | LCH | | | | (18,148 | ) |
HUF-BUBOR Rate | | Receive | | | 1.08 | % | | | 2/06/22 | | | | 1Y/6M | | | | 1,590,000,000 | | | | LCH | | | | (65,934 | ) |
PLN-WIBOR Rate | | Receive | | | 2.01 | % | | | 3/22/24 | | | | 1Y/6M | | | | 19,000,000 | | | | LCH | | | | (36,508 | ) |
HUF-BUBOR Rate | | Receive | | | 0.97 | % | | | 3/26/22 | | | | 1Y/6M | | | | 1,500,000,000 | | | | LCH | | | | (36,744 | ) |
| | | | | | | | | | | | | | | | | | | | | | | | | | |
Total Centrally Cleared Interest Rate Swaps | | | | | | | | | | | | | | | $ | (301,964 | ) |
| | | | | | | |
OTC Cross Currency Swaps
| | | | | | | | | | | | | | | | | | | | | | | | | | | | | | | | |
NOTIONAL
AMOUNT | | FUND
PAYS | | PAY/
RECEIVE
PAYMENT
FREQUENCY | | | MATURITY
DATE | | | COUNTERPARTY
| | NOTIONAL
AMOUNT | | | FUND
RECEIVES | | | UPFRONT
PREMIUMS
PAID/
(RECEIVED) | | | FAIR
VALUE | | | UNREALIZED
APPRECIATION
(DEPRECIATION) | |
| 300,000 EUR | | 4.75% | | | 1Y/6M | | | | 03/13/2028 | | | Bank of America N.A. | | | 372,150 USD | | | | 7.43 | % | | $ | 30 | | | $ | 49,024 | | | $ | 48,994 | |
| 595,000 EUR | | 6.75% | | | 1Y/6M | | | | 06/20/2026 | | | Citibank N.A. | | | 671,160 USD | | | | 9.58 | % | | | 327 | | | | (7,225 | ) | | | (7,552 | ) |
| 400,000 EUR | | 3.50% | | | 1Y/6M | | | | 10/09/2025 | | | Citibank N.A. | | | 462,000 USD | | | | 6.56 | % | | | (60 | ) | | | 18,401 | | | | 18,461 | |
| 75,333 EUR | | 4.00% | | | 1Y/6M | | | | 05/01/2020 | | | Citibank N.A. | | | 85,601 USD | | | | 7.30 | % | | | (4 | ) | | | 763 | | | | 767 | |
| 100,000 EUR | | 5.00% | | | 1Y/6M | | | | 01/15/2027 | | | Citibank N.A. | | | 112,980 USD | | | | 7.92 | % | | | – | | | | 1,624 | | | | 1,624 | |
| 158,000 EUR | | 4.00% | | | 1Y/6M | | | | 05/01/2020 | | | Citibank N.A. | | | 180,436 USD | | | | 7.33 | % | | | 750 | | | | 2,604 | | | | 1,854 | |
| 1,000,000 EUR | | 6.88% | | | 1Y/6M | | | | 04/11/2031 | | | Citibank N.A. | | | 1,122,000 USD | | | | 9.95 | % | | | (351 | ) | | | (4,690 | ) | | | (4,339 | ) |
| 66,667 EUR | | 4.00% | | | 1Y/6M | | | | 05/01/2020 | | | Citibank N.A. | | | 76,000 USD | | | | 7.13 | % | | | (3 | ) | | | 804 | | | | 807 | |
| 420,000 EUR | | 3.88% | | | 1Y/6M | | | | 03/22/2030 | | | Citibank N.A. | | | 475,860 USD | | | | 8.19 | % | | | (126 | ) | | | 11,693 | | | | 11,819 | |
| 375,000 EUR | | 3.88% | | | 1Y/6M | | | | 03/12/2029 | | | Citibank N.A. | | | 424,875 USD | | | | 6.64 | % | | | (112 | ) | | | 9,712 | | | | 9,824 | |
| | | | | | | | | | | | | | | | | | | | | | | | | | | | | | | | |
Total OTC Cross Currency Swaps | | | | 451 | | | $ | 82,710 | | | | 82,259 | |
| | | | | | | | | | | | | |
See accompanying Notes to the Financial Statements.
152
Barings Emerging Markets Debt Blended Total Return Fund 2019 Annual Report
SCHEDULE OF INVESTMENTS (CONTINUED)
June 30, 2019
OTC – Interest Rate Swaps
| | | | | | | | | | | | | | |
| DESCRIPTION | | NOTIONAL
AMOUNT | | | UNREALIZED
APPRECIATION
(DEPRECIATION) | | | VALUE | |
Agreement with Bank of America N.A. dated 3/21/2019 receiving a fixed rate of 8.21% paying the notional amount multiplied by the 3 Month MOSPRIME rate. Expiring 3/21/2024. | | RUB | | | 110,000,000 | �� | | $ | 55,451 | | | $ | 55,451 | |
Agreement with Bank of America N.A. dated 3/20/2019 receiving a fixed rate of 8.27% paying the notional amount multiplied by the 3 Month MOSPRIME rate. Expiring 3/21/2024. | | RUB | | | 94,000,000 | | | | 51,166 | | | | 51,166 | |
Agreement with Bank of America N.A. dated 4/16/2019 paying a fixed rate of 8.59% receiving the notional amount multiplied by theBRL-CDI rate. Expiring 1/2/2025. | | BRL | | | 6,000,452 | | | | (151,928 | ) | | | (151,928 | ) |
Agreement with Bank of America N.A. dated 4/9/2019 receiving a fixed rate of 8.31% paying/ the notional amount multiplied by the 3 Month MOSPRIME rate. Expiring 4/10/2024. | | RUB | | | 124,000,000 | | | | 29,638 | | | | 29,638 | |
Agreement with Bank of America N.A. dated 4/2/2019 receiving a fixed rate of 8.40% paying/ the notional amount multiplied by the 3 Month MOSPRIME rate. Expiring 4/3/2024. | | RUB | | | 73,000,000 | | | | 21,794 | | | | 21,794 | |
Agreement with Bank of America N.A. dated 4/8/2019 receiving a fixed rate of 8.35% paying the notional amount multiplied by the 3 Month MOSPRIME rate. Expiring 4/9/2024. | | RUB | | | 124,000,000 | | | | 32,943 | | | | 32,943 | |
Agreement with Bank of America N.A. dated 4/16/2019 paying a fixed rate of 8.60% receiving the notional amount multiplied by theBRL-CDI rate. Expiring 1/2/2025. | | BRL | | | 6,059,774 | | | | (154,386 | ) | | | (154,386 | ) |
Agreement with Bank of America N.A. dated 4/4/2019 receiving a fixed rate of 8.35% paying the notional amount multiplied by the 3 Month MOSPRIME rate. Expiring 4/4/2024. | | RUB | | | 73,000,000 | | | | 19,387 | | | | 19,387 | |
Agreement with BNP Paribas dated 4/16/2019 paying a fixed rate of 8.60% receiving the notional amount multiplied by theBRL-CDI rate. Expiring 1/2/2025. | | BRL | | | 12,869,211 | | | | (327,872 | ) | | | (327,872 | ) |
Agreement with Citibank N.A. dated 3/20/2019 receiving a fixed rate of 8.28% paying the notional amount multiplied by the 3 Month MOSPRIME rate. Expiring 3/21/2024. | | RUB | | | 62,000,000 | | | | 34,164 | | | | 34,164 | |
| | | | | | | | | | | | | | |
Total OTC Interest Rate Swaps | | | | | $ | (389,643 | ) | | $ | (389,643 | ) |
| | | | | | | | | | | |
See accompanying Notes to the Financial Statements.
153
Barings Emerging Markets Debt Blended Total Return Fund 2019 Annual Report
SCHEDULE OF INVESTMENTS (CONTINUED)
June 30, 2019
OTC Credit Default Swaps – Sell Protection(1)
| | | | | | | | | | | | | | | | | | | | | | | | | | | | | | | | | | |
REFERENCE
OBLIGATION | | FIXED-
DEAL
RECEIVED
RATE | | PAYMENT
FREQUENCY | | | MATURITY
DATE | | | COUNTERPARTY | | | ORIGINAL
NOTIONAL
AMOUNT | | | CURRENT
NOTIONAL
AMOUNT (2) | | | UPFRONT
PREMIUMS
PAID/
(RECEIVED) | | | FAIR
VALUE (3) | | | UNREALIZED
APPRECIATION | |
Brazil Government International Bond | | 1.00% | | | 3M | | | | 6/20/2024 | | |
| Bank of
America N.A. |
| | | 500,000 | | | | 500,000 | | | $ | (14,025 | ) | | $ | (11,449 | ) | | $ | 2,576 | |
Colombia Government International Bond | | 1.00% | | | 3M | | | | 6/20/2024 | | |
| Bank of
America N.A. |
| | | 1,000,000 | | | | 1,000,000 | | | | (5,751 | ) | | | 4,328 | | | | 10,079 | |
Indonesia Government International Bond | | 1.00% | | | 3M | | | | 6/20/2024 | | | | BNP Paribas S.A. | | | | 3,000,000 | | | | 3,000,000 | | | | (692 | ) | | | 14,028 | | | | 14,720 | |
Malaysia Government International Bond | | 1.00% | | | 3M | | | | 6/20/2024 | | | | BNP Paribas S.A. | | | | 1,500,000 | | | | 1,500,000 | | | | 27,213 | | | | 33,393 | | | | 6,180 | |
Mexico Government International Bond | | 1.00% | | | 3M | | | | 6/20/2024 | | |
| Bank of
America N.A. |
| | | 1,000,000 | | | | 1,000,000 | | | | (13,605 | ) | | | (4,935 | ) | | | 8,670 | |
Mexico Government International Bond | | 1.00% | | | 3M | | | | 6/20/2024 | | |
| JPMorgan
Chase Bank N.A. |
| | | 500,000 | | | | 500,000 | | | | (6,271 | ) | | | (2,467 | ) | | | 3,804 | |
Peruvian Government International Bond | | 1.00% | | | 3M | | | | 6/20/2024 | | |
| Bank of America
N.A. |
| | | 500,000 | | | | 500,000 | | | | (13,764 | ) | | | (11,449 | ) | | | 2,315 | |
Peruvian Government International Bond | | 1.00% | | | 3M | | | | 6/20/2024 | | |
| Bank of America
N.A. |
| | | 1,000,000 | | | | 1,000,000 | | | $ | 15,119 | | | $ | 22,484 | | | $ | 7,365 | |
| | | | | | | | | | | | | | | | | | | | | | | | | | | | | | | | | | |
Total OTC Credit Default Swaps | | | | | | | | | | | | | | | $ | (11,776 | ) | | $ | 43,933 | | | $ | 55,709 | |
| | | | | | | | | | | | | | | | | | | | | | | | | |
| (1) | If the Fund is a seller of protection and a credit event occurs, as defined under the terms of that particular swap agreement, the Fund will either (i) pay to the buyer of protection an amount equal to the notional amount of the swap and take delivery of the referenced obligation or underlying securities comprising the referenced index or (ii) pay a net settlement amount in the form of cash or securities equal to the notional amount of the swap less the recovery value of the referenced obligation or underlying securities comprising the referenced index. |
| (2) | The maximum potential amount the Portfolio could be required to make as a seller of credit protection or receive as a buyer of credit event as defined under the terms of that particular swap agreement. |
| (3) | The quoted market prices and resulting values for credit default swap agreements on asset-backed securities and credit indices serve as an indicator of the current status of the payment/performance risk and represent the expected amount paid or received for the credit derivative if the amount of the swap agreement was closed/sold as of the period end. Increasing market values, in absolute terms when compared to the notional amount of the swap, represent a deterioration of the referenced entity’s credit soundness and a greater likelihood or risk of default or other credit event occurring as defined under the terms of the agreements. |
Abbreviation Legend
See accompanying Notes to the Financial Statements.
154
Barings Global Emerging Markets Equity Fund 2019 Annual Report
SCHEDULE OF INVESTMENTS
June 30, 2019
| | | | | | | | | | | | |
| | | SHARES | | | COST | | | FAIR
VALUE | |
Equities — 89.6%*: | |
|
Common Stocks — 89.6%*: | |
|
Communication Services — 5.9%*: | |
Mail.Ru Group Ltd.+(a) | | | 4,180 | | | | $110,980 | | | | $106,673 | |
Tencent Holdings Ltd.+ | | | 12,100 | | | | 486,586 | | | | 546,163 | |
| | | | | | | | | | | | |
Total Communication Services | | | 16,280 | | | | 597,566 | | | | 652,836 | |
| | | | | | | | | | | | |
|
Consumer Discretionary — 9.3%*: | |
Alibaba Group Holding Ltd.+(a) | | | 4,029 | | | | 632,446 | | | | 682,714 | |
Naspers Ltd.+ | | | 934 | | | | 196,725 | | | | 226,754 | |
Samsonite International SA^ | | | 55,500 | | | | 164,954 | | | | 127,317 | |
| | | | | | | | | | | | |
Total Consumer Discretionary | | | 60,463 | | | | 994,125 | | | | 1,036,785 | |
| | | | | | | | | | | | |
|
Consumer Staples — 3.1%*: | |
CP ALL Public Company Limited+ | | | 71,600 | | | | 150,312 | | | | 200,786 | |
X5 Retail Group NV+ | | | 4,259 | | | | 103,537 | | | | 146,041 | |
| | | | | | | | | | | | |
Total Consumer Staples | | | 75,859 | | | | 253,849 | | | | 346,827 | |
| | | | | | | | | | | | |
|
Energy — 5.8%*: | |
CNOOC Ltd.+ | | | 117,000 | | | | 215,023 | | | | 200,100 | |
Novatek PJSC+ | | | 646 | | | | 112,843 | | | | 136,952 | |
Reliance Industries Ltd.+^ | | | 8,504 | | | | 288,054 | | | | 307,420 | |
| | | | | | | | | | | | |
Total Energy | | | 126,150 | | | | 615,920 | | | | 644,472 | |
| | | | | | | | | | | | |
|
Financials — 32.7%*: | |
AIA Group Ltd.+ | | | 21,000 | | | | 174,125 | | | | 226,487 | |
B3 SA - Brasil Bolsa Balcao+ | | | 20,557 | | | | 111,069 | | | | 200,540 | |
Banco do Brasil SA+ | | | 8,300 | | | | 56,922 | | | | 116,591 | |
Bancolombia SA+ | | | 3,723 | | | | 152,248 | | | | 190,022 | |
China Construction Bank Corp.+ | | | 496,000 | | | | 410,951 | | | | 427,318 | |
China Pacific Insurance Group Co. Ltd.+ | | | 49,400 | | | | 172,692 | | | | 193,194 | |
Grupo Financiero Banorte SAB de CV+ | | | 30,302 | | | | 215,928 | | | | 175,998 | |
Hana Financial Group, Inc.+ | | | 6,217 | | | | 237,492 | | | | 201,373 | |
HDFC Bank Ltd.+ | | | 3,800 | | | | 358,595 | | | | 494,152 | |
Itau Unibanco Holding SA+ | | | 21,781 | | | | 152,280 | | | | 205,177 | |
Mega Financial Holding Co. Ltd.+ | | | 213,000 | | | | 182,642 | | | | 211,906 | |
Ping An Insurance Group Co. of China Ltd.+ | | | 35,000 | | | | 332,657 | | | | 420,267 | |
PT Bank Negara Indonesia Persero Tbk+ | | | 354,100 | | | | 174,120 | | | | 230,594 | |
Sanlam Ltd.+ | | | 32,257 | | | | 164,909 | | | | 179,000 | |
Sberbank of Russia PJSC+†† | | | 10,509 | | | | 119,730 | | | | 160,578 | |
| | | | | | | | | | | | |
Total Financials | | | 1,305,946 | | | | 3,016,360 | | | | 3,633,197 | |
| | | | | | | | | | | | |
|
Industrials — 3.7%*: | |
China State Construction International Holdings Ltd.+ | | | 210,000 | | | | 198,648 | | | | 215,600 | |
Rumo SA+(a) | | | 36,200 | | | | 125,794 | | | | 195,426 | |
| | | | | | | | | | | | |
Total Industrials | | | 246,200 | | | | 324,442 | | | | 411,026 | |
| | | | | | | | | | | | |
See accompanying Notes to the Financial Statements.
155
Barings Global Emerging Markets Equity Fund 2019 Annual Report
SCHEDULE OF INVESTMENTS (CONTINUED)
June 30, 2019
| | | | | | | | | | | | |
| | | SHARES | | | COST | | | FAIR VALUE | |
Common Stocks(Continued) | |
|
Information Technology — 16.6%*: | |
Chicony Electronics Co. Ltd.+ | | | 49,000 | | | $ | 100,603 | | | $ | 120,530 | |
Hangzhou Hikvision Digital Technology Co. Ltd.+ | | | 33,300 | | | | 135,627 | | | | 133,718 | |
Infosys Ltd.+ | | | 12,411 | | | | 130,681 | | | | 132,798 | |
Samsung Electronics Co. Ltd.+ | | | 17,290 | | | | 692,046 | | | | 703,789 | |
Sunny Optical Technology Group Co. Ltd.+ | | | 9,400 | | | | 108,663 | | | | 97,108 | |
Taiwan Semiconductor Manufacturing Co. Ltd.+ | | | 86,000 | | | | 716,077 | | | | 661,762 | |
| | | | | | | | | | | | |
Total Information Technology | | | 207,401 | | | | 1,883,697 | | | | 1,849,705 | |
| | | | | | | | | | | | |
|
Materials — 6.2%*: | |
Angang Steel Co. Ltd.+ | | | 234,000 | | | | 156,043 | | | | 106,640 | |
Anglo American plc+ | | | 9,442 | | | | 193,738 | | | | 269,886 | |
Cemex SAB de CV+ | | | 16,900 | | | | 120,690 | | | | 71,656 | |
LG Chem Ltd.+ | | | 793 | | | | 250,323 | | | | 243,467 | |
| | | | | | | | | | | | |
Total Materials | | | 261,135 | | | | 720,794 | | | | 691,649 | |
| | | | | | | | | | | | |
|
Real Estate — 4.6%*: | |
China Overseas Land & Investment Ltd.+ | | | 72,000 | | | | 214,001 | | | | 265,448 | |
China Resources Land Ltd.+ | | | 56,000 | | | | 188,928 | | | | 246,604 | |
| | | | | | | | | | | | |
Total Real Estate | | | 128,000 | | | | 402,929 | | | | 512,052 | |
| | | | | | | | | | | | |
|
Utilities — 1.7%*: | |
Huaneng Renewables Corp. Ltd.+ | | | 694,000 | | | | 202,375 | | | | 191,008 | |
| | | | | | | | | | | | |
Total Common Stocks | | | 3,121,434 | | | | 9,012,057 | | | | 9,969,557 | |
| | | | | | | | | | | | |
| | | | | | | | | | | | |
Total Equities | | | 3,121,434 | | | | 9,012,057 | | | | 9,969,557 | |
| | | | | | | | | | | | |
|
Mutual Fund — 3.5%*: | |
iShares MSCI India ETF | | | 11,081 | | | | 372,134 | | | | 391,159 | |
| | | | | | | | | | | | |
Total Investments | | | 3,132,515 | | | | 9,384,191 | | | | 10,360,716 | |
| | | | | | | | | | | | |
| |
Other assets and liabilities — 6.9%* | | | | 764,127 | |
| | | | | | | | | | | | |
| |
Net Assets — 100.0% | | | | $11,124,843 | |
| | | | | | | | | | | | |
| * | Calculated as a percentage of net assets applicable to common shareholders. |
See accompanying Notes to the Financial Statements.
156
Barings Global Emerging Markets Equity Fund 2019 Annual Report
SCHEDULE OF INVESTMENTS (CONTINUED)
June 30, 2019
Distributions of investments by country of risk (excluding temporary cash investments) as a percentage of total investments in securities, is as follows:
| | | | | | |
| | China | | | 36.0% | |
| | India | | | 12.8% | |
| | Republic of Korea | | | 11.1% | |
| | Taiwan | | | 9.6% | |
| | Brazil | | | 6.9% | |
| | South Africa | | | 6.5% | |
| | Russia | | | 5.3% | |
| | Hong Kong | | | 3.4% | |
| | Mexico | | | 2.4% | |
| | Indonesia | | | 2.2% | |
| | Thailand | | | 2.0% | |
| | Colombia | | | 1.8% | |
| | | | | | |
| | Total | | | 100.0% | |
| | | | | | |
| ^ | Security acquired in a transaction exempt from registration under Rule 144A of the Securities Act of 1933. These securities may only be resold in transactions exempt from registration, normally to qualified institutional buyers. |
| (a) | Non-income producing security. |
See accompanying Notes to the Financial Statements.
157
Barings Global High Yield Fund 2019 Annual Report
SCHEDULE OF INVESTMENTS
June 30, 2019
| | | | | | | | | | | | | | | | | | | | |
| | | | | | | | | SHARES | | | COST | | | FAIR
VALUE | |
Equities — 0.3%*: | |
|
Common Stock — 0.3%*: | |
|
Oil and Gas — 0.3%*: | |
Jupiter Resources, Inc.+ | | | | | | | | | | | 33,592 | | | | $162,354 | | | | $88,179 | |
| | | | | | | | | | | | | | | | | | | | |
Warrants — 0.0%*: | |
|
Diversified/Conglomerate Manufacturing — 0.0%*: | |
Appvion Holdings Corp. (exp. June 13, 2023)†† | | | | | | | | | | | 319 | | | | – | | | | 40 | |
Appvion Holdings Corp. (exp. June 13, 2023)†† | | | | | | | | | | | 319 | | | | – | | | | 159 | |
| | | | | | | | | | | | | | | | | | | | |
Total Diversified/Conglomerate Manufacturing | | | | | | | | | | | 638 | | | | – | | | | 199 | |
| | | | | | | | | | | | | | | | | | | | |
Total Warrants | | | | | | | | | | | 638 | | | | – | | | | 199 | |
| | | | | | | | | | | | | | | | | | | | |
Total Equities | | | | | | | | | | | 34,230 | | | | 162,354 | | | | 88,378 | |
| | | | | | | | | | | | | | | | | | | | |
| | | | | |
| | | EFFECTIVE
INTEREST RATE | | | DUE DATE | | | PRINCIPAL ‡‡ | | | COST | | | FAIR
VALUE | |
Fixed Income — 97.4%*: | |
|
Bank Loans — 7.5%*§: | |
|
Aerospace and Defense — 1.0%*: | |
TransDigm, Inc., 1M LIBOR + 2.500% | | | 4.83 | % | | | 6/9/2023 | | | | 242,771 | | | | 239,065 | | | | 238,144 | |
Ducommun, Inc., 1M LIBOR + 4.000% | | | 6.37 | | | | 11/19/2025 | | | | 32,579 | | | | 32,423 | | | | 32,701 | |
| | | | | | | | | | | | | | | | | | | | |
Total Aerospace and Defense | | | | | | | | | | | 275,350 | | | | 271,488 | | | | 270,845 | |
| | | | | | | | | | | | | | | | | | | | |
|
Broadcasting and Entertainment — 0.2%*: | |
CSC Holdings, LLC, 1M LIBOR + 3.000% | | | 5.39 | | | | 4/15/2027 | | | | 40,202 | | | | 39,816 | | | | 40,212 | |
| | | | | | | | | | | | | | | | | | | | |
|
Chemicals, Plastics and Rubber — 0.4%*: | |
Consolidated Energy Finance, S.A., 1M LIBOR + 2.500% | | | 4.90 | | | | 5/7/2025 | | | | 108,390 | | | | 104,294 | | | | 105,409 | |
| | | | | | | | | | | | | | | | | | | | |
|
Containers, Packaging and Glass — 0.5%*: | |
BWAY Holding Co., 1M LIBOR + 3.250% | | | 5.85 | | | | 4/3/2024 | | | | 149,618 | | | | 147,548 | | | | 144,319 | |
| | | | | | | | | | | | | | | | | | | | |
|
Diversified/Conglomerate Manufacturing — 0.2%*: | |
Tank Holding Corp., 1M LIBOR + 4.000% | | | 6.63 | | | | 3/22/2026 | | | | 61,542 | | | | 61,241 | | | | 61,484 | |
| | | | | | | | | | | | | | | | | | | | |
|
Diversified/Conglomerate Service — 0.8%*: | |
Evertec Group, LLC, 1M LIBOR + 3.500% | | | 5.90 | | | | 11/27/2024 | | | | 43,095 | | | | 42,899 | | | | 43,202 | |
Vertafore, Inc., 1M LIBOR + 3.250% | | | 5.65 | | | | 7/2/2025 | | | | 179,100 | | | | 175,119 | | | | 171,861 | |
| | | | | | | | | | | | | | | | | | | | |
Total Diversified/Conglomerate Service | | | | | | | | | | | 222,195 | | | | 218,018 | | | | 215,063 | |
| | | | | | | | | | | | | | | | | | | | |
|
Electronics — 0.4%*: | |
Veritas Bermuda Ltd., 3M LIBOR + 4.500% | | | 6.89 | | | | 1/27/2023 | | | | 124,364 | | | | 115,921 | | | | 112,939 | |
| | | | | | | | | | | | | | | | | | | | |
|
Leisure, Amusement, Entertainment — 0.3%*: | |
SeaWorld Parks & Entertainment, Inc., 3M LIBOR + 3.000% | | | 5.40 | | | | 3/31/2024 | | | | 78,177 | | | | 78,091 | | | | 77,842 | |
| | | | | | | | | | | | | | | | | | | | |
See accompanying Notes to the Financial Statements.
158
Barings Global High Yield Fund 2019 Annual Report
SCHEDULE OF INVESTMENTS (CONTINUED)
June 30, 2019
| | | | | | | | | | | | | | | | | | | | |
| | | EFFECTIVE
INTEREST RATE | | | DUE DATE | | | PRINCIPAL ‡‡ | | | COST | | | FAIR
VALUE | |
|
Bank Loans(Continued) | |
|
Oil and Gas — 1.0%*: | |
Fieldwood Energy LLC, 1M LIBOR + 5.250% | | | 7.65 | % | | | 4/11/2022 | | | | 300,000 | | | $ | 303,377 | | | $ | 277,218 | |
| | | | | | | | | | | | | | | | | | | | |
|
Retail Stores — 0.6%*: | |
Michaels Stores, Inc., 1M LIBOR + 2.500% | | | 4.90 | | | | 1/28/2023 | | | | 178,881 | | | | 174,183 | | | | 172,956 | |
| | | | | | | | | | | | | | | | | | | | |
|
Telecommunications — 2.1%*: | |
CommScope, Inc., 1M LIBOR + 3.250% | | | 5.65 | | | | 4/6/2026 | | | | 29,737 | | | | 29,449 | | | | 29,618 | |
Sabre Industries, Inc. | | | 6.89 | | | | 4/15/2026 | | | | 36,223 | | | | 35,870 | | | | 36,155 | |
Sprint Communications, Inc., 1M LIBOR + 2.500% | | | 4.94 | | | | 2/3/2024 | | | | 172,895 | | | | 166,770 | | | | 170,085 | |
CenturyLink, Inc., 3M LIBOR + 2.750% | | | 5.15 | | | | 1/31/2025 | | | | 247,487 | | | | 245,913 | | | | 241,439 | |
Banff Merger Sub, Inc., 3M LIBOR + 4.250% | | | 6.58 | | | | 10/2/2025 | | | | 113,280 | | | | 112,227 | | | | 107,085 | |
| | | | | | | | | | | | | | | | | | | | |
Total Telecommunications | | | | | | | | | | | 599,622 | | | | 590,229 | | | | 584,382 | |
| | | | | | | | | | | | | | | | | | | | |
| | | | | | | | | | | | | | | | | | | | |
Total Bank Loans | | | | | | | | | | | 2,138,341 | | | | 2,104,206 | | | | 2,062,669 | |
| | | | | | | | | | | | | | | | | | | | |
|
Corporate Bonds — 89.9%*: | |
|
Aerospace and Defense — 1.5%*: | |
Heathrow Finance plc+ | | | 3.88 | | | | 3/1/2027 | | | | 100,000 | | | | 127,117 | | | | 123,528 | |
Triumph Group, Inc. | | | 4.88 | | | | 4/1/2021 | | | | 38,000 | | | | 37,302 | | | | 37,430 | |
Triumph Group, Inc. | | | 7.75 | | | | 8/15/2025 | | | | 250,000 | | | | 250,000 | | | | 241,875 | |
| | | | | | | | | | | | | | | | | | | | |
Total Aerospace and Defense | | | | | | | | | | | 388,000 | | | | 414,419 | | | | 402,833 | |
| | | | | | | | | | | | | | | | | | | | |
|
Automobile — 3.3%*: | |
AA Bond Co. Ltd.+ | | | 4.88 | | | | 7/31/2024 | | | | 100,000 | | | | 124,723 | | | | 124,672 | |
AA Bond Co. Ltd.+ | | | 5.50 | | | | 7/31/2022 | | | | 200,000 | | | | 276,944 | | | | 215,892 | |
Allison Transmission, Inc.^ | | | 5.88 | | | | 6/1/2029 | | | | 120,000 | | | | 120,000 | | | | 126,300 | |
Garrett LX I Sarl/Garrett Borrowing LLC+ | | | 5.13 | | | | 10/15/2026 | | | | 200,000 | | | | 227,313 | | | | 218,664 | |
RAC Bond Co. PLC+ | | | 5.00 | | | | 11/6/2022 | | | | 200,000 | | | | 244,128 | | | | 227,533 | |
| | | | | | | | | | | | | | | | | | | | |
Total Automobile | | | | | | | | | | | 820,000 | | | | 993,108 | | | | 913,061 | |
| | | | | | | | | | | | | | | | | | | | |
|
Beverage, Food and Tobacco — 4.9%*: | |
Boparan Finance PLC+ | | | 5.50 | | | | 7/15/2021 | | | | 150,000 | | | | 192,263 | | | | 104,742 | |
JBS Investments II GmbH^+ | | | 7.00 | | | | 1/15/2026 | | | | 200,000 | | | | 202,913 | | | | 216,600 | |
JBS USA LUX SA/JBS USA Finance, Inc.^ | | | 5.88 | | | | 7/15/2024 | | | | 137,000 | | | | 139,890 | | | | 140,939 | |
JBS USA LUX SA/JBS USA Finance, Inc.^ | | | 6.75 | | | | 2/15/2028 | | | | 250,000 | | | | 250,000 | | | | 271,562 | |
JBS USA LUX SA/JBS USA Food Co./JBS USA Finance, Inc.^ | | | 6.50 | | | | 4/15/2029 | | | | 200,000 | | | | 200,000 | | | | 217,250 | |
KeHE Distributors LLC/KeHE Finance Corp.^ | | | 7.63 | | | | 8/15/2021 | | | | 150,000 | | | | 150,785 | | | | 148,875 | |
Premier Foods Finance plc, 3M GBP LIBOR + 5.000%+ | | | 5.82 | # | | | 7/15/2022 | | | | 100,000 | | | | 126,870 | | | | 127,154 | |
Sunshine Mid BV+ | | | 6.50 | | | | 5/15/2026 | | | | 100,000 | | | | 121,055 | | | | 117,884 | |
| | | | | | | | | | | | | | | | | | | | |
Total Beverage, Food and Tobacco | | | | | | | | | | | 1,287,000 | | | | 1,383,776 | | | | 1,345,006 | |
| | | | | | | | | | | | | | | | | | | | |
See accompanying Notes to the Financial Statements.
159
Barings Global High Yield Fund 2019 Annual Report
SCHEDULE OF INVESTMENTS (CONTINUED)
June 30, 2019
| | | | | | | | | | | | | | | | | | | | |
| | | EFFECTIVE
INTEREST RATE | | | DUE DATE | | | PRINCIPAL ‡‡ | | | COST | | | FAIR
VALUE | |
|
Corporate Bonds(Continued) | |
|
Broadcasting and Entertainment — 8.3%*: | |
Arqiva Broadcast Finance PLC+ | | | 6.75 | % | | | 9/30/2023 | | | | 100,000 | | | $ | 130,610 | | | $ | 136,442 | |
Charter Communications Capital Corp.^ | | | 5.00 | | | | 2/1/2028 | | | | 275,000 | | | | 275,085 | | | | 280,830 | |
Clear Channel Worldwide Holdings, Inc.^ | | | 9.25 | | | | 2/15/2024 | | | | 190,000 | | | | 190,000 | | | | 206,150 | |
DISH DBS Corp. | | | 7.75 | | | | 7/1/2026 | | | | 125,000 | | | | 125,000 | | | | 121,250 | |
Entertainment One Ltd.+ | | | 4.63 | | | | 7/15/2026 | | | | 100,000 | | | | 125,820 | | | | 130,551 | |
Intelsat Jackson Holdings SA^ | | | 8.50 | | | | 10/15/2024 | | | | 250,000 | | | | 250,000 | | | | 247,500 | |
Intelsat Jackson Holdings SA^ | | | 9.75 | | | | 7/15/2025 | | | | 25,000 | | | | 26,264 | | | | 25,500 | |
Netflix, Inc. | | | 3.88 | | | | 11/15/2029 | | | | 100,000 | | | | 111,565 | | | | 123,178 | |
Netflix, Inc.^ | | | 5.38 | | | | 11/15/2029 | | | | 100,000 | | | | 100,000 | | | | 106,219 | |
Nexstar Escrow, Inc.^ | | | 5.63 | | | | 7/15/2027 | | | | 250,000 | | | | 250,000 | | | | 255,938 | |
Sirius XM Radio, Inc.^ | | | 4.63 | | | | 7/15/2024 | | | | 250,000 | | | | 250,000 | | | | 255,820 | |
Sirius XM Radio, Inc.^ | | | 5.50 | | | | 7/1/2029 | | | | 200,000 | | | | 200,000 | | | | 205,040 | |
Tele Columbus AG+ | | | 3.88 | | | | 5/2/2025 | | | | 150,000 | | | | 157,908 | | | | 158,678 | |
| | | | | | | | | | | | | | | | | | | | |
Total Broadcasting and Entertainment | | | | | | | | | | | 2,115,000 | | | | 2,192,252 | | | | 2,253,096 | |
| | | | | | | | | | | | | | | | | | | | |
|
Buildings and Real Estate — 1.0%*: | |
Mattamy Group Corp.+^ | | | 6.50 | | | | 10/1/2025 | | | | 45,000 | | | | 44,022 | | | | 47,419 | |
Mattamy Group Corp.+^ | | | 6.88 | | | | 12/15/2023 | | | | 123,000 | | | | 116,778 | | | | 128,074 | |
Realogy Group LLC/RealogyCo-Issuer Corp.^ | | | 9.38 | | | | 4/1/2027 | | | | 125,000 | | | | 125,000 | | | | 109,531 | |
| | | | | | | | | | | | | | | | | | | | |
Total Buildings and Real Estate | | | | | | | | | | | 293,000 | | | | 285,800 | | | | 285,024 | |
| | | | | | | | | | | | | | | | | | | | |
|
Cargo Transport — 2.8%*: | |
American Airlines Group, Inc.^ | | | 5.00 | | | | 6/1/2022 | | | | 250,000 | | | | 250,000 | | | | 257,575 | |
Kenan Advantage Group, Inc.^ | | | 7.88 | | | | 7/31/2023 | | | | 400,000 | | | | 408,581 | | | | 360,000 | |
XPO Logistics, Inc.^ | | | 6.75 | | | | 8/15/2024 | | | | 150,000 | | | | 150,000 | | | | 159,937 | |
| | | | | | | | | | | | | | | | | | | | |
Total Cargo Transport | | | | | | | | | | | 800,000 | | | | 808,581 | | | | 777,512 | |
| | | | | | | | | | | | | | | | | | | | |
|
Chemicals, Plastics and Rubber — 2.4%*: | |
Consolidated Energy Finance SA^ | | | 6.88 | | | | 6/15/2025 | | | | 100,000 | | | | 99,604 | | | | 102,416 | |
Diversey | | | 5.63 | | | | 8/15/2025 | | | | 100,000 | | | | 107,286 | | | | 94,379 | |
INEOS Group Holdings SA+ | | | 5.38 | | | | 8/1/2024 | | | | 100,000 | | | | 109,614 | | | | 116,837 | |
LBC Tank Terminals Holding Netherlands BV^ | | | 6.88 | | | | 5/15/2023 | | | | 215,000 | | | | 210,061 | | | | 212,850 | |
SGL Carbon SE+ | | | 4.63 | | | | 9/30/2024 | | | | 100,000 | | | | 112,385 | | | | 117,927 | |
| | | | | | | | | | | | | | | | | | | | |
Total Chemicals, Plastics and Rubber | | | | | | | | | | | 615,000 | | | | 638,950 | | | | 644,409 | |
| | | | | | | | | | | | | | | | | | | | |
|
Commercial Services — 0.8%*: | |
Altice Finco S.A.+ | | | 9.00 | | | | 6/15/2023 | | | | 100,000 | | | | 117,139 | | | | 118,240 | |
Wind Tre SpA, 3M EURIBOR + 2.750%+ | | | 2.75 | # | | | 1/20/2024 | | | | 100,000 | | | | 104,316 | | | | 112,144 | |
| | | | | | | | | | | | | | | | | | | | |
Total Commercial Services | | | | | | | | | | | 200,000 | | | | 221,455 | | | | 230,384 | |
| | | | | | | | | | | | | | | | | | | | |
|
Containers, Packaging and Glass — 1.8%*: | |
Ardagh Packaging Finance PLC/Ardagh Holdings USA, Inc.+^ | | | 7.25 | | | | 5/15/2024 | | | | 200,000 | | | | 205,801 | | | | 210,750 | |
BWAY Holding Co. | | | 4.75 | | | | 4/15/2024 | | | | 100,000 | | | | 115,660 | | | | 116,928 | |
See accompanying Notes to the Financial Statements.
160
Barings Global High Yield Fund 2019 Annual Report
SCHEDULE OF INVESTMENTS (CONTINUED)
June 30, 2019
| | | | | | | | | | | | | | | | | | | | |
| | | EFFECTIVE
INTEREST RATE | | | DUE DATE | | | PRINCIPAL ‡‡ | | | COST | | | FAIR
VALUE | |
|
Corporate Bonds(Continued) | |
|
Containers, Packaging and Glass(Continued) | |
BWAY Holding Co.^ | | | 7.25 | % | | | 4/15/2025 | | | | 161,000 | | | $ | 154,161 | | | $ | 155,365 | |
| | | | | | | | | | | | | | | | | | | | |
Total Containers, Packaging and Glass | | | | | | | | | | | 461,000 | | | | 475,622 | | | | 483,043 | |
| | | | | | | | | | | | | | | | | | | | |
|
Diversified/Conglomerate Manufacturing — 1.0%*: | |
Appvion ESC, 3M EURIBOR + 4.125%^¤ | | | 9.00 | # | | | 6/1/2020 | | | | 327,000 | | | | 275,264 | | | | — | |
Colfax Corp.^ | | | 6.38 | | | | 2/15/2026 | | | | 135,000 | | | | 135,000 | | | | 144,788 | |
Energizer Gamma Acquisition BV | | | 4.63 | | | | 7/15/2026 | | | | 100,000 | | | | 116,130 | | | | 118,969 | |
| | | | | | | | | | | | | | | | | | | | |
Total Diversified/Conglomerate Manufacturing | | | | | | | | | | | 562,000 | | | | 526,394 | | | | 263,757 | |
| | | | | | | | | | | | | | | | | | | | |
|
Diversified/Conglomerate Service — 3.6%*: | |
ADT LLC/Prime Finance, Inc.^ | | | 9.25 | | | | 5/15/2023 | | | | 104,000 | | | | 110,238 | | | | 109,221 | |
Algeco Global Finance PLC+ | | | 6.50 | | | | 2/15/2023 | | | | 100,000 | | | | 121,721 | | | | 118,651 | |
Carlson Travel, Inc.^ | | | 9.50 | | | | 12/15/2024 | | | | 280,000 | | | | 280,000 | | | | 279,300 | |
Genesys Telecommunications Laboratories Inc/Greeneden Lux 3 Sarl/Greeneden US Ho^ | | | 10.00 | | | | 11/30/2024 | | | | 153,000 | | | | 165,989 | | | | 166,196 | |
Iron Mountain UK PLC | | | 3.88 | | | | 11/15/2025 | | | | 100,000 | | | | 132,815 | | | | 125,831 | |
Verisure Midholding AB+ | | | 5.75 | | | | 12/1/2023 | | | | 150,000 | | | | 176,872 | | | | 176,325 | |
| | | | | | | | | | | | | | | | | | | | |
Total Diversified/Conglomerate Service | | | | | | | | | | | 887,000 | | | | 987,635 | | | | 975,524 | |
| | | | | | | | | | | | | | | | | | | | |
|
Ecological — 0.5%*: | |
Clean Harbors, Inc.^ | | | 4.88 | | | | 7/15/2027 | | | | 86,000 | | | | 86,000 | | | | 87,406 | |
Clean Harbors, Inc.^ | | | 5.13 | | | | 7/15/2029 | | | | 38,000 | | | | 38,000 | | | | 38,760 | |
| | | | | | | | | | | | | | | | | | | | |
Total Ecological | | | | | | | | | | | 124,000 | | | | 124,000 | | | | 126,166 | |
| | | | | | | | | | | | | | | | | | | | |
|
Electronics — 0.8%*: | |
Veritas US, Inc./Veritas Bermuda Ltd.^ | | | 10.50 | | | | 2/1/2024 | | | | 250,000 | | | | 256,675 | | | | 214,375 | |
| | | | | | | | | | | | | | | | | | | | |
|
Finance — 5.4%*: | |
Arrow Global Finance PLC+ | | | 5.13 | | | | 9/15/2024 | | | | 150,000 | | | | 193,174 | | | | 186,921 | |
Cabot Financial Luxembourg SA+ | | | 7.50 | | | | 10/1/2023 | | | | 100,000 | | | | 133,716 | | | | 131,122 | |
Galaxy Finco Ltd.+ | | | 7.88 | | | | 11/15/2021 | | | | 250,000 | | | | 380,524 | | | | 311,772 | |
Garfunkelux Holdco 3 S.A.+ | | | 8.50 | | | | 11/1/2022 | | | | 400,000 | | | | 559,461 | | | | 455,658 | |
Jerrold Finco PLC+ | | | 6.13 | | | | 1/15/2024 | | | | 100,000 | | | | 124,555 | | | | 128,951 | |
Virto Financial, Inc.^ | | | 6.75 | | | | 6/15/2022 | | | | 244,000 | | | | 248,914 | | | | 252,825 | |
| | | | | | | | | | | | | | | | | | | | |
Total Finance | | | | | | | | | | | 1,244,000 | | | | 1,640,344 | | | | 1,467,249 | |
| | | | | | | | | | | | | | | | | | | | |
|
Healthcare, Education and Childcare — 9.1%*: | |
Advanz Pharma Corp.+ | | | 8.00 | | | | 9/6/2024 | | | | 100,000 | | | | 95,199 | | | | 97,250 | |
Bausch Health Americas., Inc.^ | | | 8.50 | | | | 1/31/2027 | | | | 170,000 | | | | 175,361 | | | | 186,918 | |
Bausch Health Cos., Inc.^ | | | 5.88 | | | | 5/15/2023 | | | | 18,000 | | | | 15,731 | | | | 18,209 | |
Catalent Pharma Solutions, Inc.^ | | | 5.00 | | | | 7/15/2027 | | | | 95,000 | | | | 95,000 | | | | 96,663 | |
Cerba+ | | | 5.38 | | | | 4/15/2025 | | | | 100,000 | | | | 108,705 | | | | 110,299 | |
Cream Tech+ | | | 5.25 | | | | 12/15/2025 | | | | 200,000 | | | | 233,801 | | | | 231,387 | |
Endo Dac/Endo Finance LLC/Endo Finco Inc^ | | | 6.00 | | | | 2/1/2025 | | | | 240,000 | | | | 197,281 | | | | 160,800 | |
See accompanying Notes to the Financial Statements.
161
Barings Global High Yield Fund 2019 Annual Report
SCHEDULE OF INVESTMENTS (CONTINUED)
June 30, 2019
| | | | | | | | | | | | | | | | | | | | |
| | | EFFECTIVE
INTEREST RATE | | | DUE DATE | | | PRINCIPAL ‡‡ | | | COST | | | FAIR
VALUE | |
|
Corporate Bonds(Continued) | |
|
Healthcare, Education and Childcare(Continued) | |
Endo Pharmaceutical^ | | | 7.50 | % | | | 4/1/2027 | | | | 150,000 | | | $ | 150,000 | | | $ | 147,375 | |
Envision Healthcare Corp.^ | | | 8.75 | | | | 10/15/2026 | | | | 250,000 | | | | 250,000 | | | | 174,375 | |
Mallinckrodt International Finance SA/Mallinckrodt CB LLC^ | | | 5.63 | | | | 10/15/2023 | | | | 38,000 | | | | 34,101 | | | | 28,690 | |
Mallinckrodt International Finance SA/Mallinckrodt CB LLC^ | | | 5.75 | | | | 8/1/2022 | | | | 34,000 | | | | 31,787 | | | | 29,240 | |
Nidda Healthcare Holding GmbH+ | | | 3.50 | | | | 9/30/2024 | | | | 100,000 | | | | 112,228 | | | | 117,136 | |
Ortho-Clinical Diagnostics, Inc./Ortho-Clinical Diagnostics SA^ | | | 6.63 | | | | 5/15/2022 | | | | 220,000 | | | | 212,580 | | | | 210,100 | |
Recordati+ | | | 6.75 | | | | 10/30/2025 | | | | 100,000 | | | | 119,267 | | | | 123,497 | |
Service Corp. International/US | | | 5.13 | | | | 6/1/2029 | | | | 250,000 | | | | 250,000 | | | | 263,125 | |
Synlab Unsecured Bondco PLC+ | | | 8.25 | | | | 7/1/2023 | | | | 100,000 | | | | 130,246 | | | | 118,636 | |
Tenet Healthcare Corp.^ | | | 6.25 | | | | 2/1/2027 | | | | 250,000 | | | | 250,000 | | | | 258,750 | |
Unilabs Subholding AB+ | | | 5.75 | | | | 5/15/2025 | | | | 100,000 | | | | 112,188 | | | | 115,700 | |
| | | | | | | | | | | | | | | | | | | | |
Total Healthcare, Education and Childcare | | | | | | | | | | | 2,515,000 | | | | 2,573,475 | | | | 2,488,150 | |
| | | | | | | | | | | | | | | | | | | | |
|
Home and Office Furnishings, Housewares, and Durable Consumer Products — 0.8%*: | |
Balta+ | | | 7.75 | | | | 9/15/2022 | | | | 202,500 | | | | 237,939 | | | | 228,791 | |
| | | | | | | | | | | | | | | | | | | | |
|
Hotels, Motels, Inns and Gaming — 1.7%*: | |
Travelodge+ | | | 8.50 | | | | 5/15/2023 | | | | 160,000 | | | | 224,005 | | | | 212,185 | |
Wynn Las Vegas LLC/Wynn Las Vegas Capital Corp.^ | | | 5.25 | | | | 5/15/2027 | | | | 125,000 | | | | 125,000 | | | | 125,469 | |
Wynn Las Vegas LLC/Wynn Las Vegas Capital Corp.^ | | | 5.50 | | | | 3/1/2025 | | | | 125,000 | | | | 123,493 | | | | 129,100 | |
| | | | | | | | | | | | | | | | | | | | |
Total Hotels, Motels, Inns and Gaming | | | | | | | | | | | 410,000 | | | | 472,498 | | | | 466,754 | |
| | | | | | | | | | | | | | | | | | | | |
|
Insurance — 1.6%*: | |
Acrisure LLC/Acrisure Finance, Inc.^ | | | 7.00 | | | | 11/15/2025 | | | | 250,000 | | | | 250,000 | | | | 225,625 | |
Acrisure LLC/Acrisure Finance, Inc.^ | | | 8.13 | | | | 2/15/2024 | | | | 200,000 | | | | 200,000 | | | | 206,500 | |
| | | | | | | | | | | | | | | | | | | | |
Total Insurance | | | | | | | | | | | 450,000 | | | | 450,000 | | | | 432,125 | |
| | | | | | | | | | | | | | | | | | | | |
|
Leisure, Amusement, Entertainment — 4.5%*: | |
AMC Entertainment Holdings, Inc. | | | 6.38 | | | | 11/15/2024 | | | | 200,000 | | | | 260,077 | | | | 247,112 | |
Brunswick Corp. | | | 7.13 | | | | 8/1/2027 | | | | 192,000 | | | | 201,294 | | | | 224,412 | |
Cedar Fair LP^ | | | 5.25 | | | | 7/15/2029 | | | | 91,000 | | | | 91,000 | | | | 92,848 | |
Center Parks.+ | | | 4.88 | | | | 8/28/2025 | | | | 100,000 | | | | 120,989 | | | | 127,025 | |
Perform Group Financing PLC+ | | | 8.50 | | | | 11/15/2020 | | | | 100,000 | | | | 150,924 | | | | 128,519 | |
Playtech plc+ | | | 4.25 | | | | 3/7/2026 | | | | 100,000 | | | | 116,539 | | | | 120,248 | |
Thomas Cook Group PLC+ | | | 6.25 | | | | 6/15/2022 | | | | 100,000 | | | | 93,525 | | | | 42,694 | |
Vue International Bidco PLC+ | | | 7.88 | | | | 7/15/2020 | | | | 100,000 | | | | 130,542 | | | | 127,000 | |
Warner Music Group | | | 3.63 | | | | 10/15/2026 | | | | 100,000 | | | | 116,499 | | | | 119,964 | |
| | | | | | | | | | | | | | | | | | | | |
Total Leisure, Amusement, Entertainment | | | | | | | | | | | 1,083,000 | | | | 1,281,389 | | | | 1,229,822 | |
| | | | | | | | | | | | | | | | | | | | |
See accompanying Notes to the Financial Statements.
162
Barings Global High Yield Fund 2019 Annual Report
SCHEDULE OF INVESTMENTS (CONTINUED)
June 30, 2019
| | | | | | | | | | | | | | | | | | | | |
| | | EFFECTIVE
INTEREST RATE | | | DUE DATE | | | PRINCIPAL ‡‡ | | | COST | | | FAIR
VALUE | |
|
Corporate Bonds(Continued) | |
|
MachineryNon-Agriculture,Non-Construction,Non-Electronic — 0.8%*: | |
Apex Tool Group LLC/BC Mountain Finance, Inc.^ | | | 9.00 | % | | | 2/15/2023 | | | | 250,000 | | | $ | 250,000 | | | $ | 223,125 | |
| | | | | | | | | | | | | | | | | | | | |
|
Mining, Steel, Iron andNon-Precious Metals — 6.9%*: | |
Constellium NV | | | 4.25 | | | | 2/15/2026 | | | | 200,000 | | | | 231,750 | | | | 233,788 | |
First Quantum Minerals Ltd.+^ | | | 6.88 | | | | 3/1/2026 | | | | 229,000 | | | | 229,000 | | | | 212,398 | |
First Quantum Minerals Ltd.+^ | | | 7.50 | | | | 4/1/2025 | | | | 75,000 | | | | 69,835 | | | | 71,438 | |
Hecla Mining Co. | | | 6.88 | | | | 5/1/2021 | | | | 250,000 | | | | 234,814 | | | | 238,624 | |
Kinross Gold Corp.+ | | | 5.95 | | | | 3/15/2024 | | | | 127,000 | | | | 130,832 | | | | 138,770 | |
Kinross Gold Corp. | | | 6.88 | | | | 9/1/2041 | | | | 82,000 | | | | 81,609 | | | | 92,763 | |
New Gold, Inc.^ | | | 6.25 | | | | 11/15/2022 | | | | 150,000 | | | | 133,518 | | | | 139,875 | |
Northwest Acquisitions ULC/Dominion Finco, Inc.+^ | | | 7.13 | | | | 11/1/2022 | | | | 122,000 | | | | 118,809 | | | | 84,180 | |
Peabody Energy Corp.^ | | | 6.00 | | | | 3/31/2022 | | | | 228,000 | | | | 228,597 | | | | 233,415 | |
SunCoke Energy Partners LP/SunCoke Energy Partners Finance Corp.^ | | | 7.50 | | | | 6/15/2025 | | | | 250,000 | | | | 247,046 | | | | 244,062 | |
Warrior Met Coal, Inc.^ | | | 8.00 | | | | 11/1/2024 | | | | 198,000 | | | | 198,000 | | | | 206,415 | |
| | | | | | | | | | | | | | | | | | | | |
Total Mining, Steel, Iron andNon-Precious Metals | | | | | | | | 1,911,000 | | | | 1,903,810 | | | | 1,895,728 | |
| | | | | | | | | | | | | | | | | | | | |
|
Oil and Gas — 11.4%*: | |
Calumet Specialty Products Partners LP/Calumet Finance Corp. | | | 7.63 | | | | 1/15/2022 | | | | 125,000 | | | | 124,761 | | | | 120,937 | |
CGG Holding US, Inc.+ | | | 7.88 | | | | 5/1/2023 | | | | 150,000 | | | | 183,784 | | | | 182,249 | |
CGG Holding US, Inc.^+ | | | 9.00 | | | | 5/1/2023 | | | | 200,000 | | | | 212,951 | | | | 212,250 | |
Citgo Holding, Inc.^ | | | 10.75 | | | | 2/15/2020 | | | | 341,000 | | | | 341,895 | | | | 352,935 | |
Crestwood Midstream Partners LP / Crestwood Midstream Finance Corp.^ | | | 5.63 | | | | 5/1/2027 | | | | 250,000 | | | | 250,000 | | | | 249,375 | |
Ferrellgas Partners LP/Ferrellgas Partners Finance Corp. | | | 8.63 | | | | 6/15/2020 | | | | 288,000 | | | | 284,900 | | | | 211,680 | |
Genesis Energy LP/Genesis Energy Finance Corp. | | | 6.50 | | | | 10/1/2025 | | | | 300,000 | | | | 300,000 | | | | 293,250 | |
Jonah Energy LLC/Jonah Energy Finance Corp.^ | | | 7.25 | | | | 10/15/2025 | | | | 218,000 | | | | 218,000 | | | | 104,095 | |
KCA Deutag UK Finance PLC+^ | | | 9.63 | | | | 4/1/2023 | | | | 200,000 | | | | 205,150 | | | | 145,500 | |
Laredo Petroleum, Inc. | | | 5.63 | | | | 1/15/2022 | | | | 125,000 | | | | 117,463 | | | | 115,937 | |
Neptune Energy Bondco PLC^ | | | 6.63 | | | | 5/15/2025 | | | | 400,000 | | | | 403,613 | | | | 406,000 | |
Oasis Petroleum, Inc. | | | 6.88 | | | | 1/15/2023 | | | | 65,000 | | | | 64,143 | | | | 65,000 | |
Parkland Fuel Corp.^+ | | | 5.88 | | | | 7/15/2027 | | | | 182,000 | | | | 182,000 | | | | 184,903 | |
SM Energy Co. | | | 6.63 | | | | 1/15/2027 | | | | 119,000 | | | | 119,000 | | | | 110,075 | |
Transocean, Inc. | | | 6.80 | | | | 3/15/2038 | | | | 42,000 | | | | 33,882 | | | | 31,500 | |
Transocean, Inc. | | | 9.35 | | | | 12/15/2041 | | | | 32,000 | | | | 29,810 | | | | 28,960 | |
Welltec A/S+^ | | | 9.50 | | | | 12/1/2022 | | | | 200,000 | | | | 198,574 | | | | 191,000 | |
Whiting Petroleum Corp. | | | 6.63 | | | | 1/15/2026 | | | | 100,000 | | | | 100,178 | | | | 96,438 | |
| | | | | | | | | | | | | | | | | | | | |
Total Oil and Gas | | | | | | | | | | | 3,337,000 | | | | 3,370,104 | | | | 3,102,084 | |
| | | | | | | | | | | | | | | | | | | | |
See accompanying Notes to the Financial Statements.
163
Barings Global High Yield Fund 2019 Annual Report
SCHEDULE OF INVESTMENTS (CONTINUED)
June 30, 2019
| | | | | | | | | | | | | | | | | | | | |
| | | EFFECTIVE
INTEREST RATE | | | DUE DATE | | | PRINCIPAL ‡‡ | | | COST | | | FAIR
VALUE | |
|
Corporate Bonds(Continued) | |
|
Personal andNon-Durable Consumer Products Mfg. Only — 0.4%*: | |
Samsonite Finco Sarl | | | 3.50 | % | | | 5/15/2026 | | | | 100,000 | | | $ | 109,964 | | | $ | 115,473 | |
| | | | | | | | | | | | | | | | | | | | |
|
Personal Transportation — 0.4%*: | |
Getlink SE+ | | | 3.63 | | | | 10/1/2023 | | | | 100,000 | | | | 117,465 | | | | 119,334 | |
| | | | | | | | | | | | | | | | | | | | |
|
Personal, Food and Miscellaneous — 0.8%*: | |
Ocado Group PLC+ | | | 4.00 | | | | 6/15/2024 | | | | 90,000 | | | | 115,256 | | | | 118,164 | |
Simmons Foods, Inc.^ | | | 7.75 | | | | 1/15/2024 | | | | 104,000 | | | | 104,867 | | | | 112,060 | |
| | | | | | | | | | | | | | | | | | | | |
Total Personal, Food and Miscellaneous | | | | | | | | | | | 194,000 | | | | 220,123 | | | | 230,224 | |
| | | | | | | | | | | | | | | | | | | | |
|
Printing and Publishing — 0.3%*: | |
Nielsen Finance LLC/Nielsen Finance Co.^ | | | 5.00 | | | | 4/15/2022 | | | | 73,000 | | | | 71,786 | | | | 72,818 | |
| | | | | | | | | | | | | | | | | | | | |
|
Retail Stores — 2.0%*: | |
Maxeda DIY Holding B.V.+ | | | 6.13 | | | | 7/15/2022 | | | | 100,000 | | | | 114,070 | | | | 112,630 | |
Takko Luxembourg 2 SCA+ | | | 5.38 | | | | 11/15/2023 | | | | 100,000 | | | | 100,068 | | | | 95,516 | |
Travelex Financing PLC+ | | | 8.00 | | | | 5/15/2022 | | | | 300,000 | | | | 337,885 | | | | 339,950 | |
| | | | | | | | | | | | | | | | | | | | |
Total Retail Stores | | | | | | | | | | | 500,000 | | | | 552,023 | | | | 548,096 | |
| | | | | | | | | | | | | | | | | | | | |
|
Telecommunications — 7.2%*: | |
CommScope Technologies Finance LLC^ | | | 6.00 | | | | 6/15/2025 | | | | 102,000 | | | | 94,747 | | | | 95,595 | |
eircom Finance DAC+ | | | 3.50 | | | | 5/15/2026 | | | | 200,000 | | | | 229,035 | | | | 234,811 | |
GrubHub Holdings, Inc.^ | | | 5.50 | | | | 7/1/2027 | | | | 83,000 | | | | 83,000 | | | | 85,189 | |
Intelsat Connect Finance SA^ | | | 9.50 | | | | 2/15/2023 | | | | 89,000 | | | | 87,695 | | | | 78,765 | |
Sprint Corp. | | | 7.63 | | | | 3/1/2026 | | | | 250,000 | | | | 260,767 | | | | 266,500 | |
Sprint Corp. | | | 7.88 | | | | 9/15/2023 | | | | 53,000 | | | | 56,223 | | | | 57,571 | |
Telecom Italia SpA/Milano+ | | | 4.00 | | | | 4/11/2024 | | | | 100,000 | | | | 113,817 | | | | 122,749 | |
United Group BV+ | | | 4.88 | | | | 7/1/2024 | | | | 200,000 | | | | 234,968 | | | | 235,766 | |
UPC Broadband+ | | | 3.63 | | | | 6/15/2029 | | | | 100,000 | | | | 114,358 | | | | 120,533 | |
ViaSat, Inc.^ | | | 5.63 | | | | 4/15/2027 | | | | 149,000 | | | | 149,000 | | | | 154,960 | |
Virgin Media Receivables Financing Notes I DAC+ | | | 5.50 | | | | 9/15/2024 | | | | 100,000 | | | | 134,741 | | | | 131,074 | |
Virgin Media Secured Finance PLC^+ | | | 5.50 | | | | 5/15/2029 | | | | 250,000 | | | | 254,375 | | | | 253,675 | |
Ziggo B.V.+ | | | 4.25 | | | | 1/15/2027 | | | | 100,000 | | | | 115,064 | | | | 120,533 | |
| | | | | | | | | | | | | | | | | | | | |
Total Telecommunications | | | | | | | | | | | 1,776,000 | | | | 1,927,790 | | | | 1,957,721 | |
| | | | | | | | | | | | | | | | | | | | |
|
Utilities — 3.9%*: | |
Energia Group Power & Energy+ | | | 4.00 | | | | 9/15/2025 | | | | 100,000 | | | | 119,009 | | | | 115,313 | |
NextEra Energy Operating Partners LP^ | | | 4.25 | | | | 7/15/2024 | | | | 125,000 | | | | 125,000 | | | | 125,784 | |
Nordex SE+ | | | 6.50 | | | | 2/1/2023 | | | | 100,000 | | | | 124,195 | | | | 114,841 | |
NRG Energy, Inc.^ | | | 5.25 | | | | 6/15/2029 | | | | 250,000 | | | | 250,000 | | | | 266,875 | |
Techem Verwaltungsgesellschaft 674 mbH+ | | | 6.00 | | | | 7/30/2026 | | | | 250,000 | | | | 291,395 | | | | 301,605 | |
See accompanying Notes to the Financial Statements.
164
Barings Global High Yield Fund 2019 Annual Report
SCHEDULE OF INVESTMENTS (CONTINUED)
June 30, 2019
| | | | | | | | | | | | | | | | | | | | |
| | | EFFECTIVE
INTEREST RATE | | | DUE DATE | | | PRINCIPAL ‡‡ | | | COST | | | FAIR
VALUE | |
|
Corporate Bonds(Continued) | |
|
Utilities(Continued) | |
Vistra Operations Co. LLC^ | | | 5.00 | % | | | 7/31/2027 | | | | 125,000 | | | $ | 125,000 | | | $ | 129,531 | |
| | | | | | | | | | | | | | | | | | | | |
Total Utilities | | | | | | | | | | | 950,000 | | | | 1,034,599 | | | | 1,053,949 | |
| | | | | | | | | | | | | | | | | | | | |
Total Corporate Bonds | | | | | | | | | | | 23,897,500 | | | | 25,521,976 | | | | 24,545,633 | |
| | | | | | | | | | | | | | | | | | | | |
Total Fixed Income | | | | | | | | | | | 26,035,841 | | | | 27,626,182 | | | | 26,608,302 | |
| | | | | | | | | | | | | | | | | | | | |
Total Investments | | | | | | | | | | | 26,070,071 | | | | 27,788,536 | | | | 26,696,680 | |
| | | | | | | | | | | | | | | | | | | | |
| | | | | |
Other assets and liabilities — 2.3%* | | | | | | | | | | | | | | | | | | | 616,975 | |
| | | | | | | | | | | | | | | | | | | | |
| | | | | |
Net Assets — 100.0% | | | | | | | | | | | | | | | | | | | $27,313,655 | |
| | | | | | | | | | | | | | | | | | | | |
| ‡‡ | Unless otherwise indicated, all principal amounts are denominated in United States Dollars. |
| * | Calculated as a percentage of net assets applicable to common shareholders. |
Distributions of investments by country of risk (excluding temporary cash investments) as a percentage of total investments in securities, is as follows:
| | | | | | |
| | United States | | | 61.8% | |
| | United Kingdom | | | 16.3% | |
| | Germany | | | 4.7% | |
| | France | | | 2.8% | |
| | Canada | | | 2.5% | |
| | Ireland | | | 2.1% | |
| | Switzerland | | | 1.7% | |
| | Italy | | | 1.3% | |
| | Netherlands | | | 1.3% | |
| | Zambia | | | 1.1% | |
| | Other (Individually less than 1%) | | | 4.4% | |
| | | | | | |
| | Total | | | 100.0% | |
| | | | | | |
| ^ | Security acquired in a transaction exempt from registration under Rule 144A of the Securities Act of 1933. These securities may only be resold in transactions exempt from registration, normally to qualified institutional buyers. |
| § | Bank loans are exempt from registration under the Securities Act of 1933, as amended, but contain certain restrictions on resale and cannot be sold publicly. These loans pay interest at rates which adjust periodically. The interest rates shown for bank loans are the current interest rates at June 30, 2019. Bank loans are also subject to mandatory and/or optional prepayment which cannot be predicted. As a result, the remaining maturity may be substantially less than the stated maturity shown. |
| ¤ | For fair value measurement disclosure purposes, security is categorized as Level 3 (See Note 2). |
| # | Variable rate security. The interest rate shown is the rate in effect at June 30, 2019. |
See accompanying Notes to the Financial Statements.
165
Barings Global High Yield Fund 2019 Annual Report
SCHEDULE OF INVESTMENTS (CONTINUED)
June 30, 2019
A summary of outstanding derivatives at June 30, 2019 is as follows:
Forward Foreign Currency Exchange Contracts to Buy
| | | | | | | | | | | | | | | | | | | | | | |
EXPIRATION
DATE | | COUNTERPARTY | | LOCAL
CURRENCY | | | VALUE IN USD | | | IN
EXCHANGE
FOR USD | | | NET UNREALIZED
DEPRECIATION | |
| 7/8/19 | | Barclays Bank plc | | | EUR | | | | 100,479 | | | $ | 114,313 | | | $ | 114,498 | | | $ | (185 | ) |
| | | | | | | | | | | | | | | | | | | | | | |
Net unrealized depreciation on forward foreign currency exchange contracts to buy | | | $ | (185 | ) |
| | | | | | | | | | | | | | | | | | | | | | |
Forward Foreign Currency Exchange Contracts to Sell
| | | | | | | | | | | | | | | | | | | | | | |
EXPIRATION
DATE | | COUNTERPARTY | | LOCAL
CURRENCY | | | VALUE IN USD | | | IN
EXCHANGE
FOR USD | | | NET UNREALIZED
APPRECIATION
(DEPRECIATION) | |
| 7/8/19 | | Bank of America N.A. | | | EUR | | | | 4,581,765 | | | $ | 5,212,596 | | | $ | 5,150,842 | | | $ | (61,754 | ) |
| 7/8/19 | | BNP Paribas S.A. | | | EUR | | | | 304,270 | | | | 346,163 | | | | 346,270 | | | | 107 | |
| 7/8/19 | | Barclays Bank plc | | | GBP | | | | 100,845 | | | | 128,108 | | | | 128,273 | | | | 165 | |
| 7/8/19 | | BNP Paribas S.A. | | | GBP | | | | 2,400,317 | | | | 3,049,227 | | | | 3,034,150 | | | | (15,077 | ) |
| 7/8/19 | | Bank of America N.A. | | | GBP | | | | 53,374 | | | | 67,803 | | | | 68,018 | | | | 215 | |
| 7/8/19 | | Citibank N.A. | | | GBP | | | | 279,818 | | | | 355,465 | | | | 355,861 | | | | 396 | |
| | | | | | | | | | | | | | | | | | | | | | |
Net unrealized depreciation on forward foreign currency exchange contracts to sell | | | $ | (75,948 | ) |
| | | | | | | | | | | | | | | | | | | | | | |
Currency Legend
| | | | |
| EUR | | – | | Euro |
| GBP | | – | | British Pound Sterling |
See accompanying Notes to the Financial Statements.
166
Barings U.S. High Yield Fund 2019 Annual Report
SCHEDULE OF INVESTMENTS
June 30, 2019
| | | | | | | | | | | | | | | | | | | | |
| | | | | | | | | SHARES | | | COST | | | FAIR
VALUE | |
Equities — 0.5%*: | |
|
Common Stocks — 0.5%*: | |
|
Oil and Gas — 0.5%*: | |
Fieldwood Energy LLC | | | | | | | | | | | 4,100 | | | | $88,421 | | | | $123,000 | |
Fieldwood Energy LLC | | | | | | | | | | | 1,006 | | | | 35,210 | | | | 30,180 | |
Jupiter Resources, Inc.+ | | | | | | | | | | | 39,729 | | | | 192,017 | | | | 104,289 | |
| | | | | | | | | | | | | | | | | | | | |
Total Oil and Gas | | | | | | | | | | | 44,835 | | | | 315,648 | | | | 257,469 | |
| | | | | | | | | | | | | | | | | | | | |
| | | | | | | | | | | | | | | | | | | | |
Total Common Stocks | | | | | | | | | | | 44,835 | | | | 315,648 | | | | 257,469 | |
| | | | | | | | | | | | | | | | | | | | |
|
Warrants — 0.0%*: | |
|
Diversified/Conglomerate Manufacturing — 0.0%*: | |
Appvion Holdings Corp. (exp. June 13, 2023)†† | | | | | | | | | | | 357 | | | | – | | | | 45 | |
Appvion Holdings Corp. (exp. June 13, 2023)†† | | | | | | | | | | | 357 | | | | – | | | | 178 | |
| | | | | | | | | | | | | | | | | | | | |
Total Diversified/Conglomerate Manufacturing | | | | | | | | | | | 714 | | | | – | | | | 223 | |
| | | | | | | | | | | | | | | | | | | | |
Total Warrants | | | | | | | | | | | 714 | | | | – | | | | 223 | |
| | | | | | | | | | | | | | | | | | | | |
Total Equities | | | | | | | | | | | 45,549 | | | | 315,648 | | | | 257,692 | |
| | | | | | | | | | | | | | | | | | | | |
| | | | | |
| | | EFFECTIVE
INTEREST RATE | | | DUE DATE | | | PRINCIPAL ‡‡ | | | COST | | | FAIR
VALUE | |
Fixed Income — 97.1%*: | |
|
Bank Loans — 8.1%*§: | |
|
Aerospace and Defense — 0.5%*: | |
Ducommun, Inc., 1M LIBOR + 4.000% | | | 6.37 | % | | | 11/21/2025 | | | | 33,828 | | | | 33,666 | | | | 33,955 | |
TransDigm, Inc., 1M LIBOR + 2.500% | | | 4.83 | | | | 6/9/2023 | | | | 242,771 | | | | 239,064 | | | | 238,144 | |
| | | | | | | | | | | | | | | | | | | | |
Total Aerospace and Defense | | | | | | | | | | | 276,599 | | | | 272,730 | | | | 272,099 | |
| | | | | | | | | | | | | | | | | | | | |
|
Broadcasting and Entertainment — 0.7%*: | |
AP NMT Acquisition B.V., 3M LIBOR + 5.750%+ | | | 8.35 | | | | 8/13/2021 | | | | 296,114 | | | | 296,131 | | | | 293,523 | |
CSC Holdings, LLC, 1M LIBOR + 3.000% | | | 5.39 | | | | 4/15/2027 | | | | 44,968 | | | | 44,536 | | | | 44,979 | |
| | | | | | | | | | | | | | | | | | | | |
Total Broadcasting and Entertainment | | | | | | | | | | | 341,082 | | | | 340,667 | | | | 338,502 | |
| | | | | | | | | | | | | | | | | | | | |
|
Buildings and Real Estate — 0.1%*: | |
GYP Holdings III Corp., 1M LIBOR + 2.750% | | | 5.15 | | | | 6/1/2025 | | | | 30,326 | | | | 30,325 | | | | 29,498 | |
| | | | | | | | | | | | | | | | | | | | |
|
Chemicals, Plastics and Rubber — 0.3%*: | |
Consolidated Energy Finance, S.A., 1M LIBOR + 2.500% | | | 4.90 | | | | 5/7/2025 | | | | 159,164 | | | | 152,910 | | | | 154,787 | |
| | | | | | | | | | | | | | | | | | | | |
|
Containers, Packaging and Glass — 1.4%*: | |
BWAY Holding Co., 1M LIBOR + 3.250% | | | 5.85 | | | | 4/3/2024 | | | | 498,095 | | | | 482,135 | | | | 480,452 | |
Reynolds Group Holdings, Inc., 1M LIBOR + 2.750% | | | 5.15 | | | | 2/5/2023 | | | | 221,761 | | | | 213,424 | | | | 219,921 | |
| | | | | | | | | | | | | | | | | | | | |
Total Containers, Packaging and Glass | | | | | | | | | | | 719,856 | | | | 695,559 | | | | 700,373 | |
| | | | | | | | | | | | | | | | | | | | |
See accompanying Notes to the Financial Statements.
167
Barings U.S. High Yield Fund 2019 Annual Report
SCHEDULE OF INVESTMENTS (CONTINUED)
June 30, 2019
| | | | | | | | | | | | | | | | | | | | |
| | | EFFECTIVE
INTEREST RATE | | | DUE DATE | | | PRINCIPAL ‡‡ | | | COST | | | FAIR
VALUE | |
|
Bank Loans(Continued) | |
|
Diversified/Conglomerate Manufacturing — 0.2%*: | |
Tank Holding Corp., 1M LIBOR + 4.000% | | | 6.63 | % | | | 3/26/2026 | | | | 91,932 | | | $ | 91,484 | | | $ | 91,845 | |
| | | | | | | | | | | | | | | | | | | | |
|
Diversified/Conglomerate Service — 0.9%*: | |
Evertec Group, LLC, 1M LIBOR + 3.500% | | | 5.90 | | | | 11/27/2024 | | | | 45,919 | | | | 45,711 | | | | 46,034 | |
SonicWall U.S. Holdings, Inc., 3M LIBOR + 7.500% | | | 10.02 | | | | 5/18/2026 | | | | 51,897 | | | | 51,445 | | | | 47,226 | |
Vertafore, Inc., 1M LIBOR + 3.250% | | | 5.65 | | | | 7/2/2025 | | | | 398,000 | | | | 389,153 | | | | 381,913 | |
| | | | | | | | | | | | | | | | | | | | |
Total Diversified/Conglomerate Service | | | | | | | | | | | 495,816 | | | | 486,309 | | | | 475,173 | |
| | | | | | | | | | | | | | | | | | | | |
|
Electronics — 0.6%*: | |
Renaissance Holding Corp., 1M LIBOR + 7.000% | | | 9.48 | | | | 5/29/2026 | | | | 68,962 | | | | 67,767 | | | | 65,515 | |
Veritas Bermuda Ltd., 3M LIBOR + 4.500% | | | 6.89 | | | | 1/27/2023 | | | | 248,728 | | | | 231,843 | | | | 225,877 | |
| | | | | | | | | | | | | | | | | | | | |
Total Electronics | | | | | | | | | | | 317,690 | | | | 299,610 | | | | 291,392 | |
| | | | | | | | | | | | | | | | | | | | |
|
Leisure, Amusement, Entertainment — 0.2%*: | |
SeaWorld Parks & Entertainment, Inc., 3M LIBOR + 3.000% | | | 5.40 | | | | 3/31/2024 | | | | 90,696 | | | | 90,596 | | | | 90,307 | |
| | | | | | | | | | | | | | | | | | | | |
|
Oil and Gas — 0.5%*: | |
Fieldwood Energy LLC, 1M LIBOR + 5.250% | | | 7.65 | | | | 4/11/2022 | | | | 172,215 | | | | 158,169 | | | | 159,137 | |
Fieldwood Energy LLC, 1M LIBOR + 7.250% | | | 9.65 | | | | 4/11/2023 | | | | 91,996 | | | | 41,068 | | | | 76,357 | |
| | | | | | | | | | | | | | | | | | | | |
Total Oil and Gas | | | | | | | | | | | 264,211 | | | | 199,237 | | | | 235,494 | |
| | | | | | | | | | | | | | | | | | | | |
|
Retail Stores — 0.7%*: | |
Michaels Stores, Inc., 1M LIBOR + 2.500% | | | 4.90 | | | | 1/30/2023 | | | | 397,513 | | | | 387,074 | | | | 384,348 | |
| | | | | | | | | | | | | | | | | | | | |
|
Telecommunications — 2.0%*: | |
Banff Merger Sub, Inc., 3M LIBOR + 4.250% | | | 6.58 | | | | 10/2/2025 | | | | 226,560 | | | | 224,454 | | | | 214,169 | |
CenturyLink, Inc., 3M LIBOR + 2.750% | | | 5.15 | | | | 1/31/2025 | | | | 494,975 | | | | 491,823 | | | | 482,878 | |
CommScope, Inc., 1M LIBOR + 3.250% | | | 5.65 | | | | 4/6/2026 | | | | 30,557 | | | | 30,261 | | | | 30,434 | |
Sabre Industries, Inc. | | | 6.89 | | | | 4/2/2026 | | | | 45,701 | | | | 45,256 | | | | 45,616 | |
Sprint Communications, Inc., 1M LIBOR + 2.500% | | | 4.94 | | | | 2/2/2024 | | | | 248,412 | | | | 239,611 | | | | 244,375 | |
| | | | | | | | | | | | | | | | | | | | |
Total Telecommunications | | | | | | | | | | | 1,046,205 | | | | 1,031,405 | | | | 1,017,472 | |
| | | | | | | | | | | | | | | | | | | | |
| | | | | | | | | | | | | | | | | | | | |
Total Bank Loans | | | | | | | | | | | 4,231,090 | | | | 4,077,906 | | | | 4,081,290 | |
| | | | | | | | | | | | | | | | | | | | |
|
Corporate Bonds — 89.0%*: | |
|
Aerospace and Defense — 2.2%*: | |
TransDigm UK Holdings PLC | | | 6.88 | | | | 5/15/2026 | | | | 500,000 | | | | 496,625 | | | | 505,938 | |
Triumph Group, Inc. | | | 4.88 | | | | 4/1/2021 | | | | 43,000 | | | | 42,210 | | | | 42,355 | |
Triumph Group, Inc. | | | 7.75 | | | | 8/15/2025 | | | | 595,000 | | | | 599,487 | | | | 575,662 | |
| | | | | | | | | | | | | | | | | | | | |
Total Aerospace and Defense | | | | | | | | | | | 1,138,000 | | | | 1,138,322 | | | | 1,123,955 | |
| | | | | | | | | | | | | | | | | | | | |
See accompanying Notes to the Financial Statements.
168
Barings U.S. High Yield Fund 2019 Annual Report
SCHEDULE OF INVESTMENTS (CONTINUED)
June 30, 2019
| | | | | | | | | | | | | | | | | | | | |
| | | EFFECTIVE
INTEREST RATE | | | DUE DATE | | | PRINCIPAL ‡‡ | | | COST | | | FAIR
VALUE | |
|
Corporate Bonds(Continued) | |
|
Automobile — 0.6%*: | |
Allison Transmission, Inc.^ | | | 4.75 | % | | | 10/1/2027 | | | | 157,000 | | | $ | 149,346 | | | $ | 155,823 | |
Allison Transmission, Inc.^ | | | 5.88 | | | | 6/1/2029 | | | | 120,000 | | | | 120,000 | | | | 126,300 | |
| | | | | | | | | | | | | | | | | | | | |
Total Automobile | | | | | | | | | | | 277,000 | | | | 269,346 | | | | 282,123 | |
| | | | | | | | | | | | | | | | | | | | |
|
Beverage, Food and Tobacco — 3.3%*: | |
JBS Investments II GmbH^+ | | | 7.00 | | | | 1/15/2026 | | | | 200,000 | | | | 202,913 | | | | 216,600 | |
JBS USA LUX SA/JBS USA Finance, Inc.^ | | | 5.88 | | | | 7/15/2024 | | | | 165,000 | | | | 168,483 | | | | 169,744 | |
JBS USA LUX SA/JBS USA Finance, Inc.^ | | | 6.75 | | | | 2/15/2028 | | | | 250,000 | | | | 250,000 | | | | 271,562 | |
JBS USA LUX SA/JBS USA Food Co./JBS USA Finance, Inc.^ | | | 6.50 | | | | 4/15/2029 | | | | 500,000 | | | | 500,000 | | | | 543,125 | |
KeHE Distributors LLC/KeHE Finance Corp.^ | | | 7.63 | | | | 8/15/2021 | | | | 274,000 | | | | 268,987 | | | | 271,945 | |
Smithfield Foods, Inc.^ | | | 5.20 | | | | 4/1/2029 | | | | 199,000 | | | | 198,008 | | | | 216,943 | |
| | | | | | | | | | | | | | | | | | | | |
Total Beverage, Food and Tobacco | | | | | | | | | | | 1,588,000 | | | | 1,588,391 | | | | 1,689,919 | |
| | | | | | | | | | | | | | | | | | | | |
|
Broadcasting and Entertainment — 8.6%*: | |
Block Communications, Inc.^ | | | 6.88 | | | | 2/15/2025 | | | | 434,000 | | | | 434,000 | | | | 452,445 | |
CCO Holdings LLC/CCO Holdings Capital Corp.^ | | | 5.75 | | | | 2/15/2026 | | | | 700,000 | | | | 697,562 | | | | 734,125 | |
Clear Channel Worldwide Holdings, Inc.^ | | | 9.25 | | | | 2/15/2024 | | | | 190,000 | | | | 190,000 | | | | 206,150 | |
CSC Holdings LLC^ | | | 6.63 | | | | 10/15/2025 | | | | 16,000 | | | | 16,832 | | | | 17,120 | |
CSC Holdings LLC^ | | | 7.50 | | | | 4/1/2028 | | | | 250,000 | | | | 250,000 | | | | 274,450 | |
DISH DBS Corp. | | | 7.75 | | | | 7/1/2026 | | | | 280,000 | | | | 262,421 | | | | 271,600 | |
Intelsat Jackson Holdings SA^ | | | 8.50 | | | | 10/15/2024 | | | | 603,000 | | | | 603,775 | | | | 596,970 | |
Intelsat Jackson Holdings SA^ | | | 9.75 | | | | 7/15/2025 | | | | 56,000 | | | | 58,831 | | | | 57,120 | |
Netflix, Inc.^ | | | 5.38 | | | | 11/15/2029 | | | | 339,000 | | | | 340,297 | | | | 360,083 | |
Netflix, Inc. | | | 5.88 | | | | 11/15/2028 | | | | 250,000 | | | | 248,578 | | | | 276,780 | |
Nexstar Escrow, Inc.^ | | | 5.63 | | | | 7/15/2027 | | | | 271,000 | | | | 271,000 | | | | 277,436 | |
Sirius XM Radio, Inc.^ | | | 4.63 | | | | 7/15/2024 | | | | 250,000 | | | | 250,000 | | | | 255,820 | |
Sirius XM Radio, Inc.^ | | | 5.00 | | | | 8/1/2027 | | | | 350,000 | | | | 350,000 | | | | 356,090 | |
Sirius XM Radio, Inc.^ | | | 5.50 | | | | 7/1/2029 | | | | 250,000 | | | | 250,000 | | | | 256,300 | |
| | | | | | | | | | | | | | | | | | | | |
Total Broadcasting and Entertainment | | | | | | | | | | | 4,239,000 | | | | 4,223,296 | | | | 4,392,489 | |
| | | | | | | | | | | | | | | | | | | | |
|
Buildings and Real Estate — 4.5%*: | |
Brookfield Residential Properties, Inc.^+ | | | 6.50 | | | | 12/15/2020 | | | | 250,000 | | | | 249,800 | | | | 250,312 | |
Brookfield Residential Properties, Inc./Brookfield Residential US Corp.^ | | | 6.13 | | | | 7/1/2022 | | | | 225,000 | | | | 219,037 | | | | 228,938 | |
James Hardie International Finance DAC^ | | | 4.75 | | | | 1/15/2025 | | | | 244,000 | | | | 239,339 | | | | 248,880 | |
M/I Homes, Inc. | | | 5.63 | | | | 8/1/2025 | | | | 550,000 | | | | 533,242 | | | | 558,250 | |
M/I Homes, Inc. | | | 6.75 | | | | 1/15/2021 | | | | 250,000 | | | | 250,000 | | | | 254,062 | |
Mattamy Group Corp.+^ | | | 6.50 | | | | 10/1/2025 | | | | 252,000 | | | | 246,807 | | | | 265,545 | |
Mattamy Group Corp.+^ | | | 6.88 | | | | 12/15/2023 | | | | 123,000 | | | | 116,778 | | | | 128,074 | |
MPT Operating Partnership LP/MPT Finance Corp. | | | 5.00 | | | | 10/15/2027 | | | | 250,000 | | | | 250,000 | | | | 257,500 | |
Realogy Group LLC/RealogyCo-Issuer Corp.^ | | | 9.38 | | | | 4/1/2027 | | | | 138,000 | | | | 138,000 | | | | 120,923 | |
| | | | | | | | | | | | | | | | | | | | |
Total Buildings and Real Estate | | | | | | | | | | | 2,282,000 | | | | 2,243,003 | | | | 2,312,484 | |
| | | | | | | | | | | | | | | | | | | | |
See accompanying Notes to the Financial Statements.
169
Barings U.S. High Yield Fund 2019 Annual Report
SCHEDULE OF INVESTMENTS (CONTINUED)
June 30, 2019
| | | | | | | | | | | | | | | | | | | | |
| | | EFFECTIVE
INTEREST RATE | | | DUE DATE | | | PRINCIPAL ‡‡ | | | COST | | | FAIR
VALUE | |
|
Corporate Bonds(Continued) | |
|
Cargo Transport — 4.6%*: | |
American Airlines Group, Inc.^ | | | 4.63 | % | | | 3/1/2020 | | | | 250,000 | | | $ | 249,790 | | | $ | 251,562 | |
American Airlines Group, Inc.^ | | | 5.00 | | | | 6/1/2022 | | | | 412,000 | | | | 412,000 | | | | 424,484 | |
Kenan Advantage Group, Inc.^ | | | 7.88 | | | | 7/31/2023 | | | | 700,000 | | | | 714,639 | | | | 630,000 | |
Wabtec Corp. | | | 3.45 | | | | 11/15/2026 | | | | 532,000 | | | | 477,621 | | | | 519,852 | |
XPO Logistics, Inc.^ | | | 6.13 | | | | 9/1/2023 | | | | 500,000 | | | | 495,346 | | | | 518,125 | |
| | | | | | | | | | | | | | | | | | | | |
Total Cargo Transport | | | | | | | | | | | 2,394,000 | | | | 2,349,396 | | | | 2,344,023 | |
| | | | | | | | | | | | | | | | | | | | |
|
Chemicals, Plastics and Rubber — 1.5%*: | |
Consolidated Energy Finance SA^ | | | 6.88 | | | | 6/15/2025 | | | | 300,000 | | | | 298,810 | | | | 307,248 | |
LBC Tank Terminals Holding Netherlands BV^ | | | 6.88 | | | | 5/15/2023 | | | | 250,000 | | | | 244,257 | | | | 247,500 | |
Starfruit Finco BV/Starfruit US Holdco LLC+^ | | | 8.00 | | | | 10/1/2026 | | | | 180,000 | | | | 180,000 | | | | 184,950 | |
| | | | | | | | | | | | | | | | | | | | |
Total Chemicals, Plastics and Rubber | | | | | | | | | | | 730,000 | | | | 723,067 | | | | 739,698 | |
| | | | | | | | | | | | | | | | | | | | |
|
Containers, Packaging and Glass — 0.6%*: | |
BWAY Holding Co.^ | | | 7.25 | | | | 4/15/2025 | | | | 302,000 | | | | 289,170 | | | | 291,430 | |
| | | | | | | | | | | | | | | | | | | | |
|
Diversified/Conglomerate Manufacturing — 0.9%*: | |
Appvion ESC, 3M EURIBOR + 4.125%¤ | | | 9.00 | # | | | 6/1/2020 | | | | 366,000 | | | | 308,123 | | | | – | |
Colfax Corp.^ | | | 6.00 | | | | 2/15/2024 | | | | 122,000 | | | | 122,000 | | | | 129,015 | |
Colfax Corp.^ | | | 6.38 | | | | 2/15/2026 | | | | 135,000 | | | | 135,000 | | | | 144,788 | |
Energizer Holdings, Inc.^ | | | 7.75 | | | | 1/15/2027 | | | | 153,000 | | | | 160,734 | | | | 165,596 | |
| | | | | | | | | | | | | | | | | | | | |
Total Diversified/Conglomerate Manufacturing | | | | | | | | | | | 776,000 | | | | 725,857 | | | | 439,399 | |
| | | | | | | | | | | | | | | | | | | | |
|
Diversified/Conglomerate Service — 1.6%*: | |
ADT LLC/Prime Finance, Inc.^ | | | 9.25 | | | | 5/15/2023 | | | | 310,000 | | | | 327,386 | | | | 325,562 | |
Carlson Travel, Inc.^ | | | 9.50 | | | | 12/15/2024 | | | | 350,000 | | | | 333,790 | | | | 349,125 | |
Go Daddy Operating Co. LLC/GD Finance Co., Inc.^ | | | 5.25 | | | | 12/1/2027 | | | | 125,000 | | | | 125,000 | | | | 129,375 | |
Waste Pro USA, Inc.^ | | | 5.50 | | | | 2/15/2026 | | | | 17,000 | | | | 17,000 | | | | 17,382 | |
| | | | | | | | | | | | | | | | | | | | |
Total Diversified/Conglomerate Service | | | | | | | | | | | 802,000 | | | | 803,176 | | | | 821,444 | |
| | | | | | | | | | | | | | | | | | | | |
|
Ecological — 0.3%*: | |
Clean Harbors, Inc.^ | | | 4.88 | | | | 7/15/2027 | | | | 91,000 | | | | 91,000 | | | | 92,488 | |
Clean Harbors, Inc.^ | | | 5.13 | | | | 7/15/2029 | | | | 41,000 | | | | 41,000 | | | | 41,820 | |
| | | | | | | | | | | | | | | | | | | | |
Total Ecological | | | | | | | | | | | 132,000 | | | | 132,000 | | | | 134,308 | |
| | | | | | | | | | | | | | | | | | | | |
|
Electronics — 4.7%*: | |
RP Crown Parent LLC^ | | | 7.38 | | | | 10/15/2024 | | | | 96,000 | | | | 96,000 | | | | 100,080 | |
SS&C Technologies, Inc.^ | | | 5.50 | | | | 9/30/2027 | | | | 375,000 | | | | 375,000 | | | | 389,063 | |
TIBCO Software, Inc.^ | | | 11.38 | | | | 12/1/2021 | | | | 1,383,000 | | | | 1,467,518 | | | | 1,469,437 | |
Veritas US, Inc./Veritas Bermuda Ltd.^ | | | 10.50 | | | | 2/1/2024 | | | | 524,000 | | | | 487,344 | | | | 449,330 | |
| | | | | | | | | | | | | | | | | | | | |
Total Electronics | | | | | | | | | | | 2,378,000 | | | | 2,425,862 | | | | 2,407,910 | |
| | | | | | | | | | | | | | | | | | | | |
See accompanying Notes to the Financial Statements.
170
Barings U.S. High Yield Fund 2019 Annual Report
SCHEDULE OF INVESTMENTS (CONTINUED)
June 30, 2019
| | | | | | | | | | | | | | | | | | | | |
| | | EFFECTIVE
INTEREST RATE | | | DUE DATE | | | PRINCIPAL ‡‡ | | | COST | | | FAIR
VALUE | |
|
Corporate Bonds(Continued) | |
|
Finance — 6.1%*: | |
Alliance Data Systems Corp.^ | | | 5.88 | % | | | 11/1/2021 | | | | 550,000 | | | $ | 558,106 | | | $ | 566,170 | |
Ally Financial, Inc. | | | 3.88 | | | | 5/21/2024 | | | | 250,000 | | | | 247,531 | | | | 255,938 | |
Icahn Enterprises LP/Icahn Enterprises Finance Corp. | | | 6.25 | | | | 2/1/2022 | | | | 135,000 | | | | 137,623 | | | | 138,206 | |
Icahn Enterprises LP/Icahn Enterprises Finance Corp.^ | | | 6.25 | | | | 5/15/2026 | | | | 500,000 | | | | 500,000 | | | | 506,875 | |
Icahn Enterprises LP/Icahn Enterprises Finance Corp. | | | 6.38 | | | | 12/15/2025 | | | | 415,000 | | | | 416,314 | | | | 423,632 | |
LPL Holdings, Inc.^ | | | 5.75 | | | | 9/15/2025 | | | | 518,000 | | | | 512,276 | | | | 530,302 | |
Virto Financial, Inc.^ | | | 6.75 | | | | 6/15/2022 | | | | 671,000 | | | | 682,733 | | | | 695,270 | |
| | | | | | | | | | | | | | | | | | | | |
Total Finance | | | | | | | | | | | 3,039,000 | | | | 3,054,583 | | | | 3,116,393 | |
| | | | | | | | | | | | | | | | | | | | |
|
Grocery — 0.9%*: | |
Post Holdings, Inc.^ | | | 5.50 | | | | 3/1/2025 | | | | 300,000 | | | | 293,848 | | | | 309,750 | |
Post Holdings, Inc.^ | | | 5.50 | | | | 12/15/2029 | | | | 125,000 | | | | 125,000 | | | | 125,312 | |
| | | | | | | | | | | | | | | | | | | | |
Total Grocery | | | | | | | | | | | 425,000 | | | | 418,848 | | | | 435,062 | |
| | | | | | | | | | | | | | | | | | | | |
|
Healthcare, Education and Childcare — 9.1%*: | |
Avantor, Inc.^ | | | 6.00 | | | | 10/1/2024 | | | | 25,000 | | | | 26,053 | | | | 26,600 | |
Bausch Health Americas, Inc.^ | | | 9.25 | | | | 4/1/2026 | | | | 438,000 | | | | 444,228 | | | | 490,034 | |
Bausch Health Americas., Inc.^ | | | 8.50 | | | | 1/31/2027 | | | | 175,000 | | | | 180,519 | | | | 192,416 | |
Bausch Health Cos., Inc.^ | | | 5.88 | | | | 5/15/2023 | | | | 21,000 | | | | 18,353 | | | | 21,244 | |
Bausch Health Cos., Inc.^ | | | 5.50 | | | | 3/1/2023 | | | | 49,000 | | | | 39,945 | | | | 49,392 | |
Catalent Pharma Solutions, Inc.^ | | | 5.00 | | | | 7/15/2027 | | | | 98,000 | | | | 98,000 | | | | 99,715 | |
Endo Dac/Endo Finance LLC/Endo Finco Inc^ | | | 6.00 | | | | 2/1/2025 | | | | 400,000 | | | | 348,168 | | | | 268,000 | |
Endo Dac/Endo Finance LLC/Endo Finco, Inc.^ | | | 6.00 | | | | 7/15/2023 | | | | 131,000 | | | | 108,894 | | | | 94,320 | |
Endo Pharmaceutical^ | | | 7.50 | | | | 4/1/2027 | | | | 300,000 | | | | 300,000 | | | | 294,750 | |
Envision Healthcare Corp.^ | | | 8.75 | | | | 10/15/2026 | | | | 559,000 | | | | 550,050 | | | | 389,902 | |
HCA, Inc. | | | 5.38 | | | | 2/1/2025 | | | | 375,000 | | | | 379,333 | | | | 404,766 | |
Mallinckrodt International Finance SA/Mallinckrodt CB LLC^ | | | 5.50 | | | | 4/15/2025 | | | | 170,000 | | | | 147,852 | | | | 113,900 | |
Mallinckrodt International Finance SA/Mallinckrodt CB LLC^ | | | 5.63 | | | | 10/15/2023 | | | | 87,000 | | | | 78,098 | | | | 65,685 | |
Mallinckrodt International Finance SA/Mallinckrodt CB LLC^ | | | 5.75 | | | | 8/1/2022 | | | | 152,000 | | | | 141,245 | | | | 130,720 | |
Ortho-Clinical Diagnostics, Inc./Ortho-Clinical Diagnostics SA^ | | | 6.63 | | | | 5/15/2022 | | | | 1,144,000 | | | | 1,127,473 | | | | 1,092,520 | |
Service Corp. International/US | | | 5.13 | | | | 6/1/2029 | | | | 271,000 | | | | 271,000 | | | | 285,228 | |
Tenet Healthcare Corp.^ | | | 6.25 | | | | 2/1/2027 | | | | 306,000 | | | | 306,000 | | | | 316,710 | |
Teva Pharmaceutical Finance Netherlands III BV+ | | | 6.00 | | | | 4/15/2024 | | | | 300,000 | | | | 296,871 | | | | 282,938 | |
| | | | | | | | | | | | | | | | | | | | |
Total Healthcare, Education and Childcare | | | | | | | | | | | 5,001,000 | | | | 4,862,082 | | | | 4,618,840 | |
| | | | | | | | | | | | | | | | | | | | |
See accompanying Notes to the Financial Statements.
171
Barings U.S. High Yield Fund 2019 Annual Report
SCHEDULE OF INVESTMENTS (CONTINUED)
June 30, 2019
| | | | | | | | | | | | | | | | | | | | |
| | | EFFECTIVE
INTEREST RATE | | | DUE DATE | | | PRINCIPAL ‡‡ | | | COST | | | FAIR
VALUE | |
|
Corporate Bonds(Continued) | |
|
Home and Office Furnishings, Housewares, and Durable Consumer Products — 0.5%*: | |
Mattel, Inc.^ | | | 6.75 | % | | | 12/31/2025 | | | | 78,000 | | | $ | 78,000 | | | $ | 80,242 | |
Newell Brands, Inc. | | | 4.20 | | | | 4/1/2026 | | | | 157,000 | | | | 148,249 | | | | 156,032 | |
| | | | | | | | | | | | | | | | | | | | |
Total Home and Office Furnishings, Housewares, and Durable Consumer Products | | | | | | | | | | | 235,000 | | | | 226,249 | | | | 236,274 | |
| | | | | | | | | | | | | | | | | | | | |
|
Hotels, Motels, Inns and Gaming — 1.6%*: | |
Boyne USA, Inc.^ | | | 7.25 | | | | 5/1/2025 | | | | 125,000 | | | | 125,000 | | | | 135,312 | |
Golden Nugget, Inc.^ | | | 8.75 | | | | 10/1/2025 | | | | 200,000 | | | | 204,033 | | | | 210,000 | |
Wynn Las Vegas LLC/Wynn Las Vegas Capital Corp.^ | | | 5.25 | | | | 5/15/2027 | | | | 125,000 | | | | 125,000 | | | | 125,469 | |
Wynn Las Vegas LLC/Wynn Las Vegas Capital Corp.^ | | | 5.50 | | | | 3/1/2025 | | | | 350,000 | | | | 346,097 | | | | 361,480 | |
| | | | | | | | | | | | | | | | | | | | |
Total Hotels, Motels, Inns and Gaming | | | | | | | | | | | 800,000 | | | | 800,130 | | | | 832,261 | |
| | | | | | | | | | | | | | | | | | | | |
|
Insurance — 2.2%*: | |
Acrisure LLC/Acrisure Finance, Inc.^†† | | | 7.00 | | | | 11/15/2025 | | | | 500,000 | | | | 486,859 | | | | 451,250 | |
Acrisure LLC/Acrisure Finance, Inc.^†† | | | 8.13 | | | | 2/15/2024 | | | | 216,000 | | | | 216,000 | | | | 223,020 | |
CNO Financial Group, Inc. | | | 5.25 | | | | 5/30/2029 | | | | 125,000 | | | | 125,000 | | | | 135,312 | |
USI, Inc.^ | | | 6.88 | | | | 5/1/2025 | | | | 275,000 | | | | 272,207 | | | | 272,250 | |
York Risk Services Holding Corp.^ | | | 8.50 | | | | 10/1/2022 | | | | 47,000 | | | | 44,094 | | | | 38,658 | |
| | | | | | | | | | | | | | | | | | | | |
Total Insurance | | | | | | | | | | | 1,163,000 | | | | 1,144,160 | | | | 1,120,490 | |
| | | | | | | | | | | | | | | | | | | | |
|
Leisure, Amusement, Entertainment — 1.0%*: | |
Brunswick Corp. | | | 7.13 | | | | 8/1/2027 | | | | 346,000 | | | | 363,272 | | | | 404,409 | |
Cedar Fair LP^ | | | 5.25 | | | | 7/15/2029 | | | | 93,000 | | | | 93,000 | | | | 94,889 | |
| | | | | | | | | | | | | | | | | | | | |
Total Leisure, Amusement, Entertainment | | | | | | | | | | | 439,000 | | | | 456,272 | | | | 499,298 | |
| | | | | | | | | | | | | | | | | | | | |
|
MachineryNon-Agriculture,Non-Construction,Non-Electronic — 0.8%*: | |
Apex Tool Group LLC/BC Mountain Finance, Inc.^ | | | 9.00 | | | | 2/15/2023 | | | | 430,000 | | | | 421,697 | | | | 383,775 | |
| | | | | | | | | | | | | | | | | | | | |
|
Mining, Steel, Iron andNon-Precious Metals — 9.1%*: | |
Compass Minerals International, Inc.^ | | | 4.88 | | | | 7/15/2024 | | | | 124,000 | | | | 116,248 | | | | 118,265 | |
First Quantum Minerals Ltd.+^ | | | 6.88 | | | | 3/1/2026 | | | | 229,000 | | | | 229,000 | | | | 212,398 | |
First Quantum Minerals Ltd.+^ | | | 7.00 | | | | 2/15/2021 | | | | 161,000 | | | | 161,958 | | | | 164,220 | |
First Quantum Minerals Ltd.+^ | | | 7.50 | | | | 4/1/2025 | | | | 606,000 | | | | 577,038 | | | | 577,215 | |
Hecla Mining Co. | | | 6.88 | | | | 5/1/2021 | | | | 250,000 | | | | 234,814 | | | | 238,625 | |
Kinross Gold Corp.+ | | | 5.95 | | | | 3/15/2024 | | | | 152,000 | | | | 156,608 | | | | 166,087 | |
Kinross Gold Corp. | | | 6.88 | | | | 9/1/2041 | | | | 99,000 | | | | 98,527 | | | | 111,994 | |
Kissner Holdings LP/Kissner Milling Co. Ltd./BSC Holding, Inc./Kissner USA^+ | | | 8.38 | | | | 12/1/2022 | | | | 400,000 | | | | 408,287 | | | | 416,000 | |
New Gold, Inc.^ | | | 6.25 | | | | 11/15/2022 | | | | 400,000 | | | | 406,983 | | | | 373,000 | |
Northwest Acquisitions ULC/Dominion Finco, Inc.+^ | | | 7.13 | | | | 11/1/2022 | | | | 893,000 | | | | 904,294 | | | | 616,170 | |
See accompanying Notes to the Financial Statements.
172
Barings U.S. High Yield Fund 2019 Annual Report
SCHEDULE OF INVESTMENTS (CONTINUED)
June 30, 2019
| | | | | | | | | | | | | | | | | | | | |
| | | EFFECTIVE
INTEREST RATE | | | DUE DATE | | | PRINCIPAL ‡‡ | | | COST | | | FAIR
VALUE | |
|
Corporate Bonds(Continued) | |
|
Mining, Steel, Iron andNon-Precious Metals(Continued) | |
Peabody Energy Corp.^ | | | 6.00 | % | | | 3/31/2022 | | | | 524,000 | | | $ | 526,765 | | | $ | 536,445 | |
SunCoke Energy Partners LP/SunCoke Energy Partners Finance Corp.^ | | | 7.50 | | | | 6/15/2025 | | | | 550,000 | | | | 556,821 | | | | 536,937 | |
Warrior Met Coal, Inc.^ | | | 8.00 | | | | 11/1/2024 | | | | 540,000 | | | | 547,715 | | | | 562,950 | |
| | | | | | | | | | | | | | | | | | | | |
Total Mining, Steel, Iron andNon-Precious Metals | | | | | | | | 4,928,000 | | | | 4,925,058 | | | | 4,630,306 | |
| | | | | | | | | | | | | | | | | | | | |
|
Oil and Gas — 10.7%*: | |
Calumet Specialty Products Partners LP/Calumet Finance Corp. | | | 7.63 | | | | 1/15/2022 | | | | 155,000 | | | | 155,037 | | | | 149,963 | |
Calumet Specialty Products Partners LP/Calumet Finance Corp. | | | 7.75 | | | | 4/15/2023 | | | | 84,000 | | | | 83,826 | | | | 80,430 | |
Cheniere Energy Partners LP^ | | | 5.63 | | | | 10/1/2026 | | | | 250,000 | | | | 250,000 | | | | 263,750 | |
Citgo Holding, Inc.^ | | | 10.75 | | | | 2/15/2020 | | | | 762,000 | | | | 773,807 | | | | 788,670 | |
Ferrellgas LP/Ferrellgas Finance Corp. | | | 6.75 | | | | 1/15/2022 | | | | 21,000 | | | | 21,129 | | | | 18,585 | |
Ferrellgas Partners LP/Ferrellgas Partners Finance Corp. | | | 8.63 | | | | 6/15/2020 | | | | 451,000 | | | | 448,474 | | | | 331,485 | |
Genesis Energy LP/Genesis Energy Finance Corp. | | | 6.00 | | | | 5/15/2023 | | | | 18,000 | | | | 17,780 | | | | 17,865 | |
Genesis Energy LP/Genesis Energy Finance Corp. | | | 6.50 | | | | 10/1/2025 | | | | 276,000 | | | | 262,830 | | | | 269,790 | |
Jonah Energy LLC/Jonah Energy Finance Corp.^ | | | 7.25 | | | | 10/15/2025 | | | | 455,000 | | | | 429,413 | | | | 217,262 | |
Laredo Petroleum, Inc. | | | 5.63 | | | | 1/15/2022 | | | | 308,000 | | | | 287,811 | | | | 285,670 | |
Neptune Energy Bondco PLC^ | | | 6.63 | | | | 5/15/2025 | | | | 242,000 | | | | 242,264 | | | | 245,630 | |
Oasis Petroleum, Inc. | | | 6.88 | | | | 1/15/2023 | | | | 133,000 | | | | 131,249 | | | | 133,000 | |
Parkland Fuel Corp.^+ | | | 5.88 | | | | 7/15/2027 | | | | 125,000 | | | | 125,000 | | | | 126,994 | |
PBF Holding Co. LLC/PBF Finance Corp. | | | 7.25 | | | | 6/15/2025 | | | | 350,000 | | | | 360,018 | | | | 366,625 | |
SM Energy Co. | | | 6.63 | | | | 1/15/2027 | | | | 118,000 | | | | 118,000 | | | | 109,150 | |
SM Energy Co. | | | 6.75 | | | | 9/15/2026 | | | | 268,000 | | | | 258,659 | | | | 251,250 | |
Transocean Guardian Ltd.^ | | | 5.88 | | | | 1/15/2024 | | | | 161,595 | | | | 160,226 | | | | 164,221 | |
Transocean, Inc. | | | 6.80 | | | | 3/15/2038 | | | | 244,000 | | | | 197,118 | | | | 183,000 | |
Transocean, Inc. | | | 9.35 | | | | 12/15/2041 | | | | 38,000 | | | | 35,400 | | | | 34,390 | |
Tullow Oil PLC+^ | | | 6.25 | | | | 4/15/2022 | | | | 695,000 | | | | 689,939 | | | | 700,212 | |
Welltec A/S+^ | | | 9.50 | | | | 12/1/2022 | | | | 550,000 | | | | 553,526 | | | | 525,250 | |
Whiting Petroleum Corp. | | | 6.63 | | | | 1/15/2026 | | | | 187,000 | | | | 187,339 | | | | 180,338 | |
| | | | | | | | | | | | | | | | | | | | |
Total Oil and Gas | | | | | | | | | | | 5,891,595 | | | | 5,788,845 | | | | 5,443,530 | |
| | | | | | | | | | | | | | | | | | | | |
|
Personal, Food and Miscellaneous — 0.3%*: | |
Simmons Foods, Inc.^ | | | 7.75 | | | | 1/15/2024 | | | | 122,000 | | | | 122,000 | | | | 131,455 | |
| | | | | | | | | | | | | | | | | | | | |
|
Printing and Publishing — 0.5%*: | |
Nielsen Finance LLC/Nielsen Finance Co.^ | | | 5.00 | | | | 4/15/2022 | | | | 274,000 | | | | 269,715 | | | | 273,315 | |
| | | | | | | | | | | | | | | | | | | | |
See accompanying Notes to the Financial Statements.
173
Barings U.S. High Yield Fund 2019 Annual Report
SCHEDULE OF INVESTMENTS (CONTINUED)
June 30, 2019
| | | | | | | | | | | | | | | | | | | | |
| | | EFFECTIVE
INTEREST RATE | | | DUE DATE | | | PRINCIPAL ‡‡ | | | COST | | | FAIR
VALUE | |
|
Corporate Bonds(Continued) | |
|
Retail Stores — 1.7%*: | |
Albertsons Cos. LLC/Safeway, Inc./New Albertsons LP/Albertson’s LLC^ | | | 7.50 | % | | | 3/15/2026 | | | | 257,000 | | | $ | 257,000 | | | $ | 274,347 | |
KGA Escrow LLC^ | | | 7.50 | | | | 8/15/2023 | | | | 282,000 | | | | 282,000 | | | | 292,575 | |
Penske Automotive Group, Inc. | | | 5.50 | | | | 5/15/2026 | | | | 250,000 | | | | 250,000 | | | | 260,625 | |
Sonic Automotive, Inc. | | | 5.00 | | | | 5/15/2023 | | | | 32,000 | | | | 29,659 | | | | 32,280 | |
| | | | | | | | | | | | | | | | | | | | |
Total Retail Stores | | | | | | | | | | | 821,000 | | | | 818,659 | | | | 859,827 | |
| | | | | | | | | | | | | | | | | | | | |
|
Telecommunications — 8.5%*: | |
Altice Financing SA+^ | | | 6.63 | | | | 2/15/2023 | | | | 250,000 | | | | 250,971 | | | | 256,250 | |
Altice Financing SA+^ | | | 7.50 | | | | 5/15/2026 | | | | 106,000 | | | | 100,701 | | | | 106,541 | |
Altice Finco SA+^ | | | 8.13 | | | | 1/15/2024 | | | | 157,000 | | | | 158,488 | | | | 161,710 | |
CenturyLink, Inc. | | | 6.75 | | | | 12/1/2023 | | | | 280,000 | | | | 280,578 | | | | 302,050 | |
CommScope Technologies LLC^ | | | 5.00 | | | | 3/15/2027 | | | | 600,000 | | | | 574,638 | | | | 522,000 | |
Hughes Satellite Systems Corp. | | | 6.63 | | | | 8/1/2026 | | | | 550,000 | | | | 549,225 | | | | 578,187 | |
Intelsat Connect Finance SA^ | | | 9.50 | | | | 2/15/2023 | | | | 95,000 | | | | 93,607 | | | | 84,075 | |
Sprint Capital Corp. | | | 6.88 | | | | 11/15/2028 | | | | 700,000 | | | | 706,501 | | | | 719,460 | |
Sprint Corp. | | | 7.63 | | | | 3/1/2026 | | | | 125,000 | | | | 125,000 | | | | 133,250 | |
Sprint Corp. | | | 7.88 | | | | 9/15/2023 | | | | 114,000 | | | | 117,829 | | | | 123,833 | |
T-Mobile USA, Inc. | | | 4.50 | | | | 2/1/2026 | | | | 96,000 | | | | 96,000 | | | | 98,280 | |
T-Mobile USA, Inc. | | | 4.75 | | | | 2/1/2028 | | | | 210,000 | | | | 208,723 | | | | 216,058 | |
T-Mobile USA, Inc. | | | 5.38 | | | | 4/15/2027 | | | | 200,000 | | | | 200,000 | | | | 214,000 | |
Telecom Italia SpA+^ | | | 5.30 | | | | 5/30/2024 | | | | 250,000 | | | | 260,015 | | | | 258,750 | |
ViaSat, Inc.^ | | | 5.63 | | | | 4/15/2027 | | | | 149,000 | | | | 149,000 | | | | 154,960 | |
Virgin Media Secured Finance PLC^+ | | | 5.50 | | | | 5/15/2029 | | | | 250,000 | | | | 254,375 | | | | 253,675 | |
Ziggo BV+^ | | | 5.50 | | | | 1/15/2027 | | | | 140,000 | | | | 134,149 | | | | 142,409 | |
| | | | | | | | | | | | | | | | | | | | |
Total Telecommunications | | | | | | | | | | | 4,272,000 | | | | 4,259,800 | | | | 4,325,488 | |
| | | | | | | | | | | | | | | | | | | | |
|
Utilities — 2.6%*: | |
NextEra Energy Operating Partners LP^ | | | 4.25 | | | | 7/15/2024 | | | | 250,000 | | | | 250,000 | | | | 251,568 | |
NRG Energy, Inc.^ | | | 5.25 | | | | 6/15/2029 | | | | 272,000 | | | | 272,000 | | | | 290,360 | |
Vistra Operations Co. LLC^ | | | 3.55 | | | | 7/15/2024 | | | | 250,000 | | | | 249,522 | | | | 251,471 | |
Vistra Operations Co. LLC^ | | | 4.30 | | | | 7/15/2029 | | | | 250,000 | | | | 249,463 | | | | 253,440 | |
Vistra Operations Co. LLC^ | | | 5.00 | | | | 7/31/2027 | | | | 250,000 | | | | 250,000 | | | | 259,062 | |
| | | | | | | | | | | | | | | | | | | | |
Total Utilities | | | | | | | | | | | 1,272,000 | | | | 1,270,985 | | | | 1,305,901 | |
| | | | | | | | | | | | | | | | | | | | |
Total Corporate Bonds | | | | | | | | | | | 46,150,595 | | | | 45,749,969 | | | | 45,191,397 | |
| | | | | | | | | | | | | | | | | | | | |
Total Fixed Income | | | | | | | | | | | 50,381,685 | | | | 49,827,875 | | | | 49,272,687 | |
| | | | | | | | | | | | | | | | | | | | |
Total Investments | | | | | | | | | | | 50,427,234 | | | | 50,143,523 | | | | 49,530,379 | |
| | | | | | | | | | | | | | | | | | | | |
| |
Other assets and liabilities – 2.4%* | | | | 1,238,685 | |
| | | | | | | | | | | | | | | | | | | | |
| |
Net Assets – 100.0% | | | | $50,769,064 | |
| | | | | | | | | | | | | | | | | | | | |
| ‡‡ | Unless otherwise indicated, all principal amounts are denominated in United States Dollars. |
| * | Calculated as a percentage of net assets applicable to common shareholders. |
See accompanying Notes to the Financial Statements.
174
Barings U.S. High Yield Fund 2019 Annual Report
SCHEDULE OF INVESTMENTS (CONTINUED)
June 30, 2019
Distributions of investments by country of risk (excluding temporary cash investments) as a percentage of total investments in securities, is as follows:
| | | | | | |
| | United States | | | 87.0% | |
| | Canada | | | 4.2% | |
| | Zambia | | | 1.9% | |
| | Netherlands | | | 1.8% | |
| | Ghana | | | 1.4% | |
| | Denmark | | | 1.1% | |
| | Portugal | | | 1.1% | |
| | Other (Individually less than 1%) | | | 1.5% | |
| | | | | | |
| | Total | | | 100.0% | |
| | | | | | |
| ^ | Security acquired in a transaction exempt from registration under Rule 144A of the Securities Act of 1933. These securities may only be resold in transactions exempt from registration, normally to qualified institutional buyers. |
| § | Bank loans are exempt from registration under the Securities Act of 1933, as amended, but contain certain restrictions on resale and cannot be sold publicly. These loans pay interest at rates which adjust periodically. The interest rates shown for bank loans are the current interest rates at June 30, 2019. Bank loans are also subject to mandatory and/or optional prepayment which cannot be predicted. As a result, the remaining maturity may be substantially less than the stated maturity shown. |
| ¤ | For fair value measurement disclosure purposes, security is categorized as Level 3 (See Note 2). |
| # | Variable rate security. The interest rate shown is the rate in effect at June 30, 2019. |
See accompanying Notes to the Financial Statements.
175
Barings Funds Trust 2019 Annual Report
NOTES TO FINANCIAL STATEMENTS
June 30, 2019
Barings Funds Trust (the “Trust”) was organized as a business trust under the laws of the Commonwealth of Massachusetts on May 3, 2013 and commenced operations on September 16, 2013. The Trust is registered under the Investment Company Act of 1940, as amended (the “1940 Act”), as anopen-end management investment company. As of June 30, 2019, the Trust consists of eight funds (separately, a “Fund” and collectively, the “Funds”): Barings Global Floating Rate Fund (“Global Floating Rate Fund”), Barings Global Credit Income Opportunities Fund (“Global Credit Income Opportunities Fund”), Barings Active Short Duration Bond Fund (“Active Short Duration Bond Fund”), Barings Diversified Income Fund (formerly Barings Total Return Bond Fund) (“Diversified Income Fund”), Barings Emerging Markets Debt Blended Total Return Fund (“Emerging Markets Debt Blended Total Return Fund”), Barings Global Emerging Markets Equity Fund (“Global Emerging Markets Equity Fund”), Barings Global High Yield Fund (“Global High Yield Fund”) and Barings U.S. High Yield Fund (“U.S. High Yield Fund”). On November 30, 2018 the Emerging Markets Local Currency Debt Fund was liquidated. Each Fund, other than Emerging Markets Debt Blended Total Return Fund and Global Emerging Markets Equity Fund, is a “diversified” investment company. Global Credit Income Opportunities Fund and Global Floating Rate Fund commenced operations on September 16, 2013. Active Short Duration Bond Fund and Diversified Income Fund commenced operations on July 8, 2015. Emerging Markets Debt Blended Total Return Fund commenced operations on October 21, 2015. Global High Yield Fund and U.S. High Yield Fund commenced operations on October 30, 2015. Global Emerging Markets Equity Fund commenced operations on September 17, 2018. On March 1, 2019, Barings Total Return Bond Fund changed its name to Barings Diversified Income Fund.
Barings LLC (the “Adviser”), a wholly-owned indirect subsidiary of Massachusetts Mutual Life Insurance Company, is a registered investment adviser under the Investment Advisers Act of 1940, as amended (the “Advisers Act”), and serves as investment adviser to the Funds.
Barings International Investment Limited (“BIIL”), a private limited company incorporated under the laws of England, and a wholly-owned indirect subsidiary of the Adviser, serves as asub-adviser with respect to European
investments for the Global Floating Rate Fund, Global Credit Income Opportunities Fund, Emerging Markets Debt Blended Total Return Fund, Global Emerging Markets Equity Fund, and Global High Yield Fund.
The primary investment objective of the Global Floating Rate Fund is to seek a high level of current income. The Global Floating Rate Fund seeks preservation of capital as a secondary investment objective. The investment objective of the Global Credit Income Opportunities Fund is to seek an absolute return, primarily through current income and secondarily through capital appreciation. The investment objective of the Active Short Duration Bond Fund is to seek to achieve a high total rate of return primarily from current income while minimizing fluctuations in capital values by investing primarily in a diversified portfolio of short-term investment grade fixed income securities. The investment objective of the Diversified Income Fund seeks an absolute return, primarily through current income and capital appreciation. The investment objective of the Emerging Markets Debt Blended Total Return Fund is to seek to achieve maximum total return, consistent with preservation of capital and prudent investment management, through high current income generation and, where appropriate, capital appreciation. The investment objective of the Global Emerging Markets Equity Fund is to seek to achieve long-term capital growth.The investment objective of the Global High Yield Fund is to seek to provide high current income generation and, where appropriate, capital appreciation. The investment objective of the U.S. High Yield Fund is to seek to achieve a high level of total return, with an emphasis on current income, by investing primarily in high yield debt and related securities.
There can be no assurance that the Funds will achieve their investment objectives. Under normal market conditions, the Global Floating Rate Fund invests at least 80% of its net assets (including the amount of any borrowings for investment purposes) in income producing floating rate debt securities, consisting of floating rate loans, bonds and notes, issued primarily by North American and Western European companies that are primarily, at the time of purchase, rated below-investment grade (below Baa3 by Moody’s Investors Service, Inc. (“Moody’s”) or belowBBB- by either Standard & Poor’s Rating Services, a division of the McGraw-Hill Company, Inc. (“S&P”) or Fitch, Inc. (“Fitch”)) or, if unrated, determined by the Adviser or BIIL to be of comparable quality. Under normal market conditions, the
176
Barings Funds Trust 2019 Annual Report
NOTES TO FINANCIAL STATEMENTS(CONTINUED)
June 30, 2019
Global Credit Income Opportunities Fund invests at least 80% of its net assets (including the amount of any borrowings for investment purposes) in debt instruments, consisting of loans, bonds and notes. Investments may be based in U.S. andnon-U.S. markets, as well asover-the-counter and exchange traded derivatives. Investments may be issued or guaranteed by governments and their agencies, corporations, financial institutions and supranational organizations that the Adviser believes have the potential to provide a high total return over time. A significant portion of the Global Floating Rate Fund and Global Credit Income Opportunities Fund’s investments in debt instruments will be denominated in a currency other than the U.S. dollar. Although the investments innon-U.S. dollar denominated assets may be on a currency hedged or unhedged basis, the Global Floating Rate Fund and Global Credit Income Opportunities Fund expect that, under current market conditions, they will seek to hedge substantially all of their exposure to foreign currencies. Under normal market conditions, the Active Short Duration Bond Fund invests at least 80% of its net assets (including the amount of any borrowings for investment purposes) in investment grade fixed income securities (rated Baa3 or higher by Moody’s orBBB- or higher by S&P or Fitch or if unrated, determined to be of comparable quality by the Adviser). These typically include U.S. dollar-denominated corporate obligations, securities issued or guaranteed by the U.S. government or its agencies or instrumentalities, U.S. and foreign issuer dollar-denominated bonds including, but not limited to, corporate obligations, government and agency issues, private placement bonds, securities subject to resale pursuant to Rule 144A, mortgage-backed, and other asset-backed securities. Under normal market conditions, the Diversified Income Fund invests at least 80% of its net assets (including the amount of any borrowings for investment purposes) in fixed income securities. These typically include: Collateralized loan obligations, U.S. and foreign issuer dollar-denominated debt securities including, but not limited to, corporate obligations, government and agency issues, private placement bonds, securities subject to resale pursuant to Rule 144A, convertible bonds, mortgage-backed, and other asset-backed securities, loans, and securities issued or guaranteed by a government or its agencies or insrumentalities. Under normal market conditions, the Emerging Markets Debt Blended Total Return Fund will invest at least 80% of its net assets (including the amount of any borrowings for
investment purposes) in (i) securities denominated in currencies of the emerging market countries, (ii) fixed income securities or debt instruments issued by emerging market entities or sovereign nations, and/or (iii) debt instruments denominated in or based on the currencies, interest rates, or issues of emerging market countries. Emerging market countries are defined to include any country that did not become a member of the Organization for Economic Cooperation and Development (O.E.C.D.) prior to 1975 and Turkey. Certain emerging market countries are referred to as “frontier” market countries. The Emerging Markets Debt Blended Total Return Fund will likely focus its investments in Asia, Africa, the Middle East, Latin America and the developing countries of Europe. Under normal market conditions, the Global Emerging Markets Equity Fund will invest at least 80% of its net assets (including the amount of any borrowings for investment purposes) in equity and equity-related securities of issues that are economically tied to one or more emerging market countries. In general, countries may be considered emerging markets if they are included in any one of the Morgan Stanley Capital Index (“MSCI”) emerging markets indices. Under normal conditions, the Global High Yield Fund will invest at least 80% of its net assets (including the amount of any borrowing for investment purposes) in below investment grade (“high yield”) fixed and floating rate corporate debt securities including bonds, notes and other fixed and floating rate income securities issued primarily by North American and Western European companies. For this purpose, debt instruments issued by issuers based in the Channel Islands, Cayman Islands and Bermuda will be considered North American and Western European companies. Such debt securities may be secured or unsecured, and, either senior or subordinated. Secured debt means that collateral has been pledged as security against default, while investors in senior debt instruments are legally entitled to be repaid ahead of investors in subordinated (i.e.non-senior) instruments issued by the same corporation. Derivative instruments that provide exposure to such high yield debt securities or have similar economic characteristics may be used to satisfy the Fund’s 80% policy. The Adviser expects that such instruments will primarily, at the time of purchase, be rated below investment grade (commonly referred to as “junk bonds”) by at least one credit rating agency (below Baa3 by Moody’s or belowBBB- by either S&P or Fitch) or, if unrated, determined by the Adviser or BIIL, to be of comparable quality. The Global High Yield Fund may
177
Barings Funds Trust 2019 Annual Report
NOTES TO FINANCIAL STATEMENTS(CONTINUED)
June 30, 2019
invest in high yield securities of any rating, including securities that are in default at the time of purchase. Under normal circumstances, the U.S. High Yield Fund invests at least 80% of its net assets (including the amount of any borrowings for investment purposes) in lower rated fixed income securities (rated below Baa3 by Moody’s orBBB- by either S&P or Fitch (using the lower rating) or, if unrated, determined by the Adviser to be of comparable quality), and at least 80% of its net assets (including the amount of any borrowings for investment purposes) in securities of U.S. issuers. The U.S. High Yield Fund may also invest in convertible securities, preferred stocks, warrants, bank loans, and other fixed income securities, including Rule 144A securities, of both U.S. and foreign issuers. Currently, the Adviser does not expect that the U.S. High Yield Fund will invest more than 20% of its total assets in bank loans. The U.S. High Yield Fund may invest up to 15% of its total assets in securities that are not denominated in U.S. dollars including, but not limited to, corporate bonds, government and agency issues, Rule 144A securities, convertible securities, bank loans, mortgage-backed, and asset-backed securities.
Each Fund has four classes of shares: Class A, C, I, and Y, each with different expenses and dividends. With the exception of Active Short Duration Bond Fund, which has no sales charge on any class, afront-end sales charge is normally added to the net asset value (“NAV”) for Class A shares. There is nofront-end sales charge in the case of Class C, I, and Y shares. There may be a contingent deferred sales charge (“CDSC”) in certain cases as follows: 1) Effective January 15, 2018, Class A Shares purchased without an initial sales charge in accounts aggregating $500,000 or more are subject to a 1.00% contingent deferred sales charge (CDSC) if the shares are tendered and accepted for repurchase within 18 months of purchase (or within 12 months for shares purchased prior to January 15, 2018). The18-month period (or12-month period for shares purchased prior to January 15, 2018) begins on the day on which the purchase was made; and 2) Class C shares redeemed within the first year of purchase. All classes of shares have equal voting rights, with the exception of matters that relate solely to one class.
| 2. | Significant Accounting Policies |
The Trust is an investment company and follows accounting and reporting guidance in Financial Accounting Standards Board (“FASB”) Accounting Standards Codification Topic 946 (“ASC 946”).
The following is a summary of significant accounting policies followed consistently by the Funds in the preparation of their financial statements in conformity with accounting principles generally accepted in the United States of America (“U.S. GAAP”).
| | A. | Valuation of Investments |
In August 2018, FASB issued Accounting Standards UpdateNo. 2018-13 “Fair Value Measurement (Topic 820)Disclosure Framework — Changes to the Disclosure Requirements for Fair Value Measurement”, which amends the disclosure requirements for fair value measurements by modifying or removing certain disclosures and adding certain new disclosures. The amendments are effective for fiscal years, and interim periods within those fiscal years, beginning after December 15, 2019. As of June 30, 2019, Management has adopted the amendments.
The Funds’ investments in fixed income securities are generally valued using the prices provided directly by independent third party services or provided directly from one or more broker dealers or market makers, each in accordance with the valuation policies and procedures approved by the Funds’ Board of Trustees (the “Board”).
The pricing services may use valuation models or matrix pricing, which consider yield or prices with respect to comparable bond quotations from bond dealers or by reference to other securities that are considered comparable in such characteristics as credit rating, interest rates and maturity date to determine the current value. The Funds’ investments in bank loans are normally valued at the bid quotation obtained from dealers in loans by an independent pricing service in accordance with the Funds’ valuation policies and procedures approved by the Board. Short-term securities with remaining maturities of 60 days or less may be valued at amortized cost, which approximates fair value. Derivative financial instruments, such as futures contracts or options contracts that are traded on a national securities exchange, are stated at the last reported sale or settlement price on the day of valuation. Futures traded on inactive markets are valued using broker quotations. OTC derivative financial instruments, such as foreign currency contracts, options contracts, or swaps agreements, derive their value from underlying asset prices, indices, reference rates, and other inputs or a combination of these factors. These contracts are normally valued on the basis of an independent pricing service providers or broker dealer quotations. Depending
178
Barings Funds Trust 2019 Annual Report
NOTES TO FINANCIAL STATEMENTS(CONTINUED)
June 30, 2019
on the derivative type and the terms of the derivative, the value of the derivative financial instruments is assigned by independent pricing service providers using a series of techniques, which may include pricing models. The pricing models use inputs that are observed from actively quoted markets such as issuer details, indices, spreads, interest rates, curves, volatilities, dividends and exchange rates.
The assets and liabilities shown in the Statements of Assets and Liabilities related to investments purchased for“to-be-announced” (“TBA”) or when-issued securities approximate fair value and are determined using Level 2 inputs, as of June 30, 2019. The assets and liabilities shown in the Statements of Assets and Liabilities related to cash collateral held at broker on futures contracts, cash collateral held at broker on open swap contracts and cash collateral held at broker on open options contracts are determined using Level 1 inputs as of June 30, 2019.
A Valuation Committee, made up of officers of the Trust and employees of the Adviser, is responsible for determining, in accordance with the Funds’ valuation policies and procedures approved by the Board; (1) whether market quotations are readily available for investments held by the Fund; and (2) the fair value of investments held by the Fund for which market quotations are not readily available or are deemed not reliable by the Adviser. In certain cases, authorized pricing service vendors may not provide prices for a security held by the Funds, or the price provided by such pricing service vendor is deemed unreliable by the Adviser. In such cases, the Funds may use market maker quotations provided by an established market maker for that security (i.e., broker quotes) to value the security if the Adviser has experience obtaining quotations from the market maker and the Adviser determines that quotations obtained from the market maker in the past have generally been reliable (or, if the Adviser has no such experience with respect to a market maker, it determines based on other information available to it that quotations to be obtained by it from the market maker are reasonably likely to be reliable). In any such case, the Adviser will review any market quotations so obtained in light of other information in its possession for their general reliability.
Bond investments are valued on the basis of last available bid prices or current market quotations provided by dealers or pricing services. Bank loan positions are valued at the bid price from one or more brokers or dealers as obtained from a pricing service. In determining the value
of a particular investment, pricing services may use certain information with respect to transactions in such investments, quotations from dealers, pricing matrixes, market transactions in comparable investments, various relationships observed in the market between investments and calculated yield measures. Asset-backed and mortgage-backed securities are valued by independent pricing services using models that consider estimated cash flows of each tranche of the security, establish a benchmark yield and develop an estimated tranche-specific spread to the benchmark yield based on the unique attributes of the tranche.
Bank loans in which the Funds may invest have similar risks to lower-rated fixed income securities. Changes in the financial condition of the borrower or economic conditions or other circumstances may reduce the capacity of the borrower to make principal and interest payments on such instruments and may lead to defaults. Senior secured bank loans are supported by collateral; however, the value of the collateral may be insufficient to cover the amount owed to the Funds. By relying on a third party to administer a loan, the Funds are subject to the risk that the third party will fail to perform its obligations. The loans in which the Funds will invest are largely floating rate instruments; therefore, the interest rate risk generally is lower than for fixed-rate debt obligations. However, from the perspective of the borrower, an increase in interest rates may adversely affect the borrower’s financial condition. Due to the unique and customized nature of loan agreements evidencing loans and the private syndication thereof, loans are not as easily purchased or sold as publicly traded securities. Although the range of investors in loans has broadened in recent years, there can be no assurance that future levels of supply and demand in loan trading will provide the degree of liquidity which currently exists in the market. In addition, the terms of the loans may restrict their transferability without borrower consent. These factors may have an adverse effect on the market price and the Funds’ ability to dispose of particular portfolio investments. A less liquid secondary market also may make it more difficult for the Funds to obtain precise valuations of the high yield loans in its portfolio.
The Funds may invest in collateralized debt obligations (“CDOs”), which include collateralized bond obligations (“CBOs”) and collateralized loan obligations (“CLOs”). CBOs and CLOs are types of asset-backed securities. A CDO is an entity that is backed by a diversified pool of debt securities (CBOs) or syndicated bank loans (CLOs).
179
Barings Funds Trust 2019 Annual Report
NOTES TO FINANCIAL STATEMENTS(CONTINUED)
June 30, 2019
The cash flows of the CDO can be split into multiple segments, called “tranches,” which will vary in risk profile and yield. The riskiest segment is the subordinated or “equity” tranche. This tranche bears the greatest risk of defaults from the underlying assets in the CDO and serves to protect the other, more senior, tranches from default in all but the most severe circumstances. Since it is shielded from defaults by the more junior tranches, a “senior” tranche will typically have higher credit ratings and lower yields than their underlying securities, and often receive investment grade ratings from one or more of the nationally recognized rating agencies. Despite the protection from the more junior tranches, senior tranches can experience substantial losses due to actual defaults, increased sensitivity to future defaults and the disappearance of one or more protecting tranches as a result of changes in the credit profile of the underlying pool of assets.
Fair value is defined as the price that the Funds would receive upon selling an investment in a timely transaction to an independent buyer in the principal or most advantageous market of the investment. A three-tier hierarchy is utilized to maximize the use of observable market data and minimize the use of unobservable inputs and to establish classification of fair value measurements for disclosure purposes. Inputs refer broadly to the assumptions that market participants would use in pricing the asset or liability, including assumptions about risk. For example, market participants would consider the risk inherent in a particular valuation technique used to measure fair value, such as a pricing model, and/or the risk inherent in the inputs to the valuation technique. Inputs may be observable or unobservable. Observable inputs are inputs that reflect the assumptions market participants would use in pricing the asset or liability and are developed based on market data obtained from sources independent of the reporting entity.
Unobservable inputs are inputs that reflect the reporting entity’s own assumptions about the assumptions market participants would use in pricing the asset or liability and are developed based on the best information available in the circumstances. The three-tier hierarchy of inputs is summarized in the three broad levels listed below.
Level 1 – quoted prices in active markets for identical securities
Level 2 – other significant observable inputs (including quoted prices for similar securities, interest rates, prepayment speeds, credit risk, etc.)
Level 3 – significant unobservable inputs (including the Funds’ own assumptions in determining the fair value of investments)
The availability of observable inputs can vary from security to security and is affected by a wide variety of factors, including, for example, the type of security, whether the security is new and not yet established in the marketplace, the liquidity of markets, and other characteristics particular to the security. To the extent that valuation is based on models or inputs that are less observable or unobservable in the market, the determination of fair value requires more judgment. Accordingly, the degree of judgment exercised in determining fair value is greatest for instruments categorized in level 3.
The inputs used to measure fair value may fall into different levels of the fair value hierarchy. In such cases, for disclosure purposes, the level in the fair value hierarchy within which the fair value measurement falls in its entirety is determined based on the lowest level input that is significant to the fair value measurement in its entirety.
The following is a summary of the inputs used as of June 30, 2019 in valuing the Funds’ investments:
Global Floating Rate Fund
| | | | | | | | | | | | | | | | |
| DESCRIPTION | | LEVEL 1 | | | LEVEL 2 | | | LEVEL 3 | | | TOTAL INVESTMENTS | |
| |
Assets: | | | | | |
| Equities: | | | | | |
Common Stocks | | $ | – | | | $ | 1,007,602 | | | $ | 677,558 | | | $ | 1,685,160 | |
Preferred Stock | | | – | | | | – | | | | 23,368 | | | | 23,368 | |
Warrants | | | – | | | | 4,886 | | | | – | | | | 4,886 | |
| | | | | | | | | | | | | | | | |
| Total Equities | | | – | | | | 1,012,488 | | | | 700,926 | | | | 1,713,414 | |
| | | | | | | | | | | | | | | | |
180
Barings Funds Trust 2019 Annual Report
NOTES TO FINANCIAL STATEMENTS(CONTINUED)
June 30, 2019
| | | | | | | | | | | | | | | | |
| DESCRIPTION | | LEVEL 1 | | | LEVEL 2 | | | LEVEL 3 | | | TOTAL INVESTMENTS | |
| |
Fixed Income: | | | | | |
Bank Loans | | $ | – | | | $ | 231,287,361 | | | $ | 62,044 | | | $ | 231,349,405 | |
Corporate Bonds | | | – | | | | 26,057,801 | | | | 0 | | | | 26,057,801 | |
| | | | | | | | | | | | | | | | |
| Total Fixed Income | | | – | | | | 257,345,162 | | | | 62,044 | | | | 257,407,206 | |
| | | | | | | | | | | | | | | | |
| |
Derivative Securities: | | | | | |
Forward Foreign Currency Exchange Contracts | | | – | | | | 81,048 | | | | – | | | | 81,048 | |
| | | | | | | | | | | | | | | | |
| Total | | $ | – | | | $ | 258,438,698 | | | $ | 762,970 | | | $ | 259,201,668 | |
| | | | | | | | | | | | | | | | |
| |
Liabilities: | | | | | |
| Derivative Securities: | | | | | |
Forward Foreign Currency Exchange Contracts | | | – | | | | (102,331 | ) | | | – | | | | (102,331 | ) |
| | | | | | | | | | | | | | | | |
| Total Investments | | $ | – | | | $ | 258,336,367 | | | $ | 762,970 | | | $ | 259,099,337 | |
| | | | | | | | | | | | | | | | |
The following table is a summary of quantitative information about significant unobservable valuation inputs for Level 3 fair value measurement for investments held as of June 30, 2019:
| | | | | | | | |
| TYPE OF ASSETS | | FAIR VALUE AS OF
JUNE 30, 2019 | | | VALUATION
TECHNIQUE(S) | | UNOBSERVABLE INPUT |
| | | |
Equities | | | | | | | | |
| | | |
CTI Foods Holding Co, LLC | | $ | 512,659 | | | Priced at cost | | New security: Priced at cost |
| | | |
Tunstall Group Holdings Ltd | | $ | – | | | Zero Value | | Valued at zero without primary asset attached |
| | | |
Tunstall Group Holdings Ltd | | $ | – | | | Zero Value | | Valued at zero without primary asset attached |
| | | |
Boomerang Tube LLC | | $ | 147,959 | | | Discounted Cash Flow | | Average Enterprise Valuation Multiple: 5 year projection, 5.5x; EBITDA: $42.5 million; 15% discount rate |
| | | |
Templar Energy LLC | | $ | 3,286 | | | Broker Quote | | $0.38: Price source depth of 1 |
| | | |
Templar Energy LLC | | $ | 13,654 | | | Broker Quote | | $2.25 Price source depth of 1 |
| | | |
Pinnacle Agriculture Holdings A 2 | | $ | 23,368 | | | Broker Quote | | $0.09: Price source depth of 1 |
| | | |
Bank Loans | | | | | | | | |
| | | |
Boomerang Tube LLC | | $ | 62,044 | | | Discounted Cash Flow | | Average Enterprise Valuation Multiple: 5 year projection, 5.5x; EBITDA: $42.5 million; 15% discount rate |
| | | |
Corporate Bonds | | | | | | | | |
| | | |
Appvion ESC | | $ | – | | | Zero Value | | Valued at zero without primary asset attached |
Although the Fund believes the valuation methods described above are appropriate, the use of different methodologies or assumptions to determine fair value could result in different estimates of fair value at the reporting date.
181
Barings Funds Trust 2019 Annual Report
NOTES TO FINANCIAL STATEMENTS(CONTINUED)
June 30, 2019
The following is a reconciliation of investments with unobservable inputs (Level 3) that were used in determining fair value:
| | | | | | | | | | | | | | | | | | | | | | | | | | | | | | | | | | | | |
INVESTMENTS IN SECURITIES | | BALANCE
AS OF
JULY 1,
2018 | | | REALIZED
GAIN (LOSS) | | | CHANGE IN
UNREALIZED
APPRECIATION
(DEPRECIATION) | | | NET
TRANSFERS
IN (OUT)
OF
LEVEL 3*** | | | ACCRUED PREMIUMS/
DISCOUNTS | | | PURCHASES | | | SALES | | | BALANCE AS OF
JUNE 30,
2019 | | | CHANGE IN
UNREALIZED
APPRECIATION
(DEPRECIATION)
FROM
INVESTMENTS
HELD AT
JUNE 30,
2019 | |
| | | | | | | | | |
Equities | | | | | | | | | | | | | | | | | | | | | | | | | | | | | | | | | | | | |
Common Stock | | $ | 65,806 | | | $ | | | | $ | (35,913 | ) | | $ | (19,350 | ) | | $ | | | | $ | 667,015 | | | $ | | | | $ | 677,558 | | | $ | (35,913 | ) |
Preferred Stock | | $ | 238,876 | | | $ | | | | $ | (215,508 | ) | | $ | | | | $ | | | | $ | | | | $ | | | | $ | 23,368 | | | $ | (215,508 | ) |
Warrants | | $ | 8,475 | | | $ | | | | $ | – | | | $ | (8,475 | ) | | $ | | | | $ | | | | $ | | | | $ | – | | | $ | – | |
| | | | | | | | | | | | | | | | | | | | | | | | | | | | | | | | | | | | |
| | | | | | | | | |
Fixed Income | | | | | | | | | | | | | | | | | | | | | | | | | | | | | | | | | | | | |
Bank Loans | | $ | 206,150 | | | $ | (118,431 | ) | | $ | 98,862 | | | $ | – | | | $ | 233 | | | $ | 86,480 | | | $ | (211,250 | ) | | $ | 62,044 | | | $ | 98,862 | |
| | | | | | | | | | | | | | | | | | | | | | | | | | | | | | | | | | | | |
Total | | $ | 519,307 | | | $ | (118,431 | ) | | $ | (152,559 | ) | | $ | (27,825 | ) | | $ | 233 | | | $ | 753,495 | | | $ | (211,250 | ) | | $ | 762,970 | | | $ | (152,559 | ) |
| | | | | | | | | | | | | | | | | | | | | | | | | | | | | | | | | | | | |
| | *** | Transfers in to Level 3 from Level 2 occurred because observable inputs were no longer available. Transfers out of Level 3 in to Level 2 occurred because observable inputs became available. |
Global Credit Income Opportunities Fund
| | | | | | | | | | | | | | | | |
| DESCRIPTION | | LEVEL 1 | | | LEVEL 2 | | | LEVEL 3 | | | TOTAL INVESTMENTS | |
| |
Assets: | | | | | |
| Equities: | | | | | |
Common Stocks | | $ | – | | | $ | 894,009 | | | $ | 684,107 | | | $ | 1,578,116 | |
Preferred Stock | | | – | | | | – | | | | 28,042 | | | | 28,042 | |
Warrants | | | – | | | | 305 | | | | – | | | | 305 | |
| | | | | | | | | | | | | | | | |
| Total Equities | | | – | | | | 894,314 | | | | 712,149 | | | | 1,606,463 | |
| | | | | | | | | | | | | | | | |
| |
Fixed Income: | | | | | |
Asset-Backed Securities | | | – | | | | 23,698,095 | | | | – | | | | 23,698,095 | |
Bank Loans | | | – | | | | 84,733,142 | | | | 496,463 | | | | 85,229,605 | |
Corporate Bonds | | | – | | | | 87,829,651 | | | | 0 | | | | 87,829,651 | |
| | | | | | | | | | | | | | | | |
| Total Fixed Income | | | – | | | | 196,260,888 | | | | 496,463 | | | | 196,757,351 | |
| | | | | | | | | | | | | | | | |
| |
Purchased Options: | | | | | |
Put Options Purchased | | | 280,715 | | | | – | | | | – | | | | 280,715 | |
| | | | | | | | | | | | | | | | |
| Total Purchased Options | | | 280,715 | | | | – | | | | – | | | | 280,715 | |
| | | | | | | | | | | | | | | | |
| |
Derivative Securities: | | | | | |
Forward Foreign Currency Exchange Contracts | | | – | | | | 94,580 | | | | – | | | | 94,580 | |
| | | | | | | | | | | | | | | | |
| Total | | $ | 280,715 | | | $ | 197,249,782 | | | $ | 1,208,612 | | | $ | 198,739,109 | |
| | | | | | | | | | | | | | | | |
| |
Liabilities: | | | | | |
| Derivative Securities: | | | | | |
Forward Foreign Currency Exchange Contracts | | | – | | | | (52,933 | ) | | | – | | | | (52,933 | ) |
| | | | | | | | | | | | | | | | |
| Total Investments | | $ | 280,715 | | | $ | 197,196,849 | | | $ | 1,208,612 | | | $ | 198,686,176 | |
| | | | | | | | | | | | | | | | |
182
Barings Funds Trust 2019 Annual Report
NOTES TO FINANCIAL STATEMENTS(CONTINUED)
June 30, 2019
The following table is a summary of quantitative information about significant unobservable valuation inputs for Level 3 fair value measurement for investments held as of June 30, 2019:
| | | | | | | | |
| TYPE OF ASSETS | | FAIR VALUE AS OF
JUNE 30, 2019 | | | VALUATION
TECHNIQUE(S) | | UNOBSERVABLE INPUT |
| | | |
Equities | | | | | | | | |
| | | |
Tunstall Group Holdings LTD | | $ | – | | | Zero Value | | Valued at zero without primary asset attached |
| | | |
Tunstall Group Holdings LTD | | $ | – | | | Zero Value | | Valued at zero without primary asset attached |
| | | |
Boomerang Tube LLC | | $ | 147,959 | | | Discounted Cash Flow | | Average Enterprise Valuation Multiple: 5 year projection, 5.5x; EBITDA: $42.5 million; 15% discount rate |
| | | |
Maxeda DIY B.V. | | $ | 428,911 | | | Market Comparables | | LTM EBITDA€93m; Net leverage€453m; Average Comparable Valuation: 7.35X |
| | | |
Maxeda DIY B.V. | | $ | 107,236 | | | Market Comparables | | LTM EBITDA€93m; Net leverage€453m; Average Comparable Valuation: 7.35X |
| | | |
Pinnacle Agriculture Holdings A 2 | | $ | 28,042 | | | Broker Quote | | $0.09: Price source depth of 1 |
| | | |
Innovation Group | | $ | 1 | | | Priced at cost | | Priced at cost |
| | | |
Bank Loans | | | | | | | | |
| | | |
Blue Mountain CLO Ltd. | | $ | – | | | Zero Value | | Valued at zero until final accrual is received |
| | | |
Innovation Group PLC | | $ | 72,366 | | | Priced at cost | | Priced at cost |
| | | |
Innovation Group PLC | | $ | 264,519 | | | Priced at cost | | Priced at cost |
| | | |
Innovation Group PLC | | $ | 35,210 | | | Priced at cost | | Priced at cost |
| | | |
Boomerang Tube LLC | | $ | 124,368 | | | Discounted Cash Flow | | Average Enterprise Valuation Multiple: 5 year projection, 5.5x; EBITDA: $42.5 million; 15% discount rate |
Although the Fund believes the valuation methods described above are appropriate, the use of different methodologies or assumptions to determine fair value could result in different estimates of fair value at the reporting date.
The following is a reconciliation of investments with unobservable inputs (Level 3) that were used in determining fair value:
| | | | | | | | | | | | | | | | | | | | | | | | | | | | | | | | | | | | |
INVESTMENTS IN SECURITIES | | BALANCE
AS OF
JULY 1,
2018 | | | REALIZED
GAIN (LOSS) | | | CHANGE IN
UNREALIZED
APPRECIATION
(DEPRECIATION) | | | NET
TRANSFERS
IN (OUT)
OF
LEVEL 3*** | | | ACCRUED PREMIUMS/
DISCOUNTS | | | PURCHASES | | | SALES | | | BALANCE AS OF
JUNE 30,
2019 | | | CHANGE IN
UNREALIZED
APPRECIATION
(DEPRECIATION)
FROM
INVESTMENTS
HELD AT
JUNE 30,
2019 | |
| | | | | | | | | |
Equities | | | | | | | | | | | | | | | | | | | | | | | | | | | | | | | | | | | | |
Common Stock | | $ | 550,622 | | | $ | – | | | $ | (38,375 | ) | | $ | – | | | $ | – | | | $ | 171,860 | | | $ | – | | | $ | 684,107 | | | $ | (38,375 | ) |
Preferred Stock | | $ | 286,651 | | | $ | – | | | $ | (258,609 | ) | | $ | – | | | $ | – | | | $ | – | | | $ | – | | | $ | 28,042 | | | $ | (258,609 | ) |
| | | | | | | | | | | | | | | | | | | | | | | | | | | | | | | | | | | | |
183
Barings Funds Trust 2019 Annual Report
NOTES TO FINANCIAL STATEMENTS(CONTINUED)
June 30, 2019
| | | | | | | | | | | | | | | | | | | | | | | | | | | | | | | | | | | | |
INVESTMENTS IN SECURITIES | | BALANCE
AS OF
JULY 1,
2018 | | | REALIZED
GAIN (LOSS) | | | CHANGE IN
UNREALIZED
APPRECIATION
(DEPRECIATION) | | | NET
TRANSFERS
IN (OUT)
OF
LEVEL 3*** | | | ACCRUED PREMIUMS/
DISCOUNTS | | | PURCHASES | | | SALES | | | BALANCE AS OF
JUNE 30,
2019 | | | CHANGE IN
UNREALIZED
APPRECIATION
(DEPRECIATION)
FROM
INVESTMENTS
HELD AT
JUNE 30,
2019 | |
| | | | | | | | | |
Fixed Income | | | | | | | | | | | | | | | | | | | | | | | | | | | | | | | | | | | | |
Asset-Backed Securities | | $ | 10,228,154 | | | $ | (258,232 | ) | | $ | (119,880 | ) | | $ | (6,978,772 | ) | | $ | 1,791 | | | $ | – | | | $ | (2,873,061 | ) | | $ | – | | | $ | (119,880 | ) |
Bank Loans | | $ | 277,089 | | | $ | (118,458 | ) | | $ | 92,281 | | | $ | – | | | $ | 6,345 | | | $ | 530,009 | | | $ | (290,803 | ) | | $ | 496,463 | | | $ | 92,281 | |
| | | | | | | | | | | | | | | | | | | | | | | | | | | | | | | | | | | | |
Total | | $ | 11,342,516 | | | $ | (376,690 | ) | | $ | (324,583 | ) | | $ | (6,978,772 | ) | | $ | 8,136 | | | $ | 701,869 | | | $ | (3,163,864 | ) | | $ | 1,208,612 | | | $ | (324,583 | ) |
| | | | | | | | | | | | | | | | | | | | | | | | | | | | | | | | | | | | |
| | *** | Transfers in to Level 3 from Level 2 occurred because observable inputs were no longer available. Transfers out of Level 3 in to Level 2 occurred because observable inputs became available. |
Active Short Duration Bond Fund
| | | | | | | | | | | | | | | | |
| DESCRIPTION | | LEVEL 1 | | | LEVEL 2 | | | LEVEL 3 | | | TOTAL INVESTMENTS | |
| |
Assets: | | | | | |
| Fixed Income: | | | | | |
Asset-Backed Securities | | $ | – | | | $ | 317,656,878 | | | $ | 12,047,135 | | | $ | 329,704,013 | |
Corporate Bonds | | | – | | | | 247,698,431 | | | | – | | | | 247,698,431 | |
Mortgage-Backed Securities | | | – | | | | 66,096,260 | | | | – | | | | 66,096,260 | |
U.S. Treasury & Government Agencies | | | – | | | | 54,203,050 | | | | – | | | | 54,203,050 | |
| | | | | | | | | | | | | | | | |
| Total Fixed Income | | | – | | | | 685,654,619 | | | | 12,047,135 | | | | 697,701,754 | |
| | | | | | | | | | | | | | | | |
| |
Purchased Options: | | | | | |
Call Options Purchased | | | – | | | | 1,664,263 | | | | – | | | | 1,664,263 | |
Put Options Purchased | | | – | | | | 2,175,671 | | | | – | | | | 2,175,671 | |
| | | | | | | | | | | | | | | | |
| Total Purchased Options | | | – | | | | 3,839,934 | | | | – | | | | 3,839,934 | |
| | | | | | | | | | | | | | | | |
| |
Short-Term Investments: | | | | | |
Commercial Paper | | | – | | | | 25,113,396 | | | | – | | | | 25,113,396 | |
| | | | | | | | | | | | | | | | |
| Total Short-Term Investments | | | – | | | | 25,113,396 | | | | – | | | | 25,113,396 | |
| | | | | | | | | | | | | | | | |
| Total | | $ | – | | | $ | 714,607,949 | | | $ | 12,047,135 | | | $ | 726,655,084 | |
| | | | | | | | | | | | | | | | |
| |
Liabilities: | | | | | |
| Derivative Securities: | | | | | |
Centrally Cleared Interest Rate Swaps | | | – | | | | (13,411 | ) | | | – | | | | (13,411 | ) |
Futures** | | | (3,469,720 | ) | | | – | | | | – | | | | (3,469,720 | ) |
OTC – Credit Default Swaps | | | – | | | | (52,074 | ) | | | – | | | | (52,074 | ) |
| | | | | | | | | | | | | | | | |
| Total Derivative Securities | | | (3,469,720 | ) | | | (65,485 | ) | | | – | | | | (3,535,205 | ) |
| | | | | | | | | | | | | | | | |
| Total Investments | | $ | (3,469,720 | ) | | $ | 714,542,464 | | | $ | 12,047,135 | | | $ | 723,119,879 | |
| | | | | | | | | | | | | | | | |
| | ** | Centrally Cleared Swaps and Futures are valued at unrealized appreciation/depreciation. Only current day’s variation margin, if any, is reported on the Statement of Assets and Liabilities. |
184
Barings Funds Trust 2019 Annual Report
NOTES TO FINANCIAL STATEMENTS(CONTINUED)
June 30, 2019
The following table is a summary of quantitative information about significant unobservable valuation inputs for Level 3 fair value measurement for investments held as of June 30, 2019:
| | | | | | | | |
| TYPE OF ASSETS | | FAIR VALUE AS OF
JUNE 30, 2019 | | | VALUATION
TECHNIQUE(S) | | UNOBSERVABLE INPUT |
| | | |
Asset-Backed Securities | | | | | | | | |
| | | |
DRB Prime Student Loan Trust2016-R A2 | | $ | 1,754,321 | | | Broker Quote | | $100.11: Price source depth of 1 |
| | | |
SLM Student Loan Trust 2006-2 | | $ | 1,938,440 | | | Broker Quote | | $490: Price source depth of 1 |
| | | |
SoFi Alternative Trust2019-C | | $ | 4,617,317 | | | Priced at cost | | Priced at trade cost |
| | | |
SoFi Professional Loan Program2018-A | | $ | 1,059,158 | | | Broker Quote | | $77.17: Price source depth of 1 |
| | | |
SoFi Professional Loan Program2018-B Trust | | $ | 743,203 | | | Broker Quote | | $58.72: Price source depth of 1 |
| | | |
SoFi Professional Loan Program2018-D Trust | | $ | 650,140 | | | Broker Quote | | $34.50: Price source depth of 1 |
| | | |
SoFi Professional Loan Program2019-A LLC | | $ | 1,017,931 | | | Broker Quote | | $28.89: Price source depth of 1 |
| | | |
SoFi Consumer Loan Program LLC2015-A RC | | $ | 266,625 | | | Broker Quote | | $88,875.00: Price source depth of 1 |
Although the Fund believes the valuation methods described above are appropriate, the use of different methodologies or assumptions to determine fair value could result in different estimates of fair value at the reporting date.
The following is a reconciliation of investments with unobservable inputs (Level 3) that were used in determining fair value:
| | | | | | | | | | | | | | | | | | | | | | | | | | | | | | | | | | | | |
INVESTMENTS IN SECURITIES | | BALANCE
AS OF
JULY 1,
2018 | | | REALIZED
GAIN (LOSS) | | | CHANGE IN
UNREALIZED
APPRECIATION
(DEPRECIATION) | | | NET
TRANSFERS
IN (OUT)
OF
LEVEL 3*** | | | ACCRUED PREMIUMS/
DISCOUNTS | | | PURCHASES | | | SALES | | | BALANCE AS OF
JUNE 30,
2019 | | | CHANGE IN
UNREALIZED
APPRECIATION
(DEPRECIATION)
FROM
INVESTMENTS
HELD AT
JUNE 30,
2019 | |
| | | | | | | | | |
Asset–Backed Securities | | $ | 4,347,527 | | | $ | 374 | | | $ | 165,218 | | | $ | (2,198,101 | ) | | $ | 65,065 | | | $ | 9,876,845 | | | $ | (209,793 | ) | | $ | 12,047,135 | | | $ | 165,218 | |
| | | | | | | | | | | | | | | | | | | | | | | | | | | | | | | | | | | | |
| | | | | | | | | |
Mortgage–Backed Securities | | $ | 564,478 | | | $ | – | | | $ | – | | | $ | (564,478 | ) | | $ | – | | | $ | – | | | $ | – | | | $ | – | | | $ | – | |
| | | | | | | | | | | | | | | | | | | | | | | | | | | | | | | | | | | | |
Total | | $ | 4,912,005 | | | $ | 374 | | | $ | 165,218 | | | $ | (2,762,579 | ) | | $ | 65,065 | | | $ | 9,876,845 | | | $ | (209,793 | ) | | $ | 12,047,135 | | | $ | 165,218 | |
| | | | | | | | | | | | | | | | | | | | | | | | | | | | | | | | | | | | |
| | *** | Transfers in to Level 3 from Level 2 occurred because observable inputs were no longer available. Transfers out of Level 3 in to Level 2 occurred because observable inputs became available. |
Diversified Income Fund (Formerly Total Return Bond Fund)
| | | | | | | | | | | | | | | | |
| DESCRIPTION | | LEVEL 1 | | | LEVEL 2 | | | LEVEL 3 | | | TOTAL INVESTMENTS | |
| |
Assets: | | | | | |
| Fixed Income: | | | | | |
Asset-Backed Securities | | $ | – | | | $ | 23,148,091 | | | $ | 799,990 | | | $ | 23,948,081 | |
Corporate Bonds | | | – | | | | 14,637,575 | | | | – | | | | 14,637,575 | |
Mortgage-Backed Securities | | | – | | | | 2,676,040 | | | | – | | | | 2,676,040 | |
U.S. Treasury & Government Agencies | | | – | | | | 303,750 | | | | – | | | | 303,750 | |
| | | | | | | | | | | | | | | | |
| Total Fixed Income | | | – | | | | 40,765,456 | | | | 799,990 | | | | 41,565,446 | |
| | | | | | | | | | | | | | | | |
185
Barings Funds Trust 2019 Annual Report
NOTES TO FINANCIAL STATEMENTS(CONTINUED)
June 30, 2019
| | | | | | | | | | | | | | | | |
| DESCRIPTION | | LEVEL 1 | | | LEVEL 2 | | | LEVEL 3 | | | TOTAL INVESTMENTS | |
| |
Short-Term Investments: | | | | | |
Commercial Paper | | $ | – | | | $ | 1,598,313 | | | $ | – | | | $ | 1,598,313 | |
| | | | | | | | | | | | | | | | |
| Total Short-Term Investments | | | – | | | | 1,598,313 | | | | – | | | | 1,598,313 | |
| | | | | | | | | | | | | | | | |
| |
Derivative Securities: | | | | | |
Forward Foreign Currency Exchange Contracts | | | – | | | | 4,206 | | | | – | | | | 4,206 | |
| | | | | | | | | | | | | | | | |
| Total | | $ | – | | | $ | 42,367,975 | | | $ | 799,990 | | | $ | 43,167,965 | |
| | | | | | | | | | | | | | | | |
| |
Liabilities: | | | | | |
| Derivative Securities: | | | | | |
Forward Foreign Currency Exchange Contracts | | | – | | | | (24,128 | ) | | | – | | | | (24,128 | ) |
Futures** | | | (184,169 | ) | | | – | | | | – | | | | (184,169 | ) |
OTC – Credit Default Swaps | | | – | | | | (13,018 | ) | | | – | | | | (13,018 | ) |
| | | | | | | | | | | | | | | | |
| Total Derivative Securities | | | (184,169 | ) | | | (37,146 | ) | | | – | | | | (221,315 | ) |
| | | | | | | | | | | | | | | | |
| Total Investments | | $ | (184,169 | ) | | $ | 42,330,829 | | | $ | 799,990 | | | $ | 42,946,650 | |
| | | | | | | | | | | | | | | | |
| | ** | Centrally Cleared Swaps and Futures are valued at unrealized appreciation/depreciation. Only current day’s variation margin, if any, is reported on the Statement of Assets and Liabilities. |
The following table is a summary of quantitative information about significant unobservable valuation inputs for Level 3 fair value measurement for investments held as of June 30, 2019:
| | | | | | | | |
| TYPE OF ASSETS | | FAIR VALUE AS OF
JUNE 30, 2019 | | | VALUATION
TECHNIQUE(S) | | UNOBSERVABLE INPUT |
| | | |
Asset-Backed Securities | | | | | | | | |
| | | |
Horizon Aircraft Finance II Ltd. | | $ | 299,990 | | | Priced at cost | | Priced at trade cost |
| | | |
Riserva CLO Ltd. | | $ | 500,000 | | | Priced at cost | | Priced at trade cost |
Although the Fund believes the valuation methods described above are appropriate, the use of different methodologies or assumptions to determine fair value could result in different estimates of fair value at the reporting date.
The following is a reconciliation of investments with unobservable inputs (Level 3) that were used in determining fair value:
| | | | | | | | | | | | | | | | | | | | | | | | | | | | | | | | | | | | |
INVESTMENTS IN SECURITIES | | BALANCE
AS OF
JULY 1,
2018 | | | REALIZED
GAIN (LOSS) | | | CHANGE IN
UNREALIZED
APPRECIATION
(DEPRECIATION) | | | NET
TRANSFERS
IN (OUT)
OF
LEVEL 3*** | | | ACCRUED PREMIUMS/
DISCOUNTS | | | PURCHASES | | | SALES | | | BALANCE AS OF
JUNE 30,
2019 | | | CHANGE IN
UNREALIZED
APPRECIATION
(DEPRECIATION)
FROM
INVESTMENTS
HELD AT
JUNE 30,
2019 | |
| | | | | | | | | |
Asset Backed Securities | | $ | 163,761 | | | $ | 4 | | | $ | (1,250 | ) | | $ | (38,700 | ) | | $ | 15 | | | $ | 799,990 | | | $ | (123,830 | ) | | $ | 799,990 | | | $ | (1,250 | ) |
| | | | | | | | | | | | | | | | | | | | | | | | | | | | | | | | | | | | |
Total | | $ | 163,761 | | | $ | 4 | | | $ | (1,250 | ) | | $ | (38,700 | ) | | $ | 15 | | | $ | 799,990 | | | $ | (123,830 | ) | | $ | 799,990 | | | $ | (1,250 | ) |
| | | | | | | | | | | | | | | | | | | | | | | | | | | | | | | | | | | | |
| | *** | Transfers in to Level 3 from Level 2 occurred because observable inputs were no longer available. Transfers out of Level 3 in to Level 2 occurred because observable inputs became available. |
186
Barings Funds Trust 2019 Annual Report
NOTES TO FINANCIAL STATEMENTS(CONTINUED)
June 30, 2019
Emerging Markets Debt Blended Total Return Fund
| | | | | | | | | | | | | | | | |
| DESCRIPTION | | LEVEL 1 | | | LEVEL 2 | | | LEVEL 3 | | | TOTAL INVESTMENTS | |
| | | | |
Assets:* | | | | | | | | | | | | | | | | |
| Fixed Income: | | | | | | | | | | | | | | | | |
Corporate Bonds | | $ | – | | | $ | 19,805,553 | | | $ | – | | | $ | 19,805,553 | |
Foreign Government | | | – | | | | 29,214,506 | | | | – | | | | 29,214,506 | |
| | | | | | | | | | | | | | | | |
| Total Fixed Income | | | – | | | | 49,020,059 | | | | – | | | | 49,020,059 | |
| | | | | | | | | | | | | | | | |
| | | | |
Purchased Option: | | | | | | | | | | | | | | | | |
Put Option Purchased | | | – | | | | 13,031 | | | | – | | | | 13,031 | |
| Derivative Securities: | | | | | | | | | | | | | | | | |
Centrally Cleared Interest Rate Swaps | | | – | | | | 25,533 | | | | – | | | | 25,533 | |
Forward Foreign Currency Exchange Contracts | | | – | | | | 592,913 | | | | – | | | | 592,913 | |
OTC – Credit Default Swaps | | | – | | | | 74,233 | | | | – | | | | 74,233 | |
OTC – Cross Currency Swaps | | | – | | | | 94,625 | | | | – | | | | 94,625 | |
OTC – Interest Rate Swaps | | | – | | | | 244,543 | | | | – | | | | 244,543 | |
| | | | | | | | | | | | | | | | |
| Total Derivative Securities | | | – | | | | 1,031,847 | | | | – | | | | 1,031,847 | |
| | | | | | | | | | | | | | | | |
| Total | | $ | – | | | $ | 50,064,937 | | | $ | – | | | $ | 50,064,937 | |
| | | | | | | | | | | | | | | | |
| | | | |
Liabilities:* | | | | | | | | | | | | | | | | |
| Derivative Securities: | | | | | | | | | | | | | | | | |
Centrally Cleared Interest Rate Swaps | | | – | | | | (327,497 | ) | | | – | | | | (327,497 | ) |
Forward Foreign Currency Exchange Contracts | | | – | | | | (510,556 | ) | | | – | | | | (510,556 | ) |
Futures** | | | (71,794 | ) | | | – | | | | – | | | | (71,794 | ) |
OTC – Credit Default Swaps | | | – | | | | (30,300 | ) | | | – | | | | (30,300 | ) |
OTC – Cross Currency Swaps | | | – | | | | (11,915 | ) | | | – | | | | (11,915 | ) |
OTC – Interest Rate Swaps | | | – | | | | (634,186 | ) | | | – | | | | (634,186 | ) |
| | | | | | | | | | | | | | | | |
| Total Derivative Securities | | | (71,794 | ) | | | (1,514,454 | ) | | | – | | | | (1,586,248 | ) |
| | | | | | | | | | | | | | | | |
| Total Investments | | $ | (71,794 | ) | | $ | 48,550,483 | | | $ | – | | | $ | 48,478,689 | |
| | | | | | | | | | | | | | | | |
| | * | There were no transfers between levels during the year ended June 30, 2019. |
| | ** | Centrally Cleared Swaps and Futures are valued at unrealized appreciation/depreciation. Only current day’s variation margin, if any, is reported on the Statement of Assets and Liabilities. |
Global Emerging Markets Equity Fund
| | | | | | | | | | | | | | | | |
| DESCRIPTION | | LEVEL 1 | | | LEVEL 2 | | | LEVEL 3 | | | TOTAL INVESTMENTS | |
| |
Assets:* | | | | | |
| Equities: | | | | | |
Common Stocks | | $ | 7,404,338 | | | $ | 2,565,219 | | | $ | – | | | $ | 9,969,557 | |
| | | | | | | | | | | | | | | | |
| Total Equities | | | 7,404,338 | | | | 2,565,219 | | | | – | | | | 9,969,557 | |
| | | | | | | | | | | | | | | | |
| |
Mutual Fund: | | | | | |
Mutual Fund | | | 391,159 | | | | – | | | | – | | | | 391,159 | |
| | | | | | | | | | | | | | | | |
| Total | | $ | 7,795,497 | | | $ | 2,565,219 | | | $ | – | | | $ | 10,360,716 | |
| | | | | | | | | | | | | | | | |
| Total Investments | | $ | 7,795,497 | | | $ | 2,565,219 | | | $ | – | | | $ | 10,360,716 | |
| | | | | | | | | | | | | | | | |
| | * | There were no transfers between levels during the year ended June 30, 2019. |
187
Barings Funds Trust 2019 Annual Report
NOTES TO FINANCIAL STATEMENTS(CONTINUED)
June 30, 2019
Global High Yield Fund
| | | | | | | | | | | | | | | | |
| DESCRIPTION | | LEVEL 1 | | | LEVEL 2 | | | LEVEL 3 | | | TOTAL INVESTMENTS | |
| |
Assets:* | | | | | |
| Equities: | | | | | |
Common Stock | | $ | – | | | $ | 88,179 | | | $ | – | | | $ | 88,179 | |
Warrants | | | – | | | | 199 | | | | – | | | | 199 | |
| | | | | | | | | | | | | | | | |
| Total Equities | | | – | | | | 88,378 | | | | – | | | | 88,378 | |
| | | | | | | | | | | | | | | | |
| |
Fixed Income: | | | | | |
Bank Loans | | | – | | | | 2,062,669 | | | | – | | | | 2,062,669 | |
Corporate Bonds | | | – | | | | 24,545,633 | | | | 0 | | | | 24,545,633 | |
| | | | | | | | | | | | | | | | |
| Total Fixed Income | | | – | | | | 26,608,302 | | | | 0 | | | | 26,608,302 | |
| | | | | | | | | | | | | | | | |
| |
Derivative Securities: | | | | | |
Forward Foreign Currency Exchange Contracts | | | – | | | | 883 | | | | – | | | | 883 | |
| | | | | | | | | | | | | | | | |
| Total | | $ | – | | | $ | 26,697,563 | | | $ | – | | | $ | 26,697,563 | |
| | | | | | | | | | | | | | | | |
| |
Liabilities:* | | | | | |
| Derivative Securities: | | | | | |
Forward Foreign Currency Exchange Contracts | | | – | | | | (77,016 | ) | | | – | | | | (77,016 | ) |
| | | | | | | | | | | | | | | | |
| Total Investments | | $ | – | | | $ | 26,620,547 | | | $ | 0 | | | $ | 26,620,547 | |
| | | | | | | | | | | | | | | | |
| | * | There were no transfers between levels during the year ended June 30, 2019. |
The following table is a summary of quantitative information about significant unobservable valuation inputs for Level 3 fair value measurement for investments held as of June 30, 2019:
| | | | | | | | |
| TYPE OF ASSETS | | FAIR VALUE AS OF
JUNE 30, 2019 | | | VALUATION
TECHNIQUE(S) | | UNOBSERVABLE INPUT |
| | | |
Corporate Bonds | | | | | | | | |
| | | |
Appvion ESC | | $ | – | | | Zero Value | | Priced at zero value |
Although the Fund believes the valuation methods described above are appropriate, the use of different methodologies or assumptions to determine fair value could result in different estimates of fair value at the reporting date.
The following is a reconciliation of investments with unobservable inputs (Level 3) that were used in determining fair value:
| | | | | | | | | | | | | | | | | | | | | | | | | | | | | | | | | | | | |
INVESTMENTS IN SECURITIES | | BALANCE
AS OF
JULY 1,
2018 | | | REALIZED
GAIN (LOSS) | | | CHANGE IN UNREALIZED
APPRECIATION
(DEPRECIATION) | | | NET
TRANSFERS
IN (OUT)
OF
LEVEL 3 | | | ACCRUED PREMIUMS/
DISCOUNTS | | | PURCHASES | | | SALES | | | BALANCE AS OF
JUNE 30,
2019 | | | CHANGE IN UNREALIZED
APPRECIATION
(DEPRECIATION)
FROM
INVESTMENTS
HELD AT
JUNE 30,
2019 | |
| | | | | | | | | |
Fixed Income | | | | | | | | | | | | | | | | | | | | | | | | | | | | | | | | | | | | |
Corporate Bonds | | $ | – | | | $ | | | | $ | (275,264 | ) | | $ | | | | $ | 38,340 | | | $ | 236,924 | | | $ | | | | $ | – | | | $ | (275,964 | ) |
| | | | | | | | | | | | | | | | | | | | | | | | | | | | | | | | | | | | |
Total | | $ | – | | | $ | | | | $ | (275,264 | ) | | $ | | | | $ | 38,340 | | | $ | 236,924 | | | $ | | | | $ | – | | | $ | (275,964 | ) |
| | | | | | | | | | | | | | | | | | | | | | | | | | | | | | | | | | | | |
188
Barings Funds Trust 2019 Annual Report
NOTES TO FINANCIAL STATEMENTS(CONTINUED)
June 30, 2019
U.S. High Yield Fund
| | | | | | | | | | | | | | | | |
| DESCRIPTION | | LEVEL 1 | | | LEVEL 2 | | | LEVEL 3 | | | TOTAL INVESTMENTS | |
| |
Assets: | | | | | |
| Equities: | | | | | |
Common Stocks | | $ | – | | | $ | 257,469 | | | $ | – | | | $ | 257,469 | |
Warrants | | | – | | | | 223 | | | | – | | | | 223 | |
| | | | | | | | | | | | | | | | |
| Total Equities | | | – | | | | 257,692 | | | | – | | | | 257,692 | |
| | | | | | | | | | | | | | | | |
| |
Fixed Income: | | | | | |
Bank Loans | | | – | | | | 4,081,290 | | | | – | | | | 4,081,290 | |
Corporate Bonds | | | – | | | | 45,191,397 | | | | 0 | | | | 45,191,397 | |
| | | | | | | | | | | | | | | | |
| Total Fixed Income | | | – | | | | 49,272,687 | | | | 0 | | | | 49,272,687 | |
| | | | | | | | | | | | | | | | |
| Total | | $ | – | | | $ | 49,530,379 | | | $ | – | | | $ | 49,530,379 | |
| | | | | | | | | | | | | | | | |
| Total Investments | | $ | – | | | $ | 49,530,379 | | | $ | 0 | | | $ | 49,530,379 | |
| | | | | | | | | | | | | | | | |
The following table is a summary of quantitative information about significant unobservable valuation inputs for Level 3 fair value measurement for investments held as of June 30, 2019:
| | | | | | | | |
| TYPE OF ASSETS | | FAIR VALUE AS OF
JUNE 30, 2019 | | | VALUATION
TECHNIQUE(S) | | UNOBSERVABLE INPUT |
| | | |
Corporate Bonds | | | | | | | | |
| | | |
Appvion ESC | | $ | – | | | Zero Value | | Priced at zero value |
Although the Fund believes the valuation methods described above are appropriate, the use of different methodologies or assumptions to determine fair value could result in different estimates of fair value at the reporting date.
The following is a reconciliation of investments with unobservable inputs (Level 3) that were used in determining fair value:
| | | | | | | | | | | | | | | | | | | | | | | | | | | | | | | | | | | | |
INVESTMENTS IN SECURITIES | | BALANCE
AS OF
JULY 1,
2018 | | | REALIZED
GAIN (LOSS) | | | CHANGE IN UNREALIZED
APPRECIATION
(DEPRECIATION) | | | NET
TRANSFERS
IN (OUT)
OF
LEVEL 3 | | | ACCRUED PREMIUMS/
DISCOUNTS | | | PURCHASES | | | SALES | | | BALANCE AS OF
JUNE 30,
2019 | | | CHANGE IN UNREALIZED
APPRECIATION
(DEPRECIATION)
FROM
INVESTMENTS
HELD AT
JUNE 30,
2019 | |
| | | | | | | | | |
Fixed Income | | | | | | | | | | | | | | | | | | | | | | | | | | | | | | | | | | | | |
Corporate Bonds | | $ | – | | | $ | | | | $ | (308,123 | ) | | $ | | | | $ | 42,894 | | | $ | 265,229 | | | $ | | | | $ | – | | | $ | (308,123 | ) |
| | | | | | | | | | | | | | | | | | | | | | | | | | | | | | | | | | | | |
Total | | $ | – | | | $ | | | | $ | (308,123 | ) | | $ | | | | $ | 42,894 | | | $ | 265,229 | | | $ | | | | $ | – | | | $ | (308,123 | ) |
| | | | | | | | | | | | | | | | | | | | | | | | | | | | | | | | | | | | |
| | B. | When-Issued, Delayed-Delivery, Forward Commitment, andTo-Be-Announced Transactions |
The Funds may enter into when-issued, delayed-delivery, forward commitment, or TBA transactions (collectively, the “Forward Transactions”) in order to lock in the purchase price of the underlying security, or in order to
adjust the interest rate exposure of the Fund’s existing portfolio. In Forward Transactions, a Fund commits to purchase or sell particular securities, with payment and delivery to take place at a future date. In the case of TBA purchase commitments, the unit price and the estimated principal amount are established when the Fund enters
189
Barings Funds Trust 2019 Annual Report
NOTES TO FINANCIAL STATEMENTS(CONTINUED)
June 30, 2019
into a commitment, with the actual principal amount being within a specified range of the estimate. Although a Fund does not typically pay for the securities in these types of transactions until they are delivered, it immediately assumes the risks of ownership, including the risk of price fluctuation. As a result, each of these types of transactions may create investment leverage in a Fund’s portfolio and increase the volatility of the Fund. If a Fund’s counterparty fails to deliver a security purchased in a Forward Transaction, there may be a loss, and the Fund may have missed an opportunity to make an alternative investment.
These securities are valued on the basis of valuations furnished by a pricing service, selected pursuant to procedures approved by the Trustees, which determines valuations taking into account appropriate factors such asinstitutional-size trading in similar groups of securities, yield, quality, coupon rate, maturity, type of issue, trading characteristics, and other market data. Securities for which no market quotation is available are valued at fair value in accordance with procedures approved by the Trustees. The Funds record on a daily basis the unrealized appreciation (depreciation) based upon changes in the values of these securities. When a Forward Transaction is closed, the Funds record a realized gain or loss equal to the difference between the value of the transaction at the time it was opened and the value of the transaction at the time it was closed.
| | C. | Cash and Short-Term Investments |
Cash and cash equivalents consist principally of short-term investments that are readily convertible into cash and have original maturities of three months or less. At June 30, 2019, all cash and cash equivalents are held by the custodian.
| | D. | Investment Transactions, Related Investment Income and Expenses |
Investment transactions are accounted for on a trade date basis. Interest income is recorded on the accrual basis, including the amortization of premiums and accretion of discounts on bonds held using theyield-to-maturity method. Interest income from securitized investments in which the Fund(s) has/have a beneficial interest, such as the “equity” security class of a CLO vehicle (typically in the form of income or subordinated notes), are recorded upon receipt. The accrual of interest income related to these types of securities is periodically reviewed and adjustments are
made as necessary. These cash inflows are regularly reviewed to ensure these payments are not materially different from what would be required by GAAP reporting. Adjustments would be made if needed to address any changes.
In March 2017, FASB issued Accounting Standards UpdateNo. 2017-08 “Premium Amortization of Purchased Callable Debt Securities”, which amends the amortization period for certain purchased callable debt securities. Under the standards update, the premium amortization of purchased callable debt securities that have explicit,non-contingent call features and are callable at fixed prices will be amortized to the earliest call date. The guidance will be applied on a modified retrospective basis and is effective for fiscal years, and their interim periods, beginning after December 15, 2018. Management is currently evaluating the impact of this standard’s update to the Funds.
Realized gains and losses on investment transactions and unrealized appreciation and depreciation of investments are reported for financial statement and Federal income tax purposes on the identified cost method.
Expenses are recorded on the accrual basis as incurred.
The Funds do not have redemption fees.
The preparation of financial statements in conformity with U.S. GAAP requires management to make estimates and assumptions that affect the reported amounts of assets and liabilities at the date of the financial statements and the reported amounts of revenues and expenses during the reporting period. Actual results could differ from these estimates.
| | G. | Federal Income Taxation |
The Funds have elected to be taxed as a Regulated Investment Company (“RIC”) undersub-chapter M of the U.S. Internal Revenue Code of 1986, as amended, and intend to maintain this qualification and to distribute substantially all of their net taxable income to their shareholders. As of June 30, 2019, the Funds had no uncertain tax positions that would require financial statement recognition,de-recognition, or disclosure. The Funds file a U.S. federal income tax return annually after their fiscalyear-end, which is subject to examination by the Internal Revenue Service for a period of three years from the date of the filings.
190
Barings Funds Trust 2019 Annual Report
NOTES TO FINANCIAL STATEMENTS(CONTINUED)
June 30, 2019
| | H. | Dividends and Distributions |
Each Fund declares a dividend daily based on the Adviser’s projections of the Funds’ estimated net investment income and distributes such dividend monthly. To the extent that these distributions exceed net investment income, they may be classified as return of capital. The Funds also pay a distribution at least annually from their net realized capital gains, if any. Dividends and distributions are recorded on theex-dividend date. All common shares have equal dividend and other distribution rights. A notice disclosing the source(s) of a distribution will be provided if payment is made from any source other than net investment income. Any such notice would be provided only for informational purposes in order to comply with the requirements of Section 19(a) of the 1940 Act and not for tax reporting purposes. The tax composition of the Funds’ distributions for each calendar year is reported on Internal Revenue Service Form1099-DIV.
Dividends from net investment income and distributions from realized gains from investment transactions have been determined in accordance with Federal income tax regulations and may differ from net investment income and realized gains recorded by the Funds for financial reporting purposes. These differences, which could be temporary or permanent in nature may result in reclassification of distributions; however, net investment income, net realized gains and losses, and net assets are not affected.
The Funds may invest in bank loans, which usually take the form of loan participations and assignments. Loan participations and assignments are agreements to make money available to U.S. or foreign corporations, partnerships or other business entities (the “Borrower”) in a specified amount, at a specified rate and within a specified time. A loan is typically originated, negotiated and structured by a U.S. or foreign bank, insurance company or other financial institution (the “Agent”) for a group of loan investors (“Loan Investors”). The Agent typically administers and enforces the loan on behalf of the other Loan Investors in the syndicate and may hold any collateral on behalf of the Loan Investors. Such loan participations and assignments are typically senior, secured and collateralized in nature. The Funds record an investment when the Borrower withdraws money and records interest as earned. These loans pay interest at rates which are periodically reset by reference to a base
lending rate plus a spread. These base lending rates are generally the prime rate offered by a designated U.S. bank or London InterBank Offered Rate (“LIBOR”).
The loans in which the Funds invest may be subject to some restrictions on resale. For example, the Funds may be contractually obligated to receive approval from the Agent and/or Borrower prior to the sale of these investments. The Funds generally have no right to enforce compliance with the terms of the loan agreement with the Borrower. As a result, the Funds assume the credit risk of the Borrower, the selling participant and any other persons interpositioned between the Funds and the Borrower (“Intermediate Participants”). In the event that the Borrower, selling participant or Intermediate Participants become insolvent or enter into bankruptcy, the Funds may incur certain costs and delays in realizing payment or may suffer a loss of principal and/or interest.
Unfunded commitments represent the remaining obligation of the Funds to the Borrower. At any point in time, up to the maturity date of the issue, the Borrower may demand the unfunded portion. Until demanded by the Borrower, unfunded commitments are not recognized as an asset on the Statements of Assets and Liabilities. Unrealized appreciation/depreciation on unfunded commitments presented on the Statements of Assets and Liabilities represents mark to market of the unfunded portion of the Funds’ bank loans. As of June 30, 2019, the Funds had no unfunded loan commitments.
The following is a description of the derivative instruments that the Funds utilize as part of their investment strategy, including the primary underlying risk exposures related to the instrument.
The Funds are subject to foreign currency exchange rate risk in the normal course of pursuing their investment objectives. The Funds may use forward foreign currency exchange contracts to hedge against changes in the value of foreign currencies. The Funds may enter into forward foreign currency exchange contracts obligating the Funds to deliver or receive a currency at a specified future date. Forward contracts are valued daily and unrealized appreciation or depreciation is recorded daily as the difference between the contract exchange rate and the closing forward rate applied to the face amount of the contract. A realized gain or loss is recorded at the time the forward contract expires. Credit risk may arise as
191
Barings Funds Trust 2019 Annual Report
NOTES TO FINANCIAL STATEMENTS(CONTINUED)
June 30, 2019
a result of the failure of the counterparty to comply with the terms of the contract. The Funds consider the creditworthiness of each counterparty to a contract in evaluating potential credit risk quarterly. The Funds are also subject to credit risk with respect to the counterparties to derivative contracts that are not cleared through a central counterparty but instead are tradedover-the-counter between two counterparties. If a counterparty to anover-the-counter derivative becomes bankrupt or otherwise fails to perform its obligations under a derivative contract due to financial difficulties, the Funds may experience significant delays in obtaining any recovery under the derivative contract in a bankruptcy or other reorganization proceeding. The Funds may obtain only a limited recovery or may obtain no recovery in such circumstances. The counterparty risk for cleared derivatives is generally lower than for unclearedover-the-counter derivative transactions since generally a clearing organization becomes substituted for each counterparty to a cleared derivative contract and, in effect, guarantees the parties’ performance under the contract as each party to a trade looks only to the clearing house for performance of financial obligations. However, there can be no assurance that the clearing house, or its members, will satisfy its obligations to the Funds. In addition, in the event of a bankruptcy of a clearing house, the Funds could experience a loss of the funds deposited with such clearing house as margin and of any profits on its open positions. The counterparty risk to the Funds is limited to the net unrealized gain, if any, on the contract.
The use of forward foreign currency exchange contracts does not eliminate fluctuations in the underlying prices of the Funds’ investment securities; however, it does establish a rate of exchange that can be achieved in the future. The use of forward foreign currency exchange contracts involves the risk that anticipated currency movements will not be accurately predicted. A forward foreign currency exchange contract would limit the risk of loss due to a decline in the value of a particular currency; however, it would also limit any potential gain that might result should the value of the currency increase instead of decrease. These contracts may involve market risk in excess of the amount of receivable or payable reflected on the Statement of Assets and Liabilities.
The Funds may purchase and sell futures contracts to enhance returns, to attempt to hedge some of its investment risk, or as a substitute position in lieu of
holding the underlying asset on which the instrument is based. At the time of entering into a futures transaction, an investor is required to deposit and maintain a specified amount of cash or eligible securities called “initial margin.” Subsequent payments made or received by a Fund called “variation margin” are made on a daily basis as the market price of the futures contract fluctuates. Each Fund will record an unrealized gain (loss) based on the amount of variation margin. When a contract is closed, a realized gain (loss) is recorded equal to the difference between the opening and closing value of the contract.
The Funds may purchase call or put options. When a Fund purchases an option, the premium paid by the Fund is recorded as an asset and is subsequently adjusted to the current fair value of the option purchased. Purchasing call options tends to increase the Fund’s exposure to the underlying instrument. Purchasing put options tends to decrease the Fund’s exposure to the underlying instrument. Premiums paid for purchasing options that expire are treated as realized losses. Premiums paid for purchasing options that are exercised or closed are added to the amounts paid or offset against the proceeds on the underlying security to determine the realized gain or loss. The risks associated with purchasing put and call options are potential loss of the premium paid and, in the instances ofover-the-counter derivatives, the failure of the counterparty to honor its obligation under the contract.
The Funds may enter into swap options (“swaptions”). A swaption is an option to enter into apre-defined swap agreement by some specified date in the future. The writer of the swaption becomes the counterparty to the swap if the buyer exercises. The interest rate swaption agreement will specify whether the buyer of the swaption will be a fixed rate receiver or a fixed rate buyer. Depending on the terms of the particular option agreement, a Fund generally will incur a greater degree of risk when the Fund writes a swaption than the Fund will incur when it purchases a swaption. When a Fund purchases a swaption, the Fund’s risk of loss is limited to the amount of the premium it has paid should it decide to let the swaption expire unexercised.
When a Fund writes a covered call or a put option, an amount equal to the premium received by the Fund is included in the Fund’s Statement of Assets and Liabilities as an asset and as an equivalent liability. The amount of the liability is subsequentlymarked-to-market to reflect
192
Barings Funds Trust 2019 Annual Report
NOTES TO FINANCIAL STATEMENTS(CONTINUED)
June 30, 2019
the current market value of the option written. The Fund receives a premium on the sale of a call option but gives up the opportunity to profit from any increase in stock value above the exercise price of the option, and when a Fund writes a put option, it is exposed to a decline in the price of the underlying security.
Whether an option which a Fund has written expires on its stipulated expiration date or a Fund enters into a closing purchase transaction, the Fund realizes a gain (or loss, if the cost of a closing purchase transaction exceeds the premium received when the option was sold) without regard to any unrealized gain or loss on the underlying security, and the liability related to such option is extinguished. If a call option which a Fund has written is exercised, the Fund realizes a capital gain or loss from the sale of the underlying security, and the cost basis of the lots sold are decreased by the premium originally received. When a put option which a Fund has written is exercised, the amount of the premium originally received will reduce the cost of the security which the Fund purchases upon exercise of the option. Realized gains (losses) on purchased options are included in net realized gain (loss) from investments.
The Funds’ use of written options involves, to varying degrees, elements of market risk in excess of the amount recognized in the Statements of Assets and Liabilities. The face or contract amounts of these instruments reflect the extent of the Funds’ exposure to market risk. The risks may be caused by an imperfect correlation between movements in the price of the instrument and the price of the underlying securities, currencies and interest rates.
The Funds may enter into credit default swap contracts. As a seller of a credit default swap contract (“seller of protection”), a Fund is required to pay the notional amount or other agreed-upon value of a referenced debt obligation to the counterparty (or central clearing party in the case of centrally cleared swaps) in the event of a default by or other credit event involving the referenced issuer, obligation or index. In return, a Fund receives from the counterparty (or central clearing party in the case of centrally cleared swaps) a periodic stream of payments over the term of the contract.
As a purchaser of a credit default swap contract (“buyer of protection”), a Fund would receive the notional amount or other agreed upon value of a referenced debt obligation from the counterparty (or central clearing party in the case of centrally cleared swaps) in the event of default by or other credit event involving the
referenced issuer, obligation or index. In return, a Fund would make periodic payments to the counterparty (or central clearing party in the case of centrally cleared swaps) over the term of the contracts, provided no event of default has occurred.
These credit default swaps may have as a reference obligation corporate or sovereign issuers or credit indices. These credit indices are comprised of a basket of securities representing a particular sector of the market. During the period, Active Short Duration Bond Fund and Diversified Income Fund entered into credit default swaps based on a CMBX index, which is comprised of commercial mortgage-backed securities and a CDX index, which is comprised of North American and Emerging Market companies.
Credit default swaps are fair valued based upon quotations from counterparties, brokers or market-makers and the change in value, if any, is recorded as an unrealized appreciation or depreciation. For a credit default swap sold by a Fund, payment of the agreed-upon amount made by a Fund in the event of default of the referenced debt obligation is recorded as the cost of the referenced debt obligation purchased/received. For a credit default swap purchased by a Fund, the agreed-upon amount received by a Fund in the event of default of the referenced debt obligation is recorded as proceeds from sale/delivery of the referenced debt obligation and the resulting gain or loss realized on the referenced debt obligation is recorded as such by a Fund.
Any upfront payments made or received upon entering a credit default swap contract would be amortized or accreted over the life of the swap and recorded as realized gains or losses. Collateral, in the form of cash or securities, may be required to be held in segregated accounts with the custodian bank or broker in accordance with the swap agreement. The value and credit rating of each credit default swap where a Fund is the seller of protection, are both measures of the current payment/performance risk of the swap. As the value of the swap changes as a positive or negative percentage of the total notional amount, the payment/performance risk may decrease or increase, respectively. The maximum potential amount of future payments (undiscounted) that a Fund as a seller of protection could be required to make under a credit default swap agreement would be an amount equal to the notional amount of the agreement. These potential amounts would be partially offset by any recovery values of the respective referenced obligations,
193
Barings Funds Trust 2019 Annual Report
NOTES TO FINANCIAL STATEMENTS(CONTINUED)
June 30, 2019
upfront payments received upon entering into the agreement, or net amounts received from the settlement of buy protection credit default swap agreements entered into by a Fund for the same referenced entity or entities. For centrally cleared swaps, the daily change in valuation is recorded as a receivable or payable for variation margin and settled in cash with the central clearing party daily.
Entering into swap agreements involves counterparty and market risk. Such risks involve the possibility that there will be no liquid market for these agreements, that the counterparty to the agreements may default on its obligation to perform or disagree as to the meaning of the contractual terms in the agreements, that there may be unfavorable changes in interest rates, and, in the case of credit default swaps, that the Adviser does not correctly predict the creditworthiness of the issuers of the reference obligation on which the credit default swap is based. In the case of centrally cleared swaps, counterparty risk is minimal due to protections provided by the central clearing party.
Interest rate swaps involve the exchange by a Fund with another party of their respective commitments to receive or pay interest (e.g., an exchange of fixed rate payments for floating rate payments) with respect to a notional amount of principal. When a Fund enters into an interest rate swap, it typically agrees to make payments to its counterparty based on a specified long- or short-term interest rate, and will receive payments from its counterparty based on another interest rate. Other forms of interest rate swap agreements include interest rate caps, under which, in return for a specified payment stream, one party agrees to make payments to the other to the extent that interest rates exceed a specified rate, or “cap”; interest rate floors, under which, in return for a specified payment stream, one party agrees to make payments to the other to the extent that interest rates fall below a specified rate, or “floor”; and interest rate collars, under which a party sells a cap and purchases a floor or
vice versa in an attempt to protect itself against interest rate movements exceeding given minimum or maximum levels. A Fund may enter into an interest rate swap in order, for example, to hedge against the effect of interest rate changes on the value of specific securities in its portfolio, or to adjust the interest rate sensitivity (duration) or the credit exposure of its portfolio overall, or otherwise as a substitute for a direct investment in debt securities.
During the period ended June 30, 2019, the Funds’ direct investment in derivatives consisted of forward foreign currency exchange contracts, futures contracts, credit default swaps, interest rate swaps and purchased options.
The following is a summary of the fair value of derivative instruments held directly by the Funds as of June 30, 2019:
Global Floating Rate Fund
| | | | | | | | |
ASSET DERIVATIVES | | STATEMENTS OF ASSETS
AND LIABILITIES
LOCATION | | | FOREIGN
EXCHANGE
CONTRACTS RISK | |
Forward Foreign Currency Exchange Contracts | |
| Unrealized
appreciation on
forward foreign
currency exchange
contracts |
| | $ | 81,048 | |
| | | | | | | | |
Total | | | | | | $ | 81,048 | |
| | | | | | | | |
| | |
LIABILITY
DERIVATIVES | | STATEMENTS OF ASSETS
AND LIABILITIES
LOCATION | | | FOREIGN
EXCHANGE
CONTRACTS RISK | |
Forward Foreign Currency Exchange Contracts | |
| Unrealized
depreciation on
forward foreign
currency exchange
contracts |
| | $ | (102,331 | ) |
| | | | | | | | |
Total | | | | | | $ | (102,331 | ) |
| | | | | | | | |
Global Credit Income Opportunities Fund
| | | | | | | | | | | | | | | | |
ASSET DERIVATIVES | | STATEMENTS OF ASSETS
AND LIABILITIES
LOCATION | | | FOREIGN
EXCHANGE
CONTRACTS RISK | | | EQUITY RISK | | | TOTAL | |
Forward Foreign Currency Exchange Contracts | |
| Unrealized appreciation on
forward foreign currency
exchange contracts |
| | $ | 94,580 | | | $ | – | | | $ | 94,580 | |
Purchased Options | | | Investments, at fair value | | | | – | | | | 280,715 | | | | 280,715 | |
| | | | | | | | | | | | | | | | |
Total | | | | | | $ | 94,580 | | | $ | 280,715 | | | $ | 375,295 | |
| | | | | | | | | | | | | | | | |
194
Barings Funds Trust 2019 Annual Report
NOTES TO FINANCIAL STATEMENTS(CONTINUED)
June 30, 2019
| | | | | | | | | | | | | | | | |
LIABILITY
DERIVATIVES | | STATEMENTS OF ASSETS
AND LIABILITIES
LOCATION | | | FOREIGN
EXCHANGE
CONTRACTS RISK | | | EQUITY RISK | | | TOTAL | |
Forward Foreign Currency Exchange Contracts | |
| Unrealized depreciation on
forward foreign currency
exchange contracts |
| | $ | (52,933 | ) | | $ | – | | | $ | (52,933 | ) |
| | | | | | | | | | | | | | | | |
Total | | | | | | $ | (52,933 | ) | | $ | – | | | $ | (52,933 | ) |
| | | | | | | | | | | | | | | | |
Active Short Duration Bond Fund
| | | | | | | | | | | | | | | | |
ASSET DERIVATIVES | | STATEMENTS OF ASSETS
AND LIABILITIES
LOCATION | | | INTEREST RATE
RISK | | | CREDIT RISK | | | TOTAL | |
Purchased Options | |
| Investments, at fair
value |
| | $ | 3,839,934 | | | $ | – | | | $ | 3,839,934 | |
| | | | | | | | | | | | | | | | |
Total | | | | | | $ | 3,839,934 | | | $ | – | | | $ | 3,839,934 | |
| | | | | | | | | | | | | | | | |
| | | | | | | | | | | | | | | | |
LIABILITY DERIVATIVES | | STATEMENTS OF ASSETS
AND LIABILITIES
LOCATION | | | INTEREST RATE
RISK | | | CREDIT RISK | | | TOTAL | |
Futures Contracts | |
| Includes cumulative
unrealized appreciation/
depreciation of futures
contracts as reported
in the Schedule of
Investments. Only
current day’s variation
margin is reported
within the Statements
of Assets and Liabilities. |
| | $ | (3,469,720 | ) | | $ | – | | | $ | (3,469,720 | ) |
OTC – Swaps Contracts | |
| Swap contracts, at fair
value |
| | | – | | | | (52,074 | ) | | | (52,074 | ) |
Centrally Cleared Interest Rate Swap Contracts | |
| Includes cumulative
unrealized appreciation/
depreciation of swap
contracts as reported
in the Schedule of
Investments. Only
current day’s variation
margin is reported
within the Statements
of Assets and Liabilities. |
| | | (13,411 | ) | | | – | | | | (13,411 | ) |
| | | | | | | | | | | | | | | | |
Total | | | | | | $ | (3,483,131 | ) | | $ | (52,074 | ) | | $ | (3,535,205 | ) |
| | | | | | | | | | | | | | | | |
195
Barings Funds Trust 2019 Annual Report
NOTES TO FINANCIAL STATEMENTS(CONTINUED)
June 30, 2019
Diversified Income Fund (Formerly Total Return Bond Fund)
| | | | | | | | | | | | | | | | | | | | |
ASSET DERIVATIVES | | STATEMENTS OF ASSETS
AND LIABILITIES
LOCATION | | | FOREIGN
EXCHANGE
CONTRACTS RISK | | | INTEREST RATE
RISK | | | CREDIT RISK | | | TOTAL | |
Forward Foreign Currency Exchange Contracts | |
| Unrealized appreciation on
forward foreign currency
exchange contracts |
| | $ | 4,206 | | | $ | – | | | $ | – | | | $ | 4,206 | |
| | | | | | | | | | | | | | | | | | | | |
Total | | | | | | $ | 4,206 | | | $ | – | | | $ | | | | $ | 4,206 | |
| | | | | | | | | | | | | | | | | | | | |
| | | | | | | | | | | | | | | | | | | | |
LIABILITY DERIVATIVES | | STATEMENTS OF ASSETS
AND LIABILITIES
LOCATION | | | FOREIGN
EXCHANGE
CONTRACTS RISK | | | INTEREST RATE
RISK | | | CREDIT RISK | | | TOTAL | |
Forward Foreign Currency Exchange Contracts | |
| Unrealized depreciation on
forward foreign currency
exchange contracts |
| | $ | (24,128 | ) | | $ | – | | | | $ | | | $ | (24,128 | ) |
Futures Contracts | |
| Includes cumulative
unrealized appreciation/
depreciation of futures
contracts as reported in
the Schedule of
Investments. Only current
day’s variation margin is
reported within the
Statements of Assets and
Liabilities. |
| | | – | | | | (184,169 | ) | | | – | | | | (184,169 | ) |
OTC – Swaps Contracts | |
| Swap contracts, at fair
value |
| | | – | | | | – | | | | (13,018 | ) | | | (13,018 | ) |
| | | | | | | | | | | | | | | | | | | | |
Total | | | | | | $ | (24,128 | ) | | $ | (184,169 | ) | | $ | (13,018 | ) | | $ | (221,315 | ) |
| | | | | | | | | | | | | | | | | | | | |
Emerging Markets Debt Blended Total Return Fund
| | | | | | | | | | | | | | | | | | | | |
ASSET DERIVATIVES | | STATEMENTS OF ASSETS
AND LIABILITIES
LOCATION | | | FOREIGN
EXCHANGE
CONTRACTS RISK | | | INTEREST RATE
RISK | | | CREDIT RISK | | | TOTAL | |
Forward Foreign Currency Exchange Contracts | |
| Unrealized appreciation on
forward foreign currency
exchange contracts |
| | $ | 592,913 | | | $ | – | | | $ | – | | | $ | 592,913 | |
Purchased Options | | | Investments, at fair value | | | | 13,031 | | | | – | | | | – | | | | 13,031 | |
OTC – Swaps Contracts | |
| Swap contracts, at fair
value |
| | | 94,625 | | | | 244,543 | | | | 74,233 | | | | 413,401 | |
Centrally Cleared Interest Rate Swap Contracts | |
| Includes cumulative
unrealized appreciation/
depreciation of swap
contracts as reported in
the Schedule of
Investments. Only current
day’s variation margin is
reported within the
Statements of Assets and
Liabilities. |
| | | – | | | | 25,533 | | | | – | | | | 25,533 | |
| | | | | | | | | | | | | | | | | | | | |
Total | | | | | | $ | 700,569 | | | $ | 244,543 | | | $ | 74,233 | | | $ | 1,019,345 | |
| | | | | | | | | | | | | | | | | | | | |
196
Barings Funds Trust 2019 Annual Report
NOTES TO FINANCIAL STATEMENTS(CONTINUED)
June 30, 2019
| | | | | | | | | | | | | | | | | | | | |
LIABILITY
DERIVATIVES | | STATEMENTS OF ASSETS
AND LIABILITIES LOCATION | | | FOREIGN
EXCHANGE
CONTRACTS RISK | | | INTEREST RATE
RISK | | | CREDIT
RISK | | | TOTAL | |
Forward Foreign Currency Exchange Contracts | |
| Unrealized depreciation on
forward foreign currency exchange
contracts |
| | $ | (510,556 | ) | | $ | – | | | $ | – | | | $ | (510,556 | ) |
Futures Contracts | |
| Includes cumulative unrealized
appreciation/depreciation of futures
contracts as reported in the
Schedule of Investments. Only
current day’s variation margin is
reported within the Statements of
Assets and Liabilities. |
| | | – | | | | (71,794 | ) | | | – | | | | (71,794 | ) |
OTC – Swaps Contracts | | | Swap contracts, at fair value | | | | (11,915 | ) | | | (634,186 | ) | | | (30,300 | ) | | | (676,401 | ) |
Centrally Cleared Interest Rate Swaps | |
| Includes cumulative unrealized
appreciation/ depreciation of swap
contracts as reported in the
Schedule of Investments. Only
current day’s variation margin is
reported within the Statements of
Assets and Liabilities. |
| | | – | | | | (327,497 | ) | | | – | | | | (327,497 | ) |
| | | | | | | | | | | | | | | | | | | | |
Total | | | | | | $ | (522,471 | ) | | $ | (1,033,477 | ) | | $ | (30,300 | ) | | $ | (1,586,248 | ) |
| | | | | | | | | | | | | | | | | | | | |
Global High Yield Fund
| | | | | | | | |
ASSET
DERIVATIVES | | STATEMENTS OF ASSETS
AND LIABILITIES LOCATION | | | FOREIGN
EXCHANGE
CONTRACTS RISK | |
Forward Foreign Currency Exchange Contracts | |
| Unrealized appreciation on
forward foreign currency
exchange contracts |
| | $ | 883 | |
| | | | | | | | |
Total | | | | | | $ | 883 | |
| | | | | | | | |
| | | | | | | | |
LIABILITY
DERIVATIVES | | STATEMENTS OF ASSETS
AND LIABILITIES
LOCATION | | | FOREIGN
EXCHANGE
CONTRACTS RISK | |
Forward Foreign Currency Exchange Contracts | |
| Unrealized depreciation on
forward foreign currency
exchange contracts |
| | $ | (77,016 | ) |
| | | | | | | | |
Total | | | | | | $ | (77,016 | ) |
| | | | | | | | |
197
Barings Funds Trust 2019 Annual Report
NOTES TO FINANCIAL STATEMENTS(CONTINUED)
June 30, 2019
Amount of Realized Gain/(Loss) on Derivatives:
Global Floating Rate Fund
| | | | |
| | | FOREIGN
EXCHANGE
CONTRACTS RISK | |
Forward Foreign Currency Exchange Contracts | | $ | 4,813,881 | |
| | | | |
Total | | $ | 4,813,881 | |
| | | | |
Global Credit Income Opportunities Fund
| | | | | | | | | | | | |
| | | FOREIGN
EXCHANGE
CONTRACTS RISK | | | EQUITY RISK | | | TOTAL | |
Forward Foreign Currency Exchange Contracts | | $ | 3,669,530 | | | $ | – | | | $ | 3,669,530 | |
Purchased Options | | | – | | | | (511,938 | ) | | | (511,938 | ) |
| | | | | | | | | | | | |
Total | | $ | 3,669,530 | | | $ | (511,938 | ) | | $ | 3,157,592 | |
| | | | | | | | | | | | |
Active Short Duration Bond Fund
| | | | | | | | | | | | |
| | | INTEREST
RATE RISK | | | CREDIT RISK | | | TOTAL | |
Futures Contracts | | $ | (4,665,303 | ) | | $ | – | | | $ | (4,665,303 | ) |
Swaps Contracts | | | – | | | | 135,318 | | | | 135,318 | |
| | | | | | | | | | | | |
Total | | $ | (4,665,303 | ) | | $ | 135,318 | | | $ | (4,529,985 | ) |
| | | | | | | | | | | | |
Diversified Income Fund (Formerly Total Return Bond Fund)
| | | | | | | | | | | | | | | | |
| | | FOREIGN
EXCHANGE
CONTRACTS RISK | | | INTEREST RATE
RISK | | | CREDIT RISK | | | TOTAL | |
Forward Foreign Currency Exchange Contracts | | $ | (10,209 | ) | | $ | – | | | $ | – | | | $ | (10,209 | ) |
Futures Contracts | | | – | | | | (258,075 | ) | | | – | | | | (258,075 | ) |
Purchased Options | | | – | | | | 3,709 | | | | – | | | | 3,709 | |
Swaps Contracts | | | – | | | | – | | | | 13,397 | | | | 13,397 | |
| | | | | | | | | | | | | | | | |
Total | | $ | (10,209 | ) | | $ | (254,366 | ) | | $ | 13,397 | | | $ | (251,178 | ) |
| | | | | | | | | | | | | | | | |
Emerging Markets Debt Blended Total Return Fund
| | | | | | | | | | | | | | | | |
| | | FOREIGN
EXCHANGE
CONTRACTS RISK | | | INTEREST RATE
RISK | | | CREDIT RISK | | | TOTAL | |
Forward Foreign Currency Exchange Contracts | | $ | (626,857 | ) | | $ | – | | | $ | – | | | $ | (626,857 | ) |
Futures Contracts | | | – | | | | (90,314 | ) | | | – | | | | (90,314 | ) |
Purchased Options | | | 18,025 | | | | – | | | | – | | | | 18,025 | |
Swaps Contracts | | | 63,658 | | | | 303,699 | | | | 304,752 | | | | 672,109 | |
| | | | | | | | | | | | | | | | |
Total | | $ | (545,174 | ) | | $ | 213,385 | | | $ | 304,752 | | | $ | (27,037 | ) |
| | | | | | | | | | | | | | | | |
198
Barings Funds Trust 2019 Annual Report
NOTES TO FINANCIAL STATEMENTS(CONTINUED)
June 30, 2019
Global High Yield Fund
| | | | |
| | | FOREIGN
EXCHANGE
CONTRACTS RISK | |
Forward Foreign Currency Exchange Contracts | | $ | 484,537 | |
| | | | |
Total | | $ | 484,537 | |
| | | | |
Change in Unrealized Appreciation/(Depreciation) on Derivatives:
Global Floating Rate Fund
| | | | |
| | | FOREIGN
EXCHANGE
CONTRACTS RISK | |
Forward Foreign Currency Exchange Contracts | | $ | (650,658 | ) |
| | | | |
Total | | $ | (650,658 | ) |
| | | | |
Global Credit Income Opportunities Fund
| | | | | | | | | | | | |
| | | FOREIGN
EXCHANGE
CONTRACTS RISK | | | EQUITY RISK | | | TOTAL | |
Forward Foreign Currency Exchange Contracts | | $ | (774,111 | ) | | $ | | | | $ | (774,111 | ) |
Purchased Options | | | – | | | | (150,723 | ) | | | (150,723 | ) |
| | | | | | | | | | | | |
Total | | $ | (774,111 | ) | | $ | (150,723 | ) | | $ | (924,834 | ) |
| | | | | | | | | | | | |
Active Short Duration Bond Fund
| | | | | | | | | | | | |
| | | INTEREST RATE
RISK | | | CREDIT RISK | | | TOTAL | |
Futures Contracts | | $ | (3,081,643 | ) | | $ | – | | | $ | (3,081,643 | ) |
Purchased Options | | | 6,168 | | | | – | | | | 6,168 | |
Swaps Contracts | | | (13,411 | ) | | | 1,412 | | | | (11,999 | ) |
| | | | | | | | | | | | |
Total | | $ | (3,088,886 | ) | | $ | 1,412 | | | $ | (3,087,474 | ) |
| | | | | | | | | | | | |
Diversified Income Fund (Formerly Total Return Bond Fund)
| | | | | | | | | | | | | | | | |
| | | FOREIGN
EXCHANGE
CONTRACTS RISK | | | INTEREST RATE
RISK | | | CREDIT RISK | | | TOTAL | |
Forward Foreign Currency Exchange Contracts | | $ | 3,054 | | | $ | – | | | $ | – | | | $ | 3,054 | |
Futures Contracts | | | – | | | | (259,179 | ) | | | – | | | | (259,179 | ) |
Purchased Options | | | – | | | | (3,797 | ) | | | – | | | | (3,797 | ) |
Swaps Contracts | | | – | | | | – | | | | 358 | | | | 358 | |
| | | | | | | | | | | | | | | | |
Total | | $ | 3,054 | | | $ | (262,976 | ) | | $ | 358 | | | $ | (259,564 | ) |
| | | | | | | | | | | | | | | | |
199
Barings Funds Trust 2019 Annual Report
NOTES TO FINANCIAL STATEMENTS(CONTINUED)
June 30, 2019
Emerging Markets Debt Blended Total Return Fund
| | | | | | | | | | | | | | | | |
| | | FOREIGN
EXCHANGE
CONTRACTS RISK | | | INTEREST RATE
RISK | | | CREDIT RISK | | | TOTAL | |
Forward Foreign Currency Exchange Contracts | | $ | 639,745 | | | $ | | | | $ | – | | | $ | 639,745 | |
Futures Contracts | | | – | | | | (29,220 | ) | | | – | | | | (29,220 | ) |
Purchased Options | | | (37,731 | ) | | | – | | | | – | | | | (37,731 | ) |
Swaps Contracts | | | 64,532 | | | | (817,770 | ) | | | 114,200 | | | | (639,038 | ) |
| | | | | | | | | | | | | | | | |
Total | | $ | 666,546 | | | $ | (846,990 | ) | | $ | 114,200 | | | $ | (66,244 | ) |
| | | | | | | | | | | | | | | | |
Global High Yield Fund
| | | | |
| | | FOREIGN
EXCHANGE
CONTRACTS RISK | |
Forward Foreign Currency Exchange Contracts | | $ | (122,031 | ) |
| | | | |
Total | | $ | (122,031 | ) |
| | | | |
Global Floating Rate Fund
| | | | |
NUMBER OF CONTRACTS,
NOTIONAL AMOUNTS OF
SHARES/UNITS | | FOREIGN
EXCHANGE
CONTRACTS RISK | |
Forward Foreign Currency Exchange Contracts(1) | | $ | 83,520,892 | |
| | (1) Volume | of derivative activity is based on an average ofmonth-end notional amounts outstanding during the period. |
Global Credit Income Opportunities Fund
| | | | | | | | | | | | |
| | | FOREIGN
EXCHANGE
CONTRACTS RISK | | | EQUITY RISK | | | TOTAL | |
Forward Foreign Currency Exchange Contracts(1) | | $ | 68,046,707 | | | $ | – | | | $ | 68,046,707 | |
Purchased Options(1) | | $ | – | | | $ | 5,376 | | | $ | 5,376 | |
(1) Volume of derivative activity is based on an average ofmonth-end notional amounts outstanding during the period.
Active Short Duration Bond Fund
| | | | | | | | | | | | |
NUMBER OF CONTRACTS,
NOTIONAL AMOUNTS OF
SHARES/UNITS | | INTEREST RATE
RISK | | | CREDIT RISK | | | TOTAL | |
Futures Contracts(1) | | | 2,045 | | | | – | | | | 2,045 | |
Purchased Options(2) | | $ | 77,660,000 | | | $ | – | | | $ | 77,660,000 | |
OTC – Swaps Contracts(2) | | $ | – | | | $ | 520,000 | | | $ | 520,000 | |
Centrally Cleared Swap Contracts(2) | | $ | 2,600,000 | | | $ | – | | | $ | 2,600,000 | |
| | (1) Volume | of derivative activity is based on an average ofmonth-end contracts outstanding during the period. |
| | (2) Volume | of derivative activity is based on an average ofmonth-end notional amounts outstanding during the period. |
200
Barings Funds Trust 2019 Annual Report
NOTES TO FINANCIAL STATEMENTS(CONTINUED)
June 30, 2019
Diversified Income Fund (Formerly Total Return Bond Fund)
| | | | | | | | | | | | | | | | |
NUMBER OF CONTRACTS,
NOTIONAL AMOUNTS OF
SHARES/UNITS | | FOREIGN
EXCHANGE
CONTRACTS RISK | | | INTEREST RATE
RISK | | | CREDIT RISK | | | TOTAL | |
Futures Contracts(1) | | | – | | | | 84 | | | | – | | | | 84 | |
Forward Foreign Currency Exchange Contracts(2) | | $ | 1,516,602 | | | $ | – | | | $ | – | | | $ | 1,516,602 | |
Purchased Options(2) | | $ | – | | | $ | 7,950,000 | | | $ | – | | | $ | 7,950,000 | |
OTC – Swaps Contracts(2) | | $ | – | | | $ | – | | | $ | 159,167 | | | $ | 159,167 | |
Centrally Cleared Swap Contracts(2) | | $ | – | | | $ | – | | | $ | – | | | $ | – | |
| | (1) Volume | of derivative activity is based on an average ofmonth-end contracts outstanding during the period. |
| | (2) Volume | of derivative activity is based on an average ofmonth-end notional amounts outstanding during the period. |
Emerging Markets Debt Blended Total Return Fund
| | | | | | | | | | | | | | | | |
NUMBER OF CONTRACTS,
NOTIONAL AMOUNTS OF
SHARES/UNITS | | FOREIGN
EXCHANGE
CONTRACTS RISK | | | INTEREST RATE
RISK | | | CREDIT RISK | | | TOTAL | |
Futures Contracts(1) | | | – | | | | 8 | | | | – | | | | 8 | |
Forward Foreign Currency Exchange Contracts(2) | | $ | 60,220,589 | | | $ | – | | | $ | – | | | $ | 60,220,589 | |
Purchased Options(2) | | $ | 5,218,333 | | | $ | – | | | $ | – | | | $ | 5,218,333 | |
OTC – Swaps Contracts(2) | | $ | 2,371,395 | | | $ | 251,864,400 | | | $ | 9,041,667 | | | $ | 263,277,462 | |
Centrally Cleared Swap Contracts(2) | | $ | – | | | $ | 22,767,964 | | | $ | – | | | $ | 22,767,964 | |
| | (1) Volume | of derivative activity is based on an average ofmonth-end contracts outstanding during the period. |
| | (2) Volume | of derivative activity is based on an average ofmonth-end notional amounts outstanding during the period. |
Global High Yield Fund
| | | | |
NUMBER OF CONTRACTS,
NOTIONAL AMOUNTS OF
SHARES/UNITS | | FOREIGN
EXCHANGE
CONTRACTS RISK | |
Forward Foreign Currency Exchange Contracts(1) | | $ | 8,133,442 | |
| | (1) Volume | of derivative activity is based on an average ofmonth-end notional amounts outstanding during the period. |
| | K. | Disclosures about Offsetting Assets and Liabilities |
FASB issued Accounting Standards UpdateNo. 2011-11 “Disclosures about Offsetting Assets and Liabilities” (“ASU2011-11”). These disclosure requirements are intended to help better assess the effect or potential effect of offsetting arrangements on a Fund’s financial position. In addition, FASB issued Accounting Standards UpdateNo. 2013-01 “Clarifying the Scope of Offsetting Assets and Liabilities” (“ASU2013-01”), specifying which transactions are subject to disclosures about offsetting. In order to better define its contractual rights and to secure rights that will help the Fund mitigate its counterparty risk, the Fund may enter into an International Swaps and Derivatives Association, Inc. Master Agreement (“ISDA Master Agreement”) or similar agreement with its counterparties. An ISDA Master Agreement is a bilateral agreement between the Fund and a counterparty that governs certain OTC derivatives and typically contains, among other things, collateral posting terms and netting provisions in the event of a default and/or termination event. Under an ISDA Master Agreement, the Fund may, under certain circumstances, offset with the counterparty certain derivative financial instruments’ payables and/or receivables with collateral held and/or posted and create one single net payment. The provisions of the ISDA Master Agreement typically permit a single net payment in the event of default including the bankruptcy or insolvency of the counterparty. Bankruptcy or insolvency laws of a particular jurisdiction
201
Barings Funds Trust 2019 Annual Report
NOTES TO FINANCIAL STATEMENTS(CONTINUED)
June 30, 2019
may restrict or prohibit the right of offset in bankruptcy, insolvency or other events. In addition, certain ISDA Master Agreements allow counterparties to terminate derivative contracts prior to maturity in the event the Fund’s net assets decline by a stated percentage or the Fund fails to meet the terms of its ISDA Master Agreements. The result would cause the Fund to accelerate payment of any net liability owed to the counterparty.
For derivatives traded under an ISDA Master Agreement, the collateral requirements are typically calculated by netting the mark to market amount for each transaction under such agreement and comparing that amount to the value of any collateral currently pledged by the Funds and the counterparty.
Cash collateral that has been pledged to cover obligations of the Funds and cash collateral received from the counterparty, if any, is reported separately on the Statement of Assets and Liabilities as cash collateral held at broker or cash collateral due to broker, respectively.Non-cash collateral pledged by or received by the Funds, if any, is noted in the Schedule of Investments. Generally, the amount of collateral due from or to a party has to exceed a minimum transfer amount threshold before a transfer is required, which is determined each day at the close of business of the Funds, typically based on changes in market values for each transaction under an ISDA Master Agreement and netted into one amount for such agreement and any additional required collateral is delivered to/pledged by the Funds on the next business day. Typically, the Funds and counterparties are not permitted to sell,re-pledge or use the collateral they receive. To the extent amounts due to the Funds from their counterparties are not fully collateralized, contractually or otherwise, the Funds bear the risk of loss from counterpartynon-performance. The Funds attempt to mitigate counterparty risk by entering into agreements only with counterparties that they believe have the financial resources to honor their obligations and by monitoring the financial stability of those counterparties.
The following tables illustrate gross and net information about recognized assets eligible for offset in the Statement of Assets and Liabilities, and disclose such amounts subject to an enforceable master netting agreement or similar agreement, by counterparty. A master netting agreement is an agreement between two counterparties who have multiple contracts with each other that provides for the net settlement of all contracts, as well as cash collateral, through a single payment in the event of default on or termination of any one contract:
Global Floating Rate Fund
| | | | | | | | | | | | | | | | |
| DESCRIPTION | | | | | GROSS AMOUNTS OF
RECOGNIZED ASSETS | | | GROSS AMOUNTS OFFSET
IN THE STATEMENTS OF
ASSETS AND LIABILITIES | | | NET AMOUNTS OF
ASSETS PRESENTED
IN THE STATEMENTS OF
ASSETS AND LIABILITIES | |
Forward Foreign Currency Exchange Contracts | | | | | | $ | 81,048 | | | $ | – | | | $ | 81,048 | |
| | | | | | | | | | | | | | | | |
Total | | | | | | $ | 81,048 | | | $ | – | | | $ | 81,048 | |
| | | | | | | | | | | | | | | | |
| | | | | | | | | | | | | | | | |
| | | | | | GROSS AMOUNTS NOT OFFSET IN THE
STATEMENTS OF ASSETS AND LIABILITIES | | | | | | | |
| COUNTERPARTY | | NET AMOUNTS OF ASSETS
PRESENTED IN THE STATEMENTS
OF ASSETS AND LIABILITIES | | | FINANCIAL
INSTRUMENT | | | CASH
COLLATERAL
RECEIVED (a) | | | NET
AMOUNT (b) | |
Morgan Stanley & Co. | | $ | 81,048 | | | $ | (81,048 | ) | | $ | – | | | $ | – | |
| | | | | | | | | | | | | | | | |
Total | | $ | 81,048 | | | $ | (81,048 | ) | | $ | – | | | $ | – | |
| | | | | | | | | | | | | | | | |
| | (a) | Collateral disclosed is limited to an amount not to exceed 100% of the net amount of assets presented in the Statements of Assets and Liabilities, for each respective counterparty. |
| | (b) | Net Amount represents the amount that is subject to loss in the event of a counterparty failure as of June 30, 2019. |
202
Barings Funds Trust 2019 Annual Report
NOTES TO FINANCIAL STATEMENTS(CONTINUED)
June 30, 2019
| | | | | | | | | | | | | | |
| DESCRIPTION | | | | GROSS AMOUNTS OF
RECOGNIZED LIABILITIES | | | GROSS AMOUNTS OFFSET
IN THE STATEMENTS OF
ASSETS AND LIABILITIES | | | NET AMOUNTS OF
LIABILITIES PRESENTED
IN THE STATEMENTS OF
ASSETS AND LIABILITIES | |
Forward Foreign Currency Exchange Contracts | | | | $ | 102,331 | | | $ | – | | | $ | 102,331 | |
| | | | | | | | | | | | | | |
Total | | | | $ | 102,331 | | | $ | – | | | $ | 102,331 | |
| | | | | | | | | | | | | | |
| | | | | | | | | | | | | | | | |
| | | | | | GROSS AMOUNTS NOT OFFSET IN THE
STATEMENTS OF ASSETS AND LIABILITIES | | | | | | | |
| COUNTERPARTY | | NET AMOUNTS OF LIABILITIES
PRESENTED IN THE STATEMENTS
OF ASSETS AND LIABILITIES | | | FINANCIAL
INSTRUMENT | | | CASH
COLLATERAL
PLEDGED (a) | | | NET
AMOUNT (b) | |
Credit Suisse International | | $ | 2,597 | | | $ | – | | | $ | – | | | $ | 2,597 | |
Morgan Stanley & Co. | | | 99,734 | | | | (81,048 | ) | | | – | | | | 18,686 | |
| | | | | | | | | | | | | | | | |
Total | | | $102,331 | | | $ | (81,048 | ) | | $ | – | | | $ | 21,283 | |
| | | | | | | | | | | | | | | | |
| | (a) | Collateral disclosed is limited to an amount not to exceed 100% of the net amount of assets presented in the Statements of Assets and Liabilities, for each respective counterparty. |
| | (b) | Net Amount represents the amount that is subject to loss in the event of a counterparty failure as of June 30, 2019. |
Global Credit Income Opportunities Fund
| | | | | | | | | | | | |
| DESCRIPTION | | GROSS AMOUNTS OF
RECOGNIZED ASSETS | | | GROSS AMOUNTS OFFSET
IN THE STATEMENTS OF
ASSETS AND LIABILITIES | | | NET AMOUNTS OF
ASSETS PRESENTED
IN THE STATEMENTS OF
ASSETS AND LIABILITIES | |
Forward Foreign Currency Exchange Contracts | | $ | 94,580 | | | $ | – | | | $ | 94,580 | |
| | | | | | | | | | | | |
Total | | $ | 94,580 | | | $ | – | | | $ | 94,580 | |
| | | | | | | | | | | | |
| | | | | | | | | | | | | | | | |
| | | | | | GROSS AMOUNTS NOT OFFSET IN THE
STATEMENTS OF ASSETS AND LIABILITIES | | | | | | | |
| COUNTERPARTY | | NET AMOUNTS OF ASSETS
PRESENTED IN THE STATEMENTS
OF ASSETS AND LIABILITIES | | | FINANCIAL
INSTRUMENT | | | CASH
COLLATERAL
RECEIVED (a) | | | NET
AMOUNT (b) | |
Citibank N.A. | | $ | 94,580 | | | $ | (52,933 | ) | | $ | – | | | $ | 41,647 | |
| | | | | | | | | | | | | | | | |
Total | | $ | 94,580 | | | $ | (52,933 | ) | | $ | – | | | $ | 41,647 | |
| | | | | | | | | | | | | | | | |
| | (a) | Collateral disclosed is limited to an amount not to exceed 100% of the net amount of assets presented in the Statements of Assets and Liabilities, for each respective counterparty. |
| | (b) | Net Amount represents the amount that is subject to loss in the event of a counterparty failure as of June 30, 2019. |
203
Barings Funds Trust 2019 Annual Report
NOTES TO FINANCIAL STATEMENTS(CONTINUED)
June 30, 2019
| | | | | | | | | | | | |
| DESCRIPTION | | GROSS AMOUNTS OF
RECOGNIZED LIABILITIES | | | GROSS AMOUNTS OFFSET
IN THE STATEMENTS OF
ASSETS AND LIABILITIES | | | NET AMOUNTS OF
LIABILITIES PRESENTED
IN THE STATEMENTS OF
ASSETS AND LIABILITIES | |
Forward Foreign Currency Exchange Contracts | | $ | 52,933 | | | $ | – | | | $ | 52,933 | |
| | | | | | | | | | | | |
Total | | $ | 52,933 | | | $ | – | | | $ | 52,933 | |
| | | | | | | | | | | | |
| | | | | | | | | | | | | | | | |
| | | | | | GROSS AMOUNTS NOT OFFSET IN THE
STATEMENTS OF ASSETS AND LIABILITIES | | | | | | | |
| COUNTERPARTY | | NET AMOUNTS OF LIABILITIES
PRESENTED IN THE STATEMENTS
OF ASSETS AND LIABILITIES | | | FINANCIAL
INSTRUMENT | | | CASH
COLLATERAL
PLEDGED (a) | | | NET
AMOUNT (b) | |
Citibank N.A. | | $ | 52,933 | | | $ | (52,933 | ) | | $ | – | | | $ | – | |
| | | | | | | | | | | | | | | | |
Total | | $ | 52,933 | | | $ | (52,933 | ) | | $ | – | | | $ | – | |
| | | | | | | | | | | | | | | | |
| | (a) | Collateral disclosed is limited to an amount not to exceed 100% of the net amount of assets presented in the Statements of Assets and Liabilities, for each respective counterparty. |
| | (b) | Net Amount represents the amount that is subject to loss in the event of a counterparty failure as of June 30, 2019. |
Active Short Duration Bond Fund
| | | | | | | | | | | | |
| DESCRIPTION | | GROSS AMOUNTS OF
RECOGNIZED ASSETS | | | GROSS AMOUNTS OFFSET
IN THE STATEMENTS OF
ASSETS AND LIABILITIES | | | NET AMOUNTS OF
ASSETS PRESENTED
IN THE STATEMENTS OF
ASSETS AND LIABILITIES | |
Purchased Options | | $ | 3,839,934 | | | $ | – | | | $ | 3,839,934 | |
| | | | | | | | | | | | |
Total | | $ | 3,839,934 | | | $ | – | | | $ | 3,839,934 | |
| | | | | | | | | | | | |
| | | | | | | | | | | | | | | | |
| | | | | | GROSS AMOUNTS NOT OFFSET IN THE
STATEMENTS OF ASSETS AND LIABILITIES | | | | | | | |
| COUNTERPARTY | | NET AMOUNTS OF ASSETS
PRESENTED IN THE STATEMENTS
OF ASSETS AND LIABILITIES | | | FINANCIAL
INSTRUMENT | | | CASH
COLLATERAL
RECEIVED (a) | | | NET
AMOUNT (b) | |
JPMorgan Chase Bank N.A. | | $ | 3,839,934 | | | $ | (23,033 | ) | | $ | (3,740,000 | ) | | $ | 76,901 | |
| | | | | | | | | | | | | | | | |
Total | | $ | 3,839,934 | | | $ | (23,033 | ) | | $ | (3,740,000 | ) | | $ | 76,901 | |
| | | | | | | | | | | | | | | | |
| | (a) | Collateral disclosed is limited to an amount not to exceed 100% of the net amount of assets presented in the Statements of Assets and Liabilities, for each respective counterparty. |
| | (b) | Net Amount represents the amount that is subject to loss in the event of a counterparty failure as of June 30, 2019. |
204
Barings Funds Trust 2019 Annual Report
NOTES TO FINANCIAL STATEMENTS(CONTINUED)
June 30, 2019
| | | | | | | | | | | | |
| DESCRIPTION | | GROSS AMOUNTS OF
RECOGNIZED LIABILITIES | | | GROSS AMOUNTS OFFSET
IN THE STATEMENTS OF
ASSETS AND LIABILITIES | | | NET AMOUNTS OF
LIABILITIES PRESENTED
IN THE STATEMENTS OF
ASSETS AND LIABILITIES | |
Swap Contracts | | $ | 52,074 | | | $ | – | | | $ | 52,074 | |
| | | | | | | | | | | | |
Total | | $ | 52,074 | | | $ | – | | | $ | 52,074 | |
| | | | | | | | | | | | |
| | | | | | | | | | | | | | | | |
| | | | | | GROSS AMOUNTS NOT OFFSET IN THE
STATEMENTS OF ASSETS AND LIABILITIES | | | | | | | |
| COUNTERPARTY | | NET AMOUNTS OF LIABILITIES
PRESENTED IN THE STATEMENTS
OF ASSETS AND LIABILITIES | | | FINANCIAL
INSTRUMENT | | | CASH
COLLATERAL
PLEDGED (a) | | | NET
AMOUNT (b) | |
Goldman Sachs & Co. | | $ | 29,041 | | | $ | – | | | $ | – | | | $ | 29,041 | |
JPMorgan Chase Bank N.A. | | | 23,033 | | | | (23,033 | ) | | | – | | | | – | |
| | | | | | | | | | | | | | | | |
Total | | $ | 52,074 | | | $ | (23,033 | ) | | $ | – | | | $ | 29,041 | |
| | | | | | | | | | | | | | | | |
| | (a) | Collateral disclosed is limited to an amount not to exceed 100% of the net amount of assets presented in the Statements of Assets and Liabilities, for each respective counterparty. |
| | (b) | Net Amount represents the amount that is subject to loss in the event of a counterparty failure as of June 30, 2019. |
Diversified Income Fund (Formerly Total Return Bond Fund)
| | | | | | | | | | | | |
| DESCRIPTION | | GROSS AMOUNTS OF
RECOGNIZED ASSETS | | | GROSS AMOUNTS OFFSET
IN THE STATEMENTS OF
ASSETS AND LIABILITIES | | | NET AMOUNTS OF
ASSETS PRESENTED
IN THE STATEMENTS OF
ASSETS AND LIABILITIES | |
Forward Foreign Currency Exchange Contracts | | $ | 4,206 | | | $ | – | | | $ | 4,206 | |
| | | | | | | | | | | | |
Total | | $ | 4,206 | | | $ | – | | | $ | 4,206 | |
| | | | | | | | | | | | |
| | | | | | | | | | | | | | | | |
| | | | | | GROSS AMOUNTS NOT OFFSET IN THE
STATEMENTS OF ASSETS AND LIABILITIES | | | | | | | |
| COUNTERPARTY | | NET AMOUNTS OF ASSETS
PRESENTED IN THE STATEMENTS
OF ASSETS AND LIABILITIES | | | FINANCIAL
INSTRUMENT | | | CASH
COLLATERAL
RECEIVED (a) | | | NET
AMOUNT (b) | |
Bank of America N.A. | | $ | 56 | | | $ | (55 | ) | | $ | – | | | $ | 1 | |
Barclays Bank plc | | | 1,555 | | | | (1,555 | ) | | | – | | | | – | |
JPMorgan Chase Bank N.A. | | | 255 | | | | (255 | ) | | | – | | | | – | |
BNP Paribas S.A. | | | 2,340 | | | | (2,340 | ) | | | – | | | | – | |
| | | | | | | | | | | | | | | | |
Total | | $ | 4,206 | | | $ | (4,205 | ) | | $ | – | | | $ | 1 | |
| | | | | | | | | | | | | | | | |
| | (a) | Collateral disclosed is limited to an amount not to exceed 100% of the net amount of assets presented in the Statements of Assets and Liabilities, for each respective counterparty. |
| | (b) | Net Amount represents the amount that is subject to loss in the event of a counterparty failure as of June 30, 2019. |
205
Barings Funds Trust 2019 Annual Report
NOTES TO FINANCIAL STATEMENTS(CONTINUED)
June 30, 2019
| | | | | | | | | | | | |
| DESCRIPTION | | GROSS AMOUNTS OF
RECOGNIZED LIABILITIES | | | GROSS AMOUNTS OFFSET
IN THE STATEMENTS OF
ASSETS AND LIABILITIES | | | NET AMOUNTS OF
LIABILITIES PRESENTED
IN THE STATEMENTS OF
ASSETS AND LIABILITIES | |
Forward Foreign Currency Exchange Contracts | | $ | 24,128 | | | $ | – | | | $ | 24,128 | |
Swap Contracts | | | 13,018 | | | | – | | | | 13,018 | |
| | | | | | | | | | | | |
Total | | $ | 37,146 | | | $ | – | | | $ | 37,146 | |
| | | | | | | | | | | | |
| | | | | | | | | | | | | | | | |
| | | | | | GROSS AMOUNTS NOT OFFSET IN THE
STATEMENTS OF ASSETS AND LIABILITIES | | | | | | | |
| COUNTERPARTY | | NET AMOUNTS OF LIABILITIES
PRESENTED IN THE STATEMENTS
OF ASSETS AND LIABILITIES | | | FINANCIAL
INSTRUMENT | | | CASH
COLLATERAL
PLEDGED (a) | | | NET
AMOUNT (b) | |
Bank of America N.A. | | $ | 55 | | | $ | (55 | ) | | $ | – | | | $ | – | |
Barclays Bank plc | | | 21,478 | | | | (1,555 | ) | | | – | | | | 19,923 | |
Goldman Sachs & Co. | | | 7,010 | | | | – | | | | – | | | | 7,010 | |
JPMorgan Chase Bank N.A. | | | 6,263 | | | | (255 | ) | | | – | | | | 6,008 | |
BNP Paribas S.A. | | | 2,340 | | | | (2,340 | ) | | | – | | | | – | |
| | | | | | | | | | | | | | | | |
Total | | $ | 37,146 | | | $ | (4,205 | ) | | $ | – | | | $ | 32,941 | |
| | | | | | | | | | | | | | | | |
| | (a) | Collateral disclosed is limited to an amount not to exceed 100% of the net amount of assets presented in the Statements of Assets and Liabilities, for each respective counterparty. |
| | (b) | Net Amount represents the amount that is subject to loss in the event of a counterparty failure as of June 30, 2019. |
Emerging Markets Debt Blended Total Return Fund
| | | | | | | | | | | | |
| DESCRIPTION | | GROSS AMOUNTS OF
RECOGNIZED ASSETS | | | GROSS AMOUNTS OFFSET
IN THE STATEMENTS OF
ASSETS AND LIABILITIES | | | NET AMOUNTS OF
ASSETS PRESENTED
IN THE STATEMENTS OF
ASSETS AND LIABILITIES | |
Forward Foreign Currency Exchange Contracts | | $ | 592,913 | | | $ | – | | | $ | 592,913 | |
Purchased Options | | | 13,031 | | | | – | | | | 13,031 | |
Swap Contracts | | | 413,401 | | | | – | | | | 413,401 | |
| | | | | | | | | | | | |
Total | | $ | 1,019,345 | | | $ | – | | | $ | 1,019,345 | |
| | | | | | | | | | | | |
206
Barings Funds Trust 2019 Annual Report
NOTES TO FINANCIAL STATEMENTS(CONTINUED)
June 30, 2019
| | | | | | | | | | | | | | | | |
| | | | | | GROSS AMOUNTS NOT OFFSET IN THE
STATEMENTS OF ASSETS AND LIABILITIES | | | | | | | |
| COUNTERPARTY | | NET AMOUNTS OF ASSETS
PRESENTED IN THE STATEMENTS
OF ASSETS AND LIABILITIES | | | FINANCIAL
INSTRUMENT | | | CASH
COLLATERAL
RECEIVED (a) | | | NET
AMOUNT (b) | |
Bank of America N.A. | | $ | 381,680 | | | $ | (381,680 | ) | | $ | – | | | $ | – | |
Barclays Bank plc | | | 122,849 | | | | (42,206 | ) | | | – | | | | 80,643 | |
BNP Paribas S.A. | | | 131,441 | | | | (131,441 | ) | | | – | | | | – | |
Citibank N.A. | | | 174,405 | | | | (174,405 | ) | | | – | | | | – | |
Goldman Sachs & Co. | | | 69,319 | | | | (12,141 | ) | | | – | | | | 57,178 | |
JPMorgan Chase Bank N.A. | | | 139,651 | | | | (53,730 | ) | | | – | | | | 85,921 | |
| | | | | | | | | | | | | | | | |
Total | | $ | 1,019,345 | | | $ | (795,603 | ) | | $ | – | | | $ | 223,742 | |
| | | | | | | | | | | | | | | | |
| | (a) | Collateral disclosed is limited to an amount not to exceed 100% of the net amount of assets presented in the Statements of Assets and Liabilities, for each respective counterparty. |
| | (b) | Net Amount represents the amount that is subject to loss in the event of a counterparty failure as of June 30, 2019. |
| | | | | | | | | | | | |
| DESCRIPTION | | GROSS AMOUNTS OF
RECOGNIZED LIABILITIES | | | GROSS AMOUNTS OFFSET
IN THE STATEMENTS OF
ASSETS AND LIABILITIES | | | NET AMOUNTS OF
LIABILITIES PRESENTED
IN THE STATEMENTS OF
ASSETS AND LIABILITIES | |
Forward Foreign Currency Exchange Contracts | | $ | 510,556 | | | $ | – | | | $ | 510,556 | |
Swap Contracts | | | 676,401 | | | | – | | | | 676,401 | |
| | | | | | | | | | | | |
Total | | $ | 1,186,957 | | | $ | – | | | $ | 1,186,957 | |
| | | | | | | | | | | | |
| | | | | | | | | | | | | | | | |
| | | | | | GROSS AMOUNTS NOT OFFSET IN THE
STATEMENTS OF ASSETS AND LIABILITIES | | | | | | | |
| COUNTERPARTY | | NET AMOUNTS OF LIABILITIES
PRESENTED IN THE STATEMENTS
OF ASSETS AND LIABILITIES | | | FINANCIAL
INSTRUMENT | | | CASH
COLLATERAL
PLEDGED (a) | | | NET
AMOUNT (b) | |
Bank of America N.A. | | $ | 517,272 | | | $ | (381,680 | ) | | $ | – | | | $ | 135,592 | |
Barclays Bank plc | | | 42,206 | | | | (42,206 | ) | | | – | | | | – | |
BNP Paribas S.A. | | | 327,872 | | | | (131,441 | ) | | | (196,431 | ) | | | – | |
Citibank N.A. | | | 231,719 | | | | (174,405 | ) | | | – | | | | 57,314 | |
Goldman Sachs & Co. | | | 12,141 | | | | (12,141 | ) | | | – | | | | – | |
JPMorgan Chase Bank N.A. | | | 53,730 | | | | (53,730 | ) | | | – | | | | – | |
Morgan Stanley & Co. | | | 2,017 | | | | – | | | | – | | | | 2,017 | |
| | | | | | | | | | | | | | | | |
Total | | $ | 1,186,957 | | | $ | (795,603 | ) | | $ | (196,431 | ) | | $ | 194,923 | |
| | | | | | | | | | | | | | | | |
| | (a) | Collateral disclosed is limited to an amount not to exceed 100% of the net amount of assets presented in the Statements of Assets and Liabilities, for each respective counterparty. |
| | (b) | Net Amount represents the amount that is subject to loss in the event of a counterparty failure as of June 30, 2019. |
207
Barings Funds Trust 2019 Annual Report
NOTES TO FINANCIAL STATEMENTS(CONTINUED)
June 30, 2019
Global High Yield Fund
| | | | | | | | | | | | |
| DESCRIPTION | | GROSS AMOUNTS OF
RECOGNIZED ASSETS | | | GROSS AMOUNTS OFFSET
IN THE STATEMENTS OF
ASSETS AND LIABILITIES | | | NET AMOUNTS OF
ASSETS PRESENTED
IN THE STATEMENTS OF
ASSETS AND LIABILITIES | |
Forward Foreign Currency Exchange Contracts | | $ | 883 | | | $ | – | | | $ | 883 | |
| | | | | | | | | | | | |
Total | | $ | 883 | | | $ | – | | | $ | 883 | |
| | | | | | | | | | | | |
| | | | | | | | | | | | | | | | |
| | | | | | GROSS AMOUNTS NOT OFFSET IN THE
STATEMENTS OF ASSETS AND LIABILITIES | | | | | | | |
| COUNTERPARTY | | NET AMOUNTS OF ASSETS
PRESENTED IN THE STATEMENTS
OF ASSETS AND LIABILITIES | | | FINANCIAL
INSTRUMENT | | | CASH
COLLATERAL
RECEIVED (a) | | | NET
AMOUNT (b) | |
Bank of America N.A. | | $ | 215 | | | $ | (215 | ) | | $ | – | | | $ | – | |
Barclays Bank plc | | | 165 | | | | (165 | ) | | | – | | | | – | |
BNP Paribas S.A. | | | 107 | | | | (107 | ) | | | – | | | | – | |
Citibank N.A. | | | 396 | | | | – | | | | – | | | | 396 | |
| | | | | | | | | | | | | | | | |
Total | | $ | 883 | | | $ | (487 | ) | | $ | – | | | $ | 396 | |
| | | | | | | | | | | | | | | | |
| | (a) | Collateral disclosed is limited to an amount not to exceed 100% of the net amount of assets presented in the Statements of Assets and Liabilities, for each respective counterparty. |
| | (b) | Net Amount represents the amount that is subject to loss in the event of a counterparty failure as of June 30, 2019. |
| | | | | | | | | | | | |
| DESCRIPTION | | GROSS AMOUNTS OF
RECOGNIZED LIABILITIES | | | GROSS AMOUNTS OFFSET
IN THE STATEMENTS OF
ASSETS AND LIABILITIES | | | NET AMOUNTS OF
LIABILITIES PRESENTED
IN THE STATEMENTS OF
ASSETS AND LIABILITIES | |
Forward Foreign Currency Exchange Contracts | | $ | 77,016 | | | $ | – | | | $ | 77,016 | |
| | | | | | | | | | | | |
Total | | $ | 77,016 | | | $ | – | | | $ | 77,016 | |
| | | | | | | | | | | | |
| | | | | | | | | | | | | | | | |
| | | | | | GROSS AMOUNTS NOT OFFSET IN THE
STATEMENTS OF ASSETS AND LIABILITIES | | | | | | | |
| COUNTERPARTY | | NET AMOUNTS OF LIABILITIES
PRESENTED IN THE STATEMENTS
OF ASSETS AND LIABILITIES | | | FINANCIAL
INSTRUMENT | | | CASH
COLLATERAL
PLEDGED (a) | | | NET
AMOUNT (b) | |
Bank of America N.A. | | $ | 61,754 | | | $ | (215 | ) | | $ | – | | | $ | 61,539 | |
Barclays Bank plc | | | 185 | | | | (165 | ) | | | – | | | | 20 | |
BNP Paribas S.A. | | | 15,077 | | | | (107 | ) | | | – | | | | 14,970 | |
| | | | | | | | | | | | | | | | |
Total | | $ | 77,016 | | | $ | (487 | ) | | $ | – | | | $ | 76,529 | |
| | | | | | | | | | | | | | | | |
| | (a) | Collateral disclosed is limited to an amount not to exceed 100% of the net amount of assets presented in the Statements of Assets and Liabilities, for each respective counterparty. |
| | (b) | Net Amount represents the amount that is subject to loss in the event of a counterparty failure as of June 30, 2019. |
208
Barings Funds Trust 2019 Annual Report
NOTES TO FINANCIAL STATEMENTS(CONTINUED)
June 30, 2019
Investing in securities of foreign companies and foreign governments involves special risks and considerations not typically associated with investing in U.S. companies and the U.S. government. These risks include valuation of currencies and adverse political and economic developments. Moreover, securities of many foreign companies, foreign governments, and their markets may be less liquid and their prices more volatile than those of securities of comparable U.S. companies and the U.S. government.
| | M. | Foreign Currency Translation |
The books and records of the Funds are maintained in U.S. dollars. Foreign currency transactions are translated into U.S. dollars on the following basis: (i) market value of investment securities, assets and liabilities at the daily rates of exchange, and (ii) purchases and sales of investment securities, dividend and interest income and certain expenses at the rates of exchange prevailing on the respective dates of such transactions. For financial reporting purposes, the Funds do not isolate changes in the exchange rate of investment securities from the fluctuations arising from changes in the market prices of securities. However, for Federal income tax purposes, the Funds do isolate and treat as ordinary income the effect of changes in foreign exchange rates on realized gain or loss from the sale of investment securities and payables and receivables arising from trade-date and settlement-date differences.
The Funds seek to manage counterparty credit risk by entering into agreements only with counterparties the Adviser believes have the financial resources to honor their obligations. The Adviser monitors the financial stability of the Funds’ counterparties.
The Funds have entered into an Investment Management Agreement (the “Agreement”) with the Adviser. Pursuant to the Agreement, the Funds have agreed to pay the Adviser a fee payable at the end of each calendar month as set forth below:
| | |
Global Floating Rate Fund | | 0.65% of average daily net assets |
Global Credit Income Opportunities Fund | | 0.75% of average daily net assets |
| | |
Active Short Duration Bond Fund | | 0.35% of average daily net assets |
Diversified Income Fund | | 0.40% of average daily net assets |
Emerging Markets Debt Blended Total Return Fund | | 0.75% of average daily net assets |
Global Emerging Markets Equity Fund | | 0.90% of average daily net assets |
Global High Yield Fund | | 0.60% of average daily net assets |
U.S. High Yield Fund | | 0.55% of average daily net assets |
The Adviser has contractually agreed to waive and/or reimburse a portion of its fees and/or reimburse expenses (excluding distribution and service(12b-1) fees, interest expenses, taxes, acquired fund fees and expenses, fees incurred in acquiring and disposing of securities and extraordinary expenses) such that total net annual operating expenses (including12b-1 fees) for each class do not exceed the following rates (as a percentage of average daily net assets allocated to each such class):
| | | | | | | | | | | | | | | | |
| | | CLASS A | | | CLASS C | | | CLASS I | | | CLASS Y | |
Global Floating Rate Fund | | | 1.00 | % | | | 1.75 | % | | | 0.75 | % | | | 0.75 | % |
Global Credit Income Opportunities Fund | | | 1.20 | % | | | 1.95 | % | | | 0.95 | % | | | 0.95 | % |
Active Short Duration Bond Fund | | | 0.65 | % | | | 0.90 | % | | | 0.40 | % | | | 0.40 | % |
Diversified Income Fund | | | 0.80 | % | | | 1.55 | % | | | 0.55 | % | | | 0.55 | % |
Emerging Markets Debt Blended Total Return Fund | | | 1.20 | % | | | 1.95 | % | | | 0.95 | % | | | 0.95 | % |
Global Emerging Markets Equity Fund | | | 1.45 | % | | | 2.20 | % | | | 1.20 | % | | | 1.20 | % |
Global High Yield Fund | | | 1.05 | % | | | 1.80 | % | | | 0.80 | % | | | 0.80 | % |
U.S. High Yield Fund | | | 1.00 | % | | | 1.75 | % | | | 0.75 | % | | | 0.75 | % |
Pursuant to the expense waiver/reimbursement agreement, the Adviser is entitled to be reimbursed for any fees the Adviser waives and Fund expenses that the Adviser reimburses for a period of three years following
209
Barings Funds Trust 2019 Annual Report
NOTES TO FINANCIAL STATEMENTS(CONTINUED)
June 30, 2019
such fee waivers and expense reimbursements, to the extent that such reimbursement of the Adviser by a Fund will not cause the Fund to exceed any applicable expense limitation that is in place for the Fund.
The contractual management fee waiver and expense reimbursement agreements between the Funds and the Adviser will remain in effect until November 1, 2019 and may be terminated only upon the approval of the Funds’ Board of Trustees.
Subject to the supervision of the Adviser and the Board, BIIL manages the investment and reinvestment of a portion of the assets of the Global Floating Rate Fund, Global Credit Income Opportunities Fund, Emerging Markets Debt Blended Total Return Fund, Global Emerging Markets Equity Fund and Global High Yield Fund, as allocated from time to time to BIIL. As compensation for its services, the Adviser (not the Funds) pays to BIILsub-advisory fees equal to the below percentages of the advisory fee paid to the Adviser by the applicable Fund, net of any fee waivers and/or expense reimbursements:
| | | | |
Global Floating Rate Fund | | | 0.35 | % |
Global Credit Income Opportunities Fund | | | 0.35 | % |
Emerging Markets Debt Blended Total Return Fund | | | 0.50 | % |
Global Emerging Markets Equity Fund | | | 0.70 | % |
Global High Yield Fund | | | 0.35 | % |
The Adviser or its affiliates voluntarily agreed to waive certain fees for the Global Floating Rate Fund, the Active Short Duration Bond Fund, the Diversified Income Fund and the Emerging Markets Debt Blended Total Return Fund. Such arrangements may be discontinued by the Adviser at any time. For the year ended June 30, 2019, the amounts of the waivers were $905, $1,176, $291 and $107,226, respectively.
| 4. | 12b-1 Distribution and Service Plan |
ALPS Distributors, Inc. (the “Distributor”) is the Distributor of the Funds’ shares as of June 30, 2019.
The Funds have adopted a Distribution and Shareholder Services Plan (the “Plan”), pursuant to Rule12b-1 under the 1940 Act. Under the Plan, each Fund’s Class A and Class C shares may compensate certain financial institutions, including the Distributor, for certain distribution and shareholder servicing activities. The Funds’ Class A shares may expend an aggregate amount, on an annual basis, not to exceed 0.25% of the value of the average daily net assets of a Fund attributable to
Class A shares and 1.00% (0.50% for Active Short Duration Bond Fund) of the value of the average daily net assets of a Fund attributable to Class C shares. The Plan provides that the distribution and service fees are payable to the Distributor regardless of the amounts actually expended by the Distributor for distribution of the Funds’ shares and service activities.
Under its terms, the Funds’ Plan shall remain in effect from year to year, provided such continuance is approved annually by a vote of a majority of the Board’s members and a majority of the Board’s members who are not “interested persons” of the Funds and who have no direct or indirect financial interest in the operation of the Plan or in any agreement related to the Plan.
| 5. | Sales Charges and Commissions |
For the year ended June 30, 2019, the amount of sales charges retained by the Distributor on sales of Class A and Class C shares of the Funds were as follows:
| | | | | | | | |
| | | CLASS A | | | CLASS C | |
Global Floating Rate Fund | | $ | – | | | $ | 401 | |
Global Credit Income Opportunities Fund | | | – | | | | 63 | |
For the year ended June 30, 2019, the Distributor received the following commissions on sales of shares of the Funds, after concessions were paid to authorized dealers:
| | | | | | | | |
| | | DISTRIBUTOR
COMMISSIONS | | | DEALERS’
CONCESSIONS | |
Global Floating Rate Fund | | $ | 1,635 | | | $ | 45,466 | |
Global Credit Income Opportunities Fund | | | 873 | | | | 123,901 | |
Active Short Duration Bond Fund | | | – | | | | 3,882 | |
Diversified Income Fund | | | 246 | | | | 1,493 | |
Emerging Markets Debt Blended Total Return Fund | | | – | | | | 260 | |
Global High Yield Fund | | | 588 | | | | 4,572 | |
U.S. High Yield Fund | | | 9 | | | | 63 | |
| 6. | Administrator, Custody, and Transfer Agent Fees |
The Funds have engaged State Street Bank and Trust (“SSB”) to serve as the Funds’ administrator, custodian, and fund accountant. For these services, the Funds have agreed to pay SSB fees payable at the end of each
210
Barings Funds Trust 2019 Annual Report
NOTES TO FINANCIAL STATEMENTS(CONTINUED)
June 30, 2019
calendar month pursuant to an agreement between SSB and the Funds. For the year ended June 30, 2019, the aggregate effective fee for the services performed by SSB was at the following annual rate of each Fund’s average daily managed assets:
| | | | |
Aggregate Administrator, Custodian and Fund Accountant Fee to SSB: | |
Global Floating Rate Fund | | | 0.14 | % |
Global Credit Income Opportunities Fund | | | 0.15 | % |
Active Short Duration Bond Fund | | | 0.12 | % |
Diversified Income Fund | | | 0.30 | % |
Emerging Markets Debt Blended Total Return Fund | | | 0.28 | % |
Global Emerging Markets Equity Fund | | | 0.53 | % |
Global High Yield Fund | | | 0.29 | % |
U.S. High Yield Fund | | | 0.21 | % |
The Funds have engaged ALPS Fund Services, Inc. (“ALPS”) to serve as the Funds’ transfer agent. For these services, the Funds have agreed to pay ALPS fees payable at the end of each calendar month pursuant to an
agreement between ALPS and the Funds. For the year ended June 30, 2019, the effective fee for the services performed by ALPS was at the following annual rate of each Fund’s average daily managed assets:
| | | | |
Transfer Agency Fee to ALPS: | |
Global Floating Rate Fund | | | 0.02 | % |
Global Credit Income Opportunities Fund | | | 0.02 | % |
Active Short Duration Bond Fund | | | 0.02 | % |
Diversified Income Fund | | | 0.06 | % |
Emerging Markets Debt Blended Total Return Fund | | | 0.06 | % |
Global Emerging Markets Equity Fund | | | 0.17 | % |
Global High Yield Fund | | | 0.09 | % |
U.S. High Yield Fund | | | 0.04 | % |
It is the Funds’ intention to qualify as a RIC under subchapter M of the Internal Revenue Code and distribute all of its taxable income. Accordingly, no provision for Federal income taxes is required in the financial statements.
The tax character of dividends paid to shareholders during the tax year ended June 30, 2019 was as follows:
| | | | | | | | | | | | | | | | |
| | | ORDINARY
INCOME | | | NET
LONG-TERM
CAPITAL
GAINS | | | RETURN OF
CAPITAL | | | TOTAL
DISTRIBUTIONS
PAID | |
Global Floating Rate Fund | | $ | 15,249,263 | | | $ | 391,463 | | | $ | – | | | $ | 15,640,726 | |
Global Credit Income Opportunities Fund | | | 12,750,860 | | | | 1,517,782 | | | | 263,953 | | | | 14,532,595 | |
Active Short Duration Bond Fund | | | 15,755,535 | | | | 520,666 | | | | – | | | | 16,276,201 | |
Diversified Income Fund | | | 1,104,402 | | | | – | | | | – | | | | 1,104,402 | |
Emerging Markets Debt Blended Total Return Fund | | | 2,816,937 | | | | – | | | | 263,192 | | | | 3,080,129 | |
Global Emerging Markets Equity Fund | | | – | | | | – | | | | – | | | | – | |
Global High Yield Fund | | | 1,689,662 | | | | 429,794 | | | | – | | | | 2,119,456 | |
U.S. High Yield Fund | | | 3,321,860 | | | | – | | | | – | | | | 3,321,860 | |
The tax character of dividends paid to shareholders during the tax year ended June 30, 2018 was as follows:
| | | | | | | | | | | | | | | | |
| | | ORDINARY
INCOME | | | NET
LONG-TERM
CAPITAL
GAINS | | | RETURN OF
CAPITAL | | | TOTAL
DISTRIBUTIONS
PAID | |
Global Floating Rate Fund | | $ | 8,591,381 | | | $ | – | | | $ | 1,171,303 | | | $ | 9,762,684 | |
Global Credit Income Opportunities Fund | | | 9,089,382 | | | | – | | | | 496,307 | | | | 9,585,689 | |
Active Short Duration Bond Fund | | | 9,664,909 | | | | 902,028 | | | | – | | | | 10,566,937 | |
Diversified Income Fund | | | 976,520 | | | | – | | | | 33,503 | | | | 1,010,023 | |
Emerging Markets Debt Blended Total Return Fund | | | 1,342,816 | | | | 145,149 | | | | – | | | | 1,487,965 | |
Global High Yield Fund | | | 2,242,682 | | | | 57,003 | | | | – | | | | 2,299,685 | |
U.S. High Yield Fund | | | 2,968,418 | | | | 248,263 | | | | – | | | | 3,216,681 | |
| | | | | | | | | | | | | | | | |
211
Barings Funds Trust 2019 Annual Report
NOTES TO FINANCIAL STATEMENTS(CONTINUED)
June 30, 2019
As of June 30, 2019, the components of distributable earnings on atax-basis were as follows:
| | | | | | | | | | | | | | | | | | | | | | | | |
| | | UNDISTRIBUTED
ORDINARY
INCOME | | | UNDISTRIBUTED
LONG-TERM
CAPITAL GAINS | | | LATE YEAR
ORDINARY AND
POST OCTOBER
CAPITAL LOSS
DEFERRALS | | | CAPITAL LOSS
CARRYFORWARDS | | | UNREALIZED
APPRECIATION
(DEPRECIATION) | | | TOTAL
DISTRIBUTABLE
EARNINGS
(ACCUMULATED
LOSS) | |
Global Floating Rate Fund | | $ | 360,764 | | | $ | 411,459 | | | $ | (1,407,155 | ) | | $ | – | | | $ | (11,970,028 | ) | | $ | (12,604,960 | ) |
Global Credit Income Opportunities Fund | | | – | | | | – | | | | (4,562,833 | ) | | | – | | | | (10,676,275 | ) | | | (15,239,108 | ) |
Active Short Duration Bond Fund | | | 392,244 | | | | – | | | | – | | | | (8,173,460 | ) | | | 8,493,599 | | | | 712,383 | |
Diversified Income Fund | | | 28,171 | | | | – | | | | (374,581 | ) | | | (524,747 | ) | | | 459,141 | | | | (412,016 | ) |
Emerging Markets Debt Blended Total Return Fund | | | – | | | | – | | | | (830,972 | ) | | | (919,087 | ) | | | 586,865 | | | | (1,163,194 | ) |
Global Emerging Markets Equity Fund | | | 133,266 | | | | 15,187 | | | | – | | | | – | | | | 976,638 | | | | 1,125,091 | |
Global High Yield Fund | | | 121,011 | | | | – | | | | (130,619 | ) | | | – | | | | (1,093,557 | ) | | | (1,103,165 | ) |
U.S. High Yield Fund | | | 126,096 | | | | – | | | | (468,214 | ) | | | (76,546 | ) | | | (613,144 | ) | | | (1,031,808 | ) |
In accordance with the Regulated Investment Company Modernization Act of 2010, the Funds will carryforward capital losses incurred in taxable years beginning after December 22, 2010 (“post-enactment losses”) indefinitely. Post-enactment losses will also retain their character as either short-term or long-term and be utilized before anypre-enactment losses.
On June 30, 2019, the following funds had capital loss carryforwards available to be offset against future net capital gains as follows:
| | | | | | | | |
| | | UNLIMITED -
SHORT TERM | | | UNLIMITED -
LONG TERM | |
Diversified Income Fund | | $ | 385,896 | | | $ | 138,851 | |
Emerging Markets Debt Blended Total Return Fund | | | 919,087 | | | | — | |
U.S. High Yield Fund | | | 76,546 | | | | — | |
Under current tax rules, regulated investment companies can elect to treat certain late-year ordinary losses incurred and post-October capital losses (capital losses realized after October 31) as arising on the first day of the following taxable year. As of June 30, 2019, Global Floating Rate Fund, Global Credit Income Opportunities Fund and Emerging Markets Debt Blended Total Return Fund incurred late-year ordinary losses of $1,407,155, $715,777 and $459,719, respectively. As of June 30, 2019, Global Credit Income Opportunities Fund, Active Short Duration Bond Fund, Diversified Income Fund, Emerging Markets Debt Blended Total Return Fund, Global High Yield Fund and U.S. High Yield Fund have elected to defer current year post-October losses of $3,847,056, $8,173,460, $374,581, $371,253, $130,619, and $468,214, respectively.
Global Floating Rate Fund and Global Credit Income Opportunities Fund utilized $1,502,281 and $56,730 of capital loss carryforwards, respectively, during the year ended June 30, 2019.
212
Barings Funds Trust 2019 Annual Report
NOTES TO FINANCIAL STATEMENTS(CONTINUED)
June 30, 2019
As of June 30, 2019, the aggregate unrealized security gains and losses based on cost for U.S. federal income tax purposes were as follows:
| | | | | | | | | | | | | | | | |
| | | COST OF
INVESTMENTS | | | GROSS
UNREALIZED
APPRECIATION | | | GROSS
UNREALIZED
DEPRECIATION | | | NET
UNREALIZED
APPRECIATION
(DEPRECIATION) | |
Global Floating Rate Fund | | $ | 271,074,642 | | | $ | 1,059,341 | | | $ | (13,013,363 | ) | | $ | (11,954,022 | ) |
Global Credit Income Opportunities Fund | | | 209,425,157 | | | | 2,155,786 | | | | (12,936,414 | ) | | | (10,780,628 | ) |
Active Short Duration Bond Fund | | | 718,148,074 | | | | 10,308,803 | | | | (1,801,793 | ) | | | 8,507,010 | |
Diversified Income Fund | | | 42,702,545 | | | | 500,640 | | | | (39,426 | ) | | | 461,214 | |
Emerging Markets Debt Blended Total Return Fund | | | 47,827,658 | | | | 1,961,601 | | | | (756,169 | ) | | | 1,205,432 | |
Global Emerging Markets Equity Fund | | | 9,384,191 | | | | 1,293,879 | | | | (317,354 | ) | | | 976,525 | |
Global High Yield Fund | | | 27,788,536 | | | | 488,793 | | | | (1,580,649 | ) | | | (1,091,856 | ) |
U.S. High Yield Fund | | | 50,143,523 | | | | 1,286,163 | | | | (1,899,307 | ) | | | (613,144 | ) |
The difference between book-basis andtax-basis unrealized gains (losses) is attributable to wash sales and partnershipbook-tax differences.
Permanent items identified during the year ended June 30, 2019 have been reclassified among the components of net assets based on their tax basis treatment as follows:
| | | | | | | | |
| | | TOTAL
ACCUMULATED
LOSS | | | PAID-IN CAPITAL | |
Global Emerging Markets Equity Fund | | $ | 248 | | | $ | (248 | ) |
The permanent differences are primarily attributable to non-deductible organization expense.
| 8. | Investment Transactions |
Purchases and sales of securities (excluding short-term securities) for the year ended June 30, 2019 were as follows:
| | | | | | | | | | | | | | | | |
| | | PURCHASES | | | SALES | | | GOVERNMENT
PURCHASES | | | GOVERNMENT
SALES | |
Global Floating Rate Fund | | $ | 155,768,276 | | | $ | 126,988,969 | | | $ | – | | | $ | – | |
Global Credit Income Opportunities Fund | | | 118,963,728 | | | | 124,444,897 | | | | – | | | | – | |
Active Short Duration Bond Fund | | | 389,408,863 | | | | 153,848,825 | | | | 114,200,286 | | | | 70,054,582 | |
Diversified Income Fund | | | 53,927,308 | | | | 34,203,040 | | | | 18,091,940 | | | | 23,837,891 | |
Emerging Markets Debt Blended Total Return Fund | | | 42,511,831 | | | | 39,985,979 | | | | – | | | | – | |
Global Emerging Markets Equity Fund | | | 10,045,590 | | | | 738,059 | | | | – | | | | – | |
Global High Yield Fund | | | 19,458,312 | | | | 16,323,605 | | | | – | | | | – | |
U.S. High Yield Fund | | | 28,555,541 | | | | 31,988,900 | | | | – | | | | – | |
213
Barings Funds Trust 2019 Annual Report
NOTES TO FINANCIAL STATEMENTS(CONTINUED)
June 30, 2019
Transactions in common stock for the years ended June 30, 2019 and June 30, 2018 were as follows:
Global Floating Rate Fund
| | | | | | | | | | | | | | | | |
| | | FOR THE
YEAR ENDED
JUNE 30, 2019 | | | FOR THE
YEAR ENDED
JUNE 30, 2018 | |
| CLASS A | | SHARES | | | AMOUNT | | | SHARES | | | AMOUNT | |
Shares sold | | | 618,513 | | | $ | 5,784,016 | | | | 1,667,532 | | | $ | 15,918,813 | |
Shares sold through reinvestments of distributions | | | 279,598 | | | | 2,606,921 | | | | 243,001 | | | | 2,317,457 | |
Shares redeemed | | | (1,640,608 | ) | | | (15,271,436 | ) | | | (1,036,759 | ) | | | (9,887,519 | ) |
| | | | | | | | | | | | | | | | |
Net increase (decrease) | | | (742,497 | ) | | $ | (6,880,499 | ) | | | 873,774 | | | $ | 8,348,751 | |
| | | | | | | | | | | | | | | | |
CLASS C | | | | | | | | | | | | | | | | |
Shares sold | | | 208,023 | | | $ | 1,965,179 | | | | 185,281 | | | $ | 1,760,750 | |
Shares sold through reinvestments of distributions | | | 41,472 | | | | 384,747 | | | | 29,111 | | | | 276,669 | |
Shares redeemed | | | (260,855 | ) | | | (2,432,322 | ) | | | (178,196 | ) | | | (1,693,674 | ) |
| | | | | | | | | | | | | | | | |
Net increase (decrease) | | | (11,360 | ) | | $ | (82,396 | ) | | | 36,196 | | | $ | 343,745 | |
| | | | | | | | | | | | | | | | |
CLASS I | | | | | | | | | | | | | | | | |
Shares sold | | | 3,057,892 | | | $ | 29,141,715 | | | | 575,961 | | | $ | 5,511,861 | |
Shares sold through reinvestments of distributions | | | 183,732 | | | | 1,713,816 | | | | 100,453 | | | | 960,046 | |
Shares redeemed | | | (1,667,311 | ) | | | (15,786,911 | ) | | | (807,441 | ) | | | (7,709,995 | ) |
| | | | | | | | | | | | | | | | |
Net increase (decrease) | | | 1,574,313 | | | $ | 15,068,620 | | | | (131,027 | ) | | $ | (1,238,088 | ) |
| | | | | | | | | | | | | | | | |
CLASS Y | | | | | | | | | | | | | | | | |
Shares sold | | | 15,302,189 | | | $ | 144,205,728 | | | | 9,320,803 | | | $ | 89,015,823 | |
Shares sold through reinvestments of distributions | | | 811,024 | | | | 7,572,102 | | | | 568,316 | | | | 5,429,194 | |
Shares redeemed | | | (14,030,191 | ) | | | (131,010,360 | ) | | | (4,547,811 | ) | | | (43,466,701 | ) |
| | | | | | | | | | | | | | | | |
Net increase | | | 2,083,022 | | | $ | 20,767,470 | | | | 5,341,308 | | | $ | 50,978,316 | |
| | | | | | | | | | | | | | | | |
Global Credit Income Opportunities Fund
| | | | | | | | | | | | | | | | |
| | | FOR THE
YEAR ENDED
JUNE 30, 2019 | | | FOR THE
YEAR ENDED
JUNE 30, 2018 | |
| CLASS A | | SHARES | | | AMOUNT | | | SHARES | | | AMOUNT | |
Shares sold | | | 1,398,672 | | | $ | 12,824,235 | | | | 4,878,668 | | | $ | 45,886,717 | |
Shares sold through reinvestments of distributions | | | 397,695 | | | | 3,583,380 | | | | 185,198 | | | | 1,746,315 | |
Shares redeemed | | | (2,555,445 | ) | | | (22,815,351 | ) | | | (1,400,679 | ) | | | (13,240,661 | ) |
| | | | | | | | | | | | | | | | |
Net increase (decrease) | | | (759,078 | ) | | $ | (6,407,736 | ) | | | 3,663,187 | | | $ | 34,392,371 | |
| | | | | | | | | | | | | | | | |
CLASS C | | | | | | | | | | | | | | | | |
Shares sold | | | 221,588 | | | $ | 2,019,448 | | | | 371,526 | | | $ | 3,505,551 | |
Shares sold through reinvestments of distributions | | | 52,350 | | | | 470,536 | | | | 30,456 | | | | 286,954 | |
Shares redeemed | | | (275,165 | ) | | | (2,472,862 | ) | | | (150,027 | ) | | | (1,414,034 | ) |
| | | | | | | | | | | | | | | | |
Net increase (decrease) | | | (1,227 | ) | | $ | 17,122 | | | | 251,955 | | | $ | 2,378,471 | |
| | | | | | | | | | | | | | | | |
214
Barings Funds Trust 2019 Annual Report
NOTES TO FINANCIAL STATEMENTS(CONTINUED)
June 30, 2019
| | | | | | | | | | | | | | | | |
| | | FOR THE
YEAR ENDED
JUNE 30, 2019 | | | FOR THE
YEAR ENDED
JUNE 30, 2018 | |
| CLASS I | | SHARES | | | AMOUNT | | | SHARES | | | AMOUNT | |
Shares sold | | | 916,202 | | | $ | 8,199,999 | | | | – | | | $ | – | |
Shares sold through reinvestments of distributions | | | 13,545 | | | | 121,519 | | | | 93 | | | | 876 | |
Shares redeemed | | | (669,643 | ) | | | (6,000,000 | ) | | | – | | | | – | |
| | | | | | | | | | | | | | | | |
Net increase | | | 260,104 | | | $ | 2,321,518 | | | | 93 | | | $ | 876 | |
| | | | | | | | | | | | | | | | |
CLASS Y | | | | | | | | | | | | | | | | |
Shares sold | | | 7,687,011 | | | $ | 69,664,148 | | | | 7,646,098 | | | $ | 72,032,811 | |
Shares sold through reinvestments of distributions | | | 743,115 | | | | 6,700,505 | | | | 425,660 | | | | 4,011,731 | |
Shares redeemed | | | (8,977,793 | ) | | | (80,944,931 | ) | | | (3,105,523 | ) | | | (29,263,594 | ) |
| | | | | | | | | | | | | | | | |
Net increase (decrease) | | | (547,667 | ) | | $ | (4,580,278 | ) | | | 4,966,235 | | | $ | 46,780,948 | |
| | | | | | | | | | | | | | | | |
Active Short Duration Bond Fund
| | | | | | | | | | | | | | | | |
| | | FOR THE
YEAR ENDED
JUNE 30, 2019 | | | FOR THE
YEAR ENDED
JUNE 30, 2018 | |
| CLASS A | | SHARES | | | AMOUNT | | | SHARES | | | AMOUNT | |
Shares sold | | | 7,101,405 | | | $ | 70,189,358 | | | | 14,618,622 | | | $ | 145,642,052 | |
Shares sold through reinvestments of distributions | | | 431,679 | | | | 4,265,785 | | | | 386,954 | | | | 3,845,964 | |
Shares redeemed | | | (11,765,228 | ) | | | (116,239,590 | ) | | | (8,990,871 | ) | | | (89,385,833 | ) |
| | | | | | | | | | | | | | | | |
Net increase (decrease) | | | (4,232,144 | ) | | $ | (41,784,447 | ) | | | 6,014,705 | | | $ | 60,102,183 | |
| | | | | | | | | | | | | | | | |
CLASS C | | | | | | | | | | | | | | | | |
Shares sold | | | 112,192 | | | $ | 1,106,449 | | | | 103,284 | | | $ | 1,031,298 | |
Shares sold through reinvestments of distributions | | | 3,241 | | | | 32,008 | | | | 1,963 | | | | 19,485 | |
Shares redeemed | | | (112,125 | ) | | | (1,107,862 | ) | | | (13,404 | ) | | | (133,445 | ) |
| | | | | | | | | | | | | | | | |
Net increase | | | 3,308 | | | $ | 30,595 | | | | 91,843 | | | $ | 917,338 | |
| | | | | | | | | | | | | | | | |
CLASS I | | | | | | | | | | | | | | | | |
Shares sold | | | – | | | $ | – | | | | 20,309 | | | $ | 203,500 | |
Shares sold through reinvestments of distributions | | | – | | | | – | | | | – | | | | – | |
Shares redeemed | | | – | | | | – | | | | – | | | | – | |
| | | | | | | | | | | | | | | | |
Net increase | | | – | | | $ | – | | | | 20,309 | | | $ | 203,500 | |
| | | | | | | | | | | | | | | | |
CLASS Y | | | | | | | | | | | | | | | | |
Shares sold | | | 46,643,848 | | | $ | 460,231,739 | | | | 20,820,040 | | | $ | 207,162,143 | |
Shares sold through reinvestments of distributions | | | 934,483 | | | | 9,235,817 | | | | 564,556 | | | | 5,609,410 | |
Shares redeemed | | | (14,901,345 | ) | | | (147,071,661 | ) | | | (16,257,695 | ) | | | (161,293,725 | ) |
| | | | | | | | | | | | | | | | |
Net increase | | | 32,676,986 | | | $ | 322,395,895 | | | | 5,126,901 | | | $ | 51,477,828 | |
| | | | | | | | | | | | | | | | |
215
Barings Funds Trust 2019 Annual Report
NOTES TO FINANCIAL STATEMENTS(CONTINUED)
June 30, 2019
Diversified Income Fund
| | | | | | | | | | | | | | | | |
| | | FOR THE
YEAR ENDED
JUNE 30, 2019 | | | FOR THE
YEAR ENDED
JUNE 30, 2018 | |
| CLASS A | | SHARES | | | AMOUNT | | | SHARES | | | AMOUNT | |
Shares sold | | | 54,483 | | | $ | 525,242 | | | | – | | | $ | – | |
Shares sold through reinvestments of distributions | | | 130 | | | | 1,265 | | | | 40 | | | | 398 | |
Shares redeemed | | | (50,659 | ) | | | (490,472 | ) | | | (495 | ) | | | (4,965 | ) |
| | | | | | | | | | | | | | | | |
Net increase (decrease) | | | 3,954 | | | $ | 36,035 | | | | (455 | ) | | $ | (4,567 | ) |
| | | | | | | | | | | | | | | | |
CLASS C | | | | | | | | | | | | | | | | |
Shares sold | | | – | | | $ | – | | | | – | | | $ | – | |
Shares sold through reinvestments of distributions | | | – | | | | – | | | | – | | | | – | |
Shares redeemed | | | – | | | | – | | | | – | | | | – | |
| | | | | | | | | | | | | | | | |
Net increase | | | – | | | $ | – | | | | – | | | $ | – | |
| | | | | | | | | | | | | | | | |
CLASS I | | | | | | | | | | | | | | | | |
Shares sold | | | – | | | $ | – | | | | – | | | $ | – | |
Shares sold through reinvestments of distributions | | | – | | | | – | | | | – | | | | – | |
Shares redeemed | | | – | | | | – | | | | – | | | | – | |
| | | | | | | | | | | | | | | | |
Net increase | | | – | | | $ | – | | | | – | | | $ | – | |
| | | | | | | | | | | | | | | | |
CLASS Y | | | | | | | | | | | | | | | | |
Shares sold | | | 1,590,156 | | | $ | 15,528,182 | | | | 297,499 | | | $ | 2,983,984 | |
Shares sold through reinvestments of distributions | | | 26,772 | | | | 261,552 | | | | 18,366 | | | | 183,513 | |
Shares redeemed | | | (249,234 | ) | | | (2,425,063 | ) | | | (369,123 | ) | | | (3,656,973 | ) |
| | | | | | | | | | | | | | | | |
Net increase (decrease) | | | 1,367,694 | | | $ | 13,364,671 | | | | (53,258 | ) | | $ | (489,476 | ) |
| | | | | | | | | | | | | | | | |
Emerging Markets Debt Blended Total Return Fund
| | | | | | | | | | | | | | | | |
| | | FOR THE
YEAR ENDED
JUNE 30, 2019 | | | FOR THE
YEAR ENDED
JUNE 30, 2018 | |
| CLASS A | | SHARES | | | AMOUNT | | | SHARES | | | AMOUNT | |
Shares sold | | | 3,593 | | | $ | 33,551 | | | | 41,516 | | | $ | 444,647 | |
Shares sold through reinvestments of distributions | | | 1,080 | | | | 10,259 | | | | 2,054 | | | | 21,425 | |
Shares redeemed | | | (23,984 | ) | | | (224,063 | ) | | | (4,035 | ) | | | (40,621 | ) |
| | | | | | | | | | | | | | | | |
Net increase (decrease) | | | (19,311 | ) | | $ | (180,253 | ) | | | 39,535 | | | $ | 425,451 | |
| | | | | | | | | | | | | | | | |
CLASS C | | | | | | | | | | | | | | | | |
Shares sold | | | 4,308 | | | $ | 41,000 | | | | 10,058 | | | $ | 105,120 | |
Shares sold through reinvestments of distributions | | | 417 | | | | 3,993 | | | | 193 | | | | 1,964 | |
Shares redeemed | | | (7,937 | ) | | | (74,070 | ) | | | (2,108 | ) | | | (20,978 | ) |
| | | | | | | | | | | | | | | | |
Net increase (decrease) | | | (3,212 | ) | | $ | (29,077 | ) | | | 8,143 | | | $ | 86,106 | |
| | | | | | | | | | | | | | | | |
216
Barings Funds Trust 2019 Annual Report
NOTES TO FINANCIAL STATEMENTS(CONTINUED)
June 30, 2019
| | | | | | | | | | | | | | | | |
| | | FOR THE
YEAR ENDED
JUNE 30, 2019 | | | FOR THE
YEAR ENDED
JUNE 30, 2018 | |
| CLASS I | | SHARES | | | AMOUNT | | | SHARES | | | AMOUNT | |
Shares sold | | | – | | | $ | – | | | | 1,901,140 | | | $ | 20,000,000 | |
Shares sold through reinvestments of distributions | | | – | | | | – | | | | – | | | | – | |
Shares redeemed | | | – | | | | – | | | | – | | | | – | |
| | | | | | | | | | | | | | | | |
Net increase | | | – | | | $ | – | | | | 1,901,140 | | | $ | 20,000,000 | |
| | | | | | | | | | | | | | | | |
CLASS Y | | | | | | | | | | | | | | | | |
Shares sold | | | 175,657 | | | $ | 1,687,757 | | | | 1,964,043 | | | $ | 20,629,580 | |
Shares sold through reinvestments of distributions | | | 5,220 | | | | 50,400 | | | | 1,949 | | | | 20,360 | |
Shares redeemed | | | (47,558 | ) | | | (454,625 | ) | | | (41,536 | ) | | | (436,635 | ) |
| | | | | | | | | | | | | | | | |
Net increase | | | 133,319 | | | $ | 1,283,532 | | | | 1,924,456 | | | $ | 20,213,305 | |
| | | | | | | | | | | | | | | | |
Global Emerging Markets Equity Fund
| | | | | | | | |
| | | FOR THE
PERIOD ENDED
JUNE 30, 2019(1) | |
| CLASS A | | SHARES | | | AMOUNT | |
Shares sold | | | 10,000 | | | $ | 100,000 | |
Shares sold through reinvestments of distributions | | | – | | | | – | |
Shares redeemed | | | – | | | | – | |
| | | | | | | | |
Net increase | | | 10,000 | | | $ | 100,000 | |
| | | | | | | | |
CLASS C | | | | | | | | |
Shares sold | | | 10,000 | | | $ | 100,000 | |
Shares sold through reinvestments of distributions | | | – | | | | – | |
Shares redeemed | | | – | | | | – | |
| | | | | | | | |
Net increase | | | 10,000 | | | $ | 100,000 | |
| | | | | | | | |
CLASS I | | | | | | | | |
Shares sold | | | 490,000 | | | $ | 4,900,000 | |
Shares sold through reinvestments of distributions | | | – | | | | – | |
Shares redeemed | | | – | | | | – | |
| | | | | | | | |
Net increase | | | 490,000 | | | $ | 4,900,000 | |
| | | | | | | | |
CLASS Y | | | | | | | | |
Shares sold | | | 490,000 | | | $ | 4,900,000 | |
Shares sold through reinvestments of distributions | | | – | | | | – | |
Shares redeemed | | | – | | | | – | |
| | | | | | | | |
Net increase | | | 490,000 | | | $ | 4,900,000 | |
| | | | | | | | |
| | (1) | Fund commenced operation on September 17, 2018. |
217
Barings Funds Trust 2019 Annual Report
NOTES TO FINANCIAL STATEMENTS(CONTINUED)
June 30, 2019
Global High Yield Fund
| | | | | | | | | | | | | | | | |
| | | FOR THE
YEAR ENDED
JUNE 30, 2019 | | | FOR THE
YEAR ENDED
JUNE 30, 2018 | |
| CLASS A | | SHARES | | | AMOUNT | | | SHARES | | | AMOUNT | |
Shares sold | | | 230,593 | | | $ | 2,192,423 | | | | 127 | | | $ | 1,278 | |
Shares sold through reinvestments of distributions | | | 1,038 | | | | 9,771 | | | | 59 | | | | 602 | |
Shares redeemed | | | (439 | ) | | | (4,142 | ) | | | – | | | | – | |
| | | | | | | | | | | | | | | | |
Net increase | | | 231,192 | | | $ | 2,198,052 | | | | 186 | | | $ | 1,880 | |
| | | | | | | | | | | | | | | | |
CLASS C | | | | | | | | | | | | | | | | |
Shares sold | | | 11,068 | | | $ | 102,520 | | | | – | | | $ | – | |
Shares sold through reinvestments of distributions | | | 859 | | | | 8,104 | | | | 976 | | | | 9,925 | |
Shares redeemed | | | (6,704 | ) | | | (60,654 | ) | | | (4,423 | ) | | | (44,337 | ) |
| | | | | | | | | | | | | | | | |
Net increase (decrease) | | | 5,223 | | | $ | 49,970 | | | | (3,447 | ) | | $ | (34,412 | ) |
| | | | | | | | | | | | | | | | |
CLASS I | | | | | | | | | | | | | | | | |
Shares sold | | | – | | | $ | – | | | | – | | | $ | – | |
Shares sold through reinvestments of distributions | | | – | | | | – | | | | – | | | | – | |
Shares redeemed | | | – | | | | – | | | | – | | | | – | |
| | | | | | | | | | | | | | | | |
Net increase | | | – | | | $ | – | | | | – | | | $ | – | |
| | | | | | | | | | | | | | | | |
CLASS Y | | | | | | | | | | | | | | | | |
Shares sold | | | 478,228 | | | $ | 4,521,457 | | | | 350,327 | | | $ | 3,558,842 | |
Shares sold through reinvestments of distributions | | | 3,172 | | | | 30,114 | | | | 10,313 | | | | 105,798 | |
Shares redeemed | | | (386,084 | ) | | | (3,686,335 | ) | | | (485,834 | ) | | | (4,925,710 | ) |
| | | | | | | | | | | | | | | | |
Net increase (decrease) | | | 95,316 | | | $ | 865,236 | | | | (125,194 | ) | | $ | (1,261,070 | ) |
| | | | | | | | | | | | | | | | |
U.S. High Yield Fund
| | | | | | | | | | | | | | | | |
| | | FOR THE
YEAR ENDED
JUNE 30, 2019 | | | FOR THE
YEAR ENDED
JUNE 30, 2018 | |
| CLASS A | | SHARES | | | AMOUNT | | | SHARES | | | AMOUNT | |
Shares sold | | | 299,631 | | | $ | 2,936,402 | | | | 311,531 | | | $ | 3,152,721 | |
Shares sold through reinvestments of distributions | | | 11,491 | | | | 112,082 | | | | 19,367 | | | | 197,966 | |
Shares redeemed | | | (215,869 | ) | | | (2,116,695 | ) | | | (282,527 | ) | | | (2,883,028 | ) |
| | | | | | | | | | | | | | | | |
Net increase | | | 95,253 | | | $ | 931,789 | | | | 48,371 | | | $ | 467,659 | |
| | | | | | | | | | | | | | | | |
CLASS C | | | | | | | | | | | | | | | | |
Shares sold | | | – | | | $ | – | | | | – | | | $ | – | |
Shares sold through reinvestments of distributions | | | – | | | | – | | | | 88 | | | | 900 | |
Shares redeemed | | | – | | | | – | | | | (1,277 | ) | | | (12,651 | ) |
| | | | | | | | | | | | | | | | |
Net decrease | | | – | | | $ | – | | | | (1,189 | ) | | $ | (11,751 | ) |
| | | | | | | | | | | | | | | | |
218
Barings Funds Trust 2019 Annual Report
NOTES TO FINANCIAL STATEMENTS(CONTINUED)
June 30, 2019
| | | | | | | | | | | | | | | | |
| | | FOR THE
YEAR ENDED
JUNE 30, 2019 | | | FOR THE
YEAR ENDED
JUNE 30, 2018 | |
| CLASS I | | SHARES | | | AMOUNT | | | SHARES | | | AMOUNT | |
Shares sold | | | – | | | $ | – | | | | – | | | $ | – | |
Shares sold through reinvestments of distributions | | | 11,431 | | | | 110,810 | | | | 23,290 | | | | 237,490 | |
Shares redeemed | | | (279,772 | ) | | | (2,719,379 | ) | | | – | | | | – | |
| | | | | | | | | | | | | | | | |
Net increase (decrease) | | | (268,341 | ) | | $ | (2,608,569 | ) | | | 23,290 | | | $ | 237,490 | |
| | | | | | | | | | | | | | | | |
CLASS Y | | | | | | | | | | | | | | | | |
Shares sold | | | 526,284 | | | $ | 5,109,450 | | | | 2,624,846 | | | $ | 25,986,787 | |
Shares sold through reinvestments of distributions | | | 161,061 | | | | 1,565,077 | | | | 44,607 | | | | 445,882 | |
Shares redeemed | | | (1,130,987 | ) | | | (10,910,446 | ) | | | (62,945 | ) | | | (636,602 | ) |
| | | | | | | | | | | | | | | | |
Net increase (decrease) | | | (443,642 | ) | | $ | (4,235,919 | ) | | | 2,606,508 | | | $ | 25,796,067 | |
| | | | | | | | | | | | | | | | |
The Trust (the “Borrower”) has entered into a Credit Agreement (the “Credit Agreement”) with State Street Bank and Trust Company (the “Bank”). The Credit Agreement provides for a revolving credit facility of $61,000,000 (the “Facility Amount”) to be utilized for temporary or emergency purposes to fund shareholder redemptions or for other short-term liquidity purposes. Per the Credit Agreement, outstanding principal on the loan shall bear interest at a variable rate per annum equal to the higher of (a) the Federal Funds Rate as in effect on the day of the borrowing plus 1.25% and (b) the one month LIBOR rate as in effect on the day of the borrowing plus 1.25%. In addition, the Borrower shall pay to the Bank a commitment fee at the rate of 0.25% per annum on the daily unused portion of the Facility Amount. Effective July 18, 2019, the Facility Amount increased from $61,000,000 to $150,000,000.
Under the Funds’ organizational documents, its officers and Trustees may be indemnified against certain liabilities and expenses arising out of the performance of their duties to the Funds. Additionally, in the normal course of business, the Funds have entered into contracts with service providers which may contain indemnification clauses. The Funds maximum exposure under these arrangements is unknown. No claim has been made for indemnification pursuant to any such agreement of the Funds.
| 12. | Aggregate Remuneration Paid to Officers, Trustees and Their Affiliated Persons |
For the fiscal year ended June 30, 2019, the Funds paid their Trustees’ aggregate remuneration of $374,700. During the year, the Funds did not pay any compensation to any of their Trustees who are “interested persons” (as defined by the 1940 Act) of the Funds. The Funds classify Mr. Finke as an interested person of the Funds.
All of the Funds’ officers are employees of the Adviser. Pursuant to the Agreement, the Funds do not compensate their officers who are employees of the Adviser (except for the Chief Compliance Officer of the Funds unless assumed by the Adviser). For the year ended June 30, 2019, the Adviser paid the compensation of the Chief Compliance Officer of the Funds.
The Funds did not make any payments to the Adviser for the year ended June 30, 2019, other than the amounts payable to the Adviser pursuant to the Agreement.
13. Subsequent Events
Management has considered the circumstances under which the Funds should recognize or make disclosures regarding events or transactions occurring subsequent to June 30, 2019 through the date the financial statements were issued. Adjustments or additional disclosures, if any, have been included in these financial statements.
219
Barings Funds Trust 2019 Annual Report
REPORT OF INDEPENDENT REGISTERED PUBLIC ACCOUNTING FIRM
To the Board of Trustees of Barings Funds Trust and Shareholders of Barings Global Floating Rate Fund, Barings Global Credit Income Opportunities Fund, Barings Active Short Duration Bond Fund, Barings Diversified Income Fund, Barings Emerging Markets Debt Blended Total Return Fund, Barings Global Emerging Markets Equity Fund, Barings Global High Yield Fund and Barings U.S. High Yield Fund (collectively, the “Funds”):
Opinion on the Financial Statements and Financial Highlights
We have audited the accompanying statements of assets and liabilities of Barings Funds Trust comprising the Barings Global Floating Rate Fund, Barings Global Credit Income Opportunities Fund, Barings Active Short Duration Bond Fund, Barings Diversified Income Fund (formerly Barings Total Return Bond Fund), Barings Emerging Markets Debt Blended Total Return Fund, Barings Global Emerging Markets Equity Fund, Barings Global High Yield Fund and Barings U.S. High Yield Fund (the “Funds”), including the schedules of investments, as of June 30, 2019; the related statements of operations for the year then ended, the statements of changes in net assets for each of the two years in the period then ended, and the financial highlights for each of the five years in the period then ended for Barings Global Floating Rate Fund and Barings Global Credit Income Opportunities Fund; the related statements of operations, changes in net assets, and the financial highlights for the periods indicated in the table below for Barings Active Short Duration Bond Fund, Barings Diversified Income Fund (formerly Barings Total Return Bond Fund), Barings Emerging Markets Debt Blended Total Return Fund, Barings Global Emerging Markets Equity Fund, Barings Global High Yield Fund and Barings U.S. High Yield Fund; and the related notes. In our opinion, the financial statements and financial highlights present fairly, in all material respects, the financial position of each of the funds listed above constituting Barings Funds Trust as of June 30, 2019, and the results of their operations for the year then ended (or for the periods listed in the table below), the changes in their net assets for each of the two years in the period then ended (or for the periods listed in the table below), and the financial highlights for each of the five years in the period then ended (or for the periods listed in the table below), in conformity with accounting principles generally accepted in the United States of America.
| | | | | | |
INDIVIDUAL FUND COMPRISING THE
BARINGS FUNDS TRUST | | STATEMENT OF
OPERATIONS | | STATEMENTS OF
CHANGES IN
NET ASSETS | | FINANCIAL
HIGHLIGHTS |
| | | |
Barings Active Short Duration Bond Fund Barings Diversified Income Fund (formerly Barings Total Return Bond Fund) | | For the year ended June 30, 2019 | | For the years ended June 30, 2019 and 2018 | | For the years ended June 30, 2019, 2018, 2017, and the period from July 8, 2015 (commencement of operations) through June 30, 2016 |
| | | |
| Barings Emerging Markets Debt Blended Total Return Fund | | For the year ended June 30, 2019 | | For the years ended June 30, 2019 and 2018 | | For the years ended June 30, 2019, 2018, 2017, and the period from October 21, 2015 (commencement of operations) through June 30, 2016 |
| |
| Barings Global Emerging Markets Equity Fund | | For the period from September 17, 2018 (commencement of operations) through June 30, 2019 |
220
Barings Funds Trust 2019 Annual Report
REPORT OF INDEPENDENT REGISTERED PUBLIC ACCOUNTING FIRM(CONTINUED)
| | | | | | |
INDIVIDUAL FUND COMPRISING THE
BARINGS FUNDS TRUST | | STATEMENT OF
OPERATIONS | | STATEMENTS OF
CHANGES IN
NET ASSETS | | FINANCIAL
HIGHLIGHTS |
| | | |
Barings Global High Yield Fund Barings U.S. High Yield Fund | | For the year ended June 30, 2019 | | For the years ended June 30, 2019 and 2018 | | For the years ended June 30, 2019, 2018, 2017, and the period from October 30, 2015 (commencement of operations) through June 30, 2016 |
Basis for Opinion
These financial statements and financial highlights are the responsibility of the Funds’ management. Our responsibility is to express an opinion on the Funds’ financial statements and financial highlights based on our audits. We are a public accounting firm registered with the Public Company Accounting Oversight Board (United States) (PCAOB) and are required to be independent with respect to the Funds in accordance with the U.S. federal securities laws and the applicable rules and regulations of the Securities and Exchange Commission and the PCAOB.
We conducted our audits in accordance with the standards of the PCAOB. Those standards require that we plan and perform the audit to obtain reasonable assurance about whether the financial statements and financial highlights are free of material misstatement, whether due to error or fraud. The Funds are not required to have, nor were we engaged to perform, an audit of their internal control over financial reporting. As part of our audits we are required to obtain an understanding of internal control over financial reporting but not for the purpose of expressing an opinion on the effectiveness of the Funds’ internal control over financial reporting. Accordingly, we express no such opinion.
Our audits included performing procedures to assess the risks of material misstatement of the financial statements and financial highlights, whether due to error or fraud, and performing procedures that respond to those risks. Such procedures included examining, on a test basis, evidence regarding the amounts and disclosures in the financial statements and financial highlights. Our audits also included evaluating the accounting principles used and significant estimates made by management, as well as evaluating the overall presentation of the financial statements and financial highlights. Our procedures included confirmation of securities owned as of June 30, 2019, by correspondence with the custodian, brokers or agent banks; when replies were not received from brokers and selling or agent banks, we performed other auditing procedures. We believe that our audits provide a reasonable basis for our opinion.
Deloitte & Touche LLP
New York, New York
August 28, 2019
We have served as the auditor of one or more Barings LLC investment companies since 2013.
221
Barings Funds Trust 2019 Annual Report
FEDERAL TAX INFORMATION(UNAUDITED)
The following Funds designate long-term capital gain distributions as listed below:
| | | | |
| FUND | | LONG-TERM CAPITAL GAIN DISTRIBUTIONS | |
| |
Barings Global Floating Rate Fund | | $ | 391,463 | |
| |
Barings Global Credit Income Opportunities Fund | | $ | 1,517,782 | |
| |
Barings Active Short Duration Bond Fund | | $ | 520,666 | |
| |
Barings Global High Yield Fund | | $ | 429,794 | |
The following Fund paid foreign taxes during the year ended June 30, 2019 that are available as income tax credits:
| | | | |
| FUND | | FOREIGN TAX CREDIT | |
| |
Barings Emerging Markets Debt Blended Total Return Fund | | $ | 12,035 | |
The following Fund generated net foreign source income during the year ended June 30, 2019 as listed below:
| | | | |
| FUND | | FOREIGN SOURCE INCOME | |
| |
Barings Emerging Markets Debt Blended Total Return Fund | | $ | 3,194,150 | |
222
Barings Funds Trust 2019 Annual Report
INTERESTED TRUSTEE
Information about Trustees and Officers
Information pertaining to the Trustees and officers of the Trust is set forth below.
The Statement of Additional Information includes additional information about Trustees and is available, without charge, upon request by calling the Funds at1-855-439-5459 or on the Funds’ website at http://www.barings.com/funds/mutual-funds.
| | | | | | | | | | |
| NAME (AGE), ADDRESS | | POSITION(S)
WITH THE
TRUST | | OFFICE
TERM
AND
LENGTH
OF TIME
SERVED | | PRINCIPAL OCCUPATIONS
DURING PAST 5 YEARS | | PORTFOLIOS
OVERSEEN
IN FUND
COMPLEX | | OTHER DIRECTORSHIPS HELD BY
DIRECTOR |
| | | | | |
Thomas M. Finke (55) 300 South Tryon Street Suite 2500 Charlotte, NC 28202 | | Trustee | | Trustee since July 2013 | | Chairman and Chief Executive Officer (since 2008), Member of the Board of Managers (since 2006), President (2007-2008), Managing Director (2002-2008), Barings; and Chief Investment Officer and Executive Vice President (2008-2011), Massachusetts Mutual Life Insurance Company. | | 10 | | Trustee (since 2013), Barings Global Short Duration High Yield Fund(closed-end investment company advised by Barings); Director (since 2018), Barings BDC, Inc. (a business development company managed by Barings); Chairman (2012-2015), Director (since 2008), Barings (U.K.) Limited (investment advisory firm); Director (since 2008), Barings Guernsey Limited (holding company); Vice Chairman and Manager (since 2011), MM Asset Management Holding LLC (holding company); Director (since 2004), Jefferies Finance LLC (finance company); Manager (since 2005), Loan Strategies Management, LLC (general partner of an investment fund); Manager (since 2005), Jefferies Finance CP Funding LLC (investment company); Chairman and Director (2012-2015), Barings Global Advisers Limited (investment advisory firm); Manager (2011-2016), Wood Creek Capital Management, LLC (investment advisory firm); Chairman and Manager (2007-2016), Barings Real Estate Advisers LLC (real estate advisory firm); Manager (2007-2015), Credit Strategies Management LLC (general partner of an investment fund); and Manager (2004-2012), Class C Member LLC (equity holding company). |
223
Barings Funds Trust 2019 Annual Report
INDEPENDENT TRUSTEES
| | | | | | | | | | |
| NAME (AGE), ADDRESS | | POSITION(S)
WITH THE
TRUST | | OFFICE
TERM
AND
LENGTH
OF TIME
SERVED | | PRINCIPAL OCCUPATIONS DURING
PAST 5 YEARS | | PORTFOLIOS
OVERSEEN
IN FUND
COMPLEX | | OTHER DIRECTORSHIPS HELD BY
DIRECTOR |
| | | | | |
Rodney J. Dillman (66) 300 South Tryon Street Suite 2500 Charlotte, NC 28202 | | Trustee, Chairman | | Trustee since July 2013 | | Retired (since 2012); Deputy General Counsel (2011-2012), Senior Vice President (2008-2012), Vice President (2000-2008), Massachusetts Mutual Life Insurance Company; Member of the Board of Directors and President (2008-2011), MassMutual International LLC; and General Counsel (2006-2008), Babson Capital Management LLC (currently known as Barings). | | 9 | | Trustee (since 2012), Barings Global Short Duration High Yield Fund(closed-end investment company advised by Barings); and Director (2016-2017), Social Reality, Inc. (digital platform technology and management software company for internet advertising). |
| | | | | |
Bernard A. Harris, Jr. (63) 300 South Tryon Street Suite 2500 Charlotte, NC 28202 | | Trustee | | Trustee since July 2013 | | Chief Executive Officer (since 2018), National Math and Science Initiative; Chief Executive Officer and Managing Partner (since 2002), Vesalius Ventures, Inc.; Director and President (since 1998), The Space Agency; President (since 1999), The Harris Foundation; and Clinical Scientist, Flight Surgeon and Astronaut (1986-1996), NASA. | | 9 | | Trustee (since 2012), Barings Global Short Duration High Yield Fund(closed-end investment company advised by Barings); Director (since 2016), AIMIS, Inc. (American Institute of Minimally Invasive Surgery, an educator of advanced surgical techniques for women’s health specialists); Trustee (2015-2017), Forward Funds(open-end investment company); Director (since 2012),E-Cardio, Inc. (provides services for cardiac monitoring); Trustee (2011-2015), Salient Midstream & MLP Fund(closed-end investment company); Trustee (since 2011), Salient MLP & Energy Infrastructure Fund (mutual fund); Director (since 2009), Monebo Technologies Inc. (medical technology design company); Director (since 2009), The Endowment Fund; and Director (since 2008), U.S. Physical Therapy, Inc. (NYSE: USPH). |
| | | | | |
Thomas W. Okel (56) 300 South Tryon Street Suite 2500 Charlotte, NC 28202 | | Trustee | | Trustee since July 2013 | | Executive Director (2011-2019), Catawba Lands Conservancy; and Global Head of Syndicated Capital Markets (1998-2010), Bank of America Merrill Lynch. | | 10 | | Trustee (since 2012), Barings Global Short Duration High Yield Fund(closed-end investment company advised by Barings); Director (since 2018), Barings BDC, Inc. (business development company advised by Barings); and Trustee (since 2015), Horizon Funds (mutual fund complex). |
224
Barings Funds Trust 2019 Annual Report
INDEPENDENT TRUSTEES(CONTINUED)
| | | | | | | | | | |
| NAME (AGE), ADDRESS | | POSITION(S)
WITH THE
TRUST | | OFFICE
TERM AND
LENGTH OF
TIME
SERVED | | PRINCIPAL OCCUPATIONS
DURING PAST 5 YEARS | | PORTFOLIOS
OVERSEEN
IN FUND
COMPLEX | | OTHER DIRECTORSHIPS HELD BY
DIRECTOR |
| | | | | |
Cynthia R. Plouché (62) 300 South Tryon Street Suite 2500 Charlotte, NC 28202 | | Trustee | | Trustee since August 2017 | | Assessor (2014-2018), Moraine Township (property assessment); and Senior Portfolio Manager (2006-2012), Williams Capital Management, LLC (asset management). | | 9 | | Trustee (since August 2017), Barings Global Short Duration High Yield Fund(closed-end investment company advised by Barings); Trustee (since 2014), Northern Trust Funds (mutual fund complex); and Trustee(2001-2017), AXA VIP Trust (mutual fund complex). |
| | | | | |
Martin A. Sumichrast (52) 300 South Tryon Street Suite 2500 Charlotte, NC 28202 | | Trustee | | Trustee since July 2013 | | Chairman and Chief Executive Officer (since 2016), Director (since 2015), CbdMD, Inc., f/k/a Level Brands, Inc. (NYSE: YCBD) (a consumer staples company specializing in CBD); Managing Partner and Principal (since 2013), Stone Street Partners, LLC (merchant banking); and Managing Director (since 2012), Washington Capital, LLC (family office). | | 9 | | Trustee (since 2012), Barings Global Short Duration High Yield Fund(closed-end investment company advised by Barings); and Chairman and Director(2014-2017), Kure Corp. (retail). |
225
Barings Funds Trust 2019 Annual Report
OFFICERS OF THE TRUST
| | | | | | |
| NAME (AGE), ADDRESS | | POSITION(S) WITH
THE TRUST | | OFFICE TERM AND
LENGTH OF TIME
SERVED | | PRINCIPAL OCCUPATION(S)
DURING PAST 5 YEARS |
| | | |
Dan McGee (49) 300 South Tryon Street Charlotte, NC 28202 | | President | | Since August 2018 | | Managing Director (since 2013), Barings; and Managing Director (1992-2013), Principal Financial Group. |
| | | |
Carlene Pollock (52) 300 South Tryon Street Charlotte, NC 28202 | | Chief Financial Officer | | Since January 2016 | | Assistant Treasurer (2015-2016), Barings Funds Trust; Chief Financial Officer (since 2016), Assistant Treasurer (2015-2016), Barings Global Short Duration High Yield Fund(closed-end investment company advised by Barings); Director (since 2015), Barings; Director(2013-2015), Corrum Capital Management (investment adviser); and Vice President (2008-2013), Bank of New York Mellon (third party administrator). |
| | | |
Lesley Mastandrea (42) 300 South Tryon Street Charlotte, NC 28202 | | Treasurer | | Since October 2016 | | Managing Director (since 2014), Director (2007-2014), Associate Director (2006-2007), Barings; and Treasurer (since 2016), Barings Global Short Duration High Yield Fund(closed-end investment company advised by Barings). |
| | | |
Melissa LaGrant (45) 300 South Tryon Street Charlotte, NC 28202 | | Chief Compliance Officer | | Since July 2013 | | Deputy Chief Compliance Officer (since 2019), Managing Director (since 2005), Barings; Chief Compliance Officer (since 2013), Barings Finance LLC; Chief Compliance Officer (since 2006), Barings Corporate Investors and Barings Participation Investors(closed-end investment companies advised by Barings); Chief Compliance Officer (since 2012), Barings Global Short Duration High Yield Fund(closed-end investment company advised by Barings); and Chief Compliance Officer (since 2018), Barings BDC, Inc. (business development company advised by Barings). |
| | | |
Janice M. Bishop (54) 300 South Tryon Street Charlotte, NC 28202 | | Vice President, Secretary and Chief Legal Officer | | Since July 2013 | | Senior Counsel and Managing Director (since 2014), Counsel (2007-2014), Barings; Vice President, Secretary and Chief Legal Officer (since 2015), Associate Secretary (2008-2015), Barings Corporate Investors and Barings Participation Investors(closed-end investment companies advised by Barings); Vice President, Secretary and Chief Legal Officer (since 2012), Barings Global Short Duration High Yield Fund(closed-end investment company advised by Barings); Vice President and Secretary (since 2015), Assistant Secretary (2008-2015), CI Subsidiary Trust and PI Subsidiary Trust; and Secretary and Chief Legal Officer (since 2018), Barings BDC, Inc. (business development company advised by Barings). |
| | | |
Michelle Manha (46) 300 South Tryon Street Charlotte, NC 28202 | | Assistant Secretary | | Since July 2013 | | Deputy General Counsel (since 2018), Associate General Counsel (2014-2018), Managing Director (since 2014), Counsel (2008-2014), Barings; and Assistant Secretary (since 2012), Barings Global Short Duration High Yield Fund(closed-end investment company advised by Barings). |
226
Barings Funds Trust 2019 Annual Report
OFFICERS OF THE TRUST(CONTINUED)
| | | | | | |
| NAME (AGE), ADDRESS | | POSITION(S) WITH
THE TRUST | | OFFICE TERM AND
LENGTH OF TIME
SERVED | | PRINCIPAL OCCUPATION(S)
DURING PAST 5 YEARS |
| | | |
Jill Dinerman (43) 300 South Tryon Street Charlotte, NC 28202 | | Assistant Secretary | | Since February 2019 | | Associate General Counsel and Corporate Secretary (since 2018), Managing Director (since 2016), Senior Counsel (2016-2018), Counsel and Director (2011-2016), Barings; Assistant Secretary (since 2019), Barings Global Short Duration High Yield Fund(closed-end investment company advised by Barings); Assistant Secretary (since 2019), Barings Corporate Investors and Barings Participation Investors(closed-end investment companies advised by Barings); and Assistant Secretary (since 2019), Barings BDC, Inc. (a business development company managed by Barings). |
227
Barings Funds Trust 2019 Annual Report

JOINT PRIVACY NOTICE OF BARINGS LLC AND
BARINGS FUNDS TRUST
This privacy notice is being provided on behalf of Barings LLC and its affiliates: Barings Securities LLC; Barings Australia Pty Ltd; Barings Japan Limited; Barings Investment Advisers (Hong Kong) Limited; Barings Funds Trust; Barings Global Short Duration High Yield Fund; Barings BDC, Inc.; Barings Corporate Investors and Barings Participation Investors (together, for purposes of this privacy notice, “Barings”).
When you use Barings you entrust us not only with your hard-earned assets but also with your personal and financial data. We consider your data to be private and confidential, and protecting its confidentiality is important to us. Our policies and procedures regarding your personal information are summarized below.
We may collectnon-public personal information about you from:
| | ∎ | | Applications or other forms, interviews, or by other means; |
| | ∎ | | Consumer or other reporting agencies, government agencies, employers or others; |
| | ∎ | | Your transactions with us, our affiliates, or others; and |
We may share the financial information we collect with our financial service affiliates, such as insurance companies, investment companies and securities broker-dealers. Additionally, so that we may continue to offer you products and services that best meet your investment needs and to effect transactions that you request or authorize, we may disclose the information we collect, as described above, to companies that perform administrative or marketing services on our behalf, such as transfer agents, custodian banks, service providers or printers and mailers that assist us in the distribution of investor materials or that provide operational support to Barings. These companies are required to protect this information and will use this information only for the services for which we hire them, and are not permitted to use or share this information for any other purpose. Some of these companies may perform such services in jurisdictions other than the United States. We may share some or all of the information we collect with other financial institutions with whom we jointly market products. This may be done only if it is permitted by the state in which you live. Some disclosures may be limited to your name, contact and transaction information with us or our affiliates.
Any disclosures will be only to the extent permitted by federal and state law. Certain disclosures may require us to get an“opt-in” or“opt-out” from you. If this is required, we will do so before information is shared. Otherwise, we do not share any personal information about our customers or former customers unless authorized by the customer or as permitted by law.
We restrict access to personal information about you to those employees who need to know that information to provide products and services to you. We maintain physical, electronic and procedural safeguards that comply with legal standards to guard your personal information. As an added measure, we do not include personal or account information innon-securee-mails that we send you via the Internet without your prior consent. We advise you not to send such information to us innon-securee-mails.
This joint notice describes the privacy policies of Barings, the Funds and Barings Securities LLC. It applies to all Barings and the Funds accounts you presently have, or may open in the future, using your social security number or federal taxpayer identification number – whether or not you remain a shareholder of our Funds or as an advisory client of Barings. As mandated by rules issued by the Securities and Exchange Commission, we will be sending you this notice annually, as long as you own shares in the Funds or have an account with Barings.
Barings Securities LLC is a member of the Financial Industry Regulatory Authority (FINRA) and the Securities Investor Protection Corporation (SIPC). Investors may obtain information about SIPC including the SIPC brochure by contacting SIPC online at www.sipc.org or calling(202)-371-8300. Investors may obtain information about FINRA including the FINRA Investor Brochure by contacting FINRA online at www.finra.org or by calling (800)289-9999.
April 2019
228
BARINGS FUNDS TRUST
ANNUAL REPORT
June 30, 2019

The Registrant adopted a Code of Ethics for Principal Executive and Senior Financial Officers (the “Code”) on July 29, 2013, which is available on the Registrant’s website atwww.barings.com/assets/user/media/Open-End-Fund-Code-of-Ethics.pdf. During the period covered by this FormN-CSR, there were no amendments to, or waivers from, the Code.
| Item 3. | Audit Committee Financial Expert. |
The Registrant’s Board of Trustees has determined that Dr. Bernard A. Harris, Jr., Mr. Thomas W. Okel and Mr. Martin A. Sumichrast, constituting all the members of the Registrant’s Audit Committee, are audit committee financial experts. Dr. Harris, Mr. Okel and Mr. Sumichrast are “independent” for purposes of this Item 3 as required by applicable regulation.
| Item 4. | Principal Accountant Fees and Services. |
The Registrant has engaged its principal accountant, Deloitte & Touche LLP (“Deloitte”), to perform audit services, audit-related services, tax services and other services. The following tables detail the aggregate fees billed or expected to be billed for each of the last two fiscal years by Deloitte.
Fees Billed to the Registrant:
| | | | | | | | |
| | | Year Ended
June 30
2019 | | | Year Ended
June 30,
2018 | |
Audit Fees | | $ | 349,850 | | | $ | 357,560 | |
Audit-Related Fees | | $ | 0 | | | $ | 0 | |
Tax Fees | | $ | 113,000 | | | $ | 98,440 | |
All Other Fees | | $ | 0 | | | $ | 0 | |
| | | | | | | | |
Total Fees | | $ | 462,850 | | | $ | 456,00 | |
Non-Audit Fees Billed to Barings and MassMutual:
| | | | | | | | |
| | | Year Ended June 30, 2019 | | | Year Ended June 30, 2018 | |
Audit Fees | | $ | 4,319,401 | | | $ | 4,256,259 | |
Audit-Related Fees | | $ | 0 | | | $ | 0 | |
Tax Fees | | $ | 4,430,023 | | | $ | 2,714,717 | |
All Other Fees | | $ | 4,652,066 | | | $ | 12,453,397 | |
| | | | | | | | |
Total Fees | | $ | 13,401,490 | | | $ | 19,424,372 | |
The category “Audit Fees” refers to performing an audit of the Registrant’s, Barings LLC’s (“Barings”) or Massachusetts Mutual Life Insurance Company’s (“MassMutual”) annual financial statements or services that are normally provided by the principal accountant in connection with statutory and regulatory filings or engagements. The category “Audit-Related Fees” reflects fees billed by Deloitte for variousnon-audit andnon-tax services rendered to the Registrant, Barings, and MassMutual. Preparation of Federal, state and local income tax and tax compliance work are representative of the fees reported in the “Tax Fees” category. The category “All Other Fees” represents fees billed by Deloitte for consulting rendered to the Registrant, Barings, and MassMutual.
The Sarbanes-Oxley Act of 2002 and its implementing regulations allow the Registrant’s Audit Committee to establish apre-approval policy for certain services rendered by the Registrant’s principal accountant, Deloitte. During the fiscal year ended June 30, 2019, the Registrant’s Audit Committee approved all of the services rendered to the Registrant by Deloitte and did not rely on such apre-approval policy for any such services.
The Audit Committee has also reviewed the aggregate fees billed for professional services rendered by Deloitte for the years ended June 30, 2018 and June 30, 2019 for the Registrant and for thenon-audit services provided to Barings, and Barings’ parent, MassMutual. As part of this review, the Audit Committee considered whether the provision of suchnon-audit services was compatible with maintaining the principal accountant’s independence.
| Item 5. | Audit Committee of Listed Registrants. |
Not applicable.
| (a) | The Registrant’s Consolidated Schedule of Investments as of the close of the reporting period is included in the Report to Shareholders filed under Item 1 of this form. |
| Item 7. | Disclosure of Proxy Voting Policies and Procedures forClosed-End Management Investment Companies. |
Not applicable.
| Item 8. | Portfolio Managers ofClosed-End Investment Management Companies. |
Not applicable.
| Item 9. | Purchases of Equity Securities byClosed-End Management Investment Company and Affiliated Purchasers. |
Not applicable.
| Item 10. | Submission of Matters to a Vote of Security Holders. |
There have been no material changes to procedures by which the shareholders may recommend nominees to the Registrant’s Board of Trustees.
| Item 11. | Controls and Procedures. |
| (a) | The Registrant’s principal executive officer and principal financial officer, or persons performing similar functions, have concluded that the Registrant’s disclosure controls and procedures as defined in Rule30a-3(c) under the Investment Company Act of 1940, as amended (the “1940 Act”), are effective as of a date within 90 days of the filing date of this report based on the evaluation of these controls and procedures required by Rule30a-3(b) under the 1940 Act and Rules13a-15(b) or15d-15(b) under the Securities Exchange Act of 1934, as amended. |
| (b) | There were no changes in the Registrant’s internal control over financial reporting (as defined in Rule30a-3(d) under the 1940 Act) that occurred during the period covered by this report that have materially affected or are reasonably likely to materially affect, the Registrant’s internal control over financial reporting. |
| Item 12. | Disclosure of Securities Lending Activities forClosed-End Management Investment Companies. |
| (a)(1) | The Registrant has posted its Code of Ethics on its website atwww.barings.com/assets/user/media/Open-End-Fund-Code-of-Ethics.pdf. |
| (a)(2) | Certifications pursuant to Rule30a-2(a) under the 1940 Act are attached hereto. |
| (b) | Certification pursuant to Rule30a-2(b) under the 1940 Act is attached hereto. |
SIGNATURES
Pursuant to the requirements of the Securities Exchange Act of 1934 and the Investment Company Act of 1940, the Registrant has duly caused this report to be signed on its behalf by the undersigned, thereunto duly authorized.
| | |
| (Registrant) | | Barings Funds Trust |
| | |
| By (Signature and Title) | | /s/ Daniel McGee |
| | Daniel McGee, President (Principal Executive Officer) |
Pursuant to the requirements of the Securities Exchange Act of 1934 and the Investment Company Act of 1940, this report has been signed below by the following persons on behalf of the Registrant and in the capacities and on the dates indicated.
| | |
| By (Signature and Title) | | /s/ Daniel McGee |
| | Daniel McGee, President (Principal Executive Officer) |
| | |
| By (Signature and Title) | | /s/ Carlene Pollock |
| | Carlene Pollock, Chief Financial Officer (Principal Financial Officer) |