UNITED STATES
SECURITIES AND EXCHANGE COMMISSION
Washington, D.C. 20549
FORM N-CSR
CERTIFIED SHAREHOLDER REPORT OF REGISTERED
MANAGEMENT INVESTMENT COMPANIES
Investment Company Act file number(s) 811-22845
Barings Funds Trust
(Exact Name of Registrant as Specified in Charter)
300 South Tryon Street
Suite 2500
Charlotte, NC 28202
(Address of Principal Executive Offices)
Registrant’s telephone number, including area code: (704) 805-7200
Corporation Service Company (CSC)
251 Little Falls Drive
Wilmington DE 19808
United States
(Name and Address of Agent for Service)
Date of fiscal year end: September 30
Date of reporting period: July 1, 2021-September 30, 2021
Item 1. Reports to Stockholders.
| (a) | The Annual Report to Shareholders is attached hereto. |


BARINGS FUNDS TRUST
Annual Report
For the Period from July 1, 2021 to September 30, 2021

BFT Service Providers
ADVISER
Barings LLC
300 South Tryon Street
Suite 2500
Charlotte, NC 28202
SUB-ADVISER
Barings International Investments Limited
20 Old Bailey
London, UK
EC4M 7BF
COUNSEL TO THE TRUST
Ropes & Gray LLP
Prudential Tower
800 Boylston Street
Boston, MA 02110
INDEPENDENT REGISTERED PUBLIC ACCOUNTING FIRM
Deloitte & Touche LLP
30 Rockefeller Plaza
New York, NY
10112-0015
CUSTODIAN
State Street Bank & Trust Company
One Lincoln Street
Boston, MA 02111
TRANSFER AGENT AND REGISTRAR
ALPS Fund Services, Inc.
1290 Broadway
Suite 1100
Denver, CO 80203
FUND ADMINISTRATION / ACCOUNTING
State Street Bank &Trust Company
One Lincoln Street
Boston, MA 02111
FUND DISTRIBUTOR
ALPS Distributors, Inc.
1290 Broadway
Suite 1100
Denver, CO 80203
BLUE SKY ADMINISTRATION
DST Asset Manager Solutions, Inc.
2000 Crown Colony Drive
Quincy, MA 02169
PROXY VOTING POLICIES & PROCEDURES
The Trustees of Barings Funds Trust (the “Trust”) have delegated proxy voting responsibilities relating to the voting of securities held by the Trust to Barings LLC (“Barings”). A description of Barings’ proxy voting policies and procedures is available (1) without charge, upon request, by calling, toll-free 1-877-766-0014; (2) on the Trust’s website at http://www.Barings.com; and (3) on the U.S. Securities and Exchange Commission’s (“SEC”) website at http://www.sec.gov.
QUARTERLY PORTFOLIO HOLDINGS
The funds in the Trust file their complete schedules of portfolio holdings with the SEC for the first and third quarters of each fiscal year as an attachment to Form N-PORT. The funds’ Form N-PORT are available on the SEC’s website at http://www.sec.gov. A complete schedule of portfolio holdings as of each quarter-end is available on the Trust’s website at http://www.Barings.com or upon request by calling, toll-free, 1-877-766-0014.
**PLACEHOLDER FOR PRESIDENT’S MESSAGE AND FUND COMMENTARIES**

Daniel McGee
President
Barings Funds Trust
Barings Funds Trust
Barings Global Floating Rate Fund
Barings Global Credit Income Opportunities Fund
Barings Emerging Markets Debt Blended Total Return Fund
Barings Global Emerging Markets Equity Fund
Dear Shareholder,
The story of 2021 remains one of strong economic recovery, although that sentiment waned somewhat in the third quarter of the year amid uncertainty surrounding the spreading Delta variant, U.S. Federal Reserve (Fed) tapering, and headlines related to Chinese property developer Evergrande. Compounding this, a number of factors, including spikes in fuel prices, continue to disrupt normal supply-chain dynamics, with businesses experiencing shortages in products ranging from groceries to microchips.
From a bottom-up research perspective, our investment teams continue to find a generally supportive environment. While many asset classes have experienced impressive performance since the depths of the pandemic, we believe value can still be found in both developing and emerging markets. That said, there are a number of lingering uncertainties as we look toward the remainder of the year. For one, although developed markets may be through the worst of the pandemic—and further extensive lockdowns seem unlikely—there are questions as to whether new strains of the virus could slow the economic recovery. There are also a number of macro and geopolitical risks on the horizon, from ongoing U.S.-China and U.S.-Russia tensions, to conflicts in the Middle East.
Against this backdrop, we believe selectivity is as critical as ever. Whereas market beta has been a significant driver of returns over the last several months, corporate and country fundamentals have come decidedly back to the forefront. This means that simply owning the index—whether in high yield, investment grade credit or emerging markets debt—may lead to disappointing outcomes.
As active managers, and with some of the industry’s largest fixed income research teams, we believe we are well-positioned to provide access to relative value opportunities as they arise across geographies and asset classes.
You have previously received a proxy statement/prospectus with respect to the proposed reorganization of the Barings funds. The proposed reorganizations are expected to close in early December 2021, following which Barings will serve as sub-adviser to your Fund. In this unprecedented time, we appreciate your continued trust and partnership, and we look forward to helping you achieve your investment objectives.
Sincerely,

Daniel McGee
President
The statements and opinions expressed are those of the author as of the date of this report. All information is historical and not indicative of future results and subject to change. This information is not a recommendation to buy or sell any security.
Barings Global Floating Rate Fund 2021 Annual Report
Investment Objective
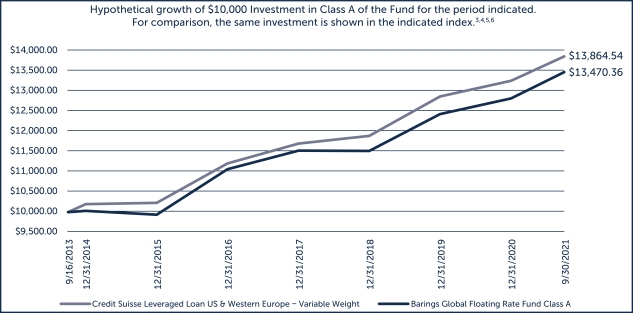
Barings Global Floating Rate Fund (“Global Floating Rate Fund” or the “Fund”) seeks a high level of current income. Preservation of capital is a secondary goal.
Portfolio Management Commentary
For the third quarter, the Barings Global Floating Rate Fund (I shares) returned +0.89%1 (net of fees), which compared to a return of +1.14% for the Fund’s benchmark5. The broadly syndicated loan market was largely able to avoid volatility that affected performance in other liquid markets during the quarter and generated a positive return. Interest income was the primary contributor to total returns across the loan market for the quarter with minimal movement in secondary market prices. Lower rated loans outperformed higher rating categories through a combination of higher income and modest price appreciation. Demand for the asset class was strong and led by the demand from ramping collateralized loan obligations, as well as continued positive net flows into loan retail funds. In the loan primary market, outside of lower activity in August, institutional loan new issuance was steady in both regions for the quarter overall.
In regards to the Fund’s performance relative to its benchmark, the main detractor from relative performance for the quarter was the Fund’s exposure to cash. This was despite the Fund’s modest cash exposure, although was a detractor nonetheless given the positive total return across the loan markets. Within industry sectors, the Fund’s attribution results benefitted from a positive impact from credit selection within the Healthcare and Energy sectors. This was partially offset by underperformance by the Fund’s holdings in the Diversified Media sector. By rating category, the Fund’s overweight exposure to lower rated loans offset some of the detractors from performance given the outperformance by that portion of the market.
The Fund did not make material changes to the target allocation between the North American and European loan markets as the focus of portfolio trading efforts are on relative value decisions within each region rather than regional shifts. Since both regions performed in a similar manner, there was no material impact to attribution results based on regional allocations. Purchasing activity during the quarter was primarily focused on what was believed to be a healthy new issue market.
2
Barings Global Floating Rate Fund 2021 Annual Report
| | | | | | | | | | | | | | | | | | | | |
| % AVERAGE ANNUAL TOTAL RETURNS 4,6,7 | | INCEPTION DATE | | | ONE YEAR | | | THREE YEARS | | | FIVE YEARS | | | INCEPTION TO DATE | |
Class A With Load | | | 09/16/2013 | | | | 6.49 | % | | | 3.09 | % | | | 4.05 | % | | | 3.59 | % |
Class A No Load | | | 09/16/2013 | | | | 9.78 | % | | | 4.14 | % | | | 4.68 | % | | | 3.98 | % |
Class C With Load | | | 09/16/2013 | | | | 7.99 | % | | | 3.37 | % | | | 3.92 | % | | | 3.22 | % |
Class C No Load | | | 09/16/2013 | | | | 8.99 | % | | | 3.37 | % | | | 3.92 | % | | | 3.22 | % |
Class I With Load | | | 09/16/2013 | | | | 10.07 | % | | | 4.44 | % | | | 4.96 | % | | | 4.28 | % |
Class I No Load | | | 09/16/2013 | | | | 10.07 | % | | | 4.44 | % | | | 4.96 | % | | | 4.28 | % |
Class Y With Load | | | 09/16/2013 | | | | 10.06 | % | | | 4.41 | % | | | 4.94 | % | | | 4.25 | % |
Class Y No Load | | | 09/16/2013 | | | | 10.06 | % | | | 4.41 | % | | | 4.94 | % | | | 4.25 | % |
| 1. | Total return describes the return to an investor of Class Y shares and includes the reinvestment of dividends and capital gains. Past performance is no guarantee of future results and investment returns and the net asset value (NAV) of shares of the Fund will fluctuate so that shares, when redeemed, may be worth more or less than their original cost. Current performance may be higher or lower than performance quoted. Call 1.855.439.5459 or visit barings.com for current month end performance. All returns 1-year or less are cumulative. |
| 2. | Ratings shown are the highest rating given by one of the following national rating agencies: S&P, Moody’s or Fitch. Additional information about ratings can be found, respectively, at www.standardandpoors.com, www.moodys.com and www.fitchratings.com. Credit ratings are subject to change. AAA, AA, single-A, and BBB are investment grade ratings categories used by S&P and Fitch; BB, single-B, CCC/CC/C and single-D are below investment grade ratings categories used by S&P and Fitch. Aaa, Aa, single-A and Baa are investment grade ratings categories used by Moody’s; Ba, B, Caa/Ca and single-C are below investment grade ratings categories used by Moody’s. Ratings categories may include gradations within each category. Bonds backed by U.S. Government or agency securities are given an implied rating equal to the rating of such securities. Holdings designated Not Publicly Rated are not rated by these national rating agencies. |
| 3. | Inception date: September 16, 2013. |
| 4. | Class A performance with the sales charges includes the maximum 3.00% sales charge. |
| 5. | Benchmark A: The Credit Suisse Global Loan Benchmark is a market capitalization weighted average of the Credit Suisse Leveraged Loan Index and the Credit Suisse Western European Leveraged Loan Index. The Credit Suisse Leveraged Loan Index is designed to mirror the investable universe of the U.S. dollar-denominated leveraged loan market. The Credit Suisse Western European Leveraged Loan Index is designed to mirror the investable universe of the Western European leveraged loan market, with loans denominated in U.S. and Western European currencies. Indices are unmanaged. It is not possible to invest directly in an index.. |
| 6. | Line graph and table do not reflect the deduction of taxes that a shareholder would pay. |
| 7. | Class C performance with the sales charges includes the 1.00% contingent deferred sales charge (CDSC) for returns of one year or less. |
3
Barings Global Credit Income Opportunities Fund 2021 Annual Report
Investment Objective
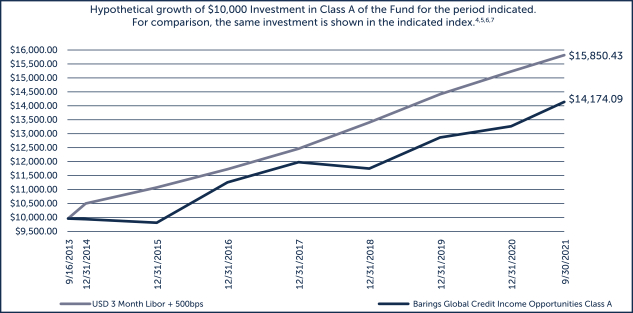
Barings Global Credit Income Opportunities Fund (“Global Credit Income Opportunities Fund” or the “Fund”) seeks absolute return, primarily through current income and secondarily through capital appreciation.
Portfolio Management Commentary
For the third quarter, Barings Global Credit Income Opportunities Fund returned +0.80%1 compared to a return of +1.27% for the 3 month USD LIBOR + 500 basis points2,6. During the quarter, the global loan market outperformed the global high yield bond market and both markets generated positive total returns. Developed markets high yield bonds outperformed emerging markets corporates, which was largely due to increased volatility for Chinese real estate developers. In the loan market, the lower rating category outperformed higher rated loans, whereas in the high yield bond market performance across rating categories was mixed. Demand for both loans and high yield bonds was healthy during the quarter and both markets were met with a steady volume of new issuance overall.
During the quarter, the Fund’s exposure to collateralized loan obligations (“CLOs”), in particular CLO double-B rated debt tranches,3 was the top contributor to the Fund’s performance. The Fund’s exposure to loan and high yield bond holdings also contributed to the Fund’s relative performance. Healthy performance from the Fund’s developed markets high yield bond holdings offset underperformance by the Fund’s exposure to emerging markets corporate bonds.
There was no material changes to the target allocations across regions or asset classed during the quarter. The Fund modestly increased the target allocation to CLOs in anticipation of a high volume of new issuance and emerging markets corporate bonds to be in a position to seek opportunities in that market given the increased volatility. However, the focus of purchasing activity during the quarter was on new issue transactions across the various high yield credit markets in which the Fund invests.
4
Barings Global Credit Income Opportunities Fund 2021 Annual Report
| | | | | | | | | | | | | | | | | | | | |
| % AVERAGE ANNUAL TOTAL RETURNS 5,7,8 | | INCEPTION DATE | | | ONE YEAR | | | THREE YEARS | | | FIVE YEARS | | | INCEPTION TO DATE | |
Class A With Load | | | 09/16/2013 | | | | 9.26 | % | | | 3.25 | % | | | 4.56 | % | | | 4.36 | % |
Class A No Load | | | 09/16/2013 | | | | 13.81 | % | | | 4.67 | % | | | 5.42 | % | | | 4.86 | % |
Class C With Load | | | 09/16/2013 | | | | 12.02 | % | | | 3.90 | % | | | 4.64 | % | | | 4.08 | % |
Class C No Load | | | 09/16/2013 | | | | 13.02 | % | | | 3.90 | % | | | 4.64 | % | | | 4.08 | % |
Class I With Load | | | 09/16/2013 | | | | 14.08 | % | | | 4.92 | % | | | 5.68 | % | | | 5.12 | % |
Class I No Load | | | 09/16/2013 | | | | 14.08 | % | | | 4.92 | % | | | 5.68 | % | | | 5.12 | % |
Class Y With Load | | | 09/16/2013 | | | | 14.08 | % | | | 4.92 | % | | | 5.68 | % | | | 5.12 | % |
Class Y No Load | | | 09/16/2013 | | | | 14.08 | % | | | 4.92 | % | | | 5.68 | % | | | 5.12 | % |
| 1. | Total return describes the return to an investor of Class Y shares and includes the reinvestment of dividends and capital gains. Past performance is no guarantee of future results and investment returns and the net asset value (NAV) of shares of the Fund will fluctuate so that shares, when redeemed, may be worth more or less than their original cost. Current performance may be higher or lower than performance quoted. Call 1.855.439.5459 or visit barings.com for current month end performance. All returns 1-year or less are cumulative. |
| 2. | A unit that is equal to 1/100th of 1% or 0.01%. |
| 3. | Ratings shown are the highest rating given by one of the following national rating agencies: S&P, Moody’s or Fitch. Additional information about ratings can be found, respectively, at www.standardandpoors.com, www.moodys.com and www.fitchratings.com. Credit ratings are subject to change. AAA, AA, single-A, and BBB are investment grade ratings categories used by S&P and Fitch; BB, single-B, CCC/CC/C and single-D are below investment grade ratings categories used by S&P and Fitch. Aaa, Aa, single-A and Baa are investment grade ratings categories used by Moody’s; Ba, single-B, Caa/Ca and single-C are below investment grade ratings categories used by Moody’s. Ratings categories may include gradations within each category. Bonds backed by U.S. Government or agency securities are given an implied rating equal to the rating of such securities. Holdings designated “Not Publicly Rated” are not rated by these national rating agencies. |
| 4. | Inception date: September 16, 2013. |
| 5. | Class A performance with the sales charges includes the maximum 3.00% sales charge. |
| 6. | Benchmark: 3-Month USD LIBOR plus 500 bps. The 3-Month USD LIBOR (London Interbank Offered Rate) is an average interest rate, determined by the Intercontinental Exchange, that banks charge one another for the use of short-term money (three months) in England’s Euro dollar market. The return shown includes 3-Month USD LIBOR plus 500 bps, or 5% per annum. LIBOR is unmanaged. It is not possible to invest directly in LIBOR. No assurance can be given that the Fund’s performance will exceed that of LIBOR by any given increment, or at all. |
| 7. | Line graph and table do not reflect the deduction of taxes that a shareholder would pay. |
| 8. | Class C performance with the sales charges includes the 1.00% contingent deferred sales charge (CDSC) for returns of one year or less. |
5
Barings Emerging Markets Debt Blended Total Return Fund 2021 Annual Report
Investment Objective
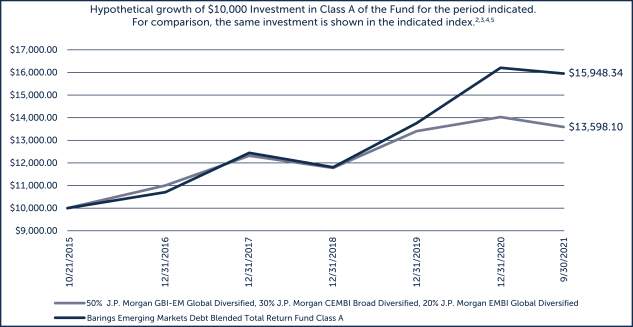
Barings Emerging Markets Debt Blended Total Return Fund (“EMD Blended Total Return Fund” or the “Fund”) seeks to achieve maximum total return, consistent with preservation of capital and prudent investment management, through high current income generation and, where appropriate, capital appreciation.
Portfolio Management Commentary
The Barings Emerging Markets Debt Blended Total Return Fund was down -2.37%1 during Q3 2021. At the index level, EM Corporate was up +0.25%, EM Sovereign was down -0.70% and EM Local was down -3.10%. Sovereign spreads widened 16 bps7 and ended the month at 355 bps, while the divergence between IG and HY ended the month at 448 bps, 11 bps wider than last month’s close. EM Local increased 31 bps ending the quarter at 5.30%. Both EM Local rates and currencies were detractors to performance at the index level with local rates detracting -0.23% and FX detracting -2.87% against a strengthening US Dollar. EM Corporate spreads, as represented by the JP Morgan CEMBI Broad Diversified Index, widened by 9 bps to 258 bps. 10-year US Treasury yields volatile on the quarter, ending the quarter up 2 bps at 1.49%. Brent Crude prices continued to climb and were up 4.5% on the quarter to $78.52/bbl, while the Refinitiv Core Commodity Index was up 7.3% on the back of strong demand as economic activity continued to recover and vaccine distributions continued across many developed and some emerging markets. While the events in China, along with expectations for rate increases in developed markets, have impacted emerging markets, in our view, there are reasons to believe the long-term picture for the asset class remains encouraging.
Many EM countries have lowered their financing needs over the last couple of years, and trade balances across the region have significantly improved since the onset of the pandemic—aided by higher commodity prices and consistent demand. As a result, while rising developed market rates can impact EM countries’ ability to access external financing, we believe many countries today are less reliant on financing from foreign investors, and thus better positioned to withstand outflows. At the same time, we believe the overall EM growth story remains positive, underpinned by the ongoing recovery across both developed and emerging markets. In particular, the increased fiscal firepower in developed markets has sustained demand for EM goods and services. Meanwhile, capital support from post-pandemic moratorium and forbearance measures has remained in place, and has continued to benefit EM countries. Global trade has also re-engaged after remaining largely flat for a number of years, which we believe should continue to support the asset class.
In Q3, EM Corporates detracted -24 bps to performance, EM Sovereign detracted -12 bps, local rates detracted -59 bps and EM FX detracted -91 bps. The top performing countries were Thailand (short FX), Russia (Corporates), Greece (Corporates), Hungary (short rates) and Switzerland (short FX). Detractors on the month were Brazil (local rates, FX, Sovereign and Corporate), China (Corporates), Chile (FX), Poland (FX) and South Africa (FX).
6
Barings Emerging Markets Debt Blended Total Return Fund 2021 Annual Report
| | | | | | | | | | | | | | | | | | | | |
| % AVERAGE ANNUAL TOTAL RETURNS 2,3,5,6 | | INCEPTION DATE | | | ONE YEAR | | | THREE YEARS | | | FIVE YEARS | | | INCEPTION TO DATE | |
Class A With Load | | | 10/21/2015 | | | | 3.60 | % | | | 9.47 | % | | | 6.66 | % | | | 6.79 | % |
Class A No Load | | | 10/21/2015 | | | | 7.91 | % | | | 10.97 | % | | | 7.53 | % | | | 7.53 | % |
Class C With Load | | | 10/21/2015 | | | | 6.13 | % | | | 10.16 | % | | | 6.76 | % | | | 6.75 | % |
Class C No Load | | | 10/21/2015 | | | | 7.13 | % | | | 10.16 | % | | | 6.76 | % | | | 6.75 | % |
Class I With Load | | | 10/21/2015 | | | | 8.20 | % | | | 11.25 | % | | | 7.81 | % | | | 7.80 | % |
Class I No Load | | | 10/21/2015 | | | | 8.20 | % | | | 11.25 | % | | | 7.81 | % | | | 7.80 | % |
Class Y With Load | | | 10/21/2015 | | | | 8.18 | % | | | 11.23 | % | | | 7.80 | % | | | 7.79 | % |
Class Y No Load | | | 10/21/2015 | | | | 8.18 | % | | | 11.23 | % | | | 7.80 | % | | | 7.79 | % |
| 1. | Total return describes the return to an investor of Class Y shares and includes the reinvestment of dividends and capital gains. Past performance is no guarantee of future results, and investment returns and the net asset value (NAV) of shares of the Fund will fluctuate so that shares, when redeemed, may be worth more or less than their original cost. Current performance may be higher or lower than performance quoted. Call 1.855.439.5459 or visit barings.com for current month-end performance. All returns one-year or less are cumulative. |
| 2. | Inception date: October 21, 2015. |
| 3. | Class A performance with the sales charges includes the maximum 4.00% sales charge. |
| 4. | Benchmark is a blend of 50% JPMorgan Government Bond Index – Emerging Markets Global Diversified (GBI-EMGD), 20% JPMorgan EMBI Global Diversified and 30% JPMorgan CEMBI Broad Diversified. |
| 5. | Line graph and table do not reflect the deduction of taxes that a shareholder would pay. |
| 6. | Class C performance with the sales charges includes the 1.00% contingent deferred sales charge (CDSC) for returns of one year or less. |
| 7. | A unit that is equal to 1/100th of 1% or 0.01%. |
7
Barings Global Emerging Markets Equity Fund 2021 Annual Report
Investment Objective
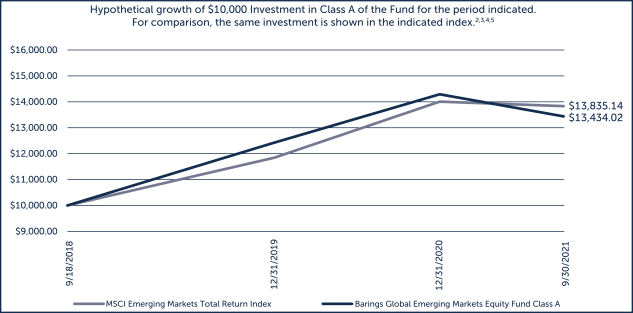
Barings Global Emerging Markets Equity Fund (the “Fund”) seeks to achieve long-term capital growth.
Portfolio Management Commentary
The Barings Global Emerging Markets Equity 40Act Fund declined -8.2%1 in Q3 and underperformed the MSCI Emerging Markets Total Return Net Index, which fell -8.1%4.
Stock selection in the Information Technology and Utilities sectors enhanced relative performance, while our positioning in the Financials and Communication Services sectors detracted from relative performance. The portfolio’s modest allocation to cash contributed in a falling market.
Renewables specialist China Longyuan Power Group was the fund’s top contributor to relative returns, after having announced earnings for the first half of the year that were ahead of consensus expectations, driven by significant power generation growth and improved operational efficiency. Nari Technology, a Chinese company that manufactures grid automation technology, was another standout performer. This is, in part, a reflection of the company’s structural growth opportunity as China continues to automate its national power grid with greater emphasis on renewable energy sources. Elsewhere, conglomerate Reliance Industries was another notable contributor, driven in part by sector-wide strength across energy companies, as oil and natural gas prices rallied significantly.
In contrast, Hong Kong listed sportswear manufacturer Topsports detracted from relative performance over the period, reflecting concerns of some near term weakness in consumption. Elsewhere, Via suffered a weak quarter, as rising inflation rates and near term growth downgrades continue to pressure the Brazilian retailer. In response to heightened regulatory risk, internet company Tencent also underperformed.
Over the period, the portfolio purchased a new position in consumer-focused Ping An Bank, which is well-positioned to benefit from continued growth in the mass affluent market. The fund also purchased a new position in Natura, a Brazilian company that is a leading provider globally of sustainably sourced cosmetics and personal care products.
8
Barings Global Emerging Markets Equity Fund 2021 Annual Report
| | | | | | | | | | | | | | | | |
| % AVERAGE ANNUAL TOTAL RETURNS 2,3,5,6 | | INCEPTION DATE | | | ONE YEAR | | | THREE YEARS | | | INCEPTION TO DATE | |
Class A With Load | | | 9/18/2018 | | | | 9.55 | % | | | 7.69 | % | | | 8.87 | % |
Class A No Load | | | 9/18/2018 | | | | 9.55 | % | | | 7.69 | % | | | 8.87 | % |
Class C With Load | | | 9/18/2018 | | | | 8.73 | % | | | 6.88 | % | | | 8.06 | % |
Class C No Load | | | 9/18/2018 | | | | 8.73 | % | | | 6.88 | % | | | 8.06 | % |
Class I With Load | | | 9/18/2018 | | | | 9.83 | % | | | 7.96 | % | | | 9.14 | % |
Class I No Load | | | 9/18/2018 | | | | 9.83 | % | | | 7.96 | % | | | 9.14 | % |
Class Y With Load | | | 9/18/2018 | | | | 9.83 | % | | | 7.96 | % | | | 9.14 | % |
Class Y No Load | | | 9/18/2018 | | | | 9.83 | % | | | 7.96 | % | | | 9.14 | % |
| 1. | Total return describes the return to an investor of Class Y shares and includes the reinvestment of dividends and capital gains. Past performance is no guarantee of future results, and investment returns and the net asset value (NAV) of shares of the Fund will fluctuate so that shares, when redeemed, may be worth more or less than their original cost. Current performance may be higher or lower than performance quoted. Call 1.855.439.5459 or visit barings.com for current month-end performance. All returns one-year or less are cumulative. The performance comparator is MSCI Emerging Markets Total Return Index with net dividends. |
| 2. | Inception date: September 18, 2018. A fund’s performance for very short time periods may not be indicative of future performance |
| 3. | Class A performance with the sales charges includes the maximum 4.00% sales charge. |
| 4. | Benchmark: MSCI Emerging Markets Total Return Index with net dividends designed to measure the equity market performance of the emerging markets. Indices are unmanaged. It is not possible to invest directly in an index. |
| 5. | Line graph and table do not reflect the deduction of taxes that a shareholder would pay. |
| 6. | Class C performance with the sales charges includes the 1.00% contingent deferred sales charge (CDSC) for returns of one year or less. |
9
Barings Funds Trust 2021 Annual Report
SHAREHOLDER EXPENSES (UNAUDITED)
As a shareholder of Barings Global Floating Rate Fund, Barings Global Credit Income Opportunities Fund, Barings Emerging Markets Debt Blended Total Return Fund, or Barings Global Emerging Markets Equity Fund you incur ongoing expenses, such as management fees, shareholder service fees, distribution fees and other fund expenses. The following table is intended to help you understand your ongoing expenses (in dollars and cents) of investing in the Funds and to compare these expenses with the ongoing expenses of investing in other funds.
The table is based on an investment of $1,000 invested at the beginning of the period and held for the entire period from July 1, 2021 to September 30, 2021.
Actual Expenses
The first line in the table below provides information about the actual account values and actual expenses. You may use the information in this line, together with the amount you invested, to estimate the expenses that you paid over the period. Simply divide your account value by $1,000 (for example, an $8,600 account value divided by $1,000 = 8.6), then multiply the result by the number in the first line for the Fund under the heading entitled “Operating Expense Incurred” to estimate the expenses you paid on your account during this period.
Hypothetical Example for Comparison Purposes
The second line in the table below provides information about the hypothetical account values and hypothetical expenses based on the Fund’s actual expense ratio and an assumed rate of return of 5% per year before expenses, which is not the Fund’s actual return. The hypothetical account value and expenses may not be used to estimate the actual ending account balance or expenses you paid for the period. You may use this information to compare the ongoing costs of investing in your Fund and other funds. To do so, compare this 5% hypothetical example with the 5% hypothetical examples that appear in the shareholder reports of the other funds.
Barings Global Floating Rate Fund
| | | | | | | | | | | | | | | | | | | | |
| | | EXPENSE
RATIO | | | BEGINNING
AMOUNT | | | ENDING
VALUE | | | AVERAGE
VALUE | | | OPERATING
EXPENSE
INCURRED* | |
Class A | | | | | | | | | | | | | | | | | | | | |
Actual | | | 1.00 | % | | $ | 1,000.00 | | | $ | 1,008.30 | | | $ | 1,004.15 | | | $ | 2.53 | |
Hypothetical | | | 1.00 | % | | | 1,000.00 | | | | 1,010.10 | | | | 1,005.05 | | | | 2.53 | |
| | | | | |
Class C | | | | | | | | | | | | | | | | | | | | |
Actual | | | 1.75 | % | | | 1,000.00 | | | | 1,006.40 | | | | 1,003.20 | | | | 4.43 | |
Hypothetical | | | 1.75 | % | | | 1,000.00 | | | | 1,008.20 | | | | 1,004.10 | | | | 4.43 | |
| | | | | |
Class I | | | | | | | | | | | | | | | | | | | | |
Actual | | | 0.75 | % | | | 1,000.00 | | | | 1,009.00 | | | | 1,004.50 | | | | 1.90 | |
Hypothetical | | | 0.75 | % | | | 1,000.00 | | | | 1,010.70 | | | | 1,005.35 | | | | 1.90 | |
| | | | | |
Class Y | | | | | | | | | | | | | | | | | | | | |
Actual | | | 0.75 | % | | | 1,000.00 | | | | 1,008.90 | | | | 1,004.45 | | | | 1.90 | |
Hypothetical | | | 0.75 | % | | | 1,000.00 | | | | 1,010.70 | | | | 1,005.35 | | | | 1.90 | |
| * | For each Class of the Fund, net expenses are equal to the annualized expense ratio net of any expenses waived or reimbursed by the adviser for such class multiplied by the average account value over the period, multiplied by 92/365. |
10
Barings Funds Trust 2021 Annual Report
SHAREHOLDER EXPENSES (UNAUDITED) (CONTINUED)
Barings Global Credit Income Opportunities Fund
| | | | | | | | | | | | | | | | | | | | |
| | | EXPENSE
RATIO | | | BEGINNING
AMOUNT | | | ENDING
VALUE | | | AVERAGE
VALUE | | | OPERATING
EXPENSE
INCURRED* | |
Class A | | | | | | | | | | | | | | | | | | | | |
Actual | | | 1.20 | % | | $ | 1,000.00 | | | $ | 1,007.90 | | | $ | 1,003.95 | | | $ | 3.04 | |
Hypothetical | | | 1.20 | % | | | 1,000.00 | | | | 1,009.60 | | | | 1,004.80 | | | | 3.04 | |
| | | | | |
Class C | | | | | | | | | | | | | | | | | | | | |
Actual | | | 1.95 | % | | | 1,000.00 | | | | 1,005.60 | | | | 1,002.80 | | | | 4.93 | |
Hypothetical | | | 1.95 | % | | | 1,000.00 | | | | 1,007.70 | | | | 1,003.85 | | | | 4.93 | |
| | | | | |
Class I | | | | | | | | | | | | | | | | | | | | |
Actual | | | 0.95 | % | | | 1,000.00 | | | | 1,008.10 | | | | 1,004.05 | | | | 2.40 | |
Hypothetical | | | 0.95 | % | | | 1,000.00 | | | | 1,010.20 | | | | 1,005.10 | | | | 2.41 | |
| | | | | |
Class Y | | | | | | | | | | | | | | | | | | | | |
Actual | | | 0.95 | % | | | 1,000.00 | | | | 1,008.00 | | | | 1,004.00 | | | | 2.40 | |
Hypothetical | | | 0.95 | % | | | 1,000.00 | | | | 1,010.20 | | | | 1,005.10 | | | | 2.41 | |
| * | For each Class of the Fund, net expenses are equal to the annualized expense ratio net of any expenses waived or reimbursed by the adviser for such class multiplied by the average account value over the period, multiplied by 92/365. |
Barings Emerging Markets Debt Blended Total Return Fund
| | | | | | | | | | | | | | | | | | | | |
| | | EXPENSE
RATIO | | | BEGINNING
AMOUNT | | | ENDING
VALUE | | | AVERAGE
VALUE | | | OPERATING
EXPENSE
INCURRED* | |
Class A | | | | | | | | | | | | | | | | | | | | |
Actual | | | 1.20 | % | | $ | 1,000.00 | | | $ | 975.60 | | | $ | 987.80 | | | $ | 2.99 | |
Hypothetical | | | 1.20 | % | | | 1,000.00 | | | | 1,009.60 | | | | 1,004.80 | | | | 3.04 | |
| | | | | |
Class C | | | | | | | | | | | | | | | | | | | | |
Actual | | | 1.95 | % | | | 1,000.00 | | | | 973.80 | | | | 986.90 | | | | 4.85 | |
Hypothetical | | | 1.95 | % | | | 1,000.00 | | | | 1,007.70 | | | | 1,003.85 | | | | 4.93 | |
| | | | | |
Class I | | | | | | | | | | | | | | | | | | | | |
Actual | | | 0.95 | % | | | 1,000.00 | | | | 975.60 | | | | 987.80 | | | | 2.37 | |
Hypothetical | | | 0.95 | % | | | 1,000.00 | | | | 1,010.20 | | | | 1,005.10 | | | | 2.41 | |
| | | | | |
Class Y | | | | | | | | | | | | | | | | | | | | |
Actual | | | 0.95 | % | | | 1,000.00 | | | | 976.20 | | | | 988.10 | | | | 2.37 | |
Hypothetical | | | 0.95 | % | | | 1,000.00 | | | | 1,010.20 | | | | 1,005.10 | | | | 2.41 | |
| * | For each Class of the Fund, net expenses are equal to the annualized expense ratio net of any expenses waived or reimbursed by the adviser for such class multiplied by the average account value over the period, multiplied by 92/365. |
11
Barings Funds Trust 2021 Annual Report
SHAREHOLDER EXPENSES (UNAUDITED) (CONTINUED)
Barings Global Emerging Markets Equity Fund
| | | | | | | | | | | | | | | | | | | | |
| | | EXPENSE
RATIO | | | BEGINNING
AMOUNT | | | ENDING
VALUE | | | AVERAGE
VALUE | | | OPERATING
EXPENSE
INCURRED* | |
Class A | | | | | | | | | | | | | | | | | | | | |
Actual | | | 1.15 | % | | $ | 1,000.00 | | | $ | 917.30 | | | $ | 958.65 | | | $ | 2.78 | |
Hypothetical | | | 1.15 | % | | | 1,000.00 | | | | 1,009.70 | | | | 1,004.85 | | | | 2.91 | |
| | | | | |
Class C | | | | | | | | | | | | | | | | | | | | |
Actual | | | 1.90 | % | | | 1,000.00 | | | | 915.50 | | | | 957.75 | | | | 4.59 | |
Hypothetical | | | 1.90 | % | | | 1,000.00 | | | | 1,007.80 | | | | 1,003.90 | | | | 4.81 | |
| | | | | |
Class I | | | | | | | | | | | | | | | | | | | | |
Actual | | | 0.90 | % | | | 1,000.00 | | | | 917.90 | | | | 958.95 | | | | 2.18 | |
Hypothetical | | | 0.90 | % | | | 1,000.00 | | | | 1,010.30 | | | | 1,005.15 | | | | 2.28 | |
| | | | | |
Class Y | | | | | | | | | | | | | | | | | | | | |
Actual | | | 0.90 | % | | | 1,000.00 | | | | 917.90 | | | | 958.95 | | | | 2.18 | |
Hypothetical | | | 0.90 | % | | | 1,000.00 | | | | 1,010.30 | | | | 1,005.15 | | | | 2.28 | |
| * | For each Class of the Fund, net expenses are equal to the annualized expense ratio net of any expenses waived or reimbursed by the adviser for such class multiplied by the average account value over the period, multiplied by 92/365. |
12
Barings Funds Trust 2021 Annual Report
FINANCIAL REPORT
13
Barings Funds Trust 2021 Annual Report
STATEMENTS OF ASSETS AND LIABILITIES
September 30, 2021
| | | | | | | | | | | | | | | | |
| | | BARINGS GLOBAL FLOATING RATE FUND | | | BARINGS GLOBAL
CREDIT INCOME
OPPORTUNITIES
FUND | | | BARINGS EMERGING
MARKETS DEBT
BLENDED TOTAL
RETURN FUND | | | BARINGS GLOBAL
EMERGING MARKETS
EQUITY FUND | |
| | | | |
| Assets | | | | | | | | | | | | | | | | |
| Investments, at fair value (cost $396,940,609, $172,694,977, $135,907,968 and $9,743,696, respectively) | | $ | 394,723,926 | | | $ | 171,120,368 | | | $ | 132,647,240 | | | $ | 11,940,984 | |
| Cash | | | 71,882,437 | | | | 10,806,999 | | | | 9,064,023 | | | | 697,440 | |
| Foreign currency, at value (cost $334,004, $3,158,437, $25,267 and $9,658, respectively) | | | 330,930 | | | | 3,108,081 | | | | 25,246 | | | | 9,675 | |
| Receivable for investments sold | | | 3,916,211 | | | | 6,247,016 | | | | 2,446,869 | | | | – | |
| Receivable for Fund shares sold | | | 149,790 | | | | 54,577 | | | | 2,262,199 | | | | – | |
| Dividend and Interest Receivable | | | 2,086,423 | | | | 2,123,973 | | | | 2,403,848 | | | | 31,991 | |
| Receivable from adviser (see Note 3) | | | – | | | | – | | | | – | | | | 39,296 | |
| Cash collateral held at broker on open swap contracts | | | – | | | | – | | | | 1,880,873 | | | | – | |
| Cash collateral held at broker on open futures contracts | | | – | | | | – | | | | 755,000 | | | | – | |
| Receivable for variation margin on open futures contracts | | | – | | | | – | | | | 2,079 | | | | – | |
| Swap contracts, at fair value (up-front net premiums paid of $0, $0, $31,489 and $0, respectively) | | | – | | | | – | | | | 280,669 | | | | – | |
| Foreign tax reclaims receivable | | | – | | | | – | | | | 26,746 | | | | 509 | |
| Unrealized appreciation on forward foreign currency exchange contracts | | | 1,981,189 | | | | 1,245,224 | | | | 2,006,191 | | | | – | |
| Unrealized appreciation on unfunded loan commitments | | | 2,024 | | | | 185 | | | | – | | | | – | |
| Prepaid expenses | | | 102,667 | | | | 75,698 | | | | 41,870 | | | | – | |
| | | | | | | | | | | | | | | | |
Total assets | | | 475,175,597 | | | | 194,782,121 | | | | 153,842,853 | | | | 12,719,895 | |
| | | | | | | | | | | | | | | | |
| | | | |
| Liabilities | | | | | | | | | | | | | | | | |
| Payable for investments purchased | | | 46,530,677 | | | | 12,045,685 | | | | 4,380,178 | | | | – | |
| Payable for Fund shares repurchased | | | 312,526 | | | | 415,823 | | | | 630,304 | | | | – | |
| Swap contracts, at fair value (up-front net premiums received of $0, $0, $156,223 and $0, respectively) | | | – | | | | – | | | | 439,310 | | | | – | |
| Payable for variation margin on open swap contracts | | | – | | | | – | | | | 37,284 | | | | – | |
| Investment advisory fee payable (see Note 3) | | | 164,133 | | | | 84,079 | | | | 53,751 | | | | – | |
| Cash collateral Due to Broker | | | 1,530,000 | | | | 1,170,000 | | | | 280,000 | | | | – | |
| Distribution fees payable | | | 16,174 | | | | 15,737 | | | | 4,166 | | | | 129 | |
| Shareholder service fees payable | | | 11,308 | | | | 10,107 | | | | 8,946 | | | | – | |
| Dividends payable | | | 145,075 | | | | 166,892 | | | | 28,198 | | | | – | |
| Written options, at fair value (premiums of $0, $0, $432,189 and $0, respectively) | | | – | | | | – | | | | 87,188 | | | | – | |
| Unrealized depreciation on forward foreign currency exchange contracts | | | – | | | | 44,625 | | | | 1,886,454 | | | | – | |
| Accrued expenses and other liabilities | | | 171,960 | | | | 157,888 | | | | 113,292 | | | | 139,542 | |
| | | | | | | | | | | | | | | | |
Total liabilities | | | 48,881,853 | | | | 14,110,836 | | | | 7,949,071 | | | | 139,671 | |
| | | | | | | | | | | | | | | | |
Total net assets | | $ | 426,293,744 | | | $ | 180,671,285 | | | $ | 145,893,782 | | | $ | 12,580,224 | |
| | | | | | | | | | | | | | | | |
See accompanying Notes to the Financial Statements.
14
Barings Funds Trust 2021 Annual Report
STATEMENTS OF ASSETS AND LIABILITIES (CONTINUED)
September 30, 2021
| | | | | | | | | | | | | | | | |
| | | BARINGS GLOBAL FLOATING RATE FUND | | | BARINGS GLOBAL
CREDIT INCOME
OPPORTUNITIES
FUND | | | BARINGS EMERGING
MARKETS DEBT
BLENDED TOTAL
RETURN FUND | | | BARINGS GLOBAL
EMERGING MARKETS
EQUITY FUND | |
|
| Composition of net assets | |
| Shares of beneficial interest outstanding (par value $0.00001 per share), unlimited number of shares authorized | | $ | 453 | | | $ | 200 | | | $ | 138 | | | $ | 10 | |
| Additional paid-in capital | | | 437,916,878 | | | | 198,664,263 | | | | 146,582,726 | | | | 10,164,303 | |
| Total distributable earnings (accumulated loss) | | | (11,623,587 | ) | | | (17,993,178 | ) | | | (689,082 | ) | | | 2,415,911 | |
| | | | | | | | | | | | | | | | |
Total net assets | | $ | 426,293,744 | | | $ | 180,671,285 | | | $ | 145,893,782 | | | $ | 12,580,224 | |
| | | | | | | | | | | | | | | | |
|
| Class A | |
| Net assets applicable to outstanding shares | | $ | 53,367,584 | | | $ | 52,874,608 | | | $ | 17,660,351 | | | $ | 123,832 | |
| | | | | | | | | | | | | | | | |
| Shares of beneficial interest outstanding | | | 5,674,143 | | | | 5,846,306 | | | | 1,667,348 | | | | 10,000 | |
| | | | | | | | | | | | | | | | |
| Net asset value per share outstanding | | $ | 9.41 | | | $ | 9.04 | | | $ | 10.59 | | | $ | 12.38 | |
| | | | | | | | | | | | | | | | |
| Maximum offering price per share outstanding (Net asset value plus sales charge of 3.00%, 4.00%, 4.00% and 4.00%, respectively) | | $ | 9.70 | | | $ | 9.42 | | | $ | 11.03 | | | $ | 12.90 | |
| | | | | | | | | | | | | | | | |
|
| Class C | |
| Net assets applicable to outstanding shares | | $ | 6,766,494 | | | $ | 5,914,226 | | | $ | 582,784 | | | $ | 123,014 | |
| | | | | | | | | | | | | | | | |
| Shares of beneficial interest outstanding | | | 721,914 | | | | 654,154 | | | | 55,016 | | | | 10,000 | |
| | | | | | | | | | | | | | | | |
| Net asset value per share outstanding | | $ | 9.37 | | | $ | 9.04 | | | $ | 10.59 | | | $ | 12.30 | |
| | | | | | | | | | | | | | | | |
|
| Class I | |
| Net assets applicable to outstanding shares | | $ | 72,614,713 | | | $ | 6,404,603 | | | $ | 976 | | | $ | 6,080,423 | |
| | | | | | | | | | | | | | | | |
| Shares of beneficial interest outstanding | | | 7,698,550 | | | | 708,150 | | | | 92 | | | | 490,000 | |
| | | | | | | | | | | | | | | | |
| Net asset value per share outstanding | | $ | 9.43 | | | $ | 9.04 | | | $ | 10.61 | | | $ | 12.41 | |
| | | | | | | | | | | | | | | | |
|
| Class Y | |
| Net assets applicable to outstanding shares | | $ | 293,544,953 | | | $ | 115,477,848 | | | $ | 127,649,671 | | | $ | 6,252,955 | |
| | | | | | | | | | | | | | | | |
| Shares of beneficial interest outstanding | | | 31,157,810 | | | | 12,769,584 | | | | 12,052,796 | | | | 503,858 | |
| | | | | | | | | | | | | | | | |
| Net asset value per share outstanding | | $ | 9.42 | | | $ | 9.04 | | | $ | 10.59 | | | $ | 12.41 | |
| | | | | | | | | | | | | | | | |
See accompanying Notes to the Financial Statements.
15
Barings Funds Trust 2021 Annual Report
STATEMENTS OF OPERATIONS
For the Period from July 1, 2021 through September 30, 2021(1)
| | | | | | | | | | | | | | | | |
| | | BARINGS GLOBAL
FLOATING RATE FUND | | | BARINGS GLOBAL CREDIT INCOME
OPPORTUNITIES
FUND | | | BARINGS EMERGING
MARKETS DEBT
BLENDED TOTAL
RETURN FUND | | | BARINGS GLOBAL EMERGING MARKETS EQUITY FUND | |
|
| Investment Income | |
Interest income (net of withholding tax of $0, $1,397, $8,633 and $0, respectively) | | $ | 4,041,773 | | | $ | 3,037,912 | | | $ | 1,931,957 | | | $ | – | |
Dividends (net of withholding tax of $0, $3,079, $0 and $11,817, respectively) | | | – | | | | 17,448 | | | | – | | | | 94,148 | |
Net bank loan fee income | | | 64,387 | | | | 24,147 | | | | – | | | | – | |
Other income | | | 7,151 | | | | 2,384 | | | | 4,050 | | | | – | |
| | | | | | | | | | | | | | | | |
Total investment income | | | 4,113,311 | | | | 3,081,891 | | | | 1,936,007 | | | | 94,148 | |
| | | | | | | | | | | | | | | | |
|
| Operating Expenses | |
Advisory fees | | | 646,208 | | | | 390,853 | | | | 267,311 | | | | 29,242 | |
12b-1 distribution and servicing plan | | | | | | | | | | | | | | | | |
Class A | | | 31,273 | | | | 26,839 | | | | 11,043 | | | | 81 | |
Class C | | | 17,209 | | | | 14,824 | | | | 1,451 | | | | 320 | |
Shareholder service fee | | | | | | | | | | | | | | | | |
Class A | | | 6,457 | | | | 1,593 | | | | 4,709 | | | | – | |
Class C | | | 247 | | | | 273 | | | | 6 | | | | – | |
Class Y | | | 21,359 | | | | 21,718 | | | | 15,444 | | | | – | |
Administrator fees | | | 27,220 | | | | 20,025 | | | | 15,414 | | | | 8,718 | |
Custody fees | | | 37,118 | | | | 26,918 | | | | 29,611 | | | | 3,370 | |
Professional fees | | | 94,155 | | | | 92,080 | | | | 67,221 | | | | 64,991 | |
Transfer agent fees | | | 10,954 | | | | 7,068 | | | | 9,691 | | | | 13,959 | |
Directors’ fees | | | 15,157 | | | | 11,934 | | | | 9,626 | | | | 6,986 | |
Registration fees | | | 31,614 | | | | 19,275 | | | | 25,641 | | | | 43,691 | |
Printing and mailing expenses | | | 14,892 | | | | 11,242 | | | | 4,135 | | | | 6,000 | |
Other operating expenses | | | 16,653 | | | | 11,594 | | | | 6,729 | | | | 6,752 | |
| | | | | | | | | | | | | | | | |
Total operating expenses | | | 970,516 | | | | 656,236 | | | | 468,032 | | | | 184,110 | |
Waiver/Reimbursement of expenses | | | | | | | | | | | | | | | | |
Class A | | | (24,950 | ) | | | (18,239 | ) | | | (17,611 | ) | | | (5,620 | ) |
Class C | | | (4,084 | ) | | | (4,246 | ) | | | (2,147 | ) | | | (2,661 | ) |
Class I | | | (25,913 | ) | | | (9,396 | ) | | | (1,771 | ) | | | (72,584 | ) |
Class Y | | | (121,465 | ) | | | (87,613 | ) | | | (95,416 | ) | | | (73,603 | ) |
| | | | | | | | | | | | | | | | |
Net operating expenses | | | 794,104 | | | | 536,742 | | | | 351,087 | | | | 29,642 | |
| | | | | | | | | | | | | | | | |
Net investment income | | | 3,319,207 | | | | 2,545,149 | | | | 1,584,920 | | | | 64,506 | |
| | | | | | | | | | | | | | | | |
See accompanying Notes to the Financial Statements.
16
Barings Funds Trust 2021 Annual Report
STATEMENTS OF OPERATIONS (CONTINUED)
For the Period from July 1, 2021 through September 30, 2021(1)
| | | | | | | | | | | | | | | | |
| | | BARINGS GLOBAL
FLOATING RATE FUND | | | BARINGS GLOBAL CREDIT INCOME
OPPORTUNITIES
FUND | | | BARINGS EMERGING
MARKETS DEBT
BLENDED TOTAL
RETURN FUND | | | BARINGS GLOBAL EMERGING MARKETS EQUITY FUND | |
|
| Realized and Unrealized Gains (Losses) | |
Net realized gain (loss) on investments | | $ | 93,208 | | | $ | 511,681 | | | $ | 369,171 | | | $ | (82,018 | ) |
Net realized gain on forward foreign currency exchange contracts | | | 2,344,620 | | | | 1,600,141 | | | | 1,601,304 | | | | 1,481 | |
Net realized loss on foreign currency and translation | | | (16,339 | ) | | | (45,255 | ) | | | (20,978 | ) | | | (861 | ) |
Net realized gain (loss) on futures contracts | | | – | | | | – | | | | (320,073 | ) | | | – | |
Net realized gain on swap contracts | | | – | | | | – | | | | 34,853 | | | | – | |
Net realized gain on written options | | | – | | | | – | | | | 318,059 | | | | – | |
Net realized gain (loss) on purchased options | | | – | | | | – | | | | (2,533 | ) | | | – | |
| | | | | | | | | | | | | | | | |
Net realized gain (loss) | | | 2,421,489 | | | | 2,066,567 | | | | 1,979,803 | | | | (81,398 | ) |
| | | | | | | | | | | | | | | | |
Net change in unrealized depreciation on investments | | | (2,220,200 | ) | | | (2,682,566 | ) | | | (4,410,873 | ) | | | (1,107,282 | ) |
Net change in unrealized appreciation (depreciation) on unfunded loan commitments | | | 1,559 | | | | (873 | ) | | | – | | | | – | |
Net change in unrealized appreciation (depreciation) on forward foreign currency exchange contracts | | | (160,578 | ) | | | (272,272 | ) | | | (1,780,492 | ) | | | – | |
Net change in unrealized appreciation (depreciation) on foreign currency and translation | | | 203,104 | | | | 38,185 | | | | (22,008 | ) | | | (47 | ) |
Net change in unrealized appreciation (depreciation) on futures contracts | | | – | | | | – | | | | 245,449 | | | | – | |
Net change in unrealized appreciation (depreciation) on swap contracts | | | – | | | | – | | | | (738,202 | ) | | | – | |
Net change in unrealized appreciation (depreciation) on written option contracts | | | – | | | | – | | | | (215,015 | ) | | | – | |
Net change in unrealized appreciation (depreciation) on purchased option contracts | | | – | | | | – | | | | (30,408 | ) | | | – | |
| | | | | | | | | | | | | | | | |
Net change in unrealized appreciation (depreciation) | | | (2,176,115 | ) | | | (2,917,526 | ) | | | (6,951,549 | ) | | | (1,107,329 | ) |
| | | | | | | | | | | | | | | | |
Net realized and unrealized gains (losses) | | | 245,374 | | | | (850,959 | ) | | | (4,971,746 | ) | | | (1,188,727 | ) |
| | | | | | | | | | | | | | | | |
Net increase (decrease) in net assets resulting from operations | | $ | 3,564,581 | | | $ | 1,694,190 | | | $ | (3,386,826 | ) | | $ | (1,124,221 | ) |
| | | | | | | | | | | | | | | | |
| (1) | | The Funds changed their fiscal year end to September 30. |
See accompanying Notes to the Financial Statements.
17
Barings Funds Trust 2021 Annual Report
STATEMENTS OF OPERATIONS
For the Year Ended June 30, 2021
| | | | | | | | | | | | | | | | |
| | | BARINGS GLOBAL
FLOATING RATE FUND | | | BARINGS GLOBAL CREDIT INCOME
OPPORTUNITIES
FUND | | | BARINGS EMERGING
MARKETS DEBT
BLENDED TOTAL
RETURN FUND | | | BARINGS GLOBAL EMERGING MARKETS EQUITY FUND | |
|
| Investment Income | |
Interest income (net of withholding tax of $0, $0, $18,965 and $0, respectively) | | $ | 12,266,468 | | | $ | 10,931,028 | | | $ | 4,998,930 | | | $ | – | |
Dividends (net of withholding tax of $0, $1,108, $0, and $35,428, respectively) | | | 642 | | | | 6,404 | | | | – | | | | 307,433 | |
Net bank loan fee income | | | 148,811 | | | | 46,433 | | | | – | | | | – | |
Other income | | | 45,751 | | | | 239,107 | | | | 6,450 | | | | – | |
| | | | | | | | | | | | | | | | |
Total investment income | | | 12,461,672 | | | | 11,222,972 | | | | 5,005,380 | | | | 307,433 | |
| | | | | | | | | | | | | | | | |
|
| Operating Expenses | |
Advisory fees | | | 1,666,618 | | | | 1,316,998 | | | | 636,946 | | | | 115,960 | |
12b-1 distribution and servicing plan | | | | | | | | | | | | | | | | |
Class A | | | 98,756 | | | | 50,210 | | | | 27,754 | | | | 321 | |
Class C | | | 67,434 | | | | 72,792 | | | | 3,372 | | | | 1,279 | |
Shareholder service fee | | | | | | | | | | | | | | | | |
Class A | | | 31,713 | | | | 9,012 | | | | 17,492 | | | | 5 | |
Class C | | | 3,639 | | | | 4,259 | | | | 80 | | | | – | |
Class Y | | | 64,821 | | | | 64,993 | | | | 38,663 | | | | – | |
Administrator fees | | | 63,258 | | | | 47,903 | | | | 45,777 | | | | 15,748 | |
Custody fees | | | 114,960 | | | | 90,130 | | | | 87,408 | | | | 17,292 | |
Professional fees | | | 155,994 | | | | 149,713 | | | | 108,250 | | | | 103,005 | |
Transfer agent fees | | | 38,731 | | | | 33,403 | | | | 39,272 | | | | 15,067 | |
Directors’ fees | | | 91,142 | | | | 75,087 | | | | 55,789 | | | | 34,757 | |
Registration fees | | | 91,428 | | | | 70,544 | | | | 72,382 | | | | 103,912 | |
Printing and mailing expenses | | | 52,756 | | | | 40,237 | | | | 21,100 | | | | 2,685 | |
Other operating expenses | | | 80,113 | | | | 60,238 | | | | 31,278 | | | | 7,303 | |
| | | | | | | | | | | | | | | | |
Total operating expenses | | | 2,621,363 | | | | 2,085,519 | | | | 1,185,563 | | | | 417,334 | |
Waiver/Reimbursement of expenses | | | | | | | | | | | | | | | | |
Class A | | | (99,623 | ) | | | (37,944 | ) | | | (59,207 | ) | | | (6,386 | ) |
Class C | | | (20,012 | ) | | | (17,806 | ) | | | (8,273 | ) | | | (6,779 | ) |
Class I | | | (77,391 | ) | | | (29,146 | ) | | | (28,684 | ) | | | (137,060 | ) |
Class Y | | | (335,126 | ) | | | (209,424 | ) | | | (251,474 | ) | | | (137,505 | ) |
| | | | | | | | | | | | | | | | |
Net operating expenses | | | 2,089,211 | | | | 1,791,199 | | | | 837,925 | | | | 129,604 | |
| | | | | | | | | | | | | | | | |
Net investment income | | | 10,372,461 | | | | 9,431,773 | | | | 4,167,455 | | | | 177,829 | |
| | | | | | | | | | | | | | | | |
See accompanying Notes to the Financial Statements.
18
Barings Funds Trust 2021 Annual Report
STATEMENTS OF OPERATIONS (CONTINUED)
For the Year Ended June 30, 2021
| | | | | | | | | | | | | | | | |
| | | BARINGS GLOBAL
FLOATING RATE FUND | | | BARINGS GLOBAL CREDIT INCOME
OPPORTUNITIES
FUND | | | BARINGS EMERGING
MARKETS DEBT
BLENDED TOTAL
RETURN FUND | | | BARINGS GLOBAL EMERGING MARKETS EQUITY FUND | |
|
| Realized and Unrealized Gains (Losses) | |
Net realized gain (loss) on investments | | $ | (3,119,797 | ) | | $ | (3,997,231 | ) | | $ | 1,715,946 | (1) | | $ | 641,489 | |
Net realized gain (loss) on forward foreign currency exchange contracts | | | (3,866,893 | ) | | | (3,416,982 | ) | | | 931,956 | | | | – | |
Net realized gain (loss) on foreign currency and translation | | | 347,689 | | | | 225,403 | | | | 97,240 | | | | (3,350 | ) |
Net realized gain (loss) on futures contracts | | | – | | | | – | | | | 374,429 | | | | – | |
Net realized gain on swap contracts | | | – | | | | – | | | | 2,399,797 | | | | – | |
Net realized gain on written options | | | – | | | | 403,346 | | | | – | | | | – | |
Net realized gain (loss) on purchased options | | | – | | | | (692,562 | ) | | | – | | | | – | |
| | | | | | | | | | | | | | | | |
Net realized gain (loss) | | | (6,639,001 | ) | | | (7,478,026 | ) | | | 5,519,368 | | | | 638,139 | |
| | | | | | | | | | | | | | | | |
Net change in unrealized appreciation on investments | | | 25,430,154 | | | | 24,653,784 | | | | 2,339,476 | (2) | | | 2,563,627 | |
Net change in unrealized appreciation on unfunded loan commitments | | | 465 | | | | 1,058 | | | | – | | | | – | |
Net change in unrealized appreciation on forward foreign currency exchange contracts | | | 1,581,637 | | | | 1,024,985 | | | | 1,045,623 | | | | – | |
Net change in unrealized appreciation on foreign currency and translation | | | 10,491 | | | | 20,125 | | | | 27,976 | | | | 114 | |
Net change in unrealized appreciation (depreciation) on futures contracts | | | – | | | | – | | | | (137,074 | ) | | | – | |
Net change in unrealized appreciation (depreciation) on swap contracts | | | – | | | | – | | | | (4,228,925 | ) | | | – | |
Net change in unrealized appreciation on written option contracts | | | – | | | | 18,451 | | | | 560,016 | | | | – | |
Net change in unrealized appreciation (depreciation) on purchased option contracts | | | – | | | | (37,712 | ) | | | 429 | | | | – | |
| | | | | | | | | | | | | | | | |
Net change in unrealized appreciation (depreciation) | | | 27,022,747 | | | | 25,680,691 | | | | (392,479 | ) | | | 2,563,741 | |
| | | | | | | | | | | | | | | | |
Net realized and unrealized gains | | | 20,383,746 | | | | 18,202,665 | | | | 5,126,889 | | | | 3,201,880 | |
| | | | | | | | | | | | | | | | |
Net increase in net assets resulting from operations | | $ | 30,756,207 | | | $ | 27,634,438 | | | $ | 9,294,344 | | | $ | 3,379,709 | |
| | | | | | | | | | | | | | | | |
| (1) | | Includes realized foreign capital gains taxes of $2,457. |
| (2) | | Net of change in unrealized appreciation/(depreciation) of foreign capital gains taxes of $4,271. |
See accompanying Notes to the Financial Statements.
19
Barings Funds Trust 2021 Annual Report
STATEMENTS OF CHANGES IN NET ASSETS
| | | | | | | | | | | | |
| | | BARINGS GLOBAL
FLOATING RATE FUND | |
| | | FOR THE PERIOD
FROM JULY 1, 2021
THROUGH
SEPTEMBER 30, 2021(1) | | | FOR THE
YEAR ENDED
JUNE 30, 2021 | | | FOR THE
YEAR ENDED
JUNE 30, 2020 | |
| | | |
| Operations | | | | | | | | | | | | |
Net investment income | | $ | 3,319,207 | | | $ | 10,372,461 | | | $ | 11,934,842 | |
Net realized gain (loss) | | | 2,421,489 | | | | (6,639,001 | ) | | | (8,284,095 | ) |
Net change in unrealized appreciation (depreciation) | | | (2,176,115 | ) | | | 27,022,747 | | | | (13,188,700 | ) |
| | | | | | | | | | | | |
Net increase (decrease) in net assets from operations | | | 3,564,581 | | | | 30,756,207 | | | | (9,537,953 | ) |
| | | | | | | | | | | | |
| | | |
| Dividends and distributions | | | | | | | | | | | | |
Class A | | | (380,457 | ) | | | (1,442,871 | ) | | | (1,752,333 | ) |
| | | | | | | | | | | | |
Class C | | | (39,580 | ) | | | (196,711 | ) | | | (263,597 | ) |
| | | | | | | | | | | | |
Class I | | | (581,952 | ) | | | (1,790,541 | ) | | | (1,584,124 | ) |
| | | | | | | | | | | | |
Class Y | | | (2,227,716 | ) | | | (6,243,052 | ) | | | (7,063,704 | ) |
| | | | | | | | | | | | |
Total dividends and distributions | | | (3,229,705 | ) | | | (9,673,175 | ) | | | (10,663,758 | ) |
| | | | | | | | | | | | |
| | | |
| Return of capital | | | | | | | | | | | | |
Class A | | | – | | | | – | | | | (360,351 | ) |
| | | | | | | | | | | | |
Class C | | | – | | | | – | | | | (52,291 | ) |
| | | | | | | | | | | | |
Class I | | | – | | | | – | | | | (369,841 | ) |
| | | | | | | | | | | | |
Class Y | | | – | | | | – | | | | (1,382,565 | ) |
| | | | | | | | | | | | |
Total return of capital | | | – | | | | – | | | | (2,165,048 | ) |
| | | | | | | | | | | | |
| | | |
| Capital Share Transactions | | | | | | | | | | | | |
Net proceeds from sale of shares | | | 76,799,769 | | | | 200,034,796 | | | | 106,125,221 | |
Net Asset Value of shares issued to shareholders in payment of distributions declared | | | 2,801,631 | | | | 8,405,707 | | | | 10,443,892 | |
Cost of shares redeemed | | | (26,975,738 | ) | | | (70,900,335 | ) | | | (153,128,901 | ) |
| | | | | | | | | | | | |
Net increase (decrease) in net assets resulting from capital stock transactions | | | 52,625,662 | | | | 137,540,168 | | | | (36,559,788 | ) |
| | | | | | | | | | | | |
Total increase (decrease) in net assets | | | 52,960,538 | | | | 158,623,200 | | | | (58,926,547 | ) |
| | | | | | | | | | | | |
| | | |
| Net Assets | | | | | | | | | | | | |
Beginning of period | | | 373,333,206 | | | | 214,710,006 | | | | 273,636,553 | |
| | | | | | | | | | | | |
End of period | | $ | 426,293,744 | | | $ | 373,333,206 | | | $ | 214,710,006 | |
| | | | | | | | | | | | |
| (1) | | The Fund changed its fiscal year end to September 30. |
See accompanying Notes to the Financial Statements.
20
Barings Funds Trust 2021 Annual Report
STATEMENTS OF CHANGES IN NET ASSETS
| | | | | | | | | | | | |
| | | BARINGS GLOBAL CREDIT
INCOME OPPORTUNITIES FUND | |
| | | FOR THE PERIOD
FROM JULY 1, 2021
THROUGH
SEPTEMBER 30, 2021(1) | | | FOR THE
YEAR ENDED
JUNE 30, 2021 | | | FOR THE
YEAR ENDED
JUNE 30, 2020 | |
| | | |
| Operations | | | | | | | | | | | | |
Net investment income | | $ | 2,545,149 | | | $ | 9,431,773 | | | $ | 10,927,198 | |
Net realized gain (loss) | | | 2,066,567 | | | | (7,478,026 | ) | | | (9,309,427 | ) |
Net change in unrealized appreciation (depreciation) | | | (2,917,526 | ) | | | 25,680,691 | | | | (12,349,471 | ) |
| | | | | | | | | | | | |
Net increase (decrease) in net assets from operations | | | 1,694,190 | | | | 27,634,438 | | | | (10,731,700 | ) |
| | | | | | | | | | | | |
| | | |
| Dividends and distributions | | | | | | | | | | | | |
Class A | | | (487,373 | ) | | | (1,036,691 | ) | | | (2,270,709 | ) |
| | | | | | | | | | | | |
Class C | | | (56,334 | ) | | | (312,103 | ) | | | (321,702 | ) |
| | | | | | | | | | | | |
Class I | | | (229,463 | ) | | | (1,177,641 | ) | | | (1,091,239 | ) |
| | | | | | | | | | | | |
Class Y | | | (1,687,604 | ) | | | (6,573,572 | ) | | | (5,901,580 | ) |
| | | | | | | | | | | | |
Total dividends and distributions | | | (2,460,774 | ) | | | (9,100,007 | ) | | | (9,585,230 | ) |
| | | | | | | | | | | | |
| | | |
| Return of capital | | | | | | | | | | | | |
Class A | | | – | | | | – | | | | (356,912 | ) |
| | | | | | | | | | | | |
Class C | | | – | | | | – | | | | (51,371 | ) |
| | | | | | | | | | | | |
Class I | | | – | | | | – | | | | (174,380 | ) |
| | | | | | | | | | | | |
Class Y | | | – | | | | – | | | | (870,042 | ) |
| | | | | | | | | | | | |
Total return of capital | | | – | | | | – | | | | (1,452,705 | ) |
| | | | | | | | | | | | |
| | | |
| Capital Share Transactions | | | | | | | | | | | | |
Net proceeds from sale of shares | | | 48,002,595 | | | | 102,024,351 | | | | 64,702,295 | |
Net Asset Value of shares issued to shareholders in payment of distributions declared | | | 1,649,175 | | | | 6,482,307 | | | | 8,443,894 | |
Cost of shares redeemed | | | (78,459,646 | ) | | | (80,935,136 | ) | | | (99,727,481 | ) |
| | | | | | | | | | | | |
Net increase (decrease) in net assets resulting from capital stock transactions | | | (28,807,876 | ) | | | 27,571,522 | | | | (26,581,292 | ) |
| | | | | | | | | | | | |
Total increase (decrease) in net assets | | | (29,574,460 | ) | | | 46,105,953 | | | | (48,350,927 | ) |
| | | | | | | | | | | | |
| | | |
| Net Assets | | | | | | | | | | | | |
Beginning of period | | | 210,245,745 | | | | 164,139,792 | | | | 212,490,719 | |
| | | | | | | | | | | | |
End of period | | $ | 180,671,285 | | | $ | 210,245,745 | | | $ | 164,139,792 | |
| | | | | | | | | | | | |
| (1) | | The Fund changed its fiscal year end to September 30. |
See accompanying Notes to the Financial Statements.
21
Barings Funds Trust 2021 Annual Report
STATEMENTS OF CHANGES IN NET ASSETS
| | | | | | | | | | | | |
| | | BARINGS EMERGING MARKETS DEBT
BLENDED TOTAL RETURN FUND | |
| | | FOR THE PERIOD
FROM JULY 1, 2021
THROUGH
SEPTEMBER 30, 2021(1) | | | FOR THE
YEAR ENDED
JUNE 30, 2021 | | | FOR THE
YEAR ENDED
JUNE 30, 2020 | |
| | | |
| Operations | | | | | | | | | | | | |
Net investment income | | $ | 1,584,920 | | | $ | 4,167,455 | | | $ | 3,720,549 | |
Net realized gain (loss) | | | 1,979,803 | | | | 5,519,368 | | | | (237,910 | ) |
Net change in unrealized appreciation (depreciation) | | | (6,951,549 | ) | | | (392,479 | ) | | | 2,688,775 | |
| | | | | | | | | | | | |
Net increase (decrease) in net assets from operations | | | (3,386,826 | ) | | | 9,294,344 | | | | 6,171,414 | |
| | | | | | | | | | | | |
| | | |
| Dividends and distributions | | | | | | | | | | | | |
Class A | | | (212,699 | ) | | | (780,889 | ) | | | (150,461 | ) |
| | | | | | | | | | | | |
Class C | | | (5,901 | ) | | | (20,356 | ) | | | (14,353 | ) |
| | | | | | | | | | | | |
Class I | | | (12 | ) | | | (697,507 | ) | | | (1,361,075 | ) |
| | | | | | | | | | | | |
Class Y | | | (1,575,410 | ) | | | (4,615,618 | ) | | | (2,004,219 | ) |
| | | | | | | | | | | | |
Total dividends and distributions | | | (1,794,022 | ) | | | (6,114,370 | ) | | | (3,530,108 | ) |
| | | | | | | | | | | | |
| | | |
| Capital Share Transactions | | | | | | | | | | | | |
Net proceeds from sale of shares | | | 29,986,332 | | | | 114,778,090 | | | | 28,149,569 | |
Net Asset Value of shares issued to shareholders in payment of distributions declared | | | 1,700,107 | | | | 4,382,808 | | | | 647,379 | |
Cost of shares redeemed | | | (9,787,651 | ) | | | (47,824,829 | ) | | | (27,212,488 | ) |
| | | | | | | | | | | | |
Net increase in net assets resulting from capital stock transactions | | | 21,898,788 | | | | 71,336,069 | | | | 1,584,460 | |
| | | | | | | | | | | | |
Total increase in net assets | | | 16,717,940 | | | | 74,516,043 | | | | 4,225,766 | |
| | | | | | | | | | | | |
| | | |
| Net Assets | | | | | | | | | | | | |
Beginning of period | | | 129,175,842 | | | | 54,659,799 | | | | 50,434,033 | |
| | | | | | | | | | | | |
End of period | | $ | 145,893,782 | | | $ | 129,175,842 | | | $ | 54,659,799 | |
| | | | | | | | | | | | |
| (1) | | The Fund changed its fiscal year end to September 30. |
See accompanying Notes to the Financial Statements.
22
Barings Funds Trust 2021 Annual Report
STATEMENTS OF CHANGES IN NET ASSETS
| | | | | | | | | | | | |
| | | BARINGS GLOBAL EMERGING
MARKETS EQUITY FUND | |
| | | FOR THE PERIOD
FROM JULY 1, 2021
THROUGH SEPTEMBER 30, 2021(1) | | | FOR THE
YEAR ENDED
JUNE 30, 2021 | | | FOR THE
YEAR ENDED
JUNE 30, 2020 | |
| | | |
| Operations | | | | | | | | | | | | |
Net investment income | | $ | 64,506 | | | $ | 177,829 | | | $ | 179,524 | |
Net realized gain (loss) | | | (81,398 | ) | | | 638,139 | | | | (343,901 | ) |
Net change in unrealized appreciation (depreciation) | | | (1,107,329 | ) | | | 2,563,741 | | | | (235,789 | ) |
| | | | | | | | | | | | |
Net increase (decrease) in net assets from operations | | | (1,124,221 | ) | | | 3,379,709 | | | | (400,166 | ) |
| | | | | | | | | | | | |
| | | |
| Dividends and distributions | | | | | | | | | | | | |
Class A | | | (1,100 | ) | | | (933 | ) | | | (3,013 | ) |
| | | | | | | | | | | | |
Class C | | | (577 | ) | | | (547 | ) | | | (2,081 | ) |
| | | | | | | | | | | | |
Class I | | | (62,328 | ) | | | (51,989 | ) | | | (163,753 | ) |
| | | | | | | | | | | | |
Class Y | | | (62,439 | ) | | | (51,989 | ) | | | (163,753 | ) |
| | | | | | | | | | | | |
Total dividends and distributions | | | (126,444 | ) | | | (105,458 | ) | | | (332,600 | ) |
| | | | | | | | | | | | |
| | | |
| Return of capital | | | | | | | | | | | | |
Class A | | | — | | | | — | | | | (137 | ) |
| | | | | | | | | | | | |
Class C | | | — | | | | — | | | | (95 | ) |
| | | | | | | | | | | | |
Class I | | | — | | | | — | | | | (7,453 | ) |
| | | | | | | | | | | | |
Class Y | | | — | | | | — | | | | (7,453 | ) |
| | | | | | | | | | | | |
Total return of capital | | | — | | | | — | | | | (15,138 | ) |
| | | | | | | | | | | | |
| | | |
| Capital Share Transactions | | | | | | | | | | | | |
Net proceeds from sale of shares | | | 112,500 | | | | 74,500 | | | | — | |
Net Asset Value of shares issued to shareholders in payment of distributions declared | | | 699 | | | | — | | | | — | |
Cost of shares redeemed | | | (8,000 | ) | | | — | | | | — | |
| | | | | | | | | | | | |
Net increase in net assets resulting from capital stock transactions | | | 105,199 | | | | 74,500 | | | | — | |
| | | | | | | | | | | | |
Total increase (decrease) in net assets | | | (1,145,466 | ) | | | 3,348,751 | | | | (747,904 | ) |
| | | | | | | | | | | | |
| | | |
| Net Assets | | | | | | | | | | | | |
Beginning of period | | | 13,725,690 | | | | 10,376,939 | | | | 11,124,843 | |
| | | | | | | | | | | | |
End of period | | $ | 12,580,224 | | | $ | 13,725,690 | | | $ | 10,376,939 | |
| | | | | | | | | | | | |
| (1) | | The Fund changed its fiscal year end to September 30. |
See accompanying Notes to the Financial Statements.
23
Barings Global Floating Rate Fund 2021 Annual Report
FINANCIAL HIGHLIGHTS
| | | | | | | | | | | | | | | | | | | | | | | | |
| | | CLASS A | |
| | | FOR THE
PERIOD FROM
JULY 1, 2021
THROUGH
SEPTEMBER 30,
2021 (1) | | | FOR THE
YEAR
ENDED
JUNE 30,
2021 | | | FOR THE
YEAR
ENDED
JUNE 30,
2020 | | | FOR THE
YEAR
ENDED
JUNE 30,
2019 | | | FOR THE
YEAR
ENDED
JUNE 30,
2018 | | | FOR THE
YEAR
ENDED
JUNE 30,
2017 | |
|
| Per Common Share Data | |
Net asset value, beginning of period | | $ | 9.40 | | | $ | 8.56 | | | $ | 9.26 | | | $ | 9.48 | | | $ | 9.54 | | | $ | 9.13 | |
Income from investment operations: | | | | | | | | | | | | | | | | | | | | | | | | |
Net investment income (2) | | | 0.07 | | | | 0.36 | | | | 0.41 | | | | 0.44 | | | | 0.43 | | | | 0.43 | |
Net realized and unrealized gain (loss) | | | 0.01 | | | | 0.81 | | | | (0.66 | ) | | | (0.18 | ) | | | (0.06 | ) | | | 0.42 | |
| | | | | | | | | | | | | | | | | | | | | | | | |
Total increase (decrease) from investment operations | | | 0.08 | | | | 1.17 | | | | (0.25 | ) | | | 0.26 | | | | 0.37 | | | | 0.85 | |
| | | | | | | | | | | | | | | | | | | | | | | | |
Less dividends and distributions: | |
From net investment income | | | (0.07 | ) | | | (0.33 | ) | | | (0.34 | ) | | | (0.44 | ) | | | (0.38 | ) | | | (0.31 | ) |
From net realized gain | | | – | | | | – | | | | (0.03 | ) | | | (0.04 | ) | | | – | | | | – | |
From return of capital | | | – | | | | – | | | | (0.08 | ) | | | – | | | | (0.05 | ) | | | (0.13 | ) |
| | | | | | | | | | | | | | | | | | | | | | | | |
Total dividends and distributions | | | (0.07 | ) | | | (0.33 | ) | | | (0.45 | ) | | | (0.48 | ) | | | (0.43 | ) | | | (0.44 | ) |
| | | | | | | | | | | | | | | | | | | | | | | | |
Net asset value, at end of period | | $ | 9.41 | | | $ | 9.40 | | | $ | 8.56 | | | $ | 9.26 | | | $ | 9.48 | | | $ | 9.54 | |
| | | | | | | | | | | | | | | | | | | | | | | | |
Total investment return (3) | | | 0.83 | %(4) | | | 13.90 | % | | | (2.79 | )% | | | 2.77 | % | | | 4.00 | % | | | 9.47 | % |
| | | | | | | | | | | | | | | | | | | | | | | | |
|
| Supplemental Data and Ratios | |
Net assets, end of period (000’s) | | $ | 53,368 | | | $ | 45,630 | | | $ | 37,431 | | | $ | 45,213 | | | $ | 53,371 | | | $ | 45,363 | |
Ratio of total expenses (before reductions and reimbursements) to average net assets | | | 1.20 | %(5) | | | 1.25 | % | | | 1.22 | % | | | 1.25 | % | | | 1.26 | % | | | 1.37 | % |
Ratio of net expenses to average net assets (6) | | | 1.00 | %(5) | | | 1.00 | % | | | 1.00 | % | | | 1.00 | % | | | 0.96 | %(7) | | | 0.99 | %(8) |
Ratio of net investment income to average net assets | | | 3.13 | %(5) | | | 3.93 | % | | | 4.63 | % | | | 4.72 | % | | | 4.55 | % | | | 4.52 | % |
Portfolio turnover rate | | | 8.71 | %(4) | | | 42.78 | % | | | 37.23 | % | | | 46.51 | % | | | 57.74 | % | | | 47.06 | % |
| (1) | | The Fund changed its fiscal year end to September 30. |
| (2) | | Calculated using average shares outstanding. |
| (3) | | Total investment return calculation does not consider the effects of sales loads and assumes the reinvestment of dividends at actual prices pursuant to the Fund’s dividend reinvestment plan. |
| (5) | | Annualized for periods less than one full year. |
| (6) | | The Adviser has agreed to waive and/or reimburse certain fees and/or expenses so that, on an annualized basis, such expenses incurred will not exceed 1.00% as a percentage of average daily net assets. |
| (7) | | Net expenses reflect a voluntary expense reimbursement to prevent a negative yield. |
| (8) | | Net expenses reflect a one-time voluntary reimbursement to the Fund during the period in connection with a change to the fee waiver and/or expense reimbursement agreement. |
See accompanying Notes to the Financial Statements.
24
Barings Global Floating Rate Fund 2021 Annual Report
FINANCIAL HIGHLIGHTS (CONTINUED)
| | | | | | | | | | | | | | | | | | | | | | | | |
| | | CLASS C | |
| | | FOR THE
PERIOD FROM
JULY 1, 2021
THROUGH
SEPTEMBER 30,
2021 (1) | | | FOR THE
YEAR
ENDED
JUNE 30,
2021 | | | FOR THE
YEAR
ENDED
JUNE 30,
2020 | | | FOR THE
YEAR
ENDED
JUNE 30,
2019 | | | FOR THE
YEAR
ENDED
JUNE 30,
2018 | | | FOR THE
YEAR
ENDED
JUNE 30,
2017 | |
|
| Per Common Share Data | |
Net asset value, beginning of period | | $ | 9.37 | | | $ | 8.53 | | | $ | 9.22 | | | $ | 9.45 | | | $ | 9.51 | | | $ | 9.10 | |
Income from investment operations: | | | | | | | | | | | | | | | | | | | | | | | | |
Net investment income (2) | | | 0.06 | | | | 0.29 | | | | 0.35 | | | | 0.37 | | | | 0.36 | | | | 0.37 | |
Net realized and unrealized gain (loss) | | | (0.01 | ) | | | 0.81 | | | | (0.66 | ) | | | (0.19 | ) | | | (0.06 | ) | | | 0.41 | |
| | | | | | | | | | | | | | | | | | | | | | | | |
Total increase (decrease) from investment operations | | | 0.05 | | | | 1.10 | | | | (0.31 | ) | | | 0.18 | | | | 0.30 | | | | 0.78 | |
| | | | | | | | | | | | | | | | | | | | | | | | |
Less dividends and distributions: | |
From net investment income | | | (0.05 | ) | | | (0.26 | ) | | | (0.29 | ) | | | (0.37 | ) | | | (0.32 | ) | | | (0.26 | ) |
From net realized gain | | | – | | | | – | | | | (0.03 | ) | | | (0.04 | ) | | | – | | | | – | |
From return of capital | | | – | | | | – | | | | (0.06 | ) | | | – | | | | (0.04 | ) | | | (0.11 | ) |
| | | | | | | | | | | | | | | | | | | | | | | | |
Total dividends and distributions | | | (0.05 | ) | | | (0.26 | ) | | | (0.38 | ) | | | (0.41 | ) | | | (0.36 | ) | | | (0.37 | ) |
| | | | | | | | | | | | | | | | | | | | | | | | |
Net asset value, at end of period | | $ | 9.37 | | | $ | 9.37 | | | $ | 8.53 | | | $ | 9.22 | | | $ | 9.45 | | | $ | 9.51 | |
| | | | | | | | | | | | | | | | | | | | | | | | |
Total investment return (3) | | | 0.64 | %(4) | | | 13.08 | % | | | (3.52 | )% | | | 2.02 | % | | | 3.24 | % | | | 8.68 | % |
| | | | | | | | | | | | | | | | | | | | | | | | |
|
| Supplemental Data and Ratios | |
Net assets, end of period (000’s) | | $ | 6,766 | | | $ | 6,714 | | | $ | 6,494 | | | $ | 8,005 | | | $ | 8,311 | | | $ | 8,018 | |
Ratio of total expenses (before reductions and reimbursements) to average net assets | | | 1.99 | %(5) | | | 2.05 | % | | | 2.04 | % | | | 2.05 | % | | | 2.09 | % | | | 2.24 | % |
Ratio of net expenses to average net assets (6) | | | 1.75 | %(5) | | | 1.75 | % | | | 1.75 | % | | | 1.74 | %(7) | | | 1.70 | %(7) | | | 1.71 | %(8) |
Ratio of net investment income to average net assets | | | 2.39 | %(5) | | | 3.20 | % | | | 3.88 | % | | | 4.00 | % | | | 3.80 | % | | | 3.91 | % |
Portfolio turnover rate | | | 8.71 | %(4) | | | 42.78 | % | | | 37.23 | % | | | 46.51 | % | | | 57.74 | % | | | 47.06 | % |
| (1) | | The Fund changed its fiscal year end to September 30. |
| (2) | | Calculated using average shares outstanding. |
| (3) | | Total investment return calculation does not consider the effects of sales loads and assumes the reinvestment of dividends at actual prices pursuant to the Fund’s dividend reinvestment plan. |
| (5) | | Annualized for periods less than one full year. |
| (6) | | The Adviser has agreed to waive and/or reimburse certain fees and/or expenses so that, on an annualized basis, such expenses incurred will not exceed 1.75% as a percentage of average daily net assets. |
| (7) | | Net expenses reflect a voluntary expense reimbursement to prevent a negative yield. |
| (8) | | Net expenses reflect a one-time voluntary reimbursement to the Fund during the period in connection with a change to the fee waiver and/or expense reimbursement agreement. |
See accompanying Notes to the Financial Statements.
25
Barings Global Floating Rate Fund 2021 Annual Report
FINANCIAL HIGHLIGHTS (CONTINUED)
| | | | | | | | | | | | | | | | | | | | | | | | |
| | | CLASS I | |
| | | FOR THE
PERIOD FROM
JULY 1, 2021
THROUGH
SEPTEMBER 30,
2021 (1) | | | FOR THE
YEAR
ENDED
JUNE 30,
2021 | | | FOR THE
YEAR
ENDED
JUNE 30,
2020 | | | FOR THE
YEAR
ENDED
JUNE 30,
2019 | | | FOR THE
YEAR
ENDED
JUNE 30,
2018 | | | FOR THE
YEAR
ENDED
JUNE 30,
2017 | |
|
| Per Common Share Data | |
Net asset value, beginning of period | | $ | 9.43 | | | $ | 8.58 | | | $ | 9.28 | | | $ | 9.50 | | | $ | 9.56 | | | $ | 9.15 | |
Income from investment operations: | | | | | | | | | | | | | | | | | | | | | | | | |
Net investment income (2) | | | 0.08 | | | | 0.38 | | | | 0.43 | | | | 0.47 | | | | 0.46 | | | | 0.47 | |
Net realized and unrealized gain (loss) | | | – | | | | 0.83 | | | | (0.66 | ) | | | (0.18 | ) | | | (0.06 | ) | | | 0.40 | |
| | | | | | | | | | | | | | | | | | | | | | | | |
Total increase (decrease) from investment operations | | | 0.08 | | | | 1.21 | | | | (0.23 | ) | | | 0.29 | | | | 0.40 | | | | 0.87 | |
| | | | | | | | | | | | | | | | | | | | | | | | |
Less dividends and distributions: | |
From net investment income | | | (0.08 | ) | | | (0.36 | ) | | | (0.36 | ) | | | (0.47 | ) | | | (0.41 | ) | | | (0.32 | ) |
From net realized gain | | | – | | | | – | | | | (0.03 | ) | | | (0.04 | ) | | | – | | | | – | |
From return of capital | | | – | | | | – | | | | (0.08 | ) | | | – | | | | (0.05 | ) | | | (0.14 | ) |
| | | | | | | | | | | | | | | | | | | | | | | | |
Total dividends and distributions | | | (0.08 | ) | | | (0.36 | ) | | | (0.47 | ) | | | (0.51 | ) | | | (0.46 | ) | | | (0.46 | ) |
| | | | | | | | | | | | | | | | | | | | | | | | |
Net asset value, at end of period | | $ | 9.43 | | | $ | 9.43 | | | $ | 8.58 | | | $ | 9.28 | | | $ | 9.50 | | | $ | 9.56 | |
| | | | | | | | | | | | | | | | | | | | | | | | |
Total investment return (3) | | | 0.90 | %(4) | | | 14.19 | % | | | (2.47 | )% | | | 3.04 | % | | | 4.28 | % | | | 9.74 | % |
| | | | | | | | | | | | | | | | | | | | | | | | |
|
| Supplemental Data and Ratios | |
Net assets, end of period (000’s) | | $ | 72,615 | | | $ | 64,969 | | | $ | 39,483 | | | $ | 32,531 | | | $ | 18,370 | | | $ | 19,733 | |
Ratio of total expenses (before reductions and reimbursements) to average net assets | | | 0.90 | %(5) | | | 0.92 | % | | | 0.92 | % | | | 0.94 | % | | | 1.03 | % | | | 1.16 | % |
Ratio of net expenses to average net assets (6) | | | 0.75 | %(5) | | | 0.75 | % | | | 0.75 | % | | | 0.75 | % | | | 0.71 | %(7) | | | 0.75 | % |
Ratio of net investment income to average net assets | | | 3.39 | %(5) | | | 4.15 | % | | | 4.87 | % | | | 5.01 | % | | | 4.78 | % | | | 4.90 | % |
Portfolio turnover rate | | | 8.71 | %(4) | | | 42.78 | % | | | 37.23 | % | | | 46.51 | % | | | 57.74 | % | | | 47.06 | % |
| (1) | | The Fund changed its fiscal year end to September 30. |
| (2) | | Calculated using average shares outstanding. |
| (3) | | Total investment return calculation assumes the reinvestment of dividends at actual prices pursuant to the Fund’s dividend reinvestment plan. |
| (5) | | Annualized for periods less than one full year. |
| (6) | | The Adviser has agreed to waive and/or reimburse certain fees and/or expenses so that, on an annualized basis, such expenses incurred will not exceed 0.75% as a percentage of average daily net assets. |
| (7) | | Net expenses reflect a voluntary expense reimbursement to prevent a negative yield. |
See accompanying Notes to the Financial Statements.
26
Barings Global Floating Rate Fund 2021 Annual Report
FINANCIAL HIGHLIGHTS (CONTINUED)
| | | | | | | | | | | | | | | | | | | | | | | | |
| | | CLASS Y | |
| | | FOR THE
PERIOD FROM
JULY 1, 2021
THROUGH
SEPTEMBER 30,
2021 (1) | | | FOR THE
YEAR
ENDED
JUNE 30,
2021 | | | FOR THE
YEAR
ENDED
JUNE 30,
2020 | | | FOR THE
YEAR
ENDED
JUNE 30,
2019 | | | FOR THE
YEAR
ENDED
JUNE 30,
2018 | | | FOR THE
YEAR
ENDED
JUNE 30,
2017 | |
|
| Per Common Share Data | |
Net asset value, beginning of period | | $ | 9.42 | | | $ | 8.58 | | | $ | 9.27 | | | $ | 9.50 | | | $ | 9.56 | | | $ | 9.15 | |
Income from investment operations: | | | | | | | | | | | | | | | | | | | | | | | | |
Net investment income (2) | | | 0.08 | | | | 0.37 | | | | 0.44 | | | | 0.47 | | | | 0.46 | | | | 0.47 | |
Net realized and unrealized gain (loss) | | | – | | | | 0.83 | | | | (0.66 | ) | | | (0.19 | ) | | | (0.06 | ) | | | 0.40 | |
| | | | | | | | | | | | | | | | | | | | | | | | |
Total increase (decrease) from investment operations | | | 0.08 | | | | 1.20 | | | | (0.22 | ) | | | 0.28 | | | | 0.40 | | | | 0.87 | |
| | | | | | | | | | | | | | | | | | | | | | | | |
Less dividends and distributions: | |
From net investment income | | | (0.08 | ) | | | (0.36 | ) | | | (0.36 | ) | | | (0.47 | ) | | | (0.41 | ) | | | (0.32 | ) |
From net realized gain | | | – | | | | – | | | | (0.03 | ) | | | (0.04 | ) | | | – | | | | – | |
From return of capital | | | – | | | | – | | | | (0.08 | ) | | | – | | | | (0.05 | ) | | | (0.14 | ) |
| | | | | | | | | | | | | | | | | | | | | | | | |
Total dividends and distributions | | | (0.08 | ) | | | (0.36 | ) | | | (0.47 | ) | | | (0.51 | ) | | | (0.46 | ) | | | (0.46 | ) |
| | | | | | | | | | | | | | | | | | | | | | | | |
Net asset value, at end of period | | $ | 9.42 | | | $ | 9.42 | | | $ | 8.58 | | | $ | 9.27 | | | $ | 9.50 | | | $ | 9.56 | |
| | | | | | | | | | | | | | | | | | | | | | | | |
Total investment return (3) | | | 0.89 | %(4) | | | 14.19 | % | | | (2.54 | )% | | | 3.03 | % | | | 4.27 | % | | | 9.73 | % |
| | | | | | | | | | | | | | | | | | | | | | | | |
|
| Supplemental Data and Ratios | |
Net assets, end of period (000’s) | | $ | 293,545 | | | $ | 256,020 | | | $ | 131,302 | | | $ | 187,887 | | | $ | 172,736 | | | $ | 122,736 | |
Ratio of total expenses (before reductions and reimbursements) to average net assets | | | 0.93 | %(5) | | | 0.95 | % | | | 0.99 | % | | | 0.96 | % | | | 1.01 | % | | | 1.14 | % |
Ratio of net expenses to average net assets (6) | | | 0.75 | %(5) | | | 0.75 | % | | | 0.75 | % | | | 0.75 | % | | | 0.71 | %(7) | | | 0.75 | % |
Ratio of net investment income to average net assets | | | 3.39 | %(5) | | | 4.08 | % | | | 4.89 | % | | | 4.99 | % | | | 4.79 | % | | | 4.90 | % |
Portfolio turnover rate | | | 8.71 | %(4) | | | 42.78 | % | | | 37.23 | % | | | 46.51 | % | | | 57.74 | % | | | 47.06 | % |
| (1) | | The Fund changed its fiscal year end to September 30. |
| (2) | | Calculated using average shares outstanding. |
| (3) | | Total investment return calculation assumes the reinvestment of dividends at actual prices pursuant to the Fund’s dividend reinvestment plan. |
| (5) | | Annualized for periods less than one full year. |
| (6) | | The Adviser has agreed to waive and/or reimburse certain fees and/or expenses so that, on an annualized basis, such expenses incurred will not exceed 0.75% as a percentage of average daily net assets. |
| (7) | | Net expenses reflect a voluntary expense reimbursement to prevent a negative yield. |
See accompanying Notes to the Financial Statements.
27
Barings Global Credit Income Opportunities Fund 2021 Annual Report
FINANCIAL HIGHLIGHTS
| | | | | | | | | | | | | | | | | | | | | | | | |
| | | CLASS A | |
| | | FOR THE
PERIOD FROM
JULY 1, 2021
THROUGH
SEPTEMBER 30,
2021 (1) | | | FOR THE
YEAR
ENDED
JUNE 30,
2021 | | | FOR THE
YEAR
ENDED
JUNE 30,
2020 | | | FOR THE
YEAR
ENDED
JUNE 30,
2019 | | | FOR THE
YEAR
ENDED
JUNE 30,
2018 | | | FOR THE
YEAR
ENDED
JUNE 30,
2017 | |
|
| Per Common Share Data | |
Net asset value, beginning of period | | $ | 9.08 | | | $ | 8.14 | | | $ | 8.93 | | | $ | 9.32 | | | $ | 9.51 | | | $ | 8.80 | |
Income from investment operations: | | | | | | | | | | | | | | | | | | | | | | | | |
Net investment income (2) | | | 0.10 | | | | 0.48 | | | | 0.46 | | | | 0.50 | | | | 0.49 | | | | 0.55 | |
Net realized and unrealized gain (loss) | | | (0.03 | ) | | | 0.90 | | | | (0.79 | ) | | | (0.30 | ) | | | (0.19 | ) | | | 0.71 | |
| | | | | | | | | | | | | | | | | | | | | | | | |
Total increase (decrease) from investment operations | | | 0.07 | | | | 1.38 | | | | (0.33 | ) | | | 0.20 | | | | 0.30 | | | | 1.26 | |
| | | | | | | | | | | | | | | | | | | | | | | | |
Less dividends and distributions: | |
From net investment income | | | (0.11 | ) | | | (0.44 | ) | | | (0.40 | ) | | | (0.48 | ) | | | (0.47 | ) | | | (0.50 | ) |
From net realized gain | | | – | | | | – | | | | – | | | | (0.10 | ) | | | – | | | | – | |
From return of capital | | | – | | | | – | | | | (0.06 | ) | | | (0.01 | ) | | | (0.02 | ) | | | (0.05 | ) |
| | | | | | | | | | | | | | | | | | | | | | | | |
Total dividends and distributions | | | (0.11 | ) | | | (0.44 | ) | | | (0.46 | ) | | | (0.59 | ) | | | (0.49 | ) | | | (0.55 | ) |
| | | | | | | | | | | | | | | | | | | | | | | | |
Net asset value, at end of period | | $ | 9.04 | | | $ | 9.08 | | | $ | 8.14 | | | $ | 8.93 | | | $ | 9.32 | | | $ | 9.51 | |
| | | | | | | | | | | | | | | | | | | | | | | | |
Total investment return (3) | | | 0.79 | %(4) | | | 17.18 | % | | | (3.69 | )% | | | 2.39 | % | | | 3.24 | % | | | 14.61 | % |
| | | | | | | | | | | | | | | | | | | | | | | | |
|
| Supplemental Data and Ratios | |
Net assets, end of period (000’s) | | $ | 52,875 | | | $ | 9,795 | | | $ | 44,860 | | | $ | 51,205 | | | $ | 60,507 | | | $ | 26,904 | |
Ratio of total expenses (before reductions and reimbursements) to average net assets | | | 1.37 | %(5) | | | 1.39 | % | | | 1.32 | % | | | 1.36 | % | | | 1.38 | % | | | 1.56 | % |
Ratio of net expenses to average net assets (6) | | | 1.20 | %(5) | | | 1.20 | % | | | 1.20 | % | | | 1.20 | % | | | 1.20 | % | | | 1.20 | % |
Ratio of net investment income to average net assets | | | 4.56 | %(5) | | | 5.65 | % | | | 5.35 | % | | | 5.46 | % | | | 5.17 | % | | | 5.83 | % |
Portfolio turnover rate | | | 14.85 | %(4) | | | 71.11 | % | | | 64.23 | % | | | 58.78 | % | | | 52.29 | % | | | 48.69 | % |
| (1) | | The Fund changed its fiscal year end to September 30. |
| (2) | | Calculated using average shares outstanding. |
| (3) | | Total investment return calculation does not consider the effects of sales loads and assumes the reinvestment of dividends at actual prices pursuant to the Fund’s dividend reinvestment plan. |
| (5) | | Annualized for periods less than one full year. |
| (6) | | The Adviser has agreed to waive and/or reimburse certain fees and/or expenses so that, on an annualized basis, such expenses incurred will not exceed 1.20% as a percentage of average daily net assets. |
See accompanying Notes to the Financial Statements.
28
Barings Global Credit Income Opportunities Fund 2021 Annual Report
FINANCIAL HIGHLIGHTS (CONTINUED)
| | | | | | | | | | | | | | | | | | | | | | | | |
| | | CLASS C | |
| | | FOR THE
PERIOD FROM
JULY 1, 2021
THROUGH
SEPTEMBER 30,
2021 (1) | | | FOR THE
YEAR
ENDED
JUNE 30,
2021 | | | FOR THE
YEAR
ENDED
JUNE 30,
2020 | | | FOR THE
YEAR
ENDED
JUNE 30,
2019 | | | FOR THE
YEAR
ENDED
JUNE 30,
2018 | | | FOR THE
YEAR
ENDED
JUNE 30,
2017 | |
|
| Per Common Share Data | |
Net asset value, beginning of period | | $ | 9.08 | | | $ | 8.13 | | | $ | 8.92 | | | $ | 9.31 | | | $ | 9.50 | | | $ | 8.79 | |
Income from investment operations: | | | | | | | | | | | | | | | | | | | | | | | | |
Net investment income (2) | | | 0.09 | | | | 0.39 | | | | 0.39 | | | | 0.43 | | | | 0.42 | | | | 0.48 | |
Net realized and unrealized gain (loss) | | | (0.04 | ) | | | 0.93 | | | | (0.78 | ) | | | (0.29 | ) | | | (0.19 | ) | | | 0.71 | |
| | | | | | | | | | | | | | | | | | | | | | | | |
Total increase (decrease) from investment operations | | | 0.05 | | | | 1.32 | | | | (0.39 | ) | | | 0.14 | | | | 0.23 | | | | 1.19 | |
| | | | | | | | | | | | | | | | | | | | | | | | |
Less dividends and distributions: | |
From net investment income | | | (0.09 | ) | | | (0.37 | ) | | | (0.35 | ) | | | (0.42 | ) | | | (0.40 | ) | | | (0.43 | ) |
From net realized gain | | | – | | | | – | | | | – | | | | (0.10 | ) | | | – | | | | – | |
From return of capital | | | – | | | | – | | | | (0.05 | ) | | | (0.01 | ) | | | (0.02 | ) | | | (0.05 | ) |
| | | | | | | | | | | | | | | | | | | | | | | | |
Total dividends and distributions | | | (0.09 | ) | | | (0.37 | ) | | | (0.40 | ) | | | (0.53 | ) | | | (0.42 | ) | | | (0.48 | ) |
| | | | | | | | | | | | | | | | | | | | | | | | |
Net asset value, at end of period | | $ | 9.04 | | | $ | 9.08 | | | $ | 8.13 | | | $ | 8.92 | | | $ | 9.31 | | | $ | 9.50 | |
| | | | | | | | | | | | | | | | | | | | | | | | |
Total investment return (3) | | | 0.56 | %(4) | | | 16.42 | % | | | (4.41 | )% | | | 1.63 | % | | | 2.47 | % | | | 13.75 | % |
| | | | | | | | | | | | | | | | | | | | | | | | |
|
| Supplemental Data and Ratios | |
Net assets, end of period (000’s) | | $ | 5,914 | | | $ | 5,846 | | | $ | 7,421 | | | $ | 8,462 | | | $ | 8,842 | | | $ | 6,628 | |
Ratio of total expenses (before reductions and reimbursements) to average net assets | | | 2.24 | %(5) | | | 2.19 | % | | | 2.18 | % | | | 2.21 | % | | | 2.21 | % | | | 2.39 | % |
Ratio of net expenses to average net assets (6) | | | 1.95 | %(5) | | | 1.95 | % | | | 1.95 | % | | | 1.95 | % | | | 1.95 | % | | | 1.95 | % |
Ratio of net investment income to average net assets | | | 3.96 | %(5) | | | 4.49 | % | | | 4.60 | % | | | 4.73 | % | | | 4.44 | % | | | 5.12 | % |
Portfolio turnover rate | | | 14.85 | %(4) | | | 71.11 | % | | | 64.23 | % | | | 58.78 | % | | | 52.29 | % | | | 48.69 | % |
| (1) | | The Fund changed its fiscal year end to September 30. |
| (2) | | Calculated using average shares outstanding. |
| (3) | | Total investment return calculation assumes the reinvestment of dividends at actual prices pursuant to the Fund’s dividend reinvestment plan. |
| (5) | | Annualized for periods less than one full year. |
| (6) | | The Adviser has agreed to waive and/or reimburse certain fees and/or expenses so that, on an annualized basis, such expenses incurred will not exceed 1.95% as a percentage of average daily net assets. |
See accompanying Notes to the Financial Statements.
29
Barings Global Credit Income Opportunities Fund 2021 Annual Report
FINANCIAL HIGHLIGHTS (CONTINUED)
| | | | | | | | | | | | | | | | | | | | | | | | |
| | | CLASS I | |
| | | FOR THE
PERIOD FROM
JULY 1, 2021
THROUGH
SEPTEMBER 30,
2021 (1) | | | FOR THE
YEAR
ENDED
JUNE 30,
2021 | | | FOR THE
YEAR
ENDED
JUNE 30,
2020 | | | FOR THE
YEAR
ENDED
JUNE 30,
2019 | | | FOR THE
YEAR
ENDED
JUNE 30,
2018 | | | FOR THE
YEAR
ENDED
JUNE 30,
2017 | |
|
| Per Common Share Data | |
Net asset value, beginning of period | | $ | 9.08 | | | $ | 8.14 | | | $ | 8.93 | | | $ | 9.32 | | | $ | 9.50 | | | $ | 8.80 | |
Income from investment operations: | | | | | | | | | | | | | | | | | | | | | | | | |
Net investment income (2) | | | 0.11 | | | | 0.48 | | | | 0.48 | | | | 0.52 | | | | 0.51 | | | | 0.58 | |
Net realized and unrealized gain (loss) | | | (0.04 | ) | | | 0.92 | | | | (0.79 | ) | | | (0.29 | ) | | | (0.18 | ) | | | 0.70 | |
| | | | | | | | | | | | | | | | | | | | | | | | |
Total increase (decrease) from investment operations | | | 0.07 | | | | 1.40 | | | | (0.31 | ) | | | 0.23 | | | | 0.33 | | | | 1.28 | |
| | | | | | | | | | | | | | | | | | | | | | | | |
Less dividends and distributions: | |
From net investment income | | | (0.11 | ) | | | (0.46 | ) | | | (0.41 | ) | | | (0.51 | ) | | | (0.49 | ) | | | (0.52 | ) |
From net realized gain | | | – | | | | – | | | | – | | | | (0.10 | ) | | | – | | | | – | |
From return of capital | | | – | | | | – | | | | (0.07 | ) | | | (0.01 | ) | | | (0.02 | ) | | | (0.06 | ) |
| | | | | | | | | | | | | | | | | | | | | | | | |
Total dividends and distributions | | | (0.11 | ) | | | (0.46 | ) | | | (0.48 | ) | | | (0.62 | ) | | | (0.51 | ) | | | (0.58 | ) |
| | | | | | | | | | | | | | | | | | | | | | | | |
Net asset value, at end of period | | $ | 9.04 | | | $ | 9.08 | | | $ | 8.14 | | | $ | 8.93 | | | $ | 9.32 | | | $ | 9.50 | |
| | | | | | | | | | | | | | | | | | | | | | | | |
Total investment return (3) | | | 0.81 | %(4) | | | 17.51 | % | | | (3.45 | )% | | | 2.65 | % | | | 3.49 | % | | | 14.90 | % |
| | | | | | | | | | | | | | | | | | | | | | | | |
|
| Supplemental Data and Ratios | |
Net assets, end of period (000’s) | | $ | 6,405 | | | $ | 21,492 | | | $ | 21,606 | | | $ | 23,203 | | | $ | 21,788 | | | $ | 22,228 | |
Ratio of total expenses (before reductions and reimbursements) to average net assets | | | 1.15 | %(5) | | | 1.08 | % | | | 1.07 | % | | | 1.09 | % | | | 1.13 | % | | | 1.27 | % |
Ratio of net expenses to average net assets (6) | | | 0.95 | %(5) | | | 0.95 | % | | | 0.95 | % | | | 0.95 | % | | | 0.95 | % | | | 0.95 | % |
Ratio of net investment income to average net assets | | | 4.96 | %(5) | | | 5.50 | % | | | 5.60 | % | | | 5.69 | % | | | 5.45 | % | | | 6.22 | % |
Portfolio turnover rate | | | 14.85 | %(4) | | | 71.11 | % | | | 64.23 | % | | | 58.78 | % | | | 52.29 | % | | | 48.69 | % |
| (1) | | The Fund changed its fiscal year end to September 30. |
| (2) | | Calculated using average shares outstanding. |
| (3) | | Total investment return calculation assumes the reinvestment of dividends at actual prices pursuant to the Fund’s dividend reinvestment plan. |
| (5) | | Annualized for periods less than one full year. |
| (6) | | The Adviser has agreed to waive and/or reimburse certain fees and/or expenses so that, on an annualized basis, such expenses incurred will not exceed 0.95% as a percentage of average daily net assets. |
See accompanying Notes to the Financial Statements.
30
Barings Global Credit Income Opportunities Fund 2021 Annual Report
FINANCIAL HIGHLIGHTS (CONTINUED)
| | | | | | | | | | | | | | | | | | | | | | | | |
| | | CLASS Y | |
| | | FOR THE
PERIOD FROM
JULY 1, 2021
THROUGH
SEPTEMBER 30,
2021 (1) | | | FOR THE
YEAR
ENDED
JUNE 30,
2021 | | | FOR THE
YEAR
ENDED
JUNE 30,
2020 | | | FOR THE
YEAR
ENDED
JUNE 30,
2019 | | | FOR THE
YEAR
ENDED
JUNE 30,
2018 | | | FOR THE
YEAR
ENDED
JUNE 30,
2017 | |
|
| Per Common Share Data | |
Net asset value, beginning of period | | $ | 9.08 | | | $ | 8.14 | | | $ | 8.93 | | | $ | 9.31 | | | $ | 9.50 | | | $ | 8.80 | |
Income from investment operations: | | | | | | | | | | | | | | | | | | | | | | | | |
Net investment income (2) | | | 0.11 | | | | 0.47 | | | | 0.48 | | | | 0.52 | | | | 0.51 | | | | 0.57 | |
Net realized and unrealized gain (loss) | | | (0.04 | ) | | | 0.93 | | | | (0.79 | ) | | | (0.28 | ) | | | (0.19 | ) | | | 0.71 | |
| | | | | | | | | | | | | | | | | | | | | | | | |
Total increase (decrease) from investment operations | | | 0.07 | | | | 1.40 | | | | (0.31 | ) | | | 0.24 | | | | 0.32 | | | | 1.28 | |
| | | | | | | | | | | | | | | | | | | | | | | | |
Less dividends and distributions: | |
From net investment income | | | (0.11 | ) | | | (0.46 | ) | | | (0.41 | ) | | | (0.51 | ) | | | (0.49 | ) | | | (0.52 | ) |
From net realized gain | | | – | | | | – | | | | – | | | | (0.10 | ) | | | – | | | | – | |
From return of capital | | | – | | | | – | | | | (0.07 | ) | | | (0.01 | ) | | | (0.02 | ) | | | (0.06 | ) |
| | | | | | | | | | | | | | | | | | | | | | | | |
Total dividends and distributions | | | (0.11 | ) | | | (0.46 | ) | | | (0.48 | ) | | | (0.62 | ) | | | (0.51 | ) | | | (0.58 | ) |
| | | | | | | | | | | | | | | | | | | | | | | | |
Net asset value, at end of period | | $ | 9.04 | | | $ | 9.08 | | | $ | 8.14 | | | $ | 8.93 | | | $ | 9.31 | | | $ | 9.50 | |
| | | | | | | | | | | | | | | | | | | | | | | | |
Total investment return (3) | | | 0.80 | %(4) | | | 17.52 | % | | | (3.44 | )% | | | 2.64 | % | | | 3.48 | % | | | 14.90 | % |
| | | | | | | | | | | | | | | | | | | | | | | | |
|
| Supplemental Data and Ratios | |
Net assets, end of period (000’s) | | $ | 115,478 | | | $ | 173,113 | | | $ | 90,254 | | | $ | 129,621 | | | $ | 140,362 | | | $ | 96,014 | |
Ratio of total expenses (before reductions and reimbursements) to average net assets | | | 1.20 | %(5) | | | 1.12 | % | | | 1.10 | % | | | 1.12 | % | | | 1.14 | % | | | 1.28 | % |
Ratio of net expenses to average net assets (6) | | | 0.95 | %(5) | | | 0.95 | % | | | 0.95 | % | | | 0.95 | % | | | 0.95 | % | | | 0.95 | % |
Ratio of net investment income to average net assets | | | 5.01 | %(5) | | | 5.35 | % | | | 5.60 | % | | | 5.71 | % | | | 5.43 | % | | | 6.14 | % |
Portfolio turnover rate | | | 14.85 | %(4) | | | 71.11 | % | | | 64.23 | % | | | 58.78 | % | | | 52.29 | % | | | 48.69 | % |
| (1) | | The Fund changed its fiscal year end to September 30. |
| (2) | | Calculated using average shares outstanding. |
| (3) | | Total investment return calculation assumes the reinvestment of dividends at actual prices pursuant to the Fund’s dividend reinvestment plan. |
| (5) | | Annualized for periods less than one full year. |
| (6) | | The Adviser has agreed to waive and/or reimburse certain fees and/or expenses so that, on an annualized basis, such expenses incurred will not exceed 0.95% as a percentage of average daily net assets. |
See accompanying Notes to the Financial Statements.
31
Barings Emerging Markets Debt Blended Total Return Fund 2021 Annual Report
FINANCIAL HIGHLIGHTS
| | | | | | | | | | | | | | | | | | | | | | | | |
| | | CLASS A | |
| | | FOR THE
PERIOD FROM
JULY 1, 2021
THROUGH
SEPTEMBER 30,
2021 (1) | | | FOR THE
YEAR
ENDED
JUNE 30,
2021 | | | FOR THE
YEAR
ENDED
JUNE 30,
2020 | | | FOR THE
YEAR
ENDED
JUNE 30,
2019 | | | FOR THE
YEAR
ENDED
JUNE 30,
2018 | | | FOR THE
YEAR
ENDED
JUNE 30,
2017 | |
|
| Per Common Share Data | |
Net asset value, beginning of period | | $ | 10.99 | | | $ | 10.42 | | | $ | 10.06 | | | $ | 9.51 | | | $ | 10.55 | | | $ | 9.90 | |
Income from investment operations: | | | | | | | | | | | | | | | | | | | | | | | | |
Net investment income (2) | | | 0.12 | | | | 0.51 | | | | 0.60 | | | | 0.55 | | | | 0.45 | | | | 0.42 | |
Net realized and unrealized gain (loss) | | | (0.39 | ) | | | 0.84 | | | | 0.38 | | | | 0.60 | | | | (0.64 | ) | | | 0.73 | |
| | | | | | | | | | | | | | | | | | | | | | | | |
Total increase (decrease) from investment operations | | | (0.27 | ) | | | 1.35 | | | | 0.98 | | | | 1.15 | | | | (0.19 | ) | | | 1.15 | |
| | | | | | | | | | | | | | | | | | | | | | | | |
Less dividends and distributions: | |
From net investment income | | | (0.13 | ) | | | (0.58 | ) | | | (0.62 | ) | | | (0.55 | ) | | | (0.55 | ) | | | (0.50 | ) |
From net realized gain | | | – | | | | (0.20 | ) | | | – | | | | – | | | | (0.30 | ) | | | – | |
From return of capital | | | – | | | | – | | | | – | | | | (0.05 | ) | | | – | | | | – | |
| | | | | | | | | | | | | | | | | | | | | | | | |
Total dividends and distributions | | | (0.13 | ) | | | (0.78 | ) | | | (0.62 | ) | | | (0.60 | ) | | | (0.85 | ) | | | (0.50 | ) |
| | | | | | | | | | | | | | | | | | | | | | | | |
Net asset value, at end of period | | $ | 10.59 | | | $ | 10.99 | | | $ | 10.42 | | | $ | 10.06 | | | $ | 9.51 | | | $ | 10.55 | |
| | | | | | | | | | | | | | | | | | | | | | | | |
Total investment return (3) | | | (2.44 | )%(4) | | | 13.32 | % | | | 10.11 | % | | | 12.59 | % | | | (2.21 | )% | | | 11.94 | % |
| | | | | | | | | | | | | | | | | | | | | | | | |
|
| Supplemental Data and Ratios | |
Net assets, end of period (000’s) | | $ | 17,660 | | | $ | 17,491 | | | $ | 6,443 | | | $ | 405 | | | $ | 566 | | | $ | 211 | |
Ratio of total expenses (before reductions and reimbursements) to average net assets | | | 1.60 | %(5) | | | 1.73 | % | | | 2.08 | % | | | 3.19 | % | | | 3.63 | % | | | 5.77 | % |
Ratio of net expenses to average net assets (6) | | | 1.20 | %(5) | | | 1.20 | % | | | 1.20 | % | | | 1.02 | %(7) | | | 1.11 | %(7) | | | 1.15 | %(7) |
Ratio of net investment income to average net assets | | | 4.24 | %(5) | | | 4.71 | % | | | 6.21 | % | | | 5.74 | % | | | 4.33 | % | | | 4.17 | % |
Portfolio turnover rate | | | 9.81 | %(4) | | | 51.81 | % | | | 126.54 | % | | | 89.98 | % | | | 51.95 | % | | | 55.66 | % |
| (1) | | The Fund changed its fiscal year end to September 30. |
| (2) | | Calculated using average shares outstanding. |
| (3) | | Total investment return calculation does not consider the effects of sales loads and assumes the reinvestment of dividends at actual prices pursuant to the Fund’s dividend reinvestment plan. |
| (5) | | Annualized for periods less than one full year. |
| (6) | | The Adviser has agreed to waive and/or reimburse certain fees and/or expenses so that, on an annualized basis, such expenses incurred will not exceed 1.20% as a percentage of average daily net assets. |
| (7) | | Net expenses reflect a voluntary expense reimbursement to prevent a negative yield. |
See accompanying Notes to the Financial Statements.
32
Barings Emerging Markets Debt Blended Total Return Fund 2021 Annual Report
FINANCIAL HIGHLIGHTS (CONTINUED)
| | | | | | | | | | | | | | | | | | | | | | | | |
| | | CLASS C | |
| | | FOR THE
PERIOD FROM
JULY 1, 2021
THROUGH
SEPTEMBER 30,
2021 (1) | | | FOR THE
YEAR
ENDED
JUNE 30,
2021 | | | FOR THE
YEAR
ENDED
JUNE 30,
2020 | | | FOR THE
YEAR
ENDED
JUNE 30,
2019 | | | FOR THE
YEAR
ENDED
JUNE 30,
2018 | | | FOR THE
YEAR
ENDED
JUNE 30,
2017 | |
|
| Per Common Share Data | |
Net asset value, beginning of period | | $ | 10.99 | | | $ | 10.42 | | | $ | 10.06 | | | $ | 9.51 | | | $ | 10.55 | | | $ | 9.90 | |
Income from investment operations: | | | | | | | | | | | | | | | | | | | | | | | | |
Net investment income (2) | | | 0.09 | | | | 0.43 | | | | 0.60 | | | | 0.49 | | | | 0.48 | | | | 0.35 | |
Net realized and unrealized gain (loss) | | | (0.38 | ) | | | 0.83 | | | | 0.31 | | | | 0.59 | | | | (0.74 | ) | | | 0.73 | |
| | | | | | | | | | | | | | | | | | | | | | | | |
Total increase (decrease) from investment operations | | | (0.29 | ) | | | 1.26 | | | | 0.91 | | | | 1.08 | | | | (0.26 | ) | | | 1.08 | |
| | | | | | | | | | | | | | | | | | | | | | | | |
Less dividends and distributions: | |
From net investment income | | | (0.11 | ) | | | (0.49 | ) | | | (0.55 | ) | | | (0.48 | ) | | | (0.48 | ) | | | (0.43 | ) |
From net realized gain | | | – | | | | (0.20 | ) | | | – | | | | – | | | | (0.30 | ) | | | – | |
From return of capital | | | – | | | | – | | | | – | | | | (0.05 | ) | | | – | | | | – | |
| | | | | | | | | | | | | | | | | | | | | | | | |
Total dividends and distributions | | | (0.11 | ) | | | (0.69 | ) | | | (0.55 | ) | | | (0.53 | ) | | | (0.78 | ) | | | (0.43 | ) |
| | | | | | | | | | | | | | | | | | | | | | | | |
Net asset value, at end of period | | $ | 10.59 | | | $ | 10.99 | | | $ | 10.42 | | | $ | 10.06 | | | $ | 9.51 | | | $ | 10.55 | |
| | | | | | | | | | | | | | | | | | | | | | | | |
Total investment return (3) | | | (2.62 | )%(4) | | | 12.51 | % | | | 9.28 | % | | | 11.78 | % | | | (2.90 | )% | | | 11.11 | % |
| | | | | | | | | | | | | | | | | | | | | | | | |
|
| Supplemental Data and Ratios | |
Net assets, end of period (000’s) | | $ | 583 | | | $ | 463 | | | $ | 225 | | | $ | 261 | | | $ | 277 | | | $ | 222 | |
Ratio of total expenses (before reductions and reimbursements) to average net assets | | | 3.43 | %(5) | | | 4.40 | % | | | 5.29 | % | | | 5.02 | % | | | 5.85 | % | | | 6.47 | % |
Ratio of net expenses to average net assets (6) | | | 1.95 | %(5) | | | 1.95 | % | | | 1.95 | % | | | 1.71 | %(7) | | | 1.85 | %(7) | | | 1.89 | %(7) |
Ratio of net investment income to average net assets | | | 3.48 | %(5) | | | 3.98 | % | | | 6.09 | % | | | 5.14 | % | | | 4.63 | % | | | 3.44 | % |
Portfolio turnover rate | | | 9.81 | %(4) | | | 51.81 | % | | | 126.54 | % | | | 89.98 | % | | | 51.95 | % | | | 55.66 | % |
| (1) | | The Fund changed its fiscal year end to September 30. |
| (2) | | Calculated using average shares outstanding. |
| (3) | | Total investment return calculation does not consider the effects of sales loads and assumes the reinvestment of dividends at actual prices pursuant to the Fund’s dividend reinvestment plan. |
| (5) | | Annualized for periods less than one full year. |
| (6) | | The Adviser has agreed to waive and/or reimburse certain fees and/or expenses so that, on an annualized basis, such expenses incurred will not exceed 1.95% as a percentage of average daily net assets. |
| (7) | | Net expenses reflect a voluntary expense reimbursement to prevent a negative yield. |
See accompanying Notes to the Financial Statements.
33
Barings Emerging Markets Debt Blended Total Return Fund 2021 Annual Report
FINANCIAL HIGHLIGHTS (CONTINUED)
| | | | | | | | | | | | | | | | | | | | | | | | |
| | | CLASS I | |
| | | FOR THE
PERIOD FROM
JULY 1, 2021
THROUGH
SEPTEMBER 30,
2021 (1) | | | FOR THE
YEAR
ENDED
JUNE 30,
2021 | | | FOR THE
YEAR
ENDED
JUNE 30,
2020 | | | FOR THE
YEAR
ENDED
JUNE 30,
2019 | | | FOR THE
YEAR
ENDED
JUNE 30,
2018 | | | FOR THE
YEAR
ENDED
JUNE 30,
2017 | |
|
| Per Common Share Data | |
Net asset value, beginning of period | | $ | 11.00 | | | $ | 10.43 | | | $ | 10.06 | | | $ | 9.51 | | | $ | 10.55 | | | $ | 9.90 | |
Income from investment operations: | | | | | | | | | | | | | | | | | | | | | | | | |
Net investment income (2) | | | 0.11 | | | | 0.57 | | | | 0.69 | | | | 0.59 | | | | 0.54 | | | | 0.45 | |
Net realized and unrealized gain (loss) | | | (0.37 | ) | | | 0.80 | | | | 0.32 | | | | 0.58 | | | | (0.70 | ) | | | 0.73 | |
| | | | | | | | | | | | | | | | | | | | | | | | |
Total increase (decrease) from investment operations | | | (0.26 | ) | | | 1.37 | | | | 1.01 | | | | 1.17 | | | | (0.16 | ) | | | 1.18 | |
| | | | | | | | | | | | | | | | | | | | | | | | |
Less dividends and distributions: | |
From net investment income | | | (0.13 | ) | | | (0.60 | ) | | | (0.64 | ) | | | (0.57 | ) | | | (0.58 | ) | | | (0.53 | ) |
From net realized gain | | | – | | | | (0.20 | ) | | | – | | | | – | | | | (0.30 | ) | | | – | |
From return of capital | | | – | | | | – | | | | – | | | | (0.05 | ) | | | – | | | | – | |
| | | | | | | | | | | | | | | | | | | | | | | | |
Total dividends and distributions | | | (0.13 | ) | | | (0.80 | ) | | | (0.64 | ) | | | (0.62 | ) | | | (0.88 | ) | | | (0.53 | ) |
| | | | | | | | | | | | | | | | | | | | | | | | |
Net asset value, at end of period | | $ | 10.61 | | | $ | 11.00 | | | $ | 10.43 | | | $ | 10.06 | | | $ | 9.51 | | | $ | 10.55 | |
| | | | | | | | | | | | | | | | | | | | | | | | |
Total investment return (3) | | | (2.44 | )%(4) | | | 13.70 | % | | | 10.39 | % | | | 12.86 | % | | | (1.94 | )% | | | 12.22 | % |
| | | | | | | | | | | | | | | | | | | | | | | | |
|
| Supplemental Data and Ratios | |
Net assets, end of period (000’s) | | $ | 1 | | | $ | 1 | | | $ | 14,563 | | | $ | 23,964 | | | $ | 22,650 | | | $ | 5,063 | |
Ratio of total expenses (before reductions and reimbursements) to average net assets | | | 706.64 | %(5) | | | 1.29 | % | | | 1.40 | % | | | 1.44 | % | | | 1.94 | % | | | 2.76 | % |
Ratio of net expenses to average net assets (6) | | | 0.95 | %(5) | | | 0.95 | % | | | 0.95 | % | | | 0.73 | %(7) | | | 0.80 | %(7) | | | 0.90 | %(7) |
Ratio of net investment income to average net assets | | | 3.98 | %(5) | | | 5.26 | % | | | 6.99 | % | | | 6.18 | % | | | 5.31 | % | | | 4.42 | % |
Portfolio turnover rate | | | 9.81 | %(4) | | | 51.81 | % | | | 126.54 | % | | | 89.98 | % | | | 51.95 | % | | | 55.66 | % |
| (1) | | The Fund changed its fiscal year end to September 30. |
| (2) | | Calculated using average shares outstanding. |
| (3) | | Total investment return calculation assumes the reinvestment of dividends at actual prices pursuant to the Fund’s dividend reinvestment plan. |
| (5) | | Annualized for periods less than one full year. |
| (6) | | The Adviser has agreed to waive and/or reimburse certain fees and/or expenses so that, on an annualized basis, such expenses incurred will not exceed 0.95% as a percentage of average daily net assets. |
| (7) | | Net expenses reflect a voluntary expense reimbursement to prevent a negative yield. |
See accompanying Notes to the Financial Statements.
34
Barings Emerging Markets Debt Blended Total Return Fund 2021 Annual Report
FINANCIAL HIGHLIGHTS (CONTINUED)
| | | | | | | | | | | | | | | | | | | | | | | | |
| | | CLASS Y | |
| | | FOR THE
PERIOD FROM
JULY 1, 2021
THROUGH
SEPTEMBER 30,
2021 (1) | | | FOR THE
YEAR
ENDED
JUNE 30,
2021 | | | FOR THE
YEAR
ENDED
JUNE 30,
2020 | | | FOR THE
YEAR
ENDED
JUNE 30,
2019 | | | FOR THE
YEAR
ENDED
JUNE 30,
2018 | | | FOR THE
YEAR
ENDED
JUNE 30,
2017 | |
|
| Per Common Share Data | |
Net asset value, beginning of period | | $ | 10.99 | | | $ | 10.42 | | | $ | 10.06 | | | $ | 9.51 | | | $ | 10.55 | | | $ | 9.90 | |
Income from investment operations: | | | | | | | | | | | | | | | | | | | | | | | | |
Net investment income (2) | | | 0.12 | | | | 0.53 | | | | 0.67 | | | | 0.59 | | | | 0.55 | | | | 0.45 | |
Net realized and unrealized gain (loss) | | | (0.38 | ) | | | 0.84 | | | | 0.33 | | | | 0.58 | | | | (0.71 | ) | | | 0.73 | |
| | | | | | | | | | | | | | | | | | | | | | | | |
Total increase (decrease) from investment operations | | | (0.26 | ) | | | 1.37 | | | | 1.00 | | | | 1.17 | | | | (0.16 | ) | | | 1.18 | |
| | | | | | | | | | | | | | | | | | | | | | | | |
Less dividends and distributions: | |
From net investment income | | | (0.14 | ) | | | (0.60 | ) | | | (0.64 | ) | | | (0.57 | ) | | | (0.58 | ) | | | (0.53 | ) |
From net realized gain | | | – | | | | (0.20 | ) | | | – | | | | – | | | | (0.30 | ) | | | – | |
From return of capital | | | – | | | | – | | | | – | | | | (0.05 | ) | | | – | | | | – | |
| | | | | | | | | | | | | | | | | | | | | | | | |
Total dividends and distributions | | | (0.14 | ) | | | (0.80 | ) | | | (0.64 | ) | | | (0.62 | ) | | | (0.88 | ) | | | (0.53 | ) |
| | | | | | | | | | | | | | | | | | | | | | | | |
Net asset value, at end of period | | $ | 10.59 | | | $ | 10.99 | | | $ | 10.42 | | | $ | 10.06 | | | $ | 9.51 | | | $ | 10.55 | |
| | | | | | | | | | | | | | | | | | | | | | | | |
Total investment return (3) | | | (2.38 | )%(4) | | | 13.61 | % | | | 10.33 | % | | | 12.86 | % | | | (1.94 | )% | | | 12.22 | % |
| | | | | | | | | | | | | | | | | | | | | | | | |
|
| Supplemental Data and Ratios | |
Net assets, end of period (000’s) | | $ | 127,650 | | | $ | 111,221 | | | $ | 33,429 | | | $ | 25,805 | | | $ | 23,122 | | | $ | 5,340 | |
Ratio of total expenses (before reductions and reimbursements) to average net assets | | | 1.26 | %(5) | | | 1.34 | % | | | 1.42 | % | | | 1.44 | % | | | 1.95 | % | | | 2.77 | % |
Ratio of net expenses to average net assets (6) | | | 0.95 | %(5) | | | 0.95 | % | | | 0.95 | % | | | 0.72 | %(7) | | | 0.80 | %(7) | | | 0.90 | %(7) |
Ratio of net investment income to average net assets | | | 4.48 | %(5) | | | 4.90 | % | | | 6.84 | % | | | 6.19 | % | | | 5.38 | % | | | 4.43 | % |
Portfolio turnover rate | | | 9.81 | %(4) | | | 51.81 | % | | | 126.54 | % | | | 89.98 | % | | | 51.95 | % | | | 55.66 | % |
| (1) | | The Fund changed its fiscal year end to September 30. |
| (2) | | Calculated using average shares outstanding. |
| (3) | | Total investment return calculation assumes the reinvestment of dividends at actual prices pursuant to the Fund’s dividend reinvestment plan. |
| (5) | | Annualized for periods less than one full year. |
| (6) | | The Adviser has agreed to waive and/or reimburse certain fees and/or expenses so that, on an annualized basis, such expenses incurred will not exceed 0.95% as a percentage of average daily net assets. |
| (7) | | Net expenses reflect a voluntary expense reimbursement to prevent a negative yield. |
See accompanying Notes to the Financial Statements.
35
Barings Global Emerging Markets Equity Fund 2021 Annual Report
FINANCIAL HIGHLIGHTS
| | | | | | | | | | | | | | | | |
| | | CLASS A | |
| | | FOR THE
PERIOD FROM
JULY 1, 2021
THROUGH
SEPTEMBER 30,
2021 (1) | | | FOR THE
YEAR
ENDED
JUNE 30,
2021 | | | FOR THE
YEAR
ENDED
JUNE 30,
2020 | | | FOR THE
PERIOD FROM
SEPTEMBER 17, 2018
THROUGH
JUNE 30,
2019 (2) | |
|
| Per Common Share Data | |
Net asset value, beginning of period | | $ | 13.61 | | | $ | 10.36 | | | $ | 11.10 | | | $ | 10.00 | |
Income from investment operations: | | | | | | | | | | | | | | | | |
Net investment income (3) | | | 0.06 | | | | 0.15 | | | | 0.15 | | | | 0.06 | |
Net realized and unrealized gain (loss) | | | (1.18 | ) | | | 3.19 | | | | (0.57 | ) | | | 1.04 | |
| | | | | | | | | | | | | | | | |
Total increase (decrease) from investment operations | | | (1.12 | ) | | | 3.34 | | | | (0.42 | ) | | | 1.10 | |
| | | | | | | | | | | | | | | | |
Less dividends and distributions: | |
From net investment income | | | (0.11 | ) | | | (0.09 | ) | | | (0.20 | ) | | | – | |
From net realized gain | | | – | | | | – | | | | (0.11 | ) | | | – | |
From return of capital | | | – | | | | – | | | | (0.01 | ) | | | – | |
| | | | | | | | | | | | | | | | |
Total dividends and distributions | | | (0.11 | ) | | | (0.09 | ) | | | (0.32 | ) | | | – | |
| | | | | | | | | | | | | | | | |
Net asset value, at end of period | | $ | 12.38 | | | $ | 13.61 | | | $ | 10.36 | | | $ | 11.10 | |
| | | | | | | | | | | | | | | | |
Total investment return (4) | | | (8.27 | )%(5) | | | 32.40 | % | | | (4.02 | )% | | | 11.04 | %(5) |
| | | | | | | | | | | | | | | | |
| | | | |
| Supplemental Data and Ratios | | | | | | | | | | | | | | | | |
Net assets, end of period (000’s) | | $ | 124 | | | $ | 136 | | | $ | 104 | | | $ | 111 | |
Ratio of total expenses (before reductions and reimbursements) to average net assets | | | 18.61 | %(6) | | | 6.21 | % | | | 9.06 | % | | | 7.43 | %(6) |
Ratio of net expenses to average net assets (7) | | | 1.15 | %(6) | | | 1.24 | % | | | 1.45 | %(8) | | | 1.45 | %(6)(8) |
Ratio of net investment income to average net assets | | | 1.75 | %(6) | | | 1.14 | % | | | 1.46 | % | | | 0.73 | %(6) |
Portfolio turnover rate | | | 7.77 | %(5) | | | 37.43 | % | | | 18.80 | % | | | 7.48 | %(5) |
| (1) | | The Fund changed its fiscal year end to September 30. |
| (2) | | Fund commenced operations on September 17, 2018. |
| (3) | | Calculated using average shares outstanding. |
| (4) | | Total investment return calculation assumes the reinvestment of dividends at actual prices pursuant to the Fund’s dividend reinvestment plan. |
| (6) | | Annualized for periods less than one full year. |
| (7) | | The Adviser has agreed to waive and/or reimburse certain fees and/or expenses so that, on an annualized basis, such expenses incurred will not exceed 1.15% as a percentage of average daily net assets. |
| (8) | | Ratio of net expenses to average net assets does not include expenses of the underlying fund in which the Fund invests. |
See accompanying Notes to the Financial Statements.
36
Barings Global Emerging Markets Equity Fund 2021 Annual Report
FINANCIAL HIGHLIGHTS (CONTINUED)
| | | | | | | | | | | | | | | | |
| | | CLASS C | |
| | | FOR THE
PERIOD FROM
JULY 1, 2021
THROUGH
SEPTEMBER 30,
2021 (1) | | | FOR THE
YEAR
ENDED
JUNE 30,
2021 | | | FOR THE
YEAR
ENDED
JUNE 30,
2020 | | | FOR THE
PERIOD FROM
SEPTEMBER 17, 2018
THROUGH
JUNE 30,
2019 (2) | |
|
| Per Common Share Data | |
Net asset value, beginning of period | | $ | 13.50 | | | $ | 10.32 | | | $ | 11.04 | | | $ | 10.00 | |
Income from investment operations: | | | | | | | | | | | | | | | | |
Net investment income (3) | | | 0.03 | | | | 0.05 | | | | 0.07 | | | | 0.00 | (4) |
Net realized and unrealized gain (loss) | | | (1.17 | ) | | | 3.18 | | | | (0.57 | ) | | | 1.04 | |
| | | | | | | | | | | | | | | | |
Total increase (decrease) from investment operations | | | (1.14 | ) | | | 3.23 | | | | (0.50 | ) | | | 1.04 | |
| | | | | | | | | | | | | | | | |
Less dividends and distributions: | |
From net investment income | | | (0.06 | ) | | | (0.05 | ) | | | (0.10 | ) | | | – | |
From net realized gain | | | – | | | | – | | | | (0.11 | ) | | | – | |
From return of capital | | | – | | | | – | | | | (0.01 | ) | | | – | |
| | | | | | | | | | | | | | | | |
Total dividends and distributions | | | (0.06 | ) | | | (0.05 | ) | | | (0.22 | ) | | | – | |
| | | | | | | | | | | | | | | | |
Net asset value, at end of period | | $ | 12.30 | | | $ | 13.50 | | | $ | 10.32 | | | $ | 11.04 | |
| | | | | | | | | | | | | | | | |
Total investment return (5) | | | (8.45 | )%(6) | | | 31.41 | % | | | (4.74 | )% | | | 10.39 | %(6) |
| | | | | | | | | | | | | | | | |
| | | | |
| Supplemental Data and Ratios | | | | | | | | | | | | | | | | |
Net assets, end of period (000’s) | | $ | 123 | | | $ | 135 | | | $ | 103 | | | $ | 110 | |
Ratio of total expenses (before reductions and reimbursements) to average net assets | | | 10.21 | %(7) | | | 7.30 | % | | | 9.82 | % | | | 8.19 | %(7) |
Ratio of net expenses to average net assets (8) | | | 1.90 | %(7) | | | 1.99 | % | | | 2.20 | %(9) | | | 2.20 | %(7)(9) |
Ratio of net investment income (loss) to average net assets | | | 1.00 | %(7) | | | 0.39 | % | | | 0.71 | % | | | (0.03 | )%(7) |
Portfolio turnover rate | | | 7.77 | %(6) | | | 37.43 | % | | | 18.80 | % | | | 7.48 | %(6) |
| (1) | | The Fund changed its fiscal year end to September 30. |
| (2) | | Fund commenced operations on September 17, 2018. |
| (3) | | Calculated using average shares outstanding. |
| (4) | | Amount rounds to less than $.01 per share. |
| (5) | | Total investment return calculation assumes the reinvestment of dividends at actual prices pursuant to the Fund’s dividend reinvestment plan. |
| (7) | | Annualized for periods less than one full year. |
| (8) | | The Adviser has agreed to waive and/or reimburse certain fees and/or expenses so that, on an annualized basis, such expenses incurred will not exceed 1.90% as a percentage of average daily net assets. |
| (9) | | Ratio of net expenses to average net assets does not include expenses of the underlying fund in which the Fund invests. |
See accompanying Notes to the Financial Statements.
37
Barings Global Emerging Markets Equity Fund 2021 Annual Report
FINANCIAL HIGHLIGHTS (CONTINUED)
| | | | | | | | | | | | | | | | |
| | | CLASS I | |
| | | FOR THE
PERIOD FROM
JULY 1, 2021
THROUGH
SEPTEMBER 30,
2021 (1) | | | FOR THE
YEAR
ENDED
JUNE 30,
2021 | | | FOR THE
YEAR
ENDED
JUNE 30,
2020 | | | FOR THE
PERIOD FROM
SEPTEMBER 17, 2018
THROUGH
JUNE 30,
2019 (2) | |
|
| Per Common Share Data | |
Net asset value, beginning of period | | $ | 13.65 | | | $ | 10.38 | | | $ | 11.13 | | | $ | 10.00 | |
Income from investment operations: | | | | | | | | | | | | | | | | |
Net investment income (3) | | | 0.06 | | | | 0.18 | | | | 0.18 | | | | 0.08 | |
Net realized and unrealized gain (loss) | | | (1.17 | ) | | | 3.20 | | | | (0.58 | ) | | | 1.05 | |
| | | | | | | | | | | | | | | | |
Total increase (decrease) from investment operations | | | (1.11 | ) | | | 3.38 | | | | (0.40 | ) | | | 1.13 | |
| | | | | | | | | | | | | | | | |
Less dividends and distributions: | |
From net investment income | | | (0.13 | ) | | | (0.11 | ) | | | (0.22 | ) | | | – | |
From net realized gain | | | – | | | | – | | | | (0.11 | ) | | | – | |
From return of capital | | | – | | | | – | | | | (0.02 | ) | | | – | |
| | | | | | | | | | | | | | | | |
Total dividends and distributions | | | (0.13 | ) | | | (0.11 | ) | | | (0.35 | ) | | | – | |
| | | | | | | | | | | | | | | | |
Net asset value, at end of period | | $ | 12.41 | | | $ | 13.65 | | | $ | 10.38 | | | $ | 11.13 | |
| | | | | | | | | | | | | | | | |
Total investment return (4) | | | (8.21 | )%(5) | | | 32.74 | % | | | (3.78 | )% | | | 11.26 | %(5) |
| | | | | | | | | | | | | | | | |
| | | | |
| Supplemental Data and Ratios | | | | | | | | | | | | | | | | |
Net assets, end of period (000’s) | | $ | 6,080 | | | $ | 6,689 | | | $ | 5,085 | | | $ | 5,452 | |
Ratio of total expenses (before reductions and reimbursements) to average net assets | | | 5.49 | %(6) | | | 3.17 | % | | | 2.96 | % | | | 2.94 | %(6) |
Ratio of net expenses to average net assets (7) | | | 0.90 | %(6) | | | 0.99 | % | | | 1.20 | %(8) | | | 1.20 | %(6)(8) |
Ratio of net investment income to average net assets | | | 2.00 | %(6) | | | 1.39 | % | | | 1.71 | % | | | 0.98 | %(6) |
Portfolio turnover rate | | | 7.77 | %(5) | | | 37.43 | % | | | 18.80 | % | | | 7.48 | %(5) |
| (1) | | The Fund changed its fiscal year end to September 30. |
| (2) | | Fund commenced operations on September 17, 2018. |
| (3) | | Calculated using average shares outstanding. |
| (4) | | Total investment return calculation assumes the reinvestment of dividends at actual prices pursuant to the Fund’s dividend reinvestment plan. |
| (6) | | Annualized for periods less than one full year. |
| (7) | | The Adviser has agreed to waive and/or reimburse certain fees and/or expenses so that, on an annualized basis, such expenses incurred will not exceed 0.90% as a percentage of average daily net assets. |
| (8) | | Ratio of net expenses to average net assets does not include expenses of the underlying fund in which the Fund invests. |
See accompanying Notes to the Financial Statements.
38
Barings Global Emerging Markets Equity Fund 2021 Annual Report
FINANCIAL HIGHLIGHTS (CONTINUED)
| | | | | | | | | | | | | | | | |
| | | CLASS Y | |
| | | FOR THE
PERIOD FROM
JULY 1, 2021
THROUGH
SEPTEMBER 30,
2021 (1) | | | FOR THE
YEAR
ENDED
JUNE 30,
2021 | | | FOR THE
YEAR
ENDED
JUNE 30,
2020 | | | FOR THE
PERIOD FROM
SEPTEMBER 17, 2018
THROUGH
JUNE 30,
2019 (2) | |
|
| Per Common Share Data | |
Net asset value, beginning of period | | $ | 13.65 | | | $ | 10.38 | | | $ | 11.13 | | | $ | 10.00 | |
Income from investment operations: | | | | | | | | | | | | | | | | |
Net investment income (3) | | | 0.06 | | | | 0.18 | | | | 0.18 | | | | 0.08 | |
Net realized and unrealized gain (loss) | | | (1.17 | ) | | | 3.20 | | | | (0.58 | ) | | | 1.05 | |
| | | | | | | | | | | | | | | | |
Total increase (decrease) from investment operations | | | (1.11 | ) | | | 3.38 | | | | (0.40 | ) | | | 1.13 | |
| | | | | | | | | | | | | | | | |
Less dividends and distributions: | |
From net investment income | | | (0.13 | ) | | | (0.11 | ) | | | (0.22 | ) | | | – | |
From net realized gain | | | – | | | | – | | | | (0.11 | ) | | | – | |
From return of capital | | | – | | | | – | | | | (0.02 | ) | | | – | |
| | | | | | | | | | | | | | | | |
Total dividends and distributions | | | (0.13 | ) | | | (0.11 | ) | | | (0.35 | ) | | | – | |
| | | | | | | | | | | | | | | | |
Net asset value, at end of period | | $ | 12.41 | | | $ | 13.65 | | | $ | 10.38 | | | $ | 11.13 | |
| | | | | | | | | | | | | | | | |
Total investment return (4) | | | (8.21 | )%(5) | | | 32.74 | % | | | (3.78 | )% | | | 11.26 | %(5) |
| | | | | | | | | | | | | | | | |
| | | | |
| Supplemental Data and Ratios | | | | | | | | | | | | | | | | |
Net assets, end of period (000’s) | | $ | 6,253 | | | $ | 6,765 | | | $ | 5,085 | | | $ | 5,452 | |
Ratio of total expenses (before reductions and reimbursements) to average net assets | | | 5.49 | %(6) | | | 3.17 | % | | | 2.96 | % | | | 2.94 | %(6) |
Ratio of net expenses to average net assets (7) | | | 0.90 | %(6) | | | 0.99 | % | | | 1.20 | %(8) | | | 1.20 | %(6)(8) |
Ratio of net investment income to average net assets | | | 2.00 | %(6) | | | 1.40 | % | | | 1.71 | % | | | 0.98 | %(6) |
Portfolio turnover rate | | | 7.77 | %(5) | | | 37.43 | % | | | 18.80 | % | | | 7.48 | %(5) |
| (1) | | The Fund changed its fiscal year end to September 30. |
| (2) | | Fund commenced operations on September 17, 2018. |
| (3) | | Calculated using average shares outstanding. |
| (4) | | Total investment return calculation assumes the reinvestment of dividends at actual prices pursuant to the Fund’s dividend reinvestment plan. |
| (6) | | Annualized for periods less than one full year. |
| (7) | | The Adviser has agreed to waive and/or reimburse certain fees and/or expenses so that, on an annualized basis, such expenses incurred will not exceed 0.90% as a percentage of average daily net assets. |
| (8) | | Ratio of net expenses to average net assets does not include expenses of the underlying fund in which the Fund invests. |
See accompanying Notes to the Financial Statements.
39
Barings Global Floating Rate Fund 2021 Annual Report
SCHEDULE OF INVESTMENTS
September 30, 2021
| | | | | | | | | | | | | | | | | | | | |
| | | | | | | | | SHARES | | | COST | | | FAIR
VALUE | |
Equities — 0.4%*: | |
|
Common Stocks — 0.4%*: | |
|
Beverage, Food and Tobacco — 0.1%*: | |
CTI Foods Holding Co. LLC(a) | | | | | | | | | | | 4,657 | | | | $495,155 | | | | $469,426 | |
| | | | | | | | | | | | | | | | | | | | |
|
Broadcasting and Entertainment — 0.1%*: | |
Technicolor SA(b) | | | | | | | | | | | 88,751 | | | | 34,103 | | | | 301,218 | |
| | | | | | | | | | | | | | | | | | | | |
|
Finance — 0.0%*: | |
Travelex Topco Ltd.(a),(b) | | | | | | | | | | | 1,622 | | | | – | | | | – | |
| | | | | | | | | | | | | | | | | | | | |
|
Healthcare, Education and Childcare — 0.1%*: | |
Don Jersey Topco Ltd.(a),(b) | | | | | | | | | | | 292,469 | | | | 195,070 | | | | 305,406 | |
| | | | | | | | | | | | | | | | | | | | |
|
Mining, Steel, Iron and Non-Precious Metals — 0.0%*: | |
Boomerang Tube LLC(a) | | | | | | | | | | | 1,769 | | | | 171,860 | | | | – | |
| | | | | | | | | | | | | | | | | | | | |
|
Oil and Gas — 0.1%*: | |
Fieldwood Energy LLC(a) | | | | | | | | | | | 26,365 | | | | 568,599 | | | | – | |
Fieldwood Energy LLC(a) | | | | | | | | | | | 6,469 | | | | 226,415 | | | | – | |
Kelly Topco Ltd.(b) | | | | | | | | | | | 7,801 | | | | 327,642 | | | | 649,433 | |
Sabine Oil & Gas LLC(a) | | | | | | | | | | | 394 | | | | 22,597 | | | | 5,122 | |
| | | | | | | | | | | | | | | | | | | | |
Total Oil and Gas | | | | | | | | | | | 41,029 | | | | 1,145,253 | | | | 654,555 | |
| | | | | | | | | | | | | | | | | | | | |
| | | | | | | | | | | | | | | | | | | | |
Total Common Stocks | | | | | | | | | | | 430,297 | | | | 2,041,441 | | | | 1,730,605 | |
| | | | | | | | | | | | | | | | | | | | |
Warrant — 0.0%*: | |
|
Finance — 0.0%*: | |
Travelex Topco Ltd.(b) | | | | | | | | | | | 285 | | | | – | | | | 28,801 | |
| | | | | | | | | | | | | | | | | | | | |
Total Equities | | | | | | | | | | | 430,582 | | | | 2,041,441 | | | | 1,759,406 | |
| | | | | | | | | | | | | | | | | | | | |
| | | | | |
| | | EFFECTIVE
INTEREST RATE | | | DUE DATE | | | PRINCIPAL ‡‡ | | | COST | | | FAIR
VALUE | |
Fixed Income — 92.2%*: | | | | | | | | | | | | | | | | | | | | |
|
Bank Loans — 88.3%*(c): | |
| | | | | |
Aerospace and Defense — 1.5%*: | | | | | | | | | | | | | | | | | | | | |
AAdvantage Loyalty IP Ltd., 3M LIBOR + 4.750% | | | 5.50 | % | | | 4/20/2028 | | | | 1,013,025 | | | | 1,002,894 | | | | 1,046,931 | |
American Airlines, Inc., 1M LIBOR + 1.750% | | | 1.84 | | | | 6/27/2025 | | | | 494,898 | | | | 446,520 | | | | 473,108 | |
CEP IV Investment 16 S.a.r.l., 3M LIBOR + 7.750%(b) | | | 8.75 | | | | 10/3/2025 | | | | 900,000 | | | | 829,823 | | | | 847,692 | |
Peraton Corp., 1M LIBOR + 3.750% | | | 4.50 | | | | 2/1/2028 | | | | 704,603 | | | | 701,396 | | | | 704,716 | |
TransDigm, Inc., 1M LIBOR + 2.250% | | | 2.33 | | | | 12/9/2025 | | | | 1,481,156 | | | | 1,391,228 | | | | 1,462,641 | |
TransDigm, Inc., 1M LIBOR + 2.250% | | | 2.33 | | | | 5/30/2025 | | | | 486,300 | | | | 485,013 | | | | 480,173 | |
United Airlines, Inc., 3M LIBOR + 3.750% | | | 4.50 | | | | 4/21/2028 | | | | 1,193,061 | | | | 1,196,274 | | | | 1,200,386 | |
| | | | | | | | | | | | | | | | | | | | |
Total Aerospace and Defense | | | | | | | | | | | 6,273,043 | | | | 6,053,148 | | | | 6,215,647 | |
| | | | | | | | | | | | | | | | | | | | |
See accompanying Notes to the Financial Statements.
40
Barings Global Floating Rate Fund 2021 Annual Report
SCHEDULE OF INVESTMENTS (CONTINUED)
September 30, 2021
| | | | | | | | | | | | | | | | | | | | |
| | | EFFECTIVE
INTEREST RATE | | | DUE DATE | | | PRINCIPAL ‡‡ | | | COST | | | FAIR
VALUE | |
Bank Loans (Continued) | |
|
Automobile — 1.1%*: | |
Clarios Global LP, 1M LIBOR + 3.250% | | | 3.34 | % | | | 4/30/2026 | | | | 970,424 | | | $ | 969,993 | | | $ | 965,572 | |
Clarios Global LP, EURIBOR + 3.250% | | | 3.25 | | | | 4/30/2026 | | | | 1,000,000 | | | | 1,189,982 | | | | 1,146,766 | |
Constellation Automotive Ltd., 3M LIBOR + 4.750%(b) | | | 7.58 | | | | 7/16/2029 | | | | 500,000 | | | | 681,194 | | | | 684,230 | |
Constellation Automotive Ltd., 3M LIBOR + 4.750%(b) | | | 4.83 | | | | 6/30/2028 | | | | 500,000 | | | | 681,194 | | | | 673,282 | |
DexKo Global, Inc., 3M LIBOR + 3.250% | | | 4.25 | | | | 7/24/2024 | | | | 299,557 | | | | 300,652 | | | | 299,264 | |
Gates Global LLC, 1M LIBOR + 2.500% | | | 3.25 | | | | 3/31/2027 | | | | 994,988 | | | | 992,618 | | | | 992,878 | |
| | | | | | | | | | | | | | | | | | | | |
Total Automobile | | | | | | | | | | | 4,264,969 | | | | 4,815,633 | | | | 4,761,992 | |
| | | | | | | | | | | | | | | | | | | | |
|
Beverage, Food and Tobacco — 2.4%*: | |
1011778 B.C. Unlimited Liability Co., 1M LIBOR + 1.750%(b) | | | 1.84 | | | | 11/19/2026 | | | | 496,212 | | | | 489,451 | | | | 489,801 | |
Amphora Finance Ltd., LIBOR – GBP + 4.750%(b) | | | 4.80 | | | | 5/23/2025 | | | | 500,000 | | | | 662,358 | | | | 647,931 | |
City Brewing Company, LLC, 3M LIBOR + 3.500% | | | 4.25 | | | | 4/5/2028 | | | | 437,190 | | | | 435,149 | | | | 432,635 | |
CTI Foods Holding Co, LLC, 6M LIBOR +
9.000%(a) | | | 10.00 | | | | 5/3/2024 | | | | 208,488 | | | | 208,488 | | | | 195,979 | |
CTI Foods Holding Co, LLC, 6M LIBOR +
7.000%(a) | | | 8.00 | | | | 5/3/2024 | | | | 315,645 | | | | 312,502 | | | | 315,645 | |
Deoleo S.A., EURIBOR + 4.000%(b) | | | 5.00 | | | | 6/24/2025 | | | | 116,529 | | | | 131,392 | | | | 133,520 | |
Froneri International Ltd., EURIBOR + 2.375%(b) | | | 2.38 | | | | 1/29/2027 | | | | 1,000,000 | | | | 1,207,170 | | | | 1,131,800 | |
IRB Holding Corp., 3M LIBOR + 3.250% | | | 4.25 | | | | 12/15/2027 | | | | 997,488 | | | | 999,803 | | | | 998,734 | |
IRB Holding Corp., 3M LIBOR + 2.750% | | | 3.75 | | | | 2/5/2025 | | | | 2,031,379 | | | | 2,033,344 | | | | 2,027,784 | |
Sunshine Investments B.V., 3M LIBOR +
2.750%(b) | | | 2.87 | | | | 3/28/2025 | | | | 154,303 | | | | 153,916 | | | | 153,193 | |
Welbilt, Inc., 1M LIBOR + 2.500% | | | 2.58 | | | | 10/23/2025 | | | | 2,000,000 | | | | 1,873,334 | | | | 1,993,340 | |
White Cap Buyer LLC, 3M LIBOR + 4.000% | | | 4.50 | | | | 10/19/2027 | | | | 1,496,231 | | | | 1,501,098 | | | | 1,499,628 | |
| | | | | | | | | | | | | | | | | | | | |
Total Beverage, Food and Tobacco | | | | | | | | | | | 9,753,465 | | | | 10,008,005 | | | | 10,019,990 | |
| | | | | | | | | | | | | | | | | | | | |
|
Broadcasting and Entertainment — 5.2%*: | |
Altice USA, Inc., 1M LIBOR + 2.250% | | | 2.33 | | | | 7/17/2025 | | | | 1,644,895 | | | | 1,632,587 | | | | 1,620,222 | |
AVSC Holding Corp., 3M LIBOR + 4.500% | | | 5.50 | | | | 10/15/2026 | | | | 510,501 | | | | 472,046 | | | | 470,207 | |
AVSC Holding Corp., 3M LIBOR + 3.250%, PIK | | | 4.25 | | | | 2/28/2025 | | | | 1,954,876 | | | | 1,747,678 | | | | 1,738,374 | |
Banijay Entertainment S.A.S, 1M LIBOR +
3.750%(b) | | | 3.83 | | | | 3/1/2025 | | �� | | 1,299,186 | | | | 1,302,475 | | | | 1,295,938 | |
Clear Channel Outdoor Holdings, Inc., 3M LIBOR + 3.500% | | | 3.63 | | | | 8/21/2026 | | | | 2,955,904 | | | | 2,897,398 | | | | 2,892,086 | |
Cumulus Media New Holdings Inc., 1M LIBOR + 3.750% | | | 4.75 | | | | 3/31/2026 | | | | 1,138,361 | | | | 1,130,516 | | | | 1,135,515 | |
DirecTV Financing, LLC, 3M LIBOR + 5.000% | | | 5.75 | | | | 7/22/2027 | | | | 2,000,000 | | | | 2,002,457 | | | | 2,000,620 | |
iHeartCommunications, Inc., 1M LIBOR + 3.000% | | | 3.08 | | | | 5/1/2026 | | | | 3,136,237 | | | | 3,096,861 | | | | 3,112,056 | |
See accompanying Notes to the Financial Statements.
41
Barings Global Floating Rate Fund 2021 Annual Report
SCHEDULE OF INVESTMENTS (CONTINUED)
September 30, 2021
| | | | | | | | | | | | | | | | | | | | |
| | | EFFECTIVE
INTEREST RATE | | | DUE DATE | | | PRINCIPAL ‡‡ | | | COST | | | FAIR
VALUE | |
Bank Loans (Continued) | | | | | | | | | | | | | | | | | | | | |
| | | | | |
Broadcasting and Entertainment (Continued) | | | | | | | | | | | | | | | | | | | | |
Learfield Communications, Inc., 1M LIBOR + 3.250% | | | 4.25 | % | | | 12/1/2023 | | | | 1,963,917 | | | $ | 1,870,446 | | | $ | 1,881,944 | |
RCN Cable, 1M LIBOR + 3.500% | | | 4.25 | | | | 9/25/2026 | | | | 1,989,987 | | | | 1,993,535 | | | | 1,987,122 | |
Technicolor SA, EURIBOR + 6.000%(b) | | | 6.00 | | | | 6/30/2024 | | | | 426,046 | | | | 432,481 | | | | 501,843 | |
Technicolor SA, EURIBOR + 3.000%(b) | | | 3.00 | | | | 12/31/2024 | | | | 857,935 | | | | 947,566 | | | | 951,245 | |
Terrier Media Buyer, Inc., 1M LIBOR + 3.500% | | | 3.58 | | | | 12/17/2026 | | | | 1,465,893 | | | | 1,464,453 | | | | 1,462,228 | |
Univision Communication, Inc., 3M LIBOR + 3.250% | | | 4.00 | | | | 5/5/2028 | | | | 1,187,802 | | | | 1,179,424 | | | | 1,185,046 | |
| | | | | | | | | | | | | | | | | | | | |
Total Broadcasting and Entertainment | | | | | | | | | | | 22,531,540 | | | | 22,169,923 | | | | 22,234,446 | |
| | | | | | | | | | | | | | | | | | | | |
|
Buildings and Real Estate — 2.3%*: | |
CP Atlas Buyer, Inc., 3M LIBOR + 3.750% | | | 4.25 | | | | 11/23/2027 | | | | 1,248,792 | | | | 1,249,029 | | | | 1,244,109 | |
Cushman & Wakefield U.S. Borrower, LLC, 1M LIBOR + 2.750% | | | 2.83 | | | | 8/21/2025 | | | | 1,496,202 | | | | 1,480,020 | | | | 1,481,614 | |
Foundation Building Materials Holding Co. LLC, 3M LIBOR + 3.250% | | | 3.75 | | | | 2/3/2028 | | | | 1,052,427 | | | | 1,047,280 | | | | 1,044,723 | |
Groupe Solmax Inc., 3M LIBOR + 4.750% | | | 5.50 | | | | 5/29/2028 | | | | 867,769 | | | | 859,238 | | | | 865,964 | |
Park River Holdings, Inc., 3M LIBOR + 3.250% | | | 4.00 | | | | 12/28/2027 | | | | 1,288,664 | | | | 1,283,006 | | | | 1,283,033 | |
Quikrete Holdings, Inc., 1M LIBOR + 2.500% | | | 2.58 | | | | 2/1/2027 | | | | 1,473,750 | | | | 1,474,025 | | | | 1,460,545 | |
SRS Distribution, Inc., 3M LIBOR + 3.750% | | | 4.25 | | | | 6/2/2028 | | | | 1,345,827 | | | | 1,335,733 | | | | 1,345,262 | |
Standard Industries Inc., 3M LIBOR + 2.500% | | | 3.00 | | | | 9/22/2028 | | | | 1,000,000 | | | | 990,004 | | | | 1,000,540 | |
| | | | | | | | | | | | | | | | | | | | |
Total Buildings and Real Estate | | | | | | | | | | | 9,773,431 | | | | 9,718,335 | | | | 9,725,790 | |
| | | | | | | | | | | | | | | | | | | | |
|
Cargo Transport — 1.0%*: | |
Kenan Advantage Group, Inc., 3M LIBOR + 7.250% | | | 8.00 | | | | 9/1/2027 | | | | 528,635 | | | | 518,163 | | | | 523,348 | |
Kenan Advantage Group, Inc., 1M LIBOR + 3.750% | | | 4.50 | | | | 3/24/2026 | | | | 1,784,925 | | | | 1,776,879 | | | | 1,780,713 | |
Worldwide Express Operations, LLC, 2M LIBOR + 4.250% | | | 5.00 | | | | 7/26/2028 | | | | 2,000,000 | | | | 1,998,611 | | | | 2,005,560 | |
| | | | | | | | | | | | | | | | | | | | |
Total Cargo Transport | | | | | | | | | | | 4,313,560 | | | | 4,293,653 | | | | 4,309,621 | |
| | | | | | | | | | | | | | | | | | | | |
|
Chemicals, Plastics and Rubber — 4.8%*: | |
Allnex (Luxembourg) & Cy S.C.A., 1M LIBOR + 3.250% | | | 4.00 | | | | 9/13/2023 | | | | 353,198 | | | | 352,703 | | | | 352,721 | |
Allnex USA, Inc., 1M LIBOR + 3.250% | | | 4.00 | | | | 9/13/2023 | | | | 266,095 | | | | 265,723 | | | | 265,736 | |
Consolidated Energy Finance SA, 6M LIBOR + 2.500% | | | 2.66 | | | | 5/7/2025 | | | | 1,454,794 | | | | 1,431,103 | | | | 1,429,335 | |
CPC Acquisition Corp., 3M LIBOR + 3.750% | | | 4.50 | | | | 12/29/2027 | | | | 995,000 | | | | 996,202 | | | | 993,756 | |
Flint Group GmbH, EURIBOR + 4.250%, PIK(b) | | | 5.00 | | | | 9/21/2023 | | | | 970,567 | | | | 1,129,077 | | | | 1,125,459 | |
Flint Group GmbH, EURIBOR + 4.250%, PIK(b) | | | 5.25 | | | | 9/21/2023 | | | | 964,799 | | | | 969,496 | | | | 980,436 | |
Flint Group US LLC, 3M LIBOR + 4.250%, PIK(b) | | | 5.25 | | | | 9/21/2023 | | | | 5,418,422 | | | | 5,337,283 | | | | 5,418,422 | |
Gemini HDPE LLC, 3M LIBOR + 3.000% | | | 3.50 | | | | 12/31/2027 | | | | 803,738 | | | | 800,413 | | | | 803,738 | |
See accompanying Notes to the Financial Statements.
42
Barings Global Floating Rate Fund 2021 Annual Report
SCHEDULE OF INVESTMENTS (CONTINUED)
September 30, 2021
| | | | | | | | | | | | | | | | | | | | |
| | | EFFECTIVE
INTEREST RATE | | | DUE DATE | | | PRINCIPAL ‡‡ | | | COST | | | FAIR
VALUE | |
Bank Loans (Continued) | | | | | | | | | | | | | | | | | | | | |
| | | | | |
Chemicals, Plastics and Rubber (Continued) | | | | | | | | | | | | | | | | | | | | |
GEON Performance Solutions, LLC, 3M LIBOR + 4.750% | | | 5.50 | % | | | 8/18/2028 | | | | 557,917 | | | $ | 553,744 | | | $ | 561,577 | |
Ineos Quattro, EURIBOR + 2.750%(b) | | | 2.75 | | | | 1/29/2026 | | | | 1,000,000 | | | | 1,202,137 | | | | 1,149,662 | |
LSF11 A5 Holdco LLC, 3M LIBOR + 3.750% | | | 4.25 | | | | 10/15/2028 | | | | 949,764 | | | | 946,930 | | | | 950,951 | |
New Arclin U.S. Holding Corp., 3M LIBOR + 3.750% | | | 4.25 | | | | 9/22/2028 | | | | 412,371 | | | | 410,310 | | | | 412,029 | |
Nobian Finance BV, EURIBOR + 3.750%(b) | | | 3.75 | | | | 7/1/2026 | | | | 500,000 | | | | 593,787 | | | | 577,455 | |
Novacap S.A., EURIBOR + 3.250%(b) | | | 3.25 | | | | 6/22/2023 | | | | 1,000,000 | | | | 1,139,961 | | | | 1,153,045 | |
Polar US Borrower, LLC, 3M LIBOR + 3.750% | | | 4.88 | | | | 10/15/2025 | | | | 1,226,572 | | | | 1,227,738 | | | | 1,223,506 | |
Solenis Holdings LLC, 3M LIBOR + 3.750% | | | 4.25 | | | | 10/1/2028 | | | | 564,193 | | | | 562,782 | | | | 563,369 | |
Solenis Holdings LLC, 1M LIBOR + 4.000% | | | 4.08 | | | | 6/26/2025 | | | | 616,769 | | | | 613,451 | | | | 616,448 | |
Sparta U.S. HoldCo LLC, 3M LIBOR + 3.500% | | | 4.25 | | | | 8/2/2028 | | | | 216,802 | | | | 215,740 | | | | 217,073 | |
Trinseo Materials Operating S.C.A., 3M LIBOR + 2.500% | | | 2.58 | | | | 5/3/2028 | | | | 1,496,250 | | | | 1,489,205 | | | | 1,490,639 | |
W.R. Grace & Co.-Conn., 3M LIBOR + 3.750% | | | 4.25 | | | | 8/11/2028 | | | | 348,837 | | | | 347,965 | | | | 349,929 | |
| | | | | | | | | | | | | | | | | | | | |
Total Chemicals, Plastics and Rubber | | | | | | | | | | | 20,116,088 | | | | 20,585,750 | | | | 20,635,286 | |
| | | | | | | | | | | | | | | | | | | | |
|
Containers, Packaging and Glass — 2.4%*: | |
Albea Beauty Holdings S.A., 3M LIBOR +
3.000%(b) | | | 4.00 | | | | 4/22/2024 | | | | 200,159 | | | | 200,052 | | | | 192,529 | |
BWAY Holding Co., 1M LIBOR + 3.250% | | | 3.33 | | | | 4/3/2024 | | | | 1,900,964 | | | | 1,895,283 | | | | 1,860,264 | |
CCP Lux Holding S.a. r.l., 3M LIBOR + 4.250%(b) | | | 4.25 | | | | 1/10/2025 | | | | 1,000,000 | | | | 1,183,483 | | | | 1,159,508 | |
Flex Acquisition Company, Inc., 3M LIBOR + 3.500% | | | 4.00 | | | | 2/23/2028 | | | | 1,341,142 | | | | 1,340,122 | | | | 1,337,977 | |
Graham Packaging Co. Inc., 1M LIBOR + 3.000% | | | 3.75 | | | | 8/4/2027 | | | | 515,231 | | | | 515,757 | | | | 514,660 | |
Hoffmaster Group, Inc., 3M LIBOR + 4.000% | | | 5.00 | | | | 11/21/2023 | | | | 1,246,448 | | | | 1,177,088 | | | | 1,198,148 | |
Kouti B.V., 3M LIBOR + 3.750%(b) | | | 3.75 | | | | 7/1/2028 | | | | 600,000 | | | | 709,013 | | | | 693,620 | |
Pretium PKG Holdings, Inc., 3M LIBOR + 6.750% | | | 7.25 | | | | 9/22/2029 | | | | 254,237 | | | | 251,695 | | | | 254,873 | |
Pretium PKG Holdings, Inc., 3M LIBOR + 4.000% | | | 4.50 | | | | 9/22/2028 | | | | 345,224 | | | | 343,498 | | | | 345,442 | |
Proampac PG Borrower LLC, 3M LIBOR + 3.750% | | | 4.50 | | | | 11/3/2025 | | | | 1,000,000 | | | | 1,002,558 | | | | 1,001,250 | |
Reynolds Consumer Products LLC, 1M LIBOR + 1.750% | | | 1.83 | | | | 2/4/2027 | | | | 245,843 | | | | 245,608 | | | | 245,090 | |
Reynolds Group Holdings Inc., 1M LIBOR + 3.500% | | | 4.00 | | | | 9/20/2028 | | | | 227,425 | | | | 226,289 | | | | 227,084 | |
Ring Container Technologies Group, LLC, 3M LIBOR + 3.750% | | | 4.25 | | | | 8/12/2028 | | | | 307,797 | | | | 307,030 | | | | 307,951 | |
Trident TPI Holdings, Inc., 3M LIBOR + 4.000% | | | 4.50 | | | | 9/15/2028 | | | | 805,312 | | | | 803,306 | | | | 806,149 | |
| | | | | | | | | | | | | | | | | | | | |
Total Containers, Packaging and Glass | | | | | | | | | | | 9,989,782 | | | | 10,200,782 | | | | 10,144,545 | |
| | | | | | | | | | | | | | | | | | | | |
See accompanying Notes to the Financial Statements.
43
Barings Global Floating Rate Fund 2021 Annual Report
SCHEDULE OF INVESTMENTS (CONTINUED)
September 30, 2021
| | | | | | | | | | | | | | | | | | | | |
| | | EFFECTIVE
INTEREST RATE | | | DUE DATE | | | PRINCIPAL ‡‡ | | | COST | | | FAIR
VALUE | |
Bank Loans (Continued) | | | | | | | | | | | | | | | | | | | | |
|
Diversified/Conglomerate Manufacturing — 2.2%*: | |
Alison Bidco S.a.r.l., 3M LIBOR + 5.500%, PIK(b) | | | 6.50 | % | | | 8/29/2023 | | | | 242,276 | | | $ | 241,767 | | | $ | 174,439 | |
Amer Sports Oyj, EURIBOR + 4.500%(b) | | | 4.50 | | | | 3/30/2026 | | | | 500,000 | | | | 564,624 | | | | 579,042 | |
Fluid-Flow Products, Inc., 3M LIBOR + 3.750% | | | 4.25 | | | | 3/31/2028 | | | | 727,191 | | | | 725,499 | | | | 725,372 | |
Grinding Media Inc., 3M LIBOR + 4.000% | | | 4.75 | | | | 10/12/2028 | | | | 1,498,358 | | | | 1,406,390 | | | | 1,500,231 | |
Hyperion Materials & Technologies, Inc., 1M LIBOR + 4.500% | | | 5.00 | | | | 8/30/2028 | | | | 551,020 | | | | 548,289 | | | | 551,709 | |
Illuminate Merger Corp., 3M LIBOR + 3.500% | | | 4.00 | | | | 7/21/2028 | | | | 540,984 | | | | 538,338 | | | | 540,421 | |
LTI Holdings, Inc., 1M LIBOR + 3.500% | | | 3.58 | | | | 9/6/2025 | | | | 594,081 | | | | 581,432 | | | | 585,265 | |
Project Alpha Intermediate Holding, Inc., 1M LIBOR + 4.000% | | | 4.09 | | | | 4/26/2024 | | | | 1,341,442 | | | | 1,343,322 | | | | 1,340,248 | |
SGB-SMIT Management GmbH, EURIBOR + 4.500%, PIK(b) | | | 4.50 | | | | 7/18/2024 | | | | 507,480 | | | | 528,592 | | | | 534,934 | |
Wilsonart LLC, 3M LIBOR + 3.500% | | | 4.50 | | | | 12/19/2026 | | | | 992,402 | | | | 987,846 | | | | 992,710 | |
Winterfell Financing Sarl, EURIBOR + 3.500%(b) | | | 3.50 | | | | 5/4/2028 | | | | 500,000 | | | | 603,484 | | | | 574,182 | |
Xella, 3M LIBOR + 4.250%(b) | | | 4.25 | | | | 4/12/2028 | | | | 1,000,000 | | | | 1,183,994 | | | | 1,159,439 | |
| | | | | | | | | | | | | | | | | | | | |
Total Diversified/Conglomerate Manufacturing | | | | | | | | 8,995,234 | | | | 9,253,577 | | | | 9,257,992 | |
| | | | | | | | | | | | | | | | | | | | |
|
Diversified/Conglomerate Service — 13.9%*: | |
Applied Systems, Inc., PRIME + 3.250% | | | 5.50 | | | | 9/19/2024 | | | | 1,000,000 | | | | 997,600 | | | | 999,630 | |
APX Group, Inc., 1M LIBOR + 3.500% | | | 4.00 | | | | 7/10/2028 | | | | 1,727,612 | | | | 1,717,867 | | | | 1,721,669 | |
Clay Holdco B.V, EURIBOR + 4.000%(b) | | | 4.00 | | | | 10/30/2026 | | | | 600,000 | | | | 715,620 | | | | 695,205 | |
Cloudera, Inc., 3M LIBOR + 3.750% | | | 4.25 | | | | 8/10/2028 | | | | 934,579 | | | | 925,234 | | | | 932,832 | |
Cloudera, Inc., 3M LIBOR + 6.000% | | | 6.50 | | | | 8/10/2029 | | | | 566,667 | | | | 563,833 | | | | 563,833 | |
CoreLogic, Inc., 1M LIBOR + 6.500% | | | 7.00 | | | | 6/4/2029 | | | | 532,670 | | | | 527,633 | | | | 543,324 | |
CoreLogic, Inc., 1M LIBOR + 3.500% | | | 4.00 | | | | 6/2/2028 | | | | 1,330,450 | | | | 1,325,868 | | | | 1,328,787 | |
Cornerstone OnDemand, Inc., 3M LIBOR + 3.750% | | | 4.25 | | | | 9/21/2028 | | | | 2,000,000 | | | | 2,000,000 | | | | 1,995,000 | |
Cornerstone OnDemand, Inc., 1M LIBOR + 3.250% | | | 3.33 | | | | 4/22/2027 | | | | 421,794 | | | | 421,235 | | | | 421,110 | |
Cvent, Inc., 1M LIBOR + 3.750% | | | 3.83 | | | | 11/29/2024 | | | | 2,341,023 | | | | 2,062,254 | | | | 2,330,418 | |
Delta TopCo, Inc., 3M LIBOR + 3.750% | | | 4.50 | | | | 12/1/2027 | | | | 997,500 | | | | 998,652 | | | | 998,208 | |
EAB Global, Inc., 3M LIBOR + 3.500% | | | 4.00 | | | | 8/16/2028 | | | | 500,000 | | | | 497,522 | | | | 497,125 | |
Element Materials Technology Group US Holdings Inc., EURIBOR + 3.250% | | | 3.25 | | | | 6/28/2024 | | | | 1,000,000 | | | | 1,194,547 | | | | 1,139,237 | |
Element Materials Technology Group US Holdings Inc., LIBOR – GBP + 4.250% | | | 4.33 | | | | 6/28/2024 | | | | 500,000 | | | | 680,938 | | | | 658,542 | |
Endure Digital Inc., 6M LIBOR + 3.500% | | | 4.25 | | | | 2/10/2028 | | | | 1,963,884 | | | | 1,954,591 | | | | 1,951,609 | |
Epicor Software Corp., 1M LIBOR + 3.250% | | | 4.00 | | | | 7/30/2027 | | | | 304,916 | | | | 304,725 | | | | 304,779 | |
Finastra USA, Inc., 6M LIBOR + 7.250% | | | 8.25 | | | | 6/13/2025 | | | | 6,482 | | | | 6,543 | | | | 6,513 | |
Finastra USA, Inc., 6M LIBOR + 3.500% | | | 4.50 | | | | 6/13/2024 | | | | 3,404,214 | | | | 3,317,300 | | | | 3,374,768 | |
Gopher Resource, LLC, 1M LIBOR + 3.250% | | | 4.25 | | | | 3/6/2025 | | | | 431,611 | | | | 388,669 | | | | 397,514 | |
Greeneden U.S. Holdings II LLC, 1M LIBOR + 4.000% | | | 4.75 | | | | 12/1/2027 | | | | 2,969,579 | | | | 2,971,072 | | | | 2,978,607 | |
Hyland Software, Inc., 1M LIBOR + 3.500% | | | 4.25 | | | | 7/1/2024 | | | | 1,988,478 | | | | 1,991,970 | | | | 1,989,512 | |
Hyland Software, Inc., 1M LIBOR + 6.250% | | | 7.00 | | | | 7/7/2025 | | | | 501,818 | | | | 501,818 | | | | 506,209 | |
IGT Holding IV AB, 3M LIBOR + 3.750%(b) | | | 4.25 | | | | 3/31/2028 | | | | 686,207 | | | | 684,538 | | | | 686,639 | |
See accompanying Notes to the Financial Statements.
44
Barings Global Floating Rate Fund 2021 Annual Report
SCHEDULE OF INVESTMENTS (CONTINUED)
September 30, 2021
| | | | | | | | | | | | | | | | | | | | |
| | | EFFECTIVE
INTEREST RATE | | | DUE DATE | | | PRINCIPAL ‡‡ | | | COST | | | FAIR
VALUE | |
Bank Loans (Continued) | | | | | | | | | | | | | | | | | | | | |
| | | | |
Diversified/Conglomerate Service (Continued) | | | | | | | | | | | | | | | | | |
Infinitas Learning Holding B.V., 3M LIBOR + 4.500%(b) | | | 4.50 | % | | | 7/31/2028 | | | | 500,000 | | | $ | 586,677 | | | $ | 579,609 | |
Informatica LLC, 3M LIBOR + 7.125% | | | 7.13 | | | | 2/25/2025 | | | | 350,242 | | | | 349,045 | | | | 354,795 | |
Informatica LLC, 1M LIBOR + 3.250% | | | 3.33 | | | | 2/25/2027 | | | | 985,000 | | | | 981,188 | | | | 981,306 | |
IRIS Bidco Ltd., LIBOR—GBP + 4.250%(b) | | | 4.25 | | | | 9/6/2025 | | | | 1,000,000 | | | | 1,383,157 | | | | 1,342,630 | |
MH Sub I LLC, 1M LIBOR + 3.500% | | | 3.58 | | | | 9/13/2024 | | | | 1,994,316 | | | | 1,989,573 | | | | 1,987,515 | |
MH Sub I, LLC, 1M LIBOR + 6.250% | | | 6.34 | | | | 2/12/2029 | | | | 500,000 | | | | 505,410 | | | | 507,030 | |
Mitchell International, Inc., 1M LIBOR + 3.250% | | | 3.33 | | | | 11/29/2024 | | | | 1,971,938 | | | | 1,940,394 | | | | 1,968,251 | |
Panther Commercial Holdings L.P, 3M LIBOR + 4.250% | | | 4.75 | | | | 1/7/2028 | | | | 1,496,250 | | | | 1,501,371 | | | | 1,499,991 | |
Project Leopard Holdings, Inc., 3M LIBOR + 4.750% | | | 5.75 | | | | 7/5/2024 | | | | 1,450,444 | | | | 1,453,970 | | | | 1,453,461 | |
Project Ruby Ultimate Parent Corp., 1M LIBOR + 3.250% | | | 4.00 | | | | 3/3/2028 | | | | 1,322,002 | | | | 1,316,954 | | | | 1,319,940 | |
Proofpoint, Inc., 3M LIBOR + 3.250% | | | 3.75 | | | | 8/31/2028 | | | | 697,674 | | | | 694,211 | | | | 693,837 | |
Redstone Buyer LLC, 3M LIBOR + 4.750% | | | 5.50 | | | | 4/27/2028 | | | | 1,905,144 | | | | 1,893,386 | | | | 1,871,804 | |
Sabre GLBL Inc., 1M LIBOR + 3.500% | | | 4.00 | | | | 12/17/2027 | | | | 790,536 | | | | 788,609 | | | | 785,841 | |
SITEL Worldwide Corp., 3M LIBOR + 3.750% | | | 4.25 | | | | 8/28/2028 | | | | 1,031,519 | | | | 1,026,422 | | | | 1,032,808 | |
Spin Holdco Inc., 3M LIBOR + 4.000% | | | 4.75 | | | | 3/1/2028 | | | | 695,283 | | | | 690,485 | | | | 696,945 | |
Summer (BC) Holdco B S.a r.l, 3M LIBOR + 5.000%(b) | | | 5.12 | | | | 12/4/2026 | | | | 3,484,817 | | | | 3,484,569 | | | | 3,485,548 | |
Surf Holdings, LLC, 3M LIBOR + 3.500%(b) | | | 3.62 | | | | 3/5/2027 | | | | 493,449 | | | | 491,679 | | | | 490,479 | |
Team.Blue Finco SARL, EURIBOR + 3.750%(b) | | | 3.75 | | | | 3/27/2028 | | | | 1,250,000 | | | | 1,485,464 | | | | 1,444,578 | |
TMF Group Holding B.V., EURIBOR + 3.250%(b) | | | 3.25 | | | | 5/5/2025 | | | | 1,500,000 | | | | 1,787,290 | | | | 1,719,281 | |
USIC Holdings, Inc., 1M LIBOR + 3.500% | | | 4.25 | | | | 5/12/2028 | | | | 949,089 | | | | 946,933 | | | | 947,902 | |
Verisure Holding AB, EURIBOR + 3.250%(b) | | | 3.25 | | | | 3/27/2028 | | | | 1,875,000 | | | | 2,256,778 | | | | 2,157,919 | |
Veritas US Inc., EURIBOR + 4.750% | | | 5.75 | | | | 9/1/2025 | | | | 742,514 | | | | 879,027 | | | | 864,073 | |
Veritas US Inc., 3M LIBOR + 5.000% | | | 6.00 | | | | 9/1/2025 | | | | 1,488,750 | | | | 1,498,831 | | | | 1,494,020 | |
Vision Solutions, Inc., 3M LIBOR + 4.250% | | | 5.00 | | | | 4/23/2028 | | | | 904,110 | | | | 899,852 | | | | 901,705 | |
W3 Topco LLC, 3M USD LIBOR + 6.000% | | | 7.00 | | | | 8/16/2025 | | | | 741,550 | | | | 733,905 | | | | 731,353 | |
Weld North Education, LLC, 3M LIBOR + 3.750% | | | 4.25 | | | | 12/21/2027 | | | | 848,997 | | | | 851,107 | | | | 849,260 | |
| | | | | | | | | | | | | | | | | | | | |
Total Diversified/Conglomerate Service | | | | | | | | | | | 57,678,108 | | | | 59,166,316 | | | | 59,182,951 | |
| | | | | | | | | | | | | | | | | | | | |
|
Electronics — 4.0%*: | |
Ahead Data Blue LLC, 3M LIBOR + 3.750% | | | 4.50 | | | | 10/18/2027 | | | | 1,706,009 | | | | 1,712,020 | | | | 1,711,690 | |
EXC Holdings III Corp., 3M LIBOR + 3.500% | | | 4.50 | | | | 12/2/2024 | | | | 1,475,936 | | | | 1,480,977 | | | | 1,479,625 | |
Ingram Micro Inc., 3M LIBOR + 3.500% | | | 4.00 | | | | 6/30/2028 | | | | 1,974,757 | | | | 1,970,170 | | | | 1,978,706 | |
ION Trading Finance Ltd., 3M LIBOR + 4.750% | | | 4.92 | | | | 4/1/2028 | | | | 2,100,568 | | | | 2,100,004 | | | | 2,102,941 | |
Ivanti Software, Inc., 3M LIBOR + 4.750% | | | 5.75 | | | | 12/1/2027 | | | | 1,990,000 | | | | 1,983,854 | | | | 1,993,423 | |
McAfee Enterprise, 3M LIBOR + 5.000% | | | 5.75 | | | | 7/27/2028 | | | | 1,146,634 | | | | 1,135,424 | | | | 1,146,279 | |
Polaris Newco LLC, 6M LIBOR + 4.000% | | | 4.50 | | | | 6/2/2028 | | | | 892,503 | | | | 888,228 | | | | 894,181 | |
See accompanying Notes to the Financial Statements.
45
Barings Global Floating Rate Fund 2021 Annual Report
SCHEDULE OF INVESTMENTS (CONTINUED)
September 30, 2021
| | | | | | | | | | | | | | | | | | | | |
| | | EFFECTIVE
INTEREST RATE | | | DUE DATE | | | PRINCIPAL ‡‡ | | | COST | | | FAIR
VALUE | |
Bank Loans (Continued) | | | | | | | | | | | | | | | | | | | | |
| | | | | |
Electronics (Continued) | | | | | | | | | | | | | | | | | | | | |
Renaissance Holding Corp., 1M LIBOR + 3.250% | | | 3.33 | % | | | 5/30/2025 | | | | 1,722,830 | | | $ | 1,708,370 | | | $ | 1,707,135 | |
Sophia, LP, 3M LIBOR + 3.750% | | | 4.50 | | | | 10/7/2027 | | | | 838,523 | | | | 837,483 | | | | 841,316 | |
Sovos Compliance, LLC, 3M LIBOR + 4.500% | | | 5.00 | | | | 8/11/2028 | | | | 462,329 | | | | 461,194 | | | | 464,835 | |
SS&C Technologies Inc., 1M LIBOR + 1.750% | | | 1.83 | | | | 4/16/2025 | | | | 466,227 | | | | 465,580 | | | | 461,761 | |
Tibco Software Inc., 1M LIBOR + 3.750% | | | 3.83 | | | | 6/30/2026 | | | | 1,979,962 | | | | 1,954,539 | | | | 1,963,885 | |
Tibco Software Inc., 1M LIBOR + 7.250% | | | 7.34 | | | | 3/3/2028 | | | | 385,441 | | | | 383,889 | | | | 389,102 | |
| | | | | | | | | | | | | | | | | | | | |
Total Electronics | | | | | | | | | | | 17,141,719 | | | | 17,081,732 | | | | 17,134,879 | |
| | | | | | | | | | | | | | | | | | | | |
|
Finance — 2.1%*: | |
Aqgen Ascensus, Inc., 3M LIBOR + 6.500% | | | 7.00 | | | | 8/2/2029 | | | | 250,358 | | | | 247,900 | | | | 247,854 | |
Aqgen Island Holdings, Inc., 3M LIBOR + 3.500% | | | 4.00 | | | | 8/1/2028 | | | | 1,158,599 | | | | 1,152,920 | | | | 1,154,741 | |
Deerfield Dakota Holding LLC, 1M LIBOR + 3.750% | | | 4.75 | | | | 4/9/2027 | | | | 497,481 | | | | 499,226 | | | | 498,491 | |
Deerfield Dakota Holding LLC, 1M LIBOR + 6.750% | | | 7.50 | | | | 4/7/2028 | | | | 1,000,000 | | | | 1,004,681 | | | | 1,030,000 | |
Edelman Financial Center, LLC, 1M LIBOR + 3.500% | | | 4.25 | | | | 4/7/2028 | | | | 997,500 | | | | 996,282 | | | | 995,166 | |
Edelman Financial Center, LLC, 1M LIBOR + 6.750% | | | 6.83 | | | | 7/20/2026 | | | | 1,000,000 | | | | 1,009,574 | | | | 1,006,560 | |
Ensono, LP, 1M LIBOR + 4.000% | | | 4.75 | | | | 5/19/2028 | | | | 903,955 | | | | 895,346 | | | | 905,275 | |
Skopima Merger Sub Inc., 1M LIBOR + 4.000% | | | 4.50 | | | | 5/12/2028 | | | | 1,962,567 | | | | 1,949,704 | | | | 1,949,810 | |
Tempo Acquisition LLC, 1M LIBOR + 2.750% | | | 2.83 | | | | 5/1/2024 | | | | 74,622 | | | | 74,754 | | | | 74,552 | |
Zera uyer LLC, 3M LIBOR + 3.250% | | | 3.75 | | | | 4/21/2028 | | | | 913,242 | | | | 908,676 | | | | 915,689 | |
| | | | | | | | | | | | | | | | | | | | |
Total Finance | | | | | | | | | | | 8,758,324 | | | | 8,739,063 | | | | 8,778,138 | |
| | | | | | | | | | | | | | | | | | | | |
|
Healthcare, Education and Childcare — 12.9%*: | |
ADMI Corp., 1M LIBOR + 3.125% | | | 3.63 | | | | 12/23/2027 | | | | 64,082 | | | | 64,348 | | | | 63,522 | |
Advanz Pharma Corp., EURIBOR + 5.000%(b) | | | 5.00 | | | | 6/1/2028 | | | | 1,000,000 | | | | 1,204,955 | | | | 1,160,620 | |
Aenova Holding GmbH, EURIBOR + 4.500%(b) | | | 4.50 | | | | 3/6/2026 | | | | 500,000 | | | | 590,996 | | | | 581,347 | |
Amneal Pharmaceuticals LLC, 1M LIBOR + 3.500% | | | 3.59 | | | | 5/4/2025 | | | | 1,458,043 | | | | 1,390,581 | | | | 1,436,785 | |
Auris Luxembourg III S.a.r.l., EURIBOR +
4.000%(b) | | | 4.00 | | | | 2/27/2026 | | | | 2,000,000 | | | | 2,321,633 | | | | 2,310,190 | |
Auris Luxembourg III Sarl, 1M LIBOR +
3.750%(b) | | | 3.83 | | | | 2/27/2026 | | | | 2,487,247 | | | | 2,469,925 | | | | 2,463,941 | |
CeramTec AcquiCo GmbH, 3M LIBOR +
2.750%(b) | | | 2.87 | | | | 3/7/2025 | | | | 1,250,000 | | | | 1,235,604 | | | | 1,236,725 | |
CeramTec AcquiCo GmbH, 3M LIBOR +
2.500%(b) | | | 2.50 | | | | 3/7/2025 | | | | 1,965,205 | | | | 2,299,642 | | | | 2,264,375 | |
Change Healthcare Holdings LLC, 3M LIBOR + 2.500% | | | 3.50 | | | | 3/1/2024 | | | | 1,199,391 | | | | 1,197,606 | | | | 1,197,952 | |
See accompanying Notes to the Financial Statements.
46
Barings Global Floating Rate Fund 2021 Annual Report
SCHEDULE OF INVESTMENTS (CONTINUED)
September 30, 2021
| | | | | | | | | | | | | | | | | | | | |
| | | EFFECTIVE
INTEREST RATE | | | DUE DATE | | | PRINCIPAL ‡‡ | | | COST | | | FAIR
VALUE | |
Bank Loans (Continued) | | | | | | | | | | | | | | | | | | | | |
| | | | |
Healthcare, Education and Childcare (Continued) | | | | | | | | | | | | | | | | | |
CHG Healthcare Services Inc., 3M LIBOR + 3.500% | | | 4.00 | % | | | 9/22/2028 | | | | 217,391 | | | $ | 216,304 | | | $ | 217,624 | |
Eagle Bidco Ltd., 3M LIBOR + 3.750%(b) | | | 3.75 | | | | 3/19/2028 | | | | 425,455 | | | | 494,527 | | | | 487,074 | |
Eagle Bidco Ltd., LIBOR – GBP + 3.750%(b) | | | 4.80 | | | | 3/10/2028 | | | | 500,000 | | | | 693,142 | | | | 671,598 | |
Eagle Bidco Ltd. 2021 Project Einstein EUR TL B, 3M LIBOR + 3.750%(b) | | | 3.75 | | | | 3/19/2028 | | | | 474,545 | | | | 551,587 | | | | 543,275 | |
Elysium Healthcare Holdings 3 Ltd., LIBOR—GBP + 5.250%(b) | | | 5.30 | | | | 4/11/2025 | | | | 1,000,000 | | | | 1,395,837 | | | | 1,320,169 | |
Endo Luxembourg Finance Co. I S.a r.l., 3M LIBOR + 5.000% | | | 6.00 | | | | 3/27/2028 | | | | 1,290,144 | | | | 1,288,042 | | | | 1,259,322 | |
Envision Healthcare Corp., 1M LIBOR + 3.750% | | | 3.83 | | | | 10/10/2025 | | | | 1,581,481 | | | | 1,249,647 | | | | 1,403,565 | |
Fugue Finance B.V., EURIBOR + 3.250%(b) | | | 3.25 | | | | 9/1/2024 | | | | 500,000 | | | | 547,552 | | | | 567,713 | |
Gainwell Acquisition Corp., 3M LIBOR + 4.000% | | | 4.75 | | | | 10/1/2027 | | | | 604,673 | | | | 596,590 | | | | 605,556 | |
Grifols Worldwide Operations USA, Inc., 3M LIBOR + 2.000% | | | 2.07 | | | | 11/15/2027 | | | | 994,937 | | | | 985,478 | | | | 978,351 | |
Horizon Therapeutics USA Inc., 1M LIBOR + 2.000% | | | 2.50 | | | | 3/15/2028 | | | | 891,045 | | | | 888,986 | | | | 888,978 | |
Horizon Therapeutics USA, Inc., 1M LIBOR + 2.250% | | | 2.38 | | | | 5/22/2026 | | | | 494,267 | | | | 495,754 | | | | 491,548 | |
Hunter Holdco 3 Ltd., 3M LIBOR + 4.250% | | | 4.75 | | | | 8/19/2028 | | | | 1,980,392 | | | | 1,965,977 | | | | 1,987,819 | |
ICON Luxembourg S.A.R.L., 3M LIBOR + 2.500% | | | 3.00 | | | | 7/3/2028 | | | | 876,449 | | | | 872,203 | | | | 879,245 | |
ICON Luxembourg S.A.R.L., 3M LIBOR + 2.500% | | | 3.00 | | | | 7/2/2028 | | | | 218,368 | | | | 217,310 | | | | 219,064 | |
Iris idco GmBH, EURIBOR + 5.000%(b) | | | 5.00 | | | | 5/31/2028 | | | | 650,000 | | | | 772,369 | | | | 753,869 | |
Jazz Financing Lux S.a.r.l., 1M LIBOR + 3.500% | | | 4.00 | | | | 5/5/2028 | | | | 1,100,690 | | | | 1,095,491 | | | | 1,101,933 | |
Lernen Bidco Ltd., EURIBOR + 4.250%(b) | | | 4.25 | | | | 10/25/2025 | | | | 2,000,000 | | | | 2,354,240 | | | | 2,293,533 | |
Lifescan Global Corp., 3M LIBOR + 6.000% | | | 6.15 | | | | 10/1/2024 | | | | 1,176,364 | | | | 1,147,094 | | | | 1,165,577 | |
Netsmart Technologies, Inc., 3M LIBOR + 4.000% | | | 4.75 | | | | 10/1/2027 | | | | 995,000 | | | | 996,268 | | | | 998,731 | |
Nidda Healthcare Holding AG, EURIBOR +
3.500%(b) | | | 3.50 | | | | 8/21/2026 | | | | 1,925,000 | | | | 2,154,805 | | | | 2,199,855 | |
Nidda Healthcare Holding AG, LIBOR – GBP + 4.500%(b) | | | 4.57 | | | | 8/21/2026 | | | | 500,000 | | | | 652,706 | | | | 668,647 | |
Organon & Co., 3M LIBOR + 3.000% | | | 3.50 | | | | 6/2/2028 | | | | 673,077 | | | | 669,856 | | | | 674,161 | |
Ortho-Clinical Diagnostics SA, 1M LIBOR + 3.000% | | | 3.08 | | | | 6/30/2025 | | | | 1,897,451 | | | | 1,885,852 | | | | 1,895,079 | |
Padagis LLC, 3M LIBOR + 4.750% | | | 5.25 | | | | 7/6/2028 | | | | 645,161 | | | | 638,897 | | | | 645,161 | |
Parexel International Corp., 1M LIBOR + 2.750% | | | 2.83 | | | | 9/27/2024 | | | | 1,717,488 | | | | 1,701,807 | | | | 1,716,028 | |
Prometric Holdings, Inc., 1M LIBOR + 3.000% | | | 4.00 | | | | 1/29/2025 | | | | 994,911 | | | | 986,083 | | | | 987,449 | |
Radiology Partners, Inc., 1M LIBOR + 4.250% | | | 4.33 | | | | 7/9/2025 | | | | 2,000,000 | | | | 1,989,242 | | | | 1,997,500 | |
RegionalCare Hospital Partners Holdings, Inc., 1M LIBOR + 3.750% | | | 3.83 | | | | 11/16/2025 | | | | 742,455 | | | | 746,097 | | | | 741,067 | |
Select Medical Corp., 1M LIBOR + 2.250% | | | 2.34 | | | | 3/6/2025 | | | | 1,000,000 | | | | 993,340 | | | | 992,250 | |
Surgery Center Holdings, Inc., 1M LIBOR + 3.750% | | | 4.50 | | | | 8/31/2026 | | | | 1,969,629 | | | | 1,963,594 | | | | 1,971,539 | |
See accompanying Notes to the Financial Statements.
47
Barings Global Floating Rate Fund 2021 Annual Report
SCHEDULE OF INVESTMENTS (CONTINUED)
September 30, 2021
| | | | | | | | | | | | | | | | | | | | |
| | | EFFECTIVE
INTEREST RATE | | | DUE DATE | | | PRINCIPAL ‡‡ | | | COST | | | FAIR
VALUE | |
Bank Loans (Continued) | | | | | | | | | | | | | | | | | | | | |
| | | | |
Healthcare, Education and Childcare (Continued) | | | | | | | | | | | | | | | | | |
Team Health Holdings, Inc., 1M LIBOR + 2.750% | | | 3.75 | % | | | 2/6/2024 | | | | 2,751,565 | | | $ | 2,686,784 | | | $ | 2,675,897 | |
Tunstall Group Holdings Ltd., EURIBOR + 5.000%(b) | | | 5.00 | | | | 8/3/2025 | | | | 321,190 | | | | 377,864 | | | | 363,988 | |
U.S. Anesthesia Partners, Inc., 3M LIBOR + 4.250% | | | 4.75 | | | | 9/23/2028 | | | | 1,250,000 | | | | 1,243,750 | | | | 1,251,363 | |
U.S. Anesthesia Partners, Inc., 3M LIBOR + 3.000% | | | 4.00 | | | | 6/23/2024 | | | | 1,987,033 | | | | 1,971,950 | | | | 1,986,417 | |
Unilabs Holding AB, EURIBOR + 2.500%(b) | | | 2.50 | | | | 4/19/2024 | | | | 500,000 | | | | 578,995 | | | | 572,902 | |
US Radiology Specialists, Inc., 3M LIBOR + 5.500% | | | 5.63 | | | | 12/10/2027 | | | | 796,517 | | | | 782,358 | | | | 799,376 | |
Verscend Holding Corp., 1M LIBOR + 4.000% | | | 4.08 | | | | 8/27/2025 | | | | 1,484,828 | | | | 1,483,341 | | | | 1,486,061 | |
| | | | | | | | | | | | | | | | | | | | |
Total Healthcare, Education and Childcare | | | | | | | | | | | 53,051,474 | | | | 55,107,009 | | | | 55,174,741 | |
| | | | | | | | | | | | | | | | | | | | |
|
Home and Office Furnishings, Housewares, and Durable Consumer Products — 2.0%*: | |
ACProducts, Inc., 3M LIBOR + 4.250% | | | 4.75 | | | | 5/17/2028 | | | | 1,487,014 | | | | 1,478,167 | | | | 1,483,564 | |
Hilding Anders International AB, 3M LIBOR + 5.000%(b) | | | 5.75 | | | | 11/30/2024 | | | | 700,000 | | | | 704,881 | | | | 685,164 | |
LBM Acquisition LLC, 3M LIBOR + 3.750% | | | 4.50 | | | | 12/17/2027 | | | | 2,255,813 | | | | 2,244,657 | | | | 2,233,255 | |
Serta Simmons Bedding LLC, 1M LIBOR + 7.500% | | | 8.50 | | | | 8/10/2023 | | | | 1,506,206 | | | | 1,506,206 | | | | 1,429,344 | |
SIWF Holdings Inc., 1M LIBOR + 4.250% | | | 4.33 | | | | 6/15/2025 | | | | 972,431 | | | | 977,619 | | | | 972,431 | |
Staples, Inc., 3M LIBOR + 5.000% | | | 5.13 | | | | 4/16/2026 | | | | 1,992,366 | | | | 1,941,413 | | | | 1,896,374 | |
| | | | | | | | | | | | | | | | | | | | |
Total Home and Office Furnishings, Housewares, and Durable Consumer Products | | | | | | | | | | | 8,913,830 | | | | 8,852,943 | | | | 8,700,132 | |
| | | | | | | | | | | | | | | | | | | | |
|
Hotels, Motels, Inns and Gaming — 3.7%*: | |
Caesars Resort Collection LLC, 1M LIBOR + 2.750% | | | 2.83 | | | | 12/23/2024 | | | | 1,948,065 | | | | 1,944,011 | | | | 1,935,364 | |
Caesars Resort Collection LLC, 3M LIBOR + 3.500% | | | 3.58 | | | | 7/21/2025 | | | | 725,415 | | | | 708,852 | | | | 725,676 | |
Casper BidCo SAS, EURIBOR + 3.875%(b) | | | 3.88 | | | | 7/31/2026 | | | | 1,500,000 | | | | 1,704,634 | | | | 1,676,173 | |
Compass IV Ltd., EURIBOR + 8.000%(b) | | | 9.00 | | | | 4/30/2026 | | | | 500,000 | | | | 592,808 | | | | 580,866 | |
Compass IV Ltd., EURIBOR + 4.000%(b) | | | 4.00 | | | | 4/30/2025 | | | | 500,000 | | | | 600,486 | | | | 578,631 | |
Golden Nugget, Inc., 2M LIBOR + 2.500% | | | 3.25 | | | | 10/4/2023 | | | | 1,797,746 | | | | 1,751,836 | | | | 1,788,272 | |
Hilton Grand Vacations Borrower LLC, 1M LIBOR + 3.000% | | | 3.50 | | | | 8/2/2028 | | | | 538,117 | | | | 535,466 | | | | 539,327 | |
HNVR Holdco Ltd., EURIBOR + 4.250%(b) | | | 4.25 | | | | 9/12/2025 | | | | 2,000,000 | | | | 2,036,843 | | | | 2,101,872 | |
Motel 6, 1M LIBOR + 5.000% | | | 5.75 | | | | 9/9/2026 | | | | 908,696 | | | | 906,471 | | | | 910,968 | |
Penn National Gaming, Inc., 1M LIBOR + 2.250% | | | 3.00 | | | | 10/15/2025 | | | | 1,768,934 | | | | 1,766,113 | | | | 1,765,502 | |
Richmond UK Bidco Ltd., LIBOR—GBP +
4.250%(b) | | | 4.41 | | | | 3/3/2024 | | | | 482,094 | | | | 610,403 | | | | 636,381 | |
See accompanying Notes to the Financial Statements.
48
Barings Global Floating Rate Fund 2021 Annual Report
SCHEDULE OF INVESTMENTS (CONTINUED)
September 30, 2021
| | | | | | | | | | | | | | | | | | | | |
| | | EFFECTIVE
INTEREST RATE | | | DUE DATE | | | PRINCIPAL ‡‡ | | | COST | | | FAIR
VALUE | |
Bank Loans (Continued) | | | | | | | | | | | | | | | | | | | | |
| | | | |
Hotels, Motels, Inns and Gaming (Continued) | | | | | | | | | | | | | | | | | |
Rouge Beachhouse B.V., EURIBOR + 4.500%(b) | | | 4.50 | % | | | 9/4/2025 | | | | 500,000 | | | $ | 586,575 | | | $ | 579,540 | |
Station Casinos LLC, 1M LIBOR + 2.250% | | | 2.50 | | | | 2/8/2027 | | | | 993,938 | | | | 969,404 | | | | 982,398 | |
Twin River Worldwide Holdings, Inc., 3M LIBOR + 3.250% | | | 3.75 | | | | 8/6/2028 | | | | 1,016,733 | | | | 1,006,611 | | | | 1,016,032 | |
| | | | | | | | | | | | | | | | | | | | |
Total Hotels, Motels, Inns and Gaming | | | | | | | | | | | 15,179,738 | | | | 15,720,513 | | | | 15,817,002 | |
| | | | | | | | | | | | | | | | | | | | |
|
Insurance — 2.9%*: | |
Acrisure LLC, 3M LIBOR + 3.500% | | | 3.63 | | | | 2/15/2027 | | | | 1,974,956 | | | | 1,952,594 | | | | 1,954,792 | |
Alliant Holdings Intermediate LLC, 1M LIBOR + 3.250% | | | 3.33 | | | | 5/9/2025 | | | | 2,235,626 | | | | 2,240,873 | | | | 2,218,859 | |
AmWINS Group, Inc., 1M LIBOR + 2.250% | | | 3.00 | | | | 2/19/2028 | | | | 449,766 | | | | 448,736 | | | | 446,901 | |
AssuredPartners, Inc., 1M LIBOR + 3.500% | | | 3.58 | | | | 2/12/2027 | | | | 1,735,027 | | | | 1,741,680 | | | | 1,723,455 | |
Asurion LLC, 1M LIBOR + 3.250% | | | 3.33 | | | | 12/23/2026 | | | | 2,977,500 | | | | 2,970,608 | | | | 2,931,766 | |
Asurion LLC, 1M LIBOR + 5.250% | | | 5.33 | | | | 1/20/2029 | | | | 1,551,724 | | | | 1,536,542 | | | | 1,543,577 | |
Hub International Ltd., 3M LIBOR + 2.750% | | | 2.88 | | | | 4/25/2025 | | | | 985,983 | | | | 972,232 | | | | 976,024 | |
Ryan Specialty Group LLC, 1M LIBOR + 3.000% | | | 3.75 | | | | 9/1/2027 | | | | 432,986 | | | | 427,480 | | | | 432,553 | |
| | | | | | | | | | | | | | | | | | | | |
Total Insurance | | | | | | | | | | | 12,343,568 | | | | 12,290,745 | | | | 12,227,927 | |
| | | | | | | | | | | | | | | | | | | | |
|
Leisure, Amusement, Entertainment — 5.3%*: | |
AMC Entertainment Holdings, Inc., 1M LIBOR + 3.000% | | | 3.08 | | | | 4/22/2026 | | | | 1,702,233 | | | | 1,454,958 | | | | 1,575,519 | |
City Football Group Ltd., 3M LIBOR + 3.500%(b) | | | 4.00 | | | | 7/21/2028 | | | | 927,835 | | | | 923,303 | | | | 923,196 | |
Crown Finance US, Inc., 6M LIBOR + 2.500% | | | 3.50 | | | | 2/28/2025 | | | | 2,071,967 | | | | 2,058,073 | | | | 1,703,032 | |
Crown Finance US, Inc., 3M LIBOR + 8.250% | | | 9.25 | | | | 5/23/2024 | | | | 118,742 | | | | 114,521 | | | | 126,757 | |
Delta 2 (LUX) Sarl, 3M LIBOR + 2.500%(b) | | | 3.50 | | | | 2/1/2024 | | | | 1,394,967 | | | | 1,396,869 | | | | 1,389,736 | |
Dorna Sports, S.L., EURIBOR + 3.000%(b) | | | 3.00 | | | | 5/3/2024 | | | | 2,478,282 | | | | 2,910,128 | | | | 2,841,407 | |
International Park Holdings B.V., EURIBOR +
3.500%(b) | | | 3.50 | | | | 6/13/2024 | | | | 500,000 | | | | 580,575 | | | | 560,531 | |
Metro-Goldwyn-Mayer, Inc., 1M LIBOR + 4.500% | | | 5.50 | | | | 7/3/2026 | | | | 3,000,000 | | | | 2,984,481 | | | | 2,996,250 | |
Motion Finco Sarl, EURIBOR + 3.000%(b) | | | 3.00 | | | | 11/12/2026 | | | | 1,500,000 | | | | 1,679,690 | | | | 1,672,541 | |
Odeon Cinemas Group Ltd., EURIBOR, PIK(b) | | | 5.38 | | | | 8/19/2023 | | | | 92,226 | | | | 124,277 | | | | 126,751 | |
Odeon Cinemas Group Ltd., EURIBOR, PIK(b) | | | 10.75 | | | | 8/19/2023 | | | | 195,134 | | | | 230,595 | | | | 230,554 | |
Parques Reunidos SAU, EURIBOR + 3.750%(b) | | | 3.75 | | | | 9/16/2026 | | | | 500,000 | | | | 546,180 | | | | 553,216 | |
Piolin Bidco SAU, 3M LIBOR + 7.500%(b) | | | 7.50 | | | | 9/16/2026 | | | | 500,000 | | | | 599,714 | | | | 582,071 | |
Playtika Holding Corp., 1M LIBOR + 2.750% | | | 2.83 | | | | 3/13/2028 | | | | 489,244 | | | | 486,971 | | | | 488,853 | |
PUG LLC, 1M LIBOR + 4.250% | | | 4.75 | | | | 2/12/2027 | | | | 918,274 | | | | 913,819 | | | | 917,126 | |
PUG LLC, 1M LIBOR + 3.500% | | | 3.58 | | | | 2/12/2027 | | | | 1,460,648 | | | | 1,444,743 | | | | 1,427,170 | |
Silk Bidco AS, EURIBOR + 4.000%(b) | | | 4.00 | | | | 2/24/2025 | | | | 500,000 | | | | 553,058 | | | | 546,805 | |
Vacalians Group, EURIBOR + 4.000%(b) | | | 4.00 | | | | 11/28/2025 | | | | 330,783 | | | | 374,140 | | | | 365,921 | |
See accompanying Notes to the Financial Statements.
49
Barings Global Floating Rate Fund 2021 Annual Report
SCHEDULE OF INVESTMENTS (CONTINUED)
September 30, 2021
| | | | | | | | | | | | | | | | | | | | |
| | | EFFECTIVE
INTEREST RATE | | | DUE DATE | | | PRINCIPAL ‡‡ | | | COST | | | FAIR
VALUE | |
Bank Loans (Continued) | | | | | | | | | | | | | | | | | | | | |
| | | | |
Leisure, Amusement, Entertainment (Continued) | | | | | | | | | | | | | | | | | |
Vue International Bidco plc, EURIBOR + 4.750%(b) | | | 4.75 | % | | | 7/3/2026 | | | | 923,797 | | | $ | 1,030,043 | | | $ | 1,005,426 | |
William Morris Endeavor Entertainment, LLC, 1M LIBOR + 2.750% | | | 2.84 | | | | 5/16/2025 | | | | 2,260,529 | | | | 2,242,150 | | | | 2,212,493 | |
WMG Acquisition Corp., 1M LIBOR + 2.125% | | | 2.21 | | | | 1/20/2028 | | | | 518,991 | | | | 519,451 | | | | 515,857 | |
| | | | | | | | | | | | | | | | | | | | |
Total Leisure, Amusement, Entertainment | | | | | | | | | | | 22,383,652 | | | | 23,167,739 | | | | 22,761,212 | |
| | | | | | | | | | | | | | | | | | | | |
|
Machinery Non-Agriculture, Non-Construction, Non-Electronic — 1.7%*: | |
Alison Bidco Sarl, EURIBOR + 5.500%, PIK(b) | | | 6.50 | | | | 8/29/2023 | | | | 848,629 | | | | 985,081 | | | | 716,064 | |
Ammeraal Beltech Holding B.V., EURIBOR + 3.750%(b) | | | 3.75 | | | | 7/30/2025 | | | | 1,000,000 | | | | 1,206,535 | | | | 1,152,130 | |
Diebold,, Inc., EURIBOR + 3.000% | | | 3.00 | | | | 11/6/2023 | | | | 1,490,816 | | | | 1,719,516 | | | | 1,711,241 | |
Madison IAQ LLC, 3M LIBOR + 3.250% | | | 3.75 | | | | 6/21/2028 | | | | 1,074,231 | | | | 1,069,015 | | | | 1,072,437 | |
Pro Mach Group, Inc., 1M LIBOR + 4.000% | | | 5.00 | | | | 8/31/2028 | | | | 892,567 | | | | 888,144 | | | | 896,396 | |
Titan Acquisition Ltd., 3M LIBOR + 3.000%(b) | | | 3.17 | | | | 3/28/2025 | | | | 1,930,866 | | | | 1,929,766 | | | | 1,894,449 | |
| | | | | | | | | | | | | | | | | | | | |
Total Machinery Non-Agriculture, Non-Construction, Non-Electronic | | | | | | | | | | | 7,237,109 | | | | 7,798,057 | | | | 7,442,717 | |
| | | | | | | | | | | | | | | | | | | | |
|
Mining, Steel, Iron and Non-Precious Metals — 0.4%*: | |
Boomerang Tube LLC, 3M LIBOR + 5.000%(a) | | | 5.15 | | | | 6/30/2022 | | | | 64,538 | | | | 64,538 | | | | – | |
US Silica Co., 1M LIBOR + 4.000% | | | 5.00 | | | | 5/1/2025 | | | | 1,848,414 | | | | 1,814,001 | | | | 1,807,989 | |
| | | | | | | | | | | | | | | | | | | | |
Total Mining, Steel, Iron and Non-Precious Metals | | | | | | | | | | | 1,912,952 | | | | 1,878,539 | | | | 1,807,989 | |
| | | | | | | | | | | | | | | | | | | | |
|
Oil and Gas — 0.8%*: | |
Buckeye Partners, L.P., 1M LIBOR + 2.250% | | | 2.33 | | | | 11/1/2026 | | | | 391,780 | | | | 391,780 | | | | 389,680 | |
Gulf Finance LLC, 3M LIBOR + 5.250% | | | 6.25 | | | | 8/25/2023 | | | | 1,602,930 | | | | 1,549,639 | | | | 1,538,140 | |
Oryx Midstream Services Permian Basin LLC | | | 3.70 | | | | 10/5/2028 | | | | 1,538,117 | | | | 1,537,926 | | | | 1,537,640 | |
| | | | | | | | | | | | | | | | | | | | |
Total Oil and Gas | | | | | | | | | | | 3,532,827 | | | | 3,479,345 | | | | 3,465,460 | |
| | | | | | | | | | | | | | | | | | | | |
|
Personal and Non-Durable Consumer Products Mfg. Only — 0.9%*: | |
Breitling Financing Sarl, EURIBOR + 3.250%(b) | | | 3.25 | | | | 7/11/2024 | | | | 1,000,000 | | | | 1,183,506 | | | | 1,155,095 | |
Coty Inc., 1M LIBOR + 2.250% | | | 2.33 | | | | 4/7/2025 | | | | 910,021 | | | | 891,656 | | | | 892,394 | |
Journey Personal Care Corp., 3M LIBOR + 4.250% | | | 5.00 | | | | 3/1/2028 | | | | 325,607 | | | | 324,113 | | | | 326,150 | |
Triton Water Holdings, Inc., 3M LIBOR + 3.500% | | | 4.00 | | | | 3/31/2028 | | | | 1,390,462 | | | | 1,386,043 | | | | 1,387,862 | |
| | | | | | | | | | | | | | | | | | | | |
Total Personal and Non-Durable Consumer Products Mfg. Only | | | | | | | | | | | 3,626,090 | | | | 3,785,318 | | | | 3,761,501 | |
| | | | | | | | | | | | | | | | | | | | |
|
Personal Transportation — 1.3%*: | |
Air Canada, 3M LIBOR + 3.500%(b) | | | 4.25 | | | | 8/11/2028 | | | | 1,530,571 | | | | 1,527,845 | | | | 1,535,668 | |
First Student Bidco, Inc., 3M LIBOR + 3.000% | | | 3.50 | | | | 7/21/2028 | | | | 1,860,216 | | | | 1,848,524 | | | | 1,849,053 | |
See accompanying Notes to the Financial Statements.
50
Barings Global Floating Rate Fund 2021 Annual Report
SCHEDULE OF INVESTMENTS (CONTINUED)
September 30, 2021
| | | | | | | | | | | | | | | | | | | | |
| | | EFFECTIVE
INTEREST RATE | | | DUE DATE | | | PRINCIPAL ‡‡ | | | COST | | | FAIR
VALUE | |
Bank Loans (Continued) | | | | | | | | | | | | | | | | | | | | |
| | | | |
Personal Transportation (Continued) | | | | | | | | | | | | | | | | | |
Kestrel Bidco, Inc., 6M LIBOR + 3.000%(b) | | | 4.00 | % | | | 12/11/2026 | | | | 2,095,597 | | | $ | 2,098,148 | | | $ | 2,042,977 | |
Naviera Armas SA, EURIBOR + 2.500%,
PIK(a),(b) | | | 5.00 | | | | 10/31/2021 | | | | 58,635 | | | | 71,453 | | | | 67,920 | |
Naviera Armas SA, EURIBOR +
2.500%(a),(b) | | | 4.31 | | | | 10/31/2021 | | | | 11,086 | | | | 13,407 | | | | 12,843 | |
Naviera Armas SA, EURIBOR + 2.500%,
PIK(a),(b) | | | 5.00 | | | | 10/31/2021 | | | | 86,833 | | | | 101,767 | | | | 100,583 | |
| | | | | | | | | | | | | | | | | | | | |
Total Personal Transportation | | | | | | | | | | | 5,642,938 | | | | 5,661,144 | | | | 5,609,044 | |
| | | | | | | | | | | | | | | | | | | | |
|
Printing and Publishing — 1.4%*: | |
Ascend Learning LLC, 1M LIBOR + 3.000% | | | 4.00 | | | | 7/12/2024 | | | | 1,492,248 | | | | 1,490,550 | | | | 1,490,920 | |
Cimpress Public Ltd. Co., 1M LIBOR + 3.500% | | | 4.00 | | | | 5/17/2028 | | | | 521,569 | | | | 516,613 | | | | 521,407 | |
Getty Images, Inc., 1M LIBOR + 4.500% | | | 4.63 | | | | 2/19/2026 | | | | 919,610 | | | | 919,610 | | | | 918,267 | |
Houghton Mifflin Harcourt Publishing Co., 1M LIBOR + 6.250% | | | 7.25 | | | | 11/22/2024 | | | | 87,695 | | | | 85,475 | | | | 87,558 | |
Springer Nature Deutschland GmbH, EURIBOR + 2.750%(b) | | | 3.25 | | | | 8/14/2026 | | | | 1,573,104 | | | | 1,904,312 | | | | 1,814,862 | |
Sylvamo Corp., 3M LIBOR + 4.500% | | | 5.00 | | | | 8/18/2028 | | | | 1,004,184 | | | | 994,142 | | | | 1,000,418 | |
| | | | | | | | | | | | | | | | | | | | |
Total Printing and Publishing | | | | | | | | | | | 5,598,410 | | | | 5,910,702 | | | | 5,833,432 | |
| | | | | | | | | | | | | | | | | | | | |
|
Retail Stores — 3.7%*: | |
At Home Group Inc., 3M LIBOR + 4.250% | | | 4.75 | | | | 7/24/2028 | | | | 458,715 | | | | 455,360 | | | | 459,289 | |
Casino Guichard-Perrachon SA, EURIBOR + 4.000%(b) | | | 4.00 | | | | 8/31/2025 | | | | 850,000 | | | | 993,710 | | | | 985,720 | |
EG Group Ltd., 3M LIBOR + 4.250%(b) | | | 4.75 | | | | 3/31/2026 | | | | 654,543 | | | | 648,488 | | | | 653,889 | |
Eyemart Express LLC, 3M LIBOR + 3.000% | | | 4.00 | | | | 8/31/2027 | | | | 972,222 | | | | 962,673 | | | | 969,383 | |
Great Outdoors Group LLC, 3M LIBOR + 4.250% | | | 5.00 | | | | 3/5/2028 | | | | 1,985,000 | | | | 1,982,779 | | | | 1,990,955 | |
Harbor Freight Tools USA, Inc., 1M LIBOR + 2.750% | | | 3.25 | | | | 10/19/2027 | | | | 971,866 | | | | 971,325 | | | | 970,836 | |
Mattress Firm, Inc., 3M LIBOR + 4.250% | | | 5.00 | | | | 9/25/2028 | | | | 2,046,392 | | | | 2,030,517 | | | | 2,042,565 | |
Michaels Cos., Inc., 3M LIBOR + 4.250% | | | 5.00 | | | | 4/15/2028 | | | | 1,223,119 | | | | 1,214,480 | | | | 1,223,670 | |
Peer Holding III B.V., EURIBOR + 3.250%(b) | | | 3.25 | | | | 1/16/2027 | | | | 1,000,000 | | | | 1,190,550 | | | | 1,156,786 | |
Petco Health and Wellness Company, Inc., 3M LIBOR + 3.250% | | | 4.00 | | | | 3/3/2028 | | | | 2,220,549 | | | | 2,216,015 | | | | 2,219,749 | |
PetSmart, Inc., 6M LIBOR + 3.750% | | | 4.50 | | | | 2/12/2028 | | | | 2,000,000 | | | | 2,004,907 | | | | 2,002,860 | |
Wand NewCo 3, Inc., 1M LIBOR + 3.000% | | | 3.08 | | | | 2/5/2026 | | | | 997,462 | | | | 987,786 | | | | 987,906 | |
| | | | | | | | | | | | | | | | | | | | |
Total Retail Stores | | | | | | | | | | | 15,379,868 | | | | 15,658,590 | | | | 15,663,608 | |
| | | | | | | | | | | | | | | | | | | | |
|
Telecommunications — 7.2%*: | |
Altice Financing SA, EURIBOR + 2.750%(b) | | | 2.75 | | | | 1/31/2026 | | | | 992,268 | | | | 1,192,305 | | | | 1,121,774 | |
Banff Merger Sub, Inc., 3M LIBOR + 5.500% | | | 6.00 | | | | 3/23/2026 | | | | 283,962 | | | | 282,542 | | | | 287,156 | |
Banff Merger Sub, Inc., 3M LIBOR + 3.750% | | | 3.88 | | | | 10/2/2025 | | | | 2,854,981 | | | | 2,848,550 | | | | 2,837,736 | |
CCI Buyer, Inc., 3M LIBOR + 4.000% | | | 4.75 | | | | 12/17/2027 | | | | 2,292,996 | | | | 2,310,971 | | | | 2,299,210 | |
CenturyLink, Inc., 1M LIBOR + 2.250% | | | 2.34 | | | | 3/15/2027 | | | | 1,527,698 | | | | 1,472,251 | | | | 1,509,656 | |
See accompanying Notes to the Financial Statements.
51
Barings Global Floating Rate Fund 2021 Annual Report
SCHEDULE OF INVESTMENTS (CONTINUED)
September 30, 2021
| | | | | | | | | | | | | | | | | | | | |
| | | EFFECTIVE
INTEREST RATE | | | DUE DATE | | | PRINCIPAL ‡‡ | | | COST | | | FAIR VALUE | |
Bank Loans (Continued) | | | | | | | | | | | | | | | | | | | | |
|
Telecommunications (Continued) | |
CommScope, Inc., 1M LIBOR + 3.250% | | | 3.34 | % | | | 4/6/2026 | | | | 1,967,315 | | | $ | 1,963,118 | | | $ | 1,955,432 | |
Consolidated Communications, Inc., 1M LIBOR + 3.500% | | | 4.25 | | | | 10/2/2027 | | | | 775,793 | | | | 776,587 | | | | 776,158 | |
DG Investment Intermediate Holdings 2, Inc., 3M LIBOR + 3.750% | | | 4.50 | | | | 3/31/2028 | | | | 1,074,203 | | | | 1,069,201 | | | | 1,077,844 | |
Digicel International Finance Ltd., 6M LIBOR + 3.250%(b) | | | 3.43 | | | | 5/28/2024 | | | | 150,254 | | | | 150,778 | | | | 144,902 | |
Eagle Broadband Investments LLC, 3M LIBOR + 3.000% | | | 3.75 | | | | 11/12/2027 | | | | 451,129 | | | | 447,168 | | | | 451,129 | |
ION Trading Technologies S.a.r.l., EURIBOR + 4.250% | | | 4.25 | | | | 3/26/2028 | | | | 897,750 | | | | 1,059,300 | | | | 1,040,720 | |
Level 3 Financing Inc., 1M LIBOR + 1.750% | | | 1.83 | | | | 3/1/2027 | | | | 1,000,000 | | | | 998,876 | | | | 987,320 | |
Lorca Finco plc, EURIBOR + 4.250%(b) | | | 4.25 | | | | 9/17/2027 | | | | 500,000 | | | | 581,694 | | | | 579,563 | |
Matterhorn Telecom SA, EURIBOR + 2.625%(b) | | | 2.63 | | | | 9/15/2026 | | | | 1,000,000 | | | | 1,207,827 | | | | 1,143,685 | |
Rackspace Technology Global, Inc., 3M LIBOR + 2.750% | | | 3.50 | | | | 2/15/2028 | | | | 1,589,196 | | | | 1,584,561 | | | | 1,577,103 | |
Syniverse Holdings, Inc., 3M LIBOR + 5.000% | | | 6.00 | | | | 3/9/2023 | | | | 1,107,316 | | | | 1,110,387 | | | | 1,106,464 | |
Syniverse Technologies, Inc., 3M LIBOR + 9.000% | | | 10.00 | | | | 3/11/2024 | | | | 1,625,482 | | | | 1,397,973 | | | | 1,624,669 | |
TDC A/S, EURIBOR + 3.000%(b) | | | 3.00 | | | | 6/4/2025 | | | | 1,000,000 | | | | 1,209,968 | | | | 1,146,627 | |
Tiger Acquisition LLC, 3M LIBOR + 3.250% | | | 3.75 | | | | 6/1/2028 | | | | 468,750 | | | | 464,274 | | | | 466,847 | |
Virgin Media SFA Finance Ltd., LIBOR – GBP + 3.250%(b) | | | 3.30 | | | | 11/15/2027 | | | | 2,250,000 | | | | 3,099,455 | | | | 2,987,449 | |
Virgin Media SFA Finance Ltd., LIBOR – GBP + 3.250%(b) | | | 3.30 | | | | 1/15/2027 | | | | 1,000,000 | | | | 1,356,628 | | | | 1,327,647 | |
Voyage Australia Pty Ltd., 3M LIBOR + 3.500%(b) | | | 4.00 | | | | 7/20/2028 | | | | 969,697 | | | | 960,244 | | | | 968,485 | |
Zayo Group Holdings, Inc., 1M LIBOR + 3.000% | | | 3.08 | | | | 3/9/2027 | | | | 860,786 | | | | 859,114 | | | | 852,755 | |
Ziggo B.V., EURIBOR + 3.000%(b) | | | 3.00 | | | | 1/31/2029 | | | | 2,000,000 | | | | 2,394,958 | | | | 2,290,197 | |
| | | | | | | | | | | | | | | | | | | | |
Total Telecommunications | | | | | | | | | | | 28,639,576 | | | | 30,798,730 | | | | 30,560,528 | |
| | | | | | | | | | | | | | | | | | | | |
|
Utilities — 1.2%*: | |
Astoria Energy LLC, 3M LIBOR + 3.500% | | | 4.50 | | | | 12/10/2027 | | | | 705,515 | | | | 702,343 | | | | 707,497 | |
DT Midstream, Inc., 3M LIBOR + 2.000% | | | 2.50 | | | | 6/26/2028 | | | | 519,531 | | | | 517,016 | | | | 519,126 | |
Edgewater Generation, L.L.C., 1M LIBOR + 3.750% | | | 3.83 | | | | 12/13/2025 | | | | 1,548,739 | | | | 1,534,261 | | | | 1,473,439 | |
Helix Gen Funding LLC, 3M LIBOR + 3.250% | | | 4.75 | | | | 6/3/2024 | | | | 1,210,518 | | | | 1,180,255 | | | | 1,171,031 | |
Techem Verwaltungsgesellschaft 675 mbH, EURIBOR + 2.375%(b) | | | 2.38 | | | | 7/15/2025 | | | | 1,000,000 | | | | 1,215,728 | | | | 1,140,836 | |
| | | | | | | | | | | | | | | | | | | | |
Total Utilities | | | | | | | | | | | 4,984,303 | | | | 5,149,603 | | | | 5,011,929 | |
| | | | | | | | | | | | | | | | | | | | |
| | | | | | | | | | | | | | | | | | | | |
Total Bank Loans | | | | | | | | | | | 368,015,598 | | | | 377,344,894 | | | | 376,238,499 | |
| | | | | | | | | | | | | | | | | | | | |
See accompanying Notes to the Financial Statements.
52
Barings Global Floating Rate Fund 2021 Annual Report
SCHEDULE OF INVESTMENTS (CONTINUED)
September 30, 2021
| | | | | | | | | | | | | | | | | | | | |
| | | EFFECTIVE
INTEREST RATE | | | DUE DATE | | | PRINCIPAL ‡‡ | | | COST | | | FAIR
VALUE | |
|
Corporate Bonds — 3.9%*: | |
|
Automobiles — 0.1%*: | |
Aston Martin Capital Holdings Ltd.(b),(d) | | | 10.50 | % | | | 11/30/2025 | | | | 500,000 | | | $ | 539,639 | | | $ | 556,875 | |
| | | | | | | | | | | | | | | | | | | | |
|
Beverage, Food and Tobacco — 0.2%*: | |
Boparan Finance plc(b) | | | 7.63 | | | | 11/30/2025 | | | | 500,000 | | | | 674,743 | | | | 592,856 | |
Picard Groupe SAS, EURIBOR + 4.000%(b) | | | 4.00 | (e) | | | 7/1/2026 | | | | 250,000 | | | | 296,438 | | | | 291,221 | |
| | | | | | | | | | | | | | | | | | | | |
Total Beverage, Food and Tobacco | | | | | | | | | | | 750,000 | | | | 971,181 | | | | 884,077 | |
| | | | | | | | | | | | | | | | | | | | |
|
Broadcasting and Entertainment — 0.4%*: | |
Banijay Entertainment SASU(b) | | | 3.50 | | | | 3/1/2025 | | | | 500,000 | | | | 608,175 | | | | 585,117 | |
Tele Columbus AG(b) | | | 3.88 | | | | 5/2/2025 | | | | 800,000 | | | | 879,760 | | | | 928,997 | |
| | | | | | | | | | | | | | | | | | | | |
Total Broadcasting and Entertainment | | | | | | | | | | | 1,300,000 | | | | 1,487,935 | | | | 1,514,114 | |
| | | | | | | | | | | | | | | | | | | | |
|
Containers, Packaging and Glass — 0.0%*: | |
Pactiv Evergreen Group Issuer LLC / Pactiv Evergreen Group Issuer, Inc.(d) | | | 4.38 | | | | 10/15/2028 | | | | 212,000 | | | | 212,000 | | | | 212,795 | |
| | | | | | | | | | | | | | | | | | | | |
|
Diversified/Conglomerate Manufacturing — 0.2%*: | |
Galapagos S.A.(a),(b),(f) | | | 4.21 | | | | 6/15/2021 | | | | 20,000 | | | | 27,263 | | | | – | |
International Design Group SpA, EURIBOR + 4.250%(b) | | | 4.25 | (e) | | | 5/15/2026 | | | | 100,000 | | | | 120,765 | | | | 116,333 | |
Mangrove Luxco III Sarl(b) | | | 7.78 | | | | 10/9/2025 | | | | 265,415 | | | | 255,278 | | | | 287,459 | |
Trivium Packaging Finance BV, EURIBOR +
3.750%(b) | | | 3.75 | (e) | | | 8/15/2026 | | | | 400,000 | | | | 482,340 | | | | 462,446 | |
| | | | | | | | | | | | | | | | | | | | |
Total Diversified/Conglomerate Manufacturing | | | | | | | | | | | 785,415 | | | | 885,646 | | | | 866,238 | |
| | | | | | | | | | | | | | | | | | | | |
|
Diversified/Conglomerate Service — 0.5%*: | |
Algeco Global Finance PLC, EURIBOR + 6.250%(b) | | | 6.25 | (e) | | | 2/15/2023 | | | | 150,000 | | | | 184,259 | | | | 174,100 | |
Brunello Bidco SpA, EURIBOR + 3.750%(b) | | | 3.75 | (e) | | | 2/15/2028 | | | | 200,000 | | | | 242,130 | | | | 231,670 | |
Carlson Travel, Inc., EURIBOR + 4.750% | | | 4.75 | (e) | | | 6/15/2025 | | | | 1,200,000 | | | | 1,372,045 | | | | 1,251,018 | |
Verisure Holding AB, EURIBOR + 3.250%(b) | | | 3.25 | | | | 2/15/2027 | | | | 450,000 | | | | 543,533 | | | | 523,509 | |
| | | | | | | | | | | | | | | | | | | | |
Total Diversified/Conglomerate Service | | | | | | | | | | | 2,000,000 | | | | 2,341,967 | | | | 2,180,297 | |
| | | | | | | | | | | | | | | | | | | | |
|
Ecological — 0.1%*: | |
APCOA Parking Holdings GmbH, EURIBOR + 5.000%(b) | | | 5.00 | (e) | | | 1/15/2027 | | | | 339,000 | | | | 401,207 | | | | 396,607 | |
| | | | | | | | | | | | | | | | | | | | |
|
Finance — 0.1%*: | |
Travelex Financing plc(a),(b),(f) | | | 8.00 | | | | 5/15/2022 | | | | 250,000 | | | | 274,580 | | | | – | |
Travelex Issuerco Ltd.(b) | | | 12.50 | | | | 8/5/2025 | | | | 226,521 | | | | 275,093 | | | | 457,822 | |
| | | | | | | | | | | | | | | | | | | | |
Total Finance | | | | | | | | | | | 476,521 | | | | 549,673 | | | | 457,822 | |
| | | | | | | | | | | | | | | | | | | | |
|
Healthcare, Education and Childcare — 0.0%*: | |
Tenet Healthcare Corp. | | | 4.63 | | | | 7/15/2024 | | | | 105,000 | | | | 104,516 | | | | 106,575 | |
| | | | | | | | | | | | | | | | | | | | |
See accompanying Notes to the Financial Statements.
53
Barings Global Floating Rate Fund 2021 Annual Report
SCHEDULE OF INVESTMENTS (CONTINUED)
September 30, 2021
| | | | | | | | | | | | | | | | | | | | |
| | | EFFECTIVE
INTEREST RATE | | | DUE DATE | | | PRINCIPAL ‡‡ | | | COST | | | FAIR
VALUE | |
Corporate Bonds (Continued) | | | | | | | | | | | | | | | | | | | | |
|
Home and Office Furnishings, Housewares, and Durable Consumer Products — 0.1%*: | |
Staples, Inc.(d) | | | 7.50 | % | | | 4/15/2026 | | | | 300,000 | | | $ | 311,443 | | | $ | 304,500 | |
| | | | | | | | | | | | | | | | | | | | |
|
Hotels, Motels, Inns and Gaming — 0.5%*: | |
Stonegate Pub Co. Financing 2019 plc, EURIBOR + 5.750%(b) | | | 5.75 | (e) | | | 7/31/2025 | | | | 1,100,000 | | | | 1,295,881 | | | | 1,270,362 | |
TVL Finance plc, 3M GBP LIBOR + 5.375%(b) | | | 5.45 | (e) | | | 7/15/2025 | | | | 600,000 | | | | 760,205 | | | | 771,252 | |
| | | | | | | | | | | | | | | | | | | | |
Total Hotels, Motels, Inns and Gaming | | | | | | | | | | | 1,700,000 | | | | 2,056,086 | | | | 2,041,614 | |
| | | | | | | | | | | | | | | | | | | | |
|
Leisure, Amusement, Entertainment — 0.2%*: | |
CPUK Finance Ltd.(b) | | | 4.88 | | | | 8/28/2047 | | | | 600,000 | | | | 790,281 | | | | 814,504 | |
CPUK Finance Ltd.(b) | | | 6.50 | | | | 8/28/2026 | | | | 100,000 | | | | 126,563 | | | | 141,982 | |
| | | | | | | | | | | | | | | | | | | | |
Total Leisure, Amusement, Entertainment | | | | | | | | | | | 700,000 | | | | 916,844 | | | | 956,486 | |
| | | | | | | | | | | | | | | | | | | | |
|
Machinery Non-Agriculture, Non-Construction, Non-Electronic — 0.1%*: | |
IMA Industria Macchine Automatiche SpA, EURIBOR + 4.000%(b) | | | 4.00 | (e) | | | 1/15/2028 | | | | 275,000 | | | | 333,873 | | | | 321,069 | |
| | | | | | | | | | | | | | | | | | | | |
|
Oil and Gas — 0.1%*: | |
KCA Deutag UK Finance plc(b) | | | 9.88 | | | | 12/1/2025 | | | | 390,061 | | | | 390,061 | | | | 424,585 | |
| | | | | | | | | | | | | | | | | | | | |
|
Personal Transportation — 0.1%*: | |
Naviera Armas S.A., EURIBOR + 6.500%(b) | | | 6.50 | (e) | | | 7/31/2023 | | | | 250,000 | | | | 290,587 | | | | 223,562 | |
Naviera Armas SA, EURIBOR + 4.250%(b) | | | 4.25 | (e) | | | 11/15/2024 | | | | 250,000 | | | | 296,118 | | | | 222,982 | |
| | | | | | | | | | | | | | | | | | | | |
Total Personal Transportation | | | | | | | | | | | 500,000 | | | | 586,705 | | | | 446,544 | |
| | | | | | | | | | | | | | | | | | | | |
|
Retail Stores — 0.7%*: | |
Afflelou SAS(b) | | | 4.25 | | | | 5/19/2026 | | | | 100,000 | | | | 121,495 | | | | 118,870 | |
Bellis Acquisition Co. plc(b) | | | 3.25 | | | | 2/16/2026 | | | | 750,000 | | | | 1,025,826 | | | | 992,572 | |
EG Global Finance plc(b) | | | 6.25 | | | | 3/30/2026 | | | | 1,080,000 | | | | 1,504,409 | | | | 1,498,848 | |
House of Fraser Funding plc(b),(f) | | | 5.95 | | | | 9/15/2020 | | | | 300,000 | | | | 365,113 | | | | 6,063 | |
NMG Holding Co., Inc. / Neiman Marcus Group LLC(d) | | | 7.13 | | | | 4/1/2026 | | | | 282,000 | | | | 282,000 | | | | 299,273 | |
| | | | | | | | | | | | | | | | | | | | |
Total Retail Stores | | | | | | | | | | | 2,512,000 | | | | 3,298,843 | | | | 2,915,626 | |
| | | | | | | | | | | | | | | | | | | | |
|
Telecommunications — 0.4%*: | |
Altice France SA(b) | | | 4.00 | | | | 7/15/2029 | | | | 500,000 | | | | 597,725 | | | | 570,004 | |
United Group BV(b) | | | 4.00 | | | | 11/15/2027 | | | | 500,000 | | | | 603,728 | | | | 571,903 | |
United Group BV(b) | | | 4.63 | | | | 8/15/2028 | | | | 450,000 | | | | 530,213 | | | | 522,691 | |
| | | | | | | | | | | | | | | | | | | | |
Total Telecommunications | | | | | | | | | | | 1,450,000 | | | | 1,731,666 | | | | 1,664,598 | |
| | | | | | | | | | | | | | | | | | | | |
See accompanying Notes to the Financial Statements.
54
Barings Global Floating Rate Fund 2021 Annual Report
SCHEDULE OF INVESTMENTS (CONTINUED)
September 30, 2021
| | | | | | | | | | | | | | | | | | | | |
| | | EFFECTIVE
INTEREST RATE | | | DUE DATE | | | PRINCIPAL ‡‡ | | | COST | | | FAIR VALUE | |
Corporate Bonds (Continued) | | | | | | | | | | | | | | | | | | | | |
|
Utilities — 0.1%*: | |
Viridian Group Finance Co. PLC/Viridian Power & Energy(b) | | | 4.75 | % | | | 9/15/2024 | | | | 350,000 | | | $ | 434,989 | | | $ | 475,599 | |
| | | | | | | | | | | | | | | | | | | | |
Total Corporate Bonds | | | | | | | | | | | 14,644,997 | | | | 17,554,274 | | | | 16,726,021 | |
| | | | | | | | | | | | | | | | | | | | |
Total Fixed Income | | | | | | | | | | | 382,660,595 | | | | 394,899,168 | | | | 392,964,520 | |
| | | | | | | | | | | | | | | | | | | | |
Total Investments | | | | | | | | | | | 383,091,177 | | | | 396,940,609 | | | | 394,723,926 | |
| | | | | | | | | | | | | | | | | | | | |
| |
Other assets and liabilities – 7.4%* | | | | 31,569,818 | |
| | | | | | | | | | | | | | | | | | | | |
| |
Net Assets – 100.0% | | | | $426,293,744 | |
| | | | | | | | | | | | | | | | | | | | |
| ‡‡ | Unless otherwise indicated, all principal amounts are denominated in United States Dollars. |
| * | Calculated as a percentage of net assets applicable to common shareholders. |
| (a) | For fair value measurement disclosure purposes, security is categorized as Level 3 (See Note 2). |
Distributions of investments by country of risk (excluding temporary cash investments) as a percentage of total investments in securities, is as follows:
| | | | | | |
| | United States | | | 70.7% | |
| | United Kingdom | | | 9.5% | |
| | Germany | | | 6.0% | |
| | France | | | 2.8% | |
| | Netherlands | | | 2.6% | |
| | Spain | | | 2.0% | |
| | Canada | | | 1.5% | |
| | Denmark | | | 1.5% | |
| | Sweden | | | 1.0% | |
| | Other (Individually less than 1%) | | | 2.4% | |
| | | | | | |
| | Total | | | 100.0% | |
| | | | | | |
| (c) | Bank loans are exempt from registration under the Securities Act of 1933, as amended, but contain certain restrictions on resale and cannot be sold publicly. These loans pay interest at rates which adjust periodically. The interest rates shown for bank loans are the current interest rates at September 30, 2021. Bank loans are also subject to mandatory and/or optional prepayment which cannot be predicted. As a result, the remaining maturity may be substantially less than the stated maturity shown. |
| (d) | Security acquired in a transaction exempt from registration under Rule 144A of the Securities Act of 1933. These securities may only be resold in transactions exempt from registration, normally to qualified institutional buyers. |
| (e) | Variable rate security. The interest rate shown is the rate in effect at September 30, 2021. |
See accompanying Notes to the Financial Statements.
55
Barings Global Floating Rate Fund 2021 Annual Report
SCHEDULE OF INVESTMENTS (CONTINUED)
September 30, 2021
A summary of outstanding derivatives at September 30, 2021 is as follows:
Forward Foreign Currency Exchange Contracts to Sell
| | | | | | | | | | | | | | | | | | | | | | |
EXPIRATION
DATE | | COUNTERPARTY | | LOCAL
CURRENCY | | | VALUE IN USD | | | IN
EXCHANGE
FOR USD | | | NET UNREALIZED
APPRECIATION | |
| 10/14/21 | | Morgan Stanley & Co. | | | EUR | | | | 1,408,470 | | | $ | 1,631,800 | | | $ | 1,661,664 | | | $ | 29,864 | |
| 10/14/21 | | Canadian Imperial Bank of Commerce | | | EUR | | | | 58,562,057 | | | | 67,847,762 | | | | 69,434,616 | | | | 1,586,854 | |
| 10/14/21 | | Morgan Stanley & Co. | | | GBP | | | | 11,461,794 | | | | 15,443,751 | | | | 15,808,222 | | | | 364,471 | |
| | | | | | | | | | | | | | | | | | | | | | |
Net unrealized appreciation on forward foreign currency exchange contracts to sell | | | $ | 1,981,189 | |
| | | | | | | | | | | | | | | | | | | | | | |
Currency Legend
| | | | |
| EUR | | – | | Euro |
| GBP | | – | | British Pound Sterling |
See accompanying Notes to the Financial Statements.
56
Barings Global Credit Income Opportunities Fund 2021 Annual Report
SCHEDULE OF INVESTMENTS
September 30, 2021
| | | | | | | | | | | | | | | | | | | | |
| | | | | | | | | SHARES | | | COST | | | FAIR
VALUE | |
Equities — 1.1%*: | |
|
Common Stocks — 1.1%*: | |
|
Broadcasting and Entertainment — 0.0%*: | |
Technicolor SA(a) | | | | | | | | | | | 14,662 | | | | $175 | | | | $49,762 | |
| | | | | | | | | | | | | | | | | | | | |
|
Diversified/Conglomerate Service — 0.0%*: | |
Innovation International Holding Ltd.(a),(b) | | | | | | | | | | | 142,479 | | | | – | | | | – | |
| | | | | | | | | | | | | | | | | | | | |
|
Finance — 0.0%*: | |
Travelex Topco Ltd.(a),(b) | | | | | | | | | | | 5,546 | | | | – | | | | – | |
| | | | | | | | | | | | | | | | | | | | |
|
Healthcare, Education and Childcare — 0.2%*: | |
Don Jersey Topco Ltd.(a),(b) | | | | | | | | | | | 257,069 | | | | 171,459 | | | | 268,441 | |
MModal, Inc., Escrow rights(b) | | | | | | | | | | | 4,725 | | | | 10,631 | | | | 3,213 | |
| | | | | | | | | | | | | | | | | | | | |
Total Healthcare, Education and Childcare | | | | | | | | | | | 261,794 | | | | 182,090 | | | | 271,654 | |
| | | | | | | | | | | | | | | | | | | | |
|
Mining, Steel, Iron and Non-Precious Metals — 0.0%*: | |
Boomerang Tube LLC(b) | | | | | | | | | | | 1,769 | | | | 171,860 | | | | – | |
| | | | | | | | | | | | | | | | | | | | |
|
Oil and Gas — 0.9%*: | |
Fieldwood Energy LLC(b) | | | | | | | | | | | 15,071 | | | | 325,033 | | | | – | |
Fieldwood Energy LLC(b) | | | | | | | | | | | 3,698 | | | | 129,430 | | | | – | |
Fieldwood Energy LLC(b) | | | | | | | | | | | 496 | | | | 27,543 | | | | 27,543 | |
Kelly Topco Ltd.(a) | | | | | | | | | | | 6,999 | | | | 293,958 | | | | 582,667 | |
Tourmaline Oil Corp.(a),(b) | | | | | | | | | | | 122,953 | | | | – | | | | 97,073 | |
Tourmaline Oil Corp.(a) | | | | | | | | | | | 28,412 | | | | 398,991 | | | | 992,603 | |
| | | | | | | | | | | | | | | | | | | | |
Total Oil and Gas | | | | | | | | | | | 177,629 | | | | 1,174,955 | | | | 1,699,886 | |
| | | | | | | | | | | | | | | | | | | | |
| | | | | | | | | | | | | | | | | | | | |
Total Common Stocks | | | | | | | | | | | 603,879 | | | | 1,529,080 | | | | 2,021,302 | |
| | | | | | | | | | | | | | | | | | | | |
Warrant — 0.0%*: | |
|
Finance — 0.0%*: | |
Travelex Topco Ltd.(a) | | | | | | | | | | | 837 | | | | – | | | | 84,583 | |
| | | | | | | | | | | | | | | | | | | | |
Total Equities | | | | | | | | | | | 604,716 | | | | 1,529,080 | | | | 2,105,885 | |
| | | | | | | | | | | | | | | | | | | | |
| | | | | |
| | | EFFECTIVE
INTEREST RATE | | | DUE DATE | | | PRINCIPAL ‡‡ | | | COST | | | FAIR
VALUE | |
Fixed Income — 93.6%*: | |
|
Asset-Backed Securities — 9.5%*: | |
|
CDO/CLO — 9.5%*: | |
Alinea CLO 2018-1 Ltd., 3M USD LIBOR +
6.000%(c) | | | 6.13 | %(d) | | | 7/20/2031 | | | | 1,250,000 | | | | 1,250,000 | | | | 1,223,601 | |
Ares XLVIII CLO, 3M USD LIBOR + 5.200%(c) | | | 5.33 | (d) | | | 7/20/2030 | | | | 800,000 | | | | 800,000 | | | | 766,043 | |
Blackrock European CLO, EURIBOR + 5.170%(a) | | | 5.17 | (d) | | | 10/15/2031 | | | | 725,000 | | | | 805,411 | | | | 817,105 | |
Canyon Capital CLO 2021-2 Ltd., 3M USD LIBOR + 6.700%(c) | | | 6.86 | (d) | | | 4/15/2034 | | | | 1,500,000 | | | | 1,470,390 | | | | 1,501,429 | |
See accompanying Notes to the Financial Statements.
57
Barings Global Credit Income Opportunities Fund 2021 Annual Report
SCHEDULE OF INVESTMENTS (CONTINUED)
September 30, 2021
| | | | | | | | | | | | | | | | | | | | |
| | | EFFECTIVE
INTEREST RATE | | | DUE DATE | | | PRINCIPAL ‡‡ | | | COST | | | FAIR
VALUE | |
|
Asset-Backed Securities (Continued) | |
|
CDO/CLO (Continued) | |
Cedar Funding IV CLO Ltd., 3M USD LIBOR +
6.610%(c) | | | 6.75 | %(d) | | | 7/23/2034 | | | | 1,000,000 | | | | $990,816 | | | | $992,892 | |
CIFC Funding Ltd. 2017-5A D, 3M USD LIBOR +
6.100%(c) | | | 6.23 | (d) | | | 11/16/2030 | | | | 500,000 | | | | 500,000 | | | | 496,785 | |
Galaxy XXIV CLO Ltd. 2017-24A E, 3M USD LIBOR + 5.500%(c) | | | 5.63 | (d) | | | 1/15/2031 | | | | 700,000 | | | | 700,000 | | | | 667,923 | |
Madison Park Funding XIII Ltd. 2014-13A(c) | | | Zero Coupon | | | | 4/19/2030 | | | | 500,000 | | | | 437,726 | | | | 242,333 | |
Madison Park Funding XXVII Ltd., 3M USD LIBOR + 5.000%(c) | | | 5.13 | (d) | | | 4/20/2030 | | | | 500,000 | | | | 500,000 | | | | 477,010 | |
Madison Park Funding XXVIII Ltd., 3M USD LIBOR + 7.600%(c) | | | 7.73 | (d) | | | 7/15/2030 | | | | 500,000 | | | | 496,236 | | | | 476,529 | |
Magnetite VII Ltd.(c) | | | Zero Coupon | | | | 1/15/2028 | | | | 2,000,000 | | | | 1,614,742 | | | | 933,570 | |
Neuberger Berman Loan Advisers CLO 24 Ltd., 3M USD LIBOR + 6.020%(c) | | | 6.15 | (d) | | | 4/19/2030 | | | | 1,500,000 | | | | 1,497,167 | | | | 1,487,546 | |
Oak Hill Credit Partners X Ltd. 2014-10A(c) | | | Zero Coupon | | | | 4/20/2034 | | | | 1,400,000 | | | | 985,472 | | | | 741,455 | |
OHA Credit Funding 9 Ltd., 3M USD LIBOR + 6.250%(c) | | | 6.43 | (d) | | | 7/19/2035 | | | | 625,000 | | | | 625,000 | | | | 625,073 | |
Steele Creek CLO Ltd. 2018-2A E, 3M USD LIBOR + 6.200%(c) | | | 6.32 | (d) | | | 8/18/2031 | | | | 850,000 | | | | 850,000 | | | | 768,828 | |
THL Credit Wind River CLO Ltd. 2017-4A E, 3M USD LIBOR + 5.800%(c) | | | 5.93 | (d) | | | 11/20/2030 | | | | 500,000 | | | | 500,000 | | | | 475,580 | |
THL Credit Wind River CLO Ltd. 2018-2A E, 3M USD LIBOR + 5.750%(c) | | | 5.88 | (d) | | | 7/15/2030 | | | | 1,450,000 | | | | 1,450,000 | | | | 1,398,144 | |
Tymon Park CLO DAC, EURIBOR + 6.160%(a),(c) | | | 6.16 | (d) | | | 7/21/2034 | | | | 1,000,000 | | | | 1,168,814 | | | | 1,139,988 | |
Wellfleet CLO Ltd. 2017-3A D, 3M USD LIBOR +
5.550%(c) | | | 5.68 | (d) | | | 1/17/2031 | | | | 1,000,000 | | | | 1,000,000 | | | | 943,709 | |
Wellfleet CLO Ltd. 2018-1, 3M USD LIBOR + 5.500%(c) | | | 5.63 | (d) | | | 7/17/2031 | | | | 1,000,000 | | | | 1,000,000 | | | | 939,751 | |
| | | | | | | | | | | | | | | | | | | | |
Total CDO/CLO | | | | | | | | | | | 19,300,000 | | | | 18,641,774 | | | | 17,115,294 | |
| | | | | | | | | | | | | | | | | | | | |
| | | | | | | | | | | | | | | | | | | | |
Total Asset-Backed Securities | | | | | | | | | | | 19,300,000 | | | | 18,641,774 | | | | 17,115,294 | |
| | | | | | | | | | | | | | | | | | | | |
|
Bank Loans — 44.0%*(e): | |
|
Aerospace and Defense — 1.5%*: | |
AAdvantage Loyalty IP Ltd., 3M LIBOR + 4.750% | | | 5.50 | | | | 4/20/2028 | | | | 506,512 | | | | 501,447 | | | | 523,465 | |
CEP IV Investment 16 S.a.r.l., 3M LIBOR + 7.750%(a) | | | 8.75 | | | | 10/3/2025 | | | | 1,050,000 | | | | 871,852 | | | | 988,974 | |
KKR Apple Bidco, LLC, 3M LIBOR + 5.750% | | | 6.25 | | | | 7/13/2029 | | | | 141,177 | | | | 140,471 | | | | 143,207 | |
Peraton Corp., 1M LIBOR + 3.750% | | | 4.50 | | | | 2/1/2028 | | | | 679,026 | | | | 675,850 | | | | 679,135 | |
United Airlines, Inc., 3M LIBOR + 3.750% | | | 4.50 | | | | 4/21/2028 | | | | 347,781 | | | | 346,151 | | | | 349,916 | |
| | | | | | | | | | | | | | | | | | | | |
Total Aerospace and Defense | | | | | | | | | | | 2,724,496 | | | | 2,535,771 | | | | 2,684,697 | |
| | | | | | | | | | | | | | | | | | | | |
See accompanying Notes to the Financial Statements.
58
Barings Global Credit Income Opportunities Fund 2021 Annual Report
SCHEDULE OF INVESTMENTS (CONTINUED)
September 30, 2021
| | | | | | | | | | | | | | | | | | | | |
| | | EFFECTIVE
INTEREST RATE | | | DUE DATE | | | PRINCIPAL ‡‡ | | | COST | | | FAIR
VALUE | |
Bank Loans (Continued) | |
|
Automobile — 0.7%*: | |
Clarios Global LP, 1M LIBOR + 3.250% | | | 3.34 | % | | | 4/30/2026 | | | | 615,988 | | | $ | 615,680 | | | $ | 612,908 | |
Constellation Automotive Ltd., 3M LIBOR +
4.750%(a) | | | 4.83 | | | | 6/30/2028 | | | | 500,000 | | | | 681,194 | | | | 673,283 | |
| | | | | | | | | | | | | | | | | | | | |
Total Automobile | | | | | | | | | | | 1,115,988 | | | | 1,296,874 | | | | 1,286,191 | |
| | | | | | | | | | | | | | | | | | | | |
|
Beverage, Food and Tobacco — 0.2%*: | |
Deoleo S.A., EURIBOR + 4.000%(a) | | | 5.00 | | | | 6/24/2025 | | | | 116,529 | | | | 131,392 | | | | 133,519 | |
IRB Holding Corp., 3M LIBOR + 2.750% | | | 3.75 | | | | 2/5/2025 | | | | 137,461 | | | | 137,855 | | | | 137,218 | |
| | | | | | | | | | | | | | | | | | | | |
Total Beverage, Food and Tobacco | | | | | | | | | | | 253,990 | | | | 269,247 | | | | 270,737 | |
| | | | | | | | | | | | | | | | | | | | |
|
Broadcasting and Entertainment — 3.1%*: | |
AVSC Holding Corp., 3M LIBOR + 3.250%, PIK | | | 4.25 | | | | 2/28/2025 | | | | 1,469,948 | | | | 1,314,148 | | | | 1,307,151 | |
Clear Channel Outdoor Holdings, Inc., 3M LIBOR + 3.500% | | | 3.63 | | | | 8/21/2026 | | | | 1,534,474 | | | | 1,463,416 | | | | 1,501,345 | |
Technicolor SA, EURIBOR + 3.000%(a) | | | 6.00 | | | | 12/31/2024 | | | | 1,245,850 | | | | 1,467,970 | | | | 1,381,350 | |
Technicolor SA, EURIBOR+ 6.000%, PIK(a) | | | 12.00 | | | | 6/30/2024 | | | | 301,143 | | | | 316,641 | | | | 369,758 | |
Technicolor SA, 6M LIBOR + 6.000%, PIK(a) | | | 12.15 | | | | 6/30/2024 | | | | 124,904 | | | | 115,848 | | | | 132,086 | |
Terrier Media Buyer, Inc., 1M LIBOR + 3.500% | | | 3.58 | | | | 12/17/2026 | | | | 257,984 | | | | 257,460 | | | | 257,340 | |
Univision Communication, Inc., 3M LIBOR + 3.250% | | | 4.00 | | | | 5/7/2028 | | | | 670,241 | | | | 663,539 | | | | 668,686 | |
| | | | | | | | | | | | | | | | | | | | |
Total Broadcasting and Entertainment | | | | | | | | | | | 5,604,544 | | | | 5,599,022 | | | | 5,617,716 | |
| | | | | | | | | | | | | | | | | | | | |
|
Cargo Transport — 0.3%*: | |
Kenan Advantage Group, Inc., 3M LIBOR + 7.250% | | | 8.00 | | | | 9/1/2027 | | | | 528,634 | | | | 518,163 | | | | 523,348 | |
| | | | | | | | | | | | | | | | | | | | |
|
Chemicals, Plastics and Rubber — 1.9%*: | |
Flint Group GmbH, EURIBOR + 4.250%, PIK(a) | | | 5.00 | | | | 9/21/2023 | | | | 1,483,284 | | | | 1,762,074 | | | | 1,720,000 | |
Flint Group GmbH, EURIBOR + 4.250%, PIK(a) | | | 5.75 | | | | 9/21/2023 | | | | 114,862 | | | | 136,827 | | | | 133,193 | |
Flint Group GmbH, 3M LIBOR + 4.250%, PIK(a) | | | 6.00 | | | | 9/21/2023 | | | | 70,930 | | | | 70,576 | | | | 70,930 | |
Flint Group US LLC, 3M LIBOR + 4.250%, PIK(a) | | | 6.00 | | | | 9/21/2023 | | | | 429,070 | | | | 426,924 | | | | 429,070 | |
Gemini HDPE LLC, 3M LIBOR + 3.000% | | | 3.50 | | | | 12/31/2027 | | | | 110,596 | | | | 109,606 | | | | 110,596 | |
GEON Performance Solutions, LLC, 3M LIBOR + 4.750% | | | 5.50 | | | | 8/18/2028 | | | | 371,945 | | | | 369,163 | | | | 374,385 | |
Solenis Holdings LLC, 1M LIBOR + 4.000% | | | 4.08 | | | | 6/26/2025 | | | | 239,076 | | | | 237,790 | | | | 238,951 | |
Solenis Holdings LLC, 3M LIBOR + 3.750% | | | 4.25 | | | | 9/21/2028 | | | | 338,515 | | | | 337,669 | | | | 338,021 | |
Solenis Holdings LLC, 1M LIBOR + 8.500% | | | 8.58 | | | | 6/26/2026 | | | | 47,145 | | | | 46,307 | | | | 47,057 | |
| | | | | | | | | | | | | | | | | | | | |
Total Chemicals, Plastics and Rubber | | | | | | | | | | | 3,205,423 | | | | 3,496,936 | | | | 3,462,203 | |
| | | | | | | | | | | | | | | | | | | | |
|
Containers, Packaging and Glass — 1.4%*: | |
Albea Beauty Holdings S.A., 3M LIBOR + 3.000%(a) | | | 4.00 | | | | 4/22/2024 | | | | 66,561 | | | | 66,525 | | | | 64,024 | |
BWAY Holding Co., 1M LIBOR + 3.250% | | | 3.33 | | | | 4/3/2024 | | | | 1,292,206 | | | | 1,292,039 | | | | 1,264,540 | |
CCP Lux Holding S.a. r.l., 3M LIBOR + 4.250%(a) | | | 4.25 | | | | 1/10/2025 | | | | 874,946 | | | | 988,415 | | | | 1,014,507 | |
Reynolds Group Holdings Inc., 1M LIBOR + 3.500% | | | 4.00 | | | | 9/20/2028 | | | | 181,940 | | | | 181,031 | | | | 181,667 | |
| | | | | | | | | | | | | | | | | | | | |
Total Containers, Packaging and Glass | | | | | | | | | | | 2,415,653 | | | | 2,528,010 | | | | 2,524,738 | |
| | | | | | | | | | | | | | | | | | | | |
See accompanying Notes to the Financial Statements.
59
Barings Global Credit Income Opportunities Fund 2021 Annual Report
SCHEDULE OF INVESTMENTS (CONTINUED)
September 30, 2021
| | | | | | | | | | | | | | | | | | | | |
| | | EFFECTIVE
INTEREST RATE | | | DUE DATE | | | PRINCIPAL ‡‡ | | | COST | | | FAIR
VALUE | |
Bank Loans (Continued) | |
|
Diversified/Conglomerate Manufacturing — 1.4%*: | |
Alison Bidco S.a.r.l., 3M LIBOR + 5.500%, PIK(a) | | | 6.50 | % | | | 8/29/2023 | | | | 315,269 | | | $ | 309,266 | | | $ | 226,993 | |
Alison Bidco S.a.r.l., 3M LIBOR + 5.500%, PIK(a) | | | 9.00 | | | | 8/29/2023 | | | | 315,268 | | | | 309,266 | | | | 226,993 | |
Amer Sports Oyj, EURIBOR + 4.500%(a) | | | 4.50 | | | | 3/30/2026 | | | | 600,000 | | | | 668,069 | | | | 694,850 | |
Grinding Media Inc., 3M LIBOR + 4.000% | | | 4.75 | | | | 9/22/2028 | | | | 299,015 | | | | 297,520 | | | | 299,389 | |
Illuminate Merger Corp., 3M LIBOR + 3.500% | | | 4.00 | | | | 7/21/2028 | | | | 360,656 | | | | 358,893 | | | | 360,281 | |
LTI Holdings, Inc., 1M LIBOR + 3.500% | | | 3.58 | | | | 9/6/2025 | | | | 737,088 | | | | 728,421 | | | | 726,150 | |
| | | | | | | | | | | | | | | | | | | | |
Total Diversified/Conglomerate Manufacturing | | | | | | | | | | | 2,627,296 | | | | 2,671,435 | | | | 2,534,656 | |
| | | | | | | | | | | | | | | | | | | | |
|
Diversified/Conglomerate Service — 6.1%*: | |
APX Group, Inc., 1M LIBOR + 3.500% | | | 4.00 | | | | 7/10/2028 | | | | 485,075 | | | | 482,720 | | | | 483,406 | |
Cloudera, Inc., 3M LIBOR + 3.750% | | | 4.25 | | | | 8/10/2028 | | | | 934,579 | | | | 925,234 | | | | 932,832 | |
Cloudera, Inc., 3M LIBOR + 6.000% | | | 6.50 | | | | 8/10/2029 | | | | 566,667 | | | | 563,833 | | | | 563,833 | |
CoreLogic, Inc., 1M LIBOR + 6.500% | | | 7.00 | | | | 6/4/2029 | | | | 355,114 | | | | 351,755 | | | | 362,216 | |
Cvent, Inc., 1M LIBOR + 3.750% | | | 3.83 | | | | 11/29/2024 | | | | 488,499 | | | | 438,678 | | | | 486,286 | |
Finastra USA, Inc., 6M LIBOR + 3.500% | | | 4.50 | | | | 6/13/2024 | | | | 806,503 | | | | 807,678 | | | | 799,526 | |
Hyland Software, Inc., 1M LIBOR + 3.500% | | | 4.25 | | | | 7/1/2024 | | | | 473,716 | | | | 470,967 | | | | 473,963 | |
Hyland Software, Inc., 1M LIBOR + 6.250% | | | 7.00 | | | | 7/7/2025 | | | | 250,909 | | | | 250,909 | | | | 253,104 | |
IGT Holding IV AB, 3M LIBOR + 3.750%(a) | | | 4.25 | | | | 3/31/2028 | | | | 457,471 | | | | 456,358 | | | | 457,759 | |
Innovation Group plc (The), 3M LIBOR + 6.000%(a),(b) | | | 6.00 | | | | 9/30/2025 | | | | 178,951 | | | | 86,107 | | | | 93,694 | |
Innovation Group plc (The), 3M LIBOR + 6.000%(a),(b) | | | 6.33 | | | | 9/30/2025 | | | | 66,929 | | | | 44,536 | | | | 40,762 | |
Innovation Group plc (The), 3M LIBOR +
10.000%(a),(b) | | | 10.08 | | | | 9/30/2025 | | | | 28,430 | | | | 38,913 | | | | 38,306 | |
Innovation Group plc (The), 3M LIBOR +
10.000%(a),(b) | | | 10.33 | | | | 9/30/2025 | | | | 29,894 | | | | 40,920 | | | | 40,279 | |
Mitchell International, Inc., 1M LIBOR + 3.250% | | | 3.33 | | | | 11/29/2024 | | | | 977,215 | | | | 932,577 | | | | 975,388 | |
Proofpoint, Inc., 3M LIBOR + 3.250% | | | 3.75 | | | | 8/31/2028 | | | | 465,116 | | | | 462,807 | | | | 462,558 | |
Redstone Buyer LLC, 3M LIBOR + 4.750% | | | 5.50 | | | | 4/27/2028 | | | | 555,144 | | | | 551,386 | | | | 545,429 | |
Sabre GLBL Inc., 1M LIBOR + 3.500% | | | 4.00 | | | | 12/17/2027 | | | | 789,313 | | | | 787,398 | | | | 784,625 | |
SITEL Worldwide Corp., 3M LIBOR + 3.750% | | | 4.25 | | | | 8/28/2028 | | | | 687,679 | | | | 684,281 | | | | 688,539 | |
Spin Holdco Inc., 3M LIBOR + 4.000% | | | 4.75 | | | | 3/4/2028 | | | | 695,283 | | | | 690,485 | | | | 696,945 | |
TMF Group Holding B.V., EURIBOR + 6.875%(a) | | | 6.88 | | | | 5/4/2026 | | | | 500,000 | | | | 545,795 | | | | 582,436 | |
USIC Holdings, Inc., 1M LIBOR + 3.500% | | | 4.25 | | | | 5/12/2028 | | | | 261,968 | | | | 260,710 | | | | 261,641 | |
USIC Holdings, Inc., 1M LIBOR + 6.500% | | | 7.25 | | | | 5/7/2029 | | | | 147,059 | | | | 145,639 | | | | 148,835 | |
Vision Solutions, Inc., 3M LIBOR + 4.250% | | | 5.00 | | | | 4/23/2028 | | | | 904,110 | | | | 899,852 | | | | 901,705 | |
| | | | | | | | | | | | | | | | | | | | |
Total Diversified/Conglomerate Service | | | | | | | | | | | 11,105,624 | | | | 10,919,538 | | | | 11,074,067 | |
| | | | | | | | | | | | | | | | | | | | |
See accompanying Notes to the Financial Statements.
60
Barings Global Credit Income Opportunities Fund 2021 Annual Report
SCHEDULE OF INVESTMENTS (CONTINUED)
September 30, 2021
| | | | | | | | | | | | | | | | | | | | |
| | | EFFECTIVE
INTEREST RATE | | | DUE DATE | | | PRINCIPAL ‡‡ | | | COST | | | FAIR
VALUE | |
Bank Loans (Continued) | |
|
Electronics — 2.5%*: | |
Ahead Data Blue LLC, 3M LIBOR + 3.750% | | | 4.50 | % | | | 10/18/2027 | | | | 237,899 | | | $ | 238,733 | | | $ | 238,691 | |
ION Trading Finance Ltd., 3M LIBOR + 4.750% | | | 4.92 | | | | 4/1/2028 | | | | 999,445 | | | | 996,946 | | | | 1,000,574 | |
Ivanti Software, Inc., 3M LIBOR + 4.750% | | | 5.75 | | | | 12/1/2027 | | | | 528,262 | | | | 521,261 | | | | 529,170 | |
McAfee Enterprise, 3M LIBOR + 5.000% | | | 5.75 | | | | 7/27/2028 | | | | 764,423 | | | | 756,950 | | | | 764,186 | |
Polaris Newco LLC, 6M LIBOR + 4.000% | | | 4.50 | | | | 6/2/2028 | | | | 595,002 | | | | 592,152 | | | | 596,121 | |
Sovos Compliance, LLC, 3M LIBOR + 4.500% | | | 5.00 | | | | 8/11/2028 | | | | 308,219 | | | | 307,463 | | | | 309,890 | |
Tibco Software Inc., 1M LIBOR + 3.750% | | | 3.83 | | | | 6/30/2026 | | | | 987,500 | | | | 960,747 | | | | 979,481 | |
Tibco Software Inc., 1M LIBOR + 7.250% | | | 7.34 | | | | 3/3/2028 | | | | 146,642 | | | | 146,052 | | | | 148,036 | |
| | | | | | | | | | | | | | | | | | | | |
Total Electronics | | | | | | | | | | | 4,567,392 | | | | 4,520,304 | | | | 4,566,149 | |
| | | | | | | | | | | | | | | | | | | | |
|
Finance — 1.3%*: | |
Aqgen Ascensus, Inc., 3M LIBOR + 6.500% | | | 7.00 | | | | 8/2/2029 | | | | 250,358 | | | | 247,900 | | | | 247,854 | |
Deerfield Dakota Holding LLC, 1M LIBOR + 6.750% | | | 7.50 | | | | 4/7/2028 | | | | 410,077 | | | | 411,997 | | | | 422,380 | |
Ensono, LP, 1M LIBOR + 4.000% | | | 4.75 | | | | 5/19/2028 | | | | 564,972 | | | | 559,591 | | | | 565,796 | |
Skopima Merger Sub Inc., 1M LIBOR + 4.000% | | | 4.50 | | | | 5/12/2028 | | | | 641,711 | | | | 635,636 | | | | 637,540 | |
Zera uyer LLC, 3M LIBOR + 3.250% | | | 3.75 | | | | 4/21/2028 | | | | 456,621 | | | | 454,338 | | | | 457,845 | |
| | | | | | | | | | | | | | | | | | | | |
Total Finance | | | | | | | | | | | 2,323,739 | | | | 2,309,462 | | | | 2,331,415 | |
| | | | | | | | | | | | | | | | | | | | |
|
Healthcare, Education and Childcare — 6.9%*: | |
Advanz Pharma Corp., EURIBOR + 5.000%(a) | | | 5.00 | | | | 6/1/2028 | | | | 1,000,000 | | | | 1,200,448 | | | | 1,160,620 | |
Aenova Holding GmbH, EURIBOR + 4.500%(a) | | | 4.50 | | | | 3/6/2026 | | | | 500,000 | | | | 590,814 | | | | 581,347 | |
Auris Luxembourg III S.a.r.l., EURIBOR + 4.000%(a) | | | 4.00 | | | | 2/27/2026 | | | | 1,000,000 | | | | 1,111,762 | | | | 1,155,095 | |
Eagle Bidco Ltd., LIBOR – GBP + 3.750%(a) | | | 4.80 | | | | 3/10/2028 | | | | 500,000 | | | | 693,142 | | | | 671,598 | |
Endo Luxembourg Finance Co. I S.a r.l., 3M LIBOR + 5.000% | | | 6.00 | | | | 3/27/2028 | | | | 603,858 | | | | 602,875 | | | | 589,432 | |
Fugue Finance B.V., EURIBOR + 3.250%(a) | | | 3.25 | | | | 9/1/2024 | | | | 750,000 | | | | 858,848 | | | | 851,570 | |
Hunter Holdco 3 Ltd., 3M LIBOR + 4.250% | | | 4.75 | | | | 8/19/2028 | | | | 653,595 | | | | 647,151 | | | | 656,046 | |
Iris idco GmBH, EURIBOR + 5.000%(a) | | | 5.00 | | | | 5/31/2028 | | | | 500,000 | | | | 594,130 | | | | 579,899 | |
Jazz Financing Lux S.a.r.l., 1M LIBOR + 3.500% | | | 4.00 | | | | 5/5/2028 | | | | 825,517 | | | | 821,618 | | | | 826,450 | |
Lernen Bidco Ltd., EURIBOR + 4.250%(a) | | | 4.25 | | | | 10/25/2025 | | | | 1,000,000 | | | | 1,185,757 | | | | 1,146,767 | |
Lifescan Global Corp., 3M LIBOR + 6.000% | | | 6.15 | | | | 10/1/2024 | | | | 152,939 | | | | 150,635 | | | | 151,537 | |
Organon & Co., 3M LIBOR + 3.000% | | | 3.50 | | | | 6/2/2028 | | | | 448,718 | | | | 446,571 | | | | 449,440 | |
Padagis LLC, 3M LIBOR + 4.750% | | | 5.25 | | | | 7/6/2028 | | | | 645,161 | | | | 638,897 | | | | 645,161 | |
Radiology Partners, Inc., 1M LIBOR + 4.250% | | | 4.33 | | | | 7/9/2025 | | | | 1,000,000 | | | | 938,039 | | | | 998,750 | |
RegionalCare Hospital Partners Holdings, Inc., 1M LIBOR + 3.750% | | | 3.83 | | | | 11/16/2025 | | | | 413,275 | | | | 415,285 | | | | 412,502 | |
Sunshine Luxembourg VII SARL, 3M LIBOR + 3.750%(a) | | | 4.50 | | | | 10/1/2026 | | | | 150,189 | | | | 149,847 | | | | 150,564 | |
Tunstall Group Holdings Ltd., EURIBOR +
5.000%(a) | | | 5.00 | | | | 8/3/2025 | | | | 282,314 | | | | 332,128 | | | | 319,932 | |
U.S. Anesthesia Partners, Inc., 3M LIBOR + 3.000% | | | 4.00 | | | | 6/23/2024 | | | | 485,983 | | | | 486,731 | | | | 485,832 | |
See accompanying Notes to the Financial Statements.
61
Barings Global Credit Income Opportunities Fund 2021 Annual Report
SCHEDULE OF INVESTMENTS (CONTINUED)
September 30, 2021
| | | | | | | | | | | | | | | | | | | | |
| | | EFFECTIVE
INTEREST RATE | | | DUE DATE | | | PRINCIPAL ‡‡ | | | COST | | | FAIR
VALUE | |
Bank Loans (Continued) | |
|
Healthcare, Education and Childcare (Continued) | |
U.S. Anesthesia Partners, Inc., 3M LIBOR + 4.250% | | | 4.75 | % | | | 10/1/2028 | | | | 570,046 | | | | $567,196 | | | | $570,667 | |
| | | | | | | | | | | | | | | | | | | | |
Total Healthcare, Education and Childcare | | | | | | | | | | | 11,481,595 | | | | 12,431,874 | | | | 12,403,209 | |
| | | | | | | | | | | | | | | | | | | | |
|
Home and Office Furnishings, Housewares, and Durable Consumer Products — 1.3%*: | |
ACProducts, Inc., 3M LIBOR + 4.250% | | | 4.75 | | | | 5/17/2028 | | | | 738,889 | | | | 731,877 | | | | 737,175 | |
Hilding Anders International AB, 3M LIBOR + 5.000%(a) | | | 5.75 | | | | 11/30/2024 | | | | 506,333 | | | | 482,831 | | | | 495,601 | |
Serta Simmons Bedding LLC, 1M LIBOR + 7.500% | | | 8.50 | | | | 8/10/2023 | | | | 1,063,006 | | | | 1,063,006 | | | | 1,008,761 | |
| | | | | | | | | | | | | | | | | | | | |
Total Home and Office Furnishings, Housewares, and Durable Consumer Products | | | | | | | | | | | 2,308,228 | | | | 2,277,714 | | | | 2,241,537 | |
| | | | | | | | | | | | | | | | | | | | |
|
Hotels, Motels, Inns and Gaming — 2.2%*: | |
Caesars Resort Collection LLC, 3M LIBOR + 3.500% | | | 3.58 | | | | 7/21/2025 | | | | 248,200 | | | | 242,533 | | | | 248,289 | |
Casper BidCo SAS, EURIBOR + 3.875%(a) | | | 3.88 | | | | 7/31/2026 | | | | 500,000 | | | | 542,693 | | | | 558,724 | |
Hilton Grand Vacations Borrower LLC, 1M LIBOR + 3.000% | | | 3.50 | | | | 8/2/2028 | | | | 358,745 | | | | 356,978 | | | | 359,552 | |
HNVR Holdco Ltd., EURIBOR + 4.250%(a) | | | 4.25 | | | | 9/12/2025 | | | | 1,000,000 | | | | 978,407 | | | | 1,050,936 | |
Motel 6, 1M LIBOR + 5.000% | | | 5.75 | | | | 9/9/2026 | | | | 180,723 | | | | 178,931 | | | | 181,175 | |
Richmond UK Bidco Ltd., LIBOR – GBP +
4.250%(a) | | | 4.41 | | | | 3/3/2024 | | | | 550,000 | | | | 675,927 | | | | 726,019 | |
Twin River Worldwide Holdings, Inc., 3M LIBOR + 3.250% | | | 3.75 | | | | 8/6/2028 | | | | 783,085 | | | | 775,329 | | | | 782,545 | |
| | | | | | | | | | | | | | | | | | | | |
Total Hotels, Motels, Inns and Gaming | | | | | | | | | | | 3,620,753 | | | | 3,750,798 | | | | 3,907,240 | |
| | | | | | | | | | | | | | | | | | | | �� |
|
Insurance — 1.0%*: | |
Acrisure LLC, 3M LIBOR + 3.500% | | | 3.63 | | | | 2/15/2027 | | | | 493,734 | | | | 474,616 | | | | 488,693 | |
Asurion LLC, 1M LIBOR + 3.125% | | | 3.21 | | | | 11/3/2023 | | | | 568,488 | | | | 554,794 | | | | 564,935 | |
Asurion LLC, 1M LIBOR + 5.250% | | | 5.33 | | | | 1/20/2029 | | | | 775,862 | | | | 768,271 | | | | 771,789 | |
| | | | | | | | | | | | | | | | | | | | |
Total Insurance | | | | | | | | | | | 1,838,084 | | | | 1,797,681 | | | | 1,825,417 | |
| | | | | | | | | | | | | | | | | | | | |
|
Leisure, Amusement, Entertainment — 5.2%*: | |
AMC Entertainment Holdings, Inc., 1M LIBOR + 3.000% | | | 3.08 | | | | 4/22/2026 | | | | 2,321,915 | | | | 2,026,158 | | | | 2,149,071 | |
City Football Group Ltd., 3M LIBOR + 3.500%(a) | | | 4.00 | | | | 7/21/2028 | | | | 927,835 | | | | 923,303 | | | | 923,196 | |
Crown Finance US, Inc., 6M LIBOR + 2.500% | | | 3.50 | | | | 2/28/2025 | | | | 1,223,723 | | | | 1,207,538 | | | | 1,005,827 | |
Crown Finance US, Inc., 3M LIBOR + 8.250% | | | 9.25 | | | | 5/23/2024 | | | | 70,130 | | | | 67,637 | | | | 74,864 | |
Dorna Sports, S.L., 6M LIBOR + 3.250%(a) | | | 3.51 | | | | 5/3/2024 | | | | 400,000 | | | | 400,000 | | | | 394,332 | |
International Park Holdings B.V., EURIBOR + 3.500%(a) | | | 3.50 | | | | 6/13/2024 | | | | 500,000 | | | | 562,901 | | | | 560,531 | |
See accompanying Notes to the Financial Statements.
62
Barings Global Credit Income Opportunities Fund 2021 Annual Report
SCHEDULE OF INVESTMENTS (CONTINUED)
September 30, 2021
| | | | | | | | | | | | | | | | | | | | |
| | | EFFECTIVE
INTEREST RATE | | | DUE DATE | | | PRINCIPAL ‡‡ | | | COST | | | FAIR
VALUE | |
Bank Loans (Continued) | |
|
Leisure, Amusement, Entertainment (continued) | |
Metro-Goldwyn-Mayer, Inc., 1M LIBOR + 4.500% | | | 5.50 | % | | | 7/3/2026 | | | | 893,847 | | | $ | 888,494 | | | $ | 892,729 | |
Motion Finco Sarl, EURIBOR + 3.000%(a) | | | 3.00 | | | | 11/12/2026 | | | | 750,000 | | | | 866,708 | | | | 836,271 | |
Odeon Cinemas Group Ltd., EURIBOR, PIK(a) | | | 10.75 | | | | 8/19/2023 | | | | 172,416 | | | | 212,923 | | | | 214,384 | |
Parques Reunidos SAU, EURIBOR + 3.750%(a) | | | 3.75 | | | | 9/16/2026 | | | | 500,000 | | | | 572,951 | | | | 553,216 | |
PUG LLC, 1M LIBOR + 3.500% | | | 3.58 | | | | 2/12/2027 | | | | 366,339 | | | | 364,931 | | | | 357,943 | |
Vacalians Group, EURIBOR + 4.000%(a) | | | 4.00 | | | | 11/28/2025 | | | | 330,783 | | | | 329,437 | | | | 365,920 | |
Vue International Bidco plc, EURIBOR + 4.750%(a) | | | 4.75 | | | | 7/3/2026 | | | | 1,000,000 | | | | 1,116,504 | | | | 1,088,362 | |
| | | | | | | | | | | | | | | | | | | | |
Total Leisure, Amusement, Entertainment | | | | | | | | | | | 9,456,988 | | | | 9,539,485 | | | | 9,416,646 | |
| | | | | | | | | | | | | | | | | | | | |
|
Machinery Non-Agriculture, Non-Construction, Non-Electronic — 0.7%*: | |
Madison IAQ LLC, 3M LIBOR + 3.250% | | | 3.75 | | | | 6/21/2028 | | | | 383,654 | | | | 381,806 | | | | 383,013 | |
Titan Acquisition Ltd., 3M LIBOR + 3.000%(a) | | | 3.17 | | | | 3/28/2025 | | | | 952,057 | | | | 952,659 | | | | 934,101 | |
| | | | | | | | | | | | | | | | | | | | |
Total Machinery Non-Agriculture, Non-Construction, Non-Electronic | | | | | | | | | | | 1,335,711 | | | | 1,334,465 | | | | 1,317,114 | |
| | | | | | | | | | | | | | | | | | | | |
|
Mining, Steel, Iron and Non-Precious Metals — 0.0%*: | |
Boomerang Tube LLC, 3M LIBOR + 5.000%(b) | | | 5.15 | | | | 6/30/2022 | | | | 129,368 | | | | 129,368 | | | | – | |
| | | | | | | | | | | | | | | | | | | | |
|
Oil and Gas — 0.7%*: | |
Gulf Finance LLC, 3M LIBOR + 5.250% | | | 6.25 | | | | 8/25/2023 | | | | 1,255,664 | | | | 1,226,766 | | | | 1,204,910 | |
| | | | | | | | | | | | | | | | | | | | |
|
Personal and Non-Durable Consumer Products Mfg. Only — 0.8%*: | |
Coty Inc., EURIBOR + 1.750% | | | 1.75 | | | | 4/5/2023 | | | | 43,224 | | | | 50,983 | | | | 49,756 | |
Coty Inc., 1M LIBOR + 2.250% | | | 2.33 | | | | 4/7/2025 | | | | 725,567 | | | | 708,189 | | | | 711,513 | |
Triton Water Holdings, Inc., 3M LIBOR + 3.500% | | | 4.00 | | | | 3/31/2028 | | | | 693,642 | | | | 690,413 | | | | 692,344 | |
| | | | | | | | | | | | | | | | | | | | |
Total Personal and Non-Durable Consumer Products Mfg. Only | | | | | | | | | | | 1,462,433 | | | | 1,449,585 | | | | 1,453,613 | |
| | | | | | | | | | | | | | | | | | | | |
|
Personal Transportation — 0.7%*: | |
Air Canada, 3M LIBOR + 3.500%(a) | | | 4.25 | | | | 8/11/2028 | | | | 353,714 | | | | 350,229 | | | | 354,892 | |
First Student Bidco, Inc., 2M LIBOR + 3.000% | | | 3.50 | | | | 7/21/2028 | | | | 860,215 | | | | 856,024 | | | | 855,054 | |
Naviera Armas SA, EURIBOR + 2.500%(a),(b) | | | 4.31 | | | | 10/31/2021 | | | | 5,525 | | | | 6,683 | | | | 6,400 | |
Naviera Armas SA, EURIBOR + 2.500%, PIK(a),(b) | | | 5.00 | | | | 10/31/2021 | | | | 43,147 | | | | 50,571 | | | | 49,979 | |
Naviera Armas SA, EURIBOR + 2.500%, PIK(a),(b) | | | 5.00 | | | | 10/31/2021 | | | | 29,283 | | | | 35,701 | | | | 33,920 | |
| | | | | | | | | | | | | | | | | | | | |
Total Personal Transportation | | | | | | | | | | | 1,291,884 | | | | 1,299,208 | | | | 1,300,245 | |
| | | | | | | | | | | | | | | | | | | | |
|
Printing and Publishing — 0.4%*: | |
Cimpress Public Ltd. Co., 1M LIBOR + 3.500% | | | 4.00 | | | | 5/17/2028 | | | | 980 | | | | 406 | | | | 980 | |
Houghton Mifflin Harcourt Publishing Co., 1M LIBOR + 6.250% | | | 7.25 | | | | 11/22/2024 | | | | 32,348 | | | | 31,529 | | | | 32,297 | |
Sylvamo Corp., 3M LIBOR + 4.500% | | | 5.00 | | | | 8/18/2028 | | | | 669,456 | | | | 662,761 | | | | 666,946 | |
| | | | | | | | | | | | | | | | | | | | |
Total Printing and Publishing | | | | | | | | | | | 702,784 | | | | 694,696 | | | | 700,223 | |
| | | | | | | | | | | | | | | | | | | | |
See accompanying Notes to the Financial Statements.
63
Barings Global Credit Income Opportunities Fund 2021 Annual Report
SCHEDULE OF INVESTMENTS (CONTINUED)
September 30, 2021
| | | | | | | | | | | | | | | | | | | | |
| | | EFFECTIVE
INTEREST RATE | | | DUE DATE | | | PRINCIPAL ‡‡ | | | COST | | | FAIR
VALUE | |
Bank Loans (Continued) | |
|
Retail Stores — 1.8%*: | |
Casino Guichard-Perrachon SA, EURIBOR + 4.000%(a) | | | 4.00 | % | | | 8/31/2025 | | | | 500,000 | | | $ | 584,535 | | | $ | 579,835 | |
Great Outdoors Group LLC, 3M LIBOR + 4.250% | | | 5.00 | | | | 3/5/2028 | | | | 612,900 | | | | 610,080 | | | | 614,739 | |
Mattress Firm, Inc., 3M LIBOR + 4.250% | | | 5.00 | | | | 9/25/2028 | | | | 773,196 | | | | 765,467 | | | | 771,750 | |
Michaels Cos., Inc., 3M LIBOR + 4.250% | | | 5.00 | | | | 4/15/2028 | | | | 603,641 | | | | 597,995 | | | | 603,912 | |
Petco Health and Wellness Company, Inc., 3M LIBOR + 3.250% | | | 4.00 | | | | 3/3/2028 | | | | 728,049 | | | | 726,374 | | | | 727,787 | |
| | | | | | | | | | | | | | | | | | | | |
Total Retail Stores | | | | | | | | | | | 3,217,786 | | | | 3,284,451 | | | | 3,298,023 | |
| | | | | | | | | | | | | | | | | | | | |
|
Telecommunications — 1.9%*: | |
Banff Merger Sub, Inc., 3M LIBOR + 5.500% | | | 6.00 | | | | 2/27/2026 | | | | 170,377 | | | | 169,525 | | | | 172,294 | |
ION Trading Technologies S.a.r.l., EURIBOR + 4.250% | | | 4.25 | | | | 3/26/2028 | | | | 498,750 | | | | 588,500 | | | | 578,178 | |
Lorca Finco plc, EURIBOR + 4.250%(a) | | | 4.25 | | | | 9/17/2027 | | | | 500,000 | | | | 581,694 | | | | 579,563 | |
Syniverse Holdings, Inc., 3M LIBOR + 5.000% | | | 6.00 | | | | 3/9/2023 | | | | 193,575 | | | | 193,018 | | | | 193,426 | |
Syniverse Technologies, Inc., 3M LIBOR + 9.000% | | | 10.00 | | | | 3/11/2024 | | | | 153,729 | | | | 152,789 | | | | 153,652 | |
Virgin Media SFA Finance Ltd., LIBOR—GBP + 3.250%(a) | | | 3.30 | | | | 1/15/2027 | | | | 1,000,000 | | | | 1,218,506 | | | | 1,327,647 | |
Voyage Australia Pty Ltd., 3M LIBOR + 3.500%(a) | | | 4.00 | | | | 7/20/2028 | | | | 484,849 | | | | 480,122 | | | | 484,243 | |
| | | | | | | | | | | | | | | | | | | | |
Total Telecommunications | | | | | | | | | | | 3,001,280 | | | | 3,384,154 | | | | 3,489,003 | |
| | | | | | | | | | | | | | | | | | | | |
| | | | | | | | | | | | | | | | | | | | |
Total Bank Loans | | | | | | | | | | | 77,575,337 | | | | 79,265,007 | | | | 79,433,097 | |
| | | | | | | | | | | | | | | | | | | | |
|
Corporate Bonds — 40.1%*: | |
|
Aerospace and Defense — 1.4%*: | |
American Airlines Inc/AAdvantage Loyalty IP Ltd.(c) | | | 5.50 | | | | 4/20/2026 | | | | 595,000 | | | | 595,000 | | | | 625,494 | |
American Airlines Inc/AAdvantage Loyalty IP Ltd.(c) | | | 5.75 | | | | 4/20/2029 | | | | 114,000 | | | | 114,000 | | | | 122,841 | |
Gatwick Airport Finance(a) | | | 4.38 | | | | 4/7/2026 | | | | 350,000 | | | | 482,510 | | | | 478,093 | |
Heathrow Finance plc(a) | | | 4.38 | | | | 3/1/2027 | | | | 100,000 | | | | 130,392 | | | | 136,839 | |
Heathrow Finance plc(a) | | | 5.25 | | | | 3/1/2024 | | | | 100,000 | | | | 128,654 | | | | 140,803 | |
Triumph Group, Inc.(c) | | | 6.25 | | | | 9/15/2024 | | | | 308,000 | | | | 308,000 | | | | 307,837 | |
Triumph Group, Inc. | | | 7.75 | | | | 8/15/2025 | | | | 750,000 | | | | 777,233 | | | | 740,625 | |
| | | | | | | | | | | | | | | | | | | | |
Total Aerospace and Defense | | | | | | | | | | | 2,317,000 | | | | 2,535,789 | | | | 2,552,532 | |
| | | | | | | | | | | | | | | | | | | | |
|
Automobile — 0.7%*: | |
Clarios Global LP/Clarios US Finance Co.(c) | | | 8.50 | | | | 5/15/2027 | | | | 162,000 | | | | 169,616 | | | | 172,328 | |
Ford Motor Co. | | | 7.45 | | | | 7/16/2031 | | | | 500,000 | | | | 579,897 | | | | 650,000 | |
Ford Motor Co. | | | 9.63 | | | | 4/22/2030 | | | | 127,000 | | | | 153,130 | | | | 180,062 | |
Mclaren Finance plc(a),(c) | | | 7.50 | | | | 8/1/2026 | | | | 250,000 | | | | 251,847 | | | | 253,062 | |
| | | | | | | | | | | | | | | | | | | | |
Total Automobile | | | | | | | | | | | 1,039,000 | | | | 1,154,490 | | | | 1,255,452 | |
| | | | | | | | | | | | | | | | | | | | |
See accompanying Notes to the Financial Statements.
64
Barings Global Credit Income Opportunities Fund 2021 Annual Report
SCHEDULE OF INVESTMENTS (CONTINUED)
September 30, 2021
| | | | | | | | | | | | | | | | | | | | |
| | | EFFECTIVE
INTEREST RATE | | | DUE DATE | | | PRINCIPAL ‡‡ | | | COST | | | FAIR
VALUE | |
Corporate Bonds (Continued) | |
|
Automobiles — 0.2%*: | |
Aston Martin Capital Holdings Ltd.(a),(c) | | | 10.50 | % | | | 11/30/2025 | | | | 400,000 | | | $ | 431,931 | | | $ | 445,500 | |
| | | | | | | | | | | | | | | | | | | | |
|
Banking — 2.9%*: | |
Absa Group Ltd., 5 year CMT + 5.411%(a) | | | 6.38 | (d),(f) | | | – | | | | 992,000 | | | | 992,000 | | | | 1,030,440 | |
Ecobank Transnational, Inc., 5 year CMT + 8.211%(a) | | | 8.75 | (d) | | | 6/17/2031 | | | | 797,000 | | | | 790,805 | | | | 806,006 | |
Nova Ljubljanska Banka dd, 5 year EUR Swap + 3.833%(a) | | | 3.65 | (d) | | | 11/19/2029 | | | | 700,000 | | | | 770,700 | | | | 795,033 | |
Piraeus Financial Holdings SA, 5 year EUR Swap + 5.774%(a) | | | 5.50 | (d) | | | 2/19/2030 | | | | 963,000 | | | | 1,071,672 | | | | 1,090,589 | |
Piraeus Financial Holdings SA, 5 year EUR Swap + 9.195%(a) | | | 8.75 | (d),(f) | | | – | | | | 750,000 | | | | 913,276 | | | | 881,577 | |
Piraeus Financial Holdings SA, 5 year EUR Swap + 9.952%(a) | | | 9.75 | (d) | | | 6/26/2029 | | | | 100,000 | | | | 95,029 | | | | 126,601 | |
Sovcombank Via SovCom Capital DAC, 5 year CMT + 6.380%(a) | | | 7.75 | (d),(f) | | | – | | | | 500,000 | | | | 512,579 | | | | 515,750 | |
| | | | | | | | | | | | | | | | | | | | |
Total Banking | | | | | | | | | | | 4,802,000 | | | | 5,146,061 | | | | 5,245,996 | |
| | | | | | | | | | | | | | | | | | | | |
|
Beverage, Food and Tobacco — 2.4%*: | |
Boparan Finance plc(a) | | | 7.63 | | | | 11/30/2025 | | | | 650,000 | | | | 894,995 | | | | 770,713 | |
Eurotorg LLC Via Bonitron DAC(a) | | | 9.00 | | | | 10/22/2025 | | | | 482,000 | | | | 482,000 | | | | 502,485 | |
Foodco Bondco SA(a) | | | 6.25 | | | | 5/15/2026 | | | | 350,000 | | | | 396,616 | | | | 383,996 | |
JBS USA LUX SA / JBS USA Food Co. / JBS USA Finance, Inc.(c) | | | 3.75 | | | | 12/1/2031 | | | | 150,000 | | | | 150,000 | | | | 156,080 | |
JBS USA LUX SA/JBS USA Finance, Inc.(c) | | | 6.75 | | | | 2/15/2028 | | | | 500,000 | | | | 500,000 | | | | 542,505 | |
JBS USA LUX SA/JBS USA Food Co./JBS USA Finance, Inc.(c) | | | 5.50 | | | | 1/15/2030 | | | | 586,000 | | | | 585,512 | | | | 651,761 | |
Picard Groupe SAS, EURIBOR + 4.000%(a) | | | 4.00 | (d) | | | 7/1/2026 | | | | 150,000 | | | | 177,863 | | | | 174,732 | |
Sunshine Mid BV(a) | | | 6.50 | | | | 5/15/2026 | | | | 950,000 | | | | 1,154,531 | | | | 1,134,865 | |
| | | | | | | | | | | | | | | | | | | | |
Total Beverage, Food and Tobacco | | | | | | | | | | | 3,818,000 | | | | 4,341,517 | | | | 4,317,137 | |
| | | | | | | | | | | | | | | | | | | | |
|
Broadcasting and Entertainment — 1.2%*: | |
Banijay Group SAS(a) | | | 6.50 | | | | 3/1/2026 | | | | 750,000 | | | | 828,338 | | | | 905,824 | |
Clear Channel Outdoor Holdings, Inc.(c) | | | 7.50 | | | | 6/1/2029 | | | | 55,000 | | | | 55,196 | | | | 57,200 | |
DISH Network Corp. | | | 3.38 | | | | 8/15/2026 | | | | 750,000 | | | | 696,569 | | | | 779,625 | |
Terrier Media Buyer, Inc.(c) | | | 8.88 | | | | 12/15/2027 | | | | 376,000 | | | | 376,000 | | | | 397,575 | |
| | | | | | | | | | | | | | | | | | | | |
Total Broadcasting and Entertainment | | | | | | | | | | | 1,931,000 | | | | 1,956,103 | | | | 2,140,224 | |
| | | | | | | | | | | | | | | | | | | | |
|
Buildings and Real Estate — 2.6%*: | |
China Aoyuan Group Ltd.(a) | | | 5.98 | | | | 8/18/2025 | | | | 1,152,000 | | | | 1,124,880 | | | | 881,467 | |
Kaisa Group Holdings Ltd.(a) | | | 9.95 | | | | 7/23/2025 | | | | 1,000,000 | | | | 1,000,149 | | | | 746,250 | |
Kaisa Group Holdings Ltd.(a) | | | 11.95 | | | | 10/22/2022 | | | | 1,000,000 | | | | 950,668 | | | | 848,800 | |
Service Properties Trust | | | 4.75 | | | | 10/1/2026 | | | | 500,000 | | | | 492,460 | | | | 495,000 | |
State Agency of Roads of Ukraine(a) | | | 6.25 | | | | 6/24/2028 | | | | 500,000 | | | | 500,000 | | | | 493,750 | |
Times China Holdings Ltd.(a) | | | 5.55 | | | | 6/4/2024 | | | | 357,000 | | | | 357,000 | | | | 329,314 | |
See accompanying Notes to the Financial Statements.
65
Barings Global Credit Income Opportunities Fund 2021 Annual Report
SCHEDULE OF INVESTMENTS (CONTINUED)
September 30, 2021
| | | | | | | | | | | | | | | | | | | | |
| | | EFFECTIVE
INTEREST RATE | | | DUE DATE | | | PRINCIPAL ‡‡ | | | COST | | | FAIR
VALUE | |
Corporate Bonds (Continued) | |
|
Buildings and Real Estate (Continued) | |
Yuzhou Group Holdings Co. Ltd.(a) | | | 8.50 | % | | | 2/4/2023 | | | | 1,000,000 | | | $ | 978,996 | | | $ | 850,500 | |
| | | | | | | | | | | | | | | | | | | | |
Total Buildings and Real Estate | | | | | | | | | | | 5,509,000 | | | | 5,404,153 | | | | 4,645,081 | |
| | | | | | | | | | | | | | | | | | | | |
|
Cargo Transport — 0.3%*: | |
Ukraine Railways Via Rail Capital Markets plc(a) | | | 7.88 | | | | 7/15/2026 | | | | 500,000 | | | | 500,000 | | | | 504,312 | |
| | | | | | | | | | | | | | | | | | | | |
|
Chemicals, Plastics and Rubber — 1.2%*: | |
Braskem Idesa SAPI(a) | | | 7.45 | | | | 11/15/2029 | | | | 300,000 | | | | 299,114 | | | | 317,400 | |
Consolidated Energy Finance SA(c) | | | 6.88 | | | | 6/15/2025 | | | | 778,000 | | | | 791,948 | | | | 805,230 | |
Nobian Finance BV(a) | | | 3.63 | | | | 7/15/2026 | | | | 500,000 | | | | 596,675 | | | | 573,567 | |
Olympus Water US Holding Corp.(c) | | | 4.25 | | | | 10/1/2028 | | | | 210,000 | | | | 210,000 | | | | 206,850 | |
Olympus Water US Holding Corp. | | | 5.38 | | | | 10/1/2029 | | | | 235,000 | | | | 275,643 | | | | 269,164 | |
| | | | | | | | | | | | | | | | | | | | |
Total Chemicals, Plastics and Rubber | | | | | | | | | | | 2,023,000 | | | | 2,173,380 | | | | 2,172,211 | |
| | | | | | | | | | | | | | | | | | | | |
|
Containers, Packaging and Glass — 1.0%*: | |
Mauser Packaging Solutions Holding Co.(c) | | | 7.25 | | | | 4/15/2025 | | | | 182,000 | | | | 177,473 | | | | 180,891 | |
Titan Holdings II BV(a) | | | 5.13 | | | | 7/15/2029 | | | | 367,000 | | | | 434,767 | | | | 431,467 | |
Trident TPI Holdings, Inc.(c) | | | 9.25 | | | | 8/1/2024 | | | | 1,125,000 | | | | 1,139,134 | | | | 1,182,218 | |
| | | | | | | | | | | | | | | | | | | | |
Total Containers, Packaging and Glass | | | | | | | | | | | 1,674,000 | | | | 1,751,374 | | | | 1,794,576 | |
| | | | | | | | | | | | | | | | | | | | |
|
Diversified/Conglomerate Manufacturing — 0.2%*: | |
International Design Group SpA, EURIBOR + 4.250%(a) | | | 4.25 | (d) | | | 5/15/2026 | | | | 100,000 | | | | 120,765 | | | | 116,333 | |
Mangrove Luxco III Sarl(a) | | | 7.78 | | | | 10/9/2025 | | | | 300,000 | | | | 317,927 | | | | 324,917 | |
| | | | | | | | | | | | | | | | | | | | |
Total Diversified/Conglomerate Manufacturing | | | | | | | | | | | 400,000 | | | | 438,692 | | | | 441,250 | |
| | | | | | | | | | | | | | | | | | | | |
|
Diversified/Conglomerate Service — 1.9%*: | |
Brunello Bidco SpA(a) | | | 3.50 | | | | 2/15/2028 | | | | 150,000 | | | | 181,597 | | | | 173,579 | |
Global Infrastructure Solutions, Inc.(c) | | | 5.63 | | | | 6/1/2029 | | | | 218,000 | | | | 218,000 | | | | 222,992 | |
Iron Mountain, Inc.(c) | | | 5.25 | | | | 7/15/2030 | | | | 554,000 | | | | 552,649 | | | | 587,922 | |
Sixsigma Networks Mexico SA de CV(a) | | | 7.50 | | | | 5/2/2025 | | | | 500,000 | | | | 490,338 | | | | 486,031 | |
Summer BC Holdco A Sarl(a) | | | 9.25 | | | | 10/31/2027 | | | | 630,736 | | | | 795,116 | | | | 793,812 | |
Verisure Midholding AB(a) | | | 5.25 | | | | 2/15/2029 | | | | 800,000 | | | | 974,992 | | | | 950,662 | |
Veritas US, Inc. / Veritas Bermuda Ltd.(c) | | | 7.50 | | | | 9/1/2025 | | | | 225,000 | | | | 228,000 | | | | 234,000 | |
| | | | | | | | | | | | | | | | | | | | |
Total Diversified/Conglomerate Service | | | | | | | | | | | 3,077,736 | | | | 3,440,692 | | | | 3,448,998 | |
| | | | | | | | | | | | | | | | | | | | |
|
Ecological — 0.4%*: | |
APCOA Parking Holdings GmbH, EURIBOR + 5.000%(a) | | | 5.00 | (d) | | | 1/15/2027 | | | | 169,000 | | | | 200,012 | | | | 197,719 | |
Aydem Yenilenebilir Enerji AS(a) | | | 7.75 | | | | 2/2/2027 | | | | 500,000 | | | | 496,053 | | | | 487,000 | |
| | | | | | | | | | | | | | | | | | | | |
Total Ecological | | | | | | | | | | | 669,000 | | | | 696,065 | | | | 684,719 | |
| | | | | | | | | | | | | | | | | | | | |
|
Electronics — 0.3%*: | |
Elastic NV(c) | | | 4.13 | | | | 7/15/2029 | | | | 462,000 | | | | 462,000 | | | | 464,310 | |
| | | | | | | | | | | | | | | | | | | | |
See accompanying Notes to the Financial Statements.
66
Barings Global Credit Income Opportunities Fund 2021 Annual Report
SCHEDULE OF INVESTMENTS (CONTINUED)
September 30, 2021
| | | | | | | | | | | | | | | | | | | | |
| | | EFFECTIVE
INTEREST RATE | | | DUE DATE | | | PRINCIPAL ‡‡ | | | COST | | | FAIR
VALUE | |
Corporate Bonds (Continued) | |
|
Farming and Agriculture — 0.3%*: | |
Aragvi Finance International DAC(a) | | | 8.45 | % | | | 4/29/2026 | | | | 514,000 | | | $ | 522,415 | | | $ | 534,239 | |
| | | | | | | | | | | | | | | | | | | | |
|
Finance — 3.9%*: | |
Credito Real SAB DE CV(a) | | | 8.00 | | | | 1/21/2028 | | | | 500,000 | | | | 500,000 | | | | 425,495 | |
Ford Motor Credit Co. LLC | | | 4.13 | | | | 8/17/2027 | | | | 247,000 | | | | 247,000 | | | | 262,067 | |
Global Aircraft Leasing Co. Ltd., Cash Rate 6.50%, PIK Rate 7.25%.(c) | | | 6.50 | | | | 9/15/2024 | | | | 2,147,628 | | | | 2,147,628 | | | | 2,110,045 | |
IIFL Finance Ltd.(a) | | | 5.88 | | | | 4/20/2023 | | | | 1,555,000 | | | | 1,536,400 | | | | 1,510,246 | |
OneMain Finance Corp. | | | 5.38 | | | | 11/15/2029 | | | | 438,000 | | | | 438,000 | | | | 474,726 | |
Travelex Financing plc(a),(b),(g) | | | 8.00 | | | | 5/15/2022 | | | | 1,050,000 | | | | 1,178,949 | | | | – | |
Travelex Issuerco Ltd.(a) | | | 12.50 | | | | 8/5/2025 | | | | 870,852 | | | | 1,045,855 | | | | 1,760,079 | |
Wanda Properties Overseas Ltd.(a) | | | 7.25 | | | | 4/28/2022 | | | | 500,000 | | | | 500,000 | | | | 493,750 | |
| | | | | | | | | | | | | | | | | | | | |
Total Finance | | | | | | | | | | | 7,308,480 | | | | 7,593,832 | | | | 7,036,408 | |
| | | | | | | | | | | | | | | | | | | | |
|
Healthcare, Education and Childcare — 2.7%*: | |
Bausch Health Cos., Inc.(c) | | | 8.50 | | | | 1/31/2027 | | | | 415,000 | | | | 420,688 | | | | 445,087 | |
Bausch Health Cos., Inc.(c) | | | 9.00 | | | | 12/15/2025 | | | | 165,000 | | | | 163,592 | | | | 174,694 | |
Bausch Health Cos., Inc.(c) | | | 4.88 | | | | 6/1/2028 | | | | 238,000 | | | | 239,439 | | | | 246,627 | |
Bausch Health Cos., Inc.(c) | | | 5.00 | | | | 1/30/2028 | | | | 204,000 | | | | 204,000 | | | | 193,539 | |
Bausch Health Cos., Inc.(c) | | | 5.00 | | | | 2/15/2029 | | | | 281,000 | | | | 281,000 | | | | 261,681 | |
Bausch Health Cos., Inc.(c) | | | 5.25 | | | | 1/30/2030 | | | | 200,000 | | | | 200,000 | | | | 186,500 | |
Bausch Health Cos., Inc.(c) | | | 5.25 | | | | 2/15/2031 | | | | 208,000 | | | | 208,000 | | | | 191,279 | |
Chrome Holdco SASU(a) | | | 5.00 | | | | 5/31/2029 | | | | 650,000 | | | | 790,463 | | | | 771,751 | |
Emergent BioSolutions, Inc.(c) | | | 3.88 | | | | 8/15/2028 | | | | 1,087,000 | | | | 1,031,101 | | | | 1,060,010 | |
Nidda BondCo GmbH(a) | | | 7.25 | | | | 9/30/2025 | | | | 500,000 | | | | 572,797 | | | | 588,126 | |
Par Pharmaceutical, Inc.(c) | | | 7.50 | | | | 4/1/2027 | | | | 708,000 | | | | 708,000 | | | | 721,275 | |
| | | | | | | | | | | | | | | | | | | | |
Total Healthcare, Education and Childcare | | | | | | | | | | | 4,656,000 | | | | 4,819,080 | | | | 4,840,569 | |
| | | | | | | | | | | | | | | | | | | | |
|
Home and Office Furnishings, Housewares, and Durable Consumer Products — 0.5%*: | |
Staples, Inc.(c) | | | 10.75 | | | | 4/15/2027 | | | | 1,000,000 | | | | 1,029,351 | | | | 973,750 | |
| | | | | | | | | | | | | | | | | | | | |
|
Hotels, Motels, Inns and Gaming — 1.0%*: | |
NH Hotel Group SA(a) | | | 4.00 | | | | 7/2/2026 | | | | 350,000 | | | | 414,053 | | | | 410,231 | |
Stonegate Pub Co. Financing 2019 plc, EURIBOR + 5.750%(a) | | | 5.75 | (d) | | | 7/31/2025 | | | | 100,000 | | | | 118,589 | | | | 115,487 | |
Stonegate Pub Co. Financing 2019 plc(a) | | | 8.00 | | | | 7/13/2025 | | | | 310,000 | | | | 448,364 | | | | 432,731 | |
Stonegate Pub Co. Financing 2019 plc(a) | | | 8.25 | | | | 7/31/2025 | | | | 100,000 | | | | 144,187 | | | | 141,612 | |
TVL Finance plc, 3M GBP LIBOR + 5.375%(a) | | | 5.45 | (d) | | | 7/15/2025 | | | | 500,000 | | | | 633,379 | | | | 642,710 | |
| | | | | | | | | | | | | | | | | | | | |
Total Hotels, Motels, Inns and Gaming | | | | | | | | | | | 1,360,000 | | | | 1,758,572 | | | | 1,742,771 | |
| | | | | | | | | | | | | | | | | | | | |
|
Leisure, Amusement, Entertainment — 1.4%*: | |
AMC Entertainment Holdings, Inc.(c) | | | 10.50 | | | | 4/24/2026 | | | | 142,000 | | | | 142,000 | | | | 152,473 | |
Caesars Entertainment, Inc.(c) | | | 6.25 | | | | 7/1/2025 | | | | 382,000 | | | | 382,000 | | | | 402,153 | |
Caesars Entertainment, Inc.(c) | | | 8.13 | | | | 7/1/2027 | | | | 279,000 | | | | 279,000 | | | | 313,526 | |
Carnival Corp.(c) | | | 5.75 | | | | 3/1/2027 | | | | 410,000 | | | | 410,000 | | | | 423,325 | |
See accompanying Notes to the Financial Statements.
67
Barings Global Credit Income Opportunities Fund 2021 Annual Report
SCHEDULE OF INVESTMENTS (CONTINUED)
September 30, 2021
| | | | | | | | | | | | | | | | | | | | |
| | | EFFECTIVE
INTEREST RATE | | | DUE DATE | | | PRINCIPAL ‡‡ | | | COST | | | FAIR
VALUE | |
Corporate Bonds (Continued) | |
|
Leisure, Amusement, Entertainment (Continued) | |
Carnival Corp. | | | 7.63 | % | | | 3/1/2026 | | | | 150,000 | | | $ | 177,892 | | | $ | 187,305 | |
CPUK Finance Ltd.(a) | | | 4.88 | | | | 2/28/2047 | | | | 100,000 | | | | 119,964 | | | | 135,751 | |
Motion Bondco DAC(a) | | | 4.50 | | | | 11/15/2027 | | | | 900,000 | | | | 1,002,547 | | | | 996,957 | |
| | | | | | | | | | | | | | | | | | | | |
Total Leisure, Amusement, Entertainment | | | | | | | | | | | 2,363,000 | | | | 2,513,403 | | | | 2,611,490 | |
| | | | | | | | | | | | | | | | | | | | |
|
Machinery Non-Agriculture, Non-Construction, Non-Electronic — 0.3%*: | |
Diebold Nixdorf Dutch Holding BV | | | 9.00 | | | | 7/15/2025 | | | | 350,000 | | | | 409,805 | | | | 439,351 | |
Esc Gcb Briggs | | | 6.88 | | | | 12/15/2049 | | | | 514,000 | | | | 504,007 | | | | 41,120 | |
| | | | | | | | | | | | | | | | | | | | |
Total Machinery Non-Agriculture, Non-Construction, Non-Electronic | | | | | | | | | | | 864,000 | | | | 913,812 | | | | 480,471 | |
| | | | | | | | | | | | | | | | | | | | |
|
Mining, Steel, Iron and Non-Precious Metals — 3.2%*: | |
First Quantum Minerals Ltd.(a),(c) | | | 6.50 | | | | 3/1/2024 | | | | 1,006,000 | | | | 977,390 | | | | 1,018,575 | |
First Quantum Minerals Ltd.(a) | | | 6.88 | | | | 10/15/2027 | | | | 719,000 | | | | 719,000 | | | | 760,792 | |
Hudbay Minerals, Inc.(c) | | | 4.50 | | | | 4/1/2026 | | | | 200,000 | | | | 201,349 | | | | 198,000 | |
Metinvest BV(a) | | | 7.65 | | | | 10/1/2027 | | | | 286,000 | | | | 282,009 | | | | 310,275 | |
Metinvest BV(a) | | | 8.50 | | | | 4/23/2026 | | | | 200,000 | | | | 210,233 | | | | 222,820 | |
Vedanta Resources Finance II plc(a) | | | 8.00 | | | | 4/23/2023 | | | | 750,000 | | | | 709,667 | | | | 726,469 | |
Vedanta Resources Finance II plc(a) | | | 8.95 | | | | 3/11/2025 | | | | 685,000 | | | | 685,000 | | | | 684,144 | |
Vedanta Resources Ltd.(a) | | | 6.38 | | | | 7/30/2022 | | | | 1,075,000 | | | | 807,982 | | | | 1,071,842 | |
Warrior Met Coal, Inc.(c) | | | 8.00 | | | | 11/1/2024 | | | | 840,000 | | | | 847,978 | | | | 852,600 | |
| | | | | | | | | | | | | | | | | | | | |
Total Mining, Steel, Iron and Non-Precious Metals | | | | | | | | | | | 5,761,000 | | | | 5,440,608 | | | | 5,845,517 | |
| | | | | | | | | | | | | | | | | | | | |
|
Oil and Gas — 5.0%*: | |
Borets International Ltd.(a) | | | 6.00 | | | | 9/17/2026 | | | | 531,000 | | | | 531,000 | | | | 552,774 | |
CVR Energy, Inc.(c) | | | 5.25 | | | | 2/15/2025 | | | | 525,000 | | | | 525,000 | | | | 519,750 | |
CVR Energy, Inc.(c) | | | 5.75 | | | | 2/15/2028 | | | | 379,000 | | | | 379,000 | | | | 375,536 | |
EnLink Midstream Partners LP | | | 5.60 | | | | 4/1/2044 | | | | 206,000 | | | | 159,753 | | | | 196,730 | |
EQM Midstream Partners LP(c) | | | 4.50 | | | | 1/15/2029 | | | | 170,000 | | | | 170,000 | | | | 176,375 | |
EQM Midstream Partners LP(c) | | | 4.75 | | | | 1/15/2031 | | | | 154,000 | | | | 154,000 | | | | 160,163 | |
Genesis Energy LP / Genesis Energy Finance Corp. | | | 8.00 | | | | 1/15/2027 | | | | 1,000,000 | | | | 1,035,638 | | | | 1,015,200 | |
Harvest Midstream I LP(c) | | | 7.50 | | | | 9/1/2028 | | | | 500,000 | | | | 534,124 | | | | 532,575 | |
Hilcorp Energy I LP / Hilcorp Finance Co.(c) | | | 6.25 | | | | 11/1/2028 | | | | 1,000,000 | | | | 1,000,000 | | | | 1,036,220 | |
KCA Deutag UK Finance plc(a) | | | 9.88 | | | | 12/1/2025 | | | | 349,977 | | | | 349,976 | | | | 380,953 | |
NGL Energy Operating LLC / NGL Energy Finance Corp.(c) | | | 7.50 | | | | 2/1/2026 | | | | 750,000 | | | | 785,355 | | | | 764,062 | |
Occidental Petroleum Corp. | | | 5.88 | | | | 9/1/2025 | | | | 153,000 | | | | 153,000 | | | | 171,475 | |
Occidental Petroleum Corp. | | | 6.13 | | | | 1/1/2031 | | | | 452,000 | | | | 474,673 | | | | 542,400 | |
Occidental Petroleum Corp. | | | 6.38 | | | | 9/1/2028 | | | | 157,000 | | | | 157,000 | | | | 183,690 | |
Targa Resources Partners LP / Targa Resources Partners Finance Corp. | | | 4.88 | | | | 2/1/2031 | | | | 251,000 | | | | 251,000 | | | | 270,766 | |
Transocean Guardian Ltd.(c) | | | 5.88 | | | | 1/15/2024 | | | | 335,000 | | | | 320,468 | | | | 333,325 | |
Transocean, Inc.(c) | | | 7.25 | | | | 11/1/2025 | | | | 600,000 | | | | 467,033 | | | | 499,629 | |
See accompanying Notes to the Financial Statements.
68
Barings Global Credit Income Opportunities Fund 2021 Annual Report
SCHEDULE OF INVESTMENTS (CONTINUED)
September 30, 2021
| | | | | | | | | | | | | | | | | | | | |
| | | EFFECTIVE
INTEREST RATE | | | DUE DATE | | | PRINCIPAL ‡‡ | | | COST | | | FAIR
VALUE | |
Corporate Bonds (Continued) | |
|
Oil and Gas (Continued) | |
Tullow Oil plc(a) | | | 7.00 | % | | | 3/1/2025 | | | | 300,000 | | | $ | 116,934 | | | $ | 260,250 | |
Tullow Oil plc(a) | | | 10.25 | | | | 5/15/2026 | | | | 1,000,000 | | | | 1,000,000 | | | | 1,040,000 | |
| | | | | | | | | | | | | | | | | | | | |
Total Oil and Gas | | | | | | | | | | | 8,812,977 | | | | 8,563,954 | | | | 9,011,873 | |
| | | | | | | | | | | | | | | | | | | | |
|
Personal Transportation — 0.3%*: | |
Mileage Plus Holdings LLC / Mileage Plus Intellectual Property Assets Ltd.(c) | | | 6.50 | | | | 6/20/2027 | | | | 237,000 | | | | 234,474 | | | | 257,654 | |
Naviera Armas S.A., EURIBOR + 6.500%(a) | | | 6.50 | (d) | | | 7/31/2023 | | | | 250,000 | | | | 288,580 | | | | 223,561 | |
| | | | | | | | | | | | | | | | | | | | |
Total Personal Transportation | | | | | | | | | | | 487,000 | | | | 523,054 | | | | 481,215 | |
| | | | | | | | | | | | | | | | | | | | |
|
Printing and Publishing — 0.4%*: | |
Getty Images, Inc.(c) | | | 9.75 | | | | 3/1/2027 | | | | 650,000 | | | | 690,286 | | | | 692,250 | |
| | | | | | | | | | | | | | | | | | | | |
|
Retail Stores — 2.0%*: | |
Bellis Finco plc(a) | | | 4.00 | | | | 2/16/2027 | | | | 100,000 | | | | 138,330 | | | | 131,502 | |
EG Global Finance plc(a) | | | 6.25 | | | | 3/30/2026 | | | | 604,000 | | | | 841,417 | | | | 838,245 | |
Future Retail Ltd.(a) | | | 5.60 | | | | 1/22/2025 | | | | 950,000 | | | | 865,360 | | | | 556,937 | |
House of Fraser Funding plc(a),(g) | | | 5.95 | | | | 9/15/2020 | | | | 150,000 | | | | 182,556 | | | | 3,032 | |
L Brands, Inc. | | | 6.88 | | | | 11/1/2035 | | | | 200,000 | | | | 242,668 | | | | 251,000 | |
Marcolin SpA(a) | | | 6.13 | | | | 11/15/2026 | | | | 400,000 | | | | 486,940 | | | | 475,099 | |
NMG Holding Co., Inc. / Neiman Marcus Group LLC(c) | | | 7.13 | | | | 4/1/2026 | | | | 263,000 | | | | 266,744 | | | | 279,109 | |
Nordstrom, Inc. | | | 5.00 | | | | 1/15/2044 | | | | 1,202,000 | | | | 1,164,887 | | | | 1,178,422 | |
| | | | | | | | | | | | | | | | | | | | |
Total Retail Stores | | | | | | | | | | | 3,869,000 | | | | 4,188,902 | | | | 3,713,346 | |
| | | | | | | | | | | | | | | | | | | | |
|
Telecommunications — 1.6%*: | |
CommScope, Inc.(c) | | | 4.75 | | | | 9/1/2029 | | | | 444,000 | | | | 444,000 | | | | 444,555 | |
DKT Finance ApS(a) | | | 7.00 | | | | 6/17/2023 | | | | 1,500,000 | | | | 1,693,079 | | | | 1,769,235 | |
Oi Movel SA(a) | | | 8.75 | | | | 7/30/2026 | | | | 628,000 | | | | 628,000 | | | | 640,560 | |
| | | | | | | | | | | | | | | | | | | | |
Total Telecommunications | | | | | | | | | | | 2,572,000 | | | | 2,765,079 | | | | 2,854,350 | |
| | | | | | | | | | | | | | | | | | | | |
|
Utilities — 0.8%*: | |
Electricite de France SA, 5 year EUR Swap + 3.995%(a) | | | 3.38 | (d),(f) | | | – | | | | 400,000 | | | | 500,414 | | | | 487,114 | |
Techem Verwaltungsgesellschaft 674 mbH(a) | | | 6.00 | | | | 7/30/2026 | | | | 879,198 | | | | 1,004,107 | | | | 1,048,431 | |
| | | | | | | | | | | | | | | | | | | | |
Total Utilities | | | | | | | | | | | 1,279,198 | | | | 1,504,521 | | | | 1,535,545 | |
| | | | | | | | | | | | | | | | | | | | |
Total Corporate Bonds | | | | | | | 70,118,391 | | | | 73,259,116 | | | | 72,466,092 | |
| | | | | | | | | | | | | | | | | | | | |
Total Fixed Income | | | | | | | 166,993,728 | | | | 171,165,897 | | | | 169,014,483 | |
| | | | | | | | | | | | | | | | | | | | |
Total Investments | | | | | | | 167,598,444 | | | | 172,694,977 | | | | 171,120,368 | |
| | | | | | | | | | | | | | | | | | | | |
| | | | | |
Other assets and liabilities – 5.3%* | | | | | | | | | | | | | | | | | | | 9,550,917 | |
| | | | | | | | | | | | | | | | | | | | |
| | | | | |
Net Assets – 100.0% | | | | | | | | | | | | | | | | | | | $180,671,285 | |
| | | | | | | | | | | | | | | | | | | | |
See accompanying Notes to the Financial Statements.
69
Barings Global Credit Income Opportunities Fund 2021 Annual Report
SCHEDULE OF INVESTMENTS (CONTINUED)
September 30, 2021
| ‡‡ | Unless otherwise indicated, all principal amounts are denominated in United States Dollars. |
| * | Calculated as a percentage of net assets applicable to common shareholders. |
Distributions of investments by country of risk (excluding temporary cash investments) as a percentage of total investments in securities, is as follows:
| | | | | | |
| | United States | | | 56.5% | |
| | United Kingdom | | | 11.5% | |
| | France | | | 4.3% | |
| | Germany | | | 3.6% | |
| | India | | | 2.7% | |
| | Spain | | | 2.6% | |
| | China | | | 2.4% | |
| | Denmark | | | 1.7% | |
| | Canada | | | 1.4% | |
| | Netherlands | | | 1.3% | |
| | Greece | | | 1.2% | |
| | Ireland | | | 1.1% | |
| | Sweden | | | 1.1% | |
| | Zambia | | | 1.0% | |
| | Other (Individually less than 1%) | | | 7.6% | |
| | | | | | |
| | Total | | | 100.0% | |
| | | | | | |
| (b) | For fair value measurement disclosure purposes, security is categorized as Level 3 (See Note 2). |
| (c) | Security acquired in a transaction exempt from registration under Rule 144A of the Securities Act of 1933. These securities may only be resold in transactions exempt from registration, normally to qualified institutional buyers. |
| (d) | Variable rate security. The interest rate shown is the rate in effect at September 30, 2021. |
| (e) | Bank loans are exempt from registration under the Securities Act of 1933, as amended, but contain certain restrictions on resale and cannot be sold publicly. These loans pay interest at rates which adjust periodically. The interest rates shown for bank loans are the current interest rates at September 30, 2021. Bank loans are also subject to mandatory and/or optional prepayment which cannot be predicted. As a result, the remaining maturity may be substantially less than the stated maturity shown. |
| (f) | Security is perpetual in nature and has no stated maturity. |
A summary of outstanding derivatives at September 30, 2021 is as follows:
Forward Foreign Currency Exchange Contracts to Buy
| | | | | | | | | | | | | | | | | | | | | | |
EXPIRATION
DATE | | COUNTERPARTY | | LOCAL
CURRENCY | | | VALUE IN USD | | | IN
EXCHANGE
FOR USD | | | NET UNREALIZED
APPRECIATION
(DEPRECIATION) | |
| 10/14/21 | | Goldman Sachs & Co. | | | CAD | | | | 54,253 | | | $ | 42,833 | | | $ | 42,412 | | | $ | 421 | |
| 10/14/21 | | Canadian Imperial Bank of Commerce | | | EUR | | | | 1,451,222 | | | | 1,681,330 | | | | 1,716,213 | | | | (34,883 | ) |
| 10/14/21 | | Morgan Stanley & Co. | | | GBP | | | | 519,198 | | | | 699,573 | | | | 709,243 | | | | (9,670 | ) |
| | | | | | | | | | | | | | | | | | | | | | |
Net unrealized depreciation on forward foreign currency exchange contracts to buy | | | $ | (44,132 | ) |
| | | | | | | | | | | | | | | | | | | | | | |
See accompanying Notes to the Financial Statements.
70
Barings Global Credit Income Opportunities Fund 2021 Annual Report
SCHEDULE OF INVESTMENTS (CONTINUED)
September 30, 2021
Forward Foreign Currency Exchange Contracts to Sell
| | | | | | | | | | | | | | | | | | | | | | |
EXPIRATION
DATE | | COUNTERPARTY | | LOCAL
CURRENCY | | | VALUE IN USD | | | IN
EXCHANGE
FOR USD | | | NET
UNREALIZED
APPRECIATION
(DEPRECIATION) | |
| 10/14/21 | | Goldman Sachs & Co. | | | CAD | | | | 173,609 | | | $ | 137,064 | | | $ | 137,012 | | | $ | (52 | ) |
| 10/14/21 | | JPMorgan Chase Bank N.A. | | | CAD | | | | 60,249 | | | | 47,566 | | | | 47,573 | | | | 7 | |
| 10/14/21 | | Barclays Bank plc | | | CAD | | | | 74,526 | | | | 58,838 | | | | 58,818 | | | | (20 | ) |
| 10/14/21 | | Morgan Stanley & Co. | | | CAD | | | | 1,132,946 | | | | 894,458 | | | | 897,571 | | | | 3,113 | |
| 10/14/21 | | Morgan Stanley & Co. | | | EUR | | | | 714,919 | | | | 828,278 | | | | 844,561 | | | | 16,283 | |
| 10/14/21 | | Citibank N.A. | | | EUR | | | | 573,000 | | | | 663,856 | | | | 677,854 | | | | 13,998 | |
| 10/14/21 | | Bank of America N.A. | | | EUR | | | | 36,120,276 | | | | 41,847,572 | | | | 42,830,593 | | | | 983,021 | |
| 10/14/21 | | Morgan Stanley & Co. | | | GBP | | | | 186,464 | | | | 251,244 | | | | 251,991 | | | | 747 | |
| 10/14/21 | | Barclays Bank plc | | | GBP | | | | 7,135,707 | | | | 9,614,732 | | | | 9,842,366 | | | | 227,634 | |
| | | | | | | | | | | | | | | | | | | | | | |
Net unrealized appreciation on forward foreign currency exchange contracts to sell | | | $ | 1,244,731 | |
| | | | | | | | | | | | | | | | | | | | | | |
Legend
| | | | |
| CAD | | – | | Canadian Dollar |
| EUR | | – | | Euro |
| GBP | | – | | British Pound Sterling |
See accompanying Notes to the Financial Statements.
71
Barings Emerging Markets Debt Blended Total Return Fund 2021 Annual Report
SCHEDULE OF INVESTMENTS
September 30, 2021
| | | | | | | | | | | | | | | | | | | | |
| | | EFFECTIVE
INTEREST RATE | | | DUE DATE | | | PRINCIPAL ‡‡ | | | COST | | | FAIR
VALUE | |
Fixed Income — 90.9%*: | |
|
Corporate Bonds — 46.3%*: | |
|
Agriculture — 1.2%*: | |
Amaggi Luxembourg International Sarl(a),(b) | | | 5.25 | % | | | 1/28/2028 | | | | 1,500,000 | | | | $1,500,000 | | | | $1,537,500 | |
MHP Lux SA(a),(b) | | | 6.25 | | | | 9/19/2029 | | | | 270,000 | | | | 274,109 | | | | 273,497 | |
| | | | | | | | | | | | | | | | | | | | |
Total Agriculture | | | | | | | | | | | 1,770,000 | | | | 1,774,109 | | | | 1,810,997 | |
| | | | | | | | | | | | | | | | | | | | |
|
Auto Manufacturers — 0.7%*: | |
Uzauto Motors AJ(a),(b) | | | 4.85 | | | | 5/4/2026 | | | | 991,000 | | | | 991,000 | | | | 979,108 | |
| | | | | | | | | | | | | | | | | | | | |
|
Auto Parts&Equipment — 0.8%*: | |
Iochpe-Maxion Austria GmbH / Maxion Wheels de Mexico S de RL de CV(a),(b) | | | 5.00 | | | | 5/7/2028 | | | | 494,000 | | | | 487,185 | | | | 489,801 | |
Tupy Overseas SA(a),(b) | | | 4.50 | | | | 2/16/2031 | | | | 643,000 | | | | 643,000 | | | | 624,224 | |
| | | | | | | | | | | | | | | | | | | | |
Total Auto Parts&Equipment | | | | | | | | | | | 1,137,000 | | | | 1,130,185 | | | | 1,114,025 | |
| | | | | | | | | | | | | | | | | | | | |
|
Building Materials — 0.1%*: | |
Cemex SAB de CV, 5 year CMT + 4.534%(a),(b) | | | 5.13 | (c),(d) | | | – | | | | 227,000 | | | | 227,000 | | | | 229,838 | |
| | | | | | | | | | | | | | | | | | | | |
|
Chemicals — 1.8%*: | |
Braskem Idesa SAPI(a),(b) | | | 7.45 | | | | 11/15/2029 | | | | 300,000 | | | | 299,114 | | | | 318,153 | |
Grupo Idesa SA de CV(a),(b) | | | 4.44 | | | | 5/22/2026 | | | | 1,078,470 | | | | 1,048,535 | | | | 595,855 | |
UPL Corp. Ltd., 5 year CMT + 3.865%(a) | | | 5.25 | (c),(d) | | | – | | | | 1,750,000 | | | | 1,790,380 | | | | 1,784,475 | |
| | | | | | | | | | | | | | | | | | | | |
Total Chemicals | | | | | | | | | | | 3,128,470 | | | | 3,138,029 | | | | 2,698,483 | |
| | | | | | | | | | | | | | | | | | | | |
|
Commercial Banks — 9.4%*: | |
Absa Group Ltd., 5 year CMT + 5.411%(a) | | | 6.38 | (c),(d) | | | – | | | | 925,000 | | | | 925,000 | | | | 960,844 | |
Access Bank plc(a),(b) | | | 6.13 | | | | 9/21/2026 | | | | 508,000 | | | | 508,000 | | | | 510,896 | |
Ipoteka-Bank ATIB(a) | | | 5.50 | | | | 11/19/2025 | | | | 544,000 | | | | 544,000 | | | | 566,032 | |
Itau Unibanco Holding SA, 5 year CMT +
3.222%(a),(b) | | | 4.63 | (c),(d) | | | – | | | | 500,000 | | | | 478,766 | | | | 477,906 | |
Kasikornbank PCL, 5 year CMT + 4.940%(a) | | | 5.28 | (c),(d) | | | – | | | | 500,000 | | | | 500,000 | | | | 523,219 | |
National Bank of Greece SA, 5 year EUR Swap + 8.464%(a) | | | 8.25 | (c) | | | 7/18/2029 | | | | 750,000 | | | | 844,200 | | | | 983,853 | |
Nova Ljubljanska Banka dd, 5 year EUR Swap + 3.833%(a) | | | 3.65 | (c) | | | 11/19/2029 | | | | 400,000 | | | | 440,400 | | | | 454,305 | |
Oman Arab Bank SAOG, 5 year CMT +
6.807%(a) | | | 7.63 | (c),(d) | | | – | | | | 443,000 | | | | 443,000 | | | | 463,050 | |
Piraeus Financial Holdings SA, 5 year EUR Swap + 5.774%(a) | | | 5.50 | (c) | | | 2/19/2030 | | | | 1,000,000 | | | | 1,108,294 | | | | 1,132,491 | |
Piraeus Financial Holdings SA, 5 year EUR Swap + 9.195%(a) | | | 8.75 | (c),(d) | | | – | | | | 1,000,000 | | | | 1,217,701 | | | | 1,175,435 | |
Piraeus Financial Holdings SA, 5 year EUR Swap + 9.952%(a) | | | 9.75 | (c) | | | 6/26/2029 | | | | 500,000 | | | | 614,716 | | | | 633,007 | |
Sovcombank Via SovCom Capital DAC, 5 year CMT + 6.380%(a),(b) | | | 7.75 | (c),(d) | | | – | | | | 1,450,000 | | | | 1,487,961 | | | | 1,496,944 | |
See accompanying Notes to the Financial Statements.
72
Barings Emerging Markets Debt Blended Total Return Fund 2021 Annual Report
SCHEDULE OF INVESTMENTS (CONTINUED)
September 30, 2021
| | | | | | | | | | | | | | | | | | | | |
| | | EFFECTIVE
INTEREST RATE | | | DUE DATE | | | PRINCIPAL ‡‡ | | | COST | | | FAIR
VALUE | |
Corporate Bonds (Continued) | |
|
Commercial Banks (Continued) | |
Sovcombank Via SovCom Capital DAC, 5 year CMT + 6.427%(a),(b) | | | 8.00 | %(c) | | | 4/7/2030 | | | | 1,165,000 | | | | $1,168,531 | | | | $1,255,287 | |
TBC Bank JSC, 5 year USD ICE Swap +
8.995%(a),(b) | | | 10.78 | (c),(d) | | | – | | | | 645,000 | | | | 645,000 | | | | 708,008 | |
Tinkoff Bank JSC Via TCS Finance Ltd., 5 year CMT + 5.150%(a),(b) | | | 6.00 | (c),(d) | | | – | | | | 1,835,000 | | | | 1,835,000 | | | | 1,833,899 | |
TMB Bank PCL, 5 year CMT + 3.256%(a) | | | 4.90 | (c),(d) | | | – | | | | 500,000 | | | | 475,955 | | | | 505,406 | |
| | | | | | | | | | | | | | | | | | | | |
Total Commercial Banks | | | | | | | | | | | 12,665,000 | | | | 13,236,524 | | | | 13,680,582 | |
| | | | | | | | | | | | | | | | | | | | |
|
Commercial Services — 1.1%*: | |
Atento Luxco 1 SA(a),(b) | | | 8.00 | | | | 2/10/2026 | | | | 633,000 | | | | 633,000 | | | | 692,660 | |
India Toll Roads(a),(b) | | | 5.50 | | | | 8/19/2024 | | | | 999,000 | | | | 999,000 | | | | 963,012 | |
| | | | | | | | | | | | | | | | | | | | |
Total Commercial Services | | | | | | | | | | | 1,632,000 | | | | 1,632,000 | | | | 1,655,672 | |
| | | | | | | | | | | | | | | | | | | | |
|
Cosmetics/Personal Care — 0.4%*: | |
Oriflame Investment Holding plc(a),(b) | | | 5.13 | | | | 5/4/2026 | | | | 521,000 | | | | 521,000 | | | | 533,400 | |
| | | | | | | | | | | | | | | | | | | | |
|
Diversified Financial Services — 1.0%*: | |
Credito Real SAB de CV SOFOM ER(a),(b) | | | 9.50 | | | | 2/7/2026 | | | | 500,000 | | | | 485,541 | | | | 453,775 | |
IIFL Finance Ltd.(a) | | | 5.88 | | | | 4/20/2023 | | | | 1,055,000 | | | | 1,014,506 | | | | 1,024,636 | |
| | | | | | | | | | | | | | | | | | | | |
Total Diversified Financial Services | | | | | | | | | | | 1,555,000 | | | | 1,500,047 | | | | 1,478,411 | |
| | | | | | | | | | | | | | | | | | | | |
|
Electric — 3.6%*: | |
Alfa Desarrollo SpA(a),(b) | | | 4.55 | | | | 9/27/2051 | | | | 1,913,000 | | | | 1,913,000 | | | | 1,862,784 | |
Electricidad Firme de Mexico Holdings SA de
CV(a),(b) | | | 4.90 | | | | 11/20/2026 | | | | 863,000 | | | | 863,000 | | | | 859,462 | |
FEL Energy VI Sarl(a),(b) | | | 5.75 | | | | 12/1/2040 | | | | 696,232 | | | | 696,232 | | | | 728,439 | |
India Cleantech Energy(a),(b) | | | 4.70 | | | | 8/10/2026 | | | | 1,083,000 | | | | 1,083,000 | | | | 1,095,725 | |
Infraestructura Energetica Nova SAB de CV(a),(b) | | | 4.75 | | | | 1/15/2051 | | | | 312,000 | | | | 303,107 | | | | 321,516 | |
Infraestructura Energetica Nova SAB de CV(a),(b) | | | 4.88 | | | | 1/14/2048 | | | | 328,000 | | | | 272,586 | | | | 337,840 | |
| | | | | | | | | | | | | | | | | | | | |
Total Electric | | | | | | | | | | | 5,195,232 | | | | 5,130,925 | | | | 5,205,766 | |
| | | | | | | | | | | | | | | | | | | | |
|
Energy-Alternate Sources — 0.7%*: | |
Aydem Yenilenebilir Enerji AS(a),(b) | | | 7.75 | | | | 2/2/2027 | | | | 500,000 | | | | 496,053 | | | | 487,500 | |
Investment Energy Resources Ltd.(a),(b) | | | 6.25 | | | | 4/26/2029 | | | | 492,000 | | | | 492,000 | | | | 533,205 | |
| | | | | | | | | | | | | | | | | | | | |
Total Energy-Alternate Sources | | | | | | | | | | | 992,000 | | | | 988,053 | | | | 1,020,705 | |
| | | | | | | | | | | | | | | | | | | | |
|
Engineering&Construction — 1.5%*: | |
Rutas 2 and 7 Finance Ltd.(a),(b) | | | Zero Coupon | | | | 9/30/2036 | | | | 850,000 | | | | 578,428 | | | | 631,125 | |
State Agency of Roads of Ukraine(a),(b) | | | 6.25 | | | | 6/24/2028 | | | | 1,528,000 | | | | 1,528,000 | | | | 1,508,900 | |
| | | | | | | | | | | | | | | | | | | | |
Total Engineering&Construction | | | | | | | | | | | 2,378,000 | | | | 2,106,428 | | | | 2,140,025 | |
| | | | | | | | | | | | | | | | | | | | |
See accompanying Notes to the Financial Statements.
73
Barings Emerging Markets Debt Blended Total Return Fund 2021 Annual Report
SCHEDULE OF INVESTMENTS (CONTINUED)
September 30, 2021
| | | | | | | | | | | | | | | | | | | | |
| | | EFFECTIVE
INTEREST RATE | | | DUE DATE | | | PRINCIPAL ‡‡ | | | COST | | | FAIR
VALUE | |
Corporate Bonds (Continued) | | | | | | | | | | | | | | | | | | | | |
|
Food — 1.3%*: | |
Aragvi Finance International DAC(a),(b) | | | 8.45 | % | | | 4/29/2026 | | | | 1,370,000 | | | | $1,422,060 | | | | $1,423,944 | |
Ulker Biskuvi Sanayi AS(a),(b) | | | 6.95 | | | | 10/30/2025 | | | | 494,000 | | | | 494,000 | | | | 523,576 | |
| | | | | | | | | | | | | | | | | | | | |
Total Food | | | | | | | | | | | 1,864,000 | | | | 1,916,060 | | | | 1,947,520 | |
| | | | | | | | | | | | | | | | | | | | |
|
Housewares — 0.7%*: | |
Turkiye Sise ve Cam Fabrikalari AS(a),(b) | | | 6.95 | | | | 3/14/2026 | | | | 1,000,000 | | | | 1,051,071 | | | | 1,095,500 | |
| | | | | | | | | | | | | | | | | | | | |
|
Insurance — 0.6%*: | |
Sagicor Financial Co. Ltd.(a),(b) | | | 5.30 | | | | 5/13/2028 | | | | 884,000 | | | | 884,000 | | | | 925,990 | |
| | | | | | | | | | | | | | | | | | | | |
|
Internet — 0.8%*: | |
B2W Digital Lux Sarl(a),(b) | | | 4.38 | | | | 12/20/2030 | | | | 706,000 | | | | 705,973 | | | | 685,703 | |
Meituan(a),(b) | | | 3.05 | | | | 10/28/2030 | | | | 529,000 | | | | 528,333 | | | | 489,957 | |
| | | | | | | | | | | | | | | | | | | | |
Total Internet | | | | | | | | | | | 1,235,000 | | | | 1,234,306 | | | | 1,175,660 | |
| | | | | | | | | | | | | | | | | | | | |
|
Iron/Steel — 0.9%*: | |
JSW Steel Ltd.(a),(b) | | | 5.05 | | | | 4/5/2032 | | | | 375,000 | | | | 374,993 | | | | 373,114 | |
Metinvest BV(a),(b) | | | 5.63 | | | | 6/17/2025 | | | | 750,000 | | | | 816,995 | | | | 908,612 | |
| | | | | | | | | | | | | | | | | | | | |
Total Iron/Steel | | | | | | | | | | | 1,125,000 | | | | 1,191,988 | | | | 1,281,726 | |
| | | | | | | | | | | | | | | | | | | | |
|
Media — 0.7%*: | |
LCPR Senior Secured Financing DAC(b) | | | 5.13 | | | | 7/15/2029 | | | | 978,000 | | | | 978,000 | | | | 1,009,785 | |
| | | | | | | | | | | | | | | | | | | | |
|
Mining — 2.0%*: | |
Vedanta Resources Finance II plc(a),(b) | | | 8.95 | | | | 3/11/2025 | | | | 1,370,000 | | | | 1,370,000 | | | | 1,368,287 | |
Vedanta Resources Finance II plc(a),(b) | | | 9.25 | | | | 4/23/2026 | | | | 550,000 | | | | 548,368 | | | | 521,813 | |
Vedanta Resources Finance II plc(a),(b) | | | 13.88 | | | | 1/21/2024 | | | | 900,000 | | | | 936,104 | | | | 973,125 | |
| | | | | | | | | | | | | | | | | | | | |
Total Mining | | | | | | | | | | | 2,820,000 | | | | 2,854,472 | | | | 2,863,225 | |
| | | | | | | | | | | | | | | | | | | | |
|
Multi-National — 0.5%*: | |
European Bank for Reconstruction & Development, GGRRC9MX – 0.500%(a),(e) | | | 8.95 | (c) | | | 10/29/2022 | | | | 1,200,000 | | | | 404,027 | | | | 381,559 | |
International Bank for Reconstruction & Development(a),(e) | | | 7.25 | | | | 11/22/2021 | | | | 960,000 | | | | 325,423 | | | | 305,244 | |
| | | | | | | | | | | | | | | | | | | | |
Total Multi-National | | | | | | | | | | | 2,160,000 | | | | 729,450 | | | | 686,803 | |
| | | | | | | | | | | | | | | | | | | | |
|
Oil and Gas — 4.4%*: | |
Petrobras Global Finance BV(a) | | | 6.75 | | | | 6/3/2050 | | | | 300,000 | | | | 294,411 | | | | 324,975 | |
Petrobras Global Finance BV(a) | | | 6.90 | | | | 3/19/2049 | | | | 900,000 | | | | 967,136 | | | | 1,007,100 | |
Petroleos Mexicanos(a) | | | 5.95 | | | | 1/28/2031 | | | | 1,700,000 | | | | 1,632,843 | | | | 1,647,980 | |
Petroleos Mexicanos(a) | | | 6.95 | | | | 1/28/2060 | | | | 1,304,000 | | | | 1,203,490 | | | | 1,129,786 | |
Tullow Oil plc(a),(b) | | | 7.00 | | | | 3/1/2025 | | | | 1,840,000 | | | | 1,348,478 | | | | 1,596,200 | |
Tullow Oil plc(a),(b) | | | 10.25 | | | | 5/15/2026 | | | | 655,000 | | | | 655,000 | | | | 681,200 | |
| | | | | | | | | | | | | | | | | | | | |
Total Oil and Gas | | | | | | | | | | | 6,699,000 | | | | 6,101,358 | | | | 6,387,241 | |
| | | | | | | | | | | | | | | | | | | | |
See accompanying Notes to the Financial Statements.
74
Barings Emerging Markets Debt Blended Total Return Fund 2021 Annual Report
SCHEDULE OF INVESTMENTS (CONTINUED)
September 30, 2021
| | | | | | | | | | | | | | | | | | | | |
| | | EFFECTIVE
INTEREST RATE | | | DUE DATE | | | PRINCIPAL ‡‡ | | | COST | | | FAIR
VALUE | |
Corporate Bonds (Continued) | |
|
Oil and Gas Services — 1.3%*: | |
Borets Finance DAC(a),(b) | | | 6.00 | % | | | 9/17/2026 | | | | 531,000 | | | | $531,000 | | | | $552,774 | |
Guara Norte Sarl(a),(b) | | | 5.20 | | | | 6/15/2034 | | | | 1,280,906 | | | | 1,280,844 | | | | 1,287,311 | |
| | | | | | | | | | | | | | | | | | | | |
Total Oil and Gas Services | | | | | | | | | | | 1,811,906 | | | | 1,811,844 | | | | 1,840,085 | |
| | | | | | | | | | | | | | | | | | | | |
|
Real Estate — 6.3%*: | |
China Aoyuan Group Ltd.(a) | | | 7.95 | | | | 2/19/2023 | | | | 700,000 | | | | 671,055 | | | | 630,000 | |
China Aoyuan Group Ltd.(a) | | | 7.95 | | | | 6/21/2024 | | | | 1,000,000 | | | | 957,151 | | | | 860,000 | |
CIFI Holdings Group Co. Ltd.(a) | | | 4.45 | | | | 8/17/2026 | | | | 330,000 | | | | 315,591 | | | | 311,025 | |
Kaisa Group Holdings Ltd., 5 year CMT + 15.718%(a) | | | 10.88 | (c),(d) | | | – | | | | 1,000,000 | | | | 983,750 | | | | 780,000 | |
Kaisa Group Holdings Ltd.(a) | | | 11.25 | | | | 4/9/2022 | | | | 750,000 | | | | 753,419 | | | | 671,437 | |
Kaisa Group Holdings Ltd.(a) | | | 11.25 | | | | 4/16/2025 | | | | 1,000,000 | | | | 922,880 | | | | 771,412 | |
Kaisa Group Holdings Ltd.(a) | | | 11.95 | | | | 10/22/2022 | | | | 1,250,000 | | | | 1,224,003 | | | | 1,061,000 | |
Logan Group Co. Ltd.(a) | | | 5.25 | | | | 10/19/2025 | | | | 200,000 | | | | 193,765 | | | | 194,024 | |
New Metro Global Ltd.(a) | | | 4.50 | | | | 5/2/2026 | | | | 200,000 | | | | 187,526 | | | | 182,759 | |
New Metro Global Ltd.(a) | | | 4.80 | | | | 12/15/2024 | | | | 200,000 | | | | 192,025 | | | | 188,500 | |
Powerlong Real Estate Holdings Ltd.(a) | | | 4.90 | | | | 5/13/2026 | | | | 330,000 | | | | 310,241 | | | | 308,351 | |
Powerlong Real Estate Holdings Ltd.(a) | | | 5.95 | | | | 4/30/2025 | | | | 200,000 | | | | 193,019 | | | | 191,525 | |
Powerlong Real Estate Holdings Ltd.(a) | | | 6.25 | | | | 8/10/2024 | | | | 200,000 | | | | 193,273 | | | | 192,500 | |
Sunac China Holdings Ltd.(a) | | | 6.80 | | | | 10/20/2024 | | | | 200,000 | | | | 183,801 | | | | 160,000 | |
Sunac China Holdings Ltd.(a) | | | 7.50 | | | | 2/1/2024 | | | | 263,000 | | | | 246,959 | | | | 213,687 | |
Sunac China Holdings Ltd.(a) | | | 7.95 | | | | 8/8/2022 | | | | 200,000 | | | | 194,074 | | | | 183,038 | |
Times China Holdings Ltd.(a) | | | 6.75 | | | | 7/16/2023 | | | | 200,000 | | | | 197,017 | | | | 193,537 | |
Times China Holdings Ltd.(a) | | | 6.75 | | | | 7/8/2025 | | | | 400,000 | | | | 374,065 | | | | 366,000 | |
Yuzhou Group Holdings Co. Ltd.(a) | | | 6.35 | | | | 1/13/2027 | | | | 802,000 | | | | 802,000 | | | | 513,280 | |
Yuzhou Group Holdings Co. Ltd.(a) | | | 7.70 | | | | 2/20/2025 | | | | 250,000 | | | | 192,680 | | | | 178,750 | |
Yuzhou Group Holdings Co. Ltd.(a) | | | 8.38 | | | | 10/30/2024 | | | | 250,000 | | | | 200,130 | | | | 191,875 | |
Yuzhou Group Holdings Co. Ltd.(a) | | | 8.50 | | | | 2/4/2023 | | | | 1,050,000 | | | | 990,995 | | | | 893,025 | |
| | | | | | | | | | | | | | | | | | | | |
Total Real Estate | | | | | | | | | | | 10,975,000 | | | | 10,479,419 | | | | 9,235,725 | |
| | | | | | | | | | | | | | | | | | | | |
|
Retail — 1.5%*: | |
Eurotorg LLC Via Bonitron DAC(a),(b) | | | 9.00 | | | | 10/22/2025 | | | | 723,000 | | | | 723,000 | | | | 760,596 | |
Future Retail Ltd.(a) | | | 5.60 | | | | 1/22/2025 | | | | 794,000 | | | | 718,333 | | | | 465,482 | |
InRetail Consumer(a),(b) | | | 3.25 | | | | 3/22/2028 | | | | 937,000 | | | | 937,000 | | | | 935,126 | |
| | | | | | | | | | | | | | | | | | | | |
Total Retail | | | | | | | | | | | 2,454,000 | | | | 2,378,333 | | | | 2,161,204 | |
| | | | | | | | | | | | | | | | | | | | |
|
Sovereign — 0.3%*: | |
Ukreximbank Via Biz Finance plc, 5 year USD ICE Swap + 8.178%(a) | | | 9.95 | (c) | | | 11/14/2029 | | | | 500,000 | | | | 500,000 | | | | 508,739 | |
| | | | | | | | | | | | | | | | | | | | |
|
Telecommunications — 1.2%*: | |
Oi Movel SA(a) | | | 8.75 | | | | 7/30/2026 | | | | 1,256,000 | | | | 1,256,000 | | | | 1,281,120 | |
Sixsigma Networks Mexico SA de CV(a),(b) | | | 7.50 | | | | 5/2/2025 | | | | 500,000 | | | | 463,000 | | | | 486,031 | |
| | | | | | | | | | | | | | | | | | | | |
Total Telecommunications | | | | | | | | | | | 1,756,000 | | | | 1,719,000 | | | | 1,767,151 | |
| | | | | | | | | | | | | | | | | | | | |
See accompanying Notes to the Financial Statements.
75
Barings Emerging Markets Debt Blended Total Return Fund 2021 Annual Report
SCHEDULE OF INVESTMENTS (CONTINUED)
September 30, 2021
| | | | | | | | | | | | | | | | | | | | |
| | | EFFECTIVE
INTEREST RATE | | | DUE DATE | | | PRINCIPAL ‡‡ | | | COST | | | FAIR
VALUE | |
Corporate Bonds (Continued) | |
|
Transportation — 1.5%*: | |
MV24 Capital BV(a),(b) | | | 6.75 | % | | | 6/1/2034 | | | | 567,732 | | | $ | 567,732 | | | $ | 601,193 | |
Prumo Participacoes e Investimentos SA(a),(b) | | | 7.50 | | | | 12/31/2031 | | | | 267,388 | | | | 274,140 | | | | 296,850 | |
Rumo Luxembourg Sarl(a),(b) | | | 4.20 | | | | 1/18/2032 | | | | 650,000 | | | | 647,347 | | | | 635,310 | |
Ukraine Railways Via Rail Capital Markets plc(a) | | | 7.88 | | | | 7/15/2026 | | | | 600,000 | | | | 600,000 | | | | 605,175 | |
| | | | | | | | | | | | | | | | | | | | |
Total Transportation | | | | | | | | | | | 2,085,120 | | | | 2,089,219 | | | | 2,138,528 | |
| | | | | | | | | | | | | | | | | | | | |
| | | | | | | | | | | | | | | | | | | | |
Total Corporate Bonds | | | | | | | | | | | 70,538,728 | | | | 68,293,820 | | | | 67,571,894 | |
| | | | | | | | | | | | | | | | | | | | |
Foreign Government — 44.6%*: | |
|
Albania — 0.6%*: | |
Albania Government International Bond(a),(b) | | | 3.50 | % | | | 6/16/2027 | | | | 740,000 | | | | $833,630 | | | | $922,753 | |
| | | | | | | | | | | | | | | | | | | | |
|
Armenia — 0.5%*: | |
Republic of Armenia International Bond(a),(b) | | | 3.60 | | | | 2/2/2031 | | | | 740,000 | | | | 724,185 | | | | 698,283 | |
| | | | | | | | | | | | | | | | | | | | |
|
Belarus — 1.9%*: | |
Republic of Belarus International Bond(a),(b) | | | 7.63 | | | | 6/29/2027 | | | | 1,000,000 | | | | 1,024,928 | | | | 983,500 | |
Republic of Belarus Ministry of Finance(a),(b) | | | 6.38 | | | | 2/24/2031 | | | | 2,030,000 | | | | 2,039,018 | | | | 1,781,325 | |
| | | | | | | | | | | | | | | | | | | | |
Total Belarus | | | | | | | | | | | 3,030,000 | | | | 3,063,946 | | | | 2,764,825 | |
| | | | | | | | | | | | | | | | | | | | |
|
Brazil — 0.6%*: | |
Brazilian Government International Bond(a) | | | 4.75 | | | | 1/14/2050 | | | | 200,000 | | | | 207,875 | | | | 176,663 | |
Brazilian Government International Bond(a) | | | 5.63 | | | | 2/21/2047 | | | | 700,000 | | | | 796,579 | | | | 698,600 | |
| | | | | | | | | | | | | | | | | | | | |
Total Brazil | | | | | | | | | | | 900,000 | | | | 1,004,454 | | | | 875,263 | |
| | | | | | | | | | | | | | | | | | | | |
|
Colombia — 4.9%*: | |
Colombian TES(a) | | | 7.25 | | | | 10/26/2050 | | | | 16,500,000,000 | | | | 4,480,319 | | | | 3,838,369 | |
Colombian TES(a) | | | 7.50 | | | | 8/26/2026 | | | | 11,978,000,000 | | | | 3,697,495 | | | | 3,253,324 | |
| | | | | | | | | | | | | | | | | | | | |
Total Colombia | | | | | | | | | | | 28,478,000,000 | | | | 8,177,814 | | | | 7,091,693 | |
| | | | | | | | | | | | | | | | | | | | |
|
Costa Rica — 0.3%*: | |
Costa Rica Government International Bond(a),(b) | | | 6.13 | | | | 2/19/2031 | | | | 500,000 | | | | 510,533 | | | | 513,375 | |
| | | | | | | | | | | | | | | | | | | | |
|
Czech Republic — 0.9%*: | |
Czech Republic Government Bond(a) | | | 1.50 | | | | 4/24/2040 | | | | 33,310,000 | | | | 1,444,072 | | | | 1,357,286 | |
| | | | | | | | | | | | | | | | | | | | |
See accompanying Notes to the Financial Statements.
76
Barings Emerging Markets Debt Blended Total Return Fund 2021 Annual Report
SCHEDULE OF INVESTMENTS (CONTINUED)
September 30, 2021
| | | | | | | | | | | | | | | | | | | | |
| | | EFFECTIVE
INTEREST RATE | | | DUE DATE | | | PRINCIPAL ‡‡ | | | COST | | | FAIR
VALUE | |
Foreign Government (Continued) | |
|
Egypt — 1.1%*: | |
Egypt Government International Bond(a),(b) | | | 5.88 | % | | | 2/16/2031 | | | | 1,345,000 | | | $ | 1,325,378 | | | $ | 1,227,313 | |
Egypt Government International Bond(a),(b) | | | 6.38 | | | | 4/11/2031 | | | | 350,000 | | | | 392,822 | | | | 396,300 | |
| | | | | | | | | | | | | | | | | | | | |
Total Egypt | | | | | | | | | | | 1,695,000 | | | | 1,718,200 | | | | 1,623,613 | |
| | | | | | | | | | | | | | | | | | | | |
|
Guatemala — 0.7%*: | |
Republic of Guatemala(a) | | | 4.65 | | | | 10/7/2041 | | | | 1,060,000 | | | | 1,033,055 | | | | 1,033,055 | |
| | | | | | | | | | | | | | | | | | | | |
|
Honduras — 0.6%*: | |
Honduras Government International Bond(a),(b) | | | 5.63 | | | | 6/24/2030 | | | | 800,000 | | | | 843,814 | | | | 831,900 | |
| | | | | | | | | | | | | | | | | | | | |
|
Israel — 2.5%*: | |
Israel Government Bond(a) | | | 3.75 | | | | 3/31/2047 | | | | 2,770,000 | | | | 1,141,898 | | | | 1,082,368 | |
Israel Government Bond(a) | | | 5.50 | | | | 1/31/2042 | | | | 5,400,000 | | | | 2,738,901 | | | | 2,616,936 | |
| | | | | | | | | | | | | | | | | | | | |
Total Israel | | | | | | | | | | | 8,170,000 | | | | 3,880,799 | | | | 3,699,304 | |
| | | | | | | | | | | | | | | | | | | | |
|
Ivory Coast — 1.4%*: | |
Ivory Coast Government International Bond(a),(b) | | | 5.75 | | | | 12/31/2032 | | | | 1,016,098 | | | | 1,040,185 | | | | 1,010,573 | |
Ivory Coast Government International Bond(a),(b) | | | 5.88 | % | | | 10/17/2031 | | | | 550,000 | | | | 600,277 | | | | 663,691 | |
Ivory Coast Government International Bond(a),(b) | | | 6.63 | | | | 3/22/2048 | | | | 300,000 | | | | 384,899 | | | | 349,633 | |
| | | | | | | | | | | | | | | | | | | | |
Total Ivory Coast | | | | | | | | | | | 1,866,098 | | | | 2,025,361 | | | | 2,023,897 | |
| | | | | | | | | | | | | | | | | | | | |
|
Jordan — 0.9%*: | |
Jordan Government International Bond(a),(b) | | | 5.85 | | | | 7/7/2030 | | | | 1,230,000 | | | | 1,235,731 | | | | 1,273,050 | |
| | | | | | | | | | | | | | | | | | | | |
|
Kenya — 0.8%*: | |
Kenya Government International Bond(a),(b) | | | 8.00 | | | | 5/22/2032 | | | | 500,000 | | | | 570,640 | | | | 550,719 | |
Kenya Government International Bond(a),(b) | | | 8.25 | | | | 2/28/2048 | | | | 600,000 | | | | 654,767 | | | | 646,800 | |
| | | | | | | | | | | | | | | | | | | | |
Total Kenya | | | | | | | | | | | 1,100,000 | | | | 1,225,407 | | | | 1,197,519 | |
| | | | | | | | | | | | | | | | | | | | |
|
Macedonia — 0.5%*: | |
North Macedonia Government International
Bond(a),(b) | | | 3.68 | | | | 6/3/2026 | | | | 550,000 | | | | 598,083 | | | | 696,024 | |
| | | | | | | | | | | | | | | | | | | | |
|
Malaysia — 3.7%*: | |
Malaysia Government Bond(a) | | | 3.96 | | | | 9/15/2025 | | | | 6,002,000 | | | | 1,521,581 | | | | 1,499,470 | |
Malaysia Government Bond(a) | | | 4.07 | | | | 6/15/2050 | | | | 9,900,000 | | | | 2,312,860 | | | | 2,273,701 | |
Malaysia Government Bond(a) | | | 4.94 | | | | 9/30/2043 | | | | 6,200,000 | | | | 1,764,558 | | | | 1,608,960 | |
| | | | | | | | | | | | | | | | | | | | |
Total Malaysia | | | | | | | | | | | 22,102,000 | | | | 5,598,999 | | | | 5,382,131 | |
| | | | | | | | | | | | | | | | | | | | |
|
Mexico — 4.1%*: | |
Mexican Bonos(a) | | | 5.75 | | | | 3/5/2026 | | | | 56,800,000 | | | | 2,936,318 | | | | 2,628,770 | |
Mexican Bonos(a) | | | 7.75 | | | | 11/13/2042 | | | | 19,200,000 | | | | 875,902 | | | | 921,444 | |
See accompanying Notes to the Financial Statements.
77
Barings Emerging Markets Debt Blended Total Return Fund 2021 Annual Report
SCHEDULE OF INVESTMENTS (CONTINUED)
September 30, 2021
| | | | | | | | | | | | | | | | | | | | |
| | | EFFECTIVE
INTEREST RATE | | | DUE DATE | | | PRINCIPAL ‡‡ | | | COST | | | FAIR
VALUE | |
Foreign Government (Continued) | |
| | | | | |
Mexico (Continued) | | | | | | | | | | | | | | | | | | | | |
Mexican Bonos(a) | | | 8.00 | % | | | 11/7/2047 | | | | 22,000,000 | | | $ | 1,044,619 | | | $ | 1,074,807 | |
Mexican Bonos(a) | | | 8.50 | | | | 5/31/2029 | | | | 25,300,000 | | | | 1,388,005 | | | | 1,312,633 | |
| | | | | | | | | | | | | | | | | | | | |
Total Mexico | | | | | | | | | | | 123,300,000 | | | | 6,244,844 | | | | 5,937,654 | |
| | | | | | | | | | | | | | | | | | | | |
|
Morocco — 0.6%*: | |
Morocco Government International Bond(a),(b) | | | 2.00 | | | | 9/30/2030 | | | | 530,000 | | | | 612,945 | | | | 598,781 | |
Morocco Government International Bond(a),(b) | | | 5.50 | | | | 12/11/2042 | | | | 200,000 | | | | 228,260 | | | | 224,975 | |
| | | | | | | | | | | | | | | | | | | | |
Total Morocco | | | | | | | | | | | 730,000 | | | | 841,205 | | | | 823,756 | |
| | | | | | | | | | | | | | | | | | | | |
|
Oman — 1.0%*: | |
Oman Government International Bond(a),(b) | | | 6.25 | | | | 1/25/2031 | | | | 550,000 | | | | 550,000 | | | | 587,125 | |
Oman Government International Bond(a),(b) | | | 7.38 | | | | 10/28/2032 | | | | 730,000 | | | | 814,591 | | | | 829,462 | |
| | | | | | | | | | | | | | | | | | | | |
Total Oman | | | | | | | | | | | 1,280,000 | | | | 1,364,591 | | | | 1,416,587 | |
| | | | | | | | | | | | | | | | | | | | |
|
Romania — 1.3%*: | |
Romania Government Bond(a) | | | 3.65 | | | | 9/24/2031 | | | | 4,350,000 | | | | 1,054,686 | | | | 957,107 | |
Romanian Government International Bond(a),(b) | | | 4.63 | | | | 4/3/2049 | | | | 750,000 | | | | 1,108,481 | | | | 1,015,931 | |
| | | | | | | | | | | | | | | | | | | | |
Total Romania | | | | | | | | | | | 5,100,000 | | | | 2,163,167 | | | | 1,973,038 | |
| | | | | | | | | | | | | | | | | | | | |
Foreign Government (Continued) | |
|
Serbia — 1.5%*: | |
Serbia International Bond(a),(b) | | | 2.05 | % | | | 9/23/2036 | | | | 1,180,000 | | | | 1,344,315 | | | | 1,282,108 | |
Serbia International Bond(a),(b) | | | 3.13 | | | | 5/15/2027 | | | | 680,000 | | | | 726,334 | | | | 865,855 | |
| | | | | | | | | | | | | | | | | | | | |
Total Serbia | | | | | | | | | | | 1,860,000 | | | | 2,070,649 | | | | 2,147,963 | |
| | | | | | | | | | | | | | | | | | | | |
|
South Africa — 5.8%*: | |
Republic of South Africa Government Bond(a) | | | 8.75 | | | | 1/31/2044 | | | | 61,800,000 | | | | 3,441,361 | | | | 3,383,413 | |
Republic of South Africa Government Bond(a) | | | 10.50 | | | | 12/21/2026 | | | | 68,700,000 | | | | 4,842,185 | | | | 5,120,422 | |
| | | | | | | | | | | | | | | | | | | | |
Total South Africa | | | | | | | | | | | 130,500,000 | | | | 8,283,546 | | | | 8,503,835 | |
| | | | | | | | | | | | | | | | | | | | |
| | | | | |
Tajikistan — 0.5%*: | | | | | | | | | | | | | | | | | | | | |
Republic of Tajikistan International Bond(a),(b) | | | 7.13 | | | | 9/14/2027 | | | | 815,000 | | | | 706,005 | | | | 725,248 | |
| | | | | | | | | | | | | | | | | | | | |
| | | | | |
Thailand — 2.9%*: | | | | | | | | | | | | | | | | | | | | |
Thailand Government Bond(a) | | | 1.60 | | | | 12/17/2029 | | | | 36,905,000 | | | | 1,210,917 | | | | 1,080,481 | |
Thailand Government Bond(a) | | | 2.88 | | | | 12/17/2028 | | | | 22,913,000 | | | | 798,717 | | | | 738,349 | |
Thailand Government Bond(a) | | | 3.30 | | | | 6/17/2038 | | | | 73,500,000 | | | | 2,673,367 | | | | 2,411,478 | |
| | | | | | | | | | | | | | | | | | | | |
Total Thailand | | | | | | | | | | | 133,318,000 | | | | 4,683,001 | | | | 4,230,308 | |
| | | | | | | | | | | | | | | | | | | | |
See accompanying Notes to the Financial Statements.
78
Barings Emerging Markets Debt Blended Total Return Fund 2021 Annual Report
SCHEDULE OF INVESTMENTS (CONTINUED)
September 30, 2021
| | | | | | | | | | | | | | | | | | | | |
| | | EFFECTIVE
INTEREST RATE | | | DUE DATE | | | PRINCIPAL ‡‡ | | | COST | | | FAIR
VALUE | |
Foreign Government (Continued) | |
| | | | | |
Turkey — 0.8%*: | | | | | | | | | | | | | | | | | | | | |
Turkey Government Bond(a) | | | 11.70 | | | | 11/13/2030 | | | | 15,000,000 | | | | $1,383,411 | | | | $1,232,992 | |
| | | | | | | | | | | | | | | | | | | | |
| | | | | |
Ukraine — 3.1%*: | | | | | | | | | | | | | | | | | | | | |
Ukraine Government International Bond(a),(b) | | | 6.88 | | | | 5/21/2029 | | | | 1,380,000 | | | | 1,427,331 | | | | 1,397,940 | |
Ukraine Government International Bond(a),(b) | | | 7.38 | | | | 9/25/2032 | | | | 1,375,000 | | | | 1,434,100 | | | | 1,403,617 | |
Ukraine Government International Bonds(a),(b) | | | 9.75 | | | | 11/1/2028 | | | | 1,460,000 | | | | 1,536,408 | | | | 1,713,493 | |
| | | | | | | | | | | | | | | | | | | | |
Total Ukraine | | | | | | | | | | | 4,215,000 | | | | 4,397,839 | | | | 4,515,050 | |
| | | | | | | | | | | | | | | | | | | | |
| | | | | |
Uruguay — 0.9%*: | | | | | | | | | | | | | | | | | | | | |
Uruguay Government International Bond(a) | | | 3.88 | | | | 7/2/2040 | | | | 50,502,999 | | | | 1,277,815 | | | | 1,343,431 | |
| | | | | | | | | | | | | | | | | | | | |
| | | | | |
Uzbekistan — 0.2%*: | | | | | | | | | | | | | | | | | | | | |
Republic of Uzbekistan Bond(a),(b) | | | 3.70 | | | | 11/25/2030 | | | | 250,000 | | | | 250,000 | | | | 241,500 | |
| | | | | | | | | | | | | | | | | | | | |
Total Foreign Government | | | | | | | | | | | 29,022,664,097 | | | | 67,584,156 | | | | 65,075,333 | |
| | | | | | | | | | | | | | | | | | | | |
| | | | | | | | | | | | | | | | | | | | |
Total Fixed Income | | | | | | | | | | | 29,093,202,825 | | | | 135,877,976 | | | | 132,647,227 | |
| | | | | | | | | | | | | | | | | | | | |
| | | | | | | | | | | | | | | | | | | | | | | | | | | | | | |
| | | COUNTERPARTY | | STRIKE
PRICE | | | EXPIRATION
DATE | | | CONTRACTS | | | NOTIONAL | | | COST | | | UNREALIZED
VALUE | | | FAIR VALUE | |
Purchased Options — 0.0%**: | |
|
Call Options Purchased — 0.0%*: | |
USD Call, BRL Put | | Bank of America N.A. | | | $6.32 | | | | 10/1/2021 | | | | 2,783,641 | | | | 2,783,640 | | | | 3,062 | | | | (3,059 | ) | | | 3 | |
USD Call, EUR Put | | BNP Paribas S.A. | | | 1.15 | | | | 10/8/2021 | | | | 10,000,000 | | | | 10,000,000 | | | | 26,930 | | | | (26,920 | ) | | | 10 | |
| | | | | | | | | | | | | | | | | | | | | | | | | | | | | | |
Total Call Options Purchased | | | | | | | | | | | 12,783,641 | | | | 12,783,640 | | | | 29,992 | | | | (29,979 | ) | | | 13 | |
| | | | | | | | | | | | | | | | | | | | | | | | | | | | | | |
Total Investments | | | | | | | | | | | | | | | 29,105,986,465 | | | | 135,907,968 | | | | | | | | 132,647,240 | |
| | | | | | | | | | | | | | | | | | | | | | | | | | | | | | |
| |
Written Options* – (0.1%) | | | | (87,188 | ) |
| | | | | | | | | | | | | | | | | | | | | | | | | | | | | | |
| |
Other assets and liabilities – 9.2%* | | | | 13,333,730 | |
| | | | | | | | | | | | | | | | | | | | | | | | | | | | | | |
| |
Net Assets – 100.0% | | | | $145,893,782 | |
| | | | | | | | | | | | | | | | | | | | | | | | | | | | | | |
| ‡‡ | | Unless otherwise indicated, all principal amounts are denominated in United States Dollars. |
| * | | Calculated as a percentage of net assets applicable to common shareholders. |
See accompanying Notes to the Financial Statements.
79
Barings Emerging Markets Debt Blended Total Return Fund 2021 Annual Report
SCHEDULE OF INVESTMENTS (CONTINUED)
September 30, 2021
Distributions of investments by country of risk (excluding temporary cash investments) as a percentage of total investments in securities, is as follows:
| | | | |
| | Mexico | | 9.8% |
| | Brazil | | 8.2% |
| | China | | 7.3% |
| | South Africa | | 7.1% |
| | India | | 6.5% |
| | Ukraine | | 6.3% |
| | Colombia | | 5.3% |
| | Malaysia | | 4.1% |
| | Thailand | | 4.0% |
| | Russia | | 3.9% |
| | Greece | | 3.0% |
| | Israel | | 2.8% |
| | Belarus | | 2.7% |
| | Turkey | | 2.5% |
| | Ghana | | 1.7% |
| | Serbia | | 1.6% |
| | Ivory Coast | | 1.5% |
| | Romania | | 1.5% |
| | Oman | | 1.4% |
| | Chile | | 1.4% |
| | Uzbekistan | | 1.3% |
| | Egypt | | 1.2% |
| | Guatemala | | 1.2% |
| | Moldova | | 1.1% |
| | Czech Republic | | 1.0% |
| | Uruguay | | 1.0% |
| | Jordan | | 1.0% |
| | Other (Individually less than 1%) | | 9.6% |
| | | | |
| | Total | | 100.0% |
| | | | |
| (b) | | Security acquired in a transaction exempt from registration under Rule 144A of the Securities Act of 1933. These securities may only be resold in transactions exempt from registration, normally to qualified institutional buyers. |
| (c) | | Variable rate security. The interest rate shown is the rate in effect at September 30, 2021. |
| (d) | | Security is perpetual in nature and has no stated maturity. |
| (e) | | For fair value measurement disclosure purposes, security is categorized as Level 3 (See Note 2). |
See accompanying Notes to the Financial Statements.
80
Barings Emerging Markets Debt Blended Total Return Fund 2021 Annual Report
SCHEDULE OF INVESTMENTS (CONTINUED)
September 30, 2021
A summary of outstanding derivatives at September 30, 2021 is as follows:
| | | | | | | | | | | | | | | | | | | | | | | | | | | | | | |
| | | COUNTERPARTY | | STRIKE
PRICE | | | EXPIRATION
DATE | | | CONTRACTS | | | NOTIONAL | | | COST | | | UNREALIZED
VALUE | | | FAIR
VALUE | |
Call Options Written — (0.1)%*: | |
OTC – BCM Swaption | | Barclays Bank plc | | | $23.14 | | | | 10/1/2021 | | | | (2,783,641 | ) | | | $(2,783,641) | | | | $(47,378) | | | | $47,375 | | | | $(3) | |
OTC – BCM Swaption | | Bank of America N.A. | | | 5.97 | | | | 1/10/2022 | | | | (6,500,000 | ) | | | (6,500,000 | ) | | | (133,099) | | | �� | 45,929 | | | | (87,170) | |
OTC – BCM Swaption | | Bank of America N.A. | | | 6.32 | | | | 10/1/2021 | | | | (2,783,641 | ) | | | (2,783,641 | ) | | | (60,127 | ) | | | 60,124 | | | | (3 | ) |
OTC – BCM Swaption | | Bank of America N.A. | | | 22.96 | | | | 10/4/2021 | | | | (2,783,641 | ) | | | (2,783,641 | ) | | | (42,103 | ) | | | 42,100 | | | | (3 | ) |
OTC – BCM Swaption | | JPMorgan Chase Bank N.A. | | | 22.80 | | | | 10/4/2021 | | | | (2,783,641 | ) | | | (2,783,641 | ) | | | (40,920 | ) | | | 40,917 | | | | (3 | ) |
OTC – BCM Swaption | | JPMorgan Chase Bank N.A. | | | 85.96 | | | | 10/1/2021 | | | | (2,783,641 | ) | | | (2,783,641 | ) | | | (47,879 | ) | | | 47,876 | | | | (3 | ) |
OTC – BCM Swaption | | JPMorgan Chase Bank N.A. | | | 6.36 | | | | 10/4/2021 | | | | (2,783,641 | ) | | | (2,783,641 | ) | | | (60,683 | ) | | | 60,680 | | | | (3 | ) |
| | | | | | | | | | | | | | | | | | | | | | | | | | | | | | |
Total Call Options Written | | | | | | | | | | | | $(432,189 | ) | | | $345,001 | | | | $(87,188 | ) |
| | | | | | | | | | | | | | | | | | | | | | | | | | | | | | |
Total Written Options | | | | | | | | | | | | $(432,189 | ) | | | $345,001 | | | | $(87,188 | ) |
| | | | | | | | | | | | | | | |
Forward Foreign Currency Exchange Contracts to Buy
| | | | | | | | | | | | | | | | | | | | | | |
EXPIRATION
DATE | | COUNTERPARTY | | LOCAL CURRENCY | | | VALUE IN
USD | | | IN
EXCHANGE
FOR USD | | | NET UNREALIZED
APPRECIATION
(DEPRECIATION) | |
| 10/26/21 | | Bank of America N.A. | | | AUD | | | | 3,480,864 | | | $ | 2,516,715 | | | $ | 2,550,543 | | | $ | (33,828 | ) |
| 10/13/21 | | JPMorgan Chase Bank N.A. | | | BRL | | | | 28,936,180 | | | | 5,306,227 | | | | 5,441,177 | | | | (134,950 | ) |
| 11/9/21 | | JPMorgan Chase Bank N.A. | | | BRL | | | | 46,138,315 | | | | 8,425,077 | | | | 8,799,061 | | | | (373,984 | ) |
| 10/13/21 | | Citibank N.A. | | | CLP | | | | 5,916,269,960 | | | | 7,291,501 | | | | 7,768,854 | | | | (477,353 | ) |
| 11/16/21 | | Goldman Sachs & Co. | | | CZK | | | | 118,011,522 | | | | 5,386,222 | | | | 5,445,094 | | | | (58,872 | ) |
| 10/26/21 | | JPMorgan Chase Bank N.A. | | | PHP | | | | 141,193,125 | | | | 2,757,128 | | | | 2,789,000 | | | | (31,872 | ) |
| 10/19/21 | | Bank of America N.A. | | | PLN | | | | 28,393,349 | | | | 7,138,775 | | | | 7,336,593 | | | | (197,818 | ) |
| 11/16/21 | | Bank of America N.A. | | | PLN | | | | 28,289,107 | | | | 7,111,903 | | | | 7,290,933 | | | | (179,030 | ) |
| 10/19/21 | | JPMorgan Chase Bank N.A. | | | RUB | | | | 229,719,754 | | | | 3,149,284 | | | | 3,050,322 | | | | 98,962 | |
| 10/19/21 | | Morgan Stanley & Co. | | | RUB | | | | 229,113,687 | | | | 3,140,976 | | | | 3,113,000 | | | | 27,976 | |
| 11/16/21 | | Citibank N.A. | | | RUB | | | | 630,917,836 | | | | 8,612,230 | | | | 8,416,502 | | | | 195,728 | |
| 11/16/21 | | JPMorgan Chase Bank N.A. | | | UAH | | | | 28,864,264 | | | | 1,073,418 | | | | 1,058,870 | | | | 14,548 | |
| 10/19/21 | | JPMorgan Chase Bank N.A. | | | ZAR | | | | 59,197,502 | | | | 3,923,349 | | | | 4,028,000 | | | | (104,651 | ) |
| | | | | | | | | | | | | | | | | | | | | | |
Net unrealized depreciation on forward foreign currency exchange contracts to buy | | | $ | (1,255,144 | ) |
| | | | | | | | | | | | | | | | | | | | | | |
See accompanying Notes to the Financial Statements.
81
Barings Emerging Markets Debt Blended Total Return Fund 2021 Annual Report
SCHEDULE OF INVESTMENTS (CONTINUED)
September 30, 2021
Forward Foreign Currency Exchange Contracts to Sell
| | | | | | | | | | | | | | | | | | | | | | |
EXPIRATION
DATE | | COUNTERPARTY | | LOCAL
CURRENCY | | | VALUE IN
USD | | | IN
EXCHANGE
FOR USD | | | NET UNREALIZED
APPRECIATION
(DEPRECIATION) | |
| 10/13/21 | | JPMorgan Chase Bank N.A. | | | BRL | | | | 23,693,320 | | | $ | 4,344,807 | | | $ | 4,574,000 | | | $ | 229,193 | |
| 11/9/21 | | JPMorgan Chase Bank N.A. | | | CAD | | | | 9,161,780 | | | | 7,232,967 | | | | 7,214,000 | | | | (18,967 | ) |
| 10/19/21 | | Morgan Stanley & Co. | | | CHF | | | | 5,027,004 | | | | 5,396,024 | | | | 5,498,200 | | | | 102,176 | |
| 11/16/21 | | Goldman Sachs & Co. | | | CHF | | | | 3,297,182 | | | | 3,541,618 | | | | 3,586,707 | | | | 45,089 | |
| 11/16/21 | | JPMorgan Chase Bank N.A. | | | CHF | | | | 1,627,998 | | | | 1,748,689 | | | | 1,775,000 | | | | 26,311 | |
| 10/26/21 | | BNP Paribas S.A. | | | CNH | | | | 59,336,351 | | | | 9,188,665 | | | | 9,100,277 | | | | (88,388 | ) |
| 10/13/21 | | Citibank N.A. | | | COP | | | | 8,124,769,100 | | | | 2,132,514 | | | | 2,095,794 | | | | (36,720 | ) |
| 11/9/21 | | Citibank N.A. | | | COP | | | | 19,171,513,097 | | | | 5,022,033 | | | | 4,896,063 | | | | (125,970 | ) |
| 11/16/21 | | Bank of America N.A. | | | EUR | | | | 678,768 | | | | 786,888 | | | | 798,369 | | | | 11,481 | |
| 11/16/21 | | BNP Paribas S.A. | | | EUR | | | | 728,359 | | | | 844,378 | | | | 861,000 | | | | 16,622 | |
| 11/16/21 | | HSBC Bank USA | | | EUR | | | | 1,891,198 | | | | 2,192,443 | | | | 2,230,015 | | | | 37,572 | |
| 10/19/21 | | Bank of America N.A. | | | ILS | | | | 11,996,632 | | | | 3,721,411 | | | | 3,705,308 | | | | (16,103 | ) |
| 10/26/21 | | Barclays Bank plc | | | JPY | | | | 344,004,067 | | | | 3,091,371 | | | | 3,120,044 | | | | 28,673 | |
| 10/26/21 | | JPMorgan Chase Bank N.A. | | | JPY | | | | 36,213,774 | | | | 325,433 | | | | 330,000 | | | | 4,567 | |
| 11/24/21 | | Bank of America N.A. | | | JPY | | | | 387,114,655 | | | | 3,479,465 | | | | 3,527,530 | | | | 48,065 | |
| 10/13/21 | | Goldman Sachs & Co. | | | MXN | | | | 127,278,790 | | | | 6,156,946 | | | | 6,346,645 | | | | 189,699 | |
| 10/19/21 | | Bank of America N.A. | | | PLN | | | | 13,741,029 | | | | 3,454,827 | | | | 3,571,000 | | | | 116,173 | |
| 10/19/21 | | JPMorgan Chase Bank N.A. | | | RON | | | | 32,383,414 | | | | 7,574,115 | | | | 7,727,000 | | | | 152,885 | |
| 10/26/21 | | Canadian Imperial Bank of Commerce | | | SGD | | | | 976,906 | | | | 719,447 | | | | 714,220 | | | | (5,227 | ) |
| 11/24/21 | | Canadian Imperial Bank of Commerce | | | SGD | | | | 2,045,342 | | | | 1,506,207 | | | | 1,503,486 | | | | (2,721 | ) |
| 10/26/21 | | Citibank N.A. | | | THB | | | | 237,834,156 | | | | 7,028,099 | | | | 7,212,888 | | | | 184,789 | |
| 10/26/21 | | Goldman Sachs & Co. | | | THB | | | | 133,477,375 | | | | 3,944,313 | | | | 4,085,000 | | | | 140,687 | |
| 11/23/21 | | Citibank N.A. | | | THB | | | | 249,253,498 | | | | 7,364,351 | | | | 7,551,071 | | | | 186,720 | |
| 10/19/21 | | JPMorgan Chase Bank N.A. | | | ZAR | | | | 86,332,236 | | | | 5,721,720 | | | | 5,822,439 | | | | 100,719 | |
| 11/16/21 | | Standard Chartered Bank | | | ZAR | | | | 38,207,444 | | | | 2,522,563 | | | | 2,570,119 | | | | 47,556 | |
| | | | | | | | | | | | | | | | | | | | | | |
Net unrealized appreciation on forward foreign currency exchange contracts to sell | | | $ | 1,374,881 | |
| | | | | | | | | | | | | | | | | | | | | | |
Currency Legend
| | | | |
| AUD | | – | | Australian Dollar |
| BRL | | – | | Brazilian Real |
| CAD | | – | | Canadian Dollar |
| CHF | | – | | Swiss Franc |
| CLP | | – | | Chilean Peso |
| CNH | | – | | Chinese Yuan Renminbi |
| COP | | – | | Colombian Peso |
| CZK | | – | | Czech Koruna |
| EUR | | – | | Euro |
| HUF | | – | | Hungarian Forint |
| ILS | | – | | Israeli Shekel |
| JPY | | – | | Japanese Yen |
See accompanying Notes to the Financial Statements.
82
Barings Emerging Markets Debt Blended Total Return Fund 2021 Annual Report
SCHEDULE OF INVESTMENTS (CONTINUED)
September 30, 2021
| | | | |
| KRW | | – | | South Korean Won |
| MXN | | – | | Mexican Peso |
| PHP | | — | | Philippines Peso |
| PLN | | – | | Polish Zloty |
| RON | | – | | Romanian New Leu |
| RUB | | – | | Russian Ruble |
| SGD | | – | | Singapore Dollar |
| THB | | – | | Thai Baht |
| UAH | | – | | Ukraine Hryvnia |
| ZAR | | – | | South African Rand |
FUTURES
| | | | | | | | | | | | | | | | | | | | | | | | | | | | | | |
| TYPE | | EXPIRATION
DATE | | CONTRACTS | | NOTIONAL
AMOUNT | | POSITION | | FAIR VALUE | | UNREALIZED
APPRECIATION |
Short Future | |
U.S. Ultra Bond | | 12/21/21 | | | | 13 | | | | | (2,592,188 | ) | | | | Short | | | | $ | (2,483,813 | ) | | | $ | 108,375 | |
| | | | | | | | | | | | | | | | | | | | | | | | | | | |
Centrally Cleared Interest Rate Swaps
| | | | | | | | | | | | | | | | | | | | | | | | | | | | |
FLOATING RATE
REFERENCE | | PAY/RECEIVE
FLOATING
RATE | | | FIXED
RATE | | | MATURITY
DATE | | | PAY/RECEIVE
PAYMENT
FREQUENCY | | | NOTIONAL
AMOUNT | | | CLEARED
EXCHANGE | | | UNREALIZED
APPRECIATION
(DEPRECIATION) | |
| ILS-TELBOR03 Rate | | | Receive | | | | 0.48 | % | | | 2/19/26 | | | | 1Y/3M | | | | 7,300,000 | | | | LCH | | | $ | 17,961 | |
| BRL-CDI Rate | | | Pay | | | | 7.40 | % | | | 1/02/29 | | | | At Maturity | | | | 5,424,561 | | | | CME | | | | (194,537 | ) |
| BRL-CDI Rate | | | Pay | | | | 5.28 | % | | | 1/02/23 | | | | At Maturity | | | | 28,007,008 | | | | CME | | | | (191,004 | ) |
| BRL-CDI Rate | | | Pay | | | | 5.76 | % | | | 1/02/23 | | | | At Maturity | | | | 22,869,409 | | | | CME | | | | (123,233 | ) |
| BRL-CDI Rate | | | Pay | | | | 5.86 | % | | | 1/02/23 | | | | At Maturity | | | | 11,440,946 | | | | CME | | | | (57,829 | ) |
| BRL-CDI Rate | | | Pay | | | | 5.86 | % | | | 1/02/23 | | | | At Maturity | | | | 11,441,936 | | | | CME | | | | (58,016 | ) |
| HUF-BUBOR rate | | | Receive | | | | 2.60 | % | | | 5/22/25 | | | | 1Y/6M | | | | 2,302,600,000 | | | | LCH | | | | 88,903 | |
| HUF-BUBOR rate | | | Receive | | | | 2.67 | % | | | 5/24/25 | | | | 1Y/6M | | | | 2,048,600,000 | | | | LCH | | | | 71,422 | |
| BRL-CDI Rate | | | Pay | | | | 8.71 | % | | | 1/02/29 | | | | 1Y/At Maturity | | | | 11,158,731 | | | | CME | | | | (248,250 | ) |
| ILS-TELBOR03 Rate | | | Receive | | | | 1.42 | % | | | 5/12/31 | | | | 1Y/3M | | | | 6,600,000 | | | | LCH | | | | (20,555 | ) |
| ILS-TELBOR03 Rate | | | Receive | | | | 1.44 | % | | | 5/19/31 | | | | 1Y/3M | | | | 7,100,000 | | | | LCH | | | | (24,370 | ) |
| PLN-WIBOR Rate | | | Receive | | | | 2.19 | % | | | 5/21/26 | | | | 1Y/6M | | | | 30,900,000 | | | | LCH | | | | 24,373 | |
| PLN-WIBOR Rate | | | Receive | | | | 2.24 | % | | | 5/24/26 | | | | 1Y/6M | | | | 27,500,000 | | | | LCH | | | | 15,375 | |
| BRL-CDI Rate | | | Pay | | | | 6.74 | % | | | 1/02/23 | | | | At Maturity | | | | 13,050,205 | | | | CME | | | | (49,684 | ) |
| KRW-KSDA Rate | | | Pay | | | | 1.48 | % | | | 6/24/23 | | | | 3M/3M | | | | 13,571,000,000 | | | | LCH | | | | (25,262 | ) |
| BRL-CDI Rate | | | Pay | | | | 5.00 | % | | | 1/02/23 | | | | At Maturity | | | | 15,843,633 | | | | CME | | | | (96,115 | ) |
| BRL-CDI Rate | | | Pay | | | | 4.98 | % | | | 1/02/23 | | | | At Maturity | | | | 7,925,069 | | | | CME | | | | (48,675 | ) |
| THB-THBFIX Rate | | | Pay | | | | 1.50 | % | | | 9/08/30 | | | | 6M/6M | | | | 33,191,000 | | | | LCH | | | | (27,819 | ) |
| THB-THBFIX Rate | | | Pay | | | | 1.51 | % | | | 9/10/30 | | | | 6M/6M | | | | 49,455,000 | | | | LCH | | | | (41,123 | ) |
| BRL-CDI Rate | | | Pay | | | | 6.38 | % | | | 1/02/23 | | | | At Maturity | | | | 15,433,848 | | | | CME | | | | 84,254 | |
| BRL-CDI Rate | | | Pay | | | | 7.49 | % | | | 1/02/29 | | | | At Maturity | | | | 9,935,952 | | | | CME | | | | (280,632 | ) |
| BRL-CDI Rate | | | Pay | | | | 7.48 | % | | | 1/02/29 | | | | At Maturity | | | | 989,335 | | | | CME | | | | (28,104 | ) |
| BRL-CDI Rate | | | Pay | | | | 5.00 | % | | | 1/02/23 | | | | At Maturity | | | | 10,352,374 | | | | CME | | | | (62,802 | ) |
| | | | | | | | | | | | | | | | | | | | | | | | | | | | |
Total Centrally Cleared Interest Rate Swaps | | | $ | (1,275,722 | ) |
| | | | | |
See accompanying Notes to the Financial Statements.
83
Barings Emerging Markets Debt Blended Total Return Fund 2021 Annual Report
SCHEDULE OF INVESTMENTS (CONTINUED)
September 30, 2021
OTC Cross Currency Swaps
| | | | | | | | | | | | | | | | | | | | | | | | | | | | | | | | |
NOTIONAL
AMOUNT | | FUND
PAYS | | PAY/
RECEIVE
PAYMENT
FREQUENCY | | | MATURITY
DATE | | | COUNTERPARTY | | NOTIONAL
AMOUNT
(USD) | | | FUND
RECEIVES | | | UPFRONT
PREMIUMS
PAID/
(RECEIVED) | | | FAIR
VALUE | | | UNREALIZED
APPRECIATION
(DEPRECIATION) | |
| 750,000 EUR | | 8.25% | | | 1Y/6M | | | | 07/18/2029 | | | Citibank N.A. | | $ | 843,675 | | | | 11.44 | % | | $ | (525 | ) | | $ | 37,871 | | | $ | 38,396 | |
| 750,000 EUR | | 5.63% | | | 6M/6M | | | | 06/17/2025 | | | Citibank N.A. | | | 819,150 | | | | 8.12 | % | | | (1,088 | ) | | | (21,405 | ) | | | (20,317 | ) |
| 550,000 EUR | | 5.88% | | | 1Y/6M | | | | 10/17/2031 | | | Citibank N.A. | | | 605,000 | | | | 8.46 | % | | | (495 | ) | | | (29,112 | ) | | | (28,617 | ) |
| 400,000 EUR | | 3.65% | | | 1Y/6M | | | | 11/19/2029 | | | Citibank N.A. | | | 440,600 | | | | 6.02 | % | | | 200 | | | | (13,489 | ) | | | (13,689 | ) |
| 350,000 EUR | | 6.38% | | | 1Y/6M | | | | 04/11/2031 | | | Citibank N.A. | | | 392,700 | | | | 9.37 | % | | | (122 | ) | | | 20,282 | | | | 20,404 | |
| 680,000 EUR | | 3.13% | | | 1Y/6M | | | | 05/15/2027 | | | Citibank N.A. | | | 735,080 | | | | 4.32 | % | | | (339 | ) | | | (75,703 | ) | | | (75,364 | ) |
| 550,000 EUR | | 3.68% | | | 1Y/6M | | | | 06/03/2026 | | | Citibank N.A. | | | 604,450 | | | | 4.79 | % | | | (467 | ) | | | (47,422 | ) | | | (46,955 | ) |
| 740,000 EUR | | 3.50% | | | 1Y/6M | | | | 06/16/2027 | | | Citibank N.A. | | | 839,530 | | | | 4.74 | % | | | 629 | | | | (35,123 | ) | | | (35,752 | ) |
| 362,000 EUR | | 2.00% | | | 1Y/6M | | | | 09/30/2030 | | | Citibank N.A. | | | 429,332 | | | | 3.47 | % | | | (109 | ) | | | 5,011 | | | | 5,120 | |
| 168,000 EUR | | 2.00% | | | 1Y/6M | | | | 09/30/2030 | | | Citibank N.A. | | | 198,408 | | | | 3.43 | % | | | 50 | | | | 711 | | | | 661 | |
| 500,000 EUR | | 9.75% | | | 1Y/6M | | | | 06/26/2024 | | | Citibank N.A. | | | 602,000 | | | | 10.88 | % | | | (100 | ) | | | 29,595 | | | | 29,695 | |
| 1,000,000 EUR | | 5.50% | | | 1Y/6M | | | | 02/19/2025 | | | Citibank N.A. | | | 1,214,500 | | | | 6.71 | % | | | (700 | ) | | | 34,315 | | | | 35,015 | |
| 1,000,000 EUR | | 8.75% | | | 6M/6M | | | | 06/16/2026 | | | JP Morgan Chase Bank N.A. | | | 1,218,000 | | | | 10.22 | % | | | 300 | | | | 83,451 | | | | 83,151 | |
| | | | | | | | | | | | | | | | | | | | | | | | | | | | | | | | |
Total OTC Cross Currency Swaps | | | $ | (2,766 | ) | | $ | (11,018 | ) | | $ | (8,252 | ) |
| | | | | | | | | | | | | |
OTC – Interest Rate Swap
| | | | | | | | | | | | | | | | | | | | | | | | | | | | | | | | |
COUNTER-
PARTY | | NOTIONAL
AMOUNT | | FUND
RECEIVES/
PAYS
FLOATING
RATE | | | FLOATING
RATE
INDEX | | | ANNUAL
FIXED
RATE | | FREQUENCY
OF FUND
RECEIPT/
PAYMENT | | | MATURITY
DATE | | | UPFRONT
PREMIUMS
PAID/
(RECEIVED) | | | VALUE | | | UNREALIZED
APPRECIATION/
(DEPRECIATION) | |
Bank of
America N.A. | | BRL 18,084,492 | | | Pay | | | | BRL-CDI | | | 5.88% | | | At Maturity | | | | 01/02/2023 | | | $ | — | | | $ | 39,874 | | | $ | 39,874 | |
| | | | | | | | | | | | | | | | | | | | | | | | | | | | | | | | |
OTC Credit Default Swaps – Sell Protection(1)
| | | | | | | | | | | | | | | | | | | | | | | | | | | | | | | | | | |
REFERENCE
OBLIGATION | | FIXED-DEAL
RECEIVED
RATE | | PAYMENT
FREQUENCY | | | MATURITY
DATE | | | COUNTERPARTY | | | ORIGINAL
NOTIONAL
AMOUNT | | | CURRENT
NOTIONAL
AMOUNT(2) | | | UPFRONT
PREMIUMS
PAID/
(RECEIVED) | | | FAIR
VALUE(3) | | | UNREALIZED
DEPRECIATION | |
Brazil Government International Bond | | 1.00% | | | 3M | | | | 12/20/2026 | | | | Morgan Stanley & Co. | | | | 2,230,000 | | | | 2,230,000 | | | $ | (44,805 | ) | | $ | (75,131 | ) | | $ | (30,326 | ) |
Brazil Government International Bond | | 1.00% | | | 3M | | | | 12/20/2026 | | |
| JPMorgan Chase
Bank N.A. |
| | | 1,110,000 | | | | 1,110,000 | | | | (59,071 | ) | | | (63,104 | ) | | | (4,033 | ) |
Colombia Government International Bond | | 1.00% | | | 3M | | | | 12/20/2026 | | | | Morgan Stanley & Co. | | | | 1,530,000 | | | | 1,530,000 | | | | (65,480 | ) | | | (77,641 | ) | | | (12,161 | ) |
Indonesia Government International Bond | | 1.00% | | | 3M | | | | 12/20/2026 | | | | Citibank N.A. | | | | 3,080,000 | | | | 3,080,000 | | | | 32,695 | | | | 29,559 | | | | (3,136 | ) |
Mexico Government International Bond | | 1.00% | | | 3M | | | | 12/20/2026 | | | | Morgan Stanley & Co. | | | | 2,445,000 | | | | 2,445,000 | | | | 14,693 | | | | (1,180 | ) | | | (15,873 | ) |
| | | | | | | | | | | | | | | | | | | | | | | | | | | | | | | | | | |
Total OTC Credit Default Swaps | | | | | | | | | | | | | | | $ | (121,968 | ) | | $ | (187,497 | ) | | $ | (65,529 | ) |
| | | | | | | | | | | | | | | | | | | | | | | | | | | | | | | | | | |
See accompanying Notes to the Financial Statements.
84
Barings Emerging Markets Debt Blended Total Return Fund 2021 Annual Report
SCHEDULE OF INVESTMENTS (CONTINUED)
September 30, 2021
| (1) | If the Fund is a seller of protection and a credit event occurs, as defined under the terms of that particular swap agreement, the Fund will either (i) pay to the buyer of protection an amount equal to the notional amount of the swap and take delivery of the referenced obligation or underlying securities comprising the referenced index or (ii) pay a net settlement amount in the form of cash or securities equal to the notional amount of the swap less the recovery value of the referenced obligation or underlying securities comprising the referenced index. |
| (2) | The maximum potential amount the Portfolio could be required to make as a seller of credit protection or receive as a buyer of credit event as defined under the terms of that particular swap agreement. |
| (3) | The quoted market prices and resulting values for credit default swap agreements on asset-backed securities and credit indices serve as an indicator of the current status of the payment/performance risk and represent the expected amount paid or received for the credit derivative if the amount of the swap agreement was closed/sold as of the period end. Increasing market values, in absolute terms when compared to the notional amount of the swap, represent a deterioration of the referenced entity’s credit soundness and a greater likelihood or risk of default or other credit event occurring as defined under the terms of the agreements. |
Abbreviation Legend
| | | | |
| OTC | | | | Over the Counter |
| PIK | | | | Payment-in-kind |
| BCM | | | | Bloomberg proprietary Credit Model |
See accompanying Notes to the Financial Statements.
85
Barings Global Emerging Markets Equity Fund 2021 Annual Report
SCHEDULE OF INVESTMENTS
September 30, 2021
| | | | | | | | | | | | | | | | | | | | |
| | | | | | | | | SHARES | | | COST | | | FAIR
VALUE | |
Equities — 94.9%*: | |
|
| Common Stocks — 94.9%*: | |
|
Communication Services — 9.6%*: | |
Mail.Ru Group Ltd.(a),(b) | | | | | | | | | | | 5,891 | | | | $145,728 | | | | $121,237 | |
NetEase, Inc.(b) | | | | | | | | | | | 1,528 | | | | 149,644 | | | | 130,491 | |
PT Telekomunikasi Indonesia Persero Tbk(b) | | | | | | | | | | | 634,000 | | | | 169,625 | | | | 163,456 | |
Tencent Holdings Ltd.(b) | | | | | | | | | | | 13,400 | | | | 556,162 | | | | 794,224 | |
| | | | | | | | | | | | | | | | | | | | |
Total Communication Services | | | | | | | | | | | 654,819 | | | | 1,021,159 | | | | 1,209,408 | |
| | | | | | | | | | | | | | | | | | | | |
|
Consumer Discretionary — 14.3%*: | |
Alibaba Group Holding Ltd.(a),(b) | | | | | | | | | | | 2,043 | | | | 353,963 | | | | 302,466 | |
Hyundai Motor Co.(b) | | | | | | | | | | | 1,060 | | | | 230,603 | | | | 179,054 | |
JD.com, Inc.(a),(b) | | | | | | | | | | | 3,262 | | | | 296,173 | | | | 235,647 | |
Li Auto, Inc.(a),(b) | | | | | | | | | | | 2,173 | | | | 70,440 | | | | 57,128 | |
Meituan(a),(b),(c) | | | | | | | | | | | 8,300 | | | | 315,692 | | | | 262,925 | |
Prosus NV(b) | | | | | | | | | | | 1,548 | | | | 124,542 | | | | 123,708 | |
Samsonite International SA(a),(b),(c) | | | | | | | | | | | 96,900 | | | | 206,895 | | | | 209,119 | |
Topsports International Holdings Ltd.(b),(c) | | | | | | | | | | | 189,000 | | | | 224,491 | | | | 216,079 | |
Yum China Holdings, Inc.(b) | | | | | | | | | | | 3,628 | | | | 212,912 | | | | 210,823 | |
| | | | | | | | | | | | | | | | | | | | |
Total Consumer Discretionary | | | | | | | | | | | 307,914 | | | | 2,035,711 | | | | 1,796,949 | |
| | | | | | | | | | | | | | | | | | | | |
|
Consumer Staples — 4.0%*: | |
Atacadao SA(b) | | | | | | | | | | | 36,000 | | | | 130,639 | | | | 117,405 | |
CP ALL Public Company Limited(b) | | | | | | | | | | | 89,200 | | | | 185,278 | | | | 167,407 | |
Natura & Co. Holding SA(a),(b) | | | | | | | | | | | 13,100 | | | | 128,985 | | | | 109,621 | |
X5 Retail Group NV(b) | | | | | | | | | | | 3,532 | | | | 134,034 | | | | 114,684 | |
| | | | | | | | | | | | | | | | | | | | |
Total Consumer Staples | | | | | | | | | | | 141,832 | | | | 578,936 | | | | 509,117 | |
| | | | | | | | | | | | | | | | | | | | |
|
Energy — 3.9%*: | |
Reliance Industries Ltd.(b),(c) | | | | | | | | | | | 7,307 | | | | 241,603 | | | | 497,607 | |
| | | | | | | | | | | | | | | | | | | | |
|
Financials — 21.5%*: | |
AIA Group Ltd.(b) | | | | | | | | | | | 21,000 | | | | 174,125 | | | | 242,651 | |
Axis Bank Ltd.(a),(b) | | | | | | | | | | | 4,245 | | | | 212,873 | | | | 216,919 | |
B3 SA – Brasil Bolsa Balcao(b) | | | | | | | | | | | 57,321 | | | | 135,087 | | | | 134,099 | |
BB Seguridade Participacoes SA(b) | | | | | | | | | | | 29,900 | | | | 132,109 | | | | 109,536 | |
China Construction Bank Corp.(b) | | | | | | | | | | | 394,000 | | | | 323,072 | | | | 282,417 | |
Grupo Financiero Banorte SAB de CV(b) | | | | | | | | | | | 33,227 | | | | 182,431 | | | | 212,950 | |
Hana Financial Group, Inc.(b) | | | | | | | | | | | 8,102 | | | | 278,900 | | | | 317,511 | |
HDFC Bank Ltd.(b) | | | | | | | | | | | 6,237 | | | | 290,658 | | | | 455,862 | |
Ping An Bank Co. Ltd.(b) | | | | | | | | | | | 50,300 | | | | 164,300 | | | | 139,563 | |
Ping An Insurance Group Co. of China Ltd.(b) | | | | | | | | | | | 30,500 | | | | 284,884 | | | | 208,632 | |
PT Bank Negara Indonesia Persero Tbk(b) | | | | | | | | | | | 443,700 | | | | 218,213 | | | | 166,630 | |
Sberbank of Russia PJSC(b) | | | | | | | | | | | 11,527 | | | | 149,452 | | | | 216,131 | |
| | | | | | | | | | | | | | | | | | | | |
Total Financials | | | | | | | | | | | 1,090,059 | | | | 2,546,104 | | | | 2,702,901 | |
| | | | | | | | | | | | | | | | | | | | |
See accompanying Notes to the Financial Statements.
86
Barings Global Emerging Markets Equity Fund 2021 Annual Report
SCHEDULE OF INVESTMENTS (CONTINUED)
September 30, 2021
| | | | | | | | | | | | | | | | | | | | |
| | | | | | | | | SHARES | | | COST | | | FAIR
VALUE | |
| | | | | |
Common Stocks (continued) | | | | | | | | | | | | | | | | | | | | |
|
Industrials — 1.8%*: | |
NARI Technology Co. Ltd.(b) | | | | | | | | | | | 40,800 | | | | $139,939 | | | | $226,724 | |
| | | | | | | | | | | | | | | | | | | | |
|
Information Technology — 27.4%*: | |
Hon Hai Precision Industry Co. Ltd.(b) | | | | | | | | | | | 52,000 | | | | 201,444 | | | | 195,976 | |
Infosys Ltd.(b) | | | | | | | | | | | 14,099 | | | | 121,697 | | | | 313,703 | |
Luxshare Precision Industry Co. Ltd.(b) | | | | | | | | | | | 21,900 | | | | 178,302 | | | | 121,020 | |
MediaTek, Inc.(b) | | | | | | | | | | | 6,000 | | | | 93,974 | | | | 194,900 | |
Powertech Technology, Inc.(b) | | | | | | | | | | | 44,000 | | | | 139,191 | | | | 165,037 | |
Samsung Electronics Co. Ltd.(b) | | | | | | | | | | | 16,342 | | | | 664,502 | | | | 1,022,755 | |
Sunny Optical Technology Group Co. Ltd.(b) | | | | | | | | | | | 5,400 | | | | 62,423 | | | | 142,064 | |
Taiwan Semiconductor Manufacturing Co. Ltd.(b) | | | | | | | | | | | 52,000 | | | | 432,977 | | | | 1,082,536 | |
United Microelectronics Corp.(b) | | | | | | | | | | | 93,000 | | | | 180,841 | | | | 213,636 | |
| | | | | | | | | | | | | | | | | | | | |
Total Information Technology | | | | | | | | | | | 304,741 | | | | 2,075,351 | | | | 3,451,627 | |
| | | | | | | | | | | | | | | | | | | | |
|
Materials — 5.6%*: | |
Anglo American plc(b) | | | | | | | | | | | 7,424 | | | | 148,406 | | | | 262,716 | |
China Resources Cement Holdings Ltd.(b) | | | | | | | | | | | 156,000 | | | | 182,259 | | | | 150,496 | |
LG Chem Ltd.(b) | | | | | | | | | | | 438 | | | | 138,261 | | | | 287,068 | |
| | | | | | | | | | | | | | | | | | | | |
Total Materials | | | | | | | | | | | 163,862 | | | | 468,926 | | | | 700,280 | |
| | | | | | | | | | | | | | | | | | | | |
|
Real Estate — 2.3%*: | |
China Resources Land Ltd.(b) | | | | | | | | | | | 36,000 | | | | 121,453 | | | | 151,914 | |
Emaar Properties PJSC(b) | | | | | | | | | | | 119,041 | | | | 133,196 | | | | 132,227 | |
| | | | | | | | | | | | | | | | | | | | |
Total Real Estate | | | | | | | | | | | 155,041 | | | | 254,649 | | | | 284,141 | |
| | | | | | | | | | | | | | | | | | | | |
|
Utilities — 4.5%*: | |
China Longyuan Power Group Corp. Ltd.(b) | | | | | | | | | | | 112,000 | | | | 106,517 | | | | 276,811 | |
ENN Natural Gas Co. Ltd.(b) | | | | | | | | | | | 41,900 | | | | 126,214 | | | | 118,526 | |
Kunlun Energy Co. Ltd.(b) | | | | | | | | | | | 160,000 | | | | 148,587 | | | | 166,893 | |
| | | | | | | | | | | | | | | | | | | | |
Total Utilities | | | | | | | | | | | 313,900 | | | | 381,318 | | | | 562,230 | |
| | | | | | | | | | | | | | | | | | | | |
Total Common Stocks | | | | | | | | | | | 3,180,275 | | | | 9,743,696 | | | | 11,940,984 | |
| | | | | | | | | | | | | | | | | | | | |
Total Equities | | | | | | | | | | | 3,180,275 | | | | 9,743,696 | | | | 11,940,984 | |
| | | | | | | | | | | | | | | | | | | | |
Total Investments | | | | | | | | | | | 3,180,275 | | | | 9,743,696 | | | | 11,940,984 | |
| | | | | | | | | | | | | | | | | | | | |
| |
Other assets and liabilities – 5.1%* | | | | 639,240 | |
| |
Net Assets – 100.0% | | | | $12,580,224 | |
| | | | | | | | | | | | | | | | | | | | |
| * | | Calculated as a percentage of net assets applicable to common shareholders. |
| (a) | | Non-income producing security. |
See accompanying Notes to the Financial Statements.
87
Barings Global Emerging Markets Equity Fund 2021 Annual Report
SCHEDULE OF INVESTMENTS (CONTINUED)
September 30, 2021
Distributions of investments by country of risk (excluding temporary cash investments) as a percentage of total investments in securities, is as follows:
| | | | | | |
| | China | | | 33.3% | |
| | Taiwan | | | 15.5% | |
| | Republic of Korea | | | 15.1% | |
| | India | | | 12.4% | |
| | Hong Kong | | | 5.6% | |
| | Brazil | | | 4.0% | |
| | Russia | | | 3.8% | |
| | Indonesia | | | 2.8% | |
| | South Africa | | | 2.2% | |
| | Mexico | | | 1.8% | |
| | Thailand | | | 1.4% | |
| | United Arab Emirates | | | 1.1% | |
| | Netherlands | | | 1.0% | |
| | | | | | |
| | Total | | | 100.0% | |
| | | | | | |
| (c) | | Security acquired in a transaction exempt from registration under Rule 144A of the Securities Act of 1933. These securities may only be resold in transactions exempt from registration, normally to qualified institutional buyers. |
See accompanying Notes to the Financial Statements.
88
Barings Funds Trust 2021 Annual Report
NOTES TO FINANCIAL STATEMENTS
September 30, 2021
Barings Funds Trust (the “Trust”) was organized as a business trust under the laws of the Commonwealth of Massachusetts on May 3, 2013 and commenced operations on September 16, 2013. The Trust is registered under the Investment Company Act of 1940, as amended (the “1940 Act”), as an open-end management investment company. As of September 30, 2021, the Trust consists of six funds (separately, a “Fund” and collectively, the “Funds”): Barings Global Floating Rate Fund (“Global Floating Rate Fund”), Barings Global Credit Income Opportunities Fund (“Global Credit Income Opportunities Fund”), Barings Active Short Duration Bond Fund (“Active Short Duration Bond Fund”), Barings Emerging Markets Debt Blended Total Return Fund (“Emerging Markets Debt Blended Total Return Fund”), Barings Global Emerging Markets Equity Fund (“Global Emerging Markets Equity Fund”) and Barings U.S. High Yield Fund (“U.S. High Yield Fund”). Each Fund, other than Emerging Markets Debt Blended Total Return Fund and Global Emerging Markets Equity Fund, is a “diversified” investment company. Global Credit Income Opportunities Fund and Global Floating Rate Fund commenced operations on September 16, 2013. Active Short Duration Bond Fund commenced operations on July 8, 2015. Emerging Markets Debt Blended Total Return Fund commenced operations on October 21, 2015. U.S. High Yield Fund commenced operations on October 30, 2015. Global Emerging Markets Equity Fund commenced operations on September 17, 2018. Active Short Duration Bond Fund and U.S. High Yield Fund are not covered by this report.
The Trust’s Board of Trustees has approved the reorganization of each Fund into certain series MassMutual Funds that are advised by an affiliate of Barings LLC (the “Adviser”) and are sub-advised by the Adviser. Each proposed reorganization is subject to approval by the shareholders of each Fund and is expected to occur in early December 2021. No assurance can be given that the reorganizations will occur. None of the proposed reorganizations is contingent upon any other proposed reorganization.
The Adviser, a wholly-owned indirect subsidiary of Massachusetts Mutual Life Insurance Company, is a registered investment adviser under the Investment Advisers Act of 1940, as amended (the “Advisers Act”), and serves as investment adviser to the Funds.
Barings International Investment Limited (“BIIL”), a private limited company incorporated under the laws of England, serves as a sub-adviser with respect to European investments for the Global Floating Rate Fund, Global Credit Income Opportunities Fund, Emerging Markets Debt Blended Total Return Fund and Global Emerging Markets Equity Fund.
The primary investment objective of the Global Floating Rate Fund is to seek a high level of current income. The Global Floating Rate Fund seeks preservation of capital as a secondary investment objective. The investment objective of the Global Credit Income Opportunities Fund is to seek an absolute return, primarily through current income and secondarily through capital appreciation. The investment objective of the Emerging Markets Debt Blended Total Return Fund is to seek to achieve maximum total return, consistent with preservation of capital and prudent investment management, through high current income generation and, where appropriate, capital appreciation. The investment objective of the Global Emerging Markets Equity Fund is to seek to achieve long-term capital growth.
There can be no assurance that the Funds will achieve their investment objectives. Under normal market conditions, the Global Floating Rate Fund invests at least 80% of its net assets (including the amount of any borrowings for investment purposes) in income producing floating rate debt securities, consisting of floating rate loans, bonds and notes, issued primarily by North American and Western European companies that are primarily, at the time of purchase, rated below-investment grade (below Baa3 by Moody’s Investors Service, Inc. (“Moody’s”) or below BBB- by either Standard & Poor’s Rating Services, a division of the McGraw-Hill Company, Inc. (“S&P”) or Fitch, Inc. (“Fitch”)) or, if unrated, determined by the Adviser or BIIL to be of comparable quality. Under normal market conditions, the Global Credit Income Opportunities Fund invests at least 80% of its net assets (including the amount of any borrowings for investment purposes) in debt instruments, consisting of loans, bonds and notes. Investments may be based in U.S. and non-U.S. markets, as well as over-the-counter and exchange traded derivatives. Investments may be issued or guaranteed by governments and their agencies, corporations, financial institutions and supranational organizations that the Adviser believes have the potential to provide a high total return over time. A significant portion of the Global Floating Rate Fund and Global Credit Income
89
Barings Funds Trust 2021 Annual Report
NOTES TO FINANCIAL STATEMENTS (CONTINUED)
September 30, 2021
Opportunities Fund’s investments in debt instruments will be denominated in a currency other than the U.S. dollar. Although the investments in non-U.S. dollar denominated assets may be on a currency hedged or unhedged basis, the Global Floating Rate Fund and Global Credit Income Opportunities Fund expect that, under current market conditions, they will seek to hedge substantially all of their exposure to foreign currencies. Under normal market conditions, the Emerging Markets Debt Blended Total Return Fund will invest at least 80% of its net assets (including the amount of any borrowings for investment purposes) in (i) securities denominated in currencies of the emerging market countries, (ii) fixed income securities or debt instruments issued by emerging market entities or sovereign nations, and/or (iii) debt instruments denominated in or based on the currencies, interest rates, or issues of emerging market countries. Emerging market countries are defined to include any country that did not become a member of the Organization for Economic Cooperation and Development (O.E.C.D.) prior to 1975 and Turkey. Certain emerging market countries are referred to as “frontier” market countries. The Emerging Markets Debt Blended Total Return Fund will likely focus its investments in Asia, Africa, the Middle East, Latin America and the developing countries of Europe. Under normal market conditions, the Global Emerging Markets Equity Fund will invest at least 80% of its net assets (including the amount of any borrowings for investment purposes) in equity and equity-related securities of issues that are economically tied to one or more emerging market countries. In general, countries may be considered emerging markets if they are included in any one of the Morgan Stanley Capital Index (“MSCI”) emerging markets indices.
Each Fund has four classes of shares: Class A, C, I, and Y, each with different expenses and dividends. A front-end sales charge is normally added to the net asset value (“NAV”) for Class A shares. There is no front-end sales charge in the case of Class C, I, and Y shares. There may be a contingent deferred sales charge (“CDSC”) in certain cases as follows: 1) Effective January 15, 2018, Class A Shares purchased without an initial sales charge in accounts aggregating $500,000 or more are subject to a 1.00% contingent deferred sales charge (CDSC) if the shares are tendered and accepted for repurchase within 18 months of purchase (or within 12 months for shares purchased prior to January 15, 2018). The 18-month period (or 12-month period for shares purchased prior to January 15, 2018) begins on the day on which the
purchase was made; and 2) Class C shares redeemed within the first year of purchase. All classes of shares have equal voting rights, with the exception of matters that relate solely to one class.
| 2. | Significant Accounting Policies |
The Trust is an investment company and follows accounting and reporting guidance in Financial Accounting Standards Board (“FASB”) Accounting Standards Codification Topic 946 (“ASC 946”).
The following is a summary of significant accounting policies followed consistently by the Funds in the preparation of their financial statements in conformity with accounting principles generally accepted in the United States of America (“U.S. GAAP”).
| | A. | Valuation of Investments |
The Funds’ investments in fixed income securities are generally valued using the prices provided directly by independent third party services or provided directly from one or more broker dealers or market makers, each in accordance with the valuation policies and procedures approved by the Funds’ Board of Trustees (the “Board”).
The pricing services may use valuation models or matrix pricing, which consider yield or prices with respect to comparable bond quotations from bond dealers or by reference to other securities that are considered comparable in such characteristics as credit rating, interest rates and maturity date to determine the current value. The Funds’ investments in bank loans are normally valued at the bid quotation obtained from dealers in loans by an independent pricing service in accordance with the Funds’ valuation policies and procedures approved by the Board. Short-term securities with remaining maturities of 60 days or less may be valued at amortized cost, which approximates fair value. Derivative financial instruments, such as futures contracts or options contracts that are traded on a national securities exchange, are stated at the last reported sale or settlement price on the day of valuation. Futures traded on inactive markets are valued using broker quotations. OTC derivative financial instruments, such as foreign currency contracts, options contracts, or swaps agreements, derive their value from underlying asset prices, indices, reference rates, and other inputs or a combination of these factors. These contracts are normally valued on the basis of an independent pricing service providers or broker dealer quotations. Depending on the derivative type and the terms of the derivative, the
90
Barings Funds Trust 2021 Annual Report
NOTES TO FINANCIAL STATEMENTS (CONTINUED)
September 30, 2021
value of the derivative financial instruments is assigned by independent pricing service providers using a series of techniques, which may include pricing models. The pricing models use inputs that are observed from actively quoted markets such as issuer details, indices, spreads, interest rates, curves, volatilities, dividends and exchange rates.
The assets and liabilities shown in the Statements of Assets and Liabilities related to investments purchased for “to-be-announced” (“TBA”) or when-issued securities approximate fair value and are determined using Level 2 inputs, as of September 30, 2021. The assets and liabilities shown in the Statements of Assets and Liabilities related to cash collateral held at broker on open futures contracts, cash collateral held at broker on open forward foreign currency exchange contracts and cash collateral held at broker on open swap contracts are determined using Level 1 inputs as of September 30, 2021.
A Valuation Committee, made up of officers of the Trust and employees of the Adviser, is responsible for determining, in accordance with the Funds’ valuation policies and procedures approved by the Board; (1) whether market quotations are readily available for investments held by the Fund; and (2) the fair value of investments held by the Fund for which market quotations are not readily available or are deemed not reliable by the Adviser. In certain cases, authorized pricing service vendors may not provide prices for a security held by the Funds, or the price provided by such pricing service vendor is deemed unreliable by the Adviser. In such cases, the Funds may use market maker quotations provided by an established market maker for that security (i.e., broker quotes) to value the security if the Adviser has experience obtaining quotations from the market maker and the Adviser determines that quotations obtained from the market maker in the past have generally been reliable (or, if the Adviser has no such experience with respect to a market maker, it determines based on other information available to it that quotations to be obtained by it from the market maker are reasonably likely to be reliable). In any such case, the Adviser will review any market quotations so obtained in light of other information in its possession for their general reliability.
Bond investments are valued on the basis of last available bid prices or current market quotations provided by dealers or pricing services. Bank loan positions are valued at the bid price from one or more brokers or dealers as
obtained from a pricing service. In determining the value of a particular investment, pricing services may use certain information with respect to transactions in such investments, quotations from dealers, pricing matrixes, market transactions in comparable investments, various relationships observed in the market between investments and calculated yield measures. Asset-backed and mortgage-backed securities are valued by independent pricing services using models that consider estimated cash flows of each tranche of the security, establish a benchmark yield and develop an estimated tranche-specific spread to the benchmark yield based on the unique attributes of the tranche.
Bank loans in which the Funds may invest have similar risks to lower-rated fixed income securities. Changes in the financial condition of the borrower or economic conditions or other circumstances may reduce the capacity of the borrower to make principal and interest payments on such instruments and may lead to defaults. Senior secured bank loans are supported by collateral; however, the value of the collateral may be insufficient to cover the amount owed to the Funds. By relying on a third party to administer a loan, the Funds are subject to the risk that the third party will fail to perform its obligations. The loans in which the Funds will invest are largely floating rate instruments; therefore, the interest rate risk generally is lower than for fixed-rate debt obligations. However, from the perspective of the borrower, an increase in interest rates may adversely affect the borrower’s financial condition. Due to the unique and customized nature of loan agreements evidencing loans and the private syndication thereof, loans are not as easily purchased or sold as publicly traded securities. Although the range of investors in loans has broadened in recent years, there can be no assurance that future levels of supply and demand in loan trading will provide the degree of liquidity which currently exists in the market. In addition, the terms of the loans may restrict their transferability without borrower consent. These factors may have an adverse effect on the market price and the Funds’ ability to dispose of particular portfolio investments. A less liquid secondary market also may make it more difficult for the Funds to obtain precise valuations of the high yield loans in its portfolio.
The Funds may invest in collateralized debt obligations (“CDOs”), which include collateralized bond obligations (“CBOs”) and collateralized loan obligations (“CLOs”). CBOs and CLOs are types of asset-backed securities. A CDO is an entity that is backed by a diversified pool of
91
Barings Funds Trust 2021 Annual Report
NOTES TO FINANCIAL STATEMENTS (CONTINUED)
September 30, 2021
debt securities (CBOs) or syndicated bank loans (CLOs). The cash flows of the CDO can be split into multiple segments, called “tranches,” which will vary in risk profile and yield. The riskiest segment is the subordinated or “equity” tranche. This tranche bears the greatest risk of defaults from the underlying assets in the CDO and serves to protect the other, more senior, tranches from default in all but the most severe circumstances. Since it is shielded from defaults by the more junior tranches, a “senior” tranche will typically have higher credit ratings and lower yields than their underlying securities, and often receive investment grade ratings from one or more of the nationally recognized rating agencies. Despite the protection from the more junior tranches, senior tranches can experience substantial losses due to actual defaults, increased sensitivity to future defaults and the disappearance of one or more protecting tranches as a result of changes in the credit profile of the underlying pool of assets.
Fair value is defined as the price that the Funds would receive upon selling an investment in a timely transaction to an independent buyer in the principal or most advantageous market of the investment. A three-tier hierarchy is utilized to maximize the use of observable market data and minimize the use of unobservable inputs and to establish classification of fair value measurements for disclosure purposes. Inputs refer broadly to the assumptions that market participants would use in pricing the asset or liability, including assumptions about risk. For example, market participants would consider the risk inherent in a particular valuation technique used to measure fair value, such as a pricing model, and/or the risk inherent in the inputs to the valuation technique. Inputs may be observable or unobservable. Observable inputs are inputs that reflect the assumptions market participants would use in pricing the asset or liability and are developed based on market data obtained from
sources independent of the reporting entity. Unobservable inputs are inputs that reflect the reporting entity’s own assumptions about the assumptions market participants would use in pricing the asset or liability and are developed based on the best information available in the circumstances. The three-tier hierarchy of inputs is summarized in the three broad levels listed below.
Level 1 – quoted prices in active markets for identical securities
Level 2 – other significant observable inputs (including quoted prices for similar securities, interest rates, prepayment speeds, credit risk, etc.)
Level 3 – significant unobservable inputs (including the Funds’ own assumptions in determining the fair value of investments)
The availability of observable inputs can vary from security to security and is affected by a wide variety of factors, including, for example, the type of security, whether the security is new and not yet established in the marketplace, the liquidity of markets, and other characteristics particular to the security. To the extent that valuation is based on models or inputs that are less observable or unobservable in the market, the determination of fair value requires more judgment. Accordingly, the degree of judgment exercised in determining fair value is greatest for instruments categorized in level 3.
The inputs used to measure fair value may fall into different levels of the fair value hierarchy. In such cases, for disclosure purposes, the level in the fair value hierarchy within which the fair value measurement falls in its entirety is determined based on the lowest level input that is significant to the fair value measurement in its entirety.
92
Barings Funds Trust 2021 Annual Report
NOTES TO FINANCIAL STATEMENTS (CONTINUED)
September 30, 2021
The following is a summary of the inputs used as of September 30, 2021 in valuing the Funds’ investments:
Global Floating Rate Fund
| | | | | | | | | | | | | | | | |
| DESCRIPTION | | LEVEL 1 | | | LEVEL 2 | | | LEVEL 3*** | | | TOTAL INVESTMENTS | |
| |
Assets: | | | | | |
| Equities: | | | | | |
Common Stocks | | $ | 301,218 | | | $ | 649,433 | | | $ | 779,954 | | | $ | 1,730,605 | |
Warrant | | | – | | | | 28,801 | | | | – | | | | 28,801 | |
| | | | | | | | | | | | | | | | |
| Total Equities | | | 301,218 | | | | 678,234 | | | | 779,954 | | | | 1,759,406 | |
| | | | | | | | | | | | | | | | |
| |
Fixed Income: | | | | | |
Bank Loans | | | – | | | | 375,545,529 | | | | 692,970 | | | | 376,238,499 | |
Corporate Bonds | | | – | | | | 16,726,021 | | | | 0 | | | | 16,726,021 | |
| | | | | | | | | | | | | | | | |
| Total Fixed Income | | | – | | | | 392,271,550 | | | | 692,970 | | | | 392,964,520 | |
| | | | | | | | | | | | | | | | |
| |
Derivative Securities: | | | | | |
Forward Foreign Currency Exchange Contracts | | | – | | | | 1,981,189 | | | | – | | | | 1,981,189 | |
| | | | | | | | | | | | | | | | |
| Total | | $ | 301,218 | | | $ | 394,930,973 | | | $ | 1,472,924 | | | $ | 396,705,115 | |
| | | | | | | | | | | | | | | | |
| Total Investments | | $ | 301,218 | | | $ | 394,930,973 | | | $ | 1,472,924 | | | $ | 396,705,115 | |
| | | | | | | | | | | | | | | | |
| | *** | None of the Level 3 assets, individually or collectively, had a material impact on the Fund. Level 3 investments at the end of the period in relation to net assets were not significant and accordingly, a reconciliation of Level 3 assets for the period ended September 30, 2021 is not presented. |
The following table is a summary of quantitative information about significant unobservable valuation inputs for Level 3 fair value measurement for investments held as of September 30, 2021:
| | | | | | | | |
| TYPE OF ASSETS | | FAIR VALUE AS OF
SEPTEMBER 30, 2021 | | | VALUATION
TECHNIQUE(S) | | UNOBSERVABLE INPUT |
Equities | | | | | | | | |
| | | |
CTI Foods Holding Co, LLC | | $ | 469,426 | | | Discounted Cash Flow | | Average Enterprise Valuation Multiple: 3 year projection, 7.1x; EBITDA: $52.5 million; 15% discount rate |
| | | |
Travelex Topco Ltd. | | $ | – | | | Zero Value | | Valued at zero |
| | | |
Don Jersey Topco Ltd. | | $ | 305,406 | | | Transaction Price | | $1.04; Trade Price |
| | | |
Boomerang Tube LLC | | $ | – | | | Zero Value | | Valued at zero |
| | | |
Fieldwood Energy LLC | | $ | – | | | Zero Value | | Valued at zero |
| | | |
Fieldwood Energy LLC | | $ | – | | | Zero Value | | Valued at zero |
| | | |
Sabine Oil & Gas LLC | | $ | 5,122 | | | Withholding Tax Reclaim | | Residual Cash |
93
Barings Funds Trust 2021 Annual Report
NOTES TO FINANCIAL STATEMENTS (CONTINUED)
September 30, 2021
| | | | | | | | |
| TYPE OF ASSETS | | FAIR VALUE AS OF
SEPTEMBER 30, 2021 | | | VALUATION
TECHNIQUE(S) | | UNOBSERVABLE INPUT |
Bank Loans | | | | | | | | |
| | | |
CTI Foods Holding Co,
LLC, 6M LIBOR +
9.000% | | $ | 195,979 | | | Discounted Cash Flow | | Average Enterprise Valuation Multiple: 3 year projection, 7.1x; EBITDA: $52.5 million;: 15% discount rate |
| | | |
CTI Foods Holding Co,
LLC, 6M LIBOR +
7.000% | | $ | 315,645 | | | Discounted Cash Flow | | Average Enterprise Valuation Multiple: 3 year projection, 7.1x; EBITDA: $52.5 million;: 15% discount rate |
| | | |
Boomerang Tube LLC | | $ | – | | | Zero Value | | Valued at zero |
| | | |
Naviera Armas SA, Term Loan A | | $ | 67,920 | | | Transaction Price | | Cost less OID |
| | | |
Naviera Armas SA, Term Loan B | | $ | 12,843 | | | Transaction Price | | Cost less OID |
| | | |
Naviera Armas SA, Term Loan C | | $ | 100,583 | | | Transaction Price | | Cost less OID |
Corporate Bonds | | | | | | | | |
| | | |
Galapagos S.A | | $ | – | | | Zero Value | | Valued at zero |
| | | |
Travelex Financing plc | | $ | – | | | Zero Value | | Valued at zero |
Although the Fund believes the valuation methods described above are appropriate, the use of different methodologies or assumptions to determine fair value could result in different estimates of fair value at the reporting date.
Global Credit Income Opportunities Fund
| | | | | | | | | | | | | | | | |
| DESCRIPTION | | LEVEL 1 | | | LEVEL 2 | | | LEVEL 3*** | | | TOTAL INVESTMENTS | |
| |
Assets: | | | | | |
| Equities: | | | | | |
Common Stocks | | $ | 1,042,365 | | | $ | 582,667 | | | $ | 396,270 | | | $ | 2,021,302 | |
Warrant | | | – | | | | 84,583 | | | | – | | | | 84,583 | |
| | | | | | | | | | | | | | | | |
| Total Equities | | | 1,042,365 | | | | 667,250 | | | | 396,270 | | | | 2,105,885 | |
| | | | | | | | | | | | | | | | |
| |
Fixed Income: | | | | | |
Asset-Backed Securities | | | – | | | | 17,115,294 | | | | – | | | | 17,115,294 | |
Bank Loans | | | – | | | | 79,129,757 | | | | 303,340 | | | | 79,433,097 | |
Corporate Bonds | | | – | | | | 72,466,092 | | | | 0 | | | | 72,466,092 | |
| | | | | | | | | | | | | | | | |
| Total Fixed Income | | | – | | | | 168,711,143 | | | | 303,340 | | | | 169,014,483 | |
| | | | | | | | | | | | | | | | |
| |
Derivative Securities: | | | | | |
Forward Foreign Currency Exchange Contracts | | | – | | | | 1,245,224 | | | | – | | | | 1,245,224 | |
| | | | | | | | | | | | | | | | |
| Total | | $ | 1,042,365 | | | $ | 170,623,617 | | | $ | 699,610 | | | $ | 172,365,592 | |
| | | | | | | | | | | | | | | | |
| | | | |
Liabilities: | | | | | | | | | | | | | | | | |
Derivative Securities: | | | | | | | | | | | | | | | | |
Forward Foreign Currency Exchange Contracts | | | – | | | | (44,625 | ) | | | – | | | | (44,625 | ) |
| | | | | | | | | | | | | | | | |
| Total Investments | | $ | 1,042,365 | | | $ | 170,578,992 | | | $ | 699,610 | | | $ | 172,320,967 | |
| | | | | | | | | | | | | | | | |
| | *** | None of the Level 3 assets, individually or collectively, had a material impact on the Fund. Level 3 investments at the end of the period in relation to net assets were not significant and accordingly, a reconciliation of Level 3 assets for the period ended September 30, 2021 is not presented. |
94
Barings Funds Trust 2021 Annual Report
NOTES TO FINANCIAL STATEMENTS (CONTINUED)
September 30, 2021
The following table is a summary of quantitative information about significant unobservable valuation inputs for Level 3 fair value measurement for investments held as of September 30, 2021:
| | | | | | | | |
| TYPE OF ASSETS | | FAIR VALUE AS OF
SEPTEMBER 30, 2021 | | | VALUATION
TECHNIQUE(S) | | UNOBSERVABLE INPUT |
Equities | | | | | | | | |
| | | |
Innovation Group | | $ | – | | | Zero Value | | Valued at zero |
| | | |
Travelex Topco Ltd. | | $ | – | | | Zero Value | | Valued at zero |
| | | |
Don Jersey Topco Ltd. | | $ | 268,441 | | | Transaction Price | | $1.04; Trade Price |
| | | |
Boomerang Tube LLC | | $ | – | | | Zero Value | | Valued at zero |
| | | |
Fieldwood Energy LLC | | $ | – | | | Zero Value | | Valued at zero |
| | | |
Fieldwood Energy LLC | | $ | – | | | Zero Value | | Valued at zero |
| | | |
Fieldwood Energy LLC | | $ | 27,543 | | | Transaction Price | | $55.53; Trade Price |
| | | |
Tourmaline Oil Corp. | | $ | 97,073 | | | Withholding Tax Reclaim | | Residual cash |
Bank Loans | | | | | | | | |
| | | |
Innovation Group plc (The) | | $ | 93,694 | | | Transaction Price | | Priced at restructure cost |
| | | |
Innovation Group plc (The) | | $ | 40,762 | | | Transaction Price | | Priced at restructure cost |
| | | |
Innovation Group plc (The) | | $ | 38,306 | | | Transaction Price | | Priced at restructure cost |
| | | |
Innovation Group plc (The) | | $ | 40,279 | | | Transaction Price | | Priced at restructure cost |
| | | |
Boomerang Tube LLC | | $ | – | | | Zero Value | | Valued at zero |
| | | |
Naviera Armas, Term Loan A | | $ | 33,920 | | | Transaction Price | | Cost less OID |
| | | |
Naviera Armas, Term Loan B | | $ | 6,400 | | | Transaction Price | | Cost less OID |
| | | |
Naviera Armas, Term Loan C | | $ | 49,979 | | | Transaction Price | | Cost less OID |
| | | |
Corporate Bonds | | | | | | | | |
| | | |
Travelex Financing PLC | | $ | – | | | Zero Value | | Valued at zero |
Note that MModal, Inc. is not included in the table above as this position was priced using a broker quote which has been adjusted for subsequent cash receipts.
Although the Fund believes the valuation methods described above are appropriate, the use of different methodologies or assumptions to determine fair value could result in different estimates of fair value at the reporting date.
95
Barings Funds Trust 2021 Annual Report
NOTES TO FINANCIAL STATEMENTS (CONTINUED)
September 30, 2021
Emerging Markets Debt Blended Total Return Fund
| | | | | | | | | | | | | | | | |
| DESCRIPTION | | LEVEL 1 | | | LEVEL 2 | | | LEVEL 3*** | | | TOTAL INVESTMENTS | |
| |
Assets: | | | | | |
| Fixed Income: | | | | | |
Corporate Bonds | | $ | – | | | $ | 66,885,091 | | | $ | 686,803 | | | $ | 67,571,894 | |
Foreign Government | | | – | | | | 65,075,333 | | | | – | | | | 65,075,333 | |
| | | | | | | | | | | | | | | | |
| Total Fixed Income | | | – | | | | 131,960,424 | | | | 686,803 | | | | 132,647,227 | |
| | | | | | | | | | | | | | | | |
| |
Purchased Options: | | | | | |
Call Options Purchased | | | – | | | | 13 | | | | – | | | | 13 | |
| | | | | | | | | | | | | | | | |
| Total Purchased Options | | | – | | | | 13 | | | | – | | | | 13 | |
| | | | | | | | | | | | | | | | |
| |
Derivative Securities: | | | | | |
Centrally Cleared Interest Rate Swaps* | | | – | | | | 302,288 | | | | – | | | | 302,288 | |
Forward Foreign Currency Exchange Contracts | | | – | | | | 2,006,191 | | | | – | | | | 2,006,191 | |
Futures* | | | 108,375 | | | | – | | | | – | | | | 108,375 | |
OTC – Credit Default Swaps | | | – | | | | 29,559 | | | | – | | | | 29,559 | |
OTC – Cross Currency Swaps | | | – | | | | 211,236 | | | | – | | | | 211,236 | |
OTC – Interest Rate Swaps | | | – | | | | 39,874 | | | | – | | | | 39,874 | |
| | | | | | | | | | | | | | | | |
| Total Derivative Securities | | | 108,375 | | | | 2,589,148 | | | | – | | | | 2,697,523 | |
| | | | | | | | | | | | | | | | |
| Total | | $ | 108,375 | | | $ | 134,549,585 | | | $ | 686,803 | | | $ | 135,344,763 | |
| | | | | | | | | | | | | | | | |
| |
Liabilities: | | | | | |
| Derivative Securities: | | | | | |
Call Options Written | | | – | | | | (87,188 | ) | | | – | | | | (87,188 | ) |
Centrally Cleared Interest Rate Swaps* | | | – | | | | (1,578,010 | ) | | | – | | | | (1,578,010 | ) |
Forward Foreign Currency Exchange Contracts | | | – | | | | (1,886,454 | ) | | | – | | | | (1,886,454 | ) |
OTC – Credit Default Swaps | | | – | | | | (217,056 | ) | | | – | | | | (217,056 | ) |
OTC – Cross Currency Swaps | | | – | | | | (222,254 | ) | | | – | | | | (222,254 | ) |
| | | | | | | | | | | | | | | | |
| Total Derivative Securities | | | – | | | | (3,990,962 | ) | | | – | | | | (3,990,962 | ) |
| | | | | | | | | | | | | | | | |
| Total Investments | | $ | 108,375 | | | $ | 130,558,623 | | | $ | 686,803 | | | $ | 131,353,801 | |
| | | | | | | | | | | | | | | | |
| | * | Centrally Cleared Swaps and Futures are valued at unrealized appreciation/depreciation. Only current day’s variation margin, if any, is reported on the Statement of Assets and Liabilities. |
| | *** | None of the Level 3 assets, individually or collectively, had a material impact on the Fund. Level 3 investments at the end of the period in relation to net assets were not significant and accordingly, a reconciliation of Level 3 assets for the period ended September 30, 2021 is not presented. |
96
Barings Funds Trust 2021 Annual Report
NOTES TO FINANCIAL STATEMENTS (CONTINUED)
September 30, 2021
The following table is a summary of quantitative information about significant unobservable valuation inputs for Level 3 fair value measurement for investments held as of September 30, 2021:
| | | | | | | | |
| TYPE OF ASSETS | | FAIR VALUE AS OF
SEPTEMBER 30, 2021 | | | VALUATION
TECHNIQUE(S) | | UNOBSERVABLE INPUT |
Foreign Government | | | | | | | | |
| | | |
| European Bank for Reconstruction and Development 10/29/22 | | $ | 381,559 | | | Broker Quote | | $31.80: Broker quote depth of 1 |
| | | |
| International Bank for Reconstruction and Development 11/22/21 | | $ | 305,244 | | | Broker Quote | | $31.80; Broker quote depth of 1 |
Although the Fund believes the valuation methods described above are appropriate, the use of different methodologies or assumptions to determine fair value could result in different estimates of fair value at the reporting date.
Global Emerging Markets Equity Fund
| | | | | | | | | | | | | | | | |
| DESCRIPTION | | LEVEL 1 | | | LEVEL 2 | | | LEVEL 3 | | | TOTAL INVESTMENTS | |
| |
Assets: | | | | | |
| Equities: | | | | | |
Common Stocks | | $ | 11,940,984 | | | $ | – | | | $ | – | | | $ | 11,940,984 | |
| | | | | | | | | | | | | | | | |
| Total Equities | | | 11,940,984 | | | | – | | | | – | | | | 11,940,984 | |
| | | | | | | | | | | | | | | | |
| Total | | $ | 11,940,984 | | | $ | – | | | $ | – | | | $ | 11,940,984 | |
| | | | | | | | | | | | | | | | |
| Total Investments | | $ | 11,940,984 | | | $ | – | | | $ | – | | | $ | 11,940,984 | |
| | | | | | | | | | | | | | | | |
| | B. | When-Issued, Delayed-Delivery, Forward Commitment, and To-Be-Announced Transactions |
The Funds may enter into when-issued, delayed-delivery, forward commitment, or TBA transactions (collectively, the “Forward Transactions”) in order to lock in the purchase price of the underlying security, or in order to adjust the interest rate exposure of the Fund’s existing portfolio. In Forward Transactions, a Fund commits to purchase or sell particular securities, with payment and delivery to take place at a future date. In the case of TBA purchase commitments, the unit price and the estimated principal amount are established when the Fund enters into a commitment, with the actual principal amount being within a specified range of the estimate. Although a Fund does not typically pay for the securities in these types of transactions until they are delivered, it immediately assumes the risks of ownership, including the risk of price fluctuation. As a result, each of these types of transactions may create investment leverage in a Fund’s portfolio and increase the volatility of the Fund. If a Fund’s counterparty fails to deliver a security purchased
in a Forward Transaction, there may be a loss, and the Fund may have missed an opportunity to make an alternative investment.
These securities are valued on the basis of valuations furnished by a pricing service, selected pursuant to procedures approved by the Trustees, which determines valuations taking into account appropriate factors such as institutional-size trading in similar groups of securities, yield, quality, coupon rate, maturity, type of issue, trading characteristics, and other market data. Securities for which no market quotation is available are valued at fair value in accordance with procedures approved by the Trustees. The Funds record on a daily basis the unrealized appreciation (depreciation) based upon changes in the values of these securities. When a Forward Transaction is closed, the Funds record a realized gain or loss equal to the difference between the value of the transaction at the time it was opened and the value of the transaction at the time it was closed.
97
Barings Funds Trust 2021 Annual Report
NOTES TO FINANCIAL STATEMENTS (CONTINUED)
September 30, 2021
| | C. | Cash and Short-Term Investments |
Cash and cash equivalents consist principally of short-term investments that are readily convertible into cash and have original maturities of three months or less. At September 30, 2021, all cash and cash equivalents are held by the custodian.
| | D. | Investment Transactions, Related Investment Income and Expenses |
Investment transactions are accounted for on a trade date basis. Interest income is recorded on the accrual basis, including the amortization of premiums and accretion of discounts on bonds held using the yield-to-maturity method. Interest income from securitized investments in which the Fund(s) has/have a beneficial interest, such as the “equity” security class of a CLO vehicle (typically in the form of income or subordinated notes), are recorded upon receipt. The accrual of interest income related to these types of securities is periodically reviewed and adjustments are made as necessary. These cash inflows are regularly reviewed to ensure these payments are not materially different from what would be required by GAAP reporting. Adjustments would be made if needed to address any changes.
In March 2017, FASB issued Accounting Standards Update No. 2017-08 “Premium Amortization of Purchased Callable Debt Securities”, which amends the amortization period for certain purchased callable debt securities. Under the standards update, the premium amortization of purchased callable debt securities that have explicit, non-contingent call features and are callable at fixed prices will be amortized to the earliest call date. The guidance will be applied on a modified retrospective basis and is effective for fiscal years, and their interim periods, beginning after December 15, 2018. Management has evaluated the impact of ASU 2017-08 and has adopted the requirements, and the impact, if any, is reflected within the Funds’ financial statements. In October 2020, ASU 2017-08 was amended by Accounting Standards Update 2020-08, Codification Improvements to Subtopic 310-20, Receivables – Nonrefundable Fees and Other Costs (“ASU 2020-08”). ASU 2020-08 requires entities to reevaluate whether callable debt securities fall within the scope of ASU 2017-08 at each reporting period. ASU 2020-08 also amends the relevant guidance to require premiums to be amortized to the “next call date” rather than the “earliest call date,” and further clarifies the definition of “next call
date.” ASU 2020-08 is effective for fiscal years, and interim periods within those fiscal years, beginning after December 15, 2020. Early adoption of ASU 2020-08 is not permitted. Management is currently evaluating the impact of applying ASU 2020-08.
Realized gains and losses on investment transactions and unrealized appreciation and depreciation of investments are reported for financial statement and Federal income tax purposes on the identified cost method.
Expenses are recorded on the accrual basis as incurred.
The Funds do not have redemption fees.
The preparation of financial statements in conformity with U.S. GAAP requires management to make estimates and assumptions that affect the reported amounts of assets and liabilities at the date of the financial statements and the reported amounts of revenues and expenses during the reporting period. Actual results could differ from these estimates.
| | G. | Federal Income Taxation |
The Funds have elected to be taxed as a Regulated Investment Company (“RIC”) under sub-chapter M of the U.S. Internal Revenue Code of 1986, as amended, and intend to maintain this qualification and to distribute substantially all of their net taxable income to their shareholders. As of September 30, 2021, the Funds had no uncertain tax positions that would require financial statement recognition, de-recognition, or disclosure. The Funds file a U.S. federal income tax return annually after their fiscal year-end, which is subject to examination by the Internal Revenue Service for a period of three years from the date of the filings.
| | H. | Dividends and Distributions |
Each Fund, except Global Emerging Markets Equity Fund, declares a dividend daily based on the Adviser’s projections of the Funds’ estimated net investment income and distributes such dividend monthly. To the extent that these distributions exceed net investment income, they may be classified as return of capital. The Funds also pay a distribution at least annually from their net realized capital gains, if any. Dividends and distributions are recorded on the ex-dividend date. All common shares have equal dividend and other distribution rights. A notice disclosing the source(s) of a
98
Barings Funds Trust 2021 Annual Report
NOTES TO FINANCIAL STATEMENTS (CONTINUED)
September 30, 2021
distribution will be provided if payment is made from any source other than net investment income. Any such notice would be provided only for informational purposes in order to comply with the requirements of Section 19(a) of the 1940 Act and not for tax reporting purposes. The tax composition of the Funds’ distributions for each calendar year is reported on Internal Revenue Service Form 1099-DIV.
Dividends from net investment income and distributions from realized gains from investment transactions have been determined in accordance with Federal income tax regulations and may differ from net investment income and realized gains recorded by the Funds for financial reporting purposes. These differences, which could be temporary or permanent in nature may result in reclassification of distributions; however, net investment income, net realized gains and losses, and net assets are not affected.
The Funds may invest in bank loans, which usually take the form of loan participations and assignments. Loan participations and assignments are agreements to make money available to U.S. or foreign corporations, partnerships or other business entities (the “Borrower”) in a specified amount, at a specified rate and within a specified time. A loan is typically originated, negotiated and structured by a U.S. or foreign bank, insurance company or other financial institution (the “Agent”) for a group of loan investors (“Loan Investors”). The Agent typically administers and enforces the loan on behalf of the other Loan Investors in the syndicate and may hold any collateral on behalf of the Loan Investors. Such loan
participations and assignments are typically senior, secured and collateralized in nature. The Funds record an investment when the Borrower withdraws money and records interest as earned. These loans pay interest at rates which are periodically reset by reference to a base lending rate plus a spread. These base lending rates are generally the prime rate offered by a designated U.S. bank or London InterBank Offered Rate (“LIBOR”).
Certain Funds may receive or pay fees associated with investment in bank loans. These fees are recorded as income when received by the Funds and are shown as Net bank loan fee income on the Statements of Operations. These fees include all associated income and expenses, including but not limited to consent fee income, amendment fees, associated closing fees and other fees associated with the processing and maintenance of these types of loans.
The loans in which the Funds invest may be subject to some restrictions on resale. For example, the Funds may be contractually obligated to receive approval from the Agent and/or Borrower prior to the sale of these investments. The Funds generally have no right to enforce compliance with the terms of the loan agreement with the Borrower. As a result, the Funds assume the credit risk of the Borrower, the selling participant and any other persons interpositioned between the Funds and the Borrower (“Intermediate Participants”). In the event that the Borrower, selling participant or Intermediate Participants become insolvent or enter into bankruptcy, the Funds may incur certain costs and delays in realizing payment or may suffer a loss of principal and/or interest.
Unfunded commitments represent the remaining obligation of the Funds to the Borrower. At any point in time, up to the maturity date of the issue, the Borrower may demand the unfunded portion. Until demanded by the Borrower, unfunded commitments are not recognized as an asset on the Statements of Assets and Liabilities. Unrealized appreciation/depreciation on unfunded commitments presented on the Statements of Assets and Liabilities represents mark to market of the unfunded portion of the Funds’ bank loans. As of September 30, 2021, the following Funds had unfunded loan commitments:
| | | | | | |
| FUND | | SECURITY | | PAR AMOUNT | |
Global Floating Rate Fund | | DG Investment Intermediate Holdings 2, Inc. | | $ | 14,451 | |
Global Floating Rate Fund | | Fluid-Flow Products, Inc. | | $ | 4,932 | |
Global Floating Rate Fund | | Naviera Armas SA | | $ | 9,136 | |
Global Floating Rate Fund | | Pro Mach Group | | $ | 144,897 | |
Global Floating Rate Fund | | Sovos Compliance, LLC | | $ | 78,840 | |
Global Floating Rate Fund | | Trident TPI Holdings, Inc. | | $ | 114,229 | |
Global Credit Income Opportunities Fund | | Naviera Armas SA | | $ | 4,568 | |
Global Credit Income Opportunities Fund | | Sovos Compliance, LLC | | $ | 53,227 | |
99
Barings Funds Trust 2021 Annual Report
NOTES TO FINANCIAL STATEMENTS (CONTINUED)
September 30, 2021
The following is a description of the derivative instruments that the Funds utilize as part of their investment strategy, including the primary underlying risk exposures related to the instrument.
The Funds are subject to foreign currency exchange rate risk in the normal course of pursuing their investment objectives. The Funds may use forward foreign currency exchange contracts to hedge against changes in the value of foreign currencies. The Funds may enter into forward foreign currency exchange contracts obligating the Funds to deliver or receive a currency at a specified future date. Forward contracts are valued daily and unrealized appreciation or depreciation is recorded daily as the difference between the contract exchange rate and the closing forward rate applied to the face amount of the contract. A realized gain or loss is recorded at the time the forward contract expires. Credit risk may arise as a result of the failure of the counterparty to comply with the terms of the contract. The Funds consider the creditworthiness of each counterparty to a contract in evaluating potential credit risk quarterly. The Funds are also subject to credit risk with respect to the counterparties to derivative contracts that are not cleared through a central counterparty but instead are traded over-the-counter between two counterparties. If a counterparty to an over-the-counter derivative becomes bankrupt or otherwise fails to perform its obligations under a derivative contract due to financial difficulties, the Funds may experience significant delays in obtaining any recovery under the derivative contract in a bankruptcy or other reorganization proceeding. The Funds may obtain only a limited recovery or may obtain no recovery in such circumstances. The counterparty risk for cleared derivatives is generally lower than for uncleared over-the-counter derivative transactions since generally a clearing organization becomes substituted for each counterparty to a cleared derivative contract and, in effect, guarantees the parties’ performance under the contract as each party to a trade looks only to the clearing house for performance of financial obligations. However, there can be no assurance that the clearing house, or its members, will satisfy its obligations to the Funds. In addition, in the event of a bankruptcy of a clearing house, the Funds could experience a loss of the funds deposited with such clearing house as margin and of any profits on its open positions. The counterparty risk to the Funds is limited to the net unrealized gain, if any, on the contract.
The use of forward foreign currency exchange contracts does not eliminate fluctuations in the underlying prices of the Funds’ investment securities; however, it does establish a rate of exchange that can be achieved in the future. The use of forward foreign currency exchange contracts involves the risk that anticipated currency movements will not be accurately predicted. A forward foreign currency exchange contract would limit the risk of loss due to a decline in the value of a particular currency; however, it would also limit any potential gain that might result should the value of the currency increase instead of decrease. These contracts may involve market risk in excess of the amount of receivable or payable reflected on the Statement of Assets and Liabilities.
The Funds may purchase and sell futures contracts to enhance returns, to attempt to hedge some of its investment risk, or as a substitute position in lieu of holding the underlying asset on which the instrument is based. At the time of entering into a futures transaction, an investor is required to deposit and maintain a specified amount of cash or eligible securities called “initial margin.” Subsequent payments made or received by a Fund called “variation margin” are made on a daily basis as the market price of the futures contract fluctuates. Each Fund will record an unrealized gain (loss) based on the amount of variation margin. When a contract is closed, a realized gain (loss) is recorded equal to the difference between the opening and closing value of the contract.
The Funds may purchase call or put options. When a Fund purchases an option, the premium paid by the Fund is recorded as an asset and is subsequently adjusted to the current fair value of the option purchased. Purchasing call options tends to increase the Fund’s exposure to the underlying instrument. Purchasing put options tends to decrease the Fund’s exposure to the underlying instrument. Premiums paid for purchasing options that expire are treated as realized losses. Premiums paid for purchasing options that are exercised or closed are added to the amounts paid or offset against the proceeds on the underlying security to determine the realized gain or loss. The risks associated with purchasing put and call options are potential loss of the premium paid and, in the instances of over-the-counter derivatives, the failure of the counterparty to honor its obligation under the contract.
100
Barings Funds Trust 2021 Annual Report
NOTES TO FINANCIAL STATEMENTS (CONTINUED)
September 30, 2021
The Funds may enter into swap options (“swaptions”). A swaption is an option to enter into a pre-defined swap agreement by some specified date in the future. The writer of the swaption becomes the counterparty to the swap if the buyer exercises. The interest rate swaption agreement will specify whether the buyer of the swaption will be a fixed rate receiver or a fixed rate buyer. Depending on the terms of the particular option agreement, a Fund generally will incur a greater degree of risk when the Fund writes a swaption than the Fund will incur when it purchases a swaption. When a Fund purchases a swaption, the Fund’s risk of loss is limited to the amount of the premium it has paid should it decide to let the swaption expire unexercised.
When a Fund writes a covered call or a put option, an amount equal to the premium received by the Fund is included in the Fund’s Statement of Assets and Liabilities as an asset and as an equivalent liability. The amount of the liability is subsequently marked-to-market to reflect the current market value of the option written. The Fund receives a premium on the sale of a call option but gives up the opportunity to profit from any increase in stock value above the exercise price of the option, and when a Fund writes a put option, it is exposed to a decline in the price of the underlying security.
Whether an option which a Fund has written expires on its stipulated expiration date or a Fund enters into a closing purchase transaction, the Fund realizes a gain (or loss, if the cost of a closing purchase transaction exceeds the premium received when the option was sold) without regard to any unrealized gain or loss on the underlying security, and the liability related to such option is extinguished. If a call option which a Fund has written is exercised, the Fund realizes a capital gain or loss from the sale of the underlying security, and the cost basis of the lots sold are decreased by the premium originally received. When a put option which a Fund has written is exercised, the amount of the premium originally received will reduce the cost of the security which the Fund purchases upon exercise of the option.
The Funds’ use of written options involves, to varying degrees, elements of market risk in excess of the amount recognized in the Statements of Assets and Liabilities. The face or contract amounts of these instruments reflect the extent of the Funds’ exposure to market risk. The risks may be caused by an imperfect correlation between movements in the price of the instrument and the price of the underlying securities, currencies and interest rates.
The Funds may enter into credit default swap contracts. As a seller of a credit default swap contract (“seller of protection”), a Fund is required to pay the notional amount or other agreed-upon value of a referenced debt obligation to the counterparty (or central clearing party in the case of centrally cleared swaps) in the event of a default by or other credit event involving the referenced issuer, obligation or index. In return, a Fund receives from the counterparty (or central clearing party in the case of centrally cleared swaps) a periodic stream of payments over the term of the contract.
As a purchaser of a credit default swap contract (“buyer of protection”), a Fund would receive the notional amount or other agreed upon value of a referenced debt obligation from the counterparty (or central clearing party in the case of centrally cleared swaps) in the event of default by or other credit event involving the referenced issuer, obligation or index. In return, a Fund would make periodic payments to the counterparty (or central clearing party in the case of centrally cleared swaps) over the term of the contracts, provided no event of default has occurred.
These credit default swaps may have as a reference obligation corporate or sovereign issuers or credit indices. These credit indices are comprised of a basket of securities representing a particular sector of the market.
Credit default swaps are fair valued based upon quotations from counterparties, brokers or market-makers and the change in value, if any, is recorded as an unrealized appreciation or depreciation. For a credit default swap sold by a Fund, payment of the agreed-upon amount made by a Fund in the event of default of the referenced debt obligation is recorded as the cost of the referenced debt obligation purchased/received. For a credit default swap purchased by a Fund, the agreed-upon amount received by a Fund in the event of default of the referenced debt obligation is recorded as proceeds from sale/delivery of the referenced debt obligation and the resulting gain or loss realized on the referenced debt obligation is recorded as such by a Fund.
Any upfront payments made or received upon entering a credit default swap contract would be amortized or accreted over the life of the swap and recorded as realized gains or losses. Collateral, in the form of cash or securities, may be required to be held in segregated accounts with the custodian bank or broker in accordance with the swap agreement. The value and credit rating of each credit default swap where a Fund is
101
Barings Funds Trust 2021 Annual Report
NOTES TO FINANCIAL STATEMENTS (CONTINUED)
September 30, 2021
the seller of protection, are both measures of the current payment/performance risk of the swap. As the value of the swap changes as a positive or negative percentage of the total notional amount, the payment/performance risk may decrease or increase, respectively. The maximum potential amount of future payments (undiscounted) that a Fund as a seller of protection could be required to make under a credit default swap agreement would be an amount equal to the notional amount of the agreement. These potential amounts would be partially offset by any recovery values of the respective referenced obligations, upfront payments received upon entering into the agreement, or net amounts received from the settlement of buy protection credit default swap agreements entered into by a Fund for the same referenced entity or entities. For centrally cleared swaps, the daily change in valuation is recorded as a receivable or payable for variation margin and settled in cash with the central clearing party daily.
Entering into swap agreements involves counterparty and market risk. Such risks involve the possibility that there will be no liquid market for these agreements, that the counterparty to the agreements may default on its obligation to perform or disagree as to the meaning of the contractual terms in the agreements, that there may be unfavorable changes in interest rates, and, in the case of credit default swaps, that the Adviser does not correctly predict the creditworthiness of the issuers of the reference obligation on which the credit default swap is based. In the case of centrally cleared swaps, counterparty risk is minimal due to protections provided by the central clearing party.
Interest rate swaps involve the exchange by a Fund with another party of their respective commitments to receive or pay interest (e.g., an exchange of fixed rate payments for floating rate payments) with respect to a notional amount of principal. When a Fund enters into an interest rate swap, it typically agrees to make payments to its counterparty based on a specified long- or short-term interest rate, and will receive payments from its counterparty based on another interest rate. Other forms of interest rate swap agreements include interest rate caps, under which, in return for a specified payment stream, one party agrees to make payments to the other to the extent that interest rates exceed a specified rate, or “cap”; interest rate floors, under which, in return for a specified payment stream, one party agrees to make payments to the other to the extent that interest rates fall below a specified rate, or “floor”; and interest rate collars, under which a party sells a cap and purchases a floor or vice versa in an attempt to protect itself against interest rate movements exceeding given minimum or maximum levels. A Fund may enter into an interest rate swap in order, for example, to hedge against the effect of interest rate changes on the value of specific securities in its portfolio, or to adjust the interest rate sensitivity (duration) or the credit exposure of its portfolio overall, or otherwise as a substitute for a direct investment in debt securities.
During the period ended September 30, 2021, the Funds’ direct investment in derivatives consisted of forward foreign currency exchange contracts, futures contracts, cross currency swaps, credit default swaps, interest rate swaps, purchased options and written options.
The following is a summary of the fair value of derivative instruments held directly by the Funds as of September 30, 2021:
Global Floating Rate Fund
| | | | | | | | | | | | | | | | | | | | |
ASSET DERIVATIVES | | FOREIGN
EXCHANGE
CONTRACTS RISK | | | INTEREST RATE
RISK | | | CREDIT RISK | | | EQUITY
RISK | | | TOTAL | |
Forward Foreign Currency Exchange Contracts(a) | | $ | 1,981,189 | | | $ | – | | | $ | – | | | $ | – | | | $ | 1,981,189 | |
| | | | | | | | | | | | | | | | | | | | |
|
| REALIZED GAIN (LOSS) | |
Forward Foreign Currency Exchange Contracts(h) | | $ | 2,344,620 | | | $ | – | | | $ | – | | | $ | – | | | $ | 2,344,620 | |
| | | | | | | | | | | | | | | | | | | | |
|
| CHANGE IN UNREALIZED APPRECIATION/(DEPRECIATION) | |
Forward Foreign Currency Exchange Contracts(m) | | $ | (160,578 | ) | | $ | – | | | $ | – | | | $ | – | | | $ | (160,578 | ) |
| | | | | | | | | | | | | | | | | | | | |
102
Barings Funds Trust 2021 Annual Report
NOTES TO FINANCIAL STATEMENTS (CONTINUED)
September 30, 2021
| | | | | | | | | | | | | | | | | | | | |
Global Credit Income Opportunities Fund | |
ASSET
DERIVATIVES | | FOREIGN
EXCHANGE
CONTRACTS RISK | | | INTEREST RATE
RISK | | | CREDIT RISK | | | EQUITY
RISK | | | TOTAL | |
Forward Foreign Currency Exchange Contracts(a) | | $ | 1,245,224 | | | $ | – | | | $ | – | | | $ | – | | | $ | 1,245,224 | |
| | | | | | | | | | | | | | | | | | | | |
|
| LIABILITY DERIVATIVES | |
Forward Foreign Currency Exchange Contracts(b) | | $ | (44,625 | ) | | $ | – | | | $ | – | | | $ | – | | | $ | (44,625 | ) |
| | | | | | | | | | | | | | | | | | | | |
|
| REALIZED GAIN (LOSS) | |
Forward Foreign Currency Exchange Contracts(h) | | $ | 1,600,141 | | | $ | – | | | $ | – | | | $ | – | | | $ | 1,600,141 | |
| | | | | | | | | | | | | | | | | | | | |
Total | | $ | 1,600,141 | | | $ | – | | | $ | – | | | $ | – | | | $ | 1,600,141 | |
| | | | | | | | | | | | | | | | | | | | |
|
| CHANGE IN UNREALIZED APPRECIATION/(DEPRECIATION) | |
| |
Forward Foreign Currency Exchange Contracts(m) | | $ | (272,272 | ) | | $ | – | | | $ | – | | | $ | – | | | $ | (272,272 | ) |
| | | | | | | | | | | | | | | | | | | | |
Total | | $ | (272,272 | ) | | $ | – | | | $ | – | | | $ | – | | | $ | (272,272 | ) |
| | | | | | | | | | | | | | | | | | | | |
Emerging Markets Debt Blended Total Return Fund
| | | | | | | | | | | | | | | | | | | | |
ASSET
DERIVATIVES | | FOREIGN
EXCHANGE
CONTRACTS RISK | | | INTEREST RATE
RISK | | | CREDIT RISK | | | EQUITY
RISK | | | TOTAL | |
Forward Foreign Currency Exchange Contracts(a) | | $ | 2,006,191 | | | $ | – | | | $ | – | | | $ | – | | | $ | 2,006,191 | |
Futures Contracts(c) | | | – | | | | 108,375 | | | | – | | | | – | | | | 108,375 | |
Purchased Options(f) | | | 13 | | | | – | | | | – | | | | – | | | | 13 | |
OTC Swap Contracts(d) | | | 211,236 | | | | 39,874 | | | | 29,559 | | | | – | | | | 280,669 | |
Centrally Cleared Swap Contracts(e) | | | – | | | | 302,288 | | | | – | | | | – | | | | 302,288 | |
| | | | | | | | | | | | | | | | | | | | |
| | $ | 2,217,440 | | | $ | 450,537 | | | $ | 29,559 | | | $ | – | | | | 2,697,536 | |
| | | | | | | | | | | | | | | | | | | | |
|
| LIABILITY DERIVATIVES | |
Forward Foreign Currency Exchange Contracts(b) | | $ | (1,886,454 | ) | | $ | – | | | $ | – | | | $ | – | | | $ | (1,886,454 | ) |
Written Options(g) | | | (87,188 | ) | | | – | | | | – | | | | – | | | | (87,188 | ) |
OTC Swap Contracts(d) | | | (222,254 | ) | | | – | | | | (217,056 | ) | | | – | | | | (439,310 | ) |
Centrally Cleared Swap Contracts(e) | | | – | | | | (1,578,010 | ) | | | – | | | | – | | | | (1,578,010 | ) |
| | | | | | | | | | | | | | | | | | | | |
Total | | $ | (2,195,896 | ) | | $ | (1,578,010 | ) | | $ | (217,056 | ) | | $ | – | | | $ | (3,990,962 | ) |
| | | | | | | | | | | | | | | | | | | | |
103
Barings Funds Trust 2021 Annual Report
NOTES TO FINANCIAL STATEMENTS (CONTINUED)
September 30, 2021
| | | | | | | | | | | | | | | | | | | | |
| REALIZED GAIN (LOSS) | | FOREIGN
EXCHANGE
CONTRACTS RISK | | | INTEREST RATE
RISK | | | CREDIT RISK | | | EQUITY
RISK | | | TOTAL | |
Forward Foreign Currency Exchange Contracts(h) | | $ | 1,601,304 | | | $ | – | | | $ | – | | | $ | – | | | $ | 1,601,304 | |
Futures Contracts(i) | | | – | | | | (320,073 | ) | | | – | | | | – | | | | (320,073 | ) |
Swap Contracts(j) | | | 582 | | | | (89,370 | ) | | | 123,641 | | | | – | | | | 34,853 | |
Purchased Options(k) | | | (2,533 | ) | | | – | | | | – | | | | – | | | | (2,533 | ) |
Written Options(l) | | | 318,059 | | | | – | | | | – | | | | – | | | | 318,059 | |
| | | | | | | | | | | | | | | | | | | | |
Total | | $ | 1,917,412 | | | $ | (409,443 | ) | | $ | 123,641 | | | $ | – | | | $ | 1,631,610 | |
| | | | | | | | | | | | | | | | | | | | |
|
| CHANGE IN UNREALIZED APPRECIATION/(DEPRECIATION) | |
Forward Foreign Currency Exchange Contracts(m) | | $ | (1,780,492 | ) | | $ | – | | | $ | – | | | $ | – | | | $ | (1,780,492 | ) |
Futures Contracts(n) | | | – | | | | 245,449 | | | | – | | | | – | | | | 245,449 | |
Swap Contracts(o) | | | 323,714 | | | | (927,064 | ) | | | (134,852 | ) | | | – | | | | (738,202 | ) |
Purchased Options(p) | | | (30,408 | ) | | | – | | | | – | | | | – | | | | (30,408 | ) |
Written Options(q) | | | (215,015 | ) | | | – | | | | – | | | | – | | | | (215,015 | ) |
| | | | | | | | | | | | | | | | | | | | |
Total | | $ | (1,702,201 | ) | | $ | (681,615 | ) | | $ | (134,852 | ) | | $ | – | | | $ | (2,518,668 | ) |
| | | | | | | | | | | | | | | | | | | | |
Global Emerging Markets Equity Fund
| | | | | | | | | | | | | | | | | | | | |
| REALIZED GAIN (LOSS) | | FOREIGN
EXCHANGE
CONTRACTS RISK | | | INTEREST RATE
RISK | | | CREDIT RISK | | | EQUITY
RISK | | | TOTAL | |
Forward Foreign Currency Exchange Contracts(h) | | $ | 1,481 | | | $ | – | | | $ | – | | | $ | – | | | $ | 1,481 | |
| | | | | | | | | | | | | | | | | | | | |
| | (a) | Statements of Assets and Liabilities location: Unrealized appreciation on forward foreign currency exchange contracts. |
| | (b) | Statements of Assets and Liabilities location: Unrealized depreciation on forward foreign currency exchange contracts. |
| | (c) | Statements of Assets and Liabilities location: Includes cumulative unrealized appreciation/ depreciation of futures contracts as reported in the Schedule of Investments. Only current day’s variation margin is reported within the Statements of Assets and Liabilities. |
| | (d) | Statements of Assets and Liabilities location: Swap contracts, at fair value. |
| | (e) | Statements of Assets and Liabilities location: Includes cumulative unrealized appreciation/ depreciation of swap contracts as reported in the Schedule of Investments. Only current day’s variation margin is reported within the Statements of Assets and Liabilities. |
| | (f) | Statements of Assets and Liabilities location: Investments, at fair value. |
| | (g) | Statements of Assets and Liabilities location: Written options, at fair value. |
| | (h) | Statements of Operations location: Net realized gain (loss) on forward foreign currency exchange contracts. |
| | (i) | Statements of Operations location: Net realized gain (loss) on futures contracts. |
| | (j) | Statements of Operations location: Net realized gain on swap contracts. |
| | (k) | Statements of Operations location: Net realized gain (loss) on purchased options. |
| | (l) | Statements of Operations location: Net realized gain (loss) on written options. |
| | (m) | Statements of Operations location: Net change in unrealized appreciation on forward foreign currency exchange contracts. |
104
Barings Funds Trust 2021 Annual Report
NOTES TO FINANCIAL STATEMENTS (CONTINUED)
September 30, 2021
| | (n) | Statements of Operations location: Net change in unrealized appreciation (depreciation) on futures contracts. |
| | (o) | Statements of Operations location: Net change in unrealized appreciation (depreciation) on swap contracts. |
| | (p) | Statements of Operations location: Net change in unrealized appreciation (depreciation) on purchased option contracts. |
| | (q) | Statements of Operations location: Net change in unrealized appreciation (depreciation) on written options. |
| | | | | | | | | | | | | | | | | | | | | | | | |
| NUMBER OF CONTRACTS, NOTIONAL AMOUNTS, OR SHARES/UNITS* | |
| FUND NAME | | FORWARD
FOREIGN
CURRENCY
EXCHANGE
CONTRACTS | | | FUTURES
CONTRACTS | | | OTC SWAP
CONTRACTS | | | CENTRALLY
CLEARED
SWAP
CONTRACTS | | | PURCHASED
OPTIONS | | | WRITTEN
OPTIONS | |
| GLOBAL FLOATING RATE FUND | | $ | 85,910,782 | | | | – | | | $ | – | | | $ | – | | | $ | – | | | $ | – | |
| GLOBAL CREDIT INCOME OPPORTUNITIES FUND | | $ | 56,055,674 | | | | – | | | $ | – | | | $ | – | | | $ | – | | | $ | – | |
| EMERGING MARKETS DEBT BLENDED TOTAL RETURN FUND | | $ | 160,673,069 | | | | 13 | | | $ | 25,997,187 | | | $ | 78,797,231 | | | $ | 14,639,401 | | | $ | 34,336,405 | |
| GLOBAL EMERGING MARKETS EQUITY FUND | | $ | 62,831 | | | | – | | | $ | – | | | $ | – | | | $ | – | | | $ | – | |
| | * | Amount(s) disclosed represent average number of contracts for futures contracts and notional amounts for forward contracts, swap contracts and purchased/written options, based on absolute values, which is indicative of volume of this derivative type, for the months that the Fund held such derivatives during the period ended September 30, 2021. |
| | K. | Disclosures about Offsetting Assets and Liabilities |
The Financial Accounting Standards Board (“FASB”) issued Accounting Standards Update No. 2011-11 “Disclosures about Offsetting Assets and Liabilities” (“ASU 2011-11”). These disclosure requirements are intended to help better assess the effect or potential effect of offsetting arrangements on a Fund’s financial position. In addition, FASB issued Accounting Standards Update No. 2013-01 “Clarifying the Scope of Offsetting Assets and Liabilities” (“ASU 2013-01”), specifying which transactions are subject to disclosures about offsetting. In order to better define its contractual rights and to secure rights that will help the Fund mitigate its counterparty risk, the Fund may enter into an International Swaps and Derivatives Association, Inc. Master Agreement (“ISDA Master Agreement”) or similar agreement with its counterparties. An ISDA Master Agreement is a bilateral agreement between the Fund and a counterparty that governs certain OTC derivatives and typically contains, among other things, collateral posting terms and netting provisions in the event of a default and/or termination event. Under an ISDA Master Agreement, the Fund may, under certain circumstances, offset with the counterparty certain derivative financial instruments’ payables and/or receivables with collateral held and/or posted and create
one single net payment. The provisions of the ISDA Master Agreement typically permit a single net payment in the event of default including the bankruptcy or insolvency of the counterparty. Bankruptcy or insolvency laws of a particular jurisdiction may restrict or prohibit the right of offset in bankruptcy, insolvency or other events. In addition, certain ISDA Master Agreements allow counterparties to terminate derivative contracts prior to maturity in the event the Fund’s net assets decline by a stated percentage or the Fund fails to meet the terms of its ISDA Master Agreements. The result would cause the Fund to accelerate payment of any net liability owed to the counterparty.
For derivatives traded under an ISDA Master Agreement, the collateral requirements are typically calculated by netting the mark to market amount for each transaction under such agreement and comparing that amount to the value of any collateral currently pledged by the Funds and the counterparty.
Cash collateral that has been pledged to cover obligations of the Funds and cash collateral received from the counterparty, if any, is reported separately on the Statement of Assets and Liabilities as cash collateral held at broker or cash collateral due to broker, respectively. Non-cash collateral pledged by or received
105
Barings Funds Trust 2021 Annual Report
NOTES TO FINANCIAL STATEMENTS (CONTINUED)
September 30, 2021
by the Funds, if any, is noted in the Schedule of Investments. Generally, the amount of collateral due from or to a party has to exceed a minimum transfer amount threshold before a transfer is required, which is determined each day at the close of business of the Funds, typically based on changes in market values for each transaction under an ISDA Master Agreement and netted into one amount for such agreement and any additional required collateral is delivered to/pledged by the Funds on the next business day. Typically, the Funds
and counterparties are not permitted to sell, re-pledge or use the collateral they receive. To the extent amounts due to the Funds from their counterparties are not fully collateralized, contractually or otherwise, the Funds bear the risk of loss from counterparty non-performance. The Funds attempt to mitigate counterparty risk by entering into agreements only with counterparties that they believe have the financial resources to honor their obligations and by monitoring the financial stability of those counterparties.
The following tables illustrate gross and net information about recognized assets eligible for offset in the Statement of Assets and Liabilities, and disclose such amounts subject to an enforceable master netting agreement or similar agreement, by counterparty. A master netting agreement is an agreement between two counterparties who have multiple contracts with each other that provides for the net settlement of all contracts, as well as cash collateral, through a single payment in the event of default on or termination of any one contract:
Global Floating Rate Fund
| | | | | | | | | | | | |
| DESCRIPTION | | GROSS AMOUNTS OF
RECOGNIZED ASSETS | | | GROSS AMOUNTS OFFSET
IN THE STATEMENTS OF
ASSETS AND LIABILITIES | | | NET AMOUNTS OF
ASSETS PRESENTED
IN THE STATEMENTS OF
ASSETS AND LIABILITIES | |
Forward Foreign Currency Exchange Contracts | | $ | 1,981,189 | | | $ | – | | | $ | 1,981,189 | |
| | | | | | | | | | | | |
Total | | $ | 1,981,189 | | | $ | – | | | $ | 1,981,189 | |
| | | | | | | | | | | | |
| | | | | | | | | | | | | | | | |
| | | | | | GROSS AMOUNTS NOT OFFSET
IN THE STATEMENTS OF
ASSETS AND LIABILITIES | | | | | | | |
| COUNTERPARTY | | NET AMOUNTS OF ASSETS
PRESENTED IN THE STATEMENTS
OF ASSETS AND LIABILITIES | | | FINANCIAL
INSTRUMENT | | | CASH
COLLATERAL
RECEIVED(a) | | | NET
AMOUNT(b) | |
Canadian Imperial Bank of Commerce | | $ | 1,586,854 | | | $ | – | | | $ | (1,530,000 | ) | | $ | 56,854 | |
Morgan Stanley & Co. | | | 394,335 | | | | – | | | | — | | | | 394,335 | |
| | | | | | | | | | | | | | | | |
Total | | $ | 1,981,189 | | | $ | – | | | $ | (1,530,000 | ) | | $ | 451,189 | |
| | | | | | | | | | | | | | | | |
| | (a) | Collateral disclosed is limited to an amount not to exceed 100% of the net amount of assets presented in the Statements of Assets and Liabilities, for each respective counterparty. |
| | (b) | Net Amount represents the amount that is subject to loss in the event of a counterparty failure as of September 30, 2021. |
106
Barings Funds Trust 2021 Annual Report
NOTES TO FINANCIAL STATEMENTS (CONTINUED)
September 30, 2021
Global Credit Income Opportunities Fund
| | | | | | | | | | | | |
| DESCRIPTION | | GROSS AMOUNTS OF
RECOGNIZED ASSETS | | | GROSS AMOUNTS OFFSET
IN THE STATEMENTS OF
ASSETS AND LIABILITIES | | | NET AMOUNTS OF
ASSETS PRESENTED
IN THE STATEMENTS OF
ASSETS AND LIABILITIES | |
Forward Foreign Currency Exchange Contracts | | $ | 1,245,224 | | | $ | — | | | $ | 1,245,224 | |
| | | | | | | | | | | | |
Total | | $ | 1,245,224 | | | $ | — | | | $ | 1,245,224 | |
| | | | | | | | | | | | |
| | | | | | | | | | | | | | | | |
| | | | | | GROSS AMOUNTS NOT OFFSET
IN THE STATEMENTS OF
ASSETS AND LIABILITIES | | | | | | | |
| COUNTERPARTY | | NET AMOUNTS OF ASSETS
PRESENTED IN THE STATEMENTS
OF ASSETS AND LIABILITIES | | | FINANCIAL
INSTRUMENT | | | CASH
COLLATERAL
RECEIVED(a) | | | NET
AMOUNT(b) | |
Bank of America N.A. | | $ | 983,021 | | | $ | – | | | $ | (910,000 | ) | | $ | 73,021 | |
Barclays Bank plc | | | 227,634 | | | | (20 | ) | | | (227,614 | ) | | | – | |
Citibank N.A. | | | 13,998 | | | | – | | | | – | | | | 13,998 | |
Goldman Sachs & Co. | | | 421 | | | | (52 | ) | | | – | | | | 369 | |
JPMorgan Chase Bank N.A. | | | 7 | | | | – | | | | – | | | | 7 | |
Morgan Stanley & Co. | | | 20,143 | | | | (9,670 | ) | | | – | | | | 10,473 | |
| | | | | | | | | | | | | | | | |
Total | | $ | 1,245,224 | | | $ | (9,742 | ) | | $ | (1,137,614 | ) | | $ | 97,868 | |
| | | | | | | | | | | | | | | | |
| | (a) | Collateral disclosed is limited to an amount not to exceed 100% of the net amount of assets presented in the Statements of Assets and Liabilities, for each respective counterparty. |
| | (b) | Net Amount represents the amount that is subject to loss in the event of a counterparty failure as of September 30, 2021. |
| | | | | | | | | | | | |
| DESCRIPTION | | GROSS AMOUNTS OF
RECOGNIZED LIABILITIES | | | GROSS AMOUNTS OFFSET
IN THE STATEMENTS OF
ASSETS AND LIABILITIES | | | NET AMOUNTS OF
LIABILITIES PRESENTED
IN THE STATEMENTS OF
ASSETS AND LIABILITIES | |
Forward Foreign Currency Exchange Contracts | | $ | 44,625 | | | $ | — | | | $ | 44,625 | |
| | | | | | | | | | | | |
Total | | $ | 44,625 | | | $ | — | | | $ | 44,625 | |
| | | | | | | | | | | | |
107
Barings Funds Trust 2021 Annual Report
NOTES TO FINANCIAL STATEMENTS (CONTINUED)
September 30, 2021
| | | | | | | | | | | | | | | | |
| | | | | | GROSS AMOUNTS NOT OFFSET
IN THE STATEMENTS OF
ASSETS AND LIABILITIES | | | | | | | |
| COUNTERPARTY | | NET AMOUNTS OF LIABILITIES
PRESENTED IN THE STATEMENTS
OF ASSETS AND LIABILITIES | | | FINANCIAL
INSTRUMENT | | | CASH
COLLATERAL
PLEDGED(a) | | | NET
AMOUNT(b) | |
Barclays Bank plc | | $ | 20 | | | $ | (20 | ) | | $ | – | | | $ | – | |
Canadian Imperial Bank of Commerce | | | 34,883 | | | | – | | | | – | | | | 34,883 | |
Goldman Sachs & Co. | | | 52 | | | | (52 | ) | | | – | | | | – | |
Morgan Stanley & Co. | | | 9,670 | | | | (9,670 | ) | | | – | | | | – | |
| | | | | | | | | | | | | | | | |
Total | | $ | 44,625 | | | $ | (9,742 | ) | | $ | – | | | $ | 34,883 | |
| | | | | | | | | | | | | | | | |
| | (a) | Collateral disclosed is limited to an amount not to exceed 100% of the net amount of assets presented in the Statements of Assets and Liabilities, for each respective counterparty. |
| | (b) | Net Amount represents the amount that is subject to loss in the event of a counterparty failure as of September 30, 2021. |
Emerging Markets Debt Blended Total Return Fund
| | | | | | | | | | | | |
| DESCRIPTION | | GROSS AMOUNTS OF
RECOGNIZED ASSETS | | | GROSS AMOUNTS OFFSET
IN THE STATEMENTS OF
ASSETS AND LIABILITIES | | | NET AMOUNTS OF
ASSETS PRESENTED
IN THE STATEMENTS OF
ASSETS AND LIABILITIES | |
Forward Foreign Currency Exchange Contracts | | $ | 2,006,191 | | | $ | – | | | $ | 2,006,191 | |
Purchased Options | | | 13 | | | | – | | | | 13 | |
Swap Contracts | | | 280,669 | | | | – | | | | 280,669 | |
| | | | | | | | | | | | |
Total | | $ | 2,286,873 | | | $ | – | | | $ | 2,286,873 | |
| | | | | | | | | | | | |
| | | | | | | | | | | | | | | | |
| | | | | | GROSS AMOUNTS NOT OFFSET
IN THE STATEMENTS OF
ASSETS AND LIABILITIES | | | | | | | |
| COUNTERPARTY | | NET AMOUNTS OF ASSETS
PRESENTED IN THE STATEMENTS
OF ASSETS AND LIABILITIES | | | FINANCIAL
INSTRUMENT | | | CASH
COLLATERAL
RECEIVED(a) | | | NET
AMOUNT(b) | |
Bank of America N.A. | | $ | 215,596 | | | $ | (215,596 | ) | | $ | – | | | $ | – | |
Barclays Bank plc | | | 28,673 | | | | (3 | ) | | | – | | | | 28,670 | |
BNP Paribas S.A. | | | 16,632 | | | | (16,632 | ) | | | – | | | | – | |
Citibank N.A. | | | 724,581 | | | | (724,581 | ) | | | – | | | | – | |
Goldman Sachs & Co. | | | 375,475 | | | | (58,872 | ) | | | (280,000 | ) | | | 36,603 | |
HSBC Bank USA | | | 37,572 | | | | – | | | | – | | | | 37,572 | |
JPMorgan Chase Bank N.A. | | | 710,636 | | | | (710,636 | ) | | | – | | | | – | |
Morgan Stanley & Co. | | | 130,152 | | | | (130,152 | ) | | | – | | | | – | |
Standard Chartered Bank | | | 47,556 | | | | – | | | | – | | | | 47,556 | |
| | | | | | | | | | | | | | | | |
Total | | $ | 2,286,873 | | | $ | (1,856,472 | ) | | $ | (280,000 | ) | | $ | 150,401 | |
| | | | | | | | | | | | | | | | |
| | (a) | Collateral disclosed is limited to an amount not to exceed 100% of the net amount of assets presented in the Statements of Assets and Liabilities, for each respective counterparty. |
| | (b) | Net Amount represents the amount that is subject to loss in the event of a counterparty failure as of September 30, 2021. |
108
Barings Funds Trust 2021 Annual Report
NOTES TO FINANCIAL STATEMENTS (CONTINUED)
September 30, 2021
| | | | | | | | | | | | |
| DESCRIPTION | | GROSS AMOUNTS OF
RECOGNIZED LIABILITIES | | | GROSS AMOUNTS OFFSET
IN THE STATEMENTS OF
ASSETS AND LIABILITIES | | | NET AMOUNTS OF
LIABILITIES PRESENTED
IN THE STATEMENTS OF
ASSETS AND LIABILITIES | |
Forward Foreign Currency Exchange Contracts | | $ | 1,886,454 | | | $ | – | | | $ | 1,886,454 | |
Swap Contracts | | | 439,310 | | | | – | | | | 439,310 | |
Written Options | | | 87,188 | | | | – | | | | 87,188 | |
| | | | | | | | | | | | |
Total | | $ | 2,412,952 | | | $ | – | | | $ | 2,412,952 | |
| | | | | | | | | | | | |
| | | | | | | | | | | | | | | | |
| | | | | | GROSS AMOUNTS NOT OFFSET
IN THE STATEMENTS OF
ASSETS AND LIABILITIES | | | | | | | |
| COUNTERPARTY | | NET AMOUNTS OF LIABILITIES
PRESENTED IN THE STATEMENTS
OF ASSETS AND LIABILITIES | | | FINANCIAL
INSTRUMENT | | | CASH
COLLATERAL
PLEDGED(a) | | | NET
AMOUNT(b) | |
Bank of America N.A. | | $ | 513,955 | | | $ | (215,596 | ) | | $ | (260,000 | ) | | $ | 38,359 | |
Barclays Bank plc | | | 3 | | | | (3 | ) | | | – | | | | – | |
BNP Paribas S.A. | | | 88,388 | | | | (16,632 | ) | | | – | | | | 71,756 | |
Canadian Imperial Bank of Commerce | | | 7,948 | | | | – | | | | – | | | | 7,948 | |
Citibank N.A. | | | 862,297 | | | | (724,581 | ) | | | (137,716 | ) | | | – | |
Goldman Sachs & Co. | | | 58,872 | | | | (58,872 | ) | | | – | | | | – | |
JPMorgan Chase Bank N.A. | | | 727,537 | | | | (710,636 | ) | | | – | | | | 16,901 | |
Morgan Stanley & Co. | | | 153,952 | | | | (130,152 | ) | | | – | | | | 23,800 | |
| | | | | | | | | | | | | | | | |
Total | | $ | 2,412,952 | | | $ | (1,856,472 | ) | | $ | (397,716 | ) | | $ | 158,764 | |
| | | | | | | | | | | | | | | | |
| | (a) | Collateral disclosed is limited to an amount not to exceed 100% of the net amount of assets presented in the Statements of Assets and Liabilities, for each respective counterparty. |
| | (b) | Net Amount represents the amount that is subject to loss in the event of a counterparty failure as of September 30, 2021. |
Investing in securities of foreign companies and foreign governments involves special risks and considerations not typically associated with investing in U.S. companies and the U.S. government. These risks include valuation of currencies and adverse political and economic developments. Moreover, securities of many foreign companies, foreign governments, and their markets may be less liquid and their prices more volatile than those of securities of comparable U.S. companies and the U.S. government.
| | M. | Foreign Currency Translation |
The books and records of the Funds are maintained in U.S. dollars. Foreign currency transactions are translated
into U.S. dollars on the following basis: (i) market value of investment securities, assets and liabilities at the daily rates of exchange, and (ii) purchases and sales of investment securities, dividend and interest income and certain expenses at the rates of exchange prevailing on the respective dates of such transactions. For financial reporting purposes, the Funds do not isolate changes in the exchange rate of investment securities from the fluctuations arising from changes in the market prices of securities. However, for Federal income tax purposes, the Funds do isolate and treat as ordinary income the effect of changes in foreign exchange rates on realized gain or loss from the sale of investment securities and payables and receivables arising from trade-date and settlement-date differences.
109
Barings Funds Trust 2021 Annual Report
NOTES TO FINANCIAL STATEMENTS (CONTINUED)
September 30, 2021
The Funds seek to manage counterparty credit risk by entering into agreements only with counterparties the Adviser believes have the financial resources to honor their obligations. The Adviser monitors the financial stability of the Funds’ counterparties.
The Funds have entered into an Investment Management Agreement (the “Agreement”) with the Adviser. Pursuant to the Agreement, the Funds have agreed to pay the Adviser a fee payable at the end of each calendar month as set forth below:
| | |
Global Floating Rate Fund | | 0.65% of average daily net assets |
Global Credit Income Opportunities Fund | | 0.75% of average daily net assets |
Emerging Markets Debt Blended Total Return Fund | | 0.75% of average daily net assets |
Global Emerging Markets Equity Fund | | 0.90% of average daily net assets |
The Adviser has contractually agreed to waive and/or reimburse a portion of its fees and/or reimburse expenses (excluding distribution and service (12b-1) fees, interest expenses, taxes, acquired fund fees and expenses, fees incurred in acquiring and disposing of securities and extraordinary expenses) such that total net annual operating expenses (including 12b-1 fees) for each class do not exceed the following rates (as a percentage of average daily net assets allocated to each such class):
| | | | | | | | | | | | | | | | |
| | | CLASS A | | | CLASS C | | | CLASS I | | | CLASS Y | |
Global Floating Rate Fund | | | 1.00 | % | | | 1.75 | % | | | 0.75 | % | | | 0.75 | % |
Global Credit Income Opportunities Fund | | | 1.20 | % | | | 1.95 | % | | | 0.95 | % | | | 0.95 | % |
Emerging Markets Debt Blended Total Return Fund | | | 1.20 | % | | | 1.95 | % | | | 0.95 | % | | | 0.95 | % |
Global Emerging Markets Equity Fund | | | 1.15 | % | | | 1.90 | % | | | 0.90 | % | | | 0.90 | % |
Pursuant to the expense waiver/reimbursement agreement, the Adviser is entitled to be reimbursed for any fees the Adviser waives and Fund expenses that the Adviser reimburses for a period of three years following such fee waivers and expense reimbursements, to the extent that such reimbursement of the Adviser by a Fund
will not cause the Fund to exceed any applicable expense limitation that is in place for the Fund.
The contractual management fee waiver and expense reimbursement agreements between the Funds and the Adviser will remain in effect until November 1, 2021 and may be terminated only upon the approval of the Funds’ Board of Trustees.
Subject to the supervision of the Adviser and the Board, BIIL manages the investment and reinvestment of a portion of the assets of the Global Floating Rate Fund, Global Credit Income Opportunities Fund, Emerging Markets Debt Blended Total Return Fund and Global Emerging Markets Equity Fund, as allocated from time to time to BIIL. As compensation for its services, the Adviser (not the Funds) pays to BIIL sub-advisory fees equal to the below percentages of the advisory fee paid to the Adviser by the applicable Fund, net of any fee waivers and/or expense reimbursements:
| | | | |
Global Floating Rate Fund | | | 0.35 | % |
Global Credit Income Opportunities Fund | | | 0.35 | % |
Emerging Markets Debt Blended Total Return Fund | | | 0.50 | % |
Global Emerging Markets Equity Fund | | | 0.70 | % |
The Adviser or its affiliates voluntarily agreed to waive certain fees for the Global Floating Rate Fund and the Emerging Markets Debt Blended Total Return Fund. Such arrangements may be discontinued by the Adviser at any time.
| 4. | 12b-1 Distribution and Service Plan |
ALPS Distributors, Inc. (the “Distributor”) is the Distributor of the Funds’ shares as of September 30, 2021.
The Funds have adopted a Distribution and Shareholder Services Plan (the “Plan”), pursuant to Rule 12b-1 under the 1940 Act. Under the Plan, each Fund’s Class A and Class C shares may compensate certain financial institutions, including the Distributor, for certain distribution and shareholder servicing activities. The Funds’ Class A shares may expend an aggregate amount, on an annual basis, not to exceed 0.25% of the value of the average daily net assets of a Fund attributable to Class A shares. The Funds’ Class C shares may expend an aggregate amount, on an annual basis, not to exceed 1.00% of the value of the average daily net assets of a Fund attributable to Class C shares. The Plan provides that the distribution and service fees are payable to the Distributor regardless of the amounts actually expended by the Distributor for distribution of the Funds’ shares and service activities.
110
Barings Funds Trust 2021 Annual Report
NOTES TO FINANCIAL STATEMENTS (CONTINUED)
September 30, 2021
Under its terms, the Funds’ Plan shall remain in effect from year to year, provided such continuance is approved annually by a vote of a majority of the Board’s members and a majority of the Board’s members who are not “interested persons” of the Funds and who have no direct or indirect financial interest in the operation of the Plan or in any agreement related to the Plan.
| 5. | Sales Charges and Commissions |
For the period ended September 30, 2021, the amount of sales charges retained by the Distributor on sales of Class A and Class C shares of the Funds were as follows:
| | | | | | | | |
| | | CLASS A | | | CLASS C | |
Global Credit Income Opportunities Fund | | $ | – | | | $ | 750 | |
For the period ended September 30, 2021, the Distributor received the following commissions on sales of shares of the Funds, after concessions were paid to authorized dealers:
| | | | | | | | |
| | | DISTRIBUTOR
COMMISSIONS | | | DEALERS’
CONCESSIONS | |
Global Floating Rate Fund | | $ | 13 | | | $ | 2,361 | |
Global Credit Income Opportunities Fund | | | 319 | | | | 1,250 | |
Emerging Markets Debt Blended Total Return Fund | | | 380 | | | | 1,377 | |
| 6. | Administrator, Custody, and Transfer Agent Fees |
The Funds have engaged State Street Bank and Trust (“SSB”) to serve as the Funds’ administrator, custodian, and fund accountant. For these services, the Funds have agreed to pay SSB fees payable at the end of each calendar month pursuant to an agreement between SSB and the Funds. For the period ended September 30, 2021, the aggregate effective fee for the services performed by SSB was at the following annual rate of each Fund’s average daily managed assets:
| | | | |
Aggregate Administrator, Custodian and Fund Accountant Fee to SSB: | |
Global Floating Rate Fund | | | 0.06 | % |
Global Credit Income Opportunities Fund | | | 0.09 | % |
Emerging Markets Debt Blended Total Return Fund | | | 0.13 | % |
Global Emerging Markets Equity Fund | | | 0.37 | % |
The Funds have engaged ALPS Fund Services, Inc. (“ALPS”) to serve as the Funds’ transfer agent. For these services, the Funds have agreed to pay ALPS fees payable at the end of each calendar month pursuant to an agreement between ALPS and the Funds. For the period ended September 30, 2021, the effective fee for the services performed by ALPS was at the following annual rate of each Fund’s average daily managed assets:
| | | | |
Transfer Agency Fee to ALPS: | |
Global Floating Rate Fund | | | 0.01 | % |
Global Credit Income Opportunities Fund | | | 0.01 | % |
Emerging Markets Debt Blended Total Return Fund | | | 0.03 | % |
Global Emerging Markets Equity Fund | | | 0.43 | % |
It is the Funds’ intention to qualify as a RIC under subchapter M of the Internal Revenue Code and distribute all of its taxable income. Accordingly, no provision for Federal income taxes is required in the financial statements.
The tax character of dividends paid to shareholders during the tax period from July 1, 2021 through September 30, 2021 was as follows:
| | | | | | | | |
| | | ORDINARY
INCOME | | | TOTAL
DISTRIBUTIONS
PAID | |
Global Floating Rate Fund | | $ | 3,229,705 | | | $ | 3,229,705 | |
Global Credit Income Opportunities Fund | | | 2,460,774 | | | | 2,460,774 | |
Emerging Markets Debt Blended Total Return Fund | | | 1,794,022 | | | | 1,794,022 | |
Global Emerging Markets Equity Fund | | | 126,444 | | | | 126,444 | |
The tax character of dividends paid to shareholders during the tax year ended June 30, 2021 was as follows:
| | | | | | | | |
| | | ORDINARY
INCOME | | | TOTAL
DISTRIBUTIONS
PAID | |
Global Floating Rate Fund | | $ | 9,673,175 | | | $ | 9,673,175 | |
Global Credit Income Opportunities Fund | | | 9,100,007 | | | | 9,100,007 | |
Emerging Markets Debt Blended Total Return Fund | | | 6,114,370 | | | | 6,114,370 | |
Global Emerging Markets Equity Fund | | | 105,458 | | | | 105,458 | |
111
Barings Funds Trust 2021 Annual Report
NOTES TO FINANCIAL STATEMENTS (CONTINUED)
September 30, 2021
The tax character of dividends paid to shareholders during the tax year ended June 30, 2020 was as follows:
| | | | | | | | | | | | | | | | |
| | | ORDINARY
INCOME | | | NET LONG-TERM
CAPITAL GAINS | | | RETURN OF
CAPITAL | | | TOTAL
DISTRIBUTIONS
PAID | |
Global Floating Rate Fund | | $ | 10,225,052 | | | $ | 438,706 | | | $ | 2,165,048 | | | $ | 12,828,806 | |
Global Credit Income Opportunities Fund | | | 9,585,231 | | | | – | | | | 1,452,704 | | | | 11,037,935 | |
Emerging Markets Debt Blended Total Return Fund | | | 3,530,108 | | | | – | | | | – | | | | 3,530,108 | |
Global Emerging Markets Equity Fund | | | 311,500 | | | | 21,100 | | | | 15,138 | | | | 347,738 | |
As of September 30, 2021, the components of distributable earnings on a tax-basis were as follows:
| | | | | | | | | | | | | | | | | | | | | | | | |
| | | UNDISTRIBUTED
ORDINARY
INCOME | | | UNDISTRIBUTED
LONG-TERM
CAPITAL GAINS | | | LATE YEAR
ORDINARY AND
POST OCTOBER
CAPITAL LOSS
DEFERRALS | | | CAPITAL LOSS
CARRYFORWARDS | | | UNREALIZED
APPRECIATION
(DEPRECIATION) | | | TOTAL
DISTRIBUTABLE
EARNINGS | |
Global Floating Rate Fund | | $ | 870,852 | | | $ | – | | | $ | – | | | $ | (10,291,851 | ) | | $ | (2,057,513 | ) | | $ | (11,478,512 | ) |
Global Credit Income Opportunities Fund | | | 411,252 | | | | – | | | | – | | | | (16,593,645 | ) | | | (1,643,893 | ) | | | (17,826,286 | ) |
Emerging Markets Debt Blended Total Return Fund1 | | | 1,653,312 | | | | 1,232,813 | | | | – | | | | – | | | | (3,547,009 | ) | | | (660,884 | ) |
Global Emerging Markets Equity Fund2 | | | 42,746 | | | | 256,441 | | | | – | | | | (80,156 | ) | | | 2,196,881 | | | | 2,415,912 | |
| | 1. | Includes undistributed balances from June 30, 2021 as follows: Undistributed Ordinary Income of 1,332,658 and Undistributed Long-Term Capital Gains of 1,232,813. |
| | 2. | Includes undistributed balances from June 30, 2021 as follows: Undistributed Long-Term Capital Gains of 256,441. |
In accordance with the Regulated Investment Company Modernization Act of 2010, the Funds will carryforward capital losses incurred in taxable years beginning after December 22, 2010 (“post-enactment losses”) indefinitely. Post-enactment losses will also retain their character as either short-term or long-term and be utilized before any pre-enactment losses.
On September 30, 2021, the following funds had capital loss carryforwards available to be offset against future net capital gains as follows:
| | | | | | | | |
| | | UNLIMITED -
SHORT TERM | | | UNLIMITED -
LONG TERM | |
Global Floating Rate Fund | | $ | 1,019,835 | | | $ | 9,272,016 | |
Global Credit Income Opportunities Fund | | | 4,721,956 | | | | 11,871,689 | |
Global Emerging Markets Equity Fund | | | 80,156 | | | | – | |
112
Barings Funds Trust 2021 Annual Report
NOTES TO FINANCIAL STATEMENTS (CONTINUED)
September 30, 2021
As of September 30, 2021, the aggregate unrealized security gains and losses based on cost for U.S. federal income tax purposes were as follows:
| | | | | | | | | | | | | | | | |
| | | COST OF
INVESTMENTS | | | GROSS
UNREALIZED
APPRECIATION | | | GROSS
UNREALIZED
DEPRECIATION | | | NET
UNREALIZED
APPRECIATION
(DEPRECIATION) | |
Global Floating Rate Fund | | $ | 396,990,386 | | | $ | 3,639,551 | | | $ | (5,906,011 | ) | | $ | (2,266,460 | ) |
Global Credit Income Opportunities Fund | | | 172,819,882 | | | | 5,381,219 | | | | (7,080,804 | ) | | | (1,699,515 | ) |
Emerging Markets Debt Blended Total Return Fund | | | 135,937,354 | | | | 2,779,417 | | | | (6,069,530 | ) | | | (3,290,113 | ) |
Global Emerging Markets Equity Fund | | | 9,744,077 | | | | 2,877,484 | | | | (680,577 | ) | | | 2,196,907 | |
The difference between book-basis and tax-basis unrealized gains (losses) is attributable to wash sales and partnership book-tax differences.
Permanent items identified during the fiscal period from July 1 through September 30, 2021 have been reclassified among the components of net assets based on their tax basis treatment as follows:
| | | | | | | | |
| | | TOTAL
DISTRIBUTABLE
EARNINGS/ ACCUMULATED
LOSS | | | PAID-IN CAPITAL | |
Global Credit Income Opportunities Fund | | $ | (2,080 | ) | | $ | 2,080 | |
Emerging Markets Debt Blended Total Return Fund | | | (1,102 | ) | | | 1,102 | |
The permanent differences are primarily attributable to perpetual bond adjustments.
8. Investment Transactions
Purchases and sales of securities (excluding short-term debt securities) for the period ended September 30, 2021 were as follows:
| | | | | | | | |
| | | PURCHASES | | | SALES | |
Global Floating Rate Fund | | $ | 80,417,150 | | | $ | 32,358,791 | |
Global Credit Income Opportunities Fund | | | 28,175,610 | | | | 50,962,373 | |
Emerging Markets Debt Blended Total Return Fund | | | 34,299,725 | | | | 12,141,086 | |
Global Emerging Markets Equity Fund | | | 965,296 | | | | 1,204,154 | |
Transactions in common stock for the period ended September 30, 2021 were as follows:
Global Floating Rate Fund
| | | | | | | | | | | | | | | | | | | | | | | | |
| | | FOR THE PERIOD FROM
JULY 1, 2021 THROUGH
SEPTEMBER 30, 2021(1) | | | FOR THE
YEAR ENDED
JUNE 30, 2021 | | | FOR THE
YEAR ENDED
JUNE 30, 2020 | |
| CLASS A | | SHARES | | | AMOUNT | | | SHARES | | | AMOUNT | | | SHARES | | | AMOUNT | |
Shares sold | | | 925,921 | | | $ | 8,692,667 | | | | 880,372 | | | $ | 8,206,644 | | | | 937,310 | | | $ | 8,607,970 | |
Shares sold through reinvestments of distributions | | | 39,996 | | | | 375,441 | | | | 158,053 | | | | 1,438,141 | | | | 235,705 | | | | 2,102,247 | |
Shares redeemed | | | (145,873 | ) | | | (1,368,826 | ) | | | (556,403 | ) | | | (5,053,635 | ) | | | (1,685,551 | ) | | | (14,925,227 | ) |
| | | | | | | | | | | | | | | | | | | | | | | | |
Net increase (decrease) | | | 820,044 | | | $ | 7,699,282 | | | | 482,022 | | | $ | 4,591,150 | | | | (512,536 | ) | | $ | (4,215,010 | ) |
| | | | | | | | | | | | | | | | | | | | | | | | |
113
Barings Funds Trust 2021 Annual Report
NOTES TO FINANCIAL STATEMENTS (CONTINUED)
September 30, 2021
| | | | | | | | | | | | | | | | | | | | | | | | |
| | | FOR THE PERIOD FROM
JULY 1, 2021 THROUGH
SEPTEMBER 30, 2021(1) | | | FOR THE
YEAR ENDED
JUNE 30, 2021 | | | FOR THE
YEAR ENDED
JUNE 30, 2020 | |
| CLASS C | | SHARES | | | AMOUNT | | | SHARES | | | AMOUNT | | | SHARES | | | AMOUNT | |
Shares sold | | | 57,911 | | | $ | 540,925 | | | | 525,854 | | | $ | 4,906,921 | | | | 116,238 | | | $ | 1,052,227 | |
Shares sold through reinvestments of distributions | | | 4,150 | | | | 38,790 | | | | 21,445 | | | | 194,007 | | | | 35,471 | | | | 315,149 | |
Shares redeemed | | | (56,863 | ) | | | (531,935 | ) | | | (591,926 | ) | | | (5,513,007 | ) | | | (258,409 | ) | | | (2,260,008 | ) |
| | | | | | | | | | | | | | | | | | | | | | | | |
Net increase (decrease) | | | 5,198 | | | $ | 47,780 | | | | (44,627 | ) | | $ | (412,079 | ) | | | (106,700 | ) | | $ | (892,632 | ) |
| | | | | | | | | | | | | | | | | | | | | | | | |
CLASS I | | | | | | | | | | | | | | | | | | | | | | | | |
Shares sold | | | 744,681 | | | $ | 7,000,000 | | | | 2,097,015 | | | $ | 19,670,000 | | | | 2,860,215 | | | $ | 26,600,000 | |
Shares sold through reinvestments of distributions | | | 61,864 | | | | 581,952 | | | | 195,755 | | | | 1,790,541 | | | | 218,857 | | | | 1,946,913 | |
Shares redeemed | | | – | | | | – | | | | – | | | | – | | | | (1,987,129 | ) | | | (18,392,138 | ) |
| | | | | | | | | | | | | | | | | | | | | | | | |
Net increase | | | 806,545 | | | $ | 7,581,952 | | | | 2,292,770 | | | $ | 21,460,541 | | | | 1,091,943 | | | $ | 10,154,775 | |
| | | | | | | | | | | | | | | | | | | | | | | | |
CLASS Y | | | | | | | | | | | | | | | | | | | | | | | | |
Shares sold | | | 6,444,419 | | | $ | 60,566,177 | | | | 17,946,963 | | | $ | 167,251,231 | | | | 7,795,746 | | | $ | 69,865,024 | |
Shares sold through reinvestments of distributions | | | 192,129 | | | | 1,805,448 | | | | 543,740 | | | | 4,983,018 | | | | 679,977 | | | | 6,079,583 | |
Shares redeemed | | | (2,668,180 | ) | | | (25,074,977 | ) | | | (6,613,341 | ) | | | (60,333,693 | ) | | | (13,429,756 | ) | | | (117,551,528 | ) |
| | | | | | | | | | | | | | | | | | | | | | | | |
Net increase (decrease) | | | 3,968,368 | | | $ | 37,296,648 | | | | 11,877,362 | | | $ | 111,900,556 | | | | (4,954,033 | ) | | $ | (41,606,921 | ) |
| | | | | | | | | | | | | | | | | | | | | | | | |
| | (1) | The Fund changed its fiscal year end to September 30 |
Global Credit Income Opportunities Fund
| | | | | | | | | | | | | | | | | | | | | | | | |
| | | FOR THE PERIOD FROM
JULY 1, 2021 THROUGH
SEPTEMBER 30, 2021(1) | | | FOR THE
YEAR ENDED
JUNE 30, 2021 | | | FOR THE
YEAR ENDED
JUNE 30, 2020 | |
| CLASS A | | SHARES | | | AMOUNT | | | SHARES | | | AMOUNT | | | SHARES | | | AMOUNT | |
Shares sold | | | 4,792,651 | | | $ | 43,343,296 | | | | 553,579 | | | $ | 4,930,649 | | | | 296,398 | | | $ | 2,525,056 | |
Shares sold through reinvestments of distributions | | | 55,390 | | | | 500,841 | | | | 114,633 | | | | 970,410 | | | | 299,001 | | | | 2,528,159 | |
Shares redeemed | | | (80,623 | ) | | | (729,633 | ) | | | (5,097,722 | ) | | | (42,911,224 | ) | | | (821,303 | ) | | | (6,756,723 | ) |
| | | | | | | | | | | | | | | | | | | | | | | | |
Net increase (decrease) | | | 4,767,418 | | | $ | 43,114,504 | | | | (4,429,510 | ) | | $ | (37,010,165 | ) | | | (225,904 | ) | | $ | (1,703,508 | ) |
| | | | | | | | | | | | | | | | | | | | | | | | |
CLASS C | | | | | | | | | | | | | | | | | | | | | | | | |
Shares sold | | | 14,122 | | | $ | 127,604 | | | | 390,924 | | | $ | 3,504,684 | | | | 124,636 | | | $ | 1,042,537 | |
Shares sold through reinvestments of distributions | | | 5,942 | | | | 53,695 | | | | 34,971 | | | | 303,090 | | | | 43,353 | | | | 365,771 | |
Shares redeemed | | | (9,983 | ) | | | (90,433 | ) | | | (694,144 | ) | | | (6,191,121 | ) | | | (204,465 | ) | | | (1,662,882 | ) |
| | | | | | | | | | | | | | | | | | | | | | | | |
Net increase (decrease) | | | 10,081 | | | $ | 90,866 | | | | (268,249 | ) | | $ | (2,383,347 | ) | | | (36,476 | ) | | $ | (254,574 | ) |
| | | | | | | | | | | | | | | | | | | | | | | | |
CLASS I | | | | | | | | | | | | | | | | | | | | | | | | |
Shares sold | | | – | | | $ | – | | | | – | | | $ | – | | | | – | | | $ | – | |
Shares sold through reinvestments of distributions | | | 8,505 | | | | 76,887 | | | | 47,607 | | | | 412,669 | | | | 54,613 | | | | 461,023 | |
Shares redeemed | | | (1,667,460 | ) | | | (15,119,920 | ) | | | (334,075 | ) | | | (3,000,000 | ) | | | – | | | | – | |
| | | | | | | | | | | | | | | | | | | | | | | | |
Net increase (decrease) | | | (1,658,955 | ) | | $ | (15,043,033 | ) | | | (286,468 | ) | | $ | (2,587,331 | ) | | | 54,613 | | | $ | 461,023 | |
| | | | | | | | | | | | | | | | | | | | | | | | |
114
Barings Funds Trust 2021 Annual Report
NOTES TO FINANCIAL STATEMENTS (CONTINUED)
September 30, 2021
| | | | | | | | | | | | | | | | | | | | | | | | |
| | | FOR THE PERIOD FROM
JULY 1, 2021 THROUGH
SEPTEMBER 30, 2021(1) | | | FOR THE
YEAR ENDED
JUNE 30, 2021 | | | FOR THE
YEAR ENDED
JUNE 30, 2020 | |
| CLASS Y | | SHARES | | | AMOUNT | | | SHARES | | | AMOUNT | | | SHARES | | | AMOUNT | |
Shares sold | | | 504,924 | | | $ | 4,531,695 | | | | 10,783,817 | | | $ | 93,589,018 | | | | 7,193,613 | | | $ | 61,134,702 | |
Shares sold through reinvestments of distributions | | | 112,594 | | | | 1,017,752 | | | | 547,556 | | | | 4,796,138 | | | | 596,969 | | | | 5,088,941 | |
Shares redeemed | | | (6,914,061 | ) | | | (62,519,660 | ) | | | (3,351,010 | ) | | | (28,832,791 | ) | | | (11,225,790 | ) | | | (91,307,876 | ) |
| | | | | | | | | | | | | | | | | | | | | | | | |
Net increase (decrease) | | | (6,296,543 | ) | | $ | (56,970,213 | ) | | | 7,980,363 | | | $ | 69,552,365 | | | | (3,435,208 | ) | | $ | (25,084,233 | ) |
| | | | | | | | | | | | | | | | | | | | | | | | |
| | (1) | The Fund changed its fiscal year end to September 30 |
Emerging Markets Debt Blended Total Return Fund
| | | | | | | | | | | | | | | | | | | | | | | | |
| | | FOR THE PERIOD FROM
JULY 1, 2021 THROUGH
SEPTEMBER 30, 2021(1) | | | FOR THE YEAR ENDED JUNE 30, 2021 | | | FOR THE YEAR ENDED JUNE 30, 2020 | |
| CLASS A | | SHARES | | | AMOUNT | | | SHARES | | | AMOUNT | | | SHARES | | | AMOUNT | |
Shares sold | | | 209,571 | | | $ | 2,264,546 | | | | 1,118,711 | | | $ | 12,167,538 | | | | 607,596 | | | $ | 5,629,686 | |
Shares sold through reinvestments of distributions | | | 18,623 | | | | 200,241 | | | | 68,937 | | | | 750,144 | | | | 13,820 | | | | 134,714 | |
Shares redeemed | | | (152,197 | ) | | | (1,637,736 | ) | | | (214,401 | ) | | | (2,335,100 | ) | | | (43,542 | ) | | | (434,004 | ) |
| | | | | | | | | | | | | | | | | | | | | | | | |
Net increase | | | 75,997 | | | $ | 827,051 | | | | 973,247 | | | $ | 10,582,582 | | | | 577,874 | | | $ | 5,330,396 | |
| | | | | | | | | | | | | | | | | | | | | | | | |
CLASS C | | | | | | | | | | | | | | | | | | | | | | | | |
Shares sold | | | 12,657 | | | $ | 137,700 | | | | 30,987 | | | $ | 341,675 | | | | 14,324 | | | $ | 146,900 | |
Shares sold through reinvestments of distributions | | | 510 | | | | 5,485 | | | | 1,686 | | | | 18,303 | | | | 761 | | | | 7,490 | |
Shares redeemed | | | (282 | ) | | | (3,033 | ) | | | (12,144 | ) | | | (131,411 | ) | | | (19,419 | ) | | | (203,101 | ) |
| | | | | | | | | | | | | | | | | | | | | | | | |
Net increase (decrease) | | | 12,885 | | | $ | 140,152 | | | | 20,529 | | | $ | 228,567 | | | | (4,334 | ) | | $ | (48,711 | ) |
| | | | | | | | | | | | | | | | | | | | | | | | |
CLASS I | | | | | | | | | | | | | | | | | | | | | | | | |
Shares sold | | | – | | | $ | – | | | | – | | | $ | – | | | | – | | | $ | – | |
Shares sold through reinvestments of distributions | | | – | | | | – | | | | – | | | | – | | | | – | | | | – | |
Shares redeemed | | | – | | | | – | | | | (1,396,653 | ) | | | (15,202,990 | ) | | | (984,551 | ) | | | (9,800,000 | ) |
| | | | | | | | | | | | | | | | | | | | | | | | |
Net increase (decrease) | | | – | | | $ | – | | | | (1,396,653 | ) | | $ | (15,202,990 | ) | | | (984,551 | ) | | $ | (9,800,000 | ) |
| | | | | | | | | | | | | | | | | | | | | | | | |
CLASS Y | | | | | | | | | | | | | | | | | | | | | | | | |
Shares sold | | | 2,548,598 | | | $ | 27,584,086 | | | | 9,356,613 | | | $ | 102,268,877 | | | | 2,290,494 | | | $ | 22,372,983 | |
Shares sold through reinvestments of distributions | | | 138,981 | | | | 1,494,381 | | | | 332,267 | | | | 3,614,361 | | | | 51,572 | | | | 505,175 | |
Shares redeemed | | | (754,794 | ) | | | (8,146,882 | ) | | | (2,776,558 | ) | | | (30,155,328 | ) | | | (1,698,477 | ) | | | (16,775,383 | ) |
| | | | | | | | | | | | | | | | | | | | | | | | |
Net increase | | | 1,932,785 | | | $ | 20,931,585 | | | | 6,912,322 | | | $ | 75,727,910 | | | | 643,589 | | | $ | 6,102,775 | |
| | | | | | | | | | | | | | | | | | | | | | | | |
| | (1) | The Fund changed its fiscal year end to September 30 |
115
Barings Funds Trust 2021 Annual Report
NOTES TO FINANCIAL STATEMENTS (CONTINUED)
September 30, 2021
Global Emerging Markets Equity Fund
| | | | | | | | | | | | | | | | | | | | | | | | |
| | | FOR THE PERIOD FROM
JULY 1, 2021 THROUGH
SEPTEMBER 30, 2021(1) | | | FOR THE YEAR ENDED
JUNE 30, 2021 | | | FOR THE YEAR ENDED
JUNE 30, 2020 | |
| CLASS A | | SHARES | | | AMOUNT | | | SHARES | | | AMOUNT | | | SHARES | | | AMOUNT | |
Shares sold | | | – | | | $ | – | | | | – | | | $ | – | | | | – | | | $ | – | |
Shares sold through reinvestments of distributions | | | – | | | | – | | | | – | | | | – | | | | – | | | | – | |
Shares redeemed | | | – | | | | – | | | | – | | | | – | | | | – | | | | – | |
| | | | | | | | | | | | | | | | | | | | | | | | |
Net increase | | | – | | | $ | – | | | | – | | | $ | – | | | | – | | | $ | – | |
| | | | | | | | | | | | | | | | | | | | | | | | |
CLASS C | | | | | | | | | | | | | | | | | | | | | | | | |
Shares sold | | | – | | | $ | – | | | | – | | | $ | – | | | | – | | | $ | – | |
Shares sold through reinvestments of distributions | | | – | | | | – | | | | – | | | | – | | | | – | | | | – | |
Shares redeemed | | | – | | | | – | | | | – | | | | – | | | | – | | | | – | |
| | | | | | | | | | | | | | | | | | | | | | | | |
Net increase | | | – | | | $ | – | | | | – | | | $ | – | | | | – | | | $ | – | |
| | | | | | | | | | | | | | | | | | | | | | | | |
CLASS I | | | | | | | | | | | | | | | | | | | | | | | | |
Shares sold | | | – | | | $ | – | | | | – | | | $ | – | | | | – | | | $ | – | |
Shares sold through reinvestments of distributions | | | – | | | | – | | | | – | | | | – | | | | – | | | | – | |
Shares redeemed | | | – | | | | – | | | | – | | | | – | | | | – | | | | – | |
| | | | | | | | | | | | | | | | | | | | | | | | |
Net increase | | | – | | | $ | – | | | | – | | | $ | – | | | | – | | | $ | – | |
| | | | | | | | | | | | | | | | | | | | | | | | |
CLASS Y | | | | | | | | | | | | | | | | | | | | | | | | |
Shares sold | | | 8,894 | | | $ | 112,500 | | | | 5,547 | | | $ | 74,500 | | | | – | | | $ | – | |
Shares sold through reinvestments of distributions | | | 53 | | | | 699 | | | | – | | | | – | | | | – | | | | – | |
Shares redeemed | | | (636 | ) | | | (8,000 | ) | | | – | | | | – | | | | – | | | | – | |
| | | | | | | | | | | | | | | | | | | | | | | | |
Net increase | | | 8,311 | | | $ | 105,199 | | | | 5,547 | | | $ | 74,500 | | | | – | | | $ | – | |
| | | | | | | | | | | | | | | | | | | | | | | | |
| | (1) | The Fund changed its fiscal year end to September 30 |
The Trust (the “Borrower”) has entered into a Credit Agreement (the “Credit Agreement”) with State Street Bank and Trust Company (the “Bank”). The Credit Agreement provides for a revolving credit facility of $150,000,000 (the “Facility Amount”) to be utilized for temporary or emergency purposes to fund shareholder redemptions or for other short-term liquidity purposes. Per the Credit Agreement, outstanding principal on the loan shall bear interest at a variable rate per annum equal to the higher of (a) the Federal Funds Rate as in effect on the day of the borrowing plus 1.25% and (b) the Overnight Bank Funding Rate as in effect on the day of the borrowing plus 1.25%. In addition, the Borrower shall pay to the Bank a commitment fee at the rate of 0.25% per annum on the daily unused portion of the Facility Amount.
For the period ended September 30, 2021, the Funds did not utilize the Facility Amount.
Under the Funds’ organizational documents, its officers and Trustees may be indemnified against certain liabilities and expenses arising out of the performance of their duties to the Funds. Additionally, in the normal course of business, the Funds have entered into contracts with service providers which may contain indemnification clauses. The Funds maximum exposure under these arrangements is unknown. No claim has been made for indemnification pursuant to any such agreement of the Funds.
| 12. | Aggregate Remuneration Paid to Officers, Trustees and Their Affiliated Persons |
For the fiscal year ended September 30, 2021, the Funds paid their Trustees’ aggregate remuneration of $57,102. During the fiscal year, the Funds did not pay any compensation to any of their Trustees who are
116
Barings Funds Trust 2021 Annual Report
NOTES TO FINANCIAL STATEMENTS (CONTINUED)
September 30, 2021
“interested persons” (as defined by the 1940 Act) of the Funds. All of the Funds’ officers are employees of the Adviser. Pursuant to the Agreement, the Funds do not compensate their officers who are employees of the Adviser (except for the Chief Compliance Officer of the Funds unless assumed by the Adviser). For the fiscal year ended September 30, 2021, the Adviser paid the compensation of the Chief Compliance Officer of the Funds. The Funds did not make any payments to the Adviser for the fiscal year ended September 30, 2021, other than the amounts payable to the Adviser pursuant to the Agreement.
13. Risks
Impacts of Covid-19
The pandemic related to the global spread of novel coronavirus disease (Covid-19), which was first detected in December 2019, has resulted in significant disruptions to global business activity and the global economy, as well as the economies of individual countries, the financial performance of individual companies and sectors, and the securities and commodities markets in general. This pandemic, the full effects of which are still unknown, has resulted in substantial market volatility and may continue to adversely impact the prices and liquidity of the fund’s investments and the fund’s performance.
14. LIBOR
In January 2021, FASB issued Accounting Standards Update 2021-01 – Reference Rate Reform (Topic 848) – Scope (“ASU 2021-01”) as an update to Accounting Standards Update 2020-04 – Reference Rate Reform (Topic 848) – Facilitation of the Effects of Reference Rate Reform on Financial Reporting (“ASU 2020-04”) in order to make certain clarifications. ASU 2020-04 and ASU 2021-01 provide optional temporary financial reporting relief from the effect of certain types of contract modifications due to the planned discontinuation of the London Interbank Offered Rate (“LIBOR”) and other interbank-offered based reference rates. The temporary relief provided by ASU 2020-04 and ASU 2021-01 is effective for certain reference rate-related contract modifications that occur during the period March 12, 2020 through December 31, 2022. Management does not believe the impact of adopting ASU 2020-04 and ASU 2021-01 will have a material impact on the financial statements.
Management has considered the circumstances under which the Funds should recognize or make disclosures regarding events or transactions occurring subsequent to September 30, 2021 through November 29, 2021, the date the financial statements were issued. Adjustments or additional disclosures, if any, have been included in these financial statements.
117
Barings Funds Trust 2021 Annual Report
REPORT OF INDEPENDENT REGISTERED PUBLIC ACCOUNTING FIRM
To the Board of Trustees of Barings Funds Trust and Shareholders of Barings Global Floating Rate Fund, Barings Global Credit Income Opportunities Fund, Barings Emerging Markets Debt Blended Total Return Fund, and Barings Global Emerging Markets Equity Fund:
Opinion on the Financial Statements and Financial Highlights
We have audited the accompanying statements of assets and liabilities of Barings Funds Trust comprising the Barings Global Floating Rate Fund, Barings Global Credit Income Opportunities Fund, Barings Emerging Markets Debt Blended Total Return Fund, and Barings Global Emerging Markets Equity Fund (collectively, the “Funds”), including the schedules of investments, as of September 30, 2021, the related statements of operations for the period from July 1, 2021 through September 30, 2021 and for the year ended June 30, 2021, the statements of changes in net assets for the period from July 1, 2021 through September 30, 2021 and for each of the two years in the period ended June 30, 2021, the financial highlights for the periods indicated in the table below, and the related notes. In our opinion, the financial statements and financial highlights present fairly, in all material respects, the financial position of each of the funds constituting Barings Funds Trust as of September 30, 2021, and the results of their operations for the period from July 1, 2021 through September 30, 2021 and for the year ended June 30, 2021, the changes in their net assets for the period from July 1, 2021 through September 30, 2021 and for each of the two years in the period ended June 30, 2021, and the financial highlights for the periods indicated in the table below, in conformity with accounting principles generally accepted in the United States of America.
| | |
INDIVIDUAL FUND COMPRISING THE BARINGS FUNDS TRUST | | FINANCIAL HIGHLIGHTS |
| |
| Barings Global Emerging Markets Equity Fund | | For the period from July 1, 2021 through September 30, 2021, year ended June 30, 2021, 2020, and period from September 17, 2018 (commencement of operations) through June 30, 2019 |
| |
| Barings Global Floating Rate Fund, Barings Global Credit Income Opportunities Fund, and Barings Emerging Markets Debt Blended Total Return Fund | | For the period from July 1, 2021 through September 30, 2021 and each of the five years in the period ended June 30, 2020 |
Basis for Opinion
These financial statements and financial highlights are the responsibility of the Funds’ management. Our responsibility is to express an opinion on the Funds’ financial statements and financial highlights based on our audits. We are a public accounting firm registered with the Public Company Accounting Oversight Board (United States) (PCAOB) and are required to be independent with respect to the Funds in accordance with the U.S. federal securities laws and the applicable rules and regulations of the Securities and Exchange Commission and the PCAOB.
We conducted our audits in accordance with the standards of the PCAOB. Those standards require that we plan and perform the audit to obtain reasonable assurance about whether the financial statements and financial highlights are free of material misstatement, whether due to error or fraud. The Funds are not required to have, nor were we engaged to perform, an audit of their internal control over financial reporting. As part of our audits
118
Barings Funds Trust 2021 Annual Report
REPORT OF INDEPENDENT REGISTERED PUBLIC ACCOUNTING FIRM (continued)
we are required to obtain an understanding of internal control over financial reporting but not for the purpose of expressing an opinion on the effectiveness of the Funds’ internal control over financial reporting. Accordingly, we express no such opinion.
Our audits included performing procedures to assess the risks of material misstatement of the financial statements and financial highlights, whether due to error or fraud, and performing procedures that respond to those risks. Such procedures included examining, on a test basis, evidence regarding the amounts and disclosures in the financial statements and financial highlights. Our audits also included evaluating the accounting principles used and significant estimates made by management, as well as evaluating the overall presentation of the financial statements and financial highlights. Our procedures included confirmation of securities owned as of September 30, 2021, by correspondence with the custodian, brokers and agent banks; when replies were not received from brokers and agent banks, we performed other auditing procedures. We believe that our audits provide a reasonable basis for our opinion.
Deloitte & Touche LLP
New York, New York
November 29, 2021
We have served as the auditor of one or more Barings LLC investment companies since 2013.
119
Barings Funds Trust 2021 Annual Report
FEDERAL TAX INFORMATION (UNAUDITED)
Of the ordinary distributions made during the fiscal year ended September 30, 2021, the following percentages qualify
for the dividends received deduction (DRD) available to corporate shareholders:
| | | | |
| FUND | | DRD% | |
| |
Barings Global Emerging Markets Equity Fund | | | 0.52 | % |
The following Funds had qualified dividend income (“QDI”) received through September 30, 2021, as follows:
| | | | |
| FUND | | QDI | |
| |
Barings Global Credit Income Opportunities Fund | | $ | 20,527 | |
| |
Barings Global Emerging Markets Equity Fund | | $ | 59,235 | |
The following Funds paid foreign taxes during the fiscal year ended September 30, 2021 that are available as income tax credits:
| | | | |
| FUND | | FOREIGN TAX CREDIT | |
| |
Barings Emerging Markets Debt Blended Total Return Fund | | $ | 8,633 | |
| |
Barings Global Emerging Markets Equity Fund | | $ | 11.817 | |
The following Funds generated net foreign source income during the fiscal year ended September 30, 2021 as listed below:
| | | | |
| FUND | | FOREIGN SOURCE INCOME | |
| |
Barings Emerging Markets Debt Blended Total Return Fund | | $ | 1,955,114 | |
| |
Barings Global Emerging Markets Equity Fund | | $ | 107,716 | |
120
Barings Funds Trust 2021 Annual Report
STATEMENT REGARDING LIQUIDITY RISK MANAGEMENT PROGRAM
Barings, the Board appointed administrator of the Funds’ liquidity risk management program (LRMP), presented the first annual report on the program to the Trusts on August 7, 2020. The report covered the structure of the program, including the program documents and related policies and procedures adopted to comply with Rule 22e-4 under the Investment Company Act of 1940, and reviewed the operation of the program from December 2018 through June 30, 2020. The report included a description of the annual liquidity assessment of the funds that Barings performed. The report noted that there were no compliance exceptions identified under Rule 22e-4 during the period. The report included a review of the governance of the program and the methodology for classifying the Funds’ investments. The report also included a discussion of liquidity monitoring during the period, including during the market liquidity challenges caused by the Covid-19 pandemic, and the impact those challenges had on the liquidity of the Funds’ investments. Barings concluded that the program has been operating effectively and adequately to ensure compliance with Rule 22e-4. There can be no assurance that the program will achieve its objectives in the future.
121
Barings Funds Trust 2021 Annual Report
INTERESTED TRUSTEE
Information about Trustees and Officers
Information pertaining to the Trustees and officers of the Trust is set forth below.
The Statement of Additional Information includes additional information about Trustees and is available, without charge, upon request by calling the Funds at 1-855-439-5459 or on the Funds’ website at http://www.barings.com/funds/mutual-funds.
| | | | | | | | | | |
| NAME (AGE), ADDRESS | | POSITION(S)
WITH THE
TRUST | | OFFICE
TERM
AND
LENGTH
OF TIME
SERVED | | PRINCIPAL OCCUPATIONS
DURING PAST 5 YEARS | | PORTFOLIOS
OVERSEEN
IN FUND
COMPLEX | | OTHER DIRECTORSHIPS HELD BY
DIRECTOR |
| | | | | |
David M. Mihalick* (48) 300 South Tryon Street Suite 2500 Charlotte, NC 28202 | | Trustee | | Trustee since 2020 | | Head of U.S. Public Fixed Income (since 2019), Head of U.S. High Yield (since 2017), Member of Global High Yield Allocation Committee (since 2017), Barings LLC. | | 9 | | Trustee (since 2020), Barings Global Short Duration High Yield Fund (closed-end investment company advised by Barings); Director (since 2020), Barings BDC, Inc. (business development company advised by Barings); Director (since March 2021), Barings Capital Investment Corporation (business development company advised by Barings). |
122
Barings Funds Trust 2021 Annual Report
INDEPENDENT TRUSTEES
| | | | | | | | | | |
NAME (AGE),
ADDRESS | | POSITION(S)
WITH THE
TRUST | | OFFICE
TERM
AND
LENGTH
OF TIME
SERVED | | PRINCIPAL OCCUPATIONS DURING PAST 5 YEARS | | PORTFOLIOS
OVERSEEN
IN FUND
COMPLEX | | OTHER DIRECTORSHIPS HELD BY
DIRECTOR |
| | | | | |
Rodney J. Dillman (69) 300 South Tryon Street Suite 2500 Charlotte, NC 28202 | | Trustee, Chairman | | Trustee since 2013 | | Retired (since 2012); Deputy General Counsel (2011-2012), Senior Vice President (2008-2012), Vice President (2000-2008), Massachusetts Mutual Life Insurance Company; Member of the Board of Directors and President (2008-2011), MassMutual International LLC; and General Counsel (2006-2008), Babson Capital Management LLC (currently known as Barings). | | 7 | | Trustee (since 2012), Barings Global Short Duration High Yield Fund (closed-end investment company advised by Barings); and Director (2016-2017), Social Reality, Inc. (digital platform technology and management software company for internet advertising). |
| | | | | |
Bernard A. Harris, Jr. (65) 300 South Tryon Street Suite 2500 Charlotte, NC 28202 | | Trustee | | Trustee since 2013 | | Chief Executive Officer (since 2018), National Math and Science Initiative; Chief Executive Officer and Managing Partner (since 2002), Vesalius Ventures, Inc.; Director and President (since 1998), The Space Agency; President (since 1999), The Harris Foundation; and Clinical Scientist, Flight Surgeon and Astronaut (1986-1996), NASA. | | 10 | | Trustee (since 2012), Barings Global Short Duration High Yield Fund (closed-end investment company advised by Barings); Director (since August 2021), Barings BDC, Inc. (business development company advised by Barings); Director (since August 2021), Barings Capital Investment Corporation (business development company advised by Barings); Director (since May 2021), Barings Private Credit Corporation (business development company advised by Barings); Director (since 2016), Salient MLP & Energy Infrastructure Fund (mutual fund); Director (since 2009), Monebo Technologies Inc. (medical technology design company); Director (since 2009), The Endowment Fund; Director (since 2008), U.S. Physical Therapy, Inc. (NYSE: USPH); Trustee (2015-2017) Forward Funds (open-end investment company); and Trustee (since 2011), Salient Midstream & MLP Fund (closed-end investment company). |
123
Barings Funds Trust 2021 Annual Report
INDEPENDENT TRUSTEES (CONTINUED)
| | | | | | | | | | |
NAME (AGE),
ADDRESS | | POSITION(S)
WITH THE
TRUST | | OFFICE
TERM
AND
LENGTH
OF TIME
SERVED | | PRINCIPAL OCCUPATIONS DURING PAST 5 YEARS | | PORTFOLIOS
OVERSEEN
IN FUND
COMPLEX | | OTHER DIRECTORSHIPS HELD BY
DIRECTOR |
| | | | | |
Thomas W. Okel (59) 300 South Tryon Street Suite 2500 Charlotte, NC 28202 | | Trustee | | Trustee since 2013 | | Executive Director (2011-2019), Catawba Lands Conservancy; and Global Head of Syndicated Capital Markets (1989-2010), Bank of America Merrill Lynch. | | 10 | | Trustee (since 2012), Barings Global Short Duration High Yield Fund (closed-end investment company advised by Barings); Director (since 2018), Barings BDC, Inc. (business development company advised by Barings); Director (since 2020), Barings Capital Investment Corporation (business development company advised by Barings); Director (since May 2021), Barings Private Credit Corporation (business development company advised by Barings); and Trustee (since 2015), Horizon Funds (mutual fund complex). |
| | | | | |
Cynthia R. Plouché (64) 300 South Tryon Street Suite 2500 Charlotte, NC 28202 | | Trustee | | Trustee since 2017 | | Assessor (2014-2018), Moraine Township (property assessment); and Senior Portfolio Manager (2006-2012), Williams Capital Management, LLC (asset management). | | 7 | | Trustee (since 2017), Barings Global Short Duration High Yield Fund (closed-end investment company advised by Barings); Trustee (since 2014), Northern Trust Funds (mutual fund complex); and Trustee (2001-2017), AXA VIP Trust (mutual fund complex). |
| | | | | |
Martin A. Sumichrast (54) 300 South Tryon Street Suite 2500 Charlotte, NC 28202 | | Trustee | | Trustee since 2013 | | Chairman and Co-Chief Executive Officer (since 2016), Director (since 2015), cbdMD, Inc. (NYSE: YCBD; a consumer staples company specializing in CBD); Founder, Chief Executive Officer and Board Member (since 2020), Adara Acquisition Corporation (NYSE: ADRA); and Managing Director (since 2017), Sumichrast 2017 Family Trust (family office). | | 7 | | Trustee (since 2012), Barings Global Short Duration High Yield Fund (closed-end investment company advised by Barings); and Chairman and Director (2014-2017), Kure Corp. (retail). |
124
Barings Funds Trust 2021 Annual Report
OFFICERS OF THE TRUST
| | | | | | |
| NAME (AGE), ADDRESS | | POSITION(S) WITH
THE TRUST | | OFFICE TERM* AND
LENGTH OF TIME
SERVED | | PRINCIPAL OCCUPATION(S)
DURING PAST 5 YEARS |
| | | |
Dan McGee (51) 300 South Tryon Street Suite 2500 Charlotte, NC 28202 | | President | | Since 2018 | | Managing Director (since 2013), Barings; and Managing Director (1992-2013), Principal Financial Group. |
| | | |
Carlene Pollock (54) 300 South Tryon Street Suite 2500 Charlotte, NC 28202 | | Chief Financial Officer | | Since 2016 | | Director (since 2015), Barings; Assistant Treasurer (2015-2016), Barings Funds Trust; Chief Financial Officer (since 2016), Assistant Treasurer (2015-2016), Barings Global Short Duration High Yield Fund (closed-end investment company advised by Barings); Director (2013-2015), Corrum Capital Management (investment adviser); and Vice President (2008-2013), Bank of New York Mellon (third party administrator). |
| | | |
Elizabeth Murray (44) 300 South Tryon Street Suite 2500 Charlotte, NC 28202 | | Treasurer | | Since 2020 | | Managing Director (since 2020), Director (2018-2020), Barings; Treasurer (since 2020), Barings Global Short Duration High Yield Fund (closed-end investment company advised by Barings); Principal Accounting Officer (since 2020), Director of External Reporting (2018-2020), Barings BDC, Inc. (business development company advised by Barings); Principal Accounting Officer (since 2020), Barings Capital Investment Corporation (business development company advised by Barings); Principal Accounting Officer (since May 2021), Barings Private Credit Corporation (business development company advised by Barings); Principal Accounting Officer (since 2020), Barings Corporate Investors and Barings Participation Investors (closed-end investment companies advised by Barings); and Vice President of Financial Reporting (2012-2018), Triangle Capital Corporation. |
| | | |
Michael Cowart (38) 300 South Tryon Street Suite 2500 Charlotte, NC 28202 | | Chief Compliance Officer | | Since 2020 | | Managing Director (since April 2021), Director (2018-2021), Barings; Chief Compliance Officer (since 2020), Barings Global Short Duration High Yield Fund (closed-end investment company advised by Barings); Chief Compliance Officer (since 2020), Barings Corporate Investors and Barings Participation Investors (closed-end investment companies advised by Barings); Chief Compliance Officer (since 2020), Barings BDC, Inc. (business development company advised by Barings); Chief Compliance Officer (since 2020), Barings Capital Investment Corporation (business development company advised by Barings); Chief Compliance Officer (since May 2021), Barings Private Credit Corporation (business development company advised by Barings); Chief Compliance Officer (since 2019), Barings Securities LLC; and Assistant General Counsel (2016-2018), LPL Financial (independent broker-dealer). |
125
Barings Funds Trust 2021 Annual Report
OFFICERS OF THE TRUST (CONTINUED)
| | | | | | |
| NAME (AGE), ADDRESS | | POSITION(S) WITH
THE TRUST | | OFFICE TERM* AND
LENGTH OF TIME
SERVED | | PRINCIPAL OCCUPATION(S)
DURING PAST 5 YEARS |
| | | |
Jill Dinerman (44) 300 South Tryon Street Suite 2500 Charlotte, NC 28202 | | Vice President, Secretary and Chief Legal Officer | | Since 2019 | | Global Head of Legal and General Counsel (since 2020), Managing Director (since 2016), Associate General Counsel and Corporate Secretary (2018-2020), Senior Counsel (2016-2018), Counsel and Director (2011-2016), Barings; Assistant Secretary (2019-2020), Barings Funds Trust; Vice President, Secretary and Chief Legal Officer (since 2020), Assistant Secretary (2019-2020), Barings Global Short Duration High Yield Fund (closed-end investment company advised by Barings); Chief Legal Officer (since 2020), Secretary (July 2020-October 2020), Assistant Secretary (2019-2020), Barings Corporate Investors and Barings Participation Investors (closed-end investment companies advised by Barings); Chief Legal Officer (since 2020), Assistant Secretary (2019-2020), Barings BDC, Inc. (business development company advised by Barings); Chief Legal Officer (since 2020), Barings Capital Investment Corporation (business development company advised by Barings); Chief Legal Officer (since May 2021), Barings Private Credit Corporation (business development company advised by Barings); Secretary (since 2018), Barings Securities LLC; Chief Legal Officer (since 2020), Barings BDC Finance I LLC; Chief Legal Officer (since 2020), Barings BDC Senior Funding I LLC; Non-Executive Director (since 2018), Baring International Investment Limited; Non-Executive Director (since May 2021), Baring Asset Management Limited; Non-Executive Director (since May 2021), Baring Investment Services Limited; Non-Executive Director (since May 2021), Barings (U.K.) Limited; Non-Executive Director (since May 2021), Barings Europe Limited. |
| | | |
Alexandra Pacini (28) 300 South Tryon Street Suite 2500 Charlotte, NC 28202 | | Assistant Secretary | | Since 2020 | | Associate Director (since April 2021), Analyst (2017-2021), Barings; Assistant Secretary (since 2020), Global Short Duration High Yield Fund (closed-end investment company advised by Barings); Assistant Secretary (since 2020), Barings Corporate Investors and Barings Participation Investors (closed-end investment companies advised by Barings); Assistant Secretary (since 2020), Barings BDC, Inc. (business development company advised by Barings); Assistant Secretary (since May 2021), Barings Private Credit Corporation (business development company advised by Barings); Assistant Secretary (since August 2021), Barings Capital Investment Corporation (business development company advised by Barings); and Legal Clerk (2015-2017), Bryan Cave LLP (law firm). |
126
Barings Funds Trust 2021 Annual Report

GLOBAL PRIVACY NOTICE
This global privacy notice (“Privacy Notice”) applies to
| | ∎ | | Barings LLC’s affiliates, subsidiaries, and investment fund management entities (each management entity a “Manager”), which may respectively be based in the United States of America (the “USA”), United Kingdom (the “UK”), Switzerland, the European Union (the “EU”), Hong Kong S.A.R., the People’s Republic of China, Australia, South Korea, Taiwan, Japan and the Cayman Islands; and |
| | ∎ | | the respective investment funds and collective investment vehicles within the Barings family of funds (which may include funds that do not feature the Barings trade name) (each a “Fund”). |
Collectively, these entities are “Barings” (“we”, “us”, “our”).
About this Privacy Notice
This Privacy Notice, which includes our Cookies Policy (to the extent applicable, a copy of which can be found at barings.com), is designed to help you understand our information collection practices depending on your relationship with us.
This Privacy Notice should be read in conjunction with any other applicable policies, terms and conditions in place between you and Barings.
Any term or provision contained in this Privacy Notice shall not apply to the extent it is incompatible with relevant applicable laws or regulations in the country or jurisdiction that applies to your Personal Data. The local addendum attached to this Privacy Notice sets out additional or different obligations and rights in a given country, state, or jurisdiction beyond the terms of this Privacy Notice. Where there is any inconsistency between the local addendum and the main body of this Privacy Notice, the relevant local addendum shall prevail.
The Barings entity that was originally responsible for collecting your Personal Data in a given country or jurisdiction will be your primary data controller. The relevant data controller(s) in a particular country or jurisdiction are set out in the relevant local addendum below. If your country or jurisdiction is not listed, your data controller will be Barings LLC.
Application of this Privacy Notice
Clients: If you interact with Barings as a private client or otherwise in your individual capacity, or in the capacity of an officer, employee, director and/or principal of one of our corporate or institutional clients (including prospective clients) (“Client”), this Privacy Notice sets out how Barings will collect and process Personal Data in connection with the services it provides you including its investment fund management services. Personal Data that we collect and process may include that of any Client including but not limited to registered shareholders or unitholders, applicants for shares or units, beneficial owners of registered shareholders or unitholders and applicants for shares or units, personal representatives, directors, officers, employees, agents, trustees and/or authorized signatories of registered shareholders or unitholders and applicants for shares or units (being natural persons) (“Corporate Individuals”) and other information relating to the dealings of Corporate Individuals with Manager or the Fund and/or their service providers.
Website Users: As regards any website or applications owned or operated by, or on behalf of, Barings, including (but not limited to) barings.com and any local variations that may be created from time to time (“Website”), if you are a user or visitor of a Website (“Website User”), this Privacy Notice also sets out how Barings collects and processes Personal Data in connection with those Websites.
Job Applicants: If you apply for a job with, or are later employed or otherwise appointed by, Barings, when applicable, we will provide you with a separate privacy notice about how we collect and process your Personal Data in connection with such appointment at that time.
127
Barings Funds Trust 2021 Annual Report
GLOBAL PRIVACY NOTICE (CONTINUED)
1. Definitions
We collect and process Personal Data in accordance with the requirements of the data protection laws (“Relevant Data Protection Laws”) applicable to the particular Personal Data at issue. The Relevant Data Protection Laws include the data protection or privacy laws of any country or jurisdiction applicable to the processing of Personal Data covered by this Privacy Notice.
“Personal Data” (or the equivalent term such as “personal information” under Relevant Data Protection Laws) means (to the extent applicable) any information: (i) held by Barings; (ii) held or obtained by the Manager or the Fund; or (iii) an individual provides to the Manager, the Fund or the Fund’s service provider, that can, in each case, identify an individual, such as name, address, email address, date of birth etc., from which that individual can be directly or indirectly personally identified, and includes information such as identification and account numbers and online identifiers, or otherwise has the meaning as set out in Relevant Data Protection Laws applicable to you.
Some of this Personal Data may include, where applicable, information classified in some jurisdictions as “Special Categories of Personal Data” (or equivalent terms such as “Sensitive Personal Data”, “sensitive information” or “sensitive personal information” under Relevant Data Protection Laws), relating to an individual’s race, ethnicity, health, political opinions, trade union membership, as well as Personal Data related to criminal matters.
“processing” means any operation or set of operations which is performed on Personal Data or on sets of Personal Data, whether or not by automated means, such as collection, recording, organization, structuring, storage, adaptation or alteration, retrieval, consultation, use, disclosure by transmission, dissemination or otherwise making available, alignment or combination, restriction, erasure or destruction, or otherwise has the meaning as set out in the applicable Relevant Data Protection Laws.
2. Personal Data collected and how we collect it
Barings will collect the following types of Personal Data, depending on your relationship with us:
| | ∎ | | Identity information such as name, address, personal contact details (including email address and telephone numbers), date of birth, financial information, passport number, nationality, job title, driver’s license or identity card information; and |
| | ∎ | | Technical and usage information such as IP address, cookies, browser type and version, time zone settings, browser plugin types, operating systems and platform, device information (including, for mobile devices, the IMEI number, wireless networks and general network information). |
Barings obtains your Personal Data from the following sources:
| | ∎ | | Directly from you when you provide such information to us, for example, through your use of our Websites or other forms to receive our services (including our investment services), when you correspond with us or submit a complaint, or transact with us or our affiliates; |
| | ∎ | | From personnel of Clients, from non-affiliated sources (such as consumer or reporting agencies, government agencies, or other non-affiliated parties), or automatically through your use of our Websites; and |
| | ∎ | | Through Corporate Individuals, e.g. if you have engaged an advisor on your behalf. |
If you are dealing with Barings as a Client, where the Manager or the Fund needs to process Personal Data: (i) in connection with a registered shareholder’s or unitholder’s contract with the Fund or Manager in respect of a Fund, (ii) in anticipation of an applicant for shares or units becoming a registered shareholder or unitholder, or (iii) where the Manager or the Fund has a legal obligation to collect certain Personal Data relating to a Corporate Individual (for example, in order to comply with anti-money laundering and anti-terrorist financing (collectively “AML”) obligations), the Manager or the Fund will not be able to deal with Client if such individual does not provide the necessary Personal Data and other information required by the Manager or the Fund.
128
Barings Funds Trust 2021 Annual Report
GLOBAL PRIVACY NOTICE (CONTINUED)
3. Purposes
If you are dealing with Barings as a Client, Barings will use the Personal Data of Corporate Individuals for the following purposes:
| | ∎ | | For the purposes of performing the contract with a Client including registered shareholder or unitholder, or in anticipation of an applicant for shares or units becoming a registered shareholder or unitholder, namely: |
| | ∎ | | for the purposes of providing services to the Client including registered shareholder or unitholder, and setting up and administering the Client’s or applicant’s or registered shareholder’s or unitholder’s account(s), as the case may be; |
| | ∎ | | for the collection of subscriptions and payment of redemptions, distributions and dividends; |
| | ∎ | | in the event of a merger or proposed merger of the Fund or any sub-fund of the Fund, or for any other restructurings; or |
| | ∎ | | to deal with queries or complaints from Clients including registered shareholders or unitholders; |
| | ∎ | | For compliance with Barings’ legal obligations including: |
| | ∎ | | AML and fraud prevention purposes, including OFAC and PEP screening for these purposes and to comply with UN, EU and other applicable sanctions regimes; |
| | ∎ | | compliance with applicable tax and regulatory reporting obligations; |
| | ∎ | | where Barings is ordered to disclose information by a court with appropriate jurisdiction; or |
| | ∎ | | recording of telephone calls and electronic communications in order to comply with applicable laws and regulatory obligations, where applicable; |
| ∎ | | Where use is for a legitimate purpose of Barings including: |
| | ∎ | | for day to day operational and business purposes; |
| | ∎ | | to take advice from the Manager’s and the Fund’s external legal and other advisors; |
| | ∎ | | board reporting and management purposes, including where required, for quality assurance; |
| | ∎ | | investigation of complaints or reports, including via ethics or whistleblowing systems or reporting hotlines, relating to conduct which is contrary to Barings’ values or which may be in breach of applicable laws and regulations; or |
| | ∎ | | administering surveys and questionnaires, such as for research and client satisfaction purposes; |
| | ∎ | | Where a Corporate Individual has consented to use for a particular purpose. If a Corporate Individual gives consent for Barings to use their Personal Data for a particular purpose and where permitted under Relevant Data Protection Laws, that Corporate Individual has the right at any time to withdraw consent to the future use of his/her Personal Data for those purposes by writing to the address specified below. |
If you are dealing with Barings as a Website User, Barings will use the Personal Data collected for the following purposes:
| | ∎ | | For our internal business administration and record keeping purposes; |
| | ∎ | | To provide you with information about our investment products and related services, facilitate your online purchases, tailor or customize your user experience, and for all other administration as may be necessary in relation to the supply of our investment products and related services and the conduct of our investment management business; |
| | ∎ | | To respond to your complaints, inquiries or comments submitted through our Website; |
| | ∎ | | Where necessary, as part of any restructuring relating to Barings, its business or assets, or as part of a merger or sale of Barings or any of Barings’s subsidiaries; |
129
Barings Funds Trust 2021 Annual Report
GLOBAL PRIVACY NOTICE (CONTINUED)
| | ∎ | | For legal and regulatory compliance purposes, including as necessary to respond to governmental, regulatory or law enforcement agency requests in any jurisdiction; to ensure the continuing security and integrity of our systems, business dealings, reputation or the security and reputation of Barings and its staff; to identify misuse of Barings’s systems and any fraud or other illegal or unlawful activity or any other activity which is or may be contrary to our legal and regulatory compliance obligations; |
| | ∎ | | As may otherwise be necessary for responsible corporate governance or as otherwise required or permitted by applicable laws and/or regulations; |
| | ∎ | | To otherwise protect the rights and property of Barings and the rights, property, and health of other persons, which may include disclosing information about you to authorities when we deem it appropriate to do so; and |
| | ∎ | | To the extent applicable, for any other purpose for which we have obtained your consent from time to time as permitted and in accordance with Relevant Data Protection Laws. |
Do-Not-Track: Please note that our Website does not recognize web browser “do-not-track” signals. For more information about our use of cookies and other online data collection mechanisms, please see our Cookies Policy located on barings.com.
To the extent required by Relevant Data Protection Laws, we will obtain your consent for any new or additional purposes for which Baring processes Personal Data.
Barings may also use your Personal Data to send you information about promotions and offers. However, we will not do so without your consent where required by Relevant Data Protection Laws. If you do not want to receive such information you can unsubscribe at any time by clicking the link at the bottom of any promotional message we send, or by contacting us using the contact details set out in this Privacy Notice.
4. International transfers
Personal Data may be transferred to a jurisdiction outside the country or jurisdiction in which you are resident or located and, if so, this will be done using a legitimate transfer mechanism as required under Relevant Data Protection Laws.
Subject to Relevant Data Protection Laws, transfers to other countries or jurisdictions may be permitted if the country or jurisdiction in question has in place data protection laws which are substantially similar to, or serve the same purposes as, those in the country or jurisdiction where you are resident or located, or otherwise deemed by the relevant authorities as providing ‘adequate protection’. However, some transfers may be to countries or jurisdictions that do not have equivalent protections and, in that case, Barings, the Manager and the Fund (as applicable) shall use reasonable efforts to implement contractual protections for the Personal Data, as required based on the legitimate transfer mechanism used.
5. Special Categories of Personal Data
Barings may, in limited circumstances and as permitted by Relevant Data Protection Laws, collect and process Special Categories of Personal Data, as well as Personal Data related to criminal matters, in connection with its obligations under applicable AML laws, which will only be used and disclosed, as necessary, for such purpose.
6. Personal Data received from other sources
Where Barings is provided with Personal Data relating to an individual by someone other than that individual (such as a beneficial owner, partners, directors, officers, employers, employees, advisors, consumer or other reporting agencies, governmental agencies or other related persons), the person providing the Personal Data: will be asked to warrant that it will only do so in accordance with Relevant Data Protection Laws; and must ensure that, before doing so, the individuals in question are made aware of the fact that Barings will hold information relating to them and may use it for any of the purposes set out in this Privacy Notice; and, where necessary, must have obtained the individuals’ consent to Barings’ use of the Personal Data. Barings may, where required under applicable laws, notify individuals whose Personal Data was received indirectly from a third party, and confirm that Barings holds their Personal Data and provide a copy of this Privacy Notice to them.
130
Barings Funds Trust 2021 Annual Report
GLOBAL PRIVACY NOTICE (CONTINUED)
7. Disclosures of Personal Data
In addition to the disclosures discussed in this Privacy Notice, Barings may also need to disclose your Personal Data:
| | ∎ | | To group companies or related body corporates of Barings (see barings.com for more information), to enable those entities to provide services to us and/or as part of shared systems which are in place; |
| | ∎ | | To organisations who provide services and support to us, including hosting, data processing, website development services, IT support and maintenance providers, call center and hotline providers and other outsourced services; and |
| | ∎ | | To enable us to comply with applicable laws and regulatory obligations and respond to requests from governmental and other regulatory authorities in any jurisdiction. |
Additionally, if you are dealing with Barings as a Client, Barings may disclose any Personal Data to other entities, except as outlined above or under section 3 of this Privacy Notice or as follows, and in each case to the extent permitted by Relevant Data Protection Laws:
| | ∎ | | To enable Barings to carry out the obligations under the contract with a Client including registered shareholder or in anticipation of an applicant for shares or units becoming a registered shareholder or unitholder; |
| | ∎ | | To anyone providing a service to Barings or a Barings agent (which may include the Manager and companies within its group of companies, the administrator and its or their sub-contractors), as data processors, for the purposes of providing services to the Manager or the Fund and on the understanding that they will keep the Personal Data confidential as required by Relevant Data Protection Laws; |
| | ∎ | | Where Personal Data needs to be shared with the depositary appointed to the Fund, in order to enable it to discharge its legal and regulatory obligations; |
| | ∎ | | Where the administrator to the Fund is subject to a separate legal obligation requiring it to act as controller of the Personal Data, including where it is required to use the Personal Data for the discharge of its own AML obligations including AML ID verification or reporting suspicious activity, or where an individual has otherwise consented to the Personal Data being shared with the administrator for specific purposes; |
| | ∎ | | Where the Client including a registered shareholder or unitholder or applicant for shares or units is a client of the Manager or a company within its group of companies, with such company for any other purposes agreed with an individual; |
| | ∎ | | Where the Manager or the Fund needs to share Personal Data with its and the Fund’s auditors, and legal and other advisors; |
| | ∎ | | In the event of a merger or proposed merger, any (or any proposed) transferee of, or successor in title to, the whole or any part of the Fund’s business, and their respective officers, employees, agents and advisers, to the extent necessary to give effect to such merger; or |
| | ∎ | | The disclosure is required by law or regulation, or court or administrative order having force of law, or is required to be made to any of the Manager’s or the Fund’s regulators, in each case in any jurisdiction. |
In any case, where Barings shares Personal Data with a non-affiliated data controller (including, as appropriate, the Fund’s service providers), the use by that non-affiliated party of the Personal Data will be subject to the non-affiliated party’s own privacy policies.
8. Security of Personal Data
Barings will maintain appropriate physical, technical and procedural safeguards designed to protect any Personal Data that you provide to us from accidental or unauthorized loss, misuse, damage, modification, access or disclosure in accordance with Relevant Data Protection Laws. Barings also restricts access to Personal Data about you to those employees who need
131
Barings Funds Trust 2021 Annual Report
GLOBAL PRIVACY NOTICE (CONTINUED)
to know that information to provide products and services to you. As an added measure, Barings does not include Personal Data or account information in non-secure e-mails that we send you via the Internet without your prior consent. We advise you not to send such information to us in non-secure e-mails.
Service providers who process your Personal Data on behalf of Barings are also required to adhere to appropriate security standards designed to protect such information against unauthorized access, destruction or loss.
9. Updates to Personal Data
Barings will use reasonable efforts to keep Personal Data up to date. However, Barings must be notified, without delay, of any change in an individual’s personal circumstances by the individual or the person that provides such information on behalf of the individual.
10. Retention of Personal Data
Barings is obliged to retain certain information to ensure accuracy, help maintain quality of service and for legal, regulatory, fraud prevention and legitimate business purposes.
Barings is obliged by law to retain AML-related identification and transaction records for a number of years depending on the relevant rule or regulation under applicable laws from the end of the relevant investor relationship or the date of the transaction.
Other information will be retained for no longer than is necessary for the purpose for which it was obtained by Barings or as required or permitted for legal, regulatory, fraud prevention and legitimate business purposes. In general, Barings (or its service providers on its behalf) (as applicable) will hold this information for a period of seven (7) years, unless it is obliged to hold it for a different period under law or applicable regulations.
Barings may also retain records of telephone calls and any electronic communications for any length of time as required or permitted by any relevant regulatory entity or as required by relevant local laws including those relating to data privacy and security.
11. Individual’s Rights in relation to Personal Data
You may have the following rights under Relevant Data Protection Laws:
| | ∎ | | An individual may have the right to request access to, correct any inaccuracies in, and in certain circumstances, request erasure, or object to or restrict the use, of their Personal Data, and object to certain uses or other processing of their Personal Data (including automated processing), in each case subject to the conditions and/or restrictions set out in Relevant Data Protection Laws. |
| | ∎ | | In limited circumstances, an individual may also have the right to data portability in respect of certain of their Personal Data, which means they can request that Barings provide a copy of their disclosable Personal Data to them or their third party nominee. |
| | ∎ | | An individual may also have the right to lodge a complaint with the relevant Barings entity that is the data controller and/or with a relevant supervisory authority about the processing of the individual’s Personal Data by the relevant Barings entity, the Manager and/or the Fund. |
| | ∎ | | An individual may also have the right to withdraw consent in specific circumstances, such as for direct marketing, or where we have otherwise relied on the individual’s consent to process their Personal Data. |
To exercise any of these rights, please send confirmation of your request, by e-mail or post, to the address below, specifying which Barings products or funds your request relates to and providing any other relevant identifying information:
Barings Data Privacy Manager
20 Old Bailey
London, UK
DPM@Barings.com
132
Barings Funds Trust 2021 Annual Report
GLOBAL PRIVACY NOTICE (CONTINUED)
Please see the relevant local addendum attached to this Privacy Notice for contact details in your country or jurisdiction.
12. Complaints
If you would like to contact us in relation to how your Personal Data is handled, please contact Barings’ Data Privacy Manager at DPM@Barings.com and your complaint will be handled in accordance with our handling procedures. You may also have the right to make a complaint with the relevant local supervisory authority; however, we would request in the first instance you contact us.
Please see the relevant local addendum attached to this Privacy Notice for contact details in your country or jurisdiction.
13. Local Country, State or Specific Jurisdictional Addenda
| | iii. | European Economic Area and UK |
| | vi. | People’s Republic of China |
14. Document Management
This document is reviewed at least once annually, and updated as required. Where required by Relevant Data Protection Laws we will notify you in the event of material changes to this Privacy Notice and, where required, seek your consent to those changes.
This document was last updated June 4, 2020.
133
Barings Funds Trust 2021 Annual Report
GLOBAL PRIVACY NOTICE: ADDENDUM FOR AUSTRALIA
This addendum sets out additional obligations and rights of Barings Australia Pty Ltd, including any associated Managers and Funds, beyond the terms of the Privacy Notice.
COLLECTION OF PERSONAL DATA
In some circumstances, we may need to collect additional Personal Data from you, or collect Personal Data from you in a way which is not described in the Privacy Notice. Where this is the case, we will provide you with additional information which details the Personal Data we will collect from you and how we will use, hold and disclose that Personal Data.
DIRECT MARKETING
Your Personal Data may also be used to enable us to market services and products that we, our group companies or related body corporates or our partners offer and which we consider may be of interest to you. If you do not want us to contact you about these products and services, please contact us using the details set out below. You will also be given an opportunity to unsubscribe from any marketing communications which we send to you electronically (such as via e-mail).
HOW DO I ACCESS MY PERSONAL INFORMATION?
You may contact us using the details below if you wish to find out about the Personal Data we hold about you. We may need to verify your identity before giving you access and, depending on the complexity of your request, we may charge a reasonable fee for processing the request.
In certain circumstances, we may not be able to tell you what Personal Data is held about you. In these circumstances, we will notify you to explain why we cannot provide the information and attempt to find alternative means to enable you to access your information.
HOW DO I REQUEST CORRECTION OF MY INFORMATION?
If you believe that the Personal Data we hold about you is inaccurate, incomplete or out of date, you should contact us using the details below. We will promptly update any Personal Data that we consider is inaccurate, incomplete or out of date. If we do not agree that your information is inaccurate, incomplete or out of date, we will notify you and provide you with the reasons.
COMPLAINTS
If you believe that your privacy has been breached, please contact us using the details below and provide details of the incident so that we can investigate and respond to you about your concerns.
We will review all communications and complaints submitted to us in this manner and will aim to respond to you in writing within a reasonable time. If your complaint is not satisfactorily resolved, you may access an external dispute resolution service or apply to the Office of the Australian Information Commissioner (“OAIC”) to have the complaint heard and determined. When we notify you about our decision, we will explain how you may access an external dispute resolution scheme or make a complaint to the OAIC.
CONTACT US
To contact us in relation to the Privacy Notice, please use the following methods:
E-mail: DPM@Barings.com
Barings Data Privacy Manager
Barings Australia Pty Ltd,
Suite 4501, Level 45,
Australia Square,
264 George Street,
Sydney, NSW 2000, Australia
134
Barings Funds Trust 2021 Annual Report
GLOBAL PRIVACY NOTICE: ADDENDUM FOR CALIFORNIA
Under the California Consumer Privacy Act (“CCPA”), we are required to provide California residents with specific information about our personal information practices. The CCPA defines the term “personal information” broadly, and includes any information that identifies, relates to, describes, is reasonably capable of being associated with, or could reasonably be linked, directly or indirectly, with a particular California resident or household. Please note that the CCPA does not apply to certain types of information, and your data may be covered by additional privacy notices based on your relationship with us.
Categories of Personal Information that We Collect, Disclose, and Sell
We do not sell any of your personal information for monetary compensation.
We currently do not share your information with non-affiliated third parties for their own marketing purpose. We collect and disclose certain personal information in the course of our business as described in the Privacy Notice, including to process your transactions, for customer service purposes, for marketing, for general administration (e.g., managing inventory) evaluating use of our services, research and development, and for legal compliance.
Please refer to section 3 of the Privacy Notice for a description of how we collect and disclose personal information and the personal information that we collect.
In addition to collecting business related information (including information such as names, business contact information and for investors, employees and certain business contacts, dates of birth, government identifiers and/or financial information) we also collect the following:
| | ∎ | | Usage Data: As described above, we collect certain technical information about a user’s use of our Websites, which may include: IP address, cookies, browser type and version, time zone settings, browser plugin types, operating systems and platform, device information (including, for mobile devices, the IMEI number, wireless networks and general network information). We do not typically associate this information with a particular user’s account and we do not seek to reidentify the user through this information. |
| | ∎ | | Audio & Video Information: If you call us, we may record your conversation for quality assurance, training, legal compliance, and customer service purposes. Certain of our premises are monitored by closed circuit television. Absent an incident, we do not usually obtain a copy of such footage, but, rather, it would be the property of the building manager. |
We disclose each of the above categories of information, for a business purpose as defined by the CCPA. For example, we may share your contact information with entities that assist us in account management, background check organizations, and, where permitted by law, with entities to assist us in marketing. We also share your information with entities that assist us in providing support and services, such as hosting our websites, applications, and other online services, to respond to inquiries and for trouble-shooting. We also share your information to assist us in analyzing and improving our services and operations; for fraud prevention; personalizing content and experiences; securing and protecting our business; defending our legal rights and the rights of others; auditing, reporting, corporate governance, and internal operations; and complying with legal obligations.
California Resident Rights
California law grants California residents certain rights and imposes restrictions on particular business practices. We are required to provide you with a notice about our information collection practices at or before the point of collection; to this end, there may be circumstances in which we provide an additional notice to you. California residents have the right to opt-out of our sale of their personal information. Subject to certain exceptions, California residents have the right to (at no charge) request that we (1) delete the personal information that we hold about them, subject to certain exceptions and (2) send a copy of the specific pieces of personal information that we have collected about them in the prior 12 months and to have this delivered, free of charge, either (a) by mail or (b) electronically in a portable and, to the extent technically
135
Barings Funds Trust 2021 Annual Report
GLOBAL PRIVACY NOTICE: ADDENDUM FOR CALIFORNIA (CONTINUED)
feasible, readily useable and transferrable format. California residents also have the right to request that we provide them certain information about how we have handled their personal information in the prior 12 months, including the:
| | ∎ | | categories of personal information collected; |
| | ∎ | | categories of sources of personal information; |
| | ∎ | | business and/or commercial purposes for collecting and selling their personal information; |
| | ∎ | | categories of third parties/with whom we have disclosed or shared their personal information; |
| | ∎ | | categories of personal information that we have disclosed or shared with a third party for a business purpose; and |
| | ∎ | | categories of third parties to whom the residents’ personal information has been sold and the specific categories of personal information sold to each category of third party. |
California residents may make Requests to Know up to twice every 12 months. The CCPA prohibits discrimination against California residents for exercising their rights under the CCPA. Discrimination may exist where a business denies or provides a different level or quality of goods or services, or charges (or suggests that it will charge) different prices, rates, or penalties on residents who exercise their CCPA rights, unless doing so is reasonably related to the value provided to the business by the residents’ data.
California residents have the right to be notified of any financial incentive offers and their material terms, the right to opt-out of such incentives at any time, and may not be included in such incentives without their prior informed opt-in consent. We currently do not offer any incentives.
CONTACT US
To contact us in relation to the Privacy Notice, including Requests to Opt-Out of Sale of Personal Information (if applicable), Requests to Know, and Requests to Delete, please use the following methods:
Electronically: Submitting a CCPA Webform found at barings.com
By Phone: 1-877-766-0014 (toll free),
E-mail: DPM@Barings.com
Barings Data Privacy Manager
20 Old Bailey
London, UK
We will respond to verifiable requests received from California consumers as required by law.
To opt-out of sharing with targeted advertisers, please visit optout.aboutads.info and optout.networkadvertising.org.
California Shine the Light
We currently do not share your information with non-affiliated third parties for their own marketing purpose.
For more information about our privacy practices, you may contact us at dpm@barings.com.
136
Barings Funds Trust 2021 Annual Report
GLOBAL PRIVACY NOTICE: ADDENDUM FOR EUROPEAN ECONOMIC AREA (EEA) AND UNITED KINGDOM
This addendum sets out additional obligations and rights of Baring Asset Management Limited (“BAML”), including any associated Managers and Funds, beyond the terms of the Privacy Notice.
RELEVANT DATA PROTECTION LAWS
To avoid doubt, “Relevant Data Protection Laws” shall mean any applicable data protection laws relating to the protection of individuals with regards to the processing of personal data including the General Data Protection Regulation (EU) 2016/679 (“GDPR”) (together with any laws implemented by EU member states (including any replacement legislation applicable in the United Kingdom, whether or not as a result of any full or partial departure of the United Kingdom from the European Union), which contain derogations from, or exemptions or authorisations for the purposes of, the GDPR, or which are otherwise intended to supplement the GDPR); the UK Data Protection Act 2018; the ePrivacy Directive 2002/58/EC as implemented by EU member states; any corresponding or equivalent national laws or regulations relating to the collection, use, disclosure and processing of personal data including any amendment, update, modification to or reenactment of such laws and guides and codes of practice issued from time to time by any supervisory authorities, in each case as amended, updated or replaced from time to time.
LAWFUL BASIS FOR PROCESSING
Under Relevant Data Protection Laws we must have a lawful basis for processing your Personal Data. When we do so, we rely on one of the following:
| | - | To perform a contract we have with you; |
| | - | To comply with a legal obligation; |
| | - | Where we have a legitimate interest as a business; or |
| | - | If you have given us your consent. |
We have set out the lawful bases we rely on at section 3 of the Privacy Notice. Unless otherwise set out in section 3, the processing of your Personal Data will be in furtherance of BAML’s legitimate interests to provide and improve our services to you, in order to preserve our business operations, and ensuring that you are provided with information which is relevant to you.
PROVIDING YOUR INFORMATION TO US
If you do not provide us with certain information (for example, if you do not provide us with information that is indicated as mandatory), BAML may not be able to manage or administer our client relationship with you and provide you with products and services. If you are a Website User, and if you block or refuse to accept cookies, or delete cookies after visiting our Website, you may not be able to access or use some of the functionalities of our Website.
INTERNATIONAL TRANSFERS
Subject to Relevant Data Protection Laws, transfers to other countries or jurisdictions outside of the UK or
EEA may be permitted where such transfer is made to jurisdictions or countries providing “adequate protection” for Personal Data (which may include US companies that have voluntarily signed up to the EU-U.S. or Swiss-U.S. Privacy Shield).
However, some transfers may be to countries or jurisdictions that do not have adequate protection and, in that case, BAML, the Manager and the Fund (as applicable) shall use reasonable efforts to implement contractual safeguards for the cross-border transfer of Personal Data, as required based on the legitimate transfer mechanism used (such as putting in place European Commission-approved “Standard Contractual Clauses”).
Where you are in the UK or the EEA, further information in relation to specific international transfers can be obtained by contacting BAML’s Data Privacy Manager at DPM@Barings.com.
137
Barings Funds Trust 2021 Annual Report
GLOBAL PRIVACY NOTICE: ADDENDUM FOR EUROPEAN ECONOMIC AREA (EEA) AND UNITED KINGDOM (CONTINUED)
COMPLAINTS
If you believe that your privacy has been breached, please contact us using the details below and provide details of the incident so that we can investigate and respond to you about your concerns.
We will review all communications and complaints submitted to us in this manner and will aim to respond to you in writing within a reasonable time. Notwithstanding the above, you have the right to make a complaint at any time to the Information Commissioner’s Office (ICO), the UK supervisory authority, or to any other supervisory authority applicable to you.
CONTACT US
To contact us in relation to the Privacy Notice, please use the following methods:
E-mail: DPM@Barings.com
Barings Data Privacy Manager
Baring Asset Management Limited
20 Old Bailey
London, UK
138
Barings Funds Trust 2021 Annual Report
GLOBAL PRIVACY NOTICE: ADDENDUM FOR HONG KONG S.A.R.
This addendum sets out additional obligations and rights of Baring Asset Management (Asia) Limited including any associated Managers and Funds (“we”, “Barings Hong Kong”), beyond the terms of the Privacy Notice.
PROVIDING YOUR INFORMATION TO US
If you do not provide us with certain information (for example, if you do not provide us with information that is indicated as mandatory), Barings Hong Kong may not be able to manage or administer our client relationship with you and provide you with products and services. If you are a Website User, and if you block or refuse to accept cookies, or delete cookies after visiting our Website, you may not be able to access or use some of the functionalities of our Website.
CONTACT DETAILS
To contact us in relation to the Privacy Notice, please use the following methods:
E-mail: DPM@Barings.com
Barings Data Privacy Manager
Baring Asset Management (Asia) Limited 35/F Gloucester Tower
15 Queens Road
Central, Hong Kong
139
Barings Funds Trust 2021 Annual Report
GLOBAL PRIVACY NOTICE: ADDENDUM FOR JAPAN
This addendum sets out additional obligations and rights of Barings Japan Ltd. including any associated Managers and Funds (“we”, “Barings Japan”), beyond the terms of the Privacy Notice.
TRANSFERS
Your primary data controller Barings Japan will jointly use your Personal Data specified in the Privacy Notice for the purposes specified therein with other group companies of Barings. Barings Japan will be responsible for the management of your Personal Data jointly used by other group companies of Barings.
CONTACT DETAILS
To contact us in relation to the Privacy Notice, please use the following methods:
E-mail: DPM@Barings.com
Barings Data Privacy Manager
Baring Japan Ltd.
7F Kyobashi Edogrand
2-2-1 Kyobashi
Chuo-ku
Tokyo 104-0031, Japan
140
Barings Funds Trust 2021 Annual Report
GLOBAL PRIVACY NOTICE: ADDENDUM FOR THE PEOPLE’S REPUBLIC OF CHINA (“PRC”) (EXCLUDING FOR THE PURPOSES OF THE PRIVACY NOTICE HONG KONG S.A.R., MACAU S.A.R. AND TAIWAN)
This addendum sets out additional obligations and rights of Barings Investment Management (Shanghai) Limited and Barings Overseas Investment Fund Management (Shanghai) Limited, including any associated Managers and Funds (“we”, “Barings PRC”), beyond the terms of the Privacy Notice.
PROVIDING YOUR INFORMATION TO US
If you do not provide Barings PRC with certain Personal Data (for example, if you do not provide us with information that is indicated as mandatory); or give us your (express or deemed) consent to the collection, use and/or disclosure of your Personal Data; or if you subsequently withdraw your consent, Barings PRC may not be able to manage or administer our client relationship with you; provide certain products and services to you; or if you are a Website User, you may not be able to access or use some of the functionalities of our Website.
SENSITIVE PERSONAL DATA
Certain types of Personal Data are considered “sensitive” and, depending on your country of work or residence and applicable laws, additional rules will apply in respect of this Personal Data. “Sensitive Personal Data” as defined under PRC laws and regulations may include (but without limitation) information relating to:
| | ∎ | | genetic or biometric information; |
| | ∎ | | tax identification number; |
| | ∎ | | national identity card number; |
| | ∎ | | sexual orientation; and |
| | ∎ | | racial or ethnic origin. |
References to “Special Categories of Personal Data” in the Privacy Notice shall for the purpose of this addendum be deemed to be references to Sensitive Personal Data.
RETENTION OF PERSONAL DATA
Your Personal Data will be kept confidential and will be retained for the retention periods set out in our Record Keeping Policy.
CONTACT DETAILS
To contact us in relation to the Privacy Notice, please use the following methods:
E-mail: DPM@Barings.com
Barings Data Privacy Manager
Barings Investment Management (Shanghai) Limited & Barings Overseas Investment Fund Management (Shanghai) Limited
Unit 4501-04 , Level 45
International Finance Center Tower 2
8 Century Avenue
Pudong District
Shanghai, China
141
Barings Funds Trust 2021 Annual Report
GLOBAL PRIVACY NOTICE: ADDENDUM FOR SOUTH KOREA
This addendum sets out additional obligations and rights of Baring Asset Management (Korea) Limited, including any associated Managers and Funds (“we”, “Barings Korea”), beyond the terms of the Privacy Notice.
COLLECTION OF PERSONAL DATA
We obtain your consent when collecting and using your Personal Data unless such collection and usage is based on Personal Information Protection Act (“PIPA”), the Act on Promotion of Information Communication Network Usage and Information Protection (“Network Act”), Protection of Credit Information Act (“Credit Information Act”), or other laws or regulations of Korea.
SENSITIVE PERSONAL DATA
Under the PIPA, information on the ideology, creed, membership of a labor union or political party, political views, health, sexual preferences, bio-data, and criminal records as defined under the Act on the Lapse of Criminal Sentences is considered “Sensitive Personal Data”.
When collecting Sensitive Personal Data from you, we comply with all the procedures and methods stipulated by the PIPA, including obtaining your separate consent for the processing of Sensitive Personal Data.
OUTSOURCING OF THE PROCESSING OF PERSONAL DATA
Please see below the list of third-party processors (“Processors”) together with the specific processing tasks to be outsourced. The Personal Data transferred to the Processors will be retained only to the extent necessary for the purposes of the services provided and to meet any regulatory requirements in accordance with any applicable laws.
We comply with all the relevant laws and regulations when outsourcing the processing of Personal Data. For example, we do not outsource the processing of Particular Identification Data as defined under the PIPA (i.e., resident registration numbers (“RRNs”), driver’s license numbers, passport numbers, and alien registration numbers) to Processors located outside of Korea.
| | |
| NAME OF THE THIRD-PARTY PROCESSOR | | OUTSOURCED TASK/SERVICE |
| |
| NAVEX Global, Inc. | | Operation of Barings’ ethics and whistleblower hotline |
PROVISION OF PERSONAL DATA TO THIRD PARTIES
Subject to your separate consent, the following Personal Data may also be disclosed to third parties, i.e., independent data controllers as set out below.
We comply with all the relevant laws and regulations when providing Personal Data to a third party. For example, we do not provide Particular Identification Data as defined under the PIPA to recipients located outside of Korea.
| | | | | | |
| RECIPIENT | | RECIPIENT’S PURPOSE
OF USE | | TRANSFERRED ITEMS | | RECIPIENT’S PERIOD OF RETENTION AND USE |
| | | |
| Barings LLC | | Regulatory, risk and compliance oversight | | Anonymized data to perform regulatory, risk and compliance oversight | | 7 years from the date of collection |
| | | |
| Baring Asset Management Limited | | Regulatory, risk and compliance oversight | | Anonymized data to perform regulatory, risk and compliance oversight | | 7 years from the date of collection |
142
Barings Funds Trust 2021 Annual Report
GLOBAL PRIVACY NOTICE: ADDENDUM FOR SOUTH KOREA (CONTINUED)
DATA PROTECTION OFFICER
The data protection officer is Ho Chul Jung ( ) and is available at +82 2 3788 0529 or via e-mail at Hochul.jung@barings.com.
DESTRUCTION OF PERSONAL DATA
Your Personal Data will be processed and stored for as long as required for the purposes for which they were collected, and in accordance with the storage periods provided for by the applicable laws. After such period, your Personal Data will be automatically and permanently erased or made anonymous.
MEASURES TO ENSURE SECURITY OF PERSONAL DATA
We take the following technical, managerial and physical measures necessary to ensure the security of your Personal Data.
Managerial measures: Designation of a data protection officer, establishment and implementation of an internal management plan, regular training of employees on personal data protection, etc.
Technical measures: Management of the right to access the Personal Data Processing system, installation of an access control system, encryption of Particular Identification Data(as defined under the PIPA), installation of security programs, etc.
Physical measures: Restriction on access to Personal Data storage mediums such as the computer room and data storage room, etc.
INSTALLATION, OPERATION, AND DENIAL OF A DEVICE THAT AUTOMATICALLY COLLECTS PERSONAL INFORMATION
We use cookies which constantly save and retrieve information of our Website Users. A cookie is a small text file of information about the basic setting of a website, sent by the website’s web server to the web browser of a user, and is stored in the hard disk of the user’s computer.
We use cookies for the following purposes: to engage in target marketing and provide customized services by analyzing the frequency and times of visits of members and non-members, identifying their preferences and interests and tracking the number of visits made.
You have the right to choose whether or not to install cookies. Therefore, you may adjust the options of your web browser to accept or refuse all cookies, or to receive notice each time cookies are installed.
143
Barings Funds Trust 2021 Annual Report
GLOBAL PRIVACY NOTICE: ADDENDUM FOR SWITZERLAND
This addendum sets out additional obligations and rights of Baring Asset Management Switzerland Sàrl, including any associated Managers and Funds (“we”, “Barings Switzerland”), beyond the terms of the Privacy Notice.
DEFINITION OF PERSONAL DATA
The definition of “Personal Data” also includes all information relating to an identified or identifiable legal entity pursuant to Article 3 (a) of the Swiss Federal Act on Data Protection (“FADP”).
INTERNATIONAL TRANSFERS
Subject to Relevant Data Protection Laws, transfers to other countries or jurisdictions may be permitted if the country or jurisdiction in question is in the European Economic Area (EEA), or on the Federal Data Protection and Information Commissioner’s (“FDPIC”) list of countries providing ‘adequate protection’ for Personal Data (which may include US companies that have voluntarily signed up to the Swiss-U.S. Privacy Shield).
However, some transfers may be to countries or jurisdictions that do not have adequate protection and, in that case, Barings Switzerland, Barings, the Manager and the Fund (as applicable) shall use reasonable efforts to implement contractual safeguards for the cross-border transfer of Personal Data, as required based on the legitimate transfer mechanism used.
When you are in Switzerland, further information in relation to specific international transfers can be obtained by contacting Barings’ Data Privacy Manager at DPM@Barings.com.
INDIVIDUAL’S RIGHTS IN RELATION TO PERSONAL DATA
Under the FADP, an individual is not granted the right to data portability in respect of his or her Personal Data.
COMPLAINTS
If you believe that your privacy has been breached, please contact us using the details below and provide details of the incident so that we can investigate and respond to you about your concerns.
We will review all communications and complaints submitted to us in this manner and will aim to respond to you in writing within a reasonable time. If your complaint is not satisfactorily resolved, you may submit a complaint to the FDPIC.
CONTACT US
To contact us in relation to the Privacy Notice, please use the following methods:
E-mail: DPM@Barings.com
Barings Data Privacy Manager
20 Old Bailey
London, UK
Phone - +442077628961
144
Barings Funds Trust 2021 Annual Report
GLOBAL PRIVACY NOTICE: ADDENDUM FOR TAIWAN
This addendum sets out additional obligations and rights of Barings SICE (Taiwan) Limited, including any associated Managers and Funds (“We”, “Barings Taiwan”), beyond the terms of the Privacy Notice. The term “process” or “processing” as used in the Privacy Notice should be taken to mean “collect”, “use” and “process” as defined in the Taiwan Personal Information Protection Law.
PROVIDING YOUR INFORMATION TO US
If you choose not to provide us with certain of your Personal Data (for example, if you do not provide us with information that is indicated as mandatory), we may not be able to manager or administer our client relationship with you; provide you with products and services; or, if you are a Website User, you may not be able to access or use some of the functionalities of our Website.
SENSITIVE PERSONAL DATA
Sensitive Personal Data and Special Categories of Personal Data shall, for purposes of Barings Taiwan’s obligation to you, include medical records, medical treatment, genetic information, sexual life (including sexual orientation) and health examination and criminal records.
YOUR RIGHTS TO YOUR PERSONAL DATA
You have rights, using the contact details below:
| | ∎ | | to make inquiries or request to review your Personal Data; |
| | ∎ | | to make copies of your Personal Data; |
| | ∎ | | to supplement or correct your Personal Data; |
| | ∎ | | to discontinue collection, processing or use of Personal Data; |
| | ∎ | | to delete your Personal Data; or |
| | ∎ | | to communicate to us your objection to the use of your Personal Data for marketing purposes. |
CONTACT DETAILS
To contact us in relation to the Privacy Notice, please use the following methods:
E-mail: DPM@Barings.com
Barings Data Privacy Manager
Baring SICE (Taiwan) Limited
21F 333 Keelung Rd.
Sec.1 Taipei 11012
Taiwan
145
Barings Funds Trust 2021 Annual Report
GLOBAL PRIVACY NOTICE: ADDENDUM FOR THE UNITED STATES OF AMERICA (THE “USA”)
This addendum sets out additional obligations and rights of Barings LLC and Barings Securities LLC including any associated Managers and Funds (“We/Barings US”) beyond the terms of the Privacy Notice.
PROVISION OF PERSONAL DATA TO OTHER ENTITIES
If you are dealing with Barings US as a Client, we may share the financial information we collect from you with our financial services affiliates, such as insurance companies, investment companies and securities broker-dealers. Additionally, so that we may continue to offer you products and services that best meet your investment needs, we may disclose Personal Data we collect, as described above, to companies that perform administrative or marketing services on our behalf, such as transfer agents, custodian banks, service providers or printers and mailers that assist us in the distribution of investor materials or that provide operational support to Barings US. These companies are required to protect this information and will use this information only for the services for which we hire them, and are not permitted to use or share this information for any other purpose. Some of these companies may perform such services in jurisdictions other than the United States. We also disclose your financial information for our everyday business purposes, such as to process and effect transactions that you request or authorize and to maintain your account(s) and as otherwise permitted by applicable law. We may share some or all of the information we collect with other financial institutions with whom we jointly market products. This may be done only if it is permitted by the state in which you live. Some disclosures may be limited to your name, contact and transaction information with us or our affiliates.
Any disclosures will be only to the extent permitted by federal and state law. Certain disclosures may require us to get an “opt-in” or “opt-out” from you. If this is required, we will do so before information is shared. Otherwise, we do not share any personal information about our customers or former customers unless authorized by the customer or as permitted by law. When you are no longer our customer, we will continue to share your information as described in this notice.
REGULATORY
The Privacy Notice describes the privacy policies of Barings. It applies to all Barings and the Funds accounts you presently have, or may open in the future, using your social security number or federal taxpayer identification number - whether or not you remain a shareholder of our Funds or as an advisory client of Barings. As mandated by rules issued by the Securities and Exchange Commission, we will be sending you this notice annually, as long as you own shares in the Funds or have an account with Barings.
Barings Securities LLC is a member of the Financial Industry Regulatory Authority (FINRA) and the Securities Investor Protection Corporation (SIPC). Investors may obtain information about SIPC including the SIPC brochure by contacting SIPC online at www.sipc.org or calling (202)-371-8300. Investors may obtain information about FINRA including the FINRA Investor Brochure by contacting FINRA online at www.finra.org or by calling (800)-289-9999.
CONTACT US
To contact us in relation to the Privacy Notice, please use the following methods:
E-mail: DPM@barings.com
Barings Data Privacy Manager
20 Old Bailey
London, UK
146
BARINGS FUNDS TRUST
ANNUAL REPORT
For the Period from July 1, 2021 to September 30, 2021

Item 2. Code of Ethics.
The Registrant adopted a Code of Ethics for Principal Executive and Senior Financial Officers (the “Code”) on July 29, 2013, which is available on the Registrant’s website at www.barings.com/us/guest/funds/barings-mutual-fund-documents and click Fund Code of Ethics. During the period covered by this Form N-CSR, there were no amendments to, or waivers from, the Code.
Item 3. Audit Committee Financial Expert.
The Registrant’s Board of Trustees has determined that Dr. Bernard A. Harris, Jr., Mr. Thomas W. Okel, and Mr. Martin A. Sumichrast, constituting all the members of the Registrant’s Audit Committee, are audit committee financial experts. Dr. Harris, Mr. Okel and Mr. Sumichrast are “independent” for purposes of this Item 3 as required by applicable regulation.
Item 4. Principal Accountant Fees and Services.
The Registrant has engaged its principal accountant, Deloitte & Touche LLP (“Deloitte”), to perform audit services, audit-related services, tax services and other services. The following tables detail the aggregate fees billed or expected to be billed for the fiscal year ended June 30, 2020, the fiscal year ended June 30, 2021 and the period July 1, 2021 through September 30, 2021 by Deloitte. The Registrant changes its fiscal year from June 30 to September 30.
Fees Billed to the Registrant:
| | | | | | | | | | | | |
| | | Period
July 1, 2021
through
September 30,
2021 | | | Year Ended
June 30,
2021 | | | Year Ended
June 30,
2020 | |
Audit Fees | | $ | 205,380 | | | $ | 293,500 | | | $ | 322,100 | |
Audit-Related Fees | | $ | 70,000 | | | $ | 0 | | | $ | 30,000 | |
Tax Fees | | $ | 56,545 | | | $ | 88,650 | | | $ | 98,393 | |
All Other Fees | | $ | 0 | | | $ | 0 | | | $ | 0 | |
| | | | | | | | | | | | |
Total Fees | | $ | 331,925 | | | $ | 382,150 | | | $ | 450,493 | |
Non-Audit Fees Billed to Barings and MassMutual:
| | | | | | | | | | | | |
| | | Period
July 1, 2021
through
September 30,
2021 | | | Year Ended
June 30,
2021 | | | Year Ended
June 30,
2020 | |
Audit Fees | | $ | 754,249 | | | $ | 3,647,481 | | | $ | 3,563,922 | |
Audit-Related Fees | | $ | 206,600 | | | $ | 1,794,671 | | | $ | 2,236,858 | |
Tax Fees | | $ | 558,514 | | | $ | 2,836,667 | | | $ | 4,357,763 | |
All Other Fees | | $ | 478,661 | | | $ | 2,831,672 | | | $ | 5,271,600 | |
| | | | | | | | | | | | |
Total Fees | | $ | 1,998,024 | | | $ | 11,110,491 | | | $ | 15,430,143 | |
The category “Audit Fees” refers to performing an audit of the Registrant’s, Barings LLC’s (“Barings”) or Massachusetts Mutual Life Insurance Company’s (“MassMutual”) annual financial statements or services that are normally provided by the principal accountant in connection with statutory and regulatory filings or engagements. The category “Audit-Related Fees” reflects fees billed by Deloitte for various non-audit and non-tax services rendered to the Registrant, Barings, and MassMutual. Preparation of Federal, state and local income tax and tax compliance work are representative of the fees reported in the “Tax Fees” category. The category “All Other Fees” represents fees billed by Deloitte for consulting rendered to the Registrant, Barings, and MassMutual.
The Sarbanes-Oxley Act of 2002 and its implementing regulations allow the Registrant’s Audit Committee to establish a pre-approval policy for certain services rendered by the Registrant’s principal accountant, Deloitte. During the period July 1, 2021 through September 30, 2021 and the fiscal year ended June 30, 2021, the Registrant’s Audit Committee approved all of the services rendered to the Registrant by Deloitte and did not rely on such a pre-approval policy for any such services.
The Audit Committee has also reviewed the aggregate fees billed for professional services rendered by Deloitte for the period July 1, 2021 through September 30, 2021 and the fiscal years ended June 30, 2021 and June 30, 2020 for the Registrant and for the non-audit services provided to Barings, and Barings’ parent, MassMutual. As part of this review, the Audit Committee considered whether the provision of such non-audit services was compatible with maintaining the principal accountant’s independence.
Item 5. Audit Committee of Listed Registrants.
Not applicable.
Item 6. Investments.
| (a) | The Registrant’s Consolidated Schedule of Investments as of the close of the reporting period is included in the Report to Shareholders filed under Item 1 of this form. |
Item 7. Disclosure of Proxy Voting Policies and Procedures for Closed-End Management Investment Companies.
Not applicable.
Item 8. Portfolio Managers of Closed-End Investment Management Companies.
Not applicable.
| Item 9. | Purchases of Equity Securities by Closed-End Management Investment Company and Affiliated Purchasers. |
Not applicable.
| Item 10. | Submission of Matters to a Vote of Security Holders. |
There have been no material changes to procedures by which the shareholders may recommend nominees to the Registrant’s Board of Trustees.
Item 11. Controls and Procedures.
| (a) | The Registrant’s principal executive officer and principal financial officer, or persons performing similar functions, have concluded that the Registrant’s disclosure controls and procedures as defined in Rule 30a-3(c) under the Investment Company Act of 1940, as amended (the “1940 Act”), are effective as of a date within 90 days of the filing date of this report based on the evaluation of these controls and procedures required by Rule 30a-3(b) under the 1940 Act and Rules 13a-15(b) or 15d-15(b) under the Securities Exchange Act of 1934, as amended. |
| (b) | There were no changes in the Registrant’s internal control over financial reporting (as defined in Rule 30a-3(d) under the 1940 Act) that occurred during the period covered by this report that have materially affected or are reasonably likely to materially affect, the Registrant’s internal control over financial reporting. |
Item 12. Disclosure of Securities Lending Activities for Closed-End Management Investment Companies.
Item 13. Exhibits.
| (a)(1) | The Registrant has posted its Code of Ethics on its website at www.barings.com/us/guest/funds/barings-mutual-fund-documents and click Fund Code of Ethics. |
Exhibit 99.1 Cert
Exhibit 99.2 Cert
Exhibit 99.906 Cert
SIGNATURES
Pursuant to the requirements of the Securities Exchange Act of 1934 and the Investment Company Act of 1940, the Registrant has duly caused this report to be signed on its behalf by the undersigned, thereunto duly authorized.
| | |
| (Registrant) | | Barings Funds Trust |
| | |
| By (Signature and Title) | | /s/ Daniel McGee |
| | Daniel McGee, President (Principal Executive Officer) |
Pursuant to the requirements of the Securities Exchange Act of 1934 and the Investment Company Act of 1940, this report has been signed below by the following persons on behalf of the Registrant and in the capacities and on the dates indicated.
| | |
| By (Signature and Title) | | /s/ Daniel McGee |
| | Daniel McGee, President (Principal Executive Officer) |
| | |
| By (Signature and Title) | | /s/ Carlene Pollock |
| | Carlene Pollock, Chief Financial Officer (Principal Financial Officer) |