UNITED STATES
SECURITIES AND EXCHANGE COMMISSION
Washington, D.C. 20549
FORM N-CSR
CERTIFIED SHAREHOLDER REPORT OF REGISTERED
MANAGEMENT INVESTMENT COMPANIES
Investment Company Act file number(s) 811-22845
Barings Funds Trust
(Exact Name of Registrant as Specified in Charter)
300 South Tryon Street
Suite 2500
Charlotte, NC 28202
(Address of Principal Executive Offices)
Registrant’s telephone number, including area code: (704) 805-7200
Corporation Service Company (CSC)
251 Little Falls Drive
Wilmington DE 19808
United States
(Name and Address of Agent for Service)
Date of fiscal year end: June 30
Date of reporting period: June 30, 2020
Item 1. Reports to Stockholders.
The Annual Report to Shareholders is attached hereto.


BARINGS FUNDS TRUST
Beginning on January 1, 2021, as permitted by regulations adopted by the U.S. Securities and Exchange Commission, paper copies of the Fund’s annual and semi-annual shareholder reports will no longer be sent by mail, unless you specifically request paper copies of the reports. Instead, the reports will be made available on the Funds’ website http://www.barings.com/, and you will be notified by mail each time a report is posted and provided with a website link to access the report.
If you already elected to receive shareholder reports electronically, you will not be affected by this change and you need not take any action. You may elect to receive shareholder reports and other communications from the Funds electronically anytime by contacting your financial intermediary (such as a broker-dealer or bank) or, if you are a direct investor, by calling 1-877-766-0014.
Beginning on January 1, 2019, you may elect to receive all future reports in paper free of charge. If you invest through a financial intermediary, you can contact your financial intermediary to request that you continue to receive paper copies of your shareholder reports. If you invest directly with the Fund, you can call 1-877-766-0014 to inform the Fund that you wish to continue receiving paper copies of your shareholder reports. Your election to receive reports in paper will apply to all funds held in your account if you invest through your financial intermediary or all funds held with the fund complex if you invest directly with the Fund.
Annual Report
June 30, 2020

BFT Service Providers
ADVISER
Barings LLC
300 South Tryon Street
Suite 2500
Charlotte, NC 28202
SUB-ADVISER
Barings International Investments Limited
20 Old Bailey
London, UK
EC4M 7BF
COUNSEL TO THE TRUST
Ropes & Gray LLP
Prudential Tower
800 Boylston Street
Boston, MA 02110
INDEPENDENT REGISTERED PUBLIC ACCOUNTING FIRM
Deloitte & Touche LLP
30 Rockefeller Plaza
New York, NY
10112-0015
CUSTODIAN
State Street Bank & Trust Company
One Lincoln Street
Boston, MA 02111
TRANSFER AGENT AND REGISTRAR
ALPS Fund Services, Inc.
1290 Broadway
Suite 1100
Denver, CO 80203
FUND ADMINISTRATION / ACCOUNTING
State Street Bank & Trust Company
One Lincoln Street
Boston, MA 02111
FUND DISTRIBUTOR
ALPS Distributors, Inc.
1290 Broadway
Suite 1100
Denver, CO 80203
BLUE SKY ADMINISTRATION
DST Asset Manager Solutions, Inc.
2000 Crown Colony Drive
Quincy, MA 02169
PROXY VOTING POLICIES & PROCEDURES
The Trustees of Barings Funds Trust (the “Trust”) have delegated proxy voting responsibilities relating to the voting of securities held by the Trust to Barings LLC (“Barings”). A description of Barings’ proxy voting policies and procedures is available (1) without charge, upon request, by calling, toll-free 1-877-766-0014; (2) on the Trust’s website at http://www.Barings.com; and (3) on the U.S. Securities and Exchange Commission’s (“SEC”) website at http://www.sec.gov.
QUARTERLY PORTFOLIO HOLDINGS
The funds in the Trust file their complete schedules of portfolio holdings with the SEC for the first and third quarters of each fiscal year as an attachment to Form N-PORT. The funds’ Form N-PORT are available on the SEC’s website at http://www.sec.gov. A complete schedule of portfolio holdings as of each quarter-end is available on the Trust’s website at http://www.Barings.com or upon request by calling, toll-free, 1-877-766-0014.

Daniel McGee
President
Barings Funds Trust
Barings Funds Trust
Barings Global Floating Rate Fund
Barings Global Credit Income Opportunities Fund
Barings Active Short Duration Bond Fund
Barings Diversified Income Fund
Barings Emerging Markets Debt Blended Total Return Fund
Barings Global Emerging Markets Equity Fund
Barings U.S. High Yield Fund
Dear Shareholder,
We hope that you and your families are staying healthy and safe. In this challenging environment, we remain focused on the safety and well-being of our teams, clients and communities.
The coronavirus certainly took center stage in the first half of the year, as the pandemic and related lockdown forced countries across the globe to adapt to a new reality of travel bans, school closures and working from home. Questions remain around how much damage the pandemic and lockdowns have caused to the economy – and to what extent that has been counterbalanced by the massive fiscal and monetary responses from governments around the world.
Perhaps unsurprisingly, changes in economic data have been extreme, both to the positive and the negative, making it difficult to gauge how quickly the recovery may come through. At this point, it is unclear how long it may take before we return to anything approaching normal. On the positive side, economic activity has slowly resumed in certain sectors. Markets, too, have made strong recoveries since volatility peaked in late March. Indeed, as the U.S. Federal Reserve introduced unprecedented measures to enhance liquidity, from purchasing fallen angels to buying individual corporate bonds, high yield and investment grade credit rallied. Emerging markets debt, too, took a positive turn – and could benefit from continued monetary stimulus and the potential for a sharper economic bounce-back in the second half of the year.
As the pandemic plays out and the U.S. presidential election nears, we expect additional volatility to enter the markets. But from a bottom-up, fundamental perspective, our investment teams believe there is still attractive value to be found across developed and emerging markets, including in less trafficked markets such as CLOs and asset-backed securities. We expect that opportunities will also emerge as the economy gradually improves. As active managers – and with some of the industry’s largest fixed income research teams – we believe we are well-positioned to provide access to the evolving relative value opportunities and capture the upside as the market recovers.
Above all, particularly through periods of volatility and change, we remain focused on delivering strong risk-adjusted returns for our shareholders. On behalf of the entire Barings team, we thank you for your trust and partnership and look forward to helping you achieve your investment objectives.
Sincerely,

Daniel McGee
President
The statements and opinions expressed are those of the author as of the date of this report. All information is historical and not indicative of future results and subject to change. This information is not a recommendation to buy or sell any security.
Barings Global Floating Rate Fund 2020 Annual Report
Investment Objective
Barings Global Floating Rate Fund (“Global Floating Rate Fund” or the “Fund”) seeks a high level of current income. Preservation of capital is a secondary goal.
Portfolio Management Commentary
How did the Fund perform?
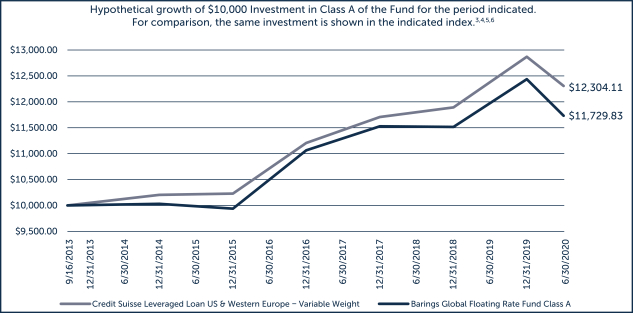
| | ∎ | | The Fund reported a net total rate of return for the annual reporting period from July 1, 2019 through June 30, 2020 of -2.54%, underperforming the Credit Suisse Global Loan Benchmark (the “Benchmark”), which returned -1.72%.1, 6 |
What factors influenced performance of the Fund?
| | ∎ | | Loan market performance for the period was heavily impacted by the sharp drawdown in March 2020 that was driven by investor uncertainty related to COVID-19 and the initial recovery in the months that followed. |
| | ∎ | | During the drawdown in March and initial recovery in late March/early April 2020, investors in the loan market generally favored higher-rated (BB) loans, which outperformed lower-rated loans for the period. As the Fund had a modest overweight exposure to loans rated single-B and lower, this was one of the primary drivers of underperformance. |
| | ∎ | | Underperformance by Fund holdings in a few industry sectors (based on the Benchmark’s industry sectors) also detracted from attribution results. For example, despite being underweight the energy sector, the Fund’s holdings in that sector underperformed the broader market. Other industry sectors in which the Fund’s holdings underperformed included the service and manufacturing sectors. |
| | ∎ | | From a regional perspective, the Fund’s allocations between the North American and European markets did not have a material impact on performance. Within the regions, the Fund’s North American holdings modestly underperformed the market, which detracted from the Fund’s relative results, whereas there was not a material impact to relative performance from the Fund’s European holdings overall. |
| | ∎ | | Given the substantial drawdown in March, the Fund’s allocation to cash (for which average weight was approximately 5%) provided a positive impact to attribution results. |
| | ∎ | | Other leading positive impacts to performance comparisons against the Benchmark over the period included credit selection within single-B rated loans, an overweight position to the forest products/containers sector, and credit selection within that sector – as that sector was not as negatively impacted by recent volatility and credit selection in the metals/minerals sector. |
Describe recent portfolio activity.
| | ∎ | | In late 2019, the Fund made a modest shift of exposure from the European market to North America, as we believed there was more compelling relative value in that market at the time. In 2020 to date, there has not been a shift between the two geographic regions, as the focus has been on individual credit decision making. |
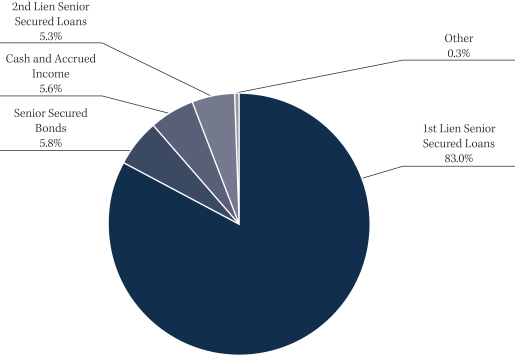
| | ∎ | | During the period, the Fund reduced its exposure to senior secured high yield bonds (by approximately 3%), in favor of first-lien senior secured loans. |
| 1. | Total return describes the return to an investor of Class Y shares and includes the reinvestment of dividends and capital gains. Past performance is no guarantee of future results and investment returns and the net asset value (NAV) of shares of the Fund will fluctuate so that shares, when redeemed, may be worth more or less than their original cost. Current performance may be higher or lower than performance quoted. Call 1.855.439.5459 or visit barings.com for current month end performance. All returns 1-year or less are cumulative. |
| 6. | Benchmark A: The Credit Suisse Global Loan Benchmark is a market capitalization weighted average of the Credit Suisse Leveraged Loan Index and the Credit Suisse Western European Leveraged Loan Index. The Credit Suisse Leveraged Loan Index is designed to mirror the investable universe of the U.S. dollar-denominated leveraged loan market. The Credit Suisse Western European Leveraged Loan Index is designed to mirror the investable universe of the Western European leveraged loan market, with loans denominated in U.S. and Western European currencies. Indices are unmanaged. It is not possible to invest directly in an index. |
2
Barings Global Floating Rate Fund 2020 Annual Report
| | ∎ | | Over the fiscal year, the Fund’s top two industry exposures, health care/education/child care and diversified/conglomerate service (based on Moody’s industries) remained the same. In 2020, the Fund increased its exposure to the leisure/amusement/entertainment sector, making it the third largest industry exposure. This increase is based on individual credit decisions in companies that are believed to be better positioned from a credit and relative value perspective. |
| | ∎ | | Changes in rating category exposure during the period were largely the result of rating agency actions during the period, along with some individual credit decisions to add exposure at discounted levels. Given the increased amount of uncertainty due to the global pandemic, rating agencies downgraded many credit facilities in the first half of 2020. |
Describe portfolio positioning at period end.
| | ∎ | | The Fund finished the twelve-month reporting period, ending June 30, 2020, with 88.3% allocated to global senior secured loans, 5.8% to global senior secured high yield bonds, and 5.6% to cash. |
| | ∎ | | From an industry perspective (based on Moody’s industries), the Fund remained well diversified across a number of sectors, with concentrations in health care/education/child care (13.2%), diversified/conglomerate services (12.2%), and leisure/amusement/entertainment (7.8%) as of June 30, 2020. |
| | ∎ | | As of June 30, 2020, the Fund had the following credit quality breakdown: 0.6% in BBB assets, 14.8% in BB assets, 65.7% in single-B assets, and 10.7% in CCC and below assets. Approximately 2.6% of the Fund’s assets are non-publicly rated. Cash and accrued income accounted for the remaining 5.6% of the portfolio assets.2 |
| | ∎ | | The top five countries in the portfolio at the end of the reporting period were the U.S. (64.1%), the U.K. (8.8%), Germany (8.1%), the Netherlands (2.7%) and France (2.6%). Overall, the Fund had exposure to 16 different countries, and we continue to focus on building a well-diversified portfolio of global floating rate securities. |
Describe market and portfolio outlook.
| | ∎ | | The global credit markets staged a strong rebound throughout the second quarter 2020, bolstered by swift action by governments, central banks and private investors, to support global economies as the world comes to terms with life during a pandemic. While default activity has increased across below investment grade credit, in our view some of these elements have helped some companies navigate the current environment. |
| | ∎ | | Despite the recovery thus far, below investment grade credit markets have not yet fully recovered to pre-pandemic levels. Therefore, we continue to believe there are opportunities for below investment grade credit to be additive to total return performance as the recovery continues. |
| | ∎ | | However, until there is a greater resolve in the global pandemic, there will remain an element of uncertainty across credit markets. For this reason, we believe that prudent asset selection and actively managed portfolios are crucial for navigating the current environment. Also, while the pace of recovery may vary at times across geographies and markets, opportunities will emerge, and therefore we believe that taking a global approach to the asset class provides the ability to capture additional relative value opportunities. |
| 2. | Ratings shown are the highest rating given by one of the following national rating agencies: S&P, Moody’s or Fitch. Additional information about ratings can be found, respectively, at www.standardandpoors.com, www.moodys.com and www.fitchratings.com. Credit ratings are subject to change. AAA, AA, single-A, and BBB are investment grade ratings categories used by S&P and Fitch; BB, single-B, CCC/CC/C and single-D are below investment grade ratings categories used by S&P and Fitch. Aaa, Aa, single-A and Baa are investment grade ratings categories used by Moody’s; Ba, B, Caa/Ca and single-C are below investment grade ratings categories used by Moody’s. Ratings categories may include gradations within each category. Bonds backed by U.S. Government or agency securities are given an implied rating equal to the rating of such securities. Holdings designated Not Publicly Rated are not rated by these national rating agencies. |
3
Barings Global Floating Rate Fund 2020 Annual Report
PORTFOLIO COMPOSITION (% OF ASSETS*)
COUNTRY COMPOSITION (% OF ASSETS**)
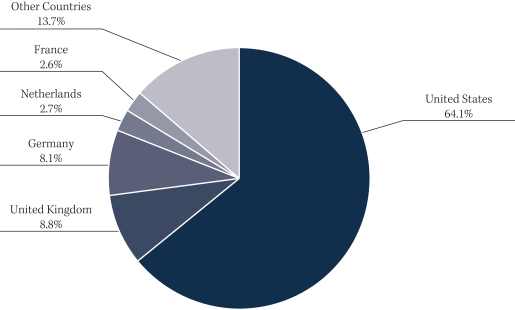
| ** | Percentage of assets are expressed by market value excluding cash and accrued income, and may vary over time. As of June 30, 2020. |
4
Barings Global Floating Rate Fund 2020 Annual Report
| | | | | | | | | | | | | | | | |
| % AVERAGE ANNUAL TOTAL RETURNS 5,7,8 | | INCEPTION DATE | | | ONE YEAR | | | THREE YEARS | | | INCEPTION TO DATE | |
Class A With Load | | | 09/16/2013 | | | | -5.71 | % | | | 0.26 | % | | | 2.16 | % |
Class A No Load | | | 09/16/2013 | | | | -2.79 | % | | | 1.29 | % | | | 2.62 | % |
Class C With Load | | | 09/16/2013 | | | | -4.44 | % | | | 0.53 | % | | | 1.86 | % |
Class C No Load | | | 09/16/2013 | | | | -3.52 | % | | | 0.53 | % | | | 1.86 | % |
Class I With Load | | | 09/16/2013 | | | | -2.47 | % | | | 1.57 | % | | | 2.92 | % |
Class I No Load | | | 09/16/2013 | | | | -2.47 | % | | | 1.57 | % | | | 2.92 | % |
Class Y With Load | | | 09/16/2013 | | | | -2.54 | % | | | 1.54 | % | | | 2.89 | % |
Class Y No Load | | | 09/16/2013 | | | | -2.54 | % | | | 1.54 | % | | | 2.89 | % |
| 3. | Duration is a measure of the sensitivity of the price – the value of principal – of a fixed-income investment to a change in interest rates. Duration is expressed as a number of years. Bond prices are said to have an inverse relationship with interest rates. Therefore, rising interest rates indicate bond prices are likely to fall, while declining interest rates indicate bond prices are likely to rise. |
| 4. | Inception date: September 16, 2013. |
| 5. | Class A performance with the sales charges includes the maximum 3.00% sales charge. |
| 6. | Benchmark A: The Credit Suisse Global Loan Benchmark is a market capitalization weighted average of the Credit Suisse Leveraged Loan Index and the Credit Suisse Western European Leveraged Loan Index. The Credit Suisse Leveraged Loan Index is designed to mirror the investable universe of the U.S. dollar-denominated leveraged loan market. The Credit Suisse Western European Leveraged Loan Index is designed to mirror the investable universe of the Western European leveraged loan market, with loans denominated in U.S. and Western European currencies. Indices are unmanaged. It is not possible to invest directly in an index. |
| 7. | Line graph and table do not reflect the deduction of taxes that a shareholder would pay. |
| 8. | Class C performance with the sales charges includes the 1.00% contingent deferred sales charge (CDSC) for returns of one year or less. |
5
Barings Global Credit Income Opportunities Fund 2020 Annual Report
Investment Objective
Barings Global Credit Income Opportunities Fund (“Global Credit Income Opportunities Fund” or the “Fund”) seeks an absolute return, primarily through current income and secondarily through capital appreciation.
Portfolio Management Commentary
How did the Fund perform?
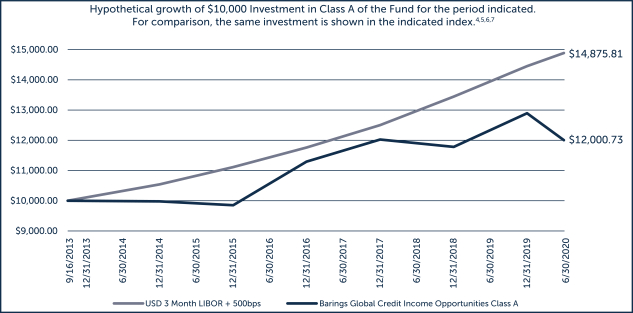
| | ∎ | | The Fund reported a net total rate of return for the annual reporting period from July 1, 2019 through June 30, 2020 of -3.44%, and underperformed the 3 Month USD LIBOR +500 basis points (bps)1 benchmark, which returned 6.71%.2, 6 |
What factors influenced performance of the Fund?
| | ∎ | | The significant decline in mark-to-market trading levels across many credit markets in March 2020, and the varied pace of recovery across markets in the months that followed had a material impact on the Fund’s return for the period. Please note that a large portion of the benchmark is static and therefore will not be influenced to mark-to-market changes, which is the main driver of the Fund’s underperformance relative to the benchmark over the period. |
| | ∎ | | For the core asset classes, high yield bonds underperformed senior secured loans over the full period, and were the biggest detractor from the Fund’s total return. Senior secured loans had a modestly positive impact on the Fund’s total return for the period, and the Fund’s European holdings outperformed the North American holdings. |
| | ∎ | | From a ratings category perspective, the Fund’s higher-rated credits in the high yield bond and senior secured loan markets outperformed lower rated credits during the fiscal year period, as those credits did not see as significant of a drawdown in March 2020, and saw their trading levels recover quicker than lower-rated credits. |
| | ∎ | | For the opportunistic asset classes, allocations to collateralized loan obligations (CLOs) and special situation credits both detracted from the Fund’s total return. |
Describe recent portfolio activity.
| | ∎ | | In the first half of the reporting period, which was in 2019, shifts in the Fund’s core asset classes (high yield bonds and senior secured loans) were focused on modestly shifting exposure from the European markets to North America in both high yield bonds and loans, as relative value was more compelling in the North American market at that time. In 2020, there have been minimal shifts between regions for core asset classes, as the focus has been on individual credit relative value decisions. |
| | ∎ | | In general, as these portfolios build over time, the Fund intends to deploy cash into asset classes which we believe offer the best relative value at that time, and will shift exposure between asset classes as relative value opportunities change. |
| | ∎ | | In regard to the opportunistic asset classes, early in the period the Fund added a modest exposure to emerging markets corporate debt (within high yield bonds). Also, the Fund’s exposure to CLOs modestly decreased over the period. |
| 1. | A unit that is equal to 1/100th of 1% or 0.01%. |
| 2. | Total return describes the return to an investor of Class Y shares and includes the reinvestment of dividends and capital gains. Past performance is no guarantee of future results and investment returns and the net asset value (NAV) of shares of the Fund will fluctuate so that shares, when redeemed, may be worth more or less than their original cost. Current performance may be higher or lower than performance quoted. Call 1.855.439.5459 or visit barings.com for current month end performance. All returns 1-year or less are cumulative. |
| 6. | Benchmark: 3-Month USD LIBOR plus 500 bps. The 3-Month USD LIBOR (London Interbank Offered Rate) is an average interest rate, determined by the Intercontinental Exchange, that banks charge one another for the use of short-term money (three months) in England’s Euro dollar market. The return shown includes 3-Month USD LIBOR plus 500 bps, or 5% per annum. LIBOR is unmanaged. It is not possible to invest directly in LIBOR. No assurance can be given that the Fund’s performance will exceed that of LIBOR by any given increment, or at all. |
6
Barings Global Credit Income Opportunities Fund 2020 Annual Report
| | ∎ | | Given the recent market events (volatility and rating agency downgrades), changes in exposure by ratings category during the period were impacted by individual credit decisions and downgrades, rather than strategic portfolio shifts. |
| | ∎ | | From an industry sector perspective, during the period there were no material changes to the Fund’s top industry exposures. |
Describe portfolio positioning at period end.
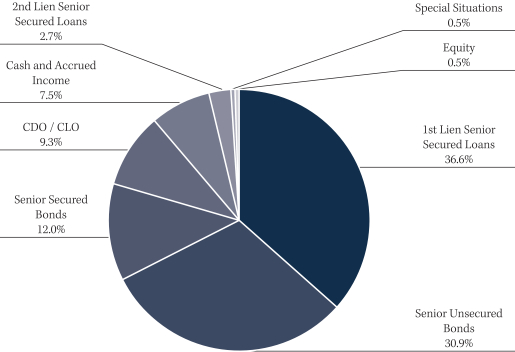
| | ∎ | | The Fund finished the annual reporting period, ended June 30, 2020, with an allocation of 42.9%, 39.3% and 9.3% to global high yield bonds, global senior secured loans and CLOs, respectively. The remainder of the portfolio was invested in equities at 0.5%, special situations at 0.5%, and cash/other at 7.5%. A significant portion of the portfolio (approximately 60.6%) was senior secured in nature (including CLOs backed by secured loans), which can potentially mitigate principal loss in default situations. |
| | ∎ | | From an industry perspective, the Fund was well diversified across a number of sectors, with concentrations in health care, education and childcare (9.0%), diversified/conglomerate services (6.7%), and broadcasting and entertainment (5.4%) as of June 30, 2020. |
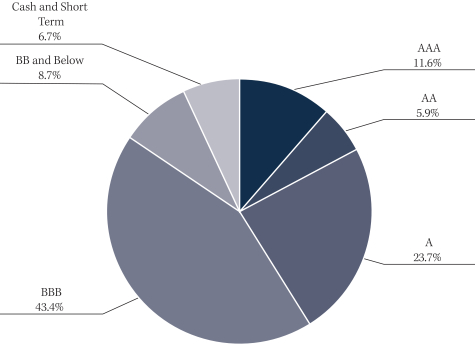
| | ∎ | | As of June 30, 2020, the Fund had the following credit quality breakdown: 3.7% in BBB assets, 26.8% in BB assets, 42.1% in single-B assets, and 15.4% in CCC and below assets. Approximately 4.3% of the Fund’s assets are not publicly rated. Cash and accrued income accounted for the remaining 7.5% of the portfolio assets.3 |
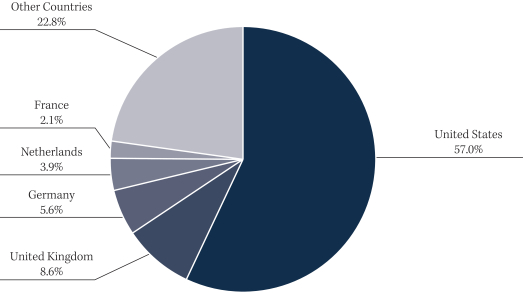
| | ∎ | | The top five countries in the portfolio at the end of the reporting period were the U.S. (57.0%), the U.K. (8.6%), Germany (5.6%), the Netherlands (3.9%) and France (2.1%). The Cayman Islands exposure related to the Fund’s CLO holdings was included in the U.S. Overall, the Fund had exposure to 29 different countries, and we continue to focus on building a well-diversified portfolio of global high yield securities. |
Describe market and portfolio outlook.
| | ∎ | | The global credit markets staged a strong rebound throughout the second quarter of 2020,bolstered by swift action by governments, central banks and private investors, to support global economies as the world comes to terms with life during a pandemic. While default activity has increased across below investment grade credit, in our view some of these elements have helped some companies navigate the current environment. |
| | ∎ | | Despite the recovery thus far, below investment grade credit markets have not yet fully recovered to pre-pandemic levels. Therefore, we continue to believe there are opportunities in below investment grade credit to be additive to total return performance as the recovery continues. |
| | ∎ | | However, until there is a clear path past the global pandemic, there will remain an element of uncertainty across credit markets. For this reason, we believe that prudent asset selection and actively managed portfolios are crucial for navigating the current environment. Also, while the pace of recovery may vary at times across geographies and markets, opportunities will emerge, and therefore we believe that taking a global, multi-credit approach to below investment grade credit provides the ability to capture additional relative value opportunities. |
| 3. | Ratings shown are the highest rating given by one of the following national rating agencies: S&P, Moody’s or Fitch. Additional information about ratings can be found, respectively, at www.standardandpoors.com, www.moodys.com and www.fitchratings.com. Credit ratings are subject to change. AAA, AA, single-A, and BBB are investment grade ratings categories used by S&P and Fitch; BB, single-B, CCC/CC/C and single-D are below investment grade ratings categories used by S&P and Fitch. Aaa, Aa, single-A and Baa are investment grade ratings categories used by Moody’s; Ba, single-B, Caa/Ca and single-C are below investment grade ratings categories used by Moody’s. Ratings categories may include gradations within each category. Bonds backed by U.S. Government or agency securities are given an implied rating equal to the rating of such securities. Holdings designated “Not Publicly Rated” are not rated by these national rating agencies. |
7
Barings Global Credit Income Opportunities Fund 2020 Annual Report
PORTFOLIO COMPOSITION (% OF ASSETS*)
COUNTRY COMPOSITION (% OF ASSETS**)
| **Percentage | of assets are expressed by market value excluding cash and accrued income, and may vary over time. As of June 30, 2020. |
8
Barings Global Credit Income Opportunities Fund 2020 Annual Report
| | | | | | | | | | | | | | | | |
| % AVERAGE ANNUAL TOTAL RETURNS 5,7,8 | | INCEPTION DATE | | | ONE YEAR | | | THREE YEARS | | | INCEPTION TO DATE | |
Class A With Load | | | 09/16/2013 | | | | -7.54 | % | | | -0.76 | % | | | 2.64 | % |
Class A No Load | | | 09/16/2013 | | | | -3.69 | % | | | 0.60 | % | | | 3.22 | % |
Class C With Load | | | 09/16/2013 | | | | -5.32 | % | | | -0.15 | % | | | 2.45 | % |
Class C No Load | | | 09/16/2013 | | | | -4.41 | % | | | -0.15 | % | | | 2.45 | % |
Class I With Load | | | 09/16/2013 | | | | -3.45 | % | | | 0.85 | % | | | 3.47 | % |
Class I No Load | | | 09/16/2013 | | | | -3.45 | % | | | 0.85 | % | | | 3.47 | % |
Class Y With Load | | | 09/16/2013 | | | | -3.44 | % | | | 0.85 | % | | | 3.47 | % |
Class Y No Load | | | 09/16/2013 | | | | -3.44 | % | | | 0.85 | % | | | 3.47 | % |
| 4. | Inception date: September 16, 2013. |
| 5. | Class A performance with the sales charges includes the maximum 3.00% sales charge. |
| 6. | Benchmark: 3-Month USD LIBOR plus 500 bps. The 3-Month USD LIBOR (London Interbank Offered Rate) is an average interest rate, determined by the Intercontinental Exchange, that banks charge one another for the use of short-term money (three months) in England’s Euro dollar market. The return shown includes 3-Month USD LIBOR plus 500 bps, or 5% per annum. LIBOR is unmanaged. It is not possible to invest directly in LIBOR. No assurance can be given that the Fund’s performance will exceed that of LIBOR by any given increment, or at all. |
| 7. | Line graph and table do not reflect the deduction of taxes that a shareholder would pay. |
| 8. | Class C performance with the sales charges includes the 1.00% contingent deferred sales charge (CDSC) for returns of one year or less. |
9
Barings Active Short Duration Bond Fund 2020 Annual Report
Investment Objective
Barings Active Short Duration Bond Fund (“Active Short Duration Bond Fund” or the “Fund”) seeks to achieve a high total rate of return, primarily from current income while minimizing fluctuations in capital values by investing primarily in a diversified portfolio of short-term investment grade fixed income securities.
Portfolio Management Commentary
How did the Fund perform?
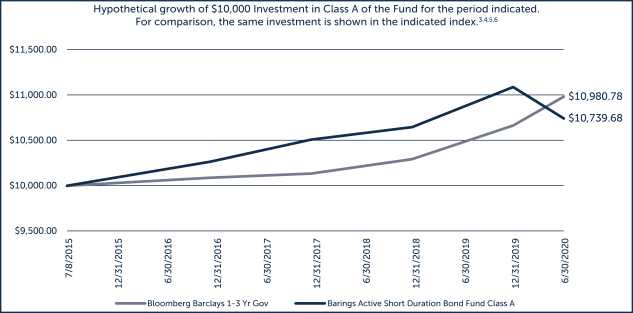
| | ∎ | | The Fund reported a net total rate of return for the period from July 1, 2019 through June 30, 2020 of -1.45%, underperforming the Bloomberg Barclays U.S. 1-3 Year Government Bond Index (the “Benchmark”), which returned 4.12%.1,5 |
What factors influenced performance of the Fund?
| | ∎ | | Financial markets were hit very hard in the first quarter of 2020 as a result of the COVID-19 pandemic, including even short maturity, high quality strategies. Given the market disruption, experienced, short U.S. Treasuries were among the highest performing sectors in the market for the period. Furthermore, an index such as the Benchmark did particularly well, as it has no credit exposure, being comprised primarily of Treasuries. |
| | ∎ | | A shorter-duration position contributed negatively to performance relative to the Benchmark as rates declined over the period. The Fund uses Treasury bonds and futures to help manage duration. The front end of the Treasury yield curve remains flat between three months and three years. The U.S. Federal Reserve (Fed) continued its accommodative monetary policy with rates held at a target of 0.00% to 0.25%. Markets are now anticipating that the next rate move will not occur before 2021. The Fund ended the period with a 0.27 year duration in accordance with our rules-based duration management process. |
| | ∎ | | We continue to favor securitized credit over corporate credit, emphasizing structure over unsecured positions. The Fund’s allocation to consumer asset-backed securities (ABS) was a negative contributor to performance. Student loans, aviation, and consumer loan collateral were among the top detractors within the ABS sector. At the onset of the crisis, the market observed prices across securitized asset classes detach from underlying fundaments, causing mark-to-market volatility that brought asset prices lower. Market concern over consumer demand impact amid the once developing COVID-19 crisis had higher beta consumer sectors – such as auto rental, timeshare and aviation – at very illiquid and wide spread levels. By the end of the reporting period, securitized risk assets had rebounded on the heels of positive technicals that allowed spreads to compress tighter and reprice collateral higher. |
| | ∎ | | The Fund’s allocation to commercial mortgage-backed securities (CMBS) and residential mortgage-backed securities (RMBS) also detracted from performance over the period. Many investors sold these securities to source liquidity with very few market participants willing to purchase them at the onset of the crisis. Prices across both CMBS and RMBS securities were negatively affected by this technical. |
| | ∎ | | The 35% allocation to investment grade corporate credit detracted from performance, but recovered much quicker than the Fund’s securitized allocations. The outbreak of the COVID-19 global pandemic resulted in a rapid repricing of corporate risk assets in the first quarter. Market spreads widened to 373 basis points (bps) on March 23, with the pace of widening much greater than the 2008-09 crisis period. Corporate spreads have recovered 223 bps since then, as a result monetary intervention and improved investor sentiment. |
| 1. | Total return describes the return to an investor of Class Y shares and includes the reinvestment of dividends and capital gains. Past performance is no guarantee of future results, and investment returns and the net asset value (NAV) of shares of the Fund will fluctuate so that shares, when redeemed, may be worth more or less than their original cost. Current performance may be higher or lower than performance quoted. Call 1.855.439.5459 or visit barings.com for current month-end performance. All returns one-year or less are cumulative. |
| 5. | Benchmark: The Bloomberg Barclays U.S. 1-3 Year Government Bond Index is comprised of the U.S. Treasury Index and U.S. Agency Index. The U.S. Government Index includes Treasuries (public obligations of the U.S. Treasury) and U.S. agency debentures (publicly issued debt of U.S. government agencies, quasi-federal corporations, and corporate or foreign debt guaranteed by the U.S. government) that have remaining maturities of more than one year, and up to but not including three years. Indexes are unmanaged. It is not possible to invest directly in an index. |
10
Barings Active Short Duration Bond Fund 2020 Annual Report
| | ∎ | | The Fund’s small position in high-quality collateralized loan obligation (CLO) tranches was also a negative contributor. Spreads widened, negatively impacting security prices as a result of volatility seen in the first quarter of 2020. The Fund is invested in AAA-rated and select AA-rated tranches. We continue to like the structural subordination offered by CLOs, and favor high quality managers. |
| | ∎ | | The allocation to BB-rated high yield corporate bonds was a neutral contributor to performance. |
Describe recent portfolio activity.
| | ∎ | | The Fund ended the period with a duration positioning of 0.27 years, as the front end of the U.S. Treasury curve remained flat. |
| | ∎ | | The Fund reduced positioning in ABS and Treasuries, while increasing allocations to investment grade corporates, high yield corporates, RMBS and CMBS over the period. The Fund’s high quality CLO weight remained unchanged. |
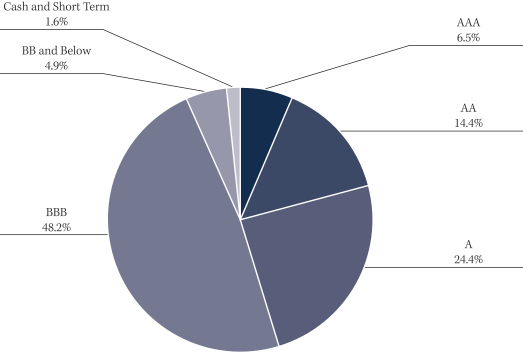
| | ∎ | | The Funds allocation to AAA-rated positions decreased, while BBB quality increased over the reporting period. |
Describe portfolio positioning at period end.
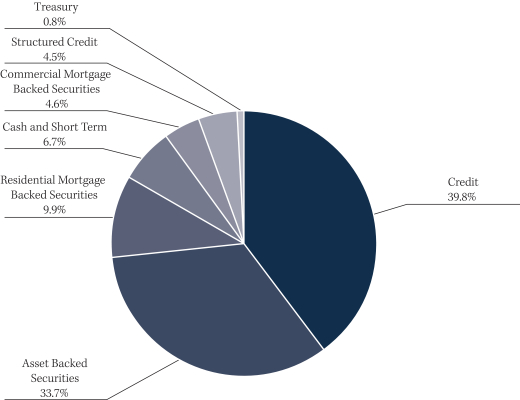
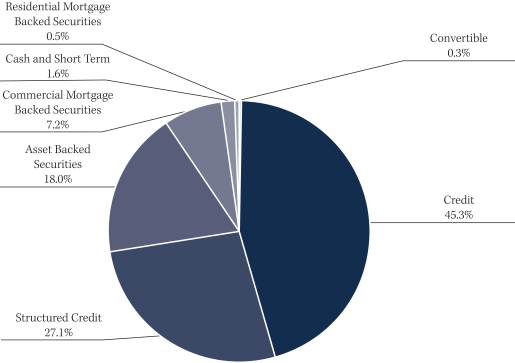
| | ∎ | | The Fund continued to be well diversified across corporate and securitized sectors. The securitized ABS allocation was 33.7% at the end of the period. Automotive loan collateral represented the largest allocation, followed by student loan collateral. Further, commercial ABS sub-sectors include timeshare, personal consumer loan, aircraft leasing and franchise receivables deals. The Fund maintained an active position in RMBS and CMBS securities, ending the period at 9.9% and 4.4%, respectively. |
| | ∎ | | At the end of the period, the Fund’s credit allocation was 39.7%. This allocation was comprised of 32.9% in investment grade corporates, 4.2% in BB-rated high yield corporates, and 0.8% in U.S. dollar-denominated emerging markets debt (EMD). Banks/brokers and independent finance represent the Fund’s largest corporate sector allocations, followed by midstream pipes and chemicals. |
| | ∎ | | High-quality AAA and AA CLO tranches represented a combined 4.5% allocation for the Fund. |
Describe market and portfolio outlook.
| | ∎ | | The market saw unprecedented events unfold over the past six months. Starting in the first quarter, financial markets were hit very hard, including even short maturity, high quality strategies. |
| | ∎ | | Starting in late April, investors experienced a case of whiplash as markets turned positive on the sentiment that the worst of the pandemic may be behind us. |
| | ∎ | | The Fed took an expedited course to stem volatility by implementing an alphabet soup of programs meant to get the market back on course, and it has largely been successful to date. Targeting the corporate credit market, it established the PMCCF and SMCCF to support credit to employers by providing liquidity to the market for outstanding corporate bonds. Targeting the securitized market, it established the TALF program to support the flow of credit to consumers and businesses. |
| | ∎ | | To date, these programs have largely accomplished their goals, as market liquidity, investor sentiment, and security prices regained much of the ground lost at the start of the crisis. |
| | ∎ | | Market trends continued to show modest signs of improvement by the end of the second quarter; however, there are still many longer-term unknowns facing investors. In our view, economic data released continues to be better than once feared at the onset of the pandemic; however, the U.S. faces a second wave of the virus as multiple states have started to relax stay-at-home orders. |
| | ∎ | | A spike in cases could open the possibility of continued consumer restrictions that run the risk of producing a second leg down for markets. While many investors are enjoying the sugar high by trading on technicals created by monetary and fiscal stimulus, we remain committed to our fundamental bottom-up process of capital preservation. |
11
Barings Active Short Duration Bond Fund 2020 Annual Report
CREDIT QUALITY BREAKDOWN (% OF ASSETS*)
PORTFOLIO COMPOSITION (% OF ASSETS*)
12
Barings Active Short Duration Bond Fund 2020 Annual Report
| | | | | | | | | | | | | | | | |
| % AVERAGE ANNUAL TOTAL RETURNS 3,4,6,7,8 | | INCEPTION DATE | | | ONE YEAR | | | THREE YEARS | | | INCEPTION TO DATE | |
Class A With Load | | | 07/08/2015 | | | | -1.68 | % | | | 0.96 | % | | | 1.24 | % |
Class A No Load | | | 07/08/2015 | | | | -1.68 | % | | | 0.96 | % | | | 1.24 | % |
Class C With Load | | | 07/08/2015 | | | | -2.44 | % | | | 0.68 | % | | | 0.97 | % |
Class C No Load | | | 07/08/2015 | | | | -1.96 | % | | | 0.68 | % | | | 0.97 | % |
Class L With Load | | | 05/01/2020 | | | | N/A | | | | N/A | | | | 3.52 | % |
Class L No Load | | | 05/01/2020 | | | | N/A | | | | N/A | | | | 3.52 | % |
Class I With Load | | | 07/08/2015 | | | | -1.45 | % | | | 1.22 | % | | | 1.49 | % |
Class I No Load | | | 07/08/2015 | | | | -1.45 | % | | | 1.22 | % | | | 1.49 | % |
Class Y With Load | | | 07/08/2015 | | | | -1.45 | % | | | 1.21 | % | | | 1.48 | % |
Class Y No Load | | | 07/08/2015 | | | | -1.45 | % | | | 1.21 | % | | | 1.48 | % |
| 2. | Ratings shown are the highest ratings given by one of the following national rating agencies: S&P, Moody’s or Fitch. Additional information about ratings can be found, respectively, at www.standardandpoors.com, www.moodys.com and www.fitchratings.com. Credit ratings are subject to change. AAA, AA, single-A and BBB are investment grade ratings categories used by S&P and Fitch. BB, single-B, CCC/CC/C and single-D are below investment grade ratings categories used by S&P and Fitch. Aaa, Aa, single-A and Baa are investment grade ratings categories used by Moody’s. Ba, single-B, Caa/Ca and single-C are below investment grade ratings categories used by Moody’s. Ratings categories may include gradations within each category. Bonds backed by U.S. government or agency securities are given an implied rating equal to the rating of such securities. Holdings designated Not Publicly Rated are not rated by these national rating agencies. |
| 3. | Inception date: July 8, 2015. |
| 4. | Class A performance with the sales charges includes the maximum 3.00% sales charge. |
| 5. | Benchmark: The Bloomberg Barclays U.S. 1-3 Year Government Bond Index is comprised of the U.S. Treasury Index and U.S. Agency Index. The U.S. Government Index includes Treasuries (public obligations of the U.S. Treasury) and U.S. agency debentures (publicly issued debt of U.S. government agencies, quasi-federal corporations, and corporate or foreign debt guaranteed by the U.S. government) that have remaining maturities of more than one year, and up to but not including three years. Indexes are unmanaged. It is not possible to invest directly in an index. |
| 6. | Line graph and table do not reflect the deduction of taxes that a shareholder would pay. |
| 7. | Class C performance with the sales charges includes the 1.00% contingent deferred sales charge (CDSC) for returns of one year or less. |
| 8. | Class L share class launched effective 05/01/2020. |
13
Barings Diversified Income Fund 2020 Annual Report
Investment Objective
The Barings Diversified Income Fund (“Diversified Income Fund” or the “Fund”) seeks to provide a total return comprised of current income and capital appreciation by investing primarily in an actively managed diversified portfolio of global investment grade rated fixed and floating rate instruments.
Portfolio Management Commentary
How did the Fund perform?
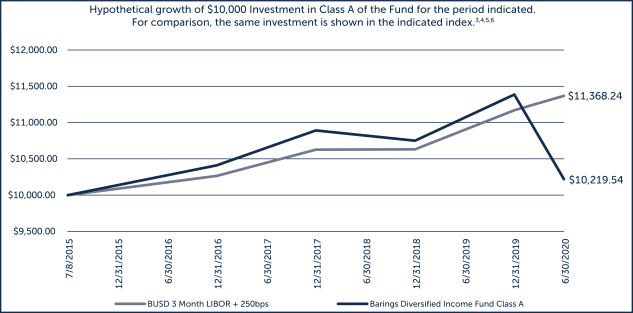
| | ∎ | | The Fund reported a total net rate of return for the period from July 1, 2019 through June 30, 2020 of -7.88%, underperforming the 3 Month LIBOR +250 basis points (bps) benchmark, which returned 4.16%.1,5 |
What factors influenced performance of the Fund?
| | ∎ | | High-quality collateralized loan obligation (CLO) positioning in AA to BBB-rated tranches detracted from performance over the period. The allocation has a high average of single-A quality. High quality CLO tranches were priced lower over the period, resulting in a mark-to-market performance impact, and speculation of the performance of underlying collateral during the COVID-19 pandemic. CLO prices saw a modest recovery starting in the second quarter; however, spreads remain at wide levels. |
| | ∎ | | The Fund’s allocations to securitized credit and consumer asset-backed securities (ABS) were both detractors from performance. Within the ABS sector, aviation, student loan, and franchise receivable collateral were among the top detractors. At the onset of the crisis, the market observed prices across securitized asset classes detach from underlying fundaments, causing mark-to-market volatility that brought asset prices lower. Market concern over consumer demand impact amid the once developing COVID-19 crisis had higher beta consumer sectors at very illiquid and wide levels. By the end of the reporting period, securitized risk assets had rebounded on the heels of positive technicals that allowed spreads to compress tighter and reprice collateral higher. |
| | ∎ | | The Fund’s allocation to commercial mortgage backed securities (CMBS) and residential mortgage backed securities (RMBS) also detracted from performance over the period. Many investors sold these securities to source liquidity with very few market participants willing to purchase them. Prices across both CMBS and RMBS were negatively affected by this technical. |
| | ∎ | | Investment grade corporate credit across both developed and emerging market geographies detracted from performance, but has recovered quicker than the Fund’s securitized allocation. The outbreak of the COVID-19 global pandemic resulted in a rapid repricing of U.S. corporate risk assets in the first quarter. U.S. corporate spreads widened to 373 bps on March 23, with the pace of widening much greater than the 2008-09 crisis period. Corporate spreads have recovered 223 bps since then, largely due to monetary intervention and improved investor sentiment. Both emerging and developed corporate markets continued to tighten leading up to the end of the reporting period; however, emerging markets debt (EMD) has largely lagged the recovery seen in the U.S. as a result of the lack of a centralized monetary authority guiding a cohesive market intervention. |
| | ∎ | | The Fund began to allocate to BB-rated high yield corporates over the period. This allocation was a neutral contributor to performance. |
| 1. | Total return describes the return to an investor of Class Y shares and includes the reinvestment of dividends and capital gains. Past performance is no guarantee of future results, and investment returns and the net asset value (NAV) of shares of the Fund will fluctuate so that shares, when redeemed, may be worth more or less than their original cost. Current performance may be higher or lower than performance quoted. Call 1.855.439.5459 or visit barings.com for current month-end performance. All returns one-year or less are cumulative. |
| 5. | Benchmark: 3-Month USD LIBOR plus 250 bps. The 3-Month USD LIBOR (London Interbank Offered Rate) is an average interest rate, determined by the Intercontinental Exchange, that banks charge one another for the use of short-term money (three months) in England’s Euro dollar market. The return shown includes 3-Month USD LIBOR plus 250 bps, or 2.5% per annum. LIBOR is unmanaged. It is not possible to invest directly in LIBOR. No assurance can be given that the Fund’s performance will exceed that of LIBOR by any given increment, or at all. |
14
Barings Diversified Income Fund 2020 Annual Report
| | ∎ | | Duration positioning was a positive contributor to performance, as rates declined over the period. The Fund uses futures to help manage duration. The front end of the Treasury yield curve remains flat between three months and three years. The U.S. Federal Reserve (Fed) continued its accommodative monetary policy with rates held at a target 0.00% to 0.25%. Markets are now anticipating that the next rate move will not occur before the end of 2020. |
Describe recent portfolio activity.
| | ∎ | | The Fund ended the period with a duration positioning of 0.53 years, as the front end of the U.S. Treasury curve remains flat. |
| | ∎ | | The Fund reduced positioning in ABS and CLO allocations, while increasing allocations to investment grade corporates, high yield corporates, RMBS, and CMBS over the period. The Fund’s hard currency EMD weight remained unchanged. |
| | ∎ | | The Funds allocation to AAA, BBB and BB-rated positions increased, while single-A and AA quality decreased over the reporting period. |
Describe portfolio positioning at period end.
| | ∎ | | High quality CLO tranches represented the Fund’s largest allocation, at 27.9%. We continued to favor the total return potential and structural subordination of CLOs, and favor AA to BBB quality tranches. |
| | ∎ | | The securitized ABS allocation was 25.3% at the end of the period. Student loan and aviation collateral were the highest sector allocations, followed by medical and property assessed clean energy (PACE) collateral. The Fund maintained an active position in CMBS and RMBS securities, ending the period at 6.8% and 2.1%, respectively. |
| | ∎ | | Investment grade corporates represent a 20.0% allocation. The Fund has favored BBB-rated positions in less cyclical industries such as banking, diversified industrials and insurance. |
| | ∎ | | EMD hard currency positioning was 18.1% at the end of the period. The hard currency EMD allocation in the Fund remained well-diversified across sectors and regions. At the end of the period, the largest sector within the EM sleeve was the financials sector, and the largest region represented in the portfolio was Latin America. |
Describe market and portfolio outlook.
| | ∎ | | The market saw unprecedented events unfold over the past six months. Starting in the first quarter, financial markets were hit very hard, including even short maturity, high quality strategies. |
| | ∎ | | Starting in late April, investors experienced a case of whiplash as markets turned positive on the sentiment that the worst of the pandemic may be behind us. |
| | ∎ | | The Fed took an expedited course to stem volatility by implementing an alphabet soup of programs meant to get the market back on course, and up to this point, it has largely been successful. Targeting the corporate credit market, it established PMCCF and SMCCF to support credit to employers by providing liquidity to the market for outstanding corporate bonds. Targeting the securitized market, it established the TALF program to support the flow of credit to consumers and businesses. |
| | ∎ | | To date, these programs have largely accomplished their goals, as market liquidity, investor sentiment, and security prices regained much of the ground lost at the start of the crisis. |
| | ∎ | | Market trends continued to show modest signs of improvement by the end of the second quarter; however, there are still many longer-term unknowns facing investors. Economic data released continues to be better than once feared at the onset of the pandemic; however, the U.S. faces a second wave of the virus as multiple states have started to relax stay-at-home orders. |
| | ∎ | | A spike in cases could open the possibility of continued consumer restrictions that run the risk of producing a significant dislocation for markets. While many investors have enjoyed the sugar high by trading on technicals created by monetary and fiscal stimulus, we remain diligent to our fundamental bottom-up process of capital preservation. |
15
Barings Diversified Income Fund 2020 Annual Report
CREDIT QUALITY BREAKDOWN (% OF ASSETS*)
PORTFOLIO COMPOSITION (% OF ASSETS*)
16
Barings Diversified Income Fund 2020 Annual Report
| | | | | | | | | | | | | | | | |
| % AVERAGE ANNUAL TOTAL RETURNS 3,4,6,7 | | INCEPTION DATE | | | ONE YEAR | | | THREE YEARS | | | INCEPTION TO DATE | |
Class A With Load | | | 07/08/2015 | | | | -11.79 | % | | | -2.95 | % | | | -0.56 | % |
Class A No Load | | | 07/08/2015 | | | | -8.11 | % | | | -1.62 | % | | | 0.26 | % |
Class C With Load | | | 07/08/2015 | | | | -9.69 | % | | | -2.35 | % | | | -0.49 | % |
Class C No Load | | | 07/08/2015 | | | | -8.80 | % | | | -2.35 | % | | | -0.49 | % |
Class I With Load | | | 07/08/2015 | | | | -7.88 | % | | | -1.37 | % | | | 0.50 | % |
Class I No Load | | | 07/08/2015 | | | | -7.88 | % | | | -1.37 | % | | | 0.50 | % |
Class Y With Load | | | 07/08/2015 | | | | -7.88 | % | | | -1.37 | % | | | 0.50 | % |
Class Y No Load | | | 07/08/2015 | | | | -7.88 | % | | | -1.37 | % | | | 0.50 | % |
| 2. | Ratings shown are the highest ratings given by one of the following national rating agencies: S&P, Moody’s or Fitch. Additional information about ratings can be found, respectively, at www.standardandpoors.com, www.moodys.com and www.fitchratings.com. Credit ratings are subject to change. AAA, AA, single-A and BBB are investment grade ratings categories used by S&P and Fitch. BB, single-B, CCC/CC/C and single-D are below investment grade ratings categories used by S&P and Fitch. Aaa, Aa, single-A and Baa are investment grade ratings categories used by Moody’s. Ba, single-B, Caa/Ca and single-C are below investment grade ratings categories used by Moody’s. Ratings categories may include gradations within each category. Bonds backed by U.S. government or agency securities are given an implied rating equal to the rating of such securities. Holdings designated Not Publicly Rated are not rated by these national rating agencies. |
| 3. | Inception date: July 8, 2015. Diversified Income strategy change effective March 1, 2019. |
| 4. | Class A performance with the sales charges includes the maximum 4.00% sales charge. |
| 5. | Benchmark: 3-Month USD LIBOR plus 250 bps. The 3-Month USD LIBOR (London Interbank Offered Rate) is an average interest rate, determined by the Intercontinental Exchange, that banks charge one another for the use of short-term money (three months) in England’s Euro dollar market. The return shown includes 3-Month USD LIBOR plus 250 bps, or 2.5% per annum. LIBOR is unmanaged. It is not possible to invest directly in LIBOR. No assurance can be given that the Fund’s performance will exceed that of LIBOR by any given increment, or at all. |
| 6. | Line graph and table do not reflect the deduction of taxes that a shareholder would pay. |
| 7. | Class C performance with the sales charges includes the 1.00% contingent deferred sales charge (CDSC) for returns of one year or less. |
17
Barings Emerging Markets Debt Blended Total Return Fund 2020 Annual Report
Investment Objective
Barings Emerging Markets Debt Blended Total Return Fund (“EMD Blended Total Return Fund” or the “Fund”) seeks to achieve maximum total return, consistent with preservation of capital and prudent investment management, through high current income generation and, where appropriate, capital appreciation.
Portfolio Management Commentary
How did the Fund perform?
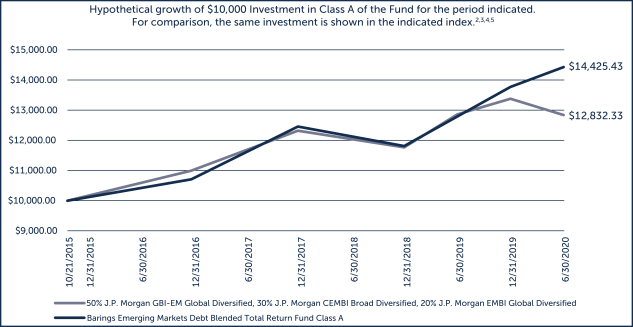
| | ∎ | | The Fund reported a net total rate of return for the period from July 1, 2019 through June 30, 2020 of 10.33%.1 The net total rate of return for the Fund’s performance benchmark – a blend of 50% JPMorgan Government Bond Index – Emerging Markets Global Diversified (GBI-EMGD), 30% JPMorgan EMBI Global Diversified and 20% JPMorgan CEMBI Broad Diversified – was -0.17%. The Fund is not managed relative to the benchmark; however, the comparison is provided to show how the Fund’s returns compare with those of a broad measure of market performance. |
| | ∎ | | All three of the Fund’s sub-strategies – emerging market (EM) corporates, EM sovereign and EM local – generated positive performance over the period. This occurred as U.S. Treasury rates rallied 136 basis points (bps) over the past 12 months, alongside a dovish U.S. Federal Reserve (Fed) and European Central Bank (ECB). Local rates in EM countries fell, while EM currencies depreciated over the period. |
What factors influenced performance of the Fund?
| | ∎ | | The Fund’s positioning, and active allocations across countries and credits, were additive to performance. EM local rallied, as we saw monetary stimulus and rate cuts across EM countries in reaction to COVID-19’s economic toll. EM debt flows were strong in the second half of 2019, with $22 billion of positive flows mostly from hard currency, which was followed by six months accounting for -$25.1 billion in net outflows for the first half of 2020. |
| | ∎ | | For the 12-month reporting period ending June 30, 2020, the Fund’s positioning in Russia, Brazil, Mexico, Hungary and South Africa contributed positively to Fund performance. However, the Fund’s positions in Argentina, India, El Salvador, Angola and Ghana detracted from performance. |
Describe recent portfolio activity.
| | ∎ | | Following the sharp sell-off experienced in March 2020, the Fund increased its exposure to EM currencies, to capture potential currency appreciation as a result of stronger balance-of-payments outlook, along with higher commodity prices. The Fund also increased exposure to EM sovereign hard currency assets, as spreads were overcompensating for defaults, and opportunities have become available following the sharp sell-off in the first half of the year. The Fund has maintained most positions, as we believe fiscal stimuli will allow for moderate growth, low inflation and lower rates in select EM local markets. Positioning in select corporate names remains similar to earlier in 2020, backed by healthy balance sheets and bonds, offering strong yields compared to some sovereign credits. |
Describe portfolio positioning at period end.
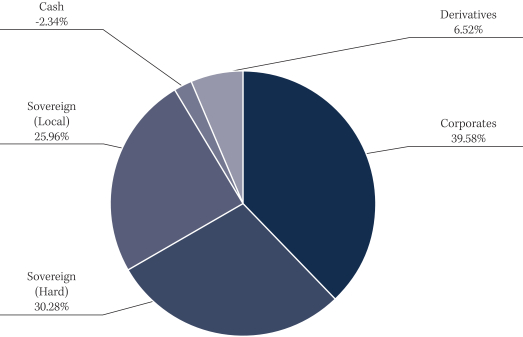
| | ∎ | | The Fund finished the reporting period, ending June 30, 2020, with a 49% exposure to sovereign hard currencies (inclusive of credit default swaps), 41% to corporate debt, 31% to sovereign local currencies, and a 0.5% settled cash position. |
| | ∎ | | The top five countries in the portfolio at the end of the reporting period were Mexico (14.8%), Brazil (14.4%), Ukraine (8.7%), Indonesia (7.2%) and South Africa (5.8%). The top five corporate issuers were Tullow Oil (2.5%), Petrobras (2.3%), PEMEX (1.9%), National Bank of Greece (1.7%) and Sovcom Bank (1.7%). Overall, the Fund had exposure to 42 countries, 36 corporates and 21 different currencies. |
| 1. | Total return describes the return to an investor of Class Y shares and includes the reinvestment of dividends and capital gains. Past performance is no guarantee of future results, and investment returns and the net asset value (NAV) of shares of the Fund will fluctuate so that shares, when redeemed, may be worth more or less than their original cost. Current performance may be higher or lower than performance quoted. Call 1.855.439.5459 or visit barings.com for current month-end performance. All returns one-year or less are cumulative. |
18
Barings Emerging Markets Debt Blended Total Return Fund 2020 Annual Report
Describe market and portfolio outlook.
| | ∎ | | We believe that the asset class is likely to benefit from continued monetary stimulus and the potential for a sharp economic rebound in the second half of the year. We expect that countries will continue down the recent path of becoming increasingly insular and relying more on domestic production of goods and services, a trend that COVID-19 is accelerating, and that may prove to be a long-term structural headwind for EMs. Technicals continue to drive the market, as the ample liquidity pumped into the system by governments and central banks continues to support asset prices. It’s difficult to say if, or when, this will take a turn in the near term. We’ve seen recent signs that fear may be creeping back into the market, as negative headlines on COVID-19 in the U.S., Brazil and other hotspots are digested. There remain risks to both the upside and downside cases for global recovery. But on balance, we think the continued monetary stimulus, along with the potential for a sharper economic bounce-back in the second half of the year, could provide a tailwind to many EMs. |
19
Barings Emerging Markets Debt Blended Total Return Fund 2020 Annual Report
PORTFOLIO COMPOSITION (% OF ASSETS*)
REGIONAL COMPOSITION (% OF ASSETS**)
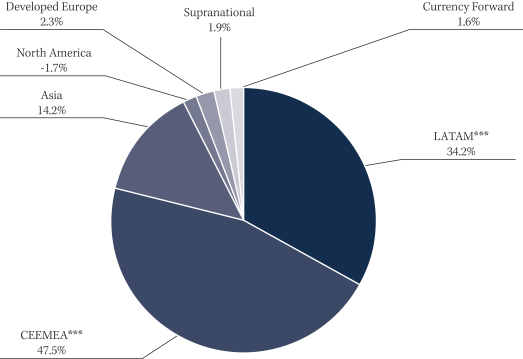
| ** | The percentages shown above are expressed by market value, excluding cash and accrued income, and may vary over time. As of June 30, 2020. |
| *** | CEEMEA: Central Europe, Eastern Europe, Middle East and Africa. |
| | LATAM: Latin America (includes countries in Central and South America). |
20
Barings Emerging Markets Debt Blended Total Return Fund 2020 Annual Report
| | | | | | | | | | | | | | | | |
| % AVERAGE ANNUAL TOTAL RETURNS 2,3,5,6 | | INCEPTION DATE | | | ONE YEAR | | | THREE YEARS | | | INCEPTION TO DATE | |
Class A With Load | | | 10/21/2015 | | | | 5.71 | % | | | 5.19 | % | | | 6.38 | % |
Class A No Load | | | 10/21/2015 | | | | 10.11 | % | | | 6.63 | % | | | 7.31 | % |
Class C With Load | | | 10/21/2015 | | | | 8.28 | % | | | 5.85 | % | | | 6.53 | % |
Class C No Load | | | 10/21/2015 | | | | 9.28 | % | | | 5.85 | % | | | 6.53 | % |
Class I With Load | | | 10/21/2015 | | | | 10.39 | % | | | 6.90 | % | | | 7.58 | % |
Class I No Load | | | 10/21/2015 | | | | 10.39 | % | | | 6.90 | % | | | 7.58 | % |
Class Y With Load | | | 10/21/2015 | | | | 10.33 | % | | | 6.88 | % | | | 7.57 | % |
Class Y No Load | | | 10/21/2015 | | | | 10.33 | % | | | 6.88 | % | | | 7.57 | % |
| 2. | Inception date: October 21, 2015. |
| 3. | Class A performance with the sales charges includes the maximum 4.00% sales charge. |
| 4. | Benchmark is a blend of 50% JPMorgan Government Bond Index – Emerging Markets Global Diversified (GBI-EMGD), 30% JPMorgan EMBI Global Diversified and 20% JPMorgan CEMBI Broad Diversified. |
| 5. | Line graph and table do not reflect the deduction of taxes that a shareholder would pay. |
| 6. | Class C performance with the sales charges includes the 1.00% contingent deferred sales charge (CDSC) for returns of one year or less. |
21
Barings Global Emerging Markets Equity Fund 2020 Annual Report
Investment Objective
The Barings Global Emerging Markets Equity Fund (the “Fund”) seeks to achieve long-term capital growth.
Portfolio Management Commentary
How did the Fund perform?
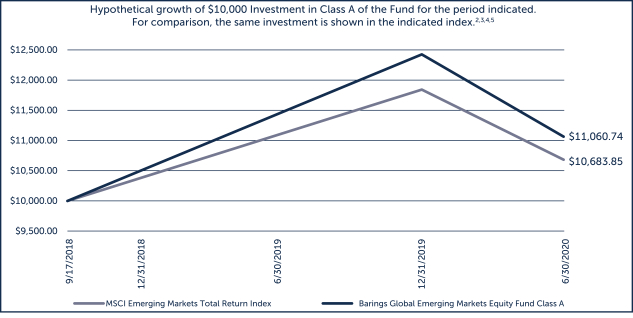
| | ∎ | | The Fund reported a net rate of return for the period from July 1, 2019, through June 30, 2020 of -3.78%, underperforming the MSCI Emerging Markets Index (the “Benchmark”), which returned -3.39%.1 |
What factors influenced performance of the Fund?
| | ∎ | | Contributors to relative Fund performance included the following: |
| | ∎ | | Tencent Holdings, a Chinese Technology group, ended the period as the Fund’s top contributor to relative returns, driven by an acceleration in online advertising revenue and a strong gaming release pipeline. |
| | ∎ | | Taiwan Semiconductor Manufacturing Co., was a strong contributor to relative returns, benefitting from earnings which beat expectations and increased optimism regarding future 5G demand. |
| | ∎ | | Reliance Industries, a large Indian conglomerate, reported strong earnings driven by capacity growth and margin expansion within its petrochemicals business, and strong subscriber acquisition within its telecommunications division. |
| | ∎ | | Detractors to relative Fund performance included the following: |
| | ∎ | | HDFC Bank, detracted on concerns that weaker economic activity in India would lead to a deterioration in asset quality. Despite this short-term weakness, the company’s most recent earnings were strong, beating expectations on growth as well as asset quality. |
| | ∎ | | PT Bank Negara Indonesia, an Indonesian bank, underperformed caused in part by a deteriorating macroeconomic environment. |
| | ∎ | | China State Construction International, detracted on lingering macroeconomic concerns, though improving orders and infrastructure investment points to a stronger profit outlook. |
Describe recent portfolio activity.
| | ∎ | | Q3 2019: Over the period, the Fund exited its position in cement manufacturer Cemex, in favor of better opportunities elsewhere. |
| | ∎ | | Q4 2019: Over the period, the Fund adjusted its exposure to the Russian energy sector, selling out of its holding in Novatek. We also initiated a position in Topsports, as we believe the company is well positioned to capitalize on the structural growth of the sportswear market in China. |
| | ∎ | | YTD 2020: While portfolio activity remained relatively low, the recent market backdrop provided a number of opportunities to start building exposure in companies with sustainable business franchises, and strong balance sheets at more attractive valuation entry points. Over the period we sold our holdings in Russian natural gas producer Gazprom, and used the proceeds to add to our position in its competitor Lukoil. Elsewhere, we exited from steel company Angang Steel, diamond producer Alrosa, and financial services group Bancolombia, and started new positions in China Resources Cement, ENN Energy, Mediatek and Powertech. |
| | ∎ | | As medium- to long-term investors, we expect the average annual turnover rate of the strategy to be 20-40%. The turnover for the Fund for the period from July 1, 2019, through June 30, 2020 was 18.8%. |
| 1. | Total return describes the return to an investor of Class Y shares and includes the reinvestment of dividends and capital gains. Past performance is no guarantee of future results, and investment returns and the net asset value (NAV) of shares of the Fund will fluctuate so that shares, when redeemed, may be worth more or less than their original cost. Current performance may be higher or lower than performance quoted. Call 1.855.439.5459 or visit barings.com for current month-end performance. All returns one-year or less are cumulative. The performance comparator is MSCI Emerging Markets Total Return Index with net dividends. |
22
Barings Global Emerging Markets Equity Fund 2020 Annual Report
Describe portfolio positioning at period end.
| | ∎ | | The Fund’s positioning at the end of the period reflects our bottom-up investment process, where we aim to identify companies with sustainable business franchises, and with future growth potential that is not fully reflected in the current share price. As a result, our active country and sector positioning relative to the Benchmark is not driven by a deliberate top-down strategy, but is a by-product of our bottom-up stock selection process. |
| | ∎ | | Relative to the Benchmark, the largest active country position was in India, and the largest active sector exposure was to financials, where in each case we continue to identify many companies that we believe have strong medium-term growth prospects and are attractively valued. |
| | ∎ | | Despite the large active position in both cases, we believe that the performance of these companies will be predominantly influenced by company-specific factors (i.e. that these companies will be largely in control of their own destiny), rather than by their respective country or sector. As bottom-up investors, we always seek these types of companies. |
| | ∎ | | As of the end of the reporting period, the top five country weightings in the Fund, on an absolute basis, were China and Hong Kong (43.4%), Taiwan (12.6%), India (11.1%), Korea (10.6%) and Russia (4.5%). |
| | ∎ | | In line with our investment process, we continue to seek out bottom-up investment opportunities where we believe the future earnings potential is not fully reflected in the current share price. |
Describe market and portfolio outlook.
| | ∎ | | In the near term, we believe that global markets are likely to remain volatile, as investors stay vigilant for any signs of an uptick in new infections which might signal a second wave. |
| | ∎ | | Clearly economic activity and corporate earnings have been, and will continue to be, significantly impacted in the short term, but we hope to begin to see some improving economic and earnings momentum from the second half of this year, as mobility restrictions are eased on a measured basis and normal consumption patterns slowly resume. |
| | ∎ | | In addition, we expect the large-scale monetary and fiscal stimulus announced globally will also help support and spur economic activity. In our view, a combination of slowly improving data, receding risk and attractive valuations should create a more positive backdrop for equity markets, as we move into the second half of this year and beyond. |
| | ∎ | | We will continue our process of building new (or adding to existing) positions in companies with strong and sustainable business franchises, where our proprietary bottom-up research has identified a significant degree of undervaluation relative to future growth potential. |
23
Barings Global Emerging Markets Equity Fund 2020 Annual Report
| | | | | | | | | | | | |
| % AVERAGE ANNUAL TOTAL RETURNS 2,3,5,6 | | INCEPTION DATE | | | ONE YEAR | | | INCEPTION TO DATE | |
Class A With Load | | | 9/17/2018 | | | | -4.02 | % | | | 3.63 | % |
Class A No Load | | | 9/17/2018 | | | | -4.02 | % | | | 3.63 | % |
Class C With Load | | | 9/17/2018 | | | | -4.74 | % | | | 2.86 | % |
Class C No Load | | | 9/17/2018 | | | | -4.74 | % | | | 2.86 | % |
Class I With Load | | | 9/17/2018 | | | | -3.78 | % | | | 3.89 | % |
Class I No Load | | | 9/17/2018 | | | | -3.78 | % | | | 3.89 | % |
Class Y With Load | | | 9/17/2018 | | | | -3.78 | % | | | 3.89 | % |
Class Y No Load | | | 9/17/2018 | | | | -3.78 | % | | | 3.89 | % |
| 2. | Inception date: September 17, 2018. A fund’s performance for very short time periods may not be indicative of future performance |
| 3. | Class A performance with the sales charges includes the maximum 4.00% sales charge. |
| 4. | Benchmark: MSCI Emerging Markets Total Return Index with net dividends designed to measure the equity market performance of the emerging markets. Indices are unmanaged. It is not possible to invest directly in an index. |
| 5. | Line graph and table do not reflect the deduction of taxes that a shareholder would pay. |
| 6. | Class C performance with the sales charges includes the 1.00% contingent deferred sales charge (CDSC) for returns of one year or less. |
24
Barings U.S. High Yield Fund 2020 Annual Report
Investment Objective
Barings U.S. High Yield Fund (“U.S. High Yield Fund” or the “Fund”) seeks to achieve a high level of total return, with an emphasis on current income, by investing primarily in high yield debt and related securities.
Portfolio Management Commentary
How did the Fund perform?
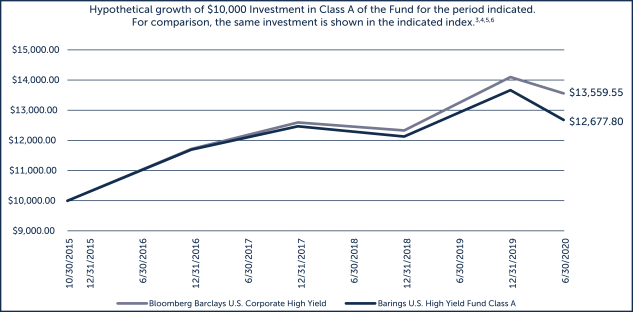
| | ∎ | | The Fund reported a net total rate of return for the reporting period from July 1, 2019 through June 30, 2020 of -3.43%, underperforming the Bloomberg Barclays U.S. Corporate High Yield Index (the “Benchmark”), which returned 0.03%.1, 5 |
What factors influenced performance of the Fund?
| | ∎ | | For much of the one-year period, the U.S. high yield bond market saw modest positive returns, driven by a stable economic outlook, accommodative central bank policies, and a strong technical backdrop. In March 2020, however, global markets experienced a historic sell-off, as a result of the COVID-19 pandemic and a freefall in crude oil prices. Following the sell-off through June month-end, crude oil prices recovered back into positive territory, and the U.S. high yield bond market rebounded on economic re-opening optimism and unprecedented actions by the U.S. Federal Reserve (Fed) – including purchasing investment grade and below investment grade bonds in the open market. However, the market remained negative for the period overall. |
| | ∎ | | Higher quality credits notably outperformed the lower end of the ratings spectrum during the one-year period, led by BBs and followed by single-Bs, while CCCs substantially lagged. As a result, the Fund’s underweight allocation to BB-rated holdings, and overweight allocation to the lower-rated categories relative to the Benchmark, were performance detractors. Security selection across single-B and CCC-rated credits was a positive contributor to Fund performance versus the Benchmark, while security selection in BB-rated holdings lagged. |
| | ∎ | | From an industry perspective, although the oil and gas sector rallied back in the second quarter of 2020 alongside the strong bounce back in crude oil prices from March lows, the sector significantly underperformed the broader market during the twelve-month period, alongside industries most directly impacted by the global economic shutdown, including the consumer cyclical and transportation sectors. The Fund’s credit selection within the telecommunications sector was the largest positive contributor to performance versus the index. The oil and gas sector was the largest detractor to relative performance as a result of credit selection and an underweight allocation on average. |
Describe recent portfolio activity.
| | ∎ | | The Fund allocation to BBs increased during the course of the one-year period, primarily through a shift from single-B rated holdings, both through relative value transactions in the secondary market and a notable portion of fallen angel purchases. Additionally, the Fund took advantage of select new issue deals, as the U.S. high yield bond market saw record new issuance activity in the second quarter of 2020. CCCs remained largely unchanged through the period. |
| | ∎ | | Across industries, the Fund’s top three sectors remained largely unchanged, led by oil & gas, telecommunications, and broadcasting & entertainment. The Fund’s position in the health care, education & child care sector was modestly reduced, while the buildings & real estate sector slightly increased during the year. |
| 1. | Total return describes the return to an investor of Class Y shares and includes the reinvestment of dividends and capital gains. Past performance is no guarantee of future results, and investment returns and the net asset value (NAV) of shares of the Fund will fluctuate so that shares, when redeemed, may be worth more or less than their original cost. Current performance may be higher or lower than performance quoted. Call 1.855.439.5459 or visit barings.com for current month-end performance. All returns one-year or less are cumulative. |
| 5. | Benchmark: Bloomberg Barclays U.S. Corporate High Yield Index. The benchmark covers the universe of fixed-rate, non-investment grade debt focusing on corporate USD denominated and non-convertible debt. It is not possible to invest directly in an index. |
25
Barings U.S. High Yield Fund 2020 Annual Report
Describe portfolio positioning at period end.
| | ∎ | | On a traded basis, the Fund finished June 30, 2020 with a 78.1% weighting to senior unsecured bonds and a 13.4% weighting to senior secured high yield bonds. The remaining balance of the portfolio was invested in senior secured loans (5.1%), and cash, accrued and other holdings (3.4%). |
| | ∎ | | From a sector perspective, the Fund remained well-diversified across a number of Moody’s-based industries, with higher concentrations, as mentioned above, in oil & gas (12.2%), telecommunications (10.7%), and broadcasting & entertainment (10.0%) as of June 30, 2020. |
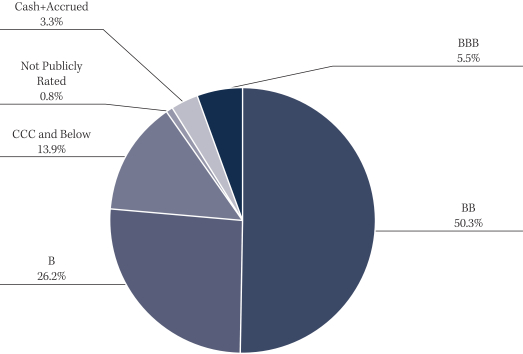
| | ∎ | | In terms of portfolio credit quality, the Fund had the following weighting breakdown: 5.5% in BBB, 50.3% in BB, 26.2% in single-B, 13.9% in CCC and below, and 3.3% in cash and accrued income. The Fund’s weighting in not-publicly rated holdings finished the period at 0.8%.2 |
Describe market and portfolio outlook.
| | ∎ | | Global credit markets staged a strong rebound throughout the second quarter of 2020, bolstered by swift action by governments, central banks and private investors to support global economies, as the world comes to terms with life during a pandemic. While default activity has increased across the U.S. high yield bond market, in our view some of these elements have softened expectations on near-term defaults from what they were at the peak of volatility in March. |
| | ∎ | | Despite the recovery thus far, the U.S. high yield bond market has not yet fully recovered to pre-pandemic levels, and we believe that the outlook for many companies will have an element of uncertainty until there is a clear path past Covid-19. The demand for high yield bonds has increased in recent months as a result of central bank actions, which we expect to continue in the near term. |
| | ∎ | | Even after a meaningful recovery, we continue to believe there are many opportunities for U.S. high yield bonds to be additive to total return performance as the recovery continues. That said, the potential for further volatility and defaults remains, which is why we continue to believe that prudent asset selection and active portfolio management will remain critical moving forward. |
| 2. | Ratings shown are the highest ratings given by one of the following national rating agencies: S&P, Moody’s or Fitch. Additional information about ratings can be found, respectively, at www.standardandpoors.com, www.moodys.com and www.fitchratings.com. Credit ratings are subject to change. AAA, AA, single-A and BBB are investment grade ratings categories used by S&P and Fitch. BB, single-B, CCC/CC/C and single-D are below investment grade ratings categories used by S&P and Fitch. Aaa, Aa, single-A and Baa are investment grade ratings categories used by Moody’s. Ba, single-B, Caa/Ca and single-C are below investment grade ratings categories used by Moody’s. Ratings categories may include gradations within each category. Bonds backed by U.S. government or agency securities are given an implied rating equal to the rating of such securities. Holdings designated Not Publicly Rated are not rated by these national rating agencies. |
26
Barings U.S. High Yield Fund 2020 Annual Report
CREDIT QUALITY COMPOSITION (% OF ASSETS*)
COUNTRY COMPOSITION (% OF ASSETS**)

| ** | The percentages of assets are expressed by market value excluding cash and accrued income, and may vary over time. As of June 30, 2020. |
27
Barings U.S. High Yield Fund 2020 Annual Report
| | | | | | | | | | | | | | | | |
| % AVERAGE ANNUAL TOTAL RETURNS 4,6,7 | | INCEPTION DATE | | | ONE YEAR | | | THREE YEARS | | | INCEPTION TO DATE | |
Class A With Load | | | 10/30/2015 | | | | -7.52 | % | | | -0.28 | % | | | 3.65 | % |
Class A No Load | | | 10/30/2015 | | | | -3.67 | % | | | 1.09 | % | | | 4.56 | % |
Class C With Load | | | 10/30/2015 | | | | -5.30 | % | | | 0.34 | % | | | 3.77 | % |
Class C No Load | | | 10/30/2015 | | | | -4.39 | % | | | 0.34 | % | | | 3.77 | % |
Class I With Load | | | 10/30/2015 | | | | -3.43 | % | | | 1.34 | % | | | 4.81 | % |
Class I No Load | | | 10/30/2015 | | | | -3.43 | % | | | 1.34 | % | | | 4.81 | % |
Class Y With Load | | | 10/30/2015 | | | | -3.43 | % | | | 1.35 | % | | | 4.81 | % |
Class Y No Load | | | 10/30/2015 | | | | -3.43 | % | | | 1.35 | % | | | 4.81 | % |
| 3. | Inception date: October 30, 2015. |
| 4. | Class A performance with the sales charges includes the maximum 4.00% sales charge. |
| 5. | Benchmark: Bloomberg Barclays U.S. Corporate High Yield Index. The benchmark covers the universe of fixed-rate, non-investment grade debt focusing on corporate USD denominated and non-convertible debt. It is not possible to invest directly in an index. |
| 6. | Line graph and table do not reflect the deduction of taxes that a shareholder would pay. |
| 7. | Class C performance with the sales charges includes the 1.00% contingent deferred sales charge (CDSC) for returns of one year or less. |
28
Barings Funds Trust 2020 Annual Report
SHAREHOLDER EXPENSES (UNAUDITED)
As a shareholder of Barings Global Floating Rate Fund, Barings Global Credit Income Opportunities Fund, Barings Active Short Duration Bond Fund, Barings Diversified Income Fund, Barings Emerging Markets Debt Blended Total Return Fund, Barings Global Emerging Markets Equity Fund or Barings U.S. High Yield Fund you incur ongoing expenses, such as management fees, shareholder service fees, distribution fees and other fund expenses. The following table is intended to help you understand your ongoing expenses (in dollars and cents) of investing in the Funds and to compare these expenses with the ongoing expenses of investing in other funds.
The table is based on an investment of $1,000 invested at the beginning of the period and held for the entire period from January 1, 2020 to June 30, 2020.
Actual Expenses
The first line in the table below provides information about the actual account values and actual expenses. You may use the information in this line, together with the amount you invested, to estimate the expenses that you paid over the period. Simply divide your account value by $1,000 (for example, an $8,600 account value divided by $1,000 = 8.6), then multiply the result by the number in the first line for the Fund under the heading entitled “Operating Expense Incurred” to estimate the expenses you paid on your account during this period.
Hypothetical Example for Comparison Purposes
The second line in the table below provides information about the hypothetical account values and hypothetical expenses based on the Fund’s actual expense ratio and an assumed rate of return of 5% per year before expenses, which is not the Fund’s actual return. The hypothetical account value and expenses may not be used to estimate the actual ending account balance or expenses you paid for the period. You may use this information to compare the ongoing costs of investing in your Fund and other funds. To do so, compare this 5% hypothetical example with the 5% hypothetical examples that appear in the shareholder reports of the other funds.
Barings Global Floating Rate Fund
| | | | | | | | | | | | | | | | | | | | |
| | | EXPENSE
RATIO | | | BEGINNING
AMOUNT | | | ENDING
VALUE | | | AVERAGE
VALUE | | | OPERATING
EXPENSE
INCURRED* | |
Class A | | | | | | | | | | | | | | | | | | | | |
Actual | | | 1.00 | % | | $ | 1,000.00 | | | $ | 943.30 | | | $ | 971.65 | | | $ | 4.83 | |
Hypothetical | | | 1.00 | % | | | 1,000.00 | | | | 1,019.90 | | | | 1,009.95 | | | | 5.02 | |
| | | | | |
Class C | | | | | | | | | | | | | | | | | | | | |
Actual | | | 1.75 | % | | | 1,000.00 | | | | 939.80 | | | | 969.90 | | | | 8.44 | |
Hypothetical | | | 1.75 | % | | | 1,000.00 | | | | 1,016.20 | | | | 1,008.10 | | | | 8.77 | |
| | | | | |
Class I | | | | | | | | | | | | | | | | | | | | |
Actual | | | 0.75 | % | | | 1,000.00 | | | | 944.50 | | | | 972.25 | | | | 3.63 | |
Hypothetical | | | 0.75 | % | | | 1,000.00 | | | | 1,021.10 | | | | 1,010.55 | | | | 3.77 | |
| | | | | |
Class Y | | | | | | | | | | | | | | | | | | | | |
Actual | | | 0.75 | % | | | 1,000.00 | | | | 944.50 | | | | 972.25 | | | | 3.63 | |
Hypothetical | | | 0.75 | % | | | 1,000.00 | | | | 1,021.10 | | | | 1,010.55 | | | | 3.77 | |
| * | For each Class of the Fund, net expenses are equal to the annualized expense ratio net of any expenses waived or reimbursed by the adviser for such class multiplied by the average account value over the period, multiplied by 182/366. |
29
Barings Funds Trust 2020 Annual Report
SHAREHOLDER EXPENSES (UNAUDITED) (CONTINUED)
Barings Global Credit Income Opportunities Fund
| | | | | | | | | | | | | | | | | | | | |
| | | EXPENSE
RATIO | | | BEGINNING
AMOUNT | | | ENDING
VALUE | | | AVERAGE
VALUE | | | OPERATING
EXPENSE
INCURRED* | |
Class A | | | | | | | | | | | | | | | | | | | | |
Actual | | | 1.20 | % | | $ | 1,000.00 | | | $ | 930.80 | | | $ | 965.40 | | | $ | 5.76 | |
Hypothetical | | | 1.20 | % | | | 1,000.00 | | | | 1,018.90 | | | | 1,009.45 | | | | 6.02 | |
| | | | | |
Class C | | | | | | | | | | | | | | | | | | | | |
Actual | | | 1.95 | % | | | 1,000.00 | | | | 927.30 | | | | 963.65 | | | | 9.34 | |
Hypothetical | | | 1.95 | % | | | 1,000.00 | | | | 1,015.20 | | | | 1,007.60 | | | | 9.77 | |
| | | | | |
Class I | | | | | | | | | | | | | | | | | | | | |
Actual | | | 0.95 | % | | | 1,000.00 | | | | 932.00 | | | | 966.00 | | | | 4.56 | |
Hypothetical | | | 0.95 | % | | | 1,000.00 | | | | 1,020.10 | | | | 1,010.05 | | | | 4.77 | |
| | | | | |
Class Y | | | | | | | | | | | | | | | | | | | | |
Actual | | | 0.95 | % | | | 1,000.00 | | | | 932.00 | | | | 966.00 | | | | 4.56 | |
Hypothetical | | | 0.95 | % | | | 1,000.00 | | | | 1,020.10 | | | | 1,010.05 | | | | 4.77 | |
| * | For each Class of the Fund, net expenses are equal to the annualized expense ratio net of any expenses waived or reimbursed by the adviser for such class multiplied by the average account value over the period, multiplied by 182/366. |
Barings Active Short Duration Bond Fund
| | | | | | | | | | | | | | | | | | | | |
| | | EXPENSE
RATIO | | | BEGINNING
AMOUNT | | | ENDING
VALUE | | | AVERAGE
VALUE | | | OPERATING
EXPENSE
INCURRED* | |
Class A | | | | | | | | | | | | | | | | | | | | |
Actual | | | 0.65 | % | | $ | 1,000.00 | | | $ | 968.70 | | | $ | 984.35 | | | $ | 3.18 | |
Hypothetical | | | 0.65 | % | | | 1,000.00 | | | | 1,021.60 | | | | 1,010.80 | | | | 3.27 | |
| | | | | |
Class C | | | | | | | | | | | | | | | | | | | | |
Actual | | | 0.90 | % | | | 1,000.00 | | | | 967.30 | | | | 983.65 | | | | 4.40 | |
Hypothetical | | | 0.90 | % | | | 1,000.00 | | | | 1,020.40 | | | | 1,010.20 | | | | 4.52 | |
| | | | | |
Class I | | | | | | | | | | | | | | | | | | | | |
Actual | | | 0.40 | % | | | 1,000.00 | | | | 969.60 | | | | 984.80 | | | | 1.96 | |
Hypothetical | | | 0.40 | % | | | 1,000.00 | | | | 1,022.90 | | | | 1,011.45 | | | | 2.01 | |
| | | | | |
Class Y | | | | | | | | | | | | | | | | | | | | |
Actual | | | 0.40 | % | | | 1,000.00 | | | | 969.60 | | | | 984.80 | | | | 1.96 | |
Hypothetical | | | 0.40 | % | | | 1,000.00 | | | | 1,022.90 | | | | 1,011.45 | | | | 2.01 | |
| | | | | |
Class L | | | | | | | | | | | | | | | | | | | | |
Actual** | | | 0.65 | % | | | 1,000.00 | | | | 1,035.20 | | | | 1,017.60 | | | | 1.10 | |
Hypothetical | | | 0.65 | % | | | 1,000.00 | | | | 1,023.80 | | | | 1,011.90 | | | | 1.11 | |
| * | For each Class of the Fund, net expenses are equal to the annualized expense ratio net of any expenses waived or reimbursed by the adviser for such class multiplied by the average account value over the period, multiplied by 182/366. |
| ** | Class L commenced operations on May 1, 2020. Actual net expenses for Class L are equal to the annualized expense ratio of Class L net of any expenses waived or reimbursed by the adviser for Class L, multiplied by the average account value over the period, multiplied by 61/366. |
30
Barings Funds Trust 2020 Annual Report
SHAREHOLDER EXPENSES (UNAUDITED) (CONTINUED)
Barings Diversified Income Fund
| | | | | | | | | | | | | | | | | | | | |
| | | EXPENSE
RATIO | | | BEGINNING
AMOUNT | | | ENDING
VALUE | | | AVERAGE
VALUE | | | OPERATING
EXPENSE
INCURRED* | |
Class A | | | | | | | | | | | | | | | | | | | | |
Actual | | | 0.80 | % | | $ | 1,000.00 | | | $ | 897.50 | | | $ | 948.75 | | | $ | 3.77 | |
Hypothetical | | | 0.80 | % | | | 1,000.00 | | | | 1,020.90 | | | | 1,010.45 | | | | 4.02 | |
| | | | | |
Class C | | | | | | | | | | | | | | | | | | | | |
Actual | | | 1.55 | % | | | 1,000.00 | | | | 894.00 | | | | 947.00 | | | | 7.30 | |
Hypothetical | | | 1.55 | % | | | 1,000.00 | | | | 1,017.20 | | | | 1,008.60 | | | | 7.77 | |
| | | | | |
Class I | | | | | | | | | | | | | | | | | | | | |
Actual | | | 0.55 | % | | | 1,000.00 | | | | 898.60 | | | | 949.30 | | | | 2.60 | |
Hypothetical | | | 0.55 | % | | | 1,000.00 | | | | 1,022.10 | | | | 1,011.05 | | | | 2.77 | |
| | | | | |
Class Y | | | | | | | | | | | | | | | | | | | | |
Actual | | | 0.55 | % | | | 1,000.00 | | | | 898.50 | | | | 949.25 | | | | 2.60 | |
Hypothetical | | | 0.55 | % | | | 1,000.00 | | | | 1,022.10 | | | | 1,011.05 | | | | 2.77 | |
| * | For each Class of the Fund, net expenses are equal to the annualized expense ratio net of any expenses waived or reimbursed by the adviser for such class multiplied by the average account value over the period, multiplied by 182/366. |
Barings Emerging Markets Debt Blended Total Return Fund
| | | | | | | | | | | | | | | | | | | | |
| | | EXPENSE
RATIO | | | BEGINNING
AMOUNT | | | ENDING
VALUE | | | AVERAGE
VALUE | | | OPERATING
EXPENSE
INCURRED* | |
Class A | | | | | | | | | | | | | | | | | | | | |
Actual | | | 1.20 | % | | $ | 1,000.00 | | | $ | 1,048.00 | | | $ | 1,024.00 | | | $ | 6.11 | |
Hypothetical | | | 1.20 | % | | | 1,000.00 | | | | 1,018.90 | | | | 1,009.45 | | | | 6.02 | |
| | | | | |
Class C | | | | | | | | | | | | | | | | | | | | |
Actual | | | 1.95 | % | | | 1,000.00 | | | | 1,043.60 | | | | 1,021.80 | | | | 9.91 | |
Hypothetical | | | 1.95 | % | | | 1,000.00 | | | | 1,015.20 | | | | 1,007.60 | | | | 9.77 | |
| | | | | |
Class I | | | | | | | | | | | | | | | | | | | | |
Actual | | | 0.95 | % | | | 1,000.00 | | | | 1,049.50 | | | | 1,024.75 | | | | 4.84 | |
Hypothetical | | | 0.95 | % | | | 1,000.00 | | | | 1,020.10 | | | | 1,010.05 | | | | 4.77 | |
| | | | | |
Class Y | | | | | | | | | | | | | | | | | | | | |
Actual | | | 0.95 | % | | | 1,000.00 | | | | 1,048.90 | | | | 1,024.45 | | | | 4.84 | |
Hypothetical | | | 0.95 | % | | | 1,000.00 | | | | 1,020.10 | | | | 1,010.05 | | | | 4.77 | |
| * | For each Class of the Fund, net expenses are equal to the annualized expense ratio net of any expenses waived or reimbursed by the adviser for such class multiplied by the average account value over the period, multiplied by 182/366. |
31
Barings Funds Trust 2020 Annual Report
SHAREHOLDER EXPENSES (UNAUDITED) (CONTINUED)
Barings Global Emerging Markets Equity Fund
| | | | | | | | | | | | | | | | | | | | |
| | | EXPENSE
RATIO** | | | BEGINNING
AMOUNT | | | ENDING
VALUE | | | AVERAGE
VALUE | | | OPERATING
EXPENSE
INCURRED* | |
Class A | | | | | | | | | | | | | | | | | | | | |
Actual | | | 1.45 | % | | $ | 1,000.00 | | | $ | 890.20 | | | $ | 945.10 | | | $ | 6.81 | |
Hypothetical | | | 1.45 | % | | | 1,000.00 | | | | 1,017.70 | | | | 1,008.85 | | | | 7.27 | |
| | | | | |
Class C | | | | | | | | | | | | | | | | | | | | |
Actual | | | 2.20 | % | | | 1,000.00 | | | | 886.90 | | | | 943.45 | | | | 10.32 | |
Hypothetical | | | 2.20 | % | | | 1,000.00 | | | | 1,013.90 | | | | 1,006.95 | | | | 11.02 | |
| | | | | |
Class I | | | | | | | | | | | | | | | | | | | | |
Actual | | | 1.20 | % | | | 1,000.00 | | | | 891.30 | | | | 945.65 | | | | 5.64 | |
Hypothetical | | | 1.20 | % | | | 1,000.00 | | | | 1,018.90 | | | | 1,009.45 | | | | 6.02 | |
| | | | | |
Class Y | | | | | | | | | | | | | | | | | | | | |
Actual | | | 1.20 | % | | | 1,000.00 | | | | 891.30 | | | | 945.65 | | | | 5.64 | |
Hypothetical | | | 1.20 | % | | | 1,000.00 | | | | 1,018.90 | | | | 1,009.45 | | | | 6.02 | |
| * | For each Class of the Fund, net expenses are equal to the annualized expense ratio net of any expenses waived or reimbursed by the adviser for such class multiplied by the average account value over the period, multiplied by 182/366. |
| ** | Expense ratios (as disclosed in the table) do not include the expenses of any underlying funds in which the Fund invests. The annualized expense ratios, as stated in the fee table of the Prospectus, may differ from the expense ratios disclosed in this report. |
Barings U.S. High Yield Fund
| | | | | | | | | | | | | | | | | | | | |
| | | EXPENSE
RATIO | | | BEGINNING
AMOUNT | | | ENDING
VALUE | | | AVERAGE
VALUE | | | OPERATING
EXPENSE
INCURRED* | |
Class A | | | | | | | | | | | | | | | | | | | | |
Actual | | | 1.00 | % | | $ | 1,000.00 | | | $ | 928.10 | | | $ | 964.05 | | | $ | 4.79 | |
Hypothetical | | | 1.00 | % | | | 1,000.00 | | | | 1,019.90 | | | | 1,009.95 | | | | 5.02 | |
| | | | | |
Class C | | | | | | | | | | | | | | | | | | | | |
Actual | | | 1.75 | % | | | 1,000.00 | | | | 924.80 | | | | 962.40 | | | | 8.37 | |
Hypothetical | | | 1.75 | % | | | 1,000.00 | | | | 1,016.20 | | | | 1,008.10 | | | | 8.77 | |
| | | | | |
Class I | | | | | | | | | | | | | | | | | | | | |
Actual | | | 0.75 | % | | | 1,000.00 | | | | 929.40 | | | | 964.70 | | | | 3.60 | |
Hypothetical | | | 0.75 | % | | | 1,000.00 | | | | 1,021.10 | | | | 1,010.55 | | | | 3.77 | |
| | | | | |
Class Y | | | | | | | | | | | | | | | | | | | | |
Actual | | | 0.75 | % | | | 1,000.00 | | | | 929.40 | | | | 964.70 | | | | 3.60 | |
Hypothetical | | | 0.75 | % | | | 1,000.00 | | | | 1,021.10 | | | | 1,010.55 | | | | 3.77 | |
| * | For each Class of the Fund, net expenses are equal to the annualized expense ratio net of any expenses waived or reimbursed by the adviser for such class multiplied by the average account value over the period, multiplied by 182/366. |
32
Barings Funds Trust 2020 Annual Report
FINANCIAL REPORT
33
Barings Funds Trust 2020 Annual Report
STATEMENTS OF ASSETS AND LIABILITIES
June 30, 2020
| | | | | | | | | | | | | | | | |
| | | BARINGS GLOBAL
FLOATING RATE FUND | | | BARINGS GLOBAL
CREDIT INCOME
OPPORTUNITIES FUND | | | BARINGS ACTIVE
SHORT DURATION
BOND FUND | | | BARINGS
DIVERSIFIED
INCOME FUND | |
| | | | |
| Assets | | | | | | | | | | | | | | | | |
| Investments, at fair value (cost $227,709,444, $175,694,976, $819,659,294 and $41,576,715, respectively) | | $ | 202,282,324 | | | $ | 152,186,861 | | | $ | 805,233,236 | | | $ | 40,320,106 | |
| Cash | | | 12,840,420 | | | | 12,572,645 | | | | 7,648,364 | | | | 188,724 | |
| Foreign currency, at value (cost $163,455, $131,043, $0 and $2,244, respectively) | | | 162,788 | | | | 131,035 | | | | – | | | | 2,224 | |
| Receivable for investments sold | | | 3,263,158 | | | | 2,916,787 | | | | 4,975,969 | | | | 845,338 | |
| Receivable for Fund shares sold | | | 1,193,531 | | | | 230,413 | | | | 1,014,492 | | | | 1,949 | |
| Interest receivable | | | 1,475,189 | | | | 2,148,691 | | | | 3,914,486 | | | | 305,374 | |
| Receivable from adviser (see Note 3) | | | – | | | | – | | | | 73,688 | | | | 30,765 | |
| Cash collateral held at broker on open forward foreign currency exchange contracts | | | – | | | | 10,000 | | | | – | | | | – | |
| Cash collateral held at broker on open futures contracts | | | – | | | | – | | | | – | | | | 229,592 | |
| Receivable for variation margin on open futures contracts | | | – | | | | – | | | | 59,355 | | | | 12,335 | |
| Foreign tax reclaims receivable | | | – | | | | – | | | | 4,758 | | | | – | |
| Unrealized appreciation on forward foreign currency exchange contracts | | | 582,821 | | | | 495,076 | | | | – | | | | 107 | |
| Prepaid expenses | | | 52,280 | | | | 42,034 | | | | 169,909 | | | | 31,257 | |
| | | | | | | | | | | | | | | | |
Total assets | | | 221,852,511 | | | | 170,733,542 | | | | 823,094,257 | | | | 41,967,771 | |
| | | | | | | | | | | | | | | | |
|
| Liabilities | |
| Payable for investments purchased | | | – | | | | – | | | | – | | | | 410,940 | |
| Payable for TBA and when-issued securities purchased | | | 5,159,932 | | | | 4,763,714 | | | | 12,439,802 | | | | 220,000 | |
| Payable for Fund shares repurchased | | | 1,009,361 | | | | 203,147 | | | | 5,212,569 | | | | 367,089 | |
| Payable for variation margin on open swap contracts | | | – | | | | – | | | | 11,810 | | | | – | |
| Investment advisory fee payable (see Note 3) | | | 125,292 | | | | 117,223 | | | | – | | | | – | |
| Cash collateral Due to Broker | | | 360,000 | | | | 500,000 | | | | 989,583 | | | | – | |
| Distribution fees payable | | | 13,067 | | | | 15,257 | | | | 30,221 | | | | 264 | |
| Shareholder service fees payable | | | 15,428 | | | | 11,325 | | | | 54,898 | | | | 3,082 | |
| Dividends payable | | | 121,046 | | | | 201,286 | | | | 284,003 | | | | 53,451 | |
| Written options, at fair value (premiums of $0, $420,757, $0 and $0, respectively) | | | – | | | | 439,208 | | | | – | | | | – | |
| Unrealized depreciation on forward foreign currency exchange contracts | | | 22,691 | | | | 47,937 | | | | – | | | | 4,280 | |
| Accrued expenses and other liabilities | | | 315,688 | | | | 294,653 | | | | 574,366 | | | | 118,933 | |
| | | | | | | | | | | | | | | | |
Total liabilities | | | 7,142,505 | | | | 6,593,750 | | | | 19,597,252 | | | | 1,178,039 | |
| | | | | | | | | | | | | | | | |
Total net assets | | $ | 214,710,006 | | | $ | 164,139,792 | | | $ | 803,497,005 | | | $ | 40,789,732 | |
| | | | | | | | | | | | | | | | |
See accompanying Notes to the Financial Statements.
34
Barings Funds Trust 2020 Annual Report
STATEMENTS OF ASSETS AND LIABILITIES (CONTINUED)
June 30, 2020
| | | | | | | | | | | | | | | | |
| | | BARINGS GLOBAL
FLOATING RATE FUND | | | BARINGS GLOBAL
CREDIT INCOME
OPPORTUNITIES FUND | | | BARINGS ACTIVE
SHORT DURATION
BOND FUND | | | BARINGS
DIVERSIFIED
INCOME FUND | |
|
| Composition of net assets | |
| Shares of beneficial interest outstanding (par value $0.00001 per share), unlimited number of shares authorized | | $ | 250 | | | $ | 202 | | | $ | 846 | | | $ | 47 | |
| Additional paid-in capital | | | 247,751,251 | | | | 199,910,263 | | | | 848,283,419 | | | | 45,520,236 | |
| Total distributable earnings (accumulated loss) | | | (33,041,495 | ) | | | (35,770,673 | ) | | | (44,787,260 | ) | | | (4,730,551 | ) |
| | | | | | | | | | | | | | | | |
Total net assets | | $ | 214,710,006 | | | $ | 164,139,792 | | | $ | 803,497,005 | | | $ | 40,789,732 | |
| | | | | | | | | | | | | | | | |
|
| Class A | |
| Net assets applicable to outstanding shares | | $ | 37,431,371 | | | $ | 44,859,831 | | | $ | 43,021,675 | | | $ | 591,704 | |
| | | | | | | | | | | | | | | | |
| Shares of beneficial interest outstanding | | | 4,372,077 | | | | 5,508,398 | | | | 4,528,637 | | | | 67,749 | |
| | | | | | | | | | | | | | | | |
| Net asset value per share outstanding | | $ | 8.56 | | | $ | 8.14 | | | $ | 9.50 | | | $ | 8.73 | |
| | | | | | | | | | | | | | | | |
| Maximum offering price per share outstanding (Net asset value plus sales charge of 3.00%, 4.00%, 0.00% and 4.00%, respectively) | | $ | 8.82 | | | $ | 8.48 | | | $ | 9.50 | | | $ | 9.09 | |
| | | | | | | | | | | | | | | | |
|
| Class C | |
| Net assets applicable to outstanding shares | | $ | 6,493,957 | | | $ | 7,420,674 | | | $ | 2,498,204 | | | $ | 175,194 | |
| | | | | | | | | | | | | | | | |
| Shares of beneficial interest outstanding | | | 761,343 | | | | 912,322 | | | | 263,328 | | | | 20,061 | |
| | | | | | | | | | | | | | | | |
| Net asset value per share outstanding | | $ | 8.53 | | | $ | 8.13 | | | $ | 9.49 | | | $ | 8.73 | |
| | | | | | | | | | | | | | | | |
|
| Class I | |
| Net assets applicable to outstanding shares | | $ | 39,482,986 | | | $ | 21,605,699 | | | $ | 94,056 | | | $ | 10,789,668 | |
| | | | | | | | | | | | | | | | |
| Shares of beneficial interest outstanding | | | 4,599,235 | | | | 2,653,573 | | | | 9,901 | | | | 1,235,482 | |
| | | | | | | | | | | | | | | | |
| Net asset value per share outstanding | | $ | 8.58 | | | $ | 8.14 | | | $ | 9.50 | | | $ | 8.73 | |
| | | | | | | | | | | | | | | | |
|
| Class Y | |
| Net assets applicable to outstanding shares | | $ | 131,301,692 | | | $ | 90,253,588 | | | $ | 656,611,099 | | | $ | 29,233,166 | |
| | | | | | | | | | | | | | | | |
| Shares of beneficial interest outstanding | | | 15,312,080 | | | | 11,085,764 | | | | 69,174,004 | | | | 3,347,243 | |
| | | | | | | | | | | | | | | | |
| Net asset value per share outstanding | | $ | 8.58 | | | $ | 8.14 | | | $ | 9.49 | | | $ | 8.73 | |
| | | | | | | | | | | | | | | | |
|
| Class L | |
| Net assets applicable to outstanding shares | | | | | | | | | | $ | 101,271,971 | | | | | |
| | | | | | | | | | | | | | | | |
| Shares of beneficial interest outstanding | | | | | | | | | | | 10,662,657 | | | | | |
| | | | | | | | | | | | | | | | |
| Net asset value per share outstanding | | | | | | | | | | $ | 9.50 | | | | | |
| | | | | | | | | | | | | | | | |
See accompanying Notes to the Financial Statements.
35
Barings Funds Trust 2020 Annual Report
STATEMENTS OF ASSETS AND LIABILITIES
June 30, 2020
| | | | | | | | | | | | |
| | | BARINGS EMERGING
MARKETS DEBT
BLENDED TOTAL
RETURN FUND | | | BARINGS GLOBAL
EMERGING MARKETS
EQUITY FUND | | | BARINGS U.S.
HIGH YIELD
FUND | |
| | | |
| Assets | | | | | | | | | | | | |
| Investments, at fair value (cost $52,955,183, $9,409,750 and $48,364,510, respectively) | | $ | 51,798,618 | | | $ | 10,150,692 | | | $ | 44,676,904 | |
| Cash | | | 1,872,215 | | | | 231,046 | | | | 1,567,880 | |
| Foreign currency, at value (cost $13,584, $0 and $0, respectively) | | | 13,584 | | | | – | | | | – | |
| Receivable for investments sold | | | 476,246 | | | | – | | | | 187,948 | |
| Receivable for Fund shares sold | | | 83,917 | | | | – | | | | 5,913 | |
| Interest receivable | | | 769,205 | | | | 36,685 | | | | 777,591 | |
| Receivable from adviser (see Note 3) | | | – | | | | 73,303 | | | | – | |
| Cash collateral held at broker on open swap contracts | | | 68,677 | | | | – | | | | – | |
| Swap contracts, at fair value | | | 1,705,030 | | | | – | | | | – | |
| Foreign tax reclaims receivable | | | 3,799 | | | | 1,365 | | | | 297 | |
| Variation margin receivable on open swap contracts | | | 61,110 | | | | – | | | | – | |
| Unrealized appreciation on forward foreign currency exchange contracts | | | 1,926,360 | | | | – | | | | – | |
| Prepaid expenses | | | 37,459 | | | | 24,228 | | | | 34,386 | |
| | | | | | | | | | | | |
Total assets | | | 58,816,220 | | | | 10,517,319 | | | | 47,250,919 | |
| | | | | | | | | | | | |
|
| Liabilities | |
| Payable for investments purchased | | | 159,206 | | | | – | | | | 19,959 | |
| Payable for TBA and when-issued securities purchased | | | 1,505,290 | | | | – | | | | 947,195 | |
| Foreign currency overdraft, at value (cost $0, $(1,241) and $0, respectively) | | | – | | | | 1,220 | | | | – | |
| Payable for Fund shares repurchased | | | 4,188 | | | | – | | | | 9,697 | |
| Investment advisory fee payable (see Note 3) | | | 16,282 | | | | – | | | | 11,391 | |
| Directors’ fees payable | | | – | | | | 4,408 | | | | – | |
| Cash collateral Due to Broker | | | 1,044,736 | | | | – | | | | – | |
| Distribution fees payable | | | 1,491 | | | | 105 | | | | 479 | |
| Shareholder service fees payable | | | – | | | | – | | | | 116 | |
| Dividends payable | | | 179,295 | | | | – | | | | 109,334 | |
| Unrealized depreciation on forward foreign currency exchange contracts | | | 1,071,754 | | | | – | | | | – | |
| Accrued expenses and other liabilities | | | 174,179 | | | | 134,647 | | | | 116,098 | |
| | | | | | | | | | | | |
Total liabilities | | | 4,156,421 | | | | 140,380 | | | | 1,214,269 | |
| | | | | | | | | | | | |
Total net assets | | $ | 54,659,799 | | | $ | 10,376,939 | | | $ | 46,036,650 | |
| | | | | | | | | | | | |
See accompanying Notes to the Financial Statements.
36
Barings Funds Trust 2020 Annual Report
STATEMENTS OF ASSETS AND LIABILITIES (CONTINUED)
June 30, 2020
| | | | | | | | | | | | |
| | | BARINGS EMERGING
MARKETS DEBT
BLENDED TOTAL
RETURN FUND | | | BARINGS GLOBAL
EMERGING MARKETS
EQUITY FUND | | | BARINGS U.S.
HIGH YIELD
FUND | |
|
| Composition of net assets | |
| Shares of beneficial interest outstanding (par value $0.00001 per share), unlimited number of shares authorized | | $ | 52 | | | $ | 10 | | | $ | 52 | |
| Additional paid-in capital | | | 53,391,594 | | | | 9,984,604 | | | | 52,120,560 | |
| Total distributable earnings (accumulated loss) | | | 1,268,153 | | | | 392,325 | | | | (6,083,962 | ) |
| | | | | | | | | | | | |
Total net assets | | $ | 54,659,799 | | | $ | 10,376,939 | | | $ | 46,036,650 | |
| | | | | | | | | | | | |
|
| Class A | |
| Net assets applicable to outstanding shares | | $ | 6,442,642 | | | $ | 103,635 | | | $ | 1,909,856 | |
| | | | | | | | | | | | |
| Shares of beneficial interest outstanding | | | 618,104 | | | | 10,000 | | | | 214,303 | |
| | | | | | | | | | | | |
| Net asset value per share outstanding | | $ | 10.42 | | | $ | 10.36 | | | $ | 8.91 | |
| | | | | | | | | | | | |
| Maximum offering price per share outstanding (Net asset value plus sales charge of 4.00%) | | $ | 10.85 | | | $ | 10.79 | | | $ | 9.28 | |
| | | | | | | | | | | | |
|
| Class C | |
| Net assets applicable to outstanding shares | | $ | 225,088 | | | $ | 103,159 | | | $ | 89,086 | |
| | | | | | | | | | | | |
| Shares of beneficial interest outstanding | | | 21,602 | | | | 10,000 | | | | 10,000 | |
| | | | | | | | | | | | |
| Net asset value per share outstanding | | $ | 10.42 | | | $ | 10.32 | | | $ | 8.91 | |
| | | | | | | | | | | | |
|
| Class I | |
| Net assets applicable to outstanding shares | | $ | 14,563,422 | | | $ | 5,085,073 | | | $ | 11,045,878 | |
| | | | | | | | | | | | |
| Shares of beneficial interest outstanding | | | 1,396,745 | | | | 490,000 | | | | 1,240,000 | |
| | | | | | | | | | | | |
| Net asset value per share outstanding | | $ | 10.43 | | | $ | 10.38 | | | $ | 8.91 | |
| | | | | | | | | | | | |
|
| Class Y | |
| Net assets applicable to outstanding shares | | $ | 33,428,647 | | | $ | 5,085,072 | | | $ | 32,991,830 | |
| | | | | | | | | | | | |
| Shares of beneficial interest outstanding | | | 3,207,689 | | | | 490,000 | | | | 3,703,638 | |
| | | | | | | | | | | | |
| Net asset value per share outstanding | | $ | 10.42 | | | $ | 10.38 | | | $ | 8.91 | |
| | | | | | | | | | | | |
See accompanying Notes to the Financial Statements.
37
Barings Funds Trust 2020 Annual Report
STATEMENTS OF OPERATIONS
For the Year Ended June 30, 2020
| | | | | | | | | | | | | | | | |
| | | BARINGS GLOBAL
FLOATING RATE FUND | | | BARINGS GLOBAL
CREDIT INCOME
OPPORTUNITIES FUND | | | BARINGS ACTIVE
SHORT DURATION
BOND FUND | | | BARINGS
DIVERSIFIED
INCOME FUND | |
| | | | |
| Investment Income | | | | | | | | | | | | | | | | |
Interest income (net of withholding tax of $0, $0, $5,516 and $482, respectively) | | $ | 13,951,742 | | | $ | 13,007,484 | | | $ | 28,339,264 | | | $ | 1,715,396 | |
Dividends | | | 8,246 | | | | 9,678 | | | | 342,537 | | | | – | |
Other income | | | 21,550 | | | | 8,352 | | | | 2,494 | | | | 1,600 | |
| | | | | | | | | | | | | | | | |
Total investment income | | | 13,981,538 | | | | 13,025,514 | | | | 28,684,295 | | | | 1,716,996 | |
| | | | | | | | | | | | | | | | |
|
| Operating Expenses | |
Advisory fees | | | 1,612,681 | | | | 1,490,789 | | | | 2,897,842 | | | | 170,083 | |
12b-1 distribution and servicing plan | | | | | | | | | | | | | | | | |
Class A | | | 106,108 | | | | 121,307 | | | | 378,477 | | | | 752 | |
Class C | | | 74,436 | | | | 79,979 | | | | 12,076 | | | | 1,891 | |
Class L (1) | | | – | | | | – | | | | 11,057 | | | | – | |
Shareholder service fee | | | | | | | | | | | | | | | | |
Class A | | | 22,310 | | | | 7,956 | | | | 73,536 | | | | 44 | |
Class C | | | 3,795 | | | | 4,488 | | | | 1,297 | | | | – | |
Class Y | | | 105,349 | | | | 64,361 | | | | 463,340 | | | | 18,787 | |
Class L (1) | | | – | | | | – | | | | 129 | | | | – | |
Administrator fees | | | 143,483 | | | | 131,114 | | | | 421,382 | | | | 54,934 | |
Custody fees | | | 123,901 | | | | 124,061 | | | | 435,128 | | | | 36,083 | |
Professional fees | | | 120,307 | | | | 115,246 | | | | 121,822 | | | | 102,087 | |
Transfer agent fees | | | 43,952 | | | | 32,361 | | | | 129,228 | | | | 21,727 | |
Directors’ fees | | | 67,938 | | | | 59,773 | | | | 155,250 | | | | 33,485 | |
Registration fees | | | 55,618 | | | | 46,057 | | | | 131,912 | | | | 52,218 | |
Printing and mailing expenses | | | 26,309 | | | | 19,431 | | | | 55,579 | | | | 14,163 | |
Other operating expenses | | | 98,667 | | | | 86,269 | | | | 287,454 | | | | 17,472 | |
| | | | | | | | | | | | | | | | |
Total operating expenses | | | 2,604,854 | | | | 2,383,192 | | | | 5,575,509 | | | | 523,726 | |
Waiver/Reimbursement of expenses | | | | | | | | | | | | | | | | |
Class A | | | (94,424 | ) | | | (59,637 | ) | | | (297,077 | ) | | | (7,298 | ) |
Class C | | | (21,377 | ) | | | (18,062 | ) | | | (12,396 | ) | | | (6,465 | ) |
Class I | | | (63,371 | ) | | | (26,920 | ) | | | (7,695 | ) | | | (74,025 | ) |
Class Y | | | (378,986 | ) | | | (180,257 | ) | | | (1,533,164 | ) | | | (198,632 | ) |
Class L (1) | | | – | | | | – | | | | (11,748 | ) | | | – | |
| | | | | | | | | | | | | | | | |
Net operating expenses | | | 2,046,696 | | | | 2,098,316 | | | | 3,713,429 | | | | 237,306 | |
| | | | | | | | | | | | | | | | |
Net investment income | | | 11,934,842 | | | | 10,927,198 | | | | 24,970,866 | | | | 1,479,690 | |
| | | | | | | | | | | | | | | | |
See accompanying Notes to the Financial Statements.
38
Barings Funds Trust 2020 Annual Report
STATEMENTS OF OPERATIONS (CONTINUED)
For the Year Ended June 30, 2020
| | | | | | | | | | | | | | | | |
| | | BARINGS GLOBAL
FLOATING RATE FUND | | | BARINGS GLOBAL
CREDIT INCOME
OPPORTUNITIES FUND | | | BARINGS ACTIVE
SHORT DURATION
BOND FUND | | | BARINGS
DIVERSIFIED
INCOME FUND | |
| | | | |
| Realized and Unrealized Gains (Losses) | | | | | | | | | | | | | | | | |
Net realized loss on investments | | $ | (10,349,719 | ) | | $ | (10,081,983 | ) | | $ | (5,245,150 | ) | | $ | (1,661,105 | ) |
Net realized gain on forward foreign currency exchange contracts | | | 1,152,178 | | | | 639,468 | | | | – | | | | 39,984 | |
Net realized gain on foreign currency and translation | | | 913,446 | | | | 810,814 | | | | – | | | | 13,145 | |
Net realized gain (loss) on futures contracts | | | – | | | | – | | | | (21,558,580 | ) | | | (1,064,569 | ) |
Net realized gain (loss) on swap contracts | | | – | | | | – | | | | 902,364 | | | | (7,026 | ) |
Net realized gain (loss) on purchased options | | | – | | | | (677,726 | ) | | | 1,219,275 | | | | – | |
| | | | | | | | | | | | | | | | |
Net realized gain (loss) | | | (8,284,095 | ) | | | (9,309,427 | ) | | | (24,682,091 | ) | | | (2,679,571 | ) |
| | | | | | | | | | | | | | | | |
Net change in unrealized depreciation on investments | | | (13,779,931 | ) | | | (12,883,497 | ) | | | (22,442,456 | ) | | | (1,722,759 | ) |
Net change in unrealized appreciation on forward foreign currency exchange contracts | | | 581,413 | | | | 405,493 | | | | – | | | | 15,749 | |
Net change in unrealized appreciation (depreciation) on foreign currency and translation | | | 9,818 | | | | 1,634 | | | | – | | | | (280 | ) |
Net change in unrealized appreciation (depreciation) on futures contracts | | | – | | | | – | | | | 2,444,155 | | | | 126,745 | |
Net change in unrealized appreciation (depreciation) on swap contracts | | | – | | | | – | | | | (76,032 | ) | | | 8,097 | |
Net change in unrealized appreciation (depreciation) on written option contracts | | | – | | | | (18,451 | ) | | | – | | | | – | |
Net change in unrealized appreciation (depreciation) on purchased option contracts | | | – | | | | 145,350 | | | | (511,402 | ) | | | – | |
| | | | | | | | | | | | | | | | |
Net change in unrealized appreciation (depreciation) | | | (13,188,700 | ) | | | (12,349,471 | ) | | | (20,585,735 | ) | | | (1,572,448 | ) |
| | | | | | | | | | | | | | | | |
Net realized and unrealized losses | | | (21,472,795 | ) | | | (21,658,898 | ) | | | (45,267,826 | ) | | | (4,252,019 | ) |
| | | | | | | | | | | | | | | | |
Net decrease in net assets resulting from operations | | $ | (9,537,953 | ) | | $ | (10,731,700 | ) | | $ | (20,296,960 | ) | | $ | (2,772,329 | ) |
| | | | | | | | | | | | | | | | |
| (1) | | Class commenced operations on May 1, 2020. |
See accompanying Notes to the Financial Statements.
39
Barings Funds Trust 2020 Annual Report
STATEMENTS OF OPERATIONS
For the Year Ended June 30, 2020
| | | | | | | | | | | | |
| | | BARINGS EMERGING
MARKETS DEBT
BLENDED TOTAL
RETURN FUND | | | BARINGS GLOBAL
EMERGING MARKETS
EQUITY FUND | | | BARINGS U.S.
HIGH YIELD
FUND | |
|
| Investment Income | |
Interest income (net of withholding tax of $39,858, $0 and $0, respectively) | | $ | 4,242,549 | | | $ | 978 | | | $ | 3,198,350 | |
Dividend income (net of withholding tax of $0, $29,256 and $0, respectively) | | | – | | | | 306,773 | | | | – | |
Other income | | | 918 | | | | – | | | | 3,936 | |
| | | | | | | | | | | | |
Total investment income | | | 4,243,467 | | | | 307,751 | | | | 3,202,286 | |
| | | | | | | | | | | | |
| | | |
| Operating Expenses | | | | | | | | | | | | |
Advisory fees | | | 406,292 | | | | 95,181 | | | | 269,901 | |
12b-1 distribution and servicing plan | | | | | | | | | | | | |
Class A | | | 5,721 | | | | 264 | | | | 6,319 | |
Class C | | | 2,560 | | | | 1,054 | | | | 944 | |
Shareholder service fee | | | | | | | | | | | | |
Class A | | | 1,197 | | | | – | | | | 3,077 | |
Class C | | | 33 | | | | – | | | | – | |
Class Y | | | 3,974 | | | | – | | | | 3,823 | |
Administrator fees | | | 57,188 | | | | 47,183 | | | | 43,807 | |
Custody fees | | | 88,979 | | | | 13,030 | | | | 42,406 | |
Professional fees | | | 83,106 | | | | 67,643 | | | | 62,528 | |
Transfer agent fees | | | 30,587 | | | | 25,248 | | | | 20,180 | |
Directors’ fees | | | 35,321 | | | | 26,107 | | | | 34,642 | |
Registration fees | | | 49,270 | | | | 34,458 | | | | 48,941 | |
Printing and mailing expenses | | | 5,441 | | | | 5,502 | | | | 5,201 | |
Other operating expenses | | | 19,479 | | | | 10,927 | | | | 18,555 | |
| | | | | | | | | | | | |
Total operating expenses | | | 789,148 | | | | 326,597 | | | | 560,324 | |
Waiver/Reimbursement of expenses | | | | | | | | | | | | |
Class A | | | (20,037 | ) | | | (8,040 | ) | | | (16,187 | ) |
Class C | | | (8,561 | ) | | | (8,033 | ) | | | (5,253 | ) |
Class I | | | (93,440 | ) | | | (91,150 | ) | | | (42,586 | ) |
Class Y | | | (144,192 | ) | | | (91,147 | ) | | | (120,988 | ) |
| | | | | | | | | | | | |
Net operating expenses | | | 522,918 | | | | 128,227 | | | | 375,310 | |
| | | | | | | | | | | | |
Net investment income | | | 3,720,549 | | | | 179,524 | | | | 2,826,976 | |
| | | | | | | | | | | | |
See accompanying Notes to the Financial Statements.
40
Barings Funds Trust 2020 Annual Report
STATEMENTS OF OPERATIONS (CONTINUED)
For the Year Ended June 30, 2020
| | | | | | | | | | | | |
| | | BARINGS EMERGING
MARKETS DEBT
BLENDED TOTAL
RETURN FUND | | | BARINGS GLOBAL
EMERGING MARKETS
EQUITY FUND | | | BARINGS U.S.
HIGH YIELD
FUND | |
| | | |
| Realized and Unrealized Gains (Losses) | | | | | | | | | | | | |
Net realized loss on investments | | $ | (1,076,140 | ) (1) | | $ | (342,152 | ) | | $ | (1,800,225 | ) |
Net realized gain (loss) on forward foreign currency exchange contracts | | | 1,321,055 | | | | (30 | ) | | | – | |
Net realized gain (loss) on foreign currency and translation | | | (40,978 | ) | | | (1,719 | ) | | | – | |
Net realized gain (loss) on futures contracts | | | (537,852 | ) | | | – | | | | – | |
Net realized gain on swap contracts | | | 113,584 | | | | – | | | | – | |
Net realized gain (loss) on purchased options | | | (17,579 | ) | | | – | | | | – | |
| | | | | | | | | | | | |
Net realized gain (loss) | | | (237,910 | ) | | | (343,901 | ) | | | (1,800,225 | ) |
| | | | | | | | | | | | |
Net change in unrealized depreciation on investments | | | (2,398,972 | ) (2) | | | (235,582 | ) | | | (3,074,461 | ) |
Net change in unrealized appreciation on forward foreign currency exchange contracts | | | 772,249 | | | | – | | | | – | |
Net change in unrealized appreciation (depreciation) on foreign currency and translation | | | (5,164 | ) | | | (207 | ) | | | – | |
Net change in unrealized appreciation (depreciation) on futures contracts | | | 71,794 | | | | – | | | | – | |
Net change in unrealized appreciation (depreciation) on swap contracts | | | 4,211,137 | | | | – | | | | – | |
Net change in unrealized appreciation (depreciation) on purchased option contracts | | | 37,731 | | | | – | | | | – | |
| | | | | | | | | | | | |
Net change in unrealized appreciation (depreciation) | | | 2,688,775 | | | | (235,789 | ) | | | (3,074,461 | ) |
| | | | | | | | | | | | |
Net realized and unrealized gains (losses) | | | 2,450,865 | | | | (579,690 | ) | | | (4,874,686 | ) |
| | | | | | | | | | | | |
Net increase (decrease) in net assets resulting from operations | | $ | 6,171,414 | | | $ | (400,166 | ) | | $ | (2,047,710 | ) |
| | | | | | | | | | | | |
| (1) | | Includes realized foreign capital gains taxes of $8,364. |
| (2) | | Net of change in unrealized appreciation/(depreciation) of foreign capital gains taxes of $2,922. |
See accompanying Notes to the Financial Statements.
41
Barings Funds Trust 2020 Annual Report
STATEMENTS OF CHANGES IN NET ASSETS
| | | | | | | | | | | | | | | | |
| | | BARINGS GLOBAL
FLOATING RATE FUND | | | BARINGS GLOBAL
CREDIT INCOME
OPPORTUNITIES FUND | |
| | | FOR THE
YEAR ENDED
JUNE 30, 2020 | | | FOR THE
YEAR ENDED
JUNE 30, 2019 | | | FOR THE
YEAR ENDED
JUNE 30, 2020 | | | FOR THE
YEAR ENDED
JUNE 30, 2019 | |
| | | | |
| Operations | | | | | | | | | | | | | | | | |
Net investment income | | $ | 11,934,842 | | | $ | 14,299,471 | | | $ | 10,927,198 | | | $ | 12,185,927 | |
Net realized gain (loss) | | | (8,284,095 | ) | | | 2,745,235 | | | | (9,309,427 | ) | | | (1,381,993 | ) |
Net change in unrealized depreciation | | | (13,188,700 | ) | | | (9,427,826 | ) | | | (12,349,471 | ) | | | (6,630,323 | ) |
| | | | | | | | | | | | | | | | |
Net increase (decrease) in net assets from operations | | | (9,537,953 | ) | | | 7,616,880 | | | | (10,731,700 | ) | | | 4,173,611 | |
| | | | | | | | | | | | | | | | |
| | | | |
| Dividends and distributions | | | | | | | | | | | | | | | | |
Class A | | | (1,752,333 | ) | | | (2,631,234 | ) | | | (2,270,709 | ) | | | (3,633,155 | ) |
| | | | | | | | | | | | | | | | |
Class C | | | (263,597 | ) | | | (385,566 | ) | | | (321,702 | ) | | | (505,418 | ) |
| | | | | | | | | | | | | | | | |
Class I | | | (1,584,124 | ) | | | (1,747,985 | ) | | | (1,091,239 | ) | | | (1,282,074 | ) |
| | | | | | | | | | | | | | | | |
Class Y | | | (7,063,704 | ) | | | (10,875,941 | ) | | | (5,901,580 | ) | | | (8,847,995 | ) |
| | | | | | | | | | | | | | | | |
Total Dividends and distributions | | | (10,663,758 | ) | | | (15,640,726 | ) | | | (9,585,230 | ) | | | (14,268,642 | ) |
| | | | | | | | | | | | | | | | |
|
| Return of capital | |
Class A | | | (360,351 | ) | | | – | | | | (356,912 | ) | | | (63,546 | ) |
| | | | | | | | | | | | | | | | |
Class C | | | (52,291 | ) | | | – | | | | (51,371 | ) | | | (9,510 | ) |
| | | | | | | | | | | | | | | | |
Class I | | | (369,841 | ) | | | – | | | | (174,380 | ) | | | (25,629 | ) |
| | | | | | | | | | | | | | | | |
Class Y | | | (1,382,565 | ) | | | – | | | | (870,042 | ) | | | (165,268 | ) |
| | | | | | | | | | | | | | | | |
Total Return of capital | | | (2,165,048 | ) | | | – | | | | (1,452,705 | ) | | | (263,953 | ) |
| | | | | | | | | | | | | | | | |
|
| Capital Share Transactions | |
Net proceeds from sale of shares | | | 106,125,221 | | | | 181,096,638 | | | | 64,702,295 | | | | 92,707,830 | |
Net Asset Value of shares issued to shareholders in payment of distributions declared | | | 10,443,892 | | | | 12,277,586 | | | | 8,443,894 | | | | 10,875,940 | |
Cost of shares redeemed | | | (153,128,901 | ) | | | (164,501,029 | ) | | | (99,727,481 | ) | | | (112,233,144 | ) |
| | | | | | | | | | | | | | | | |
Net increase (decrease) in net assets resulting from capital stock transactions | | | (36,559,788 | ) | | | 28,873,195 | | | | (26,581,292 | ) | | | (8,649,374 | ) |
| | | | | | | | | | | | | | | | |
Total increase (decrease) in net assets | | | (58,926,547 | ) | | | 20,849,349 | | | | (48,350,927 | ) | | | (19,008,358 | ) |
| | | | | | | | | | | | | | | | |
|
| Net Assets | |
Beginning of year | | | 273,636,553 | | | | 252,787,204 | | | | 212,490,719 | | | | 231,499,077 | |
| | | | | | | | | | | | | | | | |
End of year | | $ | 214,710,006 | | | $ | 273,636,553 | | | $ | 164,139,792 | | | $ | 212,490,719 | |
| | | | | | | | | | | | | | | | |
See accompanying Notes to the Financial Statements.
42
Barings Funds Trust 2020 Annual Report
STATEMENTS OF CHANGES IN NET ASSETS
| | | | | | | | | | | | | | | | |
| | | BARINGS ACTIVE
SHORT DURATION
BOND FUND | | | BARINGS DIVERSIFIED
INCOME FUND | |
| | | FOR THE
YEAR ENDED
JUNE 30, 2020 | | | FOR THE
YEAR ENDED
JUNE 30, 2019 | | | FOR THE
YEAR ENDED
JUNE 30, 2020 | | | FOR THE
YEAR ENDED
JUNE 30, 2019 | |
| | | | |
| Operations | | | | | | | | | | | | | | | | |
Net investment income | | $ | 24,970,866 | | | $ | 15,718,078 | | | $ | 1,479,690 | | | $ | 1,104,761 | |
Net realized loss | | | (24,682,091 | ) | | | (5,023,199 | ) | | | (2,679,571 | ) | | | (340,692 | ) |
Net change in unrealized appreciation (depreciation) | | | (20,585,735 | ) | | | 9,888,356 | | | | (1,572,448 | ) | | | 552,217 | |
| | | | | | | | | | | | | | | | |
Net increase (decrease) in net assets from operations | | | (20,296,960 | ) | | | 20,583,235 | | | | (2,772,329 | ) | | | 1,316,286 | |
| | | | | | | | | | | | | | | | |
| | | | |
| Dividends and distributions | | | | | | | | | | | | | | | | |
Class A | | | (4,268,051 | ) | | | (4,327,284 | ) | | | (9,395 | ) | | | (7,516 | ) |
| | | | | | | | | | | | | | | | |
Class C | | | (61,754 | ) | | | (31,974 | ) | | | (4,704 | ) | | | (4,785 | ) |
| | | | | | | | | | | | | | | | |
Class I | | | (6,754 | ) | | | (9,407 | ) | | | (406,140 | ) | | | (413,758 | ) |
| | | | | | | | | | | | | | | | |
Class Y | | | (20,482,090 | ) | | | (11,907,536 | ) | | | (1,051,301 | ) | | | (678,343 | ) |
| | | | | | | | | | | | | | | | |
Class L (1) | | | (108,096 | ) | | | – | | | | – | | | | – | |
| | | | | | | | | | | | | | | | |
Total Dividends and distributions | | | (24,926,745 | ) | | | (16,276,201 | ) | | | (1,471,540 | ) | | | (1,104,402 | ) |
| | | | | | | | | | | | | | | | |
|
| Capital Share Transactions | |
Net proceeds from sale of shares | | | 686,580,548 | | | | 531,527,546 | | | | 21,879,952 | | | | 16,053,424 | |
Net Asset Value of shares issued to shareholders in payment of distributions declared | | | 20,314,845 | | | | 13,533,610 | | | | 636,919 | | | | 262,817 | |
Cost of shares redeemed | | | (573,907,960 | ) | | | (264,419,113 | ) | | | (19,982,097 | ) | | | (2,915,535 | ) |
| | | | | | | | | | | | | | | | |
Net increase in net assets resulting from capital stock transactions | | | 132,987,433 | | | | 280,642,043 | | | | 2,534,774 | | | | 13,400,706 | |
| | | | | | | | | | | | | | | | |
Total increase (decrease) in net assets | | | 87,763,728 | | | | 284,949,077 | | | | (1,709,095 | ) | | | 13,612,590 | |
| | | | | | | | | | | | | | | | |
|
| Net Assets | |
Beginning of year | | | 715,733,277 | | | | 430,784,200 | | | | 42,498,827 | | | | 28,886,237 | |
| | | | | | | | | | | | | | | | |
End of year | | $ | 803,497,005 | | | $ | 715,733,277 | | | $ | 40,789,732 | | | $ | 42,498,827 | |
| | | | | | | | | | | | | | | | |
| (1) | | Class commenced operations on May 1, 2020. |
See accompanying Notes to the Financial Statements.
43
Barings Funds Trust 2020 Annual Report
STATEMENTS OF CHANGES IN NET ASSETS
| | | | | | | | | | | | | | | | |
| | | BARINGS EMERGING
MARKETS DEBT
BLENDED TOTAL
RETURN FUND | | | BARINGS GLOBAL
EMERGING MARKETS
EQUITY FUND | |
| | | FOR THE
YEAR ENDED
JUNE 30, 2020 | | | FOR THE
YEAR ENDED
JUNE 30, 2019 | | | FOR THE
YEAR ENDED
JUNE 30, 2020 | | | PERIOD FROM
SEPTEMBER 17, 2018 THROUGH JUNE 30, 2019 (2) | |
| | | | |
| Operations | | | | | | | | | | | | | | | | |
Net investment income | | $ | 3,720,549 | | | $ | 2,933,988 | | | $ | 179,524 | | | $ | 78,236 | |
Net realized gain (loss) | | | (237,910 | ) | | | (2,216,261 | ) | | | (343,901 | ) | | | 69,969 | |
Net change in unrealized appreciation (depreciation) | | | 2,688,775 | | | | 5,107,421 | | | | (235,789 | ) | | | 976,638 | |
| | | | | | | | | | | | | | | | |
Net increase (decrease) in net assets from operations | | | 6,171,414 | | | | 5,825,148 | | | | (400,166 | ) | | | 1,124,843 | |
| | | | | | | | | | | | | | | | |
| | | | |
| Dividends and distributions | | | | | | | | | | | | | | | | |
Class A | | | (150,461 | ) | | | (27,569 | ) | | | (3,013 | ) | | | – | |
| | | | | | | | | | | | | | | | |
Class C | | | (14,353 | ) | | | (13,395 | ) | | | (2,081 | ) | | | – | |
| | | | | | | | | | | | | | | | |
Class I | | | (1,361,075 | ) | | | (1,355,443 | ) | | | (163,753 | ) | | | – | |
| | | | | | | | | | | | | | | | |
Class Y | | | (2,004,219 | ) | | | (1,420,530 | ) | | | (163,753 | ) | | | – | |
| | | | | | | | | | | | | | | | |
Total Dividends and distributions | | | (3,530,108 | ) | | | (2,816,937 | ) | | | (332,600 | ) | | | – | |
| | | | | | | | | | | | | | | | |
|
| |
Class A | | | – | | | | (2,043 | ) | | | (137 | ) | | | – | |
| | | | | | | | | | | | | | | | |
Class C | | | – | | | | (1,174 | ) | | | (95 | ) | | | – | |
| | | | | | | | | | | | | | | | |
Class I | | | – | | | | (126,191 | ) | | | (7,453 | ) | | | – | |
| | | | | | | | | | | | | | | | |
Class Y | | | – | | | | (133,784 | ) | | | (7,453 | ) | | | – | |
| | | | | | | | | | | | | | | | |
Total Return of capital | | | – | | | | (263,192 | ) | | | (15,138 | ) | | | – | |
| | | | | | | | | | | | | | | | |
|
| Capital Share Transactions | |
Net proceeds from sale of shares | | | 28,149,569 | | | | 1,762,308 | | | | – | | | | 10,000,000 | |
Net Asset Value of shares issued to shareholders in payment of distributions declared | | | 647,379 | | | | 64,652 | | | | – | | | | – | |
Cost of shares redeemed | | | (27,212,488 | ) | | | (752,758 | ) | | | – | | | | – | |
| | | | | | | | | | | | | | | | |
Net increase in net assets resulting from capital stock transactions | | | 1,584,460 | | | | 1,074,202 | | | | – | | | | 10,000,000 | |
| | | | | | | | | | | | | | | | |
Total increase (decrease) in net assets | | | 4,225,766 | | | | 3,819,221 | | | | (747,904 | ) | | | 11,124,843 | |
| | | | | | | | | | | | | | | | |
|
| Net Assets | |
Beginning of year | | | 50,434,033 | | | | 46,614,812 | | | | 11,124,843 | | | | – | |
| | | | | | | | | | | | | | | | |
End of year | | $ | 54,659,799 | | | $ | 50,434,033 | | | $ | 10,376,939 | | | $ | 11,124,843 | |
| | | | | | | | | | | | | | | | |
| (2) | | Fund commenced operations on September 17, 2018. |
See accompanying Notes to the Financial Statements.
44
Barings Funds Trust 2020 Annual Report
STATEMENTS OF CHANGES IN NET ASSETS
| | | | | | | | |
| | | BARINGS U.S.
HIGH YIELD FUND | |
| | | FOR THE
YEAR ENDED
JUNE 30, 2020 | | | FOR THE
YEAR ENDED
JUNE 30, 2019 | |
| | |
| Operations | | | | | | | | |
Net investment income | | $ | 2,826,976 | | | $ | 3,323,214 | |
Net realized loss | | | (1,800,225 | ) | | | (467,591 | ) |
Net change in unrealized appreciation (depreciation) | | | (3,074,461 | ) | | | 140,723 | |
| | | | | | | | |
Net increase (decrease) in net assets from operations | | | (2,047,710 | ) | | | 2,996,346 | |
| | | | | | | | |
| | |
| Dividends and distributions | | | | | | | | |
Class A | | | (142,062 | ) | | | (123,204 | ) |
| | | | | | | | |
Class C | | | (4,612 | ) | | | (5,130 | ) |
| | | | | | | | |
Class I | | | (688,893 | ) | | | (869,451 | ) |
| | | | | | | | |
Class Y | | | (2,043,599 | ) | | | (2,324,075 | ) |
| | | | | | | | |
Total Dividends and distributions | | | (2,879,166 | ) | | | (3,321,860 | ) |
| | | | | | | | |
|
| Capital Share Transactions | |
Net proceeds from sale of shares | | | 8,447,531 | | | | 8,045,852 | |
Net Asset Value of shares issued to shareholders in payment of distributions declared | | | 1,475,410 | | | | 1,787,969 | |
Cost of shares redeemed | | | (9,728,479 | ) | | | (15,746,520 | ) |
| | | | | | | | |
Net increase (decrease) in net assets resulting from capital stock transactions | | | 194,462 | | | | (5,912,699 | ) |
| | | | | | | | |
Total decrease in net assets | | | (4,732,414 | ) | | | (6,238,213 | ) |
| | | | | | | | |
|
| Net Assets | |
Beginning of year | | | 50,769,064 | | | | 57,007,277 | |
| | | | | | | | |
End of year | | $ | 46,036,650 | | | $ | 50,769,064 | |
| | | | | | | | |
See accompanying Notes to the Financial Statements.
45
Barings Global Floating Rate Fund 2020 Annual Report
FINANCIAL HIGHLIGHTS
| | | | | | | | | | | | | | | | | | | | |
| | | CLASS A | |
| | | FOR THE
YEAR
ENDED
JUNE 30,
2020 | | | FOR THE
YEAR
ENDED
JUNE 30,
2019 | | | FOR THE
YEAR
ENDED
JUNE 30,
2018 | | | FOR THE
YEAR
ENDED
JUNE 30,
2017 | | | FOR THE
YEAR
ENDED
JUNE 30,
2016 | |
|
| Per Common Share Data | |
Net asset value, beginning of year | | $ | 9.26 | | | $ | 9.48 | | | $ | 9.54 | | | $ | 9.13 | | | $ | 9.60 | |
Income from investment operations: | |
Net investment income (1) | | | 0.41 | | | | 0.44 | | | | 0.43 | | | | 0.43 | | | | 0.44 | |
Net realized and unrealized gain (loss) | | | (0.66 | ) | | | (0.18 | ) | | | (0.06 | ) | | | 0.42 | | | | (0.45 | ) |
| | | | | | | | | | | | | | | | | | | | |
Total increase (decrease) from investment operations | | | (0.25 | ) | | | 0.26 | | | | 0.37 | | | | 0.85 | | | | (0.01 | ) |
| | | | | | | | | | | | | | | | | | | | |
Less dividends and distributions: | |
From net investment income | | | (0.34 | ) | | | (0.44 | ) | | | (0.38 | ) | | | (0.31 | ) | | | (0.46 | ) |
From net realized gain | | | (0.03 | ) | | | (0.04 | ) | | | – | | | | – | | | | – | |
From return of capital | | | (0.08 | ) | | | – | | | | (0.05 | ) | | | (0.13 | ) | | | – | |
| | | | | | | | | | | | | | | | | | | | |
Total dividends and distributions | | | (0.45 | ) | | | (0.48 | ) | | | (0.43 | ) | | | (0.44 | ) | | | (0.46 | ) |
| | | | | | | | | | | | | | | | | | | | |
Net asset value, at end of year | | $ | 8.56 | | | $ | 9.26 | | | $ | 9.48 | | | $ | 9.54 | | | $ | 9.13 | |
| | | | | | | | | | | | | | | | | | | | |
Total investment return (2) | | | (2.79 | )% | | | 2.77 | % | | | 4.00 | % | | | 9.47 | % | | | (0.04 | )% |
| | | | | | | | | | | | | | | | | | | | |
|
| Supplemental Data and Ratios | |
Net assets, end of year (000’s) | | $ | 37,431 | | | $ | 45,213 | | | $ | 53,371 | | | $ | 45,363 | | | $ | 13,980 | |
Ratio of total expenses (before reductions and reimbursements) to average net assets | | | 1.22 | % | | | 1.25 | % | | | 1.26 | % | | | 1.37 | % | | | 1.72 | % |
Ratio of net expenses to average net assets (3) | | | 1.00 | % | | | 1.00 | % | | | 0.96 | %(4) | | | 0.99 | %(5) | | | 1.05 | %(6) |
Ratio of net investment income to average net assets | | | 4.63 | % | | | 4.72 | % | | | 4.55 | % | | | 4.52 | % | | | 4.74 | % |
Portfolio turnover rate | | | 37.23 | % | | | 46.51 | % | | | 57.74 | % | | | 47.06 | % | | | 62.99 | % |
| (1) | | Calculated using average shares outstanding. |
| (2) | | Total investment return calculation does not consider the effects of sales loads and assumes the reinvestment of dividends at actual prices pursuant to the Fund’s dividend reinvestment plan. |
| (3) | | The Adviser has agreed to waive and/or reimburse certain fees and/or expense so that, on an annualized basis, such expenses incurred will not exceed 1.00% as a percentage of average daily net assets. |
| (4) | | Net expenses reflect a voluntary expense reimbursement to prevent a negative yield. |
| (5) | | Net expenses reflect a one-time voluntary reimbursement to the Fund during the period in connection with a change to the fee waiver and/or expense reimbursement agreement. |
| (6) | | Net expenses reflect a previous fee waiver and/or expense reimbursement agreement. |
See accompanying Notes to the Financial Statements.
46
Barings Global Floating Rate Fund 2020 Annual Report
FINANCIAL HIGHLIGHTS (CONTINUED)
| | | | | | | | | | | | | | | | | | | | |
| | | CLASS C | |
| | | FOR THE
YEAR
ENDED
JUNE 30,
2020 | | | FOR THE
YEAR
ENDED
JUNE 30,
2019 | | | FOR THE
YEAR
ENDED
JUNE 30,
2018 | | | FOR THE
YEAR
ENDED
JUNE 30,
2017 | | | FOR THE
YEAR
ENDED
JUNE 30,
2016 | |
|
| Per Common Share Data | |
Net asset value, beginning of year | | $ | 9.22 | | | $ | 9.45 | | | $ | 9.51 | | | $ | 9.10 | | | $ | 9.57 | |
Income from investment operations: | |
Net investment income (1) | | | 0.35 | | | | 0.37 | | | | 0.36 | | | | 0.37 | | | | 0.37 | |
Net realized and unrealized gain (loss) | | | (0.66 | ) | | | (0.19 | ) | | | (0.06 | ) | | | 0.41 | | | | (0.45 | ) |
| | | | | | | | | | | | | | | | | | | | |
Total increase (decrease) from investment operations | | | (0.31 | ) | | | 0.18 | | | | 0.30 | | | | 0.78 | | | | (0.08 | ) |
| | | | | | | | | | | | | | | | | | | | |
Less dividends and distributions: | |
From net investment income | | | (0.29 | ) | | | (0.37 | ) | | | (0.32 | ) | | | (0.26 | ) | | | (0.39 | ) |
From net realized gain | | | (0.03 | ) | | | (0.04 | ) | | | – | | | | – | | | | – | |
From return of capital | | | (0.06 | ) | | | – | | | | (0.04 | ) | | | (0.11 | ) | | | – | |
| | | | | | | | | | | | | | | | | | | | |
Total dividends and distributions | | | (0.38 | ) | | | (0.41 | ) | | | (0.36 | ) | | | (0.37 | ) | | | (0.39 | ) |
| | | | | | | | | | | | | | | | | | | | |
Net asset value, at end of year | | $ | 8.53 | | | $ | 9.22 | | | $ | 9.45 | | | $ | 9.51 | | | $ | 9.10 | |
| | | | | | | | | | | | | | | | | | | | |
Total investment return (2) | | | (3.52 | )% | | | 2.02 | % | | | 3.24 | % | | | 8.68 | % | | | (0.81 | )% |
| | | | | | | | | | | | | | | | | | | | |
|
| Supplemental Data and Ratios | |
Net assets, end of year (000’s) | | $ | 6,494 | | | $ | 8,005 | | | $ | 8,311 | | | $ | 8,018 | | | $ | 6,803 | |
Ratio of total expenses (before reductions and reimbursements) to average net assets | | | 2.04 | % | | | 2.05 | % | | | 2.09 | % | | | 2.24 | % | | | 2.50 | % |
Ratio of net expenses to average net assets (3) | | | 1.75 | % | | | 1.74 | %(4) | | | 1.70 | %(4) | | | 1.71 | %(5) | | | 1.80 | %(6) |
Ratio of net investment income to average net assets | | | 3.88 | % | | | 4.00 | % | | | 3.80 | % | | | 3.91 | % | | | 4.04 | % |
Portfolio turnover rate | | | 37.23 | % | | | 46.51 | % | | | 57.74 | % | | | 47.06 | % | | | 62.99 | % |
| (1) | | Calculated using average shares outstanding. |
| (2) | | Total investment return calculation does not consider the effects of sales loads and assumes the reinvestment of dividends at actual prices pursuant to the Fund’s dividend reinvestment plan. |
| (3) | | The Adviser has agreed to waive and/or reimburse certain fees and/or expense so that, on an annualized basis, such expenses incurred will not exceed 1.75% as a percentage of average daily net assets. |
| (4) | | Net expenses reflect a voluntary expense reimbursement to prevent a negative yield. |
| (5) | | Net expenses reflect a one-time voluntary reimbursement to the Fund during the period in connection with a change to the fee waiver and/or expense reimbursement agreement. |
| (6) | | Net expenses reflect a previous fee waiver and/or expense reimbursement agreement. |
See accompanying Notes to the Financial Statements.
47
Barings Global Floating Rate Fund 2020 Annual Report
FINANCIAL HIGHLIGHTS (CONTINUED)
| | | | | | | | | | | | | | | | | | | | |
| | | CLASS I | |
| | | FOR THE
YEAR
ENDED
JUNE 30,
2020 | | | FOR THE
YEAR
ENDED
JUNE 30,
2019 | | | FOR THE
YEAR
ENDED
JUNE 30,
2018 | | | FOR THE
YEAR
ENDED
JUNE 30,
2017 | | | FOR THE
YEAR
ENDED
JUNE 30,
2016 | |
|
| Per Common Share Data | |
Net asset value, beginning of year | | $ | 9.28 | | | $ | 9.50 | | | $ | 9.56 | | | $ | 9.15 | | | $ | 9.62 | |
Income from investment operations: | |
Net investment income (1) | | | 0.43 | | | | 0.47 | | | | 0.46 | | | | 0.47 | | | | 0.47 | |
Net realized and unrealized gain (loss) | | | (0.66 | ) | | | (0.18 | ) | | | (0.06 | ) | | | 0.40 | | | | (0.45 | ) |
| | | | | | | | | | | | | | | | | | | | |
Total increase (decrease) from investment operations | | | (0.23 | ) | | | 0.29 | | | | 0.40 | | | | 0.87 | | | | 0.02 | |
| | | | | | | | | | | | | | | | | | | | |
Less dividends and distributions: | |
From net investment income | | | (0.36 | ) | | | (0.47 | ) | | | (0.41 | ) | | | (0.32 | ) | | | (0.49 | ) |
From net realized gain | | | (0.03 | ) | | | (0.04 | ) | | | – | | | | – | | | | – | |
From return of capital | | | (0.08 | ) | | | – | | | | (0.05 | ) | | | (0.14 | ) | | | – | |
| | | | | | | | | | | | | | | | | | | | |
Total dividends and distributions | | | (0.47 | ) | | | (0.51 | ) | | | (0.46 | ) | | | (0.46 | ) | | | (0.49 | ) |
| | | | | | | | | | | | | | | | | | | | |
Net asset value, at end of year | | $ | 8.58 | | | $ | 9.28 | | | $ | 9.50 | | | $ | 9.56 | | | $ | 9.15 | |
| | | | | | | | | | | | | | | | | | | | |
Total investment return (2) | | | (2.47 | )% | | | 3.04 | % | | | 4.28 | % | | | 9.74 | % | | | 0.25 | % |
| | | | | | | | | | | | | | | | | | | | |
|
| Supplemental Data and Ratios | |
Net assets, end of year (000’s) | | $ | 39,483 | | | $ | 32,531 | | | $ | 18,370 | | | $ | 19,733 | | | $ | 19,903 | |
Ratio of total expenses (before reductions and reimbursements) to average net assets | | | 0.92 | % | | | 0.94 | % | | | 1.03 | % | | | 1.16 | % | | | 1.29 | % |
Ratio of net expenses to average net assets (3) | | | 0.75 | % | | | 0.75 | % | | | 0.71 | %(4) | | | 0.75 | % | | | 0.75 | % |
Ratio of net investment income to average net assets | | | 4.87 | % | | | 5.01 | % | | | 4.78 | % | | | 4.90 | % | | | 5.07 | % |
Portfolio turnover rate | | | 37.23 | % | | | 46.51 | % | | | 57.74 | % | | | 47.06 | % | | | 62.99 | % |
| (1) | | Calculated using average shares outstanding. |
| (2) | | Total investment return calculation assumes the reinvestment of dividends at actual prices pursuant to the Fund’s dividend reinvestment plan. |
| (3) | | The Adviser has agreed to waive and/or reimburse certain fees and/or expense so that, on an annualized basis, such expenses incurred will not exceed 0.75% as a percentage of average daily net assets. |
| (4) | | Net expenses reflect a voluntary expense reimbursement to prevent a negative yield. |
See accompanying Notes to the Financial Statements.
48
Barings Global Floating Rate Fund 2020 Annual Report
FINANCIAL HIGHLIGHTS (CONTINUED)
| | | | | | | | | | | | | | | | | | | | |
| | | CLASS Y | |
| | | FOR THE
YEAR
ENDED
JUNE 30,
2020 | | | FOR THE
YEAR
ENDED
JUNE 30,
2019 | | | FOR THE
YEAR
ENDED
JUNE 30,
2018 | | | FOR THE
YEAR
ENDED
JUNE 30,
2017 | | | FOR THE
YEAR
ENDED
JUNE 30,
2016 | |
|
| Per Common Share Data | |
Net asset value, beginning of year | | $ | 9.27 | | | $ | 9.50 | | | $ | 9.56 | | | $ | 9.15 | | | $ | 9.62 | |
Income from investment operations: | |
Net investment income (1) | | | 0.44 | | | | 0.47 | | | | 0.46 | | | | 0.47 | | | | 0.47 | |
Net realized and unrealized gain (loss) | | | (0.66 | ) | | | (0.19 | ) | | | (0.06 | ) | | | 0.40 | | | | (0.45 | ) |
| | | | | | | | | | | | | | | | | | | | |
Total increase (decrease) from investment operations | | | (0.22 | ) | | | 0.28 | | | | 0.40 | | | | 0.87 | | | | 0.02 | |
| | | | | | | | | | | | | | | | | | | | |
Less dividends and distributions: | |
From net investment income | | | (0.36 | ) | | | (0.47 | ) | | | (0.41 | ) | | | (0.32 | ) | | | (0.49 | ) |
From net realized gain | | | (0.03 | ) | | | (0.04 | ) | | | – | | | | – | | | | – | |
From return of capital | | | (0.08 | ) | | | – | | | | (0.05 | ) | | | (0.14 | ) | | | – | |
| | | | | | | | | | | | | | | | | | | | |
Total dividends and distributions | | | (0.47 | ) | | | (0.51 | ) | | | (0.46 | ) | | | (0.46 | ) | | | (0.49 | ) |
| | | | | | | | | | | | | | | | | | | | |
Net asset value, at end of year | | $ | 8.58 | | | $ | 9.27 | | | $ | 9.50 | | | $ | 9.56 | | | $ | 9.15 | |
| | | | | | | | | | | | | | | | | | | | |
Total investment return (2) | | | (2.54 | )% | | | 3.03 | % | | | 4.27 | % | | | 9.73 | % | | | 0.22 | % |
| | | | | | | | | | | | | | | | | | | | |
|
| Supplemental Data and Ratios | |
Net assets, end of year (000’s) | | $ | 131,302 | | | $ | 187,887 | | | $ | 172,736 | | | $ | 122,736 | | | $ | 125,957 | |
Ratio of total expenses (before reductions and reimbursements) to average net assets | | | 0.99 | % | | | 0.96 | % | | | 1.01 | % | | | 1.14 | % | | | 1.27 | % |
Ratio of net expenses to average net assets (3) | | | 0.75 | % | | | 0.75 | % | | | 0.71 | %(4) | | | 0.75 | % | | | 0.75 | % |
Ratio of net investment income to average net assets | | | 4.89 | % | | | 4.99 | % | | | 4.79 | % | | | 4.90 | % | | | 5.08 | % |
Portfolio turnover rate | | | 37.23 | % | | | 46.51 | % | | | 57.74 | % | | | 47.06 | % | | | 62.99 | % |
| (1) | | Calculated using average shares outstanding. |
| (2) | | Total investment return calculation assumes the reinvestment of dividends at actual prices pursuant to the Fund’s dividend reinvestment plan. |
| (3) | | The Adviser has agreed to waive and/or reimburse certain fees and/or expense so that, on an annualized basis, such expenses incurred will not exceed 0.75% as a percentage of average daily net assets. |
| (4) | | Net expenses reflect a voluntary expense reimbursement to prevent a negative yield. |
See accompanying Notes to the Financial Statements.
49
Barings Global Credit Income Opportunities Fund 2020 Annual Report
FINANCIAL HIGHLIGHTS
| | | | | | | | | | | | | | | | | | | | |
| | | CLASS A | |
| | | FOR THE
YEAR
ENDED
JUNE 30,
2020 | | | FOR THE
YEAR
ENDED
JUNE 30,
2019 | | | FOR THE
YEAR
ENDED
JUNE 30,
2018 | | | FOR THE
YEAR
ENDED
JUNE 30,
2017 | | | FOR THE
YEAR
ENDED
JUNE 30,
2016 | |
|
| Per Common Share Data | |
Net asset value, beginning of year | | $ | 8.93 | | | $ | 9.32 | | | $ | 9.51 | | | $ | 8.80 | | | $ | 9.51 | |
Income from investment operations: | |
Net investment income (1) | | | 0.46 | | | | 0.50 | | | | 0.49 | | | | 0.55 | | | | 0.56 | |
Net realized and unrealized gain (loss) | | | (0.79 | ) | | | (0.30 | ) | | | (0.19 | ) | | | 0.71 | | | | (0.66 | ) |
| | | | | | | | | | | | | | | | | | | | |
Total increase (decrease) from investment operations | | | (0.33 | ) | | | 0.20 | | | | 0.30 | | | | 1.26 | | | | (0.10 | ) |
| | | | | | | | | | | | | | | | | | | | |
Less dividends and distributions: | |
From net investment income | | | (0.40 | ) | | | (0.48 | ) | | | (0.47 | ) | | | (0.50 | ) | | | (0.61 | ) |
From net realized gain | | | – | | | | (0.10 | ) | | | – | | | | – | | | | – | |
From return of capital | | | (0.06 | ) | | | (0.01 | ) | | | (0.02 | ) | | | (0.05 | ) | | | – | |
| | | | | | | | | | | | | | | | | | | | |
Total dividends and distributions | | | (0.46 | ) | | | (0.59 | ) | | | (0.49 | ) | | | (0.55 | ) | | | (0.61 | ) |
| | | | | | | | | | | | | | | | | | | | |
Net asset value, at end of year | | $ | 8.14 | | | $ | 8.93 | | | $ | 9.32 | | | $ | 9.51 | | | $ | 8.80 | |
| | | | | | | | | | | | | | | | | | | | |
Total investment return (2) | | | (3.69 | )% | | | 2.39 | % | | | 3.24 | % | | | 14.61 | % | | | (0.84 | )% |
| | | | | | | | | | | | | | | | | | | | |
|
| Supplemental Data and Ratios | |
Net assets, end of year (000’s) | | $ | 44,860 | | | $ | 51,205 | | | $ | 60,507 | | | $ | 26,904 | | | $ | 12,340 | |
Ratio of total expenses (before reductions and reimbursements) to average net assets | | | 1.32 | % | | | 1.36 | % | | | 1.38 | % | | | 1.56 | % | | | 1.90 | % |
Ratio of net expenses to average net assets (3) | | | 1.20 | % | | | 1.20 | % | | | 1.20 | % | | | 1.20 | % | | | 1.20 | % |
Ratio of net investment income to average net assets | | | 5.35 | % | | | 5.46 | % | | | 5.17 | % | | | 5.83 | % | | | 6.28 | % |
Portfolio turnover rate | | | 64.23 | % | | | 58.78 | % | | | 52.29 | % | | | 48.69 | % | | | 58.08 | % |
| (1) | | Calculated using average shares outstanding. |
| (2) | | Total investment return calculation does not consider the effects of sales loads and assumes the reinvestment of dividends at actual prices pursuant to the Fund’s dividend reinvestment plan. |
| (3) | | The Adviser has agreed to waive and/or reimburse certain fees and/or expense so that, on an annualized basis, such expenses incurred will not exceed 1.20% as a percentage of average daily net assets. |
See accompanying Notes to the Financial Statements.
50
Barings Global Credit Income Opportunities Fund 2020 Annual Report
FINANCIAL HIGHLIGHTS (CONTINUED)
| | | | | | | | | | | | | | | | | | | | |
| | | CLASS C | |
| | | FOR THE
YEAR
ENDED
JUNE 30,
2020 | | | FOR THE
YEAR
ENDED
JUNE 30,
2019 | | | FOR THE
YEAR
ENDED
JUNE 30,
2018 | | | FOR THE
YEAR
ENDED
JUNE 30,
2017 | | | FOR THE
YEAR
ENDED
JUNE 30,
2016 | |
|
| Per Common Share Data | |
Net asset value, beginning of year | | $ | 8.92 | | | $ | 9.31 | | | $ | 9.50 | | | $ | 8.79 | | | $ | 9.50 | |
Income from investment operations: | |
Net investment income (1) | | | 0.39 | | | | 0.43 | | | | 0.42 | | | | 0.48 | | | | 0.49 | |
Net realized and unrealized gain (loss) | | | (0.78 | ) | | | (0.29 | ) | | | (0.19 | ) | | | 0.71 | | | | (0.65 | ) |
| | | | | | | | | | | | | | | | | | | | |
Total increase (decrease) from investment operations | | | (0.39 | ) | | | 0.14 | | | | 0.23 | | | | 1.19 | | | | (0.16 | ) |
| | | | | | | | | | | | | | | | | | | | |
Less dividends and distributions: | |
From net investment income | | | (0.35 | ) | | | (0.42 | ) | | | (0.40 | ) | | | (0.43 | ) | | | (0.55 | ) |
From net realized gain | | | – | | | | (0.10 | ) | | | – | | | | – | | | | – | |
From return of capital | | | (0.05 | ) | | | (0.01 | ) | | | (0.02 | ) | | | (0.05 | ) | | | – | |
| | | | | | | | | | | | | | | | | | | | |
Total dividends and distributions | | | (0.40 | ) | | | (0.53 | ) | | | (0.42 | ) | | | (0.48 | ) | | | (0.55 | ) |
| | | | | | | | | | | | | | | | | | | | |
Net asset value, at end of year | | $ | 8.13 | | | $ | 8.92 | | | $ | 9.31 | | | $ | 9.50 | | | $ | 8.79 | |
| | | | | | | | | | | | | | | | | | | | |
Total investment return (2) | | | (4.41 | )% | | | 1.63 | % | | | 2.47 | % | | | 13.75 | % | | | (1.59 | )% |
| | | | | | | | | | | | | | | | | | | | |
|
| Supplemental Data and Ratios | |
Net assets, end of year (000’s) | | $ | 7,421 | | | $ | 8,462 | | | $ | 8,842 | | | $ | 6,628 | | | $ | 3,578 | |
Ratio of total expenses (before reductions and reimbursements) to average net assets | | | 2.18 | % | | | 2.21 | % | | | 2.21 | % | | | 2.39 | % | | | 2.91 | % |
Ratio of net expenses to average net assets (3) | | | 1.95 | % | | | 1.95 | % | | | 1.95 | % | | | 1.95 | % | | | 1.95 | % |
Ratio of net investment income to average net assets | | | 4.60 | % | | | 4.73 | % | | | 4.44 | % | | | 5.12 | % | | | 5.50 | % |
Portfolio turnover rate | | | 64.23 | % | | | 58.78 | % | | | 52.29 | % | | | 48.69 | % | | | 58.08 | % |
| (1) | | Calculated using average shares outstanding. |
| (2) | | Total investment return calculation does not consider the effects of sales loads and assumes the reinvestment of dividends at actual prices pursuant to the Fund’s dividend reinvestment plan. |
| (3) | | The Adviser has agreed to waive and/or reimburse certain fees and/or expense so that, on an annualized basis, such expenses incurred will not exceed 1.95% as a percentage of average daily net assets. |
See accompanying Notes to the Financial Statements.
51
Barings Global Credit Income Opportunities Fund 2020 Annual Report
FINANCIAL HIGHLIGHTS (CONTINUED)
| | | | | | | | | | | | | | | | | | | | |
| | | CLASS I | |
| | | FOR THE
YEAR
ENDED
JUNE 30,
2020 | | | FOR THE
YEAR
ENDED
JUNE 30,
2019 | | | FOR THE
YEAR
ENDED
JUNE 30,
2018 | | | FOR THE
YEAR
ENDED
JUNE 30,
2017 | | | FOR THE
YEAR
ENDED
JUNE 30,
2016 | |
|
| Per Common Share Data | |
Net asset value, beginning of year | | $ | 8.93 | | | $ | 9.32 | | | $ | 9.50 | | | $ | 8.80 | | | $ | 9.51 | |
Income from investment operations: | |
Net investment income (1) | | | 0.48 | | | | 0.52 | | | | 0.51 | | | | 0.58 | | | | 0.58 | |
Net realized and unrealized gain (loss) | | | (0.79 | ) | | | (0.29 | ) | | | (0.18 | ) | | | 0.70 | | | | (0.65 | ) |
| | | | | | | | | | | | | | | | | | | | |
Total increase (decrease) from investment operations | | | (0.31 | ) | | | 0.23 | | | | 0.33 | | | | 1.28 | | | | (0.07 | ) |
| | | | | | | | | | | | | | | | | | | | |
Less dividends and distributions: | |
From net investment income | | | (0.41 | ) | | | (0.51 | ) | | | (0.49 | ) | | | (0.52 | ) | | | (0.64 | ) |
From net realized gain | | | – | | | | (0.10 | ) | | | – | | | | – | | | | – | |
From return of capital | | | (0.07 | ) | | | (0.01 | ) | | | (0.02 | ) | | | (0.06 | ) | | | – | |
| | | | | | | | | | | | | | | | | | | | |
Total dividends and distributions | | | (0.48 | ) | | | (0.62 | ) | | | (0.51 | ) | | | (0.58 | ) | | | (0.64 | ) |
| | | | | | | | | | | | | | | | | | | | |
Net asset value, at end of year | | $ | 8.14 | | | $ | 8.93 | | | $ | 9.32 | | | $ | 9.50 | | | $ | 8.80 | |
| | | | | | | | | | | | | | | | | | | | |
Total investment return (2) | | | (3.45 | )% | | | 2.65 | % | | | 3.49 | % | | | 14.90 | % | | | (0.61 | )% |
| | | | | | | | | | | | | | | | | | | | |
|
| Supplemental Data and Ratios | |
Net assets, end of year (000’s) | | $ | 21,606 | | | $ | 23,203 | | | $ | 21,788 | | | $ | 22,228 | | | $ | 24,689 | |
Ratio of total expenses (before reductions and reimbursements) to average net assets | | | 1.07 | % | | | 1.09 | % | | | 1.13 | % | | | 1.27 | % | | | 1.54 | % |
Ratio of net expenses to average net assets (3) | | | 0.95 | % | | | 0.95 | % | | | 0.95 | % | | | 0.95 | % | | | 0.95 | % |
Ratio of net investment income to average net assets | | | 5.60 | % | | | 5.69 | % | | | 5.45 | % | | | 6.22 | % | | | 6.54 | % |
Portfolio turnover rate | | | 64.23 | % | | | 58.78 | % | | | 52.29 | % | | | 48.69 | % | | | 58.08 | % |
| (1) | | Calculated using average shares outstanding. |
| (2) | | Total investment return calculation assumes the reinvestment of dividends at actual prices pursuant to the Fund’s dividend reinvestment plan. |
| (3) | | The Adviser has agreed to waive and/or reimburse certain fees and/or expense so that, on an annualized basis, such expenses incurred will not exceed 0.95% as a percentage of average daily net assets. |
See accompanying Notes to the Financial Statements.
52
Barings Global Credit Income Opportunities Fund 2020 Annual Report
FINANCIAL HIGHLIGHTS (CONTINUED)
| | | | | | | | | | | | | | | | | | | | |
| | | CLASS Y | |
| | | FOR THE
YEAR
ENDED
JUNE 30,
2020 | | | FOR THE
YEAR
ENDED
JUNE 30,
2019 | | | FOR THE
YEAR
ENDED
JUNE 30,
2018 | | | FOR THE
YEAR
ENDED
JUNE 30,
2017 | | | FOR THE
YEAR
ENDED
JUNE 30,
2016 | |
|
| Per Common Share Data | |
Net asset value, beginning of year | | $ | 8.93 | | | $ | 9.31 | | | $ | 9.50 | | | $ | 8.80 | | | $ | 9.51 | |
Income from investment operations: | |
Net investment income (1) | | | 0.48 | | | | 0.52 | | | | 0.51 | | | | 0.57 | | | | 0.59 | |
Net realized and unrealized gain (loss) | | | (0.79 | ) | | | (0.28 | ) | | | (0.19 | ) | | | 0.71 | | | | (0.66 | ) |
| | | | | | | | | | | | | | | | | | | | |
Total increase (decrease) from investment operations | | | (0.31 | ) | | | 0.24 | | | | 0.32 | | | | 1.28 | | | | (0.07 | ) |
| | | | | | | | | | | | | | | | | | | | |
Less dividends and distributions: | |
From net investment income | | | (0.41 | ) | | | (0.51 | ) | | | (0.49 | ) | | | (0.52 | ) | | | (0.64 | ) |
From net realized gain | | | – | | | | (0.10 | ) | | | – | | | | – | | | | – | |
From return of capital | | | (0.07 | ) | | | (0.01 | ) | | | (0.02 | ) | | | (0.06 | ) | | | – | |
| | | | | | | | | | | | | | | | | | | | |
Total dividends and distributions | | | (0.48 | ) | | | (0.62 | ) | | | (0.51 | ) | | | (0.58 | ) | | | (0.64 | ) |
| | | | | | | | | | | | | | | | | | | | |
Net asset value, at end of year | | $ | 8.14 | | | $ | 8.93 | | | $ | 9.31 | | | $ | 9.50 | | | $ | 8.80 | |
| | | | | | | | | | | | | | | | | | | | |
Total investment return (2) | | | (3.44 | )% | | | 2.64 | % | | | 3.48 | % | | | 14.90 | % | | | (0.61 | )% |
| | | | | | | | | | | | | | | | | | | | |
|
| Supplemental Data and Ratios | |
Net assets, end of year (000’s) | | $ | 90,254 | | | $ | 129,621 | | | $ | 140,362 | | | $ | 96,014 | | | $ | 58,312 | |
Ratio of total expenses (before reductions and reimbursements) to average net assets | | | 1.10 | % | | | 1.12 | % | | | 1.14 | % | | | 1.28 | % | | | 1.55 | % |
Ratio of net expenses to average net assets (3) | | | 0.95 | % | | | 0.95 | % | | | 0.95 | % | | | 0.95 | % | | | 0.95 | % |
Ratio of net investment income to average net assets | | | 5.60 | % | | | 5.71 | % | | | 5.43 | % | | | 6.14 | % | | | 6.56 | % |
Portfolio turnover rate | | | 64.23 | % | | | 58.78 | % | | | 52.29 | % | | | 48.69 | % | | | 58.08 | % |
| (1) | | Calculated using average shares outstanding. |
| (2) | | Total investment return calculation assumes the reinvestment of dividends at actual prices pursuant to the Fund’s dividend reinvestment plan. |
| (3) | | The Adviser has agreed to waive and/or reimburse certain fees and/or expense so that, on an annualized basis, such expenses incurred will not exceed 0.95% as a percentage of average daily net assets. |
See accompanying Notes to the Financial Statements.
53
Barings Active Short Duration Bond Fund 2020 Annual Report
FINANCIAL HIGHLIGHTS
| | | | | | | | | | | | | | | | | | | | |
| | | CLASS A | |
| | | FOR THE YEAR ENDED JUNE 30, 2020 | | | FOR THE
YEAR
ENDED
JUNE 30,
2019 | | | FOR THE
YEAR
ENDED
JUNE 30,
2018 | | | FOR THE
YEAR
ENDED
JUNE 30,
2017 | | | PERIOD FROM
JULY 8, 2015
THROUGH
JUNE 30,
2016 (1) | |
| | | | | |
| Per Common Share Data | | | | | | | | | | | | | | | | | | | | |
Net asset value, beginning of year | | $ | 9.94 | | | $ | 9.88 | | | $ | 10.01 | | | $ | 9.98 | | | $ | 10.00 | |
Income from investment operations: | | | | | | | | | | | | | | | | | | | | |
Net investment income (2) | | | 0.27 | | | | 0.27 | | | | 0.21 | | | | 0.17 | | | | 0.15 | |
Net realized and unrealized gain (loss) | | | (0.44 | ) | | | 0.08 | | | | (0.10 | ) | | | 0.03 | | | | (0.03 | )(3) |
| | | | | | | | | | | | | | | | | | | | |
Total increase (decrease) from investment operations | | | (0.17 | ) | | | 0.35 | | | | 0.11 | | | | 0.20 | | | | 0.12 | |
| | | | | | | | | | | | | | | | | | | | |
Less dividends and distributions: | | | | | | | | | | | | | | | | | | | | |
From net investment income | | | (0.27 | ) | | | (0.27 | ) | | | (0.21 | ) | | | (0.17 | ) | | | (0.14 | ) |
From net realized gain | | | – | | | | (0.02 | ) | | | (0.03 | ) | | | (0.00 | )(4) | | | – | |
| | | | | | | | | | | | | | | | | | | | |
Total dividends and distributions | | | (0.27 | ) | | | (0.29 | ) | | | (0.24 | ) | | | (0.17 | ) | | | (0.14 | ) |
| | | | | | | | | | | | | | | | | | | | |
Net asset value, at end of year | | $ | 9.50 | | | $ | 9.94 | | | $ | 9.88 | | | $ | 10.01 | | | $ | 9.98 | |
| | | | | | | | | | | | | | | | | | | | |
Total investment return (5) | | | (1.68 | )% | | | 3.52 | % | | | 1.10 | % | | | 2.12 | % | | | 1.17 | %(6) |
| | | | | | | | | | | | | | | | | | | | |
| | | | | |
| Supplemental Data and Ratios | | | | | | | | | | | | | | | | | | | | |
Net assets, end of year (000’s) | | $ | 43,022 | | | $ | 135,981 | | | $ | 177,020 | | | $ | 119,189 | | | $ | 39,992 | |
Ratio of total expenses (before reductions and reimbursements) to average net assets | | | 0.85 | % | | | 0.90 | % | | | 0.94 | % | | | 1.06 | % | | | 1.18 | %(7) |
Ratio of net expenses to average net assets (8) | | | 0.65 | % | | | 0.65 | % | | | 0.65 | % | | | 0.65 | % | | | 0.65 | %(7) |
Ratio of net investment income to average net assets | | | 2.81 | % | | | 2.75 | % | | | 2.15 | % | | | 1.72 | % | | | 1.51 | %(7) |
Portfolio turnover rate | | | 58.11 | % | | | 43.15 | % | | | 53.33 | % | | | 88.52 | % | | | 218.67 | %(6) |
| (1) | | Fund commenced operations on July 8, 2015. |
| (2) | | Calculated using average shares outstanding. |
| (3) | | The per share amount varies from the net realized and unrealized gain/loss for the period because of the timing of sales of fund shares and the per share amount of realized and unrealized gains and losses at such time. |
| (4) | | Amount rounds to less than $.01 per share. |
| (5) | | Total investment return calculation does not consider the effects of sales loads and assumes the reinvestment of dividends at actual prices pursuant to the Fund’s dividend reinvestment plan. |
| (7) | | Annualized for periods less than one full year. |
| (8) | | The Adviser has agreed to waive and/or reimburse certain fees and/or expense so that, on an annualized basis, such expenses incurred will not exceed 0.65% as a percentage of average daily net assets. |
See accompanying Notes to the Financial Statements.
54
Barings Active Short Duration Bond Fund 2020 Annual Report
FINANCIAL HIGHLIGHTS (CONTINUED)
| | | | | | | | | | | | | | | | | | | | |
| | | CLASS C | |
| | | FOR THE YEAR ENDED JUNE 30, 2020 | | | FOR THE
YEAR
ENDED
JUNE 30,
2019 | | | FOR THE
YEAR
ENDED
JUNE 30,
2018 | | | FOR THE
YEAR
ENDED
JUNE 30,
2017 | | | PERIOD FROM
JULY 8, 2015
THROUGH
JUNE 30,
2016 (1) | |
| | | | | |
| Per Common Share Data | | | | | | | | | | | | | | | | | | | | |
Net asset value, beginning of year | | $ | 9.93 | | | $ | 9.87 | | | $ | 10.01 | | | $ | 9.97 | | | $ | 10.00 | |
Income from investment operations: | | | | | | | | | | | | | | | | | | | | |
Net investment income (2) | | | 0.25 | | | | 0.25 | | | | 0.19 | | | | 0.19 | | | | 0.07 | |
Net realized and unrealized gain (loss) | | | (0.44 | ) | | | 0.08 | | | | (0.11 | ) | | | 0.05 | | | | (0.03 | )(3) |
| | | | | | | | | | | | | | | | | | | | |
Total increase (decrease) from investment operations | | | (0.19 | ) | | | 0.33 | | | | 0.08 | | | | 0.24 | | | | 0.04 | |
| | | | | | | | | | | | | | | | | | | | |
Less dividends and distributions: | | | | | | | | | | | | | | | | | | | | |
From net investment income | | | (0.25 | ) | | | (0.25 | ) | | | (0.19 | ) | | | (0.20 | ) | | | (0.07 | ) |
From net realized gain | | | – | | | | (0.02 | ) | | | (0.03 | ) | | | (0.00 | )(4) | | | – | |
| | | | | | | | | | | | | | | | | | | | |
Total dividends and distributions | | | (0.25 | ) | | | (0.27 | ) | | | (0.22 | ) | | | (0.20 | ) | | | (0.07 | ) |
| | | | | | | | | | | | | | | | | | | | |
Net asset value, at end of year | | $ | 9.49 | | | $ | 9.93 | | | $ | 9.87 | | | $ | 10.01 | | | $ | 9.97 | |
| | | | | | | | | | | | | | | | | | | | |
Total investment return (5) | | | (1.96 | )% | | | 3.23 | % | | | 0.84 | % | | | 2.41 | % | | | 0.39 | %(6) |
| | | | | | | | | | | | | | | | | | | | |
| | | | | |
| Supplemental Data and Ratios | | | | | | | | | | | | | | | | | | | | |
Net assets, end of year (000’s) | | $ | 2,498 | | | $ | 1,178 | | | $ | 1,139 | | | $ | 236 | | | $ | 257 | |
Ratio of total expenses (before reductions and reimbursements) to average net assets | | | 1.41 | % | | | 1.70 | % | | | 1.95 | % | | | 3.09 | %(7) | | | 5.44 | %(8)(9) |
Ratio of net expenses to average net assets (10) | | | 0.90 | % | | | 0.90 | % | | | 0.90 | % | | | 0.40 | %(7) | | | 1.40 | %(8)(9) |
Ratio of net investment income to average net assets | | | 2.56 | % | | | 2.51 | % | | | 1.92 | % | | | 1.94 | %(7) | | | 0.71 | %(8)(9) |
Portfolio turnover rate | | | 58.11 | % | | | 43.15 | % | | | 53.33 | % | | | 88.52 | % | | | 218.67 | %(6) |
| (1) | | Fund commenced operations on July 8, 2015. |
| (2) | | Calculated using average shares outstanding. |
| (3) | | The per share amount varies from the net realized and unrealized gain/loss for the period because of the timing of sales of fund shares and the per share amount of realized and unrealized gains and losses at such time. |
| (4) | | Amount rounds to less than $.01 per share. |
| (5) | | Total investment return calculation does not consider the effects of sales loads and assumes the reinvestment of dividends at actual prices pursuant to the Fund’s dividend reinvestment plan. |
| (7) | | Expenses shown reflect a reimbursement to the Fund during the period for an overaccrual of 12b-1 fees made during and prior to the period. |
| (8) | | Annualized for periods less than one full year. |
| (9) | | Expenses shown reflect an overaccrual of 12b-1 fees for the period of $1,478 or 0.50% of average net assets over the period. Subsequent to the period, the Fund was reimbursed for the overaccrued amount. |
| (10) | | The Adviser has agreed to waive and/or reimburse certain fees and/or expense so that, on an annualized basis, such expenses incurred will not exceed 0.90% as a percentage of average daily net assets. |
See accompanying Notes to the Financial Statements.
55
Barings Active Short Duration Bond Fund 2020 Annual Report
FINANCIAL HIGHLIGHTS (CONTINUED)
| | | | | | | | | | | | | | | | | | | | |
| | | CLASS I | |
| | | FOR THE YEAR ENDED JUNE 30, 2020 | | | FOR THE
YEAR
ENDED
JUNE 30,
2019 | | | FOR THE
YEAR
ENDED
JUNE 30,
2018 | | | FOR THE
YEAR
ENDED
JUNE 30,
2017 | | | PERIOD FROM
JULY 8, 2015
THROUGH
JUNE 30,
2016 (1) | |
| | | | | |
| Per Common Share Data | | | | | | | | | | | | | | | | | | | | |
Net asset value, beginning of year | | $ | 9.94 | | | $ | 9.88 | | | $ | 10.01 | | | $ | 9.97 | | | $ | 10.00 | |
Income from investment operations: | | | | | | | | | | | | | | | | | | | | |
Net investment income (2) | | | 0.30 | | | | 0.30 | | | | 0.24 | | | | 0.18 | | | | 0.16 | |
Net realized and unrealized gain (loss) | | | (0.44 | ) | | | 0.08 | | | | (0.10 | ) | | | 0.06 | | | | (0.03 | )(3) |
| | | | | | | | | | | | | | | | | | | | |
Total increase (decrease) from investment operations | | | (0.14 | ) | | | 0.38 | | | | 0.14 | | | | 0.24 | | | | 0.13 | |
| | | | | | | | | | | | | | | | | | | | |
Less dividends and distributions: | | | | | | | | | | | | | | | | | | | | |
From net investment income | | | (0.30 | ) | | | (0.30 | ) | | | (0.24 | ) | | | (0.20 | ) | | | (0.16 | ) |
From net realized gain | | | – | | | | (0.02 | ) | | | (0.03 | ) | | | (0.00 | )(4) | | | – | |
| | | | | | | | | | | | | | | | | | | | |
Total dividends and distributions | | | (0.30 | ) | | | (0.32 | ) | | | (0.27 | ) | | | (0.20 | ) | | | (0.16 | ) |
| | | | | | | | | | | | | | | | | | | | |
Net asset value, at end of year | | $ | 9.50 | | | $ | 9.94 | | | $ | 9.88 | | | $ | 10.01 | | | $ | 9.97 | |
| | | | | | | | | | | | | | | | | | | | |
Total investment return (5) | | | (1.45 | )% | | | 3.78 | % | | | 1.39 | % | | | 2.44 | % | | | 1.35 | %(6) |
| | | | | | | | | | | | | | | | | | | | |
| | | | | |
| Supplemental Data and Ratios | | | | | | | | | | | | | | | | | | | | |
Net assets, end of year (000’s) | | $ | 94 | | | $ | 301 | | | $ | 300 | | | $ | 100 | | | $ | 5,971 | |
Ratio of total expenses (before reductions and reimbursements) to average net assets | | | 3.86 | % | | | 2.84 | % | | | 3.07 | % | | | 1.67 | % | | | 0.96 | %(7) |
Ratio of net expenses to average net assets (8) | | | 0.40 | % | | | 0.40 | % | | | 0.40 | % | | | 0.40 | % | | | 0.44 | %(7) |
Ratio of net investment income to average net assets | | | 3.03 | % | | | 3.01 | % | | | 2.39 | % | | | 1.84 | % | | | 1.67 | %(7) |
Portfolio turnover rate | | | 58.11 | % | | | 43.15 | % | | | 53.33 | % | | | 88.52 | % | | | 218.67 | %(6) |
| (1) | | Fund commenced operations on July 8, 2015. |
| (2) | | Calculated using average shares outstanding. |
| (3) | | The per share amount varies from the net realized and unrealized gain/loss for the period because of the timing of sales of fund shares and the per share amount of realized and unrealized gains and losses at such time. |
| (4) | | Amount rounds to less than $.01 per share. |
| (5) | | Total investment return calculation assumes the reinvestment of dividends at actual prices pursuant to the Fund’s dividend reinvestment plan. |
| (7) | | Annualized for periods less than one full year. |
| (8) | | The Adviser has agreed to waive and/or reimburse certain fees and/or expense so that, on an annualized basis, such expenses incurred will not exceed 0.40% as a percentage of average daily net assets. |
See accompanying Notes to the Financial Statements.
56
Barings Active Short Duration Bond Fund 2020 Annual Report
FINANCIAL HIGHLIGHTS (CONTINUED)
| | | | | | | | | | | | | | | | | | | | |
| | | CLASS Y | |
| | | FOR THE YEAR ENDED JUNE 30, 2020 | | | FOR THE
YEAR
ENDED
JUNE 30,
2019 | | | FOR THE
YEAR
ENDED
JUNE 30,
2018 | | | FOR THE
YEAR
ENDED
JUNE 30,
2017 | | | PERIOD FROM
JULY 8, 2015
THROUGH
JUNE 30,
2016 (1) | |
| | | | | |
| Per Common Share Data | | | | | | | | | | | | | | | | | | | | |
Net asset value, beginning of year | | $ | 9.93 | | | $ | 9.87 | | | $ | 10.01 | | | $ | 9.97 | | | $ | 10.00 | |
Income from investment operations: | | | | | | | | | | | | | | | | | | | | |
Net investment income (2) | | | 0.30 | | | | 0.30 | | | | 0.24 | | | | 0.20 | | | | 0.17 | |
Net realized and unrealized gain (loss) | | | (0.44 | ) | | | 0.07 | | | | (0.11 | ) | | | 0.04 | | | | (0.04 | )(3) |
| | | | | | | | | | | | | | | | | | | | |
Total increase (decrease) from investment operations | | | (0.14 | ) | | | 0.37 | | | | 0.13 | | | | 0.24 | | | | 0.13 | |
| | | | | | | | | | | | | | | | | | | | |
Less dividends and distributions: | | | | | | | | | | | | | | | | | | | | |
From net investment income | | | (0.30 | ) | | | (0.29 | ) | | | (0.24 | ) | | | (0.20 | ) | | | (0.16 | ) |
From net realized gain | | | – | | | | (0.02 | ) | | | (0.03 | ) | | | (0.00 | )(4) | | | – | |
| | | | | | | | | | | | | | | | | | | | |
Total dividends and distributions | | | (0.30 | ) | | | (0.31 | ) | | | (0.27 | ) | | | (0.20 | ) | | | (0.16 | ) |
| | | | | | | | | | | | | | | | | | | | |
Net asset value, at end of year | | $ | 9.49 | | | $ | 9.93 | | | $ | 9.87 | | | $ | 10.01 | | | $ | 9.97 | |
| | | | | | | | | | | | | | | | | | | | |
Total investment return (5) | | | (1.45 | )% | | | 3.78 | % | | | 1.35 | % | | | 2.38 | % | | | 1.36 | %(6) |
| | | | | | | | | | | | | | | | | �� | | | |
| | | | | |
| Supplemental Data and Ratios | | | | | | | | | | | | | | | | | | | | |
Net assets, end of year (000’s) | | $ | 656,611 | | | $ | 578,272 | | | $ | 252,325 | | | $ | 204,464 | | | $ | 109,645 | |
Ratio of total expenses (before reductions and reimbursements) to average net assets | | | 0.63 | % | | | 0.61 | % | | | 0.70 | % | | | 0.82 | % | | | 0.87 | %(7) |
Ratio of net expenses to average net assets (8) | | | 0.40 | % | | | 0.40 | % | | | 0.40 | % | | | 0.40 | % | | | 0.41 | %(7) |
Ratio of net investment income to average net assets | | | 3.06 | % | | | 3.06 | % | | | 2.39 | % | | | 1.97 | % | | | 1.73 | %(7) |
Portfolio turnover rate | | | 58.11 | % | | | 43.15 | % | | | 53.33 | % | | | 88.52 | % | | | 218.67 | %(6) |
| (1) | | Fund commenced operations on July 8, 2015. |
| (2) | | Calculated using average shares outstanding. |
| (3) | | The per share amount varies from the net realized and unrealized gain/loss for the period because of the timing of sales of fund shares and the per share amount of realized and unrealized gains and losses at such time. |
| (4) | | Amount rounds to less than $.01 per share. |
| (5) | | Total investment return calculation assumes the reinvestment of dividends at actual prices pursuant to the Fund’s dividend reinvestment plan. |
| (7) | | Annualized for periods less than one full year. |
| (8) | | The Adviser has agreed to waive and/or reimburse certain fees and/or expense so that, on an annualized basis, such expenses incurred will not exceed 0.40% as a percentage of average daily net assets. |
See accompanying Notes to the Financial Statements.
57
Barings Active Short Duration Bond Fund 2020 Annual Report
FINANCIAL HIGHLIGHTS (CONTINUED)
| | | | |
| | | CLASS L | |
| | | PERIOD FROM
MAY 1, 2020
THROUGH
JUNE 30,
2020 (1) | |
| |
| Per Common Share Data | | | | |
Net asset value, beginning of period | | $ | 9.21 | |
Income from investment operations: | | | | |
Net investment income (2) | | | 0.05 | |
Net realized and unrealized gain | | | 0.28 | |
| | | | |
Total increase from investment operations | | | 0.33 | |
| | | | |
Less dividends and distributions: | | | | |
From net investment income | | | (0.04 | ) |
| | | | |
Total dividends and distributions | | | (0.04 | ) |
| | | | |
Net asset value, at end of period | | $ | 9.50 | |
| | | | |
Total investment return | | | 3.52 | %(3)(4) |
| | | | |
| |
| Supplemental Data and Ratios | | | | |
Net assets, end of period (000’s) | | $ | 101,272 | |
Ratio of total expenses (before reductions and reimbursements) to average net assets | | | 0.92 | %(5) |
Ratio of net expenses to average net assets (6) | | | 0.65 | %(5) |
Ratio of net investment income to average net assets | | | 3.17 | %(5) |
Portfolio turnover rate | | | 58.11 | %(4) |
| (1) | | Commenced operations on May 1, 2020. |
| (2) | | Calculated using average shares outstanding. |
| (3) | | Total investment return calculation assumes the reinvestment of dividends at actual prices pursuant to the Fund’s dividend reinvestment plan. |
| (5) | | Annualized for periods less than one full year. |
| (6) | | The Adviser has agreed to waive and/or reimburse certain fees and/or expense so that, on an annualized basis, such expenses incurred will not exceed 0.65% as a percentage of average daily net assets. |
See accompanying Notes to the Financial Statements.
58
Barings Diversified Income Fund 2020 Annual Report
FINANCIAL HIGHLIGHTS
| | | | | | | | | | | | | | | | | | | | |
| | | CLASS A | |
| | | FOR THE
YEAR
ENDED
JUNE 30,
2020 | | | FOR THE
YEAR
ENDED
JUNE 30,
2019 | | | FOR THE
YEAR
ENDED
JUNE 30,
2018 | | | FOR THE
YEAR
ENDED
JUNE 30,
2017 | | | PERIOD FROM
JULY 8, 2015
THROUGH
JUNE 30,
2016 (1) | |
| | | | | |
| Per Common Share Data | | | | | | | | | | | | | | | | | | | | |
Net asset value, beginning of year | | $ | 9.82 | | | $ | 9.77 | | | $ | 10.08 | | | $ | 10.18 | | | $ | 10.00 | |
Income from investment operations: | | | | | | | | | | | | | | | | | | | | |
Net investment income (2) | | | 0.29 | | | | 0.30 | | | | 0.27 | | | | 0.25 | | | | 0.25 | |
Net realized and unrealized gain (loss) | | | (1.07 | ) | | | 0.06 | | | | (0.28 | ) | | | (0.09 | ) | | | 0.20 | |
| | | | | | | | | | | | | | | | | | | | |
Total increase (decrease) from investment operations | | | (0.78 | ) | | | 0.36 | | | | (0.01 | ) | | | 0.16 | | | | 0.45 | |
| | | | | | | | | | | | | | | | | | | | |
Less dividends and distributions: | | | | | | | | | | | | | | | | | | | | |
From net investment income | | | (0.31 | ) | | | (0.31 | ) | | | (0.29 | ) | | | (0.26 | ) | | | (0.25 | ) |
From net realized gain | | | – | | | | – | | | | – | | | | – | | | | (0.02 | ) |
From return of capital | | | – | | | | – | | | | (0.01 | ) | | | – | | | | – | |
| | | | | | | | | | | | | | | | | | | | |
Total dividends and distributions | | | (0.31 | ) | | | (0.31 | ) | | | (0.30 | ) | | | (0.26 | ) | | | (0.27 | ) |
| | | | | | | | | | | | | | | | | | | | |
Net asset value, at end of year | | $ | 8.73 | | | $ | 9.82 | | | $ | 9.77 | | | $ | 10.08 | | | $ | 10.18 | |
| | | | | | | | | | | | | | | | | | | | |
Total investment return (3) | | | (8.11 | )% | | | 3.77 | % | | | (0.12 | )% | | | 1.65 | % | | | 4.63 | %(4) |
| | | | | | | | | | | | | | | | | | | | |
| | | | | |
| Supplemental Data and Ratios | | | | | | | | | | | | | | | | | | | | |
Net assets, end of year (000’s) | | $ | 592 | | | $ | 247 | | | $ | 207 | | | $ | 218 | | | $ | 211 | |
Ratio of total expenses (before reductions and reimbursements) to average net assets | | | 3.23 | % | | | 3.57 | % | | | 3.72 | % | | | 3.52 | % | | | 5.60 | %(5) |
Ratio of net expenses to average net assets (6) | | | 0.80 | % | | | 0.79 | %(7)(8) | | | 0.80 | %(7) | | | 0.80 | %(7) | | | 0.80 | %(5)(7) |
Ratio of net investment income to average net assets | | | 3.14 | % | | | 3.11 | % | | | 2.70 | % | | | 2.49 | % | | | 2.52 | %(5) |
Portfolio turnover rate | | | 104.04 | % | | | 192.64 | % | | | 172.39 | % | | | 242.55 | % | | | 434.37 | %(4) |
| (1) | | Fund commenced operations on July 8, 2015. |
| (2) | | Calculated using average shares outstanding. |
| (3) | | Total investment return calculation does not consider the effects of sales loads and assumes the reinvestment of dividends at actual prices pursuant to the Fund’s dividend reinvestment plan. |
| (5) | | Annualized for periods less than one full year. |
| (6) | | The Adviser has agreed to waive and/or reimburse certain fees and/or expense so that, on an annualized basis, such expenses incurred will not exceed 0.80% as a percentage of average daily net assets. |
| (7) | | Ratio of net expenses to average net assets does not include expenses of the underlying fund in which the Fund invests. |
| (8) | | Net expenses reflect a voluntary expense reimbursement to prevent a negative yield. |
See accompanying Notes to the Financial Statements.
59
Barings Diversified Income Fund 2020 Annual Report
FINANCIAL HIGHLIGHTS (CONTINUED)
| | | | | | | | | | | | | | | | | | | | |
| | | CLASS C | |
| | | FOR THE
YEAR
ENDED
JUNE 30,
2020 | | | FOR THE
YEAR
ENDED
JUNE 30,
2019 | | | FOR THE
YEAR
ENDED
JUNE 30,
2018 | | | FOR THE
YEAR
ENDED
JUNE 30,
2017 | | | PERIOD FROM
JULY 8, 2015
THROUGH
JUNE 30,
2016 (1) | |
| | | | | |
| Per Common Share Data | | | | | | | | | | | | | | | | | | | | |
Net asset value, beginning of year | | $ | 9.82 | | | $ | 9.77 | | | $ | 10.08 | | | $ | 10.18 | | | $ | 10.00 | |
Income from investment operations: | | | | | | | | | | | | | | | | | | | | |
Net investment income (2) | | | 0.24 | | | | 0.24 | | | | 0.19 | | | | 0.17 | | | | 0.17 | |
Net realized and unrealized gain (loss) | | | (1.10 | ) | | | 0.05 | | | | (0.27 | ) | | | (0.08 | ) | | | 0.21 | |
| | | | | | | | | | | | | | | | | | | | |
Total increase (decrease) from investment operations | | | (0.86 | ) | | | 0.29 | | | | (0.08 | ) | | | 0.09 | | | | 0.38 | |
| | | | | | | | | | | | | | | | | | | | |
Less dividends and distributions: | | | | | | | | | | | | | | | | | | | | |
From net investment income | | | (0.23 | ) | | | (0.24 | ) | | | (0.22 | ) | | | (0.19 | ) | | | (0.18 | ) |
From net realized gain | | | – | | | | – | | | | – | | | | – | | | | (0.02 | ) |
From return of capital | | | – | | | | – | | | | (0.01 | ) | | | – | | | | – | |
| | | | | | | | | | | | | | | | | | | | |
Total dividends and distributions | | | (0.23 | ) | | | (0.24 | ) | | | (0.23 | ) | | | (0.19 | ) | | | (0.20 | ) |
| | | | | | | | | | | | | | | | | | | | |
Net asset value, at end of year | | $ | 8.73 | | | $ | 9.82 | | | $ | 9.77 | | | $ | 10.08 | | | $ | 10.18 | |
| | | | | | | | | | | | | | | | | | | | |
Total investment return (3) | | | (8.80 | )% | | | 2.99 | % | | | (0.87 | )% | | | 0.89 | % | | | 3.87 | %(4) |
| | | | | | | | | | | | | | | | | | | | |
| | | | | |
| Supplemental Data and Ratios | | | | | | | | | | | | | | | | | | | | |
Net assets, end of year (000’s) | | $ | 175 | | | $ | 197 | | | $ | 196 | | | $ | 202 | | | $ | 204 | |
Ratio of total expenses (before reductions and reimbursements) to average net assets | | | 4.97 | % | | | 4.75 | % | | | 4.60 | % | | | 4.41 | % | | | 6.38 | %(5) |
Ratio of net expenses to average net assets (6) | | | 1.55 | % | | | 1.54 | %(7)(8) | | | 1.55 | %(7) | | | 1.55 | %(7) | | | 1.55 | %(5)(7) |
Ratio of net investment income to average net assets | | | 2.50 | % | | | 2.45 | % | | | 1.95 | % | | | 1.74 | % | | | 1.77 | %(5) |
Portfolio turnover rate | | | 104.04 | % | | | 192.64 | % | | | 172.39 | % | | | 242.55 | % | | | 434.37 | %(4) |
| (1) | | Fund commenced operations on July 8, 2015. |
| (2) | | Calculated using average shares outstanding. |
| (3) | | Total investment return calculation does not consider the effects of sales loads and assumes the reinvestment of dividends at actual prices pursuant to the Fund’s dividend reinvestment plan. |
| (5) | | Annualized for periods less than one full year. |
| (6) | | The Adviser has agreed to waive and/or reimburse certain fees and/or expense so that, on an annualized basis, such expenses incurred will not exceed 1.55% as a percentage of average daily net assets. |
| (7) | | Ratio of net expenses to average net assets does not include expenses of the underlying fund in which the Fund invests. |
| (8) | | Net expenses reflect a voluntary expense reimbursement to prevent a negative yield. |
See accompanying Notes to the Financial Statements.
60
Barings Diversified Income Fund 2020 Annual Report
FINANCIAL HIGHLIGHTS (CONTINUED)
| | | | | | | | | | | | | | | | | | | | |
| | | CLASS I | |
| | | FOR THE
YEAR
ENDED
JUNE 30,
2020 | | | FOR THE
YEAR
ENDED
JUNE 30,
2019 | | | FOR THE
YEAR
ENDED
JUNE 30,
2018 | | | FOR THE
YEAR
ENDED
JUNE 30,
2017 | | | PERIOD FROM
JULY 8, 2015
THROUGH
JUNE 30,
2016 (1) | |
| | | | | |
| Per Common Share Data | | | | | | | | | | | | | | | | | | | | |
Net asset value, beginning of year | | $ | 9.82 | | | $ | 9.77 | | | $ | 10.08 | | | $ | 10.18 | | | $ | 10.00 | |
Income from investment operations: | | | | | | | | | | | | | | | | | | | | |
Net investment income (2) | | | 0.33 | | | | 0.33 | | | | 0.29 | | | | 0.28 | | | | 0.27 | |
Net realized and unrealized gain (loss) | | | (1.09 | ) | | | 0.05 | | | | (0.27 | ) | | | (0.09 | ) | | | 0.20 | |
| | | | | | | | | | | | | | | | | | | | |
Total increase (decrease) from investment operations | | | (0.76 | ) | | | 0.38 | | | | 0.02 | | | | 0.19 | | | | 0.47 | |
| | | | | | | | | | | | | | | | | | | | |
Less dividends and distributions: | | | | | | | | | | | | | | | | | | | | |
From net investment income | | | (0.33 | ) | | | (0.33 | ) | | | (0.32 | ) | | | (0.29 | ) | | | (0.27 | ) |
From net realized gain | | | – | | | | – | | | | – | | | | – | | | | (0.02 | ) |
From return of capital | | | – | | | | – | | | | (0.01 | ) | | | – | | | | – | |
| | | | | | | | | | | | | | | | | | | | |
Total dividends and distributions | | | (0.33 | ) | | | (0.33 | ) | | | (0.33 | ) | | | (0.29 | ) | | | (0.29 | ) |
| | | | | | | | | | | | | | | | | | | | |
Net asset value, at end of year | | $ | 8.73 | | | $ | 9.82 | | | $ | 9.77 | | | $ | 10.08 | | | $ | 10.18 | |
| | | | | | | | | | | | | | | | | | | | |
Total investment return (3) | | | (7.88 | )% | | | 4.01 | % | | | 0.13 | % | | | 1.90 | % | | | 4.89 | %(4) |
| | | | | | | | | | | | | | | | | | | | |
| | | | | |
| Supplemental Data and Ratios | | | | | | | | | | | | | | | | | | | | |
Net assets, end of year (000’s) | | $ | 10,790 | | | $ | 12,130 | | | $ | 12,070 | | | $ | 12,457 | | | $ | 12,582 | |
Ratio of total expenses (before reductions and reimbursements) to average net assets | | | 1.19 | % | | | 1.29 | % | | | 1.30 | % | | | 1.36 | % | | | 1.37 | %(5) |
Ratio of net expenses to average net assets (6) | | | 0.55 | % | | | 0.55 | %(7)(8) | | | 0.55 | %(7) | | | 0.55 | %(7) | | | 0.55 | %(5)(7) |
Ratio of net investment income to average net assets | | | 3.51 | % | | | 3.44 | % | | | 2.94 | % | | | 2.74 | % | | | 2.77 | %(5) |
Portfolio turnover rate | | | 104.04 | % | | | 192.64 | % | | | 172.39 | % | | | 242.55 | % | | | 434.37 | %(4) |
| (1) | | Fund commenced operations on July 8, 2015. |
| (2) | | Calculated using average shares outstanding. |
| (3) | | Total investment return calculation assumes the reinvestment of dividends at actual prices pursuant to the Fund’s dividend reinvestment plan. |
| (5) | | Annualized for periods less than one full year. |
| (6) | | The Adviser has agreed to waive and/or reimburse certain fees and/or expense so that, on an annualized basis, such expenses incurred will not exceed 0.55% as a percentage of average daily net assets. |
| (7) | | Ratio of net expenses to average net assets does not include expenses of the underlying fund in which the Fund invests. |
| (8) | | Net expenses reflect a voluntary expense reimbursement to prevent a negative yield. |
See accompanying Notes to the Financial Statements.
61
Barings Diversified Income Fund 2020 Annual Report
FINANCIAL HIGHLIGHTS (CONTINUED)
| | | | | | | | | | | | | | | | | | | | |
| | | CLASS Y | |
| | | FOR THE
YEAR
ENDED
JUNE 30,
2020 | | | FOR THE
YEAR
ENDED
JUNE 30,
2019 | | | FOR THE
YEAR
ENDED
JUNE 30,
2018 | | | FOR THE
YEAR
ENDED
JUNE 30,
2017 | | | PERIOD FROM
JULY 8, 2015
THROUGH
JUNE 30,
2016 (1) | |
| | | | | |
| Per Common Share Data | | | | | | | | | | | | | | | | | | | | |
Net asset value, beginning of year | | $ | 9.82 | | | $ | 9.77 | | | $ | 10.08 | | | $ | 10.18 | | | $ | 10.00 | |
Income from investment operations: | | | | | | | | | | | | | | | | | | | | |
Net investment income (2) | | | 0.33 | | | | 0.33 | | | | 0.29 | | | | 0.27 | | | | 0.27 | |
Net realized and unrealized gain (loss) | | | (1.09 | ) | | | 0.05 | | | | (0.27 | ) | | | (0.08 | ) | | | 0.20 | |
| | | | | | | | | | | | | | | | | | | | |
Total increase (decrease) from investment operations | | | (0.76 | ) | | | 0.38 | | | | 0.02 | | | | 0.19 | | | | 0.47 | |
| | | | | | | | | | | | | | | | | | | | |
Less dividends and distributions: | | | | | | | | | | | | | | | | | | | | |
From net investment income | | | (0.33 | ) | | | (0.33 | ) | | | (0.32 | ) | | | (0.29 | ) | | | (0.27 | ) |
From net realized gain | | | – | | | | – | | | | – | | | | – | | | | (0.02 | ) |
From return of capital | | | – | | | | – | | | | (0.01 | ) | | | – | | | | – | |
| | | | | | | | | | | | | | | | | | | | |
Total dividends and distributions | | | (0.33 | ) | | | (0.33 | ) | | | (0.33 | ) | | | (0.29 | ) | | | (0.29 | ) |
| | | | | | | | | | | | | | | | | | | | |
Net asset value, at end of year | | $ | 8.73 | | | $ | 9.82 | | | $ | 9.77 | | | $ | 10.08 | | | $ | 10.18 | |
| | | | | | | | | | | | | | | | | | | | |
Total investment return (3) | | | (7.88 | )% | | | 4.01 | % | | | 0.13 | % | | | 1.90 | % | | | 4.89 | %(4) |
| | | | | | | | | | | | | | | | | | | | |
| | | | | |
| Supplemental Data and Ratios | | | | | | | | | | | | | | | | | | | | |
Net assets, end of year (000’s) | | $ | 29,233 | | | $ | 29,925 | | | $ | 16,414 | | | $ | 17,478 | | | $ | 13,011 | |
Ratio of total expenses (before reductions and reimbursements) to average net assets | | | 1.20 | % | | | 1.30 | % | | | 1.33 | % | | | 1.36 | % | | | 1.36 | %(5) |
Ratio of net expenses to average net assets (6) | | | 0.55 | % | | | 0.55 | % (7)(8) | | | 0.55 | %(7) | | | 0.55 | %(7) | | | 0.55 | %(5)(7) |
Ratio of net investment income to average net assets | | | 3.48 | % | | | 3.42 | % | | | 2.95 | % | | | 2.72 | % | | | 2.77 | %(5) |
Portfolio turnover rate | | | 104.04 | % | | | 192.64 | % | | | 172.39 | % | | | 242.55 | % | | | 434.37 | %(4) |
| (1) | | Fund commenced operations on July 8, 2015. |
| (2) | | Calculated using average shares outstanding. |
| (3) | | Total investment return calculation assumes the reinvestment of dividends at actual prices pursuant to the Fund’s dividend reinvestment plan. |
| (5) | | Annualized for periods less than one full year. |
| (6) | | The Adviser has agreed to waive and/or reimburse certain fees and/or expense so that, on an annualized basis, such expenses incurred will not exceed 0.55% as a percentage of average daily net assets. |
| (7) | | Ratio of net expenses to average net assets does not include expenses of the underlying fund in which the Fund invests. |
| (8) | | Net expenses reflect a voluntary expense reimbursement to prevent a negative yield. |
See accompanying Notes to the Financial Statements.
62
Barings Emerging Markets Debt Blended Total Return Fund 2020 Annual Report
FINANCIAL HIGHLIGHTS
| | | | | | | | | | | | | | | | | | | | |
| | | CLASS A | |
| | | FOR THE
YEAR
ENDED
JUNE 30,
2020 | | | FOR THE
YEAR
ENDED
JUNE 30,
2019 | | | FOR THE
YEAR
ENDED
JUNE 30,
2018 | | | FOR THE
YEAR
ENDED
JUNE 30,
2017 | | | PERIOD FROM
OCTOBER 21, 2015
THROUGH
JUNE 30,
2016 (1) | |
| | | | | |
| Per Common Share Data | | | | | | | | | | | | | | | | | | | | |
Net asset value, beginning of year | | $ | 10.06 | | | $ | 9.51 | | | $ | 10.55 | | | $ | 9.90 | | | $ | 10.00 | |
Income from investment operations: | | | | | | | | | | | | | | | | | | | | |
Net investment income (2) | | | 0.60 | | | | 0.55 | | | | 0.45 | | | | 0.42 | | | | 0.43 | |
Net realized and unrealized gain (loss) | | | 0.38 | | | | 0.60 | | | | (0.64 | ) | | | 0.73 | | | | (0.19 | ) |
| | | | | | | | | | | | | | | | | | | | |
Total increase (decrease) from investment operations | | | 0.98 | | | | 1.15 | | | | (0.19 | ) | | | 1.15 | | | | 0.24 | |
| | | | | | | | | | | | | | | | | | | | |
Less dividends and distributions: | | | | | | | | | | | | | | | | | | | | |
From net investment income | | | (0.62 | ) | | | (0.55 | ) | | | (0.55 | ) | | | (0.50 | ) | | | (0.34 | ) |
From net realized gain | | | – | | | | – | | | | (0.30 | ) | | | – | | | | (0.00 | )(3) |
From return of capital | | | – | | | | (0.05 | ) | | | – | | | | – | | | | – | |
| | | | | | | | | | | | | | | | | | | | |
Total dividends and distributions | | | (0.62 | ) | | | (0.60 | ) | | | (0.85 | ) | | | (0.50 | ) | | | (0.34 | ) |
| | | | | | | | | | | | | | | | | | | | |
Net asset value, at end of year | | $ | 10.42 | | | $ | 10.06 | | | $ | 9.51 | | | $ | 10.55 | | | $ | 9.90 | |
| | | | | | | | | | | | | | | | | | | | |
Total investment return (4) | | | 10.11 | % | | | 12.59 | % | | | (2.21 | )% | | | 11.94 | % | | | 2.62 | %(5) |
| | | | | | | | | | | | | | | | | | | | |
| | | | | |
| Supplemental Data and Ratios | | | | | | | | | | | | | | | | | | | | |
Net assets, end of year (000’s) | | $ | 6,443 | | | $ | 405 | | | $ | 566 | | | $ | 211 | | | $ | 198 | |
Ratio of total expenses (before reductions and reimbursements) to average net assets | | | 2.08 | % | | | 3.19 | % | | | 3.63 | % | | | 5.77 | % | | | 6.82 | %(6) |
Ratio of net expenses to average net assets (7) | | | 1.20 | % | | | 1.02 | %(8) | | | 1.11 | %(8) | | | 1.15 | %(8) | | | 1.16 | %(6) |
Ratio of net investment income to average net assets | | | 6.21 | % | | | 5.74 | % | | | 4.33 | % | | | 4.17 | % | | | 6.52 | %(6) |
Portfolio turnover rate | | | 126.54 | % | | | 89.98 | % | | | 51.95 | % | | | 55.66 | % | | | 83.26 | %(5) |
| (1) | | Fund commenced operations on October 21, 2015. |
| (2) | | Calculated using average shares outstanding. |
| (3) | | Amount rounds to less than $.01 per share. |
| (4) | | Total investment return calculation does not consider the effects of sales loads and assumes the reinvestment of dividends at actual prices pursuant to the Fund’s dividend reinvestment plan. |
| (6) | | Annualized for periods less than one full year. |
| (7) | | The Adviser has agreed to waive and/or reimburse certain fees and/or expense so that, on an annualized basis, such expenses incurred will not exceed 1.20% as a percentage of average daily net assets. |
| (8) | | Net expenses reflect a voluntary expense reimbursement to prevent a negative yield. |
See accompanying Notes to the Financial Statements.
63
Barings Emerging Markets Debt Blended Total Return Fund 2020 Annual Report
FINANCIAL HIGHLIGHTS (CONTINUED)
| | | | | | | | | | | | | | | | | | | | |
| | | CLASS C | |
| | | FOR THE
YEAR
ENDED
JUNE 30,
2020 | | | FOR THE
YEAR
ENDED
JUNE 30,
2019 | | | FOR THE
YEAR
ENDED
JUNE 30,
2018 | | | FOR THE
YEAR
ENDED
JUNE 30,
2017 | | | PERIOD FROM
OCTOBER 21, 2015
THROUGH
JUNE 30,
2016 (1) | |
| | | | | |
| Per Common Share Data | | | | | | | | | | | | | | | | | | | | |
Net asset value, beginning of year | | $ | 10.06 | | | $ | 9.51 | | | $ | 10.55 | | | $ | 9.90 | | | $ | 10.00 | |
Income from investment operations: | | | | | | | | | | | | | | | | | | | | |
Net investment income (2) | | | 0.60 | | | | 0.49 | | | | 0.48 | | | | 0.35 | | | | 0.38 | |
Net realized and unrealized gain (loss) | | | 0.31 | | | | 0.59 | | | | (0.74 | ) | | | 0.73 | | | | (0.19 | ) |
| | | | | | | | | | | | | | | | | | | | |
Total increase (decrease) from investment operations | | | 0.91 | | | | 1.08 | | | | (0.26 | ) | | | 1.08 | | | | 0.19 | |
| | | | | | | | | | | | | | | | | | | | |
Less dividends and distributions: | | | | | | | | | | | | | | | | | | | | |
From net investment income | | | (0.55 | ) | | | (0.48 | ) | | | (0.48 | ) | | | (0.43 | ) | | | (0.29 | ) |
From net realized gain | | | – | | | | – | | | | (0.30 | ) | | | – | | | | (0.00 | )(3) |
From return of capital | | | – | | | | (0.05 | ) | | | – | | | | – | | | | – | |
| | | | | | | | | | | | | | | | | | | | |
Total dividends and distributions | | | (0.55 | ) | | | (0.53 | ) | | | (0.78 | ) | | | (0.43 | ) | | | (0.29 | ) |
| | | | | | | | | | | | | | | | | | | | |
Net asset value, at end of year | | $ | 10.42 | | | $ | 10.06 | | | $ | 9.51 | | | $ | 10.55 | | | $ | 9.90 | |
| | | | | | | | | | | | | | | | | | | | |
Total investment return (4) | | | 9.28 | % | | | 11.78 | % | | | (2.90 | )% | | | 11.11 | % | | | 2.10 | %(5) |
| | | | | | | | | | | | | | | | | | | | |
| | | | | |
| Supplemental Data and Ratios | | | | | | | | | | | | | | | | | | | | |
Net assets, end of year (000’s) | | $ | 225 | | | $ | 261 | | | $ | 277 | | | $ | 222 | | | $ | 198 | |
Ratio of total expenses (before reductions and reimbursements) to average net assets | | | 5.29 | % | | | 5.02 | % | | | 5.85 | % | | | 6.47 | % | | | 7.57 | %(6) |
Ratio of net expenses to average net assets (7) | | | 1.95 | % | | | 1.71 | %(8) | | | 1.85 | %(8) | | | 1.89 | %(8) | | | 1.90 | %(6) |
Ratio of net investment income to average net assets | | | 6.09 | % | | | 5.14 | % | | | 4.63 | % | | | 3.44 | % | | | 5.79 | %(6) |
Portfolio turnover rate | | | 126.54 | % | | | 89.98 | % | | | 51.95 | % | | | 55.66 | % | | | 83.26 | %(5) |
| (1) | | Fund commenced operations on October 21, 2015. |
| (2) | | Calculated using average shares outstanding. |
| (3) | | Amount rounds to less than $.01 per share. |
| (4) | | Total investment return calculation does not consider the effects of sales loads and assumes the reinvestment of dividends at actual prices pursuant to the Fund’s dividend reinvestment plan. |
| (6) | | Annualized for periods less than one full year. |
| (7) | | The Adviser has agreed to waive and/or reimburse certain fees and/or expense so that, on an annualized basis, such expenses incurred will not exceed 1.95% as a percentage of average daily net assets. |
| (8) | | Net expenses reflect a voluntary expense reimbursement to prevent a negative yield. |
See accompanying Notes to the Financial Statements.
64
Barings Emerging Markets Debt Blended Total Return Fund 2020 Annual Report
FINANCIAL HIGHLIGHTS (CONTINUED)
| | | | | | | | | | | | | | | | | | | | |
| | | CLASS I | |
| | | FOR THE
YEAR
ENDED
JUNE 30,
2020 | | | FOR THE
YEAR
ENDED
JUNE 30,
2019 | | | FOR THE
YEAR
ENDED
JUNE 30,
2018 | | | FOR THE
YEAR
ENDED
JUNE 30,
2017 | | | PERIOD FROM
OCTOBER 21, 2015
THROUGH
JUNE 30,
2016 (1) | |
| | | | | |
| Per Common Share Data | | | | | | | | | | | | | | | | | | | | |
Net asset value, beginning of year | | $ | 10.06 | | | $ | 9.51 | | | $ | 10.55 | | | $ | 9.90 | | | $ | 10.00 | |
Income from investment operations: | | | | | | | | | | | | | | | | | | | | |
Net investment income (2) | | | 0.69 | | | | 0.59 | | | | 0.54 | | | | 0.45 | | | | 0.45 | |
Net realized and unrealized gain (loss) | | | 0.32 | | | | 0.58 | | | | (0.70 | ) | | | 0.73 | | | | (0.19 | ) |
| | | | | | | | | | | | | | | | | | | | |
Total increase (decrease) from investment operations | | | 1.01 | | | | 1.17 | | | | (0.16 | ) | | | 1.18 | | | | 0.26 | |
| | | | | | | | | | | | | | | | | | | | |
Less dividends and distributions: | | | | | | | | | | | | | | | | | | | | |
From net investment income | | | (0.64 | ) | | | (0.57 | ) | | | (0.58 | ) | | | (0.53 | ) | | | (0.36 | ) |
From net realized gain | | | – | | | | – | | | | (0.30 | ) | | | – | | | | (0.00 | )(3) |
From return of capital | | | – | | | | (0.05 | ) | | | – | | | | – | | | | – | |
| | | | | | | | | | | | | | | | | | | | |
Total dividends and distributions | | | (0.64 | ) | | | (0.62 | ) | | | (0.88 | ) | | | (0.53 | ) | | | (0.36 | ) |
| | | | | | | | | | | | | | | | | | | | |
Net asset value, at end of year | | $ | 10.43 | | | $ | 10.06 | | | $ | 9.51 | | | $ | 10.55 | | | $ | 9.90 | |
| | | | | | | | | | | | | | | | | | | | |
Total investment return (4) | | | 10.39 | % | | | 12.86 | % | | | (1.94 | )% | | | 12.22 | % | | | 2.79 | %(5) |
| | | | | | | | | | | | | | | | | | | | |
| | | | | |
| Supplemental Data and Ratios | | | | | | | | | | | | | | | | | | | | |
Net assets, end of year (000’s) | | $ | 14,563 | | | $ | 23,964 | | | $ | 22,650 | | | $ | 5,063 | | | $ | 4,753 | |
Ratio of total expenses (before reductions and reimbursements) to average net assets | | | 1.40 | % | | | 1.44 | % | | | 1.94 | % | | | 2.76 | % | | | 2.58 | %(6) |
Ratio of net expenses to average net assets (7) | | | 0.95 | % | | | 0.73 | %(8) | | | 0.80 | %(8) | | | 0.90 | %(8) | | | 0.92 | %(6) |
Ratio of net investment income to average net assets | | | 6.99 | % | | | 6.18 | % | | | 5.31 | % | | | 4.42 | % | | | 6.77 | %(6) |
Portfolio turnover rate | | | 126.54 | % | | | 89.98 | % | | | 51.95 | % | | | 55.66 | % | | | 83.26 | %(5) |
| (1) | | Fund commenced operations on October 21, 2015. |
| (2) | | Calculated using average shares outstanding. |
| (3) | | Amount rounds to less than $.01 per share. |
| (4) | | Total investment return calculation assumes the reinvestment of dividends at actual prices pursuant to the Fund’s dividend reinvestment plan. |
| (6) | | Annualized for periods less than one full year. |
| (7) | | The Adviser has agreed to waive and/or reimburse certain fees and/or expense so that, on an annualized basis, such expenses incurred will not exceed 0.95% as a percentage of average daily net assets. |
| (8) | | Net expenses reflect a voluntary expense reimbursement to prevent a negative yield. |
See accompanying Notes to the Financial Statements.
65
Barings Emerging Markets Debt Blended Total Return Fund 2020 Annual Report
FINANCIAL HIGHLIGHTS (CONTINUED)
| | | | | | | | | | | | | | | | | | | | |
| | | CLASS Y | |
| | | FOR THE
YEAR
ENDED
JUNE 30,
2020 | | | FOR THE
YEAR
ENDED
JUNE 30,
2019 | | | FOR THE
YEAR
ENDED
JUNE 30,
2018 | | | FOR THE
YEAR
ENDED
JUNE 30,
2017 | | | PERIOD FROM
OCTOBER 21, 2015
THROUGH
JUNE 30,
2016 (1) | |
| | | | | |
| Per Common Share Data | | | | | | | | | | | | | | | | | | | | |
Net asset value, beginning of year | | $ | 10.06 | | | $ | 9.51 | | | $ | 10.55 | | | $ | 9.90 | | | $ | 10.00 | |
Income from investment operations: | | | | | | | | | | | | | | | | | | | | |
Net investment income (2) | | | 0.67 | | | | 0.59 | | | | 0.55 | | | | 0.45 | | | | 0.45 | |
Net realized and unrealized gain (loss) | | | 0.33 | | | | 0.58 | | | | (0.71 | ) | | | 0.73 | | | | (0.19 | ) |
| | | | | | | | | | | | | | | | | | | | |
Total increase (decrease) from investment operations | | | 1.00 | | | | 1.17 | | | | (0.16 | ) | | | 1.18 | | | | 0.26 | |
| | | | | | | | | | | | | | | | | | | | |
Less dividends and distributions: | | | | | | | | | | | | | | | | | | | | |
From net investment income | | | (0.64 | ) | | | (0.57 | ) | | | (0.58 | ) | | | (0.53 | ) | | | (0.36 | ) |
From net realized gain | | | – | | | | – | | | | (0.30 | ) | | | – | | | | (0.00 | )(3) |
From return of capital | | | – | | | | (0.05 | ) | | | – | | | | – | | | | – | |
| | | | | | | | | | | | | | | | | | | | |
Total dividends and distributions | | | (0.64 | ) | | | (0.62 | ) | | | (0.88 | ) | | | (0.53 | ) | | | (0.36 | ) |
| | | | | | | | | | | | | | | | | | | | |
Net asset value, at end of year | | $ | 10.42 | | | $ | 10.06 | | | $ | 9.51 | | | $ | 10.55 | | | $ | 9.90 | |
| | | | | | | | | | | | | | | | | | | | |
Total investment return (4) | | | 10.33 | % | | | 12.86 | % | | | (1.94 | )% | | | 12.22 | % | | | 2.79 | %(5) |
| | | | | | | | | | | | | | | | | | | | |
| | | | | |
| Supplemental Data and Ratios | | | | | | | | | | | | | | | | | | | | |
Net assets, end of year (000’s) | | $ | 33,429 | | | $ | 25,805 | | | $ | 23,122 | | | $ | 5,340 | | | $ | 4,754 | |
Ratio of total expenses (before reductions and reimbursements) to average net assets | | | 1.42 | % | | | 1.44 | % | | | 1.95 | % | | | 2.77 | % | | | 2.58 | %(6) |
Ratio of net expenses to average net assets (7) | | | 0.95 | % | | | 0.72 | %(8) | | | 0.80 | %(8) | | | 0.90 | %(8) | | | 0.92 | %(6) |
Ratio of net investment income to average net assets | | | 6.84 | % | | | 6.19 | % | | | 5.38 | % | | | 4.43 | % | | | 6.77 | %(6) |
Portfolio turnover rate | | | 126.54 | % | | | 89.98 | % | | | 51.95 | % | | | 55.66 | % | | | 83.26 | %(5) |
| (1) | | Fund commenced operations on October 21, 2015. |
| (2) | | Calculated using average shares outstanding. |
| (3) | | Amount rounds to less than $.01 per share. |
| (4) | | Total investment return calculation assumes the reinvestment of dividends at actual prices pursuant to the Fund’s dividend reinvestment plan. |
| (6) | | Annualized for periods less than one full year. |
| (7) | | The Adviser has agreed to waive and/or reimburse certain fees and/or expense so that, on an annualized basis, such expenses incurred will not exceed 0.95% as a percentage of average daily net assets. |
| (8) | | Net expenses reflect a voluntary expense reimbursement to prevent a negative yield. |
See accompanying Notes to the Financial Statements.
66
Barings Global Emerging Markets Equity Fund 2020 Annual Report
FINANCIAL HIGHLIGHTS
| | | | | | | | |
| | | CLASS A | |
| | | FOR THE
YEAR
ENDED
JUNE 30,
2020 | | | PERIOD FROM
SEPTEMBER 17, 2018
THROUGH
JUNE 30,
2019 (1) | |
| | |
| Per Common Share Data | | | | | | | | |
Net asset value, beginning of year | | $ | 11.10 | | | $ | 10.00 | |
Income from investment operations: | | | | | | | | |
Net investment income (2) | | | 0.15 | | | | 0.06 | |
Net realized and unrealized gain (loss) | | | (0.57 | ) | | | 1.04 | |
| | | | | | | | |
Total increase (decrease) from investment operations | | | (0.42 | ) | | | 1.10 | |
| | | | | | | | |
Less dividends and distributions: | | | | | | | | |
From net investment income | | | (0.20 | ) | | | – | |
From net realized gain | | | (0.11 | ) | | | – | |
From return of capital | | | (0.01 | ) | | | – | |
| | | | | | | | |
Total dividends and distributions | | | (0.32 | ) | | | – | |
| | | | | | | | |
Net asset value, at end of year | | $ | 10.36 | | | $ | 11.10 | |
| | | | | | | | |
Total investment return (3) | | | (4.02 | )% | | | 11.04 | %(4) |
| | | | | | | | |
| | |
| Supplemental Data and Ratios | | | | | | | | |
Net assets, end of year (000’s) | | $ | 104 | | | $ | 111 | |
Ratio of total expenses (before reductions and reimbursements) to average net assets | | | 9.06 | % | | | 7.43 | %(5) |
Ratio of net expenses to average net assets (6)(7) | | | 1.45 | % | | | 1.45 | %(5) |
Ratio of net investment income to average net assets | | | 1.46 | % | | | 0.73 | %(5) |
Portfolio turnover rate | | | 18.80 | % | | | 7.48 | %(4) |
| (1) | | Fund commenced operations on September 17, 2018. |
| (2) | | Calculated using average shares outstanding. |
| (3) | | Total investment return calculation assumes the reinvestment of dividends at actual prices pursuant to the Fund’s dividend reinvestment plan. |
| (5) | | Annualized for periods less than one full year. |
| (6) | | The Adviser has agreed to waive and/or reimburse certain fees and/or expense so that, on an annualized basis, such expenses incurred will not exceed 1.45% as a percentage of average daily net assets. |
| (7) | | Ratio of net expenses to average net assets does not include expenses of the underlying fund in which the Fund invests. |
See accompanying Notes to the Financial Statements.
67
Barings Global Emerging Markets Equity Fund 2020 Annual Report
FINANCIAL HIGHLIGHTS (CONTINUED)
| | | | | | | | |
| | | CLASS C | |
| | | FOR THE
YEAR
ENDED
JUNE 30,
2020 | | | PERIOD FROM
SEPTEMBER 17, 2018
THROUGH
JUNE 30,
2019 (1) | |
| | |
| Per Common Share Data | | | | | | | | |
Net asset value, beginning of year | | $ | 11.04 | | | $ | 10.00 | |
Income from investment operations: | | | | | | | | |
Net investment income (2) | | | 0.07 | | | | 0.00 | (3) |
Net realized and unrealized gain (loss) | | | (0.57 | ) | | | 1.04 | |
| | | | | | | | |
Total increase (decrease) from investment operations | | | (0.50 | ) | | | 1.04 | |
| | | | | | | | |
Less dividends and distributions: | | | | | | | | |
From net investment income | | | (0.10 | ) | | | – | |
From net realized gain | | | (0.11 | ) | | | – | |
From return of capital | | | (0.01 | ) | | | – | |
| | | | | | | | |
Total dividends and distributions | | | (0.22 | ) | | | – | |
| | | | | | | | |
Net asset value, at end of year | | $ | 10.32 | | | $ | 11.04 | |
| | | | | | | | |
Total investment return (4) | | | (4.74 | )% | | | 10.39 | %(5) |
| | | | | | | | |
| | |
| Supplemental Data and Ratios | | | | | | | | |
Net assets, end of year (000’s) | | $ | 103 | | | $ | 110 | |
Ratio of total expenses (before reductions and reimbursements) to average net assets | | | 9.82 | % | | | 8.19 | %(6) |
Ratio of net expenses to average net assets (7)(8) | | | 2.20 | % | | | 2.20 | %(6) |
Ratio of net investment income (loss) to average net assets | | | 0.71 | % | | | (0.03 | )%(6) |
Portfolio turnover rate | | | 18.80 | % | | | 7.48 | %(5) |
| (1) | | Fund commenced operations on September 17, 2018. |
| (2) | | Calculated using average shares outstanding. |
| (3) | | Amount rounds to less than $.01 per share. |
| (4) | | Total investment return calculation assumes the reinvestment of dividends at actual prices pursuant to the Fund’s dividend reinvestment plan. |
| (6) | | Annualized for periods less than one full year. |
| (7) | | The Adviser has agreed to waive and/or reimburse certain fees and/or expense so that, on an annualized basis, such expenses incurred will not exceed 2.20% as a percentage of average daily net assets. |
| (8) | | Ratio of net expenses to average net assets does not include expenses of the underlying fund in which the Fund invests. |
See accompanying Notes to the Financial Statements.
68
Barings Global Emerging Markets Equity Fund 2020 Annual Report
FINANCIAL HIGHLIGHTS (CONTINUED)
| | | | | | | | |
| | | CLASS I | |
| | | FOR THE
YEAR
ENDED
JUNE 30,
2020 | | | PERIOD FROM
SEPTEMBER 17, 2018
THROUGH
JUNE 30,
2019 (1) | |
| | |
| Per Common Share Data | | | | | | | | |
Net asset value, beginning of year | | $ | 11.13 | | | $ | 10.00 | |
Income from investment operations: | | | | | | | | |
Net investment income (2) | | | 0.18 | | | | 0.08 | |
Net realized and unrealized gain (loss) | | | (0.58 | ) | | | 1.05 | |
| | | | | | | | |
Total increase (decrease) from investment operations | | | (0.40 | ) | | | 1.13 | |
| | | | | | | | |
Less dividends and distributions: | | | | | | | | |
From net investment income | | | (0.22 | ) | | | – | |
From net realized gain | | | (0.11 | ) | | | – | |
From return of capital | | | (0.02 | ) | | | – | |
| | | | | | | | |
Total dividends and distributions | | | (0.35 | ) | | | – | |
| | | | | | | | |
Net asset value, at end of year | | $ | 10.38 | | | $ | 11.13 | |
| | | | | | | | |
Total investment return (3) | | | (3.78 | )% | | | 11.26 | %(4) |
| | | | | | | | |
| | |
| Supplemental Data and Ratios | | | | | | | | |
Net assets, end of year (000’s) | | $ | 5,085 | | | $ | 5,452 | |
Ratio of total expenses (before reductions and reimbursements) to average net assets | | | 2.96 | % | | | 2.94 | %(5) |
Ratio of net expenses to average net assets (6)(7) | | | 1.20 | % | | | 1.20 | %(5) |
Ratio of net investment income to average net assets | | | 1.71 | % | | | 0.98 | %(5) |
Portfolio turnover rate | | | 18.80 | % | | | 7.48 | %(4) |
| (1) | | Fund commenced operations on September 17, 2018. |
| (2) | | Calculated using average shares outstanding. |
| (3) | | Total investment return calculation assumes the reinvestment of dividends at actual prices pursuant to the Fund’s dividend reinvestment plan. |
| (5) | | Annualized for periods less than one full year. |
| (6) | | The Adviser has agreed to waive and/or reimburse certain fees and/or expense so that, on an annualized basis, such expenses incurred will not exceed 1.20% as a percentage of average daily net assets. |
| (7) | | Ratio of net expenses to average net assets does not include expenses of the underlying fund in which the Fund invests. |
See accompanying Notes to the Financial Statements.
69
Barings Global Emerging Markets Equity Fund 2020 Annual Report
FINANCIAL HIGHLIGHTS (CONTINUED)
| | | | | | | | |
| | | CLASS Y | |
| | | FOR THE
YEAR
ENDED
JUNE 30,
2020 | | | PERIOD FROM
SEPTEMBER 17, 2018
THROUGH
JUNE 30,
2019 (1) | |
| | |
| Per Common Share Data | | | | | | | | |
Net asset value, beginning of year | | $ | 11.13 | | | $ | 10.00 | |
Income from investment operations: | | | | | | | | |
Net investment income (2) | | | 0.18 | | | | 0.08 | |
Net realized and unrealized gain (loss) | | | (0.58 | ) | | | 1.05 | |
| | | | | | | | |
Total increase (decrease) from investment operations | | | (0.40 | ) | | | 1.13 | |
| | | | | | | | |
Less dividends and distributions: | | | | | | | | |
From net investment income | | | (0.22 | ) | | | – | |
From net realized gain | | | (0.11 | ) | | | – | |
From return of capital | | | (0.02 | ) | | | – | |
| | | | | | | | |
Total dividends and distributions | | | (0.35 | ) | | | – | |
| | | | | | | | |
Net asset value, at end of year | | $ | 10.38 | | | $ | 11.13 | |
| | | | | | | | |
Total investment return (3) | | | (3.78 | )% | | | 11.26 | %(4) |
| | | | | | | | |
| | |
| Supplemental Data and Ratios | | | | | | | | |
Net assets, end of year (000’s) | | $ | 5,085 | | | $ | 5,452 | |
Ratio of total expenses (before reductions and reimbursements) to average net assets | | | 2.96 | % | | | 2.94 | %(5) |
Ratio of net expenses to average net assets (6)(7) | | | 1.20 | % | | | 1.20 | %(5) |
Ratio of net investment income to average net assets | | | 1.71 | %(5) | | | 0.98 | %(5) |
Portfolio turnover rate | | | 18.80 | % | | | 7.48 | %(4) |
| (1) | | Fund commenced operations on September 17, 2018. |
| (2) | | Calculated using average shares outstanding. |
| (3) | | Total investment return calculation assumes the reinvestment of dividends at actual prices pursuant to the Fund’s dividend reinvestment plan. |
| (5) | | Annualized for periods less than one full year. |
| (6) | | The Adviser has agreed to waive and/or reimburse certain fees and/or expense so that, on an annualized basis, such expenses incurred will not exceed 1.20% as a percentage of average daily net assets. |
| (7) | | Ratio of net expenses to average net assets does not include expenses of the underlying fund in which the Fund invests. |
See accompanying Notes to the Financial Statements.
70
Barings U.S. High Yield Fund 2020 Annual Report
FINANCIAL HIGHLIGHTS
| | | | | | | | | | | | | | | | | | | | |
| | | CLASS A | |
| | | FOR THE
YEAR
ENDED
JUNE 30,
2020 | | | FOR THE
YEAR
ENDED
JUNE 30,
2019 | | | FOR THE
YEAR
ENDED
JUNE 30,
2018 | | | FOR THE
YEAR
ENDED
JUNE 30,
2017 | | | PERIOD FROM
OCTOBER 30, 2015
THROUGH
JUNE 30,
2016 (1) | |
| | | | | |
| Per Common Share Data | | | | | | | | | | | | | | | | | | | | |
Net asset value, beginning of year | | $ | 9.79 | | | $ | 9.82 | | | $ | 10.59 | | | $ | 10.14 | | | $ | 10.00 | |
Income from investment operations: | | | | | | | | | | | | | | | | | | | | |
Net investment income (2) | | | 0.53 | | | | 0.58 | | | | 0.61 | | | | 0.65 | | | | 0.39 | |
Net realized and unrealized gain (loss) | | | (0.88 | ) | | | (0.02 | ) | | | (0.47 | ) | | | 0.65 | | | | 0.13 | |
| | | | | | | | | | | | | | | | | | | | |
Total increase (decrease) from investment operations | | | (0.35 | ) | | | 0.56 | | | | 0.14 | | | | 1.30 | | | | 0.52 | |
| | | | | | | | | | | | | | | | | | | | |
Less dividends and distributions: | | | | | | | | | | | | | | | | | | | | |
From net investment income | | | (0.53 | ) | | | (0.59 | ) | | | (0.61 | ) | | | (0.66 | ) | | | (0.38 | ) |
From net realized gain | | | – | | | | – | | | | (0.30 | ) | | | (0.19 | ) | | | – | |
| | | | | | | | | | | | | | | | | | | | |
Total dividends and distributions | | | (0.53 | ) | | | (0.59 | ) | | | (0.91 | ) | | | (0.85 | ) | | | (0.38 | ) |
| | | | | | | | | | | | | | | | | | | | |
Net asset value, at end of year | | $ | 8.91 | | | $ | 9.79 | | | $ | 9.82 | | | $ | 10.59 | | | $ | 10.14 | |
| | | | | | | | | | | | | | | | | | | | |
Total investment return (3) | | | (3.67 | )% | | | 5.84 | % | | | 1.32 | % | | | 13.13 | % | | | 5.36 | %(4) |
| | | | | | | | | | | | | | | | | | | | |
| | | | | |
| Supplemental Data and Ratios | | | | | | | | | | | | | | | | | | | | |
Net assets, end of year (000’s) | | $ | 1,910 | | | $ | 3,840 | | | $ | 2,918 | | | $ | 2,633 | | | $ | 206 | |
Ratio of total expenses (before reductions and reimbursements) to average net assets | | | 1.64 | % | | | 1.64 | % | | | 1.71 | % | | | 1.82 | % | | | 5.47 | %(5) |
Ratio of net expenses to average net assets (6) | | | 1.00 | % | | | 1.00 | % | | | 1.00 | % | | | 1.00 | % | | | 0.99 | %(5) |
Ratio of net investment income to average net assets | | | 5.52 | % | | | 5.99 | % | | | 5.92 | % | | | 6.21 | % | | | 5.93 | %(5) |
Portfolio turnover rate | | | 80.66 | % | | | 55.98 | % | | | 43.75 | % | | | 71.57 | % | | | 77.52 | %(4) |
| (1) | | Fund commenced operations on October 30, 2015. |
| (2) | | Calculated using average shares outstanding. |
| (3) | | Total investment return calculation does not consider the effects of sales loads and assumes the reinvestment of dividends at actual prices pursuant to the Fund’s dividend reinvestment plan. |
| (5) | | Annualized for periods less than one full year. |
| (6) | | The Adviser has agreed to waive and/or reimburse certain fees and/or expense so that, on an annualized basis, such expenses incurred will not exceed 1.00% as a percentage of average daily net assets. |
See accompanying Notes to the Financial Statements.
71
Barings U.S. High Yield Fund 2020 Annual Report
FINANCIAL HIGHLIGHTS (CONTINUED)
| | | | | | | | | | | | | | | | | | | | |
| | | CLASS C | |
| | | FOR THE
YEAR
ENDED
JUNE 30,
2020 | | | FOR THE
YEAR
ENDED
JUNE 30,
2019 | | | FOR THE
YEAR
ENDED
JUNE 30,
2018 | | | FOR THE
YEAR
ENDED
JUNE 30,
2017 | | | PERIOD FROM
OCTOBER 30, 2015
THROUGH
JUNE 30,
2016 (1) | |
| | | | | |
| Per Common Share Data | | | | | | | | | | | | | | | | | | | | |
Net asset value, beginning of year | | $ | 9.79 | | | $ | 9.82 | | | $ | 10.59 | | | $ | 10.14 | | | $ | 10.00 | |
Income from investment operations: | | | | | | | | | | | | | | | | | | | | |
Net investment income (2) | | | 0.45 | | | | 0.51 | | | | 0.53 | | | | 0.58 | | | | 0.33 | |
Net realized and unrealized gain (loss) | | | (0.87 | ) | | | (0.03 | ) | | | (0.47 | ) | | | 0.64 | | | | 0.14 | |
| | | | | | | | | | | | | | | | | | | | |
Total increase (decrease) from investment operations | | | (0.42 | ) | | | 0.48 | | | | 0.06 | | | | 1.22 | | | | 0.47 | |
| | | | | | | | | | | | | | | | | | | | |
Less dividends and distributions: | | | | | | | | | | | | | | | | | | | | |
From net investment income | | | (0.46 | ) | | | (0.51 | ) | | | (0.53 | ) | | | (0.58 | ) | | | (0.33 | ) |
From net realized gain | | | – | | | | – | | | | (0.30 | ) | | | (0.19 | ) | | | – | |
| | | | | | | | | | | | | | | | | | | | |
Total dividends and distributions | | | (0.46 | ) | | | (0.51 | ) | | | (0.83 | ) | | | (0.77 | ) | | | (0.33 | ) |
| | | | | | | | | | | | | | | | | | | | |
Net asset value, at end of year | | $ | 8.91 | | | $ | 9.79 | | | $ | 9.82 | | | $ | 10.59 | | | $ | 10.14 | |
| | | | | | | | | | | | | | | | | | | | |
Total investment return (3) | | | (4.39 | )% | | | 5.03 | % | | | 0.61 | % | | | 12.24 | % | | | 4.85 | %(4) |
| | | | | | | | | | | | | | | | | | | | |
| | | | | |
| Supplemental Data and Ratios | | | | | | | | | | | | | | | | | | | | |
Net assets, end of year (000’s) | | $ | 89 | | | $ | 98 | | | $ | 98 | | | $ | 118 | | | $ | 101 | |
Ratio of total expenses (before reductions and reimbursements) to average net assets | | | 7.31 | % | | | 7.14 | % | | | 6.43 | % | | | 6.18 | % | | | 7.30 | %(5) |
Ratio of net expenses to average net assets (6) | | | 1.75 | % | | | 1.75 | % | | | 1.75 | % | | | 1.75 | % | | | 1.73 | %(5) |
Ratio of net investment income to average net assets | | | 4.78 | % | | | 5.27 | % | | | 5.17 | % | | | 5.50 | % | | | 5.08 | %(5) |
Portfolio turnover rate | | | 80.66 | % | | | 55.98 | % | | | 43.75 | % | | | 71.57 | % | | | 77.52 | %(4) |
| (1) | | Fund commenced operations on October 30, 2015. |
| (2) | | Calculated using average shares outstanding. |
| (3) | | Total investment return calculation does not consider the effects of sales loads and assumes the reinvestment of dividends at actual prices pursuant to the Fund’s dividend reinvestment plan. |
| (5) | | Annualized for periods less than one full year. |
| (6) | | The Adviser has agreed to waive and/or reimburse certain fees and/or expense so that, on an annualized basis, such expenses incurred will not exceed 1.75% as a percentage of average daily net assets. |
See accompanying Notes to the Financial Statements.
72
Barings U.S. High Yield Fund 2020 Annual Report
FINANCIAL HIGHLIGHTS (CONTINUED)
| | | | | | | | | | | | | | | | | | | | |
| | | CLASS I | |
| | | FOR THE
YEAR
ENDED
JUNE 30,
2020 | | | FOR THE
YEAR
ENDED
JUNE 30,
2019 | | | FOR THE
YEAR
ENDED
JUNE 30,
2018 | | | FOR THE
YEAR
ENDED
JUNE 30,
2017 | | | PERIOD FROM
OCTOBER 30, 2015
THROUGH
JUNE 30,
2016 (1) | |
| | | | | |
| Per Common Share Data | | | | | | | | | | | | | | | | | | | | |
Net asset value, beginning of year | | $ | 9.79 | | | $ | 9.82 | | | $ | 10.59 | | | $ | 10.14 | | | $ | 10.00 | |
Income from investment operations: | | | | | | | | | | | | | | | | | | | | |
Net investment income (2) | | | 0.55 | | | | 0.61 | | | | 0.63 | | | | 0.68 | | | | 0.40 | |
Net realized and unrealized gain (loss) | | | (0.87 | ) | | | (0.03 | ) | | | (0.47 | ) | | | 0.64 | | | | 0.13 | |
| | | | | | | | | | | | | | | | | | | | |
Total increase (decrease) from investment operations | | | (0.32 | ) | | | 0.58 | | | | 0.16 | | | | 1.32 | | | | 0.53 | |
| | | | | | | | | | | | | | | | | | | | |
Less dividends and distributions: | | | | | | | | | | | | | | | | | | | | |
From net investment income | | | (0.56 | ) | | | (0.61 | ) | | | (0.63 | ) | | | (0.68 | ) | | | (0.39 | ) |
From net realized gain | | | – | | | | – | | | | (0.30 | ) | | | (0.19 | ) | | | – | |
| | | | | | | | | | | | | | | | | | | | |
Total dividends and distributions | | | (0.56 | ) | | | (0.61 | ) | | | (0.93 | ) | | | (0.87 | ) | | | (0.39 | ) |
| | | | | | | | | | | | | | | | | | | | |
Net asset value, at end of year | | $ | 8.91 | | | $ | 9.79 | | | $ | 9.82 | | | $ | 10.59 | | | $ | 10.14 | |
| | | | | | | | | | | | | | | | | | | | |
Total investment return (3) | | | (3.43 | )% | | | 6.07 | % | | | 1.61 | % | | | 13.36 | % | | | 5.53 | %(4) |
| | | | | | | | | | | | | | | | | | | | |
| | | | | |
| Supplemental Data and Ratios | | | | | | | | | | | | | | | | | | | | |
Net assets, end of year (000’s) | | $ | 11,046 | | | $ | 12,135 | | | $ | 14,816 | | | $ | 15,720 | | | $ | 14,863 | |
Ratio of total expenses (before reductions and reimbursements) to average net assets | | | 1.11 | % | | | 1.11 | % | | | 1.28 | % | | | 1.36 | % | | | 1.38 | %(5) |
Ratio of net expenses to average net assets (6) | | | 0.75 | % | | | 0.75 | % | | | 0.75 | % | | | 0.75 | % | | | 0.74 | %(5) |
Ratio of net investment income to average net assets | | | 5.78 | % | | | 6.28 | % | | | 6.16 | % | | | 6.50 | % | | | 6.11 | %(5) |
Portfolio turnover rate | | | 80.66 | % | | | 55.98 | % | | | 43.75 | % | | | 71.57 | % | | | 77.52 | %(4) |
| (1) | | Fund commenced operations on October 30, 2015. |
| (2) | | Calculated using average shares outstanding. |
| (3) | | Total investment return calculation assumes the reinvestment of dividends at actual prices pursuant to the Fund’s dividend reinvestment plan. |
| (5) | | Annualized for periods less than one full year. |
| (6) | | The Adviser has agreed to waive and/or reimburse certain fees and/or expense so that, on an annualized basis, such expenses incurred will not exceed 0.75% as a percentage of average daily net assets. |
See accompanying Notes to the Financial Statements.
73
Barings U.S. High Yield Fund 2020 Annual Report
FINANCIAL HIGHLIGHTS (CONTINUED)
| | | | | | | | | | | | | | | | | | | | |
| | | CLASS Y | |
| | | FOR THE
YEAR
ENDED
JUNE 30,
2020 | | | FOR THE
YEAR
ENDED
JUNE 30,
2019 | | | FOR THE
YEAR
ENDED
JUNE 30,
2018 | | | FOR THE
YEAR
ENDED
JUNE 30,
2017 | | | PERIOD FROM
OCTOBER 30, 2015
THROUGH
JUNE 30,
2016 (1) | |
| | | | | |
| Per Common Share Data | | | | | | | | | | | | | | | | | | | | |
Net asset value, beginning of year | | $ | 9.79 | | | $ | 9.82 | | | $ | 10.58 | | | $ | 10.14 | | | $ | 10.00 | |
Income from investment operations: | | | | | | | | | | | | | | | | | | | | |
Net investment income (2) | | | 0.54 | | | | 0.61 | | | | 0.62 | | | | 0.68 | | | | 0.39 | |
Net realized and unrealized gain (loss) | | | (0.86 | ) | | | (0.03 | ) | | | (0.45 | ) | | | 0.63 | | | | 0.14 | |
| | | | | | | | | | | | | | | | | | | | |
Total increase (decrease) from investment operations | | | (0.32 | ) | | | 0.58 | | | | 0.17 | | | | 1.31 | | | | 0.53 | |
| | | | | | | | | | | | | | | | | | | | |
Less dividends and distributions: | | | | | | | | | | | | | | | | | | | | |
From net investment income | | | (0.56 | ) | | | (0.61 | ) | | | (0.63 | ) | | | (0.68 | ) | | | (0.39 | ) |
From net realized gain | | | – | | | | – | | | | (0.30 | ) | | | (0.19 | ) | | | – | |
| | | | | | | | | | | | | | | | | | | | |
Total dividends and distributions | | | (0.56 | ) | | | (0.61 | ) | | | (0.93 | ) | | | (0.87 | ) | | | (0.39 | ) |
| | | | | | | | | | | | | | | | | | | | |
Net asset value, at end of year | | $ | 8.91 | | | $ | 9.79 | | | $ | 9.82 | | | $ | 10.58 | | | $ | 10.14 | |
| | | | | | | | | | | | | | | | | | | | |
Total investment return (3) | | | (3.43 | )% | | | 6.09 | % | | | 1.61 | % | | | 13.35 | % | | | 5.52 | %(4) |
| | | | | | | | | | | | | | | | | | | | |
| | | | | |
| Supplemental Data and Ratios | | | | | | | | | | | | | | | | | | | | |
Net assets, end of year (000’s) | | $ | 32,992 | | | $ | 34,695 | | | $ | 39,176 | | | $ | 14,631 | | | $ | 12,675 | |
Ratio of total expenses (before reductions and reimbursements) to average net assets | | | 1.10 | % | | | 1.09 | % | | | 1.25 | % | | | 1.36 | % | | | 1.42 | %(5) |
Ratio of net expenses to average net assets (6) | | | 0.75 | % | | | 0.75 | % | | | 0.75 | % | | | 0.75 | % | | | 0.74 | %(5) |
Ratio of net investment income to average net assets | | | 5.78 | % | | | 6.27 | % | | | 6.09 | % | | | 6.50 | % | | | 6.06 | %(5) |
Portfolio turnover rate | | | 80.66 | % | | | 55.98 | % | | | 43.75 | % | | | 71.57 | % | | | 77.52 | %(4) |
| (1) | | Fund commenced operations on October 30, 2015. |
| (2) | | Calculated using average shares outstanding. |
| (3) | | Total investment return calculation assumes the reinvestment of dividends at actual prices pursuant to the Fund’s dividend reinvestment plan. |
| (5) | | Annualized for periods less than one full year. |
| (6) | | The Adviser has agreed to waive and/or reimburse certain fees and/or expense so that, on an annualized basis, such expenses incurred will not exceed 0.75% as a percentage of average daily net assets. |
See accompanying Notes to the Financial Statements.
74
Barings Global Floating Rate Fund 2020 Annual Report
SCHEDULE OF INVESTMENTS
June 30, 2020
| | | | | | | | | | | | | | | | | | | | |
| | | | | | | | | SHARES | | | COST | | | FAIR
VALUE | |
Equities — 0.3%*: | |
|
Common Stocks — 0.3%*: | |
|
Beverage, Food and Tobacco — 0.3%*: | |
CTI Foods Holding Co. LLC(a) | | | | | | | | | | | 4,657 | | | | $495,155 | | | | $559,585 | |
| | | | | | | | | | | | | | | | | | | | |
Healthcare, Education and Childcare — 0.0%*: | |
Tunstall Group Holdings Ltd.(a),(b) | | | | | | | | | | | 469 | | | | – | | | | – | |
Tunstall Group Holdings Ltd.(a),(b) | | | | | | | | | | | 310 | | | | – | | | | – | |
| | | | | | | | | | | | | | | | | | | | |
Total Healthcare, Education and Childcare | | | | | | | | | | | 779 | | | | – | | | | – | |
| | | | | | | | | | | | | | | | | | | | |
|
Mining, Steel, Iron and Non-Precious Metals — 0.0%*: | |
Boomerang Tube LLC(a) | | | | | | | | | | | 1,769 | | | | 171,860 | | | | – | |
| | | | | | | | | | | | | | | | | | | | |
|
Oil and Gas — 0.0%*: | |
Fieldwood Energy LLC | | | | | | | | | | | 6,469 | | | | 226,415 | | | | 324 | |
Fieldwood Energy LLC | | | | | | | | | | | 26,365 | | | | 568,599 | | | | 1,318 | |
Sabine Oil & Gas LLC | | | | | | | | | | | 394 | | | | 22,597 | | | | 5,122 | |
Southcross Energy Holdings LP | | | | | | | | | | | 22 | | | | – | | | | – | |
Southcross Energy Partners LP(a) | | | | | | | | | | | 22 | | | | 5,500 | | | | – | |
Templar Energy LLC(a) | | | | | | | | | | | 8,762 | | | | 50,647 | | | | – | |
Templar Energy LLC(a) | | | | | | | | | | | 6,069 | | | | 56,021 | | | | – | |
| | | | | | | | | | | | | | | | | | | | |
Total Oil and Gas | | | | | | | | | | | 48,103 | | | | 929,779 | | | | 6,764 | |
| | | | | | | | | | | | | | | | | | | | |
Total Common Stocks | | | | | | | | | | | 55,308 | | | | 1,596,794 | | | | 566,349 | |
| | | | | | | | | | | | | | | | | | | | |
Limited Partnership — 0.0%*: | |
|
Chemicals, Plastics and Rubber — 0.0%*: | |
Pinnacle Operating Corp., earnout shares(a) | | | | | | | | | | | 40,420 | | | | – | | | | – | |
| | | | | | | | | | | | | | | | | | | | |
Warrants — 0.0%*: | |
|
Diversified/Conglomerate Manufacturing — 0.0%*: | |
Appvion Holdings Corp. (exp. June 13, 2023)(a) | | | | | | | | | | | 449 | | | | – | | | | – | |
Appvion Holdings Corp. (exp. June 13, 2023)(a) | | | | | | | | | | | 449 | | | | – | | | | – | |
| | | | | | | | | | | | | | | | | | | | |
Total Diversified/Conglomerate Manufacturing | | | | | | | | | | | 898 | | | | – | | | | – | |
| | | | | | | | | | | | | | | | | | | | |
Total Warrants | | | | | | | | | | | 898 | | | | – | | | | – | |
| | | | | | | | | | | | | | | | | | | | |
Total Equities | | | | | | | | | | | 96,626 | | | | 1,596,794 | | | | 566,349 | |
| | | | | | | | | | | | | | | | | | | | |
| | | | | |
| | | EFFECTIVE
INTEREST RATE | | | DUE DATE | | | PRINCIPAL ‡‡ | | | COST | | | FAIR
VALUE | |
Fixed Income — 93.9%*: | |
|
Bank Loans — 88.2%*(c): | |
|
Aerospace and Defense — 0.2%*: | |
TransDigm, Inc., 1M LIBOR + 2.250% | | | 2.43 | % | | | 5/30/2025 | | | | 492,487 | | | | 490,739 | | | | 441,086 | |
| | | | | | | | | | | | | | | | | | | | |
See accompanying Notes to the Financial Statements.
75
Barings Global Floating Rate Fund 2020 Annual Report
SCHEDULE OF INVESTMENTS (CONTINUED)
June 30, 2020
| | | | | | | | | | | | | | | | | | | | |
| | | | | |
| | | EFFECTIVE
INTEREST RATE | | | DUE DATE | | | PRINCIPAL ‡‡ | | | COST | | | FAIR
VALUE | |
|
Bank Loans (Continued) | |
|
Automobile — 1.7%*: | |
BCA Marketplace plc, LIBOR – GBP + 4.750%(b) | | | 5.45 | % | | | 11/13/2026 | | | | 500,000 | | | $ | 622,029 | | | $ | 575,798 | |
DexKo Global, Inc., 1M LIBOR + 3.500% | | | 4.50 | | | | 7/24/2024 | | | | 303,437 | | | | 305,039 | | | | 282,767 | |
Garrett LX III S.a r.l., EURIBOR + 2.750%(b) | | | 3.50 | | | | 9/27/2025 | | | | 818,666 | | | | 892,306 | | | | 856,537 | |
Panther BF Aggregator 2 LP, 1M LIBOR + 3.500% | | | 3.68 | | | | 4/30/2026 | | | | 1,139,537 | | | | 1,131,825 | | | | 1,082,560 | |
US Farathane LLC, 1M LIBOR + 3.500% | | | 4.50 | | | | 12/23/2021 | | | | 1,116,473 | | | | 1,119,015 | | | | 831,772 | |
| | | | | | | | | | | | | | | | | | | | |
Total Automobile | | | | | | | | | | | 3,878,113 | | | | 4,070,214 | | | | 3,629,434 | |
| | | | | | | | | | | | | | | | | | | | |
|
Beverage, Food and Tobacco — 1.8%*: | |
Accolades Wines, LIBOR – GBP + 4.750%(b) | | | 4.84 | | | | 5/23/2025 | | | | 500,000 | | | | 661,740 | | | | 556,561 | |
CTI Foods Holding Co, LLC, 3M LIBOR + 9.000%(a) | | | 10.77 | | | | 5/3/2024 | | | | 198,688 | | | | 198,688 | | | | 186,767 | |
CTI Foods Holding Co, LLC, 3M LIBOR + 7.000%(a) | | | 8.77 | | | | 5/3/2024 | | | | 310,064 | | | | 305,342 | | | | 310,064 | |
Deoleo S.A., EURIBOR + 4.000%(b) | | | 5.00 | | | | 6/24/2025 | | | | 153,876 | | | | 173,503 | | | | 148,676 | |
Deoleo S.A., EURIBOR + 3.000%(b) | | | 3.50 | | | | 6/24/2026 | | | | 66,975 | | | | 75,517 | | | | 82,018 | |
Deoleo S.A.(a),(b) | | | Zero Coupon | | | | 4/30/2021 | | | | 231,063 | | | | 50,768 | | | | – | |
IRB Holding Corp., 6M LIBOR + 2.750% | | | 3.75 | | | | 2/5/2025 | | | | 2,556,391 | | | | 2,562,245 | | | | 2,354,615 | |
Sunshine Investments B.V., 2M LIBOR + 3.250%(b) | | | 3.67 | | | | 3/28/2025 | | | | 155,877 | | | | 155,347 | | | | 151,201 | |
| | | | | | | | | | | | | | | | | | | | |
Total Beverage, Food and Tobacco | | | | | | | | | | | 4,172,934 | | | | 4,183,150 | | | | 3,789,902 | |
| | | | | | | | | | | | | | | | | | | | |
|
Broadcasting and Entertainment — 5.9%*: | |
A-L Parent LLC, 3M USD LIBOR | | | 3.43 | | | | 12/1/2023 | | | | 1,989,691 | | | | 1,840,281 | | | | 1,481,325 | |
AP NMT Acquisition B.V., 3M LIBOR + 5.750%(b) | | | 7.20 | | | | 8/13/2021 | | | | 2,040,539 | | | | 2,025,459 | | | | 1,992,077 | |
AP NMT Acquisition B.V., 3M LIBOR + 9.000%(b) | | | 10.44 | | | | 8/13/2022 | | | | 2,182,720 | | | | 2,173,978 | | | | 2,139,066 | |
AP NMT Acquisition B.V., EURIBOR + 6.000%(b) | | | 7.00 | | | | 8/13/2021 | | | | 513,175 | | | | 629,870 | | | | 567,904 | |
AVSC Holding Corp., 3M LIBOR + 4.500%, 6M LIBOR + 4.500%3M LIBOR + 4.500%, 6M LIBOR + 4.500% | | | 5.50 | | | | 10/15/2026 | | | | 511,695 | | | | 502,425 | | | | 358,186 | |
Banijay Entertainment S.A.S, 1M LIBOR + 3.750%(b) | | | 4.10 | | | | 3/4/2025 | | | | 1,312,309 | | | | 1,316,248 | | | | 1,240,132 | |
Clear Channel Outdoor Holdings, Inc., 3M LIBOR + 3.500% | | | 4.26 | | | | 8/21/2026 | | | | 1,488,750 | | | | 1,482,203 | | | | 1,345,830 | |
CSC Holdings, LLC, 1M LIBOR + 2.250% | | | 2.43 | | | | 7/17/2025 | | | | 1,162,473 | | | | 1,150,180 | | | | 1,097,084 | |
Imagina Media Audiovisual, S.L., EURIBOR + 4.500%(b) | | | 4.75 | | | | 6/26/2025 | | | | 500,000 | | | | 571,630 | | | | 490,126 | |
Imagina Media Audiovisual, S.L., EURIBOR + 7.500%(b) | | | 7.50 | | | | 12/26/2024 | | | | 500,000 | | | | 549,752 | | | | 413,942 | |
Radiate Holdco, LLC, 1M LIBOR + 3.000% | | | 3.75 | | | | 2/1/2024 | | | | 546,730 | | | | 541,702 | | | | 520,760 | |
Technicolor S.A., EURIBOR + 3.000%(b) | | | 3.00 | | | | 12/6/2023 | | | | 500,000 | | | | 539,004 | | | | 272,449 | |
See accompanying Notes to the Financial Statements.
76
Barings Global Floating Rate Fund 2020 Annual Report
SCHEDULE OF INVESTMENTS (CONTINUED)
June 30, 2020
| | | | | | | | | | | | | | | | | | | | |
| | | | | |
| | | EFFECTIVE
INTEREST RATE | | | DUE DATE | | | PRINCIPAL ‡‡ | | | COST | | | FAIR
VALUE | |
|
Bank Loans (Continued) | |
|
Broadcasting and Entertainment (Continued) | |
Terrier Media Buyer, Inc., 1M LIBOR + 4.250% | | | 4.43 | % | | | 12/17/2026 | | | | 712,271 | | | $ | 708,971 | | | $ | 677,847 | |
| | | | | | | | | | | | | | | | | | | | |
Total Broadcasting and Entertainment | | | | | | | | | | | 13,960,353 | | | | 14,031,703 | | | | 12,596,728 | |
| | | | | | | | | | | | | | | | | | | | |
|
Buildings and Real Estate — 3.6%*: | |
Core & Main L.P., 3M LIBOR + 2.750%, 6M LIBOR + 2.750% | | | 3.75 | | | | 8/1/2024 | | | | 1,958,683 | | | | 1,963,915 | | | | 1,861,356 | |
GYP Holdings III Corp., 1M LIBOR + 2.750% | | | 2.93 | | | | 6/1/2025 | | | | 2,209,185 | | | | 2,204,568 | | | | 2,129,101 | |
Quikrete Holdings, Inc., 1M LIBOR + 2.500% | | | 2.68 | | | | 2/1/2027 | | | | 1,492,500 | | | | 1,492,806 | | | | 1,431,875 | |
SRS Distribution, Inc., 6M LIBOR + 3.000% | | | 4.32 | | | | 5/23/2025 | | | | 2,410,460 | | | | 2,398,855 | | | | 2,272,462 | |
| | | | | | | | | | | | | | | | | | | | |
Total Buildings and Real Estate | | | | | | | | | | | 8,070,828 | | | | 8,060,144 | | | | 7,694,794 | |
| | | | | | | | | | | | | | | | | | | | |
|
Cargo Transport — 0.8%*: | |
Kenan Advantage Group, Inc., 1M LIBOR + 3.000% | | | 4.00 | | | | 7/31/2022 | | | | 1,909,854 | | | | 1,911,746 | | | | 1,718,067 | |
| | | | | | | | | | | | | | | | | | | | |
Total Cargo Transport | | | | | | | | | | | 1,909,854 | | | | 1,911,746 | | | | 1,718,067 | |
| | | | | | | | | | | | | | | | | | | | |
|
Chemicals, Plastics and Rubber — 6.0%*: | |
Allnex (Luxembourg) & Cy S.C.A., 3M LIBOR + 3.250%(b) | | | 4.00 | | | | 9/13/2023 | | | | 357,900 | | | | 357,078 | | | | 337,232 | |
Allnex USA, Inc., 3M LIBOR + 3.250% | | | 4.00 | | | | 9/13/2023 | | | | 269,638 | | | | 269,018 | | | | 254,067 | |
Associated Asphalt Partners LLC, 1M LIBOR + 5.250% | | | 6.25 | | | | 4/5/2024 | | | | 217,746 | | | | 217,154 | | | | 155,144 | |
Colouroz Investment 1 GmbH, EURIBOR + 3.000%(b) | | | 3.75 | | | | 9/7/2021 | | | | 322,821 | | | | 383,239 | | | | 318,804 | |
Consolidated Energy Finance, S.A., 3M LIBOR + 2.500% | | | 2.69 | | | | 5/7/2025 | | | | 2,469,792 | | | | 2,409,639 | | | | 2,235,162 | |
Diamond (BC) B.V., EURIBOR + 3.250% | | | 3.25 | | | | 9/6/2024 | | | | 977,450 | | | | 1,142,176 | | | | 1,018,547 | |
Flint Group GmbH, EURIBOR + 3.000%(b) | | | 3.75 | | | | 9/7/2021 | | | | 749,939 | | | | 866,777 | | | | 740,607 | |
Flint Group GmbH, 3M LIBOR + 3.000%(b) | | | 4.02 | | | | 9/7/2021 | | | | 521,271 | | | | 510,928 | | | | 447,970 | |
Flint Group US LLC, 3M LIBOR + 3.000%(b) | | | 4.02 | | | | 9/7/2021 | | | | 3,028,261 | | | | 2,968,546 | | | | 2,602,427 | |
GrafTech Finance, Inc., 1M LIBOR + 3.500% | | | 4.50 | | | | 2/12/2025 | | | | 2,391,441 | | | | 2,373,085 | | | | 2,323,691 | |
Novacap S.A., EURIBOR + 3.500%(b) | | | 3.50 | | | | 6/22/2023 | | | | 1,000,000 | | | | 1,137,106 | | | | 1,042,046 | |
Polar US Borrower, LLC, 3M LIBOR + 4.750% | | | 4.93 | | | | 10/15/2025 | | | | 827,920 | | | | 827,920 | | | | 778,244 | |
Solenis Holdings LLC, 3M LIBOR + 4.000% | | | 4.36 | | | | 6/26/2025 | | | | 628,526 | | | | 624,013 | | | | 601,160 | |
| | | | | | | | | | | | | | | | | | | | |
Total Chemicals, Plastics and Rubber | | | | | | | | | | | 13,762,705 | | | | 14,086,679 | | | | 12,855,101 | |
| | | | | | | | | | | | | | | | | | | | |
|
Containers, Packaging and Glass — 5.4%*: | |
Albea Beauty Holdings S.A., 3M LIBOR + 3.000%(b) | | | 4.00 | | | | 4/22/2024 | | | | 202,751 | | | | 202,591 | | | | 188,559 | |
Berry Global, Inc., 1M LIBOR + 2.000% | | | 2.18 | | | | 7/1/2026 | | | | 736,889 | | | | 738,026 | | | | 702,808 | |
BWAY Holding Co., 3M LIBOR + 3.250% | | | 4.56 | | | | 4/3/2024 | | | | 2,930,962 | | | | 2,919,669 | | | | 2,624,442 | |
Flex Acquisition Co., Inc., 3M LIBOR + 3.000% | | | 4.00 | | | | 12/29/2023 | | | | 1,412,099 | | | | 1,421,016 | | | | 1,346,281 | |
Flex Acquisition Co., Inc., 3M LIBOR + 3.2500% | | | 3.55 | | | | 6/29/2025 | | | | 852,140 | | | | 827,311 | | | | 801,011 | |
See accompanying Notes to the Financial Statements.
77
Barings Global Floating Rate Fund 2020 Annual Report
SCHEDULE OF INVESTMENTS (CONTINUED)
June 30, 2020
| | | | | | | | | | | | | | | | | | | | |
| | | | | |
| | | EFFECTIVE
INTEREST RATE | | | DUE DATE | | | PRINCIPAL ‡‡ | | | COST | | | FAIR
VALUE | |
|
Bank Loans (Continued) | |
|
Containers, Packaging and Glass (Continued) | |
ProAmpac PG Borrower LLC, 1M LIBOR + 3.500%, 2M LIBOR + 3.500%, 3M LIBOR + 3.500% | | | 4.50 | % | | | 11/20/2023 | | | | 1,221,173 | | | $ | 1,221,279 | | | $ | 1,161,640 | |
ProAmpac PG Borrower LLC, 3M LIBOR + 8.500% | | | 9.50 | | | | 11/18/2024 | | | | 750,000 | | | | 743,825 | | | | 656,250 | |
Reynolds Consumer Products LLC, 1M LIBOR + 1.750% | | | 1.93 | | | | 2/4/2027 | | | | 283,899 | | | | 283,563 | | | | 273,099 | |
Reynolds Group Holdings, Inc., 1M LIBOR + 2.750% | | | 2.93 | | | | 2/5/2023 | | | | 1,460,649 | | | | 1,464,978 | | | | 1,391,853 | |
Roy Bidco ApS, EURIBOR + 3.500%(b) | | | 3.50 | | | | 8/23/2024 | | | | 1,000,000 | | | | 1,154,609 | | | | 1,040,922 | |
Trident TPI Holdings, Inc., 3M LIBOR + 3.250% | | | 4.07 | | | | 10/17/2024 | | | | 1,492,330 | | | | 1,473,698 | | | | 1,421,445 | |
| | | | | | | | | | | | | | | | | | | | |
Total Containers, Packaging and Glass | | | | | | | | | | | 12,342,892 | | | | 12,450,565 | | | | 11,608,310 | |
| | | | | | | | | | | | | | | | | | | | |
|
Diversified/Conglomerate Manufacturing — 3.1%*: | |
Amer Sports Oyj, EURIBOR + 4.500%(b) | | | 4.50 | | | | 3/30/2026 | | | | 500,000 | | | | 563,553 | | | | 505,401 | |
LSF10 XL Bidco S.C.A., EURIBOR + 4.000%(b) | | | 4.00 | | | | 10/12/2026 | | | | 1,500,000 | | | | 1,633,650 | | | | 1,569,860 | |
LTI Holdings, Inc., 1M LIBOR + 3.500% | | | 3.68 | | | | 9/6/2025 | | | | 872,824 | | | | 875,704 | | | | 739,404 | |
Project Alpha Intermediate Holding, Inc., 6M LIBOR + 3.500% | | | 5.38 | | | | 4/26/2024 | | | | 1,358,582 | | | | 1,360,174 | | | | 1,301,969 | |
SGB-SMIT Management GmbH, EURIBOR + 4.500%, PIK(b) | | | 0.50-4.50 | | | | 7/18/2024 | | | | 501,849 | | | | 502,289 | | | | 239,626 | |
Wilsonart LLC, 3M LIBOR + 3.250% | | | 4.25 | | | | 12/19/2023 | | | | 594,149 | | | | 594,497 | | | | 571,685 | |
Winebow Group, Inc. (The), 1M LIBOR + 3.750% | | | 4.75 | | | | 7/1/2021 | | | | 2,313,288 | | | | 2,249,529 | | | | 1,732,075 | |
| | | | | | | | | | | | | | | | | | | | |
Total Diversified/Conglomerate Manufacturing | | | | | | | | | | | 7,640,692 | | | | 7,779,396 | | | | 6,660,020 | |
| | | | | | | | | | | | | | | | | | | | |
|
Diversified/Conglomerate Service — 11.5%*: | |
Allied Universal Holdco LLC, 1M LIBOR + 4.250% | | | 4.43 | | | | 7/10/2026 | | | | 526,775 | | | | 522,836 | | | | 510,861 | |
Almonde, Inc., 3M LIBOR + 7.250% | | | 8.25 | | | | 6/13/2025 | | | | 6,482 | | | | 6,593 | | | | 5,582 | |
Capri Finance LLC, 3M LIBOR + 3.000%(b) | | | 3.76 | | | | 11/1/2024 | | | | 1,135,028 | | | | 1,127,471 | | | | 1,085,371 | |
Cornerstone OnDemand, Inc., 2M LIBOR + 4.250% | | | 5.35 | | | | 4/22/2027 | | | | 500,000 | | | | 485,202 | | | | 491,565 | |
Cvent, Inc., 3M USD LIBOR | | | 3.93 | | | | 11/29/2024 | | | | 1,366,206 | | | | 1,005,898 | | | | 1,167,532 | |
EAB Global, Inc., 3M LIBOR + 3.750% | | | 4.89 | | | | 11/15/2024 | | | | 740,064 | | | | 737,745 | | | | 699,361 | |
Financial & Risk US Holdings, Inc., 1M LIBOR + 3.250% | | | 3.43 | | | | 10/1/2025 | | | | 980,025 | | | | 950,684 | | | | 956,260 | |
Finastra USA, Inc., 3M LIBOR + 3.500%, 6M LIBOR + 3.500% | | | 4.50 | | | | 6/13/2024 | | | | 3,450,922 | | | | 3,282,357 | | | | 3,008,583 | |
I-Logic Technologies Bidco Ltd., 3M LIBOR + 2.750% | | | 3.82 | | | | 12/21/2024 | | | | 1,008,009 | | | | 1,011,850 | | | | 957,608 | |
Informatica LLC, 1M LIBOR + 3.250% | | | 3.43 | | | | 2/25/2027 | | | | 997,500 | | | | 992,745 | | | | 952,612 | |
See accompanying Notes to the Financial Statements.
78
Barings Global Floating Rate Fund 2020 Annual Report
SCHEDULE OF INVESTMENTS (CONTINUED)
June 30, 2020
| | | | | | | | | | | | | | | | | | | | |
| | | | | |
| | | EFFECTIVE
INTEREST RATE | | | DUE DATE | | | PRINCIPAL ‡‡ | | | COST | | | FAIR
VALUE | |
|
Bank Loans (Continued) | |
|
Diversified/Conglomerate Service (Continued) | |
Informatica LLC, 1M LIBOR + 7.125% | | | 7.13 | % | | | 2/25/2025 | | | | 350,242 | | | $ | 348,605 | | | $ | 349,804 | |
Kronos, Inc., 1M LIBOR + 3.000% | | | 3.18 | | | | 11/1/2023 | | | | 2,056,203 | | | | 2,059,931 | | | | 2,051,700 | |
Men’s Wearhouse, Inc. (The), 1M LIBOR + 3.250% | | | 4.25 | | | | 4/9/2025 | | | | 133,179 | | | | 113,374 | | | | 21,309 | |
MH Sub I LLC, 3M LIBOR + 3.750% | | | 4.82 | | | | 9/13/2024 | | | | 2,020,284 | | | | 2,013,567 | | | | 1,940,624 | |
Mitchell International, Inc., 1M LIBOR + 3.250% | | | 3.43 | | | | 11/29/2024 | | | | 994,911 | | | | 992,630 | | | | 925,894 | |
Project Leopard Holdings, Inc., 1M LIBOR + 4.500% | | | 5.50 | | | | 7/7/2023 | | | | 1,468,937 | | | | 1,473,577 | | | | 1,429,761 | |
Surf Holdings, LLC, 3M LIBOR + 3.500%(b) | | | 3.83 | | | | 3/5/2027 | | | | 184,391 | | | | 183,951 | | | | 176,357 | |
TMF Group Holding B.V., EURIBOR + 3.250%(b) | | | 3.25 | | | | 5/5/2025 | | | | 500,000 | | | | 584,716 | | | | 512,995 | |
Ultimate Software Group, Inc. (The), 1M LIBOR + 4.000% | | | 4.75 | | | | 5/4/2026 | | | | 1,000,000 | | | | 985,000 | | | | 986,410 | |
Verisure Holding AB, EURIBOR + 3.000%(b) | | | 3.00 | | | | 10/20/2022 | | | | 2,700,000 | | | | 3,099,204 | | | | 2,946,237 | |
Verisure Holding AB, EURIBOR + 3.500%(b) | | | 3.50 | | | | 10/21/2022 | | | | 500,000 | | | | 566,875 | | | | 548,599 | |
Vertafore, Inc., 1M LIBOR + 3.250% | | | 3.43 | | | | 7/2/2025 | | | | 1,970,000 | | | | 1,969,334 | | | | 1,853,041 | |
Vertafore, Inc., 1M LIBOR + 7.250% | | | 7.43 | | | | 7/2/2026 | | | | 1,000,000 | | | | 992,454 | | | | 981,070 | |
| | | | | | | | | | | | | | | | | | | | |
Total Diversified/Conglomerate Service | | | | | | | | | | | 25,589,158 | | | | 25,506,599 | | | | 24,559,136 | |
| | | | | | | | | | | | | | | | | | | | |
|
Electronics — 3.6%*: | |
EXC Holdings III Corp., 3M LIBOR + 3.500% | | | 4.50 | | | | 12/2/2024 | | | | 484,741 | | | | 488,402 | | | | 471,813 | |
Greeneden U.S. Holdings II LLC, 3M USD LIBOR | | | 3.43 | | | | 12/1/2023 | | | | 1,484,502 | | | | 1,491,769 | | | | 1,425,923 | |
Omnitracs, Inc., 3M LIBOR + 2.750% | | | 3.05 | | | | 3/21/2025 | | | | 1,472,690 | | | | 1,470,445 | | | | 1,381,015 | |
Renaissance Holding Corp., 3M LIBOR + 3.250% | | | 4.01 | | | | 5/30/2025 | | | | 733,772 | | | | 733,772 | | | | 704,663 | |
RP Crown Parent LLC, 1M LIBOR + 2.750% | | | 3.75 | | | | 10/12/2023 | | | | 969,647 | | | | 969,138 | | | | 939,346 | |
SS&C Technologies Inc., 1M LIBOR + 1.750% | | | 1.93 | | | | 4/16/2025 | | | | 472,579 | | | | 471,691 | | | | 449,933 | |
Tibco Software Inc., 1M LIBOR + 7.250% | | | 7.43 | | | | 3/3/2028 | | | | 385,440 | | | | 383,587 | | | | 369,302 | |
Veritas Bermuda Ltd., EURIBOR + 4.500% | | | 5.50 | | | | 1/27/2023 | | | | 2,031,716 | | | | 2,118,460 | | | | 1,975,784 | |
| | | | | | | | | | | | | | | | | | | | |
Total Electronics | | | | | | | | | | | 8,035,087 | | | | 8,127,264 | | | | 7,717,779 | |
| | | | | | | | | | | | | | | | | | | | |
|
Finance — 1.7%*: | |
Deerfield Dakota Holding LLC, 1M LIBOR + 8.000% | | | 9.00 | | | | 3/6/2027 | | | | 1,000,000 | | | | 985,396 | | | | 947,500 | |
Deerfield Dakota Holding LLC, 1M LIBOR + 0.080% | | | 4.75 | | | | 4/9/2027 | | | | 332,364 | | | | 325,717 | | | | 322,393 | |
NFP Corp., 1M LIBOR + 3.250% | | | 3.43 | | | | 2/15/2027 | | | | 1,491,335 | | | | 1,484,283 | | | | 1,386,941 | |
Tempo Acquisition LLC, 1M LIBOR + 2.750% | | | 2.93 | | | | 5/1/2024 | | | | 1,084,416 | | | | 1,087,219 | | | | 1,027,484 | |
| | | | | | | | | | | | | | | | | | | | |
Total Finance | | | | | | | | | | | 3,908,115 | | | | 3,882,615 | | | | 3,684,318 | |
| | | | | | | | | | | | | | | | | | | | |
See accompanying Notes to the Financial Statements.
79
Barings Global Floating Rate Fund 2020 Annual Report
SCHEDULE OF INVESTMENTS (CONTINUED)
June 30, 2020
| | | | | | | | | | | | | | | | | | | | |
| | | | | |
| | | EFFECTIVE
INTEREST RATE | | | DUE DATE | | | PRINCIPAL ‡‡ | | | COST | | | FAIR
VALUE | |
|
Bank Loans (Continued) | |
|
Healthcare, Education and Childcare — 13.1%*: | |
Advanz Pharma Corp., 6M LIBOR + 5.500%(b) | | | 6.57 | % | | | 9/6/2024 | | | | 2,267,750 | | | $ | 2,241,143 | | | $ | 2,095,401 | |
Advanz Pharma Corp., EURIBOR + 5.250%(b) | | | 6.25 | | | | 9/6/2024 | | | | 482,500 | | | | 558,802 | | | | 504,820 | |
Aenova Holding GmbH, EURIBOR + 5.000%(b) | | | 5.00 | | | | 3/6/2025 | | | | 500,000 | | | | 536,583 | | | | 550,869 | |
Amneal Pharmaceuticals LLC, 1M LIBOR + 3.500% | | | 3.69 | | | | 5/4/2025 | | | | 1,484,845 | | | | 1,392,351 | | | | 1,353,065 | |
Arbor Pharmaceuticals, Inc., 1M LIBOR + 5.000% | | | 6.00 | | | | 7/5/2023 | | | | 1,394,523 | | | | 1,391,288 | | | | 1,265,097 | |
Auris Luxembourg III Sarl, 1M LIBOR + 3.750% | | | 3.93 | | | | 2/27/2026 | | | | 987,429 | | | | 983,407 | | | | 859,063 | |
Aveanna Healthcare, LLC, 6M LIBOR + 5.500% | | | 6.50 | | | | 3/18/2024 | | | | 1,277,146 | | | | 1,266,074 | | | | 1,130,811 | |
Change Healthcare Holdings LLC, 1M LIBOR + 2.500%, 3M LIBOR + 2.500% | | | 3.50 | | | | 3/1/2024 | | | | 1,346,078 | | | | 1,342,931 | | | | 1,290,176 | |
CTC AcquiCo GmbH, 3M LIBOR + 2.750%(b) | | | 3.11 | | | | 3/7/2025 | | | | 1,250,000 | | | | 1,230,354 | | | | 1,171,875 | |
Endo Luxembourg Finance Co. I S.a r.l., 1M LIBOR + 4.250% | | | 5.00 | | | | 4/29/2024 | | | | 2,147,571 | | | | 2,134,795 | | | | 2,024,085 | |
Envision Healthcare Corp., 1M LIBOR + 3.750% | | | 3.93 | | | | 10/10/2025 | | | | 595,421 | | | | 322,869 | | | | 388,512 | |
Ethypharm S.A., LIBOR – GBP + 4.750%(b) | | | 5.48 | | | | 7/21/2023 | | | | 500,000 | | | | 619,010 | | | | 595,159 | |
Fugue Finance B.V.(b) | | | 3.25 | | | | 9/1/2024 | | | | 500,000 | | | | 539,599 | | | | 530,252 | |
Horizon Therapeutics USA, Inc., 1M LIBOR + 2.250% | | | 2.44 | | | | 5/22/2026 | | | | 494,267 | | | | 496,156 | | | | 477,585 | |
Indivior Finance Sarl, 3M LIBOR + 4.500% | | | 5.50 | | | | 12/18/2022 | | | | 784,337 | | | | 778,630 | | | | 674,530 | |
Lifescan Global Corp., 6M LIBOR + 6.000% | | | 7.18 | | | | 10/1/2024 | | | | 358,000 | | | | 350,360 | | | | 322,558 | |
Mallinckrodt International Finance S.A., 3M LIBOR + 2.750% | | | 3.50 | | | | 9/24/2024 | | | | 357,215 | | | | 355,619 | | | | 266,125 | |
Nidda Healthcare Holding AG, LIBOR – GBP + 4.500%(b) | | | 4.76 | | | | 8/21/2026 | | | | 500,000 | | | | 652,788 | | | | 596,317 | |
Nidda Healthcare Holding AG, EURIBOR + 3.500%(b) | | | 3.50 | | | | 8/21/2026 | | | | 1,000,000 | | | | 1,084,445 | | | | 1,076,313 | |
Ortho-Clinical Diagnostics SA, 1M LIBOR + 3.250% | | | 3.43 | | | | 6/30/2025 | | | | 2,393,789 | | | | 2,378,726 | | | | 2,233,716 | |
Parexel International Corp., 1M LIBOR + 2.750% | | | 2.93 | | | | 9/27/2024 | | | | 2,266,045 | | | | 2,225,032 | | | | 2,142,840 | |
RegionalCare Hospital Partners Holdings, Inc., 1M LIBOR + 3.750% | | | 3.93 | | | | 11/17/2025 | | | | 857,941 | | | | 862,991 | | | | 802,063 | |
Rodenstock GmbH, EURIBOR + 5.250%(b) | | | 5.25 | | | | 6/5/2026 | | | | 500,000 | | | | 557,003 | | | | 524,186 | |
Sunshine Luxembourg VII S.a.r.l., 6M LIBOR + 4.250%(b) | | | 5.32 | | | | 10/1/2026 | | | | 1,475,589 | | | | 1,483,948 | | | | 1,409,808 | |
Surgery Center Holdings, Inc., 1M LIBOR + 3.250% | | | 4.25 | | | | 9/3/2024 | | | | 1,492,327 | | | | 1,492,843 | | | | 1,305,249 | |
Team Health Holdings, Inc., 1M LIBOR + 2.750% | | | 3.75 | | | | 2/6/2024 | | | | 1,947,173 | | | | 1,913,463 | | | | 1,483,512 | |
See accompanying Notes to the Financial Statements.
80
Barings Global Floating Rate Fund 2020 Annual Report
SCHEDULE OF INVESTMENTS (CONTINUED)
June 30, 2020
| | | | | | | | | | | | | | | | | | | | |
| | | | | |
| | | EFFECTIVE
INTEREST RATE | | | DUE DATE | | | PRINCIPAL ‡‡ | | | COST | | | FAIR
VALUE | |
|
Bank Loans (Continued) | |
|
Healthcare, Education and Childcare (Continued) | |
Tunstall Group Holdings Ltd., LIBOR – GBP + 5.000%, PIK(b) | | | 4.25 | % | | | 10/16/2020 | | | | 523,355 | | | $ | 821,655 | | | $ | 518,792 | |
Unilabs Holding AB, EURIBOR + 3.000%(b) | | | 3.00 | | | | 4/19/2024 | | | | 500,000 | | | | 575,316 | | | | 536,707 | |
| | | | | | | | | | | | | | | | | | | | |
Total Healthcare, Education and Childcare | | | | | | | | | | | 30,183,301 | | | | 30,588,181 | | | | 28,129,486 | |
| | | | | | | | | | | | | | | | | | | | |
|
Home and Office Furnishings, Housewares, and Durable Consumer Products — 1.0%*: | |
Serta Simmons Bedding LLC, 2M LIBOR + 7.500% | | | 8.50 | | | | 8/10/2023 | | | | 1,521,420 | | | | 1,521,420 | | | | 1,267,845 | |
SIWF Holdings Inc., 6M LIBOR + 4.250% | | | 5.32 | | | | 6/15/2025 | | | | 982,456 | | | | 989,468 | | | | 913,684 | |
| | | | | | | | | | | | | | | | | | | | |
Total Home and Office Furnishings, Housewares, and Durable Consumer Products | | | | | | | | | | | 2,503,876 | | | | 2,510,888 | | | | 2,181,529 | |
| | | | | | | | | | | | | | | | | | | | |
|
Hotels, Motels, Inns and Gaming — 3.7%*: | |
Caesars Resort Collection LLC, 1M LIBOR + 4.500% | | | 4.80 | | | | 6/19/2025 | | | | 732,742 | | | | 710,760 | | | | 687,408 | |
Caesars Resort Collection LLC, 1M LIBOR + 2.750% | | | 2.93 | | | | 12/23/2024 | | | | 1,973,365 | | | | 1,967,783 | | | | 1,749,506 | |
Compass IV Ltd., EURIBOR + 4.500%(b) | | | 4.50 | | | | 4/30/2025 | | | | 500,000 | | | | 599,392 | | | | 494,621 | |
Compass IV Ltd., EURIBOR + 8.000%(b) | | | 9.00 | | | | 4/30/2026 | | | | 500,000 | | | | 589,946 | | | | 367,244 | |
Golden Nugget, Inc., 1M LIBOR + 2.500% | | | 3.25 | | | | 10/4/2023 | | | | 314,859 | | | | 255,036 | | | | 248,739 | |
HNVR Holdco Ltd., EURIBOR + 3.250%(b) | | | 4.25 | | | | 9/12/2023 | | | | 500,000 | | | | 408,620 | | | | 445,788 | |
Penn National Gaming, Inc., 3M LIBOR + 2.250% | | | 3.00 | | | | 10/15/2025 | | | | 1,995,608 | | | | 1,991,483 | | | | 1,855,356 | |
Richmond UK Bidco Ltd., LIBOR—GBP + 4.250%(b) | | | 4.98 | | | | 3/3/2024 | | | | 482,094 | | | | 608,991 | | | | 536,880 | |
Rouge Beachhouse B.V., EURIBOR + 3.750%(b) | | | 3.75 | | | | 9/4/2025 | | | | 500,000 | | | | 586,575 | | | | 528,045 | |
Tackle Sarl, EURIBOR + 3.750%(b) | | | 3.50 | | | | 8/8/2022 | | | | 974,537 | | | | 1,091,204 | | | | 1,056,176 | |
| | | | | | | | | | | | | | | | | | | | |
Total Hotels, Motels, Inns and Gaming | | | | | | | | | | | 8,473,205 | | | | 8,809,790 | | | | 7,969,763 | |
| | | | | | | | | | | | | | | | | | | | |
|
Insurance — 2.7%*: | |
Acrisure LLC, 3M LIBOR + 3.500% | | | 3.68 | | | | 2/15/2027 | | | | 997,500 | | | | 995,130 | | | | 940,144 | |
Alliant Holdings Intermediate LLC, 1M LIBOR + 2.750% | | | 2.93 | | | | 5/9/2025 | | | | 2,258,674 | | | | 2,265,823 | | | | 2,136,005 | |
AssuredPartners, Inc., 1M LIBOR + 3.500% | | | 3.68 | | | | 2/12/2027 | | | | 1,757,102 | | | | 1,765,409 | | | | 1,676,784 | |
Confie Seguros Holding II Co., 1M LIBOR + 8.500% | | | 8.67 | | | | 10/31/2025 | | | | 1,633,626 | | | | 1,608,647 | | | | 1,095,886 | |
| | | | | | | | | | | | | | | | | | | | |
Total Insurance | | | | | | | | | | | 6,646,902 | | | | 6,635,009 | | | | 5,848,819 | |
| | | | | | | | | | | | | | | | | | | | |
|
Leisure, Amusement, Entertainment — 7.4%*: | |
AMC Entertainment Holdings, Inc., 3M LIBOR + 3.000% | | | 4.08 | | | | 4/22/2026 | | | | 1,269,450 | | | | 987,264 | | | | 917,977 | |
Columbus Capital BV, EURIBOR + 3.750%(b) | | | 3.75 | | | | 3/5/2027 | | | | 500,000 | | | | 559,415 | | | | 460,635 | |
See accompanying Notes to the Financial Statements.
81
Barings Global Floating Rate Fund 2020 Annual Report
SCHEDULE OF INVESTMENTS (CONTINUED)
June 30, 2020
| | | | | | | | | | | | | | | | | | | | |
| | | | | |
| | | EFFECTIVE
INTEREST RATE | | | DUE DATE | | | PRINCIPAL ‡‡ | | | COST | | | FAIR
VALUE | |
|
Bank Loans (Continued) | |
|
Leisure, Amusement, Entertainment (Continued) | |
Crown Finance US, Inc., 3M LIBOR + 2.250% | | | 3.32 | % | | | 2/28/2025 | | | | 2,078,082 | | | $ | 2,058,980 | | | $ | 1,555,632 | |
Delta 2 (LUX) Sarl, 1M LIBOR + 2.500%(b) | | | 3.50 | | | | 2/1/2024 | | | | 1,394,967 | | | | 1,397,888 | | | | 1,324,354 | |
Dorna Sports, S.L., EURIBOR + 2.750%(b) | | | 2.75 | | | | 5/3/2024 | | | | 978,282 | | | | 1,093,636 | | | | 1,045,980 | |
International Park Holdings B.V., EURIBOR + 3.250%(b) | | | 3.25 | | | | 6/13/2024 | | | | 500,000 | | | | 580,575 | | | | 495,042 | |
Metro-Goldwyn-Mayer, Inc., 1M LIBOR + 4.500% | | | 5.50 | | | | 7/3/2026 | | | | 3,000,000 | | | | 2,980,395 | | | | 2,865,000 | |
Parques Reunidos SAU, EURIBOR + 3.750%(b) | | | 3.75 | | | | 9/16/2026 | | | | 500,000 | | | | 545,907 | | | | 469,460 | |
Playtika Holding Corp., 3M LIBOR + 6.000% | | | 7.07 | | | | 12/10/2024 | | | | 568,750 | | | | 558,634 | | | | 567,328 | |
PUG LLC, 1M LIBOR + 3.500% | | | 3.68 | | | | 2/12/2027 | | | | 976,706 | | | | 972,075 | | | | 846,071 | |
SeaWorld Parks & Entertainment, Inc., 1M LIBOR + 3.000% | | | 3.75 | | | | 3/31/2024 | | | | 2,520,677 | | | | 2,514,116 | | | | 2,220,717 | |
Vacalians Group, EURIBOR + 4.000%(b) | | | 4.00 | | | | 12/4/2025 | | | | 500,000 | | | | 565,030 | | | | 406,218 | |
Vue International Bidco PLC, EURIBOR + 4.250%(b) | | | 4.25 | | | | 7/3/2026 | | | | 423,797 | | | | 473,851 | | | | 407,991 | |
William Morris Endeavor Entertainment, LLC, 3M LIBOR + 2.750% | | | 2.93 | | | | 5/18/2025 | | | | 2,291,007 | | | | 2,266,261 | | | | 1,860,618 | |
WMG Acquisition Corp., 1M LIBOR + 2.125% | | | 2.30 | | | | 11/1/2023 | | | | 500,000 | | | | 499,587 | | | | 485,140 | |
| | | | | | | | | | | | | | | | | | | | |
Total Leisure, Amusement, Entertainment | | | | | | | | | | | 18,001,718 | | | | 18,053,614 | | | | 15,928,163 | |
| | | | | | | | | | | | | | | | | | | | |
Machinery Non-Agriculture, Non-Construction, Non-Electronic — 1.8%*: | |
Alison Bidco S.a.r.l., 3M LIBOR + 4.500%(b) | | | 5.50 | | | | 8/29/2021 | | | | 121,536 | | | | 121,334 | | | | 88,924 | |
Alison Bidco Sarl, 3M LIBOR + 4.500%(b) | | | 5.50 | | | | 8/29/2021 | | | | 971,081 | | | | 1,106,909 | | | | 828,633 | |
Apex Tool Group, LLC, 1M LIBOR + 5.250% | | | 6.50 | | | | 8/1/2024 | | | | 1,344,045 | | | | 1,322,316 | | | | 1,198,808 | |
Titan Acquisition Ltd., 3M LIBOR + 3.000%(b) | | | 3.36 | | | | 3/28/2025 | | | | 1,948,640 | | | | 1,947,116 | | | | 1,777,414 | |
| | | | | | | | | | | | | | | | | | | | |
Total Machinery Non-Agriculture, Non-Construction, Non-Electronic | | | | | | | | | | | 4,385,302 | | | | 4,497,675 | | | | 3,893,779 | |
| | | | | | | | | | | | | | | | | | | | |
|
Mining, Steel, Iron and Non-Precious Metals — 0.3%*: | |
Boomerang Tube, LLC, 1M LIBOR + 5.000%(a) | | | 5.18 | | | | 6/30/2022 | | | | 62,600 | | | | 62,600 | | | | 7,512 | |
US Silica Co., 1M LIBOR + 4.000% | | | 5.00 | | | | 5/1/2025 | | | | 864,758 | | | | 872,333 | | | | 613,053 | |
| | | | | | | | | | | | | | | | | | | | |
Total Mining, Steel, Iron and Non-Precious Metals | | | | | | | | | | | 927,358 | | | | 934,933 | | | | 620,565 | |
| | | | | | | | | | | | | | | | | | | | |
|
Oil and Gas — 0.6%*: | |
Fieldwood Energy LLC, 3M LIBOR + 7.250% | | | Zero Coupon | | | | 4/11/2023 | | | | 864,968 | | | | 558,463 | | | | 5,190 | |
Gulf Finance LLC, 1M LIBOR + 5.250%, 3M LIBOR + 5.250% | | | 6.25 | | | | 8/25/2023 | | | | 1,623,488 | | | | 1,534,776 | | | | 1,039,032 | |
KCA Deutag Alpha Ltd., 3M LIBOR + 6.750%(b) | | | 8.20 | | | | 2/28/2023 | | | | 491,250 | | | | 489,853 | | | | 231,708 | |
Seadrill Partners Finco LLC, 3M LIBOR + 6.000% | | | 7.00 | | | | 2/21/2021 | | | | 2,714 | | | | 2,498 | | | | 463 | |
| | | | | | | | | | | | | | | | | | | | |
Total Oil and Gas | | | | | | | | | | | 2,982,420 | | | | 2,585,590 | | | | 1,276,393 | |
| | | | | | | | | | | | | | | | | | | | |
See accompanying Notes to the Financial Statements.
82
Barings Global Floating Rate Fund 2020 Annual Report
SCHEDULE OF INVESTMENTS (CONTINUED)
June 30, 2020
| | | | | | | | | | | | | | | | | | | | |
| | | | | |
| | | EFFECTIVE
INTEREST RATE | | | DUE DATE | | | PRINCIPAL ‡‡ | | | COST | | | FAIR
VALUE | |
|
Bank Loans (Continued) | |
|
Personal and Non-Durable Consumer Products Mfg. Only — 0.6%*: | |
Coty Inc., 1M LIBOR + 2.250% | | | 2.43 | % | | | 4/7/2025 | | | | 1,478,659 | | | $ | 1,437,332 | | | $ | 1,323,400 | |
| | | | | | | | | | | | | | | | | | | | |
|
Personal Transportation — 1.5%*: | |
American Airlines, Inc., 1M LIBOR + 2.000% | | | 2.18 | | | | 4/28/2023 | | | | 1,969,283 | | | | 1,959,974 | | | | 1,550,810 | |
Kestrel Bidco, Inc., 1M LIBOR + 3.000%(b) | | | 4.00 | | | | 12/11/2026 | | | | 2,116,872 | | | | 2,119,940 | | | | 1,691,741 | |
| | | | | | | | | | | | | | | | | | | | |
Total Personal Transportation | | | | | | | | | | | 4,086,155 | | | | 4,079,914 | | | | 3,242,551 | |
| | | | | | | | | | | | | | | | | | | | |
|
Printing and Publishing — 1.0%*: | |
Houghton Mifflin Harcourt Publishing Co., 1M LIBOR + 6.250% | | | 7.25 | | | | 11/22/2024 | | | | 295,820 | | | | 285,351 | | | | 275,852 | |
Springer Nature Deutschland GmbH, EURIBOR + 3.250%(b) | | | 3.75 | | | | 8/14/2024 | | | | 1,658,998 | | | | 1,851,141 | | | | 1,811,956 | |
| | | | | | | | | | | | | | | | | | | | |
Total Printing and Publishing | | | | | | | | | | | 1,954,818 | | | | 2,136,492 | | | | 2,087,808 | |
| | | | | | | | | | | | | | | | | | | | |
|
Retail Stores — 3.7%*: | |
Bass Pro Group, LLC, 3M LIBOR + 5.000% | | | 6.07 | | | | 9/25/2024 | | | | 1,479,721 | | | | 1,451,324 | | | | 1,420,000 | |
EG America LLC, 3M LIBOR + 4.000%(b) | | | 5.07 | | | | 2/7/2025 | | | | 1,080,764 | | | | 1,077,096 | | | | 1,012,319 | |
EG Group Ltd., 6M LIBOR + 4.000%(b) | | | 5.07 | | | | 2/7/2025 | | | | 219,993 | | | | 219,625 | | | | 206,061 | |
Eyemart Express LLC, 1M LIBOR + 3.000% | | | 4.00 | | | | 8/4/2024 | | | | 982,323 | | | | 985,361 | | | | 891,458 | |
Harbor Freight Tools USA, Inc., 1M LIBOR + 2.500% | | | 3.25 | | | | 8/18/2023 | | | | 1,984,302 | | | | 1,943,844 | | | | 1,906,180 | |
Kirk Beauty One GmbH, EURIBOR + 3.500%(b) | | | 3.50 | | | | 8/12/2022 | | | | 2,250,001 | | | | 2,605,050 | | | | 2,039,843 | |
Thom Europe S.A.S, EURIBOR + 4.000%(b) | | | 4.25 | | | | 8/7/2024 | | | | 500,000 | | | | 577,481 | | | | 514,001 | |
| | | | | | | | | | | | | | | | | | | | |
Total Retail Stores | | | | | | | | | | | 8,497,104 | | | | 8,859,781 | | | | 7,989,862 | |
| | | | | | | | | | | | | | | | | | | | |
|
Telecommunications — 4.9%*: | |
Banff Merger Sub, Inc., 1M LIBOR + 4.250% | | | 4.43 | | | | 10/2/2025 | | | | 985,000 | | | | 977,599 | | | | 929,594 | |
CenturyLink, Inc., 1M LIBOR + 2.250% | | | 2.43 | | | | 3/15/2027 | | | | 547,134 | | | | 546,487 | | | | 514,612 | |
CommScope, Inc., 1M LIBOR + 3.250% | | | 3.43 | | | | 4/6/2026 | | | | 1,992,408 | | | | 1,986,841 | | | | 1,882,826 | |
Digicel International Finance Ltd., 3M LIBOR + 3.250%(b) | | | 4.25 | | | | 5/28/2024 | | | | 152,210 | | | | 152,992 | | | | 127,324 | |
ION Trading Technologies Sarl, 3M LIBOR + 4.000% | | | 5.07 | | | | 11/21/2024 | | | | 1,399,924 | | | | 1,390,999 | | | | 1,339,923 | |
ION Trading Technologies Sarl, EURIBOR + 3.250% | | | 4.25 | | | | 11/21/2024 | | | | 1,368,793 | | | | 1,552,359 | | | | 1,478,524 | |
Syniverse Holdings, Inc., 3M LIBOR + 5.000% | | | 6.87 | | | | 3/9/2023 | | | | 1,118,762 | | | | 1,124,449 | | | | 791,725 | |
Syniverse Holdings, Inc., 3M LIBOR + 9.000% | | | 10.87 | | | | 3/11/2024 | | | | 2,175,482 | | | | 1,801,120 | | | | 1,087,741 | |
Virgin Media SFA Finance Ltd., LIBOR—GBP + 3.250%(b) | | | 3.34 | | | | 11/15/2027 | | | | 1,250,000 | | | | 1,725,791 | | | | 1,489,832 | |
Zayo Group Holdings, Inc., 1M LIBOR + 3.000% | | | 3.18 | | | | 3/9/2027 | | | | 963,903 | | | | 961,599 | | | | 912,739 | |
| | | | | | | | | | | | | | | | | | | | |
Total Telecommunications | | | | | | | | | | | 11,953,616 | | | | 12,220,236 | | | | 10,554,840 | |
| | | | | | | | | | | | | | | | | | | | |
See accompanying Notes to the Financial Statements.
83
Barings Global Floating Rate Fund 2020 Annual Report
SCHEDULE OF INVESTMENTS (CONTINUED)
June 30, 2020
| | | | | | | | | | | | | | | | | | | | |
| | | | | |
| | | EFFECTIVE
INTEREST RATE | | | DUE DATE | | | PRINCIPAL ‡‡ | | | COST | | | FAIR
VALUE | |
|
Bank Loans (Continued) | |
|
Utilities — 0.6%*: | |
Calpine Corp., 1M LIBOR + 2.000% | | | 2.18 | % | | | 8/12/2026 | | | | 221,180 | | | $ | 220,212 | | | $ | 212,333 | |
ExGen Renewables IV, LLC, 3M LIBOR + 3.000% | | | 4.00 | | | | 11/28/2024 | | | | 1,189,022 | | | | 1,179,256 | | | | 1,150,378 | |
| | | | | | | | | | | | | | | | | | | | |
Total Utilities | | | | | | | | | | | 1,410,202 | | | | 1,399,468 | | | | 1,362,711 | |
| | | | | | | | | | | | | | | | | | | | |
| | | | | | | | | | | | | | | | | | | | |
Total Bank Loans | | | | | | | | | | | 207,247,854 | | | | 209,329,717 | | | | 189,364,344 | |
| | | | | | | | | | | | | | | | | | | | |
|
Corporate Bonds — 5.7%*: | |
|
Automobile — 0.4%*: | |
AA Bond Co. Ltd.(b) | | | 5.50 | | | | 7/31/2043 | | | | 700,000 | | | | 919,426 | | | | 737,091 | |
RAC Bond Co. PLC(b) | | | 5.00 | | | | 11/6/2022 | | | | 200,000 | | | | 253,840 | | | | 231,640 | |
| | | | | | | | | | | | | | | | | | | | |
Total Automobile | | | | | | | | | | | 900,000 | | | | 1,173,266 | | | | 968,731 | |
| | | | | | | | | | | | | | | | | | | | |
|
Broadcasting and Entertainment — 0.5%*: | |
Tele Columbus AG(b) | | | 3.88 | | | | 5/2/2025 | | | | 800,000 | | | | 865,628 | | | | 835,884 | |
VTR Finance NV(b),(d) | | | 6.88 | | | | 1/15/2024 | | | | 200,000 | | | | 201,658 | | | | 204,584 | |
| | | | | | | | | | | | | | | | | | | | |
Total Broadcasting and Entertainment | | | | | | | | | | | 1,000,000 | | | | 1,067,286 | | | | 1,040,468 | |
| | | | | | | | | | | | | | | | | | | | |
|
Containers, Packaging and Glass — 0.1%*: | |
Bormioli Pharma Bidco SpA, 1M LIBOR + 3.500%(b) | | | 3.50 | (e) | | | 11/15/2024 | | | | 100,000 | | | | 103,614 | | | | 100,160 | |
Reynolds Group Issuer, Inc./Reynolds Group Issuer LLC/Reynolds Group Issuer Lu(d) | | | 5.13 | | | | 7/15/2023 | | | | 178,000 | | | | 178,000 | | | | 179,351 | |
| | | | | | | | | | | | | | | | | | | | |
Total Containers, Packaging and Glass | | | | | | | | | | | 278,000 | | | | 281,614 | | | | 279,511 | |
| | | | | | | | | | | | | | | | | | | | |
|
Diversified/Conglomerate Manufacturing — 0.2%*: | |
Appvion ESC, 3M EURIBOR + 4.125%(a),(d),(f) | | | 9.00 | | | | 6/1/2025 | | | | 460,000 | | | | 460,000 | | | | – | |
Fabric BC SpA, 3M EURIBOR + 4.125%(b) | | | 4.13 | (e) | | | 8/31/2026 | | | | 100,000 | | | | 109,975 | | | | 109,092 | |
Galapagos S.A., 3M EURIBOR + 4.750%(a),(b),(f) | | | 4.33 | (e) | | | 6/15/2021 | | | | 20,000 | | | | 27,263 | | | | – | |
Mangrove Luxco III Sarl(b) | | | 7.78 | | | | 10/9/2025 | | | | 265,415 | | | | 250,067 | | | | 267,488 | |
| | | | | | | | | | | | | | | | | | | | |
Total Diversified/Conglomerate Manufacturing | | | | | | | | | | | 845,415 | | | | 847,305 | | | | 376,580 | |
| | | | | | | | | | | | | | | | | | | | |
|
Diversified/Conglomerate Service — 0.8%*: | |
Algeco Global Finance PLC, 3M EURIBOR + 6.250%(b) | | | 6.25 | (e) | | | 2/15/2023 | | | | 150,000 | | | | 183,340 | | | | 156,728 | |
Algeco Global Finance PLC(b) | | | 6.50 | | | | 2/15/2023 | | | | 650,000 | | | | 713,124 | | | | 700,246 | |
Carlson Travel, Inc., 3M EURIBOR + 4.750% | | | 4.75 | (e) | | | 6/15/2023 | | | | 1,200,000 | | | | 1,371,352 | | | | 807,572 | |
| | | | | | | | | | | | | | | | | | | | |
Total Diversified/Conglomerate Service | | | | | | | | | | | 2,000,000 | | | | 2,267,816 | | | | 1,664,546 | |
| | | | | | | | | | | | | | | | | | | | |
See accompanying Notes to the Financial Statements.
84
Barings Global Floating Rate Fund 2020 Annual Report
SCHEDULE OF INVESTMENTS (CONTINUED)
June 30, 2020
| | | | | | | | | | | | | | | | | | | | |
| | | | | |
| | | EFFECTIVE
INTEREST RATE | | | DUE DATE | | | PRINCIPAL ‡‡ | | | COST | | | FAIR
VALUE | |
|
Corporate Bonds (Continued) | |
|
Electronics — 0.4%*: | |
Veritas US, Inc./Veritas Bermuda Ltd.(d) | | | 7.50 | % | | | 2/1/2023 | | | | 817,000 | | | $ | 839,054 | | | $ | 804,745 | |
| | | | | | | | | | | | | | | | | | | | |
|
Finance — 1.4%*: | |
Arrow Global Finance PLC(b) | | | 5.13 | | | | 9/15/2024 | | | | 1,000,000 | | | | 1,247,577 | | | | 1,136,062 | |
Cabot Financial Luxembourg SA(b) | | | 7.50 | | | | 10/1/2023 | | | | 300,000 | | | | 416,529 | | | | 371,709 | |
Garfunkelux Holdco 3 S.A., 3M EURIBOR + 4.500%(b) | | | 4.50 | (e) | | | 9/1/2023 | | | | 150,000 | | | | 180,172 | | | | 145,552 | |
Garfunkelux Holdco 3 S.A.(b) | | | 8.50 | | | | 11/1/2022 | | | | 1,050,000 | | | | 1,404,878 | | | | 1,222,992 | |
Jerrold Finco PLC(b) | | | 6.13 | | | | 1/15/2024 | | | | 100,000 | | | | 124,555 | | | | 118,608 | |
Travelex Financing PLC(b),(f) | | | 8.00 | | | | 5/15/2022 | | | | 250,000 | | | | 274,580 | | | | 66,151 | |
| | | | | | | | | | | | | | | | | | | | |
Total Finance | | | | | | | | | | | 2,850,000 | | | | 3,648,291 | | | | 3,061,074 | |
| | | | | | | | | | | | | | | | | | | | |
|
Healthcare, Education and Childcare — 0.1%*: | |
Tenet Healthcare Corp. | | | 4.63 | | | | 7/15/2024 | | | | 255,000 | | | | 254,318 | | | | 249,846 | |
| | | | | | | | | | | | | | | | | | | | |
|
Home and Office Furnishings, Housewares, and Durable Consumer Products — 0.1%*: | |
LSF9 Balta Issuer Sarl(b) | | | 7.75 | | | | 9/15/2022 | | | | 445,500 | | | | 538,949 | | | | 318,010 | |
| | | | | | | | | | | | | | | | | | | | |
|
Hotels, Motels, Inns and Gaming — 0.3%*: | |
TVL Finance PLC, 3M GBP LIBOR + 5.375%(b) | | | 6.04 | (e) | | | 7/15/2025 | | | | 600,000 | | | | 758,972 | | | | 609,637 | |
| | | | | | | | | | | | | | | | | | | | |
|
Leisure, Amusement, Entertainment — 0.3%*: | |
CPUK Finance Ltd.(b) | | | 4.88 | | | | 2/28/2025 | | | | 600,000 | | | | 791,482 | | | | 686,017 | |
| | | | | | | | | | | | | | | | | | | | |
|
Oil and Gas — 0.5%*: | |
CGG Holding US, Inc.(b),(d) | | | 9.00 | | | | 5/1/2023 | | | | 500,000 | | | | 520,665 | | | | 505,000 | |
KCA Deutag UK Finance PLC(b),(d),(f) | | | 9.88 | | | | 4/1/2022 | | | | 1,000,000 | | | | 1,010,545 | | | | 475,000 | |
| | | | | | | | | | | | | | | | | | | | |
Total Oil and Gas | | | | | | | | | | | 1,500,000 | | | | 1,531,210 | | | | 980,000 | |
| | | | | | | | | | | | | | | | | | | | |
|
Personal Transportation — 0.1%*: | |
Naviera Armas S.A., 3M EURIBOR + 6.500%(b) | | | 6.50 | (e) | | | 7/31/2023 | | | | 250,000 | | | | 291,859 | | | | 154,481 | |
Naviera Armas SA, 3M EURIBOR + 4.250%(b) | | | 4.25 | (e) | | | 11/15/2024 | | | | 250,000 | | | | 296,249 | | | | 148,021 | |
| | | | | | | | | | | | | | | | | | | | |
Total Personal Transportation | | | | | | | | | | | 500,000 | | | | 588,108 | | | | 302,502 | |
| | | | | | | | | | | | | | | | | | | | |
|
Retail Stores — 0.3%*: | |
House of Fraser Funding PLC, 3M GBP LIBOR + 5.750%(b),(f) | | | 5.95 | (e) | | | 9/15/2020 | | | | 300,000 | | | | 434,213 | | | | 9,293 | |
Takko Luxembourg 2 SCA(b) | | | 5.38 | | | | 11/15/2023 | | | | 1,200,000 | | | | 1,323,797 | | | | 572,985 | |
| | | | | | | | | | | | | | | | | | | | |
Total Retail Stores | | | | | | | | | | | 1,500,000 | | | | 1,758,010 | | | | 582,278 | |
| | | | | | | | | | | | | | | | | | | | |
See accompanying Notes to the Financial Statements.
85
Barings Global Floating Rate Fund 2020 Annual Report
SCHEDULE OF INVESTMENTS (CONTINUED)
June 30, 2020
| | | | | | | | | | | | | | | | | | | | |
| | | | | |
| | | EFFECTIVE
INTEREST RATE | | | DUE DATE | | | PRINCIPAL ‡‡ | | | COST | | | FAIR
VALUE | |
|
Corporate Bonds (Continued) | |
|
Utilities — 0.2%*: | |
Viridian Group Finance Co. PLC/Viridian Power & Energy(b) | | | 4.75 | % | | | 9/15/2024 | | | | 350,000 | | | | $437,252 | | | | $427,686 | |
| | | | | | | | | | | | | | | | | | | | |
Total Corporate Bonds | | | | | | | | | | | 14,440,915 | | | | 16,782,933 | | | | 12,351,631 | |
| | | | | | | | | | | | | | | | | | | | |
Total Fixed Income | | | | | | | | | | | 221,688,769 | | | | 226,112,650 | | | | 201,715,975 | |
| | | | | | | | | | | | | | | | | | | | |
Total Investments | | | | | | | | | | | 221,785,395 | | | | 227,709,444 | | | | 202,282,324 | |
| | | | | | | | | | | | | | | | | | | | |
| | | | | |
Other assets and liabilities – 5.8%* | | | | | | | | | | | | | | | | | | | 12,427,682 | |
| | | | | | | | | | | | | | | | | | | | |
| | | | | |
Net Assets – 100.0% | | | | | | | | | | | | | | | | | | | $214,710,006 | |
| | | | | | | | | | | | | | | | | | | | |
| ‡‡ | Unless otherwise indicated, all principal amounts are denominated in United States Dollars. |
| * | Calculated as a percentage of net assets applicable to common shareholders. |
| (a) | For fair value measurement disclosure purposes, security is categorized as Level 3 (See Note 2). |
Distributions of investments by country of risk (excluding temporary cash investments) as a percentage of total investments in securities, is as follows:
| | | | | | |
| | United States | | | 68.3% | |
| | United Kingdom | | | 9.1% | |
| | Germany | | | 8.6% | |
| | Netherlands | | | 3.2% | |
| | France | | | 2.8% | |
| | Spain | | | 1.9% | |
| | Sweden | | | 1.7% | |
| | Canada | | | 1.7% | |
| | Switzerland | | | 1.6% | |
| | Other (Individually less than 1%) | | | 1.1% | |
| | | | | | |
| | Total | | | 100.0% | |
| | | | | | |
| (c) | Bank loans are exempt from registration under the Securities Act of 1933, as amended, but contain certain restrictions on resale and cannot be sold publicly. These loans pay interest at rates which adjust periodically. The interest rates shown for bank loans are the current interest rates at June 30, 2020. Bank loans are also subject to mandatory and/or optional prepayment which cannot be predicted. As a result, the remaining maturity may be substantially less than the stated maturity shown. |
| (d) | Security acquired in a transaction exempt from registration under Rule 144A of the Securities Act of 1933. These securities may only be resold in transactions exempt from registration, normally to qualified institutional buyers. |
| (e) | Variable rate security. The interest rate shown is the rate in effect at June 30, 2020. |
See accompanying Notes to the Financial Statements.
86
Barings Global Floating Rate Fund 2020 Annual Report
SCHEDULE OF INVESTMENTS (CONTINUED)
June 30, 2020
A summary of outstanding derivatives at June 30, 2020 is as follows:
Forward Foreign Currency Exchange Contracts to Buy
| | | | | | | | | | | | | | | | | | | | | | |
EXPIRATION
DATE | | COUNTERPARTY | | LOCAL
CURRENCY | | | VALUE IN USD | | | IN
EXCHANGE
FOR USD | | | NET UNREALIZED
DEPRECIATION | |
| 7/14/20 | | Morgan Stanley & Co. | | | EUR | | | | 2,527,142 | | | $ | 2,839,961 | | | $ | 2,859,091 | | | $ | (19,130 | ) |
| 7/14/20 | | Canadian Imperial Bank of Commerce | | | EUR | | | | 1,019,019 | | | | 1,145,157 | | | | 1,148,328 | | | | (3,171 | ) |
| 7/14/20 | | Morgan Stanley & Co. | | | GBP | | | | 13,579 | | | | 16,827 | | | | 17,217 | | | | (390 | ) |
| | | | | | | | | | | | | | | | | | | | | | |
Net unrealized depreciation on forward foreign currency exchange contracts to buy | | | $ | (22,691 | ) |
| | | | | | | | | | | | | | | | | | | | | | |
Forward Foreign Currency Exchange Contracts to Sell
| | | | | | | | | | | | | | | | | | | | | | |
EXPIRATION
DATE | | COUNTERPARTY | | LOCAL
CURRENCY | | | VALUE IN USD | | | IN
EXCHANGE
FOR USD | | | NET UNREALIZED
APPRECIATION | |
| 7/14/20 | | Morgan Stanley & Co. | | | EUR | | | | 35,548,971 | | | $ | 39,949,348 | | | $ | 40,260,280 | | | $ | 310,932 | |
| 7/14/20 | | Canadian Imperial Bank of Commerce | | | EUR | | | | 666,059 | | | | 748,506 | | | | 750,128 | | | | 1,622 | |
| 7/14/20 | | Canadian Imperial Bank of Commerce | | | GBP | | | | 8,462,252 | | | | 10,486,360 | | | | 10,756,627 | | | | 270,267 | |
| | | | | | | | | | | | | | | | | | | | | | |
Net unrealized appreciation on forward foreign currency exchange contracts to sell | | | $ | 582,821 | |
| | | | | | | | | | | | | | | | | | | | | | |
Currency Legend
| | | | |
| EUR | | – | | Euro |
| GBP | | – | | British Pound Sterling |
See accompanying Notes to the Financial Statements.
87
Barings Global Credit Income Opportunities Fund 2020 Annual Report
SCHEDULE OF INVESTMENTS
June 30, 2020
| | | | | | | | | | | | | | | | | | | | |
| | | | | | | | | SHARES | | | COST | | | FAIR
VALUE | |
Equities — 0.3%*: | |
|
Common Stocks — 0.3%*: | |
|
Diversified/Conglomerate Service — 0.0%*: | |
Innovation Group(a),(b) | | | | | | | | | | | 403,550 | | | | $– | | | | $– | |
| | | | | | | | | | | | | | | | | | | | |
| | | | | |
Healthcare, Education and Childcare — 0.0%*: | | | | | | | | | | | | | | | | | | | | |
MModal, Inc.(a) | | | | | | | | | | | 4,725 | | | | 10,631 | | | | 3,213 | |
Tunstall Group Holdings Ltd.(a),(b) | | | | | | | | | | | 396 | | | | – | | | | – | |
Tunstall Group Holdings Ltd.(a),(b) | | | | | | | | | | | 261 | | | | – | | | | – | |
| | | | | | | | | | | | | | | | | | | | |
Total Healthcare, Education and Childcare | | | | | | | | | | | 5,382 | | | | 10,631 | | | | 3,213 | |
| | | | | | | | | | | | | | | | | | | | |
| | | |
Mining, Steel, Iron and Non-Precious Metals — 0.0%*: | | | | | | | | | | | | | |
Boomerang Tube LLC(a) | | | | | | | | | | | 1,769 | | | | 171,860 | | | | – | |
| | | | | | | | | | | | | | | | | | | | |
| | | | | |
Oil and Gas — 0.1%*: | | | | | | | | | | | | | | | | | | | | |
Fieldwood Energy LLC | | | | | | | | | | | 3,698 | | | | 129,430 | | | | 185 | |
Fieldwood Energy LLC | | | | | | | | | | | 15,071 | | | | 325,034 | | | | 754 | |
Jupiter Resources, Inc.(b) | | | | | | | | | | | 120,272 | | | | 581,286 | | | | 90,204 | |
Southcross Energy Holdings LP | | | | | | | | | | | 11 | | | | – | | | | – | |
Southcross Energy Partners LP(a) | | | | | | | | | | | 11 | | | | 2,750 | | | | – | |
| | | | | | | | | | | | | | | | | | | | |
Total Oil and Gas | | | | | | | | | | | 139,063 | | | | 1,038,500 | | | | 91,143 | |
| | | | | | | | | | | | | | | | | | | | |
| | | | | |
Retail Stores — 0.2%*: | | | | | | | | | | | | | | | | | | | | |
Maxeda DIY B.V.(a),(b) | | | | | | | | | | | 18,859,871 | | | | 373,737 | | | | 423,781 | |
Maxeda DIY B.V.(a),(b) | | | | | | | | | | | 10,446 | | | | – | | | | 55,277 | |
| | | | | | | | | | | | | | | | | | | | |
Total Retail Stores | | | | | | | | | | | 18,870,317 | | | | 373,737 | | | | 479,058 | |
| | | | | | | | | | | | | | | | | | | | |
| | | | | | | | | | | | | | | | | | | | |
Total Common Stocks | | | | | | | | | | | 19,420,081 | | | | 1,594,728 | | | | 573,414 | |
| | | | | | | | | | | | | | | | | | | | |
Limited Partnership — 0.0%*: | | | | | | | | | | | | | | | | | | | | |
| | | | | |
Chemicals, Plastics and Rubber — 0.0%*: | | | | | | | | | | | | | | | | | | | | |
Pinnacle Operating Corp., earnout shares(a) | | | | | | | | | | | 48,505 | | | | – | | | | – | |
| | | | | | | | | | | | | | | | | | | | |
Warrants — 0.0%*: | | | | | | | | | | | | | | | | | | | | |
| | | | | |
Diversified/Conglomerate Manufacturing — 0.0%*: | | | | | | | | | | | | | | | | | | | | |
Appvion Holdings Corp. (exp. June 13, 2023)(a) | | | | | | | | | | | 488 | | | | – | | | | – | |
Appvion Holdings Corp. (exp. June 13, 2023)(a) | | | | | | | | | | | 488 | | | | – | | | | – | |
| | | | | | | | | | | | | | | | | | | | |
Total Diversified/Conglomerate Manufacturing | | | | | | | | | | | 976 | | | | – | | | | – | |
| | | | | | | | | | | | | | | | | | | | |
| | | | | | | | | | | | | | | | | | | | |
Total Warrants | | | | | | | | | | | 976 | | | | – | | | | – | |
| | | | | | | | | | | | | | | | | | | | |
| | | | | | | | | | | | | | | | | | | | |
Total Equities | | | | | | | | | | | 19,469,562 | | | | 1,594,728 | | | | 573,414 | |
| | | | | | | | | | | | | | | | | | | | |
See accompanying Notes to the Financial Statements.
88
Barings Global Credit Income Opportunities Fund 2020 Annual Report
SCHEDULE OF INVESTMENTS (CONTINUED)
June 30, 2020
| | | | | | | | | | | | | | | | | | | | |
| | | EFFECTIVE
INTEREST RATE | | | DUE DATE | | | PRINCIPAL ‡‡ | | | COST | | | FAIR
VALUE | |
Fixed Income — 91.9%*: | | | | | | | | | | | | | | | | | | | | |
| | | | | |
Asset-Backed Securities — 9.3%*: | | | | | | | | | | | | | | | | | | | | |
| | | | | |
CDO/CLO — 9.3%*: | | | | | | | | | | | | | | | | | | | | |
Alinea CLO 2018-1 Ltd., 3M USD LIBOR + 6.000%(c) | | | 7.14 | (d)% | | | 7/20/2031 | | | | 1,250,000 | | | $ | 1,250,000 | | | $ | 1,074,752 | |
Anchorage Capital CLO 9 Ltd., 3M USD LIBOR + 4.000%(c) | | | 5.22 | (d) | | | 7/15/2032 | | | | 1,250,000 | | | | 1,224,892 | | | | 1,200,871 | |
Anchorage Capital CLO Ltd. 2015-6A ER, 3M USD LIBOR + 6.350%(c) | | | 7.57 | (d) | | | 7/15/2030 | | | | 500,000 | | | | 512,089 | | | | 451,631 | |
Apidos CLO XXIV, 3M USD LIBOR + 5.800%(c) | | | 6.94 | (d) | | | 10/20/2030 | | | | 1,000,000 | | | | 1,000,000 | | | | 859,992 | |
Ares XLVIII CLO, 3M USD LIBOR + 5.200%(c) | | | 6.34 | (d) | | | 7/20/2030 | | | | 800,000 | | | | 800,000 | | | | 666,890 | |
Ballyrock CLO 2019-2 Ltd., 3M USD LIBOR + 4.100%(c) | | | 4.48 | (d) | | | 11/20/2030 | | | | 1,000,000 | | | | 1,000,000 | | | | 978,272 | |
Blackrock European CLO, 3M USD LIBOR + 5.170%(b) | | | 5.17 | (d) | | | 10/15/2031 | | | | 725,000 | | | | 803,454 | | | | 719,105 | |
BlueMountain CLO Ltd. 2014-1A(a),(c) | | | Zero Coupon | | | | 4/30/2026 | | | | 250,000 | | | | 243,864 | | | | – | |
Cairn CLO XI DAC, 3M Euribor + 4.150%(b),(c) | | | 4.15 | (d) | | | 7/15/2035 | | | | 1,000,000 | | | | 1,107,100 | | | | 1,068,186 | |
CBAM Ltd. 2017-3A E, 3M USD LIBOR + 6.500%(c) | | | 7.63 | (d) | | | 10/17/2029 | | | | 750,000 | | | | 750,000 | | | | 654,535 | |
CIFC Funding Ltd. 2017-5A D, 3M USD LIBOR + 6.100%(c) | | | 7.23 | (d) | | | 11/16/2030 | | | | 500,000 | | | | 500,000 | | | | 441,474 | |
Elmwood CLO III Ltd., 3M USD LIBOR + 3.850%(c) | | | 5.07 | (d) | | | 10/15/2032 | | | | 500,000 | | | | 500,000 | | | | 492,135 | |
Galaxy XXIV CLO Ltd. 2017-24A E, 3M USD LIBOR + 5.500%(c) | | | 6.72 | (d) | | | 1/15/2031 | | | | 700,000 | | | | 700,000 | | | | 577,128 | |
Madison Park Funding XIII Ltd. 2014-13A(c) | | | Zero Coupon | | | | 4/19/2030 | | | | 500,000 | | | | 429,300 | | | | 185,701 | |
Madison Park Funding XXVII Ltd., 3M USD LIBOR + 5.000%(c) | | | 6.14 | (d) | | | 4/20/2030 | | | | 500,000 | | | | 500,000 | | | | 406,116 | |
Madison Park Funding XXVIII Ltd., 3M USD LIBOR + 7.600%(c) | | | 8.82 | (d) | | | 7/15/2030 | | | | 500,000 | | | | 495,886 | | | | 351,424 | |
Magnetite VII Ltd.(c) | | | Zero Coupon | | | | 1/15/2028 | | | | 2,000,000 | | | | 1,547,565 | | | | 836,758 | |
Oak Hill Credit Partners X Ltd. 2014-10A(c) | | | Zero Coupon | | | | 12/12/2030 | | | | 1,000,000 | | | | 751,739 | | | | 354,195 | |
Steele Creek CLO Ltd. 2018-2A E, 3M USD LIBOR + 6.200%(c) | | | 6.59 | (d) | | | 8/18/2031 | | | | 850,000 | | | | 850,000 | | | | 613,925 | |
THL Credit Wind River CLO Ltd. 2017-4A E, 3M USD LIBOR + 5.800%(c) | | | 6.18 | (d) | | | 11/20/2030 | | | | 500,000 | | | | 500,000 | | | | 422,131 | |
THL Credit Wind River CLO Ltd. 2018-2A E, 3M USD LIBOR + 5.750%(c) | | | 6.97 | (d) | | | 7/15/2030 | | | | 1,450,000 | | | | 1,450,000 | | | | 1,170,833 | |
Wellfleet CLO 2018-1 Ltd., 3M USD LIBOR + 5.500%(c) | | | 6.63 | (d) | | | 7/17/2031 | | | | 1,150,000 | | | | 1,150,000 | | | | 918,181 | |
Wellfleet CLO Ltd. 2017-3A D, 3M USD LIBOR + 5.550%(c) | | | 6.68 | (d) | | | 1/17/2031 | | | | 1,000,000 | | | | 1,000,000 | | | | 779,667 | |
| | | | | | | | | | | | | | | | | | | | |
Total CDO/CLO | | | | | | | | | | | 19,675,000 | | | | 19,065,889 | | | | 15,223,902 | |
| | | | | | | | | | | | | | | | | | | | |
| | | | | | | | | | | | | | | | | | | | |
Total Asset-Backed Securities | | | | | | | | | | | 19,675,000 | | | | 19,065,889 | | | | 15,223,902 | |
| | | | | | | | | | | | | | | | | | | | |
See accompanying Notes to the Financial Statements.
89
Barings Global Credit Income Opportunities Fund 2020 Annual Report
SCHEDULE OF INVESTMENTS (CONTINUED)
June 30, 2020
| | | | | | | | | | | | | | | | | | | | |
| | | EFFECTIVE
INTEREST RATE | | | DUE DATE | | | PRINCIPAL ‡‡ | | | COST | | | FAIR
VALUE | |
Bank Loans — 39.8%*(e): | | | | | | | | | | | | | | | | | | | | |
| | | | | |
Aerospace and Defense — 0.5%*: | | | | | | | | | | | | | | | | | | | | |
TransDigm, Inc., 1M LIBOR + 2.250% | | | 2.43 | % | | | 5/30/2025 | | | | 984,975 | | | $ | 981,477 | | | $ | 882,173 | |
| | | | | | | | | | | | | | | | | | | | |
| | | | | |
Automobile — 1.3%*: | | | | | | | | | | | | | | | | | | | | |
BCA Marketplace plc, LIBOR – GBP + 4.750%(b) | | | 5.45 | | | | 11/13/2026 | | | | 500,000 | | | | 622,029 | | | | 575,798 | |
IAA, Inc., 1M LIBOR + 2.250% | | | 2.44 | | | | 6/28/2026 | | | | 437,559 | | | | 436,611 | | | | 417,322 | |
Panther BF Aggregator 2 LP, 1M LIBOR + 3.500% | | | 3.68 | | | | 4/30/2026 | | | | 1,130,139 | | | | 1,122,305 | | | | 1,073,632 | |
| | | | | | | | | | | | | | | | | | | | |
Total Automobile | | | | | | | | | | | 2,067,698 | | | | 2,180,945 | | | | 2,066,752 | |
| | | | | | | | | | | | | | | | | | | | |
| | | | | |
Beverage, Food and Tobacco — 0.8%*: | | | | | | | | | | | | | | | | | | | | |
Deoleo S.A.(a),(b) | | | Zero Coupon | | | | 4/30/2021 | | | | 231,063 | | | | 50,862 | | | | – | |
Deoleo S.A., EURIBOR + 3.000%(b) | | | 3.50 | | | | 6/24/2026 | | | | 66,975 | | | | 75,517 | | | | 82,019 | |
Deoleo S.A., EURIBOR + 4.000%(b) | | | 5.00 | | | | 6/24/2025 | | | | 153,876 | | | | 173,503 | | | | 148,676 | |
IRB Holding Corp., 6M LIBOR + 2.750% | | | 3.75 | | | | 2/5/2025 | | | | 1,202,892 | | | | 1,205,647 | | | | 1,107,948 | |
| | | | | | | | | | | | | | | | | | | | |
Total Beverage, Food and Tobacco | | | | | | | | | | | 1,654,806 | | | | 1,505,529 | | | | 1,338,643 | |
| | | | | | | | | | | | | | | | | | | | |
| | | | | |
Broadcasting and Entertainment — 3.0%*: | | | | | | | | | | | | | | | | | | | | |
AP NMT Acquisition B.V., EURIBOR + 6.000%(b) | | | 7.00 | | | | 8/13/2021 | | | | 382,968 | | | | 474,953 | | | | 423,811 | |
AP NMT Acquisition B.V., 3M LIBOR + 5.750%(b) | | | 7.20 | | | | 8/13/2021 | | | | 2,151,489 | | | | 2,128,282 | | | | 2,100,391 | |
AP NMT Acquisition B.V., 3M LIBOR + 9.000%(b) | | | 10.44 | | | | 8/13/2022 | | | | 739,566 | | | | 732,441 | | | | 724,774 | |
Clear Channel Outdoor Holdings, Inc., 3M LIBOR + 3.500% | | | 4.26 | | | | 8/21/2026 | | | | 554,460 | | | | 552,021 | | | | 501,232 | |
CSC Holdings, LLC, 1M LIBOR + 2.500% | | | 2.68 | | | | 4/15/2027 | | | | 1,000,000 | | | | 965,854 | | | | 946,610 | |
Terrier Media Buyer, Inc., 1M LIBOR + 4.250% | | | 4.43 | | | | 12/17/2026 | | | | 261,247 | | | | 260,037 | | | | 248,621 | |
| | | | | | | | | | | | | | | | | | | | |
Total Broadcasting and Entertainment | | | | | | | | | | | 5,089,730 | | | | 5,113,588 | | | | 4,945,439 | |
| | | | | | | | | | | | | | | | | | | | |
| | | | | |
Buildings and Real Estate — 0.5%*: | | | | | | | | | | | | | | | | | | | | |
SRS Distribution, Inc., 6M LIBOR + 3.000% | | | 4.32 | | | | 5/23/2025 | | | | 852,634 | | | | 841,621 | | | | 803,821 | |
| | | | | | | | | | | | | | | | | | | | |
| | | | | |
Chemicals, Plastics and Rubber — 2.3%*: | | | | | | | | | | | | | | | | | | | | |
Colouroz Investment 1 GmbH, EURIBOR + 3.000%(b) | | | 3.75 | | | | 9/7/2021 | | | | 1,323,889 | | | | 1,572,904 | | | | 1,307,415 | |
Flint Group GmbH, EURIBOR + 3.000%(b) | | | 3.75 | | | | 9/7/2021 | | | | 280,391 | | | | 333,406 | | | | 276,901 | |
Novacap S.A., EURIBOR + 3.500%(b) | | | 3.50 | | | | 6/22/2023 | | | | 500,000 | | | | 579,310 | | | | 521,023 | |
Solenis Holdings LLC, 3M LIBOR + 4.000% | | | 4.36 | | | | 6/26/2025 | | | | 243,633 | | | | 241,884 | | | | 233,026 | |
Solenis Holdings LLC, 3M LIBOR + 8.500% | | | 8.86 | | | | 6/26/2026 | | | | 47,145 | | | | 46,086 | | | | 40,702 | |
Starfruit Finco B.V, 1M LIBOR + 3.000%(b) | | | 3.19 | | | | 10/1/2025 | | | | 1,487,516 | | | | 1,487,958 | | | | 1,392,062 | |
| | | | | | | | | | | | | | | | | | | | |
Total Chemicals, Plastics and Rubber | | | | | | | | | | | 3,882,574 | | | | 4,261,548 | | | | 3,771,129 | |
| | | | | | | | | | | | | | | | | | | | |
| | | | | |
Containers, Packaging and Glass — 2.0%*: | | | | | | | | | | | | | | | | | | | | |
Albea Beauty Holdings S.A., 3M LIBOR + 3.000%(b) | | | 4.00 | | | | 4/22/2024 | | | | 67,423 | | | | 67,369 | | | | 62,703 | |
Berry Global, Inc., 1M LIBOR + 2.000% | | | 2.18 | | | | 7/1/2026 | | | | 589,168 | | | | 590,077 | | | | 561,919 | |
BWAY Holding Co., 3M LIBOR + 3.250% | | | 4.56 | | | | 4/3/2024 | | | | 1,309,076 | | | | 1,308,778 | | | | 1,172,173 | |
See accompanying Notes to the Financial Statements.
90
Barings Global Credit Income Opportunities Fund 2020 Annual Report
SCHEDULE OF INVESTMENTS (CONTINUED)
June 30, 2020
| | | | | | | | | | | | | | | | | | | | |
| | | EFFECTIVE
INTEREST RATE | | | DUE DATE | | | PRINCIPAL ‡‡ | | | COST | | | FAIR
VALUE | |
Bank Loans (Continued) | |
| | | | | |
Containers, Packaging and Glass (Continued) | | | | | | | | | | | | | | | | | | | | |
ProAmpac PG Borrower LLC, 1M LIBOR + 3.500%, 2M LIBOR + 3.500%, 3M LIBOR + 3.500% | | | 4.50 | % | | | 11/20/2023 | | | | 498,708 | | | $ | 472,345 | | | $ | 474,396 | |
ProAmpac PG Borrower LLC, 3M LIBOR + 8.500% | | | 9.50 | | | | 11/18/2024 | | | | 500,000 | | | | 495,884 | | | | 437,500 | |
Reynolds Consumer Products LLC, 1M LIBOR + 1.750% | | | 1.93 | | | | 2/4/2027 | | | | 110,532 | | | | 110,401 | | | | 106,327 | |
Trident TPI Holdings, Inc., 3M LIBOR + 3.250% | | | 4.07 | | | | 10/17/2024 | | | | 496,183 | | | | 486,108 | | | | 472,615 | |
| | | | | | | | | | | | | | | | | | | | |
Total Containers, Packaging and Glass | | | | | | | | | | | 3,571,090 | | | | 3,530,962 | | | | 3,287,633 | |
| | | | | | | | | | | | | | | | | | | | |
|
Diversified/Conglomerate Manufacturing — 1.6%*: | |
Amer Sports Oyj, EURIBOR + 4.500%(b) | | | 4.50 | | | | 3/30/2026 | | | | 600,000 | | | | 667,660 | | | | 606,481 | |
LSF10 XL Bidco S.C.A., EURIBOR + 4.000%(b) | | | 4.00 | | | | 10/12/2026 | | | | 500,000 | | | | 544,550 | | | | 523,287 | |
LTI Holdings, Inc., 1M LIBOR + 3.500% | | | 3.68 | | | | 9/6/2025 | | | | 746,587 | | | | 735,126 | | | | 632,463 | |
Winebow Group, Inc. (The), 1M LIBOR + 3.750% | | | 4.75 | | | | 7/1/2021 | | | | 1,187,368 | | | | 1,144,734 | | | | 889,042 | |
| | | | | | | | | | | | | | | | | | | | |
Total Diversified/Conglomerate Manufacturing | | | | | | | | | | | 3,033,955 | | | | 3,092,070 | | | | 2,651,273 | |
| | | | | | | | | | | | | | | | | | | | |
|
Diversified/Conglomerate Service — 4.6%*: | |
EAB Global, Inc., Prime + 2.750% | | | 6.00 | | | | 11/15/2024 | | | | 107,435 | | | | 107,098 | | | | 101,526 | |
Finastra USA, Inc., 3M LIBOR + 3.500%, 6M LIBOR + 3.500% | | | 4.50 | | | | 6/13/2024 | | | | 817,569 | | | | 819,312 | | | | 712,772 | |
Hyland Software, Inc., 1M LIBOR + 3.250% | | | 4.00 | | | | 7/1/2024 | | | | 984,962 | | | | 976,643 | | | | 954,951 | |
Informatica LLC, 1M LIBOR + 3.250% | | | 3.43 | | | | 2/25/2027 | | | | 370,338 | | | | 368,573 | | | | 353,673 | |
Informatica LLC, 1M LIBOR + 7.125% | | | 7.13 | | | | 2/25/2025 | | | | 133,523 | | | | 132,899 | | | | 133,356 | |
Innovation Group plc (The), 1M LIBOR + 6.000%(a),(b) | | | 6.00 | | | | 4/10/2024 | | | | 83,107 | | | | 93,380 | | | | 79,365 | |
Innovation Group plc (The), LIBOR – GBP + 5.000%(a),(b) | | | 5.73 | | | | 4/9/2024 | | | | 56,573 | | | | 73,791 | | | | 63,090 | |
Innovation Group plc (The), 1M LIBOR + 6.000%(a),(b) | | | 6.00 | | | | 4/10/2024 | | | | 164,084 | | | | 184,366 | | | | 156,696 | |
Innovation Group plc (The), 1M LIBOR + 8.000%(a),(b) | | | 8.00 | | | | 4/9/2024 | | | | 145,020 | | | | 83,155 | | | | 35,939 | |
Kronos, Inc., 1M LIBOR + 3.000% | | | 3.18 | | | | 11/1/2023 | | | | 495,555 | | | | 494,659 | | | | 494,470 | |
MH Sub I LLC, 3M LIBOR + 3.750% | | | 4.82 | | | | 9/13/2024 | | | | 986,015 | | | | 974,003 | | | | 947,136 | |
Mitchell International, Inc., 1M LIBOR + 3.250% | | | 3.43 | | | | 11/29/2024 | | | | 989,873 | | | | 939,457 | | | | 921,206 | |
TMF Group Holding B.V., EURIBOR + 6.875%(b) | | | 6.88 | | | | 5/4/2026 | | | | 500,000 | | | | 539,760 | | | | 424,121 | |
Ultimate Software Group, Inc. (The), 1M LIBOR + 4.000% | | | 4.75 | | | | 5/4/2026 | | | | 372,149 | | | | 366,567 | | | | 367,092 | |
Vertafore, Inc., 1M LIBOR + 3.250% | | | 3.43 | | | | 7/2/2025 | | | | 978,038 | | | | 965,430 | | | | 919,971 | |
Vertafore, Inc., 1M LIBOR + 7.250% | | | 7.43 | | | | 7/2/2026 | | | | 879,452 | | | | 872,816 | | | | 862,804 | |
| | | | | | | | | | | | | | | | | | | | |
Total Diversified/Conglomerate Service | | | | | | | | | | | 8,063,693 | | | | 7,991,909 | | | | 7,528,168 | |
| | | | | | | | | | | | | | | | | | | | |
See accompanying Notes to the Financial Statements.
91
Barings Global Credit Income Opportunities Fund 2020 Annual Report
SCHEDULE OF INVESTMENTS (CONTINUED)
June 30, 2020
| | | | | | | | | | | | | | | | | | | | |
| | | EFFECTIVE
INTEREST RATE | | | DUE DATE | | | PRINCIPAL ‡‡ | | | COST | | | FAIR
VALUE | |
Bank Loans (Continued) | |
|
Ecological — 0.1%*: | |
GFL Environmental Inc., 1M LIBOR + 3.000%, 3M LIBOR + 3.000%(b) | | | 4.00 | % | | | 5/30/2025 | | | | 104,817 | | | $ | 104,658 | | | $ | 101,695 | |
| | | | | | | | | | | | | | | | | | | | |
|
Electronics — 2.1%*: | |
Omnitracs, Inc., 3M LIBOR + 2.750% | | | 3.05 | | | | 3/21/2025 | | | | 960,665 | | | | 962,306 | | | | 900,863 | |
Renaissance Holding Corp., 3M LIBOR + 3.250% | | | 4.01 | | | | 5/30/2025 | | | | 977,475 | | | | 978,639 | | | | 938,698 | |
RP Crown Parent LLC, 1M LIBOR + 2.750% | | | 3.75 | | | | 10/12/2023 | | | | 717,283 | | | | 715,598 | | | | 694,868 | |
Tibco Software Inc., 1M LIBOR + 7.250% | | | 7.43 | | | | 3/3/2028 | | | | 146,642 | | | | 145,937 | | | | 140,503 | |
Veritas Bermuda Ltd., 3M LIBOR + 4.500% | | | 5.50 | | | | 1/27/2023 | | | | 819,600 | | | | 805,840 | | | | 755,671 | |
| | | | | | | | | | | | | | | | | | | | |
Total Electronics | | | | | | | | | | | 3,621,665 | | | | 3,608,320 | | | | 3,430,603 | |
| | | | | | | | | | | | | | | | | | | | |
|
Finance — 0.5%*: | |
Deerfield Dakota Holding LLC, 1M LIBOR + 8.000% | | | 9.00 | | | | 4/7/2028 | | | | 410,078 | | | | 404,089 | | | | 388,548 | |
Tempo Acquisition LLC, 1M LIBOR + 2.750% | | | 2.93 | | | | 5/1/2024 | | | | 486,562 | | | | 487,932 | | | | 461,018 | |
| | | | | | | | | | | | | | | | | | | | |
Total Finance | | | | | | | | | | | 896,640 | | | | 892,021 | | | | 849,566 | |
| | | | | | | | | | | | | | | | | | | | |
|
Healthcare, Education and Childcare — 5.6%*: | |
Advanz Pharma Corp., 6M LIBOR + 5.500%(b) | | | 6.57 | | | | 9/6/2024 | | | | 1,785,250 | | | | 1,769,505 | | | | 1,649,571 | |
Aenova Holding GmbH, EURIBOR + 5.000%(b) | | | 5.00 | | | | 3/6/2025 | | | | 500,000 | | | | 536,764 | | | | 550,869 | |
Change Healthcare Holdings LLC, 1M LIBOR + 2.500%, 3M LIBOR + 2.500% | | | 3.50 | | | | 3/1/2024 | | | | 666,743 | | | | 663,642 | | | | 639,053 | |
Financiere Mendel SAS, EURIBOR + 4.750%(b) | | | 4.75 | | | | 4/13/2026 | | | | 500,000 | | | | 553,838 | | | | 552,093 | |
Lifescan Global Corp., 6M LIBOR + 6.000% | | | 7.18 | | | | 10/1/2024 | | | | 169,511 | | | | 165,893 | | | | 152,730 | |
Ortho-Clinical Diagnostics SA, 1M LIBOR + 3.250% | | | 3.43 | | | | 6/30/2025 | | | | 1,173,308 | | | | 1,173,722 | | | | 1,094,848 | |
Parexel International Corp., 1M LIBOR + 2.750% | | | 2.93 | | | | 9/27/2024 | | | | 1,327,677 | | | | 1,320,638 | | | | 1,255,491 | |
Radiology Partners, Inc., 2M LIBOR + 4.250%, 3M LIBOR + 4.250%, 12M LIBOR + 4.250% | | | 5.29-5.99 | | | | 7/9/2025 | | | | 1,000,000 | | | | 917,475 | | | | 926,790 | |
RegionalCare Hospital Partners Holdings, Inc., 1M LIBOR + 3.750% | | | 3.93 | | | | 11/17/2025 | | | | 477,558 | | | | 480,593 | | | | 446,455 | |
Rodenstock GmbH, EURIBOR + 5.250%(b) | | | 4.88 | | | | 6/5/2026 | | | | 500,000 | | | | 557,003 | | | | 524,186 | |
Tunstall Group Holdings Ltd., EURIBOR + 4.500%, PIK(b) | | | 3.00-4.50 | | | | 10/16/2020 | | | | 507,731 | | | | 596,245 | | | | 460,627 | |
U.S. Anesthesia Partners, Inc., 6M LIBOR + 3.000% | | | 4.00 | | | | 6/23/2024 | | | | 992,327 | | | | 994,557 | | | | 873,605 | |
| | | | | | | | | | | | | | | | | | | | |
Total Healthcare, Education and Childcare | | | | | | | | | | | 9,600,105 | | | | 9,729,875 | | | | 9,126,318 | |
| | | | | | | | | | | | | | | | | | | | |
|
Home and Office Furnishings, Housewares, and Durable Consumer Products — 0.7%*: | |
Hilding Anders International AB, EURIBOR + 5.000%(b) | | | 5.75 | | | | 11/30/2024 | | | | 502,190 | | | | 444,532 | | | | 311,726 | |
Serta Simmons Bedding LLC, 2M LIBOR + 7.500% | | | 8.50 | | | | 8/10/2023 | | | | 1,073,744 | | | | 1,073,744 | | | | 894,783 | |
| | | | | | | | | | | | | | | | | | | | |
Total Home and Office Furnishings, Housewares, and Durable Consumer Products | | | | | | | | | | | 1,575,934 | | | | 1,518,276 | | | | 1,206,509 | |
| | | | | | | | | | | | | | | | | | | | |
See accompanying Notes to the Financial Statements.
92
Barings Global Credit Income Opportunities Fund 2020 Annual Report
SCHEDULE OF INVESTMENTS (CONTINUED)
June 30, 2020
| | | | | | | | | | | | | | | | | | | | |
| | | EFFECTIVE
INTEREST RATE | | | DUE DATE | | | PRINCIPAL ‡‡ | | | COST | | | FAIR
VALUE | |
Bank Loans (Continued) | |
|
Hotels, Motels, Inns and Gaming — 2.7%*: | |
Caesars Resort Collection LLC, 1M LIBOR + 4.500% | | | 2.92 | % | | | 6/19/2025 | | | | 250,707 | | | $ | 243,186 | | | $ | 235,196 | |
Caesars Resort Collection LLC, 1M LIBOR + 2.750% | | | 2.93 | | | | 12/23/2024 | | | | 1,477,273 | | | | 1,468,460 | | | | 1,309,691 | |
Casper BidCo SAS, EURIBOR + 3.875%(b) | | | 3.88 | | | | 7/31/2026 | | | | 500,000 | | | | 543,343 | | | | 483,459 | |
Compass IV Ltd., EURIBOR + 4.500%(b) | | | 4.50 | | | | 4/30/2025 | | | | 500,000 | | | | 599,392 | | | | 494,620 | |
HNVR Holdco Ltd., EURIBOR + 3.250%(b) | | | 4.25 | | | | 9/12/2023 | | | | 500,000 | | | | 406,520 | | | | 445,788 | |
Penn National Gaming, Inc., 3M LIBOR + 2.250% | | | 3.00 | | | | 10/15/2025 | | | | 997,468 | | | | 895,633 | | | | 927,366 | |
Richmond UK Bidco Ltd., LIBOR – GBP + 4.250%(b) | | | 4.98 | | | | 3/3/2024 | | | | 550,000 | | | | 669,792 | | | | 612,503 | |
| | | | | | | | | | | | | | | | | | | | |
Total Hotels, Motels, Inns and Gaming | | | | | | | | | | | 4,775,448 | | | | 4,826,326 | | | | 4,508,623 | |
| | | | | | | | | | | | | | | | | | | | |
|
Insurance — 1.9%*: | |
AssuredPartners, Inc., 1M LIBOR + 3.500% | | | 3.68 | | | | 2/12/2027 | | | | 971,127 | | | | 975,719 | | | | 926,737 | |
Asurion LLC, 3M LIBOR + 3.000% | | | 3.18 | | | | 11/3/2023 | | | | 986,937 | | | | 948,924 | | | | 953,214 | |
Confie Seguros Holding II Co., 1M LIBOR + 8.500% | | | 8.67 | | | | 10/31/2025 | | | | 464,528 | | | | 456,271 | | | | 311,619 | |
Sedgwick Claims Management Services, Inc., 1M LIBOR + 3.250% | | | 3.43 | | | | 12/31/2025 | | | | 985,000 | | | | 967,369 | | | | 927,663 | |
| | | | | | | | | | | | | | | | | | | | |
Total Insurance | | | | | | | | | | | 3,407,592 | | | | 3,348,283 | | | | 3,119,233 | |
| | | | | | | | | | | | | | | | | | | | |
|
Leisure, Amusement, Entertainment — 2.8%*: | |
AMC Entertainment Holdings, Inc., 3M LIBOR + 3.000% | | | 4.08 | | | | 4/22/2026 | | | | 991,328 | | | | 774,969 | | | | 716,859 | |
Crown Finance US, Inc., 3M LIBOR + 2.250% | | | 3.32 | | | | 2/28/2025 | | | | 1,227,334 | | | | 1,204,952 | | | | 918,770 | |
Dorna Sports, S.L., 6M LIBOR + 3.000%(b) | | | 3.36 | | | | 5/3/2024 | | | | 400,000 | | | | 400,000 | | | | 371,500 | |
Eldorado Resorts LLC, 3M LIBOR + 2.250% | | | 3.25 | | | | 4/17/2024 | | | | 437,283 | | | | 434,714 | | | | 433,732 | |
Metro-Goldwyn-Mayer, Inc., 1M LIBOR + 4.500% | | | 5.50 | | | | 7/3/2026 | | | | 893,847 | | | | 887,085 | | | | 853,624 | |
Playtika Holding Corp., 3M LIBOR + 6.000% | | | 7.07 | | | | 12/10/2024 | | | | 568,750 | | | | 558,634 | | | | 567,328 | |
PUG LLC, 1M LIBOR + 3.500% | | | 3.68 | | | | 2/12/2027 | | | | 371,000 | | | | 369,241 | | | | 321,379 | |
Vue International Bidco PLC, EURIBOR + 4.250%(b) | | | 4.25 | | | | 7/3/2026 | | | | 423,797 | | | | 473,839 | | | | 407,991 | |
| | | | | | | | | | | | | | | | | | | | |
Total Leisure, Amusement, Entertainment | | | | | | | | | | | 5,313,339 | | | | 5,103,434 | | | | 4,591,183 | |
| | | | | | | | | | | | | | | | | | | | |
|
Machinery Non-Agriculture, Non-Construction, Non-Electronic — 1.2%*: | |
Alison Bidco S.a.r.l., 3M LIBOR + 4.500%(b) | | | 5.50 | | | | 8/29/2021 | | | | 316,304 | | | | 310,035 | | | | 231,430 | |
Alison Bidco Sarl, 3M LIBOR + 4.500%(b) | | | 5.50 | | | | 8/29/2021 | | | | 316,304 | | | | 310,035 | | | | 231,430 | |
Apex Tool Group, LLC, 1M LIBOR + 5.250% | | | 6.50 | | | | 8/1/2024 | | | | 176,580 | | | | 173,725 | | | | 157,499 | |
Titan Acquisition Ltd., 3M LIBOR + 3.000%(b) | | | 3.36 | | | | 3/28/2025 | | | | 1,460,821 | | | | 1,462,076 | | | | 1,332,459 | |
| | | | | | | | | | | | | | | | | | | | |
Total Machinery Non-Agriculture, Non-Construction, Non-Electronic | | | | | | | | | | | 2,270,009 | | | | 2,255,871 | | | | 1,952,818 | |
| | | | | | | | | | | | | | | | | | | | |
|
Mining, Steel, Iron and Non-Precious Metals — 0.0%*: | |
Boomerang Tube, LLC, 1M LIBOR + 5.000%(a) | | | 5.18 | | | | 6/30/2022 | | | | 125,484 | | | | 125,484 | | | | 15,058 | |
| | | | | | | | | | | | | | | | | | | | |
See accompanying Notes to the Financial Statements.
93
Barings Global Credit Income Opportunities Fund 2020 Annual Report
SCHEDULE OF INVESTMENTS (CONTINUED)
June 30, 2020
| | | | | | | | | | | | | | | | | | | | |
| | | EFFECTIVE
INTEREST RATE | | | DUE DATE | | | PRINCIPAL ‡‡ | | | COST | | | FAIR
VALUE | |
Bank Loans (Continued) | |
|
Oil and Gas — 0.7%*: | |
Fieldwood Energy LLC, 1M LIBOR + 5.250% | | | Zero Coupon | | | | 4/11/2022 | | | | 649,368 | | | $ | 615,504 | | | $ | 117,971 | |
Fieldwood Energy LLC, 3M LIBOR + 7.250% | | | Zero Coupon | | | | 4/11/2023 | | | | 885,631 | | | | 534,494 | | | | 5,314 | |
Gulf Finance LLC, 1M LIBOR + 5.250%, 3M LIBOR + 5.250% | | | 6.25 | % | | | 8/25/2023 | | | | 1,271,768 | | | | 1,223,595 | | | | 813,931 | |
KCA Deutag Alpha Ltd., 3M LIBOR + 6.750%(b) | | | 8.20 | | | | 2/28/2023 | | | | 491,250 | | | | 489,862 | | | | 231,708 | |
Seadrill Partners Finco LLC, 3M LIBOR + 6.000% | | | 7.00 | | | | 2/21/2021 | | | | 352 | | | | 311 | | | | 60 | |
| | | | | | | | | | | | | | | | | | | | |
Total Oil and Gas | | | | | | | | | | | 3,298,369 | | | | 2,863,766 | | | | 1,168,984 | |
| | | | | | | | | | | | | | | | | | | | |
|
Personal and Non-Durable Consumer Products Mfg. Only — 0.6%*: | |
Coty Inc., 1M LIBOR + 2.250% | | | 2.43 | | | | 4/7/2025 | | | | 1,178,947 | | | | 1,142,289 | | | | 1,055,158 | |
| | | | | | | | | | | | | | | | | | | | |
|
Printing and Publishing — 0.1%*: | |
Houghton Mifflin Harcourt Publishing Co., 1M LIBOR + 6.250% | | | 7.25 | | | | 11/22/2024 | | | | 109,118 | | | | 105,256 | | | | 101,752 | |
| | | | | | | | | | | | | | | | | | | | |
|
Retail Stores — 1.7%*: | |
Bass Pro Group, LLC, 3M LIBOR + 5.000% | | | 6.07 | | | | 9/25/2024 | | | | 984,810 | | | | 980,099 | | | | 945,063 | |
EG Group Ltd., EURIBOR + 4.000%(b) | | | 4.00 | | | | 2/6/2025 | | | | 489,595 | | | | 586,320 | | | | 513,894 | |
Harbor Freight Tools USA, Inc., 1M LIBOR + 2.500% | | | 3.25 | | | | 8/18/2023 | | | | 494,894 | | | | 494,894 | | | | 475,410 | |
Kirk Beauty One GmbH, EURIBOR + 3.500%(b) | | | 3.25 | | | | 8/12/2022 | | | | 500,000 | | | | 537,582 | | | | 451,158 | |
Kirk Beauty One GmbH, EURIBOR + 3.500%(b) | | | 3.50 | | | | 8/12/2022 | | | | 500,001 | | | | 534,709 | | | | 453,298 | |
| | | | | | | | | | | | | | | | | | | | |
Total Retail Stores | | | | | | | | | | | 2,969,300 | | | | 3,133,604 | | | | 2,838,823 | |
| | | | | | | | | | | | | | | | | | | | |
|
Telecommunications — 2.2%*: | |
Banff Merger Sub, Inc., 1M LIBOR + 4.250% | | | 4.43 | | | | 10/2/2025 | | | | 1,047,750 | | | | 1,013,470 | | | | 988,813 | |
CommScope, Inc., 1M LIBOR + 3.250% | | | 3.43 | | | | 4/6/2026 | | | | 992,500 | | | | 992,500 | | | | 937,913 | |
ION Trading Technologies Sarl, EURIBOR + 3.250% | | | 4.25 | | | | 11/21/2024 | | | | 1,080,118 | | | | 1,242,130 | | | | 1,166,707 | |
ION Trading Technologies Sarl, 3M LIBOR + 4.000% | | | 5.07 | | | | 11/21/2024 | | | | 280,610 | | | | 275,646 | | | | 268,583 | |
Syniverse Holdings, Inc., 3M LIBOR + 5.000% | | | 6.87 | | | | 3/9/2023 | | | | 195,576 | | | | 194,521 | | | | 138,405 | |
Syniverse Holdings, Inc., 3M LIBOR + 9.000% | | | 10.87 | | | | 3/11/2024 | | | | 153,729 | | | | 152,307 | | | | 76,865 | |
| | | | | | | | | | | | | | | | | | | | |
Total Telecommunications | | | | | | | | | | | 3,750,283 | | | | 3,870,574 | | | | 3,577,286 | |
| | | | | | | | | | | | | | | | | | | | |
|
Utilities — 0.3%*: | |
EFS Cogen Holdings I LLC, 1M LIBOR + 3.250%, 3M LIBOR + 3.250% | | | 4.25 | | | | 6/28/2023 | | | | 424,483 | | | | 424,409 | | | | 411,397 | |
| | | | | | | | | | | | | | | | | | | | |
Total Bank Loans | | | | | | | | | | | 72,622,688 | | | | 72,552,095 | | | | 65,330,037 | |
| | | | | | | | | | | | | | | | | | | | |
See accompanying Notes to the Financial Statements.
94
Barings Global Credit Income Opportunities Fund 2020 Annual Report
SCHEDULE OF INVESTMENTS (CONTINUED)
June 30, 2020
| | | | | | | | | | | | | | | | | | | | |
| | | EFFECTIVE
INTEREST RATE | | | DUE DATE | | | PRINCIPAL ‡‡ | | | COST | | | FAIR
VALUE | |
Corporate Bonds — 42.8%*: | |
|
Aerospace and Defense — 2.3%*: | |
Global Aircraft Leasing Co. Ltd.(c) | | | 6.50 | % | | | 9/15/2024 | | | | 2,000,000 | | | $ | 2,000,000 | | | $ | 1,340,000 | |
Rolls-Royce plc(b) | | | 3.38 | | | | 6/18/2026 | | | | 500,000 | | | | 602,995 | | | | 586,245 | |
TransDigm, Inc. | | | 5.50 | | | | 11/15/2027 | | | | 357,000 | | | | 357,000 | | | | 311,554 | |
Triumph Group, Inc. | | | 5.25 | | | | 6/1/2022 | | | | 875,000 | | | | 873,621 | | | | 748,125 | |
Triumph Group, Inc.(c) | | | 6.25 | | | | 9/15/2024 | | | | 308,000 | | | | 308,000 | | | | 261,800 | |
Triumph Group, Inc. | | | 7.75 | | | | 8/15/2025 | | | | 750,000 | | | | 789,513 | | | | 563,437 | |
| | | | | | | | | | | | | | | | | | | | |
Total Aerospace and Defense | | | | | | | | | | | 4,790,000 | | | | 4,931,129 | | | | 3,811,161 | |
| | | | | | | | | | | | | | | | | | | | |
|
Automobile — 2.6%*: | |
AA Bond Co. Ltd.(b) | | | 5.50 | | | | 7/31/2043 | | | | 1,300,000 | | | | 1,654,688 | | | | 1,368,884 | |
Clarios Global LP/Clarios US Finance Co.(c) | | | 8.50 | | | | 5/15/2027 | | | | 1,000,000 | | | | 1,033,783 | | | | 1,004,950 | |
Ford Motor Co. | | | 8.50 | | | | 4/21/2023 | | | | 569,000 | | | | 567,203 | | | | 601,717 | |
Gates Global LLC/Gates Global Co.(c) | | | 6.25 | | | | 1/15/2026 | | | | 550,000 | | | | 526,287 | | | | 540,375 | |
RAC Bond Co. PLC(b) | | | 5.00 | | | | 11/6/2022 | | | | 600,000 | | | | 796,861 | | | | 694,920 | |
| | | | | | | | | | | | | | | | | | | | |
Total Automobile | | | | | | | | | | | 4,019,000 | | | | 4,578,822 | | | | 4,210,846 | |
| | | | | | | | | | | | | | | | | | | | |
|
Banking — 1.4%*: | |
Alpha Bank AE(b) | | | 4.25 | | | | 2/13/2030 | | | | 275,000 | | | | 301,895 | | | | 259,190 | |
India Infoline Finance Ltd.(b) | | | 5.88 | | | | 4/20/2023 | | | | 805,000 | | | | 803,531 | | | | 636,331 | |
Nova Ljubljanska Banka dd, 5 year EUR Swap + 3.833%(b) | | | 3.65 | | | | 11/19/2029 | | | | 700,000 | | | | 770,700 | | | | 688,143 | |
Piraeus Bank SA(b) | | | 5.50 | | | | 2/19/2030 | | | | 688,000 | | | | 748,200 | | | | 543,010 | |
Piraeus Bank SA, 5 year EUR Swap + 9.952%(b) | | | 9.75 | | | | 6/26/2029 | | | | 100,000 | | | | 93,388 | | | | 94,020 | |
| | | | | | | | | | | | | | | | | | | | |
Total Banking | | | | | | | | | | | 2,568,000 | | | | 2,717,714 | | | | 2,220,694 | |
| | | | | | | | | | | | | | | | | | | | |
|
Beverage, Food and Tobacco — 2.6%*: | |
Boparan Finance PLC(b) | | | 4.38 | | | | 7/15/2021 | | | | 250,000 | | | | 248,229 | | | | 254,025 | |
Boparan Finance PLC(b) | | | 5.50 | | | | 7/15/2021 | | | | 1,300,000 | | | | 1,745,884 | | | | 1,457,531 | |
JBS USA Food Co.(c) | | | 5.50 | | | | 1/15/2030 | | | | 586,000 | | | | 585,456 | | | | 600,650 | |
JBS USA LUX SA/JBS USA Finance, Inc.(c) | | | 5.75 | | | | 6/15/2025 | | | | 344,000 | | | | 349,024 | | | | 348,300 | |
JBS USA LUX SA/JBS USA Finance, Inc.(c) | | | 6.75 | | | | 2/15/2028 | | | | 500,000 | | | | 500,000 | | | | 528,130 | |
MHP Lux SA(b) | | | 6.25 | | | | 9/19/2029 | | | | 200,000 | | | | 192,257 | | | | 190,750 | |
Sunshine Mid BV(b) | | | 6.50 | | | | 5/15/2026 | | | | 850,000 | | | | 1,013,691 | | | | 943,038 | |
| | | | | | | | | | | | | | | | | | | | |
Total Beverage, Food and Tobacco | | | | | | | | | | | 4,030,000 | | | | 4,634,541 | | | | 4,322,424 | |
| | | | | | | | | | | | | | | | | | | | |
|
Broadcasting and Entertainment — 2.4%*: | |
Banijay Group SAS(b) | | | 6.50 | | | | 3/1/2026 | | | | 750,000 | | | | 828,337 | | | | 751,031 | |
CSC Holdings LLC(c) | | | 5.75 | | | | 1/15/2030 | | | | 455,000 | | | | 472,332 | | | | 473,883 | |
Netflix, Inc. | | | 3.63 | | | | 6/15/2030 | | | | 819,000 | | | | 925,082 | | | | 945,450 | |
Outfront Media Capital LLC/Outfront Media Capital Corp.(c) | | | 6.25 | | | | 6/15/2025 | | | | 298,000 | | | | 298,000 | | | | 299,952 | |
Tele Columbus AG(b) | | | 3.88 | | | | 5/2/2025 | | | | 900,000 | | | | 968,338 | | | | 940,369 | |
Terrier Media Buyer, Inc.(c) | | | 8.88 | | | | 12/15/2027 | | | | 376,000 | | | | 376,000 | | | | 360,490 | |
See accompanying Notes to the Financial Statements.
95
Barings Global Credit Income Opportunities Fund 2020 Annual Report
SCHEDULE OF INVESTMENTS (CONTINUED)
June 30, 2020
| | | | | | | | | | | | | | | | | | | | |
| | | EFFECTIVE
INTEREST RATE | | | DUE DATE | | | PRINCIPAL ‡‡ | | | COST | | | FAIR
VALUE | |
Corporate Bonds (Continued) | |
|
Broadcasting and Entertainment (Continued) | |
VTR Finance NV(b),(c) | | | 6.88 | % | | | 1/15/2024 | | | | 224,000 | | | $ | 220,827 | | | $ | 229,134 | |
| | | | | | | | | | | | | | | | | | | | |
Total Broadcasting and Entertainment | | | | | | | | | | | 3,822,000 | | | | 4,088,916 | | | | 4,000,309 | |
| | | | | | | | | | | | | | | | | | | | |
|
Buildings and Real Estate — 1.9%*: | |
Cemex SAB de CV(b) | | | 7.38 | | | | 6/5/2027 | | | | 546,000 | | | | 546,000 | | | | 554,736 | |
Kaisa Group Holdings Ltd.(b) | | | 9.95 | | | | 7/23/2025 | | | | 1,000,000 | | | | 1,000,188 | | | | 915,000 | |
Logan Property Holdings Co. Ltd.(b) | | | 5.75 | | | | 1/14/2025 | | | | 750,000 | | | | 750,000 | | | | 745,965 | |
Sunac China Holdings Ltd.(b) | | | 6.50 | | | | 1/10/2025 | | | | 790,000 | | | | 790,000 | | | | 761,362 | |
Ukraine Railways Via Shortline PLC(b) | | | 9.88 | | | | 9/15/2021 | | | | 150,000 | | | | 152,712 | | | | 150,750 | |
| | | | | | | | | | | | | | | | | | | | |
Total Buildings and Real Estate | | | | | | | | | | | 3,236,000 | | | | 3,238,900 | | | | 3,127,813 | |
| | | | | | | | | | | | | | | | | | | | |
|
Cargo Transport — 0.7%*: | |
Kenan Advantage Group, Inc. (The)(c) | | | 7.88 | | | | 7/31/2023 | | | | 1,367,000 | | | | 1,367,000 | | | | 1,202,960 | |
| | | | | | | | | | | | | | | | | | | | |
|
Chemicals, Plastics and Rubber — 0.9%*: | |
Braskem Idesa SAPI(b) | | | 7.45 | | | | 11/15/2029 | | | | 750,000 | | | | 747,547 | | | | 702,187 | |
Consolidated Energy Finance SA(a) | | | 6.88 | | | | 6/15/2025 | | | | 874,000 | | | | 891,480 | | | | 742,900 | |
| | | | | | | | | | | | | | | | | | | | |
Total Chemicals, Plastics and Rubber | | | | | | | | | | | 1,624,000 | | | | 1,639,027 | | | | 1,445,087 | |
| | | | | | | | | | | | | | | | | | | | |
|
Commercial Services — 0.6%*: | |
DP World Salaam, 5 year CMT + 5.750%(b) | | | 6.00 | | | | 12/31/2099 | | | | 946,000 | | | | 940,551 | | | | 934,288 | |
| | | | | | | | | | | | | | | | | | | | |
|
Containers, Packaging and Glass — 1.3%*: | |
Mauser Packaging Solutions Holding Co. | | | 4.75 | | | | 4/15/2024 | | | | 950,000 | | | | 1,094,838 | | | | 1,035,330 | |
Trident TPI Holdings, Inc.(c) | | | 9.25 | | | | 8/1/2024 | | | | 1,125,000 | | | | 1,147,632 | | | | 1,153,125 | |
| | | | | | | | | | | | | | | | | | | | |
Total Containers, Packaging and Glass | | | | | | | | | | | 2,075,000 | | | | 2,242,470 | | | | 2,188,455 | |
| | | | | | | | | | | | | | | | | | | | |
|
Diversified/Conglomerate Manufacturing — 0.5%*: | |
Amsted Industries, Inc.(c) | | | 4.63 | | | | 5/15/2030 | | | | 422,000 | | | | 422,000 | | | | 417,303 | |
Appvion ESC, 3M EURIBOR + 4.125%(a),(f) | | | 9.00 | (d) | | | 6/1/2025 | | | | 500,000 | | | | 500,000 | | | | – | |
Fabric BC SpA, 3M EURIBOR + 4.125%(b) | | | 4.13 | (d) | | | 11/30/2024 | | | | 150,000 | | | | 171,205 | | | | 164,312 | |
Mangrove Luxco III Sarl(b) | | | 7.78 | | | | 10/9/2025 | | | | 300,000 | | | | 314,376 | | | | 302,343 | |
| | | | | | | | | | | | | | | | | | | | |
Total Diversified/Conglomerate Manufacturing | | | | | | | | | | | 1,372,000 | | | | 1,407,581 | | | | 883,958 | |
| | | | | | | | | | | | | | | | | | | | |
|
Diversified/Conglomerate Service — 2.2%*: | |
Algeco Global Finance PLC(b) | | | 6.50 | | | | 2/15/2023 | | | | 950,000 | | | | 1,118,824 | | | | 1,023,436 | |
EIG Investors Corp. | | | 10.88 | | | | 2/1/2024 | | | | 352,000 | | | | 367,144 | | | | 341,440 | |
Iron Mountain, Inc.(c) | | | 5.25 | | | | 7/15/2030 | | | | 554,000 | | | | 552,502 | | | | 545,690 | |
Mileage Plus Holdings LLC/Mileage Plus Intellectual Property Assets Ltd.(c) | | | 6.50 | | | | 6/20/2027 | | | | 237,000 | | | | 234,038 | | | | 237,593 | |
Verisure Midholding AB(b) | | | 5.75 | | | | 12/1/2023 | | | | 1,250,000 | | | | 1,457,908 | | | | 1,406,509 | |
| | | | | | | | | | | | | | | | | | | | |
Total Diversified/Conglomerate Service | | | | | | | | | | | 3,343,000 | | | | 3,730,416 | | | | 3,554,668 | |
| | | | | | | | | | | | | | | | | | | | |
See accompanying Notes to the Financial Statements.
96
Barings Global Credit Income Opportunities Fund 2020 Annual Report
SCHEDULE OF INVESTMENTS (CONTINUED)
June 30, 2020
| | | | | | | | | | | | | | | | | | | | |
| | | EFFECTIVE
INTEREST RATE | | | DUE DATE | | | PRINCIPAL ‡‡ | | | COST | | | FAIR
VALUE | |
Corporate Bonds (Continued) | |
|
Electronics — 1.0%*: | |
Veritas US, Inc./Veritas Bermuda Ltd.(c) | | | 10.50 | % | | | 2/1/2024 | | | | 1,419,000 | | | $ | 1,444,705 | | | $ | 1,270,005 | |
WESCO Distribution, Inc.(c) | | | 7.13 | | | | 6/15/2025 | | | | 205,000 | | | | 205,000 | | | | 215,892 | |
WESCO Distribution, Inc.(c) | | | 7.25 | | | | 6/15/2028 | | | | 212,000 | | | | 210,405 | | | | 224,190 | |
| | | | | | | | | | | | | | | | | | | | |
Total Electronics | | | | | | | | | | | 1,836,000 | | | | 1,860,110 | | | | 1,710,087 | |
| | | | | | | | | | | | | | | | | | | | |
|
Finance — 4.5%*: | |
Alliance Data Systems Corp.(c) | | | 4.75 | | | | 12/15/2024 | | | | 1,500,000 | | | | 1,501,672 | | | | 1,350,000 | |
Cabot Financial Luxembourg SA(b) | | | 7.50 | | | | 10/1/2023 | | | | 650,000 | | | | 888,844 | | | | 805,371 | |
Garfunkelux Holdco 3 S.A., 3M EURIBOR + 4.500%(b) | | | 4.50 | (d) | | | 9/1/2023 | | | | 200,000 | | | | 216,282 | | | | 194,069 | |
Garfunkelux Holdco 3 S.A.(b) | | | 8.50 | | | | 11/1/2022 | | | | 600,000 | | | | 731,144 | | | | 698,853 | |
Icahn Enterprises LP / Icahn Enterprises Finance Corp. | | | 4.75 | | | | 9/15/2024 | | | | 1,040,000 | | | | 1,049,755 | | | | 977,808 | |
Icahn Enterprises LP/Icahn Enterprises Finance Corp. | | | 6.75 | | | | 2/1/2024 | | | | 1,162,000 | | | | 1,162,000 | | | | 1,170,715 | |
Jerrold Finco PLC(b) | | | 6.13 | | | | 1/15/2024 | | | | 650,000 | | | | 822,993 | | | | 770,953 | |
Muthoot Finance Ltd.(b) | | | 6.13 | | | | 10/31/2022 | | | | 685,000 | | | | 685,000 | | | | 692,706 | |
Springleaf Finance Corp. | | | 5.38 | | | | 11/15/2029 | | | | 438,000 | | | | 438,000 | | | | 409,530 | |
Travelex Financing PLC(b),(f) | | | 8.00 | | | | 5/15/2022 | | | | 1,050,000 | | | | 1,178,948 | | | | 277,832 | |
| | | | | | | | | | | | | | | | | | | | |
Total Finance | | | | | | | | | | | 7,975,000 | | | | 8,674,638 | | | | 7,347,837 | |
| | | | | | | | | | | | | | | | | | | | |
|
Healthcare, Education and Childcare — 3.5%*: | |
Advanz Pharma Corp.(b) | | | 8.00 | | | | 9/6/2024 | | | | 500,000 | | | | 478,634 | | | | 460,000 | |
Bausch Health Americas., Inc.(c) | | | 8.50 | | | | 1/31/2027 | | | | 415,000 | | | | 421,301 | | | | 440,419 | |
Bausch Health Cos., Inc.(c) | | | 9.00 | | | | 12/15/2025 | | | | 165,000 | | | | 163,266 | | | | 177,740 | |
Bausch Health Cos., Inc.(c) | | | 5.00 | | | | 1/30/2028 | | | | 204,000 | | | | 204,000 | | | | 192,064 | |
Bausch Health Cos., Inc.(c) | | | 5.25 | | | | 1/30/2030 | | | | 200,000 | | | | 200,000 | | | | 189,750 | |
Centene Corp. | | | 4.25 | | | | 12/15/2027 | | | | 285,000 | | | | 282,750 | | | | 294,094 | |
Centene Corp. | | | 4.63 | | | | 12/15/2029 | | | | 605,000 | | | | 617,074 | | | | 638,275 | |
Cream Tech(b) | | | 5.25 | | | | 12/15/2025 | | | | 450,000 | | | | 514,174 | | | | 490,831 | |
Envision Healthcare Corp.(c) | | | 8.75 | | | | 10/15/2026 | | | | 1,492,000 | | | | 1,436,641 | | | | 708,700 | |
Nidda BondCo GmbH(b) | | | 7.25 | | | | 9/30/2025 | | | | 500,000 | | | | 586,152 | | | | 571,614 | |
Par Pharmaceutical, Inc.(c) | | | 7.50 | | | | 4/1/2027 | | | | 708,000 | | | | 708,000 | | | | 726,550 | |
Synlab Unsecured Bondco PLC(b) | | | 8.25 | | | | 7/1/2023 | | | | 750,000 | | | | 900,428 | | | | 859,477 | |
| | | | | | | | | | | | | | | | | | | | |
Total Healthcare, Education and Childcare | | | | | | | | | | | 6,274,000 | | | | 6,512,420 | | | | 5,749,514 | |
| | | | | | | | | | | | | | | | | | | | |
|
Home and Office Furnishings, Housewares, and Durable Consumer Products — 0.9%*: | |
LSF9 Balta Issuer Sarl(b) | | | 7.75 | | | | 9/15/2022 | | | | 769,500 | | | | 914,382 | | | | 549,290 | |
Resideo Funding, Inc.(c) | | | 6.13 | | | | 11/1/2026 | | | | 1,000,000 | | | | 999,582 | | | | 977,500 | |
| | | | | | | | | | | | | | | | | | | | |
Total Home and Office Furnishings, Housewares, and Durable Consumer Products | | | | | | | | | | | 1,769,500 | | | | 1,913,964 | | | | 1,526,790 | |
| | | | | | | | | | | | | | | | | | | | |
See accompanying Notes to the Financial Statements.
97
Barings Global Credit Income Opportunities Fund 2020 Annual Report
SCHEDULE OF INVESTMENTS (CONTINUED)
June 30, 2020
| | | | | | | | | | | | | | | | | | | | |
| | | EFFECTIVE
INTEREST RATE | | | DUE DATE | | | PRINCIPAL ‡‡ | | | COST | | | FAIR
VALUE | |
Corporate Bonds (Continued) | |
|
Hotels, Motels, Inns and Gaming — 1.2%*: | |
Caesars Resort Collection LLC / CRC Finco, Inc.(c) | | | 5.25 | % | | | 10/15/2025 | | | | 301,000 | | | $ | 270,128 | | | $ | 261,870 | |
Colt Merger Sub, Inc.(c) | | | 5.75 | | | | 7/1/2025 | | | | 214,000 | | | | 214,000 | | | | 215,220 | |
ESH Hospitality, Inc.(c) | | | 4.63 | | | | 10/1/2027 | | | | 396,000 | | | | 396,000 | | | | 370,755 | |
Scientific Games International, Inc.(c) | | | 8.63 | | | | 7/1/2025 | | | | 400,000 | | | | 399,298 | | | | 373,880 | |
TVL Finance PLC, 3M GBP LIBOR + 5.375%(b) | | | 6.04 | (d) | | | 7/15/2025 | | | | 500,000 | | | | 632,430 | | | | 508,031 | |
Wynn Macau Ltd.(b),(c) | | | 5.13 | | | | 12/15/2029 | | | | 270,000 | | | | 270,000 | | | | 261,900 | |
| | | | | | | | | | | | | | | | | | | | |
Total Hotels, Motels, Inns and Gaming | | | | | | | | | | | 2,081,000 | | | | 2,181,856 | | | | 1,991,656 | |
| | | | | | | | | | | | | | | | | | | | |
|
Leisure, Amusement, Entertainment — 1.2%*: | |
AMC Entertainment Holdings, Inc. | | | 6.38 | | | | 11/15/2024 | | | | 1,300,000 | | | | 1,680,338 | | | | 573,858 | |
Colt Merger Sub, Inc.(c) | | | 6.25 | | | | 7/1/2025 | | | | 382,000 | | | | 382,000 | | | | 379,612 | |
Colt Merger Sub, Inc.(c) | | | 8.13 | | | | 7/1/2027 | | | | 279,000 | | | | 279,000 | | | | 269,584 | |
CPUK Finance Ltd.(b) | | | 4.25 | | | | 2/28/2047 | | | | 300,000 | | | | 358,442 | | | | 353,878 | |
Live Nation Entertainment, Inc.(c) | | | 6.50 | | | | 5/15/2027 | | | | 325,000 | | | | 325,000 | | | | 334,750 | |
| | | | | | | | | | | | | | | | | | | | |
Total Leisure, Amusement, Entertainment | | | | | | | | | | | 2,586,000 | | | | 3,024,780 | | | | 1,911,682 | |
| | | | | | | | | | | | | | | | | | | | |
|
Machinery Non-Agriculture, Non-Construction, Non-Electronic — 0.6%*: | |
Apex Tool Group LLC/BC Mountain Finance, Inc.(c) | | | 9.00 | | | | 2/15/2023 | | | | 578,000 | | | | 575,930 | | | | 417,605 | |
Briggs & Stratton Corp.(f) | | | 6.88 | | | | 12/15/2020 | | | | 514,000 | | | | 509,702 | | | | 168,335 | |
Clark Equipment Co. | | | 5.88 | | | | 6/1/2025 | | | | 326,000 | | | | 326,000 | | | | 333,335 | |
| | | | | | | | | | | | | | | | | | | | |
Total Machinery Non-Agriculture, Non-Construction, Non-Electronic | | | | | | | | | | | 1,418,000 | | | | 1,411,632 | | | | 919,275 | |
| | | | | | | | | | | | | | | | | | | | |
|
Mining, Steel, Iron and Non-Precious Metals — 3.4%*: | |
CSN Islands XI Corp.(b) | | | 6.75 | | | | 1/28/2028 | | | | 1,081,000 | | | | 1,081,000 | | | | 925,606 | |
First Quantum Minerals Ltd.(b),(c) | | | 6.50 | | | | 3/1/2024 | | | | 1,606,000 | | | | 1,564,739 | | | | 1,515,662 | |
Metinvest BV(b) | | | 8.50 | | | | 4/23/2026 | | | | 200,000 | | | | 212,675 | | | | 195,040 | |
Northwest Acquisitions ULC/Dominion Finco, Inc.(b),(c),(f) | | | 7.13 | | | | 11/1/2022 | | | | 1,227,000 | | | | 1,242,919 | | | | 12,577 | |
PT Bayan Resources Tbk(b) | | | 6.13 | | | | 1/24/2023 | | | | 905,000 | | | | 905,000 | | | | 838,338 | |
SunCoke Energy Partners LP/SunCoke Energy Partners Finance Corp.(c) | | | 7.50 | | | | 6/15/2025 | | | | 608,000 | | | | 601,806 | | | | 513,882 | |
Vedanta Resources Ltd.(b) | | | 6.38 | | | | 7/30/2022 | | | | 1,075,000 | | | | 538,382 | | | | 814,984 | |
Warrior Met Coal, Inc.(c) | | | 8.00 | | | | 11/1/2024 | | | | 840,000 | | | | 849,525 | | | | 819,000 | |
| | | | | | | | | | | | | | | | | | | | |
Total Mining, Steel, Iron and Non-Precious Metals | | | | | | | | | | | 7,542,000 | | | | 6,996,046 | | | | 5,635,089 | |
| | | | | | | | | | | | | | | | | | | | |
|
Oil and Gas — 2.9%*: | |
Cenovus Energy, Inc.(b) | | | 6.75 | | | | 11/15/2039 | | | | 61,000 | | | | 60,847 | | | | 59,393 | |
CVR Energy, Inc.(c) | | | 5.25 | | | | 2/15/2025 | | | | 552,000 | | | | 552,000 | | | | 507,840 | |
CVR Energy, Inc.(c) | | | 5.75 | | | | 2/15/2028 | | | | 573,000 | | | | 573,000 | | | | 501,375 | |
Hilcorp Energy I LP/Hilcorp Finance Co.(c) | | | 6.25 | | | | 11/1/2028 | | | | 1,000,000 | | | | 1,000,000 | | | | 802,500 | |
See accompanying Notes to the Financial Statements.
��
98
Barings Global Credit Income Opportunities Fund 2020 Annual Report
SCHEDULE OF INVESTMENTS (CONTINUED)
June 30, 2020
| | | | | | | | | | | | | | | | | | | | |
| | | EFFECTIVE
INTEREST RATE | | | DUE DATE | | | PRINCIPAL ‡‡ | | | COST | | | FAIR VALUE | |
Corporate Bonds (Continued) | |
|
Oil and Gas (Continued) | |
Jonah Energy LLC/Jonah Energy Finance Corp.(c) | | | 7.25 | % | | | 10/15/2025 | | | | 891,000 | | | $ | 876,844 | | | $ | 109,148 | |
Jupiter Resources, Inc.(a),(b) | | | 10.00 | | | | 1/31/2024 | | | | 100,396 | | | | 100,396 | | | | 90,356 | |
KCA Deutag UK Finance PLC(b),(c),(f) | | | 9.63 | | | | 4/1/2023 | | | | 250,000 | | | | 250,000 | | | | 119,616 | |
KCA Deutag UK Finance PLC(b),(c),(f) | | | 9.88 | | | | 4/1/2022 | | | | 600,000 | | | | 612,545 | | | | 285,000 | |
MV24 Capital BV(b) | | | 6.75 | | | | 6/1/2034 | | | | 889,328 | | | | 889,328 | | | | 844,755 | |
PBF Holding Co. LLC/PBF Finance Corp. | | | 7.25 | | | | 6/15/2025 | | | | 778,000 | | | | 799,853 | | | | 706,035 | |
PT Medco Bell Pte Ltd.(b) | | | 6.38 | | | | 1/30/2027 | | | | 435,000 | | | | 429,278 | | | | 370,031 | |
Tullow Oil PLC(b) | | | 6.25 | | | | 4/15/2022 | | | | 200,000 | | | | 60,849 | | | | 146,000 | |
Tullow Oil PLC(b) | | | 7.00 | | | | 3/1/2025 | | | | 300,000 | | | | 91,152 | | | | 188,250 | |
| | | | | | | | | | | | | | | | | | | | |
Total Oil and Gas | | | | | | | | | | | 6,629,724 | | | | 6,296,092 | | | | 4,730,299 | |
| | | | | | | | | | | | | | | | | | | | |
|
Personal Transportation — 0.1%*: | |
Naviera Armas S.A., 3M EURIBOR + 6.500%(b) | | | 6.50 | (d) | | | 7/31/2023 | | | | 250,000 | | | | 289,028 | | | | 154,481 | |
| | | | | | | | | | | | | | | | | | | | |
|
Personal, Food and Miscellaneous — 0.3%*: | |
Walnut Bidco PLC(b) | | | 6.75 | | | | 8/1/2024 | | | | 397,000 | | | | 441,643 | | | | 423,193 | |
| | | | | | | | | | | | | | | | | | | | |
|
Retail Stores — 0.4%*: | |
Arabian Centres Sukuk Ltd.(b) | | | 5.38 | | | | 11/26/2024 | | | | 500,000 | | | | 500,000 | | | | 437,700 | |
House of Fraser Funding PLC, 3M GBP LIBOR + 5.750%(b),(f) | | | 5.89 | (d) | | | 9/15/2020 | | | | 150,000 | | | | 217,106 | | | | 4,647 | |
Takko Luxembourg 2 SCA, 3M USD LIBOR + 5.375%(b) | | | 5.38 | (d) | | | 11/15/2023 | | | | 200,000 | | | | 246,982 | | | | 116,844 | |
Takko Luxembourg 2 SCA(b) | | | 5.38 | | | | 11/15/2023 | | | | 350,000 | | | | 376,952 | | | | 167,120 | |
| | | | | | | | | | | | | | | | | | | | |
Total Retail Stores | | | | | | | | | | | 1,200,000 | | | | 1,341,040 | | | | 726,311 | |
| | | | | | | | | | | | | | | | | | | | |
|
Telecommunications — 2.7%*: | |
C&W Senior Financing DAC(b) | | | 6.88 | | | | 9/15/2027 | | | | 750,000 | | | | 774,561 | | | | 744,375 | |
CommScope, Inc.(c) | | | 7.13 | | | | 7/1/2028 | | | | 618,000 | | | | 618,000 | | | | 616,517 | |
HTA Group Ltd.(b) | | | 7.00 | | | | 12/18/2025 | | | | 623,000 | | | | 619,524 | | | | 629,230 | |
Sprint Capital Corp. | | | 6.88 | | | | 11/15/2028 | | | | 800,000 | | | | 785,646 | | | | 974,000 | |
Sprint Capital Corp. | | | 8.75 | | | | 3/15/2032 | | | | 500,000 | | | | 609,195 | | | | 715,625 | |
VF Ukraine PAT via VFU Funding PLC(b) | | | 6.20 | | | | 2/11/2025 | | | | 405,000 | | | | 405,000 | | | | 400,565 | |
ViaSat, Inc.(c) | | | 6.50 | | | | 7/15/2028 | | | | 327,000 | | | | 327,000 | | | | 327,069 | |
| | | | | | | | | | | | | | | | | | | | |
Total Telecommunications | | | | | | | | | | | 4,023,000 | | | | 4,138,926 | | | | 4,407,381 | |
| | | | | | | | | | | | | | | | | | | | |
|
Utilities — 0.7%*: | |
Techem Verwaltungsgesellschaft 674 mbH(b) | | | 6.00 | | | | 7/30/2026 | | | | 1,000,000 | | | | 1,143,454 | | | | 1,145,970 | |
| | | | | | | | | | | | | | | | | | | | |
Total Corporate Bonds | | | | | | | | | | | 78,173,224 | | | | 81,742,696 | | | | 70,282,228 | |
| | | | | | | | | | | | | | | | | | | | |
Total Fixed Income | | | | | | | | | | | 170,470,912 | | | | 173,360,680 | | | | 150,836,167 | |
| | | | | | | | | | | | | | | | | | | | |
See accompanying Notes to the Financial Statements.
99
Barings Global Credit Income Opportunities Fund 2020 Annual Report
SCHEDULE OF INVESTMENTS (CONTINUED)
June 30, 2020
| | | | | | | | | | | | | | | | | | | | | | | | | | | | |
| COUNTERPARTY | | STRIKE
PRICE | | | EXPIRATION
DATE | | | CONTRACTS | | | NOTIONAL | | | COST | | | UNREALIZED
VALUE | | | FAIR VALUE | |
Purchased Option — 0.5%*: | |
|
Put Option Purchased — 0.5%*: | |
S&P 500 Index Morgan Stanley & Co. | | | $2,800.00 | | | | 12/18/2020 | | | | 56 | | | | 17,361,624 | | | | $739,568 | | | | $37,712 | | | | $777,280 | |
| | | | | | | | | | | | | | | | | | | | | | | | | | | | |
Total Investments | | | | 207,302,098 | | | | 175,694,976 | | | | | | | | 152,186,861 | |
| | | | | | | | | | | | | | | | | |
| |
Written Options* – (0.3%) | | | | (439,208 | ) |
| | | | | | | | | | | | | | | | | | | | | | | | | | | | |
| |
Other assets and liabilities – 7.6%* | | | | 12,392,139 | |
| | | | | | | | | | | | | | | | | | | | | | | | | | | | |
| |
Net Assets – 100.0% | | | | $164,139,792 | |
| | | | | | | | | | | | | | | | | | | | | | | | | | | | |
| ‡‡ | Unless otherwise indicated, all principal amounts are denominated in United States Dollars. |
| * | Calculated as a percentage of net assets applicable to common shareholders. |
| (a) | For fair value measurement disclosure purposes, security is categorized as Level 3 (See Note 2). |
| | Distributions of investments by country of risk (excluding temporary cash investments) as a percentage of total investments in securities, is as follows: |
| | | | | | |
| | United States | | | 61.9% | |
| | United Kingdom | | | 9.3% | |
| | Germany | | | 6.0% | |
| | Netherlands | | | 4.3% | |
| | France | | | 2.3% | |
| | China | | | 1.6% | |
| | India | | | 1.4% | |
| | Ireland | | | 1.2% | |
| | Brazil | | | 1.2% | |
| | Sweden | | | 1.1% | |
| | Canada | | | 1.1% | |
| | Zambia | | | 1.0% | |
| | Other (Individually less than 1%) | | | 7.6% | |
| | | | | | |
| | Total | | | 100.0% | |
| | | | | | |
| (c) | Security acquired in a transaction exempt from registration under Rule 144A of the Securities Act of 1933. These securities may only be resold in transactions exempt from registration, normally to qualified institutional buyers. |
| (d) | Variable rate security. The interest rate shown is the rate in effect at June 30, 2020. |
| (e) | Bank loans are exempt from registration under the Securities Act of 1933, as amended, but contain certain restrictions on resale and cannot be sold publicly. These loans pay interest at rates which adjust periodically. The interest rates shown for bank loans are the current interest rates at June 30, 2020. Bank loans are also subject to mandatory and/or optional prepayment which cannot be predicted. As a result, the remaining maturity may be substantially less than the stated maturity shown. |
See accompanying Notes to the Financial Statements.
100
Barings Global Credit Income Opportunities Fund 2020 Annual Report
SCHEDULE OF INVESTMENTS (CONTINUED)
June 30, 2020
A summary of outstanding derivatives at June 30, 2020 is as follows:
| | | | | | | | | | | | | | | | | | | | | | | | | | | | | | | | |
| Written Options — (0.3)%*: | |
| Put Options Written — (0.3)%*: | |
| | | COUNTERPARTY | | | STRIKE
PRICE | | | EXPIRATION
DATE | | | CONTRACTS | | | NOTIONAL | | | COST | | | UNREALIZED
VALUE | | | FAIR
VALUE | |
S&P 500 Index | | | Morgan Stanley & Co. | | | | $2,500.00 | | | | 12/18/2020 | | | | (56 | ) | | | (17,361,624 | ) | | | $(420,757) | | | | $(18,451) | | | | $(439,208) | |
| | | | | | | | | | | | | | | | | | | | | | | | | | | | | | | | |
Forward Foreign Currency Exchange Contracts to Buy
| | | | | | | | | | | | | | | | | | | | | | |
EXPIRATION
DATE | | COUNTERPARTY | | LOCAL
CURRENCY | | | VALUE IN USD | | | IN
EXCHANGE
FOR USD | | | NET UNREALIZED
DEPRECIATION | |
| 7/14/20 | | Bank of America N.A. | | | EUR | | | | 3,190,442 | | | $ | 3,585,366 | | | $ | 3,601,013 | | | $ | (15,647 | ) |
| 7/14/20 | | Citibank N.A. | | | GBP | | | | 872,653 | | | | 1,081,385 | | | | 1,109,089 | | | | (27,704 | ) |
| 7/14/20 | | Goldman Sachs & Co. | | | GBP | | | | 34,698 | | | | 42,998 | | | | 43,571 | | | | (573 | ) |
| 7/14/20 | | Bank of America N.A. | | | GBP | | | | 200,635 | | | | 248,625 | | | | 252,638 | | | | (4,013 | ) |
| | | | | | | | | | | | | | | | | | | | | | |
Net unrealized depreciation on forward foreign currency exchange contracts to buy | | | $ | (47,937 | ) |
| | | | | |
Forward Foreign Currency Exchange Contracts to Sell
| | | | | | | | | | | | | | | | | | | | | | |
EXPIRATION
DATE | | COUNTERPARTY | | LOCAL
CURRENCY | | | VALUE IN USD | | | IN
EXCHANGE
FOR USD | | | NET UNREALIZED
APPRECIATION
(DEPRECIATION) | |
| 7/14/20 | | Barclays Bank plc | | | EUR | | | | 29,449,332 | | | $ | 33,094,673 | | | $ | 33,327,464 | | | $ | 232,791 | |
| 7/14/20 | | Barclays Bank plc | | | GBP | | | | 7,833,799 | | | | 9,707,585 | | | | 9,955,440 | | | | 247,855 | |
| 7/14/20 | | Bank of America N.A. | | | GBP | | | | 655,477 | | | | 812,262 | | | | 820,449 | | | | 8,187 | |
| 7/14/20 | | Goldman Sachs & Co. | | | GBP | | | | 172,646 | | | | 213,942 | | | | 220,185 | | | | 6,243 | |
| | | | | | | | | | | | | | | | | | | | | | |
Net unrealized appreciation on forward foreign currency exchange contracts to sell | | | $ | 495,076 | |
| | | | | |
Currency Legend
| | | | |
| EUR | | | | Euro |
| GBP | | | | British Pound Sterling |
See accompanying Notes to the Financial Statements.
101
Barings Active Short Duration Bond Fund 2020 Annual Report
SCHEDULE OF INVESTMENTS
June 30, 2020
| | | | | | | | | | | | | | | | | | | | |
| | | EFFECTIVE
INTEREST RATE | | | DUE DATE | | | PRINCIPAL ‡‡ | | | COST | | | FAIR
VALUE | |
Fixed Income — 93.3%*: | |
|
Asset-Backed Securities — 39.3%*: | |
|
CDO/CLO — 4.8%*: | |
Avant Loans Funding Trust 2019-A(a) | | | 3.48 | % | | | 7/15/2022 | | | | 397,722 | | | | $397,707 | | | | $398,334 | |
Bain Capital Credit CLO 2020-2 Ltd., 3M USD LIBOR + 1.850%(a) | | | 2.23 | (b) | | | 7/19/2031 | | | | 2,250,000 | | | | 2,250,000 | | | | 2,252,356 | |
Bain Capital Credit CLO Ltd. 2016-2, 3M USD LIBOR + 1.800%(a) | | | 3.02 | (b) | | | 1/15/2029 | | | | 1,500,000 | | | | 1,500,000 | | | | 1,459,388 | |
Benefit Street Partners CLO X Ltd., 3M USD LIBOR + 1.750%(a) | | | 2.97 | (b) | | | 1/15/2029 | | | | 2,200,000 | | | | 2,200,000 | | | | 2,122,626 | |
BlueMountain CLO 2013-1 Ltd., 3M USD LIBOR + 1.230%(a) | | | 2.37 | (b) | | | 1/20/2029 | | | | 2,476,745 | | | | 2,476,745 | | | | 2,448,582 | |
CBAM 2018-6 Ltd., 3M USD LIBOR + 1.270%(a) | | | 2.49 | (b) | | | 1/15/2031 | | | | 2,500,000 | | | | 2,500,000 | | | | 2,457,677 | |
CIFC Funding 2015-IV Ltd., 3M USD LIBOR + 1.850%(a) | | | 2.99 | (b) | | | 10/20/2027 | | | | 1,900,000 | | | | 1,897,910 | | | | 1,857,119 | |
Elmwood CLO II Ltd., 3M USD LIBOR + 1.450%(a) | | | 2.59 | (b) | | | 4/20/2031 | | | | 1,650,000 | | | | 1,650,000 | | | | 1,635,449 | |
FCI Funding 2019-1 LLC(a) | | | 3.63 | | | | 2/18/2031 | | | | 455,436 | | | | 455,364 | | | | 458,937 | |
GoldentTree Loan Management US CLO 1 Ltd., 3M USD LIBOR + 1.450%(a) | | | 2.59 | (b) | | | 4/20/2029 | | | | 1,250,000 | | | | 1,250,000 | | | | 1,220,755 | |
KREF Ltd. 2018-FL1 AS, 1M USD LIBOR + 1.350%(a) | | | 1.54 | (b) | | | 6/15/2036 | | | | 2,380,000 | | | | 2,380,000 | | | | 2,326,107 | |
Lunar AirCraft 2020-1 Ltd.(a) | | | 3.38 | | | | 2/15/2045 | | | | 1,540,787 | | | | 1,540,771 | | | | 1,406,586 | |
Magnetite XVIII Ltd., 3M USD LIBOR + 1.080%(a) | | | 1.47 | (b) | | | 11/15/2028 | | | | 355,000 | | | | 354,224 | | | | 349,779 | |
Milos CLO Ltd., 3M USD LIBOR + 1.070%(a) | | | 2.21 | (b) | | | 10/20/2030 | | | | 2,100,000 | | | | 2,100,000 | | | | 2,049,560 | |
Neuberger Berman CLO XX Ltd. 2015-20A BR, 3M USD LIBOR + 1.250%(a) | | | 2.47 | (b) | | | 1/15/2028 | | | | 2,600,000 | | | | 2,589,854 | | | | 2,509,369 | |
Neuberger Berman Loan Advisers CLO 24 Ltd., 3M USD LIBOR + 1.500%(a) | | | 2.64 | (b) | | | 4/19/2030 | | | | 500,000 | | | | 500,000 | | | | 486,226 | |
OCP CLO 2020-19 Ltd., 3M USD LIBOR + 1.750%(a) | | | 2.07 | (b) | | | 7/20/2031 | | | | 2,250,000 | | | | 2,250,000 | | | | 2,249,714 | |
OCP CLO Ltd. 2015-8A A2AR, 3M USD LIBOR + 1.450%(a) | | | 2.58 | (b) | | | 4/17/2027 | | | | 900,000 | | | | 900,000 | | | | 885,708 | |
Palmer Square CLO 2015-1 Ltd., 3M USD LIBOR + 1.650%(a) | | | 2.02 | (b) | | | 5/21/2029 | | | | 700,000 | | | | 700,000 | | | | 688,769 | |
Recette Clo Ltd., 3M USD LIBOR + 1.700%(a) | | | 2.84 | (b) | | | 10/20/2027 | | | | 1,034,000 | | | | 1,031,813 | | | | 1,006,071 | |
Rockford Tower CLO 2017-1 Ltd., 3M USD LIBOR + 1.450%(a) | | | 2.67 | (b) | | | 4/15/2029 | | | | 850,000 | | | | 850,000 | | | | 817,449 | |
Rockford Tower CLO 2017-2 Ltd., 3M USD LIBOR + 1.500%(a) | | | 2.72 | (b) | | | 10/15/2029 | | | | 1,250,000 | | | | 1,250,000 | | | | 1,200,531 | |
Rockford Tower CLO Ltd. 2017-3, 3M USD LIBOR + 1.190%(a) | | | 2.33 | (b) | | | 10/20/2030 | | | | 1,750,000 | | | | 1,740,091 | | | | 1,708,693 | |
RR 3 Ltd. Series 2018-3 A A1R2, 3M USD LIBOR + 1.090%(a) | | | 2.31 | (b) | | | 1/15/2030 | | | | 1,625,000 | | | | 1,619,579 | | | | 1,586,871 | |
Salem Fields CLO Ltd. 2016-2, 3M USD LIBOR + 1.150%(a) | | | 2.14 | (b) | | | 10/25/2028 | | | | 2,000,000 | | | | 1,999,047 | | | | 1,969,008 | |
See accompanying Notes to the Financial Statements.
102
Barings Active Short Duration Bond Fund 2020 Annual Report
SCHEDULE OF INVESTMENTS (CONTINUED)
June 30, 2020
| | | | | | | | | | | | | | | | | | | | |
| | | EFFECTIVE
INTEREST RATE | | | DUE DATE | | | PRINCIPAL ‡‡ | | | COST | | | FAIR
VALUE | |
Asset-Backed Securities (Continued) | |
|
CDO/CLO (Continued) | |
Treman Park CLO Ltd. 2015-1A ARR, 3M USD LIBOR + 1.070%(a) | | | 2.21 | (b) % | | | 10/20/2028 | | | | 1,170,000 | | | $ | 1,170,000 | | | $ | 1,156,167 | |
| | | | | | | | | | | | | | | | | | | | |
Total CDO/CLO | | | | | | | | | | | 39,584,690 | | | | 39,553,105 | | | | 38,707,831 | |
| | | | | | | | | | | | | | | | | | | | |
| | | | | |
Other Asset-Backed Securities — 34.5%*: | | | | | | | | | | | | | | | | | | | | |
321 Henderson Receivables II LLC 2006-3A A1, 1M USD LIBOR + 0.200%(a) | | | 0.38 | (b) | | | 9/15/2041 | | | | 96,979 | | | | 94,539 | | | | 92,123 | |
AASET 2017-1 Trust(a) | | | 3.97 | | | | 5/16/2042 | | | | 724,903 | | | | 725,477 | | | | 611,118 | |
AASET 2020-1 Trust(a) | | | 4.34 | | | | 1/16/2040 | | | | 783,605 | | | | 783,589 | | | | 415,504 | |
AASET US Ltd. 2018-2 A(a) | | | 4.45 | | | | 11/18/2038 | | | | 1,678,220 | | | | 1,688,640 | | | | 1,496,527 | |
Access Group, Inc. 2015-1 B, 1M USD LIBOR + 1.500%(a) | | | 1.68 | (b) | | | 7/25/2058 | | | | 100,000 | | | | 86,827 | | | | 87,322 | |
AccessLex Institute 2002-A A2, 28 Day ARS | | | 1.96 | (b) | | | 9/25/2037 | | | | 400,000 | | | | 392,512 | | | | 394,432 | |
AccessLex Institute 2004-A A3, 28 Day ARS | | | 1.70 | (b) | | | 7/1/2039 | | | | 250,000 | | | | 245,642 | | | | 246,402 | |
Adams Outdoor Advertising LP(a) | | | 4.81 | | | | 11/15/2048 | | | | 1,126,466 | | | | 1,140,887 | | | | 1,145,138 | |
American Credit Acceptance Receivables Trust 2017-4 C(a) | | | 2.94 | | | | 1/10/2024 | | | | 22,041 | | | | 22,040 | | | | 22,041 | |
American Credit Acceptance Receivables Trust 2019-1(a) | | | 3.50 | | | | 4/14/2025 | | | | 2,650,000 | | | | 2,649,608 | | | | 2,690,920 | |
AmeriCredit Automobile Receivables Trust 2019-3 | | | 2.58 | | | | 9/18/2025 | | | | 2,120,000 | | | | 2,119,646 | | | | 2,018,107 | |
AmeriCredit Automobile Receivables Trust 2020-1 | | | 1.80 | | | | 12/18/2025 | | | | 4,547,000 | | | | 4,546,028 | | | | 4,204,854 | |
Arbys Funding LLC 2015-1A A2(a) | | | 4.97 | | | | 10/30/2045 | | | | 76,400 | | | | 76,400 | | | | 77,848 | |
Argent Securities, Inc. Asset-Backed Pass-Through Certificates 2004-W10 M1, 1M USD LIBOR + 0.900% | | | 1.08 | (b) | | | 10/25/2034 | | | | 199,057 | | | | 183,369 | | | | 182,526 | |
ARI Fleet Lease Trust 2016-A A3(a) | | | 2.11 | | | | 7/15/2024 | | | | 16,782 | | | | 16,781 | | | | 16,790 | |
Ascentium Equipment Receivables 2019-2(a) | | | 3.78 | | | | 5/10/2027 | | | | 2,647,000 | | | | 2,646,247 | | | | 2,644,966 | |
Avis Budget Rental Car Funding AESOP LLC(a) | | | 3.02 | | | | 8/20/2026 | | | | 5,598,000 | | | | 5,595,709 | | | | 5,030,001 | |
Avis Budget Rental Car Funding AESOP LLC(a) | | | 4.15 | | | | 9/20/2023 | | | | 1,200,000 | | | | 1,225,168 | | | | 1,125,113 | |
Avis Budget Rental Car Funding AESOP LLC(a) | | | 4.53 | | | | 3/20/2023 | | | | 2,607,000 | | | | 2,667,361 | | | | 2,448,321 | |
Avis Budget Rental Car Funding AESOP LLC(a) | | | 4.73 | | | | 9/20/2024 | | | | 2,080,000 | | | | 2,174,102 | | | | 1,953,945 | |
Bank of The West Auto Trust 2019-1(a) | | | 2.90 | | | | 4/15/2025 | | | | 1,062,000 | | | | 1,061,734 | | | | 1,090,708 | |
BRE Grand Islander Timeshare Issuer LLC 2017-1A A(a) | | | 2.94 | | | | 5/25/2029 | | | | 133,570 | | | | 133,544 | | | | 134,117 | |
BRE Grand Islander Timeshare Issuer LLC 2017-1A B(a) | | | 3.24 | | | | 5/25/2029 | | | | 109,999 | | | | 109,986 | | | | 107,879 | |
BRE Grand Islander Timeshare Issuer LLC 2019-A(a) | | | 3.78 | | | | 9/26/2033 | | | | 1,076,422 | | | | 1,076,386 | | | | 1,063,506 | |
CAL Funding III Ltd.(a) | | | 4.34 | | | | 9/25/2043 | | | | 478,500 | | | | 478,448 | | | | 484,690 | |
Canadian Pacer Auto Receivables Trust 2018-2(a),(c) | | | 3.63 | | | | 1/19/2024 | | | | 470,000 | | | | 469,984 | | | | 480,906 | |
Capital Automotive LLC 2017-1A A1(a) | | | 3.87 | | | | 4/15/2047 | | | | 291,722 | | | | 291,642 | | | | 290,686 | |
Carmax Auto Owner Trust 2019-2 | | | 3.41 | | | | 10/15/2025 | | | | 615,000 | | | | 614,969 | | | | 596,584 | |
See accompanying Notes to the Financial Statements.
103
Barings Active Short Duration Bond Fund 2020 Annual Report
SCHEDULE OF INVESTMENTS (CONTINUED)
June 30, 2020
| | | | | | | | | | | | | | | | | | | | |
| | | EFFECTIVE
INTEREST RATE | | | DUE DATE | | | PRINCIPAL ‡‡ | | | COST | | | FAIR
VALUE | |
Asset-Backed Securities (Continued) | |
|
Other Asset-Backed Securities (Continued) | |
Carmax Auto Owner Trust 2019-4 | | | 2.80 | % | | | 4/15/2026 | | | | 5,159,000 | | | $ | 5,222,462 | | | $ | 4,807,758 | |
CARS-DB4 LP(a) | | | 4.17 | | | | 2/15/2050 | | | | 2,189,000 | | | | 2,188,068 | | | | 1,927,290 | |
Carvana Auto Receivables Trust 2019-4(a) | | | 3.07 | | | | 7/15/2025 | | | | 3,547,000 | | | | 3,546,956 | | | | 3,492,747 | |
Castlelake Aircraft Securitization Trust 2018-1(a) | | | 4.13 | | | | 6/15/2043 | | | | 2,011,011 | | | | 2,012,044 | | | | 1,867,299 | |
Castlelake Aircraft Securitization Trust 2019-1A(a) | | | 3.97 | | | | 4/15/2039 | | | | 1,146,785 | | | | 1,152,416 | | | | 1,003,136 | |
Castlelake Aircraft Securitization Trust 2019-1A(a) | | | 5.10 | | | | 4/15/2039 | | | | 824,562 | | | | 832,531 | | | | 459,199 | |
Centex Home Equity Loan Trust 2006-A AV4, 1M USD LIBOR + 0.250% | | | 0.43 | (b) | | | 6/25/2036 | | | | 31,254 | | | | 30,641 | | | | 30,666 | |
Chase Education Loan Trust, 3M USD LIBOR + 0.220% | | | 0.53 | (b) | | | 6/28/2040 | | | | 609,633 | | | | 577,936 | | | | 509,740 | |
CLI Funding V LLC(a) | | | 3.38 | | | | 10/18/2029 | | | | 1,809,096 | | | | 1,803,840 | | | | 1,793,911 | |
CLI Funding V LLC 2013-1A(a) | | | 2.83 | | | | 3/18/2028 | | | | 1,386,520 | | | | 1,364,246 | | | | 1,380,811 | |
CLI Funding V LLC 2013-2A(a) | | | 3.22 | | | | 6/18/2028 | | | | 585,259 | | | | 580,143 | | | | 582,490 | |
CLI Funding V LLC 2014-1A A(a) | | | 3.29 | | | | 6/18/2029 | | | | 3,984,924 | | | | 3,986,155 | | | | 3,967,734 | |
CLI Funding VI LLC(a) | | | 3.71 | | | | 5/18/2044 | | | | 1,003,707 | | | | 1,003,707 | | | | 1,005,933 | |
CLI Funding VI LLC 2017-1A A(a) | | | 3.62 | | | | 5/18/2042 | | | | 1,350,224 | | | | 1,352,839 | | | | 1,349,441 | |
CNH Equipment Trust 2020-A | | | 2.30 | | | | 10/15/2027 | | | | 974,000 | | | | 973,656 | | | | 975,571 | |
College Avenue Student Loans LLC, 1M USD LIBOR + 1.650%(a) | | | 1.83 | (b) | | | 11/26/2046 | | | | 875,985 | | | | 877,011 | | | | 823,477 | |
College Avenue Student Loans LLC(a) | | | 3.81 | | | | 12/28/2048 | | | | 1,351,000 | | | | 1,350,875 | | | | 1,305,052 | |
College Avenue Student Loans LLC 2018-A, 1M USD LIBOR + 1.200%(a) | | | 1.38 | (b) | | | 12/26/2047 | | | | 859,990 | | | | 859,990 | | | | 802,819 | |
College Loan Corp. Trust I 2005-2 B, 3M USD LIBOR + 0.490% | | | 1.71 | (b) | | | 1/15/2037 | | | | 136,628 | | | | 122,249 | | | | 114,624 | |
Commonbond Student Loan Trust 2017-A-GS(a) | | | 3.47 | | | | 5/25/2041 | | | | 964,432 | | | | 951,520 | | | | 1,008,816 | |
Commonbond Student Loan Trust 2017-A-GS(a) | | | 5.28 | | | | 5/25/2041 | | | | 128,976 | | | | 128,961 | | | | 139,394 | |
Commonbond Student Loan Trust 2018-A-GS(a) | | | 3.82 | | | | 2/25/2044 | | | | 82,546 | | | | 82,528 | | | | 81,024 | |
Commonbond Student Loan Trust 2018-BGS(a) | | | 4.12 | | | | 9/25/2045 | | | | 97,727 | | | | 97,714 | | | | 96,705 | |
Commonbond Student Loan Trust 2018-C-GS(a) | | | 4.35 | | | | 2/25/2046 | | | | 81,249 | | | | 81,241 | | | | 78,562 | |
Commonbond Student Loan Trust 2019-A-GS(a) | | | 3.04 | | | | 1/25/2047 | | | | 2,310,419 | | | | 2,309,842 | | | | 2,226,933 | |
Credit Suisse ABS Repackaging Trust 2013-A B(a) | | | 2.50 | | | | 1/25/2030 | | | | 29,516 | | | | 28,417 | | | | 29,390 | |
DB Master Finance LLC(a) | | | 3.79 | | | | 5/20/2049 | | | | 939,897 | | | | 939,898 | | | | 969,513 | |
DB Master Finance LLC(a) | | | 4.02 | | | | 5/20/2049 | | | | 1,110,607 | | | | 1,110,608 | | | | 1,155,087 | |
DB Master Finance LLC(a) | | | 4.03 | | | | 11/20/2047 | | | | 977,500 | | | | 945,823 | | | | 1,029,910 | |
Diamond Resorts Owner Trust 2016-1 A(a) | | | 3.08 | | | | 11/20/2028 | | | | 215,633 | | | | 215,633 | | | | 215,683 | |
See accompanying Notes to the Financial Statements.
104
Barings Active Short Duration Bond Fund 2020 Annual Report
SCHEDULE OF INVESTMENTS (CONTINUED)
June 30, 2020
| | | | | | | | | | | | | | | | | | | | |
| | | EFFECTIVE
INTEREST RATE | | | DUE DATE | | | PRINCIPAL ‡‡ | | | COST | | | FAIR
VALUE | |
Asset-Backed Securities (Continued) | |
|
Other Asset-Backed Securities (Continued) | |
Diamond Resorts Owner Trust 2018-1(a) | | | 3.70 | % | | | 1/21/2031 | | | | 299,772 | | | $ | 299,772 | | | $ | 303,946 | |
Diamond Resorts Owner Trust 2019-1(a) | | | 2.89 | | | | 2/20/2032 | | | | 1,514,772 | | | | 1,514,581 | | | | 1,509,754 | |
Domino’s Pizza Master Issuer LLC(a) | | | 4.12 | | | | 7/25/2048 | | | | 648,450 | | | | 648,450 | | | | 688,890 | |
Domino’s Pizza Master Issuer LLC 2017-1 A(a) | | | 3.08 | | | | 7/25/2047 | | | | 3,612,375 | | | | 3,548,050 | | | | 3,647,043 | |
DRB Prime Student Loan Trust 2016-R A2(a) | | | 3.07 | | | | 10/25/2044 | | | | 775,404 | | | | 774,060 | | | | 784,328 | |
Drive Auto Receivables Trust | | | 3.66 | | | | 11/15/2024 | | | | 381,427 | | | | 381,378 | | | | 385,057 | |
Drive Auto Receivables Trust 2019-4 | | | 2.70 | | | | 2/16/2027 | | | | 1,983,000 | | | | 1,982,956 | | | | 1,982,703 | |
DT Auto Owner Trust 2019-1(a) | | | 3.61 | | | | 11/15/2024 | | | | 1,460,000 | | | | 1,459,881 | | | | 1,472,643 | |
Earnest Student Loan Program 2017-A LLC(a) | | | 3.59 | | | | 1/25/2041 | | | | 643,812 | | | | 643,348 | | | | 653,443 | |
ECMC Group Student Loan Trust 2018-2, 1M USD LIBOR + 0.800%(a) | | | 0.98 | (b) | | | 9/25/2068 | | | | 816,127 | | | | 816,127 | | | | 788,706 | |
EdLinc Student Loan Funding Trust 2017-A A, 1M USD LIBOR – 1.150%(a) | | | 3.60 | (b) | | | 12/1/2047 | | | | 1,039,824 | | | | 1,032,922 | | | | 1,026,223 | |
Educational Funding of the South, Inc., 3M USD LIBOR + 0.650% | | | 1.64 | (b) | | | 4/25/2035 | | | | 1,041,457 | | | | 1,036,377 | | | | 1,006,974 | |
EDvestinU Private Education Loan Issue No 1 LLC(a) | | | 3.58 | | | | 11/25/2038 | | | | 1,582,395 | | | | 1,582,131 | | | | 1,604,825 | |
Elara HGV Timeshare Issuer 2016-A LLC(a) | | | 3.22 | | | | 4/25/2028 | | | | 540,999 | | | | 536,461 | | | | 530,557 | |
Elara HGV Timeshare Issuer LLC 2014-A B(a) | | | 3.02 | (d) | | | 2/25/2027 | | | | 8,752 | | | | 8,701 | | | | 8,638 | |
Elara HGV Timeshare Issuer LLC 2016-A A(a) | | | 2.73 | | | | 4/25/2028 | | | | 784,590 | | | | 772,469 | | | | 780,663 | |
Elara HGV Timeshare Issuer LLC 2017-A(a) | | | 2.96 | | | | 3/25/2030 | | | | 1,260,496 | | | | 1,251,795 | | | | 1,231,625 | |
Elara HGV Timeshare Issuer LLC 2017-A A(a) | | | 2.69 | | | | 3/25/2030 | | | | 226,462 | | | | 226,446 | | | | 225,539 | |
Elara HGV Timeshare Issuer LLC 2019-A(a) | | | 3.45 | | | | 1/25/2034 | | | | 2,552,128 | | | | 2,551,532 | | | | 2,347,262 | |
ELFI Graduate Loan Program LLC 2018-A(a) | | | 4.00 | | | | 8/25/2042 | | | | 413,992 | | | | 406,293 | | | | 411,258 | |
Exeter Automobile Receivables Eart 2019 1A(a) | | | 4.13 | | | | 12/16/2024 | | | | 7,435,000 | | | | 7,708,498 | | | | 7,682,378 | |
Exeter Automobile Receivables Trust 2019-3(a) | | | 3.11 | | | | 8/15/2025 | | | | 1,545,000 | | | | 1,544,709 | | | | 1,540,130 | |
First Franklin Mortgage Loan Trust 2004-FFH4 M5, 1M USD LIBOR + 1.575% | | | 1.76 | (b) | | | 1/25/2035 | | | | 59,481 | | | | 59,714 | | | | 59,170 | |
Flagship Credit Auto Trust 2017-4(a) | | | 3.58 | | | | 1/15/2024 | | | | 3,500,000 | | | | 3,570,446 | | | | 3,579,209 | |
Flagship Credit Auto Trust 2019-1(a) | | | 3.60 | | | | 2/18/2025 | | | | 2,175,000 | | | | 2,176,391 | | | | 2,124,469 | |
Ford Credit Auto Owner Trust 2020-REV1(a) | | | 2.54 | | | | 8/15/2031 | | | | 5,053,000 | | | | 5,052,408 | | | | 5,112,003 | |
Global SC Finance II SRL 2014-1A A1(a),(c) | | | 3.19 | | | | 7/17/2029 | | | | 126,583 | | | | 126,563 | | | | 126,061 | |
Goal Capital Funding Trust 2010-1 A, 3M USD LIBOR + 0.700%(a) | | | 1.06 | (b) | | | 8/25/2048 | | | | 113,267 | | | | 109,065 | | | | 111,328 | |
Goal Structured Solution Trust 2015-1 B, 1M USD LIBOR + 1.500%(a) | | | 1.68 | (b) | | | 9/25/2043 | | | | 100,000 | | | | 77,569 | | | | 92,134 | |
Goodgreen 2019-2(a) | | | 2.76 | | | | 10/15/2054 | | | | 2,211,194 | | | | 2,211,194 | | | | 2,190,911 | |
Goodgreen Trust 2016-1 A(a) | | | 3.23 | | | | 10/15/2052 | | | | 709,694 | | | | 701,495 | | | | 723,009 | |
Goodgreen Trust 2018-1A A(a) | | | 3.93 | | | | 10/15/2053 | | | | 3,125,143 | | | | 3,160,074 | | | | 3,250,599 | |
Goodgreen Trust 2019-1(a) | | | 3.86 | | | | 10/15/2054 | | | | 2,630,595 | | | | 2,631,059 | | | | 2,754,314 | |
HERO Funding Trust 2015-1A A(a) | | | 3.84 | | | | 9/21/2040 | | | | 463,788 | | | | 471,618 | | | | 493,456 | |
HERO Funding Trust 2016-4A A1(a) | | | 3.57 | | | | 9/20/2047 | | | | 208,741 | | | | 208,662 | | | | 218,564 | |
HERO Funding Trust 2017-2A A1(a) | | | 3.28 | | | | 9/20/2048 | | | | 77,695 | | | | 77,686 | | | | 80,248 | |
HERO Funding Trust 2017-2A A2(a) | | | 4.07 | | | | 9/20/2048 | | | | 61,046 | | | | 62,488 | | | | 64,289 | |
HERO Funding Trust 2017-3A A1(a) | | | 3.19 | | | | 9/20/2048 | | | | 519,069 | | | | 518,902 | | | | 531,048 | |
See accompanying Notes to the Financial Statements.
105
Barings Active Short Duration Bond Fund 2020 Annual Report
SCHEDULE OF INVESTMENTS (CONTINUED)
June 30, 2020
| | | | | | | | | | | | | | | | | | | | |
| | | EFFECTIVE
INTEREST RATE | | | DUE DATE | | | PRINCIPAL ‡‡ | | | COST | | | FAIR
VALUE | |
Asset-Backed Securities (Continued) | |
|
Other Asset-Backed Securities (Continued) | |
HERO Funding Trust 2018-1(a) | | | 4.67 | % | | | 9/20/2048 | | | | 818,438 | | | $ | 834,770 | | | $ | 875,527 | |
Hertz Fleet Lease Funding LP(a) | | | 3.44 | | | | 1/10/2033 | | | | 2,625,000 | | | | 2,624,604 | | | | 2,336,048 | |
Hertz Vehicle Financing II LP(a) | | | 3.29 | | | | 7/25/2022 | | | | 1,000,000 | | | | 991,760 | | | | 947,785 | |
Hertz Vehicle Financing II LP(a) | | | 3.56 | | | | 10/25/2021 | | | | 2,300,000 | | | | 2,290,998 | | | | 2,200,228 | |
Hertz Vehicle Financing II LP(a) | | | 3.60 | | | | 2/25/2024 | | | | 3,200,000 | | | | 3,265,568 | | | | 3,061,884 | |
Hertz Vehicle Financing II LP(a) | | | 4.39 | | | | 2/25/2024 | | | | 3,000,000 | | | | 2,650,207 | | | | 2,682,416 | |
Hertz Vehicle Financing LLC 2018-3(a) | | | 4.37 | | | | 7/25/2024 | | | | 620,000 | | | | 621,082 | | | | 594,625 | |
Higher Education Funding I 2004-1 B1, 28 Day ARS(a) | | | 3.48 | (b) | | | 1/1/2044 | | | | 950,000 | | | | 838,597 | | | | 777,211 | |
Hilton Grand Vacations Trust 2017-AA B(a) | | | 2.96 | (d) | | | 12/26/2028 | | | | 497,110 | | | | 498,437 | | | | 467,618 | |
Hilton Grand Vacations Trust 2018-A(a) | | | 3.54 | | | | 2/25/2032 | | | | 266,435 | | | | 266,429 | | | | 270,302 | |
Hilton Grand Vacations Trust 2019-A(a) | | | 2.84 | | | | 7/25/2033 | | | | 2,200,967 | | | | 2,200,967 | | | | 2,010,426 | |
Hilton Grand Vacations Trust 2020-A(a) | | | 4.22 | | | | 2/25/2039 | | | | 2,920,730 | | | | 2,920,677 | | | | 2,950,679 | |
Horizon Aircraft Finance I Ltd. 2018-1 A(a) | | | 4.46 | | | | 12/15/2038 | | | | 444,111 | | | | 444,102 | | | | 400,685 | |
KDAC Aviation Finance Ltd.(a) | | | 4.21 | | | | 12/15/2042 | | | | 1,016,691 | | | | 1,013,935 | | | | 862,353 | |
Kestrel Aircraft Funding Ltd.(a),(c) | | | 4.25 | | | | 12/15/2038 | | | | 3,468,836 | | | | 3,533,707 | | | | 2,896,505 | |
Laurel Road Prime Student Loan Trust 2017-B(a) | | | 2.77 | | | | 8/25/2042 | | | | 3,483,584 | | | | 3,538,417 | | | | 3,559,123 | |
Laurel Road Prime Student Loan Trust 2017-B CFX(a) | | | 3.61 | | | | 8/25/2042 | | | | 235,506 | | | | 235,473 | | | | 233,142 | |
Laurel Road Prime Student Loan Trust 2017-C B(a) | | | 2.95 | | | | 11/25/2042 | | | | 271,253 | | | | 271,154 | | | | 268,820 | |
Laurel Road Prime Student Loan Trust 2019-A(a) | | | 3.00 | | | | 10/25/2048 | | | | 687,875 | | | | 687,817 | | | | 682,145 | |
Lendmark Funding Trust 2018-1(a) | | | 3.81 | | | | 12/21/2026 | | | | 630,000 | | | | 629,973 | | | | 629,835 | |
MACH 1 Cayman 2019-1 Ltd.(a) | | | 3.47 | | | | 10/15/2039 | | | | 1,476,854 | | | | 1,476,807 | | | | 1,219,793 | |
Mariner Finance Issuance Trust 2018-A(a) | | | 4.20 | | | | 11/20/2030 | | | | 1,848,000 | | | | 1,847,879 | | | | 1,826,333 | |
Marlette Funding Trust 2019-1(a) | | | 3.44 | | | | 4/16/2029 | | | | 391,245 | | | | 391,237 | | | | 387,559 | |
Marlette Funding Trust 2019-2(a) | | | 3.13 | | | | 7/16/2029 | | | | 590,146 | | | | 590,094 | | | | 577,512 | |
Marlette Funding Trust 2019-2(a) | | | 3.53 | | | | 7/16/2029 | | | | 976,000 | | | | 975,827 | | | | 973,627 | |
Mosaic Solar Loan Trust 2018-2-GS(a) | | | 4.20 | | | | 2/22/2044 | | | | 449,175 | | | | 449,106 | | | | 464,691 | |
Mosaic Solar Loans LLC 2017-1A A(a) | | | 4.45 | | | | 6/20/2042 | | | | 67,298 | | | | 67,280 | | | | 68,657 | |
Navient Private Education Loan Trust 2018-B, 1M USD LIBOR + 0.720%(a) | | | 0.90 | (b) | | | 12/15/2059 | | | | 319,565 | | | | 319,565 | | | | 305,149 | |
Navient Student Loan Trust 2015-1 B, 1M USD LIBOR + 1.500% | | | 1.68 | (b) | | | 7/25/2052 | | | | 1,100,000 | | | | 1,095,946 | | | | 1,040,055 | |
Navient Student Loan Trust 2016-5A A, 1M USD LIBOR + 1.250%(a) | | | 1.43 | (b) | | | 6/25/2065 | | | | 801,374 | | | | 804,718 | | | | 784,999 | |
Navient Student Loan Trust 2016-6 A3, 1M USD LIBOR + 1.300%(a) | | | 1.48 | (b) | | | 3/25/2066 | | | | 550,000 | | | | 550,000 | | | | 510,438 | |
Navient Student Loan Trust 2018-1A A3, 1M USD LIBOR + 0.720%(a) | | | 0.90 | (b) | | | 3/25/2067 | | | | 1,600,000 | | | | 1,600,000 | | | | 1,428,149 | |
Navient Student Loan Trust 2018-2, 1M USD LIBOR + 0.750%(a) | | | 0.93 | (b) | | | 3/25/2067 | | | | 1,360,000 | | | | 1,360,000 | | | | 1,287,366 | |
Navient Student Loan Trust 2018-3, 1M USD LIBOR + 0.800%(a) | | | 0.98 | (b) | | | 3/25/2067 | | | | 1,600,000 | | | | 1,600,000 | | | | 1,579,416 | |
See accompanying Notes to the Financial Statements.
106
Barings Active Short Duration Bond Fund 2020 Annual Report
SCHEDULE OF INVESTMENTS (CONTINUED)
June 30, 2020
| | | | | | | | | | | | | | | | | | | | |
| | | EFFECTIVE
INTEREST RATE | | | DUE DATE | | | PRINCIPAL ‡‡ | | | COST | | | FAIR
VALUE | |
Asset-Backed Securities (Continued) | |
|
Other Asset-Backed Securities (Continued) | |
Navient Student Loan Trust 2019-2, 1M USD LIBOR + 1.000%(a) | | | 1.18 | (b) % | | | 2/27/2068 | | | | 2,516,000 | | | $ | 2,516,000 | | | $ | 2,369,520 | |
Navistar Financial Dealer Note Master Owner Trust II, 1M USD LIBOR + 0.950%(a) | | | 1.13 | (b) | | | 5/25/2024 | | | | 1,108,000 | | | | 1,108,000 | | | | 1,091,524 | |
Navistar Financial Dealer Note Master Owner Trust II, 1M USD LIBOR + 1.050%(a) | | | 1.23 | (b) | | | 9/25/2023 | | | | 300,000 | | | | 300,000 | | | | 297,768 | |
Navistar Financial Dealer Note Master Owner Trust II, 1M USD LIBOR + 1.450%(a) | | | 1.63 | (b) | | | 5/25/2024 | | | | 1,018,000 | | | | 1,018,000 | | | | 1,002,390 | |
Navistar Financial Dealer Note Master Owner Trust II, 1M USD LIBOR + 1.550%(a) | | | 1.73 | (b) | | | 9/25/2023 | | | | 520,000 | | | | 520,000 | | | | 515,462 | |
Nelnet Private Education Loan Trust 2016-A A1A, 1M USD LIBOR + 1.750%(a) | | | 1.93 | (b) | | | 12/26/2040 | | | | 114,575 | | | | 114,575 | | | | 114,868 | |
Nelnet Private Education Loan Trust 2016-A A1B(a) | | | 3.60 | | | | 12/26/2040 | | | | 137,508 | | | | 137,413 | | | | 140,266 | |
Nelnet Student Loan Trust 2006-2 B, 3M USD LIBOR + 0.200% | | | 1.19 | (b) | | | 1/25/2038 | | | | 965,091 | | | | 910,351 | | | | 828,846 | |
Nelnet Student Loan Trust 2006-3, 3M USD LIBOR + 0.250% | | | 0.55 | (b) | | | 6/25/2041 | | | | 1,610,451 | | | | 1,509,356 | | | | 1,331,281 | |
Nelnet Student Loan Trust 2007-2, 28 Day ARS(a) | | | 2.97 | (b) | | | 6/25/2035 | | | | 2,000,000 | | | | 1,976,047 | | | | 1,758,782 | |
Nelnet Student Loan Trust 2012-4, 1M USD LIBOR + 1.000%(a) | | | 1.18 | (b) | | | 7/26/2049 | | | | 900,000 | | | | 870,034 | | | | 818,452 | |
Nelnet Student Loan Trust 2018-3, 1M USD LIBOR + 0.750%(a) | | | 0.93 | (b) | | | 9/27/2066 | | | | 1,300,000 | | | | 1,300,000 | | | | 1,243,728 | |
Nelnet Student Loan Trust 2019-2, 1M USD LIBOR + 0.900%(a) | | | 1.08 | (b) | | | 6/27/2067 | | | | 958,013 | | | | 958,013 | | | | 937,214 | |
New Residential Advance Receivables Trust Advance Receivables Backed 2019-T2(a) | | | 3.06 | | | | 8/15/2053 | | | | 785,000 | | | | 784,729 | | | | 746,737 | |
New Residential Advance Receivables Trust Advance Receivables Backed 2019-T3(a) | | | 2.71 | | | | 9/15/2052 | | | | 1,370,000 | | | | 1,370,000 | | | | 1,341,974 | |
New Residential Advance Receivables Trust Advance Receivables Backed 2019-T3(a) | | | 3.06 | | | | 9/15/2052 | | | | 2,300,000 | | | | 2,300,000 | | | | 2,214,669 | |
New Residential Advance Receivables Trust Advance Receivables Backed 2019-T4(a) | | | 2.80 | | | | 10/15/2051 | | | | 2,956,000 | | | | 2,956,000 | | | | 2,630,840 | |
NorthStar Student Loan Trust III 2016-1 A, 1M USD LIBOR + 1.250%(a) | | | 1.43 | (b) | | | 5/27/2036 | | | | 96,149 | | | | 92,577 | | | | 92,074 | |
NovaStar Mortgage Funding Trust 2004-4 M5, 1M USD LIBOR + 1.725% | | | 1.91 | (b) | | | 3/25/2035 | | | | 208,156 | | | | 208,156 | | | | 205,364 | |
NP SPE II LLC(a) | | | 2.57 | | | | 9/20/2049 | | | | 734,746 | | | | 734,746 | | | | 727,948 | |
NP SPE II LLC 2017-1A A1(a) | | | 3.37 | | | | 10/21/2047 | | | | 337,810 | | | | 337,810 | | | | 344,435 | |
OneMain Financial Issuance Trust 2019-2(a) | | | 3.14 | | | | 10/14/2036 | | | | 5,800,000 | | | | 5,797,528 | | | | 5,815,420 | |
OneMain Financial Issuance Trust 2019-2(a) | | | 3.66 | | | | 10/14/2036 | | | | 2,400,000 | | | | 2,399,498 | | | | 2,028,136 | |
Orange Lake Timeshare Trust 2016-A A(a) | | | 2.61 | | | | 3/8/2029 | | | | 732,509 | | | | 719,871 | | | | 710,394 | |
Orange Lake Timeshare Trust 2016-A B(a) | | | 2.91 | | | | 3/8/2029 | | | | 296,887 | | | | 293,382 | | | | 254,106 | |
Orange Lake Timeshare Trust 2018-A(a) | | | 3.74 | | | | 11/8/2030 | | | | 577,082 | | | | 586,550 | | | | 524,478 | |
See accompanying Notes to the Financial Statements.
107
Barings Active Short Duration Bond Fund 2020 Annual Report
SCHEDULE OF INVESTMENTS (CONTINUED)
June 30, 2020
| | | | | | | | | | | | | | | | | | | | |
| | | EFFECTIVE
INTEREST RATE | | | DUE DATE | | | PRINCIPAL ‡‡ | | | COST | | | FAIR
VALUE | |
Asset-Backed Securities (Continued) | |
|
Other Asset-Backed Securities (Continued) | |
Orange Lake Timeshare Trust 2019-A(a) | | | 4.93 | % | | | 4/9/2038 | | | | 1,977,917 | | | $ | 1,977,522 | | | $ | 1,816,977 | |
Oscar US Funding X LLC(a),(c) | | | 3.27 | | | | 5/11/2026 | | | | 2,240,000 | | | | 2,239,681 | | | | 2,329,430 | |
Oxford Finance Funding 2020-1 LLC(a) | | | 3.10 | | | | 2/15/2028 | | | | 1,296,000 | | | | 1,296,000 | | | | 1,311,716 | |
Oxford Finance Funding LLC 2016-1A A(a) | | | 3.97 | | | | 6/17/2024 | | | | 31,555 | | | | 31,555 | | | | 31,696 | |
Pennsylvania Higher Education Assistance Agency, 28 day ARS | | | 1.69 | (b) | | | 10/25/2042 | | | | 950,000 | | | | 937,271 | | | | 919,268 | |
Pioneer Aircraft Finance Ltd.(a),(c) | | | 3.97 | | | | 6/15/2044 | | | | 970,050 | | | | 970,050 | | | | 833,955 | |
Popular ABS Mortgage Pass-Through Trust 2006-B A3, 1M USD LIBOR + 0.280% | | | 0.46 | (b) | | | 5/25/2036 | | | | 12,805 | | | | 12,375 | | | | 12,716 | |
Santander Revolving Auto Loan Trust 2019-A(a) | | | 2.80 | | | | 1/26/2032 | | | | 687,000 | | | | 686,709 | | | | 658,563 | |
Santander Revolving Auto Loan Trust 2019-A(a) | | | 3.00 | | | | 1/26/2032 | | | | 439,000 | | | | 438,862 | | | | 436,072 | |
Santander Revolving Auto Loan Trust 2019-A(a) | | | 3.45 | | | | 1/26/2032 | | | | 867,000 | | | | 866,958 | | | | 862,539 | |
SBA Tower Trust(a) | | | 2.84 | | | | 1/15/2025 | | | | 5,300,000 | | | | 5,300,000 | | | | 5,358,702 | |
SBA Tower Trust(a) | | | 3.87 | | | | 10/15/2049 | | | | 1,300,000 | | | | 1,304,952 | | | | 1,372,842 | |
Sierra Receivables Funding Co LLC 2017-1A A(a) | | | 2.91 | | | | 3/20/2034 | | | | 311,590 | | | | 312,445 | | | | 309,821 | |
Sierra Receivables Funding Co LLC 2018-1AB | | | 4.24 | | | | 4/20/2035 | | | | 1,458,651 | | | | 1,474,920 | | | | 1,424,464 | |
Sierra Timeshare 2016-2 Receivables Funding LLC(a) | | | 2.78 | | | | 7/20/2033 | | | | 199,333 | | | | 197,695 | | | | 198,703 | |
Sierra Timeshare 2018-2 Receivables Funding LLC(a) | | | 3.94 | | | | 6/20/2035 | | | | 250,127 | | | | 250,064 | | | | 236,677 | |
Sierra Timeshare 2018-3 Receivables Funding LLC(a) | | | 5.20 | | | | 9/20/2035 | | | | 418,475 | | | | 422,586 | | | | 402,869 | |
Sierra Timeshare 2019-1 Receivables Funding LLC(a) | | | 3.77 | | | | 1/20/2036 | | | | 1,019,449 | | | | 1,024,270 | | | | 948,837 | |
Sierra Timeshare 2019-1 Receivables Funding LLC(a) | | | 4.75 | | | | 1/20/2036 | | | | 1,354,037 | | | | 1,355,801 | | | | 1,262,187 | |
Sierra Timeshare 2019-3 Receivables Funding LLC(a) | | | 3.00 | | | | 8/20/2036 | | | | 3,869,665 | | | | 3,869,307 | | | | 3,494,724 | |
Sierra Timeshare 2019-3 Receivables Funding LLC(a) | | | 4.18 | | | | 8/20/2036 | | | | 1,886,286 | | | | 1,886,513 | | | | 1,717,310 | |
Sierra Timeshare Receivables Funding LLC 2015 3A B(a) | | | 3.08 | | | | 9/20/2032 | | | | 29,824 | | | | 29,652 | | | | 29,646 | |
Sierra Timeshare Receivables Funding LLC 2019-2(a) | | | 3.12 | | | | 5/20/2036 | | | | 235,826 | | | | 235,809 | | | | 214,547 | |
Sierra Timeshare Receivables Funding LLC 2019-2(a) | | | 4.54 | | | | 5/20/2036 | | | | 1,764,352 | | | | 1,769,692 | | | | 1,627,840 | |
SLC Student Loan Trust 2005-1 B, 3M USD LIBOR + 0.200% | | | 0.59 | (b) | | | 2/15/2045 | | | | 589,109 | | | | 533,652 | | | | 504,666 | |
SLC Student Loan Trust 2006-1, 3M USD LIBOR + 0.210% | | | 0.52 | (b) | | | 3/15/2055 | | | | 2,071,084 | | | | 1,930,494 | | | | 1,788,343 | |
See accompanying Notes to the Financial Statements.
108
Barings Active Short Duration Bond Fund 2020 Annual Report
SCHEDULE OF INVESTMENTS (CONTINUED)
June 30, 2020
| | | | | | | | | | | | | | | | | | | | |
| | | EFFECTIVE
INTEREST RATE | | | DUE DATE | | | PRINCIPAL ‡‡ | | | COST | | | FAIR
VALUE | |
Asset-Backed Securities (Continued) | |
|
Other Asset-Backed Securities (Continued) | |
SLC Student Loan Trust 2006-2 B, 3M USD LIBOR + 0.230% | | | 0.54 | (b) % | | | 12/15/2039 | | | | 1,549,630 | | | $ | 1,446,387 | | | $ | 1,360,916 | |
SLM Student Loan Trust 2003-11, 3M USD LIBOR + 0.650% | | | 0.96 | (b) | | | 12/15/2038 | | | | 872,633 | | | | 831,480 | | | | 774,294 | |
SLM Student Loan Trust 2003-14, 3M USD LIBOR + 0.600%(a) | | | 1.59 | (b) | | | 10/25/2065 | | | | 1,600,000 | | | | 1,595,831 | | | | 1,507,596 | |
SLM Student Loan Trust 2003-14 A6, 3M USD LIBOR + 0.300% | | | 1.29 | (b) | | | 7/25/2025 | | | | 25,071 | | | | 24,489 | | | | 24,852 | |
SLM Student Loan Trust 2003-4 B, 3M USD LIBOR + 0.650% | | | 0.96 | (b) | | | 6/15/2038 | | | | 337,448 | | | | 323,568 | | | | 303,789 | |
SLM Student Loan Trust 2004-1, 3M USD LIBOR + 0.500% | | | 1.49 | (b) | | | 7/25/2039 | | | | 484,709 | | | | 462,029 | | | | 435,487 | |
SLM Student Loan Trust 2004-8, 3M USD LIBOR + 0.460% | | | 1.45 | (b) | | | 1/25/2040 | | | | 1,014,293 | | | | 963,497 | | | | 890,442 | |
SLM Student Loan Trust 2005-4 B, 3M USD LIBOR + 0.180% | | | 1.17 | (b) | | | 7/25/2055 | | | | 648,125 | | | | 579,796 | | | | 571,850 | |
SLM Student Loan Trust 2005-5, 3M USD LIBOR + 0.250% | | | 1.24 | (b) | | | 10/25/2040 | | | | 650,047 | | | | 611,479 | | | | 565,068 | |
SLM Student Loan Trust 2005-6 B, 3M USD LIBOR + 0.290% | | | 1.28 | (b) | | | 1/25/2044 | | | | 1,897,091 | | | | 1,775,068 | | | | 1,484,216 | |
SLM Student Loan Trust 2005-9, 3M USD LIBOR + 0.300% | | | 1.29 | (b) | | | 1/25/2041 | | | | 750,598 | | | | 718,715 | | | | 652,958 | |
SLM Student Loan Trust 2006-2(e) | | | Zero Coupon | | | | 1/25/2041 | | | | 3,956 | | | | 1,621,960 | | | | 2,021,728 | |
SLM Student Loan Trust 2006-5 B, 3M USD LIBOR + 0.210% | | | 1.20 | (b) | | | 10/25/2040 | | | | 509,937 | | | | 456,068 | | | | 467,958 | |
SLM Student Loan Trust 2006-7 B, 3M USD LIBOR + 0.200% | | | 1.19 | (b) | | | 1/27/2042 | | | | 488,905 | | | | 455,644 | | | | 417,053 | |
SLM Student Loan Trust 2006-9 A5, 3M USD LIBOR + 0.100% | | | 1.09 | (b) | | | 1/26/2026 | | | | 16,064 | | | | 15,792 | | | | 15,661 | |
SMB Private Education Loan Trust 2014-A(a) | | | 4.00 | | | | 9/15/2042 | | | | 1,250,000 | | | | 1,271,133 | | | | 1,239,281 | |
SMB Private Education Loan Trust 2014-A A2B, 1M USD LIBOR + 1.150%(a) | | | 1.33 | (b) | | | 5/15/2026 | | | | 181,266 | | | | 182,235 | | | | 181,266 | |
SMB Private Education Loan Trust 2015-A A2B, 1M USD LIBOR + 1.000%(a) | | | 1.18 | (b) | | | 6/15/2027 | | | | 34,084 | | | | 33,690 | | | | 33,125 | |
SMB Private Education Loan Trust 2015-A A3, 1M USD LIBOR + 1.500%(a) | | | 1.68 | (b) | | | 2/17/2032 | | | | 900,000 | | | | 917,927 | | | | 894,248 | |
SMB Private Education Loan Trust 2015-C(a) | | | 4.50 | | | | 9/17/2046 | | | | 1,710,000 | | | | 1,753,651 | | | | 1,637,490 | |
SMB Private Education Loan Trust 2015-C A3, 1M USD LIBOR + 1.950%(a) | | | 2.13 | (b) | | | 8/16/2032 | | | | 700,000 | | | | 727,341 | | | | 710,273 | |
SMB Private Education Loan Trust 2016-B A2B, 1M USD LIBOR + 1.450%(a) | | | 1.63 | (b) | | | 2/17/2032 | | | | 71,704 | | | | 71,705 | | | | 71,550 | |
SMB Private Education Loan Trust 2016-C A2B, 1M USD LIBOR + 1.100%(a) | | | 1.28 | (b) | | | 9/15/2034 | | | | 171,603 | | | | 171,603 | | | | 169,923 | |
SoFi Alternative Trust 2019-C(a),(e) | | | 4.85 | | | | 1/25/2045 | | | | 3,338,621 | | | | 3,451,708 | | | | 3,625,946 | |
See accompanying Notes to the Financial Statements.
109
Barings Active Short Duration Bond Fund 2020 Annual Report
SCHEDULE OF INVESTMENTS (CONTINUED)
June 30, 2020
| | | | | | | | | | | | | | | | | | | | |
| | | EFFECTIVE
INTEREST RATE | | | DUE DATE | | | PRINCIPAL ‡‡ | | | COST | | | FAIR
VALUE | |
Asset-Backed Securities (Continued) | |
|
Other Asset-Backed Securities (Continued) | |
SoFi Consumer Loan Program 2020-1 Trust(a) | | | 2.94 | % | | | 1/25/2029 | | | | 4,000,000 | | | $ | 3,999,330 | | | $ | 3,150,395 | |
SoFi Consumer Loan Program LLC 2016-1A A(a) | | | 3.26 | | | | 8/25/2025 | | | | 175,202 | | | | 175,633 | | | | 176,069 | |
SoFi Consumer Loan Program LLC 2016-2A A(a) | | | 3.09 | | | | 10/27/2025 | | | | 9,676 | | | | 9,675 | | | | 9,649 | |
SoFi Consumer Loan Program LLC 2017-2 A(a) | | | 3.28 | | | | 2/25/2026 | | | | 67,364 | | | | 67,290 | | | | 67,291 | |
SoFi Consumer Loan Program LLC 2017-3 A(a) | | | 2.77 | | | | 5/25/2026 | | | | 152,072 | | | | 152,072 | | | | 152,823 | |
SoFi Consumer Loan Program Trust 2019-3(a) | | | 3.89 | | | | 5/25/2028 | | | | 2,766,000 | | | | 2,767,906 | | | | 2,775,713 | |
SoFi Professional Loan Program 2017-C LLC(a) | | | 4.21 | | | | 7/25/2040 | | | | 2,410,000 | | | | 2,521,446 | | | | 2,413,090 | |
SoFi Professional Loan Program 2018-A LLC(a),(e) | | | Zero Coupon | | | | 2/25/2042 | | | | 1,372,500 | | | | 1,019,293 | | | | 661,977 | |
SoFi Professional Loan Program 2018-B Trust(a),(e) | | | Zero Coupon | | | | 8/26/2047 | | | | 1,265,700 | | | | 716,868 | | | | 499,066 | |
SoFi Professional Loan Program 2018-D Trust(a),(e) | | | Zero Coupon | | | | 2/25/2048 | | | | 1,887,200 | | | | 693,389 | | | | 459,911 | |
SoFi Professional Loan Program 2019-A LLC(a),(e) | | | Zero Coupon | | | | 6/15/2048 | | | | 3,522,900 | | | | 1,091,642 | | | | 864,872 | |
SoFi Professional Loan Program 2019-A LLC(a) | | | 4.11 | | | | 6/15/2048 | | | | 870,000 | | | | 876,505 | | | | 888,652 | |
SoFi Professional Loan Program LLC 2015-C A2(a) | | | 2.51 | | | | 8/25/2033 | | | | 15,017 | | | | 14,953 | | | | 14,685 | |
SoFi Professional Loan Program LLC 2016-B A1, 1M USD LIBOR + 1.200%(a) | | | 1.38 | (b) | | | 6/25/2033 | | | | 154,403 | | | | 155,996 | | | | 153,634 | |
SoFi Professional Loan Program LLC 2016-D A1, 1M USD LIBOR + 0.950%(a) | | | 1.13 | (b) | | | 1/25/2039 | | | | 32,250 | | | | 32,250 | | | | 32,250 | |
SoFi Professional Loan Program LLC 2017-D R1(a) | | | Zero Coupon | | | | 9/25/2040 | | | | 1,233,700 | | | | 750,338 | | | | 428,168 | |
Store Master Funding I-VII A3(a) | | | 4.40 | | | | 10/20/2048 | | | | 1,884,167 | | | | 1,903,397 | | | | 1,847,931 | |
Taco Bell Funding LLC 2016-1A A23(a) | | | 4.97 | | | | 5/25/2046 | | | | 1,188,250 | | | | 1,227,053 | | | | 1,234,914 | |
Taco Bell Funding LLC 2018-1A A2I(a) | | | 4.32 | | | | 11/25/2048 | | | | 4,659,050 | | | | 4,716,211 | | | | 4,758,195 | |
TAL Advantage LLC 2017-1A A(a) | | | 4.50 | | | | 4/20/2042 | | | | 488,057 | | | | 493,530 | | | | 492,823 | |
TAL Advantage V LLC(a) | | | 3.33 | | | | 5/20/2039 | | | | 804,517 | | | | 799,556 | | | | 799,569 | |
Textainer Marine Containers VII Ltd.(a) | | | 4.11 | | | | 7/20/2043 | | | | 646,500 | | | | 639,199 | | | | 655,314 | |
TLF National Tax Lien Trust 2017-1(a) | | | 3.09 | | | | 12/15/2029 | | | | 1,205,362 | | | | 1,199,199 | | | | 1,213,115 | |
Trafigura Securitisation Finance plc 2018-1, 1M USD LIBOR + 0.730%(a),(c) | | | 0.91 | (b) | | | 3/15/2022 | | | | 1,820,000 | | | | 1,816,095 | | | | 1,815,166 | |
Trafigura Securitisation Finance plc 2018-1(a),(c) | | | 4.29 | | | | 3/15/2022 | | | | 1,800,000 | | | | 1,799,939 | | | | 1,793,162 | |
Trinity Rail Leasing 2019 LLC(a) | | | 3.82 | | | | 4/17/2049 | | | | 2,183,222 | | | | 2,182,153 | | | | 2,226,146 | |
Trinity Rail Leasing LP(a) | | | 3.82 | | | | 6/17/2048 | | | | 799,263 | | | | 798,980 | | | | 802,481 | |
See accompanying Notes to the Financial Statements.
110
Barings Active Short Duration Bond Fund 2020 Annual Report
SCHEDULE OF INVESTMENTS (CONTINUED)
June 30, 2020
| | | | | | | | | | | | | | | | | | | | |
| | | EFFECTIVE
INTEREST RATE | | | DUE DATE | | | PRINCIPAL ‡‡ | | | COST | | | FAIR
VALUE | |
Asset-Backed Securities (Continued) | |
|
Other Asset-Backed Securities (Continued) | |
TRIP Rail Master Funding LLC 2011-1A A2(a) | | | 6.02 | % | | | 7/15/2041 | | | | 1,248,118 | | | $ | 1,327,761 | | | $ | 1,286,227 | |
TRIP Rail Master Funding LLC 2017-1A A1(a) | | | 2.71 | | | | 8/15/2047 | | | | 88,577 | | | | 88,576 | | | | 88,618 | |
Triton Container Finance V LLC(a) | | | 3.95 | | | | 3/20/2043 | | | | 271,250 | | | | 271,075 | | | | 270,491 | |
VSE 2018-A Voi Mortgage LLC(a) | | | 4.02 | | | | 2/20/2036 | | | | 272,665 | | | | 272,632 | | | | 248,255 | |
Wachovia Student Loan Trust 2005-1 B, 3M USD LIBOR + 0.300% | | | 1.29 | (b) | | | 10/25/2040 | | | | 547,400 | | | | 505,465 | | | | 500,132 | |
Welk Resorts LLC 2017-AA B(a) | | | 3.41 | | | | 6/15/2033 | | | | 678,063 | | | | 681,383 | | | | 653,503 | |
Westgate Resorts LLC 2017-1A A(a) | | | 3.05 | | | | 12/20/2030 | | | | 167,047 | | | | 167,047 | | | | 166,468 | |
Westgate Resorts LLC 2018-1(a) | | | 3.38 | | | | 12/20/2031 | | | | 386,097 | | | | 385,507 | | | | 379,578 | |
Westlake Automobile Receivables Trust 2019-3(a) | | | 3.59 | | | | 3/17/2025 | | | | 2,182,000 | | | | 2,181,670 | | | | 2,161,299 | |
Willis Engine Structured Trust IV(a) | | | 4.75 | | | | 9/15/2043 | | | | 1,094,187 | | | | 1,109,109 | | | | 826,023 | |
| | | | | | | | | | | | | | | | | | | | |
Total Other Asset-Backed Securities | | | | | | | | | | | 292,526,142 | | | | 288,723,009 | | | | 276,884,698 | |
| | | | | | | | | | | | | | | | | | | | |
| | | | | | | | | | | | | | | | | | | | |
Total Asset-Backed Securities | | | | | | | | | | | 332,110,832 | | | | 328,276,114 | | | | 315,592,529 | |
| | | | | | | | | | | | | | | | | | | | |
Corporate Bonds — 39.6%*: | |
|
Advertising — 0.1%*: | |
Interpublic Group of Cos., Inc. (The) | | | 3.75 | | | | 10/1/2021 | | | | 820,000 | | | | 821,517 | | | | 850,151 | |
| | | | | | | | | | | | | | | | | | | | |
|
Agriculture — 1.6%*: | |
BAT Capital Corp.(c) | | | 3.22 | | | | 8/15/2024 | | | | 3,115,000 | | | | 3,142,918 | | | | 3,336,121 | |
Bunge Ltd. Finance Corp. | | | 3.00 | | | | 9/25/2022 | | | | 1,840,000 | | | | 1,825,278 | | | | 1,917,721 | |
Bunge Ltd. Finance Corp. | | | 3.50 | | | | 11/24/2020 | | | | 1,520,000 | | | | 1,523,511 | | | | 1,534,366 | |
Imperial Brands Finance plc(a),(c) | | | 3.13 | | | | 7/26/2024 | | | | 1,917,000 | | | | 1,935,580 | | | | 1,990,890 | |
Imperial Brands Finance plc(a),(c) | | | 3.50 | | | | 2/11/2023 | | | | 1,347,000 | | | | 1,350,800 | | | | 1,397,489 | |
Reynolds American, Inc. | | | 4.00 | | | | 6/12/2022 | | | | 2,170,000 | | | | 2,178,273 | | | | 2,292,583 | |
| | | | | | | | | | | | | | | | | | | | |
Total Agriculture | | | | | | | | | | | 11,909,000 | | | | 11,956,360 | | | | 12,469,170 | |
| | | | | | | | | | | | | | | | | | | | |
|
Auto Manufacturers — 1.8%*: | |
Ford Motor Credit Co. LLC, 3M USD LIBOR + 1.235% | | | 1.63 | (b) | | | 2/15/2023 | | | | 985,000 | | | | 985,000 | | | | 881,684 | |
Ford Motor Credit Co. LLC, 3M USD LIBOR + 0.810% | | | 2.18 | (b) | | | 4/5/2021 | | | | 1,135,000 | | | | 1,135,000 | | | | 1,089,335 | |
Ford Motor Credit Co. LLC | | | 3.09 | | | | 1/9/2023 | | | | 1,860,000 | | | | 1,864,936 | | | | 1,771,650 | |
Ford Motor Credit Co. LLC | | | 3.35 | | | | 11/1/2022 | | | | 2,075,000 | | | | 2,075,942 | | | | 1,987,393 | |
Ford Motor Credit Co. LLC | | | 5.09 | | | | 1/7/2021 | | | | 350,000 | | | | 350,135 | | | | 349,668 | |
General Motors Financial Co., Inc. | | | 3.25 | | | | 1/5/2023 | | | | 4,615,000 | | | | 4,575,993 | | | | 4,715,540 | |
Hyundai Capital America(a) | | | 2.38 | | | | 2/10/2023 | | | | 1,920,000 | | | | 1,928,815 | | | | 1,934,364 | |
Hyundai Capital America(a),(c) | | | 2.85 | | | | 11/1/2022 | | | | 1,320,000 | | | | 1,319,879 | | | | 1,346,954 | |
Nissan Motor Acceptance Corp.(a),(c) | | | 1.90 | | | | 9/14/2021 | | | | 670,000 | | | | 668,618 | | | | 657,883 | |
| | | | | | | | | | | | | | | | | | | | |
Total Auto Manufacturers | | | | | | | | | | | 14,930,000 | | | | 14,904,318 | | | | 14,734,471 | |
| | | | | | | | | | | | | | | | | | | | |
See accompanying Notes to the Financial Statements.
111
Barings Active Short Duration Bond Fund 2020 Annual Report
SCHEDULE OF INVESTMENTS (CONTINUED)
June 30, 2020
| | | | | | | | | | | | | | | | | | | | |
| | | EFFECTIVE
INTEREST RATE | | | DUE DATE | | | PRINCIPAL ‡‡ | | | COST | | | FAIR
VALUE | |
Corporate Bonds (Continued) | |
|
Beverages — 0.2%*: | |
Bacardi Ltd.(a),(c) | | | 4.45 | % | | | 5/15/2025 | | | | 319,000 | | | $ | 336,986 | | | $ | 348,988 | |
Molson Coors Beverage Co. | | | 2.10 | | | | 7/15/2021 | | | | 325,000 | | | | 324,364 | | | | 328,990 | |
Molson Coors Beverage Co. | | | 3.50 | | | | 5/1/2022 | | | | 1,089,000 | | | | 1,083,790 | | | | 1,136,284 | |
| | | | | | | | | | | | | | | | | | | | |
Total Beverages | | | | | | | | | | | 1,733,000 | | | | 1,745,140 | | | | 1,814,262 | |
| | | | | | | | | | | | | | | | | | | | |
|
Chemicals — 1.7%*: | |
DuPont de Nemours, Inc. | | | 4.49 | | | | 11/15/2025 | | | | 2,960,000 | | | | 3,261,495 | | | | 3,404,604 | |
Huntsman International LLC | | | 5.13 | | | | 11/15/2022 | | | | 4,730,000 | | | | 4,848,021 | | | | 5,010,492 | |
RPM International, Inc. | | | 3.45 | | | | 11/15/2022 | | | | 1,155,000 | | | | 1,160,067 | | | | 1,192,114 | |
Sherwin-Williams Co. (The) | | | 2.75 | | | | 6/1/2022 | | | | 90,000 | | | | 89,336 | | | | 92,955 | |
Syngenta Finance NV(a),(c) | | | 3.93 | | | | 4/23/2021 | | | | 500,000 | | | | 500,693 | | | | 504,867 | |
Syngenta Finance NV(a),(c) | | | 4.44 | | | | 4/24/2023 | | | | 3,170,000 | | | | 3,283,687 | | | | 3,327,083 | |
| | | | | | | | | | | | | | | | | | | | |
Total Chemicals | | | | | | | | | | | 12,605,000 | | | | 13,143,299 | | | | 13,532,115 | |
| | | | | | | | | | | | | | | | | | | | |
|
Commercial Banks — 8.5%*: | |
ABN AMRO Bank NV(a),(c) | | | 4.75 | | | | 7/28/2025 | | | | 1,840,000 | | | | 2,037,333 | | | | 2,027,824 | |
Banco Santander SA(c) | | | 2.75 | | | | 5/28/2025 | | | | 1,600,000 | | | | 1,600,000 | | | | 1,658,104 | |
Banco Santander SA(c) | | | 3.50 | | | | 4/11/2022 | | | | 2,400,000 | | | | 2,405,981 | | | | 2,496,075 | |
Bank of America Corp., 3M USD LIBOR + 0.930% | | | 2.82 | (b),(d) | | | 7/21/2023 | | | | 7,545,000 | | | | 7,520,408 | | | | 7,836,905 | |
Bank of Nova Scotia (The)(c) | | | 4.50 | | | | 12/16/2025 | | | | 1,795,000 | | | | 1,955,611 | | | | 2,039,489 | |
Barclays Bank plc, 3M USD LIBOR + 1.380%(c) | | | 1.77 | (b) | | | 5/16/2024 | | | | 1,235,000 | | | | 1,229,309 | | | | 1,223,706 | |
Barclays Bank plc(a),(c) | | | 10.18 | | | | 6/12/2021 | | | | 3,435,000 | | | | 3,670,940 | | | | 3,714,591 | |
BPCE SA(a),(c) | | | 5.70 | | | | 10/22/2023 | | | | 3,525,000 | | | | 3,944,499 | | | | 3,928,063 | |
Citigroup, Inc. | | | 4.40 | | | | 6/10/2025 | | | | 3,500,000 | | | | 3,825,422 | | | | 3,919,318 | |
Credit Suisse AG(a),(c) | | | 6.50 | | | | 8/8/2023 | | | | 3,720,000 | | | | 4,069,073 | | | | 4,055,767 | |
Danske Bank A/S(a),(c) | | | 5.00 | | | | 1/12/2022 | | | | 1,990,000 | | | | 2,058,135 | | | | 2,090,714 | |
Discover Bank | | | 4.20 | | | | 8/8/2023 | | | | 2,185,000 | | | | 2,235,820 | | | | 2,385,939 | |
First Horizon National Corp. | | | 3.50 | | | | 12/15/2020 | | | | 2,170,000 | | | | 2,172,116 | | | | 2,186,934 | |
Goldman Sachs Group, Inc. (The) | | | 3.20 | | | | 2/23/2023 | | | | 1,855,000 | | | | 1,901,587 | | | | 1,968,255 | |
Goldman Sachs Group, Inc. (The) | | | 4.25 | | | | 10/21/2025 | | | | 5,770,000 | | | | 6,515,256 | | | | 6,495,240 | |
HSBC Holdings plc(c) | | | 4.25 | | | | 3/14/2024 | | | | 3,615,000 | | | | 3,809,963 | | | | 3,900,361 | |
Mitsubishi UFJ Financial Group, Inc.(c) | | | 2.67 | | | | 7/25/2022 | | | | 2,580,000 | | | | 2,549,029 | | | | 2,681,755 | |
Morgan Stanley, SOFRRATE + 1.990% | | | 2.19 | (b) | | | 4/28/2026 | | | | 1,795,000 | | | | 1,795,000 | | | | 1,868,970 | |
Morgan Stanley | | | 4.10 | | | | 5/22/2023 | | | | 1,785,000 | | | | 1,899,404 | | | | 1,929,082 | |
Morgan Stanley MTN | | | 3.75 | | | | 2/25/2023 | | | | 1,886,000 | | | | 1,938,535 | | | | 2,035,355 | |
Sumitomo Mitsui Financial Group, Inc.(c) | | | 1.47 | | | | 7/8/2025 | | | | 1,440,000 | | | | 1,440,000 | | | | 1,441,763 | |
Sumitomo Mitsui Financial Group, Inc. | | | 2.45 | | | | 9/27/2024 | | | | 2,025,000 | | | | 2,025,000 | | | | 2,124,082 | |
Sumitomo Mitsui Financial Group, Inc.(c) | | | 3.75 | | | | 7/19/2023 | | | | 1,110,000 | | | | 1,165,531 | | | | 1,202,302 | |
Synchrony Bank | | | 3.00 | | | | 6/15/2022 | | | | 1,680,000 | | | | 1,642,477 | | | | 1,715,367 | |
UBS Group AG(a),(c) | | | 4.13 | | | | 9/24/2025 | | | | 1,500,000 | | | | 1,645,951 | | | | 1,700,182 | |
| | | | | | | | | | | | | | | | | | | | |
Total Commercial Banks | | | | | | | | | | | 63,981,000 | | | | 67,052,380 | | | | 68,626,143 | |
| | | | | | | | | | | | | | | | | | | | |
|
Commercial Services — 0.3%*: | |
ADT Security Corp. (The) | | | 6.25 | | | | 10/15/2021 | | | | 2,080,000 | | | | 2,164,457 | | | | 2,132,000 | |
| | | | | | | | | | | | | | | | | | | | |
See accompanying Notes to the Financial Statements.
112
Barings Active Short Duration Bond Fund 2020 Annual Report
SCHEDULE OF INVESTMENTS (CONTINUED)
June 30, 2020
| | | | | | | | | | | | | | | | | | | | |
| | | EFFECTIVE
INTEREST RATE | | | DUE DATE | | | PRINCIPAL ‡‡ | | | COST | | | FAIR
VALUE | |
Corporate Bonds (Continued) | |
|
Construction Materials — 0.1%*: | |
Masco Corp. | | | 3.50 | % | | | 4/1/2021 | | | | 590,000 | | | $ | 591,333 | | | $ | 598,134 | |
| | | | | | | | | | | | | | | | | | | | |
|
Diversified Financial Services — 3.7%*: | |
AerCap Ireland Capital DAC / AerCap Global Aviation Trust(c) | | | 2.88 | | | | 8/14/2024 | | | | 4,960,000 | | | | 4,965,204 | | | | 4,656,894 | |
AerCap Ireland Capital DAC / AerCap Global Aviation Trust | | | 4.50 | | | | 9/15/2023 | | | | 1,095,000 | | | | 1,088,047 | | | | 1,095,128 | |
Aircastle Ltd. | | | 5.00 | | | | 4/1/2023 | | | | 4,431,000 | | | | 4,583,058 | | | | 4,317,228 | |
Antares Holdings LP(a) | | | 6.00 | | | | 8/15/2023 | | | | 2,160,000 | | | | 2,218,998 | | | | 2,071,853 | |
Athene Global Funding(a) | | | 2.75 | | | | 6/25/2024 | | | | 4,355,000 | | | | 4,360,956 | | | | 4,417,272 | |
Avolon Holdings Funding Ltd.(a),(c) | | | 2.88 | | | | 2/15/2025 | | | | 1,470,000 | | | | 1,468,400 | | | | 1,233,562 | |
Brookfield Finance LLC(c) | | | 4.00 | | | | 4/1/2024 | | | | 2,275,000 | | | | 2,341,528 | | | | 2,466,862 | |
Genpact Luxembourg Sarl | | | 3.70 | | | | 4/1/2022 | | | | 2,175,000 | | | | 2,184,717 | | | | 2,233,256 | |
Lazard Group LLC | | | 3.75 | | | | 2/13/2025 | | | | 3,430,000 | | | | 3,654,849 | | | | 3,641,872 | |
LeasePlan Corp. NV(a),(c) | | | 2.88 | | | | 10/24/2024 | | | | 1,125,000 | | | | 1,122,785 | | | | 1,150,329 | |
Synchrony Financial | | | 2.85 | | | | 7/25/2022 | | | | 2,510,000 | | | | 2,512,592 | | | | 2,552,882 | |
| | | | | | | | | | | | | | | | | | | | |
Total Diversified Financial Services | | | | | | | | | | | 29,986,000 | | | | 30,501,134 | | | | 29,837,138 | |
| | | | | | | | | | | | | | | | | | | | |
|
Electric — 1.1%*: | |
Ameren Corp. | | | 2.50 | | | | 9/15/2024 | | | | 1,320,000 | | | | 1,319,630 | | | | 1,398,797 | |
Ameren Corp. | | | 2.70 | | | | 11/15/2020 | | | | 760,000 | | | | 760,934 | | | | 764,651 | |
Enel Finance International NV(a),(c) | | | 2.88 | | | | 5/25/2022 | | | | 1,050,000 | | | | 1,048,749 | | | | 1,086,065 | |
Entergy Corp. | | | 4.00 | | | | 7/15/2022 | | | | 750,000 | | | | 763,766 | | | | 796,033 | |
Entergy Texas, Inc. | | | 2.55 | | | | 6/1/2021 | | | | 460,000 | | | | 459,974 | | | | 467,092 | |
Pacific Gas and Electric Co. | | | 1.75 | | | | 6/16/2022 | | | | 2,720,000 | | | | 2,719,840 | | | | 2,724,352 | |
Puget Energy, Inc. | | | 6.00 | | | | 9/1/2021 | | | | 1,275,000 | | | | 1,316,392 | | | | 1,344,969 | |
| | | | | | | | | | | | | | | | | | | | |
Total Electric | | | | | | | | | | | 8,335,000 | | | | 8,389,285 | | | | 8,581,959 | |
| | | | | | | | | | | | | | | | | | | | |
|
Electronics — 0.1%*: | |
FLIR Systems, Inc. | | | 3.13 | | | | 6/15/2021 | | | | 855,000 | | | | 860,160 | | | | 868,958 | |
| | | | | | | | | | | | | | | | | | | | |
|
Healthcare-Products — 0.2%*: | |
Becton Dickinson and Co., 3M USD LIBOR + 0.875% | | | 1.18 | (b) | | | 12/29/2020 | | | | 1,826,000 | | | | 1,825,708 | | | | 1,826,118 | |
| | | | | | | | | | | | | | | | | | | | |
|
Home Builders — 0.3%*: | |
Lennar Corp. | | | 4.75 | | | | 4/1/2021 | | | | 2,650,000 | | | | 2,673,401 | | | | 2,682,012 | |
| | | | | | | | | | | | | | | | | | | | |
|
Household Products/Wares — 0.3%*: | |
Church & Dwight Co., Inc. | | | 2.88 | | | | 10/1/2022 | | | | 2,360,000 | | | | 2,347,470 | | | | 2,466,897 | |
| | | | | | | | | | | | | | | | | | | | |
|
Housewares — 0.6%*: | |
Newell Brands, Inc. | | | 4.35 | | | | 4/1/2023 | | | | 4,379,000 | | | | 4,462,740 | | | | 4,509,494 | |
| | | | | | | | | | | | | | | | | | | | |
|
Insurance — 2.9%*: | |
American International Group, Inc. | | | 2.50 | | | | 6/30/2025 | | | | 565,000 | | | | 564,405 | | | | 598,104 | |
American International Group, Inc. | | | 3.75 | | | | 7/10/2025 | | | | 2,600,000 | | | | 2,748,735 | | | | 2,877,267 | |
See accompanying Notes to the Financial Statements.
113
Barings Active Short Duration Bond Fund 2020 Annual Report
SCHEDULE OF INVESTMENTS (CONTINUED)
June 30, 2020
| | | | | | | | | | | | | | | | | | | | |
| | | EFFECTIVE
INTEREST RATE | | | DUE DATE | | | PRINCIPAL ‡‡ | | | COST | | | FAIR
VALUE | |
Corporate Bonds (Continued) | |
|
Insurance (Continued) | |
AmTrust Financial Services, Inc. | | | 6.13 | % | | | 8/15/2023 | | | | 3,245,000 | | | $ | 3,317,373 | | | $ | 3,010,841 | |
Athene Global Funding(a) | | | 2.50 | | | | 1/14/2025 | | | | 1,610,000 | | | | 1,612,809 | | | | 1,607,461 | |
CNA Financial Corp. | | | 5.75 | | | | 8/15/2021 | | | | 1,191,000 | | | | 1,224,506 | | | | 1,255,218 | |
Enstar Group Ltd.(c) | | | 4.50 | | | | 3/10/2022 | | | | 2,750,000 | | | | 2,778,340 | | | | 2,786,091 | |
Equitable Holdings, Inc. | | | 3.90 | | | | 4/20/2023 | | | | 368,000 | | | | 381,440 | | | | 393,906 | |
Jackson National Life Global Funding(a) | | | 2.50 | | | | 6/27/2022 | | | | 2,475,000 | | | | 2,467,054 | | | | 2,553,262 | |
Lincoln National Corp. | | | 4.00 | | | | 9/1/2023 | | | | 472,000 | | | | 478,398 | | | | 513,902 | |
Lincoln National Corp. | | | 4.20 | | | | 3/15/2022 | | | | 725,000 | | | | 743,759 | | | | 767,801 | |
Trinity Acquisition PLC | | | 3.50 | | | | 9/15/2021 | | | | 2,662,000 | | | | 2,667,679 | | | | 2,727,223 | |
Unum Group | | | 3.88 | | | | 11/5/2025 | | | | 2,625,000 | | | | 2,694,964 | | | | 2,725,377 | |
Unum Group | | | 4.50 | | | | 3/15/2025 | | | | 1,100,000 | | | | 1,094,313 | | | | 1,181,516 | |
Willis Towers Watson PLC | | | 5.75 | | | | 3/15/2021 | | | | 370,000 | | | | 376,077 | | | | 381,818 | |
| | | | | | | | | | | | | | | | | | | | |
Total Insurance | | | | | | | | | | | 22,758,000 | | | | 23,149,852 | | | | 23,379,787 | |
| | | | | | | | | | | | | | | | | | | | |
|
Investment Company Security — 1.5%*: | |
Ares Capital Corp. | | | 4.20 | | | | 6/10/2024 | | | | 4,940,000 | | | | 5,031,556 | | | | 5,058,223 | |
BlackRock TCP Capital Corp. | | | 3.90 | | | | 8/23/2024 | | | | 3,630,000 | | | | 3,593,901 | | | | 3,543,097 | |
BlackRock TCP Capital Corp. | | | 4.13 | | | | 8/11/2022 | | | | 1,140,000 | | | | 1,137,787 | | | | 1,142,859 | |
TPG Specialty Lending, Inc. | | | 3.88 | | | | 11/1/2024 | | | | 2,660,000 | | | | 2,637,392 | | | | 2,653,528 | |
| | | | | | | | | | | | | | | | | | | | |
Total Investment Company Security | | | | | | | | | | | 12,370,000 | | | | 12,400,636 | | | | 12,397,707 | |
| | | | | | | | | | | | | | | | | | | | |
|
Iron/Steel — 0.2%*: | |
Steel Dynamics, Inc. | | | 2.40 | | | | 6/15/2025 | | | | 710,000 | | | | 707,331 | | | | 731,228 | |
Steel Dynamics, Inc. | | | 2.80 | | | | 12/15/2024 | | | | 1,070,000 | | | | 1,069,281 | | | | 1,113,564 | |
| | | | | | | | | | | | | | | | | | | | |
Total Iron/Steel | | | | | | | | | | | 1,780,000 | | | | 1,776,612 | | | | 1,844,792 | |
| | | | | | | | | | | | | | | | | | | | |
|
IT Services — 1.3%*: | |
Dell International LLC/EMC Corp.(a) | | | 4.00 | | | | 7/15/2024 | | | | 2,472,000 | | | | 2,541,661 | | | | 2,664,701 | |
Dell International LLC/EMC Corp.(a) | | | 5.85 | | | | 7/15/2025 | | | | 1,155,000 | | | | 1,298,173 | | | | 1,327,326 | |
Genpact Luxembourg Sarl | | | 3.38 | | | | 12/1/2024 | | | | 2,080,000 | | | | 2,086,532 | | | | 2,146,434 | |
Leidos Holdings, Inc. | | | 4.45 | | | | 12/1/2020 | | | | 2,275,000 | | | | 2,280,508 | | | | 2,268,459 | |
Leidos, Inc.(a) | | | 2.95 | | | | 5/15/2023 | | | | 1,635,000 | | | | 1,628,713 | | | | 1,703,179 | |
| | | | | | | | | | | | | | | | | | | | |
Total IT Services | | | | | | | | | | | 9,617,000 | | | | 9,835,587 | | | | 10,110,099 | |
| | | | | | | | | | | | | | | | | | | | |
|
Lodging — 0.7%*: | |
Las Vegas Sands Corp. | | | 3.20 | | | | 8/8/2024 | | | | 4,595,000 | | | | 4,607,447 | | | | 4,579,144 | |
Marriott International, Inc. | | | 5.75 | | | | 5/1/2025 | | | | 679,000 | | | | 678,974 | | | | 737,637 | |
| | | | | | | | | | | | | | | | | | | | |
Total Lodging | | | | | | | | | | | 5,274,000 | | | | 5,286,421 | | | | 5,316,781 | |
| | | | | | | | | | | | | | | | | | | | |
|
Machinery-Diversified — 0.3%*: | |
CNH Industrial Capital LLC | | | 1.95 | | | | 7/2/2023 | | | | 515,000 | | | | 511,756 | | | | 518,380 | |
CNH Industrial Capital LLC | | | 3.88 | | | | 10/15/2021 | | | | 1,110,000 | | | | 1,116,037 | | | | 1,137,607 | |
CNH Industrial NV(c) | | | 4.50 | | | | 8/15/2023 | | | | 900,000 | | | | 909,463 | | | | 966,893 | |
| | | | | | | | | | | | | | | | | | | | |
Total Machinery-Diversified | | | | | | | | | | | 2,525,000 | | | | 2,537,256 | | | | 2,622,880 | |
| | | | | | | | | | | | | | | | | | | | |
See accompanying Notes to the Financial Statements.
114
Barings Active Short Duration Bond Fund 2020 Annual Report
SCHEDULE OF INVESTMENTS (CONTINUED)
June 30, 2020
| | | | | | | | | | | | | | | | | | | | |
| | | EFFECTIVE
INTEREST RATE | | | DUE DATE | | | PRINCIPAL ‡‡ | | | COST | | | FAIR
VALUE | |
Corporate Bonds (Continued) | |
|
Media — 0.4%*: | |
Discovery Communications LLC | | | 2.95 | % | | | 3/20/2023 | | | | 1,178,000 | | | $ | 1,191,180 | | | $ | 1,237,590 | |
Sirius XM Radio, Inc.(a) | | | 3.88 | | | | 8/1/2022 | | | | 1,898,000 | | | | 1,896,882 | | | | 1,912,444 | |
| | | | | | | | | | | | | | | | | | | | |
Total Media | | | | | | | | | | | 3,076,000 | | | | 3,088,062 | | | | 3,150,034 | |
| | | | | | | | | | | | | | | | | | | | |
|
Mining — 1.0%*: | |
Glencore Finance Canada Ltd.(a),(c) | | | 4.25 | | | | 10/25/2022 | | | | 484,000 | | | | 496,432 | | | | 511,660 | |
Glencore Funding LLC(a),(c) | | | 3.00 | | | | 10/27/2022 | | | | 730,000 | | | | 728,957 | | | | 750,885 | |
Glencore Funding LLC(a),(c) | | | 4.13 | | | | 5/30/2023 | | | | 1,880,000 | | | | 1,915,342 | | | | 2,009,775 | |
Kinross Gold Corp. | | | 5.13 | | | | 9/1/2021 | | | | 1,365,000 | | | | 1,392,865 | | | | 1,402,788 | |
Kinross Gold Corp.(c) | | | 5.95 | | | | 3/15/2024 | | | | 2,785,000 | | | | 2,898,260 | | | | 3,130,578 | |
| | | | | | | | | | | | | | | | | | | | |
Total Mining | | | | | | | | | | | 7,244,000 | | | | 7,431,856 | | | | 7,805,686 | |
| | | | | | | | | | | | | | | | | | | | |
|
Oil and Gas — 1.1%*: | |
Continental Resources, Inc. | | | 5.00 | | | | 9/15/2022 | | | | 988,000 | | | | 992,469 | | | | 970,710 | |
EQT Corp. | | | 3.00 | | | | 10/1/2022 | | | | 3,185,000 | | | | 3,130,400 | | | | 2,962,050 | |
EQT Corp. | | | 6.13 | | | | 2/1/2025 | | | | 1,420,000 | | | | 1,420,000 | | | | 1,415,058 | |
Newfield Exploration Co. | | | 5.63 | | | | 7/1/2024 | | | | 2,205,000 | | | | 2,420,142 | | | | 2,106,984 | |
Valero Energy Corp. | | | 2.70 | | | | 4/15/2023 | | | | 1,630,000 | | | | 1,628,312 | | | | 1,691,169 | |
| | | | | | | | | | | | | | | | | | | | |
Total Oil and Gas | | | | | | | | | | | 9,428,000 | | | | 9,591,323 | | | | 9,145,971 | |
| | | | | | | | | | | | | | | | | | | | |
|
Packaging and Containers — 0.3%*: | |
Graphic Packaging International, Inc. | | | 4.75 | | | | 4/15/2021 | | | | 2,696,000 | | | | 2,719,680 | | | | 2,729,700 | |
| | | | | | | | | | | | | | | | | | | | |
|
Pharmaceuticals — 1.1%*: | |
AbbVie, Inc.(a) | | | 3.80 | | | | 3/15/2025 | | | | 1,925,000 | | | | 2,078,492 | | | | 2,135,817 | |
Cardinal Health, Inc., 3M USD LIBOR + 0.770% | | | 1.08 | (b) | | | 6/15/2022 | | | | 3,085,000 | | | | 3,084,723 | | | | 3,079,652 | |
Mylan, Inc.(a) | | | 3.13 | | | | 1/15/2023 | | | | 1,920,000 | | | | 1,884,686 | | | | 2,017,889 | |
Teva Pharmaceutical Finance Netherlands III B.V.(c) | | | 2.20 | | | | 7/21/2021 | | | | 1,008,000 | | | | 983,665 | | | | 987,477 | |
Upjohn, Inc.(a) | | | 1.65 | | | | 6/22/2025 | | | | 960,000 | | | | 957,898 | | | | 978,845 | |
| | | | | | | | | | | | | | | | | | | | |
Total Pharmaceuticals | | | | | | | | | | | 8,898,000 | | | | 8,989,464 | | | | 9,199,680 | |
| | | | | | | | | | | | | | | | | | | | |
|
Pipelines — 1.8%*: | |
Energy Transfer Partners LP | | | 4.20 | | | | 9/15/2023 | | | | 4,765,000 | | | | 4,837,213 | | | | 5,062,825 | |
EnLink Midstream Partners LP | | | 4.40 | | | | 4/1/2024 | | | | 2,020,000 | | | | 2,013,017 | | | | 1,677,610 | |
EQM Midstream Partners LP | | | 4.75 | | | | 7/15/2023 | | | | 2,250,000 | | | | 2,291,708 | | | | 2,265,142 | |
MPLX LP, 3M USD LIBOR + 1.100% | | | 1.41 | (b) | | | 9/9/2022 | | | | 3,955,000 | | | | 3,955,000 | | | | 3,889,386 | |
Plains All American Pipeline LP / PAA Finance Corp. | | | 3.85 | | | | 10/15/2023 | | | | 1,644,000 | | | | 1,691,927 | | | | 1,704,852 | |
| | | | | | | | | | | | | | | | | | | | |
Total Pipelines | | | | | | | | | | | 14,634,000 | | | | 14,788,865 | | | | 14,599,815 | |
| | | | | | | | | | | | | | | | | | | | |
|
Real Estate Investment Trusts — 1.2%*: | |
CubeSmart LP | | | 4.38 | | | | 12/15/2023 | | | | 1,339,000 | | | | 1,413,246 | | | | 1,461,664 | |
Essex Portfolio LP | | | 3.50 | | | | 4/1/2025 | | | | 515,000 | | | | 540,043 | | | | 561,459 | |
See accompanying Notes to the Financial Statements.
115
Barings Active Short Duration Bond Fund 2020 Annual Report
SCHEDULE OF INVESTMENTS (CONTINUED)
June 30, 2020
| | | | | | | | | | | | | | | | | | | | |
| | | EFFECTIVE
INTEREST RATE | | | DUE DATE | | | PRINCIPAL ‡‡ | | | COST | | | FAIR
VALUE | |
Corporate Bonds (Continued) | |
|
Real Estate Investment Trusts (Continued) | |
Essex Portfolio LP | | | 3.88 | % | | | 5/1/2024 | | | | 654,000 | | | $ | 689,361 | | | $ | 711,535 | |
Service Properties Trust | | | 4.35 | | | | 10/1/2024 | | | | 2,175,000 | | | | 2,254,647 | | | | 1,960,336 | |
Tanger Properties LP | | | 3.75 | | | | 12/1/2024 | | | | 725,000 | | | | 740,978 | | | | 703,729 | |
Tanger Properties LP | | | 3.88 | | | | 12/1/2023 | | | | 1,890,000 | | | | 1,922,210 | | | | 1,857,138 | |
VEREIT Operating Partnership LP | | | 4.60 | | | | 2/6/2024 | | | | 2,140,000 | | | | 2,222,639 | | | | 2,283,181 | |
| | | | | | | | | | | | | | | | | | | | |
Total REITS | | | | | | | | | | | 9,438,000 | | | | 9,783,124 | | | | 9,539,042 | |
| | | | | | | | | | | | | | | | | | | | |
|
Retail — 1.7%*: | |
Advance Auto Parts, Inc. | | | 4.50 | | | | 12/1/2023 | | | | 2,157,000 | | | | 2,242,816 | | | | 2,340,103 | |
Dollar Tree, Inc. | | | 3.70 | | | | 5/15/2023 | | | | 3,170,000 | | | | 3,177,213 | | | | 3,397,366 | |
O’Reilly Automotive, Inc. | | | 3.80 | | | | 9/1/2022 | | | | 284,000 | | | | 284,400 | | | | 298,277 | |
O’Reilly Automotive, Inc. | | | 3.85 | | | | 6/15/2023 | | | | 3,389,000 | | | | 3,440,605 | | | | 3,567,995 | |
QVC, Inc. | | | 4.38 | | | | 3/15/2023 | | | | 3,660,000 | | | | 3,632,441 | | | | 3,659,634 | |
| | | | | | | | | | | | | | | | | | | | |
Total Retail | | | | | | | | | | | 12,660,000 | | | | 12,777,475 | | | | 13,263,375 | |
| | | | | | | | | | | | | | | | | | | | |
|
Semiconductors — 0.4%*: | |
Microchip Technology, Inc. | | | 3.92 | | | | 6/1/2021 | | | | 1,435,000 | | | | 1,435,475 | | | | 1,462,967 | |
NXP BV/NXP Funding LLC(a) | | | 4.13 | | | | 6/1/2021 | | | | 1,670,000 | | | | 1,677,890 | | | | 1,719,824 | |
| | | | | | | | | | | | | | | | | | | | |
Total Semiconductors | | | | | | | | | | | 3,105,000 | | | | 3,113,365 | | | | 3,182,791 | |
| | | | | | | | | | | | | | | | | | | | |
|
Telecommunications — 1.4%*: | |
AT&T, Inc. | | | 3.40 | | | | 5/15/2025 | | | | 1,845,000 | | | | 1,938,479 | | | | 2,027,579 | |
Qwest Corp. | | | 6.75 | | | | 12/1/2021 | | | | 2,480,000 | | | | 2,602,314 | | | | 2,620,880 | |
Sprint Communications, Inc. | | | 9.25 | | | | 4/15/2022 | | | | 1,005,000 | | | | 1,097,990 | | | | 1,110,525 | |
T-Mobile USA, Inc.(a) | | | 1.50 | | | | 2/15/2026 | | | | 1,825,000 | | | | 1,821,944 | | | | 1,824,872 | |
Telefonaktiebolaget LM Ericsson(c) | | | 4.13 | | | | 5/15/2022 | | | | 3,450,000 | | | | 3,466,001 | | | | 3,612,150 | |
| | | | | | | | | | | | | | | | | | | | |
Total Telecommunications | | | | | | | | | | | 10,605,000 | | | | 10,926,728 | | | | 11,196,006 | |
| | | | | | | | | | | | | | | | | | | | |
|
Transportation — 0.7%*: | |
Penske Truck Leasing Co. LP/PTL Finance Corp.(a) | | | 2.70 | | | | 3/14/2023 | | | | 410,000 | | | | 405,561 | | | | 419,616 | |
Penske Truck Leasing Co. LP/PTL Finance Corp.(a) | | | 3.30 | | | | 4/1/2021 | | | | 240,000 | | | | 241,251 | | | | 243,317 | |
Penske Truck Leasing Co. LP/PTL Finance Corp.(a) | | | 3.38 | | | | 2/1/2022 | | | | 830,000 | | | | 832,387 | | | | 851,437 | |
Penske Truck Leasing Co. LP/PTL Finance Corp.(a) | | | 4.88 | | | | 7/11/2022 | | | | 1,040,000 | | | | 1,059,155 | | | | 1,107,814 | |
Ryder System, Inc. | | | 2.50 | | | | 9/1/2022 | | | | 26,000 | | | | 25,400 | | | | 26,769 | |
Ryder System, Inc. | | | 3.40 | | | | 3/1/2023 | | | | 330,000 | | | | 327,521 | | | | 346,160 | |
Ryder System, Inc. | | | 3.75 | | | | 6/9/2023 | | | | 1,085,000 | | | | 1,108,342 | | | | 1,157,810 | |
Ryder System, Inc. | | | 3.88 | | | | 12/1/2023 | | | | 392,000 | | | | 400,145 | | | | 422,268 | |
Ryder System, Inc. MTN | | | 2.25 | | | | 9/1/2021 | | | | 635,000 | | | | 633,714 | | | | 643,465 | |
| | | | | | | | | | | | | | | | | | | | |
Total Transportation | | | | | | | | | | | 4,988,000 | | | | 5,033,476 | | | | 5,218,656 | |
| | | | | | | | | | | | | | | | | | | | |
See accompanying Notes to the Financial Statements.
116
Barings Active Short Duration Bond Fund 2020 Annual Report
SCHEDULE OF INVESTMENTS (CONTINUED)
June 30, 2020
| | | | | | | | | | | | | | | | | | | | |
| | | EFFECTIVE
INTEREST RATE | | | DUE DATE | | | PRINCIPAL ‡‡ | | | COST | | | FAIR
VALUE | |
Corporate Bonds (Continued) | |
|
Trucking and Leasing — 0.8%*: | |
DAE Funding LLC(a),(c) | | | 4.00 | % | | | 8/1/2020 | | | | 726,000 | | | $ | 726,458 | | | $ | 720,555 | |
Park Aerospace Holdings Ltd.(a),(c) | | | 5.25 | | | | 8/15/2022 | | | | 6,270,000 | | | | 6,428,903 | | | | 5,885,480 | |
| | | | | | | | | | | | | | | | | | | | |
Total Trucking and Leasing | | | | | | | | | | | 6,996,000 | | | | 7,155,361 | | | | 6,606,035 | |
| | | | | | | | | | | | | | | | | | | | |
|
Venture Capital — 0.2%*: | |
Hercules Capital, Inc. | | | 4.63 | | | | 10/23/2022 | | | | 1,625,000 | | | | 1,620,602 | | | | 1,565,540 | |
| | | | | | | | | | | | | | | | | | | | |
Total Corporate Bonds | | | | | | | | | | | 308,756,000 | | | | 315,444,447 | | | | 318,403,399 | |
| | | | | | | | | | | | | | | | | | | | |
Mortgage-Backed Securities — 13.7%*: | |
Angel Oak Mortgage Trust 2019-3(a) | | | 3.24 | (f) | | | 5/25/2059 | | | | 2,523,269 | | | | 2,523,240 | | | | 2,490,345 | |
Angel Oak Mortgage Trust 2019-6(a) | | | 3.39 | (f) | | | 11/25/2059 | | | | 3,250,000 | | | | 3,250,000 | | | | 3,123,072 | |
Angel Oak Mortgage Trust LLC(a) | | | 3.90 | (f) | | | 11/25/2047 | | | | 2,250,000 | | | | 2,250,000 | | | | 2,131,623 | |
BAMLL Commercial Mortgage Securities Trust 2018-DSNY, 1M USD LIBOR + 1.350%(a) | | | 1.53 | (b) | | | 9/15/2034 | | | | 270,000 | | | | 270,000 | | | | 244,268 | |
BAMLL Commercial Mortgage Securities Trust 2019-BPR(a) | | | 4.02 | (f) | | | 11/5/2032 | | | | 3,420,000 | | | | 3,439,915 | | | | 3,091,281 | |
BHMS, 1M USD LIBOR + 1.500%(a) | | | 1.68 | (b) | | | 7/15/2035 | | | | 1,800,000 | | | | 1,800,000 | | | | 1,660,238 | |
BHMS 2018-ATLS, 1M USD LIBOR + 1.250%(a) | | | 1.43 | (b) | | | 7/15/2035 | | | | 2,750,000 | | | | 2,750,000 | | | | 2,605,434 | |
BX Commercial Mortgage Trust 2019-XL, 1M USD LIBOR + 1.800%(a) | | | 1.98 | (b) | | | 10/15/2036 | | | | 1,149,347 | | | | 1,149,347 | | | | 1,103,184 | |
BX Commercial Mortgage Trust 2019-XL, 1M USD LIBOR + 2.000%(a) | | | 2.18 | (b) | | | 10/15/2036 | | | | 3,701,222 | | | | 3,710,215 | | | | 3,557,106 | |
BX Commercial Mortgage Trust 2020-BXLP, 1M USD LIBOR + 1.600%(a) | | | 1.78 | (b) | | | 12/15/2036 | | | | 5,417,000 | | | | 5,416,385 | | | | 5,186,487 | |
CAMB Commercial Mortgage Trust 2019-LIFE, 1M USD LIBOR + 2.150%(a) | | | 2.33 | (b) | | | 12/15/2037 | | | | 1,499,283 | | | | 1,499,283 | | | | 1,429,523 | |
Citigroup Mortgage Loan Trust 2019-IMC1(a) | | | 3.03 | (f) | | | 7/25/2049 | | | | 1,524,656 | | | | 1,523,923 | | | | 1,518,101 | |
Citigroup Mortgage Loan Trust 2019-IMC1(a) | | | 3.17 | (f) | | | 7/25/2049 | | | | 3,101,000 | | | | 3,100,423 | | | | 2,825,247 | |
COMM 2015-CCRE22 Mortgage Trust | | | 3.93 | (f) | | | 3/10/2048 | | | | 1,650,000 | | | | 1,640,465 | | | | 1,701,584 | |
COMM 2015-DC1 Mortgage Trust | | | 4.04 | (f) | | | 2/10/2048 | | | | 1,087,775 | | | | 1,110,542 | | | | 1,095,636 | |
COMM 2016-CR28 Mortgage Trust | | | 3.76 | (f) | | | 2/10/2049 | | | | 2,250,000 | | | | 2,479,907 | | | | 2,505,623 | |
COMM Mortgage Trust 2014-UBS2 B | | | 4.70 | (f) | | | 3/10/2047 | | | | 600,000 | | | | 641,738 | | | | 623,321 | |
Connecticut Avenue Securities Trust 2019-R02, 1M USD LIBOR + 2.300%(a) | | | 2.48 | (b) | | | 8/25/2031 | | | | 8,351,060 | | | | 8,329,407 | | | | 8,221,193 | |
Connecticut Avenue Securities Trust 2019-R03, 1M USD LIBOR + 2.150%(a) | | | 2.33 | (b) | | | 9/25/2031 | | | | 1,540,766 | | | | 1,550,125 | | | | 1,522,543 | |
Credit Suisse Mortgage Capital Certificates 2019-ICE4, 1M USD LIBOR + 1.600%(a) | | | 1.78 | (b) | | | 5/15/2036 | | | | 960,000 | | | | 960,000 | | | | 930,012 | |
Deephave Residential Mortgage Trust 2019-2(a) | | | 3.92 | (f) | | | 4/25/2059 | | | | 672,000 | | | | 672,000 | | | | 652,401 | |
See accompanying Notes to the Financial Statements.
117
Barings Active Short Duration Bond Fund 2020 Annual Report
SCHEDULE OF INVESTMENTS (CONTINUED)
June 30, 2020
| | | | | | | | | | | | | | | | | | | | |
| | | EFFECTIVE
INTEREST RATE | | | DUE DATE | | | PRINCIPAL ‡‡ | | | COST | | | FAIR
VALUE | |
Mortgage-Backed Securities (Continued) | |
Deephaven Residential Mortgage Trust 2018-1(a) | | | 2.98 | (f) % | | | 12/25/2057 | | | | 384,448 | | | $ | 379,979 | | | $ | 388,147 | |
Deephaven Residential Mortgage Trust 2018-1(a) | | | 3.03 | (f) | | | 12/25/2057 | | | | 328,804 | | | | 328,800 | | | | 327,902 | |
Deephaven Residential Mortgage Trust 2018-2(a) | | | 3.68 | (f) | | | 4/25/2058 | | | | 697,692 | | | | 697,684 | | | | 695,565 | |
Deephaven Residential Mortgage Trust 2018-3(a) | | | 3.96 | (f) | | | 8/25/2058 | | | | 659,548 | | | | 658,702 | | | | 666,198 | |
Deephaven Residential Mortgage Trust 2018-4(a) | | | 4.29 | (f) | | | 10/25/2058 | | | | 925,687 | | | | 925,687 | | | | 931,567 | |
Deephaven Residential Mortgage Trust 2019-4(a) | | | 3.48 | (f) | | | 10/25/2059 | | | | 4,400,000 | | | | 4,399,950 | | | | 4,213,252 | |
Federal Home Loan Mortgage Corp., 1M USD LIBOR + 1.500% | | | 1.00 | (b) | | | 6/25/2050 | | | | 9,400,000 | | | | 9,400,000 | | | | 9,400,000 | |
FWD Securitization Trust 2020-INV1(a) | | | 2.85 | (f) | | | 1/25/2050 | | | | 1,804,000 | | | | 1,803,912 | | | | 1,654,405 | |
GS Mortgage Securities Trust 2016-GS2 | | | 4.68 | (f) | | | 5/10/2049 | | | | 1,000,000 | | | | 1,049,847 | | | | 912,302 | |
JP Morgan Chase Commercial Mortgage Securities Trust 2013-LC11 | | | 3.96 | (f) | | | 4/15/2046 | | | | 1,015,000 | | | | 1,002,835 | | | | 735,640 | |
JP Morgan Chase Commercial Mortgage Securities Trust 2018-LAQ, 1M USD LIBOR + 1.000%(a) | | | 1.18 | (b) | | | 6/15/2032 | | | | 6,585,003 | | | | 6,582,152 | | | | 6,190,285 | |
JP Morgan Mortgage Trust 2017-6 A5(a) | | | 3.50 | (f) | | | 12/25/2048 | | | | 480,035 | | | | 486,109 | | | | 487,351 | |
JP Morgan Mortgage Trust 2018-1(a) | | | 3.50 | (f) | | | 6/25/2048 | | | | 398,797 | | | | 401,945 | | | | 403,679 | |
KNDL 2019-KNSQ Mortgage Trust, 1M USD LIBOR + 1.800%(a) | | | 1.98 | (b) | | | 5/15/2036 | | | | 865,000 | | | | 865,000 | | | | 831,532 | |
Morgan Stanley Bank of America Merrill Lynch Trust 2013-C7 | | | 3.77 | (f) | | | 2/15/2046 | | | | 1,340,000 | | | | 1,371,001 | | | | 1,321,530 | |
Morgan Stanley Capital I Trust 2012-STAR(a) | | | 4.06 | (f) | | | 8/5/2034 | | | | 1,300,000 | | | | 1,300,473 | | | | 1,265,371 | |
MSCG Trust 2018-SELF, 1M USD LIBOR + 1.180%(a) | | | 1.36 | (b) | | | 10/15/2037 | | | | 165,000 | | | | 165,000 | | | | 157,139 | |
New Residential Mortgage Loan Trust 2019-A1(a) | | | 3.60 | (f) | | | 4/25/2049 | | | | 534,795 | | | | 534,795 | | | | 547,502 | |
New Residential Mortgage Loan Trust 2019-A3(a) | | | 3.75 | (f) | | | 4/25/2049 | | | | 1,830,029 | | | | 1,830,029 | | | | 1,859,032 | |
New Residential Mortgage Loan Trust 2019-NQM1(a) | | | 3.93 | (f) | | | 1/25/2049 | | | | 1,647,420 | | | | 1,647,499 | | | | 1,622,276 | |
New Residential Mortgage Loan Trust 2020-NQM1(a) | | | 3.21 | (f) | | | 1/26/2060 | | | | 2,252,000 | | | | 2,252,000 | | | | 2,007,107 | |
OBX 2020-INV1 Trust(a) | | | 3.50 | (f) | | | 12/25/2049 | | | | 3,017,600 | | | | 3,072,311 | | | | 3,076,824 | |
PNMAC GMSR Issuer Trust 2018-GT1, 1M USD LIBOR + 2.850%(a) | | | 3.03 | (b) | | | 2/25/2023 | | | | 470,000 | | | | 470,000 | | | | 460,634 | |
PSMC Trust(a) | | | 3.50 | (f) | | | 2/25/2048 | | | | 629,266 | | | | 628,515 | | | | 637,150 | |
PSMC Trust 2018-2(a) | | | 3.50 | (f) | | | 6/25/2048 | | | | 484,904 | | | | 477,270 | | | | 491,600 | |
Sequoia Mortgage Trust 2015-1(a) | | | 2.50 | (f) | | | 1/25/2045 | | | | 211,224 | | | | 208,117 | | | | 211,499 | |
Sequoia Mortgage Trust 2018-5(a) | | | 3.50 | (f) | | | 5/25/2048 | | | | 413,894 | | | | 409,496 | | | | 419,627 | |
Sequoia Mortgage Trust 2018-7(a) | | | 4.00 | (f) | | | 9/25/2048 | | | | 132,334 | | | | 132,973 | | | | 133,296 | |
See accompanying Notes to the Financial Statements.
118
Barings Active Short Duration Bond Fund 2020 Annual Report
SCHEDULE OF INVESTMENTS (CONTINUED)
June 30, 2020
| | | | | | | | | | | | | | | | | | | | |
| | | EFFECTIVE
INTEREST RATE | | | DUE DATE | | | PRINCIPAL ‡‡ | | | COST | | | FAIR
VALUE | |
Mortgage-Backed Securities (Continued) | |
Sequoia Mortgage Trust 2019-1(a) | | | 4.00 | (f) % | | | 2/25/2049 | | | | 172,135 | | | $ | 173,707 | | | $ | 173,670 | |
Shellpoint Co-Originator Trust 2016-1 2A3(a) | | | 3.00 | (f) | | | 10/25/2031 | | | | 454,570 | | | | 458,531 | | | | 464,473 | |
Starwood Mortgage Residential Trust 2019-INV1(a) | | | 2.92 | (f) | | | 9/27/2049 | | | | 2,073,266 | | | | 2,073,266 | | | | 2,034,090 | |
Starwood Mortgage Residential Trust 2020-1(a) | | | 2.88 | (f) | | | 2/25/2050 | | | | 4,700,000 | | | | 4,699,872 | | | | 4,154,824 | |
TIAA Bank Mortgage Loan Trust 2018-2(a) | | | 3.50 | (f) | | | 7/25/2048 | | | | 246,149 | | | | 243,857 | | | | 248,136 | |
Verus Securitization Trust 2018-INV2(a) | | | 4.71 | (f) | | | 10/25/2058 | | | | 2,501,899 | | | | 2,546,963 | | | | 2,535,427 | |
Verus Securitization Trust 2019-4(a) | | | 3.21 | (f) | | | 11/25/2059 | | | | 1,750,000 | | | | 1,750,000 | | | | 1,654,103 | |
Verus Securitization Trust 2019-INV2(a) | | | 3.22 | (f) | | | 7/25/2059 | | | | 2,116,671 | | | | 2,116,645 | | | | 2,115,424 | |
Verus Securitization Trust 2019-INV3(a) | | | 3.28 | (f) | | | 11/25/2059 | | | | 1,462,000 | | | | 1,461,966 | | | | 1,395,092 | |
Verus Securitization Trust 2020-1(a) | | | 3.02 | (f) | | | 1/25/2060 | | | | 4,646,000 | | | | 4,646,000 | | | | 4,320,767 | |
Wells Fargo Mortgage Backed Securities 2019-1 Trust(a) | | | 4.00 | (f) | | | 11/25/2048 | | | | 257,384 | | | | 259,231 | | | | 258,039 | |
| | | | | | | | | | | | | | | | | | | | |
Total Mortgage-Backed Securities | | | | | | | | | | | 113,519,932 | | | | 113,979,034 | | | | 109,620,679 | |
| | | | | | | | | | | | | | | | | | | | |
U.S. Treasury & Government Agencies — 0.7%*: | |
U.S. Treasury Bonds(g) | | | 8.00 | | | | 11/15/2021 | | | | 5,000,000 | | | | 5,414,793 | | | | 5,537,500 | |
| | | | | | | | | | | | | | | | | | | | |
| | | | | | | | | | | | | | | | | | | | |
Total Fixed Income | | | | | | | | | | | 759,386,764 | | | | 763,114,388 | | | | 749,154,107 | |
| | | | | | | | | | | | | | | | | | | | |
| | | | | | | | | | | | | | | | | | | | | | | | | | | | | | |
| | | COUNTERPARTY | | STRIKE
PRICE | | | EXPIRATION
DATE | | | CONTRACTS | | | NOTIONAL | | | COST | | | UNREALIZED
VALUE | | | FAIR
VALUE | |
Purchased Options — 0.1%*: | |
|
Call Option Purchased — 0.0%*: | |
OTC – BCM Swaption | | JPMorgan Chase Bank N.A. | | | $2.44 | | | | 12/13/2032 | | | | 1,958,250 | | | | 1,958,250 | | | | 98,255 | | | | 206,191 | | | | 304,446 | |
| | | | | | | | | | | | | | | | | | | | | | | | | | | | | | |
|
Put Options Purchased — 0.1%*: | |
OTC – BCM Swaption | | JPMorgan Chase Bank N.A. | | | 2.94 | | | | 12/13/2032 | | | | 22,790,000 | | | | 22,790,000 | | | | 1,143,488 | | | | (505,675 | ) | | | 637,813 | |
OTC – BCM Swaption | | JPMorgan Chase Bank N.A. | | | 3.11 | | | | 1/31/2033 | | | | 7,500,000 | | | | 7,500,000 | | | | 358,500 | | | | (166,293 | ) | | | 192,207 | |
| | | | | | | | | | | | | | | | | | | | | | | | | | | | | | |
Total Put Options | | | | | | | | 30,290,000 | | | | 30,290,000 | | | | 1,501,988 | | | | (671,968 | ) | | | 830,020 | |
| | | | | | | | | | | | | | | | | | | | | | | | | | | | | | |
| | | | | | | | | | | | | | | | | | | | |
| | | EFFECTIVE
INTEREST RATE | | | DUE DATE | | | PRINCIPAL ‡‡ | | | COST | | | FAIR
VALUE | |
Short-Term Investments — 6.8%*: | |
|
Commercial Paper — 6.8%*: | |
|
Beverages — 0.6%*: | |
Keurig Dr Pepper, Inc. | | | 0.49 | | | | 7/13/2020 | | | | 5,000,000 | | | | 4,999,200 | | | | 4,999,200 | |
| | | | | | | | | | | | | | | | | | | | |
|
Chemicals — 1.5%*: | |
DuPont de Nemours, Inc. | | | 0.41 | | | | 8/19/2020 | | | | 3,000,000 | | | | 2,998,367 | | | | 2,998,367 | |
DuPont de Nemours, Inc. | | | 0.52 | | | | 8/13/2020 | | | | 3,000,000 | | | | 2,998,172 | | | | 2,998,172 | |
See accompanying Notes to the Financial Statements.
119
Barings Active Short Duration Bond Fund 2020 Annual Report
SCHEDULE OF INVESTMENTS (CONTINUED)
June 30, 2020
| | | | | | | | | | | | | | | | | | | | |
| | | EFFECTIVE
INTEREST RATE | | | DUE DATE | | | PRINCIPAL ‡‡ | | | COST | | | FAIR
VALUE | |
Commercial Paper (Continued) | |
|
Chemicals (Continued) | |
EI Dupont | | | 0.83 | % | | | 12/2/2020 | | | | 6,000,000 | | | $ | 5,978,953 | | | $ | 5,978,953 | |
| | | | | | | | | | | | | | | | | | | | |
Total Chemicals | | | | | | | | | | | 12,000,000 | | | | 11,975,492 | | | | 11,975,492 | |
| | | | | | | | | | | | | | | | | | | | |
|
Electric — 0.7%*: | |
Agilent Technologies, Inc. | | | 0.24 | | | | 7/2/2020 | | | | 5,000,000 | | | | 4,999,967 | | | | 4,999,967 | |
| | | | | | | | | | | | | | | | | | | | |
|
Electronics — 0.4%*: | |
Daimler AG(c) | | | 1.73 | % | | | 9/29/2020 | | | | $3,000,000 | | | | $2,987,250 | | | | $2,987,250 | |
| | | | | | | | | | | | | | | | | | | | |
|
Entertainment — 0.6%*: | |
Fidelity National Information Services | | | 0.25 | | | | 7/10/2020 | | | | 5,000,000 | | | | 4,999,688 | | | | 4,999,688 | |
| | | | | | | | | | | | | | | | | | | | |
|
Machinery-Constr&Mining — 0.6%*: | |
Parker-Hannfin Corp. | | | 0.38 | | | | 8/18/2020 | | | | 5,000,000 | | | | 4,997,533 | | | | 4,997,533 | |
| | | | | | | | | | | | | | | | | | | | |
|
Oil and Gas — 0.6%*: | |
FMC Technology, Inc. | | | 2.24 | | | | 7/15/2020 | | | | 5,000,000 | | | | 4,995,722 | | | | 4,995,722 | |
| | | | | | | | | | | | | | | | | | | | |
|
Oil and Gas Services — 0.6%*: | |
Enbridge, Inc. | | | 0.53 | | | | 7/29/2020 | | | | 5,000,000 | | | | 4,997,978 | | | | 4,997,978 | |
| | | | | | | | | | | | | | | | | | | | |
|
Packaging and Containers — 0.6%*: | |
Bemis Co., Inc. | | | 0.41 | | | | 7/15/2020 | | | | 5,000,000 | | | | 4,999,222 | | | | 4,999,222 | |
| | | | | | | | | | | | | | | | | | | | |
|
Utility — 0.6%*: | |
Entergy Corp. | | | 0.71 | | | | 9/15/2020 | | | | 5,000,000 | | | | 4,992,611 | | | | 4,992,611 | |
| | | | | | | | | | | | | | | | | | | | |
Total Commercial Paper | | | | | | | | | | | 55,000,000 | | | | 54,944,663 | | | | 54,944,663 | |
| | | | | | | | | | | | | | | | | | | | |
Total Short-Term Investments | | | | | | | | | | | 55,000,000 | | | | 54,944,663 | | | | 54,944,663 | |
| | | | | | | | | | | | | | | | | | | | |
Total Investments | | | | | | | | | | | 846,635,014 | | | | 819,659,294 | | | | 805,233,236 | |
| | | | | | | | | | | | | | | | | | | | |
| |
Other assets and liabilities – (0.2%)* | | | | (1,736,231 | ) |
| | | | | | | | | | | | | | | | | | | | |
| |
Net Assets – 100.0% | | | | $803,497,005 | |
| | | | | | | | | | | | | | | | | | | | |
| ‡‡ | Unless otherwise indicated, all principal amounts are denominated in United States Dollars. |
| * | Calculated as a percentage of net assets applicable to common shareholders. |
| (a) | Security acquired in a transaction exempt from registration under Rule 144A of the Securities Act of 1933. These securities may only be resold in transactions exempt from registration, normally to qualified institutional buyers. |
| (b) | Variable rate security. The interest rate shown is the rate in effect at June 30, 2020. |
See accompanying Notes to the Financial Statements.
120
Barings Active Short Duration Bond Fund 2020 Annual Report
SCHEDULE OF INVESTMENTS (CONTINUED)
June 30, 2020
Distributions of investments by country of risk (excluding temporary cash investments) as a percentage of total investments in securities, is as follows:
| | | | | | |
| | United States | | | 88.5% | |
| | Ireland | | | 2.4% | |
| | United Kingdom | | | 2.0% | |
| | Switzerland | | | 1.6% | |
| | Japan | | | 1.0% | |
| | Canada | | | 1.0% | |
| | Other (Individually less than 1%) | | | 3.5% | |
| | | | | | |
| | Total | | | 100.0% | |
| | | | | | |
| (d) | Variable Rate is Fixed to Float: Rate remains fixed until designated future date. |
| (e) | For fair value measurement disclosure purposes, security is categorized as Level 3 (See Note 2). |
| (f) | Effective interest rate for this security is the coupon rate at issue based on the underlying loans. |
| (g) | All or a portion of this security is held for open swaps collateral. |
A summary of outstanding derivatives at June 30, 2020 is as follows:
Futures
| | | | | | | | | | | | | | | | | | | | | | |
| TYPE | | EXPIRATION
DATE | | CONTRACTS | | | NOTIONAL
AMOUNT | | | POSITION | | | FAIR VALUE | | | UNREALIZED
DEPRECIATION | |
Short Futures | |
90 Day Euro Futures | | 09/14/20 | | | 6 | | | | (1,462,778 | ) | | | Short | | | | $ (1,496,025) | | | $ | (33,247 | ) |
90 Day Euro Futures | | 12/14/20 | | | 5 | | | | (1,218,919 | ) | | | Short | | | | (1,246,375) | | | | (27,456 | ) |
90 Day Euro Futures | | 03/15/21 | | | 5 | | | | (1,219,356 | ) | | | Short | | | | (1,247,500) | | | | (28,144 | ) |
90 Day Euro Futures | | 09/13/21 | | | 9 | | | | (2,195,180 | ) | | | Short | | | | (2,246,063) | | | | (50,883 | ) |
90 Day Euro Futures | | 03/14/22 | | | 8 | | | | (1,950,670 | ) | | | Short | | | | (1,996,400) | | | | (45,730 | ) |
90 Day Euro Futures | | 09/19/22 | | | 7 | | | | (1,706,137 | ) | | | Short | | | | (1,746,151) | | | | (40,014 | ) |
90 Day Euro Futures | | 03/13/23 | | | 6 | | | | (1,461,503 | ) | | | Short | | | | (1,495,800) | | | | (34,297 | ) |
90 Day Euro Futures | | 12/18/23 | | | 8 | | | | (1,946,870 | ) | | | Short | | | | (1,991,700) | | | | (44,830 | ) |
90 Day Euro Futures | | 12/16/24 | | | 22 | | | | (5,347,294 | ) | | | Short | | | | (5,466,451) | | | | (119,157 | ) |
U.S. 10-Year Ultra Bond | | 09/21/20 | | | 84 | | | | (13,192,362 | ) | | | Short | | | | (13,228,687) | | | | (36,325 | ) |
U.S. 2-Year Treasury Note | | 09/30/20 | | | 787 | | | | (173,777,533 | ) | | | Short | | | | (173,791,735) | | | | (14,202 | ) |
U.S. 5-Year Treasury Note | | 09/30/20 | | | 1,604 | | | | (201,139,190 | ) | | | Short | | | | (201,690,470) | | | | (551,280 | ) |
| | | | | | | | | | | | | | | | | | | | | | |
Total Short Futures | | | $ | (1,025,565 | ) |
| | | | | | | | | | | | | | | | | | | | | | |
See accompanying Notes to the Financial Statements.
121
Barings Active Short Duration Bond Fund 2020 Annual Report
SCHEDULE OF INVESTMENTS (CONTINUED)
June 30, 2020
Centrally Cleared Credit Default Swaps – Buy Protection(1)
| | | | | | | | | | | | | | | | | | | | | | | | | | | | | | | | |
REFERENCE
OBLIGATION | | FIXED-DEAL
RECEIVED
RATE | | | PAYMENT
FREQUENCY | | | MATURITY
DATE | | | ORIGINAL
NOTIONAL
AMOUNT | | | CURRENT
NOTIONAL
AMOUNT (2) | | | UPFRONT
PREMIUMS
PAID/
(RECEIVED) | | | FAIR
VALUE (3) | | | UNREALIZED
DEPRECIATION | |
| CDX.NA.IG.34† | | | 1.00 | % | | | 3M | | | | 6/20/2025 | | | | 3,300,000 | | | | 3,300,000 | | | $ | 10,685 | | | $ | (39,784 | ) | | $ | (50,469 | ) |
| CDX.NA.IG.34† | | | 1.00 | % | | | 3M | | | | 6/20/2025 | | | | 4,400,000 | | | | 4,400,000 | | | | 17,574 | | | | (53,046 | ) | | | (70,620 | ) |
| | | | | | | | | | | | | | | | | | | | | | | | | | | | | | | | |
Total Centrally Cleared Credit Default Swaps – Buy Protection | | | | | | | $ | 28,259 | | | $ | (92,830 | ) | | $ | (121,089 | ) |
| | | | | | | | | | | | | | | | | | | | | | | | | | | | | | | | |
| (1) | Represents an investment grade index of single name credit default swaps (CDS). All of the companies underlying the single name CDS within the index are rated investment grade or higher. Rating represents a weighted average of the credit ratings of all the companies underlying the single name CDS within the index. |
| (2) | The maximum potential amount the Fund could be required to make as a seller of credit protection or receive as a buyer of credit event as defined under the terms of that particular swap agreement. |
| (3) | The quoted market prices and resulting values for credit default swap agreements on asset-backed securities and credit indices serve as an indicator of the current status of the payment/performance risk and represent the expected amount paid or received for the credit derivative if the amount of the swap agreement was closed/sold as of the period end. Increasing market values, in absolute terms when compared to the notional amount of the swap, represent a deterioration of the referenced entity’s credit soundness and a greater likelihood or risk of default or other credit event occurring as defined under the terms of the agreements. |
| † | Payment is based on a percentage of the index. Reference entities are a number of individual issuers comprising the index. |
See accompanying Notes to the Financial Statements.
122
Barings Diversified Income Fund 2020 Annual Report
SCHEDULE OF INVESTMENTS
June 30, 2020
| | | | | | | | | | | | | | | | | | | | |
| | | EFFECTIVE
INTEREST RATE | | | DUE DATE | | | PRINCIPAL ‡‡ | | | COST | | | FAIR
VALUE | |
Fixed Income — 98.8%*: | |
|
Asset-Backed Securities — 45.4%*: | |
|
CDO/CLO — 27.2%*: | |
Allegro CLO X Ltd., 3M USD LIBOR + 2.750%(a) | | | 3.89 | (b)% | | | 4/20/2032 | | | | 500,000 | | | | $500,000 | | | | $484,623 | |
Anchorage Capital CLO Ltd. 2016-9A CR, 3M USD LIBOR + 2.850%(a) | | | 4.07 | (b) | | | 7/15/2032 | | | | 500,000 | | | | 500,000 | | | | 487,651 | |
Ares CLO Ltd. 2019-53A C, 3M USD LIBOR + 2.650%(a) | | | 3.67 | (b) | | | 4/24/2031 | | | | 500,000 | | | | 500,000 | | | | 491,535 | |
Ares LV CLO Ltd. 2020-55A B, 3M USD LIBOR + 2.500%(a),(c) | | | 2.87 | (b) | | | 4/15/2031 | | | | 750,000 | | | | 750,000 | | | | 751,849 | |
Avery Point VII CLO Ltd., 3M USD LIBOR + 3.600%(a) | | | 4.82 | (b) | | | 1/15/2028 | | | | 500,000 | | | | 500,000 | | | | 464,432 | |
Ballyrock CLO 2016-1 Ltd., 3M USD LIBOR + 3.500%(a) | | | 4.72 | (b) | | | 10/15/2028 | | | | 500,000 | | | | 500,000 | | | | 478,725 | |
Ballyrock CLO 2019-2 Ltd., 3M USD LIBOR + 4.100%(a) | | | 4.48 | (b) | | | 11/20/2030 | | | | 500,000 | | | | 500,000 | | | | 489,136 | |
CBAM Ltd. 2019-10, 3M USD LIBOR + 2.050%(a) | | | 3.19 | (b) | | | 4/20/2032 | | | | 500,000 | | | | 500,000 | | | | 489,376 | |
CBAM Ltd. 2019-10, 3M USD LIBOR + 2.750%(a) | | | 3.89 | (b) | | | 4/20/2032 | | | | 500,000 | | | | 500,000 | | | | 494,193 | |
Crestline Denali CLO XIV Ltd., 3M USD LIBOR + 1.800%(a) | | | 2.84 | (b) | | | 10/23/2031 | | | | 250,000 | | | | 250,000 | | | | 233,951 | |
Denali Capital CLO XI Ltd., 3M USD LIBOR + 1.650%(a) | | | 2.79 | (b) | | | 10/20/2028 | | | | 550,000 | | | | 549,515 | | | | 523,218 | |
Eaton Vance CLO Ltd. 2013-1, 3M USD LIBOR + 2.800%(a) | | | 4.02 | (b) | | | 1/15/2028 | | | | 500,000 | | | | 500,000 | | | | 488,026 | |
Eaton Vance CLO Ltd. 2019-1, 3M USD LIBOR + 1.950%(a) | | | 3.17 | (b) | | | 4/15/2031 | | | | 500,000 | | | | 500,000 | | | | 490,346 | |
Elmwood CLO II Ltd., 3M USD LIBOR + 2.900%(a) | | | 4.04 | (b) | | | 4/20/2031 | | | | 750,000 | | | | 750,000 | | | | 735,754 | |
Elmwood CLO II Ltd., 3M USD LIBOR + 3.950%(a) | | | 5.09 | (b) | | | 4/20/2031 | | | | 500,000 | | | | 500,000 | | | | 498,421 | |
KKR Financial CLO Ltd. 25 C, 3M USD LIBOR + 2.750%(a) | | | 3.97 | (b) | | | 4/15/2032 | | | | 500,000 | | | | 500,000 | | | | 489,570 | |
KREF 2018-FL1 Ltd., 1M USD LIBOR + 1.100%(a),(c) | | | 1.29 | (b) | | | 6/15/2036 | | | | 400,000 | | | | 385,323 | | | | 394,675 | |
KREF Ltd. 2018-FL1, 1M USD LIBOR + 2.550%(a) | | | 2.74 | (b) | | | 6/15/2036 | | | | 420,000 | | | | 423,324 | | | | 397,862 | |
Magnetite XXVI Ltd. 2020-26A B, 3M USD LIBOR + 2.400%(a),(c) | | | 2.60 | (b) | | | 7/15/2030 | | | | 750,000 | | | | 750,000 | | | | 749,910 | |
OCP CLO 2020-19 Ltd., 3M USD LIBOR + 2.500%(a),(c) | | | 2.82 | (b) | | | 7/20/2031 | | | | 500,000 | | | | 500,000 | | | | 499,935 | |
TICP CLO VI Ltd. 2016-2, 3M USD LIBOR + 3.300%(a) | | | 4.52 | (b) | | | 1/15/2029 | | | | 500,000 | | | | 500,000 | | | | 482,928 | |
Verde CLO, 3M USD LIBOR + 1.900%(a) | | | 3.12 | (b) | | | 4/15/2032 | | | | 500,000 | | | | 500,000 | | | | 486,817 | |
| | | | | | | | | | | | | | | | | | | | |
Total CDO/CLO | | | | | | | | | | | 11,370,000 | | | | 11,358,162 | | | | 11,102,933 | |
| | | | | | | | | | | | | | | | | | | | |
See accompanying Notes to the Financial Statements.
123
Barings Diversified Income Fund 2020 Annual Report
SCHEDULE OF INVESTMENTS (CONTINUED)
June 30, 2020
| | | | | | | | | | | | | | | | | | | | |
| | | EFFECTIVE
INTEREST RATE | | | DUE DATE | | | PRINCIPAL ‡‡ | | | COST | | | FAIR
VALUE | |
Asset-Backed Securities (Continued): | | | | | | | | | | | | | | | | | | | | |
| | | | | |
Other Asset-Backed Securities — 18.2%*: | | | | | | | | | | | | | | | | | | | | |
Aaset 2019-1 Trust(a) | | | 3.84 | % | | | 5/15/2039 | | | | 288,266 | | | $ | 288,266 | | | $ | 260,450 | |
AASET 2020-1 Trust(a) | | | 4.34 | | | | 1/16/2040 | | | | 489,753 | | | | 489,743 | | | | 259,690 | |
Access Group, Inc. 2015-1 B, 1M USD LIBOR + 1.500%(a) | | | 1.68 | (b) | | | 7/25/2058 | | | | 100,000 | | | | 86,827 | | | | 87,322 | |
AccessLex Institute 2004-A A3, 28 Day ARS | | | 1.67 | (b) | | | 7/1/2039 | | | | 100,000 | | | | 98,818 | | | | 98,561 | |
Adams Outdoor Advertising LP(a) | | | 4.81 | | | | 11/15/2048 | | | | 194,218 | | | | 201,439 | | | | 197,438 | |
Arbys Funding LLC 2015-1A A2(a) | | | 4.97 | | | | 10/30/2045 | | | | 38,200 | | | | 38,200 | | | | 38,924 | |
CARS-DB4 LP(a) | | | 4.17 | | | | 2/15/2050 | | | | 100,000 | | | | 99,957 | | | | 88,044 | |
CLI Funding VI LLC(a) | | | 4.64 | | | | 5/18/2044 | | | | 178,598 | | | | 178,569 | | | | 172,919 | |
College Avenue Student Loans LLC, 1M USD LIBOR + 1.650%(a) | | | 1.83 | (b) | | | 11/26/2046 | | | | 153,297 | | | | 147,381 | | | | 144,108 | |
College Loan Corp. Trust I 2005-2 B, 3M USD LIBOR + 0.490% | | | 1.71 | (b) | | | 1/15/2037 | | | | 71,730 | | | | 64,181 | | | | 60,178 | |
College Loan Corp. Trust I 2017-1 B2, 28 day ARS | | | 1.68 | (b) | | | 1/25/2047 | | | | 45,000 | | | | 38,887 | | | | 44,341 | |
Commonbond Student Loan Trust 2020-A-GS(a) | | | 3.16 | | | | 8/25/2050 | | | | 515,000 | | | | 514,909 | | | | 515,370 | |
Credit Suisse ABS Repackaging Trust 2013-A B(a) | | | 2.50 | | | | 1/25/2030 | | | | 25,826 | | | | 24,784 | | | | 25,716 | |
EdLinc Student Loan Funding Trust 2017-A A, 1M USD LIBOR – 1.150%(a) | | | 3.60 | (b) | | | 12/1/2047 | | | | 53,324 | | | | 52,970 | | | | 52,627 | |
EDvestinU Private Education Loan Issue No 1 LLC(a) | | | 4.49 | | | | 11/25/2043 | | | | 277,000 | | | | 276,810 | | | | 289,924 | |
Goodgreen 2019-2(a) | | | 3.86 | | | | 10/15/2054 | | | | 287,110 | | | | 287,064 | | | | 285,077 | |
Goodgreen Trust 2018-1A A(a) | | | 3.93 | | | | 10/15/2053 | | | | 270,575 | | | | 279,869 | | | | 281,437 | |
Horizon Aircraft Finance I Ltd.(a) | | | 5.27 | | | | 12/15/2038 | | | | 450,400 | | | | 459,271 | | | | 246,613 | |
Horizon Aircraft Finance II Ltd.(a) | | | 4.70 | | | | 7/15/2039 | | | | 286,538 | | | | 286,529 | | | | 158,191 | |
Kestrel Aircraft Funding Ltd.(a),(c) | | | 4.25 | | | | 12/15/2038 | | | | 309,718 | | | | 315,541 | | | | 258,617 | |
Labrador Aviation Finance Ltd. 2016-1A(a) | | | 4.30 | | | | 1/15/2042 | | | | 196,879 | | | | 197,406 | | | | 163,895 | |
Navient Student Loan Trust 2018-1B, 1M USD LIBOR + 1.200%(a) | | | 1.38 | (b) | | | 3/25/2067 | | | | 100,000 | | | | 96,002 | | | | 93,823 | |
Nelnet Private Education Loan Trust 2016-A A1B(a) | | | 3.60 | | | | 12/26/2040 | | | | 22,918 | | | | 22,780 | | | | 23,378 | |
Nelnet Student Loan Trust 2006-2 B, 3M USD LIBOR + 0.200% | | | 1.19 | (b) | | | 1/25/2038 | | | | 177,880 | | | | 167,321 | | | | 152,768 | |
Nelnet Student Loan Trust 2006-3, 3M USD LIBOR + 0.250% | | | 0.55 | (b) | | | 6/25/2041 | | | | 120,784 | | | | 113,202 | | | | 99,846 | |
Oscar US Funding Trust IX LLC 2018-2A A4(a),(c) | | | 3.63 | | | | 9/10/2025 | | | | 130,000 | | | | 129,312 | | | | 134,654 | |
Oxford Finance Funding 2020-1 LLC(a) | | | 3.10 | | | | 2/15/2028 | | | | 475,000 | | | | 475,000 | | | | 480,760 | |
Oxford Finance Funding 2020-1 LLC(a) | | | 4.04 | | | | 2/15/2028 | | | | 450,000 | | | | 450,000 | | | | 443,250 | |
Primose Funding LLC(a) | | | 4.48 | | | | 7/30/2049 | | | | 666,653 | | | | 666,740 | | | | 670,267 | |
SLC Student Loan Trust 2005-1 B, 3M USD LIBOR + 0.200% | | | 0.59 | (b) | | | 2/15/2045 | | | | 73,157 | | | | 63,651 | | | | 62,671 | |
SLM Student Loan Trust 2002-7 B, 28 day ARS | | | 3.69 | (b) | | | 12/15/2039 | | | | 80,000 | | | | 80,056 | | | | 74,374 | |
SLM Student Loan Trust 2003-14, 3M USD LIBOR + 0.550% | | | 1.54 | (b) | | | 10/25/2065 | | | | 168,711 | | | | 160,503 | | | | 151,044 | |
See accompanying Notes to the Financial Statements.
124
Barings Diversified Income Fund 2020 Annual Report
SCHEDULE OF INVESTMENTS (CONTINUED)
June 30, 2020
| | | | | | | | | | | | | | | | | | | | |
| | | EFFECTIVE
INTEREST RATE | | | DUE DATE | | | PRINCIPAL ‡‡ | | | COST | | | FAIR
VALUE | |
Asset-Backed Securities (Continued): | | | | | | | | | | | | | | | | | | | | |
|
Other Asset-Backed Securities (Continued): | |
SLM Student Loan Trust 2004-1, 3M USD LIBOR + 0.500% | | | 1.49 | (b) % | | | 7/25/2039 | | | | 157,979 | | | $ | 146,665 | | | $ | 141,937 | |
SLM Student Loan Trust 2005-6 B, 3M USD LIBOR + 0.290% | | | 1.28 | (b) | | | 1/25/2044 | | | | 98,306 | | | | 91,612 | | | | 76,911 | |
SLM Student Loan Trust 2006-5 B, 3M USD LIBOR + 0.210% | | | 1.20 | (b) | | | 10/25/2040 | | | | 92,380 | | | | 81,932 | | | | 84,775 | |
SoFi Professional Loan Program LLC 2017-A C(a) | | | 4.43 | | | | 3/26/2040 | | | | 100,000 | | | | 99,515 | | | | 104,438 | |
South Carolina Student Loan Corp. 2014-1 B, 1M USD LIBOR + 1.500% | | | 1.67 | (b) | | | 8/1/2035 | | | | 100,000 | | | | 98,834 | | | | 97,105 | |
Store Master Funding I-VII(a) | | | 4.74 | | | | 10/20/2048 | | | | 228,083 | | | | 234,778 | | | | 216,236 | |
Taco Bell Funding LLC 2016-1A A23(a) | | | 4.97 | | | | 5/25/2046 | | | | 67,900 | | | | 68,480 | | | | 70,566 | |
Textainer Marine Containers VII Ltd.(a) | | | 5.28 | | | | 4/20/2044 | | | | 181,333 | | | | 181,262 | | | | 180,215 | |
Wachovia Student Loan Trust 2005-1 B, 3M USD LIBOR + 0.300% | | | 1.29 | (b) | | | 10/25/2040 | | | | 54,740 | | | | 50,547 | | | | 50,013 | |
Willis Engine Structured Trust IV(a) | | | 4.75 | | | | 9/15/2043 | | | | 355,833 | | | | 363,802 | | | | 268,625 | |
| | | | | | | | | | | | | | | | | | | | |
Total Other Asset-Backed Securities | | | | | | | | | | | 8,333,089 | | | | 8,269,415 | | | | 7,407,098 | |
| | | | | | | | | | | | | | | | | | | | |
Total Asset-Backed Securities | | | | | | | | | | | 19,703,089 | | | | 19,627,577 | | | | 18,510,031 | |
| | | | | | | | | | | | | | | | | | | | |
Corporate Bonds — 45.6%*: | |
|
Aerospace/Defense — 0.2%*: | |
TransDigm, Inc.(a) | | | 6.25 | | | | 3/15/2026 | | | | 95,000 | | | | 93,148 | | | | 94,764 | |
| | | | | | | | | | | | | | | | | | | | |
|
Auto Manufacturers — 2.2%*: | |
BMW US Capital LLC(a),(c) | | | 3.40 | | | | 8/13/2021 | | | | 380,000 | | | | 382,659 | | | | 390,060 | |
Ford Motor Co. | | | 9.63 | | | | 4/22/2030 | | | | 100,000 | | | | 115,705 | | | | 118,430 | |
Ford Motor Credit Co. LLC | | | 3.81 | | | | 10/12/2021 | | | | 375,000 | | | | 369,387 | | | | 371,363 | |
| | | | | | | | | | | | | | | | | | | | |
Total Auto Manufacturers | | | | | | | | | | | 855,000 | | | | 867,751 | | | | 879,853 | |
| | | | | | | | | | | | | | | | | | | | |
|
Chemicals — 0.6%*: | |
UPL Corp. Ltd.(c) | | | 4.63 | | | | 6/16/2030 | | | | 260,000 | | | | 258,873 | | | | 256,750 | |
| | | | | | | | | | | | | | | | | | | | |
|
Commercial Banks — 9.9%*: | |
ABQ Finance Ltd.(c) | | | 3.13 | | | | 9/24/2024 | | | | 500,000 | | | | 490,406 | | | | 512,178 | |
Banco de Credito del Peru, 5 year CMT + 3.000%(a),(c) | | | 3.13 | (b) | | | 7/1/2030 | | | | 414,000 | | | | 410,911 | | | | 410,481 | |
Banco Santander SA(c) | | | 2.75 | | | | 5/28/2025 | | | | 400,000 | | | | 404,717 | | | | 414,526 | |
Bank Leumi Le-Israel BM, 5 year CMT + 1.631%(a),(b),(c) | | | 3.28 | | | | 1/29/2031 | | | | 500,000 | | | | 500,000 | | | | 485,312 | |
Bank of America Corp. | | | 4.20 | | | | 8/26/2024 | | | | 280,000 | | | | 303,070 | | | | 310,856 | |
Barclays plc, 3M USD LIBOR + 2.452%(c) | | | 2.85 | (b) | | | 5/7/2026 | | | | 390,000 | | | | 390,000 | | | | 407,497 | |
BPCE SA(a),(c) | | | 5.70 | | | | 10/22/2023 | | | | 385,000 | | | | 430,817 | | | | 429,022 | |
Credit Suisse AG(a),(c) | | | 6.50 | | | | 8/8/2023 | | | | 310,000 | | | | 345,470 | | | | 337,981 | |
Morgan Stanley | | | 4.10 | | | | 5/22/2023 | | | | 680,000 | | | | 718,836 | | | | 734,888 | |
| | | | | | | | | | | | | | | | | | | | |
Total Commercial Banks | | | | | | | | | | | 3,859,000 | | | | 3,994,227 | | | | 4,042,741 | |
| | | | | | | | | | | | | | | | | | | | |
See accompanying Notes to the Financial Statements.
125
Barings Diversified Income Fund 2020 Annual Report
SCHEDULE OF INVESTMENTS (CONTINUED)
June 30, 2020
| | | | | | | | | | | | | | | | | | | | |
| | | EFFECTIVE
INTEREST RATE | | | DUE DATE | | | PRINCIPAL ‡‡ | | | COST | | | FAIR
VALUE | |
Corporate Bonds (Continued): | |
|
Diversified Financial Services — 3.5%*: | |
Lazard Group LLC | | | 3.75 | % | | | 2/13/2025 | | | | 410,000 | | | $ | 436,815 | | | $ | 435,326 | |
LeasePlan Corp. NV(a),(c) | | | 2.88 | | | | 10/24/2024 | | | | 510,000 | | | | 512,806 | | | | 521,482 | |
Shinhan Financial Group Co. Ltd., 5 year CMT + 1.500%(a),(c) | | | 3.34 | (b) | | | 2/5/2030 | | | | 242,000 | | | | 242,000 | | | | 253,117 | |
SPARC EM SPC Panama Metro Line 2 SP(c) | | | Zero Coupon | | | | 12/5/2022 | | | | 237,795 | | | | 227,356 | | | | 229,021 | |
| | | | | | | | | | | | | | | | | | | | |
Total Diversified Financial Services | | | | | | | | | | | 1,399,795 | | | | 1,418,977 | | | | 1,438,946 | |
| | | | | | | | | | | | | | | | | | | | |
|
Electric — 3.7%*: | |
Adani Electricity Mumbai Ltd.(a),(c) | | | 3.95 | | | | 2/12/2030 | | | | 550,000 | | | | 526,006 | | | | 512,703 | |
Colbun SA(a),(c) | | | 3.15 | | | | 3/6/2030 | | | | 430,000 | | | | 418,140 | | | | 432,016 | |
Infraestructura Energetica Nova SAB de CV(a),(c) | | | 3.75 | | | | 1/14/2028 | | | | 288,000 | | | | 296,137 | | | | 282,240 | |
Tabreed Sukuk Spc Ltd.(c) | | | 5.50 | | | | 10/31/2025 | | | | 250,000 | | | | 266,772 | | | | 279,101 | |
| | | | | | | | | | | | | | | | | | | | |
Total Electric | | | | | | | | | | | 1,518,000 | | | | 1,507,055 | | | | 1,506,060 | |
| | | | | | | | | | | | | | | | | | | | |
|
Engineering&Construction — 0.6%*: | |
Dianjian International Finance Ltd., 5 year CMT + 1.933%(c) | | | 4.60 | (b) | | | 12/31/2099 | | | | 250,000 | | | | 246,256 | | | | 254,375 | |
| | | | | | | | | | | | | | | | | | | | |
|
Food — 0.8%*: | |
JBS USA Food Co.(a) | | | 5.50 | | | | 1/15/2030 | | | | 202,000 | | | | 206,816 | | | | 207,050 | |
Kraft Heinz Foods Co. | | | 6.88 | | | �� | 1/26/2039 | | | | 80,000 | | | | 96,826 | | | | 98,898 | |
| | | | | | | | | | | | | | | | | | | | |
Total Food | | | | | | | | | | | 282,000 | | | | 303,642 | | | | 305,948 | |
| | | | | | | | | | | | | | | | | | | | |
|
Gas — 0.5%*: | |
Grupo Energia Bogota SA ESP(a),(c) | | | 4.88 | | | | 5/15/2030 | | | | 200,000 | | | | 198,071 | | | | 209,500 | |
| | | | | | | | | | | | | | | | | | | | |
|
Insurance — 6.2%*: | |
Athene Global Funding(a) | | | 2.50 | | | | 1/14/2025 | | | | 710,000 | | | | 690,831 | | | | 708,880 | |
Enstar Group Ltd. | | | 4.95 | | | | 6/1/2029 | | | | 420,000 | | | | 443,470 | | | | 442,336 | |
Equitable Holdings, Inc. | | | 3.90 | | | | 4/20/2023 | | | | 350,000 | | | | 362,337 | | | | 374,639 | |
Hanwha Life Insurance Co. Ltd., 5 year CMT + 2.000%(c) | | | 4.70 | (b) | | | 4/23/2048 | | | | 300,000 | | | | 296,904 | | | | 303,469 | |
Prudential Financial, Inc., 3M USD LIBOR + 3.920% | | | 5.63 | (b) | | | 6/15/2043 | | | | 320,000 | | | | 344,702 | | | | 340,480 | |
Qatar Reinsurance Co. Ltd., 5 year USD Swap + 2.786%(b),(c) | | | 4.95 | | | | 12/31/2099 | | | | 350,000 | | | | 360,658 | | | | 339,062 | |
| | | | | | | | | | | | | | | | | | | | |
Total Insurance | | | | | | | | | | | 2,450,000 | | | | 2,498,902 | | | | 2,508,866 | |
| | | | | | | | | | | | | | | | | | | | |
|
Internet — 1.0%*: | |
Netflix, Inc. | | | 5.88 | | | | 11/15/2028 | | | | 85,000 | | | | 95,464 | | | | 96,794 | |
Prosus NV(a),(c) | | | 3.68 | | | | 1/21/2030 | | | | 300,000 | | | | 300,000 | | | | 314,130 | |
| | | | | | | | | | | | | | | | | | | | |
Total Internet | | | | | | | | | | | 385,000 | | | | 395,464 | | | | 410,924 | |
| | | | | | | | | | | | | | | | | | | | |
|
Investment Company Security — 1.1%*: | |
Ares Capital Corp. | | | 3.25 | | | | 7/15/2025 | | | | 230,000 | | | | 232,458 | | | | 223,218 | |
BlackRock TCP Capital Corp. | | | 4.13 | | | | 8/11/2022 | | | | 225,000 | | | | 230,977 | | | | 225,564 | |
| | | | | | | | | | | | | | | | | | | | |
Total Investment Company Security | | | | | | | | | | | 455,000 | | | | 463,435 | | | | 448,782 | |
| | | | | | | | | | | | | | | | | | | | |
See accompanying Notes to the Financial Statements.
126
Barings Diversified Income Fund 2020 Annual Report
SCHEDULE OF INVESTMENTS (CONTINUED)
June 30, 2020
| | | | | | | | | | | | | | | | | | | | |
| | | EFFECTIVE
INTEREST RATE | | | DUE DATE | | | PRINCIPAL ‡‡ | | | COST | | | FAIR
VALUE | |
Corporate Bonds (Continued): | |
| | | | | |
IT Services — 1.0%*: | | | | | | | | | | | | | | | | | | | | |
Dell International LLC/EMC Corp.(a) | | | 5.85 | % | | | 7/15/2025 | | | | 359,000 | | | $ | 403,499 | | | $ | 412,563 | |
| | | | | | | | | | | | | | | | | | | | |
|
Lodging — 0.2%*: | |
MGM Resorts International | | | 6.75 | | | | 5/1/2025 | | | | 95,000 | | | | 95,000 | | | | 94,058 | |
| | | | | | | | | | | | | | | | | | | | |
|
Media — 0.8%*: | |
CCO Holdings Capital Corp.(a) | | | 5.88 | | | | 4/1/2024 | | | | 90,000 | | | | 92,506 | | | | 92,812 | |
DISH Network Corp. | | | 3.38 | | | | 8/15/2026 | | | | 140,000 | | | | 127,120 | | | | 128,606 | |
Sirius XM Radio, Inc.(a) | | | 5.50 | | | | 7/1/2029 | | | | 90,000 | | | | 93,873 | | | | 94,736 | |
| | | | | | | | | | | | | | | | | | | | |
Total Media | | | | | | | | | | | 320,000 | | | | 313,499 | | | | 316,154 | |
| | | | | | | | | | | | | | | | | | | | |
|
Mining — 1.5%*: | |
First Quantum Minerals Ltd.(a),(c) | | | 7.25 | | | | 5/15/2022 | | | | 200,000 | | | | 195,829 | | | | 195,800 | |
Glencore Funding LLC(a),(c) | | | 4.00 | | | | 4/16/2025 | | | | 385,000 | | | | 407,899 | | | | 418,371 | |
| | | | | | | | | | | | | | | | | | | | |
Total Mining | | | | | | | | | | | 585,000 | | | | 603,728 | | | | 614,171 | |
| | | | | | | | | | | | | | | | | | | | |
|
Oil and Gas — 1.7%*: | |
EQT Corp. | | | 3.00 | | | | 10/1/2022 | | | | 205,000 | | | | 204,307 | | | | 190,650 | |
Gazprom PJSC via Gaz Finance plc(a) | | | 3.25 | | | | 2/25/2030 | | | | 500,000 | | | | 480,823 | | | | 497,500 | |
| | | | | | | | | | | | | | | | | | | | |
Total Oil and Gas | | | | | | | | | | | 705,000 | | | | 685,130 | | | | 688,150 | |
| | | | | | | | | | | | | | | | | | | | |
|
Pipelines — 1.7%*: | |
Fermaca Enterprises S de RL de CV(a),(c) | | | 6.38 | | | | 3/30/2038 | | | | 258,531 | | | | 263,689 | | | | 273,396 | |
KazTransGas JSC(a),(c) | | | 4.38 | | | | 9/26/2027 | | | | 400,000 | | | | 405,321 | | | | 430,125 | |
| | | | | | | | | | | | | | | | | | | | |
Total Pipelines | | | | | | | | | | | 658,531 | | | | 669,010 | | | | 703,521 | |
| | | | | | | | | | | | | | | | | | | | |
|
Real Estate — 1.1%*: | |
NE Property BV(c) | | | 1.88 | | | | 10/9/2026 | | | | 415,000 | | | | 450,500 | | | | 431,553 | |
| | | | | | | | | | | | | | | | | | | | |
|
Real Estate Investment Trusts — 2.8%*: | |
PLA Administradora Industrial S de RL de CV(a),(c) | | | 4.96 | | | | 7/18/2029 | | | | 290,000 | | | | 290,000 | | | | 278,942 | |
STORE Capital Corp. | | | 4.63 | | | | 3/15/2029 | | | | 555,000 | | | | 511,948 | | | | 567,502 | |
Tanger Properties LP | | | 3.88 | | | | 12/1/2023 | | | | 316,000 | | | | 322,743 | | | | 310,506 | |
| | | | | | | | | | | | | | | | | | | | |
Total REITS | | | | | | | | | | | 1,161,000 | | | | 1,124,691 | | | | 1,156,950 | |
| | | | | | | | | | | | | | | | | | | | |
|
Retail — 0.8%*: | |
El Puerto de Liverpool SAB de CV(a),(c) | | | 3.95 | | | | 10/2/2024 | | | | 320,000 | | | | 305,846 | | | | 326,435 | |
| | | | | | | | | | | | | | | | | | | | |
|
Telecommunications — 2.0%*: | |
AT&T, Inc. | | | 2.30 | | | | 6/1/2027 | | | | 225,000 | | | | 224,671 | | | | 232,936 | |
PLDT, Inc.(c) | | | 3.45 | | | | 6/23/2050 | | | | 375,000 | | | | 371,881 | | | | 376,875 | |
Sprint Capital Corp. | | | 8.75 | | | | 3/15/2032 | | | | 140,000 | | | | 200,715 | | | | 200,375 | |
| | | | | | | | | | | | | | | | | | | | |
Total Telecommunications | | | | | | | | | | | 740,000 | | | | 797,267 | | | | 810,186 | |
| | | | | | | | | | | | | | | | | | | | |
|
Transportation — 0.2%*: | |
XPO Logistics, Inc.(a) | | | 6.25 | | | | 5/1/2025 | | | | 95,000 | | | | 95,000 | | | | 99,513 | |
| | | | | | | | | | | | | | | | | | | | |
See accompanying Notes to the Financial Statements.
127
Barings Diversified Income Fund 2020 Annual Report
SCHEDULE OF INVESTMENTS (CONTINUED)
June 30, 2020
| | | | | | | | | | | | | | | | | | | | |
| | | EFFECTIVE
INTEREST RATE | | | DUE DATE | | | PRINCIPAL ‡‡ | | | COST | | | FAIR VALUE | |
Corporate Bonds (Continued): | |
| | | | | |
Trucking and Leasing — 1.5%*: | | | | | | | | | | | | | | | | | | | | |
Park Aerospace Holdings Ltd.(a),(c) | | | 5.25 | % | | | 8/15/2022 | | | | 650,000 | | | $ | 672,533 | | | $ | 610,137 | |
| | | | | | | | | | | | | | | | | | | | |
Total Corporate Bonds | | | | | | | | | | | 18,112,326 | | | | 18,461,504 | | | | 18,620,900 | |
| | | | | | | | | | | | | | | | | | | | |
|
Mortgage-Backed Securities — 7.8%*: | |
BX Commercial Mortgage Trust 2019-XL, 1M USD LIBOR + 2.000%(a) | | | 2.18 | (b) | | | 10/15/2036 | | | | 382,160 | | | | 359,502 | | | | 367,280 | |
Citigroup Commercial Mortgage Trust 2017-P7 | | | 3.71 | (d) | | | 4/14/2050 | | | | 470,000 | | | | 525,764 | | | | 526,698 | |
COMM 2014-LC17 Mortgage Trust | | | 4.73 | (d) | | | 10/10/2047 | | | | 400,000 | | | | 410,068 | | | | 371,656 | |
COMM 2014-UBS5 Mortgage Trust | | | 4.76 | (d) | | | 9/10/2047 | | | | 395,000 | | | | 409,597 | | | | 349,299 | |
Federal Home Loan Mortgage Corp., 1M USD LIBOR + 3.000% | | | 3.16 | (d) | | | 6/25/2050 | | | | 220,000 | | | | 220,000 | | | | 220,000 | |
GS Mortgage Securities Corp. II(a) | | | 3.00 | (d) | | | 7/10/2051 | | | | 500,000 | | | | 447,626 | | | | 289,120 | |
GS Mortgage Securities Corp. II | | | 4.16 | (d) | | | 7/10/2051 | | | | 92,252 | | | | 104,217 | | | | 107,895 | |
GS Mortgage Securities Trust 2016-GS2 | | | 4.68 | (d) | | | 5/10/2049 | | | | 200,000 | | | | 206,935 | | | | 182,460 | |
GS Mortgage Securities Trust 2017-GS5 | | | 3.67 | (d) | | | 3/10/2050 | | | | 200,000 | | | | 219,893 | | | | 222,355 | |
GS Mortgage Securities Trust 2017-GS6 | | | 3.43 | (d) | | | 5/10/2050 | | | | 200,000 | | | | 218,765 | | | | 222,459 | |
J.P. Morgan Chase Commercial Mortgage Securities Trust 2019-OSB(a) | | | 3.91 | (d) | | | 6/5/2039 | | | | 213,000 | | | | 211,416 | | | | 171,221 | |
JPMDB Commercial Mortgage Securities Trust 2017-C7 | | | 3.05 | (d) | | | 10/15/2050 | | | | 150,000 | | | | 153,851 | | | | 158,732 | |
| | | | | | | | | | | | | | | | | | | | |
Total Mortgage-Backed Securities | | | | | | | | | | | 3,422,412 | | | | 3,487,634 | | | | 3,189,175 | |
| | | | | | | | | | | | | | | | | | | | |
Total Fixed Income | | | | | | | | | | | 41,237,827 | | | | 41,576,715 | | | | 40,320,106 | |
| | | | | | | | | | | | | | | | | | | | |
Total Investments | | | | | | | | | | | 41,237,827 | | | | 41,576,715 | | | | 40,320,106 | |
| | | | | | | | | | | | | | | | | | | | |
| |
Other assets and liabilities – 1.2%* | | | | 469,626 | |
| | | | | | | | | | | | | | | | | | | | |
| |
Net Assets – 100.0% | | | | $40,789,732 | |
| | | | | | | | | | | | | | | | | | | | |
| ‡‡ | Unless otherwise indicated, all principal amounts are denominated in United States Dollars. |
| * | Calculated as a percentage of net assets applicable to common shareholders. |
| (a) | Security acquired in a transaction exempt from registration under Rule 144A of the Securities Act of 1933. These securities may only be resold in transactions exempt from registration, normally to qualified institutional buyers. |
| (b) | Variable rate security. The interest rate shown is the rate in effect at June 30, 2020. |
See accompanying Notes to the Financial Statements.
128
Barings Diversified Income Fund 2020 Annual Report
SCHEDULE OF INVESTMENTS (CONTINUED)
June 30, 2020
| | Distributions of investments by country of risk (excluding temporary cash investments) as a percentage of total investments in securities, is as follows: |
| | | | | | |
| | United States | | | 64.8% | |
| | Cayman Islands | | | 5.9% | |
| | Mexico | | | 2.9% | |
| | Ireland | | | 2.1% | |
| | Qatar | | | 2.1% | |
| | India | | | 1.9% | |
| | Switzerland | | | 1.9% | |
| | China | | | 1.4% | |
| | Republic of Korea | | | 1.4% | |
| | Netherlands | | | 1.3% | |
| | Russia | | | 1.2% | |
| | Israel | | | 1.2% | |
| | Chile | | | 1.1% | |
| | Romania | | | 1.1% | |
| | Kazakhstan | | | 1.1% | |
| | France | | | 1.1% | |
| | Spain | | | 1.0% | |
| | Peru | | | 1.0% | |
| | United Kingdom | | | 1.0% | |
| | Germany | | | 1.0% | |
| | Other (Individually less than 1%) | | | 3.5% | |
| | | | | | |
| | Total | | | 100.0% | |
| | | | | | |
| (d) | Effective interest rate for this security is the coupon rate at issue based on the underlying loans. |
A summary of outstanding derivatives at June 30, 2020 is as follows:
Forward Foreign Currency Exchange Contracts to Sell
| | | | | | | | | | | | | | | | | | | | | | |
EXPIRATION
DATE | | COUNTERPARTY | | LOCAL
CURRENCY | | | VALUE IN USD | | | IN
EXCHANGE
FOR USD | | | NET UNREALIZED
APPRECIATION
(DEPRECIATION) | |
| 7/7/20 | | Citibank N.A. | | | EUR | | | | 366,368 | | | $ | 411,655 | | | $ | 407,418 | | | $ | (4,237 | ) |
| 7/7/20 | | Standard Chartered Bank | | | EUR | | | | 15,302 | | | | 17,193 | | | | 17,300 | | | | 107 | |
| 7/7/20 | | Barclays Bank plc | | | EUR | | | | 8,339 | | | | 9,370 | | | | 9,345 | | | | (25 | ) |
| 8/6/20 | | HSBC Bank USA | | | EUR | | | | 391,309 | | | | 439,970 | | | | 439,952 | | | | (18 | ) |
| | | | | | | | | | | | | | | | | | | | | | |
Net unrealized depreciation on forward foreign currency exchange contracts to sell | | | $ | (4,173 | ) |
| | | | | | | | | | | | | | | | | | | | | | |
Currency Legend
See accompanying Notes to the Financial Statements.
129
Barings Diversified Income Fund 2020 Annual Report
SCHEDULE OF INVESTMENTS (CONTINUED)
June 30, 2020
Futures
| | | | | | | | | | | | | | | | | | | | | | |
| TYPE | | EXPIRATION
DATE | | CONTRACTS | | | NOTIONAL
AMOUNT | | | POSITION | | | FAIR VALUE | | | UNREALIZED
APPRECIATION
(DEPRECIATION) | |
Short Futures | |
Euro-BOBL Future | | 09/08/20 | | | 1 | | | | (151,446 | ) | | | Short | | | $ | (151,650 | ) | | $ | (204 | ) |
Euro-Bund Future | | 09/08/20 | | | 1 | | | | (198,037 | ) | | | Short | | | | (198,320 | ) | | | (283 | ) |
Euro-SCHATZ Future | | 09/08/20 | | | 3 | | | | (378,012 | ) | | | Short | | | | (377,968 | ) | | | 44 | |
U.S. 10-Year Ultra Bond | | 09/21/20 | | | 30 | | | | (4,710,700 | ) | | | Short | | | | (4,724,531 | ) | | | (13,831 | ) |
U.S. 2-Year Treasury Note | | 09/30/20 | | | 1 | | | | (220,810 | ) | | | Short | | | | (220,828 | ) | | | (18 | ) |
U.S. 5-Year Treasury Note | | 09/30/20 | | | 112 | | | | (14,042,714 | ) | | | Short | | | | (14,083,125 | ) | | | (40,411 | ) |
U.S. Ultra Bond | | 09/21/20 | | | 1 | | | | (215,435 | ) | | | Short | | | | (218,157 | ) | | | (2,721 | ) |
| | | | | | | | | | | | | | | | | | | | | | |
Total Short Futures | | | $ | (57,424 | ) |
| | | | | | | | | | | | | | | | | | | | | | |
See accompanying Notes to the Financial Statements.
130
Barings Emerging Markets Debt Blended Total Return Fund 2020 Annual Report
SCHEDULE OF INVESTMENTS
June 30, 2020
| | | | | | | | | | | | | | | | | | | | |
| | | EFFECTIVE
INTEREST RATE | | | DUE DATE | | | PRINCIPAL ‡‡ | | | COST | | | FAIR
VALUE | |
Fixed Income — 94.8%*: | |
|
Corporate Bonds — 39.0%*: | |
|
Aerospace/Defense — 0.6%*: | |
Embraer Overseas Ltd.(a),(b) | | | 5.70 | % | | | 9/16/2023 | | | | 327,000 | | | | $280,062 | | | | $311,570 | |
| | | | | | | | | | | | | | | | | | | | |
|
Chemicals — 3.2%*: | |
Braskem Idesa SAPI(a),(b) | | | 7.45 | | | | 11/15/2029 | | | | 795,000 | | | | 792,399 | | | | 744,318 | |
Grupo Idesa SA de CV(a),(b) | | | 10.13 | | | | 5/22/2026 | | | | 1,010,000 | | | | 974,667 | | | | 534,669 | |
SASOL Financing USA LLC(b) | | | 6.50 | | | | 9/27/2028 | | | | 555,000 | | | | 331,844 | | | | 490,709 | |
| | | | | | | | | | | | | | | | | | | | |
Total Chemicals | | | | | | | | | | | 2,360,000 | | | | 2,098,910 | | | | 1,769,696 | |
| | | | | | | | | | | | | | | | | | | | |
|
Commercial Banks — 6.0%*: | |
Burgan Bank SAK, 5 year USD Swap + 4.007%(b) | | | 5.75 | (c),(d) | | | | | | | 500,000 | | | | 499,251 | | | | 490,100 | |
National Bank of Greece SA, 5 year EUR Swap + 8.464%(b) | | | 8.25 | (c) | | | 7/18/2029 | | | | 750,000 | | | | 844,200 | | | | 872,116 | |
Nova Ljubljanska Banka dd, 5 year EUR Swap + 3.833%(b) | | | 3.65 | (c) | | | 11/19/2029 | | | | 400,000 | | | | 440,400 | | | | 393,225 | |
Sovcombank Via SovCom Capital DAC, 5 year CMT + 6.380%(a),(b) | | | 7.75 | (c),(d) | | | | | | | 200,000 | | | | 200,000 | | | | 182,000 | |
Sovcombank Via SovCom Capital DAC, 5 year CMT + 6.427%(a),(b) | | | 8.00 | (c) | | | 4/7/2030 | | | | 715,000 | | | | 715,000 | | | | 718,718 | |
TBC Bank JSC, 5 year USD Swap + 8.995%(a),(b) | | | 10.78 | (c),(d) | | | | | | | 645,000 | | | | 645,000 | | | | 616,378 | |
| | | | | | | | | | | | | | | | | | | | |
Total Commercial Banks | | | | | | | | | | | 3,210,000 | | | | 3,343,851 | | | | 3,272,537 | |
| | | | | | | | | | | | | | | | | | | | |
|
Diversified Financial Services — 3.9%*: | |
Gtlk Europe Capital DAC(b) | | | 4.65 | | | | 3/10/2027 | | | | 450,000 | | | | 384,517 | | | | 445,500 | |
India Infoline Finance Ltd.(b) | | | 5.88 | | | | 4/20/2023 | | | | 1,055,000 | | | | 988,830 | | | | 833,949 | |
Muthoot Finance Ltd.(a),(b) | | | 6.13 | | | | 10/31/2022 | | | | 840,000 | | | | 840,000 | | | | 849,450 | |
| | | | | | | | | | | | | | | | | | | | |
Total Diversified Financial Services | | | | | | | | | | | 2,345,000 | | | | 2,213,347 | | | | 2,128,899 | |
| | | | | | | | | | | | | | | | | | | | |
|
Electric — 0.6%*: | |
Infraestructura Energetica Nova SAB de CV(a),(b) | | | 4.88 | | | | 1/14/2048 | | | | 328,000 | | | | 271,557 | | | | 310,780 | |
| | | | | | | | | | | | | | | | | | | | |
|
Engineering&Construction — 1.0%*: | |
Rutas 2 and 7 Finance Ltd.(a),(b) | | | Zero Coupon | | | | 9/30/2036 | | | | 850,000 | | | | 560,312 | | | | 548,250 | |
| | | | | | | | | | | | | | | | | | | | |
|
Food — 2.6%*: | |
Camposol SA(a),(b) | | | 6.00 | | | | 2/3/2027 | | | | 380,000 | | | | 375,939 | | | | 373,738 | |
MHP Lux SA(a),(b) | | | 6.25 | | | | 9/19/2029 | | | | 270,000 | | | | 274,595 | | | | 257,512 | |
Minerva Luxembourg SA(a),(b) | | | 5.88 | | | | 1/19/2028 | | | | 300,000 | | | | 312,059 | | | | 291,426 | |
NBM US Holdings, Inc.(a),(b) | | | 6.63 | | | | 8/6/2029 | | | | 500,000 | | | | 525,119 | | | | 505,397 | |
| | | | | | | | | | | | | | | | | | | | |
Total Food | | | | | | | | | | | 1,450,000 | | | | 1,487,712 | | | | 1,428,073 | |
| | | | | | | | | | | | | | | | | | | | |
|
Household Products — 0.6%*: | |
Walnut Bidco plc(a),(b) | | | 6.75 | | | | 8/1/2024 | | | | 317,000 | | | | 352,647 | | | | 337,915 | |
| | | | | | | | | | | | | | | | | | | | |
See accompanying Notes to the Financial Statements.
131
Barings Emerging Markets Debt Blended Total Return Fund 2020 Annual Report
SCHEDULE OF INVESTMENTS (CONTINUED)
June 30, 2020
| | | | | | | | | | | | | | | | | | | | |
| | | EFFECTIVE
INTEREST RATE | | | DUE DATE | | | PRINCIPAL ‡‡ | | | COST | | | FAIR
VALUE | |
Corporate Bonds (Continued): | |
|
Metal Fabricate/Hardware — 0.8%*: | |
HTA Group Ltd.(a),(b) | | | 7.00 | % | | | 12/18/2025 | | | | 416,000 | | | $ | 413,679 | | | $ | 420,160 | |
| | | | | | | | | | | | | | | | | | | | |
|
Mining — 5.9%*: | |
Bayan Resources Tbk PT(a),(b) | | | 6.13 | | | | 1/24/2023 | | | | 900,000 | | | | 840,621 | | | | 833,706 | |
CSN Islands XI Corp.(a),(b) | | | 6.75 | | | | 1/28/2028 | | | | 721,000 | | | | 721,000 | | | | 617,356 | |
First Quantum Minerals Ltd.(a),(b) | | | 7.50 | | | | 4/1/2025 | | | | 250,000 | | | | 246,448 | | | | 239,375 | |
Metinvest BV(a),(b) | | | 5.63 | | | | 6/17/2025 | | | | 750,000 | | | | 815,933 | | | | 766,789 | |
Vedanta Resources Finance II plc(a),(b) | | | 9.25 | | | | 4/23/2026 | | | | 550,000 | | | | 548,027 | | | | 392,906 | |
Vedanta Resources Ltd.(a),(b) | | | 8.25 | | | | 6/7/2021 | | | | 400,000 | | | | 236,424 | | | | 348,880 | |
| | | | | | | | | | | | | | | | | | | | |
Total Mining | | | | | | | | | | | 3,571,000 | | | | 3,408,453 | | | | 3,199,012 | |
| | | | | | | | | | | | | | | | | | | | |
|
Oil and Gas — 6.5%*: | |
Petrobras Global Finance BV(b) | | | 6.75 | | | | 6/3/2050 | | | | 300,000 | | | | 294,335 | | | | 308,550 | |
Petrobras Global Finance BV(b) | | | 6.90 | | | | 3/19/2049 | | | | 900,000 | | | | 969,347 | | | | 947,250 | |
Petroleos Mexicanos(a),(b) | | | 6.95 | | | | 1/28/2060 | | | | 1,304,000 | | | | 1,203,248 | | | | 1,002,437 | |
Tullow Oil PLC(a),(b) | | | 6.25 | | | | 4/15/2022 | | | | 210,000 | | | | 63,891 | | | | 153,300 | |
Tullow Oil plc(a),(b) | | | 7.00 | | | | 3/1/2025 | | | | 1,840,000 | | | | 1,277,261 | | | | 1,154,600 | |
| | | | | | | | | | | | | | | | | | | | |
Total Oil and Gas | | | | | | | | | | | 4,554,000 | | | | 3,808,082 | | | | 3,566,137 | |
| | | | | | | | | | | | | | | | | | | | |
|
Real Estate — 2.3%*: | |
Kaisa Group Holdings Ltd.(b) | | | 11.25 | | | | 4/9/2022 | | | | 750,000 | | | | 760,914 | | | | 773,416 | |
Logan Property Holdings Co. Ltd.(b) | | | 5.75 | | | | 1/14/2025 | | | | 500,000 | | | | 500,000 | | | | 497,310 | |
| | | | | | | | | | | | | | | | | | | | |
Total Real Estate | | | | | | | | | | | 1,250,000 | | | | 1,260,914 | | | | 1,270,726 | |
| | | | | | | | | | | | | | | | | | | | |
|
Retail — 1.1%*: | |
Arabian Centres Sukuk Ltd.(a),(b) | | | 5.38 | | | | 11/26/2024 | | | | 700,000 | | | | 647,386 | | | | 612,780 | |
| | | | | | | | | | | | | | | | | | | | |
|
Sovereign — 0.9%*: | |
Ukreximbank Via Biz Finance plc, 5 year USD ICE Swap + 8.178%(b) | | | 9.95 | (c) | | | 11/14/2029 | | | | 500,000 | | | | 500,000 | | | | 485,100 | |
| | | | | | | | | | | | | | | | | | | | |
|
Telecommunications — 1.5%*: | |
Network i2i Ltd., 5 year CMT + 4.277%(a),(b) | | | 5.65 | (c),(d) | | | | | | | 400,000 | | | | 374,679 | | | | 386,875 | |
VF Ukraine PAT via VFU Funding plc(a),(b) | | | 6.20 | | | | 2/11/2025 | | | | 405,000 | | | | 405,000 | | | | 400,565 | |
| | | | | | | | | | | | | | | | | | | | |
Total Telecommunications | | | | | | | | | | | 805,000 | | | | 779,679 | | | | 787,440 | |
| | | | | | | | | | | | | | | | | | | | |
|
Transportation — 1.5%*: | |
MV24 Capital BV(a),(b) | | | 6.75 | | | | 6/1/2034 | | | | 592,885 | | | | 592,885 | | | | 563,170 | |
Prumo Participacoes e Investimentos SA(a),(b) | | | 7.50 | | | | 12/31/2031 | | | | 274,419 | | | | 281,903 | | | | 274,590 | |
| | | | | | | | | | | | | | | | | | | | |
Total Transportation | | | | | | | | | | | 867,304 | | | | 874,788 | | | | 837,760 | |
| | | | | | | | | | | | | | | | | | | | |
Total Corporate Bonds | | | | | | | | | | | 23,850,304 | | | | 22,301,379 | | | | 21,286,835 | |
| | | | | | | | | | | | | | | | | | | | |
See accompanying Notes to the Financial Statements.
132
Barings Emerging Markets Debt Blended Total Return Fund 2020 Annual Report
SCHEDULE OF INVESTMENTS (CONTINUED)
June 30, 2020
| | | | | | | | | | | | | | | | | | | | |
| | | EFFECTIVE
INTEREST RATE | | | DUE DATE | | | PRINCIPAL ‡‡ | | | COST | | | FAIR
VALUE | |
|
Foreign Government — 55.8%*: | |
|
Albania — 1.5%*: | |
Albania Government International Bond(a),(b) | | | 3.50 | % | | | 6/16/2027 | | | | 740,000 | | | $ | 832,550 | | | $ | 828,272 | |
| | | | | | | | | | | | | | | | | | | | |
|
Angola — 0.8%*: | |
Angolan Government International Bonds(a),(b) | | | 8.00 | | | | 11/26/2029 | | | | 250,000 | | | | 250,000 | | | | 206,875 | |
Angolan Government International Bonds(a),(b) | | | 8.25 | | | | 5/9/2028 | | | | 280,000 | | | | 288,786 | | | | 231,700 | |
| | | | | | | | | | | | | | | | | | | | |
Total Angola | | | | | | | | | | | 530,000 | | | | 538,786 | | | | 438,575 | |
| | | | | | | | | | | | | | | | | | | | |
|
Belarus — 4.7%*: | |
Republic of Belarus International Bond(a),(b) | | | 7.63 | | | | 6/29/2027 | | | | 1,000,000 | | | | 1,029,176 | | | | 1,030,000 | |
Republic of Belarus Ministry of Finance(a),(b) | | | 6.38 | | | | 2/24/2031 | | | | 1,630,000 | | | | 1,630,000 | | | | 1,568,875 | |
| | | | | | | | | | | | | | | | | | | | |
Total Belarus | | | | | | | | | | | 2,630,000 | | | | 2,659,176 | | | | 2,598,875 | |
| | | | | | | | | | | | | | | | | | | | |
|
Brazil — 1.1%*: | |
Brazil Notas do Tesouro Nacional Serie B(b) | | | 6.00 | | | | 8/15/2050 | | | | 780,000 | | | | 665,243 | | | | 612,853 | |
| | | | | | | | | | | | | | | | | | | | |
|
Colombia — 1.9%*: | |
Colombian TES(b) | | | 7.00 | | | | 6/30/2032 | | | | 720,400,000 | | | | 154,531 | | | | 194,389 | |
Colombian TES(b) | | | 7.50 | | | | 8/26/2026 | | | | 1,350,000,000 | | | | 446,398 | | | | 407,058 | |
Colombian TES(b) | | | 10.00 | | | | 7/24/2024 | | | | 1,385,600,000 | | | | 523,809 | | | | 452,654 | |
| | | | | | | | | | | | | | | | | | | | |
Total Colombia | | | | | | | | | | | 3,456,000,000 | | | | 1,124,738 | | | | 1,054,101 | |
| | | | | | | | | | | | | | | | | | | | |
|
Croatia — 0.8%*: | |
Croatia Government International Bond(b) | | | 1.50 | | | | 6/17/2031 | | | | 370,000 | | | | 415,449 | | | | 414,473 | |
| | | | | | | | | | | | | | | | | | | | |
|
Ecuador — 0.8%*: | |
Ecuador Government International Bond(a),(b),(e) | | | 9.65 | | | | 12/13/2026 | | | | 650,000 | | | | 243,750 | | | | 276,250 | |
Ecuador Government International Bond(a),(b),(e) | | | 10.65 | | | | 1/31/2029 | | | | 420,000 | | | | 159,600 | | | | 174,300 | |
| | | | | | | | | | | | | | | | | | | | |
Total Ecuador | | | | | | | | | | | 1,070,000 | | | | 403,350 | | | | 450,550 | |
| | | | | | | | | | | | | | | | | | | | |
|
Egypt — 0.7%*: | |
Egypt Government International Bond(a),(b) | | | 6.38 | | | | 4/11/2031 | | | | 350,000 | | | | 392,822 | | | | 363,733 | |
| | | | | | | | | | | | | | | | | | | | |
|
El Salvador — 3.9%*: | |
El Salvador Government International Bond(a),(b) | | | 7.65 | | | | 6/15/2035 | | | | 700,000 | | | | 508,561 | | | | 601,125 | |
El Salvador Government International Bonds(a),(b) | | | 7.12 | | | | 1/20/2050 | | | | 400,000 | | | | 400,000 | | | | 324,400 | |
El Salvador Government International Bonds(a),(b) | | | 8.25 | | | | 4/10/2032 | | | | 600,000 | | | | 640,848 | | | | 550,125 | |
El Salvador Government International Bonds(a),(b) | | | 8.63 | | | | 2/28/2029 | | | | 670,000 | | | | 767,445 | | | | 632,731 | |
| | | | | | | | | | | | | | | | | | | | |
Total El Salvador | | | | | | | | | | | 2,370,000 | | | | 2,316,854 | | | | 2,108,381 | |
| | | | | | | | | | | | | | | | | | | | |
|
Honduras — 1.7%*: | |
Honduras Government International Bond(a),(b) | | | 5.63 | | | | 6/24/2030 | | | | 890,000 | | | | 893,994 | | | | 904,462 | |
| | | | | | | | | | | | | | | | | | | | |
See accompanying Notes to the Financial Statements.
133
Barings Emerging Markets Debt Blended Total Return Fund 2020 Annual Report
SCHEDULE OF INVESTMENTS (CONTINUED)
June 30, 2020
| | | | | | | | | | | | | | | | | | | | |
| | | EFFECTIVE
INTEREST RATE | | | DUE DATE | | | PRINCIPAL ‡‡ | | | COST | | | FAIR
VALUE | |
Foreign Government (Continued): | |
|
Ivory Coast — 1.1%*: | |
Ivory Coast Government International Bond(a),(b) | | | 5.88 | % | | | 10/17/2031 | | | | 550,000 | | | $ | 599,778 | | | $ | 580,270 | |
| | | | | | | | | | | | | | | | | | | | |
|
Jordan — 1.9%*: | |
Kingdom of Jordan(b) | | | 5.85 | | | | 7/7/2030 | | | | 1,030,000 | | | | 1,030,000 | | | | 1,030,000 | |
| | | | | | | | | | | | | | | | | | | | |
|
Macedonia — 1.1%*: | |
North Macedonia Government International Bond(a),(b) | | | 3.68 | | | | 6/3/2026 | | | | 550,000 | | | | 596,285 | | | | 628,545 | |
| | | | | | | | | | | | | | | | | | | | |
|
Malaysia — 1.6%*: | |
Malaysia Government Bond(b) | | | 3.96 | | | | 9/15/2025 | | | | 3,502,000 | | | | 874,115 | | | | 875,704 | |
| | | | | | | | | | | | | | | | | | | | |
|
Mexico — 6.2%*: | |
Mexican Bonos(b) | | | 5.75 | | | | 3/5/2026 | | | | 14,500,000 | | | | 736,170 | | | | 648,209 | |
Mexican Bonos(b) | | | 7.75 | | | | 11/13/2042 | | | | 23,900,000 | | | | 1,003,651 | | | | 1,137,315 | |
Mexican Bonos(b) | | | 8.00 | | | | 9/5/2024 | | | | 3,200,000 | | | | 142,104 | | | | 155,888 | |
Mexican Bonos(b) | | | 8.00 | | | | 11/7/2047 | | | | 30,000,000 | | | | 1,391,323 | | | | 1,464,710 | |
| | | | | | | | | | | | | | | | | | | | |
Total Mexico | | | | | | | | | | | 71,600,000 | | | | 3,273,248 | | | | 3,406,122 | |
| | | | | | | | | | | | | | | | | | | | |
|
Peru — 2.0%*: | |
Peru Government Bond(b) | | | 6.85 | | | | 2/12/2042 | | | | 3,369,000 | | | | 1,190,607 | | | | 1,118,503 | |
| | | | | | | | | | | | | | | | | | | | |
|
Poland — 2.1%*: | |
Republic of Poland Government Bond(b) | | | 2.75 | | | | 10/25/2029 | | | | 4,000,000 | | | | 1,150,131 | | | | 1,138,589 | |
| | | | | | | | | | | | | | | | | | | | |
|
Romania — 2.6%*: | |
Romanian Government International Bond(a),(b) | | | 3.62 | | | | 5/26/2030 | | | | 890,000 | | | | 972,414 | | | | 1,079,908 | |
Romanian Government International Bond(a),(b) | | | 6.13 | | | | 1/22/2044 | | | | 250,000 | | | | 295,359 | | | | 327,734 | |
| | | | | | | | | | | | | | | | | | | | |
Total Romania | | | | | | | | | | | 1,140,000 | | | | 1,267,773 | | | | 1,407,642 | |
| | | | | | | | | | | | | | | | | | | | |
|
Senegal — 0.9%*: | |
Senegal Government International Bond(a),(b) | | | 8.75 | | | | 5/13/2021 | | | | 500,000 | | | | 498,540 | | | | 517,344 | |
| | | | | | | | | | | | | | | | | | | | |
|
Serbia — 1.5%*: | |
Serbia International Bond(a),(b) | | | 3.13 | | | | 5/15/2027 | | | | 680,000 | | | | 724,314 | | | | 800,269 | |
| | | | | | | | | | | | | | | | | | | | |
|
South Africa — 4.9%*: | |
Republic of South Africa Government Bond(b) | | | 10.50 | | | | 12/21/2026 | | | | 41,000,000 | | | | 2,616,382 | | | | 2,696,260 | |
| | | | | | | | | | | | | | | | | | | | |
|
Supranational — 1.9%*: | |
Asian Development Bank, TBIB6MIR(b),(f) | | | 9.08 | (c) | | | 7/14/2021 | | | | 1,020,000 | | | | 342,558 | | | | 329,523 | |
European Bank for Reconstruction & Development, GGRRC9MX – 0.500%(b),(f) | | | 8.50 | (c) | | | 10/29/2022 | | | | 1,200,000 | | | | 404,027 | | | | 386,304 | |
International Bank for Reconstruction & Development(b),(f) | | | 7.25 | | | | 11/22/2021 | | | | 960,000 | | | | 325,423 | | | | 300,687 | |
| | | | | | | | | | | | | | | | | | | | |
Total Supranational | | | | | | | | | | | 3,180,000 | | | | 1,072,008 | | | | 1,016,514 | |
| | | | | | | | | | | | | | | | | | | | |
See accompanying Notes to the Financial Statements.
134
Barings Emerging Markets Debt Blended Total Return Fund 2020 Annual Report
SCHEDULE OF INVESTMENTS (CONTINUED)
June 30, 2020
| | | | | | | | | | | | | | | | | | | | |
| | | EFFECTIVE
INTEREST RATE | | | DUE DATE | | | PRINCIPAL ‡‡ | | | COST | | | FAIR VALUE | |
Foreign Government (Continued): | |
|
Tajikistan — 0.3%*: | |
Republic of Tajikistan International Bond(a),(b) | | | 7.13 | % | | | 9/14/2027 | | | | 200,000 | | | $ | 156,282 | | | $ | 163,313 | |
| | | | | | | | | | | | | | | | | | | | |
|
Thailand — 2.1%*: | |
Thailand Government Bond(b) | | | 1.60 | | | | 12/17/2029 | | | | 9,105,000 | | | | 293,943 | | | | 304,488 | |
Thailand Government Bond(b) | | | 2.88 | | | | 12/17/2028 | | | | 22,913,000 | | | | 813,712 | | | | 839,833 | |
| | | | | | | | | | | | | | | | | | | | |
Total Thailand | | | | | | | | | | | 32,018,000 | | | | 1,107,655 | | | | 1,144,321 | |
| | | | | | | | | | | | | | | | | | | | |
|
Ukraine — 5.9%*: | |
Ukraine Government International Bonds(a),(b) | | | 4.38 | | | | 1/27/2030 | | | | 1,250,000 | | | | 1,386,938 | | | | 1,204,251 | |
Ukraine Government International Bonds(a),(b) | | | 6.75 | | | | 6/20/2026 | | | | 795,000 | | | | 907,296 | | | | 906,580 | |
Ukraine Government International Bonds(a),(b) | | | 9.75 | | | | 11/1/2028 | | | | 960,000 | | | | 932,105 | | | | 1,096,800 | |
| | | | | | | | | | | | | | | | | | | | |
Total Ukraine | | | | | | | | | | | 3,005,000 | | | | 3,226,339 | | | | 3,207,631 | |
| | | | | | | | | | | | | | | | | | | | |
|
Uruguay — 1.8%*: | |
Uruguay Government International Bond(b) | | | 3.88 | | | | 7/2/2040 | | | | 20,350,000 | | | | 475,290 | | | | 482,549 | |
Uruguay Government International Bond(b) | | | 4.38 | | | | 12/15/2028 | | | | 21,027,027 | | | | 552,095 | | | | 523,932 | |
| | | | | | | | | | | | | | | | | | | | |
Total Uruguay | | | | | | | | | | | 41,377,027 | | | | 1,027,385 | | | | 1,006,481 | |
| | | | | | | | | | | | | | | | | | | | |
Total Foreign Government | | | | 3,673,431,027 | | | | 30,653,804 | | | | 30,511,783 | |
| | | | | | | | | | | | | |
Total Fixed Income | | | | 3,697,281,331 | | | | 52,955,183 | | | | 51,798,618 | |
| | | | | | | | | | | | | |
Total Investments | | | | 3,697,281,331 | | | | 52,955,183 | | | | 51,798,618 | |
| | | | | | | | | | | | | |
| | |
Other assets and liabilities – 5.2%* | | | | | | | 2,861,181 | |
| | | | | | | | | | | | | | | | | | | | |
| | |
Net Assets – 100.0% | | | | | | | $54,659,799 | |
| | | | | | | | | | | | | | | | | | | | |
| ‡‡ | Unless otherwise indicated, all principal amounts are denominated in United States Dollars. |
| * | Calculated as a percentage of net assets applicable to common shareholders. |
| (a) | Security acquired in a transaction exempt from registration under Rule 144A of the Securities Act of 1933. These securities may only be resold in transactions exempt from registration, normally to qualified institutional buyers. |
See accompanying Notes to the Financial Statements.
135
Barings Emerging Markets Debt Blended Total Return Fund 2020 Annual Report
SCHEDULE OF INVESTMENTS (CONTINUED)
June 30, 2020
| | Distributions of investments by country of risk (excluding temporary cash investments) as a percentage of total investments in securities, is as follows: |
| | | | | | |
| | Mexico | | | 11.6% | |
| | Ukraine | | | 9.1% | |
| | Brazil | | | 8.6% | |
| | South Africa | | | 6.1% | |
| | India | | | 5.4% | |
| | Belarus | | | 5.0% | |
| | El Salvador | | | 4.1% | |
| | Russia | | | 3.4% | |
| | Peru | | | 2.9% | |
| | Romania | | | 2.7% | |
| | Ghana | | | 2.5% | |
| | China | | | 2.5% | |
| | Thailand | | | 2.2% | |
| | Poland | | | 2.2% | |
| | Colombia | | | 2.0% | |
| | Jordan | | | 2.0% | |
| | Supranational | | | 2.0% | |
| | Uruguay | | | 1.9% | |
| | Honduras | | | 1.7% | |
| | Malaysia | | | 1.7% | |
| | Greece | | | 1.7% | |
| | Indonesia | | | 1.6% | |
| | Albania | | | 1.6% | |
| | Serbia | | | 1.5% | |
| | Macedonia | | | 1.2% | |
| | Georgia | | | 1.2% | |
| | Saudi Arabia | | | 1.2% | |
| | Ivory Coast | | | 1.1% | |
| | Paraguay | | | 1.1% | |
| | Senegal | | | 1.0% | |
| | Other (Individually less than 1%) | | | 7.2% | |
| | | | | | |
| | Total | | | 100.0% | |
| | | | | | |
| (c) | Variable rate security. The interest rate shown is the rate in effect at June 30, 2020. |
| (d) | Security is perpetual in nature and has no stated maturity. |
| (f) | For fair value measurement disclosure purposes, security is categorized as Level 3 (See Note 2). |
See accompanying Notes to the Financial Statements.
136
Barings Emerging Markets Debt Blended Total Return Fund 2020 Annual Report
SCHEDULE OF INVESTMENTS (CONTINUED)
June 30, 2020
A summary of outstanding derivatives at June 30, 2020 is as follows:
Forward Foreign Currency Exchange Contracts to Buy
| | | | | | | | | | | | | | | | | | | | | | |
EXPIRATION
DATE | | COUNTERPARTY | | LOCAL
CURRENCY | | | VALUE IN USD | | | IN
EXCHANGE
FOR USD | | | NET UNREALIZED
APPRECIATION
(DEPRECIATION) | |
| 7/21/20 | | JPMorgan Chase Bank N.A. | | | AUD | | | | 4,526,793 | | | $ | 3,124,286 | | | $ | 2,897,940 | | | $ | 226,346 | |
| 8/18/20 | | Barclays Bank plc | | | AUD | | | | 2,248,628 | | | | 1,552,114 | | | | 1,456,180 | | | | 95,934 | |
| 7/7/20 | | JPMorgan Chase Bank N.A. | | | BRL | | | | 14,621,660 | | | | 2,688,179 | | | | 2,749,652 | | | | (61,473 | ) |
| 8/4/20 | | Goldman Sachs & Co. | | | BRL | | | | 1,505,570 | | | | 276,400 | | | | 268,000 | | | | 8,400 | |
| 8/4/20 | | JPMorgan Chase Bank N.A. | | | BRL | | | | 771,524 | | | | 141,640 | | | | 137,760 | | | | 3,880 | |
| 8/4/20 | | Citibank N.A. | | | BRL | | | | 24,977,868 | | | | 4,585,562 | | | | 4,452,000 | | | | 133,562 | |
| 10/6/20 | | JPMorgan Chase Bank N.A. | | | BRL | | | | 235,118 | | | | 43,067 | | | | 42,644 | | | | 423 | |
| 8/11/20 | | Bank of America N.A. | | | CHF | | | | 354,959 | | | | 375,087 | | | | 374,000 | | | | 1,087 | |
| 7/7/20 | | Citibank N.A. | | | CLP | | | | 1,069,114,000 | | | | 1,301,785 | | | | 1,340,145 | | | | (38,360 | ) |
| 7/7/20 | | Citibank N.A. | | | COP | | | | 9,120,849,459 | | | | 2,425,970 | | | | 2,361,470 | | | | 64,500 | |
| 7/14/20 | | JPMorgan Chase Bank N.A. | | | EUR | | | | 3,039,739 | | | | 3,416,009 | | | | 3,316,782 | | | | 99,227 | |
| 8/11/20 | | Citibank N.A. | | | EUR | | | | 803,805 | | | | 903,860 | | | | 871,219 | | | | 32,641 | |
| 8/11/20 | | Bank of America N.A. | | | EUR | | | | 298,765 | | | | 335,955 | | | | 332,000 | | | | 3,955 | |
| 7/14/20 | | JPMorgan Chase Bank N.A. | | | HUF | | | | 368,792,818 | | | | 1,169,934 | | | | 1,159,527 | | | | 10,407 | |
| 7/14/20 | | Bank of America N.A. | | | HUF | | | | 634,563,460 | | | | 2,013,048 | | | | 2,026,000 | | | | (12,952 | ) |
| 7/21/20 | | Bank of America N.A. | | | JPY | | | | 277,248,975 | | | | 2,568,301 | | | | 2,618,964 | | | | (50,663 | ) |
| 8/11/20 | | JPMorgan Chase Bank N.A. | | | KZT | | | | 372,229,798 | | | | 906,022 | | | | 884,400 | | | | 21,622 | |
| 7/7/20 | | Bank of America N.A. | | | MXN | | | | 53,180,598 | | | | 2,312,300 | | | | 2,139,031 | | | | 173,269 | |
| 8/4/20 | | Goldman Sachs & Co. | | | MXN | | | | 7,608,602 | | | | 329,571 | | | | 302,000 | | | | 27,571 | |
| 8/4/20 | | Barclays Bank plc | | | MXN | | | | 16,149,978 | | | | 699,545 | | | | 697,650 | | | | 1,895 | |
| 10/6/20 | | Goldman Sachs & Co. | | | MXN | | | | 22,408,599 | | | | 962,853 | | | | 955,000 | | | | 7,853 | |
| 7/7/20 | | Barclays Bank plc | | | PEN | | | | 3,504,302 | | | | 989,389 | | | | 990,476 | | | | (1,087 | ) |
| 7/21/20 | | Goldman Sachs & Co. | | | PHP | | | | 131,642,404 | | | | 2,644,386 | | | | 2,576,172 | | | | 68,214 | |
| 9/18/20 | | Citibank N.A. | | | PKR | | | | 71,154,548 | | | | 419,063 | | | | 429,937 | | | | (10,874 | ) |
| 11/16/20 | | Citibank N.A. | | | PKR | | | | 49,760,750 | | | | 291,431 | | | | 305,000 | | | | (13,569 | ) |
| 11/16/20 | | JPMorgan Chase Bank N.A. | | | PKR | | | | 57,709,480 | | | | 337,984 | | | | 356,724 | | | | (18,740 | ) |
| 7/14/20 | | Citibank N.A. | | | PLN | | | | 19,874,438 | | | | 5,023,684 | | | | 4,706,442 | | | | 317,242 | |
| 8/11/20 | | Bank of America N.A. | | | PLN | | | | 1,160,641 | | | | 293,403 | | | | 276,162 | | | | 17,241 | |
| 7/14/20 | | Bank of America N.A. | | | RUB | | | | 81,997,965 | | | | 1,150,442 | | | | 1,070,833 | | | | 79,609 | |
| 7/21/20 | | BNP Paribas S.A. | | | SGD | | | | 347,884 | | | | 249,640 | | | | 249,000 | | | | 640 | |
| 7/21/20 | | Citibank N.A. | | | THB | | | | 83,955,959 | | | | 2,716,235 | | | | 2,607,368 | | | | 108,867 | |
| | | | | | | | | | | | | | | | | | | | | | |
Net unrealized appreciation on forward foreign currency exchange contracts to buy | | | $ | 1,296,667 | |
| | | | | |
See accompanying Notes to the Financial Statements.
137
Barings Emerging Markets Debt Blended Total Return Fund 2020 Annual Report
SCHEDULE OF INVESTMENTS (CONTINUED)
June 30, 2020
Forward Foreign Currency Exchange Contracts to Sell
| | | | | | | | | | | | | | | | | | | | | | |
EXPIRATION
DATE | | COUNTERPARTY | | LOCAL
CURRENCY | | | VALUE IN USD | | | IN
EXCHANGE
FOR USD | | | NET
UNREALIZED
APPRECIATION
(DEPRECIATION) | |
| 7/21/20 | | Goldman Sachs & Co. | | | AUD | | | | 1,924,547 | | | $ | 1,328,277 | | | $ | 1,342,000 | | | $ | 13,723 | |
| 7/7/20 | | Citibank N.A. | | | BRL | | | | 2,481,053 | | | | 456,139 | | | | 457,000 | | | | 861 | |
| 7/7/20 | | Goldman Sachs & Co. | | | BRL | | | | 3,905,263 | | | | 717,979 | | | | 763,000 | | | | 45,021 | |
| 7/7/20 | | JPMorgan Chase Bank N.A. | | | BRL | | | | 8,235,344 | | | | 1,514,061 | | | | 1,649,412 | | | | 135,351 | |
| 7/14/20 | | Barclays Bank plc | | | CHF | | | | 924,393 | | | | 975,996 | | | | 956,748 | | | | (19,248 | ) |
| 8/11/20 | | Bank of America N.A. | | | CHF | | | | 2,013,595 | | | | 2,127,774 | | | | 2,073,052 | | | | (54,722 | ) |
| 7/7/20 | | Citibank N.A. | | | CLP | | | | 1,069,114,000 | | | | 1,301,785 | | | | 1,237,028 | | | | (64,757 | ) |
| 7/7/20 | | Citibank N.A. | | | COP | | | | 9,120,849,459 | | | | 2,425,970 | | | | 2,225,683 | | | | (200,287 | ) |
| 10/6/20 | | Citibank N.A. | | | COP | | | | 4,045,777,459 | | | | 1,068,325 | | | | 1,073,635 | | | | 5,310 | |
| 8/11/20 | | Citibank N.A. | | | CZK | | | | 9,510,010 | | | | 400,972 | | | | 380,880 | | | | (20,092 | ) |
| 7/14/20 | | Barclays Bank plc | | | HUF | | | | 938,081,830 | | | | 2,975,910 | | | | 2,864,765 | | | | (111,145 | ) |
| 7/14/20 | | Citibank N.A. | | | HUF | | | | 65,274,448 | | | | 207,072 | | | | 199,000 | | | | (8,072 | ) |
| 8/10/20 | | Bank of America N.A. | | | ILS | | | | 9,263,715 | | | | 2,676,909 | | | | 2,643,000 | | | | (33,909 | ) |
| 7/21/20 | | JPMorgan Chase Bank N.A. | | | JPY | | | | 277,248,975 | | | | 2,568,301 | | | | 2,590,109 | | | | 21,808 | |
| 8/11/20 | | JPMorgan Chase Bank N.A. | | | KZT | | | | 331,188,835 | | | | 806,127 | | | | 744,245 | | | | (61,882 | ) |
| 7/7/20 | | Bank of America N.A. | | | MXN | | | | 15,257,750 | | | | 663,409 | | | | 681,000 | | | | 17,591 | |
| 7/7/20 | | Goldman Sachs & Co. | | | MXN | | | | 37,922,848 | | | | 1,648,891 | | | | 1,741,858 | | | | 92,967 | |
| 8/4/20 | | Bank of America N.A. | | | MXN | | | | 23,758,579 | | | | 1,029,116 | | | | 1,092,767 | | | | 63,651 | |
| 8/18/20 | | Barclays Bank plc | | | MYR | | | | 427,893 | | | | 99,620 | | | | 98,366 | | | | (1,254 | ) |
| 7/7/20 | | Barclays Bank plc | | | PEN | | | | 3,504,302 | | | | 989,389 | | | | 1,007,939 | | | | 18,550 | |
| 10/6/20 | | Barclays Bank plc | | | PEN | | | | 3,504,302 | | | | 987,669 | | | | 987,545 | | | | (124 | ) |
| 7/21/20 | | JPMorgan Chase Bank N.A. | | | PHP | | | | 131,642,404 | | | | 2,644,386 | | | | 2,590,366 | | | | (54,020 | ) |
| 7/14/20 | | Canadian Imperial Bank Of Commerce | | | PLN | | | | 1,721,809 | | | | 435,224 | | | | 440,000 | | | | 4,776 | |
| 7/14/20 | | Bank of America N.A. | | | RUB | | | | 67,471,528 | | | | 946,634 | | | | 949,000 | | | | 2,366 | |
| 7/14/20 | | Goldman Sachs & Co. | | | RUB | | | | 39,129,248 | | | | 548,988 | | | | 535,000 | | | | (13,988 | ) |
| 7/21/20 | | JPMorgan Chase Bank N.A. | | | SGD | | | | 919,386 | | | | 659,745 | | | | 649,743 | | | | (10,002 | ) |
| 8/18/20 | | Bank of America N.A. | | | SGD | | | | 2,754,294 | | | | 1,976,600 | | | | 1,944,522 | | | | (32,078 | ) |
| 8/18/20 | | Goldman Sachs & Co. | | | SGD | | | | 473,338 | | | | 339,688 | | | | 335,000 | | | | (4,688 | ) |
| 7/21/20 | | JPMorgan Chase Bank N.A. | | | THB | | | | 83,955,959 | | | | 2,716,235 | | | | 2,568,246 | | | | (147,989 | ) |
| 7/14/20 | | Citibank N.A. | | | TRY | | | | 4,689,419 | | | | 682,422 | | | | 677,319 | | | | (5,103 | ) |
| 7/14/20 | | JPMorgan Chase Bank N.A. | | | TRY | | | | 15,452,294 | | | | 2,248,676 | | | | 2,228,000 | | | | (20,676 | ) |
| | | | | | | | | | | | | | | | | | | | | | |
Net unrealized depreciation on forward foreign currency exchange contracts to sell | | | $ | (442,061 | ) |
| | | | | | | | | | | | | | | | | | | | | | |
See accompanying Notes to the Financial Statements.
138
Barings Emerging Markets Debt Blended Total Return Fund 2020 Annual Report
SCHEDULE OF INVESTMENTS (CONTINUED)
June 30, 2020
Currency Legend
| | | | |
| AUD | | – | | Australian Dollar |
| BRL | | – | | Brazilian Real |
| CHF | | – | | Swiss Franc |
| CLP | | – | | Chilean Peso |
| COP | | – | | Colombian Peso |
| CZK | | – | | Czech Koruna |
| EUR | | – | | Euro |
| HUF | | – | | Hungarian Forint |
| ILS | | – | | Israeli Shekel |
| JPY | | – | | Japanese Yen |
| KZT | | – | | Kazakhstani Tenge |
| MXN | | – | | Mexican Peso |
| MYR | | – | | Malaysian Ringgit |
| PEN | | – | | Peruvian Nuevo Sol |
| PHP | | – | | Philippines Peso |
| PKR | | – | | Pakistan Rupee |
| PLN | | – | | Polish Zloty |
| RUB | | – | | Russian Ruble |
| SGD | | – | | Singapore Dollar |
| THB | | – | | Thai Baht |
| TRY | | – | | Turkish New Lira |
Centrally Cleared Interest Rate Swaps
| | | | | | | | | | | | | | | | | | | | | | | | | | |
FLOATING RATE
REFERENCE | | PAY/RECEIVE
FLOATING
RATE | | FIXED
RATE | | | MATURITY
DATE | | | PAY/RECEIVE
PAYMENT
FREQUENCY | | | NOTIONAL
AMOUNT | | | CLEARED
EXCHANGE | | | UNREALIZED
APPRECIATION
DEPRECIATION | |
BRL-CDI Rate | | Pay | | | 6.38 | % | | | 1/02/23 | | | | At Maturity | | | | 15,433,847 | | | | CME | | | $ | 231,218 | |
CZK-PRIBOR Rate | | Receive | | | 0.85 | % | | | 8/23/29 | | | | 1Y/6M | | | | 60,924,370 | | | | LCH | | | | (7,026 | ) |
CZK-PRIBOR Rate | | Pay | | | 1.94 | % | | | 1/24/25 | | | | 1Y/6M | | | | 117,500,000 | | | | CME | | | | 332,456 | |
CZK-PRIBOR Rate | | Pay | | | 1.95 | % | | | 1/24/25 | | | | 1Y/6M | | | | 61,000,000 | | | | LCH | | | | 173,862 | |
BRL-CDI rate. | | Pay | | | 7.49 | % | | | 1/02/29 | | |
| At Maturity
|
| | | 9,935,952 | | | | CME | | | | 148,410 | |
BRL-CDI rate | | Pay | | | 7.48 | % | | | 1/02/29 | | |
| At Maturity
|
| | | 11,925,502 | | | | CME | | | | 173,768 | |
HUF-BUBOR rate | | Pay | | | 0.98 | % | | | 5/25/25 | | | | 1Y/6M | | | | 922,500,000 | | | | LCH | | | | 25,630 | |
HUF-BUBOR rate | | Pay | | | 0.97 | % | | | 5/25/25 | | | | 1Y/6M | | | | 899,500,000 | | | | LCH | | | | 23,562 | |
| | | | | | | | | | | | | | | | | | | | | | | | | | |
Total Centrally Cleared Interest Rate Swaps | | | | | | | | | | | | | | | $ | 1,101,880 | |
| | | | | | | |
See accompanying Notes to the Financial Statements.
139
Barings Emerging Markets Debt Blended Total Return Fund 2020 Annual Report
SCHEDULE OF INVESTMENTS (CONTINUED)
June 30, 2020
OTC Cross Currency Swaps
| | | | | | | | | | | | | | | | | | | | | | | | | | | | | | | | |
NOTIONAL
AMOUNT | | FUND
PAYS | | PAY/
RECEIVE
PAYMENT
FREQUENCY | | | MATURITY
DATE | | | COUNTERPARTY
| | NOTIONAL
AMOUNT | | | FUND
RECEIVES | | | UPFRONT
PREMIUMS
PAID/
(RECEIVED) | | | FAIR
VALUE | | | UNREALIZED
APPRECIATION
(DEPRECIATION) | |
| 370,000 EUR | | 1.50% | | | 1Y/6M | | | | 06/17/2031 | | | Citibank N.A | | | 421,800 USD | | | | 2.73 | % | | $ | 352 | | | $ | 13,656 | | | $ | 13,304 | |
| 740,000 EUR | | 3.50% | | | 1Y/6M | | | | 06/16/2027 | | | Citibank N.A. | | | 839,530 USD | | | | 4.74 | % | | | 629 | | | | 21,062 | | | | 20,433 | |
| 550,000 EUR | | 3.68% | | | 1Y/6M | | | | 06/03/2026 | | | Citibank N.A | | | 604,450 USD | | | | 4.79 | % | | | (467 | ) | | | (31,324 | ) | | | (30,857 | ) |
| 890,000 EUR | | 3.62% | | | 1Y/6M | | | | 05/26/2030 | | | Citibank N.A | | | 977,398 USD | | | | 4.96 | % | | | 44 | | | | (54,847 | ) | | | (54,891 | ) |
| 680,000 EUR | | 3.13% | | | 1Y/6M | | | | 05/15/2027 | | | Citibank N.A. | | | 735,081 USD | | | | 4.32 | % | | | (339 | ) | | | (35,102 | ) | | | (34,763 | ) |
| 350,000 EUR | | 6.38% | | | 1Y/6M | | | | 04/11/2031 | | | Citibank N.A | | | 392,700 USD | | | | 9.37 | % | | | (122 | ) | | | 62,147 | | | | 62,269 | |
| 400,000 EUR | | 3.65% | | | 1Y/6M | | | | 11/19/2029 | | | Citibank N.A. | | | 440,600 USD | | | | 6.02 | % | | | 200 | | | | 31,619 | | | | 31,419 | |
| 550,000 EUR | | 5.88% | | | 1Y/6M | | | | 10/17/2031 | | | Citibank N.A. | | | 605,000 USD | | | | 8.46 | % | | | — | | | | 52,346 | | | | 52,346 | |
| 750,000 EUR | | 5.63% | | | 1Y/6M | | | | 06/17/2025 | | | Citibank N.A. | | | 819,150 USD | | | | 8.12 | % | | | (1,088 | ) | | | 25,590 | | | | 26,678 | |
| 317,000 EUR | | 6.75% | | | 1Y/6M | | | | 08/01/2024 | | | Citibank N.A. | | | 353,011 USD | | | | 9.71 | % | | | (365 | ) | | | 27,287 | | | | 27,652 | |
| 750,000 EUR | | 8.25% | | | 1Y/6M | | | | 07/18/2029 | | | Citibank N.A. | | | 843,675 USD | | | | 11.44 | % | | | (525 | ) | | | 137,677 | | | | 138,202 | |
| 300,000 EUR | | 6.75% | | | 1Y/6M | | | | 06/20/2026 | | | Citibank N.A. | | | 336,030 USD | | | | 9.73 | % | | | (165 | ) | | | 33,526 | | | | 33,691 | |
| 495,000 EUR | | 6.75% | | | 1Y/6M | | | | 06/20/2026 | | | Citibank N.A. | | | 558,360 USD | | | | 9.58 | % | | | 273 | | | | 56,417 | | | | 56,144 | |
| 1,250,000 EUR | | 4.38% | | | 1Y/6M | | | | 01/27/2030 | | | Citibank N.A. | | | 1,385,625 USD | | | | 6.70 | % | | | (938 | ) | | | 111,344 | | | | 112,282 | |
| | | | | | | | | | | | | | | | | | | | | | | | | | | | | | | | |
Total OTC Cross Currency Swaps | | | $ | (2,511 | ) | | $ | 451,398 | | | $ | 453,909 | |
| | | | | | | | | | | | | |
OTC – Interest Rate Swaps
| | | | | | | | | | | | | | |
| DESCRIPTION | | NOTIONAL
AMOUNT | | | UNREALIZED
APPRECIATION | | | VALUE | |
Agreement with Bank of America N.A. dated 3/20/2019 receiving a fixed rate of 8.27% paying the notional amount multiplied by the 3 Month MOSPRIME rate. Expiring 3/21/2024. | | RUB | | | 94,000,000 | | | $ | 174,992 | | | $ | 174,992 | |
Agreement with Bank of America N.A. dated 3/21/2019 receiving a fixed rate of 8.21% paying the notional amount multiplied by the 3 Month MOSPRIME rate. Expiring 3/21/2024. | | RUB | | | 110,000,000 | | | | 201,370 | | | | 201,370 | |
Agreement with Bank of America N.A. dated 10/7/2019 receiving a fixed rate of 7.05% paying/ the notional amount multiplied by the 3 Month MOSPRIME rate. Expiring 10/8/2024. | | RUB | | | 146,600,000 | | | | 230,632 | | | | 230,632 | |
Agreement with Bank of America N.A. dated 10/4/2019 receiving a fixed rate of 5.88% paying the notional amount multiplied by the BRL-CDI rate. Expiring 2/1/2023. | | BRL | | | 18,084,492 | | | | 209,246 | | | | 209,246 | |
Agreement with Bank of America N.A. dated 4/9/2019 receiving a fixed rate of 8.31% paying the notional amount multiplied by the 3 Month MOSPRIME rate. Expiring 4/10/2024. | | RUB | | | 124,000,000 | | | | 205,537 | | | | 205,537 | |
Agreement with Bank of America N.A. dated 4/8/2019 receiving a fixed rate of 8.35% paying the notional amount multiplied by the 3 Month MOSPRIME rate. Expiring 4/9/2024. | | RUB | | | 124,000,000 | | | | 208,100 | | | | 208,100 | |
Agreement with Bank of America N.A. dated 3/13/2020 receiving a fixed rate of 7.55% paying/ the notional amount multiplied by the 3 Month MOSPRIME rate. Expiring 3/17/2025. | | RUB | | | 163,800,000 | | | | 276,099 | | | | 276,099 | |
Agreement with Citibank N.A. dated 3/20/2019 receiving a fixed rate of 8.28% paying the notional amount multiplied by the 3 Month MOSPRIME rate. Expiring 3/21/2024. | | RUB | | | 62,000,000 | | | | 115,740 | | | | 115,740 | |
| | | | | | | | | | | | | | |
Total OTC Interest Rate Swaps | | | | | $ | 1,621,716 | | | $ | 1,621,716 | |
| | | | | | | | | | | |
See accompanying Notes to the Financial Statements.
140
Barings Emerging Markets Debt Blended Total Return Fund 2020 Annual Report
SCHEDULE OF INVESTMENTS (CONTINUED)
June 30, 2020
OTC Credit Default Swaps – Sell Protection(1)
| | | | | | | | | | | | | | | | | | | | | | | | | | | | | | | | | | |
REFERENCE
OBLIGATION | | FIXED-DEAL
RECEIVED
RATE | | PAYMENT
FREQUENCY | | | MATURITY
DATE | | | COUNTERPARTY | | | ORIGINAL
NOTIONAL
AMOUNT | | | CURRENT
NOTIONAL
AMOUNT(2) | | | UPFRONT
PREMIUMS
PAID/
(RECEIVED) | | | FAIR
VALUE(3) | | | UNREALIZED
APPRECIATION | |
Brazil Government International Bond | | 1.00% | | | 3M | | | | 6/20/2025 | | |
| Morgan Stanley
Capital Services,
Inc. |
| | | 380,000 | | | | 380,000 | | | $ | (29,211 | ) | | $ | (26,614 | ) | | $ | 2,597 | |
Brazil Government International Bond | | 1.00% | | | 3M | | | | 6/20/2025 | | |
| JPMorgan
Chase Bank N.A. |
| | | 1,150,000 | | | | 1,150,000 | | | | (126,596 | ) | | | (80,543 | ) | | | 46,053 | |
Colombia Government International Bond | | 1.00% | | | 3M | | | | 6/20/2025 | | | | BNP Paribas S.A. | | | | 380,000 | | | | 380,000 | | | | (23,461 | ) | | | (10,198 | ) | | | 13,263 | |
Colombia Government International Bond | | 1.00% | | | 3M | | | | 6/20/2025 | | | | BNP Paribas S.A. | | | | 1,150,000 | | | | 1,150,000 | | | | (121,940 | ) | | | (30,862 | ) | | | 91,078 | |
Indonesia Government International Bond | | 1.00% | | | 3M | | | | 6/20/2025 | | | | BNP Paribas S.A. | | | | 380,000 | | | | 380,000 | | | | (18,097 | ) | | | (5,781 | ) | | | 12,316 | |
Indonesia Government International Bond | | 1.00% | | | 3M | | | | 6/20/2025 | | | | BNP Paribas S.A. | | | | 2,700,000 | | | | 2,700,000 | | | | (180,505 | ) | | | (41,076 | ) | | | 139,429 | |
Malaysia Sovereign Sukuk Berhad – 3.043% Senior Unsecured Note due Apr 2025 | | 1.00% | | | 3M | | | | 6/20/2025 | | |
| Bank of America
N.A. |
| | | 520,000 | | | | 520,000 | | | | (2,603 | ) | | | 7,087 | | | | 9,690 | |
Mexico Government International Bond | | 1.00% | | | 3M | | | | 6/20/2025 | | |
| Morgan Stanley
Capital Services,
Inc. |
| | | 510,000 | | | | 510,000 | | | | (29,247 | ) | | | (13,330 | ) | | | 15,917 | |
Mexico Government International Bond | | 1.00% | | | 3M | | | | 6/20/2025 | | |
| JPMorgan
Chase Bank N.A. |
| | | 1,535,000 | | | | 1,535,000 | | | | (118,023 | ) | | | (40,121 | ) | | | 77,902 | |
Petroleo Brasileiro International Bond | | 1.00% | | | 3M | | | | 6/20/2025 | | | | BNP Paribas S.A. | | | | 280,000 | | | | 280,000 | | | | (44,378 | ) | | | (31,947 | ) | | | 12,431 | |
Petroleo Brasileiro International Bond | | 1.00% | | | 3M | | | | 6/20/2025 | | |
| Morgan Stanley
Capital Services,
Inc. |
| | | 830,000 | | | | 830,000 | | | | (154,016 | ) | | | (94,699 | ) | | | 59,317 | |
| | | | | | | | | | | | | | | | | | | | | | | | | | | | | | | | | | |
Total OTC Credit Default Swaps | | | | | | | | | | | | | | | $ | (848,077 | ) | | $ | (368,084 | ) | | $ | 479,993 | |
| | | | | | | | | | | | | | | | | | | | | | | | | |
| (1) | If the Fund is a seller of protection and a credit event occurs, as defined under the terms of that particular swap agreement, the Fund will either (i) pay to the buyer of protection an amount equal to the notional amount of the swap and take delivery of the referenced obligation or underlying securities comprising the referenced index or (ii) pay a net settlement amount in the form of cash or securities equal to the notional amount of the swap less the recovery value of the referenced obligation or underlying securities comprising the referenced index. |
| (2) | The maximum potential amount the Portfolio could be required to make as a seller of credit protection or receive as a buyer of credit event as defined under the terms of that particular swap agreement. |
| (3) | The quoted market prices and resulting values for credit default swap agreements on asset-backed securities and credit indices serve as an indicator of the current status of the payment/performance risk and represent the expected amount paid or received for the credit derivative if the amount of the swap agreement was closed/sold as of the period end. Increasing market values, in absolute terms when compared to the notional amount of the swap, represent a deterioration of the referenced entity’s credit soundness and a greater likelihood or risk of default or other credit event occurring as defined under the terms of the agreements. |
Abbreviation Legend
See accompanying Notes to the Financial Statements.
141
Barings Global Emerging Markets Equity Fund 2020 Annual Report
SCHEDULE OF INVESTMENTS
June 30, 2020
| | | | | | | | | | | | |
| | | SHARES | | | COST | | | FAIR
VALUE | |
Equities — 96.2%*: | |
|
Common Stocks — 96.2%*: | |
|
Communication Services — 13.6%*: | |
Mail.Ru Group Ltd.(a),(b) | | | 5,891 | | | | $145,728 | | | | $132,548 | |
PT Telekomunikasi Indonesia Persero Tbk(b) | | | 497,400 | | | | 135,601 | | | | 106,200 | |
Tencent Holdings Ltd.(b) | | | 18,200 | | | | 749,188 | | | | 1,170,830 | |
| | | | | | | | | | | | |
Total Communication Services | | | 521,491 | | | | 1,030,517 | | | | 1,409,578 | |
| | | | | | | | | | | | |
|
Consumer Discretionary — 13.5%*: | |
Alibaba Group Holding Ltd.(a),(b) | | | 4,219 | | | | 672,937 | | | | 910,038 | |
Prosus NV(a),(b) | | | 2,331 | | | | 179,030 | | | | 216,686 | |
Samsonite International SA(a),(b),(c) | | | 96,900 | | | | 206,895 | | | | 97,519 | |
Topsports International Holdings Ltd.(b),(c) | | | 142,000 | | | | 162,911 | | | | 181,382 | |
| | | | | | | | | | | | |
Total Consumer Discretionary | | | 245,450 | | | | 1,221,773 | | | | 1,405,625 | |
| | | | | | | | | | | | |
|
Consumer Staples — 2.7%*: | |
CP ALL Public Company Limited(a),(b) | | | 71,600 | | | | 150,312 | | | | 156,949 | |
X5 Retail Group NV(b) | | | 3,356 | | | | 81,585 | | | | 118,802 | |
| | | | | | | | | | | | |
Total Consumer Staples | | | 74,956 | | | | 231,897 | | | | 275,751 | |
| | | | | | | | | | | | |
|
Energy — 6.7%*: | |
CNOOC Ltd.(b) | | | 154,000 | | | | 271,158 | | | | 171,277 | |
LUKOIL PJSC(b) | | | 1,277 | | | | 79,789 | | | | 94,779 | |
Reliance Industries Ltd.(b),(c) | | | 9,341 | | | | 310,146 | | | | 431,554 | |
| | | | | | | | | | | | |
Total Energy | | | 164,618 | | | | 661,093 | | | | 697,610 | |
| | | | | | | | | | | | |
|
Financials — 26.2%*: | |
AIA Group Ltd.(b) | | | 21,000 | | | | 174,125 | | | | 195,897 | |
B3 SA – Brasil Bolsa Balcao(b) | | | 18,007 | | | | 97,380 | | | | 182,418 | |
Banco do Brasil SA(b) | | | 8,300 | | | | 56,922 | | | | 49,070 | |
China Construction Bank Corp.(b) | | | 496,000 | | | | 410,951 | | | | 401,254 | |
China Pacific Insurance Group Co. Ltd.(b) | | | 41,800 | | | | 146,124 | | | | 111,639 | |
Grupo Financiero Banorte SAB de CV(b) | | | 47,627 | | | | 285,044 | | | | 164,797 | |
Hana Financial Group, Inc.(b) | | | 5,449 | | | | 194,991 | | | | 122,312 | |
HDFC Bank Ltd.(b) | | | 8,296 | | | | 387,809 | | | | 377,136 | |
Itau Unibanco Holding SA(b) | | | 30,735 | | | | 193,827 | | | | 144,147 | |
Mega Financial Holding Co. Ltd.(b) | | | 213,000 | | | | 182,642 | | | | 223,075 | |
Ping An Insurance Group Co. of China Ltd.(b) | | | 35,000 | | | | 332,657 | | | | 349,977 | |
PT Bank Negara Indonesia Persero Tbk(b) | | | 443,700 | | | | 218,213 | | | | 142,257 | |
Sanlam Ltd.(b) | | | 38,831 | | | | 193,298 | | | | 131,895 | |
Sberbank of Russia PJSC(b) | | | 10,509 | | | | 119,730 | | | | 119,172 | |
| | | | | | | | | | | | |
Total Financials | | | 1,418,254 | | | | 2,993,713 | | | | 2,715,046 | |
| | | | | | | | | | | | |
|
Industrials — 2.1%*: | |
China State Construction International Holdings Ltd.(b) | | | 210,000 | | | | 198,648 | | | | 122,469 | |
Rumo SA(a),(b) | | | 22,985 | | | | 79,872 | | | | 95,058 | |
| | | | | | | | | | | | |
Total Industrials | | | 232,985 | | | | 278,520 | | | | 217,527 | |
| | | | | | | | | | | | |
See accompanying Notes to the Financial Statements.
142
Barings Global Emerging Markets Equity Fund 2020 Annual Report
SCHEDULE OF INVESTMENTS (CONTINUED)
June 30, 2020
| | | | | | | | | | | | |
| | | SHARES | | | COST | | | FAIR VALUE | |
Common Stocks (Continued) | |
|
Information Technology — 21.8%*: | |
Chicony Electronics Co. Ltd.(b) | | | 49,000 | | | $ | 100,603 | | | $ | 141,497 | |
Hangzhou Hikvision Digital Technology Co. Ltd.(b) | | | 38,700 | | | | 163,249 | | | | 166,035 | |
Infosys Ltd.(b) | | | 18,746 | | | | 173,086 | | | | 181,086 | |
MediaTek, Inc.(b) | | | 4,000 | | | | 44,992 | | | | 78,496 | |
Powertech Technology, Inc.(b) | | | 23,000 | | | | 69,820 | | | | 83,411 | |
Samsung Electronics Co. Ltd.(b) | | | 16,780 | | | | 671,633 | | | | 736,571 | |
Sunny Optical Technology Group Co. Ltd.(b) | | | 5,400 | | | | $62,423 | | | | $86,394 | |
Taiwan Semiconductor Manufacturing Co. Ltd.(b) | | | 74,000 | | | | 616,160 | | | | 785,033 | |
| | | | | | | | | | | | |
Total Information Technology | | | 229,626 | | | | 1,901,966 | | | | 2,258,523 | |
| | | | | | | | | | | | |
|
Materials — 5.2%*: | |
Anglo American plc(b) | | | 8,807 | | | | 177,392 | | | | 203,684 | |
China Resources Cement Holdings Ltd.(b) | | | 76,000 | | | | 92,203 | | | | 93,057 | |
LG Chem Ltd.(b) | | | 601 | | | | 189,715 | | | | 245,077 | |
| | | | | | | | | | | | |
Total Materials | | | 85,408 | | | | 459,310 | | | | 541,818 | |
| | | | | | | | | | | | |
|
Real Estate — 4.2%*: | |
China Overseas Land & Investment Ltd.(b) | | | 74,000 | | | | 225,256 | | | | 223,895 | |
China Resources Land Ltd.(b) | | | 56,000 | | | | 188,928 | | | | 212,064 | |
| | | | | | | | | | | | |
Total Real Estate | | | 130,000 | | | | 414,184 | | | | 435,959 | |
| | | | | | | | | | | | |
|
Utilities — 0.2%*: | |
ENN Energy Holdings Ltd.(b) | | | 2,000 | | | | 19,174 | | | | 22,502 | |
Total Common Stocks | | | 3,104,788 | | | | 9,212,147 | | | | 9,979,939 | |
| | | | | | | | | | | | |
Total Equities | | | 3,104,788 | | | | 9,212,147 | | | | 9,979,939 | |
| | | | | | | | | | | | |
|
Mutual Fund — 1.6%*: | |
iShares MSCI India ETF(b) | | | 5,884 | | | | 197,603 | | | | 170,753 | |
| | | | | | | | | | | | |
Total Investments | | | 3,110,672 | | | | 9,409,750 | | | | 10,150,692 | |
| | | | | | | | | | | | |
| |
Other assets and liabilities — 2.2%* | | | | 226,247 | |
| | | | | | | | | | | | |
| |
Net Assets — 100.0% | | | | $10,376,939 | |
| | | | | | | | | | | | |
| * | Calculated as a percentage of net assets applicable to common shareholders. |
| (a) | Non-income producing security. |
See accompanying Notes to the Financial Statements.
143
Barings Global Emerging Markets Equity Fund 2020 Annual Report
SCHEDULE OF INVESTMENTS (CONTINUED)
June 30, 2020
Distributions of investments by country of risk (excluding temporary cash investments) as a percentage of total investments in securities, is as follows:
| | | | | | |
| | China | | | 39.8% | |
| | Taiwan | | | 12.9% | |
| | India | | | 11.4% | |
| | Republic of Korea | | | 10.9% | |
| | Hong Kong | | | 4.7% | |
| | Brazil | | | 4.6% | |
| | Russia | | | 4.6% | |
| | South Africa | | | 3.3% | |
| | Indonesia | | | 2.5% | |
| | Netherlands | | | 2.1% | |
| | Mexico | | | 1.6% | |
| | Thailand | | | 1.6% | |
| | | | | | |
| | Total | | | 100.0% | |
| | | | | | |
| (c) | Security acquired in a transaction exempt from registration under Rule 144A of the Securities Act of 1933. These securities may only be resold in transactions exempt from registration, normally to qualified institutional buyers. |
See accompanying Notes to the Financial Statements.
144
Barings U.S. High Yield Fund 2020 Annual Report
SCHEDULE OF INVESTMENTS
June 30, 2020
| | | | | | | | | | | | | | | | | | | | |
| | | | | | | | | SHARES | | | COST | | | FAIR
VALUE | |
Equities — 0.1%*: | |
|
Common Stocks — 0.1%*: | |
|
Oil and Gas — 0.1%*: | |
Fieldwood Energy LLC | | | | | | | | | | | 1,006 | | | | $35,210 | | | | $50 | |
Fieldwood Energy LLC | | | | | | | | | | | 4,100 | | | | 88,421 | | | | 205 | |
Jupiter Resources, Inc.(a) | | | | | | | | | | | 39,729 | | | | 192,017 | | | | 29,797 | |
| | | | | | | | | | | | | | | | | | | | |
Total Oil and Gas | | | | | | | | | | | 44,835 | | | | 315,648 | | | | 30,052 | |
| | | | | | | | | | | | | | | | | | | | |
Total Common Stocks | | | | | | | | | | | 44,835 | | | | 315,648 | | | | 30,052 | |
| | | | | | | | | | | | | | | | | | | | |
Warrants — 0.0%*: | |
|
Diversified/Conglomerate Manufacturing — 0.0%*: | |
Appvion Holdings Corp. (exp. June 13, 2023)(b) | | | | | | | | | | | 357 | | | | – | | | | – | |
Appvion Holdings Corp. (exp. June 13, 2023)(b) | | | | | | | | | | | 357 | | | | – | | | | – | |
| | | | | | | | | | | | | | | | | | | | |
Total Diversified/Conglomerate Manufacturing | | | | | | | | | | | 714 | | | | – | | | | – | |
| | | | | | | | | | | | | | | | | | | | |
Total Warrants | | | | | | | | | | | 714 | | | | – | | | | – | |
| | | | | | | | | | | | | | | | | | | | |
Total Equities | | | | | | | | | | | 45,549 | | | | 315,648 | | | | 30,052 | |
| | | | | | | | | | | | | | | | | | | | |
| | | | | |
| | | EFFECTIVE
INTEREST RATE | | | DUE DATE | | | PRINCIPAL ‡‡ | | | COST | | | FAIR
VALUE | |
Fixed Income — 96.9%*: | |
|
Bank Loans — 5.1%*(c): | |
|
Broadcasting and Entertainment — 0.7%*: | |
AP NMT Acquisition B.V., 3M LIBOR + 5.750%(a) | | | 7.20 | % | | | 8/13/2021 | | | | 293,005 | | | | 293,014 | | | | 286,046 | |
CSC Holdings, LLC, 1M LIBOR + 2.500% | | | 2.68 | | | | 4/15/2027 | | | | 44,744 | | | | 44,744 | | | | 42,355 | |
| | | | | | | | | | | | | | | | | | | | |
Total Broadcasting and Entertainment | | | | | | | | | | | 337,749 | | | | 337,758 | | | | 328,401 | |
| | | | | | | | | | | | | | | | | | | | |
|
Buildings and Real Estate — 0.1%*: | |
GYP Holdings III Corp., 1M LIBOR + 2.750% | | | 2.93 | | | | 6/1/2025 | | | | 26,946 | | | | 26,946 | | | | 25,969 | |
| | | | | | | | | | | | | | | | | | | | |
|
Chemicals, Plastics and Rubber — 0.3%*: | |
Consolidated Energy Finance, S.A., 3M LIBOR + 2.500% | | | 2.69 | | | | 5/7/2025 | | | | 157,556 | | | | 152,430 | | | | 142,588 | |
| | | | | | | | | | | | | | | | | | | | |
|
Containers, Packaging and Glass — 0.9%*: | |
BWAY Holding Co., 3M LIBOR + 3.250% | | | 4.56 | | | | 4/3/2024 | | | | 439,774 | | | | 429,503 | | | | 393,782 | |
| | | | | | | | | | | | | | | | | | | | |
|
Diversified/Conglomerate Service — 1.8%*: | |
Almonde, Inc., 3M LIBOR + 7.250% | | | 8.25 | | | | 6/13/2025 | | | | 250,000 | | | | 247,633 | | | | 215,278 | |
Finastra USA, Inc., 3M LIBOR + 3.500%, 6M LIBOR + 3.500% | | | 4.50 | | | | 6/13/2024 | | | | 247,986 | | | | 239,652 | | | | 216,199 | |
SonicWall U.S. Holdings, Inc., 3M LIBOR + 7.500% | | | 7.88 | | | | 5/18/2026 | | | | 51,897 | | | | 51,511 | | | | 46,015 | |
Vertafore, Inc., 1M LIBOR + 3.250% | | | 3.43 | | | | 7/2/2025 | | | | 394,000 | | | | 386,691 | | | | 370,608 | |
| | | | | | | | | | | | | | | | | | | | |
Total Diversified/Conglomerate Service | | | | | | | | | | | 943,883 | | | | 925,487 | | | | 848,100 | |
| | | | | | | | | | | | | | | | | | | | |
See accompanying Notes to the Financial Statements.
145
Barings U.S. High Yield Fund 2020 Annual Report
SCHEDULE OF INVESTMENTS (CONTINUED)
June 30, 2020
| | | | | | | | | | | | | | | | | | | | |
| | | | | |
| | | EFFECTIVE
INTEREST RATE | | | DUE DATE | | | PRINCIPAL ‡‡ | | | COST | | | FAIR
VALUE | |
|
Bank Loans (Continued) | |
|
Electronics — 0.5%*: | |
Renaissance Holding Corp., 1M LIBOR + 7.000% | | | 7.76 | % | | | 5/29/2026 | | | | 68,963 | | | $ | 67,941 | | | $ | 62,825 | |
Veritas Bermuda Ltd., 3M LIBOR + 4.500% | | | 5.50 | % | | | 1/27/2023 | | | | 182,272 | | | | 173,284 | | | | 168,055 | |
| | | | | | | | | | | | | | | | | | | | |
Total Electronics | | | | | | | | | | | 251,235 | | | | 241,225 | | | | 230,880 | |
| | | | | | | | | | | | | | | | | | | | |
|
Oil and Gas — 0.2%*: | |
Fieldwood Energy LLC, 1M LIBOR + 5.250% | | | 6.25 | | | | 4/11/2022 | | | | 447,215 | | | | 402,925 | | | | 81,246 | |
Fieldwood Energy LLC, 3M LIBOR + 7.250% | | | 6.25 | | | | 4/11/2023 | | | | 91,996 | | | | 54,575 | | | | 552 | |
| | | | | | | | | | | | | | | | | | | | |
Total Oil and Gas | | | | | | | | | | | 539,211 | | | | 457,500 | | | | 81,798 | |
| | | | | | | | | | | | | | | | | | | | |
|
Telecommunications — 0.6%*: | |
Banff Merger Sub, Inc., 1M LIBOR + 4.250% | | | 4.43 | | | | 10/2/2025 | | | | 287,611 | | | | 277,198 | | | | 271,433 | |
CommScope, Inc., 1M LIBOR + 3.250% | | | 3.43 | | | | 4/6/2026 | | | | 30,328 | | | | 30,077 | | | | 28,660 | |
| | | | | | | | | | | | | | | | | | | | |
Total Telecommunications | | | | | | | | | | | 317,939 | | | | 307,275 | | | | 300,093 | |
| | | | | | | | | | | | | | | | | | | | |
Total Bank Loans | | | | | | | | | | | 3,014,293 | | | | 2,878,124 | | | | 2,351,611 | |
| | | | | | | | | | | | | | | | | | | | |
|
Corporate Bonds — 91.8%*: | |
|
Aerospace and Defense — 4.1%*: | |
Global Aircraft Leasing Co. Ltd.(d) | | | 6.50 | | | | 9/15/2024 | | | | 500,000 | | | | 500,000 | | | | 335,000 | |
Science Applications International Corp.(d) | | | 4.88 | | | | 4/1/2028 | | | | 117,000 | | | | 117,191 | | | | 116,305 | |
Signature Aviation US Holdings, Inc.(d) | | | 4.00 | | | | 3/1/2028 | | | | 266,000 | | | | 266,000 | | | | 240,397 | |
TransDigm, Inc. | | | 5.50 | | | | 11/15/2027 | | | | 397,000 | | | | 397,000 | | | | 346,462 | |
TransDigm, Inc.(d) | | | 8.00 | | | | 12/15/2025 | | | | 221,000 | | | | 221,000 | | | | 232,269 | |
Triumph Group, Inc.(d) | | | 6.25 | | | | 9/15/2024 | | | | 216,000 | | | | 216,000 | | | | 183,600 | |
Triumph Group, Inc. | | | 7.75 | | | | 8/15/2025 | | | | 595,000 | | | | 598,722 | | | | 446,994 | |
| | | | | | | | | | | | | | | | | | | | |
Total Aerospace and Defense | | | | | | | | | | | 2,312,000 | | | | 2,315,913 | | | | 1,901,027 | |
| | | | | | | | | | | | | | | | | | | | |
|
Automobile — 2.6%*: | |
Adient US LLC(d) | | | 9.00 | | | | 4/15/2025 | | | | 85,000 | | | | 85,000 | | | | 91,562 | |
Allison Transmission, Inc.(d) | | | 4.75 | | | | 10/1/2027 | | | | 157,000 | | | | 150,102 | | | | 155,823 | |
Asbury Automotive Group, Inc.(d) | | | 4.50 | | | | 3/1/2028 | | | | 39,000 | | | | 39,000 | | | | 37,830 | |
Asbury Automotive Group, Inc.(d) | | | 4.75 | | | | 3/1/2030 | | | | 40,000 | | | | 40,000 | | | | 39,000 | |
Clarios Global LP(d) | | | 6.75 | | | | 5/15/2025 | | | | 83,000 | | | | 83,000 | | | | 86,320 | |
Clarios Global LP/Clarios US Finance Co.(d) | | | 8.50 | | | | 5/15/2027 | | | | 28,000 | | | | 25,925 | | | | 28,139 | |
Ford Motor Co. | | | 8.50 | | | | 4/21/2023 | | | | 257,000 | | | | 257,000 | | | | 271,777 | |
Ford Motor Co. | | | 9.63 | | | | 4/22/2030 | | | | 197,000 | | | | 196,490 | | | | 233,307 | |
Gates Global LLC/Gates Global Co.(d) | | | 6.25 | | | | 1/15/2026 | | | | 250,000 | | | | 250,000 | | | | 245,625 | |
| | | | | | | | | | | | | | | | | | | | |
Total Automobile | | | | | | | | | | | 1,136,000 | | | | 1,126,517 | | | | 1,189,383 | |
| | | | | | | | | | | | | | | | | | | | |
|
Beverage, Food and Tobacco — 3.3%*: | |
JBS Investments II GmbH(d) | | | 7.00 | | | | 1/15/2026 | | | | 200,000 | | | | 202,483 | | | | 209,900 | |
JBS USA Food Co.(d) | | | 5.50 | | | | 1/15/2030 | | | | 125,000 | | | | 125,000 | | | | 128,125 | |
JBS USA LUX SA/JBS USA Finance, Inc.(d) | | | 6.75 | | | | 2/15/2028 | | | | 250,000 | | | | 250,000 | | | | 264,065 | |
JBS USA LUX SA/JBS USA Food Co./JBS USA Finance, Inc.(d) | | | 6.50 | | | | 4/15/2029 | | | | 500,000 | | | | 500,000 | | | | 530,625 | |
See accompanying Notes to the Financial Statements.
146
Barings U.S. High Yield Fund 2020 Annual Report
SCHEDULE OF INVESTMENTS (CONTINUED)
June 30, 2020
| | | | | | | | | | | | | | | | | | | | |
| | | | | |
| | | EFFECTIVE
INTEREST RATE | | | DUE DATE | | | PRINCIPAL ‡‡ | | | COST | | | FAIR
VALUE | |
|
Corporate Bonds (Continued) | |
|
Beverage, Food and Tobacco (Continued) | |
Kraft Heinz Foods Co.(d) | | | 3.75 | % | | | 4/1/2030 | | | | 51,000 | | | $ | 53,387 | | | $ | 52,661 | |
Kraft Heinz Foods Co.(d) | | | 4.25 | | | | 3/1/2031 | | | | 100,000 | | | | 100,000 | | | | 106,029 | |
Kraft Heinz Foods Co. | | | 5.20 | | | | 7/15/2045 | | | | 72,000 | | | | 77,656 | | | | 78,082 | |
Kraft Heinz Foods Co. | | | 6.50 | | | | 2/9/2040 | | | | 38,000 | | | | 45,747 | | | | 45,739 | |
Kraft Heinz Foods Co. | | | 6.88 | | | | 1/26/2039 | | | | 84,000 | | | | 104,898 | | | | 103,843 | |
| | | | | | | | | | | | | | | | | | | | |
Total Beverage, Food and Tobacco | | | | | | | | | | | 1,420,000 | | | | 1,459,171 | | | | 1,519,069 | |
| | | | | | | | | | | | | | | | | | | | |
|
Broadcasting and Entertainment — 9.1%*: | |
Banijay Entertainment Sasu(a),(d) | | | 5.38 | | | | 3/1/2025 | | | | 170,000 | | | | 170,000 | | | | 166,175 | |
Block Communications, Inc.(d) | | | 4.88 | | | | 3/1/2028 | | | | 239,000 | | | | 239,000 | | | | 236,082 | |
CCO Holdings LLC/CCO Holdings Capital Corp.(d) | | | 4.50 | | | | 5/1/2032 | | | | 79,000 | | | | 79,839 | | | | 79,988 | |
CCO Holdings LLC/CCO Holdings Capital Corp.(d) | | | 4.75 | | | | 3/1/2030 | | | | 280,000 | | | | 280,000 | | | | 286,493 | |
CCO Holdings LLC/CCO Holdings Capital Corp.(d) | | | 5.75 | | | | 2/15/2026 | | | | 500,000 | | | | 497,821 | | | | 517,170 | |
Clear Channel Worldwide Holdings, Inc.(d) | | | 5.13 | | | | 8/15/2027 | | | | 250,000 | | | | 250,000 | | | | 240,000 | |
Clear Channel Worldwide Holdings, Inc. | | | 9.25 | | | | 2/15/2024 | | | | 162,000 | | | | 162,000 | | | | 150,271 | |
CSC Holdings LLC(d) | | | 5.75 | | | | 1/15/2030 | | | | 347,000 | | | | 359,037 | | | | 361,400 | |
Diamond Sports Group LLC/Diamond Sports Finance Co.(d) | | | 5.38 | | | | 8/15/2026 | | | | 49,000 | | | | 49,000 | | | | 35,464 | |
DISH DBS Corp. | | | 5.00 | | | | 3/15/2023 | | | | 79,000 | | | | 77,943 | | | | 78,810 | |
DISH Network Corp. | | | 3.38 | | | | 8/15/2026 | | | | 143,000 | | | | 139,143 | | | | 131,362 | |
Netflix, Inc.(d) | | | 5.38 | | | | 11/15/2029 | | | | 339,000 | | | | 340,200 | | | | 371,273 | |
Netflix, Inc. | | | 5.88 | | | | 11/15/2028 | | | | 250,000 | | | | 248,695 | | | | 284,687 | |
Outfront Media Capital LLC/Outfront Media Capital Corp.(d) | | | 6.25 | | | | 6/15/2025 | | | | 250,000 | | | | 250,000 | | | | 251,638 | |
Sirius XM Radio, Inc.(d) | | | 5.00 | | | | 8/1/2027 | | | | 350,000 | | | | 350,000 | | | | 357,724 | |
Sirius XM Radio, Inc.(d) | | | 5.50 | | | | 7/1/2029 | | | | 160,000 | | | | 160,000 | | | | 168,419 | |
Tegna, Inc.(d) | | | 4.63 | | | | 3/15/2028 | | | | 250,000 | | | | 250,000 | | | | 230,000 | |
Terrier Media Buyer, Inc.(d) | | | 8.88 | | | | 12/15/2027 | | | | 261,000 | | | | 261,000 | | | | 250,234 | |
| | | | | | | | | | | | | | | | | | | | |
Total Broadcasting and Entertainment | | | | | | | | | | | 4,158,000 | | | | 4,163,678 | | | | 4,197,190 | |
| | | | | | | | | | | | | | | | | | | | |
|
Buildings and Real Estate — 5.5%*: | |
Brookfield Residential Properties, Inc./Brookfield Residential US Corp.(a),(d) | | | 4.88 | | | | 2/15/2030 | | | | 183,000 | | | | 183,000 | | | | 152,915 | |
Cemex SAB de CV(d) | | | 7.38 | | | | 6/5/2027 | | | | 250,000 | | | | 250,000 | | | | 254,000 | |
Core & Main LP, 8.625% CASH / 9.375% PIK(d) | | | 6.13 | | | | 8/15/2025 | | | | 250,000 | | | | 246,937 | | | | 249,162 | |
James Hardie International Finance DAC(d) | | | 4.75 | | | | 1/15/2025 | | | | 244,000 | | | | 240,087 | | | | 248,270 | |
M/I Homes, Inc. | | | 5.63 | | | | 8/1/2025 | | | | 550,000 | | | | 535,586 | | | | 555,500 | |
Mattamy Group Corp.(a),(d) | | | 4.63 | | | | 3/1/2030 | | | | 330,000 | | | | 329,112 | | | | 316,800 | |
Mattamy Group Corp.(a),(d) | | | 5.25 | | | | 12/15/2027 | | | | 25,000 | | | | 25,000 | | | | 24,875 | |
MPT Operating Partnership LP/MPT Finance Corp. | | | 5.00 | | | | 10/15/2027 | | | | 250,000 | | | | 250,000 | | | | 256,875 | |
See accompanying Notes to the Financial Statements.
147
Barings U.S. High Yield Fund 2020 Annual Report
SCHEDULE OF INVESTMENTS (CONTINUED)
June 30, 2020
| | | | | | | | | | | | | | | | | | | | |
| | | | | |
| | | EFFECTIVE
INTEREST RATE | | | DUE DATE | | | PRINCIPAL ‡‡ | | | COST | | | FAIR
VALUE | |
|
Corporate Bonds (Continued) | |
|
Buildings and Real Estate (Continued) | |
Service Properties Trust | | | 7.50 | % | | | 9/15/2025 | | | | 97,000 | | | $ | 97,000 | | | $ | 102,193 | |
Standard Industries, Inc.(d) | | | 4.75 | | | | 1/15/2028 | | | | 52,000 | | | | 53,582 | | | | 52,715 | |
Standard Industries, Inc.(d) | | | 5.00 | | | | 2/15/2027 | | | | 200,000 | | | | 199,014 | | | | 202,500 | |
TRI Pointe Group, Inc. | | | 5.70 | | | | 6/15/2028 | | | | 121,000 | | | | 121,000 | | | | 122,815 | |
| | | | | | | | | | | | | | | | | | | | |
Total Buildings and Real Estate | | | | | | | | | | | 2,552,000 | | | | 2,530,318 | | | | 2,538,620 | |
| | | | | | | | | | | | | | | | | | | | |
|
Cargo Transport — 1.3%*: | |
Kenan Advantage Group, Inc. (The)(d) | | | 7.88 | | | | 7/31/2023 | | | | 700,000 | | | | 703,038 | | | | 616,000 | |
| | | | | | | | | | | | | | | | | | | | |
|
Chemicals, Plastics and Rubber — 2.9%*: | |
CF Industries, Inc. | | | 4.95 | | | | 6/1/2043 | | | | 23,000 | | | | 23,085 | | | | 24,789 | |
CF Industries, Inc. | | | 5.38 | | | | 3/15/2044 | | | | 48,000 | | | | 47,175 | | | | 51,902 | |
Consolidated Energy Finance SA(b) | | | 6.88 | | | | 6/15/2025 | | | | 405,000 | | | | 403,731 | | | | 344,250 | |
CVR Partners LP/CVR Nitrogen Finance Corp.(d) | | | 9.25 | | | | 6/15/2023 | | | | 235,000 | | | | 240,202 | | | | 230,300 | |
LBC Tank Terminals Holding Netherlands BV(d) | | | 6.88 | | | | 5/15/2023 | | | | 250,000 | | | | 245,587 | | | | 252,318 | |
Starfruit Finco BV/Starfruit US Holdco LLC(a),(d) | | | 8.00 | | | | 10/1/2026 | | | | 56,000 | | | | 54,840 | | | | 57,327 | |
Univar Solutions USA, Inc.(d) | | | 5.13 | | | | 12/1/2027 | | | | 177,000 | | | | 177,000 | | | | 179,057 | |
Valvoline, Inc.(d) | | | 4.25 | | | | 2/15/2030 | | | | 176,000 | | | | 176,387 | | | | 173,360 | |
| | | | | | | | | | | | | | | | | | | | |
Total Chemicals, Plastics and Rubber | | | | | | | | | | | 1,370,000 | | | | 1,368,007 | | | | 1,313,303 | |
| | | | | | | | | | | | | | | | | | | | |
|
Containers, Packaging and Glass — 1.2%*: | |
Graphic Packaging International LLC(d) | | | 3.50 | | | | 3/15/2028 | | | | 125,000 | | | | 125,000 | | | | 124,025 | |
Mauser Packaging Solutions Holding Co.(d) | | | 7.25 | | | | 4/15/2025 | | | | 302,000 | | | | 290,983 | | | | 273,845 | |
Trident TPI Holdings, Inc.(d) | | | 9.25 | | | | 8/1/2024 | | | | 171,000 | | | | 166,544 | | | | 175,275 | |
| | | | | | | | | | | | | | | | | | | | |
Total Containers, Packaging and Glass | | | | | | | | | | | 598,000 | | | | 582,527 | | | | 573,145 | |
| | | | | | | | | | | | | | | | | | | | |
|
Diversified/Conglomerate Manufacturing — 1.6%*: | |
Amsted Industries, Inc.(d) | | | 4.63 | | | | 5/15/2030 | | | | 295,000 | | | | 295,000 | | | | 291,717 | |
Appvion ESC, 3M EURIBOR + 4.125%(b),(e) | | | 9.00 | (f) | | | 6/1/2025 | | | | 366,000 | | | | 366,000 | | | | – | |
Colfax Corp.(d) | | | 6.38 | | | | 2/15/2026 | | | | 135,000 | | | | 135,000 | | | | 141,075 | |
Energizer Holdings, Inc.(d) | | | 7.75 | | | | 1/15/2027 | | | | 153,000 | | | | 159,967 | | | | 163,139 | |
Griffon Corp. | | | 5.75 | | | | 3/1/2028 | | | | 127,000 | | | | 127,000 | | | | 125,412 | |
MTS Systems Corp.(d) | | | 5.75 | | | | 8/15/2027 | | | | 33,000 | | | | 33,000 | | | | 30,278 | |
| | | | | | | | | | | | | | | | | | | | |
Total Diversified/Conglomerate Manufacturing | | | | | | | | | | | 1,109,000 | | | | 1,115,967 | | | | 751,621 | |
| | | | | | | | | | | | | | | | | | | | |
|
Diversified/Conglomerate Service — 3.1%*: | |
Carlson Travel, Inc.(d) | | | 9.50 | | | | 12/15/2024 | | | | 350,000 | | | | 336,070 | | | | 154,000 | |
Iron Mountain, Inc.(d) | | | 5.25 | | | | 7/15/2030 | | | | 235,000 | | | | 235,000 | | | | 231,475 | |
KAR Auction Services, Inc.(d) | | | 5.13 | | | | 6/1/2025 | | | | 186,000 | | | | 162,786 | | | | 183,210 | |
Mileage Plus Holdings LLC/Mileage Plus Intellectual Property Assets Ltd.(d) | | | 6.50 | | | | 6/20/2027 | | | | 150,000 | | | | 148,125 | | | | 150,375 | |
Open Text Corp.(d) | | | 3.88 | | | | 2/15/2028 | | | | 173,000 | | | | 172,749 | | | | 166,566 | |
Open Text Holdings, Inc.(d) | | | 4.13 | | | | 2/15/2030 | | | | 180,000 | | | | 179,747 | | | | 176,850 | |
See accompanying Notes to the Financial Statements.
148
Barings U.S. High Yield Fund 2020 Annual Report
SCHEDULE OF INVESTMENTS (CONTINUED)
June 30, 2020
| | | | | | | | | | | | | | | | | | | | |
| | | | | |
| | | EFFECTIVE
INTEREST RATE | | | DUE DATE | | | PRINCIPAL ‡‡ | | | COST | | | FAIR
VALUE | |
|
Corporate Bonds (Continued) | |
|
Diversified/Conglomerate Service (Continued) | |
Prime Security Services Borrower LLC/Prime Finance, Inc.(d) | | | 6.25 | % | | | 1/15/2028 | | | | 339,000 | | | $ | 337,310 | | | $ | 319,507 | |
Sabre GLBL, Inc.(d) | | | 9.25 | | | | 4/15/2025 | | | | 50,000 | | | | 50,000 | | | | 52,688 | |
| | | | | | | | | | | | | | | | | | | | |
Total Diversified/Conglomerate Service | | | | | | | | | | | 1,663,000 | | | | 1,621,787 | | | | 1,434,671 | |
| | | | | | | | | | | | | | | | | | | | |
|
Ecological — 0.2%*: | |
Clean Harbors, Inc.(d) | | | 4.88 | | | | 7/15/2027 | | | | 91,000 | | | | 91,000 | | | | 93,502 | |
| | | | | | | | | | | | | | | | | | | | |
|
Electronics — 4.8%*: | |
Dell International LLC/EMC Corp.(d) | | | 7.13 | | | | 6/15/2024 | | | | 230,000 | | | | 238,018 | | | | 238,266 | |
Dell, Inc. | | | 6.50 | | | | 4/15/2038 | | | | 106,000 | | | | 113,291 | | | | 114,374 | |
NCR Corp.(d) | | | 8.13 | | | | 4/15/2025 | | | | 63,000 | | | | 63,000 | | | | 66,780 | |
Presidio Holdings, Inc.(d) | | | 8.25 | | | | 2/1/2028 | | | | 66,000 | | | | 66,000 | | | | 66,000 | |
RP Crown Parent LLC(d) | | | 7.38 | | | | 10/15/2024 | | | | 96,000 | | | | 96,000 | | | | 95,760 | |
Solera LLC/Solera Finance, Inc.(d) | | | 10.50 | | | | 3/1/2024 | | | | 195,000 | | | | 198,485 | | | | 198,413 | |
SS&C Technologies, Inc.(d) | | | 5.50 | | | | 9/30/2027 | | | | 280,000 | | | | 280,000 | | | | 284,099 | |
Veritas US, Inc./Veritas Bermuda Ltd.(d) | | | 10.50 | | | | 2/1/2024 | | | | 831,000 | | | | 762,911 | | | | 743,745 | |
WESCO Distribution, Inc.(d) | | | 7.13 | | | | 6/15/2025 | | | | 191,000 | | | | 191,000 | | | | 201,148 | |
WESCO Distribution, Inc.(d) | | | 7.25 | | | | 6/15/2028 | | | | 197,000 | | | | 195,518 | | | | 208,327 | |
| | | | | | | | | | | | | | | | | | | | |
Total Electronics | | | | | | | | | | | 2,255,000 | | | | 2,204,223 | | | | 2,216,912 | |
| | | | | | | | | | | | | | | | | | | | |
|
Finance — 5.4%*: | |
Alliance Data Systems Corp.(d) | | | 4.75 | | | | 12/15/2024 | | | | 300,000 | | | | 300,000 | | | | 270,000 | |
Ford Motor Credit Co. LLC | | | 4.13 | | | | 8/4/2025 | | | | 200,000 | | | | 157,746 | | | | 189,690 | |
Ford Motor Credit Co. LLC | | | 5.13 | | | | 6/16/2025 | | | | 233,000 | | | | 233,000 | | | | 233,093 | |
Ford Motor Credit Co. LLC | | | 5.60 | | | | 1/7/2022 | | | | 200,000 | | | | 177,389 | | | | 201,500 | |
Ford Motor Credit Co. LLC | | | 5.88 | | | | 8/2/2021 | | | | 200,000 | | | | 181,915 | | | | 201,940 | |
Icahn Enterprises LP / Icahn Enterprises Finance Corp. | | | 4.75 | | | | 9/15/2024 | | | | 105,000 | | | | 106,916 | | | | 98,721 | |
Icahn Enterprises LP / Icahn Enterprises Finance Corp. | | | 6.25 | | | | 5/15/2026 | | | | 500,000 | | | | 500,000 | | | | 500,350 | |
LPL Holdings, Inc.(d) | | | 5.75 | | | | 9/15/2025 | | | | 518,000 | | | | 513,054 | | | | 524,475 | |
Springleaf Finance Corp. | | | 5.38 | | | | 11/15/2029 | | | | 302,000 | | | | 304,024 | | | | 282,370 | |
| | | | | | | | | | | | | | | | | | | | |
Total Finance | | | | | | | | | | | 2,558,000 | | | | 2,474,044 | | | | 2,502,139 | |
| | | | | | | | | | | | | | | | | | | | |
|
Healthcare, Education and Childcare — 7.6%*: | |
Bausch Health Americas., Inc.(d) | | | 8.50 | | | | 1/31/2027 | | | | 175,000 | | | | 180,013 | | | | 185,719 | |
Bausch Health Cos., Inc.(d) | | | 5.88 | | | | 5/15/2023 | | | | 3,000 | | | | 2,706 | | | | 2,992 | |
Bausch Health Cos., Inc.(d) | | | 5.00 | | | | 1/30/2028 | | | | 130,000 | | | | 130,000 | | | | 122,394 | |
Bausch Health Cos., Inc.(d) | | | 5.25 | | | | 1/30/2030 | | | | 188,000 | | | | 188,000 | | | | 178,365 | |
Bausch Health Cos., Inc.(d) | | | 5.50 | | | | 3/1/2023 | | | | 37,000 | | | | 31,752 | | | | 37,000 | |
Bausch Health Cos., Inc.(d) | | | 7.00 | | | | 1/15/2028 | | | | 250,000 | | | | 263,299 | | | | 257,500 | |
Centene Corp. | | | 4.25 | | | | 12/15/2027 | | | | 108,000 | | | | 107,147 | | | | 111,446 | |
Centene Corp. | | | 4.63 | | | | 12/15/2029 | | | | 209,000 | | | | 209,000 | | | | 220,495 | |
See accompanying Notes to the Financial Statements.
149
Barings U.S. High Yield Fund 2020 Annual Report
SCHEDULE OF INVESTMENTS (CONTINUED)
June 30, 2020
| | | | | | | | | | | | | | | | | | | | |
| | | | | |
| | | EFFECTIVE
INTEREST RATE | | | DUE DATE | | | PRINCIPAL ‡‡ | | | COST | | | FAIR
VALUE | |
|
Corporate Bonds (Continued) | |
|
Healthcare, Education and Childcare (Continued) | |
Centene Corp.(d) | | | 5.25 | % | | | 4/1/2025 | | | | 104,000 | | | $ | 106,938 | | | $ | 107,086 | |
Centene Corp.(d) | | | 5.38 | | | | 6/1/2026 | | | | 19,000 | | | | 19,841 | | | | 19,696 | |
Envision Healthcare Corp.(d) | | | 8.75 | | | | 10/15/2026 | | | | 472,000 | | | | 463,924 | | | | 224,200 | |
HCA, Inc. | | | 3.50 | | | | 9/1/2030 | | | | 276,000 | | | | 274,655 | | | | 265,835 | |
HCA, Inc. | | | 5.38 | | | | 2/1/2025 | | | | 175,000 | | | | 176,701 | | | | 187,469 | |
Hillenbrand, Inc. | | | 5.75 | | | | 6/15/2025 | | | | 108,000 | | | | 108,000 | | | | 111,780 | |
Jaguar Holding Co. II / PPD Development LP(d) | | | 4.63 | | | | 6/15/2025 | | | | 154,000 | | | | 154,000 | | | | 156,726 | |
Molina Healthcare, Inc.(d) | | | 4.38 | | | | 6/15/2028 | | | | 165,000 | | | | 165,000 | | | | 164,794 | |
Ortho-Clinical Diagnostics, Inc./Ortho-Clinical Diagnostics SA(d) | | | 7.25 | | | | 2/1/2028 | | | | 400,000 | | | | 400,000 | | | | 406,592 | |
Par Pharmaceutical, Inc.(d) | | | 7.50 | | | | 4/1/2027 | | | | 300,000 | | | | 300,000 | | | | 307,860 | |
Radiology Partners, Inc.(d) | | | 9.25 | | | | 2/1/2028 | | | | 176,000 | | | | 176,000 | | | | 165,880 | |
Tenet Healthcare Corp.(d) | | | 4.88 | | | | 1/1/2026 | | | | 125,000 | | | | 125,000 | | | | 121,719 | |
Tenet Healthcare Corp.(d) | | | 5.13 | | | | 11/1/2027 | | | | 125,000 | | | | 125,000 | | | | 123,337 | |
| | | | | | | | | | | | | | | | | | | | |
Total Healthcare, Education and Childcare | | | | | | | | | | | 3,699,000 | | | | 3,706,976 | | | | 3,478,885 | |
| | | | | | | | | | | | | | | | | | | | |
|
Home and Office Furnishings, Housewares, and Durable Consumer Products — 1.1%*: | |
Newell Brands, Inc. | | | 4.70 | | | | 4/1/2026 | | | | 142,000 | | | | 135,072 | | | | 149,016 | |
Newell Brands, Inc. | | | 4.88 | | | | 6/1/2025 | | | | 88,000 | | | | 87,568 | | | | 92,162 | |
Newell Brands, Inc. | | | 5.88 | | | | 4/1/2036 | | | | 52,000 | | | | 58,668 | | | | 55,445 | |
Resideo Funding, Inc.(d) | | | 6.13 | | | | 11/1/2026 | | | | 192,000 | | | | 188,917 | | | | 187,680 | |
| | | | | | | | | | | | | | | | | | | | |
Total Home and Office Furnishings, Housewares, and Durable Consumer Products | | | | | | | | | | | 474,000 | | | | 470,225 | | | | 484,303 | |
| | | | | | | | | | | | | | | | | | | | |
|
Hotels, Motels, Inns and Gaming — 4.0%*: | |
Boyd Gaming Corp.(d) | | | 8.63 | | | | 6/1/2025 | | | | 82,000 | | | | 82,000 | | | | 85,690 | |
Boyne USA, Inc.(d) | | | 7.25 | | | | 5/1/2025 | | | | 125,000 | | | | 125,000 | | | | 130,938 | |
Caesars Resort Collection LLC / CRC Finco, Inc.(d) | | | 5.25 | | | | 10/15/2025 | | | | 90,000 | | | | 80,771 | | | | 78,300 | |
Colt Merger Sub, Inc.(d) | | | 5.75 | | | | 7/1/2025 | | | | 125,000 | | | | 125,000 | | | | 125,713 | |
ESH Hospitality, Inc.(d) | | | 4.63 | | | | 10/1/2027 | | | | 265,000 | | | | 265,000 | | | | 248,106 | |
Golden Nugget, Inc.(d) | | | 8.75 | | | | 10/1/2025 | | | | 280,000 | | | | 222,786 | | | | 158,200 | |
MGM Resorts International | | | 6.75 | | | | 5/1/2025 | | | | 250,000 | | | | 250,000 | | | | 247,520 | |
Scientific Games International, Inc.(d) | | | 5.00 | | | | 10/15/2025 | | | | 81,000 | | | | 73,116 | | | | 74,784 | |
Scientific Games International, Inc.(d) | | | 7.25 | | | | 11/15/2029 | | | | 74,000 | | | | 62,419 | | | | 59,200 | |
Scientific Games International, Inc.(d) | | | 8.25 | | | | 3/15/2026 | | | | 15,000 | | | | 12,781 | | | | 13,453 | |
Scientific Games International, Inc.(d) | | | 8.63 | | | | 7/1/2025 | | | | 113,000 | | | | 113,000 | | | | 105,621 | |
Wynn Las Vegas LLC/Wynn Las Vegas Capital Corp.(d) | | | 5.25 | | | | 5/15/2027 | | | | 98,000 | | | | 98,000 | | | | 84,721 | |
Wynn Las Vegas LLC/Wynn Las Vegas Capital Corp.(d) | | | 5.50 | | | | 3/1/2025 | | | | 250,000 | | | | 247,611 | | | | 228,750 | |
Wynn Macau Ltd.(a),(d) | | | 5.13 | | | | 12/15/2029 | | | | 188,000 | | | | 188,000 | | | | 182,360 | |
| | | | | | | | | | | | | | | | | | | | |
Total Hotels, Motels, Inns and Gaming | | | | | | | | | | | 2,036,000 | | | | 1,945,484 | | | | 1,823,356 | |
| | | | | | | | | | | | | | | | | | | | |
See accompanying Notes to the Financial Statements.
150
Barings U.S. High Yield Fund 2020 Annual Report
SCHEDULE OF INVESTMENTS (CONTINUED)
June 30, 2020
| | | | | | | | | | | | | | | | | | | | |
| | | | | |
| | | EFFECTIVE
INTEREST RATE | | | DUE DATE | | | PRINCIPAL ‡‡ | | | COST | | | FAIR
VALUE | |
|
Corporate Bonds (Continued) | |
|
Insurance — 0.8%*: | |
Acrisure LLC/Acrisure Finance, Inc.(d) | | | 7.00 | % | | | 11/15/2025 | | | | 275,000 | | | $ | 263,510 | | | $ | 262,969 | |
Acrisure LLC/Acrisure Finance, Inc.(d) | | | 8.13 | | | | 2/15/2024 | | | | 84,000 | | | | 84,000 | | | | 87,335 | |
| | | | | | | | | | | | | | | | | | | | |
Total Insurance | | | | | | | | | | | 359,000 | | | | 347,510 | | | | 350,304 | |
| | | | | | | | | | | | | | | | | | | | |
|
Leisure, Amusement, Entertainment — 1.8%*: | |
Colt Merger Sub, Inc.(d) | | | 6.25 | | | | 7/1/2025 | | | | 125,000 | | | | 125,000 | | | | 124,219 | |
Colt Merger Sub, Inc.(d) | | | 8.13 | | | | 7/1/2027 | | | | 250,000 | | | | 250,000 | | | | 241,562 | |
Live Nation Entertainment, Inc.(d) | | | 4.75 | | | | 10/15/2027 | | | | 251,000 | | | | 249,995 | | | | 215,913 | |
Ryman Hospitality Properties, Inc.(d) | | | 4.75 | | | | 10/15/2027 | | | | 296,000 | | | | 296,000 | | | | 263,440 | |
| | | | | | | | | | | | | | | | | | | | |
Total Leisure, Amusement, Entertainment | | | | | | | | | | | 922,000 | | | | 920,995 | | | | 845,134 | |
| | | | | | | | | | | | | | | | | | | | |
|
Machinery Non-Agriculture, Non-Construction, Non-Electronic — 0.7%*: | |
Apex Tool Group LLC/BC Mountain Finance, Inc.(d) | | | 9.00 | | | | 2/15/2023 | | | | 430,000 | | | | 423,690 | | | | 310,675 | |
| | | | | | | | | | | | | | | | | | | | |
|
Mining, Steel, Iron and Non-Precious Metals — 4.4%*: | |
Cleveland-Cliffs, Inc.(d) | | | 6.75 | | | | 3/15/2026 | | | | 72,000 | | | | 71,462 | | | | 69,480 | |
Compass Minerals International, Inc.(d) | | | 4.88 | | | | 7/15/2024 | | | | 124,000 | | | | 117,599 | | | | 124,310 | |
First Quantum Minerals Ltd.(a),(d) | | | 6.88 | | | | 3/1/2026 | | | | 229,000 | | | | 229,000 | | | | 216,977 | |
First Quantum Minerals Ltd.(a),(d) | | | 7.50 | | | | 4/1/2025 | | | | 158,000 | | | | 151,515 | | | | 151,285 | |
Freeport-McMoRan, Inc. | | | 4.13 | | | | 3/1/2028 | | | | 28,000 | | | | 27,018 | | | | 27,160 | |
Kinross Gold Corp. | | | 6.88 | | | | 9/1/2041 | | | | 99,000 | | | | 98,537 | | | | 120,623 | |
New Gold, Inc.(d) | | | 7.50 | | | | 7/15/2027 | | | | 279,000 | | | | 279,508 | | | | 287,842 | |
Northwest Acquisitions ULC/Dominion Finco, Inc.a,(a),(d),(e) | | | 7.13 | | | | 11/1/2022 | | | | 493,000 | | | | 498,177 | | | | 5,053 | |
Peabody Energy Corp.(d) | | | 6.00 | | | | 3/31/2022 | | | | 524,000 | | | | 525,547 | | | | 340,600 | |
SunCoke Energy Partners LP/SunCoke Energy Partners Finance Corp.(d) | | | 7.50 | | | | 6/15/2025 | | | | 196,000 | | | | 201,496 | | | | 165,659 | |
Warrior Met Coal, Inc.(d) | | | 8.00 | | | | 11/1/2024 | | | | 540,000 | | | | 546,680 | | | | 526,500 | |
| | | | | | | | | | | | | | | | | | | | |
Total Mining, Steel, Iron and Non-Precious Metals | | | | | | | | 2,742,000 | | | | 2,746,539 | | | | 2,035,489 | |
| | | | | | | | | | | | | | | | | | | | |
|
Oil and Gas — 11.8%*: | |
Antero Resources Corp. | | | 5.38 | | | | 11/1/2021 | | | | 160,000 | | | | 155,891 | | | | 148,000 | |
Apache Corp. | | | 4.38 | | | | 10/15/2028 | | | | 51,000 | | | | 46,952 | | | | 45,036 | |
Apache Corp. | | | 4.75 | | | | 4/15/2043 | | | | 26,000 | | | | 21,003 | | | | 20,932 | |
Apache Corp. | | | 5.10 | | | | 9/1/2040 | | | | 51,000 | | | | 41,328 | | | | 41,899 | |
Apache Corp. | | | 5.35 | | | | 7/1/2049 | | | | 78,000 | | | | 62,528 | | | | 62,239 | |
Buckeye Partners LP | | | 5.85 | | | | 11/15/2043 | | | | 26,000 | | | | 21,780 | | | | 22,563 | |
Cenovus Energy, Inc.(a) | | | 4.25 | | | | 4/15/2027 | | | | 37,000 | | | | 33,737 | | | | 33,511 | |
Cenovus Energy, Inc.(a) | | | 5.40 | | | | 6/15/2047 | | | | 54,000 | | | | 47,626 | | | | 46,358 | |
Cenovus Energy, Inc.(a) | | | 6.75 | | | | 11/15/2039 | | | | 61,000 | | | | 57,800 | | | | 59,393 | |
Cheniere Energy Partners LP | | | 4.50 | | | | 10/1/2029 | | | | 184,000 | | | | 184,000 | | | | 178,250 | |
Cheniere Energy Partners LP | | | 5.63 | | | | 10/1/2026 | | | | 250,000 | | | | 250,000 | | | | 248,750 | |
Continental Resources, Inc. | | | 3.80 | | | | 6/1/2024 | | | | 59,000 | | | | 51,350 | | | | 55,166 | |
See accompanying Notes to the Financial Statements.
151
Barings U.S. High Yield Fund 2020 Annual Report
SCHEDULE OF INVESTMENTS (CONTINUED)
June 30, 2020
| | | | | | | | | | | | | | | | | | | | |
| | | | | |
| | | EFFECTIVE
INTEREST RATE | | | DUE DATE | | | PRINCIPAL ‡‡ | | | COST | | | FAIR
VALUE | |
|
Corporate Bonds (Continued) | |
|
Oil and Gas (Continued) | |
Continental Resources, Inc. | | | 4.38 | % | | | 1/15/2028 | | | | 66,000 | | | $ | 54,249 | | | $ | 58,095 | |
CVR Energy, Inc.(d) | | | 5.25 | | | | 2/15/2025 | | | | 300,000 | | | | 300,000 | | | | 276,000 | |
CVR Energy, Inc.(d) | | | 5.75 | | | | 2/15/2028 | | | | 300,000 | | | | 300,000 | | | | 262,500 | |
DCP Midstream Operating LP | | | 5.13 | | | | 5/15/2029 | | | | 9,000 | | | | 8,307 | | | | 8,634 | |
DCP Midstream Operating LP(d) | | | 6.45 | | | | 11/3/2036 | | | | 4,000 | | | | 3,302 | | | | 3,600 | |
Endeavor Energy Resources LP / EER Finance, Inc.(d) | | | 6.63 | | | | 7/15/2025 | | | | 115,000 | | | | 116,182 | | | | 115,899 | |
EQM Midstream Partners LP(d) | | | 6.00 | | | | 7/1/2025 | | | | 145,000 | | | | 145,000 | | | | 146,873 | |
EQM Midstream Partners LP(d) | | | 6.50 | | | | 7/1/2027 | | | | 119,000 | | | | 119,000 | | | | 121,882 | |
Genesis Energy LP / Genesis Energy Finance Corp. | | | 5.63 | | | | 6/15/2024 | | | | 56,000 | | | | 51,607 | | | | 48,720 | |
Genesis Energy LP/Genesis Energy Finance Corp. | | | 6.00 | | | | 5/15/2023 | | | | 18,000 | | | | 17,832 | | | | 16,200 | |
Genesis Energy LP/Genesis Energy Finance Corp. | | | 6.50 | | | | 10/1/2025 | | | | 390,000 | | | | 371,242 | | | | 333,450 | |
Hilcorp Energy I LP / Hilcorp Finance Co.(d) | | | 5.75 | | | | 10/1/2025 | | | | 17,000 | | | | 10,257 | | | | 14,450 | |
Hilcorp Energy I LP/Hilcorp Finance Co.(d) | | | 5.00 | | | | 12/1/2024 | | | | 32,000 | | | | 22,817 | | | | 27,520 | |
Hilcorp Energy I LP/Hilcorp Finance Co.(d) | | | 6.25 | | | | 11/1/2028 | | | | 70,000 | | | | 61,727 | | | | 56,175 | |
Jonah Energy LLC/Jonah Energy Finance Corp.(d) | | | 7.25 | | | | 10/15/2025 | | | | 351,000 | | | | 328,457 | | | | 42,998 | |
Jupiter Resources, Inc.(a),(b) | | | 10.00 | | | | 1/31/2024 | | | | 48,085 | | | | 48,085 | | | | 43,277 | |
Laredo Petroleum, Inc. | | | 9.50 | | | | 1/15/2025 | | | | 150,000 | | | | 150,000 | | | | 103,688 | |
Laredo Petroleum, Inc. | | | 10.13 | | | | 1/15/2028 | | | | 150,000 | | | | 150,000 | | | | 103,500 | |
MEG Energy Corp.(a),(d) | | | 7.13 | | | | 2/1/2027 | | | | 270,000 | | | | 270,000 | | | | 224,437 | |
Nabors Industries Ltd.(d) | | | 7.25 | | | | 1/15/2026 | | | | 100,000 | | | | 100,472 | | | | 61,500 | |
Nabors Industries Ltd.(d) | | | 7.50 | | | | 1/15/2028 | | | | 72,000 | | | | 72,000 | | | | 44,280 | |
Neptune Energy Bondco PLC(a),(d) | | | 6.63 | | | | 5/15/2025 | | | | 242,000 | | | | 242,212 | | | | 210,540 | |
Occidental Petroleum Corp., 3M USD LIBOR + 1.450% | | | 1.84 | (f) | | | 8/15/2022 | | | | 38,000 | | | | 27,068 | | | | 34,967 | |
Occidental Petroleum Corp. | | | 2.60 | | | | 4/15/2022 | | | | 31,000 | | | | 23,578 | | | | 29,537 | |
Occidental Petroleum Corp. | | | 2.70 | | | | 8/15/2022 | | | | 73,000 | | | | 54,213 | | | | 67,959 | |
Occidental Petroleum Corp. | | | 2.70 | | | | 2/15/2023 | | | | 29,000 | | | | 17,895 | | | | 26,426 | |
Occidental Petroleum Corp. | | | 2.90 | | | | 8/15/2024 | | | | 38,000 | | | | 21,851 | | | | 32,470 | |
Occidental Petroleum Corp. | | | 3.50 | | | | 6/15/2025 | | | | 75,000 | | | | 53,925 | | | | 63,375 | |
Occidental Petroleum Corp. | | | 4.10 | | | | 2/1/2021 | | | | 163,000 | | | | 147,248 | | | | 163,652 | |
Occidental Petroleum Corp. | | | 4.20 | | | | 3/15/2048 | | | | 12,000 | | | | 8,523 | | | | 8,126 | |
Occidental Petroleum Corp. | | | 4.40 | | | | 4/15/2046 | | | | 78,000 | | | | 55,593 | | | | 54,407 | |
Occidental Petroleum Corp. | | | 4.40 | | | | 8/15/2049 | | | | 31,000 | | | | 22,170 | | | | 21,390 | |
Occidental Petroleum Corp. | | | 4.50 | | | | 7/15/2044 | | | | 32,000 | | | | 23,128 | | | | 22,080 | |
Occidental Petroleum Corp. | | | 6.45 | | | | 9/15/2036 | | | | 14,000 | | | | 10,785 | | | | 11,830 | |
Occidental Petroleum Corp. | | | 6.60 | | | | 3/15/2046 | | | | 83,000 | | | | 63,946 | | | | 72,249 | |
Occidental Petroleum Corp. | | | 6.95 | | | | 7/1/2024 | | | | 36,000 | | | | 21,190 | | | | 35,303 | |
Ovintiv, Inc. | | | 6.50 | | | | 8/15/2034 | | | | 42,000 | | | | 37,750 | | | | 37,523 | |
Ovintiv, Inc. | | | 6.63 | | | | 8/15/2037 | | | | 9,000 | | | | 7,921 | | | | 7,835 | |
Parkland Fuel Corp.(a),(d) | | | 5.88 | | | | 7/15/2027 | | | | 125,000 | | | | 125,000 | | | | 129,688 | |
PBF Holding Co. LLC/PBF Finance Corp.(d) | | | 6.00 | | | | 2/15/2028 | | | | 600,000 | | | | 600,000 | | | | 498,000 | |
PBF Holding Co. LLC/PBF Finance Corp. | | | 7.25 | | | | 6/15/2025 | | | | 350,000 | | | | 358,535 | | | | 317,625 | |
See accompanying Notes to the Financial Statements.
152
Barings U.S. High Yield Fund 2020 Annual Report
SCHEDULE OF INVESTMENTS (CONTINUED)
June 30, 2020
| | | | | | | | | | | | | | | | | | | | |
| | | | | |
| | | EFFECTIVE
INTEREST RATE | | | DUE DATE | | | PRINCIPAL ‡‡ | | | COST | | | FAIR
VALUE | |
|
Corporate Bonds (Continued) | |
|
Oil and Gas (Continued) | |
Targa Resources Partners LP / Targa Resources Partners Finance Corp.(d) | | | 5.50 | % | | | 3/1/2030 | | | | 6,000 | | | $ | 5,414 | | | $ | 5,794 | |
Targa Resources Partners LP / Targa Resources Partners Finance Corp. | | | 6.88 | | | | 1/15/2029 | | | | 24,000 | | | | 23,761 | | | | 25,140 | |
Targa Resources Partners LP/Targa Resources Partners Finance Corp. | | | 4.25 | | | | 11/15/2023 | | | | 53,000 | | | | 45,775 | | | | 50,615 | |
Welltec A/S(a),(d) | | | 9.50 | | | | 12/1/2022 | | | | 228,000 | | | | 230,784 | | | | 205,200 | |
Western Midstream Operating LP | | | 4.05 | | | | 2/1/2030 | | | | 56,000 | | | | 49,790 | | | | 53,905 | |
Western Midstream Operating LP | | | 5.30 | | | | 3/1/2048 | | | | 157,000 | | | | 120,850 | | | | 127,366 | |
Western Midstream Operating LP | | | 5.45 | | | | 4/1/2044 | | | | 79,000 | | | | 64,502 | | | | 65,791 | |
| | | | | | | | | | | | | | | | | | | | |
Total Oil and Gas | | | | | | | | | | | 6,523,085 | | | | 6,137,938 | | | | 5,454,568 | |
| | | | | | | | | | | | | | | | | | | | |
|
Personal and Non-Durable Consumer Products Mfg. Only — 0.1%*: | |
Spectrum Brands, Inc.(d) | | | 5.00 | | | | 10/1/2029 | | | | 48,000 | | | | 48,000 | | | | 47,400 | |
| | | | | | | | | | | | | | | | | | | | |
|
Personal Transportation — 0.5%*: | |
American Airlines Group, Inc.(d) | | | 3.75 | | | | 3/1/2025 | | | | 212,000 | | | | 212,000 | | | | 98,557 | |
American Airlines Group, Inc.(d) | | | 5.00 | | | | 6/1/2022 | | | | 221,000 | | | | 221,000 | | | | 128,180 | |
| | | | | | | | | | | | | | | | | | | | |
Total Personal Transportation | | | | | | | | | | | 433,000 | | | | 433,000 | | | | 226,737 | |
| | | | | | | | | | | | | | | | | | | | |
|
Personal, Food and Miscellaneous — 0.8%*: | |
Mattel, Inc.(d) | | | 5.88 | | | | 12/15/2027 | | | | 159,000 | | | | 157,809 | | | | 163,770 | |
Mattel, Inc.(d) | | | 6.75 | | | | 12/31/2025 | | | | 132,000 | | | | 134,279 | | | | 136,950 | |
Simmons Foods, Inc.(d) | | | 7.75 | | | | 1/15/2024 | | | | 83,000 | | | | 83,000 | | | | 86,586 | |
| | | | | | | | | | | | | | | | | | | | |
Total Personal, Food and Miscellaneous | | | | | | | | | | | 374,000 | | | | 375,088 | | | | 387,306 | |
| | | | | | | | | | | | | | | | | | | | |
|
Printing and Publishing — 0.9%*: | |
Cimpress plc(d) | | | 7.00 | | | | 6/15/2026 | | | | 427,000 | | | | 448,269 | | | | 393,907 | |
| | | | | | | | | | | | | | | | | | | | |
|
Retail Stores — 1.2%*: | |
Core & Main Holdings LP, 8.625% CASH / 9.375% PIK(d) | | | 8.63 | | | | 9/15/2024 | | | | 43,000 | | | | 42,678 | | | | 43,069 | |
KGA Escrow LLC(d) | | | 7.50 | | | | 8/15/2023 | | | | 282,000 | | | | 282,000 | | | | 281,647 | |
Penske Automotive Group, Inc. | | | 5.50 | | | | 5/15/2026 | | | | 250,000 | | | | 250,000 | | | | 249,375 | |
| | | | | | | | | | | | | | | | | | | | |
Total Retail Stores | | | | | | | | | | | 575,000 | | | | 574,678 | | | | 574,091 | |
| | | | | | | | | | | | | | | | | | | | |
|
Telecommunications — 9.9%*: | |
Altice Financing SA(a),(d) | | | 5.00 | | | | 1/15/2028 | | | | 222,000 | | | | 222,000 | | | | 220,526 | |
Altice Financing SA(a),(d) | | | 7.50 | | | | 5/15/2026 | | | | 106,000 | | | | 101,298 | | | | 111,035 | |
Altice Finco SA(d) | | | 7.63 | | | | 2/15/2025 | | | | 110,000 | | | | 111,331 | | | | 114,401 | |
Banff Merger Sub, Inc.(d) | | | 9.75 | | | | 9/1/2026 | | | | 185,000 | | | | 183,473 | | | | 186,156 | |
Boxer Parent Co., Inc.(d) | | | 9.13 | | | | 3/1/2026 | | | | 158,000 | | | | 158,000 | | | | 163,530 | |
CenturyLink, Inc. | | | 6.75 | | | | 12/1/2023 | | | | 139,000 | | | | 139,229 | | | | 149,396 | |
CommScope Technologies Finance LLC(d) | | | 6.00 | | | | 6/15/2025 | | | | 38,000 | | | | 33,829 | | | | 36,697 | |
CommScope Technologies LLC(d) | | | 5.00 | | | | 3/15/2027 | | | | 562,000 | | | | 540,779 | | | | 506,193 | |
See accompanying Notes to the Financial Statements.
153
Barings U.S. High Yield Fund 2020 Annual Report
SCHEDULE OF INVESTMENTS (CONTINUED)
June 30, 2020
| | | | | | | | | | | | | | | | | | | | |
| | | | | |
| | | EFFECTIVE
INTEREST RATE | | | DUE DATE | | | PRINCIPAL ‡‡ | | | COST | | | FAIR
VALUE | |
|
Corporate Bonds (Continued) | |
|
Telecommunications (Continued) | |
Hughes Satellite Systems Corp. | | | 6.63 | % | | | 8/1/2026 | | | | 426,000 | | | $ | 430,544 | | | $ | 442,137 | |
LCPR Senior Secured Financing DAC(a),(d) | | | 6.75 | | | | 10/15/2027 | | | | 200,000 | | | | 200,000 | | | | 204,000 | |
Midcontinent Communications/Midcontinent Finance Corp.(d) | | | 5.38 | | | | 8/15/2027 | | | | 149,000 | | | | 149,000 | | | | 151,292 | |
Sprint Capital Corp. | | | 6.88 | | | | 11/15/2028 | | | | 648,000 | | | | 653,433 | | | | 788,940 | |
Sprint Capital Corp. | | | 8.75 | | | | 3/15/2032 | | | | 52,000 | | | | 73,786 | | | | 74,425 | |
Sprint Corp. | | | 7.63 | | | | 3/1/2026 | | | | 114,000 | | | | 114,000 | | | | 134,562 | |
Telecom Italia Capital SA(a) | | | 6.00 | | | | 9/30/2034 | | | | 62,000 | | | | 72,319 | | | | 67,394 | |
Telecom Italia SpA(a),(d) | | | 5.30 | | | | 5/30/2024 | | | | 250,000 | | | | 258,146 | | | | 260,893 | |
ViaSat, Inc.(d) | | | 5.63 | | | | 4/15/2027 | | | | 149,000 | | | | 149,000 | | | | 152,539 | |
ViaSat, Inc.(d) | | | 6.50 | | | | 7/15/2028 | | | | 200,000 | | | | 200,000 | | | | 200,042 | |
Virgin Media Finance plc(d) | | | 5.00 | | | | 7/15/2030 | | | | 117,000 | | | | 117,000 | | | | 114,392 | |
Virgin Media Secured Finance PLC(a),(d) | | | 5.50 | | | | 5/15/2029 | | | | 250,000 | | | | 254,089 | | | | 261,250 | |
Ziggo BV(a),(d) | | | 4.88 | | | | 1/15/2030 | | | | 89,000 | | | | 89,000 | | | | 89,482 | |
Ziggo BV(a),(d) | | | 5.50 | | | | 1/15/2027 | | | | 140,000 | | | | 134,779 | | | | 141,758 | |
| | | | | | | | | | | | | | | | | | | | |
Total Telecommunications | | | | | | | | | | | 4,366,000 | | | | 4,385,035 | | | | 4,571,040 | |
| | | | | | | | | | | | | | | | | | | | |
|
Textiles and Leather — 0.1%*: | |
Hanesbrands, Inc.(d) | | | 4.88 | | | | 5/15/2026 | | | | 25,000 | | | | 26,192 | | | | 25,187 | |
| | | | | | | | | | | | | | | | | | | | |
|
Utilities — 1.0%*: | |
PG&E Corp. | | | 5.00 | | | | 7/1/2028 | | | | 95,000 | | | | 95,000 | | | | 94,972 | |
PG&E Corp. | | | 5.25 | | | | 7/1/2030 | | | | 82,000 | | | | 82,000 | | | | 82,467 | |
Vistra Operations Co. LLC(d) | | | 4.30 | | | | 7/15/2029 | | | | 250,000 | | | | 247,929 | | | | 262,838 | |
| | | | | | | | | | | | | | | | | | | | |
Total Utilities | | | | | | | | | | | 427,000 | | | | 424,929 | | | | 440,277 | |
| | | | | | | | | | | | | | | | | | | | |
Total Corporate Bonds | | | | | | | | | | | 45,782,085 | | | | 45,170,738 | | | | 42,295,241 | |
| | | | | | | | | | | | | | | | | | | | |
Total Fixed Income | | | | | | | | | | | 48,796,378 | | | | 48,048,862 | | | | 44,646,852 | |
| | | | | | | | | | | | | | | | | | | | |
Total Investments | | | | | | | | | | | 48,841,927 | | | | 48,364,510 | | | | 44,676,904 | |
| | | | | | | | | | | | | | | | | | | | |
| | | | | |
Other assets and liabilities – 3.0%* | | | | | | | | | | | | | | | | | | | 1,359,746 | |
| | | | | | | | | | | | | | | | | | | | |
| | | | | |
Net Assets – 100.0% | | | | | | | | | | | | | | | | | | | $46,036,650 | |
| | | | | | | | | | | | | | | | | | | | |
| ‡‡ | Unless otherwise indicated, all principal amounts are denominated in United States Dollars. |
| * | Calculated as a percentage of net assets applicable to common shareholders. |
See accompanying Notes to the Financial Statements.
154
Barings U.S. High Yield Fund 2020 Annual Report
SCHEDULE OF INVESTMENTS (CONTINUED)
June 30, 2020
Distributions of investments by country of risk (excluding temporary cash investments) as a percentage of total investments in securities, is as follows:
| | | | | | |
| | United States | | | 89.4% | |
| | Canada | | | 3.2% | |
| | United Kingdom | | | 1.3% | |
| | Netherlands | | | 1.3% | |
| | Portugal | | | 1.0% | |
| | Other (Individually less than 1%) | | | 3.8% | |
| | | | | | |
| | Total | | | 100.0% | |
| | | | | | |
| (b) | For fair value measurement disclosure purposes, security is categorized as Level 3 (See Note 2). |
| (c) | Bank loans are exempt from registration under the Securities Act of 1933, as amended, but contain certain restrictions on resale and cannot be sold publicly. These loans pay interest at rates which adjust periodically. The interest rates shown for bank loans are the current interest rates at June 30, 2020. Bank loans are also subject to mandatory and/or optional prepayment which cannot be predicted. As a result, the remaining maturity may be substantially less than the stated maturity shown. |
| (d) | Security acquired in a transaction exempt from registration under Rule 144A of the Securities Act of 1933. These securities may only be resold in transactions exempt from registration, normally to qualified institutional buyers. |
| (f) | Variable rate security. The interest rate shown is the rate in effect at June 30, 2020. |
See accompanying Notes to the Financial Statements.
155
Barings Funds Trust 2020 Annual Report
NOTES TO FINANCIAL STATEMENTS
June 30, 2020
Barings Funds Trust (the “Trust”) was organized as a business trust under the laws of the Commonwealth of Massachusetts on May 3, 2013 and commenced operations on September 16, 2013. The Trust is registered under the Investment Company Act of 1940, as amended (the “1940 Act”), as an open-end management investment company. As of June 30, 2020, the Trust consists of seven funds (separately, a “Fund” and collectively, the “Funds”): Barings Global Floating Rate Fund (“Global Floating Rate Fund”), Barings Global Credit Income Opportunities Fund (“Global Credit Income Opportunities Fund”), Barings Active Short Duration Bond Fund (“Active Short Duration Bond Fund”), Barings Diversified Income Fund (“Diversified Income Fund”), Barings Emerging Markets Debt Blended Total Return Fund (“Emerging Markets Debt Blended Total Return Fund”), Barings Global Emerging Markets Equity Fund (“Global Emerging Markets Equity Fund”) and Barings U.S. High Yield Fund (“U.S. High Yield Fund”). Each Fund, other than Emerging Markets Debt Blended Total Return Fund and Global Emerging Markets Equity Fund, is a “diversified” investment company. Global Credit Income Opportunities Fund and Global Floating Rate Fund commenced operations on September 16, 2013. Active Short Duration Bond Fund and Diversified Income Fund commenced operations on July 8, 2015. Emerging Markets Debt Blended Total Return Fund commenced operations on October 21, 2015. U.S. High Yield Fund commenced operations on October 30, 2015. Global Emerging Markets Equity Fund commenced operations on September 17, 2018.
Barings LLC (the “Adviser”), a wholly-owned indirect subsidiary of Massachusetts Mutual Life Insurance Company, is a registered investment adviser under the Investment Advisers Act of 1940, as amended (the “Advisers Act”), and serves as investment adviser to the Funds.
Barings International Investment Limited (“BIIL”), a private limited company incorporated under the laws of England, serves as a sub-adviser with respect to European investments for the Global Floating Rate Fund, Global Credit Income Opportunities Fund, Emerging Markets Debt Blended Total Return Fund and Global Emerging Markets Equity Fund. The Adviser also has entered into a personnel-sharing arrangement with BIIL with respect to the Diversified Income Fund, pursuant to which, certain employees of BIIL may serve as “associated persons” of the Adviser and, in this capacity, subject to the oversight
and supervision of the Adviser may provide research and related services, and discretionary investment management and trading services to the Fund on behalf of the Adviser.
The primary investment objective of the Global Floating Rate Fund is to seek a high level of current income. The Global Floating Rate Fund seeks preservation of capital as a secondary investment objective. The investment objective of the Global Credit Income Opportunities Fund is to seek an absolute return, primarily through current income and secondarily through capital appreciation. The investment objective of the Active Short Duration Bond Fund is to seek to achieve a high total rate of return primarily from current income while minimizing fluctuations in capital values by investing primarily in a diversified portfolio of short-term investment grade fixed income securities. The investment objective of the Diversified Income Fund seeks an absolute return, primarily through current income and capital appreciation. The investment objective of the Emerging Markets Debt Blended Total Return Fund is to seek to achieve maximum total return, consistent with preservation of capital and prudent investment management, through high current income generation and, where appropriate, capital appreciation. The investment objective of the Global Emerging Markets Equity Fund is to seek to achieve long-term capital growth. The investment objective of the U.S. High Yield Fund is to seek to achieve a high level of total return, with an emphasis on current income, by investing primarily in high yield debt and related securities.
There can be no assurance that the Funds will achieve their investment objectives. Under normal market conditions, the Global Floating Rate Fund invests at least 80% of its net assets (including the amount of any borrowings for investment purposes) in income producing floating rate debt securities, consisting of floating rate loans, bonds and notes, issued primarily by North American and Western European companies that are primarily, at the time of purchase, rated below-investment grade (below Baa3 by Moody’s Investors Service, Inc. (“Moody’s”) or below BBB- by either Standard & Poor’s Rating Services, a division of the McGraw-Hill Company, Inc. (“S&P”) or Fitch, Inc. (“Fitch”)) or, if unrated, determined by the Adviser or BIIL to be of comparable quality. Under normal market conditions, the Global Credit Income Opportunities Fund invests at least 80% of its net assets (including the amount of any borrowings for investment purposes) in debt instruments,
156
Barings Funds Trust 2020 Annual Report
NOTES TO FINANCIAL STATEMENTS (CONTINUED)
June 30, 2020
consisting of loans, bonds and notes. Investments may be based in U.S. and non-U.S. markets, as well as over-the-counter and exchange traded derivatives. Investments may be issued or guaranteed by governments and their agencies, corporations, financial institutions and supranational organizations that the Adviser believes have the potential to provide a high total return over time. A significant portion of the Global Floating Rate Fund and Global Credit Income Opportunities Fund’s investments in debt instruments will be denominated in a currency other than the U.S. dollar. Although the investments in non-U.S. dollar denominated assets may be on a currency hedged or unhedged basis, the Global Floating Rate Fund and Global Credit Income Opportunities Fund expect that, under current market conditions, they will seek to hedge substantially all of their exposure to foreign currencies. Under normal market conditions, the Active Short Duration Bond Fund invests at least 80% of its net assets (including the amount of any borrowings for investment purposes) in investment grade fixed income securities (rated Baa3 or higher by Moody’s or BBB- or higher by S&P or Fitch or if unrated, determined to be of comparable quality by the Adviser). These typically include U.S. dollar-denominated corporate obligations, securities issued or guaranteed by the U.S. government or its agencies or instrumentalities, U.S. and foreign issuer dollar-denominated bonds including, but not limited to, corporate obligations, government and agency issues, private placement bonds, securities subject to resale pursuant to Rule 144A, mortgage-backed, and other asset-backed securities. Under normal market conditions, the Diversified Income Fund invests at least 80% of its net assets (including the amount of any borrowings for investment purposes) in fixed income securities. These typically include: U.S. dollar denominated corporate obligations and bank loans, securities issued or guaranteed by the U.S. government or its agencies or instrumentalities, U.S. and foreign issuer dollar denominated bonds including, but not limited to, corporate obligations, government and agency issues, private placement bonds, securities subject to resale pursuant to Rule 144A, convertible bonds, mortgage-backed, and other asset-backed securities. Under normal market conditions, the Emerging Markets Debt Blended Total Return Fund will invest at least 80% of its net assets (including the amount of any borrowings for investment purposes) in (i) securities denominated in currencies of the emerging market countries, (ii) fixed income securities or debt instruments
issued by emerging market entities or sovereign nations, and/or (iii) debt instruments denominated in or based on the currencies, interest rates, or issues of emerging market countries. Emerging market countries are defined to include any country that did not become a member of the Organization for Economic Cooperation and Development (O.E.C.D.) prior to 1975 and Turkey. Certain emerging market countries are referred to as “frontier” market countries. The Emerging Markets Debt Blended Total Return Fund will likely focus its investments in Asia, Africa, the Middle East, Latin America and the developing countries of Europe. Under normal market conditions, the Global Emerging Markets Equity Fund will invest at least 80% of its net assets (including the amount of any borrowings for investment purposes) in equity and equity-related securities of issues that are economically tied to one or more emerging market countries. In general, countries may be considered emerging markets if they are included in any one of the Morgan Stanley Capital Index (“MSCI”) emerging markets indices. Under normal circumstances, the U.S. High Yield Fund invests at least 80% of its net assets (including the amount of any borrowings for investment purposes) in lower rated fixed income securities (rated below Baa3 by Moody’s or BBB- by either S&P or Fitch (using the lower rating) or, if unrated, determined by the Adviser to be of comparable quality), and at least 80% of its net assets (including the amount of any borrowings for investment purposes) in securities of U.S. issuers. The U.S. High Yield Fund may also invest in convertible securities, preferred stocks, warrants, bank loans, and other fixed income securities, including Rule 144A securities, of both U.S. and foreign issuers. Currently, the Adviser does not expect that the U.S. High Yield Fund will invest more than 20% of its total assets in bank loans. The U.S. High Yield Fund may invest up to 15% of its total assets in securities that are not denominated in U.S. dollars including, but not limited to, corporate bonds, government and agency issues, Rule 144A securities, convertible securities, bank loans, mortgage-backed, and asset-backed securities.
Each Fund has four classes of shares: Class A, C, I, and Y (except Active Short Duration Bond Fund, which has 5 classes of shares: Class A, C, I, Y and L), each with different expenses and dividends. Class L of Active Short Duration Bond Fund began operations on May 1, 2020. With the exception of Active Short Duration Bond Fund, which has no sales charge on any class, a front-end sales charge is normally added to the net asset value (“NAV”) for Class A shares. There is no front-end sales charge in
157
Barings Funds Trust 2020 Annual Report
NOTES TO FINANCIAL STATEMENTS (CONTINUED)
June 30, 2020
the case of Class C, I, and Y shares. There may be a contingent deferred sales charge (“CDSC”) in certain cases as follows: 1) Effective January 15, 2018, Class A Shares purchased without an initial sales charge in accounts aggregating $500,000 or more are subject to a 1.00% contingent deferred sales charge (CDSC) if the shares are tendered and accepted for repurchase within 18 months of purchase (or within 12 months for shares purchased prior to January 15, 2018). The 18-month period (or 12-month period for shares purchased prior to January 15, 2018) begins on the day on which the purchase was made; and 2) Class C shares redeemed within the first year of purchase. All classes of shares have equal voting rights, with the exception of matters that relate solely to one class.
| 2. | Significant Accounting Policies |
The Trust is an investment company and follows accounting and reporting guidance in Financial Accounting Standards Board (“FASB”) Accounting Standards Codification Topic 946 (“ASC 946”).
The following is a summary of significant accounting policies followed consistently by the Funds in the preparation of their financial statements in conformity with accounting principles generally accepted in the United States of America (“U.S. GAAP”).
| | A. | Valuation of Investments |
The Funds’ investments in fixed income securities are generally valued using the prices provided directly by independent third party services or provided directly from one or more broker dealers or market makers, each in accordance with the valuation policies and procedures approved by the Funds’ Board of Trustees (the “Board”).
The pricing services may use valuation models or matrix pricing, which consider yield or prices with respect to comparable bond quotations from bond dealers or by reference to other securities that are considered comparable in such characteristics as credit rating, interest rates and maturity date to determine the current value. The Funds’ investments in bank loans are normally valued at the bid quotation obtained from dealers in loans by an independent pricing service in accordance with the Funds’ valuation policies and procedures approved by the Board. Short-term securities with remaining maturities of 60 days or less may be valued at amortized cost, which approximates fair value. Derivative financial instruments, such as futures contracts or options contracts that are traded on a national securities
exchange, are stated at the last reported sale or settlement price on the day of valuation. Futures traded on inactive markets are valued using broker quotations. OTC derivative financial instruments, such as foreign currency contracts, options contracts, or swaps agreements, derive their value from underlying asset prices, indices, reference rates, and other inputs or a combination of these factors. These contracts are normally valued on the basis of an independent pricing service providers or broker dealer quotations. Depending on the derivative type and the terms of the derivative, the value of the derivative financial instruments is assigned by independent pricing service providers using a series of techniques, which may include pricing models. The pricing models use inputs that are observed from actively quoted markets such as issuer details, indices, spreads, interest rates, curves, volatilities, dividends and exchange rates.
The assets and liabilities shown in the Statements of Assets and Liabilities related to investments purchased for “to-be-announced” (“TBA”) or when-issued securities approximate fair value and are determined using Level 2 inputs, as of June 30, 2020. The assets and liabilities shown in the Statements of Assets and Liabilities related to cash collateral held at broker for futures contracts are determined using Level 1 inputs as of June 30, 2020.
A Valuation Committee, made up of officers of the Trust and employees of the Adviser, is responsible for determining, in accordance with the Funds’ valuation policies and procedures approved by the Board; (1) whether market quotations are readily available for investments held by the Fund; and (2) the fair value of investments held by the Fund for which market quotations are not readily available or are deemed not reliable by the Adviser. In certain cases, authorized pricing service vendors may not provide prices for a security held by the Funds, or the price provided by such pricing service vendor is deemed unreliable by the Adviser. In such cases, the Funds may use market maker quotations provided by an established market maker for that security (i.e., broker quotes) to value the security if the Adviser has experience obtaining quotations from the market maker and the Adviser determines that quotations obtained from the market maker in the past have generally been reliable (or, if the Adviser has no such experience with respect to a market maker, it determines based on other information available to it that quotations to be obtained by it from the market maker are reasonably likely to be reliable). In any such case, the
158
Barings Funds Trust 2020 Annual Report
NOTES TO FINANCIAL STATEMENTS (CONTINUED)
June 30, 2020
Adviser will review any market quotations so obtained in light of other information in its possession for their general reliability.
Bond investments are valued on the basis of last available bid prices or current market quotations provided by dealers or pricing services. Bank loan positions are valued at the bid price from one or more brokers or dealers as obtained from a pricing service. In determining the value of a particular investment, pricing services may use certain information with respect to transactions in such investments, quotations from dealers, pricing matrixes, market transactions in comparable investments, various relationships observed in the market between investments and calculated yield measures. Asset-backed and mortgage-backed securities are valued by independent pricing services using models that consider estimated cash flows of each tranche of the security, establish a benchmark yield and develop an estimated tranche-specific spread to the benchmark yield based on the unique attributes of the tranche.
Bank loans in which the Funds may invest have similar risks to lower-rated fixed income securities. Changes in the financial condition of the borrower or economic conditions or other circumstances may reduce the capacity of the borrower to make principal and interest payments on such instruments and may lead to defaults. Senior secured bank loans are supported by collateral; however, the value of the collateral may be insufficient to cover the amount owed to the Funds. By relying on a third party to administer a loan, the Funds are subject to the risk that the third party will fail to perform its obligations. The loans in which the Funds will invest are largely floating rate instruments; therefore, the interest rate risk generally is lower than for fixed-rate debt obligations. However, from the perspective of the borrower, an increase in interest rates may adversely affect the borrower’s financial condition. Due to the unique and customized nature of loan agreements evidencing loans and the private syndication thereof, loans are not as easily purchased or sold as publicly traded securities. Although the range of investors in loans has broadened in recent years, there can be no assurance that future levels of supply and demand in loan trading will provide the degree of liquidity which currently exists in the market. In addition, the terms of the loans may restrict their transferability without borrower consent. These factors may have an adverse effect on the market price and the Funds’ ability to dispose of particular portfolio investments. A less liquid secondary market also
may make it more difficult for the Funds to obtain precise valuations of the high yield loans in its portfolio.
The Funds may invest in collateralized debt obligations (“CDOs”), which include collateralized bond obligations (“CBOs”) and collateralized loan obligations (“CLOs”). CBOs and CLOs are types of asset-backed securities. A CDO is an entity that is backed by a diversified pool of debt securities (CBOs) or syndicated bank loans (CLOs). The cash flows of the CDO can be split into multiple segments, called “tranches,” which will vary in risk profile and yield. The riskiest segment is the subordinated or “equity” tranche. This tranche bears the greatest risk of defaults from the underlying assets in the CDO and serves to protect the other, more senior, tranches from default in all but the most severe circumstances. Since it is shielded from defaults by the more junior tranches, a “senior” tranche will typically have higher credit ratings and lower yields than their underlying securities, and often receive investment grade ratings from one or more of the nationally recognized rating agencies. Despite the protection from the more junior tranches, senior tranches can experience substantial losses due to actual defaults, increased sensitivity to future defaults and the disappearance of one or more protecting tranches as a result of changes in the credit profile of the underlying pool of assets.
Fair value is defined as the price that the Funds would receive upon selling an investment in a timely transaction to an independent buyer in the principal or most advantageous market of the investment. A three-tier hierarchy is utilized to maximize the use of observable market data and minimize the use of unobservable inputs and to establish classification of fair value measurements for disclosure purposes. Inputs refer broadly to the assumptions that market participants would use in pricing the asset or liability, including assumptions about risk. For example, market participants would consider the risk inherent in a particular valuation technique used to measure fair value, such as a pricing model, and/or the risk inherent in the inputs to the valuation technique. Inputs may be observable or unobservable. Observable inputs are inputs that reflect the assumptions market participants would use in pricing the asset or liability and are developed based on market data obtained from sources independent of the reporting entity. Unobservable inputs are inputs that reflect the reporting entity’s own assumptions about the assumptions market participants would use in pricing the asset or liability and are developed based on the best information available in
159
Barings Funds Trust 2020 Annual Report
NOTES TO FINANCIAL STATEMENTS (CONTINUED)
June 30, 2020
the circumstances. The three-tier hierarchy of inputs is summarized in the three broad levels listed below.
Level 1 – quoted prices in active markets for identical securities
Level 2 – other significant observable inputs (including quoted prices for similar securities, interest rates, prepayment speeds, credit risk, etc.)
Level 3 – significant unobservable inputs (including the Funds’ own assumptions in determining the fair value of investments)
The availability of observable inputs can vary from security to security and is affected by a wide variety of factors, including, for example, the type of security, whether the security is new and not yet established in the marketplace, the liquidity of markets, and other
characteristics particular to the security. To the extent that valuation is based on models or inputs that are less observable or unobservable in the market, the determination of fair value requires more judgment. Accordingly, the degree of judgment exercised in determining fair value is greatest for instruments categorized in level 3.
The inputs used to measure fair value may fall into different levels of the fair value hierarchy. In such cases, for disclosure purposes, the level in the fair value hierarchy within which the fair value measurement falls in its entirety is determined based on the lowest level input that is significant to the fair value measurement in its entirety.
The following is a summary of the inputs used as of June 30, 2020 in valuing the Funds’ investments:
Global Floating Rate Fund
| | | | | | | | | | | | | | | | |
| DESCRIPTION | | LEVEL 1 | | | LEVEL 2 | | | LEVEL 3 | | | TOTAL INVESTMENTS | |
| |
Assets: | | | | | |
| Equities: | | | | | |
Common Stocks | | $ | – | | | $ | 6,764 | | | $ | 559,585 | *** | | $ | 566,349 | |
Limited Partnership | | | – | | | | – | | | | 0 | *** | | | – | |
Warrants | | | – | | | | – | | | | 0 | *** | | | – | |
| | | | | | | | | | | | | | | | |
| Total Equities | | | – | | | | 6,764 | | | | 559,585 | | | | 566,349 | |
| | | | | | | | | | | | | | | | |
| |
Fixed Income: | | | | | |
Bank Loans | | | – | | | | 188,860,001 | | | | 504,343 | *** | | | 189,364,344 | |
Corporate Bonds | | | – | | | | 12,351,631 | | | | 0 | *** | | | 12,351,631 | |
| | | | | | | | | | | | | | | | |
| Total Fixed Income | | | – | | | | 201,211,632 | | | | 504,343 | | | | 201,715,975 | |
| | | | | | | | | | | | | | | | |
| |
Derivative Securities: | | | | | |
Forward Foreign Currency Exchange Contracts | | | – | | | | 582,821 | | | | – | | | | 582,821 | |
| | | | | | | | | | | | | | | | |
| Total | | $ | – | | | $ | 201,801,217 | | | $ | 1,063,928 | | | $ | 202,865,145 | |
| | | | | | | | | | | | | | | | |
| |
Liabilities: | | | | | |
| Derivative Securities: | | | | | |
Forward Foreign Currency Exchange Contracts | | | – | | | | (22,691 | ) | | | – | | | | (22,691 | ) |
| | | | | | | | | | | | | | | | |
| Total Investments | | $ | – | | | $ | 201,778,526 | | | $ | 1,063,928 | | | $ | 202,842,454 | |
| | | | | | | | | | | | | | | | |
| | *** | None of the unobservable inputs for Level 3 assets, individually or collectively, had a material impact on the Fund. Level 3 investments at the end of the period in relation to net assets were not significant and accordingly, a reconciliation of Level 3 assets for the year ended June 30, 2020 is not presented. |
160
Barings Funds Trust 2020 Annual Report
NOTES TO FINANCIAL STATEMENTS (CONTINUED)
June 30, 2020
The following table is a summary of quantitative information about significant unobservable valuation inputs for Level 3 fair value measurement for investments held as of June 30, 2020:
| | | | | | | | |
| TYPE OF ASSETS | | FAIR VALUE AS OF
JUNE 30, 2020 | | | VALUATION
TECHNIQUE(S) | | UNOBSERVABLE INPUT |
| | | |
Equities | | | | | | | | |
| | | |
CTI Foods Holding Co, LLC | | $ | 559,585 | | | Discounted Cash Flow | | Average Enterprise Valuation Multiple: 4 year projection, 7.1x; EBITDA: $53.7 million; 15% discount rate |
| | | |
Tunstall Group Holdings Ltd | | $ | – | | | Zero Value | | Valued at zero |
| | | |
Tunstall Group Holdings Ltd | | $ | – | | | Zero Value | | Valued at zero |
| | | |
Boomerang Tube LLC | | $ | – | | | Discounted Cash Flow | | Average Enterprise Valuation Multiple: 5 year projection, 5.0x; EBITDA: $20.4 million; 20% discount rate |
| | | |
Southcross Energy Partners LP | | $ | – | | | Zero Value | | Valued at zero |
| | | |
Templar Energy LLC | | $ | – | | | Broker Quote | | Valued at zero until final accrual is received |
| | | |
Templar Energy LLC | | $ | – | | | Broker Quote | | Valued at zero until final accrual is received |
| | | |
Pinnacle Operating Corp, earnout shares | | $ | – | | | Zero Value | | Valued at zero |
| | | |
Appvion Holdings Corp | | $ | – | | | Broker Quote | | Valued at zero |
| | | |
Appvion Holdings Corp | | $ | – | | | Broker Quote | | Valued at zero |
| | | |
Bank Loans | | | | | | | | |
| | | |
CTI Foods Holding Co, LLC, 3M LIBOR | | $ | 186,767 | | | Discounted Cash Flow | | Average Enterprise Valuation Multiple: 3 year projection, 7.1x; EBITDA: $53.7 million;: 15% discount rate |
| | | |
CTI Foods Holding Co, LLC, 3M LIBOR | | $ | 310,064 | | | Discounted Cash Flow | | Average Enterprise Valuation Multiple: 3 year projection, 7.1x; EBITDA: $53.7 million;: 15% discount rate |
| | | |
Deoleo S.A. | | $ | – | | | Zero Value | | Valued at zero |
| | | |
Boomerang Tube LLC | | $ | 7,512 | | | Discounted Cash Flow | | Average Enterprise Valuation Multiple: 5 year projection, 5.0x; EBITDA: $20.4 million; 20% discount rate |
| | | |
Corporate Bonds | | | | | | | | |
| | | |
Appvion ESC | | $ | – | | | Zero Value | | Valued at zero without primary asset attached |
| | | |
Galapagos S.A. | | $ | – | | | Zero Value | | Valued at zero without primary asset attached |
Although the Fund believes the valuation methods described above are appropriate, the use of different methodologies or assumptions to determine fair value could result in different estimates of fair value at the reporting date.
161
Barings Funds Trust 2020 Annual Report
NOTES TO FINANCIAL STATEMENTS (CONTINUED)
June 30, 2020
Global Credit Income Opportunities Fund
| | | | | | | | | | | | | | | | |
| DESCRIPTION | | LEVEL 1 | | | LEVEL 2 | | | LEVEL 3 | | | TOTAL INVESTMENTS | |
| |
Assets: | | | | | |
| Equities: | | | | | |
Common Stocks | | $ | – | | | $ | 91,143 | | | $ | 482,271 | *** | | $ | 573,414 | |
Limited Partnership | | | – | | | | – | | | | 0 | *** | | | – | |
Warrants | | | – | | | | – | | | | 0 | *** | | | – | |
| | | | | | | | | | | | | | | | |
| Total Equities | | | – | | | | 91,143 | | | | 482,271 | | | | 573,414 | |
| | | | | | | | | | | | | | | | |
| |
Fixed Income: | | | | | |
Asset-Backed Securities | | | – | | | | 15,223,902 | | | | 0 | *** | | | 15,223,902 | |
Bank Loans | | | – | | | | 64,979,889 | | | | 350,148 | *** | | | 65,330,037 | |
Corporate Bonds | | | – | | | | 70,191,872 | | | | 90,356 | *** | | | 70,282,228 | |
| | | | | | | | | | | | | | | | |
| Total Fixed Income | | | – | | | | 150,395,663 | | | | 440,504 | | | | 150,836,167 | |
| | | | | | | | | | | | | | | | |
| |
Purchased Option: | | | | | |
Put Option Purchased | | | 777,280 | | | | – | | | | – | | | | 777,280 | |
| |
Derivative Securities: | | | | | |
Forward Foreign Currency Exchange Contracts | | | – | | | | 495,076 | | | | – | | | | 495,076 | |
| | | | | | | | | | | | | | | | |
| Total | | $ | 777,280 | | | $ | 150,981,882 | | | $ | 922,775 | | | $ | 152,681,937 | |
| | | | | | | | | | | | | | | | |
| |
Liabilities: | | | | | |
| Derivative Securities: | | | | | |
Forward Foreign Currency Exchange Contracts | | | – | | | | (47,937 | ) | | | – | | | | (47,937 | ) |
Put Option Written | | | (439,208 | ) | | | – | | | | – | | | | (439,208 | ) |
| | | | | | | | | | | | | | | | |
| Total Derivative Securities | | | (439,208 | ) | | | (47,937 | ) | | | – | | | | (487,145 | ) |
| | | | | | | | | | | | | | | | |
| Total Investments | | $ | 338,072 | | | $ | 150,933,945 | | | $ | 922,775 | | | $ | 152,194,792 | |
| | | | | | | | | | | | | | | | |
| | *** | None of the unobservable inputs for Level 3 assets, individually or collectively, had a material impact on the Fund. Level 3 investments at the end of the period in relation to net assets were not significant and accordingly, a reconciliation of Level 3 assets for the year ended June 30, 2020 is not presented. |
The following table is a summary of quantitative information about significant unobservable valuation inputs for Level 3 fair value measurement for investments held as of June 30, 2020:
| | | | | | | | |
| TYPE OF ASSETS | | FAIR VALUE AS OF
JUNE 30, 2020 | | | VALUATION
TECHNIQUE(S) | | UNOBSERVABLE INPUT |
| | | |
Equities | | | | | | | | |
| | | |
Innovation Group | | $ | – | | | Zero Value | | Valued at zero |
| | | |
MModal, Inc. | | $ | 3,213 | | | Analyst Priced | | Analyst verified stale price and adjusted for cash receipts |
| | | |
Tunstall Group Holdings LTD | | $ | – | | | Zero Value | | Valued at zero |
| | | |
Tunstall Group Holdings LTD | | $ | – | | | Zero Value | | Valued at zero |
| | | |
Boomerang Tube LLC | | $ | – | | | Discounted Cash Flow | | Average Enterprise Valuation Multiple: 5 year projection, 5.0x; EBITDA: $20.4 million; 20% discount rate |
| | | |
Southcross Energy Partners LP | | $ | – | | | Zero Value | | Valued at zero |
162
Barings Funds Trust 2020 Annual Report
NOTES TO FINANCIAL STATEMENTS (CONTINUED)
June 30, 2020
| | | | | | | | |
| TYPE OF ASSETS | | FAIR VALUE AS OF
JUNE 30, 2020 | | | VALUATION
TECHNIQUE(S) | | UNOBSERVABLE INPUT |
| | | |
Maxeda DIY B.V. | | $ | 423,781 | | | Market Comparables | | LTM EBITDA €115m; Net leverage €409m; Average Comparable Valuation: 6.0X |
| | | |
Maxeda DIY B.V. | | $ | 55,277 | | | Market Comparables | | LTM EBITDA €115m; Net leverage €409m; Average Comparable Valuation: 6.0X |
| | | |
Pinnacle Operating Corp, earnout shares | | $ | – | | | Zero Value | | Valued at zero |
| | | |
Appvion Holdings Corp | | $ | – | | | Broker Quote | | Valued at zero |
| | | |
Appvion Holdings Corp | | $ | – | | | Broker Quote | | Valued at zero |
| | | |
Asset Backed Securities | | | | | | | | |
| | | |
BlueMountain CLO Ltd. | | $ | – | | | Zero Value | | Valued at zero |
| | | |
Bank Loans | | | | | | | | |
| | | |
Deoleo S.A. | | $ | – | | | Zero Value | | Valued at zero |
| | | |
Innovation Group PLC | | $ | 79,365 | | | Vendor Price | | $95.50: Price source depth of 1 |
| | | |
Innovation Group PLC | | $ | 35,939 | | | Vendor Price | | $24.78: Price source depth of 1 |
| | | |
Innovation Group PLC | | $ | 63,090 | | | Vendor Price | | $111.52: Price source depth of 1 |
| | | |
Innovation Group PLC | | $ | 156,696 | | | Vendor Price | | $95.50: Price source depth of 1 |
| | | |
Boomerang Tube LLC | | $ | 15,058 | | | Discounted Cash Flow | | Average Enterprise Valuation Multiple: 5 year projection, 5.0x; EBITDA: $20.4 million; 20% discount rate |
| | | |
Corporate Bonds | | | | | | | | |
| | | |
Appvion ESC | | $ | – | | | Zero Value | | Valued at zero without primary asset attached |
| | | |
Jupiter Resources, Inc. | | $ | 90,356 | | | Broker Quote | | $90.00: Price source depth of 1 |
Although the Fund believes the valuation methods described above are appropriate, the use of different methodologies or assumptions to determine fair value could result in different estimates of fair value at the reporting date.
Active Short Duration Bond Fund
| | | | | | | | | | | | | | | | |
| DESCRIPTION | | LEVEL 1 | | | LEVEL 2 | | | LEVEL 3 | | | TOTAL INVESTMENTS | |
| |
Assets: | | | | | |
| Fixed Income: | | | | | |
Asset-Backed Securities | | $ | – | | | $ | 307,459,029 | | | $ | 8,133,500 | | | $ | 315,592,529 | |
Corporate Bonds | | | – | | | | 318,403,399 | | | | – | | | | 318,403,399 | |
Mortgage-Backed Securities | | | – | | | | 109,620,679 | | | | – | | | | 109,620,679 | |
U.S. Treasury & Government Agencies | | | – | | | | 5,537,500 | | | | – | | | | 5,537,500 | |
| | | | | | | | | | | | | | | | |
| Total Fixed Income | | | – | | | | 741,020,607 | | | | 8,133,500 | | | | 749,154,107 | |
| | | | | | | | | | | | | | | | |
| |
Purchased Options: | | | | | |
Call Option Purchased | | | – | | | | 304,446 | | | | – | | | | 304,446 | |
Put Options Purchased | | | – | | | | 830,020 | | | | – | | | | 830,020 | |
| | | | | | | | | | | | | | | | |
| Total Purchased Options | | | – | | | | 1,134,466 | | | | – | | | | 1,134,466 | |
| | | | | | | | | | | | | | | | |
163
Barings Funds Trust 2020 Annual Report
NOTES TO FINANCIAL STATEMENTS (CONTINUED)
June 30, 2020
| | | | | | | | | | | | | | | | |
| DESCRIPTION | | LEVEL 1 | | | LEVEL 2 | | | LEVEL 3 | | | TOTAL INVESTMENTS | |
| |
Short-Term Investments: | | | | | |
Commercial Paper | | $ | – | | | $ | 54,944,663 | | | $ | – | | | $ | 54,944,663 | |
| | | | | | | | | | | | | | | | |
| Total Short-Term Investments | | | – | | | | 54,944,663 | | | | – | | | | 54,944,663 | |
| | | | | | | | | | | | | | | | |
| Total | | $ | – | | | $ | 797,099,736 | | | $ | 8,133,500 | | | $ | 805,233,236 | |
| | | | | | | | | | | | | | | | |
| |
Liabilities: | | | | | |
| Derivative Securities: | | | | | |
Centrally Cleared Credit Default Swaps* | | | – | | | | (121,089 | ) | | | – | | | | (121,089 | ) |
Futures* | | | (1,025,565 | ) | | | – | | | | – | | | | (1,025,565 | ) |
| | | | | | | | | | | | | | | | |
| Total Derivative Securities | | | (1,025,565 | ) | | | (121,089 | ) | | | – | | | | (1,146,654 | ) |
| | | | | | | | | | | | | | | | |
| Total Investments | | $ | (1,025,565 | ) | | $ | 796,978,647 | | | $ | 8,133,500 | | | $ | 804,086,582 | |
| | | | | | | | | | | | | | | | |
| | * | Centrally Cleared Swaps and Futures are valued at unrealized appreciation/depreciation. Only current day’s variation margin, if any, is reported on the Statement of Assets and Liabilities. |
The following table is a summary of quantitative information about significant unobservable valuation inputs for Level 3 fair value measurement for investments held as of June 30, 2020:
| | | | | | | | |
| TYPE OF ASSETS | | FAIR VALUE AS OF
JUNE 30, 2020 | | | VALUATION
TECHNIQUE(S) | | UNOBSERVABLE INPUT |
| | | |
Asset-Backed Securities | | | | | | | | |
| | | |
SLM Student Loan Trust 2006-2 | | $ | 2,021,728 | | | Broker Quote | | $511.05: Broker quote depth of 1 |
| | | |
SoFi Alternative Trust 2019-C | | $ | 3,625,946 | | | Broker Quote | | $108.61: Broker quote depth of 1 |
| | | |
SoFi Professional Loan Program 2018-A | | $ | 661,977 | | | Broker Quote | | $ 48.23: Broker quote depth of 1 |
| | | |
SoFi Professional Loan Program 2018-B Trust | | $ | 499,066 | | | Broker Quote | | $ 39.43 Broker quote depth of 1 |
| | | |
SoFi Professional Loan Program 2018-D Trust | | $ | 459,911 | | | Broker Quote | | $ 24.37: Broker quote depth of 1 |
| | | |
SoFi Professional Loan Program 2019-A LLC | | $ | 864,872 | | | Broker Quote | | $ 24.55: Broker quote depth of 1 |
Although the Fund believes the valuation methods described above are appropriate, the use of different methodologies or assumptions to determine fair value could result in different estimates of fair value at the reporting date.
The following is a reconciliation of investments with unobservable inputs (Level 3) that were used in determining fair value:
| | | | | | | | | | | | | | | | | | | | | | | | | | | | | | | | | | | | |
INVESTMENTS IN SECURITIES | | BALANCE
AS OF
JULY 1,
2019 | | | REALIZED
GAIN (LOSS) | | | CHANGE IN
UNREALIZED
APPRECIATION
(DEPRECIATION) | | | NET
TRANSFERS
IN (OUT)
OF
LEVEL 3** | | | ACCRUED PREMIUMS/
DISCOUNTS | | | PURCHASES | | | SALES | | | BALANCE AS OF
JUNE 30,
2020 | | | CHANGE IN
UNREALIZED
APPRECIATION
(DEPRECIATION)
FROM
INVESTMENTS
HELD AT
JUNE 30,
2020 | |
| | | | | | | | | |
Asset–Backed Securities | | $ | 12,047,135 | | | $ | (882,762 | ) | | $ | (247,727 | ) | | $ | (1,754,321 | ) | | $ | 92,554 | | | $ | – | | | $ | (1,121,379 | ) | | $ | 8,133,500 | | | $ | (247,727 | ) |
| | | | | | | | | | | | | | | | | | | | | | | | | | | | | | | | | | | | |
Total | | $ | 12,047,135 | | | $ | (882,762 | ) | | $ | (247,727 | ) | | $ | (1,754,321 | ) | | $ | 92,554 | | | $ | – | | | $ | (1,121,379 | ) | | $ | 8,133,500 | | | $ | (247,727 | ) |
| | | | | | | | | | | | | | | | | | | | | | | | | | | | | | | | | | | | |
| | ** | Transfers out of Level 3 into Level 2 occurred because observable inputs were now available. |
164
Barings Funds Trust 2020 Annual Report
NOTES TO FINANCIAL STATEMENTS (CONTINUED)
June 30, 2020
Diversified Income Fund
| | | | | | | | | | | | | | | | |
| DESCRIPTION | | LEVEL 1 | | | LEVEL 2 | | | LEVEL 3 | | | TOTAL INVESTMENTS | |
| |
Assets: | | | | | |
| Fixed Income: | | | | | |
Asset-Backed Securities | | $ | – | | | $ | 18,510,031 | | | $ | – | | | $ | 18,510,031 | |
Corporate Bonds | | | – | | | | 18,620,900 | | | | – | | | | 18,620,900 | |
Mortgage-Backed Securities | | | – | | | | 3,189,175 | | | | – | | | | 3,189,175 | |
| | | | | | | | | | | | | | | | |
| Total Fixed Income | | | – | | | | 40,320,106 | | | | – | | | | 40,320,106 | |
| | | | | | | | | | | | | | | | |
| |
Derivative Securities: | | | | | |
Forward Foreign Currency Exchange Contracts | | | – | | | | 107 | | | | – | | | | 107 | |
Futures* | | | 44 | | | | – | | | | – | | | | 44 | |
| | | | | | | | | | | | | | | | |
| Total Derivative Securities | | | 44 | | | | 107 | | | | – | | | | 151 | |
| | | | | | | | | | | | | | | | |
| Total | | $ | 44 | | | $ | 40,320,213 | | | $ | – | | | $ | 40,320,257 | |
| | | | | | | | | | | | | | | | |
| |
Liabilities: | | | | | |
| Derivative Securities: | | | | | |
Forward Foreign Currency Exchange Contracts | | | – | | | | (4,280 | ) | | | – | | | | (4,280 | ) |
Futures* | | | (57,468 | ) | | | – | | | | – | | | | (57,468 | ) |
| | | | | | | | | | | | | | | | |
| Total Derivative Securities | | | (57,468 | ) | | | (4,280 | ) | | | – | | | | (61,748 | ) |
| | | | | | | | | | | | | | | | |
| Total Investments | | $ | (57,424 | ) | | $ | 40,315,933 | | | $ | – | | | $ | 40,258,509 | |
| | | | | | | | | | | | | | | | |
| | * | Centrally Cleared Swaps and Futures are valued at unrealized appreciation/depreciation. Only current day’s variation margin, if any, is reported on the Statement of Assets and Liabilities. |
Emerging Markets Debt Blended Total Return Fund
| | | | | | | | | | | | | | | | |
| DESCRIPTION | | LEVEL 1 | | | LEVEL 2 | | | LEVEL 3 | | | TOTAL INVESTMENTS | |
| | | | |
Assets: | | | | | | | | | | | | | | | | |
| Fixed Income: | | | | | | | | | | | | | | | | |
Corporate Bonds | | $ | – | | | $ | 21,286,835 | | | $ | – | | | $ | 21,286,835 | |
Foreign Government | | | – | | | | 29,495,269 | | | | 1,016,514 | | | | 30,511,783 | |
| | | | | | | | | | | | | | | | |
| Total Fixed Income | | | – | | | | 50,782,104 | | | | 1,016,514 | | | | 51,798,618 | |
| | | | | | | | | | | | | | | | |
| | | | |
Derivative Securities: | | | | | | | | | | | | | | | | |
Centrally Cleared Interest Rate Swaps* | | | – | | | | 1,108,906 | | | | – | | | | 1,108,906 | |
| Forward Foreign Currency Exchange Contracts | | | – | | | | 1,926,360 | | | | – | | | | 1,926,360 | |
OTC – Credit Default Swaps | | | – | | | | 7,087 | | | | – | | | | 7,087 | |
OTC – Cross Currency Swaps | | | – | | | | 572,671 | | | | – | | | | 572,671 | |
OTC – Interest Rate Swaps | | | – | | | | 1,621,716 | | | | – | | | | 1,621,716 | |
| | | | | | | | | | | | | | | | |
| Total Derivative Securities | | | – | | | | 5,236,740 | | | | – | | | | 5,236,740 | |
| | | | | | | | | | | | | | | | |
| Total | | $ | – | | | $ | 56,018,844 | | | $ | 1,016,514 | | | $ | 57,035,358 | |
| | | | | | | | | | | | | | | | |
165
Barings Funds Trust 2020 Annual Report
NOTES TO FINANCIAL STATEMENTS (CONTINUED)
June 30, 2020
| | | | | | | | | | | | | | | | |
| DESCRIPTION | | LEVEL 1 | | | LEVEL 2 | | | LEVEL 3 | | | TOTAL INVESTMENTS | |
| | | | |
Liabilities: | | | | | | | | | | | | | | | | |
| Derivative Securities: | | | | | | | | | | | | | | | | |
Centrally Cleared Interest Rate Swaps* | | $ | – | | | $ | (7,026 | ) | | $ | – | | | $ | (7,026 | ) |
Forward Foreign Currency Exchange Contracts | | | – | | | | (1,071,754 | ) | | | – | | | | (1,071,754 | ) |
OTC – Credit Default Swaps | | | – | | | | (375,171 | ) | | | – | | | | (375,171 | ) |
OTC – Cross Currency Swaps | | | – | | | | (121,273 | ) | | | – | | | | (121,273 | ) |
| | | | | | | | | | | | | | | | |
| Total Derivative Securities | | | – | | | | (1,575,224 | ) | | | – | | | | (1,575,224 | ) |
| | | | | | | | | | | | | | | | |
| Total Investments | | $ | – | | | $ | 54,443,620 | | | $ | 1,016,514 | | | $ | 55,460,134 | |
| | | | | | | | | | | | | | | | |
| | * | Centrally Cleared Swaps are valued at unrealized appreciation/depreciation. Only current day’s variation margin, if any, is reported on the Statement of Assets and Liabilities. |
The following table is a summary of quantitative information about significant unobservable valuation inputs for Level 3 fair value measurement for investments held as of June 30, 2020:
| | | | | | | | |
| TYPE OF ASSETS | | FAIR VALUE AS OF
JUNE 30, 2020 | | | VALUATION
TECHNIQUE(S) | | UNOBSERVABLE INPUT |
| | | |
Foreign Government | | | | | | | | |
| | | |
Asian Development Bank 7/14/21 | | $ | 329,523 | | | Broker Quote | | $32.31: Broker quote depth of 1 |
| | | |
European Bank for Reconstruction and Development 10/29/22 | | $ | 386,304 | | | Broker Quote | | $32.19: Broker quote depth of 1 |
| | | |
International Bank for Reconstruction and Development 11/22/21 | | $ | 300,687 | | | Broker Quote | | $31.32: Broker quote depth of 1 |
Although the Fund believes the valuation methods described above are appropriate, the use of different methodologies or assumptions to determine fair value could result in different estimates of fair value at the reporting date.
The following is a reconciliation of investments with unobservable inputs (Level 3) that were used in determining fair value:
| | | | | | | | | | | | | | | | | | | | | | | | | | | | | | | | | | | | |
INVESTMENTS IN SECURITIES | | BALANCE
AS OF
JULY 1,
2019 | | | REALIZED
GAIN (LOSS) | | | CHANGE IN
UNREALIZED
APPRECIATION
(DEPRECIATION) | | | NET
TRANSFERS
IN (OUT)
OF LEVEL 3 | | | ACCRUED PREMIUMS/
DISCOUNTS | | | PURCHASES | | | SALES | | | BALANCE AS OF
JUNE 30,
2020 | | | CHANGE IN
UNREALIZED
APPRECIATION
(DEPRECIATION)
FROM
INVESTMENTS
HELD AT JUNE
30, 2020 | |
| | | | | | | | | |
Foreign Government | | $ | – | | | $ | 4,075 | | | $ | (55,494 | ) | | $ | – | | | $ | – | | | $ | 1,186,194 | | | $ | (118,261 | ) | | $ | 1,016,514 | | | $ | (55,494 | ) |
| | | | | | | | | | | | | | | | | | | | | | | | | | | | | | | | | | | | |
Total | | $ | – | | | $ | 4,075 | | | $ | (55,494 | ) | | $ | – | | | $ | – | | | $ | 1,186,194 | | | $ | (118,261 | ) | | $ | 1,016,514 | | | $ | (55,494 | ) |
| | | | | | | | | | | | | | | | | | | | | | | | | | | | | | | | | | | | |
166
Barings Funds Trust 2020 Annual Report
NOTES TO FINANCIAL STATEMENTS (CONTINUED)
June 30, 2020
Global Emerging Markets Equity Fund
| | | | | | | | | | | | | | | | |
| DESCRIPTION | | LEVEL 1 | | | LEVEL 2 | | | LEVEL 3 | | | TOTAL INVESTMENTS | |
| |
Assets: | | | | | |
| Equities: | | | | | |
Common Stocks | | $ | 9,979,939 | | | $ | – | | | $ | – | | | $ | 9,979,939 | |
| | | | | | | | | | | | | | | | |
| Total Equities | | | 9,979,939 | | | | – | | | | – | | | | 9,979,939 | |
| | | | | | | | | | | | | | | | |
| |
Mutual Fund: | | | | | |
Mutual Fund | | | 170,753 | | | | – | | | | – | | | | 170,753 | |
| | | | | | | | | | | | | | | | |
| Total | | $ | 10,150,692 | | | $ | – | | | $ | – | | | $ | 10,150,692 | |
| | | | | | | | | | | | | | | | |
| Total Investments | | $ | 10,150,692 | | | $ | – | | | $ | – | | | $ | 10,150,692 | |
| | | | | | | | | | | | | | | | |
U.S. High Yield Fund
| | | | | | | | | | | | | | | | |
| DESCRIPTION | | LEVEL 1 | | | LEVEL 2 | | | LEVEL 3 | | | TOTAL INVESTMENTS | |
| |
Assets: | | | | | |
| Equities: | | | | | |
Common Stocks | | $ | – | | | $ | 30,052 | | | $ | – | | | $ | 30,052 | |
Warrants | | | – | | | | – | | | | 0 | *** | | | – | |
| | | | | | | | | | | | | | | | |
| Total Equities | | | – | | | | 30,052 | | | | 0 | | | | 30,052 | |
| | | | | | | | | | | | | | | | |
| |
Fixed Income: | | | | | |
Bank Loans | | | – | | | | 2,351,611 | | | | – | | | | 2,351,611 | |
Corporate Bonds | | | – | | | | 42,251,964 | | | | 43,277 | *** | | | 42,295,241 | |
| | | | | | | | | | | | | | | | |
| Total Fixed Income | | | – | | | | 44,603,575 | | | | 43,277 | | | | 44,646,852 | |
| | | | | | | | | | | | | | | | |
| Total | | $ | – | | | $ | 44,633,627 | | | $ | 43,277 | | | $ | 44,676,904 | |
| | | | | | | | | | | | | | | | |
| Total Investments | | $ | – | | | $ | 44,633,627 | | | $ | 43,277 | | | $ | 44,676,904 | |
| | | | | | | | | | | | | | | | |
| | *** | None of the unobservable inputs for Level 3 assets, individually or collectively, had a material impact on the Fund. Level 3 investments at the end of the period in relation to net assets were not significant and accordingly, a reconciliation of Level 3 assets for the year ended June 30, 2020 is not presented. |
The following table is a summary of quantitative information about significant unobservable valuation inputs for Level 3 fair value measurement for investments held as of June 30, 2020:
| | | | | | | | |
| TYPE OF ASSETS | | FAIR VALUE AS OF
JUNE 30, 2020 | | | VALUATION
TECHNIQUE(S) | | UNOBSERVABLE INPUT |
| | | |
Equities | | | | | | | | |
| | | |
Appvion Holdings Corp. | | $ | – | | | Broker Quote | | Valued at zero |
| | | |
Appvion Holdings Corp. | | $ | – | | | Broker Quote | | Valued at zero |
| | | |
Corporate Bonds | | | | | | | | |
| | | |
Jupiter Resources | | $ | 43,277 | | | Broker Quote | | $90.00: Price source depth of 1 |
| | | |
Appvion ESC | | $ | – | | | Zero Value | | Valued at zero without primary asset attached |
167
Barings Funds Trust 2020 Annual Report
NOTES TO FINANCIAL STATEMENTS (CONTINUED)
June 30, 2020
Although the Fund believes the valuation methods described above are appropriate, the use of different methodologies or assumptions to determine fair value could result in different estimates of fair value at the reporting date.
| | B. | When-Issued, Delayed-Delivery, Forward Commitment, and To-Be-Announced Transactions |
The Funds may enter into when-issued, delayed-delivery, forward commitment, or TBA transactions (collectively, the “Forward Transactions”) in order to lock in the purchase price of the underlying security, or in order to adjust the interest rate exposure of the Fund’s existing portfolio. In Forward Transactions, a Fund commits to purchase or sell particular securities, with payment and delivery to take place at a future date. In the case of TBA purchase commitments, the unit price and the estimated principal amount are established when the Fund enters into a commitment, with the actual principal amount being within a specified range of the estimate. Although a Fund does not typically pay for the securities in these types of transactions until they are delivered, it immediately assumes the risks of ownership, including the risk of price fluctuation. As a result, each of these types of transactions may create investment leverage in a Fund’s portfolio and increase the volatility of the Fund. If a Fund’s counterparty fails to deliver a security purchased in a Forward Transaction, there may be a loss, and the Fund may have missed an opportunity to make an alternative investment.
These securities are valued on the basis of valuations furnished by a pricing service, selected pursuant to procedures approved by the Trustees, which determines valuations taking into account appropriate factors such as institutional-size trading in similar groups of securities, yield, quality, coupon rate, maturity, type of issue, trading characteristics, and other market data. Securities for which no market quotation is available are valued at fair value in accordance with procedures approved by the Trustees. The Funds record on a daily basis the unrealized appreciation (depreciation) based upon changes in the values of these securities. When a Forward Transaction is closed, the Funds record a realized gain or loss equal to the difference between the value of the transaction at the time it was opened and the value of the transaction at the time it was closed.
| | C. | Cash and Short-Term Investments |
Cash and cash equivalents consist principally of short-term investments that are readily convertible into cash
and have original maturities of three months or less. At June 30, 2020, all cash and cash equivalents are held by the custodian.
| | D. | Investment Transactions, Related Investment Income and Expenses |
Investment transactions are accounted for on a trade date basis. Interest income is recorded on the accrual basis, including the amortization of premiums and accretion of discounts on bonds held using the yield-to-maturity method. Interest income from securitized investments in which the Fund(s) has/have a beneficial interest, such as the “equity” security class of a CLO vehicle (typically in the form of income or subordinated notes), are recorded upon receipt. The accrual of interest income related to these types of securities is periodically reviewed and adjustments are made as necessary. These cash inflows are regularly reviewed to ensure these payments are not materially different from what would be required by GAAP reporting. Adjustments would be made if needed to address any changes.
In March 2017, FASB issued Accounting Standards Update No. 2017-08 “Premium Amortization of Purchased Callable Debt Securities”, which amends the amortization period for certain purchased callable debt securities. Under the standards update, the premium amortization of purchased callable debt securities that have explicit, non-contingent call features and are callable at fixed prices will be amortized to the earliest call date. The guidance will be applied on a modified retrospective basis and is effective for fiscal years, and their interim periods, beginning after December 15, 2018. Management has evaluated the impact of ASU 2017-08 and has adopted the requirements, and the impact, if any, is reflected within the Funds’ financial statements.
Realized gains and losses on investment transactions and unrealized appreciation and depreciation of investments are reported for financial statement and Federal income tax purposes on the identified cost method.
Expenses are recorded on the accrual basis as incurred.
The Funds do not have redemption fees.
The preparation of financial statements in conformity with U.S. GAAP requires management to make estimates
168
Barings Funds Trust 2020 Annual Report
NOTES TO FINANCIAL STATEMENTS (CONTINUED)
June 30, 2020
and assumptions that affect the reported amounts of assets and liabilities at the date of the financial statements and the reported amounts of revenues and expenses during the reporting period. Actual results could differ from these estimates.
| | G. | Federal Income Taxation |
The Funds have elected to be taxed as a Regulated Investment Company (“RIC”) under sub-chapter M of the U.S. Internal Revenue Code of 1986, as amended, and intend to maintain this qualification and to distribute substantially all of their net taxable income to their shareholders. As of June 30, 2020, the Funds had no uncertain tax positions that would require financial statement recognition, de-recognition, or disclosure. The Funds file a U.S. federal income tax return annually after their fiscal year-end, which is subject to examination by the Internal Revenue Service for a period of three years from the date of the filings.
| | H. | Dividends and Distributions |
Each Fund, except Global Emerging Markets Equity Fund, declares a dividend daily based on the Adviser’s projections of the Funds’ estimated net investment income and distributes such dividend monthly. To the extent that these distributions exceed net investment income, they may be classified as return of capital. The Funds also pay a distribution at least annually from their net realized capital gains, if any. Dividends and distributions are recorded on the ex-dividend date. All common shares have equal dividend and other distribution rights. A notice disclosing the source(s) of a distribution will be provided if payment is made from any source other than net investment income. Any such notice would be provided only for informational purposes in order to comply with the requirements of Section 19(a) of the 1940 Act and not for tax reporting purposes. The tax composition of the Funds’ distributions for each calendar year is reported on Internal Revenue Service Form 1099-DIV.
Dividends from net investment income and distributions from realized gains from investment transactions have been determined in accordance with Federal income tax regulations and may differ from net investment income and realized gains recorded by the Funds for financial reporting purposes. These differences, which could be temporary or permanent in nature may result in reclassification of distributions; however, net investment income, net realized gains and losses, and net assets are not affected.
The Funds may invest in bank loans, which usually take the form of loan participations and assignments. Loan participations and assignments are agreements to make money available to U.S. or foreign corporations, partnerships or other business entities (the “Borrower”) in a specified amount, at a specified rate and within a specified time. A loan is typically originated, negotiated and structured by a U.S. or foreign bank, insurance company or other financial institution (the “Agent”) for a group of loan investors (“Loan Investors”). The Agent typically administers and enforces the loan on behalf of the other Loan Investors in the syndicate and may hold any collateral on behalf of the Loan Investors. Such loan participations and assignments are typically senior, secured and collateralized in nature. The Funds record an investment when the Borrower withdraws money and records interest as earned. These loans pay interest at rates which are periodically reset by reference to a base lending rate plus a spread. These base lending rates are generally the prime rate offered by a designated U.S. bank or London InterBank Offered Rate (“LIBOR”).
The loans in which the Funds invest may be subject to some restrictions on resale. For example, the Funds may be contractually obligated to receive approval from the Agent and/or Borrower prior to the sale of these investments. The Funds generally have no right to enforce compliance with the terms of the loan agreement with the Borrower. As a result, the Funds assume the credit risk of the Borrower, the selling participant and any other persons interpositioned between the Funds and the Borrower (“Intermediate Participants”). In the event that the Borrower, selling participant or Intermediate Participants become insolvent or enter into bankruptcy, the Funds may incur certain costs and delays in realizing payment or may suffer a loss of principal and/or interest.
Unfunded commitments represent the remaining obligation of the Funds to the Borrower. At any point in time, up to the maturity date of the issue, the Borrower may demand the unfunded portion. Until demanded by the Borrower, unfunded commitments are not recognized as an asset on the Statements of Assets and Liabilities. Unrealized appreciation/depreciation on unfunded commitments presented on the Statements of Assets and Liabilities represents mark to market of the unfunded portion of the Funds’ bank loans. As of June 30, 2020, the Funds had no unfunded loan commitments:
169
Barings Funds Trust 2020 Annual Report
NOTES TO FINANCIAL STATEMENTS (CONTINUED)
June 30, 2020
The following is a description of the derivative instruments that the Funds utilize as part of their investment strategy, including the primary underlying risk exposures related to the instrument.
The Funds are subject to foreign currency exchange rate risk in the normal course of pursuing their investment objectives. The Funds may use forward foreign currency exchange contracts to hedge against changes in the value of foreign currencies. The Funds may enter into forward foreign currency exchange contracts obligating the Funds to deliver or receive a currency at a specified future date. Forward contracts are valued daily and unrealized appreciation or depreciation is recorded daily as the difference between the contract exchange rate and the closing forward rate applied to the face amount of the contract. A realized gain or loss is recorded at the time the forward contract expires. Credit risk may arise as a result of the failure of the counterparty to comply with the terms of the contract. The Funds consider the creditworthiness of each counterparty to a contract in evaluating potential credit risk quarterly. The Funds are also subject to credit risk with respect to the counterparties to derivative contracts that are not cleared through a central counterparty but instead are traded over-the-counter between two counterparties. If a counterparty to an over-the-counter derivative becomes bankrupt or otherwise fails to perform its obligations under a derivative contract due to financial difficulties, the Funds may experience significant delays in obtaining any recovery under the derivative contract in a bankruptcy or other reorganization proceeding. The Funds may obtain only a limited recovery or may obtain no recovery in such circumstances. The counterparty risk for cleared derivatives is generally lower than for uncleared over-the-counter derivative transactions since generally a clearing organization becomes substituted for each counterparty to a cleared derivative contract and, in effect, guarantees the parties’ performance under the contract as each party to a trade looks only to the clearing house for performance of financial obligations. However, there can be no assurance that the clearing house, or its members, will satisfy its obligations to the Funds. In addition, in the event of a bankruptcy of a clearing house, the Funds could experience a loss of the funds deposited with such clearing house as margin and of any profits on its open positions. The counterparty risk to the Funds is limited to the net unrealized gain, if any, on the contract.
The use of forward foreign currency exchange contracts does not eliminate fluctuations in the underlying prices of the Funds’ investment securities; however, it does establish a rate of exchange that can be achieved in the future. The use of forward foreign currency exchange contracts involves the risk that anticipated currency movements will not be accurately predicted. A forward foreign currency exchange contract would limit the risk of loss due to a decline in the value of a particular currency; however, it would also limit any potential gain that might result should the value of the currency increase instead of decrease. These contracts may involve market risk in excess of the amount of receivable or payable reflected on the Statement of Assets and Liabilities.
The Funds may purchase and sell futures contracts to enhance returns, to attempt to hedge some of its investment risk, or as a substitute position in lieu of holding the underlying asset on which the instrument is based. At the time of entering into a futures transaction, an investor is required to deposit and maintain a specified amount of cash or eligible securities called “initial margin.” Subsequent payments made or received by a Fund called “variation margin” are made on a daily basis as the market price of the futures contract fluctuates. Each Fund will record an unrealized gain (loss) based on the amount of variation margin. When a contract is closed, a realized gain (loss) is recorded equal to the difference between the opening and closing value of the contract.
The Funds may purchase call or put options. When a Fund purchases an option, the premium paid by the Fund is recorded as an asset and is subsequently adjusted to the current fair value of the option purchased. Purchasing call options tends to increase the Fund’s exposure to the underlying instrument. Purchasing put options tends to decrease the Fund’s exposure to the underlying instrument. Premiums paid for purchasing options that expire are treated as realized losses. Premiums paid for purchasing options that are exercised or closed are added to the amounts paid or offset against the proceeds on the underlying security to determine the realized gain or loss. The risks associated with purchasing put and call options are potential loss of the premium paid and, in the instances of over-the-counter derivatives, the failure of the counterparty to honor its obligation under the contract.
The Funds may enter into swap options (“swaptions”). A swaption is an option to enter into a pre-defined swap
170
Barings Funds Trust 2020 Annual Report
NOTES TO FINANCIAL STATEMENTS (CONTINUED)
June 30, 2020
agreement by some specified date in the future. The writer of the swaption becomes the counterparty to the swap if the buyer exercises. The interest rate swaption agreement will specify whether the buyer of the swaption will be a fixed rate receiver or a fixed rate buyer. Depending on the terms of the particular option agreement, a Fund generally will incur a greater degree of risk when the Fund writes a swaption than the Fund will incur when it purchases a swaption. When a Fund purchases a swaption, the Fund’s risk of loss is limited to the amount of the premium it has paid should it decide to let the swaption expire unexercised.
When a Fund writes a covered call or a put option, an amount equal to the premium received by the Fund is included in the Fund’s Statement of Assets and Liabilities as an asset and as an equivalent liability. The amount of the liability is subsequently marked-to-market to reflect the current market value of the option written. The Fund receives a premium on the sale of a call option but gives up the opportunity to profit from any increase in stock value above the exercise price of the option, and when a Fund writes a put option, it is exposed to a decline in the price of the underlying security.
Whether an option which a Fund has written expires on its stipulated expiration date or a Fund enters into a closing purchase transaction, the Fund realizes a gain (or loss, if the cost of a closing purchase transaction exceeds the premium received when the option was sold) without regard to any unrealized gain or loss on the underlying security, and the liability related to such option is extinguished. If a call option which a Fund has written is exercised, the Fund realizes a capital gain or loss from the sale of the underlying security, and the cost basis of the lots sold are decreased by the premium originally received. When a put option which a Fund has written is exercised, the amount of the premium originally received will reduce the cost of the security which the Fund purchases upon exercise of the option. Realized gains (losses) on purchased options are included in net realized gain (loss) from investments.
The Funds’ use of written options involves, to varying degrees, elements of market risk in excess of the amount recognized in the Statements of Assets and Liabilities. The face or contract amounts of these instruments reflect the extent of the Funds’ exposure to market risk. The risks may be caused by an imperfect correlation between movements in the price of the instrument and the price of the underlying securities, currencies and interest rates.
The Funds may enter into credit default swap contracts. As a seller of a credit default swap contract (“seller of protection”), a Fund is required to pay the notional amount or other agreed-upon value of a referenced debt obligation to the counterparty (or central clearing party in the case of centrally cleared swaps) in the event of a default by or other credit event involving the referenced issuer, obligation or index. In return, a Fund receives from the counterparty (or central clearing party in the case of centrally cleared swaps) a periodic stream of payments over the term of the contract.
As a purchaser of a credit default swap contract (“buyer of protection”), a Fund would receive the notional amount or other agreed upon value of a referenced debt obligation from the counterparty (or central clearing party in the case of centrally cleared swaps) in the event of default by or other credit event involving the referenced issuer, obligation or index. In return, a Fund would make periodic payments to the counterparty (or central clearing party in the case of centrally cleared swaps) over the term of the contracts, provided no event of default has occurred.
These credit default swaps may have as a reference obligation corporate or sovereign issuers or credit indices. These credit indices are comprised of a basket of securities representing a particular sector of the market. During the period, Active Short Duration Bond Fund and Diversified Income Fund entered into credit default swaps based on a CMBX index, which is comprised of commercial mortgage-backed securities and a CDX index, which is comprised of North American and Emerging Market companies.
Credit default swaps are fair valued based upon quotations from counterparties, brokers or market-makers and the change in value, if any, is recorded as an unrealized appreciation or depreciation. For a credit default swap sold by a Fund, payment of the agreed-upon amount made by a Fund in the event of default of the referenced debt obligation is recorded as the cost of the referenced debt obligation purchased/received. For a credit default swap purchased by a Fund, the agreed-upon amount received by a Fund in the event of default of the referenced debt obligation is recorded as proceeds from sale/delivery of the referenced debt obligation and the resulting gain or loss realized on the referenced debt obligation is recorded as such by a Fund.
Any upfront payments made or received upon entering a credit default swap contract would be amortized or
171
Barings Funds Trust 2020 Annual Report
NOTES TO FINANCIAL STATEMENTS (CONTINUED)
June 30, 2020
accreted over the life of the swap and recorded as realized gains or losses. Collateral, in the form of cash or securities, may be required to be held in segregated accounts with the custodian bank or broker in accordance with the swap agreement. The value and credit rating of each credit default swap where a Fund is the seller of protection, are both measures of the current payment/performance risk of the swap. As the value of the swap changes as a positive or negative percentage of the total notional amount, the payment/performance risk may decrease or increase, respectively. The maximum potential amount of future payments (undiscounted) that a Fund as a seller of protection could be required to make under a credit default swap agreement would be an amount equal to the notional amount of the agreement. These potential amounts would be partially offset by any recovery values of the respective referenced obligations, upfront payments received upon entering into the agreement, or net amounts received from the settlement of buy protection credit default swap agreements entered into by a Fund for the same referenced entity or entities. For centrally cleared swaps, the daily change in valuation is recorded as a receivable or payable for variation margin and settled in cash with the central clearing party daily.
Entering into swap agreements involves counterparty and market risk. Such risks involve the possibility that there will be no liquid market for these agreements, that the counterparty to the agreements may default on its obligation to perform or disagree as to the meaning of the contractual terms in the agreements, that there may be unfavorable changes in interest rates, and, in the case
of credit default swaps, that the Adviser does not correctly predict the creditworthiness of the issuers of the reference obligation on which the credit default swap is based. In the case of centrally cleared swaps, counterparty risk is minimal due to protections provided by the central clearing party.
Interest rate swaps involve the exchange by a Fund with another party of their respective commitments to receive or pay interest (e.g., an exchange of fixed rate payments for floating rate payments) with respect to a notional amount of principal. When a Fund enters into an interest rate swap, it typically agrees to make payments to its counterparty based on a specified long- or short-term interest rate, and will receive payments from its counterparty based on another interest rate. Other forms of interest rate swap agreements include interest rate caps, under which, in return for a specified payment stream, one party agrees to make payments to the other to the extent that interest rates exceed a specified rate, or “cap”; interest rate floors, under which, in return for a specified payment stream, one party agrees to make payments to the other to the extent that interest rates fall below a specified rate, or “floor”; and interest rate collars, under which a party sells a cap and purchases a floor or vice versa in an attempt to protect itself against interest rate movements exceeding given minimum or maximum levels. A Fund may enter into an interest rate swap in order, for example, to hedge against the effect of interest rate changes on the value of specific securities in its portfolio, or to adjust the interest rate sensitivity (duration) or the credit exposure of its portfolio overall, or otherwise as a substitute for a direct investment in debt securities.
During the period ended June 30, 2020, the Funds’ direct investment in derivatives consisted of forward foreign currency exchange contracts, futures contracts, credit default swaps, interest rate swaps and purchased options.
The following is a summary of the fair value of derivative instruments held directly by the Funds as of June 30, 2020:
Global Floating Rate Fund
| | | | | | |
ASSET DERIVATIVES | | STATEMENTS OF ASSETS
AND LIABILITIES
LOCATION | | FOREIGN
EXCHANGE
CONTRACTS RISK | |
Forward Foreign Currency Exchange Contracts | | Unrealized appreciation on
forward foreign currency
exchange contracts | | $ | 582,821 | |
| | | | | | |
Total | | | | $ | 582,821 | |
| | | | | | |
172
Barings Funds Trust 2020 Annual Report
NOTES TO FINANCIAL STATEMENTS (CONTINUED)
June 30, 2020
| | | | | | | | |
| | |
LIABILITY DERIVATIVES | | STATEMENTS OF ASSETS
AND LIABILITIES
LOCATION | | | FOREIGN
EXCHANGE
CONTRACTS
RISK | |
Forward Foreign Currency Exchange Contracts | |
| Unrealized depreciation on
forward foreign currency
exchange contracts |
| | $ | (22,691 | ) |
| | | | | | | | |
Total | | | | | | $ | (22,691 | ) |
| | | | | | | | |
Global Credit Income Opportunities Fund
| | | | | | | | | | | | | | | | |
ASSET DERIVATIVES | | STATEMENTS OF ASSETS
AND LIABILITIES
LOCATION | | | FOREIGN
EXCHANGE
CONTRACTS RISK | | | EQUITY RISK | | | TOTAL | |
Forward Foreign Currency Exchange Contracts | |
| Unrealized appreciation on
forward foreign currency
exchange contracts |
| | $ | 495,076 | | | $ | – | | | $ | 495,076 | |
Purchased Options | | | Investments, at fair value | | | | – | | | | 777,280 | | | | 777,280 | |
| | | | | | | | | | | | | | | | |
Total | | | | | | $ | 495,076 | | | $ | 777,280 | | | $ | 1,272,356 | |
| | | | | | | | | | | | | | | | |
| | | | |
LIABILITY DERIVATIVES | | STATEMENTS OF ASSETS
AND LIABILITIES
LOCATION | | | FOREIGN
EXCHANGE
CONTRACTS RISK | | | EQUITY RISK | | | TOTAL | |
Forward Foreign Currency Exchange Contracts | |
| Unrealized depreciation on
forward foreign currency
exchange contracts |
| | $ | (47,937 | ) | | $ | – | | | $ | (47,937 | ) |
Written Options | |
| Written options, at fair
value |
| | | – | | | | (439,208 | ) | | | (439,208 | ) |
| | | | | | | | | | | | | | | | |
Total | | | | | | $ | (47,937 | ) | | $ | (439,208 | ) | | $ | (487,145 | ) |
| | | | | | | | | | | | | | | | |
173
Barings Funds Trust 2020 Annual Report
NOTES TO FINANCIAL STATEMENTS (CONTINUED)
June 30, 2020
Active Short Duration Bond Fund
| | | | | | | | | | | | | | | | |
ASSET DERIVATIVES | | STATEMENTS OF ASSETS
AND LIABILITIES
LOCATION | | | INTEREST RATE
RISK | | | CREDIT RISK | | | TOTAL | |
Purchased Options | |
| Investments,
at fair value |
| | $ | 1,134,466 | | | $ | – | | | $ | 1,134,466 | |
| | | | | | | | | | | | | | | | |
Total | | | | | | $ | 1,134,466 | | | $ | – | | | $ | 1,134,466 | |
| | | | | | | | | | | | | | | | |
| | | | | | | | | | | | | | | | |
LIABILITY DERIVATIVES | | STATEMENTS OF ASSETS
AND LIABILITIES
LOCATION | | | INTEREST RATE
RISK | | | CREDIT RISK | | | TOTAL | |
Futures Contracts | |
| Includes cumulative
unrealized appreciation/
depreciation of futures
contracts as reported
in the Schedule of
Investments. Only
current day’s variation
margin is reported
within the Statements
of Assets and Liabilities. |
| | $ | (1,025,565 | ) | | $ | – | | | $ | (1,025,565 | ) |
Centrally Cleared Credit Default Swaps Contracts | |
| Includes cumulative
unrealized appreciation/
depreciation of swaps
contracts as reported
in the Schedule of
Investments. Only
current day’s variation
margin is reported
within the Statements
of Assets and Liabilities. |
| | | – | | | | (121,089 | ) | | | (121,089 | ) |
| | | | | | | | | | | | | | | | |
Total | | | | | | $ | (1,025,565 | ) | | $ | (121,089 | ) | | $ | (1,146,654 | ) |
| | | | | | | | | | | | | | | | |
174
Barings Funds Trust 2020 Annual Report
NOTES TO FINANCIAL STATEMENTS (CONTINUED)
June 30, 2020
Diversified Income Fund
| | | | | | | | | | | | | | | | |
| | | | |
ASSET DERIVATIVES | | STATEMENTS OF ASSETS
AND LIABILITIES
LOCATION | | | FOREIGN
EXCHANGE
CONTRACTS RISK | | | INTEREST RATE
RISK | | | TOTAL | |
Forward Foreign Currency Exchange Contracts | |
| Unrealized appreciation on
forward foreign currency
exchange contracts |
| | $ | 107 | | | $ | – | | | $ | 107 | |
Futures Contracts | |
| Includes cumulative
unrealized appreciation/
depreciation of futures
contracts as reported in
the Schedule of
Investments. Only current
day’s variation margin is
reported within the
Statements of Assets and
Liabilities. |
| | | – | | | | 44 | | | | 44 | |
| | | | | | | | | | | | | | | | |
Total | | | | | | $ | 107 | | | $ | 44 | | | $ | 151 | |
| | | | | | | | | | | | | | | | |
| | | | | | | | | | | | | | | | |
LIABILITY DERIVATIVES | | STATEMENTS OF ASSETS
AND LIABILITIES
LOCATION | | | FOREIGN
EXCHANGE
CONTRACTS RISK | | | INTEREST RATE
RISK | | | TOTAL | |
Forward Foreign Currency Exchange Contracts | |
| Unrealized depreciation on
forward foreign currency
exchange contracts |
| | $ | (4,280 | ) | | $ | – | | | $ | (4,280 | ) |
Futures Contracts | |
| Includes cumulative
unrealized appreciation/
depreciation of futures
contracts as reported in
the Schedule of
Investments. Only current
day’s variation margin is
reported within the
Statements of Assets and
Liabilities. |
| | | – | | | | (57,468 | ) | | | (57,468 | ) |
| | | | | | | | | | | | | | | | |
Total | | | | | | $ | (4,280 | ) | | $ | (57,468 | ) | | $ | (61,748 | ) |
| | | | | | | | | | | | | | | | |
175
Barings Funds Trust 2020 Annual Report
NOTES TO FINANCIAL STATEMENTS (CONTINUED)
June 30, 2020
Emerging Markets Debt Blended Total Return Fund
| | | | | | | | | | | | | | | | | | | | |
ASSET DERIVATIVES | | STATEMENTS OF ASSETS
AND LIABILITIES
LOCATION | | | FOREIGN
EXCHANGE
CONTRACTS RISK | | | INTEREST RATE
RISK | | | CREDIT
RISK | | | TOTAL | |
Forward Foreign Currency Exchange Contracts | |
| Unrealized appreciation on
forward foreign currency
exchange contracts |
| | $ | 1,926,360 | | | $ | – | | | | $– | | | $ | 1,926,360 | |
OTC – Swaps Contracts | |
| Swap contracts, at fair
value |
| | | 574,420 | | | | 1,621,716 | | | | 479,993 | | | | 2,676,129 | |
Centrally Cleared Credit Interest Rate Swaps Contracts | |
| Includes cumulative
unrealized appreciation/
depreciation of swaps
contracts as reported in
the Schedule of
Investments. Only current
day’s variation margin is
reported within the
Statements of Assets and
Liabilities. |
| | | – | | | | 1,108,906 | | | | – | | | | 1,108,906 | |
| | | | | | | | | | | | | | | | | | | | |
Total | | | | | | $ | 2,500,780 | | | $ | 2,730,622 | | | $ | 479,993 | | | $ | 5,711,395 | |
| | | | | | | | | | | | | | | | | | | | |
| | | | | | | | | | | | | | | | | | | | |
LIABILITY DERIVATIVES | | STATEMENTS OF ASSETS
AND LIABILITIES
LOCATION | | | FOREIGN
EXCHANGE
CONTRACTS RISK | | | INTEREST RATE
RISK | | | CREDIT
RISK | | | TOTAL | |
Forward Foreign Currency Exchange Contracts | |
| Unrealized depreciation on
forward foreign currency
exchange contracts |
| | $ | (1,071,754 | ) | | $ | – | | | $ | – | | | $ | (1,071,754 | ) |
OTC – Swaps Contracts | |
| Swap contracts, at fair
value |
| | | (120,511 | ) | | | – | | | | – | | | | (120,511 | ) |
Centrally Cleared Interest Rate Swaps Contrcts | |
| Includes cumulative
unrealized appreciation/
depreciation of swaps
contracts as reported in
the Schedule of
Investments. Only current
day’s variation margin is
reported within the
Statements of Assets and
Liabilities. |
| | | – | | | | (7,026 | ) | | | – | | | | (7,026 | ) |
| | | | | | | | | | | | | | | | | | | | |
Total | | | | | | $ | (1,192,265 | ) | | $ | (7,026 | ) | | $ | – | | | $ | (1,199,291 | ) |
| | | | | | | | | | | | | | | | | | | | |
176
Barings Funds Trust 2020 Annual Report
NOTES TO FINANCIAL STATEMENTS (CONTINUED)
June 30, 2020
Amount of Realized Gain/(Loss) on Derivatives:
Global Floating Rate Fund
| | | | |
| | | FOREIGN
EXCHANGE
CONTRACTS RISK | |
Forward Foreign Currency Exchange Contracts | | $ | 1,152,178 | |
| | | | |
Total | | $ | 1,152,178 | |
| | | | |
Global Credit Income Opportunities Fund
| | | | | | | | | | | | |
| | | FOREIGN
EXCHANGE
CONTRACTS RISK | | | EQUITY
RISK | | | TOTAL | |
Forward Foreign Currency Exchange Contracts | | $ | 639,468 | | | $ | – | | | $ | 639,468 | |
Purchased Options | | | – | | | | (677,726 | ) | | | (677,726 | ) |
| | | | | | | | | | | | |
Total | | $ | 639,468 | | | $ | (677,726 | ) | | $ | (38,258 | ) |
| | | | | | | | | | | | |
Active Short Duration Bond Fund
| | | | | | | | | | | | |
| | | INTEREST RATE
RISK | | | CREDIT
RISK | | | TOTAL | |
Futures Contracts | | $ | (21,558,580 | ) | | $ | – | | | $ | (21,558,580 | ) |
Purchased Options | | | 1,219,275 | | | | – | | | | 1,219,275 | |
Swaps Contracts | | | – | | | | 902,364 | | | | 902,364 | |
| | | | | | | | | | | | |
Total | | $ | (20,339,305 | ) | | $ | 902,364 | | | $ | (19,436,941 | ) |
| | | | | | | | | | | | |
Diversified Income Fund
| | | | | | | | | | | | | | | | |
| | | FOREIGN
EXCHANGE
CONTRACTS RISK | | | INTEREST RATE
RISK | | | CREDIT
RISK | | | TOTAL | |
Forward Foreign Currency Exchange Contracts | | $ | 39,984 | | | $ | – | | | $ | – | | | $ | 39,984 | |
Futures Contracts | | | – | | | | (1,064,569 | ) | | | – | | | | (1,064,569 | ) |
Swaps Contracts | | | – | | | | – | | | | (7,026 | ) | | | (7,026 | ) |
| | | | | | | | | | | | | | | | |
Total | | $ | 39,984 | | | $ | (1,064,569 | ) | | $ | (7,026 | ) | | $ | (1,031,611 | ) |
| | | | | | | | | | | | | | | | |
177
Barings Funds Trust 2020 Annual Report
NOTES TO FINANCIAL STATEMENTS (CONTINUED)
June 30, 2020
Emerging Markets Debt Blended Total Return Fund
| | | | | | | | | | | | | | | | |
| | | FOREIGN
EXCHANGE
CONTRACTS RISK | | | INTEREST RATE
RISK | | | CREDIT
RISK | | | TOTAL | |
Forward Foreign Currency Exchange Contracts | | $ | 1,321,055 | | | $ | – | | | $ | – | | | $ | 1,321,055 | |
Futures Contracts | | | – | | | | (537,852 | ) | | | – | | | | (537,852 | ) |
Purchased Options | | | (17,579 | ) | | | – | | | | – | | | | (17,579 | ) |
Swaps Contracts | | | 382,149 | | | | 121,269 | | | | (389,834 | ) | | | 113,584 | |
| | | | | | | | | | | | | | | | |
Total | | $ | 1,685,625 | | | $ | (416,583 | ) | | $ | (389,834 | ) | | $ | 879,208 | |
| | | | | | | | | | | | | | | | |
Global Emerging Markets Equity Fund
| | | | |
| | | FOREIGN
EXCHANGE
CONTRACTS RISK | |
Forward Foreign Currency Exchange Contracts | | $ | (30 | ) |
| | | | |
Total | | $ | (30 | ) |
| | | | |
Change in Unrealized Appreciation/(Depreciation) on Derivatives:
Global Floating Rate Fund
| | | | |
| | | FOREIGN
EXCHANGE
CONTRACTS RISK | |
Forward Foreign Currency Exchange Contracts | | $ | 581,413 | |
| | | | |
Total | | $ | 581,413 | |
| | | | |
Global Credit Income Opportunities Fund
| | | | | | | | | | | | |
| | | FOREIGN
EXCHANGE
CONTRACTS RISK | | | EQUITY
RISK | | | TOTAL | |
Forward Foreign Currency Exchange Contracts | | $ | 405,493 | | | $ | – | | | $ | 405,493 | |
Purchased Options | | | – | | | | 145,350 | | | | 145,350 | |
Written Options | | | – | | | | (18,451 | ) | | | (18,451 | ) |
| | | | | | | | | | | | |
Total | | $ | 405,493 | | | $ | 126,899 | | | $ | 532,392 | |
| | | | | | | | | | | | |
Active Short Duration Bond Fund
| | | | | | | | | | | | |
| | | INTEREST
RATE RISK | | | CREDIT RISK | | | TOTAL | |
Futures Contracts | | $ | 2,444,155 | | | $ | – | | | $ | 2,444,155 | |
Purchased Options | | | (511,402 | ) | | | – | | | | (511,402 | ) |
Swaps Contracts | | | 13,411 | | | | (89,443 | ) | | | (76,032 | ) |
| | | | | | | | | | | | |
Total | | $ | 1,946,164 | | | $ | (89,443 | ) | | $ | 1,856,721 | |
| | | | | | | | | | | | |
178
Barings Funds Trust 2020 Annual Report
NOTES TO FINANCIAL STATEMENTS (CONTINUED)
June 30, 2020
Diversified Income Fund
| | | | | | | | | | | | | | | | |
| | | FOREIGN
EXCHANGE
CONTRACTS RISK | | | INTEREST RATE
RISK | | | CREDIT RISK | | | TOTAL | |
Forward Foreign Currency Exchange Contracts | | $ | 15,749 | | | $ | – | | | $ | – | | | $ | 15,749 | |
Futures Contracts | | | – | | | | 126,745 | | | | – | | | | 126,745 | |
Swaps Contracts | | | – | | | | – | | | | 8,097 | | | | 8,097 | |
| | | | | | | | | | | | | | | | |
Total | | $ | 15,749 | | | $ | 126,745 | | | $ | 8,097 | | | $ | 150,591 | |
| | | | | | | | | | | | | | | | |
Emerging Markets Debt Blended Total Return Fund
| | | | | | | | | | | | | | | | |
| | | FOREIGN
EXCHANGE
CONTRACTS RISK | | | INTEREST RATE
RISK | | | CREDIT RISK | | | TOTAL | |
Forward Foreign Currency Exchange Contracts | | $ | 772,249 | | | $ | – | | | $ | – | | | $ | 772,249 | |
Futures Contracts | | | – | | | | 71,794 | | | | – | | | | 71,794 | |
Purchased Options | | | 37,731 | | | | – | | | | – | | | | 37,731 | |
Swaps Contracts | | | 371,652 | | | | 3,415,201 | | | | 424,284 | | | | 4,211,137 | |
| | | | | | | | | | | | | | | | |
Total | | $ | 1,181,632 | | | $ | 3,486,995 | | | $ | 424,284 | | | $ | 5,092,911 | |
| | | | | | | | | | | | | | | | |
Global Floating Rate Fund
| | | | |
NUMBER OF CONTRACTS,
NOTIONAL AMOUNTS OF
SHARES/UNITS | | FOREIGN
EXCHANGE
CONTRACTS RISK | |
Forward Foreign Currency Exchange Contracts(a) | | $ | 66,305,639 | |
| | (a) | Volume of derivative activity is based on an average of month-end notional amounts outstanding during the period. |
Global Credit Income Opportunities Fund
| | | | | | | | | | | | |
NUMBER OF CONTRACTS,
NOTIONAL AMOUNTS OF
SHARES/UNITS | | FOREIGN
EXCHANGE
CONTRACTS RISK | | | EQUITY RISK | | | TOTAL | |
Forward Foreign Currency Exchange Contracts(a) | | $ | 54,854,893 | | | $ | – | | | $ | 54,854,893 | |
Purchased Options(a) | | $ | – | | | $ | 5,250 | | | $ | 5,250 | |
Written Options(a) | | $ | – | | | $ | 5,600 | | | $ | 5,600 | |
| | (a) | Volume of derivative activity is based on an average of month-end notional amounts outstanding during the period. |
Active Short Duration Bond Fund
| | | | | | | | | | | | |
NUMBER OF CONTRACTS,
NOTIONAL AMOUNTS OF
SHARES/UNITS | | INTEREST
RATE RISK | | | CREDIT
RISK | | | TOTAL | |
Futures Contracts(a) | | | 2,718 | | | | – | | | | 2,718 | |
Purchased Options(b) | | $ | 55,003,583 | | | $ | – | | | $ | 55,003,583 | |
Centrally Cleared Swap Contracts(b) | | $ | – | | | $ | 13,214,286 | | | $ | 13,214,286 | |
| | (a) | Volume of derivative activity is based on an average of month-end contracts outstanding during the period. |
| | (b) | Volume of derivative activity is based on an average of month-end notional amounts outstanding during the period. |
179
Barings Funds Trust 2020 Annual Report
NOTES TO FINANCIAL STATEMENTS (CONTINUED)
June 30, 2020
Diversified Income Fund
| | | | | | | | | | | | |
NUMBER OF CONTRACTS,
NOTIONAL AMOUNTS OF
SHARES/UNITS | | FOREIGN
EXCHANGE
CONTRACTS RISK | | | INTEREST RATE
RISK | | | TOTAL | |
Futures Contracts(a) | | | – | | | | 121 | | | | 121 | |
Forward Foreign Currency Exchange Contracts(b) | | $ | 3,865,669 | | | | – | | | | 3,865,669 | |
| | (a) | Volume of derivative activity is based on an average of month-end contracts outstanding during the period. |
| | (b) | Volume of derivative activity is based on an average of month-end notional amounts outstanding during the period. |
Emerging Markets Debt Blended Total Return Fund
| | | | | | | | | | | | | | | | |
NUMBER OF CONTRACTS,
NOTIONAL AMOUNTS OF
SHARES/UNITS | | FOREIGN
EXCHANGE
CONTRACTS RISK | | | INTEREST RATE
RISK | | | CREDIT RISK | | | TOTAL | |
Futures Contracts(a) | | | – | | | | 8 | | | | – | | | | 8 | |
Forward Foreign Currency Exchange Contracts(b) | | $ | 82,582,030 | | | $ | – | | | $ | – | | | $ | 82,820,606 | |
OTC – Swaps Contracts | | $ | 6,872,893 | | | $ | 22,158,573 | | | $ | 8,832,500 | | | $ | 37,863,966 | |
Centrally Cleared Swap Contracts(b) | | $ | – | | | $ | 36,647,674 | | | $ | – | | | $ | 36,647,674 | |
| | (a) | Volume of derivative activity is based on an average of month-end contracts outstanding during the period. |
| | (b) | Volume of derivative activity is based on an average of month-end notional amounts outstanding during the period. |
Global Emerging Markets Equity Fund
| | | | |
NUMBER OF CONTRACTS,
NOTIONAL AMOUNTS OF
SHARES/UNITS | | FOREIGN
EXCHANGE
CONTRACTS RISK | |
Forward Foreign Currency Exchange Contracts(a) | | $ | 24,537 | |
| | (a) | Volume of derivative activity is based on an average of month-end notional amounts outstanding during the period. |
| | K. | Disclosures about Offsetting Assets and Liabilities |
The Financial Accounting Standards Board (“FASB”) issued Accounting Standards Update No. 2011-11 “Disclosures about Offsetting Assets and Liabilities” (“ASU 2011-11”). These disclosure requirements are intended to help better assess the effect or potential effect of offsetting arrangements on a Fund’s financial position. In addition, FASB issued Accounting Standards Update No. 2013-01 “Clarifying the Scope of Offsetting Assets and Liabilities” (“ASU 2013-01”), specifying which transactions are subject to disclosures about offsetting. In order to better define its contractual rights and to secure rights that will help the Fund mitigate its counterparty risk, the Fund may enter into an International Swaps and Derivatives Association, Inc. Master Agreement (“ISDA Master Agreement”) or similar agreement with its counterparties. An ISDA Master Agreement is a bilateral agreement between the Fund and a counterparty that governs certain OTC derivatives and typically contains, among other things, collateral posting terms and netting provisions in the event of a default and/or termination event. Under an ISDA Master Agreement, the Fund may, under certain circumstances, offset with the counterparty certain derivative financial instruments’ payables and/or receivables with collateral held and/or posted and create one single net payment. The provisions of the ISDA Master Agreement typically permit a single net payment in the event of default including the bankruptcy or insolvency of the counterparty. Bankruptcy or insolvency laws of a particular jurisdiction may restrict or prohibit the right of offset in bankruptcy, insolvency or other events. In addition, certain ISDA Master Agreements allow counterparties to terminate derivative contracts prior to maturity in the event the Fund’s net assets decline by a stated percentage or the Fund fails to meet the terms of its ISDA Master Agreements. The result would cause the Fund to accelerate payment of any net liability owed to the counterparty.
For derivatives traded under an ISDA Master Agreement, the collateral requirements are typically calculated by netting the mark to market amount for each transaction under such agreement and comparing that amount to the value of any collateral currently pledged by the Funds and the counterparty.
180
Barings Funds Trust 2020 Annual Report
NOTES TO FINANCIAL STATEMENTS (CONTINUED)
June 30, 2020
Cash collateral that has been pledged to cover obligations of the Funds and cash collateral received from the counterparty, if any, is reported separately on the Statement of Assets and Liabilities as cash collateral held at broker or cash collateral due to broker, respectively. Non-cash collateral pledged by or received by the Funds, if any, is noted in the Schedule of Investments. Generally, the amount of collateral due from or to a party has to exceed a minimum transfer amount threshold before a transfer is required, which is determined each day at the close of business of the Funds, typically based on changes in market values for each transaction under an ISDA Master Agreement and netted into one amount for such agreement and any additional required collateral is delivered to/pledged by the Funds on the next business day. Typically, the Funds and counterparties are not permitted to sell, re-pledge or use the collateral they receive. To the extent amounts due to the Funds from their counterparties are not fully collateralized, contractually or otherwise, the Funds bear the risk of loss from counterparty non-performance. The Funds attempt to mitigate counterparty risk by entering into agreements only with counterparties that they believe have the financial resources to honor their obligations and by monitoring the financial stability of those counterparties.
The following tables illustrate gross and net information about recognized assets eligible for offset in the Statement of Assets and Liabilities, and disclose such amounts subject to an enforceable master netting agreement or similar agreement, by counterparty. A master netting agreement is an agreement between two counterparties who have multiple contracts with each other that provides for the net settlement of all contracts, as well as cash collateral, through a single payment in the event of default on or termination of any one contract:
Global Floating Rate Fund
| | | | | | | | | | | | | | | | |
| DESCRIPTION | | | | | GROSS AMOUNTS OF
RECOGNIZED ASSETS | | | GROSS AMOUNTS OFFSET
IN THE STATEMENTS OF
ASSETS AND LIABILITIES | | | NET AMOUNTS OF
ASSETS PRESENTED
IN THE STATEMENTS OF
ASSETS AND LIABILITIES | |
Forward Foreign Currency Exchange Contracts | | | | | | $ | 582,821 | | | $ | – | | | $ | 582,821 | |
| | | | | | | | | | | | | | | | |
Total | | | | | | $ | 582,821 | | | $ | – | | �� | $ | 582,821 | |
| | | | | | | | | | | | | | | | |
| | | | | | | | | | | | | | | | |
| | | | | | GROSS AMOUNTS NOT OFFSET IN THE
STATEMENTS OF ASSETS AND LIABILITIES | | | | | | | |
| COUNTERPARTY | | NET AMOUNTS OF ASSETS
PRESENTED IN THE STATEMENTS
OF ASSETS AND LIABILITIES | | | FINANCIAL
INSTRUMENT | | | CASH
COLLATERAL
RECEIVED (a) | | | NET
AMOUNT (b) | |
Canadian Imperial Bank of Commerce | | $ | 271,889 | | | $ | (3,171 | ) | | $ | (268,718 | ) | | $ | — | |
Morgan Stanley & Co. | | | 310,932 | | | | (19,520 | ) | | | — | | | | 291,412 | |
| | | | | | | | | | | | | | | | |
Total | | $ | 582,821 | | | $ | (22,691 | ) | | $ | (268,718 | ) | | $ | 291,412 | |
| | | | | | | | | | | | | | | | |
| | (a) | Collateral disclosed is limited to an amount not to exceed 100% of the net amount of assets presented in the Statements of Assets and Liabilities, for each respective counterparty. |
| | (b) | Net Amount represents the amount that is subject to loss in the event of a counterparty failure as of June 30, 2020. |
| | | | | | | | | | | | | | |
| DESCRIPTION | | | | GROSS AMOUNTS OF
RECOGNIZED LIABILITIES | | | GROSS AMOUNTS OFFSET
IN THE STATEMENTS OF
ASSETS AND LIABILITIES | | | NET AMOUNTS OF
LIABILITIES PRESENTED
IN THE STATEMENTS OF
ASSETS AND LIABILITIES | |
Forward Foreign Currency Exchange Contracts | | | | $ | 22,691 | | | $ | – | | | $ | 22,691 | |
| | | | | | | | | | | | | | |
Total | | | | $ | 22,691 | | | $ | – | | | $ | 22,691 | |
| | | | | | | | | | | | | | |
181
Barings Funds Trust 2020 Annual Report
NOTES TO FINANCIAL STATEMENTS (CONTINUED)
June 30, 2020
| | | | | | | | | | | | | | | | |
| | | | | | GROSS AMOUNTS NOT OFFSET IN THE
STATEMENTS OF ASSETS AND LIABILITIES | | | | | | | |
| COUNTERPARTY | | NET AMOUNTS OF LIABILITIES
PRESENTED IN THE STATEMENTS
OF ASSETS AND LIABILITIES | | | FINANCIAL
INSTRUMENT | | | CASH
COLLATERAL
PLEDGED (a) | | | NET
AMOUNT (b) | |
Canadian Imperial Bank of Commerce | | $ | 3,171 | | | $ | (3,171 | ) | | $ | – | | | $ | – | |
Morgan Stanley & Co. | | | 19,520 | | | | (19,520 | ) | | | – | | | | – | |
| | | | | | | | | | | | | | | | |
Total | | | $22,691 | | | $ | (22,691 | ) | | $ | – | | | $ | – | |
| | | | | | | | | | | | | | | | |
| | (a) | Collateral disclosed is limited to an amount not to exceed 100% of the net amount of assets presented in the Statements of Assets and Liabilities, for each respective counterparty. |
| | (b) | Net Amount represents the amount that is subject to loss in the event of a counterparty failure as of June 30, 2020. |
Global Credit Income Opportunities Fund
| | | | | | | | | | | | |
| DESCRIPTION | | GROSS AMOUNTS OF
RECOGNIZED
ASSETS | | | GROSS AMOUNTS OFFSET
IN THE STATEMENTS OF
ASSETS AND LIABILITIES | | | NET AMOUNTS OF
ASSETS PRESENTED
IN THE STATEMENTS OF
ASSETS AND LIABILITIES | |
Forward Foreign Currency Exchange Contracts | | $ | 495,076 | | | $ | – | | | $ | 495,076 | |
Purchased Options | | | 777,280 | | | | – | | | | 777,280 | |
| | | | | | | | | | | | |
Total | | $ | 1,272,356 | | | $ | – | | | $ | 1,272,356 | |
| | | | | | | | | | | | |
| | | | | | | | | | | | | | | | |
| | | | | | GROSS AMOUNTS NOT OFFSET IN THE
STATEMENTS OF ASSETS AND LIABILITIES | | | | | | | |
| COUNTERPARTY | | NET AMOUNTS OF ASSETS
PRESENTED IN THE STATEMENTS
OF ASSETS AND LIABILITIES | | | FINANCIAL
INSTRUMENT | | | CASH
COLLATERAL
RECEIVED (a) | | | NET
AMOUNT (b) | |
Bank of America N.A. | | $ | 8,187 | | | $ | (8,187 | ) | | $ | – | | | $ | – | |
Barclays Bank plc | | | 480,646 | | | | – | | | | (480,646 | ) | | | – | |
Goldman Sachs & Co. | | | 6,243 | | | | (573 | ) | | | – | | | | 5,670 | |
Morgan Stanley & Co. | | | 777,280 | | | | (439,208 | ) | | | – | | | | 338,072 | |
| | | | | | | | | | | | | | | | |
Total | | $ | 1,272,356 | | | $ | (447,968 | ) | | $ | (480,646 | ) | | $ | 343,742 | |
| | | | | | | | | | | | | | | | |
| | (a) | Collateral disclosed is limited to an amount not to exceed 100% of the net amount of assets presented in the Statements of Assets and Liabilities, for each respective counterparty. |
| | (b) | Net Amount represents the amount that is subject to loss in the event of a counterparty failure as of June 30, 2020. |
182
Barings Funds Trust 2020 Annual Report
NOTES TO FINANCIAL STATEMENTS (CONTINUED)
June 30, 2020
| | | | | | | | | | | | |
| DESCRIPTION | | GROSS AMOUNTS OF
RECOGNIZED LIABILITIES | | | GROSS AMOUNTS OFFSET
IN THE STATEMENTS OF
ASSETS AND LIABILITIES | | | NET AMOUNTS OF
LIABILITIES PRESENTED
IN THE STATEMENTS OF
ASSETS AND LIABILITIES | |
Forward Foreign Currency Exchange Contracts | | $ | 47,937 | | | $ | – | | | $ | 47,937 | |
Written Options | | | 439,208 | | | | – | | | | 439,208 | |
| | | | | | | | | | | | |
Total | | $ | 487,145 | | | $ | – | | | $ | 487,145 | |
| | | | | | | | | | | | |
| | | | | | | | | | | | | | | | |
| | | | | | GROSS AMOUNTS NOT OFFSET IN THE
STATEMENTS OF ASSETS AND LIABILITIES | | | | | | | |
| COUNTERPARTY | | NET AMOUNTS OF LIABILITIES
PRESENTED IN THE STATEMENTS
OF ASSETS AND LIABILITIES | | | FINANCIAL
INSTRUMENT | | | CASH
COLLATERAL
PLEDGED (a) | | | NET
AMOUNT (b) | |
Bank of America N.A. | | $ | 19,660 | | | $ | (8,187 | ) | | $ | – | | | $ | 11,473 | |
Citibank N.A. | | | 27,704 | | | | – | | | | (10,000 | ) | | | 17,704 | |
Goldman Sachs & Co. | | | 573 | | | | (573 | ) | | | – | | | | – | |
Morgan Stanley & Co. | | | 439,208 | | | | (439,208 | ) | | | – | | | | – | |
| | | | | | | | | | | | | | | | |
Total | | $ | 487,145 | | | $ | (447,968 | ) | | $ | (10,000 | ) | | $ | 29,177 | |
| | | | | | | | | | | | | | | | |
| | (a) | Collateral disclosed is limited to an amount not to exceed 100% of the net amount of assets presented in the Statements of Assets and Liabilities, for each respective counterparty. |
| | (b) | Net Amount represents the amount that is subject to loss in the event of a counterparty failure as of June 30, 2020. |
Active Short Duration Bond Fund
| | | | | | | | | | | | |
| DESCRIPTION | | GROSS AMOUNTS OF
RECOGNIZED ASSETS | | | GROSS AMOUNTS OFFSET
IN THE STATEMENTS OF
ASSETS AND LIABILITIES | | | NET AMOUNTS OF
ASSETS PRESENTED
IN THE STATEMENTS OF
ASSETS AND LIABILITIES | |
Purchased Options | | $ | 1,134,466 | | | $ | – | | | $ | 1,134,466 | |
| | | | | | | | | | | | |
Total | | $ | 1,134,466 | | | $ | – | | | $ | 1,134,466 | |
| | | | | | | | | | | | |
| | | | | | | | | | | | | | | | |
| | | | | | GROSS AMOUNTS NOT OFFSET IN THE
STATEMENTS OF ASSETS AND LIABILITIES | | | | | | | |
| COUNTERPARTY | | NET AMOUNTS OF ASSETS
PRESENTED IN THE STATEMENTS
OF ASSETS AND LIABILITIES | | | FINANCIAL
INSTRUMENT | | | CASH
COLLATERAL
RECEIVED (a) | | | NET
AMOUNT (b) | |
JPMorgan Chase Bank N.A. | | $ | 1,134,466 | | | $ | – | | | $ | (1,010,000 | ) | | $ | 124,466 | |
| | | | | | | | | | | | | | | | |
Total | | $ | 1,134,466 | | | $ | – | | | $ | (1,010,000 | ) | | $ | 124,466 | |
| | | | | | | | | | | | | | | | |
| | (a) | Collateral disclosed is limited to an amount not to exceed 100% of the net amount of assets presented in the Statements of Assets and Liabilities, for each respective counterparty. |
| | (b) | Net Amount represents the amount that is subject to loss in the event of a counterparty failure as of June 30, 2020. |
183
Barings Funds Trust 2020 Annual Report
NOTES TO FINANCIAL STATEMENTS (CONTINUED)
June 30, 2020
Diversified Income Fund
| | | | | | | | | | | | |
| DESCRIPTION | | GROSS AMOUNTS OF
RECOGNIZED ASSETS | | | GROSS AMOUNTS OFFSET
IN THE STATEMENTS OF
ASSETS AND LIABILITIES | | | NET AMOUNTS OF
ASSETS PRESENTED
IN THE STATEMENTS OF
ASSETS AND LIABILITIES | |
Forward Foreign Currency Exchange Contracts | | $ | 107 | | | $ | – | | | $ | 107 | |
| | | | | | | | | | | | |
Total | | $ | 107 | | | $ | – | | | $ | 107 | |
| | | | | | | | | | | | |
| | | | | | | | | | | | | | | | |
| | | | | | GROSS AMOUNTS NOT OFFSET IN THE
STATEMENTS OF ASSETS AND LIABILITIES | | | | | | | |
| COUNTERPARTY | | NET AMOUNTS OF ASSETS
PRESENTED IN THE STATEMENTS
OF ASSETS AND LIABILITIES | | | FINANCIAL
INSTRUMENT | | | CASH
COLLATERAL
RECEIVED (a) | | | NET
AMOUNT (b) | |
Standard Chartered Bank | | $ | 107 | | | $ | – | | | $ | – | | | $ | 107 | |
| | | | | | | | | | | | | | | | |
Total | | $ | 107 | | | $ | – | | | $ | – | | | $ | 107 | |
| | | | | | | | | | | | | | | | |
| | (a) | Collateral disclosed is limited to an amount not to exceed 100% of the net amount of assets presented in the Statements of Assets and Liabilities, for each respective counterparty. |
| | (b) | Net Amount represents the amount that is subject to loss in the event of a counterparty failure as of June 30, 2020. |
| | | | | | | | | | | | |
| DESCRIPTION | | GROSS AMOUNTS OF
RECOGNIZED LIABILITIES | | | GROSS AMOUNTS OFFSET
IN THE STATEMENTS OF
ASSETS AND LIABILITIES | | | NET AMOUNTS OF
LIABILITIES PRESENTED
IN THE STATEMENTS OF
ASSETS AND LIABILITIES | |
Forward Foreign Currency Exchange Contracts | | $ | 4,280 | | | $ | – | | | $ | 4,280 | |
| | | | | | | | | | | | |
Total | | $ | 4,280 | | | $ | – | | | $ | 4,280 | |
| | | | | | | | | | | | |
| | | | | | | | | | | | | | | | |
| | | | | | GROSS AMOUNTS NOT OFFSET IN THE
STATEMENTS OF ASSETS AND LIABILITIES | | | | | | | |
| COUNTERPARTY | | NET AMOUNTS OF LIABILITIES
PRESENTED IN THE STATEMENTS
OF ASSETS AND LIABILITIES | | | FINANCIAL
INSTRUMENT | | | CASH
COLLATERAL
PLEDGED (a) | | | NET
AMOUNT (b) | |
Barclays Bank plc | | $ | 25 | | | $ | – | | | $ | – | | | $ | 25 | |
Citibank N.A. | | | 4,237 | | | | – | | | | – | | | | 4,237 | |
HSBC Bank USA | | | 18 | | | | – | | | | – | | | | 18 | |
| | | | | | | | | | | | | | | | |
Total | | $ | 4,280 | | | $ | – | | | $ | – | | | $ | 4,280 | |
| | | | | | | | | | | | | | | | |
| | (a) | Collateral disclosed is limited to an amount not to exceed 100% of the net amount of assets presented in the Statements of Assets and Liabilities, for each respective counterparty. |
| | (b) | Net Amount represents the amount that is subject to loss in the event of a counterparty failure as of June 30, 2020. |
184
Barings Funds Trust 2020 Annual Report
NOTES TO FINANCIAL STATEMENTS (CONTINUED)
June 30, 2020
Emerging Markets Debt Blended Total Return Fund
| | | | | | | | | | | | |
| DESCRIPTION | | GROSS AMOUNTS OF
RECOGNIZED ASSETS | | | GROSS AMOUNTS OFFSET
IN THE STATEMENTS OF
ASSETS AND LIABILITIES | | | NET AMOUNTS OF
ASSETS PRESENTED
IN THE STATEMENTS OF
ASSETS AND LIABILITIES | |
Forward Foreign Currency Exchange Contracts | | $ | 1,926,360 | | | $ | – | | | $ | 1,926,360 | |
Swap Contracts | | | 2,201,474 | | | | – | | | | 2,201,474 | |
| | | | | | | | | | | | |
Total | | $ | 4,127,834 | | | $ | – | | | $ | 4,127,834 | |
| | | | | | | | | | | | |
| | | | | | | | | | | | | | | | |
| | | | | | GROSS AMOUNTS NOT OFFSET IN THE
STATEMENTS OF ASSETS AND LIABILITIES | | | | | | | |
| COUNTERPARTY | | NET AMOUNTS OF ASSETS
PRESENTED IN THE STATEMENTS
OF ASSETS AND LIABILITIES | | | FINANCIAL
INSTRUMENT | | | CASH
COLLATERAL
RECEIVED (a) | | | NET
AMOUNT (b) | |
Bank of America N.A. | | $ | 1,871,832 | | | $ | (184,324 | ) | | $ | (1,650,000 | ) | | $ | 37,508 | |
Barclays Bank plc | | | 116,379 | | | | (116,379 | ) | | | – | | | | – | |
BNP Paribas S.A. | | | 640 | | | | (640 | ) | | | – | | | | – | |
Canadian Imperial Bank Of Commerce | | | 4,776 | | | | – | | | | – | | | | 4,776 | |
Citibank N.A. | | | 1,351,394 | | | | (482,387 | ) | | | (869,007 | ) | | | – | |
Goldman Sachs & Co. | | | 263,749 | | | | (18,676 | ) | | | (160,000 | ) | | | 85,073 | |
JPMorgan Chase Bank N.A. | | | 519,064 | | | | (374,782 | ) | | | – | | | | 144,282 | |
| | | | | | | | | | | | | | | | |
Total | | $ | 4,127,834 | | | $ | (1,177,188 | ) | | $ | (2,679,007 | ) | | $ | 271,639 | |
| | | | | | | | | | | | | | | | |
| | (a) | Collateral disclosed is limited to an amount not to exceed 100% of the net amount of assets presented in the Statements of Assets and Liabilities, for each respective counterparty. |
| | (b) | Net Amount represents the amount that is subject to loss in the event of a counterparty failure as of June 30, 2020. |
| | | | | | | | | | | | |
| DESCRIPTION | | GROSS AMOUNTS OF
RECOGNIZED LIABILITIES | | | GROSS AMOUNTS OFFSET
IN THE STATEMENTS OF
ASSETS AND LIABILITIES | | | NET AMOUNTS OF
LIABILITIES PRESENTED
IN THE STATEMENTS OF
ASSETS AND LIABILITIES | |
Forward Foreign Currency Exchange Contracts | | $ | 1,071,754 | | | $ | – | | | $ | 1,071,754 | |
Swap Contracts | | | 496,444 | | | | – | | | | 496,444 | |
| | | | | | | | | | | | |
Total | | $ | 1,568,198 | | | $ | – | | | $ | 1,568,198 | |
| | | | | | | | | | | | |
185
Barings Funds Trust 2020 Annual Report
NOTES TO FINANCIAL STATEMENTS (CONTINUED)
June 30, 2020
| | | | | | | | | | | | | | | | |
| | | | | | GROSS AMOUNTS NOT OFFSET IN THE
STATEMENTS OF ASSETS AND LIABILITIES | | | | | | | |
| COUNTERPARTY | | NET AMOUNTS OF LIABILITIES
PRESENTED IN THE STATEMENTS
OF ASSETS AND LIABILITIES | | | FINANCIAL
INSTRUMENT | | | CASH
COLLATERAL
PLEDGED (a) | | | NET
AMOUNT (b) | |
Bank of America N.A. | | $ | 184,324 | | | $ | (184,324 | ) | | $ | – | | | $ | – | |
Barclays Bank plc | | | 132,858 | | | | (116,379 | ) | | | (16,479 | ) | | | – | |
BNP Paribas S.A. | | | 119,864 | | | | (640 | ) | | | (100,000 | ) | | | 19,224 | |
Citibank N.A. | | | 482,387 | | | | (482,387 | ) | | | – | | | | – | |
Goldman Sachs & Co. | | | 18,676 | | | | (18,676 | ) | | | – | | | | – | |
JPMorgan Chase Bank N.A. | | | 495,446 | | | | (374,782 | ) | | | – | | | | 120,664 | |
Morgan Stanley Capital Services, Inc. | | | 134,643 | | | | – | | | | – | | | | 134,643 | |
| | | | | | | | | | | | | | | | |
Total | | $ | 1,568,198 | | | $ | (1,177,188 | ) | | $ | (116,479 | ) | | $ | 274,531 | |
| | | | | | | | | | | | | | | | |
| | (a) | Collateral disclosed is limited to an amount not to exceed 100% of the net amount of assets presented in the Statements of Assets and Liabilities, for each respective counterparty. |
| | (b) | Net Amount represents the amount that is subject to loss in the event of a counterparty failure as of June 30, 2020. |
Investing in securities of foreign companies and foreign governments involves special risks and considerations not typically associated with investing in U.S. companies and the U.S. government. These risks include valuation of currencies and adverse political and economic developments. Moreover, securities of many foreign companies, foreign governments, and their markets may be less liquid and their prices more volatile than those of securities of comparable U.S. companies and the U.S. government.
| | M. | Foreign Currency Translation |
The books and records of the Funds are maintained in U.S. dollars. Foreign currency transactions are translated into U.S. dollars on the following basis: (i) market value of investment securities, assets and liabilities at the daily rates of exchange, and (ii) purchases and sales of investment securities, dividend and interest income and certain expenses at the rates of exchange prevailing on the respective dates of such transactions. For financial reporting purposes, the Funds do not isolate changes in the exchange rate of investment securities from the fluctuations arising from changes in the market prices of securities. However, for Federal income tax purposes, the Funds do isolate and treat as ordinary income the effect of changes in foreign exchange rates on realized gain or loss from the sale of investment securities and payables and receivables arising from trade-date and settlement-date differences.
The Funds seek to manage counterparty credit risk by entering into agreements only with counterparties the Adviser believes have the financial resources to honor their obligations. The Adviser monitors the financial stability of the Funds’ counterparties.
The Funds have entered into an Investment Management Agreement (the “Agreement”) with the Adviser. Pursuant to the Agreement, the Funds have agreed to pay the Adviser a fee payable at the end of each calendar month as set forth below:
| | |
Global Floating Rate Fund | | 0.65% of average daily net assets |
Global Credit Income Opportunities Fund | | 0.75% of average daily net assets |
Active Short Duration Bond Fund | | 0.35% of average daily net assets |
Diversified Income Fund | | 0.40% of average daily net assets |
Emerging Markets Debt Blended Total Return Fund | | 0.75% of average daily net assets |
Global Emerging Markets Equity Fund | | 0.90% of average daily net assets |
U.S. High Yield Fund | | 0.55% of average daily net assets |
186
Barings Funds Trust 2020 Annual Report
NOTES TO FINANCIAL STATEMENTS (CONTINUED)
June 30, 2020
The Adviser has contractually agreed to waive and/or reimburse a portion of its fees and/or reimburse expenses (excluding distribution and service (12b-1) fees, interest expenses, taxes, acquired fund fees and expenses, fees incurred in acquiring and disposing of securities and extraordinary expenses) such that total net annual operating expenses (including 12b-1 fees) for each class do not exceed the following rates (as a percentage of average daily net assets allocated to each such class):
| | | | | | | | | | | | | | | | | | | | |
| | | CLASS A | | | CLASS C | | | CLASS I | | | CLASS L | | | CLASS Y | |
Global Floating Rate Fund | | | 1.00 | % | | | 1.75 | % | | | 0.75 | % | | | – | | | | 0.75 | % |
Global Credit Income Opportunities Fund | | | 1.20 | % | | | 1.95 | % | | | 0.95 | % | | | – | | | | 0.95 | % |
Active Short Duration Bond Fund | | | 0.65 | % | | | 0.90 | % | | | 0.40 | % | | | 0.65 | % | | | 0.40 | % |
Diversified Income Fund | | | 0.80 | % | | | 1.55 | % | | | 0.55 | % | | | – | | | | 0.55 | % |
Emerging Markets Debt Blended Total Return Fund | | | 1.20 | % | | | 1.95 | % | | | 0.95 | % | | | – | | | | 0.95 | % |
Global Emerging Markets Equity Fund | | | 1.45 | % | | | 2.20 | % | | | 1.20 | % | | | – | | | | 1.20 | % |
U.S. High Yield Fund | | | 1.00 | % | | | 1.75 | % | | | 0.75 | % | | | – | | | | 0.75 | % |
Pursuant to the expense waiver/reimbursement agreement, the Adviser is entitled to be reimbursed for any fees the Adviser waives and Fund expenses that the Adviser reimburses for a period of three years following such fee waivers and expense reimbursements, to the extent that such reimbursement of the Adviser by a Fund will not cause the Fund to exceed any applicable expense limitation that is in place for the Fund.
The contractual management fee waiver and expense reimbursement agreements between the Funds and the Adviser will remain in effect until November 1, 2020 and may be terminated only upon the approval of the Funds’ Board of Trustees.
Subject to the supervision of the Adviser and the Board, BIIL manages the investment and reinvestment of a portion of the assets of the Global Floating Rate Fund, Global Credit Income Opportunities Fund, Emerging
Markets Debt Blended Total Return Fund and Global Emerging Markets Equity Fund, as allocated from time to time to BIIL. As compensation for its services, the Adviser (not the Funds) pays to BIIL sub-advisory fees equal to the below percentages of the advisory fee paid to the Adviser by the applicable Fund, net of any fee waivers and/or expense reimbursements:
| | | | |
Global Floating Rate Fund | | | 0.35 | % |
Global Credit Income Opportunities Fund | | | 0.35 | % |
Emerging Markets Debt Blended Total Return Fund | | | 0.50 | % |
Global Emerging Markets Equity Fund | | | 0.70 | % |
The Adviser or its affiliates voluntarily agreed to waive certain fees for the Global Floating Rate Fund, the Active Short Duration Bond Fund, the Diversified Income Fund and the Emerging Markets Debt Blended Total Return Fund. Such arrangements may be discontinued by the Adviser at any time.
| 4. | 12b-1 Distribution and Service Plan |
ALPS Distributors, Inc. (the “Distributor”) is the Distributor of the Funds’ shares as of June 30, 2020.
The Funds have adopted a Distribution and Shareholder Services Plan (the “Plan”), pursuant to Rule 12b-1 under the 1940 Act. Under the Plan, each Fund’s Class A, Class C shares and Class L shares may compensate certain financial institutions, including the Distributor, for certain distribution and shareholder servicing activities. The Funds’ Class A shares may expend an aggregate amount, on an annual basis, not to exceed 0.25% of the value of the average daily net assets of a Fund attributable to Class A shares. The Funds’ Class C shares may expend an aggregate amount, on an annual basis, not to exceed 1.00% (0.50% for Active Short Duration Bond Fund) of the value of the average daily net assets of a Fund attributable to Class C shares. Active Short Duration Bond Fund’s Class L shares may expend an aggregate amount, on an annual basis, not to exceed 0.25% of the value of the average daily net assets of Active Short Duration Bond Fund attributable to Class L shares. The Plan provides that the distribution and service fees are payable to the Distributor regardless of the amounts actually expended by the Distributor for distribution of the Funds’ shares and service activities.
Under its terms, the Funds’ Plan shall remain in effect from year to year, provided such continuance is approved annually by a vote of a majority of the Board’s members and a majority of the Board’s members who are not “interested persons” of the Funds and who have no direct
187
Barings Funds Trust 2020 Annual Report
NOTES TO FINANCIAL STATEMENTS (CONTINUED)
June 30, 2020
or indirect financial interest in the operation of the Plan or in any agreement related to the Plan.
| 5. | Sales Charges and Commissions |
For the year ended June 30, 2020, the amount of sales charges retained by the Distributor on sales of Class A and Class C shares of the Funds were as follows:
| | | | | | | | |
| | | CLASS A | | | CLASS C | |
Global Credit Income Opportunities Fund | | $ | – | | | $ | 81 | |
For the year ended June 30, 2020, the Distributor received the following commissions on sales of shares of the Funds, after concessions were paid to authorized dealers:
| | | | | | | | |
| | | DISTRIBUTOR
COMMISSIONS | | | DEALERS’
CONCESSIONS | |
Global Floating Rate Fund | | $ | 1,157 | | | $ | 64,557 | |
Global Credit Income Opportunities Fund | | | 1,936 | | | | 13,891 | |
Active Short Duration Bond Fund | | | – | | | | 12,056 | |
Emerging Markets Debt Blended Total Return Fund | | | 651 | | | | 5,357 | |
| 6. | Administrator, Custody, and Transfer Agent Fees |
The Funds have engaged State Street Bank and Trust (“SSB”) to serve as the Funds’ administrator, custodian, and fund accountant. For these services, the Funds have agreed to pay SSB fees payable at the end of each calendar month pursuant to an agreement between SSB and the Funds. For the year ended June 30, 2020, the aggregate effective fee for the services performed by SSB
was at the following annual rate of each Fund’s average daily managed assets:
| | | | |
Aggregate Administrator, Custodian and Fund Accountant Fee to SSB: | |
Global Floating Rate Fund | | | 0.11 | % |
Global Credit Income Opportunities Fund | | | 0.13 | % |
Active Short Duration Bond Fund | | | 0.10 | % |
Diversified Income Fund | | | 0.21 | % |
Emerging Markets Debt Blended Total Return Fund | | | 0.27 | % |
Global Emerging Markets Equity Fund | | | 0.57 | % |
U.S. High Yield Fund | | | 0.18 | % |
The Funds have engaged ALPS Fund Services, Inc. (“ALPS”) to serve as the Funds’ transfer agent. For these services, the Funds have agreed to pay ALPS fees payable at the end of each calendar month pursuant to an agreement between ALPS and the Funds. For the year ended June 30, 2020, the effective fee for the services performed by ALPS was at the following annual rate of each Fund’s average daily managed assets:
| | | | |
Transfer Agency Fee to ALPS: | |
Global Floating Rate Fund | | | 0.02 | % |
Global Credit Income Opportunities Fund | | | 0.02 | % |
Active Short Duration Bond Fund | | | 0.02 | % |
Diversified Income Fund | | | 0.05 | % |
Emerging Markets Debt Blended Total Return Fund | | | 0.06 | % |
Global Emerging Markets Equity Fund | | | 0.24 | % |
U.S. High Yield Fund | | | 0.04 | % |
It is the Funds’ intention to qualify as a RIC under subchapter M of the Internal Revenue Code and distribute all of its taxable income. Accordingly, no provision for Federal income taxes is required in the financial statements.
The tax character of dividends paid to shareholders during the tax year ended June 30, 2020 was as follows:
| | | | | | | | | | | | | | | | |
| | | ORDINARY
INCOME | | | NET
LONG-TERM
CAPITAL
GAINS | | | RETURN OF
CAPITAL | | | TOTAL
DISTRIBUTIONS
PAID | |
Global Floating Rate Fund | | $ | 10,225,052 | | | $ | 438,706 | | | $ | 2,165,048 | | | $ | 12,828,806 | |
Global Credit Income Opportunities Fund | | | 9,585,231 | | | | – | | | | 1,452,704 | | | | 11,037,935 | |
Active Short Duration Bond Fund | | | 24,926,745 | | | | – | | | | – | | | | 24,926,745 | |
Diversified Income Fund | | | 1,471,540 | | | | – | | | | – | | | | 1,471,540 | |
Emerging Markets Debt Blended Total Return Fund | | | 3,530,108 | | | | – | | | | – | | | | 3,530,108 | |
Global Emerging Markets Equity Fund | | | 311,500 | | | | 21,100 | | | | 15,138 | | | | 347,738 | |
U.S. High Yield Fund | | | 2,879,166 | | | | – | | | | – | | | | 2,879,166 | |
188
Barings Funds Trust 2020 Annual Report
NOTES TO FINANCIAL STATEMENTS (CONTINUED)
June 30, 2020
The tax character of dividends paid to shareholders during the tax year ended June 30, 2019 was as follows:
| | | | | | | | | | | | | | | | |
| | | ORDINARY
INCOME | | | NET
LONG-TERM
CAPITAL
GAINS | | | RETURN OF
CAPITAL | | | TOTAL
DISTRIBUTIONS
PAID | |
Global Floating Rate Fund | | $ | 15,249,263 | | | $ | 391,463 | | | $ | – | | | $ | 15,640,726 | |
Global Credit Income Opportunities Fund | | | 12,750,860 | | | | 1,517,782 | | | | 263,953 | | | | 14,532,595 | |
Active Short Duration Bond Fund | | | 15,755,535 | | | | 520,666 | | | | – | | | | 16,276,201 | |
Diversified Income Fund | | | 1,104,402 | | | | – | | | | – | | | | 1,104,402 | |
Emerging Markets Debt Blended Total Return Fund | | | 2,816,937 | | | | – | | | | 263,192 | | | | 3,080,129 | |
U.S. High Yield Fund | | | 3,321,860 | | | | – | | | | – | | | | 3,321,860 | |
As of June 30, 2020, the components of distributable earnings on a tax-basis were as follows:
| | | | | | | | | | | | | | | | | | | | | | | | |
| | | UNDISTRIBUTED
ORDINARY
INCOME | | | UNDISTRIBUTED
LONG-TERM
CAPITAL GAINS | | | LATE YEAR
ORDINARY AND
POST OCTOBER
CAPITAL LOSS
DEFERRALS | | | CAPITAL LOSS
CARRYFORWARDS | | | UNREALIZED
APPRECIATION
(DEPRECIATION) | | | TOTAL DISTRIBUTABLE EARNINGS
(ACCUMULATED
LOSSES) | |
Global Floating Rate Fund | | $ | – | | | $ | – | | | $ | (7,134,512 | ) | | $ | – | | | $ | (25,785,937 | ) | | $ | (32,920,449 | ) |
Global Credit Income Opportunities Fund | | | – | | | | – | | | | (7,878,705 | ) | | | (4,028,412 | ) | | | (23,662,271 | ) | | | (35,569,388 | ) |
Active Short Duration Bond Fund | | | 30,001 | | | | – | | | | (21,868,663 | ) | | | (8,461,772 | ) | | | (14,204,953 | ) | | | (44,505,387 | ) |
Diversified Income Fund | | | 7,034 | | | | – | | | | (2,514,633 | ) | | | (835,465 | ) | | | (1,334,035 | ) | | | (4,677,099 | ) |
Emerging Markets Debt Blended Total Return Fund | | | 268,125 | | | | – | | | | (28,856 | ) | | | (145,037 | ) | | | 1,353,215 | | | | 1,447,447 | |
Global Emerging Markets Equity Fund | | | – | | | | – | | | | (349,045 | ) | | | – | | | | 741,370 | | | | 392,325 | |
U.S. High Yield Fund | | | 98,739 | | | | – | | | | (1,594,547 | ) | | | (789,637 | ) | | | (3,689,184 | ) | | | (5,974,629 | ) |
In accordance with the Regulated Investment Company Modernization Act of 2010, the Funds will carryforward capital losses incurred in taxable years beginning after December 22, 2010 (“post-enactment losses”) indefinitely. Post-enactment losses will also retain their character as either short-term or long-term and be utilized before any pre-enactment losses.
On June 30, 2020, the following funds had capital loss carryforwards available to be offset against future net capital gains as follows:
| | | | | | | | |
| | | UNLIMITED -
SHORT TERM | | | UNLIMITED -
LONG TERM | |
Global Credit Income Opportunities Fund | | $ | 1,729,331 | | | $ | 2,299,081 | |
Active Short Duration Bond Fund | | | 3,038,399 | | | | 5,423,373 | |
Diversified Income Fund | | | 105,552 | | | | 729,913 | |
Emerging Markets Debt Blended Total Return Fund | | | – | | | | 145,037 | |
U.S. High Yield Fund | | | 165,751 | | | | 623,886 | |
189
Barings Funds Trust 2020 Annual Report
NOTES TO FINANCIAL STATEMENTS (CONTINUED)
June 30, 2020
Under current tax rules, regulated investment companies can elect to treat certain late-year ordinary losses incurred and post-October capital losses (capital losses realized after October 31) as arising on the first day of the following taxable year. As of June 30, 2020, Global Floating Rate Fund, Global Credit Income Opportunities Fund and Global Emerging Markets Equity Fund incurred late-year ordinary losses of $817,268, $683,119 and $597, respectively. As of June 30, 2020, Global Floating Rate Fund, Global Credit Income Opportunities Fund, Active
Short Duration Bond Fund, Diversified Income Fund, Emerging Markets Debt Blended Total Return Fund, Global Emerging Markets Equity Fund and U.S. High Yield Fund have elected to defer current year post-October losses of $6,317,244, $7,195,586, $21,868,663, $2,514,633, $28,856, $348,448 and $1,594,547, respectively.
Emerging Markets Debt Blended Total Return Fund utilized $774,051 of capital loss carryforwards during the year ended June 30, 2020.
As of June 30, 2020, the aggregate unrealized security gains and losses based on cost for U.S. federal income tax purposes were as follows:
| | | | | | | | | | | | | | | | |
| | | COST OF
INVESTMENTS | | | GROSS
UNREALIZED
APPRECIATION | | | GROSS
UNREALIZED
DEPRECIATION | | | NET
UNREALIZED
APPRECIATION
(DEPRECIATION) | |
Global Floating Rate Fund | | $ | 228,062,073 | | | $ | 399,322 | | | $ | (26,179,071 | ) | | $ | (25,779,749 | ) |
Global Credit Income Opportunities Fund | | | 175,389,014 | | | | 1,318,300 | | | | (24,959,661 | ) | | | (23,641,361 | ) |
Active Short Duration Bond Fund | | | 819,438,189 | | | | 9,827,289 | | | | (24,032,242 | ) | | | (14,204,953 | ) |
Diversified Income Fund | | | 41,653,947 | | | | 456,423 | | | | (1,790,264 | ) | | | (1,333,841 | ) |
Emerging Markets Debt Blended Total Return Fund | | | 53,949,874 | | | | 1,554,679 | | | | (3,705,935 | ) | | | (2,151,256 | ) |
Global Emerging Markets Equity Fund | | | 9,409,229 | | | | 1,540,919 | | | | (799,456 | ) | | | 741,463 | |
U.S. High Yield Fund | | | 48,366,088 | | | | 1,024,263 | | | | (4,713,447 | ) | | | (3,689,184 | ) |
The difference between book-basis and tax-basis unrealized gains (losses) is attributable to wash sales and partnership book-tax differences.
Permanent items identified during the year ended June 30, 2020 have been reclassified among the components of net assets based on their tax basis treatment as follows:
| | | | | | | | |
| | | TOTAL
ACCUMULATED
LOSS | | | PAID-IN CAPITAL | |
Global Credit Income Opportunities Fund | | $ | (44 | ) | | $ | 44 | |
Emerging Markets Debt Blended Total Return Fund | | | 18,025 | | | | (18,025 | ) |
The permanent differences are primarily attributable to adjustments on partnership.
| 8. | Investment Transactions |
Purchases and sales of securities (excluding short-term debt securities) for the year ended June 30, 2020 were as follows:
| | | | | | | | | | | | | | | | |
| | | PURCHASES | | | SALES | | | GOVERNMENT
PURCHASES | | | GOVERNMENT
SALES | |
Global Floating Rate Fund | | $ | 87,316,166 | | | $ | 121,048,148 | | | $ | – | | | $ | – | |
Global Credit Income Opportunities Fund | | | 119,815,486 | | | | 144,329,237 | | | | – | | | | – | |
Active Short Duration Bond Fund | | | 498,463,585 | | | | 392,317,968 | | | | 40,486,712 | | | | 67,772,486 | |
Diversified Income Fund | | | 43,795,088 | | | | 41,148,562 | | | | 621,250 | | | | 1,074,840 | |
Emerging Markets Debt Blended Total Return Fund | | | 68,999,419 | | | | 61,771,905 | | | | – | | | | – | |
Global Emerging Markets Equity Fund | | | 2,266,357 | | | | 1,897,017 | | | | – | | | | – | |
U.S. High Yield Fund | | | 38,478,057 | | | | 38,682,886 | | | | – | | | | – | |
190
Barings Funds Trust 2020 Annual Report
NOTES TO FINANCIAL STATEMENTS (CONTINUED)
June 30, 2020
Transactions in common stock for the year ended June 30, 2020 were as follows:
Global Floating Rate Fund
| | | | | | | | | | | | | | | | |
| | | FOR THE
YEAR ENDED
JUNE 30, 2020 | | | FOR THE
YEAR ENDED
JUNE 30, 2019 | |
| CLASS A | | SHARES | | | AMOUNT | | | SHARES | | | AMOUNT | |
Shares sold | | | 937,310 | | | $ | 8,607,970 | | | | 618,513 | | | $ | 5,784,016 | |
Shares sold through reinvestments of distributions | | | 235,705 | | | | 2,102,247 | | | | 279,598 | | | | 2,606,921 | |
Shares redeemed | | | (1,685,551 | ) | | | (14,925,227 | ) | | | (1,640,608 | ) | | | (15,271,436 | ) |
| | | | | | | | | | | | | | | | |
Net decrease | | | (512,536 | ) | | $ | (4,215,010 | ) | | | (742,497 | ) | | $ | (6,880,499 | ) |
| | | | | | | | | | | | | | | | |
CLASS C | | | | | | | | | | | | | | | | |
Shares sold | | | 116,238 | | | $ | 1,052,227 | | | | 208,023 | | | $ | 1,965,179 | |
Shares sold through reinvestments of distributions | | | 35,471 | | | | 315,149 | | | | 41,472 | | | | 384,747 | |
Shares redeemed | | | (258,409 | ) | | | (2,260,008 | ) | | | (260,855 | ) | | | (2,432,322 | ) |
| | | | | | | | | | | | | | | | |
Net decrease | | | (106,700 | ) | | $ | (892,632 | ) | | | (11,360 | ) | | $ | (82,396 | ) |
| | | | | | | | | | | | | | | | |
CLASS I | | | | | | | | | | | | | | | | |
Shares sold | | | 2,860,215 | | | $ | 26,600,000 | | | | 3,057,892 | | | $ | 29,141,715 | |
Shares sold through reinvestments of distributions | | | 218,857 | | | | 1,946,913 | | | | 183,732 | | | | 1,713,816 | |
Shares redeemed | | | (1,987,129 | ) | | | (18,392,138 | ) | | | (1,667,311 | ) | | | (15,786,911 | ) |
| | | | | | | | | | | | | | | | |
Net increase | | | 1,091,943 | | | $ | 10,154,775 | | | | 1,574,313 | | | $ | 15,068,620 | |
| | | | | | | | | | | | | | | | |
CLASS Y | | | | | | | | | | | | | | | | |
Shares sold | | | 7,795,746 | | | $ | 69,865,024 | | | | 15,302,189 | | | $ | 144,205,728 | |
Shares sold through reinvestments of distributions | | | 679,977 | | | | 6,079,583 | | | | 811,024 | | | | 7,572,102 | |
Shares redeemed | | | (13,429,756 | ) | | | (117,551,528 | ) | | | (14,030,191 | ) | | | (131,010,360 | ) |
| | | | | | | | | | | | | | | | |
Net increase (decrease) | | | (4,954,033 | ) | | $ | (41,606,921 | ) | | | 2,083,022 | | | $ | 20,767,470 | |
| | | | | | | | | | | | | | | | |
Global Credit Income Opportunities Fund
| | | | | | | | | | | | | | | | |
| | | FOR THE
YEAR ENDED
JUNE 30, 2020 | | | FOR THE
YEAR ENDED
JUNE 30, 2019 | |
| CLASS A | | SHARES | | | AMOUNT | | | SHARES | | | AMOUNT | |
Shares sold | | | 296,398 | | | $ | 2,525,056 | | | | 1,398,672 | | | $ | 12,824,235 | |
Shares sold through reinvestments of distributions | | | 299,001 | | | | 2,528,159 | | | | 397,695 | | | | 3,583,380 | |
Shares redeemed | | | (821,303 | ) | | | (6,756,723 | ) | | | (2,555,445 | ) | | | (22,815,351 | ) |
| | | | | | | | | | | | | | | | |
Net decrease | | | (225,904 | ) | | $ | (1,703,508 | ) | | | (759,078 | ) | | $ | (6,407,736 | ) |
| | | | | | | | | | | | | | | | |
CLASS C | | | | | | | | | | | | | | | | |
Shares sold | | | 124,636 | | | $ | 1,042,537 | | | | 221,588 | | | $ | 2,019,448 | |
Shares sold through reinvestments of distributions | | | 43,353 | | | | 365,771 | | | | 52,350 | | | | 470,536 | |
Shares redeemed | | | (204,465 | ) | | | (1,662,882 | ) | | | (275,165 | ) | | | (2,472,862 | ) |
| | | | | | | | | | | | | | | | |
Net decrease | | | (36,476 | ) | | $ | (254,574 | ) | | | (1,227 | ) | | $ | 17,122 | |
| | | | | | | | | | | | | | | | |
191
Barings Funds Trust 2020 Annual Report
NOTES TO FINANCIAL STATEMENTS (CONTINUED)
June 30, 2020
| | | | | | | | | | | | | | | | |
| | | FOR THE
YEAR ENDED
JUNE 30, 2020 | | | FOR THE
YEAR ENDED
JUNE 30, 2019 | |
| CLASS I | | SHARES | | | AMOUNT | | | SHARES | | | AMOUNT | |
Shares sold | | | – | | | $ | – | | | | 916,202 | | | $ | 8,199,999 | |
Shares sold through reinvestments of distributions | | | 54,613 | | | | 461,023 | | | | 13,545 | | | | 121,519 | |
Shares redeemed | | | – | | | | – | | | | (669,643 | ) | | | (6,000,000 | ) |
| | | | | | | | | | | | | | | | |
Net increase | | | 54,613 | | | $ | 461,023 | | | | 260,104 | | | $ | 2,321,518 | |
| | | | | | | | | | | | | | | | |
CLASS Y | | | | | | | | | | | | | | | | |
Shares sold | | | 7,193,613 | | | $ | 61,134,702 | | | | 7,687,011 | | | $ | 69,664,148 | |
Shares sold through reinvestments of distributions | | | 596,969 | | | | 5,088,941 | | | | 743,115 | | | | 6,700,505 | |
Shares redeemed | | | (11,225,790 | ) | | | (91,307,876 | ) | | | (8,977,793 | ) | | | (80,944,931 | ) |
| | | | | | | | | | | | | | | | |
Net decrease | | | (3,435,208 | ) | | $ | (25,084,233 | ) | | | (547,667 | ) | | $ | (4,580,278 | ) |
| | | | | | | | | | | | | | | | |
Active Short Duration Bond Fund
| | | | | | | | | | | | | | | | |
| | | FOR THE
YEAR ENDED
JUNE 30, 2020 | | | FOR THE
YEAR ENDED
JUNE 30, 2019 | |
| CLASS A | | SHARES | | | AMOUNT | | | SHARES | | | AMOUNT | |
Shares sold | | | 11,719,632 | | | $ | 115,672,777 | | | | 7,101,405 | | | $ | 70,189,358 | |
Shares sold through reinvestments of distributions | | | 420,591 | | | | 4,092,410 | | | | 431,679 | | | | 4,265,785 | |
Shares redeemed | | | (21,296,207 | ) | | | (203,582,143 | ) | | | (11,765,228 | ) | | | (116,239,590 | ) |
| | | | | | | | | | | | | | | | |
Net decrease | | | (9,155,984 | ) | | $ | (83,816,956 | ) | | | (4,232,144 | ) | | $ | (41,784,447 | ) |
| | | | | | | | | | | | | | | | |
CLASS C | | | | | | | | | | | | | | | | |
Shares sold | | | 259,113 | | | $ | 2,557,857 | | | | 112,192 | | | $ | 1,106,449 | |
Shares sold through reinvestments of distributions | | | 6,376 | | | | 61,661 | | | | 3,241 | | | | 32,008 | |
Shares redeemed | | | (120,852 | ) | | | (1,130,979 | ) | | | (112,125 | ) | | | (1,107,862 | ) |
| | | | | | | | | | | | | | | | |
Net increase | | | 144,637 | | | $ | 1,488,539 | | | | 3,308 | | | $ | 30,595 | |
| | | | | | | | | | | | | | | | |
CLASS I | | | | | | | | | | | | | | | | |
Shares sold | | | – | | | $ | – | | | | – | | | $ | – | |
Shares sold through reinvestments of distributions | | | – | | | | – | | | | – | | | | – | |
Shares redeemed | | | (20,418 | ) | | | (203,186 | ) | | | – | | | | – | |
| | | | | | | | | | | | | | | | |
Net decrease | | | (20,418 | ) | | $ | (203,186 | ) | | | – | | | $ | – | |
| | | | | | | | | | | | | | | | |
CLASS Y | | | | | | | | | | | | | | | | |
Shares sold | | | 47,841,468 | | | $ | 466,968,769 | | | | 46,643,848 | | | $ | 460,231,739 | |
Shares sold through reinvestments of distributions | | | 1,655,334 | | | | 16,052,682 | | | | 934,483 | | | | 9,235,817 | |
Shares redeemed | | | (38,557,362 | ) | | | (367,924,280 | ) | | | (14,901,345 | ) | | | (147,071,661 | ) |
| | | | | | | | | | | | | | | | |
Net increase | | | 10,939,440 | | | $ | 115,097,171 | | | | 32,676,986 | | | $ | 322,395,895 | |
| | | | | | | | | | | | | | | | |
CLASS L(1) | | | | | | | | | | | | | | | | |
Shares sold | | | 10,764,003 | | | $ | 101,381,145 | | | | | | | | | |
Shares sold through reinvestments of distributions | | | 11,378 | | | | 108,092 | | | | | | | | | |
Shares redeemed | | | (112,724 | ) | | | (1,067,372 | ) | | | | | | | | |
| | | | | | | | | | | | | | | | |
Net increase | | | 10,662,657 | | | $ | 100,421,865 | | | | | | | | | |
| | | | | | | | | | | | | | | | |
| | (1) | Class commenced operations on May 1, 2020. |
192
Barings Funds Trust 2020 Annual Report
NOTES TO FINANCIAL STATEMENTS (CONTINUED)
June 30, 2020
Diversified Income Fund
| | | | | | | | | | | | | | | | |
| | | FOR THE
YEAR ENDED
JUNE 30, 2020 | | | FOR THE
YEAR ENDED
JUNE 30, 2019 | |
| CLASS A | | SHARES | | | AMOUNT | | | SHARES | | | AMOUNT | |
Shares sold | | | 43,627 | | | $ | 365,314 | | | | 54,483 | | | $ | 525,242 | |
Shares sold through reinvestments of distributions | | | 223 | | | | 2,062 | | | | 130 | | | | 1,265 | |
Shares redeemed | | | (1,218 | ) | | | (11,647 | ) | | | (50,659 | ) | | | (490,472 | ) |
| | | | | | | | | | | | | | | | |
Net increase | | | 42,632 | | | $ | 355,729 | | | | 3,954 | | | $ | 36,035 | |
| | | | | | | | | | | | | | | | |
CLASS C | | | | | | | | | | | | | | | | |
Shares sold | | | – | | | $ | – | | | | – | | | $ | – | |
Shares sold through reinvestments of distributions | | | – | | | | – | | | | – | | | | – | |
Shares redeemed | | | – | | | | – | | | | – | | | | – | |
| | | | | | | | | | | | | | | | |
Net increase | | | – | | | $ | – | | | | – | | | $ | – | |
| | | | | | | | | | | | | | | | |
CLASS I | | | | | | | | | | | | | | | | |
Shares sold | | | – | | | $ | – | | | | – | | | $ | – | |
Shares sold through reinvestments of distributions | | | – | | | | – | | | | – | | | | – | |
Shares redeemed | | | – | | | | – | | | | – | | | | – | |
| | | | | | | | | | | | | | | | |
Net increase | | | – | | | $ | – | | | | – | | | $ | – | |
| | | | | | | | | | | | | | | | |
CLASS Y | | | | | | | | | | | | | | | | |
Shares sold | | | 2,471,722 | | | $ | 21,514,638 | | | | 1,590,156 | | | $ | 15,528,182 | |
Shares sold through reinvestments of distributions | | | 67,280 | | | | 634,857 | | | | 26,772 | | | | 261,552 | |
Shares redeemed | | | (2,239,574 | ) | | | (19,970,450 | ) | | | (249,234 | ) | | | (2,425,063 | ) |
| | | | | | | | | | | | | | | | |
Net increase | | | 299,428 | | | $ | 2,179,045 | | | | 1,367,694 | | | $ | 13,364,671 | |
| | | | | | | | | | | | | | | | |
Emerging Markets Debt Blended Total Return Fund
| | | | | | | | | | | | | | | | |
| | | FOR THE
YEAR ENDED
JUNE 30, 2020 | | | FOR THE
YEAR ENDED
JUNE 30, 2019 | |
| CLASS A | | SHARES | | | AMOUNT | | | SHARES | | | AMOUNT | |
Shares sold | | | 607,596 | | | $ | 5,629,686 | | | | 3,593 | | | $ | 33,551 | |
Shares sold through reinvestments of distributions | | | 13,820 | | | | 134,714 | | | | 1,080 | | | | 10,259 | |
Shares redeemed | | | (43,542 | ) | | | (434,004 | ) | | | (23,984 | ) | | | (224,063 | ) |
| | | | | | | | | | | | | | | | |
Net increase (decrease) | | | 577,874 | | | $ | 5,330,396 | | | | (19,311 | ) | | $ | (180,253 | ) |
| | | | | | | | | | | | | | | | |
CLASS C | | | | | | | | | | | | | | | | |
Shares sold | | | 14,324 | | | $ | 146,900 | | | | 4,308 | | | $ | 41,000 | |
Shares sold through reinvestments of distributions | | | 761 | | | | 7,490 | | | | 417 | | | | 3,993 | |
Shares redeemed | | | (19,419 | ) | | | (203,101 | ) | | | (7,937 | ) | | | (74,070 | ) |
| | | | | | | | | | | | | | | | |
Net decrease | | | (4,334 | ) | | $ | (48,711 | ) | | | (3,212 | ) | | $ | (29,077 | ) |
| | | | | | | | | | | | | | | | |
CLASS I | | | | | | | | | | | | | | | | |
Shares sold | | | – | | | $ | – | | | | – | | | $ | – | |
Shares sold through reinvestments of distributions | | | – | | | | – | | | | – | | | | – | |
Shares redeemed | | | (984,551 | ) | | | (9,800,000 | ) | | | – | | | | – | |
| | | | | | | | | | | | | | | | |
Net decrease | | | (984,551 | ) | | $ | (9,800,000 | ) | | | – | | | $ | – | |
| | | | | | | | | | | | | | | | |
193
Barings Funds Trust 2020 Annual Report
NOTES TO FINANCIAL STATEMENTS (CONTINUED)
June 30, 2020
| | | | | | | | | | | | | | | | |
| | | FOR THE
YEAR ENDED
JUNE 30, 2020 | | | FOR THE
YEAR ENDED
JUNE 30, 2019 | |
| CLASS Y | | SHARES | | | AMOUNT | | | SHARES | | | AMOUNT | |
Shares sold | | | 2,290,494 | | | $ | 22,372,983 | | | | 175,657 | | | $ | 1,687,757 | |
Shares sold through reinvestments of distributions | | | 51,572 | | | | 505,175 | | | | 5,220 | | | | 50,400 | |
Shares redeemed | | | (1,698,477 | ) | | | (16,775,383 | ) | | | (47,558 | ) | | | (454,625 | ) |
| | | | | | | | | | | | | | | | |
Net increase | | | 643,589 | | | $ | 6,102,775 | | | | 133,319 | | | $ | 1,283,532 | |
| | | | | | | | | | | | | | | | |
Global Emerging Markets Equity Fund
| | | | | | | | | | | | | | | | |
| | | FOR THE
YEAR ENDED
JUNE 30, 2020 | | | PERIOD FROM
SEPTEMBER 17, 2018
THROUGH
JUNE 30, 2019(2) | |
| CLASS A | | SHARES | | | AMOUNT | | | SHARES | | | AMOUNT | |
Shares sold | | | – | | | $ | – | | | | 10,000 | | | $ | 100,000 | |
Shares sold through reinvestments of distributions | | | – | | | | – | | | | – | | | | – | |
Shares redeemed | | | – | | | | – | | | | – | | | | – | |
| | | | | | | | | | | | | | | | |
Net increase | | | – | | | $ | – | | | | 10,000 | | | $ | 100,000 | |
| | | | | | | | | | | | | | | | |
CLASS C | | | | | | | | | | | | | | | | |
Shares sold | | | – | | | $ | – | | | | 10,000 | | | $ | 100,000 | |
Shares sold through reinvestments of distributions | | | – | | | | – | | | | – | | | | – | |
Shares redeemed | | | – | | | | – | | | | – | | | | – | |
| | | | | | | | | | | | | | | | |
Net increase | | | – | | | $ | – | | | | 10,000 | | | $ | 100,000 | |
| | | | | | | | | | | | | | | | |
CLASS I | | | | | | | | | | | | | | | | |
Shares sold | | | – | | | $ | – | | | | 490,000 | | | $ | 4,900,000 | |
Shares sold through reinvestments of distributions | | | – | | | | – | | | | – | | | | – | |
Shares redeemed | | | – | | | | – | | | | – | | | | – | |
| | | | | | | | | | | | | | | | |
Net increase | | | – | | | $ | – | | | | 490,000 | | | $ | 4,900,000 | |
| | | | | | | | | | | | | | | | |
CLASS Y | | | | | | | | | | | | | | | | |
Shares sold | | | – | | | $ | – | | | | 490,000 | | | $ | 4,900,000 | |
Shares sold through reinvestments of distributions | | | – | | | | – | | | | – | | | | – | |
Shares redeemed | | | – | | | | – | | | | – | | | | – | |
| | | | | | | | | | | | | | | | |
Net increase | | | – | | | $ | – | | | | 490,000 | | | $ | 4,900,000 | |
| | | | | | | | | | | | | | | | |
| | (2) | Fund commenced operations on September 17, 2018. |
194
Barings Funds Trust 2020 Annual Report
NOTES TO FINANCIAL STATEMENTS (CONTINUED)
June 30, 2020
U.S. High Yield Fund
| | | | | | | | | | | | | | | | |
| | | FOR THE
YEAR ENDED
JUNE 30, 2020 | | | FOR THE
YEAR ENDED
JUNE 30, 2019 | |
| CLASS A | | SHARES | | | AMOUNT | | | SHARES | | | AMOUNT | |
Shares sold | | | 161,745 | | | $ | 1,594,758 | | | | 299,631 | | | $ | 2,936,402 | |
Shares sold through reinvestments of distributions | | | 13,792 | | | | 130,405 | | | | 11,491 | | | | 112,082 | |
Shares redeemed | | | (353,471 | ) | | | (3,416,025 | ) | | | (215,869 | ) | | | (2,116,695 | ) |
| | | | | | | | | | | | | | | | |
Net increase (decrease) | | | (177,934 | ) | | $ | (1,690,862 | ) | | | 95,253 | | | $ | 931,789 | |
| | | | | | | | | | | | | | | | |
CLASS C | | | | | | | | | | | | | | | | |
Shares sold | | | – | | | $ | – | | | | – | | | $ | – | |
Shares sold through reinvestments of distributions | | | – | | | | – | | | | – | | | | – | |
Shares redeemed | | | – | | | | – | | | | – | | | | – | |
| | | | | | | | | | | | | | | | |
Net increase | | | – | | | $ | – | | | | – | | | $ | – | |
| | | | | | | | | | | | | | | | |
CLASS I | | | | | | | | | | | | | | | | |
Shares sold | | | – | | | $ | – | | | | – | | | $ | – | |
Shares sold through reinvestments of distributions | | | – | | | | – | | | | 11,431 | | | | 110,810 | |
Shares redeemed | | | – | | | | – | | | | (279,772 | ) | | | (2,719,379 | ) |
| | | | | | | | | | | | | | | | |
Net decrease | | | – | | | $ | – | | | | (268,341 | ) | | $ | (2,608,569 | ) |
| | | | | | | | | | | | | | | | |
CLASS Y | | | | | | | | | | | | | | | | |
Shares sold | | | 714,332 | | | $ | 6,852,773 | | | | 526,284 | | | $ | 5,109,450 | |
Shares sold through reinvestments of distributions | | | 143,418 | | | | 1,345,005 | | | | 161,061 | | | | 1,565,077 | |
Shares redeemed | | | (699,271 | ) | | | (6,312,454 | ) | | | (1,130,987 | ) | | | (10,910,446 | ) |
| | | | | | | | | | | | | | | | |
Net increase (decrease) | | | 158,479 | | | $ | 1,885,324 | | | | (443,642 | ) | | $ | (4,235,919 | ) |
| | | | | | | | | | | | | | | | |
The Trust (the “Borrower”) has entered into a Credit Agreement (the “Credit Agreement”) with State Street Bank and Trust Company (the “Bank”). The Credit Agreement provides for a revolving credit facility of $150,000,000 (the “Facility Amount”) to be utilized for temporary or emergency purposes to fund shareholder redemptions or for other short-term liquidity purposes. Per the Credit Agreement, outstanding principal on the loan shall bear interest at a variable rate per annum equal to the higher of (a) the Federal Funds Rate as in effect on the day of the borrowing plus 1.25% and (b) the one month LIBOR rate as in effect on the day of the borrowing plus 1.25%. In addition, the Borrower shall pay to the Bank a commitment fee at the rate of 0.25% per annum on the daily unused portion of the Facility Amount.
The Global Floating Rate Fund utilized a portion of the Facility Amount on multiple dates from the period March 17, 2020 through March 25, 2020 with an average borrowing amount of $10,000,000. The average interest
rate during the period was 2.1459% and total interest paid amounted to $5,365.
The Global Credit Income Opportunities Fund utilized a portion of the Facility Amount on multiple dates from the period March 12, 2020 through April 8, 2020 with an average borrowing amount of $5,000,000. The average interest rate during the period was 2.20154% and total interest paid amounted to $8,276. The Global Credit Income Opportunities Fund also utilized a portion of the Facility Amount on multiple dates from the period June 15, 2020 through June 21, 2020 with an average borrowing amount of $1,500,000. The average interest rate during the period was 1.4417% and total interest paid amounted to $421.
The Diversified Income Fund utilized a portion of the Facility Amount on multiple dates from the period March 19, 2020 through March 24, 2020 with an average borrowing amount of $2,233,333. The average interest rate during the period was 2.1801% and total interest paid amounted to $811.
195
Barings Funds Trust 2020 Annual Report
NOTES TO FINANCIAL STATEMENTS (CONTINUED)
June 30, 2020
Under the Funds’ organizational documents, its officers and Trustees may be indemnified against certain liabilities and expenses arising out of the performance of their duties to the Funds. Additionally, in the normal course of business, the Funds have entered into contracts with service providers which may contain indemnification clauses. The Funds maximum exposure under these arrangements is unknown. No claim has been made for indemnification pursuant to any such agreement of the Funds.
| 12. | Aggregate Remuneration Paid to Officers, Trustees and Their Affiliated Persons |
For the fiscal year ended June 30, 2020, the Funds paid their Trustees’ aggregate remuneration of $488,000. During the year, the Funds did not pay any compensation to any of their Trustees who are “interested persons” (as defined by the 1940 Act) of the Funds. The Funds classify Mr. Finke as an interested person of the Funds.
All of the Funds’ officers are employees of the Adviser. Pursuant to the Agreement, the Funds do not compensate their officers who are employees of the Adviser (except for the Chief Compliance Officer of the Funds unless assumed by the Adviser). For the year ended June 30, 2020, the Adviser paid the compensation of the Chief Compliance Officer of the Funds.
The Funds did not make any payments to the Adviser for the year ended June 30, 2020, other than the amounts payable to the Adviser pursuant to the Agreement.
Impacts of Covid-19
The pandemic related to the global spread of novel coronavirus disease (Covid-19), which was first detected in December 2019, has resulted in significant disruptions to global business activity and the global economy, as well as the economies of individual countries, the
financial performance of individual companies and sectors, and the securities and commodities markets in general. This pandemic, the full effects of which are still unknown, has resulted in substantial market volatility and may continue to adversely impact the prices and liquidity of the fund’s investments and the fund’s performance.
LIBOR
On July 27, 2017, the United Kingdom’s Financial Conduct Authority (“FCA”), which regulates LIBOR, announced a desire to phase out the use of LIBOR by the end of 2021. LIBOR has historically been a common benchmark interest rate index used to make adjustments to variable-rate loans. It is used throughout global banking and financial industries to determine interest rates for a variety of financial instruments and borrowing arrangements. The transition process might lead to increased volatility and illiquidity in markets that currently rely on LIBOR to determine interest rates. It could also lead to a reduction in the value of some LIBOR-based investments held by a fund and reduce the effectiveness of new hedges placed against existing LIBOR-based investments. While some LIBOR-based instruments contemplate a scenario where LIBOR is no longer available by providing for an alternative rate-setting methodology, not all have such provisions and there may be significant uncertainty regarding the effectiveness of any such alternative methodologies. Since the usefulness of LIBOR as a benchmark could deteriorate during the transition period, these effects could occur prior to the end of 2021.
Management has considered the circumstances under which the Funds should recognize or make disclosures regarding events or transactions occurring subsequent to June 30, 2020 through August 27, 2020, the date the financial statements were issued. Adjustments or additional disclosures, if any, have been included in these financial statements.
196
Barings Funds Trust 2020 Annual Report
REPORT OF INDEPENDENT REGISTERED PUBLIC ACCOUNTING FIRM
To the Board of Trustees of Barings Funds Trust and Shareholders of Barings Global Floating Rate Fund, Barings Global Credit Income Opportunities Fund, Barings Active Short Duration Bond Fund, Barings Diversified Income Fund, Barings Emerging Markets Debt Blended Total Return Fund, Barings Global Emerging Markets Equity Fund and Barings U.S. High Yield Fund (collectively, the “Funds”):
Opinion on the Financial Statements and Financial Highlights
We have audited the accompanying statements of assets and liabilities of Barings Funds Trust comprising the Barings Global Floating Rate Fund, Barings Global Credit Income Opportunities Fund, Barings Active Short Duration Bond Fund, Barings Diversified Income Fund, Barings Emerging Markets Debt Blended Total Return Fund, Barings Global Emerging Markets Equity Fund, and Barings U.S. High Yield Fund (the “Funds”), including the schedules of investments, as of June 30, 2020; the related statements of operations for the year then ended, the statements of changes in net assets for each of the two years in the period then ended, and the financial highlights for each of the five years in the period then ended for Barings Global Floating Rate Fund and Barings Global Credit Income Opportunities Fund; the related statements of operations, changes in net assets, and the financial highlights for the periods indicated in the table below for Barings Active Short Duration Bond Fund, Barings Diversified Income Fund, Barings Emerging Markets Debt Blended Total Return Fund, Barings Global Emerging Markets Equity Fund and Barings U.S. High Yield Fund; and the related notes. In our opinion, the financial statements and financial highlights present fairly, in all material respects, the financial position of each of the funds listed above constituting Barings Funds Trust as of June 30, 2020, and the results of their operations for the year then ended, the changes in their net assets for each of the two years in the period then ended (or for the periods listed in the table below), and the financial highlights for each of the five years in the period then ended (or for the periods listed in the table below), in conformity with accounting principles generally accepted in the United States of America.
| | | | | | |
INDIVIDUAL FUND COMPRISING THE
BARINGS FUNDS TRUST | | STATEMENT OF
OPERATIONS | | STATEMENTS OF
CHANGES IN
NET ASSETS | | FINANCIAL
HIGHLIGHTS |
| | | |
Barings Active Short Duration Bond Fund Barings Diversified Income Fund | | For the year ended June 30, 2020 | | For the years ended June 30, 2020 and 2019 | | For the years ended June 30, 2020, 2019, 2018, 2017, and the period from July 8, 2015 (commencement of operations) through June 30, 2016 |
| | | |
| Barings Emerging Markets Debt Blended Total Return Fund | | For the year ended June 30, 2020 | | For the years ended June 30, 2020 and 2019 | | For the years ended June 30, 2020, 2019, 2018, 2017, and the period from October 21, 2015 (commencement of operations) through June 30, 2016 |
197
Barings Funds Trust 2020 Annual Report
REPORT OF INDEPENDENT REGISTERED PUBLIC ACCOUNTING FIRM (CONTINUED)
| | | | | | |
INDIVIDUAL FUND COMPRISING THE
BARINGS FUNDS TRUST | | STATEMENT OF
OPERATIONS | | STATEMENTS OF
CHANGES IN
NET ASSETS | | FINANCIAL
HIGHLIGHTS |
| | | |
| Barings Global Emerging Markets Equity Fund | | For the year ended June 30, 2020 | | For the year ended June 30, 2020 and period from September 17, 2018 (commencement of operations) through June 30, 2019 | | For the year ended June 30, 2020 and period from September 17, 2018 (commencement of operations) through June 30, 2019 |
| | | |
| Barings U.S. High Yield Fund | | For the year ended June 30, 2020 | | For the years ended June 30, 2020 and 2019 | | For the years ended June 30, 2020, 2019, 2018, 2017, and the period from October 30, 2015 (commencement of operations) through June 30, 2016 |
Basis for Opinion
These financial statements and financial highlights are the responsibility of the Funds’ management. Our responsibility is to express an opinion on the Funds’ financial statements and financial highlights based on our audits. We are a public accounting firm registered with the Public Company Accounting Oversight Board (United States) (PCAOB) and are required to be independent with respect to the Funds in accordance with the U.S. federal securities laws and the applicable rules and regulations of the Securities and Exchange Commission and the PCAOB.
We conducted our audits in accordance with the standards of the PCAOB. Those standards require that we plan and perform the audit to obtain reasonable assurance about whether the financial statements and financial highlights are free of material misstatement, whether due to error or fraud. The Funds are not required to have, nor were we engaged to perform, an audit of their internal control over financial reporting. As part of our audits we are required to obtain an understanding of internal control over financial reporting but not for the purpose of expressing an opinion on the effectiveness of the Funds’ internal control over financial reporting. Accordingly, we express no such opinion.
Our audits included performing procedures to assess the risks of material misstatement of the financial statements and financial highlights, whether due to error or fraud, and performing procedures that respond to those risks. Such procedures included examining, on a test basis, evidence regarding the amounts and disclosures in the financial statements and financial highlights. Our audits also included evaluating the accounting principles used and significant estimates made by management, as well as evaluating the overall presentation of the financial statements and financial highlights. Our procedures included confirmation of securities owned as of June 30, 2020, by correspondence with the custodian, brokers and selling or agent banks; when replies were not received from brokers and selling or agent banks, we performed other auditing procedures. We believe that our audits provide a reasonable basis for our opinion.
Deloitte & Touche LLP
New York, New York
August 27, 2020
We have served as the auditor of one or more Barings LLC investment companies since 2013.
198
Barings Funds Trust 2020 Annual Report
FEDERAL TAX INFORMATION (UNAUDITED)
The following Funds designate long-term capital gain distributions as listed below:
| | | | |
| FUND | | LONG-TERM CAPITAL GAIN DISTRIBUTIONS | |
| |
Barings Global Floating Rate Fund | | $ | 438,706 | |
| |
Barings Global Emerging Markets Equity Fund | | $ | 21,100 | |
Of the ordinary distributions made during the fiscal year ended June 30, 2020, the following percentages qualify for the dividends received deduction (DRD) available to corporate shareholders:
| | | | |
| FUND | | DRD% | |
| |
Barings Global Credit Income Opportunities Fund | | | 0.06 | % |
The following Funds had qualified dividend income (“QDI”) received through June 30, 2020, as follows:
| | | | |
| FUND | | QDI | |
| |
Barings Global Floating Rate Fund | | $ | 245 | |
| |
Barings Global Credit Income Opportunities Fund | | $ | 5,688 | |
| |
Barings Global Emerging Markets Equity Fund | | $ | 234,954 | |
The following Funds paid foreign taxes during the year ended June 30, 2020 that are available as income tax credits:
| | | | |
| FUND | | FOREIGN TAX CREDIT | |
| |
Barings Emerging Markets Debt Blended Total Return Fund | | $ | 45,457 | |
| |
Barings Global Emerging Markets Equity Fund | | $ | 27,888 | |
The following Funds generated net foreign source income during the year ended June 30, 2020 as listed below:
| | | | |
| FUND | | FOREIGN SOURCE INCOME | |
| |
Barings Emerging Markets Debt Blended Total Return Fund | | $ | 3,602,357 | |
| |
Barings Global Emerging Markets Equity Fund | | $ | 335,220 | |
199
Barings Funds Trust 2020 Annual Report
STATEMENT REGARDING LIQUIDITY RISK MANAGEMENT PROGRAM (UNAUDITED)
Barings, the Board appointed administrator of the Funds’ liquidity risk management program (LRMP), presented the first annual report on the program to the Trusts on August 7, 2020. The report covered the structure of the program, including the program documents and related policies and procedures adopted to comply with Rule 22e-4 under the Investment Company Act of 1940, and reviewed the operation of the program from December 2018 through June 30, 2020. The report included a description of the annual liquidity assessment of the funds that Barings performed. The report noted that there were no compliance exceptions identified under Rule 22e-4 during the period. The report included a review of the governance of the program and the methodology for classifying the Funds’ investments. The report also included a discussion of liquidity monitoring during the period, including during the market liquidity challenges caused by the Covid-19 pandemic, and the impact those challenges had on the liquidity of the Funds’ investments. Barings concluded that the program has been operating effectively and adequately to ensure compliance with Rule 22e-4. There can be no assurance that the program will achieve its objectives in the future.
200
Barings Funds Trust 2020 Annual Report
INTERESTED TRUSTEE
Information about Trustees and Officers
Information pertaining to the Trustees and officers of the Trust is set forth below.
The Statement of Additional Information includes additional information about Trustees and is available, without charge, upon request by calling the Funds at 1-855-439-5459 or on the Funds’ website at http://www.barings.com/funds/mutual-funds.
| | | | | | | | | | |
| NAME (AGE), ADDRESS | | POSITION(S)
WITH THE
TRUST | | OFFICE
TERM
AND
LENGTH
OF TIME
SERVED | | PRINCIPAL OCCUPATIONS
DURING PAST 5 YEARS | | PORTFOLIOS
OVERSEEN
IN FUND
COMPLEX | | OTHER DIRECTORSHIPS HELD BY
DIRECTOR |
| | | | | |
Thomas M. Finke (56) 300 South Tryon Street Suite 2500 Charlotte, NC 28202 | | Trustee | | Trustee since July 2013 | | Chairman and Chief Executive Officer (since 2008), Member of the Board of Managers (since 2006), President (2007-2008), Managing Director (2002-2008), Barings; and Chief Investment Officer and Executive Vice President (2008-2011), Massachusetts Mutual Life Insurance Company. | | 9 | | Trustee (since 2012), Barings Global Short Duration High Yield Fund (closed-end investment company advised by Barings); Director (since 2018), Barings BDC, Inc. (a business development company managed by Barings); Chairman (2012-2015), Director (since 2008), Barings (U.K.) Limited (investment advisory firm); Director (since 2008), Barings Guernsey Limited (holding company); Vice Chairman and Manager (since 2011), MM Asset Management Holding LLC (holding company); Director (since 2004), Jefferies Finance LLC (finance company); Manager (since 2005), Loan Strategies Management, LLC (general partner of an investment fund); Manager (since 2005), Jefferies Finance CP Funding LLC (investment company); Chairman and Director (2012-2015), Barings Global Advisers Limited (investment advisory firm); Manager (2011-2016), Wood Creek Capital Management, LLC (investment advisory firm); Chairman and Manager (2007-2016), Barings Real Estate Advisers LLC (real estate advisory firm); and Manager (2007-2015), Credit Strategies Management LLC (general partner of an investment fund). |
201
Barings Funds Trust 2020 Annual Report
INDEPENDENT TRUSTEES
| | | | | | | | | | |
| NAME (AGE), ADDRESS | | POSITION(S)
WITH THE
TRUST | | OFFICE
TERM
AND
LENGTH
OF TIME
SERVED | | PRINCIPAL OCCUPATIONS
DURING PAST 5 YEARS | | PORTFOLIOS
OVERSEEN
IN FUND
COMPLEX | | OTHER DIRECTORSHIPS HELD BY
DIRECTOR |
| | | | | |
Rodney J. Dillman (67) 300 South Tryon Street Suite 2500 Charlotte, NC 28202 | | Trustee, Chairman | | Trustee since July 2013 | | Retired (since 2012); Deputy General Counsel (2011-2012), Senior Vice President (2008-2012), Vice President (2000-2008), Massachusetts Mutual Life Insurance Company; Member of the Board of Directors and President (2008-2011), MassMutual International LLC; and General Counsel (2006-2008), Babson Capital Management LLC (currently known as Barings). | | 8 | | Trustee (since 2012), Barings Global Short Duration High Yield Fund (closed-end investment company advised by Barings); and Director (2016-2017), Social Reality, Inc. (digital platform technology and management software company for internet advertising). |
| | | | | |
Bernard A. Harris, Jr. (64) 300 South Tryon Street Suite 2500 Charlotte, NC 28202 | | Trustee | | Trustee since July 2013 | | Chief Executive Officer (since 2018), National Math and Science Initiative; Chief Executive Officer and Managing Partner (since 2002), Vesalius Ventures, Inc.; Director and President (since 1998), The Space Agency; President (since 1999), The Harris Foundation; and Clinical Scientist, Flight Surgeon and Astronaut (1986-1996), NASA. | | 8 | | Trustee (since 2012), Barings Global Short Duration High Yield Fund (closed-end investment company advised by Barings); Energy Infrastructure Fund (mutual fund); Director (since 2009), Monebo Technologies Inc. (medical technology design company); Director (since 2009), The Endowment Fund; Director (since 2008), U.S. Physical Therapy, Inc. (NYSE: USPH); Trustee (2015-2017) Forward Funds (open-end investment company); and Trustee (2011-2015), Salient Midstream & MLP Fund (closed-end investment company). |
| | | | | |
Thomas W. Okel (57) 300 South Tryon Street Suite 2500 Charlotte, NC 28202 | | Trustee | | Trustee since July 2013 | | Executive Director (2011-2019), Catawba Lands Conservancy; and Global Head of Syndicated Capital Markets (1998-2010), Bank of America Merrill Lynch. | | 9 | | Trustee (since 2012), Barings Global Short Duration High Yield Fund (closed-end investment company advised by Barings); Director (since 2018), Barings BDC, Inc. (business development company advised by Barings); Director (since 2020), Barings Capital Investment Corporation; and Trustee (since 2015), Horizon Funds (mutual fund complex). |
202
Barings Funds Trust 2020 Annual Report
INDEPENDENT TRUSTEES (CONTINUED)
| | | | | | | | | | |
| NAME (AGE), ADDRESS | | POSITION(S)
WITH THE
TRUST | | OFFICE
TERM
AND
LENGTH
OF TIME
SERVED | | PRINCIPAL OCCUPATIONS
DURING PAST 5 YEARS | | PORTFOLIOS
OVERSEEN
IN FUND
COMPLEX | | OTHER DIRECTORSHIPS HELD BY
DIRECTOR |
| | | | | |
Cynthia R. Plouché (63) 300 South Tryon Street Suite 2500 Charlotte, NC 28202 | | Trustee | | Trustee since August 2017 | | Assessor (2014-2018), Moraine Township (property assessment); and Senior Portfolio Manager (2006-2012), Williams Capital Management, LLC (asset management). | | 8 | | Trustee (since August 2017), Barings Global Short Duration High Yield Fund (closed-end investment company advised by Barings); Trustee (since 2014), Northern Trust Funds (mutual fund complex); and Trustee (2001-2017), AXA VIP Trust (mutual fund complex). |
| | | | | |
Martin A. Sumichrast (53) 300 South Tryon Street Suite 2500 Charlotte, NC 28202 | | Trustee | | Trustee since July 2013 | | Chairman and Co-Chief Executive Officer (since 2016), Director (since 2015) cbdMD, Inc., (NYSE: YCBD; a consumer staples company specializing in CBD); and Managing Director (since 2012), Washington Capital, LLC (family office). | | 8 | | Trustee (since 2012), Barings Global Short Duration High Yield Fund (closed-end investment company advised by Barings); and Chairman and Director (2014-2017), Kure Corp. (retail). |
203
Barings Funds Trust 2020 Annual Report
OFFICERS OF THE TRUST
| | | | | | |
| NAME (AGE), ADDRESS | | POSITION(S) WITH
THE TRUST | | OFFICE TERM* AND
LENGTH OF TIME
SERVED | | PRINCIPAL OCCUPATION(S)
DURING PAST 5 YEARS |
| | | |
Dan McGee (50) 300 South Tryon Street Suite 2500 Charlotte, NC 28202 | | President | | Since August 2018 | | Managing Director (since 2013), Barings; and Managing Director (1992-2013), Principal Financial Group. |
| | | |
Carlene Pollock (53) 300 South Tryon Street Suite 2500 Charlotte, NC 28202 | | Chief Financial Officer | | Since January 2016 | | Assistant Treasurer (2015-2016), Barings Funds Trust; Chief Financial Officer (since 2016), Assistant Treasurer (2015-2016), Barings Global Short Duration High Yield Fund (closed-end investment company advised by Barings); Director (since 2015), Barings; Director (2013-2015), Corrum Capital Management (investment adviser); and Vice President (2008-2013), Bank of New York Mellon (third party administrator). |
| | | |
Lesley Mastandrea (43) 300 South Tryon Street Suite 2500 Charlotte, NC 28202 | | Treasurer | | Since October 2016 | | Managing Director (since 2014), Director (2007-2014), Associate Director (2006-2007), Barings; and Treasurer (since 2016), Barings Global Short Duration High Yield Fund (closed-end investment company advised by Barings). |
| | | |
Michael Cowart (37) 300 South Tryon Street Suite 2500 Charlotte, NC 28202 | | Chief Compliance Officer | | Since January 2020 | | Director (since 2018), Barings; Chief Compliance Officer (since January 2020), Barings Corporate Investors and Barings Participation Investors (closed-end investment companies advised by Barings); Chief Compliance Officer (since January 2020), Barings Global Short Duration High Yield Fund (closed-end investment company advised by Barings); Chief Compliance Officer (since January 2020), Barings BDC, Inc. (business development company advised by Barings); Chief Compliance Officer (since November 2019), Barings Securities LLC; and Assistant General Counsel (2016-2018), LPL Financial (independent broker-dealer). |
| | | |
Janice M. Bishop (55) 300 South Tryon Street Suite 2500 Charlotte, NC 28202 | | Vice President, Secretary and Chief Legal Officer | | Since July 2013 | | Senior Counsel and Managing Director (since 2014), Counsel (2007-2014), Barings; Vice President, Secretary and Chief Legal Officer (since 2012), Barings Global Short Duration High Yield Fund (closed-end investment company advised by Barings); Vice President, Secretary and Chief Legal Officer (since 2015), Associate Secretary (2008-2015), Barings Corporate Investors and Barings Participation Investors (closed-end investment companies advised by Barings); Secretary and Chief Legal Officer (since 2018), Barings BDC, Inc. (a business development company advised by Barings); and Vice President and Secretary (since 2015), Assistant Secretary (2008-2015), CI Subsidiary Trust and PI Subsidiary Trust. |
| | | |
Jill Dinerman (43) 300 South Tryon Street Suite 2500 Charlotte, NC 28202 | | Assistant Secretary | | Since February 2019 | | General Counsel (since January 2020), Corporate Secretary (since 2018), Managing Director (since 2016), Associate General Counsel (2018-2020), Senior Counsel (2016-2018), Counsel and Director (2011-2016), Barings; Assistant Secretary (since 2019), Barings Global Short Duration High Yield Fund (closed-end investment company advised by Barings); Assistant Secretary (since 2019), Barings Corporate Investors and Barings Participation Investors (closed-end investment companies advised by Barings); and Assistant Secretary (since 2019), Barings BDC, Inc. (a business development company advised by Barings). |
204
Barings Funds Trust 2020 Annual Report
GLOBAL PRIVACY NOTICE
This global privacy notice (“Privacy Notice”) applies to
| | ∎ | | Barings LLC’s affiliates, subsidiaries, and investment fund management entities (each management entity a “Manager”), which may respectively be based in the United States of America (the “USA”), United Kingdom (the “UK”), Switzerland, the European Union (the “EU”), Hong Kong S.A.R., the People’s Republic of China, Australia, South Korea, Taiwan, Japan and the Cayman Islands; and |
| | ∎ | | the respective investment funds and collective investment vehicles within the Barings family of funds (which may include funds that do not feature the Barings trade name) (each a “Fund”). |
Collectively, these entities are “Barings” (“we”, “us”, “our”).
About this Privacy Notice
This Privacy Notice, which includes our Cookies Policy (to the extent applicable, a copy of which can be found at barings.com), is designed to help you understand our information collection practices depending on your relationship with us.
This Privacy Notice should be read in conjunction with any other applicable policies, terms and conditions in place between you and Barings.
Any term or provision contained in this Privacy Notice shall not apply to the extent it is incompatible with relevant applicable laws or regulations in the country or jurisdiction that applies to your Personal Data. The local addendum attached to this Privacy Notice sets out additional or different obligations and rights in a given country, state, or jurisdiction beyond the terms of this Privacy Notice. Where there is any inconsistency between the local addendum and the main body of this Privacy Notice, the relevant local addendum shall prevail.
The Barings entity that was originally responsible for collecting your Personal Data in a given country or jurisdiction will be your primary data controller. The relevant data controller(s) in a particular country or jurisdiction are set out in the relevant local addendum below. If your country or jurisdiction is not listed, your data controller will be Barings LLC.
Application of this Privacy Notice
Clients: If you interact with Barings as a private client or otherwise in your individual capacity, or in the capacity of an officer, employee, director and/or principal of one of our corporate or institutional clients (including prospective clients) (“Client”), this Privacy Notice sets out how Barings will collect and process Personal Data in connection with its investment fund management services. Personal Data that we collect and process may include that of registered shareholders or unitholders, applicants for shares or units, beneficial owners of registered shareholders or unitholders and applicants for shares or units, personal representatives, directors, officers, employees, agents, trustees and/or authorized signatories of registered shareholders or unitholders and applicants for shares or units (being natural persons) (“Corporate Individuals”) and other information relating to the dealings of Corporate Individuals with the Fund and/or its service providers.
Website Users: As regards any website or applications owned or operated by, or on behalf of, Barings, including (but not limited to) barings.com and any local variations that may be created from time to time (“Website”), if you are a user or visitor of a Website (“Website User”), this Privacy Notice also sets out how Barings collects and processes Personal Data in connection with those Websites.
Job Applicants: If you apply for a job with, or are later employed or otherwise appointed by, Barings, when applicable, we will provide you with a separate privacy notice about how we collect and process your Personal Data in connection with such appointment at that time.
205
Barings Funds Trust 2020 Annual Report
GLOBAL PRIVACY NOTICE (CONTINUED)
1. Definitions
We collect and process Personal Data in accordance with the requirements of the data protection laws (“Relevant Data Protection Laws”) applicable to the particular Personal Data at issue. The Relevant Data Protection Laws include the data protection or privacy laws of any country or jurisdiction applicable to the processing of Personal Data covered by this Privacy Notice.
“Personal Data” (or the equivalent term such as “personal information” under Relevant Data Protection Laws) means (to the extent applicable) any information: (i) held by Barings; (ii) held or obtained by the Manager or the Fund; or (iii) an individual provides to the Manager, the Fund or the Fund’s service provider, that can, in each case, identify an individual, such as name, address, email address, date of birth etc., from which that individual can be directly or indirectly personally identified, and includes information such as identification and account numbers and online identifiers, or otherwise has the meaning as set out in Relevant Data Protection Laws applicable to you.
Some of this Personal Data may include, where applicable, information classified in some jurisdictions as “Special Categories of Personal Data” (or equivalent terms such as “Sensitive Personal Data”, “sensitive information” or “sensitive personal information” under Relevant Data Protection Laws), relating to an individual’s race, ethnicity, health, political opinions, trade union membership, as well as Personal Data related to criminal matters.
“processing” means any operation or set of operations which is performed on Personal Data or on sets of Personal Data, whether or not by automated means, such as collection, recording, organization, structuring, storage, adaptation or alteration, retrieval, consultation, use, disclosure by transmission, dissemination or otherwise making available, alignment or combination, restriction, erasure or destruction, or otherwise has the meaning as set out in the applicable Relevant Data Protection Laws.
2. Personal Data collected and how we collect it
Barings will collect the following types of Personal Data, depending on your relationship with us:
| | ∎ | | Identity information such as name, address, personal contact details (including email address and telephone numbers), date of birth, financial information, passport number, nationality, job title, driver’s license or identity card information; and |
| | ∎ | | Technical and usage information such as IP address, cookies, browser type and version, time zone settings, browser plugin types, operating systems and platform, device information (including, for mobile devices, the IMEI number, wireless networks and general network information). |
Barings obtains your Personal Data from the following sources:
| | ∎ | | Directly from you when you provide such information to us, for example, through your use of our Websites or other forms to receive our services (including our investment services), when you correspond with us or submit a complaint, or transact with us or our affiliates; |
| | ∎ | | From personnel of Clients, from non-affiliated sources (such as consumer or reporting agencies, government agencies, or other non-affiliated parties), or automatically through your use of our Websites; and |
| | ∎ | | Through Corporate Individuals, e.g. if you have engaged an advisor on your behalf. |
If you are dealing with Barings as a Client, where the Manager or the Fund needs to process Personal Data: (i) in connection with a registered shareholder’s or unitholder’s contract with the Fund or Manager in respect of a Fund, (ii) in anticipation of an applicant for shares or units becoming a registered shareholder or unitholder, or (iii) where the Manager or the Fund has a legal obligation to collect certain Personal Data relating to a Corporate Individual (for example, in order to comply with anti-money laundering and anti-terrorist financing (collectively “AML”) obligations), the Fund will not be able to deal with the registered shareholder or unitholder or applicant for shares or units if such individual does not provide the necessary Personal Data and other information required by the Manager or the Fund.
206
Barings Funds Trust 2020 Annual Report
GLOBAL PRIVACY NOTICE (CONTINUED)
3. Purposes
If you are dealing with Barings as a Client, Barings will use the Personal Data of Corporate Individuals for the following purposes:
| | ∎ | | For the purposes of performing the contract with a registered shareholder or unitholder, or in anticipation of an applicant for shares or units becoming a registered shareholder or unitholder, namely: |
| | ∎ | | for the purposes of providing services to the registered shareholder or unitholder, and setting up and administering the applicant’s or registered shareholder’s or unitholder’s account(s), as the case may be; |
| | ∎ | | for the collection of subscriptions and payment of redemptions, distributions and dividends; |
| | ∎ | | in the event of a merger or proposed merger of the Fund or any sub-fund of the Fund, or for any other restructurings; or |
| | ∎ | | to deal with queries or complaints from registered shareholders; |
| | ∎ | | For compliance with Barings’ legal obligations including: |
| | ∎ | | AML and fraud prevention purposes, including OFAC and PEP screening for these purposes and to comply with UN, EU and other applicable sanctions regimes; |
| | ∎ | | compliance with applicable tax and regulatory reporting obligations; |
| | ∎ | | where Barings is ordered to disclose information by a court with appropriate jurisdiction; or |
| | ∎ | | recording of telephone calls and electronic communications in order to comply with applicable laws and regulatory obligations, where applicable; |
| | ∎ | | Where use is for a legitimate purpose of Barings including: |
| | ∎ | | for day to day operational and business purposes; |
| | ∎ | | to take advice from the Manager’s and the Fund’s external legal and other advisors; |
| | ∎ | | board reporting and management purposes, including where required, for quality assurance; |
| | ∎ | | investigation of complaints or reports, including via ethics or whistleblowing systems or reporting hotlines, relating to conduct which is contrary to Barings’ values or which may be in breach of applicable laws and regulations; or |
| | ∎ | | administering surveys and questionnaires, such as for research and client satisfaction purposes; |
| | ∎ | | Where a Corporate Individual has consented to use for a particular purpose. If a Corporate Individual gives consent for Barings to use their Personal Data for a particular purpose and where permitted under Relevant Data Protection Laws, that Corporate Individual has the right at any time to withdraw consent to the future use of his/her Personal Data for those purposes by writing to the address specified below. |
If you are dealing with Barings as a Website User, Barings will use the Personal Data collected for the following purposes:
| | ∎ | | For our internal business administration and record keeping purposes; |
| | ∎ | | To provide you with information about our investment products and related services, facilitate your online purchases, tailor or customize your user experience, and for all other administration as may be necessary in relation to the supply of our investment products and related services and the conduct of our investment management business; |
| | ∎ | | To respond to your complaints, inquiries or comments submitted through our Website; |
| | ∎ | | Where necessary, as part of any restructuring relating to Barings, its business or assets, or as part of a merger or sale of Barings or any of Barings’s subsidiaries; |
207
Barings Funds Trust 2020 Annual Report
GLOBAL PRIVACY NOTICE (CONTINUED)
| | ∎ | | For legal and regulatory compliance purposes, including as necessary to respond to governmental, regulatory or law enforcement agency requests in any jurisdiction; to ensure the continuing security and integrity of our systems, business dealings, reputation or the security and reputation of Barings and its staff; to identify misuse of Barings’s systems and any fraud or other illegal or unlawful activity or any other activity which is or may be contrary to our legal and regulatory compliance obligations; |
| | ∎ | | As may otherwise be necessary for responsible corporate governance or as otherwise required or permitted by applicable laws and/or regulations; |
| | ∎ | | To otherwise protect the rights and property of Barings and the rights, property, and health of other persons, which may include disclosing information about you to authorities when we deem it appropriate to do so; and |
| | ∎ | | To the extent applicable, for any other purpose for which we have obtained your consent from time to time as permitted and in accordance with Relevant Data Protection Laws. |
Do-Not-Track: Please note that our Website does not recognize web browser “do-not-track” signals. For more information about our use of cookies and other online data collection mechanisms, please see our Cookies Policy located on barings.com.
To the extent required by Relevant Data Protection Laws, we will obtain your consent for any new or additional purposes for which Baring processes Personal Data.
Barings may also use your Personal Data to send you information about promotions and offers. However, we will not do so without your consent where required by Relevant Data Protection Laws. If you do not want to receive such information you can unsubscribe at any time by clicking the link at the bottom of any promotional message we send, or by contacting us using the contact details set out in this Privacy Notice.
4. International transfers
Personal Data may be transferred to a jurisdiction outside the country or jurisdiction in which you are resident or located and, if so, this will be done using a legitimate transfer mechanism as required under Relevant Data Protection Laws.
Subject to Relevant Data Protection Laws, transfers to other countries or jurisdictions may be permitted if the country or jurisdiction in question has in place data protection laws which are substantially similar to, or serve the same purposes as, those in the country or jurisdiction where you are resident or located, or otherwise deemed by the relevant authorities as providing ‘adequate protection’. However, some transfers may be to countries or jurisdictions that do not have equivalent protections and, in that case, Barings, the Manager and the Fund (as applicable) shall use reasonable efforts to implement contractual protections for the Personal Data, as required based on the legitimate transfer mechanism used.
5. Special Categories of Personal Data
Barings may, in limited circumstances and as permitted by Relevant Data Protection Laws, collect and process Special Categories of Personal Data, as well as Personal Data related to criminal matters, in connection with its obligations under applicable AML laws, which will only be used and disclosed, as necessary, for such purpose.
6. Personal Data received from other sources
Where Barings is provided with Personal Data relating to an individual by someone other than that individual (such as a beneficial owner, partners, directors, officers, employers, employees, advisors, consumer or other reporting agencies, governmental agencies or other related persons), the person providing the Personal Data: will be asked to warrant that it will only do so in accordance with Relevant Data Protection Laws; and must ensure that, before doing so, the individuals in question are made aware of the fact that Barings will hold information relating to them and may use it for any of the purposes set out in this Privacy Notice; and, where necessary, must have obtained the individuals’ consent to Barings’ use of the Personal Data. Barings may, where required under applicable laws, notify individuals whose Personal Data was received indirectly from a third party, and confirm that Barings holds their Personal Data and provide a copy of this Privacy Notice to them.
208
Barings Funds Trust 2020 Annual Report
GLOBAL PRIVACY NOTICE (CONTINUED)
7. Disclosures of Personal Data
In addition to the disclosures discussed in this Privacy Notice, Barings may also need to disclose your Personal Data:
| | ∎ | | To group companies or related body corporates of Barings (see barings.com for more information), to enable those entities to provide services to us and/or as part of shared systems which are in place; |
| | ∎ | | To organisations who provide services and support to us, including hosting, data processing, website development services, IT support and maintenance providers, call center and hotline providers and other outsourced services; and |
| | ∎ | | To enable us to comply with applicable laws and regulatory obligations and respond to requests from governmental and other regulatory authorities in any jurisdiction. |
Additionally, if you are dealing with Barings as a Client, Barings may disclose any Personal Data to other entities, except as outlined above or under section 3 of this Privacy Notice or as follows, and in each case to the extent permitted by Relevant Data Protection Laws:
| | ∎ | | To enable Barings to carry out the obligations under the contract with a registered shareholder or in anticipation of an applicant for shares or units becoming a registered shareholder or unitholder; |
| | ∎ | | To anyone providing a service to Barings or a Barings agent (which may include the Manager and companies within its group of companies, the administrator and its or their sub-contractors), as data processors, for the purposes of providing services to the Fund and on the understanding that they will keep the Personal Data confidential as required by Relevant Data Protection Laws; |
| | ∎ | | Where Personal Data needs to be shared with the depositary appointed to the Fund, in order to enable it to discharge its legal and regulatory obligations; |
| | ∎ | | Where the administrator to the Fund is subject to a separate legal obligation requiring it to act as controller of the Personal Data, including where it is required to use the Personal Data for the discharge of its own AML obligations including AML ID verification or reporting suspicious activity, or where an individual has otherwise consented to the Personal Data being shared with the administrator for specific purposes; |
| | ∎ | | Where the registered shareholder or unitholder or applicant for shares or units is a client of the Manager or a company within its group of companies, with such company for any other purposes agreed with an individual; |
| | ∎ | | Where the Manager or the Fund needs to share Personal Data with its and the Fund’s auditors, and legal and other advisors; |
| | ∎ | | In the event of a merger or proposed merger, any (or any proposed) transferee of, or successor in title to, the whole or any part of the Fund’s business, and their respective officers, employees, agents and advisers, to the extent necessary to give effect to such merger; or |
| | ∎ | | The disclosure is required by law or regulation, or court or administrative order having force of law, or is required to be made to any of the Manager’s or the Fund’s regulators, in each case in any jurisdiction. |
In any case, where Barings shares Personal Data with a non-affiliated data controller (including, as appropriate, the Fund’s service providers), the use by that non-affiliated party of the Personal Data will be subject to the non-affiliated party’s own privacy policies.
8. Security of Personal Data
Barings will maintain appropriate physical, technical and procedural safeguards designed to protect any Personal Data that you provide to us from accidental or unauthorized loss, misuse, damage, modification, access or disclosure in accordance with Relevant Data Protection Laws. Barings also restricts access to Personal Data about you to those employees who need to know that information to provide products and services to you. As an added measure, Barings does not include Personal Data or account information in non-secure e-mails that we send you via the Internet without your prior consent. We advise you not to send such information to us in non-secure e-mails.
209
Barings Funds Trust 2020 Annual Report
GLOBAL PRIVACY NOTICE (CONTINUED)
Service providers who process your Personal Data on behalf of Barings are also required to adhere to appropriate security standards designed to protect such information against unauthorized access, destruction or loss.
9. Updates to Personal Data
Barings will use reasonable efforts to keep Personal Data up to date. However, Barings must be notified, without delay, of any change in an individual’s personal circumstances by the individual or the person that provides such information on behalf of the individual.
10. Retention of Personal Data
Barings is obliged to retain certain information to ensure accuracy, help maintain quality of service and for legal, regulatory, fraud prevention and legitimate business purposes.
Barings is obliged by law to retain AML-related identification and transaction records for a number of years depending on the relevant rule or regulation under applicable laws from the end of the relevant investor relationship or the date of the transaction.
Other information will be retained for no longer than is necessary for the purpose for which it was obtained by Barings or as required or permitted for legal, regulatory, fraud prevention and legitimate business purposes. In general, Barings (or its service providers on its behalf) (as applicable) will hold this information for a period of seven (7) years, unless it is obliged to hold it for a different period under law or applicable regulations.
Barings may also retain records of telephone calls and any electronic communications for any length of time as required or permitted by any relevant regulatory entity or as required by relevant local laws including those relating to data privacy and security.
11. Individual’s Rights in relation to Personal Data
You may have the following rights under Relevant Data Protection Laws:
| | ∎ | | An individual may have the right to request access to, correct any inaccuracies in, and in certain circumstances, request erasure, or object to or restrict the use, of their Personal Data, and object to certain uses or other processing of their Personal Data (including automated processing), in each case subject to the conditions and/or restrictions set out in Relevant Data Protection Laws. |
| | ∎ | | In limited circumstances, an individual may also have the right to data portability in respect of certain of their Personal Data, which means they can request that Barings provide a copy of their disclosable Personal Data to them or their third party nominee. |
| | ∎ | | An individual may also have the right to lodge a complaint with the relevant Barings entity that is the data controller and/or with a relevant supervisory authority about the processing of the individual’s Personal Data by the relevant Barings entity, the Manager and/or the Fund. |
| | ∎ | | An individual may also have the right to withdraw consent in specific circumstances, such as for direct marketing, or where we have otherwise relied on the individual’s consent to process their Personal Data. |
To exercise any of these rights, please send confirmation of your request, by e-mail or post, to the address below, specifying which Barings products or funds your request relates to and providing any other relevant identifying information:
Barings Data Privacy Manager
20 Old Bailey
London, UK
DPM@Barings.com
Please see the relevant local addendum attached to this Privacy Notice for contact details in your country or jurisdiction.
210
Barings Funds Trust 2020 Annual Report
GLOBAL PRIVACY NOTICE (CONTINUED)
12. Complaints
If you would like to contact us in relation to how your Personal Data is handled, please contact Barings’ Data Privacy Manager at DPM@Barings.com and your complaint will be handled in accordance with our handling procedures. You may also have the right to make a complaint with the relevant local supervisory authority; however, we would request in the first instance you contact us.
Please see the relevant local addendum attached to this Privacy Notice for contact details in your country or jurisdiction.
13. Local Country, State or Specific Jurisdictional Addenda
| | iii. | European Economic Area and UK |
| | vi. | People’s Republic of China |
14. Document Management
This document is reviewed at least once annually, and updated as required. Where required by Relevant Data Protection Laws we will notify you in the event of material changes to this Privacy Notice and, where required, seek your consent to those changes.
This document was last updated April 17, 2020.
211
Barings Funds Trust 2020 Annual Report
GLOBAL PRIVACY NOTICE: ADDENDUM FOR AUSTRALIA
This addendum sets out additional obligations and rights of Barings Australia Pty Ltd, including any associated Managers and Funds, beyond the terms of the Privacy Notice.
COLLECTION OF PERSONAL DATA
In some circumstances, we may need to collect additional Personal Data from you, or collect Personal Data from you in a way which is not described in the Privacy Notice. Where this is the case, we will provide you with additional information which details the Personal Data we will collect from you and how we will use, hold and disclose that Personal Data.
DIRECT MARKETING
Your Personal Data may also be used to enable us to market services and products that we, our group companies or related body corporates or our partners offer and which we consider may be of interest to you. If you do not want us to contact you about these products and services, please contact us using the details set out below. You will also be given an opportunity to unsubscribe from any marketing communications which we send to you electronically (such as via e-mail).
HOW DO I ACCESS MY PERSONAL INFORMATION?
You may contact us using the details below if you wish to find out about the Personal Data we hold about you. We may need to verify your identity before giving you access and, depending on the complexity of your request, we may charge a reasonable fee for processing the request.
In certain circumstances, we may not be able to tell you what Personal Data is held about you. In these circumstances, we will notify you to explain why we cannot provide the information and attempt to find alternative means to enable you to access your information.
HOW DO I REQUEST CORRECTION OF MY INFORMATION?
If you believe that the Personal Data we hold about you is inaccurate, incomplete or out of date, you should contact us using the details below. We will promptly update any Personal Data that we consider is inaccurate, incomplete or out of date. If we do not agree that your information is inaccurate, incomplete or out of date, we will notify you and provide you with the reasons.
COMPLAINTS
If you believe that your privacy has been breached, please contact us using the details below and provide details of the incident so that we can investigate and respond to you about your concerns.
We will review all communications and complaints submitted to us in this manner and will aim to respond to you in writing within a reasonable time. If your complaint is not satisfactorily resolved, you may access an external dispute resolution service or apply to the Office of the Australian Information Commissioner (“OAIC”) to have the complaint heard and determined. When we notify you about our decision, we will explain how you may access an external dispute resolution scheme or make a complaint to the OAIC.
CONTACT US
To contact us in relation to the Privacy Notice, please use the following methods:
E-mail: DPM@Barings.com
Barings Data Privacy Manager
Barings Australia Pty Ltd,
Suite 4501, Level 45,
Australia Square,
264 George Street,
Sydney, NSW 2000, Australia
212
Barings Funds Trust 2020 Annual Report
GLOBAL PRIVACY NOTICE: ADDENDUM FOR CALIFORNIA
Under the California Consumer Privacy Act (“CCPA”), we are required to provide California residents with specific information about our personal information practices. The CCPA defines the term “personal information” broadly, and includes any information that identifies, relates to, describes, is reasonably capable of being associated with, or could reasonably be linked, directly or indirectly, with a particular California resident or household. Please note that the CCPA does not apply to certain types of information, and your data may be covered by additional privacy notices based on your relationship with us.
Categories of Personal Information that We Collect, Disclose, and Sell
We do not sell any of your personal information for monetary compensation.
We currently do not share your information with non-affiliated third parties for their own marketing purpose. We collect and disclose certain personal information in the course of our business as described in the Privacy Notice, including to process your transactions, for customer service purposes, for marketing, for general administration (e.g., managing inventory) evaluating use of our services, research and development, and for legal compliance.
Please refer to section 3 of the Privacy Notice for a description of how we collect and disclose personal information and the personal information that we collect.
In addition to collecting business related information (including information such as names, business contact information and for investors, employees and certain business contacts, dates of birth, government identifiers and/or financial information) we also collect the following:
| | ∎ | | Usage Data: As described above, we collect certain technical information about a user’s use of our Websites, which may include: IP address, cookies, browser type and version, time zone settings, browser plugin types, operating systems and platform, device information (including, for mobile devices, the IMEI number, wireless networks and general network information). We do not typically associate this information with a particular user’s account and we do not seek to reidentify the user through this information. |
| | ∎ | | Audio & Video Information: If you call us, we may record your conversation for quality assurance, training, legal compliance, and customer service purposes. Certain of our premises are monitored by closed circuit television. Absent an incident, we do not usually obtain a copy of such footage, but, rather, it would be the property of the building manager. |
We disclose each of the above categories of information, for a business purpose as defined by the CCPA. For example, we may share your contact information with entities that assist us in account management, background check organizations, and, where permitted by law, with entities to assist us in marketing. We also share your information with entities that assist us in providing support and services, such as hosting our websites, applications, and other online services, to respond to inquiries and for trouble-shooting. We also share your information to assist us in analyzing and improving our services and operations; for fraud prevention; personalizing content and experiences; securing and protecting our business; defending our legal rights and the rights of others; auditing, reporting, corporate governance, and internal operations; and complying with legal obligations.
California Resident Rights
California law grants California residents certain rights and imposes restrictions on particular business practices. We are required to provide you with a notice about our information collection practices at or before the point of collection; to this end, there may be circumstances in which we provide an additional notice to you. California residents have the right to opt-out of our sale of their personal information. Subject to certain exceptions, California residents have the right to (at no charge) request that we (1) delete the personal information that we hold about them, subject to certain exceptions and (2) send a copy of the specific pieces of personal information that we have collected about them in the prior 12 months and to have this delivered, free of charge, either (a) by mail or (b) electronically in a portable and, to the extent technically
213
Barings Funds Trust 2020 Annual Report
GLOBAL PRIVACY NOTICE: ADDENDUM FOR CALIFORNIA (CONTINUED)
feasible, readily useable and transferrable format. California residents also have the right to request that we provide them certain information about how we have handled their personal information in the prior 12 months, including the:
| | ∎ | | categories of personal information collected; |
| | ∎ | | categories of sources of personal information; |
| | ∎ | | business and/or commercial purposes for collecting and selling their personal information; |
| | ∎ | | categories of third parties/with whom we have disclosed or shared their personal information; |
| | ∎ | | categories of personal information that we have disclosed or shared with a third party for a business purpose; and |
| | ∎ | | categories of third parties to whom the residents’ personal information has been sold and the specific categories of personal information sold to each category of third party. |
California residents may make Requests to Know up to twice every 12 months. The CCPA prohibits discrimination against California residents for exercising their rights under the CCPA. Discrimination may exist where a business denies or provides a different level or quality of goods or services, or charges (or suggests that it will charge) different prices, rates, or penalties on residents who exercise their CCPA rights, unless doing so is reasonably related to the value provided to the business by the residents’ data.
California residents have the right to be notified of any financial incentive offers and their material terms, the right to opt-out of such incentives at any time, and may not be included in such incentives without their prior informed opt-in consent. We currently do not offer any incentives.
CONTACT US
To contact us in relation to the Privacy Notice, including Requests to Opt-Out of Sale of Personal Information (if applicable), Requests to Know, and Requests to Delete, please use the following methods:
Electronically: Submitting a CCPA Webform found at barings.com
By Phone: 1-877-766-0014 (toll free),
E-mail: DPM@Barings.com
Barings Data Privacy Manager
20 Old Bailey
London, UK
We will respond to verifiable requests received from California consumers as required by law.
To opt-out of sharing with targeted advertisers, please visit optout.aboutads.info and optout.networkadvertising.org.
California Shine the Light
We currently do not share your information with non-affiliated third parties for their own marketing purpose.
For more information about our privacy practices, you may contact us at dpm@barings.com.
214
Barings Funds Trust 2020 Annual Report
GLOBAL PRIVACY NOTICE: ADDENDUM FOR EUROPEAN ECONOMIC AREA (EEA) AND UNITED KINGDOM
This addendum sets out additional obligations and rights of Baring Asset Management Limited (“BAML”), including any associated Managers and Funds, beyond the terms of the Privacy Notice.
RELEVANT DATA PROTECTION LAWS
To avoid doubt, “Relevant Data Protection Laws” shall mean any applicable data protection laws relating to the protection of individuals with regards to the processing of personal data including the General Data Protection Regulation (EU) 2016/679 (“GDPR”) (together with any laws implemented by EU member states (including any replacement legislation applicable in the United Kingdom, whether or not as a result of any full or partial departure of the United Kingdom from the European Union), which contain derogations from, or exemptions or authorisations for the purposes of, the GDPR, or which are otherwise intended to supplement the GDPR); the UK Data Protection Act 2018; the ePrivacy Directive 2002/58/EC as implemented by EU member states; any corresponding or equivalent national laws or regulations relating to the collection, use, disclosure and processing of personal data including any amendment, update, modification to or reenactment of such laws and guides and codes of practice issued from time to time by any supervisory authorities, in each case as amended, updated or replaced from time to time.
LAWFUL BASIS FOR PROCESSING
Under Relevant Data Protection Laws we must have a lawful basis for processing your Personal Data. When we do so, we rely on one of the following:
| | - | To perform a contract we have with you; |
| | - | To comply with a legal obligation; |
| | - | Where we have a legitimate interest as a business; or |
| | - | If you have given us your consent. |
We have set out the lawful bases we rely on at section 3 of the Privacy Notice. Unless otherwise set out in section 3, the processing of your Personal Data will be in furtherance of BAML’s legitimate interests to provide and improve our services to you, in order to preserve our business operations, and ensuring that you are provided with information which is relevant to you.
PROVIDING YOUR INFORMATION TO US
If you do not provide us with certain information (for example, if you do not provide us with information that is indicated as mandatory), BAML may not be able to manage or administer our client relationship with you and provide you with products and services. If you are a Website User, and if you block or refuse to accept cookies, or delete cookies after visiting our Website, you may not be able to access or use some of the functionalities of our Website.
INTERNATIONAL TRANSFERS
Subject to Relevant Data Protection Laws, transfers to other countries or jurisdictions outside of the UK or EEA may be permitted where such transfer is made to jurisdictions or countries providing “adequate protection” for Personal Data (which may include US companies that have voluntarily signed up to the EU-U.S. or Swiss-U.S. Privacy Shield).
However, some transfers may be to countries or jurisdictions that do not have adequate protection and, in that case, BAML, the Manager and the Fund (as applicable) shall use reasonable efforts to implement contractual safeguards for the cross-border transfer of Personal Data, as required based on the legitimate transfer mechanism used (such as putting in place European Commission-approved “Standard Contractual Clauses”).
Where you are in the UK or the EEA, further information in relation to specific international transfers can be obtained by contacting BAML’s Data Privacy Manager at DPM@Barings.com.
215
Barings Funds Trust 2020 Annual Report
GLOBAL PRIVACY NOTICE: ADDENDUM FOR EUROPEAN ECONOMIC AREA (EEA) AND UNITED KINGDOM (CONTINUED)
COMPLAINTS
If you believe that your privacy has been breached, please contact us using the details below and provide details of the incident so that we can investigate and respond to you about your concerns.
We will review all communications and complaints submitted to us in this manner and will aim to respond to you in writing within a reasonable time. Notwithstanding the above, you have the right to make a complaint at any time to the Information Commissioner’s Office (ICO), the UK supervisory authority, or to any other supervisory authority applicable to you.
CONTACT US
To contact us in relation to the Privacy Notice, please use the following methods:
E-mail: DPM@Barings.com
Barings Data Privacy Manager
Baring Asset Management Limited
20 Old Bailey
London, UK
216
Barings Funds Trust 2020 Annual Report
GLOBAL PRIVACY NOTICE: ADDENDUM FOR HONG KONG S.A.R.
This addendum sets out additional obligations and rights of Barings Asset Management (Asia) Limited and Baring Asset Management (Asia) Holdings Limited, including any associated Managers and Funds (“we”, “Barings Hong Kong”), beyond the terms of the Privacy Notice.
PROVIDING YOUR INFORMATION TO US
If you do not provide us with certain information (for example, if you do not provide us with information that is indicated as mandatory), Barings Hong Kong may not be able to manage or administer our client relationship with you and provide you with products and services. If you are a Website User, and if you block or refuse to accept cookies, or delete cookies after visiting our Website, you may not be able to access or use some of the functionalities of our Website.
CONTACT DETAILS
To contact us in relation to the Privacy Notice, please use the following methods:
E-mail: DPM@Barings.com
Barings Data Privacy Manager
Baring Asset Management (Asia) Limited & Baring Asset Management (Asia) Holdings Limited
35/F Gloucester Tower
15 Queens Road
Central, Hong Kong
217
Barings Funds Trust 2020 Annual Report
GLOBAL PRIVACY NOTICE: ADDENDUM FOR JAPAN
This addendum sets out additional obligations and rights of Barings Japan Ltd. including any associated Managers and Funds (“we”, “Barings Japan”), beyond the terms of the Privacy Notice.
TRANSFERS
Your primary data controller Barings Japan will jointly use your Personal Data specified in the Privacy Notice for the purposes specified therein with other group companies of Barings. Barings Japan will be responsible for the management of your Personal Data jointly used by other group companies of Barings.
CONTACT DETAILS
To contact us in relation to the Privacy Notice, please use the following methods:
E-mail: DPM@Barings.com
Barings Data Privacy Manager
Baring Japan Ltd.
7F Kyobashi Edogrand
2-2-1 Kyobashi
Chuo-ku
Tokyo 104-0031, Japan
218
Barings Funds Trust 2020 Annual Report
GLOBAL PRIVACY NOTICE: ADDENDUM FOR THE PEOPLE’S REPUBLIC OF CHINA (“PRC”) (EXCLUDING FOR THE PURPOSES OF THE PRIVACY NOTICE HONG KONG S.A.R., MACAU S.A.R. AND TAIWAN)
This addendum sets out additional obligations and rights of Barings Investment Management (Shanghai) Limited and Barings Overseas Investment Fund Management (Shanghai) Limited, including any associated Managers and Funds (“we”, “Barings PRC”), beyond the terms of the Privacy Notice.
PROVIDING YOUR INFORMATION TO US
If you do not provide Barings PRC with certain Personal Data (for example, if you do not provide us with information that is indicated as mandatory); or give us your (express or deemed) consent to the collection, use and/or disclosure of your Personal Data; or if you subsequently withdraw your consent, Barings PRC may not be able to manage or administer our client relationship with you; provide certain products and services to you; or if you are a Website User, you may not be able to access or use some of the functionalities of our Website.
SENSITIVE PERSONAL DATA
Certain types of Personal Data are considered “sensitive” and, depending on your country of work or residence and applicable laws, additional rules will apply in respect of this Personal Data. “Sensitive Personal Data” as defined under PRC laws and regulations may include (but without limitation) information relating to:
| | ∎ | | genetic or biometric information; |
| | ∎ | | tax identification number; |
| | ∎ | | national identity card number; |
| | ∎ | | sexual orientation; and |
| | ∎ | | racial or ethnic origin. |
References to “Special Categories of Personal Data” in the Privacy Notice shall for the purpose of this addendum be deemed to be references to Sensitive Personal Data.
RETENTION OF PERSONAL DATA
Your Personal Data will be kept confidential and will be retained for the retention periods set out in our Record Keeping Policy.
CONTACT DETAILS
To contact us in relation to the Privacy Notice, please use the following methods:
E-mail: DPM@Barings.com
Barings Data Privacy Manager
Barings Investment Management (Shanghai) Limited & Barings Overseas Investment Fund Management (Shanghai) Limited
Unit 3616, Level 36
International Finance Center Tower 2
8 Century Avenue
Pudong District
Shanghai, China
219
Barings Funds Trust 2020 Annual Report
GLOBAL PRIVACY NOTICE: ADDENDUM FOR SOUTH KOREA
This addendum sets out additional obligations and rights of Baring Asset Management (Korea) Limited, including any associated Managers and Funds (“we”, “Barings Korea”), beyond the terms of the Privacy Notice.
COLLECTION OF PERSONAL DATA
We obtain your consent when collecting and using your Personal Data unless such collection and usage is based on Personal Information Protection Act (“PIPA”), the Act on Promotion of Information Communication Network Usage and Information Protection (“Network Act”), Protection of Credit Information Act (“Credit Information Act”), or other laws or regulations of Korea.
SENSITIVE PERSONAL DATA
Under the PIPA, information on the ideology, creed, membership of a labor union or political party, political views, health, sexual preferences, bio-data, and criminal records as defined under the Act on the Lapse of Criminal Sentences is considered “Sensitive Personal Data”.
When collecting Sensitive Personal Data from you, we comply with all the procedures and methods stipulated by the PIPA, including obtaining your separate consent for the processing of Sensitive Personal Data.
OUTSOURCING OF THE PROCESSING OF PERSONAL DATA
Please see below the list of third-party processors (“Processors”) together with the specific processing tasks to be outsourced. The Personal Data transferred to the Processors will be retained only to the extent necessary for the purposes of the services provided and to meet any regulatory requirements in accordance with any applicable laws.
We comply with all the relevant laws and regulations when outsourcing the processing of Personal Data. For example, we do not outsource the processing of Particular Identification Data as defined under the PIPA (i.e., resident registration numbers (“RRNs”), driver’s license numbers, passport numbers, and alien registration numbers) to Processors located outside of Korea.
| | |
| NAME OF THE THIRD-PARTY PROCESSOR | | OUTSOURCED TASK/SERVICE |
| |
| NAVEX Global, Inc. | | Operation of Barings’ ethics and whistleblower hotline |
PROVISION OF PERSONAL DATA TO THIRD PARTIES
Subject to your separate consent, the following Personal Data may also be disclosed to third parties, i.e., independent data controllers as set out below.
We comply with all the relevant laws and regulations when providing Personal Data to a third party. For example, we do not provide Particular Identification Data as defined under the PIPA to recipients located outside of Korea.
| | | | | | |
| RECIPIENT | | RECIPIENT’S PURPOSE
OF USE | | TRANSFERRED ITEMS | | RECIPIENT’S PERIOD OF RETENTION AND USE |
| | | |
| Barings LLC | | Regulatory, risk and compliance oversight | | Anonymized data to perform regulatory, risk and compliance oversight | | 7 years from the date of collection |
| | | |
| Baring Asset Management Limited | | Regulatory, risk and compliance oversight | | Anonymized data to perform regulatory, risk and compliance oversight | | 7 years from the date of collection |
��
220
Barings Funds Trust 2020 Annual Report
GLOBAL PRIVACY NOTICE: ADDENDUM FOR SOUTH KOREA (CONTINUED)
DATA PROTECTION OFFICER
The data protection officer is Ho Chul Jung ( ) and is available at +82 2 3788 0529 or via e-mail at
Hochul.jung@barings.com.
DESTRUCTION OF PERSONAL DATA
Your Personal Data will be processed and stored for as long as required for the purposes for which they were collected, and in accordance with the storage periods provided for by the applicable laws. After such period, your Personal Data will be automatically and permanently erased or made anonymous.
MEASURES TO ENSURE SECURITY OF PERSONAL DATA
We take the following technical, managerial and physical measures necessary to ensure the security of your Personal Data.
Managerial measures: Designation of a data protection officer, establishment and implementation of an internal management plan, regular training of employees on personal data protection, etc.
Technical measures: Management of the right to access the Personal Data Processing system, installation of an access control system, encryption of Particular Identification Data(as defined under the PIPA), installation of security programs, etc.
Physical measures: Restriction on access to Personal Data storage mediums such as the computer room and data storage room, etc.
INSTALLATION, OPERATION, AND DENIAL OF A DEVICE THAT AUTOMATICALLY COLLECTS PERSONAL INFORMATION
We use cookies which constantly save and retrieve information of our Website Users. A cookie is a small text file of information about the basic setting of a website, sent by the website’s web server to the web browser of a user, and is stored in the hard disk of the user’s computer.
We use cookies for the following purposes: to engage in target marketing and provide customized services by analyzing the frequency and times of visits of members and non-members, identifying their preferences and interests and tracking the number of visits made.
You have the right to choose whether or not to install cookies. Therefore, you may adjust the options of your web browser to accept or refuse all cookies, or to receive notice each time cookies are installed.
221
Barings Funds Trust 2020 Annual Report
GLOBAL PRIVACY NOTICE: ADDENDUM FOR SWITZERLAND
This addendum sets out additional obligations and rights of Baring Asset Management Switzerland Sàrl, including any associated Managers and Funds (“we”, “Barings Switzerland”), beyond the terms of the Privacy Notice.
DEFINITION OF PERSONAL DATA
The definition of “Personal Data” also includes all information relating to an identified or identifiable legal entity pursuant to Article 3 (a) of the Swiss Federal Act on Data Protection (“FADP”).
INTERNATIONAL TRANSFERS
Subject to Relevant Data Protection Laws, transfers to other countries or jurisdictions may be permitted if the country or jurisdiction in question is in the European Economic Area (EEA), or on the Federal Data Protection and Information Commissioner’s (“FDPIC”) list of countries providing ‘adequate protection’ for Personal Data (which may include US companies that have voluntarily signed up to the Swiss-U.S. Privacy Shield).
However, some transfers may be to countries or jurisdictions that do not have adequate protection and, in that case, Barings Switzerland, Barings, the Manager and the Fund (as applicable) shall use reasonable efforts to implement contractual safeguards for the cross-border transfer of Personal Data, as required based on the legitimate transfer mechanism used.
When you are in Switzerland, further information in relation to specific international transfers can be obtained by contacting Barings’ Data Privacy Manager at DPM@Barings.com.
INDIVIDUAL’S RIGHTS IN RELATION TO PERSONAL DATA
Under the FADP, an individual is not granted the right to data portability in respect of his or her Personal Data.
COMPLAINTS
If you believe that your privacy has been breached, please contact us using the details below and provide details of the incident so that we can investigate and respond to you about your concerns.
We will review all communications and complaints submitted to us in this manner and will aim to respond to you in writing within a reasonable time. If your complaint is not satisfactorily resolved, you may submit a complaint to the FDPIC.
CONTACT US
To contact us in relation to the Privacy Notice, please use the following methods:
E-mail: DPM@Barings.com
Barings Data Privacy Manager
20 Old Bailey
London, UK
Phone - +442077628961
222
Barings Funds Trust 2020 Annual Report
GLOBAL PRIVACY NOTICE: ADDENDUM FOR TAIWAN
This addendum sets out additional obligations and rights of Barings SICE (Taiwan) Limited, including any associated Managers and Funds (“We”, “Barings Taiwan”), beyond the terms of the Privacy Notice. The term “process” or “processing” as used in the Privacy Notice should be taken to mean “collect”, “use” and “process” as defined in the Taiwan Personal Information Protection Law.
PROVIDING YOUR INFORMATION TO US
If you choose not to provide us with certain of your Personal Data (for example, if you do not provide us with information that is indicated as mandatory), we may not be able to manager or administer our client relationship with you; provide you with products and services; or, if you are a Website User, you may not be able to access or use some of the functionalities of our Website.
SENSITIVE PERSONAL DATA
Sensitive Personal Data and Special Categories of Personal Data shall, for purposes of Barings Taiwan’s obligation to you, include medical records, medical treatment, genetic information, sexual life (including sexual orientation) and health examination and criminal records.
YOUR RIGHTS TO YOUR PERSONAL DATA
You have rights, using the contact details below:
| | ∎ | | to make inquiries or request to review your Personal Data; |
| | ∎ | | to make copies of your Personal Data; |
| | ∎ | | to supplement or correct your Personal Data; |
| | ∎ | | to discontinue collection, processing or use of Personal Data; |
| | ∎ | | to delete your Personal Data; or |
| | ∎ | | to communicate to us your objection to the use of your Personal Data for marketing purposes. |
CONTACT DETAILS
To contact us in relation to the Privacy Notice, please use the following methods:
E-mail: DPM@Barings.com
Barings Data Privacy Manager
Baring SICE (Taiwan) Limited
21F 333 Keelung Rd.
Sec.1 Taipei 11012
Taiwan
223
Barings Funds Trust 2020 Annual Report
GLOBAL PRIVACY NOTICE: ADDENDUM FOR THE UNITED STATES OF AMERICA (THE “USA”)
This addendum sets out additional obligations and rights of Barings LLC and Barings Securities LLC including any associated Managers and Funds (“We/Barings US”) beyond the terms of the Privacy Notice.
PROVISION OF PERSONAL DATA TO OTHER ENTITIES
If you are dealing with Barings US as a Client, we may share the financial information we collect from you with our financial services affiliates, such as insurance companies, investment companies and securities broker-dealers. Additionally, so that we may continue to offer you products and services that best meet your investment needs, we may disclose Personal Data we collect, as described above, to companies that perform administrative or marketing services on our behalf, such as transfer agents, custodian banks, service providers or printers and mailers that assist us in the distribution of investor materials or that provide operational support to Barings US. These companies are required to protect this information and will use this information only for the services for which we hire them, and are not permitted to use or share this information for any other purpose. Some of these companies may perform such services in jurisdictions other than the United States. We also disclose your financial information for our everyday business purposes, such as to process and effect transactions that you request or authorize and to maintain your account(s) and as otherwise permitted by applicable law. We may share some or all of the information we collect with other financial institutions with whom we jointly market products. This may be done only if it is permitted by the state in which you live. Some disclosures may be limited to your name, contact and transaction information with us or our affiliates.
Any disclosures will be only to the extent permitted by federal and state law. Certain disclosures may require us to get an “opt-in” or “opt-out” from you. If this is required, we will do so before information is shared. Otherwise, we do not share any personal information about our customers or former customers unless authorized by the customer or as permitted by law. When you are no longer our customer, we will continue to share your information as described in this notice.
REGULATORY
The Privacy Notice describes the privacy policies of Barings. It applies to all Barings and the Funds accounts you presently have, or may open in the future, using your social security number or federal taxpayer identification number— whether or not you remain a shareholder of our Funds or as an advisory client of Barings. As mandated by rules issued by the Securities and Exchange Commission, we will be sending you this notice annually, as long as you own shares in the Funds or have an account with Barings.
Barings Securities LLC is a member of the Financial Industry Regulatory Authority (FINRA) and the Securities Investor Protection Corporation (SIPC). Investors may obtain information about SIPC including the SIPC brochure by contacting SIPC online at www.sipc.org or calling (202)-371-8300. Investors may obtain information about FINRA including the FINRA Investor Brochure by contacting FINRA online at www.finra.org or by calling (800)-289-9999.
CONTACT US
To contact us in relation to the Privacy Notice, please use the following methods:
E-mail: DPM@barings.com
Barings Data Privacy Manager
20 Old Bailey
London, UK
224
BARINGS FUNDS TRUST
ANNUAL REPORT
June 30, 2020

Item 2. Code of Ethics.
The Registrant adopted a Code of Ethics for Principal Executive and Senior Financial Officers (the “Code”) on July 29, 2013, which is available on the Registrant’s website at www.barings.com/us/guest/funds/barings-mutual-fund-documents and click Fund Code of Ethics. During the period covered by this Form N-CSR, there were no amendments to, or waivers from, the Code.
Item 3. Audit Committee Financial Expert.
The Registrant’s Board of Trustees has determined that Dr. Bernard A. Harris, Jr., Mr. Thomas W. Okel, and Mr. Martin A. Sumichrast, constituting all the members of the Registrant’s Audit Committee, are audit committee financial experts. Dr. Harris, Mr. Okel and Mr. Sumichrast are “independent” for purposes of this Item 3 as required by applicable regulation.
Item 4. Principal Accountant Fees and Services.
The Registrant has engaged its principal accountant, Deloitte & Touche LLP (“Deloitte”), to perform audit services, audit-related services, tax services and other services. The following tables detail the aggregate fees billed or expected to be billed for each of the last two fiscal years by Deloitte.
Fees Billed to the Registrant:
| | | | | | | | |
| | | Year Ended
June 30,
2020 | | | Year Ended
June 30,
2019 | |
Audit Fees | | $ | 338,205 | | | $ | 349,850 | |
Audit-Related Fees | | $ | 0 | | | $ | 0 | |
Tax Fees | | $ | 98,393 | | | $ | 113,000 | |
All Other Fees | | $ | 0 | | | $ | 0 | |
| | | | | | | | |
Total Fees | | $ | 436,598 | | | $ | 462,850 | |
Non-Audit Fees Billed to Barings and MassMutual:
| | | | | | | | |
| | | Year Ended
June 30,
2020 | | | Year Ended
June 30,
2019 | |
Audit Fees | | $ | 4,802,040 | | | $ | 4,319,401 | |
Audit-Related Fees | | $ | 0 | | | $ | 0 | |
Tax Fees | | $ | 4,339,419 | | | $ | 4,430,023 | |
All Other Fees | | $ | 5,482,271 | | | $ | 4,652,066 | |
| | | | | | | | |
Total Fees | | $ | 14,623,730 | | | $ | 13,401,490 | |
The category “Audit Fees” refers to performing an audit of the Registrant’s, Barings LLC’s (“Barings”) or Massachusetts Mutual Life Insurance Company’s (“MassMutual”) annual financial statements or services that are normally provided by the principal accountant in connection with statutory and regulatory filings or engagements. The category “Audit-Related Fees” reflects fees billed by Deloitte for various non-audit and non-tax services rendered to the Registrant, Barings, and MassMutual. Preparation of Federal, state and local income tax and tax compliance work are representative of the fees reported in the “Tax Fees” category. The category “All Other Fees” represents fees billed by Deloitte for consulting rendered to the Registrant, Barings, and MassMutual.
The Sarbanes-Oxley Act of 2002 and its implementing regulations allow the Registrant’s Audit Committee to establish a pre-approval policy for certain services rendered by the Registrant’s principal accountant, Deloitte. During the fiscal year ended June 30, 2020, the Registrant’s Audit Committee approved all of the services rendered to the Registrant by Deloitte and did not rely on such a pre-approval policy for any such services.
The Audit Committee has also reviewed the aggregate fees billed for professional services rendered by Deloitte for the years ended June 30, 2019 and June 30, 2020 for the Registrant and for the non-audit services provided to Barings, and Barings’ parent, MassMutual. As part of this review, the Audit Committee considered whether the provision of such non-audit services was compatible with maintaining the principal accountant’s independence.
Item 5. Audit Committee of Listed Registrants.
Not applicable.
Item 6. Investments.
| (a) | The Registrant’s Consolidated Schedule of Investments as of the close of the reporting period is included in the Report to Shareholders filed under Item 1 of this form. |
Item 7. Disclosure of Proxy Voting Policies and Procedures for Closed-End Management Investment Companies.
Not applicable.
Item 8. Portfolio Managers of Closed-End Investment Management Companies.
Not applicable.
Item 9. Purchases of Equity Securities by Closed-End Management Investment Company and Affiliated Purchasers.
Not applicable.
Item 10. Submission of Matters to a Vote of Security Holders.
There have been no material changes to procedures by which the shareholders may recommend nominees to the Registrant’s Board of Trustees.
Item 11. Controls and Procedures.
| (a) | The Registrant’s principal executive officer and principal financial officer, or persons performing similar functions, have concluded that the Registrant’s disclosure controls and procedures as defined in Rule 30a-3(c) under the Investment Company Act of 1940, as amended (the “1940 Act”), are effective as of a date within 90 days of the filing date of this report based on the evaluation of these controls and procedures required by Rule 30a-3(b) under the 1940 Act and Rules 13a-15(b) or 15d-15(b) under the Securities Exchange Act of 1934, as amended. |
| (b) | There were no changes in the Registrant’s internal control over financial reporting (as defined in Rule 30a-3(d) under the 1940 Act) that occurred during the period covered by this report that have materially affected or are reasonably likely to materially affect, the Registrant’s internal control over financial reporting. |
Item 12. Disclosure of Securities Lending Activities for Closed-End Management Investment Companies.
Item 13. Exhibits.
| (a)(1) | The Registrant has posted its Code of Ethics on its website at www.barings.com/us/guest/funds/barings-mutual-fund-documents and click Fund Code of Ethics. |
| (a)(2) | Certifications pursuant to Rule 30a-2(a) under the 1940 Act are attached hereto. |
Exhibit 99.1 Cert
Exhibit 99.2 Cert
SIGNATURES
Pursuant to the requirements of the Securities Exchange Act of 1934 and the Investment Company Act of 1940, the Registrant has duly caused this report to be signed on its behalf by the undersigned, thereunto duly authorized.
| | |
| (Registrant) | | Barings Funds Trust |
| |
| By (Signature and Title) | | /s/ Daniel McGee |
| | Daniel McGee, President (Principal Executive Officer) |
Pursuant to the requirements of the Securities Exchange Act of 1934 and the Investment Company Act of 1940, this report has been signed below by the following persons on behalf of the Registrant and in the capacities and on the dates indicated.
| | |
| By (Signature and Title) | | /s/ Daniel McGee |
| | Daniel McGee, President (Principal Executive Officer) |
| | |
| By (Signature and Title) | | /s/ Carlene Pollock |
| | Carlene Pollock, Chief Financial Officer (Principal Financial Officer) |