UNITED STATES
SECURITIES AND EXCHANGE COMMISSION
Washington, D.C. 20549
FORM N-CSR
CERTIFIED SHAREHOLDER REPORT OF REGISTERED MANAGEMENT INVESTMENT COMPANIES
Investment Company Act file number 811-22865
Forethought Variable Insurance Trust
(Exact name of registrant as specified in charter)
10 West Market Street, Suite 2300
Indianapolis, Indiana 46204
(Address of principal executive offices) (Zip code)
The Corporation Trust Company
1209 Orange Street Wilmington, DE 19801
(Name and address of agent for service)
Registrant's telephone number, including area code: 877-355-1820
Date of fiscal year end: December 31
Date of reporting period: December 31, 2021
Form N-CSR is to be used by management investment companies to file reports with the Commission not later than 10 days after the transmission to stockholders of any report that is required to be transmitted to stockholders under Rule 30e-1 under the Investment Company Act of 1940 (17 CFR 270.30e-1). The Commission may use the information provided on Form N-CSR in its regulatory, disclosure review, inspection, and policymaking roles.
A registrant is required to disclose the information specified by Form N-CSR, and the Commission will make this information public. A registrant is not required to respond to the collection of information contained in Form N-CSR unless the Form displays a currently valid Office of Management and Budget (“OMB”) control number. Please direct comments concerning the accuracy of the information collection burden estimate and any suggestions for reducing the burden to Secretary, Securities and Exchange Commission, 450 Fifth Street, NW, Washington, DC 20549-0609. The OMB has reviewed this collection of information under the clearance requirements of 44 U.S.C. § 3507.
Item 1. Reports to Stockholders.
| (a) | Include a copy of the report transmitted to stockholders pursuant to Rule 30e-1 under the Act (17 CFR 270.30e-1). |

Annual Report
December 31, 2021
Global Atlantic Portfolios
Global Atlantic American Funds® Managed Risk Portfolio
Global Atlantic Balanced Managed Risk Portfolio
Global Atlantic BlackRock Selects Managed Risk Portfolio
Global Atlantic Franklin Dividend and Income Managed Risk Portfolio
Global Atlantic Growth Managed Risk Portfolio
Global Atlantic Moderate Growth Managed Risk Portfolio
Global Atlantic Select Advisor Managed Risk Portfolio
Global Atlantic Wellington Research Managed Risk Portfolio
Class II shares
Each a separate series of the Forethought Variable Insurance Trust
Distributed by Global Atlantic Distributors, LLC
Member FINRA
Dear Shareholders/Contract Owners:
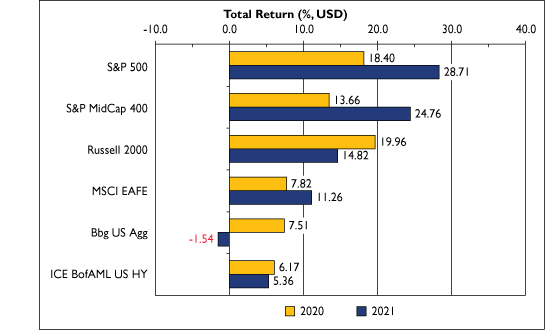
We think it goes without saying that the past two years have been truly historic. While the COVID-19 pandemic (the "Pandemic") has deservedly been front and center, and is a topic we will touch on shortly, buried beneath all the hardships and loss have been two strong years of U.S. equity returns. The S&P 500 and S&P MidCap 400 led major global equity indices, rising 28.71% and 24.76% respectively in 2021, which were meaningful improvements over 2020's strong returns that were recorded despite a historic selloff in March of that year. The Russell 2000 also performed well in 2021, up 14.82%, yet somewhat below its leading return of 19.96% in 2020. International developed large capitalization stocks, as represented by the MSCI EAFE, rose 11.26%, and while that was an improvement over its return of 7.82% in 2020, it meaningfully lagged U.S. equities. Similarly lagging were investment grade fixed income markets. Domestically, U.S. Treasury yields rose sharply while corporate spreads remained flat, resulting in a -1. 54% return on the Bbg US Agg. Domestic high yield fixed income (as represented by the ICE BofAML US HY index), fared better given the strength in equity markets and meaningful spread tightening returning 5.36%. Given these differing returns, a portfolio's exposure to equity versus fixed income, domestic versus international equity, and/or investment grade versus high yield fixed income were key determinants of performance over the past two years.
While the financial markets did not experience the historic decline and recovery of 2020 during 2021, it was a volatile year nonetheless given the continued impact of the Pandemic. Despite the development and availability of vaccines, vaccination rates remain low in many parts of the world. Together with the emergence of new variants, COVID-19 continues to negatively impact many areas of the economy, causing inconsistent and regionally disparate economic data, as well as overall financial market volatility. Since the historic bear market and recovery of 2020, financial markets have experienced spikes in volatility about every 4-6 weeks over the past 18 months, typically lasting several days before subsiding. As a result, while the performance figures shown in the graph illustrate generally strong annual returns, the intra-period path to get to these numbers was somewhat turbulent. As a result, for asset allocation funds, not only was the degree of exposure to certain asset classes an important driver of performance, but also important was the timing of those exposures.
As the U.S. economy continues to struggle with the impact of the Pandemic, we expect economic data to be directionally positive but potentially inconsistent given the emergence of new COVID-19 variants and differing vaccination rates throughout the country. Furthermore, heightened concern regarding inflation has led the U.S. Federal Reserve (the Fed) to state it will likely quicken the reduction (tapering) of its balance sheet (bond holdings) and increase rates in 2022. Globally, we believe the outlook is similar given the rapid spread of the Omicron variant and differing approaches by country with respect to how to best contain the virus. Consequently, there are concerns that economic growth globally could slow until these issues improve.
Given the hardships endured over the past two years, we hope this shareholder letter finds you healthy and wish you all the best for 2022 and beyond.
Thank you for investing in the Global Atlantic Portfolios.
Sincerely, | |||||||
|
| ||||||
Eric D. Todd, CFA | Cameron Jeffreys, CFA | ||||||
President | Senior Vice President | ||||||
Global Atlantic Investment Advisors, LLC | Global Atlantic Investment Advisors, LLC | ||||||


1
Portfolio | Benchmark | ||||||
Global Atlantic American Funds® Managed Risk Portfolio | S&P Global Managed Risk LargeMidCap Index – Moderate Conservative | ||||||
Global Atlantic Balanced Managed Risk Portfolio | S&P Global Managed Risk LargeMidCap Index – Conservative | ||||||
Global Atlantic BlackRock Selects Managed Risk Portfolio | S&P Global Managed Risk LargeMidCap Index – Moderate Conservative | ||||||
| Global Atlantic Franklin Dividend and Income Managed Risk Portfolio | S&P 500 Managed Risk Index – Moderate | ||||||
Global Atlantic Growth Managed Risk Portfolio | S&P Global Managed Risk LargeMidCap Index – Moderate Aggressive | ||||||
Global Atlantic Moderate Growth Managed Risk Portfolio | S&P Global Managed Risk LargeMidCap Index – Moderate Conservative | ||||||
Global Atlantic Select Advisor Managed Risk Portfolio | S&P Global Managed Risk LargeMidCap Index – Moderate | ||||||
Global Atlantic Wellington Research Managed Risk Portfolio | S&P 500 Managed Risk Index – Moderate Conservative | ||||||
The indices shown are for informational purposes only and are not reflective of any investment. As it is not possible to invest directly in the indices, the data shown does not reflect or compare features of an actual investment, such as its objectives, costs and expenses, liquidity, safety, guarantees or insurance, fluctuation of principal or return, or tax features. Past performance is no guarantee of future results.
This report contains the current opinions of Global Atlantic Investment Advisors, LLC and/or sub-advisers at the time of its publication and should not be considered investment advice or a recommendation of any particular security, strategy or investment product. Such opinions are subject to change without notice and securities described herein may no longer be included in, or may at any time be removed from, a Portfolio's portfolio. This report is distributed for informational purposes only. Information contained herein has been obtained from sources believed to be reliable, but not guaranteed.
Index Definitions:
S&P Global Managed Risk LargeMidCap Index – Conservative. An index that is designed to simulate a dynamic protective portfolio that allocates between the underlying equity index and cash based on realized volatilities of the underlying equity and bond indices, while maintaining a fixed allocation of 50% to the underlying bond index.
S&P Global Managed Risk LargeMidCap Index – Moderate Conservative. An index that is designed to simulate a dynamic protective portfolio that allocates between the underlying equity index and cash based on realized volatilities of the underlying equity and bond indices, while maintaining a fixed allocation of 40% to the underlying bond index.
S&P Global Managed Risk LargeMidCap Index – Moderate. An index that is designed to simulate a dynamic protective portfolio that allocates between the underlying equity index and cash based on realized volatilities of the underlying equity and bond indices, while maintaining a fixed allocation of 30% to the underlying bond index.
S&P Global Managed Risk LargeMidCap Index – Moderate Aggressive. An index that is designed to simulate a dynamic protective portfolio that allocates between the underlying equity index and cash based on realized volatilities of the underlying equity and bond indices, while maintaining a fixed allocation of 20% to the underlying bond index.
S&P 500 Managed Risk Index – Moderate Conservative. An index that is designed to simulate a dynamic protective portfolio that allocates between the underlying equity index and cash based on realized volatilities of the underlying equity and bond indices, while maintaining a fixed allocation of 40% to the underlying bond index.
2
S&P 500 Managed Risk Index – Moderate. An index that is designed to simulate a dynamic protective portfolio that allocates between the underlying equity index and cash based on realized volatilities of the underlying equity and bond indices, while maintaining a fixed allocation of 30% to the underlying bond index.
Bloomberg U.S. Aggregate Bond Index ("Bbg US Agg").1 An index weighted according to market capitalization and includes, among other categories, Treasury securities, mortgage-backed securities, government agency bonds and corporate bonds. To be included in the index, bonds must be rated investment grade by Moody's and Standard & Poor's.
ICE BofAML High Yield Cash Pay MV USI Index ("ICE BofAML US HY"). An index that tracks the performance of US dollar denominated, below investment grade corporate debt, currently in a coupon paying period, which is publicly issued in the US domestic market.
MSCI EAFE Total Return Index ("MSCI EAFE"). An index created by Morgan Stanley Capital International (MSCI) that serves as a benchmark of the performance in major developed international equity markets as represented by 21 major MSCI indexes from Europe, Australasia and the Far East.
Russell 2000® Index ("Russell 2000"). An index measuring the performance of approximately 2,000 small-cap companies in the Russell 3000 Index, which is made up of 3,000 of the biggest U.S. stocks. The Russell 2000 serves as a benchmark for small-cap stocks in the United States.
S&P MidCap 400 Total Return Index ("S&P MidCap 400"). A capitalization-weighted index which measures the performance of the mid-range sector of the U.S. stock market.
S&P 500 Index ("S&P 500"). A market capitalization weighted price index composed of 500 widely held U.S. common stocks. Frequently used as a measure of U.S. stock market performance.
1 Formerly known as the Bloomberg Barclays U.S. Aggregate Bond Index.
3
Table of Contents
Page | |||||||||||
• | Global Atlantic Portfolio Review and Portfolio of Investments | ||||||||||
Global Atlantic American Funds® Managed Risk Portfolio | 5 – 8 | ||||||||||
Global Atlantic Balanced Managed Risk Portfolio | 9 – 12 | ||||||||||
Global Atlantic BlackRock Selects Managed Risk Portfolio | 13 – 16 | ||||||||||
Global Atlantic Franklin Dividend and Income Managed Risk Portfolio | 17 – 33 | ||||||||||
Global Atlantic Growth Managed Risk Portfolio | 34 – 37 | ||||||||||
Global Atlantic Moderate Growth Managed Risk Portfolio | 38 – 41 | ||||||||||
Global Atlantic Select Advisor Managed Risk Portfolio | 42 – 44 | ||||||||||
Global Atlantic Wellington Research Managed Risk Portfolio | 45 – 60 | ||||||||||
• | Financial Statements: | ||||||||||
Statements of Assets and Liabilities | 61 – 62 | ||||||||||
Statements of Operations | 63 – 64 | ||||||||||
Statements of Changes in Net Assets | 65 – 68 | ||||||||||
Financial Highlights | 69 – 76 | ||||||||||
• | Notes to Financial Statements | 77 – 100 | |||||||||
• | Report of Independent Registered Accounting Firm | 101 | |||||||||
• | Expense Examples | 102 – 103 | |||||||||
• | Supplemental Information | 104 | |||||||||
• | Trustee and Officer Table | 104 – 107 | |||||||||
• | Privacy Notice | 108 – 109 | |||||||||
• | Proxy Voting Policy | Back Cover | |||||||||
• | Portfolio Holdings | Back Cover | |||||||||
4
Global Atlantic American Funds® Managed Risk Portfolio
Portfolio Review
December 31, 2021 (Unaudited)
Investment Objective
The Portfolio seeks to provide capital appreciation and income while seeking to manage volatility.
Management Review
The capital appreciation and income component is sub-advised by Wilshire Advisors, LLC (formerly Wilshire Associates Incorporated) ("Wilshire"), while the managed risk component is sub-advised by Milliman Financial Risk Management LLC ("Milliman").
How did the Portfolio perform during the period?
During 2021, the Portfolio outperformed its reference benchmark, the S&P Global Managed Risk LargeMidCap Index – Moderate Conservative. The Portfolio posted a return of 11.12% compared to a benchmark return of 10.38%, a difference of 74 basis points. The following discussion of relative performance pertains to this benchmark.
What factors and allocation decisions influenced the Portfolio's performance?
The Portfolio was impacted by both dynamic asset allocation tilts as well as manager selection during 2021. An overweight to U.S. large cap equities generally contributed to relative performance, as did an overweight to value equities. Other tilts within equities were towards U.S. and global, which were additive to performance, while an overweight to emerging markets relative to developed markets and an allocation to small caps detracted from returns. The fixed income portion of the Portfolio benefited from positive manager selection, while asset allocation was largely neutral.
The Portfolio made several allocation changes during the year. In the first quarter of 2021, the Portfolio reduced its allocation in American Funds Insurance Series® Bond Fund and reallocated to American Funds Insurance Series® US Govt/AAA-Rated Securities Fund in order to modestly reduce the allocation to credit versus government fixed income. The Portfolio also modestly reduced exposure in American Funds Insurance Series® Blue Chip Income & Growth Fund and reallocated to American Funds Insurance Series® New World Fund in order to overweight emerging markets equities exposure relative to U.S. equities. During the third quarter, the Portfolio reduced its out-of-benchmark, unhedged foreign fixed income allocation by lowering exposure in American Funds Insurance Series® Capital World Bond Fund and reallocating to American Funds Insurance Series® Bond Fund. The Portfolio also reduced its exposure in American Funds Insurance Series® Blue Chip Income & Growth Fund in order to lower the magnitude of the domestic value equity overweight and reallocated assets to American Funds Insurance Series® Growth Fund and American Funds Insurance Series® Growth-Income Fund. In the fourth quarter, the Portfolio switched its overweight to emerging markets equities relative to foreign developed equities by reducing exposure to American Funds Insurance Series® New World Fund and adding to American Funds Insurance Series® International Growth and Income Fund.
The volatility environment experienced during the market's recovery in the second half of 2020 continued into 2021, with brief spikes in volatility occurring approximately every four to six weeks, and typically subsiding within a few days as concerns regarding COVID-19, inflation, and/or economic growth ebbed quickly. Despite these frequent volatility spikes, their amplitude and duration were generally not sufficient to warrant hedging by the managed risk component. As a result, hedging did not have a material impact on the Portfolio's overall performance in 2021.
How was the Portfolio positioned at period end?
Wilshire believes that the Portfolio remains well positioned to meaningfully participate in a continued rally in risk assets, but also diversified to outperform broad market equities during a selloff. More specifically, at the end of the period, within equities, the Portfolio was modestly tilted to favor value over growth equities, and within foreign equities, developed economies over emerging markets. Wilshire believes that the case for value equities is driven by a combination of highly attractive relative valuations, higher beta to further economic growth and better relative performance in a rising interest rate environment. Even with the recent emergence of the Omicron variant of COVID-19, Wilshire believes that the prospects
5
Global Atlantic American Funds® Managed Risk Portfolio
Portfolio Review (Continued)
December 31, 2021 (Unaudited)
for global economic recovery remain strong and that value equities exhibit the potential for higher upside in a cyclical recovery and a larger margin of safety in an unforeseen downturn. Wilshire believes that earnings remain strong for many value sectors, while price-to-earnings expansion in recent years has not kept pace with growth equities. Wilshire anticipates that the Portfolio's overweight to foreign developed equities will benefit from strong economic growth across much of Europe, and potentially Japan, during 2022, perhaps exceeding current expectations, while emerging markets (notably China) may lag expectations somewhat due to increasing financial market restrictions and relatively strict COVID-19 protocols.
The Portfolio's performance figures for the periods ended December 31, 2021 as compared to its benchmark:
Annualized | Operating Expense* | ||||||||||||||||||||||||||
| Inception Date | One Year | Five Years | Since Inception | Gross Ratio | Net Ratio | ||||||||||||||||||||||
Global Atlantic American Funds® Managed Risk Portfolio | |||||||||||||||||||||||||||
Class II | October 31, 2013 | 11.12 | % | 9.28 | % | 7.15 | % | 1.67 | % | 1.27 | % | ||||||||||||||||
| S&P Global Managed Risk LargeMidCap Index - Moderate Conservative^ | 10.38 | % | 8.89 | % | 6.39 | % | |||||||||||||||||||||
The performance data quoted is historical. Past performance is no guarantee of future results. Current performance may be higher or lower than the performance data quoted. The principal value and investment return of an investment will fluctuate so that your shares, when redeemed, may be worth more or less than their original cost. Total returns would have been lower absent fee waivers by the Adviser. Performance figures for periods greater than one year are annualized. The returns shown do not reflect the deduction of taxes that a shareholder may pay on Portfolio distributions or on the redemption of Portfolio shares, as well as other charges and expenses of the insurance contract or separate account. Prior to October 1, 2016, the Capital Appreciation and Income Component of the Portfolio was managed by the Adviser without the use of a sub-adviser. The performance prior to that date is attributable to the Adviser's asset allocation decisions.
* The estimated operating expense ratios for Class II shares, as disclosed in the most recent prospectus dated May 1, 2021. Ratios include Acquired Fund Fees and Expenses indirectly incurred by the Portfolio. Gross operating expense ratio reflects the ratio of expenses absent waivers and/or reimbursements by the Adviser. The operating expense ratios presented here may differ from the expense ratios disclosed in the Financial Highlights table in this report.
^ The S&P Global Managed Risk LargeMidCap Index - Moderate Conservative. An index that is designed to simulate a dynamic protective portfolio that allocates between the underlying equity index and cash based on realized volatilities of the underlying equity and bond indices, while maintaining a fixed allocation of 40% to the underlying bond index.
Comparison of the Change in Value of a $10,000 Investment

6
Global Atlantic American Funds® Managed Risk Portfolio
Portfolio Review (Continued)
December 31, 2021 (Unaudited)
Holdings by Asset Class | % of Net Assets | ||||||
Variable Insurance Trusts | 96.2 | % | |||||
Short-Term Investments | 4.0 | % | |||||
Other Assets less Liabilities - Net | (0.2 | )% | |||||
100.0 | % | ||||||
Please refer to the Portfolio of Investments in this annual report for more information regarding the Portfolio's holdings as of December 31, 2021.
7
Global Atlantic American Funds® Managed Risk Portfolio
Portfolio of Investments
December 31, 2021
| Shares/ Principal | Fair Value | ||||||||||
VARIABLE INSURANCE TRUSTS - 96.2% | |||||||||||
ASSET ALLOCATION FUND - 0.9% | |||||||||||
| American Funds Insurance Series - New World Fund, Class 1 | 70,189 | $ | 2,234,116 | ||||||||
DEBT FUNDS - 33.1% | |||||||||||
| American Funds Insurance Series - American High-Income Trust, Class 1 | 652,315 | 6,647,091 | |||||||||
| American Funds Insurance Series - Capital World Bond Fund, Class 1 | 372,010 | 4,385,994 | |||||||||
| American Funds Insurance Series - The Bond Fund of America, Class 1 | 4,698,506 | 52,670,257 | |||||||||
| American Funds Insurance Series - U.S. Government Securities Fund, Class 1 | 1,129,403 | 13,180,128 | |||||||||
TOTAL DEBT FUNDS | 76,883,470 | ||||||||||
EQUITY FUNDS - 62.2% | |||||||||||
| American Funds Insurance Series - Capital World Growth and Income Fund, Class 1 | 1,350,091 | 24,868,673 | |||||||||
| American Funds Insurance Series - Global Small Capitalization Fund, Class 1 | 196,563 | 6,716,564 | |||||||||
| American Funds Insurance Series - International Growth and Income Fund, Class 1 | 693,547 | 13,607,391 | |||||||||
| American Funds Insurance Series - Washington Mutual Investors Fund, Class 1 | 2,002,533 | 36,225,815 | |||||||||
| Shares/ Principal | Fair Value | ||||||||||
EQUITY FUNDS - 62.2% (Continued) | |||||||||||
| American Funds Insurance Series Growth Fund, Class 1 | 212,226 | $ | 27,075,731 | ||||||||
| American Funds Insurance Series Growth-Income Fund, Class 1 | 535,396 | 36,058,908 | |||||||||
TOTAL EQUITY FUNDS | 144,553,082 | ||||||||||
| TOTAL VARIABLE INSURANCE TRUSTS (Cost - $170,097,146) | 223,670,668 | ||||||||||
SHORT-TERM INVESTMENTS - 4.0% | |||||||||||
MONEY MARKET FUNDS - 4.0% | |||||||||||
| Dreyfus Government Cash Management, 0.03% (a) | 9,252,207 | 9,252,207 | |||||||||
| Fidelity Investments Money Market Fund - Government Portfolio, Institutional Class, 0.01% (a) | 25,101 | 25,101 | |||||||||
| TOTAL SHORT-TERM INVESTMENTS (Cost - $9,277,308) | 9,277,308 | ||||||||||
| TOTAL INVESTMENTS - 100.2% (Cost - $179,374,454) | $ | 232,947,976 | |||||||||
| OTHER ASSETS LESS LIABILITIES - NET (0.2)% | (416,657) | ||||||||||
TOTAL NET ASSETS - 100.0% | $ | 232,531,319 | |||||||||
(a) The rate shown is the annualized seven-day yield at period end.
See accompanying notes to financial statements.
8
Global Atlantic Balanced Managed Risk Portfolio
Portfolio Review
December 31, 2021 (Unaudited)
Investment Objective
The Portfolio seeks to provide capital appreciation and income while seeking to manage volatility.
Management Review
The capital appreciation and income component is sub-advised by BlackRock Investment Management, LLC ("BlackRock")1, while the managed risk component is sub-advised by Milliman Financial Risk Management LLC ("Milliman").
How did the Portfolio perform during the period?
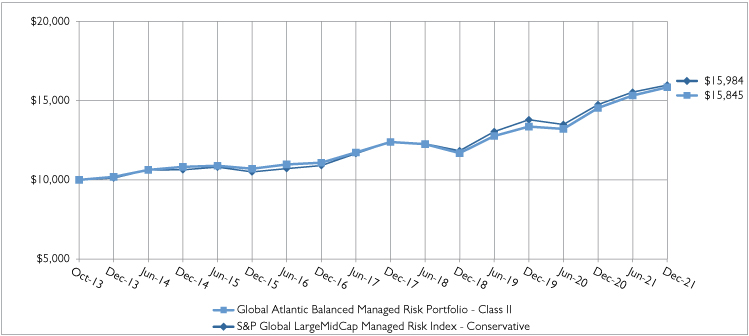
During 2021, the Portfolio outperformed its reference benchmark, the S&P Global Managed Risk LargeMidCap Index – Conservative. The Portfolio posted a return of 8.99% compared to a benchmark return of 8.36%, a difference of 63 basis points. The following discussion of relative performance pertains to this benchmark unless otherwise noted.
What factors and allocation decisions influenced the Portfolio's performance?
The Portfolio's overweight to equities was the most significant contributor to its returns, as stocks outperformed bonds overall and domestic stocks broadly outperformed their international counterparts. Within equities, the Portfolio's strategic allocation to, and rotation among, factors – along with its strategic overweight to financial stocks – were largely detractors from performance, as were international stocks. In equities, the Portfolio maintained an overweight to the U.S. relative to international markets and benefited from positions in technology and energy equities during the year. The Portfolio's factor exposures detracted from performance.
On the fixed income side, longer-duration U.S. Treasuries were sold off and the curve bear steepened to start the year, then rallied considerably as COVID-19's Delta variant reversed trends, only for inflation to force the U.S. Federal Reserve's (the "Fed") hand by the end of the year. While returns were negative across all fixed income asset classes, shifts in duration and the spread tightening in lower-quality credit bonds were sources of outperformance for the Portfolio. The Portfolio benefited from its treasuries allocation during the bull flattening periods. During the reopening phases of the COVID-19 pandemic, the Portfolio's increased holdings in credit helped outperform the fixed income benchmark.
The volatility environment experienced during the market's recovery in the second half of 2020 continued into 2021, with brief spikes in volatility occurring approximately every four to six weeks, and typically subsiding within a few days as concerns regarding COVID-19, inflation, and/or economic growth ebbed quickly. Despite these frequent volatility spikes, their amplitude and duration were generally not sufficient to warrant hedging by the managed risk component. As a result, hedging did not have a material impact on the Portfolio's overall performance in 2021.
How was the Portfolio positioned at period end?
At year-end, the Portfolio was 4% overweight equities relative to fixed income, as BlackRock's investment team believed the risk-reward in fixed income was diminished and challenged given interest rates at currently low levels and the persistent threat of inflation. BlackRock's investment team believes that despite the concerns over the Omicron variant of COVID-19 and the Fed's tapering-then-hike plans, expectations surrounding growth and earnings remain strong, which should lead to more equity outperformance in 2022. BlackRock believes that the case for cyclical assets like equities and commodities remains intact for 2022, with key drivers being continued supply constraints, higher wages, and the cautiously slow removal of some policy and fiscal support by non-U.S. central banks. As the holidays led to COVID-19 case surges, some caution has returned in the U.S. and with international markets continuing to lag from slower global demand, BlackRock's investment view was to position the Portfolio for the ongoing post-COVID-19 "restart" and the maturing cycle as interest rate hikes begin amidst strong economic growth at the end of the period.
1 Prior to May 1, 2021, BlackRock Financial Management, Inc. served as a sub-adviser to the Capital Appreciation and Income Component of the Portfolio.
9
Global Atlantic Balanced Managed Risk Portfolio
Portfolio Review (Continued)
December 31, 2021 (Unaudited)
Within fixed income, BlackRock's investment team favors a shorter duration bias, particularly within investment grade and high yield credit. This was partially offset with longer duration holdings in U.S. Treasury Inflation-Protected Securities ("TIPS") at the end of the period, which was present to not only balance inflation risks, but to also benefit sector positions should inflation run above expectations.
The Portfolio's performance figures for the periods ended December 31, 2021 as compared to its benchmark:
Annualized | Operating Expense* | ||||||||||||||||||||||||||
| Inception Date | One Year | Five Years | Since Inception | Gross Ratio | Net Ratio | ||||||||||||||||||||||
Global Atlantic Balanced Managed Risk Portfolio | |||||||||||||||||||||||||||
Class II | October 31, 2013 | 8.99 | % | 7.41 | % | 5.80 | % | 1.03 | % | 1.03 | % | ||||||||||||||||
S&P Global Managed Risk LargeMidCap Index - Conservative^ | 8.36 | % | 7.95 | % | 5.91 | % | |||||||||||||||||||||
The performance data quoted is historical. Past performance is no guarantee of future results. Current performance may be higher or lower than the performance data quoted. The principal value and investment return of an investment will fluctuate so that your shares, when redeemed, may be worth more or less than their original cost. Total returns would have been lower absent fee waivers by the Adviser. Performance figures for periods greater than one year are annualized. The returns shown do not reflect the deduction of taxes that a shareholder may pay on Portfolio distributions or on the redemption of Portfolio shares, as well as other charges and expenses of the insurance contract or separate account. Prior to October 1, 2016, the Capital Appreciation and Income Component of the Portfolio was managed by the Adviser without the use of a sub-adviser. The performance prior to that date is attributable to the Adviser's asset allocation decisions. From October 1, 2016 to May 1, 2021, BlackRock Financial Management, Inc. served as a sub-adviser to the Capital Appreciation and Income Component of the Portfolio. In addition, effective May 1, 2021 the sub-adviser to the Capital Appreciation and Income Component of the Portfolio changed from BlackRock Financial Management, Inc. to BlackRock Investment Management, LLC. No changes were made to the Portfolio's principal investment strategies or to the portfolio management team as a result of the change in sub-adviser.
* The estimated operating expense ratios for Class II shares, as disclosed in the most recent prospectus dated May 1, 2021. Ratios include Acquired Fund Fees and Expenses indirectly incurred by the Portfolio. Gross operating expense ratio reflects the ratio of expenses absent waivers and/or reimbursements by the Adviser. The operating expense ratios presented here may differ from the expense ratios disclosed in the Financial Highlights table in this report.
^ The S&P Global Managed Risk LargeMidCap Index - Conservative is designed to simulate a dynamic protective portfolio that allocates between the underlying equity index and cash, based on realized volatilities of the underlying equity and bond indices, while maintaining a fixed allocation of 50% to the underlying bond index.
Comparison of the Change in Value of a $10,000 Investment
10
Global Atlantic Balanced Managed Risk Portfolio
Portfolio Review (Continued)
December 31, 2021 (Unaudited)
Holdings by Asset Class | % of Net Assets | ||||||
Exchange Traded Funds | 96.3 | % | |||||
Short-Term Investments | 3.8 | % | |||||
Other Assets less Liabilities - Net | (0.1 | )% | |||||
100.0 | % | ||||||
Please refer to the Portfolio of Investments in this annual report for more information regarding the Portfolio's holdings as of December 31, 2021.
11
Global Atlantic Balanced Managed Risk Portfolio
Portfolio of Investments
December 31, 2021
| Shares/ Principal | Fair Value | ||||||||||
EXCHANGE TRADED FUNDS - 96.3% | |||||||||||
DEBT FUNDS - 43.2% | |||||||||||
| iShares 10+ Year Investment Grade Corporate Bond ETF | 88,859 | $ | 6,180,144 | ||||||||
| iShares 1-5 Year Investment Grade Corporate Bond ETF | 85,715 | 4,618,324 | |||||||||
iShares 3-7 Year Treasury Bond ETF | 61,379 | 7,897,636 | |||||||||
| iShares 5-10 Year Investment Grade Corporate Bond ETF | 45,001 | 2,667,209 | |||||||||
iShares 7-10 Year Treasury Bond ETF | 2,399 | 275,885 | |||||||||
| iShares Broad USD High Yield Corporate Bond ETF | 27,554 | 1,134,949 | |||||||||
| iShares Core Total USD Bond Market ETF | 161,828 | 8,565,556 | |||||||||
iShares Fallen Angels USD Bond ETF | 75,154 | 2,252,366 | |||||||||
iShares MBS ETF | 10,400 | 1,117,272 | |||||||||
iShares Short Treasury Bond ETF* | 16,884 | 1,864,331 | |||||||||
iShares TIPS Bond ETF | 62,261 | 8,044,121 | |||||||||
iShares U.S. Treasury Bond ETF | 259,640 | 6,927,195 | |||||||||
TOTAL DEBT FUNDS | 51,544,988 | ||||||||||
EQUITY FUNDS - 53.1% | |||||||||||
iShares Core MSCI EAFE ETF | 102,055 | 7,617,385 | |||||||||
iShares Core S&P 500 ETF | 51,510 | 24,569,755 | |||||||||
iShares Core S&P Mid-Cap ETF | 16,602 | 4,699,694 | |||||||||
iShares Core S&P Small-Cap ETF | 55,976 | 6,409,812 | |||||||||
iShares ESG Aware MSCI USA ETF | 82,403 | 8,891,284 | |||||||||
iShares Global Financials ETF | 4,541 | 363,553 | |||||||||
| Shares/ Principal | Fair Value | ||||||||||
EQUITY FUNDS - 53.1% (Continued) | |||||||||||
iShares Global Tech ETF | 19,444 | $ | 1,251,999 | ||||||||
iShares MSCI EAFE Growth ETF | 18,408 | 2,030,218 | |||||||||
iShares MSCI EAFE Value ETF | 70,826 | 3,568,922 | |||||||||
iShares MSCI USA Min Vol Factor ETF | 14,709 | 1,189,958 | |||||||||
iShares MSCI USA Value Factor ETF | 18,876 | 2,066,356 | |||||||||
iShares U.S. Energy ETF | 22,762 | 685,136 | |||||||||
TOTAL EQUITY FUNDS | 63,344,072 | ||||||||||
| TOTAL EXCHANGE TRADED FUNDS (Cost - $94,841,054) | 114,889,060 | ||||||||||
SHORT-TERM INVESTMENTS - 3.8% | |||||||||||
MONEY MARKET FUNDS - 3.8% | |||||||||||
| Dreyfus Government Cash Management, 0.03% (a) | 3,417,876 | 3,417,876 | |||||||||
| Fidelity Investments Money Market Fund - Government Portfolio, Institutional Class, 0.01% (a) | 1,143,322 | 1,143,322 | |||||||||
| TOTAL SHORT-TERM INVESTMENTS (Cost - $4,561,198) | 4,561,198 | ||||||||||
| TOTAL INVESTMENTS - 100.1% (Cost - $99,402,252) | $ | 119,450,258 | |||||||||
| OTHER ASSETS LESS LIABILITIES - NET (0.1)% | (74,120) | ||||||||||
TOTAL NET ASSETS - 100.0% | $ | 119,376,138 | |||||||||
* Non-income producing security.
(a) The rate shown is the annualized seven-day yield at period end.
TIPS - Treasury Inflation Protected Security
See accompanying notes to financial statements.
12
Global Atlantic BlackRock Selects Managed Risk Portfolio
Portfolio Review
December 31, 2021 (Unaudited)
Investment Objective
The Portfolio seeks to provide capital appreciation and income while seeking to manage volatility.
Management Review
The capital appreciation and income component is sub-advised by BlackRock Investment Management, LLC ("BlackRock"), while the managed risk component is sub-advised by Milliman Financial Risk Management LLC ("Milliman").
How did the Portfolio perform during the period?
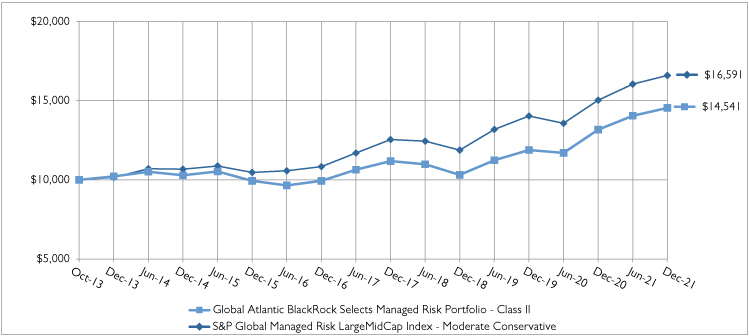
During 2021, the Portfolio outperformed its reference benchmark, the S&P Global Managed Risk LargeMidCap Index – Moderate Conservative. The Portfolio posted a return of 10.41% compared to a benchmark return of 10.38%, a difference of 3 basis points. The following discussion of relative performance pertains to this benchmark.
What factors and allocation decisions influenced the Portfolio's performance?
Risk assets experienced another strong year in 2021, albeit with increased dispersion across sectors and regions amidst periods of increased market volatility. Global equity markets started the year off strong, as first quarter U.S. manufacturing, retail and consumer data pointed toward a robust and rapid recovery from the COVID-19 pandemic. Despite solid equity market gains, expectations of a strong U.S. recovery, rising fiscal deficits, uncertainty over future U.S. Federal Reserve (the "Fed") policy and an increase in inflation, heavily pressured the long end of the U.S. Treasury curve. As a result, the yield on the U.S. 10-year increased by approximately 70 basis points in March and caused market volatility to significantly increase. Volatility continued in the second quarter, driven by weaker than expected U.S. job growth, higher than expected inflation, and statements by the Fed that the U.S. central bank anticipated raising the federal funds rate sooner than expected. Despite this uncertainty, equity markets continued to rise based on the potential for robust economic growth in the second half of 2021, coupled with a healthy U.S. consumer and the continuation of accommodative fiscal and monetary policies. BlackRock viewed the first half of 2021 as a transition into a new market regime characterized by a recognition of the potential for robust economic growth and the eventual withdrawal of ongoing liquidity support.
Persistent inflation caused market volatility to pick up in September once again. The combination of global supply chain constraints, U.S. fiscal uncertainties, discussions of an eventual tapering of bond purchases by the Fed, and concerns regarding the global credit implications related to China's largest property developer, all conspired to weigh heavily on sentiment for risk assets as the third quarter ended. Despite this, global stocks finished 2021 strong, as investors around the world put aside immediate concerns about the contagiousness of the Omicron variant of COVID-19 and evolving global central bank policy, and instead decided to embrace risk assets as the year headed toward its close.
From a broad asset allocation perspective, positioning within equities and fixed income contributed over the period but was partially offset by an exposure to cash and cash equivalents. Within equities, stock selection and an overweight allocation to information technology contributed to performance. Security selection and an overweight to consumer discretionary and healthcare, coupled with selection in financials detracted from performance. Short positioning in index level futures focused on large cap U.S. equities to manage the overall beta of the portfolio also weighed on returns. Within fixed income, positioning within credit was additive. From a currency perspective, an overweight to the Euro and emerging market currency modestly detracted from performance.
The volatility environment experienced during the market's recovery in the second half of 2020 continued into 2021, with brief spikes in volatility occurring approximately every four to six weeks, and typically subsiding within a few days as concerns regarding COVID-19, inflation, and/or economic growth ebbed quickly. Despite these frequent volatility spikes, their amplitude and duration were generally not sufficient to warrant hedging by the managed risk component. As a result, hedging did not have a material impact on the Portfolio's overall performance in 2021.
13
Global Atlantic BlackRock Selects Managed Risk Portfolio
Portfolio Review (Continued)
December 31, 2021 (Unaudited)
How was the Portfolio positioned at period end?
At year end, relative to its reference benchmark, the Portfolio was overweight equities and meaningfully underweight fixed income. Looking ahead, BlackRock continues to believe that equities offer investors the best risk-reward opportunities across all asset classes. Despite ongoing disruptions caused by the Omicron variant of COVID-19, demand for U.S. labor remains very robust, and thus supportive of U.S. wage growth. BlackRock believes that strong consumption should continue to support both U.S. gross domestic product ("GDP") and corporate profit growth, although likely at lower growth rates than enjoyed in 2021. The team is mindful that year-over-year earnings comparisons are likely to be more difficult going forward, especially considering how sharply corporate profits have accelerated in 2021. In addition, while U.S. monetary policy is expected to remain highly accommodative by nearly any historical standard, investors are expecting increases to the Fed funds rate to begin as early as March and BlackRock anticipates real interest rates drifting moderately higher from their historic lows. While BlackRock believes these factors are likely to push equity volatility levels higher, any backup in yields is likely to be contained given the insatiable appetite for yield, coupled with the fact that the total amount of bond issuance from the U.S. Treasury is likely to decline in 2022 from 2021 levels.
At the end of the period, within equities, the Portfolio was overweight the U.S., and to a lesser extent, developed Europe, and select emerging market countries (most notably China) and was underweight Japan and Canada. The Portfolio's overweight to U.S. stocks reflects BlackRock's positive view based on continued strong U.S. economic data, coupled with the demonstrated ability of U.S. corporations to maintain their margins despite rising labor and materials costs. The Portfolio also maintained smaller overweights to Europe and China; however, positioning was reduced in the later part of the year given heightened risks to economic activity associated with the rapid spread of the Omicron variant of COVID-19. In BlackRock's view, the likelihood of lockdowns is elevated in parts of Europe, and widescale lockdowns are currently being implemented in parts of China. The Portfolio remained underweight Japan, Canada, and Australia for a variety of reasons, notably the large exposure each of those markets have to financials (both banks and insurance).
From a sector perspective, at the end of the period, the Portfolio was overweight consumer discretionary, healthcare, energy and information technology and was underweight consumer staples, financials, and real estate. BlackRock believes sector positioning will be key in an economy that while still growing at above trend levels, is likely to decelerate in 2022. Within equities, positioning reflects a barbell approach with exposure to secular growth areas particularly in consumer discretionary, healthcare, and key segments of the technology sector, balanced with quality cyclical exposure that BlackRock believes would benefit from a continued recovery in the economy and from rising input costs, including energy and materials. The Portfolio is underweight defensive sectors, notably consumer staples and real estate investment trusts ("REITs"), as BlackRock believes a continued rise in interest rates could cause these slower growing, less economically sensitive sectors to lag the broader market.
Within fixed income, at the end of the period, the Portfolio was overweight high yield credit and underweight securitized assets, investment grade credit and U.S. government bonds. The team continues to believe that given the likelihood of strong – but decelerating – U.S economic growth, coupled with ongoing inflationary pressures, U.S. real interest rates are likely headed moderately higher. Further, because BlackRock believes the proximate cause of potential stock market volatility may be due to uncertainty pertaining to the timing and magnitude of the Fed's reaction function, rather than an unexpected slowdown in economic growth, the team harbors doubts that longer duration U.S. Treasuries bonds will be as effective a hedge against equity volatility as they have been in the post-2008 Global Financial Crisis period. The Portfolio was underweight duration relative to the reference benchmark (0.82 years versus 2.68 years), as the Portfolio remains underweight agency mortgages and to a lesser extent, U.S. Treasuries. Within credit, most of the exposure is in U.S. high yield which has historically been less sensitive to duration risk as compared to investment grade debt. The team also added to securitized assets over the quarter as they believe the asset class offers attractive carry and total return potential relative to other fixed income assets.
14
Global Atlantic BlackRock Selects Managed Risk Portfolio
Portfolio Review (Continued)
December 31, 2021 (Unaudited)
The Portfolio's performance figures for the periods ended December 31, 2021 as compared to its benchmark:
Annualized | Operating Expense* | ||||||||||||||||||||||||||
| Inception Date | One Year | Five Years | Since Inception | Gross Ratio | Net Ratio | ||||||||||||||||||||||
Global Atlantic BlackRock Selects Managed Risk Portfolio | |||||||||||||||||||||||||||
Class II | October 31, 2013 | 10.41 | % | 7.91 | % | 4.69 | % | 1.17 | % | 1.17 | % | ||||||||||||||||
| S&P Global Managed Risk LargeMidCap Index - Moderate Conservative^ | 10.38 | % | 8.89 | % | 6.39 | % | |||||||||||||||||||||
The performance data quoted is historical. Past performance is no guarantee of future results. Current performance may be higher or lower than the performance data quoted. The principal value and investment return of an investment will fluctuate so that your shares, when redeemed, may be worth more or less than their original cost. Total returns would have been lower absent fee waivers by the Adviser. Performance figures for periods greater than one year are annualized. The returns shown do not reflect the deduction of taxes that a shareholder may pay on Portfolio distributions or on the redemption of Portfolio shares, as well as other charges and expenses of the insurance contract or separate account. Prior to May 1, 2019, the Capital Appreciation and Income Component of the Portfolio was managed pursuant to a different investment strategy by the Adviser without the use of a sub-adviser. The performance prior to that date is attributable to the Adviser and the prior investment strategy.
* The estimated operating expense ratios for Class II shares, as disclosed in the most recent prospectus dated May 1, 2021. Ratios include Acquired Fund Fees and Expenses indirectly incurred by the Portfolio. Gross operating expense ratio reflects the ratio of expenses absent waivers and/or reimbursements by the Adviser. The operating expense ratios presented here may differ from the expense ratios disclosed in the Financial Highlights table in this report.
^ The S&P Global Managed Risk LargeMidCap Index - Moderate Conservative is designed to simulate a dynamic protective portfolio that allocates between the underlying equity index and cash, based on realized volatilities of the underlying equity and bond indices, while maintaining a fixed allocation of 40% to the underlying bond index.
Comparison of the Change in Value of a $10,000 Investment
Holdings by Asset Class | % of Net Assets | ||||||
Exchange Traded Funds | 74.0 | % | |||||
Variable Insurance Trusts | 19.6 | % | |||||
Short-Term Investments | 4.5 | % | |||||
Other Assets less Liabilities - Net | 1.9 | % | |||||
100.0 | % | ||||||
Please refer to the Portfolio of Investments in this annual report for more information regarding the Portfolio's holdings as of December 31, 2021.
15
Global Atlantic BlackRock Selects Managed Risk Portfolio
Portfolio of Investments
December 31, 2021
| Shares/ Principal | Fair Value | ||||||||||
EXCHANGE TRADED FUNDS - 74.0% | |||||||||||
DEBT FUNDS - 25.3% | |||||||||||
iShares 1-3 Year Treasury Bond ETF | 196,274 | $ | 16,789,278 | ||||||||
iShares 3-7 Year Treasury Bond ETF | 17,372 | 2,235,255 | |||||||||
iShares 7-10 Year Treasury Bond ETF | 39,040 | 4,489,600 | |||||||||
| iShares iBoxx $ Investment Grade Corporate Bond ETF | 16,887 | 2,237,865 | |||||||||
| iShares iBoxx High Yield Corporate Bond ETF | 104,948 | 9,131,526 | |||||||||
| iShares JP Morgan USD Emerging Markets Bond ETF | 20,908 | 2,280,227 | |||||||||
iShares MBS ETF | 62,665 | 6,732,101 | |||||||||
iShares Short Treasury Bond ETF | 142,482 | 15,732,862 | |||||||||
TOTAL DEBT FUNDS | 59,628,714 | ||||||||||
EQUITY FUNDS - 48.7% | |||||||||||
iShares Core MSCI EAFE ETF | 107,760 | 8,043,206 | |||||||||
iShares Core MSCI Emerging Markets ETF | 56,061 | 3,355,811 | |||||||||
iShares Core S&P U.S. Growth ETF | 377,571 | 43,662,310 | |||||||||
iShares Core S&P U.S. Value ETF | 156,538 | 11,950,111 | |||||||||
iShares Global Financials ETF | 28,937 | 2,316,696 | |||||||||
iShares Global Healthcare ETF | 79,934 | 7,221,238 | |||||||||
iShares MSCI Eurozone ETF | 259,626 | 12,724,270 | |||||||||
iShares MSCI USA Quality Factor ETF | 71,696 | 10,436,070 | |||||||||
iShares U.S. Basic Materials ETF | 8,585 | 1,203,703 | |||||||||
iShares U.S. Consumer Discretionary ETF | 67,752 | 5,691,168 | |||||||||
| Shares/ Principal | Fair Value | ||||||||||
EQUITY FUNDS - 48.7% (Continued) | |||||||||||
iShares U.S. Energy ETF | 150,046 | $ | 4,516,385 | ||||||||
iShares U.S. Industrials ETF | 31,769 | 3,581,637 | |||||||||
TOTAL EQUITY FUNDS | 114,702,605 | ||||||||||
| TOTAL EXCHANGE TRADED FUNDS (Cost - $144,529,678) | 174,331,319 | ||||||||||
VARIABLE INSURANCE TRUSTS - 19.6% | |||||||||||
ASSET ALLOCATION FUND - 19.6% | |||||||||||
| BlackRock Global Allocation VI Fund, Class I (Cost - $38,850,825) | 2,595,255 | 46,169,588 | |||||||||
SHORT-TERM INVESTMENTS - 4.5% | |||||||||||
MONEY MARKET FUNDS - 4.5% | |||||||||||
| Dreyfus Government Cash Management, 0.03% (a) | 7,720,928 | 7,720,928 | |||||||||
| Fidelity Investments Money Market Fund - Government Portfolio, Institutional Class, 0.01% (a) | 2,799,564 | 2,799,564 | |||||||||
| TOTAL SHORT-TERM INVESTMENTS (Cost - $10,520,492) | 10,520,492 | ||||||||||
| TOTAL INVESTMENTS - 98.1% (Cost - $193,900,995) | $ | 231,021,399 | |||||||||
| OTHER ASSETS LESS LIABILITIES - NET 1.9% | 4,522,125 | ||||||||||
TOTAL NET ASSETS - 100.0% | $ | 235,543,524 | |||||||||
(a) The rate shown is the annualized seven-day yield at period end.
See accompanying notes to financial statements.
16
Global Atlantic Franklin Dividend and Income Managed Risk Portfolio
Portfolio Review
December 31, 2021 (Unaudited)
Investment Objective
The Portfolio seeks to provide capital appreciation and income while seeking to manage volatility.
Management Review
The capital appreciation and income component is managed by Franklin Advisers, Inc. ("Franklin Advisers"), while the managed risk component is sub-advised by Milliman Financial Risk Management LLC ("Milliman").
How did the Portfolio perform during the period?
During 2021, the Portfolio underperformed its reference benchmark, the S&P 500 Managed Risk Index – Moderate. The Portfolio posted a return of 16.87% compared to a benchmark return of 17.71% a difference of -84 basis points. The following discussion of relative performance pertains to this benchmark unless otherwise noted.
What factors and allocation decisions influenced the Portfolio's performance?
Franklin Advisers employs a bottom-up stock selection process for the equity sleeve of the Portfolio's capital appreciation and income component, whereby the portfolio managers invest in securities without regard to benchmark comparisons. As a result, the Portfolio frequently contains sector and security allocations that may be significantly different from those of the S&P 500® Index. With respect to the equity sleeve's performance versus the S&P 500® Index, the equity sleeve of the Portfolio's capital appreciation and income component underperformed the S&P 500® Index (net of fees), posting a return of 27.53% compared to an S&P 500® Index return of 28.71%, a difference of -118 basis points.
Relative to the Portfolio's benchmark, an underweight and stock selection in financials, stock selection in consumer staples, and a combination of stock selection and an overweight in health care curbed relative performance. Factors that aided the Portfolio's performance included stock selection in the industrials sector, as well as in consumer discretionary and information technology ("IT"). The Portfolio's lack of exposure to the communication services and utilities sectors also contributed to its relative performance.
Among detractors from the Portfolio's performance, shares of medical technology company Medtronic PLC declined during the year, and the company missed revenue estimates in its most recent earnings report, citing the impact of a COVID-19 resurgence and staffing challenges in the health care industry, which pressured surgical procedure volumes. It additionally dipped in December on the news of a warning letter issued by the Food and Drug Administration about the inadequacy of medical device quality system requirements at one of its California facilities. Though Medtronic PLC's volumes remain vulnerable to the COVID-19 pandemic's path going forward, the Portfolio Managers believe its strong pipeline and proven ability to innovate should lead to promising results in the coming years. Roper Technologies, Inc., primarily an industrial software company, detracted amid some margin and cost pressures, despite strong organic growth. The company entered into agreements to divest three of its businesses in the second half of the year. In August, Roper Technologies, Inc. announced a deal to sell Zetec, Inc., a testing solutions subsidiary, for $350 million. In November, the company agreed to sell TransCore LP, a traffic management system development subsidiary, for $2.68 billion. Roper Technologies, Inc. is a high-quality company, in the view of the Portfolio Managers, and it continues to focus on improving its position in high-growth markets. Medical products supplier Becton, Dickinson and Company hindered relative performance amid concerns about the impact of the global pandemic on its routine medical procedures and a possible deceleration of Becton, Dickinson and Company's COVID-19 testing business. The Portfolio Managers believe that Becton, Dickinson and Company is using appropriately conservative estimates for its COVID-19 testing business, and that demand for related medical products and supplies will likely improve as routine health care services recover.
Among contributors, global IT services leader Accenture PLC continued to benefit from trends toward digital transformation across sectors, posting better-than-expected earnings on strong revenue growth, margin expansion and new bookings, especially for consulting services. Accenture PLC also raised its guidance amid elevated, sustained demand for digital, cloud and security services from businesses looking to improve processes and efficiency in an ongoing shift to hybrid working
17
Global Atlantic Franklin Dividend and Income Managed Risk Portfolio
Portfolio Review (Continued)
December 31, 2021 (Unaudited)
models. The company has been strategically enhancing its cloud and digital marketing suite through buyouts and partnerships. West Pharmaceutical Services, Inc., a drug packaging and delivery company, benefited from the need for supplies, such as syringes, seals and stoppers, to distribute COVID-19 vaccines. The company's recent earnings reports documented strong growth in sales, and even stronger profit growth. West Pharmaceutical Services, Inc.'s core non-COVID business has continued to perform well, especially in biologics. The company also boosted its guidance for the full year on the back of the robust results. Lithium producer Albemarle Corporation was also a leading contributor, benefiting from improving fundamentals in the lithium market, which have been bolstered by accelerating electric vehicle penetration forecasts. Prices for lithium and lithium-based chemicals more than doubled in 2021, and demand is forecast to rise sharply over the next five years, as battery costs continue to decline.
During 2021, the fixed income sleeve of the Portfolio's capital appreciation and income component outperformed the Bloomberg U.S. Aggregate Bond Index (net of fees), posting a return of -0.62% compared to the benchmark return of -1.54%, a difference of 92 basis points.
The Portfolio's overweight allocation to high-yield ("HY") corporate bonds was the primary driver of outperformance. Exposure to collateralized loan obligations ("CLOs") contributed to performance, as did overweight allocation to senior secured floating-rate bank loans and underweight allocation to investment-grade ("IG") corporate bonds. The Portfolio's overweight to non-agency residential mortgage-backed securities ("RMBS") benefited results, as did allocation to taxable and tax-exempt municipal bonds and U.S. Treasury Inflation-Protected Securities ("TIPS"). Allocation to non-U.S. dollar denominated developed market and emerging market ("EM") debt contributed to performance, as did security selection in sovereign developed market debt. Underweight allocation and security selection in agency mortgage-backed securities ("MBS") benefited results.
Conversely, the Portfolio's security selection in IG and HY corporate bonds and senior secured floating-rate loans detracted from performance. Security selection in sovereign EM debt hindered results, as did allocation to sovereign developed market debt. Security selection in taxable municipal bonds detracted from performance, as did exposure to commercial mortgage-backed securities ("CMBS") and allocation to Fannie Mae Delegated Underwriting and Servicing ("DUS") debt. The Portfolio's U.S. duration-positioning hindered results, mainly from the five-year portion of the curve. The Portfolio's non-U.S. yield curve exposure also detracted from performance. The Portfolio's foreign currency exposure hindered results; marginal gains from short New Zealand dollar positions were more than offset by losses from long Japanese yen, Turkish lira, Australian dollar, South Korean won, Russian ruble, Uruguayan peso and short euro positions.
The volatility environment experienced during the market's recovery in the second half of 2020 continued into 2021, with brief spikes in volatility occurring approximately every four to six weeks, and typically subsiding within a few days as concerns regarding COVID-19, inflation, and/or economic growth ebbed quickly. Despite these frequent volatility spikes, their amplitude and duration were generally not sufficient to warrant hedging by the managed risk component. As a result, hedging did not have a material impact on the Portfolio's overall performance in 2021.
How was the Portfolio positioned at period end?
From a sector perspective, at the end of the period, the equity portfolio of the Portfolio's largest sector concentration was industrials, followed by IT and health care. The Portfolio added positions in shipping company J.B. Hunt Transport Services, Inc., global financial services provider JPMorgan Chase & Co., and paint maker Sherwin-Williams Company. Among the positions the Portfolio Managers sold were pharmaceuticals firm Perrigo Company PLC, capital markets company State Street Corporation, and insurer Aflac Inc.
At period end, the fixed income portion of the Portfolio remained generally overweight corporate credit sectors, including HY corporate bonds, CLOs and senior secured floating-rate bank loans (with IG corporate bonds as the exception). While IG corporate bonds remain the Portfolio's largest allocation, it was reduced in 2021 and was underweight to the sector relative to the benchmark. The Portfolio Manager believes IG corporate bonds should still benefit from above trend growth, even if gross domestic product ("GDP") and earnings growth have peaked, however, the opportunity has become less compelling to the Portfolio Manager given tight valuations and marginally worse index credit quality. The Portfolio Manager has a positive view on senior secured floating rate loans and HY corporate bonds due to an expectation of limited defaults,
18
Global Atlantic Franklin Dividend and Income Managed Risk Portfolio
Portfolio Review (Continued)
December 31, 2021 (Unaudited)
ample issuer liquidity, strong economic underpinnings, and relative spreads. While 2022 could see continued volatility arising from persistent inflationary pressures, a shifting Fed reaction function, increased equity volatility and ongoing uncertainty from COVID-19 variants such as the latest Omicron variant, the Portfolio Manager nonetheless believes U.S. HY is positioned to provide attractive risk-adjusted returns given a combination of relative yield, moderate duration, and improving credit quality. The Portfolio Manager does not believe that there is a high probability of large-scale fundamental weakness in the loan market over the next year, especially to such a degree that it eclipses the significant technical tailwinds for floating rate assets. As a result, the Portfolio maintains a moderately bullish outlook for the bank loan sector, with the view that in 2022, technical conditions should remain strong and fundamentals broadly constructive with subdued default rates, against the backdrop of a rising interest rate environment. At the end of the period, within the securitized sectors, the Portfolio remained overweight in the residential mortgage-backed securities (RMBS) sector, as the Portfolio Manager expects continued fundamental strength of the US housing sector, bolstered by favorable supply/demand forces and historically low interest rates that should remain supportive for the sector. At the end of the period, the Portfolio remained underweight agency MBS and was short versus the benchmark in U.S. dollar duration. In terms of currency exposure, on the long side, the Portfolio's largest currency position was the Australian dollar at the end of the period.
The Portfolio's performance figures for the periods ended December 31, 2021 as compared to its benchmark:
Annualized | Operating Expense* | ||||||||||||||||||||||||||
| Inception Date | One Year | Five Years | Since Inception | Gross Ratio | Net Ratio | ||||||||||||||||||||||
Global Atlantic Franklin Dividend and Income Managed Risk Portfolio | |||||||||||||||||||||||||||
Class II | April 30, 2014 | 16.87 | % | 10.43 | % | 7.69 | % | 1.23 | % | 1.20 | % | ||||||||||||||||
S&P 500 Managed Risk Index - Moderate^ | 17.71 | % | 11.25 | % | 9.12 | % | |||||||||||||||||||||
The performance data quoted is historical. Past performance is no guarantee of future results. Current performance may be higher or lower than the performance data quoted. The principal value and investment return of an investment will fluctuate so that your shares, when redeemed, may be worth more or less than their original cost. Total returns would have been lower absent fee waivers by the Adviser. Performance figures for periods greater than one year are annualized. The returns shown do not reflect the deduction of taxes that a shareholder may pay on Portfolio distributions or on the redemption of Portfolio shares, as well as other charges and expenses of the insurance contract or separate account. Prior to July 5, 2017, the fixed-income sleeve of the Capital Appreciation and Income Component of the Portfolio was managed by the Adviser without the use of a sub-adviser. The performance prior to that date is attributable to the Adviser's asset allocation decisions.
The sub-adviser to the equity sleeve of the Capital Appreciation and Income Component of the Portfolio changed effective March 1, 2018 due to an organizational restructuring whereby all of the investment personnel responsible for the management of the equity sleeve transitioned from Franklin Advisory Services, LLC to Franklin Advisers.
* The estimated operating expense ratios for Class II shares, as disclosed in the most recent prospectus dated May 1, 2021. Ratios include Acquired Fund Fees and Expenses indirectly incurred by the Portfolio. Gross operating expense ratio reflects the ratio of expenses absent waivers and/or reimbursements by the Adviser. The operating expense ratios presented here may differ from the expense ratios disclosed in the Financial Highlights table in this report.
^ The S&P 500 Managed Risk Index - Moderate is designed to simulate a dynamic protective portfolio that allocates between the underlying equity index and cash, based on realized volatilities of the underlying equity and bond indices, while maintaining a fixed allocation of 30% to the underlying bond index.
19
Global Atlantic Franklin Dividend and Income Managed Risk Portfolio
Portfolio Review (Continued)
December 31, 2021 (Unaudited)
Comparison of the Change in Value of a $10,000 Investment

Holdings by Asset Class | % of Net Assets | ||||||
Common Stocks | 71.8 | % | |||||
Corporate Bonds and Notes | 8.7 | % | |||||
U.S. Treasury Securities | 5.7 | % | |||||
Asset Backed and Commercial Backed Securities | 4.2 | % | |||||
Agency Mortgage Backed Securities | 3.3 | % | |||||
Exchange Traded Funds | 1.1 | % | |||||
Sovereign Debts | 0.9 | % | |||||
Preferred Stocks | 0.0 | %^ | |||||
Purchased Options | 0.0 | %^ | |||||
Short-Term Investments | 5.8 | % | |||||
Municipal Bonds | 0.8 | % | |||||
Term Loans | 0.8 | % | |||||
Other Assets less Liabilities - Net | (3.1 | )% | |||||
100.0 | % | ||||||
Please refer to the Portfolio of Investments in this annual report for more information regarding the Portfolio's holdings as of December 31, 2021.
Derivative exposure is included in "Other Assets Less Liabilities - Net".
^ Represents less than 0.05%.
20
Global Atlantic Franklin Dividend and Income Managed Risk Portfolio
Portfolio of Investments
December 31, 2021
| Shares/ Principal | Fair Value | ||||||||||
COMMON STOCKS - 71.8% | |||||||||||
AEROSPACE & DEFENSE - 2.5% | |||||||||||
General Dynamics Corp. | 11,770 | $ | 2,453,692 | ||||||||
Raytheon Technologies Corp. | 52,755 | 4,540,095 | |||||||||
6,993,787 | |||||||||||
AIR FREIGHT & LOGISTICS - 1.5% | |||||||||||
United Parcel Service, Inc., Class B | 20,475 | 4,388,612 | |||||||||
BANKS - 1.0% | |||||||||||
JPMorgan Chase & Co. | 18,450 | 2,921,558 | |||||||||
BEVERAGES - 1.2% | |||||||||||
PepsiCo, Inc. | 20,000 | 3,474,200 | |||||||||
BIOTECHNOLOGY - 0.9% | |||||||||||
AbbVie, Inc. | 18,210 | 2,465,634 | |||||||||
BUILDING PRODUCTS - 2.1% | |||||||||||
Carlisle Cos., Inc. | 8,080 | 2,004,810 | |||||||||
Johnson Controls International PLC | 49,775 | 4,047,205 | |||||||||
6,052,015 | |||||||||||
CAPITAL MARKETS - 0.9% | |||||||||||
Nasdaq, Inc. | 12,190 | 2,560,022 | |||||||||
CHEMICALS - 7.6% | |||||||||||
Air Products and Chemicals, Inc. | 18,200 | 5,537,532 | |||||||||
Albemarle Corp. | 19,045 | 4,452,150 | |||||||||
Ecolab, Inc. | 13,100 | 3,073,129 | |||||||||
Linde PLC | 20,300 | 7,032,529 | |||||||||
Sherwin-Williams Co. (The) | 4,300 | 1,514,288 | |||||||||
21,609,628 | |||||||||||
COMMERCIAL SERVICES & SUPPLIES - 1.4% | |||||||||||
Cintas Corp. | 8,890 | 3,939,781 | |||||||||
CONSUMER DISCRETIONARY SERVICES - 0.0%† | |||||||||||
24 Hour Fitness Worldwide, Inc.* | 671 | 671 | |||||||||
ELECTRICAL EQUIPMENT - 0.5% | |||||||||||
nVent Electric PLC | 35,170 | 1,336,460 | |||||||||
ENERGY EQUIPMENT & SERVICES - 0.0%† | |||||||||||
Weatherford International PLC* | 1,897 | 52,585 | |||||||||
FOOD & STAPLES RETAILING - 0.9% | |||||||||||
Walmart, Inc. | 18,500 | 2,676,765 | |||||||||
FOOD PRODUCTS - 1.1% | |||||||||||
McCormick & Co., Inc. | 30,740 | 2,969,791 | |||||||||
| Shares/ Principal | Fair Value | ||||||||||
HEALTH CARE EQUIPMENT & SUPPLIES - 7.0% | |||||||||||
Abbott Laboratories | 32,475 | $ | 4,570,531 | ||||||||
Becton Dickinson and Co. | 17,500 | 4,400,900 | |||||||||
Medtronic PLC | 39,500 | 4,086,275 | |||||||||
Stryker Corp. | 25,985 | 6,948,909 | |||||||||
20,006,615 | |||||||||||
HEALTH CARE PROVIDERS & SERVICES - 2.1% | |||||||||||
CVS Health Corp. | 9,290 | 958,356 | |||||||||
UnitedHealth Group, Inc. | 10,025 | 5,033,954 | |||||||||
5,992,310 | |||||||||||
HOTELS, RESTAURANTS & LEISURE - 1.3% | |||||||||||
McDonald's Corp. | 13,620 | 3,651,113 | |||||||||
HOUSEHOLD PRODUCTS - 2.0% | |||||||||||
Colgate-Palmolive Co. | 26,166 | 2,233,006 | |||||||||
Procter & Gamble Co. (The) | 21,200 | 3,467,896 | |||||||||
5,700,902 | |||||||||||
INDUSTRIAL CONGLOMERATES - 4.6% | |||||||||||
Honeywell International, Inc. | 21,860 | 4,558,028 | |||||||||
Roper Technologies, Inc. | 17,115 | 8,418,184 | |||||||||
12,976,212 | |||||||||||
INSURANCE - 0.5% | |||||||||||
Erie Indemnity Co., Class A | 6,900 | 1,329,354 | |||||||||
IT SERVICES - 5.0% | |||||||||||
Accenture PLC, Class A | 23,400 | 9,700,470 | |||||||||
Visa, Inc., Class A | 21,020 | 4,555,244 | |||||||||
14,255,714 | |||||||||||
LIFE SCIENCES TOOLS & SERVICES - 1.9% | |||||||||||
West Pharmaceutical Services, Inc. | 11,700 | 5,487,417 | |||||||||
MACHINERY - 2.4% | |||||||||||
Donaldson Co., Inc. | 19,229 | 1,139,511 | |||||||||
Dover Corp. | 19,500 | 3,541,200 | |||||||||
Pentair PLC | 30,970 | 2,261,739 | |||||||||
6,942,450 | |||||||||||
MULTILINE RETAIL - 1.7% | |||||||||||
Target Corp. | 21,400 | 4,952,816 | |||||||||
OIL, GAS & CONSUMABLE FUELS - 1.4% | |||||||||||
Chevron Corp. | 13,700 | 1,607,695 | |||||||||
EOG Resources, Inc. | 16,900 | 1,501,227 | |||||||||
Exxon Mobil Corp. | 15,600 | 954,564 | |||||||||
4,063,486 | |||||||||||
PHARMACEUTICALS - 2.0% | |||||||||||
Johnson & Johnson | 20,500 | 3,506,935 | |||||||||
Pfizer, Inc. | 35,600 | 2,102,180 | |||||||||
5,609,115 | |||||||||||
See accompanying notes to financial statements.
21
Global Atlantic Franklin Dividend and Income Managed Risk Portfolio
Portfolio of Investments (Continued)
December 31, 2021
| Shares/ Principal | Fair Value | ||||||||||
ROAD & RAIL - 1.4% | |||||||||||
JB Hunt Transport Services, Inc. | 4,900 | $ | 1,001,560 | ||||||||
Norfolk Southern Corp. | 9,650 | 2,872,902 | |||||||||
3,874,462 | |||||||||||
SEMICONDUCTORS & SEMICONDUCTOR EQUIPMENT - 4.5% | |||||||||||
Analog Devices, Inc. | 36,471 | 6,410,508 | |||||||||
Texas Instruments, Inc. | 33,500 | 6,313,745 | |||||||||
12,724,253 | |||||||||||
SOFTWARE - 6.9% | |||||||||||
Microsoft Corp. | 58,685 | 19,736,939 | |||||||||
SPECIALTY RETAIL - 3.0% | |||||||||||
Lowe's Cos., Inc. | 20,300 | 5,247,144 | |||||||||
Ross Stores, Inc. | 28,100 | 3,211,268 | |||||||||
8,458,412 | |||||||||||
TEXTILES, APPAREL & LUXURY GOODS - 1.7% | |||||||||||
NIKE, Inc., Class B | 29,740 | 4,956,766 | |||||||||
TRADING COMPANIES & DISTRIBUTORS - 0.8% | |||||||||||
WW Grainger, Inc. | 4,370 | 2,264,709 | |||||||||
| TOTAL COMMON STOCKS (Cost - $81,951,909) | 204,424,554 | ||||||||||
CORPORATE BONDS AND NOTES - 8.7% | |||||||||||
AEROSPACE & DEFENSE - 0.1% | |||||||||||
Boeing Co. (The), 5.15%, 5/1/30 | $ | 150,000 | 174,927 | ||||||||
Northrop Grumman Corp., 5.25%, 5/1/50 | 100,000 | 140,545 | |||||||||
315,472 | |||||||||||
AGRICULTURE - 0.1% | |||||||||||
Altria Group, Inc., 3.40%, 5/6/30 | 300,000 | 310,692 | |||||||||
AIRLINES - 0.3% | |||||||||||
| American Airlines, Inc./AAdvantage Loyalty IP Ltd., 5.75%, 4/20/29 (a) | 100,000 | 106,759 | |||||||||
| Delta Air Lines, Inc. / SkyMiles IP Ltd., 4.50%, 10/20/25 (a) | 300,000 | 315,399 | |||||||||
| Hawaiian Brand Intellectual Property Ltd. / HawaiianMiles Loyalty Ltd., 5.75%, 1/20/26 (a) | 150,000 | 156,937 | |||||||||
| International Consolidated Airlines Group SA, 3.75%, 3/25/29 | EUR | 200,000 | 221,890 | ||||||||
| United Airlines 2020-1 Class B Pass-Through Trust, 4.88%, 1/15/26 | 44,900 | 46,584 | |||||||||
United Airlines, Inc., 4.38%, 4/15/26 (a) | 100,000 | 104,274 | |||||||||
951,843 | |||||||||||
BANKS - 1.0% | |||||||||||
Banco de Chile, 2.99%, 12/9/31 (a) | 200,000 | 197,152 | |||||||||
Banco Santander SA, 2.75%, 12/3/30 | 200,000 | 195,921 | |||||||||
Bank of America Corp. | |||||||||||
3.50%, 4/19/26 | 500,000 | 538,878 | |||||||||
2.59%, (SOFR + 2.15%), 4/29/31 (b) | 100,000 | 101,121 | |||||||||
| Shares/ Principal | Fair Value | ||||||||||
BANKS - 1.0% (Continued) | |||||||||||
| Citigroup, Inc., 2.57%, (SOFR + 2.11%), 6/3/31 (b) | $ | 100,000 | $ | 100,970 | |||||||
| Goldman Sachs Group, Inc. (The), 1.99%, (SOFR + 1.09%), 1/27/32 (b) | 300,000 | 287,959 | |||||||||
| HSBC Holdings PLC, 2.36%, (SOFR + 1.95%), 8/18/31 (b) | 200,000 | 195,607 | |||||||||
| JPMorgan Chase & Co., 4.49%, (SOFR + 3.79%), 3/24/31 (b) | 400,000 | 463,329 | |||||||||
Morgan Stanley, 3.88%, 1/27/26 | 400,000 | 432,748 | |||||||||
| Societe Generale SA, 1.79%, (US 1 Year CMT T-Note + 1.00%), 6/9/27 (a),(b) | 200,000 | 195,806 | |||||||||
| UniCredit SpA, 1.98%, (US 1 Year CMT T-Note + 1.20%), 6/3/27 (a),(b) | 200,000 | 194,963 | |||||||||
2,904,454 | |||||||||||
BEVERAGES - 0.0%† | |||||||||||
| Anheuser-Busch Cos., LLC / Anheuser-Busch InBev Worldwide, Inc., 4.70%, 2/1/36 | 100,000 | 120,854 | |||||||||
BIOTECHNOLOGY - 0.1% | |||||||||||
| Regeneron Pharmaceuticals, Inc., 1.75%, 9/15/30 | 50,000 | 47,335 | |||||||||
Royalty Pharma PLC, 2.15%, 9/2/31 | 300,000 | 283,734 | |||||||||
331,069 | |||||||||||
CHEMICALS - 0.4% | |||||||||||
Alpek SAB de CV, 3.25%, 2/25/31 (a) | 200,000 | 199,500 | |||||||||
| Braskem Netherlands Finance BV, 4.50%, 1/31/30 (a) | 200,000 | 212,700 | |||||||||
CF Industries, Inc., 5.15%, 3/15/34 | 100,000 | 120,500 | |||||||||
Sasol Financing USA LLC, 6.50%, 9/27/28 | 200,000 | 216,700 | |||||||||
| Unifrax Escrow Issuer Corp., 5.25%, 9/30/28 (a) | 100,000 | 101,075 | |||||||||
Westlake Chemical Corp., 3.38%, 6/15/30 | 50,000 | 53,043 | |||||||||
Yara International ASA, 3.15%, 6/4/30 (a) | 100,000 | 103,266 | |||||||||
1,006,784 | |||||||||||
COMMERCIAL SERVICES - 0.1% | |||||||||||
| APCOA Parking Holdings GmbH, 4.63%, 1/15/27 (a) | EUR | 100,000 | 112,628 | ||||||||
| MPH Acquisition Holdings LLC, 5.50%, 9/1/28 (a) | 100,000 | 101,375 | |||||||||
| Nielsen Finance LLC / Nielsen Finance Co., 4.75%, 7/15/31 (a) | 100,000 | 98,750 | |||||||||
312,753 | |||||||||||
COMPUTERS - 0.1% | |||||||||||
Presidio Holdings, Inc., 8.25%, 2/1/28 (a) | 100,000 | 106,500 | |||||||||
Teledyne FLIR LLC, 2.50%, 8/1/30 | 50,000 | 50,160 | |||||||||
156,660 | |||||||||||
See accompanying notes to financial statements.
22
Global Atlantic Franklin Dividend and Income Managed Risk Portfolio
Portfolio of Investments (Continued)
December 31, 2021
| Shares/ Principal | Fair Value | ||||||||||
COSMETICS & PERSONAL CARE - 0.1% | |||||||||||
Avon Products, Inc., 6.50%, 3/15/23 | $ | 135,000 | $ | 141,581 | |||||||
| Oriflame Investment Holding PLC, 5.13%, 5/4/26 (a) | 200,000 | 184,200 | |||||||||
325,781 | |||||||||||
DIVERSIFIED FINANCIAL SERVICES - 0.1% | |||||||||||
| AerCap Ireland Capital DAC / AerCap Global Aviation Trust, 3.40%, 10/29/33 | 150,000 | 152,918 | |||||||||
ELECTRIC - 1.1% | |||||||||||
Calpine Corp., 5.13%, 3/15/28 (a) | 100,000 | 101,516 | |||||||||
Colbun SA, 3.15%, 3/6/30 (a) | 200,000 | 200,000 | |||||||||
| Comision Federal de Electricidad, 3.35%, 2/9/31 (a) | 200,000 | 195,744 | |||||||||
Dominion Energy, Inc., 3.38%, 4/1/30 | 100,000 | 106,221 | |||||||||
Duke Energy Carolinas LLC, 6.10%, 6/1/37 | 100,000 | 135,848 | |||||||||
Duke Energy Corp., 3.75%, 9/1/46 | 100,000 | 107,043 | |||||||||
EDP Finance BV, 1.71%, 1/24/28 (a) | 200,000 | 194,706 | |||||||||
| Electricite de France SA, 5.25%, (USD 10 Year Swap + 3.71%), 7/29/70 (a),(b) | 400,000 | 414,724 | |||||||||
| Enel Finance International NV, 3.50%, 4/6/28 (a) | 200,000 | 213,941 | |||||||||
Exelon Corp., 4.05%, 4/15/30 | 200,000 | 222,424 | |||||||||
InterGen NV, 7.00%, 6/30/23 (a) | 200,000 | 198,500 | |||||||||
| Israel Electric Corp. Ltd., 4.25%, 8/14/28 (a) | 200,000 | 219,580 | |||||||||
| Leeward Renewable Energy Operations LLC, 4.25%, 7/1/29 (a) | 100,000 | 101,000 | |||||||||
PacifiCorp, 6.10%, 8/1/36 | 100,000 | 135,655 | |||||||||
Southern Co. (The), 3.70%, 4/30/30 | 150,000 | 163,291 | |||||||||
Talen Energy Supply LLC, 7.25%, 5/15/27 (a) | 100,000 | 88,500 | |||||||||
Vistra Operations Co. LLC | |||||||||||
4.38%, 5/1/29 (a) | 100,000 | 100,163 | |||||||||
4.30%, 7/15/29 (a) | 300,000 | 321,093 | |||||||||
3,219,949 | |||||||||||
ELECTRONICS - 0.1% | |||||||||||
Flex Ltd., 4.88%, 5/12/30 | 200,000 | 228,270 | |||||||||
FOOD - 0.3% | |||||||||||
B&G Foods, Inc., 5.25%, 9/15/27 | 100,000 | 103,375 | |||||||||
Bimbo Bakeries USA, Inc., 4.00%, 5/17/51 (a) | 200,000 | 216,804 | |||||||||
Cencosud SA, 4.38%, 7/17/27 (a) | 200,000 | 214,204 | |||||||||
JBS Finance Luxembourg Sarl | |||||||||||
2.50%, 1/15/27 (a) | 200,000 | 197,752 | |||||||||
3.63%, 1/15/32 (a) | 200,000 | 200,752 | |||||||||
932,887 | |||||||||||
FOREST PRODUCTS & PAPER - 0.1% | |||||||||||
Suzano Austria GmbH, 3.13%, 1/15/32 | 200,000 | 193,502 | |||||||||
| Shares/ Principal | Fair Value | ||||||||||
HEALTHCARE-PRODUCTS - 0.1% | |||||||||||
PerkinElmer, Inc., 2.25%, 9/15/31 | $ | 200,000 | $ | 194,702 | |||||||
| STERIS Irish FinCo UnLtd Co., 2.70%, 3/15/31 | 100,000 | 100,969 | |||||||||
295,671 | |||||||||||
HEALTHCARE-SERVICES - 0.3% | |||||||||||
Anthem, Inc., 4.65%, 1/15/43 | 100,000 | 125,294 | |||||||||
Centene Corp., 3.00%, 10/15/30 | 100,000 | 101,651 | |||||||||
| CHS/Community Health Systems, Inc., 5.63%, 3/15/27 (a) | 100,000 | 105,833 | |||||||||
DaVita, Inc., 4.63%, 6/1/30 (a) | 100,000 | 102,375 | |||||||||
| Kaiser Foundation Hospitals, 3.27%, 11/1/49 | 140,000 | 150,348 | |||||||||
| Orlando Health Obligated Group, 3.78%, 10/1/28 | 35,000 | 38,194 | |||||||||
Quest Diagnostics, Inc., 2.80%, 6/30/31 | 245,000 | 253,236 | |||||||||
876,931 | |||||||||||
HOME BUILDERS - 0.0%† | |||||||||||
| Ashton Woods USA LLC / Ashton Woods Finance Co., 4.63%, 8/1/29 (a) | 100,000 | 98,750 | |||||||||
INSURANCE - 0.2% | |||||||||||
Aflac, Inc., 3.60%, 4/1/30 | 100,000 | 110,337 | |||||||||
Arch Capital Group Ltd., 3.64%, 6/30/50 | 200,000 | 214,743 | |||||||||
| Metropolitan Life Global Funding I, 2.95%, 4/9/30 (a) | 150,000 | 158,331 | |||||||||
Radian Group, Inc., 4.88%, 3/15/27 | 200,000 | 214,613 | |||||||||
698,024 | |||||||||||
INTERNET - 0.2% | |||||||||||
| Alibaba Group Holding Ltd., 4.40%, 12/6/57 | 200,000 | 228,019 | |||||||||
| Match Group Holdings II LLC, 3.63%, 10/1/31 (a) | 100,000 | 97,125 | |||||||||
Tencent Holdings Ltd., 2.39%, 6/3/30 (a) | 200,000 | 196,077 | |||||||||
521,221 | |||||||||||
LEISURE TIME - 0.2% | |||||||||||
Carnival Corp., 5.75%, 3/1/27 (a) | 72,000 | 72,000 | |||||||||
NCL Corp. Ltd., 5.88%, 3/15/26 (a) | 200,000 | 199,114 | |||||||||
| Royal Caribbean Cruises Ltd., 5.50%, 8/31/26 (a) | 200,000 | 203,360 | |||||||||
474,474 | |||||||||||
LODGING - 0.3% | |||||||||||
Boyd Gaming Corp., 4.75%, 6/15/31 (a) | 100,000 | 102,000 | |||||||||
| Genting New York LLC / GENNY Capital, Inc., 3.30%, 2/15/26 (a) | 200,000 | 198,085 | |||||||||
Las Vegas Sands Corp., 3.90%, 8/8/29 | 100,000 | 100,785 | |||||||||
| Melco Resorts Finance Ltd., 5.75%, 7/21/28 (a) | 200,000 | 201,100 | |||||||||
See accompanying notes to financial statements.
23
Global Atlantic Franklin Dividend and Income Managed Risk Portfolio
Portfolio of Investments (Continued)
December 31, 2021
| Shares/ Principal | Fair Value | ||||||||||
LODGING - 0.3% (Continued) | |||||||||||
| Studio City Finance Ltd., 5.00%, 1/15/29 (a) | $ | 200,000 | $ | 179,000 | |||||||
Wynn Macau Ltd., 5.63%, 8/26/28 (a) | 200,000 | 185,197 | |||||||||
966,167 | |||||||||||
MACHINERY-CONSTRUCTION & MINING - 0.0%† | |||||||||||
Caterpillar, Inc., 2.60%, 4/9/30 | 50,000 | 52,154 | |||||||||
MACHINERY-DIVERSIFIED - 0.0%† | |||||||||||
| Westinghouse Air Brake Technologies Corp., 3.20%, 6/15/25 | 50,000 | 52,059 | |||||||||
MEDIA - 0.3% | |||||||||||
| Charter Communications Operating LLC / Charter Communications Operating Capital, 2.80%, 4/1/31 | 200,000 | 197,867 | |||||||||
| Diamond Sports Group LLC / Diamond Sports Finance Co., 5.38%, 8/15/26 (a) | 200,000 | 100,000 | |||||||||
Fox Corp., 3.50%, 4/8/30 | 200,000 | 215,448 | |||||||||
Time Warner Cable LLC, 6.75%, 6/15/39 | 100,000 | 136,550 | |||||||||
| Univision Communications, Inc., 5.13%, 2/15/25 (a) | 100,000 | 101,000 | |||||||||
750,865 | |||||||||||
MULTI-NATIONAL - 0.1% | |||||||||||
| African Export-Import Bank (The), 3.99%, 9/21/29 (a) | 200,000 | 206,286 | |||||||||
| Banque Ouest Africaine de Developpement, 5.00%, 7/27/27 (a) | 200,000 | 220,436 | |||||||||
426,722 | |||||||||||
OIL & GAS - 0.5% | |||||||||||
Aker BP ASA, 4.00%, 1/15/31 (a) | 200,000 | 216,474 | |||||||||
| BP Capital Markets America, Inc., 3.94%, 9/21/28 | 100,000 | 110,801 | |||||||||
| Continental Resources, Inc./Ok, 5.75%, 1/15/31 (a) | 200,000 | 235,524 | |||||||||
Ecopetrol SA | |||||||||||
5.38%, 6/26/26 | 100,000 | 105,376 | |||||||||
4.63%, 11/2/31 | 100,000 | 97,220 | |||||||||
Exxon Mobil Corp., 2.61%, 10/15/30 | 100,000 | 103,750 | |||||||||
| Harvest Operations Corp., 4.20%, 6/1/23 (a) | 100,000 | 104,056 | |||||||||
| Occidental Petroleum Corp., 6.13%, 1/1/31 | 100,000 | 121,860 | |||||||||
Petroleos Mexicanos, 6.63%, 6/15/35 | 80,000 | 76,864 | |||||||||
Phillips 66, 2.15%, 12/15/30 | 100,000 | 96,344 | |||||||||
| Sunoco LP / Sunoco Finance Corp., 4.50%, 5/15/29 | 100,000 | 101,552 | |||||||||
| TotalEnergies Capital International SA, 3.46%, 2/19/29 | 100,000 | 108,421 | |||||||||
1,478,242 | |||||||||||
| Shares/ Principal | Fair Value | ||||||||||
OIL & GAS SERVICES - 0.1% | |||||||||||
| Baker Hughes Holdings LLC / Baker Hughes Co-Obligor, Inc., 4.49%, 5/1/30 | $ | 50,000 | $ | 57,411 | |||||||
| Schlumberger Holdings Corp., 3.90%, 5/17/28 (a) | 150,000 | 162,153 | |||||||||
219,564 | |||||||||||
PACKAGING & CONTAINERS - 0.1% | |||||||||||
| Amcor Flexibles North America, Inc., 2.63%, 6/19/30 | 50,000 | 50,229 | |||||||||
| Mauser Packaging Solutions Holding Co., 7.25%, 4/15/25 (a) | 150,000 | 150,380 | |||||||||
| Pactiv Evergreen Group Issuer, Inc. / Pactiv Evergreen Group Issuer LLC / Reynolds Gro, 4.00%, 10/15/27 (a) | 100,000 | 97,250 | |||||||||
WRKCo, Inc., 3.00%, 6/15/33 | 50,000 | 51,483 | |||||||||
349,342 | |||||||||||
PHARMACEUTICALS - 0.3% | |||||||||||
AbbVie, Inc. | |||||||||||
3.20%, 11/21/29 | 100,000 | 107,019 | |||||||||
4.55%, 3/15/35 | 100,000 | 120,578 | |||||||||
| Bayer US Finance II LLC, 4.38%, 12/15/28 (a) | 100,000 | 111,784 | |||||||||
CVS Health Corp., 4.78%, 3/25/38 | 100,000 | 122,219 | |||||||||
| Endo Luxembourg Finance Co. I Sarl / Endo US, Inc., 6.13%, 4/1/29 (a) | 100,000 | 98,000 | |||||||||
Prestige Brands, Inc., 3.75%, 4/1/31 (a) | 100,000 | 97,000 | |||||||||
| Teva Pharmaceutical Finance Netherlands III BV, 5.13%, 5/9/29 | 100,000 | 98,031 | |||||||||
754,631 | |||||||||||
PIPELINES - 0.6% | |||||||||||
Boardwalk Pipelines LP, 3.40%, 2/15/31 | 125,000 | 129,164 | |||||||||
Cheniere Energy, Inc., 4.63%, 10/15/28 | 100,000 | 105,750 | |||||||||
| Crestwood Midstream Partners LP / Crestwood Midstream Finance Corp., 6.00%, 2/1/29 (a) | 100,000 | 103,875 | |||||||||
Energy Transfer LP | |||||||||||
4.75%, 1/15/26 | 100,000 | 109,329 | |||||||||
4.95%, 5/15/28 | 100,000 | 110,992 | |||||||||
Enterprise Products Operating LLC | |||||||||||
3.13%, 7/31/29 | 100,000 | 106,286 | |||||||||
4.45%, 2/15/43 | 100,000 | 114,398 | |||||||||
Rattler Midstream LP, 5.63%, 7/15/25 (a) | 100,000 | 104,000 | |||||||||
| Sabine Pass Liquefaction LLC, 5.00%, 3/15/27 | 400,000 | 449,521 | |||||||||
TransCanada PipeLines Ltd. | |||||||||||
4.25%, 5/15/28 | 100,000 | 111,597 | |||||||||
4.88%, 5/15/48 | 200,000 | 255,158 | |||||||||
See accompanying notes to financial statements.
24
Global Atlantic Franklin Dividend and Income Managed Risk Portfolio
Portfolio of Investments (Continued)
December 31, 2021
| Shares/ Principal | Fair Value | ||||||||||
PIPELINES - 0.6% (Continued) | |||||||||||
| Venture Global Calcasieu Pass LLC, 4.13%, 8/15/31 (a) | $ | 100,000 | $ | 106,000 | |||||||
| Williams Cos., Inc. (The), 3.50%, 11/15/30 | 50,000 | 53,200 | |||||||||
1,859,270 | |||||||||||
REITS - 0.3% | |||||||||||
Equinix, Inc., 1.45%, 5/15/26 | 50,000 | 49,035 | |||||||||
| Healthcare Trust of America Holdings LP, 2.00%, 3/15/31 | 300,000 | 284,177 | |||||||||
| MPT Operating Partnership LP / MPT Finance Corp, 3.50%, 3/15/31 | 100,000 | 101,125 | |||||||||
| National Retail Properties, Inc., 4.30%, 10/15/28 | 300,000 | 337,549 | |||||||||
771,886 | |||||||||||
RETAIL - 0.1% | |||||||||||
Kohl's Corp., 3.38%, 5/1/31 | 200,000 | 203,903 | |||||||||
Murphy Oil USA, Inc., 4.75%, 9/15/29 | 100,000 | 105,250 | |||||||||
309,153 | |||||||||||
SEMICONDUCTORS - 0.1% | |||||||||||
SK Hynix, Inc., 2.38%, 1/19/31 (a) | 200,000 | 192,607 | |||||||||
SOFTWARE - 0.1% | |||||||||||
Fiserv, Inc., 2.65%, 6/1/30 | 100,000 | 101,572 | |||||||||
MSCI, Inc., 3.25%, 8/15/33 (a) | 100,000 | 101,125 | |||||||||
202,697 | |||||||||||
TELECOMMUNICATIONS - 0.4% | |||||||||||
Altice France SA, 5.50%, 1/15/28 (a) | 200,000 | 198,254 | |||||||||
AT&T, Inc., 3.50%, 6/1/41 | 300,000 | 309,169 | |||||||||
| CommScope Technologies LLC, 5.00%, 3/15/27 (a) | 100,000 | 93,500 | |||||||||
T-Mobile USA, Inc. | |||||||||||
3.88%, 4/15/30 | 300,000 | 328,538 | |||||||||
3.30%, 2/15/51 | 100,000 | 98,035 | |||||||||
1,027,496 | |||||||||||
TEXTILES - 0.1% | |||||||||||
Mohawk Industries, Inc., 3.63%, 5/15/30 | 200,000 | 214,558 | |||||||||
TRANSPORTATION - 0.2% | |||||||||||
CSX Corp., 4.10%, 3/15/44 | 100,000 | 116,038 | |||||||||
FedEx Corp., 4.05%, 2/15/48 | 200,000 | 225,293 | |||||||||
| First Student Bidco, Inc. / First Transit Parent, Inc., 4.00%, 7/31/29 (a) | 100,000 | 97,200 | |||||||||
438,531 | |||||||||||
TRUCKING & LEASING - 0.1% | |||||||||||
DAE Funding LLC, 1.55%, 8/1/24 (a) | 200,000 | 198,500 | |||||||||
| TOTAL CORPORATE BONDS AND NOTES (Cost - $24,184,671) | 24,693,403 | ||||||||||
| Shares/ Principal | Fair Value | ||||||||||
U.S. TREASURY SECURITIES - 5.7% | |||||||||||
U.S. Treasury Note | |||||||||||
0.13%, 1/31/23 | $ | 350,000 | $ | 348,797 | |||||||
1.13%, 2/28/25 | 750,000 | 752,871 | |||||||||
0.25%, 6/30/25 | 900,000 | 874,687 | |||||||||
0.25%, 7/31/25 | 1,100,000 | 1,067,387 | |||||||||
0.25%, 8/31/25 | 500,000 | 484,551 | |||||||||
0.25%, 9/30/25 | 1,900,000 | 1,840,625 | |||||||||
0.38%, 11/30/25 | 2,065,000 | 2,003,534 | |||||||||
0.38%, 12/31/25 | 3,370,000 | 3,267,978 | |||||||||
1.38%, 11/15/31 | 99,000 | 97,871 | |||||||||
U.S. Treasury Bond | |||||||||||
1.13%, 5/15/40 | 465,000 | 408,855 | |||||||||
1.13%, 8/15/40 | 725,000 | 635,055 | |||||||||
1.75%, 8/15/41 | 345,000 | 335,566 | |||||||||
3.13%, 11/15/41 | 325,000 | 391,739 | |||||||||
2.50%, 5/15/46†† | 915,000 | 1,015,150 | |||||||||
2.25%, 8/15/46 | 405,000 | 429,917 | |||||||||
2.75%, 8/15/47 | 150,000 | 175,242 | |||||||||
2.75%, 11/15/47 | 319,000 | 372,869 | |||||||||
3.13%, 5/15/48 | 100,000 | 125,469 | |||||||||
3.00%, 8/15/48 | 330,000 | 405,410 | |||||||||
2.88%, 5/15/49 | 100,000 | 120,957 | |||||||||
1.25%, 5/15/50 | 720,000 | 614,362 | |||||||||
2.38%, 5/15/51 | 305,000 | 338,359 | |||||||||
1.88%, 11/15/51 | 140,000 | 139,541 | |||||||||
| TOTAL U.S. TREASURY SECURITIES (Cost - $16,083,832) | 16,246,792 | ||||||||||
ASSET BACKED AND COMMERCIAL BACKED SECURITIES - 4.2% | |||||||||||
| Adagio CLO VIII DAC, 1.65%, (3 Month EUR Libor + 1.65%), 4/15/32 (a),(b) | EUR | 250,000 | 284,329 | ||||||||
| AMMC CLO 21 Ltd., 2.23%, (3 Month US Libor + 2.10%), 11/2/30 (a),(b) | 300,000 | 298,174 | |||||||||
| AMMC CLO XI Ltd., 2.03%, (3 Month US Libor + 1.90%), 4/30/31 (a),(b) | 400,000 | 395,996 | |||||||||
| Antares CLO 2018-1 Ltd., 1.78%, (3 Month US Libor + 1.65%), 4/20/31 (a),(b) | 250,000 | 248,753 | |||||||||
| BlueMountain Fuji Eur CLO V DAC, 1.55%, (3 Month EUR Libor + 1.55%), 1/15/33 (a),(b) | EUR | 250,000 | 280,007 | ||||||||
| BRAVO Residential Funding Trust 2019-1, 3.50%, 3/25/58 (a) | 37,087 | 37,370 | |||||||||
| BRAVO Residential Funding Trust 2019-NQM2, 3.50%, 10/25/44 (a),(c) | 84,988 | 87,333 | |||||||||
| BX 2021-LBA3 Mortgage Trust, 1.01%, (1 Month US Libor + 0.90%), 10/15/36 (a),(b) | 130,000 | 129,685 | |||||||||
See accompanying notes to financial statements.
25
Global Atlantic Franklin Dividend and Income Managed Risk Portfolio
Portfolio of Investments (Continued)
December 31, 2021
| Shares/ Principal | Fair Value | ||||||||||
ASSET BACKED AND COMMERCIAL BACKED SECURITIES - 4.2% (Continued) | |||||||||||
| BX Commercial Mortgage Trust 2021-VOLT, 1.06%, (1 Month US Libor + 0.95%), 9/15/36 (a),(b) | $ | 130,000 | $ | 128,799 | |||||||
| Carlyle GMS Finance MM CLO 2015-1 LLC, 2.32%, (3 Month US Libor + 2.20%), 10/15/31 (a),(b) | 250,000 | 248,478 | |||||||||
| CARLYLE US CLO 2017-4 Ltd., 2.92%, (3 Month US Libor + 2.80%), 1/15/30 (a),(b) | 200,000 | 192,689 | |||||||||
| Cent CLO 21 Ltd., 3.33%, (3 Month US Libor + 3.20%), 7/27/30 (a),(b) | 250,000 | 241,552 | |||||||||
| CIM Trust 2018-INV1, 4.00%, 8/25/48 (a),(c) | 34,664 | 35,180 | |||||||||
| CIM Trust 2019-INV1, 4.00%, 2/25/49 (a),(c) | 26,363 | 26,683 | |||||||||
| DBCG Mortgage Trust 2017-BBG, 0.81%, (1 Month US Libor + 0.70%), 6/15/34 (a),(b) | 160,000 | 159,568 | |||||||||
| Eleven Madison Trust 2015-11MD Mortgage Trust, 3.55%, 9/10/35 (a),(c) | 250,000 | 262,862 | |||||||||
| Ellington CLO III Ltd., 1.78%, (3 Month US Libor + 1.65%), 7/20/30 (a),(b) | 237,220 | 237,247 | |||||||||
Fannie Mae Connecticut Avenue Securities | |||||||||||
| 5.35%, (1 Month US Libor + 5.25%), 10/25/23 (b) | 64,378 | 66,631 | |||||||||
| 4.50%, (1 Month US Libor + 4.40%), 1/25/24 (b) | 98,832 | 102,441 | |||||||||
| 2.70%, (1 Month US Libor + 2.60%), 5/25/24 (b) | 94,558 | 96,167 | |||||||||
| 3.00%, (1 Month US Libor + 2.90%), 7/25/24 (b) | 72,828 | 73,944 | |||||||||
| 5.00%, (1 Month US Libor + 4.90%), 11/25/24 (b) | 123,210 | 127,983 | |||||||||
| 4.10%, (1 Month US Libor + 4.00%), 5/25/25 (b) | 6,582 | 6,599 | |||||||||
| 5.10%, (1 Month US Libor + 5.00%), 7/25/25 (b) | 7,344 | 7,363 | |||||||||
| 6.10%, (1 Month US Libor + 6.00%), 9/25/28 (b) | 291,153 | 301,127 | |||||||||
| 5.40%, (1 Month US Libor + 5.30%), 10/25/28 (b) | 285,830 | 296,704 | |||||||||
| 4.55%, (1 Month US Libor + 4.45%), 1/25/29 (b) | 89,595 | 92,781 | |||||||||
| FirstKey Homes 2020-SFR2 Trust, 1.27%, 10/19/37 (a) | 149,573 | 145,770 | |||||||||
| Freddie Mac Structured Agency Credit Risk Debt Notes | |||||||||||
| 4.10%, (1 Month US Libor + 4.00%), 8/25/24 (b) | 108,933 | 111,038 | |||||||||
| 4.00%, (1 Month US Libor + 3.90%), 12/25/27 (b) | 70,911 | 71,027 | |||||||||
| 4.80%, (1 Month US Libor + 4.70%), 4/25/28 (b) | 146,340 | 151,140 | |||||||||
| Shares/ Principal | Fair Value | ||||||||||
ASSET BACKED AND COMMERCIAL BACKED SECURITIES - 4.2% (Continued) | |||||||||||
| Freddie Mac Structured Agency Credit Risk Debt Notes (continued) | |||||||||||
| 5.65%, (1 Month US Libor + 5.55%), 7/25/28 (b) | $ | 351,134 | $ | 365,116 | |||||||
| 4.75%, (1 Month US Libor + 4.65%), 10/25/28 (b) | 268,697 | 277,685 | |||||||||
| 5.25%, (1 Month US Libor + 5.15%), 11/25/28 (b) | 159,538 | 165,062 | |||||||||
| Halcyon Loan Advisors Funding 2018-1 Ltd., 1.93%, (3 Month US Libor + 1.80%), 7/21/31 (a),(b) | 170,000 | 169,583 | |||||||||
| Holland Park CLO DAC, 0.92%, (3 Month EUR Libor + 0.92%), 11/14/32 (a),(b) | EUR | 500,000 | 568,263 | ||||||||
| Home Partners of America 2021-3 Trust, 2.65%, 1/17/41 (a) | 80,000 | 79,182 | |||||||||
| Home Partners of America Trust 2021-2, 2.30%, 12/17/26 (a) | 209,877 | 207,052 | |||||||||
| JP Morgan Mortgage Trust, 2.50%, 6/25/52 (a),(c) | 120,000 | 121,041 | |||||||||
| JP Morgan Mortgage Trust 2021-13, 2.50%, 4/25/52 (a),(c) | 256,642 | 258,547 | |||||||||
| JP Morgan Mortgage Trust 2021-14, 2.50%, 5/25/52 (a),(c) | 187,356 | 188,980 | |||||||||
| LCM XXV Ltd., 2.43%, (3 Month US Libor + 2.30%), 7/20/30 (a),(b) | 440,000 | 436,875 | |||||||||
| Madison Park Euro Funding VIII DAC, 0.95%, (3 Month EUR Libor + 0.95%), 4/15/32 (a),(b) | EUR | 600,000 | 682,334 | ||||||||
| Madison Park Funding XXII Ltd., 2.12%, (3 Month US Libor + 2.00%), 1/15/33 (a),(b) | 250,000 | 250,004 | |||||||||
| Mill City Mortgage Loan Trust 2016-1, 2.50%, 4/25/57 (a),(c) | 6,309 | 6,301 | |||||||||
| Mill City Mortgage Loan Trust 2018-4, 3.50%, 4/25/66 (a),(c) | 128,892 | 132,376 | |||||||||
| Neuberger Berman Loan Advisers CLO 27 Ltd., 1.22%, (3 Month US Libor + 1.10%), 1/15/30 (a),(b) | 649,000 | 647,216 | |||||||||
| New Economy Assets Phase 1 Sponsor LLC, 1.91%, 10/20/61 (a) | 260,000 | 255,007 | |||||||||
| OBX 2021-J3 Trust, 2.50%, 10/25/51 (a),(c) | 95,304 | 96,369 | |||||||||
| Octagon Investment Partners 33 Ltd., 2.88%, (3 Month US Libor + 2.75%), 1/20/31 (a),(b) | 100,000 | 98,218 | |||||||||
| Octagon Investment Partners 35 Ltd., 1.23%, (3 Month US Libor + 1.10%), 1/20/31 (a),(b) | 500,000 | 496,422 | |||||||||
| Provident Funding Mortgage Trust 2019-1, 3.00%, 12/25/49 (a),(c) | 29,696 | 29,854 | |||||||||
| Provident Funding Mortgage Trust 2021-J1, 2.50%, 10/25/51 (a),(c) | 161,080 | 162,578 | |||||||||
| PSMC 2021-3 Trust, 2.50%, 8/25/51 (a),(c) | 326,500 | 330,658 | |||||||||
See accompanying notes to financial statements.
26
Global Atlantic Franklin Dividend and Income Managed Risk Portfolio
Portfolio of Investments (Continued)
December 31, 2021
| Shares/ Principal | Fair Value | ||||||||||
ASSET BACKED AND COMMERCIAL BACKED SECURITIES - 4.2% (Continued) | |||||||||||
| Strata CLO I Ltd., 2.32%, (3 Month US Libor + 2.20%), 1/15/31 (a),(b) | $ | 200,000 | $ | 198,850 | |||||||
| TICP CLO VI Ltd., 1.24%, (3 Month US Libor + 1.12%), 1/15/34 (a),(b) | 300,000 | 299,845 | |||||||||
| Towd Point Mortgage Trust 2017-1, 2.75%, 10/25/56 (a),(c) | 40,759 | 41,130 | |||||||||
| Towd Point Mortgage Trust 2017-2, 2.75%, 4/25/57 (a),(c) | 54,502 | 54,895 | |||||||||
| Towd Point Mortgage Trust 2017-3, 2.75%, 7/25/57 (a),(c) | 45,342 | 45,810 | |||||||||
| Voya CLO 2014-1 Ltd., 2.92%, (3 Month US Libor + 2.80%), 4/18/31 (a),(b) | 200,000 | 187,956 | |||||||||
| TOTAL ASSET BACKED AND COMMERCIAL BACKED SECURITIES (Cost - $11,848,749) | 11,798,629 | ||||||||||
AGENCY MORTGAGE BACKED SECURITIES - 3.3% | |||||||||||
FEDERAL NATIONAL MORTGAGE ASSOCIATION - 2.6% | |||||||||||
Fannie Mae Pool, 3.00%, 11/1/48 | 590,193 | 617,599 | |||||||||
Federal National Mortgage Association | |||||||||||
2.00%, 1/1/37 (d) | 1,950,000 | 1,997,836 | |||||||||
2.50%, 1/1/52 (d) | 4,790,000 | 4,890,290 | |||||||||
7,505,725 | |||||||||||
GOVERNMENT NATIONAL MORTGAGE ASSOCIATION - 0.7% | |||||||||||
Ginnie Mae | |||||||||||
2.00%, 1/20/52 (d) | 1,000,000 | 1,009,531 | |||||||||
2.50%, 1/20/52 (d) | 900,000 | 922,219 | |||||||||
1,931,750 | |||||||||||
| TOTAL AGENCY MORTGAGE BACKED SECURITIES (Cost - $9,383,576) | 9,437,475 | ||||||||||
EXCHANGE TRADED FUNDS - 1.1% | |||||||||||
DEBT FUNDS - 1.1% | |||||||||||
| SPDR Blackstone Senior Loan ETF (Cost - $2,999,711) | 65,600 | 2,993,328 | |||||||||
SOVEREIGN DEBTS - 0.9% | |||||||||||
| Banque Centrale de Tunisie International Bond, 5.75%, 1/30/25 (a) | 200,000 | 151,730 | |||||||||
| Colombia Government International Bond, 5.00%, 6/15/45 | 200,000 | 180,500 | |||||||||
| Dominican Republic International Bond, 8.90%, 2/15/23 (a) | DOP | 8,000,000 | 144,034 | ||||||||
| Indonesia Government International Bond, 4.35%, 1/8/27 (a) | 200,000 | 222,593 | |||||||||
| Iraq International Bond, 5.80%, 1/15/28 (a) | 203,125 | 194,025 | |||||||||
| Mexico Government International Bond, 4.50%, 4/22/29 | 200,000 | 222,756 | |||||||||
| Shares/ Principal | Fair Value | ||||||||||
SOVEREIGN DEBTS - 0.9% (Continued) | |||||||||||
| Panama Government International Bond, 3.75%, 4/17/26 (a) | $ | 70,000 | $ | 74,277 | |||||||
| Peruvian Government International Bond, 2.78%, 1/23/31 | 200,000 | 199,002 | |||||||||
| Republic of Belarus International Bond, 7.63%, 6/29/27 (a) | 200,000 | 182,940 | |||||||||
| Republic of South Africa Government International Bond, 5.88%, 6/22/30 | 200,000 | 222,760 | |||||||||
| Romanian Government International Bond, 6.13%, 1/22/44 (a) | 130,000 | 170,290 | |||||||||
| Russian Foreign Bond - Eurobond, 4.88%, 9/16/23 (a) | 200,000 | 210,560 | |||||||||
| Turkey Government International Bond, 5.25%, 3/13/30 | 200,000 | 171,862 | |||||||||
| Ukraine Government International Bond, 7.38%, 9/25/32 (a) | 200,000 | 178,052 | |||||||||
| TOTAL SOVEREIGN DEBTS (Cost - $2,676,949) | 2,525,381 | ||||||||||
MUNICIPAL BONDS - 0.8% | |||||||||||
California Health Facilities Financing Authority | |||||||||||
2.93%, 6/1/32 | 45,000 | 47,005 | |||||||||
2.98%, 6/1/33 | 40,000 | 41,754 | |||||||||
3.03%, 6/1/34 | 30,000 | 31,255 | |||||||||
| California State University, 2.72%, 11/1/52 | 90,000 | 90,780 | |||||||||
| City of Austin TX Electric Utility Revenue, 6.26%, 11/15/32 | 150,000 | 192,080 | |||||||||
| Commonwealth Financing Authority, 2.99%, 6/1/42 | 325,000 | 332,790 | |||||||||
| County of Broward FL Airport System Revenue, 3.48%, 10/1/43 | 50,000 | 51,309 | |||||||||
| Foothill-Eastern Transportation Corridor Agency, 4.09%, 1/15/49 | 135,000 | 145,107 | |||||||||
| Gilroy Unified School District, 3.36%, 8/1/47 | 100,000 | 104,683 | |||||||||
| Greenville City School District, 3.54%, 1/1/51 | 110,000 | 115,609 | |||||||||
| Massachusetts School Building Authority, 3.40%, 10/15/40 | 85,000 | 88,953 | |||||||||
| Metropolitan Transportation Authority, 4.00%, 11/15/45 | 95,000 | 108,463 | |||||||||
| New York State Dormitory Authority, 3.14%, 7/1/43 | 45,000 | 46,470 | |||||||||
Salt Lake City Corp., 3.10%, 4/1/38 | 40,000 | 41,597 | |||||||||
San Bernardino Community College District | |||||||||||
2.69%, 8/1/41 | 250,000 | 251,273 | |||||||||
2.86%, 8/1/49 | 150,000 | 150,348 | |||||||||
| San Jose Redevelopment Agency Successor Agency, 3.23%, 8/1/27 | 90,000 | 96,720 | |||||||||
State of Illinois, 5.10%, 6/1/33 | 120,000 | 138,706 | |||||||||
Texas State University System | |||||||||||
2.94%, 3/15/33 | 35,000 | 37,216 | |||||||||
3.29%, 3/15/40 | 30,000 | 31,362 | |||||||||
See accompanying notes to financial statements.
27
Global Atlantic Franklin Dividend and Income Managed Risk Portfolio
Portfolio of Investments (Continued)
December 31, 2021
| Shares/ Principal | Fair Value | ||||||||||
MUNICIPAL BONDS - 0.8% (Continued) | |||||||||||
| University of Pittsburgh-of the Commonwealth System of Higher Education, 3.01%, 9/15/41 | $ | 80,000 | $ | 85,271 | |||||||
Utah Transit Authority, 3.44%, 12/15/42 | 60,000 | 62,554 | |||||||||
| TOTAL MUNICIPAL BONDS (Cost - $2,202,628) | 2,291,305 | ||||||||||
TERM LOANS - 0.8% | |||||||||||
| 24 Hour Fitness Worldwide, Inc., 1.13%, (3 Month US Libor + 1.00%), 12/29/25 (b) | 31,368 | 22,962 | |||||||||
| Acrisure LLC 4.25%, (3 Month US Libor + 3.75%), 2/15/27 (b) | 5,855 | 5,838 | |||||||||
| 4.75%, (3 Month US Libor + 4.25%), 2/15/27 (b) | 3,414 | 3,408 | |||||||||
| Adient US LLC, 3.59%, (3 Month US Libor + 3.50%), 4/10/28 (b) | 29,850 | 29,819 | |||||||||
| ADMI Corp. 3.88%, (2 Month US Libor + 3.13%), 12/23/27 (b) | 4,065 | 4,036 | |||||||||
| 4.00%, (1 Month US Libor + 3.50%), 12/23/27 (b) | 3,837 | 3,827 | |||||||||
| AI Convoy (Luxembourg) Sarl, 4.50%, 1/18/27 | 19,744 | 19,759 | |||||||||
| Air Canada, 4.25%, (3 Month US Libor + 3.50%), 8/11/28 (b) | 154,806 | 154,170 | |||||||||
| Alliant Holdings Intermediate LLC 3.35%, (1 Month US Libor + 3.25%), 5/9/25 (b) | 38,215 | 37,802 | |||||||||
| 4.00%, (1 Month US Libor + 3.50%), 11/6/27 (b) | 1,379 | 1,376 | |||||||||
| Allied Universal Holdco LLC, 4.25%, (3 Month US Libor + 3.75%), 5/12/28 (b) | 7,182 | 7,151 | |||||||||
| Amentum Government Services Holdings LLC, 5.50%, (3 Month US Libor + 4.75%), 1/29/27 (b) | 9,925 | 9,902 | |||||||||
| American Airlines, Inc., 5.50%, (3 Month US Libor + 4.75%), 4/20/28 (b) | 6,131 | 6,342 | |||||||||
| American Trailer World Corp., 4.50%, (1 Month US Libor + 3.75%), 3/3/28 (b) | 5,373 | 5,347 | |||||||||
| Aptean, Inc., 4.35%, (1 Month US Libor + 4.25%), 4/23/26 (b) | 11,939 | 11,861 | |||||||||
| Apx Group, Inc., 4.00%, (1 Month US Libor + 3.50%), 7/10/28 (b) | 3,018 | 3,010 | |||||||||
| Arches Buyer, Inc., 3.75%, (1 Month US Libor + 3.25%), 12/6/27 (b) | 6,422 | 6,370 | |||||||||
| Ascensus Holdings, Inc., 4.00%, (3 Month US Libor + 3.50%), 8/2/28 (b) | 9,079 | 9,032 | |||||||||
| ASP Blade Holdings, Inc, 4.50%, (1 Month US Libor + 4.00%), 10/13/28 (b) | 2,142 | 2,140 | |||||||||
| Shares/ Principal | Fair Value | ||||||||||
TERM LOANS - 0.8% (Continued) | |||||||||||
| AssuredPartners, Inc. 3.60%, (1 Month US Libor + 3.50%), 2/12/27 (b) | $ | 29,449 | $ | 29,188 | |||||||
| 4.00%, (1 Month US Libor + 3.50%), 2/12/27 (b) | 2,538 | 2,532 | |||||||||
| Astoria Energy LLC, 4.50%, (3 Month US Libor + 3.50%), 12/10/27 (b) | 1,235 | 1,230 | |||||||||
| Astra Acquisition Corp., 5.75%, (1 Month US Libor + 5.25%), 10/25/28 (b) | 7,930 | 7,765 | |||||||||
| Astro One Acquisition Corp., 0.00%, 10/20/28 (e) | 4,520 | 4,481 | |||||||||
| Asurion LLC 3.23%, (1 Month US Libor + 3.13%), 11/3/23 (b) | 13,480 | 13,436 | |||||||||
| 3.35%, (1 Month US Libor + 3.25%), 12/23/26 (b) | 9,093 | 9,025 | |||||||||
| 3.35%, (1 Month US Libor + 3.25%), 7/31/27 (b) | 8,400 | 8,341 | |||||||||
| 5.35%, (1 Month US Libor + 5.25%), 1/31/28 (b) | 354 | 355 | |||||||||
| 5.35%, (1 Month US Libor + 5.25%), 1/20/29 (b) | 6,001 | 5,973 | |||||||||
| AthenaHealth Inc, 4.40%, (3 Month US Libor + 4.25%), 2/11/26 (b) | 23,000 | 22,977 | |||||||||
| Atlas Purchaser, Inc., 6.00%, (3 Month US Libor + 5.25%), 5/8/28 (b) | 12,151 | 11,908 | |||||||||
| Aveanna Healthcare LLC. 0.00%, 7/17/28(e) | 1,145 | 1,138 | |||||||||
| 4.25%, (3 Month US Libor + 3.75%), 7/17/28 (b) | 4,910 | 4,880 | |||||||||
| Avis Budget Car Rental LLC, 1.86%, (3 Month US Libor + 1.75%), 8/6/27 (b) | 84,645 | 83,387 | |||||||||
Bali Finco, Inc., 0.00%, 6/30/26 (e) | 6,110 | 6,047 | |||||||||
| Bally's Corp., 3.75%, (1 Month US Libor + 3.25%), 10/2/28 (b) | 10,501 | 10,496 | |||||||||
| Banijay Entertainment SAS, 3.84%, (1 Month US Libor + 3.75%), 3/1/25 (b) | 18,729 | 18,635 | |||||||||
| Barracuda Networks, Inc., 4.50%, (3 Month US Libor + 3.75%), 2/12/25 (b) | 6,433 | 6,449 | |||||||||
| Caesars Resort Collection LLC, 2.85%, (1 Month US Libor + 2.75%), 12/23/24 (b) | 28,939 | 28,758 | |||||||||
| CCI Buyer, Inc., 4.50%, (3 Month US Libor + 4.00%), 12/17/27 (b) | 1,295 | 1,295 | |||||||||
CCRR Parent, Inc., 0.00%, 3/6/28 (e) | 1,791 | 1,788 | |||||||||
| Cengage Learning, Inc., 5.75%, (3 Month US Libor + 4.75%), 7/14/26 (b) | 9,923 | 9,940 | |||||||||
See accompanying notes to financial statements.
28
Global Atlantic Franklin Dividend and Income Managed Risk Portfolio
Portfolio of Investments (Continued)
December 31, 2021
| Shares/ Principal | Fair Value | ||||||||||
TERM LOANS - 0.8% (Continued) | |||||||||||
| Charter Next Generation, Inc., 4.50%, (1 Month US Libor + 3.75%), 12/1/27 (b) | $ | 1,748 | $ | 1,750 | |||||||
| CHG Healthcare Services, Inc., 4.00%, (3 Month US Libor + 3.50%), 9/29/28 (b) | 2,109 | 2,107 | |||||||||
| Citadel Securities LP, 2.60%, (3 Month US Libor + 2.50%), 2/2/28 (b) | 9,925 | 9,855 | |||||||||
| City Brewing Co., LLC, 4.25%, (3 Month US Libor + 3.50%), 4/5/28 (b) | 7,389 | 6,979 | |||||||||
| Clarios Global LP, 3.35%, (1 Month US Libor + 3.25%), 4/30/26 (b) | 16,947 | 16,832 | |||||||||
| Clear Channel Outdoor Holdings, Inc., 3.63%, (3 Month US Libor + 3.50%), 8/21/26 (b) | 9,849 | 9,705 | |||||||||
| Cloudera, Inc. 4.25%, (1 Month US Libor + 3.75%), 10/8/28 (b) | 4,364 | 4,347 | |||||||||
| 6.50%, (1 Month US Libor + 6.00%), 10/8/29 (b) | 1,860 | 1,855 | |||||||||
| CNT Holdings I Corp., 4.25%, (3 Month US Libor + 3.50%), 11/8/27 (b) | 1,784 | 1,784 | |||||||||
| Cobham Ultra US Co. Borrower LLC, 0.00%, 11/17/28 (e) | 2,410 | 2,401 | |||||||||
| Commscope, Inc., 3.35%, (1 Month US Libor + 3.25%), 4/6/26 (b) | 29,398 | 28,988 | |||||||||
| Conair Holdings LLC, 4.25%, (3 Month US Libor + 3.75%), 5/17/28 (b) | 9,975 | 9,970 | |||||||||
| Cornerstone OnDemand, Inc., 4.25%, (3 Month US Libor + 3.75%), 10/16/28 (b) | 8,071 | 8,039 | |||||||||
| Coty, Inc., 2.35%, (3 Month US Libor + 2.25%), 4/7/25 (b) | 63,427 | 62,555 | |||||||||
| CSC Holdings LLC, 2.36%, (3 Month US Libor + 2.25%), 7/17/25 (b) | 36,275 | 35,686 | |||||||||
| Cushman & Wakefield U.S. Borrower, LLC., 2.84%, (1 Month US Libor + 2.75%), 8/21/25 (b) | 9,899 | 9,823 | |||||||||
| Cyanco Intermediate 2 Corp., 3.59%, (1 Month US Libor + 3.50%), 3/16/25 (b) | 12,132 | 11,974 | |||||||||
| DCert Buyer, Inc., 4.10%, (1 Month US Libor + 4.00%), 10/16/26 (b) | 19,650 | 19,599 | |||||||||
| Delta Air Lines, Inc., 4.75%, (3 Month US Libor + 3.75%), 10/20/27 (b) | 5,518 | 5,829 | |||||||||
| DexKo Global, Inc. 4.25%, (3 Month US Libor + 3.75%), 10/4/28 (b) | 1,804 | 1,796 | |||||||||
| 4.25%, (3 Month US Libor + 3.75%), 10/4/28 (b) | 344 | 342 | |||||||||
| Shares/ Principal | Fair Value | ||||||||||
TERM LOANS - 0.8% (Continued) | |||||||||||
| Dynasty Acquisition Co., Inc. 3.63%, (3 Month US Libor + 3.50%), 4/6/26 (b) | $ | 42,867 | $ | 41,643 | |||||||
| 3.72%, (3 Month US Libor + 3.50%), 4/6/26 (b) | 79,733 | 77,455 | |||||||||
| ECI Macola/Max Holding LLC, 4.50%, (3 Month US Libor + 3.75%), 11/9/27 (b) | 7,070 | 7,065 | |||||||||
| Edelman Financial Engines Center LLC, (The), 4.25%, (1 Month US Libor + 3.50%), 4/7/28 (b) | 19,900 | 19,870 | |||||||||
| eResearch Technology, Inc., 5.50%, (1 Month US Libor + 4.50%), 2/4/27 (b) | 2,158 | 2,163 | |||||||||
| Evergreen AcqCo 1 LP, 6.25%, (3 Month US Libor + 5.50%), 4/26/28 (b) | 9,100 | 9,040 | |||||||||
| FINThrive Software, Inc. Holdings, Inc., 0.00%, 11/18/28 (e) | 4,043 | 4,040 | |||||||||
| First Brands Group, LLC, 6.00%, (3 Month US Libor + 5.00%), 3/30/27 (b) | 15,970 | 16,018 | |||||||||
| First Student Bidco, Inc. 3.50%, (3 Month US Libor + 3.00%), 7/13/28 (b) | 2,477 | 2,465 | |||||||||
| 3.50%, (3 Month US Libor + 3.00%), 7/21/28 (b) | 914 | 910 | |||||||||
| Flynn Restaurant Group LP, 0.00%, 12/4/28 (e) | 4,555 | 4,493 | |||||||||
| Gainwell Acquisition Corp., 4.75%, (3 Month US Libor + 4.00%), 10/1/27 (b) | 28,470 | 28,513 | |||||||||
| Global Medical Response, Inc., 5.25%, (3 Month US Libor + 4.25%), 3/14/25 (b) | 3,764 | 3,746 | |||||||||
| Global Tel Link Corp., 4.35%, (1 Month US Libor + 4.25%), 11/29/25 (b) | 38,815 | 37,650 | |||||||||
| Golden Nugget LLC, 3.25%, (3 Month US Libor + 2.50%), 10/4/23 (b) | 2,880 | 2,860 | |||||||||
| Great Outdoors Group LLC, 4.50%, (3 Month US Libor + 3.75%), 3/6/28 (b) | 24,423 | 24,428 | |||||||||
| Greeneden US Holdings II LLC, 4.75%, (1 Month US Libor + 4.00%), 12/1/27 (b) | 9,606 | 9,634 | |||||||||
| Heartland Dental LLC, 4.09%, (3 Month US Libor + 4.00%), 4/30/25 (b) | 2,798 | 2,791 | |||||||||
| Highline AfterMarket Acquisition LLC, 5.25%, (1 Month US Libor + 4.50%), 11/9/27 (b) | 6,870 | 6,759 | |||||||||
| Hilton Grand Vacations Borrower LLC, 3.50%, (1 Month US Libor + 3.00%), 8/2/28 (b) | 17,955 | 17,968 | |||||||||
| Hunter Holdco 3 Limited, 4.75%, (3 Month US Libor + 4.25%), 8/19/28 (b) | 3,699 | 3,696 | |||||||||
| Hyland Software, Inc., 4.25%, (3 Month US Libor + 3.50%), 7/1/24 (b) | 7,367 | 7,389 | |||||||||
| ICON Luxembourg SARL, 3.00%, (3 Month US Libor + 2.50%), 7/3/28 (b) | 3,642 | 3,640 | |||||||||
See accompanying notes to financial statements.
29
Global Atlantic Franklin Dividend and Income Managed Risk Portfolio
Portfolio of Investments (Continued)
December 31, 2021
| Shares/ Principal | Fair Value | ||||||||||
TERM LOANS - 0.8% (Continued) | |||||||||||
| Idera, Inc., 4.50%, (1 Month US Libor + 3.75%), 3/2/28 (b) | $ | 12,921 | $ | 12,901 | |||||||
| IGT Holding IV AB, 4.00%, (3 Month US Libor + 3.50%), 3/31/28 (b) | 16,360 | 16,309 | |||||||||
| Illuminate Buyer LLC, 3.60%, (1 Month US Libor + 3.50%), 6/30/27 (b) | 3,390 | 3,366 | |||||||||
| Indigo Merger Sub Inc., 3.00%, (3 Month US Libor + 2.50%), 7/3/28 (b) | 907 | 907 | |||||||||
| Ineos US Petrochem, LLC, 3.25%, (1 Month US Libor + 2.75%), 1/29/26 (b) | 7,492 | 7,466 | |||||||||
| IRB Holding Corp., 4.25%, (3 Month US Libor + 3.25%), 12/15/27 (b) | 6,556 | 6,549 | |||||||||
| Ivanti Software, Inc., 5.25%, (3 Month US Libor + 4.25%), 12/1/27 (b) | 9,950 | 9,953 | |||||||||
| Jane Street Group, LLC, 2.85%, (1 Month US Libor + 2.75%), 1/26/28 (b) | 8,553 | 8,480 | |||||||||
| Jazz Financing Lux SARL, 4.00%, (1 Month US Libor + 3.50%), 5/5/28 (b) | 3,807 | 3,820 | |||||||||
| Kenan Advantage Group, Inc. (The), 4.50%, (1 Month US Libor + 3.75%), 3/24/26 (b) | 52,003 | 51,750 | |||||||||
| Kuehg Corp., 4.75%, (3 Month US Libor + 3.75%), 2/21/25 (b) | 39,590 | 38,714 | |||||||||
| LaserShip, Inc, 5.25%, (1 Month US Libor + 4.50%), 4/30/28 (b) | 4,182 | 4,182 | |||||||||
| Logmein, Inc., 4.84%, (3 Month US Libor + 4.75%), 8/31/27 (b) | 32,538 | 32,325 | |||||||||
| LSF11 AS Holdco LLC, 4.25%, (3 Month US Libor + 3.75%), 10/15/28 (b) | 973 | 971 | |||||||||
| Lucid Energy Group II Borrower LLC, 5.00%, (3 Month US Libor + 4.25%), 11/22/28 (b) | 4,544 | 4,485 | |||||||||
| Madison IAQ LLC, 3.75%, (1 Month US Libor + 3.25%), 6/21/28 (b) | 4,384 | 4,377 | |||||||||
| Madison Safety & Flow LLC, 0.00%, 12/14/28 (e) | 2,504 | 2,501 | |||||||||
| Magenta Buyer LLC, 5.75%, (3 Month US Libor + 5.00%), 7/27/28 (b) | 16,902 | 16,844 | |||||||||
| McGraw-Hill Education, Inc., 5.25%, (1 Month US Libor + 4.75%), 7/28/28 (b) | 14,098 | 14,019 | |||||||||
| Medline Borrower, LP, 3.75%, (1 Month US Libor + 3.25%), 10/23/28 (b) | 4,738 | 4,736 | |||||||||
| MH Sub I, LLC, 4.75%, (1 Month US Libor + 3.75%), 9/13/24 (b) | 8,307 | 8,316 | |||||||||
| Shares/ Principal | Fair Value | ||||||||||
TERM LOANS - 0.8% (Continued) | |||||||||||
| Michaels Companies, Inc. (The), 5.00%, (3 Month US Libor + 4.25%), 4/15/28 (b) | $ | 9,950 | $ | 9,852 | |||||||
| Mitchell International, Inc., 4.25%, (1 Month US Libor + 3.75%), 10/16/28 (b) | 9,298 | 9,235 | |||||||||
Motion Finco, LLC | |||||||||||
0.00%, 11/12/26 (e) | 87,086 | 84,986 | |||||||||
| 3.47%, (3 Month US Libor + 3.25%), 11/12/26 (b) | 12,415 | 12,116 | |||||||||
| MPH Acquisition Holdings LLC, 4.75%, (1 Month US Libor + 4.25%), 9/1/28 (b) | 6,299 | 6,138 | |||||||||
| NIC Acquisition Corp., 4.50%, (3 Month US Libor + 3.75%), 12/29/27 (b) | 13,137 | 12,940 | |||||||||
| Numericable U.S. LLC, 4.12%, (2 Month US Libor + 4.00%), 8/14/26 (b) | 9,793 | 9,734 | |||||||||
| Osmosis Debt Merger Sub, Inc. 4.50%, (1 Month US Libor + 4.00%), 7/31/28 (b) | 8,539 | 8,545 | |||||||||
| Pactiv Evergreen Group Holdings, Inc., 4.00%, (1 Month US Libor + 3.50%), 9/25/28 (b) | 3,675 | 3,666 | |||||||||
| Pathway Vet Alliance LLC, 3.85%, (1 Month US Libor + 3.75%), 3/31/27 (b) | 19,328 | 19,248 | |||||||||
| PECF USS Intermediate Holding Corp., 4.75%, (3 Month US Libor + 4.25%), 11/4/28 (b) | 2,409 | 2,410 | |||||||||
| Peraton Corp., 4.50%, (1 Month US Libor + 3.75%), 2/1/28 (b) | 13,385 | 13,380 | |||||||||
| PetsMart, LLC, 4.50%, (3 Month US Libor + 3.75%), 2/11/28 (b) | 3,535 | 3,537 | |||||||||
| PetVet Care Centers LLC, 0.00%, 2/14/25 (e) | 2,012 | 2,009 | |||||||||
| Phoenix Guarantor, Inc., 3.35%, (1 Month US Libor + 3.25%), 3/5/26 (b) | 22,340 | 22,173 | |||||||||
| Phoenix Newco, Inc., 4.50%, (3 Month US Libor + 4.00%), 11/15/28 (b) | 2,323 | 2,322 | |||||||||
| Pitney Bowes, Inc., 4.11%, (1 Month US Libor + 4.00%), 3/17/28 (b) | 37,296 | 37,273 | |||||||||
| Playtika Holding Corp., 2.85%, (1 Month US Libor + 2.75%), 3/13/28 (b) | 4,237 | 4,214 | |||||||||
| Pluto Acquisition I, Inc., 4.18%, (3 Month US Libor + 4.00%), 6/22/26 (b) | 4,440 | 4,417 | |||||||||
| Polaris Newco LLC, 4.50%, (3 Month US Libor + 4.00%), 6/2/28 (b) | 13,277 | 13,265 | |||||||||
| Pre Paid Legal Services, Inc., 0.00%, 12/7/28 (e) | 5,088 | 5,054 | |||||||||
| Primary Products Finance LLC, 0.00%, 10/25/28 (e) | 3,081 | 3,081 | |||||||||
| Prime Security Services Borrower, LLC, 3.50%, (1 Month US Libor + 2.75%), 9/23/26 (b) | 17,826 | 17,799 | |||||||||
See accompanying notes to financial statements.
30
Global Atlantic Franklin Dividend and Income Managed Risk Portfolio
Portfolio of Investments (Continued)
December 31, 2021
| Shares/ Principal | Fair Value | ||||||||||
TERM LOANS - 0.8% (Continued) | |||||||||||
| Quest Software U.S. Holdings, Inc., 4.38%, (3 Month US Libor + 4.25%), 5/16/25 (b) | $ | 19,746 | $ | 19,709 | |||||||
Radiate Holdco LLC, 0.00%, 9/25/26 (e) | 10,890 | 10,845 | |||||||||
| Radiology Partners, Inc., 4.34%, (3 Month US Libor + 4.25%), 7/9/25 (b) | 5,069 | 4,989 | |||||||||
| Raptor Acquisition Corp., 4.75%, (3 Month US Libor + 4.00%), 11/1/26 (b) | 3,718 | 3,725 | |||||||||
| Red Planet Borrower LLC, 4.25%, (3 Month US Libor + 3.75%), 10/2/28 (b) | 4,448 | 4,419 | |||||||||
| Rent-A-Center, Inc., 3.75%, (1 Month US Libor + 3.25%), 2/17/28 (b) | 32,212 | 32,112 | |||||||||
| Restoration Hardware, Inc., 3.00%, (3 Month US Libor + 2.50%), 10/20/28 (b) | 6,666 | 6,646 | |||||||||
Reverb Buyer, Inc. | |||||||||||
| 1.00%, (1 Month US Libor + 1.00%), 11/1/28 (b) | 555 | 554 | |||||||||
| 4.00%, (1 Month US Libor + 3.50%), 11/1/28 (b) | 2,916 | 2,910 | |||||||||
| Revint Intermediate II LLC, 0.00%, 10/15/27 (e) | 2,119 | 2,119 | |||||||||
| Rocket Software, Inc., 4.35%, (1 Month US Libor + 4.25%), 11/28/25 (b) | 9,229 | 9,164 | |||||||||
| Russell Investments U.S. Institutional Holdco, Inc., 4.50%, (1 Month US Libor + 3.50%), 5/30/25 (b) | 15,000 | 14,985 | |||||||||
| SCIH Salt Holdings, Inc., 4.75%, (3 Month US Libor + 4.00%), 3/16/27 (b) | 8,725 | 8,631 | |||||||||
| Sedgwick Claims Management Services, Inc., 3.35%, (1 Month US Libor + 3.25%), 12/31/25 (b) | 9,898 | 9,813 | |||||||||
Sovos Compliance LLC | |||||||||||
| 5.00%, (1 Month US Libor + 4.50%), 8/11/28 (b) | 1,927 | 1,930 | |||||||||
| 5.00%, (1 Month US Libor + 4.50%), 8/11/28 (b) | 333 | 334 | |||||||||
| Sparta U.S. HoldCo LLC, 4.25%, (3 Month US Libor + 3.50%), 8/2/28 (b) | 4,700 | 4,701 | |||||||||
| Staples, Inc., 5.13%, (3 Month US Libor + 5.00%), 4/16/26 (b) | 19,458 | 18,769 | |||||||||
| Thor Industries, Inc., 3.13%, (1 Month US Libor + 3.00%), 2/1/26 (b) | 56,011 | 56,025 | |||||||||
| Tiger Acquisition LLC, 3.75%, (3 Month US Libor + 3.25%), 6/1/28 (b) | 22,444 | 22,283 | |||||||||
| Tory Burch LLC, 3.50%, (3 Month US Libor + 3.00%), 4/16/28 (b) | 3,928 | 3,918 | |||||||||
| Triton Water Holdings, Inc., 4.00%, (3 Month US Libor + 3.50%), 3/31/28 (b) | 3,833 | 3,788 | |||||||||
| Truck Hero, Inc., 4.00%, (1 Month US Libor + 3.25%), 1/31/28 (b) | 2,165 | 2,151 | |||||||||
| U.S. Anesthesia Partners, Inc., 4.75%, (3 Month US Libor + 4.25%), 10/2/28 (b) | 3,670 | 3,657 | |||||||||
| U.S. Renal Care, Inc., 5.13%, (1 Month US Libor + 5.00%), 6/26/26 (b) | 15,283 | 14,830 | |||||||||
U.S. Silica Co., 0.00%, 5/1/25 (e) | 9,896 | 9,658 | |||||||||
| Shares/ Principal | Fair Value | ||||||||||
TERM LOANS - 0.8% (Continued) | |||||||||||
| UKG, Inc., 3.75%, (3 Month US Libor + 3.25%), 5/4/26 (b) | $ | 5,201 | $ | 5,170 | |||||||
| United AirLines Inc, 4.50%, (3 Month US Libor + 3.75%), 4/21/28 (b) | 29,875 | 29,915 | |||||||||
| Univision Communications, Inc., 4.00%, (3 Month US Libor + 3.25%), 3/15/26 (b) | 14,595 | 14,608 | |||||||||
| US Radiology Specialists, Inc., 0.00%, 12/15/27 (e) | 4,918 | 4,907 | |||||||||
| USIC Holdings, Inc., 4.25%, (1 Month US Libor + 3.50%), 5/12/28 (b) | 7,730 | 7,712 | |||||||||
| Valeant Pharmaceuticals International , 3.10%, (1 Month US Libor + 3.00%), 6/2/25 (b) | 30,363 | 30,203 | |||||||||
| Varsity Brands Holdings, 4.50%, 1 Month US Libor + 3.50%), 12/16/24 (b) | 84,685 | 82,968 | |||||||||
| VC GB Holdings I Corp., 4.00%, (3 Month US Libor + 3.50%), 7/21/28 (b) | 1,990 | 1,972 | |||||||||
| Veritas US Inc., 6.00%, (3 Month US Libor + 5.00%), 9/1/25 (b) | 14,921 | 14,907 | |||||||||
| Verscend Holding Corp., 4.10%, (1 Month US Libor + 4.00%), 8/27/25 (b) | 9,824 | 9,812 | |||||||||
| Vertex Aerospace Service, 0.00%, 12/6/28 (e) | 4,135 | 4,123 | |||||||||
| Vertical Midco Gmbh, 4.00%, (1 Month US Libor + 3.50%), 7/30/27 (b) | 15,622 | 15,620 | |||||||||
| Waystar Technologies, Inc., 4.09%, (1 Month US Libor + 4.00%), 10/22/26 (b) | 19,650 | 19,617 | |||||||||
| Westjet Airlines Ltd., 4.00%, (3 Month US Libor + 3.00%), 12/11/26 (b) | 55,895 | 54,110 | |||||||||
| Whatabrands LLC, 3.75%, (1 Month US Libor + 3.25%), 8/3/28 (b) | 3,935 | 3,917 | |||||||||
| Woof Holdings, Inc., 4.50%, (3 Month US Libor + 3.75%), 12/21/27 (b) | 2,350 | 2,350 | |||||||||
| TOTAL TERM LOANS (Cost - $2,354,569) | 2,355,569 | ||||||||||
PREFERRED STOCKS - 0.0%† | |||||||||||
CONSUMER DISCRETIONARY SERVICES - 0.0%† | |||||||||||
| 24 Hour Fitness Worldwide, Inc., 0.00% (Cost - $2,145) | 1,589 | 2,979 | |||||||||
Contracts | Notional Amount | ||||||||||||||
PURCHASED OPTIONS - 0.0%† | |||||||||||||||
| EUR/RUB, Deutsche Bank, October 2022, Call @ 83.32 RUB | 341,000 | 28,412,120,000 | RUB | 5,512 | |||||||||||
| EUR/NOK, Citibank, October 2022, Call @ 9.37 NOK | 227,000 | 2,126,990,000 | NOK | 1,382 | |||||||||||
| TOTAL PURCHASED OPTIONS (Cost - $9,584) | $ | 6,894 | |||||||||||||
See accompanying notes to financial statements.
31
Global Atlantic Franklin Dividend and Income Managed Risk Portfolio
Portfolio of Investments (Continued)
December 31, 2021
| Shares/ Principal | Fair Value | ||||||||||
SHORT-TERM INVESTMENTS - 5.8% | |||||||||||
MONEY MARKET FUNDS - 5.8% | |||||||||||
| Dreyfus Government Cash Management, 0.03% (f) | 8,189,373 | $ | 8,189,373 | ||||||||
| Fidelity Investments Money Market Fund - Government Portfolio, Institutional Class, 0.01% (f) | 8,398,194 | 8,398,194 | |||||||||
| TOTAL SHORT-TERM INVESTMENTS (Cost - $16,587,567) | 16,587,567 | ||||||||||
| TOTAL INVESTMENTS - 103.1% (Cost - $170,285,890) | $ | 293,363,876 | |||||||||
| OTHER ASSETS LESS LIABILITIES - NET (3.1)% | (8,766,403) | ||||||||||
TOTAL NET ASSETS - 100.0% | $ | 284,597,473 | |||||||||
* Non-income producing security.
† Represents less than 0.05%.
†† A portion of this investment is held as collateral for derivative investments.
(a) 144A - Security was purchased pursuant to Rule 144a under the Securities Act of 1933 and may not be resold subject to that rule, except
to qualified institutional buyers. As of December 31, 2021, these securities amounted to $21,878,336 or 7.7% of net assets.
(b) Variable rate security. The rate shown is the rate in effect at period end.
(c) Adjustable rate security with an interest rate that is not based on a published reference index and spread. The rate is based on the structure of the agreement and current market conditions. The coupon rate shown represents the rate at period end.
(d) When-issued, or delayed delivery, all or a portion may be subject to dollar-roll transactions.
(e) The loan will settle after December 31, 2021. The interest rate, based on the LIBOR and the agreed upon spread on trade date, will be determined at the time of settlement.
(f) The rate shown is the annualized seven-day yield at period end.
CLO - Collateralized Loan Obligation
CMT - Treasury Constant Maturity Rate
DOP - Dominican Peso
EUR - EURO
Libor - London Interbank Offer Rate
PLC - Public Limited Company
SOFR - Secured Overnight Financing Rate
FUTURES CONTRACTS | |||||||||||||||||||||||
LONG FUTURES CONTRACTS | Counterparty | Number of Contracts | Expiration Date | Notional Value | Fair Value/ Unrealized Appreciation (Depreciation) | ||||||||||||||||||
U.S. 2 Year Note Future | JP Morgan Securities LLC | 20 | 3/31/2022 | $ | 4,363,437 | $ | (4,284 | ) | |||||||||||||||
U.S. Ultra Bond Future | JP Morgan Securities LLC | 12 | 3/22/2022 | 2,365,500 | 51,750 | ||||||||||||||||||
47,466 | |||||||||||||||||||||||
SHORT FUTURES CONTRACTS | |||||||||||||||||||||||
U.S. 10 Year Note Future | JP Morgan Securities LLC | 1 | 3/22/2022 | 130,469 | (1,537 | ) | |||||||||||||||||
U.S. 10 Year Ultra Future | JP Morgan Securities LLC | 7 | 3/22/2022 | 1,025,063 | 6,271 | ||||||||||||||||||
U.S. 5 Year Note Future | JP Morgan Securities LLC | 22 | 3/31/2022 | 2,661,484 | 2,235 | ||||||||||||||||||
U.S. Long Bond Future | JP Morgan Securities LLC | 4 | 3/22/2022 | 641,750 | (8,875 | ) | |||||||||||||||||
(1,906 | ) | ||||||||||||||||||||||
TOTAL NET UNREALIZED APPRECIATION ON FUTURES CONTRACTS | $ | 45,560 | |||||||||||||||||||||
INTEREST RATE SWAPTIONS PURCHASED | |||||||||||||||||||||||||||||||||||
Counterparty | Description* | Floating Rate Index | Exercise Rate | Expiration Date | Notional Amount† | Fair Value | Premiums Paid | Unrealized Appreciation (Depreciation) | |||||||||||||||||||||||||||
Citibank NA | Call - IRS Swaption | Pays 3 months US Libor | Receive 1.35% | 05/16/22 | $ | 2,400,000 | $ | 15,272 | $ | 17,580 | $ | (2,308 | ) | ||||||||||||||||||||||
| TOTAL FAIR VALUE, PREMIUMS PAID AND NET UNREALIZED DEPRECIATION ON INTEREST RATE SWAPTIONS PURCHASED | $ | 15,272 | $ | 17,580 | $ | (2,308 | ) | ||||||||||||||||||||||||||||
INTEREST RATE SWAPTIONS WRITTEN | |||||||||||||||||||||||||||||||||||
Counterparty | Description* | Floating Rate Index | Exercise Rate | Expiration Date | Notional Amount† | Fair Value | Premiums Received | Unrealized Appreciation (Depreciation) | |||||||||||||||||||||||||||
Citibank NA | Put - IRS Swaption | Receive 3 months US Libor | Pays 1.75% | 05/16/22 | $ | 2,400,000 | $ | (11,125 | ) | $ | (18,312 | ) | $ | 7,187 | |||||||||||||||||||||
| TOTAL FAIR VALUE, PREMIUMS RECEIVED AND NET UNREALIZED APPRECIATION ON INTEREST RATE SWAPTIONS WRITTEN | $ | (11,125 | ) | $ | (18,312 | ) | $ | 7,187 | |||||||||||||||||||||||||||
* The Fund may receive or pay a variable rate.
† Unless otherwise indicated, notional amount is shown in USD.
See accompanying notes to financial statements.
32
Global Atlantic Franklin Dividend and Income Managed Risk Portfolio
Portfolio of Investments (Continued)
December 31, 2021
CREDIT DEFAULT SWAPS | |||||||||||||||||||||||||||||||||||||||||||||||
Counterparty | Reference Obligation/ Index | Payment Frequency | Buy/Sell Protection | Fixed Rate Received | Fixed Rate Paid | Credit Rating* | Expiration Date | Notional Amount** | Fair Value | Premiums Paid (Received) | Unrealized Appreciation (Depreciation) | ||||||||||||||||||||||||||||||||||||
Citibank NA | Avon Products, Inc. | Quarterly | Sell | – | 5.00 | % | BB1 | 03/20/23 | $ | 135,000 | $ | (6,467 | ) | $ | (4,770 | ) | $ | (1,697 | ) | ||||||||||||||||||||||||||||
Citibank NA | Nabors Industries, Inc. | Quarterly | Buy | 1.00 | % | – | CCC- | 12/20/23 | 170,000 | (17,103 | ) | (10,001 | ) | (7,102 | ) | ||||||||||||||||||||||||||||||||
Citibank NA | MCDX.NA.31 | Quarterly | Buy | 1.00 | % | – | NR | 12/20/23 | 1,050,000 | 12,912 | 4,186 | 8,726 | |||||||||||||||||||||||||||||||||||
JP Morgan | Air France-KLM | Quarterly | Buy | 5.00 | % | – | NR | 12/20/25 | 80,000 | 2,153 | (423 | ) | 2,576 | ||||||||||||||||||||||||||||||||||
JP Morgan | Air France-KLM | Quarterly | Buy | 5.00 | % | – | NR | 06/20/26 | 80,000 | 1,944 | 1,255 | 689 | |||||||||||||||||||||||||||||||||||
Citibank NA | Carnival Corp. | Quarterly | Buy | 1.00 | % | – | B- | 12/20/26 | 100,000 | (13,622 | ) | (12,043 | ) | (1,579 | ) | ||||||||||||||||||||||||||||||||
JP Morgan | Nordstrom, Inc. | Quarterly | Buy | 1.00 | % | – | BB+ | 12/20/26 | 165,000 | (17,644 | ) | (13,997 | ) | (3,647 | ) | ||||||||||||||||||||||||||||||||
JP Morgan | United Airlines Holdings, Inc. | Quarterly | Buy | 5.00 | % | – | B | 12/20/26 | 15,000 | 559 | 432 | 127 | |||||||||||||||||||||||||||||||||||
JP Morgan | United Airlines Holdings, Inc. | Quarterly | Buy | 5.00 | % | – | B | 12/20/26 | 10,000 | 372 | 308 | 64 | |||||||||||||||||||||||||||||||||||
Citibank NA | Carnival Corp. | Quarterly | Buy | 1.00 | % | – | B- | 12/20/26 | 20,000 | (2,724 | ) | (2,584 | ) | (140 | ) | ||||||||||||||||||||||||||||||||
Citibank NA | Carnival Corp. | Quarterly | Buy | 1.00 | % | – | B- | 12/20/26 | 8,000 | (1,090 | ) | (1,288 | ) | 198 | |||||||||||||||||||||||||||||||||
Citibank NA | CDX.NA.HY.37 | Quarterly | Sell | – | 5.00 | % | NR | 12/20/26 | 187,500 | (17,451 | ) | (17,034 | ) | (417 | ) | ||||||||||||||||||||||||||||||||
Citibank NA | CDX.NA.HY.37 | Quarterly | Sell | – | 5.00 | % | NR | 12/20/26 | 187,500 | (17,451 | ) | (17,136 | ) | (315 | ) | ||||||||||||||||||||||||||||||||
| TOTAL FAIR VALUE, PREMIUM PAID (RECEIVED) AND NET UNREALIZED DEPRECIATION ON CREDIT DEFAULT SWAPS | $ | (75,612 | ) | $ | (73,095 | ) | $ | (2,517 | ) | ||||||||||||||||||||||||||||||||||||||
* Credit ratings for the underlying securities in the index are assigned based on the higher ratings of either Moody's or S&P. If both are unrated, then Fitch is used. If all three agencies are unrated, a credit rating is assigned using an internal credit analyst rating.
** The maximum potential amount the Portfolio may pay should a negative credit event take place as defined under the terms of the agreement.
NR - Not Rated
FORWARD FOREIGN CURRENCY CONTRACTS | |||||||||||||||||||
Settlement Date | Counterparty | Currency Units to Receive | In Exchange For | Unrealized Appreciation (Depreciation) | |||||||||||||||
01/19/22 | JP Morgan Chase Bank | 213,000 | AUD | 157,219 | USD | $ | (2,348 | ) | |||||||||||
01/19/22 | JP Morgan Chase Bank | 182,500,000 | KRW | 157,877 | USD | (4,423 | ) | ||||||||||||
01/19/22 | JP Morgan Chase Bank | 220,000 | SGD | 161,785 | USD | 1,382 | |||||||||||||
01/19/22 | JP Morgan Chase Bank | 162,626 | USD | 220,000 | SGD | (542 | ) | ||||||||||||
03/01/22 | JP Morgan Chase Bank | 250,000 | AUD | 184,597 | USD | (2,808 | ) | ||||||||||||
03/01/22 | JP Morgan Chase Bank | 172,836 | USD | 245,000 | NZD | 5,246 | |||||||||||||
03/18/22 | JP Morgan Chase Bank | 804,546 | USD | 707,660 | EUR | (1,492 | ) | ||||||||||||
03/22/22 | JP Morgan Chase Bank | 965,000 | TRY | 99,577 | USD | (31,892 | ) | ||||||||||||
03/22/22 | JP Morgan Chase Bank | 82,124 | USD | 965,000 | TRY | 14,439 | |||||||||||||
06/07/22 | JP Morgan Chase Bank | 1,430,979 | USD | 1,260,000 | EUR | (7,322 | ) | ||||||||||||
06/22/22 | JP Morgan Chase Bank | 12,765,000 | JPY | 112,811 | USD | (1,718 | ) | ||||||||||||
TOTAL NET UNREALIZED DEPRECIATION ON FORWARD FOREIGN CURRENCY CONTRACTS | $ | (31,478 | ) | ||||||||||||||||
AUD - Australian Dollar
EUR - Euro
JPY - Japanese Yen
KRW - South Korean Won
NZD - New Zealand Dollar
SGD - Singapore Dollar
TRY - Turkish Lira
USD - United States Dollar
See accompanying notes to financial statements.
33
Global Atlantic Growth Managed Risk Portfolio
Portfolio Review
December 31, 2021 (Unaudited)
Investment Objective
The Portfolio seeks to provide capital appreciation and income while seeking to manage volatility.
Management Review
The capital appreciation and income component is sub-advised by BlackRock Investment Management, LLC ("BlackRock")1, while the managed risk component is sub-advised by Milliman Financial Risk Management LLC ("Milliman").
How did the Portfolio perform during the period?
During 2021, the Portfolio modestly outperformed its reference benchmark, the S&P Global Managed Risk LargeMidCap Index – Moderate Aggressive. The Portfolio posted a return of 14.69% compared to a benchmark return of 14.49%, a difference of 20 basis points. The following discussion of relative performance pertains to this benchmark unless otherwise noted.
What factors and allocation decisions influenced the Portfolio's performance?
The Portfolio's overweight to equities was the largest driver of its returns, as stocks outperformed bonds overall and domestic stocks broadly outperformed their international counterparts. Within equities, the Portfolio's strategic allocation to, and rotation among, factors – along with its strategic overweight to financial stocks – were largely detractors from performance, as were international stocks. In equities, the Portfolio maintained an overweight to the U.S. relative to international markets and benefited from positions in technology and energy equities during the year. The Portfolio's factor exposures detracted from performance.
On the fixed income side, longer-duration U.S. Treasuries sold off and the curve bear steepened to start the year, then rallied considerably as COVID-19's Delta variant reversed trends, only for inflation to force the U.S. Federal Reserve's ("the "Fed") hand by the end of the year. While returns were negative across all fixed income asset classes, shifts in duration and the spread tightening in lower-quality credit bonds were sources of outperformance for the Portfolio. The Portfolio benefited from its treasuries allocation during the bull flattening periods. During the reopening phases of the COVID-19 pandemic, the Portfolio's increased holdings in credit helped outperform the fixed income benchmark.
The volatility environment experienced during the market's recovery in the second half of 2020 continued into 2021, with brief spikes in volatility occurring approximately every four to six weeks, and typically subsiding within a few days as concerns regarding COVID-19, inflation, and/or economic growth ebbed quickly. Despite these frequent volatility spikes, their amplitude and duration were generally not sufficient to warrant hedging by the managed risk component. As a result, hedging did not have a material impact on the Portfolio's overall performance in 2021.
How was the Portfolio positioned at period end?
At year-end, the Portfolio was 2.5% overweight equities relative to fixed income, as BlackRock's investment team believes the risk-reward in fixed income was diminished and challenged given interest rates at currently low levels and the persistent threat of inflation. BlackRock's investment team believes that despite the concerns over the Omicron variant of COVID-19 and the Fed's tapering-then-hike plans, expectations surrounding growth and earnings remain strong, which should lead to more equity outperformance in 2022. BlackRock believes that the case for cyclical assets like equities and commodities remains intact for 2022, with key drivers being continued supply constraints, higher wages, and the cautiously slow removal of some policy and fiscal support by non-U.S. central banks. As the holidays led to COVID-19 case surges, some caution has returned in the U.S. and with international markets continuing to lag from slower global demand, BlackRock's investment
1 Prior to May 1, 2021, BlackRock Financial Management, Inc. served as a sub-adviser to the Capital Appreciation and Income Component of the Portfolio.
34
Global Atlantic Growth Managed Risk Portfolio
Portfolio Review (Continued)
December 31, 2021 (Unaudited)
view was to position the Portfolio for the ongoing post-COVID-19 "restart" and the maturing cycle as interest rate hikes begin amidst strong economic growth.
Within fixed income, BlackRock's investment team favors a shorter duration bias, particularly within investment grade and high yield credit. This was partially offset with longer duration holdings in U.S. Treasury Inflation-Protected Securities ("TIPS") at the end of the period, which was present to not only balance inflation risks, but to also benefit sector positions should inflation run above expectations.
The Portfolio's performance figures for the periods ended December 31, 2021 as compared to its benchmark:
Annualized | Operating Expense* | ||||||||||||||||||||||||||
| Inception Date | One Year | Five Years | Since Inception | Gross Ratio | Net Ratio | ||||||||||||||||||||||
Global Atlantic Growth Managed Risk Portfolio | |||||||||||||||||||||||||||
Class II | April 30, 2014 | 14.69 | % | 9.39 | % | 6.25 | % | 1.01 | % | 0.98 | % | ||||||||||||||||
| S&P Global Managed Risk LargeMidCap Index - Moderate Aggressive^ | 14.49 | % | 10.70 | % | 7.14 | % | |||||||||||||||||||||
The performance data quoted is historical. Past performance is no guarantee of future results. Current performance may be higher or lower than the performance data quoted. The principal value and investment return of an investment will fluctuate so that your shares, when redeemed, may be worth more or less than their original cost. Total returns would have been lower absent fee waivers by the Adviser. Performance figures for periods greater than one year are annualized. The returns shown do not reflect the deduction of taxes that a shareholder may pay on Portfolio distributions or on the redemption of Portfolio shares, as well as other charges and expenses of the insurance contract or separate account. Prior to October 1, 2016, the Capital Appreciation and Income Component of the Portfolio was managed by the Adviser without the use of a sub-adviser. The performance prior to that date is attributable to the Adviser's asset allocation decisions. From October 1, 2016 to May 1, 2021, BlackRock Financial Management, Inc. served as a sub-adviser to Capital Appreciation and Income Component of the Portfolio. In addition, effective May 1, 2021 the sub-adviser to the Capital Appreciation and Income Component of the Portfolio changed from BlackRock Financial Management, Inc. to BlackRock Investment Management, LLC. No changes were made to the Portfolio's principal investment strategies or to the portfolio management team as a result of the change in sub-adviser.
* The estimated operating expense ratios for Class II shares, as disclosed in the most recent prospectus dated May 1, 2021. Ratios include Acquired Fund Fees and Expenses indirectly incurred by the Portfolio. Gross operating expense ratio reflects the ratio of expenses absent waivers and/or reimbursements by the Adviser. The operating expense ratios presented here may differ from the expense ratios disclosed in the Financial Highlights table in this report.
^ The S&P Global Managed Risk LargeMidCap Index - Moderate Aggressive is designed to simulate a dynamic protective portfolio that allocates between the underlying equity index and cash, based on realized volatilities of the underlying equity and bond indices, while maintaining a fixed allocation of 20% to the underlying bond index.
35
Global Atlantic Growth Managed Risk Portfolio
Portfolio Review (Continued)
December 31, 2021 (Unaudited)
Comparison of the Change in Value of a $10,000 Investment

Holdings by Asset Class | % of Net Assets | ||||||
Exchange Traded Funds | 96.5 | % | |||||
Short-Term Investments | 3.1 | % | |||||
Other Assets less Liabilities - Net | 0.4 | % | |||||
100.0 | % | ||||||
Please refer to the Portfolio of Investments in this annual report for more information regarding the Portfolio's holdings as of December 31, 2021.
Derivative exposure is included in "Other Assets Less Liabilities - Net".
36
Global Atlantic Growth Managed Risk Portfolio
Portfolio of Investments
December 31, 2021
| Shares/ Principal | Fair Value | ||||||||||
EXCHANGE TRADED FUNDS - 96.5% | |||||||||||
DEBT FUNDS - 13.7% | |||||||||||
| iShares 10+ Year Investment Grade Corporate Bond ETF | 77,087 | $ | 5,361,401 | ||||||||
iShares 10-20 Year Treasury Bond ETF | 26,210 | 3,889,564 | |||||||||
| iShares 1-5 Year Investment Grade Corporate Bond ETF | 134,964 | 7,271,860 | |||||||||
iShares Core Total USD Bond Market ETF | 219,748 | 11,631,262 | |||||||||
iShares MBS ETF | 36,541 | 3,925,599 | |||||||||
iShares Short Treasury Bond ETF | 52,681 | 5,817,036 | |||||||||
iShares TIPS Bond ETF | 61,986 | 8,008,591 | |||||||||
iShares U.S. Treasury Bond ETF | 410,804 | 10,960,251 | |||||||||
TOTAL DEBT FUNDS | 56,865,564 | ||||||||||
EQUITY FUNDS - 82.8% | |||||||||||
iShares Core MSCI EAFE ETF | 560,587 | 41,842,213 | |||||||||
iShares Core S&P 500 ETF | 274,465 | 130,917,060 | |||||||||
iShares Core S&P Mid-Cap ETF | 92,725 | 26,248,593 | |||||||||
iShares Core S&P Small-Cap ETF | 178,019 | 20,384,956 | |||||||||
iShares ESG Aware MSCI USA ETF | 576,213 | 62,173,383 | |||||||||
iShares Global Financials ETF | 29,796 | 2,385,468 | |||||||||
iShares Global Tech ETF | 126,071 | 8,117,712 | |||||||||
iShares MSCI EAFE Growth ETF | 112,283 | 12,383,692 | |||||||||
| Shares/ Principal | Fair Value | ||||||||||
EQUITY FUNDS - 82.8% (Continued) | |||||||||||
iShares MSCI EAFE Value ETF | 258,978 | $ | 13,049,901 | ||||||||
iShares MSCI USA Min Vol Factor ETF | 51,223 | 4,143,941 | |||||||||
iShares MSCI USA Value Factor ETF | 131,057 | 14,346,810 | |||||||||
iShares U.S. Energy ETF | 227,807 | 6,856,991 | |||||||||
TOTAL EQUITY FUNDS | 342,850,720 | ||||||||||
| TOTAL EXCHANGE TRADED FUNDS (Cost - $256,865,752) | 399,716,284 | ||||||||||
SHORT-TERM INVESTMENTS - 3.1% | |||||||||||
MONEY MARKET FUNDS - 3.1% | |||||||||||
| Dreyfus Government Cash Management, 0.03% (a) | 8,843,134 | 8,843,134 | |||||||||
| Fidelity Investments Money Market Fund - Government Portfolio, Institutional Class, 0.01% (a) | 3,916,045 | 3,916,045 | |||||||||
| TOTAL SHORT-TERM INVESTMENTS (Cost - $12,759,179) | 12,759,179 | ||||||||||
| TOTAL INVESTMENTS - 99.6% (Cost - $269,624,931) | $ | 412,475,463 | |||||||||
| OTHER ASSETS LESS LIABILITIES - NET 0.4% | 1,784,490 | ||||||||||
TOTAL NET ASSETS - 100.0% | $ | 414,259,953 | |||||||||
(a) The rate shown is the annualized seven-day yield at period end.
TIPS - Treasury Inflation Protected Security
FUTURES CONTRACTS | |||||||||||||||||||||||
SHORT FUTURES CONTRACTS | Counterparty | Number of Contracts | Expiration Date | Notional Value | Fair Value/ Unrealized Appreciation (Depreciation) | ||||||||||||||||||
E-Mini Russell 2000 Future | Goldman Sachs & Co. | 25 | 3/18/2022 | $ | 2,803,500 | $ | (84,030 | ) | |||||||||||||||
MSCI EAFE Future | Goldman Sachs & Co. | 53 | 3/18/2022 | 6,152,770 | (148,140 | ) | |||||||||||||||||
NASDAQ 100 E-Mini Future | Goldman Sachs & Co. | 3 | 3/18/2022 | 979,245 | (20,590 | ) | |||||||||||||||||
S&P 500 E-Mini Future | Goldman Sachs & Co. | 76 | 3/18/2022 | 18,082,300 | (612,792 | ) | |||||||||||||||||
S&P MID 400 E-Mini Future | Goldman Sachs & Co. | 12 | 3/18/2022 | 3,405,240 | (137,930 | ) | |||||||||||||||||
TOTAL NET UNREALIZED DEPRECIATION ON FUTURES CONTRACTS | $ | (1,003,482 | ) | ||||||||||||||||||||
See accompanying notes to financial statements.
37
Global Atlantic Moderate Growth Managed Risk Portfolio
Portfolio Review
December 31, 2021 (Unaudited)
Investment Objective
The Portfolio seeks to provide capital appreciation and income while seeking to manage volatility.
Management Review
The capital appreciation and income component is sub-advised by BlackRock Investment Management, LLC ("BlackRock")1, while the managed risk component is sub-advised by Milliman Financial Risk Management LLC ("Milliman").
How did the Portfolio perform during the period?
During 2021, the Portfolio outperformed its reference benchmark, the S&P Global Managed Risk LargeMidCap Index – Moderate Conservative. The Portfolio posted a return of 11.91% compared to a benchmark return of 10.38%, a difference of 153 basis points. The following discussion of relative performance pertains to this benchmark unless otherwise noted.
What factors and allocation decisions influenced the Portfolio's performance?
The Portfolio's overweight to equities was the largest driver of its returns, as stocks outperformed bonds overall and domestic stocks broadly outperformed their international counterparts. Within equities, the Portfolio's strategic allocation to, and rotation among, factors – along with its strategic overweight to financial stocks – were largely detractors from performance, as were international stocks. In equities, the Portfolio maintained an overweight to the U.S. relative to international markets and benefited from positions in technology and energy equities during the year. The Portfolio's factor exposures detracted from performance.
On the fixed income side, longer-duration U.S. Treasuries sold off and the curve bear steepened to start the year, then rallied considerably as COVID-19's Delta variant reversed trends, only for inflation to force the U.S. Federal Reserve's (the "Fed") hand by the end of the year. While returns were negative across all fixed income asset classes, shifts in duration and the spread tightening in lower-quality credit bonds were sources of outperformance for the Portfolio. The Portfolio benefited from its treasuries allocation during the bull flattening periods. During the reopening phases of the COVID-19 pandemic, the Portfolio's increased holdings in credit helped outperform the fixed income benchmark.
The volatility environment experienced during the market's recovery in the second half of 2020 continued into 2021, with brief spikes in volatility occurring approximately every four to six weeks, and typically subsiding within a few days as concerns regarding COVID-19, inflation, and/or economic growth ebbed quickly. Despite these frequent volatility spikes, their amplitude and duration were generally not sufficient to warrant hedging by the managed risk component. As a result, hedging did not have a material impact on the Portfolio's overall performance in 2021.
How was the Portfolio positioned at period end?
At year-end, the Portfolio was 4% overweight equities relative to fixed income, as BlackRock's investment team believes the risk-reward in fixed income was diminished and challenged given interest rates at currently low levels and the persistent threat of inflation. BlackRock's investment team believes that despite the concerns over the Omicron variant of COVID-19 and the Fed's tapering-then-hike plans, expectations surrounding growth and earnings remain strong, which should lead to more equity outperformance in 2022. BlackRock believes that the case for cyclical assets like equities and commodities remains intact for 2022, with key drivers being continued supply constraints, higher wages, and the cautiously slow removal of some policy and fiscal support by non-US central banks. As the holidays led to COVID-19 case surges, some caution has returned in the U.S. and with international markets continuing to lag from slower global demand, BlackRock's investment view was to position the Portfolio for the ongoing post-COVID-19 "restart" and the maturing cycle as interest rate hikes begin amidst strong economic growth.
1 Prior to May 1, 2021, BlackRock Financial Management, Inc. served as a sub-adviser to the Capital Appreciation and Income Component of the Portfolio
38
Global Atlantic Moderate Growth Managed Risk Portfolio
Portfolio Review (Continued)
December 31, 2021 (Unaudited)
Within fixed income, the investment team favors a shorter duration bias, particularly within investment grade and high yield credit. This was partially offset with longer duration holdings in U.S. Treasury Inflation-Protected Securities ("TIPS") at the end of the period, which was present to not only balance inflation risks, but to also benefit sector positions should inflation run above expectations.
The Portfolio's performance figures for the periods ended December 31, 2021 as compared to its benchmark:
Annualized | Operating Expense* | ||||||||||||||||||||||||||
| Inception Date | One Year | Five Years | Since Inception | Gross Ratio | Net Ratio | ||||||||||||||||||||||
Global Atlantic Moderate Growth Managed Risk Portfolio | |||||||||||||||||||||||||||
Class II | April 30, 2014 | 11.91 | % | 8.46 | % | 6.30 | % | 1.01 | % | 1.01 | % | ||||||||||||||||
| S&P Global Managed Risk LargeMidCap Index - Moderate Conservative^ | 10.38 | % | 8.89 | % | 6.28 | % | |||||||||||||||||||||
The performance data quoted is historical. Past performance is no guarantee of future results. Current performance may be higher or lower than the performance data quoted. The principal value and investment return of an investment will fluctuate so that your shares, when redeemed, may be worth more or less than their original cost. Total returns would have been lower absent fee waivers by the Adviser. Performance figures for periods greater than one year are annualized. The returns shown do not reflect the deduction of taxes that a shareholder may pay on Portfolio distributions or on the redemption of Portfolio shares, as well as other charges and expenses of the insurance contract or separate account. Prior to October 1, 2016, the Capital Appreciation and Income Component of the Portfolio was managed by the Adviser without the use of a sub-adviser. The performance prior to that date is attributable to the Adviser's asset allocation decisions. From October 1, 2016 to May 1, 2021, BlackRock Financial Management, Inc. served as a sub-adviser to Capital Appreciation and Income Component of the Portfolio. In addition, effective May 1, 2021 the sub-adviser to the Capital Appreciation and Income Component of the Portfolio changed from BlackRock Financial Management, Inc. to BlackRock Investment Management, LLC. No changes were made to the Portfolio's principal investment strategies or to the portfolio management team as a result of the change in sub-adviser.
* The estimated operating expense ratios for Class II shares, as disclosed in the most recent prospectus dated May 1, 2021. Ratios include Acquired Fund Fees and Expenses indirectly incurred by the Portfolio. Gross operating expense ratio reflects the ratio of expenses absent waivers and/or reimbursements by the Adviser. The operating expense ratios presented here may differ from the expense ratios disclosed in the Financial Highlights table in this report.
^ The S&P Global Managed Risk LargeMidCap Index - Moderate Conservative is designed to simulate a dynamic protective portfolio that allocates between the underlying equity index and cash, based on realized volatilities of the underlying equity and bond indices, while maintaining a fixed allocation of 40% to the underlying bond index.
Comparison of the Change in Value of a $10,000 Investment
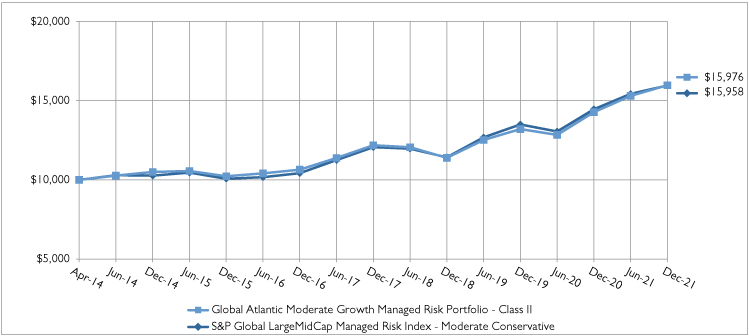
39
Global Atlantic Moderate Growth Managed Risk Portfolio
Portfolio Review (Continued)
December 31, 2021 (Unaudited)
Holdings by Asset Class | % of Net Assets | ||||||
Exchange Traded Funds | 96.1 | % | |||||
Short-Term Investments | 3.8 | % | |||||
Other Assets less Liabilities - Net | 0.1 | % | |||||
100.0 | % | ||||||
Please refer to the Portfolio of Investments in this annual report for more information regarding the Portfolio's holdings as of December 31, 2021.
Derivative exposure is included in "Other Assets Less Liabilities - Net".
40
Global Atlantic Moderate Growth Managed Risk Portfolio
Portfolio of Investments
December 31, 2021
| Shares/ Principal | Fair Value | ||||||||||
EXCHANGE TRADED FUNDS - 96.1% | |||||||||||
DEBT FUNDS - 28.7% | |||||||||||
| iShares 10+ Year Investment Grade Corporate Bond ETF | 53,534 | $ | 3,723,290 | ||||||||
| iShares 1-5 Year Investment Grade Corporate Bond ETF | 78,202 | 4,213,524 | |||||||||
iShares 3-7 Year Treasury Bond ETF | 36,309 | 4,671,879 | |||||||||
| iShares Broad USD High Yield Corporate Bond ETF | 16,312 | 671,891 | |||||||||
| iShares Core Total USD Bond Market ETF | 196,607 | 10,406,409 | |||||||||
iShares Fallen Angels USD Bond ETF | 65,022 | 1,948,709 | |||||||||
iShares Short Treasury Bond ETF | 5,474 | 604,439 | |||||||||
iShares TIPS Bond ETF | 52,016 | 6,720,467 | |||||||||
iShares U.S. Treasury Bond ETF | 282,591 | 7,539,528 | |||||||||
TOTAL DEBT FUNDS | 40,500,136 | ||||||||||
EQUITY FUNDS - 67.4% | |||||||||||
iShares Core MSCI EAFE ETF | 155,510 | 11,607,266 | |||||||||
iShares Core S&P 500 ETF | 71,951 | 34,319,908 | |||||||||
iShares Core S&P Mid-Cap ETF | 25,153 | 7,120,311 | |||||||||
iShares Core S&P Small-Cap ETF | 78,674 | 9,008,960 | |||||||||
iShares ESG Aware MSCI USA ETF | 153,257 | 16,536,430 | |||||||||
iShares Global Financials ETF | 7,601 | 608,536 | |||||||||
iShares Global Tech ETF | 29,492 | 1,898,990 | |||||||||
iShares MSCI EAFE Growth ETF | 26,779 | 2,953,456 | |||||||||
| Shares/ Principal | Fair Value | ||||||||||
EQUITY FUNDS - 67.4% (Continued) | |||||||||||
iShares MSCI EAFE Value ETF | 97,545 | $ | 4,915,293 | ||||||||
iShares MSCI USA Min Vol Factor ETF | 17,419 | 1,409,197 | |||||||||
iShares MSCI USA Value Factor ETF | 35,677 | 3,905,561 | |||||||||
iShares U.S. Energy ETF | 30,767 | 926,087 | |||||||||
TOTAL EQUITY FUNDS | 95,209,995 | ||||||||||
| TOTAL EXCHANGE TRADED FUNDS (Cost - $96,758,980) | 135,710,131 | ||||||||||
SHORT-TERM INVESTMENTS - 3.8% | |||||||||||
MONEY MARKET FUNDS - 3.8% | |||||||||||
| Dreyfus Government Cash Management, 0.03% (a) | 3,949,223 | 3,949,223 | |||||||||
| Fidelity Investments Money Market Fund - Government Portfolio, Institutional Class, 0.01% (a) | 1,353,308 | 1,353,308 | |||||||||
| TOTAL SHORT-TERM INVESTMENTS (Cost - $5,302,531) | 5,302,531 | ||||||||||
| TOTAL INVESTMENTS - 99.9% (Cost - $102,061,511) | $ | 141,012,662 | |||||||||
| OTHER ASSETS LESS LIABILITIES - NET 0.1% | 169,446 | ||||||||||
TOTAL NET ASSETS - 100.0% | $ | 141,182,108 | |||||||||
(a) The rate shown is the annualized seven-day yield at period end.
TIPS - Treasury Inflation Protected Security
FUTURES CONTRACTS | |||||||||||||||||||||||
SHORT FUTURES CONTRACTS | Counterparty | Number of Contracts | Expiration Date | Notional Value | Fair Value/ Unrealized Appreciation (Depreciation) | ||||||||||||||||||
E-Mini Russell 2000 Future | Goldman Sachs & Co. | 3 | 3/18/2022 | $ | 336,420 | $ | (12,795 | ) | |||||||||||||||
MSCI EAFE Future | Goldman Sachs & Co. | 5 | 3/18/2022 | 580,450 | (16,610 | ) | |||||||||||||||||
S&P 500 E-Mini Future | Goldman Sachs & Co. | 6 | 3/18/2022 | 1,427,550 | (57,875 | ) | |||||||||||||||||
S&P MID 400 E-Mini Future | Goldman Sachs & Co. | 2 | 3/18/2022 | 567,540 | (28,820 | ) | |||||||||||||||||
TOTAL NET UNREALIZED DEPRECIATION ON FUTURES CONTRACTS | $(116,100) | ||||||||||||||||||||||
See accompanying notes to financial statements.
41
Global Atlantic Select Advisor Managed Risk Portfolio
Portfolio Review
December 31, 2021 (Unaudited)
Investment Objective
The Portfolio seeks to provide capital appreciation and income while seeking to manage volatility.
Management Review
The capital appreciation and income component is sub-advised by Wilshire Advisors, LLC (formerly Wilshire Associates Incorporated) ("Wilshire"), while the managed risk component is sub-advised by Milliman Financial Risk Management LLC ("Milliman").
How did the Portfolio perform during the period?
During 2021, the Portfolio outperformed its reference benchmark, the S&P Global Managed Risk LargeMidCap Index – Moderate. The Portfolio posted a return of 13.31% compared to a benchmark return of 12.42%, a difference of 89 basis points. The following discussion of relative performance pertains to this benchmark.
What factors and allocation decisions influenced the Portfolio's performance?
The Portfolio was impacted by both dynamic asset allocation tilts as well as manager selection during 2021. Tilts within U.S. equities contributed during the year. A modest detraction from the Portfolio's overweight to value and foreign equities (primarily emerging markets) was more than offset by small cap equity exposure. Tilts within fixed income, notably a modest overweight to high yield contributed to performance. Manager selection within equities detracted, while it contributed to performance within fixed income.
There were no allocation changes to the Portfolio made during the first or second quarters of 2021. In the third quarter, the Portfolio reduced fixed income duration by initiating a new allocation to the iShares Core 1-5 Year USD Bond ETF, sourced by eliminating the allocations to the iShares 1-5 Year Investment Grade Corporate Bond ETF and the iShares Core Total USD Bond Market ETF. During the fourth quarter, the Portfolio removed its overweight to emerging markets equities relative to foreign developed equities and instead moved to overweight foreign developed equities. To enact this positioning, 1% [of the Portfolio's assets] were reallocated from iShares Core MSCI Emerging Markets ETF to iShares Core MSCI EAFE ETF.
The volatility environment experienced during the market's recovery in the second half of 2020 continued into 2021, with brief spikes in volatility occurring approximately every four to six weeks, and typically subsiding within a few days as concerns regarding COVID-19, inflation, and/or economic growth ebbed quickly. Despite these frequent volatility spikes, their amplitude and duration were generally not sufficient to warrant hedging by the managed risk component. As a result, hedging did not have a material impact on the Portfolio's overall performance in 2021.
How was the Portfolio positioned at period end?
Wilshire believes that the Portfolio remains well positioned to meaningfully participate in a continued rally in risk assets, but also diversified to outperform broad market equities during a selloff. More specifically, at the end of the period, within equities, the Portfolio was modestly tilted to favor value over growth equities, and within foreign equities, developed economies over emerging markets. The case for value equities, Wilshire believes, is driven by a combination of highly attractive relative valuations, high beta to further economic growth and better relative performance in a rising interest rate environment. Even with the recent emergence of the Omicron variant of COVID-19, Wilshire believes that the prospects for global economic recovery remain strong and that value equities exhibit the potential for higher upside in a cyclical recovery and a larger margin of safety in an unforeseen downturn. Earnings remain strong for many value sectors, while price-to-earnings expansion in recent years has not kept pace with growth equities. Wilshire expects the Portfolio's overweight to foreign developed equities to benefit from strong economic growth across much of Europe, and potentially Japan, during 2022, perhaps exceeding current expectations, while emerging markets (notably China) may lag expectations somewhat due to increasing financial market restrictions and relatively strict COVID-19 protocols.
Within fixed income at the end of the period, the Portfolio was underweight duration due to concerns that inflation and tighter monetary policy could lead to rising interest rates during 2022.
42
Global Atlantic Select Advisor Managed Risk Portfolio
Portfolio Review (Continued)
December 31, 2021 (Unaudited)
The Portfolio's performance figures for the periods ended December 31, 2021 as compared to its benchmark:
Annualized | Operating Expense* | ||||||||||||||||||||||||||
| Inception Date | One Year | Five Years | Since Inception | Gross Ratio | Net Ratio | ||||||||||||||||||||||
Global Atlantic Select Advisor Managed Risk Portfolio | |||||||||||||||||||||||||||
Class II | October 31, 2013 | 13.31 | % | 9.39 | % | 7.13 | % | 1.83 | % | 1.21 | % | ||||||||||||||||
S&P Global Managed Risk LargeMidCap Index - Moderate^ | 12.42 | % | 9.79 | % | 6.83 | % | |||||||||||||||||||||
The performance data quoted is historical. Past performance is no guarantee of future results. Current performance may be higher or lower than the performance data quoted. The principal value and investment return of an investment will fluctuate so that your shares, when redeemed, may be worth more or less than their original cost. Total returns would have been lower absent fee waivers by the Adviser. Performance figures for periods greater than one year are annualized. The returns shown do not reflect the deduction of taxes that a shareholder may pay on Portfolio distributions or on the redemption of Portfolio shares, as well as other charges and expenses of the insurance contract or separate account. Prior to October 1, 2016, the Capital Appreciation and Income Component of the Portfolio was managed by the Adviser without the use of a sub-adviser. The performance prior to that date is attributable to the Adviser's asset allocation decisions.
* The estimated operating expense ratios for Class II shares, as disclosed in the most recent prospectus dated May 1, 2021. Ratios include Acquired Fund Fees and Expenses indirectly incurred by the Portfolio. Gross operating expense ratio reflects the ratio of expenses absent waivers and/or reimbursements by the Adviser. The operating expense ratios presented here may differ from the expense ratios disclosed in the Financial Highlights table in this report.
^ The S&P Global Managed Risk LargeMidCap Index - Moderate is designed to simulate a dynamic protective portfolio that allocates between the underlying equity index and cash, based on realized volatilities of the underlying equity and bond indices, while maintaining a fixed allocation of 30% to the underlying bond index.
Comparison of the Change in Value of a $10,000 Investment

Holdings by Asset Class | % of Net Assets | ||||||
Variable Insurance Trusts | 79.1 | % | |||||
Exchange Traded Funds | 17.1 | % | |||||
Short-Term Investments | 3.8 | % | |||||
Other Assets less Liabilities - Net | 0.0 | %^ | |||||
100.0 | % | ||||||
Please refer to the Portfolio of Investments in this annual report for more information regarding the Portfolio's holdings as of December 31, 2021.
^ Represents less than 0.05%.
43
Global Atlantic Select Advisor Managed Risk Portfolio
Portfolio of Investments
December 31, 2021
| Shares/ Principal | Fair Value | ||||||||||
VARIABLE INSURANCE TRUSTS - 79.1% | |||||||||||
DEBT FUNDS - 19.2% | |||||||||||
MFS High Yield Portfolio | 362,811 | $ | 2,028,115 | ||||||||
MFS Total Return Bond Series, Class I | 1,331,925 | 18,154,144 | |||||||||
TOTAL DEBT FUNDS | 20,182,259 | ||||||||||
EQUITY FUNDS - 59.9% | |||||||||||
| American Century VP Mid Cap Value, Class I | 163,900 | 4,100,769 | |||||||||
| American Century VP Value Fund, Class I | 747,537 | 10,218,832 | |||||||||
MFS Growth Series | 203,754 | 16,169,895 | |||||||||
| MFS VIT II - International Intrinsic Value Portfolio, Class I | 190,158 | 7,153,758 | |||||||||
| MFS VIT II Blended Research Core Equity Portfolio, Class I | 59,833 | 4,100,348 | |||||||||
MFS VIT Mid Cap Growth Series | 259,149 | 3,037,221 | |||||||||
Putnam VT Growth Opportunities | 244,290 | 4,033,222 | |||||||||
Putnam VT Large Cap Value Fund | 461,552 | 14,395,797 | |||||||||
TOTAL EQUITY FUNDS | 63,209,842 | ||||||||||
| TOTAL VARIABLE INSURANCE TRUSTS (Cost - $58,728,173) | 83,392,101 | ||||||||||
EXCHANGE TRADED FUNDS - 17.1% | |||||||||||
DEBT FUNDS - 4.8% | |||||||||||
iShares Core 1-5 Year USD Bond ETF | 99,993 | 5,042,647 | |||||||||
| Shares/ Principal | Fair Value | ||||||||||
EXCHANGE TRADED FUNDS - 17.1% (Continued) | |||||||||||
EQUITY FUNDS - 12.3% | |||||||||||
iShares Core MSCI EAFE ETF | 121,467 | $ | 9,066,297 | ||||||||
iShares Core MSCI Emerging Markets ETF | 16,259 | 973,264 | |||||||||
iShares Core S&P Small-Cap ETF | 26,026 | 2,980,237 | |||||||||
TOTAL EQUITY FUNDS | 13,019,798 | ||||||||||
| TOTAL EXCHANGE TRADED FUNDS (Cost - $16,291,749) | 18,062,445 | ||||||||||
SHORT-TERM INVESTMENTS - 3.8% | |||||||||||
MONEY MARKET FUNDS - 3.8% | |||||||||||
| Dreyfus Government Cash Management, 0.03% (a) | 3,956,820 | 3,956,820 | |||||||||
| Fidelity Investments Money Market Fund - Government Portfolio, Institutional Class, 0.01% (a) | 98,251 | 98,251 | |||||||||
| TOTAL SHORT-TERM INVESTMENTS (Cost - $4,055,071) | 4,055,071 | ||||||||||
| TOTAL INVESTMENTS - 100.0% (Cost - $79,074,993) | $ | 105,509,617 | |||||||||
| OTHER ASSETS LESS LIABILITIES - NET 0.0%† | 22,018 | ||||||||||
TOTAL NET ASSETS - 100.0% | $ | 105,531,635 | |||||||||
† Represents less than 0.05%.
(a) The rate shown is the annualized seven-day yield at period end.
See accompanying notes to financial statements.
44
Global Atlantic Wellington Research Managed Risk Portfolio
Portfolio Review
December 31, 2021 (Unaudited)
Investment Objective
The Portfolio seeks to provide capital appreciation and income while seeking to manage volatility.
Management Review
The capital appreciation and income component is sub-advised by Wellington Management Company LLP ("Wellington Management") while the managed risk component is sub-advised by Milliman Financial Risk Management LLC ("Milliman").
How did the Portfolio perform during the period?
During 2021, the Portfolio underperformed its reference benchmark, the S&P 500 Managed Risk Index – Moderate Conservative. The Portfolio posted a return of 12.38% compared to a benchmark return of 15.02%, a difference of -264 basis points. The following discussion of relative performance pertains to this benchmark unless otherwise noted.
What factors and allocation decisions influenced the Portfolio's performance?
The equity portion of the Capital Appreciation and Income Component of the Portfolio underperformed the S&P 500® Index, net of fees, during the year, returning 24.57%, versus the S&P 500® Index's return of 28.71%, a difference of -373 basis points. Relative equity underperformance in the Portfolio was driven by poor security selection within the information technology, consumer staples, and consumer discretionary sectors, which was only partially offset by stronger security selection within the communication services, financials, and utilities sectors.
Top detractors from relative performance during the period included an overweight position in Global Payments, Inc. (information technology), an underweight position in NVIDIA Corporation (information technology), and an out-of-benchmark position in Performance Food Group Co. (consumer staples). While Global Payments Inc. reported consistent results driven by strength in its merchant solutions and business and consumer segments, shares remained under pressure throughout the year amid investors' elevated expectations for further growth compounded with disruption narratives driven by newer entrants to the electronic payments industry. Shares of NVIDIA Corporation, a leading producer of graphics processing units ("GPUs"), rose during the period as optimism around the metaverse concept surged. NVIDIA Corporation is at the forefront of the metaverse transformation due to its data center network and technology infrastructure. The share price of Performance Food Group Co., a food distribution company, fell during the period after posting fiscal year third quarter 2021 results that missed adjusted earnings per share expectations as higher input costs impacted margins. Later in the period, management completed a $2.1B acquisition of Core-Mark Holding Company, a large wholesale distributor to the convenience retail industry.
Top contributors to relative performance during the period included positioning in JPMorgan Chase & Co. (financials), an underweight to Walt Disney Co. (communication services), and an out-of-benchmark position in Marvell Technology Group Ltd. (information technology). Shares of JPMorgan were trading higher in the first quarter of 2021 after the bank reported fourth and first-quarter results that came in ahead of estimates, largely due to better-than-anticipated revenues and lower provision expense. The Portfolio eliminated its position in JPMorgan during the period. Shares of Walt Disney fell during the period after reporting second-quarter revenue below expectations, including fewer Disney+ subscribers than expected. Management noted that the average monthly revenue per Disney+ subscriber decreased significantly due to the launch of Hotstar, the company's streaming service in India that now comprises approximately a third of the total Disney+ subscriber base. The Portfolio eliminated its position in the stock during the period. Shares of Marvell Technology, Inc., a semiconductor infrastructure solutions company, rose during the period. Management released top and bottom line third quarter 2021 results ahead of expectations and raised guidance for fourth quarter 2021. Additionally, Marvell Technology, Inc. completed its acquisition of Innovium, Inc., a provider of networking solutions for data centers, enabling participation in the fastest growing segment of the switch market with a cloud-optimized solution.
45
Global Atlantic Wellington Research Managed Risk Portfolio
Portfolio Review (Continued)
December 31, 2021 (Unaudited)
The fixed income portion of the Capital Appreciation and Income Component of the Portfolio outperformed the Bloomberg U.S. Aggregate Bond Index (net of fees) during the year, returning -1.19% versus the benchmark return of -1.54%, a difference of 35 basis points. Broad fixed income markets largely generated negative total returns in 2021, driven by rising U.S. Treasury yields. Yields rose significantly in the first quarter of 2021 following an improving growth outlook and reinforced reflation narrative, offsetting positive price appreciation from spread tightening. Credit spreads tightened considerably during the first half of the year as COVID-19 vaccination rates increased, economic data improved and fiscal stimulus continued to be supportive; however, spreads widened in the second half of 2021, driven by increasing inflation risk and concerns over the impact of new COVID-19 variants on the economic recovery. The Bloomberg U.S. Aggregate Bond Index returned -1.54% while the 10-year U.S. Treasury note yield rose from 0.93% to 1.52%
Both sector allocation and security selection contributed positively to the fixed income portion of the Portfolio. Security selection within investment grade corporates contributed the most to relative returns, with industrials, financials and utilities all aiding results. Within non-corporate investment grade credit, an overweight to and security selection within taxable municipals contributed. Agency mortgage-backed securities ("MBS") contributed positively due to an underweight to and security selection within pass-throughs. Within the securitized sectors, out-of-benchmark allocations to collateralized loan obligations ("CLOs") and non-agency mortgage-backed securities ("NA RMBS") as well as an overweight to commercial mortgage-backed securities ("CMBS") contributed to relative returns. Duration and yield curve positioning had a negligible impact on the Portfolio's performance during the year.
The volatility environment experienced during the market's recovery in the second half of 2020 continued into 2021, with brief spikes in volatility occurring approximately every four to six weeks, and typically subsiding within a few days as concerns regarding COVID-19, inflation, and/or economic growth ebbed quickly. Despite these frequent volatility spikes, their amplitude and duration were generally not sufficient to warrant hedging by the managed risk component. As a result, hedging did not have a material impact on the Portfolio's overall performance in 2021.
How was the Portfolio positioned at period end?
The equity portion of the Portfolio is managed in an industry-neutral structure by Wellington Management's US Research Equity Team, and is designed to add value through fundamental, bottom-up stock selection. The equity portion of the Portfolio consists of multiple sub-portfolios, with each sub-portfolio actively managed by one or more of Wellington Management's Global Industry Analysts ("GIAs"). The allocation of assets to each sub-portfolio corresponds to the relative weight of the analysts' coverage universe within the S&P 500® Index. However, within in an industry, an analyst's stock selection may result in an overweight or underweight to certain sub-industries in his or her area of coverage. Wellington's GIAs remain focused on fundamental, bottom-up stock selection with an eye on how the macro-economic outlook will affect the companies in which they invest.
Wellington's GIAs remain diligent in the face of a considerably unpredictable and volatile market. They remain cognizant of the emergence of new COVID-19 variants and the impacts of waning stimulus measures globally. The inflation and supply chain disruptions being felt throughout the globe are also top of mind for the analysts. They continue to see disruptions in supply chains driven by closed factories and crowded ports delaying shipments. However, Wellington's GIAs believe consumer demand remains strong, supported by large stimulus measures globally, leading to large supply and demand mismatches. The analysts utilize their deep industry knowledge to discern likely impacts on their coverage and look for opportunities amongst the dispersion of outcomes.
At the end of the period, the fixed income portion of the Portfolio was overweight investment grade credit from a market value perspective but underweight from a spread duration perspective reflecting our more cautious view as valuations still look rich relative to historical levels. Also, Wellington was looking to hold a moderate underweight duration position as Wellington expects those rates will move higher over the next year, but not necessarily in a linear path. At the end of the period, the Portfolio was most underweight investment grade corporates and agency MBS while being overweight non-corporate investment grade credit. On an industry basis, the Portfolio was positioned overweight the less cyclical sectors like communications and utilities while remaining cautious on more cyclical sectors such as energy at the end of the period. The Portfolio retained an overweight to taxable municipals given the diversification benefit and still strong fundamentals based on a bounce-back in economic activity and generous direct and indirect Federal support. Wellington was cautious on
46
Global Atlantic Wellington Research Managed Risk Portfolio
Portfolio Review (Continued)
December 31, 2021 (Unaudited)
agency MBS due to rate uncertainty remaining a risk, and a sudden move was more problematic for MBS. At the end of the period, the Portfolio held an allocation to collateralized mortgage obligations ("CMOs") and a modest allocation to delegated underwriting and servicing ("DUS") for their stable cash flows. The Portfolio also held out-of-benchmark allocations to collateral loan obligations and non-agency residential mortgages as well as a small underweight to commercial mortgage-backed securities at the end of the period.
The Portfolio's performance figures for the periods ended December 31, 2021 as compared to its benchmark:
Annualized | Operating Expense* | ||||||||||||||||||||||||||
| Inception Date | One Year | Five Years | Since Inception | Gross Ratio | Net Ratio | ||||||||||||||||||||||
Global Atlantic Wellington Research Managed Risk Portfolio | |||||||||||||||||||||||||||
Class II | October 31, 2013 | 12.38 | % | 10.03 | % | 8.29 | % | 1.23 | % | 1.22 | % | ||||||||||||||||
S&P 500 Managed Risk Index - Moderate Conservative^ | 15.02 | % | 10.26 | % | 8.67 | % | |||||||||||||||||||||
The performance data quoted is historical. Past performance is no guarantee of future results. Current performance may be higher or lower than the performance data quoted. The principal value and investment return of an investment will fluctuate so that your shares, when redeemed, may be worth more or less than their original cost. Total returns would have been lower absent fee waivers by the Adviser. Performance figures for periods greater than one year are annualized. The returns shown do not reflect the deduction of taxes that a shareholder may pay on Portfolio distributions or on the redemption of Portfolio shares, as well as other charges and expenses of the insurance contract or separate account.
* The estimated operating expense ratios for Class II shares, as disclosed in the most recent prospectus dated May 1, 2021. Ratios include Acquired Fund Fees and Expenses indirectly incurred by the Portfolio. Gross operating expense ratio reflects the ratio of expenses absent waivers and/or reimbursements by the Adviser. The operating expense ratios presented here may differ from the expense ratios disclosed in the Financial Highlights table in this report.
^ The S&P 500 Managed Risk Index - Moderate Conservative is designed to simulate a dynamic protective portfolio that allocates between the underlying equity index and cash, based on realized volatilities of the underlying equity and bond indices, while maintaining a fixed allocation of 40% to the underlying bond index.
Comparison of the Change in Value of a $10,000 Investment

47
Global Atlantic Wellington Research Managed Risk Portfolio
Portfolio Review (Continued)
December 31, 2021 (Unaudited)
Holdings by Asset Class | % of Net Assets | ||||||
Common Stocks | 62.4 | % | |||||
U.S. Treasury Securities | 11.0 | % | |||||
Corporate Bonds and Notes | 10.4 | % | |||||
Agency Mortgage Backed Securities | 6.4 | % | |||||
Asset Backed and Commercial Backed Securities | 4.4 | % | |||||
Municipal Bonds | 0.7 | % | |||||
Sovereign Debts | 0.3 | % | |||||
Short-Term Investments | 9.9 | % | |||||
Other Assets less Liabilities - Net | (5.5 | )% | |||||
100.0 | % | ||||||
Please refer to the Portfolio of Investments in this annual report for more information regarding the Portfolio's holdings as of December 31, 2021.
Derivative exposure is included in "Other Assets Less Liabilities - Net".
48
Global Atlantic Wellington Research Managed Risk Portfolio
Portfolio of Investments
December 31, 2021
| Shares/ Principal | Fair Value | ||||||||||
COMMON STOCKS - 62.4% | |||||||||||
AEROSPACE & DEFENSE - 0.9% | |||||||||||
Boeing Co. (The)* | 5,967 | $ | 1,201,276 | ||||||||
General Dynamics Corp. | 6,343 | 1,322,325 | |||||||||
Raytheon Technologies Corp. | 24,658 | 2,122,068 | |||||||||
4,645,669 | |||||||||||
AIR FREIGHT & LOGISTICS - 0.3% | |||||||||||
FedEx Corp. | 5,380 | 1,391,483 | |||||||||
AIRLINES - 0.2% | |||||||||||
JetBlue Airways Corp.* | 66,087 | 941,079 | |||||||||
AUTOMOBILES - 1.1% | |||||||||||
Tesla, Inc.* | 5,200 | 5,495,256 | |||||||||
BANKS - 0.6% | |||||||||||
PNC Financial Services Group, Inc. (The) | 13,557 | 2,718,450 | |||||||||
BEVERAGES - 1.1% | |||||||||||
Constellation Brands, Inc., Class A | 13,124 | 3,293,730 | |||||||||
Monster Beverage Corp.* | 19,544 | 1,877,006 | |||||||||
5,170,736 | |||||||||||
BIOTECHNOLOGY - 1.1% | |||||||||||
Alnylam Pharmaceuticals, Inc.* | 1,080 | 183,146 | |||||||||
Amicus Therapeutics, Inc.* | 10,609 | 122,534 | |||||||||
Apellis Pharmaceuticals, Inc.* | 1,370 | 64,774 | |||||||||
Arena Pharmaceuticals, Inc.* | 1,543 | 143,406 | |||||||||
Ascendis Pharma A/S, ADR* | 1,105 | 148,656 | |||||||||
BioAtla, Inc.* | 1,936 | 38,004 | |||||||||
Biogen, Inc.* | 1,514 | 363,239 | |||||||||
Blueprint Medicines Corp.* | 1,228 | 131,531 | |||||||||
Celldex Therapeutics, Inc.* | 2,189 | 84,583 | |||||||||
Exact Sciences Corp.* | 8,391 | 653,072 | |||||||||
Immunocore Holdings PLC, ADR* | 1,475 | 50,504 | |||||||||
Kodiak Sciences, Inc.* | 1,084 | 91,901 | |||||||||
Kymera Therapeutics, Inc.* | 1,410 | 89,521 | |||||||||
Madrigal Pharmaceuticals, Inc.* | 852 | 72,198 | |||||||||
Mirati Therapeutics, Inc.* | 862 | 126,447 | |||||||||
Moderna, Inc.* | 1,327 | 337,031 | |||||||||
Myovant Sciences Ltd.* | 27,620 | 430,043 | |||||||||
Regeneron Pharmaceuticals, Inc.* | 1,062 | 670,674 | |||||||||
REVOLUTION Medicines, Inc.* | 2,323 | 58,470 | |||||||||
Sarepta Therapeutics, Inc.* | 711 | 64,026 | |||||||||
Seagen, Inc.* | 2,054 | 317,548 | |||||||||
United Therapeutics Corp.* | 421 | 90,970 | |||||||||
Veracyte, Inc.* | 10,148 | 418,098 | |||||||||
Vertex Pharmaceuticals, Inc.* | 3,630 | 797,148 | |||||||||
Verve Therapeutics, Inc.* | 1,565 | 57,702 | |||||||||
5,605,226 | |||||||||||
| Shares/ Principal | Fair Value | ||||||||||
BUILDING PRODUCTS - 0.8% | |||||||||||
Johnson Controls International PLC | 24,377 | $ | 1,982,094 | ||||||||
Trane Technologies PLC | 5,155 | 1,041,465 | |||||||||
Zurn Water Solutions Corp. | 18,165 | 661,206 | |||||||||
3,684,765 | |||||||||||
CAPITAL MARKETS - 3.0% | |||||||||||
Ares Management Corp., Class A | 22,039 | 1,791,109 | |||||||||
Charles Schwab Corp. (The) | 83,893 | 7,055,401 | |||||||||
Hamilton Lane, Inc., Class A | 7,211 | 747,204 | |||||||||
Morgan Stanley | 35,586 | 3,493,122 | |||||||||
S&P Global, Inc. | 3,085 | 1,455,904 | |||||||||
14,542,740 | |||||||||||
CHEMICALS - 1.7% | |||||||||||
Cabot Corp. | 16,392 | 921,230 | |||||||||
Celanese Corp. | 8,066 | 1,355,572 | |||||||||
FMC Corp. | 11,304 | 1,242,197 | |||||||||
Ingevity Corp.* | 6,213 | 445,472 | |||||||||
Linde PLC | 6,508 | 2,254,566 | |||||||||
Livent Corp.* | 13,687 | 333,689 | |||||||||
PPG Industries, Inc. | 9,506 | 1,639,215 | |||||||||
8,191,941 | |||||||||||
COMMERCIAL SERVICES & SUPPLIES - 0.4% | |||||||||||
Aurora Innovation, Inc.* | 44,471 | 500,743 | |||||||||
Waste Management, Inc. | 8,030 | 1,340,207 | |||||||||
1,840,950 | |||||||||||
COMMUNICATIONS EQUIPMENT - 0.3% | |||||||||||
Arista Networks, Inc.* | 10,056 | 1,445,550 | |||||||||
CONSTRUCTION & ENGINEERING - 0.1% | |||||||||||
Dycom Industries, Inc.* | 3,835 | 359,570 | |||||||||
CONSUMER FINANCE - 0.7% | |||||||||||
American Express Co. | 19,129 | 3,129,504 | |||||||||
OneMain Holdings, Inc. | 9,300 | 465,372 | |||||||||
3,594,876 | |||||||||||
CONTAINERS & PACKAGING - 0.1% | |||||||||||
Ball Corp. | 5,338 | 513,889 | |||||||||
DIVERSIFIED CONSUMER SERVICES - 0.1% | |||||||||||
Houghton Mifflin Harcourt Co.* | 34,462 | 554,838 | |||||||||
DIVERSIFIED FINANCIAL SERVICES - 0.4% | |||||||||||
Equitable Holdings, Inc. | 53,137 | 1,742,362 | |||||||||
Voya Financial, Inc. | 5,864 | 388,842 | |||||||||
2,131,204 | |||||||||||
See accompanying notes to financial statements.
49
Global Atlantic Wellington Research Managed Risk Portfolio
Portfolio of Investments (Continued)
December 31, 2021
| Shares/ Principal | Fair Value | ||||||||||
ELECTRIC UTILITIES - 1.8% | |||||||||||
Duke Energy Corp. | 23,842 | $ | 2,501,026 | ||||||||
Edison International | 26,416 | 1,802,892 | |||||||||
Exelon Corp. | 39,056 | 2,255,875 | |||||||||
FirstEnergy Corp. | 49,375 | 2,053,506 | |||||||||
8,613,299 | |||||||||||
ELECTRICAL EQUIPMENT - 0.0%† | |||||||||||
Regal Rexnord Corp. | 615 | 104,661 | |||||||||
ENERGY EQUIPMENT & SERVICES - 0.2% | |||||||||||
Schlumberger NV | 26,439 | 791,848 | |||||||||
ENTERTAINMENT - 1.0% | |||||||||||
Electronic Arts, Inc. | 14,531 | 1,916,639 | |||||||||
Netflix, Inc.* | 1,270 | 765,098 | |||||||||
ROBLOX Corp., Class A* | 12,506 | 1,290,119 | |||||||||
Roku, Inc.* | 4,764 | 1,087,145 | |||||||||
5,059,001 | |||||||||||
EQUITY REAL ESTATE INVESTMENT - 1.4% | |||||||||||
American Tower Corp. | 4,240 | 1,240,200 | |||||||||
AvalonBay Communities, Inc. | 4,742 | 1,197,782 | |||||||||
Rexford Industrial Realty, Inc. | 21,061 | 1,708,258 | |||||||||
Ryman Hospitality Properties, Inc.* | 11,475 | 1,055,241 | |||||||||
Welltower, Inc. | 17,593 | 1,508,951 | |||||||||
6,710,432 | |||||||||||
FOOD & STAPLES RETAILING - 1.0% | |||||||||||
Performance Food Group Co.* | 64,256 | 2,948,708 | |||||||||
Sysco Corp. | 24,043 | 1,888,578 | |||||||||
4,837,286 | |||||||||||
FOOD PRODUCTS - 0.7% | |||||||||||
Mondelez International, Inc., Class A | 51,911 | 3,442,218 | |||||||||
HEALTH CARE EQUIPMENT & SUPPLIES - 2.2% | |||||||||||
Align Technology, Inc.* | 1,782 | 1,171,095 | |||||||||
Baxter International, Inc. | 14,709 | 1,262,621 | |||||||||
Boston Scientific Corp.* | 42,555 | 1,807,736 | |||||||||
Edwards Lifesciences Corp.* | 14,905 | 1,930,943 | |||||||||
Inari Medical, Inc.* | 5,185 | 473,235 | |||||||||
Insulet Corp.* | 3,262 | 867,920 | |||||||||
Stryker Corp. | 7,129 | 1,906,437 | |||||||||
Teleflex, Inc. | 3,901 | 1,281,400 | |||||||||
10,701,387 | |||||||||||
HEALTH CARE PROVIDERS & SERVICES - 2.1% | |||||||||||
agilon health, Inc.* | 38,148 | 1,029,996 | |||||||||
Anthem, Inc. | 4,320 | 2,002,493 | |||||||||
Centene Corp.* | 20,572 | 1,695,133 | |||||||||
HCA Healthcare, Inc. | 3,041 | 781,294 | |||||||||
Humana, Inc. | 3,580 | 1,660,619 | |||||||||
Laboratory Corp. of America Holdings* | 1,488 | 467,544 | |||||||||
| Shares/ Principal | Fair Value | ||||||||||
HEALTH CARE PROVIDERS & SERVICES - 2.1% (Continued) | |||||||||||
McKesson Corp. | 2,346 | $ | 583,145 | ||||||||
UnitedHealth Group, Inc. | 4,443 | 2,231,008 | |||||||||
10,451,232 | |||||||||||
HOTELS, RESTAURANTS & LEISURE - 1.4% | |||||||||||
Airbnb, Inc., Class A* | 12,146 | 2,022,188 | |||||||||
Chipotle Mexican Grill, Inc.* | 432 | 755,244 | |||||||||
Hyatt Hotels Corp., Class A* | 8,274 | 793,477 | |||||||||
Starbucks Corp. | 25,985 | 3,039,465 | |||||||||
6,610,374 | |||||||||||
HOUSEHOLD DURABLES - 0.3% | |||||||||||
DR Horton, Inc. | 14,006 | 1,518,951 | |||||||||
INDUSTRIAL CONGLOMERATES - 0.3% | |||||||||||
Honeywell International, Inc. | 6,826 | 1,423,289 | |||||||||
INSURANCE - 1.9% | |||||||||||
American International Group, Inc. | 27,859 | 1,584,063 | |||||||||
Assurant, Inc. | 3,054 | 475,996 | |||||||||
Assured Guaranty Ltd. | 13,795 | 692,509 | |||||||||
Chubb Ltd. | 9,481 | 1,832,772 | |||||||||
Hartford Financial Services Group, Inc. (The) | 12,775 | 881,986 | |||||||||
Marsh & McLennan Cos., Inc. | 8,429 | 1,465,129 | |||||||||
MetLife, Inc. | 11,650 | 728,009 | |||||||||
Oscar Health, Inc., Class A* | 21,187 | 166,318 | |||||||||
Trupanion, Inc.* | 9,066 | 1,196,984 | |||||||||
9,023,766 | |||||||||||
INTERACTIVE MEDIA & SERVICES - 4.6% | |||||||||||
Alphabet, Inc., Class A* | 5,050 | 14,630,052 | |||||||||
Bumble, Inc., Class A* | 15,597 | 528,115 | |||||||||
Cargurus, Inc.* | 26,949 | 906,564 | |||||||||
Match Group, Inc.* | 1,973 | 260,929 | |||||||||
Meta Platforms, Inc., Class A* | 16,146 | 5,430,707 | |||||||||
Snap, Inc., Class A* | 10,721 | 504,209 | |||||||||
22,260,576 | |||||||||||
INTERNET & DIRECT MARKETING RETAIL - 2.8% | |||||||||||
Amazon.com, Inc.* | 4,130 | 13,770,824 | |||||||||
IT SERVICES - 2.1% | |||||||||||
FleetCor Technologies, Inc.* | 3,281 | 734,419 | |||||||||
Genpact Ltd. | 19,714 | 1,046,419 | |||||||||
Global Payments, Inc. | 18,173 | 2,456,626 | |||||||||
GoDaddy, Inc., Class A* | 13,753 | 1,167,080 | |||||||||
Nuvei Corp.* | 4,668 | 303,327 | |||||||||
PayPal Holdings, Inc.* | 7,773 | 1,465,832 | |||||||||
Shopify, Inc., Class A* | 805 | 1,108,799 | |||||||||
Snowflake, Inc., Class A* | 526 | 178,182 | |||||||||
Visa, Inc., Class A | 8,254 | 1,788,724 | |||||||||
WEX, Inc.* | 1,217 | 170,855 | |||||||||
10,420,263 | |||||||||||
See accompanying notes to financial statements.
50
Global Atlantic Wellington Research Managed Risk Portfolio
Portfolio of Investments (Continued)
December 31, 2021
| Shares/ Principal | Fair Value | ||||||||||
LIFE SCIENCES TOOLS & SERVICES - 1.3% | |||||||||||
Agilent Technologies, Inc. | 9,266 | $ | 1,479,317 | ||||||||
Danaher Corp. | 8,437 | 2,775,857 | |||||||||
ICON PLC* | 1,390 | 430,483 | |||||||||
NanoString Technologies, Inc.* | 13,736 | 580,071 | |||||||||
Syneos Health, Inc.* | 6,111 | 627,478 | |||||||||
Waters Corp.* | 1,452 | 541,015 | |||||||||
6,434,221 | |||||||||||
MACHINERY - 1.4% | |||||||||||
Fortive Corp. | 23,985 | 1,829,816 | |||||||||
Ingersoll Rand, Inc. | 27,484 | 1,700,435 | |||||||||
Kennametal, Inc. | 9,201 | 330,408 | |||||||||
Parker-Hannifin Corp. | 3,534 | 1,124,236 | |||||||||
Westinghouse Air Brake Technologies Corp. | 17,842 | 1,643,426 | |||||||||
6,628,321 | |||||||||||
MEDIA - 1.8% | |||||||||||
Charter Communications, Inc., Class A* | 4,575 | 2,982,763 | |||||||||
DISH Network Corp., Class A* | 28,322 | 918,766 | |||||||||
New York Times Co. (The), Class A | 18,152 | 876,741 | |||||||||
Omnicom Group, Inc. | 53,046 | 3,886,680 | |||||||||
8,664,950 | |||||||||||
OIL, GAS & CONSUMABLE FUELS - 1.9% | |||||||||||
ConocoPhillips | 26,095 | 1,883,537 | |||||||||
Marathon Petroleum Corp. | 13,355 | 854,586 | |||||||||
Pioneer Natural Resources Co. | 4,218 | 767,170 | |||||||||
Royal Dutch Shell PLC, Class A, ADR | 48,184 | 2,091,186 | |||||||||
Royal Dutch Shell PLC, Class B, ADR | 79,609 | 3,451,050 | |||||||||
9,047,529 | |||||||||||
PERSONAL PRODUCTS - 0.4% | |||||||||||
Estee Lauder Cos, Inc. (The), Class A | 5,249 | 1,943,180 | |||||||||
PHARMACEUTICALS - 3.1% | |||||||||||
Aclaris Therapeutics, Inc.* | 4,632 | 67,349 | |||||||||
AstraZeneca PLC, ADR | 28,135 | 1,638,864 | |||||||||
Bristol-Myers Squibb Co. | 41,892 | 2,611,966 | |||||||||
Elanco Animal Health, Inc.* | 23,043 | 653,961 | |||||||||
Eli Lilly and Co. | 13,215 | 3,650,247 | |||||||||
Novartis AG, ADR | 10,209 | 892,981 | |||||||||
Pfizer, Inc. | 64,202 | 3,791,128 | |||||||||
Zoetis, Inc. | 6,350 | 1,549,591 | |||||||||
14,856,087 | |||||||||||
PROFESSIONAL SERVICES - 1.0% | |||||||||||
Equifax, Inc. | 1,034 | 302,745 | |||||||||
IHS Markit Ltd. | 23,193 | 3,082,814 | |||||||||
TransUnion | 725 | 85,970 | |||||||||
TriNet Group, Inc.* | 13,219 | 1,259,242 | |||||||||
4,730,771 | |||||||||||
| Shares/ Principal | Fair Value | ||||||||||
ROAD & RAIL – 0.4% | |||||||||||
JB Hunt Transport Services, Inc. | 2,189 | $ | 447,431 | ||||||||
Uber Technologies, Inc.* | 34,674 | 1,453,881 | |||||||||
1,901,312 | |||||||||||
| SEMICONDUCTORS & SEMICONDUCTOR EQUIPMENT - 3.5% | |||||||||||
Advanced Micro Devices, Inc.* | 25,979 | 3,738,378 | |||||||||
KLA Corp. | 3,420 | 1,470,976 | |||||||||
Marvell Technology, Inc. | 33,931 | 2,968,623 | |||||||||
Micron Technology, Inc. | 23,035 | 2,145,711 | |||||||||
NVIDIA Corp. | 5,319 | 1,564,371 | |||||||||
Teradyne, Inc. | 9,065 | 1,482,400 | |||||||||
Texas Instruments, Inc. | 14,466 | 2,726,407 | |||||||||
Xilinx, Inc. | 3,640 | 771,789 | |||||||||
16,868,655 | |||||||||||
SOFTWARE - 6.2% | |||||||||||
Adobe, Inc.* | 2,632 | 1,492,502 | |||||||||
Avalara, Inc.* | 1,981 | 255,767 | |||||||||
Ceridian HCM Holding, Inc.* | 3,982 | 415,960 | |||||||||
Confluent, Inc., Class A* | 1,288 | 98,197 | |||||||||
Gitlab, Inc., Class A* | 1,024 | 89,088 | |||||||||
Guidewire Software, Inc.* | 3,641 | 413,363 | |||||||||
HashiCorp, Inc., Class A* | 1,800 | 163,872 | |||||||||
Microsoft Corp. | 61,926 | 20,826,952 | |||||||||
Palo Alto Networks, Inc.* | 426 | 237,180 | |||||||||
Qualtrics International, Inc., Class A* | 7,208 | 255,163 | |||||||||
Rapid7, Inc.* | 2,156 | 253,740 | |||||||||
salesforce.com, Inc.* | 11,527 | 2,929,356 | |||||||||
SentinelOne, Inc., Class A* | 4,093 | 206,655 | |||||||||
ServiceNow, Inc.* | 1,867 | 1,211,888 | |||||||||
UiPath, Inc., Class A* | 5,728 | 247,049 | |||||||||
Varonis Systems, Inc* | 5,123 | 249,900 | |||||||||
Workday, Inc., Class A* | 3,627 | 990,824 | |||||||||
30,337,456 | |||||||||||
SPECIALTY RETAIL - 1.3% | |||||||||||
Five Below, Inc.* | 3,771 | 780,182 | |||||||||
Ross Stores, Inc. | 10,997 | 1,256,737 | |||||||||
TJX Cos., Inc. (The) | 35,891 | 2,724,845 | |||||||||
Ulta Beauty, Inc.* | 4,424 | 1,824,192 | |||||||||
6,585,956 | |||||||||||
| TECHNOLOGY HARDWARE, STORAGE & PERIPHERALS - 2.5% | |||||||||||
Apple, Inc. | 67,675 | 12,017,050 | |||||||||
TEXTILES, APPAREL & LUXURY GOODS - 0.1% | |||||||||||
PVH Corp. | 6,984 | 744,844 | |||||||||
TOBACCO - 0.4% | |||||||||||
Philip Morris International, Inc. | 21,192 | 2,013,240 | |||||||||
See accompanying notes to financial statements.
51
Global Atlantic Wellington Research Managed Risk Portfolio
Portfolio of Investments (Continued)
December 31, 2021
| Shares/ Principal | Fair Value | ||||||||||
WIRELESS TELECOMMUNICATION SERVICES – 0.4% | |||||||||||
T-Mobile US, Inc.* | 15,006 | $ | 1,740,396 | ||||||||
| TOTAL COMMON STOCKS (Cost - $177,959,810) | 303,081,597 | ||||||||||
U.S. TREASURY SECURITIES - 11.0% | |||||||||||
U.S. Treasury Note | |||||||||||
0.13%, 5/15/23 | $ | 355,000 | 352,975 | ||||||||
0.25%, 9/30/23 | 1,060,000 | 1,052,630 | |||||||||
0.38%, 10/31/23 | 1,165,000 | 1,158,265 | |||||||||
0.50%, 11/30/23 | 490,000 | 488,182 | |||||||||
0.13%, 1/15/24 | 500,000 | 493,770 | |||||||||
0.25%, 3/15/24 | 2,315,000 | 2,287,690 | |||||||||
0.25%, 5/15/24 | 260,000 | 256,506 | |||||||||
2.00%, 6/30/24 | 300,000 | 308,437 | |||||||||
0.63%, 10/15/24 | 300,000 | 297,633 | |||||||||
0.75%, 11/15/24 | 885,000 | 880,229 | |||||||||
1.00%, 12/15/24 | 975,000 | 976,295 | |||||||||
0.25%, 5/31/25 | 275,000 | 267,588 | |||||||||
0.25%, 7/31/25 | 1,190,000 | 1,154,718 | |||||||||
0.25%, 8/31/25 | 1,475,000 | 1,429,425 | |||||||||
0.25%, 9/30/25 | 1,225,000 | 1,186,719 | |||||||||
0.38%, 11/30/25 | 375,000 | 363,838 | |||||||||
0.38%, 12/31/25 | 1,550,000 | 1,503,076 | |||||||||
0.38%, 1/31/26 | 515,000 | 498,464 | |||||||||
0.75%, 3/31/26 | 475,000 | 466,224 | |||||||||
0.75%, 4/30/26 | 415,000 | 406,992 | |||||||||
0.75%, 5/31/26 | 260,000 | 254,800 | |||||||||
0.88%, 6/30/26 | 1,125,000 | 1,107,773 | |||||||||
0.63%, 7/31/26 | 2,215,000 | 2,155,039 | |||||||||
0.75%, 8/31/26 | 505,000 | 493,993 | |||||||||
0.88%, 9/30/26 | 2,105,000 | 2,068,738 | |||||||||
1.13%, 10/31/26 | 685,000 | 680,879 | |||||||||
1.63%, 10/31/26 | 275,000 | 279,823 | |||||||||
1.25%, 11/30/26 | 3,110,000 | 3,110,000 | |||||||||
1.25%, 12/31/26 | 1,200,000 | 1,199,531 | |||||||||
1.75%, 12/31/26 | 100,000 | 102,414 | |||||||||
1.25%, 3/31/28 | 1,010,000 | 1,001,833 | |||||||||
1.25%, 6/30/28 | 265,000 | 262,505 | |||||||||
1.38%, 10/31/28 | 185,000 | 184,422 | |||||||||
1.50%, 11/30/28 | 725,000 | 728,512 | |||||||||
1.38%, 11/15/31 | 3,900,000 | 3,855,516 | |||||||||
U.S. Treasury Bond | |||||||||||
| 1.75%, 8/15/41†† | 2,925,000 | 2,845,020 | |||||||||
2.00%, 11/15/41 | 3,445,000 | 3,495,598 | |||||||||
3.13%, 11/15/41 | 80,000 | 96,428 | |||||||||
3.38%, 5/15/44 | 675,000 | 852,689 | |||||||||
3.00%, 11/15/44 | 610,000 | 730,022 | |||||||||
2.50%, 2/15/45 | 3,295,000 | 3,636,985 | |||||||||
2.88%, 8/15/45 | 545,000 | 642,248 | |||||||||
2.50%, 5/15/46 | 805,000 | 893,110 | |||||||||
3.00%, 5/15/47 | 470,000 | 572,666 | |||||||||
| Shares/ Principal | Fair Value | ||||||||||
U.S. TREASURY SECURITIES - 11.0% (Continued) | |||||||||||
U.S. Treasury Bond (continued) | |||||||||||
2.75%, 8/15/47 | $ | 420,000 | $ | 490,678 | |||||||
2.75%, 11/15/47 | 47,000 | 54,937 | |||||||||
3.13%, 5/15/48 | 140,000 | 175,656 | |||||||||
1.38%, 8/15/50 | 450,000 | 396,070 | |||||||||
1.63%, 11/15/50 | 805,000 | 753,524 | |||||||||
2.00%, 8/15/51 | 2,170,000 | 2,222,216 | |||||||||
1.88%, 11/15/51 | 1,850,000 | 1,843,930 | |||||||||
| U.S. Treasury Strip Principal, 0.00%, 5/15/50 (b) | 300,000 | 173,702 | |||||||||
| TOTAL U.S. TREASURY SECURITIES (Cost - $52,274,522) | 53,190,913 | ||||||||||
CORPORATE BONDS AND NOTES - 10.4% | |||||||||||
AEROSPACE & DEFENSE - 0.3% | |||||||||||
| BAE Systems Holdings, Inc., 3.85%, 12/15/25 (a) | 100,000 | 107,230 | |||||||||
Boeing Co. (The) | |||||||||||
1.43%, 2/4/24 | 265,000 | 264,639 | |||||||||
2.20%, 2/4/26 | 325,000 | 325,012 | |||||||||
3.25%, 3/1/28 | 214,000 | 221,638 | |||||||||
3.45%, 11/1/28 | 85,000 | 88,955 | |||||||||
3.63%, 2/1/31 | 100,000 | 106,750 | |||||||||
3.60%, 5/1/34 | 20,000 | 20,981 | |||||||||
3.95%, 8/1/59 | 95,000 | 99,078 | |||||||||
| Lockheed Martin Corp., 4.85%, 9/15/41 | 50,000 | 63,698 | |||||||||
| Raytheon Technologies Corp., 3.95%, 8/16/25 | 150,000 | 162,697 | |||||||||
1,460,678 | |||||||||||
AGRICULTURE - 0.3% | |||||||||||
BAT Capital Corp., 3.56%, 8/15/27 | 895,000 | 939,281 | |||||||||
| Imperial Brands Finance PLC, 3.75%, 7/21/22 (a) | 475,000 | 480,245 | |||||||||
1,419,526 | |||||||||||
AIRLINES - 0.0%† | |||||||||||
| United Airlines 2016-1 Class AA Pass-Through Trust, 3.10%, 7/7/28 | 78,893 | 80,471 | |||||||||
| United Airlines 2018-1 Class B Pass Through Trust, 4.60%, 3/1/26 | 25,484 | 25,803 | |||||||||
106,274 | |||||||||||
AUTO MANUFACTURERS - 0.3% | |||||||||||
| General Motors Financial Co., Inc., 3.70%, 5/9/23 | 600,000 | 617,932 | |||||||||
| Hyundai Capital America, 0.80%, 4/3/23 (a) | 375,000 | 373,318 | |||||||||
| Nissan Motor Acceptance Corp., 2.00%, 3/9/26 (a) | 60,000 | 59,128 | |||||||||
| Volkswagen Group of America Finance LLC, 3.35%, 5/13/25 (a) | 225,000 | 236,822 | |||||||||
1,287,200 | |||||||||||
See accompanying notes to financial statements.
52
Global Atlantic Wellington Research Managed Risk Portfolio
Portfolio of Investments (Continued)
December 31, 2021
| Shares/ Principal | Fair Value | ||||||||||
BANKS - 3.7% | |||||||||||
Banco Santander SA, 3.13%, 2/23/23 | $ | 200,000 | $ | 204,720 | |||||||
Bank of America Corp. | |||||||||||
4.20%, 8/26/24 | 160,000 | 171,539 | |||||||||
1.73%, (SOFR + 0.96%), 7/22/27 (c) | 435,000 | 432,079 | |||||||||
| 3.42%, (3 Month US Libor + 1.04%), 12/20/28 (c) | 11,000 | 11,753 | |||||||||
| 3.97%, (3 Month US Libor + 1.21%), 2/7/30 (c) | 225,000 | 248,058 | |||||||||
| 3.19%, (3 Month US Libor + 1.18%), 7/23/30 (c) | 180,000 | 190,001 | |||||||||
| 2.65%, (SOFR + 1.22%), 3/11/32 (c) | 290,000 | 293,993 | |||||||||
| 2.30%, (SOFR + 1.22%), 7/21/32 (c) | 355,000 | 349,448 | |||||||||
| 2.48%, (US 5 Year CMT T-Note + 1.20%), 9/21/36 (c) | 250,000 | 242,453 | |||||||||
| 3.31%, (SOFR + 1.58%), 4/22/42 (c) | 25,000 | 26,350 | |||||||||
Barclays PLC | |||||||||||
| 3.93%, (3 Month US Libor + 1.61%), 5/7/25 (c) | 355,000 | 373,405 | |||||||||
| 2.89%, (US 1 Year CMT T-Note + 1.30%), 11/24/32 (c) | 360,000 | 362,978 | |||||||||
| 3.33%, (US 1 Year CMT T-Note + 1.30%), 11/24/42 (c) | 220,000 | 224,521 | |||||||||
BNP Paribas SA | |||||||||||
3.38%, 1/9/25 (a) | 200,000 | 210,079 | |||||||||
| 2.82%, (3 Month US Libor + 1.11%), 11/19/25 (a),(c) | 200,000 | 205,875 | |||||||||
| BPCE SA | |||||||||||
5.70%, 10/22/23 (a) | 275,000 | 295,642 | |||||||||
5.15%, 7/21/24 (a) | 600,000 | 649,946 | |||||||||
Citigroup, Inc. | |||||||||||
4.05%, 7/30/22 | 50,000 | 51,019 | |||||||||
3.50%, 5/15/23 | 300,000 | 310,152 | |||||||||
3.30%, 4/27/25 | 70,000 | 74,376 | |||||||||
5.50%, 9/13/25 | 55,000 | 62,223 | |||||||||
| 3.67%, (3 Month US Libor + 1.39%), 7/24/28 (c) | 100,000 | 107,926 | |||||||||
| Cooperatieve Rabobank UA, 1.11%, (US 1 Year CMT T-Note + 0.55%), 2/24/27 (a),(c) | 250,000 | 242,683 | |||||||||
Credit Agricole SA | |||||||||||
3.75%, 4/24/23 (a) | 250,000 | 259,036 | |||||||||
3.25%, 10/4/24 (a) | 250,000 | 261,584 | |||||||||
4.38%, 3/17/25 (a) | 200,000 | 214,764 | |||||||||
Credit Suisse Group AG | |||||||||||
3.57%, 1/9/23 (a) | 285,000 | 285,081 | |||||||||
| 1.44%, (3 Month US Libor + 1.24%), 6/12/24 (a),(c) | 260,000 | 262,662 | |||||||||
3.09%, (SOFR + 1.73%), 5/14/32 (a),(c) | 995,000 | 1,013,593 | |||||||||
| Credit Suisse Group Funding Guernsey Ltd., 3.80%, 9/15/22 | 395,000 | 403,522 | |||||||||
| Shares/ Principal | Fair Value | ||||||||||
BANKS - 3.7% (Continued) | |||||||||||
Danske Bank A/S | |||||||||||
5.00%, 1/12/22 (a) | $ | 200,000 | $ | 200,177 | |||||||
3.88%, 9/12/23 (a) | 200,000 | 208,037 | |||||||||
5.38%, 1/12/24 (a) | 200,000 | 215,325 | |||||||||
| 1.62%, (US 1 Year CMT T-Note + 1.35%), 9/11/26 (a),(c) | 435,000 | 428,759 | |||||||||
Goldman Sachs Group, Inc. (The) | |||||||||||
3.50%, 1/23/25 | 200,000 | 210,821 | |||||||||
| 3.27%, (3 Month US Libor + 1.20%), 9/29/25 (c) | 460,000 | 482,754 | |||||||||
1.43%, (SOFR + 0.80%), 3/9/27 (c) | 495,000 | 485,172 | |||||||||
2.62%, (SOFR + 1.28%), 4/22/32 (c) | 550,000 | 554,577 | |||||||||
6.75%, 10/1/37 | 50,000 | 71,038 | |||||||||
3.21%, (SOFR + 1.51%), 4/22/42 (c) | 30,000 | 31,202 | |||||||||
HSBC Holdings PLC | |||||||||||
3.60%, 5/25/23 | 200,000 | 207,417 | |||||||||
1.59%, (SOFR + 1.29%), 5/24/27 (c) | 495,000 | 484,346 | |||||||||
2.21%, (SOFR + 1.29%), 8/17/29 (c) | 425,000 | 416,970 | |||||||||
2.87%, (SOFR + 1.41%), 11/22/32 (c) | 520,000 | 524,934 | |||||||||
JPMorgan Chase & Co. | |||||||||||
2.95%, 10/1/26 | 400,000 | 422,492 | |||||||||
2.07%, (SOFR + 1.02%), 6/1/29 (c) | 10,000 | 9,927 | |||||||||
2.58%, (SOFR + 1.25%), 4/22/32 (c) | 325,000 | 329,549 | |||||||||
Morgan Stanley | |||||||||||
4.35%, 9/8/26 | 455,000 | 502,625 | |||||||||
1.93%, (SOFR + 1.02%), 4/28/32 (c) | 210,000 | 200,892 | |||||||||
2.51%, (SOFR + 1.20%), 10/20/32 (c) | 125,000 | 125,026 | |||||||||
2.48%, (SOFR + 1.36%), 9/16/36 (c) | 500,000 | 481,426 | |||||||||
NBK SPC Ltd., 2.75%, 5/30/22 (a) | 900,000 | 906,660 | |||||||||
| PNC Financial Services Group, Inc. (The), 3.90%, 4/29/24 | 50,000 | 52,980 | |||||||||
Santander Holdings USA, Inc. | |||||||||||
3.70%, 3/28/22 | 465,000 | 466,991 | |||||||||
3.40%, 1/18/23 | 75,000 | 76,657 | |||||||||
| Standard Chartered PLC, 0.99%, (US 1 Year CMT T-Note + 0.78%), 1/12/25 (a),(c) | 260,000 | 257,064 | |||||||||
| UBS Group AG, 1.49%, (US 1 Year CMT T-Note + 0.85%), 8/10/27 (a),(c) | 385,000 | 375,797 | |||||||||
| UniCredit SpA, 1.98%, (US 1 Year CMT T-Note + 1.20%), 6/3/27 (a),(c) | 250,000 | 243,703 | |||||||||
| US Bancorp, 2.49%, (US 5 Year CMT T-Note + 0.95%), 11/3/36 (c) | 940,000 | 937,495 | |||||||||
Wells Fargo & Co., 3.00%, 2/19/25 | 150,000 | 156,662 | |||||||||
18,108,936 | |||||||||||
BIOTECHNOLOGY - 0.1% | |||||||||||
Gilead Sciences, Inc., 2.80%, 10/1/50 | 310,000 | 301,883 | |||||||||
Royalty Pharma PLC, 3.30%, 9/2/40 | 105,000 | 106,118 | |||||||||
408,001 | |||||||||||
See accompanying notes to financial statements.
53
Global Atlantic Wellington Research Managed Risk Portfolio
Portfolio of Investments (Continued)
December 31, 2021
| Shares/ Principal | Fair Value | ||||||||||
COMMERCIAL SERVICES - 0.1% | |||||||||||
| ERAC USA Finance LLC, 3.30%, 10/15/22 (a) | $ | 500,000 | $ | 510,384 | |||||||
Global Payments, Inc., 2.15%, 1/15/27 | 200,000 | 200,919 | |||||||||
711,303 | |||||||||||
COMPUTERS - 0.2% | |||||||||||
Apple, Inc., 3.25%, 2/23/26 | 105,000 | 112,294 | |||||||||
Kyndryl Holdings, Inc., 3.15%, 10/15/31 (a) | 755,000 | 733,200 | |||||||||
845,494 | |||||||||||
DIVERSIFIED FINANCIAL SERVICES - 0.4% | |||||||||||
| AerCap Ireland Capital DAC / AerCap Global Aviation Trust, 3.88%, 1/23/28 | 240,000 | 254,699 | |||||||||
Avolon Holdings Funding Ltd. | |||||||||||
2.13%, 2/21/26 (a) | 269,000 | 264,154 | |||||||||
4.38%, 5/1/26 (a) | 211,000 | 226,107 | |||||||||
2.53%, 11/18/27 (a) | 558,000 | 542,434 | |||||||||
| Capital One Financial Corp., 4.20%, 10/29/25 | 105,000 | 114,211 | |||||||||
| Intercontinental Exchange, Inc., 1.85%, 9/15/32 | 465,000 | 446,719 | |||||||||
1,848,324 | |||||||||||
ELECTRIC - 0.9% | |||||||||||
Alabama Power Co., 1.45%, 9/15/30 | 30,000 | 28,069 | |||||||||
| American Transmission Systems, Inc., 2.65%, 1/15/32 (a) | 290,000 | 293,038 | |||||||||
Appalachian Power Co., 3.40%, 6/1/25 | 200,000 | 211,105 | |||||||||
Cleco Corporate Holdings LLC | |||||||||||
3.74%, 5/1/26 | 345,000 | 368,062 | |||||||||
3.38%, 9/15/29 | 140,000 | 142,513 | |||||||||
| Consolidated Edison Co. of New York, Inc., 3.20%, 12/1/51 | 190,000 | 190,630 | |||||||||
| Dominion Energy South Carolina, Inc., 6.63%, 2/1/32 | 80,000 | 108,823 | |||||||||
Duke Energy Corp. | |||||||||||
3.75%, 4/15/24 | 225,000 | 236,317 | |||||||||
2.65%, 9/1/26 | 70,000 | 72,511 | |||||||||
Georgia Power Co., 4.75%, 9/1/40 | 65,000 | 76,866 | |||||||||
| Mid-Atlantic Interstate Transmission LLC, 4.10%, 5/15/28 (a) | 400,000 | 439,671 | |||||||||
| NextEra Energy Capital Holdings, Inc., 1.90%, 6/15/28 | 295,000 | 292,142 | |||||||||
| Niagara Mohawk Power Corp., 1.96%, 6/27/30 (a) | 335,000 | 320,454 | |||||||||
Oglethorpe Power Corp., 6.19%, 1/1/31 (a) | 100,000 | 120,407 | |||||||||
Pennsylvania Electric Co., 3.60%, 6/1/29 (a) | 57,000 | 60,702 | |||||||||
| San Diego Gas & Electric Co., 1.70%, 10/1/30 | 685,000 | 656,194 | |||||||||
SCE Recovery Funding LLC | |||||||||||
0.86%, 11/15/31 | 115,463 | 110,106 | |||||||||
1.94%, 5/15/38 | 50,000 | 47,712 | |||||||||
2.51%, 11/15/43 | 30,000 | 28,829 | |||||||||
| Shares/ Principal | Fair Value | ||||||||||
ELECTRIC - 0.9% (Continued) | |||||||||||
| Sempra Energy, 4.13%, (US 5 Year CMT T-Note + 2.87%), 4/1/52 (c) | $ | 255,000 | $ | 258,472 | |||||||
Southern California Edison Co. | |||||||||||
3.70%, 8/1/25 | 45,000 | 48,065 | |||||||||
4.65%, 10/1/43 | 20,000 | 23,423 | |||||||||
4.00%, 4/1/47 | 50,000 | 55,314 | |||||||||
Southern Co. (The) | |||||||||||
2.95%, 7/1/23 | 290,000 | 297,012 | |||||||||
| 4.00%, (US 5 Year CMT T-Note + 3.73%), 1/15/51 (c) | 60,000 | 61,350 | |||||||||
4,547,787 | |||||||||||
FOOD - 0.1% | |||||||||||
Conagra Brands, Inc. | |||||||||||
4.60%, 11/1/25 | 100,000 | 109,997 | |||||||||
1.38%, 11/1/27 | 210,000 | 200,701 | |||||||||
| Sigma Alimentos SA de CV, 4.13%, 5/2/26 (a) | 240,000 | 254,444 | |||||||||
565,142 | |||||||||||
GAS - 0.1% | |||||||||||
Boston Gas Co., 3.15%, 8/1/27 (a) | 60,000 | 62,289 | |||||||||
| CenterPoint Energy Resources Corp., 0.67%, (3 Month US Libor + 0.50%), 3/2/23 (c) | 10,000 | 9,977 | |||||||||
| Eastern Energy Gas Holdings LLC, 3.60%, 12/15/24 | 84,000 | 89,124 | |||||||||
| KeySpan Gas East Corp., 2.74%, 8/15/26 (a) | 275,000 | 280,822 | |||||||||
442,212 | |||||||||||
HEALTHCARE-PRODUCTS - 0.0%† | |||||||||||
Boston Scientific Corp., 2.65%, 6/1/30 | 30,000 | 30,613 | |||||||||
HEALTHCARE-SERVICES - 0.5% | |||||||||||
Aetna, Inc., 2.80%, 6/15/23 | 210,000 | 215,185 | |||||||||
Anthem, Inc., 3.50%, 8/15/24 | 75,000 | 79,212 | |||||||||
| Bon Secours Mercy Health, Inc., 2.10%, 6/1/31 | 135,000 | 132,731 | |||||||||
Children's Hospital/DC, 2.93%, 7/15/50 | 140,000 | 138,358 | |||||||||
CommonSpirit Health | |||||||||||
4.20%, 8/1/23 | 105,000 | 109,810 | |||||||||
2.78%, 10/1/30 | 191,000 | 195,691 | |||||||||
4.35%, 11/1/42 | 95,000 | 109,305 | |||||||||
4.19%, 10/1/49 | 20,000 | 23,352 | |||||||||
Dignity Health | |||||||||||
3.81%, 11/1/24 | 92,000 | 97,396 | |||||||||
4.50%, 11/1/42 | 270,000 | 322,638 | |||||||||
| Memorial Sloan-Kettering Cancer Center, 2.96%, 1/1/50 | 20,000 | 20,510 | |||||||||
Mercy Health, 3.56%, 8/1/27 | 270,000 | 289,519 | |||||||||
| Ochsner LSU Health System of North Louisiana, 2.51%, 5/15/31 | 240,000 | 235,017 | |||||||||
See accompanying notes to financial statements.
54
Global Atlantic Wellington Research Managed Risk Portfolio
Portfolio of Investments (Continued)
December 31, 2021
| Shares/ Principal | Fair Value | ||||||||||
HEALTHCARE-SERVICES - 0.5% (Continued) | |||||||||||
Sutter Health, 2.29%, 8/15/30 | $ | 75,000 | $ | 74,971 | |||||||
Toledo Hospital (The) | |||||||||||
5.33%, 11/15/28 | 190,000 | 213,085 | |||||||||
5.75%, 11/15/38 | 75,000 | 87,582 | |||||||||
2,344,362 | |||||||||||
INSURANCE - 0.6% | |||||||||||
American International Group, Inc. | |||||||||||
4.25%, 3/15/29 | 655,000 | 749,065 | |||||||||
3.40%, 6/30/30 | 170,000 | 184,014 | |||||||||
| Athene Global Funding, 2.50%, 3/24/28 (a) | 650,000 | 654,212 | |||||||||
| Equitable Financial Life Global Funding, 1.40%, 8/27/27 (a) | 275,000 | 266,697 | |||||||||
| Fidelity National Financial, Inc., 3.40%, 6/15/30 | 50,000 | 52,837 | |||||||||
| Nippon Life Insurance Co., 2.90%, (US 5 Year CMT T-Note + 2.60%), 9/16/51 (a),(c) | 815,000 | 806,875 | |||||||||
| Northwestern Mutual Life Insurance Co. (The), 3.63%, 9/30/59 (a) | 30,000 | 33,180 | |||||||||
| Principal Financial Group, Inc., 3.40%, 5/15/25 | 150,000 | 158,473 | |||||||||
2,905,353 | |||||||||||
INVESTMENT COMPANIES - 0.1% | |||||||||||
JAB Holdings BV, 3.75%, 5/28/51 (a) | 250,000 | 272,149 | |||||||||
LODGING - 0.1% | |||||||||||
| Genting New York LLC / GENNY Capital, Inc., 3.30%, 2/15/26 (a) | 600,000 | 594,255 | |||||||||
MACHINERY-DIVERSIFIED - 0.0%† | |||||||||||
| Westinghouse Air Brake Technologies Corp., 4.40%, 3/15/24 | 40,000 | 42,315 | |||||||||
MEDIA - 0.2% | |||||||||||
| Charter Communications Operating LLC / Charter Communications Operating Capital | |||||||||||
4.46%, 7/23/22 | 175,000 | 177,583 | |||||||||
5.13%, 7/1/49 | 52,000 | 60,510 | |||||||||
4.80%, 3/1/50 | 70,000 | 78,632 | |||||||||
4.40%, 12/1/61 | 55,000 | 57,120 | |||||||||
Comcast Corp., 2.89%, 11/1/51 (a) | 332,000 | 322,362 | |||||||||
Discovery Communications LLC | |||||||||||
4.65%, 5/15/50 | 229,000 | 269,555 | |||||||||
4.00%, 9/15/55 | 136,000 | 143,062 | |||||||||
1,108,824 | |||||||||||
OIL & GAS - 0.3% | |||||||||||
Equinor ASA | |||||||||||
3.00%, 4/6/27 | 610,000 | 643,864 | |||||||||
3.13%, 4/6/30 | 40,000 | 43,015 | |||||||||
| Shares/ Principal | Fair Value | ||||||||||
OIL & GAS - 0.3% (Continued) | |||||||||||
Hess Corp. | |||||||||||
7.30%, 8/15/31 | $ | 460,000 | $ | 613,086 | |||||||
5.60%, 2/15/41 | 145,000 | 179,455 | |||||||||
Qatar Energy, 3.13%, 7/12/41 (a) | 200,000 | 202,123 | |||||||||
1,681,543 | |||||||||||
PIPELINES - 0.3% | |||||||||||
| Eastern Gas Transmission & Storage, Inc., 3.60%, 12/15/24 (a) | 41,000 | 43,501 | |||||||||
Energy Transfer LP | |||||||||||
7.60%, 2/1/24 | 90,000 | 98,924 | |||||||||
4.95%, 6/15/28 | 20,000 | 22,515 | |||||||||
| Enterprise Products Operating LLC, 3.20%, 2/15/52 | 50,000 | 49,222 | |||||||||
| Galaxy Pipeline Assets Bidco Ltd., 2.16%, 3/31/34 (a) | 710,000 | 695,885 | |||||||||
Gray Oak Pipeline LLC | |||||||||||
2.60%, 10/15/25 (a) | 144,000 | 144,346 | |||||||||
3.45%, 10/15/27 (a) | 25,000 | 26,114 | |||||||||
| Sabine Pass Liquefaction LLC, 5.75%, 5/15/24 | 100,000 | 108,772 | |||||||||
| Western Midstream Operating LP, 4.00%, 7/1/22 | 200,000 | 200,500 | |||||||||
1,389,779 | |||||||||||
REITS - 0.4% | |||||||||||
American Tower Corp., 5.00%, 2/15/24 | 31,000 | 33,364 | |||||||||
CubeSmart LP, 2.25%, 12/15/28 | 265,000 | 265,274 | |||||||||
EPR Properties | |||||||||||
4.75%, 12/15/26 | 60,000 | 64,156 | |||||||||
4.95%, 4/15/28 | 60,000 | 64,789 | |||||||||
3.75%, 8/15/29 | 378,000 | 381,836 | |||||||||
3.60%, 11/15/31 | 545,000 | 539,803 | |||||||||
SBA Tower Trust | |||||||||||
3.45%, 3/15/23 (a) | 155,000 | 155,600 | |||||||||
2.84%, 1/15/25 (a) | 100,000 | 102,879 | |||||||||
1.88%, 1/15/26 (a) | 95,000 | 95,158 | |||||||||
1.63%, 11/15/26 (a) | 115,000 | 112,995 | |||||||||
1,815,854 | |||||||||||
SAVINGS & LOANS - 0.0%† | |||||||||||
| Nationwide Building Society, 3.62%, (3 Month US Libor + 1.18%), 4/26/23 (a),(c) | 200,000 | 201,631 | |||||||||
SEMICONDUCTORS - 0.4% | |||||||||||
Broadcom, Inc. | |||||||||||
4.70%, 4/15/25 | 600,000 | 656,258 | |||||||||
4.30%, 11/15/32 | 50,000 | 56,256 | |||||||||
2.60%, 2/15/33 (a) | 170,000 | 165,931 | |||||||||
3.42%, 4/15/33 (a) | 300,000 | 314,858 | |||||||||
Marvell Technology, Inc., 4.20%, 6/22/23 | 20,000 | 20,781 | |||||||||
Microchip Technology, Inc., 0.97%, 2/15/24 | 530,000 | 525,427 | |||||||||
1,739,511 | |||||||||||
See accompanying notes to financial statements.
55
Global Atlantic Wellington Research Managed Risk Portfolio
Portfolio of Investments (Continued)
December 31, 2021
| Shares/ Principal | Fair Value | ||||||||||
SOFTWARE – 0.2% | |||||||||||
Oracle Corp. | |||||||||||
3.25%, 11/15/27 | $ | 140,000 | $ | 147,510 | |||||||
3.60%, 4/1/50 | 20,000 | 19,653 | |||||||||
3.95%, 3/25/51 | 460,000 | 479,303 | |||||||||
3.85%, 4/1/60 | 70,000 | 69,403 | |||||||||
715,869 | |||||||||||
TELECOMMUNICATIONS - 0.5% | |||||||||||
AT&T, Inc. | |||||||||||
2.55%, 12/1/33 | 266,000 | 260,524 | |||||||||
4.30%, 12/15/42 | 45,000 | 51,016 | |||||||||
3.10%, 2/1/43 | 280,000 | 273,025 | |||||||||
3.65%, 6/1/51 | 37,000 | 38,461 | |||||||||
3.30%, 2/1/52 | 335,000 | 329,333 | |||||||||
3.85%, 6/1/60 | 33,000 | 34,614 | |||||||||
| Sprint Spectrum Co. LLC / Sprint Spectrum Co. II LLC / Sprint Spectrum Co. III LLC, 4.74%, 3/20/25 (a) | 333,125 | 348,515 | |||||||||
T-Mobile USA, Inc., 2.70%, 3/15/32 (a) | 795,000 | 800,980 | |||||||||
| Verizon Communications, Inc., 2.36%, 3/15/32 (a) | 484,000 | 477,486 | |||||||||
2,613,954 | |||||||||||
TRANSPORTATION - 0.1% | |||||||||||
Canadian Pacific Railway Co., 2.45%, 12/2/31 | 275,000 | 280,272 | |||||||||
TRUCKING & LEASING - 0.2% | |||||||||||
DAE Funding LLC, 1.55%, 8/1/24 (a) | 500,000 | 496,250 | |||||||||
| Penske Truck Leasing Co. LP/ PTL Finance Corp. | |||||||||||
4.88%, 7/11/22 (a) | 50,000 | 51,085 | |||||||||
2.70%, 11/1/24 (a) | 110,000 | 113,373 | |||||||||
3.95%, 3/10/25 (a) | 345,000 | 367,718 | |||||||||
1,028,426 | |||||||||||
| TOTAL CORPORATE BONDS AND NOTES (Cost - $49,618,249) | 50,515,587 | ||||||||||
AGENCY MORTGAGE BACKED SECURITIES - 6.4% | |||||||||||
FEDERAL HOME LOAN MORTGAGE CORPORATION - 0.2% | |||||||||||
Freddie Mac Gold Pool | |||||||||||
3.00%, 9/1/28 | 3,867 | 4,044 | |||||||||
2.50%, 10/1/28 | 7,026 | 7,275 | |||||||||
2.50%, 12/1/31 | 40,693 | 42,218 | |||||||||
3.50%, 11/1/34 | 38,615 | 41,274 | |||||||||
3.00%, 2/1/43 | 22,102 | 23,467 | |||||||||
3.50%, 10/1/43 | 11,483 | 12,323 | |||||||||
4.00%, 8/1/44 | 6,986 | 7,573 | |||||||||
3.00%, 11/1/46 | 650,938 | 686,852 | |||||||||
3.00%, 12/1/46 | 181,155 | 191,195 | |||||||||
1,016,221 | |||||||||||
| Shares/ Principal | Fair Value | ||||||||||
FEDERAL NATIONAL MORTGAGE ASSOCIATION - 4.6% | |||||||||||
Fannie Mae Pool | |||||||||||
3.07%, 2/1/25 | $ | 70,000 | $ | 73,284 | |||||||
2.47%, 5/1/25 | 137,651 | 142,344 | |||||||||
2.68%, 5/1/25 | 300,925 | 313,177 | |||||||||
2.99%, 10/1/25 | 102,745 | 108,246 | |||||||||
3.09%, 10/1/25 | 49,164 | 51,877 | |||||||||
2.50%, 4/1/28 | 10,143 | 10,500 | |||||||||
3.00%, 10/1/28 | 6,205 | 6,488 | |||||||||
2.50%, 2/1/30 | 20,183 | 20,918 | |||||||||
2.50%, 6/1/30 | 51,756 | 53,656 | |||||||||
2.50%, 10/1/31 | 104,572 | 108,452 | |||||||||
2.50%, 12/1/31 | 43,862 | 45,471 | |||||||||
3.00%, 7/1/43 | 33,906 | 35,711 | |||||||||
4.00%, 11/1/43 | 14,014 | 15,422 | |||||||||
3.00%, 1/1/46 | 862,314 | 900,095 | |||||||||
4.00%, 1/1/46 | 194,360 | 207,455 | |||||||||
4.00%, 2/1/46 | 212,258 | 228,999 | |||||||||
3.00%, 10/1/46 | 910,839 | 960,542 | |||||||||
2.50%, 7/1/50 | 389,259 | 400,224 | |||||||||
2.50%, 12/1/51 | 400,000 | 409,772 | |||||||||
Federal National Mortgage Association | |||||||||||
2.00%, 1/1/37 (d) | 1,300,000 | 1,331,891 | |||||||||
2.00%, 1/1/52 (d) | 5,600,000 | 5,586,000 | |||||||||
2.50%, 1/1/52 (d) | 4,523,000 | 4,617,700 | |||||||||
3.00%, 1/1/52 (d) | 2,105,000 | 2,181,964 | |||||||||
4.50%, 1/1/52 (d) | 850,000 | 910,961 | |||||||||
2.00%, 2/1/52 (d) | 2,750,000 | 2,737,109 | |||||||||
Freddie Mac Pool | |||||||||||
2.00%, 3/1/51 | 654,382 | 653,168 | |||||||||
2.50%, 12/1/51 | 400,000 | 410,153 | |||||||||
22,521,579 | |||||||||||
| GOVERNMENT NATIONAL MORTGAGE ASSOCIATION - 1.6% | |||||||||||
Ginnie Mae | |||||||||||
2.00%, 1/20/52 (d) | 1,175,000 | 1,186,199 | |||||||||
2.50%, 1/20/52 (d) | 2,050,000 | 2,100,609 | |||||||||
3.00%, 1/20/52 (d) | 2,150,000 | 2,225,922 | |||||||||
4.00%, 1/20/52 (d) | 1,610,000 | 1,693,016 | |||||||||
4.50%, 1/20/52 (d) | 350,000 | 368,977 | |||||||||
Ginnie Mae II Pool | |||||||||||
3.00%, 12/20/42 | 17,607 | 18,661 | |||||||||
4.00%, 12/20/44 | 6,440 | 6,933 | |||||||||
4.00%, 8/20/48 | 18,519 | 19,658 | |||||||||
4.00%, 10/20/48 | 17,699 | 18,787 | |||||||||
Government National Mortgage Association | |||||||||||
3.50%, 7/20/43 | 19,108 | 20,258 | |||||||||
4.00%, 9/20/48 | 41,000 | 43,443 | |||||||||
7,702,463 | |||||||||||
| TOTAL AGENCY MORTGAGE BACKED SECURITIES (Cost - $31,013,823) | 31,240,263 | ||||||||||
See accompanying notes to financial statements.
56
Global Atlantic Wellington Research Managed Risk Portfolio
Portfolio of Investments (Continued)
December 31, 2021
| Shares/ Principal | Fair Value | ||||||||||
| ASSET BACKED AND COMMERCIAL BACKED SECURITIES - 4.4% | |||||||||||
| Affirm Asset Securitization Trust 2020-Z1, 1.07%, 8/15/25 (a) | $ | 141,872 | $ | 141,413 | |||||||
| Affirm Asset Securitization Trust 2021-A, 0.88%, 8/15/25 (a) | 140,000 | 139,992 | |||||||||
| Affirm Asset Securitization Trust 2021-B, 1.03%, 8/17/26 (a) | 195,000 | 193,571 | |||||||||
| Aligned Data Centers Issuer LLC, 1.94%, 8/15/46 (a) | 325,000 | 319,767 | |||||||||
| Angel Oak Mortgage Trust 2019-6, 2.62%, 11/25/59 (a),(e) | 32,332 | 32,361 | |||||||||
| Angel Oak Mortgage Trust 2021-6, 1.46%, 9/25/66 (a),(e) | 380,254 | 376,767 | |||||||||
| Angel Oak Mortgage Trust I LLC 2019-2, 3.63%, 3/25/49 (a),(e) | 21,645 | 21,669 | |||||||||
| Arbor Multifamily Mortgage Securities Trust 2021-MF3, 2.57%, 10/15/54 (a) | 300,000 | 307,746 | |||||||||
| ARI Fleet Lease Trust 2018-B, 3.22%, 8/16/27 (a) | 8,277 | 8,299 | |||||||||
| Banc of America Commercial Mortgage Trust 2015-UBS7, 3.71%, 9/15/48 | 155,000 | 164,283 | |||||||||
BANK 2021-BNK35, 2.29%, 6/15/64 | 360,000 | 363,172 | |||||||||
| Battalion CLO XX Ltd., 1.89%, (3 Month US Libor + 1.75%), 7/15/34 (a),(c) | 500,000 | 499,641 | |||||||||
| Bayview Koitere Fund Trust 2017-RT4, 3.50%, 7/28/57 (a),(e) | 95,551 | 96,569 | |||||||||
| Bayview Koitere Fund Trust 2017-SPL3, 4.00%, 11/28/53 (a),(e) | 45,142 | 45,918 | |||||||||
| Bayview Opportunity Master Fund IVa Trust 2017-SPL5, 3.50%, 6/28/57 (a),(e) | 60,402 | 60,893 | |||||||||
| Bayview Opportunity Master Fund IVb Trust 2017-SPL4, 3.50%, 1/28/55 (a),(e) | 44,480 | 44,809 | |||||||||
| BFLD Trust 2020-OBRK, 2.16%, (1 Month US Libor + 2.05%), 11/15/28 (a),(c) | 180,000 | 180,968 | |||||||||
| BlueMountain CLO XXXII Ltd., 1.25%, (3 Month US Libor + 1.17%), 10/15/34 (a),(c) | 270,000 | 270,005 | |||||||||
| BX Trust 2021-ARIA, 1.41%, (1 Month US Libor + 1.30%), 10/15/36 (a),(c) | 360,000 | 359,107 | |||||||||
| BX Trust 2021-LGCY, 0.62%, (1 Month US Libor + 0.51%), 10/15/23 (a),(c) | 815,000 | 804,022 | |||||||||
BXHPP Trust 2021-FILM | |||||||||||
| 0.76%, (1 Month US Libor + 0.65%), 8/15/36 (a),(c) | 185,000 | 183,475 | |||||||||
| 1.01%, (1 Month US Libor + 0.90%), 8/15/36 (a),(c) | 155,000 | 153,241 | |||||||||
| Castlelake Aircraft Structured Trust 2019-1, 3.97%, 4/15/39 (a) | 177,502 | 174,981 | |||||||||
CF Hippolyta LLC, 1.53%, 3/15/61 (a) | 96,451 | 94,890 | |||||||||
CFMT 2021-AL1 LLC, 1.39%, 9/22/31 (a) | 722,327 | 720,570 | |||||||||
| Citigroup Commercial Mortgage Trust 2019-SMRT, 4.15%, 1/10/36 (a) | 100,000 | 104,795 | |||||||||
| Shares/ Principal | Fair Value | ||||||||||
| ASSET BACKED AND COMMERCIAL BACKED SECURITIES - 4.4% (Continued) | |||||||||||
| COLT 2021-5 Mortgage Loan Trust, 1.73%, 11/26/66 (a),(e) | $ | 318,891 | $ | 318,454 | |||||||
| Columbia Cent CLO 31 Ltd., 1.68%, (3 Month US Libor + 1.55%), 4/20/34 (a),(c) | 150,000 | 147,339 | |||||||||
| COMM 2013-CCRE8 Mortgage Trust, 3.33%, 6/10/46 | 12,416 | 12,605 | |||||||||
| Connecticut Avenue Security Trust 2021-R01, 1.60%, (SOFR + 1.55%), 10/25/41 (a),(c) | 70,000 | 70,336 | |||||||||
| Countrywide Asset-Backed Certificates, 0.46%, (1 Month US Libor + 0.37%), 4/25/36 (c) | 46,887 | 46,080 | |||||||||
| Credit Acceptance Auto Loan Trust 2020-3, 1.24%, 10/15/29 (a) | 420,000 | 419,396 | |||||||||
| Credit Suisse First Boston Mortgage Securities Corp., 4.50%, 7/25/20 | 4,743 | 4,702 | |||||||||
| CSMC 2021-NQM8, 1.84%, 10/25/66 (a),(e) | 180,000 | 179,851 | |||||||||
| Domino's Pizza Master Issuer LLC, 3.15%, 4/25/51 (a) | 199,000 | 203,397 | |||||||||
| Enterprise Fleet Financing 2019-1 LLC, 2.98%, 10/20/24 (a) | 20,763 | 20,799 | |||||||||
| Fannie Mae Connecticut Avenue Securities 5.00%, (1 Month US Libor + 4.90%), 11/25/24 (c) | 53,102 | 55,159 | |||||||||
| 2.30%, (1 Month US Libor + 2.20%), 1/25/30 (c) | 126,066 | 128,128 | |||||||||
Fannie Mae REMICS | |||||||||||
3.50%, 6/25/44 | 83,913 | 86,824 | |||||||||
3.00%, 1/25/45 | 265,815 | 275,226 | |||||||||
3.00%, 10/25/45 | 812,811 | 844,162 | |||||||||
3.00%, 12/25/45 | 285,581 | 297,025 | |||||||||
3.50%, 2/25/48 | 179,096 | 187,256 | |||||||||
3.00%, 12/25/54 | 541,048 | 561,273 | |||||||||
Fannie Mae-Aces | |||||||||||
| 0.50%, (1 Month US Libor + 0.40%), 10/25/24 (c) | 20,780 | 20,774 | |||||||||
2.39%, 10/25/36 (e) | 383,390 | 395,337 | |||||||||
| FBR Securitization Trust, 0.78%, (1 Month US Libor + 0.68%), 10/25/35 (c) | 5,548 | 5,424 | |||||||||
| FirstKey Homes 2021-SFR1 Trust, 1.54%, 8/17/38 (a) | 394,647 | 385,515 | |||||||||
| Flagstar Mortgage Trust 2018-3, 4.00%, 5/25/48 (a),(e) | 105,280 | 106,905 | |||||||||
| Flagstar Mortgage Trust 2021-9INV, 2.00%, 9/25/41 (a),(e) | 186,479 | 187,870 | |||||||||
| Ford Credit Auto Lease Trust 2021-A, 0.78%, 9/15/25 | 130,000 | 128,979 | |||||||||
| Ford Credit Auto Owner Trust 2021-REV1, 1.61%, 10/17/33 (a) | 100,000 | 98,715 | |||||||||
| Freddie Mac Multifamily Structured Pass Through Certificates, 2.36%, 10/25/36 | 245,000 | 249,008 | |||||||||
See accompanying notes to financial statements.
57
Global Atlantic Wellington Research Managed Risk Portfolio
Portfolio of Investments (Continued)
December 31, 2021
| Shares/ Principal | Fair Value | ||||||||||
| ASSET BACKED AND COMMERCIAL BACKED SECURITIES - 4.4% (Continued) | |||||||||||
Freddie Mac REMICS | |||||||||||
2.00%, 7/15/31 | $ | 23,463 | $ | 23,638 | |||||||
1.75%, 3/15/41 | 46,559 | 46,673 | |||||||||
1.75%, 9/15/42 | 337,618 | 338,974 | |||||||||
1.50%, 10/15/42 | 27,506 | 27,584 | |||||||||
3.00%, 6/15/45 | 368,784 | 379,169 | |||||||||
3.00%, 7/15/47 | 227,262 | 235,407 | |||||||||
| Freddie Mac STACR REMIC Trust 2020-DNA5, 2.85%, (SOFR + 2.80%), 10/25/50 (a),(c) | 187,743 | 189,327 | |||||||||
| Freddie Mac STACR REMIC Trust 2021-DNA1, 0.70%, (SOFR + 0.65%), 1/25/51 (a),(c) | 38,108 | 38,106 | |||||||||
| Freddie Mac Structured Agency Credit Risk Debt Notes | |||||||||||
| 5.10%, (1 Month US Libor + 5.00%), 12/25/28 (c) | 154,412 | 161,340 | |||||||||
| 2.60%, (1 Month US Libor + 2.50%), 3/25/30 (c) | 293,115 | 298,685 | |||||||||
0.85%, (SOFR + 0.80%), 8/25/33 (a),(c) | 107,203 | 107,249 | |||||||||
| FREMF 2013-K24 Mortgage Trust, 3.51%, 11/25/45 (a),(e) | 35,000 | 35,568 | |||||||||
| FREMF 2015-K44 Mortgage Trust, 3.67%, 1/25/48 (a),(e) | 65,000 | 68,378 | |||||||||
| FREMF 2015-K46 Mortgage Trust, 3.69%, 4/25/48 (a),(e) | 35,000 | 36,871 | |||||||||
| FREMF 2015-K50 Mortgage Trust, 3.78%, 10/25/48 (a),(e) | 45,000 | 47,863 | |||||||||
| FREMF 2016-K55 Mortgage Trust, 4.16%, 4/25/49 (a),(e) | 55,000 | 59,794 | |||||||||
| FREMF 2017-K725 Mortgage Trust, 3.88%, 2/25/50 (a),(e) | 35,000 | 36,995 | |||||||||
| FREMF 2018-K733 Mortgage Trust, 4.08%, 9/25/25 (a),(e) | 230,000 | 247,784 | |||||||||
| Government National Mortgage Association 0.68%, (1 Month US Libor + 0.60%), 5/20/65 (c) | 53,874 | 53,727 | |||||||||
| 0.70%, (1 Month US Libor + 0.62%), 8/20/65 (c) | 60,000 | 59,863 | |||||||||
| 0.78%, (1 Month US Libor + 0.70%), 10/20/65 (c) | 138 | 140 | |||||||||
| 1.08%, (1 Month US Libor + 1.00%), 12/20/65 (c) | 56,234 | 56,745 | |||||||||
| GSR Mortgage Loan Trust 2005-AR6, 2.85%, 9/25/35 (e) | 5,222 | 5,137 | |||||||||
| Home Partners of America Trust 2021-2, 2.30%, 12/17/26 (a) | 339,800 | 335,227 | |||||||||
| Horizon Aircraft Finance III Ltd., 3.43%, 11/15/39 (a) | 230,555 | 225,763 | |||||||||
| KKR Clo 16 Ltd., 1.34%, (3 Month US Libor + 1.21%), 10/20/34 (a),(c) | 250,000 | 250,179 | |||||||||
| Life 2021-BMR Mortgage Trust, 0.81%, (1 Month US Libor + 0.70%), 3/15/38 (a),(c) | 100,000 | 99,251 | |||||||||
| Shares/ Principal | Fair Value | ||||||||||
| ASSET BACKED AND COMMERCIAL BACKED SECURITIES - 4.4% (Continued) | |||||||||||
| Magnetite VII Ltd., 0.92%, (3 Month US Libor + 0.80%), 1/15/28 (a),(c) | $ | 524,600 | $ | 525,012 | |||||||
| Magnetite XVIII Ltd., 1.66%, (3 Month US Libor + 1.50%), 11/15/28 (a),(c) | 360,000 | 360,134 | |||||||||
| Magnetite XXIX Ltd., 1.52%, (3 Month US Libor + 1.40%), 1/15/34 (a),(c) | 250,000 | 249,999 | |||||||||
| Mercury Financial Credit Card Master Trust, 1.54%, 3/20/26 (a) | 135,000 | 135,076 | |||||||||
| METLIFE SECURITIZATION TRUST, 3.00%, 4/25/55 (a),(e) | 61,690 | 62,823 | |||||||||
| Mill City Mortgage Loan Trust 2016-1, 2.50%, 4/25/57 (a),(e) | 1,577 | 1,575 | |||||||||
| Mill City Mortgage Loan Trust 2017-3, 2.75%, 1/25/61 (a),(e) | 53,705 | 54,354 | |||||||||
| New Economy Assets Phase 1 Sponsor, LLC, 2.41%, 10/20/61 (a) | 120,000 | 120,311 | |||||||||
| New Residential Mortgage Loan Trust 2019-RPL3, 2.75%, 7/25/59 (a),(e) | 65,876 | 68,070 | |||||||||
| Octagon Investment Partners XVII LTD, 1.52%, (3 Month US Libor + 1.40%), 1/25/31 (a),(c) | 250,000 | 249,312 | |||||||||
| OneMain Direct Auto Receivables Trust 2018-1, 3.43%, 12/16/24 (a) | 11,253 | 11,257 | |||||||||
| SCF Equipment Leasing 2021-1 LLC, 0.83%, 8/21/28 (a) | 455,000 | 453,413 | |||||||||
| Seasoned Credit Risk Transfer Trust Series 2019-3, 3.50%, 10/25/58 | 133,220 | 137,540 | |||||||||
| Seasoned Credit Risk Transfer Trust Series 2021-1, 2.50%, 9/25/60 | 663,650 | 680,653 | |||||||||
| SFAVE Commercial Mortgage Securities Trust 2015-5AVE, 4.14%, 1/5/43 (a),(e) | 100,000 | 105,553 | |||||||||
| SoFi Consumer Loan Program 2021-1 Trust, 0.49%, 9/25/30 (a) | 113,397 | 112,922 | |||||||||
Sonic Capital LLC, 2.19%, 8/20/51 (a) | 169,575 | 165,094 | |||||||||
| SOUND POINT CLO III-R Ltd., 1.07%, (3 Month US Libor + 0.95%), 4/15/29 (a),(c) | 500,000 | 498,852 | |||||||||
| SREIT Trust 2021-MFP, 1.19%, (1 Month US Libor + 1.08%), 11/15/38 (a),(c) | 415,000 | 413,012 | |||||||||
| Starwood Mortgage Residential Trust 2021-6, 1.92%, 11/25/66 (a),(e) | 275,000 | 275,763 | |||||||||
| Structured Adjustable Rate Mortgage Loan Trust | |||||||||||
2.43%, 2/25/34 (e) | 2,989 | 2,714 | |||||||||
2.64%, 9/25/34 (e) | 2,978 | 2,817 | |||||||||
| Structured Adjustable Rate Mortgage Loan Trust Series 2005-19XS, 0.40%, (1 Month US Libor + 0.30%), 10/25/35 (c) | 2,447 | 2,372 | |||||||||
Taco Bell Funding LLC | |||||||||||
1.95%, 8/25/51 (a) | 150,000 | 146,901 | |||||||||
2.29%, 8/25/51 (a) | 140,000 | 136,993 | |||||||||
See accompanying notes to financial statements.
58
Global Atlantic Wellington Research Managed Risk Portfolio
Portfolio of Investments (Continued)
December 31, 2021
| Shares/ Principal | Fair Value | ||||||||||
| ASSET BACKED AND COMMERCIAL BACKED SECURITIES - 4.4% (Continued) | |||||||||||
| Towd Point Mortgage Trust 2016-3, 2.25%, 4/25/56 (a),(e) | $ | 5,048 | $ | 5,050 | |||||||
| Towd Point Mortgage Trust 2017-2, 2.75%, 4/25/57 (a),(e) | 16,770 | 16,891 | |||||||||
| Towd Point Mortgage Trust 2017-4, 2.75%, 6/25/57 (a),(e) | 80,026 | 81,702 | |||||||||
| Towd Point Mortgage Trust 2018-1, 3.00%, 1/25/58 (a),(e) | 33,694 | 34,224 | |||||||||
| Vantage Data Centers Issuer LLC, 3.19%, 7/15/44 (a) | 185,567 | 189,094 | |||||||||
| Vantage Data Centers LLC, 1.65%, 9/15/45 (a) | 265,000 | 257,338 | |||||||||
| Wellfleet CLO X Ltd., 1.88%, (3 Month US Libor + 1.75%), 7/20/32 (a),(c) | 250,000 | 249,849 | |||||||||
| Wells Fargo Commercial Mortgage Trust 2015-NXS1, 3.15%, 5/15/48 | 250,000 | 261,458 | |||||||||
| Wells Fargo Commercial Mortgage Trust 2017-C38, 3.45%, 7/15/50 | 400,000 | 431,664 | |||||||||
| TOTAL ASSET BACKED AND COMMERCIAL BACKED SECURITIES (Cost - $21,162,238) | 21,264,692 | ||||||||||
MUNICIPAL BONDS - 0.7% | |||||||||||
| Chicago O'Hare International Airport, 6.40%, 1/1/40 | 30,000 | 45,165 | |||||||||
| Chicago Transit Authority Sales & Transfer Tax Receipts Revenue | |||||||||||
6.90%, 12/1/40 | 80,000 | 112,674 | |||||||||
6.90%, 12/1/40 | 70,000 | 98,589 | |||||||||
| Chicago Transit Authority Sales Tax Receipts Fund, 1.84%, 12/1/23 | 100,000 | 101,133 | |||||||||
County of Sacramento CA, 5.73%, 8/15/23 | 315,000 | 328,220 | |||||||||
| Foothill-Eastern Transportation Corridor Agency | |||||||||||
4.09%, 1/15/49 | 15,000 | 16,123 | |||||||||
3.92%, 1/15/53 | 155,000 | 165,694 | |||||||||
| Golden State Tobacco Securitization Corp. | |||||||||||
2.75%, 6/1/34 | 10,000 | 10,060 | |||||||||
3.29%, 6/1/42 | 20,000 | 20,347 | |||||||||
3.00%, 6/1/46 | 45,000 | 46,096 | |||||||||
| Illinois Municipal Electric Agency, 6.83%, 2/1/35 | 195,000 | 251,863 | |||||||||
| Kansas Development Finance Authority, 5.37%, 5/1/26 | 90,000 | 98,248 | |||||||||
Metropolitan Transportation Authority | |||||||||||
6.20%, 11/15/26 | 10,000 | 11,305 | |||||||||
6.81%, 11/15/40 | 180,000 | 256,128 | |||||||||
5.18%, 11/15/49 | 65,000 | 88,980 | |||||||||
| Municipal Electric Authority of Georgia, 6.64%, 4/1/57 | 210,000 | 319,714 | |||||||||
| New Jersey Transportation Trust Fund Authority, 2.55%, 6/15/23 | 30,000 | 30,683 | |||||||||
| Shares/ Principal | Fair Value | ||||||||||
MUNICIPAL BONDS - 0.7% (Continued) | |||||||||||
| New York State Urban Development Corp., 1.83%, 3/15/29 | $ | 40,000 | $ | 39,444 | |||||||
| Philadelphia Authority for Industrial Development, 6.55%, 10/15/28 | 270,000 | 339,291 | |||||||||
| Sales Tax Securitization Corp., 4.79%, 1/1/48 | 130,000 | 165,617 | |||||||||
State of Illinois, 5.10%, 6/1/33 | 870,000 | 1,005,619 | |||||||||
University of California, 1.61%, 5/15/30 | 20,000 | 19,404 | |||||||||
| TOTAL MUNICIPAL BONDS (Cost - $3,287,891) | 3,570,397 | ||||||||||
SOVEREIGN DEBTS - 0.3% | |||||||||||
| Chile Government International Bond, 2.55%, 7/27/33 | 820,000 | 797,450 | |||||||||
| Qatar Government International Bond, 3.38%, 3/14/24 (a) | 200,000 | 209,416 | |||||||||
| Saudi Government International Bond, 2.88%, 3/4/23 (a) | 330,000 | 337,770 | |||||||||
| TOTAL SOVEREIGN DEBTS (Cost - $1,352,356) | 1,344,636 | ||||||||||
SHORT-TERM INVESTMENTS - 9.9% | |||||||||||
MONEY MARKET FUNDS - 9.9% | |||||||||||
| Fidelity Investments Money Market Fund - Government Portfolio, Institutional Class, 0.01% (f) | 30,947,331 | 30,947,331 | |||||||||
| Dreyfus Government Cash Management, 0.03% (f) | 16,872,548 | 16,872,548 | |||||||||
| TOTAL SHORT-TERM INVESTMENTS (Cost - $47,819,879) | 47,819,879 | ||||||||||
| TOTAL INVESTMENTS - 105.5% (Cost - $384,488,768) | $ | 512,027,964 | |||||||||
| OTHER ASSETS LESS LIABILITIES - NET (5.5)% | (26,554,179 | ) | |||||||||
TOTAL NET ASSETS - 100.0% | $ | 485,473,785 | |||||||||
* Non-income producing security.
† Represents less than 0.05%.
†† A portion of this investment is held as collateral for derivative investments.
(a) 144A - Security was purchased pursuant to Rule 144a under the Securities Act of 1933 and may not be resold subject to that rule, except to qualified institutional buyers. As of December 31, 2021, these securities amounted to $34,747,635 or 7.2% of net assets.
(b) Rate shown represents discount rate at the time of purchase and year-end.
(c) Variable rate security. The rate shown is the rate in effect at period end.
(d) When-issued, or delayed delivery, all or a portion may be subject to dollar-roll transactions.
(e) Adjustable rate security with an interest rate that is not based on a published reference index and spread. The rate is based on the structure of the agreement and current market conditions. The coupon rate shown represents the rate at period end.
(f) The rate shown is the annualized seven-day yield at period end.
ADR - American Depositary Receipt
CLO - Collateralized Loan Obligation
CMT - Treasury Constant Maturity Rate
Libor - London Interbank Offer Rate
PLC - Public Limited Company
REMIC - Real Estate Mortgage Investment Conduit
SOFR - Secured Overnight Financing Rate
STRIP - Separate trading of registered interest and principal of securities
See accompanying notes to financial statements.
59
Global Atlantic Wellington Research Managed Risk Portfolio
Portfolio of Investments (Continued)
December 31, 2021
FUTURES CONTRACTS | |||||||||||||||||||||||
LONG FUTURES CONTRACTS | Counterparty | Number of Contracts | Expiration Date | Notional Value | Fair Value/ Unrealized Appreciation (Depreciation) | ||||||||||||||||||
U.S. 2 Year Note Future | JP Morgan Chase Bank | 24 | 3/31/2022 | $ | 5,236,125 | $ | (2,625 | ) | |||||||||||||||
U.S. 5 Year Note Future | JP Morgan Chase Bank | 36 | 3/31/2022 | 4,355,156 | 17,375 | ||||||||||||||||||
14,750 | |||||||||||||||||||||||
SHORT FUTURES CONTRACTS | |||||||||||||||||||||||
U.S. 10 Year Ultra Future | JP Morgan Chase Bank | 23 | 3/22/2022 | 3,368,062 | (32,562 | ) | |||||||||||||||||
TOTAL NET UNREALIZED DEPRECIATION ON FUTURES CONTRACTS | $ | (17,812 | ) | ||||||||||||||||||||
See accompanying notes to financial statements.
60
Global Atlantic Portfolios
Statements of Assets and Liabilities
December 31, 2021
Assets: | Global Atlantic American Funds® Managed Risk Portfolio | Global Atlantic Balanced Managed Risk Portfolio | Global Atlantic BlackRock Selects Managed Risk Portfolio | Global Atlantic Franklin Dividend and Income Managed Risk Portfolio | |||||||||||||||
Investments in securities, at cost | $ | 179,374,454 | $ | 99,402,252 | $ | 193,900,995 | $ | 170,285,890 | |||||||||||
Investments in securities, at fair value | $ | 232,947,976 | $ | 119,450,258 | $ | 231,021,399 | $ | 293,363,876 | |||||||||||
| Swaptions purchased, at fair value (premiums paid $-, $-, $- and $17,580, respectively) | - | - | - | 15,272 | |||||||||||||||
Cash | - | - | - | 703 | |||||||||||||||
Foreign cash (cost $-, $-, $- and $22,062, respectively) | - | - | - | 22,033 | |||||||||||||||
Deposit with broker | 33,180 | 43,771 | 41,282 | 92,330 | |||||||||||||||
Segregated cash for derivatives | - | - | - | 20,302 | |||||||||||||||
| Unrealized appreciation on forward foreign currency contracts | - | - | - | 21,067 | |||||||||||||||
Unrealized appreciation on futures contracts, net | - | - | - | 45,560 | |||||||||||||||
Interest and dividends receivable | 262 | 21,403 | 5,085,451 | 552,978 | |||||||||||||||
Prepaid expenses | 8,687 | 4,441 | 8,809 | 10,528 | |||||||||||||||
Total Assets | 232,990,105 | 119,519,873 | 236,156,941 | 294,144,649 | |||||||||||||||
Liabilities: | |||||||||||||||||||
| Swaptions written, at fair value (premiums received $-, $-, $- and $18,312, respectively) | - | - | - | 11,125 | |||||||||||||||
Premiums received on open swap contracts | - | - | - | 73,095 | |||||||||||||||
Unrealized depreciation on forward foreign currency contracts | - | - | - | 52,545 | |||||||||||||||
Unrealized depreciation on swap contracts, net | - | - | - | 2,517 | |||||||||||||||
| Due to foreign custodian (cost $-, $134, $- and $-, respectively) | - | 128 | - | - | |||||||||||||||
Payable for securities purchased | - | - | - | 8,855,145 | |||||||||||||||
Payable for portfolio shares redeemed | 284,039 | 47,178 | 426,261 | 250,347 | |||||||||||||||
Accrued distribution (12b-1) fees | 48,993 | 25,182 | 49,723 | 59,717 | |||||||||||||||
Accrued investment advisory fees | 97,985 | 55,400 | 109,391 | 202,210 | |||||||||||||||
Administrative service fees payable | 5,902 | 3,058 | 5,984 | 7,214 | |||||||||||||||
Accrued expenses and other liabilities | 21,867 | 12,789 | 22,058 | 33,261 | |||||||||||||||
Total Liabilities | 458,786 | 143,735 | 613,417 | 9,547,176 | |||||||||||||||
Net Assets | $ | 232,531,319 | $ | 119,376,138 | $ | 235,543,524 | $ | 284,597,473 | |||||||||||
Composition of Net Assets: | |||||||||||||||||||
Paid-in capital | $ | 172,393,318 | $ | 96,242,068 | $ | 191,025,478 | $ | 155,972,002 | |||||||||||
Total distributable earnings | 60,138,001 | 23,134,070 | 44,518,046 | 128,625,471 | |||||||||||||||
Net Assets | $ | 232,531,319 | $ | 119,376,138 | $ | 235,543,524 | $ | 284,597,473 | |||||||||||
Class II Shares: | |||||||||||||||||||
Net Assets | $ | 232,531,319 | $ | 119,376,138 | $ | 235,543,524 | $ | 284,597,473 | |||||||||||
| Total shares outstanding at end of period ($0 par value, unlimited shares authorized) | 16,768,268 | 8,602,868 | 18,909,670 | 17,231,062 | |||||||||||||||
| Net asset value, offering and redemption price per share (Net assets ÷ Total shares of beneficial interest outstanding) | $ | 13.87 | $ | 13.88 | $ | 12.46 | $ | 16.52 | |||||||||||
See accompanying notes to financial statements.
61
Global Atlantic Portfolios
Statements of Assets and Liabilities (Continued)
December 31, 2021
Assets: | Global Atlantic Growth Managed Risk Portfolio | Global Atlantic Moderate Growth Managed Risk Portfolio | Global Atlantic Select Advisor Managed Risk Portfolio | Global Atlantic Wellington Research Managed Risk Portfolio | |||||||||||||||
Investments in securities, at cost | $ | 269,624,931 | $ | 102,061,511 | $ | 79,074,993 | $ | 384,488,768 | |||||||||||
Investments in securities, at fair value | $ | 412,475,463 | $ | 141,012,662 | $ | 105,509,617 | $ | 512,027,964 | |||||||||||
| Foreign cash (cost $-, $-, $- and $4, respectively) | - | - | - | 3 | |||||||||||||||
Deposit with broker | 3,318,016 | 396,563 | 41,364 | 53,057 | |||||||||||||||
Receivable for securities sold | - | - | - | 6,569,328 | |||||||||||||||
Receivable for portfolio shares sold | - | - | 25,469 | - | |||||||||||||||
Interest and dividends receivable | 105,288 | 31,347 | 13,440 | 818,433 | |||||||||||||||
Prepaid expenses | 15,523 | 5,272 | 3,972 | 18,130 | |||||||||||||||
Total Assets | 415,914,290 | 141,445,844 | 105,593,862 | 519,486,915 | |||||||||||||||
Liabilities: | |||||||||||||||||||
Unrealized depreciation on futures contracts, net | 1,003,482 | 116,100 | - | 17,812 | |||||||||||||||
Due to custodian | - | - | - | 40 | |||||||||||||||
Payable for securities purchased | - | - | - | 33,255,916 | |||||||||||||||
Payable for portfolio shares redeemed | 324,490 | 35,218 | - | 230,661 | |||||||||||||||
Accrued distribution (12b-1) fees | 87,172 | 29,758 | 22,273 | 102,321 | |||||||||||||||
Accrued investment advisory fees | 188,331 | 65,467 | 26,873 | 347,017 | |||||||||||||||
Administrative service fees payable | 10,499 | 3,584 | 2,679 | 12,343 | |||||||||||||||
Accrued expenses and other liabilities | 40,363 | 13,609 | 10,402 | 47,020 | |||||||||||||||
Total Liabilities | 1,654,337 | 263,736 | 62,227 | 34,013,130 | |||||||||||||||
Net Assets | $ | 414,259,953 | $ | 141,182,108 | $ | 105,531,635 | $ | 485,473,785 | |||||||||||
Composition of Net Assets: | |||||||||||||||||||
Paid-in capital | $ | 261,951,022 | $ | 93,307,912 | $ | 72,031,484 | $ | 317,041,459 | |||||||||||
Total distributable earnings | 152,308,931 | 47,874,196 | 33,500,151 | 168,432,326 | |||||||||||||||
Net Assets | $ | 414,259,953 | $ | 141,182,108 | $ | 105,531,635 | $ | 485,473,785 | |||||||||||
Class II Shares: | |||||||||||||||||||
Net Assets | $ | 414,259,953 | $ | 141,182,108 | $ | 105,531,635 | $ | 485,473,785 | |||||||||||
| Total shares outstanding at end of period ($0 par value, unlimited shares authorized) | 28,046,983 | 9,728,846 | 7,288,001 | 29,504,021 | |||||||||||||||
| Net asset value, offering and redemption price per share (Net assets ÷ Total shares of beneficial interest outstanding) | $ | 14.77 | $ | 14.51 | $ | 14.48 | $ | 16.45 | |||||||||||
See accompanying notes to financial statements.
62
Global Atlantic Portfolios
Statements of Operations
For the Year Ended December 31, 2021
| Global Atlantic American Funds® Managed Risk Portfolio | Global Atlantic Balanced Managed Risk Portfolio | Global Atlantic BlackRock Selects Managed Risk Portfolio | Global Atlantic Franklin Dividend and Income Managed Risk Portfolio | ||||||||||||||||
Investment Income: | |||||||||||||||||||
Dividend income | $ | 5,627,117 | $ | 1,735,461 | $ | 8,720,709 | $ | 3,201,840 | |||||||||||
Interest income* | 3,248 | 3,751 | 2,943 | 1,657,718 | |||||||||||||||
Total Investment Income | 5,630,365 | 1,739,212 | 8,723,652 | 4,859,558 | |||||||||||||||
Expenses: | |||||||||||||||||||
Investment advisory fee | 2,117,576 | 531,164 | 1,323,321 | 2,370,797 | |||||||||||||||
Distribution fees (12b-1) - Class II Shares | 588,215 | 241,438 | 601,509 | 697,293 | |||||||||||||||
Administrative service fees | 74,358 | 30,508 | 76,039 | 88,145 | |||||||||||||||
Legal fees | 50,192 | 20,562 | 51,353 | 59,371 | |||||||||||||||
Trustees fees | 20,039 | 7,881 | 20,641 | 23,630 | |||||||||||||||
Custody fees | 3,114 | 3,347 | 4,330 | 18,439 | |||||||||||||||
Miscellaneous expenses | 80,387 | 34,669 | 82,371 | 96,321 | |||||||||||||||
Total Expenses | 2,933,881 | 869,569 | 2,159,564 | 3,353,996 | |||||||||||||||
Expenses waived/reimbursed | (941,145 | ) | (68 | ) | - | (61,783 | ) | ||||||||||||
Net Expenses | 1,992,736 | 869,501 | 2,159,564 | 3,292,213 | |||||||||||||||
Net Investment Income | 3,637,629 | 869,711 | 6,564,088 | 1,567,345 | |||||||||||||||
| Net Realized and Change in Unrealized Gain (Loss) | |||||||||||||||||||
Net realized gain (loss) on: | |||||||||||||||||||
Investments | 6,195,510 | 8,357,769 | 21,097,288 | 23,871,578 | |||||||||||||||
Futures contracts | (947,305 | ) | (486,779 | ) | (1,298,299 | ) | (3,151,093 | ) | |||||||||||
Swap contracts | - | - | - | 133,578 | |||||||||||||||
Swaptions | - | - | - | 30,884 | |||||||||||||||
Forward foreign currency contracts | - | - | - | (103,281 | ) | ||||||||||||||
Foreign currency translations | - | - | - | (69,760 | ) | ||||||||||||||
Capital gain distributions from underlying funds | 5,590,040 | - | 1,464,281 | 1,642 | |||||||||||||||
10,838,245 | 7,870,990 | 21,263,270 | 20,713,548 | ||||||||||||||||
Net change in unrealized appreciation/(depreciation) on: | |||||||||||||||||||
Investments | 10,258,753 | (602,928 | ) | (4,091,875 | ) | 20,888,994 | |||||||||||||
Futures contracts | - | - | - | 28,786 | |||||||||||||||
Swap contracts | - | - | - | 268,473 | |||||||||||||||
Swaptions | - | - | - | 15,519 | |||||||||||||||
Forward foreign currency contracts | - | - | - | 3,019 | |||||||||||||||
Foreign currency translations | - | 6 | - | (1,001 | ) | ||||||||||||||
10,258,753 | (602,922 | ) | (4,091,875 | ) | 21,203,790 | ||||||||||||||
Net Realized and Change in Unrealized Gain | 21,096,998 | 7,268,068 | 17,171,395 | 41,917,338 | |||||||||||||||
| Net Increase in Net Assets Resulting from Operations | $ | 24,734,627 | $ | 8,137,779 | $ | 23,735,483 | $ | 43,484,683 | |||||||||||
| * Foreign taxes withheld | $ | - | $ | - | $ | - | $ | 2,828 | |||||||||||
See accompanying notes to financial statements.
63
Global Atlantic Portfolios
Statements of Operations (Continued)
For the Year Ended December 31, 2021
Global Atlantic Growth Managed Risk Portfolio | Global Atlantic Moderate Growth Managed Risk Portfolio | Global Atlantic Select Advisor Managed Risk Portfolio | Global Atlantic Wellington Research Managed Risk Portfolio | ||||||||||||||||
Investment Income: | |||||||||||||||||||
Dividend income* | $ | 6,739,917 | $ | 2,397,855 | $ | 1,669,590 | $ | 3,156,166 | |||||||||||
Interest income | 4,823 | 1,718 | 1,458 | 2,908,658 | |||||||||||||||
Total Investment Income | 6,744,740 | 2,399,573 | 1,671,048 | 6,064,824 | |||||||||||||||
Expenses: | |||||||||||||||||||
Investment advisory fee | 2,306,408 | 786,434 | 977,315 | 3,986,558 | |||||||||||||||
Distribution fees (12b-1) - Class II Shares | 1,048,367 | 357,470 | 271,476 | 1,172,517 | |||||||||||||||
Administrative service fees | 132,526 | 45,188 | 34,318 | 148,210 | |||||||||||||||
Legal fees | 89,497 | 30,502 | 23,168 | 99,976 | |||||||||||||||
Trustees fees | 35,741 | 12,179 | 9,307 | 39,739 | |||||||||||||||
Custody fees | 7,502 | 3,582 | 1,541 | 39,579 | |||||||||||||||
Miscellaneous expenses | 143,439 | 49,016 | 37,141 | 161,767 | |||||||||||||||
Total Expenses | 3,763,480 | 1,284,371 | 1,354,266 | 5,648,346 | |||||||||||||||
Expenses waived/reimbursed | (73,227 | ) | - | (659,283 | ) | (8,890 | ) | ||||||||||||
Net Expenses | 3,690,253 | 1,284,371 | 694,983 | 5,639,456 | |||||||||||||||
Net Investment Income | 3,054,487 | 1,115,202 | 976,065 | 425,368 | |||||||||||||||
| Net Realized and Change in Unrealized Gain (Loss) | |||||||||||||||||||
Net realized gain (loss) on: | |||||||||||||||||||
Investments | 36,148,667 | 10,642,802 | 3,914,952 | 51,321,946 | |||||||||||||||
Short Sales | - | - | - | (11,640 | ) | ||||||||||||||
Futures contracts | (9,525,906 | ) | (1,629,986 | ) | (832,716 | ) | (5,409,892 | ) | |||||||||||
Foreign currency translations | - | - | - | 4 | |||||||||||||||
Capital gain distributions from underlying funds | - | - | 4,078,695 | - | |||||||||||||||
26,622,761 | 9,012,816 | 7,160,931 | 45,900,418 | ||||||||||||||||
Net change in unrealized appreciation/(depreciation) on: | |||||||||||||||||||
Investments | 28,885,693 | 6,086,629 | 5,422,242 | 8,256,287 | |||||||||||||||
Short Sales | - | - | - | 4,393 | |||||||||||||||
Futures contracts | (1,003,482 | ) | (116,100 | ) | - | (14,249 | ) | ||||||||||||
27,882,211 | 5,970,529 | 5,422,242 | 8,246,431 | ||||||||||||||||
Net Realized and Change in Unrealized Gain | 54,504,972 | 14,983,345 | 12,583,173 | 54,146,849 | |||||||||||||||
| Net Increase in Net Assets Resulting from Operations | $ | 57,559,459 | $ | 16,098,547 | $ | 13,559,238 | $ | 54,572,217 | |||||||||||
| * Foreign taxes withheld | $ | - | $ | - | $ | - | $ | 32,897 | |||||||||||
See accompanying notes to financial statements.
64
Global Atlantic Portfolios
Statements of Changes in Net Assets
| Global Atlantic American Funds® Managed Risk Portfolio | Global Atlantic Balanced Managed Risk Portfolio | ||||||||||||||||||
| For the Year Ended December 31, 2021 | For the Year Ended December 31, 2020 | For the Year Ended December 31, 2021 | For the Year Ended December 31, 2020 | ||||||||||||||||
Increase/(Decrease) in Net Assets: | |||||||||||||||||||
From Operations: | |||||||||||||||||||
Net investment income | $ | 3,637,629 | $ | 2,587,380 | $ | 869,711 | $ | 847,173 | |||||||||||
Net realized gain (loss) | 10,838,245 | (2,748,624 | ) | 7,870,990 | 2,278,355 | ||||||||||||||
Net change in unrealized appreciation | 10,258,753 | 22,115,981 | (602,922 | ) | 3,639,210 | ||||||||||||||
Net increase in net assets resulting from operations | 24,734,627 | 21,954,737 | 8,137,779 | 6,764,738 | |||||||||||||||
From Distributions to Shareholders: | |||||||||||||||||||
Total distributions paid | (2,588,253 | ) | (10,946,578 | ) | (3,352,759 | ) | (2,932,502 | ) | |||||||||||
From Shares of Beneficial Interest: | |||||||||||||||||||
Proceeds from shares sold | 2,542,369 | 1,178,916 | 40,138,168 | * | 1,600,003 | ||||||||||||||
Reinvestment of distributions | 2,588,253 | 10,946,578 | 3,352,759 | 2,932,502 | |||||||||||||||
Cost of shares redeemed | (26,498,814 | ) | (22,296,853 | ) | (11,674,154 | ) | (9,001,607 | ) | |||||||||||
| Net increase (decrease) in net assets from share transactions of beneficial interest | (21,368,192 | ) | (10,171,359 | ) | 31,816,773 | (4,469,102 | ) | ||||||||||||
Total increase (decrease) in net assets | 778,182 | 836,800 | 36,601,793 | (636,866 | ) | ||||||||||||||
Net Assets: | |||||||||||||||||||
Beginning of year | 231,753,137 | 230,916,337 | 82,774,345 | 83,411,211 | |||||||||||||||
End of year | $ | 232,531,319 | $ | 231,753,137 | $ | 119,376,138 | $ | 82,774,345 | |||||||||||
Share Activity | |||||||||||||||||||
Class II | |||||||||||||||||||
Shares sold | 194,559 | 100,731 | 2,893,630 | ** | 130,327 | ||||||||||||||
Shares reinvested | 188,373 | 956,033 | 244,548 | 240,764 | |||||||||||||||
Shares redeemed | (1,980,985 | ) | (1,866,833 | ) | (854,658 | ) | (718,892 | ) | |||||||||||
| Net increase (decrease) in shares of beneficial interest outstanding | (1,598,053 | ) | (810,069 | ) | 2,283,520 | (347,801 | ) | ||||||||||||
* Includes the value received from shares issued in connection with the reorganization. See Note 13 in the Notes to Financial Statements.
** Includes shares issued in connection with reorganization. See Note 13 in the Notes to Financial Statements.
See accompanying notes to financial statements.
65
Global Atlantic Portfolios
Statements of Changes in Net Assets (Continued)
| Global Atlantic BlackRock Selects Managed Risk Portfolio | Global Atlantic Franklin Dividend and Income Managed Risk Portfolio | ||||||||||||||||||
| For the Year Ended December 31, 2021 | For the Year Ended December 31, 2020 | For the Year Ended December 31, 2021 | For the Year Ended December 31, 2020 | ||||||||||||||||
Increase/(Decrease) in Net Assets: | |||||||||||||||||||
From Operations: | |||||||||||||||||||
Net investment income | $ | 6,564,088 | $ | 3,231,574 | $ | 1,567,345 | $ | 2,448,465 | |||||||||||
Net realized gain (loss) | 21,263,270 | (5,056,161 | ) | 20,713,548 | (7,091,155 | ) | |||||||||||||
Net change in unrealized appreciation (depreciation) | (4,091,875 | ) | 25,566,951 | 21,203,790 | 23,567,513 | ||||||||||||||
Net increase in net assets resulting from operations | 23,735,483 | 23,742,364 | 43,484,683 | 18,924,823 | |||||||||||||||
From Distributions to Shareholders: | |||||||||||||||||||
Total distributions paid | (3,232,570 | ) | (3,599,871 | ) | (2,279,680 | ) | (3,749,479 | ) | |||||||||||
From Shares of Beneficial Interest: | |||||||||||||||||||
Proceeds from shares sold | 579,780 | 79,796 | 2,120,219 | 447,708 | |||||||||||||||
Reinvestment of distributions | 3,232,570 | 3,599,871 | 2,279,680 | 3,749,479 | |||||||||||||||
Cost of shares redeemed | (30,606,891 | ) | (25,839,874 | ) | (36,223,378 | ) | (36,396,533 | ) | |||||||||||
| Net decrease in net assets from share transactions of beneficial interest | (26,794,541 | ) | (22,160,207 | ) | (31,823,479 | ) | (32,199,346 | ) | |||||||||||
Total increase (decrease) in net assets | (6,291,628 | ) | (2,017,714 | ) | 9,381,524 | (17,024,002 | ) | ||||||||||||
Net Assets: | |||||||||||||||||||
Beginning of year | 241,835,152 | 243,852,866 | 275,215,949 | 292,239,951 | |||||||||||||||
End of year | $ | 235,543,524 | $ | 241,835,152 | $ | 284,597,473 | $ | 275,215,949 | |||||||||||
Share Activity: | |||||||||||||||||||
Class II | |||||||||||||||||||
Shares sold | 47,191 | 7,563 | 136,965 | 33,720 | |||||||||||||||
Shares reinvested | 261,535 | 342,845 | 142,036 | 286,657 | |||||||||||||||
Shares redeemed | (2,535,018 | ) | (2,455,342 | ) | (2,354,879 | ) | (2,742,834 | ) | |||||||||||
| Net decrease in shares of beneficial interest outstanding | (2,226,292 | ) | (2,104,934 | ) | (2,075,878 | ) | (2,422,457 | ) | |||||||||||
See accompanying notes to financial statements.
66
Global Atlantic Portfolios
Statements of Changes in Net Assets (Continued)
| Global Atlantic Growth Managed Risk Portfolio | Global Atlantic Moderate Growth Managed Risk Portfolio | ||||||||||||||||||
| For the Year Ended December 31, 2021 | For the Year Ended December 31, 2020 | For the Year Ended December 31, 2021 | For the Year Ended December 31, 2020 | ||||||||||||||||
Increase/(Decrease) in Net Assets: | |||||||||||||||||||
From Operations: | |||||||||||||||||||
Net investment income | $ | 3,054,487 | $ | 3,306,543 | $ | 1,115,202 | $ | 1,280,235 | |||||||||||
Net realized gain (loss) | 26,622,761 | (7,333,654 | ) | 9,012,816 | 824,898 | ||||||||||||||
Net change in unrealized appreciation | 27,882,211 | 30,202,535 | 5,970,529 | 8,505,598 | |||||||||||||||
Net increase in net assets resulting from operations | 57,559,459 | 26,175,424 | 16,098,547 | 10,610,731 | |||||||||||||||
From Distributions to Shareholders: | |||||||||||||||||||
Total distributions paid | (3,307,515 | ) | (5,912,075 | ) | (2,321,936 | ) | (3,975,331 | ) | |||||||||||
From Shares of Beneficial Interest: | |||||||||||||||||||
Proceeds from shares sold | 3,493,684 | 2,080,533 | 495,371 | 497,766 | |||||||||||||||
Reinvestment of distributions | 3,307,515 | 5,912,075 | 2,321,936 | 3,975,331 | |||||||||||||||
Cost of shares redeemed | (58,918,955 | ) | (47,687,648 | ) | (16,598,040 | ) | (13,143,344 | ) | |||||||||||
| Net decrease in net assets from share transactions of beneficial interest | (52,117,756 | ) | (39,695,040 | ) | (13,780,733 | ) | (8,670,247 | ) | |||||||||||
Total increase (decrease) in net assets | 2,134,188 | (19,431,691 | ) | (4,122 | ) | (2,034,847 | ) | ||||||||||||
Net Assets: | |||||||||||||||||||
Beginning of year | 412,125,765 | 431,557,456 | 141,186,230 | 143,221,077 | |||||||||||||||
End of year | $ | 414,259,953 | $ | 412,125,765 | $ | 141,182,108 | $ | 141,186,230 | |||||||||||
Share Activity: | |||||||||||||||||||
Class II | |||||||||||||||||||
Shares sold | 251,577 | 181,435 | 36,302 | 41,262 | |||||||||||||||
Shares reinvested | 227,165 | 498,488 | 162,260 | 327,188 | |||||||||||||||
Shares redeemed | (4,192,259 | ) | (3,941,439 | ) | (1,180,641 | ) | (1,051,269 | ) | |||||||||||
| Net decrease in shares of beneficial interest outstanding | (3,713,517 | ) | (3,261,516 | ) | (982,079 | ) | (682,819 | ) | |||||||||||
See accompanying notes to financial statements.
67
Global Atlantic Portfolios
Statements of Changes in Net Assets (Continued)
| Global Atlantic Select Advisor Managed Risk Portfolio | Global Atlantic Wellington Research Managed Risk Portfolio | ||||||||||||||||||
| For the Year Ended December 31, 2021 | For the Year Ended December 31, 2020 | For the Year Ended December 31, 2021 | For the Year Ended December 31, 2020 | ||||||||||||||||
Increase/(Decrease) in Net Assets: | |||||||||||||||||||
From Operations: | |||||||||||||||||||
Net investment income | $ | 976,065 | $ | 1,302,850 | $ | 425,368 | $ | 2,360,063 | |||||||||||
Net realized gain | 7,160,931 | 3,452,135 | 45,900,418 | 15,790,524 | |||||||||||||||
Net change in unrealized appreciation | 5,422,242 | 1,779,597 | 8,246,431 | 28,039,177 | |||||||||||||||
Net increase in net assets resulting from operations | 13,559,238 | 6,534,582 | 54,572,217 | 46,189,764 | |||||||||||||||
From Distributions to Shareholders: | |||||||||||||||||||
Total distributions paid | (4,843,261 | ) | (5,170,996 | ) | (19,065,724 | ) | (9,160,697 | ) | |||||||||||
From Shares of Beneficial Interest: | |||||||||||||||||||
Proceeds from shares sold | 232,268 | 166,966 | 31,704,858 | * | 4,163,564 | ||||||||||||||
Reinvestment of distributions | 4,843,261 | 5,170,996 | 19,065,724 | 9,160,697 | |||||||||||||||
Cost of shares redeemed | (16,371,977 | ) | (12,959,944 | ) | (56,645,530 | ) | (43,065,096 | ) | |||||||||||
| Net decrease in net assets from share transactions of beneficial interest | (11,296,448 | ) | (7,621,982 | ) | (5,874,948 | ) | (29,740,835 | ) | |||||||||||
Total increase (decrease) in net assets | (2,580,471 | ) | (6,258,396 | ) | 29,631,545 | 7,288,232 | |||||||||||||
Net Assets: | |||||||||||||||||||
Beginning of year | 108,112,106 | 114,370,502 | 455,842,240 | 448,554,008 | |||||||||||||||
End of year | $ | 105,531,635 | $ | 108,112,106 | $ | 485,473,785 | $ | 455,842,240 | |||||||||||
Share Activity: | |||||||||||||||||||
Class II | |||||||||||||||||||
Shares sold | 16,317 | 12,842 | 1,922,530 | ** | 288,437 | ||||||||||||||
Shares reinvested | 337,275 | 423,505 | 1,178,351 | 647,857 | |||||||||||||||
Shares redeemed | (1,143,850 | ) | (1,002,340 | ) | (3,526,877 | ) | (3,039,406 | ) | |||||||||||
| Net decrease in shares of beneficial interest outstanding | (790,258 | ) | (565,993 | ) | (425,996 | ) | (2,103,112 | ) | |||||||||||
* Includes the value received from shares issued in connection with the reorganization. See Note 13 in the Notes to Financial Statements.
** Includes shares issued in connection with reorganization. See Note 13 in the Notes to Financial Statements.
See accompanying notes to financial statements.
68
Global Atlantic Portfolios
Financial Highlights
Global Atlantic American Funds® Managed Risk Portfolio
Selected data for a Class II share outstanding throughout each year
| For the Year Ended December 31, 2021 | For the Year Ended December 31, 2020 | For the Year Ended December 31, 2019 | For the Year Ended December 31, 2018 | For the Year Ended December 31, 2017 | |||||||||||||||||||
Net asset value, beginning of year | $ | 12.62 | $ | 12.04 | $ | 10.93 | $ | 11.98 | $ | 10.64 | |||||||||||||
Income from investment operations: | |||||||||||||||||||||||
Net investment income (a,b) | 0.21 | 0.14 | 0.17 | 0.20 | 0.15 | ||||||||||||||||||
Net realized and unrealized gain (loss) (c) | 1.19 | 1.06 | 1.62 | (0.76 | ) | 1.35 | |||||||||||||||||
| Total income (loss) from investment operations | 1.40 | 1.20 | 1.79 | (0.56 | ) | 1.50 | |||||||||||||||||
Less distributions from: | |||||||||||||||||||||||
Net investment income | (0.15 | ) | (0.18 | ) | (0.21 | ) | (0.15 | ) | (0.14 | ) | |||||||||||||
Net realized gains | - | (0.44 | ) | (0.47 | ) | (0.34 | ) | (0.02 | ) | ||||||||||||||
| Total distributions from net investment income and net realized gains | (0.15 | ) | (0.62 | ) | (0.68 | ) | (0.49 | ) | (0.16 | ) | |||||||||||||
Net asset value, end of year | $ | 13.87 | $ | 12.62 | $ | 12.04 | $ | 10.93 | $ | 11.98 | |||||||||||||
Total return (d) | 11.12 | % | 10.49 | % | 16.72 | % | (4.75 | )% | 14.16 | % | |||||||||||||
Ratios and Supplemental Data: | |||||||||||||||||||||||
Net assets, end of year (in 000's) | $ | 232,531 | $ | 231,753 | $ | 230,916 | $ | 216,902 | $ | 240,415 | |||||||||||||
| Ratio of net expenses to average net assets (e) | 0.85 | % | 0.86 | % | 0.86 | % | 0.86 | % | 0.86 | % | |||||||||||||
| Ratio of gross expenses to average net assets (e,f) | 1.25 | % | 1.26 | % | 1.26 | % | 1.24 | % | 1.27 | % | |||||||||||||
| Ratio of net investment income to average net assets (b,e) | 1.55 | % | 1.18 | % | 1.41 | % | 1.66 | % | 1.29 | % | |||||||||||||
Portfolio turnover rate | 18 | % | 35 | % | 30 | % | 34 | % | 43 | % | |||||||||||||
(a) Net investment income has been calculated using the average shares method, which more appropriately presents the per share data for the period.
(b) Recognition of net investment income by the Portfolio is affected by the timing of the declaration of dividends by the underlying investment companies in which the Portfolio invests.
(c) Realized and unrealized gain (loss) per share are balancing amounts necessary to reconcile the change in net asset value per share for the period, and may not reconcile with aggregate gains and losses in the statement of operations due to timing of share transactions.
(d) Total returns are historical and assume changes in share price and reinvestment of dividends and capital gains distributions. Total return does not reflect the deduction of taxes that a shareholder may pay on Portfolio distributions or on the redemption of Portfolio shares, as well as other charges and expenses of the insurance contract or separate account. Total returns would have been lower absent fee waivers by the Adviser.
(e) Does not include the expenses of the investment companies in which the Portfolio invests.
(f) Represents the ratio of expenses to average net assets absent fee waivers and/or expense reimbursements by the Adviser.
See accompanying notes to financial statements.
69
Global Atlantic Portfolios
Financial Highlights
Global Atlantic Balanced Managed Risk Portfolio
Selected data for a Class II share outstanding throughout each year
| For the Year Ended December 31, 2021 | For the Year Ended December 31, 2020 | For the Year Ended December 31, 2019 | For the Year Ended December 31, 2018 | For the Year Ended December 31, 2017 | |||||||||||||||||||
Net asset value, beginning of year | $ | 13.10 | $ | 12.51 | $ | 11.26 | $ | 12.09 | $ | 10.95 | |||||||||||||
Income from investment operations: | |||||||||||||||||||||||
Net investment income (a,b) | 0.12 | 0.13 | 0.19 | 0.17 | 0.13 | ||||||||||||||||||
Net realized and unrealized gain (loss) (c) | 1.05 | 0.93 | 1.42 | (0.85 | ) | 1.16 | |||||||||||||||||
| Total income (loss) from investment operations | 1.17 | 1.06 | 1.61 | (0.68 | ) | 1.29 | |||||||||||||||||
Less distributions from: | |||||||||||||||||||||||
Net investment income | (0.10 | ) | (0.21 | ) | (0.20 | ) | (0.15 | ) | (0.15 | ) | |||||||||||||
Net realized gains | (0.29 | ) | (0.26 | ) | (0.16 | ) | - | - | |||||||||||||||
| Total distributions from net investment income and net realized gains | (0.39 | ) | (0.47 | ) | (0.36 | ) | (0.15 | ) | (0.15 | ) | |||||||||||||
Net asset value, end of year | $ | 13.88 | $ | 13.10 | $ | 12.51 | $ | 11.26 | $ | 12.09 | |||||||||||||
Total return (d) | 8.99 | % | 8.78 | % | 14.34 | % | (5.66 | )% | 11.80 | % | |||||||||||||
Ratios and Supplemental Data: | |||||||||||||||||||||||
Net assets, end of year (in 000's) | $ | 119,376 | $ | 82,774 | $ | 83,411 | $ | 81,748 | $ | 95,893 | |||||||||||||
| Ratio of net expenses to average net assets (e) | 0.90 | % | 0.92 | % (f) | 0.91 | % | 0.91 | % (f) | 0.91 | % | |||||||||||||
| Ratio of gross expenses to average net assets (e,g) | 0.90 | % | 0.92 | % | 0.91 | % (g) | 0.91 | % | 0.91 | % (g) | |||||||||||||
| Ratio of net investment income to average net assets (b,e) | 0.90 | % | 1.06 | % | 1.54 | % | 1.42 | % | 1.14 | % | |||||||||||||
Portfolio turnover rate | 82 | % (h) | 119 | % | 107 | % | 75 | % | 49 | % | |||||||||||||
(a) Net investment income has been calculated using the average shares method, which more appropriately presents the per share data for the period.
(b) Recognition of net investment income by the Portfolio is affected by the timing of the declaration of dividends by the underlying investment companies in which the Portfolio invests.
(c) Realized and unrealized gain (loss) per share are balancing amounts necessary to reconcile the change in net asset value per share for the period, and may not reconcile with aggregate gains and losses in the statement of operations due to timing of share transactions.
(d) Total returns are historical and assume changes in share price and reinvestment of dividends and capital gains distributions. Total return does not reflect the deduction of taxes that a shareholder may pay on Portfolio distributions or on the redemption of Portfolio shares, as well as other charges and expenses of the insurance contract or separate account. Total returns would have been lower absent fee waivers by the Adviser.
(e) Does not include the expenses of the investment companies in which the Portfolio invests.
(f) Represents the ratio of expenses to average net assets inclusive of the Adviser's recapture of waived/reimbursed fees from prior periods.
(g) Represents the ratio of expenses to average net assets absent fee waivers and/or expense reimbursements by the Adviser.
(h) During the year ended December 31, 2021, the Portfolio engaged in security transactions associated with the transition of assets from Global Atlantic Goldman Sachs Dynamic Trends Allocation Portfolio, which merged into the Portfolio on August 20, 2021. Certain security transactions were excluded from the portfolio turnover rate calculation. If these transactions were included, portfolio turnover would have been higher.
See accompanying notes to financial statements.
70
Global Atlantic Portfolios
Financial Highlights
Global Atlantic BlackRock Selects Managed Risk Portfolio
Selected data for a Class II share outstanding throughout each year
| For the Year Ended December 31, 2021 | For the Year Ended December 31, 2020 | For the Year Ended December 31, 2019 | For the Year Ended December 31, 2018 | For the Year Ended December 31, 2017 | |||||||||||||||||||
Net asset value, beginning of year | $ | 11.44 | $ | 10.49 | $ | 9.15 | $ | 10.11 | $ | 9.04 | |||||||||||||
Income from investment operations: | |||||||||||||||||||||||
Net investment income (a,b) | 0.33 | 0.15 | 0.15 | 0.04 | 0.16 | ||||||||||||||||||
Net realized and unrealized gain (loss) (c) | 0.86 | 0.97 | 1.24 | (0.82 | ) | 0.97 | |||||||||||||||||
| Total income (loss) from investment operations | 1.19 | 1.12 | 1.39 | (0.78 | ) | 1.13 | |||||||||||||||||
Less distributions from: | |||||||||||||||||||||||
Net investment income | (0.17 | ) | (0.17 | ) | (0.05 | ) | (0.18 | ) | (0.06 | ) | |||||||||||||
Net asset value, end of year | $ | 12.46 | $ | 11.44 | $ | 10.49 | $ | 9.15 | $ | 10.11 | |||||||||||||
Total return (d) | 10.41 | % | 10.82 | % | 15.22 | % | (7.78 | )% | 12.54 | % | |||||||||||||
Ratios and Supplemental Data: | |||||||||||||||||||||||
Net assets, end of year (in 000's) | $ | 235,544 | $ | 241,835 | $ | 243,853 | $ | 241,801 | $ | 285,869 | |||||||||||||
| Ratio of net expenses to average net assets (e) | 0.90 | % | 0.91 | % | 0.80 | % | 0.57 | % | 0.57 | % | |||||||||||||
| Ratio of gross expenses to average net assets (e,f) | 0.90 | % | 0.91 | % | 1.02 | % | 1.24 | % | 1.26 | % | |||||||||||||
| Ratio of net investment income to average net assets (b,e) | 2.73 | % | 1.39 | % | 1.47 | % | 3.87 | % | 1.66 | % | |||||||||||||
Portfolio turnover rate | 93 | % | 110 | % | 154 | % | 7 | % | 1 | % | |||||||||||||
(a) Net investment income has been calculated using the average shares method, which more appropriately presents the per share data for the period.
(b) Recognition of net investment income by the Portfolio is affected by the timing of the declaration of dividends by the underlying investment companies in which the Portfolio invests.
(c) Realized and unrealized gain (loss) per share are balancing amounts necessary to reconcile the change in net asset value per share for the period, and may not reconcile with aggregate gains and losses in the statement of operations due to timing of share transactions.
(d) Total returns are historical and assume changes in share price and reinvestment of dividends and capital gains distributions. Total return does not reflect the deduction of taxes that a shareholder may pay on Portfolio distributions or on the redemption of Portfolio shares, as well as other charges and expenses of the insurance contract or separate account. Total returns would have been lower absent fee waivers by the Adviser.
(e) Does not include the expenses of the investment companies in which the Portfolio invests.
(f) Represents the ratio of expenses to average net assets absent fee waivers and/or expense reimbursements by the Adviser.
See accompanying notes to financial statements.
71
Global Atlantic Portfolios
Financial Highlights
Global Atlantic Franklin Dividend and Income Managed Risk Portfolio
Selected data for a Class II share outstanding throughout each year
| For the Year Ended December 31, 2021 | For the Year Ended December 31, 2020 | For the Year Ended December 31, 2019 | For the Year Ended December 31, 2018 | For the Year Ended December 31, 2017 | |||||||||||||||||||
Net asset value, beginning of year | $ | 14.25 | $ | 13.45 | $ | 11.31 | $ | 12.13 | $ | 10.64 | |||||||||||||
Income from investment operations: | |||||||||||||||||||||||
Net investment income (a,b) | 0.09 | 0.12 | 0.16 | 0.15 | 0.12 | ||||||||||||||||||
Net realized and unrealized gain (loss) (c) | 2.31 | 0.87 | 2.14 | (0.85 | ) | 1.48 | |||||||||||||||||
| Total income (loss) from investment operations | 2.40 | 0.99 | 2.30 | (0.70 | ) | 1.60 | |||||||||||||||||
Less distributions from: | |||||||||||||||||||||||
Net investment income | (0.13 | ) | (0.19 | ) | (0.16 | ) | (0.12 | ) | (0.11 | ) | |||||||||||||
Net asset value, end of year | $ | 16.52 | $ | 14.25 | $ | 13.45 | $ | 11.31 | $ | 12.13 | |||||||||||||
Total return (d) | 16.87 | % | 7.50 | % | 20.40 | % | (5.82 | )% | 15.14 | % | |||||||||||||
Ratios and Supplemental Data: | |||||||||||||||||||||||
Net assets, end of year (in 000's) | $ | 284,598 | $ | 275,216 | $ | 292,240 | $ | 264,283 | $ | 302,607 | |||||||||||||
| Ratio of net expenses to average net assets (e) | 1.18 | % | 1.16 | % | 1.16 | % | 1.15 | % | 1.13 | % | |||||||||||||
| Ratio of gross expenses to average net assets (e,f) | 1.20 | % | 1.22 | % | 1.21 | % | 1.19 | % | 1.24 | % | |||||||||||||
| Ratio of net investment income to average net assets (b,e) | 0.56 | % | 0.91 | % | 1.24 | % | 1.24 | % | 1.04 | % | |||||||||||||
Portfolio turnover rate | 18 | % (g) | 24 | % (g) | 20 | % (g) | 24 | % (g) | 43 | % (g) | |||||||||||||
(a) Net investment income has been calculated using the average shares method, which more appropriately presents the per share data for the period.
(b) Recognition of net investment income by the Portfolio is affected by the timing of the declaration of dividends by the underlying investment companies in which the Portfolio invests.
(c) Realized and unrealized gain (loss) per share are balancing amounts necessary to reconcile the change in net asset value per share for the period, and may not reconcile with aggregate gains and losses in the statement of operations due to timing of share transactions.
(d) Total returns are historical and assume changes in share price and reinvestment of dividends and capital gains distributions. Total return does not reflect the deduction of taxes that a shareholder may pay on Portfolio distributions or on the redemption of Portfolio shares, as well as other charges and expenses of the insurance contract or separate account. Total returns would have been lower absent fee waivers by the Adviser.
(e) Does not include the expenses of the investment companies or fees on swaps in which the Portfolio invests.
(f) Represents the ratio of expenses to average net assets absent fee waivers and/or expense reimbursements by the Adviser.
(g) The portfolio turnover rate excludes mortgage dollar roll transactions for the years ended December 31, 2021, December 31, 2020, December 31, 2019, December 31, 2018 and December 31, 2017. If these were included in the calculation, the turnover percentage would be 59%, 77%, 55%, 48% and 55%, respectively.
See accompanying notes to financial statements.
72
Global Atlantic Portfolios
Financial Highlights
Global Atlantic Growth Managed Risk Portfolio
Selected data for a Class II share outstanding throughout each year
| For the Year Ended December 31, 2021 | For the Year Ended December 31, 2020 | For the Year Ended December 31, 2019 | For the Year Ended December 31, 2018 | For the Year Ended December 31, 2017 | |||||||||||||||||||
Net asset value, beginning of year | $ | 12.98 | $ | 12.32 | $ | 10.67 | $ | 11.64 | $ | 10.03 | |||||||||||||
Income from investment operations: | |||||||||||||||||||||||
Net investment income (a,b) | 0.10 | 0.10 | 0.16 | 0.14 | 0.11 | ||||||||||||||||||
Net realized and unrealized gain (loss) (c) | 1.81 | 0.74 | 1.66 | (0.99 | ) | 1.65 | |||||||||||||||||
| Total income (loss) from investment operations | 1.91 | 0.84 | 1.82 | (0.85 | ) | 1.76 | |||||||||||||||||
Less distributions from: | |||||||||||||||||||||||
Net investment income | (0.12 | ) | (0.18 | ) | (0.17 | ) | (0.12 | ) | (0.15 | ) | |||||||||||||
Net asset value, end of year | $ | 14.77 | $ | 12.98 | $ | 12.32 | $ | 10.67 | $ | 11.64 | |||||||||||||
Total return (d) | 14.69 | % | 7.00 | % | 17.11 | % | (7.33 | )% | 17.61 | % | |||||||||||||
Ratios and Supplemental Data: | |||||||||||||||||||||||
Net assets, end of year (in 000's) | $ | 414,260 | $ | 412,126 | $ | 431,557 | $ | 423,635 | $ | 489,447 | |||||||||||||
| Ratio of net expenses to average net assets (e) | 0.88 | % | 0.88 | % | 0.89 | % | 0.91 | % (f) | 0.91 | % | |||||||||||||
| Ratio of gross expenses to average net assets (e) | 0.90 | % | 0.91 | % (g) | 0.91 | % (g) | 0.89 | % | 0.91 | % (g) | |||||||||||||
| Ratio of net investment income to average net assets (b,e) | 0.73 | % | 0.82 | % | 1.38 | % | 1.24 | % | 1.04 | % | |||||||||||||
Portfolio turnover rate | 32 | % | 102 | % | 69 | % | 53 | % | 51 | % | |||||||||||||
(a) Net investment income has been calculated using the average shares method, which more appropriately presents the per share data for the period.
(b) Recognition of net investment income by the Portfolio is affected by the timing of the declaration of dividends by the underlying investment companies in which the Portfolio invests.
(c) Realized and unrealized gain (loss) per share are balancing amounts necessary to reconcile the change in net asset value per share for the period, and may not reconcile with aggregate gains and losses in the statement of operations due to timing of share transactions.
(d) Total returns are historical and assume changes in share price and reinvestment of dividends and capital gains distributions. Total return does not reflect the deduction of taxes that a shareholder may pay on Portfolio distributions or on the redemption of Portfolio shares, as well as other charges and expenses of the insurance contract or separate account. Total returns would have been lower absent fee waivers by the Adviser.
(e) Does not include the expenses of the investment companies in which the Portfolio invests.
(f) Represents the ratio of expenses to average net assets inclusive of the Adviser's recapture of waived/reimbursed fees from prior periods.
(g) Represents the ratio of expenses to average net assets absent fee waivers and/or expense reimbursements by the Adviser.
See accompanying notes to financial statements.
73
Global Atlantic Portfolios
Financial Highlights
Global Atlantic Moderate Growth Managed Risk Portfolio
Selected data for a Class II share outstanding throughout each year
| For the Year Ended December 31, 2021 | For the Year Ended December 31, 2020 | For the Year Ended December 31, 2019 | For the Year Ended December 31, 2018 | For the Year Ended December 31, 2017 | |||||||||||||||||||
Net asset value, beginning of year | $ | 13.18 | $ | 12.57 | $ | 11.00 | $ | 11.90 | $ | 10.52 | |||||||||||||
Income from investment operations: | |||||||||||||||||||||||
Net investment income (a,b) | 0.11 | 0.12 | 0.17 | 0.16 | 0.12 | ||||||||||||||||||
Net realized and unrealized gain (loss) (c) | 1.46 | 0.86 | 1.58 | (0.93 | ) | 1.40 | |||||||||||||||||
| Total income (loss) from investment operations | 1.57 | 0.98 | 1.75 | (0.77 | ) | 1.52 | |||||||||||||||||
Less distributions from: | |||||||||||||||||||||||
Net investment income | (0.13 | ) | (0.19 | ) | (0.18 | ) | (0.13 | ) | (0.14 | ) | |||||||||||||
Net realized gains | (0.11 | ) | (0.18 | ) | - | - | - | ||||||||||||||||
| Total distributions from net investment income and net realized gains | (0.24 | ) | (0.37 | ) | (0.18 | ) | (0.13 | ) | (0.14 | ) | |||||||||||||
Net asset value, end of year | $ | 14.51 | $ | 13.18 | $ | 12.57 | $ | 11.00 | $ | 11.90 | |||||||||||||
Total return (d) | 11.91 | % | 8.08 | % | 15.94 | % | (6.50 | )% | 14.47 | % | |||||||||||||
Ratios and Supplemental Data: | |||||||||||||||||||||||
Net assets, end of year (in 000's) | $ | 141,182 | $ | 141,186 | $ | 143,221 | $ | 135,945 | $ | 153,178 | |||||||||||||
| Ratio of net expenses to average net assets (e) | 0.90 | % | 0.91 | % | 0.91 | % | 0.91 | % (f) | 0.91 | % | |||||||||||||
| Ratio of gross expenses to average net assets (e) | 0.90 | % | 0.91 | % (g) | 0.91 | % (g) | 0.89 | % | 0.91 | % (g) | |||||||||||||
| Ratio of net investment income to average net assets (b,e) | 0.78 | % | 0.94 | % | 1.46 | % | 1.35 | % | 1.09 | % | |||||||||||||
Portfolio turnover rate | 44 | % | 110 | % | 91 | % | 65 | % | 52 | % | |||||||||||||
(a) Net investment income has been calculated using the average shares method, which more appropriately presents the per share data for the period.
(b) Recognition of net investment income by the Portfolio is affected by the timing of the declaration of dividends by the underlying investment companies in which the Portfolio invests.
(c) Realized and unrealized gain (loss) per share are balancing amounts necessary to reconcile the change in net asset value per share for the period, and may not reconcile with aggregate gains and losses in the statement of operations due to timing of share transactions.
(d) Total returns are historical and assume changes in share price and reinvestment of dividends and capital gains distributions. Total return does not reflect the deduction of taxes that a shareholder may pay on Portfolio distributions or on the redemption of Portfolio shares, as well as other charges and expenses of the insurance contract or separate account. Total returns would have been lower absent fee waivers by the Adviser.
(e) Does not include the expenses of the investment companies in which the Portfolio invests.
(f) Represents the ratio of expenses to average net assets inclusive of the Adviser's recapture of waived/reimbursed fees from prior periods.
(g) Represents the ratio of expenses to average net assets absent fee waivers and/or expense reimbursements by the Adviser.
See accompanying notes to financial statements.
74
Global Atlantic Portfolios
Financial Highlights
Global Atlantic Select Advisor Managed Risk Portfolio
Selected data for a Class II share outstanding throughout each year
| For the Year Ended December 31, 2021 | For the Year Ended December 31, 2020 | For the Year Ended December 31, 2019 | For the Year Ended December 31, 2018 | For the Year Ended December 31, 2017 | |||||||||||||||||||
Net asset value, beginning of year | $ | 13.38 | $ | 13.23 | $ | 11.53 | $ | 12.55 | $ | 11.04 | |||||||||||||
Income from investment operations: | |||||||||||||||||||||||
Net investment income (a,b) | 0.13 | 0.16 | 0.21 | 0.13 | 0.11 | ||||||||||||||||||
Net realized and unrealized gain (loss) (c) | 1.64 | 0.65 | 2.05 | (0.87 | ) | 1.55 | |||||||||||||||||
| Total income (loss) from investment operations | 1.77 | 0.81 | 2.26 | (0.74 | ) | 1.66 | |||||||||||||||||
Less distributions from: | |||||||||||||||||||||||
Net investment income | (0.18 | ) | (0.24 | ) | (0.15 | ) | (0.12 | ) | (0.15 | ) | |||||||||||||
Net realized gains | (0.49 | ) | (0.42 | ) | (0.41 | ) | (0.16 | ) | - | ||||||||||||||
| Total distributions from net investment income and net realized gains | (0.67 | ) | (0.66 | ) | (0.56 | ) | (0.28 | ) | (0.15 | ) | |||||||||||||
Net asset value, end of year | $ | 14.48 | $ | 13.38 | $ | 13.23 | $ | 11.53 | $ | 12.55 | |||||||||||||
Total return (d) | 13.31 | % | 6.61 | % | 19.96 | % | (5.99 | )% | 15.06 | % | |||||||||||||
Ratios and Supplemental Data: | |||||||||||||||||||||||
Net assets, end of year (in 000's) | $ | 105,532 | $ | 108,112 | $ | 114,371 | $ | 107,874 | $ | 119,955 | |||||||||||||
| Ratio of net expenses to average net assets (e) | 0.64 | % | 0.64 | % | 0.64 | % | 0.63 | % | 0.63 | % | |||||||||||||
| Ratio of gross expenses to average net assets (e,f) | 1.25 | % | 1.26 | % | 1.27 | % | 1.24 | % | 1.26 | % | |||||||||||||
| Ratio of net investment income to average net assets (b,e) | 0.90 | % | 1.24 | % | 1.68 | % | 1.07 | % | 0.95 | % | |||||||||||||
Portfolio turnover rate | 17 | % | 54 | % | 22 | % | 32 | % | 36 | % | |||||||||||||
(a) Net investment income has been calculated using the average shares method, which more appropriately presents the per share data for the period.
(b) Recognition of net investment income by the Portfolio is affected by the timing of the declaration of dividends by the underlying investment companies in which the Portfolio invests.
(c) Realized and unrealized gain (loss) per share are balancing amounts necessary to reconcile the change in net asset value per share for the period, and may not reconcile with aggregate gains and losses in the statement of operations due to timing of share transactions.
(d) Total returns are historical and assume changes in share price and reinvestment of dividends and capital gains distributions. Total return does not reflect the deduction of taxes that a shareholder may pay on Portfolio distributions or on the redemption of Portfolio shares, as well as other charges and expenses of the insurance contract or separate account. Total returns would have been lower absent fee waivers by the Adviser.
(e) Does not include the expenses of the investment companies in which the Portfolio invests.
(f) Represents the ratio of expenses to average net assets absent fee waivers and/or expense reimbursements by the Adviser.
See accompanying notes to financial statements.
75
Global Atlantic Portfolios
Financial Highlights
Global Atlantic Wellington Research Managed Risk Portfolio
Selected data for a Class II share outstanding throughout each year
| For the Year Ended December 31, 2021 | For the Year Ended December 31, 2020 | For the Year Ended December 31, 2019 | For the Year Ended December 31, 2018 | For the Year Ended December 31, 2017 | |||||||||||||||||||
Net asset value, beginning of year | $ | 15.23 | $ | 14.00 | $ | 12.38 | $ | 13.40 | $ | 11.82 | |||||||||||||
Income from investment operations: | |||||||||||||||||||||||
Net investment income (a,b) | 0.01 | 0.08 | 0.13 | 0.12 | 0.09 | ||||||||||||||||||
Net realized and unrealized gain (loss) (c) | 1.86 | 1.46 | 2.23 | (0.79 | ) | 1.56 | |||||||||||||||||
| Total income (loss) from investment operations | 1.87 | 1.54 | 2.36 | (0.67 | ) | 1.65 | |||||||||||||||||
Less distributions from: | |||||||||||||||||||||||
Net investment income | (0.09 | ) | (0.14 | ) | (0.13 | ) | (0.09 | ) | (0.07 | ) | |||||||||||||
Net realized gains | (0.56 | ) | (0.17 | ) | (0.61 | ) | (0.26 | ) | - | ||||||||||||||
| Total distributions from net investment income and net realized gains | (0.65 | ) | (0.31 | ) | (0.74 | ) | (0.35 | ) | (0.07 | ) | |||||||||||||
Net asset value, end of year | $ | 16.45 | $ | 15.23 | $ | 14.00 | $ | 12.38 | $ | 13.40 | |||||||||||||
Total return (d) | 12.38 | % | 11.16 | % | 19.32 | % | (5.07 | )% | 13.99 | % | |||||||||||||
Ratios and Supplemental Data: | |||||||||||||||||||||||
Net assets, end of year (in 000's) | $ | 485,474 | $ | 455,842 | $ | 448,554 | $ | 414,731 | $ | 478,812 | |||||||||||||
| Ratio of net expenses to average net assets (e) | 1.20 | % | 1.21 | % | 1.20 | % | 1.20 | % (f) | 1.20 | % | |||||||||||||
| Ratio of gross expenses to average net assets (e) | 1.20 | % | 1.22 | % (g) | 1.21 | % (g) | 1.19 | % | 1.21 | % (g) | |||||||||||||
| Ratio of net investment income to average net assets (b,e) | 0.09 | % | 0.54 | % | 0.93 | % | 0.89 | % | 0.68 | % | |||||||||||||
Portfolio turnover rate | 91 | % (h,i) | 85 | % (h) | 53 | % (h) | 66 | % (h) | 67 | % (h) | |||||||||||||
(a) Net investment income has been calculated using the average shares method, which more appropriately presents the per share data for the period.
(b) Recognition of net investment income by the Portfolio is affected by the timing of the declaration of dividends by the underlying investment companies in which the Portfolio invests.
(c) Realized and unrealized gain (loss) per share are balancing amounts necessary to reconcile the change in net asset value per share for the period, and may not reconcile with aggregate gains and losses in the statement of operations due to timing of share transactions.
(d) Total returns are historical and assume changes in share price and reinvestment of dividends and capital gains distributions. Total return does not reflect the deduction of taxes that a shareholder may pay on Portfolio distributions or on the redemption of Portfolio shares, as well as other charges and expenses of the insurance contract or separate account. Total returns would have been lower absent fee waivers by the Adviser.
(e) Does not include the expenses of the investment companies in which the Portfolio invests.
(f) Represents the ratio of expenses to average net assets inclusive of the Adviser's recapture of waived/reimbursed fees from prior periods.
(g) Represents the ratio of expenses to average net assets absent fee waivers and/or expense reimbursements by the Adviser.
(h) The portfolio turnover rates excludes mortgage dollar roll transactions for the years ended December 31, 2021, December 31, 2020, December 31, 2019, December 31, 2018 and December 31, 2017. If these were included in the calculation the turnover percentage would be 162%, 116%, 70%, 92%, and 106%, respectively.
(i) During the year ended December 31, 2021, the Portfolio engaged in security transactions associated with the transition of assets from Global Atlantic PIMCO Tactical Allocation Portfolio, which merged into the Portfolio on August 20, 2021. Certain security transactions were excluded from the portfolio turnover rate calculation. If these transactions were included, portfolio turnover would have been higher.
See accompanying notes to financial statements.
76
Global Atlantic Portfolios
Notes to Financial Statements
December 31, 2021
1. ORGANIZATION
As of December 31, 2021, the Global Atlantic Portfolios were comprised of sixteen different actively managed portfolios, eight of which are discussed in this report (each, a "Portfolio" and collectively, the "Portfolios"). Each Portfolio is a series of shares of beneficial interest of Forethought Variable Insurance Trust (the "Trust"), a statutory trust organized under the laws of the State of Delaware, and registered under the Investment Company Act of 1940, as amended (the "1940 Act"), as an open-end management investment company.
Portfolio | Commencement Date | Investment Objective | |||||||||
| Global Atlantic American Funds® Managed Risk Portfolio | October 31, 2013 | Capital appreciation and income while seeking to manage volatility. | |||||||||
| Global Atlantic Balanced Managed Risk Portfolio | October 31, 2013 | Capital appreciation and income while seeking to manage volatility. | |||||||||
Global Atlantic BlackRock Selects Managed Risk Portfolio | October 31, 2013 | Capital appreciation and income while seeking to manage volatility. | |||||||||
| Global Atlantic Franklin Dividend and Income Managed Risk Portfolio | April 30, 2014 | Capital appreciation and income while seeking to manage volatility. | |||||||||
| Global Atlantic Growth Managed Risk Portfolio | April 30, 2014 | Capital appreciation and income while seeking to manage volatility. | |||||||||
Global Atlantic Moderate Growth Managed Risk Portfolio | April 30, 2014 | Capital appreciation and income while seeking to manage volatility. | |||||||||
Global Atlantic Select Advisor Managed Risk Portfolio | October 31, 2013 | Capital appreciation and income while seeking to manage volatility. | |||||||||
Global Atlantic Wellington Research Managed Risk Portfolio | October 31, 2013 | Capital appreciation and income while seeking to manage volatility. | |||||||||
Each Portfolio is diversified. Certain of the Portfolios operate as "fund of funds." A "fund of funds" typically invests in multiple underlying funds and the level of its interest in any particular underlying fund may fluctuate. The Portfolios are intended to be funding vehicles for variable annuity contracts offered by the separate accounts of Forethought Life Insurance Company. The assets of each Portfolio are segregated and a shareholder's interest is limited to the Portfolio in which shares are held. Each Portfolio pays its own expenses.
As of December 31, 2021, the Portfolios offered Class II shares at net asset value.
References herein to a Portfolio's investment in a particular instrument include direct investments and indirect investments through investment companies such as open-end funds (mutual funds), exchange-traded funds and closed-end funds, as applicable.
2. SIGNIFICANT ACCOUNTING POLICIES
The following is a summary of significant accounting policies followed by the Portfolios in preparation of their financial statements. The policies are in conformity with U.S. generally accepted accounting principles ("US GAAP"). The preparation of the financial statements requires management to make estimates and assumptions that affect the reported amounts of assets and liabilities and disclosure of contingent assets and liabilities at the date of the financial statements and the reported amounts of income and expenses for the period. Actual results could differ from those estimates. Each Portfolio is an investment company and accordingly follows the investment company accounting and reporting guidance of the Financial Accounting Standards Board ("FASB") Accounting Standard Codification Topic 946 "Financial Services – Investment Companies".
Securities Valuation – Securities listed on an exchange are valued at the last reported sale price at the close of the regular trading session of the primary exchange on the business day the value is being determined, or in the case of securities listed on NASDAQ at the NASDAQ Official Closing Price. In the absence of a sale such securities shall be valued at the mean between the current bid and ask prices on the day of valuation. Futures and future options are valued at the final settle price or, in the absence of a settle price, at the last sale price on the day of valuation. Debt securities are valued on the basis of
77
Global Atlantic Portfolios
Notes to Financial Statements (Continued)
December 31, 2021
valuations provided by dealers or by an independent pricing service which take into account appropriate factors such as trading activity, readily available market quotations (including broker quotes), yield, quality, coupon rate, maturity, type of issue, trading characteristic, call features, credit ratings and other data. Short-term debt obligations having 60 days or less remaining until maturity, at time of purchase, may be valued at amortized cost to the extent it is determined that amortized cost approximates fair value.
Valuation of Investment Companies – The Portfolios may invest in one or more portfolios of open-end investment companies (the "Underlying Fund" or "Underlying Funds"). Each Underlying Fund is valued at its respective net asset value as reported by such investment company (except exchange-traded funds ("ETFs")). ETFs are valued daily at the last sale price or official closing price on the principal exchange or system on which the investment is traded. Each Underlying Fund values securities in its portfolio for which market quotations are readily available at their market values (generally the last reported sale price) and all other securities and assets at their fair value based on the methods established by each Underlying Fund's board(s) of trustees.
Illiquid Investments – Pursuant to Rule 22e-4 under the 1940 Act, a Portfolio may not acquire any "illiquid investment" if, immediately after the acquisition, the Portfolio would have invested more than 15% of its net assets in illiquid investments that are assets. An "illiquid investment" is any investment that a Portfolio reasonably expects cannot be sold or disposed of in current market conditions in seven calendar days or less without the sale or disposition significantly changing the market value of the investment. The Trust has implemented a liquidity risk management program and related procedures to identify illiquid investments pursuant to Rule 22e-4, and the Board of Trustees ("Board") has approved the designation of the Adviser to administer the Trust's liquidity risk management program and related procedures. Illiquid investments include securities subject to contractual or legal restrictions on resale (e.g., because they have not been registered under the Securities Act of 1933) and securities that are otherwise not readily marketable (e.g., because trading in the security is suspended or because market makers do not exist or will not entertain bids or offers).
These investments will be valued at their fair market value as determined using the valuation procedures approved by the Board. The Board has delegated execution of these procedures to a Fair Value Committee composed of one or more of the following: (i) Chief Compliance Officer of the Trust, (ii) Principal Financial Officer, and (iii) representative of the Global Atlantic Investment Advisors, LLC (the "Adviser") and/or Sub-Adviser. The Fair Value Committee at its discretion may also include a representative from The Bank of New York Mellon (the "Administrator") and third party consultants or advisers (such as an accounting firm or fair value pricing specialist) on an as-needed basis to assist in determining a security-specific fair value or valuation method. The Board reviews and approves the execution of this process and the resultant fair value prices at least quarterly to assure the process produces reliable results.
Fair Value Committee and Valuation Process – The Fair Value Committee is composed of one or more of the following: (i) Chief Compliance Officer of the Trust, (ii) Principal Financial Officer, and (iii) representative of the Adviser and/or Sub- Adviser. The Fair Value Committee at its discretion may also include a representative from the Administrator and third party consultants or advisers (such as an accounting firm or fair value pricing specialist) on an as-needed basis to assist in determining a security-specific fair value or valuation method. The applicable investments are valued collectively via inputs from each of these groups. For example, fair value determinations are required for the following securities: (i) securities for which market quotations are not readily available on a particular business day (including without limitation securities for which there is a short and temporary lapse in the provision of a price by the regular pricing source); (ii) securities for which, in the opinion of the Adviser or relevant Sub-Adviser, the prices or values available do not represent the fair value of the instrument (factors which may cause the Adviser or Sub-Adviser to make such a judgment include, but are not limited to, the following: the availability of only a bid price or an ask price; the spread between bid and ask prices; the frequency of sales; the thinness of the market; the size of reported trades; and actions of the securities markets or regulators, such as the suspension or limitation of trading); (iii) securities determined to be illiquid; (iv) securities with respect to which an event that will affect the value thereof has occurred (a "significant event") subsequent to the determination of the closing price reported on the principal exchange on which the securities are traded, but prior to the relevant Portfolio's calculation of its net asset value ("NAV"); and (v) mutual funds that do not provide timely NAV information. Specifically, interests in commodity pools or managed futures pools are valued on a daily basis by reference to the closing market prices of each futures contract or other asset held by a pool, as adjusted for pool expenses. Restricted or illiquid securities, such as private placements or non-traded securities are valued via inputs from the Adviser or Sub-Adviser valuation based upon the current bid for the security from two or more independent dealers or other parties reasonably familiar with the facts and circumstances of the security (who
78
Global Atlantic Portfolios
Notes to Financial Statements (Continued)
December 31, 2021
should take into consideration all relevant factors as may be appropriate under the circumstances). If the Adviser or Sub- Adviser is unable to obtain a current bid from such independent dealers or other independent parties, the fair value team shall determine the fair value of restricted or illiquid securities using certain factors, such as, but not limited to: (i) the type of security; (ii) the cost at date of purchase; (iii) the size and nature of the Portfolio's holdings; (iv) the discount from market value of unrestricted securities of the same class at the time of purchase and subsequent thereto; (v) information as to any transactions or offers with respect to the security; (vi) the nature and duration of restrictions on disposition of the security and the existence of any registration rights, as well as any estimation of the cost of registration or otherwise qualifying the security for public sale, including commissions; (vii) how the yield of the security compares to similar securities of companies of similar or equal creditworthiness; (viii) the level of recent trades of similar or comparable securities; (ix) the liquidity characteristics of the security; (x) current market conditions; (xi) the market value of any securities into which the security is convertible or exchangeable; (xii) the security's embedded option values; and (xiii) information about the financial condition of the issuer and its prospects.
Each Portfolio utilizes various methods to measure the fair value of all of its investments on a recurring basis. US GAAP establishes a hierarchy that prioritizes inputs to valuation methods. The three levels of input are:
Level 1 – Unadjusted quoted prices in active markets for identical assets and liabilities that the Portfolio has the ability to access.
Level 2 – Observable inputs other than quoted prices included in Level 1 that are observable for the asset or liability, either directly or indirectly. These inputs may include quoted prices for the identical instrument in an inactive market, prices for similar instruments, interest rates, prepayment speeds, credit risk, yield curves, default rates and similar data.
Level 3 – Unobservable inputs for the asset or liability, to the extent relevant observable inputs are not available, representing the Portfolio's own assumptions about the assumptions a market participant would use in valuing the asset or liability, and would be based on the best information available.
The availability of observable inputs can vary from security to security and is affected by a wide variety of factors, including, for example, the type of security, whether the security is new and not yet established in the marketplace, the liquidity of markets, and other characteristics particular to the security. To the extent that valuation is based on models or inputs that are less observable or unobservable in the market, the determination of fair value requires more judgment. Accordingly, the degree of judgment exercised in determining fair value is greatest for instruments categorized in Level 3.
The inputs used to measure fair value may fall into different levels of the fair value hierarchy. In such cases, for disclosure purposes, the level in the fair value hierarchy within which the fair value measurement falls in its entirety is determined based on the lowest level input that is significant to the fair value measurement in its entirety.
The inputs or methodology used for valuing securities are not necessarily an indication of the risk associated with investing in those securities. The following tables summarize the inputs used as of December 31, 2021 for each Portfolio's investments measured at fair value:
Global Atlantic American Funds® Managed Risk Portfolio
Assets | Level 1 | Level 2 | Level 3 | Total | |||||||||||||||
Variable Insurance Trusts | $ | 223,670,668 | $ | - | $ | - | $ | 223,670,668 | |||||||||||
Short-Term Investments | 9,277,308 | - | - | 9,277,308 | |||||||||||||||
Total | $ | 232,947,976 | $ | - | $ | - | $ | 232,947,976 | |||||||||||
Global Atlantic Balanced Managed Risk Portfolio
Assets | Level 1 | Level 2 | Level 3 | Total | |||||||||||||||
Exchange Traded Funds | $ | 114,889,060 | $ | - | $ | - | $ | 114,889,060 | |||||||||||
Short-Term Investments | 4,561,198 | - | - | 4,561,198 | |||||||||||||||
Total | $ | 119,450,258 | $ | - | $ | - | $ | 119,450,258 | |||||||||||
79
Global Atlantic Portfolios
Notes to Financial Statements (Continued)
December 31, 2021
Global Atlantic BlackRock Selects Managed Risk Portfolio
Assets | Level 1 | Level 2 | Level 3 | Total | |||||||||||||||
Exchange Traded Funds | $ | 174,331,319 | $ | - | $ | - | $ | 174,331,319 | |||||||||||
Variable Insurance Trusts | 46,169,588 | - | - | 46,169,588 | |||||||||||||||
Short-Term Investments | 10,520,492 | - | - | 10,520,492 | |||||||||||||||
Total | $ | 231,021,399 | $ | - | $ | - | $ | 231,021,399 | |||||||||||
Global Atlantic Franklin Dividend and Income Managed Risk Portfolio
Assets | Level 1 | Level 2 | Level 3 | Total | |||||||||||||||
Common Stocks | $ | 204,423,883 | $ | 671 | $ | - | $ | 204,424,554 | |||||||||||
Corporate Bonds and Notes | - | 24,693,403 | - | 24,693,403 | |||||||||||||||
U.S. Treasury Securities | - | 16,246,792 | - | 16,246,792 | |||||||||||||||
Asset Backed and Commercial Backed Securities | - | 11,798,629 | - | 11,798,629 | |||||||||||||||
Agency Mortgage Backed Securities | - | 9,437,475 | - | 9,437,475 | |||||||||||||||
Exchange Traded Funds | 2,993,328 | - | - | 2,993,328 | |||||||||||||||
Sovereign Debts | - | 2,525,381 | - | 2,525,381 | |||||||||||||||
Municipal Bonds | - | 2,291,305 | - | 2,291,305 | |||||||||||||||
Term Loans | - | 2,355,569 | - | 2,355,569 | |||||||||||||||
Preferred Stocks | - | 2,979 | - | 2,979 | |||||||||||||||
Purchased Options | - | 6,894 | - | 6,894 | |||||||||||||||
Short-Term Investments | 16,587,567 | - | - | 16,587,567 | |||||||||||||||
Futures Contracts* | 60,256 | - | - | 60,256 | |||||||||||||||
Swap Contracts* | - | 12,380 | - | 12,380 | |||||||||||||||
Forward Foreign Currency Contracts | - | 21,067 | - | 21,067 | |||||||||||||||
Swaptions Written | - | 7,187 | - | 7,187 | |||||||||||||||
Total | $ | 224,065,034 | $ | 69,399,732 | $ | - | $ | 293,464,766 | |||||||||||
Liabilities | Level 1 | Level 2 | Level 3 | Total | |||||||||||||||
Futures Contracts* | $ | 14,696 | $ | - | $ | - | $ | 14,696 | |||||||||||
Swap Contracts* | - | 14,897 | - | 14,897 | |||||||||||||||
Forward Foreign Currency Contracts | - | 52,545 | - | 52,545 | |||||||||||||||
Swaptions Purchased | - | 2,308 | - | 2,308 | |||||||||||||||
Total | $ | 14,696 | $ | 69,750 | $ | - | $ | 84,446 | |||||||||||
Global Atlantic Growth Managed Risk Portfolio
Assets | Level 1 | Level 2 | Level 3 | Total | |||||||||||||||
Exchange Traded Funds | $ | 399,716,284 | $ | - | $ | - | $ | 399,716,284 | |||||||||||
Short-Term Investments | 12,759,179 | - | - | 12,759,179 | |||||||||||||||
Total | $ | 412,475,463 | $ | - | $ | - | $ | 412,475,463 | |||||||||||
Liabilities | Level 1 | Level 2 | Level 3 | Total | |||||||||||||||
Futures Contracts* | $ | 1,003,482 | $ | - | $ | - | $ | 1,003,482 | |||||||||||
Total | $ | 1,003,482 | $ | - | $ | - | $ | 1,003,482 | |||||||||||
80
Global Atlantic Portfolios
Notes to Financial Statements (Continued)
December 31, 2021
Global Atlantic Moderate Growth Managed Risk Portfolio
Assets | Level 1 | Level 2 | Level 3 | Total | |||||||||||||||
Exchange Traded Funds | $ | 135,710,131 | $ | - | $ | - | $ | 135,710,131 | |||||||||||
Short-Term Investments | 5,302,531 | - | - | 5,302,531 | |||||||||||||||
Total | $ | 141,012,662 | $ | - | $ | - | $ | 141,012,662 | |||||||||||
Liabilities | Level 1 | Level 2 | Level 3 | Total | |||||||||||||||
Futures Contracts* | $ | 116,100 | $ | - | $ | - | $ | 116,100 | |||||||||||
Total | $ | 116,100 | $ | - | $ | - | $ | 116,100 | |||||||||||
Global Atlantic Select Advisor Managed Risk Portfolio
Assets | Level 1 | Level 2 | Level 3 | Total | |||||||||||||||
Variable Insurance Trusts | $ | 83,392,101 | $ | - | $ | - | $ | 83,392,101 | |||||||||||
Exchange Traded Funds | 18,062,445 | - | - | 18,062,445 | |||||||||||||||
Short-Term Investments | 4,055,071 | - | - | 4,055,071 | |||||||||||||||
Total | $ | 105,509,617 | $ | - | $ | - | $ | 105,509,617 | |||||||||||
Global Atlantic Wellington Research Managed Risk Portfolio
Assets | Level 1 | Level 2 | Level 3 | Total | |||||||||||||||
Common Stocks | $ | 303,081,597 | $ | - | $ | - | $ | 303,081,597 | |||||||||||
U.S. Treasury Securities | - | 53,190,913 | - | 53,190,913 | |||||||||||||||
Corporate Bonds & Notes | - | 50,515,587 | - | 50,515,587 | |||||||||||||||
Agency and Mortgage Backed Securities | - | 31,240,263 | - | 31,240,263 | |||||||||||||||
Asset Backed and Commercial Backed Securities | - | 21,264,692 | - | 21,264,692 | |||||||||||||||
Municipal Bonds | - | 3,570,397 | - | 3,570,397 | |||||||||||||||
Sovereign Debts | - | 1,344,636 | - | 1,344,636 | |||||||||||||||
Short-Term Investments | 47,819,879 | - | - | 47,819,879 | |||||||||||||||
Futures Contracts* | 17,375 | - | - | 17,375 | |||||||||||||||
Total | $ | 350,918,851 | $ | 161,126,488 | $ | - | $ | 512,045,339 | |||||||||||
Liabilities | Level 1 | Level 2 | Level 3 | Total | |||||||||||||||
Futures Contracts* | $ | 35,187 | $ | - | $ | - | $ | 35,187 | |||||||||||
Total | $ | 35,187 | $ | - | $ | - | $ | 35,187 | |||||||||||
* Net unrealized appreciation/(depreciation) as presented in the Portfolio of Investments.
The Portfolios did not hold any Level 3 securities during the year.
Security Transactions and Related Income – Security transactions are accounted for on a trade date basis. Interest income is recognized on an accrual basis. Discounts are accreted and premiums are amortized on securities over the lesser of the lives of the respective securities or to the call date, for any callable securities. Dividend income is recorded on the ex-dividend date. Realized gains or losses from sales of securities are determined by comparing the identified cost of the security lot sold with the net sales proceeds.
Dividends and Distributions to Shareholders – Dividends from net investment income and distributions from net realized capital gains, if any, are declared and paid annually. Dividends and distributions to shareholders are recorded on ex- date and are determined in accordance with Federal income tax regulations, which may differ from US GAAP. These "book/tax" differences are considered either temporary (e.g., deferred losses, capital loss carryforwards) or permanent in nature. To the extent these differences are permanent in nature, such amounts are reclassified within the composition of net assets based on their Federal tax-basis treatment; temporary differences do not require reclassification. These reclassifications have no effect on net assets, results from operations or net asset values per share of the Portfolios.
81
Global Atlantic Portfolios
Notes to Financial Statements (Continued)
December 31, 2021
Cash and Cash Equivalents – Cash and cash equivalents include cash and overnight investments in interest-bearing demand deposits with a financial institution with original maturities of three months or less. The Portfolios maintain deposits with a financial institution which are generally an amount that is in excess of federally insured limits. The Portfolios have not experienced any losses on their accounts.
Federal Income Tax – It is each Portfolio's policy to qualify as a regulated investment company by complying with the provisions of the Internal Revenue Code that are applicable to regulated investment companies and to distribute substantially all of their taxable income and net realized gains to shareholders. Therefore, no Federal income tax provision is required.
Each Portfolio will recognize the tax benefits of uncertain tax positions only where the position is "more likely than not" to be sustained assuming examination by tax authorities. Management has analyzed each Portfolio's tax positions, and has concluded that no liability for unrecognized tax benefits should be recorded related to uncertain tax positions taken in each Portfolio's 2019 and 2020 tax returns, or is expected to be taken in each Portfolio's December 31, 2021 tax return. Each Portfolio identified its major tax jurisdictions as U.S. Federal and foreign jurisdictions where the Portfolios make significant investments; however, the Portfolios are not aware of any tax positions for which it is reasonably possible that the total amounts of unrecognized tax benefits will change materially in the next twelve months.
Foreign Currency Translation – The accounting records of the Portfolios are maintained in U.S. dollars. Foreign currencies, as well as investment securities and other assets and liabilities denominated in foreign currencies, are translated into U.S. dollars using exchange rates deemed appropriate by the investment adviser. Purchases and sales of securities, income receipts and expense payments are translated into U.S. dollars on the respective dates of such transactions.
Net realized gains and losses on foreign currency transactions represent net gains and losses from currency realized between the trade and settlement dates on securities transactions and the difference between income accrued versus income received. The effects of changes in foreign currency exchange rates on investments in securities are included with the net realized and change in unrealized gain or loss on foreign currency translations.
Forward Foreign Currency Contracts – As foreign securities are purchased, a Portfolio may enter into forward currency contracts in order to hedge against foreign currency exchange rate risks. A forward involves an obligation to purchase or sell a specific currency at a future date, which may be any fixed number of days from the date of the contract agreed upon by the parties, at a price set at the time of the contract. The market value of the contract fluctuates with changes in currency exchange rates. The contract is marked-to-market daily and the change in market value is recorded by a Portfolio as an unrealized gain or loss. As foreign securities are sold, a portion of the contract is generally closed and a Portfolio records a realized gain or loss equal to the difference between the value of the contract at the time it was opened and the value at the time it was closed. Realized gains and losses from contract transactions are included as a component of net realized gains/(losses) from forward foreign currency contracts in the Statements of Operations.
For the year ended December 31, 2021, realized gains/(losses) and the change in unrealized appreciation/(depreciation) on forward foreign currency contracts subject to currency risk, as disclosed in the Statements of Operations, is as follows:
Realized Gain/(Loss) | Change in Unrealized Appreciation/(Depreciation) | ||||||||||
Global Atlantic Franklin Dividend and Income Managed Risk Portfolio | $ | (103,281 | ) | $ | 3,019 | ||||||
Options Transactions – Certain Portfolios are subject to equity price risk, interest rate risk and foreign currency risk in the normal course of pursuing their investment objectives and may purchase or sell options to help hedge against this risk.
A Portfolio may purchase and write (i.e., sell) put and call options. Such options may relate to particular securities or securities indices, including ETFs, and may or may not be listed on a domestic or foreign securities exchange and may or may not be issued by the Options Clearing Corporation. Options trading is a highly specialized activity that entails greater than ordinary investment risk. Options may be more volatile than the underlying instruments, and therefore, on a percentage basis, an investment in options may be subject to greater fluctuation than an investment in the underlying instruments themselves. A call option for a particular security gives the purchaser of the option, in return for a premium, the right, but not the obligation, to buy, and the writer (seller) the obligation to sell, the underlying security at the stated exercise price at any time prior to
82
Global Atlantic Portfolios
Notes to Financial Statements (Continued)
December 31, 2021
the expiration of the option for American options or only at expiration for European options, regardless of the market price of the security. The premium paid to the writer is in consideration for undertaking the obligation under the option contract. A put option for a particular security gives the purchaser the right, but not the obligation, to sell the security at the stated exercise price at any time prior to the expiration date of the option for American options or only at expiration for European options, regardless of the market price of the security.
Securities index options are put options and call options on various securities indices. In most respects, they are identical to listed options on common stocks. The primary difference between stock options and index options occurs when index options are exercised. In the case of stock options, the underlying security, common stock, is delivered. However, upon the exercise of an index option, settlement does not occur by delivery of the securities comprising the index. The option holder who exercises the index option receives an amount of cash if the closing level of the securities index upon which the option is based is greater than, in the case of a call, or less than, in the case of a put, the exercise price of the option. This amount of cash is equal to the difference between the closing price of the securities index and the exercise price of the option expressed in dollars times a specified multiple. A securities index fluctuates with changes in the market value of the securities included in the index.
The Portfolios may purchase and sell options on the same types of futures in which it may invest. Options on futures are similar to options on underlying instruments except that options on futures give the purchaser the right, but not the obligation, to buy in return for the premium paid, to assume a position in a futures contract (a long position if the option is a call and a short position if the option is a put), rather than to purchase or sell the futures contract, at a specified exercise price at any time during the period of the option. Upon exercise of the option, the delivery of the futures position by the writer of the option to the holder of the option will be accompanied by the delivery of the accumulated balance in the writer's futures margin account which represents the amount by which the market price of the futures contract, at exercise, exceeds (in the case of a call) or is less than (in the case of a put) the exercise price of the option on the futures contract. Purchasers of options who fail to exercise their options prior to the exercise date suffer a loss of the premium paid.
Futures Contracts – The Portfolios are subject to equity price risk in the normal course of pursuing their investment objectives. The Portfolios may sell futures contracts to hedge against market risk, foreign currency exchange rate risks, and to reduce return volatility. Futures are standardized, exchange-traded contracts that provide for the future sale by one party and purchase by another party of a specified amount of a specific financial instrument (e.g., units of a securities index) for a specified price, date, time and place designated at the time the contract is made. Brokerage fees are incurred when a futures contract is bought or sold and initial and variation margin deposits must be maintained. Entering into a contract to buy is commonly referred to as buying or purchasing a contract or holding a long position. Entering into a contract to sell is commonly referred to as selling a contract or holding a short position. The Portfolios may also buy or sell hedge instruments based on one or more market indices in an attempt to maintain the Portfolios' volatility at a targeted level. Initial margin deposits required upon entering into futures contracts are satisfied by the segregation of specific securities or cash as collateral for the account of the broker (the Portfolio's agent in acquiring the futures position). During the period the futures contracts are open, changes in the value of the contracts are recognized as unrealized gains or losses by "marking to market" on a daily basis to reflect the market value of the contracts at the end of each day's trading. Variation margin payments are received or made depending upon whether unrealized gains or losses are incurred. When the contracts are closed, a Portfolio recognizes a realized gain or loss equal to the difference between the proceeds from, or cost of, the closing transaction and the Portfolio's basis in the contract. If a Portfolio were unable to liquidate a futures contract and/or enter into an offsetting closing transaction, the Portfolio would continue to be subject to market risk with respect to the value of the contracts and continue to be required to maintain the margin deposits on the futures contracts. Each Portfolio segregates liquid securities having a value at least equal to the amount of the current obligation under any open futures contract. These amounts are disclosed on the Statements of Assets and Liabilities as Deposits with Brokers when applicable. Risks may exceed amounts recognized in the Statements of Assets and Liabilities. With futures, there is minimal counterparty credit risk to a Portfolio since futures are exchange traded and the exchange's clearinghouse, as counterparty to all exchange traded futures, guarantees the futures against default.
83
Global Atlantic Portfolios
Notes to Financial Statements (Continued)
December 31, 2021
For the year ended December 31, 2021, realized gains/(losses) and the change in unrealized appreciation/(depreciation) on futures contracts by risk type, as disclosed in the Statements of Operations, is as follows:
Risk Type | Realized Gain/(Loss) | Change in Unrealized Appreciation/(Depreciation) | |||||||||||||
Global Atlantic American Funds® Managed Risk Portfolio | Equity | $ | (947,305 | ) | $ | - | |||||||||
Global Atlantic Balanced Managed Risk Portfolio | Equity | (486,779 | ) | - | |||||||||||
Global Atlantic BlackRock Selects Managed Risk Portfolio | Equity | (1,298,299 | ) | - | |||||||||||
Global Atlantic Franklin Dividend and Income Managed Risk Portfolio | Interest Rate | (3,151,093 | ) | 28,786 | |||||||||||
Global Atlantic Growth Managed Risk Portfolio | Equity | (9,525,906 | ) | (1,003,482 | ) | ||||||||||
Global Atlantic Moderate Growth Managed Risk Portfolio | Equity | (1,629,986 | ) | (116,100 | ) | ||||||||||
Global Atlantic Select Advisor Managed Risk Portfolio | Equity | (832,716 | ) | - | |||||||||||
Global Atlantic Wellington Research Managed Risk Portfolio | Equity | (5,635,964 | ) | - | |||||||||||
Interest Rate | 226,072 | (14,249 | ) | ||||||||||||
Swap Agreements – Certain Portfolios are subject to equity price risk and/or interest rate risk in the normal course of pursuing their investment objectives. These Portfolios may enter into various swap transactions for investment purposes or to manage interest rate, equity, foreign exchange (currency), or credit risk. These are two-party contracts entered into primarily to exchange the returns (or differentials in rates of returns) earned or realized on particular pre-determined investments or instruments. In a standard over-the-counter ("OTC") swap, two parties agree to exchange the returns, differentials in rates of return or some other amount earned or realized on the "notional amount" (i.e., the return or increase in value of a particular dollar amount invested in a "basket" of securities, representing a particular index or industry sectors) of predetermined investments or instruments.
Certain Portfolios may enter into credit default swaps ("CDS"). CDS are two-party contracts that transfer credit exposure between the parties. One party (the "buyer") receives credit protection and the other party (the "seller") takes on credit risk. The buyer typically makes predetermined periodic payments to the seller in exchange for the seller's commitment to purchase the underlying reference obligation if a defined credit event occurs, such as a default, bankruptcy or failure to pay interest or principal on a reference debt instrument, with respect to a specified issuer or one of the reference issuers in a CDS portfolio. If the defined credit event occurs, the seller must pay the agreed-upon value of a reference obligation to the counterparty or perform pursuant to the agreement. The buyer must then surrender the reference obligation to the seller. As a seller of credit protection in a CDS, a Portfolio would be liable for the notional amount of the swap.
The swaps in which a Portfolio may invest may be centrally-cleared or bi-laterally traded. The gross returns to be exchanged or "swapped" between the parties are calculated with respect to a notional amount. Changes in the value of swap agreements are recognized as unrealized gains or losses in the Statements of Operations by "marking to market" on a daily basis to reflect the value of the swap agreement at the end of each trading day. Payments received or paid at the beginning of a swap agreement are reflected as such on the Statements of Assets and Liabilities and may be referred to as upfront payments. A Portfolio amortizes upfront payments and/or accrues for the fixed payment stream on swap agreements on a daily basis with the net amount recorded as a component of unrealized gain or loss on the Statements of Operations. Realized gains and losses from the decrease in notional value of the swap are recognized on trade date. A liquidation payment received or made at the termination of the swap agreement is recorded as a realized gain or loss on the Statements of Operations. A Portfolio segregates cash or liquid securities having a value at least equal to the amount of its current obligation under any swap transaction. Swap agreements involve, to varying degrees, lack of liquidity and elements of credit, market and counterparty risk in excess of amounts recognized on the Statements of Assets and Liabilities. Each Portfolio's maximum risk of loss from the counterparty credit risk is the discounted net value of the cash flow to be received from the counterparty over the contract's remaining life, to be the extent that amount is positive.
Swaps may involve greater risks than direct investments in securities because swaps may be leveraged and, when traded in the OTC markets, are subject to counterparty risk, credit risk and pricing risk, each of which individually and collectively, may have a considerable impact on the performance of a Portfolio. CDS in particular may involve greater risks than investing in a referenced instrument directly. Swaps, especially those that are not exchange-traded, may also be considered illiquid. It
84
Global Atlantic Portfolios
Notes to Financial Statements (Continued)
December 31, 2021
may not be possible for a Portfolio to liquidate a swap position at an advantageous time or price, which may result in significant losses. Although central clearing and exchange-trading of swaps may decrease counterparty risk and increase market liquidity, exchange-trading and clearing does not make the contracts risk free, but rather, the primary credit risk on such contracts is the creditworthiness of the clearing broker or the clearinghouse.
The Portfolios use cash and certain securities as collateral to swap agreements as indicated on the Portfolio of Investments and Statements of Assets and Liabilities. Such collateral is held for the benefit of the counterparty in a segregated account to prevent non-payment by the Portfolios. If the counterparty defaults, a Portfolio may seek return of this collateral and incur certain costs exercising their rights to the collateral.
For the year ended December 31, 2021, realized gains/(losses) and the change in unrealized appreciation/(depreciation) on swap agreements by risk type, as disclosed in the Statements of Operations, is as follows:
Risk Type | Realized Gain/(Loss) | Change in Unrealized Appreciation/(Depreciation) | |||||||||||||
Global Atlantic Franklin Dividend and Income Managed Risk Portfolio | Interest Rate | $ | 35,767 | $ | (6,646 | ) | |||||||||
Credit | 75,116 | 51,422 | |||||||||||||
Currency | 22,694 | 223,697 | |||||||||||||
For the year ended December 31, 2021, realized gains/(losses) and the change in unrealized appreciation/(depreciation) on swaptions, as disclosed in the Statements of Operations, is as follows:
Risk Type | Realized Gain/(Loss) | Change in Unrealized Appreciation/(Depreciation) | |||||||||||||
Global Atlantic Franklin Dividend and Income Managed Risk Portfolio | Interest Rate | $ | 30,884 | $ | 15,519 | ||||||||||
Offsetting of Financial Assets/Liabilities and Derivative Assets/Liabilities – The following tables present certain of the Portfolios' asset/liability derivatives available for offset under a master netting arrangement net of collateral pledged as of December 31, 2021.
Global Atlantic Franklin Dividend and Income Managed Risk Portfolio
| Gross Amounts of Recognized Assets (1) | Financial Instruments and Derivatives Available for Offset | Net Amount of Assets Presented in the Statements of Assets & Liabilities | Collateral Received (2) | Net Amount of Recognized Assets | Gross Amounts of Recognized Liabilities (1) | Financial Instruments and Derivatives Available for Offset | Net Amount of Liabilities Presented in the Statements of Assets & Liabilities | Collateral Pledged (2) | Net Amount of Recognized Liabilities | ||||||||||||||||||||||||||||||||||
Citibank NA | $ | 16,111 | $ | (13,558 | ) | $ | 2,553 | $ | - | $ | 2,553 | $ | 13,558 | $ | (13,558 | ) | $ | - | $ | - | $ | - | |||||||||||||||||||||
JP Morgan | 3,456 | (3,456 | ) | - | - | - | 3,647 | (3,456 | ) | 191 | (191 | ) | - | ||||||||||||||||||||||||||||||
| JP Morgan Chase Bank | 21,067 | (21,067 | ) | - | - | - | 52,545 | (21,067 | ) | 31,478 | (31,478 | ) | - | ||||||||||||||||||||||||||||||
| JP Morgan Securities LLC | 60,256 | (14,696 | ) | 45,560 | - | 45,560 | 14,696 | (14,696 | ) | - | - | - | |||||||||||||||||||||||||||||||
Total | $ | 100,890 | $ | (52,777 | ) | $ | 48,113 | $ | - | $ | 48,113 | $ | 84,446 | $ | (52,777 | ) | $ | 31,669 | $ | (31,669 | ) | $ | - | ||||||||||||||||||||
85
Global Atlantic Portfolios
Notes to Financial Statements (Continued)
December 31, 2021
Global Atlantic Growth Managed Risk Portfolio
| Gross Amounts of Recognized Assets (1) | Financial Instruments and Derivatives Available for Offset | Net Amount of Assets Presented in the Statements of Assets & Liabilities | Collateral Received (2) | Net Amount of Recognized Assets | Gross Amounts of Recognized Liabilities (1) | Financial Instruments and Derivatives Available for Offset | Net Amount of Liabilities Presented in the Statements of Assets & Liabilities | Collateral Pledged (2) | Net Amount of Recognized Liabilities | ||||||||||||||||||||||||||||||||||
| Goldman Sachs & Co. | $ | - | $ | - | $ | - | $ | - | $ | - | $ | 1,003,482 | $ | - | $ | 1,003,482 | $ | (1,003,482 | ) | $ | - | ||||||||||||||||||||||
Total | $ | - | $ | - | $ | - | $ | - | $ | - | $ | 1,003,482 | $ | - | $ | 1,003,482 | $ | (1,003,482 | ) | $ | - | ||||||||||||||||||||||
Global Atlantic Moderate Growth Managed Risk Portfolio
| Gross Amounts of Recognized Assets (1) | Financial Instruments and Derivatives Available for Offset | Net Amount of Assets Presented in the Statements of Assets & Liabilities | Collateral Received (2) | Net Amount of Recognized Assets | Gross Amounts of Recognized Liabilities (1) | Financial Instruments and Derivatives Available for Offset | Net Amount of Liabilities Presented in the Statements of Assets & Liabilities | Collateral Pledged (2) | Net Amount of Recognized Liabilities | ||||||||||||||||||||||||||||||||||
| Goldman Sachs & Co. | $ | - | $ | - | $ | - | $ | - | $ | - | $ | 116,100 | $ | - | $ | 116,100 | $ | (116,100 | ) | $ | - | ||||||||||||||||||||||
Total | $ | - | $ | - | $ | - | $ | - | $ | - | $ | 116,100 | $ | - | $ | 116,100 | $ | (116,100 | ) | $ | - | ||||||||||||||||||||||
Global Atlantic Wellington Research Managed Risk Portfolio
| Gross Amounts of Recognized Assets (1) | Financial Instruments and Derivatives Available for Offset | Net Amount of Assets Presented in the Statements of Assets & Liabilities | Collateral Received (2) | Net Amount of Recognized Assets | Gross Amounts of Recognized Liabilities (1) | Financial Instruments and Derivatives Available for Offset | Net Amount of Liabilities Presented in the Statements of Assets & Liabilities | Collateral Pledged (2) | Net Amount of Recognized Liabilities | ||||||||||||||||||||||||||||||||||
| JP Morgan Chase Bank | $ | 17,375 | $ | (17,375 | ) | $ | - | $ | - | $ | - | $ | 35,187 | $ | (17,375 | ) | $ | 17,812 | $ | (17,812 | ) | $ | - | ||||||||||||||||||||
Total | $ | 17,375 | $ | (17,375 | ) | $ | - | $ | - | $ | - | $ | 35,187 | $ | (17,375 | ) | $ | 17,812 | $ | (17,812 | ) | $ | - | ||||||||||||||||||||
(1) Gross unrealized appreciation/(depreciation) as presented in the Portfolio of Investments.
(2) The amount is limited to the net derivative balance and, accordingly, may not include collateral or excess collateral received or pledged.
86
Global Atlantic Portfolios
Notes to Financial Statements (Continued)
December 31, 2021
Impact of Derivatives on the Statements of Assets and Liabilities – The following table presents a summary of the location of derivative investments categorized by primary risk exposure on the Portfolios' Statements of Assets and Liabilities as of December 31, 2021:
Global Atlantic Franklin Dividend and Income Managed Risk Portfolio
Equity | Interest Rate Contracts | Credit Contracts | Currency Contracts | Total | |||||||||||||||||||
Assets | |||||||||||||||||||||||
| Unrealized appreciation on Futures Contracts | $ | - | $ | 45,560 | $ | - | $ | - | $ | 45,560 | |||||||||||||
| Unrealized appreciation on Swaptions | - | 4,879 | - | - | 4,879 | ||||||||||||||||||
| Unrealized appreciation on Forward Foreign Currency Contracts | - | - | - | 21,067 | 21,067 | ||||||||||||||||||
Liabilities | |||||||||||||||||||||||
| Unrealized depreciation on Swap Contracts | - | - | (2,517 | ) | - | (2,517 | ) | ||||||||||||||||
| Unrealized depreciation on Forward Foreign Currency Contracts | - | - | - | (52,545 | ) | (52,545 | ) | ||||||||||||||||
Total | $ | - | $ | 50,439 | $ | (2,517 | ) | $ | (31,478 | ) | $ | 16,444 | |||||||||||
Global Atlantic Growth Managed Risk Portfolio
Equity | Interest Rate Contracts | Credit Contracts | Currency Contracts | Total | |||||||||||||||||||
Liabilities | |||||||||||||||||||||||
| Unrealized depreciation on Futures Contracts | $ | (1,003,482 | ) | $ | - | $ | - | $ | - | $ | (1,003,482 | ) | |||||||||||
Total | $ | (1,003,482 | ) | $ | - | $ | - | $ | - | $ | (1,003,482 | ) | |||||||||||
Global Atlantic Moderate Growth Managed Risk Portfolio
Equity | Interest Rate Contracts | Credit Contracts | Currency Contracts | Total | |||||||||||||||||||
Liabilities | |||||||||||||||||||||||
| Unrealized depreciation on Futures Contracts | $ | (116,100 | ) | $ | - | $ | - | $ | - | $ | (116,100 | ) | |||||||||||
Total | $ | (116,100 | ) | $ | - | $ | - | $ | - | $ | (116,100 | ) | |||||||||||
Global Atlantic Wellington Research Managed Risk Portfolio
Equity | Interest Rate Contracts | Credit Contracts | Currency Contracts | Total | |||||||||||||||||||
Liabilities | |||||||||||||||||||||||
| Unrealized depreciation on Futures Contracts | $ | - | $ | (17,812 | ) | $ | - | $ | - | $ | (17,812 | ) | |||||||||||
Total | $ | - | $ | (17,812 | ) | $ | - | $ | - | $ | (17,812 | ) | |||||||||||
87
Global Atlantic Portfolios
Notes to Financial Statements (Continued)
December 31, 2021
The notional value of the derivative instruments outstanding as of December 31, 2021, as disclosed in the Portfolios of Investments, and the amounts of realized and changes in unrealized gains and losses on derivative instruments during the year as disclosed above and within in the Statements of Operations serve as indicators of the volume of derivative activity for the Portfolios.
Short Sales – A Portfolio may make short sales of securities: (i) to offset potential declines in long positions in similar securities; (ii) to increase the flexibility of the Portfolio; (iii) for investment return; (iv) as part of a risk arbitrage strategy; and (v) as part of its overall portfolio management strategies involving the use of derivative instruments. A short sale is a transaction in which a Portfolio sells a security it does not own or have the right to acquire (or that it owns but does not wish to deliver) in anticipation that the market price of that security will decline.
When a Portfolio makes a short sale, the broker-dealer through which the short sale is made must borrow the security sold short and deliver it to the party purchasing the security. The Portfolio is required to make a margin deposit in connection with such short sales; the Portfolio may have to pay a fee to borrow particular securities and will often be obligated to pay over any dividends and accrued interest on borrowed securities.
If the price of the security sold short increases between the time of the short sale and the time a Portfolio covers its short position, the Portfolio will incur a loss; conversely, if the price declines, the Portfolio will realize a capital gain. Any gain will be decreased, and any loss increased, by the transaction costs described above. The successful use of short selling may be adversely affected by imperfect correlation between movements in the price of the security sold short and the securities being hedged.
To the extent a Portfolio sells securities short, it will provide collateral to the broker-dealer and (except in the case of short sales "against the box") will maintain additional asset coverage in the form of cash, U.S. government securities or other liquid securities with its custodian in a segregated account in an amount at least equal to the difference between the current market value of the securities sold short and any amounts required to be deposited as collateral with the selling broker (not including the proceeds of the short sale). A Portfolio does not intend to enter into short sales (other than short sales "against the box") if immediately after such sales the aggregate of the value of all collateral plus the amount in such segregated account exceeds 10% of the value of the Portfolio's net assets. This percentage may be varied by action of the Board of Trustees. A short sale is "against the box" to the extent a Portfolio contemporaneously owns, or has the right to obtain at no added cost, securities identical to those sold short. The SEC adopted a final rule related to the use of derivatives, reverse repurchase agreements and certain other transactions, which may include short sales in some cases, by registered investment companies that will rescind and withdraw the guidance of the SEC and its staff regarding asset segregation and coverage transactions.
When-Issued and Delayed-Delivery Transactions – The Portfolios may engage in when-issued or delayed-delivery transactions. The Portfolios record when-issued securities on the trade date and maintain security positions such that sufficient liquid assets will be available to make payment for the securities purchased. Securities purchased on a when-issued or delayed-delivery basis are marked to market daily and begin earning interest on the settlement date. Losses may occur on these transactions due to changes in market conditions or the failure of counterparties to perform under the contract.
Real Estate Investment Trusts – Certain Portfolios may invest in real estate investment trusts ("REITs"). REITs are pooled investment vehicles that own, and typically operate, income-producing real estate. If a REIT meets certain requirements, including distributing to shareholders substantially all of its taxable income (other than net capital gains), then it is not taxed on the income distributed to shareholders. REITs are subject to management fees and other expenses, and so a Portfolio that invests in REITs will bear its proportionate share of the costs of the REITs' operations. Along with the risks common to different types of real estate-related securities, such as loss to casualty or condemnation, increases in property taxes and operating expenses, zoning law amendments, changes in interest rates, overbuilding and increased competition, variations in market value, and possible environmental liabilities, REITs involve additional risk factors. These include poor performance by the REIT's manager, changes to the tax laws, and failure by the REIT to qualify for tax free distribution of income or exemption under the 1940 Act. In addition, REITs are not diversified and are heavily dependent on cash flow.
Distributions from a Portfolio's investments in REITs may be characterized as ordinary income, a net capital gain or a return of capital. The Portfolios record distributions that represent a net capital gain as a realized gain and distributions that represent a return of capital as a reduction of the cost of investment. REITs report information on the source of their distributions
88
Global Atlantic Portfolios
Notes to Financial Statements (Continued)
December 31, 2021
annually in the following calendar year. As a result, a Portfolio may estimate the source of REIT distributions for accounting purposes and then makes adjustments when the actual source information is reported by the REIT. These estimates are based on the most recent REIT distribution information available.
Mortgage Dollar Roll Transactions – A mortgage dollar roll transaction involves a sale by a Portfolio of mortgage related securities that it holds with an agreement by the Portfolio to repurchase similar securities at an agreed upon price and date. The securities purchased will bear the same interest rate as those sold, but generally will be collateralized by pools of mortgages with different prepayment histories than those securities sold. The Portfolios account for mortgage dollar rolls as purchases and sales transactions.
Expenses – Expenses of the Trust that are directly identifiable to a specific Portfolio are charged to that Portfolio. Expenses, which are not readily identifiable to a specific Portfolio, are allocated in such a manner as deemed equitable, taking into consideration the nature and type of expense and the relative sizes of the Portfolios in the Trust.
Indemnification – The Trust indemnifies its officers and Trustees for certain liabilities that may arise from the performance of their duties to the Trust. Additionally, in the normal course of business, the Portfolios enter into contracts that contain a variety of representations and warranties and which provide general indemnities. Each Portfolio's maximum exposure under these arrangements is unknown, as this would involve future claims that may be made against the Portfolios that have not yet occurred. However, the Portfolios expect the risk of loss due to these warranties and indemnities to be remote.
3. INVESTMENT TRANSACTIONS
For the year ended December 31, 2021, cost of purchases and proceeds from sales of portfolio securities, other than short- term investments, were as follows:
Purchases | Sales | ||||||||||
Global Atlantic American Funds® Managed Risk Portfolio | $ | 40,669,134 | $ | 54,063,256 | |||||||
Global Atlantic Balanced Managed Risk Portfolio | 75,940,566 | 78,821,696 | |||||||||
Global Atlantic BlackRock Selects Managed Risk Portfolio | 213,127,775 | 237,257,311 | |||||||||
Global Atlantic Franklin Dividend and Income Managed Risk Portfolio | 159,417,647 | 196,572,785 | |||||||||
Global Atlantic Growth Managed Risk Portfolio | 128,607,332 | 187,500,641 | |||||||||
Global Atlantic Moderate Growth Managed Risk Portfolio | 59,423,797 | 74,961,176 | |||||||||
Global Atlantic Select Advisor Managed Risk Portfolio | 17,519,613 | 28,410,732 | |||||||||
Global Atlantic Wellington Research Managed Risk Portfolio | 723,392,370 | 771,820,504 | |||||||||
4. AGREEMENTS AND TRANSACTIONS WITH RELATED PARTIES
The Adviser serves as the Portfolios' investment adviser. The Adviser has engaged the following sub-advisers for the Portfolios:
Portfolio | Sub-Adviser | ||||||
Global Atlantic American Funds® Managed Risk Portfolio | Wilshire Advisors, LLC* Milliman Financial Risk Management, LLC | ||||||
Global Atlantic Balanced Managed Risk Portfolio | BlackRock Investment Management, LLC** Milliman Financial Risk Management, LLC | ||||||
Global Atlantic BlackRock Selects Managed Risk Portfolio | BlackRock Investment Management, LLC Milliman Financial Risk Management, LLC | ||||||
Global Atlantic Franklin Dividend and Income Managed Risk Portfolio | Franklin Advisers, Inc. Milliman Financial Risk Management, LLC | ||||||
89
Global Atlantic Portfolios
Notes to Financial Statements (Continued)
December 31, 2021
Portfolio | Sub-Adviser | ||||||
Global Atlantic Growth Managed Risk Portfolio | BlackRock Investment Management, LLC** Milliman Financial Risk Management, LLC | ||||||
Global Atlantic Moderate Growth Managed Risk Portfolio | BlackRock Investment Management, LLC** Milliman Financial Risk Management, LLC | ||||||
Global Atlantic Select Advisor Managed Risk Portfolio | Wilshire Advisors, LLC* Milliman Financial Risk Management, LLC | ||||||
Global Atlantic Wellington Research Managed Risk Portfolio | Wellington Management Company LLP Milliman Financial Risk Management, LLC | ||||||
* Formerly Wilshire Associates Incorporated
** Changed from BlackRock Financial Management, Inc., effective May 1, 2021
The Bank of New York Mellon serves as the Administrator, Fund Accountant and Custodian for the Portfolios and BNY Mellon Investment Servicing (US) Inc. (together with The Bank of New York Mellon, "BNYM") serves as the Transfer Agent for the Portfolios.
Pursuant to an Investment Advisory Agreement with the Trust, on behalf of the Portfolios, the Adviser, under the oversight of the Board, directs the daily investment operations of the Portfolios and supervises the performance of administrative and professional services provided by others. As compensation for its services and the related expenses borne by the Adviser, the Portfolios pay the Adviser an advisory fee, computed on average daily net assets and accrued daily and paid monthly.
The following chart details the annual advisory fee for each Portfolio for the year ended December 31, 2021.
Portfolio | Advisory Fee* | ||||||
Global Atlantic American Funds® Managed Risk Portfolio | 0.900% on first $500 million | ||||||
0.875% on next $500 million | |||||||
| 0.850% over $1 billion | |||||||
Global Atlantic Balanced Managed Risk Portfolio | 0.550% on first $500 million | ||||||
0.525% on next $500 million | |||||||
| 0.500% over $1 billion | |||||||
Global Atlantic BlackRock Selects Managed Risk Portfolio | 0.550% on first $500 million | ||||||
0.525% on next $500 million | |||||||
| 0.500% over $1 billion | |||||||
Global Atlantic Franklin Dividend and Income Managed Risk Portfolio | 0.850% on first $500 million | ||||||
0.825% on next $500 million | |||||||
| 0.800% over $1 billion | |||||||
Global Atlantic Growth Managed Risk Portfolio | 0.550% on first $500 million | ||||||
0.525% on next $500 million | |||||||
| 0.500% over $1 billion | |||||||
Global Atlantic Moderate Growth Managed Risk Portfolio | 0.550% on first $500 million | ||||||
0.525% on next $500 million | |||||||
| 0.500% over $1 billion | |||||||
Global Atlantic Select Advisor Managed Risk Portfolio | 0.900% on first $500 million | ||||||
0.875% on next $500 million | |||||||
| 0.850% over $1 billion | |||||||
Global Atlantic Wellington Research Managed Risk Portfolio | 0.850% on first $500 million | ||||||
0.825% on next $500 million | |||||||
| 0.800% over $1 billion | |||||||
* Calculated daily based on the average daily net assets.
90
Global Atlantic Portfolios
Notes to Financial Statements (Continued)
December 31, 2021
During the year ended December 31, 2021, with respect to each Portfolio, the Adviser contractually agreed to waive its fees and to reimburse expenses, at least until the expiration dates listed below, to ensure that total annual portfolio operating expenses after fee waiver and/or reimbursement (exclusive of any front-end or contingent deferred loads, brokerage fees and commissions, acquired fund fees and expenses, borrowing costs (such as interest and dividend expense on securities sold short), taxes and extraordinary expenses, such as litigation) will not exceed the average daily net asset percentages attributable to the Portfolio's shares listed below ("Waiver Agreements"). The expense reimbursement is subject to possible recoupment from the Portfolio in future years on a rolling three year basis (within the three years after the fees have been waived or reimbursed) if such recoupment can be achieved within the lesser of the expense limits listed below and any expense limits applicable at the time of recoupment. The agreements may be terminated only by the Portfolio's Board of Trustees, on 60 days' written notice to the Adviser.
Portfolio | Operating Expense Limitation | Expiration Date | |||||||||
Global Atlantic American Funds® Managed Risk Portfolio | 0.87 | % | May 1, 2022 | ||||||||
Global Atlantic Balanced Managed Risk Portfolio | 0.92 | % | September 1, 2022 | ||||||||
Global Atlantic BlackRock Selects Managed Risk Portfolio | 0.94 | % | May 1, 2022 | ||||||||
Global Atlantic Franklin Dividend and Income Managed Risk Portfolio* | 1.19 | % | May 1, 2022 | ||||||||
Global Atlantic Growth Managed Risk Portfolio | 0.88 | % | May 1, 2022 | ||||||||
Global Atlantic Moderate Growth Managed Risk Portfolio | 0.92 | % | May 1, 2022 | ||||||||
Global Atlantic Select Advisor Managed Risk Portfolio | 0.64 | % | May 1, 2022 | ||||||||
Global Atlantic Wellington Research Managed Risk Portfolio** | 1.19 | %*** | September 1, 2022 | ||||||||
* Prior to May 1, 2021, the Expense Limitation was 1.16%.
** Prior to August 20, 2021, the Expense Limitation was 1.21%.
*** The Portfolio is also subject to a Total Expense Limit of 1.20%, which includes Acquired Fund Fees and Expenses as defined in the Portfolio's prospectus, effective through August 31, 2022.
In addition, the Adviser has agreed to waive 0.40% of its fees for Global Atlantic American Funds® Managed Risk Portfolio and Global Atlantic Select Advisor Managed Risk Portfolio for as long as each Portfolio relies primarily on investments in underlying funds to achieve its principal investment strategy. These waivers are not subject to recoupment.
The Adviser or its affiliates may receive compensation from managers of underlying funds in which certain Portfolios invest. This compensation may create a conflict of interest for the Adviser in the selection of underlying funds for investment by the Portfolio. However, the Adviser will voluntarily reduce the amount of its compensation under its Advisory Agreement with the Portfolio by the amount of compensation received from managers of underlying funds. The minimum amount of this waiver, until at least April 30, 2022 for each Portfolio is based on estimated amounts expected to be received during the current fiscal year. The actual amount of each waiver may be higher to the extent the payments exceed the Adviser's estimates, but it will not be lower. These waivers are not subject to recoupment by the Adviser. The waivers may be terminated only by the Portfolio's Board of Trustees, on 60 days' written notice to the Adviser.
For the year ended December 31, 2021, the Adviser waived, reimbursed, or recaptured fees as follows:
| Investment Advisory Fee Waiver | Investment Advisory Fee Reimbursed* | Investment Advisory Fee Recaptured | Total | ||||||||||||||||
Global Atlantic American Funds® Managed Risk Portfolio | $ | 941,145 | $ | - | $ | - | $ | 941,145 | |||||||||||
Global Atlantic Balanced Managed Risk Portfolio | - | 68 | - | 68 | |||||||||||||||
Global Atlantic BlackRock Selects Managed Risk Portfolio | - | - | - | - | |||||||||||||||
| Global Atlantic Franklin Dividend and Income Managed Risk Portfolio | 61,783 | - | - | 61,783 | |||||||||||||||
Global Atlantic Growth Managed Risk Portfolio | 73,227 | - | - | 73,227 | |||||||||||||||
Global Atlantic Moderate Growth Managed Risk Portfolio | - | - | - | - | |||||||||||||||
Global Atlantic Select Advisor Managed Risk Portfolio | 659,283 | - | - | 659,283 | |||||||||||||||
Global Atlantic Wellington Research Managed Risk Portfolio | 8,719 | 171 | - | 8,890 | |||||||||||||||
* For additonal information on investment advisory fees reimbursed, please see Note 10, payments by affiliates.
91
Global Atlantic Portfolios
Notes to Financial Statements (Continued)
December 31, 2021
If the Adviser waives any fee or reimburses any expense pursuant to the Waiver Agreements, and the Portfolio's operating expenses are subsequently less than the expense limitation, the Adviser shall be entitled to reimbursement by the Portfolio for such waived fees or reimbursed expenses provided that such reimbursement does not cause the Portfolio's expenses to exceed the amount of the expense limitation. If Portfolio operating expenses subsequently exceed the expense limitation, the reimbursements shall be suspended.
The Adviser may recapture the following amounts by the following dates:
December 31, 2022 | December 31, 2023 | December 31, 2024 | |||||||||||||
Global Atlantic American Funds® Managed Risk Portfolio | $ | - | $ | - | $ | - | |||||||||
Global Atlantic Balanced Managed Risk Portfolio | - | - | - | ||||||||||||
Global Atlantic BlackRock Selects Managed Risk Portfolio | 35,171 | - | - | ||||||||||||
Global Atlantic Franklin Dividend and Income Managed Risk Portfolio | 143,809 | 156,982 | 61,783 | ||||||||||||
Global Atlantic Growth Managed Risk Portfolio | 76,229 | 118,163 | 73,227 | ||||||||||||
Global Atlantic Moderate Growth Managed Risk Portfolio | - | - | - | ||||||||||||
Global Atlantic Select Advisor Managed Risk Portfolio | 38,360 | 27,191 | 12,758 | ||||||||||||
Global Atlantic Wellington Research Managed Risk Portfolio | 13,260 | 31,810 | 8,719 | ||||||||||||
The following amounts expired unrecouped as of the date listed below:
December 31, 2021 | |||||||
Global Atlantic American Funds® Managed Risk Portfolio | $ | - | |||||
Global Atlantic Balanced Managed Risk Portfolio | - | ||||||
Global Atlantic BlackRock Selects Managed Risk Portfolio | 99,190 | ||||||
Global Atlantic Franklin Dividend and Income Managed Risk Portfolio | 105,768 | ||||||
Global Atlantic Growth Managed Risk Portfolio | - | ||||||
Global Atlantic Moderate Growth Managed Risk Portfolio | - | ||||||
Global Atlantic Select Advisor Managed Risk Portfolio | 15,417 | ||||||
Global Atlantic Wellington Research Managed Risk Portfolio | - | ||||||
The Trust, on behalf of the Portfolios, has adopted a distribution and shareholder servicing plan (the "Plan") pursuant to Rule 12b-1 under the 1940 Act for Class II shares. The fee charged under the Plan is calculated at an annual rate of 0.25% of the average daily net assets attributable to each Portfolio's Class II shares and, for the year ended December 31, 2021, was paid to Global Atlantic Distributors, LLC ("GAD") to provide compensation for ongoing distribution-related activities or services and/or maintenance of the Portfolios' shareholder accounts, not otherwise required to be provided by the Adviser. GAD is an affiliate of the Adviser.
For the year ended December 31, 2021, the Portfolios expensed the following distribution fees:
Fees Paid | |||||||
Global Atlantic American Funds® Managed Risk Portfolio | $ | 588,215 | |||||
Global Atlantic Balanced Managed Risk Portfolio | 241,438 | ||||||
Global Atlantic BlackRock Selects Managed Risk Portfolio | 601,509 | ||||||
Global Atlantic Franklin Dividend and Income Managed Risk Portfolio | 697,293 | ||||||
Global Atlantic Growth Managed Risk Portfolio | 1,048,367 | ||||||
Global Atlantic Moderate Growth Managed Risk Portfolio | 357,470 | ||||||
Global Atlantic Select Advisor Managed Risk Portfolio | 271,476 | ||||||
Global Atlantic Wellington Research Managed Risk Portfolio | 1,172,517 | ||||||
92
Global Atlantic Portfolios
Notes to Financial Statements (Continued)
December 31, 2021
For the year ended December 31, 2021, the Trustees received fees in the amounts as follows:
Fees Received | |||||||
Global Atlantic American Funds® Managed Risk Portfolio | $ | 20,039 | |||||
Global Atlantic Balanced Managed Risk Portfolio | 7,881 | ||||||
Global Atlantic BlackRock Selects Managed Risk Portfolio | 20,641 | ||||||
Global Atlantic Franklin Dividend and Income Managed Risk Portfolio | 23,630 | ||||||
Global Atlantic Growth Managed Risk Portfolio | 35,741 | ||||||
Global Atlantic Moderate Growth Managed Risk Portfolio | 12,179 | ||||||
Global Atlantic Select Advisor Managed Risk Portfolio | 9,307 | ||||||
Global Atlantic Wellington Research Managed Risk Portfolio | 39,739 | ||||||
5. CONTROL OWNERSHIP
The beneficial ownership, either directly or indirectly, of more than 25% of the voting securities of a Portfolio creates a presumption of the control of the Portfolio, under section 2(a)(9) of the 1940 Act. As of December 31, 2021, Forethought Life Insurance Company Separate Account A owned 100% of the voting securities of each Portfolio. The Trust has no knowledge as to whether all or any portion of the shares owned of record are also owned beneficially.
Shareholder Concentration Risk – Forethought Life Insurance Company, certain accounts, or the Adviser's affiliates may from time to time own (beneficially or of record) or control a significant percentage of a Portfolio's shares. Redemptions by these entities of their holdings in a Portfolio may impact the Portfolio's liquidity and NAV. These redemptions may also force a Portfolio to sell securities.
6. AGGREGATE UNREALIZED APPRECIATION AND DEPRECIATION – TAX BASIS
As of December 31, 2021, the aggregate cost of investments for federal income tax purposes, the gross unrealized appreciation and depreciation and the aggregated net unrealized appreciation (depreciation) on investments were as follows:
| Tax Cost | Gross Unrealized Appreciation | Gross Unrealized Depreciation | Net Unrealized Appreciation/ (Depreciation) | ||||||||||||||||
Global Atlantic American Funds® Managed Risk Portfolio | $ | 184,908,211 | $ | 54,214,262 | $ | (6,174,497 | ) | $ | 48,039,765 | ||||||||||
Global Atlantic Balanced Managed Risk Portfolio | 99,855,875 | 20,450,514 | (5,962,860 | ) | 14,487,654 | ||||||||||||||
Global Atlantic BlackRock Selects Managed Risk Portfolio | 197,998,846 | 37,416,979 | (4,394,426 | ) | 33,022,553 | ||||||||||||||
| Global Atlantic Franklin Dividend and Income Managed Risk Portfolio | 170,359,543 | 124,442,914 | (1,420,929 | ) | 123,021,985 | ||||||||||||||
Global Atlantic Growth Managed Risk Portfolio | 270,229,814 | 143,208,403 | (1,960,197 | ) | 141,248,206 | ||||||||||||||
Global Atlantic Moderate Growth Managed Risk Portfolio | 102,828,493 | 39,293,743 | (1,225,674 | ) | 38,068,069 | ||||||||||||||
Global Atlantic Select Advisor Managed Risk Portfolio | 80,056,818 | 26,519,071 | (1,066,272 | ) | 25,452,799 | ||||||||||||||
Global Atlantic Wellington Research Managed Risk Portfolio | 385,823,027 | 131,219,188 | (8,495,929 | ) | 122,723,259 | ||||||||||||||
93
Global Atlantic Portfolios
Notes to Financial Statements (Continued)
December 31, 2021
7. DISTRIBUTIONS TO SHAREHOLDERS AND TAX COMPONENTS OF CAPITAL
The tax character of fund distributions paid for the years ended December 31, 2021 and 2020 were as follows:
| For fiscal year ended 12/31/2021 | Ordinary Income | Long-Term Capital Gains | Return of Capital | Total | |||||||||||||||
Global Atlantic American Funds® Managed Risk Portfolio | $ | 2,588,253 | $ | - | $ | - | $ | 2,588,253 | |||||||||||
Global Atlantic Balanced Managed Risk Portfolio | 2,007,723 | 1,345,036 | - | 3,352,759 | |||||||||||||||
Global Atlantic BlackRock Selects Managed Risk Portfolio | 3,232,570 | - | - | 3,232,570 | |||||||||||||||
| Global Atlantic Franklin Dividend and Income Managed Risk Portfolio | 2,279,680 | - | - | 2,279,680 | |||||||||||||||
Global Atlantic Growth Managed Risk Portfolio | 3,307,515 | - | - | 3,307,515 | |||||||||||||||
Global Atlantic Moderate Growth Managed Risk Portfolio | 1,805,831 | 516,105 | - | 2,321,936 | |||||||||||||||
Global Atlantic Select Advisor Managed Risk Portfolio | 1,303,856 | 3,539,405 | - | 4,843,261 | |||||||||||||||
| Global Atlantic Wellington Research Managed Risk Portfolio | 4,391,614 | 14,674,109 | - | 19,065,723 | |||||||||||||||
For fiscal year ended 12/31/2020 | Ordinary Income | Long-Term Capital Gains | Return of Capital | Total | |||||||||||||||
Global Atlantic American Funds® Managed Risk Portfolio | $ | 3,161,617 | $ | 7,784,961 | $ | - | $ | 10,946,578 | |||||||||||
Global Atlantic Balanced Managed Risk Portfolio | 2,932,502 | - | - | 2,932,502 | |||||||||||||||
Global Atlantic BlackRock Selects Managed Risk Portfolio | 3,599,871 | - | - | 3,599,871 | |||||||||||||||
| Global Atlantic Franklin Dividend and Income Managed Risk Portfolio | 3,749,479 | - | - | 3,749,479 | |||||||||||||||
Global Atlantic Growth Managed Risk Portfolio | 5,912,075 | - | - | 5,912,075 | |||||||||||||||
Global Atlantic Moderate Growth Managed Risk Portfolio | 3,975,331 | - | - | 3,975,331 | |||||||||||||||
Global Atlantic Select Advisor Managed Risk Portfolio | 1,879,214 | 3,291,782 | - | 5,170,996 | |||||||||||||||
| Global Atlantic Wellington Research Managed Risk Portfolio | 4,701,709 | 4,458,988 | - | 9,160,697 | |||||||||||||||
As of December 31, 2021, the components of accumulated earnings/(deficit) on a tax basis were as follows:
| Undistributed Ordinary Income | Undistributed Long-Term Capital Gains | Post-October Loss and Late Year Loss | Capital Loss Carryforward | Unrealized Appreciation/ (Depreciation) | Total Accumulated Earnings/ (Defecits) | ||||||||||||||||||||||
| Global Atlantic American Funds® Managed Risk Portfolio | $ | 3,636,632 | $ | 8,461,604 | $ | - | $ | - | $ | 48,039,765 | $ | 60,138,001 | |||||||||||||||
Global Atlantic Balanced Managed Risk Portfolio | 2,739,543 | 5,906,873 | - | - | 14,487,654 | 23,134,070 | |||||||||||||||||||||
| Global Atlantic BlackRock Selects Managed Risk Portfolio | 11,495,493 | - | - | - | 33,022,553 | 44,518,046 | |||||||||||||||||||||
| Global Atlantic Franklin Dividend and Income Managed Risk Portfolio | 1,665,070 | 3,938,416 | - | - | 123,021,985 | 128,625,471 | |||||||||||||||||||||
Global Atlantic Growth Managed Risk Portfolio | 3,053,494 | 8,007,231 | - | - | 141,248,206 | 152,308,931 | |||||||||||||||||||||
| Global Atlantic Moderate Growth Managed Risk Portfolio | 2,843,893 | 6,962,234 | - | - | 38,068,069 | 47,874,196 | |||||||||||||||||||||
| Global Atlantic Select Advisor Managed Risk Portfolio | 1,363,374 | 6,683,978 | - | - | 25,452,799 | 33,500,151 | |||||||||||||||||||||
| Global Atlantic Wellington Research Managed Risk Portfolio | 13,137,460 | 32,571,607 | - | - | 122,723,259 | 168,432,326 | |||||||||||||||||||||
The difference between book basis and tax basis unrealized appreciation (depreciation), undistributed ordinary income (loss) and accumulated net realized gain (loss) from investments is primarily attributable to the tax deferral of losses on wash sales, and the mark-to-market on passive foreign investment companies and open 1256 options and futures contracts, forward foreign currency contracts and swaps. The unrealized appreciation (depreciation) in the table above includes unrealized foreign currency gains (losses) of $4,187 for Global Atlantic Franklin Dividend and Income Managed Risk Portfolio.
94
Global Atlantic Portfolios
Notes to Financial Statements (Continued)
December 31, 2021
At December 31, 2021, the Portfolios did not have capital loss carry forwards for federal income tax purposes available to offset future capital gains.
During the year ended December 31, 2021, the following Portfolios utilized capital loss carryforwards.
Utilized | |||||||
Global Atlantic American Funds® Managed Risk Portfolio | $ | 1,985,436 | |||||
Global Atlantic BlackRock Selects Managed Risk Portfolio | 15,343,336 | ||||||
Global Atlantic Franklin Dividend and Income Managed Risk Portfolio | 16,965,213 | ||||||
Global Atlantic Growth Managed Risk Portfolio | 17,267,902 | ||||||
Permanent book and tax differences, primarily attributable to the reclassification of Portfolio distributions, resulted in reclassifications for the Portfolios for the fiscal year ended December 31, 2021 as follows:
| Paid In Capital | Accumulated Earnings (Losses) | ||||||||||
Global Atlantic Balanced Managed Risk Portfolio | $ | 21,241 | $ | (21,241 | ) | ||||||
Global Atlantic Wellington Research Managed Risk Portfolio | 70,179 | (70,179 | ) | ||||||||
8. NEW ACCOUNTING PRONOUNCEMENTS
In March 2020, the FASB issued Accounting Standards Update No. 2020-04 ("ASU 2020-04"), "Reference Rate Reform (Topic 840): Facilitation of the Effects of Reference Rate Reform on Financial Reporting". ASU 2020-04 provides entities with optional guidance to ease the potential accounting burden associated with transitioning away from reference rates (e.g., LIBOR) that are expected to be discontinued. ASU 2020-04 allows, among other things, certain contract modifications to be accounted as a continuation of the existing contract. This ASU was effective upon the issuance and its optional relief can be applied through December 31, 2022. Management has reviewed the requirements and believes the adoption of this ASU will not have a material impact on the financial statements.
9. OTHER RISKS
The Portfolios' risks include, but are not limited to, the following:
Credit Risk – There is a risk that security issuers will not make interest and/or principal payments on their securities. In addition, the credit quality of securities may be lowered if an issuer's financial condition changes. Lower credit quality will lead to greater volatility in the price of a security and in shares of a Portfolio or an underlying fund. Lower credit quality also will affect liquidity and make it difficult to sell the security. This means that, compared to issuers of higher rated securities, issuers of lower rated securities are less likely to have the capacity to pay interest and repay principal when due in the event of adverse business, financial or economic conditions and/or may be in default or not current in the payment of interest or principal. Default, or the market's perception that an issuer is likely to default, tends to reduce the value and liquidity of fixed income securities, thereby reducing the value of your investment in Portfolio shares. In addition, default may cause a Portfolio to directly or indirectly incur expenses in seeking recovery of principal or interest.
A Portfolio could lose money on a debt security if an issuer or borrower is unable or fails to meet its obligations, including failing to make interest payments and/or to repay principal when due. Changes in an issuer's financial strength, the market's perception of the issuer's financial strength or in a security's credit rating, which reflects a third party's assessment of the credit risk presented by a particular issuer, may affect debt securities' value. A Portfolio may incur substantial losses on debt securities that are inaccurately perceived to present a different amount of credit risk by the market, the Sub-Adviser and/or Underlying Fund manager or the rating agencies than such securities actually do.
95
Global Atlantic Portfolios
Notes to Financial Statements (Continued)
December 31, 2021
Derivatives Risk – The use of derivatives is a highly specialized activity that involves investment techniques and risks different from those associated with investments in more traditional securities and instruments. The use of derivatives may increase costs, reduce a Portfolio's returns and/or increase volatility. Volatility is defined as the characteristic of a security, an index or a market to fluctuate significantly in price within a short time period. Many types of derivatives are also subject to counterparty risk, which is the risk that the other party in the transaction will not fulfill its contractual obligation. A risk of a Portfolio's use of derivatives is that the fluctuations in their values may not correlate perfectly with, and may be more sensitive to market events than, the overall securities markets. The possible lack of a liquid secondary market for derivatives and the resulting inability to sell or otherwise close-out a derivatives position at an advantageous time or price could expose a Portfolio to losses and could make derivatives more difficult to value accurately. Derivatives typically give rise to a form of leverage and may expose a Portfolio to greater risk and increase its costs. The Dodd-Frank Wall Street Reform and Consumer Protection Act (the "Dodd-Frank Act") and related regulatory developments require the clearing and exchange-trading of many standardized over-the-counter ("OTC") derivative instruments deemed to be "swaps." The Commodity Futures Trading Commission ("CFTC") has implemented mandatory exchange-trading and clearing requirements under the Dodd-Frank Act and the CFTC continues to approve contracts for central clearing. Uncleared swaps are subject to margin requirements that are being implemented on a phase-in basis. In addition, the SEC recently adopted Rule 18f-4 under the 1940 Act which will regulate the use of derivatives for certain investment companies (the "Derivatives Rule"). The Derivatives Rule will require, among other things, that certain entities adopt a derivatives risk management program, comply with limitations on leveraged- related risk based on a relative "value-at-risk" test and update reporting and disclosure procedures. Although the full impact of the Derivatives Rule on the Portfolios remains uncertain, these requirements may limit the ability of a Portfolio to use derivatives, short sales, and reverse repurchase agreements and similar financing transactions as part of its investment strategies, as well as increase a Portfolio's expenses. Compliance with Rule 18f-4 will be required by August 2022. The regulation of the derivatives markets has increased over the past several years, and there can be no assurance that any new governmental regulation will not adversely affect a Portfolio's ability to achieve its investment result.
Exchange-Traded Funds Risk – The Portfolios may invest in passive ETFs. An ETF is a type of index fund that is bought and sold on a securities exchange. An ETF trades like common stock and represents a fixed portfolio of securities designed to track the performance and dividend yield of a particular domestic or foreign market index. A Portfolio may purchase an ETF to gain exposure to a portion of the U.S. or a foreign market while awaiting an opportunity to purchase securities directly. The risks of owning an ETF generally reflect the risks of owning the underlying securities it is designed to track, although lack of liquidity in an ETF could result in it being more volatile than the underlying securities, which may result in a Portfolio paying significantly more or receiving significantly less for ETF shares than the value of the relevant underlying securities. Additionally, an ETF has fees and expenses that increase the cost of investing in the ETF versus the costs of owning the underlying securities directly.
Market Risk – The market prices of securities may go up or down, sometimes rapidly or unpredictably, due to general market conditions, such as real or perceived adverse economic or political conditions, inflation, changes in interest rates or currency rates, limited dealer capacity, lack of liquidity in the markets or adverse investor sentiment. Each Portfolio has exposure to instruments that may be more volatile and carry more risk than some other forms of investment. Adverse market conditions may be prolonged and may not have the same impact on all types of securities. Market prices of securities also may go down due to events or conditions that affect particular sectors, industries or issuers. When market prices fall, the value of your investment will go down. Local, regional or global events such as war, acts of terrorism, the spread of infectious illness or other public health issues, natural disasters, recessions, or other events could also have a significant impact on the Portfolio and its investments. The market prices of securities may also be negatively impacted by trading activity and investor interest, including interest driven by factors unrelated to market conditions or financial performance. In these circumstances, the value of the Portfolio's investments, particularly any short positions or exposures, may fluctuate dramatically.
A Portfolio may experience a substantial or complete loss on any individual security. Since the global financial crisis that began in 2008, the U.S. and many foreign economies continue to experience its after-effects, which have resulted, and may continue to result, in slower growth and an unusually high degree of volatility in the financial markets, both domestic and foreign. Changes in the U.S. and governmental market support activities implemented since the financial crisis could negatively affect the markets generally and increase market volatility. This could reduce the value and liquidity of the securities in which the Portfolio invests and make identifying investment risks and opportunities especially difficult.
96
Global Atlantic Portfolios
Notes to Financial Statements (Continued)
December 31, 2021
Policy and legislative changes in the U.S. and abroad affect many aspects of financial regulation and may, in some cases, contribute to decreased liquidity and increased volatility in the financial markets. Economies and financial markets around the world are becoming increasingly interconnected. As a result, whether or not a Portfolio has exposure to securities of issuers located in or with significant exposure to countries experiencing economic and financial difficulties, the value and liquidity of the Portfolio's investments may be negatively affected.
In addition, market prices of securities in broad market segments may be adversely affected by a prominent issuer having experienced losses or by the lack of earnings or such an issuer's failure to meet the market's expectations with respect to new products or services, or even by factors wholly unrelated to the value or condition of the issuer, such as changes in interest rates. An increase in interest rates or other adverse conditions (e.g., inflation/deflation, increased selling of fixed income investments across other pooled investment vehicles or accounts, changes in investor perception or changes in government intervention in the markets) may lead to increased redemptions and increased portfolio turnover, which could reduce liquidity for certain Portfolio investments, adversely affect values of portfolio holdings and increase a Portfolio's costs. If dealer capacity in fixed income markets is insufficient for market conditions, this has the potential to further inhibit liquidity and increase volatility in the fixed income markets. The spread of an infectious respiratory illness caused by a novel strain of coronavirus (known as "COVID-19") has caused volatility, severe market dislocations and liquidity constraints in many markets, including markets for the securities the Portfolios hold, and may adversely affect the Portfolios' investments and operations. The transmission of COVID-19 and efforts to contain its spread could lead to a significant economic downturn or recession, increased market volatility, a greater number of market closures, higher default rates and adverse effects on the values and liquidity of securities or other assets. Such impacts, which may vary across asset classes, may adversely affect the performance of the Portfolios. In certain cases, an exchange or market may close or issue trading halts on specific securities or even the entire market, which may result in the Portfolios being, among other things, unable to buy or sell certain securities or financial instruments or to accurately price their investments.
10. PAYMENTS BY AFFILIATES
During the year ended December 31, 2021, the Adviser reimbursed the Global Atlantic American Funds Managed Risk Portfolio $1,280 and the Global Atlantic BlackRock Selects Managed Risk Portfolio $7,428 for losses due to security trades executed incorrectly. The amount compensated was less than 0.01% of each of the Portfolio's average net assets, thus having no impact on either Portfolio's total return.
In connection with the Reorganization (as defined below), the Adviser voluntarily reimbursed the Global Atlantic Balanced Managed Risk Portfolio $3,119 and the Global Atlantic Wellington Research Managed Risk Portfolio $942 for brokerage commissions incurred. Additionally, the Adviser voluntarily reimbursed the Global Atlantic Balanced Managed Risk Portfolio $68 and the Global Atlantic Wellington Research Managed Risk Portfolio $171 for custody transaction fees incurred. The dollar amounts of the voluntary custody transaction fee reimbursement are included in the statements of operations as expenses waived / reimbursed and are not available to be recouped by the Adviser.
11. OTHER RECENT DEVELOPMENTS
Ongoing concerns regarding the economies of certain countries in Europe, as well as the possibility that one or more countries could leave the European Union (the "EU"), create risks for investing in the European markets. These risks may be heightened due to the June 2016 referendum in which the United Kingdom ("UK") voted to exit the EU (commonly known as "Brexit"). On January 31, 2020, the UK withdrew from the EU. This commenced a transition period that lasted until December 31, 2020. On December 30, 2020, the EU and UK signed the EU-UK Trade and Cooperation Agreement ("TCA"), an agreement on the terms governing certain aspects of the EU's and the UK's relationship following the end of the transition period. Notwithstanding the TCA, there is likely to be considerable uncertainty as to the UK's post-transition framework. The full impact of Brexit on the UK and EU economies and the broader global economy is not yet known. The impact could be significant and could, among other outcomes, result in increased volatility and illiquidity, potentially lower economic growth and decreased asset valuations. Brexit may have a destabilizing impact on the EU to the extent other member states similarly seek to withdraw from the union. Brexit may also have a negative impact on the economy and currency of the UK as a result of anticipated, or actual changes to the UK's economic and political relations with the EU. Any or all of these challenges may affect the value of a Portfolio's investments economically tied to the UK or the EU.
97
Global Atlantic Portfolios
Notes to Financial Statements (Continued)
December 31, 2021
On March 5, 2021, the United Kingdom's Financial Conduct Authority ("FCA") and ICE Benchmark Authority formally announced the dates after which the LIBORs will no longer be representative and subsequently cease publication. Certain LIBORs ceased publication on December 31, 2021, and others will cease publication after June 30, 2023. The unavailability or replacement of LIBOR presents risks to applicable Portfolios, including the risk that any pricing adjustments to a Portfolio's investments resulting from a substitute reference rate may adversely affect the Portfolio's performance and/or NAV. The impact of a substitute reference rate, if any, will vary on an investment-by-investment basis. The Adviser or Sub- Adviser may have discretion to determine a substitute reference rate, including any price or other adjustments to account for differences between the substitute reference rate and the previous rate. The substitute reference rate and any adjustments selected could negatively impact a Portfolio's investment performance or financial condition, including in ways unforeseen by the Adviser or Sub-Adviser.
In addition, the current ongoing outbreak of COVID-19, a respiratory illness caused by a novel strain of coronavirus, has caused volatility, severe market dislocations and liquidity constraints in many markets, including markets for the securities the Portfolios hold, and may adversely affect the Portfolios' investments and operations. The transmission of COVID-19 and efforts to contain its spread have resulted in, among other things: quarantines and travel restrictions, including border closings, strained healthcare systems, event cancellations, disruptions to business operations and supply chains, and a reduction in consumer and business spending, as well as general concern and uncertainty that has negatively affected the economy. These disruptions have led to instability in the market place, including equity and debt market losses and overall volatility, and the jobs market. The impact of COVID-19, and other infectious illness outbreaks, epidemics or pandemics that may arise in the future, could adversely affect the economies of many nations or the entire global economy, the financial well-being and performance of individual issuers, borrowers and sectors and the health of the markets generally in potentially significant and unforeseen ways. In addition, the impact of infectious illnesses, such as COVID-19, in emerging market countries may be greater due to generally less established healthcare systems. The COVID-19 crisis or other public health crises may exacerbate other pre-existing political, social and economic risks in certain countries or globally.
12. OTHER MATTERS
On February 1, 2021, Global Atlantic Financial Group Limited (together with its subsidiaries, "Global Atlantic") was acquired by KKR & Co. Inc. (the "Transaction"). Under the 1940 Act, the Transaction resulted in the automatic termination of the existing: (i) investment advisory agreement between the Adviser and the Trust on behalf of each Portfolio; (ii) sub-advisory agreements between the Adviser, the sub-advisers and the Trust on behalf of each applicable Portfolio; and (iii) underwriting agreement between GAD and the Trust on behalf of the Portfolios (collectively, the "Existing Agreements").
At a meeting held on September 22, 2020, the Board, including all of the Trustees who are not "interested persons," as that term is defined in the 1940 Act, unanimously voted to approve each of the following to become effective upon the closing of the Transaction: (i) a new investment advisory agreement between the Adviser and the Trust on behalf of each Portfolio ("New Advisory Agreement"); (ii) new sub-advisory agreements between the Adviser, the sub-advisers and the Trust on behalf of each applicable Portfolio; and (iii) a new underwriting agreement between GAD and the Trust on behalf of each Portfolio (collectively, the "New Agreements"). The New Advisory Agreement was also subject to shareholder approval. At a special meeting of shareholders held on November 23, 2020, the New Advisory Agreement was approved by the shareholders of each Portfolio. The New Agreements took effect on February 1, 2021.
13. REORGANIZATION
At a meeting held on May 4, 2021, the Board approved an Agreement and Plan of Reorganization (the "Plan") that provides for the reorganization of each Acquired Portfolio identified below (each an "Acquired Portfolio") into the corresponding Acquiring Portfolio identified below (each an "Acquiring Portfolio") (each a "Reorganization" and collectively, the "Reorganizations"). The purpose of the Reorganizations was to combine portfolios with the same investment objectives and fundamental investment policies. Each Reorganization occurred after the close of business on August 20, 2021.
Acquired Portfolio | Corresponding Acquiring Portfolio | ||||||
Global Atlantic Goldman Sachs Dynamic Trends | |||||||
Allocation Portfolio | Global Atlantic Balanced Managed Risk Portfolio | ||||||
Global Atlantic PIMCO Tactical Allocation Portfolio | Global Atlantic Wellington Research Managed Risk Portfolio | ||||||
98
Global Atlantic Portfolios
Notes to Financial Statements (Continued)
December 31, 2021
Pursuant to the terms of the Plan, after the close of business on August 20, 2021, each Acquired Portfolio transferred all of its assets to the corresponding Acquiring Portfolio, in exchange for shares of the corresponding Acquiring Portfolio and the assumption of all of the liabilities of the Acquired Portfolio by the corresponding Acquiring Portfolio.
After the close of business on August 20, 2021, the consummation of each Reorganization was accomplished by a tax-free exchange of shares^ of each Acquiring Fund in the following amounts:
| Acquired Portfolio Name/ Share Class Name | Acquired Portfolio Net Assets | Acquired Portfolio Shares Outstanding | Acquiring Portfolio Name/ Share Class Name | Acquiring Portfolio Net Assets | Acquiring Portfolio Shares Outstanding | Net Assets Post Reorganization | Shares Outstanding Post Reorganization | ||||||||||||||||||||||||
| Global Atlantic Goldman Sachs Dynamic Trends Allocation Portfolio Class II | $ | 35,866,849 | 3,190,084 | Global Atlantic Balanced Managed Risk Portfolio Class II | $ | 83,729,746 | 6,025,857 | 119,596,595 | 8,607,109 | ||||||||||||||||||||||
| Global Atlantic PIMCO Tactical Allocation Portfolio Class II | 29,594,401 | 2,632,666 | Global Atlantic Wellington Research Managed Risk Portfolio Class II | 461,923,590 | 27,929,332 | 491,517,991 | 29,718,698 | ||||||||||||||||||||||||
^ Shares of 2,581,252 and 1,789,366 were exchanged for Global Atlantic Balanced Managed Risk Portfolio and Global Atlantic Wellington Research Managed Risk Portfolio, respectively.
On the reorganization date, the Acquired Portfolio had the following total investment cost and value, representing the principal assets acquired by the Acquiring Portfolio:
Acquired Portfolios | Total Investment Value | Total Investment Cost | Unrealized Appreciation (Depreciation) on Investments | ||||||||||||
| Global Atlantic Goldman Sachs Dynamic Trends Allocation Portfolio | $ | 35,887,570 | $ | 30,780,835 | $ | 5,106,735 | |||||||||
Global Atlantic PIMCO Tactical Allocation Portfolio | 19,820,415 | 16,356,550 | 3,463,865 | ||||||||||||
For financial reporting purposes, assets received and shares issued by the Acquiring Portfolio were recorded at fair value; however, the cost basis of the investments received from the Acquired Portfolio were carried forward to reflect the tax-free status of the acquisition.
The net assets and net unrealized appreciation (depreciation) immediately before the acquisition were as follows:
Acquired Portfolios | Class | Acquired Portfolios | Acquiring Portfolios | Class | |||||||||||||||||||||||
Net Assets | Unrealized Appreciation (Depreciation) on Investments | Net Assets | |||||||||||||||||||||||||
| Global Atlantic Goldman Sachs Dynamic Trends Allocation Portfolio | II | $ | 35,866,849 | $ | 5,106,735 | Global Atlantic Balanced Managed Risk Portfolio | II | $ | 83,729,746 | ||||||||||||||||||
| Global Atlantic PIMCO Tactical Allocation Portfolio | II | 29,594,401 | 3,463,865 | Global Atlantic Wellington Research Managed Risk Portfolio | II | 461,923,590 | |||||||||||||||||||||
99
Global Atlantic Portfolios
Notes to Financial Statements (Continued)
December 31, 2021
The financial statements reflect the operations of the Acquiring Portfolios for the period prior to the acquisition and the combined portfolios for the period subsequent to the portfolio reorganization. Assuming the acquisition had been completed on January 1, 2021, the Acquiring Portfolio's unaudited pro forma results of operations for the year ended December 31, 2021, are as follows:
Acquiring Portfolios | Net Investment Income | Net realized and unrealized gain (loss) on Investments | Net increase in net assets resulting from operations | ||||||||||||
Global Atlantic Balanced Managed Risk Portfolio | $ | 799,428 | $ | 10,438,337 | $ | 11,237,765 | |||||||||
| Global Atlantic Wellington Research Managed Risk Portfolio | 495,251 | 55,940,935 | 56,436,186 | ||||||||||||
Since the combined investment Porfolios have been managed as a single integrated portfolio since the acquisition was completed, it is also not practicable to separate the amounts of revenue and earnings of the Acquired Portfolios that have been included in the Acquiring Portfolio's Statements of Operations since August 20, 2021.
Since both the Acquired Portfolios and the Acquiring Portfolios sold and redeemed shares throughout the period, it is not practicable to provide pro-forma information on a per-share basis.
14. SUBSEQUENT EVENTS
The Portfolios evaluated subsequent events from December 31, 2021 through the date these financial statements were issued. There were no significant events that would have a material impact on the Portfolios' financial statements.
100
Report of Independent Registered Public Accounting Firm
To the Board of Trustees of Forethought Variable Insurance Trust
and the Shareholders of Each of the Separate Series of Forethought Variable Insurance Trust
Opinion on the Financial Statements
We have audited the accompanying statement of assets and liabilities of Global Atlantic American Funds® Managed Risk Portfolio, Global Atlantic Balanced Managed Risk Portfolio, Global Atlantic BlackRock Selects Managed Risk Portfolio, Global Atlantic Franklin Dividend and Income Managed Risk Portfolio, Global Atlantic Growth Managed Risk Portfolio, Global Atlantic Moderate Growth Managed Risk Portfolio, Global Atlantic Select Advisor Managed Risk Portfolio, and Global Atlantic Wellington Research Managed Risk Portfolio (collectively, the Portfolios), including the portfolio of investments, as of December 31, 2021, the related statements of operations for the year then ended, the statements of changes in net assets for each of the two years in the period then ended, and the related notes to the financial statements (collectively, the financial statements), and the financial highlights for each of the five years in the period then ended. In our opinion, the financial statements and financial highlights present fairly, in all material respects, the financial position of the Portfolios as of December 31, 2021, the results of its operations for the year then ended, the changes in net assets for each of the two years in the period then ended, and the financial highlights for each of the five years in the period then ended, in conformity with accounting principles generally accepted in the United States of America.
Basis for Opinion
These financial statements are the responsibility of the Portfolios' management. Our responsibility is to express an opinion on the Portfolios' financial statements and financial highlights based on our audits. We are a public accounting firm registered with the Public Company Accounting Oversight Board (United States) (PCAOB) and are required to be independent with respect to the Portfolios in accordance with U.S. federal securities laws and the applicable rules and regulations of the Securities and Exchange Commission and the PCAOB.
We conducted our audits in accordance with the standards of the PCAOB. Those standards require that we plan and perform the audit to obtain reasonable assurance about whether the financial statements are free of material misstatement, whether due to error or fraud. The Portfolios are not required to have, nor were we engaged to perform, an audit of its internal control over financial reporting. As part of our audits, we are required to obtain an understanding of internal control over financial reporting but not for the purpose of expressing an opinion on the effectiveness of the Portfolios' internal control over financial reporting. Accordingly, we express no such opinion.
Our audits included performing procedures to assess the risks of material misstatement of the financial statements, whether due to error or fraud, and performing procedures that respond to those risks. Such procedures included examining, on a test basis, evidence regarding the amounts and disclosures in the financial statements. Our procedures included confirmation of investments owned as of December 31, 2021, by correspondence with the custodians and brokers or by other appropriate auditing procedures where replies from custodians or brokers were not received. Our audits also included evaluating the accounting principles used and significant estimates made by management, as well as evaluating the overall presentation of the financial statements. We believe that our audits provide a reasonable basis for our opinion.
/s/ RSM US LLP
We have served as the auditor of one or more investment companies advised by Global Atlantic Investment Advisors, LLC since 2013.
Denver, Colorado
February 23, 2022
101
Global Atlantic Portfolios
Expense Examples
December 31, 2021 (Unaudited)
As a shareholder of the Portfolios, you incur ongoing costs, including management fees; distribution and/or service (12b-1) fees; and other Portfolio expenses. This example is intended to help you understand your ongoing costs (in dollars) of investing in each Portfolio and to compare these costs with the ongoing costs of investing in other mutual funds.
The example is based on an investment of $1,000 invested at the beginning of the period and held for the entire period from July 1, 2021 through December 31, 2021.
Actual Expenses
The "Actual" expenses set of columns in the table below provides information about actual account values and actual expenses. You may use the information below together with the amount you invested, to estimate the expenses that you paid over the period. Simply divide your account value by $1,000 (for example, an $8,600 account value divided by $1,000 = 8.6), then multiply the result by the number in the table under the heading entitled "Expenses Paid During Period" to estimate the expenses you paid on your account during this period.
Hypothetical Example for Comparison Purposes
The "Hypothetical" expenses set of columns in the table below provides information about hypothetical account values and hypothetical expenses based on each Portfolio's actual expense ratio and an assumed rate of return of 5% per year before expenses, which is not the Portfolio's actual return. The hypothetical account values and expenses may not be used to estimate the actual ending account balances or expenses you paid for the period. You may use this information to compare this 5% hypothetical example for a specific Portfolio with the 5% hypothetical examples that appear in the shareholder reports of other funds.
Please note that the expenses shown in the table are meant to highlight your ongoing costs only and do not reflect any transactional costs, such as sales charges (loads), or redemption fees or other expenses charged by your insurance contract or separate account. Therefore, the Hypothetical columns of the table are useful in comparing ongoing costs only, and will not help you determine the relative total costs of owning different funds. In addition, if these transactional costs were included, your costs would have been higher.
Actual | Hypothetical (5% return before expenses) | ||||||||||||||||||||||||||||||
Class | Portfolio's Annualized Expense Ratio | Beginning Account Value 7-1-21 | Ending Account Value 12-31-21 | Expenses Paid During Period* | Ending Account Value 12-31-21 | Expenses Paid During Period* | |||||||||||||||||||||||||
| Global Atlantic American Funds® Managed Risk Portfolio | II | 0.84 | % | $ | 1,000 | $ | 1,040.30 | $ | 4.32 | $ | 1,020.97 | $ | 4.28 | ||||||||||||||||||
| Global Atlantic Balanced Managed Risk Portfolio | II | 0.90 | % | $ | 1,000 | $ | 1,033.80 | $ | 4.61 | $ | 1,020.67 | $ | 4.58 | ||||||||||||||||||
| Global Atlantic BlackRock Selects Managed Risk Portfolio | II | 0.89 | % | $ | 1,000 | $ | 1,035.30 | $ | 4.57 | $ | 1,020.72 | $ | 4.53 | ||||||||||||||||||
| Global Atlantic Franklin Dividend and Income Managed Risk Portfolio | II | 1.19 | % | $ | 1,000 | $ | 1,087.00 | $ | 6.26 | $ | 1,019.21 | $ | 6.06 | ||||||||||||||||||
| Global Atlantic Growth Managed Risk Portfolio | II | 0.88 | % | $ | 1,000 | $ | 1,053.60 | $ | 4.56 | $ | 1,020.77 | $ | 4.48 | ||||||||||||||||||
| Global Atlantic Moderate Growth Managed Risk Portfolio | II | 0.89 | % | $ | 1,000 | $ | 1,043.90 | $ | 4.59 | $ | 1,020.72 | $ | 4.53 | ||||||||||||||||||
* Expenses are equal to the Portfolio's annualized expense ratio, multiplied by the number of days in the period (184) divided by the number of days in the fiscal year (365).
102
Global Atlantic Portfolios
Expense Examples (Continued)
December 31, 2021 (Unaudited)
Actual | Hypothetical (5% return before expenses) | ||||||||||||||||||||||||||||||
Class | Portfolio's Annualized Expense Ratio | Beginning Account Value 7-1-21 | Ending Account Value 12-31-21 | Expenses Paid During Period* | Ending Account Value 12-31-21 | Expenses Paid During Period* | |||||||||||||||||||||||||
| Global Atlantic Select Advisor Managed Risk Portfolio | II | 0.64 | % | $ | 1,000 | $ | 1,042.70 | $ | 3.30 | $ | 1,021.98 | $ | 3.26 | ||||||||||||||||||
| Global Atlantic Wellington Research Managed Risk Portfolio | II | 1.20 | % | $ | 1,000 | $ | 1,051.30 | $ | 6.20 | $ | 1,019.16 | $ | 6.11 | ||||||||||||||||||
* Expenses are equal to the Portfolio's annualized expense ratio, multiplied by the number of days in the period (184) divided by the number of days in the fiscal year (365).
103
Global Atlantic Portfolios
Supplemental Information
December 31, 2021 (Unaudited)
Trustees and Officers
The Trustees and officers of the Trust, together with information as to their principal business occupations during the past five years and other information, are shown below. Unless otherwise noted, the address of each Trustee and Officer is c/o Global Atlantic Investment Advisors, LLC, 10 West Market Street, Suite 2300, Indianapolis, Indiana 46204.
Independent Trustees
Name and Year of Birth | Position/ Term of Office1 | Principal Occupation During the Past Five Years | Number of Portfolios in Fund Complex Overseen by Trustee | Other Directorships held by Trustee During the Past Five Years | |||||||||||||||
| Mark Garbin (1951) | Trustee since 2013 | Mr. Garbin serves as Managing Principal of Coherent Capital Management LLC (since 2007). | 16 | Mr. Garbin serves as Director of OHA CLO Enhanced Equity II Genpar LLP (since 2021), Carlyle Tactical Private Credit Fund (since 2018), iCapital KKR Private Markets Fund (Formerly Altegris KKR Commitments Fund) (since 2014), Two Roads Shared Trust (since 2012), Northern Lights Fund Trust (since 2013), and Northern Lights Variable Trust (since 2013). Previously, Mr. Garbin served as Director of Oak Hill Advisors Mortgage Strategies Fund (Offshore) (2014–2017). | |||||||||||||||
| Mitchell E. Appel (1970) | Trustee since 2013 | Mr. Appel serves as President of Value Line Funds (since 2008), as Chief Financial Officer (since 2008) and President (since 2009) of EULAV Securities LLC, and as President (since 2009) and Treasurer (since 2011) of EULAV Asset Management. | 16 | Mr. Appel serves as Director of Value Line Funds (since 2010) and EULAV Asset Management (since 2010). | |||||||||||||||
| Joseph E. Breslin (1953) | Trustee since 2013 | Mr. Breslin serves as Senior Counsel of White Oak Global Advisors, LLC (since 2016) and has provided consultant services to investment managers (since 2009). Previously, Mr. Breslin served as Counsel of Common fund (2014–2016). | 16 | Mr. Breslin serves as Director of Kinetics Mutual Funds, Inc. (since 2000), Kinetics Portfolios Trust (since 2000) and Northern Lights Fund Trust IV (since 2015). Previously, Mr. Breslin served as Director of BlueArc Multi-Strategy Fund (2014–2017) and Hatteras Trust (2004–2016). | |||||||||||||||
104
Global Atlantic Portfolios
Supplemental Information (Continued)
December 31, 2021 (Unaudited)
Interested Trustee and Officers of the Trust
Name and Year of Birth | Position/ Term of Office1 | Principal Occupation During the Past Five Years | Number of Portfolios in Fund Complex Overseen by Trustee | Other Directorships held by Trustee During the Past Five Years | |||||||||||||||
| Robert M. Arena, Jr. (1968)2 | Trustee since 2013 | Mr. Arena serves as President of The Global Atlantic Financial Group LLC ("TGAFG") (since 2021); as Director of Global Atlantic Financial Group Limited ("GAFGL") (since 2021); as President and Head of Life and Retirement of Ariel Re (Holdings) Limited, Global Atlantic Financial Life Limited ("GAFLL") and Global Atlantic Financial Limited (formerly Commonwealth Re Midco Limited) ("GAFL") (since 2020); as Director and President of Global Atlantic Financial Company ("GAFC") (since 2017 and 2020, respectively); as Director of GAFL (since 2019); as Director, President and Head of Life and Retirement of Global Atlantic (Fin) Company (since 2017, 2019 and 2017, respectively); as Director, Chairman and President of Forethought Life Insurance Company ("FLIC") (since 2016, 2017 and 2016, respectively); as Director, Chairman and President of Commonwealth Annuity and Life Insurance Company ("CWA") and First Allmerica Financial Life Insurance Company (FAFLIC") (since 2017, 2017 and 2018, respectively); as Director, Chairman and Chief Executive Officer of Accordia Life and Annuity Company ("Accordia") (since 2016, 2017 and 2017, respectively); as Manager and Chairman of Global Atlantic Investment Advisors, LLC ("GAIA") (since 2016); and as Manager, Chairman and President of Global Atlantic Distributors, LLC ("GAD") (since 2012, 2012 and 2013, respectively); Previously, Mr. Arena has served as President and Head of Life and Retirement of GAFGL (2020–2021); as Co-President, Head of Life and Retirement of GAFGL, GAFL and GAFLL (2017–2020); as President and Head of Individual Markets (2019–2020) and Co-President and Head of Life and Retirement of GAFC (2017–2019 and 2016–2019, respectively); as Co-President of Global Atlantic (Fin) Company (2017–2019); as Executive Vice President of CWA (2017–2018); as Executive Vice President of Forethought Financial Group, Inc. ("FFG") (2013–2014); and as President of Forethought Annuity, FFG (2013–2015). | 16 | None | |||||||||||||||
105
Global Atlantic Portfolios
Supplemental Information (Continued)
December 31, 2021 (Unaudited)
Name and Year of Birth | Position/ Term of Office1 | Principal Occupation During the Past Five Years | Number of Portfolios in Fund Complex Overseen by Trustee | Other Directorships held by Trustee During the Past Five Years | |||||||||||||||
| Barrie Ribet (1982)3 | Trustee since 2021 | Ms. Ribet serves as Managing Director of GAFC (since 2017); Managing Director of FLIC, CWA, Accordia, and FAFLIC (since 2019) and Managing Director of Global Atlantic Equipment Management, LLC (since 2021). Previously, Ms. Ribet served as Senior Vice President, Head of Asset Origination of GAFC (from 2015 to 2017). | 16 | None | |||||||||||||||
| Eric Todd (1969) | President and Chief Executive Officer since 2021 | Mr. Todd is currently Chief Product Officer of GAFC, he also serves as Managing Director of GAFC (since 2015); Manager, President and Chief Investment Officer of GAIA (since 2013); Manager of GAD (since 2016); Director and Managing Director of FLIC (since 2014 and 2018, respectively); and Director and Managing Director of CWA, FAFLIC and Accordia (since 2017 and 2018, respectively). | N/A | N/A | |||||||||||||||
| Deborah Schunder (1967) | Vice President since 2014 | Ms. Schunder serves as Senior Vice President, Head of Investment Product Management, Sales Reporting, Analytics and Compensation of GAFC (since 2021). Previously, Ms. Schunder served as Vice President of Investment Product Management of GAFC (2013–2021). | N/A | N/A | |||||||||||||||
| Trent M. Statczar (1971) | Treasurer and Principal Financial Officer since 2019 | Mr. Statczar serves as Senior Director of Foreside Management Services, LLC (since 2008). | N/A | N/A | |||||||||||||||
| Sarah M. Patterson (1976) | Secretary/Chief Legal Officer since 2013 | Ms. Patterson serves as Managing Director, General Counsel for Individual Markets and Assistant Secretary for FLIC, Accordia, FAFLIC, CWA and GAFC (since 2019, 2020, and 2014, respectively); as Secretary of GAIA (since 2016); and as Assistant Secretary of GAD (since 2016). Previously Ms. Patterson served as Associate General Counsel of FLIC, Accordia, FAFLIC, CWA and GAFC (2014–2020), Senior Vice President (2016–2019) and Vice President (2014–2016) of GAFGL and Vice President and Assistant General Counsel of FFG (2013–2014). | N/A | N/A | |||||||||||||||
| David Capalbo (1968) | Chief Compliance Officer since 2018 | Mr. Capalbo serves as Vice President of Compliance Operations of GAFC (since 2021) and Chief Compliance Officer of GAIA (since 2018). Previously, Mr. Capalbo served as Assistant Vice President and Senior Compliance Officer of GAFC (2016–2021) and Senior Director of Asset Management Compliance of Columbia Threadneedle Investments (2006–2016). | N/A | N/A | |||||||||||||||
106
Global Atlantic Portfolios
Supplemental Information (Continued)
December 31, 2021 (Unaudited)
Name and Year of Birth | Position/ Term of Office1 | Principal Occupation During the Past Five Years | Number of Portfolios in Fund Complex Overseen by Trustee | Other Directorships held by Trustee During the Past Five Years | |||||||||||||||
| Elizabeth Constant (1976) | Assistant Secretary since 2017 | Ms. Constant serves as Vice President and Assistant General Counsel of GAFC (since 2020). Previously, Ms. Constant served as Assistant Vice President and Legal Counsel (2016–2020) and Associate Counsel (2014–2016) of GAFC. | N/A | N/A | |||||||||||||||
1 The term of office for each Trustee and officer listed above will continue indefinitely until the individual resigns or is removed.
2 Mr. Arena is an interested person of the Trust because he is an officer of GAFGL. Mr. Arena holds comparable positions with the GAIA, GAD, FLIC, CWA, and certain other companies affiliated with GAIA.
3 Ms. Ribet is an interested person of the Trust because she is Managing Director of GAFC. Ms. Ribet holds comparable positions with the FLIC, CWA, and certain other companies affiliated with GAIA.
107
PRIVACY NOTICE
FACTS | WHAT DOES FORETHOUGHT VARIABLE INSURANCE TRUST DO WITH YOUR PERSONAL INFORMATION? | ||||||
WHY? | Financial companies choose how they share your personal information. Federal law gives consumers the right to limit some, but not all sharing. Federal law also requires us to tell you how we collect, share, and protect your personal information. Please read this notice carefully to understand what we do. | ||||||
WHAT? | The types of personal information we collect and share depends on the product or service that you have with us. This information can include: ◼ Social Security number and wire transfer instructions ◼ account transactions and transaction history ◼ investment experience and purchase history When you are no longer our customer, we continue to share your information as described in this notice. | ||||||
HOW? | All financial companies need to share customers' personal information to run their everyday business. In the section below, we list the reasons financial companies can share their customers' personal information; the reasons Forethought Variable Insurance Trust chooses to share; and whether you can limit this sharing. | ||||||
| Reasons we can share your personal information: | Does Forethought Variable Insurance Trust share information? | Can you limit this sharing? | |||||||||
| For our everyday business purposes – such as to process your transactions, maintain your account(s), respond to court orders and legal investigations, or report to credit bureaus. | Yes | No | |||||||||
| For our marketing purposes – to offer our products and services to you. | No | We don't share | |||||||||
For joint marketing with other financial companies. | No | We don't share | |||||||||
| For our affiliates' everyday business purposes – information about your transactions and records. | No | We don't share | |||||||||
| For our affiliates' everyday business purposes – information about your credit worthiness. | No | We don't share | |||||||||
For nonaffiliates to market to you | No | We don't share | |||||||||
108
WHAT WE DO:
How does Forethought Variable Insurance Trust protect my personal information? | To protect your personal information from unauthorized access and use, we use security measures that comply with federal law. These measures include computer safeguards and secured files and buildings. Our service providers are held accountable for adhering to strict policies and procedures to prevent any misuse of your nonpublic personal information. | ||||||
How does Forethought Variable Insurance Trust collect my personal information? | We collect your personal information, for example, when you ◼ open an account or deposit money ◼ direct us to buy securities or direct us to sell your securities ◼ seek advice about your investments We also collect your personal information from others, such as credit bureaus, affiliates, or other companies. | ||||||
Why can't I limit all sharing? | Federal law gives you the right to limit only: ◼ sharing for affiliates' everyday business purposes – information about your creditworthiness. ◼ affiliates from using your information to market to you. ◼ sharing for nonaffiliates to market to you. State laws and individual companies may give you additional rights to limit sharing. | ||||||
DEFINITIONS
Affiliates | Companies related by common ownership or control. They can be financial and nonfinancial companies. ◼ Forethought Variable Insurance Trust has no affiliates. | ||||||
Nonaffiliates | Companies not related by common ownership or control. They can be financial and nonfinancial companies. ◼ Forethought Variable Insurance Trust does not share with nonaffiliates so they can market to you. | ||||||
Joint marketing | A formal agreement between nonaffiliated financial companies that together market financial products or services to you. ◼ Forethought Variable Insurance Trust does not jointly market. | ||||||
109
PROXY VOTING POLICY
Information regarding how the Portfolios voted proxies relating to portfolio securities during the most recent 12-month period ended June 30 is available (1) on or through the Portfolios' website at http://connect.rightprospectus.com/globalatlanticportfolios and (2) on the U.S. Securities and Exchange Commission's website at http://www.sec.gov.
PORTFOLIO HOLDINGS
Each Portfolio files its complete schedule of portfolio holdings with the SEC for the first and third quarters of each fiscal year on Form N-PORT. The Portfolios' Form N-PORTs are available: (i) on the SEC's website at http://www.sec.gov; and (ii) on the Portfolios' website at http://connect.rightprospectus.com/globalatlanticportfolios. Each Portfolio will post to http://connect.rightprospectus.com/globalatlanticportfolios, a complete list of its portfolio holdings as of the last calendar day of each month approximately 30 days following the end of the month. Each Portfolio's portfolio holdings will remain available on the website noted above at least until the next monthly update.
INVESTMENT ADVISER
Global Atlantic Investment Advisors, LLC
10 West Market Street, Suite 2300
Indianapolis, IN 46204
ADMINISTRATOR
The Bank of New York Mellon
240 Greenwich Street
New York, NY 10286
INVESTMENT SUB-ADVISERS
BlackRock Investment Management, LLC
1 University Square Drive
Princeton, NJ 08540-6455
Franklin Advisers, Inc.
One Franklin Parkway
San Mateo, CA 94403
Wilshire Advisors, LLC
1299 Ocean Avenue, Suite700
New York, NY 10282
Milliman Financial Risk Management, LLC
71 S. Wacker Drive, 31st Floor
Chicago, IL 60606
Wellington Management Company LLP
280 Congress Street
Boston, MA 02210
| (b) | Not applicable. |
Item 2. Code of Ethics.
| (a) | As of the end of the period covered by this report, the registrant has adopted a code of ethics that applies to the registrant’s principal executive officer, principal financial officer, principal accounting officer or controller, or persons performing similar functions, regardless of whether these individuals are employed by the registrant or a third party. |
| (c) | Amendments: During the period covered by the report, there have not been any amendments to the provisions of the code of ethics. |
| (d) | Waivers: During the period covered by the report, the registrant has not granted any express or implicit waivers from the provisions of the code of ethics. |
| (e) | The Code of Ethics is not posted on the registrant’s website. |
| (f) | A copy of the Code of Ethics is filed herewith. |
Item 3. Audit Committee Financial Expert.
The board of Trustees of the registrant has determined that the registrant has at least one “audit committee financial expert” as defined by Item 3 of Form N-CSR serving on its audit committee. Joseph E. Breslin is the “audit committee financial expert” and is “independent” (as each term is defined in Item 3 of Form N-CSR).
Item 4. Principal Accountant Fees and Services.
Audit Fees
| (a) | The aggregate fees billed for each of the last two fiscal years for professional services rendered by the principal accountant for the audit of the registrant's annual financial statements or services that are normally provided by the accountant in connection with statutory and regulatory filings or engagements for those fiscal years are: |
| 2020 | 2021 | |||||
| $ | 392,750 | $ | 300,000 | |||
Audit-Related Fees
| (b) | The aggregate fees billed in each of the last two fiscal years for assurance and related services by the principal accountant that are reasonably related to the performance of the audit of the registrant's financial statements and are not reported under paragraph (a) of this Item are: |
| 2020 | 2021 | |||||
| $ | 0 | $ | 0 | |||
Tax Fees
| (c) | The aggregate fees billed in each of the last two fiscal years for professional services rendered by the principal accountant for tax compliance, tax advice, and tax planning are: |
| 2020 | 2021 | |||||
| $ | 78,250 | $ | 78,250 | |||
Preparation of Federal & State income tax returns, assistance with calculation of required income and capital gain distributions.
All Other Fees
| (d) | The aggregate fees billed in each of the last two fiscal years for products and services provided by the principal accountant, other than the services reported in paragraphs (a) through (c) of this Item are: |
| 2020 | 2021 | |||||
| $ | 14,250 | $ | 24,000 | |||
Review of annual registration statement filings for 2020 and 2021 and a fee for review of portfolio reorganization activities in 2021.
Audit Committee’s Pre-Approval Policies
| (e)(1) | The registrant’s Audit Committee is required to pre-approve all audit services and, when appropriate, any non-audit services (including audit-related, tax and all other services) to the registrant. The registrant’s Audit Committee also is required to pre-approve, when appropriate, any non-audit services (including audit-related, tax and all other services) to its adviser, or any entity controlling, controlled by or under common control with the adviser that provides ongoing services to the registrant, to the extent that the services may be determined to have an impact on the operations or financial reporting of the registrant. Services are reviewed on an engagement by engagement basis by the Audit Committee. |
Percentages of Services Approved by the Audit Committee
| (e)(2) | The percentage of services described in each of paragraphs (b) through (d) of this Item that were approved by the audit committee pursuant to paragraph (c)(7)(i)(C) of Rule 2-01 of Regulation S-X are as follows: |
All services described in paragraphs (b) through (d) of Item 4 were pre-approved by the Audit Committee.
| (f) | During the audit of registrant's financial statements for the most recent fiscal year, less than 50 percent of the hours expended on the principal accountant's engagement were attributed to work performed by persons other than the principal accountant's full-time, permanent employees. |
| (g) | The aggregate non-audit fees billed by the registrant's accountant for services rendered to the registrant, and rendered to the registrant's investment adviser (not including any sub-adviser whose role is primarily portfolio management and is subcontracted with or overseen by another investment adviser), and any entity controlling, controlled by, or under common control with the adviser that provides ongoing services to the registrant for each of the last two fiscal years of the registrant for the fiscal year ended December 31, 2021 were $102,250 and $0, respectively and for the fiscal year ended December 31, 2020, were $92,500 and $0, respectively. |
| (h) | The audit committee considered the non-audit services rendered to the registrant’s investment adviser and any entity controlling, controlled by, or under common control with the investment adviser, and believes the services are compatible with the principal accountant’s independence. |
Item 5. Audit Committee of Listed Registrants.
Not applicable.
Item 6. Investments.
| (a) | Schedule of Investments in securities of unaffiliated issuers as of the close of the reporting period is included as part of the report to shareholders filed under Item 1(a) of this form. |
| (b) | Not applicable. |
Item 7. Disclosure of Proxy Voting Policies and Procedures for Closed-End Management Investment Companies.
Not applicable.
Item 8. Portfolio Managers of Closed-End Management Investment Companies.
Not applicable.
Item 9. Purchases of Equity Securities by Closed-End Management Investment Company and Affiliated Purchasers.
Not applicable.
Item 10. Submission of Matters to a Vote of Security Holders.
Not applicable.
Item 11. Controls and Procedures.
| (a) | Based on an evaluation of the registrant’s disclosure controls and procedures as of a date within 90 days of filing date of this Form N-CSR, the principal executive officer and principal financial officer of the registrant have concluded that the disclosure controls and procedures of the registrant are reasonably designed to ensure that the information required in filings on Form N-CSR is recorded, processed, summarized, and reported by the filing date, including that information required to be disclosed is accumulated and communicated to the registrant’s management, including the registrant’s principal executive officer and principal financial officer, as appropriate to allow timely decisions regarding required disclosure. |
| (b) | There were no changes in the registrant’s internal control over financial reporting (as defined in Rule 30a-3(d) under the 1940 Act (17 CFR 270.30a-3(d)) that occurred during the period covered by this report that has materially affected, or are reasonably likely to materially affect, the registrant’s internal control over financial reporting. |
Item 12. Disclosure of Securities Lending Activities for Closed-End Management Investment Companies.
Not applicable.
Item 13. Exhibits.
| (a)(1) | Code of ethics, or any amendment thereto, that is the subject of disclosure required by Item 2 is filed herewith. |
| (a)(2) | Certifications pursuant to Rule 30a-2(a) under the 1940 Act and Section 302 of the Sarbanes-Oxley Act of 2002 are filed herewith. |
| (a)(2)(1) | Not applicable. |
| (a)(2)(2) | Not applicable. |
| (b) | Certifications pursuant to Rule 30a-2(b) under the 1940 Act and Section 906 of the Sarbanes-Oxley Act of 2002 are filed herewith. |
SIGNATURES
Pursuant to the requirements of the Securities Exchange Act of 1934 and the Investment Company Act of 1940, the registrant has duly caused this report to be signed on its behalf by the undersigned, thereunto duly authorized.
| (Registrant) | Forethought Variable Insurance Trust |
| By (Signature and Title)* | /s/ Trent M. Statczar |
| Trent M. Statczar, Treasurer | |
| (principal financial officer) |
| Date | February 25, 2022 |
Pursuant to the requirements of the Securities Exchange Act of 1934 and the Investment Company Act of 1940, this report has been signed below by the following persons on behalf of the registrant and in the capacities and on the dates indicated.
| By (Signature and Title)* | /s/ Eric D. Todd |
| Eric D. Todd President | |
| (principal executive officer) |
| Date | February 25, 2022 |
| By (Signature and Title)* | /s/ Trent M. Statczar |
| Trent M. Statczar, Treasurer | |
| (principal financial officer) |
| Date | February 25, 2022 |
* Print the name and title of each signing officer under his or her signature.