UNITED STATES
SECURITIES AND EXCHANGE COMMISSION
Washington, D.C. 20549
FORM N-CSR
CERTIFIED SHAREHOLDER REPORT OF REGISTERED MANAGEMENT INVESTMENT COMPANIES
Investment Company Act file number 811-22865
Forethought Variable Insurance Trust
(Exact name of registrant as specified in charter)
10 West Market Street, Suite 2300
Indianapolis, Indiana 46204
(Address of principal executive offices) (Zip code)
The Corporation Trust Company
1209 Orange Street Wilmington, DE 19801
(Name and address of agent for service)
Registrant's telephone number, including area code: 877-355-1820
Date of fiscal year end: December 31
Date of reporting period: December 31, 2022
Form N-CSR is to be used by management investment companies to file reports with the Commission not later than 10 days after the transmission to stockholders of any report that is required to be transmitted to stockholders under Rule 30e-1 under the Investment Company Act of 1940 (17 CFR 270.30e-1). The Commission may use the information provided on Form N-CSR in its regulatory, disclosure review, inspection, and policymaking roles.
A registrant is required to disclose the information specified by Form N-CSR, and the Commission will make this information public. A registrant is not required to respond to the collection of information contained in Form N-CSR unless the Form displays a currently valid Office of Management and Budget (“OMB”) control number. Please direct comments concerning the accuracy of the information collection burden estimate and any suggestions for reducing the burden to Secretary, Securities and Exchange Commission, 450 Fifth Street, NW, Washington, DC 20549-0609. The OMB has reviewed this collection of information under the clearance requirements of 44 U.S.C. § 3507.
Item 1. Reports to Stockholders.
| (a) | Include a copy of the report transmitted to stockholders pursuant to Rule 30e-1 under the Act (17 CFR 270.30e-1). |

Annual Report
December 31, 2022
Global Atlantic Portfolios
Global Atlantic American Funds® Managed Risk Portfolio
Global Atlantic Balanced Managed Risk Portfolio
Global Atlantic BlackRock Selects Managed Risk Portfolio
Global Atlantic Franklin Dividend and Income Managed Risk Portfolio
Global Atlantic Growth Managed Risk Portfolio
Global Atlantic Moderate Growth Managed Risk Portfolio
Global Atlantic Select Advisor Managed Risk Portfolio
Global Atlantic Wellington Research Managed Risk Portfolio
Class II shares
Each a separate series of the Forethought Variable Insurance Trust
Distributed by Global Atlantic Distributors, LLC
Member FINRA
Dear Shareholders/Contract Owners:
Since the COVID-19 Pandemic (the "Pandemic") began nearly three years ago, the financial markets have experienced a prolonged period of heightened volatility driven by the global economic uncertainties posed under the circumstances and central banks' responses to rapidly changing conditions. In 2020 and 2021, the additional Pandemic-related easing of monetary policy from an already accommodative position helped fuel a two-year broad-based equity rally. In 2022, however, the decade-long accommodative policies from global central banks that fueled the bull market led to a rise in inflation. When combined with already challenging supply chains made worse by China's zero COVID policy and Russia's invasion of Ukraine, which drove food and energy prices higher (Ukraine a large wheat supplier, Russia a large energy supplier), inflation rose to levels not seen in decades. As a consequence, central banks quickly pivoted to an aggressive tightening schedule in an attempt to curb inflation, which led to concerns over slowing growth and the possibility of a recession.
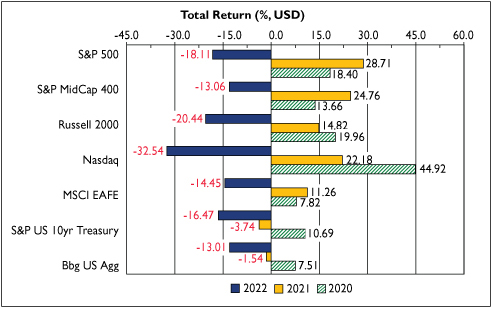
The result was meaningfully negative returns in both equity and fixed income markets in 2022, as shown in the chart below. International equity indices generally fared better than U.S. indices, particularly the U.S. technology-focused Nasdaq and U.S. small cap-oriented Russell 2000, both of which finished the year in a bear market (defined as down 20% or more). Within fixed income, the Federal Reserve increased interest rates on seven occasions in 2022 by a total of 425 basis points which resulted in fixed income volatility levels not seen since the 2008 Global Financial Crisis. To illustrate the impact, the U.S. 10-year Treasury peaked in October 2022 at 4.33% and finished the year at 3.88%, compared to ending 2021 and 2020 at 1.51% and 0.92%, respectively. This rapid rise in rates, which has not been experienced since the early 1980s, led to some of the weakest returns in history across much of fixed income, with the S&P U.S. 10-year Treasury Index ("S&P US 10yr Treasury") down -16.47% and the Bbg US Agg down -13.01% in 2022. Unlike many historical periods when fixed income returns helped partially offset negative equity returns in diversified portfolios, this did not happen in 2022.
We expect inflation, interest rates, and the Ukraine/Russia conflict to be the key concerns surrounding economic growth in 2023, particularly given the lag effect that interest rate changes typically have on the economy, and therefore, economic data. In addition, while the Pandemic has eased somewhat with the greater adoption of vaccines globally, COVID-19 has not been eliminated and may continue to pose a risk if new variants and/or regional outbreaks emerge.
Given the hardships endured in recent years, we hope this shareholder letter finds you healthy and wish you all the best for 2023 and beyond.
Thank you for investing in the Global Atlantic Portfolios.
Sincerely, | |

| | 
| |
Eric D. Todd, CFA | | Cameron Jeffreys, CFA | |
President | | Senior Vice President | |
Global Atlantic Investment Advisors, LLC | | Global Atlantic Investment Advisors, LLC | |
1
Portfolio | | Benchmark | |
Global Atlantic American Funds® Managed Risk Portfolio | | S&P Global Managed Risk LargeMidCap Index – Moderate Conservative | |
Global Atlantic Balanced Managed Risk Portfolio | | S&P Global Managed Risk LargeMidCap Index – Conservative | |
Global Atlantic BlackRock Selects Managed Risk Portfolio | | S&P Global Managed Risk LargeMidCap Index – Moderate Conservative | |
Global Atlantic Franklin Dividend and Income Managed
Risk Portfolio | | S&P 500 Managed Risk Index – Moderate | |
Global Atlantic Growth Managed Risk Portfolio | | S&P Global Managed Risk LargeMidCap Index – Moderate Aggressive | |
Global Atlantic Moderate Growth Managed Risk Portfolio | | S&P Global Managed Risk LargeMidCap Index – Moderate Conservative | |
Global Atlantic Select Advisor Managed Risk Portfolio | | S&P Global Managed Risk LargeMidCap Index – Moderate | |
Global Atlantic Wellington Research Managed Risk Portfolio | | S&P 500 Managed Risk Index – Moderate Conservative | |
The indices shown are for informational purposes only and are not reflective of any investment. As it is not possible to invest directly in the indices, the data shown does not reflect or compare features of an actual investment, such as its objectives, costs and expenses, liquidity, safety, guarantees or insurance, fluctuation of principal or return, or tax features. Past performance is no guarantee of future results.
This report contains the current opinions of Global Atlantic Investment Advisors, LLC and/or sub-advisers at the time of its publication and should not be considered investment advice or a recommendation of any particular security, strategy or investment product. Such opinions are subject to change without notice and securities described herein may no longer be included in, or may at any time be removed from, a Portfolio's portfolio. This report is distributed for informational purposes only. Information contained herein has been obtained from sources believed to be reliable, but not guaranteed.
Index Definitions:
Bloomberg Global Aggregate Index. A broad global market capitalization weighted equity index that represents large and mid-cap companies across all 23 developed market countries, capturing approximately 85% of each countries' market capitalization.
Bloomberg U.S. Aggregate Bond Index ("Bbg US Agg"). An index weighted according to market capitalization and includes, among other categories, Treasury securities, mortgage-backed securities, government agency bonds and corporate bonds. To be included in the index, bonds must be rated investment grade by Moody's and S&P Global Ratings.
MSCI EAFE Total Return Index ("MSCI EAFE"). An index created by Morgan Stanley Capital International (MSCI) that serves as a benchmark of the performance in major developed international equity markets as represented by 21 major MSCI indexes from Europe, Australasia and the Far East.
MSCI World Index. A broad global market capitalization weighted equity index that represents large and mid-cap companies across all 23 developed market countries, capturing approximately 85% of each countries' market capitalization.
Nasdaq Composite ("Nasdaq"). A broad-based market capitalization-weighted index of over 3,700 stocks listed on the Nasdaq Stock Exchange. As a broad index that is heavily weighted toward the technology sector, the Nasdaq serves as a benchmark for technology stocks in the United States.
Russell 2000® Index ("Russell 2000"). An index measuring the performance of approximately 2,000 small-cap companies in the Russell 3000 Index, which is made up of 3,000 of the biggest U.S. stocks. The Russell 2000 serves as a benchmark for small-cap stocks in the United States.
S&P 500 Index ("S&P 500"). A market capitalization weighted price index composed of 500 widely held U.S. common stocks. Frequently used as a measure of U.S. stock market performance.
S&P 500 Managed Risk Index – Moderate. An index that is designed to simulate a dynamic protective portfolio that allocates between the underlying equity index and cash based on realized volatilities of the underlying equity and bond indices, while maintaining a fixed allocation of 30% to the underlying bond index.
2
S&P 500 Managed Risk Index – Moderate Conservative. An index that is designed to simulate a dynamic protective portfolio that allocates between the underlying equity index and cash based on realized volatilities of the underlying equity and bond indices, while maintaining a fixed allocation of 40% to the underlying bond index.
S&P Global Managed Risk LargeMidCap Index – Conservative. An index that is designed to simulate a dynamic protective portfolio that allocates between the underlying equity index and cash based on realized volatilities of the underlying equity and bond indices, while maintaining a fixed allocation of 50% to the underlying bond index.
S&P Global Managed Risk LargeMidCap Index – Moderate. An index that is designed to simulate a dynamic protective portfolio that allocates between the underlying equity index and cash based on realized volatilities of the underlying equity and bond indices, while maintaining a fixed allocation of 30% to the underlying bond index.
S&P Global Managed Risk LargeMidCap Index – Moderate Aggressive. An index that is designed to simulate a dynamic protective portfolio that allocates between the underlying equity index and cash based on realized volatilities of the underlying equity and bond indices, while maintaining a fixed allocation of 20% to the underlying bond index.
S&P Global Managed Risk LargeMidCap Index – Moderate Conservative. An index that is designed to simulate a dynamic protective portfolio that allocates between the underlying equity index and cash based on realized volatilities of the underlying equity and bond indices, while maintaining a fixed allocation of 40% to the underlying bond index.
S&P MidCap 400 Total Return Index ("S&P MidCap 400"). A capitalization-weighted index which measures the performance of the mid-range sector of the U.S. stock market.
S&P SmallCap 600 Index. A capitalization-weighted index that seeks to measure the small-cap segment of the U.S. equity market.
S&P U.S. Treasury Bond Current 10-Year Index ("S&P U.S. 10yr Treasury"). An index that holds the most recently issued 10-year U.S. Treasury Note or bond.
5434559.1
3
| | | | | Page | |
• | | Global Atlantic Portfolio Review and Portfolio of Investments | | | |
| | | Global Atlantic American Funds® Managed Risk Portfolio | | | 5 – 8 | | |
| | | Global Atlantic Balanced Managed Risk Portfolio | | | 9 – 12 | | |
| | | Global Atlantic BlackRock Selects Managed Risk Portfolio | | | 13 – 17 | | |
| | | Global Atlantic Franklin Dividend and Income Managed Risk Portfolio | | | 18 – 28 | | |
| | | Global Atlantic Growth Managed Risk Portfolio | | | 29 – 32 | | |
| | | Global Atlantic Moderate Growth Managed Risk Portfolio | | | 33 – 36 | | |
| | | Global Atlantic Select Advisor Managed Risk Portfolio | | | 37 – 40 | | |
| | | Global Atlantic Wellington Research Managed Risk Portfolio | | | 41 – 53 | | |
• | | Financial Statements: | | | |
| | | Statements of Assets and Liabilities | | | 54 – 55 | | |
| | | Statements of Operations | | | 56 – 57 | | |
| | | Statements of Changes in Net Assets | | | 58 – 61 | | |
| | | Financial Highlights | | | 62 – 69 | | |
• | | Notes to Financial Statements | | | 70 – 92 | | |
• | | Report of Independent Registered Accounting Firm | | | 93 | | |
• | | Expense Examples | | | 94 – 95 | | |
• | | Supplemental Information | | | 96 – 97 | | |
• | | Trustee and Officer Table | | | 98 – 101 | | |
• | | Privacy Notice | | | 102 – 103 | | |
• | | Proxy Voting Policy | | Back Cover | |
• | | Portfolio Holdings | | Back Cover | |
4
Global Atlantic American Funds® Managed Risk Portfolio
Portfolio Review
December 31, 2022 (Unaudited)
Investment Objective
The Portfolio seeks to provide capital appreciation and income while seeking to manage volatility.
Management Review
The capital appreciation and income component is sub-advised by Wilshire Advisors, LLC (formerly Wilshire Associates Incorporated) ("Wilshire"), while the managed risk component is sub-advised by Milliman Financial Risk Management LLC ("Milliman").
How did the Portfolio perform during the period?
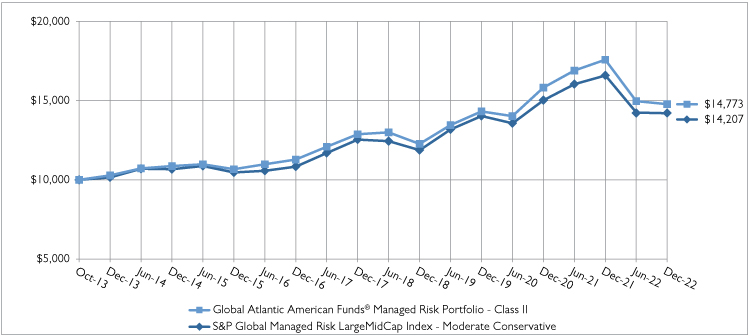
During 2022, the Portfolio underperformed its reference benchmark, the S&P Global Managed Risk LargeMidCap Index – Moderate Conservative. The Portfolio posted a return of -15.94% compared to a benchmark return of -14.37%, a difference of -157 basis points. The following discussion of relative performance pertains to this benchmark.
What factors and allocation decisions influenced the Portfolio's performance?
The Portfolio was impacted by both dynamic asset allocation as well as manager selection during 2022. An overweight to U.S. large cap equities generally contributed to relative performance, as did an overweight to value equities. Other tilts within equities were towards U.S. and global, which modestly detracted to performance. The fixed income portion of the Portfolio benefited from a modest overweight to government securities, an underweight to fixed income duration early in the year, and a modest overweight to credit later in the year. From a manager selection perspective, those within equities detracted from performance while those in fixed income were additive.
The Portfolio made several allocation changes during the year. In the first quarter of 2022, the Portfolio eliminated its small allocation to the American Funds Insurance Series® Capital World Bond Fund to remove an out-of-benchmark allocation. Furthermore, the Portfolio eliminated its exposure to the American Funds Insurance Series® New World Fund and reduced its allocation to the American Funds Insurance Series® Capital World Growth & Income Fund and American Funds Insurance Series® Global Small Cap Fund, moving it to the American Funds® International Growth and Income Fund to reduce emerging markets exposure and to avoid being overweight domestic equities relative to foreign equities. During the second quarter, the Portfolio removed its underweight to duration by trimming exposure to American Funds Insurance Series® U.S. Government Securities Fund and reallocating to American Funds Insurance Series® The Bond Fund of America. Additionally, the Portfolio's allocation to American Funds Insurance Series® Growth-Income Fund and American Funds Insurance Series® Washington Mutual Investors Fund was reduced and reallocated to American Funds Insurance Series® Growth Fund to remove the overweight to domestic value equities. In the third quarter, the Portfolio reduced its allocation to American Funds Insurance Series® U.S. Government Securities Fund and reallocated to American Funds Insurance Series® The Bond Fund of America and American Funds Insurance Series® American High-Income Trust Fund in order to enact an overweight to credit relative to government fixed income.
From a volatility perspective, the Milliman Managed Risk Strategy ("MMRS") was a contributor to performance during the year, reducing both the Portfolio's volatility and maximum drawdown during a period when most asset classes, most notably equities and fixed income, posted negative returns.
How was the Portfolio positioned at period end?
Wilshire believes that the Portfolio remains well positioned to meaningfully participate in a rally in risk assets but also sufficiently diversified to potentially outperform broad market equities during a selloff. At year end, the only active equity tilt in place is a modest overweight to emerging markets equities relative to foreign developed equities due to a mixture of Wilshire's strong outlook for emerging markets GDP growth in 2023 (particularly China – as it exits COVID protocols) and a hazier outlook for Europe, which is exposed to the negative economic effects of Russia's invasion of Ukraine. Within fixed income, the Portfolio is roughly neutral overall, though with a modest overweight to credit relative to government fixed
5
Global Atlantic American Funds® Managed Risk Portfolio
Portfolio Review (Continued)
December 31, 2022 (Unaudited)
income. Given the weak returns generated in 2022 due to the inflationary and rising interest rate environment, Wilshire believes that fixed income enters 2023 attractively priced and expects the asset class to generate attractive returns over the coming decade. Wilshire believes that equities are somewhat more difficult to predict. While global equity markets were down substantially during 2022, Wilshire believes the negative returns can mostly be explained by the rise in interest rates (and related rise in discount rates). Wilshire believes that if corporate earnings growth is flat to modest in 2023, then year-end 2022 prices are probably fair, but if corporate earnings growth is positive and meets expectations, then equities could rally during 2023. Overall, the Portfolio is neutral for fixed income versus equities, and Wilshire believes both have a better outlook entering 2023 than they did entering 2022.
The Portfolio's performance figures for the periods ended December 31, 2022 as compared to its benchmark:
| | | | | | | Annualized | | Operating
Expense* | |
| | | Inception
Date | | One
Year | | Five
Years | | Since
Inception | | Gross
Ratio | | Net
Ratio | |
Global Atlantic American Funds® Managed Risk Portfolio | |
Class II | | October 31, 2013 | | | -15.94 | % | | | 2.79 | % | | | 4.35 | % | | | 1.63 | % | | | 1.23 | % | |
S&P Global Managed Risk LargeMidCap Index - Moderate
Conservative^ | | | | | | | -14.37 | % | | | 2.52 | % | | | 3.91 | % | | | | | | | | | |
The performance data quoted is historical. Past performance is no guarantee of future results. Current performance may be higher or lower than the performance data quoted. The principal value and investment return of an investment will fluctuate so that your shares, when redeemed, may be worth more or less than their original cost. Total returns would have been lower absent fee waivers by the Adviser. Performance figures for periods greater than one year are annualized. The returns shown do not reflect the deduction of taxes that a shareholder may pay on Portfolio distributions or on the redemption of Portfolio shares, as well as other charges and expenses of the insurance contract or separate account. Prior to October 1, 2016, the Capital Appreciation and Income Component of the Portfolio was managed by the Adviser without the use of a sub-adviser. The performance prior to that date is attributable to the Adviser's asset allocation decisions.
* The estimated operating expense ratios for Class II shares, as disclosed in the most recent prospectus dated May 1, 2022. Ratios include Acquired Fund Fees and Expenses indirectly incurred by the Portfolio. Gross operating expense ratio reflects the ratio of expenses absent waivers and/or reimbursements by the Adviser. The operating expense ratios presented here may differ from the expense ratios disclosed in the Financial Highlights table in this report.
^ The S&P Global Managed Risk LargeMidCap Index - Moderate Conservative. An index that is designed to simulate a dynamic protective portfolio that allocates between the underlying equity index and cash based on realized volatilities of the underlying equity and bond indices, while maintaining a fixed allocation of 40% to the underlying bond index.
Comparison of the Change in Value of a $10,000 Investment
6
Global Atlantic American Funds® Managed Risk Portfolio
Portfolio Review (Continued)
December 31, 2022 (Unaudited)
Holdings by Asset Class | | % of Net Assets | |
Variable Insurance Trusts | | | 85.9 | % | |
Mutual Funds | | | 8.6 | % | |
Short-Term Investments | | | 3.9 | % | |
Other Assets less Liabilities - Net | | | 1.6 | % | |
| | | | 100.0 | % | |
Please refer to the Portfolio of Investments in this annual report for more information regarding the Portfolio's holdings as of December 31, 2022.
Derivative exposure is included in "Other Assets less Liabilities - Net"
5435661.3
7
Global Atlantic American Funds® Managed Risk Portfolio
Portfolio of Investments
December 31, 2022
| | | Shares/
Principal | | Fair
Value | |
VARIABLE INSURANCE TRUSTS - 85.9% | |
DEBT FUNDS - 32.9% | |
American Funds Insurance Series -
American High-Income Trust, Class 1 | | | 762,233 | | | $ | 6,501,848 | | |
American Funds Insurance Series -
The Bond Fund of America, Class 1 | | | 4,839,554 | | | | 45,540,200 | | |
American Funds Insurance Series -
U.S. Government Securities Fund, Class 1 | | | 489,503 | | | | 4,890,132 | | |
TOTAL DEBT FUNDS | | | | | 56,932,180 | | |
EQUITY FUNDS - 53.0% | |
American Funds Insurance Series -
Capital World Growth and
Income Fund, Class 1 | | | 1,402,456 | | | | 16,366,664 | | |
American Funds Insurance Series -
Global Small Capitalization Fund, Class 1* | | | 201,971 | | | | 3,275,966 | | |
American Funds Insurance Series -
Washington Mutual Investors Fund, Class 1 | | | 1,937,573 | | | | 24,587,798 | | |
American Funds Insurance Series
Growth Fund, Class 1 | | | 319,003 | | | | 24,336,706 | | |
American Funds Insurance Series
Growth-Income Fund, Class 1 | | | 457,107 | | | | 22,951,341 | | |
TOTAL EQUITY FUNDS | | | | | 91,518,475 | | |
TOTAL VARIABLE INSURANCE TRUSTS
(Cost - $150,902,581) | | | | | 148,450,655 | | |
| | | Shares/
Principal | | Fair
Value | |
MUTUAL FUNDS - 8.6% | |
EQUITY FUNDS - 8.6% | |
International Growth and Income
Fund (Cost - $17,106,904) | | | 464,567 | | | $ | 14,801,108 | | |
SHORT-TERM INVESTMENTS - 3.9% | |
MONEY MARKET FUNDS - 3.9% | |
Dreyfus Government Cash
Management, 4.19% (a) | | | 6,687,191 | | | | 6,687,191 | | |
Fidelity Investments Money Market
Fund - Government Portfolio,
Institutional Class, 4.06% (a) | | | 15,004 | | | | 15,004 | | |
TOTAL SHORT-TERM INVESTMENTS
(Cost - $6,702,195) | | | | | | | 6,702,195 | | |
TOTAL INVESTMENTS - 98.4%
(Cost - $174,711,680) | | | | | | $ | 169,953,958 | | |
OTHER ASSETS LESS LIABILITIES - NET 1.6% | | | | | | | 2,724,422 | | |
TOTAL NET ASSETS - 100.0% | | | | | | $ | 172,678,380 | | |
* Non-income producing security.
(a) The rate shown is the annualized seven-day yield at period end.
FUTURES CONTRACTS | |
SHORT FUTURES CONTRACTS | | Counterparty | | Number of
Contracts | | Expiration Date | | Notional Value | | Fair Value/
Unrealized
Appreciation
(Depreciation) | |
E-Mini Russell 2000 Future | | Goldman Sachs & Co. | | | 30 | | | 3/17/2023 | | $ | 2,656,350 | | | $ | 54,538 | | |
MSCI EAFE Future | | Goldman Sachs & Co. | | | 118 | | | 3/17/2023 | | | 11,501,460 | | | | 167,920 | | |
MSCI Emerging Market Index Future | | Goldman Sachs & Co. | | | 74 | | | 3/17/2023 | | | 3,549,780 | | | | 44,065 | | |
S&P 500 E-Mini Future | | Goldman Sachs & Co. | | | 119 | | | 3/17/2023 | | | 22,972,950 | | | | 532,142 | | |
S&P MID 400 E-Mini Future | | Goldman Sachs & Co. | | | 15 | | | 3/17/2023 | | | 3,663,900 | | | | 58,900 | | |
TOTAL NET UNREALIZED APPRECIATION ON FUTURES CONTRACTS | | $ | 857,565 | | |
See accompanying notes to financial statements.
8
Global Atlantic Balanced Managed Risk Portfolio
Portfolio Review
December 31, 2022 (Unaudited)
Investment Objective
The Portfolio seeks to provide capital appreciation and income while seeking to manage volatility.
Management Review
The capital appreciation and income component is sub-advised by BlackRock Investment Management, LLC ("BlackRock"), while the managed risk component is sub-advised by Milliman Financial Risk Management LLC ("Milliman").
How did the Portfolio perform during the period?
During 2022, the Portfolio underperformed its reference benchmark, the S&P Global Managed Risk LargeMidCap Index – Conservative. The Portfolio posted a return of -15.07% compared to a benchmark return of -13.75%, a difference of -132 basis points. The following discussion of relative performance pertains to this benchmark unless otherwise noted.
What factors and allocation decisions influenced the Portfolio's performance?
The past year was very challenging, with continued inflation pressures leading to faster than expected tightening by the U.S. Federal Reserve (the "Fed"), which in turn spurred fears of a recession. These dynamics posed headwinds for both equity and fixed income markets, with almost all asset classes delivering negative returns in 2022. From an asset allocation perspective, the Portfolio benefited from its underweight to fixed income despite being hurt by this positioning early in the year as equities rallied. Certain inflation sensitive asset classes such as commodities and energy sector equities performed well given the inflationary environment. In this vein, the Portfolio's overweight to energy equities was the biggest contributor to performance. Within equities, the Portfolio benefited from a relative overweight to U.S. equity markets and a relative overweight to value within non-U.S. developed markets. Factor exposure across value, minimum volatility, and momentum in the U.S. helped the Portfolio as well. A relative overweight to environmental, social, and governance ("ESG") equities detracted as ESG equities underperformed the broad market. Sector overweight positions were mixed during the year, with energy stocks performing well while infrastructure, global technology, and high dividend stocks detracted from performance. Within fixed income, the Portfolio was hurt by a relative overweight to longer duration fixed income as the Fed continued to raise interest rates in the U.S. and by exposure to high yield.
From a volatility perspective, the Milliman Managed Risk Strategy ("MMRS") was a significant contributor to performance during the year, reducing both the Portfolio's volatility and maximum drawdown during a period when most asset classes, most notably equities and fixed income, posted negative returns.
How was the Portfolio positioned at period end?
In BlackRock's view, outsized Fed influence, recession risk, and inflation uncertainty vastly widens the range of outcomes and thus diminishes risk-taking appetite. In this environment, BlackRock sought to de-risk the Portfolio by reducing active positions relative to the benchmark in order to create the ability to be nimble at a later date. These proactive moves have generally served the Portfolio well amidst this challenging period.
Given the continued uncertainty, the Portfolio ended the period neutral to equities and slightly underweight to fixed income. Within equities, the Portfolio is slightly overweight to the U.S. relative to non-U.S. developed markets and emerging markets. BlackRock reduced this relative overweight to the U.S. equity markets over the period. Within U.S. equities, the Portfolio maintains an overweight to ESG equities, but BlackRock reduced that overweight in the period as well. From a sector and factor perspective, the Portfolio is overweight momentum, minimum volatility, and energy stocks. Within non-U.S. developed markets, the Portfolio is overweight value, and within emerging markets, the Portfolio holds minimum volatility stocks.
Within fixed income, BlackRock's investment team believes the increase in yields has uncovered new opportunities, namely in shorter-term credit. BlackRock reduced the Portfolio's underweight to fixed income over the period and removed the allocation to treasury inflation-protected securities ("TIPS") given BlackRock's view that inflation should moderate into 2023. The Portfolio is also overweight to convertible bonds, as convertibles are generally less rate sensitive and offer exposure to technology companies.
9
Global Atlantic Balanced Managed Risk Portfolio
Portfolio Review (Continued)
December 31, 2022 (Unaudited)
The Portfolio's performance figures for the periods ended December 31, 2022 as compared to its benchmark:
| | | | | | | Annualized | | Operating
Expense* | |
| | | Inception
Date | | One
Year | | Five
Years | | Since
Inception | | Gross
Ratio | | Net
Ratio | |
Global Atlantic Balanced Managed Risk Portfolio | |
Class II | | October 31, 2013 | | | -15.07 | % | | | 1.67 | % | | | 3.29 | % | | | 1.00 | % | | | 1.00 | % | |
S&P Global Managed Risk LargeMidCap Index - Conservative^ | | | | | -13.75 | % | | | 2.17 | % | | | 3.57 | % | | | | | |
The performance data quoted is historical. Past performance is no guarantee of future results. Current performance may be higher or lower than the performance data quoted. The principal value and investment return of an investment will fluctuate so that your shares, when redeemed, may be worth more or less than their original cost. Total returns would have been lower absent fee waivers by the Adviser. Performance figures for periods greater than one year are annualized. The returns shown do not reflect the deduction of taxes that a shareholder may pay on Portfolio distributions or on the redemption of Portfolio shares, as well as other charges and expenses of the insurance contract or separate account. Prior to October 1, 2016, the Capital Appreciation and Income Component of the Portfolio was managed by the Adviser without the use of a sub-adviser. The performance prior to that date is attributable to the Adviser's asset allocation decisions. From October 1, 2016 to May 1, 2021, BlackRock Financial Management, Inc. served as a sub-adviser to the Capital Appreciation and Income Component of the Portfolio. In addition, effective May 1, 2021 the sub-adviser to the Capital Appreciation and Income Component of the Portfolio changed from BlackRock Financial Management, Inc. to BlackRock Investment Management, LLC. No changes were made to the Portfolio's principal investment strategies or to the portfolio management team as a result of the change in sub-adviser.
* The estimated operating expense ratios for Class II shares, as disclosed in the most recent prospectus dated May 1, 2022. Ratios include Acquired Fund Fees and Expenses indirectly incurred by the Portfolio. Gross operating expense ratio reflects the ratio of expenses absent waivers and/or reimbursements by the Adviser. The operating expense ratios presented here may differ from the expense ratios disclosed in the Financial Highlights table in this report.
^ The S&P Global Managed Risk LargeMidCap Index - Conservative is designed to simulate a dynamic protective portfolio that allocates between the underlying equity index and cash, based on realized volatilities of the underlying equity and bond indices, while maintaining a fixed allocation of 50% to the underlying bond index.
Comparison of the Change in Value of a $10,000 Investment

10
Global Atlantic Balanced Managed Risk Portfolio
Portfolio Review (Continued)
December 31, 2022 (Unaudited)
Holdings by Asset Class | | % of Net Assets | |
Exchange-Traded Funds | | | 94.5 | % | |
Short-Term Investments | | | 4.1 | % | |
Other Assets less Liabilities - Net | | | 1.4 | % | |
| | | | 100.0 | % | |
Please refer to the Portfolio of Investments in this annual report for more information regarding the Portfolio's holdings as of December 31, 2022.
Derivative exposure is included in "Other Assets less Liabilities - Net"
5435661.3
11
Global Atlantic Balanced Managed Risk Portfolio
Portfolio of Investments
December 31, 2022
| | | Shares/
Principal | | Fair
Value | |
EXCHANGE TRADED FUNDS - 94.5% | |
DEBT FUNDS - 46.0% | |
iShares 0-5 Year High Yield Corporate
Bond ETF | | | 59,340 | | | $ | 2,426,413 | | |
iShares 10+ Year Investment Grade
Corporate Bond ETF | | | 35,936 | | | | 1,789,253 | | |
iShares 10-20 Year Treasury Bond ETF | | | 22,889 | | | | 2,476,132 | | |
iShares 1-3 Year Treasury Bond ETF | | | 46,704 | | | | 3,790,964 | | |
iShares 1-5 Year Investment Grade
Corporate Bond ETF | | | 43,346 | | | | 2,159,498 | | |
iShares 20+ Year Treasury Bond ETF | | | 10,218 | | | | 1,017,304 | | |
iShares 3-7 Year Treasury Bond ETF | | | 29,237 | | | | 3,359,039 | | |
iShares 5-10 Year Investment Grade
Corporate Bond ETF | | | 48,711 | | | | 2,411,682 | | |
iShares 7-10 Year Treasury Bond ETF | | | 6,962 | | | | 666,820 | | |
iShares Convertible Bond ETF | | | 12,199 | | | | 847,464 | | |
iShares Core Total USD Bond Market ETF | | | 269,521 | | | | 12,109,578 | | |
iShares Core U.S. Aggregate Bond ETF | | | 65,421 | | | | 6,345,183 | | |
iShares TIPS Bond ETF | | | 16,839 | | | | 1,792,343 | | |
TOTAL DEBT FUNDS | | | | | 41,191,673 | | |
EQUITY FUNDS - 48.5% | |
iShares Core MSCI EAFE ETF | | | 80,978 | | | | 4,991,484 | | |
iShares Core S&P 500 ETF | | | 56,006 | | | | 21,518,065 | | |
iShares Core S&P Mid-Cap ETF | | | 14,805 | | | | 3,581,182 | | |
iShares Core S&P Small-Cap ETF | | | 23,731 | | | | 2,245,902 | | |
iShares ESG Aware MSCI USA ETF | | | 64,760 | | | | 5,488,410 | | |
iShares MSCI EAFE Growth ETF | | | 15,536 | | | | 1,301,295 | | |
| | | Shares/
Principal | | Fair
Value | |
EQUITY FUNDS - 48.5% (Continued) | |
iShares MSCI EAFE Value ETF | | | 32,973 | | | $ | 1,512,801 | | |
iShares MSCI Emerging Markets
Min Vol Factor ETF | | | 7,720 | | | | 409,546 | | |
iShares MSCI USA Min Vol Factor ETF | | | 9,196 | | | | 663,032 | | |
iShares MSCI USA Momentum Factor ETF | | | 8,909 | | | | 1,300,090 | | |
iShares U.S. Energy ETF | | | 8,889 | | | | 413,250 | | |
TOTAL EQUITY FUNDS | | | | | 43,425,057 | | |
TOTAL EXCHANGE TRADED FUNDS
(Cost - $79,691,561) | | | | | 84,616,730 | | |
SHORT-TERM INVESTMENTS - 4.1% | |
MONEY MARKET FUNDS - 4.1% | |
Dreyfus Government Cash
Management, 4.19% (a) | | | 2,785,958 | | | | 2,785,958 | | |
Fidelity Investments Money Market
Fund - Government Portfolio,
Institutional Class, 4.06% (a) | | | 884,401 | | | | 884,401 | | |
TOTAL SHORT-TERM INVESTMENTS
(Cost - $3,670,359) | | | | | 3,670,359 | | |
TOTAL INVESTMENTS - 98.6%
(Cost - $83,361,920) | | | | $ | 88,287,089 | | |
OTHER ASSETS LESS LIABILITIES - NET 1.4% | | | | | 1,212,006 | | |
TOTAL NET ASSETS - 100.0% | | | | $ | 89,499,095 | | |
(a) The rate shown is the annualized seven-day yield at period end.
TIPS - Treasury Inflation Protected Security
FUTURES CONTRACTS | |
SHORT FUTURES CONTRACTS | | Counterparty | | Number of
Contracts | | Expiration Date | | Notional Value | | Fair Value/
Unrealized
Appreciation
(Depreciation) | |
E-Mini Russell 2000 Future | | Goldman Sachs & Co. | | | 16 | | | 3/17/2023 | | $ | 1,416,720 | | | $ | 31,890 | | |
MSCI EAFE Future | | Goldman Sachs & Co. | | | 37 | | | 3/17/2023 | | | 3,606,390 | | | | 55,655 | | |
MSCI Emerging Market Index Future | | Goldman Sachs & Co. | | | 4 | | | 3/17/2023 | | | 191,880 | | | | 3,990 | | |
S&P 500 E-Mini Future | | Goldman Sachs & Co. | | | 69 | | | 3/17/2023 | | | 13,320,450 | | | | 352,203 | | |
S&P MID 400 E-Mini Future | | Goldman Sachs & Co. | | | 10 | | | 3/17/2023 | | | 2,442,600 | | | | 45,480 | | |
TOTAL NET UNREALIZED APPRECIATION ON FUTURES CONTRACTS | | | | | | | | | | $ | 489,218 | | |
See accompanying notes to financial statements.
12
Global Atlantic BlackRock Selects Managed Risk Portfolio
Portfolio Review
December 31, 2022 (Unaudited)
Investment Objective
The Portfolio seeks to provide capital appreciation and income while seeking to manage volatility.
Management Review
The capital appreciation and income component is sub-advised by BlackRock Investment Management, LLC ("BlackRock"), while the managed risk component is sub-advised by Milliman Financial Risk Management LLC ("Milliman").
How did the Portfolio perform during the period?
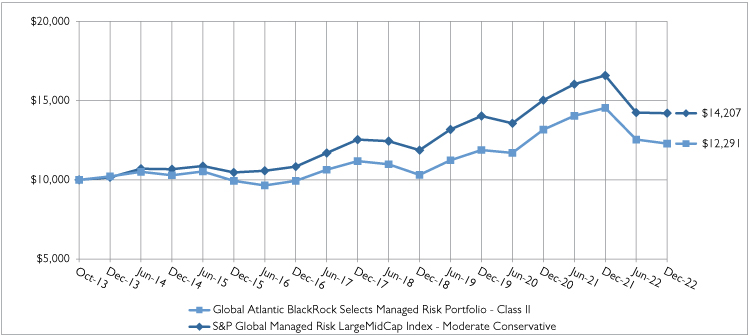
During 2022, the Portfolio underperformed its reference benchmark, the S&P Global Managed Risk LargeMidCap Index – Moderate Conservative. The Portfolio posted a return of -15.48% compared to a benchmark return of -14.37%, a difference of -111 basis points. The following discussion of relative performance pertains to this benchmark.
What factors and allocation decisions influenced the Portfolio's performance?
The year 2022 presented a challenging market with global equity markets down 18% (as measured by the MSCI World Index), the worst calendar year for equities since the 2008 Global Financial Crisis. As difficult of an environment as it was for equities, 2022 was arguably tougher for bond investors as global bond markets were down 16% (as measured by the Bloomberg Global Aggregate Index). Market volatility was driven by multi-decade high levels of inflation that proved to be more persistent than initially expected and followed a period of supply chain bottlenecks and the Russian invasion of the Ukraine. This caused central bank policy to turn hawkish to combat higher prices. While market participants had anticipated the removal of central bank easing going into 2022, the magnitude and rapidity of the change needed was beyond what most expected. For perspective, in March 2022, the U.S. Federal Reserve (the "Fed") was still conducting quantitative easing, with the Fed Funds rate at 0%. As of the fourth quarter of 2022, the Fed Funds rate was just shy of 4.5% after a historic 4 consecutive 75-basis point interest rate hikes, followed by a 50-basis point increase to cap off the year.
Global stocks and bonds came under considerable selling pressure during the first quarter of 2022, as the combination of anticipated rate hikes from the world's major central banks, the eruption of hostilities between Russia and Ukraine, and renewed lockdown concerns in China caused investors to shun both high quality bonds and risky assets. Broad equity market weakness continued throughout the second and third quarters, as investors remained concerned that central banks would tighten monetary policy too aggressively, causing an unintended economic contraction. During prior risk-off periods, investors have been able to seek stability in high quality fixed income, but that was not the case this year. Rapidly rising interest rates and a consistently hawkish Fed put downward pressure on high quality fixed income, leaving very few places for investors to seek refuge from market volatility. Although equity markets rallied sharply at the beginning of the fourth quarter on better-than-expected corporate earnings while bonds followed suit in November following better than expected U.S. Consumer Price Index ("CPI") data, stocks and bonds resumed their declines in December as both U.S. payrolls and hourly earnings growth came in well above Wall Street consensus estimates, prompting investor concerns that the Fed would continue tightening monetary policy into 2023. In addition, the Bank of Japan's decision to alter its policy of "yield curve control" ("YCC") also weighed on global risk assets, as the economic consequences of the shift encouraged Japanese investors to sell their foreign securities holdings (including U.S. Treasuries) and repatriate capital back home, further draining liquidity from global capital markets.
From a broad asset allocation perspective, an exposure to cash and cash equivalents was the largest overall contributor for the year but was partially offset by an underweight to both equities and fixed income. Within equities, an overweight to energy positively impacted returns. Security selection within information technology was additive but was partially offset by an overweight allocation to the sector. An underweight to consumer staples detracted, as did security selection within industrials and materials. Security selection within consumer discretionary, an overweight to consumer discretionary and an underweight to financials also negatively impacted returns. Within fixed income, exposure to credit and positioning within U.S. Treasuries was additive.
13
Global Atlantic BlackRock Selects Managed Risk Portfolio
Portfolio Review (Continued)
December 31, 2022 (Unaudited)
From a volatility perspective, the Milliman Managed Risk Strategy ("MMRS") was a modest detractor to performance during the year.
How was the Portfolio positioned at period end?
At year end, relative to its reference benchmark, the Portfolio was underweight both equities and fixed income. Looking ahead, BlackRock continues to believe that despite the challenges faced in 2022, many underestimate how adaptive, innovative, and flexible the U.S. economy can be. As a result, the BlackRock team believes that the U.S. will likely avoid a material economic contraction in 2023 (and may avoid a recession altogether), as the strength of the U.S. labor market should provide structural support for overall consumption. Across major macro indicators, BlackRock anticipates inflation to continue to moderate, with core PCE (Personal Consumption Expenditures Price Index) declining to the 3.0-3.5% range and core CPI falling below 4% by mid-2023. BlackRock believes nominal GDP for 2022 will end between 6-7% and fall closer to 3.5% for 2023 (as compared to a nominal GDP, NGDP, of 14% in 2021). Going forward, BlackRock anticipates real GDP to be closer to 1.5-2.0%, which would give some room for U.S. Treasury Rates to come down from current levels. In terms of future central bank tightening, the BlackRock team believes the Fed is likely to maintain a tightening bias early in 2023 given the strength of the U.S. jobs market. That said, BlackRock believes the magnitude of increases will be more in line with historical moves (i.e., incremental 25-basis point hikes), which would likely have a much smaller impact on interest rate volatility and as a result allow for more stability across both fixed income and equity markets.
At the end of the period, the Portfolio was overweight the U.S., and to a lesser extent select emerging market countries, and was significantly underweight non-U.S. developed markets, most notably Japan, Canada, the United Kingdom and Australia. The Portfolio's overweight to U.S. stocks reflects the BlackRock team's view that the U.S. will likely avoid a material economic contraction in 2023 (and may avoid a recession altogether), as the strength of the U.S. labor market should provide structural support for overall consumption. The Portfolio remained underweight Japan, Canada, and Australia for a variety of reasons, notably the large exposure each of those markets have to financials (both banks and insurance). Within Europe, the team has become more constructive in recent months and narrowed the underweight given recent U.S. dollar weakness, as well as signs of a deceleration in inflation and energy prices.
From a sector perspective, the Portfolio was overweight energy and healthcare and was underweight financials, industrials, real estate, consumer discretionary, consumer staples, and communication services. Sector positioning reflects a barbell approach favoring secular growth themes alongside quality cyclicals. This reflects a desire to lean into "GARP" (growth at a reasonable price) and quality (companies that can generate strong free cash flows and have low leverage ratios.) Energy remains the Portfolio's largest overweight given the current undersupply and potential impact from the reopening of the Chinese economy. Financials remain the Portfolio's largest underweight as the BlackRock team remains cautious on banks and insurance companies, as flat and/or inverted yield curves (despite meaningfully higher interest rates) may place pressure on the net interest margins of various banking firms.
Within fixed income, the Portfolio was overweight high yield credit and, to a lesser extent, U.S. government bonds, and it was underweight securitized assets. The Portfolio was underweight duration relative to the reference benchmark (2.04 years vs. 2.53 years). While BlackRock believes the bulk of the U.S. interest rate hikes have occurred, it expects continued tightening from central banks (albeit at smaller increments). Within credit, most of the exposure is in U.S. high yield, which has historically been less sensitive to duration risk as compared to investment grade debt. While economic growth is decelerating, BlackRock does not expect a sharp contraction in economic activity in the U.S. given the strength of the U.S. labor market. As a result, the BlackRock team does not expect a significant increase in corporate credit downgrades or defaults. BlackRock also added to securitized assets over the fourth quarter as the possibility of falling interest rate volatility may help support mortgage-bond prices.
Given the current environment, BlackRock maintained exposure to cash equivalents as the team believes it to be a more efficient means to hedge equity risk compared to short- and intermediate-term U.S. Treasuries.
14
Global Atlantic BlackRock Selects Managed Risk Portfolio
Portfolio Review (Continued)
December 31, 2022 (Unaudited)
The Portfolio's performance figures for the periods ended December 31, 2022 as compared to its benchmark:
| | | | | | | Annualized | | Operating
Expense* | |
| | | Inception
Date | | One
Year | | Five
Years | | Since
Inception | | Gross
Ratio | | Net
Ratio | |
Global Atlantic BlackRock Selects Managed Risk Portfolio | |
Class II | | October 31, 2013 | | | -15.48 | % | | | 1.90 | % | | | 2.28 | % | | | 1.17 | % | | | 1.17 | % | |
S&P Global Managed Risk LargeMidCap Index - Moderate
Conservative^ | | | | | | | -14.37 | % | | | 2.52 | % | | | 3.91 | % | | | | | | | | | |
The performance data quoted is historical. Past performance is no guarantee of future results. Current performance may be higher or lower than the performance data quoted. The principal value and investment return of an investment will fluctuate so that your shares, when redeemed, may be worth more or less than their original cost. Total returns would have been lower absent fee waivers by the Adviser. Performance figures for periods greater than one year are annualized. The returns shown do not reflect the deduction of taxes that a shareholder may pay on Portfolio distributions or on the redemption of Portfolio shares, as well as other charges and expenses of the insurance contract or separate account. Prior to May 1, 2019, the Capital Appreciation and Income Component of the Portfolio was managed pursuant to a different investment strategy by the Adviser without the use of a sub-adviser. The performance prior to that date is attributable to the Adviser and the prior investment strategy.
* The estimated operating expense ratios for Class II shares, as disclosed in the most recent prospectus dated May 1, 2022. Ratios include Acquired Fund Fees and Expenses indirectly incurred by the Portfolio. Gross operating expense ratio reflects the ratio of expenses absent waivers and/or reimbursements by the Adviser. The operating expense ratios presented here may differ from the expense ratios disclosed in the Financial Highlights table in this report.
^ The S&P Global Managed Risk LargeMidCap Index - Moderate Conservative is designed to simulate a dynamic protective portfolio that allocates between the underlying equity index and cash, based on realized volatilities of the underlying equity and bond indices, while maintaining a fixed allocation of 40% to the underlying bond index.
Comparison of the Change in Value of a $10,000 Investment
15
Global Atlantic BlackRock Selects Managed Risk Portfolio
Portfolio Review (Continued)
December 31, 2022 (Unaudited)
Holdings by Asset Class | | % of Net Assets | |
Exchange-Traded Funds | | | 71.9 | % | |
Variable Insurance Trusts | | | 22.1 | % | |
Short-Term Investments | | | 4.6 | % | |
Other Assets less Liabilities - Net | | | 1.4 | % | |
| | | | 100.0 | % | |
Please refer to the Portfolio of Investments in this annual report for more information regarding the Portfolio's holdings as of December 31, 2022.
Derivative exposure is included in "Other Assets less Liabilities - Net"
5435661.3
16
Global Atlantic BlackRock Selects Managed Risk Portfolio
Portfolio of Investments
December 31, 2022
| | | Shares/
Principal | | Fair
Value | |
EXCHANGE TRADED FUNDS - 71.9% | |
DEBT FUNDS - 29.2% | |
iShares 1-3 Year Treasury Bond ETF | | | 203,976 | | | $ | 16,556,732 | | |
iShares 20+ Year Treasury Bond ETF | | | 25,255 | | | | 2,514,388 | | |
iShares 3-7 Year Treasury Bond ETF | | | 30,120 | | | | 3,460,487 | | |
iShares 7-10 Year Treasury Bond ETF | | | 26,793 | | | | 2,566,233 | | |
iShares iBoxx $ Investment Grade
Corporate Bond ETF | | | 121,301 | | | | 12,788,764 | | |
iShares iBoxx High Yield Corporate
Bond ETF | | | 69,423 | | | | 5,111,615 | | |
iShares MBS ETF | | | 92,933 | | | | 8,619,536 | | |
TOTAL DEBT FUNDS | | | | | 51,617,755 | | |
EQUITY FUNDS - 42.7% | |
iShares Core Dividend Growth ETF | | | 183,119 | | | | 9,155,950 | | |
iShares Core MSCI EAFE ETF | | | 68,550 | | | | 4,225,422 | | |
iShares Core S&P U.S. Growth ETF | | | 354,533 | | | | 28,901,530 | | |
iShares Core S&P U.S. Value ETF | | | 141,166 | | | | 9,970,555 | | |
iShares Global Healthcare ETF | | | 29,977 | | | | 2,544,448 | | |
iShares Global Materials ETF | | | 10,380 | | | | 816,491 | | |
iShares MSCI Eurozone ETF | | | 128,110 | | | | 5,057,142 | | |
iShares MSCI Global Min Vol Factor ETF | | | 79,291 | | | | 7,534,231 | | |
iShares MSCI USA Quality Factor ETF | | | 14,363 | | | | 1,636,807 | | |
iShares U.S. Energy ETF | | | 106,053 | | | | 4,930,404 | | |
iShares U.S. Industrials ETF | | | 8,626 | | | | 832,064 | | |
TOTAL EQUITY FUNDS | | | | | 75,605,044 | | |
TOTAL EXCHANGE TRADED FUNDS
(Cost - $118,652,298) | | | | | 127,222,799 | | |
| | | Shares/
Principal | | Fair
Value | |
VARIABLE INSURANCE TRUSTS - 22.1% | |
ASSET ALLOCATION FUND - 22.1% | |
BlackRock Global Allocation VI Fund,
Class I (Cost - $39,638,730)* | | | 2,646,094 | | | $ | 39,082,810 | | |
SHORT-TERM INVESTMENTS - 4.6% | |
MONEY MARKET FUNDS - 4.6% | |
Dreyfus Government Cash
Management, 4.19% (a) | | | 5,847,101 | | | | 5,847,101 | | |
Fidelity Investments Money Market
Fund - Government Portfolio,
Institutional Class, 4.06% (a) | | | 2,324,980 | | | | 2,324,980 | | |
TOTAL SHORT-TERM INVESTMENTS
(Cost - $8,172,081) | | | | | 8,172,081 | | |
TOTAL INVESTMENTS - 98.6%
(Cost - $166,463,109) | | | | $ | 174,477,690 | | |
OTHER ASSETS LESS LIABILITIES - NET 1.4% | | | | | 2,501,218 | | |
TOTAL NET ASSETS - 100.0% | | | | $ | 176,978,908 | | |
* Non-income producing security.
(a) The rate shown is the annualized seven-day yield at period end.
FUTURES CONTRACTS | |
SHORT FUTURES CONTRACTS | | Counterparty | | Number of
Contracts | | Expiration Date | | Notional Value | | Fair Value/
Unrealized
Appreciation
(Depreciation) | |
E-Mini Russell 2000 Future | | Goldman Sachs & Co. | | | 19 | | | 3/17/2023 | | $ | 1,682,355 | | | $ | 35,113 | | |
MSCI EAFE Future | | Goldman Sachs & Co. | | | 92 | | | 3/17/2023 | | | 8,967,240 | | | | 125,060 | | |
MSCI Emerging Market Index Future | | Goldman Sachs & Co. | | | 40 | | | 3/17/2023 | | | 1,918,800 | | | | 23,385 | | |
S&P 500 E-Mini Future | | Goldman Sachs & Co. | | | 123 | | | 3/17/2023 | | | 23,745,150 | | | | 560,515 | | |
S&P MID 400 E-Mini Future | | Goldman Sachs & Co. | | | 18 | | | 3/17/2023 | | | 4,396,680 | | | | 63,635 | | |
TOTAL NET UNREALIZED APPRECIATION ON FUTURES CONTRACTS | | | | | | | | | | $ | 807,708 | | |
See accompanying notes to financial statements.
17
Global Atlantic Franklin Dividend and Income Managed Risk Portfolio
Portfolio Review
December 31, 2022 (Unaudited)
Investment Objective
The Portfolio seeks to provide capital appreciation and income while seeking to manage volatility.
Management Review
The capital appreciation and income component is managed by Franklin Advisers, Inc. ("Franklin Advisers"), while the managed risk component is sub-advised by Milliman Financial Risk Management LLC ("Milliman").
How did the Portfolio perform during the period?
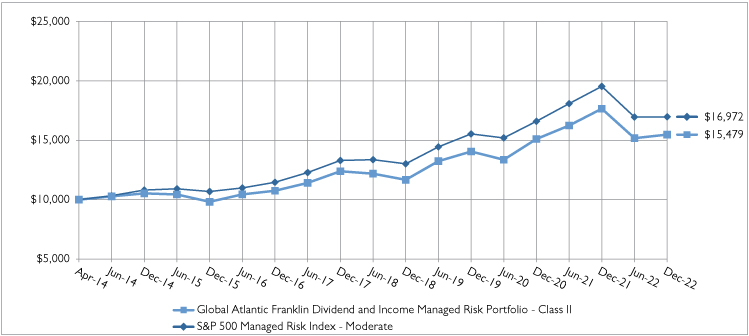
During 2022, the Portfolio outperformed its reference benchmark, the S&P 500 Managed Risk Index – Moderate. The Portfolio posted a return of -12.33% compared to a benchmark return of -13.13%, a difference of 80 basis points. The following discussion of relative performance pertains to this benchmark unless otherwise noted.
What factors and allocation decisions influenced the Portfolio's performance?
Franklin Advisers employs a bottom-up stock selection process for the equity sleeve of the Portfolio's capital appreciation and income component, whereby the portfolio managers invest in securities without regard to benchmark comparisons. As a result, the Portfolio frequently contains sector and security allocations that may be significantly different from those of the S&P 500® Index. With respect to the equity sleeve's performance versus the S&P 500® Index, the equity sleeve of the Portfolio's capital appreciation and income component outperformed the S&P 500® Index (net of fees), posting a return of -10.20% compared to an S&P 500® Index return of -18.11%, a difference of 791 basis points.
Relative to the Portfolio's benchmark, security selection and an underweight in the consumer discretionary and information technology sectors contributed to relative performance during the year. A lack of exposure to the communication services sector also enhanced results, as did an overweight to the industrials sector. In contrast, stock selection in the health care sector detracted from relative performance, as did an underweight in the energy and financials sectors and lack of exposure to utilities.
Among the contributors, shares of defense contractor Raytheon Technologies Corp. ("Raytheon") rallied during the 12-month reporting period, buoyed by growing U.S. Department of Defense budgets as well as additional demand for U.S.-made defense systems to assist Ukraine in its war against Russia. The Franklin Portfolio Managers believe demand for Raytheon's missile defense systems will continue, though there could be some pressure on its commercial air division if a recessionary environment were to emerge. In the information technology sector, an underweight position in consumer electronics giant Apple, Inc. ("Apple") supported relative results. Its shares lost value and significantly underperformed the benchmark index during the reporting period on concerns that rising COVID-19 cases in China would negatively impact production of its new iPhone 14. Shares of Air Products and Chemicals, Inc. ("Air Products") rallied in the materials sector after the company posted resilient fiscal fourth-quarter results. The company overcame concerns late in the reporting period on its ability to manage cost inflation in Europe and whether continued lockdowns in China would hurt results. Additionally, the growth pipeline in the United States looks excellent, in the view of the Franklin Portfolio Managers, as Air Products continues to announce large projects in areas such as carbon-free hydrogen. In the industrials sector, shares of diversified technology and manufacturing company Honeywell International, Inc. rose late in the reporting period after the company reported upbeat third-quarter earnings and full-year 2022 guidance. Year-over-year sales increases were particularly pronounced in its building technologies and performance materials lines of business.
Among detractors, shares of drug packaging and delivery company West Pharmaceutical Services, Inc. declined during the period as sales in its contract manufacturing business were softer in 2021. Its shares continued to decline through the end of the reporting period after the company reported a year-over-year decline in third-quarter net sales. The company lowered its full-year 2022 guidance during the year as management noted decreasing demand for COVID-19-related products. The Franklin Portfolio Managers remain constructive on the company, however, given its potential to drive customers to
18
Global Atlantic Franklin Dividend and Income Managed Risk Portfolio
Portfolio Review (Continued)
December 31, 2022 (Unaudited)
higher-margin services and build out its international presence as emerging markets move toward more stringent pharmaceutical standards. Shares of enterprise software company Microsoft Corp. ("Microsoft") have fallen from record-high levels in late 2021, pressured by concerns of a potential recession, persistent inflation, rising interest rates and a more hawkish U.S. Federal Reserve (the "Fed") – a dynamic pressuring technology stocks in general. Supply-chain issues, exacerbated by COVID-19 lockdowns in China, a key chip supplier, also impacted investor sentiment. Microsoft reduced its guidance in June, citing the strength of the U.S. dollar, which could weigh on overseas revenues and profits. Concerns about slowing growth for personal computer shipments and growth for its Office 365 productivity software have risen. However, the Franklin Portfolio Managers continue to believe that the trends of helping business customers move to the cloud and providing workers with productivity tools should support attractive growth over the medium- to longer-term. Sportswear manufacturer Nike, Inc. ("Nike") weighed on performance, pressured by supply-chain disruptions and production shortfalls as well as softer market conditions in China. In June, Nike lowered its guidance amid margin pressures and uncertainty surrounding China. More recently, the company felt the combined impact of supply-chain issues and sharply-rising inflation as inventories surged, driving markdowns that lowered earnings. The Franklin Portfolio Managers continue to believe that Nike's strong brand and direct-to-consumer digital strategy will likely help it maintain market share and pricing advantages over an increasingly competitive field.
During 2022, the fixed income sleeve of the Portfolio's capital appreciation and income component underperformed the Bloomberg U.S. Aggregate Bond Index (net of fees), posting a return of -14.41% compared to the benchmark return of -13.01%, a difference of -140 basis points. The Portfolio's exposure to high-yield ("HY") corporate bonds, collateralized loan obligations ("CLOs") and senior secured floating-rate bank loans detracted from results, as did security selection in investment-grade ("IG") corporate bonds and mortgage-backed securities ("MBS"). Exposure to sovereign emerging market ("EM") debt hindered returns, as did allocation to non-U.S. dollar denominated developed market debt. Exposure in taxable municipal bonds and the Portfolio's non-U.S. yield curve positioning detracted from results.
Conversely, U.S. yield curve positioning was a major contributor to relative performance, mainly from the five-year portion of the curve. Foreign currency exposure also benefited results – gains from a short euro position were more than offset by the negative contribution from a long South Korean won position. An underweight allocation to agency MBS and an overweight allocation to non-agency residential mortgage-backed securities ("RMBS") were significant contributors to performance. Underweight allocation to IG corporate bonds also benefited performance. Security selection in sovereign developed market debt and allocation to non-U.S. dollar denominated EM debt contributed to results.
From a volatility perspective, the Milliman Managed Risk Strategy ("MMRS") was a modest detractor to performance during the year.
How was the Portfolio positioned at period end?
From an equity sector perspective, at the end of the period, the Portfolio's largest sector concentration was information technology, followed by industrials and health care. Over the year, positions were added in food company Mondelez International, Inc., medical technology manufacturer Danaher Corp. and consumer electronics giant Apple. There were no significant disposals over the 12-month reporting period.
At period end, the Portfolio's largest fixed income allocations were U.S. Treasuries ("UST"), IG corporate bonds and MBS. The Portfolio remained overweight CLOs and senior secured floating-rate bank loans and underweight IG corporate bonds. The Portfolio moved from an overweight to underweight allocation in HY corporate bonds. Overall, Franklin believes corporate fundamentals remain generally strong, providing most IG companies substantial flexibility to manage through a more challenging economic environment. Amid continued market uncertainty, however, the Franklin Portfolio Managers remain moderately bearish on the sector as tighter overall financial conditions will result in slower growth and deteriorating fundamentals. The Franklin Portfolio Managers decreased allocation to senior secured floating-rate loans and HY corporate bonds while maintaining CLO exposure. Despite the challenging economic environment, it is worth noting that the overall quality of HY issuers has improved as the percentage of BB rated issuers in HY indices is near the higher end of the historical range. Although spreads likely have more widening than tightening bias from current levels over the near-term, over a multi-year horizon the Franklin Portfolio Managers believe the case for HY remains compelling, given historically attractive yields and the foregoing considerations.
19
Global Atlantic Franklin Dividend and Income Managed Risk Portfolio
Portfolio Review (Continued)
December 31, 2022 (Unaudited)
As rates are expected to stay higher-for-longer, the Franklin Portfolio Manager anticipates loan issuers that are more levered with cyclical and secularly challenged business models will undergo higher amounts of distress. Accordingly, the Franklin Portfolio Manager has maintained de-risking the Portfolio from lower-quality issuers in cyclical industries. The Franklin Portfolio Manager continues to focus on stringent security selection, favors higher-quality bias and maintains liquidity buffers to protect against spread widening. Within the securitized sectors, the Portfolio remained underweight MBS and overweight the RMBS sector, adding to MBS while reducing RMBS allocation over the period. The Franklin Portfolio Manager expects MBS volatility to remain high prior to Fed meetings and macroeconomic data releases. The RMBS asset class has been impacted by heavier supply and slower prepayment levels which have led to wider new issue spreads for the sector. The Franklin Portfolio Manager has reintroduced slight exposure to treasury inflation-protected securities ("TIPS"). The Portfolio was short versus the benchmark in U.S. dollar duration. In terms of currency exposure, on the long side, the Portfolio's largest currency position was the Dominican peso. The Portfolio exited Japanese yen, New Zealand dollar, South Korean won, Australian dollar, Norwegian krone, and Russian ruble allocations. The Portfolio also reduced its short euro exposure.
The Portfolio's performance figures for the periods ended December 31, 2022 as compared to its benchmark:
| | | | | Annualized | | Operating
Expense* | |
| | | Inception
Date | | One
Year | | Five
Years | | Since
Inception | | Gross
Ratio | | Net
Ratio | |
Global Atlantic Franklin Dividend and Income Managed Risk Portfolio | |
Class II | | April 30, 2014 | | | -12.33 | % | | | 4.55 | % | | | 5.17 | % | | | 1.21 | % | | | 1.20 | % | |
S&P 500 Managed Risk Index - Moderate^ | | | | | -13.13 | % | | | 4.99 | % | | | 6.29 | % | | | | | |
The performance data quoted is historical. Past performance is no guarantee of future results. Current performance may be higher or lower than the performance data quoted. The principal value and investment return of an investment will fluctuate so that your shares, when redeemed, may be worth more or less than their original cost. Total returns would have been lower absent fee waivers by the Adviser. Performance figures for periods greater than one year are annualized. The returns shown do not reflect the deduction of taxes that a shareholder may pay on Portfolio distributions or on the redemption of Portfolio shares, as well as other charges and expenses of the insurance contract or separate account. Prior to July 5, 2017, the fixed-income sleeve of the Capital Appreciation and Income Component of the Portfolio was managed by the Adviser without the use of a sub-adviser. The performance prior to that date is attributable to the Adviser's asset allocation decisions. The sub-adviser to the equity sleeve of the Capital Appreciation and Income Component of the Portfolio changed effective March 1, 2018 due to an organizational restructuring whereby all of the investment personnel responsible for the management of the equity sleeve transitioned from Franklin Advisory Services, LLC to Franklin Advisers.
* The estimated operating expense ratios for Class II shares, as disclosed in the most recent prospectus dated May 1, 2022. Ratios include Acquired Fund Fees and Expenses indirectly incurred by the Portfolio. Gross operating expense ratio reflects the ratio of expenses absent waivers and/or reimbursements by the Adviser. The operating expense ratios presented here may differ from the expense ratios disclosed in the Financial Highlights table in this report.
^ The S&P 500 Managed Risk Index - Moderate is designed to simulate a dynamic protective portfolio that allocates between the underlying equity index and cash, based on realized volatilities of the underlying equity and bond indices, while maintaining a fixed allocation of 30% to the underlying bond index.
20
Global Atlantic Franklin Dividend and Income Managed Risk Portfolio
Portfolio Review (Continued)
December 31, 2022 (Unaudited)
Comparison of the Change in Value of a $10,000 Investment
Holdings by Asset Class | | % of Net Assets | |
Common Stocks | | | 69.6 | % | |
U.S. Treasury Securities and Agency Bonds | | | 8.0 | % | |
Corporate Bonds and Notes | | | 6.4 | % | |
Short-Term Investments | | | 5.5 | % | |
Agency Mortgage Backed Securities | | | 4.8 | % | |
Asset Backed and Commercial Backed Securities | | | 3.9 | % | |
Mutual Funds | | | 0.7 | % | |
Municipal Bonds | | | 0.5 | % | |
Sovereign Debts | | | 0.3 | % | |
Preferred Stocks | | | 0.0 | %^ | |
Term Loans | | | 0.0 | %^ | |
Other Assets less Liabilities - Net | | | 0.3 | % | |
| | | | 100.0 | % | |
Please refer to the Portfolio of Investments in this annual report for more information regarding the Portfolio's holdings as of December 31, 2022.
Derivative exposure is included in "Other Assets less Liabilities - Net"
^ Represents less than 0.05%.
5435661.3
21
Global Atlantic Franklin Dividend and Income Managed Risk Portfolio
Portfolio of Investments
December 31, 2022
| | | Shares/
Principal | | Fair
Value | |
COMMON STOCKS - 69.6% | |
AEROSPACE & DEFENSE - 3.1% | |
General Dynamics Corp. | | | 9,689 | | | $ | 2,403,938 | | |
Raytheon Technologies Corp. | | | 43,522 | | | | 4,392,240 | | |
| | | | | | | | 6,796,178 | | |
AIR FREIGHT & LOGISTICS - 1.5% | |
United Parcel Service, Inc., Class B | | | 18,042 | | | | 3,136,421 | | |
BANKS - 1.0% | |
JPMorgan Chase & Co. | | | 15,751 | | | | 2,112,209 | | |
BEVERAGES - 1.4% | |
PepsiCo, Inc. | | | 17,183 | | | | 3,104,281 | | |
BIOTECHNOLOGY - 1.2% | |
AbbVie, Inc. | | | 16,133 | | | | 2,607,254 | | |
BUILDING PRODUCTS - 1.9% | |
Carlisle Cos., Inc. | | | 6,779 | | | | 1,597,471 | | |
Johnson Controls International PLC | | | 40,615 | | | | 2,599,360 | | |
| | | | | | | | 4,196,831 | | |
CAPITAL MARKETS - 1.0% | |
Nasdaq, Inc. | | | 33,601 | | | | 2,061,421 | | |
CHEMICALS - 6.9% | |
Air Products and Chemicals, Inc. | | | 14,510 | | | | 4,472,853 | | |
Albemarle Corp. | | | 10,942 | | | | 2,372,882 | | |
Ecolab, Inc. | | | 11,360 | | | | 1,653,562 | | |
Linde PLC | | | 16,725 | | | | 5,455,360 | | |
Sherwin-Williams Co. (The) | | | 4,106 | | | | 974,477 | | |
| | | | | | | | 14,929,134 | | |
COMMERCIAL SERVICES & SUPPLIES - 1.3% | |
Cintas Corp. | | | 6,325 | | | | 2,856,496 | | |
CONSUMER DISCRETIONARY SERVICES - 0.0%† | |
24 Hour Fitness Worldwide, Inc.* | | | 671 | | | | 5 | | |
ELECTRICAL EQUIPMENT - 0.5% | |
nVent Electric PLC | | | 30,260 | | | | 1,164,102 | | |
ENERGY EQUIPMENT & SERVICES - 0.0%† | |
Weatherford International PLC* | | | 1,897 | | | | 96,595 | | |
FOOD & STAPLES RETAILING - 1.0% | |
Walmart, Inc. | | | 15,942 | | | | 2,260,416 | | |
FOOD PRODUCTS - 1.7% | |
McCormick & Co., Inc. | | | 26,538 | | | | 2,199,735 | | |
Mondelez International, Inc., Class A | | | 22,380 | | | | 1,491,627 | | |
| | | | | | | | 3,691,362 | | |
HEALTH CARE EQUIPMENT & SUPPLIES - 6.6% | |
Abbott Laboratories | | | 27,874 | | | | 3,060,287 | | |
Becton Dickinson and Co. | | | 14,797 | | | | 3,762,877 | | |
| | | Shares/
Principal | | Fair
Value | |
HEALTH CARE EQUIPMENT & SUPPLIES - 6.6% (Continued) | |
Medtronic PLC | | | 31,500 | | | $ | 2,448,180 | | |
Stryker Corp. | | | 20,715 | | | | 5,064,610 | | |
| | | | | | | | 14,335,954 | | |
HEALTH CARE PROVIDERS & SERVICES - 2.4% | |
CVS Health Corp. | | | 7,828 | | | | 729,491 | | |
UnitedHealth Group, Inc. | | | 8,497 | | | | 4,504,940 | | |
| | | | | | | | 5,234,431 | | |
HOTELS, RESTAURANTS & LEISURE - 1.8% | |
McDonald's Corp. | | | 11,647 | | | | 3,069,334 | | |
Starbucks Corp. | | | 8,800 | | | | 872,960 | | |
| | | | | | | | 3,942,294 | | |
HOUSEHOLD PRODUCTS - 2.1% | |
Colgate-Palmolive Co. | | | 22,528 | | | | 1,774,981 | | |
Procter & Gamble Co. (The) | | | 18,329 | | | | 2,777,943 | | |
| | | | | | | | 4,552,924 | | |
INDUSTRIAL CONGLOMERATES - 1.8% | |
Honeywell International, Inc. | | | 18,519 | | | | 3,968,622 | | |
INSURANCE - 0.7% | |
Erie Indemnity Co., Class A | | | 5,728 | | | | 1,424,668 | | |
IT SERVICES - 3.9% | |
Accenture PLC, Class A | | | 17,421 | | | | 4,648,619 | | |
Visa, Inc., Class A | | | 17,947 | | | | 3,728,669 | | |
| | | | | | | | 8,377,288 | | |
LIFE SCIENCES TOOLS & SERVICES - 1.3% | |
Danaher Corp. | | | 2,210 | | | | 586,578 | | |
West Pharmaceutical Services, Inc. | | | 9,650 | | | | 2,271,128 | | |
| | | | | | | | 2,857,706 | | |
MACHINERY - 1.6% | |
Donaldson Co., Inc. | | | 15,179 | | | | 893,588 | | |
Dover Corp. | | | 15,567 | | | | 2,107,927 | | |
Pentair PLC | | | 12,220 | | | | 549,656 | | |
| | | | | | | | 3,551,171 | | |
MULTILINE RETAIL - 1.3% | |
Target Corp. | | | 18,941 | | | | 2,822,967 | | |
OIL, GAS & CONSUMABLE FUELS - 2.6% | |
Chevron Corp. | | | 13,427 | | | | 2,410,012 | | |
EOG Resources, Inc. | | | 13,089 | | | | 1,695,287 | | |
Exxon Mobil Corp. | | | 13,236 | | | | 1,459,931 | | |
| | | | | | | | 5,565,230 | | |
PHARMACEUTICALS - 2.2% | |
Johnson & Johnson | | | 17,660 | | | | 3,119,639 | | |
Pfizer, Inc. | | | 30,547 | | | | 1,565,228 | | |
| | | | | | | | 4,684,867 | | |
See accompanying notes to financial statements.
22
Global Atlantic Franklin Dividend and Income Managed Risk Portfolio
Portfolio of Investments (Continued)
December 31, 2022
| | | Shares/
Principal | | Fair
Value | |
ROAD & RAIL - 1.6% | |
JB Hunt Transport Services, Inc. | | | 7,900 | | | $ | 1,377,444 | | |
Norfolk Southern Corp. | | | 8,475 | | | | 2,088,410 | | |
| | | | | | | | 3,465,854 | | |
SEMICONDUCTORS & SEMICONDUCTOR EQUIPMENT - 3.9% | |
Analog Devices, Inc. | | | 26,113 | | | | 4,283,316 | | |
Texas Instruments, Inc. | | | 25,033 | | | | 4,135,952 | | |
| | | | | | | | 8,419,268 | | |
SOFTWARE - 8.1% | |
Microsoft Corp. | | | 49,537 | | | | 11,879,964 | | |
Roper Technologies, Inc. | | | 13,270 | | | | 5,733,834 | | |
| | | | | | | | 17,613,798 | | |
SPECIALTY RETAIL - 2.7% | |
Lowe's Cos., Inc. | | | 15,159 | | | | 3,020,279 | | |
Ross Stores, Inc. | | | 24,152 | | | | 2,803,323 | | |
| | | | | | | | 5,823,602 | | |
TECHNOLOGY HARDWARE, STORAGE & PERIPHERALS - 0.2% | |
Apple, Inc. | | | 2,900 | | | | 376,797 | | |
TEXTILES, APPAREL & LUXURY GOODS - 1.4% | |
NIKE, Inc., Class B | | | 25,058 | | | | 2,932,037 | | |
TRADING COMPANIES & DISTRIBUTORS - 0.9% | |
WW Grainger, Inc. | | | 3,534 | | | | 1,965,788 | | |
TOTAL COMMON STOCKS
(Cost - $69,752,269) | | | | | 150,927,971 | | |
U.S. TREASURY SECURITIES AND AGENCY BONDS - 8.0% | |
U.S. Treasury Bond | |
1.13%, 5/15/40 | | $ | 465,000 | | | | 293,259 | | |
1.13%, 8/15/40 | | | 1,175,000 | | | | 735,293 | | |
1.75%, 8/15/41 | | | 2,340,000 | | | | 1,613,229 | | |
2.50%, 5/15/46†† | | | 915,000 | | | | 688,180 | | |
2.25%, 8/15/46 | | | 795,000 | | | | 567,369 | | |
2.75%, 8/15/47 | | | 150,000 | | | | 118,020 | | |
2.75%, 11/15/47 | | | 319,000 | | | | 250,963 | | |
3.13%, 5/15/48 | | | 100,000 | | | | 84,754 | | |
3.00%, 8/15/48 | | | 330,000 | | | | 273,307 | | |
2.88%, 5/15/49 | | | 100,000 | | | | 81,176 | | |
1.25%, 5/15/50 | | | 940,000 | | | | 511,235 | | |
2.38%, 5/15/51 | | | 275,000 | | | | 199,160 | | |
1.88%, 11/15/51 | | | 960,000 | | | | 614,175 | | |
U.S. Treasury Inflation Indexed Note,
0.63%, 1/15/26 | | | 608,287 | | | | 584,383 | | |
U.S. Treasury Note | |
0.38%, 12/31/25 | | | 2,550,000 | | | | 2,281,254 | | |
1.88%, 2/28/27 | | | 1,580,000 | | | | 1,449,218 | | |
2.75%, 4/30/27 | | | 2,200,000 | | | | 2,087,938 | | |
3.25%, 6/30/27 | | | 1,880,000 | | | | 1,820,589 | | |
| | | Shares/
Principal | | Fair
Value | |
U.S. TREASURY SECURITIES AND AGENCY BONDS - 8.0% (Continued) | |
U.S. Treasury Note (continued) | |
3.13%, 8/31/27 | | $ | 710,000 | | | $ | 683,985 | | |
1.88%, 2/15/32 | | | 2,080,000 | | | | 1,770,762 | | |
2.88%, 5/15/32 | | | 715,000 | | | | 661,263 | | |
TOTAL U.S. TREASURY
SECURITIES AND AGENCY
BONDS (Cost - $19,378,967) | | | | | 17,369,512 | | |
CORPORATE BONDS AND NOTES - 6.4% | |
AEROSPACE & DEFENSE - 0.1% | |
Boeing Co. (The), 5.15%, 5/1/30 | | | 150,000 | | | | 146,746 | | |
AGRICULTURE - 0.1% | |
Altria Group, Inc., 3.40%, 5/6/30 | | | 100,000 | | | | 85,720 | | |
Imperial Brands Finance PLC,
4.25%, 7/21/25 (a) | | | 200,000 | | | | 191,208 | | |
| | | | | | | | 276,928 | | |
AIRLINES - 0.2% | |
Delta Air Lines, Inc. / SkyMiles IP Ltd.,
4.50%, 10/20/25 (a) | | | 300,000 | | | | 292,808 | | |
United Airlines 2020-1 Class B
Pass-Through Trust, 4.88%, 1/15/26 | | | 38,100 | | | | 35,909 | | |
| | | | | | | | 328,717 | | |
BANKS - 2.3% | |
Banco de Chile, 2.99%, 12/9/31 (a) | | | 200,000 | | | | 170,115 | | |
Banco Santander SA, 2.75%, 12/3/30 | | | 200,000 | | | | 154,587 | | |
Bank of America Corp. | |
3.86%, (3 Month US Libor + 0.94%),
7/23/24 (b) | | | 200,000 | | | | 198,189 | | |
3.50%, 4/19/26 | | | 500,000 | | | | 476,897 | | |
2.59%, (SOFR + 2.15%), 4/29/31 (b) | | | 100,000 | | | | 81,683 | | |
BNP Paribas SA, 2.82%, (3 Month
US Libor + 1.11%), 11/19/25 (a),(b) | | | 200,000 | | | | 189,551 | | |
BPCE SA, 2.05%, (SOFR + 1.09%),
10/19/27 (a),(b) | | | 250,000 | | | | 215,420 | | |
Citigroup, Inc. | |
4.04%, (3 Month US Libor + 1.02%),
6/1/24 (b) | | | 200,000 | | | | 198,690 | | |
2.57%, (SOFR + 2.11%), 6/3/31 (b) | | | 100,000 | | | | 81,119 | | |
3.06%, (SOFR + 1.35%), 1/25/33 (b) | | | 200,000 | | | | 162,259 | | |
Credit Suisse Group AG, 4.55%, 4/17/26 | | | 250,000 | | | | 220,736 | | |
Deutsche Bank AG/New York NY,
5.37%, 9/9/27 | | | 150,000 | | | | 150,564 | | |
Goldman Sachs Group, Inc. (The) | |
1.95%, (SOFR + 0.91%), 10/21/27 (b) | | | 50,000 | | | | 43,778 | | |
1.99%, (SOFR + 1.09%), 1/27/32 (b) | | | 300,000 | | | | 228,870 | | |
HSBC Holdings PLC | |
0.98%, (SOFR + 0.71%), 5/24/25 (b) | | | 200,000 | | | | 185,246 | | |
1.59%, (SOFR + 1.29%), 5/24/27 (b) | | | 200,000 | | | | 172,695 | | |
JPMorgan Chase & Co.,
4.49%, (SOFR + 3.79%), 3/24/31 (b) | | | 400,000 | | | | 374,609 | | |
See accompanying notes to financial statements.
23
Global Atlantic Franklin Dividend and Income Managed Risk Portfolio
Portfolio of Investments (Continued)
December 31, 2022
| | | Shares/
Principal | | Fair
Value | |
BANKS - 2.3% (Continued) | |
KeyBank NA/Cleveland OH,
4.15%, 8/8/25 | | $ | 250,000 | | | $ | 244,587 | | |
Mitsubishi UFJ Financial Group, Inc.,
5.06%, (US 1 Year CMT T-Note + 1.55%),
9/12/25 (b) | | | 200,000 | | | | 198,683 | | |
Morgan Stanley, 3.88%, 1/27/26 | | | 400,000 | | | | 386,956 | | |
Nordea Bank Abp, 4.75%, 9/22/25 (a) | | | 200,000 | | | | 198,909 | | |
Societe Generale SA, 1.79%, (US 1 Year
CMT T-Note + 1.00%), 6/9/27 (a),(b) | | | 200,000 | | | | 172,537 | | |
Toronto-Dominion Bank (The),
4.69%, 9/15/27 | | | 200,000 | | | | 198,021 | | |
US Bancorp,
5.73%, (SOFR + 1.43%), 10/21/26 (b) | | | 100,000 | | | | 101,895 | | |
Wells Fargo & Co.,
4.54%, (SOFR + 1.56%), 8/15/26 (b) | | | 100,000 | | | | 98,054 | | |
| | | | | | | | 4,904,650 | | |
BEVERAGES - 0.0%† | |
Anheuser-Busch Cos., LLC /
Anheuser-Busch InBev Worldwide, Inc.,
4.70%, 2/1/36 | | | 100,000 | | | | 94,716 | | |
BIOTECHNOLOGY - 0.1% | |
Biogen, Inc., 2.25%, 5/1/30 | | | 100,000 | | | | 81,498 | | |
Royalty Pharma PLC, 2.15%, 9/2/31 | | | 300,000 | | | | 227,655 | | |
| | | | | | | | 309,153 | | |
COMPUTERS - 0.0%† | |
Apple, Inc., 2.65%, 5/11/50 | | | 100,000 | | | | 66,716 | | |
DIVERSIFIED FINANCIAL SERVICES - 0.1% | |
AerCap Ireland Capital DAC /
AerCap Global Aviation Trust,
3.40%, 10/29/33 | | | 150,000 | | | | 114,203 | | |
ELECTRIC - 1.0% | |
Colbun SA, 3.15%, 3/6/30 (a) | | | 200,000 | | | | 172,858 | | |
Comision Federal de Electricidad,
3.35%, 2/9/31 (a) | | | 200,000 | | | | 156,106 | | |
Dominion Energy, Inc., 3.38%, 4/1/30 | | | 100,000 | | | | 88,362 | | |
Duke Energy Carolinas LLC, 6.10%, 6/1/37 | | | 100,000 | | | | 103,942 | | |
Duke Energy Corp., 3.75%, 9/1/46 | | | 100,000 | | | | 74,690 | | |
EDP Finance BV, 1.71%, 1/24/28 (a) | | | 200,000 | | | | 165,356 | | |
Electricite de France SA,
5.25%, (USD 10 Year Swap + 3.71%),
7/29/70 (a),(b) | | | 400,000 | | | | 398,629 | | |
Enel Finance International NV,
3.50%, 4/6/28 (a) | | | 200,000 | | | | 175,652 | | |
Exelon Corp., 4.05%, 4/15/30 | | | 200,000 | | | | 186,146 | | |
Korea Electric Power Corp.,
5.38%, 4/6/26 (a) | | | 200,000 | | | | 201,796 | | |
PacifiCorp, 6.10%, 8/1/36 | | | 100,000 | | | | 102,528 | | |
Southern Co. (The), 3.70%, 4/30/30 | | | 50,000 | | | | 45,269 | | |
| | | Shares/
Principal | | Fair
Value | |
ELECTRIC - 1.0% (Continued) | |
Talen Energy Supply LLC,
7.25%, 5/15/27 (a) | | $ | 100,000 | | | $ | 103,500 | | |
Vistra Operations Co. LLC,
4.30%, 7/15/29 (a) | | | 300,000 | | | | 270,790 | | |
| | | | | | | | 2,245,624 | | |
FOOD - 0.2% | |
General Mills, Inc., 5.24%, 11/18/25 | | | 50,000 | | | | 50,139 | | |
JBS USA LUX SA / JBS USA Food Co. /
JBS USA Finance, Inc. | |
2.50%, 1/15/27 (a) | | | 200,000 | | | | 174,944 | | |
3.63%, 1/15/32 (a) | | | 200,000 | | | | 162,000 | | |
| | | | | | | | 387,083 | | |
HEALTHCARE-PRODUCTS - 0.2% | |
GE HealthCare Technologies, Inc.,
5.60%, 11/15/25 (a) | | | 100,000 | | | | 100,693 | | |
PerkinElmer, Inc., 2.25%, 9/15/31 | | | 200,000 | | | | 157,271 | | |
STERIS Irish FinCo UnLtd Co.,
2.70%, 3/15/31 | | | 100,000 | | | | 81,486 | | |
| | | | | | | | 339,450 | | |
HEALTHCARE-SERVICES - 0.3% | |
Centene Corp., 3.00%, 10/15/30 | | | 100,000 | | | | 81,975 | | |
DaVita, Inc., 4.63%, 6/1/30 (a) | | | 100,000 | | | | 80,270 | | |
Elevance Health, Inc., 4.65%, 1/15/43 | | | 100,000 | | | | 91,174 | | |
Kaiser Foundation Hospitals,
3.27%, 11/1/49 | | | 140,000 | | | | 101,926 | | |
Quest Diagnostics, Inc., 2.80%, 6/30/31 | | | 245,000 | | | | 205,705 | | |
| | | | | | | | 561,050 | | |
INSURANCE - 0.1% | |
Arch Capital Group Ltd., 3.64%, 6/30/50 | | | 200,000 | | | | 139,017 | | |
Metropolitan Life Global Funding I,
4.30%, 8/25/29 (a) | | | 150,000 | | | | 142,797 | | |
| | | | | | | | 281,814 | | |
LODGING - 0.1% | |
Las Vegas Sands Corp., 3.90%, 8/8/29 | | | 100,000 | | | | 84,869 | | |
Studio City Finance Ltd.,
5.00%, 1/15/29 (a) | | | 200,000 | | | | 147,996 | | |
| | | | | | | | 232,865 | | |
MACHINERY-CONSTRUCTION & MINING - 0.0%† | |
Caterpillar, Inc., 2.60%, 4/9/30 | | | 50,000 | | | | 43,562 | | |
MEDIA - 0.2% | |
Charter Communications Operating LLC /
Charter Communications Operating Capital,
2.80%, 4/1/31 | | | 200,000 | | | | 156,162 | | |
Fox Corp., 3.50%, 4/8/30 | | | 200,000 | | | | 177,716 | | |
Time Warner Cable LLC, 6.75%, 6/15/39 | | | 100,000 | | | | 94,867 | | |
| | | | | | | | 428,745 | | |
See accompanying notes to financial statements.
24
Global Atlantic Franklin Dividend and Income Managed Risk Portfolio
Portfolio of Investments (Continued)
December 31, 2022
| | | Shares/
Principal | | Fair
Value | |
MISCELLANEOUS MANUFACTURING - 0.0%† | |
Eaton Corp., 4.15%, 3/15/33 | | $ | 100,000 | | | $ | 93,176 | | |
MULTI-NATIONAL - 0.2% | |
African Export-Import Bank (The),
3.99%, 9/21/29 (a) | | | 200,000 | | | | 173,340 | | |
Banque Ouest Africaine de
Developpement, 5.00%, 7/27/27 (a) | | | 200,000 | | | | 187,564 | | |
| | | | | | | | 360,904 | | |
OIL & GAS - 0.2% | |
Aker BP ASA, 4.00%, 1/15/31 (a) | | | 200,000 | | | | 176,065 | | |
Harvest Operations Corp.,
4.20%, 6/1/23 (a) | | | 100,000 | | | | 99,702 | | |
Petroleos Mexicanos, 6.63%, 6/15/35 | | | 80,000 | | | | 58,072 | | |
Phillips 66, 2.15%, 12/15/30 | | | 100,000 | | | | 80,250 | | |
| | | | | | | | 414,089 | | |
OIL & GAS SERVICES - 0.1% | |
Baker Hughes Holdings LLC /
Baker Hughes Co-Obligor, Inc.,
4.49%, 5/1/30 | | | 50,000 | | | | 47,784 | | |
Schlumberger Holdings Corp.,
3.90%, 5/17/28 (a) | | | 150,000 | | | | 140,005 | | |
| | | | | | | | 187,789 | | |
PACKAGING & CONTAINERS - 0.0%† | |
Amcor Flexibles North America, Inc.,
2.63%, 6/19/30 | | | 50,000 | | | | 40,761 | | |
PHARMACEUTICALS - 0.1% | |
Bayer US Finance II LLC,
4.38%, 12/15/28 (a) | | | 100,000 | | | | 94,274 | | |
CVS Health Corp., 4.78%, 3/25/38 | | | 100,000 | | | | 91,418 | | |
Teva Pharmaceutical Finance
Netherlands III BV, 5.13%, 5/9/29 | | | 100,000 | | | | 89,055 | | |
| | | | | | | | 274,747 | | |
PIPELINES - 0.3% | |
Crestwood Midstream Partners LP /
Crestwood Midstream Finance Corp.,
6.00%, 2/1/29 (a) | | | 100,000 | | | | 91,751 | | |
Energy Transfer LP | |
4.75%, 1/15/26 | | | 100,000 | | | | 97,502 | | |
4.95%, 5/15/28 | | | 100,000 | | | | 96,200 | | |
Enterprise Products Operating LLC,
3.13%, 7/31/29 | | | 100,000 | | | | 88,205 | | |
Sabine Pass Liquefaction LLC,
5.00%, 3/15/27 | | | 200,000 | | | | 196,345 | | |
TransCanada PipeLines Ltd.,
4.25%, 5/15/28 | | | 100,000 | | | | 94,861 | | |
Williams Cos., Inc. (The),
3.50%, 11/15/30 | | | 50,000 | | | | 43,844 | | |
| | | | | | | | 708,708 | | |
| | | Shares/
Principal | | Fair
Value | |
REITS - 0.3% | |
Healthcare Realty Holdings LP,
2.00%, 3/15/31 | | $ | 300,000 | | | $ | 227,409 | | |
MPT Operating Partnership LP /
MPT Finance Corp., 3.50%, 3/15/31 | | | 100,000 | | | | 68,548 | | |
National Retail Properties, Inc.,
4.30%, 10/15/28 | | | 300,000 | | | | 278,842 | | |
| | | | | | | | 574,799 | | |
SOFTWARE - 0.1% | |
Fiserv, Inc., 2.65%, 6/1/30 | | | 150,000 | | | | 126,468 | | |
TELECOMMUNICATIONS - 0.1% | |
T-Mobile USA, Inc. | |
3.88%, 4/15/30 | | | 200,000 | | | | 181,642 | | |
3.30%, 2/15/51 | | | 100,000 | | | | 66,775 | | |
| | | | | | | | 248,417 | | |
TRANSPORTATION - 0.0%† | |
CSX Corp., 4.10%, 3/15/44 | | | 100,000 | | | | 84,401 | | |
TOTAL CORPORATE BONDS AND NOTES
(Cost - $15,655,925) | | | | | 13,876,281 | | |
AGENCY MORTGAGE BACKED SECURITIES - 4.8% | |
FEDERAL HOME LOAN MORTGAGE CORPORATION - 1.4% | |
Freddie Mac Pool | |
2.50%, 10/1/51 | | | 584,298 | | | | 498,014 | | |
2.00%, 3/1/52 | | | 695,129 | | | | 567,216 | | |
2.00%, 4/1/52 | | | 1,540,254 | | | | 1,256,830 | | |
2.50%, 5/1/52 | | | 966,747 | | | | 821,777 | | |
| | | | | | | | 3,143,837 | | |
FEDERAL NATIONAL MORTGAGE ASSOCIATION - 3.4% | |
Fannie Mae or Freddie Mac | |
5.00%, 1/1/53 (c) | | | 1,124,000 | | | | 1,108,369 | | |
5.50%, 1/1/53 (c) | | | 1,135,000 | | | | 1,138,724 | | |
Fannie Mae Pool, 3.00%, 11/1/48 | | | 244,059 | | | | 219,020 | | |
Freddie Mac Pool | |
2.00%, 1/1/52 | | | 620,416 | | | | 508,147 | | |
4.00%, 8/1/52 | | | 1,177,650 | | | | 1,106,851 | | |
4.50%, 8/1/52 | | | 2,762,195 | | | | 2,666,783 | | |
Ginnie Mae II Pool | |
2.00%, 7/20/52 | | | 320,572 | | | | 269,069 | | |
2.50%, 7/20/52 | | | 312,755 | | | | 271,340 | | |
| | | | | | | | 7,288,303 | | |
TOTAL AGENCY MORTGAGE
BACKED SECURITIES
(Cost - $10,788,353) | | | | | 10,432,140 | | |
ASSET BACKED AND COMMERCIAL BACKED SECURITIES - 3.9% | |
Adagio CLO VIII DAC, 3.03%,
(3 Month EUR Libor + 1.65%),
4/15/32 (a),(b) | | EUR | 250,000 | | | | 248,358 | | |
See accompanying notes to financial statements.
25
Global Atlantic Franklin Dividend and Income Managed Risk Portfolio
Portfolio of Investments (Continued)
December 31, 2022
| | | Shares/
Principal | | Fair
Value | |
ASSET BACKED AND COMMERCIAL BACKED SECURITIES - 3.9% (Continued) | |
Antares CLO 2018-1 Ltd., 5.89%,
(3 Month US Libor + 1.65%),
4/20/31 (a),(b) | | $ | 250,000 | | | $ | 237,971 | | |
BlueMountain Fuji Eur CLO V DAC,
2.93%, (3 Month EUR Libor + 1.55%),
1/15/33 (a),(b) | | EUR | 250,000 | | | | 247,520 | | |
BRAVO Residential Funding Trust
2019-1, 3.50%, 3/25/58 (a) | | | 17,075 | | | | 16,812 | | |
BRAVO Residential Funding Trust
2019-NQM2, 3.50%, 10/25/44 (a),(d) | | | 62,211 | | | | 57,630 | | |
BX 2021-LBA3 Mortgage Trust, 5.22%,
(1 Month US Libor + 0.90%),
10/15/36 (a),(b) | | | 130,000 | | | | 123,028 | | |
BX Commercial Mortgage Trust
2021-VOLT, 5.27%, (1 Month
US Libor + 0.95%), 9/15/36 (a),(b) | | | 130,000 | | | | 122,593 | | |
BX Trust 2022-IND, 5.82%,
(1 Month Term SOFR + 1.49%),
4/15/37 (a),(b) | | | 205,389 | | | | 201,022 | | |
Carlyle GMS Finance MM CLO
2015-1 LLC, 6.28%, (3 Month
US Libor + 2.20%), 10/15/31 (a),(b) | | | 250,000 | | | | 234,717 | | |
CIFC Funding 2022-II Ltd., 5.28%,
(3 Month Term SOFR + 1.32%),
4/19/35 (a),(b) | | | 310,000 | | | | 304,090 | | |
CIM Trust 2018-INV1, 4.00%,
8/25/48 (a),(d) | | | 20,548 | | | | 19,733 | | |
CIM Trust 2019-INV1, 4.00%,
2/25/49 (a),(d) | | | 14,620 | | | | 13,954 | | |
COLT 2022-4 Mortgage Loan Trust,
4.30%, 3/25/67 (a),(d) | | | 93,616 | | | | 90,692 | | |
Dryden 97 CLO Ltd., 5.26%,
(3 Month Term SOFR + 1.30%),
4/20/35 (a),(b) | | | 250,000 | | | | 241,407 | | |
Eleven Madison Trust 2015-11MD
Mortgage Trust, 3.55%, 9/10/35 (a),(d) | | | 250,000 | | | | 231,446 | | |
Ellington CLO III Ltd., 5.89%,
(3 Month US Libor + 1.65%),
7/20/30 (a),(b) | | | 236,186 | | | | 233,180 | | |
Fannie Mae Connecticut Avenue Securities | |
9.64%, (1 Month US Libor + 5.25%),
10/25/23 (b) | | | 48,465 | | | | 49,328 | | |
8.79%, (1 Month US Libor + 4.40%),
1/25/24 (b) | | | 77,743 | | | | 79,700 | | |
6.99%, (1 Month US Libor + 2.60%),
5/25/24 (b) | | | 63,765 | | | | 63,772 | | |
7.29%, (1 Month US Libor + 2.90%),
7/25/24 (b) | | | 43,380 | | | | 43,331 | | |
9.29%, (1 Month US Libor + 4.90%),
11/25/24 (b) | | | 92,449 | | | | 95,749 | | |
9.69%, (1 Month US Libor + 5.30%),
10/25/28 (b) | | | 175,187 | | | | 180,948 | | |
FirstKey Homes 2020-SFR2 Trust,
1.27%, 10/19/37 (a) | | | 148,332 | | | | 131,352 | | |
Freddie Mac STACR REMIC Trust
2022-DNA3, 5.93%, (SOFR + 2.00%),
4/25/42 (a),(b) | | | 91,942 | | | | 90,921 | | |
| | | Shares/
Principal | | Fair
Value | |
ASSET BACKED AND COMMERCIAL BACKED SECURITIES - 3.9% (Continued) | |
Freddie Mac Structured Agency
Credit Risk Debt Notes | |
9.09%, (1 Month US Libor + 4.70%),
4/25/28 (b) | | $ | 96,308 | | | $ | 99,499 | | |
9.54%, (1 Month US Libor + 5.15%),
11/25/28 (b) | | | 104,911 | | | | 108,145 | | |
Halcyon Loan Advisors Funding
2018-1 Ltd., 6.04%, (3 Month
US Libor + 1.80%), 7/21/31 (a),(b) | | | 170,000 | | | | 160,734 | | |
Holland Park CLO DAC, 2.72%,
(3 Month EUR Libor + 0.92%),
11/14/32 (a),(b) | | EUR | 500,000 | | | | 514,286 | | |
Home Partners of America 2021-3
Trust, 2.65%, 1/17/41 (a) | | | 74,771 | | | | 62,296 | | |
Home Partners of America Trust 2021-2,
2.30%, 12/17/26 (a) | | | 204,168 | | | | 172,763 | | |
JP Morgan Mortgage Trust, 2.50%,
6/25/52 (a),(d) | | | 105,077 | | | | 90,399 | | |
JP Morgan Mortgage Trust 2021-13,
2.50%, 4/25/52 (a),(d) | | | 219,420 | | | | 188,770 | | |
JP Morgan Mortgage Trust 2021-14,
2.50%, 5/25/52 (a),(d) | | | 165,029 | | | | 141,976 | | |
LCM XXV Ltd., 6.54%, (3 Month
US Libor + 2.30%), 7/20/30 (a),(b) | | | 440,000 | | | | 408,915 | | |
Madison Park Euro Funding VIII DAC,
2.20%, (3 Month EUR Libor + 0.82%),
4/15/32 (a),(b) | | | 600,000 | | | | 617,579 | | |
Mill City Mortgage Loan Trust 2018-4,
3.48%, 4/25/66 (a),(d) | | | 94,946 | | | | 90,155 | | |
Neuberger Berman Loan Advisers
CLO 27 Ltd., 5.18%, (3 Month
US Libor + 1.10%), 1/15/30 (a),(b) | | | 649,000 | | | | 637,672 | | |
New Economy Assets Phase 1
Sponsor LLC, 1.91%, 10/20/61 (a) | | | 260,000 | | | | 219,972 | | |
OBX 2021-J3 Trust, 2.50%,
10/25/51 (a),(d) | | | 82,704 | | | | 71,151 | | |
Octagon Investment Partners 35 Ltd.,
5.34%, (3 Month US Libor + 1.10%),
1/20/31 (a),(b) | | | 500,000 | | | | 481,906 | | |
Provident Funding Mortgage
Trust 2019-1, 3.00%, 12/25/49 (a),(d) | | | 24,661 | | | | 20,271 | | |
Provident Funding Mortgage
Trust 2021-J1, 2.50%, 10/25/51 (a),(d) | | | 148,285 | | | | 127,299 | | |
PSMC 2021-3 Trust, 2.50%,
8/25/51 (a),(d) | | | 277,822 | | | | 241,296 | | |
Strata CLO I Ltd., 6.28%,
(3 Month US Libor + 2.20%),
1/15/31 (a),(b) | | | 200,000 | | | | 196,553 | | |
TICP CLO VI Ltd., 5.20%,
(3 Month US Libor + 1.12%),
1/15/34 (a),(b) | | | 300,000 | | | | 294,185 | | |
Towd Point Mortgage Trust 2017-1,
2.75%, 10/25/56 (a),(d) | | | 15,212 | | | | 14,969 | | |
Towd Point Mortgage Trust 2017-2,
2.75%, 4/25/57 (a),(d) | | | 20,349 | | | | 20,032 | | |
See accompanying notes to financial statements.
26
Global Atlantic Franklin Dividend and Income Managed Risk Portfolio
Portfolio of Investments (Continued)
December 31, 2022
| | | Shares/
Principal | | Fair
Value | |
ASSET BACKED AND COMMERCIAL BACKED SECURITIES - 3.9% (Continued) | |
Towd Point Mortgage Trust 2017-3,
2.75%, 7/25/57 (a),(d) | | $ | 24,240 | | | $ | 23,558 | | |
TOTAL ASSET BACKED AND
COMMERCIAL BACKED
SECURITIES (Cost - $8,959,115) | | | | | 8,363,635 | | |
MUTUAL FUNDS - 0.7% | |
DEBT FUNDS - 0.7% | |
Franklin Floating Rate Daily Access Fund
(Cost - $1,495,000) | | | 198,803 | | | | 1,459,215 | | |
MUNICIPAL BONDS - 0.5% | |
California Health Facilities Financing
Authority, 2.93%, 6/1/32 | | | 45,000 | | | | 37,679 | | |
City of Austin TX Electric Utility
Revenue, 6.26%, 11/15/32 | | | 140,000 | | | | 149,441 | | |
City of Salt Lake City UT Sales and
Excise Tax Revenue,
3.10%, 4/1/38 | | | 40,000 | | | | 31,602 | | |
Golden State Tobacco Securitization
Corp., 3.85%, 6/1/50 | | | 305,000 | | | | 269,661 | | |
Greenville City School District,
3.54%, 1/1/51 | | | 110,000 | | | | 79,834 | | |
Massachusetts School Building Authority,
3.40%, 10/15/40 | | | 85,000 | | | | 68,576 | | |
Regents of The University of California
Medical Center Pooled Revenue,
4.56%, 5/15/53 | | | 100,000 | | | | 87,482 | | |
San Bernardino Community College District | |
2.69%, 8/1/41 | | | 250,000 | | | | 176,280 | | |
2.86%, 8/1/49 | | | 150,000 | | | | 95,725 | | |
San Jose Redevelopment Agency
Successor Agency, 3.23%, 8/1/27 | | | 90,000 | | | | 83,344 | | |
Texas State University System,
2.94%, 3/15/33 | | | 35,000 | | | | 29,144 | | |
TOTAL MUNICIPAL BONDS
(Cost - $1,370,678) | | | | | 1,108,768 | | |
SOVEREIGN DEBTS - 0.3% | |
Colombia Government International
Bond, 5.00%, 6/15/45 | | | 200,000 | | | | 135,920 | | |
Dominican Republic International
Bond, 8.90%, 2/15/23 (a) | | DOP | 8,000,000 | | | | 141,444 | | |
Panama Government International
Bond, 3.75%, 4/17/26 (a) | | | 70,000 | | | | 65,836 | | |
Peruvian Government International
Bond, 2.78%, 1/23/31 | | | 200,000 | | | | 165,391 | | |
Romanian Government International
Bond, 6.13%, 1/22/44 (a) | | | 130,000 | | | | 119,271 | | |
TOTAL SOVEREIGN DEBTS
(Cost - $807,092) | | | | | 627,862 | | |
| | | Shares/
Principal | | Fair
Value | |
TERM LOANS - 0.0%† | |
Aptean, Inc., 8.98%,
(3 Month US Libor + 4.25%),
4/23/26 (b) | | $ | 11,816 | | | $ | 11,265 | | |
Cloudera, Inc., 10.38%,
(1 Month US Libor + 6.00%), 10/8/29 (b) | | | 1,860 | | | | 1,546 | | |
CSC Holdings LLC, 8.82%,
(1 Month US Libor + 4.50%), 7/17/25 (b) | | | 35,895 | | | | 33,831 | | |
Osmosis Buyer Ltd., 0.00%, 7/31/28 (e) | | | 428 | | | | 403 | | |
TOTAL TERM LOANS
(Cost - $17,095) | | | | | 47,045 | | |
PREFERRED STOCKS - 0.0%† | |
CONSUMER DISCRETIONARY SERVICES - 0.0%† | |
24 Hour Fitness Worldwide, Inc., 0.00%
(Cost - $2,145)* | | | 1,589 | | | | 16 | | |
SHORT-TERM INVESTMENTS - 5.5% | |
MONEY MARKET FUNDS - 5.5% | |
Dreyfus Government Cash
Management, 4.19% (f) | | | 6,445,894 | | | | 6,445,894 | | |
Fidelity Investments Money Market
Fund - Government Portfolio,
Institutional Class, 4.06% (f) | | | 5,454,538 | | | | 5,454,538 | | |
TOTAL SHORT-TERM INVESTMENTS
(Cost - $11,900,432) | | | | | 11,900,432 | | |
TOTAL INVESTMENTS - 99.7%
(Cost - $140,127,071) | | | | $ | 216,112,877 | | |
OTHER ASSETS LESS LIABILITIES - NET 0.3% | | | | | 718,889 | | |
TOTAL NET ASSETS - 100.0% | | | | $ | 216,831,766 | | |
* Non-income producing security.
† Represents less than 0.05%.
†† A portion of this investment is held as collateral for derivative investments.
(a) 144A - Security was purchased pursuant to Rule 144a under the Securities Act of 1933 and may not be resold subject to that rule, except to qualified institutional buyers. As of December 31, 2022, these securities amounted to $12,816,350 or 5.9% of net assets.
(b) Variable rate security. The rate shown is the rate in effect at period end.
(c) When-issued, or delayed delivery. All or a portion may be subject to dollar-roll transactions.
(d) Adjustable rate security with an interest rate that is not based on a published reference index and spread. The rate is based on the structure of the agreement and current market conditions. The coupon rate shown represents the rate at period end.
(e) The loan will settle after December 31, 2022. The interest rate, based on the LIBOR and the agreed upon spread on trade date, will be determined at the time of settlement.
(f) The rate shown is the annualized seven-day yield at period end.
CLO - Collateralized Loan Obligation
CMT - Treasury Constant Maturity Rate
DOP - Dominican Peso
EUR - EURO
Libor - London Interbank Offer Rate
PLC - Public Limited Company
REMIC - Real Estate Mortgage Investment Conduit
SOFR - Secured Overnight Financing Rate
See accompanying notes to financial statements.
27
Global Atlantic Franklin Dividend and Income Managed Risk Portfolio
Portfolio of Investments (Continued)
December 31, 2022
FUTURES CONTRACTS | |
LONG FUTURES CONTRACTS | | Counterparty | | Number of
Contracts | | Expiration Date | | Notional Value | | Fair Value/
Unrealized
Appreciation
(Depreciation) | |
U.S. 10 Year Note Future | | J. P. Morgan Securities LLC | | | 3 | | | 3/22/2023 | | $ | 336,891 | | | $ | (2,203 | ) | |
U.S. 2 Year Note Future | | J. P. Morgan Securities LLC | | | 17 | | | 3/31/2023 | | | 3,486,328 | | | | 2,459 | | |
U.S. 5 Year Note Future | | J. P. Morgan Securities LLC | | | 3 | | | 3/31/2023 | | | 323,789 | | | | (764 | ) | |
| | | | (508 | ) | |
SHORT FUTURES CONTRACTS | |
Fed Fund 30 Day Future | | J. P. Morgan Securities LLC | | | 27 | | | 12/29/2023 | | | 10,728,296 | | | | 17,852 | | |
MSCI EAFE Future | | Goldman Sachs & Co. | | | 35 | | | 3/17/2023 | | | 3,411,450 | | | | 33,485 | | |
S&P 500 E-Mini Future | | Goldman Sachs & Co. | | | 183 | | | 3/17/2023 | | | 35,328,150 | | | | 675,157 | | |
S&P MID 400 E-Mini Future | | Goldman Sachs & Co. | | | 13 | | | 3/17/2023 | | | 3,175,380 | | | | 28,420 | | |
| | | | 754,914 | | |
TOTAL NET UNREALIZED APPRECIATION ON FUTURES CONTRACTS | | | | | | | | | | $ | 754,406 | | |
INTEREST RATE SWAPS | |
Counterparty | | Payment
Frequency | | Fund
Receives | | Fund Pays | | Expiration
Date | | Notional
Amount | | Fair
Value | | Premiums
Paid
(Received) | | Unrealized
Appreciation
(Depreciation) | |
Citibank NA | | At Maturity | | SOFR | | | 1.924 | % | | 08/12/27 | | | 500,000 | USD | | $ | 41,538 | | | $ | 41 | | | $ | 41,497 | | |
TOTAL FAIR VALUE, PREMIUMS PAID (RECEIVED) AND NET UNREALIZED
APPRECIATION ON INTEREST RATE SWAPS | | | | | | | | | | | | $ | 41,538 | | | $ | 41 | | | $ | 41,497 | | |
CREDIT DEFAULT SWAPS | |
Counterparty | | Reference
Obligation/
Index | | Payment
Frequency | | Buy/Sell
Protection | | Fixed
Rate
Received | | Fixed
Rate
Paid | | Credit
Rating* | | Expiration
Date | | Notional
Amount** | | Fair
Value | | Premiums
Paid
(Received) | | Unrealized
Appreciation
(Depreciation) | |
Citibank NA | | Avon Products, Inc. | | Quarterly | | Sell | | | - | | | | 5.00 | % | | NR | | 03/20/23 | | $ | 135,000 | | | $ | (1,494 | ) | | $ | (840 | ) | | $ | (654 | ) | |
Citibank NA | | MCDX.NA.31 | | Quarterly | | Buy | | | 1.00 | % | | | - | | | NR | | 12/20/23 | | | 1,050,000 | | | | 5,223 | | | | 2,058 | | | | 3,165 | | |
JP Morgan | | Air France-KLM | | Quarterly | | Sell | | | 5.00 | % | | | - | | | NR | | 06/20/26 | | | 80,000 | | | | (3,817 | ) | | | 1,007 | | | | (4,824 | ) | |
Citibank NA | | Carnival Corp. | | Quarterly | | Buy | | | 1.00 | % | | | - | | | B- | | 06/21/27 | | | 200,000 | | | | (77,128 | ) | | | (32,384 | ) | | | (44,744 | ) | |
Citibank NA | | CDX.EM.38 | | Quarterly | | Sell | | | - | | | | 1.00 | % | | NR | | 12/20/27 | | | 570,000 | | | | 33,158 | | | | 45,223 | | | | (12,065 | ) | |
Citibank NA | | CDX.NA.HY.39 | | Quarterly | | Sell | | | - | | | | 5.00 | % | | NR | | 12/20/27 | | | 250,000 | | | | (1,958 | ) | | | 8,261 | | | | (10,219 | ) | |
Citibank NA | | CDX.NA.HY.39 | | Quarterly | | Sell | | | - | | | | 5.00 | % | | NR | | 12/20/27 | | | 1,365,000 | | | | (10,680 | ) | | | 28,132 | | | | (38,812 | ) | |
Citibank NA | | CDX.NA.HY.39 | | Quarterly | | Sell | | | - | | | | 5.00 | % | | NR | | 12/20/27 | | | 250,000 | | | | (1,956 | ) | | | 2,047 | | | | (4,003 | ) | |
Citibank NA | | CDX.NA.HY.39 | | Quarterly | | Sell | | | - | | | | 5.00 | % | | NR | | 12/20/27 | | | 250,000 | | | | (1,956 | ) | | | (591 | ) | | | (1,365 | ) | |
TOTAL FAIR VALUE PREMIUM PAID (RECEIVED) AND NET UNREALIZED
DEPRECIATION ON CREDIT DEFAULT SWAPS | | | | | | | | | | | | | | | | | | $ | (60,608 | ) | | $ | 52,913 | | | $ | (113,521 | ) | |
* Credit ratings for the underlying securities in the index are assigned based on the higher ratings of either Moody's or S&P. If both are unrated, then Fitch is used. If all three agencies are unrated, a credit rating is assigned using an internal credit analyst rating.
** The maximum potential amount the Portfolio may pay should a negative credit event take place as defined under the terms of the agreement.
NR - Not Rated
TOTAL RETURN SWAPS | |
| Counterparty | | Reference
Obligation/
Index | | Payment
Frequency | | Expiration
Date | | Notional
Amount** | | Fair
Value | | Unrealized
Appreciation
(Depreciation) | |
JP Morgan | | Markit CDX iBoxx | | Quarterly | | 03/20/2023 | | | 150,000 | | | $ | (3,163 | ) | | $ | (3,163 | ) | |
TOTAL FAIR VALUE AND NET UNREALIZED DEPRECIATION ON TOTAL RETURN SWAPS | | | | | | | | | | $ | (3,163 | ) | | $ | (3,163 | ) | |
** The maximum potential amount the Portfolio may pay should a negative credit event take place as defined under the terms of the agreement.
FORWARD FOREIGN CURRENCY CONTRACTS | |
Settlement Date | | Counterparty | | Currency Units to
Receive | | In Exchange For | | Unrealized Appreciation
(Depreciation) | |
05/30/23 | | JP Morgan Chase Bank | | | 1,746,496 | USD | | | 1,638,118 | EUR | | $ | (18,869 | ) | |
TOTAL NET UNREALIZED DEPRECIATION ON FORWARD FOREIGN CURRENCY CONTRACTS | | | | | | | | $ | (18,869 | ) | |
EUR - Euro
USD - United States Dollar
See accompanying notes to financial statements.
28
Global Atlantic Growth Managed Risk Portfolio
Portfolio Review
December 31, 2022 (Unaudited)
Investment Objective
The Portfolio seeks to provide capital appreciation and income while seeking to manage volatility.
Management Review
The capital appreciation and income component is sub-advised by BlackRock Investment Management, LLC ("BlackRock"), while the managed risk component is sub-advised by Milliman Financial Risk Management LLC ("Milliman").
How did the Portfolio perform during the period?
During 2022, the Portfolio outperformed its reference benchmark, the S&P Global Managed Risk LargeMidCap Index – Moderate Aggressive. The Portfolio posted a return of -14.56% compared to a benchmark return of -15.42%, a difference of 86 basis points. The following discussion of relative performance pertains to this benchmark unless otherwise noted.
What factors and allocation decisions influenced the Portfolio's performance?
The past year was very challenging, with continued inflation pressures leading to faster than expected tightening by the U.S. Federal Reserve (the "Fed"), which in turn spurred fears of a recession. These dynamics posed headwinds for both equity and fixed income markets, with almost all asset classes delivering negative returns in 2022. From an asset allocation perspective, the Portfolio benefited from its underweight to fixed income despite being hurt by this positioning early in the year as equities rallied. Certain inflation sensitive asset classes such as commodities and energy sector equities performed well given the inflationary environment. In this vein, the Portfolio's overweight to energy equities was the biggest contributor to performance. Within equities, the Portfolio benefited from a relative overweight to U.S. equity markets and a relative overweight to value within non-U.S. developed markets. Factor exposure across value, minimum volatility, and momentum in the U.S. helped the Portfolio as well. A relative overweight to environmental, social, and governance ("ESG") equities detracted as ESG equities underperformed the broad market. Sector overweight positions were mixed during the year, with energy stocks performing well while global technology and high dividend stocks detracted from performance. Within fixed income, the Portfolio was hurt by a relative overweight to longer duration fixed income as the Fed continued to raise interest rates in the U.S.
From a volatility perspective, the Milliman Managed Risk Strategy ("MMRS") was a significant contributor to performance during the year, reducing both the Portfolio's volatility and maximum drawdown during a period when most asset classes, most notably equities and fixed income, posted negative returns.
How was the Portfolio positioned at period end?
In BlackRock's view, outsized Fed influence, recession risk, and inflation uncertainty vastly widens the range of outcomes and thus diminishes risk-taking appetite. In this environment, BlackRock sought to de-risk the Portfolio by reducing active positions relative to the benchmark in order to create the ability to be nimble at a later date. These proactive moves have generally served the Portfolio well amidst this challenging period.
Given the continued uncertainty, the Portfolio ended the period neutral to equities and slightly underweight to fixed income. Within equities, the Portfolio is slightly overweight to the U.S. relative to non-U.S. developed markets and emerging markets. BlackRock reduced this relative overweight to the U.S. equity markets over the period. Within U.S. equities, the Portfolio maintains an overweight to ESG equities, but BlackRock reduced that overweight in the period as well. From a sector and factor perspective, the Portfolio is overweight momentum, minimum volatility, and energy stocks. Within non-U.S. developed markets, the Portfolio is overweight value, and within emerging markets, the Portfolio holds minimum volatility stocks.
Within fixed income, BlackRock's investment team believes the increase in yields has uncovered new opportunities, namely in shorter-term credit. BlackRock reduced the Portfolio's underweight to fixed income over the period and removed the allocation to treasury inflation-protected securities ("TIPS") given BlackRock's view that inflation should moderate into 2023. The Portfolio is also overweight to convertible bonds, as convertibles are generally less rate sensitive and offer exposure to technology companies.
29
Global Atlantic Growth Managed Risk Portfolio
Portfolio Review (Continued)
December 31, 2022 (Unaudited)
The Portfolio's performance figures for the periods ended December 31, 2022 as compared to its benchmark:
| | | | | Annualized | | Operating
Expense* | |
| | | Inception
Date | | One
Year | | Five
Years | | Since
Inception | | Gross
Ratio | | Net
Ratio | |
Global Atlantic Growth Managed Risk Portfolio | |
Class II | | April 30, 2014 | | | -14.56 | % | | | 2.62 | % | | | 3.61 | % | | | 1.01 | % | | | 0.99 | % | |
S&P Global Managed Risk LargeMidCap Index - Moderate
Aggressive^ | | | | | | | -15.42 | % | | | 3.19 | % | | | 4.26 | % | | | | | | | | | |
The performance data quoted is historical. Past performance is no guarantee of future results. Current performance may be higher or lower than the performance data quoted. The principal value and investment return of an investment will fluctuate so that your shares, when redeemed, may be worth more or less than their original cost. Total returns would have been lower absent fee waivers by the Adviser. Performance figures for periods greater than one year are annualized. The returns shown do not reflect the deduction of taxes that a shareholder may pay on Portfolio distributions or on the redemption of Portfolio shares, as well as other charges and expenses of the insurance contract or separate account. Prior to October 1, 2016, the Capital Appreciation and Income Component of the Portfolio was managed by the Adviser without the use of a sub-adviser. The performance prior to that date is attributable to the Adviser's asset allocation decisions. From October 1, 2016 to May 1, 2021, BlackRock Financial Management, Inc. served as a sub-adviser to Capital Appreciation and Income Component of the Portfolio. In addition, effective May 1, 2021 the sub-adviser to the Capital Appreciation and Income Component of the Portfolio changed from BlackRock Financial Management, Inc. to BlackRock Investment Management, LLC. No changes were made to the Portfolio's principal investment strategies or to the portfolio management team as a result of the change in sub-adviser.
* The estimated operating expense ratios for Class II shares, as disclosed in the most recent prospectus dated May 1, 2022. Ratios include Acquired Fund Fees and Expenses indirectly incurred by the Portfolio. Gross operating expense ratio reflects the ratio of expenses absent waivers and/or reimbursements by the Adviser. The operating expense ratios presented here may differ from the expense ratios disclosed in the Financial Highlights table in this report.
^ The S&P Global Managed Risk LargeMidCap Index - Moderate Aggressive is designed to simulate a dynamic protective portfolio that allocates between the underlying equity index and cash, based on realized volatilities of the underlying equity and bond indices, while maintaining a fixed allocation of 20% to the underlying bond index.
Comparison of the Change in Value of a $10,000 Investment
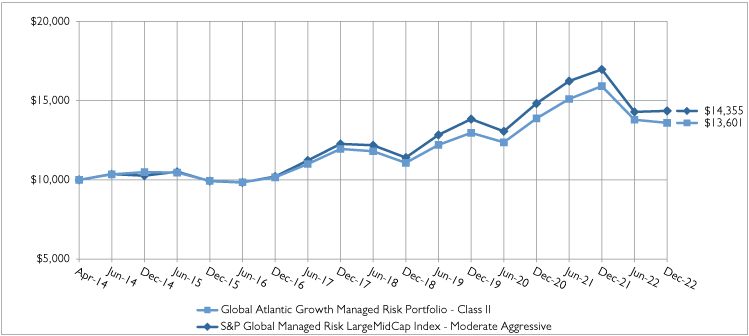
30
Global Atlantic Growth Managed Risk Portfolio
Portfolio Review (Continued)
December 31, 2022 (Unaudited)
Holdings by Asset Class | | % of Net Assets | |
Exchange-Traded Funds | | | 92.9 | % | |
Short-Term Investments | | | 5.0 | % | |
Other Assets less Liabilities - Net | | | 2.1 | % | |
| | | | 100.0 | % | |
Please refer to the Portfolio of Investments in this annual report for more information regarding the Portfolio's holdings as of December 31, 2022.
Derivative exposure is included in "Other Assets less Liabilities - Net"
5435661.3
31
Global Atlantic Growth Managed Risk Portfolio
Portfolio of Investments
December 31, 2022
| | | Shares/
Principal | | Fair
Value | |
EXCHANGE TRADED FUNDS - 92.9% | |
DEBT FUNDS - 15.1% | |
iShares 0-5 Year High Yield
Corporate Bond ETF | | | 66,671 | | | $ | 2,726,177 | | |
iShares 10+ Year Investment Grade
Corporate Bond ETF | | | 46,728 | | | | 2,326,587 | | |
iShares 10-20 Year Treasury Bond ETF | | | 63,747 | | | | 6,896,151 | | |
iShares 1-3 Year Treasury Bond ETF | | | 82,502 | | | | 6,696,687 | | |
iShares 1-5 Year Investment Grade
Corporate Bond ETF | | | 56,033 | | | | 2,791,564 | | |
iShares 20+ Year Treasury Bond ETF | | | 12,853 | | | | 1,279,645 | | |
iShares 3-7 Year Treasury Bond ETF | | | 33,314 | | | | 3,827,445 | | |
iShares 5-10 Year Investment Grade
Corporate Bond ETF | | | 53,077 | | | | 2,627,842 | | |
iShares 7-10 Year Treasury Bond ETF | | | 9,347 | | | | 895,256 | | |
iShares Convertible Bond ETF | | | 41,354 | | | | 2,872,862 | | |
iShares Core Total USD Bond Market ETF | | | 147,736 | | | | 6,637,779 | | |
iShares Core U.S. Aggregate Bond ETF | | | 77,478 | | | | 7,514,591 | | |
TOTAL DEBT FUNDS | | | | | 47,092,586 | | |
EQUITY FUNDS - 77.8% | |
iShares Core MSCI EAFE ETF | | | 473,158 | | | | 29,165,459 | | |
iShares Core S&P 500 ETF | | | 303,017 | | | | 116,422,162 | | |
iShares Core S&P Mid-Cap ETF | | | 81,995 | | | | 19,833,771 | | |
iShares Core S&P Small-Cap ETF | | | 123,985 | | | | 11,733,940 | | |
iShares ESG Aware MSCI USA ETF | | | 352,443 | | | | 29,869,544 | | |
iShares MSCI EAFE Growth ETF | | | 91,005 | | | | 7,622,579 | | |
| | | Shares/
Principal | | Fair
Value | |
EQUITY FUNDS - 77.8% (Continued) | |
iShares MSCI EAFE Value ETF | | | 218,669 | | | $ | 10,032,534 | | |
iShares MSCI Emerging Markets
Min Vol Factor ETF | | | 77,551 | | | | 4,114,081 | | |
iShares MSCI USA Min Vol Factor ETF | | | 47,520 | | | | 3,426,192 | | |
iShares MSCI USA Momentum Factor ETF | | | 53,567 | | | | 7,817,032 | | |
iShares U.S. Energy ETF | | | 41,715 | | | | 1,939,330 | | |
iShares U.S. Infrastructure ETF | | | 38,784 | | | | 1,406,308 | | |
TOTAL EQUITY FUNDS | | | | | 243,382,932 | | |
TOTAL EXCHANGE TRADED FUNDS
(Cost - $222,159,463) | | | | | 290,475,518 | | |
SHORT-TERM INVESTMENTS - 5.0% | |
MONEY MARKET FUNDS - 5.0% | |
Dreyfus Government Cash Management,
4.19% (a) | | | 12,744,242 | | | | 12,744,242 | | |
Fidelity Investments Money Market
Fund - Government Portfolio,
Institutional Class, 4.06% (a) | | | 2,940,618 | | | | 2,940,618 | | |
TOTAL SHORT-TERM INVESTMENTS
(Cost - $15,684,860) | | | | | 15,684,860 | | |
TOTAL INVESTMENTS - 97.9%
(Cost - $237,844,323) | | | | $ | 306,160,378 | | |
OTHER ASSETS LESS
LIABILITIES - NET 2.1% | | | | | 6,716,517 | | |
TOTAL NET ASSETS - 100.0% | | | | $ | 312,876,895 | | |
(a) The rate shown is the annualized seven-day yield at period end.
FUTURES CONTRACTS | |
SHORT FUTURES CONTRACTS | | Counterparty | | Number of
Contracts | | Expiration Date | | Notional Value | | Fair Value/
Unrealized
Appreciation
(Depreciation) | |
E-Mini Russell 2000 Future | | Goldman Sachs & Co. | | | 76 | | | 3/17/2023 | | $ | 6,729,420 | | | $ | 131,218 | | |
MSCI EAFE Future | | Goldman Sachs & Co. | | | 216 | | | 3/17/2023 | | | 21,053,520 | | | | 303,195 | | |
MSCI Emerging Market Index Future | | Goldman Sachs & Co. | | | 27 | | | 3/17/2023 | | | 1,295,190 | | | | 16,180 | | |
S&P 500 E-Mini Future | | Goldman Sachs & Co. | | | 356 | | | 3/17/2023 | | | 68,725,800 | | | | 1,661,562 | | |
S&P MID 400 E-Mini Future | | Goldman Sachs & Co. | | | 46 | | | 3/17/2023 | | | 11,235,960 | | | | 176,950 | | |
TOTAL NET UNREALIZED APPRECIATION ON FUTURES CONTRACTS | | | | | | | | | | $ | 2,289,105 | | |
See accompanying notes to financial statements.
32
Global Atlantic Moderate Growth Managed Risk Portfolio
Portfolio Review
December 31, 2022 (Unaudited)
Investment Objective
The Portfolio seeks to provide capital appreciation and income while seeking to manage volatility.
Management Review
The capital appreciation and income component is sub-advised by BlackRock Investment Management, LLC ("BlackRock"), while the managed risk component is sub-advised by Milliman Financial Risk Management LLC ("Milliman").
How did the Portfolio perform during the period?
During 2022, the Portfolio underperformed its reference benchmark, the S&P Global Managed Risk LargeMidCap Index – Moderate Conservative. The Portfolio posted a return of -15.38% compared to a benchmark return of -14.37%, a difference of -101 basis points. The following discussion of relative performance pertains to this benchmark unless otherwise noted.
What factors and allocation decisions influenced the Portfolio's performance?
The past year was very challenging, with continued inflation pressures leading to faster than expected tightening by the U.S. Federal Reserve (the "Fed"), which in turn spurred fears of a recession. These dynamics posed headwinds for both equity and fixed income markets, with almost all asset classes delivering negative returns in 2022. From an asset allocation perspective, the Portfolio benefited from its underweight to fixed income despite being hurt by this positioning early in the year as equities rallied. Certain inflation sensitive asset classes such as commodities and energy sector equities performed well given the inflationary environment. In this vein, the Portfolio's overweight to energy equities was the biggest contributor to performance. Within equities, the Portfolio benefited from a relative overweight to U.S. equity markets and a relative overweight to value within non-U.S. developed markets. Factor exposure across value, minimum volatility, and momentum in the U.S. helped the Portfolio as well. A relative overweight to environmental, social, and governance ("ESG") equities detracted as ESG equities underperformed the broad market. Sector overweight positions were mixed during the year, with energy stocks performing well while global technology and high dividend stocks detracted from performance. Within fixed income, the Portfolio was hurt by a relative overweight to longer duration fixed income as the Fed continued to raise interest rates in the U.S. and exposure to high yield.
From a volatility perspective, the Milliman Managed Risk Strategy ("MMRS") was a significant contributor to performance during the year, reducing both the Portfolio's volatility and maximum drawdown during a period when most asset classes, most notably equities and fixed income, posted negative returns.
How was the Portfolio positioned at period end?
In BlackRock's view, outsized Fed influence, recession risk, and inflation uncertainty vastly widens the range of outcomes, and thus diminishes risk-taking appetite. In this environment, BlackRock sought to de-risk the Portfolio by reducing active positions relative to the benchmark in order to create the ability to be nimble at a later date. These proactive moves have generally served the Portfolio well amidst this challenging period. Given the continued uncertainty, the Portfolio ended the period neutral to equities and slightly underweight to fixed income.
Within equities, the Portfolio is slightly overweight to U.S. relative to non-U.S. developed markets and emerging markets. BlackRock reduced this relative overweight to the U.S. equity markets over the period. Within U.S. equities, the Portfolio maintains an overweight to ESG equities, but BlackRock reduced that overweight in the period as well. From a sector and factor perspective, the Portfolio is overweight momentum, minimum volatility, infrastructure, and energy stocks. Within non-U.S. developed markets, the Portfolio is overweight value, and within emerging markets, the Portfolio holds minimum volatility stocks. Within fixed income, BlackRock's investment team believes the increase in yields has uncovered new opportunities, namely in shorter-term credit. BlackRock reduced the Portfolio's underweight to fixed income over the period and removed the allocation to treasury inflation-protected securities ("TIPS") given BlackRock's view that inflation should moderate into 2023. The Portfolio is also overweight to convertible bonds, as convertibles are generally less rate sensitive and offer exposure to technology companies.
33
Global Atlantic Moderate Growth Managed Risk Portfolio
Portfolio Review (Continued)
December 31, 2022 (Unaudited)
The Portfolio's performance figures for the periods ended December 31, 2022 as compared to its benchmark:
| | | | | | | Annualized | | Operating
Expense* | |
| | | Inception
Date | | One
Year | | Five
Years | | Since
Inception | | Gross
Ratio | | Net
Ratio | |
Global Atlantic Moderate Growth Managed Risk Portfolio | |
Class II | | April 30, 2014 | | | -15.38 | % | | | 2.10 | % | | | 3.54 | % | | | 1.01 | % | | | 1.01 | % | |
S&P Global Managed Risk LargeMidCap Index - Moderate
Conservative^ | | | | | | | -14.37 | % | | | 2.52 | % | | | 3.67 | % | | | | | | | | | |
The performance data quoted is historical. Past performance is no guarantee of future results. Current performance may be higher or lower than the performance data quoted. The principal value and investment return of an investment will fluctuate so that your shares, when redeemed, may be worth more or less than their original cost. Total returns would have been lower absent fee waivers by the Adviser. Performance figures for periods greater than one year are annualized. The returns shown do not reflect the deduction of taxes that a shareholder may pay on Portfolio distributions or on the redemption of Portfolio shares, as well as other charges and expenses of the insurance contract or separate account. Prior to October 1, 2016, the Capital Appreciation and Income Component of the Portfolio was managed by the Adviser without the use of a sub-adviser. The performance prior to that date is attributable to the Adviser's asset allocation decisions. From October 1, 2016 to May 1, 2021, BlackRock Financial Management, Inc. served as a sub-adviser to Capital Appreciation and Income Component of the Portfolio. In addition, effective May 1, 2021 the sub-adviser to the Capital Appreciation and Income Component of the Portfolio changed from BlackRock Financial Management, Inc. to BlackRock Investment Management, LLC. No changes were made to the Portfolio's principal investment strategies or to the portfolio management team as a result of the change in sub-adviser.
* The estimated operating expense ratios for Class II shares, as disclosed in the most recent prospectus dated May 1, 2022. Ratios include Acquired Fund Fees and Expenses indirectly incurred by the Portfolio. Gross operating expense ratio reflects the ratio of expenses absent waivers and/or reimbursements by the Adviser. The operating expense ratios presented here may differ from the expense ratios disclosed in the Financial Highlights table in this report.
^ The S&P Global Managed Risk LargeMidCap Index - Moderate Conservative is designed to simulate a dynamic protective portfolio that allocates between the underlying equity index and cash, based on realized volatilities of the underlying equity and bond indices, while maintaining a fixed allocation of 40% to the underlying bond index.
Comparison of the Change in Value of a $10,000 Investment
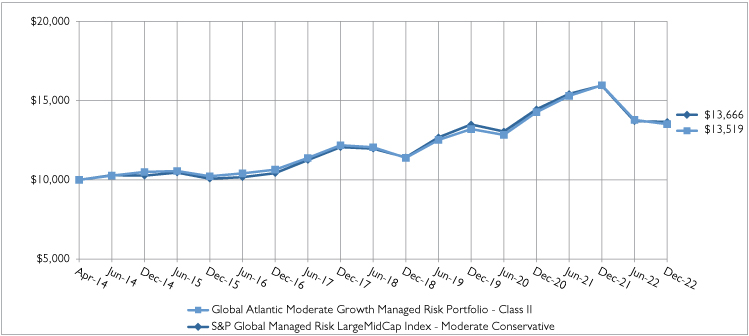
34
Global Atlantic Moderate Growth Managed Risk Portfolio
Portfolio Review (Continued)
December 31, 2022 (Unaudited)
Holdings by Asset Class | | % of Net Assets | |
Exchange-Traded Funds | | | 92.8 | % | |
Short-Term Investments | | | 5.6 | % | |
Other Assets less Liabilities - Net | | | 1.6 | % | |
| | | | 100.0 | % | |
Please refer to the Portfolio of Investments in this annual report for more information regarding the Portfolio's holdings as of December 31, 2022.
Derivative exposure is included in "Other Assets less Liabilities - Net"
5435661.3
35
Global Atlantic Moderate Growth Managed Risk Portfolio
Portfolio of Investments
December 31, 2022
| | | Shares/
Principal | | Fair
Value | |
EXCHANGE TRADED FUNDS - 92.8% | |
DEBT FUNDS - 31.2% | |
iShares 0-5 Year High Yield
Corporate Bond ETF | | | 45,298 | | | $ | 1,852,235 | | |
iShares 10+ Year Investment Grade
Corporate Bond ETF | | | 29,730 | | | | 1,480,257 | | |
iShares 10-20 Year Treasury Bond ETF | | | 24,199 | | | | 2,617,848 | | |
iShares 1-3 Year Treasury Bond ETF | | | 41,585 | | | | 3,375,454 | | |
iShares 1-5 Year Investment Grade
Corporate Bond ETF | | | 36,459 | | | | 1,816,387 | | |
iShares 20+ Year Treasury Bond ETF | | | 8,171 | | | | 813,505 | | |
iShares 3-7 Year Treasury Bond ETF | | | 22,881 | | | | 2,628,798 | | |
iShares 5-10 Year Investment Grade
Corporate Bond ETF | | | 37,699 | | | | 1,866,478 | | |
iShares 7-10 Year Treasury Bond ETF | | | 6,405 | | | | 613,471 | | |
iShares Convertible Bond ETF | | | 13,837 | | | | 961,256 | | |
iShares Core Total USD Bond Market ETF | | | 209,912 | | | | 9,431,346 | | |
iShares Core U.S. Aggregate Bond ETF | | | 52,101 | | | | 5,053,276 | | |
TOTAL DEBT FUNDS | | | | | 32,510,311 | | |
EQUITY FUNDS - 61.6% | |
iShares Core MSCI EAFE ETF | | | 121,927 | | | | 7,515,580 | | |
iShares Core S&P 500 ETF | | | 81,342 | | | | 31,252,410 | | |
iShares Core S&P Mid-Cap ETF | | | 21,767 | | | | 5,265,220 | | |
iShares Core S&P Small-Cap ETF | | | 35,694 | | | | 3,378,080 | | |
iShares ESG Aware MSCI USA ETF | | | 92,431 | | | | 7,833,527 | | |
iShares MSCI EAFE Growth ETF | | | 23,266 | | | | 1,948,760 | | |
| | | Shares/
Principal | | Fair
Value | |
EQUITY FUNDS - 61.6% (Continued) | |
iShares MSCI EAFE Value ETF | | | 51,292 | | | $ | 2,353,277 | | |
iShares MSCI Emerging Markets Min
Vol Factor ETF | | | 16,590 | | | | 880,099 | | |
iShares MSCI USA Min Vol Factor ETF | | | 12,389 | | | | 893,247 | | |
iShares MSCI USA Momentum Factor ETF | | | 13,507 | | | | 1,971,077 | | |
iShares U.S. Energy ETF | | | 9,126 | | | | 424,268 | | |
iShares U.S. Infrastructure ETF | | | 9,904 | | | | 359,119 | | |
TOTAL EQUITY FUNDS | | | | | 64,074,664 | | |
TOTAL EXCHANGE TRADED FUNDS
(Cost - $81,338,473) | | | | | 96,584,975 | | |
SHORT-TERM INVESTMENTS - 5.6% | |
MONEY MARKET FUNDS - 5.6% | |
Dreyfus Government Cash
Management, 4.19% (a) | | | 4,839,354 | | | | 4,839,354 | | |
Fidelity Investments Money Market
Fund - Government Portfolio,
Institutional Class, 4.06% (a) | | | 991,583 | | | | 991,583 | | |
TOTAL SHORT-TERM INVESTMENTS
(Cost - $5,830,937) | | | | | 5,830,937 | | |
TOTAL INVESTMENTS - 98.4%
(Cost - $87,169,410) | | | | $ | 102,415,912 | | |
OTHER ASSETS LESS LIABILITIES - NET 1.6% | | | | | 1,670,053 | | |
TOTAL NET ASSETS - 100.0% | | | | $ | 104,085,965 | | |
(a) The rate shown is the annualized seven-day yield at period end.
FUTURES CONTRACTS | |
SHORT FUTURES CONTRACTS | | Counterparty | | Number of
Contracts | | Expiration Date | | Notional Value | | Fair Value/
Unrealized
Appreciation
(Depreciation) | |
E-Mini Russell 2000 Future | | Goldman Sachs & Co. | | | 20 | | | 3/17/2023 | | $ | 1,770,900 | | | $ | 33,488 | | |
MSCI EAFE Future | | Goldman Sachs & Co. | | | 51 | | | 3/17/2023 | | | 4,970,970 | | | | 68,625 | | |
MSCI Emerging Market Index Future | | Goldman Sachs & Co. | | | 6 | | | 3/17/2023 | | | 287,820 | | | | 4,835 | | |
S&P 500 E-Mini Future | | Goldman Sachs & Co. | | | 89 | | | 3/17/2023 | | | 17,181,450 | | | | 400,947 | | |
S&P MID 400 E-Mini Future | | Goldman Sachs & Co. | | | 12 | | | 3/17/2023 | | | 2,931,120 | | | | 49,245 | | |
TOTAL NET UNREALIZED APPRECIATION ON FUTURES CONTRACTS | | | | | | | | | | $ | 557,140 | | |
See accompanying notes to financial statements.
36
Global Atlantic Select Advisor Managed Risk Portfolio
Portfolio Review
December 31, 2022 (Unaudited)
Investment Objective
The Portfolio seeks to provide capital appreciation and income while seeking to manage volatility.
Management Review
The capital appreciation and income component is sub-advised by Wilshire Advisors, LLC (formerly Wilshire Associates Incorporated) ("Wilshire"), while the managed risk component is sub-advised by Milliman Financial Risk Management LLC ("Milliman").
How did the Portfolio perform during the period?
During 2022, the Portfolio underperformed its reference benchmark, the S&P Global Managed Risk LargeMidCap Index – Moderate. The Portfolio posted a return of -15.94% compared to a benchmark return of -14.78%, a difference of -116 basis points. The following discussion of relative performance pertains to this benchmark.
What factors and allocation decisions influenced the Portfolio's performance?
The Portfolio was impacted by both dynamic asset allocation as well as manager selection during 2022. Tilts within U.S. equities contributed during the year, primarily due to an overweight to value equities (relative to growth), which was removed mid-year. Wilshire's decision to gain domestic small cap equity exposure via an exchange-traded fund ("ETF") that tracks the S&P SmallCap 600 index rather than the Russell 2000 index was also beneficial, as the ETF tracking the former index significantly outperformed the ETF tracking the latter during the year. The Portfolio also benefited from a foreign fair value pricing tailwind, which more than offset a mild overweight to emerging markets equities. Tilts within fixed income, notably an underweight to fixed income duration, contributed to performance during 2022. From a manager selection perspective, those within equities contributed to performance while those in fixed income detracted.
The Portfolio made several allocation changes during the year. During the first quarter, the Portfolio sought to further reduce duration by replacing its allocation to iShares Core 1-5 Year USD Bond ETF ("ISTB") with iShares Floating Rate Bond ETF ("FLOT"). The FLOT has virtually no duration and allowed the overall Portfolio to reduce duration by more than 0.5 years. A modest overweight to foreign developed equities was also implemented by trimming exposure from American Century VP Value and reallocating it to MFS® VIT II International Intrinsic Value. In the second quarter, the Portfolio removed its underweight to duration by eliminating the allocation to FLOT and initiating positions in iShares 1-5 Year Investment Grade Corporate Bond ETF ("IGSB") and iShares Core Total USD Bond Market ETF ("IUSB"). In addition, the Portfolio's overweight to domestic value equities was removed by increasing the allocation to Putnam VT Growth Opportunities, while trimming Putnam VT Large Cap Value and American Century VP Mid Cap Value. The small overweight to foreign developed equities was also removed, while a small overweight to emerging markets equities (relative to foreign developed equities) was implemented. During the third quarter, the allocation to IUSB was eliminated and allocated to iShares Broad USD Investment Grade Corporate Bond ETF ("USIG") in order to overweight credit relative to government fixed income.
From a volatility perspective, the Milliman Managed Risk Strategy ("MMRS") was a contributor to performance during the year, reducing both the Portfolio's volatility and maximum drawdown during a period when most asset classes, most notably equities and fixed income, posted negative returns.
How was the Portfolio positioned at period end?
Wilshire believes that the Portfolio remains well positioned to meaningfully participate in a rally in risk assets but also sufficiently diversified to potentially outperform broad market equities during a selloff. At year end, the only active equity tilt in place is a modest overweight to emerging markets equities relative to foreign developed equities due to a mixture of what Wilshire believes is a strong outlook for emerging markets GDP growth in 2023 (particularly China – as it exits COVID protocols) and a hazier outlook for Europe, which is exposed to the negative economic effects of Russia's invasion of Ukraine. Within fixed income, the Portfolio is roughly neutral overall, though with a modest overweight to credit relative to government fixed income. Given the weak returns generated in 2022 due to the inflationary and rising interest rate
37
Global Atlantic Select Advisor Managed Risk Portfolio
Portfolio Review (Continued)
December 31, 2022 (Unaudited)
environment, Wilshire believes that fixed income enters 2023 attractively priced and expects the asset class to generate attractive returns over the coming decade. Wilshire believes that equities are somewhat more difficult to predict. While global equity markets were down substantially during 2022, Wilshire believes the negative returns can mostly be explained by the rise in interest rates (and related rise in discount rates). Wilshire believes that if corporate earnings growth is flat to modest in 2023, then year-end 2022 prices are probably fair, but if corporate earnings growth is positive and meets expectations, then equities could rally during 2023. Overall, the Portfolio is neutral for fixed income versus equities, and Wilshire believes both have a better outlook entering 2023 than they did entering 2022.
The Portfolio's performance figures for the periods ended December 31, 2022 as compared to its benchmark:
| | | | | Annualized | | Operating
Expense* | |
| | | Inception
Date | | One
Year | | Five
Years | | Since
Inception | | Gross
Ratio | | Net
Ratio | |
Global Atlantic Select Advisor Managed Risk Portfolio | |
Class II | | October 31, 2013 | | | -15.94 | % | | | 2.75 | % | | | 4.33 | % | | | 1.78 | % | | | 1.17 | % | |
S&P Global Managed Risk LargeMidCap Index - Moderate^ | | | | | -14.78 | % | | | 2.88 | % | | | 4.23 | % | | | | | |
The performance data quoted is historical. Past performance is no guarantee of future results. Current performance may be higher or lower than the performance data quoted. The principal value and investment return of an investment will fluctuate so that your shares, when redeemed, may be worth more or less than their original cost. Total returns would have been lower absent fee waivers by the Adviser. Performance figures for periods greater than one year are annualized. The returns shown do not reflect the deduction of taxes that a shareholder may pay on Portfolio distributions or on the redemption of Portfolio shares, as well as other charges and expenses of the insurance contract or separate account. Prior to October 1, 2016, the Capital Appreciation and Income Component of the Portfolio was managed by the Adviser without the use of a sub-adviser. The performance prior to that date is attributable to the Adviser's asset allocation decisions.
* The estimated operating expense ratios for Class II shares, as disclosed in the most recent prospectus dated May 1, 2022. Ratios include Acquired Fund Fees and Expenses indirectly incurred by the Portfolio. Gross operating expense ratio reflects the ratio of expenses absent waivers and/or reimbursements by the Adviser. The operating expense ratios presented here may differ from the expense ratios disclosed in the Financial Highlights table in this report.
^ The S&P Global Managed Risk LargeMidCap Index - Moderate is designed to simulate a dynamic protective portfolio that allocates between the underlying equity index and cash, based on realized volatilities of the underlying equity and bond indices, while maintaining a fixed allocation of 30% to the underlying bond index.
Comparison of the Change in Value of a $10,000 Investment
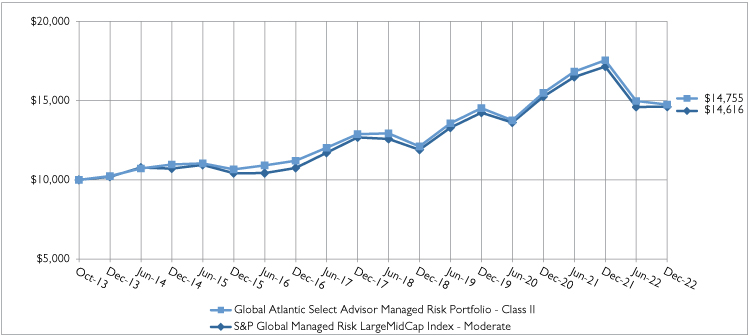
38
Global Atlantic Select Advisor Managed Risk Portfolio
Portfolio Review (Continued)
December 31, 2022 (Unaudited)
Holdings by Asset Class | | % of Net Assets | |
Variable Insurance Trusts | | | 76.3 | % | |
Exchange-Traded Funds | | | 16.8 | % | |
Short-Term Investments | | | 5.0 | % | |
Other Assets less Liabilities - Net | | | 1.9 | % | |
| | | | 100.0 | % | |
Please refer to the Portfolio of Investments in this annual report for more information regarding the Portfolio's holdings as of December 31, 2022.
Derivative exposure is included in "Other Assets less Liabilities - Net"
5435661.3
39
Global Atlantic Select Advisor Managed Risk Portfolio
Portfolio of Investments
December 31, 2022
| | | Shares/
Principal | | Fair
Value | |
VARIABLE INSURANCE TRUSTS - 76.3% | |
DEBT FUNDS - 18.5% | |
MFS High Yield Portfolio* | | | 310,811 | | | $ | 1,467,029 | | |
MFS Total Return Bond Series, Class I* | | | 1,168,538 | | | | 13,157,733 | | |
TOTAL DEBT FUNDS | | | | | 14,624,762 | | |
EQUITY FUNDS - 57.8% | |
American Century VP Mid Cap
Value, Class I | | | 104,276 | | | | 2,205,429 | | |
American Century VP Value
Fund, Class I | | | 534,099 | | | | 6,649,527 | | |
MFS Growth Series* | | | 244,023 | | | | 11,717,968 | | |
MFS VIT II - International Intrinsic
Value Portfolio, Class I* | | | 189,763 | | | | 5,169,142 | | |
MFS VIT II Blended Research Core
Equity Portfolio, Class I* | | | 77,190 | | | | 3,665,002 | | |
MFS VIT Mid Cap Growth Series* | | | 308,585 | | | | 2,209,472 | | |
Putnam VT Growth Opportunities* | | | 445,071 | | | | 4,375,044 | | |
Putnam VT Large Cap Value Fund | | | 350,551 | | | | 9,619,121 | | |
TOTAL EQUITY FUNDS | | | | | 45,610,705 | | |
TOTAL VARIABLE INSURANCE TRUSTS
(Cost - $56,222,073) | | | | | 60,235,467 | | |
EXCHANGE TRADED FUNDS - 16.8% | |
DEBT FUNDS - 4.7% | |
iShares 1-5 Year Investment Grade
Corporate Bond ETF | | | 44,452 | | | | 2,214,598 | | |
iShares Broad USD Investment Grade
Corporate Bond ETF | | | 29,789 | | | | 1,462,938 | | |
TOTAL DEBT FUNDS | | | | | 3,677,536 | | |
| | | Shares/
Principal | | Fair
Value | |
EQUITY FUNDS - 12.1% | |
iShares Core MSCI EAFE ETF | | | 95,515 | | | $ | 5,887,545 | | |
iShares Core MSCI Emerging Markets ETF | | | 31,625 | | | | 1,476,888 | | |
iShares Core S&P Small-Cap ETF | | | 23,246 | | | | 2,200,001 | | |
TOTAL EQUITY FUNDS | | | | | 9,564,434 | | |
TOTAL EXCHANGE TRADED FUNDS
(Cost - $13,673,868) | | | | | 13,241,970 | | |
SHORT-TERM INVESTMENTS - 5.0% | |
MONEY MARKET FUNDS - 5.0% | |
Dreyfus Government Cash
Management, 4.19% (a) | | | 3,894,329 | | | | 3,894,329 | | |
Fidelity Investments Money Market
Fund - Government Portfolio,
Institutional Class, 4.06% (a) | | | 40,925 | | | | 40,925 | | |
TOTAL SHORT-TERM INVESTMENTS
(Cost - $3,935,254) | | | | | 3,935,254 | | |
TOTAL INVESTMENTS - 98.1%
(Cost - $73,831,195) | | | | $ | 77,412,691 | | |
OTHER ASSETS LESS LIABILITIES - NET 1.9% | | | | | 1,508,532 | | |
TOTAL NET ASSETS - 100.0% | | | | $ | 78,921,223 | | |
* Non-income producing security.
(a) The rate shown is the annualized seven-day yield at period end.
FUTURES CONTRACTS | |
SHORT FUTURES CONTRACTS | | Counterparty | | Number of
Contracts | | Expiration Date | | Notional Value | | Fair Value/
Unrealized
Appreciation
(Depreciation) | |
E-Mini Russell 2000 Future | | Goldman Sachs & Co. | | | 14 | | | 3/17/2023 | | $ | 1,239,630 | | | $ | 24,593 | | |
MSCI EAFE Future | | Goldman Sachs & Co. | | | 72 | | | 3/17/2023 | | | 7,017,840 | | | | 102,915 | | |
MSCI Emerging Market Index Future | | Goldman Sachs & Co. | | | 15 | | | 3/17/2023 | | | 719,550 | | | | 8,455 | | |
S&P 500 E-Mini Future | | Goldman Sachs & Co. | | | 58 | | | 3/17/2023 | | | 11,196,900 | | | | 272,795 | | |
S&P MID 400 E-Mini Future | | Goldman Sachs & Co. | | | 16 | | | 3/17/2023 | | | 3,908,160 | | | | 63,310 | | |
TOTAL NET UNREALIZED APPRECIATION ON FUTURES CONTRACTS | | | | | | | | | | $ | 472,068 | | |
See accompanying notes to financial statements.
40
Global Atlantic Wellington Research Managed Risk Portfolio
Portfolio Review
December 31, 2022 (Unaudited)
Investment Objective
The Portfolio seeks to provide capital appreciation and income while seeking to manage volatility.
Management Review
The capital appreciation and income component is sub-advised by Wellington Management Company LLP ("Wellington") while the managed risk component is sub-advised by Milliman Financial Risk Management LLC ("Milliman").
How did the Portfolio perform during the period?
During 2022, the Portfolio underperformed its reference benchmark, the S&P 500 Managed Risk Index – Moderate Conservative. The Portfolio posted a return of -17.13% compared to a benchmark return of -12.94%, a difference of -419 basis points. The following discussion of relative performance pertains to this benchmark unless otherwise noted.
What factors and allocation decisions influenced the Portfolio's performance?
The equity portion of the capital appreciation and income component of the Portfolio underperformed the S&P 500® Index, net of fees, during the year, returning -18.77%, versus the S&P 500® Index's return of -18.11%, a difference of -66 basis points. Relative equity underperformance in the Portfolio was driven by poor security selection within the information technology, health care, and industrials sectors, which was only partially offset by stronger security selection within the consumer staples, utilities, and financials sectors.
Top detractors from relative performance during the period included not owning ExxonMobil Corp. ("Exxon Mobil") (energy), an overweight position in Amazon.com, Inc. ("Amazon") (consumer discretionary) and an overweight position in Meta Platforms, Inc. ("Meta Platforms") (communication services). Shares of Exxon Mobil advanced during the period with crude oil prices soaring as tensions between Russia and Ukraine threatened to create a tighter oil market. Shares of Amazon fell during the period after the company reported an unexpected first quarter loss. Results from both the company's core online retailing business and its advertising unit came in short of estimates. The Portfolio held Meta Platforms and Amazon at the end of the period. The share price of Meta Platforms fell after management released disappointing second quarter results and weak near-term guidance.
Top contributors to relative performance during the period included an underweight position in Tesla, Inc. ("Tesla") (consumer discretionary), an out-of-benchmark position in Shell PLC ("Shell") (energy) and an out-of-benchmark position in Performance Food Group Co. ("Performance Food Group") (consumer staples). Shares of Tesla fell after news that CEO, Elon Musk, planned to buy Twitter for $44 billion raised investor concern. Additionally, the company continued to grapple with supply chain issues and COVID-related shutdowns in Shanghai. Shares of Shell advanced after the oil and gas conglomerate reported adjusted profit for the fourth quarter that beat consensus estimates. Shell also announced a share repurchase program to buy back $8.5 billion worth of its own shares during the first half of 2022 using proceeds from its Permian divestment and capital allocation framework. The share price of Performance Food Group rose after the company reported higher fiscal first-quarter sales and earnings as the food-services provider raised prices and benefited from a recent acquisition. Wellington Management believes the company has done an excellent job passing through price increases and expanding gross profit dollars amid a difficult macro backdrop.
The fixed income portion of the capital appreciation and income component of the Portfolio underperformed the Bloomberg U.S. Aggregate Bond Index (net of fees) during the year, returning -13.72% versus the benchmark return of -13.01%, a difference of -71 basis points. Broad fixed income markets largely generated negative total returns in 2022, driven by rising U.S. Treasury yields. Government bond yields moved sharply higher in 2022 following ongoing monetary policy tightening intentions in response to persistent inflation pressures. U.S. labor market strength persisted while housing market resilience was tested by surging mortgage rates, lack of inventory, and home price appreciation. Central banks across most developed markets reinforced their hawkish intentions and expressed a willingness to keep policy in restrictive territory, even in the face of slower growth and weaker labor markets. The 10-year U.S. Treasury note yield rose from 1.52% to 3.88%.
41
Global Atlantic Wellington Research Managed Risk Portfolio
Portfolio Review (Continued)
December 31, 2022 (Unaudited)
Both sector allocation and security selection detracted from the fixed income portion of the Portfolio. Security selection within investment grade corporates was the primary detractor from relative returns, particularly on account of industrials (technology issuers) and financials (banking issuers). An overweight to and selection within utilities issuers had a positive impact on relative performance. Within non-corporate investment grade credit, an overweight to and security selection within taxable municipals detracted. Agency mortgage-backed securities ("MBS") contributed positively due positioning within pass-throughs. Within the securitized sectors, out-of-benchmark allocations to collateralized loan obligations ("CLOs") and non-agency mortgage-backed securities ("NA RMBS"), as well as an overweight to commercial mortgage-backed securities ("CMBS"), detracted from relative returns. Duration/yield curve positioning had a negative impact during the year.
From a volatility perspective, the Milliman Managed Risk Strategy ("MMRS") was a meaningful contributor to performance during the year, reducing both the Portfolio's volatility and maximum drawdown during a period when most asset classes, most notably equities and fixed income, posted negative returns.
How was the Portfolio positioned at period end?
The equity portion of the Portfolio is managed in an industry-neutral structure by Wellington's U.S. Research Equity Team and is designed to add value through fundamental, bottom-up stock selection. The equity portion of the Portfolio consists of multiple sub-portfolios, with each sub-portfolio actively managed by one or more of Wellington's Global Industry Analysts ("GIA"). The allocation of assets to each sub-portfolio corresponds to the relative weight of the analysts' coverage universe within the S&P 500 Index. However, within an industry, an analyst's stock selection may result in an overweight or underweight to certain sub-industries in his or her area of coverage.
Wellington expects the macroeconomic challenges that roiled markets in 2022 to remain front and center as Wellington's GIAs seek to position their portfolios for success. While there are unique challenges within each region, Wellington believes persistent inflation, tight monetary policy, and recession risk underly 2023 global equity investment outlooks.
In Asia, Wellington expects that China's re-opening will impact variables such as supply chains, fuel costs, inflation, economic growth, and worldwide consumer demand. However, Wellington believes the risk for disruption remains as the COVID virus evolves. In Europe, war between Russia and Ukraine continues and is resulting in an extreme increase in heating/fuel costs in the region, impacting consumer spending, industrial investment, and ultimately growth rates. In the U.S., Wellington finds that inflation, the U.S. Federal Reserve's (the "Fed") response, recession risk, and the impact of job losses on consumers are top of mind. Wellington believes that how these interconnected variables play out will define global market regimes for the coming years.
At the end of the period, the fixed income portion of the Portfolio was overweight investment grade credit from a market value perspective but underweight from a spread duration perspective, reflecting our more cautious view on the sector as fundamentals are strong but have likely peaked. While Wellington believes the substantially higher interest rate environment and growing growth concerns are likely to provide support for Fixed Income assets and greater downside protection going forward, the Portfolio maintained a modest short duration position at year end given recent interest rate volatility. The Portfolio was underweight U.S. government bonds in order to gain exposure to high quality securitized sectors such as asset-backed securities ("ABS"), CMBS, and NA RMBS. The Portfolio was slightly overweight agency MBS on account of neutral weight to pass-throughs and out-of-benchmark exposure to collateralized mortgage obligations ("CMOs"). From a sector perspective, Wellington has increased the Portfolio's positions in utilities and some parts of insurance sectors where it views valuations as attractive. In terms of non-corporate credit, the Wellington team remains positive on taxable municipals as they think this sector still provides diversification and a broad selection of high-quality issuers that have benefitted from fiscal support, although they are more cautious on the not-for-profit hospital sector given continued operating headwinds.
The Portfolio's performance figures for the periods ended December 31, 2022 as compared to its benchmark:
| | | | | | | Annualized | | Operating
Expense* | |
| | | Inception
Date | | One
Year | | Five
Years | | Since
Inception | | Gross
Ratio | | Net
Ratio | |
Global Atlantic Wellington Research Managed Risk Portfolio | |
Class II | | October 31, 2013 | | | -17.13 | % | | | 3.23 | % | | | 5.18 | % | | | 1.21 | % | | | 1.20 | % | |
S&P 500 Managed Risk Index - Moderate Conservative^ | | | | | -12.94 | % | | | 4.45 | % | | | 6.07 | % | | | | | |
42
Global Atlantic Wellington Research Managed Risk Portfolio
Portfolio Review (Continued)
December 31, 2022 (Unaudited)
The performance data quoted is historical. Past performance is no guarantee of future results. Current performance may be higher or lower than the performance data quoted. The principal value and investment return of an investment will fluctuate so that your shares, when redeemed, may be worth more or less than their original cost. Total returns would have been lower absent fee waivers by the Adviser. Performance figures for periods greater than one year are annualized. The returns shown do not reflect the deduction of taxes that a shareholder may pay on Portfolio distributions or on the redemption of Portfolio shares, as well as other charges and expenses of the insurance contract or separate account.
* The estimated operating expense ratios for Class II shares, as disclosed in the most recent prospectus dated May 1, 2022. Ratios include Acquired Fund Fees and Expenses indirectly incurred by the Portfolio. Gross operating expense ratio reflects the ratio of expenses absent waivers and/or reimbursements by the Adviser. The operating expense ratios presented here may differ from the expense ratios disclosed in the Financial Highlights table in this report.
^ The S&P 500 Managed Risk Index - Moderate Conservative is designed to simulate a dynamic protective portfolio that allocates between the underlying equity index and cash, based on realized volatilities of the underlying equity and bond indices, while maintaining a fixed allocation of 40% to the underlying bond index.
Comparison of the Change in Value of a $10,000 Investment

Holdings by Asset Class | | % of Net Assets | |
Common Stocks | | | 59.8 | % | |
U.S. Treasury Securities and Agency Bonds | | | 10.8 | % | |
Short-Term Investments | | | 9.2 | % | |
Corporate Bonds and Notes | | | 9.1 | % | |
Agency Mortgage Backed Securities | | | 8.9 | % | |
Asset Backed and Commercial Backed Securities | | | 2.8 | % | |
Exchange-Traded Funds | | | 1.2 | % | |
Municipal Bonds | | | 0.8 | % | |
Sovereign Debts | | | 0.0 | %^ | |
Other Assets less Liabilities - Net | | | (2.6 | )% | |
| | | | 100.0 | % | |
Please refer to the Portfolio of Investments in this annual report for more information regarding the Portfolio's holdings as of December 31, 2022.
Derivative exposure is included in "Other Assets less Liabilities - Net"
^ Represents less than 0.05%.
5435661.3
43
Global Atlantic Wellington Research Managed Risk Portfolio
Portfolio of Investments
December 31, 2022
| | | Shares/
Principal | | Fair
Value | |
COMMON STOCKS - 59.8% | |
AEROSPACE & DEFENSE - 1.5% | |
Boeing Co. (The)* | | | 5,336 | | | $ | 1,016,455 | | |
General Dynamics Corp. | | | 4,786 | | | | 1,187,454 | | |
Lockheed Martin Corp. | | | 2,682 | | | | 1,304,766 | | |
Raytheon Technologies Corp. | | | 18,874 | | | | 1,904,764 | | |
| | | | | | 5,413,439 | | |
AIR FREIGHT & LOGISTICS - 0.0%† | |
FedEx Corp. | | | 1,001 | | | | 173,373 | | |
AIRLINES - 0.2% | |
JetBlue Airways Corp.* | | | 80,931 | | | | 524,433 | | |
Southwest Airlines Co.* | | | 4,271 | | | | 143,804 | | |
| | | | | | 668,237 | | |
AUTOMOBILES - 0.2% | |
Ford Motor Co. | | | 27,514 | | | | 319,988 | | |
Tesla, Inc.* | | | 3,683 | | | | 453,672 | | |
| | | | | | 773,660 | | |
BANKS - 0.2% | |
JPMorgan Chase & Co. | | | 5,626 | | | | 754,447 | | |
BEVERAGES - 1.3% | |
Constellation Brands, Inc., Class A | | | 13,163 | | | | 3,050,526 | | |
Monster Beverage Corp.* | | | 16,091 | | | | 1,633,719 | | |
| | | | | | 4,684,245 | | |
BIOTECHNOLOGY - 1.2% | |
Alkermes PLC* | | | 5,126 | | | | 133,942 | | |
Alnylam Pharmaceuticals, Inc.* | | | 1,023 | | | | 243,116 | | |
Apellis Pharmaceuticals, Inc.* | | | 1,316 | | | | 68,050 | | |
Ascendis Pharma A/S, ADR* | | | 881 | | | | 107,597 | | |
Biogen, Inc.* | | | 1,690 | | | | 467,995 | | |
Blueprint Medicines Corp.* | | | 695 | | | | 30,448 | | |
Celldex Therapeutics, Inc.* | | | 2,341 | | | | 104,338 | | |
Genmab A/S, ADR* | | | 4,197 | | | | 177,869 | | |
Horizon Therapeutics PLC* | | | 1,049 | | | | 119,376 | | |
Incyte Corp.* | | | 1,487 | | | | 119,436 | | |
Karuna Therapeutics, Inc.* | | | 1,569 | | | | 308,308 | | |
Moderna, Inc.* | | | 1,590 | | | | 285,596 | | |
PTC Therapeutics, Inc.* | | | 1,845 | | | | 70,424 | | |
Regeneron Pharmaceuticals, Inc.* | | | 1,050 | | | | 757,564 | | |
REVOLUTION Medicines, Inc.* | | | 2,323 | | | | 55,334 | | |
Sarepta Therapeutics, Inc.* | | | 793 | | | | 102,757 | | |
Seagen, Inc.* | | | 1,619 | | | | 208,058 | | |
Syndax Pharmaceuticals, Inc.* | | | 2,049 | | | | 52,147 | | |
United Therapeutics Corp.* | | | 536 | | | | 149,056 | | |
Vertex Pharmaceuticals, Inc.* | | | 2,987 | | | | 862,586 | | |
| | | | | | 4,423,997 | | |
| | | Shares/
Principal | | Fair
Value | |
BUILDING PRODUCTS - 0.5% | |
AZEK Co., Inc. (The), Class A* | | | 8,294 | | | $ | 168,534 | | |
Builders FirstSource, Inc.* | | | 10,400 | | | | 674,752 | | |
Fortune Brands Innovations, Inc. | | | 7,389 | | | | 421,986 | | |
Johnson Controls International PLC | | | 7,590 | | | | 485,760 | | |
Masterbrand, Inc.* | | | 7,389 | | | | 55,787 | | |
| | | | | | 1,806,819 | | |
CAPITAL MARKETS - 4.1% | |
Ares Management Corp., Class A | | | 36,843 | | | | 2,521,535 | | |
BlackRock, Inc., Class A | | | 2,043 | | | | 1,447,731 | | |
Charles Schwab Corp. (The) | | | 51,738 | | | | 4,307,706 | | |
Goldman Sachs Group, Inc. (The) | | | 6,342 | | | | 2,177,716 | | |
Morgan Stanley | | | 12,908 | | | | 1,097,438 | | |
MSCI, Inc. | | | 3,745 | | | | 1,742,062 | | |
Tradeweb Markets, Inc., Class A | | | 16,408 | | | | 1,065,371 | | |
| | | | | | 14,359,559 | | |
CHEMICALS - 1.7% | |
Cabot Corp. | | | 11,870 | | | | 793,391 | | |
Celanese Corp. | | | 6,269 | | | | 640,943 | | |
FMC Corp. | | | 10,182 | | | | 1,270,714 | | |
Ingevity Corp.* | | | 4,392 | | | | 309,372 | | |
Linde PLC | | | 5,586 | | | | 1,822,041 | | |
Livent Corp.* | | | 11,089 | | | | 220,338 | | |
PPG Industries, Inc. | | | 8,315 | | | | 1,045,528 | | |
| | | | | | 6,102,327 | | |
COMMERCIAL SERVICES & SUPPLIES - 0.3% | |
Aurora Innovation, Inc.* | | | 29,736 | | | | 35,981 | | |
Clean Harbors, Inc.* | | | 3,680 | | | | 419,962 | | |
Waste Connections, Inc. | | | 4,208 | | | | 557,812 | | |
| | | | | | 1,013,755 | | |
COMMUNICATIONS EQUIPMENT - 0.1% | |
Arista Networks, Inc.* | | | 1,964 | | | | 238,331 | | |
CONSTRUCTION & ENGINEERING - 0.2% | |
Fluor Corp.* | | | 24,308 | | | | 842,515 | | |
CONTAINERS & PACKAGING - 0.1% | |
Ball Corp. | | | 5,338 | | | | 272,985 | | |
DIVERSIFIED FINANCIAL SERVICES - 0.2% | |
Equitable Holdings, Inc. | | | 24,558 | | | | 704,815 | | |
DIVERSIFIED TELECOMMUNICATION - 0.4% | |
AT&T, Inc. | | | 78,518 | | | | 1,445,516 | | |
ELECTRIC UTILITIES - 1.9% | |
Duke Energy Corp. | | | 20,249 | | | | 2,085,444 | | |
Edison International | | | 22,864 | | | | 1,454,608 | | |
Exelon Corp. | | | 33,599 | | | | 1,452,485 | | |
FirstEnergy Corp. | | | 38,508 | | | | 1,615,026 | | |
| | | | | | 6,607,563 | | |
See accompanying notes to financial statements.
44
Global Atlantic Wellington Research Managed Risk Portfolio
Portfolio of Investments (Continued)
December 31, 2022
| | | Shares/
Principal | | Fair
Value | |
ELECTRICAL EQUIPMENT - 0.2% | |
AMETEK, Inc. | | | 3,589 | | | $ | 501,455 | | |
Emerson Electric Co. | | | 1,739 | | | | 167,048 | | |
| | | | | | 668,503 | | |
ENERGY EQUIPMENT & SERVICES - 0.4% | |
Schlumberger NV | | | 23,922 | | | | 1,278,870 | | |
ENTERTAINMENT - 0.6% | |
Electronic Arts, Inc. | | | 3,155 | | | | 385,478 | | |
Walt Disney Co. (The)* | | | 20,054 | | | | 1,742,291 | | |
| | | | | | 2,127,769 | | |
EQUITY REAL ESTATE INVESTMENT - 1.2% | |
Kimco Realty Corp. | | | 42,500 | | | | 900,150 | | |
Rexford Industrial Realty, Inc. | | | 9,668 | | | | 528,260 | | |
Ryman Hospitality Properties, Inc. | | | 11,529 | | | | 942,842 | | |
Sun Communities, Inc. | | | 5,444 | | | | 778,492 | | |
Welltower, Inc. | | | 15,859 | | | | 1,039,557 | | |
| | | | | | 4,189,301 | | |
FOOD & STAPLES RETAILING - 2.1% | |
Performance Food Group Co.* | | | 93,765 | | | | 5,474,938 | | |
Sysco Corp. | | | 23,549 | | | | 1,800,321 | | |
| | | | | | 7,275,259 | | |
FOOD PRODUCTS - 1.2% | |
Archer-Daniels-Midland Co. | | | 13,977 | | | | 1,297,764 | | |
Hershey Co. (The) | | | 9,588 | | | | 2,220,293 | | |
Kellogg Co. | | | 11,690 | | | | 832,796 | | |
| | | | | | 4,350,853 | | |
HEALTH CARE EQUIPMENT & SUPPLIES - 1.7% | |
Abbott Laboratories | | | 8,297 | | | | 910,928 | | |
Baxter International, Inc. | | | 12,327 | | | | 628,307 | | |
Boston Scientific Corp.* | | | 27,264 | | | | 1,261,505 | | |
Dexcom, Inc.* | | | 6,077 | | | | 688,159 | | |
Edwards Lifesciences Corp.* | | | 12,972 | | | | 967,841 | | |
Insulet Corp.* | | | 1,779 | | | | 523,720 | | |
Stryker Corp. | | | 5,002 | | | | 1,222,939 | | |
| | | | | | 6,203,399 | | |
HEALTH CARE PROVIDERS & SERVICES - 2.6% | |
agilon health, Inc.* | | | 50,797 | | | | 819,864 | | |
Centene Corp.* | | | 21,240 | | | | 1,741,892 | | |
Elevance Health, Inc. | | | 2,745 | | | | 1,408,103 | | |
HCA Healthcare, Inc. | | | 6,205 | | | | 1,488,952 | | |
Humana, Inc. | | | 2,743 | | | | 1,404,937 | | |
Laboratory Corp. of America Holdings | | | 527 | | | | 124,098 | | |
McKesson Corp. | | | 2,011 | | | | 754,366 | | |
Molina Healthcare, Inc.* | | | 1,319 | | | | 435,560 | | |
UnitedHealth Group, Inc. | | | 2,155 | | | | 1,142,538 | | |
| | | | | | 9,320,310 | | |
| | | Shares/
Principal | | Fair
Value | |
HOTELS, RESTAURANTS & LEISURE - 1.1% | |
Airbnb, Inc., Class A* | | | 24,931 | | | $ | 2,131,601 | | |
Hyatt Hotels Corp., Class A* | | | 8,373 | | | | 757,338 | | |
Starbucks Corp. | | | 10,787 | | | | 1,070,070 | | |
| | | | | | 3,959,009 | | |
HOUSEHOLD DURABLES - 0.1% | |
DR Horton, Inc. | | | 1,014 | | | | 90,388 | | |
Lennar Corp., Class A | | | 3,249 | | | | 294,035 | | |
| | | | | | 384,423 | | |
INDEPENDENT POWER AND RENEWABLE
ELECTRICITY PRODUCERS - 0.4% | |
AES Corp. (The) | | | 43,712 | | | | 1,257,157 | | |
INDUSTRIAL CONGLOMERATES - 0.5% | |
Honeywell International, Inc. | | | 7,735 | | | | 1,657,611 | | |
INSURANCE - 2.0% | |
American International Group, Inc. | | | 18,633 | | | | 1,178,351 | | |
Arch Capital Group Ltd.* | | | 13,366 | | | | 839,118 | | |
Assured Guaranty Ltd. | | | 10,654 | | | | 663,318 | | |
Chubb Ltd. | | | 6,507 | | | | 1,435,444 | | |
Marsh & McLennan Cos., Inc. | | | 9,312 | | | | 1,540,950 | | |
MetLife, Inc. | | | 10,778 | | | | 780,004 | | |
Trupanion, Inc.* | | | 12,061 | | | | 573,259 | | |
| | | | | | 7,010,444 | | |
INTERACTIVE MEDIA & SERVICES - 3.3% | |
Alphabet, Inc., Class A* | | | 77,169 | | | | 6,808,621 | | |
Bumble, Inc., Class A* | | | 38,386 | | | | 808,025 | | |
Cargurus, Inc.* | | | 52,712 | | | | 738,495 | | |
Match Group, Inc.* | | | 12,795 | | | | 530,865 | | |
Meta Platforms, Inc., Class A* | | | 22,535 | | | | 2,711,862 | | |
| | | | | | 11,597,868 | | |
INTERNET & DIRECT MARKETING RETAIL - 2.6% | |
Amazon.com, Inc.* | | | 83,025 | | | | 6,974,100 | | |
Etsy, Inc.* | | | 17,792 | | | | 2,131,126 | | |
| | | | | | 9,105,226 | | |
IT SERVICES - 2.6% | |
Block, Inc.* | | | 13,576 | | | | 853,116 | | |
FleetCor Technologies, Inc.* | | | 2,412 | | | | 443,036 | | |
Genpact Ltd. | | | 9,528 | | | | 441,337 | | |
Global Payments, Inc. | | | 11,640 | | | | 1,156,085 | | |
GoDaddy, Inc., Class A* | | | 11,816 | | | | 884,073 | | |
Okta, Inc.* | | | 1,237 | | | | 84,524 | | |
PayPal Holdings, Inc.* | | | 13,307 | | | | 947,724 | | |
Snowflake, Inc., Class A* | | | 665 | | | | 95,454 | | |
VeriSign, Inc.* | | | 11,052 | | | | 2,270,523 | | |
Visa, Inc., Class A | | | 6,317 | | | | 1,312,420 | | |
WEX, Inc.* | | | 4,604 | | | | 753,445 | | |
| | | | | | 9,241,737 | | |
See accompanying notes to financial statements.
45
Global Atlantic Wellington Research Managed Risk Portfolio
Portfolio of Investments (Continued)
December 31, 2022
| | | Shares/
Principal | | Fair
Value | |
LIFE SCIENCES TOOLS & SERVICES - 1.6% | |
Agilent Technologies, Inc. | | | 9,295 | | | $ | 1,390,997 | | |
Danaher Corp. | | | 8,875 | | | | 2,355,602 | | |
ICON PLC* | | | 1,946 | | | | 378,010 | | |
Illumina, Inc.* | | | 3,348 | | | | 676,966 | | |
Syneos Health, Inc.* | | | 25,316 | | | | 928,591 | | |
| | | | | | 5,730,166 | | |
MACHINERY - 1.2% | |
Caterpillar, Inc. | | | 2,530 | | | | 606,087 | | |
Flowserve Corp. | | | 16,381 | | | | 502,569 | | |
Fortive Corp. | | | 6,193 | | | | 397,900 | | |
Ingersoll Rand, Inc. | | | 8,479 | | | | 443,028 | | |
Kennametal, Inc. | | | 9,624 | | | | 231,553 | | |
Middleby Corp. (The)* | | | 3,515 | | | | 470,658 | | |
PACCAR, Inc. | | | 2,448 | | | | 242,279 | | |
Westinghouse Air Brake Technologies Corp. | | | 11,980 | | | | 1,195,724 | | |
| | | | | | 4,089,798 | | |
MEDIA - 0.7% | |
Charter Communications, Inc., Class A* | | | 917 | | | | 310,955 | | |
New York Times Co. (The), Class A | | | 16,327 | | | | 529,974 | | |
Omnicom Group, Inc. | | | 21,882 | | | | 1,784,915 | | |
| | | | | | 2,625,844 | | |
OIL, GAS & CONSUMABLE FUELS - 3.2% | |
| BP PLC, ADR | | | 92,748 | | | | 3,239,688 | | |
ConocoPhillips | | | 21,913 | | | | 2,585,734 | | |
Diamondback Energy, Inc. | | | 2,733 | | | | 373,820 | | |
EOG Resources, Inc. | | | 5,971 | | | | 773,364 | | |
Marathon Petroleum Corp. | | | 10,642 | | | | 1,238,622 | | |
Shell PLC, ADR | | | 52,392 | | | | 2,983,724 | | |
| | | | | | 11,194,952 | | |
PHARMACEUTICALS - 4.1% | |
Aclaris Therapeutics, Inc.* | | | 4,060 | | | | 63,945 | | |
AstraZeneca PLC, ADR | | | 23,513 | | | | 1,594,181 | | |
Bristol-Myers Squibb Co. | | | 6,697 | | | | 481,849 | | |
Elanco Animal Health, Inc.* | | | 23,043 | | | | 281,585 | | |
Eli Lilly and Co. | | | 10,900 | | | | 3,987,656 | | |
GSK PLC, ADR | | | 16,036 | | | | 563,505 | | |
Intra-Cellular Therapies, Inc.* | | | 3,867 | | | | 204,642 | | |
Merck & Co., Inc. | | | 25,336 | | | | 2,811,029 | | |
Novartis AG, ADR | | | 9,169 | | | | 831,812 | | |
Pfizer, Inc. | | | 54,614 | | | | 2,798,421 | | |
Royalty Pharma PLC, Class A | | | 1,130 | | | | 44,658 | | |
Zoetis, Inc. | | | 6,443 | | | | 944,222 | | |
| | | | | | 14,607,505 | | |
PROFESSIONAL SERVICES - 0.2% | |
Science Applications International Corp. | | | 4,147 | | | | 460,027 | | |
TriNet Group, Inc.* | | | 5,146 | | | | 348,899 | | |
| | | | | | 808,926 | | |
| | | Shares/
Principal | | Fair
Value | |
ROAD & RAIL - 0.2% | |
Knight-Swift Transportation Holdings, Inc. | | | 15,159 | | | $ | 794,483 | | |
SEMICONDUCTORS & SEMICONDUCTOR EQUIPMENT - 2.3% | |
Advanced Micro Devices, Inc.* | | | 17,510 | | | | 1,134,123 | | |
Intel Corp. | | | 19,273 | | | | 509,385 | | |
KLA Corp. | | | 2,425 | | | | 914,298 | | |
Marvell Technology, Inc. | | | 15,476 | | | | 573,231 | | |
Micron Technology, Inc. | | | 18,544 | | | | 926,829 | | |
NVIDIA Corp. | | | 4,021 | | | | 587,629 | | |
ON Semiconductor Corp.* | | | 15,171 | | | | 946,215 | | |
Teradyne, Inc. | | | 7,420 | | | | 648,137 | | |
Texas Instruments, Inc. | | | 11,428 | | | | 1,888,134 | | |
| | | | | | 8,127,981 | | |
SOFTWARE - 5.1% | |
Adobe, Inc.* | | | 1,498 | | | | 504,122 | | |
Ceridian HCM Holding, Inc.* | | | 13,646 | | | | 875,391 | | |
Guidewire Software, Inc.* | | | 3,101 | | | | 193,999 | | |
HashiCorp, Inc., Class A* | | | 9,297 | | | | 254,180 | | |
HubSpot, Inc.* | | | 414 | | | | 119,700 | | |
Microsoft Corp. | | | 54,896 | | | | 13,165,159 | | |
Palo Alto Networks, Inc.* | | | 2,039 | | | | 284,522 | | |
Qualtrics International, Inc., Class A* | | | 11,088 | | | | 115,093 | | |
Rapid7, Inc.* | | | 1,340 | | | | 45,533 | | |
Salesforce, Inc.* | | | 9,141 | | | | 1,212,005 | | |
SentinelOne, Inc., Class A* | | | 4,093 | | | | 59,717 | | |
ServiceNow, Inc.* | | | 2,273 | | | | 882,538 | | |
Workday, Inc., Class A* | | | 2,622 | | | | 438,739 | | |
| | | | | | 18,150,698 | | |
SPECIALTY RETAIL - 0.8% | |
TJX Cos., Inc. (The) | | | 35,639 | | | | 2,836,864 | | |
TECHNOLOGY HARDWARE, STORAGE & PERIPHERALS - 1.7% | |
Apple, Inc. | | | 47,107 | | | | 6,120,613 | | |
TEXTILES, APPAREL & LUXURY GOODS - 0.5% | |
NIKE, Inc., Class B | | | 16,487 | | | | 1,929,144 | | |
TOBACCO - 0.7% | |
Altria Group, Inc. | | | 11,346 | | | | 518,626 | | |
Philip Morris International, Inc. | | | 18,759 | | | | 1,898,598 | | |
| | | | | | 2,417,224 | | |
TRADING COMPANIES & DISTRIBUTORS - 0.2% | |
United Rentals, Inc.* | | | 365 | | | | 129,728 | | |
WESCO International, Inc.* | | | 3,849 | | | | 481,895 | | |
| | | | | | 611,623 | | |
See accompanying notes to financial statements.
46
Global Atlantic Wellington Research Managed Risk Portfolio
Portfolio of Investments (Continued)
December 31, 2022
| | | Shares/
Principal | | Fair
Value | |
WIRELESS TELECOMMUNICATION SERVICES - 0.6% | |
T-Mobile US, Inc.* | | | 14,022 | | | $ | 1,963,080 | | |
TOTAL COMMON STOCKS
(Cost - $154,286,088) | | | | | 211,922,223 | | |
U.S. TREASURY SECURITIES AND AGENCY BONDS - 10.8% | |
U.S. Treasury Bond | |
3.25%, 5/15/42 | | $ | 45,000 | | | | 39,720 | | |
3.38%, 8/15/42 | | | 4,465,000 | | | | 4,017,802 | | |
4.00%, 11/15/42 | | | 499,000 | | | | 491,749 | | |
3.00%, 11/15/44 | | | 610,000 | | | | 507,158 | | |
2.50%, 2/15/45 | | | 2,620,000 | | | | 1,987,720 | | |
2.88%, 8/15/45 | | | 545,000 | | | | 442,195 | | |
2.50%, 5/15/46 | | | 805,000 | | | | 605,448 | | |
3.00%, 5/15/47 | | | 470,000 | | | | 387,658 | | |
2.75%, 8/15/47 | | | 320,000 | | | | 251,775 | | |
2.88%, 5/15/52 | | | 3,536,100 | | | | 2,859,821 | | |
3.00%, 8/15/52 | | | 997,500 | | | | 829,484 | | |
4.00%, 11/15/52 | | | 320,000 | | | | 323,300 | | |
U.S. Treasury Note | |
0.38%, 10/31/23 | | | 175,000 | | | | 168,759 | | |
0.13%, 1/15/24 | | | 500,000 | | | | 476,855 | | |
1.50%, 2/29/24 | | | 250,000 | | | | 241,064 | | |
2.50%, 4/30/24 | | | 180,000 | | | | 174,937 | | |
0.25%, 5/15/24 | | | 260,000 | | | | 244,816 | | |
3.25%, 8/31/24 | | | 1,460,000 | | | | 1,430,173 | | |
4.25%, 9/30/24 | | | 62,000 | | | | 61,709 | | |
4.50%, 11/30/24 | | | 1,550,000 | | | | 1,550,848 | | |
1.00%, 12/15/24 | | | 85,000 | | | | 79,604 | | |
1.13%, 1/15/25 | | | 1,400,000 | | | | 1,310,914 | | |
1.50%, 2/15/25 | | | 350,000 | | | | 329,670 | | |
2.63%, 4/15/25 | | | 495,000 | | | | 476,747 | | |
2.75%, 5/15/25 | | | 355,000 | | | | 342,575 | | |
0.75%, 5/31/26 | | | 260,000 | | | | 232,162 | | |
0.88%, 6/30/26 | | | 475,000 | | | | 425,255 | | |
0.63%, 7/31/26 | | | 2,215,000 | | | | 1,959,583 | | |
0.75%, 8/31/26 | | | 505,000 | | | | 447,753 | | |
0.88%, 9/30/26 | | | 1,715,000 | | | | 1,524,876 | | |
1.13%, 10/31/26 | | | 510,000 | | | | 456,769 | | |
1.25%, 11/30/26 | | | 140,000 | | | | 125,798 | | |
1.25%, 12/31/26 | | | 4,100,000 | | | | 3,676,707 | | |
2.50%, 3/31/27†† | | | 325,000 | | | | 305,437 | | |
2.75%, 4/30/27 | | | 535,000 | | | | 507,748 | | |
2.63%, 5/31/27 | | | 460,000 | | | | 434,269 | | |
3.25%, 6/30/27 | | | 295,000 | | | | 285,678 | | |
3.13%, 8/31/27 | | | 1,390,000 | | | | 1,339,070 | | |
4.13%, 9/30/27 | | | 1,142,100 | | | | 1,148,212 | | |
4.13%, 10/31/27 | | | 1,235,500 | | | | 1,242,064 | | |
3.88%, 11/30/27 | | | 1,170,000 | | | | 1,165,521 | | |
1.25%, 3/31/28 | | | 440,000 | | | | 383,178 | | |
1.25%, 6/30/28 | | | 265,000 | | | | 229,587 | | |
1.50%, 11/30/28 | | | 195,000 | | | | 169,711 | | |
| | | Shares/
Principal | | Fair
Value | |
U.S. TREASURY SECURITIES AND AGENCY
BONDS - 10.8% (Continued) | |
U.S. Treasury Note (continued) | |
2.38%, 3/31/29 | | $ | 210,000 | | | $ | 191,387 | | |
2.63%, 7/31/29 | | | 125,000 | | | | 115,371 | | |
4.00%, 10/31/29 | | | 318,000 | | | | 318,845 | | |
3.88%, 11/30/29 | | | 271,000 | | | | 269,814 | | |
2.75%, 8/15/32 | | | 237,000 | | | | 216,596 | | |
4.13%, 11/15/32 | | | 1,348,000 | | | | 1,380,647 | | |
TOTAL U.S. TREASURY SECURITIES AND
AGENCY BONDS (Cost - $41,450,637) | | | | | 38,184,539 | | |
CORPORATE BONDS AND NOTES - 9.1% | |
AEROSPACE & DEFENSE - 0.1% | |
BAE Systems Holdings, Inc.,
3.85%, 12/15/25 (a) | | | 100,000 | | | | 96,501 | | |
Lockheed Martin Corp.,
4.85%, 9/15/41 | | | 50,000 | | | | 46,457 | | |
Raytheon Technologies Corp.,
3.95%, 8/16/25 | | | 150,000 | | | | 146,714 | | |
| | | | | | 289,672 | | |
AGRICULTURE - 0.2% | |
Philip Morris International, Inc. | |
5.13%, 11/17/27 | | | 170,000 | | | | 171,426 | | |
5.63%, 11/17/29 | | | 115,000 | | | | 117,009 | | |
5.75%, 11/17/32 | | | 280,000 | | | | 286,318 | | |
| | | | | | 574,753 | | |
AIRLINES - 0.0%† | |
United Airlines 2016-1 Class AA
Pass-Through Trust, 3.10%, 7/7/28 | | | 73,617 | | | | 64,629 | | |
United Airlines 2018-1 Class B
Pass Through Trust, 4.60%, 3/1/26 | | | 22,147 | | | | 20,199 | | |
| | | | | | 84,828 | | |
AUTO MANUFACTURERS - 0.3% | |
General Motors Financial Co., Inc.,
3.70%, 5/9/23 | | | 600,000 | | | | 597,024 | | |
Hyundai Capital America, 0.80%, 4/3/23 (a) | | | 375,000 | | | | 370,626 | | |
Volkswagen Group of America Finance LLC,
3.35%, 5/13/25 (a) | | | 225,000 | | | | 215,031 | | |
| | | | | | 1,182,681 | | |
BANKS - 2.6% | |
Banco Santander SA, 3.13%, 2/23/23 | | | 200,000 | | | | 199,414 | | |
Bank of America Corp. | |
1.73%, (SOFR + 0.96%), 7/22/27 (b) | | | 435,000 | | | | 381,339 | | |
3.42%, (3 Month US Libor + 1.04%),
12/20/28 (b) | | | 11,000 | | | | 9,962 | | |
2.65%, (SOFR + 1.22%), 3/11/32 (b) | | | 290,000 | | | | 232,874 | | |
2.30%, (SOFR + 1.22%), 7/21/32 (b) | | | 45,000 | | | | 34,781 | | |
Barclays PLC, 3.93%, (3 Month US
Libor + 1.61%), 5/7/25 (b) | | | 355,000 | | | | 344,381 | | |
See accompanying notes to financial statements.
47
Global Atlantic Wellington Research Managed Risk Portfolio
Portfolio of Investments (Continued)
December 31, 2022
| | | Shares/
Principal | | Fair
Value | |
BANKS - 2.6% (Continued) | |
BNP Paribas SA | |
3.38%, 1/9/25 (a) | | $ | 200,000 | | | $ | 192,590 | | |
2.82%, (3 Month US Libor + 1.11%),
11/19/25 (a),(b) | | | 200,000 | | | | 189,551 | | |
| BPCE SA | |
5.70%, 10/22/23 (a) | | | 275,000 | | | | 272,914 | | |
5.15%, 7/21/24 (a) | | | 600,000 | | | | 587,510 | | |
Citigroup, Inc., 3.50%, 5/15/23 | | | 300,000 | | | | 298,548 | | |
Cooperatieve Rabobank UA, 1.11%,
(US 1 Year CMT T-Note + 0.55%),
2/24/27 (a),(b) | | | 250,000 | | | | 218,638 | | |
Credit Agricole SA | |
3.75%, 4/24/23 (a) | | | 250,000 | | | | 248,897 | | |
3.25%, 10/4/24 (a) | | | 250,000 | | | | 240,740 | | |
4.38%, 3/17/25 (a) | | | 200,000 | | | | 192,929 | | |
Credit Suisse Group AG, 3.09%, 5/14/32 (a) | | | 425,000 | | | | 294,945 | | |
Danske Bank A/S | |
3.88%, 9/12/23 (a) | | | 200,000 | | | | 197,490 | | |
5.38%, 1/12/24 (a) | | | 200,000 | | | | 198,398 | | |
1.62%, (US 1 Year CMT T-Note + 1.35%),
9/11/26 (a),(b) | | | 435,000 | | | | 383,455 | | |
Goldman Sachs Group, Inc. (The) | |
5.70%, 11/1/24 | | | 614,000 | | | | 622,042 | | |
3.50%, 1/23/25 | | | 200,000 | | | | 193,328 | | |
3.27%, (3 Month US Libor + 1.20%),
9/29/25 (b) | | | 460,000 | | | | 443,475 | | |
1.43%, (SOFR + 0.80%), 3/9/27 (b) | | | 495,000 | | | | 434,080 | | |
3.21%, (SOFR + 1.51%), 4/22/42 (b) | | | 30,000 | | | | 21,742 | | |
HSBC Holdings PLC, 7.39%, (SOFR + 3.35%),
11/3/28 (b) | | | 350,000 | | | | 367,309 | | |
JPMorgan Chase & Co. | |
2.95%, 10/1/26 | | | 400,000 | | | | 373,601 | | |
2.07%, (SOFR + 1.02%), 6/1/29 (b) | | | 10,000 | | | | 8,368 | | |
2.58%, (SOFR + 1.25%), 4/22/32 (b) | | | 325,000 | | | | 261,305 | | |
4.91%, (SOFR + 2.08%), 7/25/33 (b) | | | 170,000 | | | | 162,636 | | |
Morgan Stanley | |
4.35%, 9/8/26 | | | 455,000 | | | | 442,158 | | |
1.93%, (SOFR + 1.02%), 4/28/32 (b) | | | 210,000 | | | | 158,985 | | |
2.51%, (SOFR + 1.20%), 10/20/32 (b) | | | 625,000 | | | | 488,973 | | |
5.30%, (SOFR + 2.62%), 4/20/37 (b) | | | 289,000 | | | | 265,108 | | |
PNC Financial Services Group, Inc. (The),
3.90%, 4/29/24 | | | 50,000 | | | | 49,405 | | |
Standard Chartered PLC, 0.99%,
(US 1 Year CMT T-Note + 0.78%),
1/12/25 (a),(b) | | | 260,000 | | | | 245,349 | | |
Wells Fargo & Co., 3.00%, 2/19/25 | | | 150,000 | | | | 143,777 | | |
| | | | | | 9,400,997 | | |
BEVERAGES - 0.1% | |
Anheuser-Busch InBev Worldwide, Inc.,
4.38%, 4/15/38 | | | 300,000 | | | | 269,494 | | |
| | | Shares/
Principal | | Fair
Value | |
COMMERCIAL SERVICES - 0.0%† | |
Ashtead Capital, Inc., 5.50%, 8/11/32 (a) | | $ | 200,000 | | | $ | 191,931 | | |
DIVERSIFIED FINANCIAL SERVICES - 0.6% | |
Aviation Capital Group LLC,
1.95%, 9/20/26 (a) | | | 410,000 | | | | 346,713 | | |
Avolon Holdings Funding Ltd.,
2.13%, 2/21/26 (a) | | | 184,000 | | | | 158,450 | | |
Capital One Financial Corp., 4.20%, 10/29/25 | | | 105,000 | | | | 101,547 | | |
Intercontinental Exchange, Inc. | |
4.00%, 9/15/27 | | | 411,000 | | | | 397,664 | | |
4.35%, 6/15/29 | | | 1,146,000 | | | | 1,110,791 | | |
| | | | | | 2,115,165 | | |
ELECTRIC - 1.3% | |
Alabama Power Co., 1.45%, 9/15/30 | | | 30,000 | | | | 23,449 | | |
Appalachian Power Co., 3.40%, 6/1/25 | | | 200,000 | | | | 192,871 | | |
CMS Energy Corp., 4.75%,
(US 5 Year CMT T-Note + 4.12%),
6/1/50 (b) | | | 202,000 | | | | 174,722 | | |
Consolidated Edison Co. of New York, Inc. | |
3.20%, 12/1/51 | | | 315,000 | | | | 219,499 | | |
4.50%, 5/15/58 | | | 75,000 | | | | 62,858 | | |
Dominion Energy South Carolina, Inc.,
6.63%, 2/1/32 | | | 80,000 | | | | 88,050 | | |
Duke Energy Corp. | |
3.75%, 4/15/24 | | | 225,000 | | | | 221,064 | | |
2.65%, 9/1/26 | | | 70,000 | | | | 64,793 | | |
4.50%, 8/15/32 | | | 767,000 | | | | 723,038 | | |
5.00%, 8/15/52 | | | 75,000 | | | | 66,986 | | |
Georgia Power Co. | |
4.70%, 5/15/32 | | | 315,000 | | | | 304,800 | | |
4.75%, 9/1/40 | | | 65,000 | | | | 59,019 | | |
5.13%, 5/15/52 | | | 165,000 | | | | 154,079 | | |
ITC Holdings Corp., 4.95%, 9/22/27 (a) | | | 120,000 | | | | 118,604 | | |
Niagara Mohawk Power Corp.,
1.96%, 6/27/30 (a) | | | 335,000 | | | | 265,743 | | |
Oglethorpe Power Corp., 6.19%, 1/1/31 (a) | | | 100,000 | | | | 100,885 | | |
Pacific Gas and Electric Co.,
5.90%, 6/15/32 | | | 200,000 | | | | 195,967 | | |
SCE Recovery Funding LLC | |
0.86%, 11/15/31 | | | 103,959 | | | | 86,499 | | |
1.94%, 5/15/38 | | | 50,000 | | | | 34,794 | | |
2.51%, 11/15/43 | | | 30,000 | | | | 18,945 | | |
Sempra Energy, 4.13%,
(US 5 Year CMT T-Note + 2.87%),
4/1/52 (b) | | | 95,000 | | | | 74,125 | | |
Southern California Edison Co. | |
3.70%, 8/1/25 | | | 45,000 | | | | 43,571 | | |
5.95%, 11/1/32 | | | 505,000 | | | | 536,233 | | |
4.00%, 4/1/47 | | | 50,000 | | | | 39,227 | | |
Southern Co. (The) | |
2.95%, 7/1/23 | | | 290,000 | | | | 287,189 | | |
See accompanying notes to financial statements.
48
Global Atlantic Wellington Research Managed Risk Portfolio
Portfolio of Investments (Continued)
December 31, 2022
| | | Shares/
Principal | | Fair
Value | |
ELECTRIC - 1.3% (Continued) | |
Southern Co. (The) (continued) | |
4.00%, (US 5 Year CMT T-Note + 3.73%),
1/15/51 (b) | | $ | 175,000 | | | $ | 159,250 | | |
Texas Electric Market Stabilization Funding
N LLC, 4.27%, 8/1/34 (a) | | | 370,000 | | | | 352,010 | | |
| | | | | | 4,668,270 | | |
ENTERTAINMENT - 0.2% | |
Warnermedia Holdings, Inc.,
4.05%, 3/15/29 (a) | | | 816,000 | | | | 707,294 | | |
FOOD - 0.1% | |
Sigma Alimentos SA de CV, 4.13%, 5/2/26 (a) | | | 240,000 | | | | 227,401 | | |
GAS - 0.3% | |
Boston Gas Co., 3.15%, 8/1/27 (a) | | | 60,000 | | | | 53,984 | | |
CenterPoint Energy Resources Corp.,
5.28%, (3 Month US Libor + 0.50%),
3/2/23 (b) | | | 6,000 | | | | 5,997 | | |
Eastern Energy Gas Holdings LLC,
3.60%, 12/15/24 | | | 84,000 | | | | 81,160 | | |
KeySpan Gas East Corp., 2.74%, 8/15/26 (a) | | | 275,000 | | | | 245,998 | | |
Southern California Gas Co. | |
2.95%, 4/15/27 | | | 280,000 | | | | 258,545 | | |
6.35%, 11/15/52 | | | 359,000 | | | | 394,827 | | |
| | | | | | 1,040,511 | | |
HEALTHCARE-SERVICES - 0.4% | |
Aetna, Inc., 2.80%, 6/15/23 | | | 210,000 | | | | 207,786 | | |
Bon Secours Mercy Health, Inc. | |
3.56%, 8/1/27 | | | 270,000 | | | | 249,639 | | |
2.10%, 6/1/31 | | | 135,000 | | | | 105,664 | | |
Children's Hospital/DC, 2.93%, 7/15/50 | | | 115,000 | | | | 73,016 | | |
CommonSpirit Health | |
4.20%, 8/1/23 | | | 105,000 | | | | 104,226 | | |
2.78%, 10/1/30 | | | 191,000 | | | | 157,944 | | |
4.35%, 11/1/42 | | | 60,000 | | | | 50,918 | | |
4.19%, 10/1/49 | | | 10,000 | | | | 7,843 | | |
Dignity Health, 3.81%, 11/1/24 | | | 92,000 | | | | 89,238 | | |
Elevance Health, Inc., 3.50%, 8/15/24 | | | 75,000 | | | | 73,188 | | |
Memorial Sloan-Kettering Cancer Center,
2.96%, 1/1/50 | | | 20,000 | | | | 13,358 | | |
Sutter Health, 2.29%, 8/15/30 | | | 75,000 | | | | 60,841 | | |
Toledo Hospital (The), 5.75%, 11/15/38 | | | 75,000 | | | | 70,796 | | |
UnitedHealth Group, Inc. | |
4.20%, 5/15/32 | | | 135,000 | | | | 128,521 | | |
4.75%, 5/15/52 | | | 20,000 | | | | 18,566 | | |
| | | | | | 1,411,544 | | |
INSURANCE - 0.7% | |
American International Group, Inc.,
3.40%, 6/30/30 | | | 120,000 | | | | 106,121 | | |
Athene Global Funding, 2.50%, 3/24/28 (a) | | | 650,000 | | | | 543,762 | | |
CNO Global Funding, 2.65%, 1/6/29 (a) | | | 530,000 | | | | 450,439 | | |
| | | Shares/
Principal | | Fair
Value | |
INSURANCE - 0.7% (Continued) | |
Corebridge Financial, Inc. | |
3.90%, 4/5/32 (a) | | $ | 410,000 | | | $ | 360,867 | | |
6.88%, (US 5 Year CMT T-Note + 3.85%),
12/15/52 (a),(b) | | | 320,000 | | | | 297,490 | | |
Liberty Mutual Group, Inc. | |
4.57%, 2/1/29 (a) | | | 110,000 | | | | 102,805 | | |
5.50%, 6/15/52 (a) | | | 370,000 | | | | 334,173 | | |
Northwestern Mutual Life Insurance Co.
(The), 3.63%, 9/30/59 (a) | | | 30,000 | | | | 20,820 | | |
Principal Financial Group, Inc.,
3.40%, 5/15/25 | | | 150,000 | | | | 145,288 | | |
Progressive Corp. (The), 3.95%, 3/26/50 | | | 95,000 | | | | 76,899 | | |
| | | | | | 2,438,664 | | |
LODGING - 0.1% | |
Genting New York LLC / GENNY
Capital, Inc., 3.30%, 2/15/26 (a) | | | 600,000 | | | | 525,251 | | |
OIL & GAS - 0.5% | |
BP Capital Markets PLC, 4.88%,
(US 5 Year CMT T-Note + 4.40%),
12/22/71 (b) | | | 318,000 | | | | 278,250 | | |
Equinor ASA, 3.00%, 4/6/27 | | | 610,000 | | | | 569,848 | | |
Hess Corp., 7.30%, 8/15/31 | | | 460,000 | | | | 500,927 | | |
Qatar Energy, 3.13%, 7/12/41 (a) | | | 200,000 | | | | 153,682 | | |
Var Energi ASA, 8.00%, 11/15/32 (a) | | | 350,000 | | | | 361,451 | | |
| | | | | | 1,864,158 | | |
PIPELINES - 0.5% | |
Cheniere Energy Partners LP,
3.25%, 1/31/32 | | | 530,000 | | | | 421,391 | | |
Eastern Gas Transmission & Storage, Inc.,
3.60%, 12/15/24 | | | 41,000 | | | | 39,614 | | |
EIG Pearl Holdings Sarl, 3.55%, 8/31/36 (a) | | | 565,000 | | | | 472,853 | | |
Energy Transfer LP, 7.60%, 2/1/24 | | | 90,000 | | | | 91,517 | | |
Gray Oak Pipeline LLC | |
2.60%, 10/15/25 (a) | | | 144,000 | | | | 130,699 | | |
3.45%, 10/15/27 (a) | | | 25,000 | | | | 22,145 | | |
Sabine Pass Liquefaction LLC | |
4.50%, 5/15/30 | | | 300,000 | | | | 278,810 | | |
5.90%, 9/15/37 (a) | | | 210,000 | | | | 210,809 | | |
| | | | | | 1,667,838 | | |
REITS - 0.2% | |
CubeSmart LP, 2.25%, 12/15/28 | | | 265,000 | | | | 218,842 | | |
SBA Tower Trust | |
2.84%, 1/15/25 (a) | | | 100,000 | | | | 94,173 | | |
1.88%, 1/15/26 (a) | | | 95,000 | | | | 84,274 | | |
1.63%, 11/15/26 (a) | | | 115,000 | | | | 98,261 | | |
VICI Properties LP / VICI Note Co., Inc.,
4.13%, 8/15/30 (a) | | | 115,000 | | | | 100,644 | | |
| | | | | | 596,194 | | |
See accompanying notes to financial statements.
49
Global Atlantic Wellington Research Managed Risk Portfolio
Portfolio of Investments (Continued)
December 31, 2022
| | | Shares/
Principal | | Fair
Value | |
SEMICONDUCTORS - 0.3% | |
Intel Corp., 4.15%, 8/5/32 | | $ | 690,000 | | | $ | 647,192 | | |
Microchip Technology, Inc., 0.97%, 2/15/24 | | | 530,000 | | | | 503,455 | | |
| | | | | | 1,150,647 | | |
TELECOMMUNICATIONS - 0.3% | |
AT&T, Inc. | |
2.55%, 12/1/33 | | | 266,000 | | | | 205,217 | | |
4.30%, 12/15/42 | | | 45,000 | | | | 37,128 | | |
3.85%, 6/1/60 | | | 33,000 | | | | 23,019 | | |
Sprint Spectrum Co. LLC / Sprint
Spectrum Co. II LLC / Sprint
Spectrum Co. III LLC, 4.74%, 3/20/25 (a) | | | 230,625 | | | | 227,996 | | |
Verizon Communications, Inc.,
2.36%, 3/15/32 | | | 536,000 | | | | 425,483 | | |
| | | | | | 918,843 | | |
TRUCKING & LEASING - 0.3% | |
DAE Funding LLC, 1.55%, 8/1/24 (a) | | | 500,000 | | | | 465,480 | | |
Penske Truck Leasing Co. LP / PTL
Finance Corp. | |
2.70%, 11/1/24 (a) | | | 110,000 | | | | 103,739 | | |
3.95%, 3/10/25 (a) | | | 345,000 | | | | 332,555 | | |
| | | | | | 901,774 | | |
TOTAL CORPORATE BONDS AND
NOTES (Cost - $34,482,448) | | | | | 32,227,910 | | |
AGENCY MORTGAGE BACKED SECURITIES - 8.9% | |
FEDERAL HOME LOAN MORTGAGE CORPORATION - 0.2% | |
Freddie Mac Gold Pool | |
3.00%, 9/1/28 | | | 2,528 | | | | 2,410 | | |
2.50%, 10/1/28 | | | 5,044 | | | | 4,720 | | |
2.50%, 12/1/31 | | | 30,942 | | | | 29,006 | | |
3.50%, 11/1/34 | | | 31,282 | | | | 30,207 | | |
3.00%, 2/1/43 | | | 19,206 | | | | 17,783 | | |
3.50%, 10/1/43 | | | 9,393 | | | | 8,703 | | |
4.00%, 8/1/44 | | | 5,505 | | | | 5,311 | | |
3.00%, 11/1/46 | | | 550,223 | | | | 485,246 | | |
3.00%, 12/1/46 | | | 149,666 | | | | 132,052 | | |
| | | | | | 715,438 | | |
FEDERAL NATIONAL MORTGAGE ASSOCIATION - 6.8% | |
Fannie Mae Pool | |
2.50%, 4/1/28 | | | 7,357 | | | | 7,040 | | |
3.00%, 10/1/28 | | | 4,441 | | | | 4,233 | | |
2.50%, 2/1/30 | | | 14,531 | | | | 13,556 | | |
2.50%, 6/1/30 | | | 42,567 | | | | 39,686 | | |
2.50%, 10/1/31 | | | 80,408 | | | | 75,390 | | |
2.50%, 12/1/31 | | | 31,699 | | | | 29,712 | | |
2.50%, 2/1/41 | | | 71,439 | | | | 62,815 | | |
2.00%, 4/1/41 | | | 152,067 | | | | 129,549 | | |
2.00%, 5/1/41 | | | 170,488 | | | | 145,248 | | |
2.00%, 7/1/41 | | | 324,668 | | | | 276,604 | | |
| | | Shares/
Principal | | Fair
Value | |
FEDERAL NATIONAL MORTGAGE
ASSOCIATION - 6.8% (Continued) | |
Fannie Mae Pool (continued) | |
2.00%, 10/1/41 | | $ | 156,930 | | | $ | 131,932 | | |
2.00%, 10/1/41 | | | 138,485 | | | | 116,474 | | |
1.50%, 11/1/41 | | | 345,511 | | | | 280,731 | | |
3.00%, 7/1/43 | | | 29,054 | | | | 26,266 | | |
4.00%, 11/1/43 | | | 11,471 | | | | 11,333 | | |
3.00%, 1/1/46 | | | 738,360 | | | | 649,643 | | |
4.00%, 1/1/46 | | | 147,639 | | | | 142,111 | | |
4.00%, 2/1/46 | | | 159,335 | | | | 153,372 | | |
3.00%, 10/1/46 | | | 775,873 | | | | 684,107 | | |
3.50%, 4/1/50 | | | 598,713 | | | | 550,879 | | |
2.50%, 7/1/50 | | | 339,946 | | | | 292,617 | | |
3.00%, 7/1/50 | | | 296,854 | | | | 262,187 | | |
2.00%, 4/1/51 | | | 184,715 | | | | 150,777 | | |
2.50%, 5/1/51 | | | 1,476,984 | | | | 1,257,373 | | |
3.50%, 7/1/51 | | | 996,549 | | | | 916,696 | | |
2.50%, 8/1/51 | | | 1,023,416 | | | | 881,006 | | |
2.00%, 9/1/51 | | | 742,549 | | | | 616,253 | | |
3.00%, 10/1/51 | | | 658,058 | | | | 585,507 | | |
2.50%, 11/1/51 | | | 705,607 | | | | 615,232 | | |
2.50%, 12/1/51 | | | 378,028 | | | | 321,099 | | |
2.50%, 1/1/52 | | | 396,012 | | | | 340,080 | | |
Federal National Mortgage Association | |
3.50%, 1/1/38 (c) | | | 125,000 | | | | 119,727 | | |
4.00%, 1/1/38 (c) | | | 415,000 | | | | 404,949 | | |
2.50%, 1/1/52 (c) | | | 390,000 | | | | 331,195 | | |
3.00%, 1/1/52 (c) | | | 740,000 | | | | 650,737 | | |
2.00%, 1/1/53 (c) | | | 275,000 | | | | 224,383 | | |
3.50%, 1/1/53 (c) | | | 415,000 | | | | 377,715 | | |
4.00%, 1/1/53 (c) | | | 1,440,000 | | | | 1,353,375 | | |
4.50%, 1/1/53 (c) | | | 4,265,000 | | | | 4,115,725 | | |
5.00%, 1/1/53 (c) | | | 475,000 | | | | 468,395 | | |
5.50%, 1/1/53 (c) | | | 250,000 | | | | 250,820 | | |
Freddie Mac Pool | |
2.50%, 7/1/41 | | | 230,283 | | | | 202,476 | | |
2.00%, 11/1/41 | | | 269,988 | | | | 227,031 | | |
2.50%, 2/1/42 | | | 523,530 | | | | 448,133 | | |
2.50%, 1/1/51 | | | 270,244 | | | | 232,131 | | |
2.00%, 3/1/51 | | | 604,898 | | | | 495,032 | | |
2.00%, 5/1/51 | | | 2,389,749 | | | | 1,957,577 | | |
2.00%, 5/1/51 | | | 136,145 | | | | 111,141 | | |
2.50%, 7/1/51 | | | 749,079 | | | | 641,475 | | |
3.00%, 10/1/51 | | | 559,697 | | | | 499,170 | | |
2.00%, 4/1/52 | | | 1,358,653 | | | | 1,120,220 | | |
| | | | | | 24,000,915 | | |
GOVERNMENT NATIONAL MORTGAGE ASSOCIATION - 1.9% | |
Ginnie Mae | |
3.00%, 1/20/52 (c) | | | 1,400,000 | | | | 1,247,969 | | |
2.00%, 1/20/53 (c) | | | 1,175,000 | | | | 985,348 | | |
See accompanying notes to financial statements.
50
Global Atlantic Wellington Research Managed Risk Portfolio
Portfolio of Investments (Continued)
December 31, 2022
| | | Shares/
Principal | | Fair
Value | |
GOVERNMENT NATIONAL MORTGAGE ASSOCIATION - 1.9% (Continued) | |
Ginnie Mae (continued) | |
2.50%, 1/20/53 (c) | | $ | 1,837,000 | | | $ | 1,593,597 | | |
3.50%, 1/20/53 (c) | | | 1,775,000 | | | | 1,631,890 | | |
4.00%, 1/20/53 (c) | | | 1,135,000 | | | | 1,075,590 | | |
4.50%, 1/20/53 (c) | | | 350,000 | | | | 339,992 | | |
Ginnie Mae II Pool | |
3.00%, 12/20/42 | | | 14,800 | | | | 13,540 | | |
4.00%, 12/20/44 | | | 5,114 | | | | 4,974 | | |
4.00%, 8/20/48 | | | 13,365 | | | | 12,917 | | |
4.00%, 10/20/48 | | | 12,998 | | | | 12,562 | | |
Government National Mortgage Association | |
3.50%, 7/20/43 | | | 15,717 | | | | 14,747 | | |
4.00%, 9/20/48 | | | 30,044 | | | | 29,035 | | |
| | | | | | 6,962,161 | | |
TOTAL AGENCY MORTGAGE BACKED
SECURITIES (Cost - $33,353,344) | | | | | 31,678,514 | | |
ASSET BACKED AND COMMERCIAL BACKED
SECURITIES - 2.8% | |
Affirm Asset Securitization Trust 2020-Z1,
1.07%, 8/15/25 (a) | | | 63,396 | | | | 61,278 | | |
Affirm Asset Securitization Trust 2021-B,
1.03%, 8/17/26 (a) | | | 195,000 | | | | 185,495 | | |
Angel Oak Mortgage Trust 2019-6, 2.62%,
11/25/59 (a),(d) | | | 15,505 | | | | 14,880 | | |
Banc of America Commercial Mortgage
Trust 2015-UBS7, 3.71%, 9/15/48 | | | 155,000 | | | | 146,797 | | |
BFLD Trust 2020-OBRK, 6.37%,
(1 Month US Libor + 2.05%), 11/15/28 (a),(b) | | | 180,000 | | | | 178,655 | | |
BX Trust 2021-ARIA, 5.62%,
(1 Month US Libor + 1.30%), 10/15/36 (a),(b) | | | 360,000 | | | | 337,099 | | |
BX Trust 2021-LGCY, 4.82%,
(1 Month US Libor + 0.51%), 10/15/36 (a),(b) | | | 815,000 | | | | 777,907 | | |
BXHPP Trust 2021-FILM | |
4.97%, (1 Month US Libor + 0.65%),
8/15/36 (a),(b) | | | 185,000 | | | | 174,619 | | |
5.22%, (1 Month US Libor + 0.90%),
8/15/36 (a),(b) | | | 155,000 | | | | 146,099 | | |
Castlelake Aircraft Structured
Trust 2019-1, 3.97%, 4/15/39 (a) | | | 151,817 | | | | 128,305 | | |
CF Hippolyta Issuer LLC, 1.53%, 3/15/61 (a) | | | 95,172 | | | | 82,111 | | |
CFMT 2021-AL1 LLC, 1.39%, 9/22/31 (a) | | | 408,769 | | | | 387,827 | | |
Citigroup Commercial Mortgage Trust
2019-SMRT, 4.15%, 1/10/36 (a) | | | 100,000 | | | | 97,533 | | |
Connecticut Avenue Security Trust
2021-R01, 5.48%, (SOFR + 1.55%),
10/25/41 (a),(b) | | | 70,000 | | | | 68,232 | | |
Credit Suisse First Boston Mortgage
Securities Corp., 4.50%, 6/1/23 | | | 4,666 | | | | 5,042 | | |
Fannie Mae Connecticut Avenue Securities,
9.29%, (1 Month US Libor + 4.90%),
11/25/24 (b) | | | 39,844 | | | | 41,266 | | |
| | | Shares/
Principal | | Fair
Value | |
ASSET BACKED AND COMMERCIAL BACKED
SECURITIES - 2.8% (Continued) | |
Fannie Mae REMICS | |
3.00%, 4/25/43 | | $ | 228,241 | | | $ | 207,210 | | |
3.50%, 6/25/44 | | | 58,448 | | | | 55,453 | | |
3.00%, 1/25/45 | | | 206,285 | | | | 188,593 | | |
3.00%, 1/25/45 | | | 120,733 | | | | 104,930 | | |
3.00%, 12/25/45 | | | 239,449 | | | | 218,358 | | |
1.50%, 10/25/49 | | | 232,227 | | | | 186,362 | | |
3.00%, 12/25/54 | | | 374,300 | | | | 355,294 | | |
Fannie Mae-Aces | |
4.31%, (1 Month US Libor + 0.40%),
10/25/24 (b) | | | 17,422 | | | | 17,375 | | |
2.39%, 10/25/36 (d) | | | 383,390 | | | | 297,702 | | |
Flagstar Mortgage Trust 2018-3,
4.00%, 5/25/48 (a),(d) | | | 79,731 | | | | 72,658 | | |
Flagstar Mortgage Trust 2021-9INV,
2.00%, 9/25/41 (a),(d) | | | 163,562 | | | | 136,968 | | |
Ford Credit Auto Lease Trust 2021-A,
0.78%, 9/15/25 | | | 130,000 | | | | 126,575 | | |
Ford Credit Auto Owner Trust 2021-REV1,
1.61%, 10/17/33 (a) | | | 100,000 | | | | 88,901 | | |
Freddie Mac Multifamily Structured Pass
Through Certificates | |
2.40%, 3/25/32 | | | 280,000 | | | | 235,506 | | |
3.71%, 9/25/32 (d) | | | 104,000 | | | | 97,660 | | |
2.36%, 10/25/36 | | | 245,000 | | | | 184,685 | | |
Freddie Mac REMICS | |
4.00%, 9/15/41 | | | 204,044 | | | | 195,740 | | |
1.75%, 9/15/42 | | | 267,261 | | | | 242,811 | | |
1.50%, 10/15/42 | | | 21,600 | | | | 18,892 | | |
3.00%, 6/15/45 | | | 270,350 | | | | 251,599 | | |
3.00%, 7/15/47 | | | 184,863 | | | | 168,545 | | |
4.00%, 7/15/48 | | | 143,623 | | | | 133,678 | | |
2.00%, 7/25/50 | | | 446,961 | | | | 390,015 | | |
Freddie Mac STACR REMIC Trust
2020-DNA5, 6.73%, (SOFR + 2.80%),
10/25/50 (a),(b) | | | 104,421 | | | | 104,520 | | |
Freddie Mac Structured Agency Credit
Risk Debt Notes, 4.73%, (SOFR + 0.80%),
8/25/33 (a),(b) | | | 14,637 | | | | 14,607 | | |
Government National Mortgage Association | |
3.97%, (1 Month US Libor + 0.60%),
5/20/65 (b) | | | 44,916 | | | | 44,579 | | |
4.46%, (1 Month US Libor + 0.62%),
8/20/65 (b) | | | 51,118 | | | | 50,710 | | |
4.54%, (1 Month US Libor + 0.70%),
10/20/65 (b) | | | 103 | | | | 101 | | |
3.47%, (1 Month US Libor + 1.00%),
12/20/65 (b) | | | 46,023 | | | | 45,728 | | |
GSR Mortgage Loan Trust 2005-AR6,
3.77%, 9/25/35 (d) | | | 3,907 | | | | 3,986 | | |
See accompanying notes to financial statements.
51
Global Atlantic Wellington Research Managed Risk Portfolio
Portfolio of Investments (Continued)
December 31, 2022
| | | Shares/
Principal | | Fair
Value | |
ASSET BACKED AND COMMERCIAL BACKED
SECURITIES - 2.8% (Continued) | |
Home Partners of America Trust 2021-2,
2.30%, 12/17/26 (a) | | $ | 330,558 | | | $ | 279,712 | | |
Horizon Aircraft Finance III Ltd.,
3.43%, 11/15/39 (a) | | | 222,449 | | | | 171,269 | | |
Life 2021-BMR Mortgage Trust,
5.02%, (1 Month US Libor + 0.70%),
3/15/38 (a),(b) | | | 98,297 | | | | 95,214 | | |
Mercury Financial Credit Card Master
Trust, 1.54%, 3/20/26 (a) | | | 135,000 | | | | 128,614 | | |
METLIFE SECURITIZATION TRUST,
3.00%, 4/25/55 (a),(d) | | | 49,194 | | | | 45,388 | | |
Mill City Mortgage Loan Trust 2017-3,
2.75%, 1/25/61 (a),(d) | | | 29,770 | | | | 27,539 | | |
New Economy Assets Phase 1 Sponsor,
LLC, 2.41%, 10/20/61 (a) | | | 120,000 | | | | 98,705 | | |
New Residential Mortgage Loan Trust
2019-RPL3, 2.75%, 7/25/59 (a),(d) | | | 50,717 | | | | 47,329 | | |
SCF Equipment Leasing 2021-1 LLC,
0.83%, 8/21/28 (a) | | | 455,000 | | | | 432,490 | | |
Seasoned Credit Risk Transfer
Trust Series 2019-3, 3.50%, 10/25/58 | | | 102,710 | | | | 98,906 | | |
Seasoned Credit Risk Transfer
Trust Series 2021-1, 2.50%, 9/25/60 | | | 579,477 | | | | 523,557 | | |
SFAVE Commercial Mortgage Securities
Trust 2015-5AVE, 4.14%, 1/5/43 (a),(d) | | | 100,000 | | | | 70,510 | | |
SoFi Consumer Loan Program 2021-1
Trust, 0.49%, 9/25/30 (a) | | | 38,527 | | | | 37,611 | | |
SREIT Trust 2021-MFP, 5.40%,
(1 Month US Libor + 1.08%), 11/15/38 (a),(b) | | | 415,000 | | | | 395,299 | | |
Structured Adjustable Rate Mortgage Loan
Trust | |
3.78%, 2/25/34 (d) | | | 2,578 | | | | 2,493 | | |
3.99%, 9/25/34 (d) | | | 2,226 | | | | 2,095 | | |
Structured Adjustable Rate Mortgage Loan
Trust Series 2005-19XS, 4.69%,
(1 Month US Libor + 0.30%), 10/25/35 (b) | | | 48 | | | | 47 | | |
Towd Point Mortgage Trust 2017-2,
2.75%, 4/25/57 (a),(d) | | | 6,261 | | | | 6,164 | | |
Towd Point Mortgage Trust 2017-4,
2.75%, 6/25/57 (a),(d) | | | 54,979 | | | | 51,945 | | |
Towd Point Mortgage Trust 2018-1,
3.00%, 1/25/58 (a),(d) | | | 21,108 | | | | 20,296 | | |
Wells Fargo Commercial Mortgage Trust
2015-NXS1, 3.15%, 5/15/48 | | | 250,000 | | | | 236,432 | | |
TOTAL ASSET BACKED AND
COMMERCIAL BACKED SECURITIES
(Cost - $10,763,090) | | | | | 9,844,501 | | |
EXCHANGE TRADED FUNDS - 1.2% | |
EQUITY FUNDS - 1.2% | |
SPDR S&P 500 ETF TRUST
(Cost - $4,489,945) | | | 11,492 | | | | 4,394,886 | | |
| | | Shares/
Principal | | Fair
Value | |
MUNICIPAL BONDS - 0.8% | |
Chicago O'Hare International Airport,
6.40%, 1/1/40 | | $ | 30,000 | | | $ | 33,533 | | |
Chicago Transit Authority Sales & Transfer
Tax Receipts Revenue, 6.90%, 12/1/40 | | | 75,000 | | | | 83,128 | | |
Chicago Transit Authority Sales Tax
Receipts Fund, 1.84%, 12/1/23 | | | 100,000 | | | | 97,346 | | |
County of Sacramento CA, 5.73%, 8/15/23 | | | 91,896 | | | | 92,244 | | |
Dallas Fort Worth International Airport | |
4.09%, 11/1/51 | | | 15,000 | | | | 12,490 | | |
4.51%, 11/1/51 | | | 85,000 | | | | 76,400 | | |
Foothill-Eastern Transportation Corridor
Agency, 4.09%, 1/15/49 | | | 15,000 | | | | 11,327 | | |
Golden State Tobacco Securitization Corp. | |
2.75%, 6/1/34 | | | 10,000 | | | | 8,025 | | |
3.29%, 6/1/42 | | | 20,000 | | | | 14,796 | | |
3.00%, 6/1/46 | | | 40,000 | | | | 37,024 | | |
Illinois Municipal Electric Agency,
6.83%, 2/1/35 | | | 195,000 | | | | 211,823 | | |
Kansas Development Finance Authority,
5.37%, 5/1/26 | | | 75,000 | | | | 75,653 | | |
Metropolitan Transportation Authority | |
6.20%, 11/15/26 | | | 10,000 | | | | 10,164 | | |
6.81%, 11/15/40 | | | 180,000 | | | | 188,082 | | |
5.18%, 11/15/49 | | | 65,000 | | | | 56,095 | | |
Municipal Electric Authority of Georgia,
6.64%, 4/1/57 | | | 232,000 | | | | 248,180 | | |
New Jersey Transportation Trust Fund
Authority, 2.55%, 6/15/23 | | | 30,000 | | | | 29,667 | | |
New York State Urban Development Corp.,
1.83%, 3/15/29 | | | 40,000 | | | | 33,253 | | |
Philadelphia Authority for Industrial
Development, 6.55%, 10/15/28 | | | 270,000 | | | | 282,225 | | |
State of Illinois, 5.10%, 6/1/33 | | | 1,130,000 | | | | 1,084,505 | | |
University of California, 1.61%, 5/15/30 | | | 20,000 | | | | 15,927 | | |
TOTAL MUNICIPAL BONDS
(Cost - $3,043,069) | | | | | 2,701,887 | | |
SOVEREIGN DEBTS - 0.0%† | |
Qatar Government International Bond,
3.38%, 3/14/24 (Cost - $202,789) (a) | | | 200,000 | | | | 195,895 | | |
SHORT-TERM INVESTMENTS - 9.2% | |
MONEY MARKET FUNDS - 9.1% | |
Dreyfus Government Cash
Management, 4.19% (e) | | | 12,202,123 | | | | 12,202,123 | | |
Fidelity Investments Money Market
Fund - Government Portfolio,
Institutional Class, 4.06% (e) | | | 20,186,293 | | | | 20,186,293 | | |
TOTAL MONEY MARKET FUNDS
(Cost - $32,388,416) | | | | | 32,388,416 | | |
See accompanying notes to financial statements.
52
Global Atlantic Wellington Research Managed Risk Portfolio
Portfolio of Investments (Continued)
December 31, 2022
| | | Shares/
Principal | | Fair
Value | |
U.S. TREASURY SECURITIES - 0.1% | |
United States Treasury Bill,
4.29%, 3/23/23 (Cost - $109,596) (f) | | $ | 110,000 | | | $ | 108,976 | | |
TOTAL SHORT-TERM INVESTMENTS
(Cost - $32,498,012) | | | | | 32,497,392 | | |
TOTAL INVESTMENTS - 102.6%
(Cost - $314,569,422) | | | | $ | 363,647,747 | | |
OTHER ASSETS LESS
LIABILITIES - NET (2.6)% | | | | | (9,156,335 | ) | |
TOTAL NET ASSETS - 100.0% | | | | $ | 354,491,412 | | |
* Non-income producing security.
† Represents less than 0.05%.
†† A portion of this investment is held as collateral for derivative investments.
(a) 144A - Security was purchased pursuant to Rule 144a under the Securities Act of 1933 and may not be resold subject to that rule, except to qualified institutional buyers. As of December 31, 2022, these securities amounted to $17,570,619 or 5.0% of net assets.
(b) Variable rate security. The rate shown is the rate in effect at period end.
(c) When-issued, or delayed delivery. All or a portion may be subject to dollar-roll transactions.
(d) Adjustable rate security with an interest rate that is not based on a published reference index and spread. The rate is based on the structure of the agreement and current market conditions. The coupon rate shown represents the rate at period end.
(e) The rate shown is the annualized seven-day yield at period end.
(f) Rate shown represents discount rate at the time of purchase.
ADR - American Depositary Receipt
CMT - Treasury Constant Maturity Rate
Libor - London Interbank Offer Rate
PLC - Public Limited Company
REMIC - Real Estate Mortgage Investment Conduit
SOFR - Secured Overnight Financing Rate
FUTURES CONTRACTS | |
LONG FUTURES CONTRACTS | | Counterparty | | Number of
Contracts | | Expiration Date | | Notional Value | | Fair Value/
Unrealized
Appreciation
(Depreciation) | |
U.S. 10 Year Note Future | | JP Morgan Chase Bank | | | 2 | | | 3/22/2023 | | $ | 224,594 | | | $ | 734 | | |
U.S. 10 Year Ultra Future | | JP Morgan Chase Bank | | | 2 | | | 3/22/2023 | | | 236,562 | | | | 1,078 | | |
U.S. 2 Year Note Future | | JP Morgan Chase Bank | | | 10 | | | 3/31/2023 | | | 2,050,781 | | | | 2,289 | | |
U.S. 5 Year Note Future | | JP Morgan Chase Bank | | | 11 | | | 3/31/2023 | | | 1,187,227 | | | | (4,281 | ) | |
| | | | (180 | ) | |
SHORT FUTURES CONTRACTS | |
E-Mini Russell 2000 Future | | Goldman Sachs & Co. | | | 143 | | | 3/17/2023 | | | 12,661,935 | | | | 260,998 | | |
S&P 500 E-Mini Future | | Goldman Sachs & Co. | | | 425 | | | 3/17/2023 | | | 82,046,250 | | | | 2,045,145 | | |
S&P MID 400 E-Mini Future | | Goldman Sachs & Co. | | | 14 | | | 3/17/2023 | | | 3,419,640 | | | | 49,555 | | |
| | | | 2,355,698 | | |
TOTAL NET UNREALIZED APPRECIATION ON FUTURES CONTRACTS | | | | | | | | | | $ | 2,355,518 | | |
See accompanying notes to financial statements.
53
Global Atlantic Portfolios
Statements of Assets and Liabilities
December 31, 2022
Assets: | | Global Atlantic
American Funds®
Managed Risk
Portfolio | | Global Atlantic
Balanced
Managed Risk
Portfolio | | Global Atlantic
BlackRock
Selects
Managed Risk
Portfolio | | Global Atlantic
Franklin Dividend
and Income
Managed Risk
Portfolio | |
Investments in securities, at cost | | $ | 174,711,680 | | | $ | 83,361,920 | | | $ | 166,463,109 | | | $ | 140,127,071 | | |
Investments in securities, at fair value | | $ | 169,953,958 | | | $ | 88,287,089 | | | $ | 174,477,690 | | | $ | 216,112,877 | | |
Premiums paid on open swap contracts, net | | | - | | | | - | | | | - | | | | 52,954 | | |
Cash | | | - | | | | - | | | | 157 | | | | 198 | | |
Foreign cash (cost $-, $-, $- and $1,095, respectively) | | | - | | | | - | | | | - | | | | 878 | | |
Deposit with broker | | | 2,036,990 | | | | 831,505 | | | | 1,847,380 | | | | 2,121,279 | | |
Segregated cash for derivatives | | | - | | | | - | | | | - | | | | 90,442 | | |
Unrealized appreciation on futures contracts, net | | | 857,565 | | | | 489,218 | | | | 807,708 | | | | 754,406 | | |
Receivable for securities sold | | | - | | | | - | | | | - | | | | 24,229 | | |
Interest and dividends receivable | | | 264,955 | | | | 13,391 | | | | 39,109 | | | | 580,232 | | |
Prepaid expenses | | | 8,338 | | | | 4,374 | | | | 8,594 | | | | 10,367 | | |
Total Assets | | | 173,121,806 | | | | 89,625,577 | | | | 177,180,638 | | | | 219,747,862 | | |
Liabilities: | |
Unrealized depreciation on forward foreign
currency contracts | | | - | | | | - | | | | - | | | | 18,869 | | |
Unrealized depreciation on swap contracts | | | - | | | | - | | | | - | | | | 75,187 | | |
Due to custodian | | | 256,406 | | | | - | | | | - | | | | - | | |
Due to foreign custodian (cost $-, $137, $- and $-,
respectively) | | | - | | | | 114 | | | | - | | | | - | | |
Payable for securities purchased | | | - | | | | 7,800 | | | | - | | | | 2,514,278 | | |
Payable for portfolio shares redeemed | | | 44,124 | | | | 38,475 | | | | 47,293 | | | | 62,349 | | |
Accrued distribution (12b-1) fees | | | 37,179 | | | | 19,349 | | | | 38,147 | | | | 46,787 | | |
Accrued investment advisory fees | | | 74,358 | | | | 42,566 | | | | 83,924 | | | | 152,868 | | |
Administrative service fees payable | | | 8,978 | | | | 4,754 | | | | 9,293 | | | | 11,395 | | |
Accrued expenses and other liabilities | | | 22,381 | | | | 13,424 | | | | 23,073 | | | | 34,363 | | |
Total Liabilities | | | 443,426 | | | | 126,482 | | | | 201,730 | | | | 2,916,096 | | |
Net Assets | | $ | 172,678,380 | | | $ | 89,499,095 | | | $ | 176,978,908 | | | $ | 216,831,766 | | |
Composition of Net Assets: | |
Paid-in capital | | $ | 160,655,173 | | | $ | 92,404,474 | | | $ | 179,221,854 | | | $ | 128,421,173 | | |
Total distributable earnings (losses) | | | 12,023,207 | | | | (2,905,379 | ) | | | (2,242,946 | ) | | | 88,410,593 | | |
Net Assets | | $ | 172,678,380 | | | $ | 89,499,095 | | | $ | 176,978,908 | | | $ | 216,831,766 | | |
Class II Shares: | |
Net Assets | | $ | 172,678,380 | | | $ | 89,499,095 | | | $ | 176,978,908 | | | $ | 216,831,766 | | |
Total shares outstanding at end of period
($0 par value, unlimited shares authorized) | | | 15,917,786 | | | | 8,379,629 | | | | 17,949,607 | | | | 15,366,887 | | |
Net asset value, offering and redemption
price per share
(Net assets ÷ Total shares of beneficial
interest outstanding) | | $ | 10.85 | | | $ | 10.68 | | | $ | 9.86 | | | $ | 14.11 | | |
See accompanying notes to financial statements.
54
Global Atlantic Portfolios
Statements of Assets and Liabilities (Continued)
December 31, 2022
Assets: | | Global Atlantic
Growth
Managed Risk
Portfolio | | Global Atlantic
Moderate Growth
Managed Risk
Portfolio | | Global Atlantic
Select Advisor
Managed Risk
Portfolio | | Global Atlantic
Wellington
Research
Managed Risk
Portfolio | |
Investments in securities, at cost | | $ | 237,844,323 | | | $ | 87,169,410 | | | $ | 73,831,195 | | | $ | 314,569,422 | | |
Investments in securities, at fair value | | $ | 306,160,378 | | | $ | 102,415,912 | | | $ | 77,412,691 | | | $ | 363,647,747 | | |
Cash | | | - | | | | - | | | | - | | | | 38 | | |
Deposit with broker | | | 4,722,107 | | | | 1,210,013 | | | | 1,092,820 | | | | 3,982,134 | | |
Unrealized appreciation on futures contracts, net | | | 2,289,105 | | | | 557,140 | | | | 472,068 | | | | 2,355,518 | | |
Receivable for securities sold | | | - | | | | - | | | | - | | | | 2,259,809 | | |
Interest and dividends receivable | | | 55,026 | | | | 20,948 | | | | 14,000 | | | | 969,259 | | |
Prepaid expenses | | | 15,154 | | | | 5,037 | | | | 3,813 | | | | 17,208 | | |
Total Assets | | | 313,241,770 | | | | 104,209,050 | | | | 78,995,392 | | | | 373,231,713 | | |
Liabilities: | |
Due to custodian | | | 1 | | | | - | | | | 5 | | | | - | | |
Payable for securities purchased | | | 17,826 | | | | 7,444 | | | | - | | | | 18,275,414 | | |
Payable for portfolio shares redeemed | | | 81,098 | | | | 24,008 | | | | 23,573 | | | | 68,340 | | |
Accrued distribution (12b-1) fees | | | 67,416 | | | | 22,484 | | | | 16,980 | | | | 76,236 | | |
Accrued investment advisory fees | | | 139,447 | | | | 49,464 | | | | 18,471 | | | | 248,544 | | |
Administrative service fees payable | | | 16,417 | | | | 5,429 | | | | 4,119 | | | | 18,441 | | |
Accrued expenses and other liabilities | | | 42,670 | | | | 14,256 | | | | 11,021 | | | | 53,326 | | |
Total Liabilities | | | 364,875 | | | | 123,085 | | | | 74,169 | | | | 18,740,301 | | |
Net Assets | | $ | 312,876,895 | | | $ | 104,085,965 | | | $ | 78,921,223 | | | $ | 354,491,412 | | |
Composition of Net Assets: | |
Paid-in capital | | $ | 229,979,352 | | | $ | 86,831,860 | | | $ | 69,808,746 | | | $ | 312,404,284 | | |
Total distributable earnings | | | 82,897,543 | | | | 17,254,105 | | | | 9,112,477 | | | | 42,087,128 | | |
Net Assets | | $ | 312,876,895 | | | $ | 104,085,965 | | | $ | 78,921,223 | | | $ | 354,491,412 | | |
Class II Shares: | |
Net Assets | | $ | 312,876,895 | | | $ | 104,085,965 | | | $ | 78,921,223 | | | $ | 354,491,412 | | |
Total shares outstanding at end of period
($0 par value, unlimited shares authorized) | | | 25,695,843 | | | | 9,345,530 | | | | 7,207,809 | | | | 29,785,986 | | |
Net asset value, offering and redemption
price per share
(Net assets ÷ Total shares of beneficial
interest outstanding) | | $ | 12.18 | | | $ | 11.14 | | | $ | 10.95 | | | $ | 11.90 | | |
See accompanying notes to financial statements.
55
Global Atlantic Portfolios
Statements of Operations
For the Year Ended December 31, 2022
| | | Global Atlantic
American Funds®
Managed Risk
Portfolio | | Global Atlantic
Balanced
Managed Risk
Portfolio | | Global Atlantic
BlackRock
Selects
Managed Risk
Portfolio | | Global Atlantic
Franklin Dividend
and Income
Managed Risk
Portfolio | |
Investment Income: | |
Dividend income | | $ | 7,016,026 | | | $ | 2,103,137 | | | $ | 3,101,783 | | | $ | 3,082,866 | | |
Interest income ** | | | 148,527 | | | | 74,526 | | | | 148,950 | | | | 2,021,212 | | |
Total Investment Income | | | 7,164,553 | | | | 2,177,663 | | | | 3,250,733 | | | | 5,104,078 | | |
Expenses: | |
Investment advisory fee | | | 1,737,136 | | | | 555,213 | | | | 1,088,789 | | | | 2,018,838 | | |
Distribution fees (12b-1) - Class II Shares | | | 482,538 | | | | 252,369 | | | | 494,904 | | | | 593,776 | | |
Administrative service fees | | | 62,501 | | | | 32,691 | | | | 64,107 | | | | 76,920 | | |
Legal fees | | | 50,203 | | | | 26,258 | | | | 51,514 | | | | 61,867 | | |
Trustees fees | | | 20,509 | | | | 10,703 | | | | 20,980 | | | | 25,141 | | |
Custody fees | | | 4,721 | | | | 5,732 | | | | 5,265 | | | | 19,316 | | |
Miscellaneous expenses | | | 78,292 | | | | 40,706 | | | | 80,330 | | | | 97,455 | | |
Total Expenses | | | 2,435,900 | | | | 923,672 | | | | 1,805,889 | | | | 2,893,313 | | |
Expenses waived | | | (772,060 | ) | | | - | | | | - | | | | (66,940 | ) | |
Net Expenses | | | 1,663,840 | | | | 923,672 | | | | 1,805,889 | | | | 2,826,373 | | |
Net Investment Income | | | 5,500,713 | | | | 1,253,991 | | | | 1,444,844 | | | | 2,277,705 | | |
Net Realized and Change in
Unrealized Gain (Loss) | |
Net realized gain (loss) on: | |
Investments | | | 2,688,065 | | | | (3,718,244 | ) | | | (5,379,515 | ) | | | 13,283,906 | | |
Futures contracts | | | (2,483,971 | ) | | | (295,171 | ) | | | (3,144,664 | ) | | | (3,922,012 | ) | |
Swap contracts | | | - | | | | - | | | | - | | | | 24,795 | | |
Swaptions | | | - | | | | - | | | | - | | | | 15,625 | | |
Forward foreign currency contracts | | | - | | | | - | | | | - | | | | 153,856 | | |
Foreign currency translations | | | - | | | | - | | | | - | | | | (1,793 | ) | |
Capital gain distributions from underlying funds | | | 15,752,327 | | | | - | | | | 111,968 | | | | - | | |
| | | | 15,956,421 | | | | (4,013,415 | ) | | | (8,412,211 | ) | | | 9,554,377 | | |
Net change in unrealized appreciation/(depreciation) on: | |
Investments | | | (58,331,244 | ) | | | (15,122,837 | ) | | | (29,105,823 | ) | | | (47,092,180 | ) | |
Futures contracts | | | 857,565 | | | | 489,218 | | | | 807,708 | | | | 708,846 | | |
Swap contracts | | | - | | | | - | | | | - | | | | (72,670 | ) | |
Swaptions | | | - | | | | - | | | | - | | | | (4,879 | ) | |
Forward foreign currency contracts | | | - | | | | - | | | | - | | | | 12,609 | | |
Foreign currency translations | | | - | | | | 17 | | | | - | | | | 4,816 | | |
| | | | (57,473,679 | ) | | | (14,633,602 | ) | | | (28,298,115 | ) | | | (46,443,458 | ) | |
Net Realized and Change in Unrealized Gain (Loss) | | | (41,517,258 | ) | | | (18,647,017 | ) | | | (36,710,326 | ) | | | (36,889,081 | ) | |
Net Decrease in Net Assets
Resulting from Operations | | $ | (36,016,545 | ) | | $ | (17,393,026 | ) | | $ | (35,265,482 | ) | | $ | (34,611,376 | ) | |
| ** Foreign taxes withheld | | $ | - | | | $ | - | | | $ | - | | | $ | 492 | | |
See accompanying notes to financial statements.
56
Global Atlantic Portfolios
Statements of Operations (Continued)
For the Year Ended December 31, 2022
| | | Global Atlantic
Growth
Managed Risk
Portfolio | | Global Atlantic
Moderate Growth
Managed Risk
Portfolio | | Global Atlantic
Select Advisor
Managed Risk
Portfolio | | Global Atlantic
Wellington
Research
Managed Risk
Portfolio | |
Investment Income: | |
Dividend income * | | $ | 6,308,187 | | | $ | 2,266,007 | | | $ | 2,030,003 | | | $ | 3,157,509 | | |
Interest income | | | 312,983 | | | | 100,333 | | | | 78,072 | | | | 3,812,335 | | |
Total Investment Income | | | 6,621,170 | | | | 2,366,340 | | | | 2,108,075 | | | | 6,969,844 | | |
Expenses: | |
Investment advisory fee | | | 1,917,333 | | | | 642,230 | | | | 794,380 | | | | 3,415,379 | | |
Distribution fees (12b-1) - Class II Shares | | | 871,515 | | | | 291,923 | | | | 220,661 | | | | 1,004,523 | | |
Administrative service fees | | | 112,891 | | | | 37,812 | | | | 28,583 | | | | 130,107 | | |
Legal fees | | | 90,744 | | | | 30,389 | | | | 22,964 | | | | 104,520 | | |
Trustees fees | | | 36,901 | | | | 12,406 | | | | 9,357 | | | | 42,829 | | |
Custody fees | | | 8,680 | | | | 5,711 | | | | 3,441 | | | | 57,724 | | |
Miscellaneous expenses | | | 141,864 | | | | 47,442 | | | | 35,863 | | | | 162,327 | | |
Total Expenses | | | 3,179,928 | | | | 1,067,913 | | | | 1,115,249 | | | | 4,917,409 | | |
Expenses waived | | | (112,196 | ) | | | - | | | | (550,357 | ) | | | (135,879 | ) | |
Net Expenses | | | 3,067,732 | | | | 1,067,913 | | | | 564,892 | | | | 4,781,530 | | |
Net Investment Income | | | 3,553,438 | | | | 1,298,427 | | | | 1,543,183 | | | | 2,188,314 | | |
Net Realized and Change in
Unrealized Gain (Loss) | |
Net realized gain (loss) on: | |
Investments | | | 8,356,347 | | | | 1,408,156 | | | | 846,587 | | | | (2,134,689 | ) | |
Futures contracts | | | 981,456 | | | | (489,126 | ) | | | (1,248,786 | ) | | | (4,604,279 | ) | |
Swap contracts | | | - | | | | - | | | | - | | | | 2,243 | | |
Foreign currency translations | | | - | | | | - | | | | - | | | | (130 | ) | |
Capital gain distributions from underlying funds | | | - | | | | - | | | | 4,899,763 | | | | - | | |
| | | 9,337,803 | | | | 919,030 | | | | 4,497,564 | | | | (6,736,855 | ) | |
Net change in unrealized appreciation/(depreciation) on: | |
Investments | | | (74,534,477 | ) | | | (23,704,649 | ) | | | (22,853,128 | ) | | | (78,460,871 | ) | |
Futures contracts | | | 3,292,587 | | | | 673,240 | | | | 472,068 | | | | 2,373,330 | | |
| | | | (71,241,890 | ) | | | (23,031,409 | ) | | | (22,381,060 | ) | | | (76,087,541 | ) | |
Net Realized and Change in Unrealized Gain (Loss) | | | (61,904,087 | ) | | | (22,112,379 | ) | | | (17,883,496 | ) | | | (82,824,396 | ) | |
Net Decrease in Net Assets
Resulting from Operations | | $ | (58,350,649 | ) | | $ | (20,813,952 | ) | | $ | (16,340,313 | ) | | $ | (80,636,082 | ) | |
| * Foreign taxes withheld | | $ | - | | | $ | - | | | $ | - | | | $ | 7,747 | | |
See accompanying notes to financial statements.
57
Global Atlantic Portfolios
Statements of Changes in Net Assets
| | | Global Atlantic American Funds®
Managed Risk Portfolio | | Global Atlantic Balanced
Managed Risk Portfolio | |
| | | For the
Year Ended
December 31,
2022 | | For the
Year Ended
December 31,
2021 | | For the
Year Ended
December 31,
2022 | | For the
Year Ended
December 31,
2021 | |
Increase/(Decrease) in Net Assets: | |
From Operations: | |
Net investment income | | $ | 5,500,713 | | | $ | 3,637,629 | | | $ | 1,253,991 | | | $ | 869,711 | | |
Net realized gain (loss) | | | 15,956,421 | | | | 10,838,245 | | | | (4,013,415 | ) | | | 7,870,990 | | |
Net change in unrealized appreciation (depreciation) | | | (57,473,679 | ) | | | 10,258,753 | | | | (14,633,602 | ) | | | (602,922 | ) | |
Net increase (decrease) in net assets
resulting from operations | | | (36,016,545 | ) | | | 24,734,627 | | | | (17,393,026 | ) | | | 8,137,779 | | |
From Distributions to Shareholders: | |
Total distributions paid | | | (12,098,249 | ) | | | (2,588,253 | ) | | | (8,646,423 | ) | | | (3,352,759 | ) | |
From Shares of Beneficial Interest: | |
Proceeds from shares sold | | | 338,549 | | | | 2,542,369 | | | | 1,041,348 | | | | 40,138,168 | * | |
Reinvestment of distributions | | | 12,098,249 | | | | 2,588,253 | | | | 8,646,423 | | | | 3,352,759 | | |
Cost of shares redeemed | | | (24,174,943 | ) | | | (26,498,814 | ) | | | (13,525,365 | ) | | | (11,674,154 | ) | |
Net increase (decrease) in net assets from share
transactions of beneficial interest | | | (11,738,145 | ) | | | (21,368,192 | ) | | | (3,837,594 | ) | | | 31,816,773 | | |
Total increase (decrease) in net assets | | | (59,852,939 | ) | | | 778,182 | | | | (29,877,043 | ) | | | 36,601,793 | | |
Net Assets: | |
Beginning of year | | | 232,531,319 | | | | 231,753,137 | | | | 119,376,138 | | | | 82,774,345 | | |
End of year | | $ | 172,678,380 | | | $ | 232,531,319 | | | $ | 89,499,095 | | | $ | 119,376,138 | | |
Share Activity: | |
Class II | |
Shares sold | | | 26,063 | | | | 194,559 | | | | 82,642 | | | | 2,893,630 | ** | |
Shares reinvested | | | 1,130,678 | | | | 188,373 | | | | 816,470 | | | | 244,548 | | |
Shares redeemed | | | (2,007,223 | ) | | | (1,980,985 | ) | | | (1,122,351 | ) | | | (854,658 | ) | |
Net increase (decrease) in shares of beneficial
interest outstanding | | | (850,482 | ) | | | (1,598,053 | ) | | | (223,239 | ) | | | 2,283,520 | | |
* Includes the value received from shares issued in connection with the reorganization of Global Atlantic Goldman Sachs Dynamic Trends Allocation Portfolio into Global Atlantic Balanced Managed Risk Portfolio on August 20, 2021.
** Includes shares issued in connection with the reorganization of Global Atlantic Goldman Sachs Dynamic Trends Allocation Portfolio into Global Atlantic Balanced Managed Risk Portfolio on August 20, 2021.
See accompanying notes to financial statements.
58
Global Atlantic Portfolios
Statements of Changes in Net Assets (Continued)
| | | Global Atlantic BlackRock
Selects Managed Risk Portfolio | | Global Atlantic Franklin
Dividend and Income
Managed Risk Portfolio | |
| | | For the
Year Ended
December 31,
2022 | | For the
Year Ended
December 31,
2021 | | For the
Year Ended
December 31,
2022 | | For the
Year Ended
December 31,
2021 | |
Increase/(Decrease) in Net Assets: | |
From Operations: | |
Net investment income | | $ | 1,444,844 | | | $ | 6,564,088 | | | $ | 2,277,705 | | | $ | 1,567,345 | | |
Net realized gain (loss) | | | (8,412,211 | ) | | | 21,263,270 | | | | 9,554,377 | | | | 20,713,548 | | |
Net change in unrealized appreciation (depreciation) | | | (28,298,115 | ) | | | (4,091,875 | ) | | | (46,443,458 | ) | | | 21,203,790 | | |
Net increase (decrease) in net assets
resulting from operations | | | (35,265,482 | ) | | | 23,735,483 | | | | (34,611,376 | ) | | | 43,484,683 | | |
From Distributions to Shareholders: | |
Total distributions paid | | | (11,495,510 | ) | | | (3,232,570 | ) | | | (5,603,502 | ) | | | (2,279,680 | ) | |
From Shares of Beneficial Interest: | |
Proceeds from shares sold | | | 1,020,002 | | | | 579,780 | | | | 1,268,275 | | | | 2,120,219 | | |
Reinvestment of distributions | | | 11,495,510 | | | | 3,232,570 | | | | 5,603,502 | | | | 2,279,680 | | |
Cost of shares redeemed | | | (24,319,136 | ) | | | (30,606,891 | ) | | | (34,422,606 | ) | | | (36,223,378 | ) | |
Net decrease in net assets from share
transactions of beneficial interest | | | (11,803,624 | ) | | | (26,794,541 | ) | | | (27,550,829 | ) | | | (31,823,479 | ) | |
Total increase (decrease) in net assets | | | (58,564,616 | ) | | | (6,291,628 | ) | | | (67,765,707 | ) | | | 9,381,524 | | |
Net Assets: | |
Beginning of year | | | 235,543,524 | | | | 241,835,152 | | | | 284,597,473 | | | | 275,215,949 | | |
End of year | | $ | 176,978,908 | | | $ | 235,543,524 | | | $ | 216,831,766 | | | $ | 284,597,473 | | |
Share Activity: | |
Class II | |
Shares sold | | | 93,230 | | | | 47,191 | | | | 88,453 | | | | 136,965 | | |
Shares reinvested | | | 1,169,431 | | | | 261,535 | | | | 406,935 | | | | 142,036 | | |
Shares redeemed | | | (2,222,724 | ) | | | (2,535,018 | ) | | | (2,359,563 | ) | | | (2,354,879 | ) | |
Net decrease in shares of beneficial
interest outstanding | | | (960,063 | ) | | | (2,226,292 | ) | | | (1,864,175 | ) | | | (2,075,878 | ) | |
See accompanying notes to financial statements.
59
Global Atlantic Portfolios
Statements of Changes in Net Assets (Continued)
| | | Global Atlantic Growth
Managed Risk Portfolio | | Global Atlantic Moderate
Growth Managed Risk Portfolio | |
| | | For the
Year Ended
December 31,
2022 | | For the
Year Ended
December 31,
2021 | | For the
Year Ended
December 31,
2022 | | For the
Year Ended
December 31,
2021 | |
Increase/(Decrease) in Net Assets: | |
From Operations: | |
Net investment income | | $ | 3,553,438 | | | $ | 3,054,487 | | | $ | 1,298,427 | | | $ | 1,115,202 | | |
Net realized gain | | | 9,337,803 | | | | 26,622,761 | | | | 919,030 | | | | 9,012,816 | | |
Net change in unrealized appreciation (depreciation) | | | (71,241,890 | ) | | | 27,882,211 | | | | (23,031,409 | ) | | | 5,970,529 | | |
Net increase (decrease) in net assets
resulting from operations | | | (58,350,649 | ) | | | 57,559,459 | | | | (20,813,952 | ) | | | 16,098,547 | | |
From Distributions to Shareholders: | |
Total distributions paid | | | (11,060,740 | ) | | | (3,307,515 | ) | | | (9,806,139 | ) | | | (2,321,936 | ) | |
From Shares of Beneficial Interest: | |
Proceeds from shares sold | | | 439,922 | | | | 3,493,684 | | | | 414,629 | | | | 495,371 | | |
Reinvestment of distributions | | | 11,060,740 | | | | 3,307,515 | | | | 9,806,139 | | | | 2,321,936 | | |
Cost of shares redeemed | | | (43,472,331 | ) | | | (58,918,955 | ) | | | (16,696,820 | ) | | | (16,598,040 | ) | |
Net decrease in net assets from share
transactions of beneficial interest | | | (31,971,669 | ) | | | (52,117,756 | ) | | | (6,476,052 | ) | | | (13,780,733 | ) | |
Total increase (decrease) in net assets | | | (101,383,058 | ) | | | 2,134,188 | | | | (37,096,143 | ) | | | (4,122 | ) | |
Net Assets: | |
Beginning of year | | | 414,259,953 | | | | 412,125,765 | | | | 141,182,108 | | | | 141,186,230 | | |
End of year | | $ | 312,876,895 | | | $ | 414,259,953 | | | $ | 104,085,965 | | | $ | 141,182,108 | | |
Share Activity: | |
Class II | |
Shares sold | | | 36,630 | | | | 251,577 | | | | 32,895 | | | | 36,302 | | |
Shares reinvested | | | 911,099 | | | | 227,165 | | | | 885,031 | | | | 162,260 | | |
Shares redeemed | | | (3,298,869 | ) | | | (4,192,259 | ) | | | (1,301,242 | ) | | | (1,180,641 | ) | |
Net decrease in shares of beneficial
interest outstanding | | | (2,351,140 | ) | | | (3,713,517 | ) | | | (383,316 | ) | | | (982,079 | ) | |
See accompanying notes to financial statements.
60
Global Atlantic Portfolios
Statements of Changes in Net Assets (Continued)
| | | Global Atlantic Select Advisor
Managed Risk Portfolio | | Global Atlantic Wellington
Research Managed Risk Portfolio | |
| | | For the
Year Ended
December 31,
2022 | | For the
Year Ended
December 31,
2021 | | For the
Year Ended
December 31,
2022 | | For the
Year Ended
December 31,
2021 | |
Increase/(Decrease) in Net Assets: | |
From Operations: | |
Net investment income | | $ | 1,543,183 | | | $ | 976,065 | | | $ | 2,188,314 | | | $ | 425,368 | | |
Net realized gain (loss) | | | 4,497,564 | | | | 7,160,931 | | | | (6,736,855 | ) | | | 45,900,418 | | |
Net change in unrealized appreciation (depreciation) | | | (22,381,060 | ) | | | 5,422,242 | | | | (76,087,541 | ) | | | 8,246,431 | | |
Net increase (decrease) in net assets
resulting from operations | | | (16,340,313 | ) | | | 13,559,238 | | | | (80,636,082 | ) | | | 54,572,217 | | |
From Distributions to Shareholders: | |
Total distributions paid | | | (8,047,361 | ) | | | (4,843,261 | ) | | | (45,730,140 | ) | | | (19,065,724 | ) | |
From Shares of Beneficial Interest: | |
Proceeds from shares sold | | | 427,856 | | | | 232,268 | | | | 15,470 | | | | 31,704,858 | * | |
Reinvestment of distributions | | | 8,047,361 | | | | 4,843,261 | | | | 45,730,140 | | | | 19,065,724 | | |
Cost of shares redeemed | | | (10,697,955 | ) | | | (16,371,977 | ) | | | (50,361,761 | ) | | | (56,645,530 | ) | |
Net decrease in net assets from share
transactions of beneficial interest | | | (2,222,738 | ) | | | (11,296,448 | ) | | | (4,616,151 | ) | | | (5,874,948 | ) | |
Total increase (decrease) in net assets | | | (26,610,412 | ) | | | (2,580,471 | ) | | | (130,982,373 | ) | | | 29,631,545 | | |
Net Assets: | |
Beginning of year | | | 105,531,635 | | | | 108,112,106 | | | | 485,473,785 | | | | 455,842,240 | | |
End of year | | $ | 78,921,223 | | | $ | 105,531,635 | | | $ | 354,491,412 | | | $ | 485,473,785 | | |
Share Activity: | |
Class II | |
Shares sold | | | 32,763 | | | | 16,317 | | | | 1,086 | | | | 1,922,530 | ** | |
Shares reinvested | | | 738,968 | | | | 337,275 | | | | 3,868,878 | | | | 1,178,351 | | |
Shares redeemed | | | (851,923 | ) | | | (1,143,850 | ) | | | (3,587,999 | ) | | | (3,526,877 | ) | |
Net increase (decrease) in shares of beneficial
interest outstanding | | | (80,192 | ) | | | (790,258 | ) | | | 281,965 | | | | (425,996 | ) | |
* Includes the value received from shares issued in connection with the reorganization of Global Atlantic PIMCO Tactical Allocation Portfolio into Global Atlantic Wellington Research Managed Risk Portfolio on August 20, 2021.
** Includes shares issued in connection with the reorganization of Global Atlantic PIMCO Tactical Allocation Portfolio into Global Atlantic Wellington Research Managed Risk Portfolio on August 20, 2021.
See accompanying notes to financial statements.
61
Global Atlantic Portfolios
Financial Highlights
Global Atlantic American Funds® Managed Risk Portfolio
Selected data for a Class II share outstanding throughout each year
| | | For the
Year Ended
December 31, 2022 | | For the
Year Ended
December 31, 2021 | | For the
Year Ended
December 31, 2020 | | For the
Year Ended
December 31, 2019 | | For the
Year Ended
December 31, 2018 | |
Net asset value, beginning of year | | $ | 13.87 | | | $ | 12.62 | | | $ | 12.04 | | | $ | 10.93 | | | $ | 11.98 | | |
Income from investment operations: | |
Net investment income (a,b) | | | 0.34 | | | | 0.21 | | | | 0.14 | | | | 0.17 | | | | 0.20 | | |
Net realized and unrealized gain (loss) (c) | | | (2.56 | ) | | | 1.19 | | | | 1.06 | | | | 1.62 | | | | (0.76 | ) | |
Total income (loss) from
investment operations | | | (2.22 | ) | | | 1.40 | | | | 1.20 | | | | 1.79 | | | | (0.56 | ) | |
Less distributions from: | |
Net investment income | | | (0.24 | ) | | | (0.15 | ) | | | (0.18 | ) | | | (0.21 | ) | | | (0.15 | ) | |
Net realized gains | | | (0.56 | ) | | | - | | | | (0.44 | ) | | | (0.47 | ) | | | (0.34 | ) | |
Total distributions from net
investment income and
net realized gains | | | (0.80 | ) | | | (0.15 | ) | | | (0.62 | ) | | | (0.68 | ) | | | (0.49 | ) | |
Net asset value, end of year | | $ | 10.85 | | | $ | 13.87 | | | $ | 12.62 | | | $ | 12.04 | | | $ | 10.93 | | |
Total return (d) | | | (15.94 | )% | | | 11.12 | % | | | 10.49 | % | | | 16.72 | % | | | (4.75 | )% | |
Ratios and Supplemental Data: | |
Net assets, end of year (in 000's) | | $ | 172,678 | | | $ | 232,531 | | | $ | 231,753 | | | $ | 230,916 | | | $ | 216,902 | | |
Ratio of net expenses to
average net assets (e) | | | 0.86 | % | | | 0.85 | % | | | 0.86 | % | | | 0.86 | % | | | 0.86 | % | |
Ratio of gross expenses to
average net assets (e,f) | | | 1.26 | % | | | 1.25 | % | | | 1.26 | % | | | 1.26 | % | | | 1.24 | % | |
Ratio of net investment income to
average net assets (b,e) | | | 2.85 | % | | | 1.55 | % | | | 1.18 | % | | | 1.41 | % | | | 1.66 | % | |
Portfolio turnover rate | | | 41 | % | | | 18 | % | | | 35 | % | | | 30 | % | | | 34 | % | |
(a) Net investment income has been calculated using the average shares method, which more appropriately presents the per share data for the period.
(b) Recognition of net investment income by the Portfolio is affected by the timing of the declaration of dividends by the underlying investment companies in which the Portfolio invests.
(c) Realized and unrealized gain (loss) per share are balancing amounts necessary to reconcile the change in net asset value per share for the period, and may not reconcile with aggregate gains and losses in the statement of operations due to timing of share transactions.
(d) Total returns are historical and assume changes in share price and reinvestment of dividends and capital gains distributions. Total return does not reflect the deduction of taxes that a shareholder may pay on Portfolio distributions or on the redemption of Portfolio shares, as well as other charges and expenses of the insurance contract or separate account. Total returns would have been lower absent fee waivers by the Adviser.
(e) Does not include the expenses of the investment companies in which the Portfolio invests.
(f) Represents the ratio of expenses to average net assets absent fee waivers and/or expense reimbursements by the Adviser.
See accompanying notes to financial statements.
62
Global Atlantic Portfolios
Financial Highlights
Global Atlantic Balanced Managed Risk Portfolio
Selected data for a Class II share outstanding throughout each year
| | | For the
Year Ended
December 31, 2022 | | For the
Year Ended
December 31, 2021 | | For the
Year Ended
December 31, 2020 | | For the
Year Ended
December 31, 2019 | | For the
Year Ended
December 31, 2018 | |
Net asset value, beginning of year | | $ | 13.88 | | | $ | 13.10 | | | $ | 12.51 | | | $ | 11.26 | | | $ | 12.09 | | |
Income from investment operations: | |
Net investment income (a,b) | | | 0.15 | | | | 0.12 | | | | 0.13 | | | | 0.19 | | | | 0.17 | | |
Net realized and unrealized gain (loss) (c) | | | (2.25 | ) | | | 1.05 | | | | 0.93 | | | | 1.42 | | | | (0.85 | ) | |
Total income (loss) from
investment operations | | | (2.10 | ) | | | 1.17 | | | | 1.06 | | | | 1.61 | | | | (0.68 | ) | |
Less distributions from: | |
Net investment income | | | (0.11 | ) | | | (0.10 | ) | | | (0.21 | ) | | | (0.20 | ) | | | (0.15 | ) | |
Net realized gains | | | (0.99 | ) | | | (0.29 | ) | | | (0.26 | ) | | | (0.16 | ) | | | - | | |
Total distributions from net
investment income and
net realized gains | | | (1.10 | ) | | | (0.39 | ) | | | (0.47 | ) | | | (0.36 | ) | | | (0.15 | ) | |
Net asset value, end of year | | $ | 10.68 | | | $ | 13.88 | | | $ | 13.10 | | | $ | 12.51 | | | $ | 11.26 | | |
Total return (d) | | | (15.07 | )% | | | 8.99 | % | | | 8.78 | % | | | 14.34 | % | | | (5.66 | )% | |
Ratios and Supplemental Data: | |
Net assets, end of year (in 000's) | | $ | 89,499 | | | $ | 119,376 | | | $ | 82,774 | | | $ | 83,411 | | | $ | 81,748 | | |
Ratio of net expenses to
average net assets (e) | | | 0.91 | % | | | 0.90 | % | | | 0.92 | % (f) | | | 0.91 | % | | | 0.91 | % (f) | |
Ratio of gross expenses to
average net assets (e,g) | | | 0.91 | % | | | 0.90 | % | | | 0.92 | % | | | 0.91 | % | | | 0.91 | % | |
Ratio of net investment income to
average net assets (b,e) | | | 1.24 | % | | | 0.90 | % | | | 1.06 | % | | | 1.54 | % | | | 1.42 | % | |
Portfolio turnover rate | | | 52 | % | | | 82 | % (h) | | | 119 | % | | | 107 | % | | | 75 | % | |
(a) Net investment income has been calculated using the average shares method, which more appropriately presents the per share data for the period.
(b) Recognition of net investment income by the Portfolio is affected by the timing of the declaration of dividends by the underlying investment companies in which the Portfolio invests.
(c) Realized and unrealized gain (loss) per share are balancing amounts necessary to reconcile the change in net asset value per share for the period, and may not reconcile with aggregate gains and losses in the statement of operations due to timing of share transactions.
(d) Total returns are historical and assume changes in share price and reinvestment of dividends and capital gains distributions. Total return does not reflect the deduction of taxes that a shareholder may pay on Portfolio distributions or on the redemption of Portfolio shares, as well as other charges and expenses of the insurance contract or separate account. Total returns would have been lower absent fee waivers by the Adviser.
(e) Does not include the expenses of the investment companies in which the Portfolio invests.
(f) Represents the ratio of expenses to average net assets inclusive of the Adviser's recapture of waived/reimbursed fees from prior periods.
(g) Represents the ratio of expenses to average net assets absent fee waivers and/or expense reimbursements by the Adviser.
(h) During the year ended December 31, 2021, the Portfolio engaged in security transactions associated with the transition of assets from Global Atlantic Goldman Sachs Dynamic Trends Allocation Portfolio, which merged into the Portfolio on August 20, 2021. Certain security transactions were excluded from the portfolio turnover rate calculation. If these transactions were included, portfolio turnover would have been higher.
See accompanying notes to financial statements.
63
Global Atlantic Portfolios
Financial Highlights
Global Atlantic BlackRock Selects Managed Risk Portfolio
Selected data for a Class II share outstanding throughout each year
| | | For the
Year Ended
December 31, 2022 | | For the
Year Ended
December 31, 2021 | | For the
Year Ended
December 31, 2020 | | For the
Year Ended
December 31, 2019 | | For the
Year Ended
December 31, 2018 | |
Net asset value, beginning of year | | $ | 12.46 | | | $ | 11.44 | | | $ | 10.49 | | | $ | 9.15 | | | $ | 10.11 | | |
Income from investment operations: | |
Net investment income (a,b) | | | 0.08 | | | | 0.33 | | | | 0.15 | | | | 0.15 | | | | 0.04 | | |
Net realized and unrealized gain (loss) (c) | | | (2.01 | ) | | | 0.86 | | | | 0.97 | | | | 1.24 | | | | (0.82 | ) | |
Total income (loss) from
investment operations | | | (1.93 | ) | | | 1.19 | | | | 1.12 | | | | 1.39 | | | | (0.78 | ) | |
Less distributions from: | |
Net investment income | | | (0.38 | ) | | | (0.17 | ) | | | (0.17 | ) | | | (0.05 | ) | | | (0.18 | ) | |
Net realized gains | | | (0.29 | ) | | | - | | | | - | | | | - | | | | - | | |
Total distributions from net
investment income and
net realized gains | | | (0.67 | ) | | | (0.17 | ) | | | (0.17 | ) | | | (0.05 | ) | | | (0.18 | ) | |
Net asset value, end of year | | $ | 9.86 | | | $ | 12.46 | | | $ | 11.44 | | | $ | 10.49 | | | $ | 9.15 | | |
Total return (d) | | | (15.48 | )% | | | 10.41 | % | | | 10.82 | % | | | 15.22 | % | | | (7.78 | )% | |
Ratios and Supplemental Data: | |
Net assets, end of year (in 000's) | | $ | 176,979 | | | $ | 235,544 | | | $ | 241,835 | | | $ | 243,853 | | | $ | 241,801 | | |
Ratio of net expenses to
average net assets (e) | | | 0.91 | % | | | 0.90 | % | | | 0.91 | % | | | 0.80 | % | | | 0.57 | % | |
Ratio of gross expenses to
average net assets (e,f) | | | 0.91 | % | | | 0.90 | % | | | 0.91 | % | | | 1.02 | % | | | 1.24 | % | |
Ratio of net investment income to
average net assets (b,e) | | | 0.73 | % | | | 2.73 | % | | | 1.39 | % | | | 1.47 | % | | | 3.87 | % | |
Portfolio turnover rate | | | 80 | % | | | 93 | % | | | 110 | % | | | 154 | % | | | 7 | % | |
(a) Net investment income has been calculated using the average shares method, which more appropriately presents the per share data for the period.
(b) Recognition of net investment income by the Portfolio is affected by the timing of the declaration of dividends by the underlying investment companies in which the Portfolio invests.
(c) Realized and unrealized gain (loss) per share are balancing amounts necessary to reconcile the change in net asset value per share for the period, and may not reconcile with aggregate gains and losses in the statement of operations due to timing of share transactions.
(d) Total returns are historical and assume changes in share price and reinvestment of dividends and capital gains distributions. Total return does not reflect the deduction of taxes that a shareholder may pay on Portfolio distributions or on the redemption of Portfolio shares, as well as other charges and expenses of the insurance contract or separate account. Total returns would have been lower absent fee waivers by the Adviser.
(e) Does not include the expenses of the investment companies in which the Portfolio invests.
(f) Represents the ratio of expenses to average net assets absent fee waivers and/or expense reimbursements by the Adviser.
See accompanying notes to financial statements.
64
Global Atlantic Portfolios
Financial Highlights
Global Atlantic Franklin Dividend and Income Managed Risk Portfolio
Selected data for a Class II share outstanding throughout each year
| | | For the
Year Ended
December 31, 2022 | | For the
Year Ended
December 31, 2021 | | For the
Year Ended
December 31, 2020 | | For the
Year Ended
December 31, 2019 | | For the
Year Ended
December 31, 2018 | |
Net asset value, beginning of year | | $ | 16.52 | | | $ | 14.25 | | | $ | 13.45 | | | $ | 11.31 | | | $ | 12.13 | | |
Income from investment operations: | |
Net investment income (a,b) | | | 0.14 | | | | 0.09 | | | | 0.12 | | | | 0.16 | | | | 0.15 | | |
Net realized and unrealized gain (loss) (c) | | | (2.18 | ) | | | 2.31 | | | | 0.87 | | | | 2.14 | | | | (0.85 | ) | |
Total income (loss) from
investment operations | | | (2.04 | ) | | | 2.40 | | | | 0.99 | | | | 2.30 | | | | (0.70 | ) | |
Less distributions from: | |
Net investment income | | | (0.11 | ) | | | (0.13 | ) | | | (0.19 | ) | | | (0.16 | ) | | | (0.12 | ) | |
Net realized gains | | | (0.26 | ) | | | - | | | | - | | | | - | | | | - | | |
Total distributions from net
investment income and
net realized gains | | | (0.37 | ) | | | (0.13 | ) | | | (0.19 | ) | | | (0.16 | ) | | | (0.12 | ) | |
Net asset value, end of year | | $ | 14.11 | | | $ | 16.52 | | | $ | 14.25 | | | $ | 13.45 | | | $ | 11.31 | | |
Total return (d) | | | (12.33 | )% | | | 16.87 | % | | | 7.50 | % | | | 20.40 | % | | | (5.82 | )% | |
Ratios and Supplemental Data: | |
Net assets, end of year (in 000's) | | $ | 216,832 | | | $ | 284,598 | | | $ | 275,216 | | | $ | 292,240 | | | $ | 264,283 | | |
Ratio of net expenses to
average net assets (e) | | | 1.19 | % | | | 1.18 | % | | | 1.16 | % | | | 1.16 | % | | | 1.15 | % | |
Ratio of gross expenses to
average net assets (e,f) | | | 1.22 | % | | | 1.20 | % | | | 1.22 | % | | | 1.21 | % | | | 1.19 | % | |
Ratio of net investment income to
average net assets (b,e) | | | 0.96 | % | | | 0.56 | % | | | 0.91 | % | | | 1.24 | % | | | 1.24 | % | |
Portfolio turnover rate | | | 21 | % (g) | | | 18 | % (g) | | | 24 | % (g) | | | 20 | % (g) | | | 24 | % (g) | |
(a) Net investment income has been calculated using the average shares method, which more appropriately presents the per share data for the period.
(b) Recognition of net investment income by the Portfolio is affected by the timing of the declaration of dividends by the underlying investment companies in which the Portfolio invests.
(c) Realized and unrealized gain (loss) per share are balancing amounts necessary to reconcile the change in net asset value per share for the period, and may not reconcile with aggregate gains and losses in the statement of operations due to timing of share transactions.
(d) Total returns are historical and assume changes in share price and reinvestment of dividends and capital gains distributions. Total return does not reflect the deduction of taxes that a shareholder may pay on Portfolio distributions or on the redemption of Portfolio shares, as well as other charges and expenses of the insurance contract or separate account. Total returns would have been lower absent fee waivers by the Adviser.
(e) Does not include the expenses of the investment companies or fees on swaps in which the Portfolio invests.
(f) Represents the ratio of expenses to average net assets absent fee waivers and/or expense reimbursements by the Adviser.
(g) The portfolio turnover rate excludes mortgage dollar roll transactions for the years ended December 31, 2022, December 31, 2021, December 31, 2020, December 31, 2019 and December 31, 2018. If these were included in the calculation, the turnover percentage would be 58%, 59%, 77%, 55% and 48%, respectively.
See accompanying notes to financial statements.
65
Global Atlantic Portfolios
Financial Highlights
Global Atlantic Growth Managed Risk Portfolio
Selected data for a Class II share outstanding throughout each year
| | | For the
Year Ended
December 31, 2022 | | For the
Year Ended
December 31, 2021 | | For the
Year Ended
December 31, 2020 | | For the
Year Ended
December 31, 2019 | | For the
Year Ended
December 31, 2018 | |
Net asset value, beginning of year | | $ | 14.77 | | | $ | 12.98 | | | $ | 12.32 | | | $ | 10.67 | | | $ | 11.64 | | |
Income from investment operations: | |
Net investment income (a,b) | | | 0.13 | | | | 0.10 | | | | 0.10 | | | | 0.16 | | | | 0.14 | | |
Net realized and unrealized gain (loss) (c) | | | (2.28 | ) | | | 1.81 | | | | 0.74 | | | | 1.66 | | | | (0.99 | ) | |
Total income (loss) from
investment operations | | | (2.15 | ) | | | 1.91 | | | | 0.84 | | | | 1.82 | | | | (0.85 | ) | |
Less distributions from: | |
Net investment income | | | (0.12 | ) | | | (0.12 | ) | | | (0.18 | ) | | | (0.17 | ) | | | (0.12 | ) | |
Net realized gains | | | (0.32 | ) | | | - | | | | - | | | | - | | | | - | | |
Total distributions from net
investment income and
net realized gains | | | (0.44 | ) | | | (0.12 | ) | | | (0.18 | ) | | | (0.17 | ) | | | (0.12 | ) | |
Net asset value, end of year | | $ | 12.18 | | | $ | 14.77 | | | $ | 12.98 | | | $ | 12.32 | | | $ | 10.67 | | |
Total return (d) | | | (14.56 | )% | | | 14.69 | % | | | 7.00 | % | | | 17.11 | % | | | (7.33 | )% | |
Ratios and Supplemental Data: | |
Net assets, end of year (in 000's) | | $ | 312,877 | | | $ | 414,260 | | | $ | 412,126 | | | $ | 431,557 | | | $ | 423,635 | | |
Ratio of net expenses to
average net assets (e) | | | 0.88 | % | | | 0.88 | % | | | 0.88 | % | | | 0.89 | % | | | 0.91 | % (f) | |
Ratio of gross expenses to
average net assets (e) | | | 0.91 | % (g) | | | 0.90 | % | | | 0.91 | % (g) | | | 0.91 | % (g) | | | 0.89 | % | |
Ratio of net investment income to
average net assets (b,e) | | | 1.02 | % | | | 0.73 | % | | | 0.82 | % | | | 1.38 | % | | | 1.24 | % | |
Portfolio turnover rate | | | 44 | % | | | 32 | % | | | 102 | % | | | 69 | % | | | 53 | % | |
(a) Net investment income has been calculated using the average shares method, which more appropriately presents the per share data for the period.
(b) Recognition of net investment income by the Portfolio is affected by the timing of the declaration of dividends by the underlying investment companies in which the Portfolio invests.
(c) Realized and unrealized gain (loss) per share are balancing amounts necessary to reconcile the change in net asset value per share for the period, and may not reconcile with aggregate gains and losses in the statement of operations due to timing of share transactions.
(d) Total returns are historical and assume changes in share price and reinvestment of dividends and capital gains distributions. Total return does not reflect the deduction of taxes that a shareholder may pay on Portfolio distributions or on the redemption of Portfolio shares, as well as other charges and expenses of the insurance contract or separate account. Total returns would have been lower absent fee waivers by the Adviser.
(e) Does not include the expenses of the investment companies in which the Portfolio invests.
(f) Represents the ratio of expenses to average net assets inclusive of the Adviser's recapture of waived/reimbursed fees from prior periods.
(g) Represents the ratio of expenses to average net assets absent fee waivers and/or expense reimbursements by the Adviser.
See accompanying notes to financial statements.
66
Global Atlantic Portfolios
Financial Highlights
Global Atlantic Moderate Growth Managed Risk Portfolio
Selected data for a Class II share outstanding throughout each year
| | | For the
Year Ended
December 31, 2022 | | For the
Year Ended
December 31, 2021 | | For the
Year Ended
December 31, 2020 | | For the
Year Ended
December 31, 2019 | | For the
Year Ended
December 31, 2018 | |
Net asset value, beginning of year | | $ | 14.51 | | | $ | 13.18 | | | $ | 12.57 | | | $ | 11.00 | | | $ | 11.90 | | |
Income from investment operations: | |
Net investment income (a,b) | | | 0.14 | | | | 0.11 | | | | 0.12 | | | | 0.17 | | | | 0.16 | | |
Net realized and unrealized gain (loss) (c) | | | (2.38 | ) | | | 1.46 | | | | 0.86 | | | | 1.58 | | | | (0.93 | ) | |
Total income (loss) from
investment operations | | | (2.24 | ) | | | 1.57 | | | | 0.98 | | | | 1.75 | | | | (0.77 | ) | |
Less distributions from: | |
Net investment income | | | (0.13 | ) | | | (0.13 | ) | | | (0.19 | ) | | | (0.18 | ) | | | (0.13 | ) | |
Net realized gains | | | (1.00 | ) | | | (0.11 | ) | | | (0.18 | ) | | | - | | | | - | | |
Total distributions from net
investment income and
net realized gains | | | (1.13 | ) | | | (0.24 | ) | | | (0.37 | ) | | | (0.18 | ) | | | (0.13 | ) | |
Net asset value, end of year | | $ | 11.14 | | | $ | 14.51 | | | $ | 13.18 | | | $ | 12.57 | | | $ | 11.00 | | |
Total return (d) | | | (15.38 | )% | | | 11.91 | % | | | 8.08 | % | | | 15.94 | % | | | (6.50 | )% | |
Ratios and Supplemental Data: | |
Net assets, end of year (in 000's) | | $ | 104,086 | | | $ | 141,182 | | | $ | 141,186 | | | $ | 143,221 | | | $ | 135,945 | | |
Ratio of net expenses to
average net assets (e) | | | 0.91 | % | | | 0.90 | % | | | 0.91 | % | | | 0.91 | % | | | 0.91 | % (f) | |
Ratio of gross expenses to
average net assets (e) | | | 0.91 | % | | | 0.90 | % | | | 0.91 | % (g) | | | 0.91 | % (g) | | | 0.89 | % | |
Ratio of net investment income to
average net assets (b,e) | | | 1.11 | % | | | 0.78 | % | | | 0.94 | % | | | 1.46 | % | | | 1.35 | % | |
Portfolio turnover rate | | | 48 | % | | | 44 | % | | | 110 | % | | | 91 | % | | | 65 | % | |
(a) Net investment income has been calculated using the average shares method, which more appropriately presents the per share data for the period.
(b) Recognition of net investment income by the Portfolio is affected by the timing of the declaration of dividends by the underlying investment companies in which the Portfolio invests.
(c) Realized and unrealized gain (loss) per share are balancing amounts necessary to reconcile the change in net asset value per share for the period, and may not reconcile with aggregate gains and losses in the statement of operations due to timing of share transactions.
(d) Total returns are historical and assume changes in share price and reinvestment of dividends and capital gains distributions. Total return does not reflect the deduction of taxes that a shareholder may pay on Portfolio distributions or on the redemption of Portfolio shares, as well as other charges and expenses of the insurance contract or separate account. Total returns would have been lower absent fee waivers by the Adviser.
(e) Does not include the expenses of the investment companies in which the Portfolio invests.
(f) Represents the ratio of expenses to average net assets inclusive of the Adviser's recapture of waived/reimbursed fees from prior periods.
(g) Represents the ratio of expenses to average net assets absent fee waivers and/or expense reimbursements by the Adviser.
See accompanying notes to financial statements.
67
Global Atlantic Portfolios
Financial Highlights
Global Atlantic Select Advisor Managed Risk Portfolio
Selected data for a Class II share outstanding throughout each year
| | | For the
Year Ended
December 31, 2022 | | For the
Year Ended
December 31, 2021 | | For the
Year Ended
December 31, 2020 | | For the
Year Ended
December 31, 2019 | | For the
Year Ended
December 31, 2018 | |
Net asset value, beginning of year | | $ | 14.48 | | | $ | 13.38 | | | $ | 13.23 | | | $ | 11.53 | | | $ | 12.55 | | |
Income from investment operations: | |
Net investment income (a,b) | | | 0.22 | | | | 0.13 | | | | 0.16 | | | | 0.21 | | | | 0.13 | | |
Net realized and unrealized gain (loss) (c) | | | (2.53 | ) | | | 1.64 | | | | 0.65 | | | | 2.05 | | | | (0.87 | ) | |
Total income (loss) from
investment operations | | | (2.31 | ) | | | 1.77 | | | | 0.81 | | | | 2.26 | | | | (0.74 | ) | |
Less distributions from: | |
Net investment income | | | (0.15 | ) | | | (0.18 | ) | | | (0.24 | ) | | | (0.15 | ) | | | (0.12 | ) | |
Net realized gains | | | (1.07 | ) | | | (0.49 | ) | | | (0.42 | ) | | | (0.41 | ) | | | (0.16 | ) | |
Total distributions from net
investment income and
net realized gains | | | (1.22 | ) | | | (0.67 | ) | | | (0.66 | ) | | | (0.56 | ) | | | (0.28 | ) | |
Net asset value, end of year | | $ | 10.95 | | | $ | 14.48 | | | $ | 13.38 | | | $ | 13.23 | | | $ | 11.53 | | |
Total return (d) | | | (15.94 | )% | | | 13.31 | % | | | 6.61 | % | | | 19.96 | % | | | (5.99 | )% | |
Ratios and Supplemental Data: | |
Net assets, end of year (in 000's) | | $ | 78,921 | | | $ | 105,532 | | | $ | 108,112 | | | $ | 114,371 | | | $ | 107,874 | | |
Ratio of net expenses to
average net assets (e) | | | 0.64 | % | | | 0.64 | % | | | 0.64 | % | | | 0.64 | % | | | 0.63 | % | |
Ratio of gross expenses to
average net assets (e,f) | | | 1.26 | % | | | 1.25 | % | | | 1.26 | % | | | 1.27 | % | | | 1.24 | % | |
Ratio of net investment income to
average net assets (b,e) | | | 1.75 | % | | | 0.90 | % | | | 1.24 | % | | | 1.68 | % | | | 1.07 | % | |
Portfolio turnover rate | | | 33 | % | | | 17 | % | | | 54 | % | | | 22 | % | | | 32 | % | |
(a) Net investment income has been calculated using the average shares method, which more appropriately presents the per share data for the period.
(b) Recognition of net investment income by the Portfolio is affected by the timing of the declaration of dividends by the underlying investment companies in which the Portfolio invests.
(c) Realized and unrealized gain (loss) per share are balancing amounts necessary to reconcile the change in net asset value per share for the period, and may not reconcile with aggregate gains and losses in the statement of operations due to timing of share transactions.
(d) Total returns are historical and assume changes in share price and reinvestment of dividends and capital gains distributions. Total return does not reflect the deduction of taxes that a shareholder may pay on Portfolio distributions or on the redemption of Portfolio shares, as well as other charges and expenses of the insurance contract or separate account. Total returns would have been lower absent fee waivers by the Adviser.
(e) Does not include the expenses of the investment companies in which the Portfolio invests.
(f) Represents the ratio of expenses to average net assets absent fee waivers and/or expense reimbursements by the Adviser.
See accompanying notes to financial statements.
68
Global Atlantic Portfolios
Financial Highlights
Global Atlantic Wellington Research Managed Risk Portfolio
Selected data for a Class II share outstanding throughout each year
| | | For the
Year Ended
December 31, 2022 | | For the
Year Ended
December 31, 2021 | | For the
Year Ended
December 31, 2020 | | For the
Year Ended
December 31, 2019 | | For the
Year Ended
December 31, 2018 | |
Net asset value, beginning of year | | $ | 16.45 | | | $ | 15.23 | | | $ | 14.00 | | | $ | 12.38 | | | $ | 13.40 | | |
Income from investment operations: | |
Net investment income (a,b) | | | 0.08 | | | | 0.01 | | | | 0.08 | | | | 0.13 | | | | 0.12 | | |
Net realized and unrealized gain (loss) (c) | | | (2.91 | ) | | | 1.86 | | | | 1.46 | | | | 2.23 | | | | (0.79 | ) | |
Total income (loss) from
investment operations | | | (2.83 | ) | | | 1.87 | | | | 1.54 | | | | 2.36 | | | | (0.67 | ) | |
Less distributions from: | |
Net investment income | | | (0.02 | ) | | | (0.09 | ) | | | (0.14 | ) | | | (0.13 | ) | | | (0.09 | ) | |
Net realized gains | | | (1.70 | ) | | | (0.56 | ) | | | (0.17 | ) | | | (0.61 | ) | | | (0.26 | ) | |
Total distributions from net
investment income and
net realized gains | | | (1.72 | ) | | | (0.65 | ) | | | (0.31 | ) | | | (0.74 | ) | | | (0.35 | ) | |
Net asset value, end of year | | $ | 11.90 | | | $ | 16.45 | | | $ | 15.23 | | | $ | 14.00 | | | $ | 12.38 | | |
Total return (d) | | | (17.13 | )% | | | 12.38 | % | | | 11.16 | % | | | 19.32 | % | | | (5.07 | )% | |
Ratios and Supplemental Data: | |
Net assets, end of year (in 000's) | | $ | 354,491 | | | $ | 485,474 | | | $ | 455,842 | | | $ | 448,554 | | | $ | 414,731 | | |
Ratio of net expenses to
average net assets (e) | | | 1.19 | % | | | 1.20 | % | | | 1.21 | % | | | 1.20 | % | | | 1.20 | % (f) | |
Ratio of gross expenses to
average net assets (e) | | | 1.22 | % | | | 1.20 | % | | | 1.22 | % (g) | | | 1.21 | % (g) | | | 1.19 | % | |
Ratio of net investment income to
average net assets (b,e) | | | 0.54 | % | | | 0.09 | % | | | 0.54 | % | | | 0.93 | % | | | 0.89 | % | |
Portfolio turnover rate | | | 80 | % (h) | | | 91 | % (h,i) | | | 85 | % (h) | | | 53 | % (h) | | | 66 | % (h) | |
(a) Net investment income has been calculated using the average shares method, which more appropriately presents the per share data for the period.
(b) Recognition of net investment income by the Portfolio is affected by the timing of the declaration of dividends by the underlying investment companies in which the Portfolio invests.
(c) Realized and unrealized gain (loss) per share are balancing amounts necessary to reconcile the change in net asset value per share for the period, and may not reconcile with aggregate gains and losses in the statement of operations due to timing of share transactions.
(d) Total returns are historical and assume changes in share price and reinvestment of dividends and capital gains distributions. Total return does not reflect the deduction of taxes that a shareholder may pay on Portfolio distributions or on the redemption of Portfolio shares, as well as other charges and expenses of the insurance contract or separate account. Total returns would have been lower absent fee waivers by the Adviser.
(e) Does not include the expenses of the investment companies in which the Portfolio invests.
(f) Represents the ratio of expenses to average net assets inclusive of the Adviser's recapture of waived/reimbursed fees from prior periods.
(g) Represents the ratio of expenses to average net assets absent fee waivers and/or expense reimbursements by the Adviser.
(h) The portfolio turnover rates excludes mortgage dollar roll transactions for the years ended December 31, 2022, December 31, 2021, December 31, 2020, December 31, 2019 and December 31, 2018. If these were included in the calculation the turnover percentage would be 165%, 162%, 116%, 70% and 92%, respectively.
(i) During the year ended December 31, 2021, the Portfolio engaged in security transactions associated with the transition of assets from Global Atlantic PIMCO Tactical Allocation Portfolio, which merged into the Portfolio on August 20, 2021. Certain security transactions were excluded from the portfolio turnover rate calculation. If these transactions were included, portfolio turnover would have been higher.
See accompanying notes to financial statements.
69
Global Atlantic Portfolios
Notes to Financial Statements
December 31, 2022
1. ORGANIZATION
As of December 31, 2022, the Global Atlantic Portfolios were comprised of sixteen different actively managed portfolios, eight of which are discussed in this report (each, a "Portfolio" and collectively, the "Portfolios"). Each Portfolio is a series of shares of beneficial interest of Forethought Variable Insurance Trust (the "Trust"), a statutory trust organized under the laws of the State of Delaware, and registered under the Investment Company Act of 1940, as amended (the "1940 Act"), as an open-end management investment company.
Portfolio | | Commencement Date | | Investment Objective | |
Global Atlantic American Funds®
Managed Risk Portfolio | | October 31, 2013 | | Capital appreciation and income while seeking to manage volatility. | |
Global Atlantic Balanced Managed Risk
Portfolio | | October 31, 2013 | | Capital appreciation and income while seeking to manage volatility. | |
Global Atlantic BlackRock Selects Managed Risk
Portfolio | | October 31, 2013 | | Capital appreciation and income while seeking to manage volatility. | |
Global Atlantic Franklin Dividend and
Income Managed Risk Portfolio | | April 30, 2014 | | Capital appreciation and income while seeking to manage volatility. | |
Global Atlantic Growth Managed Risk
Portfolio | | April 30, 2014 | | Capital appreciation and income while seeking to manage volatility. | |
Global Atlantic Moderate Growth Managed Risk Portfolio | | April 30, 2014 | | Capital appreciation and income while seeking to manage volatility. | |
Global Atlantic Select Advisor Managed Risk Portfolio | | October 31, 2013 | | Capital appreciation and income while seeking to manage volatility. | |
Global Atlantic Wellington Research Managed Risk Portfolio | | October 31, 2013 | | Capital appreciation and income while seeking to manage volatility. | |
Each Portfolio is diversified. Certain of the Portfolios operate as "fund of funds." A "fund of funds" typically invests in multiple underlying funds and the level of its interest in any particular underlying fund may fluctuate. The Portfolios are intended to be funding vehicles for variable annuity contracts offered by the separate accounts of Forethought Life Insurance Company. The assets of each Portfolio are segregated and a shareholder's interest is limited to the Portfolio in which shares are held. Each Portfolio pays its own expenses.
As of December 31, 2022, the Portfolios offered Class II shares at net asset value.
References herein to a Portfolio's investment in a particular instrument include direct investments and indirect investments through investment companies such as open-end funds (mutual funds), exchange-traded funds and closed-end funds, as applicable.
2. SIGNIFICANT ACCOUNTING POLICIES
The following is a summary of significant accounting policies followed by the Portfolios in preparation of their financial statements. The policies are in conformity with U.S. generally accepted accounting principles ("US GAAP"). The preparation of the financial statements requires management to make estimates and assumptions that affect the reported amounts of assets and liabilities and disclosure of contingent assets and liabilities at the date of the financial statements and the reported amounts of income and expenses for the period. Actual results could differ from those estimates. Each Portfolio is an investment company and accordingly follows the investment company accounting and reporting guidance of the Financial Accounting Standards Board ("FASB") Accounting Standard Codification Topic 946 "Financial Services – Investment Companies".
Securities Valuation – Securities listed on an exchange are valued at the last reported sale price at the close of the regular trading session of the primary exchange on the business day the value is being determined, or in the case of securities listed on NASDAQ at the NASDAQ Official Closing Price. In the absence of a sale such securities shall be valued at the mean between the current bid and ask prices on the day of valuation. Futures and future options are valued at the final settle price or, in the absence of a settle price, at the last sale price on the day of valuation. Debt securities are valued on the basis of
70
Global Atlantic Portfolios
Notes to Financial Statements (Continued)
December 31, 2022
valuations provided by dealers or by an independent pricing service which take into account appropriate factors such as trading activity, readily available market quotations (including broker quotes), yield, quality, coupon rate, maturity, type of issue, trading characteristic, call features, credit ratings and other data. Short-term debt obligations having 60 days or less remaining until maturity, at time of purchase, may be valued at amortized cost to the extent it is determined that amortized cost approximates fair value.
Valuation of Investment Companies – The Portfolios may invest in one or more portfolios of open-end investment companies (the "Underlying Fund" or "Underlying Funds"). Each Underlying Fund is valued at its respective net asset value as reported by such investment company (except exchange-traded funds ("ETFs")). ETFs are valued daily at the last sale price or official closing price on the principal exchange or system on which the investment is traded. Each Underlying Fund values securities in its portfolio for which market quotations are readily available at their market values (generally the last reported sale price) and all other securities and assets at their fair value based on the methods approved by each Underlying Fund's board(s) of trustees.
Illiquid Investments – Pursuant to Rule 22e-4 under the 1940 Act, a Portfolio may not acquire any "illiquid investment" if, immediately after the acquisition, the Portfolio would have invested more than 15% of its net assets in illiquid investments that are assets. An "illiquid investment" is any investment that a Portfolio reasonably expects cannot be sold or disposed of in current market conditions in seven calendar days or less without the sale or disposition significantly changing the market value of the investment. The Trust has implemented a liquidity risk management program and related procedures to identify illiquid investments pursuant to Rule 22e-4, and the Board of Trustees ("Board") has approved the designation of the Adviser to administer the Trust's liquidity risk management program and related procedures. Illiquid investments include securities subject to contractual or legal restrictions on resale (e.g., because they have not been registered under the Securities Act of 1933) and securities that are otherwise not readily marketable (e.g., because trading in the security is suspended or because market makers do not exist or will not entertain bids or offers). These investments will be valued at their fair value, as outlined below.
Valuation Designee and Valuation Process – Prior to September 8, 2022, when the price of a security was not readily available or deemed unreliable, the fair market value was determined using the valuation procedures approved by the Board. The Board had delegated execution of these procedures to the Trust's Fair Value Committee. As of September 8, 2022, pursuant to Rule 2a-5 under the 1940 Act, the Board has designated Global Atlantic Investment Advisors, LLC (the "Adviser"), investment adviser to the Portfolios, as the Portfolios' Valuation Designee (the "Designee") with responsibility for establishing fair value when the price of a security is not readily available or deemed unreliable. Such investments will be valued at their fair market value as determined using the valuation procedures established by the Designee and approved by the Board. The Adviser carries out its designated activities through the Adviser's Fair Value Committee.
In accordance with the valuation procedures, fair value determinations are required for, among others, the following securities: (i) securities for which market quotations are not readily available on a particular business day (including without limitation securities for which there is a short and temporary lapse in the provision of a price by the regular pricing source); (ii) securities for which, in the opinion of the Adviser or relevant Sub-Adviser, the prices or values available do not represent the fair value of the instrument (factors which may cause the Adviser or Sub-Adviser to make such a judgment include, but are not limited to, the following: the availability of only a bid price or an ask price; the spread between bid and ask prices; the frequency of sales; the thinness of the market; the size of reported trades; and actions of the securities markets or regulators, such as the suspension or limitation of trading); (iii) securities determined to be illiquid; (iv) securities with respect to which an event that will affect the value thereof has occurred (a "significant event") subsequent to the determination of the closing price reported on the principal exchange on which the securities are traded, but prior to the relevant Portfolio's calculation of its net asset value ("NAV"); and (v) mutual funds that do not provide timely NAV information. Restricted or illiquid securities, such as private placements or non-traded securities are valued via inputs from the Adviser or Sub-Adviser valuation based upon the current bid for the security from two or more independent dealers or other parties reasonably familiar with the facts and circumstances of the security (who should take into consideration all relevant factors as may be appropriate under the circumstances). If the Adviser or Sub-Adviser is unable to obtain a current bid from such independent dealers or other independent parties, the Designee shall determine the fair value of restricted or illiquid securities using certain factors, such as, but not limited to: (i) the type of security; (ii) the cost at date of purchase; (iii) the size and nature of the Portfolio's holdings; (iv) the discount from market value of unrestricted securities of the same class at the time of purchase and subsequent thereto; (v) information as to any transactions or offers with respect to the security; (vi) the nature and duration
71
Global Atlantic Portfolios
Notes to Financial Statements (Continued)
December 31, 2022
of restrictions on disposition of the security and the existence of any registration rights, as well as any estimation of the cost of registration or otherwise qualifying the security for public sale, including commissions; (vii) how the yield of the security compares to similar securities of companies of similar or equal creditworthiness; (viii) the level of recent trades of similar or comparable securities; (ix) the liquidity characteristics of the security; (x) current market conditions; (xi) the market value of any securities into which the security is convertible or exchangeable; (xii) the security's embedded option values; and (xiii) information about the financial condition of the issuer and its prospects.
Each Portfolio utilizes various methods to measure the fair value of all of its investments on a recurring basis. US GAAP establishes a hierarchy that prioritizes inputs to valuation methods. The three levels of input are:
Level 1 – Unadjusted quoted prices in active markets for identical assets and liabilities that the Portfolio has the ability to access.
Level 2 – Observable inputs other than quoted prices included in Level 1 that are observable for the asset or liability, either directly or indirectly. These inputs may include quoted prices for the identical instrument in an inactive market, prices for similar instruments, interest rates, prepayment speeds, credit risk, yield curves, default rates and similar data.
Level 3 – Unobservable inputs for the asset or liability, to the extent relevant observable inputs are not available, representing the Portfolio's own assumptions about the assumptions a market participant would use in valuing the asset or liability, and would be based on the best information available.
The availability of observable inputs can vary from security to security and is affected by a wide variety of factors, including, for example, the type of security, whether the security is new and not yet established in the marketplace, the liquidity of markets, and other characteristics particular to the security. To the extent that valuation is based on models or inputs that are less observable or unobservable in the market, the determination of fair value requires more judgment. Accordingly, the degree of judgment exercised in determining fair value is greatest for instruments categorized in Level 3.
The inputs used to measure fair value may fall into different levels of the fair value hierarchy. In such cases, for disclosure purposes, the level in the fair value hierarchy within which the fair value measurement falls in its entirety is determined based on the lowest level input that is significant to the fair value measurement in its entirety.
The inputs or methodology used for valuing securities are not necessarily an indication of the risk associated with investing in those securities. The following tables summarize the inputs used as of December 31, 2022 for each Portfolio's investments measured at fair value:
Global Atlantic American Funds® Managed Risk Portfolio
Assets | | Level 1 | | Level 2 | | Level 3 | | Total | |
Variable Insurance Trusts | | $ | 148,450,655 | | | $ | - | | | $ | - | | | $ | 148,450,655 | | |
Short-Term Investments | | | 6,702,195 | | | | - | | | | - | | | | 6,702,195 | | |
Mutual Fund | | | 14,801,108 | | | | - | | | | - | | | | 14,801,108 | | |
Futures Contracts* | | | 857,565 | | | | - | | | | - | | | | 857,565 | | |
Total | | $ | 170,811,523 | | | $ | - | | | $ | - | | | $ | 170,811,523 | | |
Global Atlantic Balanced Managed Risk Portfolio
Assets | | Level 1 | | Level 2 | | Level 3 | | Total | |
Exchange-Traded Funds | | $ | 84,616,730 | | | $ | - | | | $ | - | | | $ | 84,616,730 | | |
Short-Term Investments | | | 3,670,359 | | | | - | | | | - | | | | 3,670,359 | | |
Futures Contracts* | | | 489,218 | | | | - | | | | - | | | | 489,218 | | |
Total | | $ | 88,776,307 | | | $ | - | | | $ | - | | | $ | 88,776,307 | | |
72
Global Atlantic Portfolios
Notes to Financial Statements (Continued)
December 31, 2022
Global Atlantic BlackRock Selects Managed Risk Portfolio
Assets | | Level 1 | | Level 2 | | Level 3 | | Total | |
Exchange-Traded Funds | | $ | 127,222,799 | | | $ | - | | | $ | - | | | $ | 127,222,799 | | |
Variable Insurance Trusts | | | 39,082,810 | | | | - | | | | - | | | | 39,082,810 | | |
Short-Term Investments | | | 8,172,081 | | | | - | | | | - | | | | 8,172,081 | | |
Futures Contracts* | | | 807,708 | | | | - | | | | - | | | | 807,708 | | |
Total | | $ | 175,285,398 | | | $ | - | | | $ | - | | | $ | 175,285,398 | | |
Global Atlantic Franklin Dividend and Income Managed Risk Portfolio
Assets | | Level 1 | | Level 2 | | Level 3 | | Total | |
Common Stocks | | $ | 150,927,966 | | | $ | 5 | | | $ | - | | | $ | 150,927,971 | | |
U.S. Treasury Securities and Agency Bonds | | | - | | | | 17,369,512 | | | | - | | | | 17,369,512 | | |
Corporate Bonds and Notes | | | - | | | | 13,876,281 | | | | - | | | | 13,876,281 | | |
Agency Mortgage Backed Securities | | | - | | | | 10,432,140 | | | | - | | | | 10,432,140 | | |
Asset Backed and Commercial Backed Securities | | | - | | | | 8,363,635 | | | | - | | | | 8,363,635 | | |
Mutual Funds | | | 1,459,215 | | | | - | | | | - | | | | 1,459,215 | | |
Municipal Bonds | | | - | | | | 1,108,768 | | | | - | | | | 1,108,768 | | |
Sovereign Debts | | | - | | | | 627,862 | | | | - | | | | 627,862 | | |
Term Loans | | | - | | | | 47,045 | | | | - | | | | 47,045 | | |
Preferred Stocks | | | - | | | | 16 | | | | - | | | | 16 | | |
Short-Term Investments | | | 11,900,432 | | | | - | | | | - | | | | 11,900,432 | | |
Futures Contracts* | | | 757,373 | | | | - | | | | - | | | | 757,373 | | |
Swap Contracts* | | | - | | | | 44,662 | | | | - | | | | 44,662 | | |
Total | | $ | 165,044,986 | | | $ | 51,869,926 | | | $ | - | | | $ | 216,914,912 | | |
Liabilities | | Level 1 | | Level 2 | | Level 3 | | Total | |
Futures Contracts* | | $ | 2,967 | | | $ | - | | | $ | - | | | $ | 2,967 | | |
Swap Contracts* | | | - | | | | 119,849 | | | | - | | | | 119,849 | | |
Forward Foreign Currency Contracts | | | - | | | | 18,869 | | | | - | | | | 18,869 | | |
Total | | $ | 2,967 | | | $ | 138,718 | | | $ | - | | | $ | 141,685 | | |
Global Atlantic Growth Managed Risk Portfolio
Assets | | Level 1 | | Level 2 | | Level 3 | | Total | |
Exchange-Traded Funds | | $ | 290,475,518 | | | $ | - | | | $ | - | | | $ | 290,475,518 | | |
Short-Term Investments | | | 15,684,860 | | | | - | | | | - | | | | 15,684,860 | | |
Futures Contracts* | | | 2,289,105 | | | | - | | | | - | | | | 2,289,105 | | |
Total | | $ | 308,449,483 | | | $ | - | | | $ | - | | | $ | 308,449,483 | | |
Global Atlantic Moderate Growth Managed Risk Portfolio
Assets | | Level 1 | | Level 2 | | Level 3 | | Total | |
Exchange-Traded Funds | | $ | 96,584,975 | | | $ | - | | | $ | - | | | $ | 96,584,975 | | |
Short-Term Investments | | | 5,830,937 | | | | | | - | | | | 5,830,937 | | |
Futures Contracts* | | | 557,140 | | | | | | - | | | | 557,140 | | |
Total | | $ | 102,973,052 | | | $ | - | | | $ | - | | | $ | 102,973,052 | | |
73
Global Atlantic Portfolios
Notes to Financial Statements (Continued)
December 31, 2022
Global Atlantic Select Advisor Managed Risk Portfolio
Assets | | Level 1 | | Level 2 | | Level 3 | | Total | |
Variable Insurance Trusts | | $ | 60,235,467 | | | $ | - | | | $ | - | | | $ | 60,235,467 | | |
Exchange-Traded Funds | | | 13,241,970 | | | | - | | | | - | | | | 13,241,970 | | |
Short-Term Investments | | | 3,935,254 | | | | - | | | | - | | | | 3,935,254 | | |
Futures Contracts* | | | 472,068 | | | | | | | | | | | | 472,068 | | |
Total | | $ | 77,884,759 | | | $ | - | | | $ | - | | | $ | 77,884,759 | | |
Global Atlantic Wellington Research Managed Risk Portfolio
Assets | | Level 1 | | Level 2 | | Level 3 | | Total | |
Common Stocks | | $ | 211,922,223 | | | $ | - | | | $ | - | | | $ | 211,922,223 | | |
Corporate Bonds & Notes | | | - | | | | 32,227,910 | | | | - | | | | 32,227,910 | | |
U.S. Treasury Securities and Agency Bonds | | | - | | | | 38,184,539 | | | | - | | | | 38,184,539 | | |
Agency and Mortgage Backed Securities | | | - | | | | 31,678,514 | | | | - | | | | 31,678,514 | | |
Asset Backed and Commercial Backed Securities | | | - | | | | 9,844,501 | | | | - | | | | 9,844,501 | | |
Exchange-Traded Funds | | | 4,394,886 | | | | - | | | | - | | | | 4,394,886 | | |
Municipal Bonds | | | - | | | | 2,701,887 | | | | - | | | | 2,701,887 | | |
Sovereign Debts | | | - | | �� | | 195,895 | | | | - | | | | 195,895 | | |
Short-Term Investments | | | 32,388,416 | | | | 108,976 | | | | - | | | | 32,497,392 | | |
Futures Contracts* | | | 2,359,799 | | | | - | | | | - | | | | 2,359,799 | | |
Total | | $ | 251,065,324 | | | $ | 114,942,222 | | | $ | - | | | $ | 366,007,546 | | |
Liabilities | | Level 1 | | Level 2 | | Level 3 | | Total | |
Futures Contracts* | | $ | 4,281 | | | $ | - | | | $ | - | | | $ | 4,281 | | |
Total | | $ | 4,281 | | | $ | - | | | $ | - | | | $ | 4,281 | | |
* Net unrealized appreciation/(depreciation) as presented in the Portfolio of Investments.
The Portfolios did not hold any Level 3 securities during the year.
Security Transactions and Related Income – Security transactions are accounted for on a trade date basis. Interest income is recognized on an accrual basis. Discounts are accreted and premiums are amortized on securities over the lesser of the lives of the respective securities or to the call date, for any callable securities. Dividend income is recorded on the ex-dividend date. Realized gains or losses from sales of securities are determined by comparing the identified cost of the security lot sold with the net sales proceeds.
Dividends and Distributions to Shareholders – Dividends from net investment income and distributions from net realized capital gains, if any, are declared and paid annually. Dividends and distributions to shareholders are recorded on ex-date and are determined in accordance with Federal income tax regulations, which may differ from US GAAP. These "book/tax" differences are considered either temporary (e.g., deferred losses, capital loss carryforwards) or permanent in nature. To the extent these differences are permanent in nature, such amounts are reclassified within the composition of net assets based on their Federal tax-basis treatment; temporary differences do not require reclassification. These reclassifications have no effect on net assets, results from operations or net asset values per share of the Portfolios.
Cash and Cash Equivalents – Cash and cash equivalents include cash and overnight investments in interest-bearing demand deposits with a financial institution with original maturities of three months or less. The Portfolios may maintain deposits with a financial institution which could be an amount that is in excess of federally insured limits. The Portfolios have not experienced any losses on their accounts.
Federal Income Tax – It is each Portfolio's policy to qualify as a regulated investment company by complying with the provisions of the Internal Revenue Code that are applicable to regulated investment companies and to distribute substantially all of their taxable income and net realized gains to shareholders. Therefore, no Federal income tax provision is required.
74
Global Atlantic Portfolios
Notes to Financial Statements (Continued)
December 31, 2022
Each Portfolio will recognize the tax benefits of uncertain tax positions only where the position is "more likely than not" to be sustained assuming examination by tax authorities. Management has analyzed each Portfolio's tax positions, and has concluded that no liability for unrecognized tax benefits should be recorded related to uncertain tax positions taken in each Portfolio's 2020 and 2021 tax returns, or is expected to be taken in each Portfolio's 2022 tax return. Each Portfolio identified its major tax jurisdictions as U.S. Federal and foreign jurisdictions where the Portfolios make significant investments; however, the Portfolios are not aware of any tax positions for which it is reasonably possible that the total amounts of unrecognized tax benefits will change materially in the next twelve months.
Foreign Currency Translation – The accounting records of the Portfolios are maintained in U.S. dollars. Foreign currencies, as well as investment securities and other assets and liabilities denominated in foreign currencies, are translated into U.S. dollars using exchange rates deemed appropriate by the investment adviser. Purchases and sales of securities, income receipts and expense payments are translated into U.S. dollars on the respective dates of such transactions.
Net realized gains and losses on foreign currency transactions represent net gains and losses from currency realized between the trade and settlement dates on securities transactions and the difference between income accrued versus income received. The effects of changes in foreign currency exchange rates on investments in securities are included with the net realized and change in unrealized gain or loss on foreign currency translations.
Forward Foreign Currency Contracts – As foreign securities are purchased, a Portfolio may enter into forward currency contracts in order to hedge against foreign currency exchange rate risks. A forward involves an obligation to purchase or sell a specific currency at a future date, which may be any fixed number of days from the date of the contract agreed upon by the parties, at a price set at the time of the contract. The market value of the contract fluctuates with changes in currency exchange rates. The contract is marked-to-market daily and the change in market value is recorded by a Portfolio as an unrealized gain or loss. As foreign securities are sold, a portion of the contract is generally closed and a Portfolio records a realized gain or loss equal to the difference between the value of the contract at the time it was opened and the value at the time it was closed. Realized gains and losses from contract transactions are included as a component of net realized gains/(losses) from forward foreign currency contracts in the Statements of Operations.
For the year ended December 31, 2022, realized gains/(losses) and the change in unrealized appreciation/(depreciation) on forward foreign currency contracts subject to currency risk, as disclosed in the Statements of Operations, is as follows:
| | | Realized Gain/(Loss) | | Change in Unrealized
Appreciation/(Depreciation) | |
Global Atlantic Franklin Dividend and Income Managed Risk Portfolio | | $ | 153,856 | | | $ | 12,609 | | |
Options Transactions – Certain Portfolios are subject to equity price risk, interest rate risk and foreign currency risk in the normal course of pursuing their investment objectives and may purchase or sell options to help hedge against this risk.
A Portfolio may purchase and write (i.e., sell) put and call options. Such options may relate to particular securities or securities indices, including ETFs, and may or may not be listed on a domestic or foreign securities exchange and may or may not be issued by the Options Clearing Corporation. Options trading is a highly specialized activity that entails greater than ordinary investment risk. Options may be more volatile than the underlying instruments, and therefore, on a percentage basis, an investment in options may be subject to greater fluctuation than an investment in the underlying instruments themselves. A call option for a particular security gives the purchaser of the option, in return for a premium, the right, but not the obligation, to buy, and the writer (seller) the obligation to sell, the underlying security at the stated exercise price at any time prior to the expiration of the option for American options or only at expiration for European options, regardless of the market price of the security. The premium paid to the writer is in consideration for undertaking the obligation under the option contract. A put option for a particular security gives the purchaser the right, but not the obligation, to sell the security at the stated exercise price at any time prior to the expiration date of the option for American options or only at expiration for European options, regardless of the market price of the security.
Securities index options are put options and call options on various securities indices. In most respects, they are identical to listed options on common stocks. The primary difference between stock options and index options occurs when index options are exercised. In the case of stock options, the underlying security, common stock, is delivered. However, upon the exercise of an index option, settlement does not occur by delivery of the securities comprising the index. The option holder
75
Global Atlantic Portfolios
Notes to Financial Statements (Continued)
December 31, 2022
who exercises the index option receives an amount of cash if the closing level of the securities index upon which the option is based is greater than, in the case of a call, or less than, in the case of a put, the exercise price of the option. This amount of cash is equal to the difference between the closing price of the securities index and the exercise price of the option expressed in dollars times a specified multiple. A securities index fluctuates with changes in the market value of the securities included in the index.
The Portfolios may purchase and sell options on the same types of futures in which it may invest. Options on futures are similar to options on underlying instruments except that options on futures give the purchaser the right, but not the obligation, to buy in return for the premium paid, to assume a position in a futures contract (a long position if the option is a call and a short position if the option is a put), rather than to purchase or sell the futures contract, at a specified exercise price at any time during the period of the option. Upon exercise of the option, the delivery of the futures position by the writer of the option to the holder of the option will be accompanied by the delivery of the accumulated balance in the writer's futures margin account which represents the amount by which the market price of the futures contract, at exercise, exceeds (in the case of a call) or is less than (in the case of a put) the exercise price of the option on the futures contract. Purchasers of options who fail to exercise their options prior to the exercise date suffer a loss of the premium paid.
For the year ended December 31, 2022, realized gain/(loss) and the change in unrealized appreciation/(depreciation) on purchased options transactions by risk type, as disclosed within net realized gain/(loss) and net change in unrealized appreciation/(depreciation) on investments in the Statements of Operations, is as follows:
| | Risk Type | | Realized Gain/(Loss) | | Change in Unrealized
Appreciation/(Depreciation) | |
Global Atlantic Franklin Dividend and Income
Managed Risk Portfolio | | Currency | | $ | (3,310 | ) | | $ | 2,690 | | |
Futures Contracts – The Portfolios are subject to equity price risk in the normal course of pursuing their investment objectives. The Portfolios may sell futures contracts to hedge against market risk, foreign currency exchange rate risks, and to reduce return volatility. Futures are standardized, exchange-traded contracts that provide for the future sale by one party and purchase by another party of a specified amount of a specific financial instrument (e.g., units of a securities index) for a specified price, date, time and place designated at the time the contract is made. Brokerage fees are incurred when a futures contract is bought or sold and initial and variation margin deposits must be maintained. Entering into a contract to buy is commonly referred to as buying or purchasing a contract or holding a long position. Entering into a contract to sell is commonly referred to as selling a contract or holding a short position. The Portfolios may also buy or sell hedge instruments based on one or more market indices in an attempt to maintain the Portfolios' volatility at a targeted level. Initial margin deposits required upon entering into futures contracts are satisfied by the segregation of specific securities or cash as collateral for the account of the broker (the Portfolio's agent in acquiring the futures position). During the period the futures contracts are open, changes in the value of the contracts are recognized as unrealized gains or losses by "marking to market" on a daily basis to reflect the market value of the contracts at the end of each day's trading. Variation margin payments are received or made depending upon whether unrealized gains or losses are incurred. When the contracts are closed, a Portfolio recognizes a realized gain or loss equal to the difference between the proceeds from, or cost of, the closing transaction and the Portfolio's basis in the contract. If a Portfolio were unable to liquidate a futures contract and/or enter into an offsetting closing transaction, the Portfolio would continue to be subject to market risk with respect to the value of the contracts and continue to be required to maintain the margin deposits on the futures contracts. These amounts are disclosed on the Statements of Assets and Liabilities as Deposits with Brokers when applicable. Risks may exceed amounts recognized in the Statements of Assets and Liabilities. With futures, there is minimal counterparty credit risk to a Portfolio since futures are exchange traded and the exchange's clearinghouse, as counterparty to all exchange traded futures, guarantees the futures against default.
For the year ended December 31, 2022, realized gains/(losses) and the change in unrealized appreciation/(depreciation) on futures contracts by risk type, as disclosed in the Statements of Operations, is as follows:
| | | Risk Type | | Realized Gain/(Loss) | | Change in Unrealized
Appreciation/(Depreciation) | |
Global Atlantic American Funds® Managed Risk Portfolio | | Equity | | $ | (2,483,971 | ) | | $ | 857,565 | | |
Global Atlantic Balanced Managed Risk Portfolio | | Equity | | | (295,171 | ) | | | 489,218 | | |
Global Atlantic BlackRock Selects Managed Risk Portfolio | | Equity | | | (3,144,664 | ) | | | 807,708 | | |
76
Global Atlantic Portfolios
Notes to Financial Statements (Continued)
December 31, 2022
| | | Risk Type | | Realized Gain/(Loss) | | Change in Unrealized
Appreciation/(Depreciation) | |
Global Atlantic Franklin Dividend and Income Managed Risk Portfolio | | Equity | | $ | (3,298,680 | ) | | $ | 737,062 | | |
Global Atlantic Franklin Dividend and Income Managed Risk Portfolio | | Interest Rate | | | (623,332 | ) | | | (28,216 | ) | |
Global Atlantic Growth Managed Risk Portfolio | | Equity | | | 981,456 | | | | 3,292,587 | | |
Global Atlantic Moderate Growth Managed Risk Portfolio | | Equity | | | (489,126 | ) | | | 673,240 | | |
Global Atlantic Select Advisor Managed Risk Portfolio | | Equity | | | (1,248,786 | ) | | | 472,068 | | |
Global Atlantic Wellington Research Managed Risk Portfolio | | Equity | | | (4,026,356 | ) | | | 2,355,698 | | |
Global Atlantic Wellington Research Managed Risk Portfolio | | Interest Rate | | | (577,923 | ) | | | 17,632 | | |
Swap Agreements – Certain Portfolios are subject to equity price risk and/or interest rate risk in the normal course of pursuing their investment objectives. These Portfolios may enter into various swap transactions for investment purposes or to manage interest rate, equity, foreign exchange (currency), or credit risk. These are two-party contracts entered into primarily to exchange the returns (or differentials in rates of returns) earned or realized on particular pre-determined investments or instruments. In a standard over-the-counter ("OTC") swap, two parties agree to exchange the returns, differentials in rates of return or some other amount earned or realized on the "notional amount" (i.e., the return or increase in value of a particular dollar amount invested in a "basket" of securities, representing a particular index or industry sectors) of predetermined investments or instruments.
Certain Portfolios may enter into credit default swaps ("CDS"). CDS are two-party contracts that transfer credit exposure between the parties. One party (the "buyer") receives credit protection and the other party (the "seller") takes on credit risk. The buyer typically makes predetermined periodic payments to the seller in exchange for the seller's commitment to purchase the underlying reference obligation if a defined credit event occurs, such as a default, bankruptcy or failure to pay interest or principal on a reference debt instrument, with respect to a specified issuer or one of the reference issuers in a CDS portfolio. If the defined credit event occurs, the seller must pay the agreed-upon value of a reference obligation to the counterparty or perform pursuant to the agreement. The buyer must then surrender the reference obligation to the seller. As a seller of credit protection in a CDS, a Portfolio would be liable for the notional amount of the swap.
The swaps in which a Portfolio may invest may be centrally-cleared or bi-laterally traded. The gross returns to be exchanged or "swapped" between the parties are calculated with respect to a notional amount. Changes in the value of swap agreements are recognized as unrealized gains or losses in the Statements of Operations by "marking to market" on a daily basis to reflect the value of the swap agreement at the end of each trading day. Payments received or paid at the beginning of a swap agreement are reflected as such on the Statements of Assets and Liabilities and may be referred to as upfront payments. A Portfolio amortizes upfront payments and/or accrues for the fixed payment stream on swap agreements on a daily basis with the net amount recorded as a component of unrealized gain or loss on the Statements of Operations. Realized gains and losses from the decrease in notional value of the swap are recognized on trade date. A liquidation payment received or made at the termination of the swap agreement is recorded as a realized gain or loss on the Statements of Operations. Swap agreements involve, to varying degrees, lack of liquidity and elements of credit, market and counterparty risk in excess of amounts recognized on the Statements of Assets and Liabilities. Each Portfolio's maximum risk of loss from the counterparty credit risk is the discounted net value of the cash flow to be received from the counterparty over the contract's remaining life, to be the extent that amount is positive.
Swaps may involve greater risks than direct investments in securities because swaps may be leveraged and, when traded in the OTC markets, are subject to counterparty risk, credit risk and pricing risk, each of which individually and collectively, may have a considerable impact on the performance of a Portfolio. CDS in particular may involve greater risks than investing in a referenced instrument directly. Swaps, especially those that are not exchange-traded, may also be considered illiquid. It may not be possible for a Portfolio to liquidate a swap position at an advantageous time or price, which may result in significant losses. Although central clearing and exchange-trading of swaps may decrease counterparty risk and increase market liquidity, exchange-trading and clearing does not make the contracts risk free, but rather, the primary credit risk on such contracts is the creditworthiness of the clearing broker or the clearinghouse.
The Portfolios use cash and certain securities as collateral to swap agreements as indicated on the Portfolio of Investments and Statements of Assets and Liabilities. Such collateral is held for the benefit of the counterparty in a segregated account to prevent non-payment by the Portfolios. If the counterparty defaults, a Portfolio may seek return of this collateral and incur certain costs exercising their rights to the collateral.
77
Global Atlantic Portfolios
Notes to Financial Statements (Continued)
December 31, 2022
For the year ended December 31, 2022, realized gains/(losses) and the change in unrealized appreciation/(depreciation) on swap agreements by risk type, as disclosed in the Statements of Operations, is as follows:
| | | Risk Type | | Realized Gain/(Loss) | | Change in Unrealized
Appreciation/(Depreciation) | |
Global Atlantic Franklin Dividend and Income Managed Risk Portfolio | | Interest Rate | | $ | 32,232 | | | $ | 41,497 | | |
| | | Credit | | | (7,437 | ) | | | (114,167 | ) | |
Global Atlantic Wellington Research Managed Risk Portfolio | | Credit | | | 2,243 | | | | - | | |
For the year ended December 31, 2022, realized gains/(losses) and the change in unrealized appreciation/(depreciation) on swaptions, as disclosed in the Statements of Operations, is as follows:
| | | Risk Type | | Realized Gain/(Loss) | | Change in Unrealized
Appreciation/(Depreciation) | |
Global Atlantic Franklin Dividend and Income Managed Risk Portfolio | | Interest Rate | | $ | 15,625 | | | $ | (4,879 | ) | |
Offsetting of Financial Assets/Liabilities and Derivative Assets/Liabilities – The following tables present certain of the Portfolios' asset/liability derivatives available for offset under a master netting arrangement net of collateral pledged as of December 31, 2022.
Global Atlantic American Funds® Managed Risk Portfolio
Counterparty | | Gross
Amounts of
Recognized
Assets (1) | | Financial
Instruments
and
Derivatives
Available for
Offset | | Net Amount
of Assets
Presented
in the
Statements of
Assets &
Liabilities | | Collateral
Received (2) | | Net
Amount of
Recognized
Assets | | Gross
Amounts of
Recognized
Liabilities (1) | | Financial
Instruments
and
Derivatives
Available for
Offset | | Net
Amount of
Liabilities
Presented
in the
Statements
of Assets &
Liabilities | | Collateral
Pledged (2) | | Net
Amount of
Recognized
Liabilities | |
Goldman Sachs &
Co. | | $ | 857,565 | | | $ | - | | | $ | 857,565 | | | $ | - | | | $ | 857,565 | | | $ | - | | | $ | - | | | $ | - | | | $ | - | | | $ | - | | |
| | | $ | 857,565 | | | $ | - | | | $ | 857,565 | | | $ | - | | | $ | 857,565 | | | $ | - | | | $ | - | | | $ | - | | | $ | - | | | $ | - | | |
Global Atlantic Balanced Managed Risk Portfolio
Counterparty | | Gross
Amounts of
Recognized
Assets (1) | | Financial
Instruments
and
Derivatives
Available for
Offset | | Net Amount
of Assets
Presented
in the
Statements of
Assets &
Liabilities | | Collateral
Received (2) | | Net
Amount of
Recognized
Assets | | Gross
Amounts of
Recognized
Liabilities (1) | | Financial
Instruments
and
Derivatives
Available for
Offset | | Net
Amount of
Liabilities
Presented
in the
Statements
of Assets &
Liabilities | | Collateral
Pledged (2) | | Net
Amount of
Recognized
Liabilities | |
Goldman Sachs &
Co. | | $ | 489,218 | | | $ | - | | | $ | 489,218 | | | $ | - | | | $ | 489,218 | | | $ | - | | | $ | - | | | $ | - | | | $ | - | | | $ | - | | |
| | | $ | 489,218 | | | $ | - | | | $ | 489,218 | | | $ | - | | | $ | 489,218 | | | $ | - | | | $ | - | | | $ | - | | | $ | - | | | $ | - | | |
78
Global Atlantic Portfolios
Notes to Financial Statements (Continued)
December 31, 2022
Global Atlantic BlackRock Selects Managed Risk Portfolio
Counterparty | | Gross
Amounts of
Recognized
Assets (1) | | Financial
Instruments
and
Derivatives
Available for
Offset | | Net Amount
of Assets
Presented
in the
Statements of
Assets &
Liabilities | | Collateral
Received (2) | | Net
Amount of
Recognized
Assets | | Gross
Amounts of
Recognized
Liabilities (1) | | Financial
Instruments
and
Derivatives
Available for
Offset | | Net
Amount of
Liabilities
Presented
in the
Statements
of Assets &
Liabilities | | Collateral
Pledged (2) | | Net
Amount of
Recognized
Liabilities | |
Goldman Sachs &
Co. | | $ | 807,708 | | | $ | - | | | $ | 807,708 | | | $ | - | | | $ | 807,708 | | | $ | - | | | $ | - | | | $ | - | | | $ | - | | | $ | - | | |
| | | $ | 807,708 | | | $ | - | | | $ | 807,708 | | | $ | - | | | $ | 807,708 | | | $ | - | | | $ | - | | | $ | - | | | $ | - | | | $ | - | | |
Global Atlantic Franklin Dividend and Income Managed Risk Portfolio
Counterparty | | Gross
Amounts of
Recognized
Assets (1) | | Financial
Instruments
and
Derivatives
Available for
Offset | | Net Amount
of Assets
Presented
in the
Statements of
Assets &
Liabilities | | Collateral
Received (2) | | Net
Amount of
Recognized
Assets | | Gross
Amounts of
Recognized
Liabilities (1) | | Financial
Instruments
and
Derivatives
Available for
Offset | | Net
Amount of
Liabilities
Presented
in the
Statements
of Assets &
Liabilities | | Collateral
Pledged (2) | | Net
Amount of
Recognized
Liabilities | |
Citibank NA | | $ | 44,662 | | | $ | (44,662 | ) | | $ | - | | | $ | - | | | $ | - | | | $ | 111,862 | | | $ | (44,662 | ) | | $ | 67,200 | | | $ | (67,200 | ) | | $ | - | | |
Goldman Sachs &
Co. | | | 737,062 | | | | - | | | | 737,062 | | | | - | | | | 737,062 | | | | | | - | | | | - | | | | - | | | | - | | |
JP Morgan | | | - | | | | - | | | | - | | | | - | | | | - | | | | 7,987 | | | | - | | | | 7,987 | | | | (7,987 | ) | | | - | | |
JP Morgan Chase
Bank | | | - | | | | - | | | | - | | | | - | | | | - | | | | 18,869 | | | | - | | | | 18,869 | | | | (18,869 | ) | | | - | | |
JP Morgan
Securities LLC | | | 20,311 | | | | (2,967 | ) | | | 17,344 | | | | - | | | | 17,344 | | | | 2,967 | | | | (2,967 | ) | | | - | | | | - | | | | - | | |
Total | | $ | 802,035 | | | $ | (47,629 | ) | | $ | 754,406 | | | $ | - | | | $ | 754,406 | | | $ | 141,685 | | | $ | (47,629 | ) | | $ | 94,056 | | | $ | (94,056 | ) | | $ | - | | |
Global Atlantic Growth Managed Risk Portfolio
Counterparty | | Gross
Amounts of
Recognized
Assets (1) | | Financial
Instruments
and
Derivatives
Available for
Offset | | Net Amount
of Assets
Presented
in the
Statements of
Assets &
Liabilities | | Collateral
Received (2) | | Net
Amount of
Recognized
Assets | | Gross
Amounts of
Recognized
Liabilities (1) | | Financial
Instruments
and
Derivatives
Available for
Offset | | Net
Amount of
Liabilities
Presented
in the
Statements
of Assets &
Liabilities | | Collateral
Pledged (2) | | Net
Amount of
Recognized
Liabilities | |
Goldman Sachs &
Co. | | $ | 2,289,105 | | | $ | - | | | $ | 2,289,105 | | | $ | - | | | $ | 2,289,105 | | | $ | | | | $ | - | | | $ | - | | | $ | - | | | $ | - | | |
| | | $ | 2,289,105 | | | $ | - | | | $ | 2,289,105 | | | $ | - | | | $ | 2,289,105 | | | $ | - | | | $ | - | | | $ | - | | | $ | - | | | $ | - | | |
Global Atlantic Moderate Growth Managed Risk Portfolio
Counterparty | | Gross
Amounts of
Recognized
Assets (1) | | Financial
Instruments
and
Derivatives
Available for
Offset | | Net Amount
of Assets
Presented
in the
Statements of
Assets &
Liabilities | | Collateral
Received (2) | | Net
Amount of
Recognized
Assets | | Gross
Amounts of
Recognized
Liabilities (1) | | Financial
Instruments
and
Derivatives
Available for
Offset | | Net
Amount of
Liabilities
Presented
in the
Statements
of Assets &
Liabilities | | Collateral
Pledged (2) | | Net
Amount of
Recognized
Liabilities | |
Goldman Sachs &
Co. | | $ | 557,140 | | | $ | - | | | $ | 557,140 | | | $ | - | | | $ | 557,140 | | | $ | | | | $ | - | | | $ | - | | | $ | - | | | $ | - | | |
| | | $ | 557,140 | | | $ | - | | | $ | 557,140 | | | $ | - | | | $ | 557,140 | | | $ | - | | | $ | - | | | $ | - | | | $ | - | | | $ | - | | |
79
Global Atlantic Portfolios
Notes to Financial Statements (Continued)
December 31, 2022
Global Atlantic Select Advisor Managed Risk Portfolio
Counterparty | | Gross
Amounts of
Recognized
Assets (1) | | Financial
Instruments
and
Derivatives
Available for
Offset | | Net Amount
of Assets
Presented
in the
Statements of
Assets &
Liabilities | | Collateral
Received (2) | | Net
Amount of
Recognized
Assets | | Gross
Amounts of
Recognized
Liabilities (1) | | Financial
Instruments
and
Derivatives
Available for
Offset | | Net
Amount of
Liabilities
Presented
in the
Statements
of Assets &
Liabilities | | Collateral
Pledged (2) | | Net
Amount of
Recognized
Liabilities | |
Goldman Sachs &
Co. | | $ | 472,068 | | | $ | - | | | $ | 472,068 | | | $ | - | | | $ | 472,068 | | | $ | - | | | $ | - | | | $ | - | | | $ | - | | | $ | - | | |
Total | | $ | 472,068 | | | $ | - | | | $ | 472,068 | | | $ | - | | | $ | 472,068 | | | $ | - | | | $ | - | | | $ | - | | | $ | - | | | $ | - | | |
Global Atlantic Wellington Research Managed Risk Portfolio
Counterparty | | Gross
Amounts of
Recognized
Assets (1) | | Financial
Instruments
and
Derivatives
Available for
Offset | | Net Amount
of Assets
Presented
in the
Statements of
Assets &
Liabilities | | Collateral
Received (2) | | Net
Amount of
Recognized
Assets | | Gross
Amounts of
Recognized
Liabilities (1) | | Financial
Instruments
and
Derivatives
Available for
Offset | | Net
Amount of
Liabilities
Presented
in the
Statements
of Assets &
Liabilities | | Collateral
Pledged (2) | | Net
Amount of
Recognized
Liabilities | |
Goldman Sachs &
Co. | | $ | 2,355,698 | | | $ | - | | | $ | 2,355,698 | | | $ | - | | | $ | 2,355,698 | | | $ | - | | | $ | - | | | $ | - | | | $ | - | | | $ | - | | |
JP Morgan
Chase Bank | | | 4,101 | | | | (4,101 | ) | | | - | | | | - | | | | - | | | | 4,281 | | | | (4,101 | ) | | | 180 | | | | (180 | ) | | | - | | |
Total | | $ | 2,359,799 | | | $ | (4,101 | ) | | $ | 2,355,698 | | | $ | - | | | $ | 2,355,698 | | | $ | 4,281 | | | $ | (4,101 | ) | | $ | 180 | | | $ | (180 | ) | | $ | - | | |
(1) Gross unrealized appreciation/(depreciation) as presented in the Portfolio of Investments.
(2) The amount is limited to the net derivative balance and, accordingly, may not include collateral or excess collateral received or pledged.
Impact of Derivatives on the Statements of Assets and Liabilities – The following table presents a summary of the location of derivative investments categorized by primary risk exposure on the Portfolios' Statements of Assets and Liabilities as of December 31, 2022:
Global Atlantic American Funds® Managed Risk Portfolio
| | | Equity | | Interest Rate
Contracts | | Credit
Contracts | | Currency
Contracts | | Total | |
Assets | |
Unrealized appreciation on Futures
Contracts | | $ | 857,565 | | | $ | - | | | $ | - | | | $ | - | | | $ | 857,565 | | |
Total | | $ | 857,565 | | | $ | - | | | $ | - | | | $ | - | | | $ | 857,565 | | |
Global Atlantic Balanced Managed Risk Portfolio
| | | Equity | | Interest Rate
Contracts | | Credit
Contracts | | Currency
Contracts | | Total | |
Assets | |
Unrealized appreciation on Futures
Contracts | | $ | 489,218 | | | $ | - | | | $ | - | | | $ | - | | | $ | 489,218 | | |
Total | | $ | 489,218 | | | $ | - | | | $ | - | | | $ | - | | | $ | 489,218 | | |
80
Global Atlantic Portfolios
Notes to Financial Statements (Continued)
December 31, 2022
Global Atlantic BlackRock Selects Managed Risk Portfolio
| | | Equity | | Interest Rate
Contracts | | Credit
Contracts | | Currency
Contracts | | Total | |
Assets | |
Unrealized appreciation on Futures
Contracts | | $ | 807,708 | | | $ | - | | | $ | - | | | $ | - | | | $ | 807,708 | | |
Total | | $ | 807,708 | | | $ | - | | | $ | - | | | $ | - | | | $ | 807,708 | | |
Global Atlantic Franklin Dividend and Income Managed Risk Portfolio
| | | Equity | | Interest Rate
Contracts | | Credit
Contracts | | Currency
Contracts | | Total | |
Assets | |
Unrealized appreciation on Futures
Contracts | | $ | 737,062 | | | $ | 17,852 | | | $ | - | | | $ | - | | | $ | 754,914 | | |
Unrealized appreciation on Swap
Contracts | | | - | | | | 41,497 | | | | - | | | | - | | | | 41,497 | | |
Liabilities | |
Unrealized depreciation on Futures
Contracts | | | - | | | | (508 | ) | | | - | | | | - | | | | (508 | ) | |
Unrealized depreciation on Swap
Contracts | | | - | | | | - | | | | (116,684 | ) | | | - | | | | (116,684 | ) | |
Unrealized depreciation on
Forward Foreign Exchange
Contracts | | | - | | | | - | | | | - | | | | (18,869 | ) | | | (18,869 | ) | |
Total | | $ | 737,062 | | | $ | 58,841 | | | $ | (116,684 | ) | | $ | (18,869 | ) | | $ | 660,350 | | |
Global Atlantic Growth Managed Risk Portfolio
| | | Equity | | Interest Rate
Contracts | | Credit
Contracts | | Currency
Contracts | | Total | |
Assets | |
Unrealized appreciation on Futures
Contracts | | $ | 2,289,105 | | | $ | - | | | $ | - | | | $ | - | | | $ | 2,289,105 | | |
Total | | $ | 2,289,105 | | | $ | - | | | $ | - | | | $ | - | | | $ | 2,289,105 | | |
Global Atlantic Moderate Growth Managed Risk Portfolio
| | | Equity | | Interest Rate
Contracts | | Credit
Contracts | | Currency
Contracts | | Total | |
Assets | |
Unrealized appreciation on Futures
Contracts | | $ | 557,140 | | | $ | - | | | $ | - | | | $ | - | | | $ | 557,140 | | |
Total | | $ | 557,140 | | | $ | - | | | $ | - | | | $ | - | | | $ | 557,140 | | |
Global Atlantic Select Advisor Managed Risk Portfolio
| | | Equity | | Interest Rate
Contracts | | Credit
Contracts | | Currency
Contracts | | Total | |
Assets | |
Unrealized appreciation on Futures
Contracts | | $ | 472,068 | | | $ | - | | | $ | - | | | $ | - | | | $ | 472,068 | | |
Total | | $ | 472,068 | | | $ | - | | | $ | - | | | $ | - | | | $ | 472,068 | | |
81
Global Atlantic Portfolios
Notes to Financial Statements (Continued)
December 31, 2022
Global Atlantic Wellington Research Managed Risk Portfolio
| | | Equity | | Interest Rate
Contracts | | Credit
Contracts | | Currency
Contracts | | Total | |
Assets | |
Unrealized appreciation on Futures
Contracts | | $ | 2,355,698 | | | $ | - | | | $ | - | | | $ | - | | | $ | 2,355,698 | | |
Liabilities | |
Unrealized depreciation on Futures
Contracts | | | - | | | | (180 | ) | | | - | | | | - | | | | (180 | ) | |
Total | | $ | 2,355,698 | | | $ | (180 | ) | | $ | - | | | $ | - | | | $ | 2,355,518 | | |
The notional value of the derivative instruments outstanding as of December 31, 2022, as disclosed in the Portfolios of Investments, and the amounts of realized and changes in unrealized gains and losses on derivative instruments during the year as disclosed above and within in the Statements of Operations serve as indicators of the volume of derivative activity for the Portfolios.
Short Sales – A Portfolio may make short sales of securities: (i) to offset potential declines in long positions in similar securities; (ii) to increase the flexibility of the Portfolio; (iii) for investment return; (iv) as part of a risk arbitrage strategy; and (v) as part of its overall portfolio management strategies involving the use of derivative instruments. A short sale is a transaction in which a Portfolio sells a security it does not own or have the right to acquire (or that it owns but does not wish to deliver) in anticipation that the market price of that security will decline.
When a Portfolio makes a short sale, the broker-dealer through which the short sale is made must borrow the security sold short and deliver it to the party purchasing the security. The Portfolio is required to make a margin deposit in connection with such short sales; the Portfolio may have to pay a fee to borrow particular securities and will often be obligated to pay over any dividends and accrued interest on borrowed securities.
If the price of the security sold short increases between the time of the short sale and the time a Portfolio covers its short position, the Portfolio will incur a loss; conversely, if the price declines, the Portfolio will realize a capital gain. Any gain will be decreased, and any loss increased, by the transaction costs described above. The successful use of short selling may be adversely affected by imperfect correlation between movements in the price of the security sold short and the securities being hedged.
As of December 31, 2022, the Portfolios did not hold any short sales of securities.
When-Issued and Delayed-Delivery Transactions – The Portfolios may engage in when-issued or delayed-delivery transactions. The Portfolios record when-issued securities on the trade date. Securities purchased on a when-issued or delayed-delivery basis are marked to market daily and begin earning interest on the settlement date. Losses may occur on these transactions due to changes in market conditions or the failure of counterparties to perform under the contract.
Real Estate Investment Trusts – Certain Portfolios may invest in real estate investment trusts ("REITs"). REITs are pooled investment vehicles that own, and typically operate, income-producing real estate. If a REIT meets certain requirements, including distributing to shareholders substantially all of its taxable income (other than net capital gains), then it is not taxed on the income distributed to shareholders. REITs are subject to management fees and other expenses, and so a Portfolio that invests in REITs will bear its proportionate share of the costs of the REITs' operations. Along with the risks common to different types of real estate-related securities, such as loss to casualty or condemnation, increases in property taxes and operating expenses, zoning law amendments, changes in interest rates, overbuilding and increased competition, variations in market value, and possible environmental liabilities, REITs involve additional risk factors. These include poor performance by the REIT's manager, changes to the tax laws, and failure by the REIT to qualify for tax free distribution of income or exemption under the 1940 Act. In addition, REITs are not diversified and are heavily dependent on cash flow.
82
Global Atlantic Portfolios
Notes to Financial Statements (Continued)
December 31, 2022
Distributions from a Portfolio's investments in REITs may be characterized as ordinary income, a net capital gain or a return of capital. The Portfolios record distributions that represent a net capital gain as a realized gain and distributions that represent a return of capital as a reduction of the cost of investment. REITs report information on the source of their distributions annually in the following calendar year. As a result, a Portfolio may estimate the source of REIT distributions for accounting purposes and then makes adjustments when the actual source information is reported by the REIT. These estimates are based on the most recent REIT distribution information available.
Mortgage Dollar Roll Transactions – A mortgage dollar roll transaction involves a sale by a Portfolio of mortgage related securities that it holds with an agreement by the Portfolio to repurchase similar securities at an agreed upon price and date. The securities purchased will bear the same interest rate as those sold, but generally will be collateralized by pools of mortgages with different prepayment histories than those securities sold. The Portfolios account for mortgage dollar rolls as purchases and sales transactions.
Expenses – Expenses of the Trust that are directly identifiable to a specific Portfolio are charged to that Portfolio. Expenses, which are not readily identifiable to a specific Portfolio, are allocated in such a manner as deemed equitable, taking into consideration the nature and type of expense and the relative sizes of the Portfolios in the Trust.
Indemnification – The Trust indemnifies its officers and Trustees for certain liabilities that may arise from the performance of their duties to the Trust. Additionally, in the normal course of business, the Portfolios enter into contracts that contain a variety of representations and warranties and which provide general indemnities. Each Portfolio's maximum exposure under these arrangements is unknown, as this would involve future claims that may be made against the Portfolios that have not yet occurred. However, the Portfolios expect the risk of loss due to these warranties and indemnities to be remote.
3. INVESTMENT TRANSACTIONS
For the year ended December 31, 2022, cost of purchases and proceeds from sales of portfolio securities, other than short- term investments, were as follows:
| | | Purchases | | Sales | |
Global Atlantic American Funds® Managed Risk Portfolio | | $ | 76,091,535 | | | $ | 80,867,318 | | |
Global Atlantic Balanced Managed Risk Portfolio | | | 50,592,640 | | | | 62,005,492 | | |
Global Atlantic BlackRock Selects Managed Risk Portfolio | | | 150,005,334 | | | | 169,715,099 | | |
Global Atlantic Franklin Dividend and Income Managed Risk Portfolio | | | 132,826,295 | | | | 171,580,993 | | |
Global Atlantic Growth Managed Risk Portfolio | | | 144,243,162 | | | | 187,287,350 | | |
Global Atlantic Moderate Growth Managed Risk Portfolio | | | 53,578,585 | | | | 70,396,089 | | |
Global Atlantic Select Advisor Managed Risk Portfolio | | | 27,637,738 | | | | 33,609,232 | | |
Global Atlantic Wellington Research Managed Risk Portfolio | | | 630,227,718 | | | | 682,629,949 | | |
During the year ended December 31, 2022, the Global Atlantic Franklin Dividend and Income Managed Risk Portfolio and the Global Atlantic Wellington Research Managed Risk Portfolio sold securities to Funds that are affiliated with each of the Fund's Investment Sub-Adviser, Franklin Advisers, Inc. and Wellington Management Company LLP, respectively. The Global Atlantic Wellington Research Managed Risk Portfolio also purchased securities from a Fund that is affiliated with the Fund's Investment Sub-Adviser. These transactions complied with Rule 17a-7 under the 1940 Act. The transactions were as follows:
Selling Fund | | Net Proceeds | | Net Realized Loss | |
Global Atlantic Franklin Dividend and Income Portfolio | | $ | 1,497,047 | | | $ | (56,933 | ) | |
Global Atlantic Wellington Research Managed Risk Portfolio | | $ | 28,474 | | | $ | (16,733 | ) | |
Purchasing Fund | | Net Cost | |
Global Atlantic Wellington Research Managed Risk Portfolio | | $ | 114,794 | | |
83
Global Atlantic Portfolios
Notes to Financial Statements (Continued)
December 31, 2022
4. AGREEMENTS AND TRANSACTIONS WITH RELATED PARTIES
The Adviser serves as the Portfolios' investment adviser. The Adviser has engaged the following sub-advisers for the Portfolios:
Portfolio | | Sub-Adviser | |
Global Atlantic American Funds® Managed Risk Portfolio | | Wilshire Advisors, LLC
Milliman Financial Risk Management, LLC | |
Global Atlantic Balanced Managed Risk Portfolio | | BlackRock Investment Management, LLC
Milliman Financial Risk Management, LLC | |
Global Atlantic BlackRock Selects Managed Risk Portfolio | | BlackRock Investment Management, LLC
Milliman Financial Risk Management, LLC | |
Global Atlantic Franklin Dividend and Income Managed Risk Portfolio | | Franklin Advisers, Inc.
Milliman Financial Risk Management, LLC | |
Global Atlantic Growth Managed Risk Portfolio | | BlackRock Investment Management, LLC
Milliman Financial Risk Management, LLC | |
Global Atlantic Moderate Growth Managed Risk Portfolio | | BlackRock Investment Management, LLC
Milliman Financial Risk Management, LLC | |
Global Atlantic Select Advisor Managed Risk Portfolio | | Wilshire Advisors, LLC
Milliman Financial Risk Management, LLC | |
Global Atlantic Wellington Research Managed Risk Portfolio | | Wellington Management Company LLP
Milliman Financial Risk Management, LLC | |
The Bank of New York Mellon serves as the Administrator, Fund Accountant and Custodian for the Portfolios and BNY Mellon Investment Servicing (US) Inc. (together with The Bank of New York Mellon, "BNYM") serves as the Transfer Agent for the Portfolios.
Pursuant to an investment advisory agreement between the Trust, on behalf of the Portfolios and the Adviser (the "Advisory Agreement"), the Adviser, under the oversight of the Board, directs the daily investment operations of the Portfolios and supervises the performance of administrative and professional services provided by others. As compensation for its services and the related expenses borne by the Adviser, the Portfolios pay the Adviser an advisory fee, computed on average daily net assets and accrued daily and paid monthly.
The following chart details the annual advisory fee for each Portfolio for the year ended December 31, 2022.
Portfolio | | Advisory Fee* | |
Global Atlantic American Funds® Managed Risk Portfolio | | 0.900% on first $500 million | |
| | | 0.875% on next $500 million | |
| | | 0.850% over $1 billion | |
Global Atlantic Balanced Managed Risk Portfolio | | 0.550% on first $500 million | |
| | | 0.525% on next $500 million | |
| | | 0.500% over $1 billion | |
Global Atlantic BlackRock Selects Managed Risk Portfolio | | 0.550% on first $500 million | |
| | | 0.525% on next $500 million | |
| | | 0.500% over $1 billion | |
Global Atlantic Franklin Dividend and Income Managed Risk Portfolio | | 0.850% on first $500 million | |
| | | 0.825% on next $500 million | |
| | | 0.800% over $1 billion | |
Global Atlantic Growth Managed Risk Portfolio | | 0.550% on first $500 million | |
| | | 0.525% on next $500 million | |
| | | 0.500% over $1 billion | |
84
Global Atlantic Portfolios
Notes to Financial Statements (Continued)
December 31, 2022
Portfolio | | Advisory Fee* | |
Global Atlantic Moderate Growth Managed Risk Portfolio | | 0.550% on first $500 million | |
| | | 0.525% on next $500 million | |
| | | 0.500% over $1 billion | |
Global Atlantic Select Advisor Managed Risk Portfolio | | 0.900% on first $500 million | |
| | | 0.875% on next $500 million | |
| | | 0.850% over $1 billion | |
Global Atlantic Wellington Research Managed Risk Portfolio | | 0.850% on first $500 million | |
| | | 0.825% on next $500 million | |
| | | 0.800% over $1 billion | |
* Calculated daily based on the average daily net assets.
During the year ended December 31, 2022, with respect to each Portfolio, the Adviser contractually agreed to waive its fees and to reimburse expenses, at least until the expiration dates listed below, to ensure that total annual portfolio operating expenses after fee waiver and/or reimbursement (exclusive of any front-end or contingent deferred loads, brokerage fees and commissions, acquired fund fees and expenses, borrowing costs (such as interest and dividend expense on securities sold short), taxes and extraordinary expenses, such as litigation) will not exceed the average daily net asset percentages attributable to the Portfolio's shares listed below ("Waiver Agreements"). The expense reimbursement is subject to possible recoupment from the Portfolio in future years on a rolling three year basis (within the three years after the fees have been waived or reimbursed) if such recoupment can be achieved within the lesser of the expense limits listed below and any expense limits applicable at the time of recoupment. The agreements may be terminated only by the Portfolio's Board of Trustees, on 60 days' written notice to the Adviser.
Portfolio | | Operating Expense Limitation | | Expiration Date | |
Global Atlantic American Funds® Managed Risk Portfolio | | | 0.87 | % | | May 1, 2023 | |
Global Atlantic Balanced Managed Risk Portfolio | | | 0.92 | % | | May 1, 2023 | |
Global Atlantic BlackRock Selects Managed Risk Portfolio | | | 0.94 | % | | May 1, 2023 | |
Global Atlantic Franklin Dividend and Income Managed Risk Portfolio | | | 1.19 | % | | May 1, 2023 | |
Global Atlantic Growth Managed Risk Portfolio | | | 0.88 | % | | May 1, 2023 | |
Global Atlantic Moderate Growth Managed Risk Portfolio | | | 0.92 | % | | May 1, 2023 | |
Global Atlantic Select Advisor Managed Risk Portfolio | | | 0.64 | % | | May 1, 2023 | |
Global Atlantic Wellington Research Managed Risk Portfolio* | | | 1.19 | % | | May 1, 2023 | |
* Prior to September 1, 2022, the Portfolio was also subject to a Total Expense Limit of 1.20%, which included Acquired Fund Fees and Expenses as defined in the Portfolio's prospectus.
In addition, the Adviser has agreed to waive 0.40% of its fees for Global Atlantic American Funds® Managed Risk Portfolio and Global Atlantic Select Advisor Managed Risk Portfolio for as long as each Portfolio relies primarily on investments in underlying funds to achieve its principal investment strategy. These waivers are not subject to recoupment.
The Adviser or its affiliates may receive compensation from managers of underlying funds in which certain Portfolios invest. This compensation may create a conflict of interest for the Adviser in the selection of underlying funds for investment by the Portfolio. However, the Adviser will voluntarily reduce the amount of its compensation under its Advisory Agreement with the Portfolio by the amount of compensation received from managers of underlying funds. The minimum amount of this waiver, until at least April 30, 2023 for each Portfolio is based on estimated amounts expected to be received during the current fiscal year. The actual amount of each waiver may be higher to the extent the payments exceed the Adviser's estimates, but it will not be lower. These waivers are not subject to recoupment by the Adviser. The waivers may be terminated only by the Portfolio's Board of Trustees, on 60 days' written notice to the Adviser.
85
Global Atlantic Portfolios
Notes to Financial Statements (Continued)
December 31, 2022
For the year ended December 31, 2022, the Adviser waived, reimbursed, or recaptured fees as follows:
Portfolio | | Investment
Advisory Fee
Waiver | | Investment
Advisory Fee
Reimbursed | | Investment
Advisory Fee
Recaptured | | Total | |
Global Atlantic American Funds® Managed Risk Portfolio | | $ | 772,060 | | | $ | - | | | $ | - | | | $ | 772,060 | | |
Global Atlantic Balanced Managed Risk Portfolio | | | - | | | | - | | | | - | | | | - | | |
Global Atlantic BlackRock Selects Managed Risk Portfolio | | | - | | | | - | | | | - | | | | - | | |
Global Atlantic Franklin Dividend and Income Managed
Risk Portfolio | | | 66,940 | | | | - | | | | - | | | | 66,940 | | |
Global Atlantic Growth Managed Risk Portfolio | | | 112,196 | | | | - | | | | - | | | | 112,196 | | |
Global Atlantic Moderate Growth Managed Risk Portfolio | | | - | | | | - | | | | - | | | | - | | |
Global Atlantic Select Advisor Managed Risk Portfolio | | | 550,357 | | | | - | | | | - | | | | 550,357 | | |
Global Atlantic Wellington Research Managed Risk Portfolio | | | 135,879 | | | | - | | | | - | | | | 135,879 | | |
If the Adviser waives any fee or reimburses any expense pursuant to the Waiver Agreements, and the Portfolio's operating expenses are subsequently less than the expense limitation, the Adviser shall be entitled to reimbursement by the Portfolio for such waived fees or reimbursed expenses provided that such reimbursement does not cause the Portfolio's expenses to exceed the amount of the expense limitation. If Portfolio operating expenses subsequently exceed the expense limitation, the reimbursements shall be suspended.
The Adviser may recapture the following amounts by the following dates:
Portfolio | | December 31, 2023 | | December 31, 2024 | | December 31, 2025 | |
Global Atlantic American Funds® Managed Risk Portfolio | | $ | - | | | $ | - | | | $ | - | | |
Global Atlantic Balanced Managed Risk Portfolio | | | - | | | | - | | | | - | | |
Global Atlantic BlackRock Selects Managed Risk Portfolio | | | - | | | | - | | | | - | | |
Global Atlantic Franklin Dividend and Income Managed Risk Portfolio | | | 156,982 | | | | 61,783 | | | | 66,940 | | |
Global Atlantic Growth Managed Risk Portfolio | | | 118,163 | | | | 73,227 | | | | 112,196 | | |
Global Atlantic Moderate Growth Managed Risk Portfolio | | | - | | | | - | | | | - | | |
Global Atlantic Select Advisor Managed Risk Portfolio | | | 27,191 | | | | 12,758 | | | | 27,211 | | |
Global Atlantic Wellington Research Managed Risk Portfolio | | | 31,810 | | | | 8,719 | | | | 135,879 | | |
The following amounts expired unrecouped as of the date listed below:
Portfolio | | December 31, 2022 | |
Global Atlantic American Funds® Managed Risk Portfolio | | $ | - | | |
Global Atlantic Balanced Managed Risk Portfolio | | | - | | |
Global Atlantic BlackRock Selects Managed Risk Portfolio | | | 35,171 | | |
Global Atlantic Franklin Dividend and Income Managed Risk Portfolio | | | 143,809 | | |
Global Atlantic Growth Managed Risk Portfolio | | | 76,229 | | |
Global Atlantic Moderate Growth Managed Risk Portfolio | | | - | | |
Global Atlantic Select Advisor Managed Risk Portfolio | | | 38,360 | | |
Global Atlantic Wellington Research Managed Risk Portfolio | | | 13,260 | | |
The Trust, on behalf of the Portfolios, has adopted a distribution and shareholder servicing plan (the "Plan") pursuant to Rule 12b-1 under the 1940 Act for Class II shares. The fee charged under the Plan is calculated at an annual rate of 0.25% of the average daily net assets attributable to each Portfolio's Class II shares and, for the year ended December 31, 2022, was paid to Global Atlantic Distributors, LLC ("GAD") to provide compensation for ongoing distribution-related activities or services and/or maintenance of the Portfolios' shareholder accounts, not otherwise required to be provided by the Adviser. GAD is an affiliate of the Adviser.
86
Global Atlantic Portfolios
Notes to Financial Statements (Continued)
December 31, 2022
For the year ended December 31, 2022, the Portfolios expensed the following distribution fees:
Portfolio | | Fees Paid | |
Global Atlantic American Funds® Managed Risk Portfolio | | $ | 482,538 | | |
Global Atlantic Balanced Managed Risk Portfolio | | | 252,369 | | |
Global Atlantic BlackRock Selects Managed Risk Portfolio | | | 494,904 | | |
Global Atlantic Franklin Dividend and Income Managed Risk Portfolio | | | 593,776 | | |
Global Atlantic Growth Managed Risk Portfolio | | | 871,515 | | |
Global Atlantic Moderate Growth Managed Risk Portfolio | | | 291,923 | | |
Global Atlantic Select Advisor Managed Risk Portfolio | | | 220,661 | | |
Global Atlantic Wellington Research Managed Risk Portfolio | | | 1,004,523 | | |
For the year ended December 31, 2022, the trustees received fees in the amounts as follows:
Portfolio | | Fees Received | |
Global Atlantic American Funds® Managed Risk Portfolio | | $ | 20,509 | | |
Global Atlantic Balanced Managed Risk Portfolio | | | 10,703 | | |
Global Atlantic BlackRock Selects Managed Risk Portfolio | | | 20,980 | | |
Global Atlantic Franklin Dividend and Income Managed Risk Portfolio | | | 25,141 | | |
Global Atlantic Growth Managed Risk Portfolio | | | 36,901 | | |
Global Atlantic Moderate Growth Managed Risk Portfolio | | | 12,406 | | |
Global Atlantic Select Advisor Managed Risk Portfolio | | | 9,357 | | |
Global Atlantic Wellington Research Managed Risk Portfolio | | | 42,829 | | |
5. CONTROL OWNERSHIP
The beneficial ownership, either directly or indirectly, of more than 25% of the voting securities of a Portfolio creates a presumption of the control of the Portfolio, under section 2(a)(9) of the 1940 Act. As of December 31, 2022, Forethought Life Insurance Company Separate Account A owned 100% of the voting securities of each Portfolio. The Trust has no knowledge as to whether all or any portion of the shares owned of record are also owned beneficially.
Shareholder Concentration Risk – Forethought Life Insurance Company, certain accounts, or the Adviser's affiliates may from time to time own (beneficially or of record) or control a significant percentage of a Portfolio's shares. Redemptions by these entities of their holdings in a Portfolio may impact the Portfolio's liquidity and NAV. These redemptions may also force a Portfolio to sell securities.
6. AGGREGATE UNREALIZED APPRECIATION AND DEPRECIATION – TAX BASIS
As of December 31, 2022, the aggregate cost of investments for federal income tax purposes, the gross unrealized appreciation and depreciation and the aggregated net unrealized appreciation (depreciation) on investments were as follows:
| | Tax
Cost | | Gross
Unrealized
Appreciation | | Gross
Unrealized
Depreciation | | Net Unrealized
Appreciation/
(Depreciation) | |
Global Atlantic American Funds® Managed Risk Portfolio | | $ | 181,791,236 | | | $ | 6,618,159 | | | $ | (17,597,872 | ) | | $ | (10,979,713 | ) | |
Global Atlantic Balanced Managed Risk Portfolio | | | 84,825,338 | | | | 10,840,811 | | | | (11,996,554 | ) | | | (1,155,743 | ) | |
Global Atlantic BlackRock Selects Managed Risk Portfolio | | | 172,493,097 | | | | 12,211,172 | | | | (9,418,871 | ) | | | 2,792,301 | | |
Global Atlantic Franklin Dividend and Income Managed
Risk Portfolio | | | 141,341,589 | | | | 82,673,941 | | | | (7,169,869 | ) | | | 75,504,072 | | |
Global Atlantic Growth Managed Risk Portfolio | | | 242,700,725 | | | | 76,671,063 | | | | (10,922,305 | ) | | | 65,748,758 | | |
Global Atlantic Moderate Growth Managed Risk Portfolio | | | 89,037,270 | | | | 20,259,880 | | | | (6,324,098 | ) | | | 13,935,782 | | |
Global Atlantic Select Advisor Managed Risk Portfolio | | | 75,701,779 | | | | 8,606,796 | | | | (6,423,816 | ) | | | 2,182,980 | | |
Global Atlantic Wellington Research Managed Risk Portfolio | | | 320,150,202 | | | | 67,946,511 | | | | (25,557,314 | ) | | | 42,389,197 | | |
87
Global Atlantic Portfolios
Notes to Financial Statements (Continued)
December 31, 2022
7. DISTRIBUTIONS TO SHAREHOLDERS AND TAX COMPONENTS OF CAPITAL
The tax character of fund distributions paid for the years ended December 31, 2022 and 2021 were as follows:
For fiscal year ended
12/31/2022 | | Ordinary
Income | | Long-Term
Capital Gains | | Return of
Capital | | Total | |
Global Atlantic American Funds® Managed Risk Portfolio | | $ | 3,636,634 | | | $ | 8,461,615 | | | $ | - | | | $ | 12,098,249 | | |
Global Atlantic Balanced Managed Risk Portfolio | | | 2,726,133 | | | | 5,920,290 | | | | - | | | | 8,646,423 | | |
Global Atlantic BlackRock Selects Managed Risk Portfolio | | | 11,495,510 | | | | - | | | | - | | | | 11,495,510 | | |
Global Atlantic Franklin Dividend and Income Managed
Risk Portfolio | | | 1,665,082 | | | | 3,938,420 | | | | - | | | | 5,603,502 | | |
Global Atlantic Growth Managed Risk Portfolio | | | 3,041,455 | | | | 8,019,285 | | | | - | | | | 11,060,740 | | |
Global Atlantic Moderate Growth Managed Risk Portfolio | | | 2,836,971 | | | | 6,969,168 | | | | - | | | | 9,806,139 | | |
Global Atlantic Select Advisor Managed Risk Portfolio | | | 1,369,351 | | | | 6,678,010 | | | | - | | | | 8,047,361 | | |
Global Atlantic Wellington Research Managed
Risk Portfolio | | | 13,157,592 | | | | 32,572,548 | | | | - | | | | 45,730,140 | | |
For fiscal year ended
12/31/2021 | | Ordinary
Income | | Long-Term
Capital Gains | | Return of
Capital | | Total | |
Global Atlantic American Funds® Managed Risk Portfolio | | $ | 2,588,253 | | | $ | - | | | $ | - | | | $ | 2,588,253 | | |
Global Atlantic Balanced Managed Risk Portfolio | | | 2,007,723 | | | | 1,345,036 | | | | - | | | | 3,352,759 | | |
Global Atlantic BlackRock Selects Managed Risk Portfolio | | | 3,232,570 | | | | - | | | | - | | | | 3,232,570 | | |
Global Atlantic Franklin Dividend and Income Managed
Risk Portfolio | | | 2,279,680 | | | | - | | | | - | | | | 2,279,680 | | |
Global Atlantic Growth Managed Risk Portfolio | | | 3,307,515 | | | | - | | | | - | | | | 3,307,515 | | |
Global Atlantic Moderate Growth Managed Risk Portfolio | | | 1,805,831 | | | | 516,105 | | | | - | | | | 2,321,936 | | |
Global Atlantic Select Advisor Managed Risk Portfolio | | | 1,303,856 | | | | 3,539,405 | | | | - | | | | 4,843,261 | | |
Global Atlantic Wellington Research Managed
Risk Portfolio | | | 4,391,614 | | | | 14,674,109 | | | | - | | | | 19,065,723 | | |
As of December 31, 2022, the components of accumulated earnings/(deficit) on a tax basis were as follows:
| | | Undistributed
Ordinary
Income | | Undistributed
Long-Term
Capital Gains | | Post-October
Loss and Late
Year Loss | | Capital Loss
Carryforward | | Unrealized
Appreciation/
(Depreciation) | | Total
Accumulated
Earnings/
(Defecits) | |
Global Atlantic American Funds® Managed
Risk Portfolio | | $ | 5,500,711 | | | $ | 17,502,209 | | | $ | - | | | $ | - | | | $ | (10,979,713 | ) | | $ | 12,023,207 | | |
Global Atlantic Balanced Managed Risk Portfolio | | | 1,253,984 | | | | - | | | | - | | | | (3,003,620 | ) | | | (1,155,743 | ) | | | (2,905,379 | ) | |
Global Atlantic BlackRock Selects Managed
Risk Portfolio | | | 1,444,827 | | | | - | | | | - | | | | (6,480,074 | ) | | | 2,792,301 | | | | (2,242,946 | ) | |
Global Atlantic Franklin Dividend and Income
Managed Risk Portfolio | | | 2,371,526 | | | | 10,534,995 | | | | - | | | | - | | | | 75,504,072 | | | | 88,410,593 | | |
Global Atlantic Growth Managed Risk Portfolio | | | 3,553,435 | | | | 13,595,350 | | | | - | | | | - | | | | 65,748,758 | | | | 82,897,543 | | |
Global Atlantic Moderate Growth Managed
Risk Portfolio | | | 1,298,422 | | | | 2,019,901 | | | | - | | | | - | | | | 13,935,782 | | | | 17,254,105 | | |
Global Atlantic Select Advisor Managed Risk
Portfolio | | | 1,543,176 | | | | 5,386,321 | | | | - | | | | - | | | | 2,182,980 | | | | 9,112,477 | | |
Global Atlantic Wellington Research Managed
Risk Portfolio | | | 2,239,640 | | | | - | | | | - | | | | (2,541,709 | ) | | | 42,389,197 | | | | 42,087,128 | | |
The difference between book basis and tax basis unrealized appreciation (depreciation), undistributed ordinary income (loss) and accumulated net realized gain (loss) from investments is primarily attributable to the tax deferral of losses on wash sales, and the mark-to-market on passive foreign investment companies and open 1256 options and futures contracts, forward foreign currency contracts and swaps. The unrealized appreciation (depreciation) in the table above includes unrealized foreign currency gains of $22 and $(159) for Global Atlantic Balanced Managed Risk Portfolio and Global Atlantic Franklin Dividend and Income Managed Risk Portfolio.
88
Global Atlantic Portfolios
Notes to Financial Statements (Continued)
December 31, 2022
At December 31, 2022, the Portfolios had capital loss carry forwards for federal income tax purposes available to offset future capital gains as follows:
| | | Non-Expiring
Short-Term | | Non-Expiring
Long-Term | | Total | |
Global Atlantic American Funds® Managed Risk Portfolio | | $ | - | | | $ | - | | | $ | - | | |
Global Atlantic Balanced Managed Risk Portfolio | | | 2,481,883 | | | | 521,737 | | | | 3,003,620 | | |
Global Atlantic BlackRock Selects Managed Risk Portfolio | | | 6,282,691 | | | | 197,383 | | | | 6,480,074 | | |
Global Atlantic Franklin Dividend and Income Managed Risk Portfolio | | | - | | | | - | | | | - | | |
Global Atlantic Growth Managed Risk Portfolio | | | - | | | | - | | | | - | | |
Global Atlantic Moderate Growth Managed Risk Portfolio | | | - | | | | - | | | | - | | |
Global Atlantic Select Advisor Managed Risk Portfolio | | | - | | | | - | | | | - | | |
Global Atlantic Wellington Research Managed Risk Portfolio | | | 2,541,709 | | | | - | | | | 2,541,709 | | |
During the year ended December 31, 2022, the portfolios did not utilize capital loss carryforwards.
Permanent book and tax differences, primarily attributable to the reclassification of Portfolio distributions, resulted in reclassifications for the Portfolios for the fiscal year ended December 31, 2022 as follows:
| | | Paid-In
Capital | | Accumulated
Earnings (Losses) | |
Global Atlantic Wellington Research Managed Risk Portfolio | | $ | (21,024 | ) | | $ | 21,024 | | |
8. NEW ACCOUNTING PRONOUNCEMENTS
In March 2020, the FASB issued Accounting Standards Update No. 2020-04 ("ASU 2020-04"), "Reference Rate Reform (Topic 840): Facilitation of the Effects of Reference Rate Reform on Financial Reporting". ASU 2020-04 provides entities with optional guidance to ease the potential accounting burden associated with transitioning away from reference rates (e.g., LIBOR) that are expected to be discontinued. ASU 2020-04 allows, among other things, certain contract modifications to be accounted as a continuation of the existing contract. This ASU was effective upon the issuance and its optional relief can be applied through December 31, 2024. Management has reviewed the requirements and believes the adoption of this ASU will not have a material impact on the financial statements.
9. OTHER RISKS
The Portfolios' risks include, but are not limited to, the following:
Credit Risk – There is a risk that security issuers will not make interest and/or principal payments on their securities. In addition, the credit quality of securities may be lowered if an issuer's financial condition changes. Lower credit quality will lead to greater volatility in the price of a security and in shares of a Portfolio. Lower credit quality also will affect liquidity and make it difficult to sell the security. This means that, compared to issuers of higher rated securities, issuers of lower rated securities are less likely to have the capacity to pay interest and repay principal when due in the event of adverse business, financial or economic conditions and/or may be in default or not current in the payment of interest or principal. Default, or the perception (whether by market participants, rating agencies, pricing services or otherwise) that an issuer is likely to default, tends to reduce the value and liquidity of fixed income securities, thereby reducing the value of your investment in Portfolio shares. In addition, default may cause a Portfolio to directly or indirectly incur expenses in seeking recovery of principal or interest.
A Portfolio could lose money on a debt security if an issuer or borrower is unable or fails to meet its obligations, including failing to make interest payments and/or to repay principal when due. Changes in an issuer's financial strength, the market's perception of the issuer's financial strength or in a security's credit rating, which reflects a third party's assessment of the credit risk presented by a particular issuer, may affect debt securities' value. A Portfolio may incur substantial losses on debt securities that are inaccurately perceived to present a different amount of credit risk by the market, the Sub-Adviser and/or Underlying Fund manager or the rating agencies than such securities actually do.
89
Global Atlantic Portfolios
Notes to Financial Statements (Continued)
December 31, 2022
Derivatives Risk – The use of derivatives is a highly specialized activity that involves investment techniques and risks different from those associated with investments in more traditional securities and instruments. The use of derivatives may increase costs, reduce a Portfolio's returns and/or increase volatility. Volatility is defined as the characteristic of a security, an index or a market to fluctuate significantly in price within a short time period. Many types of derivatives are also subject to counterparty risk, which is the risk that the other party in the transaction will not fulfill its contractual obligation. A risk of a Portfolio's use of derivatives is that the fluctuations in their values may not correlate perfectly with, and may be more sensitive to market events than, the overall securities markets. The possible lack of a liquid secondary market for derivatives and the resulting inability to sell or otherwise close-out a derivatives position at an advantageous time or price could expose a Portfolio to losses and could make derivatives more difficult to value accurately. Derivatives typically give rise to a form of leverage and may expose a Portfolio to greater risk and increase its costs. The Dodd-Frank Wall Street Reform and Consumer Protection Act (the "Dodd-Frank Act") and related regulatory developments require the clearing and exchange-trading of many standardized over-the-counter ("OTC") derivative instruments deemed to be "swaps." The Commodity Futures Trading Commission ("CFTC") has implemented mandatory exchange-trading and clearing requirements under the Dodd-Frank Act and the CFTC continues to approve contracts for central clearing. Uncleared swaps are subject to margin requirements that are being implemented on a phase-in basis. Rule 18f-4 under the 1940 Act requires, among other things, that certain entities adopt a derivatives risk management program, comply with limitations on leveraged-related risk based on a relative "value-at-risk" test and update reporting and disclosure procedures. The regulation of the derivatives markets has increased over the past several years, and there can be no assurance that any new governmental regulation will not adversely affect a Portfolio's ability to achieve its investment result.
Exchange-Traded Funds Risk – The Portfolios may invest in ETFs. Disruptions to the creations and redemptions process through which market makers directly purchase and sell ETF shares, the existence of extreme market volatility or potential lack of an active trading market, or changes in the liquidity of the market for an ETF's underlying portfolio holdings, may result in the ETF's shares trading at significantly above (at a premium to) or below (at a discount to) net asset value, which may result in a Portfolio paying significantly more or receiving significantly less for ETF shares than the value of the relevant ETF's underlying holdings. An ETF's shares could also trade at a premium or discount to net asset value when an ETF's underlying securities trade on a foreign exchange that is closed when the securities exchange on which the ETF trades is open. The current price of the ETF's underlying securities and the last quoted price for the underlying security are likely to deviate in such circumstances. There can be no assurance that an active trading market for an ETF's shares will develop or be maintained. Trading may be halted, for example, due to market conditions. Because the value of ETF shares depends on the demand in the market, a Portfolio's holdings may not be able to be liquidated at the most optimal time, adversely affecting performance.
There can be no assurance that an ETF's investment objectives will be achieved. Each ETF is subject to specific risks, depending on the nature of the ETF. These risks could include liquidity risk, sector risk, foreign and emerging market risk, as well as risks associated with real estate investments and natural resources. ETFs in which a Portfolio invests will not be able to replicate exactly the performance of the indices they track, if any, because the total return generated by the securities will be reduced by transaction costs incurred in adjusting the actual balance of the securities. In addition, ETFs in which a Portfolio invests will incur expenses not incurred by their applicable indices. Certain securities comprising the indices tracked by the ETFs may, from time to time, temporarily be unavailable, which may further impede the ETFs' ability to track their applicable indices. An investment in an ETF presents the risk that the ETF may no longer meet the listing requirements of any applicable exchanges on which the ETF is listed.
Market Risk – The market prices of securities may go up or down, sometimes rapidly or unpredictably, due to general market conditions, such as real or perceived adverse economic or political conditions, inflation, changes in interest rates or currency rates, limited dealer capacity, lack of liquidity in the markets or adverse investor sentiment. Each Portfolio has exposure to instruments that may be more volatile and carry more risk than some other forms of investment. Adverse market conditions may be prolonged and may not have the same impact on all types of securities. Market prices of securities also may go down due to events or conditions that affect particular sectors, industries or issuers. When market prices fall, the value of your investment will go down. Local, regional or global events such as war, acts of terrorism, the spread of infectious illness or other public health issues, natural disasters, recessions, or other events could also have a significant impact on the Portfolio and its investments. The market prices of securities may also be negatively impacted by trading activity and investor interest, including interest driven by factors unrelated to market conditions or financial performance. In these circumstances, the value of the Portfolio's investments, particularly any short positions or exposures, may fluctuate dramatically.
90
Global Atlantic Portfolios
Notes to Financial Statements (Continued)
December 31, 2022
A Portfolio may experience a substantial or complete loss on any individual security.
Policy and legislative changes in the U.S. and abroad affect many aspects of financial regulation and may, in some cases, contribute to decreased liquidity and increased volatility in the financial markets. Economies and financial markets around the world are becoming increasingly interconnected. As a result, whether or not a Portfolio has exposure to securities of issuers located in or with significant exposure to countries experiencing economic and financial difficulties, the value and liquidity of the Portfolio's investments may be negatively affected.
In addition, market prices of securities in broad market segments may be adversely affected by a prominent issuer having experienced losses or by the lack of earnings or such an issuer's failure to meet the market's expectations with respect to new products or services, or even by factors wholly unrelated to the value or condition of the issuer, such as changes in interest rates. An increase in interest rates or other adverse conditions (e.g., inflation/deflation, increased selling of fixed income investments across other pooled investment vehicles or accounts, changes in investor perception or changes in government intervention in the markets) may lead to increased redemptions and increased portfolio turnover, which could reduce liquidity for certain Portfolio investments, adversely affect values of portfolio holdings and increase a Portfolio's costs. If dealer capacity in fixed income markets is insufficient for market conditions, this has the potential to further inhibit liquidity and increase volatility in the fixed income markets. The spread of an infectious respiratory illness caused by a novel strain of coronavirus (known as "COVID-19") has caused volatility, severe market dislocations and liquidity constraints in many markets, including markets for the securities the Portfolios hold, and may adversely affect the Portfolios' investments and operations. The transmission of COVID-19 and efforts to contain its spread could lead to a significant economic downturn or recession, increased market volatility, a greater number of market closures, higher default rates and adverse effects on the values and liquidity of securities or other assets. Such impacts, which may vary across asset classes, may adversely affect the performance of the Portfolios. In certain cases, an exchange or market may close or issue trading halts on specific securities or even the entire market, which may result in the Portfolios being, among other things, unable to buy or sell certain securities or financial instruments or to accurately price their investments.
10. OTHER RECENT DEVELOPMENTS
Ongoing concerns regarding the economies of certain countries in Europe, as well as the possibility that one or more countries could leave the European Union (the "EU"), create risks for investing in the European markets. For example, the United Kingdom ("UK") withdrew from the EU in January 2020 (commonly known as "Brexit"). This commenced a transition period that lasted until December 31, 2020. On December 30, 2020, the EU and UK signed the EU-UK Trade and Cooperation Agreement ("TCA"), an agreement on the terms governing certain aspects of the EU's and the UK's relationship following the end of the transition period. Notwithstanding the TCA, there continues to be considerable uncertainty as to the UK's post-transition framework. Although the full impact of Brexit is not yet known, the impact on the UK, EU and global markets could include increased volatility and illiquidity, potentially lower economic growth and decreased asset valuations. Brexit may have a destabilizing impact on the EU to the extent other member states similarly seek to withdraw from the union. Brexit may also have a negative impact on the economy and currency of the UK as a result of anticipated, or actual changes to the UK's economic and political relations with the EU. Any or all of these challenges may affect the value of a Portfolio's investments economically tied to the UK or the EU.
On March 5, 2021, the United Kingdom's Financial Conduct Authority ("FCA") and ICE Benchmark Authority formally announced the dates after which the LIBORs will no longer be representative and subsequently cease publication. Certain LIBORs ceased publication on December 31, 2021, and others will cease publication after June 30, 2023. However, the FCA, the LIBOR administrator and other regulators also announced that certain sterling and yen LIBOR settings would be calculated on a "synthetic" basis through the end of 2022. In connection with supervisory guidance from regulators, certain regulated entities have ceased to enter into certain new LIBOR contracts after January 1, 2022. The unavailability or replacement of LIBOR presents risks to applicable Portfolios, including the risk that any pricing adjustments to a Portfolio's investments resulting from a substitute reference rate may adversely affect the Portfolio's performance and/or NAV. The impact of a substitute reference rate, if any, will vary on an investment-by-investment basis. The Adviser or Sub-Adviser may have discretion to determine a substitute reference rate, including any price or other adjustments to account for differences between the substitute reference rate and the previous rate. The substitute reference rate and any adjustments selected could negatively impact a Portfolio's investment performance or financial condition, including in ways unforeseen by the Adviser or Sub-Adviser.
91
Global Atlantic Portfolios
Notes to Financial Statements (Continued)
December 31, 2022
In addition, the outbreak of COVID-19, a respiratory illness caused by a novel strain of coronavirus, has caused volatility, severe market dislocations and liquidity constraints in many markets, including markets for the securities the Portfolios hold, and may adversely affect the Portfolios' investments and operations. The transmission of COVID-19 and efforts to contain its spread have resulted in, among other things: quarantines and travel restrictions, including border closings, strained healthcare systems, event cancellations, disruptions to business operations and supply chains, and a reduction in consumer and business spending, as well as general concern and uncertainty that has negatively affected the economy. These disruptions have led to instability in the market place and greater overall volatility. The impact of COVID-19, and other infectious illness outbreaks, epidemics or pandemics that may arise in the future, could adversely affect the economies of many nations or the entire global economy, the financial well-being and performance of individual issuers, borrowers and sectors and the health of the markets generally in potentially significant and unforeseen ways. In addition, the impact of infectious illnesses, such as COVID-19, in emerging market countries may be greater due to generally less established healthcare systems. The COVID-19 crisis or other public health crises may exacerbate other pre-existing political, social and economic risks in certain countries or globally.
11. SUBSEQUENT EVENTS
The Portfolios evaluated subsequent events from December 31, 2022 through the date these financial statements were issued. There were no significant events that would have a material impact on the Portfolios' financial statements.
92
Report of Independent Registered Public Accounting Firm
To the Board of Trustees of Forethought Variable Insurance Trust
and the Shareholders of Each of the Separate Series of Forethought Variable Insurance Trust
Opinion on the Financial Statements
We have audited the accompanying statement of assets and liabilities of Global Atlantic American Funds® Managed Risk Portfolio, Global Atlantic Balanced Managed Risk Portfolio, Global Atlantic BlackRock Selects Managed Risk Portfolio, Global Atlantic Franklin Dividend and Income Managed Risk Portfolio, Global Atlantic Growth Managed Risk Portfolio, Global Atlantic Moderate Growth Managed Risk Portfolio, Global Atlantic Select Advisor Managed Risk Portfolio, and Global Atlantic Wellington Research Managed Risk Portfolio (collectively, the Portfolios), including the portfolio of investments, as of December 31, 2022, the related statements of operations for the year then ended, the statements of changes in net assets for each of the two years in the period then ended, and the related notes to the financial statements (collectively, the financial statements), and the financial highlights for each of the five years in the period then ended. In our opinion, the financial statements and financial highlights present fairly, in all material respects, the financial position of the Portfolios as of December 31, 2022, the results of its operations for the year then ended, the changes in net assets for each of the two years in the period then ended, and the financial highlights for each of the five years in the period then ended, in conformity with accounting principles generally accepted in the United States of America.
Basis for Opinion
These financial statements are the responsibility of the Portfolios' management. Our responsibility is to express an opinion on the Portfolios' financial statements and financial highlights based on our audits. We are a public accounting firm registered with the Public Company Accounting Oversight Board (United States) (PCAOB) and are required to be independent with respect to the Portfolios in accordance with U.S. federal securities laws and the applicable rules and regulations of the Securities and Exchange Commission and the PCAOB.
We conducted our audits in accordance with the standards of the PCAOB. Those standards require that we plan and perform the audit to obtain reasonable assurance about whether the financial statements are free of material misstatement, whether due to error or fraud. The Portfolios are not required to have, nor were we engaged to perform, an audit of its internal control over financial reporting. As part of our audits, we are required to obtain an understanding of internal control over financial reporting but not for the purpose of expressing an opinion on the effectiveness of the Portfolios' internal control over financial reporting. Accordingly, we express no such opinion.
Our audits included performing procedures to assess the risks of material misstatement of the financial statements, whether due to error or fraud, and performing procedures that respond to those risks. Such procedures included examining, on a test basis, evidence regarding the amounts and disclosures in the financial statements. Our procedures included confirmation of investments owned as of December 31, 2022, by correspondence with the custodians and brokers or by other appropriate auditing procedures where replies from custodians or brokers were not received. Our audits also included evaluating the accounting principles used and significant estimates made by management, as well as evaluating the overall presentation of the financial statements. We believe that our audits provide a reasonable basis for our opinion.
/s/ RSM US LLP
We have served as the auditor of one or more investment companies advised by Global Atlantic Investment Advisors, LLC since 2013.
Denver, Colorado
February 23, 2023
93
Global Atlantic Portfolios
Expense Examples
December 31, 2022 (Unaudited)
As a shareholder of the Portfolios, you incur ongoing costs, including management fees; distribution and/or service (12b-1) fees; and other Portfolio expenses. This example is intended to help you understand your ongoing costs (in dollars) of investing in each Portfolio and to compare these costs with the ongoing costs of investing in other mutual funds.
The example is based on an investment of $1,000 invested at the beginning of the period and held for the entire period from July 1, 2022 through December 31, 2022.
Actual Expenses
The "Actual" expenses set of columns in the table below provides information about actual account values and actual expenses. You may use the information below together with the amount you invested, to estimate the expenses that you paid over the period. Simply divide your account value by $1,000 (for example, an $8,600 account value divided by $1,000 = 8.6), then multiply the result by the number in the table under the heading entitled "Expenses Paid During Period" to estimate the expenses you paid on your account during this period.
Hypothetical Example for Comparison Purposes
The "Hypothetical" expenses set of columns in the table below provides information about hypothetical account values and hypothetical expenses based on each Portfolio's actual expense ratio and an assumed rate of return of 5% per year before expenses, which is not the Portfolio's actual return. The hypothetical account values and expenses may not be used to estimate the actual ending account balances or expenses you paid for the period. You may use this information to compare this 5% hypothetical example for a specific Portfolio with the 5% hypothetical examples that appear in the shareholder reports of other funds.
Please note that the expenses shown in the table are meant to highlight your ongoing costs only and do not reflect any transactional costs, such as sales charges (loads), or redemption fees or other expenses charged by your insurance contract or separate account. Therefore, the Hypothetical columns of the table are useful in comparing ongoing costs only, and will not help you determine the relative total costs of owning different funds. In addition, if these transactional costs were included, your costs would have been higher.
| | | | | | | | | Actual | | Hypothetical
(5% return before
expenses) | |
| | | Class | | Portfolio's
Annualized
Expense
Ratio | | Beginning
Account Value
7-1-22 | | Ending
Account
Value
12-31-22 | | Expenses
Paid
During
Period* | | Ending
Account
Value
12-31-22 | | Expenses
Paid
During
Period* | |
Global Atlantic
American Funds®
Managed Risk Portfolio | | II | | | 0.87 | % | | $ | 1,000 | | | $ | 987.20 | | | $ | 4.36 | | | $ | 1,020.82 | | | $ | 4.43 | | |
Global Atlantic Balanced
Managed Risk Portfolio | | II | | | 0.92 | % | | $ | 1,000 | | | $ | 977.50 | | | $ | 4.59 | | | $ | 1,020.57 | | | $ | 4.69 | | |
Global Atlantic BlackRock
Selects Managed Risk Portfolio | | II | | | 0.92 | % | | $ | 1,000 | | | $ | 979.70 | | | $ | 4.59 | | | $ | 1,020.57 | | | $ | 4.69 | | |
Global Atlantic Franklin
Dividend and Income
Managed Risk Portfolio | | II | | | 1.19 | % | | $ | 1,000 | | | $ | 1,019.90 | | | $ | 6.06 | | | $ | 1,019.21 | | | $ | 6.06 | | |
Global Atlantic Growth
Managed Risk Portfolio | | II | | | 0.88 | % | | $ | 1,000 | | | $ | 985.90 | | | $ | 4.40 | | | $ | 1,020.77 | | | $ | 4.48 | | |
Global Atlantic Moderate
Growth Managed
Risk Portfolio | | II | | | 0.92 | % | | $ | 1,000 | | | $ | 980.70 | | | $ | 4.59 | | | $ | 1,020.57 | | | $ | 4.69 | | |
* Expenses are equal to the Portfolio's annualized expense ratio, multiplied by the number of days in the period (184) divided by the number of days in the fiscal year (365).
94
Global Atlantic Portfolios
Expense Examples (Continued)
December 31, 2022 (Unaudited)
| | | | | | | | | Actual | | Hypothetical
(5% return before
expenses) | |
| | | Class | | Portfolio's
Annualized
Expense
Ratio | | Beginning
Account Value
7-1-22 | | Ending
Account
Value
12-31-22 | | Expenses
Paid
During
Period* | | Ending
Account
Value
12-31-22 | | Expenses
Paid
During
Period* | |
Global Atlantic Select
Advisor Managed
Risk Portfolio | | II | | | 0.64 | % | | $ | 1,000 | | | $ | 984.80 | | | $ | 3.20 | | | $ | 1,021.98 | | | $ | 3.26 | | |
Global Atlantic Wellington
Research Managed
Risk Portfolio | | II | | | 1.19 | % | | $ | 1,000 | | | $ | 975.10 | | | $ | 5.92 | | | $ | 1,019.21 | | | $ | 6.06 | | |
* Expenses are equal to the Portfolio's annualized expense ratio, multiplied by the number of days in the period (184) divided by the number of days in the fiscal year (365).
95
Global Atlantic Portfolios
Supplemental Information
December 31, 2022 (Unaudited)
Approval of Renewal of Investment Advisory Agreement and Sub-Advisory Agreements for Global Atlantic American Funds® Managed Risk Portfolio, Global Atlantic Balanced Managed Risk Portfolio, Global Atlantic BlackRock Selects Managed Risk Portfolio, Global Atlantic Franklin Dividend and Income Managed Risk Portfolio, Global Atlantic Growth Managed Risk Portfolio, Global Atlantic Moderate Growth Managed Risk Portfolio, Global Atlantic Select Advisor Managed Risk Portfolio and Global Atlantic Wellington Research Managed Risk Portfolio.
At an in-person meeting held on November 3, 2022, the Board of Trustees (the "Trustees" or the "Board") of Forethought Variable Insurance Trust (the "Trust"), including a majority of the Trustees who are not "interested persons" (the "Independent Trustees"), as that term is defined in the Investment Company Act of 1940, as amended (the "1940 Act"), considered the renewal of: (i) the existing investment advisory agreement between Global Atlantic Investment Advisors, LLC (the "Adviser") and the Trust, on behalf of each of Global Atlantic American Funds® Managed Risk Portfolio ("GA American"), Global Atlantic Balanced Managed Risk Portfolio ("GA Balanced"), Global Atlantic BlackRock Selects Managed Risk Portfolio ("GA BlackRock Selects"), Global Atlantic Franklin Dividend and Income Managed Risk Portfolio ("GA Franklin"), Global Atlantic Growth Managed Risk Portfolio ("GA Growth"), Global Atlantic Moderate Growth Managed Risk Portfolio ("GA Moderate Growth"), Global Atlantic Select Advisor Managed Risk Portfolio ("GA Select Advisor") and Global Atlantic Wellington Research Managed Risk Portfolio ("GA Wellington") (each a "Portfolio" and collectively the "Portfolios") (the "Advisory Agreement"); (ii) the existing sub-advisory agreement between the Adviser, the Trust, on behalf of GA Balanced, GA BlackRock Selects, GA Growth and GA Moderate Growth, and BlackRock Investment Management, LLC ("BIM"); (iii) the existing sub-advisory agreement between the Adviser, the Trust, on behalf of GA Franklin, and Franklin Advisers, Inc. ("Franklin"); (iv) the existing sub-advisory agreement between the Adviser, the Trust, on behalf of GA American, GA Balanced, GA BlackRock Selects, GA Franklin, GA Growth, GA Moderate Growth, GA Select Advisor and GA Wellington, and Milliman Financial Risk Management LLC ("Milliman"); (v) the existing sub-advisory agreement between the Adviser, the Trust, on behalf of GA Wellington, and Wellington Management Company LLP ("Wellington"); and (vi) the existing sub-advisory agreement between the Adviser, the Trust, on behalf of GA American and GA Select Advisor, and Wilshire Advisors LLC ("Wilshire" and together with BIM, Franklin, Milliman and Wellington the "Sub-Advisers") (collectively the sub-advisory agreements listed in items (ii) through (vi) above, the "Sub-Advisory Agreements").
To discuss and review the materials relating to the proposed renewal of the Advisory Agreement and Sub-Advisory Agreements (collectively, the "Agreements") in advance of the November 3, 2022 meeting, the Independent Trustees met via videoconference on October 27, 2022 with independent counsel to the Independent Trustees ("Independent Counsel") and with representatives of the Adviser in attendance and counsel to the Trust ("Trust Counsel").
Prior to the meetings, the Trustees requested, received and reviewed written responses from the Adviser and the Sub-Advisers to questions posed to the Adviser and the Sub-Advisers by counsel, on behalf of the Trustees. Following the meeting on October 27, 2022, the Independent Trustees requested additional information on certain items and the Adviser provided such information prior to the November 3, 2022 meeting. The Trustees also received a memorandum from Independent Counsel describing the legal standards for their consideration of the renewal of the Agreements. During the meetings, the Board and the Adviser discussed information relating to the Board's consideration of the Gartenberg factors with respect to each Portfolio. The Trustees also reviewed comparative information relating to advisory fees and total expenses and received presentations concerning the services provided under the Agreements from personnel of the Adviser at the meetings. Prior to voting on the renewal of the Agreements at the November 3, 2022 meeting, the Independent Trustees met in executive session with Independent Counsel and Trust Counsel present.
The Trustees relied upon the advice of counsel and their own business judgment in determining the material factors to be considered in evaluating the Agreements and the weight to be given to each such factor. The conclusions reached by the Trustees were based on a comprehensive evaluation of all of the information provided and were not the result of any one factor. Moreover, each Trustee may have afforded different weight to the various factors in reaching his or her conclusions with respect to the Agreements.
Nature, Extent, and Quality of Services. The Trustees noted that they were generally satisfied with the nature, extent and quality of the services provided by the Adviser and Sub-Advisers.
Performance. The Trustees requested and reviewed information regarding the investment performance of the Portfolios over 1-year, 3-year and since inception periods as compared to their respective benchmark indices and peer groups. The Trustees noted that they were generally satisfied with the Adviser's and Sub-Advisers' investment performance.
96
Global Atlantic Portfolios
Supplemental Information (Continued)
December 31, 2022 (Unaudited)
Fees and Expenses. The Trustees reviewed the Portfolios' fees and expenses, including the fees paid to the Adviser and Sub-Advisers. The Trustees concluded that the advisory fee charged to each Portfolio and the sub-advisory fee paid by the Adviser to each Sub-Adviser, as applicable, were not unreasonable in light of the services provided to each respective Portfolio.
Profitability. The Trustees noted that, based on information received from the Adviser regarding a per Portfolio analysis of the profitability of each Portfolio to the Adviser, they: (i) concluded that the profitability levels for the Adviser were not excessive; and (ii) considered that the sub-advisory fees were negotiated by the Adviser at arm's length. The Trustees also noted that they would continue to monitor the Adviser's profitability in the future.
Economies of Scale. The Trustees concluded that they were satisfied with the extent to which economies of scale, if any, would be shared for the benefit of each Portfolio's shareholders. The Trustees also noted that they would continue to monitor each Portfolio's growth and consider any additional opportunities to realize benefits from economies of scale for shareholders in the future.
Other Benefits. The Trustees noted that they had considered other benefits to the Adviser or Sub-Advisers and their respective affiliates from their relationships with the applicable Portfolios and that they would continue to consider these benefits in connection with future annual renewals.
Conclusion. Having requested and received such information from the Adviser and Sub-Advisers as the Trustees believed to be reasonably necessary to evaluate the terms of the Agreements, and as assisted by the advice of counsel, the Trustees, including all of the Independent Trustees voting separately, unanimously concluded that renewing the Advisory Agreement and Sub-Advisory Agreements was in the best interests of each Portfolio and its shareholders. The Trustees noted that, in considering the Agreements, they did not identify any one factor as all important and each Trustee may have afforded different weight to the various factors.
97
Global Atlantic Portfolios
Supplemental Information (Continued)
December 31, 2022 (Unaudited)
Trustees and Officers
The Trustees and officers of the Trust, together with information as to their principal business occupations during the past five years and other information, are shown below. Unless otherwise noted, the address of each Trustee and Officer is c/o Global Atlantic Investment Advisors, LLC, 10 West Market Street, Suite 2300, Indianapolis, Indiana 46204.
Independent Trustees
Name and Year of Birth | | Position/ Term of Office1 | | Principal Occupation During the Past Five Years | | Number of Portfolios in Fund Complex Overseen by Trustee | | Other Directorships held by Trustee During the Past Five Years | |
Mark Garbin
(1951) | | Trustee since 2013 | | Mr. Garbin serves as Managing Principal of Coherent Capital Management LLC (since 2007). | | | 16 | | | Mr. Garbin serves as Director of OHA CLO Enhanced Equity II Genpar LLP (since 2021), Carlyle Tactical Private Credit Fund (since 2018), iCapital KKR Private Markets Fund (Formerly Altegris KKR Commitments Fund) (since 2014), Two Roads Shared Trust (since 2012), Northern Lights Fund Trust (since 2013), and Northern Lights Variable Trust (since 2013). Previously, Mr. Garbin served as Director of Oak Hill Advisors Mortgage Strategies Fund (Offshore) (2014–2017). | |
Mitchell E. Appel
(1970) | | Trustee since 2013 | | Mr. Appel serves as President of Value Line Funds (since 2008), as Chief Financial Officer (since 2008) and President (since 2009) of EULAV Securities LLC, and as Chief Executive Officer (since 2009) of EULAV Asset Management. | | | 16 | | | Mr. Appel serves as Director of Value Line Funds (since 2010) and EULAV Asset Management (since 2010). | |
Joseph E. Breslin
(1953) | | Trustee since 2013 | | Mr. Breslin serves as Senior Counsel of White Oak Global Advisors, LLC (since 2016) and has provided consultant services to investment managers (since 2009). Previously, Mr. Breslin served as Counsel of Common fund (2014–2016). | | | 16 | | | Mr. Breslin serves as Director of Kinetics Mutual Funds, Inc. (since 2000), Kinetics Portfolios Trust (since 2000) and Northern Lights Fund Trust IV (since 2015). Previously, Mr. Breslin served as Director of BlueArc Multi-Strategy Fund (2014–2017) and Hatteras Trust (2004–2016). | |
98
Global Atlantic Portfolios
Supplemental Information (Continued)
December 31, 2022 (Unaudited)
Interested Trustees and Officers of the Trust
Name and Year of Birth | | Position/ Term of Office1 | | Principal Occupation During the Past Five Years | | Number of Portfolios in Fund Complex Overseen by Trustee | | Other Directorships held by Trustee During the Past Five Years | |
Robert M.
Arena, Jr.
(1968)2 | | Trustee since 2013 | | Mr. Arena serves as Co-President of The Global Atlantic Financial Group LLC (since 2022); as Director and Co-President of Global Atlantic Financial Group Limited ("GAFGL") (since 2021); as President and Head of Life and Retirement of Ariel Re (Holdings) Limited and Global Atlantic Financial Life Limited (since 2020); as Director and Co-President of Global Atlantic Financial Limited (formerly Commonwealth Re Midco Limited) (since 2019 and 2021, respectively); as Director, Chairman and Co-President of Global Atlantic Financial Company ("GAFC") (since 2017, 2021 and 2021, respectively); as Director and Co-President of Global Atlantic (Fin) Company (since 2017 and 2021, respectively); as Director, Chairman and President of Forethought Life Insurance Company ("FLIC") (since 2016, 2017 and 2016, respectively); as Director, Chairman and President of Commonwealth Annuity and Life Insurance Company ("CWA") and First Allmerica Financial Life Insurance Company ("FAFLIC") (since 2017, 2017 and 2021, respectively); as Director, Chairman and President of Accordia Life and Annuity Company ("Accordia") (since 2016, 2017 and 2021, respectively); as Manager and Chairman of Global Atlantic Investment Advisors, LLC ("GAIA") (since 2016); and as Manager, Chairman and President of Global Atlantic Distributors, LLC ("GAD") (since 2012, 2012 and 2013, respectively). Mr. Arena holds and has previously held comparable positions with GAIA, GAD, FLIC, CWA, and certain other companies affiliated with GAIA. | | | 16 | | | None | |
99
Global Atlantic Portfolios
Supplemental Information (Continued)
December 31, 2022 (Unaudited)
Name and Year of Birth | | Position/ Term of Office1 | | Principal Occupation During the Past Five Years | | Number of Portfolios in Fund Complex Overseen by Trustee | | Other Directorships held by Trustee During the Past Five Years | |
Barrie Ribet3
1982 | | Trustee since 2021 | | Ms. Ribet serves as Managing Director of GAFC (since 2017); as Managing Director of FLIC, CWA, Accordia, and FAFLIC (since 2019); as Managing Director of Global Atlantic Equipment Management, LLC (since 2021); as Director and Chief Executive Officer of Emporium Holdco Inc. and eRESI Holdings, Inc. (since 2021); as Manager and Chief Executive Officer of eRESI Capital Holdco LLC (since 2021); as Chief Executive Officer of eRESI Capital LLC (since 2021) and as Director of Infinity Transportation Equipment Leasing, LLC (since 2021). Previously, Ms. Ribet served as Senior Vice President, Head of Asset Origination of GAFC (from 2015 to 2017). | | | 16 | | | None | |
Eric Todd
1969 | | President and Chief Executive Officer since 2021 | | Mr. Todd is currently Chief Product Officer of GAFC, he also serves as Managing Director of GAFC (since 2015); Manager, President and Chief Investment Officer of GAIA (since 2013); Manager of GAD (since 2016); Director and Managing Director of FLIC (since 2014 and 2018, respectively); and Director and Managing Director of CWA, FAFLIC and Accordia (since 2017 and 2018, respectively). | | | N/A | | | N/A | |
Deborah Schunder
(1967) | | Vice President since 2014 | | Ms. Schunder serves as Senior Vice President, Head of Investment Product Management, Sales Planning and Sales Compensation of GAFC (since 2022). Previously, Ms. Schunder served as Senior Vice President, Head of Investment Product Management, Sales Reporting, Analytics and Compensation of GAFC (2020-2022). Previously, Ms. Schunder served as Vice President of Investment Product Management of GAFC (2013–2020). | | | N/A | | | N/A | |
Trent M. Statczar
(1971) | | Treasurer and Principal Financial Officer since 2019
Principal Accounting Officer since 2021 | | Mr. Statczar serves as Senior Director of Foreside Management Services, LLC (since 2008). | | | N/A | | | N/A | |
100
Global Atlantic Portfolios
Supplemental Information (Continued)
December 31, 2022 (Unaudited)
Name and Year of Birth | | Position/ Term of Office1 | | Principal Occupation During the Past Five Years | | Number of Portfolios in Fund Complex Overseen by Trustee | | Other Directorships held by Trustee During the Past Five Years | |
Sarah M. Patterson
(1976) | | Secretary/Chief Legal Officer since 2013 | | Ms. Patterson serves as Managing Director, General Counsel for Individual Markets and Assistant Secretary for FLIC, Accordia, FAFLIC, CWA and GAFC (since 2019, 2020, and 2014, respectively); as Secretary of GAIA (since 2016); as Managing Director, General Counsel and Secretary of Global Atlantic Insurance Network (since 2019); and as Assistant Secretary of GAD (since 2016). Previously Ms. Patterson served as Associate General Counsel of FLIC, Accordia, FAFLIC, CWA and GAFC (2014–2020), Senior Vice President (2016–2019). | | | N/A | | | N/A | |
David Capalbo
(1968) | | Chief Compliance Officer since 2018 | | Mr. Capalbo serves as Vice President of Investment Compliance of GAFC (since 2022); Vice President of Compliance Operations of GAFC (since 2021); as Chief Compliance Officer and Vice President of GAIA (since 2018 and 2022, respectively); as Vice President, SEC 38a-1 Chief Compliance Officer and Deputy Anti-Money Laundering Officer of CWA, FAFLIC and FLIC (since 2021, 2021 and 2022, respectively); and Vice President of Accordia (since 2021). Previously, Mr. Capalbo served as Assistant Vice President of GAIA (2018–2022) and Assistant Vice President and Senior Compliance Officer of GAFC (2016–2021). | | | N/A | | | N/A | |
Elizabeth Constant
(1976) | | Assistant Secretary since 2017 | | Ms. Constant serves as Vice President and Assistant General Counsel of GAFC (since 2020) and Vice President, Assistant General Counsel and Assistant Secretary of FLIC (since 2021). Previously, Ms. Constant served as Assistant Vice President and Legal Counsel (2016–2020) and Associate Counsel (2014–2016) of GAFC. | | | N/A | | | N/A | |
1 The term of office for each Trustee and officer listed above will continue indefinitely until the individual resigns or is removed.
2 Mr. Arena is an interested person of the Trust because he is an officer of GAFGL.
3 Ms. Ribet is an interested person of the Trust because she is Managing Director of GAFC.
101
PRIVACY NOTICE
FACTS | | WHAT DOES FORETHOUGHT VARIABLE INSURANCE TRUST DO WITH YOUR PERSONAL INFORMATION? | |
WHY? | | Financial companies choose how they share your personal information. Federal law gives consumers the right to limit some, but not all sharing. Federal law also requires us to tell you how we collect, share, and protect your personal information. Please read this notice carefully to understand what we do. | |
WHAT? | | The types of personal information we collect and share depends on the product or service that you have with us. This information can include:
◼ Social Security number and wire transfer instructions
◼ account transactions and transaction history
◼ investment experience and purchase history
When you are no longer our customer, we continue to share your information as described in this notice. | |
HOW? | | All financial companies need to share customers' personal information to run their everyday business. In the section below, we list the reasons financial companies can share their customers' personal information; the reasons Forethought Variable Insurance Trust chooses to share; and whether you can limit this sharing. | |
Reasons we can share your
personal information: | | Does Forethought Variable
Insurance Trust share information? | | Can you limit this sharing? | |
| For our everyday business purposes – such as to process your transactions, maintain your account(s), respond to court orders and legal investigations, or report to credit bureaus. | | Yes | | No | |
| For our marketing purposes – to offer our products and services to you. | | No | | We don't share | |
For joint marketing with other financial companies. | | No | | We don't share | |
| For our affiliates' everyday business purposes – information about your transactions and records. | | No | | We don't share | |
| For our affiliates' everyday business purposes – information about your credit worthiness. | | No | | We don't share | |
For nonaffiliates to market to you | | No | | We don't share | |
102
WHAT WE DO:
How does Forethought Variable Insurance Trust protect my personal information? | | To protect your personal information from unauthorized access and use, we use security measures that comply with federal law. These measures include computer safeguards and secured files and buildings.
Our service providers are held accountable for adhering to strict policies and procedures to prevent any misuse of your nonpublic personal information. | |
How does Forethought Variable Insurance Trust collect my personal information? | | We collect your personal information, for example, when you
◼ open an account or deposit money
◼ direct us to buy securities or direct us to sell your securities
◼ seek advice about your investments
We also collect your personal information from others, such as credit bureaus, affiliates, or other companies. | |
Why can't I limit all sharing? | | Federal law gives you the right to limit only:
◼ sharing for affiliates' everyday business purposes – information about your creditworthiness.
◼ affiliates from using your information to market to you.
◼ sharing for nonaffiliates to market to you.
State laws and individual companies may give you additional rights to limit sharing. | |
DEFINITIONS
Affiliates | | Companies related by common ownership or control. They can be financial and nonfinancial companies.
◼ Forethought Variable Insurance Trust has no affiliates. | |
Nonaffiliates | | Companies not related by common ownership or control. They can be financial and nonfinancial companies.
◼ Forethought Variable Insurance Trust does not share with nonaffiliates so they can market to you. | |
Joint marketing | | A formal agreement between nonaffiliated financial companies that together market financial products or services to you.
◼ Forethought Variable Insurance Trust does not jointly market. | |
103
PROXY VOTING POLICY
Information regarding how the Portfolios voted proxies relating to portfolio securities during the most recent 12-month period ended June 30 is available (1) on or through the Portfolios' website at http://connect.rightprospectus.com/globalatlanticportfolios and (2) on the U.S. Securities and Exchange Commission's website at http://www.sec.gov.
PORTFOLIO HOLDINGS
Each Portfolio files its complete schedule of portfolio holdings with the SEC for the first and third quarters of each fiscal year on Form N-PORT. The Portfolios' Form N-PORTs are available: (i) on the SEC's website at http://www.sec.gov; and (ii) on the Portfolios' website at http://connect.rightprospectus.com/globalatlanticportfolios. Each Portfolio will post to http://connect.rightprospectus.com/globalatlanticportfolios, a complete list of its portfolio holdings as of the last calendar day of each month approximately 30 days following the end of the month. Each Portfolio's portfolio holdings will remain available on the website noted above at least until the next monthly update.
INVESTMENT ADVISER
Global Atlantic Investment Advisors, LLC
10 West Market Street, Suite 2300
Indianapolis, IN 46204
ADMINISTRATOR
The Bank of New York Mellon
240 Greenwich Street
New York, NY 10286
BlackRock Investment Management, LLC
1 University Square Drive
Princeton, NJ 08540-6455
Franklin Advisers, Inc.
One Franklin Parkway
San Mateo, CA 94403
Wilshire Advisors, LLC
1299 Ocean Avenue, Suite700
New York, NY 10282
Milliman Financial Risk Management, LLC
71 S. Wacker Drive, 31st Floor
Chicago, IL 60606
Wellington Management Company LLP
280 Congress Street
Boston, MA 02210
Item 2. Code of Ethics.
| (a) | As of the end of the period covered by this report, the registrant has adopted a code of ethics that applies to the registrant’s principal executive officer, principal financial officer, principal accounting officer or controller, or persons performing similar functions, regardless of whether these individuals are employed by the registrant or a third party. |
| (c) | Amendments: During the period covered by the report, there have not been any amendments to the provisions of the code of ethics. |
| (d) | Waivers: During the period covered by the report, the registrant has not granted any express or implicit waivers from the provisions of the code of ethics. |
| (e) | The Code of Ethics is not posted on the registrant’s website. |
| (f) | A copy of the Code of Ethics is filed herewith. |
Item 3. Audit Committee Financial Expert.
The board of Trustees of the registrant has determined that the registrant has at least one “audit committee financial expert” as defined by Item 3 of Form N-CSR serving on its audit committee. Joseph E. Breslin is the “audit committee financial expert” and is “independent” (as each term is defined in Item 3 of Form N-CSR).
Item 4. Principal Accountant Fees and Services.
Audit Fees
| (a) | The aggregate fees billed for each of the last two fiscal years for professional services rendered by the principal accountant for the audit of the registrant's annual financial statements or services that are normally provided by the accountant in connection with statutory and regulatory filings or engagements for those fiscal years are: |
| 2021 | | | 2022 | |
| $ | 300,000 | | | $ | 330,000 | |
Audit-Related Fees
| (b) | The aggregate fees billed in each of the last two fiscal years for assurance and related services by the principal accountant that are reasonably related to the performance of the audit of the registrant's financial statements and are not reported under paragraph (a) of this Item are: |
Tax Fees
| (c) | The aggregate fees billed in each of the last two fiscal years for professional services rendered by the principal accountant for tax compliance, tax advice, and tax planning are: |
| 2021 | | | 2022 | |
| $ | 78,250 | | | $ | 60,000 | |
Preparation of Federal & State income tax returns, assistance with calculation of required income and capital gain distributions.
All Other Fees
| (d) | The aggregate fees billed in each of the last two fiscal years for products and services provided by the principal accountant, other than the services reported in paragraphs (a) through (c) of this Item are: |
| 2021 | | | 2022 | |
| $ | 24,000 | | | $ | 17,500 | |
Review of annual registration statement filings for 2021 and 2022 and a fee for review of portfolio reorganization activities in 2021.
Audit Committee’s Pre-Approval Policies
| (e)(1) | The registrant’s Audit Committee is required to pre-approve all audit services and, when appropriate, any non-audit services (including audit-related, tax and all other services) to the registrant. The registrant’s Audit Committee also is required to pre-approve, when appropriate, any non-audit services (including audit-related, tax and all other services) to its adviser, or any entity controlling, controlled by or under common control with the adviser that provides ongoing services to the registrant, to the extent that the services may be determined to have an impact on the operations or financial reporting of the registrant. Services are reviewed on an engagement by engagement basis by the Audit Committee. |
Percentages of Services Approved by the Audit Committee
| (e)(2) | The percentage of services described in each of paragraphs (b) through (d) of this Item that were approved by the audit committee pursuant to paragraph (c)(7)(i)(C) of Rule 2-01 of Regulation S-X are as follows: |
All services described in paragraphs (b) through (d) of Item 4 were pre-approved by the Audit Committee.
| (f) | During the audit of registrant's financial statements for the most recent fiscal year, less than 50 percent of the hours expended on the principal accountant's engagement were attributed to work performed by persons other than the principal accountant's full-time, permanent employees. |
| (g) | The aggregate non-audit fees billed by the registrant's accountant for services rendered to the registrant, and rendered to the registrant's investment adviser (not including any sub-adviser whose role is primarily portfolio management and is subcontracted with or overseen by another investment adviser), and any entity controlling, controlled by, or under common control with the adviser that provides ongoing services to the registrant for each of the last two fiscal years of the registrant for the fiscal year ended December 31, 2022 were $75,500 and $0, respectively and for the fiscal year ended December 31, 2021, were $102,250 and $0, respectively. |
| (h) | The audit committee considered the non-audit services rendered to the registrant’s investment adviser and any entity controlling, controlled by, or under common control with the investment adviser, and believes the services are compatible with the principal accountant’s independence. |
Item 5. Audit Committee of Listed Registrants.
Not applicable.
Item 6. Investments.
| (a) | Schedule of Investments in securities of unaffiliated issuers as of the close of the reporting period is included as part of the report to shareholders filed under Item 1(a) of this form. |
Item 7. Disclosure of Proxy Voting Policies and Procedures for Closed-End Management Investment Companies.
Not applicable.
Item 8. Portfolio Managers of Closed-End Management Investment Companies.
Not applicable.
Item 9. Purchases of Equity Securities by Closed-End Management Investment Company and Affiliated Purchasers.
Not applicable.
Item 10. Submission of Matters to a Vote of Security Holders.
Not applicable.
Item 11. Controls and Procedures.
| (a) | Based on an evaluation of the registrant’s disclosure controls and procedures as of a date within 90 days of filing date of this Form N-CSR, the principal executive officer and principal financial officer of the registrant have concluded that the disclosure controls and procedures of the registrant are reasonably designed to ensure that the information required in filings on Form N-CSR is recorded, processed, summarized, and reported by the filing date, including that information required to be disclosed is accumulated and communicated to the registrant’s management, including the registrant’s principal executive officer and principal financial officer, as appropriate to allow timely decisions regarding required disclosure. |
| (b) | There were no changes in the registrant’s internal control over financial reporting (as defined in Rule 30a-3(d) under the 1940 Act (17 CFR 270.30a-3(d))) that occurred during the period covered by this report that has materially affected, or are reasonably likely to materially affect, the registrant’s internal control over financial reporting. |
Item 12. Disclosure of Securities Lending Activities for Closed-End Management Investment Companies.
Not applicable.
Item 13. Exhibits.
SIGNATURES
Pursuant to the requirements of the Securities Exchange Act of 1934 and the Investment Company Act of 1940, the registrant has duly caused this report to be signed on its behalf by the undersigned, thereunto duly authorized.
| (Registrant) | Forethought Variable Insurance Trust |
| By (Signature and Title)* | /s/ Trent M. Statczar |
| | Trent M. Statczar, Treasurer |
| | Treasurer (Principal Financial Officer and Principal Accounting Officer) |
Pursuant to the requirements of the Securities Exchange Act of 1934 and the Investment Company Act of 1940, this report has been signed below by the following persons on behalf of the registrant and in the capacities and on the dates indicated.
| By (Signature and Title)* | /s/ Eric D. Todd |
| | Eric D. Todd President |
| | President (Principal Executive Officer) |
| By (Signature and Title)* | /s/ Trent M. Statczar |
| | Trent M. Statczar, Treasurer |
| | Treasurer (Principal Financial Officer and Principal Accounting Officer) |
* Print the name and title of each signing officer under his or her signature.