UNITED STATES
SECURITIES AND EXCHANGE COMMISSION
Washington, D.C. 20549
FORM N-CSR
CERTIFIED SHAREHOLDER REPORT OF REGISTERED MANAGEMENT INVESTMENT COMPANIES
Investment Company Act file number 811-22865
Forethought Variable Insurance Trust
(Exact name of registrant as specified in charter)
10 West Market Street, Suite 2300
Indianapolis, Indiana 46204
(Address of principal executive offices) (Zip code)
The Corporation Trust Company
1209 Orange Street Wilmington, DE 19801
(Name and address of agent for service)
Registrant's telephone number, including area code: 877-355-1820
Date of fiscal year end: December 31
Date of reporting period: December 31, 2023
Form N-CSR is to be used by management investment companies to file reports with the Commission not later than 10 days after the transmission to stockholders of any report that is required to be transmitted to stockholders under Rule 30e-1 under the Investment Company Act of 1940 (17 CFR 270.30e-1). The Commission may use the information provided on Form N-CSR in its regulatory, disclosure review, inspection, and policymaking roles.
A registrant is required to disclose the information specified by Form N-CSR, and the Commission will make this information public. A registrant is not required to respond to the collection of information contained in Form N-CSR unless the Form displays a currently valid Office of Management and Budget (“OMB”) control number. Please direct comments concerning the accuracy of the information collection burden estimate and any suggestions for reducing the burden to Secretary, Securities and Exchange Commission, 450 Fifth Street, NW, Washington, DC 20549-0609. The OMB has reviewed this collection of information under the clearance requirements of 44 U.S.C. § 3507.
Item 1. Reports to Stockholders.
| (a) | Include a copy of the report transmitted to stockholders pursuant to Rule 30e-1 under the Act (17 CFR 270.30e-1). |

Annual Report
December 31, 2023
Global Atlantic Portfolios
Global Atlantic American Funds® Managed Risk Portfolio
Global Atlantic Balanced Managed Risk Portfolio
Global Atlantic BlackRock Selects Managed Risk Portfolio
Global Atlantic Franklin Dividend and Income Managed Risk Portfolio
Global Atlantic Growth Managed Risk Portfolio
Global Atlantic Moderate Growth Managed Risk Portfolio
Global Atlantic Select Advisor Managed Risk Portfolio
Global Atlantic Wellington Research Managed Risk Portfolio
Class II shares
Each a separate series of the Forethought Variable Insurance Trust
Distributed by Global Atlantic Distributors, LLC
Member FINRA
Dear Shareholders/Contract Owners:
The U.S. Federal Reserve (the "Fed") slowed the pace and size of interest rate increases in 2023 (the "Period"), implementing just four 25 basis point hikes versus the seven totaling 425 basis points in 2022 as economic data began to soften in the third and fourth quarters of 2023. The path to reach this point, however, was anything but smooth, as periods of heightened volatility throughout the year were driven by a variety of events and circumstances. From March through May 2023, the surprise failures of three U.S. banks and the acquisition of troubled Credit Suisse Group AG by UBS Group AG, generated concerns of another global financial crisis. This was largely averted due to the rapid response from regulators and the banking industry. Although the Fed paused its rate hiking path in June, they raised rates in July given the continued strength of inflation and economic data, particularly the labor market. This increase in July represented the Fed's last interest rate increase of 2023 as signs of softening in the economy began to appear through the summer, prompting the Fed to hold steady on rates. As we moved into the fourth quarter, some weaker than expected inflation and employment data points in November were perhaps an inflection point for both the economy and the Fed. During November and December, treasury yields declined significantly – approximately 100 basis points across the yield curve – on the widely held view that the Fed is finished raising interest rates. This prompted a meaningful equity rally, with many indices globally rising 10-20%. The market's focus has now shifted to the timing of the Fed's interest rate cuts, where many are expecting reductions to begin in the first half of 2024 despite Fed guidance that cuts should not be expected until later in the year.
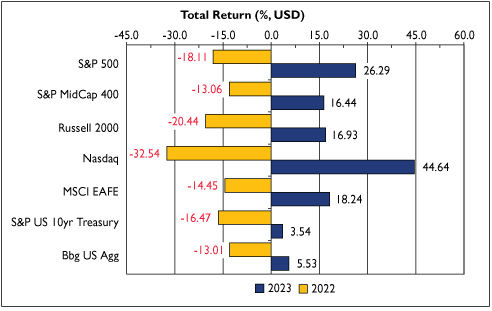
Interest rate expectations were a key driver of both equity and fixed income returns in 2023. Although there was significant volatility in U.S. Treasury yields during the Period as market expectations regarding future Fed increases and decreases changed frequently, Treasury yields at Period end were relatively flat compared to year-end 2022. Furthermore, the yield curve remained inverted throughout the Period, meaning short-term rates were higher than long-term rates, albeit slightly less-so year over year. Despite this backdrop of heightened volatility, equity indices generally posted strong returns in 2023, more than making up for the losses suffered in 2022. Fixed income generally posted positive returns as well, however unlike equities, they did not make up for the steep losses incurred in 2022 when global central banks began to aggressively tighten monetary policy.
Although it appears that we are at, or near, the end of the rate hiking cycle, there is a disconnect on the timing of the interest rate cuts in 2024, with the Fed's guidance that cuts will come later and market expectations that cuts will come sooner. In our view, this could lead to continued market volatility until one side is "proven correct". Notably, the Fed has indicated that they would only cut rates earlier than their guidance if a recession was likely. Not to be overlooked, geopolitical conflicts in the Middle East and Europe continue to provide a meaningful degree of uncertainty.
Thank you for investing in the Global Atlantic Portfolios.
Sincerely, | |

| | 
| |
Eric D. Todd, CFA | | Cameron Jeffreys, CFA | |
President | | Senior Vice President | |
Global Atlantic Investment Advisors, LLC | | Global Atlantic Investment Advisors, LLC | |
1
Portfolio | | Benchmark | |
Global Atlantic American Funds® Managed Risk Portfolio | | S&P Global Managed Risk LargeMidCap Index – Moderate Conservative | |
Global Atlantic Balanced Managed Risk Portfolio | | S&P Global Managed Risk LargeMidCap Index – Conservative | |
Global Atlantic BlackRock Selects Managed Risk Portfolio | | S&P Global Managed Risk LargeMidCap Index – Moderate Conservative | |
Global Atlantic Franklin Dividend and Income Managed
Risk Portfolio | | S&P 500 Managed Risk Index – Moderate | |
Global Atlantic Growth Managed Risk Portfolio | | S&P Global Managed Risk LargeMidCap Index – Moderate Aggressive | |
Global Atlantic Moderate Growth Managed Risk Portfolio | | S&P Global Managed Risk LargeMidCap Index – Moderate Conservative | |
Global Atlantic Select Advisor Managed Risk Portfolio | | S&P Global Managed Risk LargeMidCap Index – Moderate | |
Global Atlantic Wellington Research Managed Risk Portfolio | | S&P 500 Managed Risk Index – Moderate Conservative | |
The indices shown are for informational purposes only and are not reflective of any investment. As it is not possible to invest directly in the indices, the data shown does not reflect or compare features of an actual investment, such as its objectives, costs and expenses, liquidity, safety, guarantees or insurance, fluctuation of principal or return, or tax features. Past performance is no guarantee of future results.
This report contains the current opinions of Global Atlantic Investment Advisors, LLC and/or sub-advisers at the time of its publication and should not be considered investment advice or a recommendation of any particular security, strategy or investment product. Such opinions are subject to change without notice and securities described herein may no longer be included in, or may at any time be removed from, a Portfolio's portfolio. This report is distributed for informational purposes only. Information contained herein has been obtained from sources believed to be reliable, but not guaranteed.
Index Definitions:
Bloomberg Global Aggregate Index. A broad global investment grade fixed income index comprising a variety of currencies, treasuries, government-related and securitized fixed-rate bonds from both developed and emerging markets issuers.
Bloomberg U.S. Aggregate Bond Index ("Bbg US Agg"). An index weighted according to market capitalization and includes, among other categories, Treasury securities, mortgage-backed securities, government agency bonds and corporate bonds. To be included in the index, bonds must be rated investment grade by Moody's and S&P Global Ratings.
MSCI EAFE Total Return Index ("MSCI EAFE"). An index created by Morgan Stanley Capital International (MSCI) that serves as a benchmark of the performance in major developed international equity markets as represented by 21 major MSCI indexes from Europe, Australasia and the Far East.
Nasdaq Composite ("Nasdaq"). A broad-based market capitalization-weighted index of over 3,700 stocks listed on the Nasdaq Stock Exchange. As a broad index that is heavily weighted toward the technology sector, the Nasdaq serves as a benchmark for technology stocks in the United States.
Russell 2000® Index ("Russell 2000"). An index measuring the performance of approximately 2,000 small-cap companies in the Russell 3000 Index, which is made up of 3,000 of the biggest U.S. stocks. The Russell 2000 serves as a benchmark for small-cap stocks in the United States.
S&P 500 Index ("S&P 500"). A market capitalization weighted price index composed of 500 widely held U.S. common stocks. Frequently used as a measure of U.S. stock market performance.
S&P 500 Managed Risk Index – Moderate. An index that is designed to simulate a dynamic protective portfolio that allocates between the underlying equity index and cash based on realized volatilities of the underlying equity and bond indices, while maintaining a fixed allocation of 30% to the underlying bond index.
S&P 500 Managed Risk Index – Moderate Conservative. An index that is designed to simulate a dynamic protective portfolio that allocates between the underlying equity index and cash based on realized volatilities of the underlying equity and bond indices, while maintaining a fixed allocation of 40% to the underlying bond index.
2
S&P Global Managed Risk LargeMidCap Index – Conservative. An index that is designed to simulate a dynamic protective portfolio that allocates between the underlying equity index and cash based on realized volatilities of the underlying equity and bond indices, while maintaining a fixed allocation of 50% to the underlying bond index.
S&P Global Managed Risk LargeMidCap Index – Moderate. An index that is designed to simulate a dynamic protective portfolio that allocates between the underlying equity index and cash based on realized volatilities of the underlying equity and bond indices, while maintaining a fixed allocation of 30% to the underlying bond index.
S&P Global Managed Risk LargeMidCap Index – Moderate Aggressive. An index that is designed to simulate a dynamic protective portfolio that allocates between the underlying equity index and cash based on realized volatilities of the underlying equity and bond indices, while maintaining a fixed allocation of 20% to the underlying bond index.
S&P Global Managed Risk LargeMidCap Index – Moderate Conservative. An index that is designed to simulate a dynamic protective portfolio that allocates between the underlying equity index and cash based on realized volatilities of the underlying equity and bond indices, while maintaining a fixed allocation of 40% to the underlying bond index.
S&P MidCap 400 Total Return Index ("S&P MidCap 400"). A capitalization-weighted index which measures the performance of the mid-range sector of the U.S. stock market.
S&P U.S. Treasury Bond Current 10-Year Index ("S&P U.S. 10yr Treasury"). An index that holds the most recently issued 10-year U.S. Treasury Note or bond.
3404124
3
| | | | | Page | |
• | | Global Atlantic Portfolio Review and Portfolio of Investments | | | |
| | | Global Atlantic American Funds® Managed Risk Portfolio | | | 5 – 8 | | |
| | | Global Atlantic Balanced Managed Risk Portfolio | | | 9 – 11 | | |
| | | Global Atlantic BlackRock Selects Managed Risk Portfolio | | | 12 – 15 | | |
| | | Global Atlantic Franklin Dividend and Income Managed Risk Portfolio | | | 16 – 26 | | |
| | | Global Atlantic Growth Managed Risk Portfolio | | | 27 – 30 | | |
| | | Global Atlantic Moderate Growth Managed Risk Portfolio | | | 31 – 34 | | |
| | | Global Atlantic Select Advisor Managed Risk Portfolio | | | 35 – 38 | | |
| | | Global Atlantic Wellington Research Managed Risk Portfolio | | | 39 – 52 | | |
• | | Financial Statements: | | | |
| | | Statements of Assets and Liabilities | | | 53 – 54 | | |
| | | Statements of Operations | | | 55 – 56 | | |
| | | Statements of Changes in Net Assets | | | 57 – 60 | | |
| | | Financial Highlights | | | 61 – 68 | | |
• | | Notes to Financial Statements | | | 69 – 88 | | |
• | | Report of Independent Registered Accounting Firm | | | 89 | | |
• | | Expense Examples | | | 90 – 91 | | |
• | | Supplemental Information | | | 92 – 93 | | |
• | | Trustee and Officer Table | | | 94 – 97 | | |
• | | Privacy Notice | | | 98 – 99 | | |
• | | Proxy Voting Policy | | | Back Cover | | |
• | | Portfolio Holdings | | | Back Cover | | |
4
Global Atlantic American Funds® Managed Risk Portfolio
Portfolio Review
December 31, 2023 (Unaudited)
Investment Objective
The Portfolio seeks to provide capital appreciation and income while seeking to manage volatility.
Management Review
The capital appreciation and income component is sub-advised by Wilshire Advisors LLC ("Wilshire"), while the managed risk component is sub-advised by Milliman Financial Risk Management LLC ("Milliman").
How did the Portfolio perform during the period?
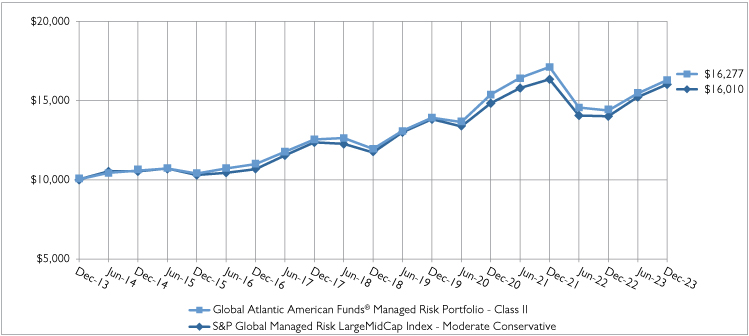
During 2023, the Portfolio underperformed its reference benchmark, the S&P Global Managed Risk LargeMidCap Index – Moderate Conservative. The Portfolio posted a return of 13.27% compared to a benchmark return of 14.46%, a difference of -119 basis points. The following discussion of relative performance pertains to this benchmark.
What factors and allocation decisions influenced the Portfolio's performance?
The Portfolio was impacted by both dynamic asset allocation as well as manager selection during 2023. Within equities, the Portfolio maintained a largely neutral position for much of the year. Within global equities, a small overweight to global small cap equities and an overweight to emerging markets equities relative to foreign developed equities detracted modestly from returns. Within fixed income, a modest overweight relative to equities and in government securities relative to credit detracted modestly from returns. From a manager selection perspective, those within equities contributed to performance, particularly the American Funds® (AFIS) Washington Mutual Investors Fund, while those within fixed income detracted from returns, particularly the American Funds Insurance Series® The Bond Fund of America.
The Portfolio made several allocation changes during the year. While there were no allocation changes made during the first quarter, Wilshire removed an overall overweight position to credit and initiated a more targeted overweight position in investment grade credit relative to high yield during the second quarter to improve the credit quality of the Portfolio. During the third quarter, the Portfolio initiated an overweight position to government fixed income relative to investment grade credit, and due to the relative attractiveness of core fixed income, the Portfolio implemented a modestly overweight position in fixed income relative to equities during the fourth quarter.
From a volatility perspective, while the Milliman Managed Risk Strategy ("MMRS") was a contributor to performance in 2022 when volatility was more sustained and market returns were negative, it was a meaningful detractor from performance in 2023, as several significant yet brief episodes of heightened volatility, particularly surrounding interest rates, spooked markets. As concerns around inflation, U.S. Federal Reserve policy, and economic growth increased at different times throughout the year, the MMRS, as designed, sought to reduce volatility and limit downside risk. However, because markets recovered quickly in each instance, the Portfolio's defensive positioning resulted in the MMRS being a detractor to performance during 2023.
How was the Portfolio positioned at period end?
At year-end, the Portfolio was defensively positioned with a modest overweight towards fixed income to weather a potentially volatile market environment for risk assets. Within fixed income, the Portfolio is tilted toward high-quality government securities and underweight credit sectors, while within equities, the Portfolio is neutral across geographies, market capitalization, and styles.
The fight against inflation and economic growth continued to be the focal point of 2023. Through efforts of the central banks, both U.S. and non-U.S. developed economies experienced a downward trend of inflation throughout the year. With inflationary pressure softening, Wilshire believes that fixed income is attractively priced and expects it to generate attractive positive real returns going forward. Globally, developed markets displayed resiliency and generated double-digit returns in 2023 despite a bearish view of the equity risk premium going into the year. During 2024, Wilshire believes that U.S. and non-U.S. developed equities are unlikely to generate levels of return that compare to the strong returns recorded during 2023,
5
Global Atlantic American Funds® Managed Risk Portfolio
Portfolio Review (Continued)
December 31, 2023 (Unaudited)
though central bank easing could provide a tailwind to risk assets that keeps equities in positive territory for the year. While the degree of an economic slowdown around the world is hard to forecast, Wilshire believes it is unlikely that either domestic or foreign developed equities will go through a severe slowdown. Overall, the Portfolio is positioned slightly defensively with a modest overweight to fixed income.
The Portfolio's performance figures for the periods ended December 31, 2023 as compared to its benchmark:
| | | | | | | Annualized | | Operating
Expense* | |
| | | Inception
Date | | One
Year | | Five
Years | | Ten
Years | | Gross
Ratio | | Net
Ratio | |
Global Atlantic American Funds® Managed Risk Portfolio | |
Class II | | October 31, 2013 | | | 13.27 | % | | | 6.41 | % | | | 4.99 | % | | | 1.56 | % | | | 1.16 | % | |
S&P Global Managed Risk LargeMidCap Index - Moderate Conservative^ | | | | | | | 14.46 | % | | | 6.49 | % | | | 4.82 | % | | | | | | | |
The performance data quoted is historical. Past performance is no guarantee of future results. Current performance may be higher or lower than the performance data quoted. The principal value and investment return of an investment will fluctuate so that your shares, when redeemed, may be worth more or less than their original cost. Total returns would have been lower absent fee waivers by the Adviser. Performance figures for periods greater than one year are annualized. The returns shown do not reflect the deduction of taxes that a shareholder may pay on Portfolio distributions or on the redemption of Portfolio shares, as well as other charges and expenses of the insurance contract or separate account. Prior to October 1, 2016, the Capital Appreciation and Income Component of the Portfolio was managed by the Adviser without the use of a sub-adviser. The performance prior to that date is attributable to the Adviser's asset allocation decisions.
* The estimated operating expense ratios for Class II shares, as disclosed in the most recent prospectus dated May 1, 2023. Ratios include Acquired Fund Fees and Expenses indirectly incurred by the Portfolio. Gross operating expense ratio reflects the ratio of expenses absent waivers and/or reimbursements by the Adviser. The operating expense ratios presented here may differ from the expense ratios disclosed in the Financial Highlights table in this report.
^ The S&P Global Managed Risk LargeMidCap Index - Moderate Conservative. An index that is designed to simulate a dynamic protective portfolio that allocates between the underlying equity index and cash based on realized volatilities of the underlying equity and bond indices, while maintaining a fixed allocation of 40% to the underlying bond index.
Comparison of the Change in Value of a $10,000 Investment
6
Global Atlantic American Funds® Managed Risk Portfolio
Portfolio Review (Continued)
December 31, 2023 (Unaudited)
Holdings by Asset Class | | % of Net Assets | |
Variable Insurance Trusts | | | 86.8 | % | |
Mutual Funds | | | 8.7 | % | |
Short-Term Investments | | | 4.6 | % | |
Other Assets less Liabilities - Net | | | (0.1 | )% | |
| | | | 100.0 | % | |
Please refer to the Portfolio of Investments in this annual report for more information regarding the Portfolio's holdings as of December 31, 2023.
3404166
7
Global Atlantic American Funds® Managed Risk Portfolio
Portfolio of Investments
December 31, 2023
| | | Shares/
Principal | | Fair
Value | |
VARIABLE INSURANCE TRUSTS - 86.8% | |
DEBT FUNDS - 34.9% | |
American Funds Insurance Series -
American High-Income Trust, Class 1 | | | 175,347 | | | $ | 1,567,600 | | |
American Funds Insurance Series -
The Bond Fund of America, Class 1 (a) | | | 4,569,778 | | | | 43,595,682 | | |
American Funds Insurance Series -
U.S. Government Securities Fund, Class 1 | | | 1,255,001 | | | | 12,437,062 | | |
TOTAL DEBT FUNDS | | | | | 57,600,344 | | |
EQUITY FUNDS - 51.9% | |
American Funds Insurance Series -
Capital World Growth and
Income Fund, Class 1 | | | 1,037,409 | | | | 14,368,117 | | |
American Funds Insurance Series -
Global Small Capitalization Fund, Class 1 | | | 178,743 | | | | 3,319,254 | | |
American Funds Insurance Series -
Washington Mutual Investors Fund, Class 1 | | | 1,637,812 | | | | 23,731,895 | | |
American Funds Insurance Series
Growth Fund, Class 1 | | | 237,545 | | | | 23,621,440 | | |
American Funds Insurance Series
Growth-Income Fund, Class 1 | | | 346,934 | | | | 20,559,332 | | |
TOTAL EQUITY FUNDS | | | | | 85,600,038 | | |
TOTAL VARIABLE INSURANCE TRUSTS
(Cost - $127,236,541) | | | | | 143,200,382 | | |
| | | Shares/
Principal | | Fair
Value | |
MUTUAL FUNDS - 8.7% | |
EQUITY FUNDS - 8.7% | |
American Funds International Growth
and Income Fund (Cost - $14,669,453) | | | 400,181 | | | $ | 14,346,476 | | |
SHORT-TERM INVESTMENTS - 4.6% | |
MONEY MARKET FUNDS - 4.6% | |
Dreyfus Government Cash
Management, 5.25% (b) | | | 7,336,822 | | | | 7,336,822 | | |
Fidelity Investments Money Market
Fund - Government Portfolio,
Institutional Class, 5.25% (b) | | | 219,152 | | | | 219,152 | | |
TOTAL SHORT-TERM INVESTMENTS
(Cost - $7,555,974) | | | | | 7,555,974 | | |
TOTAL INVESTMENTS - 100.1%
(Cost - $149,461,968) | | | | $ | 165,102,832 | | |
OTHER ASSETS LESS LIABILITIES - NET (0.1)% | | | | | (197,370 | ) | |
TOTAL NET ASSETS - 100.0% | | | | $ | 164,905,462 | | |
(a) The fair value of this holding exceeds 25% of the Fund's net assets. Additional information for this holding, including financial statements, is available from the SEC's EDGAR database at www.sec.gov.
(b) The rate shown is the annualized seven-day yield at period end.
See accompanying notes to financial statements.
8
Global Atlantic Balanced Managed Risk Portfolio
Portfolio Review
December 31, 2023 (Unaudited)
Investment Objective
The Portfolio seeks to provide capital appreciation and income while seeking to manage volatility.
Management Review
The capital appreciation and income component is sub-advised by BlackRock Investment Management, LLC ("BlackRock"), while the managed risk component is sub-advised by Milliman Financial Risk Management LLC ("Milliman").
How did the Portfolio perform during the period?
During 2023, the Portfolio underperformed its reference benchmark, the S&P Global Managed Risk LargeMidCap Index – Conservative. The Portfolio posted a return of 10.81% compared to a benchmark return of 12.49%, a difference of -168 basis points. The following discussion of relative performance pertains to this benchmark unless otherwise noted.
What factors and allocation decisions influenced the Portfolio's performance?
In contrast to a very difficult 2022 where nearly all asset classes posted significantly negative returns, 2023 saw a meaningful reversal, particularly in equities. Equity markets had a strong start in January, resulting in some of the Portfolio's factor exposures, namely U.S. minimum volatility and U.S. momentum equities, detracting from overall performance. Furthermore, an overweight to global energy equities hurt returns amidst falling commodity prices and moderating inflation. As the generative artificial intelligence ("AI") theme unfolded in 2023, through May, the U.S. equity market was dominated by the performance of a narrow set of stocks, the "Magnificent 7" technology giants (Alphabet, Amazon, Apple, Meta Platforms, Microsoft, NVIDIA, and Tesla). With this, BlackRock's overweight to technology equities, alongside a regional overweight to U.S. equities, emerged as the biggest contributors to performance. Unexpected positive earnings and the expected end of the U.S. Federal Reserve's (the "Fed") interest rate hiking cycle acted as tailwinds for BlackRock's risk-on stance in the latter part of the year. Consequently, on an asset allocation basis, the Portfolio benefited from its overweight position in equities in the fourth quarter.
Within fixed income, the Portfolio benefited from an overweight position in investment grade credit. While an overweight position to long duration treasuries contributed positively as bond yields fell in the fourth quarter, it was a detractor from Portfolio performance over the entire year. BlackRock maintained this position as a diversifier to the Portfolio's equity exposure.
From a volatility perspective, while the Milliman Managed Risk Strategy ("MMRS") was a significant contributor to performance in 2022 when volatility was more sustained and market returns were negative, it was a meaningful detractor to performance in 2023, as several significant yet brief episodes of heightened volatility, particularly surrounding interest rates, spooked markets. As concerns around inflation, Fed policy, and economic growth increased at different times throughout the year, the MMRS, as designed, sought to reduce volatility and limit downside risk. However, because markets recovered quickly in each instance, the Portfolio's defensive positioning resulted in the MMRS being a detractor to performance during 2023.
How was the Portfolio positioned at period end?
Amidst a backdrop of robust real economic activity, consumer resilience, and upward revisions in earnings despite interest rate hikes, BlackRock shifted to a cautious risk-on stance in the fourth quarter. This involved shifting to an overweight in equities and repositioning the Portfolio within equity and fixed income. BlackRock believes that the prospects for earnings growth appear most promising in the U.S. As a result, the Portfolio is overweight U.S. equities relative to non-U.S. developed markets and emerging market equities. Specifically, within U.S. equities, the Portfolio retains an overweight position in growth, technology, and quality equities, and has increased its exposure to mega-cap equities. As a hedge to its pro-growth and pro-technology exposure, BlackRock has introduced an overweight to global energy equities. In non-U.S. developed equities, the Portfolio maintains an overweight to value to balance the overweight position in U.S. growth.
Within fixed income, BlackRock maintains a duration barbell, with overweight positions in short duration fixed income to take advantage of the high front-end rates, and long duration treasuries as a diversifier to our equity exposure. BlackRock also increased the Portfolio's exposure to investment grade credit to take advantage of elevated yields.
9
Global Atlantic Balanced Managed Risk Portfolio
Portfolio Review (Continued)
December 31, 2023 (Unaudited)
The Portfolio's performance figures for the periods ended December 31, 2023 as compared to its benchmark:
| | | | | | | Annualized | | Operating
Expense* | |
| | | Inception
Date | | One
Year | | Five
Years | | Ten
Years | | Gross
Ratio | | Net
Ratio | |
Global Atlantic Balanced Managed Risk Portfolio | |
Class II | | October 31, 2013 | | | 10.81 | % | | | 4.99 | % | | | 3.88 | % | | | 1.00 | % | | | 1.00 | % | |
S&P Global Managed Risk LargeMidCap Index - Conservative^ | | | | | | | 12.49 | % | | | 5.55 | % | | | 4.36 | % | | | | | | | |
The performance data quoted is historical. Past performance is no guarantee of future results. Current performance may be higher or lower than the performance data quoted. The principal value and investment return of an investment will fluctuate so that your shares, when redeemed, may be worth more or less than their original cost. Total returns would have been lower absent fee waivers by the Adviser. Performance figures for periods greater than one year are annualized. The returns shown do not reflect the deduction of taxes that a shareholder may pay on Portfolio distributions or on the redemption of Portfolio shares, as well as other charges and expenses of the insurance contract or separate account. Prior to October 1, 2016, the Capital Appreciation and Income Component of the Portfolio was managed by the Adviser without the use of a sub-adviser. The performance prior to that date is attributable to the Adviser's asset allocation decisions. From October 1, 2016 to May 1, 2021, BlackRock Financial Management, Inc. served as a sub-adviser to the Capital Appreciation and Income Component of the Portfolio. In addition, effective May 1, 2021 the sub-adviser to the Capital Appreciation and Income Component of the Portfolio changed from BlackRock Financial Management, Inc. to BlackRock Investment Management, LLC. No changes were made to the Portfolio's principal investment strategies or to the portfolio management team as a result of the change in sub-adviser.
* The estimated operating expense ratios for Class II shares, as disclosed in the most recent prospectus dated May 1, 2023. Ratios include Acquired Fund Fees and Expenses indirectly incurred by the Portfolio. Gross operating expense ratio reflects the ratio of expenses absent waivers and/or reimbursements by the Adviser. The operating expense ratios presented here may differ from the expense ratios disclosed in the Financial Highlights table in this report.
^ The S&P Global Managed Risk LargeMidCap Index - Conservative is designed to simulate a dynamic protective portfolio that allocates between the underlying equity index and cash, based on realized volatilities of the underlying equity and bond indices, while maintaining a fixed allocation of 50% to the underlying bond index.
Comparison of the Change in Value of a $10,000 Investment

Holdings by Asset Class | | % of Net Assets | |
Exchange Traded Funds | | | 95.4 | % | |
Short-Term Investments | | | 4.7 | % | |
Other Assets less Liabilities - Net | | | (0.1 | )% | |
| | | | 100.0 | % | |
Please refer to the Portfolio of Investments in this annual report for more information regarding the Portfolio's holdings as of December 31, 2023.
3404166
10
Global Atlantic Balanced Managed Risk Portfolio
Portfolio of Investments
December 31, 2023
| | | Shares/
Principal | | Fair
Value | |
EXCHANGE TRADED FUNDS - 95.4% | |
DEBT FUNDS - 44.9% | |
iShares 10+ Year Investment Grade
Corporate Bond ETF | | | 35,528 | | | $ | 1,871,970 | | |
iShares 10-20 Year Treasury Bond ETF | | | 5,586 | | | | 604,740 | | |
iShares 1-3 Year Treasury Bond ETF | | | 28,907 | | | | 2,371,530 | | |
iShares 1-5 Year Investment Grade
Corporate Bond ETF | | | 39,768 | | | | 2,039,104 | | |
iShares 20+ Year Treasury Bond ETF | | | 49,530 | | | | 4,897,526 | | |
iShares 3-7 Year Treasury Bond ETF | | | 23,253 | | | | 2,723,624 | | |
iShares 5-10 Year Investment Grade
Corporate Bond ETF | | | 35,907 | | | | 1,867,164 | | |
iShares 7-10 Year Treasury Bond ETF | | | 7,436 | | | | 716,756 | | |
iShares Core U.S. Aggregate Bond ETF | | | 56,874 | | | | 5,644,745 | | |
iShares iBoxx $ Investment Grade
Corporate Bond ETF | | | 25,494 | | | | 2,821,166 | | |
iShares J.P. Morgan USD Emerging
Markets Bond ETF | | | 10,031 | | | | 893,361 | | |
iShares MBS ETF | | | 61,736 | | | | 5,808,123 | | |
iShares TIPS Bond ETF | | | 11,234 | | | | 1,207,543 | | |
iShares Treasury Floating Rate Bond ETF | | | 97,257 | | | | 4,908,561 | | |
TOTAL DEBT FUNDS | | | | | 38,375,913 | | |
EQUITY FUNDS - 50.5% | |
iShares Core MSCI EAFE ETF | | | 57,560 | | | | 4,049,346 | | |
iShares Core MSCI Emerging Markets ETF | | | 4,924 | | | | 249,056 | | |
iShares Core S&P 500 ETF (a) | | | 49,263 | | | | 23,529,487 | | |
iShares Core S&P Mid-Cap ETF | | | 12,187 | | | | 3,377,627 | | |
iShares Core S&P Small-Cap ETF | | | 16,402 | | | | 1,775,516 | | |
| | | Shares/
Principal | | Fair
Value | |
EQUITY FUNDS - 50.5% (Continued) | |
iShares Global Energy ETF | | | 5,561 | | | $ | 217,491 | | |
iShares MSCI EAFE Growth ETF | | | 9,612 | | | | 930,922 | | |
iShares MSCI EAFE Value ETF | | | 28,104 | | | | 1,464,218 | | |
iShares MSCI USA Quality Factor ETF | | | 30,752 | | | | 4,524,849 | | |
iShares S&P 100 ETF | | | 3,679 | | | | 821,852 | | |
iShares S&P 500 Growth ETF | | | 8,456 | | | | 635,046 | | |
iShares U.S. Technology ETF | | | 12,759 | | | | 1,566,167 | | |
TOTAL EQUITY FUNDS | | | | | 43,141,577 | | |
TOTAL EXCHANGE TRADED FUNDS
(Cost - $66,170,512) | | | | | 81,517,490 | | |
SHORT-TERM INVESTMENTS - 4.7% | |
MONEY MARKET FUNDS - 4.7% | |
Dreyfus Government Cash
Management, 5.25% (b) | | | 3,189,414 | | | | 3,189,414 | | |
Fidelity Investments Money Market
Fund - Government Portfolio,
Institutional Class, 5.25% (b) | | | 844,337 | | | | 844,337 | | |
TOTAL SHORT-TERM INVESTMENTS
(Cost - $4,033,751) | | | | | 4,033,751 | | |
TOTAL INVESTMENTS - 100.1%
(Cost - $70,204,263) | | | | $ | 85,551,241 | | |
OTHER ASSETS LESS LIABILITIES - NET (0.1)% | | | | | (57,145 | ) | |
TOTAL NET ASSETS - 100.0% | | | | $ | 85,494,096 | | |
(a) The fair value of this holding exceeds 25% of the Fund's net assets. Additional information for this holding, including financial statements, is available from the SEC's EDGAR database at www.sec.gov.
(b) The rate shown is the annualized seven-day yield at period end.
TIPS - Treasury Inflation Protected Security
See accompanying notes to financial statements.
11
Global Atlantic BlackRock Selects Managed Risk Portfolio
Portfolio Review
December 31, 2023 (Unaudited)
Investment Objective
The Portfolio seeks to provide capital appreciation and income while seeking to manage volatility.
Management Review
The capital appreciation and income component is sub-advised by BlackRock Investment Management, LLC ("BlackRock"), while the managed risk component is sub-advised by Milliman Financial Risk Management LLC ("Milliman").
How did the Portfolio perform during the period?
During 2023, the Portfolio underperformed its reference benchmark, the S&P Global Managed Risk LargeMidCap Index – Moderate Conservative. The Portfolio posted a return of 11.39% compared to a benchmark return of 14.46%, a difference of -307 basis points. The following discussion of relative performance pertains to this benchmark.
What factors and allocation decisions influenced the Portfolio's performance?
Global stocks, as measured by the MSCI World Index returned 24% in 2023. With the exception of the last two months of the year, most of the gains enjoyed in the market cap weighted indexes were driven by a small handful of large-cap information technology and communication services stocks, due to excitement around artificial intelligence (AI). Regionally, U.S. equities led the performance for the year, with the S&P 500® Index returning 26.3%. Several non-U.S. markets, including Europe and Japan, also posted strong absolute and relative returns (+20.4% and +20.0% respectively). One non-U.S. market that lagged during the year was China, which continued to struggle as housing concerns weighed on consumer sentiment and Chinese regulators unexpectedly announced restrictive new rules for online gaming companies. Global bonds as measured by the Bloomberg Global Aggregate Bond Index returned 5.7% for the year, capping off what was another volatile year for the asset class. Following a weaker third quarter where a spike in U.S. yields caused weakness across government bonds, the apparent end to the United States Federal Reserve's (the "Fed") historic interest rate hiking cycle in the fourth quarter boosted bonds of all maturities. Several non-U.S. developed market sovereigns were further supported by a weaker U.S. dollar. In U.S. corporate credit, both investment grade and high yield bonds generated positive returns for the year as the expectation of interest rate cuts and an absence of any sign of a pending U.S. recession, provided bond investors favorable macro news.
From a broad asset allocation perspective, exposure to cash and cash equivalents detracted from performance but was partially offset by an underweight to fixed income, which contributed to performance. Within equities, security selection was the largest overall detractor for the year, notably selection within consumer discretionary, industrials, information technology, communication services and materials. An overweight to energy and healthcare weighed on performance whereas an underweight to financials contributed. From a regional perspective, an overweight to emerging market (EM) equities hurt performance, but positive security selection within select EM countries partially offset the negative contribution. Within fixed income, an overweight to and positioning within credit, notably high yield exposure, added to performance. Duration management, specifically tactical yield curve positioning added to performance. Lastly, currency management, notably being overweight the euro, was additive for the year.
From a volatility perspective, the Milliman Managed Risk Strategy ("MMRS") was a meaningful detractor to performance in 2023, as several significant yet brief episodes of heightened volatility, particularly surrounding interest rates, spooked markets. As concerns around inflation, Fed policy, and economic growth increased at different times throughout the year, the MMRS, as designed, sought to reduce volatility and limit downside risk. However, because markets recovered quickly in each instance, the Portfolio's defensive positioning resulted in the MMRS being a detractor to performance during 2023.
How was the Portfolio positioned at period end?
At year end, relative to its reference benchmark, the Portfolio was overweight equities and underweight fixed income. Within equities, the Portfolio was overweight the U.S., and to a lesser extent, select emerging market countries, and was underweight
12
Global Atlantic BlackRock Selects Managed Risk Portfolio
Portfolio Review (Continued)
December 31, 2023 (Unaudited)
non-U.S. developed markets, most notably Canada and Australia. The Portfolio's overweight to U.S. stocks reflects the view that despite the episodic risk posed to stocks by the instability of long-term U.S. interest rates, U.S. stocks do not appear expensive when looked at on a forward price/earnings basis. BlackRock believes a likely pivot in Fed monetary policy toward the back half of 2024 may also prove supportive of equity valuations broadly. Unlike 2023, a year in which stock appreciation was largely driven by multiple expansion, BlackRock believes stock market performance in 2024 will be more dependent on earnings growth. The Portfolio remained underweight Canada and Australia for a variety of reasons, notably the large exposure each of those markets have to financials (both banks and insurance). The Portfolio was modestly underweight Japan at the beginning of 2023 and ended the year slightly overweight given the view that monetary policy remains loose and economic growth favorable, as the country continues to benefit from improving corporate governance and profitability.
From an equity sector perspective, the Portfolio was overweight information technology, consumer discretionary, communication services, industrials and energy and was underweight financials, real estate, consumer staples, materials and utilities. Overweight positions are concentrated in "stable growth" and "quality" companies that can generate earnings consistently and are aligned with long-term structural trends. Information technology remains the Portfolio's largest overweight, with tilts in favor of semi-conductor and software companies. Financials remains the Portfolio's largest underweight, driven primarily from limited U.S. bank exposure, as the outlook remains challenged given funding pressures and increased regulation. Relatedly, the Portfolio is underweight real estate due to the weak demand for office space in the aftermath of the COVID-19 pandemic, coupled with the difficult lending environment impacting the industry.
Within fixed income, the Portfolio was overweight high yield credit and to a lesser extent, non-U.S. government bonds, and underweight U.S. Treasuries, securitized assets, and investment grade debt. The Portfolio was slightly underweight duration as well. In the current environment, BlackRock believes asset classes like high yield bonds and emerging market debt will continue to offer some of the highest yields seen in years. BlackRock is also of the view that downgrade/default risk is low and a recession will likely be avoided because many companies termed out their debt several years ago when interest rates were much lower. The Portfolio ends the year underweight U.S. Treasuries with positioning focused at the belly of the curve, at the expense of long-dated rates. The Portfolio remains underweight fixed income as a whole and BlackRock continued to find opportunities in credit and government bonds outside of the U.S.
Looking ahead, BlackRock's expectation for 2024 is that real U.S. GDP will decelerate to a rate of about 1.5% annualized. If inflation also slows – as the team expects it will – to a range of roughly 2.5%-3.0% by December 2024, that implies a nominal 2024 GDP rate between 4.0% and 4.5%. Not only is that a level far from what most economists would consider a "recession," but it is also a reasonably good environment for corporate profits. In addition, a transition in monetary policy whereby the Fed begins to cut rates would be supportive for stocks. According to Bloomberg, current top-down consensus estimates for 2023 and 2024 S&P 500 earnings are $221 and $244 respectively, implying a growth rate of 10%. Given remarkably stable corporate margins, particularly for large and mega-cap companies, actual earnings may be modestly stronger. Based on the current state of the U.S. economy, the expected path of inflation, corporate profit resiliency, and the eventual decline in short-term interest rates, BlackRock is taking the view that stocks have the potential to return somewhere in the mid to high single digits at the index level next year. Meanwhile, BlackRock believes that a portfolio of high-quality bonds, with some select allocations to high yield, securitized assets, and certain emerging market sovereigns, can provide a blended yield of mid-single digits.
The Portfolio's performance figures for the periods ended December 31, 2023 as compared to its benchmark:
| | | | | | | Annualized | | Operating
Expense* | |
| | | Inception
Date | | One
Year | | Five
Years | | Ten
Years | | Gross
Ratio | | Net
Ratio | |
Global Atlantic BlackRock Selects Managed Risk Portfolio | |
Class II | | October 31, 2013 | | | 11.39 | % | | | 5.83 | % | | | 2.97 | % | | | 1.20 | % | | | 1.20 | % | |
S&P Global Managed Risk LargeMidCap Index - Moderate Conservative^ | | | | | | | 14.46 | % | | | 6.49 | % | | | 4.82 | % | | | | | | | | | |
13
Global Atlantic BlackRock Selects Managed Risk Portfolio
Portfolio Review (Continued)
December 31, 2023 (Unaudited)
The performance data quoted is historical. Past performance is no guarantee of future results. Current performance may be higher or lower than the performance data quoted. The principal value and investment return of an investment will fluctuate so that your shares, when redeemed, may be worth more or less than their original cost. Total returns would have been lower absent fee waivers by the Adviser. Performance figures for periods greater than one year are annualized. The returns shown do not reflect the deduction of taxes that a shareholder may pay on Portfolio distributions or on the redemption of Portfolio shares, as well as other charges and expenses of the insurance contract or separate account. Prior to May 1, 2019, the Capital Appreciation and Income Component of the Portfolio was managed pursuant to a different investment strategy by the Adviser without the use of a sub-adviser. The performance prior to that date is attributable to the Adviser and the prior investment strategy.
* The estimated operating expense ratios for Class II shares, as disclosed in the most recent prospectus dated May 1, 2023. Ratios include Acquired Fund Fees and Expenses indirectly incurred by the Portfolio. Gross operating expense ratio reflects the ratio of expenses absent waivers and/or reimbursements by the Adviser. The operating expense ratios presented here may differ from the expense ratios disclosed in the Financial Highlights table in this report.
^ The S&P Global Managed Risk LargeMidCap Index - Moderate Conservative is designed to simulate a dynamic protective portfolio that allocates between the underlying equity index and cash, based on realized volatilities of the underlying equity and bond indices, while maintaining a fixed allocation of 40% to the underlying bond index.
Comparison of the Change in Value of a $10,000 Investment

Holdings by Asset Class | | % of Net Assets | |
Exchange Traded Funds | | | 73.3 | % | |
Variable Insurance Trusts | | | 21.9 | % | |
Short-Term Investments | | | 4.9 | % | |
Other Assets less Liabilities - Net | | | (0.1 | )% | |
| | | | 100.0 | % | |
Please refer to the Portfolio of Investments in this annual report for more information regarding the Portfolio's holdings as of December 31, 2023.
3404166
14
Global Atlantic BlackRock Selects Managed Risk Portfolio
Portfolio of Investments
December 31, 2023
| | | Shares/
Principal | | Fair
Value | |
EXCHANGE TRADED FUNDS - 73.3% | |
DEBT FUNDS - 27.1% | |
iShares 1-3 Year Treasury Bond ETF | | | 19,099 | | | $ | 1,566,882 | | |
iShares 20+ Year Treasury Bond ETF | | | 34,068 | | | | 3,368,644 | | |
iShares 3-7 Year Treasury Bond ETF | | | 60,979 | | | | 7,142,470 | | |
iShares iBoxx $ High Yield Corporate
Bond ETF | | | 72,232 | | | | 5,590,035 | | |
iShares iBoxx $ Investment Grade
Corporate Bond ETF | | | 110,049 | | | | 12,178,022 | | |
iShares J.P. Morgan EM Local Currency
Bond ETF | | | 43,061 | | | | 1,581,200 | | |
iShares J.P. Morgan USD Emerging Markets
Bond ETF | | | 18,157 | | | | 1,617,062 | | |
iShares MBS ETF | | | 128,826 | | | | 12,119,950 | | |
TOTAL DEBT FUNDS | | | | | 45,164,265 | | |
EQUITY FUNDS - 46.2% | |
iShares Core MSCI EAFE ETF | | | 216,986 | | | | 15,264,965 | | |
iShares Core S&P U.S. Growth ETF | | | 307,127 | | | | 31,971,921 | | |
iShares Core S&P U.S. Value ETF | | | 19,423 | | | | 1,637,942 | | |
iShares Global Healthcare ETF | | | 18,609 | | | | 1,613,772 | | |
iShares MSCI Eurozone ETF | | | 34,079 | | | | 1,616,708 | | |
iShares MSCI Global Min Vol Factor ETF | | | 70,899 | | | | 7,114,715 | | |
iShares MSCI USA Quality Factor ETF | | | 65,121 | | | | 9,581,904 | | |
iShares MSCI USA Value Factor ETF | | | 16,483 | | | | 1,667,420 | | |
iShares U.S. Consumer Discretionary ETF | | | 32,735 | | | | 2,480,331 | | |
| | | Shares/
Principal | | Fair
Value | |
EQUITY FUNDS - 46.2% (Continued) | |
iShares U.S. Energy ETF | | | 34,827 | | | $ | 1,536,567 | | |
iShares U.S. Industrials ETF | | | 21,739 | | | | 2,486,072 | | |
TOTAL EQUITY FUNDS | | | | | 76,972,317 | | |
TOTAL EXCHANGE TRADED FUNDS
(Cost - $101,637,440) | | | | | 122,136,582 | | |
VARIABLE INSURANCE TRUSTS - 21.9% | |
ASSET ALLOCATION FUND - 21.9% | |
BlackRock Global Allocation VI Fund,
Class I (Cost - $33,384,243)* | | | 2,241,648 | | | | 36,561,274 | | |
SHORT-TERM INVESTMENTS - 4.9% | |
MONEY MARKET FUNDS - 4.9% | |
Dreyfus Government Cash
Management, 5.25% (a) | | | 6,205,729 | | | | 6,205,729 | | |
Fidelity Investments Money Market
Fund - Government Portfolio,
Institutional Class, 5.25% (a) | | | 1,900,725 | | | | 1,900,725 | | |
TOTAL SHORT-TERM INVESTMENTS
(Cost - $8,106,454) | | | | | 8,106,454 | | |
TOTAL INVESTMENTS - 100.1%
(Cost - $143,128,137) | | | | $ | 166,804,310 | | |
OTHER ASSETS LESS LIABILITIES - NET (0.1)% | | | | | (118,613 | ) | |
TOTAL NET ASSETS - 100.0% | | | | $ | 166,685,697 | | |
* Non-income producing security.
(a) The rate shown is the annualized seven-day yield at period end.
See accompanying notes to financial statements.
15
Global Atlantic Franklin Dividend and Income Managed Risk Portfolio
Portfolio Review
December 31, 2023 (Unaudited)
Investment Objective
The Portfolio seeks to provide capital appreciation and income while seeking to manage volatility.
Management Review
The capital appreciation and income component is managed by Franklin Advisers, Inc. ("Franklin Advisers"), while the managed risk component is sub-advised by Milliman Financial Risk Management LLC ("Milliman").
How did the Portfolio perform during the period?
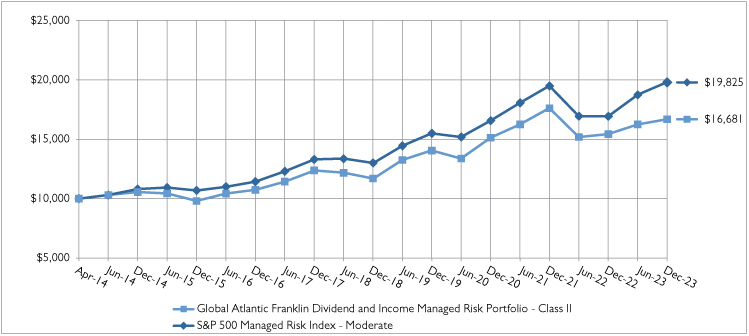
During 2023, the Portfolio underperformed its reference benchmark, the S&P 500 Managed Risk Index – Moderate. The Portfolio posted a return of 7.77% compared to a benchmark return of 16.81%, a difference of -904 basis points. The following discussion of relative performance pertains to this benchmark unless otherwise noted.
What factors and allocation decisions influenced the Portfolio's performance?
Franklin Advisers employs a bottom-up stock selection process for the equity sleeve of the Portfolio's capital appreciation and income component, whereby the portfolio managers invest in securities without regard to benchmark comparisons. As a result, the Portfolio frequently contains sector and security allocations that may be significantly different from those of the S&P 500® Index. With respect to the equity sleeve's performance versus the S&P 500® Index, the equity sleeve of the Portfolio's capital appreciation and income component underperformed the S&P 500® Index (net of fees), posting a return of -12.75% compared to an S&P 500® Index return of 26.29%, a difference of -1,354 basis points.
Relative to the Portfolio's benchmark, the key driver of underperformance was the Portfolio's lack of exposure to several heavily-weighted, growth- and technology-oriented index constituents – including chipmaker Nvidia, Meta Platforms, Amazon, Google parent Alphabet, and electric vehicle maker Tesla – that were part of the so-called "Magnificent Seven" stocks that led markets higher in 2023. Many of the leading stocks were viewed as poised to benefit from the rise of artificial intelligence ("AI"). On a sector basis, stock selection and an underweight in information technology ("IT") made the sector the largest detractor during the period. Stock selection in consumer discretionary and a combination of stock selection and an overweight within industrials also hindered relative returns. In contrast, an underweight in financials, along with stock selection in the sector, contributed to relative performance, as did a lack of exposure to the utilities and real estate sectors.
Among the detractors, below-benchmark exposure to Apple, another Magnificent Seven stock, weighed on relative performance within the IT sector as its shares rose sharply during the year. Apple benefited from demand for its iPhone and from optimism surrounding AI, especially in the first seven months of the year. The shares rallied with the broader market in the final two months of 2023, bolstered by a November earnings release that showed quarter-over-quarter revenue growth, led by services, and strong gross margins amid renewed demand for iPhones. In the industrials sector, shares of aerospace and defense firm Raytheon Technologies, renamed RTX in July, posted a double-digit decline during the period. In the third quarter, RTX lowered its free cash flow estimate as it announced that some key aircraft engines would require accelerated inspections, costing as much as $7 billion in repairs and compensation to airlines for lost aircraft service. Furthermore, revenue growth on the company's defense side fell shy of Wall Street forecasts. Despite the challenges, the Franklin Advisers Portfolio Managers believe RTX is well-positioned to increase earnings because of its balance between commercial aerospace and defense. While industrial gas producer, Air Products and Chemicals, beat third-quarter earnings estimates, its shares declined sharply as investors were disappointed by weaker than expected guidance, a larger-than-expected decline in revenues driven by lower energy cost pass-throughs, and a significant increase in its cost estimate (to $7 billion, up from $4.5 billion) for its Louisiana blue hydrogen project due to inflation and the expanded scope of the project. The Franklin Advisers Portfolio Managers remain constructive on the company's long-term outlook, which they believe is supported by investments in hydrogen and the potential benefits of the Inflation Reduction Act.
Among contributors, enterprise software company Microsoft, the Portfolio's largest holding, was the year's top overall relative contributor. Microsoft's suite of products remains well positioned to benefit from increasing enterprise technology spending, due in part to its exposure to AI and the company's early investment in ChatGPT's parent, OpenAI (not a portfolio holding).
16
Global Atlantic Franklin Dividend and Income Managed Risk Portfolio
Portfolio Review (Continued)
December 31, 2023 (Unaudited)
Microsoft's integration of ChatGPT technology is highly attractive, in the Franklin Advisers Portfolio Managers' assessment. The company released robust quarterly earnings in late October, bolstered by strong growth across numerous business lines, including its Azure cloud, one of many areas in which growth was stronger than the company's forecast. The shares reached all-time highs in July, lifted by news of the company's potential acquisition of videogame company Activision Blizzard (not a portfolio holding), which closed in October. Drug packaging and delivery company West Pharmaceutical Services contributed to relative performance. The company repeatedly announced quarterly financial results that beat analysts' estimates and raised guidance, bolstered by particular strength in its generics segment. Although its COVID-19-related business has waned, the company's base business growth has been strong, supported by proprietary, high-value products. The shares declined late in the year amid concerns about demand for products related to COVID-19 vaccines and therapies, as West Pharma's net sales for the third quarter missed analysts' estimates. Earnings surpassed consensus expectations, however, and in October the company raised its 2023 adjusted profit forecast for the third time in 2023, supported by the U.S. dollar's strength. The Franklin Advisers Portfolio Managers continue to appreciate West Pharma's efficiency improvements and believe the company is well-positioned as COVID-19 comparisons recede. Shares of industrial supply company W.W. Grainger advanced sharply during the year amid a string of above-consensus earnings results and raised guidance, closing the year near an all-time high. The company reported better-than-expected growth in multiple business lines, led by its "high-touch solutions" segment, where volumes surged on a year-over-year basis, highlighting what the Portfolio Managers view as the company's high level of customer service and support. Grainger shares also benefited from continuing signs of cooling inflation. The company continues to grow its dividend and its generous share buyback program.
During 2023, the fixed income sleeve of the Portfolio's capital appreciation and income component outperformed the Bloomberg U.S. Aggregate Bond Index (net of fees), posting a return of 6.82% compared to the benchmark return of 5.53%, a difference of 129 basis points. The Portfolio's yield curve positioning was a major contributor to relative returns over the performance period, led by its exposure to the two- to 10-year portion of the yield curve. The Portfolio's exposure to, and security selection in, corporate credit sectors lifted results, led by its collateralized loan obligations ("CLOs") positions, senior secured floating-rate bank loans, and high yield ("HY") corporate bonds. An overweight allocation to non-agency residential mortgage-backed securities ("NA RMBS") added to outperformance, as did exposure to taxable municipal bonds, sovereign emerging markets ("EM"), and agency mortgage-backed securities ("MBS"). Security selection in sovereign developed nations and EM debt were accretive to performance for the year. Conversely, the Portfolio's security selection in agency MBS and Investment Grade ("IG") corporate bonds, as well as exposure to agency multi-family commercial mortgages modestly hurt performance for the period.
From a volatility perspective, the Milliman Managed Risk Strategy ("MMRS") was a meaningful detractor to performance in 2023, as several significant yet brief episodes of heightened volatility, particularly surrounding interest rates, spooked markets. As concerns around inflation, United States Federal Reserve (the "Fed") policy, and economic growth increased at different times throughout the year, the MMRS, as designed, sought to reduce volatility and limit downside risk. However, because markets recovered quickly in each instance, the Portfolio's defensive positioning resulted in the MMRS being a detractor to performance during 2023.
How was the Portfolio positioned at period end?
From an equity sector perspective, at the end of the period the Portfolio's largest sector concentration was information technology, followed by healthcare and industrials. Over the year, a new position was added in brokerage firm Charles Schwab. The Franklin Advisers Portfolio Managers exited positions in water treatment and management company Pentair and health care company CVS Health during the 12-month period.
At period-end, the Portfolio's largest allocations were U.S. Treasuries ("UST"), IG corporate bonds, and MBS. At the end of the period, the Portfolio remained overweight CLOs, senior secured floating-rate bank loans, and, to a lesser extent, HY corporate bonds. Throughout the year, the Franklin Advisers Portfolio Manager added IG corporate bonds as yields became attractive, moving to an overweight exposure. Within corporate credit, year-end spreads moved to their tightest levels since January of 2022, with all-in yields falling from their multi-decade peaks in October, which made IG corporate bonds less attractive at year-end levels. In the Franklin Advisers Portfolio Manager's view, corporate credit sectors continue to be priced for perfection, looking past any impacts of slowing economic growth. In the HY market, yields still appear attractive, but there remains a significant overhang of idiosyncratic risk as some management teams are beginning to reduce earnings estimates. The Franklin Advisers Portfolio Manager is hesitant to take on wholesale corporate credit risk at current levels, but the dedicated credit research team is finding pockets of value in select sectors and issuers that have strong risk/reward characteristics.
17
Global Atlantic Franklin Dividend and Income Managed Risk Portfolio
Portfolio Review (Continued)
December 31, 2023 (Unaudited)
Within the securitized sectors, the Portfolio entered the year with an underweight exposure to MBS. Throughout 2023, MBS spreads were impacted by high levels of volatility as uncertainty in the path of the U.S. economy and Fed action caused spreads to widen during the year. The Franklin Advisers Portfolio Manager took the opportunity to add to MBS when spreads moved to the higher end of the trading range seen over the year. Given very low prepayment activity as a result of rapidly rising mortgage interest rates, lower-coupon MBS provide a stable alternative to UST with added yields. After falling in the first part of the year, home price appreciation increased into the year-end period as low levels of inventory and stretched affordability put downward pressure on transaction volumes. This provides a strong base for RMBS fundamentals. The Portfolio Manager continues to believe that seasoned RMBS deals offer superior return characteristics and is comfortable with the current out-of-index exposure. The Portfolio continued to hold a slight exposure to treasury inflation-protected securities.
The Portfolio's performance figures for the periods ended December 31, 2023 as compared to its benchmark:
| | | | | Annualized | | Operating
Expense* | |
| | | Inception
Date | | One
Year | | Five
Years | | Since
Inception | | Gross
Ratio | | Net
Ratio | |
Global Atlantic Franklin Dividend and Income Managed Risk Portfolio | |
Class II | | April 30, 2014 | | | 7.77 | % | | | 7.40 | % | | | 5.43 | % | | | 1.23 | % | | | 1.20 | % | |
S&P 500 Managed Risk Index - Moderate^ | | | | | 16.81 | % | | | 8.78 | % | | | 7.33 | % | | | | | |
The performance data quoted is historical. Past performance is no guarantee of future results. Current performance may be higher or lower than the performance data quoted. The principal value and investment return of an investment will fluctuate so that your shares, when redeemed, may be worth more or less than their original cost. Total returns would have been lower absent fee waivers by the Adviser. Performance figures for periods greater than one year are annualized. The returns shown do not reflect the deduction of taxes that a shareholder may pay on Portfolio distributions or on the redemption of Portfolio shares, as well as other charges and expenses of the insurance contract or separate account. Prior to July 5, 2017, the fixed-income sleeve of the Capital Appreciation and Income Component of the Portfolio was managed by the Adviser without the use of a sub-adviser. The performance prior to that date is attributable to the Adviser's asset allocation decisions. The sub-adviser to the equity sleeve of the Capital Appreciation and Income Component of the Portfolio changed effective March 1, 2018 due to an organizational restructuring whereby all of the investment personnel responsible for the management of the equity sleeve transitioned from Franklin Advisory Services, LLC to Franklin Advisers.
* The estimated operating expense ratios for Class II shares, as disclosed in the most recent prospectus dated May 1, 2023. Ratios include Acquired Fund Fees and Expenses indirectly incurred by the Portfolio. Gross operating expense ratio reflects the ratio of expenses absent waivers and/or reimbursements by the Adviser. The operating expense ratios presented here may differ from the expense ratios disclosed in the Financial Highlights table in this report.
^ The S&P 500 Managed Risk Index - Moderate is designed to simulate a dynamic protective portfolio that allocates between the underlying equity index and cash, based on realized volatilities of the underlying equity and bond indices, while maintaining a fixed allocation of 30% to the underlying bond index.
18
Global Atlantic Franklin Dividend and Income Managed Risk Portfolio
Portfolio Review (Continued)
December 31, 2023 (Unaudited)
Comparison of the Change in Value of a $10,000 Investment
Holdings by Asset Class | | % of Net Assets | |
Common Stocks | | | 70.6 | % | |
Corporate Bonds and Notes | | | 8.3 | % | |
Agency Mortgage Backed Securities | | | 6.9 | % | |
U.S. Treasury Securities and Agency Bonds | | | 6.7 | % | |
Short-Term Investments | | | 5.5 | % | |
Asset Backed and Commercial Backed Securities | | | 2.7 | % | |
Mutual Funds | | | 0.8 | % | |
Municipal Bonds | | | 0.3 | % | |
Sovereign Debts | | | 0.3 | % | |
Preferred Stocks | | | 0.0 | %^ | |
Other Assets less Liabilities - Net | | | (2.1 | )% | |
| | | | 100.0 | % | |
Please refer to the Portfolio of Investments in this annual report for more information regarding the Portfolio's holdings as of December 31, 2023.
Derivatives are included in "Other Assets less Liabilities - Net".
^ Represents less than 0.05%.
3404166
19
Global Atlantic Franklin Dividend and Income Managed Risk Portfolio
Portfolio of Investments
December 31, 2023
| | | Shares/
Principal | | Fair
Value | |
COMMON STOCKS - 70.6% | |
AEROSPACE & DEFENSE - 2.4% | |
General Dynamics Corp. | | | 8,559 | | | $ | 2,222,515 | | |
RTX Corp. | | | 30,520 | | | | 2,567,953 | | |
| | | | | | | | 4,790,468 | | |
AIR FREIGHT & LOGISTICS - 1.3% | |
United Parcel Service, Inc., Class B | | | 16,087 | | | | 2,529,359 | | |
BANKS - 1.2% | |
JPMorgan Chase & Co. | | | 13,999 | | | | 2,381,230 | | |
BEVERAGES - 1.3% | |
PepsiCo, Inc. | | | 15,153 | | | | 2,573,586 | | |
BIOTECHNOLOGY - 1.1% | |
AbbVie, Inc. | | | 14,229 | | | | 2,205,068 | | |
BUILDING PRODUCTS - 1.9% | |
Carlisle Cos., Inc. | | | 5,952 | | | | 1,859,583 | | |
Johnson Controls International PLC | | | 35,815 | | | | 2,064,377 | | |
| | | | | | | | 3,923,960 | | |
CAPITAL MARKETS - 1.4% | |
Charles Schwab Corp. (The) | | | 10,096 | | | | 694,605 | | |
Nasdaq, Inc. | | | 37,997 | | | | 2,209,145 | | |
| | | | | | | | 2,903,750 | | |
CHEMICALS - 6.4% | |
Air Products and Chemicals, Inc. | | | 12,358 | | | | 3,383,620 | | |
Albemarle Corp. | | | 4,978 | | | | 719,222 | | |
Ecolab, Inc. | | | 10,012 | | | | 1,985,880 | | |
Linde PLC | | | 13,875 | | | | 5,698,601 | | |
Sherwin-Williams Co. (The) | | | 3,511 | | | | 1,095,081 | | |
| | | | | | | | 12,882,404 | | |
COMMERCIAL SERVICES & SUPPLIES - 1.4% | |
Cintas Corp. | | | 4,451 | | | | 2,682,440 | | |
Veralto Corp. | | | 1,713 | | | | 140,911 | | |
| | | | | | | | 2,823,351 | | |
CONSUMER DISCRETIONARY SERVICES - 0.0%† | |
24 Hour Fitness Worldwide, Inc.* | | | 671 | | | | 5 | | |
CONSUMER STAPLES DISTRIBUTION & RETAIL - 2.1% | |
Target Corp. | | | 14,622 | | | | 2,082,465 | | |
Walmart, Inc. | | | 14,133 | | | | 2,228,068 | | |
| | | | | | | | 4,310,533 | | |
ELECTRICAL EQUIPMENT - 0.8% | |
nVent Electric PLC | | | 26,160 | | | | 1,545,794 | | |
FINANCIAL SERVICES - 2.0% | |
Visa, Inc., Class A | | | 15,617 | | | | 4,065,886 | | |
| | | Shares/
Principal | | Fair
Value | |
FOOD PRODUCTS - 1.8% | |
McCormick & Co., Inc. | | | 23,090 | | | $ | 1,579,818 | | |
Mondelez International, Inc., Class A | | | 29,335 | | | | 2,124,734 | | |
| | | | | | | | 3,704,552 | | |
GROUND TRANSPORTATION - 1.6% | |
JB Hunt Transport Services, Inc. | | | 7,099 | | | | 1,417,954 | | |
Norfolk Southern Corp. | | | 7,376 | | | | 1,743,539 | | |
| | | | | | | | 3,161,493 | | |
HEALTH CARE EQUIPMENT & SUPPLIES - 6.7% | |
Abbott Laboratories | | | 24,674 | | | | 2,715,867 | | |
Becton Dickinson & Co. | | | 13,781 | | | | 3,360,221 | | |
Medtronic PLC | | | 24,685 | | | | 2,033,551 | | |
Stryker Corp. | | | 17,974 | | | | 5,382,494 | | |
| | | | | | | | 13,492,133 | | |
HEALTH CARE PROVIDERS & SERVICES - 2.2% | |
UnitedHealth Group, Inc. | | | 8,504 | | | | 4,477,101 | | |
HOTELS, RESTAURANTS & LEISURE - 2.0% | |
McDonald's Corp. | | | 10,968 | | | | 3,252,122 | | |
Starbucks Corp. | | | 8,800 | | | | 844,888 | | |
| | | | | | | | 4,097,010 | | |
HOUSEHOLD PRODUCTS - 1.9% | |
Colgate-Palmolive Co. | | | 19,792 | | | | 1,577,620 | | |
Procter & Gamble Co. (The) | | | 16,015 | | | | 2,346,838 | | |
| | | | | | | | 3,924,458 | | |
INDUSTRIAL CONGLOMERATES - 1.7% | |
Honeywell International, Inc. | | | 16,345 | | | | 3,427,710 | | |
INSURANCE - 0.7% | |
Erie Indemnity Co., Class A | | | 3,963 | | | | 1,327,288 | | |
IT SERVICES - 2.2% | |
Accenture PLC, Class A | | | 12,371 | | | | 4,341,108 | | |
LIFE SCIENCES TOOLS & SERVICES - 2.1% | |
Danaher Corp. | | | 7,266 | | | | 1,680,917 | | |
West Pharmaceutical Services, Inc. | | | 7,210 | | | | 2,538,785 | | |
| | | | | | | | 4,219,702 | | |
MACHINERY - 1.4% | |
Donaldson Co., Inc. | | | 13,230 | | | | 864,581 | | |
Dover Corp. | | | 12,577 | | | | 1,934,468 | | |
| | | | | | | | 2,799,049 | | |
OIL, GAS & CONSUMABLE FUELS - 2.1% | |
Chevron Corp. | | | 11,975 | | | | 1,786,191 | | |
EOG Resources, Inc. | | | 11,278 | | | | 1,364,074 | | |
Exxon Mobil Corp. | | | 11,787 | | | | 1,178,464 | | |
| | | | | | | | 4,328,729 | | |
See accompanying notes to financial statements.
20
Global Atlantic Franklin Dividend and Income Managed Risk Portfolio
Portfolio of Investments (Continued)
December 31, 2023
| | | Shares/
Principal | | Fair
Value | |
PHARMACEUTICALS - 1.6% | |
Johnson & Johnson | | | 15,610 | | | $ | 2,446,711 | | |
Pfizer, Inc. | | | 26,578 | | | | 765,181 | | |
| | | | | | 3,211,892 | | |
SEMICONDUCTORS & SEMICONDUCTOR EQUIPMENT - 3.6% | |
Analog Devices, Inc. | | | 18,670 | | | | 3,707,115 | | |
Texas Instruments, Inc. | | | 20,947 | | | | 3,570,626 | | |
| | | | | | 7,277,741 | | |
SOFTWARE - 10.0% | |
Microsoft Corp. | | | 37,027 | | | | 13,923,633 | | |
Roper Technologies, Inc. | | | 11,550 | | | | 6,296,714 | | |
| | | | | | 20,220,347 | | |
SPECIALTY RETAIL - 2.9% | |
Lowe's Cos., Inc. | | | 13,189 | | | | 2,935,212 | | |
Ross Stores, Inc. | | | 21,045 | | | | 2,912,417 | | |
| | | | | | 5,847,629 | | |
TECHNOLOGY HARDWARE, STORAGE & PERIPHERALS - 0.3% | |
Apple, Inc. | | | 2,873 | | | | 553,139 | | |
TEXTILES, APPAREL & LUXURY GOODS - 1.2% | |
NIKE, Inc., Class B | | | 21,802 | | | | 2,367,043 | | |
TRADING COMPANIES & DISTRIBUTORS - 1.3% | |
WW Grainger, Inc. | | | 3,086 | | | | 2,557,337 | | |
TOTAL COMMON STOCKS
(Cost - $60,824,494) | | | | | 142,270,855 | | |
CORPORATE BONDS AND NOTES - 8.3% | |
AEROSPACE & DEFENSE - 0.1% | |
Boeing Co. (The) | |
5.15%, 5/1/30 | | $ | 150,000 | | | | 152,901 | | |
3.65%, 3/1/47 | | | 100,000 | | | | 74,173 | | |
| | | | | | | | 227,074 | | |
AGRICULTURE - 0.2% | |
Altria Group, Inc., 3.40%, 5/6/30 | | | 100,000 | | | | 91,357 | | |
Imperial Brands Finance PLC,
4.25%, 7/21/25 (a) | | | 200,000 | | | | 196,467 | | |
Philip Morris International, Inc.,
5.38%, 2/15/33 | | | 200,000 | | | | 205,365 | | |
| | | | | | | | 493,189 | | |
AIRLINES - 0.1% | |
Delta Air Lines, Inc. / SkyMiles IP Ltd.,
4.50%, 10/20/25 (a) | | | 200,000 | | | | 197,004 | | |
United Airlines 2020-1 Class B
Pass-Through Trust, 4.88%, 1/15/26 | | | 30,400 | | | | 29,426 | | |
| | | | | | | | 226,430 | | |
APPAREL - 0.1% | |
Tapestry, Inc., 7.05%, 11/27/25 | | | 150,000 | | | | 153,432 | | |
| | | Shares/
Principal | | Fair
Value | |
BANKS - 2.3% | |
ABN AMRO Bank NV, 6.34%,
(US 1 Year CMT T-Note + 1.65%),
9/18/27 (a),(b) | | $ | 200,000 | | | $ | 204,538 | | |
Banco Santander SA, 2.75%, 12/3/30 | | | 200,000 | | | | 166,453 | | |
Bank of America Corp. | |
3.50%, 4/19/26 | | | 500,000 | | | | 486,752 | | |
2.59%, (SOFR + 2.15%), 4/29/31 (b) | | | 100,000 | | | | 86,308 | | |
1.92%, (SOFR + 1.37%), 10/24/31 (b) | | | 200,000 | | | | 162,626 | | |
BNP Paribas SA, 2.82%, (3 Month
Term SOFR + 1.37%), 11/19/25 (a),(b) | | | 200,000 | | | | 194,901 | | |
BPCE SA, 2.05%, (SOFR + 1.09%),
10/19/27 (a),(b) | | | 250,000 | | | | 227,000 | | |
Citigroup, Inc. | |
2.57%, (SOFR + 2.11%), 6/3/31 (b) | | | 100,000 | | | | 85,544 | | |
3.06%, (SOFR + 1.35%), 1/25/33 (b) | | | 200,000 | | | | 170,926 | | |
Deutsche Bank AG/New York NY,
5.37%, 9/9/27 | | | 150,000 | | | | 152,105 | | |
Goldman Sachs Group, Inc. (The) | |
1.95%, (SOFR + 0.91%), 10/21/27 (b) | | | 50,000 | | | | 45,759 | | |
1.99%, (SOFR + 1.09%), 1/27/32 (b) | | | 300,000 | | | | 242,823 | | |
2.38%, (SOFR + 1.25%), 7/21/32 (b) | | | 200,000 | | | | 164,421 | | |
HSBC Holdings PLC | |
0.98%, (SOFR + 0.71%), 5/24/25 (b) | | | 200,000 | | | | 195,936 | | |
1.59%, (SOFR + 1.29%), 5/24/27 (b) | | | 200,000 | | | | 183,515 | | |
JPMorgan Chase & Co.,
4.49%, (3 Month Term SOFR + 3.79%),
3/24/31 (b) | | | 400,000 | | | | 390,585 | | |
Mitsubishi UFJ Financial Group, Inc.,
5.06%, (US 1 Year CMT T-Note + 1.55%),
9/12/25 (b) | | | 200,000 | | | | 199,265 | | |
Mizuho Financial Group, Inc.,
5.78%, (US 1 Year CMT T-Note + 1.65%),
7/6/29 (b) | | | 200,000 | | | | 205,890 | | |
Morgan Stanley, 2.24%, (SOFR + 1.18%),
7/21/32 (b) | | | 500,000 | | | | 408,236 | | |
Nordea Bank Abp, 4.75%, 9/22/25 (a) | | | 200,000 | | | | 199,142 | | |
Societe Generale SA, 1.79%,
(US 1 Year CMT T-Note + 1.00%),
6/9/27 (a),(b) | | | 200,000 | | | | 182,100 | | |
Truist Financial Corp., 7.16%,
(SOFR + 2.45%), 10/30/29 (b) | | | 50,000 | | | | 54,058 | | |
US Bancorp, 5.73%, (SOFR + 1.43%),
10/21/26 (b) | | | 100,000 | | | | 100,650 | | |
Wells Fargo & Co.,
4.54%, (SOFR + 1.56%), 8/15/26 (b) | | | 100,000 | | | | 98,954 | | |
| | | | | | | | 4,608,487 | | |
BEVERAGES - 0.0%† | |
Anheuser-Busch Cos., LLC /
Anheuser-Busch InBev Worldwide, Inc.,
4.70%, 2/1/36 | | | 100,000 | | | | 100,061 | | |
See accompanying notes to financial statements.
21
Global Atlantic Franklin Dividend and Income Managed Risk Portfolio
Portfolio of Investments (Continued)
December 31, 2023
| | | Shares/
Principal | | Fair
Value | |
BIOTECHNOLOGY - 0.3% | |
Amgen, Inc., 5.25%, 3/2/33 | | $ | 100,000 | | | $ | 102,669 | | |
Biogen, Inc., 2.25%, 5/1/30 | | | 100,000 | | | | 85,421 | | |
CSL Finance PLC, 4.25%, 4/27/32 (a) | | | 150,000 | | | | 146,507 | | |
Royalty Pharma PLC, 2.15%, 9/2/31 | | | 300,000 | | | | 245,216 | | |
| | | | | | | | 579,813 | | |
COMPUTERS - 0.0%† | |
Apple, Inc., 2.65%, 5/11/50 | | | 100,000 | | | | 69,110 | | |
COSMETICS & PERSONAL CARE - 0.1% | |
Estee Lauder Cos., Inc. (The),
4.65%, 5/15/33 | | | 150,000 | | | | 151,029 | | |
Kenvue, Inc., 5.05%, 3/22/28 | | | 150,000 | | | | 153,800 | | |
| | | | | | 304,829 | | |
DIVERSIFIED FINANANCIAL SERVICES - 0.1% | |
AerCap Ireland Capital DAC /
AerCap Global Aviation Trust,
3.40%, 10/29/33 | | | 150,000 | | | | 128,801 | | |
ELECTRIC - 1.1% | |
Comision Federal de Electricidad,
3.35%, 2/9/31 (a) | | | 200,000 | | | | 166,487 | | |
Constellation Energy Generation LLC,
6.13%, 1/15/34 | | | 50,000 | | | | 53,602 | | |
Dominion Energy, Inc., 3.38%, 4/1/30 | | | 100,000 | | | | 92,194 | | |
DTE Energy Co., 4.88%, 6/1/28 | | | 150,000 | | | | 151,243 | | |
Duke Energy Carolinas LLC,
6.10%, 6/1/37 | | | 100,000 | | | | 107,946 | | |
Duke Energy Corp., 3.75%, 9/1/46 | | | 100,000 | | | | 77,348 | | |
Duke Energy Ohio, Inc., 5.25%, 4/1/33 | | | 50,000 | | | | 51,593 | | |
EDP Finance BV, 1.71%, 1/24/28 (a) | | | 200,000 | | | | 177,849 | | |
Electricite de France SA,
5.70%, 5/23/28 (a) | | | 200,000 | | | | 207,129 | | |
Enel Finance International NV,
3.50%, 4/6/28 (a) | | | 200,000 | | | | 187,555 | | |
Exelon Corp., 4.05%, 4/15/30 | | | 200,000 | | | | 191,281 | | |
Florida Power & Light Co.,
4.63%, 5/15/30 | | | 100,000 | | | | 100,843 | | |
Korea Electric Power Corp.,
5.38%, 4/6/26 (a) | | | 200,000 | | | | 201,956 | | |
NextEra Energy Capital Holdings, Inc.,
6.05%, 3/1/25 | | | 50,000 | | | | 50,452 | | |
Southern Co. (The), 3.70%, 4/30/30 | | | 50,000 | | | | 47,174 | | |
Vistra Operations Co. LLC, 4.30%,
7/15/29 (a) | | | 300,000 | | | | 280,990 | | |
Xcel Energy, Inc., 5.45%, 8/15/33 | | | 150,000 | | | | 154,950 | | |
| | | | | | 2,300,592 | | |
FOOD - 0.2% | |
Hershey Co. (The), 4.50%, 5/4/33 | | | 100,000 | | | | 100,858 | | |
JBS USA LUX SA / JBS USA Food Co. /
JBS USA Finance, Inc., 3.63%, 1/15/32 | | | 200,000 | | | | 171,429 | | |
SYSCO Corp., 6.00%, 1/17/34 | | | 50,000 | | | | 54,227 | | |
| | | | | | | | 326,514 | | |
| | | Shares/
Principal | | Fair
Value | |
HEALTHCARE-PRODUCTS - 0.3% | |
Baxter International, Inc., 2.54%, 2/1/32 | | $ | 200,000 | | | $ | 167,965 | | |
GE Healthcare Technologies, Inc.,
5.60%, 11/15/25 | | | 100,000 | | | | 100,903 | | |
Revvity, Inc., 2.25%, 9/15/31 | | | 200,000 | | | | 164,251 | | |
STERIS Irish FinCo UnLtd Co.,
2.70%, 3/15/31 | | | 100,000 | | | | 86,170 | | |
| | | | | | | | 519,289 | | |
HEALTHCARE-SERVICES - 0.4% | |
Centene Corp., 3.00%, 10/15/30 | | | 100,000 | | | | 86,653 | | |
DaVita, Inc., 4.63%, 6/1/30 (a) | | | 100,000 | | | | 87,219 | | |
Elevance Health, Inc., 4.65%, 1/15/43 | | | 100,000 | | | | 92,617 | | |
IQVIA, Inc., 6.25%, 2/1/29 (a) | | | 100,000 | | | | 104,485 | | |
Kaiser Foundation Hospitals,
3.27%, 11/1/49 | | | 140,000 | | | | 105,694 | | |
Quest Diagnostics, Inc., 2.80%, 6/30/31 | | | 245,000 | | | | 213,862 | | |
UnitedHealth Group, Inc., 3.05%, 5/15/41 | | | 100,000 | | | | 78,407 | | |
| | | | | | | | 768,937 | | |
INSURANCE - 0.4% | |
AIA Group Ltd., 4.95%, 4/4/33 (a) | | | 200,000 | | | | 201,735 | | |
Arch Capital Group Ltd., 3.64%, 6/30/50 | | | 200,000 | | | | 153,289 | | |
Arthur J Gallagher & Co., 3.05%, 3/9/52 | | | 200,000 | | | | 134,100 | | |
Corebridge Financial, Inc.,
6.05%, 9/15/33 (a) | | | 150,000 | | | | 156,510 | | |
Metropolitan Life Global Funding I,
4.30%, 8/25/29 (a) | | | 150,000 | | | | 146,220 | | |
| | | | | | | | 791,854 | | |
INTERNET - 0.1% | |
Meta Platforms, Inc., 4.95%, 5/15/33 | | | 150,000 | | | | 155,167 | | |
LODGING - 0.1% | |
Studio City Finance Ltd., 5.00%, 1/15/29 (a) | | | 200,000 | | | | 168,000 | | |
MEDIA - 0.3% | |
Charter Communications Operating LLC /
Charter Communications Operating
Capital, 2.80%, 4/1/31 | | | 200,000 | | | | 168,977 | | |
Comcast Corp., 4.80%, 5/15/33 | | | 100,000 | | | | 101,431 | | |
Fox Corp., 3.50%, 4/8/30 | | | 200,000 | | | | 184,776 | | |
Time Warner Cable LLC, 6.75%, 6/15/39 | | | 100,000 | | | | 99,501 | | |
Walt Disney Co. (The), 2.75%, 9/1/49 | | | 150,000 | | | | 103,312 | | |
| | | | | | 657,997 | | |
MISCELLANEOUS MANUFACTURING - 0.0%† | |
Eaton Corp., 4.15%, 3/15/33 | | | 100,000 | | | | 97,980 | | |
MULTI-NATIONAL - 0.2% | |
African Export-Import Bank (The),
3.99%, 9/21/29 (a) | | | 200,000 | | | | 178,880 | | |
Banque Ouest Africaine de
Developpement, 5.00%, 7/27/27 (a) | | | 200,000 | | | | 186,050 | | |
| | | | | | 364,930 | | |
See accompanying notes to financial statements.
22
Global Atlantic Franklin Dividend and Income Managed Risk Portfolio
Portfolio of Investments (Continued)
December 31, 2023
| | | Shares/
Principal | | Fair
Value | |
OIL & GAS - 0.3% | |
Aker BP ASA, 4.00%, 1/15/31 (a) | | $ | 200,000 | | | $ | 183,891 | | |
Baker Hughes Holdings LLC / Baker
Hughes Co-Obligor, Inc., 4.49%, 5/1/30 | | | 50,000 | | | | 50,065 | | |
BP Capital Markets America, Inc.,
4.89%, 9/11/33 | | | 200,000 | | | | 203,832 | | |
Citgo Petroleum Corp. | |
6.38%, 6/15/26 (a) | | | 50,000 | | | | 49,836 | | |
8.38%, 1/15/29 (a) | | | 100,000 | | | | 102,832 | | |
Petroleos Mexicanos, 6.63%, 6/15/35 | | | 80,000 | | | | 61,372 | | |
| | | | | | 651,828 | | |
PACKAGING & CONTAINERS - 0.0%† | |
Amcor Flexibles North America, Inc.,
2.63%, 6/19/30 | | | 50,000 | | | | 43,326 | | |
PHARMACEUTICALS - 0.3% | |
AbbVie, Inc., 4.05%, 11/21/39 | | | 100,000 | | | | 90,633 | | |
Bayer US Finance II LLC,
4.38%, 12/15/28 (a) | | | 100,000 | | | | 95,130 | | |
CVS Health Corp. | |
5.30%, 6/1/33 | | | 100,000 | | | | 102,804 | | |
4.78%, 3/25/38 | | | 100,000 | | | | 94,987 | | |
Pfizer Investment Enterprises Pte Ltd.,
4.75%, 5/19/33 | | | 100,000 | | | | 100,245 | | |
Teva Pharmaceutical Finance
Netherlands III BV, 5.13%, 5/9/29 | | | 100,000 | | �� | | 95,494 | | |
| | | | | | 579,293 | | |
PIPELINES - 0.4% | |
Energy Transfer LP | |
4.75%, 1/15/26 | | | 100,000 | | | | 99,367 | | |
4.95%, 5/15/28 | | | 100,000 | | | | 99,597 | | |
Enterprise Products Operating LLC,
3.13%, 7/31/29 | | | 100,000 | | | | 93,637 | | |
Sabine Pass Liquefaction LLC,
5.00%, 3/15/27 | | | 200,000 | | | | 200,943 | | |
TransCanada PipeLines Ltd.,
4.25%, 5/15/28 | | | 100,000 | | | | 97,424 | | |
Transcontinental Gas Pipe Line Co. LLC,
3.25%, 5/15/30 | | | 100,000 | | | | 90,774 | | |
Williams Cos., Inc. (The), 3.50%, 11/15/30 | | | 50,000 | | | | 45,871 | | |
| | | | | | 727,613 | | |
REITS - 0.3% | |
Healthcare Realty Holdings LP, 2.00%,
3/15/31 | | | 300,000 | | | | 240,516 | | |
MPT Operating Partnership LP /
MPT Finance Corp., 3.50%, 3/15/31 | | | 100,000 | | | | 62,487 | | |
Simon Property Group LP, 3.25%, 9/13/49 | | | 200,000 | | | | 145,012 | | |
VICI Properties LP / VICI Note Co., Inc.,
4.50%, 9/1/26 (a) | | | 100,000 | | | | 96,794 | | |
| | | | | | 544,809 | | |
| | | Shares/
Principal | | Fair
Value | |
RETAIL - 0.1% | |
Target Corp., 2.95%, 1/15/52 | | $ | 200,000 | | | $ | 143,918 | | |
SOFTWARE - 0.1% | |
Fiserv, Inc., 2.65%, 6/1/30 | | | 150,000 | | | | 132,072 | | |
TELECOMMUNICATIONS - 0.3% | |
AT&T, Inc., 2.55%, 12/1/33 | | | 250,000 | | | | 203,955 | | |
T-Mobile USA, Inc. | |
3.88%, 4/15/30 | | | 200,000 | | | | 189,820 | | |
3.30%, 2/15/51 | | | 100,000 | | | | 72,572 | | |
Verizon Communications, Inc., 2.36%,
3/15/32 | | | 150,000 | | | | 124,968 | | |
| | | | | | 591,315 | | |
TRANSPORTATION - 0.1% | |
CSX Corp., 4.10%, 3/15/44 | | | 100,000 | | | | 87,678 | | |
Union Pacific Corp., 3.20%, 5/20/41 | | | 150,000 | | | | 120,415 | | |
| | | | | | 208,093 | | |
TOTAL CORPORATE BONDS AND NOTES
(Cost - $17,582,489) | | | | | 16,664,753 | | |
AGENCY MORTGAGE BACKED SECURITIES - 6.9% | |
FEDERAL HOME LOAN MORTGAGE CORPORATION - 3.6% | |
Freddie Mac Pool | |
2.00%, 3/1/51 | | | 595,467 | | | | 488,264 | | |
2.50%, 10/1/51 | | | 542,054 | | | | 462,289 | | |
3.00%, 2/1/52 | | | 732,297 | | | | 650,720 | | |
2.00%, 3/1/52 | | | 660,406 | | | | 539,794 | | |
2.00%, 4/1/52 | | | 1,471,713 | | | | 1,201,692 | | |
2.50%, 5/1/52 | | | 922,612 | | | | 785,288 | | |
4.00%, 8/1/52 | | | 739,886 | | | | 700,636 | | |
4.50%, 8/1/52 | | | 2,603,488 | | | | 2,527,122 | | |
| | | | | | | | 7,355,805 | | |
FEDERAL NATIONAL MORTGAGE ASSOCIATION - 2.8% | |
Fannie Mae or Freddie Mac | |
3.50%, 1/1/54 (c) | | | 550,000 | | | | 504,625 | | |
4.00%, 1/1/54 (c) | | | 530,000 | | | | 501,512 | | |
5.00%, 1/1/54 (c) | | | 680,000 | | | | 673,200 | | |
5.50%, 1/1/54 (c) | | | 1,580,000 | | | | 1,587,468 | | |
6.00%, 1/1/54 (c) | | | 1,070,000 | | | | 1,086,970 | | |
Fannie Mae Pool | |
3.00%, 11/1/48 | | | 222,992 | | | | 200,639 | | |
3.00%, 1/1/52 | | | 525,834 | | | | 467,922 | | |
2.50%, 4/1/52 | | | 219,017 | | | | 186,389 | | |
3.50%, 12/1/52 | | | 524,252 | | | | 483,008 | | |
| | | | | | | | 5,691,733 | | |
See accompanying notes to financial statements.
23
Global Atlantic Franklin Dividend and Income Managed Risk Portfolio
Portfolio of Investments (Continued)
December 31, 2023
| | | Shares/
Principal | | Fair
Value | |
GOVERNMENT NATIONAL MORTGAGE ASSOCIATION - 0.5% | |
Ginnie Mae, 5.50%, 1/20/54 (c) | | $ | 420,000 | | | $ | 422,592 | | |
Ginnie Mae II Pool | |
2.00%, 7/20/52 | | | 289,905 | | | | 245,329 | | |
2.50%, 7/20/52 | | | 286,316 | | | | 250,880 | | |
| | | | | | | | 918,801 | | |
TOTAL AGENCY MORTGAGE
BACKED SECURITIES
(Cost - $14,065,091) | | | | | 13,966,339 | | |
U.S. TREASURY SECURITIES AND AGENCY BONDS - 6.7% | |
Federal Farm Credit Banks Funding Corp.,
2.10%, 2/25/36 | | | 140,000 | | | | 105,830 | | |
U.S. Treasury Bond | |
1.13%, 8/15/40 | | | 475,000 | | | | 304,464 | | |
1.75%, 8/15/41 | | | 905,000 | | | | 631,980 | | |
3.88%, 2/15/43 | | | 85,000 | | | | 81,341 | | |
2.50%, 5/15/46†† | | | 915,000 | | | | 688,073 | | |
2.25%, 8/15/46 | | | 795,000 | | | | 567,773 | | |
2.75%, 8/15/47 | | | 150,000 | | | | 117,328 | | |
2.75%, 11/15/47 | | | 319,000 | | | | 249,431 | | |
3.13%, 5/15/48 | | | 100,000 | | | | 83,688 | | |
3.00%, 8/15/48 | | | 330,000 | | | | 269,852 | | |
2.88%, 5/15/49 | | | 100,000 | | | | 79,840 | | |
1.25%, 5/15/50 | | | 980,000 | | | | 531,114 | | |
2.38%, 5/15/51 | | | 449,000 | | | | 322,052 | | |
1.88%, 11/15/51 | | | 695,000 | | | | 441,759 | | |
3.63%, 5/15/53 | | | 135,000 | | | | 125,423 | | |
U.S. Treasury Inflation Indexed Note,
0.63%, 1/15/26 | | | 628,002 | | | | 606,137 | | |
U.S. Treasury Note | |
3.88%, 3/31/25 | | | 285,000 | | | | 282,529 | | |
0.38%, 12/31/25 | | | 900,000 | | | | 834,293 | | |
1.88%, 2/28/27 | | | 1,580,000 | | | | 1,481,991 | | |
2.75%, 4/30/27 | | | 2,200,000 | | | | 2,117,500 | | |
3.25%, 6/30/27 | | | 1,400,000 | | | | 1,368,992 | | |
3.13%, 8/31/27 | | | 1,520,000 | | | | 1,478,259 | | |
3.63%, 3/31/28 | | | 415,000 | | | | 410,818 | | |
4.38%, 8/31/28 | | | 301,000 | | | | 307,725 | | |
1.88%, 2/15/32 | | | 35,000 | | | | 30,146 | | |
TOTAL U.S. TREASURY
SECURITIES AND AGENCY
BONDS (Cost - $14,704,278) | | | | | 13,518,338 | | |
ASSET BACKED AND COMMERCIAL BACKED
SECURITIES - 2.7% | |
Antares CLO 2018-1 Ltd., 7.33%,
(3 Month Term SOFR + 1.91%),
4/20/31 (a),(b) | | | 250,000 | | | | 247,598 | | |
Benchmark 2023-V3 Mortgage Trust,
6.36%, 7/15/56 (d) | | | 20,000 | | | | 20,960 | | |
BRAVO Residential Funding Trust 2019-1,
3.50%, 3/25/58 (a) | | | 10,089 | | | | 9,884 | | |
| | | Shares/
Principal | | Fair
Value | |
ASSET BACKED AND COMMERCIAL BACKED
SECURITIES - 2.7% (Continued) | |
BRAVO Residential Funding Trust
2019-NQM2, 3.50%, 10/25/44 (a),(d) | | $ | 48,989 | | | $ | 45,309 | | |
BX 2021-LBA3 Mortgage Trust,
6.38%, (1 Month Term SOFR + 1.01%),
10/15/36 (a),(b) | | | 130,000 | | | | 126,350 | | |
BX Commercial Mortgage Trust
2021-VOLT, 6.43%, (1 Month
Term SOFR + 1.06%), 9/15/36 (a),(b) | | | 130,000 | | | | 126,585 | | |
BX Trust 2022-IND, 6.85%, (1 Month
Term SOFR + 1.49%), 4/15/37 (a),(b) | | | 170,069 | | | | 168,787 | | |
Carlyle Direct Lending CLO 2015-1R LLC,
7.86%, (3 Month Term SOFR + 2.46%),
10/15/31 (a),(b) | | | 250,000 | | | | 249,087 | | |
CIFC Funding 2022-II Ltd., 6.72%,
(3 Month Term SOFR + 1.32%),
4/19/35 (a),(b) | | | 310,000 | | | | 308,963 | | |
CIM Trust 2018-INV1, 4.00%,
8/25/48 (a),(d) | | | 18,059 | | | | 16,619 | | |
CIM Trust 2019-INV1, 4.00%,
2/25/49 (a),(d) | | | 10,722 | | | | 10,108 | | |
COLT 2022-4 Mortgage Loan Trust,
4.30%, 3/25/67 (a),(d) | | | 84,572 | | | | 80,594 | | |
Dryden 97 CLO Ltd., 6.72%, (3 Month
Term SOFR + 1.30%), 4/20/35 (a),(b) | | | 250,000 | | | | 249,035 | | |
Eleven Madison Trust 2015-11MD
Mortgage Trust, 3.55%, 9/10/35 (a),(d) | | | 250,000 | | | | 224,539 | | |
Ellington CLO III Ltd., 7.33%, (3 Month
Term SOFR + 1.91%), 7/20/30 (a),(b) | | | 170,723 | | | | 170,766 | | |
Fannie Mae Connecticut Avenue Securities | |
9.85%, (SOFR + 4.51%), 1/25/24 (b) | | | 67,927 | | | | 68,056 | | |
8.05%, (SOFR + 2.71%), 5/25/24 (b) | | | 47,971 | | | | 48,196 | | |
8.35%, (SOFR + 3.01%), 7/25/24 (b) | | | 30,571 | | | | 30,830 | | |
FirstKey Homes 2020-SFR2 Trust,
1.27%, 10/19/37 (a) | | | 146,931 | | | | 136,035 | | |
Freddie Mac STACR REMIC Trust
2022-DNA3, 7.34%, (SOFR + 2.00%),
4/25/42 (a),(b) | | | 71,724 | | | | 72,302 | | |
Freddie Mac Structured Agency Credit
Risk Debt Notes, 10.60%,
(SOFR + 5.26%), 11/25/28 (b) | | | 83,484 | | | | 88,202 | | |
Home Partners of America 2021-3 Trust,
2.65%, 1/17/41 (a) | | | 73,490 | | | | 62,105 | | |
Home Partners of America Trust
2021-2, 2.30%, 12/17/26 (a) | | | 202,070 | | | | 182,573 | | |
JP Morgan Mortgage Trust, 2.50%,
6/25/52 (a),(d) | | | 96,561 | | | | 83,751 | | |
JP Morgan Mortgage Trust 2021-13,
2.50%, 4/25/52 (a),(d) | | | 199,176 | | | | 172,754 | | |
JP Morgan Mortgage Trust 2021-14,
2.50%, 5/25/52 (a),(d) | | | 149,351 | | | | 129,538 | | |
Mill City Mortgage Loan Trust 2018-4,
3.50%, 4/25/66 (a),(d) | | | 74,325 | | | | 71,437 | | |
Neuberger Berman Loan Advisers
CLO 27 Ltd., 6.76%, (3 Month Term
SOFR + 1.36%), 1/15/30 (a),(b) | | | 649,000 | | | | 642,098 | | |
See accompanying notes to financial statements.
24
Global Atlantic Franklin Dividend and Income Managed Risk Portfolio
Portfolio of Investments (Continued)
December 31, 2023
| | | Shares/
Principal | | Fair
Value | |
ASSET BACKED AND COMMERCIAL BACKED
SECURITIES - 2.7% (Continued) | |
New Economy Assets Phase 1
Sponsor LLC, 1.91%, 10/20/61 (a) | | $ | 260,000 | | | $ | 226,822 | | |
OBX 2021-J3 Trust, 2.50%, 10/25/51 (a),(d) | | | 75,828 | | | | 66,527 | | |
Octagon Investment Partners 35 Ltd.,
6.78%, (3 Month Term SOFR + 1.36%),
1/20/31 (a),(b) | | | 500,000 | | | | 492,380 | | |
Provident Funding Mortgage Trust
2019-1, 3.00%, 12/25/49 (a),(d) | | | 22,104 | | | | 18,878 | | |
Provident Funding Mortgage Trust
2021-J1, 2.50%, 10/25/51 (a),(d) | | | 138,174 | | | | 118,530 | | |
PSMC 2021-3 Trust, 2.50%, 8/25/51 (a),(d) | | | 255,169 | | | | 221,319 | | |
Strata CLO I Ltd., 7.86%, (3 Month
Term SOFR + 2.46%), 1/15/31 (a),(b) | | | 200,000 | | | | 199,992 | | |
TICP CLO VI Ltd., 6.78%, (3 Month
Term SOFR + 1.38%), 1/15/34 (a),(b) | | | 300,000 | | | | 299,815 | | |
Towd Point Mortgage Trust 2017-1,
2.75%, 10/25/56 (a),(d) | | | 2,924 | | | | 2,900 | | |
Towd Point Mortgage Trust 2017-3,
2.75%, 7/25/57 (a),(d) | | | 12,550 | | | | 12,293 | | |
TOTAL ASSET BACKED AND
COMMERCIAL BACKED
SECURITIES (Cost - $5,779,550) | | | | | 5,502,517 | | |
MUTUAL FUNDS - 0.8% | |
DEBT FUNDS - 0.8% | |
Franklin Floating Rate Daily Access Fund
(Cost - $1,495,000) | | | 198,803 | | | | 1,542,713 | | |
MUNICIPAL BONDS - 0.3% | |
Golden State Tobacco Securitization
Corp., 3.85%, 6/1/50 | | | 270,000 | | | | 249,746 | | |
Greenville City School District,
3.54%, 1/1/51 | | | 110,000 | | | | 86,843 | | |
San Bernardino Community
College District | |
2.69%, 8/1/41 | | | 250,000 | | | | 179,896 | | |
2.86%, 8/1/49 | | | 150,000 | | | | 99,292 | | |
TOTAL MUNICIPAL BONDS
(Cost - $770,060) | | | | | 615,777 | | |
SOVEREIGN DEBTS - 0.3% | |
Colombia Government International
Bond, 5.00%, 6/15/45 | | | 200,000 | | | | 154,922 | | |
Panama Government International
Bond, 3.75%, 4/17/26 (a) | | | 70,000 | | | | 65,595 | | |
| | | Shares/
Principal | | Fair
Value | |
SOVEREIGN DEBTS - 0.3% (Continued) | |
Peruvian Government International
Bond, 2.78%, 1/23/31 | | $ | 200,000 | | | $ | 174,142 | | |
Romanian Government International
Bond, 6.13%, 1/22/44 (a) | | | 130,000 | | | | 127,842 | | |
TOTAL SOVEREIGN DEBTS
(Cost - $652,214) | | | | | 522,501 | | |
PREFERRED STOCKS - 0.0%† | |
CONSUMER DISCRETIONARY SERVICES - 0.0%† | |
24 Hour Fitness Worldwide, Inc., 0.00%
(Cost - $2,145)* | | | 1,589 | | | | 16 | | |
SHORT-TERM INVESTMENTS - 5.5% | |
MONEY MARKET FUNDS - 5.5% | |
Dreyfus Government Cash
Management, 5.25% (e) | | | 7,128,828 | | | | 7,128,828 | | |
Fidelity Investments Money Market
Fund - Government Portfolio,
Institutional Class, 5.25% (e) | | | 3,967,576 | | | | 3,967,576 | | |
TOTAL SHORT-TERM INVESTMENTS
(Cost - $11,096,404) | | | | | 11,096,404 | | |
TOTAL INVESTMENTS - 102.1%
(Cost - $126,971,725) | | | | $ | 205,700,213 | | |
OTHER ASSETS LESS LIABILITIES - NET (2.1)% | | | | | (4,292,741 | ) | |
TOTAL NET ASSETS - 100.0% | | | | $ | 201,407,472 | | |
* Non-income producing security.
† Represents less than 0.05%.
†† A portion of this investment, valued at $452,782, is held as collateral for derivative investments.
(a) 144A - Security was purchased pursuant to Rule 144a under the Securities Act of 1933 and may not be resold subject to that rule, except to qualified institutional buyers. As of December 31, 2023, these securities amounted to $9,966,917 or 4.9% of net assets.
(b) Variable rate or fixed to variable rate security. The rate shown is the rate in effect at period end.
(c) When-issued, or delayed delivery. All or a portion may be subject to dollar-roll transactions.
(d) Adjustable rate security with an interest rate that is not based on a published reference index and spread. The rate is based on the structure of the agreement and current market conditions. The coupon rate shown represents the rate at period end.
(e) The rate shown is the annualized seven-day yield at period end.
CLO - Collateralized Loan Obligation
CMT - Treasury Constant Maturity Rate
PLC - Public Limited Company
REMIC - Real Estate Mortgage Investment Conduit
SOFR - Secured Overnight Financing Rate
See accompanying notes to financial statements.
25
Global Atlantic Franklin Dividend and Income Managed Risk Portfolio
Portfolio of Investments (Continued)
December 31, 2023
FUTURES CONTRACTS | |
LONG FUTURES CONTRACTS | | Counterparty | | Number of
Contracts | | Expiration Date | | Notional Value | | Fair Value/
Unrealized
Appreciation
(Depreciation) | |
U.S. 10 Year Note Future | | J. P. Morgan Securities LLC | | | 9 | | | 3/19/2024 | | $ | 1,016,016 | | | $ | 33,328 | | |
U.S. 2 Year Note Future | | J. P. Morgan Securities LLC | | | 30 | | | 3/28/2024 | | | 6,177,422 | | | | 63,750 | | |
U.S. 5 Year Note Future | | J. P. Morgan Securities LLC | | | 3 | | | 3/28/2024 | | | 326,320 | | | | 7,500 | | |
U.S. Long Bond Future | | J. P. Morgan Securities LLC | | | 4 | | | 3/19/2024 | | | 499,750 | | | | 32,875 | | |
| | | | 137,453 | | |
SHORT FUTURES CONTRACTS | |
CME 3-Month SOFR Futures | | J. P. Morgan Securities LLC | | | 29 | | | 12/18/2024 | | | 6,979,575 | | | | (24,581 | ) | |
U.S. 10 Year Ultra Future | | J. P. Morgan Securities LLC | | | 17 | | | 3/19/2024 | | | 2,006,266 | | | | (77,182 | ) | |
U.S. Ultra Bond Future | | J. P. Morgan Securities LLC | | | 1 | | | 3/19/2024 | | | 133,594 | | | | (10,812 | ) | |
| | | | (112,575 | ) | |
TOTAL NET UNREALIZED APPRECIATION ON FUTURES CONTRACTS | | | | | | | | | | $ | 24,878 | | |
INTEREST RATE SWAPS | |
Counterparty | | Payment
Frequency | | Fund
Receives | | Fund Pays | | Expiration
Date | | Notional
Amount | | Fair
Value | | Premiums
Paid
(Received) | | Unrealized
Appreciation
(Depreciation) | |
Citibank NA | | At Maturity | | SOFR | | | 1.924 | % | | 08/12/27 | | | 500,000 | | | $ | 35,832 | | | $ | 41 | | | $ | 35,791 | | |
TOTAL FAIR VALUE, PREMIUMS PAID (RECEIVED) AND NET UNREALIZED
APPRECIATION ON INTEREST RATE SWAPS | | | | | | | | | | | | $ | 35,832 | | | $ | 41 | | | $ | 35,791 | | |
CREDIT DEFAULT SWAPS | |
Counterparty | | Reference
Obligation/
Index | | Payment
Frequency | | Buy/Sell
Protection | | Fixed
Rate
Received | | Fixed
Rate
Paid | | Credit
Rating* | | Expiration
Date | | Notional
Amount** | | Fair
Value | | Premiums
Paid
(Received) | | Unrealized
Appreciation
(Depreciation) | |
Citibank NA | | Carnival Corp. | | Quarterly | | Buy | | | 1.00 | % | | | - | | | B+ | | 06/21/27 | | $ | 115,000 | | | $ | (7,417 | ) | | $ | (14,456 | ) | | $ | 7,039 | | |
Citibank NA | | CDX.NA.HY.40 | | Quarterly | | Sell | | | - | | | | 5.00 | % | | NR | | 06/20/28 | | | 39,600 | | | | (2,495 | ) | | | 4 | | | | (2,499 | ) | |
Citibank NA | | CDX.NA.HY.40 | | Quarterly | | Sell | | | - | | | | 5.00 | % | | NR | | 06/20/28 | | | 168,300 | | | | (10,602 | ) | | | (3,649 | ) | | | (6,953 | ) | |
Citibank NA | | CDX.NA.HY.40 | | Quarterly | | Sell | | | - | | | | 5.00 | % | | NR | | 06/20/28 | | | 227,700 | | | | (14,340 | ) | | | (3,982 | ) | | | (10,358 | ) | |
TOTAL FAIR VALUE PREMIUM PAID (RECEIVED) AND NET UNREALIZED
DEPRECIATION ON CREDIT DEFAULT SWAPS | | | | | | | | | | | | | | | | | | $ | (34,854 | ) | | $ | (22,083 | ) | | $ | (12,771 | ) | |
* Credit ratings for the underlying securities in the credit default swaps are assigned based on the higher ratings of either Moody's or S&P. If both are unrated, then Fitch is used.
** The maximum potential amount the Portfolio may pay should a negative credit event take place as defined under the terms of the agreement.
NR - Not Rated
FORWARD FOREIGN CURRENCY CONTRACTS | |
Settlement Date | | Counterparty | | Currency Units to
Receive | | In Exchange For | | Unrealized Appreciation
(Depreciation) | |
01/09/24 | | JP Morgan Chase Bank | | | 17,000,000 | JPY | | | 116,286 | USD | | $ | 4,508 | | |
02/26/24 | | JP Morgan Chase Bank | | | 280,299 | USD | | | 256,000 | EUR | | | (3,143 | ) | |
02/26/24 | | JP Morgan Chase Bank | | | 247,000 | EUR | | | 261,380 | USD | | | 12,096 | | |
TOTAL NET UNREALIZED APPRECIATION ON FORWARD FOREIGN CURRENCY CONTRACTS | | | | | | | | $ | 13,461 | | |
EUR - Euro
JPY - Japanese Yen
USD - United States Dollar
See accompanying notes to financial statements.
26
Global Atlantic Growth Managed Risk Portfolio
Portfolio Review
December 31, 2023 (Unaudited)
Investment Objective
The Portfolio seeks to provide capital appreciation and income while seeking to manage volatility.
Management Review
The capital appreciation and income component is sub-advised by BlackRock Investment Management, LLC ("BlackRock"), while the managed risk component is sub-advised by Milliman Financial Risk Management LLC ("Milliman").
How did the Portfolio perform during the period?
During 2023, the Portfolio underperformed its reference benchmark, the S&P Global Managed Risk LargeMidCap Index – Moderate Aggressive. The Portfolio posted a return of 13.83% compared to a benchmark return of 17.89%, a difference of -406 basis points. The following discussion of relative performance pertains to this benchmark unless otherwise noted.
What factors and allocation decisions influenced the Portfolio's performance?
In contrast to a very difficult 2022 where nearly all asset classes posted significantly negative returns, 2023 saw a meaningful reversal, particularly in equities. Equity markets had a strong start in January, resulting in some of the Portfolio's factor exposures, namely U.S. minimum volatility and U.S. momentum equities, detracting from overall performance. Furthermore, an overweight to global energy and infrastructure equities hurt returns amidst falling commodity prices and moderating inflation. As the generative artificial intelligence ("AI") theme unfolded in 2023, through May, the U.S. equity market was dominated by the performance of a narrow set of stocks, the "Magnificent 7" technology giants (Alphabet, Amazon, Apple, Meta Platforms, Microsoft, NVIDIA, and Tesla). With this, BlackRock's overweight to technology equities, alongside a regional overweight to U.S. equities, emerged as the biggest contributors to performance. Positive earnings surprises and the expected end of the U.S. Federal Reserve's (the "Fed") interest rate hiking cycle acted as tailwinds for BlackRock's risk-on stance in the latter part of the year. Consequently, on an asset allocation basis, the Portfolio benefited from its overweight position in equities in the fourth quarter.
Within fixed income, the Portfolio benefited from an overweight position in investment grade credit. While an overweight position to long duration treasuries contributed positively as bond yields fell in the fourth quarter, it was a detractor from Portfolio performance over the entire year. BlackRock maintained this position as a diversifier to the Portfolio's equity exposure.
From a volatility perspective, while the Milliman Managed Risk Strategy ("MMRS") was a significant contributor to performance in 2022 when volatility was more sustained and market returns were negative, it was a meaningful detractor to performance in 2023, as several significant yet brief episodes of heightened volatility, particularly surrounding interest rates, spooked markets. As concerns around inflation, Fed policy, and economic growth increased at different times throughout the year, the MMRS, as designed, sought to reduce volatility and limit downside risk. However, because markets recovered quickly in each instance, the Portfolio's defensive positioning resulted in the MMRS being a detractor to performance during 2023.
How was the Portfolio positioned at period end?
Amidst a backdrop of robust real economic activity, consumer resilience, and upward revisions in earnings despite interest rate hikes, BlackRock shifted to a cautious risk-on stance in the fourth quarter. This involved shifting to an overweight in equities and repositioning the Portfolio within equity and fixed income. BlackRock believes that the prospects for earnings growth appear most promising in the U.S. As a result, the Portfolio is overweight U.S. equities relative to non-U.S. developed markets and emerging market equities. Specifically, within U.S. equities, the Portfolio retains an overweight position in growth, technology, quality, and infrastructure equities, and has increased its exposure to mega-cap equities. As a hedge to its pro-growth and pro-technology exposure, BlackRock has introduced an overweight to global energy equities. In non-U.S. developed equities, the Portfolio maintains an overweight to value to balance the overweight position in U.S. growth.
Within fixed income, BlackRock maintains a duration barbell, with overweight positions in short duration fixed income to take advantage of the high front-end rates, and long duration treasuries as a diversifier to our equity exposure. BlackRock also increased the Portfolio's exposure to investment grade credit to take advantage of elevated yields.
27
Global Atlantic Growth Managed Risk Portfolio
Portfolio Review (Continued)
December 31, 2023 (Unaudited)
The Portfolio's performance figures for the periods ended December 31, 2023 as compared to its benchmark:
| | | | | Annualized | | Operating
Expense* | |
| | | Inception
Date | | One
Year | | Five
Years | | Since
Inception | | Gross
Ratio | | Net
Ratio | |
Global Atlantic Growth Managed Risk Portfolio | |
Class II | | April 30, 2014 | | | 13.83 | % | | | 6.93 | % | | | 4.62 | % | | | 1.00 | % | | | 0.97 | % | |
S&P Global Managed Risk LargeMidCap Index - Moderate
Aggressive^ | | | | | 17.89 | % | | | 8.21 | % | | | 5.59 | % | | | | | | | | | |
The performance data quoted is historical. Past performance is no guarantee of future results. Current performance may be higher or lower than the performance data quoted. The principal value and investment return of an investment will fluctuate so that your shares, when redeemed, may be worth more or less than their original cost. Total returns would have been lower absent fee waivers by the Adviser. Performance figures for periods greater than one year are annualized. The returns shown do not reflect the deduction of taxes that a shareholder may pay on Portfolio distributions or on the redemption of Portfolio shares, as well as other charges and expenses of the insurance contract or separate account. Prior to October 1, 2016, the Capital Appreciation and Income Component of the Portfolio was managed by the Adviser without the use of a sub-adviser. The performance prior to that date is attributable to the Adviser's asset allocation decisions. From October 1, 2016 to May 1, 2021, BlackRock Financial Management, Inc. served as a sub-adviser to Capital Appreciation and Income Component of the Portfolio. In addition, effective May 1, 2021 the sub-adviser to the Capital Appreciation and Income Component of the Portfolio changed from BlackRock Financial Management, Inc. to BlackRock Investment Management, LLC. No changes were made to the Portfolio's principal investment strategies or to the portfolio management team as a result of the change in sub-adviser.
* The estimated operating expense ratios for Class II shares, as disclosed in the most recent prospectus dated May 1, 2023. Ratios include Acquired Fund Fees and Expenses indirectly incurred by the Portfolio. Gross operating expense ratio reflects the ratio of expenses absent waivers and/or reimbursements by the Adviser. The operating expense ratios presented here may differ from the expense ratios disclosed in the Financial Highlights table in this report.
^ The S&P Global Managed Risk LargeMidCap Index – Moderate Aggressive is designed to simulate a dynamic protective portfolio that allocates between the underlying equity index and cash, based on realized volatilities of the underlying equity and bond indices, while maintaining a fixed allocation of 20% to the underlying bond index.
Comparison of the Change in Value of a $10,000 Investment
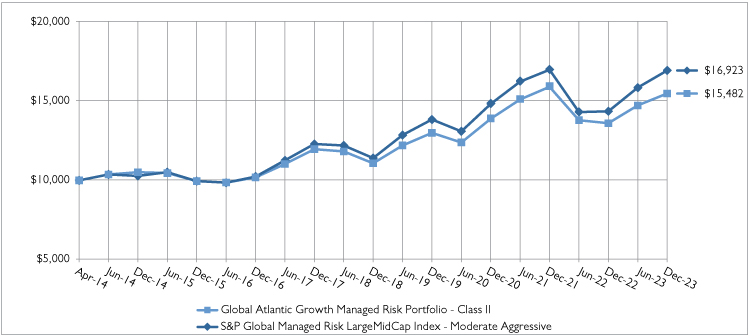
28
Global Atlantic Growth Managed Risk Portfolio
Portfolio Review (Continued)
December 31, 2023 (Unaudited)
Holdings by Asset Class | | % of Net Assets | |
Exchange Traded Funds | | | 95.6 | % | |
Short-Term Investments | | | 4.5 | % | |
Other Assets less Liabilities - Net | | | (0.1 | )% | |
| | | | 100.0 | % | |
Please refer to the Portfolio of Investments in this annual report for more information regarding the Portfolio's holdings as of December 31, 2023.
3404166
29
Global Atlantic Growth Managed Risk Portfolio
Portfolio of Investments
December 31, 2023
| | | Shares/
Principal | | Fair
Value | |
EXCHANGE TRADED FUNDS - 95.6% | |
DEBT FUNDS - 14.3% | |
iShares 10+ Year Investment Grade
Corporate Bond ETF | | | 38,654 | | | $ | 2,036,679 | | |
iShares 10-20 Year Treasury Bond ETF | | | 5,884 | | | | 637,002 | | |
iShares 1-3 Year Treasury Bond ETF | | | 29,637 | | | | 2,431,420 | | |
iShares 1-5 Year Investment Grade
Corporate Bond ETF | | | 43,135 | | | | 2,211,747 | | |
iShares 20+ Year Treasury Bond ETF | | | 87,885 | | | | 8,690,069 | | |
iShares 3-7 Year Treasury Bond ETF | | | 24,925 | | | | 2,919,465 | | |
iShares 5-10 Year Investment Grade
Corporate Bond ETF | | | 36,653 | | | | 1,905,956 | | |
iShares 7-10 Year Treasury Bond ETF | | | 8,888 | | | | 856,714 | | |
iShares Core U.S. Aggregate Bond ETF | | | 74,749 | | | | 7,418,838 | | |
iShares iBoxx $ Investment Grade
Corporate Bond ETF | | | 29,600 | | | | 3,275,536 | | |
iShares MBS ETF | | | 46,130 | | | | 4,339,911 | | |
iShares Treasury Floating Rate Bond ETF | | | 133,566 | | | | 6,741,076 | | |
TOTAL DEBT FUNDS | | | | | 43,464,413 | | |
EQUITY FUNDS - 81.3% | |
iShares Core MSCI EAFE ETF | | | 323,593 | | | | 22,764,768 | | |
iShares Core MSCI Emerging Markets ETF | | | 48,837 | | | | 2,470,175 | | |
iShares Core S&P 500 ETF (a) | | | 251,710 | | | | 120,224,247 | | |
iShares Core S&P Mid-Cap ETF | | | 71,712 | | | | 19,874,981 | | |
iShares Core S&P Small-Cap ETF | | | 95,057 | | | | 10,289,920 | | |
iShares ESG Aware MSCI USA ETF | | | 76,520 | | | | 8,028,478 | | |
iShares Global Energy ETF | | | 19,476 | | | | 761,706 | | |
iShares MSCI EAFE Growth ETF | | | 51,361 | | | | 4,974,313 | | |
| | | Shares/
Principal | | Fair
Value | |
EQUITY FUNDS - 81.3% (Continued) | |
iShares MSCI EAFE Value ETF | | | 160,637 | | | $ | 8,369,188 | | |
iShares MSCI USA Min Vol Factor ETF | | | 30,859 | | | | 2,407,928 | | |
iShares MSCI USA Quality Factor ETF | | | 182,168 | | | | 26,804,200 | | |
iShares S&P 100 ETF | | | 20,247 | | | | 4,522,977 | | |
iShares S&P 500 Growth ETF | | | 49,621 | | | | 3,726,537 | | |
iShares U.S. Infrastructure ETF | | | 27,272 | | | | 1,098,243 | | |
iShares U.S. Technology ETF | | | 87,945 | | | | 10,795,249 | | |
TOTAL EQUITY FUNDS | | | | | 247,112,910 | | |
TOTAL EXCHANGE TRADED FUNDS
(Cost - $192,156,455) | | | | | 290,577,323 | | |
SHORT-TERM INVESTMENTS - 4.5% | |
MONEY MARKET FUNDS - 4.5% | |
Dreyfus Government Cash
Management, 5.25% (b) | | | 10,692,092 | | | | 10,692,092 | | |
Fidelity Investments Money Market
Fund - Government Portfolio,
Institutional Class, 5.25% (b) | | | 2,912,103 | | | | 2,912,103 | | |
TOTAL SHORT-TERM INVESTMENTS
(Cost - $13,604,195) | | | | | 13,604,195 | | |
TOTAL INVESTMENTS - 100.1%
(Cost - $205,760,650) | | | | $ | 304,181,518 | | |
OTHER ASSETS LESS
LIABILITIES - NET (0.1)% | | | | | (202,130 | ) | |
TOTAL NET ASSETS - 100.0% | | | | $ | 303,979,388 | | |
(a) The fair value of this holding exceeds 25% of the Fund's net assets. Additional information for this holding, including financial statements, is available from the SEC's EDGAR database at www.sec.gov.
(b) The rate shown is the annualized seven-day yield at period end.
See accompanying notes to financial statements.
30
Global Atlantic Moderate Growth Managed Risk Portfolio
Portfolio Review
December 31, 2023 (Unaudited)
Investment Objective
The Portfolio seeks to provide capital appreciation and income while seeking to manage volatility.
Management Review
The capital appreciation and income component is sub-advised by BlackRock Investment Management, LLC ("BlackRock"), while the managed risk component is sub-advised by Milliman Financial Risk Management LLC ("Milliman").
How did the Portfolio perform during the period?
During 2023, the Portfolio underperformed its reference benchmark, the S&P Global Managed Risk LargeMidCap Index – Moderate Conservative. The Portfolio posted a return of 12.82% compared to a benchmark return of 14.46%, a difference of -164 basis points. The following discussion of relative performance pertains to this benchmark unless otherwise noted.
What factors and allocation decisions influenced the Portfolio's performance?
In contrast to a very difficult 2022 where nearly all asset classes posted significantly negative returns, 2023 saw a meaningful reversal, particularly in equities. Equity markets had a strong start in January, resulting in some of the Portfolio's factor exposures, namely U.S. minimum volatility and U.S. momentum equities, detracting from overall performance. Furthermore, an overweight to global energy and infrastructure equities hurt returns amidst falling commodity prices and moderating inflation. As the generative artificial intelligence ("AI") theme unfolded in 2023, through May, the U.S. equity market was dominated by the performance of a narrow set of stocks, the "Magnificent 7" technology giants (Alphabet, Amazon, Apple, Meta Platforms, Microsoft, NVIDIA, and Tesla). With this, BlackRock's overweight to technology equities, alongside a regional overweight to U.S. equities, emerged as the biggest contributors to performance. Unexpected positive earnings and the expected end of the U.S. Federal Reserve's (the "Fed") interest rate hiking cycle acted as tailwinds for BlackRock's risk-on stance in the latter part of the year. Consequently, on an asset allocation basis, the Portfolio benefited from its overweight position in equities in the fourth quarter.
Within fixed income, the Portfolio benefited from an overweight position in investment grade credit. While an overweight position to long duration treasuries contributed positively as bond yields fell in the fourth quarter, it was a detractor from Portfolio performance over the entire year. BlackRock maintained this position as a diversifier to the Portfolio's equity exposure.
From a volatility perspective, while the Milliman Managed Risk Strategy ("MMRS") was a significant contributor to performance in 2022 when volatility was more sustained and market returns were negative, it was a meaningful detractor to performance in 2023, as several significant yet brief episodes of heightened volatility, particularly surrounding interest rates, spooked markets. As concerns around inflation, Fed policy, and economic growth increased at different times throughout the year, the MMRS, as designed, sought to reduce volatility and limit downside risk. However, because markets recovered quickly in each instance, the Portfolio's defensive positioning resulted in the MMRS being a detractor to performance during 2023.
How was the Portfolio positioned at period end?
Amidst a backdrop of robust real economic activity, consumer resilience, and upward revisions in earnings despite interest rate hikes, BlackRock shifted to a cautious risk-on stance in the fourth quarter. This involved shifting to an overweight in equities and repositioning the Portfolio within equity and fixed income. BlackRock believes that the prospects for earnings growth appear most promising in the U.S. As a result, the Portfolio is overweight U.S. equities relative to non-U.S. developed markets and emerging market equities. Specifically, within U.S. equities, the Portfolio retains an overweight position in growth, technology, quality, and infrastructure equities, and has increased its exposure to mega-cap equities. As a hedge to its pro-growth and pro-technology exposure, BlackRock has introduced an overweight to global energy equities. In non-U.S. developed equities, the Portfolio maintains an overweight value to balance the overweight position in U.S. growth.
31
Global Atlantic Moderate Growth Managed Risk Portfolio
Portfolio Review (Continued)
December 31, 2023 (Unaudited)
Within fixed income, BlackRock maintains a duration barbell, with overweight positions in short duration fixed income to take advantage of the high front-end rates, and long duration treasuries as a diversifier to our equity exposure. BlackRock also increased the Portfolio's exposure to investment grade credit to take advantage of elevated yields and closed out of its overweight treasury inflation-protected securities position given BlackRock's view that inflation will continue to moderate.
The Portfolio's performance figures for the periods ended December 31, 2023 as compared to its benchmark:
| | | | | | | Annualized | | Operating
Expense* | |
| | | Inception
Date | | One
Year | | Five
Years | | Since
Inception | | Gross
Ratio | | Net
Ratio | |
Global Atlantic Moderate Growth Managed Risk Portfolio | |
Class II | | April 30, 2014 | | | 12.82 | % | | | 6.01 | % | | | 4.46 | % | | | 1.00 | % | | | 1.00 | % | |
S&P Global Managed Risk LargeMidCap Index - Moderate
Conservative^ | | | | | 14.46 | % | | | 6.49 | % | | | 4.73 | % | | | | | | | | | |
The performance data quoted is historical. Past performance is no guarantee of future results. Current performance may be higher or lower than the performance data quoted. The principal value and investment return of an investment will fluctuate so that your shares, when redeemed, may be worth more or less than their original cost. Total returns would have been lower absent fee waivers by the Adviser. Performance figures for periods greater than one year are annualized. The returns shown do not reflect the deduction of taxes that a shareholder may pay on Portfolio distributions or on the redemption of Portfolio shares, as well as other charges and expenses of the insurance contract or separate account. Prior to October 1, 2016, the Capital Appreciation and Income Component of the Portfolio was managed by the Adviser without the use of a sub-adviser. The performance prior to that date is attributable to the Adviser's asset allocation decisions. From October 1, 2016 to May 1, 2021, BlackRock Financial Management, Inc. served as a sub-adviser to Capital Appreciation and Income Component of the Portfolio. In addition, effective May 1, 2021 the sub-adviser to the Capital Appreciation and Income Component of the Portfolio changed from BlackRock Financial Management, Inc. to BlackRock Investment Management, LLC. No changes were made to the Portfolio's principal investment strategies or to the portfolio management team as a result of the change in sub-adviser.
* The estimated operating expense ratios for Class II shares, as disclosed in the most recent prospectus dated May 1, 2023. Ratios include Acquired Fund Fees and Expenses indirectly incurred by the Portfolio. Gross operating expense ratio reflects the ratio of expenses absent waivers and/or reimbursements by the Adviser. The operating expense ratios presented here may differ from the expense ratios disclosed in the Financial Highlights table in this report.
^ The S&P Global Managed Risk LargeMidCap Index – Moderate Conservative is designed to simulate a dynamic protective portfolio that allocates between the underlying equity index and cash, based on realized volatilities of the underlying equity and bond indices, while maintaining a fixed allocation of 40% to the underlying bond index.
Comparison of the Change in Value of a $10,000 Investment
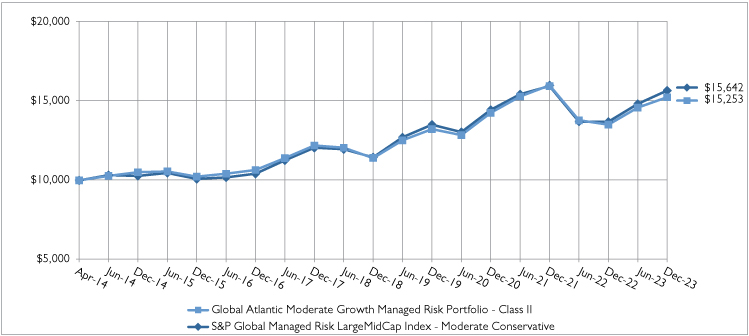
32
Global Atlantic Moderate Growth Managed Risk Portfolio
Portfolio Review (Continued)
December 31, 2023 (Unaudited)
Holdings by Asset Class | | % of Net Assets | |
Exchange Traded Funds | | | 95.4 | % | |
Short-Term Investments | | | 4.7 | % | |
Other Assets less Liabilities - Net | | | (0.1 | )% | |
| | | | 100.0 | % | |
Please refer to the Portfolio of Investments in this annual report for more information regarding the Portfolio's holdings as of December 31, 2023.
3404166
33
Global Atlantic Moderate Growth Managed Risk Portfolio
Portfolio of Investments
December 31, 2023
| | | Shares/
Principal | | Fair
Value | |
EXCHANGE TRADED FUNDS - 95.4% | |
DEBT FUNDS - 30.5% | |
iShares 10+ Year Investment Grade
Corporate Bond ETF | | | 30,989 | | | $ | 1,632,810 | | |
iShares 10-20 Year Treasury Bond ETF | | | 4,793 | | | | 518,890 | | |
iShares 1-3 Year Treasury Bond ETF | | | 23,088 | | | | 1,894,140 | | |
iShares 1-5 Year Investment Grade
Corporate Bond ETF | | | 32,543 | | | | 1,668,642 | | |
iShares 20+ Year Treasury Bond ETF | | | 43,144 | | | | 4,266,079 | | |
iShares 3-7 Year Treasury Bond ETF | | | 18,966 | | | | 2,221,488 | | |
iShares 5-10 Year Investment Grade
Corporate Bond ETF | | | 29,377 | | | | 1,527,604 | | |
iShares 7-10 Year Treasury Bond ETF | | | 6,746 | | | | 650,247 | | |
iShares Core U.S. Aggregate Bond ETF | | | 46,817 | | | | 4,646,587 | | |
iShares iBoxx $ Investment Grade
Corporate Bond ETF | | | 21,888 | | | | 2,422,126 | | |
iShares J.P. Morgan USD Emerging
Markets Bond ETF | | | 5,675 | | | | 505,415 | | |
iShares MBS ETF | | | 47,538 | | | | 4,472,375 | | |
iShares Treasury Floating Rate Bond ETF | | | 73,653 | | | | 3,717,267 | | |
TOTAL DEBT FUNDS | | | | | 30,143,670 | | |
EQUITY FUNDS - 64.9% | |
iShares Core MSCI EAFE ETF | | | 84,444 | | | | 5,940,635 | | |
iShares Core MSCI Emerging Markets ETF | | | 4,659 | | | | 235,652 | | |
iShares Core S&P 500 ETF (a) | | | 68,392 | | | | 32,666,071 | | |
iShares Core S&P Mid-Cap ETF | | | 18,206 | | | | 5,045,793 | | |
iShares Core S&P Small-Cap ETF | | | 24,274 | | | | 2,627,661 | | |
iShares ESG Aware MSCI USA ETF | | | 11,079 | | | | 1,162,409 | | |
| | | Shares/
Principal | | Fair
Value | |
EQUITY FUNDS - 64.9% (Continued) | |
iShares Global Energy ETF | | | 6,319 | | | $ | 247,136 | | |
iShares MSCI EAFE Growth ETF | | | 13,372 | | | | 1,295,078 | | |
iShares MSCI EAFE Value ETF | | | 41,850 | | | | 2,180,385 | | |
iShares MSCI USA Min Vol Factor ETF | | | 5,041 | | | | 393,349 | | |
iShares MSCI USA Quality Factor ETF | | | 47,791 | | | | 7,031,968 | | |
iShares S&P 100 ETF | | | 4,661 | | | | 1,041,221 | | |
iShares S&P 500 Growth ETF | | | 12,654 | | | | 950,315 | | |
iShares U.S. Infrastructure ETF | | | 7,939 | | | | 319,704 | | |
iShares U.S. Technology ETF | | | 23,251 | | | | 2,854,060 | | |
TOTAL EQUITY FUNDS | | | | | 63,991,437 | | |
TOTAL EXCHANGE TRADED FUNDS
(Cost - $69,281,609) | | | | | 94,135,107 | | |
SHORT-TERM INVESTMENTS - 4.7% | |
MONEY MARKET FUNDS - 4.7% | |
Dreyfus Government Cash
Management, 5.25% (b) | | | 3,634,156 | | | | 3,634,156 | | |
Fidelity Investments Money Market
Fund - Government Portfolio,
Institutional Class, 5.25% (b) | | | 963,206 | | | | 963,206 | | |
TOTAL SHORT-TERM INVESTMENTS
(Cost - $4,597,362) | | | | | 4,597,362 | | |
TOTAL INVESTMENTS - 100.1%
(Cost - $73,878,971) | | | | $ | 98,732,469 | | |
OTHER ASSETS LESS LIABILITIES - NET (0.1)% | | | | | (53,470 | ) | |
TOTAL NET ASSETS - 100.0% | | | | $ | 98,678,999 | | |
(a) The fair value of this holding exceeds 25% of the Fund's net assets. Additional information for this holding, including financial statements, is available from the SEC's EDGAR database at www.sec.gov.
(b) The rate shown is the annualized seven-day yield at period end.
See accompanying notes to financial statements.
34
Global Atlantic Select Advisor Managed Risk Portfolio
Portfolio Review
December 31, 2023 (Unaudited)
Investment Objective
The Portfolio seeks to provide capital appreciation and income while seeking to manage volatility.
Management Review
The capital appreciation and income component is sub-advised by Wilshire Advisors LLC ("Wilshire"), while the managed risk component is sub-advised by Milliman Financial Risk Management LLC ("Milliman").
How did the Portfolio perform during the period?
During 2023, the Portfolio underperformed its reference benchmark, the S&P Global Managed Risk LargeMidCap Index – Moderate. The Portfolio posted a return of 12.82% compared to a benchmark return of 16.22%, a difference of -340 basis points. The following discussion of relative performance pertains to this benchmark.
What factors and allocation decisions influenced the Portfolio's performance?
The Portfolio was impacted by both dynamic asset allocation as well as manager selection during 2023. Within equities, an overweight to U.S. value relative to growth detracted during the year. Within fixed income, a modest overweight relative to equities and in government securities relative to credit detracted modestly from returns. From a manager selection perspective, those within equities detracted from performance, particularly the MFS® Growth Series and American Century VP Value Fund underlying funds, which more than offset a strong contribution from the Putnam VT Large Cap Value Fund underlying fund. Manager selection within fixed income contributed to returns, particularly the MFS® Total Return Bond Series underlying fund.
The Portfolio made several allocation changes during the year. During the first quarter, the Portfolio initiated an overweight position in U.S. small cap equities relative to U.S. large cap equities, a position that was subsequently removed in the second quarter. Additionally, an overweight position to credit was removed in favor of a more targeted overweight position in investment grade credit relative to high yield to improve the credit quality of the Portfolio, and an overweight position to emerging market equities relative to developed equities was removed. During the third quarter, the Portfolio removed its overweight position in U.S. value equities relative to U.S. growth, while in the fourth quarter, the Portfolio implemented a modestly overweight position in fixed income relative to equities due to Wilshire's view of the relative attractiveness of fixed income at the time.
From a volatility perspective, while the Milliman Managed Risk Strategy ("MMRS") was a contributor to performance in 2022 when volatility was more sustained and market returns were negative, it was a meaningful detractor to performance in 2023, as several significant yet brief episodes of heightened volatility, particularly surrounding interest rates, spooked markets. As concerns around inflation, United States Federal Reserve (the "Fed") policy, and economic growth increased at different times throughout the year, the MMRS, as designed, sought to reduce volatility and limit downside risk. However, because markets recovered quickly in each instance, the Portfolio's defensive positioning resulted in the MMRS being a detractor to performance during 2023.
How was the Portfolio positioned at period end?
At year-end, the Portfolio was defensively positioned with a modest overweight towards fixed income to weather a potentially volatile market environment for risk assets. Within fixed income, the Portfolio is tilted toward high-quality government securities and underweight credit sectors, while within equities, the Portfolio is neutral across geographies, market capitalization, and styles.
The fight against inflation and economic growth continued to be the focal point of 2023. Through efforts of the central banks, both U.S. and non-U.S. developed economies experienced a downward trend of inflation throughout the year. With inflationary pressure softening, Wilshire believes that fixed income is attractively priced and expects it to generate attractive
35
Global Atlantic Select Advisor Managed Risk Portfolio
Portfolio Review (Continued)
December 31, 2023 (Unaudited)
positive real returns going forward. Globally, developed markets displayed resiliency and generated double-digit returns in 2023 despite a bearish view of the equity risk premium going into the year. During 2024, Wilshire believes that U.S. and non-U.S. developed equities are unlikely to generate levels of return that compare to the strong returns recorded during 2023, though central bank easing could provide a tailwind to risk assets that keeps equities in positive territory for the year. While the degree of an economic slowdown around the world is hard to forecast, Wilshire believes it is unlikely that either domestic or foreign developed equities will go through a severe slowdown. Overall, the Portfolio is positioned slightly defensively with a modest overweight to fixed income.
The Portfolio's performance figures for the periods ended December 31, 2023 as compared to its benchmark:
| | | | | | | Annualized | | Operating
Expense* | |
| | | Inception
Date | | One
Year | | Five
Years | | Ten
Years | | Gross
Ratio | | Net
Ratio | |
Global Atlantic Select Advisor Managed Risk Portfolio | |
Class II | | October 31, 2013 | | | 12.82 | % | | | 6.57 | % | | | 4.98 | % | | | 1.78 | % | | | 1.16 | % | |
S&P Global Managed Risk LargeMidCap Index - Moderate^ | | | | | 16.22 | % | | | 7.37 | % | | | 5.24 | % | | | | | |
The performance data quoted is historical. Past performance is no guarantee of future results. Current performance may be higher or lower than the performance data quoted. The principal value and investment return of an investment will fluctuate so that your shares, when redeemed, may be worth more or less than their original cost. Total returns would have been lower absent fee waivers by the Adviser. Performance figures for periods greater than one year are annualized. The returns shown do not reflect the deduction of taxes that a shareholder may pay on Portfolio distributions or on the redemption of Portfolio shares, as well as other charges and expenses of the insurance contract or separate account. Prior to October 1, 2016, the Capital Appreciation and Income Component of the Portfolio was managed by the Adviser without the use of a sub-adviser. The performance prior to that date is attributable to the Adviser's asset allocation decisions.
* The estimated operating expense ratios for Class II shares, as disclosed in the most recent prospectus dated May 1, 2023. Ratios include Acquired Fund Fees and Expenses indirectly incurred by the Portfolio. Gross operating expense ratio reflects the ratio of expenses absent waivers and/or reimbursements by the Adviser. The operating expense ratios presented here may differ from the expense ratios disclosed in the Financial Highlights table in this report.
^ The S&P Global Managed Risk LargeMidCap Index - Moderate is designed to simulate a dynamic protective portfolio that allocates between the underlying equity index and cash, based on realized volatilities of the underlying equity and bond indices, while maintaining a fixed allocation of 30% to the underlying bond index.
Comparison of the Change in Value of a $10,000 Investment
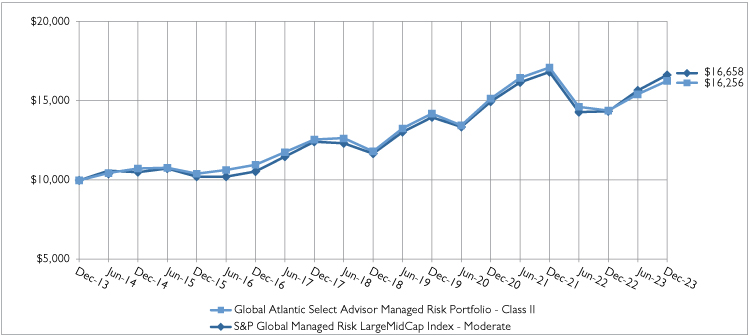
36
Global Atlantic Select Advisor Managed Risk Portfolio
Portfolio Review (Continued)
December 31, 2023 (Unaudited)
Holdings by Asset Class | | % of Net Assets | |
Variable Insurance Trusts | | | 78.1 | % | |
Exchange Traded Funds | | | 17.0 | % | |
Short-Term Investments | | | 4.9 | % | |
Other Assets less Liabilities - Net | | | 0.0 | %^ | |
| | | | 100.0 | % | |
Please refer to the Portfolio of Investments in this annual report for more information regarding the Portfolio's holdings as of December 31, 2023.
^ Represents less than 0.05%.
3404166
37
Global Atlantic Select Advisor Managed Risk Portfolio
Portfolio of Investments
December 31, 2023
| | | Shares/
Principal | | Fair
Value | |
VARIABLE INSURANCE TRUSTS - 78.1% | |
DEBT FUNDS - 20.0% | |
MFS Total Return Bond Series, Class I* | | | 1,300,218 | | | $ | 15,212,552 | | |
EQUITY FUNDS - 58.1% | |
American Century VP Mid Cap
Value, Class I | | | 112,114 | | | | 2,179,496 | | |
American Century VP Value Fund, Class I | | | 595,287 | | | | 7,256,550 | | |
MFS Growth Series* | | | 178,326 | | | | 10,751,258 | | |
MFS VIT II - International Intrinsic
Value Portfolio, Class I* | | | 173,494 | | | | 5,100,716 | | |
MFS VIT II Blended Research Core
Equity Portfolio, Class I* | | | 65,265 | | | | 3,618,932 | | |
MFS VIT Mid Cap Growth Series* | | | 170,177 | | | | 1,458,419 | | |
Putnam VT Large Cap Growth Fund* | | | 356,600 | | | | 5,006,661 | | |
Putnam VT Large Cap Value Fund* | | | 299,412 | | | | 8,754,814 | | |
TOTAL EQUITY FUNDS | | | | | 44,126,846 | | |
TOTAL VARIABLE INSURANCE TRUSTS
(Cost - $48,588,637) | | | | | 59,339,398 | | |
EXCHANGE TRADED FUNDS - 17.0% | |
DEBT FUNDS - 5.6% | |
iShares 1-5 Year Investment Grade
Corporate Bond ETF | | | 41,344 | | | | 2,119,914 | | |
iShares Core U.S. Aggregate Bond ETF | | | 21,535 | | | | 2,137,349 | | |
TOTAL DEBT FUNDS | | | | | 4,257,263 | | |
| | | Shares/
Principal | | Fair
Value | |
EQUITY FUNDS - 11.4% | |
iShares Core MSCI EAFE ETF | | | 82,467 | | | $ | 5,801,553 | | |
iShares Core MSCI Emerging Markets ETF | | | 14,142 | | | | 715,302 | | |
iShares Core S&P Small-Cap ETF | | | 20,182 | | | | 2,184,702 | | |
TOTAL EQUITY FUNDS | | | | | 8,701,557 | | |
TOTAL EXCHANGE TRADED FUNDS
(Cost - $11,973,838) | | | | | 12,958,820 | | |
SHORT-TERM INVESTMENTS - 4.9% | |
MONEY MARKET FUNDS - 4.9% | |
Dreyfus Government Cash
Management, 5.25% (a) | | | 3,512,267 | | | | 3,512,266 | | |
Fidelity Investments Money Market
Fund - Government Portfolio,
Institutional Class, 5.25% (a) | | | 241,005 | | | | 241,005 | | |
TOTAL SHORT-TERM INVESTMENTS
(Cost - $3,753,271) | | | | | 3,753,271 | | |
TOTAL INVESTMENTS - 100.0%
(Cost - $64,315,746) | | | | $ | 76,051,489 | | |
OTHER ASSETS LESS LIABILITIES - NET (0.0)%† | | | | | (29,725 | ) | |
TOTAL NET ASSETS - 100.0% | | | | $ | 76,021,764 | | |
* Non-income producing security.
† Represents less than 0.05%.
(a) The rate shown is the annualized seven-day yield at period end.
See accompanying notes to financial statements.
38
Global Atlantic Wellington Research Managed Risk Portfolio
Portfolio Review
December 31, 2023 (Unaudited)
Investment Objective
The Portfolio seeks to provide capital appreciation and income while seeking to manage volatility.
Management Review
The capital appreciation and income component is sub-advised by Wellington Management Company LLP ("Wellington Management") while the managed risk component is sub-advised by Milliman Financial Risk Management LLC ("Milliman").
How did the Portfolio perform during the period?
During 2023, the Portfolio underperformed its reference benchmark, the S&P 500 Managed Risk Index – Moderate Conservative. The Portfolio posted a return of 14.27% compared to a benchmark return of 15.10%, a difference of -83 basis points. The following discussion of relative performance pertains to this benchmark unless otherwise noted.
What factors and allocation decisions influenced the Portfolio's performance?
The equity portion of the Capital Appreciation and Income Component of the Portfolio is managed in an industry-neutral structure by Wellington Management's US Research Equity Team, and is designed to add value through fundamental, bottom-up stock selection. It consists of multiple sub-portfolios, with each sub-portfolio actively managed by one or more of Wellington Management's Global Industry Analysts (GIAs). The allocation of assets to each sub-portfolio corresponds to the relative weight of the analysts' coverage universe within the S&P 500® Index. However, within an industry, an analyst's stock selection may result in an overweight or underweight to certain sub-industries in his or her area of coverage.
The equity portion of the Capital Appreciation and Income Component of the Portfolio underperformed the S&P 500® Index, net of fees, during the year, returning 25.73%, versus the S&P 500® Index's return of 26.29%, a difference of -56 basis points. Relative equity underperformance in the Portfolio was driven by a sector underweight to information technology, as well as security selection in the information technology, consumer staples, and materials sectors. This was only partially offset by stronger security selection within the healthcare, energy, and communication services sectors.
Top detractors from relative performance during the period included underweight positions in NVIDIA (information technology), Apple (information technology) and Tesla (consumer discretionary). Shares of NVIDIA surged during the period after the chipmaker provided strong quarterly results, driven by strong data center demand on the growing need for chips for generative artificial intelligence and language learning models. Shares of Apple climbed higher during the period. Despite the iPhone maker missing consensus expectations for the first quarter, its install base grew to 2 billion devices. The iPhone install base, in particular, is at an all-time high and experienced double-digit growth in emerging markets. Apple later reported second-quarter earnings ahead of consensus estimates led by strong iPhone sales and healthy operating margins. Shares of Tesla rose during the period after reporting strong financial results in 2022. Elon Musk's outlook gave investors optimism that demand remained strong and outpaced production capacity following last year's vehicle price cuts. The company's Model Y was the number one selling vehicle globally in the first quarter, becoming the first EV to claim that title.
Top contributors to relative performance during the period included overweight positions in Meta Platform (communication services) and Amazon (consumer discretionary) and an out-of-benchmark position in Ares Management (financials). Shares of Meta Platforms rose after the company reported (in January 2023) better-than-forecast revenue for the fourth quarter of 2022 and boosted its stock buyback authorization by $40 billion. The company later reported solid second and third quarter results, buoyed by a rebound in online advertising and cost cutting. Shares of Amazon benefited from positive investor sentiment attributed partly to further cost cutting measures and advancements in AI. The current trend toward AI should benefit Amazon Web Services and increase demand for its cloud computing platforms. Shares of Ares Management rose after the company reported healthy results for the second quarter of 2023 with continued fundraising momentum as underlying demand for the firm's strategies remains strong.
The fixed income portion of the Capital Appreciation and Income Component of the Portfolio outperformed the Bloomberg U.S. Aggregate Bond Index (net of fees) during the year, returning 5.81% versus the benchmark return of 5.53%, a difference
39
Global Atlantic Wellington Research Managed Risk Portfolio
Portfolio Review (Continued)
December 31, 2023 (Unaudited)
of 28 basis points. Global fixed income sectors largely generated positive total returns during 2023 despite elevated interest rate volatility over most of the period. Higher-yielding sectors generally performed best, benefiting from their coupon advantage and spread tightening. Global sovereign yields ended mixed. Yields rose earlier in the period amid multiple rate increases from the U.S. Federal Reserve (the "Fed") and other major central banks across Europe, while Asian central banks pursued more dovish approaches. Yields plunged by the end of the period in response to accommodative central bank policy expectations amid weaker economic data, including moderating inflation. Security selection contributed to, while allocation decisions detracted from, relative performance. Security selection within investment grade corporates was the primary contributor to relative returns, particularly within the industrials, energy, and consumer cyclical sectors, however, an underweight to industrials detracted from relative returns. An overweight to, and security selection within, Financials and Utilities had a positive impact on relative performance. Within non-corporate investment grade credit, an overweight to, and security selection within, taxable municipals contributed to relative returns. Agency mortgage-backed securities (MBS) contributed positively due to an underweight and positioning within pass-throughs. Within the securitized sectors, out-of-benchmark allocations to non-agency residential mortgage-backed securities ("NA RMBS") as well as selection within commercial mortgage-backed securities ("CMBS") contributed to relative returns. Duration/yield curve positioning had a positive impact during the year.
From a volatility perspective, while the Milliman Managed Risk Strategy ("MMRS") was a significant contributor to performance in 2022 when volatility was more sustained and market returns were negative, it was a meaningful detractor to performance in 2023, as several significant yet brief episodes of heightened volatility, particularly surrounding interest rates, spooked markets. As concerns around inflation, Fed policy, and economic growth increased at different times throughout the year, the MMRS, as designed, sought to reduce volatility and limit downside risk. However, because markets recovered quickly in each instance, the Portfolio's defensive positioning resulted in the MMRS being a detractor to performance during 2023.
How was the Portfolio positioned at period end?
The final quarter of 2023 was marked by a significant market rally in December, closing out a resilient year for global markets. The broad rally underscored the adaptability of global markets, even as geopolitical tensions and global central bank policy uncertainties posed headwinds. Inflation remains at the forefront of global economic considerations. As 2023 drew to a close, the market observed indications of inflationary pressures beginning to ease in most of the world, including the U.S. However, officials warn that inflation mitigation is an ongoing process, and premature rate cuts could lead to a trend reversal in 2024. Valuations for risk assets and lower yields have priced in much of this good news and the portfolio management team remains cognizant of the balance of risks around the real economy, monetary policy and geopolitics. The lagged impacts of a rapid tightening campaign are finally starting to show signs of slowing economic growth but have had a less pronounced impact on inflation than expected. Central banks remain in an uneasy position with resilient employment, inflation still above target, and an unclear path toward achieving/sustaining 2% inflation. On balance, Wellington believes that early signs of weakening growth are appearing, as consumer demand ebbs alongside the depletion of excess savings that support a softer landing. The Wellington team continues to closely track these macroeconomic developments.
At the end of the year, the equity portion of the Capital Appreciation and Income Component of the Portfolio was marginally overweight to the healthcare and financials sectors, and marginally underweight the information technology and consumer staples sectors. Moving forward, Wellington foresees a landscape of more balanced valuations, providing a broader spectrum of opportunities for investors who rely on fundamental analysis. While the economy has displayed recent positive momentum, it may begin to exhibit subtle signs of deceleration. Consumer spending may see a decline as the labor market cools, wage growth moderates, and the boost to consumption from excess savings wanes.
In the fixed income portfolio, the Portfolio maintains a very modest procyclical stance. Current levels of interest rates provide cushion to fixed income performance even if inflation remains above target, though the inversion of the curve is a headwind for longer duration assets. Additionally, Wellington believes security selection can aid benchmark-relative outperformance going forward as growth continues to slow, driving increased dispersion across sectors and within investment grade credit. At the end of the year, the Portfolio was underweight investment grade credit from both a market value and spread duration perspective, as Wellington believes that while fundamentals remain strong, they have peaked and shown some deterioration against a backdrop of very tight valuations. Wellington is most cautious on the long duration segment given weakening fundamentals and tight spreads that offer little cushion against widening. As a result, the Portfolio maintains an underweight to the long end portion of the investment grade market. From a sector perspective, Wellington maintains an overweight in
40
Global Atlantic Wellington Research Managed Risk Portfolio
Portfolio Review (Continued)
December 31, 2023 (Unaudited)
utilities and some parts of insurance where valuations are attractive. In non-corporate credit, Wellington is positive on taxable municipals as the sector still provides diversification and comprises high-quality issuers that have benefitted from fiscal support. The Portfolio was underweight U.S. government in favor of high-quality securitized sectors such as asset-backed securities ("ABS"), commercial mortgage-backed securities (CMBS), and non-agency residential mortgage-backed securities (NA RMBS), which Wellington believes offers attractive carry for short duration, high quality assets. The portfolio was overweight agency MBS, modestly underweight pass-throughs, and exposed to out-of-benchmark collateralized mortgage obligations ("CMOs"). Wellington ended the period with a modest duration underweight as valuations priced in an overly aggressive easing path for the Fed, making the long end look vulnerable to fiscal deterioration.
The Portfolio's performance figures for the periods ended December 31, 2023 as compared to its benchmark:
| | | | | | | Annualized | | Operating
Expense* | |
| | | Inception
Date | | One
Year | | Five
Years | | Ten
Years | | Gross
Ratio | | Net
Ratio | |
Global Atlantic Wellington Research Managed Risk Portfolio | |
Class II | | October 31, 2013 | | | 14.27 | % | | | 7.13 | % | | | 5.82 | % | | | 1.24 | % | | | 1.21 | % | |
S&P 500 Managed Risk Index - Moderate Conservative^ | | | | | 15.10 | % | | | 7.84 | % | | | 6.73 | % | | | | | | | | | |
The performance data quoted is historical. Past performance is no guarantee of future results. Current performance may be higher or lower than the performance data quoted. The principal value and investment return of an investment will fluctuate so that your shares, when redeemed, may be worth more or less than their original cost. Total returns would have been lower absent fee waivers by the Adviser. Performance figures for periods greater than one year are annualized. The returns shown do not reflect the deduction of taxes that a shareholder may pay on Portfolio distributions or on the redemption of Portfolio shares, as well as other charges and expenses of the insurance contract or separate account.
* The estimated operating expense ratios for Class II shares, as disclosed in the most recent prospectus dated May 1, 2023. Ratios include Acquired Fund Fees and Expenses indirectly incurred by the Portfolio. Gross operating expense ratio reflects the ratio of expenses absent waivers and/or reimbursements by the Adviser. The operating expense ratios presented here may differ from the expense ratios disclosed in the Financial Highlights table in this report.
^ The S&P 500 Managed Risk Index - Moderate Conservative is designed to simulate a dynamic protective portfolio that allocates between the underlying equity index and cash, based on realized volatilities of the underlying equity and bond indices, while maintaining a fixed allocation of 40% to the underlying bond index.
Comparison of the Change in Value of a $10,000 Investment

41
Global Atlantic Wellington Research Managed Risk Portfolio
Portfolio Review (Continued)
December 31, 2023 (Unaudited)
Holdings by Asset Class | | % of Net Assets | |
Common Stocks | | | 62.5 | % | |
U.S. Treasury Securities and Agency Bonds | | | 11.8 | % | |
Corporate Bonds and Notes | | | 8.9 | % | |
Agency Mortgage Backed Securities | | | 8.6 | % | |
Short-Term Investments | | | 4.6 | % | |
Asset Backed and Commercial Backed Securities | | | 2.8 | % | |
Municipal Bonds | | | 0.6 | % | |
Exchange Traded Funds | | | 0.3 | % | |
Other Assets less Liabilities - Net | | | (0.1 | )% | |
| | | | 100.0 | % | |
Please refer to the Portfolio of Investments in this annual report for more information regarding the Portfolio's holdings as of December 31, 2023.
Derivatives are included in "Other Assets less Liabilities - Net".
3404166
42
Global Atlantic Wellington Research Managed Risk Portfolio
Portfolio of Investments
December 31, 2023
| | | Shares/
Principal | | Fair
Value | |
COMMON STOCKS - 62.5% | |
AEROSPACE & DEFENSE - 1.2% | |
Boeing Co. (The)* | | | 3,506 | | | $ | 913,874 | | |
General Dynamics Corp. | | | 8,439 | | | | 2,191,355 | | |
RTX Corp. | | | 10,459 | | | | 880,020 | | |
| | | | 3,985,249 | | |
AIR FREIGHT & LOGISTICS - 0.2% | |
C.H. Robinson Worldwide, Inc. | | | 7,635 | | | | 659,588 | | |
AUTOMOBILE COMPONENTS - 0.1% | |
Goodyear Tire & Rubber Co. (The)* | | | 30,228 | | | | 432,865 | | |
AUTOMOBILES - 0.3% | |
Tesla, Inc.* | | | 4,133 | | | | 1,026,968 | | |
BANKS - 1.3% | |
JPMorgan Chase & Co. | | | 16,851 | | | | 2,866,355 | | |
Wells Fargo & Co. | | | 27,993 | | | | 1,377,816 | | |
| | | | 4,244,171 | | |
BEVERAGES - 1.3% | |
Constellation Brands, Inc., Class A | | | 7,111 | | | | 1,719,084 | | |
Monster Beverage Corp.* | | | 44,540 | | | | 2,565,950 | | |
| | | | 4,285,034 | | |
BIOTECHNOLOGY - 1.3% | |
AbbVie, Inc. | | | 3,559 | | | | 551,538 | | |
Alnylam Pharmaceuticals, Inc.* | | | 675 | | | | 129,202 | | |
Apellis Pharmaceuticals, Inc.* | | | 1,513 | | | | 90,568 | | |
Ascendis Pharma A/S, ADR* | | | 741 | | | | 93,329 | | |
Biogen, Inc.* | | | 1,362 | | | | 352,445 | | |
Bridgebio Pharma, Inc.* | | | 1,513 | | | | 61,080 | | |
Celldex Therapeutics, Inc.* | | | 2,457 | | | | 97,445 | | |
Crinetics Pharmaceuticals, Inc.* | | | 2,127 | | | | 75,679 | | |
Cytokinetics, Inc.* | | | 5,840 | | | | 487,581 | | |
Gilead Sciences, Inc. | | | 3,617 | | | | 293,013 | | |
Immunocore Holdings PLC, ADR* | | | 1,409 | | | | 96,263 | | |
Karuna Therapeutics, Inc.* | | | 921 | | | | 291,506 | | |
Moderna, Inc.* | | | 982 | | | | 97,660 | | |
Regeneron Pharmaceuticals, Inc.* | | | 577 | | | | 506,773 | | |
REVOLUTION Medicines, Inc.* | | | 3,326 | | | | 95,390 | | |
Rocket Pharmaceuticals, Inc.* | | | 2,530 | | | | 75,824 | | |
Sage Therapeutics, Inc.* | | | 4,040 | | | | 87,547 | | |
Sarepta Therapeutics, Inc.* | | | 631 | | | | 60,847 | | |
Syndax Pharmaceuticals, Inc.* | | | 2,451 | | | | 52,966 | | |
United Therapeutics Corp.* | | | 427 | | | | 93,893 | | |
Vaxcyte, Inc.* | | | 1,190 | | | | 74,732 | | |
Vertex Pharmaceuticals, Inc.* | | | 1,917 | | | | 780,008 | | |
| | | | 4,545,289 | | |
BROADLINE RETAIL - 3.4% | |
Amazon.com, Inc.* | | | 74,681 | | | | 11,347,031 | | |
| | | Shares/
Principal | | Fair
Value | |
BUILDING PRODUCTS - 0.7% | |
AZEK Co., Inc. (The)* | | | 13,183 | | | $ | 504,250 | | |
Builders FirstSource, Inc.* | | | 6,564 | | | | 1,095,794 | | |
Johnson Controls International PLC | | | 5,416 | | | | 312,178 | | |
Trane Technologies PLC | | | 1,735 | | | | 423,167 | | |
| | | | 2,335,389 | | |
CAPITAL MARKETS - 2.6% | |
Ares Management Corp., Class A | | | 19,631 | | | | 2,334,519 | | |
Intercontinental Exchange, Inc. | | | 5,256 | | | | 675,028 | | |
KKR & Co., Inc.^ | | | 9,965 | | | | 825,600 | | |
Northern Trust Corp. | | | 15,672 | | | | 1,322,403 | | |
S&P Global, Inc. | | | 5,404 | | | | 2,380,570 | | |
Tradeweb Markets, Inc., Class A | | | 15,074 | | | | 1,369,925 | | |
| | | | 8,908,045 | | |
CHEMICALS - 1.6% | |
Cabot Corp. | | | 11,323 | | | | 945,470 | | |
Celanese Corp. | | | 4,660 | | | | 724,024 | | |
FMC Corp. | | | 9,484 | | | | 597,966 | | |
Ingevity Corp.* | | | 5,189 | | | | 245,025 | | |
Linde PLC | | | 4,357 | | | | 1,789,463 | | |
Livent Corp.* | | | 9,723 | | | | 174,820 | | |
PPG Industries, Inc. | | | 5,998 | | | | 897,001 | | |
| | | | 5,373,769 | | |
COMMERCIAL SERVICES & SUPPLIES - 0.6% | |
Clean Harbors, Inc.* | | | 6,402 | | | | 1,117,213 | | |
Veralto Corp. | | | 2,497 | | | | 205,403 | | |
Waste Connections, Inc. | | | 5,619 | | | | 838,748 | | |
| | | | 2,161,364 | | |
CONSTRUCTION & ENGINEERING - 0.1% | |
Fluor Corp.* | | | 9,206 | | | | 360,599 | | |
CONSUMER STAPLES DISTRIBUTION & RETAIL - 0.6% | |
Performance Food Group Co.* | | | 29,192 | | | | 2,018,627 | | |
CONTAINERS & PACKAGING - 0.1% | |
Ball Corp. | | | 4,684 | | | | 269,424 | | |
ELECTRIC UTILITIES - 1.3% | |
Edison International | | | 16,334 | | | | 1,167,718 | | |
Exelon Corp. | | | 21,472 | | | | 770,845 | | |
NextEra Energy, Inc. | | | 17,849 | | | | 1,084,148 | | |
PG&E Corp. | | | 78,743 | | | | 1,419,736 | | |
| | | | 4,442,447 | | |
ENERGY EQUIPMENT & SERVICES - 0.3% | |
Schlumberger NV | | | 16,919 | | | | 880,465 | | |
ENTERTAINMENT - 0.7% | |
Netflix, Inc.* | | | 2,927 | | | | 1,425,098 | | |
Spotify Technology SA* | | | 5,463 | | | | 1,026,552 | | |
| | | | 2,451,650 | | |
See accompanying notes to financial statements.
43
Global Atlantic Wellington Research Managed Risk Portfolio
Portfolio of Investments (Continued)
December 31, 2023
| | | Shares/
Principal | | Fair
Value | |
FINANCIAL SERVICES - 3.2% | |
Berkshire Hathaway, Inc., Class B* | | | 12,524 | | | $ | 4,466,810 | | |
Block, Inc.* | | | 19,568 | | | | 1,513,585 | | |
FleetCor Technologies, Inc.* | | | 2,468 | | | | 697,481 | | |
Global Payments, Inc. | | | 9,919 | | | | 1,259,713 | | |
PayPal Holdings, Inc.* | | | 6,372 | | | | 391,304 | | |
Visa, Inc., Class A | | | 5,243 | | | | 1,365,015 | | |
WEX, Inc.* | | | 6,621 | | | | 1,288,116 | | |
| | | | 10,982,024 | | |
GAS UTILITIES - 0.3% | |
Atmos Energy Corp. | | | 7,512 | | | | 870,641 | | |
GROUND TRANSPORTATION - 1.0% | |
Knight-Swift Transportation Holdings, Inc. | | | 21,975 | | | | 1,266,859 | | |
Uber Technologies, Inc.* | | | 36,564 | | | | 2,251,245 | | |
| | | | 3,518,104 | | |
HEALTH CARE EQUIPMENT & SUPPLIES - 1.5% | |
Abbott Laboratories | | | 10,451 | | | | 1,150,342 | | |
Boston Scientific Corp.* | | | 21,531 | | | | 1,244,707 | | |
Dexcom, Inc.* | | | 6,832 | | | | 847,783 | | |
Edwards Lifesciences Corp.* | | | 11,324 | | | | 863,455 | | |
Insulet Corp.* | | | 2,832 | | | | 614,487 | | |
Stryker Corp. | | | 1,530 | | | | 458,174 | | |
| | | | 5,178,948 | | |
HEALTH CARE PROVIDERS & SERVICES - 2.2% | |
agilon health, Inc.* | | | 54,991 | | | | 690,137 | | |
Cencora, Inc. | | | 6,401 | | | | 1,314,637 | | |
Centene Corp.* | | | 9,279 | | | | 688,595 | | |
Elevance Health, Inc. | | | 1,742 | | | | 821,457 | | |
HCA Healthcare, Inc. | | | 3,647 | | | | 987,170 | | |
Humana, Inc. | | | 2,032 | | | | 930,270 | | |
Molina Healthcare, Inc.* | | | 2,673 | | | | 965,782 | | |
UnitedHealth Group, Inc. | | | 1,905 | | | | 1,002,925 | | |
| | | | 7,400,973 | | |
HEALTH CARE REITS - 0.3% | |
Welltower, Inc. | | | 9,559 | | | | 861,935 | | |
HOTEL & RESORT REITS - 0.2% | |
Ryman Hospitality Properties, Inc. | | | 7,465 | | | | 821,598 | | |
HOTELS, RESTAURANTS & LEISURE - 0.9% | |
Chipotle Mexican Grill, Inc.* | | | 873 | | | | 1,996,516 | | |
Hyatt Hotels Corp., Class A | | | 7,656 | | | | 998,419 | | |
| | | | 2,994,935 | | |
HOUSEHOLD DURABLES - 0.5% | |
Lennar Corp., Class A | | | 7,104 | | | | 1,058,780 | | |
Skyline Champion Corp.* | | | 7,206 | | | | 535,118 | | |
| | | | 1,593,898 | | |
| | | Shares/
Principal | | Fair
Value | |
INDUSTRIAL REITS - 0.3% | |
EastGroup Properties, Inc. | | | 6,162 | | | $ | 1,130,973 | | |
INSURANCE - 1.7% | |
Arch Capital Group Ltd.* | | | 9,428 | | | | 700,218 | | |
Assured Guaranty Ltd. | | | 6,899 | | | | 516,252 | | |
Chubb Ltd. | | | 5,147 | | | | 1,163,222 | | |
Everest Group Ltd. | | | 2,541 | | | | 898,447 | | |
Marsh & McLennan Cos., Inc. | | | 3,239 | | | | 613,693 | | |
Progressive Corp. (The) | | | 8,218 | | | | 1,308,963 | | |
Trupanion, Inc.* | | | 21,631 | | | | 659,962 | | |
| | | | 5,860,757 | | |
INTERACTIVE MEDIA & SERVICES - 3.6% | |
Alphabet, Inc., Class A* | | | 50,109 | | | | 6,999,726 | | |
Meta Platforms, Inc., Class A* | | | 14,587 | | | | 5,163,215 | | |
| | | | 12,162,941 | | |
IT SERVICES - 0.2% | |
Squarespace, Inc., Class A* | | | 25,236 | | | | 833,040 | | |
LIFE SCIENCES TOOLS & SERVICES - 1.2% | |
Agilent Technologies, Inc. | | | 6,111 | | | | 849,612 | | |
Danaher Corp. | | | 6,982 | | | | 1,615,216 | | |
ICON PLC* | | | 3,855 | | | | 1,091,235 | | |
Illumina, Inc.* | | | 3,242 | | | | 451,416 | | |
| | | | 4,007,479 | | |
MACHINERY - 0.8% | |
Flowserve Corp. | | | 11,165 | | | | 460,221 | | |
Fortive Corp. | | | 11,622 | | | | 855,728 | | |
Ingersoll Rand, Inc. | | | 7,184 | | | | 555,610 | | |
Middleby Corp. (The)* | | | 4,474 | | | | 658,439 | | |
| | | | 2,529,998 | | |
MEDIA - 0.4% | |
New York Times Co. (The), Class A | | | 12,107 | | | | 593,122 | | |
Omnicom Group, Inc. | | | 9,735 | | | | 842,175 | | |
| | | | 1,435,297 | | |
OIL, GAS & CONSUMABLE FUELS - 2.7% | |
| BP PLC, ADR | | | 65,607 | | | | 2,322,488 | | |
ConocoPhillips | | | 12,491 | | | | 1,449,830 | | |
EOG Resources, Inc. | | | 4,684 | | | | 566,530 | | |
EQT Corp. | | | 11,812 | | | | 456,652 | | |
Marathon Petroleum Corp. | | | 7,372 | | | | 1,093,710 | | |
Shell PLC, ADR | | | 37,363 | | | | 2,458,485 | | |
Targa Resources Corp. | | | 7,309 | | | | 634,933 | | |
| | | | 8,982,628 | | |
PASSENGER AIRLINES - 0.3% | |
Delta Air Lines, Inc. | | | 22,974 | | | | 924,244 | | |
PERSONAL CARE PRODUCTS - 0.5% | |
Haleon PLC, ADR | | | 208,748 | | | | 1,717,996 | | |
See accompanying notes to financial statements.
44
Global Atlantic Wellington Research Managed Risk Portfolio
Portfolio of Investments (Continued)
December 31, 2023
| | | Shares/
Principal | | Fair
Value | |
PHARMACEUTICALS - 2.8% | |
AstraZeneca PLC, ADR | | | 19,535 | | | $ | 1,315,682 | | |
Elanco Animal Health, Inc.* | | | 16,945 | | | | 252,481 | | |
Eli Lilly and Co. | | | 5,969 | | | | 3,479,450 | | |
GSK PLC, ADR | | | 14,236 | | | | 527,586 | | |
Merck & Co., Inc. | | | 19,597 | | | | 2,136,465 | | |
Novartis AG, ADR | | | 6,503 | | | | 656,608 | | |
Pfizer, Inc. | | | 16,416 | | | | 472,617 | | |
Structure Therapeutics, Inc., ADR* | | | 2,024 | | | | 82,498 | | |
Zoetis, Inc. | | | 3,428 | | | | 676,584 | | |
| | | | 9,599,971 | | |
PROFESSIONAL SERVICES - 0.5% | |
Ceridian HCM Holding, Inc.* | | | 12,222 | | | | 820,341 | | |
Science Applications International Corp. | | | 6,864 | | | | 853,332 | | |
| | | | 1,673,673 | | |
REAL ESTATE MANAGEMENT & DEVELOPMENT - 0.1% | |
CoStar Group, Inc.* | | | 3,314 | | | | 289,610 | | |
SEMICONDUCTORS & SEMICONDUCTOR EQUIPMENT - 4.0% | |
Advanced Micro Devices, Inc.* | | | 23,509 | | | | 3,465,462 | | |
First Solar, Inc.* | | | 2,270 | | | | 391,076 | | |
KLA Corp. | | | 2,466 | | | | 1,433,486 | | |
Marvell Technology, Inc. | | | 14,682 | | | | 885,471 | | |
Micron Technology, Inc. | | | 20,760 | | | | 1,771,658 | | |
NVIDIA Corp. | | | 5,245 | | | | 2,597,429 | | |
ON Semiconductor Corp.* | | | 10,146 | | | | 847,495 | | |
Texas Instruments, Inc. | | | 13,456 | | | | 2,293,710 | | |
| | | | 13,685,787 | | |
SOFTWARE - 9.3% | |
Adobe, Inc.* | | | 6,077 | | | | 3,625,538 | | |
HubSpot, Inc.* | | | 2,772 | | | | 1,609,257 | | |
Intuit, Inc. | | | 5,120 | | | | 3,200,154 | | |
Microsoft Corp. | | | 49,601 | | | | 18,651,960 | | |
ServiceNow, Inc.* | | | 4,027 | | | | 2,845,035 | | |
Synopsys, Inc.* | | | 3,110 | | | | 1,601,370 | | |
| | | | 31,533,314 | | |
SPECIALIZED REITS - 0.2% | |
Extra Space Storage, Inc. | | | 4,761 | | | | 763,331 | | |
SPECIALTY RETAIL - 1.4% | |
AutoZone, Inc.* | | | 626 | | | | 1,618,592 | | |
TJX Cos., Inc. (The) | | | 31,822 | | | | 2,985,222 | | |
| | | | 4,603,814 | | |
TECHNOLOGY HARDWARE, STORAGE & PERIPHERALS - 3.2% | |
Apple, Inc. | | | 56,429 | | | | 10,864,275 | | |
TOBACCO - 0.9% | |
Philip Morris International, Inc. | | | 31,348 | | | | 2,949,220 | | |
| | | Shares/
Principal | | Fair
Value | |
TRADING COMPANIES & DISTRIBUTORS - 0.1% | |
AerCap Holdings NV* | | | 5,442 | | | $ | 404,449 | | |
WIRELESS TELECOMMUNICATION SERVICES - 0.5% | |
T-Mobile US, Inc. | | | 11,271 | | | | 1,807,079 | | |
TOTAL COMMON STOCKS
(Cost - $131,290,296) | | | | | 211,710,906 | | |
U.S. TREASURY SECURITIES AND AGENCY BONDS - 11.8% | |
U.S. Treasury Bond | |
3.25%, 5/15/42 | | $ | 45,000 | | | | 39,630 | | |
3.38%, 8/15/42 | | | 934,500 | | | | 836,414 | | |
4.00%, 11/15/42 | | | 853,300 | | | | 832,301 | | |
3.88%, 2/15/43 | | | 293,000 | | | | 280,387 | | |
3.88%, 5/15/43 | | | 810,500 | | | | 775,547 | | |
4.38%, 8/15/43 | | | 564,000 | | | | 577,836 | | |
4.75%, 11/15/43 | | | 401,000 | | | | 431,639 | | |
3.00%, 11/15/44 | | | 610,000 | | | | 506,872 | | |
2.50%, 2/15/45 | | | 2,620,000 | | | | 1,992,223 | | |
2.88%, 8/15/45 | | | 545,000 | | | | 441,258 | | |
2.50%, 5/15/46 | | | 805,000 | | | | 605,354 | | |
3.00%, 5/15/47 | | | 355,900 | | | | 291,963 | | |
2.75%, 8/15/47 | | | 320,000 | | | | 250,300 | | |
2.88%, 5/15/52 | | | 1,311,700 | | | | 1,049,565 | | |
4.00%, 11/15/52 | | | 1,421,300 | | | | 1,408,919 | | |
3.63%, 2/15/53 | | | 810,000 | | | | 751,591 | | |
3.63%, 5/15/53 | | | 1,435,900 | | | | 1,334,041 | | |
4.13%, 8/15/53 | | | 650,800 | | | | 660,969 | | |
4.75%, 11/15/53 | | | 398,000 | | | | 448,434 | | |
U.S. Treasury Note | |
1.50%, 2/15/25 | | | 350,000 | | | | 337,791 | | |
3.88%, 3/31/25 | | | 676,000 | | | | 670,138 | | |
2.63%, 4/15/25 | | | 495,000 | | | | 482,954 | | |
3.88%, 4/30/25 | | | 725,000 | | | | 718,571 | | |
4.25%, 5/31/25 | | | 2,250,000 | | | | 2,242,002 | | |
4.63%, 6/30/25 | | | 905,000 | | | | 907,298 | | |
4.75%, 7/31/25 | | | 655,000 | | | | 658,070 | | |
5.00%, 8/31/25 | | | 645,400 | | | | 651,451 | | |
5.00%, 9/30/25 | | | 582,000 | | | | 588,047 | | |
4.88%, 11/30/25 | | | 1,930,000 | | | | 1,950,431 | | |
4.00%, 2/15/26 | | | 231,000 | | | | 230,007 | | |
4.63%, 3/15/26 | | | 43,000 | | | | 43,385 | | |
4.38%, 8/15/26 | | | 1,534,700 | | | | 1,545,611 | | |
0.75%, 8/31/26 | | | 505,000 | | | | 463,199 | | |
4.63%, 9/15/26 | | | 310,000 | | | | 314,444 | | |
4.63%, 10/15/26 | | | 140,000 | | | | 142,144 | | |
1.13%, 10/31/26 | | | 420,000 | | | | 387,762 | | |
4.63%, 11/15/26 | | | 170,000 | | | | 172,763 | | |
1.25%, 11/30/26 | | | 140,000 | | | | 129,500 | | |
1.25%, 12/31/26 | | | 1,164,000 | | | | 1,074,972 | | |
2.50%, 3/31/27†† | | | 327,000 | | | | 312,719 | | |
2.75%, 4/30/27 | | | 155,000 | | | | 149,187 | | |
2.63%, 5/31/27 | | | 144,000 | | | | 137,914 | | |
See accompanying notes to financial statements.
45
Global Atlantic Wellington Research Managed Risk Portfolio
Portfolio of Investments (Continued)
December 31, 2023
| | | Shares/
Principal | | Fair
Value | |
U.S. TREASURY SECURITIES AND AGENCY BONDS - 11.8% (Continued) | |
U.S. Treasury Note (continued) | |
3.25%, 6/30/27 | | $ | 295,000 | | | $ | 288,466 | | |
3.13%, 8/31/27 | | | 260,600 | | | | 253,444 | | |
4.13%, 9/30/27 | | | 806,100 | | | | 811,768 | | |
4.13%, 10/31/27 | | | 908,300 | | | | 914,686 | | |
3.88%, 11/30/27 | | | 192,200 | | | | 191,937 | | |
3.88%, 12/31/27 | | | 313,600 | | | | 313,330 | | |
3.50%, 1/31/28 | | | 325,200 | | | | 320,322 | | |
4.00%, 2/29/28 | | | 678,100 | | | | 680,881 | | |
1.25%, 3/31/28 | | | 44,000 | | | | 39,492 | | |
3.63%, 3/31/28 | | | 475,000 | | | | 470,213 | | |
3.50%, 4/30/28 | | | 205,000 | | | | 201,917 | | |
3.63%, 5/31/28 | | | 218,000 | | | | 215,880 | | |
4.00%, 6/30/28 | | | 308,600 | | | | 310,336 | | |
4.13%, 7/31/28 | | | 688,200 | | | | 695,942 | | |
4.38%, 8/31/28 | | | 1,081,200 | | | | 1,105,358 | | |
4.63%, 9/30/28 | | | 1,303,000 | | | | 1,346,213 | | |
4.88%, 10/31/28 | | | 650,000 | | | | 679,148 | | |
1.50%, 11/30/28 | | | 195,000 | | | | 174,571 | | |
4.38%, 11/30/28 | | | 536,000 | | | | 549,023 | | |
2.38%, 3/31/29 | | | 53,000 | | | | 49,261 | | |
2.63%, 7/31/29 | | | 125,000 | | | | 117,192 | | |
4.00%, 10/31/29 | | | 318,000 | | | | 319,876 | | |
3.88%, 11/30/29 | | | 171,000 | | | | 170,886 | | |
3.88%, 12/31/29 | | | 196,300 | | | | 196,208 | | |
3.50%, 4/30/30 | | | 112,000 | | | | 109,616 | | |
3.75%, 5/31/30 | | | 129,000 | | | | 128,033 | | |
3.75%, 6/30/30 | | | 254,000 | | | | 252,065 | | |
4.00%, 7/31/30 | | | 101,200 | | | | 101,896 | | |
4.13%, 8/31/30 | | | 366,800 | | | | 371,929 | | |
3.88%, 8/15/33 | | | 48,000 | | | | 48,038 | | |
4.50%, 11/15/33 | | | 496,000 | | | | 521,808 | | |
TOTAL U.S. TREASURY SECURITIES AND
AGENCY BONDS (Cost - $40,824,928) | | | | | 39,775,338 | | |
CORPORATE BONDS AND NOTES - 8.9% | |
AEROSPACE & DEFENSE - 0.3% | |
Heico Corp. | |
5.25%, 8/1/28 | | | 449,000 | | | | 458,830 | | |
5.35%, 8/1/33 | | | 466,000 | | | | 478,635 | | |
| | | | 937,465 | | |
AUTO MANUFACTURERS - 0.0%† | |
Daimler Truck Finance North America LLC,
5.15%, 1/16/26 (a) | | | 150,000 | | | | 150,460 | | |
BANKS - 2.2% | |
Bank of America Corp. | |
1.73%, (SOFR + 0.96%), 7/22/27 (b) | | | 435,000 | | | | 398,696 | | |
3.42%, (3 Month US Libor + 1.30%),
12/20/28 (b) | | | 11,000 | | | | 10,357 | | |
| | | Shares/
Principal | | Fair
Value | |
BANKS - 2.2% (Continued) | |
5.82%, (SOFR + 1.57%), 9/15/29 (b) | | $ | 449,000 | | | $ | 463,786 | | |
2.30%, (SOFR + 1.22%), 7/21/32 (b) | | | 45,000 | | | | 36,791 | | |
BNP Paribas SA | |
2.82%, (3 Month US Libor + 1.37%),
11/19/25 (a),(b) | | | 200,000 | | | | 194,901 | | |
5.89%, (SOFR + 1.87%), 12/5/34 (a),(b) | | | 320,000 | | | | 334,921 | | |
BPCE SA, 6.71%, (SOFR + 2.27%),
10/19/29 (a),(b) | | | 485,000 | | | | 511,128 | | |
Commonwealth Bank of Australia, 5.07%,
9/14/28 (a) | | | 500,000 | | | | 511,697 | | |
Credit Agricole SA, 6.32%, (SOFR + 1.86%),
10/3/29 (a),(b) | | | 548,000 | | | | 574,823 | | |
Credit Suisse AG, 7.50%, 2/15/28 | | | 544,000 | | | | 596,324 | | |
Danske Bank A/S | |
1.62%, (US 1 Year CMT T-Note + 1.35%),
9/11/26 (a),(b) | | | 435,000 | | | | 405,988 | | |
6.26%, (US 1 Year CMT T-Note + 1.18%),
9/22/26 (a),(b) | | | 310,000 | | | | 315,390 | | |
Deutsche Bank AG, 6.82%, (SOFR + 2.51%),
11/20/29 (b) | | | 375,000 | | | | 395,194 | | |
JPMorgan Chase & Co., 2.07%, (SOFR +
1.02%), 6/1/29 (b) | | | 10,000 | | | | 8,875 | | |
M&T Bank Corp. | |
4.55%, (SOFR + 1.78%), 8/16/28 (b) | | | 130,000 | | | | 125,071 | | |
7.41%, (SOFR + 2.80%), 10/30/29 (b) | | | 425,000 | | | | 457,595 | | |
Manufacturers & Traders Trust Co., 4.70%,
1/27/28 | | | 301,000 | | | | 292,680 | | |
Morgan Stanley, 5.95%, (US 5 Year CMT
T-Note + 2.43%), 1/19/38 (b) | | | 272,000 | | | | 275,594 | | |
Standard Chartered PLC, 0.99%, (US 1 Year
CMT T-Note + 0.78%), 1/12/25 (a),(b) | | | 260,000 | | | | 259,620 | | |
UBS AG, 5.65%, 9/11/28 | | | 315,000 | | | | 326,958 | | |
UBS Group AG, 6.30%, (US 1 Year
CMT T-Note + 2.00%), 9/22/34 (a),(b) | | | 200,000 | | | | 212,279 | | |
Wells Fargo & Co. | |
3.00%, 2/19/25 | | | 150,000 | | | | 146,690 | | |
6.30%, (SOFR + 1.79%), 10/23/29 (b) | | | 330,000 | | | | 348,110 | | |
4.90%, (SOFR + 2.10%), 7/25/33 (b) | | | 368,000 | | | | 359,002 | | |
| | | | 7,562,470 | | |
BIOTECHNOLOGY - 0.0%† | |
Gilead Sciences, Inc., 5.55%, 10/15/53 | | | 75,000 | | | | 81,516 | | |
BUILDING MATERIALS - 0.0%† | |
Carrier Global Corp. | |
5.90%, 3/15/34 (a) | | | 40,000 | | | | 43,367 | | |
6.20%, 3/15/54 (a) | | | 30,000 | | | | 34,849 | | |
| | | | 78,216 | | |
COMMERCIAL SERVICES - 0.2% | |
Ashtead Capital, Inc. | |
5.50%, 8/11/32 (a) | | | 200,000 | | | | 197,924 | | |
5.95%, 10/15/33 (a) | | | 200,000 | | | | 204,146 | | |
ERAC USA Finance LLC, 5.40%, 5/1/53 (a) | | | 138,000 | | | | 145,457 | | |
See accompanying notes to financial statements.
46
Global Atlantic Wellington Research Managed Risk Portfolio
Portfolio of Investments (Continued)
December 31, 2023
| | | Shares/
Principal | | Fair
Value | |
COMMERCIAL SERVICES - 0.2% (Continued) | |
UL Solutions, Inc., 6.50%, 10/20/28 (a) | | $ | 115,000 | | | $ | 121,028 | | |
| | | | 668,555 | | |
DIVERSIFIED FINANCIAL SERVICES - 0.4% | |
American Express Co. | |
6.49%, (SOFR + 1.94%), 10/30/31 (b) | | | 35,000 | | | | 38,010 | | |
5.04%, (SOFR + 1.84%), 5/1/34 (b) | | | 767,000 | | | | 767,249 | | |
Capital One Financial Corp. | |
7.15%, (SOFR + 2.44%), 10/29/27 (b) | | | 105,000 | | | | 109,053 | | |
6.31%, (SOFR + 2.64%), 6/8/29 (b) | | | 195,000 | | | | 200,320 | | |
Nasdaq, Inc. | |
5.95%, 8/15/53 | | | 35,000 | | | | 37,746 | | |
6.10%, 6/28/63 | | | 35,000 | | | | 37,957 | | |
| | | | 1,190,335 | | |
ELECTRIC - 1.3% | |
Alabama Power Co., 1.45%, 9/15/30 | | | 30,000 | | | | 24,254 | | |
Appalachian Power Co., 3.40%, 6/1/25 | | | 200,000 | | | | 195,403 | | |
Arizona Public Service Co. | |
4.35%, 11/15/45 | | | 190,000 | | | | 160,326 | | |
3.75%, 5/15/46 | | | 20,000 | | | | 15,264 | | |
4.25%, 3/1/49 | | | 45,000 | | | | 36,514 | | |
3.35%, 5/15/50 | | | 36,000 | | | | 25,573 | | |
Dominion Energy South Carolina, Inc.,
6.63%, 2/1/32 | | | 80,000 | | | | 90,527 | | |
Dominion Energy, Inc. | |
3.38%, 4/1/30 | | | 5,000 | | | | 4,610 | | |
4.35%, (US 5 Year CMT T-Note + 3.20%),
4/15/72 (b) | | | 526,000 | | | | 466,805 | | |
Duke Energy Corp., 2.65%, 9/1/26 | | | 70,000 | | | | 66,466 | | |
Georgia Power Co. | |
4.70%, 5/15/32 | | | 918,000 | | | | 915,706 | | |
4.75%, 9/1/40 | | | 65,000 | | | | 60,431 | | |
Metropolitan Edison Co., 5.20%, 4/1/28 (a) | | | 15,000 | | | | 15,122 | | |
NextEra Energy Capital Holdings, Inc.,
5.75%, 9/1/25 | | | 135,000 | | | | 136,327 | | |
Pacific Gas and Electric Co. | |
4.55%, 7/1/30 | | | 321,125 | | | | 305,797 | | |
4.50%, 7/1/40 | | | 874,175 | | | | 741,106 | | |
Pennsylvania Electric Co., 5.15%, 3/30/26 (a) | | | 10,000 | | | | 9,987 | | |
SCE Recovery Funding LLC | |
0.86%, 11/15/31 | | | 92,356 | | | | 78,685 | | |
1.94%, 5/15/38 | | | 50,000 | | | | 37,639 | | |
2.51%, 11/15/43 | | | 30,000 | | | | 20,700 | | |
Sempra, 4.13%, (US 5 Year CMT
T-Note + 2.87%), 4/1/52 (b) | | | 251,000 | | | | 215,400 | | |
Southern California Edison Co. | |
3.70%, 8/1/25 | | | 45,000 | | | | 44,090 | | |
4.00%, 4/1/47 | | | 50,000 | | | | 40,922 | | |
5.88%, 12/1/53 | | | 190,000 | | | | 205,254 | | |
Texas Electric Market Stabilization
Funding N LLC, 4.27%, 8/1/34 (a) | | | 348,089 | | | | 336,544 | | |
| | | | 4,249,452 | | |
| | | Shares/
Principal | | Fair
Value | |
ENTERTAINMENT - 0.1% | |
Warnermedia Holdings, Inc., 4.05%, 3/15/29 | | $ | 278,000 | | | $ | 263,877 | | |
FOOD - 0.1% | |
Sigma Alimentos SA de CV, 4.13%, 5/2/26 (a) | | | 240,000 | | | | 233,915 | | |
GAS - 0.1% | |
Boston Gas Co., 3.15%, 8/1/27 (a) | | | 60,000 | | | | 56,430 | | |
KeySpan Gas East Corp., 2.74%, 8/15/26 (a) | | | 275,000 | | | | 256,519 | | |
Southern Co. Gas Capital Corp., 5.75%,
9/15/33 | | | 145,000 | | | | 152,625 | | |
| | | | 465,574 | | |
HEALTHCARE-PRODUCTS - 0.1% | |
Alcon Finance Corp., 5.38%, 12/6/32 (a) | | | 400,000 | | | | 413,430 | | |
HEALTHCARE-SERVICES - 0.4% | |
Children's Hospital/DC, 2.93%, 7/15/50 | | | 85,000 | | | | 56,191 | | |
Dignity Health, 3.81%, 11/1/24 | | | 92,000 | | | | 90,425 | | |
Humana, Inc. | |
5.88%, 3/1/33 | | | 183,000 | | | | 195,411 | | |
5.95%, 3/15/34 | | | 228,000 | | | | 244,504 | | |
5.50%, 3/15/53 | | | 163,000 | | | | 169,376 | | |
Memorial Sloan-Kettering Cancer Center,
2.96%, 1/1/50 | | | 20,000 | | | | 14,381 | | |
Providence St Joseph Health Obligated
Group, 5.40%, 10/1/33 | | | 435,000 | | | | 443,953 | | |
Toledo Hospital (The), 5.75%, 11/15/38 | | | 75,000 | | | | 74,689 | | |
| | | | 1,288,930 | | |
INSURANCE - 0.4% | |
American International Group, Inc.,
3.40%, 6/30/30 | | | 120,000 | | | | 110,580 | | |
Athene Holding Ltd., 5.88%, 1/15/34 | | | 460,000 | | | | 464,980 | | |
Corebridge Financial, Inc. | |
6.05%, 9/15/33 (a) | | | 90,000 | | | | 93,906 | | |
5.75%, 1/15/34 | | | 355,000 | | | | 364,620 | | |
Corebridge Global Funding, 5.90%,
9/19/28 (a) | | | 55,000 | | | | 56,716 | | |
Principal Financial Group, Inc., 3.40%,
5/15/25 | | | 150,000 | | | | 146,622 | | |
| | | | 1,237,424 | | |
LODGING - 0.2% | |
Genting New York LLC / GENNY
Capital, Inc., 3.30%, 2/15/26 (a) | | | 600,000 | | | | 546,851 | | |
MACHINERY-DIVERSIFIED - 0.2% | |
John Deere Capital Corp., 5.15%, 9/8/33 | | | 782,000 | | | | 824,484 | | |
MEDIA - 0.1% | |
Comcast Corp., 3.25%, 11/1/39 | | | 348,000 | | | | 283,034 | | |
MINING - 0.3% | |
Glencore Funding LLC | |
6.38%, 10/6/30 (a) | | | 709,000 | | | | 762,112 | | |
See accompanying notes to financial statements.
47
Global Atlantic Wellington Research Managed Risk Portfolio
Portfolio of Investments (Continued)
December 31, 2023
| | | Shares/
Principal | | Fair
Value | |
MINING - 0.3% (Continued) | |
Glencore Funding LLC (continued) | |
5.70%, 5/8/33 (a) | | $ | 65,000 | | | $ | 67,575 | | |
6.50%, 10/6/33 (a) | | | 149,000 | | | | 162,804 | | |
| | | | 992,491 | | |
OIL & GAS - 0.2% | |
Occidental Petroleum Corp. | |
6.13%, 1/1/31 | | | 192,000 | | | | 199,332 | | |
6.45%, 9/15/36 | | | 134,000 | | | | 142,135 | | |
6.20%, 3/15/40 | | | 383,000 | | | | 395,448 | | |
| | | | 736,915 | | |
PASSENGER AIRLINES - 0.0%† | |
United Airlines 2016-1 Class AA
Pass-Through Trust, 3.10%, 7/7/28 | | | 68,340 | | | | 62,256 | | |
United Airlines 2018-1 Class B Pass
Through Trust, 4.60%, 3/1/26 | | | 18,809 | | | | 17,504 | | |
| | | | 79,760 | | |
PHARMACEUTICALS - 0.2% | |
Bayer US Finance LLC, 6.25%, 1/21/29 (a) | | | 200,000 | | | | 204,627 | | |
Pfizer Investment Enterprises Pte Ltd.,
5.11%, 5/19/43 | | | 386,000 | | | | 385,827 | | |
| | | | 590,454 | | |
PIPELINES - 0.2% | |
Columbia Pipelines Operating Co. LLC | |
5.93%, 8/15/30 (a) | | | 80,000 | | | | 82,833 | | |
6.50%, 8/15/43 (a) | | | 138,000 | | | | 148,254 | | |
Enbridge, Inc., 6.70%, 11/15/53 | | | 73,000 | | | | 85,233 | | |
Gray Oak Pipeline LLC | |
2.60%, 10/15/25 (a) | | | 144,000 | | | | 136,514 | | |
3.45%, 10/15/27 (a) | | | 25,000 | | | | 23,264 | | |
Targa Resources Corp., 6.15%, 3/1/29 | | | 160,000 | | | | 167,517 | | |
| | | | 643,615 | | |
REAL ESTATE - 0.1% | |
Jones Lang LaSalle, Inc., 6.88%, 12/1/28 | | | 435,000 | | | | 459,721 | | |
REITS - 1.0% | |
Extra Space Storage LP, 5.90%, 1/15/31 | | | 215,000 | | | | 224,702 | | |
GLP Capital LP / GLP Financing II, Inc.,
6.75%, 12/1/33 | | | 522,000 | | | | 563,176 | | |
LXP Industrial Trust, 6.75%, 11/15/28 | | | 540,000 | | | | 568,026 | | |
Realty Income Corp., 4.90%, 7/15/33 | | | 963,000 | | | | 963,189 | | |
SBA Tower Trust | |
2.84%, 1/15/25 (a) | | | 100,000 | | | | 96,614 | | |
1.88%, 1/15/26 (a) | | | 95,000 | | | | 88,092 | | |
1.63%, 11/15/26 (a) | | | 115,000 | | | | 102,682 | | |
VICI Properties LP / VICI Note Co., Inc. | |
5.75%, 2/1/27 (a) | | | 366,000 | | | | 366,191 | | |
4.13%, 8/15/30 (a) | | | 515,000 | | | | 469,127 | | |
| | | | 3,441,799 | | |
| | | Shares/
Principal | | Fair
Value | |
SEMICONDUCTORS - 0.1% | |
Broadcom, Inc., 3.47%, 4/15/34 (a) | | $ | 493,000 | | | $ | 429,668 | | |
SOFTWARE - 0.1% | |
Microsoft Corp., 4.50%, 6/15/47 (a) | | | 200,000 | | | | 196,439 | | |
Oracle Corp., 3.65%, 3/25/41 | | | 286,000 | | | | 228,235 | | |
| | | | 424,674 | | |
TELECOMMUNICATIONS - 0.2% | |
AT&T, Inc. | |
4.30%, 2/15/30 | | | 201,000 | | | | 197,127 | | |
4.30%, 12/15/42 | | | 45,000 | | | | 39,276 | | |
3.85%, 6/1/60 | | | 33,000 | | | | 24,719 | | |
Sprint Spectrum Co. LLC / Sprint
Spectrum Co. II LLC / Sprint
Spectrum Co. III LLC, 4.74%, 3/20/25 (a) | | | 128,125 | | | | 127,026 | | |
T-Mobile USA, Inc., 6.00%, 6/15/54 | | | 57,000 | | | | 62,767 | | |
Verizon Communications, Inc. | |
2.88%, 11/20/50 | | | 70,000 | | | | 47,707 | | |
2.99%, 10/30/56 | | | 110,000 | | | | 73,057 | | |
3.00%, 11/20/60 | | | 71,000 | | | | 46,549 | | |
| | | | 618,228 | | |
TRUCKING & LEASING - 0.4% | |
DAE Funding LLC, 1.55%, 8/1/24 (a) | | | 500,000 | | | | 486,672 | | |
Penske Truck Leasing Co. LP /
PTL Finance Corp. | |
3.95%, 3/10/25 (a) | | | 345,000 | | | | 338,690 | | |
5.70%, 2/1/28 (a) | | | 340,000 | | | | 347,613 | | |
5.55%, 5/1/28 (a) | | | 215,000 | | | | 218,484 | | |
| | | | 1,391,459 | | |
TOTAL CORPORATE BONDS AND NOTES
(Cost - $29,634,281) | | | | | 30,284,772 | | |
AGENCY MORTGAGE BACKED SECURITIES - 8.6% | |
FEDERAL HOME LOAN MORTGAGE CORPORATION - 2.6% | |
Freddie Mac Gold Pool | |
3.00%, 9/1/28 | | | 1,931 | | | | 1,813 | | |
2.50%, 10/1/28 | | | 3,836 | | | | 3,644 | | |
2.50%, 12/1/31 | | | 25,758 | | | | 24,234 | | |
3.50%, 11/1/34 | | | 26,958 | | | | 26,292 | | |
3.00%, 2/1/43 | | | 17,470 | | | | 16,451 | | |
3.50%, 10/1/43 | | | 8,465 | | | | 7,964 | | |
4.00%, 8/1/44 | | | 5,204 | | | | 5,038 | | |
3.00%, 11/1/46 | | | 502,370 | | | | 444,572 | | |
3.00%, 12/1/46 | | | 130,332 | | | | 115,338 | | |
Freddie Mac Pool | |
2.00%, 5/1/36 | | | 97,578 | | | | 88,132 | | |
2.00%, 5/1/36 | | | 18,973 | | | | 17,082 | | |
2.00%, 7/1/36 | | | 63,143 | | | | 56,976 | | |
4.50%, 1/1/38 | | | 161,627 | | | | 160,702 | | |
4.50%, 5/1/38 | | | 33,774 | | | | 33,561 | | |
2.50%, 7/1/41 | | | 211,386 | | | | 190,457 | | |
2.00%, 11/1/41 | | | 250,935 | | | | 215,145 | | |
See accompanying notes to financial statements.
48
Global Atlantic Wellington Research Managed Risk Portfolio
Portfolio of Investments (Continued)
December 31, 2023
| | | Shares/
Principal | | Fair
Value | |
FEDERAL HOME LOAN MORTGAGE CORPORATION - 2.6% (Continued) | |
Freddie Mac Pool (continued) | |
2.50%, 2/1/42 | | $ | 485,191 | | | $ | 419,967 | | |
2.50%, 1/1/51 | | | 249,405 | | | | 214,870 | | |
2.00%, 2/1/51 | | | 135,258 | | | | 110,939 | | |
2.00%, 3/1/51 | | | 571,156 | | | | 468,442 | | |
2.00%, 5/1/51 | | | 126,299 | | | | 104,425 | | |
2.00%, 5/1/51 | | | 2,231,732 | | | | 1,829,906 | | |
2.50%, 7/1/51 | | | 696,331 | | | | 599,725 | | |
3.00%, 10/1/51 | | | 514,480 | | | | 459,270 | | |
2.00%, 4/1/52 | | | 1,276,428 | | | | 1,056,103 | | |
4.50%, 7/1/52 | | | 81,318 | | | | 78,907 | | |
4.50%, 8/1/52 | | | 461,481 | | | | 447,265 | | |
4.50%, 8/1/52 | | | 86,217 | | | | 83,688 | | |
5.00%, 8/1/52 | | | 224,012 | | | | 222,283 | | |
4.50%, 9/1/52 | | | 20,356 | | | | 19,741 | | |
5.00%, 10/1/52 | | | 880,294 | | | | 871,591 | | |
5.00%, 1/1/53 | | | 223,912 | | | | 221,841 | | |
5.00%, 1/1/53 | | | 117,158 | | | | 116,038 | | |
5.50%, 2/1/53 | | | 34,486 | | | | 34,649 | | |
5.00%, 4/1/53 | | | 109,653 | | | | 108,569 | | |
| | | | 8,875,620 | | |
FEDERAL NATIONAL MORTGAGE ASSOCIATION - 4.0% | |
Fannie Mae Pool | |
2.50%, 4/1/28 | | | 5,356 | | | | 5,296 | | |
3.00%, 10/1/28 | | | 3,249 | | | | 3,126 | | |
2.50%, 2/1/30 | | | 10,814 | | | | 10,265 | | |
2.50%, 6/1/30 | | | 34,794 | | | | 33,028 | | |
2.50%, 10/1/31 | | | 65,590 | | | | 62,457 | | |
2.50%, 12/1/31 | | | 16,929 | | | | 16,120 | | |
2.00%, 4/1/36 | | | 35,218 | | | | 31,821 | | |
2.00%, 6/1/36 | | | 14,121 | | | | 12,743 | | |
2.00%, 9/1/36 | | | 36,275 | | | | 32,733 | | |
2.00%, 9/1/36 | | | 13,731 | | | | 12,423 | | |
2.00%, 3/1/37 | | | 27,716 | | | | 25,073 | | |
3.50%, 6/1/37 | | | 114,674 | | | | 110,248 | | |
4.00%, 1/1/38 | | | 378,678 | | | | 374,338 | | |
4.50%, 1/1/38 | | | 169,160 | | | | 168,197 | | |
4.50%, 4/1/38 | | | 356,437 | | | | 355,499 | | |
2.50%, 2/1/41 | | | 64,244 | | | | 57,886 | | |
2.00%, 4/1/41 | | | 141,512 | | | | 121,326 | | |
2.00%, 5/1/41 | | | 157,686 | | | | 135,193 | | |
2.00%, 7/1/41 | | | 298,512 | | | | 255,939 | | |
2.00%, 10/1/41 | | | 127,712 | | | | 109,498 | | |
1.50%, 11/1/41 | | | 321,371 | | | | 266,702 | | |
3.00%, 7/1/43 | | | 26,633 | | | | 24,516 | | |
5.00%, 8/1/43 | | | 120,501 | | | | 120,152 | | |
4.00%, 11/1/43 | | | 9,242 | | | | 9,372 | | |
4.00%, 1/1/46 | | | 136,125 | | | | 131,304 | | |
4.00%, 2/1/46 | | | 147,127 | | | | 141,906 | | |
| | | Shares/
Principal | | Fair
Value | |
FEDERAL NATIONAL MORTGAGE ASSOCIATION - 4.0% (Continued) | |
Fannie Mae Pool (continued) | |
4.00%, 3/1/46 | | $ | 14,988 | | | $ | 14,541 | | |
3.00%, 10/1/46 | | | 680,145 | | | | 615,919 | | |
4.50%, 7/1/48 | | | 28,072 | | | | 27,778 | | |
4.50%, 11/1/48 | | | 12,012 | | | | 11,868 | | |
4.00%, 1/1/49 | | | 19,110 | | | | 18,510 | | |
4.00%, 8/1/49 | | | 8,292 | | | | 8,039 | | |
3.50%, 4/1/50 | | | 548,867 | | | | 507,726 | | |
3.00%, 7/1/50 | | | 270,774 | | | | 242,808 | | |
4.50%, 10/1/50 | | | 9,072 | | | | 8,955 | | |
2.00%, 11/1/50 | | | 303,023 | | | | 248,735 | | |
2.00%, 12/1/50 | | | 320,697 | | | | 264,835 | | |
2.00%, 2/1/51 | | | 73,248 | | | | 60,560 | | |
2.00%, 4/1/51 | | | 175,347 | | | | 144,974 | | |
2.50%, 5/1/51 | | | 1,070,741 | | | | 921,457 | | |
3.50%, 7/1/51 | | | 902,512 | | | | 838,855 | | |
2.50%, 8/1/51 | | | 945,114 | | | | 818,073 | | |
4.00%, 8/1/51 | | | 18,968 | | | | 18,437 | | |
2.00%, 9/1/51 | | | 203,947 | | | | 169,765 | | |
3.00%, 10/1/51 | | | 585,744 | | | | 524,554 | | |
2.50%, 11/1/51 | | | 643,348 | | | | 565,034 | | |
2.50%, 12/1/51 | | | 346,031 | | | | 297,141 | | |
2.50%, 1/1/52 | | | 372,251 | | | | 320,350 | | |
4.50%, 7/1/52 | | | 460,378 | | | | 446,682 | | |
4.00%, 8/1/52 | | | 222,438 | | | | 210,431 | | |
4.50%, 8/1/52 | | | 24,376 | | | | 23,625 | | |
4.50%, 8/1/52 | | | 38,519 | | | | 37,332 | | |
5.00%, 8/1/52 | | | 42,381 | | | | 42,010 | | |
4.00%, 9/1/52 | | | 357,870 | | | | 340,000 | | |
4.50%, 9/1/52 | | | 573,946 | | | | 556,605 | | |
4.50%, 9/1/52 | | | 134,481 | | | | 131,000 | | |
4.50%, 9/1/52 | | | 12,990 | | | | 12,710 | | |
5.00%, 9/1/52 | | | 42,704 | | | | 42,335 | | |
5.00%, 9/1/52 | | | 20,731 | | | | 20,608 | | |
4.00%, 10/1/52 | | | 222,976 | | | | 211,749 | | |
5.00%, 10/1/52 | | | 42,366 | | | | 41,992 | | |
5.50%, 10/1/52 | | | 439,423 | | | | 443,075 | | |
4.50%, 11/1/52 | | | 29,271 | | | | 28,677 | | |
5.50%, 1/1/53 | | | 210,799 | | | | 211,768 | | |
5.00%, 5/1/53 | | | 261,438 | | | | 258,896 | | |
5.50%, 8/1/53 | | | 55,170 | | | | 55,443 | | |
4.50%, 1/1/54 (c) | | | 397,000 | | | | 384,842 | | |
5.50%, 1/1/54 (c) | | | 215,000 | | | | 216,016 | | |
Freddie Mac Pool | |
5.00%, 11/1/43 | | | 72,608 | | | | 73,034 | | |
4.00%, 4/1/47 | | | 9,449 | | | | 9,205 | | |
4.00%, 11/1/48 | | | 167,267 | | | | 161,557 | | |
4.50%, 11/1/48 | | | 9,334 | | | | 9,171 | | |
4.00%, 5/1/49 | | | 26,160 | | | | 25,412 | | |
4.00%, 7/1/49 | | | 30,566 | | | | 29,552 | | |
See accompanying notes to financial statements.
49
Global Atlantic Wellington Research Managed Risk Portfolio
Portfolio of Investments (Continued)
December 31, 2023
| | | Shares/
Principal | | Fair
Value | |
FEDERAL NATIONAL MORTGAGE ASSOCIATION - 4.0% (Continued) | |
Freddie Mac Pool (continued) | |
4.50%, 8/1/49 | | $ | 19,808 | | | $ | 19,559 | | |
4.50%, 10/1/52 | | | 133,443 | | | | 129,328 | | |
5.50%, 3/1/53 | | | 55,589 | | | | 55,921 | | |
5.50%, 9/1/53 | | | 55,391 | | | | 56,058 | | |
5.50%, 9/1/53 | | | 55,694 | | | | 56,031 | | |
5.50%, 9/1/53 | | | 55,197 | | | | 55,759 | | |
| | | | 13,672,458 | | |
GOVERNMENT NATIONAL MORTGAGE ASSOCIATION - 2.0% | |
Ginnie Mae II Pool | |
3.00%, 12/20/42 | | | 13,369 | | | | 12,399 | | |
3.50%, 7/20/43 | | | 14,210 | | | | 13,539 | | |
4.00%, 12/20/44 | | | 4,609 | | | | 4,517 | | |
4.00%, 8/20/48 | | | 11,896 | | | | 11,551 | | |
4.00%, 9/20/48 | | | 26,725 | | | | 25,949 | | |
4.00%, 10/20/48 | | | 11,568 | | | | 11,178 | | |
3.00%, 11/20/49 | | | 153,072 | | | | 139,906 | | |
2.00%, 12/20/50 | | | 745,664 | | | | 633,421 | | |
2.00%, 1/20/51 | | | 193,842 | | | | 164,317 | | |
2.00%, 2/20/51 | | | 170,725 | | | | 144,819 | | |
2.50%, 3/20/51 | | | 190,806 | | | | 167,228 | | |
3.00%, 7/20/51 | | | 648,402 | | | | 587,744 | | |
2.50%, 8/1/51 | | | 734,360 | | | | 643,232 | | |
2.50%, 10/20/51 | | | 435,395 | | | | 380,986 | | |
3.50%, 1/20/52 | | | 959,098 | | | | 892,058 | | |
3.00%, 3/20/52 | | | 502,229 | | | | 454,399 | | |
3.50%, 3/20/52 | | | 401,065 | | | | 373,212 | | |
4.00%, 4/20/52 | | | 165,135 | | | | 157,643 | | |
4.00%, 5/20/52 | | | 471,694 | | | | 450,433 | | |
3.50%, 7/20/52 | | | 320,911 | | | | 298,512 | | |
4.00%, 8/20/52 | | | 442,045 | | | | 422,178 | | |
4.50%, 8/20/52 | | | 331,624 | | | | 322,748 | | |
2.50%, 12/20/52 | | | 353,038 | | | | 308,689 | | |
| | | | 6,620,658 | | |
TOTAL AGENCY MORTGAGE BACKED
SECURITIES (Cost - $30,166,310) | | | | | 29,168,736 | | |
ASSET BACKED AND COMMERCIAL BACKED SECURITIES - 2.8% | |
Affirm Asset Securitization Trust 2020-Z1,
1.07%, 8/15/25 (a) | | | 14,983 | | | | 14,773 | | |
Angel Oak Mortgage Trust 2019-6, 2.62%,
11/25/59 (a),(d) | | | 11,532 | | | | 10,881 | | |
Banc of America Commercial Mortgage
Trust 2015-UBS7, 3.71%, 9/15/48 | | | 155,000 | | | | 149,123 | | |
Castlelake Aircraft Structured
Trust 2019-1A, 3.97%, 4/15/39 (a) | | | 143,690 | | | | 125,076 | | |
CF Hippolyta Issuer LLC | |
1.53%, 3/15/61 (a) | | | 311,008 | | | | 278,207 | | |
5.97%, 8/15/62 (a) | | | 97,713 | | | | 95,833 | | |
| | | Shares/
Principal | | Fair
Value | |
ASSET BACKED AND COMMERCIAL BACKED SECURITIES - 2.8% (Continued) | |
CFMT 2021-AL1 LLC, 1.39%, 9/22/31 (a) | | $ | 213,584 | | | $ | 203,561 | | |
Citigroup Commercial Mortgage
Trust 2019-SMRT, 4.15%, 1/10/36 (a) | | | 100,000 | | | | 99,830 | | |
Connecticut Avenue Security Trust,
6.89%, (SOFR + 1.55%), 10/25/41 (a),(b) | | | 70,000 | | | | 69,957 | | |
Credit Suisse First Boston Mortgage
Securities Corp., 4.50%, 7/25/20 | | | 4,565 | | | | 3,760 | | |
Enterprise Fleet Financing 2023-3 LLC,
6.40%, 3/20/30 (a) | | | 365,000 | | | | 372,639 | | |
Fannie Mae REMICS | |
3.00%, 4/25/43 | | | 205,821 | | | | 188,124 | | |
3.50%, 6/25/44 | | | 48,089 | | | | 46,666 | | |
3.00%, 1/25/45 | | | 179,715 | | | | 163,609 | | |
3.00%, 1/25/45 | | | 124,405 | | | | 110,917 | | |
3.00%, 12/25/45 | | | 209,274 | | | | 193,068 | | |
1.50%, 10/25/49 | | | 210,173 | | | | 164,437 | | |
3.00%, 12/25/54 | | | 312,749 | | | | 298,361 | | |
Fannie Mae-Aces, 5.84%, (SOFR + 0.51%),
10/25/24 (b) | | | 11,090 | | | | 11,007 | | |
Flagstar Mortgage Trust 2018-3INV,
4.00%, 5/25/48 (a),(d) | | | 68,653 | | | | 62,653 | | |
Flagstar Mortgage Trust 2021-9INV,
2.00%, 9/25/41 (a),(d) | | | 146,044 | | | | 123,226 | | |
Ford Credit Auto Owner
Trust 2021-REV1, 1.61%, 10/17/33 (a) | | | 100,000 | | | | 92,296 | | |
Freddie Mac Multifamily Structured Pass
Through Certificates | |
2.40%, 3/25/32 | | | 280,000 | | | | 241,826 | | |
4.43%, 2/25/33 (d) | | | 260,000 | | | | 259,962 | | |
Freddie Mac REMICS | |
4.00%, 9/15/41 | | | 192,900 | | | | 186,410 | | |
1.75%, 9/15/42 | | | 215,958 | | | | 200,557 | | |
1.50%, 10/15/42 | | | 18,994 | | | | 16,833 | | |
3.00%, 6/15/45 | | | 231,800 | | | | 216,772 | | |
3.00%, 7/15/47 | | | 163,157 | | | | 150,745 | | |
4.00%, 7/15/48 | | | 145,376 | | | | 135,953 | | |
Freddie Mac STACR REMIC Trust,
8.14%, (SOFR + 2.80%), 10/25/50 (a),(b) | | | 68,523 | | | | 69,417 | | |
Government National Mortgage Association | |
2.50%, 10/20/49 | | | 435,863 | | | | 380,692 | | |
6.04%, (1 Month US Libor + 0.71%),
5/20/65 (b) | | | 36,390 | | | | 36,220 | | |
6.06%, (1 Month US Libor + 0.73%),
8/20/65 (b) | | | 44,796 | | | | 44,700 | | |
6.14%, (1 Month US Libor + 0.81%),
10/20/65 (b) | | | 54 | | | | 53 | | |
6.44%, (1 Month US Libor + 1.11%),
12/20/65 (b) | | | 39,278 | | | | 39,401 | | |
GSR Mortgage Loan Trust 2005-AR6,
4.84%, 9/25/35 (d) | | | 3,261 | | | | 3,116 | | |
Home Partners of America Trust 2021-2,
2.30%, 12/17/26 (a) | | | 327,161 | | | | 295,594 | | |
See accompanying notes to financial statements.
50
Global Atlantic Wellington Research Managed Risk Portfolio
Portfolio of Investments (Continued)
December 31, 2023
| | | Shares/
Principal | | Fair
Value | |
ASSET BACKED AND COMMERCIAL BACKED SECURITIES - 2.8% (Continued) | |
Horizon Aircraft Finance III Ltd., 2019-2,
3.43%, 11/15/39 (a) | | $ | 213,572 | | | $ | 169,061 | | |
Kubota Credit Owner Trust 2023-2,
5.28%, 1/18/28 (a) | | | 240,000 | | | | 242,780 | | |
Life 2021-BMR Mortgage Trust, 6.18%,
(1 Month US Libor + 0.81%), 3/15/38 (a),(b) | | | 98,297 | | | | 96,142 | | |
Metlife Securitization Trust, 3.00%,
4/25/55 (a),(d) | | | 40,931 | | | | 38,142 | | |
Mill City Mortgage Loan Trust 2017-3,
2.75%, 1/25/61 (a),(d) | | | 16,410 | | | | 15,999 | | |
Navient Private Education Refi Loan
Trust 2023-A, 5.51%, 10/15/71 (a) | | | 300,860 | | | | 302,488 | | |
New Economy Assets Phase 1 Sponsor
LLC, 1.91%, 10/20/61 (a) | | | 375,000 | | | | 327,147 | | |
New Economy Assets Phase 1 Sponsor,
LLC, 2.41%, 10/20/61 (a) | | | 120,000 | | | | 96,800 | | |
New Residential Mortgage Loan Trust
2019-RPL3, 2.75%, 7/25/59 (a),(d) | | | 42,022 | | | | 39,377 | | |
Retained Vantage Data Centers Issuer
LLC, 5.00%, 9/15/48 (a) | | | 561,000 | | | | 523,262 | | |
SCF Equipment Leasing 2021-1 LLC,
0.83%, 8/21/28 (a) | | | 108,928 | | | | 107,376 | | |
Seasoned Credit Risk Transfer Trust
Series 2019-3, 3.50%, 10/25/58 | | | 88,647 | | | | 82,187 | | |
Seasoned Credit Risk Transfer Trust
Series 2021-1, 2.50%, 9/25/60 | | | 539,522 | | | | 491,310 | | |
SFAVE Commercial Mortgage Securities
Trust 2015-5AVE, 4.14%, 1/5/43 (a),(d) | | | 100,000 | | | | 71,535 | | |
SFS Auto Receivables Securitization
Trust 2023-1, 5.89%, 3/22/27 (a) | | | 117,393 | | | | 117,536 | | |
Stack Infrastructure Issuer LLC, 5.90%,
7/25/48 (a) | | | 525,000 | | | | 517,630 | | |
Structured Adjustable Rate Mortgage
Loan Trust | |
6.48%, 2/25/34 (d) | | | 1,966 | | | | 1,838 | | |
5.81%, 9/25/34 (d) | | | 1,821 | | | | 1,744 | | |
Texas Natural Gas Securitization
Finance Corp. | |
5.10%, 4/1/35 | | | 190,000 | | | | 193,636 | | |
5.17%, 4/1/41 | | | 145,000 | | | | 149,841 | | |
Towd Point Mortgage Trust 2017-4,
2.75%, 6/25/57 (a),(d) | | | 42,218 | | | | 40,233 | | |
Towd Point Mortgage Trust 2018-1,
3.00%, 1/25/58 (a),(d) | | | 14,634 | | | | 14,187 | | |
Wells Fargo Commercial Mortgage
Trust 2015-NXS1, 3.15%, 5/15/48 | | | 250,000 | | | | 240,374 | | |
Wheels Fleet Lease Funding 1 LLC,
6.46%, 8/18/38 (a) | | | 250,000 | | | | 253,049 | | |
TOTAL ASSET BACKED AND
COMMERCIAL BACKED SECURITIES
(Cost - $9,725,059) | | | | | 9,289,929 | | |
| | | Shares/
Principal | | Fair
Value | |
MUNICIPAL BONDS - 0.6% | |
Golden State Tobacco Securitization
Corp., 3.00%, 6/1/46 | | $ | 40,000 | | | $ | 36,402 | | |
Illinois Municipal Electric Agency,
6.83%, 2/1/35 | | | 195,000 | | | | 208,470 | | |
Kansas Development Finance Authority,
5.37%, 5/1/26 | | | 60,000 | | | | 60,258 | | |
Metropolitan Transportation Authority | |
6.20%, 11/15/26 | | | 5,000 | | | | 5,102 | | |
6.81%, 11/15/40 | | | 180,000 | | | | 199,435 | | |
5.18%, 11/15/49 | | | 65,000 | | | | 63,373 | | |
Philadelphia Authority for Industrial
Development, 6.55%, 10/15/28 | | | 270,000 | | | | 287,660 | | |
State of Illinois, 5.10%, 6/1/33 | | | 1,225,000 | | | | 1,212,064 | | |
University of California, 1.61%, 5/15/30 | | | 20,000 | | | | 16,907 | | |
TOTAL MUNICIPAL BONDS
(Cost - $2,296,325) | | | | | 2,089,671 | | |
EXCHANGE TRADED FUNDS - 0.3% | |
EQUITY FUNDS - 0.3% | |
SPDR S&P 500 ETF TRUST
(Cost - $794,034) | | | 1,741 | | | | 827,515 | | |
SHORT-TERM INVESTMENTS - 4.6% | |
MONEY MARKET FUNDS - 4.6% | |
Dreyfus Government Cash Management,
5.25% (e) | | | 11,816,064 | | | | 11,816,064 | | |
Fidelity Investments Money Market
Fund - Government Portfolio, Institutional
Class, 5.25% (e) | | | 3,901,839 | | | | 3,901,839 | | |
TOTAL SHORT-TERM INVESTMENTS
(Cost - $15,717,903) | | | | | 15,717,903 | | |
TOTAL INVESTMENTS - 100.1%
(Cost - $260,449,136) | | | | $ | 338,864,770 | | |
OTHER ASSETS LESS
LIABILITIES - NET (0.1)% | | | | | (227,537 | ) | |
TOTAL NET ASSETS - 100.0% | | | | $ | 338,637,233 | | |
* Non-income producing security.
^ Affiliated security
† Represents less than 0.05%.
†† A portion of this investment, valued at $134,737, is held as collateral for derivative investments.
(a) 144A - Security was purchased pursuant to Rule 144a under the Securities Act of 1933 and may not be resold subject to that rule, except to qualified institutional buyers. As of December 31, 2023, these securities amounted to $15,979,366 or 4.7% of net assets.
(b) Variable rate or fixed to variable rate security. The rate shown is the rate in effect at period end.
(c) When-issued, or delayed delivery. All or a portion may be subject to dollar-roll transactions.
(d) Adjustable rate security with an interest rate that is not based on a published reference index and spread. The rate is based on the structure of the agreement and current market conditions. The coupon rate shown represents the rate at period end.
(e) The rate shown is the annualized seven-day yield at period end.
See accompanying notes to financial statements.
51
Global Atlantic Wellington Research Managed Risk Portfolio
Portfolio of Investments (Continued)
December 31, 2023
ADR - American Depositary Receipt
CMT - Treasury Constant Maturity Rate
Libor - London Interbank Offer Rate
PLC - Public Limited Company
REMIC - Real Estate Mortgage Investment Conduit
SOFR - Secured Overnight Financing Rate
FUTURES CONTRACTS | |
LONG FUTURES CONTRACTS | | Counterparty | | Number of
Contracts | | Expiration Date | | Notional Value | | Fair Value/
Unrealized
Appreciation
(Depreciation) | |
U.S. 5 Year Note Future | | JP Morgan Chase Bank | | | 20 | | | 3/28/2024 | | $ | 2,175,469 | | | $ | 54,008 | | |
AFFILIATED ISSUER TRANSACTIONS | |
An affiliated company is a company in which the Fund has ownership of at least 5% of the voting securities, or a company that is under common ownership or control. Fiscal year to date transactions with companies which are or were affiliates are as follows:
| | Value at
12/31/22 | | Purchases
Cost | | Sales
Proceeds | | Net Realized
Gain/(Loss) | | Net Change in
Unrealized
Appreciation
(Depreciation) | | Dividend
Income | | Capital Gain
Distributions | | Number of
Shares at
12/31/23 | | Value at
12/31/23 | |
KKR & Co., Inc | | $ | - | | | $ | 634,854 | | | $ | (44,549 | ) | | $ | 9,801 | | | $ | 225,494 | | | $ | 1,708 | | | $ | - | | | | 9,965 | | | $ | 825,600 | | |
See accompanying notes to financial statements.
52
Global Atlantic Portfolios
Statements of Assets and Liabilities
December 31, 2023
Assets: | | Global Atlantic
American Funds®
Managed Risk
Portfolio | | Global Atlantic
Balanced
Managed Risk
Portfolio | | Global Atlantic
BlackRock
Selects
Managed Risk
Portfolio | | Global Atlantic
Franklin Dividend
and Income
Managed Risk
Portfolio | |
Investments in securities, at cost | | $ | 149,461,968 | | | $ | 70,204,263 | | | $ | 143,128,137 | | | $ | 126,971,725 | | |
Investments in securities, at fair value | | $ | 165,102,832 | | | $ | 85,551,241 | | | $ | 166,804,310 | | | $ | 205,700,213 | | |
Cash | | | 175 | | | | - | | | | 50 | | | | 179 | | |
Deposit with broker for futures contracts | | | 45,224 | | | | 31,320 | | | | 25,142 | | | | 56,337 | | |
Segregated cash for swap contracts | | | - | | | | - | | | | - | | | | 40,383 | | |
Unrealized appreciation on forward foreign
currency contracts | | | - | | | | - | | | | - | | | | 16,604 | | |
Unrealized appreciation on futures contracts, net | | | - | | | | - | | | | - | | | | 24,878 | | |
Unrealized appreciation on swap contracts, net | | | - | | | | - | | | | - | | | | 23,020 | | |
Receivable for securities sold | | | - | | | | - | | | | - | | | | 4 | | |
Interest and dividends receivable | | | 33,792 | | | | 19,221 | | | | 37,880 | | | | 594,652 | | |
Prepaid expenses | | | 7,733 | | | | 4,023 | | | | 7,849 | | | | 9,566 | | |
Total Assets | | | 165,189,756 | | | | 85,605,805 | | | | 166,875,231 | | | | 206,465,836 | | |
Liabilities: | |
Payable to broker for swap contracts | | | - | | | | - | | | | - | | | | 8,242 | | |
Premiums received on open swap contracts, net | | | - | | | | - | | | | - | | | | 22,042 | | |
Unrealized depreciation on forward foreign
currency contracts | | | - | | | | - | | | | - | | | | 3,143 | | |
Due to custodian | | | - | | | | 125 | | | | - | | | | - | | |
Due to foreign custodian (cost $-, $-, $- and $48,
respectively) | | | - | | | | - | | | | - | | | | 172 | | |
Payable for securities purchased | | | - | | | | - | | | | - | | | | 4,698,540 | | |
Payable for portfolio shares redeemed | | | 152,219 | | | | 35,002 | | | | 49,577 | | | | 93,207 | | |
Accrued distribution (12b-1) fees | | | 34,556 | | | | 17,945 | | | | 34,983 | | | | 42,398 | | |
Accrued investment advisory fees | | | 69,952 | | | | 42,848 | | | | 76,962 | | | | 142,527 | | |
Administrative service fees payable | | | 8,224 | | | | 4,339 | | | | 8,362 | | | | 10,179 | | |
Regulatory and compliance fees payable | | | 643 | | | | 333 | | | | 655 | | | | 796 | | |
Accrued expenses and other liabilities | | | 18,700 | | | | 11,117 | | | | 18,995 | | | | 37,118 | | |
Total Liabilities | | | 284,294 | | | | 111,709 | | | | 189,534 | | | | 5,058,364 | | |
Net Assets | | $ | 164,905,462 | | | $ | 85,494,096 | | | $ | 166,685,697 | | | $ | 201,407,472 | | |
Composition of Net Assets: | |
Paid-in capital | | $ | 155,233,511 | | | $ | 75,684,448 | | | $ | 152,207,772 | | | $ | 110,709,391 | | |
Total distributable earnings | | | 9,671,951 | | | | 9,809,648 | | | | 14,477,925 | | | | 90,698,081 | | |
Net Assets | | $ | 164,905,462 | | | $ | 85,494,096 | | | $ | 166,685,697 | | | $ | 201,407,472 | | |
Class II Shares: | |
Net Assets | | $ | 164,905,462 | | | $ | 85,494,096 | | | $ | 166,685,697 | | | $ | 201,407,472 | | |
Total shares outstanding at end of period
($0 par value, unlimited shares authorized) | | | 15,787,480 | | | | 7,336,135 | | | | 15,325,963 | | | | 14,224,550 | | |
Net asset value, offering and redemption
price per share
(Net assets ÷ Total shares of beneficial
interest outstanding) | | $ | 10.45 | | | $ | 11.65 | | | $ | 10.88 | | | $ | 14.16 | | |
See accompanying notes to financial statements.
53
Global Atlantic Portfolios
Statements of Assets and Liabilities (Continued)
December 31, 2023
Assets: | | Global Atlantic
Growth
Managed Risk
Portfolio | | Global Atlantic
Moderate Growth
Managed Risk
Portfolio | | Global Atlantic
Select Advisor
Managed Risk
Portfolio | | Global Atlantic
Wellington
Research
Managed Risk
Portfolio | |
Investments in securities, at cost | | $ | 205,760,650 | | | $ | 73,878,971 | | | $ | 64,315,745 | | | $ | 259,849,030 | | |
Investments in affiliates securities, at cost | | | - | | | | - | | | | - | | | | 600,106 | | |
Investments in securities, at fair value | | $ | 304,181,518 | | | $ | 98,732,469 | | | $ | 76,051,489 | | | $ | 338,039,170 | | |
Investments in affiliates securities, at fair value | | | - | | | | - | | | | - | | | | 825,600 | | |
Cash | | | - | | | | - | | | | 15 | | | | - | | |
Deposit with broker for futures contracts | | | 34,339 | | | | 28,146 | | | | 32,559 | | | | - | | |
Unrealized appreciation on futures contracts, net | | | - | | | | - | | | | - | | | | 54,008 | | |
Receivable for securities sold | | | - | | | | - | | | | - | | | | 1,254,601 | | |
Interest and dividends receivable | | | 72,891 | | | | 23,374 | | | | 15,167 | | | | 1,122,946 | | |
Prepaid expenses | | | 14,254 | | | | 4,629 | | | | 3,561 | | | | 15,931 | | |
Total Assets | | | 304,303,002 | | | | 98,788,618 | | | | 76,102,791 | | | | 341,312,256 | | |
Liabilities: | |
Payable to broker for futures contracts | | | - | | | | - | | | | - | | | | 27,446 | | |
Payable for securities purchased | | | - | | | | - | | | | - | | | | 1,909,881 | | |
Payable for portfolio shares redeemed | | | 68,020 | | | | 23,871 | | | | 31,957 | | | | 353,274 | | |
Accrued distribution (12b-1) fees | | | 63,787 | | | | 20,702 | | | | 15,927 | | | | 71,088 | | |
Accrued investment advisory fees | | | 138,269 | | | | 48,433 | | | | 19,706 | | | | 238,135 | | |
Administrative service fees payable | | | 15,239 | | | | 4,897 | | | | 3,791 | | | | 16,884 | | |
Regulatory and compliance fees payable | | | 1,186 | | | | 385 | | | | 298 | | | | 1,333 | | |
Accrued expenses and other liabilities | | | 37,113 | | | | 11,331 | | | | 9,348 | | | | 56,982 | | |
Total Liabilities | | | 323,614 | | | | 109,619 | | | | 81,027 | | | | 2,675,023 | | |
Net Assets | | $ | 303,979,388 | | | $ | 98,678,999 | | | $ | 76,021,764 | | | $ | 338,637,233 | | |
Composition of Net Assets: | |
Paid-in capital | | $ | 198,546,966 | | | $ | 72,615,584 | | | $ | 64,682,594 | | | $ | 249,773,827 | | |
Total distributable earnings | | | 105,432,422 | | | | 26,063,415 | | | | 11,339,171 | | | | 88,863,406 | | |
Net Assets | | $ | 303,979,388 | | | $ | 98,678,999 | | | $ | 76,021,765 | | | $ | 338,637,233 | | |
Class II Shares: | |
Net Assets | | $ | 303,979,388 | | | $ | 98,678,999 | | | $ | 76,021,764 | | | $ | 338,637,233 | | |
Total shares outstanding at end of period
($0 par value, unlimited shares authorized) | | | 23,361,757 | | | | 8,147,068 | | | | 6,832,437 | | | | 25,085,317 | | |
Net asset value, offering and redemption
price per share
(Net assets ÷ Total shares of beneficial
interest outstanding) | | $ | 13.01 | | | $ | 12.11 | | | $ | 11.13 | | | $ | 13.50 | | |
See accompanying notes to financial statements.
54
Global Atlantic Portfolios
Statements of Operations
For the Year Ended December 31, 2023
| | | Global Atlantic
American Funds®
Managed Risk
Portfolio | | Global Atlantic
Balanced
Managed Risk
Portfolio | | Global Atlantic
BlackRock
Selects
Managed Risk
Portfolio | | Global Atlantic
Franklin Dividend
and Income
Managed Risk
Portfolio | |
Investment Income: | |
Dividend income | | $ | 3,791,261 | | | $ | 2,203,239 | | | $ | 3,989,645 | | | $ | 2,660,142 | | |
Interest income ** | | | 351,194 | | | | 195,965 | | | | 360,626 | | | | 2,752,443 | | |
Total Investment Income | | | 4,142,455 | | | | 2,399,204 | | | | 4,350,271 | | | | 5,412,585 | | |
Expenses: | |
Investment advisory fee | | | 1,508,174 | | | | 480,303 | | | | 934,608 | | | | 1,751,942 | | |
Distribution fees (12b-1) - Class II Shares | | | 418,937 | | | | 218,319 | | | | 424,822 | | | | 515,277 | | |
Administrative service fees | | | 55,131 | | | | 28,731 | | | | 55,905 | | | | 67,809 | | |
Legal fees | | | 46,558 | | | | 24,251 | | | | 47,242 | | | | 57,288 | | |
Trustees fees | | | 19,970 | | | | 10,418 | | | | 20,325 | | | | 24,764 | | |
Custody fees | | | 3,151 | | | | 4,144 | | | | 3,915 | | | | 20,765 | | |
Regulatory and compliance fees | | | 7,906 | | | | 4,119 | | | | 8,020 | | | | 9,724 | | |
Miscellaneous expenses | | | 64,362 | | | | 33,515 | | | | 65,465 | | | | 87,210 | | |
Total Expenses | | | 2,124,189 | | | | 803,800 | | | | 1,560,302 | | | | 2,534,779 | | |
Expenses waived | | | (671,206 | ) | | | (385 | ) | | | - | | | | (82,060 | ) | |
Net Expenses | | | 1,452,983 | | | | 803,415 | | | | 1,560,302 | | | | 2,452,719 | | |
Net Investment Income | | | 2,689,472 | | | | 1,595,789 | | | | 2,789,969 | | | | 2,959,866 | | |
Net Realized and Change in Unrealized Gain (Loss) | |
Net realized gain (loss) on: | |
Investments | | | (1,335,547 | ) | | | (1,444,408 | ) | | | 3,989,454 | | | | 14,000,661 | | |
Futures contracts | | | (3,126,021 | ) | | | (1,221,692 | ) | | | (3,467,596 | ) | | | (3,741,410 | ) | |
Swap contracts | | | - | | | | - | | | | - | | | | (89,506 | ) | |
Swaptions | | | - | | | | - | | | | - | | | | 41,640 | | |
Forward foreign currency contracts | | | - | | | | - | | | | - | | | | (61,166 | ) | |
Foreign currency translations | | | - | | | | 22 | | | | - | | | | (48,852 | ) | |
Capital gain distributions from underlying funds | | | 2,882,747 | | | | - | | | | - | | | | - | | |
| | | | (1,578,821 | ) | | | (2,666,078 | ) | | | 521,858 | | | | 10,101,367 | | |
Net change in unrealized appreciation/(depreciation) on: | |
Investments | | | 20,398,586 | | | | 10,421,809 | | | | 15,661,592 | | | | 2,742,682 | | |
Futures contracts | | | (857,565 | ) | | | (489,218 | ) | | | (807,708 | ) | | | (729,528 | ) | |
Swap contracts | | | - | | | | - | | | | - | | | | 98,207 | | |
Forward foreign currency contracts | | | - | | | | - | | | | - | | | | 32,330 | | |
Foreign currency translations | | | - | | | | (23 | ) | | | - | | | | (10,893 | ) | |
| | | | 19,541,021 | | | | 9,932,568 | | | | 14,853,884 | | | | 2,132,798 | | |
Net Realized and Change in Unrealized Gain | | | 17,962,200 | | | | 7,266,490 | | | | 15,375,742 | | | | 12,234,165 | | |
Net Increase in Net Assets
Resulting from Operations | | $ | 20,651,672 | | | $ | 8,862,279 | | | $ | 18,165,711 | | | $ | 15,194,031 | | |
| ** Foreign taxes withheld | | $ | - | | | $ | - | | | $ | - | | | $ | 31 | | |
See accompanying notes to financial statements.
55
Global Atlantic Portfolios
Statements of Operations (Continued)
For the Year Ended December 31, 2023
| | | Global Atlantic
Growth
Managed Risk
Portfolio | | Global Atlantic
Moderate Growth
Managed Risk
Portfolio | | Global Atlantic
Select Advisor
Managed Risk
Portfolio | | Global Atlantic
Wellington
Research
Managed Risk
Portfolio | |
Investment Income: | |
Dividend income * | | $ | 5,975,480 | | | $ | 2,264,063 | | | $ | 1,486,018 | | | $ | 2,485,228 | | |
Dividend income affiliated securities | | | - | | | | - | | | | - | | | | 1,708 | | |
Interest income | | | 677,334 | | | | 221,324 | | | | 172,489 | | | | 5,260,310 | | |
Total Investment Income | | | 6,652,814 | | | | 2,485,387 | | | | 1,658,507 | | | | 7,747,246 | | |
Expenses: | |
Investment advisory fee | | | 1,681,865 | | | | 554,287 | | | | 685,844 | | | | 2,913,700 | | |
Distribution fees (12b-1) - Class II Shares | | | 764,484 | | | | 251,949 | | | | 190,512 | | | | 856,971 | | |
Administrative service fees | | | 100,605 | | | | 33,155 | | | | 25,071 | | | | 112,776 | | |
Legal fees | | | 84,908 | | | | 27,987 | | | | 21,178 | | | | 95,353 | | |
Trustees fees | | | 36,320 | | | | 12,066 | | | | 9,061 | | | | 40,906 | | |
Custody fees | | | 7,617 | | | | 3,830 | | | | 2,489 | | | | 38,928 | | |
Regulatory and compliance fees | | | 14,421 | | | | 4,752 | | | | 3,597 | | | | 16,187 | | |
Miscellaneous expenses | | | 117,505 | | | | 38,642 | | | | 29,414 | | | | 146,435 | | |
Total Expenses | | | 2,807,725 | | | | 926,668 | | | | 967,166 | | | | 4,221,256 | | |
Expenses waived | | | (116,741 | ) | | | - | | | | (479,455 | ) | | | (142,076 | ) | |
Net Expenses | | | 2,690,984 | | | | 926,668 | | | | 487,711 | | | | 4,079,180 | | |
Net Investment Income | | | 3,961,830 | | | | 1,558,719 | | | | 1,170,796 | | | | 3,668,066 | | |
Net Realized and Change in Unrealized Gain (Loss) | |
Net realized gain (loss) on: | |
Investments | | | 18,144,557 | | | | 3,412,075 | | | | (371,552 | ) | | | 20,527,974 | | |
Investments in affiliated securities | | | - | | | | - | | | | - | | | | 9,801 | | |
Futures contracts | | | (10,238,408 | ) | | | (1,893,006 | ) | | | (2,057,393 | ) | | | (5,689,581 | ) | |
Capital gain distributions from underlying funds | | | - | | | | - | | | | 2,732,168 | | | | - | | |
| | | | 7,906,149 | | | | 1,519,069 | | | | 303,223 | | | | 14,848,194 | | |
Net change in unrealized appreciation/(depreciation) on: | |
Investments | | | 30,104,813 | | | | 9,606,996 | | | | 8,154,248 | | | | 29,111,815 | | |
Investments in affiliated securities | | | - | | | | - | | | | - | | | | 225,494 | | |
Futures contracts | | | (2,289,105 | ) | | | (557,140 | ) | | | (472,068 | ) | | | (2,301,510 | ) | |
| | | | 27,815,708 | | | | 9,049,856 | | | | 7,682,180 | | | | 27,035,799 | | |
Net Realized and Change in Unrealized Gain | | | 35,721,857 | | | | 10,568,925 | | | | 7,985,403 | | | | 41,883,993 | | |
Net Increase in Net Assets
Resulting from Operations | | $ | 39,683,687 | | | $ | 12,127,644 | | | $ | 9,156,199 | | | $ | 45,552,059 | | |
| * Foreign taxes withheld | | $ | - | | | $ | - | | | $ | - | | | $ | 12,088 | | |
See accompanying notes to financial statements.
56
Global Atlantic Portfolios
Statements of Changes in Net Assets
| | | Global Atlantic American Funds®
Managed Risk Portfolio | | Global Atlantic Balanced
Managed Risk Portfolio | |
| | | For the
Year Ended
December 31,
2023 | | For the
Year Ended
December 31,
2022 | | For the
Year Ended
December 31,
2023 | | For the
Year Ended
December 31,
2022 | |
Increase/(Decrease) in Net Assets: | |
From Operations: | |
Net investment income | | $ | 2,689,472 | | | $ | 5,500,713 | | | $ | 1,595,789 | | | $ | 1,253,991 | | |
Net realized gain (loss) | | | (1,578,821 | ) | | | 15,956,421 | | | | (2,666,078 | ) | | | (4,013,415 | ) | |
Net change in unrealized appreciation (depreciation) | | | 19,541,021 | | | | (57,473,679 | ) | | | 9,932,568 | | | | (14,633,602 | ) | |
Net increase (decrease) in net assets
resulting from operations | | | 20,651,672 | | | | (36,016,545 | ) | | | 8,862,279 | | | | (17,393,026 | ) | |
From Distributions to Shareholders: | |
Total distributions paid | | | (23,002,928 | ) | | | (12,098,249 | ) | | | (1,253,987 | ) | | | (8,646,423 | ) | |
From Shares of Beneficial Interest: | |
Proceeds from shares sold | | | 806,381 | | | | 338,549 | | | | 1,754,541 | | | | 1,041,348 | | |
Reinvestment of distributions | | | 23,002,928 | | | | 12,098,249 | | | | 1,253,987 | | | | 8,646,423 | | |
Cost of shares redeemed | | | (29,230,971 | ) | | | (24,174,943 | ) | | | (14,621,819 | ) | | | (13,525,365 | ) | |
Net decrease in net assets from share
transactions of beneficial interest | | | (5,421,662 | ) | | | (11,738,145 | ) | | | (11,613,291 | ) | | | (3,837,594 | ) | |
Total decrease in net assets | | | (7,772,918 | ) | | | (59,852,939 | ) | | | (4,004,999 | ) | | | (29,877,043 | ) | |
Net Assets: | |
Beginning of year | | | 172,678,380 | | | | 232,531,319 | | | | 89,499,095 | | | | 119,376,138 | | |
End of year | | $ | 164,905,462 | | | $ | 172,678,380 | | | $ | 85,494,096 | | | $ | 89,499,095 | | |
Share Activity: | |
Class II | |
Shares sold | | | 70,791 | | | | 26,063 | | | | 157,787 | | | | 82,642 | | |
Shares reinvested | | | 2,460,206 | | | | 1,130,678 | | | | 118,974 | | | | 816,470 | | |
Shares redeemed | | | (2,661,303 | ) | | | (2,007,223 | ) | | | (1,320,255 | ) | | | (1,122,351 | ) | |
Net decrease in shares of beneficial
interest outstanding | | | (130,306 | ) | | | (850,482 | ) | | | (1,043,494 | ) | | | (223,239 | ) | |
See accompanying notes to financial statements.
57
Global Atlantic Portfolios
Statements of Changes in Net Assets (Continued)
| | | Global Atlantic BlackRock
Selects Managed Risk Portfolio | | Global Atlantic Franklin
Dividend and Income
Managed Risk Portfolio | |
| | | For the
Year Ended
December 31,
2023 | | For the
Year Ended
December 31,
2022 | | For the
Year Ended
December 31,
2023 | | For the
Year Ended
December 31,
2022 | |
Increase/(Decrease) in Net Assets: | |
From Operations: | |
Net investment income | | $ | 2,789,969 | | | $ | 1,444,844 | | | $ | 2,959,866 | | | $ | 2,277,705 | | |
Net realized gain (loss) | | | 521,858 | | | | (8,412,211 | ) | | | 10,101,367 | | | | 9,554,377 | | |
Net change in unrealized appreciation (depreciation) | | | 14,853,884 | | | | (28,298,115 | ) | | | 2,132,798 | | | | (46,443,458 | ) | |
Net increase (decrease) in net assets
resulting from operations | | | 18,165,711 | | | | (35,265,482 | ) | | | 15,194,031 | | | | (34,611,376 | ) | |
From Distributions to Shareholders: | |
Total distributions paid | | | (1,444,840 | ) | | | (11,495,510 | ) | | | (12,906,543 | ) | | | (5,603,502 | ) | |
From Shares of Beneficial Interest: | |
Proceeds from shares sold | | | 255,879 | | | | 1,020,002 | | | | 828,436 | | | | 1,268,275 | | |
Reinvestment of distributions | | | 1,444,840 | | | | 11,495,510 | | | | 12,906,543 | | | | 5,603,502 | | |
Cost of shares redeemed | | | (28,714,801 | ) | | | (24,319,136 | ) | | | (31,446,761 | ) | | | (34,422,606 | ) | |
Net decrease in net assets from share
transactions of beneficial interest | | | (27,014,082 | ) | | | (11,803,624 | ) | | | (17,711,782 | ) | | | (27,550,829 | ) | |
Total decrease in net assets | | | (10,293,211 | ) | | | (58,564,616 | ) | | | (15,424,294 | ) | | | (67,765,707 | ) | |
Net Assets: | |
Beginning of year | | | 176,978,908 | | | | 235,543,524 | | | | 216,831,766 | | | | 284,597,473 | | |
End of year | | $ | 166,685,697 | | | $ | 176,978,908 | | | $ | 201,407,472 | | | $ | 216,831,766 | | |
Share Activity: | |
Class II | |
Shares sold | | | 25,109 | | | | 93,230 | | | | 58,119 | | | | 88,453 | | |
Shares reinvested | | | 146,834 | | | | 1,169,431 | | | | 1,005,966 | | | | 406,935 | | |
Shares redeemed | | | (2,795,587 | ) | | | (2,222,724 | ) | | | (2,206,422 | ) | | | (2,359,563 | ) | |
Net decrease in shares of beneficial
interest outstanding | | | (2,623,644 | ) | | | (960,063 | ) | | | (1,142,337 | ) | | | (1,864,175 | ) | |
See accompanying notes to financial statements.
58
Global Atlantic Portfolios
Statements of Changes in Net Assets (Continued)
| | | Global Atlantic Growth
Managed Risk Portfolio | | Global Atlantic Moderate
Growth Managed Risk Portfolio | |
| | | For the
Year Ended
December 31,
2023 | | For the
Year Ended
December 31,
2022 | | For the
Year Ended
December 31,
2023 | | For the
Year Ended
December 31,
2022 | |
Increase/(Decrease) in Net Assets: | |
From Operations: | |
Net investment income | | $ | 3,961,830 | | | $ | 3,553,438 | | | $ | 1,558,719 | | | $ | 1,298,427 | | |
Net realized gain | | | 7,906,149 | | | | 9,337,803 | | | | 1,519,069 | | | | 919,030 | | |
Net change in unrealized appreciation (depreciation) | | | 27,815,708 | | | | (71,241,890 | ) | | | 9,049,856 | | | | (23,031,409 | ) | |
Net increase (decrease) in net assets
resulting from operations | | | 39,683,687 | | | | (58,350,649 | ) | | | 12,127,644 | | | | (20,813,952 | ) | |
From Distributions to Shareholders: | |
Total distributions paid | | | (17,148,808 | ) | | | (11,060,740 | ) | | | (3,318,334 | ) | | | (9,806,139 | ) | |
From Shares of Beneficial Interest: | |
Proceeds from shares sold | | | 508,471 | | | | 439,922 | | | | 172,609 | | | | 414,629 | | |
Reinvestment of distributions | | | 17,148,808 | | | | 11,060,740 | | | | 3,318,334 | | | | 9,806,139 | | |
Cost of shares redeemed | | | (49,089,665 | ) | | | (43,472,331 | ) | | | (17,707,219 | ) | | | (16,696,820 | ) | |
Net decrease in net assets from share
transactions of beneficial interest | | | (31,432,386 | ) | | | (31,971,669 | ) | | | (14,216,276 | ) | | | (6,476,052 | ) | |
Total decrease in net assets | | | (8,897,507 | ) | | | (101,383,058 | ) | | | (5,406,966 | ) | | | (37,096,143 | ) | |
Net Assets: | |
Beginning of year | | | 312,876,895 | | | | 414,259,953 | | | | 104,085,965 | | | | 141,182,108 | | |
End of year | | $ | 303,979,388 | | | $ | 312,876,895 | | | $ | 98,678,999 | | | $ | 104,085,965 | | |
Share Activity: | |
Class II | |
Shares sold | | | 42,495 | | | | 36,630 | | | | 14,953 | | | | 32,895 | | |
Shares reinvested | | | 1,479,621 | | | | 911,099 | | | | 305,837 | | | | 885,031 | | |
Shares redeemed | | | (3,856,202 | ) | | | (3,298,869 | ) | | | (1,519,252 | ) | | | (1,301,242 | ) | |
Net decrease in shares of beneficial
interest outstanding | | | (2,334,086 | ) | | | (2,351,140 | ) | | | (1,198,462 | ) | | | (383,316 | ) | |
See accompanying notes to financial statements.
59
Global Atlantic Portfolios
Statements of Changes in Net Assets (Continued)
| | | Global Atlantic Select Advisor
Managed Risk Portfolio | | Global Atlantic Wellington
Research Managed Risk Portfolio | |
| | | For the
Year Ended
December 31,
2023 | | For the
Year Ended
December 31,
2022 | | For the
Year Ended
December 31,
2023 | | For the
Year Ended
December 31,
2022 | |
Increase/(Decrease) in Net Assets: | |
From Operations: | |
Net investment income | | $ | 1,170,796 | | | $ | 1,543,183 | | | $ | 3,668,066 | | | $ | 2,188,314 | | |
Net realized gain (loss) | | | 303,223 | | | | 4,497,564 | | | | 14,848,194 | | | | (6,736,855 | ) | |
Net change in unrealized appreciation (depreciation) | | | 7,682,180 | | | | (22,381,060 | ) | | | 27,035,799 | | | | (76,087,541 | ) | |
Net increase (decrease) in net assets
resulting from operations | | | 9,156,199 | | | | (16,340,313 | ) | | | 45,552,059 | | | | (80,636,082 | ) | |
From Distributions to Shareholders: | |
Total distributions paid | | | (6,929,505 | ) | | | (8,047,361 | ) | | | (2,239,646 | ) | | | (45,730,140 | ) | |
From Shares of Beneficial Interest: | |
Proceeds from shares sold | | | 191,581 | | | | 427,856 | | | | - | | | | 15,470 | | |
Reinvestment of distributions | | | 6,929,505 | | | | 8,047,361 | | | | 2,239,646 | | | | 45,730,140 | | |
Cost of shares redeemed | | | (12,247,238 | ) | | | (10,697,955 | ) | | | (61,406,238 | ) | | | (50,361,761 | ) | |
Net decrease in net assets from share
transactions of beneficial interest | | | (5,126,152 | ) | | | (2,222,738 | ) | | | (59,166,592 | ) | | | (4,616,151 | ) | |
Total decrease in net assets | | | (2,899,458 | ) | | | (26,610,412 | ) | | | (15,854,179 | ) | | | (130,982,373 | ) | |
Net Assets: | |
Beginning of year | | | 78,921,223 | | | | 105,531,635 | | | | 354,491,412 | | | | 485,473,785 | | |
End of year | | $ | 76,021,765 | | | $ | 78,921,223 | | | $ | 338,637,233 | | | $ | 354,491,412 | | |
Share Activity: | |
Class II | |
Shares sold | | | 16,815 | | | | 32,763 | | | | - | | | | 1,086 | | |
Shares reinvested | | | 695,036 | | | | 738,968 | | | | 185,555 | | | | 3,868,878 | | |
Shares redeemed | | | (1,087,223 | ) | | | (851,923 | ) | | | (4,886,224 | ) | | | (3,587,999 | ) | |
Net increase (decrease) in shares of beneficial
interest outstanding | | | (375,372 | ) | | | (80,192 | ) | | | (4,700,669 | ) | | | 281,965 | | |
See accompanying notes to financial statements.
60
Global Atlantic Portfolios
Financial Highlights
Global Atlantic American Funds® Managed Risk Portfolio
Selected data for a Class II share outstanding throughout each year
| | | For the
Year Ended
December 31, 2023 | | For the
Year Ended
December 31, 2022 | | For the
Year Ended
December 31, 2021 | | For the
Year Ended
December 31, 2020 | | For the
Year Ended
December 31, 2019 | |
Net asset value, beginning of year | | $ | 10.85 | | | $ | 13.87 | | | $ | 12.62 | | | $ | 12.04 | | | $ | 10.93 | | |
Income from investment operations: | |
Net investment income (a,b) | | | 0.18 | | | | 0.34 | | | | 0.21 | | | | 0.14 | | | | 0.17 | | |
Net realized and unrealized gain (loss) (c) | | | 1.06 | | | | (2.56 | ) | | | 1.19 | | | | 1.06 | | | | 1.62 | | |
Total income (loss) from
investment operations | | | 1.24 | | | | (2.22 | ) | | | 1.40 | | | | 1.20 | | | | 1.79 | | |
Less distributions from: | |
Net investment income | | | (0.39 | ) | | | (0.24 | ) | | | (0.15 | ) | | | (0.18 | ) | | | (0.21 | ) | |
Net realized gains | | | (1.25 | ) | | | (0.56 | ) | | | - | | | | (0.44 | ) | | | (0.47 | ) | |
Total distributions from net
investment income and
net realized gains | | | (1.64 | ) | | | (0.80 | ) | | | (0.15 | ) | | | (0.62 | ) | | | (0.68 | ) | |
Net asset value, end of year | | $ | 10.45 | | | $ | 10.85 | | | $ | 13.87 | | | $ | 12.62 | | | $ | 12.04 | | |
Total return (d) | | | 13.27 | % | | | (15.94 | )% | | | 11.12 | % | | | 10.49 | % | | | 16.72 | % | |
Ratios and Supplemental Data: | |
Net assets, end of year (in 000's) | | $ | 164,905 | | | $ | 172,678 | | | $ | 232,531 | | | $ | 231,753 | | | $ | 230,916 | | |
Ratio of net expenses to
average net assets (e) | | | 0.87 | % | | | 0.86 | % | | | 0.85 | % | | | 0.86 | % | | | 0.86 | % | |
Ratio of gross expenses to
average net assets (e,f) | | | 1.27 | % | | | 1.26 | % | | | 1.25 | % | | | 1.26 | % | | | 1.26 | % | |
Ratio of net investment income to
average net assets (b,e) | | | 1.60 | % | | | 2.85 | % | | | 1.55 | % | | | 1.18 | % | | | 1.41 | % | |
Portfolio turnover rate | | | 12 | % | | | 41 | % | | | 18 | % | | | 35 | % | | | 30 | % | |
(a) Net investment income has been calculated using the average shares method, which more appropriately presents the per share data for the period.
(b) Recognition of net investment income by the Portfolio is affected by the timing of the declaration of dividends by the underlying investment companies in which the Portfolio invests.
(c) Realized and unrealized gain (loss) per share are balancing amounts necessary to reconcile the change in net asset value per share for the period, and may not reconcile with aggregate gains and losses in the statement of operations due to timing of share transactions.
(d) Total returns are historical and assume changes in share price and reinvestment of dividends and capital gains distributions. Total return does not reflect the deduction of taxes that a shareholder may pay on Portfolio distributions or on the redemption of Portfolio shares, as well as other charges and expenses of the insurance contract or separate account. Total returns would have been lower absent fee waivers by the Adviser.
(e) Does not include the expenses of the investment companies in which the Portfolio invests.
(f) Represents the ratio of expenses to average net assets absent fee waivers and/or expense reimbursements by the Adviser.
See accompanying notes to financial statements.
61
Global Atlantic Portfolios
Financial Highlights
Global Atlantic Balanced Managed Risk Portfolio
Selected data for a Class II share outstanding throughout each year
| | | For the
Year Ended
December 31, 2023 | | For the
Year Ended
December 31, 2022 | | For the
Year Ended
December 31, 2021 | | For the
Year Ended
December 31, 2020 | | For the
Year Ended
December 31, 2019 | |
Net asset value, beginning of year | | $ | 10.68 | | | $ | 13.88 | | | $ | 13.10 | | | $ | 12.51 | | | $ | 11.26 | | |
Income from investment operations: | |
Net investment income (a,b) | | | 0.20 | | | | 0.15 | | | | 0.12 | | | | 0.13 | | | | 0.19 | | |
Net realized and unrealized gain (loss) (c) | | | 0.94 | | | | (2.25 | ) | | | 1.05 | | | | 0.93 | | | | 1.42 | | |
Total income (loss) from
investment operations | | | 1.14 | | | | (2.10 | ) | | | 1.17 | | | | 1.06 | | | | 1.61 | | |
Less distributions from: | |
Net investment income | | | (0.17 | ) | | | (0.11 | ) | | | (0.10 | ) | | | (0.21 | ) | | | (0.20 | ) | |
Net realized gains | | | - | | | | (0.99 | ) | | | (0.29 | ) | | | (0.26 | ) | | | (0.16 | ) | |
Total distributions from net
investment income and
net realized gains | | | (0.17 | ) | | | (1.10 | ) | | | (0.39 | ) | | | (0.47 | ) | | | (0.36 | ) | |
Net asset value, end of year | | $ | 11.65 | | | $ | 10.68 | | | $ | 13.88 | | | $ | 13.10 | | | $ | 12.51 | | |
Total return (d) | | | 10.81 | % | | | (15.07 | )% | | | 8.99 | % | | | 8.78 | % | | | 14.34 | % | |
Ratios and Supplemental Data: | |
Net assets, end of year (in 000's) | | $ | 85,494 | | | $ | 89,499 | | | $ | 119,376 | | | $ | 82,774 | | | $ | 83,411 | | |
Ratio of net expenses to
average net assets (e) | | | 0.92 | % | | | 0.91 | % | | | 0.90 | % | | | 0.92 | % (f) | | | 0.91 | % | |
Ratio of gross expenses to
average net assets (e,g) | | | 0.92 | % | | | 0.91 | % | | | 0.90 | % | | | 0.92 | % | | | 0.91 | % | |
Ratio of net investment income to
average net assets (b,e) | | | 1.83 | % | | | 1.24 | % | | | 0.90 | % | | | 1.06 | % | | | 1.54 | % | |
Portfolio turnover rate | | | 74 | % | | | 52 | % | | | 82 | % (h) | | | 119 | % | | | 107 | % | |
(a) Net investment income has been calculated using the average shares method, which more appropriately presents the per share data for the period.
(b) Recognition of net investment income by the Portfolio is affected by the timing of the declaration of dividends by the underlying investment companies in which the Portfolio invests.
(c) Realized and unrealized gain (loss) per share are balancing amounts necessary to reconcile the change in net asset value per share for the period, and may not reconcile with aggregate gains and losses in the statement of operations due to timing of share transactions.
(d) Total returns are historical and assume changes in share price and reinvestment of dividends and capital gains distributions. Total return does not reflect the deduction of taxes that a shareholder may pay on Portfolio distributions or on the redemption of Portfolio shares, as well as other charges and expenses of the insurance contract or separate account. Total returns would have been lower absent fee waivers by the Adviser.
(e) Does not include the expenses of the investment companies in which the Portfolio invests.
(f) Represents the ratio of expenses to average net assets inclusive of the Adviser's recapture of waived/reimbursed fees from prior periods.
(g) Represents the ratio of expenses to average net assets absent fee waivers and/or expense reimbursements by the Adviser.
(h) During the year ended December 31, 2021, the Portfolio engaged in security transactions associated with the transition of assets from Global Atlantic Goldman Sachs Dynamic Trends Allocation Portfolio, which merged into the Portfolio on August 20, 2021. Certain security transactions were excluded from the portfolio turnover rate calculation. If these transactions were included, portfolio turnover would have been higher.
See accompanying notes to financial statements.
62
Global Atlantic Portfolios
Financial Highlights
Global Atlantic BlackRock Selects Managed Risk Portfolio
Selected data for a Class II share outstanding throughout each year
| | | For the
Year Ended
December 31, 2023 | | For the
Year Ended
December 31, 2022 | | For the
Year Ended
December 31, 2021 | | For the
Year Ended
December 31, 2020 | | For the
Year Ended
December 31, 2019 | |
Net asset value, beginning of year | | $ | 9.86 | | | $ | 12.46 | | | $ | 11.44 | | | $ | 10.49 | | | $ | 9.15 | | |
Income from investment operations: | |
Net investment income (a,b) | | | 0.17 | | | | 0.08 | | | | 0.33 | | | | 0.15 | | | | 0.15 | | |
Net realized and unrealized gain (loss) (c) | | | 0.94 | | | | (2.01 | ) | | | 0.86 | | | | 0.97 | | | | 1.24 | | |
Total income (loss) from
investment operations | | | 1.11 | | | | (1.93 | ) | | | 1.19 | | | | 1.12 | | | | 1.39 | | |
Less distributions from: | |
Net investment income | | | (0.09 | ) | | | (0.38 | ) | | | (0.17 | ) | | | (0.17 | ) | | | (0.05 | ) | |
Net realized gains | | | - | | | | (0.29 | ) | | | - | | | | - | | | | - | | |
Total distributions from net
investment income and
net realized gains | | | (0.09 | ) | | | (0.67 | ) | | | (0.17 | ) | | | (0.17 | ) | | | (0.05 | ) | |
Net asset value, end of year | | $ | 10.88 | | | $ | 9.86 | | | $ | 12.46 | | | $ | 11.44 | | | $ | 10.49 | | |
Total return (d) | | | 11.39 | % | | | (15.48 | )% | | | 10.41 | % | | | 10.82 | % | | | 15.22 | % | |
Ratios and Supplemental Data: | |
Net assets, end of year (in 000's) | | $ | 166,686 | | | $ | 176,979 | | | $ | 235,544 | | | $ | 241,835 | | | $ | 243,853 | | |
Ratio of net expenses to
average net assets (e) | | | 0.92 | % | | | 0.91 | % | | | 0.90 | % | | | 0.91 | % | | | 0.80 | % | |
Ratio of gross expenses to
average net assets (e,f) | | | 0.92 | % | | | 0.91 | % | | | 0.90 | % | | | 0.91 | % | | | 1.02 | % | |
Ratio of net investment income to
average net assets (b,e) | | | 1.64 | % | | | 0.73 | % | | | 2.73 | % | | | 1.39 | % | | | 1.47 | % | |
Portfolio turnover rate | | | 78 | % | | | 80 | % | | | 93 | % | | | 110 | % | | | 154 | % | |
(a) Net investment income has been calculated using the average shares method, which more appropriately presents the per share data for the period.
(b) Recognition of net investment income by the Portfolio is affected by the timing of the declaration of dividends by the underlying investment companies in which the Portfolio invests.
(c) Realized and unrealized gain (loss) per share are balancing amounts necessary to reconcile the change in net asset value per share for the period, and may not reconcile with aggregate gains and losses in the statement of operations due to timing of share transactions.
(d) Total returns are historical and assume changes in share price and reinvestment of dividends and capital gains distributions. Total return does not reflect the deduction of taxes that a shareholder may pay on Portfolio distributions or on the redemption of Portfolio shares, as well as other charges and expenses of the insurance contract or separate account. Total returns would have been lower absent fee waivers by the Adviser.
(e) Does not include the expenses of the investment companies in which the Portfolio invests.
(f) Represents the ratio of expenses to average net assets absent fee waivers and/or expense reimbursements by the Adviser.
See accompanying notes to financial statements.
63
Global Atlantic Portfolios
Financial Highlights
Global Atlantic Franklin Dividend and Income Managed Risk Portfolio
Selected data for a Class II share outstanding throughout each year
| | | For the
Year Ended
December 31, 2023 | | For the
Year Ended
December 31, 2022 | | For the
Year Ended
December 31, 2021 | | For the
Year Ended
December 31, 2020 | | For the
Year Ended
December 31, 2019 | |
Net asset value, beginning of year | | $ | 14.11 | | | $ | 16.52 | | | $ | 14.25 | | | $ | 13.45 | | | $ | 11.31 | | |
Income from investment operations: | |
Net investment income (a,b) | | | 0.20 | | | | 0.14 | | | | 0.09 | | | | 0.12 | | | | 0.16 | | |
Net realized and unrealized gain (loss) (c) | | | 0.79 | | | | (2.18 | ) | | | 2.31 | | | | 0.87 | | | | 2.14 | | |
Total income (loss) from
investment operations | | | 0.99 | | | | (2.04 | ) | | | 2.40 | | | | 0.99 | | | | 2.30 | | |
Less distributions from: | |
Net investment income | | | (0.17 | ) | | | (0.11 | ) | | | (0.13 | ) | | | (0.19 | ) | | | (0.16 | ) | |
Net realized gains | | | (0.77 | ) | | | (0.26 | ) | | | - | | | | - | | | | - | | |
Total distributions from net
investment income and
net realized gains | | | (0.94 | ) | | | (0.37 | ) | | | (0.13 | ) | | | (0.19 | ) | | | (0.16 | ) | |
Net asset value, end of year | | $ | 14.16 | | | $ | 14.11 | | | $ | 16.52 | | | $ | 14.25 | | | $ | 13.45 | | |
Total return (d) | | | 7.77 | % | | | (12.33 | )% | | | 16.87 | % | | | 7.50 | % | | | 20.40 | % | |
Ratios and Supplemental Data: | |
Net assets, end of year (in 000's) | | $ | 201,407 | | | $ | 216,832 | | | $ | 284,598 | | | $ | 275,216 | | | $ | 292,240 | | |
Ratio of net expenses to
average net assets (e) | | | 1.19 | % | | | 1.19 | % | | | 1.18 | % | | | 1.16 | % | | | 1.16 | % | |
Ratio of gross expenses to
average net assets (e,f) | | | 1.23 | % | | | 1.22 | % | | | 1.20 | % | | | 1.22 | % | | | 1.21 | % | |
Ratio of net investment income to
average net assets (b,e) | | | 1.44 | % | | | 0.96 | % | | | 0.56 | % | | | 0.91 | % | | | 1.24 | % | |
Portfolio turnover rate | | | 10 | % (g) | | | 21 | % (g) | | | 18 | % (g) | | | 24 | % (g) | | | 20 | % (g) | |
(a) Net investment income has been calculated using the average shares method, which more appropriately presents the per share data for the period.
(b) Recognition of net investment income by the Portfolio is affected by the timing of the declaration of dividends by the underlying investment companies in which the Portfolio invests.
(c) Realized and unrealized gain (loss) per share are balancing amounts necessary to reconcile the change in net asset value per share for the period, and may not reconcile with aggregate gains and losses in the statement of operations due to timing of share transactions.
(d) Total returns are historical and assume changes in share price and reinvestment of dividends and capital gains distributions. Total return does not reflect the deduction of taxes that a shareholder may pay on Portfolio distributions or on the redemption of Portfolio shares, as well as other charges and expenses of the insurance contract or separate account. Total returns would have been lower absent fee waivers by the Adviser.
(e) Does not include the expenses of the investment companies or fees on swaps in which the Portfolio invests.
(f) Represents the ratio of expenses to average net assets absent fee waivers and/or expense reimbursements by the Adviser.
(g) The portfolio turnover rate excludes mortgage dollar roll transactions for the years ended December 31, 2023, December 31, 2022, December 31, 2021, December 31, 2020 and December 31, 2019. If these were included in the calculation, the turnover percentage would be 34%, 58%, 59%, 77%, and 55%, respectively.
See accompanying notes to financial statements.
64
Global Atlantic Portfolios
Financial Highlights
Global Atlantic Growth Managed Risk Portfolio
Selected data for a Class II share outstanding throughout each year
| | | For the
Year Ended
December 31, 2023 | | For the
Year Ended
December 31, 2022 | | For the
Year Ended
December 31, 2021 | | For the
Year Ended
December 31, 2020 | | For the
Year Ended
December 31, 2019 | |
Net asset value, beginning of year | | $ | 12.18 | | | $ | 14.77 | | | $ | 12.98 | | | $ | 12.32 | | | $ | 10.67 | | |
Income from investment operations: | |
Net investment income (a,b) | | | 0.16 | | | | 0.13 | | | | 0.10 | | | | 0.10 | | | | 0.16 | | |
Net realized and unrealized gain (loss) (c) | | | 1.43 | | | | (2.28 | ) | | | 1.81 | | | | 0.74 | | | | 1.66 | | |
Total income (loss) from
investment operations | | | 1.59 | | | | (2.15 | ) | | | 1.91 | | | | 0.84 | | | | 1.82 | | |
Less distributions from: | |
Net investment income | | | (0.16 | ) | | | (0.12 | ) | | | (0.12 | ) | | | (0.18 | ) | | | (0.17 | ) | |
Net realized gains | | | (0.60 | ) | | | (0.32 | ) | | | - | | | | - | | | | - | | |
Total distributions from net
investment income and
net realized gains | | | (0.76 | ) | | | (0.44 | ) | | | (0.12 | ) | | | (0.18 | ) | | | (0.17 | ) | |
Net asset value, end of year | | $ | 13.01 | | | $ | 12.18 | | | $ | 14.77 | | | $ | 12.98 | | | $ | 12.32 | | |
Total return (d) | | | 13.83 | % | | | (14.56 | )% | | | 14.69 | % | | | 7.00 | % | | | 17.11 | % | |
Ratios and Supplemental Data: | |
Net assets, end of year (in 000's) | | $ | 303,979 | | | $ | 312,877 | | | $ | 414,260 | | | $ | 412,126 | | | $ | 431,557 | | |
Ratio of net expenses to
average net assets (e) | | | 0.88 | % | | | 0.88 | % | | | 0.88 | % | | | 0.88 | % | | | 0.89 | % | |
Ratio of gross expenses to
average net assets (e) | | | 0.92 | % (f) | | | 0.91 | % (f) | | | 0.90 | % | | | 0.91 | % (f) | | | 0.91 | % (f) | |
Ratio of net investment income to
average net assets (b,e) | | | 1.30 | % | | | 1.02 | % | | | 0.73 | % | | | 0.82 | % | | | 1.38 | % | |
Portfolio turnover rate | | | 54 | % | | | 44 | % | | | 32 | % | | | 102 | % | | | 69 | % | |
(a) Net investment income has been calculated using the average shares method, which more appropriately presents the per share data for the period.
(b) Recognition of net investment income by the Portfolio is affected by the timing of the declaration of dividends by the underlying investment companies in which the Portfolio invests.
(c) Realized and unrealized gain (loss) per share are balancing amounts necessary to reconcile the change in net asset value per share for the period, and may not reconcile with aggregate gains and losses in the statement of operations due to timing of share transactions.
(d) Total returns are historical and assume changes in share price and reinvestment of dividends and capital gains distributions. Total return does not reflect the deduction of taxes that a shareholder may pay on Portfolio distributions or on the redemption of Portfolio shares, as well as other charges and expenses of the insurance contract or separate account. Total returns would have been lower absent fee waivers by the Adviser.
(e) Does not include the expenses of the investment companies in which the Portfolio invests.
(f) Represents the ratio of expenses to average net assets absent fee waivers and/or expense reimbursements by the Adviser.
See accompanying notes to financial statements.
65
Global Atlantic Portfolios
Financial Highlights
Global Atlantic Moderate Growth Managed Risk Portfolio
Selected data for a Class II share outstanding throughout each year
| | | For the
Year Ended
December 31, 2023 | | For the
Year Ended
December 31, 2022 | | For the
Year Ended
December 31, 2021 | | For the
Year Ended
December 31, 2020 | | For the
Year Ended
December 31, 2019 | |
Net asset value, beginning of year | | $ | 11.14 | | | $ | 14.51 | | | $ | 13.18 | | | $ | 12.57 | | | $ | 11.00 | | |
Income from investment operations: | |
Net investment income (a,b) | | | 0.18 | | | | 0.14 | | | | 0.11 | | | | 0.12 | | | | 0.17 | | |
Net realized and unrealized gain (loss) (c) | | | 1.20 | | | | (2.38 | ) | | | 1.46 | | | | 0.86 | | | | 1.58 | | |
Total income (loss) from
investment operations | | | 1.38 | | | | (2.24 | ) | | | 1.57 | | | | 0.98 | | | | 1.75 | | |
Less distributions from: | |
Net investment income | | | (0.16 | ) | | | (0.13 | ) | | | (0.13 | ) | | | (0.19 | ) | | | (0.18 | ) | |
Net realized gains | | | (0.25 | ) | | | (1.00 | ) | | | (0.11 | ) | | | (0.18 | ) | | | - | | |
Total distributions from net
investment income and
net realized gains | | | (0.41 | ) | | | (1.13 | ) | | | (0.24 | ) | | | (0.37 | ) | | | (0.18 | ) | |
Net asset value, end of year | | $ | 12.11 | | | $ | 11.14 | | | $ | 14.51 | | | $ | 13.18 | | | $ | 12.57 | | |
Total return (d) | | | 12.82 | % | | | (15.38 | )% | | | 11.91 | % | | | 8.08 | % | | | 15.94 | % | |
Ratios and Supplemental Data: | |
Net assets, end of year (in 000's) | | $ | 98,679 | | | $ | 104,086 | | | $ | 141,182 | | | $ | 141,186 | | | $ | 143,221 | | |
Ratio of net expenses to
average net assets (e) | | | 0.92 | % | | | 0.91 | % | | | 0.90 | % | | | 0.91 | % | | | 0.91 | % | |
Ratio of gross expenses to
average net assets (e) | | | 0.92 | % | | | 0.91 | % | | | 0.90 | % | | | 0.91 | % (f) | | | 0.91 | % (f) | |
Ratio of net investment income to
average net assets (b,e) | | | 1.55 | % | | | 1.11 | % | | | 0.78 | % | | | 0.94 | % | �� | | 1.46 | % | |
Portfolio turnover rate | | | 64 | % | | | 48 | % | | | 44 | % | | | 110 | % | | | 91 | % | |
(a) Net investment income has been calculated using the average shares method, which more appropriately presents the per share data for the period.
(b) Recognition of net investment income by the Portfolio is affected by the timing of the declaration of dividends by the underlying investment companies in which the Portfolio invests.
(c) Realized and unrealized gain (loss) per share are balancing amounts necessary to reconcile the change in net asset value per share for the period, and may not reconcile with aggregate gains and losses in the statement of operations due to timing of share transactions.
(d) Total returns are historical and assume changes in share price and reinvestment of dividends and capital gains distributions. Total return does not reflect the deduction of taxes that a shareholder may pay on Portfolio distributions or on the redemption of Portfolio shares, as well as other charges and expenses of the insurance contract or separate account. Total returns would have been lower absent fee waivers by the Adviser.
(e) Does not include the expenses of the investment companies in which the Portfolio invests.
(f) Represents the ratio of expenses to average net assets absent fee waivers and/or expense reimbursements by the Adviser.
See accompanying notes to financial statements.
66
Global Atlantic Portfolios
Financial Highlights
Global Atlantic Select Advisor Managed Risk Portfolio
Selected data for a Class II share outstanding throughout each year
| | | For the
Year Ended
December 31, 2023 | | For the
Year Ended
December 31, 2022 | | For the
Year Ended
December 31, 2021 | | For the
Year Ended
December 31, 2020 | | For the
Year Ended
December 31, 2019 | |
Net asset value, beginning of year | | $ | 10.95 | | | $ | 14.48 | | | $ | 13.38 | | | $ | 13.23 | | | $ | 11.53 | | |
Income from investment operations: | |
Net investment income (a,b) | | | 0.17 | | | | 0.22 | | | | 0.13 | | | | 0.16 | | | | 0.21 | | |
Net realized and unrealized gain (loss) (c) | | | 1.10 | | | | (2.53 | ) | | | 1.64 | | | | 0.65 | | | | 2.05 | | |
Total income (loss) from
investment operations | | | 1.27 | | | | (2.31 | ) | | | 1.77 | | | | 0.81 | | | | 2.26 | | |
Less distributions from: | |
Net investment income | | | (0.24 | ) | | | (0.15 | ) | | | (0.18 | ) | | | (0.24 | ) | | | (0.15 | ) | |
Net realized gains | | | (0.85 | ) | | | (1.07 | ) | | | (0.49 | ) | | | (0.42 | ) | | | (0.41 | ) | |
Total distributions from net
investment income and
net realized gains | | | (1.09 | ) | | | (1.22 | ) | | | (0.67 | ) | | | (0.66 | ) | | | (0.56 | ) | |
Net asset value, end of year | | $ | 11.13 | | | $ | 10.95 | | | $ | 14.48 | | | $ | 13.38 | | | $ | 13.23 | | |
Total return (d) | | | 12.82 | % | | | (15.94 | )% | | | 13.31 | % | | | 6.61 | % | | | 19.96 | % | |
Ratios and Supplemental Data: | |
Net assets, end of year (in 000's) | | $ | 76,022 | | | $ | 78,921 | | | $ | 105,532 | | | $ | 108,112 | | | $ | 114,371 | | |
Ratio of net expenses to
average net assets (e) | | | 0.64 | % | | | 0.64 | % | | | 0.64 | % | | | 0.64 | % | | | 0.64 | % | |
Ratio of gross expenses to
average net assets (e,f) | | | 1.27 | % | | | 1.26 | % | | | 1.25 | % | | | 1.26 | % | | | 1.27 | % | |
Ratio of net investment income to
average net assets (b,e) | | | 1.54 | % | | | 1.75 | % | | | 0.90 | % | | | 1.24 | % | | | 1.68 | % | |
Portfolio turnover rate | | | 19 | % | | | 33 | % | | | 17 | % | | | 54 | % | | | 22 | % | |
(a) Net investment income has been calculated using the average shares method, which more appropriately presents the per share data for the period.
(b) Recognition of net investment income by the Portfolio is affected by the timing of the declaration of dividends by the underlying investment companies in which the Portfolio invests.
(c) Realized and unrealized gain (loss) per share are balancing amounts necessary to reconcile the change in net asset value per share for the period, and may not reconcile with aggregate gains and losses in the statement of operations due to timing of share transactions.
(d) Total returns are historical and assume changes in share price and reinvestment of dividends and capital gains distributions. Total return does not reflect the deduction of taxes that a shareholder may pay on Portfolio distributions or on the redemption of Portfolio shares, as well as other charges and expenses of the insurance contract or separate account. Total returns would have been lower absent fee waivers by the Adviser.
(e) Does not include the expenses of the investment companies in which the Portfolio invests.
(f) Represents the ratio of expenses to average net assets absent fee waivers and/or expense reimbursements by the Adviser.
See accompanying notes to financial statements.
67
Global Atlantic Portfolios
Financial Highlights
Global Atlantic Wellington Research Managed Risk Portfolio
Selected data for a Class II share outstanding throughout each year
| | | For the
Year Ended
December 31, 2023 | | For the
Year Ended
December 31, 2022 | | For the
Year Ended
December 31, 2021 | | For the
Year Ended
December 31, 2020 | | For the
Year Ended
December 31, 2019 | |
Net asset value, beginning of year | | $ | 11.90 | | | $ | 16.45 | | | $ | 15.23 | | | $ | 14.00 | | | $ | 12.38 | | |
Income from investment operations: | |
Net investment income (a,b) | | | 0.13 | | | | 0.08 | | | | 0.01 | | | | 0.08 | | | | 0.13 | | |
Net realized and unrealized gain (loss) (c) | | | 1.56 | | | | (2.91 | ) | | | 1.86 | | | | 1.46 | | | | 2.23 | | |
Total income (loss) from
investment operations | | | 1.69 | | | | (2.83 | ) | | | 1.87 | | | | 1.54 | | | | 2.36 | | |
Less distributions from: | |
Net investment income | | | (0.09 | ) | | | (0.02 | ) | | | (0.09 | ) | | | (0.14 | ) | | | (0.13 | ) | |
Net realized gains | | | - | | | | (1.70 | ) | | | (0.56 | ) | | | (0.17 | ) | | | (0.61 | ) | |
Total distributions from net
investment income and
net realized gains | | | (0.09 | ) | | | (1.72 | ) | | | (0.65 | ) | | | (0.31 | ) | | | (0.74 | ) | |
Net asset value, end of year | | $ | 13.50 | | | $ | 11.90 | | | $ | 16.45 | | | $ | 15.23 | | | $ | 14.00 | | |
Total return (d) | | | 14.27 | % | | | (17.13 | )% | | | 12.38 | % | | | 11.16 | % | | | 19.32 | % | |
Ratios and Supplemental Data: | |
Net assets, end of year (in 000's) | | $ | 338,637 | | | $ | 354,491 | | | $ | 485,474 | | | $ | 455,842 | | | $ | 448,554 | | |
Ratio of net expenses to
average net assets (e) | | | 1.19 | % | | | 1.19 | % | | | 1.20 | % | | | 1.21 | % | | | 1.20 | % | |
Ratio of gross expenses to
average net assets (e) | | | 1.23 | % | | | 1.22 | % | | | 1.20 | % | | | 1.22 | % (f) | | | 1.21 | % (f) | |
Ratio of net investment income to
average net assets (b,e) | | | 1.07 | % | | | 0.54 | % | | | 0.09 | % | | | 0.54 | % | | | 0.93 | % | |
Portfolio turnover rate | | | 90 | % (g) | | | 80 | % (g) | | | 91 | % (g,h) | | | 85 | % (g) | | | 53 | % (g) | |
(a) Net investment income has been calculated using the average shares method, which more appropriately presents the per share data for the period.
(b) Recognition of net investment income by the Portfolio is affected by the timing of the declaration of dividends by the underlying investment companies in which the Portfolio invests.
(c) Realized and unrealized gain (loss) per share are balancing amounts necessary to reconcile the change in net asset value per share for the period, and may not reconcile with aggregate gains and losses in the statement of operations due to timing of share transactions.
(d) Total returns are historical and assume changes in share price and reinvestment of dividends and capital gains distributions. Total return does not reflect the deduction of taxes that a shareholder may pay on Portfolio distributions or on the redemption of Portfolio shares, as well as other charges and expenses of the insurance contract or separate account. Total returns would have been lower absent fee waivers by the Adviser.
(e) Does not include the expenses of the investment companies in which the Portfolio invests.
(f) Represents the ratio of expenses to average net assets absent fee waivers and/or expense reimbursements by the Adviser.
(g) The portfolio turnover rates excludes mortgage dollar roll transactions for the years ended December 31, 2023, December 31, 2022, December 31, 2021, December 31, 2020 and December 31, 2019. If these were included in the calculation the turnover percentage would be 114%, 165%, 162%, 116% and 70% respectively.
(h) During the year ended December 31, 2021, the Portfolio engaged in security transactions associated with the transition of assets from Global Atlantic PIMCO Tactical Allocation Portfolio, which merged into the Portfolio on August 20, 2021. Certain security transactions were excluded from the portfolio turnover rate calculation. If these transactions were included, portfolio turnover would have been higher.
See accompanying notes to financial statements.
68
Global Atlantic Portfolios
Notes to Financial Statements
December 31, 2023
1. ORGANIZATION
As of December 31, 2023, the Global Atlantic Portfolios were comprised of sixteen different actively managed portfolios, eight of which are discussed in this report (each, a "Portfolio" and collectively, the "Portfolios"). Each Portfolio is a series of shares of beneficial interest of Forethought Variable Insurance Trust (the "Trust"), a statutory trust organized under the laws of the State of Delaware, and registered under the Investment Company Act of 1940, as amended (the "1940 Act"), as an open-end management investment company.
Portfolio | | Commencement Date | | Investment Objective | |
Global Atlantic American Funds® Managed Risk Portfolio | | October 31, 2013 | | Capital appreciation and income while seeking to manage volatility. | |
Global Atlantic Balanced Managed Risk Portfolio | | October 31, 2013 | | Capital appreciation and income while seeking to manage volatility. | |
Global Atlantic BlackRock Selects Managed Risk Portfolio | | October 31, 2013 | | Capital appreciation and income while seeking to manage volatility. | |
Global Atlantic Franklin Dividend and Income Managed Risk Portfolio | | April 30, 2014 | | Capital appreciation and income while seeking to manage volatility. | |
Global Atlantic Growth Managed Risk Portfolio | | April 30, 2014 | | Capital appreciation and income while seeking to manage volatility. | |
Global Atlantic Moderate Growth Managed Risk Portfolio | | April 30, 2014 | | Capital appreciation and income while seeking to manage volatility. | |
Global Atlantic Select Advisor Managed Risk Portfolio | | October 31, 2013 | | Capital appreciation and income while seeking to manage volatility. | |
Global Atlantic Wellington Research Managed Risk Portfolio | | October 31, 2013 | | Capital appreciation and income while seeking to manage volatility. | |
Each Portfolio is diversified. Certain of the Portfolios operate as "fund of funds." A "fund of funds" typically invests in multiple underlying funds and the level of its interest in any particular underlying fund may fluctuate. The Portfolios are intended to be funding vehicles for variable annuity contracts offered by the separate accounts of Forethought Life Insurance Company. The assets of each Portfolio are segregated and a shareholder's interest is limited to the Portfolio in which shares are held. Each Portfolio pays its own expenses.
As of December 31, 2023, the Portfolios offered Class II shares at net asset value.
References herein to a Portfolio's investment in a particular instrument include direct investments and indirect investments through investment companies such as open-end funds (mutual funds, exchange traded funds, and variable insurance trusts) and closed-end funds, as applicable.
2. SIGNIFICANT ACCOUNTING POLICIES
The following is a summary of significant accounting policies followed by the Portfolios in preparation of their financial statements. The policies are in conformity with U.S. generally accepted accounting principles ("US GAAP"). The preparation of the financial statements requires management to make estimates and assumptions that affect the reported amounts of assets and liabilities and disclosure of contingent assets and liabilities at the date of the financial statements and the reported amounts of income and expenses for the period. Actual results could differ from those estimates. Each Portfolio is an investment company and accordingly follows the investment company accounting and reporting guidance of the Financial Accounting Standards Board ("FASB") Accounting Standard Codification Topic 946 "Financial Services – Investment Companies".
Securities Valuation – Securities listed on an exchange are valued at the last reported sale price at the close of the regular trading session of the primary exchange on the business day the value is being determined, or in the case of securities listed on NASDAQ at the NASDAQ Official Closing Price. In the absence of a sale such securities shall be valued at the mean between the current bid and ask prices on the day of valuation. Futures and future options are valued at the final settle price or, in the absence of a settle price, at the last sale price on the day of valuation. Debt securities are valued on the basis of
69
Global Atlantic Portfolios
Notes to Financial Statements (Continued)
December 31, 2023
valuations provided by dealers or by an independent pricing service which take into account appropriate factors such as trading activity, readily available market quotations (including broker quotes), yield, quality, coupon rate, maturity, type of issue, trading characteristic, call features, credit ratings and other data. Short-term debt obligations having 60 days or less remaining until maturity, at time of purchase, may be valued at amortized cost to the extent it is determined that amortized cost approximates fair value. Forward currency contracts are valued at the forward currency contract rates, determined at 11:00 am Eastern Time or the nearest time prior to the close of the New York Stock Exchange. Exchange listed swaps are valued at the last quoted sales price or, in the absence of a sale, at the mean between the current bid and ask prices. Other swaps are valued by a pricing service provider covering the specific type of swap.
Valuation of Investment Companies – The Portfolios may invest in one or more portfolios of open-end investment companies (the "Underlying Fund" or "Underlying Funds"). Each Underlying Fund is valued at its respective net asset value as reported by such investment company (except exchange-traded funds ("ETFs")). ETFs are valued daily at the last sale price or official closing price on the principal exchange or system on which the investment is traded. Each Underlying Fund values securities in its portfolio for which market quotations are readily available at their market values (generally the last reported sale price) and all other securities and assets at their fair value based on the methods approved by each Underlying Fund's board(s) of trustees.
Illiquid Investments – Pursuant to Rule 22e-4 under the 1940 Act, a Portfolio may not acquire any "illiquid investment" if, immediately after the acquisition, the Portfolio would have invested more than 15% of its net assets in illiquid investments that are assets. An "illiquid investment" is any investment that a Portfolio reasonably expects cannot be sold or disposed of in current market conditions in seven calendar days or less without the sale or disposition significantly changing the market value of the investment. The Trust has implemented a liquidity risk management program and related procedures to identify illiquid investments pursuant to Rule 22e-4, and the Board of Trustees ("Board") has approved the designation of the Adviser to administer the Trust's liquidity risk management program and related procedures. Illiquid investments include securities subject to contractual or legal restrictions on resale (e.g., because they have not been registered under the Securities Act of 1933) and securities that are otherwise not readily marketable (e.g., because trading in the security is suspended or because market makers do not exist or will not entertain bids or offers). These investments will be valued at their fair value, as outlined below.
Valuation Designee and Valuation Process – Pursuant to Rule 2a-5 under the 1940 Act, the Board has designated Global Atlantic Investment Advisors, LLC (the "Adviser"), investment adviser to the Portfolios, as the Portfolios' Valuation Designee (the "Designee") with responsibility for establishing fair value when the price of a security is not readily available or deemed unreliable. Such investments will be valued at their fair market value as determined using the valuation procedures established by the Designee and approved by the Board. The Adviser carries out its designated activities through the Adviser's Fair Value Committee.
In accordance with the valuation procedures, fair value determinations are required for, among others, the following securities: (i) securities for which market quotations are not readily available on a particular business day (including without limitation securities for which there is a short and temporary lapse in the provision of a price by the regular pricing source); (ii) securities for which, in the opinion of the Adviser or relevant Sub-Adviser, the prices or values available do not represent the fair value of the instrument (factors which may cause the Adviser or Sub-Adviser to make such a judgment include, but are not limited to, the following: the availability of only a bid price or an ask price; the spread between bid and ask prices; the frequency of sales; the thinness of the market; the size of reported trades; and actions of the securities markets or regulators, such as the suspension or limitation of trading); (iii) securities determined to be illiquid; (iv) securities with respect to which an event that will affect the value thereof has occurred (a "significant event") subsequent to the determination of the closing price reported on the principal exchange on which the securities are traded, but prior to the relevant Portfolio's calculation of its net asset value ("NAV"); and (v) mutual funds that do not provide timely NAV information. Restricted or illiquid securities, such as private placements or non-traded securities are valued via inputs from the Adviser or Sub-Adviser valuation based upon the current bid for the security from two or more independent dealers or other parties reasonably familiar with the facts and circumstances of the security (who should take into consideration all relevant factors as may be appropriate under the circumstances). If the Adviser or Sub-Adviser is unable to obtain a current bid from such independent dealers or other independent parties, the Designee shall determine the fair value of restricted or illiquid securities using certain factors, such as, but not limited to: (i) the type of security; (ii) the cost at date of purchase; (iii) the size and nature of the Portfolio's holdings; (iv) the discount from market value of unrestricted securities of the same class at the time of purchase and subsequent thereto; (v) information as to any transactions or offers with respect to the security; (vi) the nature and duration
70
Global Atlantic Portfolios
Notes to Financial Statements (Continued)
December 31, 2023
of restrictions on disposition of the security and the existence of any registration rights, as well as any estimation of the cost of registration or otherwise qualifying the security for public sale, including commissions; (vii) how the yield of the security compares to similar securities of companies of similar or equal creditworthiness; (viii) the level of recent trades of similar or comparable securities; (ix) the liquidity characteristics of the security; (x) current market conditions; (xi) the market value of any securities into which the security is convertible or exchangeable; (xii) the security's embedded option values; and (xiii) information about the financial condition of the issuer and its prospects.
Each Portfolio utilizes various methods to measure the fair value of all of its investments on a recurring basis. US GAAP establishes a hierarchy that prioritizes inputs to valuation methods. The three levels of input are:
Level 1 – Unadjusted quoted prices in active markets for identical assets and liabilities that the Portfolio has the ability to access.
Level 2 – Observable inputs other than quoted prices included in Level 1 that are observable for the asset or liability, either directly or indirectly. These inputs may include quoted prices for the identical instrument in an inactive market, prices for similar instruments, interest rates, prepayment speeds, credit risk, yield curves, default rates and similar data.
Level 3 – Unobservable inputs for the asset or liability, to the extent relevant observable inputs are not available, representing the Portfolio's own assumptions about the assumptions a market participant would use in valuing the asset or liability, and would be based on the best information available.
The availability of observable inputs can vary from security to security and is affected by a wide variety of factors, including, for example, the type of security, whether the security is new and not yet established in the marketplace, the liquidity of markets, and other characteristics particular to the security. To the extent that valuation is based on models or inputs that are less observable or unobservable in the market, the determination of fair value requires more judgment. Accordingly, the degree of judgment exercised in determining fair value is greatest for instruments categorized in Level 3.
The inputs used to measure fair value may fall into different levels of the fair value hierarchy. In such cases, for disclosure purposes, the level in the fair value hierarchy within which the fair value measurement falls in its entirety is determined based on the lowest level input that is significant to the fair value measurement in its entirety.
The inputs or methodology used for valuing securities are not necessarily an indication of the risk associated with investing in those securities. The following tables summarize the inputs used as of December 31, 2023 for each Portfolio's investments measured at fair value:
Global Atlantic American Funds® Managed Risk Portfolio
Assets | | Level 1 | | Level 2 | | Level 3 | | Total | |
Variable Insurance Trusts | | $ | 143,200,382 | | | $ | - | | | $ | - | | | $ | 143,200,382 | | |
Mutual Funds | | | 14,346,476 | | | | - | | | | - | | | | 14,346,476 | | |
Short-Term Investments | | | 7,555,974 | | | | - | | | | - | | | | 7,555,974 | | |
Total | | $ | 165,102,832 | | | $ | - | | | $ | - | | | $ | 165,102,832 | | |
Global Atlantic Balanced Managed Risk Portfolio
Assets | | Level 1 | | Level 2 | | Level 3 | | Total | |
Exchange Traded Funds | | $ | 81,517,490 | | | $ | - | | | $ | - | | | $ | 81,517,490 | | |
Short-Term Investments | | | 4,033,751 | | | | - | | | | - | | | | 4,033,751 | | |
Total | | $ | 85,551,241 | | | $ | - | | | $ | - | | | $ | 85,551,241 | | |
71
Global Atlantic Portfolios
Notes to Financial Statements (Continued)
December 31, 2023
Global Atlantic BlackRock Selects Managed Risk Portfolio
Assets | | Level 1 | | Level 2 | | Level 3 | | Total | |
Exchange Traded Funds | | $ | 122,136,582 | | | $ | - | | | $ | - | | | $ | 122,136,582 | | |
Variable Insurance Trusts | | | 36,561,274 | | | | - | | | | - | | | | 36,561,274 | | |
Short-Term Investments | | | 8,106,454 | | | | - | | | | - | | | | 8,106,454 | | |
Total | | $ | 166,804,310 | | | $ | - | | | $ | - | | | $ | 166,804,310 | | |
Global Atlantic Franklin Dividend and Income Managed Risk Portfolio
Assets | | Level 1 | | Level 2 | | Level 3 | | Total | |
Common Stocks | | $ | 142,270,850 | | | $ | 5 | | | $ | - | | | $ | 142,270,855 | | |
Corporate Bonds and Notes | | | - | | | | 16,664,753 | | | | - | | | | 16,664,753 | | |
Agency Mortgage Backed Securities | | | - | | | | 13,966,339 | | | | - | | | | 13,966,339 | | |
U.S. Treasury Securities and Agency Bonds | | | - | | | | 13,518,338 | | | | - | | | | 13,518,338 | | |
Asset Backed and Commercial Backed Securities | | | - | | | | 5,502,517 | | | | - | | | | 5,502,517 | | |
Mutual Funds | | | 1,542,713 | | | | - | | | | - | | | | 1,542,713 | | |
Municipal Bonds | | | - | | | | 615,777 | | | | - | | | | 615,777 | | |
Sovereign Debts | | | - | | | | 522,501 | | | | - | | | | 522,501 | | |
Preferred Stocks | | | - | | | | 16 | | | | - | | | | 16 | | |
Short-Term Investments | | | 11,096,404 | | | | - | | | | - | | | | 11,096,404 | | |
Futures Contracts* | | | 137,453 | | | | - | | | | - | | | | 137,453 | | |
Swap Contracts* | | | - | | | | 42,830 | | | | - | | | | 42,830 | | |
Forward Foreign Currency Contracts* | | | - | | | | 16,604 | | | | - | | | | 16,604 | | |
Total | | $ | 155,047,420 | | | $ | 50,849,680 | | | $ | - | | | $ | 205,897,100 | | |
Liabilities | | Level 1 | | Level 2 | | Level 3 | | Total | |
Futures Contracts* | | $ | 112,575 | | | $ | - | | | $ | - | | | $ | 112,575 | | |
Swap Contracts* | | | - | | | | 19,810 | | | | - | | | | 19,810 | | |
Forward Foreign Currency Contracts* | | | - | | | | 3,143 | | | | - | | | | 3,143 | | |
Total | | $ | 112,575 | | | $ | 22,953 | | | $ | - | | | $ | 135,528 | | |
Global Atlantic Growth Managed Risk Portfolio
Assets | | Level 1 | | Level 2 | | Level 3 | | Total | |
Exchange Traded Funds | | $ | 290,577,323 | | | $ | - | | | $ | - | | | $ | 290,577,323 | | |
Short-Term Investments | | | 13,604,195 | | | | - | | | | - | | | | 13,604,195 | | |
Total | | $ | 304,181,518 | | | $ | - | | | $ | - | | | $ | 304,181,518 | | |
Global Atlantic Moderate Growth Managed Risk Portfolio
Assets | | Level 1 | | Level 2 | | Level 3 | | Total | |
Exchange Traded Funds | | $ | 94,135,107 | | | $ | - | | | $ | - | | | $ | 94,135,107 | | |
Short-Term Investments | | | 4,597,362 | | | | | | - | | | | 4,597,362 | | |
Total | | $ | 98,732,469 | | | $ | - | | | $ | - | | | $ | 98,732,469 | | |
Global Atlantic Select Advisor Managed Risk Portfolio
Assets | | Level 1 | | Level 2 | | Level 3 | | Total | |
Variable Insurance Trusts | | $ | 59,339,398 | | | $ | - | | | $ | - | | | $ | 59,339,398 | | |
Exchange Traded Funds | | | 12,958,820 | | | | - | | | | - | | | | 12,958,820 | | |
Short-Term Investments | | | 3,753,271 | | | | - | | | | - | | | | 3,753,271 | | |
Total | | $ | 76,051,489 | | | $ | - | | | $ | - | | | $ | 76,051,489 | | |
72
Global Atlantic Portfolios
Notes to Financial Statements (Continued)
December 31, 2023
Global Atlantic Wellington Research Managed Risk Portfolio
Assets | | Level 1 | | Level 2 | | Level 3 | | Total | |
Common Stocks | | $ | 211,710,906 | | | $ | - | | | $ | - | | | $ | 211,710,906 | | |
Corporate Bonds & Notes | | | - | | | | 30,284,772 | | | | - | | | | 30,284,772 | | |
U.S. Treasury Securities and Agency Bonds | | | - | | | | 39,775,338 | | | | - | | | | 39,775,338 | | |
Agency Mortgage Backed Securities | | | - | | | | 29,168,736 | | | | - | | | | 29,168,736 | | |
Asset Backed and Commercial Backed Securities | | | - | | | | 9,289,929 | | | | - | | | | 9,289,929 | | |
Exchange Traded Funds | | | 827,515 | | | | - | | | | - | | | | 827,515 | | |
Municipal Bonds | | | - | | | | 2,089,671 | | | | - | | | | 2,089,671 | | |
Short-Term Investments | | | 15,717,903 | | | | - | | | | - | | | | 15,717,903 | | |
Futures Contracts* | | | 54,008 | | | | - | | | | - | | | | 54,008 | | |
Total | | $ | 228,310,332 | | | $ | 110,608,446 | | | $ | - | | | $ | 338,918,778 | | |
* Net unrealized appreciation/(depreciation) as presented in the Portfolio of Investments.
The Portfolios did not hold any Level 3 securities during the year ended December 31, 2023.
Security Transactions and Related Income – Security transactions are accounted for on a trade date basis. Interest income is recognized on the accrual basis and includes, where applicable, the pro-rata amortization of premium or accretion of discount calculated using constant yield to maturity or effective yield. Dividend income is recorded on the ex-dividend date. Realized gains or losses from sales of securities are determined by comparing the identified cost of the security lot sold with the net sales proceeds.
Dividends and Distributions to Shareholders – Dividends from net investment income and distributions from net realized capital gains, if any, are declared and paid annually. Dividends and distributions to shareholders are recorded on ex-date and are determined in accordance with Federal income tax regulations, which may differ from US GAAP. These "book/tax" differences are considered either temporary (e.g., deferred losses, capital loss carryforwards) or permanent in nature. To the extent these differences are permanent in nature, such amounts are reclassified within the composition of net assets based on their Federal tax-basis treatment; temporary differences do not require reclassification. These reclassifications have no effect on net assets, results from operations or net asset values per share of the Portfolios.
Cash and Cash Equivalents – Cash and cash equivalents include cash and overnight investments in interest-bearing demand deposits with a financial institution with original maturities of three months or less. The Portfolios may maintain deposits with a financial institution which could be an amount that is in excess of federally insured limits. The Portfolios have not experienced any losses on their accounts.
Federal Income Tax – It is each Portfolio's policy to qualify as a regulated investment company by complying with the provisions of the Internal Revenue Code that are applicable to regulated investment companies and to distribute substantially all of their taxable income and net realized gains to shareholders. Therefore, no Federal income tax provision is required.
Each Portfolio will recognize the tax benefits of uncertain tax positions only where the position is "more likely than not" to be sustained assuming examination by tax authorities. Management has analyzed each Portfolio's tax positions, and has concluded that no liability for unrecognized tax benefits should be recorded related to uncertain tax positions taken in each Portfolio's 2021 and 2022 tax returns, or is expected to be taken in each Portfolio's 2023 tax return. Each Portfolio identified its major tax jurisdictions as U.S. Federal and foreign jurisdictions where the Portfolios make significant investments; however, the Portfolios are not aware of any tax positions for which it is reasonably possible that the total amounts of unrecognized tax benefits will change materially in the next twelve months.
Foreign Currency Translation – The accounting records of the Portfolios are maintained in U.S. dollars. Foreign currencies, as well as investment securities and other assets and liabilities denominated in foreign currencies, are translated into U.S. dollars using exchange rates deemed appropriate by the investment adviser. Purchases and sales of securities, income receipts and expense payments are translated into U.S. dollars on the respective dates of such transactions.
73
Global Atlantic Portfolios
Notes to Financial Statements (Continued)
December 31, 2023
Net realized gains and losses on foreign currency transactions represent net gains and losses from currency realized between the trade and settlement dates on securities transactions and the difference between income accrued versus income received. The effects of changes in foreign currency exchange rates on investments in securities are included with the net realized and change in unrealized gain or loss on foreign currency translations.
Forward Foreign Currency Contracts – As foreign securities are purchased, a Portfolio may enter into forward currency contracts in order to hedge against foreign currency exchange rate risks. A forward involves an obligation to purchase or sell a specific currency at a future date, which may be any fixed number of days from the date of the contract agreed upon by the parties, at a price set at the time of the contract. The market value of the contract fluctuates with changes in currency exchange rates. The contract is marked-to-market daily and the change in market value is recorded by a Portfolio as an unrealized gain or loss. As foreign securities are sold, a portion of the contract is generally closed and a Portfolio records a realized gain or loss equal to the difference between the value of the contract at the time it was opened and the value at the time it was closed. Realized gains and losses from contract transactions are included as a component of net realized gains/(losses) from forward foreign currency contracts in the Statements of Operations.
For the year ended December 31, 2023, realized gains/(losses) and the change in unrealized appreciation/(depreciation) on forward foreign currency contracts subject to currency risk, as disclosed in the Statements of Operations, is as follows:
| | | Realized Gain/(Loss) | | Change in Unrealized
Appreciation/(Depreciation) | |
Global Atlantic Franklin Dividend and Income Managed Risk Portfolio | | $ | (61,166 | ) | | $ | 32,330 | | |
Options Transactions – Certain Portfolios are subject to equity price risk, interest rate risk and foreign currency risk in the normal course of pursuing their investment objectives and may purchase or sell options to help hedge against this risk.
A Portfolio may purchase and write (i.e., sell) put and call options. Such options may relate to particular securities or securities indices, including ETFs, and may or may not be listed on a domestic or foreign securities exchange and may or may not be issued by the Options Clearing Corporation. Options trading is a highly specialized activity that entails greater than ordinary investment risk. Options may be more volatile than the underlying instruments, and therefore, on a percentage basis, an investment in options may be subject to greater fluctuation than an investment in the underlying instruments themselves. A call option for a particular security gives the purchaser of the option, in return for a premium, the right, but not the obligation, to buy, and the writer (seller) the obligation to sell, the underlying security at the stated exercise price at any time prior to the expiration of the option for American options or only at expiration for European options, regardless of the market price of the security. The premium paid to the writer is in consideration for undertaking the obligation under the option contract. A put option for a particular security gives the purchaser the right, but not the obligation, to sell the security at the stated exercise price at any time prior to the expiration date of the option for American options or only at expiration for European options, regardless of the market price of the security.
Securities index options are put options and call options on various securities indices. In most respects, they are identical to listed options on common stocks. The primary difference between stock options and index options occurs when index options are exercised. In the case of stock options, the underlying security, common stock, is delivered. However, upon the exercise of an index option, settlement does not occur by delivery of the securities comprising the index. The option holder who exercises the index option receives an amount of cash if the closing level of the securities index upon which the option is based is greater than, in the case of a call, or less than, in the case of a put, the exercise price of the option. This amount of cash is equal to the difference between the closing price of the securities index and the exercise price of the option expressed in dollars times a specified multiple. A securities index fluctuates with changes in the market value of the securities included in the index.
The Portfolios may purchase and sell options on the same types of futures in which it may invest. Options on futures are similar to options on underlying instruments except that options on futures give the purchaser the right, but not the obligation, to buy in return for the premium paid, to assume a position in a futures contract (a long position if the option is a call and a short position if the option is a put), rather than to purchase or sell the futures contract, at a specified exercise price at any time during the period of the option. Upon exercise of the option, the delivery of the futures position by the writer of the option to the holder of the option will be accompanied by the delivery of the accumulated balance in the writer's futures margin account which represents the amount by which the market price of the futures contract, at exercise,
74
Global Atlantic Portfolios
Notes to Financial Statements (Continued)
December 31, 2023
exceeds (in the case of a call) or is less than (in the case of a put) the exercise price of the option on the futures contract. Purchasers of options who fail to exercise their options prior to the exercise date suffer a loss of the premium paid.
Futures Contracts – The Portfolios are subject to equity price risk in the normal course of pursuing their investment objectives. The Portfolios may sell futures contracts to hedge against market risk, foreign currency exchange rate risks, and to reduce return volatility. Futures are standardized, exchange-traded contracts that provide for the future sale by one party and purchase by another party of a specified amount of a specific financial instrument (e.g., units of a securities index) for a specified price, date, time and place designated at the time the contract is made. Brokerage fees are incurred when a futures contract is bought or sold and initial and variation margin deposits must be maintained. Entering into a contract to buy is commonly referred to as buying or purchasing a contract or holding a long position. Entering into a contract to sell is commonly referred to as selling a contract or holding a short position. The Portfolios may also buy or sell hedge instruments based on one or more market indices in an attempt to maintain the Portfolios' volatility at a targeted level. Initial margin deposits required upon entering into futures contracts are satisfied by the segregation of specific securities or cash as collateral for the account of the broker (the Portfolio's agent in acquiring the futures position). During the period the futures contracts are open, changes in the value of the contracts are recognized as unrealized gains or losses by "marking to market" on a daily basis to reflect the market value of the contracts at the end of each day's trading. Variation margin payments are received or made depending upon whether unrealized gains or losses are incurred. When the contracts are closed, a Portfolio recognizes a realized gain or loss equal to the difference between the proceeds from, or cost of, the closing transaction and the Portfolio's basis in the contract. If a Portfolio were unable to liquidate a futures contract and/or enter into an offsetting closing transaction, the Portfolio would continue to be subject to market risk with respect to the value of the contracts and continue to be required to maintain the margin deposits on the futures contracts. These amounts are disclosed on the Statements of Assets and Liabilities as Deposits with Brokers when applicable. Risks may exceed amounts recognized in the Statements of Assets and Liabilities. With futures, there is minimal counterparty credit risk to a Portfolio since futures are exchange traded and the exchange's clearinghouse, as counterparty to all exchange traded futures, guarantees the futures against default.
For the year ended December 31, 2023, realized gains/(losses) and the change in unrealized appreciation/(depreciation) on futures contracts by risk type, as disclosed in the Statements of Operations, is as follows:
| | | Risk Type | | Realized Gain/(Loss) | | Change in Unrealized
Appreciation/(Depreciation) | |
Global Atlantic American Funds® Managed Risk Portfolio | | Equity | | $ | (3,126,021 | ) | | $ | (857,565 | ) | |
Global Atlantic Balanced Managed Risk Portfolio | | Equity | | | (1,221,692 | ) | �� | | (489,218 | ) | |
Global Atlantic BlackRock Selects Managed Risk Portfolio | | Equity | | | (3,467,596 | ) | | | (807,708 | ) | |
Global Atlantic Franklin Dividend and Income Managed Risk Portfolio | | Equity | | | (3,728,498 | ) | | | (737,062 | ) | |
Global Atlantic Franklin Dividend and Income Managed Risk Portfolio | | Interest Rate | | | (12,912 | ) | | | 7,534 | | |
Global Atlantic Growth Managed Risk Portfolio | | Equity | | | (10,238,408 | ) | | | (2,289,105 | ) | |
Global Atlantic Moderate Growth Managed Risk Portfolio | | Equity | | | (1,893,006 | ) | | | (557,140 | ) | |
Global Atlantic Select Advisor Managed Risk Portfolio | | Equity | | | (2,057,393 | ) | | | (472,068 | ) | |
Global Atlantic Wellington Research Managed Risk Portfolio | | Equity | | | (5,697,414 | ) | | | (2,355,698 | ) | |
Global Atlantic Wellington Research Managed Risk Portfolio | | Interest Rate | | | 7,833 | | | | 54,188 | | |
Swap Agreements – Certain Portfolios are subject to equity price risk and/or interest rate risk in the normal course of pursuing their investment objectives. These Portfolios may enter into various swap transactions for investment purposes or to manage interest rate, equity, foreign exchange (currency), or credit risk. These are two-party contracts entered into primarily to exchange the returns (or differentials in rates of returns) earned or realized on particular pre-determined investments or instruments. In a standard over-the-counter ("OTC") swap, two parties agree to exchange the returns, differentials in rates of return or some other amount earned or realized on the "notional amount" (i.e., the return or increase in value of a particular dollar amount invested in a "basket" of securities, representing a particular index or industry sectors) of predetermined investments or instruments.
Certain Portfolios may enter into credit default swaps ("CDS"). CDS are two-party contracts that transfer credit exposure between the parties. One party (the "buyer") receives credit protection and the other party (the "seller") takes on credit risk. The buyer typically makes predetermined periodic payments to the seller in exchange for the seller's commitment to purchase the underlying reference obligation if a defined credit event occurs, such as a default, bankruptcy or failure to pay
75
Global Atlantic Portfolios
Notes to Financial Statements (Continued)
December 31, 2023
interest or principal on a reference debt instrument, with respect to a specified issuer or one of the reference issuers in a CDS portfolio. If the defined credit event occurs, the seller must pay the agreed-upon value of a reference obligation to the counterparty or perform pursuant to the agreement. The buyer must then surrender the reference obligation to the seller. As a seller of credit protection in a CDS, a Portfolio would be liable for the notional amount of the swap.
The swaps in which a Portfolio may invest may be centrally-cleared or bi-laterally traded. The gross returns to be exchanged or "swapped" between the parties are calculated with respect to a notional amount. Changes in the value of swap agreements are recognized as unrealized gains or losses in the Statements of Operations by "marking to market" on a daily basis to reflect the value of the swap agreement at the end of each trading day. Payments received or paid at the beginning of a swap agreement are reflected as such on the Statements of Assets and Liabilities and may be referred to as upfront payments. A Portfolio amortizes upfront payments and/or accrues for the fixed payment stream on swap agreements on a daily basis with the net amount recorded as a component of unrealized gain or loss on the Statements of Operations. Realized gains and losses from the decrease in notional value of the swap are recognized on trade date. A liquidation payment received or made at the termination of the swap agreement is recorded as a realized gain or loss on the Statements of Operations. Swap agreements involve, to varying degrees, lack of liquidity and elements of credit, market and counterparty risk in excess of amounts recognized on the Statements of Assets and Liabilities. Each Portfolio's maximum risk of loss from the counterparty credit risk is the discounted net value of the cash flow to be received from the counterparty over the contract's remaining life, to the extent that amount is positive.
Swaps may involve greater risks than direct investments in securities because swaps may be leveraged and, when traded in the OTC markets, are subject to counterparty risk, credit risk and pricing risk, each of which individually and collectively, may have a considerable impact on the performance of a Portfolio. CDS in particular may involve greater risks than investing in a referenced instrument directly. Swaps, especially those that are not exchange-traded, may also be considered illiquid. It may not be possible for a Portfolio to liquidate a swap position at an advantageous time or price, which may result in significant losses. Although central clearing and exchange-trading of swaps may decrease counterparty risk and increase market liquidity, exchange-trading and clearing does not make the contracts risk free, but rather, the primary credit risk on such contracts is the creditworthiness of the clearing broker or the clearinghouse.
The Portfolios use cash and certain securities as collateral to swap agreements as indicated on the Portfolio of Investments and Statements of Assets and Liabilities. Such collateral is held for the benefit of the counterparty in a segregated account to prevent non-payment by the Portfolios. If the counterparty defaults, a Portfolio may seek return of this collateral and incur certain costs exercising their rights to the collateral.
For the year ended December 31, 2023, realized gains/(losses) and the change in unrealized appreciation/(depreciation) on swap agreements by risk type, as disclosed in the Statements of Operations, is as follows:
| | | Risk Type | | Realized Gain/(Loss) | | Change in Unrealized
Appreciation/(Depreciation) | |
Global Atlantic Franklin Dividend and Income Managed Risk Portfolio | | Interest Rate | | $ | - | | | $ | (5,706 | ) | |
| | | Credit | | | (89,506 | ) | | | 103,913 | | |
Swaption Transactions – Certain portfolios may enter into swaption transactions. A swaption, also known as a swap option, refers to an option to enter into an interest rate swap or some other type of swap. In exchange for an options premium, the buyer gains the right but not the obligation to enter into a specified swap agreement with the issuer on a specified future date.
For the year ended December 31, 2023, realized gains/(losses) and the change in unrealized appreciation/(depreciation) on swaptions, as disclosed in the Statements of Operations, is as follows:
| | | Risk Type | | Realized Gain/(Loss) | | Change in Unrealized
Appreciation/(Depreciation) | |
Global Atlantic Franklin Dividend and Income Managed Risk Portfolio | | Interest Rate | | $ | 41,640 | | | $ | - | | |
76
Global Atlantic Portfolios
Notes to Financial Statements (Continued)
December 31, 2023
Offsetting of Financial Assets/Liabilities and Derivative Assets/Liabilities – The following tables present certain of the Portfolios' asset/liability derivatives available for offset under a master netting arrangement net of collateral pledged as of December 31, 2023.
Global Atlantic Franklin Dividend and Income Managed Risk Portfolio
| | | Gross
Amounts of
Recognized
Assets (1) | | Financial
Instruments
and
Derivatives
Available for
Offset | | Net Amount
of Assets
Presented
in the
Statements of
Assets &
Liabilities | | Collateral
Received (2) | | Net
Amount of
Recognized
Assets | | Gross
Amounts of
Recognized
Liabilities (1) | | Financial
Instruments
and
Derivatives
Available for
Offset | | Net
Amount of
Liabilities
Presented
in the
Statements
of Assets &
Liabilities | | Collateral
Pledged (2) | | Net
Amount of
Recognized
Liabilities | |
Citibank NA | | $ | 42,830 | | | $ | (19,810 | ) | | $ | 23,020 | | | $ | - | | | $ | 23,020 | | | $ | 19,810 | | | $ | (19,810 | ) | | $ | - | | | $ | - | | | $ | - | | |
JP Morgan Chase
Bank | | | 16,604 | | | | (3,143 | ) | | | 13,461 | | | | - | | | | 13,461 | | | | 3,143 | | | | (3,143 | ) | | | - | | | | - | | | | - | | |
JP Morgan
Securities LLC | | | 137,453 | | | | (112,575 | ) | | | 24,878 | | | | - | | | | 24,878 | | | | 112,575 | | | | (112,575 | ) | | | - | | | | - | | | | - | | |
Total | | $ | 196,887 | | | $ | (135,528 | ) | | $ | 61,359 | | | $ | - | | | $ | 61,359 | | | $ | 135,528 | | | $ | (135,528 | ) | | $ | - | | | $ | - | | | $ | - | | |
Global Atlantic Wellington Research Managed Risk Portfolio
| | | Gross
Amounts of
Recognized
Assets (1) | | Financial
Instruments
and
Derivatives
Available for
Offset | | Net Amount
of Assets
Presented
in the
Statements of
Assets &
Liabilities | | Collateral
Received (2) | | Net
Amount of
Recognized
Assets | | Gross
Amounts of
Recognized
Liabilities (1) | | Financial
Instruments
and
Derivatives
Available for
Offset | | Net
Amount of
Liabilities
Presented
in the
Statements
of Assets &
Liabilities | | Collateral
Pledged (2) | | Net
Amount of
Recognized
Liabilities | |
JP Morgan Chase
Bank | | $ | 54,008 | | | $ | - | | | $ | 54,008 | | | $ | - | | | $ | 54,008 | | | $ | - | | | $ | - | | | $ | - | | | $ | - | | | $ | - | | |
Total | | $ | 54,008 | | | $ | - | | | $ | 54,008 | | | $ | - | | | $ | 54,008 | | | $ | - | | | $ | - | | | $ | - | | | $ | - | | | $ | - | | |
(1) Gross unrealized appreciation/(depreciation) as presented in the Portfolio of Investments.
(2) The amount is limited to the net derivative balance and, accordingly, may not include collateral or excess collateral received or pledged.
Impact of Derivatives on the Statements of Assets and Liabilities – The following table presents a summary of the location of derivative investments categorized by primary risk exposure on the Portfolios' Statements of Assets and Liabilities as of December 31, 2023:
Global Atlantic Franklin Dividend and Income Managed Risk Portfolio
| | | Equity | | Interest Rate
Contracts | | Credit
Contracts | | Currency
Contracts | | Total | |
Assets | |
Unrealized appreciation on Futures
Contracts | | $ | - | | | $ | 137,453 | | | $ | - | | | $ | - | | | $ | 137,453 | | |
Unrealized appreciation on Swap
Contracts | | | - | | | | 35,791 | | | | 7,039 | | | | - | | | | 42,830 | | |
Unrealized appreciation on
Forward Foreign Exchange
Contracts | | | - | | | | - | | | | - | | | | 16,604 | | | | 16,604 | | |
77
Global Atlantic Portfolios
Notes to Financial Statements (Continued)
December 31, 2023
Global Atlantic Franklin Dividend and Income Managed Risk Portfolio (Continued)
| | | Equity | | Interest Rate
Contracts | | Credit
Contracts | | Currency
Contracts | | Total | |
Liabilities | |
Unrealized depreciation on Futures
Contracts | | $ | - | | | $ | (112,575 | ) | | $ | - | | | $ | - | | | $ | (112,575 | ) | |
Unrealized depreciation on Swap
Contracts | | | - | | | | - | | | | (19,810 | ) | | | - | | | | (19,810 | ) | |
Unrealized depreciation on
Forward Foreign Exchange
Contracts | | | - | | | | - | | | | - | | | | (3,143 | ) | | | (3,143 | ) | |
Total | | $ | - | | | $ | 60,669 | | | $ | (12,771 | ) | | $ | 13,461 | | | $ | 61,359 | | |
Global Atlantic Wellington Research Managed Risk Portfolio
| | | Equity | | Interest Rate
Contracts | | Credit
Contracts | | Currency
Contracts | | Total | |
Assets | |
Unrealized appreciation on Futures
Contracts | | $ | 54,008 | | | $ | - | | | $ | - | | | $ | - | | | $ | 54,008 | | |
The notional value of the derivative instruments outstanding as of December 31, 2023, as disclosed in the Portfolios of Investments, and the amounts of realized and changes in unrealized gains and losses on derivative instruments during the period as disclosed above and within the Statements of Operations serve as indicators of the volume of derivative activity for the Portfolios. In addition, for the fiscal year ended December 31, 2023, the relevant values for each derivative type were as follows:
| | Average Number of Contracts or Notional Amounts* | |
| Fund | | Long
Futures
Contracts | | Long
Futures
Notional
Value | | Short
Futures
Contracts | | Short
Futures
Notional
Value | | Forward
Contracts
Notional
Value** | | Swap
Agreements
Notional
Value** | | Swaptions
Notional
Value** | |
Global Atlantic American Funds® Managed Risk Portfolio | | | - | | | $ | - | | | | 76 | | | $ | 10,166,318 | | | $ | - | | | $ | - | | | $ | - | | |
Global Atlantic Balanced Managed Risk Portfolio | | | - | | | | - | | | | 32 | | | | 5,042,858 | | | | - | | | | - | | | | - | | |
Global Atlantic BlackRock Selects Managed Risk Portfolio | | | - | | | | - | | | | 79 | | | | 10,949,964 | | | | - | | | | - | | | | - | | |
Global Atlantic Franklin Dividend and Income Managed
Risk Portfolio | | | 37 | | | | 6,482,159 | | | | 80 | | | | 15,810,842 | | | | 1,396,549 | �� | | | 3,278,433 | | | | 200,000 | | |
Global Atlantic Growth Managed Risk Portfolio | | | - | | | | - | | | | 235 | | | | 37,858,015 | | | | - | | | | - | | | | - | | |
Global Atlantic Moderate Growth Managed Risk Portfolio | | | - | | | | - | | | | 44 | | | | 6,948,603 | | | | - | | | | - | | | | - | | |
Global Atlantic Select Advisor Managed Risk Portfolio | | | - | | | | - | | | | 47 | | | | 6,864,462 | | | | - | | | | - | | | | - | | |
Global Atlantic Wellington Research Managed Risk Portfolio | | | 43 | | | | 5,868,414 | | | | 148 | | | | 26,476,080 | | | | - | | | | - | | | | - | | |
* Amounts disclosed represent average month-end number of contracts or notional amounts held for the fiscal year ended December 31, 2023, which is indicative volume for these derivative types.
** Based on absolute values.
Short Sales – A Portfolio may make short sales of securities: (i) to offset potential declines in long positions in similar securities; (ii) to increase the flexibility of the Portfolio; (iii) for investment return; (iv) as part of a risk arbitrage strategy; and (v) as part of its overall portfolio management strategies involving the use of derivative instruments. A short sale is a transaction in which a Portfolio sells a security it does not own or have the right to acquire (or that it owns but does not wish to deliver) in anticipation that the market price of that security will decline.
78
Global Atlantic Portfolios
Notes to Financial Statements (Continued)
December 31, 2023
When a Portfolio makes a short sale, the broker-dealer through which the short sale is made must borrow the security sold short and deliver it to the party purchasing the security. The Portfolio is required to make a margin deposit in connection with such short sales; the Portfolio may have to pay a fee to borrow particular securities and will often be obligated to pay over any dividends and accrued interest on borrowed securities.
If the price of the security sold short increases between the time of the short sale and the time a Portfolio covers its short position, the Portfolio will incur a loss; conversely, if the price declines, the Portfolio will realize a capital gain. Any gain will be decreased, and any loss increased, by the transaction costs described above. The successful use of short selling may be adversely affected by imperfect correlation between movements in the price of the security sold short and the securities being hedged.
To the extent a Portfolio sells securities short, it will provide collateral to the broker-dealer. A Portfolio does not intend to enter into short sales (other than short sales "against the box") if immediately after such sales the aggregate of the value of all collateral exceeds 10% of the value of the Portfolio's net assets. This percentage may be varied by action of the Board of Trustees. A short sale is "against the box" to the extent the Portfolio contemporaneously owns, or has the right to obtain at no added cost, securities identical to those sold short.
As of December 31, 2023, the Portfolios did not hold any short sales of securities.
When-Issued and Delayed-Delivery Transactions – The Portfolios may engage in when-issued or delayed-delivery transactions. The Portfolios record when-issued securities on the trade date. Securities purchased on a when-issued or delayed-delivery basis are marked to market daily and begin earning interest on the settlement date. Losses may occur on these transactions due to changes in market conditions or the failure of counterparties to perform under the contract.
Real Estate Investment Trusts – Certain Portfolios may invest in real estate investment trusts ("REITs"). REITs are pooled investment vehicles that own, and typically operate, income-producing real estate. If a REIT meets certain requirements, including distributing to shareholders substantially all of its taxable income (other than net capital gains), then it is not taxed on the income distributed to shareholders. REITs are subject to management fees and other expenses, and so a Portfolio that invests in REITs will bear its proportionate share of the costs of the REITs' operations. Along with the risks common to different types of real estate-related securities, such as loss to casualty or condemnation, increases in property taxes and operating expenses, zoning law amendments, changes in interest rates, overbuilding and increased competition, variations in market value, and possible environmental liabilities, REITs involve additional risk factors. These include poor performance by the REIT's manager, changes to the tax laws, and failure by the REIT to qualify for tax free distribution of income or exemption under the 1940 Act. In addition, REITs are not diversified and are heavily dependent on cash flow.
Distributions from a Portfolio's investments in REITs may be characterized as ordinary income, a net capital gain or a return of capital. The Portfolios record distributions that represent a net capital gain as a realized gain and distributions that represent a return of capital as a reduction of the cost of investment. REITs report information on the source of their distributions annually in the following calendar year. As a result, a Portfolio may estimate the source of REIT distributions for accounting purposes and then makes adjustments when the actual source information is reported by the REIT. These estimates are based on the most recent REIT distribution information available.
Mortgage Dollar Roll Transactions – A mortgage dollar roll transaction involves a sale by a Portfolio of mortgage related securities that it holds with an agreement by the Portfolio to repurchase similar securities at an agreed upon price and date. The securities purchased will bear the same interest rate as those sold, but generally will be collateralized by pools of mortgages with different prepayment histories than those securities sold. The Portfolios account for mortgage dollar rolls as purchases and sales transactions.
Expenses – Expenses of the Trust that are directly identifiable to a specific Portfolio are charged to that Portfolio. Expenses, which are not readily identifiable to a specific Portfolio, are allocated in such a manner as deemed equitable, taking into consideration the nature and type of expense and the relative sizes of the Portfolios in the Trust.
Indemnification – The Trust indemnifies its officers and Trustees for certain liabilities that may arise from the performance of their duties to the Trust. Additionally, in the normal course of business, the Portfolios enter into contracts that contain a variety of representations and warranties and which provide general indemnities. Each Portfolio's maximum exposure under
79
Global Atlantic Portfolios
Notes to Financial Statements (Continued)
December 31, 2023
these arrangements is unknown, as this would involve future claims that may be made against the Portfolios that have not yet occurred. However, the Portfolios expect the risk of loss due to these warranties and indemnities to be remote.
3. INVESTMENT TRANSACTIONS
For the year ended December 31, 2023, cost of purchases and proceeds from sales of portfolio securities, other than short- term investments, were as follows:
| | | Purchases
(Excluding U.S.
Government
Securities) | | Purchases U.S.
Government
Securities | | Sales
(Excluding U.S.
Government
Securities) | | Sales U.S.
Government
Securities | |
Global Atlantic American Funds® Managed Risk
Portfolio | | $ | 19,074,999 | | | $ | - | | | $ | 43,843,000 | | | $ | - | | |
Global Atlantic Balanced Managed Risk Portfolio | | | 62,024,420 | | | | - | | | | 74,101,115 | | | | - | | |
Global Atlantic BlackRock Selects Managed Risk
Portfolio | | | 126,948,971 | | | | - | | | | 154,207,860 | | | | - | | |
Global Atlantic Franklin Dividend and Income
Managed Risk Portfolio | | | 10,121,347 | | | | 56,062,143 | | | | 35,476,040 | | | | 57,218,182 | | |
Global Atlantic Growth Managed Risk Portfolio | | | 158,716,000 | | | | - | | | | 206,863,673 | | | | - | | |
Global Atlantic Moderate Growth Managed Risk
Portfolio | | | 61,297,689 | | | | - | | | | 76,766,699 | | | | - | | |
Global Atlantic Select Advisor Managed Risk
Portfolio | | | 14,176,862 | | | | - | | | | 23,138,852 | | | | - | | |
Global Atlantic Wellington Research Managed
Risk Portfolio | | | 200,580,912 | | | | 171,647,423 | | | | 256,119,844 | | | | 174,082,391 | | |
4. AGREEMENTS AND TRANSACTIONS WITH RELATED PARTIES
The Adviser serves as the Portfolios' investment adviser. The Adviser has engaged the following sub-advisers for the Portfolios:
Portfolio | | Sub-Adviser | |
Global Atlantic American Funds® Managed Risk Portfolio | | Wilshire Advisors LLC
Milliman Financial Risk Management, LLC | |
Global Atlantic Balanced Managed Risk Portfolio | | BlackRock Investment Management, LLC
Milliman Financial Risk Management, LLC | |
Global Atlantic BlackRock Selects Managed Risk Portfolio | | BlackRock Investment Management, LLC
Milliman Financial Risk Management, LLC | |
Global Atlantic Franklin Dividend and Income Managed Risk Portfolio | | Franklin Advisers, Inc.
Milliman Financial Risk Management, LLC | |
Global Atlantic Growth Managed Risk Portfolio | | BlackRock Investment Management, LLC
Milliman Financial Risk Management, LLC | |
Global Atlantic Moderate Growth Managed Risk Portfolio | | BlackRock Investment Management, LLC
Milliman Financial Risk Management, LLC | |
Global Atlantic Select Advisor Managed Risk Portfolio | | Wilshire Advisors LLC
Milliman Financial Risk Management, LLC | |
Global Atlantic Wellington Research Managed Risk Portfolio | | Wellington Management Company LLP
Milliman Financial Risk Management, LLC | |
80
Global Atlantic Portfolios
Notes to Financial Statements (Continued)
December 31, 2023
The Bank of New York Mellon serves as the Administrator, Fund Accountant and Custodian for the Portfolios and BNY Mellon Investment Servicing (US) Inc. (together with The Bank of New York Mellon, "BNYM") serves as the Transfer Agent for the Portfolios.
Pursuant to an investment advisory agreement between the Trust, on behalf of the Portfolios and the Adviser (the "Advisory Agreement"), the Adviser, under the oversight of the Board, directs the daily investment operations of the Portfolios and supervises the performance of administrative and professional services provided by others. As compensation for its services and the related expenses borne by the Adviser, the Portfolios pay the Adviser an advisory fee, computed on average daily net assets and accrued daily and paid monthly.
The following chart details the annual advisory fee for each Portfolio for the year ended December 31, 2023.
Portfolio | | Advisory Fee* | |
Global Atlantic American Funds® Managed Risk Portfolio | | 0.900% on first $500 million | |
| | | 0.875% on next $500 million | |
| | | 0.850% over $1 billion | |
Global Atlantic Balanced Managed Risk Portfolio | | 0.550% on first $500 million | |
| | | 0.525% on next $500 million | |
| | | 0.500% over $1 billion | |
Global Atlantic BlackRock Selects Managed Risk Portfolio | | 0.550% on first $500 million | |
| | | 0.525% on next $500 million | |
| | | 0.500% over $1 billion | |
Global Atlantic Franklin Dividend and Income Managed Risk Portfolio | | 0.850% on first $500 million | |
| | | 0.825% on next $500 million | |
| | | 0.800% over $1 billion | |
Global Atlantic Growth Managed Risk Portfolio | | 0.550% on first $500 million | |
| | | 0.525% on next $500 million | |
| | | 0.500% over $1 billion | |
Global Atlantic Moderate Growth Managed Risk Portfolio | | 0.550% on first $500 million | |
| | | 0.525% on next $500 million | |
| | | 0.500% over $1 billion | |
Global Atlantic Select Advisor Managed Risk Portfolio | | 0.900% on first $500 million | |
| | | 0.875% on next $500 million | |
| | | 0.850% over $1 billion | |
Global Atlantic Wellington Research Managed Risk Portfolio | | 0.850% on first $500 million | |
| | | 0.825% on next $500 million | |
| | | 0.800% over $1 billion | |
* Calculated daily based on the average daily net assets.
During the year ended December 31, 2023, with respect to each Portfolio, the Adviser contractually agreed to waive its fees and to reimburse expenses, at least until the expiration dates listed below, to ensure that total annual portfolio operating expenses after fee waiver and/or reimbursement (exclusive of any front-end or contingent deferred loads, brokerage fees and commissions, acquired fund fees and expenses, borrowing costs (such as interest and dividend expense on securities sold short), taxes and extraordinary expenses, such as litigation) will not exceed the average daily net asset percentages attributable to the Portfolio's shares listed below ("Waiver Agreements"). The expense reimbursement is subject to possible recoupment from the Portfolio in future years on a rolling three year basis (within the three years after the fees have been waived or reimbursed) if such recoupment can be achieved within the lesser of the expense limits listed below and any expense limits applicable at the time of recoupment. The agreements may be terminated only by the Portfolio's Board of Trustees, on 60 days' written notice to the Adviser.
81
Global Atlantic Portfolios
Notes to Financial Statements (Continued)
December 31, 2023
Portfolio | | Operating Expense Limitation | | Expiration Date | |
Global Atlantic American Funds® Managed Risk Portfolio | | | 0.87 | % | | May 1, 2024 | |
Global Atlantic Balanced Managed Risk Portfolio | | | 0.92 | % | | May 1, 2024 | |
Global Atlantic BlackRock Selects Managed Risk Portfolio | | | 0.94 | % | | May 1, 2024 | |
Global Atlantic Franklin Dividend and Income Managed Risk Portfolio | | | 1.19 | % | | May 1, 2024 | |
Global Atlantic Growth Managed Risk Portfolio | | | 0.88 | % | | May 1, 2024 | |
Global Atlantic Moderate Growth Managed Risk Portfolio | | | 0.92 | % | | May 1, 2024 | |
Global Atlantic Select Advisor Managed Risk Portfolio | | | 0.64 | % | | May 1, 2024 | |
Global Atlantic Wellington Research Managed Risk Portfolio | | | 1.19 | % | | May 1, 2024 | |
In addition, the Adviser has agreed to waive 0.40% of its fees for Global Atlantic American Funds® Managed Risk Portfolio and Global Atlantic Select Advisor Managed Risk Portfolio for as long as each Portfolio relies primarily on investments in underlying funds to achieve its principal investment strategy. These waivers are not subject to recoupment.
The Adviser or its affiliates may receive compensation from managers of underlying funds in which the Global Atlantic Select Advisor Managed Risk Portfolio invests. This compensation may create a conflict of interest for the Adviser in the selection of underlying funds for investment by the Portfolio. However, the Adviser will voluntarily reduce the amount of its compensation under its Advisory Agreement with the Portfolio by the amount of the compensation received from managers of underlying funds. The minimum amount of this waiver, until at least May 1, 2024, for the Portfolio is 0.14% and is based on estimated amounts expected to be received during the current fiscal year. The actual amount of each waiver may be higher to the extent the payments exceed the Adviser's estimates, but it will not be lower. These waivers are not subject to recoupment by the Adviser. The waivers may be terminated only by the Portfolio's Board of Trustees, on 60 days' written notice to the Adviser.
For the year ended December 31, 2023, the Adviser waived, reimbursed, or recaptured fees as follows:
| | | Investment
Advisory Fee
Waiver | | Investment
Advisory Fee
Reimbursed | | Investment
Advisory Fee
Recaptured | | Total | |
Global Atlantic American Funds® Managed Risk Portfolio | | $ | 671,206 | | | $ | - | | | $ | - | | | $ | 671,206 | | |
Global Atlantic Balanced Managed Risk Portfolio | | | 385 | | | | - | | | | - | | | | 385 | | |
Global Atlantic BlackRock Selects Managed Risk Portfolio | | | - | | | | - | | | | - | | | | - | | |
Global Atlantic Franklin Dividend and Income Managed
Risk Portfolio | | | 82,060 | | | | - | | | | - | | | | 82,060 | | |
Global Atlantic Growth Managed Risk Portfolio | | | 116,741 | | | | - | | | | - | | | | 116,741 | | |
Global Atlantic Moderate Growth Managed Risk Portfolio | | | - | | | | - | | | | - | | | | - | | |
Global Atlantic Select Advisor Managed Risk Portfolio | | | 479,455 | | | | - | | | | - | | | | 479,455 | | |
Global Atlantic Wellington Research Managed Risk Portfolio | | | 142,076 | | | | - | | | | - | | | | 142,076 | | |
If the Adviser waives any fee or reimburses any expense pursuant to the Waiver Agreements, and the Portfolio's operating expenses are subsequently less than the expense limitation, the Adviser shall be entitled to reimbursement by the Portfolio for such waived fees or reimbursed expenses provided that such reimbursement does not cause the Portfolio's expenses to exceed the amount of the expense limitation. If Portfolio operating expenses subsequently exceed the expense limitation, the reimbursements shall be suspended.
The Adviser may recapture the following amounts by the following dates:
| | | December 31, 2024 | | December 31, 2025 | | December 31, 2026 | |
Global Atlantic American Funds® Managed Risk Portfolio | | $ | - | | | $ | - | | | $ | - | | |
Global Atlantic Balanced Managed Risk Portfolio | | | - | | | | - | | | | 385 | | |
Global Atlantic BlackRock Selects Managed Risk Portfolio | | | - | | | | - | | | | - | | |
Global Atlantic Franklin Dividend and Income Managed Risk Portfolio | | | 61,783 | | | | 66,940 | | | | 82,060 | | |
Global Atlantic Growth Managed Risk Portfolio | | | 73,227 | | | | 112,196 | | | | 116,741 | | |
Global Atlantic Moderate Growth Managed Risk Portfolio | | | - | | | | - | | | | - | | |
Global Atlantic Select Advisor Managed Risk Portfolio | | | 12,758 | | | | 27,211 | | | | 25,457 | | |
Global Atlantic Wellington Research Managed Risk Portfolio | | | 8,719 | | | | 135,879 | | | | 142,076 | | |
82
Global Atlantic Portfolios
Notes to Financial Statements (Continued)
December 31, 2023
The following amounts expired unrecouped as of the date listed below:
| | | December 31, 2023 | |
Global Atlantic American Funds® Managed Risk Portfolio | | $ | - | | |
Global Atlantic Balanced Managed Risk Portfolio | | | - | | |
Global Atlantic BlackRock Selects Managed Risk Portfolio | | | - | | |
Global Atlantic Franklin Dividend and Income Managed Risk Portfolio | | | 156,982 | | |
Global Atlantic Growth Managed Risk Portfolio | | | 118,163 | | |
Global Atlantic Moderate Growth Managed Risk Portfolio | | | - | | |
Global Atlantic Select Advisor Managed Risk Portfolio | | | 27,191 | | |
Global Atlantic Wellington Research Managed Risk Portfolio | | | 31,810 | | |
The Trust, on behalf of the Portfolios, has adopted a distribution and shareholder servicing plan (the "Plan") pursuant to Rule 12b-1 under the 1940 Act for Class II shares. The fee charged under the Plan is calculated at an annual rate of 0.25% of the average daily net assets attributable to each Portfolio's Class II shares and, for the year ended December 31, 2023, was paid to Global Atlantic Distributors, LLC ("GAD") to provide compensation for ongoing distribution-related activities or services and/or maintenance of the Portfolios' shareholder accounts, not otherwise required to be provided by the Adviser. GAD is an affiliate of the Adviser.
For the year ended December 31, 2023, the Portfolios expensed the following distribution fees:
| | | Fees Paid | |
Global Atlantic American Funds® Managed Risk Portfolio | | $ | 418,937 | | |
Global Atlantic Balanced Managed Risk Portfolio | | | 218,319 | | |
Global Atlantic BlackRock Selects Managed Risk Portfolio | | | 424,822 | | |
Global Atlantic Franklin Dividend and Income Managed Risk Portfolio | | | 515,277 | | |
Global Atlantic Growth Managed Risk Portfolio | | | 764,484 | | |
Global Atlantic Moderate Growth Managed Risk Portfolio | | | 251,949 | | |
Global Atlantic Select Advisor Managed Risk Portfolio | | | 190,512 | | |
Global Atlantic Wellington Research Managed Risk Portfolio | | | 856,971 | | |
For the year ended December 31, 2023, the Trustees received fees in the amounts as follows:
| | | Fees Received | |
Global Atlantic American Funds® Managed Risk Portfolio | | $ | 19,970 | | |
Global Atlantic Balanced Managed Risk Portfolio | | | 10,418 | | |
Global Atlantic BlackRock Selects Managed Risk Portfolio | | | 20,325 | | |
Global Atlantic Franklin Dividend and Income Managed Risk Portfolio | | | 24,764 | | |
Global Atlantic Growth Managed Risk Portfolio | | | 36,320 | | |
Global Atlantic Moderate Growth Managed Risk Portfolio | | | 12,066 | | |
Global Atlantic Select Advisor Managed Risk Portfolio | | | 9,061 | | |
Global Atlantic Wellington Research Managed Risk Portfolio | | | 40,906 | | |
Foreside Fund Officer Services, LLC ("Foreside", d/b/a ACA Group) provides compliance and financial control services for the Portfolios pursuant to a written agreement with the Trust, on behalf of the Portfolios, including providing the Treasurer to the Portfolios. The Portfolios pay Foreside an annual basis-point fee based on the Portfolio's daily net assets, subject to a fee minimum, and reimburses for certain expenses incurred on behalf of the Portfolios. Total fees paid to Foreside pursuant to these agreements are reflected as "Regulatory and Compliance" fees on the Statement of Operations.
5. CONTROL OWNERSHIP
The beneficial ownership, either directly or indirectly, of more than 25% of the voting securities of a Portfolio creates a presumption of the control of the Portfolio, under section 2(a)(9) of the 1940 Act. As of December 31, 2023, Forethought Life Insurance Company Separate Account A owned 100% of the voting securities of each Portfolio. The Trust has no knowledge as to whether all or any portion of the shares owned of record are also owned beneficially.
83
Global Atlantic Portfolios
Notes to Financial Statements (Continued)
December 31, 2023
Shareholder Concentration Risk – Forethought Life Insurance Company, certain accounts, or the Adviser's affiliates may from time to time own (beneficially or of record) or control a significant percentage of a Portfolio's shares. Redemptions by these entities of their holdings in a Portfolio may impact the Portfolio's liquidity and NAV. These redemptions may also force a Portfolio to sell securities.
6. AGGREGATE UNREALIZED APPRECIATION AND DEPRECIATION – TAX BASIS
As of December 31, 2023, the aggregate cost of investments for federal income tax purposes, the gross unrealized appreciation and depreciation and the aggregated net unrealized appreciation (depreciation) on investments were as follows:
| | | Tax
Cost | | Gross
Unrealized
Appreciation | | Gross
Unrealized
Depreciation | | Net Unrealized
Appreciation/
(Depreciation) | |
Global Atlantic American Funds® Managed Risk Portfolio | | $ | 156,206,942 | | | $ | 20,723,326 | | | $ | (11,827,436 | ) | | $ | 8,895,890 | | |
Global Atlantic Balanced Managed Risk Portfolio | | | 71,156,238 | | | | 17,217,983 | | | | (2,822,980 | ) | | | 14,395,003 | | |
Global Atlantic BlackRock Selects Managed Risk Portfolio | | | 146,793,686 | | | | 23,865,501 | | | | (3,854,877 | ) | | | 20,010,624 | | |
Global Atlantic Franklin Dividend and Income Managed
Risk Portfolio | | | 127,311,988 | | | | 82,071,254 | | | | (3,681,896 | ) | | | 78,389,358 | | |
Global Atlantic Growth Managed Risk Portfolio | | | 208,091,926 | | | | 100,277,082 | | | | (4,187,491 | ) | | | 96,089,591 | | |
Global Atlantic Moderate Growth Managed Risk Portfolio | | | 75,051,941 | | | | 26,304,330 | | | | (2,623,801 | ) | | | 23,680,529 | | |
Global Atlantic Select Advisor Managed Risk Portfolio | | | 65,528,074 | | | | 12,880,148 | | | | (2,356,733 | ) | | | 10,523,415 | | |
Global Atlantic Wellington Research Managed Risk Portfolio | | | 263,093,384 | | | | 84,285,918 | | | | (8,514,533 | ) | | | 75,771,385 | | |
7. DISTRIBUTIONS TO SHAREHOLDERS AND TAX COMPONENTS OF CAPITAL
The tax character of fund distributions paid for the years ended December 31, 2023 and 2022 were as follows:
For fiscal year ended
12/31/2023 | | Ordinary
Income | | Long-Term
Capital Gains | | Return of
Capital | | Total | |
Global Atlantic American Funds® Managed Risk Portfolio | | $ | 5,500,719 | | | $ | 17,502,209 | | | $ | - | | | $ | 23,002,928 | | |
Global Atlantic Balanced Managed Risk Portfolio | | | 1,253,987 | | | | - | | | | - | | | | 1,253,987 | | |
Global Atlantic BlackRock Selects Managed Risk Portfolio | | | 1,444,840 | | | | - | | | | - | | | | 1,444,840 | | |
Global Atlantic Franklin Dividend and Income Managed
Risk Portfolio | | | 2,371,539 | | | | 10,535,004 | | | | - | | | | 12,906,543 | | |
Global Atlantic Growth Managed Risk Portfolio | | | 3,553,450 | | | | 13,595,358 | | | | - | | | | 17,148,808 | | |
Global Atlantic Moderate Growth Managed Risk Portfolio | | | 1,298,429 | | | | 2,019,905 | | | | - | | | | 3,318,334 | | |
Global Atlantic Select Advisor Managed Risk Portfolio | | | 1,543,184 | | | | 5,386,321 | | | | - | | | | 6,929,505 | | |
Global Atlantic Wellington Research Managed Risk
Portfolio | | | 2,239,646 | | | | - | | | | - | | | | 2,239,646 | | |
For fiscal year ended
12/31/2022 | | Ordinary
Income | | Long-Term
Capital Gains | | Return of
Capital | | Total | |
Global Atlantic American Funds® Managed Risk Portfolio | | $ | 3,636,634 | | | $ | 8,461,615 | | | $ | - | | | $ | 12,098,249 | | |
Global Atlantic Balanced Managed Risk Portfolio | | | 2,726,133 | | | | 5,920,290 | | | | - | | | | 8,646,423 | | |
Global Atlantic BlackRock Selects Managed Risk Portfolio | | | 11,495,510 | | | | - | | | | - | | | | 11,495,510 | | |
Global Atlantic Franklin Dividend and Income Managed
Risk Portfolio | | | 1,665,082 | | | | 3,938,420 | | | | - | | | | 5,603,502 | | |
Global Atlantic Growth Managed Risk Portfolio | | | 3,041,455 | | | | 8,019,285 | | | | - | | | | 11,060,740 | | |
Global Atlantic Moderate Growth Managed Risk Portfolio | | | 2,836,971 | | | | 6,969,168 | | | | - | | | | 9,806,139 | | |
Global Atlantic Select Advisor Managed Risk Portfolio | | | 1,369,351 | | | | 6,678,010 | | | | - | | | | 8,047,361 | | |
Global Atlantic Wellington Research Managed Risk
Portfolio | | | 13,157,592 | | | | 32,572,548 | | | | - | | | | 45,730,140 | | |
84
Global Atlantic Portfolios
Notes to Financial Statements (Continued)
December 31, 2023
As of December 31, 2023, the components of accumulated earnings/(deficit) on a tax basis were as follows:
| | | Undistributed
Ordinary
Income | | Undistributed
Long-Term
Capital Gains | | Post-October
Loss and Late
Year Loss | | Capital Loss
Carryforward | | Net
Unrealized
Appreciation/
(Depreciation) | | Total
Accumulated
Earnings/
(Defecits) | |
Global Atlantic American Funds® Managed
Risk Portfolio | | $ | 2,689,464 | | | $ | - | | | $ | - | | | $ | (1,913,403 | ) | | $ | 8,895,890 | | | $ | 9,671,951 | | |
Global Atlantic Balanced Managed Risk Portfolio | | | 1,595,808 | | | | - | | | | - | | | | (6,181,163 | ) | | | 14,395,003 | | | | 9,809,648 | | |
Global Atlantic BlackRock Selects Managed
Risk Portfolio | | | 2,789,956 | | | | - | | | | - | | | | (8,322,655 | ) | | | 20,010,624 | | | | 14,477,925 | | |
Global Atlantic Franklin Dividend and Income
Managed Risk Portfolio | | | 3,042,428 | | | | 9,266,295 | | | | - | | | | - | | | | 78,389,358 | | | | 90,698,081 | | |
Global Atlantic Growth Managed Risk Portfolio | | | 3,961,815 | | | | 5,381,016 | | | | - | | | | - | | | | 96,089,591 | | | | 105,432,422 | | |
Global Atlantic Moderate Growth Managed
Risk Portfolio | | | 1,558,712 | | | | 824,174 | | | | - | | | | - | | | | 23,680,529 | | | | 26,063,415 | | |
Global Atlantic Select Advisor Managed Risk
Portfolio | | | 1,170,788 | | | | - | | | | - | | | | (355,032 | ) | | | 10,523,415 | | | | 11,339,171 | | |
Global Atlantic Wellington Research Managed
Risk Portfolio | | | 3,815,408 | | | | 9,276,613 | | | | - | | | | - | | | | 75,771,385 | | | | 88,863,406 | | |
The difference between book basis and tax basis unrealized appreciation (depreciation), undistributed ordinary income (loss) and accumulated net realized gain (loss) from investments is primarily attributable to the tax deferral of losses on wash sales, the mark-to-market on passive foreign investment companies, and open 1256 options and futures contracts, forward foreign currency contracts and swaps. The unrealized appreciation (depreciation) in the table above includes unrealized foreign currency gains (losses) of $1,133 for Global Atlantic Franklin Dividend and Income Managed Risk Portfolio.
At December 31, 2023, the Portfolios had capital loss carry forwards for federal income tax purposes available to offset future capital gains as follows:
| | Non-Expiring
Short-Term | | Non-Expiring
Long-Term | | Total | |
Global Atlantic American Funds® Managed Risk Portfolio | | $ | 1,913,403 | | | $ | - | | | $ | 1,913,403 | | |
Global Atlantic Balanced Managed Risk Portfolio | | | 3,214,924 | | | | 2,966,239 | | | | 6,181,163 | | |
Global Atlantic BlackRock Selects Managed Risk Portfolio | | | 7,633,418 | | | | 689,237 | | | | 8,322,655 | | |
Global Atlantic Franklin Dividend and Income Managed Risk Portfolio | | | - | | | | - | | | | - | | |
Global Atlantic Growth Managed Risk Portfolio | | | - | | | | - | | | | - | | |
Global Atlantic Moderate Growth Managed Risk Portfolio | | | - | | | | - | | | | - | | |
Global Atlantic Select Advisor Managed Risk Portfolio | | | 355,032 | | | | - | | | | 355,032 | | |
Global Atlantic Wellington Research Managed Risk Portfolio | | | - | | | | - | | | | - | | |
During the year ended December 31, 2023, Global Atlantic Wellington Research Managed Risk Portfolio utilized $2,541,709 in capital loss carryforwards.
There were no permanent book and tax differences that resulted in reclassifications for the Portfolios for the fiscal year ended December 31, 2023.
8. NEW ACCOUNTING PRONOUNCEMENTS
In March 2020, the FASB issued Accounting Standards Update No. 2020-04 ("ASU 2020-04"), "Reference Rate Reform (Topic 840): Facilitation of the Effects of Reference Rate Reform on Financial Reporting". ASU 2020-04 provides entities with optional guidance to ease the potential accounting burden associated with transitioning away from reference rates (e.g., LIBOR) that are expected to be discontinued. ASU 2020-04 allows, among other things, certain contract modifications to be accounted as a continuation of the existing contract. This ASU was effective upon the issuance and its optional relief can be applied through December 31, 2024. Management has reviewed the requirements and believes the adoption of this ASU will not have a material impact on the financial statements.
85
Global Atlantic Portfolios
Notes to Financial Statements (Continued)
December 31, 2023
9. OTHER RISKS
The Portfolios' risks include, but are not limited to, the following:
Credit Risk – There is a risk that security issuers will not make interest and/or principal payments on their securities. In addition, the credit quality of securities may be lowered if an issuer's financial condition changes. Lower credit quality will lead to greater volatility in the price of a security and in shares of a Portfolio. Lower credit quality also will affect liquidity and make it difficult to sell the security. This means that, compared to issuers of higher rated securities, issuers of lower rated securities are less likely to have the capacity to pay interest and repay principal when due in the event of adverse business, financial or economic conditions and/or may be in default or not current in the payment of interest or principal. Default, or the perception (whether by market participants, rating agencies, pricing services or otherwise) that an issuer is likely to default, tends to reduce the value and liquidity of fixed income securities, thereby reducing the value of your investment in Portfolio shares. In addition, default may cause a Portfolio to directly or indirectly incur expenses in seeking recovery of principal or interest.
A Portfolio could lose money on a debt security if an issuer or borrower is unable or fails to meet its obligations, including failing to make interest payments and/or to repay principal when due. Changes in an issuer's financial strength, the market's perception of the issuer's financial strength or in a security's credit rating, which reflects a third party's assessment of the credit risk presented by a particular issuer, may affect debt securities' value. A Portfolio may incur substantial losses on debt securities that are inaccurately perceived to present a different amount of credit risk by the market, the Sub-Adviser and/or Underlying Fund manager or the rating agencies than such securities actually do. These risks are heightened in market environments where interest rates are rising.
Derivatives Risk – The use of derivatives is a highly specialized activity that involves investment techniques and risks different from those associated with investments in more traditional securities and instruments. The use of derivatives may increase costs, reduce a Portfolio's returns and/or increase volatility. Volatility is defined as the characteristic of a security, an index or a market to fluctuate significantly in price within a short time period. Many types of derivatives are also subject to counterparty risk, which is the risk that the other party in the transaction will not fulfill its contractual obligation. A risk of a Portfolio's use of derivatives is that the fluctuations in their values may not correlate perfectly with, and may be more sensitive to market events than, the overall securities markets. The possible lack of a liquid secondary market for derivatives and the resulting inability to sell or otherwise close-out a derivatives position at an advantageous time or price could expose a Portfolio to losses and could make derivatives more difficult to value accurately. Derivatives typically give rise to a form of leverage and may expose a Portfolio to greater risk and increase its costs. The Dodd-Frank Wall Street Reform and Consumer Protection Act (the "Dodd-Frank Act") and related regulatory developments require the clearing and exchange-trading of many standardized over-the-counter ("OTC") derivative instruments deemed to be "swaps." The Commodity Futures Trading Commission ("CFTC") has implemented mandatory exchange-trading and clearing requirements under the Dodd-Frank Act and the CFTC continues to approve contracts for central clearing. Uncleared swaps are subject to margin requirements that are being implemented on a phase-in basis.
Exchange-Traded Funds Risk – The Portfolios may invest in ETFs. Investments in underlying ETFs typically present the same risks as investments in conventional Underlying Funds. In addition, disruptions to the creations and redemptions process through which market makers directly purchase and sell ETF shares, the existence of extreme market volatility or potential lack of an active trading market, or changes in the liquidity of the market for an ETF's underlying portfolio holdings, may result in the ETF's shares trading at significantly above (at a premium to) or below (at a discount to) net asset value, which may result in a Portfolio paying significantly more or receiving significantly less for ETF shares than the value of the relevant ETF's underlying holdings. An ETF's shares could also trade at a premium or discount to net asset value when an ETF's underlying securities trade on a foreign exchange that is closed when the securities exchange on which the ETF trades is open. The current price of the ETF's underlying securities and the last quoted price for the underlying security are likely to deviate in such circumstances. There can be no assurance that an active trading market for an ETF's shares will develop or be maintained. Trading may be halted, for example, due to market conditions. Because the value of ETF shares depends on the demand in the market, a Portfolio's holdings may not be able to be liquidated at the most optimal time, adversely affecting performance.
86
Global Atlantic Portfolios
Notes to Financial Statements (Continued)
December 31, 2023
There can be no assurance that an ETF's investment objectives will be achieved. Each ETF is subject to specific risks, depending on the nature of the ETF. These risks could include liquidity risk, sector risk, foreign and emerging market risk, as well as risks associated with real estate investments and natural resources. ETFs in which a Portfolio invests will not be able to replicate exactly the performance of the indices they track, if any, because the total return generated by the securities will be reduced by transaction costs incurred in adjusting the actual balance of the securities. In addition, ETFs in which a Portfolio invests will incur expenses not incurred by their applicable indices. Certain securities comprising the indices tracked by the ETFs may, from time to time, temporarily be unavailable, which may further impede the ETFs' ability to track their applicable indices. An investment in an ETF presents the risk that the ETF may no longer meet the listing requirements of any applicable exchanges on which the ETF is listed.
Market Risk – The market prices of securities may go up or down, sometimes rapidly or unpredictably, due to general market conditions, such as real or perceived adverse economic or political conditions, inflation, changes in interest rates or currency rates, limited dealer capacity, lack of liquidity in the markets or adverse investor sentiment. Each Portfolio has exposure to instruments that may be more volatile and carry more risk than some other forms of investment. Adverse market conditions may be prolonged and may not have the same impact on all types of securities. Market prices of securities also may go down due to events or conditions that affect particular sectors, industries or issuers. When market prices fall, the value of your investment will go down. Local, regional or global events such as war, military conflict, acts of terrorism, the spread of infectious illness or other public health issues, natural disasters, recessions, inflation, rapid interest rate changes, supply chain disruptions, sanctions, increased government spending, social unrest or other events could also have a significant impact on the Portfolio and its investments. The market prices of securities may also be negatively impacted by trading activity and investor interest, including interest driven by factors unrelated to market conditions or financial performance. In these circumstances, the value of the Portfolio's investments, particularly any short positions or exposures, may fluctuate dramatically.
A Portfolio may experience a substantial or complete loss on any individual security.
Policy and legislative changes in the U.S. and abroad affect many aspects of financial regulation and may, in some cases, contribute to decreased liquidity and increased volatility in the financial markets. Economies and financial markets around the world are becoming increasingly interconnected. As a result, whether or not a Portfolio has exposure to securities of issuers located in or with significant exposure to countries experiencing economic and financial difficulties, the value and liquidity of the Portfolio's investments may be negatively affected.
In addition, market prices of securities in broad market segments may be adversely affected by a prominent issuer having experienced losses or by the lack of earnings or such an issuer's failure to meet the market's expectations with respect to new products or services, or even by factors wholly unrelated to the value or condition of the issuer, such as changes in interest rates. For example, adverse developments in the banking or financial services sector could impact companies operating in various sectors or industries and adversely impact Portfolio developments. An increase in interest rates or other adverse conditions (e.g., inflation/deflation, increased selling of fixed income investments across other pooled investment vehicles or accounts, changes in investor perception or changes in government intervention in the markets) may lead to increased redemptions and increased portfolio turnover, which could reduce liquidity for certain Portfolio investments, adversely affect values of portfolio holdings and increase a Portfolio's costs. If dealer capacity in fixed income markets is insufficient for market conditions, this has the potential to further inhibit liquidity and increase volatility in the fixed income markets.
10. OTHER RECENT DEVELOPMENTS
As a result of benchmark reforms, publication of most LIBOR settings has ceased. Some LIBOR settings continue to be published but only on a temporary, synthetic and non-representative basis and are expected to cease being published in September 2024. The unavailability or replacement of LIBOR presents risks to applicable Portfolios, including the risk that any pricing adjustments to a Portfolio's investments resulting from a substitute reference rate (e.g., the Secured Overnight Financing Rate ("SOFR"), which is a measure of the cost of borrowing cash overnight, collateralized by the U.S. Treasury securities and is intended to replace the U.S. dollar) may adversely affect the Portfolio's performance and/or NAV. The impact of a substitute reference rate, if any, will vary on an investment-by-investment basis. The Adviser or Sub-Adviser may have discretion to determine a substitute reference rate, including any price or other adjustments to account for differences
87
Global Atlantic Portfolios
Notes to Financial Statements (Continued)
December 31, 2023
between the substitute reference rate and the previous rate. The substitute reference rate and any adjustments selected could negatively impact a Portfolio's investment performance or financial condition, including in ways unforeseen by the Adviser or Sub-Adviser.
11. SUBSEQUENT EVENTS
The Portfolios evaluated subsequent events from December 31, 2023 through the date these financial statements were issued. There were no significant events that would have a material impact on the Portfolios' financial statements.
88
Report of Independent Registered Public Accounting Firm
To the Shareholders and Board of Trustees of
Forethought Variable Insurance Trust
Opinion on the Financial Statements
We have audited the accompanying statements of assets and liabilities, including the portfolios of investments, of Global Atlantic American Funds® Managed Risk Portfolio, Global Atlantic Balanced Managed Risk Portfolio, Global Atlantic BlackRock Selects Managed Risk Portfolio, Global Atlantic Franklin Dividend and Income Managed Risk Portfolio, Global Atlantic Growth Managed Risk Portfolio, Global Atlantic Moderate Growth Managed Risk Portfolio, Global Atlantic Select Advisor Managed Risk Portfolio, and Global Atlantic Wellington Research Managed Risk Portfolio (the "Portfolios"), each a series of Forethought Variable Insurance Trust, as of December 31, 2023, the related statements of operations and changes in net assets, the related notes, and the financial highlights for the year then ended (collectively referred to as the "financial statements"). In our opinion, the financial statements present fairly, in all material respects, the financial position of each of the Portfolios as of December 31, 2023, the results of their operations, the changes in net assets, and the financial highlights for the year then ended, in conformity with accounting principles generally accepted in the United States of America.
The Portfolios' financial statements and financial highlights for the years ended December 31, 2022, and prior, were audited by other auditors whose report dated February 23, 2023, expressed an unqualified opinion on those financial statements and financial highlights.
Basis for Opinion
These financial statements are the responsibility of the Portfolios' management. Our responsibility is to express an opinion on the Portfolios' financial statements based on our audit. We are a public accounting firm registered with the Public Company Accounting Oversight Board (United States) ("PCAOB") and are required to be independent with respect to the Portfolios in accordance with the U.S. federal securities laws and the applicable rules and regulations of the Securities and Exchange Commission and the PCAOB.
We conducted our audit in accordance with the standards of the PCAOB. Those standards require that we plan and perform the audit to obtain reasonable assurance about whether the financial statements are free of material misstatement whether due to error or fraud.
Our audit included performing procedures to assess the risks of material misstatement of the financial statements, whether due to error or fraud, and performing procedures that respond to those risks. Such procedures included examining, on a test basis, evidence regarding the amounts and disclosures in the financial statements. Our procedures included confirmation of securities owned as of December 31, 2023, by correspondence with the custodian and brokers; when replies were not received from brokers, we performed other auditing procedures. Our audit also included evaluating the accounting principles used and significant estimates made by management, as well as evaluating the overall presentation of the financial statements. We believe that our audit provides a reasonable basis for our opinion.
We have served as the Portfolios' auditor since 2023.

COHEN & COMPANY, LTD.
Milwaukee, Wisconsin
February 27, 2024
89
Global Atlantic Portfolios
Expense Examples
December 31, 2023 (Unaudited)
As a shareholder of the Portfolios, you incur ongoing costs, including management fees; distribution and/or service (12b-1) fees; and other Portfolio expenses. This example is intended to help you understand your ongoing costs (in dollars) of investing in each Portfolio and to compare these costs with the ongoing costs of investing in other mutual funds.
The example is based on an investment of $1,000 invested at the beginning of the period and held for the entire period from July 1, 2023 through December 31, 2023.
Actual Expenses
The "Actual" expenses set of columns in the table below provides information about actual account values and actual expenses. You may use the information below together with the amount you invested, to estimate the expenses that you paid over the period. Simply divide your account value by $1,000 (for example, an $8,600 account value divided by $1,000 = 8.6), then multiply the result by the number in the table under the heading entitled "Expenses Paid During Period" to estimate the expenses you paid on your account during this period.
Hypothetical Example for Comparison Purposes
The "Hypothetical" expenses set of columns in the table below provides information about hypothetical account values and hypothetical expenses based on each Portfolio's actual expense ratio and an assumed rate of return of 5% per year before expenses, which is not the Portfolio's actual return. The hypothetical account values and expenses may not be used to estimate the actual ending account balances or expenses you paid for the period. You may use this information to compare this 5% hypothetical example for a specific Portfolio with the 5% hypothetical examples that appear in the shareholder reports of other funds.
Please note that the expenses shown in the table are meant to highlight your ongoing costs only and do not reflect any transactional costs, such as sales charges (loads), or redemption fees or other expenses charged by your insurance contract or separate account. Therefore, the Hypothetical columns of the table are useful in comparing ongoing costs only, and will not help you determine the relative total costs of owning different funds. In addition, if these transactional costs were included, your costs would have been higher.
| | | | | | | | | Actual | | Hypothetical
(5% return before
expenses) | |
| | | Class | | Portfolio's
Annualized
Expense
Ratio | | Beginning
Account Value
7-1-23 | | Ending
Account
Value
12-31-23 | | Expenses
Paid
During
Period* | | Ending
Account
Value
12-31-23 | | Expenses
Paid
During
Period* | |
Global Atlantic
American Funds®
Managed Risk Portfolio | | | II | | | | 0.86 | % | | $ | 1,000 | | | $ | 1,057.60 | | | $ | 4.46 | | | $ | 1,020.87 | | | $ | 4.38 | | |
Global Atlantic Balanced
Managed Risk Portfolio | | | II | | | | 0.92 | % | | $ | 1,000 | | | $ | 1,039.90 | | | $ | 4.73 | | | $ | 1,020.57 | | | $ | 4.69 | | |
Global Atlantic BlackRock
Selects Managed Risk Portfolio | | | II | | | | 0.91 | % | | $ | 1,000 | | | $ | 1,042.00 | | | $ | 4.68 | | | $ | 1,020.62 | | | $ | 4.63 | | |
Global Atlantic Franklin
Dividend and Income
Managed Risk Portfolio | | | II | | | | 1.19 | % | | $ | 1,000 | | | $ | 1,026.70 | | | $ | 6.08 | | | $ | 1,019.21 | | | $ | 6.06 | | |
Global Atlantic Growth
Managed Risk Portfolio | | | II | | | | 0.88 | % | | $ | 1,000 | | | $ | 1,050.40 | | | $ | 4.55 | | | $ | 1,020.77 | | | $ | 4.48 | | |
Global Atlantic Moderate
Growth Managed
Risk Portfolio | | | II | | | | 0.92 | % | | $ | 1,000 | | | $ | 1,046.50 | | | $ | 4.75 | | | $ | 1,020.57 | | | $ | 4.69 | | |
* Expenses are equal to the Portfolio's annualized expense ratio, multiplied by the number of days in the period (184) divided by the number of days in the fiscal year (365).
90
Global Atlantic Portfolios
Expense Examples (Continued)
December 31, 2023 (Unaudited)
| | | | | | | | | Actual | | Hypothetical
(5% return before
expenses) | |
| | | Class | | Portfolio's
Annualized
Expense
Ratio | | Beginning
Account Value
7-1-23 | | Ending
Account
Value
12-31-23 | | Expenses
Paid
During
Period* | | Ending
Account
Value
12-31-23 | | Expenses
Paid
During
Period* | |
Global Atlantic Select
Advisor Managed
Risk Portfolio | | | II | | | | 0.64 | % | | $ | 1,000 | | | $ | 1,053.10 | | | $ | 3.31 | | | $ | 1,021.98 | | | $ | 3.26 | | |
Global Atlantic Wellington
Research Managed
Risk Portfolio | | | II | | | | 1.19 | % | | $ | 1,000 | | | $ | 1,059.00 | | | $ | 6.18 | | | $ | 1,019.21 | | | $ | 6.06 | | |
* Expenses are equal to the Portfolio's annualized expense ratio, multiplied by the number of days in the period (184) divided by the number of days in the fiscal year (365).
91
Global Atlantic Portfolios
Supplemental Information
December 31, 2023 (Unaudited)
Approval of Renewal of Investment Advisory Agreement and Sub-Advisory Agreements for Global Atlantic American Funds® Managed Risk Portfolio, Global Atlantic Balanced Managed Risk Portfolio, Global Atlantic BlackRock Selects Managed Risk Portfolio, Global Atlantic Franklin Dividend and Income Managed Risk Portfolio, Global Atlantic Growth Managed Risk Portfolio, Global Atlantic Moderate Growth Managed Risk Portfolio, Global Atlantic Select Advisor Managed Risk Portfolio and Global Atlantic Wellington Research Managed Risk Portfolio.
At an in-person meeting held on November 2, 2023, the Board of Trustees (the "Trustees" or the "Board") of Forethought Variable Insurance Trust (the "Trust"), including a majority of the Trustees who are not "interested persons" (the "Independent Trustees"), as that term is defined in the Investment Company Act of 1940, as amended (the "1940 Act"), considered the renewal of: (i) the existing investment advisory agreement between Global Atlantic Investment Advisors, LLC (the "Adviser") and the Trust, on behalf of each of Global Atlantic American Funds® Managed Risk Portfolio ("GA American"), Global Atlantic Balanced Managed Risk Portfolio ("GA Balanced"), Global Atlantic BlackRock Selects Managed Risk Portfolio ("GA BlackRock Selects"), Global Atlantic Franklin Dividend and Income Managed Risk Portfolio ("GA Franklin"), Global Atlantic Growth Managed Risk Portfolio ("GA Growth"), Global Atlantic Moderate Growth Managed Risk Portfolio ("GA Moderate Growth"), Global Atlantic Select Advisor Managed Risk Portfolio ("GA Select Advisor") and Global Atlantic Wellington Research Managed Risk Portfolio ("GA Wellington") (each a "Portfolio" and collectively the "Portfolios") (the "Advisory Agreement"); (ii) the existing sub-advisory agreement between the Adviser, the Trust, on behalf of GA Balanced, GA BlackRock Selects, GA Growth and GA Moderate Growth, and BlackRock Investment Management, LLC ("BIM"); (iii) the existing sub-advisory agreement between the Adviser, the Trust, on behalf of GA Franklin, and Franklin Advisers, Inc. ("Franklin"); (iv) the existing sub-advisory agreement between the Adviser, the Trust, on behalf of GA American, GA Balanced, GA BlackRock Selects, GA Franklin, GA Growth, GA Moderate Growth, GA Select Advisor and GA Wellington, and Milliman Financial Risk Management LLC ("Milliman"); (v) the existing sub-advisory agreement between the Adviser, the Trust, on behalf of GA Wellington, and Wellington Management Company LLP ("Wellington"); and (vi) the existing sub-advisory agreement between the Adviser, the Trust, on behalf of GA American and GA Select Advisor, and Wilshire Advisors LLC ("Wilshire" and together with BIM, Franklin, Milliman and Wellington the "Sub-Advisers") (collectively the sub-advisory agreements listed in items (ii) through (vi) above, the "Sub-Advisory Agreements").
To discuss and review the materials relating to the proposed renewal of the Advisory Agreement and Sub-Advisory Agreements (collectively, the "Agreements") in advance of the November 2, 2023 meeting, the Independent Trustees met via videoconference on October 23, 2023 with independent counsel to the Independent Trustees ("Independent Counsel") and with representatives of the Adviser in attendance and counsel to the Trust ("Trust Counsel").
Prior to the meetings, the Trustees requested, received and reviewed written responses from the Adviser and the Sub-Advisers to questions posed to the Adviser and the Sub-Advisers by counsel, on behalf of the Trustees. Following the meeting on October 23, 2023, the Independent Trustees requested additional information on certain items and the Adviser provided such information prior to the November 2, 2023 meeting. The Trustees also received a memorandum from Independent Counsel describing the legal standards for their consideration of the renewal of the Agreements. During the meetings, the Board and the Adviser discussed information relating to the Board's consideration of the Gartenberg factors with respect to each Portfolio. The Trustees also reviewed comparative information relating to advisory fees and total expenses and received presentations concerning the services provided under the Agreements from personnel of the Adviser at the meetings. Prior to voting on the renewal of the Agreements at the November 2, 2023 meeting, the Independent Trustees met in executive session with Independent Counsel and Trust Counsel present.
The Trustees relied upon the advice of counsel and their own business judgment in determining the material factors to be considered in evaluating the Agreements and the weight to be given to each such factor. The conclusions reached by the Trustees were based on a comprehensive evaluation of all of the information provided and were not the result of any one factor. Moreover, each Trustee may have afforded different weight to the various factors in reaching his or her conclusions with respect to the Agreements.
Nature, Extent, and Quality of Services. The Trustees noted that they were generally satisfied with the nature, extent and quality of the services provided by the Adviser and Sub-Advisers.
Performance. The Trustees requested and reviewed information regarding the investment performance of the Portfolios over 1-year, 3-year and since inception periods as compared to their respective benchmark indices and peer groups. The Trustees noted that they were generally satisfied with the Adviser's and Sub-Advisers' investment performance.
92
Global Atlantic Portfolios
Supplemental Information (Continued)
December 31, 2023 (Unaudited)
Fees and Expenses. The Trustees reviewed the Portfolios' fees and expenses, including the fees paid to the Adviser and Sub-Advisers. The Trustees also reviewed the advisory fees and total expenses of each Portfolio as compared to the Portfolio's peer group and Morningstar category. The Trustees concluded that the advisory fee charged to each Portfolio and the sub-advisory fee paid by the Adviser to each Sub-Adviser, as applicable, were not unreasonable in light of the services provided to each respective Portfolio.
Profitability. The Trustees noted that, based on information received from the Adviser regarding a per Portfolio analysis of the profitability of each Portfolio to the Adviser, they: (i) concluded that the profitability levels for the Adviser were not excessive; and (ii) considered that the sub-advisory fees were negotiated by the Adviser at arm's length. The Trustees also noted that they would continue to monitor the Adviser's profitability in the future.
Economies of Scale. The Trustees concluded that they were satisfied with the extent to which economies of scale, if any, would be shared for the benefit of each Portfolio's shareholders. The Trustees also noted that they would continue to monitor each Portfolio's growth and consider any additional opportunities to realize benefits from economies of scale for shareholders in the future.
Other Benefits. The Trustees noted that they had considered other benefits to the Adviser or Sub-Advisers and their respective affiliates from their relationships with the applicable Portfolios and that they would continue to consider these benefits in connection with future annual renewals.
Conclusion. Having requested and received such information from the Adviser and Sub-Advisers as the Trustees believed to be reasonably necessary to evaluate the terms of the Agreements, and as assisted by the advice of counsel, the Trustees, including all of the Independent Trustees voting separately, unanimously concluded that renewing the Advisory Agreement and Sub-Advisory Agreements was in the best interests of each Portfolio and its shareholders. The Trustees noted that, in considering the Agreements, they did not identify any one factor as all important and each Trustee may have afforded different weight to the various factors.
Change in Independent Registered Public Accounting Firm
On March 24, 2023, based on the recommendation and approval of the Audit Committee of the Board of Trustees of Forethought Variable Insurance Trust (the "Trust"), the Board of Trustees approved the appointment of Cohen & Company, Ltd. ("Cohen") as the Portfolios' independent registered public accounting firm for the fiscal year ending December 31, 2023. RSM US LLP ("RSM"), which previously served as the independent registered public accounting firm for the Portfolios, declined to stand for reacceptance of the role for the 2023 audit due to an anticipated independence issue and not based upon any issues related to the 2022 audit. RSM's reports on the Portfolios' financial statements for the fiscal years ended December 31, 2021 and December 31, 2022 contained no adverse opinion or disclaimer of opinion nor were they qualified or modified as to uncertainty, audit scope or accounting principle.
During the fiscal years ended December 31, 2021 and December 31, 2022 and during the subsequent interim period through March 24, 2023: (i) there were no disagreements with RSM on any matter of accounting principles or practices, financial statement disclosure or auditing scope or procedure, which disagreements, if not resolved to the satisfaction of RSM, would have caused RSM to make reference to the subject matter of the disagreements in connection with its reports on the Portfolios' financial statements for such periods; and (ii) there were no "reportable events" of the kind described in Item 304(a)(1)(v) of Regulation S-K under the Securities Exchange Act of 1934, as amended.
During the Portfolios' fiscal years ended December 31, 2021 and December 31, 2022, and the subsequent interim period through March 24, 2023, neither the Trust, nor anyone on its behalf, consulted with Cohen on items which: (i) concerned the application of accounting principles to a specified transaction, either completed or proposed, or the type of audit opinion that might be rendered on the Portfolios' financial statements; or (ii) concerned the subject of a disagreement (as described in paragraph (a)(1)(iv) of Item 304 of Regulation S-K) or reportable events (as described in paragraph (a)(1)(v) of said Item 304).
93
Global Atlantic Portfolios
Supplemental Information (Continued)
December 31, 2023 (Unaudited)
Trustees and Officers
The Trustees and officers of the Trust, together with information as to their principal business occupations during the past five years and other information, are shown below. Unless otherwise noted, the address of each Trustee and Officer is c/o Global Atlantic Investment Advisors, LLC, 10 West Market Street, Suite 2300, Indianapolis, Indiana 46204.
Independent Trustees
Name and Year of Birth | | Position/ Term of Office1 | | Principal Occupation During the Past Five Years | | Number of Portfolios in Fund Complex Overseen by Trustee | | Other Directorships held by Trustee During the Past Five Years | |
Mark Garbin
(1951) | | Trustee since 2013 | | Mr. Garbin serves as Managing Principal of Coherent Capital Management LLC (since 2007). | | | 16 | | | Mr. Garbin serves as Director of OHA CLO Enhanced Equity II Genpar LLP (since 2021), OFI Carlyle Tactical Private Credit Fund (since 2018), iDirect Private Markets Fund (Formerly Altegris KKR Commitments Fund) (since 2014), Two Roads Shared Trust (since 2012), Northern Lights Fund Trust (since 2013), and Northern Lights Variable Trust (since 2013). | |
Mitchell E. Appel
(1970) | | Trustee since 2013 | | Mr. Appel serves as President of Value Line Funds (since 2008), as Chief Financial Officer (since 2008) and President (since 2009) of EULAV Securities LLC, and as Chief Executive Officer, President (since 2009) and Treasurer (since 2011) of EULAV Asset Management. | | | 16 | | | Mr. Appel serves as Director of Value Line Funds (since 2010) and EULAV Asset Management (since 2010). | |
Joseph E. Breslin
(1953) | | Trustee since 2013 | | Mr. Breslin serves as Senior Counsel of White Oak Global Advisors, LLC (since 2016) and has provided consultant services to investment managers (since 2009). Previously, Mr. Breslin served as Counsel of Common Fund (2014–2016). | | | 16 | | | Mr. Breslin serves as Director of Kinetics Mutual Funds, Inc. (since 2000), Kinetics Portfolios Trust (since 2000) and Northern Lights Fund Trust IV (since 2015). | |
94
Global Atlantic Portfolios
Supplemental Information (Continued)
December 31, 2023 (Unaudited)
Interested Trustees and Officers of the Trust
Name and Year of Birth | | Position/ Term of Office1 | | Principal Occupation During the Past Five Years | | Number of Portfolios in Fund Complex Overseen by Trustee | | Other Directorships held by Trustee During the Past Five Years | |
Robert M. Arena, Jr.
(1968)2 | | Trustee since 2013 | | Mr. Arena serves as Co-President of The Global Atlantic Financial Group LLC (since 2022); as Director and Co-President of Global Atlantic Financial Group Limited ("GAFGL") (since 2021); as President and Head of Life and Retirement of Ariel Re (Holdings) Limited and Global Atlantic Financial Life Limited (since 2020); as Director and Co-President of Global Atlantic Financial Limited (formerly Commonwealth Re Midco Limited) (since 2019 and 2021, respectively); as Director, Chairman and Co-President of Global Atlantic Financial Company ("GAFC") (since 2017, 2021 and 2021, respectively); as Director and Co-President of Global Atlantic (Fin) Company (since 2017 and 2021, respectively); as Director, Chairman and President of Forethought Life Insurance Company ("FLIC") (since 2016, 2017 and 2016, respectively); as Director, Chairman and President of Commonwealth Annuity and Life Insurance Company ("CWA") and First Allmerica Financial Life Insurance Company ("FAFLIC") (since 2017, 2017 and 2021, respectively); as Director, Chairman and President of Accordia Life and Annuity Company ("Accordia") (since 2016, 2017 and 2021, respectively); as Manager and Chairman of Global Atlantic Investment Advisors, LLC ("GAIA") (since 2016); and as Manager, Chairman and President of Global Atlantic Distributors, LLC ("GAD") (since 2012, 2012 and 2013, respectively). Mr. Arena holds and has previously held comparable positions with GAIA, GAD, FLIC, CWA, and certain other companies affiliated with GAIA. | | | 16 | | | None | |
95
Global Atlantic Portfolios
Supplemental Information (Continued)
December 31, 2023 (Unaudited)
Name and Year of Birth | | Position/ Term of Office1 | | Principal Occupation During the Past Five Years | | Number of Portfolios in Fund Complex Overseen by Trustee | | Other Directorships held by Trustee During the Past Five Years | |
Barrie Ribet3
(1982) | | Trustee since 2021 | | Ms. Ribet serves as Managing Director of GAFC and Global Atlantic (Fin) Company (since 2017 and 2022, respectively); as Managing Director of FLIC, CWA, Accordia, and FAFLIC (since 2019); as Managing Director of Global Atlantic Equipment Management, LLC (since 2021); as Director and Chief Executive Officer of Emporium Holdco Inc. and eRESI Holdings, Inc. (since 2021); as Manager and Chief Executive Officer of eRESI Capital Holdco LLC (since 2021); as Chief Executive Officer of eRESI Capital LLC (since 2021) and as Director of Infinity Transportation Equipment Leasing, LLC (since 2021). Previously, Ms. Ribet served as Senior Vice President, Head of Asset Origination of GAFC (from 2015 to 2017). | | | 16 | | | None | |
Eric Todd
(1969) | | President and Chief Executive Officer since 2021 | | Mr. Todd is currently Chief Product Officer of GAFC, he also serves as Managing Director of GAFC (since 2015); Manager, President and Chief Investment Officer of GAIA (since 2013); Manager of GAD (since 2016); Director and Managing Director of FLIC (since 2014 and 2018, respectively); and Director and Managing Director of CWA, FAFLIC and Accordia (since 2017 and 2018, respectively). | | | N/A | | | N/A | |
Deborah Schunder
(1967) | | Vice President since 2014 | | Ms. Schunder serves as Senior Vice President, Head of Investment Product Management, Sales Planning and Sales Compensation of GAFC (since 2022). Previously, Ms. Schunder served as Senior Vice President, Head of Investment Product Management, Sales Reporting, Analytics and Compensation of GAFC (2020–2022). Previously, Ms. Schunder served as Vice President of Investment Product Management of GAFC (2013–2020). | | | N/A | | | N/A | |
Trent M. Statczar
(1971) | | Treasurer and Principal Financial Officer since 2019 Principal Accounting Officer since 2021 | | Mr. Statczar serves as Senior Principal Consultant of ACA Global (formerly, Senior Director of Foreside Management Services, LLC) (since 2008). | | | N/A | | | N/A | |
96
Global Atlantic Portfolios
Supplemental Information (Continued)
December 31, 2023 (Unaudited)
Name and Year of Birth | | Position/ Term of Office1 | | Principal Occupation During the Past Five Years | | Number of Portfolios in Fund Complex Overseen by Trustee | | Other Directorships held by Trustee During the Past Five Years | |
Sarah M. Patterson
(1976) | | Secretary/Chief Legal Officer since 2013 | | Ms. Patterson serves as Managing Director, General Counsel for Individual Markets and Assistant Secretary for FLIC, Accordia, FAFLIC, CWA and GAFC (since 2019, 2020, and 2014, respectively); as Secretary of GAIA (since 2016); as Managing Director, General Counsel and Secretary of Global Atlantic Insurance Network (since 2019); and as Assistant Secretary of GAD (since 2016). Previously Ms. Patterson served as Associate General Counsel of FLIC, Accordia, FAFLIC, CWA and GAFC (2014–2020), Senior Vice President (2016–2019). | | | N/A | | | N/A | |
David Capalbo
(1968) | | Chief Compliance Officer since 2018 | | Mr. Capalbo serves as Vice President of Investment Compliance of GAFC (since 2022); Vice President of Compliance Operations of GAFC (since 2021); as Chief Compliance Officer and Vice President of GAIA (since 2018 and 2022, respectively); as Vice President, SEC 38a-1 Chief Compliance Officer and Deputy Anti-Money Laundering Officer of CWA, FAFLIC and FLIC (since 2021, 2021 and 2022, respectively); and Vice President of Accordia (since 2021). Previously, Mr. Capalbo served as Assistant Vice President of GAIA (2018–2022) and Assistant Vice President and Senior Compliance Officer of GAFC (2016–2021). | | | N/A | | | N/A | |
Elizabeth Constant
(1976) | | Assistant Secretary since 2017 | | Ms. Constant serves as Vice President, Assistant General Counsel and Assistant Secretary of GAFC and FLIC (since 2022 and 2021, respectively). Previously, Ms. Constant served as Vice President and Assistant General Counsel (2020–2022) and Assistant Vice President and Legal Counsel (2016–2020) and Associate Counsel (2014–2016) of GAFC. | | | N/A | | | N/A | |
1 The term of office for each Trustee and officer listed above will continue indefinitely until the individual resigns or is removed.
2 Mr. Arena is an interested person of the Trust because he is an officer of GAFGL.
3 Ms. Ribet is an interested person of the Trust because she is Managing Director of GAFC.
97
PRIVACY NOTICE
FACTS | | WHAT DOES FORETHOUGHT VARIABLE INSURANCE TRUST DO WITH YOUR PERSONAL INFORMATION? | |
WHY? | | Financial companies choose how they share your personal information. Federal law gives consumers the right to limit some, but not all sharing. Federal law also requires us to tell you how we collect, share, and protect your personal information. Please read this notice carefully to understand what we do. | |
WHAT? | | The types of personal information we collect and share depends on the product or service that you have with us. This information can include:
◼ Social Security number and wire transfer instructions
◼ account transactions and transaction history
◼ investment experience and purchase history
When you are no longer our customer, we continue to share your information as described in this notice. | |
HOW? | | All financial companies need to share customers' personal information to run their everyday business. In the section below, we list the reasons financial companies can share their customers' personal information; the reasons Forethought Variable Insurance Trust chooses to share; and whether you can limit this sharing. | |
Reasons we can share your
personal information: | | Does Forethought Variable
Insurance Trust share information? | | Can you limit this sharing? | |
| For our everyday business purposes – such as to process your transactions, maintain your account(s), respond to court orders and legal investigations, or report to credit bureaus. | | Yes | | No | |
| For our marketing purposes – to offer our products and services to you. | | No | | We don't share | |
For joint marketing with other financial companies. | | No | | We don't share | |
| For our affiliates' everyday business purposes – information about your transactions and records. | | No | | We don't share | |
| For our affiliates' everyday business purposes – information about your credit worthiness. | | No | | We don't share | |
For nonaffiliates to market to you | | No | | We don't share | |
98
WHAT WE DO:
How does Forethought Variable Insurance Trust protect my personal information? | | To protect your personal information from unauthorized access and use, we use security measures that comply with federal law. These measures include computer safeguards and secured files and buildings.
Our service providers are held accountable for adhering to strict policies and procedures to prevent any misuse of your nonpublic personal information. | |
How does Forethought Variable Insurance Trust collect my personal information? | | We collect your personal information, for example, when you
◼ open an account or deposit money
◼ direct us to buy securities or direct us to sell your securities
◼ seek advice about your investments
We also collect your personal information from others, such as credit bureaus, affiliates, or other companies. | |
Why can't I limit all sharing? | | Federal law gives you the right to limit only:
◼ sharing for affiliates' everyday business purposes – information about your creditworthiness.
◼ affiliates from using your information to market to you.
◼ sharing for nonaffiliates to market to you.
State laws and individual companies may give you additional rights to limit sharing. | |
DEFINITIONS
Affiliates | | Companies related by common ownership or control. They can be financial and nonfinancial companies.
◼ Forethought Variable Insurance Trust has no affiliates. | |
Nonaffiliates | | Companies not related by common ownership or control. They can be financial and nonfinancial companies.
◼ Forethought Variable Insurance Trust does not share with nonaffiliates so they can market to you. | |
Joint marketing | | A formal agreement between nonaffiliated financial companies that together market financial products or services to you.
◼ Forethought Variable Insurance Trust does not jointly market. | |
99
PROXY VOTING POLICY
Information regarding how the Portfolios voted proxies relating to portfolio securities during the most recent 12-month period ended June 30 is available (1) on or through the Portfolios' website at http://connect.rightprospectus.com/globalatlanticportfolios and (2) on the U.S. Securities and Exchange Commission's website at http://www.sec.gov.
PORTFOLIO HOLDINGS
Each Portfolio files its complete schedule of portfolio holdings with the SEC for the first and third quarters of each fiscal year on Form N-PORT. The Portfolios' Form N-PORTs are available: (i) on the SEC's website at http://www.sec.gov; and (ii) on the Portfolios' website at http://connect.rightprospectus.com/globalatlanticportfolios. Each Portfolio will post to http://connect.rightprospectus.com/globalatlanticportfolios, a complete list of its portfolio holdings as of the last calendar day of each month approximately 30 days following the end of the month. Each Portfolio's portfolio holdings will remain available on the website noted above at least until the next monthly update.
INVESTMENT ADVISER
Global Atlantic Investment Advisors, LLC
10 West Market Street, Suite 2300
Indianapolis, IN 46204
ADMINISTRATOR
The Bank of New York Mellon
240 Greenwich Street
New York, NY 10286
BlackRock Investment Management, LLC
1 University Square Drive
Princeton, NJ 08540-6455
Franklin Advisers, Inc.
One Franklin Parkway
San Mateo, CA 94403
Wilshire Advisors LLC
1299 Ocean Avenue, Suite700
New York, NY 10282
Milliman Financial Risk Management, LLC
71 S. Wacker Drive, 31st Floor
Chicago, IL 60606
Wellington Management Company LLP
280 Congress Street
Boston, MA 02210
Item 2. Code of Ethics.
| (a) | As of the end of the period covered by this report, the registrant has adopted a code of ethics that applies to the registrant’s principal executive officer, principal financial officer, principal accounting officer or controller, or persons performing similar functions, regardless of whether these individuals are employed by the registrant or a third party. |
| (c) | Amendments: During the period covered by the report, there have not been any amendments to the provisions of the code of ethics. |
| (d) | Waivers: During the period covered by the report, the registrant has not granted any express or implicit waivers from the provisions of the code of ethics. |
| (e) | The Code of Ethics is not posted on the registrant’s website. |
| (f) | A copy of the Code of Ethics is filed herewith. |
Item 3. Audit Committee Financial Expert.
The board of Trustees of the registrant has determined that the registrant has at least one “audit committee financial expert” as defined by Item 3 of Form N-CSR serving on its audit committee. Joseph E. Breslin is the “audit committee financial expert” and is “independent” (as each term is defined in Item 3 of Form N-CSR).
Item 4. Principal Accountant Fees and Services.
Audit Fees
| (a) | The aggregate fees billed for each of the last two fiscal years for professional services rendered by the principal accountant for the audit of the registrant's annual financial statements or services that are normally provided by the accountant in connection with statutory and regulatory filings or engagements for those fiscal years are: |
| 2022 | | | 2023 | |
| $ | 330,000 | | | $ | 291,000 | |
Audit-Related Fees
| (b) | The aggregate fees billed in each of the last two fiscal years for assurance and related services by the principal accountant that are reasonably related to the performance of the audit of the registrant's financial statements and are not reported under paragraph (a) of this Item are: |
Tax Fees
| (c) | The aggregate fees billed in each of the last two fiscal years for professional services rendered by the principal accountant for tax compliance, tax advice, and tax planning are: |
| 2022 | | | 2023 | |
| $ | 60,000 | | | $ | 64,000 | |
Preparation of Federal & State income tax returns, assistance with calculation of required income and capital gain distributions.
All Other Fees
| (d) | The aggregate fees billed in each of the last two fiscal years for products and services provided by the principal accountant, other than the services reported in paragraphs (a) through (c) of this Item are: |
Review of annual registration statement filings for 2022.
Audit Committee’s Pre-Approval Policies
| (e)(1) | The registrant’s Audit Committee is required to pre-approve all audit services and, when appropriate, any non-audit services (including audit-related, tax and all other services) to the registrant. The registrant’s Audit Committee also is required to pre-approve, when appropriate, any non-audit services (including audit-related, tax and all other services) to its adviser, or any entity controlling, controlled by or under common control with the adviser that provides ongoing services to the registrant, to the extent that the services may be determined to have an impact on the operations or financial reporting of the registrant. Services are reviewed on an engagement by engagement basis by the Audit Committee. |
Percentages of Services Approved by the Audit Committee
| (e)(2) | The percentage of services described in each of paragraphs (b) through (d) of this Item that were approved by the audit committee pursuant to paragraph (c)(7)(i)(C) of Rule 2-01 of Regulation S-X are as follows: |
All services described in paragraphs (b) through (d) of Item 4 were pre-approved by the Audit Committee.
| (f) | During the audit of registrant's financial statements for the most recent fiscal year, less than 50 percent of the hours expended on the principal accountant's engagement were attributed to work performed by persons other than the principal accountant's full-time, permanent employees. |
| (g) | The aggregate non-audit fees billed by the registrant's accountant for services rendered to the registrant, and rendered to the registrant's investment adviser (not including any sub-adviser whose role is primarily portfolio management and is subcontracted with or overseen by another investment adviser), and any entity controlling, controlled by, or under common control with the adviser that provides ongoing services to the registrant for each of the last two fiscal years were $77,500 for the fiscal year 2022 and $64,000 for the fiscal year 2023. |
| (h) | The audit committee considered the non-audit services rendered to the registrant’s investment adviser and any entity controlling, controlled by, or under common control with the investment adviser, and believes the services are compatible with the principal accountant’s independence. |
Item 5. Audit Committee of Listed Registrants.
Not applicable.
Item 6. Investments.
| (a) | Schedule of Investments in securities of unaffiliated issuers as of the close of the reporting period is included as part of the report to shareholders filed under Item 1(a) of this form. |
Item 7. Disclosure of Proxy Voting Policies and Procedures for Closed-End Management Investment Companies.
Not applicable.
Item 8. Portfolio Managers of Closed-End Management Investment Companies.
Not applicable.
Item 9. Purchases of Equity Securities by Closed-End Management Investment Company and Affiliated Purchasers.
Not applicable.
Item 10. Submission of Matters to a Vote of Security Holders.
Not applicable.
Item 11. Controls and Procedures.
| (a) | Based on an evaluation of the registrant’s disclosure controls and procedures as of a date within 90 days of filing date of this Form N-CSR, the principal executive officer and principal financial officer of the registrant have concluded that the disclosure controls and procedures of the registrant are reasonably designed to ensure that the information required in filings on Form N-CSR is recorded, processed, summarized, and reported by the filing date, including that information required to be disclosed is accumulated and communicated to the registrant’s management, including the registrant’s principal executive officer and principal financial officer, as appropriate to allow timely decisions regarding required disclosure. |
| (b) | There were no changes in the registrant’s internal control over financial reporting (as defined in Rule 30a-3(d) under the 1940 Act (17 CFR 270.30a-3(d))) that occurred during the period covered by this report that has materially affected, or are reasonably likely to materially affect, the registrant’s internal control over financial reporting. |
Item 12. Disclosure of Securities Lending Activities for Closed-End Management Investment Companies.
Not applicable.
Item 13. Exhibits.
SIGNATURES
Pursuant to the requirements of the Securities Exchange Act of 1934 and the Investment Company Act of 1940, the registrant has duly caused this report to be signed on its behalf by the undersigned, thereunto duly authorized.
| (Registrant) | Forethought Variable Insurance Trust |
| By (Signature and Title)* | /s/ Trent M. Statczar |
| | Trent M. Statczar, Treasurer |
| | (Principal Financial Officer and Principal Accounting Officer) |
Pursuant to the requirements of the Securities Exchange Act of 1934 and the Investment Company Act of 1940, this report has been signed below by the following persons on behalf of the registrant and in the capacities and on the dates indicated.
| By (Signature and Title)* | /s/ Eric D. Todd |
| | Eric D. Todd, President |
| | (Principal Executive Officer) |
| By (Signature and Title)* | /s/ Trent M. Statczar |
| | Trent M. Statczar, Treasurer |
| | (Principal Financial Officer and Principal Accounting Officer) |
* Print the name and title of each signing officer under his or her signature.