UNITED STATES
SECURITIES AND EXCHANGE COMMISSION
Washington, D.C. 20549
FORM N-CSR
CERTIFIED SHAREHOLDER REPORT OF REGISTERED
MANAGEMENT INVESTMENT COMPANIES
Investment Company Act file number811-22875
Bluestone Community Development Fund
(Exact name of registrant as specified in charter)
37 West Avenue, Suite 301
Wayne, PA 19087
(Address of principal executive offices) (Zip code)
Kenneth R. Smith
Bluestone Community Development Fund
37 West Avenue, Suite 301
Wayne, PA 19087
(Name and address of agent for service)
Registrant's telephone number, including area code:(610) 337-6500
Date of fiscal year end:June 30
Date of reporting period:June 30, 2019
ITEM 1. REPORTS TO STOCKHOLDERS.
| 
(Formerly known as The 504 Fund)*
ANNUAL REPORT FOR THE YEAR ENDED
JUNE 30, 2019 * Name change effective May 1, 2019. |

|
TABLE OF CONTENTS
|
| | |
Schedule of Investments | 1 |
Statement of Assets and Liabilities | 5 |
Statement of Operations | 6 |
Statements of Changes in Net Assets | 7 |
Statement of Cash Flows | 8 |
Financial Highlights | 9 |
Notes to Financial Statements | 10 |
Report of Independent Registered Public Accounting Firm | 19 |
Other Information (Unaudited) | 20 |
Trustees and Officers (Unaudited) | 23 |

|
Schedule of Investments
June 30, 2019
|
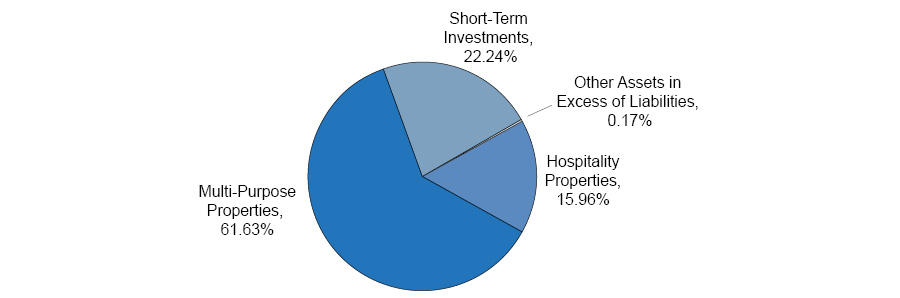
INVESTMENT TYPE AS A PERCENTAGE OF NET ASSETS AS FOLLOWS:
Description, State(a),
Acquisition Date | Stated
Interest Rate | | Effective
Interest Rate | | | Maturity | | | Cost | | | Principal | �� | | Fair Value | |
504 First Lien Loans(b) — 77.59% | | | | | | | | | | | | | | | | | | | | |
Hospitality Properties — 15.96% | | | | | | | | | | | | | | | | | | | | |
McDonough Hospitality Plaza, LLC, Georgia, 12/14/2016 | 6.500% (6.500% Fixed) | | | 5.250%(c) | | | | 9/5/2024 | | | $ | 4,502,167 | | | $ | 4,500,000 | | | $ | 4,666,140 | |
Moses Lake Investors, LLC, Washington, 9/18/2014(d) | Prime + 2.250% (5.500% Floor) | | | 7.750% | | | | 10/1/2039 | | | | 941,182 | | | | 907,436 | | | | 911,037 | |
Vaibhav Laxmi, Inc., Illinois, 8/14/2015 | 5 Year Libor + 4.750% (6.500% Floor) | | | 6.000%(c) | | | | 9/1/2026 | | | | 1,591,520 | | | | 1,591,437 | | | | 1,592,376 | |
Total Hospitality Properties | | | | | | | 7,169,553 | |
| | | | | | | | | | | | | | | | | | | | | |
Multi-Purpose Properties — 61.63% | | | | | | | | | | | | | | | | | | | | |
1250 Philadelphia, LLC, California, 10/3/2014 | 5 Year Libor + 4.000% (5.930% Floor) | | | 5.930% | | | | 10/15/2039 | | | | 2,396,323 | | | | 2,313,211 | | | | 2,366,623 | |
413 East 53rd Street, LLC, New York, 2/4/2014 | 3 Year Libor + 4.170% (4.950% Floor) | | | 6.187% | | | | 2/1/2044 | | | | 1,614,953 | | | | 1,589,869 | | | | 1,620,141 | |
7410-7428 Bellaire, LLC, California, 8/22/2014 | 5 Year Libor + 4.000% (5.780% Floor) | | | 5.780% | | | | 9/15/2039 | | | | 2,291,950 | | | | 2,213,070 | | | | 2,097,614 | |
77 West Mount Pleasant Avenue, LLC, New Jersey, 4/30/2015 | 3 Year Libor + 4.000% (5.125% Floor) | | | 6.836% | | | | 5/1/2040 | | | | 319,048 | | | | 305,505 | | | | 311,344 | |
AKT Elevon Partners, LLC, California, 9/17/2015 | 5 Year Libor + 3.880% (5.700% Floor) | | | 4.970%(c) | | | | 10/1/2045 | | | | 4,075,420 | | | | 4,077,834 | | | | 4,039,258 | |
Anthony Ghostine, Kristina J. Ghostine, California, 12/1/2014 | 3 Year Libor + 5.150% (6.300% Floor) | | | 6.020%(c) | | | | 12/1/2044 | | | | 341,655 | | | | 341,655 | | | | 338,324 | |
See accompanying notes to financial statements.
1

|
SCHEDULE OF INVESTMENTS (continued)
June 30, 2019
|
Description, State(a),
Acquisition Date — (continued) | Stated
Interest Rate | | Effective
Interest Rate | | | Maturity | | | Cost | | | Principal | | | Fair Value | |
Multi-Purpose Properties — (continued) | | | | | | | | | | | | | | | | | | | | |
CBERT Williston, LLC, North Dakota, 9/18/2015 | 5 Year Libor + 4.250% (5.132% Floor) | | | 6.450% | | | | 1/1/2038 | | | $ | 1,196,052 | | | $ | 1,160,929 | | | $ | 784,788 | |
CV Investment Properties, LLC, Arizona, 5/29/2014 | 5 Year Libor + 4.750% (6.000% Floor) | | | 7.821% | | | | 10/30/2038 | | | | 611,712 | | | | 582,607 | | | | 621,030 | |
Grigorian Investments, LLC, California, 9/2/2014 | 5 Year Libor + 4.500% (6.330% Floor) | | | 6.330% | | | | 9/15/2039 | | | | 510,403 | | | | 496,371 | | | | 502,655 | |
Marcus D. Chu, Tracey Chu, California, 3/13/2015 | 5 Year Libor + 4.750% (6.586% Floor) | | | 6.586% | | | | 3/10/2040 | | | | 1,712,283 | | | | 1,635,090 | | | | 1,672,762 | |
Mariano D. Cibran, Florida, 5/23/2016 | 3 Year Libor + 5.160% (6.160% Floor) | | | 6.240% | | | | 6/1/2046 | | | | 1,271,283 | | | | 1,230,996 | | | | 1,240,611 | |
Palomar Oaks Corp., California, 1/30/2014 | 5 Year Libor + 4.500% (6.280% Floor) | | | 7.180% | | | | 2/1/2039 | | | | 1,256,376 | | | | 1,235,235 | | | | 1,264,733 | |
Rayr Holdings, LLC, California, 7/31/2015 | 3 Year Libor + 5.775% (7.025% Floor) | | | 8.628% | | | | 7/1/2045 | | | | 932,837 | | | | 889,092 | | | | 919,178 | |
Ruby View Investments, LLC, Nevada, 5/15/2014 | 5 Year Libor + 4.000% (6.500% Floor) | | | 6.500% | | �� | | 6/26/2037 | | | | 1,965,930 | | | | 1,883,500 | | | | 1,935,296 | |
Rug Palace, Inc. dba Rug Palace Expo, California, 2/27/2014 | Prime + 2.250% (5.500% Floor) | | | 6.620% | | | | 2/15/2044 | | | | 649,840 | | | | 649,840 | | | | 636,888 | |
SGLP Enterprises, LLC, Smokin’ Guns BBQ & Catering, Inc., Missouri, 3/18/2016 | 1 Month Libor + 4.500% | | | 6.930% | | | | 9/12/2023 | | | | 621,293 | | | | 615,294 | | | | 617,011 | |
Shiv Shakti Investments, LLC, Georgia, 6/20/2017 | 6.500% (6.500% Fixed) | | | 5.250%(c) | | | | 12/15/2024 | | | | 1,752,837 | | | | 1,750,000 | | | | 1,787,030 | |
South Washington Street Realty, LLC, Indiana, 7/21/2016 | 3 Year Libor + 5.160% (5.910% Floor) | | | 6.035% | | | | 7/1/2046 | | | | 286,693 | | | | 277,097 | | | | 284,232 | |
Stanley Avenue Realty, LLC, New York, 9/17/2014 | 4 Year Libor + 3.720% (5.370% Floor) | | | 6.073% | | | | 9/15/2044 | | | | 1,809,148 | | | | 1,809,084 | | | | 1,859,304 | |
Storage Fit, LLC, Texas, 2/12/2015 | 5 Year Libor + 5.750% (7.390% Floor) | | | 5.140%(c) | | | | 3/1/2045 | | | | 402,145 | | | | 402,474 | | | | 396,783 | |
Watson Kellogg Property, LLC, Idaho, 2/9/2015 | 5 Year Libor + 4.250% (5.700% Floor) | | | 5.920% | | | | 6/1/2040 | | | | 629,766 | | | | 604,082 | | | | 622,222 | |
See accompanying notes to financial statements.
2

|
SCHEDULE OF INVESTMENTS (continued)
June 30, 2019
|
Description, State(a),
Acquisition Date — (continued) | Stated
Interest Rate | | Effective
Interest Rate | | | Maturity | | | Cost | | | Principal | | | Fair Value | |
Multi-Purpose Properties — (continued) | | | | | | | | | | | | | | | | | | | | |
Watson Osburn Property, LLC, Idaho, 2/9/2015 | 5 Year Libor + 4.250% (5.700% Floor) | | | 5.880% | | | | 6/1/2040 | | | $ | 503,636 | | | $ | 482,345 | | | $ | 497,061 | |
ZC Park, LLC, Arizona, 10/17/2014 | 5 Year Libor + 4.000% (5.880% Floor) | | | 5.880% | | | | 10/15/2044 | | | | 1,319,129 | | | | 1,261,020 | | | | 1,281,272 | |
Total Multi-Purpose Properties | | | | | | | 27,696,160 | |
| | | | | | | | | | | | | | | | | |
Total 504 First Lien Loans (identified cost of $35,505,581) | | | | | | $ | 34,865,713 | |
| | | Shares | | | Fair Value | |
Short-Term Investments — 22.24% | | | | | | | | |
Morgan Stanley Liquidity Fund - Institutional Class, 2.19%(e) | | | 9,995,622 | | | $ | 9,995,622 | |
Total Short-Term Investments (Cost $9,995,622) | | | | | | | 9,995,622 | |
| | | | | | | | | |
Total Investments — 99.83% Cost ($45,501,203) | | | | | | | 44,861,335 | |
Other Assets in Excess of Liabilities — 0.17% | | | | | | | 77,308 | |
TOTAL NET ASSETS — 100.00% | | | | | | $ | 44,938,643 | |
(a) | The states listed correspond to the location of the underlying collateral of the 504 First Lien Loan, which may differ from the location of the borrower. |
(b) | 504 First Lien Loans are restricted as to resale. The cost and fair value as of June 30, 2019 was $35,505,581 and $34,865,713, respectively. Fair value is determined using significant unobservable inputs. |
(c) | The effective rate is net of a sub-servicing fee collected on the 504 First Lien Loan by the selling agent. As a result, the effective rate may be less than the 504 First Lien Loan floor rate. |
(d) | Represents an investment in the 504 First Lien Loan through a participation agreement with a financial institution. A participation agreement typically results in a contractual relationship only with a financial institution, not with the borrower. |
(e) | The rate shown is the annualized 7-day yield as of June 30, 2019. |
See accompanying notes to financial statements.
3

|
SCHEDULE OF INVESTMENTS (continued)
June 30, 2019
|
INVESTMENT TYPE AS A PERCENTAGE OF NET ASSETS BY STATE:
Hospitality Properties | | | | |
Georgia | | | 10.38 | % |
Illinois | | | 3.55 | % |
Washington | | | 2.03 | % |
Total Hospitality Properties | | | 15.96 | % |
| | | | | |
Multi-Purpose Properties | | | | |
Arizona | | | 4.23 | % |
California | | | 30.80 | % |
Florida | | | 2.76 | % |
Georgia | | | 3.98 | % |
Idaho | | | 2.49 | % |
Indiana | | | 0.63 | % |
Missouri | | | 1.37 | % |
Nevada | | | 4.31 | % |
New Jersey | | | 0.69 | % |
New York | | | 7.74 | % |
North Dakota | | | 1.75 | % |
Texas | | | 0.88 | % |
Total Multi-Purpose Properties | | | 61.63 | % |
| | | | | |
Short-Term Investments | | | 22.24 | % |
Total Investments | | | 99.83 | % |
| | | | | |
Other Assets in Excess of Liabilities | | | 0.17 | % |
| | | | | |
Total Net Assets | | | 100.00 | % |
See accompanying notes to financial statements.
4

|
Statement of Assets and Liabilities
June 30, 2019
|
Assets: | | | | |
Investments in 504 First Lien Loans, at fair value (cost $35,505,581) | | $ | 34,865,713 | |
Short-term investments, at fair value (cost $9,995,622) | | | 9,995,622 | |
Receivables: | | | | |
Interest | | | 174,398 | |
Receivable for paydowns | | | 1,955 | |
Prepaid expenses | | | 19,745 | |
Other assets | | | 1,497 | |
Total Assets | | | 45,058,930 | |
| | | | | |
Liabilities: | | | | |
Payables: | | | | |
Audit | | | 63,027 | |
Advisory fees | | | 32,741 | |
Accounting and administration | | | 7,211 | |
Legal | | | 6,528 | |
Chief Compliance Officer | | | 4,999 | |
Transfer agent | | | 3,567 | |
Custodian | | | 1,038 | |
Accrued other expenses | | | 1,176 | |
Total Liabilities | | | 120,287 | |
| | | | | |
Net Assets | | $ | 44,938,643 | |
| | | | | |
Net Assets Consist of: | | | | |
Paid in Capital (unlimited shares authorized, no par value) | | $ | 45,602,506 | |
Total accumulated deficit | | | (663,863 | ) |
Net Assets | | $ | 44,938,643 | |
| | | | | |
Shares | | | | |
Net assets applicable to outstanding shares | | $ | 44,938,643 | |
Number of outstanding shares | | | 4,582,150 | |
Net asset and redemption price value per share | | $ | 9.81 | |
Maximum offering price per share (Net asset value per share divided by 0.99)1 | | $ | 9.91 | |
1 | The offering price per share reflects a maximum sales charge of 1.00%. |
See accompanying notes to financial statements.
5

|
Statement of Operations
FOR THE YEAR ENDED
June 30, 2019
|
Investment Income: | | | | |
Interest | | $ | 2,416,391 | |
Total Investment Income | | | 2,416,391 | |
| | | | | |
Expenses: | | | | |
Advisory fees | | | 757,319 | |
Legal expense | | | 130,693 | |
Accounting and administration expenses | | | 87,721 | |
Trustees’ expenses | | | 76,500 | |
Audit expense | | | 64,663 | |
Chief Compliance Officer expense | | | 59,998 | |
Insurance expense | | | 35,600 | |
Registration expense | | | 25,852 | |
Transfer agent expense | | | 20,995 | |
Custodian expense | | | 12,239 | |
Printing expense | | | 11,250 | |
Miscellaneous | | | 21,849 | |
Total Expenses | | | 1,304,679 | |
Less: Expenses waived | | | (510,025 | ) |
Net expenses | | | 794,654 | |
Net investment income | | | 1,621,737 | |
| | | | | |
Net Change in Unrealized Appreciation on Investments: | | | | |
Net change in unrealized appreciation on investments | | | 965,183 | |
Total net change in unrealized appreciation on investments | | | 965,183 | |
| | | | | |
Net Increase in Net Assets from Operations | | $ | 2,586,920 | |
See accompanying notes to financial statements.
6

|
Statements of Changes in Net Assets
|
| | | Year Ended
June 30, 2019 | | | Year Ended
June 30, 2018 | |
Increase (Decrease) in Net Assets From: | | | | | | | | |
Operations: | | | | | | | | |
Net investment income | | $ | 1,621,737 | | | $ | 1,979,550 | |
Net change in unrealized appreciation (depreciation) on investments | | | 965,183 | | | | (1,003,754 | ) |
Net increase in net assets from operations | | | 2,586,920 | | | | 975,796 | |
| | | | | | | | | |
Distributions to Shareholders: | | | | | | | | |
Distributions | | | (1,688,861 | ) | | | (1,831,415 | )1 |
Total distributions to shareholders: | | | (1,688,861 | ) | | | (1,831,415 | ) |
| | | | | | | | | |
Capital Transactions: | | | | | | | | |
Reinvestment of distributions | | | 510,762 | | | | 512,234 | |
Cost of shares redeemed | | | (2,316,434 | ) | | | (2,421,327 | ) |
Net decrease from capital transactions | | | (1,805,672 | ) | | | (1,909,093 | ) |
| | | | | | | | | |
Total decrease in net assets | | | (907,613 | ) | | | (2,764,712 | ) |
| | | | | | | | | |
Net Assets: | | | | | | | | |
Beginning of year | | | 45,846,256 | | | | 48,610,968 | |
End of year | | $ | 44,938,643 | | | $ | 45,846,256 | 2 |
| | | | | | | | | |
Capital Share Transactions: | | | | | | | | |
Shares reinvested | | | 52,760 | | | | 53,024 | |
Shares redeemed | | | (239,796 | ) | | | (249,621 | ) |
Net decrease | | | (187,036 | ) | | | (196,597 | ) |
1 | Includes net investment income distributions of $1,831,415. |
2 | Net Assets - End of year includes accumulated undistributed net investment income of $0 for the year ended June 30, 2018. The SEC eliminated the requirement to disclose undistributed net investment income effective November 5, 2018. |
See accompanying notes to financial statements.
7

|
Statement of Cash Flows
FOR THE year ENDED
June 30, 2019
|
Cash Flows from Operating Activities: | | | | |
Net increase in net assets resulting from operations | | $ | 2,586,920 | |
Adjustments to reconcile net increase in net assets from operations to net cash provided by operating activities: | | | | |
Principal paydowns | | | 5,318,355 | |
Net purchase of short-term investments | | | (3,462,304 | ) |
Decrease in other assets and prepaid expenses | | | 201 | |
Decrease in interest receivables | | | 6,813 | |
Increase in receivables for paydowns | | | (1,955 | ) |
Decrease in accrued expenses | | | (30,882 | ) |
Net realized paydown losses | | | 24,467 | |
Amortization of premium on investments | | | 18,101 | |
Net change in unrealized appreciation on investments | | | (965,183 | ) |
Net cash provided by operating activities | | | 3,494,533 | |
| | | | | |
Cash Flows from Financing Activities: | | | | |
Shareholder redemptions paid | | | (2,316,434 | ) |
Cash distributions paid1 | | | (1,178,099 | ) |
Net cash used in financing activities | | | (3,494,533 | ) |
| | | | | |
Net increase in cash | | | — | |
| | | | | |
Cash at beginning of year | | | — | |
Cash at end of year | | $ | — | |
1 | Noncash financing activities not included herein consist of reinvestment of dividends of $510,762. |
See accompanying notes to financial statements.
8

|
Financial Highlights
|
Per share income and capital changes for a share outstanding throughout the year.
| | | Year Ended
June 30,
2019 | | | Year Ended
June 30,
2018 | | | Year Ended
June 30,
2017 | | | Year Ended
June 30,
2016 | | | Year Ended
June 30,
2015 | |
Net asset value, beginning of year | | $ | 9.61 | | | $ | 9.79 | | | $ | 10.17 | | | $ | 9.93 | | | $ | 9.91 | |
| | | | | | | | | | | | | | | | | | | | | |
Income (loss) from Investment Operations: | | | | | | | | | | | | | | | | | | | | |
Net investment income | | | 0.35 | | | | 0.41 | | | | 0.34 | | | | 0.31 | | | | 0.20 | |
Net realized and unrealized gain (loss) on investments | | | 0.21 | | | | (0.21 | ) | | | (0.37 | ) | | | 0.28 | | | | 0.02 | |
Total income (loss) from investment operations | | | 0.56 | | | | 0.20 | | | | (0.03 | ) | | | 0.59 | | | | 0.22 | |
| | | | | | | | | | | | | | | | | | | | | |
Less Distributions: | | | | | | | | | | | | | | | | | | | | |
Net investment income | | | (0.35 | ) | | | (0.38 | ) | | | (0.35 | ) | | | (0.35 | ) | | | (0.20 | ) |
Net realized gains | | | (0.01 | ) | | | — | | | | — | | | | — | | | | — | |
Total distributions | | | (0.36 | ) | | | (0.38 | ) | | | (0.35 | ) | | | (0.35 | ) | | | (0.20 | ) |
| | | | | | | | | | | | | | | | | | | | | |
Net asset value, end of year | | $ | 9.81 | | | $ | 9.61 | | | $ | 9.79 | | | $ | 10.17 | | | $ | 9.93 | |
| | | | | | | | | | | | | | | | | | | | | |
Total return | | | 5.96 | % | | | 2.04 | % | | | (0.30 | )% | | | 5.98 | % | | | 2.18 | % |
| | | | | | | | | | | | | | | | | | | | | |
Ratios/Supplemental Data: | | | | | | | | | | | | | | | | | | | | |
Net assets, end of year (in thousands) | | $ | 44,939 | | | $ | 45,846 | | | $ | 48,611 | | | $ | 52,681 | | | $ | 45,814 | |
Ratio of expenses to average net assets | | | | | | | | | | | | | | | | | | | | |
Before waiver inclusive of interest expense | | | 2.87 | % | | | 3.08 | % | | | 3.11 | % | | | 2.84 | % | | | 3.76 | % |
After waiver inclusive of interest expense | | | 1.75 | % | | | 1.89 | % | | | 1.79 | % | | | 1.43 | % | | | 2.24 | % |
Before waiver exclusive of interest expense | | | 2.87 | % | | | 2.94 | % | | | 3.07 | % | | | 2.83 | % | | | 3.76 | % |
After waiver exclusive of interest expense | | | 1.75 | % | | | 1.75 | % | | | 1.75 | % | | | 1.42 | % | | | 2.24 | % |
Ratio of net investment income (loss) to average net assets | | | 3.57 | % | | | 4.17 | % | | | 3.40 | % | | | 3.18 | % | | | 1.97 | % |
Portfolio turnover rate | | | 0 | % | | | 0 | % | | | 4 | % | | | 13 | % | | | 13 | % |
See accompanying notes to financial statements.
9

|
Notes to Financial Statements
June 30, 2019
|
1. Organization
Bluestone Community Development Fund (the “Fund”); formerly known as The 504 Fund, was organized as a Delaware statutory trust on July 29, 2013 and is registered with the Securities and Exchange Commission (the “SEC”) as a closed-end, non-diversified management investment company under the Investment Company Act of 1940, as amended (the “1940 Act”), that operates as an “interval fund” pursuant to Rule 23c-3 under the 1940 Act. The Fund is managed by Bluestone Capital Partners LLC (the “Adviser”), a Puerto Rico limited liability company registered under the Investment Advisers Act of 1940, as amended (the “Advisers Act”). One trustee of the Fund is an officer and a member of the Adviser. Three officers of the Fund are officers and members of the Adviser. Prior to March 1, 2019, the Fund was managed by 504 Fund Advisors, LLC (the “Prior Adviser”), an Illinois limited liability company registered under the Advisers Act, which was a wholly owned subsidiary of Live Oak Bancshares, Inc. (“Live Oak”), a bank holding company. Government Loan Solutions, Inc. (“GLS”), also a subsidiary of Live Oak, provides the Adviser with data and research which is material to the Adviser’s valuation of the Fund’s investments. Robert O. Judge, a portfolio manager for the Fund, is the chief executive officer of GLS, and Jordan M. Blanchard, a portfolio manager for the Fund, is an employee of Live Oak. Prior to March 1, 2019, Messrs. Judge and Blanchard, each an officer of the Prior Adviser, each served as an officer of the Fund. The offering of the Fund’s shares of beneficial interest in the Fund (the “Shares”) is registered under the Securities Act of 1933, as amended (the “Securities Act”). Shares are offered on a continuous basis monthly (generally as of the last business day of each month) at the net asset value (“NAV”) per Share plus a sales charge of up to 1.00%. There are an unlimited number of authorized Shares.
The Fund’s investment objectives are to provide current income, consistent with the preservation of capital, and to enable institutional Fund investors that are subject to regulatory examination for CRA compliance to claim favorable regulatory consideration of their investment under the Community Reinvestment Act of 1977, as amended (the “CRA”). The Fund seeks to achieve its objectives by investing primarily in a portfolio of 504 First Lien Loans secured by owner-occupied commercial real estate which represent the non-guaranteed portions of U.S. Small Business Administration (“SBA”) Section 504 transactions (“504 First Lien Loans”). 504 First Lien Loans are not guaranteed by the SBA, the U.S. government or by its agencies, instrumentalities or sponsored enterprises.
2. Accounting Policies
The following is a summary of significant accounting policies followed by the Fund in preparation of its financial statements. The policies are in conformity with accounting principles generally accepted in the United States of America (“GAAP”). The Fund is an investment company and follows the investment company accounting and reporting guidance under Financial Accounting Standards Board (“FASB”) Accounting Standards Codification (“ASC”) Topic 946, “Financial Services-Investment Companies”. In the normal course of business, the Fund has entered into contracts that contain a variety of representations which provide general indemnifications. The Fund’s maximum exposure under these arrangements is unknown as this would involve future claims that may be made against the Fund that have not yet occurred. However, the Fund expects the risk of loss to be remote.
Investment Valuation – Investments for which market quotations are readily available are valued at current fair value, and all other investments are valued at fair value as determined in good faith by the Fund’s Board of Trustees (the “Board”), in accordance with the policies and procedures (the “Valuation Procedures”) adopted by the Board. The Board has a standing valuation committee (the “Valuation Committee”) that is composed of members appointed by the Board. The Valuation Committee operates under the Valuation Procedures approved by the Board. The Valuation Committee makes quarterly reports to the Board concerning investments for which market quotations are not readily available. Investments in money market funds (short-term investments) are valued at the closing NAV per share.
10

|
NOTES TO FINANCIAL STATEMENTS
June 30, 2019
|
2. Accounting Policies (continued)
504 First Lien Loans – The fair values of 504 First Lien Loans are analyzed using a pricing methodology designed to incorporate, among other things, the present value of the projected stream of cash flows on such investments (the “discounted cash flow” methodology). This pricing methodology takes into account a number of relevant factors, including changes in prevailing interest rates, yield spreads, the borrower’s creditworthiness, the debt service coverage ratio, lien position, delinquency status, frequency of previous late payments and the projected rate of prepayments. Newly purchased loans are initially fair valued at cost and subsequently analyzed using the discounted cash flow methodology. Loans with a pending short payoff will be fair valued at the anticipated recovery rate. Valuations of 504 First Lien Loans are determined no less frequently than weekly by the Valuation Committee.
Investment Transactions and Income – Investment transactions are recorded on the trade date basis. Interest income is recorded on the basis of interest accrued, adjusted for amortization of premium or accretion of discount using the effective yield. Fees associated with loan amendments, paydown gain/losses, and prepayment penalties are recognized immediately. Dividend income is recorded on the ex-dividend date for dividends received in cash and/or securities. 504 First Lien Loans will be placed in non-accrual status and related interest income reduced by ceasing current accruals and writing off interest receivables when the collection of all or a portion of interest has become doubtful as identified by the Adviser as part of the valuation process.
Distributions to Shareholders – The Fund expects to declare and pay dividends of net investment income quarterly and net realized capital gains annually. Unless shareholders specify otherwise, dividends will be reinvested in Shares of the Fund.
Use of Estimates – The preparation of financial statements in conformity with GAAP requires management to make estimates and assumptions that affect the reported amounts of assets and liabilities and disclosure of contingent assets and liabilities at the date of the financial statements and the reported amounts of increases and decreases in net assets from operations during the reporting period. Actual results could differ from those estimates.
Federal Income Taxes – The Fund intends to elect and to qualify each year to be treated as a regulated investment company under the provisions of Subchapter M of the Internal Revenue Code of 1986, as amended. In order to so qualify, the Fund must meet certain requirements with respect to the sources of its income, the diversification of its assets and the distribution of its income. If the Fund qualifies as a regulated investment company, it will not be subject to federal income or excise tax on income or net capital gains that it distributes in a timely manner to its shareholders in the form of investment company taxable income or net capital gain distributions.
Accounting for Uncertainty in Income Taxes – GAAP requires an evaluation of tax positions taken (or expected to be taken) in the course of preparing a Fund’s tax return to determine whether these positions meet a “more-likely-than-not” standard that, based on the technical merits, have a more than fifty percent likelihood of being sustained by a taxing authority upon examination. A tax position that meets the “more-likely-than-not” recognition threshold is measured to determine the amount of benefit to recognize in the financial statements. The Fund recognizes interest and penalties, if any, related to unrecognized tax benefits as income tax expense in the Statement of Operations.
GAAP requires management of the Fund to analyze all open tax years for all major jurisdictions, which the Fund considers to be its federal and relevant state income tax filings. The open tax years for the Fund include the current year plus the prior three tax years. As of and during the year ended June 30, 2019, the Fund did not record a liability for any unrecognized tax benefits. The Fund has no examination in progress and is not aware of any tax positions for which it is reasonably possible that the total amounts of unrecognized tax benefits will significantly change in the next twelve months.
Expenses – Fund expenses are charged to the Fund and recorded on an accrual basis.
11

|
NOTES TO FINANCIAL STATEMENTS
June 30, 2019
|
2. Accounting Policies (continued)
Fair Value Measurements – Under GAAP for fair value measurements, a three-tier hierarchy to prioritize the assumptions, referred to as inputs, is used in valuation techniques to measure fair value. The three-tier hierarchy of inputs is summarized in the three broad levels listed below.
| | ● | Level 1 – Unadjusted quoted prices in active markets for identical, unrestricted assets or liabilities that the Fund has the ability to access at the measurement date. |
| | ● | Level 2 – Other significant observable inputs (including quoted prices for similar investments, interest rates, prepayment speeds, credit risk, etc.). |
| | ● | Level 3 – Significant unobservable inputs (including the Fund’s own assumptions in determining the fair value of investment). |
The following table sets forth information about the levels within the fair value hierarchy at which the Fund’s investments are measured as of June 30, 2019:
| | Level 1 | | | Level 2 | | | Level 3 | | | Total | |
Hospitality Properties | | $ | — | | | $ | — | | | $ | 7,169,553 | | | $ | 7,169,553 | |
Multi-Purpose Properties | | | — | | | | — | | | | 27,696,160 | | | | 27,696,160 | |
Short-Term Investments | | | 9,995,622 | | | | — | | | | — | | | | 9,995,622 | |
Total Investments | | $ | 9,995,622 | | | $ | — | | | $ | 34,865,713 | | | $ | 44,861,335 | |
For the year ended June 30, 2019, there were no transfers into or out of Level 1, Level 2 or Level 3.
Should a transfer between Levels occur, it is the Fund’s policy to recognize transfers in and out of all Levels at the end of the reporting period.
The following is a reconciliation of investments in which significant unobservable inputs (Level 3) were used in determining fair value:
Investments | | Balance as of
June 30, 2018 | | | Purchase and
funding of
investments | | | Proceeds
from principal
payments* | | | Net realized
gain on
investments | | | Net change
in unrealized
appreciation
on
investments | | | Amortization
of discount
and premium | | | Balance as of
June 30, 2019 | |
Hospitality Properties1 | | $ | 6,977,959 | | | $ | — | | | $ | (42,910 | ) | | $ | — | | | $ | 235,309 | | | $ | (805 | ) | | $ | 7,169,553 | |
Multi-Purpose Properties2 | | | 32,283,494 | | | | — | | | | (5,299,912 | ) | | | — | | | | 729,874 | | | | (17,296 | ) | | | 27,696,160 | |
Total Investments | | $ | 39,261,453 | | | $ | — | | | $ | (5,342,822 | ) | | $ | — | | | $ | 965,183 | | | $ | (18,101 | ) | | $ | 34,865,713 | |
* | Inclusive of net realized paydown losses and prepayment penalty fees received. |
1 | Change in unrealized appreciation from Hospitality Properties held at June 30, 2019 is $235,309. |
2 | Change in unrealized appreciation from Multi-Purpose Properties held at June 30, 2019 is $619,407. |
12

|
NOTES TO FINANCIAL STATEMENTS
June 30, 2019
|
2. Accounting Policies (continued)
The following is a summary of quantitative information about significant unobservable valuation inputs for Level 3 fair value measurements for investments held as of June 30, 2019:
Type of Level 3
Investments | | Fair Value as of
June 30, 2019 | | | Valuation
Technique | | | Unobservable
Inputs | | | Weighted
Average | | | Range | | | Impact to Fair
Value from
an Increase
in Input | |
Hospitality Properties | | $ | 7,169,553 | | | | Discounted
Cash Flows | | | | Purchase Price | | | | $100.52 | | | | $100-104 | | | | Decrease** | |
| | | | | | | | | | | Debt Service Coverage Ratio | | | | 1.86 | | | | 1.34-2.03 | | | | N/A* | |
| | | | | | | | | | | Effective Loan To Value Ratio | | | | 45.54% | | | | 42%-53% | | | | Decrease | |
| | | | | | | | | | | Average Personal Credit Score | | | | 732 | | | | 687-761 | | | | N/A* | |
Multi-Purpose Properties | | $ | 27,696,160 | | | | Discounted
Cash Flows | | | | Purchase Price | | | | $102.60 | | | | $100-105 | | | | Decrease** | |
| | | | | | | | | | | Debt Service Coverage Ratio | | | | 1.60 | | | | 0.78-4.29 | | | | N/A* | |
| | | | | | | | | | | Effective Loan To Value Ratio | | | | 54.20% | | | | 39%-119% | | | | Decrease | |
| | | | | | | | | | | Average Personal Credit Score | | | | 758 | | | | 685-819 | | | | N/A* | |
Total Level 3 Investments | | $ | 34,865,713 | | | | | | | | | | | | | | | | | | | | | |
* | A decrease in the input would result in a decrease in fair value. |
** | An increase in the spread from the Fund’s purchase price to the benchmark utilized within the fair value methodology would result in a decrease in fair value. |
3. Concentration of Risk
504 First Lien Loans Risk – The Fund predominantly invests in fixed or variable rate 504 First Lien Loans arranged through private negotiations between a small business borrower (the “Borrower”) and one or more 504 First Lien Loan lenders. 504 First Lien Loans are secured by real property and have a claim on the assets of the Borrower that is senior to the second lien held by a certified development company and any claims held by unsecured creditors. The 504 First Lien Loans the Fund will invest in are not rated. 504 First Lien Loans are subject to a number of risks, including credit risk, liquidity risk, valuation risk and interest rate risk. Although the 504 First Lien Loans in which the Fund will invest will be secured by real property, there can be no assurance that such real property can be readily liquidated or that the liquidation of such real property would satisfy the Borrower’s obligation in the event of non-payment of scheduled interest or principal, which could result in substantial loss to the Fund. In the event of the bankruptcy or insolvency of a Borrower, the Fund could experience delays or limitations with respect to its ability to realize the benefits of the real property securing a 504 First Lien Loan. In the event of a decline in the value of the already pledged real property, the Fund will be exposed to the risk that the value of the real property will not at all times equal or exceed the amount of the Borrower’s obligations under the 504 First Lien Loan. In
13

|
NOTES TO FINANCIAL STATEMENTS
June 30, 2019
|
3. Concentration of Risk (continued)
general, the secondary trading market for 504 First Lien Loans is not fully-developed. No active trading market may exist for certain 504 First Lien Loans, which may make it difficult to value them. Illiquidity and adverse market conditions may mean that the Fund may not be able to sell certain 504 First Lien Loans quickly or at a fair price. To the extent that a secondary market does exist for certain 504 First Lien Loans, the market for them may be subject to irregular trading activity, wide bid/ask spreads and extended trade settlement periods.
Credit Risk – Credit risk is the risk that one or more debt instruments in the Fund’s portfolio will decline in price or fail to pay interest or principal when due because the borrower experiences a decline in its financial status. Losses may occur because the market value of a debt security is affected by the creditworthiness of the issuer and by general economic and specific industry conditions.
Qualification for CRA Credit Risk – Although the Adviser believes that the Fund’s 504 First Lien Loan investments will have the community development qualities that are eligible for favorable consideration as community development loans and qualified investments under the CRA, there is no guarantee that an investor will receive CRA credit for an investment in the Fund.
Geographic Concentration Risk – The Fund’s 504 First Lien Loan investments are currently concentrated in California. As a result, the Fund may be more susceptible to being adversely affected by any single occurrence in California. Mortgaged properties in California may be particularly susceptible to economic risks of the state and certain types of hazards, such as earthquakes, floods, mudslides, wildfires and other natural disasters, for which there may or may not be insurance. As of June 30, 2019, 30.80% of the Fund’s investments were associated with properties located in California. Mortgaged properties in other states similarly may be adversely affected by natural disasters, for which there may not be insurance and which could result in substantial loss to the Fund.
Valuation Risk – Unlike publicly traded equity securities that trade on national exchanges, there is no central place or exchange for 504 First Lien Loans to trade. Due to the lack of centralized information and trading, the Adviser’s judgment plays a greater role in the valuation process and the valuation of 504 First Lien Loans. Uncertainties in the conditions of the financial market, unreliable reference data, lack of transparency and inconsistency of valuation models and processes may lead to inaccurate asset pricing. In addition, other market participants may value instruments differently than the Fund, and therefore the actual amount received in the sale of the 504 First Lien Loan may be less than the fair value of such loan, as determined by the Fund.
For other risks associated with the Fund and its investments please refer to the “Risks” section in the Fund’s current prospectus.
4. Periodic Repurchase Offers
The Fund will make periodic offers to repurchase a portion of its outstanding Shares at NAV per Share. The Fund has adopted a fundamental policy to make repurchase offers once every twelve months. The Fund will offer to repurchase 10% of its outstanding Shares, unless the Board has approved a different amount (not less than 5% or more than 25% of its outstanding Shares for a particular repurchase offer). The Fund does not currently expect to charge a repurchase fee.
14

|
NOTES TO FINANCIAL STATEMENTS
June 30, 2019
|
4. Periodic Repurchase Offers (continued)
For the year ended June 30, 2019, the Fund had one repurchase offer as follows:
Repurchase
Offer Notice | Repurchase
Request Deadline | Repurchase
Pricing Date | Repurchase
Offer Amount | % of Shares
Repurchased | Number of
Shares
Repurchased |
December 14, 2018 | January 9, 2019 | January 18, 2019 | 5% | 5% | 239,796 |
5. Administration, Distribution, Transfer Agency and Custodian Agreements
The Fund and its administrator, UMB Fund Services, Inc. (“UMBFS”), are parties to an administration agreement under which UMBFS provides administrative and fund accounting services.
UMBFS also serves as the transfer agent and dividend disbursing agent for the Fund.
UMB Bank, N.A. serves as the custodian and escrow agent (the “Custodian”) for the Fund. The Custodian plays no role in determining the investment policies of the Fund or which securities are to be purchased and sold by the Fund.
The Fund and Foreside Fund Services, LLC (the “Distributor”) are parties to a distribution agreement under which the Distributor acts as the principal underwriter for the Fund.
6. Investment Advisory Agreement
The Fund has entered into an investment advisory agreement (the “Investment Advisory Agreement”) with the Adviser, effective May 1, 2019. Under the Investment Advisory Agreement, the Adviser makes investment decisions for the Fund and continuously reviews, supervises and administers the investment program of the Fund, subject to the supervision of, and policies established by, the Board. For providing these services, the Adviser will receive a fee from the Fund, accrued daily and paid monthly, at an annual rate equal to 1.50% of the Fund’s average daily net assets. In addition, the Adviser has contractually agreed to waive or reduce its advisory fees and/or reimburse expenses of the Fund to ensure that total annual fund operating expenses (“Total Annual Expenses”) after fee waiver and/or expense reimbursement (excluding interest, leverage interest (i.e., any expenses incurred in connection with borrowings made by the Fund), taxes, brokerage commissions, acquired fund fees and expenses and extraordinary expenses (collectively, “Excluded Expenses”)) will not exceed 1.75% of the Fund’s average net assets pursuant to an operating expenses limitation agreement dated March 1, 2019 (the “Operating Expenses Limitation Agreement”). Under the terms of the Operating Expenses Limitation Agreement, the Adviser is permitted to be reimbursed in any subsequent month in the three-year period from the date of the fee waiver and/or expense reimbursement if the aggregate amount actually paid by the Fund toward operating expenses for such month (taking into account the reimbursement) will not cause the Fund to exceed the lesser of: (a) the expense limitation in effect at the time of the fee waiver and/or expense reimbursement; or (b) the expense limitation in effect at the time of the reimbursement. The Operating Expenses Limitation Agreement is in effect through at least May 1, 2021, and may be terminated only by, or with the consent of, the Board.
From March 1, 2019 to April 30, 2019, the Fund had entered into an interim investment advisory agreement (the “Interim Agreement”) with the Adviser. Under the Interim Agreement, the Adviser made investment decisions for the Fund and continuously reviewed, supervised and administered the investment program of the Fund, subject to the supervision of, and policies established by, the Board. For providing these services, the Adviser received a fee from the Fund, accrued
15

|
NOTES TO FINANCIAL STATEMENTS
June 30, 2019
|
6. Investment Advisory Agreement (continued)
daily and paid monthly, at an annual rate equal to 1.50% of the Fund’s average daily net assets. However, the Adviser had contractually agreed to waive or reduce its management fees and/or reimburse expenses of the Fund pursuant to the Operating Expenses Limitation Agreement.
Prior to March 1, 2019, the Fund had entered into an investment advisory agreement (the “Prior Agreement”) with the Prior Adviser. Under the Prior Agreement, the Prior Adviser made investment decisions for the Fund and continuously reviewed, supervised and administrated the investment program of the Fund, subject to the supervision of, and policies established by, the Board. For providing these services, the Prior Adviser received a fee from the Fund, accrued daily and paid monthly, at an annual rate equal to 1.75% of the Fund’s average daily net assets. However, the Prior Adviser had contractually agreed to waive or reduce its management fees and/or reimburse expenses of the Fund to ensure that total annual fund operating expenses after fee waiver and/or expense reimbursement (excluding interest, leverage interest (i.e., any expenses incurred in connection with borrowings made by the Fund), taxes, brokerage commissions, acquired fund fees and expenses and extraordinary expenses, and including organizational and offering costs) would not exceed 1.75% of the average net assets of the Fund (the “Prior Operating Expenses Limitation Agreement”). Under the terms of the Prior Operating Expenses Limitation Agreement, the Prior Adviser was permitted to be reimbursed for fee waivers and/or expense reimbursements made for a period of three fiscal years following the end of the fiscal year in which such waiver or reimbursement was accrued, except for initial organizational expenses which were subject to reimbursement by the Fund to the Prior Adviser for a period of three years from the date on which such expenses were incurred, subject to the limitation on the Fund’s expenses in effect at the time such reimbursement was paid to the Prior Adviser. Effective March 1, 2019, the Prior Operating Expense Limitation Agreement was terminated and, as a result, the Prior Adviser is not eligible to be reimbursed by the Fund for any previously waived fees or expenses reimbursed.
For the year ended June 30, 2019, the Adviser waived expenses totaling $136,921 that are subject to reimbursement.
As of June 30, 2019, the Adviser’s fees and expenses subject to reimbursement were as follows:
7. Investment Transactions
For the year ended June 30, 2019, there were proceeds from principal payments of $5,318,355 and no long term purchases in the Fund.
8. Federal Tax Information
At June 30, 2019, gross unrealized appreciation (depreciation) of investments owned by the Fund, based on cost for federal income tax purposes, were as follows:
Cost of investments | | $ | 45,501,203 | |
Gross unrealized appreciation | | $ | 272,041 | |
Gross unrealized depreciation | | | (911,909 | ) |
Net unrealized depreciation on investments | | $ | (639,868 | ) |
16

|
NOTES TO FINANCIAL STATEMENTS
June 30, 2019
|
8. Federal Tax Information (continued)
GAAP requires that certain components of net assets be reclassified between financial and tax reporting. These reclassifications have no effect on net assets or net asset value per share. For the year ended June 30, 2019, permanent differences in book and tax accounting resulting primarily from differing treatments for amortization of organizational costs have been reclassified to paid in capital and total accumulated deficit as follows:
Increase (Decrease) |
Paid in
Capital | Total
Accumulated
Deficit |
1,422 | (1,422) |
As of June 30, 2019, the components of distributable earnings (accumulated deficit) on a tax basis for the Fund were as follows:
Undistributed ordinary income | | $ | 471 | |
Accumulated capital and other losses | | | (24,466 | ) |
Unrealized depreciation on investments | | | (639,868 | ) |
Total distributable earnings (accumulated deficit) | | $ | (663,863 | ) |
As of June 30, 2019, the Fund had a short-term capital loss carryover of $0 and long-term capital loss carryover of $24,466. To the extent that the fund may realize future net capital gains, those gains will be offset by any of its unused capital loss carryfoward. Future capital loss carryover utilization in any given year may be subject to Internal Revenue Code limitations.
The tax character of distributions paid during the fiscal years ended June 30, 2019 and June 30, 2018 were as follows:
| | 2019 | | | 2018 | |
Distribution paid from: | | | | | | | | |
Ordinary income | | $ | 1,644,310 | | | $ | 1,831,415 | |
Long-term capital gains | | | 44,551 | | | | — | |
Total Distributions | | $ | 1,688,861 | | | $ | 1,831,415 | |
17

|
NOTES TO FINANCIAL STATEMENTS
JUNe 30, 2019
|
9. Control Ownership
The beneficial ownership, either directly or indirectly, of more than 25% of the voting securities creates a presumption of control of the Fund, under Section 2(a)(9) of the 1940 Act. As of June 30, 2019, Northwest Federal Credit Union had ownership in the Fund in the amount of 46.31%.
10. Related Party Transaction
The Trustees of the Fund who are not “interested persons” of the Fund as defined by the 1940 Act (the “Independent Trustees”) approved the following compensation to be paid to Robert O. Judge in his previous capacity as President of the Fund: (a) an annual retainer of $10,000 for service as President; and (b) $1,500 per Board meeting attended. The Fund paid Mr. Judge $16,000 for his services as President for the period July 1, 2018 to February 28, 2019.
Effective as of March 1, 2019, Lee A. Calfo replaced Mr. Judge as President of the Fund. Mr. Calfo is not compensated by the Fund for his services as President.
11. Subsequent Events
The Fund has evaluated the events and transactions through the date the financial statements were issued and determined there were no subsequent events that required adjustments to our disclosure in the financial statements.
18

|
Report of Independent Registered Public Accounting Firm
|
To the Shareholders and Board of Trustees of
Bluestone Community Development Fund
Opinion on the Financial Statements
We have audited the accompanying statement of assets and liabilities, including the schedule of investments, of Bluestone Community Development Fund (formerly known as The 504 Fund) (the “Fund”), as of June 30, 2019, and the related statements of operations and cash flows for the year then ended, the statements of changes in net assets for each of the two years in the period then ended, including the related notes, and the financial highlights for each of the five years in the period then ended (collectively referred to as the “financial statements”). In our opinion, the financial statements present fairly, in all material respects, the financial position of the Fund as of June 30, 2019, the results of its operations and its cash flows for the year then ended, the changes in its net assets for each of the two years in the period then ended, and the financial highlights for each of the five years in the period then ended, in conformity with accounting principles generally accepted in the United States of America.
Basis for Opinion
These financial statements are the responsibility of the Fund’s management. Our responsibility is to express an opinion on the Fund’s financial statements based on our audits. We are a public accounting firm registered with the Public Company Accounting Oversight Board (United States) (“PCAOB”) and are required to be independent with respect to the Fund in accordance with the U.S. federal securities laws and the applicable rules and regulations of the Securities and Exchange Commission and the PCAOB.
We conducted our audits in accordance with the standards of the PCAOB. Those standards require that we plan and perform the audit to obtain reasonable assurance about whether the financial statements are free of material misstatement, whether due to error or fraud.
Our audits included performing procedures to assess the risks of material misstatement of the financial statements, whether due to error or fraud, and performing procedures that respond to those risks. Such procedures included examining, on a test basis, evidence regarding the amounts and disclosures in the financial statements. Our procedures included confirmation of securities owned as of June 30, 2019, by correspondence with the custodian. Our audits also included evaluating the accounting principles used and significant estimates made by management, as well as evaluating the overall presentation of the financial statements. We believe that our audits provide a reasonable basis for our opinion.
Emphasis of Matter
As discussed in Note 2 to the financial statements, the financial statements include investments valued at $34,865,713 (77.59% of net assets) as of June 30, 2019, whose fair values have been estimated by management in accordance with policies approved by and under the general oversight of the Board of Trustees in the absence of readily determinable fair values.
We have served as the Fund’s auditor since 2013.

COHEN & COMPANY, LTD.
Milwaukee, Wisconsin
August 28, 2019
19

|
Other Information (Unaudited)
June 30, 2019
|
Proxy Voting
For a description of the policies and procedures that the Fund uses to determine how to vote proxies relating to portfolio securities, please call the Fund at 855-386-3504 and request a Statement of Additional Information. One will be mailed to you free of charge. The Statement of Additional Information is also available on the SEC’s website at http://www.sec.gov.
Information on how the Fund voted proxies relating to portfolio securities during the most recent 12-month period ended June 30 is available without charge, upon request, by calling the Fund at 855-386-3504 or by accessing the SEC’s website http://www.sec.gov.
Disclosure of Portfolio Holdings
The Fund files a complete schedule of portfolio holdings with the SEC for the first and third quarters of each fiscal year on Form N-Q. The Fund’s Form N-Q is available on the SEC’s website at www.sec.gov.
Matters Submitted for Shareholder Consent
The Board sought shareholder approval of the Investment Advisory Agreement by written consent of shareholders, rather than by calling a special meeting of shareholders, because the Fund had a limited number of shareholders as of the close of business on March 15, 2019 (the “Record Date”). The Fund’s Amended and Restated Agreement and Declaration of Trust provides that any action to be taken by shareholders may be taken without a meeting and by written consent. The Board mailed a Notice, Consent Solicitation Statement and the Consent of Shareholder to shareholders on or about March 22, 2019. Shareholders holding a majority of the Fund’s outstanding shares affirmatively consented to approve the Investment Advisory Agreement on or before May 1, 2019.
As of the Record Date, 4,556,132.538 shares of the Fund were issued and outstanding and entitled to vote on the proposal. The results of the consent solicitation were as follows:
Proposal: To approve a new investment advisory agreement between Bluestone Community Development Fund and Bluestone Capital Partners LLC.
Consent | Consent Withheld | Abstain |
4,548,101.075 | — | 8,031.463 |
Long Term Capital Gains Designation
Pursuant to IRC 852(b)(3) of the Internal Revenue Code, the Fund hereby designates $44,551 as long-term capital gains distributed during the year ended, June 30, 2019.
Basis for Approval of Advisory Agreement
At an in-person meeting held on February 26, 2019 (the “Board Meeting”), the Board (also referred to as the “Trustees”), including a majority of the Trustees who are not “interested persons” of the Fund as defined by the 1940 Act (the “Independent Trustees”), approved the interim investment advisory agreement (the “Interim Agreement”) dated March 1, 2019 and the permanent investment advisory agreement (the “Permanent Agreement”) dated May 1, 2019 between Bluestone Community Development Fund (the “Fund”) and Bluestone Capital Partners LLC (“Bluestone”). The Independent Trustees were assisted by independent legal counsel throughout the review and approval process, including meeting separately in
20

|
OTHER INFORMATION (UNAUDITED)
June 30, 2019
|
executive session with their counsel, who provided advice regarding their duties and responsibilities in connection with the review of the Interim and Permanent Agreements. In reaching its decision, the Board considered that the material terms of the Interim and Permanent Agreements are substantially similar to those of the investment advisory agreement (the “Prior Agreement”) between the Fund and 504 Fund Advisors, LLC (the “Prior Adviser”) and that the annual advisory fee rate would be lowered from 1.75% to 1.50% of the current net assets of the Fund. The Board also considered the presentation by Bluestone and information received at or prior to its Board Meeting in response to detailed requests by the Board and their counsel. The Board also considered alternatives to approving the Interim and Permanent Agreements, noting discussions in prior Board meetings relating to other potential successor investment advisers.
The Trustees discussed the factors relevant in determining whether to approve the Interim and Permanent Agreements, including the following: (1) the nature, extent, and quality of the services to be provided by Bluestone; (2) the cost of the services to be provided and the profits to be realized by Bluestone and its affiliates from services rendered to the Fund; (3) comparative fee and expense data for the Fund; (4) the extent to which economies of scale would be realized as the Fund grows and whether the proposed advisory fee for the Fund reflects these economies of scale for the benefit of the Fund; and (5) other financial benefits to Bluestone and its affiliates resulting from services rendered to the Fund. In their deliberations, the Trustees did not identify any particular information that was all-important or controlling.
Nature, Extent and Quality of Services to be Provided to the Fund. The Trustees considered the scope of services to be provided under the Interim and Permanent Agreements, noting that the services to be performed by Bluestone under the Interim and Permanent Agreements are the same as the services performed by 504 Fund Advisors under the Prior Agreement, and are adequate and appropriate. In considering the nature, extent and quality of the services to be provided by Bluestone, the Board reviewed the resources and financial condition of Bluestone, its members, and certain of its affiliates. The Board noted that Bluestone is an affiliate of Bluestone Capital Management, LLC (“BCM”), an SEC-registered investment adviser organized in 2012 and controlled by Mr. Calfo with discretionary and non-discretionary assets under management of approximately $254 million and $2.3 billion, respectively, as of December 31, 2018 and significant resources to support the operations and financial condition of Bluestone. Mr. Calfo also represented to the Board that the principals of both Bluestone and BCM have significant business and personal resources to support the management of the Fund. The Board also reviewed the qualifications of Messrs. Calfo and Gladue to serve as portfolio managers for the Fund and the continued service of Messrs. Blanchard and Judge as portfolio managers for the Fund. The Board noted that Messrs. Blanchard and Judge have served as portfolio managers for the Fund since its inception and each are registered representatives of Bluestone and will continue to provide services to the Fund in connection with a services agreement entered into between Bluestone and Live Oak. The Board also noted that as a Portfolio Manager with BCM, Mr. Calfo currently serves as a portfolio manager for an open-end investment company for which BCM serves as a sub-adviser. Bluestone’s Form ADV registration statement was provided to the Board, as was the response of Bluestone to a detailed series of questions from Fund counsel. The Board also considered other services to be provided to the Fund by Bluestone, such as monitoring adherence to the Fund’s investment restrictions and monitoring compliance with various Fund policies and procedures and with applicable securities regulations. Based on the factors above, as well as those discussed below, the Board concluded that it was satisfied with the nature, extent and quality of the services to be provided to the Fund by Bluestone.
Investment Performance of Bluestone; Review of Fund Performance. The Board noted that Bluestone, as a newly-registered investment adviser, does not have any investment performance history. Bluestone does not manage any separate accounts or funds that are comparable to the Fund’s investment strategies.
Cost of Services Provided and Profits Realized by Bluestone. The Board noted that the annual advisory fee rate of 1.50% payable by the Fund under the Interim and Permanent Agreements is lower than the annual advisory fee rate of 1.75% paid by the Fund under the Prior Agreement. The Board then considered the management fees and expense ratios of a peer group of closed-end loan participation funds and business development company funds compiled by the Fund’s administrator, and
21

|
OTHER INFORMATION (UNAUDITED)
June 30, 2019
|
concluded that the management fee was reasonable and the result of arm’s length negotiations. Additionally, the Board took into consideration that Bluestone has contractually agreed to limit the total annual operating expenses of the Fund to 1.75% through at least March 1, 2021, which may result in Bluestone waiving some or all of its management fees or reimbursing Fund expenses. The Board also evaluated the compensation, benefits and profitability expected to be received by Bluestone from its relationship with the Fund. The Board reviewed a pro forma budget prepared by Bluestone and Bluestone represented to the Board that BCM would support Bluestone in the event of any operating income shortfalls.
Economies of Scale. The Board determined that, while Bluestone is likely to realize economies of scale in managing the Fund if assets grow in size, the Fund will not initially benefit from economies of scale. The Board also determined that through fee waivers, Bluestone was in effect providing access to economies of scale to the Fund and its shareholders that they may not have achieved until the Fund reached significantly higher asset levels. The Board noted that Bluestone has the ability to recoup previously waived fees and expenses under the terms of its operating expenses limitation agreement with the Fund. The Board concluded that the assets of the Fund were not likely to increase to such an extent that breakpoints would be appropriate, particularly in light of the operating expenses limitation agreement in place, and that the fee arrangement was appropriate.
Benefits Derived from the Relationship with the Fund. The Board considered the direct and indirect benefits that could be received by Bluestone from its association with the Fund. The Board determined that the benefits Bluestone may receive, such as greater name recognition and the ability to attract additional investor assets, appear to be reasonable, and in many cases, may benefit the Fund.
Section 15(f) Safe Harbor. The Board also considered whether the Assignment was structured to comply with Section 15(f) of the 1940 Act, which contains provisions intended to protect the interests of Fund shareholders.
Section 15(f) of the 1940 Act is a safe harbor that permits an investment adviser to receive any amount or benefit in connection with a sale of an interest in the adviser that results in an assignment of an investment advisory agreement, provided two conditions are satisfied. First, during the three-year period immediately following the transaction, at least 75% of the fund’s board of trustees must not be “interested persons” (as defined in the 1940 Act) of the investment adviser or predecessor adviser. Second, no “unfair burden” may be imposed on the fund as a result of the transaction. The term “unfair burden,” as defined in the 1940 Act, includes any arrangement during the two-year period after the transaction whereby the investment adviser (or predecessor or successor adviser), or any interested person of any such investment adviser, receives or is entitled to receive any compensation, directly or indirectly (1) from any person in connection with the purchase or sale of securities or other property to, from or on behalf of such fund, other than bona fide ordinary compensation as principal underwriter for such fund; or (2) from such fund or its security holders for other than bona fide compensation for investment advisory services or other services. If either condition of Section 15(f) is not met, the safe harbor is not available.
The Board considered that at least 75% of the Board’s Trustees are Independent Trustees and that the Board has not been advised of any circumstances arising under the Assignment that might result in the imposition of an “unfair burden” being imposed on the Fund. The Board also considered that Bluestone informed the Board that it intends to comply with the conditions of Section 15(f), including that the annual advisory fee rate will be lowered from 1.75% to 1.50% of the current net assets of the Fund and that the current operating expenses limitation agreement will maintain a total annual expense limit of 1.75% of the Fund’s average annual net assets at least through March 1, 2021.
Based on all of the information considered, the Board concluded that the terms of the Interim and Permanent Agreements were fair and reasonable and that the approval of the Interim and Permanent Agreements was in the best interests of the Fund and its shareholders.
22

|
Trustees and Officers (Unaudited)
June 30, 2019
|
Information pertaining to the Trustees and officers of the Fund is set forth below. Trustees who are not “interested persons” of the Fund as that term is defined in the 1940 Act are referred to as “Independent Trustees.” Unless otherwise noted, the business address of each Trustee or officer is c/o Bluestone Community Development Fund, 37 West Avenue, Suite 301, Wayne, PA 19087. The business address for Mr. Gladue is c/o Bluestone Capital Partners LLC, 151 Calle San Francisco, Suite 200 PMB 5333, San Juan, PR 00901-1607. The business address for Ms. Cordle is c/o Oyster Consulting, LLC, 4128 Innslake Dr., Glen Allen, VA 23060. The Statement of Additional Information includes additional information about the Trustees and is available, without charge, upon request by calling the Fund at 855-386-3504.
Name and
Year of Birth | Position with
Fund and
Length of Term | Principal Occupations
in the Past 5 Years | Number of
Portfolios
in Fund
Complex
Overseen
By Trustee | Other Directorships
Held in the Past 5
Years |
Interested Trustee | | | |
Lee A. Calfo
Born: 1977 | Trustee, President and Principal Executive Officer (Indefinite term; since 2019) | Chief Executive Officer and Portfolio Manager, Bluestone Capital Partners LLC (investment advisory firm) (since 2019); Chief Executive Officer, J. Alden Associates, Inc. (broker-dealer) (since 2018); Chief Executive Officer and Founder, MCG Securities LLC (broker-dealer) (since 2012); Chief Executive Officer and Portfolio Manager, Bluestone Capital Management, LLC (investment advisory firm) (since 2010) | 1 | N/A |
Independent Trustees | | | |
J. Clay Singleton, Ph.D., CFA
Born: 1947 | Trustee
(Indefinite term; since 2013) | Principal in Marshall-Singleton (a fiduciary liability consulting firm) (since 2017); Professor Emeritus of Finance, Crummer Graduate School of Business, Rollins College (2002-2017) | 1 | Independent Trustee, USFS Funds Trust (an open-end investment company with two series) (2013-2014) |
Cornelius J. Lavelle
Born: 1944 | Trustee
(Indefinite term; since 2013) | Retired; Director-Institutional Equities, Citigroup Global Markets Inc. (multinational financial services firm) (1997-2009) | 1 | Independent Trustee, Broadview Funds Trust (an open-end investment company with one series) (since 2013); Independent Trustee, USFS Funds Trust (an open-end investment company with two series) (2013-2014) |
23

|
TRUSTEES AND OFFICERS (UNAUDITED)
June 30, 2019
|
Name and
Year of Birth | Position with
Fund and
Length of Term | Principal Occupations
in the Past 5 Years | Number of
Portfolios
in Fund
Complex
Overseen
By Trustee | Other Directorships
Held in the Past 5
Years |
Independent Trustees (continued) | | | |
George Stelljes, III
Born: 1961 | Chairman of the Board (Indefinite term; since August 2016) and Trustee (Indefinite term; since 2013) | Managing Partner, St. John’s Capital, LLC (private investment fund) (since 2012); President, Chief Investment Officer and Director of the Gladstone Companies (family of public and private investment funds) (2001-2012) | 1 | Director, Oxford Square Capital Corp. (f/k/a TICC Capital Corp.) (business development company) (since 2016); Director, Intrepid Capital Corporation (asset management firm) (since 2003); Director, Gladstone Capital Corporation (business development company) (2001–2012); Director, Gladstone Commercial Corporation (real estate investment trust) (2003–2012); Director, Gladstone Investment Corporation (business development company) (2005–2012) |
24

|
TRUSTEES AND OFFICERS (UNAUDITED)
June 30, 2019
|
Name and
Year of Birth | Position with
Fund and
Length of Term | Principal Occupations
in the Past 5 Years | Number of
Portfolios
in Fund
Complex
Overseen
By Trustee | Other Directorships
Held in the Past 5
Years |
Other Officers | | | | |
Joseph Gladue
Born: 1959 | Treasurer, Principal Financial Officer and Principal Accounting Officer (Indefinite term; since 2019) | Chief Compliance Officer and Portfolio Manager, Bluestone Capital Partners LLC (investment advisory firm) (since 2019); Director of Research, MCG Securities, LLC (broker dealer) (since 2015); Director of Research, J. Alden Associates, Inc. (broker dealer) (since 2019): Vice President Corporate Development, BofI Federal Bank (2014-2015) | N/A | N/A |
Kenneth R. Smith
Born: 1967 | Secretary (Indefinite term; since 2019) | Chief Compliance Officer, Bluestone Capital Partners LLC (investment advisory firm) (since2019); Chief Compliance Officer and Partner, Alden Capital Management, LLC (asset management firm) (since 2018); Chief Compliance Officer and Partner, J. Alden Associates, Inc. (broker dealer) (since 2018); Chief Compliance Officer, Dekania Capital Management, LLC (investment advisory firm) (since 2016); Chief Compliance Officer, Cohen & Company Financial Management, LLC (investment advisory firm) (since 2016); Chief Compliance Officer, Bluestone Capital Management, LLC (investment advisory firm) (since 2014); Chief Compliance Officer, Merion Capital Group (broker dealer) (since 2011); Chief Compliance Officer and Founder, Compass Financial Advisors, LLC (investment advisory firm) (since 2003) | N/A | N/A |
Polly W. Cordle
Born: 1973 | Chief Compliance Officer and AML Compliance Officer (Indefinite term; since 2018) | Associate Director, Oyster Consulting, LLC (compliance consulting to financial services firms) (since 2010) | N/A | N/A |
25
BLUESTONE COMMUNITY DEVELOPMENT FUND
37 West Avenue, Suite 301
Wayne, PA 19087
INVESTMENT ADVISER
Bluestone Capital Partners LLC
151 Calle San Francisco, Suite 200 PMB 5333
San Juan, PR 00901-1607
INDEPENDENT REGISTERED PUBLIC ACCOUNTING FIRM
Cohen & Company, Ltd.
342 North Water Street, Suite 830
Milwaukee, WI 53202
LEGAL COUNSEL
Godfrey & Kahn, S.C.
833 East Michigan Street, Suite 1800
Milwaukee, WI 53202
CUSTODIAN
UMB Bank, N.A.
1010 Grand Boulevard
Kansas City, MO 64106
DISTRIBUTOR
Foreside Fund Services, LLC
Three Canal Plaza, Suite 100
Portland, ME 04101
TRANSFER AGENT
UMB Fund Services, Inc.
235 West Galena Street
Milwaukee, WI 53212
There can be no assurance that the Fund will achieve its investment objectives. An investment in the Fund is an appropriate investment only for those investors who can tolerate a high degree of risk and do not require a liquid investment. Investors may lose some or all of their investment in the Fund. The Fund is not designed to be a complete investment program and may not be a suitable investment for all investors. The risk factors described are the principal risk factors associated with an investment in the Fund, as well as those factors associated with an investment in an investment company with similar investment objectives and investment policies.
This report is submitted for the general information of the shareholders of the Fund. It is not authorized for distribution to prospective investors unless preceded or accompanied by an effective prospectus, which includes information regarding the Fund’s risks, objectives, fees, expenses and experience of its management and other considerations.
ITEM 2. CODE OF ETHICS.
(a) Bluestone Community Development Fund (the “registrant” or the “Fund”), as of the end of the period covered by this report, has adopted a code of ethics (the “code of ethics”) that applies to the registrant's principal executive officer, principal financial officer, principal accounting officer and controller, or persons performing similar functions, regardless of whether these individuals are employed by the registrant or a third party.
(c) There have been no amendments, during the period covered by this report, to the code of ethics.
(d) The registrant has not granted any waivers, during the period covered by this report, including an implicit waiver, from any provision of the code of ethics.
A copy of the registrant’s code of ethics is filed herewith.
ITEM 3. AUDIT COMMITTEE FINANCIAL EXPERT.
The registrant’s board of trustees has determined that there are two audit committee financial experts serving on its audit committee. Mr. George Stelljes, III and Dr. J. Clay Singleton are each qualified to serve as audit committee financial experts on its audit committee and each is "independent," as defined by Item 3(a)(2) of Form N-CSR.
ITEM 4. PRINCIPAL ACCOUNTANT FEES AND SERVICES.
The registrant has engaged Cohen & Company, Ltd. to perform audit services, audit-related services, tax services and other services during the fiscal year ended June 30, 2019. “Audit services” refer to performing an audit of the registrant's annual financial statements or services that are normally provided by the accountant in connection with statutory and regulatory filings or engagements for those fiscal years. “Audit-related services” refer to the assurance and related services by the principal accountant that are reasonably related to the performance of the audit. “Tax services” refer to professional services rendered by the principal accountant for tax compliance, tax advice, and tax planning. The following table details the aggregate fees billed or expected to be billed for the fiscal years 2018 and 2019 for audit fees, audit-related fees, tax fees and other fees by Cohen & Company, Ltd.
| | FYE 6/30/2018 | FYE 6/30/2019 |
| Audit Fees | $70,000 | $60,000 |
| Audit-Related Fees | $1,636 | $1,000 |
| Tax Fees | $3,000 | $3,000 |
| All Other Fees | $0 | $0 |
The audit committee has adopted pre-approval policies and procedures that require the audit committee to pre-approve all audit and non-audit services of the registrant, including services provided to any entity affiliated with the registrant.
The percentage of fees billed by Cohen & Company, Ltd. applicable to non-audit services pursuant to waiver of pre-approval requirement were as follows:
| | FYE 6/30/2018 | FYE 6/30/2019 |
| Audit-Related Fees | 0% | 0% |
| Tax Fees | 0% | 0% |
| All Other Fees | 0% | 0% |
All of the principal accountant’s hours spent on auditing the registrant’s financial statements were attributed to work performed by full-time permanent employees of the principal accountant.
The following table indicates the non-audit fees billed or expected to be billed by the registrant’s accountant for services to the registrant and to the registrant’s investment adviser (and any other controlling entity, etc.) for the last two fiscal years.
The amount of fees billed by Cohen & Company, Ltd. applicable to non-audit fees were as follows:
| | FYE 6/30/2018 | FYE 6/30/2019 |
| Registrant | $3,000(1) | $3,000(1) |
| Registrant’s Investment Adviser | $0 | $0 |
| | (1) | The aggregate non-audit fees were for tax services rendered to the registrant. As disclosed above, the amount of fees billed for such services were $3,000 for the fiscal years ended June 30, 2018 and 2019. |
ITEM 5. AUDIT COMMITTEE OF LISTED REGISTRANTS.
Not applicable.
ITEM 6. INVESTMENTS.
Schedule of Investments in securities of unaffiliated issuers as of the close of the reporting period is included as part of the report to shareholders filed under Item 1 of this Form.
ITEM 7. DISCLOSURE OF PROXY VOTING POLICIES AND PROCEDURES FOR CLOSED-END MANAGEMENT INVESTMENT COMPANIES.
Not applicable. During the period covered by this report, the Fund invested exclusively in non-voting securities. In the event that the Fund invests in voting securities, the Adviser will adopt proxy voting policies and procedures.
ITEM 8. PORTFOLIO MANAGERS OF CLOSED-END MANAGEMENT INVESTMENT COMPANIES.
(a)(1) Identification of Portfolio Manager(s) and Description of Role of Portfolio Manager(s)
The following table provides biographical information about the Portfolio Managers, who are primarily responsible for the day-to-day portfolio management of the Fund as of the date hereof:
| Name of Portfolio Manager | Title | Length of Time of Service to the Fund | Business Experience During the Past 5 Years |
| Lee A. Calfo | Portfolio Manager | Since 2019 | Mr. Calfo is the Chief Executive Officer for Bluestone Capital Partners LLC (2019 -present). Mr. Calfo is also the President and founder of Bluestone Capital Management, LLC, an investment advisory firm, where he serves as a Portfolio Manager and has managed the firm’s asset management strategies (2010 – present). He has also served as the Chief Executive Officer of MCG Securities LLC, a broker-dealer (2012 – present) and the Chief Executive Officer of J. Alden Associates, Inc., a broker-dealer, and Alden Capital Management, an asset management firm (2018 – present). Prior to founding Bluestone Capital Management, LLC, Mr. Calfo served as President of Iron Bay Capital in 2011, Portfolio Manager at Boenning & Scattergood, Inc. (2007 - 2009, and Chief Investment Officer and Director of Research at Cohen & Company Securities, LLC (2004 – 2007). |
| Joseph Gladue | Portfolio Manager | Since 2019 | Mr. Gladue is the Chief Financial Officer and for Bluestone Capital Partners LLC (2019 – present). Mr. Gladue has also served as the Director of Research for MCG Securities, LLC, a broker-dealer, (2015 – present) and the Director of Research for J. Alden Associates, Inc., broker-dealer (2018 – present). Mr. Gladue served as Vice President Corporate Development for BofI Federal Bank (2014 - 2015). He also served as an Analyst for B. Riley & Co., LLC (2007 - 2012 and Cohen & Company Securities, LLC (2003 – 2007). |
Jordan M. Blanchard | Portfolio
Manger | Since Inception | Mr. Blanchard served as the Chief Executive Officer and Chief Operating Officer of 504 Fund Advisors, LLC (2015 – present). Mr. Blanchard is also the General Manager – Renewable Energy Lending for Live Oak Bank (2016 – present). Mr. Blanchard was the Manager – Loan Syndications at Live Oak Banking Company, a wholly-owned subsidiary of Live Oak Bancshares, Inc., in 2017. Mr. Blanchard was the Managing Director of 504 Secondary Markets for Government Loan Solutions, Inc. (“GLS”), a wholly-owned subsidiary of Live Oak Bancshares, Inc. (2013 – 2015). GLS is a financial services company specializing in the SBA secondary market. Prior to joining GLS, Mr. Blanchard was President of Wholesale 504 Lending Consultants, LLC (“W504”), a financial services company that facilitated the sale and settlement of SBA 504 first lien loans through the temporary SBA First Mortgage Lien Pool program (2011 – 2012). Prior to joining W504, Mr. Blanchard was Executive Vice President of Capital Markets for CDC Direct Capital (“CDC Direct”) from 2009 to 2011. CDC Direct is a subsidiary of CDC Small Business Finance, the nation’s largest certified development company. |
Robert O. Judge | Portfolio
Manger | Since Inception | Mr. Judge is Chief Investment Officer for 504 Fund Advisors, LLC (2015 – present). Mr. Judge also is currently Chief Executive Officer of GLS, which he co-founded in 2006 for the purpose of bringing greater transparency, efficiency, and productivity to the SBA marketplace through the use of technology. GLS also assists lenders in compliance with Financial Accounting Standards Board (“FASB”) Accounting Standards Codification Topic 820 (“ASC 820”) regarding the proper valuation of their SBA servicing portfolios. Mr. Judge is the editor of the CPR Report®, a monthly publication that tracks SBA loan default, prepayment and secondary market activity. |
(a)(2) Other Accounts Managed by Portfolio Manager(s) or Management Team Member and Potential Conflicts of Interest
The following table provides information about portfolios and accounts, other than the Fund, for which the Portfolio Managers are primarily responsible for the day-to-day portfolio management as of June 30, 2019:
Name of Portfolio Manager | Type of Accounts | Total Number of Accounts Managed | Total Assets
($ millions) | Number of Accounts Managed for Which Advisory Fee is Based on Performance | Total Assets for Which Advisory Fee is Based on Performance |
| Lee A. Calfo | Registered Investment Companies | 0 | $0 | 0 | $0 |
| | Other Pooled Investment Vehicles | 1 | $70 | 0 | $0 |
| | Other Accounts | 100 | $30 | 0 | $0 |
| | | | | | |
| Joseph Gladue | Registered Investment Companies | 0 | $0 | 0 | $0 |
| | Other Pooled Investment Vehicles | 0 | $0 | 0 | $0 |
| | Other Accounts | 0 | $0 | 0 | $0 |
| | | | | | |
| Jordan M. Blanchard | Registered Investment Companies | 0 | $0 | 0 | $0 |
| | Other Pooled Investment Vehicles | 0 | $0 | 0 | $0 |
| | Other Accounts | 0 | $0 | 0 | $0 |
| | | | | | |
| Robert O. Judge | Registered Investment Companies | 0 | $0 | 0 | $0 |
| | Other Pooled Investment Vehicles | 0 | $0 | 0 | $0 |
| | Other Accounts | 0 | $0 | 0 | $0 |
Potential Conflicts of Interests
Bluestone Capital Partners LLC (the "Adviser") serves as the Fund’s investment adviser. The Adviser and the portfolio managers will be subject to certain conflicts of interest in their management of the Fund. These conflicts will arise primarily from the involvement of the Adviser and the portfolio managers in other activities that may conflict with those of the Fund and in connection with the allocation of investment opportunities between the Fund and other accounts managed by a portfolio manager.
The Adviser believes that the portfolio managers have sufficient time and resources to discharge their responsibilities to the Fund. However, conflicts of interest may arise in allocating time, services or functions between the Fund and other entities or businesses to which a portfolio manager provides services. A portfolio manager will devote such time to the Fund as he believes is reasonably necessary to the conduct of the business of the Fund and its respective investments.
In the ordinary course of his business activities, a portfolio manager may engage in activities where the interests of the Fund and its shareholders conflict with the interest of other entities or businesses to which a portfolio manager provides services. Other present and future activities of the portfolio managers or such entities or businesses may give rise to additional conflicts of interest. In the event that a conflict of interest arises, a portfolio manager will attempt to resolve such conflicts in a fair and equitable manner and in accordance with the requirements and limitations of the Investment Company Act of 1940, as amended.
(a)(3) Compensation Structure of Portfolio Manager(s) as of June 30, 2019
Messrs. Calfo and Gladue are compensated through their respective equity ownership interests in the Adviser. Neither Mr. Calfo nor Mr. Gladue receives compensation from the Fund. Mr. Blanchard is compensated by Live Oak Banking Company, a wholly-owned subsidiary of Live Oak Bancshares, with a fixed salary plus a bonus based on the performance of Live Oak Bancshares. Mr. Judge is compensated by Government Loan Solutions (“GLS”), a wholly-owned subsidiary of Live Oak Bancshares, with a fixed salary plus a bonus based upon the performance of GLS. Neither Mr. Judge nor Mr. Blanchard receives compensation from the Adviser or the Fund.
(a)(4) Disclosure of Securities Ownership
The following table sets forth the dollar range of equity securities beneficially owned by each Portfolio Manager in the Fund as of June 30, 2019:
| Portfolio Manager | Dollar Range of Fund Shares Beneficially Owned |
| Lee A. Calfo | None |
| Joseph Gladue | None |
| Jordan M. Blanchard | None |
| Robert O. Judge | None |
ITEM 9. PURCHASES OF EQUITY SECURITIES BY CLOSED-END MANAGEMENT INVESTMENT COMPANY AND AFFILIATED PURCHASERS.
There were no purchases made by or on behalf of the registrant or any “affiliated purchaser,” as defined in Rule 10b-18(a)(3) under the Exchange Act (17 CFR 240.10b-18(a)(3)), of shares or other units of any class of the registrant’s equity securities that is registered by the registrant pursuant to Section 12 of the Exchange Act (15 U.S.C. 781).
There were no purchases that do not satisfy the conditions of the safe harbor of Rule 10b-18 under the Exchange Act (17 CFR 240.10b-18), made in the period covered by this report.
ITEM 10. SUBMISSION OF MATTERS TO A VOTE OF SECURITY HOLDERS.
There have been no material changes to the procedures by which the shareholders may recommend nominees to the registrant's board of trustees, where those changes were implemented after the registrant last provided disclosure in response to the requirements of Item 407(c)(2)(iv) of Regulation S-K (17 CFR 229.407) (as required by Item 22(b)(15) of Schedule 14A (17 CFR 240.14a-101)), or this Item.
ITEM 11. CONTROLS AND PROCEDURES.
(a) The registrant's principal executive and principal financial officers, or persons performing similar functions, have concluded that the registrant's disclosure controls and procedures (as defined in Rule 30a-3(c) under the Investment Company Act of 1940, as amended (the "1940 Act") (17 CFR 270.30a-3(c))) are effective, as of a date within 90 days of the filing date of the report that includes the disclosure required by this paragraph, based on their evaluation of these controls and procedures required by Rule 30a-3(b) under the 1940 Act (17 CFR 270.30a-3(b)) and Rules 13a-15(b) or 15d-15(b) under the Securities Exchange Act of 1934, as amended (17 CFR 240.13a-15(b) or 240.15d-15(b)).
(b) There were no changes in the registrant's internal control over financial reporting (as defined in Rule 30a-3(d) under the 1940 Act (17 CFR 270.30a-3(d)) that occurred during the period covered by this report that have materially affected, or are reasonably likely to materially affect, the registrant's internal control over financial reporting.
ITEM 12. DISCLOSURE OF SECURITIES LENDING ACTIVITIES FOR CLOSED-END MANAGEMENT INVESTMENT COMPANIES.
Not applicable
ITEM 13. EXHIBITS.
(a)(1) Registrant’s Code of Ethics is filed herewith.
(a)(2) Certifications pursuant to Rule 30a-2(a) under the 1940 Act and Section 302 of the Sarbanes-Oxley Act of 2002 are filed herewith.
(a)(3) Not applicable.
(a)(4) There was no change in the registrant’s independent public accountant for the period covered by this report.
(b) Certifications pursuant to Rule 30a-2(b) under the 1940 Act and Section 906 of the Sarbanes-Oxley Act of 2002 are filed herewith.
SIGNATURES
Pursuant to the requirements of the Securities Exchange Act of 1934 and the Investment Company Act of 1940, the registrant has duly caused this report to be signed on its behalf by the undersigned, thereunto duly authorized.
| (Registrant) | Bluestone Community Development Fund | |
| | | |
| By (Signature and Title) | /s/ Lee A. Calfo | |
| | Lee A. Calfo, President | |
| | (principal executive officer) | |
| | | |
| Date | September 9, 2019 | |
Pursuant to the requirements of the Securities Exchange Act of 1934 and the Investment Company Act of 1940, this report has been signed below by the following persons on behalf of the registrant and in the capacities and on the dates indicated.
| By (Signature and Title) | /s/ Lee A. Calfo | |
| | Lee A. Calfo, President | |
| | (principal executive officer) | |
| | | |
| Date | September 9, 2019 | |
| | | |
| By (Signature and Title) | /s/ Joseph Gladue | |
| | Joseph Gladue, Treasurer | |
| | (principal financial officer) | |
| | | |
| Date | September 9, 2019 | |