Washington, D.C. 20549
ITEM 1. REPORTS TO STOCKHOLDERS.
The Report to Shareholders is attached herewith.
| 
ANNUAL REPORT FOR THE YEAR ENDED
JUNE 30, 2016 |

| SHAREHOLDER LETTER
June 30, 2016 |
| | |
Dear Shareholder:
The fiscal year ended on June 30, 2016 has been strong for the 504 Fund (the “Fund”) in terms of its performance, both absolute and relative, as well as providing an opportunity for institutional Fund investors that are subject to regulatory examination for compliance with the Community Reinvestment Act of 1977 (the “CRA”) to claim favorable regulatory consideration of their investment under the CRA. Moreover, the Fund has accomplished these important goals while also maintaining the strong credit metrics discussed below.
The best way to tell the Fund’s performance story is by comparison of our returns:
| Six Months Ended June 30, 2016 | Calendar Year Ended December 31, 2015 | Calendar Year Ended December 31, 2014 |
The 504 Fund | 4.27% | 3.71% | -0.56% |
Barclays Aggregate Bond Index | 5.31% | 0.55% | 5.97% |
BofA Merrill Lynch 1-3 Year U.S. Corp/Gov Bond Index | 1.65% | 0.67% | 0.78% |
BofA Merrill Lynch 3-5 Year U.S. Corp/Gov Bond Index | 3.86% | 1.57% | 2.46% |
Past performance does not guarantee future results. The performance data quoted represent past performance and current returns may be lower or higher. Share prices and investment returns fluctuate and an investor’s shares may be worth more or less than original cost upon redemption. For periods more than one year, performance is annualized. For performance data as of the most recent month-end please call 910-247-4880. The Adviser has contractually agreed to waive or reduce its management fees and/or reimburse expenses of the Fund until at least January 1, 2018 to ensure that total expenses do not exceed 1.75% of the Fund’s average net assets. May be subject to a 1% sales charge. The quoted performance reflects fee waivers and/or expense reimbursements in effect during those periods. Returns would have been lower without the waivers and reimbursements. Gross 3.54% and net 2.08%.
Strong investment performance is only part of the value equation for our shareholders. Since the Fund’s inception in mid-December of 2013, it has received investor deposits of over $50 million and successfully deployed all but $4.7 million of that sum in a total of 36 504 First Lien Loans. In so doing, the following statistics about asset deployment are important to consider:
| | ● | 336 new jobs were created (to qualify, most businesses must create or retain one job for every $65,000 of Small Business Administration (SBA) second lien loan financing ($100,000 for a small manufacturer)); |
| | ● | 275 jobs have been maintained; |
| | ● | $17.4 million or 36.8% of the loan portfolio involves women-owned businesses; |
| | ● | $14.5 million or 30.7% of the loan portfolio involves minority-owned businesses; |
| | ● | As of June 30, 2016, none of the Fund’s portfolio loans were troubled or in arrears; |
| | ● | The present Debt Service Coverage Ratio (“DSCR”) is 1.65 to 1; |
| | ● | The current average individual credit score is 748; |
| | ● | The effective Loan-to-Value ratio (“LTV”) is 50.2% of the Fund’s loan portfolio; |

|
SHAREHOLDER LETTER (CONTINUED)
June 30, 2016
|
| | |
| | ● | The current gross effective floor coupon rate of the Fund’s loan portfolio is 5.7%. |
| | ● | 30-Day SEC Yield*: 3.07% and Unsubsidized 30-Day SEC Yield**: 1.87% |
These metrics should be important to the Fund’s shareholders as they speak to the experience of the Fund’s portfolio management team in the 504 first lien loan space. Led by Robert Judge and Jordan Blanchard, the Fund’s portfolio management team has decades of experience in U.S. Small Business Administration (“SBA”) lending activities; and, 504 Fund Advisors, LLC (the “Adviser”), the Fund’s investment adviser, is a subsidiary of and controlled by Live Oak Bancshares, Inc. (“Live Oak”) of Wilmington, North Carolina (ticker: LOB). Live Oak is the second largest originator of SBA 7(a) loans in the United States based on lending volume through the end of the second quarter of 2016 according to the SBA. The point being, the Fund’s portfolio management team as well as the Adviser’s parent organization are well versed in SBA lending; this experience represents itself in the success the Fund has enjoyed since it commenced operations in mid-December of 2013.
The Adviser believes that the Fund represents an appropriate investment for investors looking for additional yield in floating rate loans in order to help against rising interest rates. The biggest risk, with the exception of default risk, to an investor’s bond portfolio that is composed primarily of fixed coupon instruments is the highly negative effect on bond pricing associated with a rising interest rate environment. As interest rates, using the 10-year U.S. Treasury as a benchmark, are at our near absolute lows since the 1950s, interest rate risk is an important consideration for any investor in this environment.
The Fund’s portfolio of loans have the strong credit and collateral metrics laid out above. Moreover, the Fund’s portfolio holdings have been the most senior security in the capital structure of the borrowing entities – they are secured by real estate and have the additional credit enhancement of having the U.S. government be in a first loss position for up to a maximum of 40% of each whole loan.
When considering all of these characteristics, the Fund offers the potential of a bond investment that will likely not be highly correlated to the fixed coupon bond market. Moreover, the Fund’s diversified portfolio of small-sized 504 first lien loans is not similar to any other available investment product that we have been able to identify. Therefore, we believe that the Fund’s loan portfolio may provide value to an overall portfolio plan.
Thank you for your continued investment in the Fund.
Sincerely,

* | The 30-Day SEC Yield - The 30-Day SEC Yield is computed under an SEC standardized formula based on net income earned over the past 30 days. It is a “subsidized” yield, which means it includes contractual expense reimbursements and it would be lower without those reimbursements. |
** | The Unsubsidized 30-Day SEC Yield - The Unsubsidized 30-Day SEC Yield is computed under an SEC standardized formula based on net income earned over the past 30 days. It excludes contractual expense reimbursements, resulting in a lower yield. |

|
TABLE OF CONTENTS
|
| | |
Schedule of Investments | 1 |
Statement of Assets and Liabilities | 5 |
Statement of Operations | 6 |
Statements of Changes in Net Assets | 7 |
Statement of Cash Flows | 8 |
Financial Highlights | 9 |
Notes to Financial Statements | 10 |
Report of Independent Registered Public Accounting Firm | 18 |
Other Information (Unaudited) | 19 |
Trustees and Officers (Unaudited) | 20 |

|
SCHEDULE OF INVESTMENTS
JUNE 30, 2016
|
| | |
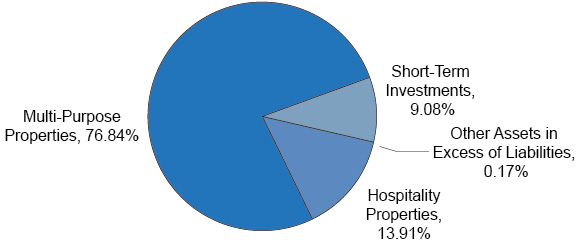
INVESTMENT TYPE AS A PERCENTAGE OF NET ASSETS AS FOLLOWS:
Description, State, Acquisition Date | Stated Interest Rate | | Effective Interest Rate | Maturity | | Cost | | | Principal | | | Fair Value | |
504 First Lien Loans — 90.75% | | | | | | | | | | | | | | |
Hospitality Properties — 13.91% | | | | | | | | | | | | | |
D S Hospitality, LLC, California, 3/10/2014(a),(b) | 1 Year Libor + 5.16% (5.43% Floor) | | 5.97 | % | 3/15/2044 | | $ | 1,660,619 | | | $ | 1,629,000 | | | $ | 1,698,803 | |
Moses Lake Investors, LLC, Washington, 9/18/2014(b),(c) | Prime + 2.25% (5.50% Floor) | | 5.75 | % | 10/1/2039 | | | 1,002,997 | | | | 965,426 | | | | 1,007,528 | |
Vaibhav Laxmi, Inc., Illinois, 8/14/2015(b) | 5 Year Libor + 4.75% (6.50% Floor) | | 6.00 | %* | 9/1/2026 | | | 1,655,307 | | | | 1,655,191 | | | | 1,678,430 | |
YC Anchorage Hotel Group, L.P., Alaska, 5/8/2014(b) | 3 Year Libor + 5.18% (6.18% Floor) | | 5.38 | %* | 5/15/2044 | | | 2,834,465 | | | | 2,835,937 | | | | 2,944,667 | |
Total Hospitality Properties | | | | | | | | | | | | | | | | 7,329,428 | |
| | | | | | | | | | | | | | | | | | |
Multi-Purpose Properties — 76.84% | | | | | | | | | | | | | | | | |
1250 Philadelphia, LLC, California, 10/3/2014(a),(b) | 5 Year Libor + 4.00% (5.93% Floor) | | 5.93 | % | 10/15/2039 | | | 2,568,258 | | | | 2,473,088 | | | | 2,671,850 | |
413 East 53rd Street, LLC,
New York, 2/4/2014(b) | 3 Year Libor + 4.17% (4.95% Floor) | | 4.95 | % | 2/1/2044 | | | 1,694,829 | | | | 1,667,305 | | | | 1,737,449 | |
7410-7428 Bellaire, LLC, California, 8/22/2014(a),(b) | 5 Year Libor + 4.00% (5.78% Floor) | | 5.78 | % | 9/15/2039 | | | 2,461,020 | | | | 2,370,299 | | | | 2,548,758 | |
77 West Mount Pleasant Avenue, LLC, New Jersey, 4/30/2015(b) | 3 Year Libor + 4.00% (5.125% Floor) | | 5.125 | % | 5/1/2040 | | | 341,426 | | | | 326,175 | | | | 343,932 | |
AKT Elevon Partners, LLC, California, 9/17/2015(b) | 5 Year Libor + 3.88% (5.70% Floor) | | 4.97 | %* | 10/1/2045 | | | 4,260,630 | | | | 4,263,155 | | | | 4,415,435 | |
Anthony Ghostine, Kristina J. Ghostine, California, 12/1/2014(b) | 3 Year Libor + 5.15% (6.30% Floor) | | 5.15 | %* | 12/1/2044 | | | 398,382 | | | | 398,382 | | | | 411,362 | |
BT Vineland, LLC, California, 1/5/2015(b) | 3 Year Libor + 5.40% (6.74% Floor) | | 5.34 | %* | 1/1/2045 | | | 936,501 | | | | 937,002 | | | | 972,983 | |
Caruba Properties, LLC,
New Jersey, 6/12/2014(b) | 6.00% (6.00% Floor) | | 6.00 | % | 9/2/2036 | | | 616,577 | | | | 598,098 | | | | 634,068 | |
See accompanying notes to financial statements.
1

|
SCHEDULE OF INVESTMENTS
(continued)
JUNE 30, 2016 |
| | |
Description, State, Acquisition Date — (continued) | Stated
Interest Rate | | Effective Interest Rate | Maturity | | Cost | | | Principal | | | Fair Value | |
Multi-Purpose Properties — (continued) | | | | | | | | | | | | | |
CBERT Rifle, LLC, Utah, 7/23/2015(b) | 5 Year Libor + 4.25% (5.147% Floor) | | 5.147 | % | 9/1/2037 | | $ | 1,414,046 | | | $ | 1,371,487 | | | $ | 1,453,337 | |
CBERT Williston, LLC, Colorado, 9/18/2015(b) | 5 Year Libor + 4.25% (5.132% Floor) | | 5.132 | % | 1/1/2038 | | | 1,297,075 | | | | 1,256,254 | | | | 1,315,261 | |
CV Investment Properties, LLC, Arizona, 5/29/2014(a),(b) | 5 Year Libor + 4.75% (6.00% Floor) | | 6.27 | % | 10/30/2038 | | | 654,093 | | | | 621,385 | | | | 669,965 | |
Edward Adourian, LLC, California, 3/7/2014(b) | 6.66% (6.66% Floor) | | 6.66 | % | 3/15/2039 | | | 509,267 | | | | 487,416 | | | | 525,522 | |
Greenland Group US, LLC, New Jersey, 6/25/2014(b) | 6.375%
(6.375% Floor) | | 6.375 | % | 2/1/2037 | | | 327,689 | | | | 311,248 | | | | 337,452 | |
Grigorian Investments, LLC, California, 9/2/2014(b) | 5 Year Libor +4.50% (6.33% Floor) | | 6.33 | % | 9/15/2039 | | | 545,164 | | | | 529,198 | | | | 566,152 | |
Marcus D. Chu, Tracey Chu, California, 3/13/2015(b) | 5 Year Libor + 4.75% (6.586% Floor) | | 6.586 | % | 3/10/2040 | | | 1,822,951 | | | | 1,735,789 | | | | 1,883,990 | |
Mariano D. Cibran, Florida, 5/23/2016(b) | 3 Year Libor + 5.16% (6.16% Floor) | | 6.24 | % | 6/1/2046 | | | 1,315,802 | | | | 1,272,500 | | | | 1,344,460 | |
None of Your Business, LLC, Illinois, 9/11/2014(b) | 3 Year Libor + 5.00% (6.25% Floor) | | 6.25 | % | 9/15/2044 | | | 506,765 | | | | 489,692 | | | | 512,864 | |
Palomar Oaks Corp., California, 1/30/2014(b) | 5 Year Libor + 4.50% (6.28% Floor) | | 6.28 | % | 2/1/2039 | | | 1,328,112 | | | | 1,304,516 | | | | 1,379,030 | |
PATC, LLC, California, 8/19/2014(a),(b) | 3 Year Libor + 3.25% (4.36% Floor) | | 4.36 | % | 9/15/2044 | | | 4,050,650 | | | | 4,012,465 | | | | 4,158,359 | |
PennRose Studios, LLC, California, 12/17/2014(b) | 3 Year Libor + 5.40% (6.63% Floor) | | 5.23 | %* | 1/1/2045 | | | 900,954 | | | | 902,326 | | | | 938,346 | |
Rayr Holdings, LLC, California, 7/31/2015(b) | 3 Year Libor + 5.775% (7.025% Floor) | | 7.025 | % | 7/1/2045 | | | 963,861 | | | | 917,544 | | | | 971,276 | |
Ruby View Investments, LLC, Oregon, 5/15/2014(a),(b) | 5 Year Libor + 4.00% (6.50% Floor) | | 6.50 | % | 6/26/2037 | | | 2,129,681 | | | | 2,033,408 | | | | 2,190,408 | |
Rug Palace, Inc. dba Rug Palace Expo, California, 2/27/2014(b) | Prime + 2.25% (5.50% Floor) | | 4.62 | %* | 2/15/2044 | | | 677,272 | | | | 677,272 | | | | 693,588 | |
SGLP Enterprises, LLC, Smokin' Guns BBQ & Catering, Inc., Missouri, 3/18/2016(b) | 1 Month Libor + 4.50% | | 4.97 | % | 9/12/2023 | | | 751,809 | | | | 740,499 | | | | 747,690 | |
Stanley Avenue Realty, LLC, New York, 9/17/2014(b) | 4 Year Libor + 3.72% (4.77% Floor) | | 4.77 | % | 9/15/2044 | | | 1,897,102 | | | | 1,897,031 | | | | 1,991,939 | |
Storage Fit, LLC, California, 2/12/2015(b) | 5 Year Libor + 5.75% (7.39% Floor) | | 5.14 | %* | 3/1/2045 | | | 416,091 | | | | 416,432 | | | | 432,081 | |
Summers Holdings, LLC, Missouri, 3/18/2016(b) | 1 Month Libor + 2.85% | | 3.32 | % | 4/15/2021 | | | 526,356 | | | | 517,214 | | | | 521,889 | |
Watson Kellogg Property, LLC, Washington, 2/9/2015(a),(b) | 5 Year Libor + 4.25% (5.70% Floor) | | 5.92 | % | 6/1/2040 | | | 668,652 | | | | 639,608 | | | | 692,670 | |
See accompanying notes to financial statements.
2

|
SCHEDULE OF INVESTMENTS
(continued)
JUNE 30, 2016 |
| | |
Description, State, Acquisition Date — (continued) | Stated
Interest Rate | | Effective Interest Rate | Maturity | | Cost | | | Principal | | | Fair Value | |
Multi-Purpose Properties — (continued) | | | | | | | | | | | | | |
Watson Osburn Property, LLC, Washington, 2/9/2015(a),(b) | 5 Year Libor + 4.25% (5.70% Floor) | | 5.88 | % | 6/1/2040 | | $ | 535,594 | | | $ | 511,471 | | | $ | 553,907 | |
Watson RathDrum Property, LLC, Washington, 2/9/2015(a),(b) | 5 Year Libor + 4.25% (5.70% Floor) | | 5.92 | % | 6/1/2040 | | | 1,399,142 | | | | 1,342,685 | | | | 1,454,074 | |
ZC Park, LLC, Arizona, 10/17/2014(b) | 5 Year Libor + 4.00% (5.88% Floor) | | 5.88 | % | 10/15/2044 | | | 1,383,599 | | | | 1,319,817 | | | | 1,412,151 | |
Total Multi-Purpose Properties | | | | | | | | | | | | | | | | 40,482,248 | |
| | | | | | | | | | | | | | | | | | |
Total 504 First Lien Loans (identified cost of $46,452,738) | | | | | | | | | | $ | 47,811,676 | |
| | | | | | | | | | | | | | | | | | |
| | | | | | | Shares | | | Fair Value | |
Short-Term Investments — 9.08% | | | | | | | | | | | | | | | | |
Federated Government Obligations Fund - Institutional Class, 0.25%(d) | | | | | | | 4,782,041 | | | $ | 4,782,041 | |
Total Short-Term Investments (Cost $4,782,041) | | | | | | | | | | | 4,782,041 | |
| | | | | | | | | | | | | | | | | | |
Total Investments — 99.83% (Cost $51,234,779) | | | | | | | | | | | 52,593,717 | |
Other Assets in Excess of Liabilities — 0.17% | | | | | | | | | | | 87,774 | |
Total Net Assets —100.00% | | | | | | | | | | $ | 52,681,491 | |
(a) | All or a portion of these 504 First Lien Loans may serve as collateral for any debt extended on the line of credit (see Note 8). |
(b) | 504 First Lien Loans are restricted as to resale. The cost and fair value as of June 30, 2016 was $46,452,738 and $47,811,676, respectively. |
(c) | Represents an investment in the 504 First Lien Loan through a participation agreement with a financial institution. A participation agreement typically results in a contractual relationship only with a financial institution, not with the borrower. |
(d) | The rate shown is the annualized 7-day yield as of June 30, 2016. |
* | The effective rate is net of a sub-servicing fee collected on the 504 First Lien Loan by the selling agent. As a result, the effective rate may be less than the 504 First Lien Loan floor rate. |
See accompanying notes to financial statements.
3

|
SCHEDULE OF INVESTMENTS
(CONTINUED)
JUNE 30, 2016 |
| | |
INVESTMENT TYPE AS A PERCENTAGE OF NET ASSETS BY STATE:
Hospitality Properties | |
Alaska | 5.59% |
California | 3.22% |
Illinois | 3.19% |
Washington | 1.91% |
Total Hospitality Properties | 13.91% |
| | |
Multi-Purpose Properties | |
Arizona | 3.95% |
California | 42.84% |
Colorado | 2.50% |
Florida | 2.55% |
Illinois | 0.96% |
Missouri | 2.41% |
New Jersey | 2.50% |
New York | 7.08% |
Oregon | 4.16% |
Utah | 2.76% |
Washington | 5.13% |
Total Multi-Purpose Properties | 76.84% |
| | |
Short-Term Investments | 9.08% |
Total Investments | 99.83% |
| | |
Other Assets in Excess of Liabilities | 0.17% |
| | |
Total Net Assets | 100.00% |
See accompanying notes to financial statements.
4

|
Statement of Assets and Liabilities
JUNE 30, 2016
|
| | |
Assets: | | | |
Investments in 504 First Lien Loans, at fair value (cost $46,452,738) | | $ | 47,811,676 | |
Short-term investments, at fair value (cost $4,782,041) | | | 4,782,041 | |
Receivables: | | | | |
Interest | | | 179,996 | |
Principal paydowns | | | 771 | |
Prepaid expenses | | | 17,715 | |
Total assets | | | 52,792,199 | |
| | | | | |
Liabilities: | | | | |
Payables: | | | | |
Audit | | | 58,000 | |
Advisory fees | | | 22,611 | |
Legal | | | 8,278 | |
Accounting and administration | | | 6,285 | |
Chief Compliance Officer | | | 5,426 | |
Transfer agent | | | 4,075 | |
Custodian | | | 1,017 | |
Trustees | | | 229 | |
Accrued other expenses | | | 4,787 | |
Total liabilities | | | 110,708 | |
| | | | | |
Net Assets | | $ | 52,681,491 | |
| | | | | |
Net Assets Consist of: | | | | |
Capital (unlimited shares authorized, no par value) | | $ | 51,389,237 | |
Accumulated undistributed net investment income | | | 259 | |
Accumulated net realized loss on investments | | | (66,943 | ) |
Accumulated net unrealized appreciation on investments | | | 1,358,938 | |
Net Assets | | $ | 52,681,491 | |
| | | | | |
Shares | | | | |
Net assets applicable to outstanding shares | | $ | 52,681,491 | |
Number of outstanding shares | | | 5,179,606 | |
Net asset and redemption price value per share | | $ | 10.17 | |
Maximum offering price per share (Net asset value per share divided by 0.99)1 | | $ | 10.27 | |
1 | Effective October 28, 2015, the offering price per share reflects a maximum sales charge of 1.00%. Prior to October 28, 2015, the maximum sales charge was 2.00%. |
See accompanying notes to financial statements.
5

|
Statement of Operations
FOR THE YEAR ENDED
JUNE 30, 2016
|
| | |
Investment Income: | | | |
Interest | | $ | 2,403,126 | |
Total investment income | | | 2,403,126 | |
| | | | | |
Expenses: | | | | |
Management fees | | | 911,994 | |
Legal expense | | | 130,759 | |
Accounting and administration expenses | | | 83,228 | |
Audit expense | | | 69,021 | |
Chief Compliance Officer expense | | | 60,163 | |
Trustees' expenses | | | 57,144 | |
Insurance expense | | | 34,590 | |
Registration expense | | | 29,604 | |
Transfer agent expense | | | 22,059 | |
Custodian expense | | | 12,473 | |
Printing expense | | | 7,809 | |
Interest expense | | | 3,677 | |
Miscellaneous | | | 55,960 | |
Total expenses | | | 1,478,481 | |
Less: Expenses waived | | | (733,064 | ) |
Net expenses | | | 745,417 | |
Net investment income | | | 1,657,709 | |
| | | | | |
Realized and Unrealized Gain on Investments: | | | | |
Net realized gain on investments | | | 6,057 | |
Net change in unrealized appreciation on investments | | | 1,335,233 | |
Net realized and unrealized gain on investments | | | 1,341,290 | |
| | | | | |
Net Increase in Net Assets from Operations | | $ | 2,998,999 | |
See accompanying notes to financial statements.
6

|
StatementS of Changes in Net Assets
|
| | |
| | | Year Ended
June 30, 2016 | | | Year Ended
June 30, 2015 | |
Increase in Net Assets From: | | | | | | |
Operations: | | | | | | |
Net investment income | | $ | 1,657,709 | | | $ | 806,948 | |
Net realized gain on investments | | | 6,057 | | | | 2,595 | |
Net change in unrealized appreciation on investments | | | 1,335,233 | | | | 92,007 | |
Net increase in net assets from operations | | | 2,998,999 | | | | 901,550 | |
| | | | | | | | | |
Distributions to Shareholders: | | | | | | | | |
From net investment income | | | (1,831,666 | ) | | | (861,232 | ) |
Total distributions to shareholders | | | (1,831,666 | ) | | | (861,232 | ) |
| | | | | | | | | |
Capital Transactions: | | | | | | | | |
Net proceeds from shares sold | | | 8,000,000 | | | | 5,193,800 | |
Reinvestment of distributions | | | 438,105 | | | | 681,929 | |
Cost of shares redeemed | | | (2,737,731 | ) | | | — | |
Net increase from capital transactions | | | 5,700,374 | | | | 5,875,729 | |
| | | | | | | | | |
Total increase in net assets | | | 6,867,707 | | | | 5,916,047 | |
| | | | | | | | | |
Net Assets: | | | | | | | | |
Beginning of year | | | 45,813,784 | | | | 39,897,737 | |
End of year | | $ | 52,681,491 | | | $ | 45,813,784 | |
| | | | | | | | | |
Accumulated undistributed net investment income | | $ | 259 | | | $ | 156,728 | |
| | | | | | | | | |
Capital Share Transactions: | | | | | | | | |
Shares sold | | | 795,228 | | | | 519,103 | |
Shares reinvested | | | 43,634 | | | | 68,976 | |
Shares redeemed | | | (271,600 | ) | | | — | |
Net increase | | | 567,262 | | | | 588,079 | |
See accompanying notes to financial statements.
7

|
STATEMENT OF CASH FLOWS
FOR THE YEAR ENDED
JUNE 30, 2016
|
| | |
Cash Flows from Operating Activities: | | | |
Net increase in net assets resulting from operations | | $ | 2,998,999 | |
Adjustments to reconcile net increase in net assets from operations to net cash used in operating activities: | | | | |
Purchase of investment securities | | | (13,257,412 | ) |
Proceeds from principal payments and sales of portfolio investments | | | 5,626,846 | |
Net sale of short-term investment securities | | | 2,101,118 | |
Decrease in other assets | | | 28,618 | |
Increase in dividends and interest receivable | | | (44,292 | ) |
Increase in receivables for principal paydowns | | | (771 | ) |
Decrease in accrued expenses | | | (4,011 | ) |
Amortization of premium on investments | | | 23,487 | |
Net realized gain on investments | | | (6,057 | ) |
Net unrealized appreciation on investments | | | (1,335,233 | ) |
Net cash used in operating activities | | | (3,868,708 | ) |
| | | | | |
Cash Flows from Financing Activities: | | | | |
Shareholder subscriptions received | | | 8,000,000 | |
Shareholder redemptions paid | | | (2,737,731 | ) |
Line of Credit borrowings | | | 2,275,000 | |
Line of Credit repayments | | | (2,275,000 | ) |
Cash distributions paid* | | | (1,393,561 | ) |
Net cash provided by financing activities | | | 3,868,708 | |
| | | | | |
Net Increase in Cash | | | — | |
| | | | | |
Cash at beginning of year | | | — | |
Cash at end of year | | $ | — | |
| | | | | |
Supplement Disclosure of Interest Expense Paid | | $ | 3,677 | |
* | Noncash financing activities not included herein consist of reinvestment of dividends of $438,105. |
See accompanying notes to financial statements.
8

|
FINANCIAL HIGHLIGHTS
|
| | |
Per share income and capital changes for a share outstanding throughout the period.
| | | Year Ended
June 30, 2016 | | | Year Ended
June 30, 2015 | | | Period Ended
June 30, 2014* | |
Net asset value, beginning of year | | $ | 9.93 | | | | 9.91 | | | | 10.00 | |
| | | | | | | | | | | | | |
Income from Investment Operations: | | | | | | | | | | | | |
Net investment income (loss) | | | 0.31 | | | | 0.20 | | | | (0.06 | ) |
Net realized and unrealized gain (loss) on investments | | | 0.28 | | | | 0.02 | | | | (0.03 | ) |
Total from investment operations | | | 0.59 | | | | 0.22 | | | | (0.09 | ) |
| | | | | | | | | | | | | |
Less Distributions: | | | | | | | | | | | | |
From net investment income | | | (0.35 | ) | | | (0.20 | ) | | | — | |
Total distributions | | | (0.35 | ) | | | (0.20 | ) | | | — | |
| | | | | | | | | | | | | |
Net asset value, end of year | | $ | 10.17 | | | $ | 9.93 | | | $ | 9.91 | |
| | | | | | | | | | | | | |
Total return | | | 5.98 | % | | | 2.18 | % | | | (0.90 | )%1 |
| | | | | | | | | | | | | |
Ratios/Supplemental Data: | | | | | | | | | | | | |
Net assets, end of period (in thousands) | | $ | 52,681 | | | $ | 45,814 | | | $ | 39,898 | |
Ratio of expenses to average net assets | | | | | | | | | | | | |
Before waiver inclusive of interest expense | | | 2.84 | % | | | 3.76 | % | | | 4.66 | %2 |
After waiver inclusive of interest expense | | | 1.43 | % | | | 2.24 | % | | | 2.50 | %2 |
Before waiver exclusive of interest expense | | | 2.83 | % | | | 3.76 | % | | | 4.66 | %2 |
After waiver exclusive of interest expense | | | 1.42 | % | | | 2.24 | % | | | 2.50 | %2 |
Ratio of net investment income (loss) to average net assets | | | 3.18 | % | | | 1.97 | % | | | (1.21 | )%2 |
Portfolio turnover rate | | | 13 | % | | | 13 | % | | | 0.00 | %1 |
* | Commenced operations on December 16, 2013. |
See accompanying notes to financial statements.
9

|
NOTES TO FINANCIAL STATEMENTS
JUNE 30, 2016
|
| | |
1. Organization
The 504 Fund (the “Fund”) was organized as a Delaware statutory trust on July 29, 2013 and is registered with the Securities and Exchange Commission (the “SEC”) as a closed-end, non-diversified management investment company under the Investment Company Act of 1940, as amended (the “1940 Act”), that operates as an “interval fund” pursuant to Rule 23c-3 under the 1940 Act. The Fund is managed by 504 Fund Advisors, LLC (the “Adviser”), an Illinois limited liability company registered under the Investment Advisers Act of 1940, as amended (the “Advisers Act”). The Adviser is a subsidiary of Live Oak Bancshares, Inc. (“Live Oak”), a bank holding company. Government Loan Solutions, Inc. (“GLS”), also a subsidiary of Live Oak, provides the Adviser with data and research which is material to the Adviser’s valuation of the Fund’s investments. The Fund’s president is an employee of GLS and the chief investment officer of the Adviser and the Fund’s secretary and treasurer is an employee of Live Oak and the chief executive officer of the Adviser. The offering of the Fund’s shares of beneficial interest in the Fund (the “Shares”) is registered under the Securities Act of 1933, as amended (the “Securities Act”). Shares are offered on a continuous basis monthly (generally as of the last business day of each month) at the net asset value (“NAV”) per Share plus a sales charge of up to 1.00%. The maximum sales charge of 1.00% became effective on October 28, 2015; prior to October 28, 2015, the maximum sales charge was 2.00%. There are an unlimited number of authorized Shares.
The Fund’s investment objectives are to provide current income, consistent with the preservation of capital, and to enable institutional Fund investors that are subject to regulatory examination for CRA compliance to claim favorable regulatory consideration of their investment under the Community Reinvestment Act of 1977, as amended (the “CRA”). The Fund seeks to achieve its objectives by investing primarily in a portfolio of 504 First Lien Loans secured by owner-occupied commercial real estate which represent the non-guaranteed portions of U.S. Small Business Administration (“SBA”) Section 504 transactions (“504 First Lien Loans”). 504 First Lien Loans are not guaranteed by the SBA, the U.S. government or by its agencies, instrumentalities or sponsored enterprises.
2. Accounting Policies
The following is a summary of significant accounting policies followed by the Fund in preparation of its financial statements. The policies are in conformity with accounting principles generally accepted in the United States of America (“GAAP”). The Fund is an investment company and follows the investment company accounting and reporting guidance under Financial Accounting Standards Board (“FASB”) Accounting Standards Codification (“ASC”) Topic 946, “Financial Services-Investment Companies”. In the normal course of business, the Fund has entered into contracts that contain a variety of representations which provide general indemnifications. The Fund’s maximum exposure under these arrangements is unknown as this would involve future claims that may be made against the Fund that have not yet occurred. However, the Fund expects the risk of loss to be remote.
Investment Valuation – Investments for which market quotations are readily available are valued at current fair value, and all other investments are valued at fair value as determined in good faith by the Fund’s Board of Trustees (“the Board”), in accordance with the policies and procedures (the “Valuation Procedures”) adopted by the Board. The Board has a standing valuation committee (the “Valuation Committee”) that is composed of representatives from the Adviser, the Board chairman and the Fund’s other officers, as appointed by the Board. The Valuation Committee operates under the Valuation Procedures approved by the Board. The Fund’s Valuation Committee makes quarterly reports to the Board concerning investments for which market quotations are not readily available. Investments in money market funds (short-term investments) are valued at the closing NAV per share.
10

|
NOTES TO FINANCIAL STATEMENTS
JUNE 30, 2016
|
| | |
2. Accounting Policies (continued)
504 First Lien Loans – The fair values of 504 First Lien Loans are analyzed using a pricing methodology designed to incorporate, among other things, the present value of the projected stream of cash flows on such investments (the “discounted cash flow” methodology). This pricing methodology takes into account a number of relevant factors, including changes in prevailing interest rates, yield spreads, the borrower’s creditworthiness, the debt service coverage ratio, lien position, delinquency status, frequency of previous late payments and the projected rate of prepayments. Newly purchased loans are initially fair valued at cost and subsequently analyzed using the discounted cash flow methodology. Loans with a pending short payoff will be fair valued at the anticipated recovery rate. Valuations of 504 First Lien Loans are determined no less frequently than weekly by the Board’s Valuation Committee.
Income – Interest income is recorded on the basis of interest accrued, adjusted for amortization of premium or accretion of discount. Fees associated with loan amendments are recognized immediately. Dividend income is recorded on the ex-dividend date for dividends received in cash and/or securities. 504 First Lien Loans will be placed in non-accrual status and related interest income reduced by ceasing current accruals and writing off interest receivables when the collection of all or a portion of interest has become doubtful as identified by the Adviser as part of the valuation process.
Distributions to Shareholders – The Fund expects to declare and pay dividends of net investment income quarterly and net realized capital gains annually. Unless shareholders specify otherwise, dividends will be reinvested in Shares of the Fund.
Use of Estimates – The preparation of financial statements in conformity with GAAP requires management to make estimates and assumptions that affect the reported amounts of assets and liabilities and disclosure of contingent assets and liabilities at the date of the financial statements and the reported amounts of increases and decreases in net assets from operations during the reporting period. Actual results could differ from those estimates.
Federal Income Taxes – The Fund intends to elect and to qualify each year to be treated as a regulated investment company under the provisions of Subchapter M of the Internal Revenue Code of 1986, as amended. In order to so qualify, the Fund must meet certain requirements with respect to the sources of its income, the diversification of its assets and the distribution of its income. If the Fund qualifies as a regulated investment company, it will not be subject to federal income or excise tax on income or net capital gains that it distributes in a timely manner to its shareholders in the form of investment company taxable income or net capital gain distributions.
Accounting for Uncertainty in Income Taxes – The Income Tax Statement requires an evaluation of tax positions taken (or expected to be taken) in the course of preparing a Fund’s tax return to determine whether these positions meet a “more-likely-than-not” standard that, based on the technical merits, have a more than fifty percent likelihood of being sustained by a taxing authority upon examination. A tax position that meets the “more-likely-than-not” recognition threshold is measured to determine the amount of benefit to recognize in the financial statements. The Fund recognizes interest and penalties, if any, related to unrecognized tax benefits as income tax expense in the Statement of Operations.
GAAP requires management of the Fund to analyze all open tax years for all major jurisdictions, which the Fund considers to be its federal income tax filings. The open tax years for the Fund include all years since inception. As of and during the year ended June 30, 2016, the Fund did not record a liability for any unrecognized tax benefits. The Fund has no examination in progress and is not aware of any tax positions for which it is reasonably possible that the total amounts of unrecognized tax benefits will significantly change in the next twelve months.
Expenses – Fund expenses are charged to the Fund and recorded on an accrual basis.
11

|
NOTES TO FINANCIAL STATEMENTS
JUNE 30, 2016
|
| | |
2. Accounting Policies (continued)
Fair Value Measurements – Under generally accepted accounting principles for fair value measurements, a three-tier hierarchy to prioritize the assumptions, referred to as inputs, is used in valuation techniques to measure fair value. The three-tier hierarchy of inputs is summarized in the three broad levels listed below.
| | ● | Level 1 – Unadjusted quoted prices in active markets for identical, unrestricted assets or liabilities that the Fund has the ability to access at the measurement date; |
| | ● | Level 2 – Other significant observable inputs (including quoted prices for similar investments, interest rates, prepayment speeds, credit risk, etc.); and |
| | ● | Level 3 – Significant unobservable inputs (including the Fund’s own assumptions in determining the fair value of investment). |
The following table sets forth information about the levels within the fair value hierarchy at which the Fund’s investments are measured as of June 30, 2016:
| | Level 1 | | | Level 2 | | | Level 3 | | | Total | |
Hospitality Properties | | $ | — | | | $ | — | | | $ | 7,329,428 | | | $ | 7,329,428 | |
Multi-Purpose Properties | | | — | | | | — | | | | 40,482,248 | | | | 40,482,248 | |
Short-Term Investments | | | 4,782,041 | | | | — | | | | — | | | | 4,782,041 | |
Total Investments | | $ | 4,782,041 | | | $ | — | | | $ | 47,811,676 | | | $ | 52,593,717 | |
For the year ended June 30, 2016, there were no transfers into or out of Level 1, Level 2 or Level 3.
Should a transfer between Levels occur, it is the Fund’s policy to recognize transfers in and out of all Levels at the end of reporting period.
The following is a reconciliation of investments in which significant unobservable inputs (Level 3) were used in determining value:
Investments | | Balance as of June 30, 2015 | | Purchase and funding of investments | | Proceeds from principal payments and sales of investments | | | Net realized gain on investments | | Net change in unrealized appreciation on investments | | Amortization of discount and premium | | | Balance as of June 30, 2016 | |
Hospitality Properties | | $ | 9,582,782 | | $ | 2,605,634 | | $ | (5,014,548 | ) | | $ | 6,057 | | $ | 154,817 | | $ | (5,314 | ) | | $ | 7,329,428 | |
Multi-Purpose Properties | | | 29,280,525 | | | 10,651,778 | | | (612,298 | ) | | | — | | | 1,180,416 | | | (18,173 | ) | | | 40,482,248 | |
Total Investments | | $ | 38,863,307 | | $ | 13,257,412 | | $ | (5,626,846 | ) | | $ | 6,057 | | $ | 1,335,233 | | $ | (23,487 | ) | | $ | 47,811,676 | |
Change in unrealized appreciation included in the Statement of Operations attributable to Level 3 investments held as of the reporting date is $1,336,429.
12

|
NOTES TO FINANCIAL STATEMENTS
JUNE 30, 2016
|
| | |
2. Accounting Policies (continued)
The following is a summary of quantitative information about significant unobservable valuation inputs for Level 3 fair value measurements for investments held as of June 30, 2016:
Type of Level 3 Investments | Fair Value as of June 30, 2016 | Valuation Technique | Unobservable Inputs | Weighted Average | Range | Impact to Fair Value from an Increase in Input |
Hospitality Properties | $ 7,329,428 | Discounted
Cash Flows | Purchase Price | $101.01 | $100-104 | Decrease** |
| | | Debt Service Coverage Ratio | 2.07 | 1.27-2.74 | N/A* |
| | | Effective Loan To Value Ratio | 49.6% | 46%-53% | Decrease |
| | | Average Personal Credit Score | 716 | 687-761 | N/A* |
Multi-Purpose Properties | 40,482,248 | Discounted
Cash Flows | Purchase Price | $102.50 | $100-105 | Decrease** |
| | | Debt Service Coverage Ratio | 1.60 | 1.01-3.28 | N/A* |
| | | Effective Loan To Value Ratio | 50.13% | 37.45%-64% | Decrease |
| | | Average Personal Credit Score | 755 | 686-819 | N/A* |
Total Investments | $ 47,811,676 | | | | | |
* | A decrease in the input would result in a decrease in fair value. |
** | An increase in the spread from the Fund’s purchase price to the benchmark utilized within the fair value methodology would result in a decrease in fair value. |
13

|
NOTES TO FINANCIAL STATEMENTS
JUNE 30, 2016
|
| | |
3. Concentration of Risk
504 First Lien Loans Risk – The Fund predominantly invests in fixed or variable rate 504 First Lien Loans arranged through private negotiations between a small business borrower (the “Borrower”) and one or more 504 First Lien Loan lenders. 504 First Lien Loans are secured by real property and have a claim on the assets of the Borrower that is senior to the second lien held by a certified development company and any claims held by unsecured creditors. The 504 First Lien Loans the Fund will invest in are not rated. 504 First Lien Loans are subject to a number of risks, including credit risk, liquidity risk, valuation risk and interest rate risk. 504 First Lien Loans are considered restricted securities that are subject to substantial holding periods because the secondary market for 504 First Lien Loans is not fully developed. Although the 504 First Lien Loans in which the Fund will invest will be secured by real property, there can be no assurance that such real property can be readily liquidated or that the liquidation of such real property would satisfy the Borrower’s obligation in the event of non-payment of scheduled interest or principal, which could result in substantial loss to the Fund. In the event of the bankruptcy or insolvency of a Borrower, the Fund could experience delays or limitations with respect to its ability to realize the benefits of the real property securing a 504 First Lien Loan. In the event of a decline in the value of the already pledged real property, the Fund will be exposed to the risk that the value of the real property will not at all times equal or exceed the amount of the Borrower’s obligations under the 504 First Lien Loan. In general, the secondary trading market for 504 First Lien Loans is not fully-developed. No active trading market may exist for certain 504 First Lien Loans, which may make it difficult to value them. Illiquidity and adverse market conditions may mean that the Fund may not be able to sell certain 504 First Lien Loans quickly or at a fair price. To the extent that a secondary market does exist for certain 504 First Lien Loans, the market for them may be subject to irregular trading activity, wide bid/ask spreads and extended trade settlement periods.
Credit Risk – Credit risk is the risk that one or more debt instruments in the Fund’s portfolio will decline in price or fail to pay interest or principal when due because the borrower experiences a decline in its financial status. Losses may occur because the market value of a debt security is affected by the creditworthiness of the issuer and by general economic and specific industry conditions.
Qualification for CRA Credit Risk – Although the Adviser believes that the Fund’s 504 First Lien Loan investments will have the community development qualities that are eligible for favorable consideration as community development loans and qualified investments under the CRA, there is no guarantee that an investor will receive CRA credit for an investment in the Fund.
Geographic Concentration Risk – The Fund’s 504 First Lien Loan investments are concentrated in certain states as of June 30, 2016, which are listed in the last section of the Schedule of Investments. As a result, the Fund may be more susceptible to being adversely affected by any single occurrence in those states. Mortgaged properties in California, for example, may be particularly susceptible to economic risks of the state and certain types of hazards, such as earthquakes, floods, mudslides, wildfires and other natural disasters, for which there may or may not be insurance. As of June 30, 2016, 46.06% of the Fund’s investments were associated with properties located in California. Mortgaged properties in other states similarly may be adversely affected by natural disasters, for which there may not be insurance and which could result in substantial loss to the Fund.
Valuation Risk – Unlike publicly traded equity securities that trade on national exchanges, there is no central place or exchange for 504 First Lien Loans to trade. Due to the lack of centralized information and trading, the Adviser’s judgment plays a greater role in the valuation process and the valuation of 504 First Lien Loans. Uncertainties in the conditions of the financial market, unreliable reference data, lack of transparency and inconsistency of valuation models and processes may lead to inaccurate asset pricing. In addition, other market participants may value instruments differently than the Fund. As a result, the Fund may be subject to the risk that when a 504 First Lien Loan is sold in the market, the amount received by the Fund is less than the value that such 504 First Lien Loan is carried at on the Fund’s books.
For other risks associated with the Fund and its investments please refer to the “Risks” section in the Fund’s current prospectus.
14

|
NOTES TO FINANCIAL STATEMENTS
JUNE 30, 2016
|
| | |
4. Periodic Repurchase Offers
The Fund will make periodic offers to repurchase a portion of its outstanding Shares at NAV per Share. The Fund has adopted a fundamental policy to make repurchase offers once every twelve months. The Fund will offer to repurchase 5% of its outstanding Shares, unless the Board has approved a higher amount (but not more than 25% of its outstanding Shares). The Fund does not currently expect to charge a repurchase fee.
For the year ended June 30, 2016, the Fund had one repurchase offer as follows:
Repurchase Offer Notice | Repurchase Request Deadline | Repurchase Pricing Date | Repurchase Offer Amount | % of Shares
Tendered | Number of
Shares Tendered |
December 15, 2015 | January 12, 2016 | January 22, 2016 | 5% | 5% | 271,600 |
For the year ended June 30, 2015, the Fund repurchased no Shares.
5. Administration, Distribution, Transfer Agency and Custodian Agreements.
The Fund and its administrator, UMB Fund Services, Inc. (“UMBFS”), are parties to an administration agreement under which UMBFS provides administrative and fund accounting services.
UMBFS also serves as the transfer agent and dividend disbursing agent for the Fund.
UMB Bank, N.A. serves as the custodian and escrow agent (the “Custodian”) for the Fund. The Custodian plays no role in determining the investment policies of the Fund or which securities are to be purchased and sold by the Fund.
The Fund and Foreside Fund Services, LLC (the “Distributor”), are parties to a distribution agreement under which the Distributor acts as the principal underwriter for the Fund.
6. Investment Advisory Agreement
The Fund has entered into an investment advisory agreement (the “Investment Advisory Agreement”) with the Adviser, effective April 1, 2015. Under the Investment Advisory Agreement, the Adviser makes investment decisions for the Fund and continuously reviews, supervises and administers the investment program of the Fund, subject to the supervision of, and policies established by, the Board. For providing these services, the Adviser will receive a fee from the Fund, accrued daily and paid monthly, at an annual rate equal to 1.75% of the Fund’s average daily net assets. However, from April 1, 2015 until December 31, 2015, the Adviser voluntarily waived its management fee. As of December 31, 2015, the voluntary waiver was terminated by the Adviser. In addition, the Adviser has contractually agreed to waive or reduce its management fees and/or reimburse expenses of the Fund to ensure that total annual Fund operating expenses after fee waiver and/or expense reimbursement (excluding any interest, leverage interest (i.e., any expenses incurred in connection with borrowings made by the Fund), taxes, brokerage commissions, acquired fund fees and expenses and extraordinary expenses and including organizational and offering costs) will not exceed 1.75% of the Fund’s average net assets pursuant to an operating expenses limitation agreement dated March 1, 2015 (the “Operating Expenses Limitation Agreement”). Under the terms of the Investment Advisory Agreement and the Operating Expenses Limitation Agreement, any such contractual reductions made by the Adviser in its fees or payment of expenses which are the Fund’s obligation are subject to reimbursement by the Fund to the Adviser for a period of three fiscal years following the end of the fiscal year in which such reduction or payment was accrued, except for initial organizational expenses which are subject to reimbursement by the Fund to the Adviser for a period of three years from the date on which such expenses were incurred. The Operating Expenses Limitation Agreement is in effect through at least January 1, 2018, and may be terminated only by, or with the consent of, the Board. Organization costs amounting to $213,643 are also subject to reimbursement by the Fund to the Adviser for a period of three years from the date on which such expenses were incurred, if the aggregate amount actually paid by the Fund toward the operating expenses for such fiscal year (taking into account the reimbursement) does not exceed the applicable limitation on Fund expenses. Such reimbursement may not be paid prior to the Fund’s payment of current ordinary operating expenses.
15

|
NOTES TO FINANCIAL STATEMENTS
JUNE 30, 2016
|
| | |
6. Investment Advisory Agreement (continued)
For the year ended June 30, 2016, the Adviser waived expenses totaling $562,480 that are subject to reimbursement, as well as $170,584 that are not subject to reimbursement.
As of June 30, 2016, the Adviser’s fees and expenses subject to reimbursement were as follows:
December 16, 2016 | June 30, 2017 | June 30, 2018 | June 30, 2019 |
$ 213,643 | $ 372,327 | $ 371,559 | $ 562,480 |
7. Investment Transactions
For the year ended June 30, 2016, there were long term purchases of $13,257,412 and long term sales of $5,626,846 in the Fund.
8. Revolving Credit Agreement
Effective July 1, 2015, the Fund entered into a secured, revolving line of credit facility with Park Sterling Bank for the period of one year, which expired on July 1, 2016. The Fund is currently renegotiating the renewal of the line of credit facility with Park Sterling Bank. The maximum principal amount of the credit facility is $10 million. The line of credit is subject to a borrowing base of the lesser of either the aggregate principal amount of outstanding collateral 504 First Lien Loans or the aggregate market value of collateral 504 First Lien Loans (the “Borrowing Base”). The line of credit facility is secured by certain 504 First Lien Loans and all cash and cash equivalents held by the Fund and pledged as collateral. The Fund anticipates that this line of credit facility will be used for investment purposes, to satisfy repurchase requests from shareholders and to otherwise provide the Fund with liquidity. The Fund will incur additional interest and other expenses with respect to the use of this and other future line of credit facilities. A renewal fee of 0.25% per annum is payable on the line of credit. The interest rate on the line of credit facility is equal to 1-month LIBOR plus 2.50%. Collateral for the line of credit facility will be held by UMB Bank, N.A. as custodian. During the year ended June 30, 2016, the Fund paid $3,677 in interest on borrowings. The average interest rate and the average daily balance for borrowings under the line of credit facility for the year ended June 30, 2016, was 2.69% and $681,250, respectively. For the period from September 1, 2015 to September 21, 2015 the maximum balance outstanding was $2,275,000. As of June 30, 2016 the interest rate on the line of credit facility was 2.97% and there were no outstanding borrowings.
9. Federal Tax Information
At June 30, 2016, gross unrealized appreciation (depreciation) of investments owned by the Fund, based on cost for federal income tax purposes, were as follows:
Cost of investments | | $ | 51,234,779 | |
Gross unrealized appreciation | | $ | 1,367,525 | |
Gross unrealized depreciation | | | (8,587 | ) |
Net unrealized depreciation on investments | | $ | 1,358,938 | |
16

|
NOTES TO FINANCIAL STATEMENTS
JUNE 30, 2016
|
| | |
9. Federal Tax Information (continued)
GAAP requires that certain components of net assets be reclassified between financial and tax reporting. These reclassifications have no effect on net assets or net asset value per share. For the year ended June 30, 2016 permanent differences in book and tax accounting resulting primarily from differing treatments for paydowns and amortization of organizational costs have been reclassified to paid in capital, accumulated net investment income and accumulated net realized loss on investments as follows:
Paid-In
Capital | Accumulated
Net Investment
Income (Loss) | Accumulated
Net Realized
Gain (Loss) |
$1,422 | $17,488 | $(18,910) |
As of June 30, 2016, the components of accumulated earnings (deficit) on a tax basis for the Fund were as follows:
Undistributed ordinary income | | $ | 259 | |
Undistributed long-term gains | | | — | |
Tax accumulated earnings | | | 259 | |
Accumulated capital and other losses | | $ | (66,943 | ) |
Unrealized appreciation on investments | | | 1,358,938 | |
Total accumulated earnings (deficit) | | $ | 1,292,254 | |
The tax character of distributions paid during the fiscal years ended June 30, 2016 and June 30, 2015 were as follows:
| | 2016 | | | 2015 | |
Distribution paid from: | | | | | | |
Ordinary income | | $ | 1,831,666 | | | $ | 861,232 | |
Long-term capital gains | | | — | | | | — | |
Total Distributions | | $ | 1,831,666 | | | $ | 861,232 | |
As of June 30, 2016, the Fund had a short-term capital loss carryover of $10,522 and long-term capital loss carryover of $56,421. To the extent that the Fund may realize future net capital gains, those gains will be offset by any of its unused capital loss carryforward. Future capital loss carryover utilization in any given year may be subject to Internal Revenue Code limitations.
10. Control Ownership
The beneficial ownership, either directly or indirectly, of more than 25% of the voting securities creates a presumption of control of the Fund, under Section 2(a)(9) of the 1940 Act. As of June 30, 2016, Northwest Federal Credit Union had ownership in the Fund in the amount of 53.89%.
17

|
NOTES TO FINANCIAL STATEMENTS
JUNE 30, 2016
|
| | |
11. Related Party Transaction
As of June 30, 2016, Mark A. Elste served as the Fund’s Chairman and President. Mr. Elste also had a membership interest in the Adviser. On May 10, 2016, the Trustees of the Board who are not “interested persons” of the Fund (as the term is defined in the 1940 Act), approved the following compensation to be paid to Mr. Elste in his capacity as a Trustee and Chairman of the Board: (a) an annual retainer of $10,000 for each calendar year for service as a Trustee; (b) an annual retainer of $4,000 for each calendar year for service as Chairman; and (c) $1,500 per Board meeting attending. For the fiscal year ended June 30, 2016, the Fund paid Mr. Elste $5,000 for his services as a Trustee and Chairman.
12. Subsequent Events
The Fund has evaluated the events and transactions through the date the financial statements were issued and determined there were no subsequent events that required adjustments to our disclosure in the financial statements except for the following:
On August 23, 2016, the Fund’s Board of Trustees (the “Board”) accepted the resignation of Mark A. Elste, who served as the Fund’s Chairman, President, Principal Executive Officer, Principal Accounting Officer and Principal Financial Officer.Effective August 23, 2016, the Board appointed George Stelljes, III to serve as Chairman, Robert O. Judge to serve as President and Principal Executive Officer, and Constantine Andrew (Dean) Pelos to serve as Principal Financial Officer and Principal Accounting Officer. The Audit Committee of the Board ratified these officer appointments on September 12, 2016.
18

|
REPORT OF INDEPENDENT REGISTERED
PUBLIC ACCOUNTING FIRM
|
| | |
To the Shareholders and Board of Trustees of
The 504 Fund
We have audited the accompanying statement of assets and liabilities, including the schedule of investments, of The 504 Fund (the “Fund”) as of June 30, 2016, and the related statements of operations and cash flows for the year then ended, the statements of changes in net assets for each of the two years in the period then ended, and the financial highlights for each of the three periods in the period then ended. These financial statements and financial highlights are the responsibility of the Fund’s management. Our responsibility is to express an opinion on these financial statements and financial highlights based on our audits.
We conducted our audits in accordance with the standards of the Public Company Accounting Oversight Board (United States). Those standards require that we plan and perform the audit to obtain reasonable assurance about whether the financial statements and financial highlights are free of material misstatement. An audit includes examining, on a test basis, evidence supporting the amounts and disclosures in the financial statements. Our procedures included confirmation of securities owned as of June 30, 2016, by correspondence with the custodian and counterparties. An audit also includes assessing the accounting principles used and significant estimates made by management, as well as evaluating the overall financial statement presentation. We believe that our audits provide a reasonable basis for our opinion.
In our opinion, the financial statements and financial highlights referred to above present fairly, in all material respects, the financial position of The 504 Fund as of June 30, 2016, the results of its operations and its cash flows for the year then ended, the changes in its net assets for each of the two years in the period then ended, and the financial highlights for each of the three periods in the period then ended, in conformity with accounting principles generally accepted in the United States of America.
As discussed in Note 2 to the financial statements, the financial statements include investments valued at $47,811,676 (90.76% of net assets) as of June 30, 2016, whose fair values have been estimated by management in accordance with policies approved by and under the general oversight of the Board of Trustees in the absence of readily determinable fair values.

COHEN FUND AUDIT SERVICES, LTD.
Cleveland, Ohio
September 13, 2016
19

|
OTHER INFORMATION (UNAUDITED)
JUNE 30, 2016
|
| | |
Proxy Voting
For a description of the policies and procedures that the Fund uses to determine how to vote proxies relating to portfolio securities, please call 800-996-2862 and request a Statement of Additional Information. One will be mailed to you free of charge. The Statement of Additional Information is also available on the SEC’s website at http://www.sec.gov.
Information on how the Fund voted proxies relating to portfolio securities during the most recent 12-month period ended June 30 is available without charge, upon request, by calling 877-997-9971 or by accessing the SEC’s website http://www.sec.gov.
Disclosure of Portfolio Holdings
The Fund files a complete schedule of portfolio holdings with the SEC for the first and third quarters of each fiscal year on Form N-Q. The Fund’s Form N-Q is available on the SEC’s website at www.sec.gov, and may also be reviewed and copied at the SEC’s Public Reference Room in Washington, DC. Information on the operation of the Public Reference Room may be obtained by calling 1-800-SEC-0330.
20

|
TRUSTEES AND OFFICERS (UNAUDITED)
JUNE 30, 2016
|
| | |
Information pertaining to the Trustees and officers of the Fund is set forth below. Trustees who are not “interested persons” of the Fund as that term is defined in the 1940 Act are referred to as “Independent Trustees.” The business address of each Trustee or officer is c/o The 504 Fund, 1741 Tiburon Drive, Wilmington, North Carolina 28403. The Statement of Additional Information includes additional information about the Trustees and is available, without charge, upon request by calling the Fund at 855-386-3504.
Name and
Year of Birth | Position with
Fund and
Length of Term | Principal Occupations
in the Past 5 Years | Number of Portfolios in Fund Complex Overseen By Trustee | Other Directorships Held in the Past 5 Years |
Independent Trustees | | | |
J. Clay Singleton,
Ph.D., CFA
Born: 1947 | Trustee (Indefinite term; since 2013) | Professor of Finance, Crummer Graduate School of Business, Rollins College (since 2002); Consultant, Director of Indexes, PCE Investment Bankers (2005-2011) | 1 | Independent Trustee, USFS Funds Trust (an open-end investment company with two series) (2013-2014) |
Cornelius J. Lavelle
Born: 1944 | Trustee (Indefinite term; since 2013) | Retired; Director-Institutional Equities, Citigroup Global Markets Inc. (multinational financial services firm) (1997- 2009) | 1 | Independent Trustee, Broadview Funds Trust (an open-end investment company with one series) (since 2013); Independent Trustee, USFS Funds Trust (an open-end investment company with two series) (2013-2014) |
21

|
TRUSTEES AND OFFICERS (UNAUDITED)
JUNE 30, 2016
|
| | |
Name and
Year of Birth | Position with
Fund and
Length of Term | Principal Occupations
in the Past 5 Years | Number of Portfolios in Fund Complex Overseen By Trustee | Other Directorships Held in the Past 5 Years |
Independent Trustees (continued) | | | |
George Stelljes, III1
Born: 1961 | Chairman of the Board (Indefinite term; since 2016) and Trustee
(Indefinite term; since 2013) | Retired; President, Chief Investment Officer and Director of the Gladstone Companies (family of public and private investment funds) (2002-2013) | 1 | Director, Gladstone Capital Corporation (business development company) (resigned 2013); Director, Gladstone Commercial Corporation (real estate investment trust) (resigned 2013); Director, Gladstone Investment Corporation (business development company (resigned 2013); Director, Gladstone Land Corporation (real estate investment company) (resigned 2012) |
1 Effective August 23, 2016, Mr. Stelljes was appointed by the Board as Chairman.
22

|
TRUSTEES AND OFFICERS (UNAUDITED)
JUNE 30, 2016
|
| | |
Name and
Year of Birth | Position with
Fund and
Length of Term | Principal Occupations
in the Past 5 Years | Number of Portfolios in Fund Complex Overseen By Trustee | Other Directorships Held in the Past 5 Years |
Other Officers | | | | |
Robert O. Judge2
Born: 1961 | President and Principal Executive Officer (Indefinite term; since 2016) | Chief Investment Officer, 504 Fund Advisors, LLC (investment advisory firm) (since 2015); Portfolio Manager, The 504 Fund (since 2013); Chief Executive Officer of Government Loan Solutions, Inc. (a financial services company) (since 2006) | N/A | N/A |
Constantine Andrew (Dean) Pelos3
Born: 1960 | Principal Financial Officer, Principal Accounting Officer (Indefinite term; since 2016) and Chief Compliance Officer and AML Compliance Officer (Indefinite term; since 2015) | Director, Oyster Consulting, Inc. (compliance consulting to financial services firms) (since 2015); Senior Consultant, Oyster Consulting, Inc. (2013-2015); Independent Investment Manager, LaSalle St. Securities, LLC (broker-dealer) (2009-2013); Partner, Head of Trading, Chief Compliance Officer, Sterling Investment Services, Inc. (broker-dealer) (1991-2009) | N/A | N/A |
Jordan M. Blanchard
Born: 1966 | Secretary and Treasurer (Indefinite term; since 2015) | Chief Executive Officer and Chief Operating Officer, 504 Fund Advisors, LLC (investment advisory firm) (since 2015); Portfolio Manager, The 504 Fund (since 2013); General Manager - Renewable Energy Lending, Live Oak Bank (since 2016); Managing Director of 504 Secondary Markets, Government Loan Solutions, Inc. (a financial services company) (2013-2016); President, Wholesale 504 Lending Consultants, LLC (financial services company) (2011-2012); Executive Vice President of Capital Markets, CDC Direct Capital (community development corporation subsidiary) (2009-2011) | N/A | N/A |
2 | Effective August 23, 2016, Mr. Judge was appointed by the Board as President and Principal Executive Officer. |
3 | Effective August 23, 2016, Mr. Pelos was appointed by the Board as Principal Financial Officer and Principal Accounting Officer. |
23
THE 504 FUND
1741 Tiburon Drive
Wilmington, NC 28403
INVESTMENT ADVISER
504 Fund Advisors, LLC
1741 Tiburon Drive
Wilmington, NC 28403
INDEPENDENT REGISTERED PUBLIC ACCOUNTING FIRM
Cohen Fund Audit Services
1350 Euclid Ave., Suite 800
Cleveland, OH 44115
LEGAL COUNSEL
Godfrey & Kahn, S.C.
833 East Michigan Street, Suite 1800
Milwaukee, WI 53202
CUSTODIAN
UMB Bank, N.A.
1010 Grand Boulevard
Kansas City, MO 64106
DISTRIBUTOR
Foreside Fund Services, LLC
Three Canal Plaza, Suite 100
Portland, Maine 04101
TRANSFER AGENT
UMB Fund Services, Inc.
235 West Galena Street
Milwaukee, WI 53212
There can be no assurance that the Fund will achieve its investment objectives. An investment in the Fund is an appropriate investment only for those investors who can tolerate a high degree of risk and do not require a liquid investment. Investors may lose some or all of their investment in the Fund. The Fund is not designed to be a complete investment program and may not be a suitable investment for all investors. The risk factors described are the principal risk factors associated with an investment in the Fund, as well as those factors associated with an investment in an investment company with similar investment objectives and investment policies.
This report is submitted for the general information of the shareholders of the Fund. It is not authorized for distribution to prospective investors unless preceded or accompanied by an effective prospectus, which includes information regarding the Fund’s risks, objectives, fees, expenses and experience of its management and other considerations.