11525 Park Woods Circle, Ste. 200
11525 Park Woods Circle, Ste. 200
John H. Grady
1650 Market Street, Ste. 4900
Item 1. Reports to Stockholders.

ANNUAL REPORT
DECEMBER 31, 2016
WWW.WILDERMUTHENDOWMENTFUND.COM ● 1-888-889-8981 ●
DISTRIBUTED BY SQN SECURITIES, LLC (MEMBER FINRA/SIPC)
Wildermuth Endowment Strategy Fund |
Table of Contents | |
| |
Letter to Shareholders | 2 |
Portfolio Review | 3 |
Schedule of Investments | 5 |
Statement of Assets and Liabilities | 12 |
Statement of Operations | 13 |
Statements of Changes in Net Assets | 14 |
Statement of Cash Flows | 15 |
Financial Highlights | 16 |
Notes to Financial Statements | 18 |
Report of Independent Registered Public Accounting Firm | 29 |
Trustees and Officers | 30 |
Additional Information | 33 |
Privacy Policy | 35 |
Wildermuth Endowment Strategy Fund Letter to Shareholders |
Dear Investor:
We are pleased to present this annual report for the Wildermuth Endowment Strategy Fund (the “Fund”) covering the 12-month period from January 1, 2016 to December 31, 2016.
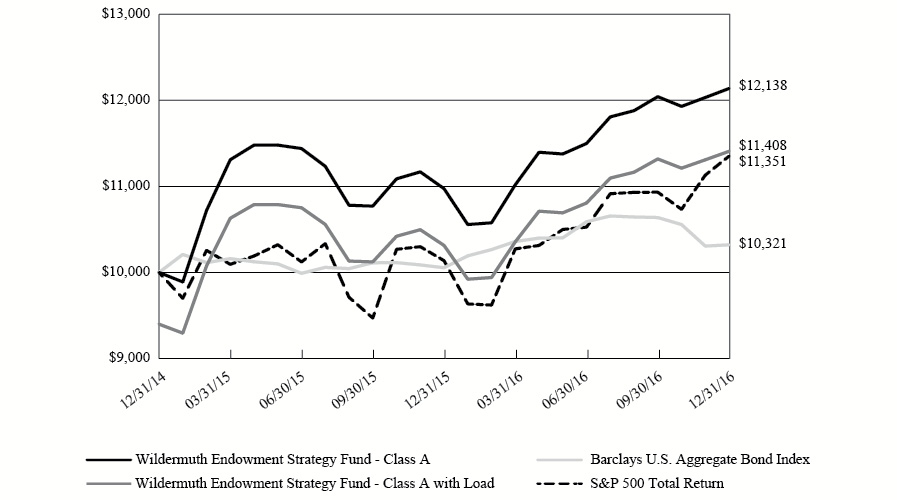
During the 12 months ended December 31, 2016, the Fund delivered a 10.61% total return versus 8.24% for a 60% stock and 40% bond portfolio represented by a 11.96% annual return for the S&P 500® Total Return Index and 2.65% for the Barclays U.S. Aggregate Bond Index. The Fund’s performance resulted from nearly all asset classes delivering positive to strong returns, with a few delivering negative returns on the year.
The asset classes that most contributed to the Fund’s performance included private equity, real estate, real estate debt, oil and gas, and US and emerging markets equity.
Within private equity, successful company growth and development contributed to strong returns across the category. In the real estate sector, nearly all classifications enjoyed success, including multifamily, opportunistic, leisure, healthcare, and office. Returns were generated through both rental income and capital appreciation. Returns were also enhanced through the judicious purchase of some holdings from distressed sellers.
Oil and gas enjoyed strong returns on the year after some positions suffered because of the decline in oil prices during the first six weeks of the year. Allocation to the oil and gas sector was increased substantially after oil hit its low in February through the addition of several new investments enabling the fund to benefit from the recovery of oil prices in general and the appreciation of various assets including drilling rights.
Public equity markets in the U.S. and abroad generally contributed to overall returns, but various markets contributed very differently. U.S. fund positions delivered strong returns and as a group, outperformed U.S. markets. Similarly, public equity investments in emerging markets delivered strong returns and as a group outpaced category index returns. While equity positions in developed foreign markets also were stronger than the overall market indices, the overall flat returns of the sector acted as a significant drag on this category resulting in weak returns for developed foreign markets.
A few other asset classes within the Fund experienced weak or negative returns on the year, although no categories delivered significant losses. Fixed income as a category contributed almost nothing to the fund’s returns, with several subcategories experiencing small losses. Absolute return as a category generated very modest returns, and a few specific investments experienced losses. Managed futures generated a loss for the portfolio and delivered the poorest performance of any category within the fund.
Looking forward to 2017, inevitable change in global markets and new unknowns in the U.S. associated with a new President and his incoming administration will present both interesting challenges and exciting opportunities for investors. In this environment, we are optimistic about many opportunities to add or expand exposure to attractive asset classes and specific investments, and we believe the Fund is uniquely positioned to benefit from the current investment environment.
Thank you for your continued confidence and support.
Sincerely,
Daniel Wildermuth
President and Chief Executive Officer, and
Chairman and Trustee of the Fund
February 2017
2
Wildermuth Endowment Strategy Fund Portfolio Review
December 31, 2016 (Unaudited) |
The Fund’s performance figures* for the period ended December 31, 2016, compared to its benchmarks:
| One
Year | Annualized
Since Inception1 |
Class A | 10.61% | 10.17% |
Class A with Load2 | 3.96% | 6.81% |
S&P 500® Total Return Index** | 11.96% | 6.54% |
Barclays U.S. Aggregate Bond Index*** | 2.65% | 1.59% |
| | Cumulative
Since Inception3,4 |
Class C | | 10.43% |
Class C with Sales Charge5 | | 9.43% |
S&P 500® Total Return Index** | | 12.73% |
Barclays U.S. Aggregate Bond Index*** | | 0.81% |
1 | The Class A inception date is December 31, 2014. |
2 | Calculated using the maximum sales load of 6.00% |
3 | Not annualized for periods less than one year. |
4 | The Class C inception date is March 14, 2016. |
5 | Class C shares are subject to a Contingent Deferred Sales Charge of 1.00% on any shares redeemed within 365 days of purchase. |
* | The performance data quoted here represents past performance. Current performance may be lower or higher than the performance data quoted above. Investment return and principal value will fluctuate, so that shares, when redeemed, may be worth more or less than their original cost. The returns shown do not reflect the deduction of taxes that a shareholder would pay on Fund distributions or on the redemptions of Fund shares. Past performance is no guarantee of future results. Class A has a total annual operating expense of 17.26% and Class C has a total annual operating expense of 18.01% per the prospectus dated March 15, 2016. |
** | The S&P 500® Total Return Index is an unmanaged market capitalization-weighted index of 500 widely held common stocks. Investors cannot invest directly in an index. |
*** | The Barclays U.S. Aggregate Bond Index is a broad-based benchmark that measures the investment grade, U.S. dollar-denominated, fixed-rate taxable bond market, including Treasuries, government-related and corporate securities, MBS (agency fixed-rate and hybrid ARM pass-through securities), ABS, and CMBS. Investors cannot invest directly in an index. |
3
Wildermuth Endowment Strategy Fund Portfolio Review - Continued
December 31, 2016 (Unaudited) |
Growth of a $10,000 Investment
Holdings by type of Investment | % of
Net Assets | 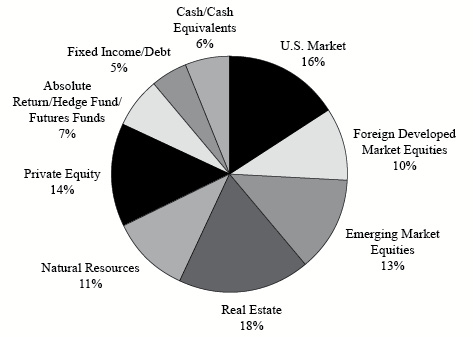
|
U.S. Market | 15.95% |
Foreign Developed Market Equities | 10.14% |
Emerging Market Equities | 12.95% |
Real Estate | 18.42% |
Natural Resources | 10.92% |
Private Equity | 13.81% |
Absolute Return/Hedge Fund/Futures Fund | 6.94% |
Fixed Income/Debt | 4.87% |
Cash/Cash Equivalents | 6.00% |
| | 100.00% |
| | |
| | |
Please refer to the Schedule of Investments in this Annual Report for detailed analysis of the Fund’s Holdings.
4
Wildermuth Endowment Strategy Fund Schedule of Investments
December 31, 2016 |
Number
of Shares | | | | Value | |
| | | COMMON STOCKS — 28.6% | | | |
| | | ADVERTISING — 0.2% | | | |
| | 6,934 | | Havas SA | | $ | 58,509 | |
| | | | | | | | |
| | | | AGRICULTURE — 0.7% | | | | |
| | 1,814 | | Bunge, Ltd. | | | 131,043 | |
| | 997 | | Sipef SA | | | 63,610 | |
| | 1,448 | | Swedish Match AB | | | 46,192 | |
| | | | | | | 240,845 | |
| | | | AIRLINES — 0.1% | | | | |
| | 18,401 | | Qantas Airways, Ltd. | | | 44,370 | |
| | | | | | | | |
| | | | AUTO MANUFACTURERS — 0.2% | | | | |
| | 1,700 | | Suzuki Motor Corp. | | | 59,963 | |
| | | | | | | | |
| | | | AUTO PARTS & EQUIPMENT — 0.5% | | | | |
| | 206 | | Continental AG | | | 39,914 | |
| | 21,362 | | SORL Auto Parts, Inc.(a) | | | 64,941 | |
| | 1,471 | | Tenneco, Inc.(a) | | | 91,893 | |
| | | | | | | 196,748 | |
| | | | BANKS — 2.0% | | | | |
| | 1,743 | | Bank of the Ozarks, Inc. | | | 91,664 | |
| | 7,007 | | Bendigo & Adelaide Bank, Ltd. | | | 64,489 | |
| | 1,053 | | Capital One Financial Corp. | | | 91,864 | |
| | 2,093 | | Erste Group Bank AG | | | 61,426 | |
| | 8,700 | | Huntington Bancshares, Inc. | | | 115,014 | |
| | 871 | | JPMorgan Chase & Co. | | | 75,159 | |
| | 10,164 | | Mitsubishi UFJ Financial Group, Inc., ADR | | | 62,610 | |
| | 9,200 | | Oversea-Chinese Banking Corp., Ltd. | | | 56,803 | |
| | 1,326 | | Wells Fargo & Co. | | | 73,076 | |
| | 4,310 | | Yamaguchi Financial Group, Inc. | | | 47,041 | |
| | | | | | | 739,146 | |
| | | | BEVERAGES — 0.1% | | | | |
| | 634 | | Heineken Holding NV | | | 44,228 | |
| | | | | | | | |
| | | | BIOTECHNOLOGY — 0.5% | | | | |
| | 599 | | China Biologic Products, Inc.(a) | | | 64,404 | |
| | 769 | | United Therapeutics Corp.(a) | | | 110,298 | |
| | | | | | | 174,702 | |
| | | | BUILDING MATERIALS — 0.9% | | | | |
| | 8,501 | | Asahi Glass Co., Ltd. | | | 58,017 | |
| | 5,300 | | Nihon Flush Co., Ltd. | | | 59,255 | |
| | 4,126 | | Owens Corning | | | 212,736 | |
| | | | | | | 330,008 | |
See accompanying notes to financial statements.
5
Wildermuth Endowment Strategy Fund Schedule of Investments - Continued
December 31, 2016 |
Number
of Shares | | | | Value | |
| | | COMMON STOCKS (CONTINUED) | | | |
| | | CHEMICALS — 0.3% | | | |
| | 1,117 | | Croda International PLC | | $ | 44,111 | |
| | 2,810 | | Teijin, Ltd. | | | 57,075 | |
| | | | | | | 101,186 | |
| | | | COMMERCIAL SERVICES — 1.7% | | | | |
| | 848 | | Groupe Crit | | | 60,821 | |
| | 1,818 | | Intrum Justitia AB | | | 61,516 | |
| | 5,246 | | McMillan Shakespeare, Ltd. | | | 41,292 | |
| | 769 | | S&P Global, Inc. | | | 82,698 | |
| | 5,472 | | Total System Services, Inc. | | | 268,292 | |
| | 1,174 | | United Rentals, Inc.(a) | | | 123,951 | |
| | | | | | | 638,570 | |
| | | | COMPUTERS — 0.4% | | | | |
| | 537 | | Ingenico Group SA | | | 42,972 | |
| | 537 | | International Business Machines Corp. | | | 89,137 | |
| | | | | | | 132,109 | |
| | | | DISTRIBUTION/WHOLESALE — 0.1% | | | | |
| | 6,217 | | Inchcape PLC | | | 53,927 | |
| | | | | | | | |
| | | | DIVERSIFIED FINANCIAL SERVICES — 0.5% | | | | |
| | 5,700 | | Ally Financial, Inc. | | | 108,414 | |
| | 11,900 | | Mitsubishi UFJ Lease & Finance Co., Ltd. | | | 61,625 | |
| | | | | | | 170,039 | |
| | | | ELECTRIC — 0.4% | | | | |
| | 2,421 | | Brookfield Infrastructure Partners LP | | | 81,031 | |
| | 2,558 | | Huaneng Power International, Inc., ADR | | | 66,610 | |
| | | | | | | 147,641 | |
| | | | ELECTRICAL COMPONENTS & EQUIPMENT — 0.2% | | | | |
| | 1,098 | | OSRAM Licht AG | | | 57,703 | |
| | | | | | | | |
| | | | ELECTRONICS — 0.2% | | | | |
| | 17,715 | | AU Optronics Corp., ADR | | | 62,711 | |
| | | | | | | | |
| | | | ENERGY-ALTERNATE SOURCES — 0.1% | | | | |
| | 5,071 | | Innergex Renewable Energy, Inc. | | | 53,051 | |
| | | | | | | | |
| | | | ENGINEERING & CONSTRUCTION — 0.4% | | | | |
| | 1,966 | | Argan, Inc. | | | 138,701 | |
| | | | | | | | |
| | | | ENTERTAINMENT — 0.2% | | | | |
| | 1,978 | | Cinemark Holdings, Inc. | | | 75,876 | |
| | | | | | | | |
| | | | FOOD — 0.7% | | | | |
| | 3,280 | | Dean Foods Co. | | | 71,438 | |
| | 3,275 | | Hain Celestial Group, Inc.(a) | | | 127,823 | |
See accompanying notes to financial statements.
6
Wildermuth Endowment Strategy Fund Schedule of Investments - Continued
December 31, 2016 |
Number
of Shares | | | | Value | |
| | | COMMON STOCKS (CONTINUED) | | | |
| | | FOOD (Continued) | | | |
| | 13,272 | | J Sainsbury PLC | | $ | 40,884 | |
| | | | | | | 240,145 | |
| | | | GAS — 0.1% | | | | |
| | 1,932 | | Enagas SA | | | 49,161 | |
| | | | | | | | |
| | | | HEALTHCARE-PRODUCTS — 0.3% | | | | |
| | 4,194 | | Exactech, Inc.(a) | | | 114,496 | |
| | | | | | | | |
| | | | HEALTHCARE-SERVICES — 1.1% | | | | |
| | 784 | | Chemed Corp. | | | 125,762 | |
| | 6,496 | | HealthSouth Corp. | | | 267,895 | |
| | | | | | | 393,657 | |
| | | | HOME FURNISHINGS — 0.2% | | | | |
| | 5,829 | | Panasonic Corp. | | | 59,447 | |
| | | | | | | | |
| | | | INSURANCE — 0.9% | | | | |
| | 8,703 | | State National Cos., Inc. | | | 120,624 | |
| | 233 | | Swiss Life Holding AG | | | 66,067 | |
| | 523 | | Swiss Re AG | | | 49,655 | |
| | 1,807 | | Unum Group | | | 79,381 | |
| | | | | | | 315,727 | |
| | | | INTERNET — 0.2% | | | | |
| | 303 | | Iliad SA | | | 58,372 | |
| | | | | | | | |
| | | | LEISURE TIME — 0.4% | | | | |
| | 2,729 | | Norwegian Cruise Line Holdings, Ltd.(a) | | | 116,064 | |
| | 2,996 | | TUI AG | | | 42,076 | |
| | | | | | | 158,140 | |
| | | | LODGING — 0.5% | | | | |
| | 1,480 | | Marriott International, Inc., Class A | | | 122,367 | |
| | 944 | | Wyndham Worldwide Corp. | | | 72,093 | |
| | | | | | | 194,460 | |
| | | | MACHINERY-DIVERSIFIED — 0.5% | | | | |
| | 548 | | Cummins, Inc. | | | 74,895 | |
| | 4,700 | | Eagle Industry Co., Ltd. | | | 62,581 | |
| | 3,124 | | Hollysys Automation Technologies, Ltd. | | | 57,232 | |
| | | | | | | 194,708 | |
| | | | OIL & GAS — 1.6% | | | | |
| | 11,285 | | Alon USA Energy, Inc. | | | 128,423 | |
| | 7,555 | | Enerplus Corp. | | | 71,621 | |
| | 2,078 | | Murphy Oil Corp. | | | 64,688 | |
| | 1,730 | | Neste Oyj | | | 66,602 | |
| | 6,323 | | Rowan Cos. Plc, Class A(a) | | | 119,442 | |
See accompanying notes to financial statements.
7
Wildermuth Endowment Strategy Fund Schedule of Investments - Continued
December 31, 2016 |
Number
of Shares | | | | Value | |
| | | COMMON STOCKS (CONTINUED) | | | |
| | | OIL & GAS (Continued) | | | |
| | 1,465 | | Tesoro Corp. | | $ | 128,114 | |
| | | | | | | 578,890 | |
| | | | OIL & GAS SERVICES — 0.4% | | | | |
| | 5,099 | | Subsea 7 SA(a) | | | 64,747 | |
| | 5,447 | | World Point Terminals LP | | | 90,148 | |
| | | | | | | 154,895 | |
| | | | PHARMACEUTICALS — 2.1% | | | | |
| | 3,400 | | Astellas Pharma, Inc. | | | 47,326 | |
| | 530 | | Bayer AG | | | 55,415 | |
| | 7,037 | | BTG PLC(a) | | | 51,302 | |
| | 2,426 | | Daiichi Sankyo Co., Ltd. | | | 49,743 | |
| | 770 | | Johnson & Johnson | | | 88,712 | |
| | 2,861 | | Mitsubishi Tanabe Pharma Corp. | | | 56,246 | |
| | 784 | | Novartis AG, ADR | | | 57,107 | |
| | 2,569 | | Novo Nordisk A/S, ADR | | | 92,124 | |
| | 4,730 | | Omega Protein Corp.(a) | | | 118,486 | |
| | 2,585 | | USANA Health Sciences, Inc.(a) | | | 158,202 | |
| | | | | | | 774,663 | |
| | | | PIPELINES — 2.2% | | | | |
| | 5,200 | | Boardwalk Pipeline Partners LP | | | 90,272 | |
| | 1,306 | | Buckeye Partners LP | | | 86,405 | |
| | 2,495 | | DCP Midstream Partners LP | | | 95,758 | |
| | 6,540 | | Energy Transfer Equity LP | | | 126,288 | |
| | 2,437 | | Genesis Energy LP | | | 87,781 | |
| | 3,040 | | Kinder Morgan, Inc. | | | 62,958 | |
| | 1,813 | | Phillips 66 Partners LP | | | 88,184 | |
| | 1,896 | | Spectra Energy Partners LP | | | 86,913 | |
| | 1,655 | | TC PipeLines LP | | | 97,380 | |
| | | | | | | 821,939 | |
| | | | RETAIL — 1.1% | | | | |
| | 1,467 | | Asbury Automotive Group, Inc.(a) | | | 90,514 | |
| | 829 | | AutoNation, Inc.(a) | | | 40,331 | |
| | 3,922 | �� | Michaels Cos., Inc.(a) | | | 80,205 | |
| | 416 | | Pandora A/S | | | 54,526 | |
| | 1,027 | | Target Corp. | | | 74,180 | |
| | 1,097 | | Wal-Mart Stores, Inc. | | | 75,824 | |
| | | | | | | 415,580 | |
| | | | SAVINGS & LOANS — 0.4% | | | | |
| | 9,212 | | Banc of California, Inc. | | | 159,828 | |
| | | | | | | | |
| | | | SEMICONDUCTORS — 2.0% | | | | |
| | 501 | | Broadcom, Ltd. | | | 88,562 | |
| | 2,860 | | Cirrus Logic, Inc.(a) | | | 161,704 | |
| | 1,383 | | Lam Research Corp. | | | 146,225 | |
| | 809 | | NXP Semiconductors NV(a) | | | 79,290 | |
See accompanying notes to financial statements.
8
Wildermuth Endowment Strategy Fund Schedule of Investments - Continued
December 31, 2016 |
Number
of Shares | | | | Value | |
| | | COMMON STOCKS (CONTINUED) | | | |
| | | SEMICONDUCTORS (Continued) | | | |
| | 1,318 | | Skyworks Solutions, Inc. | | $ | 98,402 | |
| | 17,689 | | Telit Communications PLC | | | 60,107 | |
| | 1,229 | | Texas Instruments, Inc. | | | 89,680 | |
| | | | | | | 723,970 | |
| | | | SOFTWARE — 1.6% | | | | |
| | 2,010 | | Cerner Corp.(a) | | | 95,214 | |
| | 2,613 | | Changyou.com, Ltd., ADR(a) | | | 55,448 | |
| | 759 | | Check Point Software Technologies, Ltd.(a) | | | 64,105 | |
| | 681 | | Dassault Systemes | | | 51,996 | |
| | 1,405 | | Fiserv, Inc.(a) | | | 149,323 | |
| | 1,487 | | Open Text Corp. | | | 91,912 | |
| | 2,438 | | Synchronoss Technologies, Inc.(a) | | | 93,375 | |
| | | | | | | 601,373 | |
| | | | TELECOMMUNICATIONS — 1.5% | | | | |
| | 21,284 | | CenturyLink, Inc. | | | 506,133 | |
| | 1,081 | | Millicom International Cellular SA | | | 46,324 | |
| | | | | | | 552,457 | |
| | | | TRANSPORTATION — 0.5% | | | | |
| | 7,550 | | Ship Finance International, Ltd. | | | 112,117 | |
| | 15,426 | | Teekay Offshore Partners LP | | | 78,056 | |
| | | | | | | 190,173 | |
| | | | TRUCKING & LEASING — 0.6% | | | | |
| | 4,887 | | Greenbrier Cos., Inc. | | | 203,055 | |
| | | | | | | | |
| | | | TOTAL COMMON STOCKS (Cost $9,820,557) | | | 10,475,169 | |
| | | | | | | | |
| | | | EXCHANGE TRADED FUNDS — 16.0% | | | | |
| | | | CLOSED-END FUNDS — 0.5% | | | | |
| | 20,484 | | PIMCO High Income Fund | | | 187,838 | |
| | | | | | | | |
| | | | DEBT FUNDS — 2.8% | | | | |
| | 5,031 | | iShares Core U.S. Aggregate Bond | | | 543,650 | |
| | 1,294 | | iShares iBoxx $Investment Grade Corporate Bond | | | 151,631 | |
| | 1,500 | | iShares JP Morgan USD Emerging Markets Bond | | | 165,330 | |
| | 5,835 | | PowerShares Emerging Markets Sovereign Debt Portfolio | | | 164,897 | |
| | | | | | | 1,025,508 | |
| | | | EQUITY FUNDS — 12.7% | | | | |
| | 6,858 | | iShares MSCI All Peru Capped | | | 224,943 | |
| | 7,079 | | iShares MSCI Brazil Capped | | | 236,014 | |
| | 5,908 | | iShares MSCI Chile Capped | | | 221,077 | |
| | 6,695 | | iShares MSCI EAFE | | | 386,502 | |
| | 8,387 | | iShares MSCI India | | | 224,856 | |
| | 12,433 | | iShares MSCI Poland Capped | | | 225,276 | |
| | 7,273 | | iShares MSCI Taiwan | | | 213,608 | |
| | 3,079 | | iShares MSCI Thailand Capped | | | 221,965 | |
See accompanying notes to financial statements.
9
Wildermuth Endowment Strategy Fund Schedule of Investments - Continued
December 31, 2016 |
Number
of Shares | | | | Value | |
| | | EXCHANGE TRADED FUNDS (CONTINUED) | | | |
| | | EQUITY FUNDS (Continued) | | | |
| | 3,036 | | SPDR S&P China | | $ | 218,744 | |
| | 12,103 | | VanEck Vectors Russia | | | 256,826 | |
| | 62,121 | | Vanguard FTSE Emerging Markets | | | 2,222,689 | |
| | | | | | | 4,652,500 | |
| | | | | | | | |
| | | | TOTAL EXCHANGE TRADED FUNDS (Cost $5,719,053) | | | 5,865,846 | |
| | | | | | | | |
| | | | ABSOLUTE RETURN INVESTMENTS — 3.5% | | | | |
| | | | MANAGED FUTURES — 3.5% | | | | |
| | 500,000 | | Dunn-WMA LP(b) | | | 432,192 | |
| | 900 | | Fort Global Offshore Fund, SPC(b) | | | 853,248 | |
| | | | | | | 1,285,440 | |
| | | | | | | | |
| | | | TOTAL ABSOLUTE RETURN INVESTMENTS (Cost $1,400,000) | | | 1,285,440 | |
| | | | | | | | |
| | | | COMMODITY & NATURAL RESOURCE INVESTMENTS — 6.6% | | | | |
| | 857 | | Casillas Petroleum Resource Partners, LLC(b) | | | 856,834 | |
| | 1,200,000 | | Kayne Anderson Energy Fund VII(b) | | | 1,544,798 | |
| | | | TOTAL COMMODITY & NATURAL RESOURCE INVESTMENTS (Cost $2,083,195) | | | 2,401,632 | |
| | | | | | | | |
| | | | HEDGE FUNDS — 2.7% | | | | |
| | 925,000 | | Direct Lending Income Fund LP(b) | | | 971,116 | |
| | | | TOTAL HEDGE FUNDS (Cost $925,000) | | | 971,116 | |
| | | | | | | | |
| | | | PRIVATE EQUITY — 13.9% | | | | |
| | 50 | | Atlas Fintech Holdings Corp.(b) | | | 500,000 | |
| | 2,500 | | Clear Guide Medical, Inc.(b)(c) | | | 2,989,100 | |
| | 10 | | GPB Automotive Portfolio LP(b) | | | 500,695 | |
| | 337,207 | | Tout, Inc. - Series C Preferred Stock(b) | | | 1,099,998 | |
| | | | TOTAL PRIVATE EQUITY (Cost $4,355,073) | | | 5,089,793 | |
| | | | | | | | |
| | | | PUBLIC NON-TRADED BUSINESS DEVELOPMENT COMPANIES — 3.5% | | | | |
| | 23,217 | | CION Investment Corp.(b) | | | 210,116 | |
| | 22,462 | | Corporate Capital Trust, Inc.(b) | | | 201,481 | |
| | 95,638 | | Franklin Square Energy & Power Fund(b) | | | 718,716 | |
| | 18,605 | | HMS Income Fund, Inc.(b) | | | 149,767 | |
| | | | TOTAL PUBLIC NON-TRADED BUSINESS DEVELOPMENT COMPANIES (Cost $1,223,868) | | | 1,280,080 | |
| | | | | | | | |
| | | | PRIVATE REAL ESTATE INVESTMENTS — 13.5% | | | | |
| | 95,075 | | ARC Property Trust, Inc.(b) | | | 1,348,168 | |
| | 101,470 | | Cottonwood Residential, Inc.(b) | | | 1,738,181 | |
| | 800 | | PCG Select Series I LLC - Series A Preferred Stock(b)(c) | | | 816,359 | |
| | 56 | | Shopoff Land Fund III LP(b) | | | 50,680 | |
See accompanying notes to financial statements.
10
Wildermuth Endowment Strategy Fund Schedule of Investments - Continued
December 31, 2016 |
Number
of Shares | | | | Value | |
| | | PRIVATE REAL ESTATE INVESTMENTS (CONTINUED) | | | |
| | 1,000,000 | | Stonehill Strategic Hotel Credit Opportunity Fund II LP(b) | | $ | 1,000,000 | |
| | | | TOTAL PRIVATE REAL ESTATE INVESTMENTS (Cost $4,509,805) | | | 4,953,388 | |
| | | | | | | | |
| | | | PUBLIC REAL ESTATE INVESTMENTS — 5.0% | | | | |
| | | | PUBLIC NON-TRADED REAL ESTATE INVESTMENT TRUSTS — 4.8% | | | | |
| | 111,521 | | Behringer Harvard Opportunity(b) | | | 399,245 | |
| | 135,025 | | CNL Lifestyle Properties(b) | | | 283,553 | |
| | 18,060 | | Dividend Capital Diversified(b) | | | 136,718 | |
| | 136,771 | | Highlands REIT, Inc.(b) | | | 47,870 | |
| | 153,283 | | Inventrust Properties Corp.(b) | | | 481,309 | |
| | 102,130 | | KBS REIT II, Inc.(b) | | | 372,776 | |
| | 3,330 | | Phillips Edison Grocery Center(b) | | | 33,964 | |
| | | | | | | 1,755,435 | |
| | | | PUBLIC NON-TRADED REAL ESTATE LIMITED PARTNERSHIP — 0.1% | | | | |
| | 1,725 | | Uniprop Manufactured Housing Communities Income Fund II(b) | | | 21,286 | |
| | | | | | | | |
| | | | PUBLICLY TRADED REAL ESTATE INVESTMENT TRUSTS — 0.1% | | | | |
| | 964 | | Befimmo SA | | | 54,255 | |
| | | | TOTAL PUBLIC REAL ESTATE INVESTMENTS (Cost $1,477,545) | | | 1,830,976 | |
| | | | | | | | |
| | | | SHORT-TERM INVESTMENTS — 4.8% | | | | |
| | 1,769,241 | | Fidelity Institutional Government Portfolio - Institutional Class, 0.43%(d) | | | 1,769,241 | |
| | | | TOTAL SHORT-TERM INVESTMENTS (Cost $1,769,241) | | | 1,769,241 | |
| | | | | | | | |
| | | | TOTAL INVESTMENTS — 98.1% (Cost $33,283,337) | | | 35,922,681 | |
| | | | Other assets less liabilities — 1.9% | | | 714,205 | |
| | | | | | | | |
| | | | TOTAL NET ASSETS —100.0% | | $ | 36,636,886 | |
ADR – American Depositary Receipt
LLC – Limited Liability Company
LP – Limited Partnership
PLC – Public Limited Company
REIT – Real Estate Investment Trust
SPC – Segregated Portfolio Company
(b) | Illiquid Security. Total illiquid securities represent 48.47% of net assets as of December 31, 2016. |
(c) | Denotes an investment in an affiliated entity. Please refer to Note 8, Investments in Affiliated Issuers, in the notes to financial statements. |
(d) | Represents the current rate as of December 31, 2016. |
See accompanying notes to financial statements.
11
Wildermuth Endowment Strategy Fund Statement of Assets and Liabilities
As of December 31, 2016 |
Assets: | | | |
Investments in unaffiliated issuers at value (cost $30,228,264) | | $ | 32,117,222 | |
Investments in affiliated issuers at value (cost $3,055,073) | | | 3,805,459 | |
Cash | | | 952 | |
Receivables: | | | | |
Tax credit | | | 244,927 | |
Due from Adviser | | | 50,837 | |
Dividends and interest | | | 69,394 | |
Fund shares sold | | | 86,298 | |
Prepaid expenses | | | 44,726 | |
Funded commitment | | | 300,000 | |
Total assets | | | 36,719,815 | |
| | | | | |
Liabilities: | | | | |
Payables: | | | | |
Professional fees | | | 27,400 | |
Shareholder servicing fees | | | 15,676 | |
Transfer agent fees and expenses | | | 11,565 | |
Fund accounting and administration | | | 9,453 | |
Custody fees | | | 3,918 | |
Distribution fees | | | 2,930 | |
Accrued other liabilities | | | 11,987 | |
Total liabilities | | | 82,929 | |
Net Assets | | $ | 36,636,886 | |
| | | | | |
Net Assets Consist of: | | | | |
Paid in capital ($0 par value, 25,000,000 shares authorized) | | $ | 34,018,338 | |
Accumulated net realized loss on investments | | | (20,771 | ) |
Net unrealized appreciation (depreciation) on: | | | | |
Investments | | | 2,639,344 | |
Foreign currency translations | | | (25 | ) |
Net Assets | | $ | 36,636,886 | |
| | | | | |
Net Assets: | | | | |
Class A | | $ | 31,685,928 | |
Class C(1) | | | 4,950,958 | |
Net Assets | | $ | 36,636,886 | |
| | | | | |
Shares of Beneficial Interest Issued and Outstanding: | | | | |
Class A shares | | | 2,683,090 | |
Class C shares(1) | | | 422,019 | |
Total Shares Outstanding | | | 3,105,109 | |
| | | | | |
Net Asset Value, Offering Price and Redemption Proceeds per Share(2) | | | | |
Class A | | $ | 11.81 | |
Class C(1)(4) | | $ | 11.73 | |
Class A - Maximum offering price per share (Net asset value per share divided by 0.94)(3) | | $ | 12.56 | |
(1) | Class C inception date was March 14, 2016. |
(2) | Redemptions made within 90 days of purchase may be assessed a redemption fee of 2.00%. |
(3) | Reflects a maximum sales charge of 6.00%. |
(4) | Class C Shares of the Fund are subject to a Contingent Deferred Sales Charge (“CDSC”) of 1.00% on any shares sold within 365 days of purchase. |
See accompanying notes to financial statements.
12
Wildermuth Endowment Strategy Fund Statement of Operations
For the year ended December 31, 2016 |
Investment Income: | | | |
Dividends from unaffiliated issuers (net of foreign withholding taxes of $7,787) | | $ | 566,917 | |
Dividends from affiliated issuers (net of foreign witholding taxes of $0) | | | 28,526 | |
Interest | | | 4,196 | |
Total investment income | | | 599,639 | |
| | | | | |
Expenses: | | | | |
Advisory fees (see Note 4) | | | 351,712 | |
Legal fees | | | 235,432 | |
Accounting & administration servicing fees | | | 92,234 | |
Transfer agent fees | | | 75,172 | |
Shareholder servicing fees - Class A | | | 54,093 | |
Registration fees | | | 52,224 | |
Trustees' fees | | | 43,555 | |
Chief compliance officer fees | | | 39,342 | |
Chief financial officer fees | | | 38,725 | |
Printing and postage expenses | | | 32,583 | |
Insurance expense | | | 26,043 | |
Custodian fees | | | 23,513 | |
Miscellaneous expenses | | | 21,668 | |
Audit fees | | | 20,388 | |
Distribution fees - Class C* | | | 13,576 | |
Shareholder servicing fees - Class C* | | | 4,525 | |
Total expenses | | | 1,124,785 | |
Expenses waived and reimbursed from Adviser (see Note 4) | | | (525,023 | ) |
Net expenses | | | 599,762 | |
Net investment loss | | | (123 | ) |
| | | | | |
Realized and Unrealized Gain (Loss) on Investments and Foreign Currency: | | | | |
Net realized gain (loss) on: | | | | |
Investments in unaffiliated issuers | | | 6,127 | |
Distributions of realized gains by underlying investment companies | | | 12,670 | |
Foreign currency transactions | | | (2,484 | ) |
Total net realized gain | | | 16,313 | |
Net change in unrealized appreciation/depreciation on: | | | | |
Investments in unaffiliated issuers | | | 1,834,192 | |
Investments in affiliated issuers | | | 750,386 | |
Foreign currency translations | | | (25 | ) |
Total net change in unrealized appreciation/depreciation | | | 2,584,553 | |
Net realized and unrealized gain on investments and foreign currency | | | 2,600,866 | |
| | | | | |
Net Increase in Net Assets from Operations | | $ | 2,600,743 | |
* | Reflects operations for the period from March 14, 2016 (inception date) to December 31, 2016. |
See accompanying notes to financial statements.
13
Wildermuth Endowment Strategy Fund Statements of Changes in Net Assets |
| | | For the
year ended
December 31,
2016 | | | For the
period ended
December 31,
2015(2) | |
Change in Net Assets From: | | | | | | |
Operations: | | | | | | |
Net investment income (loss) | | $ | (123 | ) | | $ | 24,563 | |
Net realized gain (loss) on investments | | | 3,643 | | | | (208,701 | ) |
Distributions of realized gains by underlying investment companies | | | 12,670 | | | | 25,810 | |
Net change in unrealized appreciation/depreciation on investments | | | 2,584,553 | | | | 54,766 | |
Net increase (decrease) in net assets resulting from operations | | | 2,600,743 | | | | (103,562 | ) |
| | | | | | | | | |
Distributions to Shareholders: | | | | | | | | |
From net investment income | | | — | | | | (10,989 | ) |
From return of capital - Class A | | | (351,953 | ) | | | (135,124 | ) |
From return of capital - Class C(1) | | | (27,113 | ) | | | — | |
Total distributions to shareholders | | | (379,066 | ) | | | (146,113 | ) |
| | | | | | | | | |
Capital Share Transactions: | | | | | | | | |
Net proceeds from Class A shares sold | | | 15,811,022 | | | | 14,121,176 | |
Net proceeds from Class C shares sold(1) | | | 4,773,737 | | | | — | |
Reinvestment of distributions from Class A shares | | | 224,283 | | | | 95,473 | |
Reinvestment of distributions from Class C shares(1) | | | 24,899 | | | | — | |
Cost of Class A shares redeemed | | | (867,149 | ) | | | — | |
Cost of Class C shares redeemed(1) | | | (20,000 | ) | | | — | |
Redemption fees | | | 1,443 | | | | — | |
Net increase from capital share transactions | | | 19,948,235 | | | | 14,216,649 | |
| | | | | | | | | |
Net change in net assets | | | 22,169,912 | | | | 13,966,974 | |
| | | | | | | | | |
Net Assets: | | | | | | | | |
Beginning of period | | | 14,466,974 | | | | 500,000 | |
End of period | | $ | 36,636,886 | | | $ | 14,466,974 | |
| | | | | | | | | |
Undistributed net investment income | | $ | — | | | $ | 11,209 | |
| | | | | | | | | |
Transactions in Shares: | | | | | | | | |
Issuance of Class A shares | | | 1,399,946 | | | | 1,281,421 | |
Issuance of Class C shares(1) | | | 421,583 | | | | — | |
Class A shares reinvested | | | 20,041 | | | | 8,770 | |
Class C shares reinvested(1) | | | 2,177 | | | | — | |
Class A shares redeemed | | | (77,088 | ) | | | — | |
Class C shares redeemed(1) | | | (1,741 | ) | | | — | |
Net increase in shares of beneficial interest outstanding | | | 1,764,918 | | | | 1,290,191 | |
(1) | Reflects operations for the period from March 14, 2016 (inception date) to December 31, 2016. |
(2) | The Wildermuth Endowment Strategy Fund commenced operations on January 2, 2015 (inception date 12/31/2014). |
See accompanying notes to financial statements.
14
Wildermuth Endowment Strategy Fund Statement of Cash Flows |
| | | For the
year ended
December 31,
2016 | |
Cash flows from operating activities: | | | |
Net increase in net assets resulting from operations | | $ | 2,600,743 | |
Adjustments to reconcile net increase in net assets resulting from operations to net cash used in operating activities: | | | | |
Purchases of investments | | | (31,027,582 | ) |
Purchases of short term investments, net | | | (259,479 | ) |
Proceeds from sale of investments | | | 12,097,351 | |
Net realized gain from investments | | | (6,127 | ) |
Net unrealized appreciation on investments | | | (2,584,578 | ) |
Return of capital and non-income distributions received | | | 373,464 | |
Distributions of realized gains by underlying investment companies | | | (12,670 | ) |
| | | | | |
Changes in assets and liabilities | | | | |
(Increase)/Decrease in assets: | | | | |
Receivable from tax credit | | | (244,927 | ) |
Due from Investment Adviser | | | (8,084 | ) |
Dividend and interest receivable | | | 77,591 | |
Receivable for fund shares sold | | | (86,298 | ) |
Receivable for securities sold | | | 79,117 | |
Receivable from affiliate | | | 2,719 | |
Funded commitment | | | (200,000 | ) |
Prepaid expenses and other assets | | | (12,554 | ) |
Increase/(Decrease) in liabilities: | | | | |
Payable for securities purchased | | | (371,835 | ) |
Payable for shareholder servicing fees | | | 9,484 | |
Payable for trustee fees | | | (13,246 | ) |
Payable for fund accounting and administration fees | | | 26,841 | |
Payables for transfer agent fees and expenses | | | 8,379 | |
Payable for distribution fees | | | 2,930 | |
Accrued expenses and other liabilities | | | (20,311 | ) |
Net cash used in operating activities | | | (19,569,072 | ) |
| | | | | |
Cash flows from financing activities: | | | | |
Proceeds from shares sold | | | 20,584,759 | |
Cost of shares redeemed, net of redemption fees | | | (885,706 | ) |
Cash distributions paid, net of reinvestment | | | (129,884 | ) |
Net cash provided by financing activities | | | 19,569,169 | |
| | | | | |
Net increase in cash | | | 97 | |
Cash at beginning of year | | | 855 | |
Cash at end of year | | $ | 952 | |
| | | | | |
Supplemental disclosure of non-cash activity: | | | | |
Non-cash financing activities not included herein consist of reinvestment of distributions | | $ | 249,182 | |
See accompanying notes to financial statements.
15
Wildermuth Endowment Strategy Fund Financial Highlights – Class A |
Per share income and capital changes for a share outstanding throughout each period.
| | | For the
year ended
December 31,
2016(1)(2) | | | For the
period ended
December 31,
2015(11) | |
| | | | | | | |
Net asset value, beginning of period | | $ | 10.79 | | | $ | 10.00 | |
| | | | | | | | | |
Income from Investment Operations: | | | | | | | | |
Net investment income(3) | | | 0.01 | | | | 0.05 | |
Net realized and unrealized gain on investments | | | 1.19 | | | | 0.93 | (4) |
Total from investment operations | | | 1.20 | | | | 0.98 | |
Less Distributions: | | | | | | | | |
From net investment income | | | — | | | | (0.03 | ) |
From return of capital | | | (0.18 | ) | | | (0.16 | ) |
Total distributions | | | (0.18 | ) | | | (0.19 | ) |
| | | | | | | | | |
Net asset value, end of period | | $ | 11.81 | | | $ | 10.79 | |
| | | | | | | | | |
Total return(5) | | | 11.27 | % | | | 9.74 | %(6) |
| | | | | | | | | |
Ratios and Supplemental Data: | | | | | | | | |
Net assets, end of period (in thousands) | | $ | 31,686 | | | $ | 14,467 | |
Ratio of expenses before waivers to average net assets(8) | | | 4.73 | % | | | 16.65 | %(7) |
Ratio of net expenses to average net assets(8)(9) | | | 2.50 | % | | | 2.50 | %(7) |
Ratio of net investment income to average net assets(8)(10) | | | 0.07 | % | | | 0.49 | %(7) |
Portfolio turnover rate | | | 55 | % | | | 107 | %(6) |
(1) | Includes adjustments in accordance with accounting principles generally accepted in the United States and consequently, the net asset value for financial reporting purposes and the returns based upon those net asset values may differ from the net asset values and returns for shareholder processing. |
(2) | Redemption fees consisted of per share amounts of less than $0.01 |
(3) | Per share amounts calculated using the average shares method, which more appropriately presents the per share data for the period. |
(4) | Realized and unrealized gain per share does not correlate to the aggregate of the net realized and unrealized gains on the Statement of Operations for the period ended December 31, 2015, primarily due to the timing of sales and repurchases of the Fund’s shares in relation to fluctuating market values for the Fund’s portfolio. |
(5) | Total returns would have been lower had certain expenses not been waived or absorbed by the Adviser. Returns shown do not include payment of a maximum sales load of 6.00% of offering price. If the sales charge was included total returns would be lower. |
(8) | The ratios of expenses and net investment income to average net assets do not reflect the Fund’s proportionate share of income and expenses of underlying investment companies in which the Fund invests. |
(9) | Represents the ratio of expenses to average net assets net of fee waivers and/or expense reimbursements by the Adviser. |
(10) | Recognition of net investment income by the Fund is affected by the timing of the declaration of dividends by the underlying investment companies in which the Fund invests. |
(11) | The Wildermuth Endowment Strategy Fund commenced operations on January 2, 2015 (inception date 12/31/2014). |
See accompanying notes to financial statements.
16
Wildermuth Endowment Strategy Fund Financial Highlights – Class C |
Per share income and capital changes for a share outstanding throughout the period.
| | | For the
period ended December 31,
2016(1)(2) | |
| | | | |
Net asset value, beginning of period | | $ | 10.68 | |
| | | | | |
Income from Investment Operations: | | | | |
Net investment loss(3) | | | (0.07 | ) |
Net realized and unrealized gain on investments | | | 1.25 | |
Total from investment operations | | | 1.18 | |
Less Distributions: | | | | |
From return of capital | | | (0.13 | ) |
Total distributions | | | (0.13 | ) |
| | | | | |
Net asset value, end of period | | $ | 11.73 | |
| | | | | |
Total return(4)(5) | | | 11.10 | % |
| | | | | |
Ratios and Supplemental Data: | | | | |
Net assets, end of period (in thousands) | | $ | 4,951 | |
Ratio of expenses before waivers to average net assets(6)(7) | | | 5.63 | % |
Ratio of net expenses to average net assets(6)(7)(8) | | | 3.25 | % |
Ratio of net investment loss to average net assets(6)(7)(9) | | | (0.77 | %) |
Portfolio turnover rate(5) | | | 55 | % |
(1) | Reflects operations for the period from March 14, 2016 (inception date) to December 31, 2016. |
(2) | Includes adjustments in accordance with accounting principles generally accepted in the United States and consequently, the net asset value for financial reporting purposes and the returns based upon those net asset values may differ from the net asset values and returns for shareholder processing. |
(3) | Per share amounts calculated using the average shares method, which more appropriately presents the per share data for the period. |
(4) | Total returns would have been lower had certain expenses not been waived or absorbed by the Adviser. Returns shown do not include payment of a Contingent Deferred Sales Charge (“CDSC”) of 1.00% on any shares sold within 365 days of purchase. If the sales charge was included total returns would be lower. |
(7) | The ratios of expenses and net investment loss to average net assets do not reflect the Fund’s proportionate share of income and expenses of underlying investment companies in which the Fund invests. |
(8) | Represents the ratio of expenses to average net assets net of fee waivers and/or expense reimbursements by the Adviser. |
(9) | Recognition of net investment loss by the Fund is affected by the timing of the declaration of dividends by the underlying investment companies in which the Fund invests. |
See accompanying notes to financial statements.
17
Wildermuth Endowment Strategy Fund Notes to Financial Statements
December 31, 2016 |
1. ORGANIZATION
Wildermuth Endowment Strategy Fund (the “Fund”) is registered under the Investment Company Act of 1940, as amended (the “1940 Act”), as a non-diversified, closed-end management investment company that is operated as an interval fund. The Fund was organized as a Delaware statutory trust on August 28, 2013, and did not have any operations from that date until December 31, 2014, other than those relating to organizational matters and registration of its shares under applicable securities law. The Fund commenced operations on January 2, 2015. The Fund’s investment objective is to seek total return through a combination of long-term capital appreciation and income generation. The Fund will pursue its objective by investing in assets that Wildermuth Advisory, LLC (the “Adviser”) believes provide favorable long-term capital appreciation and risk-adjusted return potential, as well as in income-producing assets that the Adviser believes will provide consistent income generation and liquidity.
The Fund is engaged in a continuous offering, up to a maximum of 25 million shares of beneficial interest, and will operate as an interval fund that will offer to make quarterly repurchases of shares at the Fund’s net asset value (“NAV”). The Fund currently offers two different classes of shares: Class A and Class C shares. In addition, the Fund has registered Class I shares, which are not currently being offered.
2. SUMMARY OF SIGNIFICANT ACCOUNTING POLICIES
The following is a summary of significant accounting policies followed by the Fund in the preparation of its financial statements. These policies are in conformity with accounting principles generally accepted in the United States of America (“GAAP”). The preparation of financial statements requires management to make estimates and assumptions that affect the reported amounts of assets and liabilities and disclosure of contingent assets and liabilities at the date of the financial statements and the reported amounts of income and expenses for the period. Actual results could differ from those estimates. The Fund follows the specialized accounting and reporting requirements under GAAP that are applicable to investment companies.
Investment Valuation – For purposes of determining the NAV of the Fund, and as applicable, readily marketable portfolio securities listed on the NYSE are valued, except as indicated below, at the last sale price reflected on the consolidated tape at the close of the NYSE on the business day as of which such value is being determined. If there has been no sale on such day, the securities are valued at the mean of the closing bid and asked prices on such day. If no bid or asked prices are quoted on such day or if market prices may be unreliable because of events occurring after the close of trading, then the security is valued by such method as the Fair Value Committee shall determine in good faith to reflect its fair market value. Readily marketable securities not listed on the NYSE but listed on other domestic or foreign securities exchanges are valued in a like manner. Portfolio securities traded on more than one securities exchange are valued at the last sale price on the business day as of which such value is being determined as reflected on the consolidated tape at the close of the exchange representing the principal market for such securities. Securities trading on NASDAQ are valued at the closing price, or, in the case of securities not reported by NASDAQ, a comparable source, as the Fair Value Committee deems appropriate to reflect their fair market value. If there has been no sale on such day, the securities are valued at the mean of the closing bid and asked prices for the day, or if no asked price is available, at the bid price. However, certain debt securities may be valued on the basis of prices provided by a pricing service based on broker or dealer supplied valuations or matrix pricing, a method of valuing securities by reference to the value of other securities with similar characteristics, such as rating, interest rate and maturity.
The “last reported” trade price or sale price or “closing” bid price of a security on any trading day shall be deemed to be: (a) with respect to securities traded primarily on the NYSE, the American Stock Exchange or NASDAQ, the last reported trade price or sale price, as the case may be, as of 4:00 p.m., Eastern Time, on that day, and (b) for securities listed, traded or quoted on any other exchange, market, system or service, the market price as of the end of the “regular hours” trading period that is generally accepted as such by such exchange, market, system or service. If, in the future, the benchmark times generally accepted in the securities industry for determining the market price of a stock as of a given trading day shall change from those set forth above, the fair market value of a security shall be determined as of such other generally accepted benchmark times.
Non-dollar-denominated securities, if any, are valued as of the close of the NYSE at the closing price of such securities in their principal trading market, but may be valued at fair value if subsequent events occurring before the computation of NAV have materially affected the value of the securities. Trading may take place in foreign issues held by the Fund, if any, at times when the Fund is not open for business. As a result, the Fund’s NAV may change at times when it is not possible to purchase or sell shares of the Fund.
18
Wildermuth Endowment Strategy Fund Notes to Financial Statements - Continued
December 31, 2016 |
If market quotations are not readily available, securities are valued at fair values as determined in good faith by the Board of Trustees (the “Board”). The Board has delegated the day-to-day responsibility for determining these fair values in accordance with the policies it has approved to the Fair Value Committee, subject to Valuation Committee and ultimately Board oversight. The Fair Value Committee will provide the Board with periodic reports, no less frequently than quarterly, that discuss the functioning of the valuation process, if applicable to that period, and that identify issues and valuations problems that have arisen, if any. As appropriate, the Valuation Committee and the Board will review any securities valued by the Fair Value Committee in accordance with the Fund’s valuation policies during these periodic reports.
Investments in privately placed debt instruments initially will be valued at cost (purchase price plus all related acquisition costs and expenses, such as legal fees and closing costs) and thereafter will be revalued quarterly at fair value.
Investment Funds that are Private Funds and Non-Traded REITs (“Non-Traded Funds”) will be difficult to value, particularly to the extent that their underlying investments are not publicly traded. In the event a Non-Traded Fund does not report a value to the Fund on a timely basis, the Fair Value Committee, acting under the Valuation Committee and ultimately the Board’s supervision and pursuant to policies implemented by the Board, will determine the fair value of the Fund’s investment based on the most recent value reported by the Non-Traded Fund, as well as any other relevant information available at the time the Fund values its investments. Following procedures adopted by the Board, in the absence of specific transaction activity in a particular investment fund, the Fair Value Committee will consider whether it is appropriate, in light of all relevant circumstances, to value the Fund’s investment at the NAV reported by the Non-Traded Fund at the time of valuation or to adjust the value to reflect a premium or discount.
There is no single standard for determining fair value of a security. Rather, the Fair Value Committee’s fair value calculations will involve significant professional judgment in the application of both observable and unobservable attributes. In determining the fair value of a security for which there are no readily available market quotations, the Fair Value Committee, acting under the Valuation Committee and ultimately the Board’s supervision and pursuant to policies implemented by the Board, may consider several factors, including, but not limited to: (i) the nature and pricing history (if any) of the security; (ii) whether any dealer quotations for the security are available; (iii) possible valuation methodologies that could be used to determine the fair value of the security; (iv) the recommendation of the portfolio manager of the Fund with respect to the valuation of the security; (v) whether the same or similar securities are held by other accounts managed by the Adviser and the method used to price the security in those accounts; (vi) the extent to which the fair value to be determined for the security will result from the use of data or formula produced by third parties independent of the Fund; and (vii) the liquidity or illiquidity of the market for the security. Based on its review of all relevant information, the Fair Value Committee may conclude in certain circumstances that the information provided by the asset manager and/or issuer of a Non-Traded Fund does not represent the fair value of the Fund’s investment in such security.
Because any Corporate Subsidiary through which the Fund invests in private equity investments or private oil and gas funds is treated as a regular taxable corporation, for U.S. federal income tax purposes any Corporate Subsidiary will incur tax expenses. Any Corporate Subsidiary used by the Fund will accrue, in accordance with generally accepted accounting principles, a deferred income tax liability balance at the currently effective maximum statutory U.S. federal income tax rate (currently 35%) plus an assumed state and local income tax rate, for its future tax liability associated with the capital appreciation of its investments and the distributions received on equity securities considered to be return of capital. In calculating its Daily NAV, the Fund will, among other things, account for any Corporate Subsidiary’s deferred tax liability and/or asset balances. Any deferred tax liability balance of any Corporate Subsidiary used by the Fund will reduce the Fund’s NAV.
GAAP defines fair value, establishes a three-tier framework for measuring fair value based on a hierarchy of inputs, and expands disclosure about fair value measurements. It also provides guidance on determining when there has been a significant decrease in the volume and level of activity for an asset or liability, when a transaction is not orderly and how that information must be incorporated into a fair value measurement. The hierarchy distinguishes between market data obtained from independent sources (observable inputs) and the Fund’s own market assumptions (unobservable inputs). These inputs are used in determining the fair value of the Fund’s investments. These inputs are summarized in the three broad levels listed below:
| | ● | Level 1 – quoted prices in active markets for identical securities. An active market for the security is a market in which transactions occur with sufficient frequency and volume to provide pricing information on an ongoing basis. A quoted price in an active market provides the most reliable evidence of fair value. |
| | ● | Level 2 – other significant observable inputs (including quoted prices for similar securities, interest rates, prepayment speeds, credit risk, etc. and quoted prices for identical or similar assets in markets that are not active.) Inputs that are derived principally from or corroborated by observable market data. An adjustment to any observable input that is significant to the fair value may render the measurement a Level 3 measurement. |
19
Wildermuth Endowment Strategy Fund Notes to Financial Statements - Continued
December 31, 2016 |
| | ● | Level 3 – significant unobservable inputs, including the Fund’s own assumptions in determining the fair value of investments. |
The availability of observable inputs can vary from security to security and is affected by a wide variety of factors, including, for example, the type of security, whether the security is new and not yet established in the marketplace, the liquidity of markets, and other characteristics particular to the security. To the extent that valuation is based on models or inputs that are less observable or unobservable in the market, the determination of fair value requires more judgment. Accordingly, the degree of judgment exercised in determining fair value is greatest for instruments categorized in Level 3.
The inputs used to measure fair value may fall into different levels of the fair value hierarchy. In such cases, for disclosure purposes, the level in the fair value hierarchy within which the fair value measurement falls in its entirety is determined based on the lowest level input that is significant to the fair value measurement in its entirety.
In May 2015, the Financial Accounting Standards Board (the “FASB”) issued Accounting Standard Update (“ASU”) 2015-07, Disclosures for Investments in Certain Entities That Calculate Net Asset Value per Unit (or Its Equivalent), modifying ASC 820. ASU 2015-07 became effective for interim and annual reporting periods beginning after December 15, 2015. Under the modifications, certain investments valued at net asset value are no longer included in the fair value hierarchy. The value of these investments is $4,362,718 and are excluded from the fair value hierarchy as of December 31, 2016.
The inputs or methodology used for valuing securities are not necessarily an indication of the risk associated with investing in those securities. The following is a summary of the valuation inputs, representing 100% of the Fund’s investments, used to value the Fund’s assets and liabilities as of December 31, 2016:
| | | | | | Fair Value Measurements at the
End of the Reporting Period Using | | | | |
Investment in Securities | | Practical
Expedient** | | | Level 1
Quoted Prices | | | Level 2
Other Significant Observable Inputs | | | Level 3
Significant Unobservable Inputs | | | Total | |
Security Type | | | | | | | | | | | | | | | |
Common Stocks* | | $ | — | | | $ | 10,475,169 | | | $ | — | | | $ | — | | | $ | 10,475,169 | |
Exchange Traded Funds* | | | — | | | | 5,865,846 | | | | — | | | | — | | | | 5,865,846 | |
Absolute Return Investments | | | 1,285,440 | (1)(5)(6) | | | — | | | | — | | | | — | | | | 1,285,440 | |
Commodity & Natural Resource Investments | | | 1,544,798 | (2)(5)(6) | | | — | | | | — | | | | 856,834 | | | | 2,401,632 | |
Hedge Funds | | | 971,116 | (3)(5)(6) | | | — | | | | — | | | | — | | | | 971,116 | |
Private Equity | | | — | | | | — | | | | — | | | | 5,089,793 | | | | 5,089,793 | |
Public Non-Traded Business Development Companies | | | 561,364 | (4)(5)(6) | | | — | | | | — | | | | 718,716 | | | | 1,280,080 | |
Private Real Estate Investments | | | — | | | | — | | | | — | | | | 4,953,388 | | | | 4,953,388 | |
Public Real Estate Investments* | | | — | | | | 54,255 | | | | — | | | | 1,776,721 | | | | 1,830,976 | |
Short Term Investments | | | — | | | | 1,769,241 | | | | — | | | | — | | | | 1,769,241 | |
Total | | $ | 4,362,718 | | | $ | 18,164,511 | | | $ | — | | | $ | 13,395,452 | | | $ | 35,922,681 | |
* | All sub-categories within the security type represent their respective evaluation status. For a detailed breakout by industry, please refer to the Schedule of Investments. |
20
Wildermuth Endowment Strategy Fund Notes to Financial Statements - Continued
December 31, 2016 |
** | Certain investments that are measured at fair value using the net asset value per share (or its equivalent) practical expedient have not been categorized in the fair value hierarchy. The fair value amounts presented in this table are intended to permit reconciliation of the fair value hierarchy to the amounts presented in the schedule of investments. |
(1) | Security | Withdrawals Permitted | Redemption Notice Period | Investment Objective | Investment Strategy | Lock Up Period |
| | Dunn-WMA LP | Monthly | 10 days | Capital Gains | Managed Futures | None |
| | Fort Global Offshore Fund, SPC | Weekly | 5 days | Capital Gains | Managed Futures - Diversified | None |
| | | | | | | |
(2) | Security | Withdrawals Permitted | Redemption Notice Period | Investment Objective | Investment Strategy | Lock Up Period |
| | Kayne Anderson Energy Fund VII | Not
Applicable | Not
Applicable | Capital Gains | Purchase oil and gas companies; extraction and production companies. | None |
| | | | | | | |
(3) | Security | Withdrawals Permitted | Redemption Notice Period | Investment Objective | Investment Strategy | Lock Up Period |
| | Direct Lending Income Fund LP | Quarterly | 35 days | Current Income | Buying existing small business loans | None |
| | | | | | | |
(4) | Security | Withdrawals Permitted | Redemption Notice Period | Investment Objective | Investment Strategy | Lock Up Period |
| | CION Investment Corp. | Quarterly | 45 days | Current Income | Middle market private business loans | None |
| | Corporate Capital Trust, Inc. | Quarterly | 45 days | Current Income | Middle market private business loans | None |
| | HMS Income Fund, Inc. | Quarterly | 45 days | Current Income | Middle market private business loans | None |
(5) | Redemption frequency and redemption notice period reflect general redemption terms, and exclude liquidity restrictions. Different tranches may have different liquidity terms and may be subject to investor level gates. |
(6) | These investments are domiciled in the United States. |
For the year ended December 31, 2016, there were no transfers in and out of Level 1, Level 2 and Level 3. It is the Fund’s policy to recognize transfers into and out of all Levels at the end of the reporting period.
The following is a roll forward of the activity in investments in which significant unobservable inputs (Level 3) were used in determining fair value on a recurring basis:
| | Beginning balance January 1, 2016 | | | Transfers into
Level 3 during the period | | | Transfers out of
Level 3 during the period | | | Purchases | | | (Sales) | | | Net realized gain | | | Tax Basis Adjustments | | | Change in net unrealized gain | | | Ending balance December 31,
2016 | |
Wildermuth Endowment Strategy Fund | | | | | | | | | | | | | | | | | | | | | | | | | | | |
Commodity & Natural Resource Investments | | $ | — | | | $ | — | | | $ | — | | | $ | 856,834 | | | $ | — | | | $ | — | | | $ | — | | | $ | — | | | $ | 856,834 | |
Private Equity | | | 500,000 | | | | — | | | | — | | | | 4,100,000 | | | | — | | | | — | | | | (244,927 | ) | | | 734,720 | | | | 5,089,793 | |
Public Non-Traded
Business Development Companies | | | — | | | | — | | | | — | | | | 645,280 | | | | — | | | | — | | | | (1,432 | ) | | | 74,868 | | | | 718,716 | |
Private Real Estate Investments | | | 580,712 | | | | — | | | | — | | | | 4,064,922 | | | | — | | | | — | | | | (96,092 | ) | | | 403,846 | | | | 4,953,388 | |
Public Real Estate Investments | | | 1,609,645 | | | | — | | | | — | | | | 240,778 | | | | (8,150 | ) | | | 2,181 | | | | (112,740 | ) | | | 45,007 | | | | 1,776,721 | |
| | | $ | 2,690,357 | | | $ | — | | | $ | — | | | $ | 9,907,814 | | | $ | (8,150 | ) | | $ | 2,181 | | | $ | (455,191 | ) | | $ | 1,258,441 | | | $ | 13,395,452 | |
The change in net unrealized gain included in the Statement of Operations attributable to Level 3 investments as of December 31, 2016 is $1,258,441.
21
Wildermuth Endowment Strategy Fund Notes to Financial Statements - Continued
December 31, 2016 |
The following is a summary of quantitative information about significant unobservable valuation inputs for Level 3 Fair Value Measurements for investments held as of December 31, 2016:
Type of Level 3 Investment | | Fair Value as of
December 31, 2016 | | Valuation Technique | Unobservable Inputs |
Commodity & Natural Resource Investments | | $ | 856,834 | | Private Transaction Cost | Not Applicable* |
Private Equity | | $ | 5,089,793 | | Private Transaction Cost, Option Pricing Method** | Not Applicable* |
Public Non- Traded Business Development Companies | | $ | 718,716 | | Current Value Method*** | Not Applicable* |
Private Real Estate Investments | | $ | 4,953,388 | | Private Transaction Cost | Not Applicable* |
Public Real Estate Investments | | $ | 1,776,721 | | Current Value Method*** | Not Applicable* |
* | Financial information is not prepared in accordance with GAAP or ASC Topic 946 |
** | Relies on financial option theory to allocate value among different classes of members’ equity based upon a future option “claim” on value. Under this method, the values of the various classes of stock are estimated as the net value of a series of call options, representing the present value of the expected future returns to the shareholders. |
*** | The Current Value Method, also referred to as the “Waterfall Method,” is based on allocating the Enterprise Value (individual assets net of liabilities) across the various classes of securities, in conformance with liquidation preferences and conversion values. |
Security Transactions and Related Income – Security transactions are accounted for on trade date basis. Interest income is recognized on an accrual basis. Discounts are accreted and premiums are amortized on securities purchased over the lives of the respective securities. Dividend income is recorded on the ex-dividend date. Realized gains or losses from sales of securities are determined by comparing the identified cost of the security lot sold with the net sales proceeds.
Dividends and Distributions to Shareholders – Dividends from gross investment income are declared and distributed quarterly. Distributable net realized capital gains are declared and distributed annually. Dividends from gross investment income and distributions from net realized gains are recorded on ex- dividend date and determined in accordance with federal income tax regulations, which may differ from GAAP. These “book/tax” differences are considered either temporary (i.e., deferred losses, capital loss carry forwards) or permanent in nature. To the extent these differences are permanent in nature, such amounts are reclassified within the composition of net assets based on their federal tax-basis treatment; temporary differences do not require reclassification.
Distributions received from investments in securities that represent a return of capital or capital gains are recorded as a reduction of cost of investment or as a realized gain, respectively. The calendar year-end amounts of ordinary income, capital gains, and return of capital included in distributions received from the Fund’s investments in real estate investment trusts (“REITs”) are reported to the Fund after the end of the calendar year; accordingly, the Fund estimates these amounts for accounting purposes until the characterization of REIT distributions is reported to the Fund after the end of the calendar year. Estimates are based on the most recent REIT distribution information available.
Investment Companies – The Fund may obtain investment exposure to various asset classes by investing in other investment companies, including registered investment companies, such as ETFs, mutual funds and closed-end funds, as well as hedge funds, private equity funds or other privately offered pooled investment vehicles that are not registered under the 1940 Act (collectively “Investment Funds”). Each Investment Fund is subject to specific risks, depending on the nature of the fund. These risks could include liquidity risk, sector risk, and foreign currency risk, as well as risks associated with fixed income securities and commodities among others. Also, the Fund’s performance depends in part upon the performance of the Investment Fund managers and selected strategies, the adherence by such Investment Fund managers to such selected strategies, the instruments used by such Investment Fund managers and the Adviser’s ability to select Investment Funds and strategies and effectively allocate Fund assets among them. By investing in Investment Funds indirectly through the Fund, the investor bears asset-based fees at the Fund level, in addition to any asset-based fees and/or performance-based fees and allocations at the Investment Fund level. Moreover, an investor in the Fund bears a proportionate share of the fees and
22
Wildermuth Endowment Strategy Fund Notes to Financial Statements - Continued
December 31, 2016 |
expenses of the Fund (including organizational and offering expenses, operating costs, sales charges, brokerage transaction expenses, and administrative fees) and, indirectly, similar expenses of the Investment Funds. Thus, an investor in the Fund may be subject to higher fees and operating expenses than if he or she invested in an Investment Fund directly.
Federal Income Taxes – It is the Fund’s policy to qualify as a regulated investment company by complying with the provisions of the Internal Revenue Code that are applicable to regulated investment companies and to distribute substantially all of its taxable income and net realized gains to shareholders. Therefore, no federal income tax provision has been recorded.
The Fund recognizes the tax benefits of uncertain tax positions only where the position is “more likely than not” to be sustained assuming examination by tax authorities. Management has analyzed the Fund’s tax positions, and has concluded that no liability for unrecognized tax benefits should be recorded related to uncertain tax positions taken or expected to be taken on returns filed for open tax years 2015 and 2016. The Fund identifies its major tax jurisdictions as U.S. federal, and foreign jurisdictions where the Fund makes significant investments; however, the Fund is not aware of any tax positions for which it is reasonably possible that the total amounts of unrecognized tax benefits will change materially in the next twelve months.
Redemption Fee – For shares held for 90 days or less, the Fund will deduct a 2% redemption fee from the redemption amount if the shares are sold pursuant to the Fund’s quarterly repurchase program. Shares held longest will be treated as being repurchased first and shares held shortest as being repurchased last. The redemption fee does not apply to shares that were acquired through reinvestment of distributions. Shares held for more than 90 days are not subject to the 2% fee. Redemption fees are paid to the Fund directly and are designed to offset costs associated with fluctuations in Fund asset levels and cash flow caused by short-term shareholder trading. For the year ended December 31, 2016, the Fund had contributions to capital due to redemption fees in the amount of $1,443.
Indemnification – The Fund indemnifies its officers and trustees for certain liabilities that may arise from the performance of their duties to the Fund. Additionally, in the normal course of business, the Fund enters into contracts that contain a variety of representations and warranties and which provide general indemnities. The Fund’s maximum exposure under these arrangements is unknown, as this would involve future claims that may be made against the Fund that have not yet occurred. However, based on industry experience, the risk of loss due to these warranties and indemnities appears to be remote.
Foreign Currency Translation – The accounting records of the Fund are maintained in U.S. dollars. All assets and liabilities denominated in foreign currencies are translated into U.S. dollars based on the rate of exchange of such currencies against U.S. dollars on the date of valuation. Purchases and sales of securities, income, and expenses are translated at the rate of exchange quoted on the respective date that such transactions are recorded. The Fund does not isolate that portion of the results of operations resulting from changes in foreign exchange rates on investments from the fluctuations arising from changes in market prices of securities held. Such fluctuations are included with the net realized and unrealized gain or loss from investments.
Reported net realized foreign exchange gains or losses arise from sales of portfolio securities, sales and maturities of short-term securities, sales of foreign currencies, currency gains or losses realized between the trade and settlement dates on securities transactions, and the difference between the amounts of dividends, interest, and foreign withholding taxes recorded on the Fund’s books and the U.S. dollar equivalent of the amounts actually received or paid. Net unrealized foreign exchange gains and losses arise from changes in the value of assets and liabilities other than investments in securities at each reporting period, resulting from changes in the exchange rate.
3. INVESTMENT TRANSACTIONS
The cost of purchases and proceeds from the sale of securities, other than short-term investments, for the year ended December 31, 2016, amounted to $31,027,582 and $12,097,351, respectively.
4. ADVISORY FEE AND OTHER SERVICE PROVIDER TRANSACTIONS
Advisory Fees – The Adviser is entitled to receive a monthly fee equal to the annual rate of 1.50% of the Fund’s average daily net assets. For the year ended December 31, 2016, the Adviser earned $351,712 in advisory fees.
23
Wildermuth Endowment Strategy Fund Notes to Financial Statements - Continued
December 31, 2016 |
The Adviser and the Fund have entered into an expense limitation and reimbursement agreement (the “Expense Limitation Agreement”) under which the Adviser has agreed contractually to waive its fees and to pay or absorb the direct, ordinary operating expenses of the Fund (including offering and organizational expenses but excluding front-end or contingent deferred loads, brokerage fees and commissions, acquired fund fees and expenses, borrowing costs (such as interest and dividend expenses on securities sold short), taxes and extraordinary expenses such as litigation)), to the extent that they exceed 2.50% and 3.25% per annum of the Fund’s average daily net assets attributable to Class A and Class C shares (the “Expense Limitation”), respectively, through March 31, 2017. In consideration of the Adviser’s agreement to limit the Fund’s expenses, the Fund has agreed to repay the Adviser in the amount of any fees waived and Fund expenses paid or absorbed. Any waiver or reimbursement of fees by the Adviser is subject to repayment by the Fund within three years following such waiver or reimbursement; provided, however, that (i) the Fund is able to make such repayment without exceeding the expense limitation in place at the time the fees being repaid were waived or the Fund’s current expense limitation, whichever is lower, and (ii) such repayment is approved by the Fund’s Board of Trustees. The Expense Limitation Agreement will remain in effect for successive twelve-month periods provided that such continuance is specifically approved at least annually by the Board of Trustees. The Expense Limitation Agreement may be terminated only by the Fund’s Board on 60 days’ written notice to the Adviser. During the year ended December 31, 2016, the Adviser did not recoup any expenses. At December 31, 2016, $73,173 is subject to recoupment through December 31, 2017, $703,853 through December 31, 2018 and an additional $525,023 through December 31, 2019, to the extent the Expense Limitation Agreement is still in effect.
The Fund has adopted a Distribution Agreement (the “Agreement”) with SQN Securities, LLC (the “Distributor”) to act as the Fund’s principal underwriter and distributor. The Agreement provides that a monthly distribution fee is calculated at an annual rate equal to 0.75% of the Fund’s average daily net assets attributable to Class C. Class A shares are not currently subject to a distribution fee. For the year ended December 31, 2016, $13,576 had been accrued for Class C distribution fees.
Pursuant to a separate Shareholder Services Plan and Agreement (the “Plan) with Hemlock Fund Services, LLC (the “Servicer), an affiliate of the Distributor, the Fund will pay a shareholder servicing fee to the Servicer in connection with servicing shares of the Fund. The Plan provides that a monthly service fee is calculated at an annual rate equal 0.25% of average daily net assets separately attributable to Class A and Class C. For the year ended December 31, 2016, Class A had accrued $54,093 in shareholder service fees and Class C had accrued $4,525.
Trustees – Each Independent Trustee will receive a retainer of $5,000 per year, plus $2,500 for each board or board committee meeting the trustee attends in person ($3,000 for attendance by the chairperson of the audit committee at each meeting of the audit committee), $500 for each meeting the trustee attends telephonically. If there is a meeting of the Board and one or more committees in a single day, the fees will be limited to $3,000 per day ($3,500 for the chairperson of the audit committee if there is a meeting of such committee) for an in person meeting and $750 ($1,000 for the chairperson of the audit committee if there is a meeting of such committee) for meetings attended telephonically. No “interested persons” who serve as Trustees of the Fund will receive any compensation for their services as Trustees. None of the executive officers receive compensation from the Fund.
Other Service Providers – Pursuant to an agreement with Vigilant Compliance, LLC (“Vigilant”), an employee of Vigilant serves as the Chief Compliance Officer and Chief Financial Officer of the Fund. For the provision of these services, Vigilant receives compensation for these services. For the year ended December 31, 2016, the amounts accrued for payment to Vigilant for these services were $39,342 for Chief Compliance Officer and $38,725 for Chief Financial Officer. These amounts are shown in the Statement of Operations under “Chief compliance officer fees” and “Chief financial officer fees”.
Pursuant to a separate, previous servicing agreement with RCS Advisory Services, LLC (“RCSAS”), previously the Administrator of the Fund and an affiliate of RCS, the Fund paid RCSAS customary fees for providing administration and fund accounting services to the Fund. RCSAS had entered into a contract with Gemini Fund Services (“GFS”) pursuant to which GFS served as sub-administrator and provided sub-fund accounting services for the Trust from January 1, 2016 through March 11, 2016. During that period, $13,244 had been accrued for services provided. Effective March 12, 2016 UMB Fund Services, Inc. (“UMBFS”) replaced GFS as the Fund’s administrator and fund accounting service provider.
Pursuant to a separate, previous servicing agreement with American National Stock Transfer, LLC (“ANST”), ANST had served as the Transfer Agent for the Fund for the period January 1, 2016 through March 11, 2016 and was an affiliate of the RCS and GFS. ANST had entered into an agreement with GFS to serve as sub-transfer agent to the Fund. For the period January 1, 2016 through March 11, 2016, $17,346 was accrued for payment to ANST for services provided. Effective March 12, 2016, UMBFS replaced ANST as the Fund’s transfer agent.
24
Wildermuth Endowment Strategy Fund Notes to Financial Statements - Continued
December 31, 2016 |
MUFG Union Bank, N.A. (“MUFG”) served as the Fund’s custodian for the period January 1, 2016 through March 11, 2016. For this period, $3,922 was accrued for payment to MUFG for services provided. Effective March 12, 2016, UMB Bank, N.A. replaced MUFG as the Fund’s custodian.
5. FEDERAL TAX INFORMATION
At December 31, 2016, gross unrealized appreciation and depreciation on investments based on cost for federal income tax purposes were as follows:
Cost of investments | | $ | 33,164,338 | |
Gross unrealized appreciation | | $ | 3,454,348 | |
Gross unrealized depreciation | | | (696,005 | ) |
Net unrealized appreciation on investments | | $ | 2,758,343 | |
The difference between cost amounts for financial statement and federal income tax purposes is due primarily to timing differences in recognizing certain gains and losses in security transactions and investments in partnerships.
GAAP requires that certain components of net assets be reclassified between financial and tax reporting. These reclassifications have no effect on net assets or net asset value per share. For the year ended December 31, 2016, permanent differences in book and tax accounting have been reclassified to paid-in capital, accumulated net investment income (loss) and accumulated realized gain (loss) as follows:
Increase (Decrease) |
Paid in
Capital | Accumulated Net
Investment Income (Loss) | Accumulated Net
Realized Gain (Loss) |
$ (132,356) | $ (11,086) | $ 143,442 |
As of December 31, 2016, the components of accumulated earnings (deficit) on a tax basis were as follows:
Undistributed ordinary income | | $ | — | |
Undistributed long-term gains | | | — | |
Tax accumulated earnings | | | — | |
Accumulated capital and other losses | | | (139,770 | ) |
Net unrealized appreciation on investments | | | 2,758,343 | |
Net unrealized depreciation on foreign currency translations | | | (25 | ) |
Total accumulated earnings/(deficit) | | $ | 2,618,548 | |
The tax character of distributions paid during the fiscal years ended December 31, 2016 and December 31, 2015 were as follows:
| | | 2016 | | | 2015 | |
Distributions paid from: | | | | | | |
Ordinary income | | $ | — | | | $ | 10,989 | |
Long-term capital gains | | | — | | | | — | |
Return of capital | | | 379,066 | | | | 135,124 | |
Total distributions paid | | $ | 379,066 | | | $ | 146,113 | |
25
Wildermuth Endowment Strategy Fund Notes to Financial Statements - Continued
December 31, 2016 |
As of December 31, 2016, the Fund had net capital loss carryovers as follows:
Not subject to expiration: | | | |
Short Term | | $ | 117,992 | |
Long Term | | | 21,778 | |
| | | $ | 139,770 | |
Capital loss carryovers are available to offset future realized capital gains and thereby reduce further taxable gain distributions.
6. REPURCHASE OFFERS
Pursuant to Rule 23c 3 under the Investment Company Act of 1940, as amended, the Fund offers shareholders on a quarterly basis the option of redeeming shares, at net asset value, of no less than 5% and no more than 25% of the shares outstanding. There is no guarantee that shareholders will be able to sell all of the shares they desire in a quarterly repurchase offer, although each shareholder will have the right to require the Fund to purchase up to and including 5% of such shareholder’s shares in each quarterly repurchase. Limited liquidity will be provided to shareholders only through the Fund’s quarterly repurchases.
During the year ended December 31, 2016, the Fund completed four quarterly repurchase offers. In those offers, the Fund offered to repurchase up to 5% of the number of its outstanding shares as of the Repurchase Pricing Dates. The results of those repurchase offers were as follows:
Repurchase Pricing Date | | February 1, 2016 | | | May 2, 2016 | | | August 1, 2016 | | | October 31, 2016 | |
% of Shares Offered - Total Fund | | | 5.00 | % | | | 5.00 | % | | | 5.00 | % | | | 5.00 | % |
Number of Shares Offered - Total Fund | | | 67,010 | | | | 88,582 | | | | 110,859 | | | | 137,910 | |
Pricing Date Net Asset Value - Class A | | $ | 10.36 | | | $ | 11.15 | | | $ | 11.44 | | | $ | 11.55 | |
Pricing Date Net Asset Value - Class C | | Not Applicable | | | $ | 11.14 | | | $ | 11.40 | | | $ | 11.49 | |
Number of Shares Tendered - Class A | | | 8,562 | | | | 31,158 | | | | 5,151 | | | | 32,217 | |
Number of Shares Tendered - Class C | | Not Applicable | | | | — | | | | — | | | | 1,741 | |
% of Shares Tendered - Total Fund | | | 0.64 | % | | | 1.76 | % | | | 0.23 | % | | | 1.23 | % |
7. INVESTMENT IN RESTRICTED SECURITIES
Restricted securities include securities that have not been registered under the Securities Act of 1933, as amended, and securities that are subject to restrictions on resale. The Fund may invest in restricted securities that are consistent with the Fund’s investment objectives and investment strategies. Investments in restricted securities are valued at fair value as determined in good faith in accordance with procedures adopted by the Board of Trustees. It is possible that the estimated value may differ significantly from the amount that might ultimately be realized in the near term, and the difference could be material.
26
Wildermuth Endowment Strategy Fund Notes to Financial Statements - Continued
December 31, 2016 |
Additional information on each illiquid restricted security held by the Fund at December 31, 2016 is as follows:
Security | Initial
Acquisition Date | | Shares | | | Cost | | | Value | | | % of
Net Assets | |
ARC Property Trust, Inc. | June 30, 2016 | | | 95,075 | | | $ | 1,140,145 | | | $ | 1,348,168 | | | | 3.68 | % |
Atlas Fintech Holdings Corp. | December 20, 2016 | | | 50 | | | | 500,000 | | | | 500,000 | | | | 1.37 | % |
Behringer Harvard Opportunity | February 17, 2015 | | | 111,521 | | | | 237,920 | | | | 399,245 | | | | 1.09 | % |
Casillas Petroleum Resource Partners, LLC | October 11, 2016 | | | 857 | | | | 856,834 | | | | 856,834 | | | | 2.34 | % |
CION Investment Corp. | November 16, 2015 | | | 23,217 | | | | 210,000 | | | | 210,116 | | | | 0.57 | % |
Clear Guide Medical, Inc. | April 19, 2016 | | | 2,500 | | | | 2,255,073 | | | | 2,989,100 | | | | 8.16 | % |
CNL Lifestyle Properties | February 2, 2015 | | | 135,025 | | | | 334,162 | | | | 283,553 | | | | 0.77 | % |
Corporate Capital Trust, Inc. | October 30, 2015 | | | 22,462 | | | | 210,026 | | | | 201,481 | | | | 0.55 | % |
Cottonwood Residential, Inc. | February 17, 2015 | | | 101,470 | | | | 1,518,979 | | | | 1,738,181 | | | | 4.74 | % |
Direct Lending Income Fund LP | April 29, 2016 | | | 925,000 | | | | 925,000 | | | | 971,116 | | | | 2.65 | % |
Dividend Capital Diversified | June 2, 2015 | | | 18,060 | | | | 106,315 | | | | 136,718 | | | | 0.37 | % |
Dunn-WMA LP | September 29, 2016 | | | 500,000 | | | | 500,000 | | | | 432,192 | | | | 1.18 | % |
Fort Global Offshore Fund, SPC | September 29, 2016 | | | 900 | | | | 900,000 | | | | 853,248 | | | | 2.33 | % |
Franklin Square Energy & Power Fund | April 19, 2016 | | | 95,638 | | | | 643,848 | | | | 718,716 | | | | 1.96 | % |
GPB Automotive Portfolio LP | March 13, 2015 | | | 10 | | | | 500,000 | | | | 500,695 | | | | 1.37 | % |
Highland REIT, Inc. | April 28, 2016 | | | 136,771 | | | | 34,827 | | | | 47,870 | | | | 0.13 | % |
HMS Income Fund, Inc. | November 11, 2015 | | | 18,605 | | | | 159,994 | | | | 149,767 | | | | 0.41 | % |
Inventrust Properties Corp. | March 2, 2015 | | | 153,283 | | | | 369,386 | | | | 481,309 | | | | 1.31 | % |
Kayne Anderson Energy Fund VII | September 12, 2016 | | | 1,200,000 | | | | 1,226,361 | | | | 1,544,798 | | | | 4.22 | % |
KBS REIT II, Inc. | March 12, 2015 | | | 102,130 | | | | 288,472 | | | | 372,776 | | | | 1.02 | % |
PCG Select Series I LLC - Series A Preferred Stock | June 23, 2016 | | | 800 | | | | 800,000 | | | | 816,359 | | | | 2.23 | % |
Phillips Edison Grocery Center | February 3, 2016 | | | 3,330 | | | | 28,374 | | | | 33,964 | | | | 0.09 | % |
Shopoff Land Fund III LP | April 28, 2015 | | | 56 | | | | 50,680 | | | | 50,680 | | | | 0.14 | % |
Stonehill Strategic Hotel Credit Opportunity Fund II LP | July 18, 2016 | | | 1,000,000 | | | | 1,000,000 | | | | 1,000,000 | | | | 2.73 | % |
Tout, Inc. - Series C Preferred Stock | June 2, 2016 | | | 337,207 | | | | 1,100,000 | | | | 1,099,998 | | | | 3.00 | % |
Uniprop Manufactured Housing Communities Income Fund II | August 31, 2015 | | | 1,725 | | | | 14,801 | | | | 21,286 | | | | 0.06 | % |
| | | | | | | | $ | 15,911,197 | | | $ | 17,758,170 | | | | | |
27
Wildermuth Endowment Strategy Fund Notes to Financial Statements - Continued
December 31, 2016 |
8. INVESTMENTS IN AFFILIATED ISSUERS
An affiliated issuer is an entity in which the Fund has ownership of at least 5% of the voting securities. Issuers that are affiliates of the Fund at period-end are noted in the Fund’s Schedule of Investments. Additional security purchases and the reduction of certain security shares outstanding of existing portfolio holdings that were not considered affiliated in prior years may result in the Fund owning in excess of 5% of the outstanding shares at period-end. The table below reflects transactions during the period with entities that are affiliates as of December 31, 2016 and may include acquisitions of new investments, prior year holdings that became affiliated during the period and prior period affiliated holdings that are no longer affiliated as of period-end.
Security Description | | Value Beginning
of Period | | | Purchases | | | Sales Proceeds | | | Change in Unrealized Appreciation (Depreciation) | | | Net Realized Gain (Loss) | | | Value End
of Period | | | Dividends Credited
to Income | |
Clear Guide Medical, Inc. | | $ | — | | | $ | 2,255,073 | | | $ | — | | | $ | 734,027 | | | $ | — | | | $ | 2,989,100 | | | $ | — | |
PCG Select Series I LLC - Series A Preferred Stock | | | — | | | | 800,000 | | | | — | | | | 16,359 | | | | — | | | | 816,359 | | | | 28,526 | |
| | | $ | — | | | $ | 3,055,073 | | | $ | — | | | $ | 750,386 | | | $ | — | | | $ | 3,805,459 | | | $ | 28,526 | |
9. OFFERING PRICE PER SHARE
Class A shares are offered subject to a maximum sales charge of 6.00% of the offering price, while Class C shares are not subject to sales loads but are subject to a 1% contingent deferred sales charges on shares redeemed during the first 365 days after purchase. For the year ended December 31, 2016, the various broker dealers received $179,294 in underwriting commissions for sales of shares, of which $39,647 was retained by the principal underwriter or other affiliated broker-dealers. For the year ended December 31, 2016, contingent deferred sales charges in the amount of $194 were applied to Class C shareholders.
10. RECENT ACCOUNTING PRONOUNCEMENT
In October 2016, the U.S. Securities and Exchange Commission adopted new rules and amended existing rules (together, the “final rules”) intended to modernize the reporting and disclosure of information by registered investment companies. In part, the final rules amend Regulation S-X and require standardized, enhanced disclosure about derivatives in investment company financial statements, as well as other amendments. The compliance date for the amendments to Regulation S-X is August 1, 2017. Management is currently evaluating the impact that the adoption of the amendments to Regulation S-X may have on the Fund’s financial statements and related disclosures.
11. SUBSEQUENT EVENTS
Subsequent events after the balance sheet date have been evaluated through the date the financial statements were issued.
The Fund completed a quarterly repurchase offer on February 1, 2017. 42,412 shares of Class A and 5,596 shares of Class C were tendered, constituting 1.45% of the outstanding shares of the fund on the Repurchase Pricing Date.
Management has concluded that there are no outstanding circumstances requiring adjustment or disclosure in the financial statements.
28
Wildermuth Endowment Strategy Fund Report of Independent Registered Public Accounting Firm |
To the Board of Trustees and the Shareholders of
Wildermuth Endowment Strategy Fund
We have audited the accompanying statement of assets and liabilities of Wildermuth Endowment Strategy Fund, (the “Fund”) including the schedule of investments, as of December 31, 2016, and the related statements of operations and cash flows for the year then ended and the statements of changes in net assets and the financial highlights for the year then ended and the period from January 2, 2015 (commencement of operations) through December 31, 2015. These financial statements and financial highlights are the responsibility of the Fund’s management. Our responsibility is to express an opinion on these financial statements and financial highlights based on our audits.
We conducted our audits in accordance with the standards of the Public Company Accounting Oversight Board (United States). Those standards require that we plan and perform the audits to obtain reasonable assurance about whether the financial statements and financial highlights are free of material misstatement. An audit includes examining, on a test basis, evidence supporting the amounts and disclosures in the financial statements. Our procedures included confirmation of securities owned as of December 31, 2016 by correspondence with the custodian and other appropriate parties. An audit also includes assessing the accounting principles used and significant estimates made by management, as well as evaluating the overall financial statement presentation. We believe that our audits provide a reasonable basis for our opinion.
As explained in Note 7, the financial statements include investments valued at $17,758,170 (48% of net assets), whose fair values have been estimated under procedures established by the Board of Trustees in the absence of readily ascertainable fair values.
In our opinion, the financial statements and financial highlights referred to above present fairly, in all material respects, the financial position of Wildermuth Endowment Strategy Fund as of December 31, 2016, and the results of its operations and cash flows for the year then ended, and the changes in its net assets and its financial highlights for the year then ended and the period from January 2, 2015 through December 31, 2015, in conformity with accounting principles generally accepted in the United States of America.

BBD, LLP
Philadelphia, Pennsylvania
February 28, 2017
29
Wildermuth Endowment Strategy Fund Trustees and Officers
December 31, 2016 (Unaudited) |
Following is a list of the trustees of the Trust and their principal occupation over the last five years.
Independent Trustees |
Name, Age,
Address* | Position/Term
of Office** | Principal Occupation(s) During Past 5 Years | Number of Portfolios Overseen in Fund Complex*** | Other Directorships Held by
Trustee During Last 5 Years |
Anthony Lewis,
Age 70 | Trustee, Since December 2013 | Chairman and CEO of The Lewis Group USA (executive consulting firm) | 1 | Director, Chairman of the Compensation Committee, and Member of the Audit Committee, Torotel Inc. (Magnetics, Aerospace and Defense); Trustee, Northern Lights Fund Trust II (mutual fund complex) |
R. Martel Day,
Age 67 | Trustee, Since December 2013 | Principal of NLR Advisory Services, LLC (since 2013); Manager and CEO (2013) and Manager and President (2009-2013) of Independence Realty Securities, LLC; Manager and President of Independence Realty Advisor, LLC (2009-2013); Executive Vice President of Independence Realty Trust, Inc. (2009-2013); Manager and President of Independence Mortgage Advisor, LLC (2011-2013); Executive Vice President of Independence Mortgage Trust, Inc. (2011-2013); Executive Vice President - Director of Business Development of Inland Securities Corporation (2005-2009) | 1 | Director, and Member of the Audit Committee, Jones Lang LaSalle Income Property Trust; Director, Inland Bancorp, Inc.; Former Director and Past Chairman, Investment Program Association; Director, SFA Holdings |
Randall D. Fretz,
Age 64 | Trustee, Since December 2013 | Consultant/Chief of Staff, Kids II (design/manufacture children’s products)(since 2014); Senior Vice President (2003-2014) and Corporate Secretary (2013-2014) of Columbia Property Trust (NYSE: CXP); Senior Vice President (2005-2013) and Assistant Secretary (2010-2013) of Wells Timberland REIT, Inc. (now known as CatchMark Timber Trust, Inc. (NYSE: CTT); Senior Vice President of Wells Core Office Income REIT, Inc. (2007 – 2013) | 1 | None |
30
Wildermuth Endowment Strategy Fund Trustees and Officers - Continued
December 31, 2016 (Unaudited) |
Interested Trustees and Officers |
Name, Age,
Address* | Position/Term
of Office** | Principal Occupation(s) During Past 5 Years | Number of Portfolios Overseen in Fund Complex*** | Other Directorships Held by
Trustee During Last 5 Years |
Daniel Wildermuth^,
Age 53 | Trustee, Chairman of the Board, President and Chief Executive Officer | President and CEO, Wildermuth Advisory, LLC from 2013 to present; CEO, Kalos Capital and associated Kalos companies from 2001 to present; CEO, Wildermuth Asset Management from 2016 to present. | 1 | None |
Carol Wildermuth^,
Age 52 | Trustee and Executive Vice President | CFO, Wildermuth Advisory 2016 to present; President, Kalos Financial, 2016 to present; COO, Kalos Financial from 2001 to present; COO, Kalos Management from 2004 to present; COO, Wildermuth Asset Management, 2016 to present; COO, Wildermuth Advisory, LLC from 2013 to 2016; COO, Kalos Capital, from 1997 to 2016. | 1 | None |
Gerard Scarpati,
Age 61 | Treasurer and Chief Financial Officer | Director, Vigilant Compliance, LLC (an investment management services company) from February 2010 to present; Independent Consultant to the Securities Industry from 2004 to February 2010 | N/A | N/A |
Robert Amweg,
Age 63 | Chief Compliance Officer | Compliance Director, Vigilant Compliance, LLC (an investment management services company) from August 2013 to present; Consultant to the financial services industry from September 2012 to present; and Chief Financial Officer and Chief Accounting Officer, Turner Investments, LP from February 2007 to August 2012 | N/A | N/A |
Candice Lightfoot^,
Age 35 | Secretary | COO, Wildermuth Advisory, LLC from Dec 2016 to present; Vice President of Operations from 2015 to 2016; Operations Manager from 2013 to 2015; Project Manager, Kalos Financial, Kalos Capital & Kalos Management from 2012 to 2016; Client Services Manager, Hansch Financial Group from 2009 to 2012. | N/A | N/A |
31
Wildermuth Endowment Strategy Fund Trustees and Officers - Continued
December 31, 2016 (Unaudited) |
Interested Trustees and Officers (continued) |
Name, Age,
Address* | Position/Term
of Office** | Principal Occupation(s) During Past 5 Years | Number of Portfolios Overseen in Fund Complex*** | Other Directorships Held by
Trustee During Last 5 Years |
Amanda Coetzee^,
Age 56 | Assistant Secretary | Chief Compliance Officer, Wildermuth Advisory, LLC from 2013 to present; Assistant Portfolio Manager, Kalos Management from 2003 to 2013 | N/A | N/A |
* | The address for the trustee and officer listed is 11525 Park Woods Circle, Ste. 200, Alpharetta, Georgia 30005-2422. |
** | The term of office for each trustee and officer listed above will continue indefinitely. |
*** | The term “Fund Complex” refers to all present and future funds advised by Wildermuth Advisory, LLC. |
^ | “Interested persons” of the Trust as that term is defined under the 1940 Act because of their affiliation with Wildermuth Advisory, LLC, the Fund’s Adviser. |
32
Wildermuth Endowment Strategy Fund Additional Information
December 31, 2016 (Unaudited) |
Proxy Voting Policy — Information regarding how the Fund votes proxies relating to portfolio securities for the most recent period ended June 30, as well as a description of the policies and procedures that the Fund used to determine how to vote proxies is available without charge, upon request, by calling 1-888-889-8981 or by referring to the Securities and Exchange Commission’s (“SEC”) website at http://www.sec.gov. A description of the policies and procedures is also included in the Fund’s Statement of Additional Information, which is available on the SEC’s website at http://www.sec.gov.
Portfolio Holdings — The Fund files its complete schedule of portfolio holdings with the SEC for the first and third quarters of each fiscal year on Form N-Q. Form N-Q is available on the SEC’s website at http://www.sec.gov and may be reviewed and copied at the SEC’s Public Reference Room in Washington, DC (1-800-SEC-0330). The information on Form N-Q is available without charge, upon request, by calling 1-888-889-8981
Renewal of the Management Agreement:
The Adviser manages and oversees the Fund’s investment program pursuant to a Management Agreement. At a meeting of the Fund’s Board of Trustees on November 9, 2016, the Trustees approved the continuation of the Management Agreement for a one-year term. In considering whether to approve the Agreement, the Trustees reviewed such information and considered such factors as they deemed relevant, including the nature, extent and quality of the services provided by the Adviser to the Fund; the investment performance of the Fund; the costs of services provided to the Fund; the profits to be realized by the Adviser and its affiliates from the relationship; and the extent to which economies of scale can and/or will benefit shareholders.
At the meeting, the Trustees reviewed various materials, including the Adviser’s responses to a questionnaire sent on behalf of the Board. This information included the Management Agreement, the Adviser’s Form ADV, a description of the firm and its organizational and management structure, its history and the manner in which investment decisions are made and executed, the financial condition of the Adviser and its ability to provide the services required under the Management Agreement, an overview of the personnel that perform services for the Fund, the Adviser’s compliance policies, and its regulatory history.
The Adviser’s response also included information on Fund expenses, including comparative expense ratio information for other investment companies with strategies similar to the Fund. The Trustees also reviewed a memorandum from legal counsel that summarized the fiduciary duties and responsibilities of the Trustees in considering a one-year renewal of the Management Agreement, including the types of information and factors that should be considered in order to make an informed decision.
Services Provided. The Trustees reviewed and analyzed various factors that they determined were relevant. The Trustees concluded that the Adviser had sufficient quality and depth of personnel, resources, investment methods and compliance policies and procedures required to perform its duties under the Management Agreement and that the Adviser may reasonably be expected to continue to provide a high quality of services under the Management Agreement with respect to the Fund.
Performance. The Board reviewed information provided by the Adviser relating to the Fund’s performance since inception as compared to its benchmark as well as a group of comparable funds. The Trustees noted that the Fund had outperformed its benchmark for the since inception period ended September 30, 2016 and had generally outperformed its peer group for the one year and since inception periods ended October 31, 2016. The Board acknowledged the difficulty in determining a peer group for the Fund in light of its relatively unique asset classes and structure. After further discussion, the Board concluded that the Fund’s past performance was acceptable.
Fees and Expenses. The Board discussed the fee level set by the Management Agreement and the Fund’s total operating expenses as compared to a peer group prepared by the Adviser. The Board noted that its advisory fee was generally within the range of those in its peer group although on the higher end. The Board also noted the Adviser’s commitment to renew the current expense limitation agreement, under which the Adviser had agreed to waive or limit its advisory fee and/or reimburse expenses in order to limit net annual operating expenses, exclusive of certain fees, so as not to exceed 2.50% and 3.25%, of Fund’s average net assets for Class A and Class C shares, respectively, until at least March 31, 2018. The Board concluded that, based on Adviser’s experience, expertise and services provided to Fund and the unique nature of the Fund’s strategy, the advisory fee charged by the Adviser, although on the higher end of the Fund’s peers, was reasonable. The Board also noted that the Adviser does not expect to receive additional “fall-out” benefits beyond advisory fees for the foreseeable future.
33
Wildermuth Endowment Strategy Fund Additional Information - Continued
December 31, 2016 (Unaudited) |
Profitability. The Board considered the level of profits accrued and that could be expected to accrue to the Adviser with respect to the Fund based on the profitability analysis and selected financial information provided by the Adviser. The Board considered the advisory fees paid to the Adviser under the Management Agreement for a twelve month period ended September 30, 2016, and noted that the Adviser had not realized any positive revenues, much less any profit, from the Fund since its inception. The Board discussed the services provided by the Adviser and the Adviser’s commitment to the Fund and concluded that profits realized from the Adviser’s relationship with the Fund were not excessive.
Economies of Scale. The Board considered the extent to which the Fund will realize economies of scale as it grows, and whether the fee levels reflect these economies of scale for the benefit of investors. The Board discussed the current size of the Fund and the Adviser’s expectations for growth thereof, and concluded that any material economies of scale would not be achieved in the near term.
Based upon all of the foregoing considerations, the Board, including a majority of the Independent Trustees, approved the continuation of the Management Agreement for the Fund.
34
Wildermuth Endowment Strategy Fund Privacy Policy
|
Wildermuth Endowment Strategy Fund (the “Fund”) is committed to protecting your privacy. This privacy notice, which is required by state and federal law, explains the Fund’s privacy policy (the “Policy”). This Policy’s terms apply both to our current shareholders and to former shareholders as well.
2. | HOW WE PROTECT YOUR INFORMATION |
We are committed to maintaining the privacy of our shareholders and to safeguarding their non-public personal information. The following information is provided to help you understand what personal information we collect, how we protect that information and why, in certain cases, we may share information with select other parties.
3. | WHAT KIND OF INFORMATION WE COLLECT |
The Fund may collect nonpublic personal information regarding investors from sources such as the following:
| | ● | Account Applications and other forms, which may include a shareholder’s name, address, social security number and/or personally identifiable financial information; |
| | ● | Account History, including information about a shareholder’s losses or gains; and |
| | ● | Correspondence and Communication, with the Fund’s representatives and their affiliates. |
4. | WHO HAS ACCESS TO SHAREHOLDER INFORMATION |
We do not disclose any non-public personal information about our shareholders or former shareholders to anyone, except as permitted by law or as is necessary in order to provide services to shareholders (for example, to a transfer agent, investment adviser or third party administrator). We restrict access to non-public personal information about our shareholders to Fund personnel and employees of Fund service providers with a legitimate business need for the information. We will maintain physical, electronic and procedural safeguards designed to protect the non-public personal information of our shareholders.
Third parties that handle this information shall agree to follow the standards the Fund has established.
5. | UPDATING YOUR INFORMATION |
To help us keep your information up-to-date and accurate, please contact the Fund if there is any change in your personal information.
Adopted December 2013
35
THIS PAGE INTENTIONALLY LEFT BLANK
THIS PAGE INTENTIONALLY LEFT BLANK
Investment Adviser
Wildermuth Advisory, LLC
11525 Park Woods Circle, Ste. 200
Alpharetta, Georgia 30005
Distributor
SQN Securities, LLC
100 Wall Street, 28th Floor
New York, New York 10005
This report and the financial statements contained herein are submitted for the general information of shareholders and are not authorized for distribution to prospective investors unless preceded or accompanied by an effective prospectus. Nothing herein contained is to be considered an offer of sale or solicitation of an offer to buy shares of the Wildermuth Endowment Strategy Fund. Such offering is made only by prospectus, which includes details as to offering price and other material information.
Distributed by SQN Securities, LLC
Member FINRA
Item 2. Code of Ethics.
(a) The Registrant has adopted a code of ethics (the “Code”), as that term is defined in Item 2 of Form N-CSR, that applies to the Registrant’s principal executive officer, principal financial officer, principal accounting officer or controller, or persons performing similar functions, regardless of whether these individuals are employed by the Registrant or a third party. A copy of the Code is attached as an exhibit.
(c) There have been no substantive amendments during the period covered by this report, to a provision of the code of ethics that applies to Registrant’s principal executive officer, principal financial offer, principal accounting officer or controller, or persons performing similar functions, regardless of whether these individuals are employed by the Registrant or a third party.
(d) The Registrant has not granted any waivers, including an implicit waiver, from a provision of the code of ethics that applies to Registrant’s principal executive officer, principal financial offer, principal accounting officer or controller, or persons performing similar functions, regardless of whether these individuals are employed by the Registrant or a third party.
Item 3. Audit Committee Financial Expert.
(a) (1) The Board of Trustees of the Registrant (the “Board”) has determined that the Registrant has at least one Board member serving on the Audit Committee that possesses the attributes identified in Instruction 2(b) of Item 3 to Form N-CSR to qualify as an “audit committee financial expert.”
(2) Randall D. Fretz is the Registrant’s audit committee financial expert and is “independent” for purposes of Item 3(a)(2) to Form N-CSR.
Item 4. Principal Accountant Fees and Services.
The aggregate fees for professional services by BBD, LLP during the fiscal year 2015 and 2014 were as follows:
(e) Audit Committee’s pre-approval policies and procedures.
(f) None.
(h) Not applicable.
Item 5. Audit Committee of Listed Registrants.
Not applicable.
Item 6. Schedule of Investments.
Included as part of the report to shareholders filed under Item 1 of this Form N-CSR.
Item 7. Disclosure of Proxy Voting Policies and Procedures for Closed-End Management Investment Companies.
The Registrant’s Proxy Voting Policies and Procedures is attached hereto as Exhibit 12(c).
Item 8. Portfolio Managers of Closed-End Management Investment Companies.
(a)(1) Identification of Portfolio Manager(s) or Management Team Members and Description of Role of Portfolio Manager(s) or Management Team Members
The following tables provide biographical information about the portfolio managers who are primarily responsible for the day-to-day portfolio management of the Registrant as of December 31, 2016:
(a)(2) Other Accounts Managed by Portfolio Manager(s) or Management Team Member and Potential Conflicts of Interest
The following tables provide information about portfolios and accounts, other than the Registrant, for which the portfolio managers are primarily responsible for the day-to-day portfolio management as of December 31, 2016:
Daniel Wildermuth is responsible for managing other accounts, including registered investment companies, separate accounts and other pooled investment vehicles. He may manage separate accounts and other pooled investment vehicles that may have materially higher, lower or different fee arrangements than the Registrant and may in the future also be subject to performance-based fees. The side-by-side management of these separate accounts and/or pooled investment vehicles may raise potential conflicts of interest relating to cross trading and the allocation of investment opportunities. The investment adviser has a fiduciary responsibility to manage all client accounts in a fair and equitable manner. The investment adviser seeks to provide best execution of all securities transactions and to allocate investments to client accounts in a fair and timely manner. To this end, the investment adviser has developed policies and procedures designed to mitigate and manage the potential conflicts of interest that may arise from side-by-side management.
The portfolio managers receive a salary, retirement plan benefits and discretionary bonuses from the investment adviser and/or the sub-adviser, as applicable.
The following tables set forth the dollar range of equity securities beneficially owned by the portfolio manager in the Registrant as of December 31, 2016:
(b) Not applicable.
Item 9. Purchases of Equity Securities by Closed-End Management Investment Company and Affiliated Purchasers.
Item 10. Submission of Matters to a Vote of Security Holders.
Not applicable.
Item 11. Controls and Procedures.
Item 12. Exhibits.
Pursuant to the requirements of the Securities Exchange Act of 1934 and the Investment Company Act of 1940, the Registrant has duly caused this report to be signed on its behalf by the undersigned, thereunto duly authorized.
Pursuant to the requirements of the Securities Exchange Act of 1934 and the Investment Company Act of 1940, this report has been signed below by the following persons on behalf of the Registrant and in the capacities and on the dates indicated.