UNITED STATES
SECURITIES AND EXCHANGE COMMISSION
Washington, D.C. 20549
FORM N-CSR
CERTIFIED SHAREHOLDER REPORT OF REGISTERED
MANAGEMENT INVESTMENT COMPANIES
Investment Company Act file number: 811-22885
Broadview Funds Trust
(Exact name of registrant as specified in charter)
330 East Kilbourn Ave., Suite 1475
Milwaukee, Wisconsin 53202
(Address of principal executive offices) (Zip code)
ALPS Fund Services, Inc.
1290 Broadway, Suite 1100
Denver, CO 80203
(Name and address of agent for service)
Registrant’s telephone number, including area code: (414) 918-3900
Date of fiscal year end: September 30, 2014
Date of reporting period: November 26, 2013 – September 30, 2014
| Item 1. | Reports to Stockholders. |


| | | | |
| |
Shareholder Letter | | | 1 | |
| |
Manager Commentary | | | 5 | |
| |
Disclosure of Fund Expenses | | | 7 | |
| |
Schedule of Investments | | | 8 | |
| |
Statement of Assets and Liabilities | | | 11 | |
| |
Statement of Operations | | | 12 | |
| |
Statements of Changes in Net Assets | | | 13 | |
| |
Financial Highlights | | | 14 | |
| |
Notes to Financial Statements | | | 15 | |
| |
Report of Independent Registered Public Accounting Firm | | | 20 | |
| |
Additional Information | | | 21 | |
| |
Trustees and Officers | | | 22 | |
| | |
Broadview Opportunity Fund | | Shareholder Letter |
| | September 30, 2014 (Unaudited) |
Dear Fellow Shareholders,
Fiscal 2014 was a volatile year. The first fiscal quarter, ended December 31, 2013, was positive with the Broadview Opportunity Fund (the “Fund”) returning 8.81%. Contributing to performance were Consumer Discretionary and Industrial holdings, while our Health Care investments tempered performance. During the second fiscal quarter ended March 31, 2014, the Fund declined sharply in January, rebounded in February, and completed March with a return of 1.05%. Our overweight in Health Care helped performance while our overweight in Industrials that underperformed negatively impacted performance. During the third fiscal quarter ended June 30, 2014, the Fund moved lower through mid-May before clawing back to finish the quarter with a return of 1.29%. Strong performance in the Health Care and Industrial sectors were balanced out by poor performance in the Energy and Information Technology sectors. During the fourth fiscal quarter ended September 30, 2014 Fund performance fell through July, moved higher through August, but fell again during September, with a return of -5.85%. Industrial and Consumer Discretionary holdings led the Fund lower.
Overall, during the fiscal year ended September 30, 2014, the Fund posted a gain of 4.86% compared to a gain of 8.97% for the Russell 2500 Index and a gain of 3.93% for the Russell 2000 Index. Over fiscal 2014, top contributors to Fund return included Universal Health Services, Inc., Cl B (UHS), PTC Inc. (PTC), F5 Networks, Inc. (FFIV) and U.S. Silica Holdings, Inc. (SLCA). Bottom detractors to performance included Vocera Communications, Inc. (VCRA), UTi Worldwide Inc. (UTIW), MedAssets, Inc. (MDAS), and SciQuest, Inc. (SQI).
Consumer Sectors Overview – Faraz Farzam, CFA
Broadly speaking our consumer portfolio delivered positive results for the quarter ended September 30, 2014 driven primarily by the acquisition of Annie’s, Inc. (BNNY) by General Mills (GIS) for a nearly 40% premium. Other standouts in the quarter were Ulta Salon, Cosmetics & Fragrance, Inc. (ULTA) and Lululemon Athletica, Inc. (LULU), whose stocks delivered solid gains following better than expected results.
Our worst performing investment was Kate Spade & Co (KATE). Although delivering strong results even against lofty expectations, investors punished the shares on fears of a promotional handbag environment jeopardizing future profitability. Although we feel confident in the outlook for KATE’s fundamentals, we recognize the stock was richly valued. We are monitoring the situation closely.
It is worth noting that over the past five years KATE’s stock has been one of the most successful investments for the Fund. Although we have sold most of the position, we chose to hold on to a small position entering the third quarter due to, what we believe, are tremendous growth prospects in front of the company. Although this decision hurt the Fund’s performance in the calendar quarter ended September 30, 2014, we feel a longer term perspective is needed.
Over the course of the year we have opportunistically added to our consumer positions. The backdrop for consumer spending is shaping up optimistically, in our opinion. Employment continues to improve and gasoline prices are in sharp decline, providing a nice tailwind for consumer spending in the all-important holiday shopping season.
Technology Sector Overview – Faraz Farzam, CFA
Our technology holdings did not fare as well as our consumer investments. Once again our results were bifurcated. We had some outstanding stocks, like F5 Networks, Inc. (FFIV), Fortinet, Inc. (FTNT) and the acquisition of TIBCO Software, Inc. (TIBX) by Vista Equity Partners for a 25% premium. However, some of our newer positions, especially SciQuest, Inc. (SQI), continued to weigh on our performance. We wrote last quarter about the struggles of SciQuest and why we like the business fundamentally. Although we continue to hold steadfastly to our long term thesis, in the near term, investors continue to pressure the shares and SciQuest was our weakest performer in the quarter ended June 30, 2014. Looking ahead, the fourth quarter is seasonally the strongest period for technology shares and valuations remain attractive.
Where Are Regional Banks Headed? – Rick Lane, CFA
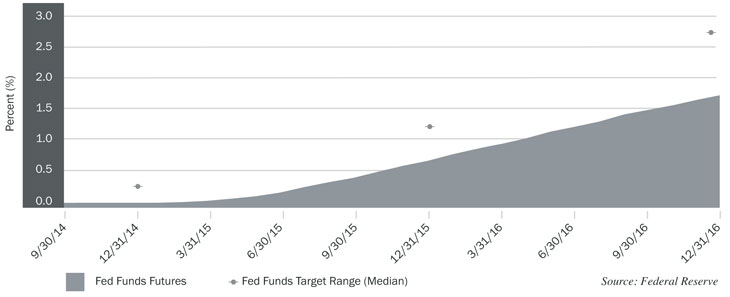
Regional bank stocks have underperformed during the first three calendar quarters of 2014. The KRE Regional Bank Index lost -5.75%, while the Russell 2500 gained 0.28%, and the Russell 2000 Index lost -4.41%. As we contemplate the future prospects for regional banks and our current underweight position, we want to present the bull and bear case for the banking industry. We view the likely positive drivers as higher interest rates, a domestic focus, and sustained strong loan growth. Negative factors include a persistently harsh regulatory environment, the possibility of a Financial Accounting Standards Board (FASB) driven change (increase) in reserving methodology, and of course, the distinct possibility that interest rates do not go up as much or as quickly as the market has already baked into 2015 and 2016 earnings estimates.
We believe rising interest rates are the most important piece of the puzzle. In our opinion, without some relief on that front, bank stocks are unlikely to meaningfully outperform. For approximately five years, bank loan rates, net interest income, and net interest margins (essentially the pre-tax pre-overhead profit margin or gross margin) have been under continuous downward pressure from the Federal Reserve’s zero-interest-rate policy. Investors have witnessed many rising interest rate head fakes since “The Great Recession.” Each time, bank stocks enjoyed nice moves only to “hit the wall” when rates did not in fact rise.
| | |
Annual Report | September 30, 2014 | | 1 |
| | |
Broadview Opportunity Fund | | Shareholder Letter |
| | September 30, 2014 (Unaudited) |
In September, on the heels of some hawkish Federal Reserve talk, bank stocks appeared on the verge of an upside breakout. At that time, the 10-year Treasury bond (the widely watched barometer of interest rates as it pertains to bank equity prices) was yielding 2.6% “on its way to 3% by year end.” Yet again, this was a head fake as weak macro environments outside the U.S. and multiple geo-political events combined to reduce the 10-year Treasury bond back down to a current yield of 2.28%. Higher interest rates are crucial for bank profitability to continue improving. Most economists and market observers agree that monetary policy must normalize sooner or later with a Federal Funds rate closer to 2-3%.
We view a rate hike as likely being a year away. That said, stock prices tend to anticipate by six months to a year. Interestingly, many investors are factoring a significant rise in short-term rates into their earnings estimates. While impossible to ascertain, one can compare the market-driven forward Fed Funds rates (proxy for short term rates) with what the Federal Reserve is “telling us” they anticipate Fed Funds rates will be one, two, and three years out. This exercise causes incremental caution on our part. We believe investors remain quite skeptical of the Fed’s higher short-term interest rates over the next three years. This is clearly illustrated in the chart below. We conclude this aspect of the discussion by stating that sooner or later short-term interest rates are likely to rise and that will be very good for bank earnings. We are very uncertain as to the timing, but even if it is not until 2017, equity prices may begin to anticipate as early 2015.
Another very attractive feature of regional banks is their significant domestic exposure. Our economy is clearly growing faster than most foreign markets, facilitating a stronger earnings outlook for banks relative to many other industries. Also, the strengthening dollar does not hurt the bank earnings results as it does many other industries. Relative to many other verticals, we see bank earnings being somewhat insulated to the negative impact of slowing foreign economies, compounded by the strong dollar and attendant negative foreign currency translation.
Stronger loan growth for regional banks is the final factor in the equation. Loan growth in the first half of 2014 rose to a rate not seen since before the recession. This loan growth continues to help bank earnings as assets shift from lower yielding investment securities into higher yielding loans. Similar to the rising interest rate story, we have seen an ebb and flow. While recent loan growth is encouraging, we need to see another quarter or two to really confirm the trend.
While we continue to see a compelling bull case for bank stocks, we are also cautious about many trends in the industry. One of the greatest concerns is the harsh regulatory environment. The recession has caused a major shift in bank regulation from standards that were too relaxed before the recession to standards that make it difficult for banks to generate acceptable returns. Notable changes include exceedingly high capital levels, strict stress testing, and increased difficulty in gaining acquisition approvals. We are encouraged that many unhealthy practices from the past have ended but believe that the regulatory environment has become too stringent to support a healthy banking industry. As the cycle progresses and the last downturn looks further away, we expect regulators to dial back the overzealous oversight. That has been the experience of many previous cycles. Regulation has always been cyclical and should improve from here.
A potential change in reserve accounting methodology is another significant, yet underappreciated, concern for banks. The Financial Accounting Standards Board has proposed a change in reserve accounting from an incurred loss model to an expected loss model. Instead of provisioning for loan losses as they are realized, banks will have to estimate projected losses over the life of a loan. While the final ruling will not likely be made
| | |
Broadview Opportunity Fund | | Shareholder Letter |
| | September 30, 2014 (Unaudited) |
until early next year, we estimate that banks may have to increase their loan loss reserves from an industry average of roughly 1.3% to perhaps more than 2.0%. This would probably occur through a onetime charge to retained earnings. While this is not the end of the world, this will reduce the excess capital that banks hold and potentially reduce stock repurchase programs and acquisitions. Although concerning, banks will have time to adjust as implementation will likely be slated for 2017 and fully effective in 2018.
Financials (including banks, insurance, capital markets, Real Estate Investment Trusts (REITs), and consumer finance) represent a significant part of both the Russell 2000 and Russell 2500 indices. As such, we thought it important to let investors understand our thinking. While underweight the group, we have spent significant time traveling around various regions of the U.S. prioritizing our opportunities. When we are closer to that day of rising interest rates, we will be ready to invest. Generally, we prefer some level of asset sensitivity and growing geographies. We have initiated small positions in perhaps half of the banks we have on our interest list and will continue to monitor conditions. If the economic outlook worsens, we will make adjustments accordingly.
Callaway Golf Company (ELY) – Rick Whiting
The mantra for Cubs fans has always been “Just wait until next year!” And so it has been for our investment in Callaway in 2014. Both Callaway and the game of golf have been unloved orphans of a sort. Callaway has no publicly traded peers. Ping remains a private company. Adams Golf and Taylormade are both owned by the German conglomerate Adidas. Cobra is owned by the German Puma. Titleist is the property of Korea’s Fila. And Nike Golf is, well, Nike. While we do not own Callaway as take over bait per se, we can not help but note that golf club manufacturers have been a preferred asset for sport clothing companies who wish to build upon a brand. The challenge from an investor’s point of view is that given Callaway’s small market cap, a dearth of analyst coverage from Wall Street, and the lack of publicly traded “pure comps,” it is difficult to value the stock. That, in our minds, equals an orphan discount to its private market value.
The game of golf has not received much love lately either. Sales of equipment have not rebounded to pre-recession levels. Golf courses have been closing and Dick’s Sporting goods has meaningfully downsized the floor space allocated to golf. Hence, much like tennis in the past, the media attention on the game has been in the form of an obituary: It takes too long to play. It costs too much to play. It is too hard to play well. The only ones left to care are yesterday’s generation.
We will not argue that golf, as a sport, may have matured in North America, Europe and Japan. Nor would we argue that, in halcyon days of excess pre-2008, many golf courses were built with little economic merit to support them. But we would argue that the core demographic that plays the game has been returning to this late cycle consumer activity. Rounds played following an abysmal spring have been up year-over-year. The golfer’s wallet has been open. While industry data can be hard to come by, according to Golf Datatech as of April 30, 2014, the sale of the irons and wedges increased 30% in both units and dollars, while there were modest declines in the sales of woods in both dollars (-14%) and units (-10%) this past spring. While Dick’s Sporting Goods did pull back on golf in its stores, it did also remain committed to its Golfgalaxy business, which offers a product selection and services far beyond the generalist approach of its big box stores.
Golf is not a game for everyone, but there remains a vibrant set of players and generally a demographic that can afford to embrace the new equipment that makes the game more playable. While it may be beyond our investment time horizon, the growth of the game in emerging markets has been parabolic albeit off of a nascent base. One need only to look at the PGA (Professional Golf Association) and the LPGA (Ladies Professional Golf Association) to see that many of the top ranked players come from Asia and that there are tours playing a robust schedule in an Asian market. The associations get growth and are bringing the game to a wider and untapped demographic.
Finally, we like the company within its industry. Chip Brewer, CEO, succeeds a litany of weaker attempts to manage the company since the tenure of founder Ely Callaway. To date, Mr. Brewer has met every metric he has provided in his plans to return the company and the brand to prominence. He has stripped the business of ancillary pursuits and focused it on what it does best: bring top shelf research and development from the bench to the store and into the hands of players. He has used the iconic brand names such as APEX and Big Bertha to rekindle the interest of golfers and has won back loyalty while creating industry buzz about the quality and playability of Callaway equipment. Mr. Brewer, who once repaired Adams Golf before selling it to Taylormade, has made good on his desire to focus the Callaway brand and win back market share. The job is far from done, but the progress is measurable.
We do not know if the pieces are in place or not for the Cubs in 2015, but we believe that they are in place for ELY. Granted, we need the consumer to be confident. We would like to see income growth and continued progress on unemployment. A modicum of decent weather would help as well. However, even in the face of economic headwinds, improvement in margins and market share should benefit the business. But just like standing on the tee, a little tailwind is always welcome.
Healthcare Industry and Envision Healthcare (EVHC) – Aaron Garcia, CFA
Despite the roiling market, healthcare has been a relative safe haven with many of our portfolio stocks up strongly for the nine-month period ended September 30, 2014. We have taken advantage of some of these prices. We exited several successful investments, such as Omnicare, Inc.
| | |
Annual Report | September 30, 2014 | | 3 |
| | |
Broadview Opportunity Fund | | Shareholder Letter |
| | September 30, 2014 (Unaudited) |
(OCR), and Align Technologies (ALGN). We have also pruned some core healthcare positions, such as Edwards Lifesciences Corp. (EW), and Universal Health Services, Inc. Cl B (UHS). These trims were primarily tactical as the market continues to correct. That said, we continue to see value in the overall healthcare sector.
There continue to be many changes in the industry due to the implementation of the Affordable Care Act. We are finding opportunities by diligently separating the winners from the losers. More recently, we have taken a new position on Envision Healthcare.
Envision Healthcare is a provider of emergency room, hospitalist, and anesthesiology outsourced services for hospitals. They provide these services across multiple locations which result in cost savings to the hospital system. Envision also has an outsourced ambulatory services for hospitals and communities.
We have a long history with Envision as we used to own its parent company Laidlaw in the early 2000s. More recently, the company emerged from private equity earlier this year with the same management team. There are several tailwinds to Envision’s business that we think can drive outsized performance. First, hospital systems have an increased appetite for outsourcing due to rising healthcare provider costs and a declining reimbursement headwind from Medicare/Medicaid. Second, there are many industry consolidation opportunities in the outsourced provider space. We believe Envision is well capitalized and appropriately sized to benefit from this. Third, Envision’s emergency room services are a direct beneficiary of less uninsured patients. Uninsured patients typically use the ER for primary care and much of the hospitals uncompensated care originates from this area. To summarize, Envision is a secular growth story that we feel is well positioned in the healthcare sector with a strong, long-tenured management team. We are excited about the prospects for this company over the next several years.
As we wrap up our first year as the Broadview Opportunity Fund, we thank our valuable shareholders for investing alongside us through the changes. If you have any suggestions on how we may better serve you, call Customer Service at 855-846-146 or e-mail at broadviewfunds@alpsinc.com. Don’t forget to check our website for popular documents and performance results at www.bvafunds.com.
Best regards,
| | | | | | |
 | |  | |  | |  |
| Richard J. Whiting | | Faraz Farzam, CFA | | Aaron J. Garcia, CFA | | Richard E. Lane, CFA |
The views and information discussed in this commentary are as of the date of publication, are subject to change, and may not reflect the writers’ current views. The views expressed represent an assessment of market conditions at a specific point in time, are opinions only and should not be relied upon as investment advice regarding a particular investment or markets in general. Such information does not constitute a recommendation to buy or sell specific securities or investment vehicles. It should not be assumed that any investment will be profitable or will equal the performance of the fund(s) or any securities or any sectors mentioned herein. The subject matter contained herein has been derived from several sources believed to be reliable and accurate at the time of compilation.
A NOTE ON FORWARD LOOKING STATEMENTS
Except for historical information contained in this report for the Fund, the matters discussed in this report may constitute forward-looking statements made pursuant to the safe-harbor provisions of the Private Securities Litigation Reform Act of 1995. These include any adviser or portfolio manager predictions, assessments, analyses or outlooks for individual securities, industries, market sectors and/or markets. These statements involve risks and uncertainties. In addition to the general risks described for the Fund in the current Prospectus, other factors bearing on this report include the accuracy of the adviser’s or portfolio managers’ forecasts and predictions, and the appropriateness of the investment programs designed by the adviser or portfolio managers to implement their strategies efficiently and effectively. Any one or more of these factors, as well as other risks affecting the securities markets and investment instruments generally, could cause the actual results of the Fund to differ materially as compared to benchmarks associated with the Fund.
| | |
Broadview Opportunity Fund | | Manager Commentary |
| | September 30, 2014 (Unaudited) |
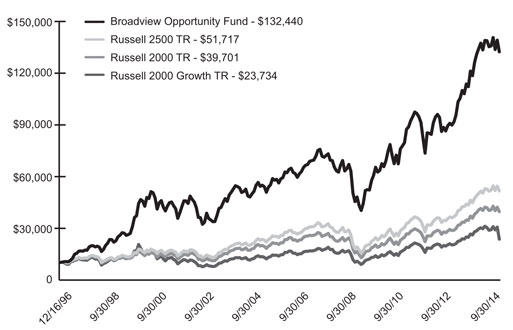
GROWTH OF $10,000 INVESTMENT IN THE FUND
From its inception (12/16/96) to 9/30/14 as compared to the Russell 2500 TR(1), the Russell 2000 TR(2) and the Russell 2000 Growth TR(3)
| | | | | | | | | | |
| PERFORMANCE (For Periods Ended 9/30/14) | | | | | | | | |
| | |
| | | Total Return* | | Annualized Total Return* |
| | | 3 Months | | 1 Year | | 5 Year | | 10 Year | | Since Inception** |
Broadview Opportunity Fund | | -5.85% | | 4.86% | | 15.15% | | 10.24% | | 15.63% |
Russell 2500 TR | | -5.35% | | 8.97% | | 15.99% | | 9.45% | | 9.68% |
Russell 2000 TR | | -7.36% | | 3.93% | | 14.29% | | 8.19% | | 8.06% |
Russell 2000 Growth TR | | -6.13% | | 3.79% | | 15.51% | | 9.03% | | 6.18% |
In order to more accurately represent the investment strategy of the Fund, The Russell 2500 Total Return Index has replaced the Russell 2000 Total Return Index as the primary benchmark for the Fund, and the Russell 2000 Total Return Index has replaced the Russell 2000 Growth Total Return Index as the secondary benchmark for the Fund.
Performance data quoted represents past performance. Past performance does not guarantee future results. Investment return and principal value of an investment will fluctuate so that an investor’s shares, when sold or redeemed, may be worth more or less than the original cost. Current performance data may be higher or lower than actual data quoted. For most recent month end performance please visit bvafunds.com or call 1-855-846-1463. As of the Fund’s Prospectus dated December 1, 2013, the Broadview Opportunity Fund’s annual operating expense ratio is 1.21%. One cannot invest directly in an index.
| (1) | Russell 2500 Total Return - A broad index featuring 2,500 stocks that cover the small- and mid-cap market capitalizations. The Russell 2500 is a market cap weighted index that includes the smallest 2,500 companies covered in the Russell 3000 universe of United States-based listed equities. |
| (2) | The Russell 2000 Total Return Index measures the performance of the 2,000 smallest companies in the Russell 3000 Index which comprises the 3,000 largest U.S. companies based on total market capitalization. |
| (3) | The Russell 2000 Growth Index measures the performance of those Russell 2000 companies with higher price-to-book ratios and higher forecasted growth values. |
| * | Total return includes change in share prices and in each case includes reinvestments of any dividends, interest and capital gain distributions. |
| ** | Fund Inception Date: December 16, 1996 |
| | |
Annual Report | September 30, 2014 | | 5 |
| | |
Broadview Opportunity Fund | | Manager Commentary |
| | September 30, 2014 (Unaudited) |
|
| SECTOR ALLOCATION (as of September 30, 2014) (As a percentage of Net Assets) |

Holdings are subject to change.
These allocations may not reflect the current or future positions of the portfolio.
| | |
Broadview Opportunity Fund | | Disclosure of Fund Expenses |
| | September 30, 2014 (Unaudited) |
As a shareholder of the Broadview Opportunity Fund (the “Fund”) you will incur two types of costs: (1) transaction costs; and (2) ongoing costs, including management fees and other Fund expenses. The following examples are intended to help you understand your ongoing costs (in dollars) of investing in the Fund and to compare these costs with the ongoing costs of investing in other mutual funds. The examples are based on an investment of $1,000 invested on April 1, 2014 and held until September 30, 2014.
Actual Expenses. The first line of the table below provides information about actual account values and actual expenses. You may use the information in this line, together with the amount you invested, to estimate the expenses that you paid over the period. Simply divide your account value by $1,000 (for example, an $8,600 account value divided by $1,000 = 8.6), then multiply the result by the number in the first line under the heading “Expenses Paid During Period” to estimate the expenses you paid on your account during this period.
Hypothetical Example for Comparison Purposes. The second line of the table below provides information about hypothetical account values and hypothetical expenses based on the Fund’s actual expense ratio and an assumed rate of return of 5% per year before expenses, which is not the Fund’s actual return. The hypothetical account values and expenses may not be used to estimate the actual ending account balance or expenses you paid for the period. You may use this information to compare the ongoing costs of investing in the Fund and other mutual funds. To do so, compare this 5% hypothetical example with the 5% hypothetical examples that appear in the shareholder reports of the other funds. The expenses shown in the table are meant to highlight ongoing Fund costs only and do not reflect transaction fees. Therefore, the second line of the table below is useful in comparing ongoing costs only, and may not help you determine the relative total costs of owning different funds. In addition, if these transactional costs were included, your costs would have been higher.
| | | | | | | | | | | | | | | | |
| | | Beginning
Account Value
4/1/14 | | | Ending
Account Value
9/30/14 | | | Expense Ratio(a) | | | Expenses Paid
During period
4/1/14 -9/30/14(b) | |
| | | | |
Actual | | | $ 1,000.00 | | | | $ 953.70 | | | | 1.27 | % | | | $ 6.22 | |
Hypothetical (5% return before expenses) | | | $ 1,000.00 | | | | $ 1,018.70 | | | | 1.27 | % | | | $ 6.43 | |
| (a) | The Fund’s expense ratios have been based on the Fund’s most recent fiscal half-year expenses. |
| (b) | Expenses are equal to the Fund’s annualized expense ratio multiplied by the average account value over the period, multiplied by the number of days in the most recent fiscal half-year (183)/365 (to reflect the half-year period). |
| | |
Annual Report | September 30, 2014 | | 7 |
| | |
Broadview Opportunity Fund | | Schedule of Investments |
| | September 30, 2014 |
| | | | | | | | |
| | | Shares | | | Value | |
COMMON STOCKS (88.81%) | | | | | | | | |
CONSUMER DISCRETIONARY (16.39%) | | | | | | | | |
Consumer Durables & Apparel (4.63%) | | | | | | | | |
Black Diamond, Inc.(a) | | | 382,531 | | | $ | 2,891,934 | |
Callaway Golf Co. | | | 993,773 | | | | 7,194,917 | |
Tumi Holdings, Inc.(a) | | | 618,950 | | | | 12,595,632 | |
Vince Holding Corp.(a) | | | 318,600 | | | | 9,640,836 | |
Winnebago Industries, Inc.(a) | | | 439,654 | | | | 9,571,268 | |
| | | | | | | | |
| | | | | | | 41,894,587 | |
| | | | | | | | |
Media (5.17%) | | | | | | | | |
Interpublic Group of Cos., Inc. | | | 799,700 | | | | 14,650,504 | |
MDC Partners, Inc. - Class A | | | 1,424,883 | | | | 27,343,505 | |
National CineMedia, Inc. | | | 328,124 | | | | 4,761,079 | |
| | | | | | | | |
| | | | | | | 46,755,088 | |
| | | | | | | | |
Retailing (6.59%) | | | | | | | | |
Hibbett Sports, Inc.(a) | | | 247,550 | | | | 10,553,057 | |
Kate Spade & Co.(a) | | | 315,528 | | | | 8,276,299 | |
Lululemon Athletica, Inc.(a) | | | 251,700 | | | | 10,573,917 | |
Ulta Salon Cosmetics & Fragrance, Inc.(a) | | | 139,200 | | | | 16,449,264 | |
Urban Outfitters, Inc.(a) | | | 373,323 | | | | 13,700,954 | |
| | | | | | | | |
| | | | | | | 59,553,491 | |
| | | | | | | | |
CONSUMER STAPLES (1.23%) | | | | | | | | |
Food (1.23%) | | | | | | | | |
Annie’s, Inc.(a) | | | 242,600 | | | | 11,135,340 | |
| | | | | | | | |
| | |
ENERGY (1.63%) | | | | | | | | |
Capital Goods (0.59%) | | | | | | | | |
Chicago Bridge & Iron Co. N.V. | | | 92,900 | | | | 5,374,265 | |
| | | | | | | | |
| | |
Energy (1.04%) | | | | | | | | |
Rowan Cos. PLC - Class A | | | 82,135 | | | | 2,078,837 | |
Whiting Petroleum Corp.(a) | | | 94,231 | | | | 7,307,614 | |
| | | | | | | | |
| | | | | | | 9,386,451 | |
| | | | | | | | |
FINANCIALS (7.47%) | | | | | | | | |
Banks (5.95%) | | | | | | | | |
CoBiz Financial, Inc. | | | 1,047,746 | | | | 11,713,800 | |
Columbia Banking System, Inc. | | | 320,938 | | | | 7,962,472 | |
First Horizon National Corp. | | | 362,200 | | | | 4,447,816 | |
First Midwest Bancorp, Inc. | | | 418,400 | | | | 6,732,056 | |
Hancock Holding Co. | | | 270,100 | | | | 8,656,705 | |
Zions Bancorporation | | | 489,900 | | | | 14,236,494 | |
| | | | | | | | |
| | | | | | | 53,749,343 | |
| | | | | | | | |
Insurance (1.52%) | | | | | | | | |
Hilltop Holdings, Inc.(a) | | | 106,259 | | | | 2,130,493 | |
MGIC Investment Corp.(a) | | | 1,492,275 | | | | 11,654,668 | |
| | | | | | | | |
| | | | | | | 13,785,161 | |
| | | | | | | | |
HEALTH CARE (14.50%) | | | | | | | | |
Biotechnology (1.77%) | | | | | | | | |
Exact Sciences Corp.(a) | | | 824,075 | | | | 15,970,574 | |
| | | | | | | | |
| | |
Health Care Equipment & Services (12.45%) | | | | | | | | |
Edwards Lifesciences Corp.(a) | | | 117,950 | | | | 12,048,592 | |
Envision Healthcare Holdings, Inc.(a) | | | 357,500 | | | | 12,398,100 | |
Hanger, Inc.(a) | | | 46,550 | | | | 955,206 | |
HealthSouth Corp. | | | 457,002 | | | | 16,863,374 | |
NxStage Medical, Inc.(a) | | | 1,466,525 | | | | 19,255,473 | |
See Notes to Financial Statements.
| | |
Broadview Opportunity Fund | | Schedule of Investments |
| | September 30, 2014 |
| | | | | | | | |
| | | Shares | | | Value | |
COMMON STOCKS (88.81%) (continued) | | | | | | | | |
HEALTH CARE (14.50%) (continued) | | | | | | | | |
Health Care Equipment & Services (12.45%) (continued) | | | | | | | | |
Omnicare, Inc. | | | 75,900 | | | $ | 4,725,534 | |
PAREXEL International Corp.(a) | | | 288,206 | | | | 18,182,917 | |
Select Medical Holdings Corp. | | | 1,027,200 | | | | 12,357,216 | |
Universal Health Services, Inc. - Class B | | | 150,700 | | | | 15,748,150 | |
| | | | | | | | |
| | | | | | | 112,534,562 | |
| | | | | | | | |
Pharmaceuticals, Biotechnology & Life Sciences (0.28%) | | | | | | | | |
Meridian Bioscience, Inc. | | | 145,360 | | | | 2,571,418 | |
| | | | | | | | |
| | |
INDUSTRIALS (22.58%) | | | | | | | | |
Automobiles & Components (2.99%) | | | | | | | | |
Gentex Corp. | | | 701,600 | | | | 18,781,832 | |
Modine Manufacturing Co.(a) | | | 428,767 | | | | 5,089,465 | |
Swift Transportation Co.(a) | | | 149,900 | | | | 3,144,902 | |
| | | | | | | | |
| | | | | | | 27,016,199 | |
| | | | | | | | |
Capital Goods (11.75%) | | | | | | | | |
Crane Co. | | | 135,400 | | | | 8,558,634 | |
Douglas Dynamics, Inc. | | | 347,118 | | | | 6,768,801 | |
Dynamic Materials Corp. | | | 164,216 | | | | 3,128,315 | |
Hexcel Corp.(a) | | | 454,429 | | | | 18,040,831 | |
Kennametal, Inc. | | | 327,000 | | | | 13,508,370 | |
Masco Corp. | | | 590,600 | | | | 14,127,152 | |
MasTec, Inc.(a) | | | 329,200 | | | | 10,080,104 | |
Regal-Beloit Corp. | | | 154,300 | | | | 9,913,775 | |
Stock Building Supply Holdings, Inc.(a) | | | 538,101 | | | | 8,453,567 | |
Terex Corp. | | | 284,100 | | | | 9,025,857 | |
Twin Disc, Inc. | | | 172,790 | | | | 4,658,418 | |
| | | | | | | | |
| | | | | | | 106,263,824 | |
| | | | | | | | |
Commercial Services & Supplies (2.22%) | | | | | | | | |
Kforce, Inc. | | | 556,000 | | | | 10,880,920 | |
Robert Half International, Inc. | | | 187,343 | | | | 9,179,807 | |
| | | | | | | | |
| | | | | | | 20,060,727 | |
| | | | | | | | |
Diversified Financials (2.10%) | | | | | | | | |
Mobile Mini, Inc. | | | 543,837 | | | | 19,017,980 | |
| | | | | | | | |
| | |
Electronics (1.47%) | | | | | | | | |
FEI Co. | | | 176,084 | | | | 13,280,255 | |
| | | | | | | | |
| | |
Machinery (0.98%) | | | | | | | | |
Astec Industries, Inc. | | | 241,500 | | | | 8,807,505 | |
| | | | | | | | |
| | |
Transportation (1.07%) | | | | | | | | |
UTi Worldwide, Inc.(a) | | | 910,167 | | | | 9,675,075 | |
| | | | | | | | |
| | |
INFORMATION TECHNOLOGY (18.64%) | | | | | | | | |
Retailing (1.39%) | | | | | | | | |
Arrow Electronics, Inc.(a) | | | 184,692 | | | | 10,222,702 | |
ScanSource, Inc.(a) | | | 67,336 | | | | 2,329,152 | |
| | | | | | | | |
| | | | | | | 12,551,854 | |
| | | | | | | | |
Semiconductors & Semiconductor Equipment (2.89%) | | | | | | | | |
MKS Instruments, Inc. | | | 400,600 | | | | 13,372,028 | |
Veeco Instruments, Inc.(a) | | | 366,600 | | | | 12,812,670 | |
| | | | | | | | |
| | | | | | | 26,184,698 | |
| | | | | | | | |
See Notes to Financial Statements.
| | |
Annual Report | September 30, 2014 | | 9 |
| | |
Broadview Opportunity Fund | | Schedule of Investments |
| | September 30, 2014 |
| | | | | | | | |
| | | Shares | | | Value | |
COMMON STOCKS (88.81%) (continued) | | | | | | | | |
INFORMATION TECHNOLOGY (18.64%) (continued) | | | | | | | | |
Software & Services (9.46%) | | | | | | | | |
Infoblox, Inc.(a) | | | 519,900 | | | $ | 7,668,525 | |
Informatica Corp.(a) | | | 614,400 | | | | 21,037,056 | |
PTC, Inc.(a) | | | 725,019 | | | | 26,753,201 | |
Qlik Technologies, Inc.(a) | | | 347,700 | | | | 9,401,808 | |
SciQuest, Inc.(a) | | | 470,750 | | | | 7,080,080 | |
TIBCO Software, Inc.(a) | | | 573,700 | | | | 13,556,531 | |
| | | | | | | | |
| | | | | | | 85,497,201 | |
| | | | | | | | |
Technology Hardware & Equipment (4.90%) | | | | | | | | |
Ciena Corp.(a) | | | 530,800 | | | | 8,874,976 | |
F5 Networks, Inc.(a) | | | 151,302 | | | | 17,965,599 | |
Fortinet, Inc.(a) | | | 690,395 | | | | 17,442,830 | |
| | | | | | | | |
| | | | | | | 44,283,405 | |
| | | | | | | | |
MATERIALS (6.37%) | | | | | | | | |
Materials (6.37%) | | | | | | | | |
Allegheny Technologies, Inc. | | | 433,958 | | | | 16,099,842 | |
Celanese Corp. - Series A | | | 242,550 | | | | 14,194,026 | |
Sealed Air Corp. | | | 301,700 | | | | 10,523,296 | |
Vulcan Materials Co. | | | 278,200 | | | | 16,755,986 | |
| | | | | | | | |
| | | | | | | 57,573,150 | |
| | | | | | | | |
TOTAL COMMON STOCKS | | | | | | | | |
(COST $648,365,723) | | | | | | | 802,922,153 | |
| | | | | | | | |
| | |
SHORT-TERM SECURITY (8.72%) | | | | | | | | |
MONEY MARKET FUND (8.72%) | | | | | | | | |
Morgan Stanley Institutional Liquidity Funds - Government Portfolio, Institutional Class, 7 Day Yield 0.040% | | | 78,874,418 | | | | 78,874,418 | |
| | | | | | | | |
| | |
TOTAL SHORT-TERM SECURITY | | | | | | | | |
(COST $78,874,418) | | | | | | | 78,874,418 | |
| | | | | | | | |
| | |
TOTAL INVESTMENTS (97.53%) | | | | | | | | |
(COST $727,240,141) | | | | | | | 881,796,571 | |
| | | | | | | | |
| | |
TOTAL ASSETS IN EXCESS OF OTHER LIABILITIES (2.47%) | | | | | | | 22,354,909 | |
| | | | | | | | |
| | |
NET ASSETS 100.00% | | | | | | $ | 904,151,480 | |
| | | | | | | | |
| (a) | | Non-income producing security. |
Percentages are stated as a percent of net assets.
Common Abbreviations:
N.V. - Naamloze Vennootschap is the Dutch term for a public limited liability corporation.
PLC - Public Limited Company.
See Notes to Financial Statements.
| | |
Broadview Opportunity Fund | | Statement of Assets and Liabilities |
| | September 30, 2014 |
| | | | |
ASSETS: | | | | |
Investments in securities, at value | | $ | 881,796,571 | |
Receivable for investments sold | | | 26,424,904 | |
Receivable for shareholder purchases | | | 479,324 | |
Dividends and interest receivable | | | 231,915 | |
Prepaid expenses | | | 34,785 | |
| |
Total assets | | | 908,967,499 | |
| |
| |
LIABILITIES: | | | | |
Payable for management fees | | | 794,857 | |
Payable for investments purchased | | | 2,441,212 | |
Payable to shareholders for redemptions | | | 1,179,129 | |
Payable for Board of Trustees fees | | | 621 | |
Payable for chief compliance officer fees | | | 2,500 | |
Accrued expenses and other liabilities | | | 397,700 | |
| |
Total liabilities | | | 4,816,019 | |
| |
NET ASSETS | | $ | 904,151,480 | |
| |
| |
NET ASSETS CONSIST OF: | | | | |
Paid-in capital | | $ | 670,590,771 | |
Accumulated net realized gain on investments | | | 79,004,279 | |
Net unrealized appreciation on investments | | | 154,556,430 | |
| |
NET ASSETS | | $ | 904,151,480 | |
| |
| |
INVESTMENTS IN SECURITIES, AT COST | | $ | 727,240,141 | |
| |
PRICING OF SHARES: | | | | |
Net Asset Value, offering and redemption price per share | | $ | 38.48 | |
Net Assets | | $ | 904,151,480 | |
Shares of beneficial interest outstanding | | | 23,494,475 | |
See Notes to Financial Statements.
| | |
Annual Report | September 30, 2014 | | 11 |
| | |
Broadview Opportunity Fund | | Statement of Operations |
| | For the Year Ended September 30, 2014 |
| | | | |
| |
INVESTMENT INCOME: | | | | |
Dividends | | $ | 7,404,673 | |
Foreign taxes withheld | | | (200,763) | |
Interest | | | 19,028 | |
| |
Total Investment Income | | | 7,222,938 | |
| |
| |
EXPENSES: | | | | |
Management fees | | | 9,672,959 | |
Administration and accounting services | | | 357,978 | |
Transfer agent fees | | | 1,522,078 | |
Professional fees | | | 69,816 | |
Custodian fees | | | 70,945 | |
Board of Trustees fees | | | 46,083 | |
Chief compliance officer fees | | | 25,000 | |
Printing and postage expenses | | | 174,872 | |
Registration fees | | | 102,102 | |
Other expenses | | | 44,694 | |
| |
Total Expenses | | | 12,086,527 | |
| |
NET INVESTMENT LOSS | | | (4,863,589) | |
| |
| |
REALIZED AND UNREALIZED GAIN/(LOSS) FROM INVESTMENTS | | | | |
Net realized gain on investments | | | 106,189,173 | |
Net change in unrealized depreciation of investments | | | (59,401,011) | |
| |
NET REALIZED AND UNREALIZED GAIN FROM INVESTMENTS | | | 46,788,162 | |
| |
NET INCREASE IN NET ASSETS RESULTING FROM OPERATIONS | | $ | 41,924,573 | |
| |
See Notes to Financial Statements.
| | |
Broadview Opportunity Fund | | Statements of Changes in Net Assets |
| | |
| | | | | | | | |
| | | For the Year Ended
September 30, 2014 | | | For the Year Ended
September 30, 2013 | |
| |
OPERATIONS: | | | | | | | | |
Net investment loss | | $ | (4,863,589) | | | $ | (3,086,077) | |
Net realized gain on investments | | | 106,189,173 | | | | 85,160,769 | |
Net change in unrealized appreciation/(depreciation) on investments | | | (59,401,011) | | | | 146,688,701 | |
| |
Net increase in net assets resulting from operations | | | 41,924,573 | | | | 228,763,393 | |
| |
| | |
DISTRIBUTIONS TO SHAREHOLDERS (Note 5): | | | | | | | | |
From net realized gains on investments | | | (93,415,501) | | | | (16,810,686) | |
| |
Total distributions | | | (93,415,501) | | | | (16,810,686) | |
| |
| | |
SHARE TRANSACTIONS (Note 5): | | | | | | | | |
Proceeds from sales of shares | | | 292,037,410 | | | | 223,348,986 | |
Distributions reinvested | | | 91,810,255 | | | | 16,262,495 | |
Cost of shares redeemed | | | (280,928,344) | | | | (217,381,818) | |
| |
Net increase from share transactions | | | 102,919,321 | | | | 22,229,663 | |
| |
| | |
Net increase in net assets | | | 51,428,393 | | | | 234,182,370 | |
| |
| | |
NET ASSETS: | | | | | | | | |
Beginning of year | | | 852,723,087 | | | | 618,540,717 | |
| |
End of year* | | $ | 904,151,480 | | | $ | 852,723,087 | |
| |
*Includes accumulated net investment income/(loss) of: | | $ | 0 | | | $ | 0 | |
| | |
Other Information: | | | | | | | | |
SHARE TRANSACTIONS: | | | | | | | | |
Sold | | | 7,308,930 | | | | 6,268,465 | |
Distributions reinvested | | | 2,355,046 | | | | 555,062 | |
Redeemed | | | (7,045,649) | | | | (6,388,918) | |
| |
Net increase in shares outstanding | | | 2,618,327 | | | | 434,609 | |
| |
See Notes to Financial Statements.
| | |
Annual Report | September 30, 2014 | | 13 |
| | |
Broadview Opportunity Fund | | Financial Highlights |
| | For a Share Outstanding Throughout the Years Presented |
| | | | | | | | | | | | | | | | | | | | |
| | | For the Year Ended
September 30, 2014(a) | | | For the Year Ended
September 30, 2013 | | | For the Year Ended September 30, 2012 | | | For the Year Ended September 30, 2011 | | | For the Year Ended September 30, 2010 | |
| |
NET ASSET VALUE, BEGINNING OF YEAR | | $ | 40.85 | | | $ | 30.26 | | | $ | 25.54 | | | $ | 26.37 | | | $ | 22.72 | |
INCOME/(LOSS) FROM OPERATIONS: | | | | | | | | | | | | | | | | | | | | |
Net investment loss | | | (0.21) | | | | (0.15) | | | | (0.10) | | | | (0.15) | | | | (0.11) | |
Net realized and unrealized gain/(loss) on investments | | | 2.18 | | | | 11.59 | | | | 6.02 | | | | (0.68) | | | | 3.79 | |
| |
Total from investment operations | | | 1.97 | | | | 11.44 | | | | 5.92 | | | | (0.83) | | | | 3.68 | |
| |
| | | | | |
LESS DISTRIBUTIONS: | | | | | | | | | | | | | | | | | | | | |
From net investment income | | | – | | | | – | | | | – | | | | – | | | | (0.03) | |
From net realized gains on investments | | | (4.34) | | | | (0.85) | | | | (1.20) | | | | – | | | | – | |
| |
Total distributions | | | (4.34) | | | | (0.85) | | | | (1.20) | | | | – | | | | (0.03) | |
| |
INCREASE/(DECREASE) IN NET ASSET VALUE | | | (2.37) | | | | 10.59 | | | | 4.72 | | | | (0.83) | | | | 3.65 | |
| |
NET ASSET VALUE, END OF YEAR | | $ | 38.48 | | | $ | 40.85 | | | $ | 30.26 | | | $ | 25.54 | | | $ | 26.37 | |
| |
| | | | | |
TOTAL RETURN | | | 4.86% | | | | 38.91% | | | | 23.48% | | | | (3.15%) | | | | 16.21% | |
| | | | | |
SUPPLEMENTAL DATA: | | | | | | | | | | | | | | | | | | | | |
Net assets, end of year (000’s) | | $ | 904,151 | | | $ | 852,723 | | | $ | 618,541 | | | $ | 434,932 | | | $ | 424,027 | |
| | | | | |
RATIOS TO AVERAGE NET ASSETS: | | | | | | | | | | | | | | | | | | | | |
Operating expenses | | | 1.25% | | | | 1.26% | | | | 1.26% | | | | 1.26% | | | | 1.30% | |
Net investment loss | | | (0.50%) | | | | (0.44%) | | | | (0.34%) | | | | (0.48%) | | | | (0.47%) | |
| | | | | |
PORTFOLIO TURNOVER RATE | | | 56% | | | | 70% | | | | 55% | | | | 78% | | | | 59% | |
| (a) | On November 25, 2013, shareholders of the FMI Focus Fund, a series of FMI Funds, Inc. (the “Predecessor Fund”), approved a tax-free reorganization under which all assets and liabilities of the Predecessor Fund were transferred to the Broadway Opportunity Fund, a series of Broadview Funds Trust, at the close of business on November 29, 2013. |
See Notes to Financial Statements.
| | |
Broadview Opportunity Fund | | Notes to Financial Statements |
| | September 30, 2014 |
1. ORGANIZATION
Broadview Funds Trust (the “Trust”) is an open-end management investment company registered under the Investment Company Act of 1940, as amended (the “1940 Act”). The Trust was organized on September 9, 2013 as a Delaware statutory trust. The Trust currently offers one series, the Broadview Opportunity Fund (the “Fund”). The Fund is a diversified portfolio with an investment objective to seek capital appreciation.
On November 25, 2013, shareholders of the FMI Focus Fund, a series of FMI Funds, Inc. (the “Predecessor Fund”), approved a tax-free reorganization under which all assets and liabilities of the Predecessor Fund were transferred to the Fund, a series of the Trust, at the close of business on November 29, 2013. The Predecessor Fund commenced operations on December 16, 1996.
2. SIGNIFICANT ACCOUNTING POLICIES
The following is a summary of significant accounting policies consistently followed by the Fund. These policies are in conformity with U.S. generally accepted accounting principles (“GAAP”). The Fund is considered an investment company for financial reporting purposes under GAAP.
Use of Estimates — The preparation of financial statements in conformity with GAAP requires management to make estimates and assumptions that affect the amounts reported in financial statements. Actual results could differ from those estimates.
Investment Valuation — The Fund’s portfolio securities are valued as of the close of trading of the New York Stock Exchange (“NYSE”) (normally 4:00 p.m., Eastern Time). Each security, excluding short-term investments, is valued at the last sale price reported by the principal security exchange on which the issue is traded. Securities that are traded on the Nasdaq Stock Market, Inc. are valued at the Nasdaq Official Closing Price or if no sale is reported, the mean between the bid and the ask. Securities which are traded over-the-counter are valued at the last sale price or, if no sale, at the mean between the bid and the ask. Securities sold short which are listed on a national securities exchange or the Nasdaq Stock Market but which were not traded on the valuation date are valued at the mean between the bid and the ask. Unlisted equity securities for which market quotations are readily available are valued at the last sale price or, if no sale price, the mean between the bid and the ask. Options purchased or written by the Fund are valued at the mean of the highest bid and lowest ask price of all the exchanges on which the option trades. Securities for which quotations are not readily available are valued at fair value as determined by the investment adviser in accordance with procedures approved by the Board of Trustees. The fair value of a security is the amount which the Fund might reasonably expect to receive upon a current sale. The fair value of a security may differ from the last quoted price and the Fund may not be able to sell a security at the fair value. Market quotations may not be available, for example, if trading in particular securities was halted during the day and not resumed prior to the close of trading on the New York Stock Exchange. As of September 30, 2014 there were no securities that were internally fair valued. Variable rate demand notes are recorded at par value which approximates market value. Short-term investments with maturities of 60 days or less are valued at amortized cost which approximates value. For financial reporting purposes, investment transactions are recorded on the trade date.
Securities Transactions and Related Investment Income — Securities transactions are accounted for on trade date. Dividend income is recorded on the ex-dividend date. Realized gains and losses from investment transactions are determined using the identified cost basis. Interest income which includes amortization of premium and accretion of discount, is recorded on the accrual basis.
Fair Value Measurements — A three-tier hierarchy has been established to classify fair value measurements for disclosure purposes. Inputs refer broadly to the assumptions that market participants would use in pricing the asset or liability, including assumptions about risk. Inputs may be observable or unobservable. Observable inputs are inputs that reflect the assumptions market participants would use in pricing the asset or liability that are developed based on market data obtained from sources independent of the reporting entity. Unobservable inputs are inputs that reflect the reporting entity’s own assumptions about the assumptions market participants would use in pricing the asset or liability that are developed based on the best information available. In accordance with the authoritative guidance on fair value measurements and disclosure under GAAP, the Fund discloses fair value of its investments in a hierarchy that prioritizes the inputs to valuation techniques used to measure the fair value.
Various inputs are used in determining the value of the Fund’s investments as of the reporting period end. These inputs are categorized in the following hierarchy under applicable financial accounting standards:
| | | | |
Level 1 | | — | | Unadjusted quoted prices in active markets for identical, unrestricted assets or liabilities that the Fund has the ability to access at the measurement date; |
| | |
Level 2 | | — | | Quoted prices which are not active, quoted prices for similar assets or liabilities in active markets or inputs other than quoted prices that are observable (either directly or indirectly) for substantially the full term of the asset or liability; and |
| | |
Annual Report | September 30, 2014 | | 15 |
| | |
Broadview Opportunity Fund | | Notes to Financial Statements |
| | September 30, 2014 |
| | | | |
Level 3 | | — | | Significant unobservable prices or inputs (including the Fund’s own assumptions in determining the fair value of investments) where there is little or no market activity for the asset or liability at the measurement date. |
The availability of observable inputs can vary from security to security and is affected by a wide variety of factors, including, for example, the type of security, whether the security is new and not yet established in the marketplace, the liquidity of markets, and other characteristics particular to the security. To the extent that valuation is based on models or inputs that are less observable or unobservable in the market, the determination of fair value requires more judgment. Accordingly, the degree of judgment exercised in determining fair value is greatest for instruments categorized in Level 3.
An investment level within the fair value hierarchy is based on the lowest level input, individually or in the aggregate, that is significant to fair value measurement. The valuation techniques used by the Fund to measure fair value during the year ended September 30, 2014 maximized the use of observable inputs and minimized the use of unobservable inputs.
The inputs or methodologies used for valuing securities are not necessarily an indication of the risk or liquidity associated with investing in those securities. The following is a summary of the inputs used in valuing the Fund’s investments as of September 30, 2014:
Broadview Opportunity Fund
| | | | | | | | | | | | | | | | |
| | | Valuation Inputs | | | | |
| Investments in Securities at Value* | | Level 1 | | | Level 2 | | | Level 3 | | | Total | |
Common Stocks | | $ | 802,922,153 | | | $ | – | | | $ | – | | | $ | 802,922,153 | |
Short-Term Security | | | 78,874,418 | | | | – | | | | – | | | | 78,874,418 | |
| | | | |
Total | | $ | 881,796,571 | | | $ | – | | | $ | – | | | $ | 881,796,571 | |
| | | | |
| * | See Schedule of Investments for industry classification. |
It is the Fund’s policy to recognize transfers between levels at the end of the reporting period. There were no transfers between Levels 1 and 2 during the year ended September 30, 2014.
For the year ended September 30, 2014, the Fund did not have any unobservable inputs (Level 3) used in determining fair value.
Distributions to Shareholders — Dividends from net investment income and distributions of net realized capital gains, if any, will be declared and paid at least annually. Income and capital gains distributions are determined in accordance with income tax regulations, which may differ from GAAP. Distributions to shareholders are recorded on the ex-dividend date.
Income Taxes — As of and during the year ended September 30, 2014, the Fund did not have a liability for any unrecognized tax benefits. The Fund files U.S. federal, state, and local tax returns as required. The Fund’s tax returns are subject to examination by the relevant tax authorities until expiration of the applicable statute of limitations which is generally three years after the filing of the tax return for federal purposes and four years for most state returns. Tax returns for open years have incorporated no uncertain tax positions that require a provision for income taxes. The Fund intends to continue to qualify each year as a “regulated investment company” under Subchapter M of the Internal Revenue Code of 1986, as amended. By so qualifying, the Fund will not be subject to Federal income taxes to the extent that it distributes substantially all of its taxable or tax-exempt income, if any, for its tax year ending September 30. In addition, by distributing in each calendar year substantially all of its net investment income, capital gains and certain other amounts, if any, the Fund will not be subject to a Federal excise tax. Therefore, no provision is made by the Fund for Federal income or excise taxes.
3. ADVISORY FEES, ADMINISTRATION FEES AND OTHER AGREEMENTS
Investment Advisory
Effective the close of business on November 29, 2013, the Fund entered into an investment advisory agreement with Broadview Advisors, LLC (the “Adviser”). The Fund pays the Adviser a monthly fee based upon the average daily net assets of the Fund and calculated at an annual rate of 1.00%.
Prior to November 29, 2013, Fiduciary Management, Inc. (“FMI”) was the Predecessor Fund’s investment adviser. As full compensation for the investment advisory services provided to the Fund, FMI received monthly compensation based on the Fund’s average daily net assets at the annual rate of 1.00%.
| | |
Broadview Opportunity Fund | | Notes to Financial Statements |
| | September 30, 2014 |
Prior to November 29, 2013, FMI had an investment sub-advisory agreement with the Adviser, with whom a certain director of the Predecessor Fund was affiliated, to assist it in the day-to-day management of the Predecessor Fund. The Adviser determined which securities were purchased, retained or sold for the Predecessor Fund. FMI paid the Adviser 0.85% of the first $500 million of the average daily net assets of the Predecessor Fund and 0.80% of the Predecessor Fund’s average daily net assets in excess of $500 million.
Under the Trust’s organizational documents, each director, officer, employee or other agent of the Fund (including the Adviser) is indemnified, to the extent permitted by the Act, against certain liabilities that may arise out of performance of their duties to the Fund. Additionally, in the normal course of business, the Fund enters into contracts that contain a variety of indemnification clauses. The Fund’s maximum exposure under these arrangements is unknown as this would involve future claims that may be made against the Fund that have not yet occurred. However, the Fund has not had prior claims or losses pursuant to these contracts and believes the risk of loss to be remote.
Beneficial Ownership
At September 30, 2014, one financial intermediary is the record owner of approximately 33% of the Fund’s shares.
Fund Accounting Fees and Expenses
Effective December 2, 2013, ALPS Fund Services, Inc. (“ALPS” or the “Administrator”) provides administrative, fund accounting and other services to the Fund under the Administration, Bookkeeping and Pricing Services Agreement (the “Administration Agreement”) with the Trust. Under the Agreement, ALPS is paid fees, accrued on a daily basis and paid on a monthly basis following the end of the month, based on the greater of (a) an annual total fee of $175,000 from the first to the last, or projected last, day of the then current year of service under the Administration Agreement; or (b) the following basis point fee schedule:
| | | | |
| Average Total Net Assets | | Basis Points (annualized) | | |
Between $0-$500M | | 4.0 | | |
$500M-$1B | | 2.5 | | |
Above $1B | | 1.0 | | |
The basis point fee schedule is as follows. The Fund pays the administrator 4 basis points of the first $500 million of the average daily net assets and 2.5 basis points of the Fund’s average daily net assets for the next $500 million-$1billion and 1 basis point over $1billion average daily net assets.
The Administrator is also reimbursed by the Fund for certain out of pocket expenses.
Prior to the close of business on December 2, 2013, U.S. Bancorp Financial Services, LLC (“USBFS”) served as administrator to the Predecessor Fund. In connection with its duties as administrator, USBFS prepared and maintained the books, accounts and other documents required by the 1940 Act, calculated the Predecessor Fund’s net asset value, responded to shareholder inquiries, prepared the Predecessor Fund’s financial statements, prepared reports and filings with the SEC and with state Blue Sky authorities, furnished statistical and research data, clerical, accounting and bookkeeping services and stationery and office supplies, kept and maintained the Predecessor Fund’s financial accounts and records and generally assists in all aspects of the Predecessor Fund’s operations.
The Fund has entered into a Distribution Plan (the “Plan”) pursuant to Rule 12b-1 under the Act. The Plan provides that the Fund may incur certain costs which may not exceed the lesser of a monthly amount equal to 0.25% of the Fund’s daily net assets or the actual distribution costs incurred during the year. Amounts payable under the Plan are paid monthly for any activities or expenses primarily intended to result in the sale of shares of the Fund. For the year ended September 30, 2014, no such expenses were incurred. The Fund presently intends not to utilize the Plan or pay any 12b-1 fees during the fiscal year ending September 30, 2015.
Transfer Agent And Shareholder Services Agreement
Effective December 2, 2013, ALPS serves as transfer, dividend paying and shareholder servicing agent for the Fund (the “Transfer Agent”) under a Transfer Agency and Services Agreement with the Trust.
Prior to the close of business on December 2, 2013, under the terms of the prior Transfer Agent and Shareholder Services Agreement, USBFS maintained the records of each shareholder’s account, answered shareholders’ inquiries concerning their accounts, processed purchases and redemptions of the Predecessor Fund’s shares, acted as dividend and distribution disbursing agent and performed other shareholder service functions.
| | |
Annual Report | September 30, 2014 | | 17 |
| | |
Broadview Opportunity Fund | | Notes to Financial Statements |
| | September 30, 2014 |
Compliance Services
Effective December 2, 2013, ALPS provides Chief Compliance Officer services to the Fund. Additionally, ALPS provides services in monitoring and testing the policies and procedures of the Trust in conjunction with requirements under Rule 38a-1 under the 1940 Act. ALPS is compensated under the Chief Compliance Officer Services Agreement.
Distributor
Effective December 2, 2013, the Fund has entered into a Distribution Agreement with ALPS Distributors, Inc. (“the Distributor”) to provide distribution services to the Fund. The Distributor serves as underwriter/distributor of shares of the Fund.
Prior to December 2, 2013, Rafferty Capital Markets, LLC provided distribution services to the Predecessor Fund.
Officer and Trustee Compensation
Officers of the Trust and Trustees who are “interested persons” of the Trust or the Adviser will receive no salary or fees from the Trust. Each Trustee who is not an “interested person” receives an annual fee of $15,000 each year. The Trust reimburses each Trustee and Officer for his or her travel and other expenses relating to attendance at such meetings.
Certain Trustees and Officers of the Trust are also officers of the Adviser.
4. PURCHASES AND SALES OF INVESTMENT SECURITIES
The aggregate cost of purchases and proceeds from sales of investment securities, excluding short-term securities, are shown below for the year ended September 30, 2014.
| | | | |
| Broadview Opportunity Fund | | | |
Cost of Investments Purchased | | $ | 466,799,800 | |
Proceeds from Investments Sold | | $ | 469,969,314 | |
5. TAX BASIS INFORMATION
Distributions are determined in accordance with federal income tax regulations, which differ from GAAP, and, therefore, may differ significantly in amount or character from net investment income and realized gains for financial reporting purposes. Financial reporting records are adjusted for permanent book/tax differences to reflect tax character but are not adjusted for temporary differences. The amounts and characteristics of tax basis distributions and composition of distributable earnings/(accumulated losses) are finalized at fiscal year-end.
The tax character of distributions paid during the year ended September 30, 2014, were as follows:
| | | | | | |
| | | Ordinary Income | | | Long-Term Capital Gain |
Broadview Opportunity Fund | | $ | 22,814,664 | | | $ 70,600,837 |
The tax character of distributions paid during the year ended September 30, 2013, were as follows:
| | | | | | |
| | | Ordinary Income | | | Long-Term Capital Gain |
Broadview Opportunity Fund | | $ | – | | | $ 16,810,686 |
For the year ended September 30, 2014 the following reclassifications, which had no impact on results of operations or net assets and were primarily attributed to differences in the treatment of net investment loss, were recorded to reflect tax character:
| | | | | | | | | | |
| Fund | | Paid-in Capital | | | Accumulated Net
Investment Gain | | | Accumulated Net
Realized Loss |
Broadview Opportunity Fund | | $ | 1 | | | $ | 4,863,589 | | | $ (4,863,590) |
| | | | | | | | | | |
| | |
Broadview Opportunity Fund | | Notes to Financial Statements |
| | September 30, 2014 |
As of September 30, 2014, net unrealized appreciation/(depreciation) of investments based on the federal tax cost were as follows:
| | | | | | | | | | | | | | | | |
| | | Cost of Investments | | | Gross Unrealized
Appreciation | | | Gross Unrealized
Depreciation | | | Net Appreciation on
Investments | |
Broadview Opportunity Fund | | $ | 729,987,663 | | | $ | 182,531,748 | | | $ | (30,722,840 | ) | | $ | 151,808,908 | |
The difference between book basis and tax basis is primarily attributable to wash sales.
At September 30, 2014, components of distributable earning on a tax basis were as follows:
| | | | |
| | | Broadview Opportunity Fund | |
Undistributed net investment income | | $ | 4,505,220 | |
Accumulated net realized gain | | | 77,246,581 | |
Net unrealized appreciation on investments | | | 151,808,908 | |
Total distributable earnings | | $ | 233,560,709 | |
| |
6. COMMITMENTS AND CONTINGENCIES
Under the Trust’s organizational documents, its Officers and Trustees are indemnified against certain liabilities arising out of the performance of their duties to the Fund. In addition, in the normal course of business, the Trust entered into contracts with its service providers, on behalf of the Fund, and others that provide for general indemnifications. The Fund’s maximum exposure under these arrangements is unknown, as this would involve future claims that may be made against the Fund. The Fund expects the risk of loss to be remote.
| | |
Annual Report | September 30, 2014 | | 19 |
| | |
Broadview Opportunity Fund | | Report of Independent Registered Public Accounting Firm |
| | |
To the Board of Directors and Shareholders of
Broadview Opportunity Fund:
In our opinion, the accompanying statements of assets and liabilities, including the schedules of investments and the related statements of operations and of changes in net assets and the financial highlights present fairly, in all material respects, the financial position of the Broadview Opportunity Fund (hereafter referred to as the “Fund”) at September 30, 2014, the operations for the year then ended, the changes in the net assets for each of the two years in the period then ended and the financial highlights for each of the periods presented, in conformity with accounting principles generally accepted in the United States of America. These financial statements and financial highlights (hereafter referred to as “financial statements”) are the responsibility of the Fund’s management; our responsibility is to express an opinion on these financial statements based on our audit. We conducted our audit of the financial statements in accordance with the standards of the Public Company Accounting Oversight Board (United States). Those standards require that we plan and perform the audit to obtain reasonable assurance about whether the financial statements are free of material misstatement. An audit includes examining, on a test basis, evidence supporting the amounts and disclosures in the financial statements, assessing the accounting principles used and significant estimates made by management, and evaluating the overall financial statement presentation. We believe that our audit, which included confirmation of securities at September 30, 2014 by correspondence with the custodian and brokers, provide a reasonable basis for our opinion.

November 25, 2014
Milwaukee, WI
| | |
Broadview Opportunity Fund | | Additional Information |
| | September 30, 2014 (Unaudited) |
1. PROXY VOTING POLICIES AND VOTING RECORD
A description of the policies and procedures that the Fund uses to vote proxies relating to portfolio securities is available without charge upon request by calling toll-free 855-846-1463, or on the Securities and Exchange Commission’s (“SEC”) website at http://www.sec.gov. Information regarding how the Fund voted proxies relating to portfolio securities during the most recent 12-month period ended June 30th is available without charge upon request by calling toll-free 855-846-1463, or on the SEC’s website at http://www.sec.gov.
2. QUARTERLY PORTFOLIO HOLDINGS
The Trust files a complete listing of portfolio holdings for the Fund with the SEC four times each fiscal year at quarter-ends. The Fund files the schedule of portfolio holdings with the SEC on Form N-CSR (second and fourth quarters) and on Form N-Q (first and third quarters). The filings are available upon request by calling 855-846-1463. Furthermore, you may obtain a copy of the filing on the SEC’s website at http://www.sec.gov. The Fund’s Forms N-CSR and N-Q may also be reviewed and copied at the SEC’s Public Reference Room in Washington, D.C., and information on the operation of the Public Reference Room may be obtained by calling 1-800-SEC-0330.
3. TAX DESIGNATIONS
Pursuant to Section 852(b)(3) of the Internal Revenue Code, the Broadview Opportunity Fund designates $70,600,837 respectively as a long-term capital gain dividend.
| | |
Annual Report | September 30, 2014 | | 21 |
| | |
Broadview Opportunity Fund | | Trustees and Officers |
| | September 30, 2014 (Unaudited) |
The business affairs of the Fund are managed under the direction of the Trust’s Board of Trustees in accordance with the laws of the State of Delaware. Information pertaining to the Trustees and Officers of the Trust are set forth below. Trustees who are not deemed to be “interested persons” of the Trust as defined in the Investment Company Act of 1940, as amended (the “1940 Act”), are referred to as “Independent Trustees.” Trustees who are deemed to be interested persons of the Trust as defined in the 1940 Act are referred to as “Interested Trustees”. The Fund’s Statement of Additional Information includes additional information about the trustees and is available upon request by calling toll-free 1-855-846-1463.
| | | | | | |
INTERESTED AND NON-INTERESTED TRUSTEES |
| | | |
| Name, Address and Year of Birth(1) | | Position(s) With the Trust, Term
of Office, Length of Time Served
and Number of Portfolios in
Fund Complex Overseen | | Principal Occupation(s)
During the Past 5 Years | | Other Directorships Held by
Trustee During the Past 5 Years |
Interested Trustee | | | | | | |
Richard J. Whiting(2) Born: 1957 | | Chairman and Trustee (since 2013); Indefinite Term; 1 Portfolio | | Manager of Trading Department and Portfolio Manager, Broadview Advisors, LLC (since 2001) | | None |
| Non-Interested Trustees | | | | | | |
Gregory W. Berger Born: 1961 | | Trustee (since 2013); Indefinite Term; 1 Portfolio | | Attorney and Shareholder, Brownstein Hyatt Farber Schreck, LLP (law firm) (1994 to present) | | None |
Cornelius J. Lavelle Born: 1944 | | Trustee (since 2013); Indefinite Term; 1 Portfolio | | Retired; Director, Institutional Equities, Citigroup Global Markets Inc. (multinational financial services firm) (1997 to 2009) | | Independent Trustee, USFS Funds Trust (an open-end investment company with two portfolios) (2013-2014); Independent Trustee, The 504 Fund (a closed-end investment company) |
Philip J. Uihlein, Sr. Born: 1950 | | Trustee (since 2013); Indefinite Term; 1 Portfolio | | Retired; President, U-Line Corporation (refrigeration appliance manufacturer) (1977 to 2008); Chief Executive Officer, U-Line Corporation (1986 to 2008) | | None |
| (1) | Unless otherwise noted, the business address of each Trustee is c/o Broadview Funds Trust, 330 East Kilbourn Avenue, Suite 1475, Milwaukee, Wisconsin 53202. |
| (2) | Mr. Whiting is an “interested person” of the Trust (as defined in the 1940 Act) because he is an employee and officer of the Adviser. |
| | | | |
| OFFICERS |
| | |
| Name, Address and Year of Birth | | Position(s) With the Trust, Term of
Office and Length of Time Served | | Principal Occupation(s) During the
Past 5 Years |
Other Officers | | | | |
Richard E. Lane 330 E. Kilbourn Ave., Suite 1475, Milwaukee, WI 53202 Born: 1955 | | President and Principal Executive Officer (since 2013); Indefinite Term | | President, Broadview Advisors, LLC (since 2001) |
Aaron J. Garcia 330 E. Kilbourn Ave., Suite 1475, Milwaukee, WI 53202 Born: 1977 | | Treasurer and Principal Financial Officer and Principal Accounting Officer (since 2013); Indefinite Term | | Portfolio Manager, Broadview Advisors, LLC (since 2003) |
Faraz Farzam 330 E. Kilbourn Ave., Suite 1475, Milwaukee, WI 53202 Born: 1973 | | Secretary (since 2013); Indefinite Term | | Portfolio Manager, Broadview Advisors, LLC (since 2001) |
Melanie H. Zimdars ALPS Fund Services, Inc. 1290 Broadway, Suite 1100 Denver, CO 80203 Born: 1976 | | Chief Compliance Officer and AML Compliance Officer (since 2013); Indefinite Term | | Vice President, Deputy Chief Compliance Officer, ALPS Fund Services, Inc. (since 2009) |
Intentionally Left Blank

| | (a) | The Registrant, as of the end of the period covered by this report, has adopted a code of ethics that applies to the Registrant’s principal executive officer, principal financial officer, principal accounting officer or controller or any persons performing similar functions on behalf of the Registrant. |
| | (c) | During the period covered by this report, no amendments to the provisions of the code of ethics adopted in paragraph (a) of this Item were made. |
| | (d) | During the period covered by this report, no implicit or explicit waivers to the provisions of the code of ethics adopted in paragraph (a) of this Item were granted. |
| | (f) | A copy of the Registrant’s Code of Ethics is filed as an exhibit hereto. |
| Item 3. | Audit Committee Financial Expert. |
The Board of Directors of the Registrant has determined that the Registrant has at least one Audit Committee Financial Expert serving on its audit committee. The Registrant’s Audit Committee Financial Expert is Mr. Cornelius J. Lavelle, Independent Trustee and Audit Committee Chair.
| Item 4. | Principal Accountant Fees and Services. |
| | (a) | Audit Fees: For the Registrant’s fiscal year ended September 30, 2014 the aggregate fees billed for professional services rendered by the principal accountant for the audit of the Registrant’s annual financial statements or services that are normally provided by the accountant in connection with statutory or regulatory filings or engagements was $29,000. |
| | (b) | Audit-Related Fees: For the Registrant’s fiscal year ended September 30, 2014, the aggregate fees billed for assurance and related services by the principal accountant that are reasonably related to the performance of the |
| | |
| | audit of the Registrant’s financial statements and are not reported under paragraph (a) of this Item was $0. |
| |
(c) | | Tax Fees: For the Registrant’s fiscal year ended September 30, 2014, the aggregate fees billed for professional services rendered by the principal accountant for tax compliance, tax advice and tax planning was $5,200. The fiscal year 2014 tax fee was for services for review of the dividend calculation, excise tax preparation and federal tax return preparation. |
| |
(d) | | All Other Fees: For the Registrant’s fiscal year ended September 30, 2014, the aggregate fees billed for products and services provided by the principal accountant, other than the services reported in paragraphs (a) through (c) of this Item, was $0. |
| |
(e)(1) | | Audit Committee Pre-Approval Policies and Procedures: All services to be performed by the Registrant’s principal accountant must be pre-approved by the Registrant’s audit committee. |
| |
(e)(2) | | No services described in paragraphs (b) through (d) of this Item were approved by the Registrant’s audit committee pursuant to paragraph (c)(7)(i)(C) of Rule 2-01 of Regulation S-X. |
| |
(f) | | Not applicable. |
| |
(g) | | No non-audit fees were billed by the Registrant’s principal accountant for services rendered to the Registrant’s investment adviser. |
| |
| (h) | | Not applicable. |
| Item 5. | Audit Committee of Listed Registrants. |
| | Not applicable to the Registrant. |
| Item 6. | Schedule of Investments. |
| | (a) | The Registrant’s “Schedule I – Investments in securities of unaffiliated issuers” (as set forth in 17 CFR 210.12-12) is included in Item 1 of this Form N-CSR. |
| | (b) | Not applicable to the Registrant. |
| Item 7. | Disclosure of Proxy Voting Policies and Procedures for Closed-End Management Investment Companies. |
| | Not applicable to the Registrant. |
| Item 8. | Portfolio Managers of Closed-End Management Investment Companies. |
| | Not applicable to the Registrant. |
| Item 9. | Purchases of Equity Securities by Closed-End Management Investment Company and Affiliated Purchasers. |
| | Not applicable to the Registrant. |
| Item 10. | Submission of Matters to a Vote of Security Holders. |
| Item 11. | Controls and Procedures. |
| | (a) | The Registrant’s principal executive officer and principal financial officer have evaluated the Registrant’s disclosure controls and procedures (as defined in Rule 30a-3(c) under the Investment Company Act of 1940, as amended (the “1940 Act”)) within 90 days of the filing of this report, as required by Rule 30a-3(b) under the Act and Rules 13a-15(b) or 15d-15(b) under the Securities Exchange Act of 1934 and have concluded that the Registrant’s disclosure controls and procedures were effective as of that date. |
| | (b) | There was no change in the Registrant’s internal control over financial reporting (as defined in Rule 30a-3(d) under the Act, as amended) during the second fiscal quarter of the period covered by this report that has materially affected, or is reasonably likely to materially affect, the Registrant’s internal control over financial reporting. |
| | |
(a)(1) | | The Registrant’s Code of Ethics for Principal Executive Officer, Principal Financial Officer and Principal Accounting Officer, which is the subject of the disclosure required by Item 2 of Form N-CSR, is filed hereto as Exhibit 12.a.1. |
| |
(a)(2) | | A separate certification for the Registrant’s Principal Executive Officer and Principal Financial Officer as required by Rule 30a-2(a) under the 1940 Act (17 CFR 270.30a-2(a)), are attached hereto as Ex 99.Cert. |
| |
(a)(3) | | None. |
| |
(b) | | The certifications by the Registrant’s Principal Executive Officer and Principal Financial Officer, as required by Rule 30a-2(b) of the 1940 Act and Section 906 of the Sarbanes-Oxley Act of 2002 are attached hereto as Ex99.906Cert. |
SIGNATURES
Pursuant to the requirements of the Securities Exchange Act of 1934 and the Investment Company Act of 1940, the Registrant has duly caused this report to be signed on its behalf by the undersigned, thereunto duly authorized.
Broadview Funds Trust
| | |
| By: | | /s/ Richard E. Lane |
| | Richard E. Lane |
| | President |
| |
| Date: | | December 9, 2014 |
Pursuant to the requirements of the Securities Exchange Act of 1934 and the Investment Company Act of 1940, this report has been signed below by the following persons on behalf of the Registrant and in the capacities and on the dates indicated.
| | |
| By: | | /s/ Richard E. Lane |
| | Richard E. Lane |
| | President (Principal Executive Officer) |
| |
| Date: | | December 9, 2014 |
| | |
| By: | | /s/ Aaron J. Garcia |
| | Aaron J. Garcia |
| | Chief Financial Officer (Principal Financial Officer) |
| |
| Date: | | December 9, 2014 |