UNITED STATES
SECURITIES AND EXCHANGE COMMISSION
Washington, D.C. 20549
FORM N-CSR
CERTIFIED SHAREHOLDER REPORT OF REGISTERED
MANAGEMENT INVESTMENT COMPANIES
Investment Company Act file number: 811-22885
Broadview Funds Trust
(Exact name of registrant as specified in charter)
330 East Kilbourn Ave., Suite 1475
Milwaukee, Wisconsin 53202
(Address of principal executive offices) (Zip code)
Angela L. Pingel
Broadview Advisors, LLC
330 East Kilbourn Ave., Suite 1475
Milwaukee, Wisconsin 53202
(Name and address of agent for service)
Registrant’s telephone number, including area code: (414) 918-3900
Date of fiscal year end: September 30, 2016
Date of reporting period: September 30, 2016
Item 1. Reports to Stockholders.
table of contents
| Shareholder Letter | 1 |
| Manager Commentary | 4 |
| Disclosure of Fund Expenses | 6 |
| Schedule of Investments | 7 |
| Statement of Assets and Liabilities | 11 |
| Statement of Operations | 12 |
| Statements of Changes in Net Assets | 13 |
| Financial Highlights | 14 |
| Notes to Financial Statements | 15 |
| Report of Independent Registered Public Accounting Firm | 20 |
| Additional Information | 21 |
| Trustees and Officers | 22 |
Dear Fellow Shareholders,
High Anxiety – Rick Lane, CFA
Our title borrows from Mel Brooks’ satirical movie, “High Anxiety.” In the film—a parody of suspense classics like Vertigo—Mr. Brooks’ character is taken to the Psychoneurotic Institute for the Very, Very Nervous. While the market has certainly improved during the first three quarters of 2016, election jitters may cause increased volatility and potentially a market correction. We are only three weeks from the big day and, considering how bizarre this particular race has been, it is hardly surprising that the markets appear to be skittish. Both candidates are very unpopular, but the real issue impacting the markets is the enormous gulf between the two candidates’ proposed economic policies.
Until recently, most observers felt that no matter who won the White House, the Senate was up for grabs, with perhaps a bias toward the Republicans retaining it. The House looked fairly certain to remain Republican. The consensus thinking, of course, was that a divided government assured gridlock and the absence of bad legislation. However, with Donald Trump’s missteps, the concern has quickly morphed into the possibility of a Democratic sweep. Though seemingly remote, we think this prospect is sufficiently tangible to frighten the markets. Given the suspicion of banks and Wall Street by outspoken critics like Senator Warren, many investors view a Democratic sweep as a “black swan” event. In such an event, we would have to seriously reevaluate
our portfolio.
We will likely refrain from changing much until we see the election outcome. It is fair to assume that many businesses across our country have put capital spending plans and other important decisions on hold pending the election. This has most likely produced a negative impact on the economy as a whole. An election of a split government would likely prevent poor legislation and allow the country to get back to work.
Financials Update – Rick Lane, CFA
As outlined in previous shareholder letters, we have been very constructive with our financials holdings. We continue to feel an increase in interest rates by the Federal Reserve is on the horizon, most likely in December of this year. In our opinion, just two or three increases would be positive for bank earnings. With this positive backdrop, two additional factors bolster enthusiasm for our financials holdings: energy exposure and bank consolidation.
Concerning energy exposure, we have previously mentioned our purchases of LegacyTexas Financial Group, Inc. (LTXB) and Hilltop Holdings Inc. (HTH) of Texas, IBERIABANK Corp. (IBKC) of Louisiana, and Zions Bancorporation (ZION) of Utah. Energy banks (banks with exposure to the energy sector) were under severe pressure following the decline in energy prices. We felt the sell-off was excessive. This has proven to be the case. We believe the excellent franchises we picked up “on the cheap” still look very solid as the energy recovery is in the early stages.
As for the consolidation theme, we own CoBiz Financial Inc. (COBZ), Guaranty Bancorp (GBNK), and National Bank Holdings Corp. (NBHC), all in the booming Denver market. These three banks are essentially the last remaining locally-based publicly held banks in the very attractive Colorado market. LegacyTexas Financial Group is similarly positioned in Texas. With approximately $8 billion in assets concentrated in the economic powerhouse of Dallas, we believe that the scarcity value here is extremely lucrative.
All of these banks enjoy strong regional franchises and represent a good value on their own. Additionally, they all could be terrific buyout prospects. One never knows when lighting will strike, but that possibility adds potential upside to stock price.
We also own Renasant Corporation (RNST) in Mississippi, and Western Alliance Bancorp. (WAL) in Arizona (as Sam Koehler discussed in last quarter’s letter). These banks enjoy strong organic growth in their respective geographies. They have grown through smart acquisitions, and we feel should continue to do so in the future.
Real estate investment trusts (“REITs”) have had a significant effect on our relative financials sector performance due to a lack of ownership. Our investment strategy focuses on capital appreciation. Therefore, we have traditionally avoided REITs due to their focus on yield. The desire for yield in a zero-interest-rate environment has driven REITs higher and our lack of investment has detracted from our relative financials sector performance. REITs will likely continue to outperform if interest rates stay low. We believe our investments away from REITs are better positioned for interest rate increases.
Technology Update – Faraz Farzam, CFA
Technology was the best performing sector in the portfolio during the third quarter of 2016. Our largest portfolio holding, Intersil Corp. (ISIL), was acquired by Japanese semiconductor manufacturer Renesas Electronics Corp. in a $3 billion all cash deal valuing the company at $22.50 per share, a 44% premium to the pre-announcement closing price of $15.64. In our letter for the period ended September 30, 2015, we wrote in depth about the investment merits of Intersil and prognosticated a takeover in the rapidly consolidating semiconductor space. Similarly, another one of our technology holdings, Infoblox Inc. (BLOX), was acquired by Vista Equity Partners, at $26.50 per share. We rolled some of our profits into existing portfolio holdings, Pandora Media, Inc. (P) and Veeco Instruments Inc. (VECO). We believe these companies have material upside potential and identifiable catalysts. We would direct shareholders and readers to our June 30, 2016 letter for a detailed review of the Pandora investment case. Although we are entering what is historically a seasonally strong period for technology stocks, we would not be surprised if tech stocks pulled back as we navigate third quarter reporting season given that tech stocks already have had a significant run to date.
| | |
| Annual Report | September 30, 2016 | 1 |
| Broadview Opportunity Fund | Shareholder Letter |
September 30, 2016 (Unaudited)
Consumer Update – Faraz Farzam, CFA
Last quarter, we discussed the general rebound in Consumer Discretionary stocks and our investment in Hibbett Sports, Inc. (HIBB). Although the rebound has continued into the third quarter of 2016, the performance has been choppy. Our investment in retailers has yielded positive results, but our sole restaurant investment, Chuy’s Holdings, Inc. (CHUY) has pulled back sharply after posting what we felt were good results. This speaks to what we see as a broader and rather extreme rotation that has taken place between retailers and restaurants. Our valuation discipline has been critical here. We exploited the strength in several names like Lululemon Athletica Inc. (LULU) and Nordstrom, Inc. (JWN) by liquidating the positions entirely. Although the economic environment continues to favor Consumer Discretionary stocks, we remain steadfast and selective, investing only in companies we believe are solid durable businesses that are trading at discounts and selling our winners as they approach fair valuation.
Callaway Golf Company (ELY) – Rick Whiting
One of the hallmarks of our investment process is to know the management of a company and to understand their thought process. We do not believe that it is enough to have a static understanding of where the company is positioned today, but rather we wish to have confidence in management’s view of the opportunities and challenges before them, as well as their contingency plans should things change. Most importantly, we want to share with management a common understanding of the financial and structural metrics by which we may objectively judge their performance.
It is in this light that we would like to thank Chip Brewer, CEO and President of Callaway Golf, as well as his assembled management team and their employees. Mr. Brewer took the helm of Callaway in 2012. His challenges were threefold: define a new path for an iconic brand that was adrift, rationalize the cost structure of the business, and energize the talent in-house while the world proclaimed the game of golf to be dead. Let us not forget that in 2012, while the U.S. consumer was starting to feel a shade more confident, their wallets were open only for essentials such as replacing an aging fleet of cars, getting out from under credit card and mortgage debt and doing deferred maintenance on their homes. Golf clubs were not at the top of most priority lists.
Mr. Brewer presented investors with a check list of items he felt needed to be addressed for the company to win in a stagnant environment and to blossom in a recovering economic environment. He gave of a very clear vision of how success or failure would be defined and the metrics to measure progress along the way. We believe Mr. Brewer and the team at Callaway have executed on the plan beautifully and have not let themselves be sidetracked along the way. Throughout, they have also dealt with hurdles incumbent in a bumpy recovery, foreign currency headwinds and competitors with less stable business plans.
Today we own a substantially smaller position in the company’s stock. We believe Callaway continues to have a pristine balance sheet, market share opportunities and operating margin initiatives on the table. We still have a great deal of confidence in Mr. Brewer’s leadership but the narrative has changed somewhat.
The restructuring and its benefits, while ongoing, are largely behind us. We do see a pathway to growth as gasoline remains inexpensive, unemployment is historically low, and consumers have already done much of the heavy lifting addressing necessities. Yet, as the company pivots from repair to growth, the metrics to measure steps along the way become more subjective. We feel there is still upside in the stock, but prudence in investing has led us to reposition the size of our investment, re-underwrite the fundamentals, enjoy some profits, and thank the team at Callaway for a job well done.
Best regards,
| Broadview Opportunity Fund | Shareholder Letter |
September 30, 2016 (Unaudited)
The views and information discussed in this commentary are as of the date of publication, are subject to change, and may not reflect the writer’s current views. The views expressed represent an assessment of market conditions at a specific point in time, are opinions only and should not be relied upon as investment advice regarding a particular investment or markets in general. Such information does not constitute a recommendation to buy or sell specific securities or investment vehicles. It should not be assumed that any investment will be profitable or will equal the performance of the Fund or any securities or any sectors mentioned herein. The subject matter contained herein has been derived from several sources believed to be reliable and accurate at the time of compilation.
A NOTE ON FORWARD LOOKING STATEMENTS
Except for historical information contained in this report for the Fund, the matters discussed in this report may constitute forward-looking statements made pursuant to the safe-harbor provisions of the Private Securities Litigation Reform Act of 1995. These include any adviser or portfolio manager predictions, assessments, analyses or outlooks for individual securities, industries, market sectors and/or markets. These statements involve risks and uncertainties. In addition to the general risks described for the Fund in the current Prospectus, other factors bearing on this report include the accuracy of the adviser’s or portfolio managers’ forecasts and predictions, and the appropriateness of the investment programs designed by the adviser or portfolio managers to implement their strategies efficiently and effectively. Any one or more of these factors, as well as other risks affecting the securities markets and investment instruments generally, could cause the actual results of the Fund to differ materially as compared to benchmarks associated with the Fund.
| | |
| Annual Report | September 30, 2016 | 3 |
MANAGEMENT’S DISCUSSION OF FUND PERFORMANCE
Absolute performance for the fiscal year ended September 30, 2016 was positive. However, as often happens when the market gets expensive, the strategy used to manage the Fund underperformed relative to its benchmarks, the Russell 2500® Index and Russell 2000® Index. Cash has continued to flow out of actively managed investment vehicles like the Fund into passive vehicles like exchange‐traded funds that track major market securities indices. This trend supports the largest positions in capitalization-weighted securities indices. These are companies that do not fit the Adviser’s Five Pillar investment process, especially when it comes to valuation and perpetuates the strategy’s underperformance against
its benchmarks.
In the first fiscal quarter ended December 31, 2015, the Fund returned 0.92%. Contributing to performance were investments in Consumer Discretionary and Industrials. Energy, Financials, Health Care, and Information Technology investments negatively impacted performance. In the second fiscal quarter ended March 31, 2016, the Fund returned -.80%. Consumer Discretionary, Materials and Health Care performed well while investments in Financials was a drag on performance. In the third fiscal quarter ended June 30, 2016, the Fund gained 3.48%. Consumer Discretionary and Industrials investments faced challenges while Energy, Health Care and Information Technology investments provided positive performance. The markets made an upward shift in the Fund’s fourth fiscal quarter ended September 30, 2016, as Financials and Information Technology helped the Fund advance 8.28%.
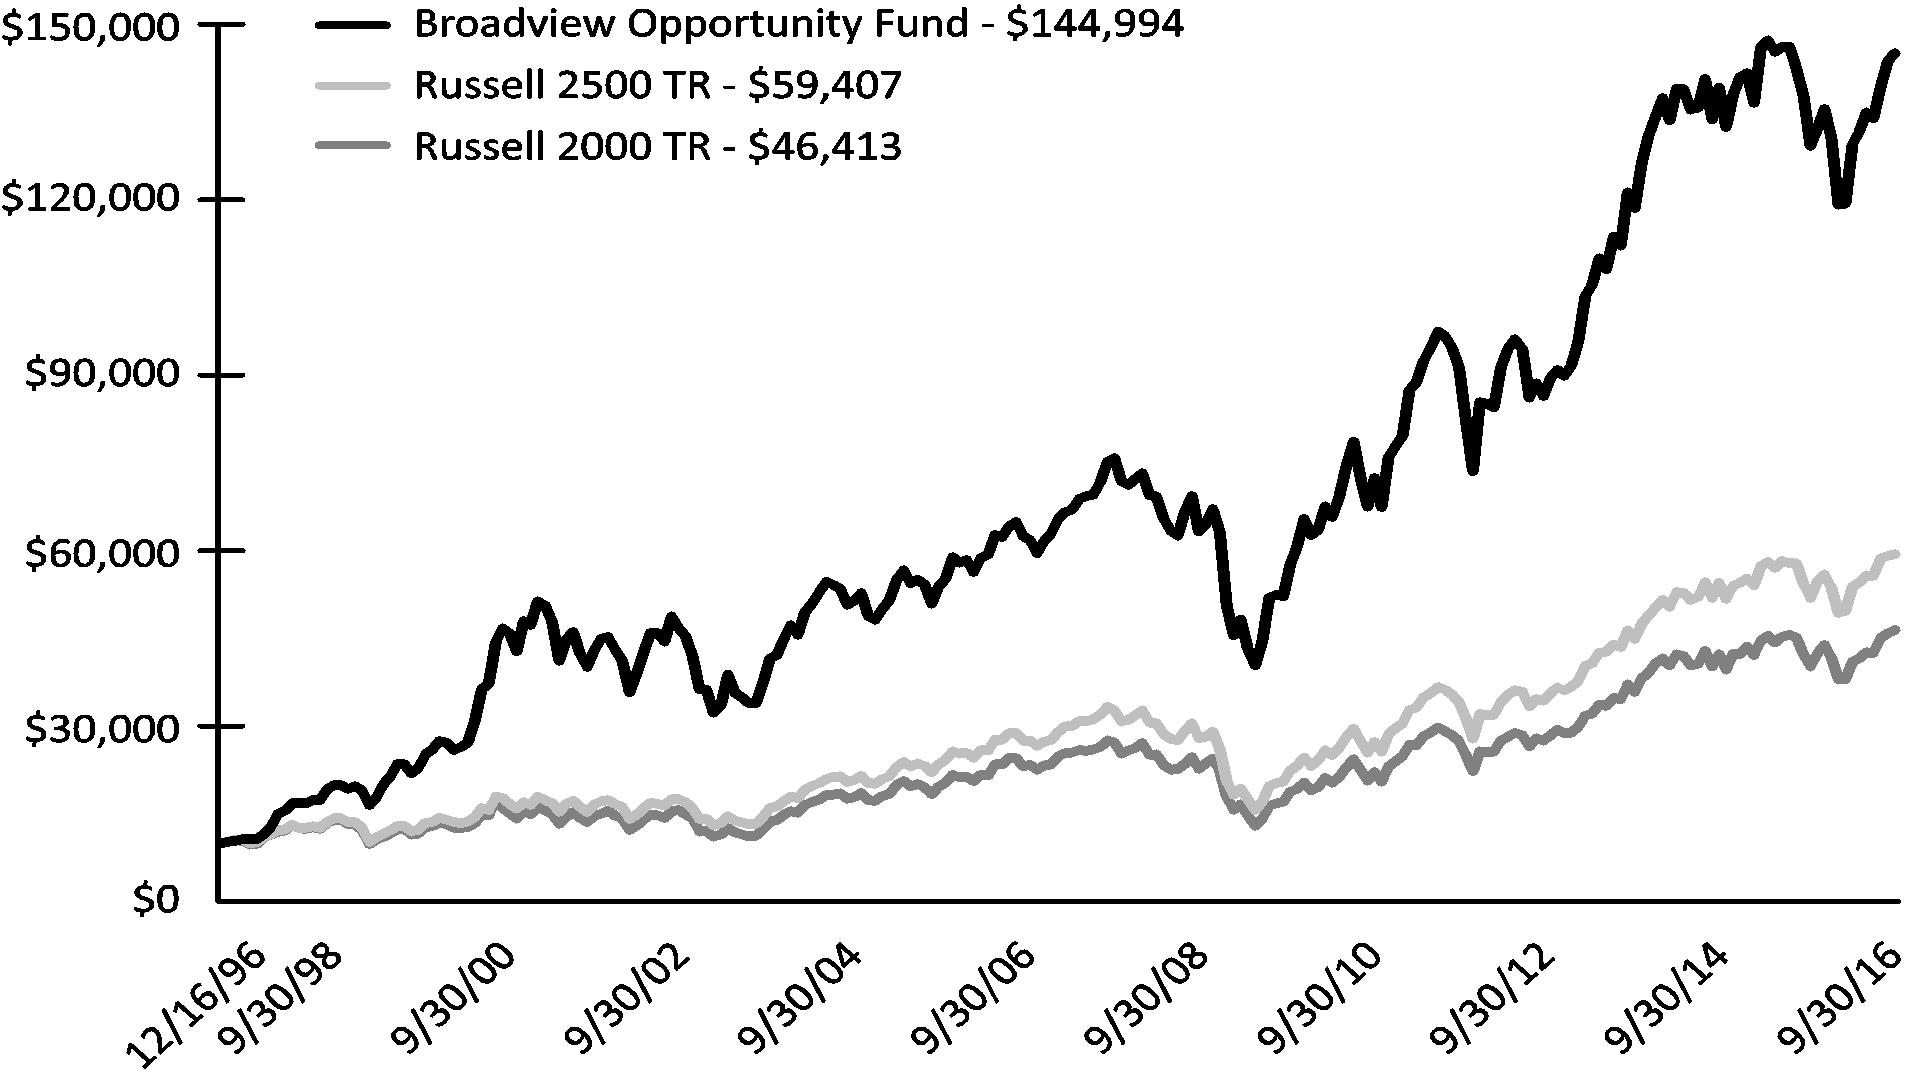
Overall, during the fiscal year ended September 30, 2016, the Fund posted a gain of 12.17% compared to a gain of 14.44% for the Russell 2500® Index, and a gain of 15.47% for the Russell 2000® Index. Top contributors to Fund performance included Tumi Holdings, Inc. (TUMI), Astec Industries, Inc. (ASTE), and Intersil Corporation (ISIL). Bottom detractors to performance included MDC Partners Inc. (MDCA), MGIC Investment Corporation (MTG), and KForce Inc. (KFRC).
GROWTH OF $10,000 INVESTMENT IN THE FUND
From its inception (12/16/96) to 9/30/16 as compared to the Russell 2500 TR Index(1) and the Russell 2000 TR Index(2)
| Broadview Opportunity Fund | Manager Commentary |
September 30, 2016 (Unaudited)
PERFORMANCE (For Periods Ended 9/30/16)
| | Total Return* | | Annualized Total Return* |
| | 3 Months | | 1 Year | 5 Year | 10 Year | 15 Year | Since Inception** |
| Broadview Opportunity Fund | 8.28% | | 12.17% | 14.51% | 8.70% | 9.77% | 14.47% |
| Russell 2500 TR Index | 6.56% | | 14.44% | 16.30% | 7.95% | 10.07% | 9.42% |
| Russell 2000 TR Index | 9.05% | | 15.47% | 15.82% | 7.07% | 9.26% | 8.07% |
Performance data quoted represents past performance. Past performance does not guarantee future results. Investment return and principal value of an investment will fluctuate so that an investor’s shares, when sold or redeemed, may be worth more or less than the original cost. Current performance data may be higher or lower than actual data quoted. For the most recent month-end performance please visit bvafunds.com or call 1-855-846-1463. As of the Fund’s Prospectus dated January 28, 2016, the Broadview Opportunity Fund’s annual operating expense ratio is 1.23%. One cannot invest directly in an index.
(1) | Russell 2500 Total Return Index - A broad index featuring 2,500 stocks that cover the small- and mid-cap market capitalizations. The Russell 2500 is a market cap weighted index that includes the smallest 2,500 companies covered in the Russell 3000 universe of United States-based listed equities. |
(2) | The Russell 2000 Total Return Index measures the performance of the 2,000 smallest companies in the Russell 3000 Index which comprises the 3,000 largest U.S. companies based on total market capitalization. |
| * | Total return includes changes in share prices and in each case includes reinvestments of any dividends, interest and capital gain distributions. The returns do not reflect the deduction of taxes that a shareholder would pay on Fund distributions or the redemption of Fund shares. |
| ** | Fund Inception Date: December 16, 1996. |
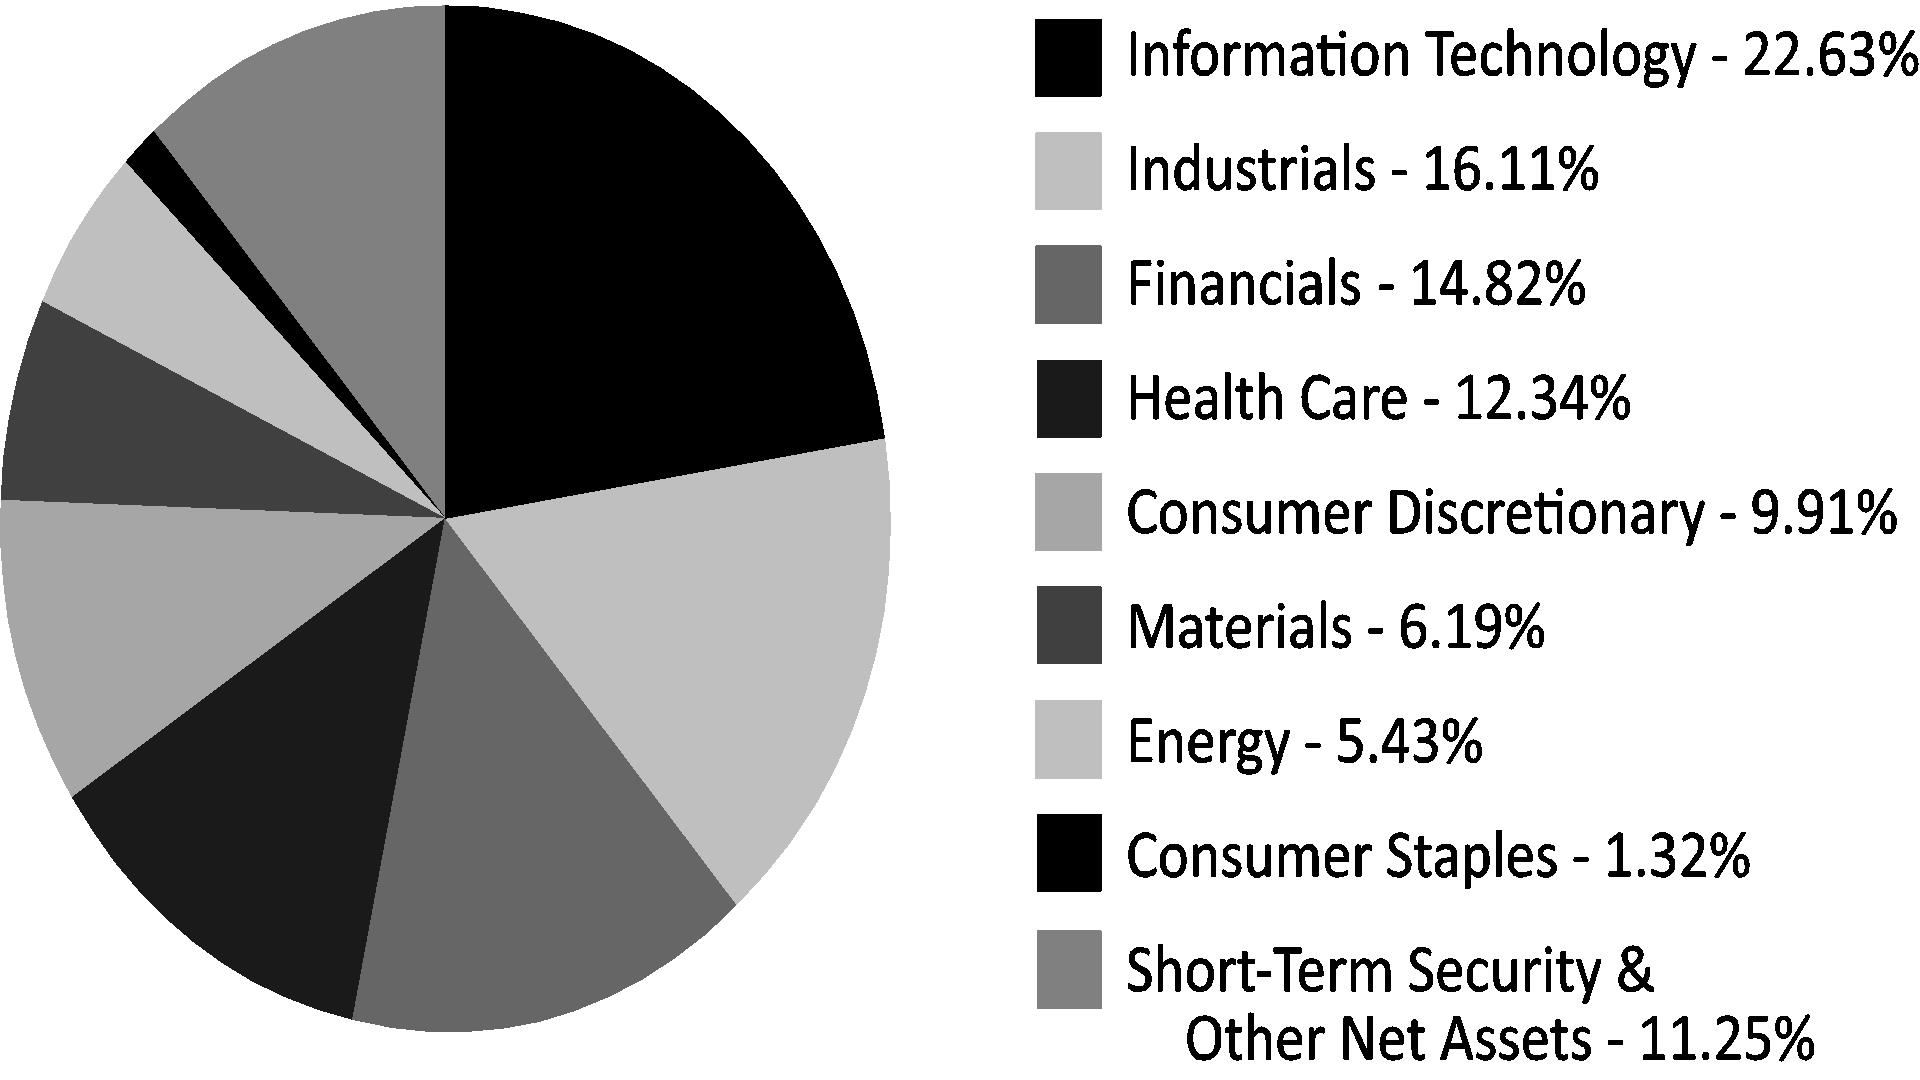
SECTOR ALLOCATION (as of September 30, 2016) (As a percentage of Net Assets)
Holdings are subject to change.
These allocations may not reflect the current or future positions of the portfolio.
| | |
| Annual Report | September 30, 2016 | 5 |
As a shareholder of the Broadview Opportunity Fund (the “Fund”) you will incur ongoing costs, including management fees and other Fund expenses. The following examples are intended to help you understand your ongoing costs (in dollars) of investing in the Fund and to compare these costs with the ongoing costs of investing in other mutual funds. The examples are based on an investment of $1,000 invested on April 1, 2016 and held until September 30, 2016.
Actual Expenses. The first line of the table below provides information about actual account values and actual expenses. You may use the information in this line, together with the amount you invested, to estimate the expenses that you paid over the period. Simply divide your account value by $1,000 (for example, an $8,600 account value divided by $1,000 = 8.6), then multiply the result by the number in the first line under the heading “Expenses Paid During Period” to estimate the expenses you paid on your account during this period.
Hypothetical Example for Comparison Purposes. The second line of the table below provides information about hypothetical account values and hypothetical expenses based on the Fund’s actual expense ratio and an assumed rate of return of 5% per year before expenses, which is not the Fund’s actual return. The hypothetical account values and expenses may not be used to estimate the actual ending account balance or expenses you paid for the period. You may use this information to compare the ongoing costs of investing in the Fund and other mutual funds. To do so, compare this 5% hypothetical example with the 5% hypothetical examples that appear in the shareholder reports of the other funds. The expenses shown in the table are meant to highlight ongoing Fund costs only and do not reflect any transactional costs, such as sales charges (loads), redemption fees, or exchange fees that, although not charged by the Fund, may be charged by other funds. Therefore, the second line of the table below is useful in comparing ongoing costs only, and may not help you determine the relative total costs of owning different funds.
| | Beginning Account Value
4/1/16 | Ending Account Value
9/30/16 | Expense
Ratio(a) | Expenses Paid
During Period
4/1/16 - 9/30/16(b) |
| Broadview Opportunity Fund |
| Actual | $1,000.00 | $1,120.40 | 1.24% | $6.57 |
| Hypothetical (5% return before expenses) | $1,000.00 | $1,018.80 | 1.24% | $6.26 |
(a) | The Fund's expense ratios have been based on the Fund's most recent fiscal half-year expenses. |
(b) | Expenses are equal to the Fund's annualized expense ratio multiplied by the average account value over the period, multiplied by the number of days in the most recent fiscal half-year (183)/366 (to reflect the half-year period). |
| | | Shares | | | Value | |
| COMMON STOCKS (88.75%) | | | | |
| CONSUMER DISCRETIONARY (9.91%) | | | | |
| Automobiles & Components (0.24%) | |
| Gentex Corp. | | | 89,700 | | | $ | 1,575,132 | |
| | | | | | | | | |
| Hotels Restaurants & Leisure (1.17%) | |
Chuy's Holdings, Inc.(a) | | | 273,250 | | | | 7,634,605 | |
| | | | | | | | | |
| Leisure Products (2.29%) | |
| Brunswick Corp. | | | 195,300 | | | | 9,526,734 | |
| Callaway Golf Co. | | | 323,123 | | | | 3,751,458 | |
| Polaris Industries, Inc. | | | 22,300 | | | | 1,726,912 | |
| | | | | | | | 15,005,104 | |
| Media (2.36%) | |
| Interpublic Group of Cos., Inc. | | | 195,150 | | | | 4,361,603 | |
| MDC Partners, Inc. - Class A | | | 461,092 | | | | 4,942,906 | |
| National CineMedia, Inc. | | | 416,931 | | | | 6,137,224 | |
| | | | | | | | 15,441,733 | |
| Specialty Retail (3.85%) | |
| Dick's Sporting Goods, Inc. | | | 39,800 | | | | 2,257,456 | |
Hibbett Sports, Inc.(a) | | | 413,850 | | | | 16,512,615 | |
Urban Outfitters, Inc.(a) | | | 184,923 | | | | 6,383,542 | |
| | | | | | | | 25,153,613 | |
| CONSUMER STAPLES (1.32%) | | | | | |
| Beverages (0.48%) | |
The Boston Beer Co. Inc - Class A(a) | | | 20,300 | | | | 3,151,778 | |
| | | | | | | | | |
| Food Products (0.84%) | |
Freshpet, Inc.(a) | | | 632,017 | | | | 5,466,947 | |
| | | | | | | | | |
| ENERGY (5.43%) | | | | | |
| Energy Equipment & Services (2.82%) | |
| Superior Energy Services, Inc. | | | 421,449 | | | | 7,543,937 | |
| U.S. Silica Holdings, Inc. | | | 127,686 | | | | 5,945,060 | |
Whiting Petroleum Corp.(a) | | | 565,281 | | | | 4,940,556 | |
| | | | | | | | 18,429,553 | |
| Oil, Gas & Consumable Fuels (2.61%) | |
Gulfport Energy Corp.(a) | | | 299,300 | | | | 8,455,225 | |
| Range Resources Corp. | | | 196,400 | | | | 7,610,500 | |
WPX Energy, Inc.(a) | | | 77,700 | | | | 1,024,863 | |
| | | | | | | | 17,090,588 | |
| FINANCIALS (14.82%) | | | | | |
| Banks (12.15%) | |
Allegiance Bancshares, Inc.(a) | | | 35,241 | | | | 951,507 | |
| CoBiz Financial, Inc. | | | 923,967 | | | | 12,298,001 | |
| First Horizon National Corp. | | | 411,300 | | | | 6,264,099 | |
| Guaranty Bancorp | | | 174,580 | | | | 3,116,253 | |
Hilltop Holdings, Inc.(a) | | | 350,609 | | | | 7,874,678 | |
| IBERIABANK Corp. | | | 81,122 | | | | 5,444,909 | |
| LegacyTexas Financial Group, Inc. | | | 293,681 | | | | 9,289,130 | |
| National Bank Holdings Corp. - Class A | | | 26,806 | | | | 626,456 | |
| Renasant Corp. | | | 139,194 | | | | 4,681,094 | |
Western Alliance Bancorp(a) | | | 337,100 | | | | 12,654,734 | |
| Zions Bancorporation | | | 523,300 | | | | 16,232,766 | |
| | | | | | | | 79,433,627 | |
| See Notes to Financial Statements. | |
| Annual Report | September 30, 2016 | 7 |
| | | Shares | | | Value | |
| COMMON STOCKS (88.75%) (continued) | | | | |
| FINANCIALS (14.82%) (continued) | | | | |
| Thrifts & Mortgage Finance (2.67%) | |
MGIC Investment Corp.(a) | | | 2,182,375 | | | $ | 17,459,000 | |
| | | | | | | | | |
| HEALTH CARE (12.34%) | | | | | |
| Biotechnology (1.42%) | |
Exact Sciences Corp.(a) | | | 500,506 | | | | 9,294,397 | |
| | | | | | | | | |
| Health Care Equipment & Supplies (2.22%) | |
K2M Group Holdings, Inc.(a) | | | 196,600 | | | | 3,495,548 | |
NxStage Medical, Inc.(a) | | | 440,681 | | | | 11,012,618 | |
| | | | | | | | 14,508,166 | |
| Health Care Providers & Services (3.87%) | |
Envision Healthcare Holdings, Inc.(a) | | | 125,600 | | | | 2,797,112 | |
| HealthSouth Corp. | | | 367,602 | | | | 14,913,613 | |
Select Medical Holdings Corp.(a) | | | 560,380 | | | | 7,565,130 | |
| | | | | | | | 25,275,855 | |
| Health Care Technology (1.94%) | |
Allscripts Healthcare Solutions, Inc.(a) | | | 965,400 | | | | 12,714,318 | |
| | | | | | | | | |
| Life Sciences Tools & Services (1.86%) | |
ICON PLC(a) | | | 43,600 | | | | 3,373,332 | |
PAREXEL International Corp.(a) | | | 25,106 | | | | 1,743,612 | |
VWR Corp.(a) | | | 247,850 | | | | 7,029,026 | |
| | | | | | | | 12,145,970 | |
| Pharmaceuticals (1.03%) | |
Catalent, Inc.(a) | | | 260,718 | | | | 6,736,953 | |
| | | | | | | | | |
| INDUSTRIALS (16.11%) | | | | | |
| Aerospace & Defense (2.46%) | |
| B/E Aerospace, Inc. | | | 121,500 | | | | 6,276,690 | |
| Hexcel Corp. | | | 221,779 | | | | 9,824,810 | |
| | | | | | | | 16,101,500 | |
| Building Products (2.09%) | |
| Masco Corp. | | | 397,400 | | | | 13,634,794 | |
| | | | | | | | | |
| Commercial Services & Supplies (2.21%) | |
| Mobile Mini, Inc. | | | 478,837 | | | | 14,460,877 | |
| | | | | | | | | |
| Electrical Equipment (1.24%) | |
| Regal-Beloit Corp. | | | 136,800 | | | | 8,138,232 | |
| | | | | | | | | |
| Machinery (3.86%) | |
| Astec Industries, Inc. | | | 292,537 | | | | 17,514,190 | |
| Crane Co. | | | 38,100 | | | | 2,400,681 | |
Rexnord Corp.(a) | | | 248,000 | | | | 5,309,680 | |
| | | | | | | | 25,224,551 | |
| Professional Services (1.61%) | |
| Kforce, Inc. | | | 435,188 | | | | 8,917,002 | |
| Robert Half International, Inc. | | | 42,243 | | | | 1,599,320 | |
| | | | | | | | 10,516,322 | |
| Road & Rail (0.36%) | |
Genesee & Wyoming, Inc. - Class A(a) | | | 33,950 | | | | 2,340,853 | |
| See Notes to Financial Statements. | |
| 8 | www.bvafunds.com |
| Broadview Opportunity Fund | Schedule of Investments |
September 30, 2016
| | | Shares | | | Value | |
| COMMON STOCKS (88.75%) (continued) | | | | |
| INDUSTRIALS (16.11%) (continued) | | | | |
| Trading Companies & Distribution (2.28%) | |
BMC Stock Holdings, Inc.(a) | | | 400,980 | | | $ | 7,109,376 | |
HD Supply Holdings, Inc.(a) | | | 244,131 | | | | 7,807,309 | |
| | | | | | | | 14,916,685 | |
| INFORMATION TECHNOLOGY (22.63%) | | | | | |
| Communication Equipment (1.97%) | |
Ciena Corp.(a) | | | 591,200 | | | | 12,888,160 | |
| | | | | | | | | |
| Electrical Equipment & Services (0.95%) | |
Arrow Electronics, Inc.(a) | | | 96,692 | | | | 6,185,387 | |
| | | | | | | | | |
| Electronic Equipment & Instruments (1.21%) | |
Zebra Technologies Corp. - Class A(a) | | | 113,300 | | | | 7,886,813 | |
| | | | | | | | | |
| Internet Software & Services (1.50%) | |
Pandora Media, Inc.(a) | | | 683,400 | | | | 9,793,122 | |
| | | | | | | | | |
| IT Services (0.53%) | |
Acxiom Corp.(a) | | | 131,141 | | | | 3,494,908 | |
| | | | | | | | | |
| Semiconductors & Semiconductor Equipment (6.78%) | |
| Intersil Corp. - Class A | | | 875,500 | | | | 19,199,715 | |
| MKS Instruments, Inc. | | | 271,200 | | | | 13,486,776 | |
Veeco Instruments, Inc.(a) | | | 594,200 | | | | 11,664,146 | |
| | | | | | | | 44,350,637 | |
| Software (9.69%) | |
CommVault Systems, Inc.(a) | | | 271,600 | | | | 14,430,108 | |
Fortinet, Inc.(a) | | | 145,895 | | | | 5,387,902 | |
Imperva, Inc.(a) | | | 110,100 | | | | 5,913,471 | |
Infoblox, Inc.(a) | | | 436,843 | | | | 11,519,550 | |
Mobileye NV(a) | | | 90,000 | | | | 3,831,300 | |
PROS Holdings, Inc.(a) | | | 282,300 | | | | 6,382,803 | |
PTC, Inc.(a) | | | 281,019 | | | | 12,451,952 | |
Tableau Software, Inc. - Class A(a) | | | 62,100 | | | | 3,432,267 | |
| | | | | | | | 63,349,353 | |
| MATERIALS (6.19%) | | | | | |
| Chemicals (2.36%) | |
Ferro Corp.(a) | | | 404,000 | | | | 5,579,240 | |
Flotek Industries, Inc.(a) | | | 309,100 | | | | 4,494,314 | |
Kraton Corp.(a) | | | 154,000 | | | | 5,396,160 | |
| | | | | | | | 15,469,714 | |
| Construction Materials (3.83%) | |
Summit Materials, Inc. - Class A(a) | | | 418,273 | | | | 7,758,964 | |
| Vulcan Materials Co. | | | 151,800 | | | | 17,264,214 | |
| | | | | | | | 25,023,178 | |
| | | | | | | | | |
| TOTAL COMMON STOCKS | | | | | |
| (COST $450,838,496) | | | | 580,292,425 | |
| See Notes to Financial Statements. | |
| Annual Report | September 30, 2016 | 9 |
| | | Shares | | | Value | |
| SHORT-TERM SECURITY (13.06%) | | | | |
MONEY MARKET FUND (13.06%) | | | | | | |
| Morgan Stanley Institutional Liquidity Funds - Government Portfolio, Institutional Class, 7 Day Yield 0.291% | | | 85,386,652 | | | $ | 85,386,652 | |
| | | | | | | | | |
| TOTAL SHORT-TERM SECURITY | | | | | |
| (COST $85,386,652) | | | | 85,386,652 | |
| | | | | | | | | |
| TOTAL INVESTMENTS (101.81%) | | | | | | | | |
| (COST $536,225,148) | | | | | | | 665,679,077 | |
| | | | | | | | | |
| TOTAL LIABILITIES IN EXCESS OF OTHER ASSETS (-1.81%) | | | | | | | (11,841,004 | ) |
| | | | | | | | | |
| NET ASSETS 100.00% | | | | | | $ | 653,838,073 | |
(a) | Non-income producing security. |
| Percentages are stated as a percent of net assets. | | |
| Broadview Opportunity Fund | Statement of Assets and Liabilities |
| | September 30, 2016 |
| ASSETS: | | | |
| Investments in securities, at value | | $ | 665,679,077 | |
| Receivable for investments sold | | | 2,182,709 | |
| Receivable for shareholder purchases | | | 170,075 | |
| Dividends and interest receivable | | | 207,770 | |
| Prepaid expenses | | | 17,044 | |
| Total assets | | | 668,256,675 | |
| | | | | |
| LIABILITIES: | |
| Payable for management fees | | | 541,561 | |
| Payable for investments purchased | | | 1,707,163 | |
| Payable to shareholders for redemptions | | | 11,944,881 | |
| Payable for transfer agency fees | | | 122,375 | |
| Payable for Board of Trustees fees | | | 418 | |
| Payable for chief compliance officer fees | | | 5,200 | |
| Accrued expenses and other liabilities | | | 97,004 | |
| Total liabilities | | | 14,418,602 | |
| NET ASSETS | | $ | 653,838,073 | |
| | | | | |
| NET ASSETS CONSIST OF: | |
| Paid-in capital | | $ | 503,164,995 | |
| Accumulated net investment loss | | | (1,977,457 | ) |
| Accumulated net realized gain on investments | | | 23,196,606 | |
| Net unrealized appreciation on investments | | | 129,453,929 | |
| NET ASSETS | | $ | 653,838,073 | |
| | | | | |
| INVESTMENTS IN SECURITIES, AT COST | | $ | 536,225,148 | |
| | | | | |
| PRICING OF SHARES: | | | | |
| Net Asset Value, offering and redemption price per share | | $ | 34.80 | |
| Net Assets | | $ | 653,838,073 | |
| Shares of beneficial interest outstanding (unlimited number of shares authorized with no par value per share) | | | 18,786,323 | |
| See Notes to Financial Statements. | |
| Annual Report | September 30, 2016 | 11 |
| INVESTMENT INCOME: | | | |
| Dividends and Interest | | $ | 5,654,872 | |
| Foreign taxes withheld | | | (87,327 | ) |
| Total Investment Income | | | 5,567,545 | |
| | | | | |
| EXPENSES: | | | | |
| Management fees | | | 6,719,933 | |
| Administration and accounting services | | | 248,706 | |
| Transfer agent fees | | | 1,046,571 | |
| Professional fees | | | 63,964 | |
| Custodian fees | | | 50,878 | |
| Board of Trustees fees | | | 60,552 | |
| Chief compliance officer fees | | | 31,023 | |
| Printing and postage expenses | | | 87,421 | |
| Registration fees | | | 56,792 | |
| Other expenses | | | 50,058 | |
| Total Expenses | | | 8,415,898 | |
| NET INVESTMENT LOSS | | | (2,848,353 | ) |
| | | | | |
| REALIZED AND UNREALIZED GAIN/(LOSS) FROM INVESTMENTS: | | | | |
| Net realized gain on investments | | | 29,120,359 | |
| Net change in unrealized appreciation of investments | | | 49,176,293 | |
| NET REALIZED AND UNREALIZED GAIN FROM INVESTMENTS | | | 78,296,652 | |
| NET INCREASE IN NET ASSETS RESULTING FROM OPERATIONS | | $ | 75,448,299 | |
| See Notes to Financial Statements. | |
| 12 | www.bvafunds.com |
| | | For the
Year Ended
September 30, 2016 | | | For the
Year Ended
September 30, 2015 | |
| OPERATIONS: | |
| Net investment loss | | $ | (2,848,353 | ) | | $ | (4,244,959 | ) |
| Net realized gain on investments | | | 29,120,359 | | | | 74,142,425 | |
| Net change in unrealized appreciation/(depreciation) on investments | | | 49,176,293 | | | | (74,278,794 | ) |
| Net increase/(decrease) in net assets resulting from operations | | | 75,448,299 | | | | (4,381,328 | ) |
| | | | | | | | | |
| DISTRIBUTIONS TO SHAREHOLDERS (Note 5): | |
| From net realized gains on investments | | | (59,156,314 | ) | | | (95,669,184 | ) |
| Total distributions | | | (59,156,314 | ) | | | (95,669,184 | ) |
| | | | | | | | | |
| SHARE TRANSACTIONS (Note 5): | | | | | | | | |
| Proceeds from sales of shares | | | 78,741,917 | | | | 147,080,123 | |
| Distributions reinvested | | | 57,589,371 | | | | 93,541,782 | |
| Cost of shares redeemed | | | (241,014,827 | ) | | | (302,493,246 | ) |
| Net decrease from share transactions | | | (104,683,539 | ) | | | (61,871,341 | ) |
| | | | | | | | | |
| Net decrease in net assets | | | (88,391,554 | ) | | | (161,921,853 | ) |
| | | | | | | | | |
| NET ASSETS: | | | | | | | | |
| Beginning of year | | | 742,229,627 | | | | 904,151,480 | |
| End of year* | | $ | 653,838,073 | | | $ | 742,229,627 | |
| *Includes accumulated net investment income/(loss) of: | | $ | (1,977,457 | ) | | $ | 0 | |
| | | | | | | | | |
| Other Information: | | | | | | | | |
| SHARE TRANSACTIONS: | | | | | | | | |
| Sold | | | 2,496,244 | | | | 3,865,177 | |
| Distributions reinvested | | | 1,824,758 | | | | 2,490,463 | |
| Redeemed | | | (7,464,570 | ) | | | (7,920,224 | ) |
| Net decrease in shares outstanding | | | (3,143,568 | ) | | | (1,564,584 | ) |
| See Notes to Financial Statements. | |
| Annual Report | September 30, 2016 | 13 |
| | | For the
Year Ended
September 30, 2016 | | | For the
Year Ended
September 30, 2015 | | | For the
Year Ended
September 30, 2014(a) | | | For the
Year Ended
September 30, 2013 | | | For the
Year Ended
September 30, 2012 | |
| NET ASSET VALUE, BEGINNING OF YEAR | | $ | 33.85 | | | $ | 38.48 | | | $ | 40.85 | | | $ | 30.26 | | | $ | 25.54 | |
| INCOME/(LOSS) FROM OPERATIONS: | | | | | | | | | | | | | | | | | | | | |
| Net investment loss | | | (0.14 | )(b) | | | (0.19 | ) | | | (0.21 | ) | | | (0.15 | ) | | | (0.10 | ) |
| Net realized and unrealized gain/(loss) on investments | | | 3.96 | | | | (0.33 | ) | | | 2.18 | | | | 11.59 | | | | 6.02 | |
| Total from investment operations | | | 3.82 | | | | (0.52 | ) | | | 1.97 | | | | 11.44 | | | | 5.92 | |
| | | | | | | | | | | | | | | | | | | | | |
| LESS DISTRIBUTIONS: | | | | | | | | | | | | | | | | | | | | |
| From net realized gains on investments | | | (2.87 | ) | | | (4.11 | ) | | | (4.34 | ) | | | (0.85 | ) | | | (1.20 | ) |
| Total distributions | | | (2.87 | ) | | | (4.11 | ) | | | (4.34 | ) | | | (0.85 | ) | | | (1.20 | ) |
| INCREASE/(DECREASE) IN NET ASSET VALUE | | | 0.95 | | | | (4.63 | ) | | | (2.37 | ) | | | 10.59 | | | | 4.72 | |
| NET ASSET VALUE, END OF YEAR | | $ | 34.80 | | | $ | 33.85 | | | $ | 38.48 | | | $ | 40.85 | | | $ | 30.26 | |
| | | | | | | | | | | | | | | | | | | | | |
| TOTAL RETURN | | | 12.17 | % | | | (2.40 | %) | | | 4.86 | % | | | 38.91 | % | | | 23.48 | % |
| | | | | | | | | | | | | | | | | | | | | |
| SUPPLEMENTAL DATA: | | | | | | | | | | | | | | | | | | | | |
| Net assets, end of year (000's) | | $ | 653,838 | | | $ | 742,230 | | | $ | 904,151 | | | $ | 852,723 | | | $ | 618,541 | |
| | | | | | | | | | | | | | | | | | | | | |
| RATIOS TO AVERAGE NET ASSETS: | | | | | | | | | | | | | | | | | | | | |
| Operating expenses | | | 1.25 | % | | | 1.23 | % | | | 1.25 | % | | | 1.26 | % | | | 1.26 | % |
| Net investment loss | | | (0.42 | %) | | | (0.48 | %) | | | (0.50 | %) | | | (0.44 | %) | | | (0.34 | %) |
| | | | | | | | | | | | | | | | | | | | | |
| PORTFOLIO TURNOVER RATE | | | 40 | % | | | 41 | % | | | 56 | % | | | 70 | % | | | 55 | % |
(a) | On November 25, 2013, shareholders of the FMI Focus Fund, a series of FMI Funds, Inc. (the "Predecessor Fund"), approved a tax-free reorganization under which all assets and liabilities of the Predecessor Fund were transferred to the Broadview Opportunity Fund, a series of Broadview Funds Trust, at the close of business on November 29, 2013. |
(b) | Per share amounts are based upon average shares outstanding. |
| See Notes to Financial Statements. | |
| 14 | www.bvafunds.com |
1. ORGANIZATION
Broadview Funds Trust (the “Trust”) is an open-end management investment company registered under the Investment Company Act of 1940, as amended (the “1940 Act”). The Trust was organized on September 9, 2013 as a Delaware statutory trust. The Trust currently offers one series, the Broadview Opportunity Fund (the “Fund”). The Fund is a diversified portfolio with an investment objective to seek capital appreciation.
On November 25, 2013, shareholders of the FMI Focus Fund, a series of FMI Funds, Inc. (the “Predecessor Fund”), approved a tax-free reorganization under which all assets and liabilities of the Predecessor Fund were transferred to the Fund, a series of the Trust, at the close of business on November 29, 2013. The Predecessor Fund commenced operations on December 16, 1996.
2. SIGNIFICANT ACCOUNTING POLICIES
The following is a summary of significant accounting policies consistently followed by the Fund. These policies are in conformity with U.S. generally accepted accounting principles (“GAAP”). The Fund is an investment company and accordingly follows the investment company accounting and reporting guidance of the Financial Accounting Standards Board (“FASB”) Accounting Standards Codification Topic 946 Financials Services- Investment Companies.
Use of Estimates — The preparation of financial statements in conformity with GAAP requires management to make estimates and assumptions that affect the reported amounts of assets and liabilities and disclosure of contingent assets and liabilities at the date of the financial statements and the reported amounts of increases and decreases in net assets from operations during the reporting period. Actual results could differ from those estimates.
Investment Valuation — The Fund’s portfolio securities are fair valued as of the close of trading of the New York Stock Exchange (“NYSE”) (normally 4:00 p.m., Eastern Time). Each security, excluding short-term investments, is valued at the last sale price reported by the principal security exchange on which the issue is traded. Securities that are traded on the Nasdaq Stock Market, Inc. are valued at the Nasdaq Official Closing Price or if no sale is reported, the mean between the bid and the ask. Securities which are traded over-the-counter are valued at the last sale price or, if no sale, at the mean between the bid and the ask. Securities sold short which are listed on a national securities exchange or the Nasdaq Stock Market but which were not traded on the valuation date are valued at the mean between the bid and the ask. Unlisted equity securities for which market quotations are readily available are valued at the last sale price or, if no sale price, the mean between the bid and the ask. Options purchased or written by the Fund are valued at the mean of the highest bid and lowest ask price of all the exchanges on which the option trades. Securities for which quotations are not readily available are valued at fair value as determined by the investment adviser in accordance with procedures approved by the Board of Trustees. The fair value of a security is the amount which the Fund might reasonably expect to receive upon a current sale. The fair value of a security may differ from the last quoted price and the Fund may not be able to sell a security at the fair value. Market quotations may not be available, for example, if trading in particular securities was halted during the day and not resumed prior to the close of trading on the New York Stock Exchange. As of September 30, 2016, there were no securities that were internally fair valued by the investment adviser. Variable rate demand notes are recorded at par value which approximates market value. Money market funds, representing short-term investments, are valued at their net asset value. Other short-term investments with maturities of 60 days or less are valued at fair value. For financial reporting purposes, investment transactions are recorded on the trade date.
Securities Transactions and Related Investment Income — Dividend income is recorded on the ex-dividend date. Realized gains and losses from investment transactions are determined using the identified cost basis. Interest income which includes amortization of premium and accretion of discount, is recorded on the accrual basis. Withholding taxes on foreign dividends have been provided for in accordance with the Fund’s understanding of the applicable country’s tax rules and regulations.
Fair Value Measurements — A three-tier hierarchy has been established to classify fair value measurements for disclosure purposes. Inputs refer broadly to the assumptions that market participants would use in pricing the asset or liability, including assumptions about risk. Inputs may be observable or unobservable. Observable inputs are inputs that reflect the assumptions market participants would use in pricing the asset or liability that are developed based on market data obtained from sources independent of the reporting entity. Unobservable inputs are inputs that reflect the reporting entity’s own assumptions about the assumptions market participants would use in pricing the asset or liability that are developed based on the best information available. In accordance with the authoritative guidance on fair value measurements and disclosure under GAAP, the Fund discloses fair value of its investments in a hierarchy that prioritizes the inputs to valuation techniques used to measure the fair value.
Various inputs are used in determining the value of the Fund’s investments as of the reporting period end. These inputs are categorized in the following hierarchy under GAAP:
| | |
| Annual Report | September 30, 2016 | 15 |
| Broadview Opportunity Fund | Notes to Financial Statements |
| | September 30, 2016 |
| Level 1 — | Unadjusted quoted prices in active markets for identical, unrestricted assets or liabilities that the Fund has the ability to access at the measurement date; |
| Level 2 — | Quoted prices which are not active, quoted prices for similar assets or liabilities in active markets or inputs other than quoted prices that are observable (either directly or indirectly) for substantially the full term of the asset or liability; and |
| Level 3 — | Significant unobservable prices or inputs (including the Fund’s own assumptions in determining the fair value of investments) where there is little or no market activity for the asset or liability at the measurement date. |
The availability of observable inputs can vary from security to security and is affected by a wide variety of factors, including, for example, the type of security, whether the security is new and not yet established in the marketplace, the liquidity of markets, and other characteristics particular to the security. To the extent that valuation is based on models or inputs that are less observable or unobservable in the market, the determination of fair value requires more judgment. Accordingly, the degree of judgment exercised in determining fair value is greatest for instruments categorized in Level 3.
An investment level within the fair value hierarchy is based on the lowest level input, individually or in the aggregate, that is significant to fair value measurement. The valuation techniques used by the Fund to measure fair value during the year ended September 30, 2016, maximized the use of observable inputs and minimized the use of unobservable inputs.
The inputs or methodologies used for valuing securities are not necessarily an indication of the risk or liquidity associated with investing in those securities. The following is a summary of the inputs used in valuing the Fund’s investments as of September 30, 2016:
| Broadview Opportunity Fund | |
| | | Valuation Inputs | | | | |
| Investments in Securities at Fair Value* | | Level 1 | | | Level 2 | | | Level 3 | | | Total | |
| Common Stocks | | $ | 580,292,425 | | | $ | – | | | $ | – | | | $ | 580,292,425 | |
| Short-Term Security | | | 85,386,652 | | | | – | | | | – | | | | 85,386,652 | |
| Total | | $ | 665,679,077 | | | $ | – | | | $ | – | | | $ | 665,679,077 | |
| * | See Schedule of Investments for industry classification. |
It is the Fund’s policy to recognize transfers between levels at the end of the reporting period. There were no transfers between Levels 1 and 2 during the year ended September 30, 2016.
For the year ended September 30, 2016, the Fund did not have any unobservable inputs (Level 3) used in determining fair value.
Distributions to Shareholders — Dividends from net investment income and distributions of net realized capital gains, if any, will be declared and paid at least annually. Income and capital gains distributions are determined in accordance with income tax regulations, which may differ from GAAP. Distributions to shareholders are recorded on the ex-dividend date.
Income Taxes — As of and during the year ended September 30, 2016, the Fund did not have a liability for any unrecognized tax benefits. The Fund files U.S. federal, state, and local tax returns as required. The Fund’s tax returns are subject to examination by the relevant tax authorities until expiration of the applicable statute of limitations which is generally three years after the filing of the tax return for federal purposes and four years for most state returns. Tax returns for open years have incorporated no uncertain tax positions that require a provision for income taxes. The Fund intends to continue to qualify each year as a “regulated investment company” under Subchapter M of the Internal Revenue Code of 1986, as amended. By so qualifying, the Fund will not be subject to Federal income taxes to the extent that it distributes substantially all of its taxable or tax‐exempt income, if any, for its tax year ending September 30. In addition, by distributing in each calendar year substantially all of its net investment income, capital gains and certain other amounts, if any, the Fund will not be subject to a Federal excise tax. Therefore, no provision is made by the Fund for Federal income or excise taxes.
| Broadview Opportunity Fund | Notes to Financial Statements |
| | September 30, 2016 |
3. ADVISORY FEES, ADMINISTRATION FEES AND OTHER AGREEMENTS
Investment Advisory Agreement
Effective as of the close of business on November 29, 2013, the Fund entered into an investment advisory agreement with Broadview Advisors, LLC (the “Adviser”). The Fund pays the Adviser a monthly fee based upon the average daily net assets of the Fund and calculated at an annual
rate of 1.00%.
Prior to November 29, 2013, Fiduciary Management, Inc. (“FMI”) was the Predecessor Fund’s investment adviser. As full compensation for the investment advisory services provided to the Predecessor Fund, FMI received monthly compensation based on the Predecessor Fund’s average daily net assets at the annual rate of 1.00%.
Prior to November 29, 2013, FMI had an investment sub-advisory agreement with the Adviser, with whom a certain director of the Predecessor Fund was affiliated, to assist it in the day-to-day management of the Predecessor Fund. The Adviser determined which securities were purchased, retained or sold for the Predecessor Fund. FMI paid the Adviser 0.85% of the first $500 million of the average daily net assets of the Predecessor Fund and 0.80% of the Predecessor Fund’s average daily net assets in excess of $500 million.
Beneficial Ownership
At September 30, 2016, Charles Schwab & Co and Wells Fargo Advisors, LLC are each a record owner of 25% of the Fund’s shares.
Fund Accounting Fees and Expenses
ALPS Fund Services, Inc. (“ALPS” or the “Administrator”) provides administrative, fund accounting and other services to the Fund under the Administration, Bookkeeping and Pricing Services Agreement (the “Administration Agreement”) with the Trust. Under the Agreement, ALPS is paid fees, accrued on a daily basis and paid on a monthly basis following the end of the month.
The Administrator is also reimbursed by the Fund for certain out of pocket expenses.
The Fund has entered into a Distribution Plan (the “Plan”) pursuant to Rule 12b-1 under the Act. The Plan provides that the Fund may incur certain costs which may not exceed the lesser of a monthly amount equal to 0.25% of the Fund’s daily net assets or the actual distribution costs incurred during the year. Amounts payable under the Plan are paid monthly for any activities or expenses primarily intended to result in the sale of shares of the Fund. For the year ended September 30, 2016, no such expenses were incurred. The Fund presently intends not to utilize the Plan or pay any 12b-1 fees during the fiscal year ending September 30, 2017.
Transfer Agent and Shareholder Services Agreement
ALPS serves as transfer, dividend paying and shareholder servicing agent for the Fund (the “Transfer Agent”) under a Transfer Agency and Services Agreement with the Trust.
Compliance Services
ALPS provides Chief Compliance Officer services to the Fund. Additionally, ALPS provides services in monitoring and testing the policies and procedures of the Trust in conjunction with requirements under Rule 38a-1 under the 1940 Act. ALPS is compensated under the Chief Compliance Officer Services Agreement.
Distributor
The Fund has entered into a Distribution Agreement with ALPS Distributors, Inc. (the “Distributor”) to provide distribution services to the Fund. The Distributor serves as underwriter/distributor of shares of the Fund.
Officer and Trustee Compensation
Officers of the Trust and Trustees who are “interested persons” of the Trust or the Adviser will receive no salary or fees from the Trust. Each Trustee who is not an “interested person” receives an annual fee of $20,000 each year. The Trust reimburses each Trustee and Officer for his or her travel and other expenses relating to attendance at such meetings.
Certain Trustees and Officers of the Trust are also officers of the Adviser or ALPS.
| Broadview Opportunity Fund | Notes to Financial Statements |
| | September 30, 2016 |
4. PURCHASES AND SALES OF INVESTMENT SECURITIES
The aggregate cost of purchases and proceeds from sales of investment securities, excluding short-term securities, are shown below for the year ended September 30, 2016.
| Broadview Opportunity Fund | | | |
| Cost of Investments Purchased | | $ | 229,084,468 | |
| Proceeds from Investments Sold | | $ | 340,827,486 | |
5. TAX BASIS INFORMATION
Distributions are determined in accordance with federal income tax regulations, which differ from GAAP, and, therefore, may differ significantly in amount or character from net investment income and realized gains for financial reporting purposes. Financial reporting records are adjusted for permanent book/tax differences to reflect tax character but are not adjusted for temporary differences. The amounts and characteristics of tax basis distributions and composition of distributable earnings/(accumulated losses) are finalized at fiscal year-end.
The tax character of distributions paid during the year ended September 30, 2016, were as follows:
| | Ordinary Income | | | Long-Term Capital Gain | |
| | $ | – | | | $ | 59,156,314 | |
The tax character of distributions paid during the year ended September 30, 2015, were as follows:
| | Ordinary Income | | | Long-Term Capital Gain | |
| | $ | 5,030,412 | | | $ | 90,638,772 | |
| | | | | | | | |
For the year ended September 30, 2016, the following reclassification, which had no impact on results of operations or net assets was recorded to reflect the tax character of the Fund’s net operating loss:
| | Paid-in Capital | | | Accumulated Net Investment Income | | | Accumulated Net Realized Loss | |
| | $ | (870,896 | ) | | $ | 870,896 | | | $ | – | |
As of September 30, 2016, net unrealized appreciation/(depreciation) of investments based on the federal tax cost was as follows:
| | Cost of Investments | | | Gross Unrealized Appreciation | | | Gross Unrealized Depreciation | | | Net Appreciation on Investments | |
| | $ | 537,372,093 | | | $ | 152,065,211 | | | $ | (23,758,227 | ) | | $ | 128,306,984 | |
The difference between book basis and tax basis is primarily attributable to wash sales.
At September 30, 2016, components of distributable earning on a tax basis were as follows:
| Accumulated net realized gain | | | 24,343,551 | |
| Net unrealized appreciation on investments | | | 128,306,984 | |
| Other cumulative effect of timing differences | | | (1,977,457 | ) |
| Total distributable earnings | | $ | 150,673,078 | |
Capital Losses: As of September 30, 2016, the Fund elected to defer to the year ending September 30, 2017, late year ordinary losses in the amount of $1,977,457.
| Broadview Opportunity Fund | Notes to Financial Statements |
| | September 30, 2016 |
6. COMMITMENTS AND CONTINGENCIES
Under the Trust’s organizational documents, each director, officer, employee or other agent of the Fund (including the Adviser) is indemnified, to the extent permitted by the Act, against certain liabilities that may arise out of performance of their duties to the Fund. Additionally, in the normal course of business, the Fund enters into contracts that contain a variety of indemnification clauses. The Fund’s maximum exposure under these arrangements is unknown as this would involve future claims that may be made against the Fund that have not yet occurred. However, the Fund has not had prior claims or losses pursuant to these contracts and believes the risk of loss to be remote.
| | |
| Annual Report | September 30, 2016 | 19 |
To the Shareholders of Broadview Opportunity Fund and
Board of Trustees of Broadview Funds Trust
We have audited the accompanying statement of assets and liabilities, including the schedule of investments, of Broadview Funds Trust comprising Broadview Opportunity Fund (the “Fund”), as of September 30, 2016, and the related statements of operations and changes in net assets, and the financial highlights for the year then ended. These financial statements and financial highlights are the responsibility of the Fund’s management. Our responsibility is to express an opinion on these financial statements and financial highlights based on our audit. The statement of changes in net assets and financial highlights for the periods ended prior to September 30, 2016, were audited by other auditors whose report dated November 27, 2015, expressed an unqualified opinion on that statement and financial highlights.
We conducted our audit in accordance with the standards of the Public Company Accounting Oversight Board (United States). Those standards require that we plan and perform the audit to obtain reasonable assurance about whether the financial statements and financial highlights are free of material misstatement. An audit includes examining, on a test basis, evidence supporting the amounts and disclosures in the financial statements. Our procedures included confirmation of securities owned as of September 30, 2016, by correspondence with the custodian and brokers. An audit also includes assessing the accounting principles used and significant estimates made by management, as well as evaluating the overall financial statement presentation. We believe that our audit provides a reasonable basis for our opinion.
In our opinion, the financial statements and financial highlights referred to above present fairly, in all material respects, the financial position of the Fund, as of September 30, 2016, and the results of its operations, changes in its net assets, and its financial highlights for the year then ended, in conformity with accounting principles generally accepted in the United States of America.
Cleveland, Ohio
November 22, 2016
1. PROXY VOTING POLICIES AND VOTING RECORD
A description of the policies and procedures that the Fund uses to vote proxies relating to portfolio securities is available without charge upon request by calling toll-free 855-846-1463, or on the Securities and Exchange Commission’s (“SEC”) website at http://www.sec.gov. Information regarding how the Fund voted proxies relating to portfolio securities during the most recent 12-month period ended June 30th is available without charge upon request by calling toll-free 855-846-1463, or on the SEC’s website at http://www.sec.gov.
2. QUARTERLY PORTFOLIO HOLDINGS
The Trust files a complete listing of portfolio holdings for the Fund with the SEC four times each fiscal year at quarter-ends. The Fund files the schedule of portfolio holdings with the SEC on Form N-CSR (second and fourth quarters) and on Form N-Q (first and third quarters). The filings are available upon request by calling 855-846-1463. Furthermore, you may obtain a copy of the filing on the SEC’s website at http://www.sec.gov. The Fund’s Forms N-CSR and N-Q may also be reviewed and copied at the SEC’s Public Reference Room in Washington, D.C., and information on the operation of the Public Reference Room may be obtained by calling 1-800-SEC-0330.
3. TAX DESIGNATIONS
Pursuant to Section 852(b)(3) of the Internal Revenue Code, the Broadview Opportunity Fund designates $59,156,314 respectively as a long‐term capital gain dividend.
The Broadview Opportunity Fund designates the following as a percentage of taxable ordinary income distributions, or up to the maximum amount allowable, for the calendar year ended December 31, 2015:
Qualified Dividend Income: 16.47%
Dividend Received Deduction: 16.43%
The business affairs of the Fund are managed under the direction of the Trust’s Board of Trustees in accordance with the laws of the State of Delaware. Information pertaining to the Trustees and Officers of the Trust are set forth below. Trustees who are not deemed to be “interested persons” of the Trust as defined in the 1940 Act, are referred to as “Independent Trustees.” Trustees who are deemed to be interested persons of the Trust as defined in the 1940 Act are referred to as “Interested Trustees”. The Fund’s Statement of Additional Information includes additional information about the trustees and is available upon request by calling toll-free 1-855-846-1463.
INTERESTED AND NON-INTERESTED TRUSTEES
Name, Address and Year of Birth(1) | Position(s) With the Trust, Term of Office, Length of Time Served and Number of Portfolios in Fund Complex Overseen | Principal Occupation(s)
During the Past 5 Years | Other Directorships Held by Trustee During the Past 5 Years |
| Interested Trustee | | | |
Richard J. Whiting(2) Born: 1957 | Chairman and Trustee (since 2013); Indefinite Term;
1 Portfolio | Manager of Trading Department and Portfolio Manager, Broadview Advisors, LLC (since 2001) | None |
| Non-Interested Trustees | | | |
Gregory W. Berger Born: 1961 | Trustee (since 2013); Indefinite Term; 1 Portfolio | Attorney and Shareholder, Brownstein Hyatt Farber Schreck, LLP (law firm) (1994 to present) | None |
Cornelius J. Lavelle Born: 1944 | Trustee (since 2013); Indefinite Term; 1 Portfolio | Retired; Director, Institutional Equities, Citigroup Global Markets Inc. (multinational financial services firm) (1997 to 2009) | Independent Trustee, The 504 Fund (a closed-end investment company); Independent Trustee, USFS Funds Trust (an open-end investment company with two portfolios) (2013-2014) |
Philip J. Uihlein, Sr. Born: 1950 | Trustee (since 2013); Indefinite Term; 1 Portfolio | Retired; President, U-Line Corporation (refrigeration appliance manufacturer) (1977 to 2008); Chief Executive Officer, U-Line Corporation (1986 to 2008) | None |
OFFICERS
Name, Address and Year of Birth(1) | Position(s) With the Trust, Term of
Office and Length of Time Served | Principal Occupation(s) During the Past 5 Years |
| Other Officers | | |
Richard E. Lane Born: 1955 | President and Principal Executive Officer (since 2013); Indefinite Term | President, Broadview Advisors, LLC (since 2001) |
Aaron J. Garcia Born: 1977 | Treasurer and Principal Financial Officer and Principal Accounting Officer (since 2013); Indefinite Term | Portfolio Manager, Broadview Advisors, LLC (since 2003) |
Faraz Farzam Born: 1973 | Secretary (since 2013); Indefinite Term | Portfolio Manager, Broadview Advisors, LLC (since 2001) |
Melanie H. Zimdars Born: 1976 | Chief Compliance Officer and AML Compliance Officer (since 2013);
Indefinite Term | Vice President, Deputy Chief Compliance Officer, ALPS Fund Services, Inc. (since 2009) |
Angela L. Pingel Born: 1971 | Vice President and Assistant Secretary (since 2015); Indefinite Term | General Counsel and Chief Compliance Officer, Broadview Advisors, LLC (since 2015);
Vice President and Counsel, U.S. Bancorp Fund Services, LLC (2011-2015) |
(1) | Unless otherwise noted, the business address of each Trustee and Officer is c/o Broadview Funds Trust, 330 East Kilbourn Avenue, Suite 1475, Milwaukee, Wisconsin 53202. |
(2) | Mr. Whiting is an “interested person” of the Trust (as defined in the 1940 Act) because he is an employee and officer of the Adviser. |
Item 2. Code of Ethics.
| (a) | The Registrant has adopted a code of ethics that applies to the Registrant’s principal executive officer, principal financial officer, principal accounting officer or controller or any persons performing similar functions on behalf of the Registrant. |
| (c) | During the period covered by this report, no amendments to the provisions of the code of ethics adopted in paragraph (a) of this Item were made. |
| (d) | During the period covered by this report, no implicit or explicit waivers to the provisions of the code of ethics adopted in paragraph (a) of this Item were granted. |
| (f) | A copy of the Registrant’s Code of Ethics is filed as an exhibit hereto. |
Item 3. Audit Committee Financial Expert.
The Board of Trustees of the Registrant has determined that the Registrant has at least one audit committee financial expert serving on its audit committee. Mr. Cornelius J. Lavelle serves as the Registrant’s audit committee financial expert and is considered to be “independent” as defined in Item 3 of Form N-CSR.
Item 4. Principal Accountant Fees and Services.
| (a) | Audit Fees: Audit fees billed for the registrant for the fiscal years ended September 30, 2016 and September 30, 2015 were $15,000 and $30,218, respectively. These amounts represent aggregate fees billed by the Registrant’s independent accountant, Cohen & Company, Ltd. (“Cohen”), for fiscal year ended September 30, 2016 and PricewaterhouseCoopers, LLP (“PwC”), for fiscal year ended September 30, 2015 in connection with the annual audits of the registrant’s financial statements and for services normally provided by the accountant in connection with the registrant’s statutory and regulatory filings for those fiscal years. |
| (b) | Audit-Related Fees: There were no additional fees billed in the fiscal years ended September 30, 2016 and September 30, 2015 for assurance and related services by Cohen or PwC that were reasonably related to the performance of the audit of the registrant’s financial statements that were not reported under paragraph (a) of this Item. |
| (c) | Tax Fees: The tax fees billed for the fiscal years ended September 30, 2016 and September 30, 2015 were $3,000 and $5,655, respectively, for professional services rendered by Cohen or PwC for tax compliance, tax advice, and tax planning. These services were for the completion of the fund’s federal and state income tax returns, excise tax returns, and assistance with distribution calculations. |
| (d) | All Other Fees: For the Registrant’s fiscal year ended September 30, 2016, the aggregate fees billed for products and services provided by the principal accountant, other than the services reported in paragraphs (a) through (c) of this Item, was $0. |
| (e)(1) | Audit Committee Pre-Approval Policies and Procedures: All services to be performed by the Registrant’s principal accountant must be pre-approved by the Registrant’s audit committee. |
| (e)(2) | No services described in paragraphs (b) through (d) of this Item were approved by the Registrant’s audit committee pursuant to paragraph (c)(7)(i)(C) of Rule 2-01 of Regulation S-X. |
| (g) | No non-audit fees were billed by the Registrant’s principal accountant for services rendered to the Registrant’s investment adviser. |
Item 5. Audit Committee of Listed Registrants.
Not applicable to the Registrant.
Item 6. Schedule of Investments.
| (a) | The Registrant’s “Schedule I – Investments in securities of unaffiliated issuers” (as set forth in 17 CFR 210.12-12) is included in Item 1 of this Form N-CSR. |
| (b) | Not applicable to the Registrant. |
Item 7. Disclosure of Proxy Voting Policies and Procedures for Closed-End Management Investment Companies.
Not applicable to the Registrant.
Item 8. Portfolio Managers of Closed-End Management Investment Companies.
Not applicable to the Registrant.
Item 9. Purchases of Equity Securities by Closed-End Management Investment Company and Affiliated Purchasers.
Not applicable to the Registrant.
Item 10. Submission of Matters to a Vote of Security Holders.
None.
Item 11. Controls and Procedures.
| (a) | The Registrant’s principal executive officer and principal financial officer have evaluated the Registrant’s disclosure controls and procedures (as defined in Rule 30a-3(c) under the Investment Company Act of 1940, as amended (the “1940 Act”)) within 90 days of the filing of this report, as required by Rule 30a-3(b) under the Act and Rules 13a-15(b) or 15d-15(b) under the Securities Exchange Act of 1934, and have concluded that the Registrant’s disclosure controls and procedures were effective as of that date. |
| (b) | There was no change in the Registrant’s internal control over financial reporting (as defined in Rule 30a-3(d) under the Act, as amended) during the second fiscal quarter of the period covered by this report that has materially affected, or is reasonably likely to materially affect, the Registrant’s internal control over financial reporting. |
Item 12. Exhibits.
| | (a)(1) | The Registrant’s Code of Ethics for Principal Executive Officer, Principal Financial Officer and Principal Accounting Officer, which is the subject of the disclosure required by Item 2 of Form N-CSR, is filed hereto as Exhibit 12.a.1. |
| | (a)(2) | A separate certification for the Registrant’s Principal Executive Officer and Principal Financial Officer as required by Rule 30a-2(a) under the 1940 Act (17 CFR 270.30a-2(a)), are attached hereto as Ex 99.Cert. |
| | (b) | The certifications by the Registrant’s Principal Executive Officer and Principal Financial Officer, as required by Rule 30a-2(b) of the 1940 Act and Section 906 of the Sarbanes-Oxley Act of 2002 are attached hereto as Ex99.906Cert. |
SIGNATURES
Pursuant to the requirements of the Securities Exchange Act of 1934 and the Investment Company Act of 1940, the Registrant has duly caused this report to be signed on its behalf by the undersigned, thereunto duly authorized.
Broadview Funds Trust
| By: | /s/ Richard E. Lane | |
| | Richard E. Lane | |
| | President | |
| | | |
| Date: | December 2, 2016 | |
Pursuant to the requirements of the Securities Exchange Act of 1934 and the Investment Company Act of 1940, this report has been signed below by the following persons on behalf of the Registrant and in the capacities and on the dates indicated.
| By: | /s/ Richard E. Lane | |
| | Richard E. Lane | |
| | President (Principal Executive Officer) | |
| | | |
| Date: | December 2, 2016 | |
| By: | /s/ Aaron J. Garcia | |
| | Aaron J. Garcia | |
| | Chief Financial Officer (Principal Financial Officer) | |
| | | |
| Date: | December 2, 2016 | |