UNITED STATES
SECURITIES AND EXCHANGE COMMISSION
Washington, D.C. 20549
FORM N-CSR
CERTIFIED SHAREHOLDER REPORT OF REGISTERED
MANAGEMENT INVESTMENT COMPANIES
Investment Company Act file number: 811-22885
Broadview Funds Trust
(Exact name of registrant as specified in charter)
330 East Kilbourn Ave., Suite 1475
Milwaukee, Wisconsin 53202
(Address of principal executive offices) (Zip code)
Angela L. Pingel
Broadview Advisors, LLC
330 East Kilbourn Ave., Suite 1475
Milwaukee, Wisconsin 53202
(Name and address of agent for service)
Registrant’s telephone number, including area code: (414) 918-3900
| Date of fiscal year end: | September 30, 2018 |
| | |
| Date of reporting period: | September 30, 2018 |
| Item 1. | Reports to Stockholders. |

table of contents
| Shareholder Letter | 1 |
| Manager Commentary | 4 |
| Disclosure of Fund Expenses | 6 |
| Schedule of Investments | 7 |
| Statement of Assets and Liabilities | 10 |
| Statement of Operations | 11 |
| Statements of Changes in Net Assets | 12 |
| Financial Highlights | 13 |
| Notes to Financial Statements | 14 |
| Report of Independent Registered Public Accounting Firm | 18 |
| Additional Information | 19 |
| Trustees and Officers | 20 |
| Privacy Notice | 21 |
| Broadview Opportunity Fund | Shareholder Letter |
September 30, 2018 (Unaudited)
Dear Fellow Shareholders,
Economic and Market Overview – Rick Lane, CFA
The market decline of early October (time of this writing) was a clear reaction to rising interest rates. One never knows the exact tipping point as interest rates have been on the rise for some time. Is this the tipping point? Higher interest rates will create competition for equities and will eventually slow the economy. The latter has already been felt in interest-sensitive industries like housing and automotive and the fear is that it will spread.
The counter to this line of thinking is that rates are going up BECAUSE the economy is so strong. Our thinking is that the Federal Reserve (the Fed) is simply normalizing interest rates after almost eight years of incredibly low rates. Most economists feel the so-called neutral rate for short-term interest rates should be around 2.5%-3.0% based on today’s roughly 2.0% inflation rate. We believe the Fed feels that the U.S. economy is on strong enough legs that it needs to move to a neutral policy stance. In fact, we feel the Fed should have moved to neutral several years ago when the economy was in the early growth stage of the cycle.
The problem with doing it now is that while the economy is indeed quite strong overall, early-cycle industries, like housing and automotive, are slowing so investors are already on high alert for the next economic downturn. Rising interest rates exacerbate these fears. Our position, as we have outlined in previous shareholder letters, is that we are indeed late in the current economic cycle. While the next recession is likely sometime in the next several years, barring an exogenous event, it is not imminent.
What is imminent, however, is a revaluation of equities based on higher rates, and a heightened sense of where we are in the cycle. We would guess, highlighting the word guess, that following a digestion period, the market will stabilize and move somewhat higher until the next economic downturn, whenever that is. Again, this is a guess based on years of equity investing experience on the part of the Broadview team. We believe investors should be careful about risk from here on, recognizing the risk-reward late in the economic and market cycle is no longer as favorable. Our strategy is to continue to look for companies that meet our five pillar criteria while being very careful around valuation and economic sensitivity in the event the next downturn occurs sooner than expected.
Nordstrom, Inc. (JWN) – Faraz Farzam, CFA
Overall, our consumer names delivered positive relative and absolute performance in the third calendar quarter. Last quarter we wrote about our opportunistic position increase in upscale retailer Nordstrom, Inc. We are pleased to report the company delivered. Nordstrom’s second quarter results exceeded expectations across the board.
We continue to like the outlook for the company’s fundamentals and believe they are not only a best-in-class retailer, but also a best-in-class e-commerce vendor reporting 35% of their sales online. Inventories are lean, which bodes well for merchandise margins. The investment cycle that we wrote about last quarter is behind them. We believe this bodes well for the company’s overall earnings growth going forward. Although continued sales outperformance is not a given, we think this is one of the best merchandising and management teams in the business and we like the outlook for Nordstrom into the fourth quarter with the critical holiday season.
Technology Sector Overview – Faraz Farzam, CFA
We continued outperforming in the technology sector this quarter as investors rotated out of the semiconductor-related stocks due to peak cycle concerns. We were well positioned for this rotation as we previously sold all but one of our semiconductor stocks while continuing to hold software and IT service stocks.
Our best performing software stock was Acxiom Holdings, Inc. (ACXM), which changed its name and symbol to LiveRamp Holdings, Inc. (RAMP) on October 2, 2018. This company was really two companies in one: the legacy Acxiom Marketing Solutions (AMS) business, and LiveRamp, an advertising technology software platform. Management announced the sale of its AMS business and brand to Interpublic Group of Companies, Inc. (IPG) for $2.3 billion. As a result, the company made the aforementioned name change. The company will maintain its strategic LiveRamp business which is growing at a better than 25% rate and boasts already strong profitability for a company of its size and growth profile. We believe management will use proceeds from the sale of AMS for share repurchases. While the stock price has gone up, we believe it remains undervalued relative to its software peers, especially when considering the company’s solid profitability and growth profile. Conglomerate companies generally tend to trade at a discount, but now LiveRamp can shine on its own as a standalone entity. We believe the stock’s valuation should continue to expand and shed its discount.
Our largest technology investment, network and communication gear maker, Ciena Corp. (CIEN), delivered strong results for the second quarter and a positive outlook. Recently, the stock has been trading at 10-year highs. Japanese telecommunications service providers, like SoftBank Group Corp. (9984-JP) and NTT DoCoMo, Inc. (9437-JP), long captive to domestic equipment makers, have begun opening up their networks to international equipment providers. Ciena’s dominant competitive position has gained them a place inside these large and capital-intensive networks. Like their recent success in India and Europe, these markets could provide a multi-year investment for Ciena’s equipment.
| Annual Report | September 30, 2018 | 1 |
| Broadview Opportunity Fund | Shareholder Letter |
September 30, 2018 (Unaudited)
Looking forward, we will keep an eye on the valuations of our software holdings. We expect technology investors may crowd into the “working” software companies after they abandoned semiconductor and semiconductor capital equipment stocks. We have already seen evidence of this with PROS Holdings, Inc. (PRO), which we sold as it reached our valuation target. We will also look for opportunities in the aftermath of the selloff of semiconductor-related companies while being cognizant of the duration of the economic cycle.
Healthcare Sector Overview – Aaron Garcia, CFA
Healthcare stocks have broadly outperformed the market in 2018, with the third calendar quarter being no different. However, throughout 2018, we have continued to be underweight in healthcare. Thus, our call appears to be incorrect. But as we have written in the past, the regulatory backdrop is very uncertain. We expect further volatility through the November midterm elections, regardless of the outcome.
While our thinking has not changed, we will continue to look for names that we believe are more insulated from regulatory risk and offer compelling growth stories at a palatable valuation. Valuations in healthcare appear expensive overall. We think that medical device companies will face less scrutiny than pharmaceutical and pharmaceutical supply chain companies in the coming quarters. We also think that the continued move of care outside the hospital and into alternative sites, including the home, is a theme that will persist for some time. Finally, we remain enthused with the diagnostic sector. Specifically, there are many technological advancements in the molecular diagnostic industry that we believe can drive outsized revenue growth. As the medical community grows its understanding of the genetic component of pharmaceutical treatment, we believe these diagnostic companies will have increased value to pharmaceutical drug development.
Despite our underweight in healthcare, we have benefited from a few strong names. K2M Group Holdings, Inc. (KTWO), one of our larger positions, was acquired in the third quarter by a larger medical device company. The acquisition was strategic as K2M has built up a large market share position in medical implants to treat scoliosis and has an exciting new class of products that are utilized in vivo during spine surgeries. While we were happy with the premium associated with the buyout, we felt the company had strong growth prospects over the next several years. We have reallocated some capital to another company in this industry, as we believe small capitalization medical device companies have significant private market value in a growing space.
Unfortunately, several of our healthcare names detracted from performance in the third quarter. Varex Imaging Corporation (VREX), an imaging component company, had weak quarterly results that drove a re-rating of the stock’s valuation. We think the international opportunity for this company is appealing. Developing countries are at the beginning of a long upgrade cycle to digital imaging technology, following the adoption curve that the United States and Europe have already experienced. However, a more concerning tariff environment and global trade jitters caused many of their customers to delay purchase. We continue to like the opportunity, but we need to see better near-term execution from management before getting more positive on the name.
We also suffered from poor performance in Stericycle, Inc. (SRCL), a medical waste company that is undergoing a large restructuring and IT deployment. This company previously engaged in an aggressive acquisition campaign. Stericycle now needs to better integrate many of the companies it has purchased over the last 20 years. We believe this process, while painful, will drive future margin growth and improve return on invested capital. We view the near-term underperformance here as less critical given the longer-term opportunity, while acknowledging that this investment may take some time to bear fruit. We also saw poor performance from Diplomat Pharmacy, Inc. (DPLO), a company in the specialty pharmacy sub-industry. We have reduced the size of the position, due to the increased rhetoric on the drug supply chain rebates. Although we were broadly concerned about this very issue, we felt the company’s strategy of targeting small and mid-sized clients in the pharmacy benefit management (PBM) business was very well conceived, as the larger PBMs do not provide a high level of service to smaller customers. In this current environment, we believe it is prudent to wait for more government clarity.
Best Regards,
 |  |  |  |
| | | | |
| Richard E. Lane, CFA | Faraz Farzam, CFA | Aaron J. Garcia, CFA | Richard J. Whiting |
| Broadview Opportunity Fund | Shareholder Letter |
September 30, 2018 (Unaudited)
The views and information discussed in this commentary are as of the date of publication, are subject to change, and may not reflect current views. The views expressed represent an assessment of market conditions at a specific point in time, are opinions only and should not be relied upon as investment advice regarding a particular investment or markets in general. Such information does not constitute a recommendation to buy or sell specific securities or investment vehicles. It should not be assumed that any investment will be profitable or will equal the performance of the Fund or any securities or any sectors mentioned herein. The subject matter contained herein has been derived from several sources believed to be reliable and accurate at the time of compilation.
A NOTE ON FORWARD-LOOKING STATEMENTS
Except for historical information contained in this report for the Fund, the matters discussed in this report may constitute forward-looking statements made pursuant to the safe-harbor provisions of the Private Securities Litigation Reform Act of 1995. These include any adviser or portfolio manager predictions, assessments, analyses or outlooks for individual securities, industries, market sectors and/or markets. These statements involve risks and uncertainties. In addition to the general risks described for the Fund in the current Prospectus, other factors bearing on this report include the accuracy of the adviser’s or portfolio managers’ forecasts and predictions, and the appropriateness of the investment programs designed by the adviser or portfolio managers to implement their strategies efficiently and effectively. Any one or more of these factors, as well as other risks affecting the securities markets and investment instruments generally, could cause the actual results of the Fund to differ materially as compared to benchmarks associated with the Fund.
| Annual Report | September 30, 2018 | 3 |
| Broadview Opportunity Fund | Manager Commentary |
September 30, 2018 (Unaudited)
MANAGEMENT’S DISCUSSION OF FUND PERFORMANCE
Overall, during the fiscal year ended September 30, 2018, the Fund posted a gain of 15.29% compared to a gain of 15.24% for the Russell 2000® Index, and a gain of 16.19% for the Russell 2500® Index. Top contributors to Fund performance included Freshpet Inc. (FRPT), Boston Beer Company, Inc. Class A (SAM), Acxiom Holdings Inc. (ACXM), and Encompass Health Corp. (EHC). The most negative contributors to Fund performance were Summit Materials, Inc. Class A (SUM), Veeco Instruments Inc. (VECO), Acadia Healthcare Company, Inc. (ACHC), and Realogy Holdings Corp. (RLGY).
In the first fiscal quarter ended December 31, 2017, the Fund returned 3.65%, slightly outperforming the Russell 2000® Index which returned 3.34%, but underperforming the Russell 2500® Index which returned 5.24%. The economy was doing well, tax rates were lowered, and a business-friendly U.S. Administration began lowering regulatory hurdles. The Fund was positioned well with our investments in Financials, Industrials and Materials leading performance. Health Care, Information Technology and Cash positions negatively impacted Fund performance.
In the second fiscal quarter ended March 31, 2018, the Fund returned 0.09%, outperforming the Russell 2000® Index and Russell 2500® Index which returned -0.08% and -0.24%, respectively. Rising interest rates and ongoing trade negotiations were a damper to the markets. The Fund’s holdings in the Materials sector gave back some of the previous gains. The Fund’s Consumer Staples and Health Care investments were also underperformers. Offsetting this, the Fund’s Technology investments provided positive performance.
In the third fiscal quarter ended June 30, 2018, the Fund gained 7.55%, compared to gains of 7.75% for the Russell 2000® Index and 5.71% for the Russell 2500®Index. The economy and corporate earnings were strong while the outlook for tariff issues, rising inflation, and rising short-term interest rates presented headwinds. We generally viewed equities as fairly valued, but certainly not cheap. Positively impacting Fund performance for the quarter were our Consumer Staples and Health Care investments, while Materials investments and cash negatively weighed on performance.
The Fund returned 3.34% in the fourth fiscal quarter ended September 30, 2018, compared to a return of 3.58% for the Russell 2000® Index and 4.70% for the Russell 2500® Index. The Fund’s holdings in Financials, Information Technology and Consumer Staples contributed positively to performance. The Fund’s holdings in Consumer Discretionary, Health Care, and Materials investments detracted from fourth quarter performance.
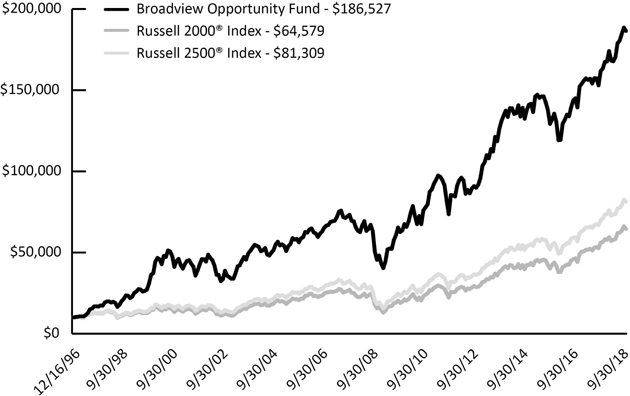
GROWTH OF $10,000 INVESTMENT IN THE FUND**
From its inception (12/16/96) to 9/30/18 as compared to the Russell 2000 Index(1) and the Russell 2500 Index(2)
| Broadview Opportunity Fund | Manager Commentary |
September 30, 2018 (Unaudited)
PERFORMANCE* (For Periods Ended 9/30/18)
| | Total Return** | | Annualized Total Return** |
| | 3 Months | | 1 Year | 5 Year | 10 Year | 15 Year | 20 Year | Since Inception*** |
| Broadview Opportunity Fund | 3.34% | | 15.29% | 8.11% | 11.43% | 9.84% | 12.46% | 14.37% |
| Russell 2000® Index(1) | 3.58% | | 15.24% | 11.07% | 11.11% | 10.12% | 9.45% | 8.94% |
| Russell 2500® Index(2) | 4.70% | | 16.19% | 11.37% | 12.02% | 10.71% | 10.52% | 10.10% |
Performance data quoted represents past performance. Past performance does not guarantee future results. Investment return and principal value of an investment will fluctuate so that an investor’s shares, when sold or redeemed, may be worth more or less than the original cost. Current performance data may be higher or lower than actual data quoted. For the most recent month-end performance please visit bvafunds.com or call 1-855-846-1463. As of the Fund’s Prospectus dated January 26, 2018, the Broadview Opportunity Fund’s annual operating expense ratio is 1.25%. One cannot invest directly in an index.
| (1) | The Russell 2000® Index measures the performance of the 2,000 smallest companies in the Russell 3000® Index. The Russell 2000® Index serves as a benchmark for small-cap stocks in the United States. |
| (2) | The Russell 2500® Index is a market cap weighted index that includes the smallest 2,500 companies covered in the Russell 3000® Index, which comprises the 3,000 largest U.S. companies based on total market capitalization. |
| * | The Adviser believes that the Russell 2000® Index is the most appropriate benchmark for the Fund. As a result, the Russell 2000® Index is the primary benchmark for the Fund, and the Russell 2500® Index is the secondary benchmark for the Fund. |
| ** | Returns in the graph and table above reflect changes in share prices and the reinvestment of any dividends, interest and capital gain distributions. The returns do not reflect the deduction of taxes that a shareholder would pay on Fund distributions or the redemption of Fund shares. |
| *** | Fund Inception Date: December 16, 1996. |
SECTOR ALLOCATION (as of September 30, 2018) (As a percentage of net assets)

Holdings are subject to change.
These allocations may not reflect the current or future positions of the portfolio.
| Annual Report | September 30, 2018 | 5 |
| Broadview Opportunity Fund | Disclosure of Fund Expenses |
September 30, 2018 (Unaudited)
As a shareholder of the Broadview Opportunity Fund (the “Fund”) you will incur ongoing costs, including management fees and other Fund expenses. The following examples are intended to help you understand your ongoing costs (in dollars) of investing in the Fund and to compare these costs with the ongoing costs of investing in other mutual funds. The examples are based on an investment of $1,000 invested on April 1, 2018 and held until September 30, 2018.
Actual Expenses. The first line of the table below provides information about actual account values and actual expenses. You may use the information in this line, together with the amount you invested, to estimate the expenses that you paid over the period. Simply divide your account value by $1,000 (for example, an $8,600 account value divided by $1,000 = 8.6), then multiply the result by the number in the first line under the heading “Expenses Paid During Period” to estimate the expenses you paid on your account during this period.
Hypothetical Example for Comparison Purposes. The second line of the table below provides information about hypothetical account values and hypothetical expenses based on the Fund’s actual expense ratio and an assumed rate of return of 5% per year before expenses, which is not the Fund’s actual return. The hypothetical account values and expenses may not be used to estimate the actual ending account balance or expenses you paid for the period. You may use this information to compare the ongoing costs of investing in the Fund and other mutual funds. To do so, compare this 5% hypothetical example with the 5% hypothetical examples that appear in the shareholder reports of the other funds. The expenses shown in the table are meant to highlight ongoing Fund costs only and do not reflect any transactional costs, such as sales charges (loads), redemption fees, or exchange fees that, although not charged by the Fund, may be charged by other funds. Therefore, the second line of the table below is useful in comparing ongoing costs only, and may not help you determine the relative total costs of owning different funds.
| | Beginning Account
Value
4/1/18 | Ending Account
Value
9/30/18 | Expense
Ratio(a) | Expenses Paid
During Period
4/1/18 - 9/30/18(b) |
| Broadview Opportunity Fund | | | | |
| Actual | $1,000.00 | $1,111.40 | 1.20% | $6.35 |
| Hypothetical (5% return before expenses) | $1,000.00 | $1,019.05 | 1.20% | $6.07 |
| (a) | The Fund's expense ratios have been based on the Fund's most recent fiscal half-year expenses. |
| (b) | Expenses are equal to the Fund's annualized expense ratio multiplied by the average account value over the period, multiplied by the number of days in the most recent fiscal half-year 183/365 (to reflect the half-year period). |
| Broadview Opportunity Fund | Schedule of Investments |
September 30, 2018
| | | Shares | | | Value | |
| COMMON STOCKS (86.56%) | | | | | | | | |
| CONSUMER DISCRETIONARY (7.01%) | | | | | | | | |
| Chemicals (1.22%) | | | | | | | | |
| Scotts Miracle-Gro Co. | | | 84,072 | | | $ | 6,618,988 | |
| | | | | | | | | |
| Hotels, Restaurants & Leisure (1.85%) | | | | | | | | |
| Chuy's Holdings, Inc.(a) | | | 382,583 | | | | 10,042,804 | |
| | | | | | | | | |
| Leisure Products (0.52%) | | | | | | | | |
| Brunswick Corp. | | | 42,244 | | | | 2,831,193 | |
| | | | | | | | | |
| Media (0.92%) | | | | | | | | |
| National CineMedia, Inc. | | | 472,509 | | | | 5,003,870 | |
| | | | | | | | | |
| Multiline Retail (1.68%) | | | | | | | | |
| Nordstrom, Inc. | | | 153,200 | | | | 9,162,892 | |
| | | | | | | | | |
| Specialty Retail (0.82%) | | | | | | | | |
| Hibbett Sports, Inc.(a) | | | 237,851 | | | | 4,471,599 | |
| | | | | | | | | |
| CONSUMER STAPLES (2.86%) | | | | | | | | |
| Beverages (1.58%) | | | | | | | | |
| Boston Beer Co., Inc. - Class A(a) | | | 29,900 | | | | 8,596,250 | |
| | | | | | | | | |
| Food Products (1.28%) | | | | | | | | |
| Freshpet, Inc.(a) | | | 190,100 | | | | 6,976,670 | |
| | | | | | | | | |
| ENERGY (6.92%) | | | | | | | | |
| Energy Equipment & Services (1.25%) | | | | | | | | |
| Helmerich & Payne, Inc. | | | 44,800 | | | | 3,080,896 | |
| Superior Energy Services, Inc.(a) | | | 172,750 | | | | 1,682,585 | |
| Unit Corp.(a) | | | 79,070 | | | | 2,060,564 | |
| | | | | | | | 6,824,045 | |
| Oil, Gas & Consumable Fuels (5.67%) | | | | | | | | |
| Carrizo Oil & Gas, Inc.(a) | | | 171,700 | | | | 4,326,840 | |
| Oasis Petroleum, Inc.(a) | | | 275,300 | | | | 3,903,754 | |
| Parsley Energy, Inc. - Class A(a) | | | 151,931 | | | | 4,443,982 | |
| Range Resources Corp. | | | 255,700 | | | | 4,344,343 | |
| Whiting Petroleum Corp.(a) | | | 140,750 | | | | 7,465,380 | |
| WPX Energy, Inc.(a) | | | 314,900 | | | | 6,335,788 | |
| | | | | | | 30,820,087 | |
| FINANCIALS (16.86%) | | | | | | | | |
| Banks (11.77%) | | | | | | | | |
| Chemical Financial Corp. | | | 149,887 | | | | 8,003,966 | |
| CoBiz Financial, Inc. | | | 438,867 | | | | 9,716,515 | |
| First Horizon National Corp. | | | 167,900 | | | | 2,897,954 | |
| Guaranty Bancorp | | | 57,892 | | | | 1,719,392 | |
| IBERIABANK Corp. | | | 56,900 | | | | 4,628,815 | |
| LegacyTexas Financial Group, Inc. | | | 296,481 | | | | 12,630,091 | |
| Veritex Holdings, Inc.(a) | | | 113,800 | | | | 3,215,988 | |
| Western Alliance Bancorp.(a) | | | 246,600 | | | | 14,029,074 | |
| Zions Bancorp. | | | 143,000 | | | | 7,171,450 | |
| | | | | | | | 64,013,245 | |
| Consumer Finance (1.48%) | | | | | | | | |
| PRA Group, Inc.(a) | | | 223,850 | | | | 8,058,600 | |
See Notes to Financial Statements.
| Annual Report | September 30, 2018 | 7 |
| Broadview Opportunity Fund | Schedule of Investments |
September 30, 2018
| | | Shares | | | Value | |
| COMMON STOCKS (86.56%) (continued) | | | | | | | | |
| FINANCIALS (16.86%) (continued) | | | | | | | | |
| Thrifts & Mortgage Finance (3.61%) | | | | | | | | |
| MGIC Investment Corp.(a) | | | 1,473,575 | | | $ | 19,613,283 | |
| | | | | | | | | |
| HEALTH CARE (11.22%) | | | | | | | | |
| Biotechnology (1.21%) | | | | | | | | |
| Natera, Inc.(a) | | | 275,513 | | | | 6,595,781 | |
| | | | | | | | | |
| Health Care Equipment & Supplies (3.74%) | | | | | | | | |
| Globus Medical, Inc. - Class A(a) | | | 100,400 | | | | 5,698,704 | |
| K2M Group Holdings, Inc.(a) | | | 429,815 | | | | 11,764,037 | |
| Varex Imaging Corp.(a) | | | 101,459 | | | | 2,907,815 | |
| | | | | | | | 20,370,556 | |
| Health Care Providers & Services (6.27%) | | | | | | | | |
| AMN Healthcare Services, Inc.(a) | | | 84,320 | | | | 4,612,304 | |
| Diplomat Pharmacy, Inc.(a) | | | 123,200 | | | | 2,391,312 | |
| Encompass Health Corp. | | | 106,432 | | | | 8,296,374 | |
| Envision Healthcare Corp.(a) | | | 63,500 | | | | 2,903,855 | |
| MEDNAX, Inc.(a) | | | 113,300 | | | | 5,286,578 | |
| Select Medical Holdings Corp.(a) | | | 435,280 | | | | 8,009,152 | |
| Tivity Health, Inc.(a) | | | 80,500 | | | | 2,588,075 | |
| | | | | | | | 34,087,650 | |
| INDUSTRIALS (19.13%) | | | | | | | | |
| Building Products (1.34%) | | | | | | | | |
| Masco Corp. | | | 198,813 | | | | 7,276,556 | |
| | | | | | | | | |
| Commercial Services & Supplies (0.97%) | | | | | | | | |
| Stericycle, Inc.(a) | | | 89,800 | | | | 5,269,464 | |
| | | | | | | | | |
| Construction & Engineering (1.96%) | | | | | | | | |
| Construction Partners, Inc. - Class A(a) | | | 191,073 | | | | 2,311,983 | |
| Willscot Corp.(a) | | | 486,450 | | | | 8,342,618 | |
| | | | | | | | 10,654,601 | |
| Electrical Equipment (1.62%) | | | | | | | | |
| Generac Holdings, Inc.(a) | | | 84,301 | | | | 4,755,419 | |
| Sensata Technologies Holding N.V.(a) | | | 82,400 | | | | 4,082,920 | |
| | | | | | | | 8,838,339 | |
| Industrial Conglomerates (1.68%) | | | | | | | | |
| Carlisle Cos., Inc. | | | 75,000 | | | | 9,135,000 | |
| | | | | | | | | |
| Machinery (9.56%) | | | | | | | | |
| Astec Industries, Inc. | | | 98,437 | | | | 4,962,209 | |
| Crane Co. | | | 101,000 | | | | 9,933,350 | |
| Gardner Denver Holdings, Inc.(a) | | | 211,500 | | | | 5,993,910 | |
| Kornit Digital, Ltd.(a) | | | 431,400 | | | | 9,447,660 | |
| Rexnord Corp.(a) | | | 291,900 | | | | 8,990,520 | |
| Twin Disc, Inc.(a) | | | 159,500 | | | | 3,674,880 | |
| Welbilt, Inc.(a) | | | 430,052 | | | | 8,979,486 | |
| | | | | | | | 51,982,015 | |
| Trading Companies & Distributors (2.00%) | | | | | | | | |
| Beacon Roofing Supply, Inc.(a) | | | 117,700 | | | | 4,259,563 | |
| BMC Stock Holdings, Inc.(a) | | | 69,250 | | | | 1,291,513 | |
| MRC Global, Inc.(a) | | | 284,300 | | | | 5,336,311 | |
| | | | | | | | 10,887,387 | |
See Notes to Financial Statements.
| Broadview Opportunity Fund | Schedule of Investments |
September 30, 2018
| | | Shares | | | Value | |
| COMMON STOCKS (86.56%) (continued) | | | | | | | | |
| INFORMATION TECHNOLOGY (15.12%) | | | | | | | | |
| Communications Equipment (2.01%) | | | | | | | | |
| Ciena Corp.(a) | | | 349,300 | | | $ | 10,912,132 | |
| | | | | | | | | |
| IT Services (1.39%) | | | | | | | | |
| Acxiom Corp.(a) | | | 152,241 | | | | 7,522,228 | |
| | | | | | | | | |
| Semiconductors & Semiconductor Equipment (1.22%) | | | | | | | | |
| Marvell Technology Group, Ltd. | | | 344,600 | | | | 6,650,780 | |
| | | | | | | | | |
| Software (10.50%) | | | | | | | | |
| Box, Inc. - Class A(a) | | | 227,500 | | | | 5,439,525 | |
| CommVault Systems, Inc.(a) | | | 159,654 | | | | 11,175,780 | |
| CyberArk Software, Ltd.(a) | | | 77,845 | | | | 6,215,145 | |
| FireEye, Inc.(a) | | | 493,200 | | | | 8,384,400 | |
| Imperva, Inc.(a) | | | 241,700 | | | | 11,226,965 | |
| PTC, Inc.(a) | | | 77,019 | | | | 8,178,647 | |
| Tableau Software, Inc. - Class A(a) | | | 58,250 | | | | 6,508,855 | |
| | | | | | | | 57,129,317 | |
| MATERIALS (7.44%) | | | | | | | | |
| Chemicals (3.95%) | | | | | | | | |
| Ferro Corp.(a) | | | 481,353 | | | | 11,177,017 | |
| Kraton Corp.(a) | | | 143,470 | | | | 6,764,610 | |
| Olin Corp. | | | 113,100 | | | | 2,904,408 | |
| Westlake Chemical Corp. | | | 7,700 | | | | 639,947 | |
| | | | | | | | 21,485,982 | |
| Construction Materials (1.53%) | | | | | | | | |
| Summit Materials, Inc. - Class A(a) | | | 143,213 | | | | 2,603,613 | |
| Vulcan Materials Co. | | | 51,650 | | | | 5,743,480 | |
| | | | | | | | 8,347,093 | |
| Metals & Mining (1.96%) | | | | | | | | |
| Allegheny Technologies, Inc.(a) | | | 360,000 | | | | 10,638,000 | |
| | | | | | | | | |
| TOTAL COMMON STOCKS (COST $333,002,808) | | | | | | | 470,816,407 | |
| | | | | | | | | |
| SHORT-TERM SECURITY (12.26%) | | | | | | | | |
| MONEY MARKET FUND (12.26%) | | | | | | | | |
| Morgan Stanley Institutional Liquidity Funds - Government Portfolio, Institutional Class, 7 Day Yield 1.939% | | | 66,701,266 | | | | 66,701,266 | |
| | | | | | | | | |
| TOTAL SHORT-TERM SECURITY (COST $66,701,266) | | | | | | | 66,701,266 | |
| | | | | | | | | |
| TOTAL INVESTMENTS (98.82%) (COST $399,704,074) | | | | | | | 537,517,673 | |
| | | | | | | | | |
| TOTAL ASSETS IN EXCESS OF OTHER LIABILITIES (1.18%) | | | | | | | 6,442,930 | |
| | | | | | | | | |
| NET ASSETS 100.00% | | | | | | $ | 543,960,603 | |
| (a) | Non-income producing security. |
Percentages are stated as a percent of net assets.
See Notes to Financial Statements.
| Annual Report | September 30, 2018 | 9 |
| Broadview Opportunity Fund | Statement of Assets and Liabilities |
September 30, 2018
| ASSETS: | | | |
| Investments in securities, at value | | $ | 537,517,673 | |
| Receivable for investments sold | | | 7,545,372 | |
| Receivable for shareholder purchases | | | 163,567 | |
| Dividends and interest receivable | | | 182,119 | |
| Prepaid expenses | | | 17,150 | |
| Total assets | | | 545,425,881 | |
| | | | | |
| LIABILITIES: | | | | |
| Payable for management fees | | | 451,559 | |
| Payable for investments purchased | | | 424,259 | |
| Payable to shareholders for redemptions | | | 375,735 | |
| Payable for transfer agency fees | | | 122,297 | |
| Payable for compliance service fees | | | 2,833 | |
| Accrued expenses and other liabilities | | | 88,595 | |
| Total liabilities | | | 1,465,278 | |
| NET ASSETS | | $ | 543,960,603 | |
| | | | | |
| NET ASSETS CONSIST OF: | | | | |
| Paid-in capital | | $ | 342,167,274 | |
| Total distributable earnings | | | 201,793,329 | |
| NET ASSETS | | $ | 543,960,603 | |
| | | | | |
| INVESTMENTS IN SECURITIES, AT COST | | $ | 399,704,074 | |
| | | | | |
| PRICING OF SHARES: | | | | |
| Net Asset Value, offering and redemption price per share | | $ | 38.41 | |
| Net Assets | | $ | 543,960,603 | |
| Shares of beneficial interest outstanding (unlimited number of shares authorized with no par value per share) | | | 14,161,836 | |
See Notes to Financial Statements.
| Broadview Opportunity Fund | Statement of Operations |
For the Year Ended September 30, 2018
| INVESTMENT INCOME: | | | |
| Dividends | | $ | 3,655,676 | |
| Foreign taxes withheld | | | (100 | ) |
| Total Investment Income | | | 3,655,576 | |
| | | | | |
| EXPENSES: | | | | |
| Management fees | | | 5,777,370 | |
| Administration and accounting services | | | 214,764 | |
| Transfer agent fees | | | 604,144 | |
| Professional fees | | | 78,342 | |
| Custodian fees | | | 31,801 | |
| Board of Trustees fees | | | 60,144 | |
| Compliance service fees | | | 33,857 | |
| Printing and postage expenses | | | 59,342 | |
| Registration fees | | | 56,615 | |
| Other expenses | | | 44,030 | |
| Total Expenses | | | 6,960,409 | |
| NET INVESTMENT LOSS | | | (3,304,833 | ) |
| | | | | |
| REALIZED AND UNREALIZED GAIN/(LOSS) FROM INVESTMENTS: | | | | |
| Net realized gain on investments | | | 83,867,641 | |
| Net change in unrealized appreciation of investments | | | 2,338,916 | |
| NET REALIZED AND UNREALIZED GAIN FROM INVESTMENTS | | | 86,206,557 | |
| NET INCREASE IN NET ASSETS RESULTING FROM OPERATIONS | | $ | 82,901,724 | |
See Notes to Financial Statements.
| Annual Report | September 30, 2018 | 11 |
| Broadview Opportunity Fund | Statements of Changes in Net Assets |
| | | For the Year Ended September 30, 2018 | | | For the Year Ended September 30, 2017 | |
| OPERATIONS: | | | | | | | | |
| Net investment loss | | $ | (3,304,833 | ) | | $ | (4,132,946 | ) |
| Net realized gain on investments | | | 83,867,641 | | | | 67,963,720 | |
| Net change in unrealized appreciation on investments | | | 2,338,916 | | | | 6,020,754 | |
| Net increase in net assets resulting from operations | | | 82,901,724 | | | | 69,851,528 | |
| | | | | | | | | |
| TOTAL DISTRIBUTIONS TO SHAREHOLDERS (Note 5)(a) | | $ | (62,281,529 | ) | | $ | (30,306,302 | ) |
| | | | | | | | | |
| SHARE TRANSACTIONS: | | | | | | | | |
| Proceeds from sales of shares | | | 38,272,723 | | | | 69,718,699 | |
| Distributions reinvested | | | 61,406,985 | | | | 29,553,564 | |
| Cost of shares redeemed | | | (188,069,577 | ) | | | (180,925,285 | ) |
| Net decrease from share transactions | | | (88,389,869 | ) | | | (81,653,022 | ) |
| | | | | | | | | |
| Net decrease in net assets | | | (67,769,674 | ) | | | (42,107,796 | ) |
| | | | | | | | | |
| NET ASSETS: | | | | | | | | |
| Beginning of year | | | 611,730,277 | | | | 653,838,073 | |
| End of year | | $ | 543,960,603 | | | $ | 611,730,277 | |
| | | | | | | | | |
| Other Information: | | | | | | | | |
| SHARE TRANSACTIONS: | | | | | | | | |
| Sold | | | 1,049,443 | | | | 1,948,981 | |
| Distributions reinvested | | | 1,770,674 | | | | 824,597 | |
| Redeemed | | | (5,147,149 | ) | | | (5,071,033 | ) |
| Net decrease in shares outstanding | | | (2,327,032 | ) | | | (2,297,455 | ) |
| (a) | For the prior year ended September 30, 2017, Total Distributions consisted of net realized gains of $30,306,302. |
See Notes to Financial Statements.
| Broadview Opportunity Fund | Financial Highlights |
For a Share Outstanding Throughout the Years Presented
| | | For the Year Ended September 30, 2018 | | | For the Year Ended September 30, 2017 | | | For the Year Ended September 30, 2016 | | | For the Year Ended September 30, 2015 | | | For the Year Ended September 30, 2014(a) | |
| NET ASSET VALUE, BEGINNING OF PERIOD | | $ | 37.10 | | | $ | 34.80 | | | $ | 33.85 | | | $ | 38.48 | | | $ | 40.85 | |
| INCOME/(LOSS) FROM OPERATIONS: | | | | | | | | | | | | | | | | | | | | |
| Net investment loss | | | (0.21 | )(b) | | | (0.23 | )(b) | | | (0.14 | )(b) | | | (0.19 | ) | | | (0.21 | ) |
| Net realized and unrealized gain/(loss) on investments | | | 5.46 | | | | 4.20 | | | | 3.96 | | | | (0.33 | ) | | | 2.18 | |
| Total from investment operations | | | 5.25 | | | | 3.97 | | | | 3.82 | | | | (0.52 | ) | | | 1.97 | |
| | | | | | | | | | | | | | | | | | | | | |
| LESS DISTRIBUTIONS: | | | | | | | | | | | | | | | | | | | | |
| From net realized gains on investments | | | (3.94 | ) | | | (1.67 | ) | | | (2.87 | ) | | | (4.11 | ) | | | (4.34 | ) |
| Total distributions | | | (3.94 | ) | | | (1.67 | ) | | | (2.87 | ) | | | (4.11 | ) | | | (4.34 | ) |
| INCREASE/(DECREASE) IN NET ASSET VALUE | | | 1.31 | | | | 2.30 | | | | 0.95 | | | | (4.63 | ) | | | (2.37 | ) |
| NET ASSET VALUE, END OF PERIOD | | $ | 38.41 | | | $ | 37.10 | | | $ | 34.80 | | | $ | 33.85 | | | $ | 38.48 | |
| | | | | | | | | | | | | | | | | | | | | |
| TOTAL RETURN | | | 15.29 | % | | | 11.58 | % | | | 12.17 | % | | | (2.40 | %) | | | 4.86 | % |
| | | | | | | | | | | | | | | | | | | | | |
| SUPPLEMENTAL DATA: | | | | | | | | | | | | | | | | | | | | |
| Net assets, end of period (000's) | | $ | 543,961 | | | $ | 611,730 | | | $ | 653,838 | | | $ | 742,230 | | | $ | 904,151 | |
| | | | | | | | | | | | | | | | | | | | | |
| RATIOS TO AVERAGE NET ASSETS: | | | | | | | | | | | | | | | | | | | | |
| Operating expenses | | | 1.21 | % | | | 1.23 | % | | | 1.25 | % | | | 1.23 | % | | | 1.25 | % |
| Net investment loss | | | (0.57 | %) | | | (0.64 | %) | | | (0.42 | %) | | | (0.48 | %) | | | (0.50 | %) |
| | | | | | | | | | | | | | | | | | | | | |
| PORTFOLIO TURNOVER RATE | | | 49 | % | | | 53 | % | | | 40 | % | | | 41 | % | | | 56 | % |
| (a) | On November 25, 2013, shareholders of the FMI Focus Fund, a series of FMI Funds, Inc. (the "Predecessor Fund"), approved a tax-free reorganization under which all assets and liabilities of the Predecessor Fund were transferred to the Broadview Opportunity Fund, a series of Broadview Funds Trust, at the close of business on November 29, 2013. |
| (b) | Per share amounts are based upon average shares outstanding. |
See Notes to Financial Statements.
| Annual Report | September 30, 2018 | 13 |
| Broadview Opportunity Fund | Notes to Financial Statements |
September 30, 2018
1. ORGANIZATION
Broadview Funds Trust (the “Trust”) is an open-end management investment company registered under the Investment Company Act of 1940, as amended (the “1940 Act”). The Trust was organized on September 9, 2013 as a Delaware statutory trust. The Trust currently offers one series, the Broadview Opportunity Fund (the “Fund”). The Fund is a diversified portfolio with an investment objective to seek capital appreciation.
On November 25, 2013, shareholders of the FMI Focus Fund, a series of FMI Funds, Inc. (the “Predecessor Fund”), approved a tax-free reorganization under which all assets and liabilities of the Predecessor Fund were transferred to the Fund, a series of the Trust, at the close of business on November 29, 2013. The Predecessor Fund commenced operations on December 16, 1996. On the date of the reorganization, the Predecessor Fund was deemed to be the accounting survivor for financial reporting purposes, and as a result, the financial statements and the financial highlights reflect the operations of the Predecessor Fund for periods prior to the reorganization date.
2. SIGNIFICANT ACCOUNTING POLICIES
The following is a summary of significant accounting policies consistently followed by the Fund. These policies are in conformity with U.S. generally accepted accounting principles (“GAAP”). The Fund is an investment company and accordingly follows the investment company accounting and reporting guidance of the Financial Accounting Standards Board (“FASB”) Accounting Standards Codification Topic 946 Financials Services-Investment Companies.
Use of Estimates — The preparation of financial statements in conformity with GAAP requires management to make estimates and assumptions that affect the reported amounts of assets and liabilities and disclosure of contingent assets and liabilities at the date of the financial statements and the reported amounts of increases and decreases in net assets from operations during the reporting period. Actual results could differ from those estimates.
Investment Valuation — The Fund’s portfolio securities are fair valued as of the close of trading of the New York Stock Exchange (“NYSE”) (normally 4:00 p.m., Eastern Time). Each security, excluding short-term investments and securities listed on the NASDAQ Stock Market, LLC (“NASDAQ”), is valued at the last sale price reported by the principal security exchange on which the issue is traded. Securities that are traded on NASDAQ are valued at the Nasdaq Official Closing Price or if no sale is reported, the mean between the bid and the ask. Securities which are traded over-the-counter are valued at the last sale price or, if no sale price, at the mean between the bid and the ask. Securities for which quotations are not readily available are valued at fair value as determined by the investment adviser in accordance with procedures approved by the Board of Trustees. The fair value of a security is the amount which the Fund might reasonably expect to receive upon a current sale. The fair value of a security may differ from the last quoted price and the Fund may not be able to sell a security at the fair value. Market quotations may not be available, for example, if trading in particular securities was halted during the day and not resumed prior to the close of trading on the NYSE. As of September 30, 2018, there were no securities that were internally fair valued by the investment adviser. Variable rate demand notes are recorded at par value which approximates fair value. Variable rate demand notes are recorded at par value, which approximates fair value. Money market funds, representing short-term investments, are valued at their net asset value. Other short-term investments with maturities of 60 days or less are valued at fair value.
Securities Transactions and Related Investment Income — Dividend income is recorded on the ex-dividend date. Realized gains and losses from investment transactions are determined using the identified cost basis. Interest income which includes amortization of premium and accretion of discount, is recorded on the accrual basis. Withholding taxes on foreign dividends have been provided for in accordance with the Fund’s understanding of the applicable country’s tax rules and regulations. For financial reporting purposes, investment transactions are recorded on the trade date.
Fair Value Measurement — A three-tier hierarchy has been established to classify fair value measurements for disclosure purposes. Inputs refer broadly to the assumptions that market participants would use in pricing the asset or liability, including assumptions about risk. Inputs may be observable or unobservable. Observable inputs are inputs that reflect the assumptions market participants would use in pricing the asset or liability that are developed based on market data obtained from sources independent of the reporting entity. Unobservable inputs are inputs that reflect the reporting entity’s own assumptions about the assumptions market participants would use in pricing the asset or liability that are developed based on the best information available. In accordance with the authoritative guidance on fair value measurements and disclosure under GAAP, the Fund discloses fair value of its investments in a hierarchy that prioritizes the inputs to valuation techniques used to measure the fair value.
| Broadview Opportunity Fund | Notes to Financial Statements |
September 30, 2018
Various inputs are used in determining the value of the Fund’s investments as of the reporting period end. These inputs are categorized in the following hierarchy under GAAP:
| Level 1 — | Unadjusted quoted prices in active markets for identical, unrestricted assets or liabilities that the Fund has the ability to access at the measurement date; |
| | |
| Level 2 — | Quoted prices which are not active, quoted prices for similar assets or liabilities in active markets or inputs other than quoted prices that are observable (either directly or indirectly) for substantially the full term of the asset or liability; and |
| | |
| Level 3 — | Significant unobservable prices or inputs (including the Fund’s own assumptions in determining the fair value of investments) where there is little or no market activity for the asset or liability at the measurement date. |
The availability of observable inputs can vary from security to security and is affected by a wide variety of factors, including, for example, the type of security, whether the security is new and not yet established in the marketplace, the liquidity of markets, and other characteristics particular to the security. To the extent that valuation is based on models or inputs that are less observable or unobservable in the market, the determination of fair value requires more judgment. Accordingly, the degree of judgment exercised in determining fair value is greatest for instruments categorized in Level 3.
An investment level within the fair value hierarchy is based on the lowest level input, individually or in the aggregate, that is significant to fair value measurement. The valuation techniques used by the Fund to measure fair value during the year ended September 30, 2018, maximized the use of observable inputs and minimized the use of unobservable inputs.
The inputs or methodologies used for valuing securities are not necessarily an indication of the risk or liquidity associated with investing in those securities. The following is a summary of the inputs used in valuing the Fund’s investments as of September 30, 2018:
Broadview Opportunity Fund
| | | Valuation Inputs | | | | |
| Investments in Securities at Fair Value* | | Level 1 | | | Level 2 | | | Level 3 | | | Total | |
| Common Stocks | | $ | 470,816,407 | | | $ | – | | | $ | – | | | $ | 470,816,407 | |
| Short-Term Security | | | 66,701,266 | | | | – | | | | – | | | | 66,701,266 | |
| Total | | $ | 537,517,673 | | | $ | – | | | $ | – | | | $ | 537,517,673 | |
| * | See Schedule of Investments for industry classification. |
For the year ended September 30, 2018, the Fund did not have any unobservable inputs (Level 3) used in determining fair value.
Distributions to Shareholders — Dividends from net investment income and distributions of net realized capital gains, if any, will be declared and paid at least annually. Income and capital gains distributions are determined in accordance with income tax regulations, which may differ from GAAP. The Fund may utilize earnings and profits distributed to shareholders on redemption of shares as part of the dividends paid deduction (commonly referred to as equalization). Distributions to shareholders are recorded on the ex-dividend date.
Income Taxes — As of and during the year ended September 30, 2018, the Fund did not have a liability for any unrecognized tax benefits. The Fund files U.S. federal, state, and local tax returns as required. The Fund’s tax returns are subject to examination by the relevant tax authorities until expiration of the applicable statute of limitations which is generally three years after the filing of the tax return for federal purposes and four years for most state returns. Tax returns for open years have incorporated no uncertain tax positions that require a provision for income taxes. The Fund intends to continue to qualify each year as a “regulated investment company” under Subchapter M of the Internal Revenue Code of 1986, as amended. By so qualifying, the Fund will not be subject to Federal income taxes to the extent that it distributes substantially all of its taxable or tax-exempt income, if any, for its tax year ending September 30. In addition, by distributing in each calendar year substantially all of its net investment income, capital gains and certain other amounts, if any, the Fund will not be subject to a Federal excise tax. Therefore, no provision is made by the Fund for Federal income or excise taxes.
| Annual Report | September 30, 2018 | 15 |
| Broadview Opportunity Fund | Notes to Financial Statements |
September 30, 2018
3. ADVISORY FEES AND OTHER AGREEMENTS
Investment Advisory Agreement
Effective as of the close of business on November 29, 2013, the Fund entered into an investment advisory agreement with Broadview Advisors, LLC (the “Adviser”). The Fund pays the Adviser a monthly management fee based upon the average daily net assets of the Fund and calculated at an annual rate of 1.00%.
Distributor/Distribution Plan
The Fund has entered into a Distribution Agreement with ALPS Distributors, Inc. (the “Distributor”) to provide distribution services to the Fund. The Distributor serves as underwriter/distributor of shares of the Fund.
The Fund has entered into a Distribution Plan (the “Plan”) pursuant to Rule 12b-1 under the Act. The Plan provides that the Fund may incur certain costs which may not exceed the lesser of a monthly amount equal to 0.25% of the Fund’s daily net assets or the actual distribution costs incurred during the year. Amounts payable under the Plan are paid monthly for any activities or expenses primarily intended to result in the sale of shares of the Fund. For the year ended September 30, 2018, no such expenses were incurred. The Fund presently intends not to utilize the Plan or pay any 12b-1 fees during the fiscal year ending September 30, 2019.
Officer and Trustee Compensation
Officers of the Trust and Trustees who are “interested persons” of the Trust or the Adviser will receive no salary or fees from the Trust. Each Trustee who is not an “interested person” receives an annual fee of $20,000 each year. The Trust reimburses each Trustee and Officer for his or her travel and other expenses relating to attendance at such meetings.
Certain Trustees and Officers of the Trust are also officers of the Adviser.
4. PURCHASES AND SALES OF INVESTMENT SECURITIES
The aggregate cost of purchases and proceeds from sales of investment securities, excluding short-term securities, are shown below for the year ended September 30, 2018.
| Broadview Opportunity Fund | | | |
| Cost of Investments Purchased | | $ | 257,657,647 | |
| Proceeds from Investments Sold | | $ | 423,942,601 | |
5. TAX BASIS INFORMATION
Distributions are determined in accordance with federal income tax regulations, which differ from GAAP, and, therefore, may differ significantly in amount or character from net investment income and realized gains for financial reporting purposes. Financial reporting records are adjusted for permanent book/tax differences to reflect tax character but are not adjusted for temporary differences. The amounts and characteristics of tax basis distributions and composition of distributable earnings/(accumulated losses) are finalized at fiscal year-end.
The tax character of distributions paid during the year ended September 30, 2018, were as follows:
| | | Ordinary Income | | | Long-Term Capital Gain | |
| | | $ | 1,936,655 | | | $ | 60,344,874 | |
The tax character of distributions paid during the year ended September 30, 2017, were as follows:
| | | Ordinary Income | | | Long-Term Capital Gain | |
| | | $ | – | | | $ | 30,306,302 | |
| Broadview Opportunity Fund | Notes to Financial Statements |
September 30, 2018
For the year ended September 30, 2018, the following reclassification, which had no impact on results of operations or net assets was recorded to reflect the tax character of the Fund’s net operating loss and equalization utilized:
| | | Paid-in Capital | | | Distributable Earnings | |
| | | $ | 9,045,170 | | | $ | (9,045,170 | ) |
As of September 30, 2018, net unrealized appreciation/(depreciation) of investments based on the federal tax cost was as follows:
| | | Cost of Investments for Income Tax Purposes | | | Gross Appreciation (excess of value over tax cost) | | | Gross Depreciation (excess of tax cost over value) | | | Net Appreciation on Investments | |
| Broadview Opportunity Fund | | $ | 401,664,502 | | | $ | 143,674,743 | | | $ | (7,821,572 | ) | | $ | 135,853,171 | |
The difference between book basis and tax basis is primarily attributable to wash sales.
At September 30, 2018, components of distributable earnings on a tax basis were as follows:
| Undistributed net investment income | | $ | 4,890,486 | |
| Accumulated net realized gain | | | 61,049,672 | |
| Net unrealized appreciation on investments | | | 135,853,171 | |
| Other cumulative effect of timing differences | | | – | |
| Total distributable earnings | | $ | 201,793,329 | |
6. COMMITMENTS AND CONTINGENCIES
Under the Trust’s organizational documents, each director, officer, employee or other agent of the Fund (including the Adviser) is indemnified, to the extent permitted by the Act, against certain liabilities that may arise out of performance of their duties to the Fund. Additionally, in the normal course of business, the Fund enters into contracts that contain a variety of indemnification clauses. The Fund’s maximum exposure under these arrangements is unknown as this would involve future claims that may be made against the Fund that have not yet occurred. However, the Fund has not had prior claims or losses pursuant to these contracts and believes the risk of loss to be remote.
7. SUBSEQUENT EVENTS
On November 14, 2018, the Fund paid a short-term distribution in the amount of $0.40 and a long-term distribution in the amount of $5.85 per share to shareholders of record as of November 13, 2018.
| Annual Report | September 30, 2018 | 17 |
| | Report of Independent Registered |
| Broadview Opportunity Fund | Public Accounting Firm |
To the Shareholders of Broadview Opportunity Fund and
Board of Trustees of Broadview Funds Trust
Opinion on the Financial Statements
We have audited the accompanying statement of assets and liabilities, including the schedule of investments, of Broadview Funds Trust comprising Broadview Opportunity Fund (the “Fund”) as of September 30, 2018, and the related statement of operations for the year then ended, the statements of changes in net assets for each of the two years in the period then ended, including the related notes, and the financial highlights for each of the three years in the period then ended (collectively referred to as the “financial statements”). In our opinion, the financial statements present fairly, in all material respects, the financial position of the Fund as of September 30, 2018, the results of its operations for the year then ended, the changes in its net assets for each of the two years in the period then ended, and the financial highlights for each of the three years in the period then ended, in conformity with accounting principles generally accepted in the United States of America.
The Fund’s financial highlights for the years ended September 30, 2015, and prior, were audited by other auditors whose report dated November 27, 2015, expressed an unqualified opinion on those financial highlights.
Basis for Opinion
These financial statements are the responsibility of the Fund’s management. Our responsibility is to express an opinion on the Fund’s financial statements based on our audits. We are a public accounting firm registered with the Public Company Accounting Oversight Board (United States) (“PCAOB”) and are required to be independent with respect to the Fund in accordance with the U.S. federal securities laws and the applicable rules and regulations of the Securities and Exchange Commission and the PCAOB.
We conducted our audits in accordance with the standards of the PCAOB. Those standards require that we plan and perform the audit to obtain reasonable assurance about whether the financial statements are free of material misstatement, whether due to error or fraud.
Our audits included performing procedures to assess the risks of material misstatement of the financial statements, whether due to error or fraud, and performing procedures that respond to those risks. Such procedures included examining, on a test basis, evidence regarding the amounts and disclosures in the financial statements and confirmation of securities owned as of September 30, 2018, by correspondence with the custodian and brokers. Our audits also included evaluating the accounting principles used and significant estimates made by management, as well as evaluating the overall presentation of the financial statements. We believe that our audits provide a reasonable basis for our opinion.
We have served as the Fund’s auditor since 2015.
 | |
| | |
| COHEN & COMPANY, LTD. | |
| Milwaukee, Wisconsin | |
| November 20, 2018 | |
| Broadview Opportunity Fund | Additional Information |
September 30, 2018 (Unaudited)
1. PROXY VOTING POLICIES AND VOTING RECORD
A description of the policies and procedures that the Fund uses to vote proxies relating to portfolio securities is available without charge upon request by calling toll-free 855-846-1463, or on the Securities and Exchange Commission’s (“SEC”) website at http://www.sec.gov. Information regarding how the Fund voted proxies relating to portfolio securities during the most recent 12-month year ended June 30th is available without charge upon request by calling toll-free 855-846-1463, or on the SEC’s website at http://www.sec.gov.
2. QUARTERLY PORTFOLIO HOLDINGS
The Trust files a complete listing of portfolio holdings for the Fund with the SEC four times each fiscal year at quarter-ends. The Fund files the schedule of portfolio holdings with the SEC on Form N-CSR (second and fourth quarters) and on Form N-Q (first and third quarters). The filings are available upon request by calling 855-846-1463. Furthermore, you may obtain a copy of the filing on the SEC’s website at http://www.sec.gov. The Fund’s Forms N-CSR and N-Q may also be reviewed and copied at the SEC’s Public Reference Room in Washington, D.C., and information on the operation of the Public Reference Room may be obtained by calling 1-800-SEC-0330.
3. TAX DESIGNATIONS
Pursuant to Section 852(b)(3) of the Internal Revenue Code, the Broadview Opportunity Fund designates $68,846,650 as a long-term capital gain dividend. This amount includes $8,501,776 of earnings and profits distributed to shareholders on redemptions.
The Fund designated 100% of the income dividends distributed between January 1, 2017 and December 31, 2017, as qualified dividend income (QDI) as defined in Section 1(h)(11) of the Internal Revenue Code.
The Fund designated 100% of the income dividends distributed between January 1, 2017 and December 31, 2017, as qualifying for the corporate dividends received deduction (DRD) as defined in Section 854(b)(2) of the Internal Revenue Code.
| Annual Report | September 30, 2018 | 19 |
| Broadview Opportunity Fund | Trustees and Officers |
September 30, 2018 (Unaudited)
The business affairs of the Fund are managed under the direction of the Trust’s Board of Trustees in accordance with the laws of the State of Delaware. Information pertaining to the Trustees and Officers of the Trust are set forth below. Trustees who are not deemed to be “interested persons” of the Trust as defined in the 1940 Act, are referred to as “Non-Interested Trustees.” Trustees who are deemed to be interested persons of the Trust as defined in the 1940 Act are referred to as “Interested Trustees.” The Fund’s Statement of Additional Information includes additional information about the Trustees and is available upon request by calling toll-free 1-855-846-1463.
INTERESTED AND NON-INTERESTED TRUSTEES
| Name, Address and Year of Birth(1) | Position(s) With the Trust, Term of Office, Length of Time Served and Number of Portfolios in Fund Complex Overseen | Principal Occupation(s) During the Past 5 Years | Other Directorships Held by Trustee During the Past 5 Years |
| Interested Trustee | | | |
Richard J. Whiting(2) Born: 1957 | Chairman and Trustee (since 2013); Indefinite Term; 1 Portfolio | Manager of Trading Department and Portfolio Manager, Broadview Advisors, LLC (since 2001) | None |
| Non-Interested Trustees | | | |
Gregory W. Berger Born: 1961 | Trustee (since 2013); Indefinite Term; 1 Portfolio | Attorney and Shareholder, Brownstein Hyatt Farber Schreck, LLP (law firm) (1994 to present) | None |
Cornelius J. Lavelle Born: 1944 | Trustee (since 2013); Indefinite Term; 1 Portfolio | Retired; Director, Institutional Equities, Citigroup Global Markets Inc. (multinational financial services firm) (1997 to 2009) | Independent Trustee, The 504 Fund (a closed-end investment company); Independent Trustee, USFS Funds Trust (an open-end investment company) (2013-2014) |
Philip J. Uihlein, Sr. Born: 1950 | Trustee (since 2013); Indefinite Term; 1 Portfolio | Retired; President, U-Line Corporation (refrigeration appliance manufacturer) (1977 to 2008); Chief Executive Officer, U-Line Corporation (1986 to 2008) | None |
OFFICERS
| Name, Address and Year of Birth(1) | Position(s) With the Trust, Term of Office and Length of Time Served | Principal Occupation(s) During the Past 5 Years |
| Other Officers | | |
Richard E. Lane Born: 1955 | President and Principal Executive Officer (since 2013); Indefinite Term | President, Broadview Advisors, LLC (since 2001) |
Aaron J. Garcia Born: 1977 | Treasurer and Principal Financial Officer and Principal Accounting Officer (since 2013); Indefinite Term | Portfolio Manager, Broadview Advisors, LLC (since 2003) |
Faraz Farzam Born: 1973 | Secretary (since 2013); Indefinite Term | Portfolio Manager, Broadview Advisors, LLC (since 2001) |
Angela L. Pingel(3) Born: 1971 | Chief Compliance Officer and AML Compliance Officer (since 2017), Vice President and Assistant Secretary (since 2015); Indefinite Term | General Counsel and Chief Compliance Officer, Broadview Advisors, LLC (since 2015); Secretary, Managed Portfolio Series (on open-end investment company) (2011-2015); Vice President and Counsel, U.S. Bancorp Fund Services, LLC (2011-2015) |
| (1) | Unless otherwise noted, the business address of each Trustee and Officer is c/o Broadview Funds Trust, 330 East Kilbourn Avenue, Suite 1475, Milwaukee, Wisconsin 53202. |
| (2) | Mr. Whiting is an “interested person” of the Trust (as defined in the 1940 Act) because he is an employee and officer of the Adviser. |
| (3) | Effective October 20, 2017, Angela L. Pingel replaced Melanie H. Zimdars as Chief Compliance Officer and AML Compliance Officer of the Trust. |
| Broadview Opportunity Fund | Privacy Notice |
September 30, 2018 (Unaudited)
The Fund collects nonpublic personal information about its customers from the following sources:
| • | Account Applications and other forms, which may include a customer’s name, address, social security number, and information about a customer’s investment goals and risk tolerance; |
| • | Account History, including information about the transactions and balances in a customer’s account; and |
| • | Correspondence, written, or telephonic, between a customer and the Fund or service providers to the Fund. |
In addition, the Fund may obtain consumer information about its customers from consumer reports.
The Fund will not release nonpublic personal or consumer information about its customers or their accounts unless one of the following conditions is met:
| • | Prior written consent is received. |
| • | The Fund believes the recipient to be the fund customer or the customer’s authorized representative. |
| • | The Fund is required by law to release information to the recipient. |
The Fund does not give or sell nonpublic personal or consumer information about its customers or their fund accounts to any other company, individual, or group.
The Fund will only use nonpublic personal or consumer information about its customers and their accounts to attempt to better serve their investment needs or to suggest services or educational materials that may be of interest to them.
The Fund restricts access to nonpublic personal and consumer information about customers to those employees who need to know that information in order to provide products or services. The Fund may also share personal information with companies that it hires to provide support services. When the Fund or its Transfer Agent shares nonpublic personal or consumer information with other service providers, it protects that information with a strict confidentiality agreement. The Fund also maintains reasonable physical, electronic and procedural safeguards that comply with federal standards to protect against unauthorized access to and properly dispose of customers’ nonpublic personal and consumer information. The Fund will adhere to the policies and practices described in this notice for current and former shareholders of the Fund.
| Annual Report | September 30, 2018 | 21 |

| (a) | The Registrant has adopted a code of ethics that applies to the Registrant’s principal executive officer, principal financial officer, principal accounting officer or controller or any persons performing similar functions on behalf of the Registrant. |
| (c) | During the period covered by this report, no amendments to the provisions of the code of ethics adopted in paragraph (a) of this Item were made. |
| (d) | During the period covered by this report, no implicit or explicit waivers to the provisions of the code of ethics adopted in paragraph (a) of this Item were granted. |
| (f) | A copy of the Registrant’s Code of Ethics is filed as an exhibit hereto. |
| Item 3. | Audit Committee Financial Expert. |
The Board of Trustees of the Registrant has determined that the Registrant has at least one audit committee financial expert serving on its audit committee. Mr. Cornelius J. Lavelle serves as the Registrant’s audit committee financial expert and is considered to be “independent” as defined in Item 3 of Form N-CSR.
| Item 4. | Principal Accountant Fees and Services. |
| (a) | Audit Fees: Audit fees billed for the Registrant for the fiscal years ended September 30, 2018 and September 30, 2017 were $15,000 and $15,000, respectively. These amounts represent aggregate fees billed by the Registrant’s independent accountant, Cohen & Company, Ltd. (“Accountant”), in connection with the annual audits of the Registrant’s financial statements and for services normally provided by the Accountant in connection with the Registrant’s statutory and regulatory filings for those fiscal years. |
| (b) | Audit-Related Fees: There were no additional fees billed in the fiscal years ended September 30, 2018 and September 30, 2017 for assurance and related services by the Accountant that were reasonably related to the performance of the audit of the Registrant’s financial statements that were not reported under paragraph (a) of this Item. |
| (c) | Tax Fees: The tax fees billed for the fiscal years ended September 30, 2018 and September 30, 2017 were $3,000 and $3,000, respectively, for professional services rendered by the Accountant for tax compliance, tax advice, and tax planning. These services were for the completion of the fund’s federal and state income tax returns, excise tax returns, and assistance with distribution calculations. |
| (d) | All Other Fees: For the Registrant’s fiscal years ended September 30, 2018 and September 30, 2017 the aggregate fees billed for products and services provided by the principal accountant, other than the services reported in paragraphs (a) through (c) of this Item, were $0. |
| (e)(1) | Audit Committee Pre-Approval Policies and Procedures: All services to be performed by the Registrant’s principal accountant must be pre-approved by the Registrant’s audit committee. |
| (e)(2) | No services described in paragraphs (b) through (d) of this Item were approved by the Registrant’s audit committee pursuant to paragraph (c)(7)(i)(C) of Rule 2-01 of Regulation S-X. |
| (g) | No non-audit fees were billed by the Registrant’s principal accountant for services rendered to the Registrant’s investment adviser. |
| Item 5. | Audit Committee of Listed Registrants. |
Not applicable to the Registrant.
| Item 6. | Schedule of Investments. |
| (a) | The Registrant’s “Schedule I – Investments in securities of unaffiliated issuers” (as set forth in 17 CFR 210.12-12) is included in Item 1 of this Form N-CSR. |
| (b) | Not applicable to the Registrant. |
| Item 7. | Disclosure of Proxy Voting Policies and Procedures for Closed-End Management Investment Companies. |
Not applicable to the Registrant.
| Item 8. | Portfolio Managers of Closed-End Management Investment Companies. |
Not applicable to the Registrant.
| Item 9. | Purchases of Equity Securities by Closed-End Management Investment Company and Affiliated Purchasers. |
Not applicable to the Registrant.
Item 10. Submission of Matters to a Vote of Security Holders.
None.
Item 11. Controls and Procedures.
| (a) | The Registrant’s principal executive officer and principal financial officer have evaluated the Registrant’s disclosure controls and procedures (as defined in Rule 30a-3(c) under the Investment Company Act of 1940, as amended (the “1940 Act”)) within 90 days of the filing of this report, as required by Rule 30a-3(b) under the Act and Rules 13a-15(b) or 15d-15(b) under the Securities Exchange Act of 1934, and have concluded that the Registrant’s disclosure controls and procedures were effective as of that date. |
| (b) | There was no change in the Registrant’s internal control over financial reporting (as defined in Rule 30a-3(d) under the Act, as amended) during the second fiscal quarter of the period covered by this report that has materially affected, or is reasonably likely to materially affect, the Registrant’s internal control over financial reporting. |
Item 12. Disclosure of Securities Lending Activities for Closed-End Management Investment Companies.
Not applicable to the Registrant.
Item 13. Exhibits.
| (a)(1) | The Registrant’s Code of Ethics for Principal Executive Officer, Principal Financial Officer and Principal Accounting Officer, which is the subject of the disclosure required by Item 2 of Form N-CSR, is filed hereto as Exhibit 13.a.1. |
| (a)(2) | A separate certification for the Registrant’s Principal Executive Officer and Principal Financial Officer as required by Rule 30a-2(a) under the 1940 Act (17 CFR 270.30a-2(a)), are attached hereto as Ex99.Cert. |
| (b) | The certifications by the Registrant’s Principal Executive Officer and Principal Financial Officer, as required by Rule 30a-2(b) of the 1940 Act, and Section 906 of the Sarbanes-Oxley Act of 2002 are attached hereto as Ex99.906Cert. |
SIGNATURES
Pursuant to the requirements of the Securities Exchange Act of 1934 and the Investment Company Act of 1940, the Registrant has duly caused this report to be signed on its behalf by the undersigned, thereunto duly authorized.
Broadview Funds Trust
| By: | /s/ Richard E. Lane | |
| | Richard E. Lane | |
| | President | |
| | | |
| Date: | December 7, 2018 | |
Pursuant to the requirements of the Securities Exchange Act of 1934 and the Investment Company Act of 1940, this report has been signed below by the following persons on behalf of the Registrant and in the capacities and on the dates indicated.
| By: | /s/ Richard E. Lane | |
| | Richard E. Lane | |
| | President (Principal Executive Officer) | |
| | | |
| Date: | December 7, 2018 | |
| By: | /s/ Aaron J. Garcia | |
| | Aaron J. Garcia | |
| | Chief Financial Officer (Principal Financial Officer) | |
| | | |
| Date: | December 7, 2018 | |