UNITED STATES
SECURITIES AND EXCHANGE COMMISSION
Washington, D.C. 20549
FORM N-CSR
CERTIFIED SHAREHOLDER REPORT OF REGISTERED
MANAGEMENT INVESTMENT COMPANIES
Investment Company Act file number: 811-22885
Broadview Funds Trust
(Exact name of registrant as specified in charter)
330 East Kilbourn Ave., Suite 1475
Milwaukee, Wisconsin 53202
(Address of principal executive offices) (Zip code)
Angela L. Pingel
Broadview Advisors, LLC
330 East Kilbourn Ave., Suite 1475
Milwaukee, Wisconsin 53202
(Name and address of agent for service)
Registrant’s telephone number, including area code: (414) 918-3900
Date of fiscal year end: September 30, 2017
Date of reporting period: September 30, 2017
Item 1. Reports to Stockholders.

table of contents
| Shareholder Letter | 1 |
| Manager Commentary | 7 |
Disclosure of Fund Expenses | 9 |
| Schedule of Investments | 10 |
| Statement of Assets and Liabilities | 14 |
| Statement of Operations | 15 |
| Statements of Changes in Net Assets | 16 |
| Financial Highlights | 17 |
| Notes to Financial Statements | 18 |
| Report of Independent Registered Public Accounting Firm | 23 |
| Additional Information | 24 |
| Trustees and Officers | 25 |
| Broadview Opportunity Fund | Shareholder Letter |
September 30, 2017 (Unaudited)
Dear Fellow Shareholders,
Economic growth has clearly accelerated throughout 2017 here in the United States as well as much of the rest of the world. Growth momentum looks likely to continue for the foreseeable future. U.S. tax reform finally seems possible, if not likely. Lower corporate taxes could add 6% to 7% to corporate earnings next year. We believe the economy is strong enough to handle a few more rounds of interest rate increases which the Fed seems destined to engineer. In our opinion, this is a fairly positive background for equity prices, again, for the near to intermediate‐term time frame.
Eventually, the cycle will end. The U.S. is near full employment and equity prices are, generally speaking, rich. We will be watching for signs of excessive optimism, but for now we like the Fund’s portfolio and are finding opportunities to deploy cash. Indeed, following a very frustrating period, it appears that the Fund’s holdings are starting to participate in the rally. This is very encouraging.
The Fund’s bank stocks are reporting strong earnings and the stock prices are moving accordingly. The largest position, private mortgage insurer MGIC Investment Corporation (MTG), continues to report solid results. Notwithstanding MGIC’s stock appreciation of about 57% for the fiscal year ended September 30, 2017, in our opinion, its valuation is still quite inexpensive. On the bank side, we believe a merger and acquisition cycle is still in front of us. Merger and acquisition activity in the banking industry seemed to take a back seat under the previous administration. As a result, we believe there is substantial pent up ambition for consolidation. The improved regulatory background combined with higher stock prices should usher in an era of increased takeover activity. In our opinion, there are a handful of attractive takeover candidates in the Fund’s portfolio.
Elsewhere in the Fund’s portfolio, housing related holdings, including building supplies manufacturers BMC Stock Holdings, Inc. (BMCH) and Masco Corp. (MAS), and mortgage brokerage Realogy Holdings Corp. (RLGY), continue to do well. We recently added roofing material manufacturer Carlisle Companies, Inc. (CSL) to the portfolio which Sam Koehler profiles later in the shareholder letter. We continue to be very enthusiastic about infrastructure spending, particularly on highways. Infrastructure holdings include highway equipment manufacturer Astec Industries, Inc. (ASTE), and construction materials manufacturers Summit Materials, Inc. (SUM), U.S. Concrete, Inc. (USCR) and Vulcan Materials Co. (VMC). Two noteworthy aspects to the infrastructure story are worth highlighting. First, funding has come through strongly at the state and local level supplemented by a five‐year federal bill. Second, we believe the cycle is likely to last well beyond the current economic cycle per se. Infrastructure spending did not really pick up until 2013, four years after the overall economy picked up. California just doubled its four‐year highway improvement program and its first project under the program is not scheduled to begin until next year. So, it appears there is a long way to go in this sector.
The Fund’s healthcare holdings have done well this year. We believe they are solid positions. Technology and manufacturing holdings have been a real mixed bag this year but many of the laggards are starting to pick up on improving business trends. This is encouraging following some disappointments last year and earlier this year.
A final note on the energy sector. We believe this area is a very attractive place for prospecting, no pun intended. Following the boom from 2011‐2014 and the subsequent bust in 2015 and 2016, energy markets appear to be coming into balance. We are going very slow here as this balance is taking longer than originally thought and investors have little to no appetite for the group. The direction in the stocks continues flat to down. But as the old saying goes, “they don’t ring the bell at the bottom.” We believe there are tremendous values in the space but being too early can sometimes be indistinguishable from being wrong. We are excited about the potential but uncertain about the timing.
What’s Wrong with the Russell 2000® Index? ‐ Jim Wenzler, CFA
In the world of investment management, there are literally hundreds of indices that can be used to benchmark a manager over a market cycle. The theory being, if a manager can use their expertise (i.e., fundamental analysis, quantitative analysis, macro analysis, etc.…) to gain an edge and still own companies that populate the index, then over time you are better off owning the active manager. This seems easy enough and yet thousands of managers in all asset classes struggle to beat the index when measured “net of fees,” that is after the expenses of offering a product, and over a complete business cycle. I’ll get to my thoughts on the Russell 2000® Index soon, but first let me emphasize the phrase from the prior sentence “over a complete economic cycle”. Below is an academic rendering of what economic cycles look like.
| Annual Report | September 30, 2017 | 1 |
| Broadview Opportunity Fund | Shareholder Letter |
September 30, 2017 (Unaudited)
In theory, sectors of the economy come in and go out of favor throughout a complete economic cycle and managers invest accordingly. This is where theory and practice collide because, if it is that simple, anyone could do it. Cycles have varying ages, winners, mini‐cycles, and more. Looking at the S&P 500 Index as an example, Fortune reported the following in March 2017, “At 96 months old, this bull market is not the oldest in modern history (post‐World War II): That title goes to the bull market that lasted from the fall of 1990 to the early spring of 2000, or 113 months… That record dot‐com bull market, which is also the best‐performing, with a 417% gain, lasted just more than a year longer than the current bull market’s age… The average age of a bull market, meanwhile, is 57 months.” 1 Updating the results through September 2017, the S&P 500 Index has achieved a total return of 311.2% over this 103‐month‐old bull market.
This leads me to my question at the beginning of this article, “what’s wrong with the Russell 2000® Index?” To understand the make‐up of the index, it is best done with a comparison. Constituents in the S&P 500® Index must pass four quality hurdles before being included: market capitalization, liquidity, profitability, and having a U.S. headquarters. In the Russell 2000® Index there are no quality constraints other than size. The next comparison relates to balance sheets. Small companies tend to have weaker balance sheets as their access to credit markets is limited relative to the large companies found in the S&P 500® Index. As Neuberger Berman noted in a recent white paper, “The preponderance of investment grade‐rated companies in the S&P 500 (roughly 91% by index weight) allows for broad access to 30‐year debt. The comparable figure of investment grade‐rated companies in the Russell 2000 is roughly 9%.”2
Now add the switch by investors away from active managers to passive strategies and you begin to see what happens. As more money flows into passive Russell 2000® Index strategies via index funds and exchange‐traded funds (“ETFs”), there is a disproportionate effect to the “riskier” companies (i.e., lower quality, higher beta) compared to the investment grade‐rated S&P 500® Index. Effectively, the valuations of the companies underlying the Russell 2000® Index are not being determined by bottom‐up, fundamental based analysis but instead by money flows into the index via these investment vehicles. As long as new money outpaces departing money from the indexes like the Russell 2000® Index, the longer lower quality, higher beta names continue to outperform.
Which brings me to my conclusion. Since inception in December 1996, our bottom‐up, fundamental process has outperformed the Russell 2000® Index. We have been through two full market cycles and are enduring the third, albeit not without a few bandages and rolled ankles. Having been tested in past cycles with the same, intact portfolio management team, we know that ultimately price discovery, not money flows, will dictate the valuation of companies. In the end, its earnings that matter.
Carlisle Companies, Inc. (CSL) – Sam Koehler, CFA
Carlisle is a diversified manufacturing company that we recently added to the Fund’s portfolio. It is comprised of five industrial segments with a shared emphasis on highly engineered products: construction materials, interconnect technologies, fluid technologies, brake and friction, and food service products. In these segments, the company employs a "Carlisle Operating System" with Lean Six Sigma principles. They have demonstrated an ability to reduce costs and enhance profitability, with over $200 million of accumulated savings since 2008.
Carlisle Construction Materials (CCM) is Carlisle’s largest segment and manufactures commercial roofing materials, insulation and ancillary products in which Carlisle is a leader in rubber, thermoplastic polyolefin, and polyvinyl chloride membrane roofing. Almost all of Carlisle's roofing sales are focused in the commercial market and much of this business is for replacement roofing, a more stable market than new construction. U.S. commercial roofing shipments have remained well below the peak in 2006, which, along with a long‐term market shift from asphalt roofing, leads us to believe there is ample opportunity for long‐term growth. Carlisle recently announced the accretive acquisition of Accella Performance Materials to add to the construction materials segment. Accella will bring specialty polyurethane spray foam and liquid roofing products to Carlisle. This is consistent with management's desire to acquire a more complete building envelope product offering.
| Broadview Opportunity Fund | Shareholder Letter |
September 30, 2017 (Unaudited)
Carlisle Interconnect Technologies (CIT) manufactures wire, cable, and other connection equipment for power and data transfer with a focus in the aerospace, medical, defense, test and measurement and industrial markets. This segment focuses on products that are integrated with customer specifications and often require certification, which drives customer entrenchment and higher profitability. Carlisle has made recent acquisitions in the aerospace and medical industries and will likely look to these industries for acquisition opportunities because of the long‐term growth and profitability.
Carlisle Fluid Technologies (CFT) was acquired in early 2015 and manufactures liquid and powder finishing equipment for diverse markets including automotive, automotive refinishing, aerospace, agriculture, construction, marine and rail. Carlisle has undertaken significant restructuring initiatives since this acquisition which should result in improved financial performance in 2018 and beyond. As a newer platform, we believe there is a great deal of value to unlock through rationalization, organic growth, and potential acquisitions in the fluid technologies space. Carlisle FoodService Products (CFS) and Carlisle Brake & Friction (CBF) segments are both showing positive improvements but not considered core long-term holdings and management has expressed a willingness to divest if the right opportunity arises.
The opportunity to invest in Carlisle at what we believe is an attractive valuation came from two main investor concerns: construction materials margins and an interconnect technologies business transition. Carlisle has substantially increased the construction materials margin profile and profitability over the past several years. This was driven by internal improvements along with raw material price declines. Investors are concerned that this segment may be at peak margins now that raw material prices have started to rise again. While we agree that the very current margins may not be fully maintained, we believe the internal improvements over the past several years will limit margin degradation and allow the construction materials segment to still earn high levels of profitability. The concerns in interconnect technologies have arisen from a revenue gap in aerospace sales due to a technology shift. The aerospace market has seen lower demand for in‐flight entertainment systems for which Carlisle has provided legacy cable‐intensive systems. Instead, the narrow‐body plane market has shifted to satellite communications technology for in‐flight connectivity. While Carlisle is well positioned for the emerging “SatCom” opportunity, sales have been delayed due to longer customer configuration timelines and certification delays. Additionally, the legacy in‐flight entertainment products have declined more rapidly than anticipated because of slower wide‐plane production and retro‐fit opportunities, as well as pricing pressures. We believe these interconnect technologies concerns are transitory, and the long‐term outlook remains encouraging.
Carlisle has continued to repurchase shares and still has plenty of capacity to make additional acquisitions with a manageable leverage position. We believe the management team has proven to be both strong business operators of the current business platforms and astute capital allocators through acquisitions and divestitures. Despite what we regard as transient concerns in the construction materials and interconnect technologies segments, we believe the discounted valuation, core profitability, and growth opportunities in defensible market niches makes this an attractive long‐term holding.
Premier, Inc. (PINC) – Aaron Garcia, CFA
We would like to take this opportunity to highlight the Fund’s recent investment in Premier, Inc. Founded in North Carolina, Premier offers purchasing and analytics services through its market leading Group Purchasing Organization (“GPO”) and software offerings. We believe that Premier’s services are very valuable to healthcare executives in the current regulatory environment.
Hospitals must contend with shrinking reimbursement from both government and private payers while also facing pressure to measure outcomes and improve their standard of care. Premier’s solutions help hospitals counter rising healthcare costs. Further, the company is on the leading edge of providing value based measurement tools. We are convinced that the healthcare industry needs to pivot to value‐based care and reimbursement. The U.S. economy cannot continue to support the growth in healthcare spend.
The equity of the company has somewhat underperformed due to an uncertain hospital spending environment, and we feel this is an opportunistic time to invest in this company. Also, there is some worry that customer retention levels will fall. We have long admired the GPO business. In our opinion, the operating metrics are simply splendid: greater than 40% operating margins; highly recurring revenues; strong free cash flow; almost 100% customer retention; and a consolidated competitive landscape that is currently pricing rationally. The larger the GPO, the more leverage it has over the suppliers and the more value it can drive for its partners. Additionally, the management team is long tenured, and we believe very strong. The current valuation of Premier’s stock is at the lower end of the valuation range, at 9x forward earnings before interest, taxes, depreciation and amortization (“EBITDA”). The closest sized competitor, MedAssets, was purchased by private equity for 19x EBITDA. While we would not expect Premier’s stock to trade at that level in the public market, we believe that there is room for valuation appreciation as Premier continues to execute.
| Annual Report | September 30, 2017 | 3 |
| Broadview Opportunity Fund | Shareholder Letter |
September 30, 2017 (Unaudited)
Technology Sector Review – Faraz Farzam, CFA
In aggregate, the Fund’s technology names performed poorly in the third calendar quarter. Although software investments like Tableau Software, Inc. (DATA) and CommVault Systems, Inc. (CVLT) delivered strong performance, it was not enough to offset declines in two of the Fund’s largest positions – Veeco Instruments Inc. (VECO) and Ciena Corp. (CIEN), on the back of disappointing short‐term outlooks.
Going into the third calendar quarter, both Veeco and Ciena were two of the Fund’s standout tech stocks, and although both delivered better than expected results in the second calendar quarter, their lukewarm outlooks sent both stocks downward during the third calendar quarter; unfairly, in our opinion. Telecommunication gear maker Ciena has been a long‐term holding, initially purchased in 2010. Since 2010, Ciena has grown revenues and profit margins far beyond what Wall Street had been expecting. We believe they have a dominant position globally in optical systems technology, critical infrastructure that drives the internet. Management has nearly tripled operating margins and taken share nearly every year from competitors. However, during the second calendar quarter the company tempered its short‐term outlook due to a slowdown in government spending. Although federal government spending represents less than 20% of the business, the third calendar quarter is usually a strong quarter as budgets get flushed during the government's fiscal year end. With the arrival of the new administration, prior budgets are receiving greater scrutiny and delaying planned rollouts. In our opinion, the long‐term outlook for Ciena remains bright. The company has penetrated three of India's largest telecom providers and believes that India is on the early stages of a long and sustained optical buildout. Both Verizon Communications Inc. (VZ) and AT&T Inc. (T) are top Ciena customers planning significant multi‐year buildouts of their metro networks.
Veeco was another disappointing stock. Like Ciena, they posted strong results for the second calendar quarter, however their outlook was tempered due to delayed orders for their newly acquired advanced packaging technology from Taiwan Semiconductor Manufacturing Co., LTD. (Taiwan: 2330‐TW). Although Veeco boasts 70% market share in advanced packaging for semiconductors ‐ a critical technology that reduces size and power consumption in electronic devices, in the short‐term Taiwan Semiconductor needs to eat through large capacity purchases made in the first half of 2017 in anticipation of the iPhone 8 and X launches. Although Veeco’s core business was much better than anticipated, the advanced packaging disappointment surprisingly overshadowed this aspect of the story. With the recent iPhone launches we believe that the advanced packaging business is poised to recover. Furthermore, we believe there will be continuing strength in Veeco’s core business. We remain optimistic that both Veeco’s and Ciena’s stocks will rebound as their fundamentals recover from short‐term speed bumps.
Consumer Sector Review – Faraz Farzam, CFA
Last quarter, our consumer discussion focused on the now cliché term “retail apocalypse.” Our discussion this quarter will focus on two topics. First, is there a future for traditional brick and mortar retail? And second, how do we profit from the so‐called “Amazon Effect?”
The consensus view today is that retail is dead. Brick and mortar is in terminal decline and the only opportunities in retail are bad ones. If this were true, however, we wonder why Amazon.com Inc. (AMZN) just spent nearly $14 billion acquiring 400 Whole Foods stores? Further, the company has opened 11 physical bookstores. There is no question we are saturated with stores in this country, a fact we outlined in detail last quarter. There is also no question that many retailers will close or go bankrupt. However, as Amazon’s own actions indicate, there is indeed a future for retail.
The case study to point to as an “investment playbook” is Best Buy Co., Inc. (BBY). Coming out of the last downturn, Best Buy looked like it was in trouble. Even though Circuit City had gone bankrupt, positioning Best Buy to capture that business, the retailer was in peril. Large parts of their offerings were under attack from the first iteration of the “Amazon Effect.”
Physical media (DVDs, CDs and video games, etc.) were being increasingly downloaded and not purchased in stores. Accessories like cables and connectors were easily obtainable online. Consumers were “Showrooming;” going to Best Buy to see which TVs they liked but making their final purchases on Amazon at better prices. Best Buy was saddled with large boxes and long‐term leases while sales seemed to inexorably be moving online. The stock reached an all‐time low of $12 in 2012. Today, Best Buy’s stock is hitting new highs. How did Best Buy engineer this dramatic turnaround in the face of the Amazon juggernaut? The strategic plan involved 5 initiatives:
| • | Stop growing stores and start rationalizing the base. ‐ Best Buy has closed nearly 500 stores in over 3 years. |
| • | Redeploy capital to ecommerce. ‐ Best Buy’s ecommerce as a percentage of sales is approaching 20%. |
| • | Match Amazon on price. ‐ By matching Amazon’s price on TV's, Best Buy can still capitalize on high margin accessories. |
| • | Cut costs but reinvest savings in store labor. ‐ Consumers still want a differentiated store experience where their questions can be answered by a knowledgeable staff. |
| • | Innovate. ‐ Today innovations such as connected devices, drones, and wearable cameras are driving consumers in Best Buy stores to find out what's best for them. |
| Broadview Opportunity Fund | Shareholder Letter |
September 30, 2017 (Unaudited)
In our last newsletter we made our case for troubled retailer Hibbett Sports, Inc. (HIBB). Although we won’t reiterate our detailed analysis, we can say that Hibbett is deploying the same investment playbook as Best Buy. A quick review of Hibbett:
| • | They have stopped growing stores. |
| • | They just recently launched a modern ecommerce platform. |
| • | They are investing in store technology such as POS (point of sale) systems. |
| • | Nike, Inc. (NKE), their number one partner, is finally driving innovation in the category after two years of fashion dormancy. |
We have also taken a page out of this playbook for the Fund’s portfolio in an attempt to profit from the Amazon Effect. As Hibbett redeployed capital away from physical stores, so have we. Two investments that we would like to discuss today, Freshpet Inc. (FRPT) and Boston Beer Company, Inc. (SAM); consumer staple companies in categories that are agnostic to the shift online.
Boston Beer Company, the manufacturer of Samuel Adams Beer, has a roughly 1% share of the U.S. beer market. The Fund began purchasing Boston Beer Company stock last year as the company struggled with declining beer volumes in their core lager and seasonal categories. According to the U.S. Brewers Association, the number of craft brewers in this country is now well over 5,000. Five years ago, that number was only about 2,000. Last year alone, 800 craft breweries began production.
Beer production is a high fixed‐cost capital‐intensive endeavor and consequently, many are rightly asking if we are in the midst of a “craft bubble.” Although demand for craft beer has outpaced traditional session lagers, we believe the explosion of craft breweries is unsustainable. So, why is this good for Samuel Adams? During the ascent of the craft phenomenon, Samuel Adams lost considerable share at grocery stores and bars and restaurants as vendors gave shelf space and increased taps to the new and emerging craft brands. However, grocers have a finite amount of shelf space and bars have only a finite number of taps.
When the bubble inevitably bursts as the vast number of breweries close due to lack of volume to cover fixed costs, we believe an obvious beneficiary will be Samuel Adams. Over the years, Samuel Adams has built a formidable distribution network. The beer distributors that we have talked to have all expressed their tremendous affinity for Samuel Adams as an innovator and partner. Through programs such as “Freshest Beer,” Samuel Adams has cultivated true partnerships with distributors and grocers. The distributors in turn are educating restauranteurs and bar owners that their new craft taps are not generating as much volume as, say, a Samuel Adams.
The new craft brands are generally bigger, hoppier and more alcoholic. Consumers do not drink as much of them, and so the restaurants, by adding more and more craft taps, are losing volume and economics. When the craft shakeout comes, the biggest beneficiary could be Samuel Adams. The Fund began buying Boston Beer Company around the $150 level. The stock currently is trading at an EBITDA multiple of 12x. We believe the private market value may be north of $200 as beer assets tend to be acquired for EBITDA multiples in the 15 ‐ 20x range.
Freshpet engages in the manufacture, marketing, and distribution of ultra‐premium pet food and pet treats for dogs and cats. Freshpet’s differentiation is multifaceted. Not only do they use better, fresher ingredients versus dry kibbles, their product is cooked in what they call a “kitchen” and sold through their own refrigerators to keep the products consistently fresh. Freshpet places their refrigerators in grocery stores, pet specialty stores, and mass retailers like Costco Wholesale Corp. (COST) and Target Corp. (TGT). They currently have 17,000 refrigerators in the field and the company believes this number can double over time.
Freshpet’s research shows that currently only 30% of dog owners are familiar with the brand. When consumers try Freshpet products, the repeat rates are as high as 70%. New CEO Bill Cyr, who engineered a turnaround at Sunny Delight Beverages Co., has embarked on an aggressive and, so far, successful marketing program to increase awareness and trial for a brand that currently has a tiny share of a $26 billion industry. Their plan to spend over two million dollars in advertising has already delivered solid throughput in their existing refrigerators. Freshpet already has a solid presence in Whole Foods which was acquired by Amazon and, according to Instacart, the online ordering service, Freshpet is their #3 branded pet food in terms of revenues. Although Freshpet has been one of the Fund’s best consumer names this year we believe the outlook for the company and the stock continues to be robust.
Best regards,
| | | |
| Richard E. Lane, CFA | Faraz Farzam, CFA | Aaron J. Garcia, CFA | Richard J. Whiting |
| Annual Report | September 30, 2017 | 5 |
| Broadview Opportunity Fund | Shareholder Letter |
September 30, 2017 (Unaudited)
1 | Fortune.com “Happy Birthday, Bull Market! It May Be Your Last http://fortune.com/2017/03/09/stock-market-bull-market-longest/ |
2 | Small Cap Team, “The Role of Central Bank Policies in Small-Cap Active Manager Performance Cycles,” Neuberger Berman May 31, 2017, https://www.nb.com/documents/public/en-us/central_bank_policies_in_small-cap_active_performance_cycles_may_2017.pdf |
The views and information discussed in this commentary are as of the date of publication, are subject to change, and may not reflect current views. The views expressed represent an assessment of market conditions at a specific point in time, are opinions only and should not be relied upon as investment advice regarding a particular investment or markets in general. Such information does not constitute a recommendation to buy or sell specific securities or investment vehicles. It should not be assumed that any investment will be profitable or will equal the performance of the Fund or any securities or any sectors mentioned herein. The subject matter contained herein has been derived from several sources believed to be reliable and accurate at the time of compilation.
A NOTE ON FORWARD LOOKING STATEMENTS
Except for historical information contained in this report for the Fund, the matters discussed in this report may constitute forward-looking statements made pursuant to the safe-harbor provisions of the Private Securities Litigation Reform Act of 1995. These include any adviser or portfolio manager predictions, assessments, analyses or outlooks for individual securities, industries, market sectors and/or markets. These statements involve risks and uncertainties. In addition to the general risks described for the Fund in the current Prospectus, other factors bearing on this report include the accuracy of the adviser’s or portfolio managers’ forecasts and predictions, and the appropriateness of the investment programs designed by the adviser or portfolio managers to implement their strategies efficiently and effectively. Any one or more of these factors, as well as other risks affecting the securities markets and investment instruments generally, could cause the actual results of the Fund to differ materially as compared to benchmarks associated with the Fund.
Beta - is a measure of the volatility, or systematic risk, of a security or a portfolio in comparison to the market as a whole.
Standard & Poor’s 500 Index (S&P 500) - An index of 500 stocks chosen for market size, liquidity and industry grouping, among other factors. The S&P 500 is designed to be a leading indicator of U.S. equities and is meant to reflect the risk/return characteristics of the large cap universe.
Investment grade refers to the quality of a company's credit. Most companies are issued a rating based on their financial strength, future prospects and past history. An equity security issued by a company with an investment grade credit rating may have less risk of permanent loss of capital.
Russell 2000®Index - An index measuring the performance of approximately 2,000 small-cap companies in the Russell 3000®Index, which is made up of 3,000 of the biggest U.S. stocks. The Russell 2000®serves as a benchmark for small-cap stocks in the United States.
| Broadview Opportunity Fund | Manager Commentary |
September 30, 2017 (Unaudited)
MANAGEMENT’S DISCUSSION OF FUND PERFORMANCE
Absolute performance for the fiscal year ended September 30, 2017 was positive. However, as often happens when the market gets expensive, the strategy used to manage the Fund underperformed relative to its benchmarks, the Russell 2000® Index and Russell 2500® Index. Cash has continued to flow out of actively managed investment vehicles like the Fund into passive vehicles like exchange‐traded funds that track major market securities indices. This trend supports the largest positions in capitalization‐weighted securities indices. These are companies that do not fit the Adviser’s Five Pillar investment process, especially when it comes to valuation and perpetuates the strategy’s underperformance against its benchmarks.
In the first fiscal quarter ended December 31, 2016, the Fund returned 6.20% but underperformed. The Fund was positioned defensively while the market reacted positively to the surprising presidential election results. Contributing to performance were investments in Financials, Health Care, and Consumer Staples. Consumer Discretionary, Energy, Industrials, Information Technology, and Materials investments negatively impacted performance. In the second fiscal quarter ended March 31, 2017, the Fund returned 1.56%. Information Technology and Industrials performed well, while investments in Consumer Discretionary and Energy were a drag on performance. In the third fiscal quarter ended June 30, 2017, the Fund gained 0.64%. Consumer Staples, Financials, Health Care, Information Technology, and Materials provided positive performance while Consumer Discretionary, Energy, and Industrials investments faced challenges. The fund returned 2.80% in the fourth fiscal quarter ended September 30, 2017, as Financials and Materials contributed positively to performance. Consumer Discretionary, Energy, Health Care, Industrials, and Information Technology investments detracted from fourth quarter performance.
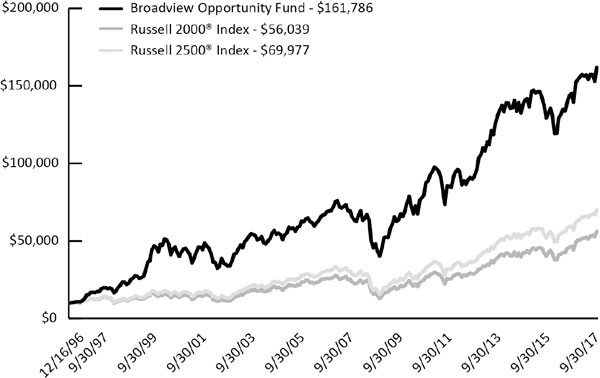
Overall, during the fiscal year ended September 30, 2017, the Fund posted a gain of 11.58% compared to a gain of 20.74% for the Russell 2000® Index and a gain of 17.79% for the Russell 2500® Index. Top contributors to Fund performance included MGIC Investment Corporation (MTG), Zions Bancorporation (ZION), Exact Sciences Corporation (EXAS), and Summit Materials, Inc. (SUM). The most negative contributors were Hibbett Sports, Inc. (HIBB), Range Resources Corporation (RRC), Pandora Media, Inc. (P), and National CineMedia, Inc. (NCMI).
GROWTH OF $10,000 INVESTMENT IN THE FUND
From its inception (12/16/96) to 9/30/17 as compared to the Russell 2000 Index(1)and the Russell 2500 Index(2)
| Annual Report | September 30, 2017 | 7 |
| Broadview Opportunity Fund | Manager Commentary |
September 30, 2017 (Unaudited)
PERFORMANCE* (For Periods Ended 9/30/17)
| | Total Return** | | | Annualized Total Return** | |
| | 3 Months | | 1 Year | 5 Year | 10 Year | 15 Year | Since Inception*** |
| Broadview Opportunity Fund | 2.80% | | 11.58% | 12.22% | 8.39% | 11.33% | 14.33% |
Russell 2000® Index | 5.67% | | 20.74% | 13.79% | 7.85% | 11.37% | 8.64% |
Russell 2500® Index | 4.74% | | 17.79% | 13.86% | 8.19% | 11.85% | 9.81% |
Performance data quoted represents past performance. Past performance does not guarantee future results. Investment return and principal value of an investment will fluctuate so that an investor’s shares, when sold or redeemed, may be worth more or less than the original cost. Current performance data may be higher or lower than actual data quoted. For the most recent month-end performance please visit bvafunds.com or call 1-855-846-1463. As of the Fund’s Prospectus dated January 27, 2017, the Broadview Opportunity Fund’s annual operating expense ratio is 1.27%. One cannot invest directly in an index.
(1) | The Russell 2000®Index measures the performance of the 2,000 smallest companies in the Russell 3000®Index. |
(2) | The Russell 2500®Index is a market cap weighted index that includes the smallest 2,500 companies covered in the Russell 3000®Index, which comprises the 3,000 largest U.S. companies based on total market capitalization. |
| * | The Adviser believes that the Russell 2000®Index is the most appropriate benchmark for the Fund. As a result, the Russell 2000®Index has replaced the Russell 2500®Index as the primary benchmark for the Fund, and the Russell 2500®Index is now reflected as the secondary benchmark for the Fund. |
| ** | Total return includes changes in share prices and in each case includes reinvestments of any dividends, interest and capital gain distributions. The returns do not reflect the deduction of taxes that a shareholder would pay on Fund distributions or the redemption of Fund shares. |
| *** | Fund Inception Date: December 16, 1996. |
SECTOR ALLOCATION (as of September 30, 2017) (As a percentage of Net Assets)
Holdings are subject to change.
These allocations may not reflect the current or future positions of the portfolio.
| Broadview Opportunity Fund | Disclosure of Fund Expenses |
September 30, 2017 (Unaudited)
As a shareholder of the Broadview Opportunity Fund (the “Fund”) you will incur ongoing costs, including management fees and other Fund expenses. The following examples are intended to help you understand your ongoing costs (in dollars) of investing in the Fund and to compare these costs with the ongoing costs of investing in other mutual funds. The examples are based on an investment of $1,000 invested on April 1, 2017 and held until September 30, 2017.
Actual Expenses. The first line of the table below provides information about actual account values and actual expenses. You may use the information in this line, together with the amount you invested, to estimate the expenses that you paid over the period. Simply divide your account value by $1,000 (for example, an $8,600 account value divided by $1,000 = 8.6), then multiply the result by the number in the first line under the heading “Expenses Paid During Period” to estimate the expenses you paid on your account during this period.
Hypothetical Example for Comparison Purposes. The second line of the table below provides information about hypothetical account values and hypothetical expenses based on the Fund’s actual expense ratio and an assumed rate of return of 5% per year before expenses, which is not the Fund’s actual return. The hypothetical account values and expenses may not be used to estimate the actual ending account balance or expenses you paid for the period. You may use this information to compare the ongoing costs of investing in the Fund and other mutual funds. To do so, compare this 5% hypothetical example with the 5% hypothetical examples that appear in the shareholder reports of the other funds. The expenses shown in the table are meant to highlight ongoing Fund costs only and do not reflect any transactional costs, such as sales charges (loads), redemption fees, or exchange fees that, although not charged by the Fund, may be charged by other funds. Therefore, the second line of the table below is useful in comparing ongoing costs only, and may not help you determine the relative total costs of owning different funds.
| | Beginning Account Value 4/1/17 | Ending Account Value 9/30/17 | Expense Ratio(a) | Expenses Paid During Period 4/1/17 - 9/30/17(b) |
| Broadview Opportunity Fund | | | | |
| Actual | $1,000.00 | $1,034.60 | 1.21% | $6.17 |
| Hypothetical (5% return before expenses) | $1,000.00 | $1,019.00 | 1.21% | $6.12 |
(a) | The Fund's expense ratios have been based on the Fund's most recent fiscal half-year expenses. |
(b) | Expenses are equal to the Fund's annualized expense ratio multiplied by the average account value over the period, multiplied by the number of days in the most recent fiscal half-year (183)/365 (to reflect the half-year period). |
| Annual Report | September 30, 2017 | 9 |
| Broadview Opportunity Fund | Schedule of Investments |
| | | Shares | | | Value | |
| COMMON STOCKS (90.20%) | | | | | | |
| CONSUMER DISCRETIONARY (6.49%) | | | | | | |
| Hotels, Restaurants & Leisure (1.30%) | | | | | | |
Chuy's Holdings, Inc.(a) | | | 377,807 | | | $ | 7,952,837 | |
| | | | | | | | | |
| Leisure Products (2.49%) | | | | | | | | |
| Brunswick Corp. | | | 144,810 | | | | 8,105,016 | |
| Polaris Industries, Inc. | | | 68,150 | | | | 7,130,534 | |
| | | | | | | | 15,235,550 | |
| Media (0.77%) | | | | | | | | |
| National CineMedia, Inc. | | | 677,731 | | | | 4,730,562 | |
| | | | | | | | | |
| Specialty Retail (1.93%) | | | | | | | | |
| Dick's Sporting Goods, Inc. | | | 225,300 | | | | 6,085,353 | |
Hibbett Sports, Inc.(a) | | | 104,751 | | | | 1,492,702 | |
Urban Outfitters, Inc.(a) | | | 175,223 | | | | 4,187,830 | |
| | | | | | | | 11,765,885 | |
| CONSUMER STAPLES (2.49%) | | | | | | | | |
| Beverages (1.13%) | | | | | | | | |
Boston Beer Co., Inc. ‐ Class A(a) | | | 44,400 | | | | 6,935,280 | |
| | | | | | | | | |
| Food Products (1.36%) | | | | | | | | |
Freshpet, Inc.(a) | | | 530,517 | | | | 8,302,591 | |
| | | | | | | | | |
| ENERGY (2.40%) | | | | | | | | |
| Oil, Gas & Consumable Fuels (2.40%) | | | | | | | | |
Gulfport Energy Corp.(a) | | | 106,100 | | | | 1,521,474 | |
Oasis Petroleum, Inc.(a) | | | 635,400 | | | | 5,794,848 | |
Parsley Energy, Inc. ‐ Class A(a) | | | 58,500 | | | | 1,540,890 | |
| Range Resources Corp. | | | 299,200 | | | | 5,855,344 | |
| | | | | | | | 14,712,556 | |
| FINANCIALS (19.83%) | | | | | | | | |
| Banks (13.27%) | | | | | | | | |
| Bank of the Ozarks, Inc. | | | 147,391 | | | | 7,082,137 | |
| Chemical Financial Corp. | | | 131,237 | | | | 6,858,446 | |
| CoBiz Financial, Inc. | | | 782,767 | | | | 15,373,544 | |
| First Horizon National Corp. | | | 141,700 | | | | 2,713,555 | |
| Guaranty Bancorp | | | 230,567 | | | | 6,409,763 | |
| LegacyTexas Financial Group, Inc. | | | 297,481 | | | | 11,875,441 | |
| Renasant Corp. | | | 36,194 | | | | 1,552,723 | |
Western Alliance Bancorp(a) | | | 269,300 | | | | 14,294,444 | |
| Zions Bancorporation | | | 318,300 | | | | 15,017,394 | |
| | | | | | | | 81,177,447 | |
| Consumer Finance (0.92%) | | | | | | | | |
PRA Group, Inc.(a) | | | 197,250 | | | | 5,651,212 | |
| | | | | | | | | |
| Thrifts & Mortgage Finance (5.64%) | | | | | | | | |
MGIC Investment Corp.(a) | | | 2,751,475 | | | | 34,475,982 | |
| | | | | | | | | |
| HEALTH CARE (13.33%) | | | | | | | | |
| Biotechnology (0.99%) | | | | | | | | |
Natera, Inc.(a) | | | 469,752 | | | | 6,055,103 | |
| | | | | | | | | |
| Health Care Equipment & Supplies (1.95%) | | | | | | | | |
K2M Group Holdings, Inc.(a) | | | 429,815 | | | | 9,116,376 | |
NxStage Medical, Inc.(a) | | | 101,581 | | | | 2,803,636 | |
| | | | | | | | 11,920,012 | |
| See Notes to Financial Statements. |
| Broadview Opportunity Fund | Schedule of Investments |
| | | Shares | | | Value | |
| COMMON STOCKS (90.20%) (continued) | | | | | | |
| HEALTH CARE (13.33%) (continued) | | | | | | |
| Health Care Providers & Services (9.22%) | | | | | | |
Acadia Healthcare Co., Inc.(a) | | | 183,500 | | | $ | 8,763,960 | |
Advisory Board Co.(a) | | | 57,000 | | | | 3,056,625 | |
AMN Healthcare Services, Inc.(a) | | | 153,800 | | | | 7,028,660 | |
Diplomat Pharmacy, Inc.(a) | | | 381,800 | | | | 7,907,078 | |
| HealthSouth Corp. | | | 360,302 | | | | 16,699,998 | |
MEDNAX, Inc.(a) | | | 67,200 | | | | 2,897,664 | |
Premier, Inc. ‐ Class A(a) | | | 179,100 | | | | 5,833,287 | |
Select Medical Holdings Corp.(a) | | | 221,680 | | | | 4,256,256 | |
| | | | | | | | 56,443,528 | |
| Health Care Technology (0.30%) | | | | | | | | |
Allscripts Healthcare Solutions, Inc.(a) | | | 129,600 | | | | 1,844,208 | |
| | | | | | | | | |
| Pharmaceuticals (0.87%) | | | | | | | | |
Catalent, Inc.(a) | | | 133,163 | | | | 5,315,867 | |
| | | | | | | | | |
| INDUSTRIALS (15.24%) | | | | | | | | |
| Aerospace & Defense (1.92%) | | | | | | | | |
| Hexcel Corp. | | | 77,339 | | | | 4,440,805 | |
KLX, Inc.(a) | | | 137,500 | | | | 7,277,875 | |
| | | | | | | | 11,718,680 | |
| Building Products (2.15%) | | | | | | | | |
| Masco Corp. | | | 336,500 | | | | 13,126,865 | |
| | | | | | | | | |
| Commercial Services & Supplies (1.18%) | | | | | | | | |
| Mobile Mini, Inc. | | | 210,239 | | | | 7,242,734 | |
| | | | | | | | | |
| Electrical Equipment & Services (0.57%) | | | | | | | | |
Generac Holdings, Inc.(a) | | | 76,051 | | | | 3,493,022 | |
| | | | | | | | | |
| Industrial Conglomerates (1.00%) | | | | | | | | |
| Carlisle Cos., Inc. | | | 61,300 | | | | 6,147,777 | |
| | | | | | | | | |
| Machinery (5.50%) | | | | | | | | |
| Astec Industries, Inc. | | | 93,337 | | | | 5,227,806 | |
Colfax Corp.(a) | | | 143,930 | | | | 5,993,245 | |
| Crane Co. | | | 101,300 | | | | 8,102,987 | |
Kornit Digital, Ltd.(a) | | | 146,400 | | | | 2,239,920 | |
Rexnord Corp.(a) | | | 323,000 | | | | 8,207,430 | |
Welbilt, Inc.(a) | | | 167,500 | | | | 3,860,875 | |
| | | | | | | | 33,632,263 | |
| Professional Services (0.26%) | | | | | | | | |
| Kforce, Inc. | | | 78,650 | | | | 1,588,730 | |
| | | | | | | | | |
| Trading Companies & Distribution (2.66%) | | | | | | | | |
BMC Stock Holdings, Inc.(a) | | | 503,961 | | | | 10,759,567 | |
MRC Global, Inc.(a) | | | 85,600 | | | | 1,497,144 | |
| MSC Industrial Direct Co., Inc. ‐ Class A | | | 53,101 | | | | 4,012,843 | |
| | | | | | | | 16,269,554 | |
| INFORMATION TECHNOLOGY (14.97%) | | | | | | | | |
| Communications Equipment (1.83%) | | | | | | | | |
Ciena Corp.(a) | | | 508,400 | | | | 11,169,548 | |
| | | | | | | | | |
| Electronic Equipment & Instruments (1.61%) | | | | | | | | |
Sensata Technologies Holding N.V.(a) | | | 133,000 | | | | 6,393,310 | |
| See Notes to Financial Statements. |
| Annual Report | September 30, 2017 | 11 |
| Broadview Opportunity Fund | Schedule of Investments |
| | | Shares | | | Value | |
| COMMON STOCKS (90.20%) (continued) | | | | | | |
| INFORMATION TECHNOLOGY (14.97%) (continued) | | | | | | |
| Electronic Equipment & Instruments (1.61%) (continued) | | | | | | |
Zebra Technologies Corp. ‐ Class A(a) | | | 32,100 | | | $ | 3,485,418 | |
| | | | | | | | 9,878,728 | |
| Internet Software & Services (0.48%) | | | | | | | | |
Hortonworks, Inc.(a) | | | 171,500 | | | | 2,906,925 | |
| | | | | | | | | |
| IT Services (0.60%) | | | | | | | | |
Acxiom Corp.(a) | | | 149,541 | | | | 3,684,690 | |
| | | | | | | | | |
| Semiconductors & Semiconductor Equipment (2.89%) | | | | | | | | |
| Marvell Technology Group, Ltd. | | | 317,100 | | | | 5,676,090 | |
Veeco Instruments, Inc.(a) | | | 559,900 | | | | 11,981,860 | |
| | | | | | | | 17,657,950 | |
| Software (7.56%) | | | | | | | | |
CommVault Systems, Inc.(a) | | | 242,700 | | | | 14,756,160 | |
CyberArk Software, Ltd.(a) | | | 98,245 | | | | 4,028,045 | |
Fortinet, Inc.(a) | | | 117,895 | | | | 4,225,357 | |
Imperva, Inc.(a) | | | 127,900 | | | | 5,550,860 | |
PROS Holdings, Inc.(a) | | | 189,700 | | | | 4,577,461 | |
PTC, Inc.(a) | | | 113,419 | | | | 6,383,221 | |
Tableau Software, Inc. ‐ Class A(a) | | | 89,950 | | | | 6,736,356 | |
| | | | | | | | 46,257,460 | |
| MATERIALS (14.45%) | | | | | | | | |
| Chemicals (6.86%) | | | | | | | | |
| Celanese Corp. ‐ Series A | | | 21,000 | | | | 2,189,670 | |
Ferro Corp.(a) | | | 560,703 | | | | 12,503,677 | |
Kraton Corp.(a) | | | 265,470 | | | | 10,735,607 | |
| Olin Corp. | | | 132,900 | | | | 4,551,825 | |
| U.S. Silica Holdings, Inc. | | | 114,086 | | | | 3,544,652 | |
| Westlake Chemical Corp. | | | 101,400 | | | | 8,425,326 | |
| | | | | | | | 41,950,757 | |
| Construction Materials (4.84%) | | | | | | | | |
Summit Materials, Inc. ‐ Class A(a) | | | 413,052 | | | | 13,230,055 | |
US Concrete, Inc.(a) | | | 41,500 | | | | 3,166,450 | |
| Vulcan Materials Co. | | | 110,550 | | | | 13,221,780 | |
| | | | | | | | 29,618,285 | |
| Containers & Packaging (1.16%) | | | | | | | | |
| Sealed Air Corp. | | | 166,600 | | | | 7,117,152 | |
| | | | | | | | | |
| Metals & Mining (1.59%) | | | | | | | | |
Allegheny Technologies, Inc.(a) | | | 405,400 | | | | 9,689,060 | |
| | | | | | | | | |
| REAL ESTATE (1.00%) | | | | | | | | |
| Real Estate Management & Development (1.00%) | | | | | | | | |
| Realogy Holdings Corp. | | | 186,000 | | | | 6,128,700 | |
| | | | | | | | | |
| TOTAL COMMON STOCKS (COST $416,322,817) | | | | | | �� | 551,797,500 | |
| See Notes to Financial Statements. |
| Broadview Opportunity Fund | Schedule of Investments |
| | | Shares | | | Value | |
| SHORT‐TERM SECURITY (9.70%) | | | | | | |
| MONEY MARKET FUND (9.70%) | | | | | | |
| Morgan Stanley Institutional Liquidity Funds ‐ Government Portfolio, Institutional Class, 7 Day Yield 0.900% | | | 59,304,950 | | | $ | 59,304,950 | |
| | | | | | | | | |
| TOTAL SHORT‐TERM SECURITY (COST $59,304,950) | | | | | | | 59,304,950 | |
| | | | | | | | | |
| TOTAL INVESTMENTS (99.90%) (COST $475,627,767) | | | | | | | 611,102,450 | |
| | | | | | | | | |
| TOTAL ASSETS IN EXCESS OF OTHER LIABILITIES (0.10%) | | | | | | | 627,827 | |
| | | | | | | | | |
| NET ASSETS 100.00% | | | | | | $ | 611,730,277 | |
(a) | Non-income producing security. |
Percentages are stated as a percent of net assets.
| See Notes to Financial Statements. |
| Annual Report | September 30, 2017 | 13 |
| Broadview Opportunity Fund | Statement of Assets and Liabilities |
| ASSETS: | | | |
| Investments in securities, at value | | $ | 611,102,450 | |
| Receivable for investments sold | | | 9,777,885 | |
| Receivable for shareholder purchases | | | 76,905 | |
| Dividends and interest receivable | | | 179,382 | |
| Prepaid expenses | | | 25,424 | |
| Total assets | | | 621,162,046 | |
| | | | | |
| LIABILITIES: | | | | |
| Payable for management fees | | | 488,853 | |
| Payable for investments purchased | | | 8,264,433 | |
| Payable to shareholders for redemptions | | | 496,880 | |
| Payable for transfer agency fees | | | 77,739 | |
| Payable for Board of Trustees fees | | | 593 | |
| Payable for chief compliance officer fees | | | 5,202 | |
| Accrued expenses and other liabilities | | | 98,069 | |
| Total liabilities | | | 9,431,769 | |
| NET ASSETS | | $ | 611,730,277 | |
| | | | | |
| NET ASSETS CONSIST OF: | | | | |
| Paid‐in capital | | $ | 421,511,973 | |
| Accumulated net investment loss | | | (3,075,881 | ) |
| Accumulated net realized gain on investments | | | 57,819,502 | |
| Net unrealized appreciation on investments | | | 135,474,683 | |
| NET ASSETS | | $ | 611,730,277 | |
| | | | | |
| INVESTMENTS IN SECURITIES, AT COST | | $ | 475,627,767 | |
| | | | | |
| PRICING OF SHARES: | | | | |
| Net Asset Value, offering and redemption price per share | | $ | 37.10 | |
| Net Assets | | $ | 611,730,277 | |
| Shares of beneficial interest outstanding (unlimited number of shares authorized with no par value per share) | | | 16,488,868 | |
| See Notes to Financial Statements. |
| Broadview Opportunity Fund | Statement of Operations |
| For the Year Ended September 30, 2017 |
| INVESTMENT INCOME: | | | |
| Dividends | | $ | 3,235,117 | |
| Interest | | | 499,947 | |
| Total Investment Income | | | 3,735,064 | |
| | | | | |
| EXPENSES: | | | | |
| Management fees | | | 6,415,785 | |
| Administration and accounting services | | | 218,716 | |
| Transfer agent fees | | | 845,258 | |
| Professional fees | | | 99,530 | |
| Custodian fees | | | 39,860 | |
| Board of Trustees fees | | | 60,768 | |
| Chief compliance officer fees | | | 31,212 | |
| Printing and postage expenses | | | 67,162 | |
| Registration fees | | | 38,931 | |
| Other expenses | | | 50,788 | |
| Total Expenses | | | 7,868,010 | |
| NET INVESTMENT LOSS | | | (4,132,946 | ) |
| | | | | |
| REALIZED AND UNREALIZED GAIN/(LOSS) FROM INVESTMENTS: | | | | |
| Net realized gain on investments | | | 67,963,720 | |
| Net change in unrealized appreciation of investments | | | 6,020,754 | |
| NET REALIZED AND UNREALIZED GAIN FROM INVESTMENTS | | | 73,984,474 | |
| NET INCREASE IN NET ASSETS RESULTING FROM OPERATIONS | | $ | 69,851,528 | |
| See Notes to Financial Statements. |
| Annual Report | September 30, 2017 | 15 |
| Broadview Opportunity Fund | Statements of Changes in Net Assets |
| | | For the Year Ended September 30, 2017 | | | For the Year Ended September 30, 2016 | |
| OPERATIONS: | | | | | | |
| Net investment loss | | $ | (4,132,946 | ) | | $ | (2,848,353 | ) |
| Net realized gain on investments | | | 67,963,720 | | | | 29,120,359 | |
| Net change in unrealized appreciation on investments | | | 6,020,754 | | | | 49,176,293 | |
| Net increase in net assets resulting from operations | | | 69,851,528 | | | | 75,448,299 | |
| | | | | | | | | |
| DISTRIBUTIONS TO SHAREHOLDERS (Note 5): | | | | | | | | |
| From net realized gains on investments | | | (30,306,302 | ) | | | (59,156,314 | ) |
| Total distributions | | | (30,306,302 | ) | | | (59,156,314 | ) |
| | | | | | | | | |
| SHARE TRANSACTIONS: | | | | | | | | |
| Proceeds from sales of shares | | | 69,718,699 | | | | 78,741,917 | |
| Distributions reinvested | | | 29,553,564 | | | | 57,589,371 | |
| Cost of shares redeemed | | | (180,925,285 | ) | | | (241,014,827 | ) |
| Net decrease from share transactions | | | (81,653,022 | ) | | | (104,683,539 | ) |
| | | | | | | | | |
| Net decrease in net assets | | | (42,107,796 | ) | | | (88,391,554 | ) |
| | | | | | | | | |
| NET ASSETS: | | | | | | | | |
| Beginning of year | | | 653,838,073 | | | | 742,229,627 | |
| End of year* | | $ | 611,730,277 | | | $ | 653,838,073 | |
| *Includes accumulated net investment loss of: | | $ | (3,075,881 | ) | | $ | (1,977,457 | ) |
| | | | | | | | | |
| Other Information: | | | | | | | | |
| SHARE TRANSACTIONS: | | | | | | | | |
| Sold | | | 1,948,981 | | | | 2,496,244 | |
| Distributions reinvested | | | 824,597 | | | | 1,824,758 | |
| Redeemed | | | (5,071,033 | ) | | | (7,464,570 | ) |
| Net decrease in shares outstanding | | | (2,297,455 | ) | | | (3,143,568 | ) |
See Notes to Financial Statements.
| Broadview Opportunity Fund | Financial Highlights |
For a Share Outstanding Throughout the Years Presented
| | | For the Year Ended September 30, 2017 | | | For the Year Ended September 30, 2016 | | | For the Year Ended September 30, 2015 | | | For the Year Ended September 30, 2014(a) | | | For the Year Ended September 30, 2013 | |
| NET ASSET VALUE, BEGINNING OF YEAR | | $ | 34.80 | | | $ | 33.85 | | | $ | 38.48 | | | $ | 40.85 | | | $ | 30.26 | |
| INCOME/(LOSS) FROM OPERATIONS: | | | | | | | | | | | | | | | | | | | | |
| Net investment loss | | | (0.23 | )(b) | | | (0.14 | )(b) | | | (0.19 | ) | | | (0.21 | ) | | | (0.15 | ) |
| Net realized and unrealized gain/(loss) on investments | | | 4.20 | | | | 3.96 | | | | (0.33 | ) | | | 2.18 | | | | 11.59 | |
| Total from investment operations | | | 3.97 | | | | 3.82 | | | | (0.52 | ) | | | 1.97 | | | | 11.44 | |
| | | | | | | | | | | | | | | | | | | | | |
| LESS DISTRIBUTIONS: | | | | | | | | | | | | | | | | | | | | |
| From net realized gains on investments | | | (1.67 | ) | | | (2.87 | ) | | | (4.11 | ) | | | (4.34 | ) | | | (0.85 | ) |
| Total distributions | | | (1.67 | ) | | | (2.87 | ) | | | (4.11 | ) | | | (4.34 | ) | | | (0.85 | ) |
| INCREASE/(DECREASE) IN NET ASSET VALUE | | | 2.30 | | | | 0.95 | | | | (4.63 | ) | | | (2.37 | ) | | | 10.59 | |
| NET ASSET VALUE, END OF YEAR | | $ | 37.10 | | | $ | 34.80 | | | $ | 33.85 | | | $ | 38.48 | | | $ | 40.85 | |
| | | | | | | | | | | | | | | | | | | | | |
| TOTAL RETURN | | | 11.58 | % | | | 12.17 | % | | | (2.40 | %) | | | 4.86 | % | | | 38.91 | % |
| | | | | | | | | | | | | | | | | | | | | |
| SUPPLEMENTAL DATA: | | | | | | | | | | | | | | | | | | | | |
| Net assets, end of year (000's) | | $ | 611,730 | | | $ | 653,838 | | | $ | 742,230 | | | $ | 904,151 | | | $ | 852,723 | |
| | | | | | | | | | | | | | | | | | | | | |
| RATIOS TO AVERAGE NET ASSETS: | | | | | | | | | | | | | | | | | | | | |
| Operating expenses | | | 1.23 | % | | | 1.25 | % | | | 1.23 | % | | | 1.25 | % | | | 1.26 | % |
| Net investment loss | | | (0.64 | %) | | | (0.42 | %) | | | (0.48 | %) | | | (0.50 | %) | | | (0.44 | %) |
| | | | | | | | | | | | | | | | | | | | | |
| PORTFOLIO TURNOVER RATE | | | 53 | % | | | 40 | % | | | 41 | % | | | 56 | % | | | 70 | % |
(a) | On November 25, 2013, shareholders of the FMI Focus Fund, a series of FMI Funds, Inc. (the "Predecessor Fund"), approved a tax-free reorganization under which all assets and liabilities of the Predecessor Fund were transferred to the Broadview Opportunity Fund, a series of Broadview Funds Trust, at the close of business on November 29, 2013. |
(b) | Per share amounts are based upon average shares outstanding. |
See Notes to Financial Statements.
| Annual Report | September 30, 2017 | 17 |
| Broadview Opportunity Fund | Notes to Financial Statements |
September 30, 2017
1. ORGANIZATION
Broadview Funds Trust (the “Trust”) is an open‐end management investment company registered under the Investment Company Act of 1940, as amended (the “1940 Act”). The Trust was organized on September 9, 2013 as a Delaware statutory trust. The Trust currently offers one series, the Broadview Opportunity Fund (the “Fund”). The Fund is a diversified portfolio with an investment objective to seek capital appreciation.
On November 25, 2013, shareholders of the FMI Focus Fund, a series of FMI Funds, Inc. (the “Predecessor Fund”), approved a tax‐free reorganization under which all assets and liabilities of the Predecessor Fund were transferred to the Fund, a series of the Trust, at the close of business on November 29, 2013. The Predecessor Fund commenced operations on December 16, 1996. On the date of the reorganization, the Predecessor Fund was deemed to be the accounting survivor for financial reporting purposes, and as a result, the financial statements and the financial highlights reflect the operations of the Predecessor Fund for periods prior to the reorganization date.
2. SIGNIFICANT ACCOUNTING POLICIES
The following is a summary of significant accounting policies consistently followed by the Fund. These policies are in conformity with U.S. generally accepted accounting principles (“GAAP”). The Fund is an investment company and accordingly follows the investment company accounting and reporting guidance of the Financial Accounting Standards Board (“FASB”) Accounting Standards Codification Topic 946 Financials Services‐Investment Companies.
Use of Estimates — The preparation of financial statements in conformity with GAAP requires management to make estimates and assumptions that affect the reported amounts of assets and liabilities and disclosure of contingent assets and liabilities on the date of the financial statements and the reported amounts of increases and decreases in net assets from operations during the reporting period. Actual results could differ from those estimates.
Investment Valuation — The Fund’s portfolio securities are fair valued as of the close of trading of the New York Stock Exchange (“NYSE”) (normally 4:00 p.m., Eastern Time). Each security, excluding short‐term investments, is valued at the last sale price reported by the principal security exchange on which the issue is traded. Securities that are traded on the Nasdaq Stock Market, Inc. are valued at the Nasdaq Official Closing Price or if no sale is reported, at the mean between the bid and the ask. Securities which are traded over‐the‐counter are valued at the last sale price or, if no sale is reported, at the mean between the bid and the ask. Securities sold short which are listed on a national securities exchange or the Nasdaq Stock Market but which were not traded on the valuation date are valued at the mean between the bid and the ask. Unlisted equity securities for which market quotations are readily available are valued at the last sale price or, if no sale price, the mean between the bid and the ask. Options purchased or written by the Fund are valued at the mean of the highest bid and lowest ask price of all the exchanges on which the option trades. Securities for which quotations are not readily available are valued at fair value as determined by the investment adviser in accordance with procedures approved by the Board of Trustees. The fair value of a security is the amount which the Fund might reasonably expect to receive upon a current sale. The fair value of a security may differ from the last quoted price and the Fund may not be able to sell a security at the fair value. Market quotations may not be available, for example, if trading in particular securities was halted during the day and not resumed prior to the close of trading on the New York Stock Exchange. As of September 30, 2017, there were no securities that were internally fair valued by the investment adviser. Variable rate demand notes are recorded at par value which approximates market value. Money market funds, representing short‐term investments, are valued at their net asset value. Other short‐term investments with maturities of 60 days or less are valued at fair value.
Securities Transactions and Related Investment Income — Dividend income is recorded on the ex‐dividend date. Realized gains and losses from investment transactions are determined using the identified cost basis. Interest income which includes amortization of premium and accretion of discount, is recorded on the accrual basis. Withholding taxes on foreign dividends have been provided for in accordance with the Fund’s understanding of the applicable country’s tax rules and regulations. For financial reporting purposes, investment transactions are recorded on the trade date.
Fair Value Measurements — A three‐tier hierarchy has been established to classify fair value measurements for disclosure purposes. Inputs refer broadly to the assumptions that market participants would use in pricing the asset or liability, including assumptions about risk. Inputs may be observable or unobservable. Observable inputs are inputs that reflect the assumptions market participants would use in pricing the asset or liability that are developed based on market data obtained from sources independent of the reporting entity. Unobservable inputs are inputs that reflect the reporting entity’s own assumptions about the assumptions market participants would use in pricing the asset or liability that are developed based on the best information available. In accordance with the authoritative guidance on fair value measurements and disclosure under GAAP, the Fund discloses fair value of its investments in a hierarchy that prioritizes the inputs to valuation techniques used to measure the fair value.
| Broadview Opportunity Fund | Notes to Financial Statements |
September 30, 2017
Various inputs are used in determining the value of the Fund’s investments as of the reporting period end. These inputs are categorized in the following hierarchy under GAAP:
| Level 1 — | Unadjusted quoted prices in active markets for identical, unrestricted assets or liabilities that the Fund has the ability to access at the measurement date; |
| Level 2 — | Quoted prices which are not active, quoted prices for similar assets or liabilities in active markets or inputs other than quoted prices that are observable (either directly or indirectly) for substantially the full term of the asset or liability; and |
| Level 3 — | Significant unobservable prices or inputs (including the Fund’s own assumptions in determining the fair value of investments) where there is little or no market activity for the asset or liability at the measurement date. |
The availability of observable inputs can vary from security to security and is affected by a wide variety of factors, including, for example, the type of security, whether the security is new and not yet established in the marketplace, the liquidity of markets, and other characteristics particular to the security. To the extent that valuation is based on models or inputs that are less observable or unobservable in the market, the determination of fair value requires more judgment. Accordingly, the degree of judgment exercised in determining fair value is greatest for instruments categorized in Level 3.
An investment level within the fair value hierarchy is based on the lowest level input, individually or in the aggregate, that is significant to fair value measurement. The valuation techniques used by the Fund to measure fair value during the year ended September 30, 2017, maximized the use of observable inputs and minimized the use of unobservable inputs.
The inputs or methodologies used for valuing securities are not necessarily an indication of the risk or liquidity associated with investing in those securities. The following is a summary of the inputs used in valuing the Fund’s investments as of September 30, 2017:
Broadview Opportunity Fund
| | | Valuation Inputs | | | | |
| Investments in Securities at Fair Value* | | Level 1 | | | Level 2 | | | Level 3 | | | Total | |
| Common Stocks | | $ | 551,797,500 | | | $ | – | | | $ | – | | | $ | 551,797,500 | |
| Short‐Term Security | | | 59,304,950 | | | | – | | | | – | | | | 59,304,950 | |
| Total | | $ | 611,102,450 | | | $ | – | | | $ | – | | | $ | 611,102,450 | |
| * | See Schedule of Investments for industry classification. |
It is the Fund’s policy to recognize transfers between levels at the end of the reporting period. There were no transfers between Levels 1 and 2 during the year ended September 30, 2017.
For the year ended September 30, 2017, the Fund did not have any unobservable inputs (Level 3) used in determining fair value.
Distributions to Shareholders — Dividends from net investment income and distributions of net realized capital gains, if any, will be declared and paid at least annually. Income and capital gains distributions are determined in accordance with income tax regulations, which may differ from GAAP. Distributions to shareholders are recorded on the ex‐dividend date.
Income Taxes — As of and during the year ended September 30, 2017, the Fund did not have a liability for any unrecognized tax benefits. The Fund files U.S. federal, state, and local tax returns as required. The Fund’s tax returns are subject to examination by the relevant tax authorities until expiration of the applicable statute of limitations which is generally three years after the filing of the tax return for federal purposes and four years for most state returns. Tax returns for open years have incorporated no uncertain tax positions that require a provision for income taxes. The Fund intends to continue to qualify each year as a “regulated investment company” under Subchapter M of the Internal Revenue Code of 1986, as amended. By so qualifying, the Fund will not be subject to Federal income taxes to the extent that it distributes substantially all of its taxable or tax-exempt income, if any, for its tax year ending September 30. In addition, by distributing in each calendar year substantially all of its net investment income, capital gains and certain other amounts, if any, the Fund will not be subject to a Federal excise tax. Therefore, no provision is made by the Fund for Federal income or excise taxes.
| Annual Report | September 30, 2017 | 19 |
| Broadview Opportunity Fund | Notes to Financial Statements |
September 30, 2017
3. ADVISORY FEES, ADMINISTRATION FEES AND OTHER AGREEMENTS
Investment Advisory Agreement
Effective as of the close of business on November 29, 2013, the Fund entered into an investment advisory agreement with Broadview Advisors, LLC (the “Adviser”). The Fund pays the Adviser a monthly fee based upon the average daily net assets of the Fund and calculated at an annual rate of 1.00%.
Beneficial Ownership
At September 30, 2017, Wells Fargo Advisors, LLC is a record owner of 26% of the Fund’s shares.
Fund Accounting Fees and Expenses
ALPS Fund Services, Inc. (“ALPS” or the “Administrator”) provides administrative, fund accounting and other services to the Fund under the Administration, Bookkeeping and Pricing Services Agreement (the “Administration Agreement”) with the Trust. Under the Agreement, ALPS is paid fees, accrued on a daily basis and paid on a monthly basis following the end of the month.
The Administrator is also reimbursed by the Fund for certain out of pocket expenses.
The Fund has entered into a Distribution Plan (the “Plan”) pursuant to Rule 12b‐1 under the Act. The Plan provides that the Fund may incur certain costs which may not exceed the lesser of a monthly amount equal to 0.25% of the Fund’s daily net assets or the actual distribution costs incurred during the year. Amounts payable under the Plan are paid monthly for any activities or expenses primarily intended to result in the sale of shares of the Fund. For the year ended September 30, 2017, no such expenses were incurred. The Fund presently intends not to utilize the Plan or pay any 12b‐1 fees during the fiscal year ending September 30, 2018.
Transfer Agent and Shareholder Services Agreement
ALPS serves as transfer, dividend paying and shareholder servicing agent for the Fund (the “Transfer Agent”) under a Transfer Agency and Services Agreement with the Trust.
Compliance Services
Through September 30, 2017, ALPS provided Chief Compliance Officer services to the Fund. Additionally, ALPS provided services in monitoring and testing the policies and procedures of the Trust in conjunction with requirements under Rule 38a‐1 under the 1940 Act. ALPS was compensated under the Chief Compliance Officer Services Agreement. See Note 7, Subsequent Events.
Distributor
The Fund has entered into a Distribution Agreement with ALPS Distributors, Inc. (the “Distributor”) to provide distribution services to the Fund. The Distributor serves as underwriter/distributor of shares of the Fund.
Officer and Trustee Compensation
Officers of the Trust and Trustees who are “interested persons” of the Trust or the Adviser will receive no salary or fees from the Trust. Each Trustee who is not an “interested person” receives an annual fee of $20,000 each year. The Trust reimburses each Trustee and Officer for his or her travel and other expenses relating to attendance at such meetings.
Certain Trustees and Officers of the Trust are also officers of the Adviser.
4. PURCHASES AND SALES OF INVESTMENT SECURITIES
The aggregate cost of purchases and proceeds from sales of investment securities, excluding short‐term securities, are shown below for the year ended September 30, 2017.
| Broadview Opportunity Fund | | | |
| Cost of Investments Purchased | | $ | 298,087,103 | |
| Proceeds from Investments Sold | | $ | 400,129,035 | |
| Broadview Opportunity Fund | Notes to Financial Statements |
September 30, 2017
5. TAX BASIS INFORMATION
Distributions are determined in accordance with federal income tax regulations, which differ from GAAP, and, therefore, may differ significantly in amount or character from net investment income and realized gains for financial reporting purposes. Financial reporting records are adjusted for permanent book/tax differences to reflect tax character but are not adjusted for temporary differences. The amounts and characteristics of tax basis distributions and composition of distributable earnings/(accumulated losses) are finalized at fiscal year‐end.
The tax character of distributions paid during the year ended September 30, 2017, were as follows:
| | | Ordinary Income | | Long-Term Capital Gain | |
| | | $ | – | | | $ | 30,306,302 | |
The tax character of distributions paid during the year ended September 30, 2016, were as follows:
| | | Ordinary Income | | Long-Term Capital Gain | |
| | | $ | – | | | $ | 59,156,314 | |
For the year ended September 30, 2017, the following reclassification, which had no impact on results of operations or net assets was recorded to reflect the tax character of the Fund’s net operating loss:
| | Paid-in Capital | | Accumulated Net Investment Income/(Loss) | | Accumulated Net Realized Gain/(Loss) | |
| | | $ | – | | | $ | 3,034,522 | | | $ | (3,034,522 | ) |
As of September 30, 2017, net unrealized appreciation/(depreciation) of investments based on the federal tax cost was as follows:
| | | Cost of Investments | | | Gross Unrealized Appreciation | | | Gross Unrealized Depreciation | | | Net Unrealized Appreciation on Investments | |
| | | $ | 478,732,911 | | | $ | 152,475,764 | | | $ | (20,106,225 | ) | | $ | 132,369,539 | |
The difference between book basis and tax basis is primarily attributable to wash sales.
At September 30, 2017, components of distributable earnings on a tax basis were as follows:
| Undistributed net investment income | | $ | 1,936,600 | |
| Accumulated net realized gain | | | 58,988,046 | |
| Net unrealized appreciation on investments | | | 132,369,539 | |
| Other cumulative effect of timing differences | | | (3,075,881 | ) |
| Total distributable earnings | | $ | 190,218,304 | |
Capital Losses: As of September 30, 2017, the Fund elected to defer to the year ending September 30, 2018, late year ordinary losses in the amount of $3,075,881.
| Annual Report | September 30, 2017 | 21 |
| Broadview Opportunity Fund | Notes to Financial Statements |
September 30, 2017
6. COMMITMENTS AND CONTINGENCIES
Under the Trust’s organizational documents, each director, officer, employee or other agent of the Fund (including the Adviser) is indemnified, to the extent permitted by the Act, against certain liabilities that may arise out of performance of their duties to the Fund. Additionally, in the normal course of business, the Fund enters into contracts that contain a variety of indemnification clauses. The Fund’s maximum exposure under these arrangements is unknown as this would involve future claims that may be made against the Fund that have not yet occurred. However, the Fund has not had prior claims or losses pursuant to these contracts and believes the risk of loss to be remote.
7. SUBSEQUENT EVENTS
Through October 20, 2017, ALPS provided Chief Compliance Officer services to the Fund and was compensated under the Chief Compliance Officer Services Agreement. Effective October 20, 2017, Melanie H. Zimdars resigned as the Trust’s Chief Compliance Officer and AML Compliance Officer and the Board of Trustees of the Trust terminated the Chief Compliance Officer Services Agreement. Also effective October 20, 2017, the Board of Trustees of the Trust appointed Angela L. Pingel as the Trust’s new Chief Compliance Officer and AML Compliance Officer. The Trust, on behalf of the Fund, entered into a Chief Compliance Officer Support Services Agreement with ALPS on October 20, 2017. Under the Chief Compliance Officer Support Services Agreement, ALPS provides support services to assist the Trust’s newly appointed Chief Compliance Officer with monitoring and testing the policies and procedures of the Trust in conjunction with the requirements of Rule 38a‐1 under the 1940 Act and ALPS is compensated under such agreement.
| Report of Independent Registered |
| Broadview Opportunity Fund | Public Accounting Firm |
To the Shareholders of Broadview Opportunity Fund and
Board of Trustees of Broadview Funds Trust
We have audited the accompanying statement of assets and liabilities, including the schedule of investments, of Broadview Funds Trust comprising Broadview Opportunity Fund (the “Fund”), as of September 30, 2017, and the related statement of operations for the year then ended, and the statements of changes in net assets and the financial highlights for each of the two years in the period then ended. These financial statements and financial highlights are the responsibility of the Fund’s management. Our responsibility is to express an opinion on these financial statements and financial highlights based on our audits. The financial highlights for the years ended prior to September 30, 2016, were audited by other auditors whose report dated November 27, 2015, expressed an unqualified opinion on those financial highlights.
We conducted our audits in accordance with the standards of the Public Company Accounting Oversight Board (United States). Those standards require that we plan and perform the audit to obtain reasonable assurance about whether the financial statements and financial highlights are free of material misstatement. An audit includes examining, on a test basis, evidence supporting the amounts and disclosures in the financial statements. Our procedures included confirmation of securities owned as of September 30, 2017, by correspondence with the custodian and brokers. An audit also includes assessing the accounting principles used and significant estimates made by management, as well as evaluating the overall financial statement presentation. We believe that our audits provide a reasonable basis for our opinion.
In our opinion, the financial statements and financial highlights referred to above present fairly, in all material respects, the financial position of Broadview Opportunity Fund as of September 30, 2017, the results of its operations for the year then ended, and the changes in its net assets and the financial highlights for each of the two years in the period then ended, in conformity with accounting principles generally accepted in the United States of America.
COHEN & COMPANY, LTD.
Cleveland, Ohio
November 21, 2017
| Annual Report | September 30, 2017 | 23 |
| Broadview Opportunity Fund | Additional Information |
| September 30, 2017 (Unaudited) |
1. PROXY VOTING POLICIES AND VOTING RECORD
A description of the policies and procedures that the Fund uses to vote proxies relating to portfolio securities is available without charge upon request by calling toll‐free 855‐846‐1463, or on the Securities and Exchange Commission’s (“SEC”) website at http://www.sec.gov. Information regarding how the Fund voted proxies relating to portfolio securities during the most recent 12‐month period ended June 30th is available without charge upon request by calling toll‐free 855‐846‐1463, or on the SEC’s website at http://www.sec.gov.
2. QUARTERLY PORTFOLIO HOLDINGS
The Trust files a complete listing of portfolio holdings for the Fund with the SEC four times each fiscal year at quarter‐ends. The Fund files the schedule of portfolio holdings with the SEC on Form N‐CSR (second and fourth quarters) and on Form N‐Q (first and third quarters). The filings are available upon request by calling 855‐846‐1463. Furthermore, you may obtain a copy of the filing on the SEC’s website at http://www.sec.gov. The Fund’s Forms N‐CSR and N‐Q may also be reviewed and copied at the SEC’s Public Reference Room in Washington, D.C., and information on the operation of the Public Reference Room may be obtained by calling 1‐800‐SEC‐0330.
3. TAX DESIGNATIONS
Pursuant to Section 852(b)(3) of the Internal Revenue Code, the Broadview Opportunity Fund designates $30,306,302 as a long‐term capital gain dividend.
| Broadview Opportunity Fund | Trustees and Officers |
| September 30, 2017 (Unaudited) |
The business affairs of the Fund are managed under the direction of the Trust’s Board of Trustees in accordance with the laws of the State of Delaware. Information pertaining to the Trustees and Officers of the Trust are set forth below. Trustees who are not deemed to be “interested persons” of the Trust as defined in the 1940 Act, are referred to as “Independent Trustees.” Trustees who are deemed to be interested persons of the Trust as defined in the 1940 Act are referred to as “Interested Trustees”. The Fund’s Statement of Additional Information includes additional information about the trustees and is available upon request by calling toll‐free 1‐855‐846‐1463.
INTERESTED AND NON‐INTERESTED TRUSTEES
Name, Address and Year of Birth(1) | Position(s) With the Trust, Term of Office, Length of Time Served and Number of Portfolios in Fund Complex Overseen | Principal Occupation(s) During the Past 5 Years | Other Directorships Held by Trustee During the Past 5 Years |
| Interested Trustee | | | |
Richard J. Whiting(2) Born: 1957 | Chairman and Trustee (since 2013); Indefinite Term; 1 Portfolio | Manager of Trading Department and Portfolio Manager, Broadview Advisors, LLC (since 2001) | None |
| Non‐Interested Trustees | | | |
Gregory W. Berger Born: 1961 | Trustee (since 2013); Indefinite Term; 1 Portfolio | Attorney and Shareholder, Brownstein Hyatt Farber Schreck, LLP (law firm) (1994 to present) | None |
Cornelius J. Lavelle Born: 1944 | Trustee (since 2013); Indefinite Term; 1 Portfolio | Retired; Director, Institutional Equities, Citigroup Global Markets Inc. (multinational financial services firm) (1997 to 2009) | Independent Trustee, The 504 Fund (a closed‐end investment company); Independent Trustee, USFS Funds Trust (an open‐end investment company with two portfolios) (2013‐2014) |
Philip J. Uihlein, Sr. Born: 1950 | Trustee (since 2013); Indefinite Term; 1 Portfolio | Retired; President, U‐Line Corporation (refrigeration appliance manufacturer) (1977 to 2008); Chief Executive Officer, U-Line Corporation (1986 to 2008) | None |
Name, Address and Year of Birth(1) | Position(s) With the Trust, Term of Office and Length of Time Served | Principal Occupation(s) During the Past 5 Years |
| Other Officers | | |
Richard E. Lane Born: 1955 | President and Principal Executive Officer (since 2013); Indefinite Term | President, Broadview Advisors, LLC (since 2001) |
Aaron J. Garcia Born: 1977 | Treasurer and Principal Financial Officer and Principal Accounting Officer (since 2013); Indefinite Term | Portfolio Manager, Broadview Advisors, LLC (since 2003) |
Faraz Farzam Born: 1973 | Secretary (since 2013); Indefinite Term | Portfolio Manager, Broadview Advisors, LLC (since 2001) |
Angela L. Pingel(3) Born: 1971 | Chief Compliance Officer and AML Compliance Officer (since 2017), Vice President and Assistant Secretary (since 2015); Indefinite Term | General Counsel and Chief Compliance Officer, Broadview Advisors, LLC (since 2015); Vice President and Counsel, U.S. Bancorp Fund Services, LLC (2011‐2015) |
(1) | Unless otherwise noted, the business address of each Trustee and Officer is c/o Broadview Funds Trust, 330 East Kilbourn Avenue, Suite 1475, Milwaukee, Wisconsin 53202. |
(2) | Mr. Whiting is an “interested person” of the Trust (as defined in the 1940 Act) because he is an employee and officer of the Adviser. |
(3) | Effective October 20, 2017, Angela L. Pingel replaced Melanie H. Zimdars as Chief Compliance Officer and AML Compliance Officer of the Trust. |
| Annual Report | September 30, 2017 | 25 |

Item 2. Code of Ethics.
| (a) | The Registrant has adopted a code of ethics that applies to the Registrant’s principal executive officer, principal financial officer, principal accounting officer or controller or any persons performing similar functions on behalf of the Registrant. |
| (c) | During the period covered by this report, no amendments to the provisions of the code of ethics adopted in paragraph (a) of this Item were made. |
| (d) | During the period covered by this report, no implicit or explicit waivers to the provisions of the code of ethics adopted in paragraph (a) of this Item were granted. |
| (f) | A copy of the Registrant’s Code of Ethics is filed as an exhibit hereto. |
Item 3. Audit Committee Financial Expert.
The Board of Trustees of the Registrant has determined that the Registrant has at least one audit committee financial expert serving on its audit committee. Mr. Cornelius J. Lavelle serves as the Registrant’s audit committee financial expert and is considered to be “independent” as defined in Item 3 of Form N-CSR.
Item 4. Principal Accountant Fees and Services.
| (a) | Audit Fees: Audit fees billed for the Registrant for the fiscal years ended September 30, 2017 and September 30, 2016 were $15,000 and $15,000, respectively. These amounts represent aggregate fees billed by the Registrant’s independent accountant, Cohen & Company, Ltd. (“Accountant”), in connection with the annual audits of the Registrant’s financial statements and for services normally provided by the Accountant in connection with the Registrant’s statutory and regulatory filings for those fiscal years. |
| (b) | Audit-Related Fees: There were no additional fees billed in the fiscal years ended September 30, 2017 and September 30, 2016 for assurance and related services by the Accountant that were reasonably related to the performance of the audit of the Registrant’s financial statements that were not reported under paragraph (a) of this Item. |
| (c) | Tax Fees: The tax fees billed for the fiscal years ended September 30, 2017 and September 30, 2016 were $3,000 and $3,000, respectively, for professional services rendered by the Accountant for tax compliance, tax advice, and tax planning. These services were for the completion of the fund’s federal and state income tax returns, excise tax returns, and assistance with distribution calculations. |
| (d) | All Other Fees: For the Registrant’s fiscal years ended September 30, 2017 and September 30, 2016 the aggregate fees billed for products and services provided by the principal accountant, other than the services reported in paragraphs (a) through (c) of this Item, were $0. |
| (e)(1) | Audit Committee Pre-Approval Policies and Procedures: All services to be performed by the Registrant’s principal accountant must be pre-approved by the Registrant’s audit committee. |
| (e)(2) | No services described in paragraphs (b) through (d) of this Item were approved by the Registrant’s audit committee pursuant to paragraph (c)(7)(i)(C) of Rule 2-01 of Regulation S-X. |
| (g) | No non-audit fees were billed by the Registrant’s principal accountant for services rendered to the Registrant’s investment adviser. |
Item 5. Audit Committee of Listed Registrants.
Not applicable to the Registrant.
Item 6. Schedule of Investments.
| (a) | The Registrant’s “Schedule I – Investments in securities of unaffiliated issuers” (as set forth in 17 CFR 210.12-12) is included in Item 1 of this Form N-CSR. |
| (b) | Not applicable to the Registrant. |
Item 7. Disclosure of Proxy Voting Policies and Procedures for Closed-End Management Investment Companies.
Not applicable to the Registrant.
Item 8. Portfolio Managers of Closed-End Management Investment Companies.
Not applicable to the Registrant.
Item 9. Purchases of Equity Securities by Closed-End Management Investment Company and Affiliated Purchasers.
Not applicable to the Registrant.
Item 10. Submission of Matters to a Vote of Security Holders.
None.
Item 11. Controls and Procedures.
| (a) | The Registrant’s principal executive officer and principal financial officer have evaluated the Registrant’s disclosure controls and procedures (as defined in Rule 30a-3(c) under the Investment Company Act of 1940, as amended (the “1940 Act”)) within 90 days of the filing of this report, as required by Rule 30a-3(b) under the Act and Rules 13a-15(b) or 15d-15(b) under the Securities Exchange Act of 1934, and have concluded that the Registrant’s disclosure controls and procedures were effective as of that date. |
| (b) | There was no change in the Registrant’s internal control over financial reporting (as defined in Rule 30a-3(d) under the Act, as amended) during the second fiscal quarter of the period covered by this report that has materially affected, or is reasonably likely to materially affect, the Registrant’s internal control over financial reporting. |
Item 12. Exhibits.
| (a)(1) | The Registrant’s Code of Ethics for Principal Executive Officer, Principal Financial Officer and Principal Accounting Officer, which is the subject of the disclosure required by Item 2 of Form N-CSR, is filed hereto as Exhibit 12.a.1. |
| (a)(2) | A separate certification for the Registrant’s Principal Executive Officer and Principal Financial Officer as required by Rule 30a-2(a) under the 1940 Act (17 CFR 270.30a-2(a)), are attached hereto as Ex 99.Cert. |
| (b) | The certifications by the Registrant’s Principal Executive Officer and Principal Financial Officer, as required by Rule 30a-2(b) of the 1940 Act and Section 906 of the Sarbanes-Oxley Act of 2002 are attached hereto as Ex99.906Cert. |
SIGNATURES
Pursuant to the requirements of the Securities Exchange Act of 1934 and the Investment Company Act of 1940, the Registrant has duly caused this report to be signed on its behalf by the undersigned, thereunto duly authorized.
Broadview Funds Trust
| By: | /s/ Richard E. Lane | |
| | Richard E. Lane | |
| | President | |
| | | |
| Date: | November 27, 2017 | |
Pursuant to the requirements of the Securities Exchange Act of 1934 and the Investment Company Act of 1940, this report has been signed below by the following persons on behalf of the Registrant and in the capacities and on the dates indicated.
| By: | /s/ Richard E. Lane | |
| | Richard E. Lane | |
| | President (Principal Executive Officer) | |
| | | |
| Date: | November 27, 2017 | |
| By: | /s/ Aaron J. Garcia | |
| | Aaron J. Garcia | |
| | Chief Financial Officer (Principal Financial Officer) | |
| | | |
| Date: | November 27, 2017 | |