Free Writing Prospectus Filed Pursuant to Rule 433 Registration Statement No. 333-191801 December 12, 2014
|

Free Writing Prospectus
Filed Pursuant to Rule 433
Registration Statement No. 333-191801
December 12, 2014
Investor Presentation
3Q’14
3Q’14 Financial Data—$15.0 Million Offering
|
Forward Looking Statements
This Presentation, including information incorporated herein by reference, may contain forward-looking statements within the meaning of the Private Securities Litigation Reform Act of 1995. Words such as “may,” “could,” “should,” “would,” “believe,” “anticipate,” “estimate,” “expect,” “intend,” “plan,” “project,” “is confident that,” and similar expressions are intended to identify these forward-looking statements. These forward-looking statements involve risk and uncertainty and a variety of factors could cause our actual results and experience to differ materially from the anticipated results or other expectations expressed in these forward-looking statements. We do not have a policy of updating or revising forward looking statements except as otherwise required by law, and silence by management over time should not be construed to mean that actual events are occurring as estimated in such forward-looking statements.
Our ability to predict results or the actual effect of future plans or strategies is inherently uncertain. Factors that could have a material adverse effect on our operations and the operations of our subsidiary, Prime Meridian Bank, include, but are not limited to, changes in:
risk factors named in the Prospectus general economic conditions legislative/regulatory changes
monetary and fiscal policies of the U.S. Government
the quality and composition of our loan or investment portfolios competition demand for loan and deposit products demand for financial services in our primary trade area litigation, tax, and other regulatory matters accounting principles and guidelines
other economic, competitive, governmental, regulatory, or technological factors affecting us
Prime Meridian Holding Company (“Prime Meridian”) has filed a registration statement (including a Prospectus) with the SEC for the Offering to which this communication relates. Before you invest, you should read the Prospectus in that registration statement and other documents Prime Meridian has filed with the SEC for more complete information about Prime Meridian and this Offering. You may get these documents for free by visiting EDGAR on the SEC Web site at www.sec.gov or you may access the Prospectus at Prime Meridian’s website at www.primemeridianbank.com. Alternatively, Prime Meridian will arrange to send you the Prospectus if you request it by calling (850) 907-2301, or by emailing a request to: sdixon@primemeridianbank.com.
2 |
|
|
Table of Contents
SECTION DESCRIPTION
I. Offering Overview II. Company Overview III. Financial Highlights
IV. Appendix
|

I. Offering Overview
|
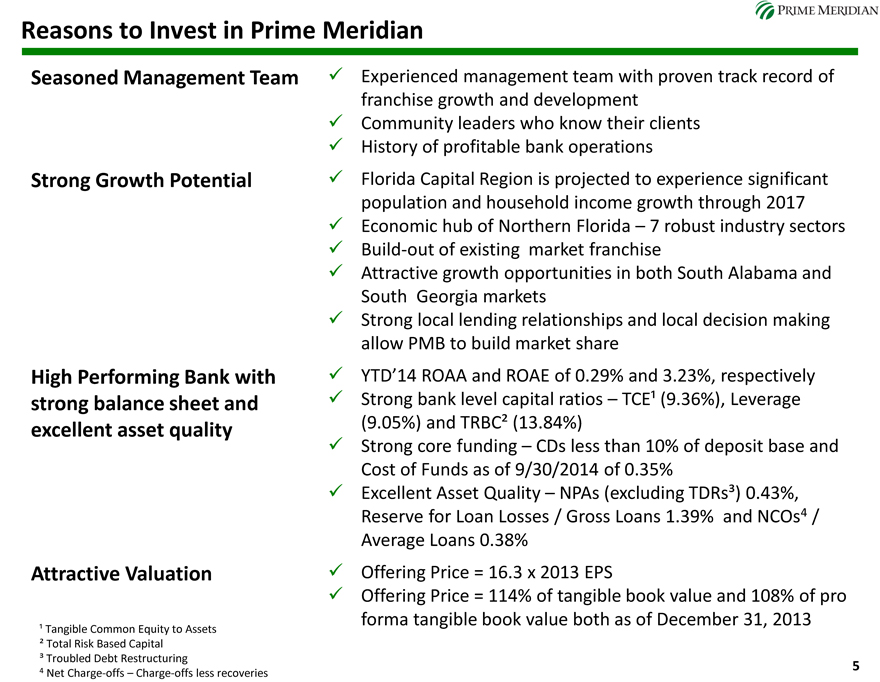
Reasons to Invest in Prime Meridian
Seasoned Management Team
Strong Growth Potential
High Performing Bank with strong balance sheet and excellent asset quality
Attractive Valuation
Experienced management team with proven track record of franchise growth and development Community leaders who know their clients History of profitable bank operations Florida Capital Region is projected to experience significant population and household income growth through 2017 Economic hub of Northern Florida – 7 robust industry sectors Build-out of existing market franchise Attractive growth opportunities in both South Alabama and South Georgia markets Strong local lending relationships and local decision making allow PMB to build market share
YTD’14 ROAA and ROAE of 0.29% and 3.23%, respectively
Strong bank level capital ratios – TCE¹ (9.36%), Leverage (9.05%) and TRBC² (13.84%) Strong core funding – CDs less than 10% of deposit base and Cost of Funds as of 9/30/2014 of 0.35% Excellent Asset Quality – NPAs (excluding TDRs³) 0.43%, Reserve for Loan Losses / Gross Loans 1.39% and NCOs4 / Average Loans 0.38% Offering Price = 16.3 x 2013 EPS
Offering Price = 114% of tangible book value and 108% of pro forma tangible book value both as of December 31, 2013
¹ Tangible Common Equity to Assets
² Total Risk Based Capital
³ Troubled Debt Restructuring
4 Net Charge-offs – Charge-offs less recoveries
5 |
|
|
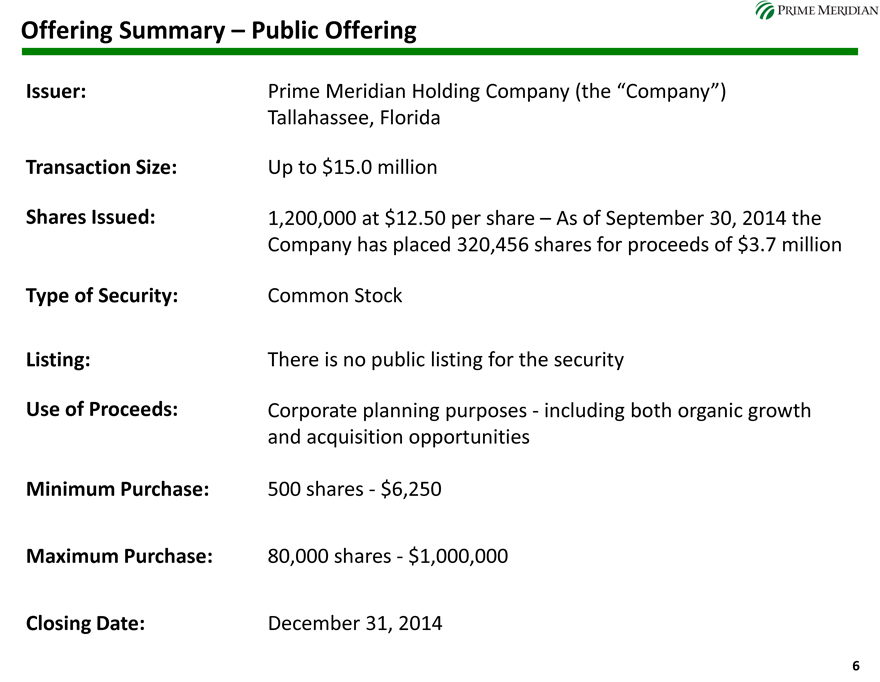
Offering Summary – Public Offering
Issuer: Prime Meridian Holding Company (the “Company”)
Tallahassee, Florida
Transaction Size: Up to $15.0 million
Shares Issued: 1,200,000 at $12.50 per share – As of September 30, 2014 the
Company has placed 320,456 shares for proceeds of $3.7 million
Type of Security: Common Stock
Listing: There is no public listing for the security
Use of Proceeds: Corporate planning purposes—including both organic growth
and acquisition opportunities
Minimum Purchase: 500 shares—$6,250
Maximum Purchase: 80,000 shares—$1,000,000
Closing Date: December 31, 2014
6 |
|
|
Use of Proceeds
In the event the Bank raises $5.0 million or less, the net proceeds of the offering will be used for:
General corporate purposes, which may include:
maintaining liquidity for the Company
continuing to support the growth of the Bank while maintaining strong capital levels
Should the Bank raise between $5.0 million and $10.0 million, the net proceeds of the offering will be used for general corporate purposes, while also considering:
Branching or branch acquisition opportunities in the following markets:
North Florida South Georgia South Alabama
In the event the Bank raises more than $10.0 million, the net proceeds of the offering will be used for all of the aforementioned purposes above, while also considering:
The acquisition of another financial institution within the next 18 months
Source: S-1 Registration Statement
7 |
|
|
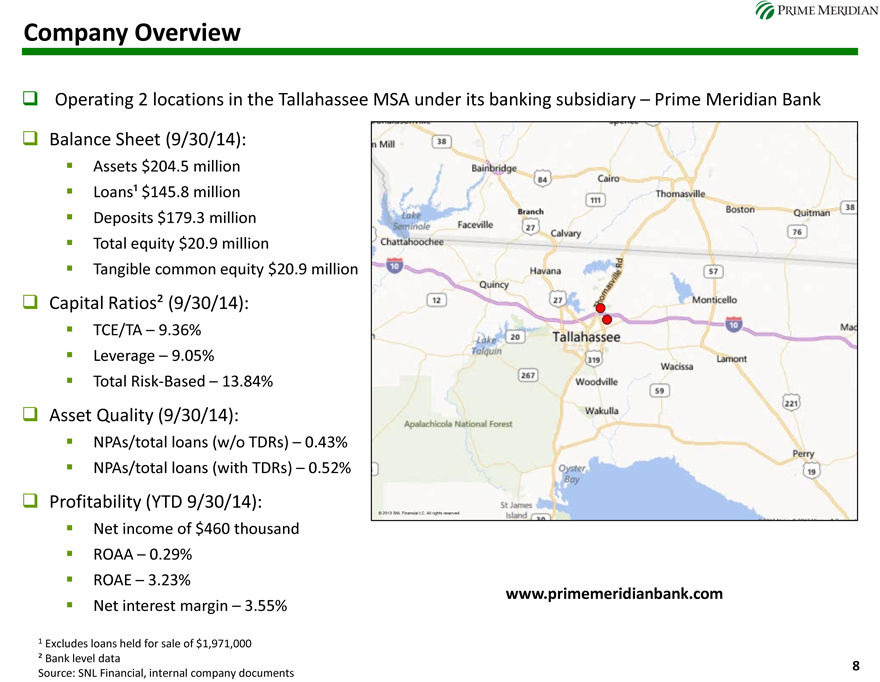
Company Overview
Operating 2 locations in the Tallahassee MSA under its banking subsidiary – Prime Meridian Bank
Balance Sheet (9/30/14):
Assets $204.5 million Loans¹ $145.8 million Deposits $179.3 million Total equity $20.9 million
Tangible common equity $20.9 million
Capital Ratios² (9/30/14):
TCE/TA – 9.36% Leverage – 9.05% Total Risk-Based – 13.84%
Asset Quality (9/30/14):
NPAs/total loans (w/o TDRs) – 0.43% NPAs/total loans (with TDRs) – 0.52%
Profitability (YTD 9/30/14):
Net income of $460 thousand ROAA – 0.29% ROAE – 3.23% Net interest margin – 3.55%
1 Excludes loans held for sale of $1,971,000
² Bank level data
Source: SNL Financial, internal company documents
www.primemeridianbank.com
8
|

II. Company Overview
|
A Community Focused Institution
“Building bankers to serve our clients and community in order to optimize shareholder value.”
Established in 2008, Prime Meridian Bank was founded by a group of local business professionals.
Our Competitive Strengths:
Experienced and engaged management team and local Board
Strong brand and culture
Expertise in commercial lending Effective and flexible technology Stable and scalable platform
10
|
A Community Focused Institution
“Let’s think of a few good reasons why it CAN be done!”
Our Core Principles:
Passion – level of intense excellence and commitment beyond simply meeting requirements
Grace – high level of service with courtesy and compassion
Integrity – doing the right thing because it’s the right thing to do
Tenacity – culture of looking at new ideas, tackling challenges and overcoming obstacles
Accountability – accepting full and ultimate responsibility
11
|
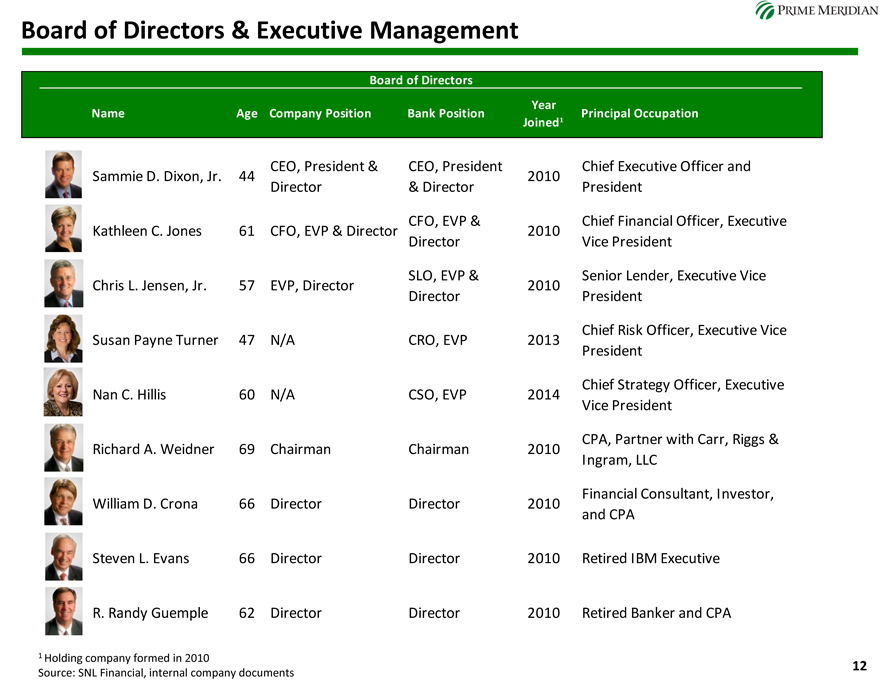
Board of Directors & Executive Management
Board of Directors
Year
Name Age Company Position Bank Position Principal Occupation Joined¹
CEO, President & CEO, President Chief Executive Officer and Sammie D. Dixon, Jr. 44 2010 Director & Director President
CFO, EVP & Chief Financial Officer, Executive Kathleen C. Jones 61 CFO, EVP & Director 2010 Director Vice President
SLO, EVP & Senior Lender, Executive Vice Chris L. Jensen, Jr. 57 EVP, Director 2010 Director President
Chief Risk Officer, Executive Vice Susan Payne Turner 47 N/A CRO, EVP 2013 President
Chief Strategy Officer, Executive Nan C. Hillis 60 N/A CSO, EVP 2014 Vice President
CPA, Partner with Carr, Riggs & Richard A. Weidner 69 Chairman Chairman 2010 Ingram, LLC
Financial Consultant, Investor, William D. Crona 66 Director Director 2010 and CPA
Steven L. Evans 66 Director Director 2010 Retired IBM Executive
R. Randy Guemple 62 Director Director 2010 Retired Banker and CPA
ing company formed in 2010
Source: SNL Financial, internal company documents 12
|
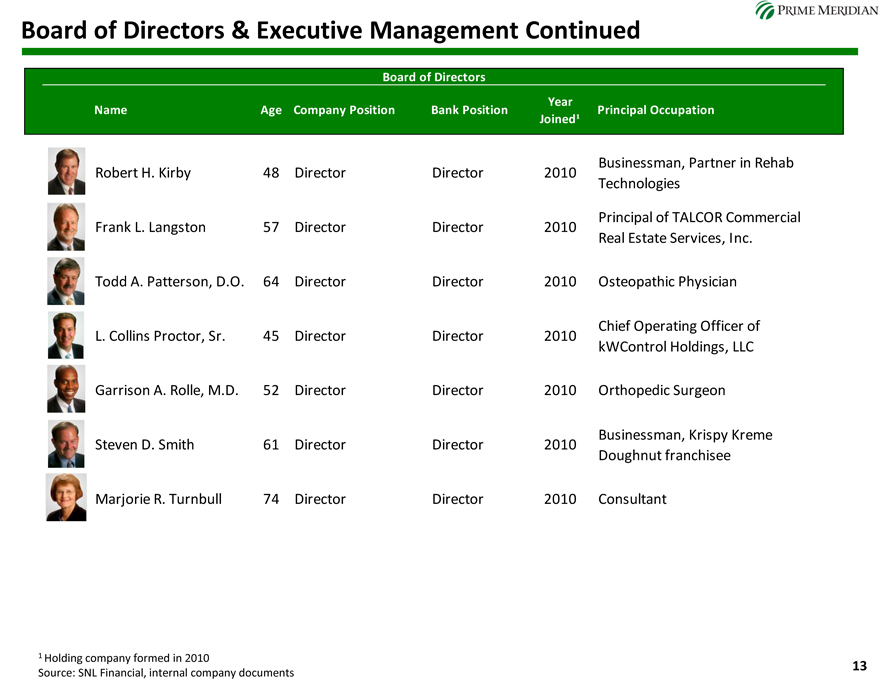
Board of Directors & Executive Management Continued
Board of Directors
Year
Name Age Company Position Bank Position Principal Occupation Joined¹
Businessman, Partner in Rehab Robert H. Kirby 48 Director Director 2010 Technologies
Principal of TALCOR Commercial Frank L. Langston 57 Director Director 2010 Real Estate Services, Inc.
Todd A. Patterson, D.O. 64 Director Director 2010 Osteopathic Physician
Chief Operating Officer of L. Collins Proctor, Sr. 45 Director Director 2010 kWControl Holdings, LLC
Garrison A. Rolle, M.D. 52 Director Director 2010 Orthopedic Surgeon
Businessman, Krispy Kreme Steven D. Smith 61 Director Director 2010 Doughnut franchisee
Marjorie R. Turnbull 74 Director Director 2010 Consultant
1 Holding company formed in 2010
Source: SNL Financial, internal company documents
13
|
Executive Management Team
Sammie D. Dixon, Jr., Chief Executive Officer
Prior to joining the Bank, from June 2005 to December 2006, Mr. Dixon was the Senior Vice President and Commercial Sales Manager for Regions Bank in Tallahassee, Florida. From August 2003 to June 2005, he served as Chief Executive Officer and President for Bank of Thomas County, Georgia. From April 1999 to 2003, Mr. Dixon held various positions with Bank of Florida – Southwest in Naples, Florida. Mr. Dixon began his banking career with NationsBank in 1997. Mr. Dixon is active in the community as a member of the Rotary Club of Tallahassee, a Board member of Big Bend Hospice Foundation, a member of the Tallahassee Memorial Hospital Foundation Board of Trustees, a Board member of the Economic Development Council of Tallahassee/Leon County, and a member of Saint Peter’s Anglican Church. Mr. Dixon’s banking experience and intimate knowledge of the Bank qualifies him to serve on our Board of Directors.
Kathleen C. Jones, Chief Financial Officer
Prior to joining the Bank, Mrs. Jones spent 36 years with SunTrust Bank and its predecessor institutions. Mrs. Jones retired from SunTrust Bank in 2007, at the position of the North Florida Regional Senior Vice President and Senior Banking Operations Manager. She is a 1978 graduate of Florida State University where she received a Bachelor of Science in Finance. She also is a 1988 graduate of the Graduate School of Banking of the South in Baton Rouge, Louisiana. Mrs. Jones is a member of Thomasville Road Baptist Church. Mrs. Jones’ banking experience and intimate knowledge of the Company’s financial operations qualify her to serve on our Board of Directors.
Source: SNL Financial, internal company documents
14
|
Executive Management Team
Chris Jensen, Jr., Senior Lender
Prior to joining the Bank, from February 2005 to 2007, Mr. Jensen served as Tallahassee Market President for Regions Bank. Before that, Mr. Jensen held various management positions with SouthTrust Bank from 1997 to 2005, culminating with the position of Tallahassee’s Market President. He also served as Senior Lender for First Bank of Tallahassee in its de novo stage in 1990. Mr. Jensen has over 30 years of lending experience in Tallahassee and the surrounding markets. He is active in the community and currently serves on the Boards of several local groups including the Young Actors Theatre, the Suwannee River Area Council for the Boy Scouts of America and the Rotary Club of Tallahassee. Mr. Jensen’s banking experience and intimate knowledge of the Bank’s lending activities and market qualifies him to serve on our Board of Directors.
Susan Payne Turner, Chief Risk Officer
Mrs. Turner was formerly a Regional Retail Leader for Centennial Bank, where her responsibilities included management of retail for ten branches located in Leon, Wakulla, Calhoun and Liberty Counties. Prior to this position, Mrs. Turner was Chief Financial Officer for a community bank with responsibilities in: financials, budgeting, staff management and development; AML/BSA compliance; deposit compliance; facility expansion; GLBA-Technology; and audit/exam initiatives. Mrs. Turner began her banking career while working part-time in high school and has worked in many areas of banking including operations, marketing, compliance, financials and human resources. She is a graduate of Florida State University and received her Master’s in Business Administration from Troy University in 2005. Mrs. Turner also graduated from the Graduate School of Banking at LSU. She is the immediate past Chair for Tallahassee Community College Foundation and has recently been selected as a Co-Chair for the Tallahassee Community College’s Alumni Association. She is also the Chair for the Wakulla County Senior Citizens’ Council and serves on the Wakulla County Chamber of Commerce Board as Director Emeritus.
Source: SNL Financial, internal company documents
15
|
Executive Management Team
Nan C. Hillis, Chief Strategy Officer
Mrs. Hillis is a veteran banker and former BB&T Region President. She previously oversaw bank operations for BB&T’s Central Florida Region, including 57 branches in Polk, Osceola, Orange, Seminole and Brevard counties, with deposits exceeding $2.7 billion. She served BB&T in the central Florida area from July, 2006 to June, 2012. She joined BB&T in 2002 serving mostly as a corporate and community lender. As their city executive in Tallahassee, she later earned the bank’s highest internal recognition as a leader and revenue producer. Mrs. Hillis has a Bachelor’s Degree in Finance and Marketing from Florida State University (FSU). She is immediate past chair of the FSU College of Business Board of Governors, serves on the FSU Foundation Board of Trustees, and chairs the Audit Committee. She served as a former member of the National Board of Directors of the Girl Scouts of the USA, a position she held for 9 years. Mrs. Hillis manages Prime Meridian Bank’s sales program as well as identifies and enhances the bank’s strategies for acquisition and expansion.
Source: SNL Financial, internal company documents
16
|
THIS PAGE INTENTIONALLY LEFT BLANK
17
|
Franchise Footprint – Metro Tallahassee
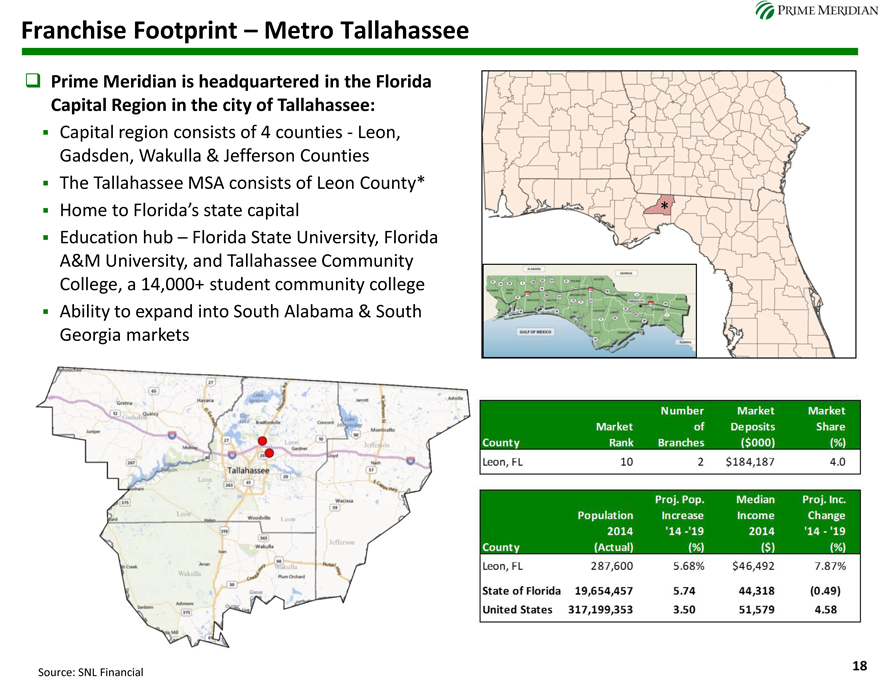
Prime Meridian is headquartered in the Florida Capital Region in the city of Tallahassee:
Capital region consists of 4 counties—Leon, Gadsden, Wakulla & Jefferson Counties The Tallahassee MSA consists of Leon County*
Home to Florida’s state capital
Education hub – Florida State University, Florida A&M University, and Tallahassee Community College, a 14,000+ student community college Ability to expand into South Alabama & South Georgia markets
Source: SNL Financial
Country Market Rank Number of Branches Market Deposits ($000) Market Share (%)
Leon, FL 10
2
$184,187
4.0
Country
Population 2014 (Actual) Proj. Pop. Increase ‘14 - ‘19 (%) Median Income 2014 ($) Proj. Inc. Change ‘14 - ‘19 (%)
Leon, FL 287,600 5.68% $46,492 7.87%
State of Florida
19,654,457
5.74
44,318
(0.49)
United States 317,199,353
3.50
51,579
4.58
18
|
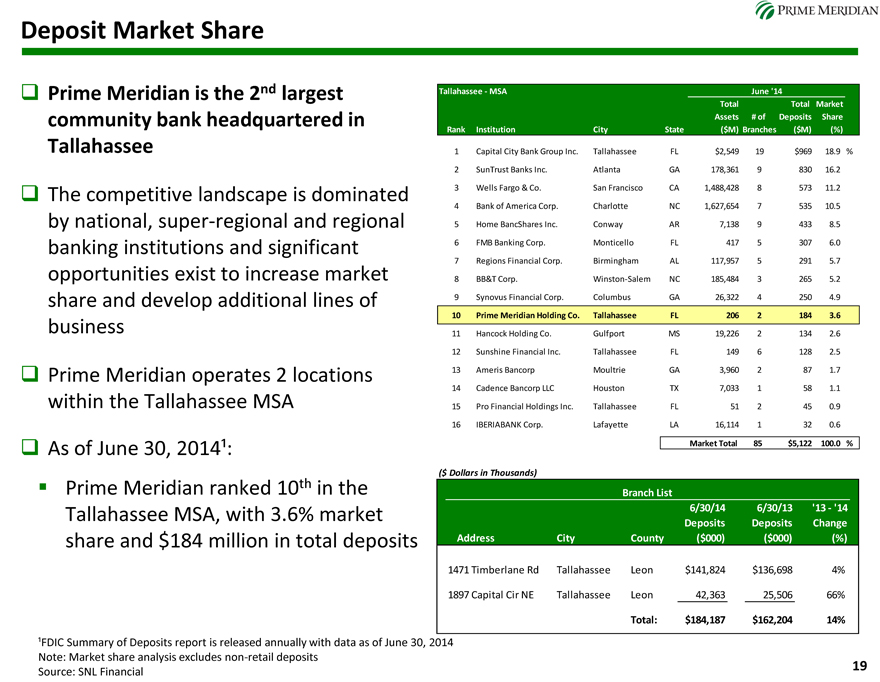
prime meridian Deposit Market Share Prime Meridian is the 2nd largest community bank headquartered in Tallahassee The competitive landscape is dominated by national, super-regional and regional banking institutions and significant opportunities exist to increase market share and develop additional lines of business Prime Meridian operates 2 locations within the Tallahassee MSA As of June 30, 2014¹: Prime Meridian ranked 10th in the Tallahassee MSA, with 3.6% market share and $184 million in total deposits 1 Capital City Bank Group Inc. Tallahassee FL $2,549 19 $969 18.9 % 2 SunTrust Banks Inc. Atlanta GA 178,361 9 830 16.2 3 Wells Fargo & Co. San Francisco CA 1,488,428 8 573 11.2 4 Bank of America Corp. Charlotte NC 1,627,654 7 535 10.5 5 Home BancShares Inc. Conway AR 7,138 9 433 8.5 6 FMB Banking Corp. Monticello FL 417 5 307 6.0 7 Regions Financial Corp. Birmingham AL 117,957 5 291 5.7 8 BB&T Corp. Winston-Salem NC 185,484 3 265 5.2 9 Synovus Financial Corp. Columbus GA 26,322 4 250 4.9 10 Prime Meridian Holding Co. Tallahassee FL 206 2 184 3.6 11 Hancock Holding Co. Gulfport MS 19,226 2 134 2.6 12 Sunshine Financial Inc. Tallahassee FL 149 6 128 2.5 13 Ameris Bancorp Moultrie GA 3,960 2 87 1.7 14 Cadence Bancorp LLC Houston TX 7,033 1 58 1.1 15 Pro Financial Holdings Inc. Tallahassee FL 51 2 45 0.9 16 IBERIABANK Corp. Lafayette LA 16,114 1 32 0.6 Market Total 85 $5,122 100.0 % ($ Dollars in Thousands) 1471 Timberlane Rd Tallahassee Leon $141,824 $136,698 4% 1897 Capital Cir NE Tallahassee Leon 42,363 25,506 66% Total: $184,187 $162,204 14% ¹FDIC Summary of Deposits report is released annually with data as of June 30, 2014 Note: Market share analysis excludes non-retail deposits Source: SNL Financial 19
|
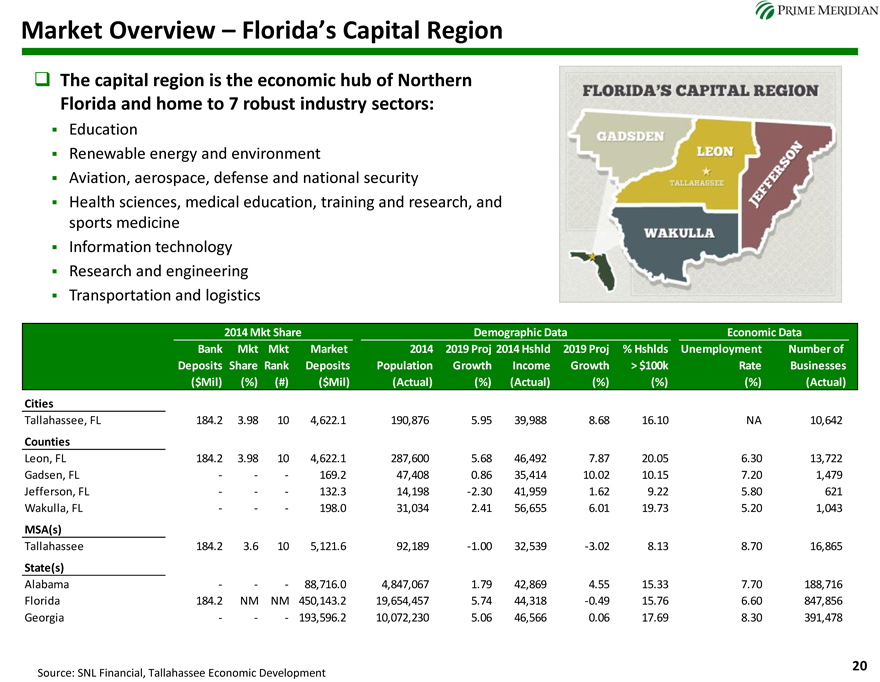
prime meridian Market Overview – Florida’s Capital Region The capital region is the economic hub of Northern Florida and home to 7 robust industry sectors: Education Renewable energy and environment Aviation, aerospace, defense and national security Health sciences, medical education, training and research, and sports medicine Information technology Research and engineering Transportation and logistics Florida“s capital region Gadsden leon Tallahassee jeffrson Wakulla) Cities Tallahassee, FL 184.2 3.98 10 4,622.1 190,876 5.95 39,988 8.68 16.10 NA 10,642 Counties Leon, FL 184.2 3.98 10 4,622.1 287,600 5.68 46,492 7.87 20.05 6.30 13,722 Gadsen, FL ——169.2 47,408 0.86 35,414 10.02 10.15 7.20 1,479 Jefferson, FL ——132.3 14,198 -2.30 41,959 1.62 9.22 5.80 621 Wakulla, FL ——198.0 31,034 2.41 56,655 6.01 19.73 5.20 1,043 MSA(s) Tallahassee 184.2 3.6 10 5,121.6 92,189 -1.00 32,539 -3.02 8.13 8.70 16,865 State(s) Alabama —— 88,716.0 4,847,067 1.79 42,869 4.55 15.33 7.70 188,716 Florida 184.2 NM NM 450,143.2 19,654,457 5.74 44,318 -0.49 15.76 6.60 847,856 Georgia ——193,596.2 10,072,230 5.06 46,566 0.06 17.69 8.30 391,478 Source: SNL Financial, Tallahassee Economic Development 20
|
prime meridian Post Transaction Opportunities Build-out of existing operating platform Additional capital enables growth of existing balance sheet Strong infrastructure can support a much larger institution Scalable employee base helps facilitate increased market share Expansion into neighboring growth markets Branching or acquisitions Franchise expansion within the Florida panhandle market Attractive growth opportunities in the South Alabama & South Georgia markets Strong deposit market Florida Panhandle is a liquid deposit market with available low cost deposits Prime Meridian continues to attract lower cost core deposits The market is dominated by larger regional and super-regional institutions; significant opportunities exist to gain market share from these institutions 21
|

III. Financial Highlights
|
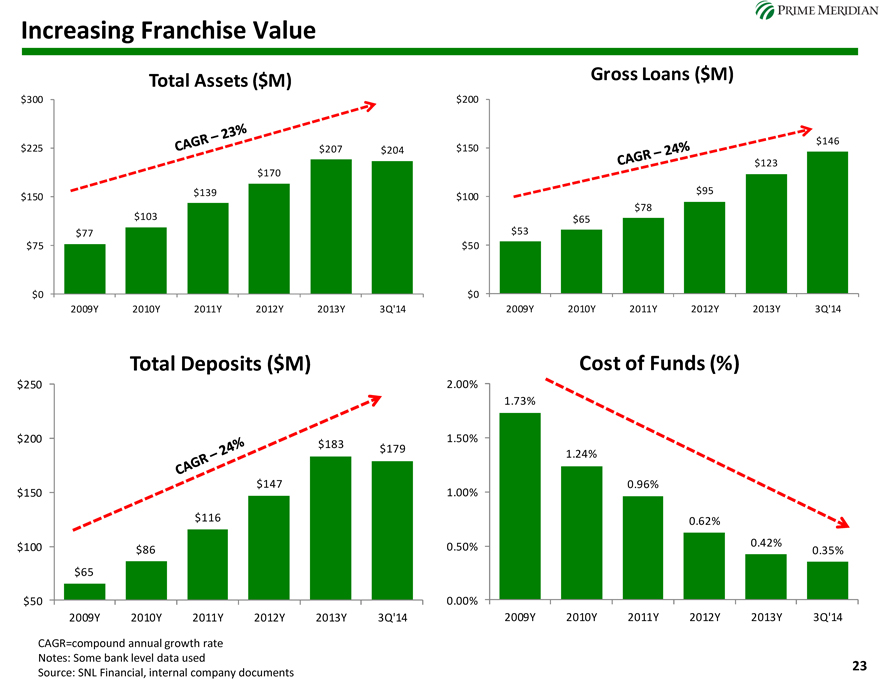
prime meridian Increasing Franchise Value Total Assets ($M) $300 $225 $207 $204 $170 $139 $150 $103 $77 $75 $0 2009Y 2010Y 2011Y 2012Y 2013Y 3Q’14 Cagr – 23% Gross Loans ($M) $200 $146 $150 $123 $95 $100 $78 $65 $53 $50 $0 2009Y 2010Y 2011Y 2012Y 2013Y 3Q’14 Cagr – 24% Total Deposits ($M) $250 $200 $183 $179 $150 $147 $116 $100 $86 $65 $50 2009Y 2010Y 2011Y 2012Y 2013Y 3Q’14 Cost of Funds (%) 2.00% 1.73% 1.50% 1.24% 0.96% 1.00% 0.62% 0.50% 0.42% 0.35% 0.00% 2009Y 2010Y 2011Y 2012Y 2013Y 3Q’14 CAGR=compound annual growth rate Notes: Some bank level data used Source: SNL Financial, internal company documents 23
|
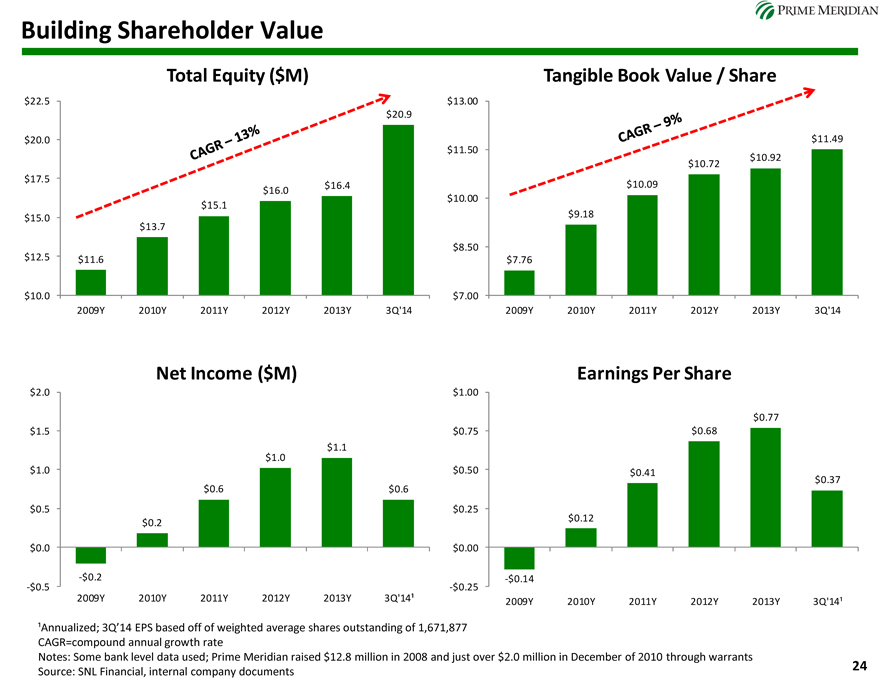
prime meridian Building Shareholder Value Total Equity ($M) Tangible Book Value / Share $22.5 $13.00 $20.9 $20.0 $11.49 $11.50 $10.92 $10.72 $17.5 $16.4 $10.09 $16.0 $10.00 $15.1 $9.18 $15.0 $13.7 $8.50 $12.5 $11.6 $7.76 $10.0 $7.00 2009Y 2010Y 2011Y 2012Y 2013Y 3Q’14 2009Y 2010Y 2011Y 2012Y 2013Y 3Q’14 Net Income ($M) Earnings Per Share $2.0 $1.00 $0.77 $1.5 $0.75 $0.68 $1.1 $1.0 $1.0 $0.50 $0.41 $0.37 $0.6 $0.6 $0.5 $0.25 $0.12 $0.2 $0.0 $0.00 -$0.2 -$0.14 -$0.5 -$0.25 2009Y 2010Y 2011Y 2012Y 2013Y 3Q’14¹ 2009Y 2010Y 2011Y 2012Y 2013Y 3Q’14¹ Cagr – 13% Cagr – 9% 1Annualized; 3Q’14 EPS based off of weighted average shares outstanding of 1,671,877 CAGR=compound annual growth rate Notes: Some bank level data used; Prime Meridian raised $12.8 million in 2008 and just over $2.0 million in December of 2010 through warrants Source: SNL Financial, internal company documents 24
|
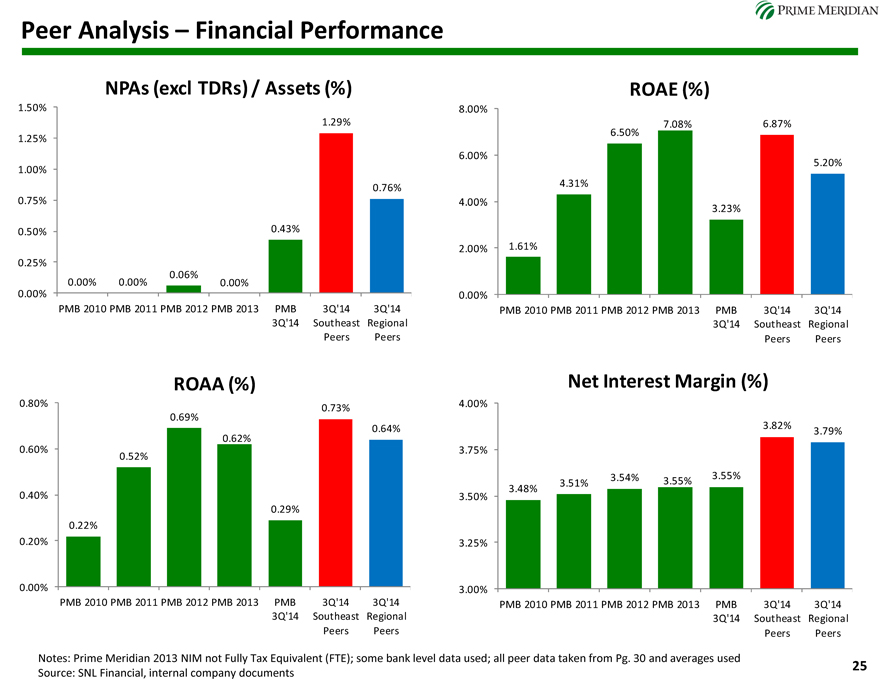
prime meridian Peer Analysis – Financial Performance NPAs (excl TDRs) / Assets (%) ROAE (%) 1.50% 8.00% 1.29% 7.08% 6.87% 6.50% 1.25% 6.00% 5.20% 1.00% 4.31% 0.76% 0.75% 4.00% 3.23% 0.50% 0.43% 2.00% 1.61% 0.25% 0.06% 0.00% 0.00% 0.00% 0.00% 0.00% PMB 2010 PMB 2011 PMB 2012 PMB 2013 PMB 3Q’14 3Q’14 PMB 2010 PMB 2011 PMB 2012 PMB 2013 PMB 3Q’14 3Q’14 3Q’14 Southeast Regional 3Q’14 Southeast Regional Peers Peers Peers Peers ROAA (%) Net Interest Margin (%) 0.80% 4.00% 0.73% 0.69% 3.82% 0.64% 3.79% 0.62% 0.60% 3.75% 0.52% 3.54% 3.55% 3.51% 3.55% 3.48% 0.40% 3.50% 0.29% 0.22% 0.20% 3.25% 0.00% 3.00% PMB 2010 PMB 2011 PMB 2012 PMB 2013 PMB 3Q’14 3Q’14 PMB 2010 PMB 2011 PMB 2012 PMB 2013 PMB 3Q’14 3Q’14 3Q’14 Southeast Regional 3Q’14 Southeast Regional Peers Peers Peers Peers Notes: Prime Meridian 2013 NIM not Fully Tax Equivalent (FTE); some bank level data used; all peer data taken from Pg. 30 and averages used 25 Source: SNL Financial, internal company documents
|
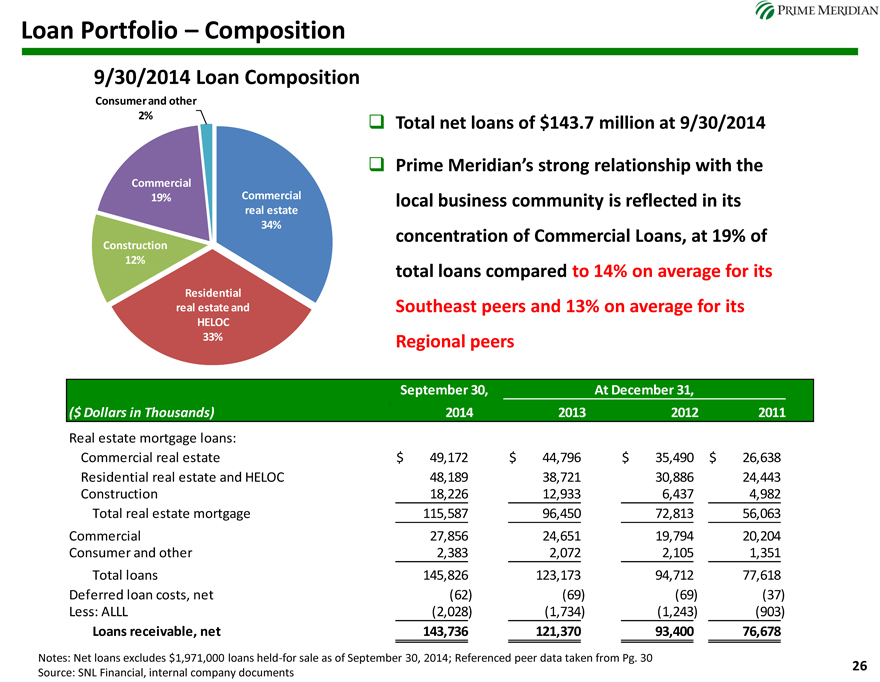
prime meridian Loan Portfolio – Composition 9/30/2014 Loan Composition Consumer and other 2%? Total net loans of $143.7 million at 9/30/2014 ? Prime Meridian’s strong relationship with the local business community is reflected in its concentration of Commercial Loans, at 19% of total loans compared to 14% on average for its Southeast peers and 13% on average for its Regional Real estate mortgage loans: Commercial real estate $ 49,172 $ 44,796 $ 35,490 $ 26,638 Residential real estate and HELOC 48,189 38,721 30,886 24,443 Construction 18,226 12,933 6,437 4,982 Total real estate mortgage 115,587 96,450 72,813 56,063 Commercial 27,856 24,65119,794 20,204 Consumer and other 2,383 2,072 2,105 1,351 Total loans 145,826 123,173 94,712 77,618 Deferred loan costs, net (62) (69) (69) (37) Less: ALLL (2,028) (1,734) (1,243) (903) Loans receivable, net 143,736 121,370 93,400 76,678 Notes: Net loans excludes $1,971,000 loans held-for sale as of September 30, 2014; Referenced peer data taken from Pg. 30 26 Source: SNL Financial, internal company documents
|
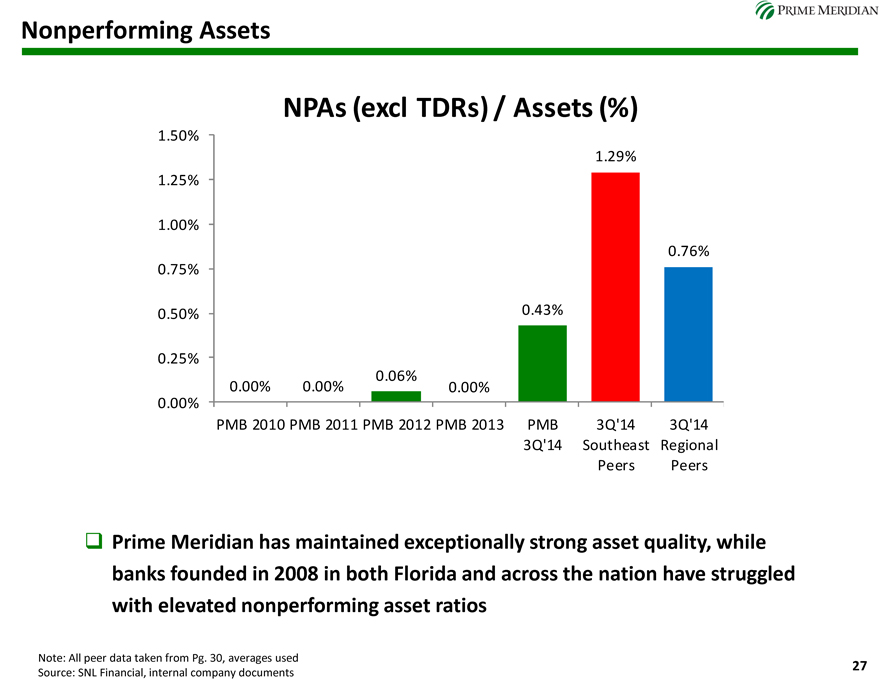
prime meridian Nonperforming Assets NPAs (excl TDRs) / Assets (%) 1.50% 1.29% 1.25% 1.00% 0.76% 0.75% 0.50% 0.43% 0.25% 0.06% 0.00% 0.00% 0.00% 0.00% PMB 2010 PMB 2011 PMB 2012 PMB 2013 PMB 3Q’14 3Q’14 3Q’14 Southeast Regional Peers Peers Prime Meridian has maintained exceptionally strong asset quality, while banks founded in 2008 in both Florida and across the nation have struggled with elevated nonperforming asset ratios Note: All peer data taken from Pg. 30, averages used 27 Source: SNL Financial, internal company documents 27
|
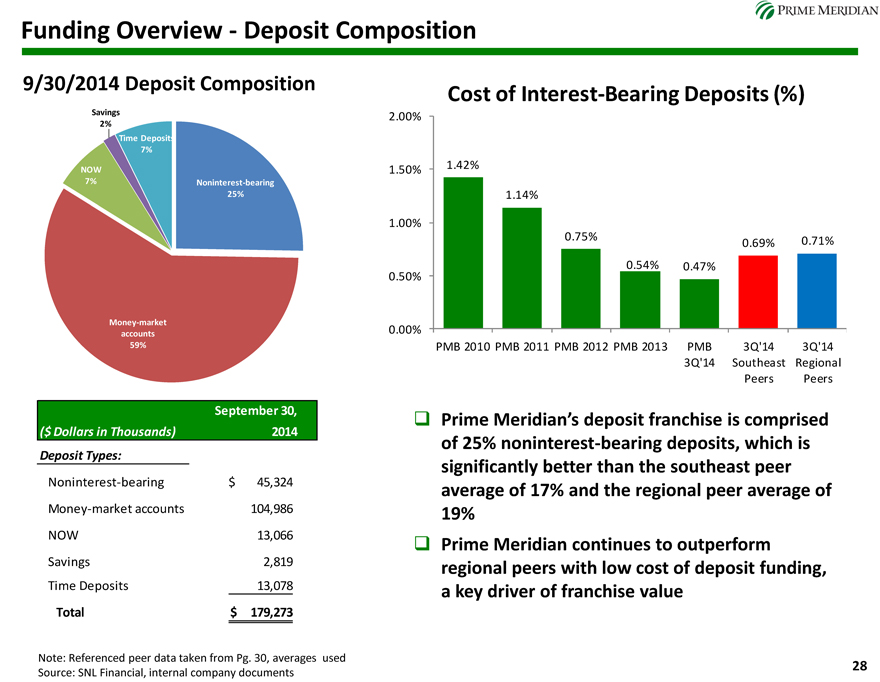
prime meridian Funding Overview—Deposit Composition 9/30/2014 Deposit Composition Savings 2% Time Deposits 7% NOW 7% Noninterest-bearing 25% Money-market accounts 59% time Deposits 7% Cost of Interest-Bearing Deposits (%) 2.00% 1.50% 1.42% 1.14% 1.00% 0.75% 0.71% 0.69% 0.54% 0.47% 0.50% 0.00% PMB 2010 PMB 2011 PMB 2012 PMB 2013 PMB 3Q’14 3Q’14 3Q’14 Southeast Regional Peers Peers September 30, ($ Dollars in Thousands) 2014 Deposit Types: Noninterest-bearing $ 45,324 Money-market accounts 104,986 NOW 13,066 Savings 2,819 Time Deposits 13,078 Total $ 179,273 Prime Meridian’s deposit franchise is comprised of 25% noninterest-bearing deposits, which is significantly better than the southeast peer average of 17% and the regional peer average of 19% Prime Meridian continues to outperform regional peers with low cost of deposit funding, a key driver of franchise value Note: Referenced peer data taken from Pg. 30, averages used Source: SNL Financial, internal company documents 28
|
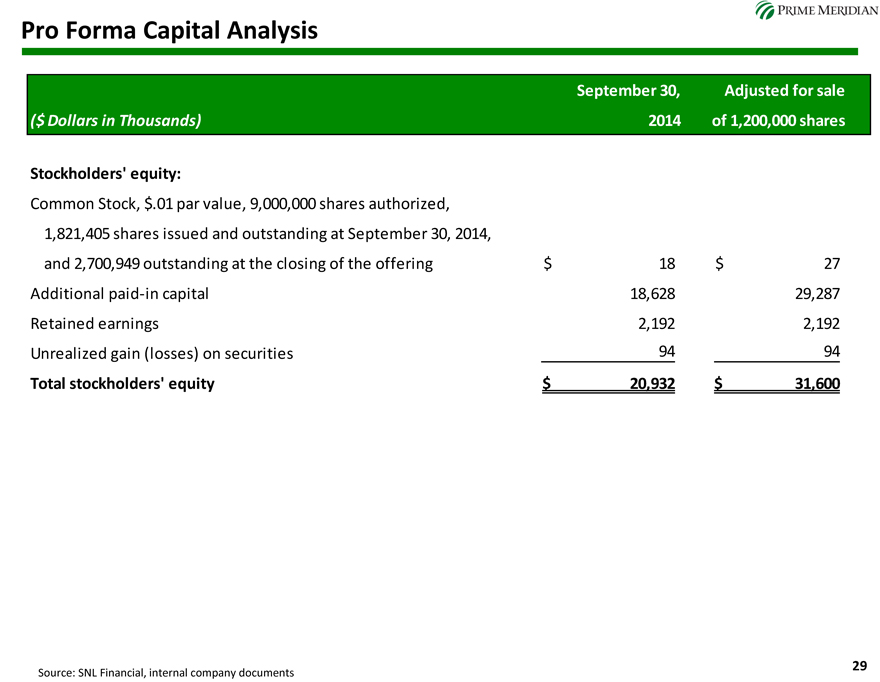
prime meridian Pro Forma Capital Analysis Stockholders’ equity: Common Stock, $.01 par value, 9,000,000 shares authorized, 1,821,405 shares issued and outstanding at September 30, 2014, and 2,700,949 outstanding at the closing of the offering $ 18 $ 27 Additional paid-in capital 18,628 29,287 Retained earnings 2,192 2,192 Unrealized gain (losses) on securities 94 94 Total stockholders’ equity $ 20,932 $ 31,600 Source: SNL Financial, internal company documents 29
|
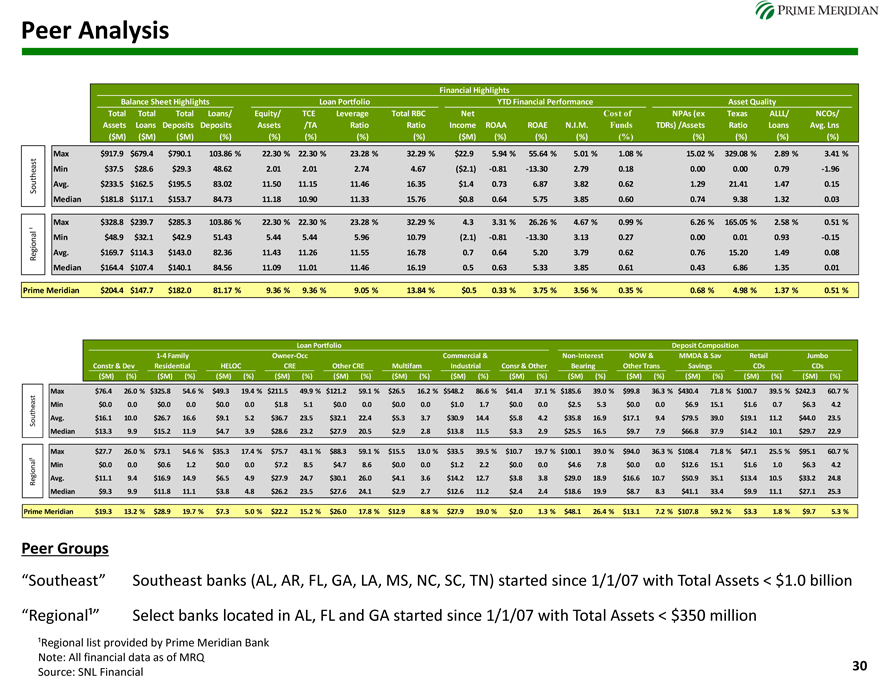
prime meridian Peer Analysis ) Max $917.9 $679.4 $790.1 103.86 % 22.30 % 22.30 % 23.28 % 32.29 % $22.9 5.94 % 55.64 % 5.01 % 1.08 % 15.02 % 329.08 % 2.89 % 3.41 % st ea Min $37.5 $28.6 $29.3 48.62 2.01 2.01 2.74 4.67 ($2.1) -0.81 -13.30 2.79 0.18 0.00 0.00 0.79 -1.96 outh Avg. $233.5 $162.5 $195.5 83.02 11.50 11.15 11.46 16.35 $1.4 0.73 6.87 3.82 0.62 1.29 21.41 1.47 0.15 S Median $181.8 $117.1 $153.7 84.73 11.18 10.90 11.33 15.76 $0.8 0.64 5.75 3.85 0.60 0.74 9.38 1.32 0.03 Max $328.8 $239.7 $285.3 103.86 % 22.30 % 22.30 % 23.28 % 32.29 % 4.3 3.31 % 26.26 % 4.67 % 0.99 % 6.26 % 165.05 % 2.58 % 0.51 % ¹ nal Min $48.9 $32.1 $42.9 51.43 5.44 5.44 5.96 10.79 (2.1) -0.81 -13.30 3.13 0.27 0.00 0.01 0.93 -0.15 Regio Avg. $169.7 $114.3 $143.0 82.36 11.43 11.26 11.55 16.78 0.7 0.64 5.20 3.79 0.62 0.76 15.20 1.49 0.08 Median $164.4 $107.4 $140.1 84.56 11.09 11.01 11.46 16.19 0.5 0.63 5.33 3.85 0.61 0.43 6.86 1.35 0.01 Prime Meridian $204.4 $147.7 $182.0 81.17 % 9.36 % 9.36 % 9.05 % 13.84 % $0.5 0.33 % 3.75 % 3.56 % 0.35 % 0.68 % 4.98 % 1.37 % 0.51 % Max $76.4 26.0 % $325.8 54.6 % $49.3 19.4 % $211.5 49.9 % $121.2 59.1 % $26.5 16.2 % $548.2 86.6 % $41.4 37.1 % $185.6 39.0 % $99.8 36.3 % $430.4 71.8 % $100.7 39.5 % $242.3 60.7 % st thea Min $0.0 0.0 $0.0 0.0 $0.0 0.0 $1.8 5.1 $0.0 0.0 $0.0 0.0 $1.0 1.7 $0.0 0.0 $2.5 5.3 $0.0 0.0 $6.9 15.1 $1.6 0.7 $6.3 4.2 u So Avg. $16.1 10.0 $26.7 16.6 $9.1 5.2 $36.7 23.5 $32.1 22.4 $5.3 3.7 $30.9 14.4 $5.8 4.2 $35.8 16.9 $17.1 9.4 $79.5 39.0 $19.1 11.2 $44.0 23.5 Median $13.3 9.9 $15.2 11.9 $4.7 3.9 $28.6 23.2 $27.9 20.5 $2.9 2.8 $13.8 11.5 $3.3 2.9 $25.5 16.5 $9.7 7.9 $66.8 37.9 $14.2 10.1 $29.7 22.9 Max $27.7 26.0 % $73.1 54.6 % $35.3 17.4 % $75.7 43.1 % $88.3 59.1 % $15.5 13.0 % $33.5 39.5 % $10.7 19.7 % $100.1 39.0 % $94.0 36.3 % $108.4 71.8 % $47.1 25.5 % $95.1 60.7 % a l¹ Min $0.0 0.0 $0.6 1.2 $0.0 0.0 $7.2 8.5 $4.7 8.6 $0.0 0.0 $1.2 2.2 $0.0 0.0 $4.6 7.8 $0.0 0.0 $12.6 15.1 $1.6 1.0 $6.3 4.2 Region Avg. $11.1 9.4 $16.9 14.9 $6.5 4.9 $27.9 24.7 $30.1 26.0 $4.1 3.6 $14.2 12.7 $3.8 3.8 $29.0 18.9 $16.6 10.7 $50.9 35.1 $13.4 10.5 $33.2 24.8 Median $9.3 9.9 $11.8 11.1 $3.8 4.8 $26.2 23.5 $27.6 24.1 $2.9 2.7 $12.6 11.2 $2.4 2.4 $18.6 19.9 $8.7 8.3 $41.1 33.4 $9.9 11.1 $27.1 25.3 Prime Meridian $19.3 13.2 % $28.9 19.7 % $7.3 5.0 % $22.2 15.2 % $26.0 17.8 % $12.9 8.8 % $27.9 19.0 % $2.0 1.3 % $48.1 26.4 % $13.1 7.2 % $107.8 59.2 % $3.3 1.8 % $9.7 5.3 % Peer Groups “Southeast” Southeast banks (AL, AR, FL, GA, LA, MS, NC, SC, TN) started since 1/1/07 with Total Assets < $1.0 billion “Regionalą” Select banks located in AL, FL and GA started since 1/1/07 with Total Assets < $350 million ¹Regional list provided by Prime Meridian Bank Note: All financial data as of MRQ Source: SNL Financial 30
|

IV. Appendix
|
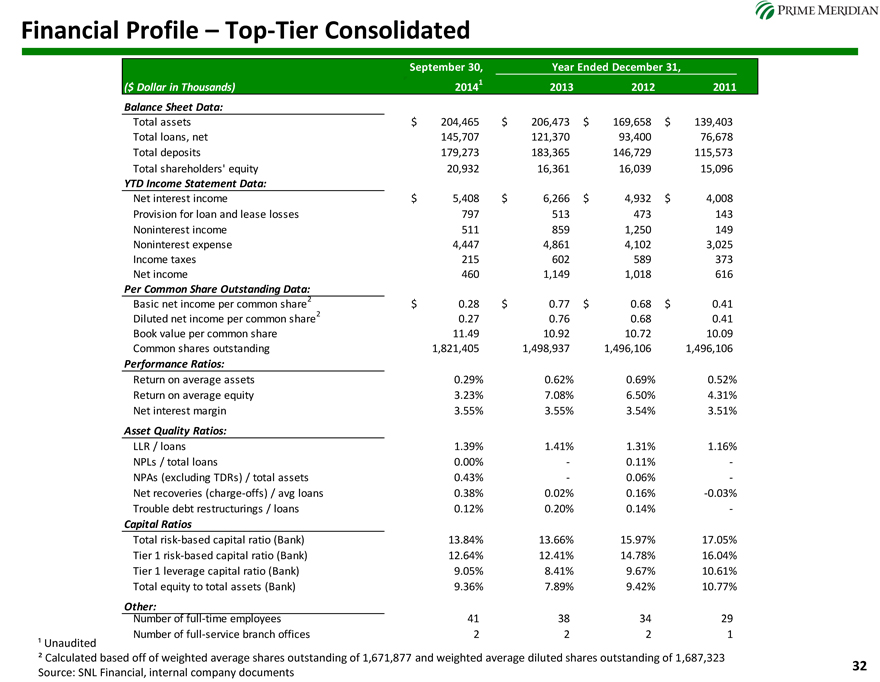
prime meridian Financial Profile – Top-Tier Consolidated September 30, Year Ended December 31, 1 ($ Dollar in Thousands) 2014 2013 2012 2011 Balance Sheet Data: Total assets $ 204,465 $ 206,473 $ 169,658 $ 139,403 Total loans, net 145,707 121,370 93,400 76,678 Total deposits 179,273 183,365 146,729 115,573 Total shareholders’ equity 20,932 16,361 16,039 15,096 YTD Income Statement Data: Net interest income $ 5,408 $ 6,266 $ 4,932 $ 4,008 Provision for loan and lease losses 797 513 473 143 Noninterest income 511 859 1,250 149 Noninterest expense 4,447 4,861 4,102 3,025 Income taxes 215 602 589 373 Net income 460 1,149 1,018 616 Per Common Share Outstanding Data: 2 Basic net income per common share $ 0.28 $ 0.77 $ 0.68 $ 0.41 2 Diluted net income per common share 0.27 0.76 0.68 0.41 Book value per common share 11.49 10.92 10.72 10.09 Common shares outstanding 1,821,405 1,498,937 1,496,106 1,496,106 Performance Ratios: Return on average assets 0.29% 0.62% 0.69% 0.52% Return on average equity 3.23% 7.08% 6.50% 4.31% Net interest margin 3.55% 3.55% 3.54% 3.51% Asset Quality Ratios: LLR / loans 1.39% 1.41% 1.31% 1.16% NPLs / total loans 0.00% —0.11% -NPAs (excluding TDRs) / total assets 0.43% —0.06% -Net recoveries (charge-offs) / avg loans 0.38% 0.02% 0.16% -0.03% Trouble debt restructurings / loans 0.12% 0.20% 0.14% —Capital Ratios Total risk-based capital ratio (Bank) 13.84% 13.66% 15.97% 17.05% Tier 1 risk-based capital ratio (Bank) 12.64% 12.41% 14.78% 16.04% Tier 1 leverage capital ratio (Bank) 9.05% 8.41% 9.67% 10.61% Total equity to total assets (Bank) 9.36% 7.89% 9.42% 10.77% Other: Number of full-time employees 41 38 34 29 Number of full-service branch offices 2 2 2 1 ¹ Unaudited ² Calculated based off of weighted average shares outstanding of 1,671,877 and weighted average diluted shares outstanding of 1,687,323 Source: SNL Financial, internal company documents 32
|
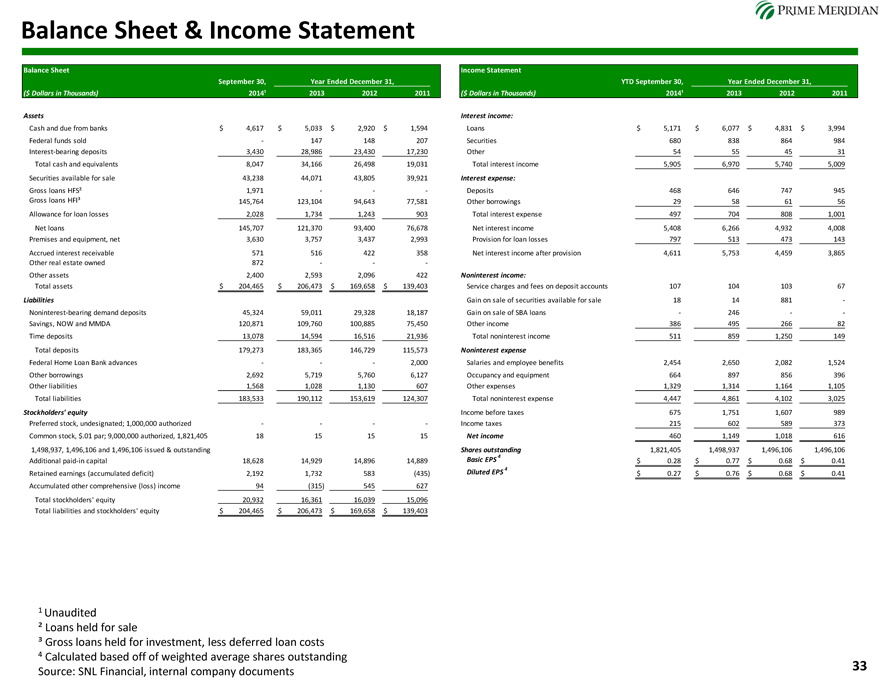
Balance Sheet & Income Statement
Balance Sheet
September 30, Year Ended December 31,
($ Dollars in Thousands) 2014¹ 2013 2012 2011
Assets
Cash and due from banks $ 4,617 $ 5,033 $ 2,920 $ 1,594
Federal funds sold—147 148 207
Interest-bearing deposits 3,430 28,986 23,430 17,230
Total cash and equivalents 8,047 34,166 26,498 19,031
Securities available for sale 43,238 44,071 43,805 39,921
Gross loans HFS² 1,971 — -
Gross loans HFI³ 145,764 123,104 94,643 77,581
Allowance for loan losses 2,028 1,734 1,243 903
Net loans 145,707 121,370 93,400 76,678
Premises and equipment, net 3,630 3,757 3,437 2,993
Accrued interest receivable 571 516 422 358
Other real estate owned 872 — -
Other assets 2,400 2,593 2,096 422
Total assets $ 204,465 $ 206,473 $ 169,658 $ 139,403
Liabilities
Noninterest-bearing demand deposits 45,324 59,011 29,328 18,187
Savings, NOW and MMDA 120,871 109,760 100,885 75,450
Time deposits 13,078 14,594 16,516 21,936
Total deposits 179,273 183,365 146,729 115,573
Federal Home Loan Bank advances ——2,000
Other borrowings 2,692 5,719 5,760 6,127
Other liabilities 1,568 1,028 1,130 607
Total liabilities 183,533 190,112 153,619 124,307
Stockholders’ equity
Preferred stock, undesignated; 1,000,000 authorized — —
Common stock, $.01 par; 9,000,000 authorized, 1,821,405 18 15 15 15
1,498,937, 1,496,106 and 1,496,106 issued & outstanding
Additional paid-in capital 18,628 14,929 14,896 14,889
Retained earnings (accumulated deficit) 2,192 1,732 583(435)
Accumulated other comprehensive (loss) income 94(315) 545 627
Total stockholders’ equity 20,932 16,361 16,039 15,096
Total liabilities and stockholders’ equity $ 204,465 $ 206,473 $ 169,658 $ 139,403
Income Statement
YTD September 30, Year Ended December 31,
($ Dollars in Thousands) 2014¹ 2013 2012 2011
Interest income:
Loans $ 5,171 $ 6,077 $ 4,831 $ 3,994
Securities 680 838 864 984
Other 54 55 45 31
Total interest income 5,905 6,970 5,740 5,009
Interest expense:
Deposits 468 646 747 945
Other borrowings 29 58 61 56
Total interest expense 497 704 808 1,001
Net interest income 5,408 6,266 4,932 4,008
Provision for loan losses 797 513 473 143
Net interest income after provision 4,611 5,753 4,459 3,865
Noninterest income:
Service charges and fees on deposit accounts 107 104 103 67
Gain on sale of securities available for sale 18 14 881 -
Gain on sale of SBA loans—246 —
Other income 386 495 266 82
Total noninterest income 511 859 1,250 149
Noninterest expense
Salaries and employee benefits 2,454 2,650 2,082 1,524
Occupancy and equipment 664 897 856 396
Other expenses 1,329 1,314 1,164 1,105
Total noninterest expense 4,447 4,861 4,102 3,025
Income before taxes 675 1,751 1,607 989
Income taxes 215 602 589 373
Net income 460 1,149 1,018 616
Shares outstanding 1,821,405 1,498,937 1,496,106 1,496,106
Basic EPS 4 $ 0.28 $ 0.77 $ 0.68 $ 0.41
Diluted EPS 4 $ 0.27 $ 0.76 $ 0.68 $ 0.41
1 |
| Unaudited |
² Loans held for sale
³ Gross loans held for investment, less deferred loan costs
4 |
| Calculated based off of weighted average shares outstanding Source: SNL Financial, internal company documents |
33
|
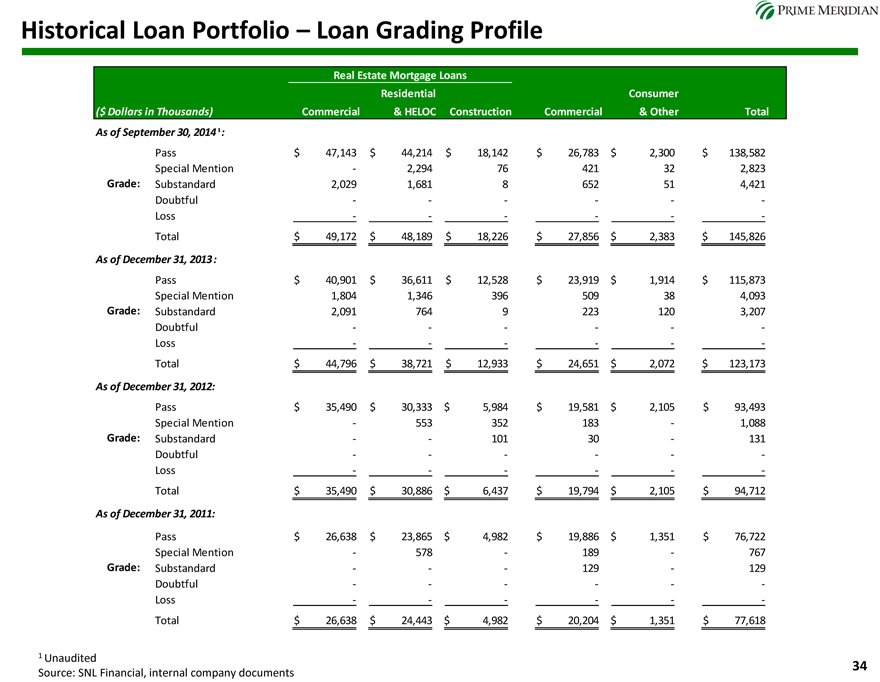
Historical Loan Portfolio – Loan Grading Profile
Real Estate Mortgage Loans
Residential Consumer
($ Dollars in Thousands) Commercial & HELOC Construction Commercial & Other Total
As of September 30, 2014¹:
Pass $ 47,143 $ 44,214 $ 18,142 $ 26,783 $ 2,300 $ 138,582 Special Mention — 2,294 76 421 32 2,823 Grade: Substandard 2,029 1,681 8 652 51 4,421 Doubtful — — — — — -Loss — — — — — -
Total $ 49,172 $ 48,189 $ 18,226 $ 27,856 $ 2,383 $ 145,826
As of December 31, 2013:
Pass $ 40,901 $ 36,611 $ 12,528 $ 23,919 $ 1,914 $ 115,873 Special Mention 1,804 1,346 396 509 38 4,093 Grade: Substandard 2,091 764 9 223 120 3,207 Doubtful — — — — — -Loss — — — — — -
Total $ 44,796 $ 38,721 $ 12,933 $ 24,651 $ 2,072 $ 123,173
As of December 31, 2012:
Pass $ 35,490 $ 30,333 $ 5,984 $ 19,581 $ 2,105 $ 93,493 Special Mention — 553 352 183 — 1,088 Grade: Substandard — — 101 30 — 131 Doubtful — — — — — -Loss — — — — — -
Total $ 35,490 $ 30,886 $ 6,437 $ 19,794 $ 2,105 $ 94,712
As of December 31, 2011:
Pass $ 26,638 $ 23,865 $ 4,982 $ 19,886 $ 1,351 $ 76,722 Special Mention — 578 — 189 — 767 Grade: Substandard — — — 129 — 129 Doubtful — — — — — -Loss — — — — — -
Total $ 26,638 $ 24,443 $ 4,982 $ 20,204 $ 1,351 $ 77,618
1 Unaudited
Source: SNL Financial, internal company documents
34
|
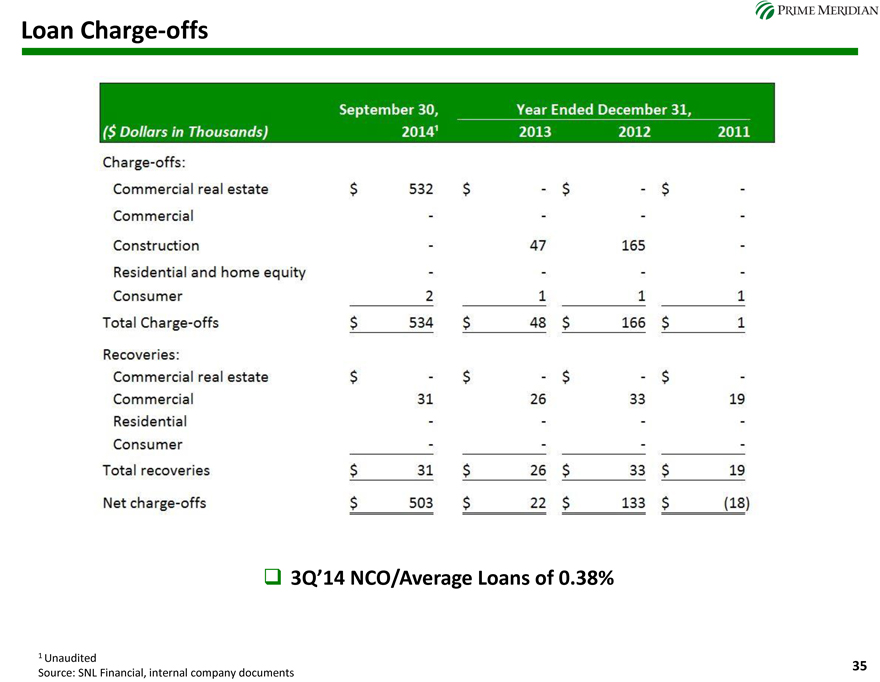
Loan Charge-offs
($ Dollars in Thousands)
September 30, 2014 1
Year Ended December 31,
2013 2012 2011
Charge-offs:
Commercial real estate $532 $- $-$-
Commercial
Construction
Residential and home equity
Consumer
Total Charge-offs
Recoveries:
Commercial real estate
Commercial
Residential
Consumer
Total recoveries
Net charge-offs
- 47 165 –
2 1 1 1
$-
$-
$-
$-
31 26 33 19
$534 $48 $166 $1
$31 $26 $33 $19
$503 $22 $133 $ (18)
3Q’14 NCO/Average Loans of 0.38%
1 Unaudited
Source: SNL Financial, internal company documents
35
|
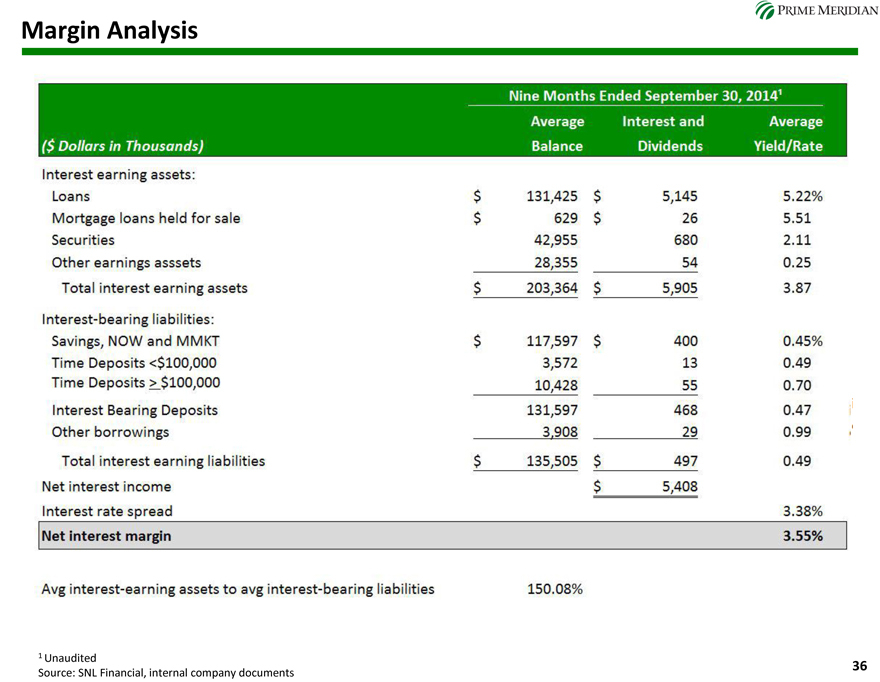
Margin Analysis
($ Dollars in Thousands)
Nine Months Ended September 30, 20141
Average Balance Interest and Dividends Average Yield/ Rate
Interest earning assets:
Loans
Mortgage loans held for sale
Securities
Other earnings asssets
Interest-bearing liabilities:
Savings, NOW and MMKT
Time Deposits < $100,000
Total interest earning assets
Time Deposits > $100,000
Interest Bearing Deposits
Other borrowings
Total interest earning liabilities
Net interest income
Interest rate spread
Net interest margin
$203,364
$131,425
$629
42,955
28,355
$5,145
$26
680
54
$5,905
5.22%
5.51
2.11
0.25
3.87
$117,597
3,572
10,428
131,597
3,908
$135,505
$400
13
55
468
29
$497
$5,408
0.45%
0.49
0.70
0.47
0.99
0.49
3.38%
3.55%
Avg interest-earning assets to avg interest-bearing liabilities 150.08
1 Unaudited
Source: SNL Financial, internal company documents
36
|
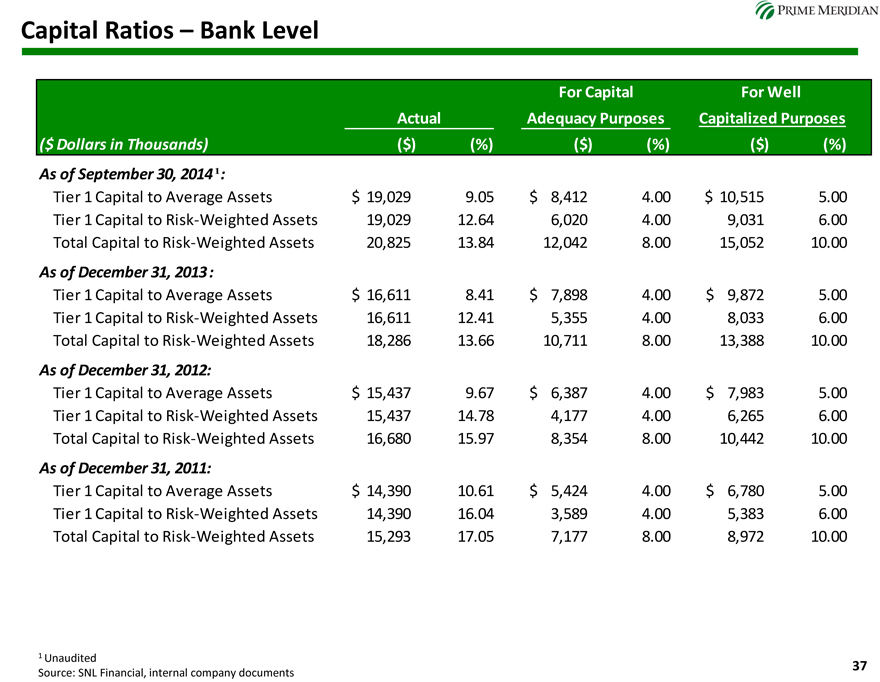
Capital Ratios – Bank Level
For Capital For Well
Actual Adequacy Purposes Capitalized Purposes
($ Dollars in Thousands)($)(%)($)(%)($)(%)
As of September 30, 2014 ¹:
Tier 1 Capital to Average Assets $ 19,029 9.05 $ 8,412 4.00 $ 10,515 5.00
Tier 1 Capital to Risk-Weighted Assets 19,029 12.64 6,020 4.00 9,031 6.00
Total Capital to Risk-Weighted Assets 20,825 13.84 12,042 8.00 15,052 10.00
As of December 31, 2013:
Tier 1 Capital to Average Assets $ 16,611 8.41 $ 7,898 4.00 $ 9,872 5.00
Tier 1 Capital to Risk-Weighted Assets 16,611 12.41 5,355 4.00 8,033 6.00
Total Capital to Risk-Weighted Assets 18,286 13.66 10,711 8.00 13,388 10.00
As of December 31, 2012:
Tier 1 Capital to Average Assets $ 15,437 9.67 $ 6,387 4.00 $ 7,983 5.00
Tier 1 Capital to Risk-Weighted Assets 15,437 14.78 4,177 4.00 6,265 6.00
Total Capital to Risk-Weighted Assets 16,680 15.97 8,354 8.00 10,442 10.00
As of December 31, 2011:
Tier 1 Capital to Average Assets $ 14,390 10.61 $ 5,424 4.00 $ 6,780 5.00
Tier 1 Capital to Risk-Weighted Assets 14,390 16.04 3,589 4.00 5,383 6.00
Total Capital to Risk-Weighted Assets 15,293 17.05 7,177 8.00 8,972 10.00
1 Unaudited
Source: SNL Financial, internal company documents
37
|

www.primemeridianbank.com