Filed Pursuant to Rule 433
Registration No. 333-216974
April 28, 2017

PRIME MERIDIAN BANK
Prime Meridian Holding Company | OTCQX: PMHG Common Equity Offering | April 28, 2017
Forward Looking Statements
This Presentation, including information incorporated herein by reference, may contain forward-looking statements within the meaning of the Private Securities Litigation Reform Act of 1995. Words such as “may,” “could,” “should,” “would,” “believe,” “anticipate,” “estimate,” “expect,” “intend,” “plan,” “project,” “is confident that,” and similar expressions are intended to identify these forward-looking statements. These forward-looking statements involve risk and uncertainty and a variety of factors could cause our actual results and experience to differ materially from the anticipated results or other expectations expressed in these forward-looking statements. We do not have a policy of updating or revising forward looking statements except as otherwise required by law, and silence by management over time should not be construed to mean that actual events are occurring as estimated in such forward-looking statements.
Our ability to predict results or the actual effect of future plans or strategies is inherently uncertain. Factors that could have a material adverse effect on our operations and the operations of our subsidiary, Prime Meridian Bank, include, but are not limited to, changes in:
risk factors named in the Prospectus
general economic conditions
legislative/regulatory changes
monetary and fiscal policies of the U.S. Government
the quality and composition of our loan or investment portfolios
competition
demand for loan and deposit products
demand for financial services in our primary trade area
litigation, tax, and other regulatory matters
accounting principles and guidelines
other economic, competitive, governmental, regulatory, or technological factors affecting us
The factors listed above should not be construed as exhaustive. A number of important factors could cause actual results to differ materially from those indicated by the forward-looking statements. Information on these factors can be found in the Company’s Registration Statement on FormS-1, as amended, filed with the Securities and Exchange Commission on March 28, 2017, and other reports and statements Prime Meridian Holding Company has filed with the Securities and Exchange Commission which are available at its website (www.sec.gov). We do not have a policy of updating or revising forward-looking statements except as otherwise required by law, and silence by management over time should not be construed to mean that actual events are occurring as estimated in such forward-looking statements.
PRIME MERIDIAN HOLDING COMPANY INVESTORS.PRIMEMERIDIANBANK.COM | OTCQX: PMHG 2
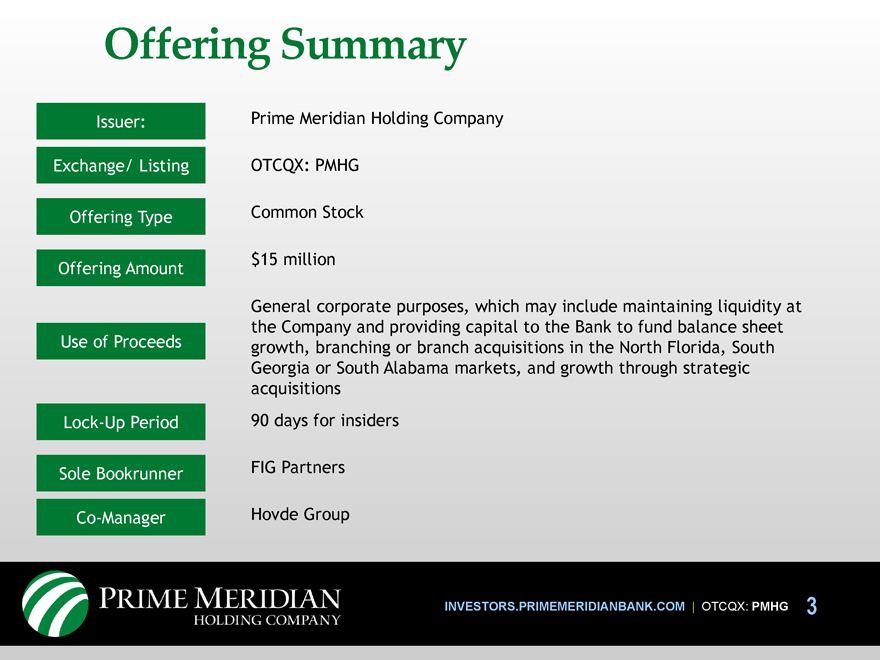
Offering Summary
Issuer: Prime Meridian Holding Company
Exchange/ Listing OTCQX: PMHG
Offering Type Common Stock
Offering Amount $15 million
Use of Proceeds
General corporate purposes, which may include maintaining liquidity at the Company and providing capital to the Bank to fund balance sheet growth, branching or branch acquisitions in the North Florida, South Georgia or South Alabama markets, and growth through strategic acquisitions
Lock-Up Period 90 days for insiders
Sole Bookrunner FIG Partners
Co-Manager Hovde Group
PRIME MERIDIAN HOLDING COMPANY INVESTORS.PRIMEMERIDIANBANK.COM | OTCQX: PMHG 3
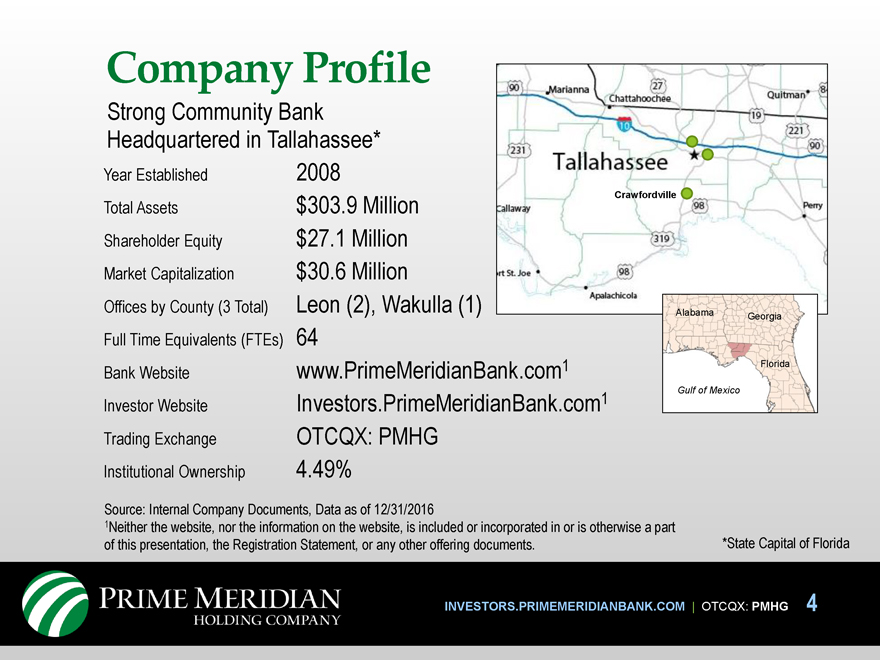
Company Profile
Strong Community Bank Headquartered in Tallahassee*
Year Established 2008
Total Assets $303.9 Million
Shareholder Equity $27.1 Million
Market Capitalization $30.6 Million
Offices by County (3 Total) Leon (2), Wakulla (1)
Full Time Equivalents (FTEs) 64
Bank Website www.PrimeMeridianBank.com1
Investor Website Investors.PrimeMeridianBank.com1
Trading Exchange OTCQX: PMHG
Institutional Ownership 4.49%
Source: Internal Company Documents, Data as of 12/31/2016
1Neither the website, nor the information on the website, is included or incorporated in or is otherwise a part of this presentation, the Registration Statement, or any other offering documents. *State Capital of Florida
Tallahassee
Marianna Chattahoochee
Quitman
Crawfordville
Perry
Callaway
St. Joe
Apalachicola
90 27 84 19 221 90 231 98 319 98
Alabama
Georgia
Florida
PRIME MERIDIAN HOLDING COMPANY INVESTORS.PRIMEMERIDIANBANK.COM | OTCQX: PMHG 4

Company Culture
Who we are. What we stand for.
MISSION Building bankers to serve our clients and community
in order to optimize shareholder value.
PURPOSE Banking done right, right away.
CORE PRINCIPLES
• Passion – level of intense excellence and commitment beyond simply meeting requirements
• Grace – high level of service with courtesy and compassion
• Integrity – doing the right thing because it’s the right thing to do
• Tenacity – culture of looking at new ideas, tackling challenges and
overcoming obstacles
• Accountability – accepting full and ultimate responsibility
PRIME MERIDIAN HOLDING COMPANY INVESTORS.PRIMEMERIDIANBANK.COM | OTCQX: PMHG 5

Management Team
Experienced management team with proven track record of franchise growth and development
Community leaders who know their clients
History of profitable bank operations
Sammie D. Dixon, Jr. President and Chief Executive Officer
Age: 47 | 20 years banking experience
R. Randy Guemple Executive Vice President and Chief Financial Officer
Age: 65 | 39 years banking and CPA experience
Chris L. Jensen, Jr. Executive Vice President and Senior Lending Officer
Age: 60 | 35 years banking experience
Susan Payne Turner Bank Executive Vice President and Chief Risk Officer
Age: 50 | 33 years banking experience
PRIME MERIDIAN HOLDING COMPANY INVESTORS.PRIMEMERIDIANBANK.COM | OTCQX: PMHG 6
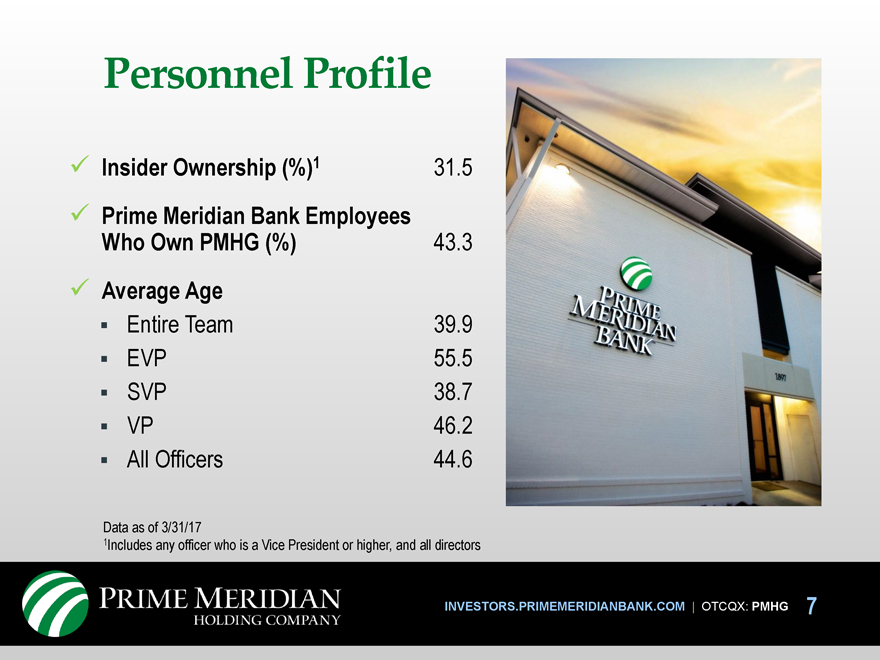
Personnel Profile
Prime Meridian Bank
Insider Ownership (%)1 31.5
Prime Meridian Bank Employees
Who Own PMHG (%) 43.3
Average Age
Entire Team 39.9
EVP 55.5
SVP 38.7
VP 46.2
All Officers 44.6
Data as of 3/31/17
1Includes any officer who is a Vice President or higher, and all directors
PRIME MERIDIAN BANK
PRIME MERIDIAN HOLDING COMPANY INVESTORS.PRIMEMERIDIANBANK.COM | OTCQX: PMHG 7
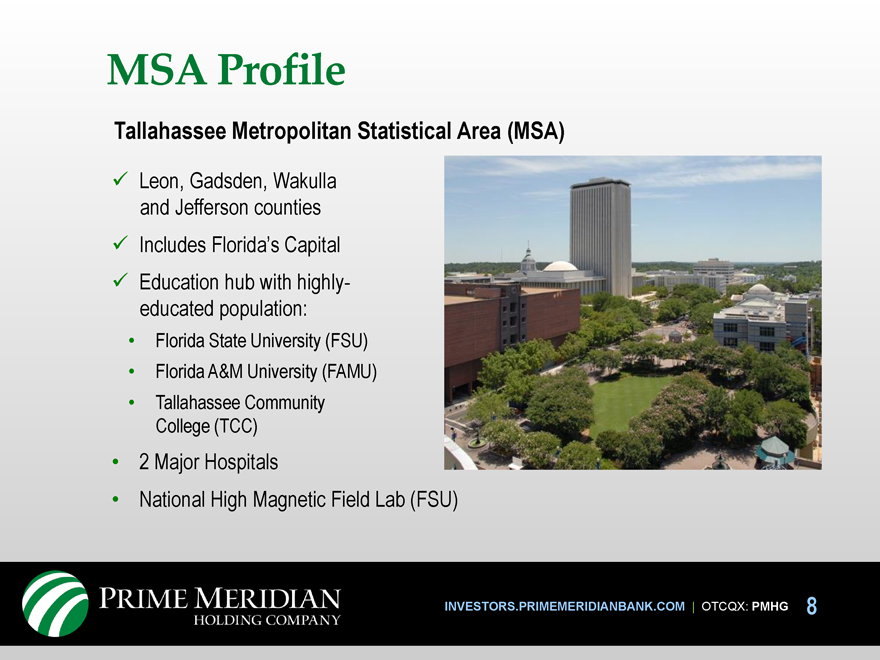
MSA Profile
Tallahassee Metropolitan Statistical Area (MSA)
Leon, Gadsden, Wakulla and Jefferson counties
Includes Florida’s Capital
Education hub with highly-educated population:
• Florida State University (FSU)
• Florida A&M University (FAMU)
• Tallahassee Community
College (TCC)
• 2 Major Hospitals
• National High Magnetic Field Lab (FSU)
PRIME MERIDIAN HOLDING COMPANY INVESTORS.PRIMEMERIDIANBANK.COM | OTCQX: PMHG 8
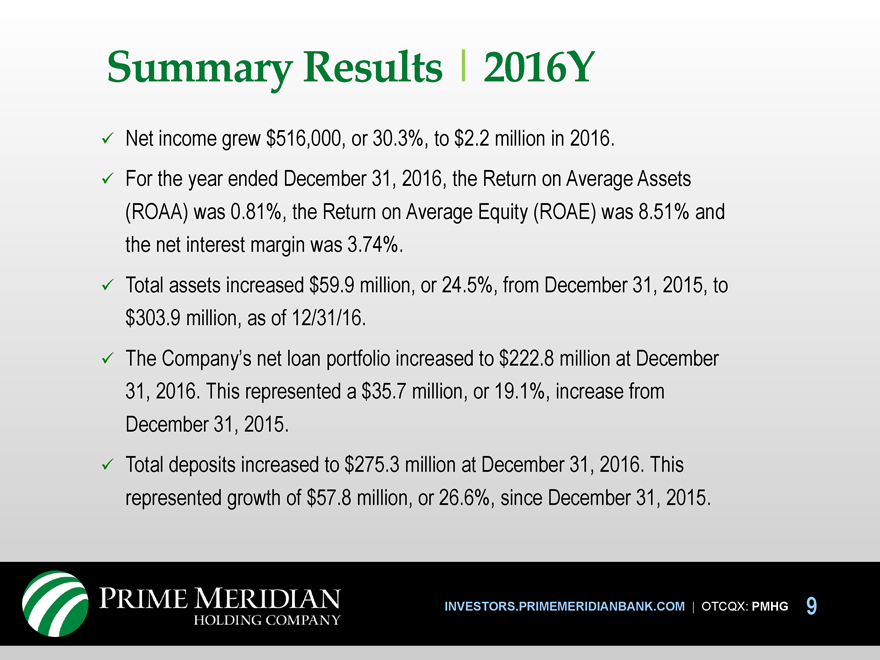
Summary Results | 2016Y
Net income grew $516,000, or 30.3%, to $2.2 million in 2016.
For the year ended December 31, 2016, the Return on Average Assets (ROAA) was 0.81%, the Return on Average Equity (ROAE) was 8.51% and the net interest margin was 3.74%.
Total assets increased $59.9 million, or 24.5%, from December 31, 2015, to $303.9 million, as of 12/31/16.
The Company’s net loan portfolio increased to $222.8 million at December 31, 2016. This represented a $35.7 million, or 19.1%, increase from December 31, 2015.
Total deposits increased to $275.3 million at December 31, 2016. This represented growth of $57.8 million, or 26.6%, since December 31, 2015.
PRIME MERIDIAN HOLDING COMPANY INVESTORS.PRIMEMERIDIANBANK.COM | OTCQX: PMHG 9
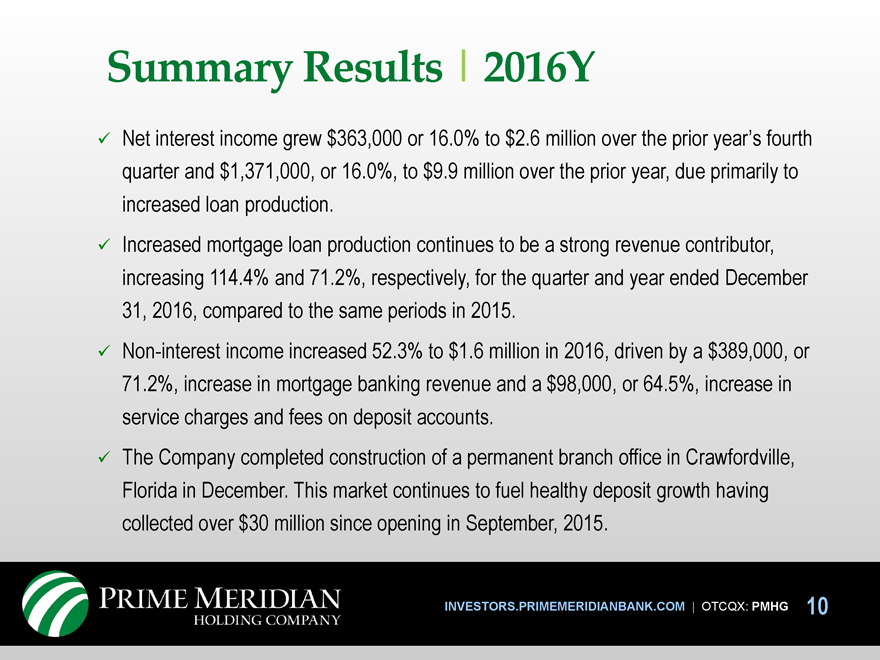
Summary Results | 2016Y
Net interest income grew $363,000 or 16.0% to $2.6 million over the prior year’s fourth quarter and $1,371,000, or 16.0%, to $9.9 million over the prior year, due primarily to increased loan production.
Increased mortgage loan production continues to be a strong revenue contributor, increasing 114.4% and 71.2%, respectively, for the quarter and year ended December 31, 2016, compared to the same periods in 2015.
Non-interest income increased 52.3% to $1.6 million in 2016, driven by a $389,000, or
71.2%, increase in mortgage banking revenue and a $98,000, or 64.5%, increase in service charges and fees on deposit accounts.
The Company completed construction of a permanent branch office in Crawfordville, Florida in December. This market continues to fuel healthy deposit growth having collected over $30 million since opening in September, 2015.
Prime Meridian Holding Company INVESTORS.PRIMEMERIDIANBANK.COM | OTCQX: PMHG 10
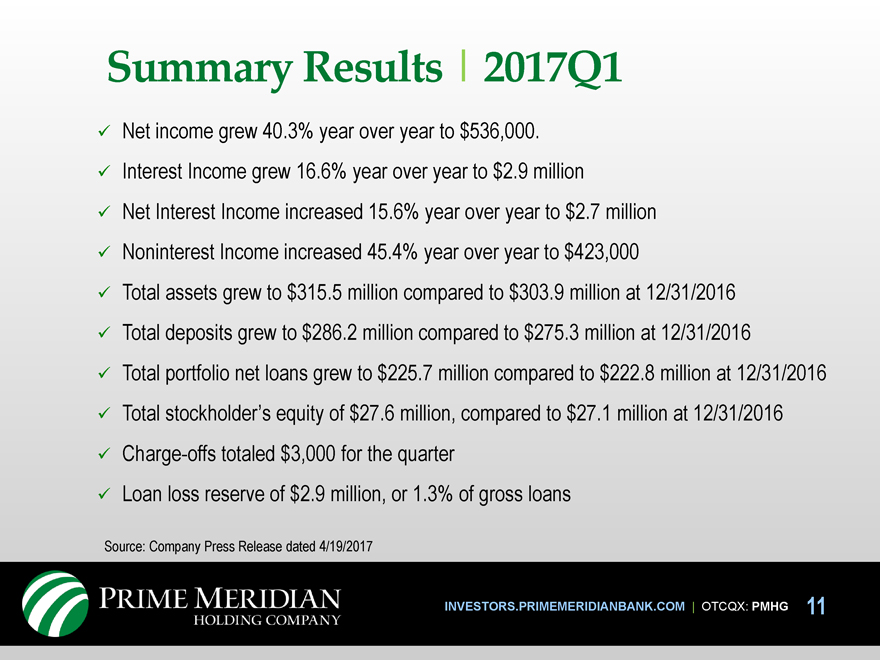
Summary Results | 2017Q1
Net income grew 40.3% year over year to $536,000. Interest Income grew 16.6% year over year to $2.9 million
Net Interest Income increased 15.6% year over year to $2.7 million Noninterest Income increased 45.4% year over year to $423,000
Total assets grew to $315.5 million compared to $303.9 million at 12/31/2016 Total deposits grew to $286.2 million compared to $275.3 million at 12/31/2016
Total portfolio net loans grew to $225.7 million compared to $222.8 million at 12/31/2016
Total stockholder’s equity of $27.6 million, compared to $27.1 million at 12/31/2016
Charge-offs totaled $3,000 for the quarter
Loan loss reserve of $2.9 million, or 1.3% of gross loans
Source: Company Press Release dated 4/19/2017
Prime Meridian Holding Company INVESTORS.PRIMEMERIDIANBANK.COM | OTCQX: PMHG 11
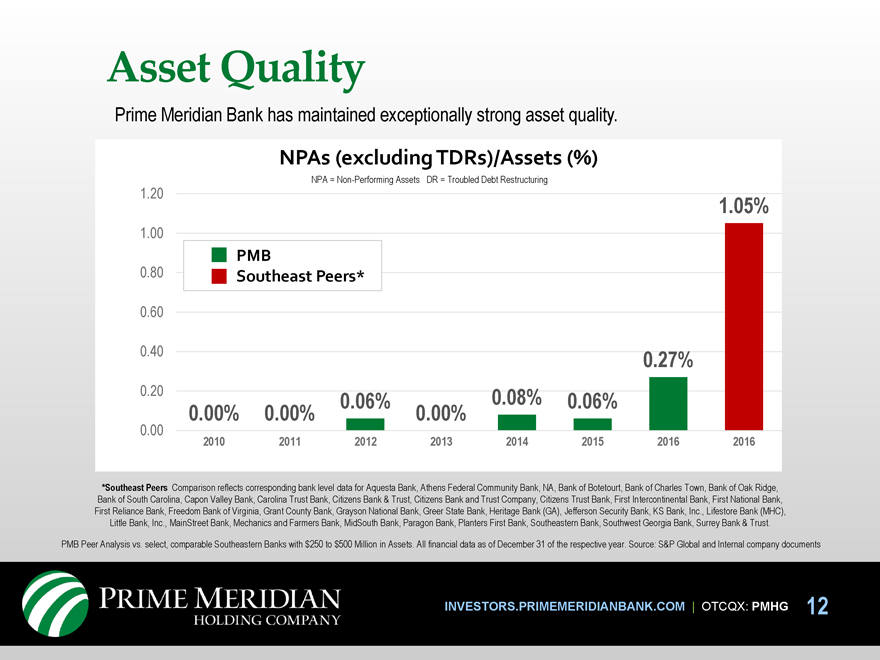
Asset Quality
Prime Meridian Bank has maintained exceptionally strong asset quality.
NPAs (excluding TDRs)/Assets (%)
NPA = Non-Performing Assets DR = Troubled Debt Restructuring
1.20
1.05%
1.00
PMB
0.80 Southeast Peers*
0.60
0.40 0.27%
0.20 0.06% 0.08% 0.06%
0.00% 0.00% 0.00%
0.00
2010 2011 2012 2013 2014 2015 2016 2016
*Southeast Peers Comparison reflects corresponding bank level data for Aquesta Bank, Athens Federal Community Bank, NA, Bank of Botetourt, Bank of Charles Town, Bank of Oak Ridge, Bank of South Carolina, Capon Valley Bank, Carolina Trust Bank, Citizens Bank & Trust, Citizens Bank and Trust Company, Citizens Trust Bank, First Intercontinental Bank, First National Bank, First Reliance Bank, Freedom Bank of Virginia, Grant County Bank, Grayson National Bank, Greer State Bank, Heritage Bank (GA), Jefferson Security Bank, KS Bank, Inc., Lifestore Bank (MHC), Little Bank, Inc., MainStreet Bank, Mechanics and Farmers Bank, MidSouth Bank, Paragon Bank, Planters First Bank, Southeastern Bank, Southwest Georgia Bank, Surrey Bank & Trust.
PMB Peer Analysis vs. select, comparable Southeastern Banks with $250 to $500 Million in Assets. All financial data as of December 31 of the respective year. Source: S&P Global and Internal company documents
Prime Meridian Holding Company INVESTORS.PRIMEMERIDIANBANK.COM | OTCQX: PMHG 12
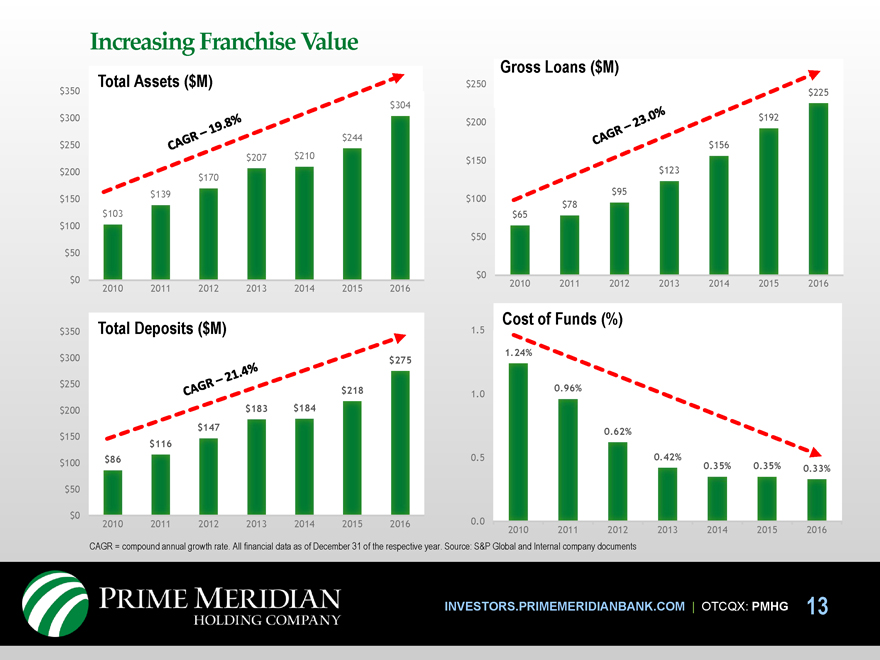
Increasing Franchise Value
Gross Loans ($M)
Total Assets ($M) $250
$350 $225
$304
$300 $192
$200
$244
$250 $156
$207 $210 $150
$200 $123
$170
$139 $95
$150 $100
$103 $78
$65
$100
$50
$50
$0
$0 2010 2011 2012 2013 2014 2015 2016
2010 2011 2012 2013 2014 2015 2016
1.5 Cost of Funds (%)
$350 Total Deposits ($M)
1.24%
$300 $275
$250 0.96%
$218 1.0
$200 $183 $184
$150 $147 0.62%
$116
$86 0.5 0.42%
$100 0.35% 0.35%
0.33%
$50
$0
2010 2011 2012 2013 2014 2015 2016 0.0
2010 2011 2012 2013 2014 2015 2016
CAGR = compound annual growth rate. All financial data as of December 31 of the respective year. Source: S&P Global and Internal company documents
Prime Meridian Holding Company INVESTORS.PRIMEMERIDIANBANK.COM | OTCQX: PMHG 13
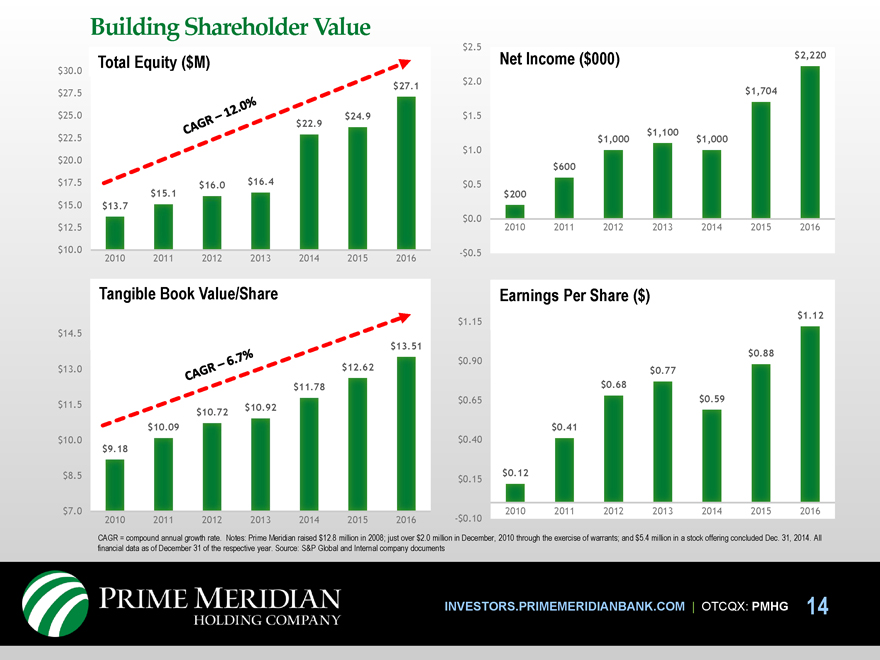
Building Shareholder Value
$2.5
Total Equity ($M) Net Income ($000) $2,220
$30.0
$2.0
$27.1
$27.5 $1,704
$25.0 $24.9 $1.5
$22.9 $1,100
$22.5 $1,000 $1,000
$1.0
$20.0
$600
$17.5 $16.0 $16.4 $0.5
$15.1 $200
$15.0 $13.7
$0.0
$12.5 2010 2011 2012 2013 2014 2015 2016
$10.0 -$0.5
2010 2011 2012 2013 2014 2015 2016
Tangible Book Value/Share Earnings Per Share ($)
$1.12
$1.15
$14.5
$13.51
$0.88
$0.90
$13.0 $12.62 $0.77
$11.78 $0.68
$0.65 $0.59
$11.5 $10.92
$10.72
$10.09 $0.41
$10.0 $9.18 $0.40
$8.5 $0.12
$0.15
$7.0 2010 2011 2012 2013 2014 2015 2016
2010 2011 2012 2013 2014 2015 2016 -$0.10
CAGR = compound annual growth rate. Notes: Prime Meridian raised $12.8 million in 2008; just over $2.0 million in December, 2010 through the exercise of warrants; and $5.4 million in a stock offering concluded Dec. 31, 2014. All financial data as of December 31 of the respective year. Source: S&P Global and Internal company documents
Prime Meridian Holding Company INVESTORS.PRIMEMERIDIANBANK.COM | OTCQX: PMHG 14
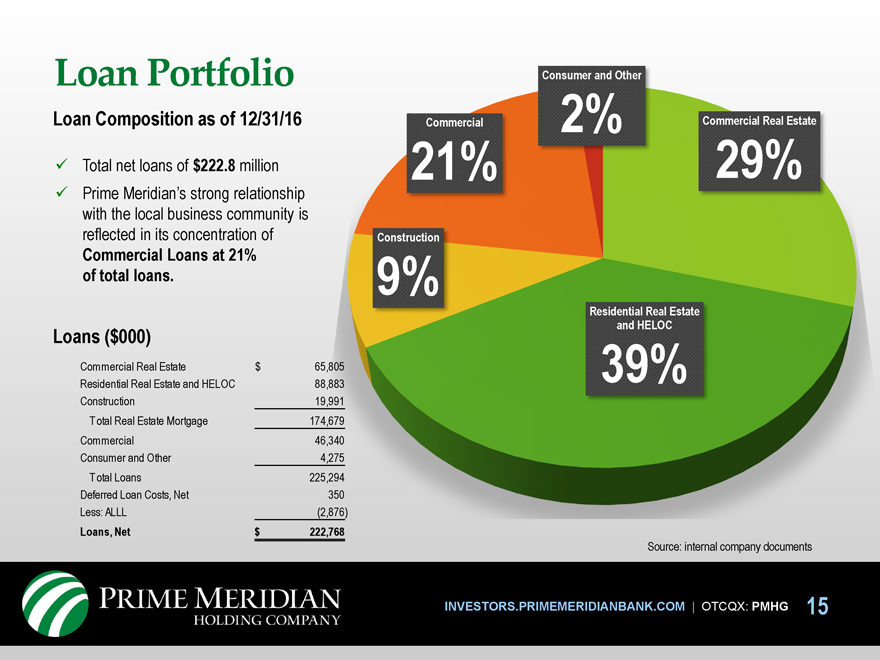
Loan Portfolio
Loan Composition as of 12/31/16
Total net loans of $222.8 million
Prime Meridian’s strong relationship with the local business community is reflected in its concentration of
Commercial Loans at 21% of total loans.
Loans ($000)
Commercial Real Estate $65,805
Residential Real Estate and HELOC 88,883
Construction 19,991
Total Real Estate Mortgage 174,679
Commercial 46,340
Consumer and Other 4,275
Total Loans 225,294
Deferred Loan Costs, Net 350
Less: ALLL (2,876)
Loans, Net $222,768
Consumer and Other
Commercial 2% Commercial Real Estate
21% 29%
Construction
9%
Residential Real Estate
and HELOC
39%
Source: internal company documents
Prime Meridian Holding Company INVESTORS.PRIMEMERIDIANBANK.COM | OTCQX: PMHG 15
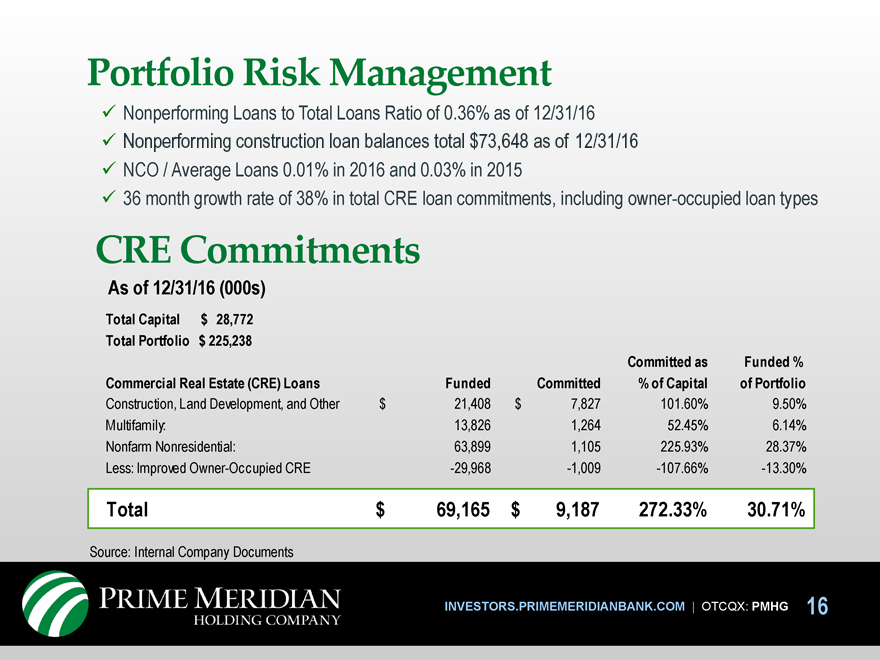
Portfolio Risk Management
Nonperforming Loans to Total Loans Ratio of 0.36% as of 12/31/16
Nonperforming construction loan balances total $73,648 as of 12/31/16
NCO / Average Loans 0.01% in 2016 and 0.03% in 2015
36 month growth rate of 38% in total CRE loan commitments, including owner-occupied loan types
CRE Commitments
As of 12/31/16 (000s)
Total Capital $ 28,772 Total Portfolio $ 225,238
Committed as Funded %
Commercial Real Estate (CRE) Loans Funded Committed % of Capital of Portfolio
Construction, Land Development, and Other $ 21,408 $ 7,827 101.60% 9.50%
Multifamily: 13,826 1,264 52.45% 6.14%
Nonfarm Nonresidential: 63,899 1,105 225.93% 28.37%
Less: Improved Owner-Occupied CRE-29,968-1,009-107.66%-13.30%
Total $ 69,165 $ 9,187 272.33% 30.71%
Source: Internal Company Documents
Prime Meridian Holding Company INVESTORS.PRIMEMERIDIANBANK.COM | OTCQX: PMHG 16
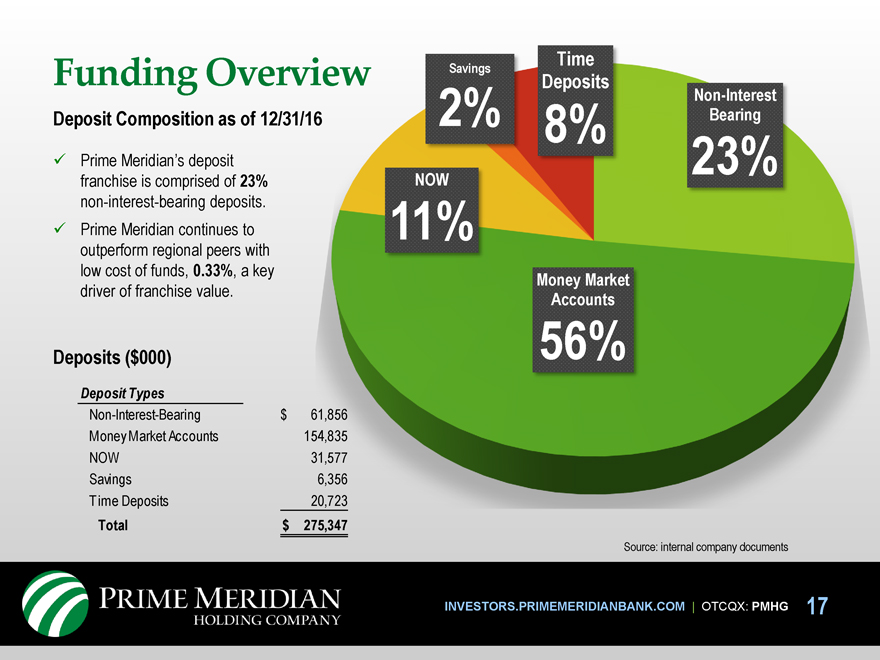
Funding Overview
Deposit Composition as of 12/31/16
Prime Meridian’s deposit franchise is comprised of 23% non-interest-bearing deposits.
Prime Meridian continues to outperform regional peers with low cost of funds, 0.33%, a key driver of franchise value.
Deposits ($000)
Deposit Types
Non-Interest-Bearing $61,856
Money Market Accounts 154,835
NOW 31,577
Savings 6,356
Time Deposits 20,723
Total $275,347
Time
Savings
Deposits
Non-Interest
2% 8% Bearing
23%
NOW
11%
Money Market
Accounts
56%
Source: internal company documents
Prime Meridian Holding Company INVESTORS.PRIMEMERIDIANBANK.COM | OTCQX: PMHG 17

Deposit Market Share Note: Market share analysis excludesnon-retail deposits. Source: S&P Global.
Total
Deposit Parent Company Name Parent City Parent State Total Active Branches 2015 Total Deposits 2015 ($000) Total Market Share 2015 (%) Total Active Branches 2016 Total Deposits 2016 ($000) Total Market Share 2016 (%)
Leon
1 SunTrust Banks Inc. Atlanta GA 8 874,937 16.03 8 1,096,622 17.94
2 Capital City Bank Group Inc. Tallahassee FL 15 780,288 14.30 15 891,275 14.58
3 Bank of America Corp. Charlotte NC 7 705,595 12.93 7 771,746 12.63
4 BB&T Corp. Winston-Salem NC 3 605,709 11.10 3 758,278 12.41
5 Wells Fargo & Co. San Francisco CA 8 639,914 11.72 7 664.148 10.87
6 Regions Financial Corp. Birmingham AL 5 355,911 6.52 5 430,296 7.04
7 Home BancShares Inc. Conway AR 6 313,774 5.75 6 294,767 4.82
8 Synovus Financial Corp. Columbus GA 4 264,204 4.84 4 272,898 4.47
9 Hancock Holding Co. Gulfport MS 3 212,720 3.90 3 237,283 3.88
10 FMB Banking Corp. Monticello FL 4 215,591 3.95 4 221,317 3.62
11 Prime Meridian Holding Co. Tallahassee FL 2 201,201 3.69 2 219,949 3.60
12 Sunshine Financial Inc. Tallahassee FL 6 131,549 2.41 5 137,911 2.26
13 American Commerce Bancshares Inc. Bremen GA 2 36,886 0.68 1 47,677 0.78
14 PeoplesSouth Bancshares Inc. Colquitt GA 2 65,924 1.21 2 35,764 0.59
15 Ameris Bancorp Moultrie GA 1 24,145 0.44 1 31,237 0.51
- IBERIABANK Corp. Lafayette LA 1 29,812 0.55 0 - -
- Cadence Bancorp LLC Houston TX 0 - - 0 - -
Market Total 7 5,458,160 73 6,111,168
Wakulla
1 Home BancShares Inc. Conway AR 2 109,659 55.56 1 93,934 46.04
2 Ameris Bancorp Moultrie GA 1 58,522 29.65 1 58,143 28.50
3 Capital City Bank Group Inc. Tallahassee FL 1 29,174 14.78 1 29.641 14.53
4 Prime Meridian Holding Co. Tallahassee FL 0 - - 1 22,307 10.93
Market Total 4 197,355 4 204,025
Grand Total 81 5,655,515 77 6,315,193
Analysis current as of 6/30/2016
Prime Meridian Bank Deposits – Leon County (12/31/16) $245.4 million. Prime Meridian Bank Deposits – Wakulla County (12/31/16) $29.9 million.
Source: internal company documents.
Prime Meridian Holding Company INVESTORS.PRIMEMERIDIANBANK.COM | OTCQX: PMHG 18
Investment Considerations
Strong Growth Potential
Through 2020, Florida’s Capital Region is projected to experience significant population and household income growth1 of 5.46% and
5.33%, respectively.
Attractive growth opportunities in North Florida, South Alabama and South Georgia markets.
Build-out of existing market franchise.
1 Source: Nielsen. Demographic data is provided by Nielsen based primarily on US Census data. Fornon-census year data, Nielsen uses samples and projections to estimate the demographic data. S&P Global performs calculations on the underlying data provided by Nielsen for some of the data presented on this page.
PRIME MERIDIAN HOLDING COMPANY
INVESTORS.PRIMEMERIDIANBANK.COM | OTCQX: PMHG 19

Investment Considerations
Strong Economic Market in Northern Florida
Seven robust industry factors
Education
Aviation, aerospace, defense and national security
Health sciences, medical education, training and research, and sports medicine
Information technology
Research and engineering
Renewable energy and environment
Transportation and logistics
Strong local lending relationships and local decision-making allow PMB to build market share.
Building on a team of 64 full-time equivalent employees* to ensure a high level of client service and a “deep bench” for future growth.
*As of 12/31/2016
PRIME MERIDIAN HOLDING COMPANY
INVESTORS.PRIMEMERIDIANBANK.COM | OTCQX: PMHG 20
Investment Considerations
High-performing Company with strong balance sheet and excellent asset quality
ROAA and ROAE of 0.81% and 8.51%, respectively
Strong bank level capital ratios
Tier 1 Leverage 8.73%
Tier 1 Risk Based Capital Ratio 11.70%
Total Risk Based Capital Ratio 12.95%
ROAA = Return on Average Assets ROAE = Return on Average Equity
All data as of 12/31/16
PRIME MERIDIAN HOLDING COMPANY
INVESTORS.PRIMEMERIDIANBANK.COM | OTCQX: PMHG 21
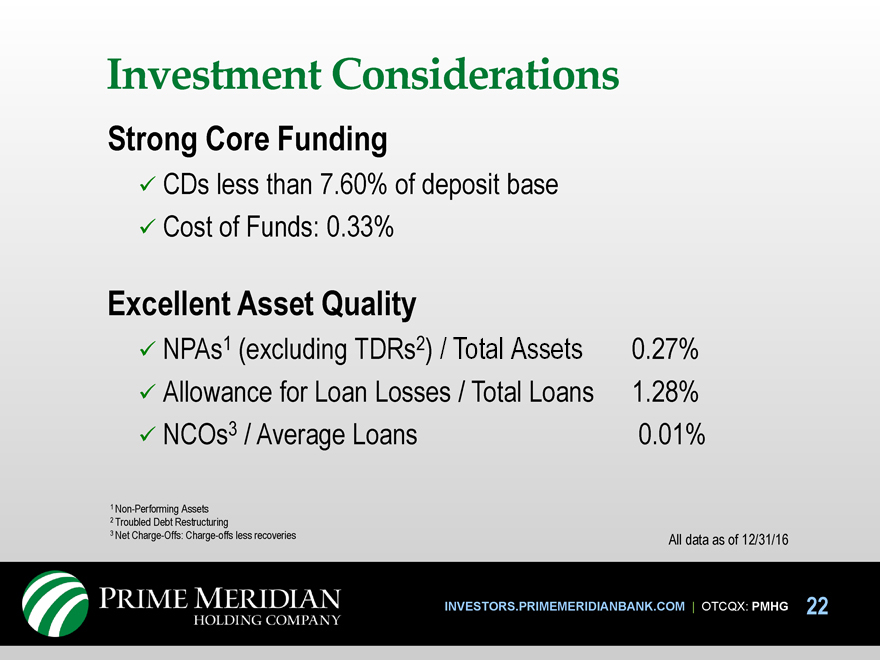
Investment Considerations
Strong Core Funding
CDs less than 7.60% of deposit base
Cost of Funds: 0.33%
Excellent Asset Quality
NPAs1 (excluding TDRs2) / Total Assets 0.27%
Allowance for Loan Losses / Total Loans 1.28%
NCOs3 / Average Loans 0.01%
1Non-Performing Assets
2 Troubled Debt Restructuring
3 Net Charge-Offs: Charge-offs less recoveries All data as of 12/31/16
PRIME MERIDIAN HOLDING COMPANY
INVESTORS.PRIMEMERIDIANBANK.COM | OTCQX: PMHG 22
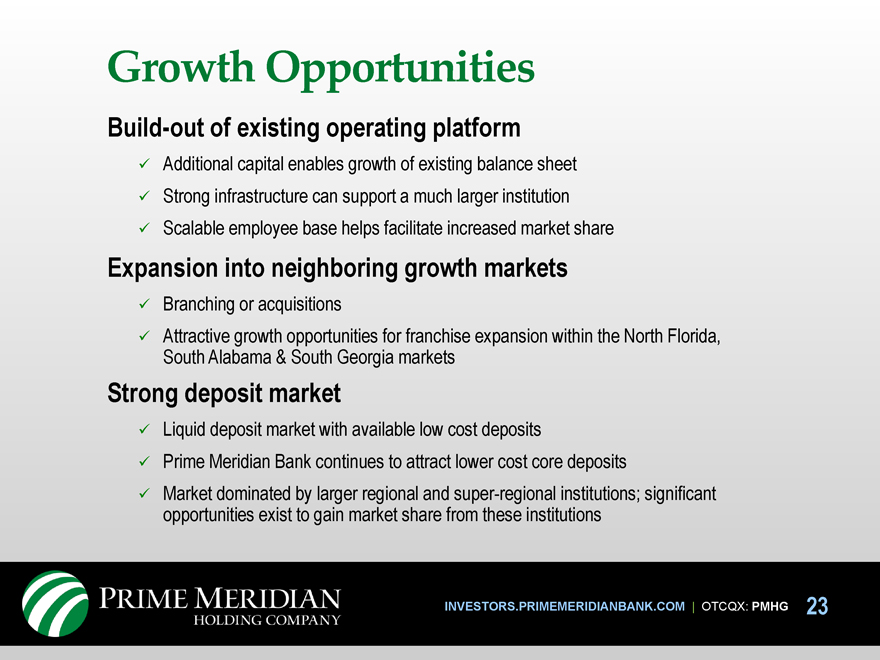
Growth Opportunities
Build-out of existing operating platform
Additional capital enables growth of existing balance sheet
Strong infrastructure can support a much larger institution
Scalable employee base helps facilitate increased market share
Expansion into neighboring growth markets
Branching or acquisitions
Attractive growth opportunities for franchise expansion within the North Florida, South Alabama & South Georgia markets
Strong deposit market
Liquid deposit market with available low cost deposits
Prime Meridian Bank continues to attract lower cost core deposits
Market dominated by larger regional and super-regional institutions; significant opportunities exist to gain market share from these institutions
PRIME MERIDIAN HOLDING COMPANY
INVESTORS.PRIMEMERIDIANBANK.COM | OTCQX: PMHG 23

Appendix
PRIME MERIDIAN HOLDING COMPANY
INVESTORS.PRIMEMERIDIANBANK.COM | OTCQX: PMHG 24
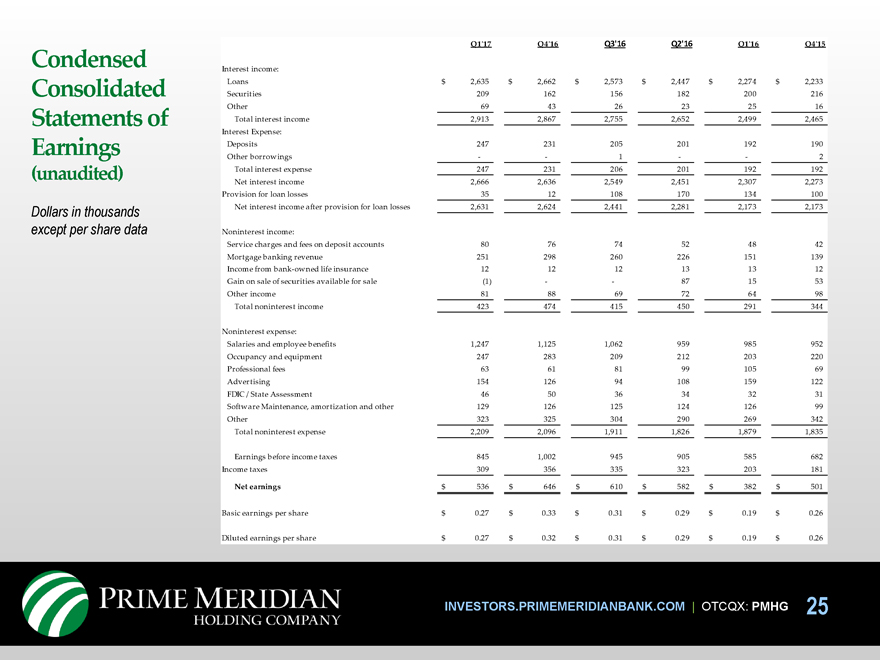
Condensed Consolidated Statements of Earnings
(unaudited)
Dollars in thousands except per share data
Q1’17 Q4’16 Q3’16 Q2’16 Q1’16 Q4’15
Interest income:
Loans $ 2,635 $ 2,662 $ 2,573 $ 2,447 $ 2,274 $ 2,233
Securities 209 162 156 182 200 216
Other 69 43 26 23 25 16
Total interest income 2,913 2,867 2,755 2,652 2,499 2,465
Interest Expense:
Deposits 247 231 205 201 192 190
Other borrowings - - 1 - - 2
Total interest expense 247 231 206 201 192 192
Net interest income 2,666 2,636 2,549 2,451 2,307 2,273
Provision for loan losses 35 12 108 170 134 100
Net interest income after provision for loan losses 2,631 2,624 2,441 2,281 2,173 2,173
Noninterest income:
Service charges and fees on deposit accounts 80 76 74 52 48 42
Mortgage banking revenue 251 298 260 226 151 139
Income from bank-owned life insurance 12 12 12 13 13 12
Gain on sale of securities available for sale (1) - - 87 15 53
Other income 81 88 69 72 64 98
Total noninterest income 423 474 415 450 291 344
Noninterest expense:
Salaries and employee benefits 1,247 1,125 1,062 959 985 952
Occupancy and equipment 247 283 209 212 203 220
Professional fees 63 61 81 99 105 69
Advertising 154 126 94 108 159 122
FDIC / State Assessment 46 50 36 34 32 31
Software Maintenance, amortization and other 129 126 125 124 126 99
Other 323 325 304 290 269 342
Total noninterest expense 2,209 2,096 1,911 1,826 1,879 1,835
Earnings before income taxes 845 1,002 945 905 585 682
Income taxes 309 356 335 323 203 181
Net earnings $ 536 $ 646 $ 610 $ 582 $ 382 $ 501
Basic earnings per share $ 0.27 $ 0.33 $ 0.31 $ 0.29 $ 0.19 $ 0.26
Diluted earnings per share $ 0.27 $ 0.32 $ 0.31 $ 0.29 $ 0.19 $ 0.26
PRIME MERIDIAN HOLDING COMPANY
INVESTORS.PRIMEMERIDIANBANK.COM | OTCQX: PMHG 25
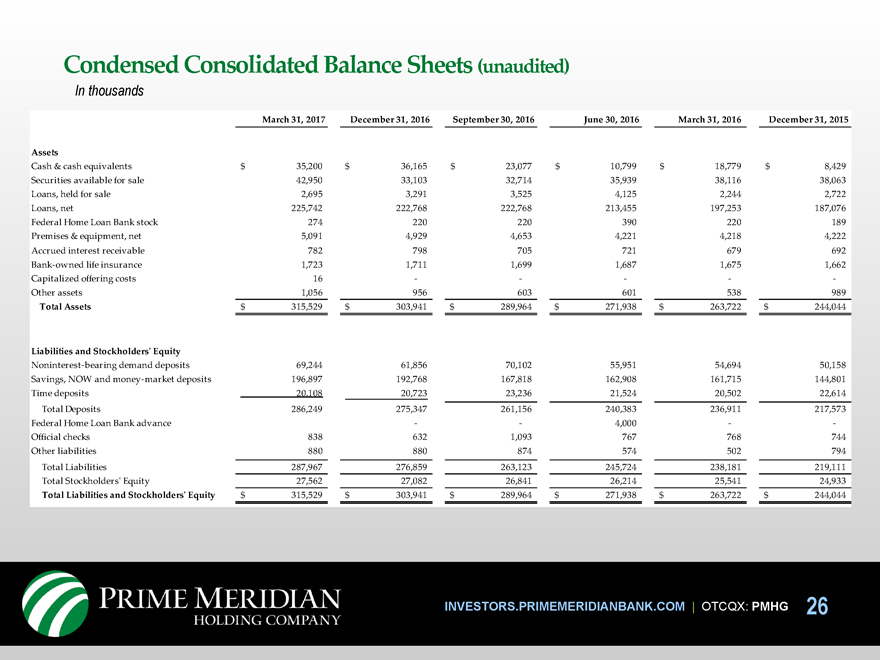
Condensed Consolidated Balance Sheets (unaudited)
In thousands
March 31, 2017 December 31, 2016 September 30, 2016 June 30, 2016 March 31, 2016 December 31, 2015
Assets
Cash & cash equivalents $ 35,200 $ 36,165 $ 23,077 $ 10,799 $ 18,779 $ 8,429
Securities available for sale 42,950 33,103 32,714 35,939 38,116 38,063
Loans, held for sale 2,695 3,291 3,525 4,125 2,244 2,722
Loans, net 225,742 222,768 222,768 213,455 197,253 187,076
Federal Home Loan Bank stock 274 220 220 390 220 189
Premises & equipment, net 5,091 4,929 4,653 4,221 4,218 4,222
Accrued interest receivable 782 798 705 721 679 692
Bank-owned life insurance 1,723 1,711 1,699 1,687 1,675 1,662
Capitalized offering costs 16 - - - - -
Other assets 1,056 956 603 601 538 989
Total Assets $ 315,529 $ 303,941 $ 289,964 $ 271,938 $ 263,722 $ 244,044
Liabilities and Stockholders’ Equity
Noninterest-bearing demand deposits 69,244 61,856 70,102 55,951 54,694 50,158
Savings, NOW and money-market deposits 196,897 192,768 167,818 162,908 161,715 144,801
Time deposits 20,108 20,723 23,236 21,524 20,502 22,614
Total Deposits 286,249 275,347 261,156 240,383 236,911 217,573
Federal Home Loan Bank advance - - 4,000 - -
Official checks 838 632 1,093 767 768 744
Other liabilities 880 880 874 574 502 794
Total Liabilities 287,967 276,859 263,123 245,724 238,181 219,111
Total Stockholders’ Equity 27,562 27,082 26,841 26,214 25,541 24,933
Total Liabilities and Stockholders’ Equity $ 315,529 $ 303,941 $ 289,964 $ 271,938 $ 263,722 $ 244,044
PRIME MERIDIAN HOLDING COMPANY
INVESTORS.PRIMEMERIDIANBANK.COM | OTCQX: PMHG 26

Financial Highlights (unaudited)
Q1’17 Q4’16 Q3’16 Q2’16 Q1’16 Q4’15
Per Share Data:
Earnings per share - Basic $ 0.27 $ 0.33 $ 0.31 $ 0.29 $ 0.19 $ 0.26
Earnings per share - Diluted $ 0.27 $ 0.32 $ 0.31 $ 0.29 $ 0.19 $ 0.26
Book value per share $ 13.74 $ 13.51 $ 13.52 $ 13.24 $ 12.92 $ 12.62
Selected Performance Ratios and Other Data:
Return on average assets(1) 0.70% 0.87% 0.87% 0.87% 0.60% 0.81%
Return on average equity(1) 7.88% 9.62% 9.14% 9.04% 6.05% 8.18%
Average yield on earning assets 3.94% 4.00% 4.06% 4.09% 4.05% 4.12%
Net interest margin 3.60% 3.68% 3.76% 3.78% 3.74% 3.80%
Efficiency ratio(2) 71.51% 67.40% 64.47% 62.94% 72.32% 70.12%
Asset Quality Data:
Nonaccrual loans $ 805,000 $ 811,000 $ 1,161,000 $ 439,000 $ 133,000 $ 137,000
Totalnon-performing assets $ 805,000 $ 811,000 $ 1,161,000 $ 439,000 $ 133,000 $ 137,000
Non-performing assets/total assets 0.26% 0.27% 0.40% 0.16% 0.05% 0.06%
Regulatory Capital Ratios:
Tier 1 Leverage Capital Ratio 8.65% 8.73% 9.01% 9.16% 9.36% 9.48%
Common Equity Tier I Capital Ratio 11.54% 11.70% 11.55% 11.70% 12.25% 12.79%
Tier I Risk Based Capital Ratio 11.54% 11.70% 11.55% 11.70% 12.25% 12.79%
Total Capital Ratio 12.79% 12.95% 12.80% 12.95% 13.50% 14.05%
1 ROAA and ROAE are annualized
2 Efficiency Ratio represents noninterest expense divided by the sum of net interest income plus noninterest income.
PRIME MERIDIAN HOLDING COMPANY
INVESTORS.PRIMEMERIDIANBANK.COM | OTCQX: PMHG 27