UNITED STATES
SECURITIES AND EXCHANGE COMMISSION
Washington, D.C. 20549
FORM N-CSR
CERTIFIED SHAREHOLDER REPORT OF REGISTERED
MANAGEMENT INVESTMENT COMPANIES
Investment Company Act file number 811-22894
INVESTMENT MANAGERS SERIES TRUST II
(Exact name of registrant as specified in charter)
235 W. Galena Street
Milwaukee, WI 53212
(Address of principal executive offices) (Zip code)
Diane J. Drake
Mutual Fund Administration, LLC
2220 E. Route 66, Suite 226
Glendora, CA 91740
(Name and address of agent for service)
(626) 385-5777
Registrant's telephone number, including area code
Date of fiscal year end: September 30
Date of reporting period: September 30, 2022
Item 1. Report to Stockholders.
The registrant’s annual report transmitted to shareholders pursuant to Rule 30e-1 under the Investment Company Act of 1940, as amended (the “Investment Company Act”), is as follows:

The First Trust Capital Management Funds
Each a series of Investment Managers Series Trust II
| Table of Contents | |
| | |
| Shareholder Letter | 1 |
| Fund Performance | 8 |
| Schedule of Investments | 12 |
| Statements of Assets and Liabilities | 37 |
| Statements of Operations | 39 |
| Statements of Changes in Net Assets | 40 |
| Statements of Cash Flows | 42 |
| Financial Highlights | 44 |
| Notes to Financial Statements | 48 |
| Report of Independent Registered Public Accounting Firm | 64 |
| Supplemental Information | 65 |
| Expense Examples | 72 |
This report and the financial statements contained herein are provided for the general information of the shareholders of the First Trust Capital Management Funds. This report is not authorized for distribution to prospective investors in the Funds unless preceded or accompanied by an effective prospectus.
www.firsttrustcapital.com

FIRST TRUST CAPITAL MANAGEMENT FUNDS
ANNUAL SHAREHOLDER LETTER
Contents
| |
| Executive-Level Overview | Market Perspective |
| First Trust Merger Arbitrage Fund | VARAX | VARBX |
| First Trust Multi-Strategy Fund | OMOAX | OMOIX |
Executive-Level Overview
We like to preface our Annual Shareholder Letter with an Executive-level overview to reinforce our investment process and current mindset in present market conditions. As financial markets have faced rate hikes from the Federal Reserve (the “Fed”) and elevated volatility across both equity and credit markets, we continue to be cognizant of the current headline risks that have kept many investors cautious. The volatility across bond markets was in part due to the announcement of multiple rounds of rate hikes and a renewed Fed commitment to maintain an aggressive stance on fighting inflation. In periods of such significant volatility, both to the upside and downside, it becomes inherently more difficult for investors to position portfolios and adjust to new data. In our view, these market environments result in a host of investment implications which tend to manifest themselves in reduced deal volumes, investor base turnover, and pronounced shifts in investor biases. While we actively consider and monitor many of those macro-level risks and their effects on global capital markets, we remain steadfast in our effort to help investors build durable portfolios that provide a high probability of generating positive absolute performance regardless of the broader market environment and throughout various market cycles. While this approach can, at times, limit participation in attractive markets over the short-term, it also alleviates the responsibility of timing shifts in market sentiment that may unwind successful trades rapidly. Over the long term, we remain confident in our products’ ability to help investors construct portfolios that adhere to those investment guidelines. As is customary in our Annual Shareholder Letter, we will review what we believe to be the important drivers of performance and opportunity across each of our Funds for the past fiscal year period.
First Trust Merger Arbitrage Fund
The First Trust Merger Arbitrage Fund (the “Fund”) A and I share classes returned 0.91% and 1.27%, respectively, for the one-year fiscal period ending September 30, 2022. Comparatively, the Bloomberg Aggregate U.S. Bond Index1 (the “Aggregate”) suffered losses of -14.60% over that same lookback period. Downside volatility was not contained to the fixed income market as the S&P 500 Index lost -15.47% of its value in that same time frame. The team is pleased with our preservation of capital and relative performance given one of the worst time periods since the 1930’s for the traditional ”60/40” portfolio.
Amidst challenging market conditions, our merger arbitrage and SPAC portfolio continued to generate consistent returns despite a complicated macro landscape of inflation, rising rates and war. More specifically, the Fund generated positive returns in 8 of the last 12 months, having returned an average of +0.30% in each of those positive months. Comparatively, the Aggregate generated positive returns in only 3 of the last 12 months. In the nine months when the Aggregate saw a negative return, the Fund generated an average monthly return of +0.14% compared to the Aggregate’s average return over those same months of -2.09%. Additionally, the Fund continues to generate those returns with relatively muted risk levels despite macro risks, with realized volatility over the trailing one-year period of only 1.19%. Comparatively, the Aggregate demonstrated a realized volatility of 6.91% over that same timeframe. Additionally, correlation between the Fund and both the Aggregate and the S&P 500 index remains low at 0.06 and 0.44, respectively. As some modest spread widening was seen during market selloff periods, we remain confident in the Fund’s potential to generate a strong risk-adjusted and absolute return stream, largely isolated from broader market factors and developments over full market cycles. Although merger arbitrage strategies are not driven or anchored to market beta or risk, they are not completely agnostic to actions from market participants, and we are proud to have provided ballast to our shareholders’ portfolios during this difficult time period.
| 1 | The Aggregate broadly tracks $15 trillion of fixed income securities, nearly the entire U.S. investment-grade bond market, and includes government securities, mortgage-backed securities, asset-backed securities and corporate securities. |
First Trust Capital Management | 225 W. Wacker Drive | Suite 2100 | Chicago, IL 60606 | P: 773.386.6700 | F: 847.386.2910
The top five deals in the Fund as of September 30, 2022 were Avalara Inc. (AVLR) at a 5.2% position size, Zendesk (ZEN) at 4.2%, Flagstar Bancorp Inc. (FBC) at 3.4%, Switch Inc. (SWCH) at 2.5%, and Change Healthcare Inc. (CHNG) at 2.5%.
Periods of market volatility always bring both worry and opportunity to investors. During these times, we work to make sure our current portfolio risk profile is cognizant of the wider macro environment while keeping our focus on analyzing the opportunities the deal landscape presents us. As has been widely discussed, the market shock and knock-on effects across all assets are significant as we continue to adjust to a new Fed tightening regime and inflation.
The first half of 2022 was quite challenging for M&A in terms of opportunity set, and the expectation of merger activity to decline in softer economic periods is common. Despite this, M&A activity has been better than expected when compared to similar historic market periods, and even during the historically “quiet” summer months. Overall, the deal landscape presented fewer opportunities than typical, but more than enough for our risk-averse style of investing in the deals with the highest probability of closure.
On the SPAC side of the portfolio, we continue to increase our capital allocation into this unique asset class. As a group, SPAC yields to maturity have widened out to over 3%, providing us with significant opportunities to engage. Considering that you are guaranteed the return of your capital from the cash-in-trust and the attractive yield to maturity, SPACs have become a very attractive place to invest amidst the current market conditions. Over the course of the year, we have seen IPO volume contract, correlated to market conditions and the increased scrutiny on SPAC reporting coming from the SEC. When that picture becomes clearer, we are hopeful that the IPO volume could scale back up. In the meantime, the SPAC universe remains vast with many solid investment opportunities available given its material yield in short-dated positions.
We will adapt by remaining intellectually nimble to the current fact set and will be in a good position to take advantage of any market dislocations in high probability opportunities within the merger arb and SPAC universe. Over our 22-year history of merger arbitrage investing, this has worked out well for us with shallow drawdowns, quick recoveries, and no losing years in our entire operating history. We continue to approach the markets as we always have, with a great deal of humility and a risk-adjusted mindset. Thank you to our shareholders for their continued trust.
First Trust Multi-Strategy Fund
The First Trust Multi-Strategy Fund (the “Fund”) A and I Share Classes returned -5.82% and -5.54%, respectively, for the 1-year fiscal period ending September 30, 2022. The Fund’s benchmark, the ICE BofA 3-Month U.S. Treasury Bill Index, finished the fiscal year ending September 30, 2022 with a +0.62% return. The Fund’s negative performance, and underperformance relative to the benchmark, is attributable to the Fund’s put writing and structured credit strategies over the trailing one-year lookback period. These negative returns were largely driven by pressure and volatility seen in the structured credit book along with substantial equity sell-offs affecting our options strategy. Over a longer-term lookback, the overall correlation benefit across the three strategies remains robust, as the Fund’s volatility has remained very low at 4.13%. The diversification benefit within the portfolio is also evident in the fact that the strategies’ overall return-to-risk ratio was higher than each of the underlying strategies on a stand-alone basis.
First Trust Capital Management | 225 W. Wacker Drive | Suite 2100 | Chicago, IL 60606 | P: 773.386.6700 | F: 847.386.2910
Aside from the detractors in the portfolio, the merger arbitrage strategy continued its strong performance with its conservative approach to the merger and acquisition space contributing positive attribution to the portfolio over the year. Additionally, over the course of this year as equity markets sold off and created wider spreads, we were able to use dry powder within the Fund to take advantage of deeply discounted merger arbitrage investments that had been affected. While flows provide short-term volatility in merger spreads, they typically do not influence the fundamental outcomes of M&A deals.
Given the recent volatility in equity markets, we are likely to keep our Merger Arbitrage and Structured Credit allocations in the overweight position to mute aggregate portfolio volatility. We will look to incrementally scale into our Secured Put position if/when we see implied volatility grow to extreme levels, while also focusing on keeping the risk balanced between Merger Arbitrage and Structured Credit.
We continue to believe in the power of conviction-weighted portfolios and think that one of the main challenges to multi-alternative mutual funds historically has been overly diversified portfolios that largely net themselves out to minimal returns. In that vein, we currently allocate to three sub-strategies within the overall Fund. One of our key responsibilities is to remain constantly vigilant with respect to balancing the portfolio across the best mix of underlying strategies, attempting to provide the best chance to meet or exceed our absolute return mandate with a stable risk profile. The underlying strategies in the portfolio were largely selected for their attractive correlation benefits when viewed alongside one another, so the portfolio tends to run relatively balanced from a strategy exposure perspective. Importantly, shifts between strategy allocations have tended to be incremental in nature, in which one strategy may see a decrease in allocation across the course of a quarter while that harvested capital has been pushed to another underlying team with a more active opportunity set. As of the end of the fiscal year, the sub-strategy allocations were as follows: Asset Backed Fixed Income (35%), Arbitrage (42%), and Option Writing (22%).

As always, we thank you for your continued support and intend to work hard to maintain it.
Kind Regards,
 |  |
| | |
Michael Peck, CFA Chief Executive Officer, Co-Chief Investment Officer mpeck@FirstTrustCapital.com | Brian R. Murphy Co-Chief Investment Officer bmurphy@FirstTrustCapital.com |
First Trust Capital Management | 225 W. Wacker Drive | Suite 2100 | Chicago, IL 60606 | P: 773.386.6700 | F: 847.386.2910
The views were those of the Portfolio Fund Managers as of September 30, 2022 and may not reflect their views on the date this material is first published or anytime thereafter. These views are intended to assist the shareholders of the Funds in understanding their investments and do not constitute investment advice. This material may contain discussions about investments that may or may not be held by the Funds as of the date of this material. All current and future holdings are subject to risk and to change.
VARBX Risk Considerations
You could lose money by investing in a fund. An investment in a fund is not a deposit of a bank and is not insured or guaranteed. There can be no assurance that a fund’s objective(s) will be achieved. Please refer to each fund’s prospectus and SAI for additional details on a fund’s risks. The order of the below risk factors does not indicate the significance of any particular risk factor.
Market risk is the risk that a particular security, or shares of a fund in general may fall in value. Securities are subject to market fluctuations caused by such factors as general economic conditions, political events, regulatory or market developments, changes in interest rates and perceived trends in securities prices. Shares of a fund could decline in value or underperform other investments as a result. In addition, local, regional or global events such as war, acts of terrorism, spread of infectious disease or other public health issues, recessions, or other events could have significant negative impact on a fund. In February 2022, Russia invaded Ukraine which has caused and could continue to cause significant market disruptions and volatility within the markets in Russia, Europe, and the United States. The hostilities and sanctions resulting from those hostilities could have a significant impact on certain fund investments as well as fund performance. The COVID-19 global pandemic and the ensuing policies enacted by governments and central banks have caused and may continue to cause significant volatility and uncertainty in global financial markets. While the U.S. has resumed “reasonably” normal business activity, many countries continue to impose lockdown measures. Additionally, there is no guarantee that vaccines will be effective against emerging variants of the disease.
In managing a fund’s investment portfolio, the portfolio managers will apply investment techniques and risk analyses that may not have the desired result.
Investments in companies that are the subject of a publicly announced transaction carry the risk the transaction is renegotiated, takes longer to complete than originally planned and that the transaction is never completed. Any such event could cause a fund to incur a loss. The risk/reward payout of merger arbitrage strategies typically is asymmetric, with the losses in failed transactions often far exceeding the gains in successful transactions.
An investment in SPACs, which are typically traded in the over-the-counter market, may also have little or no liquidity and may be subject to restrictions on resale.
Any decrease in negative correlation or increase in positive correlation between hedging positions the Advisor anticipated would be offsetting (such as short and long positions in securities or currencies held by the Fund) could result in significant losses for the Fund.
Leverage may result in losses that exceed the amount originally invested and may accelerate the rates of losses.
Short selling creates special risks which could result in increased gains or losses and volatility of returns. Because losses on short sales arise from increases in the value of the security sold short, such losses are theoretically unlimited.
The use of derivatives, including options, can lead to losses because of adverse movements in the price or value of the underlying asset, index or rate, which may be magnified by certain features of the derivatives.
The Fund must segregate liquid assets or engage in other measures to “cover” open positions with respect to certain kinds of derivatives and short sales.
Certain fund investments may be subject to restrictions on resale, trade over-the-counter or in limited volume, or lack an active trading market. Illiquid securities may trade at a discount and may be subject to wide fluctuations in market value.
High portfolio turnover may result in higher levels of transaction costs and may generate greater tax liabilities for shareholders.
A fund classified as “non-diversified” may invest a relatively high percentage of its assets in a limited number of issuers. As a result, a fund may be more susceptible to a single adverse economic or regulatory occurrence affecting one or more of these issuers, experience increased volatility and be highly concentrated in certain issuers.
The prices of fixed income securities respond to economic developments, particularly interest rate changes, changes to an issuer’s credit rating or market perceptions about the creditworthiness of an issuer.
There is no guarantee that a fund will provide a fixed or stable level of distributions at any time or over any period of time.
High yield securities, or “junk” bonds, are less liquid and are subject to greater market fluctuations and risk of loss than securities with higher ratings, and therefore, are considered to be highly speculative.
First Trust Capital Management | 225 W. Wacker Drive | Suite 2100 | Chicago, IL 60606 | P: 773.386.6700 | F: 847.386.2910
Preferred securities combine some of the characteristics of both common stocks and bonds. Preferred stocks are typically subordinated to other debt instruments in terms of priority to corporate income, and therefore will be subject to greater credit risk than those debt instruments.
Securities of micro-, small- and mid-capitalization companies may be more vulnerable to adverse general market or economic developments, may be less liquid, and may experience greater price volatility than larger, more established companies.
Securities of non-U.S. issuers are subject to additional risks, including currency fluctuations, political risks, withholding, the lack of adequate financial information, and exchange control restrictions impacting non-U.S. issuers.
As the use of Internet technology has become more prevalent in the course of business, funds have become more susceptible to potential operational risks through breaches in cyber security.
Changes in currency exchange rates and the relative value of non-US currencies may affect the value of a fund’s investments and the value of a fund’s shares.
First Trust Capital Management is the adviser to the Fund. The Fund’s distributor is First Trust Portfolios L.P.
The information presented is not intended to constitute an investment recommendation for, or advice to, any specific person. By providing this information, First Trust is not undertaking to give advice in any fiduciary capacity within the meaning of ERISA, the Internal Revenue Code or any other regulatory framework. Financial professionals are responsible for evaluating investment risks independently and for exercising independent judgment in determining whether investments are appropriate for their clients.
OMOIX Risk Considerations
You could lose money by investing in a fund. An investment in a fund is not a deposit of a bank and is not insured or guaranteed. There can be no assurance that a fund’s objective(s) will be achieved. Please refer to each fund’s prospectus and SAI for additional details on a fund’s risks. The order of the below risk factors does not indicate the significance of any particular risk factor.
Alternative Investments may employ complex strategies, have unique investment and risk characteristics and may not be appropriate for all investors.
Market risk is the risk that a particular security, or shares of a fund in general may fall in value. Securities are subject to market fluctuations caused by such factors as general economic conditions, political events, regulatory or market developments, changes in interest rates and perceived trends in securities prices. Shares of a fund could decline in value or underperform other investments as a result. In addition, local, regional or global events such as war, acts of terrorism, spread of infectious disease or other public health issues, recessions, or other events could have significant negative impact on a fund. In February 2022, Russia invaded Ukraine which has caused and could continue to cause significant market disruptions and volatility within the markets in Russia, Europe, and the United States. The hostilities and sanctions resulting from those hostilities could have a significant impact on certain fund investments as well as fund performance. The COVID-19 global pandemic and the ensuing policies enacted by governments and central banks have caused and may continue to cause significant volatility and uncertainty in global financial markets. While the U.S. has resumed “reasonably” normal business activity, many countries continue to impose lockdown measures. Additionally, there is no guarantee that vaccines will be effective against emerging variants of the disease.
In managing a fund’s investment portfolio, the portfolio managers will apply investment techniques and risk analyses that may not have the desired result.
Because the shares of CEFs cannot be redeemed upon demand, shares of many CEFs will trade on exchanges at market prices rather than net asset value, which may cause the shares to trade at a price greater than NAV (premium) or less than NAV (discount).
A fund may invest in the shares of CEFs, ETFs and ETNs which involves additional expenses that would not be present in a direct investment in the underlying funds. In addition, a fund’s investment performance and risks may be related to the investment performance and risks of the underlying funds.
Collateralized loan obligations (“CLOs”) carry additional risks, including, the possibility that distributions from collateral securities will not be adequate to make interest or other payments, the quality of the collateral may decline in value or default, the possibility that the investments in CLOs are subordinate to other classes or tranches, and the complex structure of the security may not be fully understood at the time of investment and may produce disputes with the issuer or unexpected investment results.
Certain structured products may be thinly traded or have a limited trading market and as a result may be characterized by the fund as illiquid securities.
Mortgage-related securities are more susceptible to adverse economic, political or regulatory events that affect the value of real estate. They are also subject to the risk that the rate of mortgage prepayments decreases, which extends the average life of a security and increases the interest rate exposure. Investments in companies that are the subject of a publicly announced transaction carry the risk the transaction is renegotiated, takes longer to complete than originally planned and that the transaction is never completed. Any such event could cause the fund to incur a loss. The risk/reward payout of merger arbitrage strategies typically is asymmetric, with the losses in failed transactions often far exceeding the gains in successful transactions.
First Trust Capital Management | 225 W. Wacker Drive | Suite 2100 | Chicago, IL 60606 | P: 773.386.6700 | F: 847.386.2910
The stocks of companies that have recently conducted an initial public offering are often subject to price volatility and speculative trading. These stocks may have exhibited above average price appreciation in connection with the initial public offering prior to inclusion in a fund. The price of stocks included in a fund may not continue to appreciate and their performance may not replicate the performance exhibited in the past.
The use of derivatives, including futures, options, swap agreements, and forward contracts, can lead to losses because of adverse movements in the price or value of the underlying asset, index or rate, which may be magnified by certain features of the derivatives.
Short selling creates special risks which could result in increased gains or losses and volatility of returns. Because losses on short sales arise from increases in the value of the security sold short, such losses are theoretically unlimited.
Leverage may result in losses that exceed the amount originally invested and may accelerate the rates of losses.
A fund may be subject to the risk that a counterparty will not fulfill its obligations which may result in significant financial loss to a fund.
Certain securities are subject to call, credit, interest rate, extension, and prepayment risks. These risks could result in a decline in a security’s value and/or income, increased volatility as interest rates rise or fall and have an adverse impact on a fund’s performance.
Subordinated securities are more likely to suffer a credit loss than non-subordinated securities of the same issuer and that loss is likely to be proportionately greater and take more time to recover interest or principal.
High yield securities, or “junk” bonds, are less liquid and are subject to greater market fluctuations and risk of loss than securities with higher ratings, and therefore, are considered to be highly speculative. Repurchase agreements typically involve the acquisition by a fund of fixed-income securities from a selling financial institution such as a bank or broker-dealer. A fund may incur a loss if the other party to a repurchase agreement is unwilling or unable to fulfill its contractual obligations to repurchase the underlying security. Reverse repurchase agreements involve the risk that the other party may fail to return the securities in a timely manner or at all. A fund could lose money if it is unable to recover the securities and/or if the value of collateral held by a fund, including the value of the investments made with cash collateral, is less than the value of securities.
To the extent a fund invests in floating or variable rate obligations that use the London Interbank Offered Rate (“LIBOR”) as a reference interest rate, it is subject to LIBOR Risk. The United Kingdom’s Financial Conduct Authority, which regulates LIBOR, has ceased making LIBOR available as a reference rate over a phase-out period that began December 31, 2021. There is no assurance that any alternative reference rate, including the Secured Overnight Financing Rate (“SOFR”) will be similar to or produce the same value or economic equivalence as LIBOR or that instruments using an alternative rate will have the same volume or liquidity. The unavailability or replacement of LIBOR may affect the value, liquidity or return on certain fund investments and may result in costs incurred in connection with closing out positions and entering into new trades. Any potential effects of the transition away from LIBOR on a fund or on certain instruments in which a fund invests can be difficult to ascertain, and they may vary depending on a variety of factors, and they could result in losses to a fund.
Securities of micro, small- and mid-capitalization companies may experience greater price volatility and be less liquid than larger, more established companies.
Securities of non-U.S. issuers are subject to additional risks, including currency fluctuations, political risks, withholding, the lack of adequate financial information, and exchange control restrictions impacting non-U.S. issuers. These risks may be heightened for securities of companies located in, or with significant operations in, emerging market countries.
Changes in currency exchange rates and the relative value of non-US currencies may affect the value of a fund’s investments and the value of a fund’s shares.
Stocks with growth characteristics tend to be more volatile than certain other stocks and their prices may fluctuate more dramatically than the overall stock market.
A fund with significant exposure to a single sector may be more affected by an adverse economic or political development than a broadly diversified fund.
High portfolio turnover may result in higher levels of transaction costs and may generate greater tax liabilities for shareholders.
Portfolio holdings that are valued using techniques other than market quotations may be subject to greater fluctuation in their valuations from one day to the next than if market quotations were used.
Value stocks are subject to the risk that valuations never improve or that the returns on value stocks are less than returns on other styles of investing or the overall stock market.
Securities issued or guaranteed by federal agencies and U.S. government sponsored instrumentalities may or may not be backed by the full faith and credit of the U.S. government.
As the use of Internet technology has become more prevalent in the course of business, funds have become more susceptible to potential operational risks through breaches in cyber security.
The prices of fixed income securities respond to economic developments, particularly interest rate changes, changes to an issuer’s credit rating or market perceptions about the creditworthiness of an issuer.
There is no guarantee that a fund will provide a fixed or stable level of distributions at any time or over any period of time.
First Trust Capital Management | 225 W. Wacker Drive | Suite 2100 | Chicago, IL 60606 | P: 773.386.6700 | F: 847.386.2910
First Trust Capital Management is the adviser to the Fund. The Fund’s distributor is First Trust Portfolios L.P.
The information presented is not intended to constitute an investment recommendation for, or advice to, any specific person. By providing this information, First Trust is not undertaking to give advice in any fiduciary capacity within the meaning of ERISA, the Internal Revenue Code or any other regulatory framework. Financial professionals are responsible for evaluating investment risks independently and for exercising independent judgment in determining whether investments are appropriate for their clients.
First Trust Capital Management | 225 W. Wacker Drive | Suite 2100 | Chicago, IL 60606 | P: 773.386.6700 | F: 847.386.2910
First Trust Merger Arbitrage Fund
FUND PERFORMANCE at September 30, 2022 (Unaudited)

This graph compares a hypothetical $500,000 investment in the Fund’s Class I shares with a similar investment in the Bloomberg Barclays US Aggregate Bond Index and the S&P 500 Index during the periods shown. The performance graph above is shown for the Fund’s Class I shares. Class A shares performance may vary. Results include the reinvestment of all dividends and capital gains.
| Average Annual Total Returns as of September 30, 2022 | 1 Year | 5 Years | 10 Years |
| Before deducting maximum sales charge | | | |
| Class A¹ | 0.91% | 3.18% | 3.47% |
| Class I² | 1.27% | 3.52% | 3.79% |
| After deducting maximum sales charge | | | |
| Class A¹ | -4.88% | 1.96% | 2.86% |
| Bloomberg Barclays US Aggregate Bond Index | -14.60% | -0.27% | 0.89% |
| S&P 500 Index | -15.47% | 9.24% | 11.70% |
| 1 | Maximum sales charge for Class A shares is 5.75%. No sales charge applies on investments of $1 million or more, but a contingent deferred sales charge of 1.00% will be imposed to the extent a finder’s fee was paid on certain redemptions of such shares within 12 months of the date of purchase. |
| 2 | Class I shares do not have any initial or deferred sales charge. |
The performance data quoted here represents past performance and past performance is not a guarantee of future results. Investment return and principal value will fluctuate so that an investor’s shares, when redeemed, may be worth more or less than their original cost. Current performance may be lower or higher than the performance information quoted. The most recent month end performance may be obtained by calling (877) 779-1999.
The expense ratios for Class A and Class I shares were 2.12% and 1.81%, respectively, which were the amounts stated in the current prospectus dated February 1, 2022. For the Fund’s current one year expense ratios, please refer to the Financial Highlights section of this report. The Fund’s advisor has contractually agreed to waive its fees and/or pay for operating expenses of the Fund to ensure that total annual fund operating expenses do not exceed 1.85% and 1.55% of the average daily net assets of the Fund’s Class A and Class I shares, respectively. This agreement is in effect until November 1, 2023, and it may be terminated before that date only by the Trust’s Board of Trustees.
First Trust Merger Arbitrage Fund
FUND PERFORMANCE at September 30, 2022 (Unaudited) – Continued
The Fund commenced investment operations on October 1, 2015, after the reorganization of Highland Capital Management Institutional Fund, LLC, a Delaware limited liability company which commenced operations on April 1, 2000 (the “Predecessor Fund”), into the Fund, pursuant to which the Predecessor Fund transferred substantially all of its assets into the Fund. As a result of the reorganization, the Fund is the accounting successor of the Predecessor Fund. The Predecessor Fund was not registered under the 1940 Act and, therefore, was not subject to certain restrictions imposed by the 1940 Act on registered investment companies and by the Internal Revenue Code of 1986, as amended, on regulated investment companies such as the Fund. Performance results shown in the graph and the performance table above for the period prior to October 1, 2015 reflect the performance of the Predecessor Fund.
Returns reflect the reinvestment of distributions made by the Fund, if any. The graph and the performance table shown do not reflect the deduction of taxes that a shareholder would pay on Fund distributions or the redemption of Fund shares. Shares redeemed within 30 days of purchase will be charged a redemption fee of 1.00%.
The Bloomberg Barclays US Aggregate Bond Index is market capitalization weighted and includes treasury securities, government agency bonds, mortgage backed bonds and corporate bonds. It excludes municipal bonds and treasury inflation-protected securities because of tax treatment. The S&P 500 Index includes a representative sample of 500 leading companies in leading industries of the U.S. economy and assumes any dividends are reinvested back into the index. These indices do not reflect expenses, fees or sales charge, which would lower performance. The indices are unmanaged and they are not available for investment.
First Trust Multi-Strategy Fund
FUND PERFORMANCE at September 30, 2022 (Unaudited)
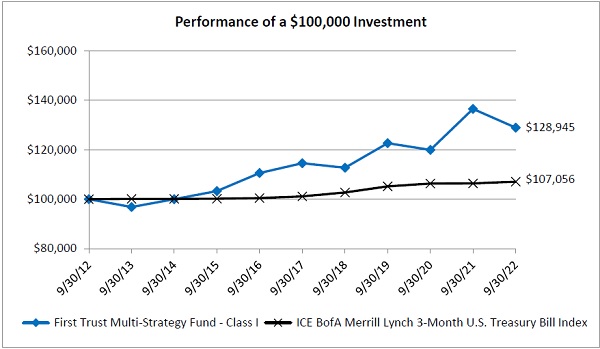
This graph compares a hypothetical $100,000 investment in the Fund’s Class I shares with a similar investment in the ICE BofA Merrill Lynch 3-Month U.S. Treasury Bill Index during the periods shown. The performance graph above is shown for the Fund’s Class I shares. Class A shares performance may vary. Results include the reinvestment of all dividends and capital gains.
| Average Annual Total Returns as of September 30, 2022 | 1 Year | 5 Years | 10 Years |
| Before deducting maximum sales charge | | | |
| Class A¹ | -5.82% | 2.11% | 2.27% |
| Class I² | -5.54% | 2.40% | 2.57% |
| After deducting maximum sales charge | | | |
| Class A¹ | -10.52% | 1.06% | 1.75% |
| ICE BofA Merrill Lynch 3-Month U.S. Treasury Bill Index | 0.62% | 1.15% | 0.68% |
| 1 | Effective August 22, 2022, maximum sales charge was lowered from 5.00% to 4.50%. No sales charge applies on investments of $250,000 or more, but a contingent deferred sales charge of 0.50% will be imposed to the extent a finder’s fee was paid on certain redemptions of such shares within 12 months of the date of purchase. Prior to August 22, 2022, the contingent deferred sales charge was 1.00%. |
| 2 | Class I shares do not have any initial or deferred sales charge. |
The performance data quoted here represents past performance and past performance is not a guarantee of future results. Investment return and principal value will fluctuate so that an investor’s shares, when redeemed, may be worth more or less than their original cost. Current performance may be lower or higher than the performance information quoted. The most recent month end performance may be obtained by calling (877) 779-1999.
The expense ratios for Class A and Class I shares were 2.60% and 2.37%, respectively, which were the amounts stated in the current prospectus dated February 1, 2022, as amended April 27, 2022. For the Fund’s current one year expense ratios, please refer to the Financial Highlights section of this report. The Fund’s advisor has contractually agreed to waive its fees and/or pay for operating expenses of the Fund to ensure that total annual fund operating expenses do not exceed 1.85% and 1.55% of the average daily net assets of the Fund’s Class A and Class I shares, respectively. This agreement is in effect until November 1, 2023, and it may be terminated before that date only by the Trust’s Board of Trustees.
First Trust Multi-Strategy Fund
FUND PERFORMANCE at September 30, 2022 (Unaudited) – Continued
The Fund commenced investment operations on December 16, 2016, after the reorganization of Vivaldi Orinda Macro Opportunities Fund, which commenced operations on April 30, 2012 (the “Predecessor Fund”), into the Fund, pursuant to which the Predecessor Fund transferred substantially all of its assets into the Fund. As a result of the reorganization, the Fund is the accounting successor of the Predecessor Fund. Performance results shown in the graph and the performance table above for the period prior to December 16, 2016 reflect the performance of the Predecessor Fund.
Returns reflect the reinvestment of distributions made by the Fund, if any. The graph and the performance table shown do not reflect the deduction of taxes that a shareholder would pay on Fund distributions or the redemption of Fund shares.
The ICE BofA Merrill Lynch 3-Month U.S. Treasury Bill Index tracks the performance of the U.S. Dollar denominated U.S. Treasury Bills publicly issued in the U.S. Domestic Market with a remaining term to final maturity of less than 3 months. This index does not reflect expenses, fees or sales charges, which would lower performance. The index is unmanaged and it is not available for investment.
First Trust Merger Arbitrage Fund
SCHEDULE OF INVESTMENTS
As of September 30, 2022
Number
of Shares | | | | | Value | |
| | | | | COMMON STOCKS — 95.3% | | | | |
| | | | | COMMERCIAL BANKS-CENTRAL US — 3.4% | | | | |
| | 2,212,106 | | | Flagstar Bancorp, Inc.1 | | $ | 73,884,340 | |
| | | | | | | | | |
| | | | | COMMERCIAL BANKS-SOUTHERN US — 0.0% | | | | |
| | 2,600 | | | First Horizon Corp.1 | | | 59,540 | |
| | | | | | | | | |
| | | | | COMPUTER DATA SECURITY — 0.6% | | | | |
| | 494,500 | | | Ping Identity Holding Corp.* | | | 13,880,615 | |
| | | | | | | | | |
| | | | | COMPUTER SERVICES — 1.9% | | | | |
| | 731,189 | | | Computer Services, Inc.1 | | | 40,763,787 | |
| | | | | | | | | |
| | | | | ELECTRONIC MEASURING INSTRUMENTS — 0.5% | | | | |
| | 193,068 | | | CyberOptics Corp.* | | | 10,383,197 | |
| | | | | | | | | |
| | | | | ENTERPRISE SOFTWARE/SERVICE — 5.5% | | | | |
| | 1,221,556 | | | Avalara, Inc.*,1 | | | 112,138,841 | |
| | 727,295 | | | BTRS Holdings, Inc.* | | | 6,734,752 | |
| | | | | | | | 118,873,593 | |
| | | | | INTERNET APPLICATION SOFTWARE — 4.2% | | | | |
| | 1,195,756 | | | Zendesk, Inc.* | | | 90,997,032 | |
| | | | | | | | | |
| | | | | MEDICAL INFORMATION SYSTEMS — 2.7% | | | | |
| | 549,850 | | | 1Life Healthcare, Inc.*,1 | | | 9,429,927 | |
| | 1,800,181 | | | Change Healthcare, Inc.* | | | 49,486,976 | |
| | | | | | | | 58,916,903 | |
| | | | | MEDICAL-BIOMEDICAL/GENERICS — 5.6% | | | | |
| | 276,667 | | | Biohaven Pharmaceutical Holding Co., Ltd.* | | | 41,823,750 | |
| | 715,842 | | | ChemoCentryx, Inc.*,1 | | | 36,980,398 | |
| | 1,017,722 | | | Forma Therapeutics Holdings, Inc.* | | | 20,303,554 | |
| | 345,341 | | | Global Blood Therapeutics, Inc.* | | | 23,517,722 | |
| | | | | | | | 122,625,424 | |
| | | | | OIL REFINING & MARKETING — 0.2% | | | | |
| | 218,718 | | | Sprague Resources LP1 | | | 4,339,365 | |
| | | | | | | | | |
| | | | | REITS-SINGLE TENANT — 1.3% | | | | |
| | 908,972 | | | STORE Capital Corp. | | | 28,478,093 | |
| | | | | | | | | |
| | | | | SPECIFIED PURPOSE ACQUISITIONS — 66.9% | | | | |
| | 195,867 | | | 10X Capital Venture Acquisition Corp. II - Class A* | | | 1,958,670 | |
| | 45,000 | | | 10X Capital Venture Acquisition Corp. III - Class A* | | | 454,500 | |
First Trust Merger Arbitrage Fund
SCHEDULE OF INVESTMENTS - Continued
As of September 30, 2022
Number
of Shares | | | | | Value | |
| | | | | COMMON STOCKS (Continued) | | | | |
| | | | | SPECIFIED PURPOSE ACQUISITIONS (Continued) | | | | |
| | 1,000,031 | | | 26 Capital Acquisition Corp.* | | $ | 9,870,306 | |
| | 35,042 | | | 5:01 Acquisition Corp. - Class A* | | | 350,070 | |
| | 3,200 | | | 7 Acquisition Corp. - Class A* | | | 32,288 | |
| | 288,514 | | | 7GC & Co. Holdings, Inc. - Class A* | | | 2,867,829 | |
| | 575,337 | | | ABG Acquisition Corp. I - Class A* | | | 5,713,096 | |
| | 146,522 | | | Accelerate Acquisition Corp. - Class A* | | | 1,438,846 | |
| | 421,934 | | | Accretion Acquisition Corp.* | | | 4,194,024 | |
| | 543,572 | | | Achari Ventures Holdings Corp. I* | | | 5,462,899 | |
| | 988,000 | | | Acropolis Infrastructure Acquisition Corp. - Class A* | | | 9,588,540 | |
| | 321,806 | | | Adara Acquisition Corp. - Class A* | | | 3,201,970 | |
| | 701,030 | | | Adit EdTech Acquisition Corp.* | | | 6,933,187 | |
| | 230,460 | | | Advanced Merger Partners, Inc. - Class A* | | | 2,267,726 | |
| | 511,254 | | | Aequi Acquisition Corp. - Class A* | | | 5,107,427 | |
| | 556,574 | | | Aesther Healthcare Acquisition Corp. - Class A*,2 | | | 5,671,489 | |
| | 651,500 | | | Aetherium Acquisition Corp. - Class A*,2 | | | 6,475,910 | |
| | 15,800 | | | AfterNext HealthTech Acquisition Corp. - Class A* | | | 154,366 | |
| | 122,956 | | | Agile Growth Corp. - Class A* | | | 1,220,953 | |
| | 5,730 | | | Ahren Acquisition Corp. - Class A* | | | 57,529 | |
| | 32,807 | | | Alpha Partners Technology Merger Corp.* | | | 322,165 | |
| | 20,633 | | | ALSP Orchid Acquisition Corp. I - Class A* | | | 206,949 | |
| | 97,276 | | | AltEnergy Acquisition Corp. - Class A* | | | 970,814 | |
| | 1,049,725 | | | Altimeter Growth Corp. II - Class A* | | | 10,402,775 | |
| | 100 | | | Andretti Acquisition Corp. - Class A* | | | 1,004 | |
| | 354,938 | | | Anzu Special Acquisition Corp. I - Class A* | | | 3,489,041 | |
| | 26,700 | | | Apeiron Capital Investment Corp. - Class A* | | | 268,335 | |
| | 256,028 | | | Apollo Strategic Growth Capital II - Class A* | | | 2,526,996 | |
| | 3,600 | | | APx Acquisition Corp. I - Class A* | | | 36,540 | |
| | 250,567 | | | Arbor Rapha Capital Bioholdings Corp. I - Class A* | | | 2,533,232 | |
| | 128,996 | | | Arctos NorthStar Acquisition Corp.* | | | 1,278,350 | |
| | 125,000 | | | Arena Fortify Acquisition Corp. - Class A* | | | 1,253,750 | |
| | 13,070 | | | Ares Acquisition Corp. - Class A* | | | 129,785 | |
| | 121,020 | | | Argus Capital Corp. - Class A* | | | 1,216,856 | |
| | 233,669 | | | Armada Acquisition Corp. I* | | | 2,317,996 | |
| | 109,925 | | | Arogo Capital Acquisition Corp. - Class A* | | | 1,092,654 | |
| | 502,283 | | | Arrowroot Acquisition Corp. - Class A* | | | 4,932,419 | |
| | 200,200 | | | ARYA Sciences Acquisition Corp. IV - Class A* | | | 1,983,982 | |
| | 159,629 | | | ARYA Sciences Acquisition Corp. V - Class A* | | | 1,564,364 | |
| | 192,109 | | | Ascendant Digital Acquisition Corp. III - Class A* | | | 1,947,985 | |
| | 20,658 | | | Astrea Acquisition Corp. - Class A* | | | 203,275 | |
| | 1,078,165 | | | Athena Consumer Acquisition Corp. - Class A* | | | 10,835,558 | |
| | 1,008,223 | | | Athlon Acquisition Corp. - Class A* | | | 9,961,243 | |
First Trust Merger Arbitrage Fund
SCHEDULE OF INVESTMENTS - Continued
As of September 30, 2022
Number
of Shares | | | | | Value | |
| | | | | COMMON STOCKS (Continued) | | | | |
| | | | | SPECIFIED PURPOSE ACQUISITIONS (Continued) | | | | |
| | 314,379 | | | Atlantic Avenue Acquisition Corp. - Class A* | | $ | 3,156,365 | |
| | 153,049 | | | Atlantic Coastal Acquisition Corp. - Class A* | | | 1,502,941 | |
| | 284,632 | | | Atlantic Coastal Acquisition Corp. II - Class A* | | | 2,852,013 | |
| | 59,674 | | | Ault Disruptive Technologies Corp.* | | | 601,514 | |
| | 1,100 | | | Aura FAT Projects Acquisition Corp. - Class A* | | | 11,077 | |
| | 970,391 | | | Aurora Acquisition Corp. - Class A* | | | 9,597,167 | |
| | 227,431 | | | Aurora Technology Acquisition Corp. - Class A* | | | 2,278,859 | |
| | 901,851 | | | Austerlitz Acquisition Corp. I - Class A* | | | 8,847,158 | |
| | 1,897,771 | | | Austerlitz Acquisition Corp. II - Class A* | | | 18,617,134 | |
| | 165,000 | | | Authentic Equity Acquisition Corp. - Class A* | | | 1,641,750 | |
| | 935,922 | | | Avalon Acquisition, Inc. - Class A* | | | 9,368,579 | |
| | 281,865 | | | Avanti Acquisition Corp.* | | | 2,824,287 | |
| | 35,419 | | | Avista Public Acquisition Corp. II - Class A* | | | 361,628 | |
| | 14,375 | | | AXIOS Sustainable Growth Acquisition Corp. - Class A* | | | 145,331 | |
| | 182,040 | | | B Riley Principal 250 Merger Corp. - Class A* | | | 1,782,172 | |
| | 343,174 | | | Banner Acquisition Corp. - Class A* | | | 3,397,423 | |
| | 1,143,700 | | | Banyan Acquisition Corp. - Class A* | | | 11,425,563 | |
| | 369,050 | | | Battery Future Acquisition Corp. - Class A* | | | 3,723,235 | |
| | 197,172 | | | BCLS Acquisition Corp. - Class A* | | | 1,975,663 | |
| | 4,400 | | | Belong Acquisition Corp. - Class A* | | | 43,384 | |
| | 441,803 | | | Benessere Capital Acquisition Corp. - Class A* | | | 4,581,497 | |
| | 249,829 | | | Berenson Acquisition Corp. I - Class A* | | | 2,458,317 | |
| | 1,038,690 | | | Better World Acquisition Corp.2 | | | 10,760,828 | |
| | 90,136 | | | Big Sky Growth Partners, Inc. - Class A* | | | 881,530 | |
| | 140,000 | | | BioPlus Acquisition Corp. - Class A* | | | 1,402,800 | |
| | 18,377 | | | Biotech Acquisition Co. - Class A* | | | 182,392 | |
| | 481 | | | Bite Acquisition Corp.* | | | 4,733 | |
| | 152,100 | | | Black Mountain Acquisition Corp. - Class A* | | | 1,525,563 | |
| | 11,903 | | | Black Spade Acquisition Co. - Class A* | | | 116,530 | |
| | 65,000 | | | Blockchain Coinvestors Acquisition Corp. I - Class A* | | | 655,850 | |
| | 385,890 | | | Blockchain Moon Acquisition Corp.* | | | 3,851,182 | |
| | 23,463 | | | Blue Ocean Acquisition Corp. - Class A* | | | 234,865 | |
| | 17,539 | | | Blue Safari Group Acquisition Corp. - Class A* | | | 180,476 | |
| | 774,530 | | | BlueRiver Acquisition Corp. - Class A* | | | 7,667,847 | |
| | 850,753 | | | BOA Acquisition Corp. - Class A* | | | 8,456,485 | |
| | 887,287 | | | Bridgetown Holdings Ltd. - Class A* | | | 8,899,489 | |
| | 139,523 | | | Bright Lights Acquisition Corp. - Class A* | | | 1,382,673 | |
| | 252 | | | Broad Capital Acquisition Corp.* | | | 2,520 | |
| | 104,300 | | | Broadscale Acquisition Corp. - Class A* | | | 1,027,355 | |
| | 29,902 | | | Build Acquisition Corp. - Class A* | | | 293,638 | |
| | 43,259 | | | BurTech Acquisition Corp. - Class A* | | | 432,590 | |
First Trust Merger Arbitrage Fund
SCHEDULE OF INVESTMENTS - Continued
As of September 30, 2022
Number
of Shares | | | | | Value | |
| | | | | COMMON STOCKS (Continued) | | | | |
| | | | | SPECIFIED PURPOSE ACQUISITIONS (Continued) | | | | |
| | 3,000 | | | BYTE Acquisition Corp. - Class A* | | $ | 29,700 | |
| | 75,195 | | | C5 Acquisition Corp. - Class A* | | | 754,206 | |
| | 102,786 | | | Cactus Acquisition Corp. I Ltd. - Class A* | | | 1,032,999 | |
| | 916,100 | | | Canna-Global Acquisition Corp. - Class A* | | | 9,280,093 | |
| | 4,340 | | | Capitalworks Emerging Markets Acquisition Corp. - Class A* | | | 43,877 | |
| | 744,270 | | | Carney Technology Acquisition Corp. II - Class A* | | | 7,405,486 | |
| | 941,469 | | | Cartesian Growth Corp. - Class A* | | | 9,329,958 | |
| | 199,998 | | | CARTESIAN GROWTH Corp. II* | | | 1,999,980 | |
| | 310,164 | | | Cartica Acquisition Corp. - Class A* | | | 3,129,555 | |
| | 130,854 | | | Cascadia Acquisition Corp. - Class A* | | | 1,286,295 | |
| | 1 | | | Catalyst Partners Acquisition Corp. - Class A* | | | 10 | |
| | 516,372 | | | Catcha Investment Corp. - Class A* | | | 5,112,083 | |
| | 187,642 | | | CF Acquisition Corp. IV - Class A* | | | 1,867,038 | |
| | 517,754 | | | CF Acquisition Corp. VII - Class A* | | | 5,177,540 | |
| | 159,542 | | | CF Acquisition Corp. VIII - Class A* | | | 1,627,328 | |
| | 31,347 | | | Chain Bridge I - Class A* | | | 316,605 | |
| | 16,847 | | | Chavant Capital Acquisition Corp.* | | | 169,649 | |
| | 28,750 | | | Chenghe Acquisition Co. - Class A* | | | 289,513 | |
| | 601,461 | | | Churchill Capital Corp. V - Class A* | | | 5,954,464 | |
| | 64,171 | | | Churchill Capital Corp. VI - Class A* | | | 630,865 | |
| | 1,082,110 | | | Churchill Capital Corp. VII - Class A* | | | 10,637,141 | |
| | 741,214 | | | Clarim Acquisition Corp. - Class A* | | | 7,330,606 | |
| | 1,182,547 | | | Class Acceleration Corp.* | | | 11,683,564 | |
| | 194,631 | | | Climate Real Impact Solutions II Acquisition Corp. - Class A* | | | 1,919,062 | |
| | 785,732 | | | Colicity, Inc. - Class A* | | | 7,731,603 | |
| | 3,000 | | | Coliseum Acquisition Corp. - Class A* | | | 29,460 | |
| | 6,639 | | | Colombier Acquisition Corp. - Class A* | | | 64,531 | |
| | 82,310 | | | Colonnade Acquisition Corp. II - Class A* | | | 816,515 | |
| | 30,900 | | | Compass Digital Acquisition Corp. - Class A* | | | 301,893 | |
| | 1,410,848 | | | Compute Health Acquisition Corp. - Class A* | | | 13,925,070 | |
| | 166,638 | | | Concord Acquisition Corp. - Class A* | | | 1,674,712 | |
| | 84,084 | | | Concord Acquisition Corp. II - Class A* | | | 814,774 | |
| | 704,614 | | | Concord Acquisition Corp. III - Class A* | | | 7,067,278 | |
| | 935,917 | | | Constellation Acquisition Corp. I - Class A* | | | 9,293,656 | |
| | 296,832 | | | Conx Corp. - Class A* | | | 2,968,320 | |
| | 334,744 | | | Corner Growth Acquisition Corp. - Class A* | | | 3,337,398 | |
| | 26,500 | | | Counter Press Acquisition Corp.* | | | 267,120 | |
| | 152,801 | | | COVA Acquisition Corp. - Class A* | | | 1,518,842 | |
| | 4,476 | | | Crescera Capital Acquisition Corp. - Class A* | | | 44,939 | |
| | 209,886 | | | Crixus BH3 Acquisition Co. - Class A* | | | 2,084,168 | |
| | 127,239 | | | Crown PropTech Acquisitions - Class A* | | | 1,262,211 | |
First Trust Merger Arbitrage Fund
SCHEDULE OF INVESTMENTS - Continued
As of September 30, 2022
Number
of Shares | | | | | Value | |
| | | | | COMMON STOCKS (Continued) | | | | |
| | | | | SPECIFIED PURPOSE ACQUISITIONS (Continued) | | | | |
| | 530,636 | | | Crucible Acquisition Corp. - Class A* | | $ | 5,285,135 | |
| | 313,339 | | | D & Z Media Acquisition Corp. - Class A* | | | 3,092,656 | |
| | 6,132 | | | Deep Lake Capital Acquisition Corp.* | | | 61,136 | |
| | 308,331 | | | Deep Medicine Acquisition Corp. - Class A* | | | 3,107,976 | |
| | 111,500 | | | Denali Capital Acquisition Corp. - Class A* | | | 1,122,805 | |
| | 231,585 | | | DHB Capital Corp. - Class A* | | | 2,278,796 | |
| | 633,658 | | | DHC Acquisition Corp. - Class A* | | | 6,266,878 | |
| | 150,000 | | | DiamondHead Holdings Corp. - Class A* | | | 1,480,500 | |
| | 740,577 | | | Digital Health Acquisition Corp.* | | | 7,502,045 | |
| | 4,293 | | | Digital Transformation Opportunities Corp. - Class A* | | | 42,157 | |
| | 200 | | | DILA Capital Acquisition Corp. - Class A* | | | 1,990 | |
| | 421,432 | | | Direct Selling Acquisition Corp. - Class A* | | | 4,269,106 | |
| | 267 | | | Disruptive Acquisition Corp. I - Class A* | | | 2,654 | |
| | 506,118 | | | dMY Technology Group, Inc. VI - Class A* | | | 5,040,935 | |
| | 29,600 | | | DP Cap Acquisition Corp. I - Class A* | | | 298,664 | |
| | 530,611 | | | Dragoneer Growth Opportunities Corp. III - Class A* | | | 5,194,682 | |
| | 811,457 | | | DTRT Health Acquisition Corp. - Class A* | | | 8,252,518 | |
| | 287,198 | | | East Resources Acquisition Co. - Class A* | | | 2,883,468 | |
| | 199,833 | | | Edify Acquisition Corp. - Class A* | | | 1,976,348 | |
| | 993,132 | | | EG Acquisition Corp. - Class A* | | | 9,712,732 | |
| | 439,580 | | | Emerging Markets Horizon Corp. - Class A* | | | 4,391,404 | |
| | 961,920 | | | Empowerment & Inclusion Capital I Corp. - Class A* | | | 9,503,770 | |
| | 793,340 | | | Enterprise 4.0 Technology Acquisition Corp. - Class A* | | | 8,012,734 | |
| | 627,604 | | | Epiphany Technology Acquisition Corp. - Class A* | | | 6,200,728 | |
| | 542,764 | | | EQ Health Acquisition Corp. - Class A* | | | 5,359,794 | |
| | 176,005 | | | ESGEN Acquisition Corp. - Class A* | | | 1,784,691 | |
| | 206,265 | | | Eucrates Biomedical Acquisition Corp.* | | | 2,068,838 | |
| | 218,600 | | | European Biotech Acquisition Corp. - Class A* | | | 2,168,512 | |
| | 300,000 | | | EVe Mobility Acquisition Corp. - Class A* | | | 3,027,000 | |
| | 23,365 | | | Everest Consolidator Acquisition Corp. - Class A* | | | 234,818 | |
| | 30,000 | | | Evergreen Corp. - Class A* | | | 302,400 | |
| | 252,212 | | | Evo Acquisition Corp. - Class A* | | | 2,479,244 | |
| | 300,000 | | | ExcelFin Acquisition Corp. - Class A* | | | 3,006,000 | |
| | 669,285 | | | Executive Network Partnering Corp. - Class A* | | | 6,679,464 | |
| | 1,036,619 | | | Far Peak Acquisition Corp. - Class A* | | | 10,252,162 | |
| | 805,288 | | | FAST Acquisition Corp. II - Class A* | | | 7,903,902 | |
| | 150,000 | | | Fat Projects Acquisition Corp. - Class A* | | | 1,492,500 | |
| | 155,060 | | | Feutune Light Acquisition Corp. - Class A* | | | 1,542,847 | |
| | 880 | | | FG Merger Corp.* | | | 8,818 | |
| | 387,000 | | | Fifth Wall Acquisition Corp. III - Class A* | | | 3,808,080 | |
| | 174,817 | | | Figure Acquisition Corp. I - Class A* | | | 1,721,947 | |
First Trust Merger Arbitrage Fund
SCHEDULE OF INVESTMENTS - Continued
As of September 30, 2022
Number
of Shares | | | | | Value | |
| | | | | COMMON STOCKS (Continued) | | | | |
| | | | | SPECIFIED PURPOSE ACQUISITIONS (Continued) | | | | |
| | 509,696 | | | Financial Strategies Acquisition Corp.* | | $ | 5,112,251 | |
| | 50,182 | | | Finnovate Acquisition Corp. - Class A* | | | 506,336 | |
| | 400,300 | | | FinServ Acquisition Corp. II - Class A* | | | 3,938,952 | |
| | 1,097,844 | | | Fintech Acquisition Corp. V - Class A* | | | 10,934,526 | |
| | 401,078 | | | FinTech Acquisition Corp. VI - Class A* | | | 3,990,726 | |
| | 1,000,001 | | | Fintech Ecosystem Development Corp. - Class A*,2 | | | 10,050,010 | |
| | 6,360 | | | Fintech Evolution Acquisition Group - Class A* | | | 63,091 | |
| | 385,000 | | | First Light Acquisition Group, Inc. - Class A*,2 | | | 3,792,250 | |
| | 391,809 | | | First Reserve Sustainable Growth Corp. - Class A* | | | 3,847,564 | |
| | 73,561 | | | Flame Acquisition Corp. - Class A* | | | 723,105 | |
| | 478,435 | | | Focus Impact Acquisition Corp. - Class A* | | | 4,793,919 | |
| | 449,251 | | | Forest Road Acquisition Corp. II - Class A* | | | 4,416,137 | |
| | 572,049 | | | Fortistar Sustainable Solutions Corp. - Class A* | | | 5,657,565 | |
| | 420,474 | | | Fortress Capital Acquisition Corp. - Class A* | | | 4,183,716 | |
| | 165,178 | | | Fortress Value Acquisition Corp. IV - Class A* | | | 1,625,352 | |
| | 1,137,226 | | | Forum Merger IV Corp. - Class A* | | | 11,167,559 | |
| | 123,844 | | | Frazier Lifesciences Acquisition Corp. - Class A* | | | 1,234,725 | |
| | 200 | | | Freedom Acquisition I Corp. - Class A* | | | 1,981 | |
| | 376,348 | | | Frontier Acquisition Corp. - Class A* | | | 3,729,609 | |
| | 343,426 | | | Frontier Investment Corp. - Class A* | | | 3,441,129 | |
| | 670,947 | | | FTAC Athena Acquisition Corp. - Class A* | | | 6,655,794 | |
| | 332,659 | | | FTAC Hera Acquisition Corp. - Class A* | | | 3,301,641 | |
| | 141,963 | | | FTAC Zeus Acquisition Corp. - Class A* | | | 1,426,728 | |
| | 752,424 | | | Fusion Acquisition Corp. II - Class A* | | | 7,403,852 | |
| | 350,401 | | | Future Health ESG Corp.* | | | 3,504,010 | |
| | 35,842 | | | FutureTech II Acquisition Corp. - Class A* | | | 360,212 | |
| | 272,635 | | | G&P Acquisition Corp. - Class A* | | | 2,723,624 | |
| | 249,400 | | | Galata Acquisition Corp. - Class A* | | | 2,491,506 | |
| | 189,624 | | | Games & Esports Experience Acquisition Corp. - Class A* | | | 1,924,684 | |
| | 18,804 | | | Gaming & Hospitality Acquisition Corp. - Class A* | | | 185,219 | |
| | 13,175 | | | Genesis Growth Tech Acquisition Corp. - Class A* | | | 133,331 | |
| | 1,000 | | | Genesis Unicorn Capital Corp. - Class A* | | | 9,970 | |
| | 66,666 | | | Gesher I Acquisition Corp. - Class A* | | | 667,327 | |
| | 90,424 | | | Gladstone Acquisition Corp. - Class A* | | | 918,708 | |
| | 42,027 | | | Glenfarne Merger Corp. - Class A* | | | 412,285 | |
| | 5,000 | | | Global Blockchain Acquisition Corp.* | | | 49,850 | |
| | 390,402 | | | Global Consumer Acquisition Corp.* | | | 3,974,292 | |
| | 145,600 | | | Global Partner Acquisition Corp. II - Class A* | | | 1,450,176 | |
| | 6,000 | | | Globalink Investment, Inc.* | | | 59,760 | |
| | 1,018,145 | | | Goal Acquisitions Corp.* | | | 10,018,547 | |
| | 1,375 | | | GoGreen Investments Corp. - Class A* | | | 13,929 | |
First Trust Merger Arbitrage Fund
SCHEDULE OF INVESTMENTS - Continued
As of September 30, 2022
Number
of Shares | | | | | Value | |
| | | | | COMMON STOCKS (Continued) | | | | |
| | | | | SPECIFIED PURPOSE ACQUISITIONS (Continued) | | | | |
| | 253,489 | | | Golden Arrow Merger Corp. - Class A* | | $ | 2,491,797 | |
| | 222,941 | | | Golden Falcon Acquisition Corp. - Class A* | | | 2,218,263 | |
| | 8,554 | | | Good Works II Acquisition Corp.* | | | 85,626 | |
| | 287,421 | | | Gores Holdings VII, Inc. - Class A* | | | 2,833,971 | |
| | 228,602 | | | Gores Technology Partners II, Inc. - Class A* | | | 2,244,872 | |
| | 2,800 | | | Gores Technology Partners, Inc. - Class A* | | | 27,510 | |
| | 200 | | | Graf Acquisition Corp. IV* | | | 1,950 | |
| | 350,937 | | | Group Nine Acquisition Corp. - Class A* | | | 3,470,767 | |
| | 560,574 | | | GX Acquisition Corp. II - Class A* | | | 5,502,034 | |
| | 196,916 | | | Hamilton Lane Alliance Holdings I, Inc. - Class A* | | | 1,947,499 | |
| | 2,253 | | | Hawks Acquisition Corp. - Class A* | | | 22,170 | |
| | 794,535 | | | Health Assurance Acquisition Corp. - Class A* | | | 7,929,459 | |
| | 36 | | | Healthcare AI Acquisition Corp. - Class A* | | | 363 | |
| | 489,698 | | | Healthcare Services Acquisition Corp. - Class A* | | | 4,867,598 | |
| | 200 | | | Heartland Media Acquisition Corp.* | | | 1,992 | |
| | 459,179 | | | Hennessy Capital Investment Corp. V - Class A* | | | 4,532,097 | |
| | 110,936 | | | HH&L Acquisition Co. - Class A* | | | 1,102,704 | |
| | 424,527 | | | HIG Acquisition Corp. - Class A* | | | 4,258,006 | |
| | 791,459 | | | Highland Transcend Partners I Corp. - Class A* | | | 7,882,932 | |
| | 18,200 | | | Home Plate Acquisition Corp. - Class A* | | | 179,088 | |
| | 493,871 | | | Horizon Acquisition Corp. II - Class A* | | | 4,938,710 | |
| | 27,691 | | | Hudson Executive Investment Corp. II - Class A* | | | 272,756 | |
| | 1,058,104 | | | Hudson Executive Investment Corp. III - Class A* | | | 10,401,162 | |
| | 253,893 | | | HumanCo Acquisition Corp. - Class A* | | | 2,528,774 | |
| | 100,200 | | | Hunt Cos. Acquisition Corp. I - Class A* | | | 1,017,030 | |
| | 542,852 | | | Ibere Pharmaceuticals - Class A* | | | 5,379,663 | |
| | 100,036 | | | Iconic Sports Acquisition Corp. - Class A* | | | 1,014,365 | |
| | 161,078 | | | Inception Growth Acquisition Ltd.* | | | 1,594,672 | |
| | 2,971 | | | Industrial Human Capital, Inc.* | | | 30,156 | |
| | 24,425 | | | Industrial Tech Acquisitions II, Inc. - Class A* | | | 244,250 | |
| | 825 | | | Infinite Acquisition Corp. - Class A* | | | 8,234 | |
| | 90,000 | | | InFinT Acquisition Corp.* | | | 912,600 | |
| | 100 | | | Inflection Point Acquisition Corp. - Class A* | | | 982 | |
| | 25,000 | | | Innovative International Acquisition Corp. - Class A* | | | 253,500 | |
| | 454,287 | | | INSU Acquisition Corp. III - Class A* | | | 4,524,699 | |
| | 5 | | | Integral Acquisition Corp. I - Class A* | | | 50 | |
| | 79,890 | | | Integrated Rail and Resources Acquisition Corp. - Class A* | | | 802,894 | |
| | 50,000 | | | Integrated Wellness Acquisition Corp. - Class A* | | | 505,500 | |
| | 417,652 | | | Intelligent Medicine Acquisition Corp. - Class A* | | | 4,205,756 | |
| | 350,000 | | | InterPrivate II Acquisition Corp. - Class A* | | | 3,444,245 | |
| | 760,205 | | | InterPrivate III Financial Partners, Inc. - Class A* | | | 7,450,009 | |
First Trust Merger Arbitrage Fund
SCHEDULE OF INVESTMENTS - Continued
As of September 30, 2022
Number
of Shares | | | | | Value | |
| | | | | COMMON STOCKS (Continued) | | | | |
| | | | | SPECIFIED PURPOSE ACQUISITIONS (Continued) | | | | |
| | 5,872 | | | InterPrivate IV InfraTech Partners, Inc. - Class A* | | $ | 57,839 | |
| | 81,920 | | | Investcorp Europe Acquisition Corp. I - Class A* | | | 830,669 | |
| | 86,788 | | | ION Acquisition Corp. III Ltd. - Class A* | | | 856,598 | |
| | 194,597 | | | Iris Acquisition Corp.* | | | 1,914,834 | |
| | 229,124 | | | Iron Spark I, Inc. - Class A | | | 2,268,328 | |
| | 2,859 | | | Itiquira Acquisition Corp. - Class A* | | | 28,418 | |
| | 8,481 | | | IX Acquisition Corp. - Class A* | | | 84,386 | |
| | 31,187 | | | Jack Creek Investment Corp. - Class A* | | | 310,311 | |
| | 250,100 | | | Jackson Acquisition Co. - Class A* | | | 2,490,996 | |
| | 118,750 | | | Jatt Acquisition Corp. - Class A* | | | 1,193,437 | |
| | 176,476 | | | Jaws Juggernaut Acquisition Corp. - Class A* | | | 1,732,994 | |
| | 698,266 | | | Jaws Mustang Acquisition Corp. - Class A* | | | 6,940,764 | |
| | 265,761 | | | Jiya Acquisition Corp. - Class A* | | | 2,652,295 | |
| | 164,168 | | | JOFF Fintech Acquisition Corp. - Class A* | | | 1,617,055 | |
| | 733,286 | | | Juniper II Corp. - Class A* | | | 7,303,529 | |
| | 72,200 | | | Jupiter Acquisition Corp. - Class A* | | | 698,896 | |
| | 2,900 | | | Jupiter Wellness Acquisition Corp. - Class A* | | | 29,087 | |
| | 202,782 | | | Kadem Sustainable Impact Corp. - Class A* | | | 1,993,347 | |
| | 74,998 | | | Kairos Acquisition Corp. - Class A* | | | 746,980 | |
| | 29,200 | | | Kernel Group Holdings, Inc. - Class A* | | | 289,956 | |
| | 268,228 | | | Khosla Ventures Acquisition Co. III - Class A* | | | 2,623,270 | |
| | 16,307 | | | Kimbell Tiger Acquisition Corp. - Class A* | | | 165,190 | |
| | 1,070,194 | | | Kismet Acquisition II Corp. - Class A* | | | 10,627,026 | |
| | 1,192,867 | | | Kismet Acquisition III Corp. - Class A* | | | 11,809,383 | |
| | 243,183 | | | KKR Acquisition Holdings I Corp. - Class A* | | | 2,392,921 | |
| | 896,520 | | | KL Acquisition Corp. - Class A* | | | 8,875,548 | |
| | 1,199 | | | KnightSwan Acquisition Corp. - Class A* | | | 11,954 | |
| | 275,000 | | | L Catterton Asia Acquisition Corp. - Class A* | | | 2,730,750 | |
| | 662,352 | | | Lakeshore Acquisition II Corp.*,2 | | | 6,656,638 | |
| | 260,100 | | | Landcadia Holdings IV, Inc. - Class A* | | | 2,554,182 | |
| | 15,733 | | | LAVA Medtech Acquisition Corp. - Class A* | | | 158,274 | |
| | 909,106 | | | Lazard Growth Acquisition Corp. I* | | | 9,018,332 | |
| | 201,034 | | | LDH Growth Corp. I - Class A* | | | 1,990,237 | |
| | 549,945 | | | Learn CW Investment Corp. - Class A* | | | 5,416,958 | |
| | 121,198 | | | Lefteris Acquisition Corp. - Class A* | | | 1,211,980 | |
| | 2,123,976 | | | Legato Merger Corp. II*,2 | | | 21,091,082 | |
| | 52,112 | | | Leo Holdings Corp. II - Class A* | | | 519,036 | |
| | 458,542 | | | Lerer Hippeau Acquisition Corp. - Class A* | | | 4,507,468 | |
| | 16,626 | | | Levere Holdings Corp. - Class A* | | | 164,265 | |
| | 801,082 | | | LF Capital Acquisition Corp. II - Class A* | | | 8,050,874 | |
| | 97,250 | | | Liberty Resources Acquisition Corp. - Class A* | | | 983,197 | |
First Trust Merger Arbitrage Fund
SCHEDULE OF INVESTMENTS - Continued
As of September 30, 2022
Number
of Shares | | | | | Value | |
| | | | | COMMON STOCKS (Continued) | | | | |
| | | | | SPECIFIED PURPOSE ACQUISITIONS (Continued) | | | | |
| | 68,430 | | | Lionheart III Corp. - Class A* | | $ | 690,459 | |
| | 143,047 | | | LIV Capital Acquisition Corp. II - Class A* | | | 1,437,622 | |
| | 50,000 | | | Live Oak Mobility Acquisition Corp. - Class A* | | | 491,000 | |
| | 45,419 | | | LMF Acquisition Opportunities, Inc. - Class A* | | | 466,453 | |
| | 237,400 | | | Logistics Innovation Technologies Corp. - Class A* | | | 2,319,398 | |
| | 1,132,902 | | | Longview Acquisition Corp. II - Class A* | | | 11,125,098 | |
| | 356,794 | | | Lux Health Tech Acquisition Corp. - Class A* | | | 3,571,508 | |
| | 743,809 | | | M3-Brigade Acquisition II Corp. - Class A* | | | 7,296,841 | |
| | 558,053 | | | M3-Brigade Acquisition III Corp. - Class A* | | | 5,619,594 | |
| | 27,119 | | | Macondray Capital Acquisition Corp. I - Class A* | | | 271,732 | |
| | 600,000 | | | Malacca Straits Acquisition Co., Ltd. - Class A*,2 | | | 6,156,000 | |
| | 3,010 | | | Marblegate Acquisition Corp. - Class A* | | | 29,980 | |
| | 283,139 | | | Marlin Technology Corp. - Class A* | | | 2,817,233 | |
| | 985,728 | | | Mason Industrial Technology, Inc. - Class A* | | | 9,660,134 | |
| | 116,076 | | | Maxpro Capital Acquisition Corp. - Class A* | | | 1,175,850 | |
| | 687,685 | | | McLaren Technology Acquisition Corp. - Class A* | | | 6,931,865 | |
| | 722,436 | | | MDH Acquisition Corp. - Class A* | | | 7,108,770 | |
| | 388,393 | | | Medicus Sciences Acquisition Corp.* | | | 3,845,091 | |
| | 706,793 | | | MedTech Acquisition Corp. - Class A* | | | 7,018,454 | |
| | 146,508 | | | Mercury Ecommerce Acquisition Corp. - Class A* | | | 1,460,685 | |
| | 24,055 | | | Metal Sky Star Acquisition Corp.* | | | 239,347 | |
| | 23,197 | | | Mission Advancement Corp. - Class A* | | | 227,795 | |
| | 65,165 | | | Monterey Bio Acquisition Corp.* | | | 658,167 | |
| | 596,962 | | | Monument Circle Acquisition Corp. - Class A* | | | 5,903,954 | |
| | 48,881 | | | Moringa Acquisition Corp. - Class A* | | | 485,388 | |
| | 176,863 | | | Motive Capital Corp II - Class A* | | | 1,766,861 | |
| | 30,500 | | | Mountain & Co. I Acquisition Corp. - Class A* | | | 312,320 | |
| | 4,583 | | | Murphy Canyon Acquisition Corp. - Class A* | | | 46,334 | |
| | 259,798 | | | Nabors Energy Transition Corp. - Class A* | | | 2,610,970 | |
| | 355,748 | | | Natural Order Acquisition Corp.* | | | 3,553,923 | |
| | 29,123 | | | New Vista Acquisition Corp. - Class A* | | | 289,483 | |
| | 68,198 | | | Newbury Street Acquisition Corp.* | | | 670,386 | |
| | 524,907 | | | Newcourt Acquisition Corp. - Class A* | | | 5,327,806 | |
| | 150,500 | | | NewHold Investment Corp. II - Class A* | | | 1,479,415 | |
| | 32,925 | | | NightDragon Acquisition Corp. - Class A* | | | 323,324 | |
| | 78,046 | | | Noble Rock Acquisition Corp. - Class A* | | | 775,777 | |
| | 1,124,964 | | | North Atlantic Acquisition Corp. - Class A* | | | 11,187,767 | |
| | 131,891 | | | North Mountain Merger Corp. - Class A* | | | 1,324,186 | |
| | 35,557 | | | Northern Genesis Acquisition Corp. III* | | | 348,814 | |
| | 640,563 | | | Northern Star Investment Corp. II - Class A* | | | 6,322,357 | |
| | 301,152 | | | Northern Star Investment Corp. III - Class A* | | | 2,964,841 | |
First Trust Merger Arbitrage Fund
SCHEDULE OF INVESTMENTS - Continued
As of September 30, 2022
Number
of Shares | | | | | Value | |
| | | | | COMMON STOCKS (Continued) | | | | |
| | | | | SPECIFIED PURPOSE ACQUISITIONS (Continued) | | | | |
| | 17,508 | | | Northern Star Investment Corp. IV - Class A* | | $ | 171,753 | |
| | 106 | | | NorthView Acquisition Corp.* | | | 1,054 | |
| | 496,505 | | | Nubia Brand International Corp. - Class A* | | | 4,960,085 | |
| | 22,140 | | | OceanTech Acquisitions I Corp. - Class A* | | | 225,607 | |
| | 52,823 | | | Omega Alpha SPAC - Class A* | | | 525,589 | |
| | 778,101 | | | OmniLit Acquisition Corp. - Class A*,2 | | | 7,843,258 | |
| | 864,991 | | | One Equity Partners Open Water I Corp. - Class A* | | | 8,537,461 | |
| | 219,004 | | | Onyx Acquisition Co. I - Class A* | | | 2,216,320 | |
| | 890 | | | OPY Acquisition Corp. I - Class A* | | | 8,838 | |
| | 424,015 | | | Orion Acquisition Corp. - Class A* | | | 4,172,308 | |
| | 175,006 | | | Orion Biotech Opportunities Corp. - Class A* | | | 1,725,559 | |
| | 2,400 | | | Osiris Acquisition Corp. - Class A* | | | 23,400 | |
| | 145,800 | | | Oxbridge Acquisition Corp. - Class A* | | | 1,466,748 | |
| | 18,564 | | | Oxus Acquisition Corp. - Class A* | | | 187,682 | |
| | 47,381 | | | Oyster Enterprises Acquisition Corp. - Class A* | | | 467,177 | |
| | 207 | | | Panacea Acquisition Corp. II - Class A* | | | 2,029 | |
| | 65,666 | | | Papaya Growth Opportunity Corp. I - Class A* | | | 658,630 | |
| | 661,472 | | | Parabellum Acquisition Corp. - Class A* | | | 6,541,958 | |
| | 75,551 | | | Pathfinder Acquisition Corp. - Class A* | | | 750,977 | |
| | 385,000 | | | Patria Latin American Opportunity Acquisition Corp. - Class A* | | | 3,919,300 | |
| | 28,063 | | | Pearl Holdings Acquisition Corp. - Class A* | | | 279,788 | |
| | 76,064 | | | Pegasus Digital Mobility Acquisition Corp. - Class A* | | | 763,683 | |
| | 4,000 | | | PepperLime Health Acquisition Corp. - Class A* | | | 39,960 | |
| | 457,670 | | | Perception Capital Corp. II - Class A* | | | 4,649,927 | |
| | 45,000 | | | Peridot Acquisition Corp. II - Class A* | | | 446,175 | |
| | 354,255 | | | Periphas Capital Partnering Corp. - Class A* | | | 8,767,811 | |
| | 387,600 | | | Phoenix Biotech Acquisition Corp. - Class A* | | | 3,914,760 | |
| | 583,112 | | | Pine Island Acquisition Corp. - Class A* | | | 5,819,458 | |
| | 332,134 | | | Pine Technology Acquisition Corp. - Class A* | | | 3,268,199 | |
| | 18,820 | | | Pioneer Merger Corp. - Class A* | | | 187,447 | |
| | 952,442 | | | Pivotal Investment Corp. III - Class A* | | | 9,386,316 | |
| | 128,884 | | | Plum Acquisition Corp. I - Class A* | | | 1,277,240 | |
| | 767,725 | | | Pontem Corp. - Class A* | | | 7,631,186 | |
| | 235,453 | | | Population Health Investment Co., Inc. - Class A* | | | 2,349,821 | |
| | 58,817 | | | Portage Fintech Acquisition Corp. - Class A* | | | 579,347 | |
| | 25,803 | | | Powered Brands - Class A* | | | 257,256 | |
| | 655,052 | | | PowerUp Acquisition Corp. - Class A* | | | 6,642,227 | |
| | 323,273 | | | Priveterra Acquisition Corp. - Class A* | | | 3,184,239 | |
| | 59,554 | | | Progress Acquisition Corp. - Class A* | | | 594,647 | |
| | 88,900 | | | PROOF Acquisition Corp. I - Class A* | | | 886,333 | |
| | 200,803 | | | Property Solutions Acquisition Corp. II - Class A* | | | 1,969,877 | |
First Trust Merger Arbitrage Fund
SCHEDULE OF INVESTMENTS - Continued
As of September 30, 2022
Number
of Shares | | | | | Value | |
| | | | | COMMON STOCKS (Continued) | | | | |
| | | | | SPECIFIED PURPOSE ACQUISITIONS (Continued) | | | | |
| | 548,826 | | | PropTech Investment Corp. II - Class A* | | $ | 5,460,819 | |
| | 173,014 | | | Prospector Capital Corp. - Class A* | | | 1,724,950 | |
| | 160,619 | | | PWP Forward Acquisition Corp. I - Class A* | | | 1,577,279 | |
| | 120,381 | | | Pyrophyte Acquisition Corp. - Class A* | | | 1,222,192 | |
| | 1,159,101 | | | Quantum FinTech Acquisition Corp.* | | | 11,428,736 | |
| | 5,299 | | | Recharge Acquisition Corp. - Class A* | | | 53,599 | |
| | 348,255 | | | Relativity Acquisition Corp. - Class A* | | | 3,492,998 | |
| | 739,140 | | | Research Alliance Corp. II - Class A* | | | 7,258,355 | |
| | 500,000 | | | Revelstone Capital Acquisition Corp. - Class A* | | | 4,960,000 | |
| | 1,098,594 | | | Revolution Healthcare Acquisition Corp. - Class A* | | | 10,799,179 | |
| | 638,049 | | | RF Acquisition Corp. - Class A*,2 | | | 6,297,544 | |
| | 31,250 | | | Rigel Resource Acquisition Corp. - Class A* | | | 315,313 | |
| | 344,636 | | | RMG Acquisition Corp. III - Class A* | | | 3,429,128 | |
| | 25,640 | | | ROC Energy Acquisition Corp.* | | | 257,426 | |
| | 50,000 | | | Rocket Internet Growth Opportunities Corp. - Class A* | | | 495,500 | |
| | 151,300 | | | Rose Hill Acquisition Corp. - Class A* | | | 1,537,208 | |
| | 830,924 | | | Rosecliff Acquisition Corp. I - Class A* | | | 8,176,292 | |
| | 200,000 | | | Ross Acquisition Corp. II - Class A* | | | 1,982,020 | |
| | 20,115 | | | Roth CH Acquisition IV Corp.* | | | 201,753 | |
| | 3,453 | | | Roth CH Acquisition V Corp.* | | | 34,426 | |
| | 93,690 | | | RXR Acquisition Corp. - Class A* | | | 921,910 | |
| | 600 | | | Sagaliam Acquisition Corp. - Class A* | | | 6,000 | |
| | 175,000 | | | Sanaby Health Acquisition Corp. I - Class A* | | | 1,771,000 | |
| | 946,157 | | | Sandbridge X2 Corp. - Class A* | | | 9,300,723 | |
| | 202,417 | | | Sarissa Capital Acquisition Corp. - Class A* | | | 2,024,170 | |
| | 234,927 | | | Science Strategic Acquisition Corp. Alpha - Class A* | | | 2,323,428 | |
| | 384,671 | | | ScION Tech Growth I - Class A* | | | 3,837,093 | |
| | 162,929 | | | ScION Tech Growth II - Class A* | | | 1,619,514 | |
| | 551,829 | | | SCP & CO Healthcare Acquisition Co. - Class A* | | | 5,446,552 | |
| | 229,721 | | | SDCL EDGE Acquisition Corp. - Class A* | | | 2,271,941 | |
| | 496,232 | | | Seaport Calibre Materials Acquisition Corp. - Class A* | | | 4,977,207 | |
| | 874,177 | | | Seaport Global Acquisition II Corp. - Class A*,2 | | | 8,741,770 | |
| | 100,000 | | | Semper Paratus Acquisition Corp.* | | | 1,016,000 | |
| | 362,652 | | | Senior Connect Acquisition Corp. I - Class A* | | | 3,608,387 | |
| | 140 | | | Shelter Acquisition Corp. I - Class A* | | | 1,386 | |
| | 419,016 | | | ShoulderUp Technology Acquisition Corp. - Class A* | | | 4,202,730 | |
| | 40 | | | SHUAA Partners Acquisition Corp. I - Class A* | | | 405 | |
| | 360 | | | Sierra Lake Acquisition Corp. - Class A* | | | 3,607 | |
| | 11,713 | | | Signal Hill Acquisition Corp. - Class A* | | | 116,544 | |
| | 300,404 | | | Silver Spike Acquisition Corp. II - Class A* | | | 2,980,008 | |
| | 800 | | | SILVERspac, Inc. - Class A* | | | 7,836 | |
First Trust Merger Arbitrage Fund
SCHEDULE OF INVESTMENTS - Continued
As of September 30, 2022
Number
of Shares | | | | | Value | |
| | | | | COMMON STOCKS (Continued) | | | | |
| | | | | SPECIFIED PURPOSE ACQUISITIONS (Continued) | | | | |
| | 480,077 | | | Simon Property Group Acquisition Holdings, Inc. - Class A* | | $ | 4,728,758 | |
| | 251,250 | | | Sizzle Acquisition Corp.* | | | 2,527,575 | |
| | 200 | | | Skydeck Acquisition Corp. - Class A* | | | 1,966 | |
| | 531,512 | | | Slam Corp. - Class A* | | | 5,267,284 | |
| | 185,216 | | | Soar Technology Acquisition Corp. - Class A* | | | 1,907,725 | |
| | 17,500 | | | Social Capital Hedosophia Holdings Corp. IV - Class A* | | | 175,175 | |
| | 1,166,800 | | | Social Capital Hedosophia Holdings Corp. VI - Class A* | | | 11,668,000 | |
| | 313,011 | | | Social Capital Suvretta Holdings Corp. II - Class A* | | | 3,067,508 | |
| | 344,176 | | | Social Capital Suvretta Holdings Corp. IV - Class A* | | | 3,386,692 | |
| | 681,596 | | | Social Leverage Acquisition Corp. I - Class A* | | | 6,700,089 | |
| | 8,797 | | | Southport Acquisition Corp. - Class A* | | | 88,146 | |
| | 17,900 | | | Spindletop Health Acquisition Corp. - Class A* | | | 180,253 | |
| | 441,814 | | | Sports Ventures Acquisition Corp. - Class A* | | | 4,400,467 | |
| | 501,956 | | | SportsMap Tech Acquisition Corp.* | | | 5,019,560 | |
| | 29,007 | | | SportsTek Acquisition Corp. - Class A* | | | 285,429 | |
| | 1,435 | | | Spree Acquisition Corp. I Ltd. - Class A* | | | 14,494 | |
| | 26,297 | | | Springwater Special Situations Corp.* | | | 261,918 | |
| | 400 | | | ST Energy Transition I Ltd. - Class A* | | | 4,012 | |
| | 76,746 | | | StoneBridge Acquisition Corp. - Class A* | | | 775,135 | |
| | 14,507 | | | Stratim Cloud Acquisition Corp. - Class A* | | | 142,169 | |
| | 10,000 | | | Summit Healthcare Acquisition Corp. - Class A* | | | 98,200 | |
| | 42,641 | | | Supernova Partners Acquisition Corp. III Ltd. - Class A* | | | 422,146 | |
| | 669,715 | | | Sustainable Development Acquisition I Corp. - Class A* | | | 6,603,390 | |
| | 450,388 | | | SVF Investment Corp. - Class A* | | | 4,485,864 | |
| | 44,926 | | | SVF Investment Corp. II - Class A* | | | 445,666 | |
| | 324,652 | | | Tailwind International Acquisition Corp. - Class A* | | | 3,220,548 | |
| | 250,000 | | | Talon 1 Acquisition Corp. - Class A* | | | 2,547,500 | |
| | 150,000 | | | Target Global Acquisition I Corp. - Class A* | | | 1,503,000 | |
| | 8,509 | | | Tastemaker Acquisition Corp. - Class A* | | | 84,920 | |
| | 271,391 | | | TCV Acquisition Corp. - Class A* | | | 2,659,632 | |
| | 120,810 | | | TCW Special Purpose Acquisition Corp. - Class A* | | | 1,185,146 | |
| | 709,805 | | | Tech and Energy Transition Corp. - Class A* | | | 6,998,677 | |
| | 311,472 | | | Technology & Telecommunication Acquisition Corp. - Class A* | | | 3,145,867 | |
| | 621,416 | | | Tekkorp Digital Acquisition Corp. - Class A* | | | 6,226,588 | |
| | 196,715 | | | TG Venture Acquisition Corp. - Class A* | | | 1,957,314 | |
| | 10,000 | | | Thrive Acquisition Corp. - Class A* | | | 101,500 | |
| | 882,544 | | | Thunder Bridge Capital Partners III, Inc. - Class A* | | | 8,693,058 | |
| | 100,000 | | | Thunder Bridge Capital Partners IV, Inc. - Class A* | | | 973,000 | |
| | 135,820 | | | Tiga Acquisition Corp. - Class A* | | | 1,409,812 | |
| | 97,167 | | | Tio Tech - Class A* | | | 961,467 | |
| | 422,198 | | | Tishman Speyer Innovation Corp. II - Class A* | | | 4,158,650 | |
First Trust Merger Arbitrage Fund
SCHEDULE OF INVESTMENTS - Continued
As of September 30, 2022
Number
of Shares | | | | | Value | |
| | | | | COMMON STOCKS (Continued) | | | | |
| | | | | SPECIFIED PURPOSE ACQUISITIONS (Continued) | | | | |
| | 450,000 | | | TKB Critical Technologies I - Class A* | | $ | 4,558,500 | |
| | 310,354 | | | TLG Acquisition One Corp. - Class A* | | | 3,060,090 | |
| | 169,750 | | | TLGY Acquisition Corp. - Class A* | | | 1,716,172 | |
| | 871,002 | | | TPG Pace Beneficial II Corp.* | | | 8,518,312 | |
| | 197,000 | | | Trajectory Alpha Acquisition Corp. - Class A* | | | 1,952,270 | |
| | 248,881 | | | Trine II Acquisition Corp. - Class A* | | | 2,495,032 | |
| | 167,203 | | | Tristar Acquisition I Corp. - Class A* | | | 1,656,982 | |
| | 104,645 | | | Turmeric Acquisition Corp. - Class A* | | | 1,046,450 | |
| | 411,601 | | | Twelve Seas Investment Corp. II - Class A* | | | 4,052,212 | |
| | 500 | | | Twin Ridge Capital Acquisition Corp. - Class A* | | | 4,960 | |
| | 3,252 | | | two - Class A* | | | 32,168 | |
| | 17,542 | | | TZP Strategies Acquisition Corp. - Class A* | | | 174,543 | |
| | 748,318 | | | USHG Acquisition Corp. - Class A* | | | 7,370,932 | |
| | 1,100 | | | UTA Acquisition Corp. - Class A* | | | 11,022 | |
| | 19,537 | | | Vahanna Tech Edge Acquisition I Corp. - Class A* | | | 195,956 | |
| | 800 | | | Valor Latitude Acquisition Corp. - Class A* | | | 7,880 | |
| | 366,031 | | | VectoIQ Acquisition Corp. II - Class A* | | | 3,612,726 | |
| | 464,110 | | | Velocity Acquisition Corp. - Class A* | | | 4,562,201 | |
| | 414,798 | | | Vision Sensing Acquisition Corp. - Class A* | | | 4,206,052 | |
| | 6,000 | | | VMG Consumer Acquisition Corp. - Class A* | | | 60,180 | |
| | 604 | | | VPC Impact Acquisition Holdings II - Class A* | | | 5,992 | |
| | 421,840 | | | Vy Global Growth - Class A* | | | 4,231,055 | |
| | 15,536 | | | Warburg Pincus Capital Corp. I-B - Class A* | | | 154,117 | |
| | 14,267 | | | Western Acquisition Ventures Corp.* | | | 142,099 | |
| | 25,325 | | | WinVest Acquisition Corp.* | | | 253,250 | |
| | 26,800 | | | World Quantum Growth Acquisition Corp. - Class A* | | | 268,804 | |
| | 13,700 | | | Worldwide Webb Acquisition Corp. - Class A* | | | 137,000 | |
| | 294,965 | | | Z-Work Acquisition Corp. - Class A* | | | 2,905,405 | |
| | | | | | | | 1,454,682,976 | |
| | | | | TELECOM SERVICE — 2.5% | | | | |
| | 1,637,828 | | | Switch, Inc. - Class A1 | | | 55,178,425 | |
| | | | | TOTAL COMMON STOCKS | | | | |
| | | | | (Cost $2,088,100,865) | | | 2,073,063,290 | |
| | | | | UNITS — 0.7% | | | | |
| | | | | PIPELINES — 0.7% | | | | |
| | 949,808 | | | Shell Midstream Partners LP1 | | | 15,016,464 | |
| | | | | TOTAL UNITS | | | | |
| | | | | (Cost $15,205,844) | | | 15,016,464 | |
First Trust Merger Arbitrage Fund
SCHEDULE OF INVESTMENTS - Continued
As of September 30, 2022
Number
of Shares | | | | | Value | |
| | | | WARRANTS — 0.0% | | | |
| | 5,000 | | | Blockchain Coinvestors Acquisition Corp. I, Expiration Date: January 3, 2024* | | $ | 352 | |
| | 22,500 | | | Phoenix Biotech Acquisition Corp., Expiration Date: September 1, 2026* | | | 3,325 | |
| | 39 | | | Tailwind International Acquisition Corp., Expiration Date: March 1, 2028* | | | 1 | |
| | | | | TOTAL WARRANTS | | | | |
| | | | | (Cost $0) | | | 3,678 | |
| | | | | | | | | |
| | | | | SHORT-TERM INVESTMENTS — 7.0% | | | | |
| | 151,505,191 | | | Morgan Stanley Institutional Liquidity Fund - Government Portfolio - Institutional Class, 2.76%3 | | | 151,505,191 | |
| | | | | TOTAL SHORT-TERM INVESTMENTS | | | | |
| | | | | (Cost $151,505,191) | | | 151,505,191 | |
| | | | | TOTAL INVESTMENTS — 103.0% | | | | |
| | | | | (Cost $2,254,811,900) | | | 2,239,588,623 | |
| | | | | | | | | |
| | | | | Liabilities in Excess of Other Assets — (3.0)% | | | (64,256,757 | ) |
| | | | | TOTAL NET ASSETS — 100.0% | | $ | 2,175,331,866 | |
| | | | | | | | | |
| | | | | SECURITIES SOLD SHORT — (3.8)% | | | | |
| | | | | COMMON STOCKS — (3.8)% | | | | |
| | | | | APPLIANCES — (0.3)% | | | | |
| | (102,552 | ) | | iRobot Corp.* | | | (5,776,754 | ) |
| | | | | | | | | |
| | | | | MEDICAL-BIOMEDICAL/GENERICS — (0.0)% | | | | |
| | (138,334 | ) | | Biohaven Ltd.* | | | (871,504 | ) |
| | | | | | | | | |
| | | | | S & L/THRIFTS-EASTERN US — (3.5)% | | | | |
| | (8,881,825 | ) | | New York Community Bancorp, Inc. | | | (75,761,968 | ) |
| | | | | TOTAL COMMON STOCKS | | | | |
| | | | | (Proceeds $103,681,053) | | | (82,410,226 | ) |
| | | | | | | | | |
| | | | | WARRANTS — (0.0)% | | | | |
| | (5,000 | ) | | Blockchain Coinvestors Acquisition Corp. I, Expiration Date: January 3, 2024* | | | (352 | ) |
| | (22,500 | ) | | Phoenix Biotech Acquisition Corp., Expiration Date: September 1, 2026* | | | (3,325 | ) |
| | (39 | ) | | Tailwind International Acquisition Corp., Expiration Date: March 1, 2028* | | | (1 | ) |
| | | | | TOTAL WARRANTS | | | | |
| | | | | (Proceeds $2,478) | | | (3,678 | ) |
| | | | | TOTAL SECURITIES SOLD SHORT | | | | |
| | | | | (Proceeds $103,683,531) | | $ | (82,413,904 | ) |
Number
of Contracts | | | | | | |
| | | | WRITTEN OPTIONS CONTRACTS — (0.0)% | | | | |
| | | | | CALL OPTIONS — (0.0)% | | | | |
| | | | | 1life Healthcare, Inc. | | | | |
First Trust Merger Arbitrage Fund
SCHEDULE OF INVESTMENTS - Continued
As of September 30, 2022
Number
of Contracts | | | | | Value | |
| | | | | WRITTEN OPTIONS CONTRACTS (Continued) | | | | |
| | | | | CALL OPTIONS (Continued) | | | | |
| | (1,064 | ) | | Exercise Price: $17.50, Notional Amount: $(1,862,000),
Expiration Date: November 18, 2022* | | $ | (15,960 | ) |
| | (449 | ) | | Exercise Price: $17.50, Notional Amount: $(785,750),
Expiration Date: January 20, 2023* | | | (8,980 | ) |
| | | | | Bridgetown Holdings Ltd. | | | | |
| | (47 | ) | | Exercise Price: $10.00, Notional Amount: $(47,000),
Expiration Date: October 21, 2022* | | | (235 | ) |
| | | | | Citrix Systems, Inc. | | | | |
| | (5 | ) | | Exercise Price: $105.00, Notional Amount: $(52,500),
Expiration Date: January 20, 2023* | | | — | |
| | | | | Forma Therapeutics Holdings, Inc. | | | | |
| | (1,848 | ) | | Exercise Price: $20.00, Notional Amount: $(3,696,000),
Expiration Date: October 21, 2022* | | | (9,240 | ) |
| | (369 | ) | | Exercise Price: $20.00, Notional Amount: $(738,000),
Expiration Date: January 20, 2023* | | | (1,845 | ) |
| | | | | Global Blood Therapeutics, Inc. | | | | |
| | (1,193 | ) | | Exercise Price: $70.00, Notional Amount: $(8,351,000),
Expiration Date: December 16, 2022* | | | (2,982 | ) |
| | | | | Social Capital Hedosophia Hldgs Corp. VI | | | | |
| | (121 | ) | | Exercise Price: $10.00, Notional Amount: $(121,000),
Expiration Date: January 20, 2023* | | | (423 | ) |
| | (3 | ) | | Exercise Price: $10.00, Notional Amount: $(3,000),
Expiration Date: January 19, 2024* | | | (11 | ) |
| | | | | Social Capital Hedosophia Holdings Corp. IV | | | | |
| | (174 | ) | | Exercise Price: $10.00, Notional Amount: $(174,000),
Expiration Date: October 21, 2022* | | | (435 | ) |
| | (1 | ) | | Exercise Price: $10.00, Notional Amount: $(1,000),
Expiration Date: January 20, 2023* | | | (3 | ) |
| | | | | Social Capital Hedosophia Holdings Corp. VI | | | | |
| | (11,410 | ) | | Exercise Price: $10.00, Notional Amount: $(11,410,000),
Expiration Date: October 21, 2022* | | | (39,935 | ) |
| | | | | STORE Capital Corp. | | | | |
| | (17 | ) | | Exercise Price: $32.50, Notional Amount: $(55,250),
Expiration Date: January 20, 2023* | | | (85 | ) |
| | | | | TOTAL CALL OPTIONS | | | | |
| | | | | (Proceeds $316,809) | | | (80,134 | ) |
| | | | | TOTAL WRITTEN OPTIONS CONTRACTS | | | | |
| | | | | (Proceeds $316,809) | | $ | (80,134 | ) |
LP — Limited Partnership
| * | Non-income producing security. |
| 1 | All or a portion of this security is segregated as collateral for securities sold short and written options contracts. The market value of the securities pledged as collateral was $145,963,032, which represents 6.71% of the total net assets of the Fund. |
First Trust Merger Arbitrage Fund
SCHEDULE OF INVESTMENTS - Continued
As of September 30, 2022
| 3 | The rate is the annualized seven-day yield at period end. |
See accompanying Notes to Financial Statements.
First Trust Merger Arbitrage Fund
SUMMARY OF INVESTMENTS
As of September 30, 2022
| Security Type/Sector | Percent of Total
Net Assets | |
| Common Stocks | | |
| Specified Purpose Acquisitions | 66.9 | % |
| Medical-Biomedical/Generics | 5.6 | % |
| Enterprise Software/Service | 5.5 | % |
| Internet Application Software | 4.2 | % |
| Commercial Banks-Central US | 3.4 | % |
| Medical Information Systems | 2.7 | % |
| Telecom Service | 2.5 | % |
| Computer Services | 1.9 | % |
| REITS-Single Tenant | 1.3 | % |
| Computer Data Security | 0.6 | % |
| Electronic Measuring Instruments | 0.5 | % |
| Oil Refining & Marketing | 0.2 | % |
| Commercial Banks-Southern US | 0.0 | % |
| Total Common Stocks | 95.3 | % |
| Units | | |
| Pipelines | 0.7 | % |
| Warrants | 0.0 | % |
| Short-Term Investments | 7.0 | % |
| Total Investments | 103.0 | % |
| Liabilities in Excess of Other Assets | (3.0 | )% |
| Total Net Assets | 100.0 | % |
Please refer to the Schedule of Investments for information on securities sold short and written options contracts.
See accompanying Notes to Financial Statements.
First Trust Multi-Strategy Fund
SCHEDULE OF INVESTMENTS
As of September 30, 2022
Principal
Amount | | | | | Value | |
| | | | | ASSET-BACKED SECURITIES — 10.5% | | | | |
| | | | | Carvana Auto Receivables Trust | | | | |
| $ | 100,000 | | | Series 2021-N1, Class E, 2.88%, 1/10/20281,2 | | $ | 89,514 | |
| | 100,000 | | | Series 2022-N1, Class E, 6.01%, 12/11/20281,2 | | | 93,001 | |
| | 250,000 | | | Greystone CRE Notes Ltd.
Series 2021-HC2, Class D, 6.96% (1-Month Term SOFR+411 basis points), 12/15/20391,2,3 | | | 235,752 | |
| | 250,000 | | | Home RE Ltd.
Series 2021-2, Class M2, 5.53% (30-Day SOFR Average+325 basis points), 1/25/20341,2,3,4 | | | 225,791 | |
| | 250,000 | | | Oaktown Re VII Ltd.
Series 2021-2, Class M1B, 5.18% (30-Day SOFR Average+290 basis points), 4/25/20341,2,3,4 | | | 233,608 | |
| | 500,000 | | | Palmer Square Loan Funding Ltd.
Series 2020-1A, Class SUB, 0.000%, 2/19/20281,2,4 | | | 342,498 | |
| | 200,000 | | | Upstart Securitization Trust
Series 2021-5, Class C, 4.15%, 11/20/20311,2 | | | 165,999 | |
| | | | | Veros Automobile Receivables Trust | | | | |
| | 150,000 | | | Series 2020-1, Class D, 5.64%, 2/16/20271,2 | | | 148,039 | |
| | 150,000 | | | Series 2022-1, Class D, 7.23%, 7/16/20291,2 | | | 146,149 | |
| | 358,963 | | | Western Mortgage Reference Notes
Series 2021-CL2, Class M4, 7.63% (30-Day SOFR Average+535 basis points), 7/25/20591,2,3,4,5 | | | 342,332 | |
| | | | | TOTAL ASSET-BACKED SECURITIES | | | | |
| | | | | (Cost $2,294,178) | | | 2,022,683 | |
| | | | | | | | | |
| | | | | COLLATERALIZED MORTGAGE OBLIGATIONS — 22.6% | | | | |
| | | | | Alternative Loan Trust | | | | |
| | 32,122 | | | Series 2005-3CB, Class 1A4, 5.25%, 3/25/20352 | | | 27,360 | |
| | 4,762,649 | | | Series 2006-HY10, Class 1X, 0.48%, 5/25/20362,4 | | | 64,439 | |
| | 221,310 | | | Series 2006-6CB, Class 2A3, 5.75%, 5/25/20362,5 | | | 98,878 | |
| | 50,000 | | | Arivo Acceptance Auto Loan Receivables Trust
Series 2022-1A, Class D, 7.38%, 9/17/20291,2 | | | 47,904 | |
| | 33,931 | | | Banc of America Funding Trust
Series 2007-A, Class 2A1, 3.31% (1-Month USD Libor+32 basis points), 2/20/20472,3,5 | | | 31,034 | |
| | 135,601 | | | Bear Stearns Trust
Series 2005-7, Class 22A1, 3.53%, 9/25/20352,4,5 | | | 87,850 | |
| | 250,000 | | | Bellemeade Re Ltd.
Series 2022-1, Class M2, 6.88% (30-Day SOFR Average+460 basis points), 1/26/20321,2,3,4 | | | 228,006 | |
| | 342,282 | | | Citigroup Mortgage Loan Trust
Series 2007-6, Class 1A2A, 3.30%, 3/25/20372,4,5 | | | 261,679 | |
| | 369,949 | | | CSMC Mortgage-Backed Trust
Series 2006-6, Class 1A4, 6.00%, 7/25/20362,5 | | | 205,404 | |
First Trust Multi-Strategy Fund
SCHEDULE OF INVESTMENTS - Continued
As of September 30, 2022
Principal
Amount | | | | | Value | |
| | | | | COLLATERALIZED MORTGAGE OBLIGATIONS (Continued) | | | | |
| $ | 870,846 | | | CSMC Trust
Series 2017-RPL3, Class B5, 4.35%, 8/1/20571,2,4,5 | | $ | 781,723 | |
| | 285,358 | | | DSLA Mortgage Loan Trust
Series 2006-AR2, Class 2A1A, 3.19% (1-Month USD Libor+20 basis points), 10/19/20362,3,5 | | | 202,113 | |
| | 100,000 | | | Freddie Mac Multifamily Structured Credit Risk
Series 2021-MN1, Class M2, 6.03% (30-Day SOFR Average+375 basis points), 1/25/20511,2,3,4 | | | 92,185 | |
| | 250,000 | | | Freddie Mac STACR REMIC Trust
Series 2021-HQA4, Class B2, 9.28% (30-Day SOFR Average+700 basis points), 12/25/20411,2,3,4 | | | 204,062 | |
| | 182,528 | | | Freddie Mac Structured Agency Credit Risk Debt Notes
Series 2018-SPI3, Class B, 4.16%, 8/25/20481,2,4,5 | | | 140,539 | |
| | 65,033 | | | HarborView Mortgage Loan Trust
Series 2006-14, Class 2A1A, 3.29% (1-Month USD Libor+30 basis points), 1/25/20472,3,5 | | | 56,792 | |
| | 1,365 | | | IndyMac INDA Mortgage Loan Trust
Series 2007-AR2, Class A1, 3.46%, 6/25/20372,4 | | | 1,084 | |
| | 100,384 | | | JP Morgan Alternative Loan Trust
Series 2007-A2, Class 11A1, 3.45% (1-Month USD Libor+36 basis points), 6/25/20372,3,5 | | | 57,475 | |
| | 458,448 | | | JP Morgan Mortgage Trust
Series 2005-A8, Class 3A1, 2.96%, 11/25/20352,4,5 | | | 414,757 | |
| | 100,000 | | | Lendingpoint Asset Securitization Trust
Series 2022-B, Class C, 8.45%, 10/15/20291,2 | | | 93,609 | |
| | | | | MASTR Alternative Loan Trust | | | | |
| | 530,470 | | | Series 2007-HF1, Class 4A1, 7.00%, 10/25/20472,5 | | | 266,709 | |
| | 222,997 | | | Series 2005-5, Class 3A1, 5.75%, 8/25/20352,5 | | | 122,256 | |
| | 429,136 | | | Morgan Stanley Mortgage Loan Trust
Series 2006-13AX, Class A2, 3.42% (1-Month USD Libor+34 basis points), 10/25/20362,3,4,5 | | | 147,240 | |
| | | | | RALI Trust | | | | |
| | 104,253 | | | Series 2006-QS6, Class 1A2, 6.00%, 6/25/20362,5 | | | 84,985 | |
| | 211,478 | | | Series 2007-QS5, Class A1, 5.50%, 3/25/20372,5 | | | 171,842 | |
| | 330,653 | | | Series 2005-QS13, Class 2A1, 3.79% (1-Month USD Libor+70 basis points), 9/25/20352,3,5 | | | 280,430 | |
| | 204,762 | | | Wells Fargo Alternative Loan
Series 2005-1, Class 3A1, 5.50%, 2/25/20352,5 | | | 197,780 | |
| | | | | TOTAL COLLATERALIZED MORTGAGE OBLIGATIONS | | | | |
| | | | | (Cost $5,304,979) | | | 4,368,135 | |
First Trust Multi-Strategy Fund
SCHEDULE OF INVESTMENTS - Continued
As of September 30, 2022
Number
of Shares | | | | | Value | |
| | | | | COMMON STOCKS — 20.0% | | | | |
| | | | | COMMERCIAL BANKS-CENTRAL US — 1.4% | | | | |
| | 8,351 | | | Flagstar Bancorp, Inc.5 | | $ | 278,923 | |
| | | | | | | | | |
| | | | | COMPUTER DATA SECURITY — 0.3% | | | | |
| | 1,935 | | | Ping Identity Holding Corp.* | | | 54,315 | |
| | | | | | | | | |
| | | | | COMPUTER SERVICES — 0.8% | | | | |
| | 2,966 | | | Computer Services, Inc.5 | | | 165,355 | |
| | | | | | | | | |
| | | | | ELECTRONIC MEASURING INSTRUMENTS — 0.2% | | | | |
| | 794 | | | CyberOptics Corp.*,5 | | | 42,701 | |
| | | | | | | | | |
| | | | | ENTERPRISE SOFTWARE/SERVICE — 2.4% | | | | |
| | 4,718 | | | Avalara, Inc.*,5 | | | 433,112 | |
| | 2,818 | | | BTRS Holdings, Inc.* | | | 26,095 | |
| | | | | | | | 459,207 | |
| | | | | INTERNET APPLICATION SOFTWARE — 1.8% | | | | |
| | 4,637 | | | Zendesk, Inc.*,5 | | | 352,876 | |
| | | | | | | | | |
| | | | | MEDICAL INFORMATION SYSTEMS — 1.2% | | | | |
| | 2,223 | | | 1Life Healthcare, Inc.*,5 | | | 38,124 | |
| | 6,983 | | | Change Healthcare, Inc.* | | | 191,963 | |
| | | | | | | | 230,087 | |
| | | | | MEDICAL-BIOMEDICAL/GENERICS — 2.5% | | | | |
| | 1,075 | | | Biohaven Pharmaceutical Holding Co., Ltd.*,6 | | | 162,508 | |
| | 2,871 | | | ChemoCentryx, Inc.*,5 | | | 148,316 | |
| | 4,076 | | | Forma Therapeutics Holdings, Inc.*,5 | | | 81,316 | |
| | 1,343 | | | Global Blood Therapeutics, Inc.*,5 | | | 91,458 | |
| | | | | | | | 483,598 | |
| | | | | OIL REFINING & MARKETING — 0.9% | | | | |
| | 8,897 | | | Sprague Resources LP5 | | | 176,517 | |
| | | | | | | | | |
| | | | | REITS-SINGLE TENANT — 0.6% | | | | |
| | 3,530 | | | STORE Capital Corp. | | | 110,595 | |
| | | | | | | | | |
| | | | | SPECIFIED PURPOSE ACQUISITIONS — 6.8% | | | | |
| | 7,508 | | | 26 Capital Acquisition Corp.*,5 | | | 74,104 | |
| | 905 | | | Adara Acquisition Corp. - Class A*,5 | | | 9,005 | |
| | 8,200 | | | Adit EdTech Acquisition Corp.*,5 | | | 81,098 | |
| | 254 | | | Altimeter Growth Corp. II - Class A*,5,6 | | | 2,517 | |
| | 1,950 | | | Armada Acquisition Corp. I*,5 | | | 19,344 | |
First Trust Multi-Strategy Fund
SCHEDULE OF INVESTMENTS - Continued
As of September 30, 2022
Number
of Shares | | | | | Value | |
| | | | | COMMON STOCKS (Continued) | | | | |
| | | | | SPECIFIED PURPOSE ACQUISITIONS (Continued) | | | | |
| | 82 | | | Atlantic Coastal Acquisition Corp. - Class A*,5 | | $ | 805 | |
| | 7,449 | | | Aurora Acquisition Corp. - Class A*,5,6 | | | 73,671 | |
| | 7,490 | | | Benessere Capital Acquisition Corp. - Class A*,5 | | | 77,671 | |
| | 8,500 | | | Better World Acquisition Corp.*,5 | | | 88,060 | |
| | 231 | | | Blue Safari Group Acquisition Corp. - Class A*,5,6 | | | 2,377 | |
| | 8,052 | | | BOA Acquisition Corp. - Class A*,5 | | | 80,037 | |
| | 200 | | | Bridgetown Holdings Ltd. - Class A*,5,6 | | | 2,006 | |
| | 7,566 | | | Cartesian Growth Corp. - Class A*,5,6 | | | 74,979 | |
| | 3,392 | | | Crown PropTech Acquisitions - Class A*,5,6 | | | 33,649 | |
| | 8,122 | | | Far Peak Acquisition Corp. - Class A*,5,6 | | | 80,327 | |
| | 818 | | | Fintech Acquisition Corp. V - Class A*,5 | | | 8,147 | |
| | 6,965 | | | FTAC Athena Acquisition Corp. - Class A*,5,6 | | | 69,093 | |
| | 3,832 | | | Hennessy Capital Investment Corp. V - Class A*,5 | | | 37,822 | |
| | 7,101 | | | Highland Transcend Partners I Corp. - Class A*,5,6 | | | 70,726 | |
| | 43 | | | Horizon Acquisition Corp. II - Class A*,5,6 | | | 430 | |
| | 8,232 | | | InterPrivate III Financial Partners, Inc. - Class A*,5 | | | 80,674 | |
| | 4,500 | | | Longview Acquisition Corp. II - Class A*,5 | | | 44,190 | |
| | 4,019 | | | Lux Health Tech Acquisition Corp. - Class A*,5 | | | 40,230 | |
| | 4,500 | | | M3-Brigade Acquisition II Corp. - Class A*,5 | | | 44,145 | |
| | 4,500 | | | Northern Star Investment Corp. II - Class A*,5 | | | 44,415 | |
| | 173 | | | One Equity Partners Open Water I Corp. - Class A*,5 | | | 1,707 | |
| | 323 | | | Pine Island Acquisition Corp. - Class A*,5 | | | 3,223 | |
| | 8,507 | | | Quantum FinTech Acquisition Corp.*,5 | | | 83,879 | |
| | 8,077 | | | Sports Ventures Acquisition Corp. - Class A*,5,6 | | | 80,447 | |
| | | | | | | | 1,308,778 | |
| | | | | TELECOM SERVICE — 1.1% | | | | |
| | 6,475 | | | Switch, Inc. - Class A5 | | | 218,143 | |
| | | | | TOTAL COMMON STOCKS | | | | |
| | | | | (Cost $3,900,279) | | | 3,881,095 | |
Principal
Amount | | | | | | |
| | | | CORPORATE BONDS — 1.5% | | | |
| | | | FINANCIALS — 1.5% | | | |
| $ | 300,000 | | | ConnectOne Bancorp, Inc.
5.19% (3-Month USD Libor+284 basis points), 2/1/20282,4 | | | 298,070 | |
| | | | | TOTAL CORPORATE BONDS | | | | |
| | | | | (Cost $300,000) | | | 298,070 | |
First Trust Multi-Strategy Fund
SCHEDULE OF INVESTMENTS - Continued
As of September 30, 2022
Number
of Contracts | | | | | Value | |
| | | | | PURCHASED OPTIONS CONTRACTS — 63.0% | | | | |
| | | | | CALL OPTIONS — 62.7% | | | | |
| | | | | S&P 500 Index | | | | |
| | 25 | | | Exercise Price: $1,000.00, Notional Amount: $2,500,000,
Expiration Date: December 16, 2022* | | $ | 6,463,625 | |
| | 22 | | | Exercise Price: $1,000.00, Notional Amount: $2,200,000,
Expiration Date: March 17, 2023* | | | 5,684,470 | |
| | | | | TOTAL CALL OPTIONS | | | | |
| | | | | (Cost $13,344,054) | | | 12,148,095 | |
| | | | | PUT OPTIONS — 0.3% | | | | |
| | | | | S&P 500 Index | | | | |
| | 25 | | | Exercise Price: $2,000.00, Notional Amount: $5,000,000,
Expiration Date: December 16, 2022* | | | 12,250 | |
| | 22 | | | Exercise Price: $2,000.00, Notional Amount: $4,400,000,
Expiration Date: March 17, 2023* | | | 35,310 | |
| | | | | TOTAL PUT OPTIONS | | | | |
| | | | | (Cost $30,098) | | | 47,560 | |
| | | | | TOTAL PURCHASED OPTIONS CONTRACTS | | | | |
| | | | | (Cost $13,374,152) | | $ | 12,195,655 | |
Number
of Shares | | | | | | |
| | | | UNITS — 0.3% | | | |
| | | | PIPELINES — 0.3% | | | |
| | 4,130 | | | Shell Midstream Partners LP5 | | | 65,295 | |
| | | | | TOTAL UNITS | | | | |
| | | | | (Cost $66,119) | | | 65,295 | |
| | | | | SHORT-TERM INVESTMENTS — 23.2% | | | | |
| | 4,491,310 | | | Morgan Stanley Institutional Liquidity Fund - Government Portfolio - Institutional Class 2.76%5,7 | | | 4,491,310 | |
| | | | | TOTAL SHORT-TERM INVESTMENTS | | | | |
| | | | | (Cost $4,491,310) | | | 4,491,310 | |
| | | | | TOTAL INVESTMENTS — 141.1% | | | | |
| | | | | (Cost $29,731,017) | | | 27,322,243 | |
| | | | | | | | | |
| | | | | Liabilities in Excess of Other Assets — (41.1)% | | | (7,958,226 | ) |
| | | | | TOTAL NET ASSETS — 100.0% | | $ | 19,364,017 | |
| | | | | | | | | |
| | | | | SECURITIES SOLD SHORT — (1.6)% | | | | |
| | | | | COMMON STOCKS — (1.6)% | | | | |
| | | | | APPLIANCES — (0.1)% | | | | |
| | (417 | ) | | iRobot Corp.* | | | (23,490 | ) |
First Trust Multi-Strategy Fund
SCHEDULE OF INVESTMENTS - Continued
As of September 30, 2022
Number
of Shares | | | | | Value | |
| | | | | SECURITIES SOLD SHORT (Continued) | | | | |
| | | | | COMMON STOCKS (Continued) | | | | |
| | | | | | | | | |
| | | | | MEDICAL-BIOMEDICAL/GENERICS — (0.0)% | | | | |
| | (538 | ) | | Biohaven Ltd.*,6 | | $ | (3,389 | ) |
| | | | | | | | | |
| | | | | S & L/THRIFTS-EASTERN US — (1.5)% | | | | |
| | (33,532 | ) | | New York Community Bancorp, Inc. | | | (286,028 | ) |
| | | | | TOTAL COMMON STOCKS | | | | |
| | | | | (Proceeds $352,437) | | | (312,907 | ) |
| | | | | TOTAL SECURITIES SOLD SHORT | | | | |
| | | | | (Proceeds $352,437) | | $ | (312,907 | ) |
Number
of Contracts | | | | | | |
| | | | | WRITTEN OPTIONS CONTRACTS — (41.1)% | | | | |
| | | | | CALL OPTIONS — (39.0)% | | | | |
| | | | | 1life Healthcare, Inc. | | | | |
| | (3 | ) | | Exercise Price: $17.50, Notional Amount: $(5,250),
Expiration Date: November 18, 2022* | | | (45 | ) |
| | (2 | ) | | Exercise Price: $17.50, Notional Amount: $(3,500),
Expiration Date: January 20, 2023* | | | (40 | ) |
| | | | | Forma Therapeutics Holdings, Inc. | | | | |
| | (7 | ) | | Exercise Price: $20.00, Notional Amount: $(14,000),
Expiration Date: October 21, 2022* | | | (35 | ) |
| | (1 | ) | | Exercise Price: $20.00, Notional Amount: $(2,000),
Expiration Date: January 20, 2023* | | | (5 | ) |
| | | | | Global Blood Therapeutics, Inc. | | | | |
| | (5 | ) | | Exercise Price: $70.00, Notional Amount: $(35,000),
Expiration Date: December 16, 2022* | | | (13 | ) |
| | | | | S&P 500 Index | | | | |
| | (25 | ) | | Exercise Price: $2,000.00, Notional Amount: $(5,000,000),
Expiration Date: December 16, 2022* | | | (3,992,500 | ) |
| | (22 | ) | | Exercise Price: $2,000.00, Notional Amount: $(4,400,000),
Expiration Date: March 17, 2023* | | | (3,555,420 | ) |
| | | | | TOTAL CALL OPTIONS | | | | |
| | | | | (Proceeds $8,736,112) | | | (7,548,058 | ) |
| | | | | PUT OPTIONS — (2.1)% | | | | |
| | | | | S&P 500 Index | | | | |
| | (9 | ) | | Exercise Price: $4,000.00, Notional Amount: $(3,600,000),
Expiration Date: October 21, 2022* | | | (364,680 | ) |
| | (2 | ) | | Exercise Price: $3,800.00, Notional Amount: $(760,000),
Expiration Date: October 21, 2022* | | | (44,890 | ) |
| | (25 | ) | | Exercise Price: $1,000.00, Notional Amount: $(2,500,000),
Expiration Date: December 16, 2022* | | | (875 | ) |
First Trust Multi-Strategy Fund
SCHEDULE OF INVESTMENTS - Continued
As of September 30, 2022
Number
of Contracts | | | | | Value | |
| | | | | WRITTEN OPTIONS CONTRACTS (Continued) | | | | |
| | | | | PUT OPTIONS (Continued) | | | | |
| | (22 | ) | | Exercise Price: $1,000.00, Notional Amount: $(2,200,000),
Expiration Date: March 17, 2023* | | $ | (4,455 | ) |
| | | | | TOTAL PUT OPTIONS | | | | |
| | | | | (Proceeds $301,393) | | | (414,900 | ) |
| | | | | TOTAL WRITTEN OPTIONS CONTRACTS | | | | |
| | | | | (Proceeds $9,037,505) | | $ | (7,962,958 | ) |
LP — Limited Partnership
REMIC — Real Estate Mortgage Investment Conduit
| * | Non-income producing security. |
| 1 | Security exempt from registration under Rule 144A of the Securities Act of 1933. These securities are restricted and may be resold in transactions exempt from registration normally to qualified institutional buyers. The total value of these securities is $3,610,711, which represents 18.65% of the total net assets of the Fund. |
| 3 | Variable or floating rate security, which interest rate adjusts periodically based on changes in current interest rates and prepayments on the underlying pool of assets. Rate shown is the rate in effect as of period end. |
| 5 | All or a portion of this security is segregated as collateral for securities sold short and written options contracts. The market value of the securities pledged as collateral was $5,385,268, which represents 27.81% of the total net assets of the Fund. |
| 6 | Foreign security denominated in U.S. Dollars. |
| 7 | The rate is the annualized seven-day yield at period end. |
See accompanying Notes to Financial Statements.
First Trust Multi-Strategy Fund
SUMMARY OF INVESTMENTS
As of September 30, 2022
| Security Type/Sector | Percent of Total
Net Assets | |
| Asset-Backed Securities | 10.5 | % |
| Collateralized Mortgage Obligations | 22.6 | % |
| Common Stocks | | |
| Financials | 8.2 | % |
| Technology | 6.5 | % |
| Health Care | 2.5 | % |
| Communications | 1.1 | % |
| Energy | 0.9 | % |
| Real Estate | 0.6 | % |
| Industrials | 0.2 | % |
| Total Common Stocks | 20.0 | % |
| Corporate Bonds | | |
| Financials | 1.5 | % |
| Purchased Options Contracts | 63.0 | % |
| Units | | |
| Pipelines | 0.3 | % |
| Short-Term Investments | 23.2 | % |
| Total Investments | 141.1 | % |
| Liabilities in Excess of Other Assets | (41.1 | )% |
| Total Net Assets | 100.0 | % |
Please refer to the Schedule of Investments for information on securities sold short and written options contracts.
See accompanying Notes to Financial Statements.
STATEMENTS OF ASSETS AND LIABILITIES
As of September 30, 2022
| | | First Trust Merger Arbitrage Fund | | | First Trust Multi-Strategy Fund | |
| Assets: | | | | | | |
| Investments, at cost | | $ | 2,161,421,387 | | | $ | 16,356,865 | |
| Investments in affiliated issuers, at cost | | | 93,390,513 | | | | - | |
| Purchased options contracts, at cost | | | - | | | | 13,374,152 | |
| Investments, at value | | $ | 2,146,051,844 | | | $ | 15,126,588 | |
| Investments in affiliated issuers, at value | | | 93,536,779 | | | | - | |
| Purchased options contracts, at value | | | - | | | | 12,195,655 | |
| Cash deposited with brokers for securities sold short and written options contracts | | | 85,615,624 | | | | 1,047,370 | |
| Receivables: | | | | | | | | |
| Investment securities sold | | | 1,122,115 | | | | 202,384 | |
| Fund shares sold | | | 16,090,307 | | | | - | |
| Dividends and interest | | | 1,082,216 | | | | 37,821 | |
| Prepaid expenses | | | 100,471 | | | | 10,624 | |
| Total assets | | | 2,343,599,356 | | | | 28,620,442 | |
| Liabilities: | | | | | | | | |
| Securities sold short, proceeds | | $ | 103,683,531 | | | $ | 352,437 | |
| Written options contracts, proceeds | | | 316,809 | | | | 9,037,505 | |
| Securities sold short, at value | | $ | 82,413,904 | | | $ | 312,907 | |
| Written options contracts, at value | | | 80,134 | | | | 7,962,958 | |
| Payables: | | | | | | | | |
| Due to custodian | | | - | | | | 453,036 | |
| Investment securities purchased | | | 78,020,321 | | | | 340,540 | |
| Fund shares redeemed | | | 4,877,969 | | | | 133,438 | |
| Advisory fees | | | 2,162,884 | | | | 20,153 | |
| Shareholder servicing fees (Note 8) | | | 182,457 | | | | 1,957 | |
| Distribution fees (Note 7) | | | 18,812 | | | | 456 | |
| Fund services fees | | | 275,554 | | | | - | |
| Trustees' deferred compensation (Note 3) | | | 42,165 | | | | 9,524 | |
| Shareholder reporting fees | | | 33,075 | | | | 93 | |
| Auditing fees | | | 15,003 | | | | 14,953 | |
| Legal fees | | | 8,116 | | | | 485 | |
| Chief Compliance Officer fees | | | 3,390 | | | | 1,398 | |
| Trustees' fees and expenses | | | 727 | | | | 1,023 | |
| Accrued other expenses | | | 132,979 | | | | 3,504 | |
| Total liabilities | | | 168,267,490 | | | | 9,256,425 | |
| Net Assets | | $ | 2,175,331,866 | | | $ | 19,364,017 | |
STATEMENTS OF ASSETS AND LIABILITIES - Continued
As of September 30, 2022
| | | First Trust
Merger Arbitrage
Fund | | | First Trust
Multi-Strategy
Fund | |
| Components of Net Assets: | | | | | | |
| Paid-in capital (par value of $0.01 per share with an unlimited number of shares authorized) | | $ | 2,172,683,498 | | | $ | 22,014,893 | |
| Total distributable earnings (accumulated deficit) | | | 2,648,368 | | | | (2,650,876 | ) |
| Net Assets | | $ | 2,175,331,866 | | | $ | 19,364,017 | |
| | | | | | | | | |
| Maximum Offering Price per Share: | | | | | | | | |
| Class A Shares: | | | | | | | | |
| Net assets applicable to shares outstanding | | $ | 80,293,091 | | | $ | 1,059,198 | |
| Number of shares issued and outstanding | | | 7,717,920 | | | | 45,663 | |
| Redemption price per share* | | $ | 10.40 | | | $ | 23.20 | |
| Maximum sales charge (5.75%, 4.50%, respectively, of offering price)** | | | 0.63 | | | | 1.09 | |
| Maximum offering price to public | | $ | 11.03 | | | $ | 24.29 | |
| | | | | | | | | |
| Class I Shares: | | | | | | | | |
| Net assets applicable to shares outstanding | | $ | 2,095,038,775 | | | $ | 18,304,819 | |
| Number of shares issued and outstanding | | | 197,523,996 | | | | 773,083 | |
| Redemption price per share | | $ | 10.61 | | | $ | 23.68 | |
| * | A Contingent Deferred Sales Charge ("CDSC") of 1.00% and 0.50%, respectively, for the Merger Arbitrage Fund and Multi-Strategy Fund may be imposed on certain redemptions of shares within 12 months of the date of purchase to the extent a finder's fee was paid on the sale of such shares. Prior to August 22, 2022, a CDSC of 1.00% for the Multi-Strategy Fund was imposed on certain redemptions of shares within 12 months of the date of purchase to the extent a finder's fee was paid on the sale of such shares. |
| ** | There are no sales charges on investments of $1 million or more for Merger Arbitrage Fund and $250,000 or more for the Multi-Strategy Fund. On sales of $25,000 or more, the sales charge will be reduced for both Funds. Prior to August 22, 2022, the Multi-Strategy Fund’s sales charge was 5.00%, which was reduced on sales of $50,000 or more. |
See accompanying Notes to Financial Statements.
STATEMENTS OF OPERATIONS
For the Year Ended September 30, 2022
| | | First Trust Merger Arbitrage Fund | | | First Trust Multi-Strategy Fund | |
| Investment income: | | | | | | |
| Dividends | | $ | 14,591,454 | | | $ | 356,715 | |
| Interest | | | 2,496,671 | | | | 700,219 | |
| Total investment income | | | 17,088,125 | | | | 1,056,934 | |
| | | | | | | | | |
| Expenses: | | | | | | | | |
| Advisory fees | | | 16,079,937 | | | | 368,339 | |
| Shareholder servicing fees Class A (Note 8) | | | 99,313 | | | | 2,116 | |
| Shareholder servicing fees Class I (Note 8) | | | 1,020,100 | | | | 25,505 | |
| Distribution fees - (Note 7) | | | 168,345 | | | | 3,518 | |
| Dividends on securities sold short | | | 5,042,066 | | | | 48,713 | |
| Fund services fees | | | 1,456,358 | | | | 39,993 | |
| Miscellaneous | | | 135,847 | | | | 4,516 | |
| Registration fees | | | 105,463 | | | | 40,831 | |
| Shareholder reporting fees | | | 94,644 | | | | 17,541 | |
| Legal fees | | | 63,010 | | | | 26,294 | |
| Trustees' fees and expenses | | | 46,447 | | | | 1,843 | |
| Chief Compliance Officer fees | | | 23,006 | | | | 24,328 | |
| Insurance fees | | | 19,001 | | | | 1,132 | |
| Auditing fees | | | 15,002 | | | | 14,972 | |
| Interest expense | | | - | | | | 2,641 | |
| Total expenses | | | 24,368,539 | | | | 622,282 | |
| Advisory fees recovered | | | 8,524 | | | | - | |
| Fees paid indirectly (Note 3) | | | (17,252 | ) | | | (94,483 | ) |
| Net expenses | | | 24,359,811 | | | | 527,799 | |
| Net investment income (loss) | | | (7,271,686 | ) | | | 529,135 | |
| | | | | | | | | |
| Realized and Unrealized Gain (Loss) | | | | | | | | |
| Net realized gain (loss) on: | | | | | | | | |
| Investments | | | 17,985,930 | | | | (240,201 | ) |
| Investments in affiliated issuers | | | 23,284 | | | | - | |
| Purchased options contracts | | | 15,387 | | | | (1,287,940 | ) |
| Securities sold short | | | (10,442,698 | ) | | | (94,831 | ) |
| Written options contracts | | | 2,779,575 | | | | 757,509 | |
| Net realized gain (loss) | | | 10,361,478 | | | | (865,463 | ) |
| Net change in unrealized appreciation/depreciation on: | | | | | | | | |
| Investments | | | (14,890,294 | ) | | | (1,350,732 | ) |
| Investments in affiliated issuers | | | 145,633 | | | | - | |
| Purchased options contracts | | | - | | | | (1,178,497 | ) |
| Securities sold short | | | 25,229,641 | | | | 160,940 | |
| Written options contracts | | | 163,514 | | | | 1,074,352 | |
| Net change in unrealized appreciation/depreciation | | | 10,648,494 | | | | (1,293,937 | ) |
| Net realized and unrealized gain (loss) | | | 21,009,972 | | | | (2,159,400 | ) |
| Net Increase (Decrease) in Net Assets from Operations | | $ | 13,738,286 | | | $ | (1,630,265 | ) |
See accompanying Notes to Financial Statements.
First Trust Merger Arbitrage Fund
STATEMENTS OF CHANGES IN NET ASSETS
| | | For the
Year Ended
September 30, 2022 | | | For the
Year Ended
September 30, 2021 | |
| Increase (Decrease) in Net Assets from: | | | | | | | | |
| Operations: | | | | | | | | |
| Net investment income (loss) | | $ | (7,271,686 | ) | | $ | (544,284 | ) |
| Net realized gain (loss) on investments, purchased options contracts, securities sold short and written options contracts | | | 10,361,478 | | | | 54,186,679 | |
Net change in unrealized appreciation/depreciation on investments, affiliated issuers, securities sold short and written options contracts | | | 10,648,494 | | | | (7,148,307 | ) |
| Net increase (decrease) in net assets resulting from operations | | | 13,738,286 | | | | 46,494,088 | |
| | | | | | | | | |
| Distributions to Shareholders: | | | | | | | | |
| Distributions: | | | | | | | | |
| Class A | | | (4,692,018 | ) | | | (384,641 | ) |
| Class I | | | (49,749,615 | ) | | | (3,779,861 | ) |
| Total distributions to shareholders | | | (54,441,633 | ) | | | (4,164,502 | ) |
| | | | | | | | | |
| Capital Transactions: | | | | | | | | |
| Net proceeds from shares sold: | | | | | | | | |
| Class A | | | 51,062,971 | | | | 24,040,095 | |
| Class I | | | 1,842,927,021 | | | | 239,222,041 | |
| Reinvestment of distributions: | | | | | | | | |
| Class A | | | 4,596,214 | | | | 374,347 | |
| Class I | | | 41,128,488 | | | | 3,145,463 | |
| Cost of shares redeemed: | | | | | | | | |
| Class A1 | | | (27,589,979 | ) | | | (15,605,297 | ) |
| Class I2 | | | (379,096,312 | ) | | | (140,232,886 | ) |
| Net increase (decrease) in net assets from capital transactions | | | 1,533,028,403 | | | | 110,943,763 | |
| | | | | | | | | |
| Total increase (decrease) in net assets | | | 1,492,325,056 | | | | 153,273,349 | |
| | | | | | | | | |
| Net Assets: | | | | | | | | |
| Beginning of period | | | 683,006,810 | | | | 529,733,461 | |
| End of period | | $ | 2,175,331,866 | | | $ | 683,006,810 | |
| Capital Share Transactions: | | | | | | | | |
| Shares sold: | | | | | | | | |
| Class A | | | 4,878,329 | | | | 2,192,987 | |
| Class I | | | 174,102,221 | | | | 21,368,580 | |
| Shares reinvested: | | | | | | | | |
| Class A | | | 444,079 | | | | 35,961 | |
| Class I | | | 3,905,839 | | | | 297,584 | |
| Shares redeemed: | | | | | | | | |
| Class A | | | (2,645,420 | ) | | | (1,434,678 | ) |
| Class I | | | (35,680,305 | ) | | | (12,841,642 | ) |
| Net increase (decrease) in capital share transactions | | | 145,004,743 | | | | 9,618,792 | |
| 1 | Net of redemption fee proceeds of $2,508 and $2,160, respectively. |
| 2 | Net of redemption fee proceeds of $68,332 and $6,164, respectively. |
See accompanying Notes to Financial Statements.
First Trust Multi-Strategy Fund
STATEMENTS OF CHANGES IN NET ASSETS
| | | For the
Year Ended
September 30, 2022 | | | For the
Year Ended
September 30, 2021 | |
| Increase (Decrease) in Net Assets from: | | | | | | | | |
| Operations: | | | | | | | | |
| Net investment income (loss) | | $ | 529,135 | | | $ | 1,383,476 | |
| Net realized gain (loss) on investments, purchased options contracts, securities sold short and written options contracts | | | (865,463 | ) | | | 3,407,685 | |
Net change in unrealized appreciation/depreciation on investments, purchased options contracts, securities sold short and written options contracts | | | (1,293,937 | ) | | | 467,336 | |
| Net increase (decrease) from payment by affiliates (Note 3) | | | — | | | | 440 | |
| Net increase (decrease) in net assets resulting from operations | | | (1,630,265 | ) | | | 5,258,937 | |
| | | | | | | | | |
| Distributions to Shareholders: | | | | | | | | |
| Distributions: | | | | | | | | |
| Class A | | | (17,718 | ) | | | (68,636 | ) |
| Class I | | | (358,557 | ) | | | (1,268,427 | ) |
| From return of capital: | | | | | | | | |
| Class A | | | (43,133 | ) | | | (29,877 | ) |
| Class I | | | (1,026,523 | ) | | | (500,024 | ) |
| Total distributions to shareholders | | | (1,445,931 | ) | | | (1,866,964 | ) |
| | | | | | | | | |
| Capital Transactions: | | | | | | | | |
| Net proceeds from shares sold: | | | | | | | | |
| Class A | | | 103,364 | | | | 887,343 | |
| Class I | | | 6,809,918 | | | | 14,899,646 | |
| Reinvestment of distributions: | | | | | | | | |
| Class A | | | 54,601 | | | | 89,314 | |
| Class I | | | 1,261,837 | | | | 1,603,738 | |
| Cost of shares redeemed: | | | | | | | | |
| Class A | | | (864,645 | ) | | | (1,689,077 | ) |
| Class I | | | (22,860,846 | ) | | | (29,412,486 | ) |
| Net increase (decrease) in net assets from capital transactions | | | (15,495,771 | ) | | | (13,621,522 | ) |
| | | | | | | | | |
| Total increase (decrease) in net assets | | | (18,571,967 | ) | | | (10,229,549 | ) |
| | | | | | | | | |
| Net Assets: | | | | | | | | |
| Beginning of period | | | 37,935,984 | | | | 48,165,533 | |
| End of period | | $ | 19,364,017 | | | $ | 37,935,984 | |
| Capital Share Transactions: | | | | | | | | |
| Shares sold: | | | | | | | | |
| Class A | | | 4,186 | | | | 34,353 | |
| Class I | | | 262,415 | | | | 571,647 | |
| Shares reinvested: | | | | | | | | |
| Class A | | | 2,224 | | | | 3,475 | |
| Class I | | | 50,313 | | | | 61,264 | |
| Shares redeemed: | | | | | | | | |
| Class A | | | (34,265 | ) | | | (67,244 | ) |
| Class I | | | (906,617 | ) | | | (1,142,814 | ) |
| Net increase (decrease) in capital share transactions | | | (621,744 | ) | | | (539,319 | ) |
See accompanying Notes to Financial Statements.
First Trust Merger Arbitrage Fund
STATEMENT OF CASH FLOWS
For the Year Ended September 30, 2022
| Increase (Decrease) in Cash: | | | |
| Cash flows provided by (used for) operating activities: | | | |
| Net increase (decrease) in net assets resulting from operations | | $ | 13,738,286 | |
| Adjustments to reconcile net increase (decrease) in net assets from operations to net cash provided by (used for) operating activities: | | | | |
| Purchases of long-term investments | | | (4,540,892,022 | ) |
| Sales of long-term investments | | | 3,106,791,059 | |
| Return of capital dividends received | | | 28,337,061 | |
| Proceeds from securities sold short | | | 536,409,419 | |
| Cover short securities | | | (603,586,100 | ) |
| Proceeds from written options | | | 3,487,646 | |
| Closed written options | | | (75,052 | ) |
| Purchases/Sales of short-term investments, net | | | (143,967,081 | ) |
| (Increase) Decrease in Assets: | | | | |
| Investment securities sold receivable | | | 4,742,294 | |
| Dividends and interest receivables | | | (1,032,055 | ) |
| Prepaid expenses and other assets | | | (58,249 | ) |
| Increase (Decrease) in Liabilities: | | | | |
| Investment securities purchased payable | | | 67,881,310 | |
| Advisory fees payable | | | 1,457,212 | |
| Interest and dividends on securities sold short | | | (239,136 | ) |
| Accrued expenses | | | 376,249 | |
| Net realized (gain)/loss | | | (10,165,366 | ) |
| Net change in unrealized appreciation/depreciation | | | (10,648,494 | ) |
| Net cash used for operating activities | | | (1,547,443,019 | ) |
| | | | | |
| Cash flows provided by (used for) financing activities: | | | | |
| Proceeds from shares sold | | | 1,878,548,911 | |
| Cost of shares redeemed | | | (402,139,876 | ) |
| Dividends paid to shareholders, net of reinvestments | | | (8,716,931 | ) |
| Net cash provided by (used for) financing activities | | | 1,467,692,104 | |
| | | | | |
| Net increase (decrease) in cash | | | (79,750,915 | ) |
| | | | | |
| Cash and cash equivalents | | | | |
| Beginning cash balance | | | 1,620,103 | |
| Beginning cash held at brokers | | | 163,746,436 | |
| Total beginning cash and cash equivalents | | | 165,366,539 | |
| | | | | |
| Ending cash balance | | | - | |
| Ending cash held at brokers | | | 85,615,624 | |
| Total ending cash and cash equivalents | | $ | 85,615,624 | |
| Supplemental disclosure of interest expense paid | | $ | 24,700 | |
| Non cash financing activities not included herein consist of $45,724,702 of reinvested dividends. | | | | |
See accompanying Notes to Financial Statements.
First Trust Multi-Strategy Fund
STATEMENT OF CASH FLOWS
For the Year Ended September 30, 2022
| Increase (Decrease) in Cash: | | | |
| Cash flows provided by (used for) operating activities: | | | |
| Net increase (decrease) in net assets resulting from operations | | $ | (1,630,265 | ) |
| Adjustments to reconcile net increase (decrease) in net assets from operations to net cash provided by (used for) operating activities: | | | | |
| Purchases of long-term investments | | | (79,202,820 | ) |
| Sales of long-term investments | | | 83,866,453 | |
| Return of capital dividends received | | | 141,447 | |
| Proceeds from securities sold short | | | 5,586,286 | |
| Cover short securities | | | (9,404,533 | ) |
| Proceeds from written options | | | 28,633,603 | |
| Closed written options | | | (18,837,801 | ) |
| Purchases/Sales of short-term investments, net | | | 1,645,471 | |
| (Increase) Decrease in Assets: | | | | |
| Investment securities sold receivable | | | (70,677 | ) |
| Dividends and interest receivables | | | 27,643 | |
| Prepaid expenses and other assets | | | 436 | |
| Increase (Decrease) in Liabilities: | | | | |
| Cash due to custodian payable | | | 453,036 | |
| Investment securities purchased payable | | | 169,928 | |
| Advisory fees payable | | | (16,196 | ) |
| Interest and dividends on securities sold short | | | (4,843 | ) |
| Accrued expenses | | | (7,083 | ) |
| Net amortization on investments | | | (27,193 | ) |
| Net realized (gain)/loss | | | 217,258 | |
| Net change in unrealized appreciation/depreciation | | | 1,293,937 | |
| Net cash provided by operating activities | | | 12,834,087 | |
| | | | | |
| Cash flows provided by (used for) financing activities: | | | | |
| Proceeds from shares sold | | | 6,913,467 | |
| Cost of shares redeemed | | | (23,628,563 | ) |
| Dividends paid to shareholders, net of reinvestments | | | (129,493 | ) |
| Net cash provided by (used for) financing activities | | | (16,844,589 | ) |
| | | | | |
| Net increase (decrease) in cash | | | (4,010,502 | ) |
| | | | | |
| Cash and cash equivalents | | | | |
| Beginning cash balance | | | 146,872 | |
| Beginning cash held at brokers | | | 4,911,000 | |
| Total beginning cash and cash equivalents | | | 5,057,872 | |
| | | | | |
| Ending cash balance | | | - | |
| Ending cash held at brokers | | | 1,047,370 | |
| Total ending cash and cash equivalents | | $ | 1,047,370 | |
| Supplemental disclosure of interest expense paid | | $ | 3,395 | |
| Non cash financing activities not included herein consist of $1,316,438 of reinvested dividends. | | | | |
See accompanying Notes to Financial Statements.
First Trust Merger Arbitrage Fund
FINANCIAL HIGHLIGHTS
Class A
Per share operating performance.
For a capital share outstanding throughout each period.
| | | For the Year Ended September 30, | |
| | | 2022 | | | 2021 | | | 2020 | | | 2019 | | | 2018 | |
| Net asset value, beginning of period | | $ | 11.16 | | | $ | 10.33 | | | $ | 10.86 | | | $ | 10.51 | | | $ | 10.63 | |
| Income from Investment Operations: | | | | | | | | | | | | | | | | | | | | |
| Net investment income (loss)1 | | | (0.09 | ) | | | (0.04 | ) | | | (0.14 | ) | | | - | | | | 0.18 | |
| Net realized and unrealized gain (loss) | | | 0.18 | | | | 0.96 | | | | 0.19 | | | | 0.55 | | | | (0.12 | ) |
| Net increase from payments by affiliates | | | - | | | | - | | | | - | | | | - | | | | - | 2,3 |
| Total from investment operations | | | 0.09 | | | | 0.92 | | | | 0.05 | | | | 0.55 | | | | 0.06 | |
| | | | | | | | | | | | | | | | | | | | | |
| Less Distributions: | | | | | | | | | | | | | | | | | | | | |
| From net investment income | | | (0.27 | ) | | | - | | | | - | | | | (0.10 | ) | | | - | |
| From net realized gain | | | (0.58 | ) | | | (0.09 | ) | | | (0.58 | ) | | | (0.10 | ) | | | (0.18 | ) |
| Total distributions | | | (0.85 | ) | | | (0.09 | ) | | | (0.58 | ) | | | (0.20 | ) | | | (0.18 | ) |
| | | | | | | | | | | | | | | | | | | | | |
| Redemption Fee Proceeds1 | | | - | 3 | | | - | 3 | | | - | 3 | | | - | 3 | | | - | 3 |
| | | | | | | | | | | | | | | | | | | | | |
| Net asset value, end of period | | $ | 10.40 | | | $ | 11.16 | | | $ | 10.33 | | | $ | 10.86 | | | $ | 10.51 | |
| | | | | | | | | | | | | | | | | | | | | |
| Total return4 | | | 0.91 | % | | | 8.95 | % | | | 0.47 | % | | | 5.26 | % | | | 0.57 | % |
| | | | | | | | | | | | | | | | | | | | | |
| Ratios and Supplemental Data: | | | | | | | | | | | | | | | | | | | | |
| Net assets, end of period (in thousands) | | $ | 80,293 | | | $ | 56,252 | | | $ | 43,870 | | | $ | 58,887 | | | $ | 78,053 | |
| | | | | | | | | | | | | | | | | | | | | |
| Ratio of expenses to average net assets (including dividends and interest on securities sold short and interest expense): | | | | | | | | | | | | | | | | | | | | |
| Before fees waived and expenses absorbed/recovered | | | 2.19 | %5 | | | 2.08 | %5 | | | 2.40 | %5 | | | 2.78 | %5 | | | 2.43 | %5 |
| After fees waived and expenses absorbed/recovered | | | 2.19 | %5 | | | 2.08 | %5 | | | 2.40 | %5 | | | 2.78 | %5 | | | 2.46 | %5 |
| Ratio of net investment income (loss) to average net assets (including dividends and interest on securities sold short and interest expense): | | | | | | | | | | | | | | | | | | | | |
| Before fees waived and expenses absorbed/recovered | | | (0.86 | )% | | | (0.38 | )% | | | (1.34 | )% | | | 0.03 | % | | | 1.77 | % |
| After fees waived and expenses absorbed/recovered | | | (0.86 | )% | | | (0.38 | )% | | | (1.34 | )% | | | 0.03 | % | | | 1.74 | % |
| | | | | | | | | | | | | | | | | | | | | |
| Portfolio turnover rate | | | 294 | % | | | 459 | % | | | 644 | % | | | 716 | % | | | 670 | % |
| 1 | Based on average daily shares outstanding for the period. |
| 2 | Affiliate reimbursed the Fund $2,674 for errors during processing. The reimbursement had no impact to the Fund's performance. |
| 3 | Amount represents less than $0.01 per share. |
| 4 | Total returns would have been higher/lower had expenses not been recovered/waived and absorbed by the Advisor. Returns shown include Rule 12b-1 fees of up to 0.25% and do not reflect the deduction of taxes that a shareholder would pay on Fund distributions or the redemption of Fund shares. Returns shown do not include payment of sales load of 5.75% of offering price which is reduced on sales of $25,000 or more. Returns do not include payment of Contingent Deferred Sales Charge (“CDSC”) of 1.00% on certain redemptions of Class A shares made within 12 months of purchase. If the sales charge was included total returns would be lower. |
| 5 | If dividends and interest on securities sold short and interest expense had been excluded, the expense ratios would have been lowered by 0.39% for the year ended September 30, 2022. For the years ended September 30, 2021, 2020, 2019, and 2018, the ratios would have been lowered by 0.23%, 0.55%, 0.95%, and 0.64%, respectively. |
See accompanying Notes to Financial Statements.
First Trust Merger Arbitrage Fund
FINANCIAL HIGHLIGHTS
Class I
Per share operating performance.
For a capital share outstanding throughout each period.
| | | For the Year Ended September 30, | |
| | | 2022 | | | 2021 | | | 2020 | | | 2019 | | | 2018 | |
| Net asset value, beginning of period | | $ | 11.36 | | | $ | 10.48 | | | $ | 10.97 | | | $ | 10.62 | | | $ | 10.70 | |
| Income from Investment Operations: | | | | | | | | | | | | | | | | | | | | |
| Net investment income (loss)1 | | | (0.06 | ) | | | (0.01 | ) | | | (0.11 | ) | | | 0.04 | | | | 0.21 | |
| Net realized and unrealized gain (loss) | | | 0.19 | | | | 0.98 | | | | 0.20 | | | | 0.54 | | | | (0.11 | ) |
| Net increase from payments by affiliates | | | - | | | | - | | | | - | | | | - | | | | - | 2,3 |
| Total from investment operations | | | 0.13 | | | | 0.97 | | | | 0.09 | | | | 0.58 | | | | 0.10 | |
| | | | | | | | | | | | | | | | | | | | | |
| Less Distributions: | | | | | | | | | | | | | | | | | | | | |
| From net investment income | | | (0.30 | ) | | | - | | | | - | | | | (0.13 | ) | | | - | |
| From net realized gain | | | (0.58 | ) | | | (0.09 | ) | | | (0.58 | ) | | | (0.10 | ) | | | (0.18 | ) |
| Total distributions | | | (0.88 | ) | | | (0.09 | ) | | | (0.58 | ) | | | (0.23 | ) | | | (0.18 | ) |
| | | | | | | | | | | | | | | | | | | | | |
| Redemption Fee Proceeds1 | | | - | 3 | | | - | 3 | | | - | 3 | | | - | 3 | | | - | 3 |
| | | | | | | | | | | | | | | | | | | | | |
| Net asset value, end of period | | $ | 10.61 | | | $ | 11.36 | | | $ | 10.48 | | | $ | 10.97 | | | $ | 10.62 | |
| | | | | | | | | | | | | | | | | | | | | |
| Total return4 | | | 1.27 | % | | | 9.30 | % | | | 0.85 | % | | | 5.52 | % | | | 0.94 | % |
| | | | | | | | | | | | | | | | | | | | | |
| Ratios and Supplemental Data: | | | | | | | | | | | | | | | | | | | | |
| Net assets, end of period (in thousands) | | $ | 2,095,039 | | | $ | 626,755 | | | $ | 485,864 | | | $ | 576,943 | | | $ | 473,711 | |
| | | | | | | | | | | | | | | | | | | | | |
| Ratio of expenses to average net assets (including dividends and interest on securities sold short and interest expense): | | | | | | | | | | | | | | | | | | | | |
| Before fees waived and expenses absorbed/recovered | | | 1.88 | %5 | | | 1.77 | %5 | | | 2.07 | %5 | | | 2.47 | %5 | | | 2.14 | %5 |
| After fees waived and expenses absorbed/recovered | | | 1.88 | %5 | | | 1.77 | %5 | | | 2.07 | %5 | | | 2.47 | %5 | | | 2.17 | %5 |
| Ratio of net investment income (loss) to average net assets (including dividends and interest on securities sold short and interest expense): | | | | | | | | | | | | | | | | | | | | |
| Before fees waived and expenses absorbed/recovered | | | (0.55 | )% | | | (0.07 | )% | | | (1.01 | )% | | | 0.34 | % | | | 2.06 | % |
| After fees waived and expenses absorbed/recovered | | | (0.55 | )% | | | (0.07 | )% | | | (1.01 | )% | | | 0.34 | % | | | 2.03 | % |
| | | | | | | | | | | | | | | | | | | | | |
| Portfolio turnover rate | | | 294 | % | | | 459 | % | | | 644 | % | | | 716 | % | | | 670 | % |
| 1 | Based on average daily shares outstanding for the period. |
| 2 | Affiliate reimbursed the Fund $2,674 for errors during processing. The reimbursement had no impact to the Fund's performance. |
| 3 | Amount represents less than $0.01 per share. |
| 4 | Total returns would have been higher/lower had expenses not been recovered/waived and absorbed by the Advisor. Returns shown do not reflect the deduction of taxes that a shareholder would pay on Fund distributions or the redemption of Fund shares. |
| 5 | If dividends and interest on securities sold short and interest expense had been excluded, the expense ratios would have been lowered by 0.39% for the year ended September 30, 2022. For the years ended September 30, 2021, 2020, 2019, and 2018, the ratios would have been lowered by 0.23%, 0.55%, 0.95%, and 0.64%, respectively. |
See accompanying Notes to Financial Statements.
First Trust Multi-Strategy Fund
FINANCIAL HIGHLIGHTS
Class A
Per share operating performance.
For a capital share outstanding throughout each period.
| | | For the Year Ended September 30, | |
| | | 2022 | | | 2021 | | | 2020 | | | 2019 | | | 2018 | |
| Net asset value, beginning of period | | $ | 25.84 | | | $ | 23.90 | | | $ | 27.08 | | | $ | 25.62 | | | $ | 26.92 | |
| Income from Investment Operations: | | | | | | | | | | | | | | | | | | | | |
| Net investment income1 | | | 0.36 | | | | 0.86 | | | | 0.35 | | | | 0.41 | | | | 0.24 | |
| Net realized and unrealized gain (loss) | | | (1.82 | ) | | | 2.34 | | | | (0.98 | ) | | | 1.72 | | | | (0.73 | ) |
| Net increase from payments by affiliates (Note 3) | | | - | | | | - | 2 | | | - | | | | - | | | | - | |
| Total from investment operations | | | (1.46 | ) | | | 3.20 | | | | (0.63 | ) | | | 2.13 | | | | (0.49 | ) |
| | | | | | | | | | | | | | | | | | | | | |
| Less Distributions: | | | | | | | | | | | | | | | | | | | | |
| From net investment income | | | (0.24 | ) | | | (0.89 | ) | | | (0.58 | ) | | | (0.67 | ) | | | - | |
| From net realized gain | | | - | | | | - | | | | (1.62 | ) | | | - | | | | (0.81 | ) |
| From return of capital | | | (0.94 | ) | | | (0.37 | ) | | | (0.35 | ) | | | - | | | | - | |
| Total distributions | | | (1.18 | ) | | | (1.26 | ) | | | (2.55 | ) | | | (0.67 | ) | | | (0.81 | ) |
| | | | | | | | | | | | | | | | | | | | | |
| Net asset value, end of period | | $ | 23.20 | | | $ | 25.84 | | | $ | 23.90 | | | $ | 27.08 | | | $ | 25.62 | |
| | | | | | | | | | | | | | | | | | | | | |
| Total return3 | | | (5.82 | )% | | | 13.53 | % | | | (2.45 | )% | | | 8.44 | % | | | (1.89 | )% |
| | | | | | | | | | | | | | | | | | | | | |
| Ratios and Supplemental Data: | | | | | | | | | | | | | | | | | | | | |
| Net assets, end of period (in thousands) | | $ | 1,059 | | | $ | 1,900 | | | $ | 2,460 | | | $ | 5,554 | | | $ | 7,767 | |
| | | | | | | | | | | | | | | | | | | | | |
| Ratio of expenses to average net assets (including dividends and interest on securities sold short and interest expense): | | | | | | | | | | | | | | | | | | | | |
| Before fees waived and expenses absorbed | | | 2.33 | %4 | | | 2.29 | %4 | | | 2.19 | %4 | | | 2.49 | %4 | | | 3.12 | %4,5 |
| After fees waived and expenses absorbed | | | 2.02 | %4 | | | 2.05 | %4 | | | 2.10 | %4 | | | 2.33 | %4 | | | 2.98 | %4,5 |
| Ratio of net investment income (loss) to average net assets (including dividends and interest on securities sold short and interest expense): | | | | | | | | | | | | | | | | | | | | |
| Before fees waived and expenses absorbed | | | 1.12 | % | | | 3.12 | % | | | 1.30 | % | | | 1.42 | % | | | 0.80 | % |
| After fees waived and expenses absorbed | | | 1.43 | % | | | 3.36 | % | | | 1.39 | % | | | 1.58 | % | | | 0.94 | % |
| | | | | | | | | | | | | | | | | | | | | |
| Portfolio turnover rate | | | 190 | % | | | 170 | % | | | 223 | % | | | 286 | % | | | 275 | % |
| 1 | Based on average shares outstanding for the period. |
| 2 | Amount represents less than $0.01 per share. |
| 3 | Total returns would have been higher/lower had expenses not been recovered/waived and absorbed by the Advisor. Returns shown include Rule 12b-1 fees of up to 0.25% and do not reflect the deduction of taxes that a shareholder would pay on Fund distributions or the redemption of Fund shares. Returns shown do not include payment of sales load of 4.50% of offering price which is reduced on sales of $25,000 or more. Prior to August 22, 2022, returns shown did not include payment of sales load of 5.00% of offering price which was reduced on sales of $50,000 or more. Returns do not include payment of Contingent Deferred Sales Charge (“CDSC”) of 0.50% on certain redemptions of Class A shares made within 12 months of purchase. If the sales charge was included total returns would be lower. |
| 4 | If dividends and interest on securities sold short and interest expense had been excluded, the expense ratios would have been lowered by 0.17% for year ended September 30, 2022. For the years ended September 30, 2021, 2020 ,2019, and 2018 the ratios would have been lowered by 0.27%, 0.31%, 0.50%, and 0.78%, respectively. |
| 5 | Effective August 1, 2018, the Fund's advisor had contractually agreed to waive its fees and/or pay for operating expenses of the Fund to ensure that the total annual fund operating expenses (excluding taxes, leverage interest, brokerage commissions, dividend and interest expenses on short sales, acquired fund fees and expenses as determined in accordance with SEC Form N-1A, expenses incurred in connection with any merger or reorganization, or extraordinary expenses such as litigation) do not exceed 1.85% of average daily net assets of the Fund. Prior to August 1, 2018, the annual operating expense limitation was 2.25%. |
See accompanying Notes to Financial Statements.
First Trust Multi-Strategy Fund
FINANCIAL HIGHLIGHTS
Class I
Per share operating performance.
For a capital share outstanding throughout each period.
| | | For the Year Ended September 30, | |
| | | 2022 | | | 2021 | | | 2020 | | | 2019 | | | 2018 | |
| Net asset value, beginning of period | | $ | 26.36 | | | $ | 24.35 | | | $ | 27.57 | | | $ | 26.17 | | | $ | 27.40 | |
| Income from Investment Operations: | | | | | | | | | | | | | | | | | | | | |
| Net investment income1 | | | 0.44 | | | | 0.93 | | | | 0.42 | | | | 0.50 | | | | 0.33 | |
| Net realized and unrealized gain (loss) | | | (1.86 | ) | | | 2.41 | | | | (1.01 | ) | | | 1.74 | | | | (0.75 | ) |
| Net increase from payments by affiliates (Note 3) | | | - | | | | - | 2 | | | - | | | | - | | | | - | |
| Total from investment operations | | | (1.42 | ) | | | 3.34 | | | | (0.59 | ) | | | 2.24 | | | | (0.42 | ) |
| | | | | | | | | | | | | | | | | | | | | |
| Less Distributions: | | | | | | | | | | | | | | | | | | | | |
| From net investment income | | | (0.26 | ) | | | (0.94 | ) | | | (0.64 | ) | | | (0.84 | ) | | | - | |
| From net realized gain | | | - | | | | - | | | | (1.62 | ) | | | - | | | | (0.81 | ) |
| From return of capital | | | (1.00 | ) | | | (0.39 | ) | | | (0.37 | ) | | | - | | | | - | |
| Total distributions | | | (1.26 | ) | | | (1.33 | ) | | | (2.63 | ) | | | (0.84 | ) | | | (0.81 | ) |
| | | | | | | | | | | | | | | | | | | | | |
| Net asset value, end of period | | $ | 23.68 | | | $ | 26.36 | | | $ | 24.35 | | | $ | 27.57 | | | $ | 26.17 | |
| | | | | | | | | | | | | | | | | | | | | |
| Total return3 | | | (5.54 | )% | | | 13.84 | % | | | (2.23 | )% | | | 8.80 | % | | | (1.60 | )% |
| | | | | | | | | | | | | | | | | | | | | |
| Ratios and Supplemental Data: | | | | | | | | | | | | | | | | | | | | |
| Net assets, end of period (in thousands) | | $ | 18,305 | | | $ | 36,036 | | | $ | 45,706 | | | $ | 47,554 | | | $ | 57,368 | |
| | | | | | | | | | | | | | | | | | | | | |
| Ratio of expenses to average net assets (including dividends and interest on securities sold short and interest expense): | | | | | | | | | | | | | | | | | | | | |
| Before fees waived and expenses absorbed | | | 2.01 | %4 | | | 2.06 | %4 | | | 1.92 | %4 | | | 2.17 | %4 | | | 2.82 | %4,5 |
| After fees waived and expenses absorbed | | | 1.71 | %4 | | | 1.82 | %4 | | | 1.83 | %4 | | | 2.01 | %4 | | | 2.68 | %4,5 |
| Ratio of net investment income (loss) to average net assets (including dividends and interest on securities sold short and interest expense): | | | | | | | | | | | | | | | | | | | | |
| Before fees waived and expenses absorbed | | | 1.43 | % | | | 3.35 | % | | | 1.57 | % | | | 1.74 | % | | | 1.10 | % |
| After fees waived and expenses absorbed | | | 1.74 | % | | | 3.59 | % | | | 1.66 | % | | | 1.90 | % | | | 1.24 | % |
| | | | | | | | | | | | | | | | | | | | | |
| Portfolio turnover rate | | | 190 | % | | | 170 | % | | | 223 | % | | | 286 | % | | | 275 | % |
| 1 | Based on average shares outstanding for the period. |
| 2 | Amount represents less than $0.01 per share. |
| 3 | Total returns would have been higher/lower had expenses not been recovered/waived and absorbed by the Advisor. Returns shown do not reflect the deduction of taxes that a shareholder would pay on Fund distributions or the redemption of Fund shares. |
| 4 | If dividends and interest on securities sold short and interest expense had been excluded, the expense ratios would have been lowered by 0.17% for the year ended September 30, 2022. For the periods ended 2021, 2020, 2019 and 2018, the ratios would have been lowered by 0.27%, 0.31%, 0.50%, and 0.78%, respectively. |
| 5 | Effective August 1, 2018, the Fund's advisor had contractually agreed to waive its fees and/or pay for operating expenses of the Fund to ensure that the total annual fund operating expenses (excluding taxes, leverage interest, brokerage commissions, dividend and interest expenses on short sales, acquired fund fees and expenses as determined in accordance with SEC Form N-1A, expenses incurred in connection with any merger or reorganization, or extraordinary expenses such as litigation) do not exceed 1.55% of average daily net assets of the Fund. Prior to August 1, 2018, the annual operating expense limitation was 1.95%. |
See accompanying Notes to Financial Statements.
First Trust Capital Management Funds
NOTES TO FINANCIAL STATEMENTS
September 30, 2022
Note 1 – Organization
First Trust Merger Arbitrage Fund (the ‘‘Merger Arbitrage Fund’’) and First Trust Multi-Strategy Fund (the “Multi-Strategy Fund”) (each a “Fund” and collectively the ‘‘Funds’’) are organized as a series of Investment Managers Series Trust II, a Delaware statutory trust (the “Trust”) which is registered as an open-end management investment company under the Investment Company Act of 1940, as amended (the “1940 Act”). The Merger Arbitrage Fund is a non-diversified fund. The Multi-Strategy Fund is a diversified fund.
The Merger Arbitrage Fund seeks returns that are largely uncorrelated with the returns of the general stock market and capital appreciation. The Fund commenced investment operations on October 1, 2015 with Class A and Class I shares. Prior to that date, its only activity was the receipt of a $1,000 investment from principals of the Fund’s advisor and a transfer of 307,251 newly issued shares of the Fund’s Class I in exchange for the net assets of Highland Capital Management Institutional Fund, LLC, a Delaware limited liability company (the “Company”) valued at $3,073,511. This exchange was nontaxable. The primary assets received by the Fund were cash, interest receivable and securities of the Company with a fair value of $2,249,946 (identified cost of investments transferred were $2,271,450), totaling $3,073,511. For financial reporting purposes, assets received and shares issued by the Fund were recorded at fair value; however, the cost basis of the investments received from the Company was carried forward to align ongoing reporting of the Fund’s realized and unrealized gains and losses with amounts distributable to shareholders for tax purposes.
The Multi-Strategy Fund seeks to achieve long-term capital appreciation by pursuing positive absolute returns across market cycles. In pursuing its objective, the Fund seeks to generate attractive long-term returns with low sensitivity to traditional equity and fixed-income indices. The Fund commenced investment operations on December 16, 2016 with Class A and Class I shares. Prior to that date, the Fund acquired the assets and assumed the liabilities of Vivaldi Orinda Macro Opportunities Fund (the “Predecessor Fund”), a series of Advisors Series Trust. The reorganization was accomplished by the following tax-free exchange in which each shareholder of the Predecessor Fund received the same aggregate share net asset value in the corresponding classes as noted below:
| | | Shares Issued | | | Net Assets | |
| Class A | | | 1,058,074 | | | $ | 28,004,864 | |
| Class I | | | 3,174,754 | | | $ | 85,334,375 | |
The net unrealized appreciation of investments transferred was $3,090,238 as of the date of the acquisition.
The shares of each class of each Fund represent an interest in the same portfolio of investments of each particular Fund and have equal rights as to voting, redemptions, dividends and liquidation, subject to the approval of the Trustees. Income, expenses (other than expenses attributable to a specific class) and realized and unrealized gains and losses on investments are allocated to each class of shares in proportion to their relative net assets. Shareholders of a class that bears distribution and service expenses under the terms of a distribution plan have exclusive voting rights to that distribution plan.
Each Fund is an investment company and accordingly follows the investment company accounting and reporting guidance of the Financial Accounting Standards Board (FASB) Accounting Standard Codification Topic 946 “Financial Services—Investment Companies.”
Note 2 – Accounting Policies
The following is a summary of the significant accounting policies consistently followed by the Funds in the preparation of their financial statements. The preparation of financial statements in conformity with accounting principles generally accepted in the United States of America (“GAAP”) requires management to make estimates and assumptions that affect the reported amounts and disclosures in the financial statements. Actual results could differ from these estimates.
First Trust Capital Management Funds
NOTES TO FINANCIAL STATEMENTS - Continued
September 30, 2022
(a) Valuation of Investments
The Funds value equity securities at the last reported sale price on the principal exchange or in the principal over the counter (“OTC”) market in which such securities are traded, as of the close of regular trading on the NYSE on the day the securities are being valued or, if the last-quoted sales price is not readily available, the securities will be valued at the last bid or the mean between the last available bid and ask price. Securities traded on the NASDAQ are valued at the NASDAQ Official Closing Price (“NOCP”). Investments in open-end investment companies are valued at the daily closing net asset value of the respective investment company. Options are valued at the mean between the last available bid and ask prices used. Debt securities are valued by utilizing a price supplied by independent pricing service providers. The independent pricing service providers may use various valuation methodologies including matrix pricing and other analytical pricing models as well as market transactions and dealer quotations. These models generally consider such factors as yields or prices of bonds of comparable quality, type of issue, coupon, maturity, ratings and general market conditions. If a price is not readily available for a portfolio security, the security will be valued at fair value (the amount which the Funds might reasonably expect to receive for the securities were upon its current sale). The Board of Trustees has designated the Advisor as the Funds’ valuation designee (the “Valuation Designee”) to make all fair value determinations with respect to the Funds’ portfolio investments, subject to the Board’s oversight. As the Valuation Designee, the Advisor has adopted and implemented policies and procedures to be followed when the Funds must utilize fair value pricing. Prior to September 8, 2022, securities were valued at fair value as determined in good faith by the Funds’ advisor, subject to review and approval by the Valuation Committee, pursuant to procedures adopted by the Board of Trustees. The actions of the Valuation Committee were subsequently reviewed by the Board at its next regularly scheduled board meeting. The Valuation Committee met as needed. The Valuation Committee was comprised of all the Trustees, but action may have been taken by any one of the Trustees.
(b) Foreign Currency Translation
The Funds’ records are maintained in U.S. dollars. The value of securities, currencies and other assets and liabilities denominated in currencies other than U.S. dollars are translated into U.S. dollars based upon foreign exchange rates prevailing at the end of the reporting period. The currencies are translated into U.S. dollars by using the exchange rates quoted as of 4:00 PM Eastern Standard Time. Purchases and sales of investment securities, income and expenses are translated on the respective dates of such transactions.
The Funds do not isolate that portion of their net realized and unrealized gains and losses on investments resulting from changes in foreign exchange rates from the impact arising from changes in market prices. Such fluctuations are included with net realized and unrealized gain or loss from investments and foreign currency.
Net realized foreign currency transaction gains and losses arise from sales of foreign currencies, currency gains or losses realized between the trade and settlement dates on securities transactions, and the differences between the amounts of dividends, interest, and foreign withholding taxes recorded on the Funds’ books and the U.S. dollar equivalent of the amounts actually received or paid. Net unrealized foreign currency translation gains and losses arise from changes in the value of assets and liabilities, other than investments in securities, resulting from changes in the exchange rates.
(c) Short Sales
Short sales are transactions in which the Funds sell a security they do not own in anticipation of a decline in the value of that security. To complete such a transaction, the Funds must borrow the security to make delivery to the buyer. The Funds then are obligated to replace the security borrowed by purchasing the security at market price at the time of replacement. The price at such time may be more or less than the price at which the security was sold by the Funds. When a security is sold short, a decrease in the value of the security will be recognized as a gain and an increase in the value of the security will be recognized as a loss, which is potentially limitless. Until the security is replaced, the Funds are required to pay the lender amounts equal to dividend or interest that accrue during the period of the loan which is recorded as an expense. To borrow the security, the Funds also may be required to pay a premium or an interest fee, which are recorded as interest expense. Cash or securities are segregated for the broker to meet the necessary margin requirements. The Funds are subject to the risk that they may not always be able to close out a short position at a particular time or at an acceptable price.
First Trust Capital Management Funds
NOTES TO FINANCIAL STATEMENTS - Continued
September 30, 2022
(d) Options
The Funds may write or purchase options contracts primarily to enhance the Funds’ returns or reduce volatility. In addition, the Funds may utilize options in an attempt to generate gains from option premiums or to reduce overall portfolio risk. When a Fund writes or purchases an option, an amount equal to the premium received or paid by a Fund is recorded as a liability or an asset and is subsequently adjusted to the current market value of the option written or purchased. Premiums received or paid from writing or purchasing options which expire unexercised are treated by a Fund on the expiration date as realized gains or losses. The difference between the premium and the amount paid or received on effecting a closing purchase or sale transaction, including brokerage commissions, is also treated as a realized gain or loss. If an option is exercised, the premium paid or received is added to the cost of the purchase or proceeds from the sale in determining whether a Fund has realized a gain or a loss on investment transactions. A Fund, as a writer of an option, may have no control over whether the underlying securities may be sold (call) or purchased (put) and as a result bears the market risk of an unfavorable change in the price of the security underlying the written option.
(e) Exchange Traded Funds (“ETFs”)
ETFs typically trade on securities exchanges and their shares may, at times, trade at a premium or discount to their net asset values. In addition, an ETF may not replicate exactly the performance of the benchmark index it seeks to track for a number of reasons, including transaction costs incurred by the ETF, the temporary unavailability of certain index securities in the secondary market or discrepancies between the ETF and the index with respect to the weighting of securities or the number of securities held. Investing in ETFs, which are investment companies, may involve duplication of advisory fees and certain other expenses. As a result, Fund shareholders indirectly bear their proportionate share of these incurred expenses. Therefore, the cost of investing in the Fund will be higher than the cost of investing directly in ETFs and may be higher than other mutual funds that invest directly in securities.
Each ETF in which each Fund invests is subject to specific risks, depending on the nature of the ETF. Each ETF is subject to the risks associated with direct ownership of the securities comprising the index on which the ETF is based. These risks could include liquidity risk, sector risk, and risks associated with fixed-income securities.
(f) Closed-end Funds (“CEFs”)
The Multi-Strategy Fund may invest in shares of CEFs. A CEF is a pooled investment vehicle that is registered under the Investment Company Act of 1940 and whose shares are listed and traded on U.S. national securities exchanges. Investments in CEFs are subject to various risks, including reliance on management’s ability to meet a CEF’s investment objective and to manage a CEF’s portfolio, and fluctuation in the market value of a CEF’s shares compared to the changes in the value of the underlying securities that the CEF owns. In addition, the Fund bears a pro rata share of the management fees and expenses of each underlying CEF, which results in the Fund’s shareholders being subject to higher expenses than if they invested directly in the CEFs.
First Trust Capital Management Funds
NOTES TO FINANCIAL STATEMENTS - Continued
September 30, 2022
(g) Investment Transactions, Investment Income and Expenses
Investment transactions are accounted for on the trade date. Realized gains and losses on investments are determined on the identified cost basis. Dividend income is recorded net of applicable withholding taxes on the ex-dividend date and interest income is recorded on an accrual basis. Withholding taxes on foreign dividends, if applicable, are paid (a portion of which may be reclaimable) or provided for in accordance with the applicable country’s tax rules and rates and are disclosed on the Statements of Operations. Withholding tax reclaims are filed in certain countries to recover a portion of the amounts previously withheld. The Fund records a reclaim receivable based on a number of factors, including a jurisdiction’s legal obligation to pay reclaims as well as payment history and market convention. Discounts or premiums on debt securities are accreted or amortized to interest income over the lives of the respective securities using the effective interest method. Income and expenses of the Funds are allocated on a pro rata basis to each class of shares’ relative net assets, except for distribution and service fees which are unique to each class of shares. Expenses incurred by the Trust with respect to more than one Fund are allocated in proportion to the net assets of each Fund except where allocation of direct expenses to each Fund or an alternative allocation method can be more appropriately made.
(h) Federal Income Taxes
Each Fund intends to comply with the requirements of Subchapter M of the Internal Revenue Code applicable to regulated investment companies and to distribute substantially all of its net investment income and any net realized gains to its shareholders. Therefore, no provision is made for federal income or excise taxes. Due to the timing of dividend distributions and the differences in accounting for income and realized gains and losses for financial statement and federal income tax purposes, the fiscal year in which amounts are distributed may differ from the year in which the income and realized gains and losses are recorded by the Funds.
Accounting for Uncertainty in Income Taxes (the “Income Tax Statement”) requires an evaluation of tax positions taken (or expected to be taken) in the course of preparing a Fund’s tax returns to determine whether these positions meet a “more-likely-than-not” standard that, based on the technical merits, have a more than fifty percent likelihood of being sustained by a taxing authority upon examination. A tax position that meets the “more-likely-than-not” recognition threshold is measured to determine the amount of benefit to recognize in the financial statements. The Funds recognize interest and penalties, if any, related to unrecognized tax benefits as income tax expense on the Statements of Operations.
The Income Tax Statement requires management of the Funds to analyze tax positions taken in the prior three open tax years, if any, and tax positions expected to be taken in the Funds’ current tax year, as defined by the IRS statute of limitations for all major jurisdictions, including federal tax authorities and certain state tax authorities. As of September 30, 2022, and during the prior three open tax years, the Funds did not have a liability for any unrecognized tax benefits. The Funds have no examination in progress and are not aware of any tax positions for which it is reasonably possible that the total amounts of unrecognized tax benefits will significantly change in the next twelve months.
(i) Distributions to Shareholders
The Funds will make distributions of net investment income per the table below and net capital gains, if any, at least annually. The Multi-Strategy Fund seeks to make distributions once per quarter based on a pre-determined rate. A portion of the distributions made by the Multi-Strategy Fund may be treated as return of capital for tax purposes. Shareholders who receive a payment of a distribution consisting of a return of capital may be under the impression that they are receiving net profits when, in fact, they are not. Shareholders should not assume that the source of a distribution from the Multi-Strategy Fund is net profit. The Multi-Strategy Fund may make additional payments of dividends or distributions if it deems it desirable at any other time during the year. Distributions to shareholders are recorded on the ex-dividend date. The amount and timing of distributions are determined in accordance with federal income tax regulations, which may differ from GAAP.
First Trust Capital Management Funds
NOTES TO FINANCIAL STATEMENTS - Continued
September 30, 2022
| | Distribution Frequency of Net Investment Income |
| Merger Arbitrage Fund | Annually |
| Multi-Strategy Fund | Quarterly |
The character of distributions made during the year from net investment income or net realized gains may differ from the characterization for federal income tax purposes due to differences in the recognition of income, expense and gain (loss) items for financial statement and tax purposes.
(j) Illiquid Securities
Pursuant to Rule 22e-4 under the 1940 Act, the Funds have adopted a Liquidity Risk Management Program (“LRMP”) that requires, among other things, that the Funds limit their illiquid investments that are assets to no more than 15% of net assets. An illiquid investment is any security which may not reasonably be expected to be sold or disposed of in current market conditions in seven calendar days or less without the sale or disposition significantly changing the market value of the investment. If the Advisor, at any time, determines that the value of illiquid securities held by a Fund exceeds 15% of its net asset value, the Advisor will take such steps as it considers appropriate to reduce them as soon as reasonably practicable in accordance with the Funds’ written LRMP.
Note 3 – Investment Advisory and Other Agreements
The Trust, on behalf of the Funds, entered into an Investment Advisory Agreement (the “Agreement”) with First Trust Capital Management L.P. (the “Advisor”). Under the terms of the Agreement, the Funds pay a monthly investment advisory fee to the Advisor at the following annual rates based on the average daily net assets of the Funds:
| Merger Arbitrage Fund | 1.25% |
| Multi-Strategy Fund | 1.20% |
The Advisor has engaged Glenmede Investment Management, LP and Angel Oak Capital Advisors, LLC, (each, a "Sub-Advisor" and together, the “Sub-Advisors”) to manage certain assets of the Multi-Strategy Fund and pays the Sub-Advisors from its advisory fees.
The Advisor has contractually agreed to waive its fee and/or pay for expenses of the Funds to ensure that the annual Funds’ operating expenses (excluding any taxes, leverage interest, acquired fund fees and expenses (as determined in accordance with Form N-1A), dividend and interest expense on short sales, brokerage commissions, expenses incurred in connection with any merger or reorganization and extraordinary expenses such as litigation expenses) do not exceed the following levels:
| | Annual Expense Limit | Annual Expense Limit |
| | Class A Shares† | Class I Shares† |
| Merger Arbitrage Fund | 1.85% | 1.55% |
| Multi-Strategy Fund | 1.85% | 1.55% |
| † | The limit on annual operating expenses is calculated based on each Fund’s average daily net assets. |
First Trust Capital Management Funds
NOTES TO FINANCIAL STATEMENTS - Continued
September 30, 2022
This agreement is in effect until November 1, 2023 for each Fund. These agreements may be terminated before that date only by the Trust’s Board of Trustees.
The Advisor is permitted to seek reimbursement from the Funds, subject to certain limitations, of fees waived or payments made to the Funds for a period ending three full fiscal years after the date of the waiver or payment. This reimbursement may be requested from the Funds if the reimbursement will not cause the Funds’ annual expense ratio to exceed the lesser of (a) the expense limitation amount in effect at the time such fees were waived or payments made, or (b) the expense limitation amount in effect at the time of the reimbursement. For the year ended September 30, 2022, the Advisor recovered $8,524 of its previously waived advisory fees for the Merger Arbitrage Fund.
UMB Fund Services, Inc. (“UMBFS”) serves as the Funds’ fund accountant, transfer agent and co-administrator; and Mutual Fund Administration, LLC (“MFAC”) serves as the Funds’ other co-administrator. UMB Bank, n.a., an affiliate of UMBFS, serves as the Funds’ custodian. The Funds’ allocated fees incurred for fund accounting, fund administration, transfer agency and custody services for the year ended September 30, 2022, are reported as “Fund services fees” on the Statements of Operations. UMBFS, UMB Bank, n.a., and MFAC have voluntarily waived their fees that they would otherwise be paid, and/or to assume expenses in the amount of $0 for the Merger Arbitrage Fund and $94,001 for the Multi-Strategy Fund for the year ended September 30, 2022. This amount is shown as a reduction of expenses, “Fees paid indirectly”, on the Statements of Operations.
First Trust Portfolios L.P., an affiliate of the Advisor, serves as the Funds’ distributor (the “Distributor”). Prior to November 1, 2021, IMST Distributors, LLC served as the Funds’ distributor. The Distributor does not receive compensation from the Funds for its distribution services; the Advisor pays the Distributor a fee for its distribution-related services.
The Funds have a fee arrangement with their custodian, UMB Bank, n.a., which provides for custody fees to be reduced by earning credits based on cash balances left on deposit with the custodian. For the year ended September 30, 2022, there were no fees reduced by earning credits.
Certain trustees and officers of the Trust are employees of UMBFS or MFAC. The Funds do not compensate trustees and officers affiliated with the Funds’ co-administrators. For the year ended September 30, 2022, the Funds’ allocated fees incurred to Trustees who are not affiliated with the Funds’ co-administrators are reported on the Statements of Operations. A portion of the fees were paid by the Trust’s Co-Administrators. Such amount is shown as a reduction of expenses, “Fees paid indirectly”, on the Statements of Operations as follows:
| | | | Fees Paid Indirectly | |
| Merger Arbitrage Fund | | | $ | 17,252 | |
| Multi-Strategy Fund | | | | 482 | |
The Funds’ Board of Trustees has adopted a Deferred Compensation Plan (the “Plan”) for the Independent Trustees that enables Trustees to elect to receive payment in cash or the option to select various fund(s) in the Trust in which their deferred accounts shall be deemed to be invested. If a trustee elects to defer payment, the Plan provides for the creation of a deferred payment account. The Funds’ liability for these amounts is adjusted for market value changes in the invested fund(s) and remains a liability of the Funds until distributed in accordance with the Plan. The Trustees Deferred compensation liability under the Plan constitutes a general unsecured obligation of each Fund and is disclosed on the Statements of Assets and Liabilities. Contributions made under the plan and the change in unrealized appreciation/depreciation and income are included in the Trustees’ fees and expenses on the Statements of Operations.
First Trust Capital Management Funds
NOTES TO FINANCIAL STATEMENTS - Continued
September 30, 2022
Dziura Compliance Consulting, LLC provides Chief Compliance Officer (“CCO”) services to the Trust. The Funds’ allocated fees incurred for CCO services for the year ended September 30, 2022, are reported on the Statements of Operations.
During the year ended September 30, 2021, UMBFS reimbursed the Multi-Strategy Fund $440 for an error during processing. This amount is reported on the Fund’s Statements of Changes in Net Assets under the caption “Payment by affiliates.” This payment had no impact on the Fund’s performance.
The Funds are permitted to purchase or sell securities from or to certain affiliated funds under specified conditions outlined in procedures adopted by the Board. The procedures have been designed to ensure that any purchase or sale of securities by a Fund from or to another fund or portfolio that is or could be considered an affiliate by virtue of having a common investment adviser (or affiliated investment advisers), common trustees and/or common officers complies with Rule 17a-7 of the 1940 Act. Further, as defined under these procedures, each transaction is affected at the current market price to minimize trading costs, where permissible. For the year ended September 30, 2022, the Funds did not engage in purchases and sales of securities pursuant to Rule 17a-7 of the 1940 Act.
Note 4 – Federal Income Taxes
At September 30, 2022, the cost of investments on a tax basis and gross unrealized appreciation (depreciation) on investments for federal income tax purposes were as follows:
| | | Merger Arbitrage Fund | | | Multi-Strategy Fund | |
| Cost of investments | | $ | 2,155,734,802 | | | $ | 20,396,480 | |
| | | | | | | | | |
| Gross unrealized appreciation | | $ | 28,017,078 | | | $ | 1,247,026 | |
| Gross unrealized depreciation | | | (26,657,295 | ) | | | (2,597,128 | ) |
| Net unrealized appreciation (depreciation) on investments | | $ | 1,359,783 | | | $ | (1,350,102 | ) |
The difference between cost amounts for financial statement and federal income tax purposes is due primarily to timing differences in recognizing certain gains and losses in security transactions.
GAAP requires that certain components of net assets be reclassified between financial and tax reporting. These reclassifications have no effect on net assets or net asset value per share. For the year ended September 30, 2022, permanent differences in book and tax accounting have been reclassified to paid-in capital and total distributable earnings (loss) as follows:
| | | | | Increase (Decrease) | |
| Fund | | | | Paid-in Capital | | | | Total Distributable Earnings (Accumulated Deficit) | |
| Merger Arbitrage Fund | | | $ | (23,079 | ) | | | 23,079 | |
| Multi-Strategy Fund | | | | 145,281 | | | | (145,281 | ) |
First Trust Capital Management Funds
NOTES TO FINANCIAL STATEMENTS - Continued
September 30, 2022
As of September 30, 2022, the components of accumulated earnings (deficit) on a tax basis were as follows:
| | | Merger Arbitrage Fund | | | Multi-Strategy Fund | |
| Undistributed ordinary income | | $ | - | | | $ | - | |
| Undistributed long-term capital gains | | | 1,452,279 | | | | - | |
| Accumulated earnings | | | 1,452,279 | | | | - | |
| | | | | | | | | |
| Accumulated capital and other losses | | | (121,529 | ) | | | (1,291,251 | ) |
| Unrealized appreciation (depreciation) on investments | | | 1,359,783 | | | | (1,350,102 | ) |
| Unrealized deferred compensation | | | (42,165 | ) | | | (9,524 | ) |
| Total accumulated earnings (accumulated deficit) | | $ | 2,648,368 | | | $ | (2,650,877 | ) |
The tax character of distributions paid during the years ended September 30, 2022 and 2021 was as follows:
| | | Merger Arbitrage Fund | | | Multi-Strategy Fund | |
| Distribution paid from: | | 2022 | | | 2021 | | | 2022 | | | 2021 | |
| Ordinary income | | $ | 48,501,516 | | | $ | 4,101,016 | | | $ | 376,275 | | | $ | 1,337,063 | |
| Net long-term capital gains | | | 5,940,117 | | | | 63,486 | | | | - | | | | - | |
| Return of Capital | | | - | | | | - | | | | 1,069,656 | | | | 529,901 | |
| Total taxable distributions | | $ | 54,441,633 | | | $ | 4,164,502 | | | $ | 1,445,931 | | | $ | 1,866,964 | |
As of September 30, 2022, the Merger Arbitrage Fund had qualified late-year ordinary losses of $121,529, which are deferred until fiscal year 2023 for tax purposes. Net late-year losses incurred after December 31, and within the taxable year are deemed to arise on the first day of the funds next taxable year.
As of September 30, 2022, the Multi-Strategy had qualified post October losses of $1,299,021.
At September 30, 2022, the Multi-Strategy Fund had capital loss carryforwards, which reduce the Fund’s taxable income arising from the future net realized gains on investments, if any, to the extent permitted by the Code, and thus will reduce the amount of distributions to shareholders which gains on investments, if any, to the extent permitted by the Code, and thus will reduce the amount of distributions to shareholders which would otherwise be necessary to relieve the Fund of any liability for federal tax.
During the year ended September 30, 2022, the Multi-Strategy Fund utilized $390,518 of capital loss carryovers.
Note 5 – Redemption Fee
The Merger Arbitrage Fund may impose a redemption fee of 1.00% of the total redemption amount on all shares redeemed within 30 days of purchase. For the years ended September 30, 2022 and 2021, the Fund received $70,840 and $8,324, respectively, in redemption fees.
Note 6 – Investment Transactions
For the year ended September 30, 2022, purchases and sales of investments, excluding short-term investments, were as follows:
First Trust Capital Management Funds
NOTES TO FINANCIAL STATEMENTS - Continued
September 30, 2022
| | | | Purchases | | | Sales | | | Proceeds from Securities Sold Short | | | Cover Short Securities | |
| Merger Arbitrage Fund | | | $ | 4,540,882,750 | | | $ | 3,106,766,400 | | | $ | 536,409,419 | | | $ | 603,586,100 | |
| Multi-Strategy Fund | | | | 37,726,916 | | | | 57,052,641 | | | | 5,586,286 | | | | 9,404,533 | |
Note 7 – Distribution Plan
The Trust, on behalf of the Funds, has adopted a Distribution Plan (the “Plan”) pursuant to Rule 12b-1 under the 1940 Act that allows the Funds to pay distribution fees for the sale and distribution of its shares. With respect to Class A, the Plan provides for the payment of distribution fees at the annual rate of up to 0.25% of average daily net assets. Class I does not pay any distribution fees.
For the year ended September 30, 2022, distribution fees incurred are disclosed on the Statements of Operations.
Note 8 – Shareholder Servicing Plan
The Trust, on behalf of the Merger Arbitrage Fund and Multi-Strategy Fund, has adopted a Shareholder Servicing Plan to pay a fee at an annual rate of up to 0.15% of average daily net assets of Class A shares and 0.10% of average daily net assets of Class I shares serviced by shareholder servicing agents who provide administrative and support services to their customers.
For the year ended September 30, 2022, shareholder servicing fees incurred are disclosed on the Statements of Operations.
Note 9 – Indemnifications
In the normal course of business, the Funds enter into contracts that contain a variety of representations which provide general indemnifications. The Funds’ maximum exposure under these arrangements is unknown, as this would involve future claims that may be made against the Funds that have not yet occurred. However, the Funds expect the risk of loss to be remote from any such claims.
Note 10 – Fair Value Measurements and Disclosure
Fair Value Measurements and Disclosures defines fair value, establishes a framework for measuring fair value in accordance with GAAP, and expands disclosure about fair value measurements. It also provides guidance on determining when there has been a significant decrease in the volume and level of activity for an asset or a liability, when a transaction is not orderly, and how that information must be incorporated into a fair value measurement.
Under Fair Value Measurements and Disclosures, various inputs are used in determining the value of the Funds’ investments. These inputs are summarized into three broad Levels as described below:
| ● | Level 1 – Unadjusted quoted prices in active markets for identical assets or liabilities that the Funds have the ability to access. |
| ● | Level 2 – Observable inputs other than quoted prices included in Level 1 that are observable for the asset or liability, either directly or indirectly. These inputs may include quoted prices for the identical instrument on an inactive market, prices for similar instruments, interest rates, prepayment speeds, credit risk, yield curves, default rates and similar data. |
First Trust Capital Management Funds
NOTES TO FINANCIAL STATEMENTS - Continued
September 30, 2022
| ● | Level 3 – Unobservable inputs for the asset or liability, to the extent relevant observable inputs are not available, representing the Funds’ own assumptions about the assumptions a market participant would use in valuing the asset or liability, and would be based on the best information available. |
The availability of observable inputs can vary from security to security and is affected by a wide variety of factors, including for example, the type of security, whether the security is new and not yet established in the marketplace, the liquidity of markets, and other characteristics particular to the security. To the extent that valuation is based on models or inputs that are less observable or unobservable in the market, the determination of fair value requires more judgment. Accordingly, the degree of judgment exercised in determining fair value is greatest for instruments categorized in Level 3.
The inputs to measure fair value may fall into different Levels of the fair value hierarchy. In such cases, for disclosure purposes, the Level in the fair value hierarchy within which the fair value measurement falls in its entirety is determined based on the lowest Level input that is significant to the fair value measurement in its entirety.
The inputs or methodology used for valuing securities are not an indication of the risk associated with investing in those securities. The following is a summary of the inputs used, as of September 30, 2022, in valuing the Funds’ assets and liabilities carried at fair value:
| Merger Arbitrage Fund | | Level 1 | | | Level 2 | | | Level 3** | | | Total | |
| Assets | | | | | | | | | | | | | | | | |
| Investments | | | | | | | | | | | | | | | | |
| Common Stocks* | | $ | 2,073,063,290 | | | $ | - | | | $ | - | | | $ | 2,073,063,290 | |
| Units* | | | 15,016,464 | | | | - | | | | - | | | | 15,016,464 | |
| Warrants | | | 3,678 | | | | - | | | | - | | | | 3,678 | |
| Short-Term Investments | | | 151,505,191 | | | | - | | | | - | | | | 151,505,191 | |
| Total Investments | | $ | 2,239,588,623 | | | $ | - | | | $ | - | | | $ | 2,239,588,623 | |
| | | | | | | | | | | | | | | | | |
| Liabilities | | | | | | | | | | | | | | | | |
| Securities Sold Short | | | | | | | | | | | | | | | | |
| Common Stocks* | | $ | 82,410,226 | | | $ | - | | | $ | - | | | $ | 82,410,226 | |
| Warrants | | | 3,678 | | | | - | | | | - | | | | 3,678 | |
| Total Securities Sold Short | | | 82,413,904 | | | | - | | | | - | | | | 82,413,904 | |
| Written Options Contracts | | | 76,714 | | | | 3,420 | | | | - | | | | 80,134 | |
| Total Securities Sold Short and Options | | $ | 82,490,618 | | | $ | 3,420 | | | $ | - | | | $ | 82,494,038 | |
First Trust Capital Management Funds
NOTES TO FINANCIAL STATEMENTS - Continued
September 30, 2022
| Multi-Strategy Fund | | Level 1 | | | Level 2 | | | Level 3** | | | Total | |
| Assets | | | | | | | | | | | | | | | | |
| Investments | | | | | | | | | | | | | | | | |
| Asset-Backed Securities | | $ | - | | | $ | 2,022,683 | | | $ | - | | | $ | 2,022,683 | |
| Collateralized Mortgage Obligations | | | - | | | | 4,368,135 | | | | - | | | | 4,368,135 | |
| Common Stocks* | | | 3,881,095 | | | | - | | | | - | | | | 3,881,095 | |
| Corporate Bonds*** | | | - | | | | 298,070 | | | | - | | | | 298,070 | |
| Units* | | | 65,295 | | | | - | | | | - | | | | 65,295 | |
| Short-Term Investments | | | 4,491,310 | | | | - | | | | - | | | | 4,491,310 | |
| Total Investments | | | 8,437,700 | | | | 6,688,888 | | | | - | | | | 15,126,588 | |
| Purchased Options Contracts | | | 12,195,655 | | | | - | | | | - | | | | 12,195,655 | |
| Total Investments and Options | | $ | 20,633,355 | | | $ | 6,688,888 | | | $ | - | | | $ | 27,322,243 | |
| | | | | | | | | | | | | | | | | |
| Liabilities | | | | | | | | | | | | | | | | |
| Securities Sold Short | | | | | | | | | | | | | | | | |
| Common Stocks* | | $ | 312,907 | | | $ | - | | | $ | - | | | $ | 312,907 | |
| Total Securities Sold Short | | | 312,907 | | | | - | | | | - | | | | 312,907 | |
| Written Options Contracts | | | 7,962,945 | | | | 13 | | | | - | | | | 7,962,958 | |
| Total Securities Sold Short and Options | | $ | 8,275,852 | | | $ | 13 | | | $ | - | | | $ | 8,275,865 | |
| * | All common stocks and units held in the Funds are Level 1. For a detailed break-out of common stocks by major industry classification, please refer to the Schedule of Investments. |
| ** | The Funds did not hold any Level 3 securities at period end. |
| *** | All corporate bonds held in the Funds are Level 2. For a detailed break-out of common stocks by major industry classification, please refer to the Schedule of Investments. |
The following is a reconciliation of assets in which significant unobservable inputs (Level 3) were used in determining value:
| | | Closed-End Funds | |
| Balance as of September 30, 2021 | | $ | 34,548 | |
| Transfers into Level 3 during the period | | | - | |
| Transfers out of Level 3 during the period | | | - | |
| Total gains or losses for the period | | | | |
| Included in earnings (or changes in net assets) | | | 653,753 | |
| Included in other comprehensive income | | | - | |
| Purchases, sales, and principal paydowns | | | | |
| Net purchases | | | - | |
| Net sales | | | (688,301 | ) |
| Principal paydown | | | - | |
| Balance as of September 30, 2022 | | $ | - | |
| Change in unrealized gains or losses for the period included in earnings (or changes in net assets) for assets held at the end of the reporting period | | $ | - | |
First Trust Capital Management Funds
NOTES TO FINANCIAL STATEMENTS - Continued
September 30, 2022
Note 11 – Derivative and Hedging Disclosure
Derivatives and Hedging requires enhanced disclosures about the Funds’ derivative and hedging activities, including how such activities are accounted for and their effects on the Funds’ financial position, performance and cash flows. The Funds invested in options contracts during the year ended September 30, 2022.
The effects of these derivative instruments on the Funds’ financial position and financial performance as reflected on the Statements of Assets and Liabilities and Statements of Operations are presented in the tables below. The fair values of derivative instruments as of September 30, 2022, by risk category are as follows:
| | | Merger Arbitrage Fund |
| | | Liability Derivatives | |
| Derivatives not designated as hedging instruments | | Statements of Asset
and Liabilities
Location
| | | Value | |
| Equity contracts | | Written options contracts, at value | | $ | 80,134 | |
| | | Multi-Strategy Fund |
| | | Asset Derivatives | | | Liability Derivatives | |
| Derivatives not designated as hedging instruments | | Statements of Asset
and Liabilities
Location | | | Value | | | Statements of Asset
and Liabilities
Location | | | Value | |
| Equity contracts | | Purchased options contracts, at value | | $ | 12,195,655 | | | Written options contracts, at value | | $ | 7,962,958 | |
The effects of derivative instruments on the Statements of Operations for the year ended September 30, 2022, are as follows:
| Merger Arbitrage Fund |
| Amount of Realized Gain or (Loss) on Derivatives Recognized in Income |
| Derivatives not designated as hedging instruments | | Purchased Options Contracts | | | Written Options Contracts | |
| Equity contracts | | $ | 15,387 | | | $ | 2,779,575 | |
| Multi-Strategy Fund |
| Amount of Realized Gain or (Loss) on Derivatives Recognized in Income |
| Derivatives not designated as hedging instruments | | Purchased Options Contracts | | | Written Options Contracts | |
| Equity contracts | | $ | (1,287,940 | ) | | $ | 757,509 | |
First Trust Capital Management Funds
NOTES TO FINANCIAL STATEMENTS - Continued
September 30, 2022
| Merger Arbitrage Fund |
Change in Unrealized Appreciation/Depreciation on Derivatives Recognized in Income
|
| Derivatives not designated as hedging instruments | | Written Options Contracts | |
| Equity contracts | | $ | 163,514 | |
| Multi-Strategy Fund |
Change in Unrealized Appreciation/Depreciation on Derivatives Recognized in Income
|
| Derivatives not designated as hedging instruments | | Purchased Options Contracts | | | Written Options Contracts | |
| Equity contracts | | $ | (1,178,497 | ) | | $ | 1,074,352 | |
The number of contracts is included on the Schedules of Investments. The quarterly average volumes of derivative instruments as of September 30, 2022, are as follows:
| Merger Arbitrage Fund |
| Derivative | | Quarterly Average | | | Amount | |
| Options Contracts - Written | | Average Notional Value | | | $ | (44,404,330 | ) |
| Multi-Strategy Fund |
| Derivative | | Quarterly Average | | | Amount | |
| Options Contracts – Purchased | | Average Notional Value | | | $ | 5,640,000 | |
| Options Contracts - Written | | Average Notional Value | | | | (7,728,740 | ) |
Note 12 – Borrowing
The Funds have entered into a borrowing agreement with BNP Paribas (acting through its New York Branch). The Funds may borrow amounts up to one-third of the value of its assets. The Funds are charged interest of Overnight Bank Funding Rate (“OBFR”) plus 1.20% for borrowing under this agreement. The Funds did not borrow under the line of credit agreement during the year ended September 30, 2022.
Note 13 – Investments in Affiliated Issuers
An affiliated issuer is an entity in which the Fund has ownership of a least 5% of the voting securities or any investment in a First Trust Capital Management Fund. Issuers that are affiliates of the Funds at period-end are noted in the Funds Schedule of Investments. Additional security purchases and the reduction of certain securities shares outstanding of existing portfolio holdings that were not considered affiliated in prior years may result in the Fund owning in excess of 5% of the outstanding shares at period-end. The table below reflects transactions during the period with entities that are affiliates as of September 30, 2022 and may include acquisitions of new investments, prior year holdings that became affiliated during the period and prior period affiliated holdings that are no longer affiliated as of period-end:
First Trust Capital Management Funds
NOTES TO FINANCIAL STATEMENTS - Continued
September 30, 2022
Merger Arbitrage Fund
| Security Description | | Value
Beginning of Period | | | Purchases | | | Sales
Proceeds | | | Net
Realized
Gain (Loss) | | | Transfer Prior Year Unrealized Appreciation (Depreciation) | | | Change in Unrealized Appreciation (Depreciation) | | | Value
End of
Period | | | Dividend
Income* | |
| Aesther Healthcare Acquisition Corp. - Class A⁽¹⁾ | | $ | - | | | $ | 5,621,397 | | | $ | - | | | $ | - | | | $ | - | | | $ | 50,092 | | | $ | 5,671,489 | | | $ | - | |
| Better World Acquisition Corp.⁽¹⁾ | | | 251,875 | | | | 10,455,889 | | | | - | | | | - | | | | 10,875 | | | | 42,189 | | | | 10,760,828 | | | | - | |
| Fintech Ecosystem Development Corp. - Class A⁽¹⁾ | | | - | | | | 10,069,943 | | | | - | | | | - | | | | - | | | | (19,933 | ) | | | 10,050,010 | | | | - | |
| First Light Acquisition Group, Inc. - Class A⁽¹⁾ | | | - | | | | 3,815,350 | | | | - | | | | - | | | | - | | | | (23,100 | ) | | | 3,792,250 | | | | - | |
| Aetherium Acquisition Corp. - Class A⁽¹⁾ | | | - | | | | 6,462,447 | | | | - | | | | - | | | | - | | | | 13,463 | | | | 6,475,910 | | | | - | |
| Lakeshore Acquisition II Corp.⁽¹⁾ | | | - | | | | 6,633,718 | | | | - | | | | - | | | | - | | | | 22,920 | | | | 6,656,638 | | | | - | |
| Legato Merger Corp. II⁽¹⁾ | | | - | | | | 21,170,919 | | | | - | | | | - | | | | - | | | | (79,837 | ) | | | 21,091,082 | | | | - | |
| Malacca Straits Acquisition Co., Ltd. - Class A⁽¹⁾ | | | 1,830,292 | | | | 6,120,000 | | | | (1,842,608 | ) | | | 23,824 | | | | (11,508 | ) | | | 36,000 | | | | 6,156,000 | | | | - | |
| OmniLit Acquisition Corp. - Class A⁽¹⁾ | | | - | | | | 7,790,767 | | | | - | | | | - | | | | - | | | | 52,491 | | | | 7,843,258 | | | | - | |
| RF Acquisition Corp. - Class A⁽¹⁾ | | | - | | | | 6,301,175 | | | | - | | | | - | | | | - | | | | (3,631 | ) | | | 6,297,544 | | | | - | |
| Seaport Global Acquisition II Corp. - Class A⁽¹⁾ | | | - | | | | 8,686,158 | | | | - | | | | - | | | | - | | | | 55,612 | | | | 8,741,770 | | | | - | |
| Total | | $ | 2,082,167 | | | $ | 93,127,763 | | | $ | (1,842,608 | ) | | $ | 23,824 | | | $ | (633 | ) | | $ | 146,266 | | | $ | 93,536,779 | | | $ | - | |
| * | Net of foreign withholding taxes. |
| (1) | Not an affiliate at the beginning of the period. |
First Trust Capital Management Funds
NOTES TO FINANCIAL STATEMENTS - Continued
September 30, 2022
Merger Arbitrage Fund
| Security Description | | Shares Beginning of Period | | | Purchases | | | Sales | | | Stock Split | | | Shares End of Period | |
| Aesther Healthcare Acquisition Corp. - Class A⁽¹⁾ | | | - | | | | 556,574 | | | | - | | | | - | | | | 556,574 | |
| Better World Acquisition Corp.⁽¹⁾ | | | 25,000 | | | | 1,013,690 | | | | - | | | | - | | | | 1,038,690 | |
| Fintech Ecosystem Development Corp. - Class A⁽¹⁾ | | | - | | | | 1,000,001 | | | | - | | | | - | | | | 1,000,001 | |
| First Light Acquisition Group, Inc. - Class A⁽¹⁾ | | | - | | | | 385,000 | | | | - | | | | - | | | | 385,000 | |
| Aetherium Acquisition Corp. - Class A⁽¹⁾ | | | - | | | | 651,500 | | | | - | | | | - | | | | 651,500 | |
| Lakeshore Acquisition II Corp.⁽¹⁾ | | | - | | | | 662,352 | | | | - | | | | - | | | | 662,352 | |
| Legato Merger Corp. II⁽¹⁾ | | | - | | | | 2,123,976 | | | | - | | | | - | | | | 2,123,976 | |
| Malacca Straits Acquisition Co., Ltd. - Class A⁽¹⁾ | | | 184,134 | | | | 600,000 | | | | (184,134 | ) | | | - | | | | 600,000 | |
| OmniLit Acquisition Corp. - Class A⁽¹⁾ | | | - | | | | 778,101 | | | | - | | | | - | | | | 778,101 | |
| RF Acquisition Corp. - Class A⁽¹⁾ | | | - | | | | 638,049 | | | | - | | | | - | | | | 638,049 | |
| Seaport Global Acquisition II Corp. - Class A⁽¹⁾ | | | - | | | | 874,177 | | | | - | | | | - | | | | 874,177 | |
| Total | | | 209,134 | | | | 9,283,420 | | | | (184,134 | ) | | | - | | | | 9,308,420 | |
| (1) | Not an affiliate at the beginning of the period. |
Note 14 – Market Disruption and Geopolitical Risks
Certain local, regional or global events such as war, acts of terrorism, the spread of infectious illness or other public health issues, or other events could have a significant impact on a security or instrument. Since 2020, the novel strain of coronavirus (COVID-19) has negatively affected the worldwide economy, as well as the economies of individual countries, the financial health of individual companies and the market in general in significant and unforeseen ways. Following Russia’s large-scale invasion of Ukraine, the President of the United States signed an Executive Order in February 2022 prohibiting U.S. persons from entering transactions with the Central Bank of Russia and Executive Orders in March 2022 prohibiting U.S. persons from importing oil and gas from Russia as well as other popular Russian exports, such as diamonds, seafood and vodka. There may also be restrictions on investments in Chinese companies. For example, the President of the United States of America signed an Executive Order in June 2021 affirming and expanding the U.S. policy prohibiting U.S. persons from purchasing or investing in publicly-traded securities of companies identified by the U.S. Government as “Chinese Military-Industrial Complex Companies.” The list of such companies can change from time to time, and as a result of forced selling or an inability to participate in an investment the Advisor otherwise believes is attractive, the Funds may incur losses. The duration of the coronavirus outbreak and the Russian-Ukraine conflict could adversely affect the Funds’ performance, the performance of the securities in which the Funds invest and may lead to losses on your investment. The ultimate impact of COVID-19 and Russia Invasion on the financial performance of the Funds’ investments is not reasonably estimable at this time. Management is actively monitoring these events.
First Trust Capital Management Funds
NOTES TO FINANCIAL STATEMENTS - Continued
September 30, 2022
Note 15 - Investments by Other Registered Investment Companies
For purposes of the 1940 Act, each Fund is treated as a registered investment company. Section 12(d)(1) of the 1940 Act restricts investments by investment companies in the securities of other investment companies, including shares of the Fund. Rule 12d1-4 of the 1940 Act permits other investment companies to invest in the Funds beyond the limits in Section 12(d)(1), subject to certain terms and conditions, including that such investment companies enter into an agreement with the Fund.
Note 16 – New Accounting Pronouncements
In October 2020, the SEC adopted new regulations governing the use of derivatives by registered investment companies (“Rule 18f-4”). Rule 18f-4 will impose limits on the amount of derivatives a Fund can enter into, eliminate the asset segregation framework currently used by funds to comply with Section 18 of the 1940 Act, and require funds whose use of derivatives is greater than a limited specified amount to establish and maintain a comprehensive derivatives risk management program and appoint a derivatives risk manager. The Funds have adopted procedures in accordance with Rule 18f-4.
In December 2020, the SEC adopted a new rule providing a framework for fund valuation practices (“Rule 2a-5”). Rule 2a-5 establishes requirements for determining fair value in good faith for purposes of the 1940 Act. Rule 2a-5 will permit fund boards to designate certain parties to perform fair value determinations, subject to board oversight and certain other conditions. Rule 2a-5 also defines when market quotations are “readily available” for purposes of the 1940 Act and the threshold for determining whether a fund must fair value a security. In connection with Rule 2a-5, the SEC also adopted related recordkeeping requirements and is rescinding previously issued guidance, including with respect to the role of a board in determining fair value and the accounting and auditing of fund investments. The Funds have adopted procedures in accordance with Rule 2a-5.
In March 2020, FASB issued ASU 2020-04, Reference Rate Reform: Facilitation of the Effects of Reference Rate Reform on Financial Reporting. The main objective of the new guidance is to provide relief to companies that will be impacted by the expected change in benchmark interest rates at the end of 2021, when participating banks will no longer be required to submit London Interbank Offered Rate (“LIBOR”) quotes by the UK Financial Conduct Authority. The new guidance allows companies to, provided the only change to existing contracts are a change to an approved benchmark interest rate, account for modifications as a continuance of the existing contract without additional analysis. In addition, derivative contracts that qualified for hedge accounting prior to modification will be allowed to continue to receive such treatment, even if critical terms change due to a change in the benchmark interest rate. For new and existing contracts, the Funds may elect to apply the amendments as of March 12, 2020 through December 31, 2022. Management is currently assessing the impact of the ASU’s adoption to the Funds’ financial statements and various filings.
Note 17 – Events Subsequent to the Fiscal Period End
The Funds have adopted financial reporting rules regarding subsequent events which require an entity to recognize in the financial statements the effects of all subsequent events that provide additional evidence about conditions that existed at the date of the balance sheet. Management has evaluated the Funds’ related events and transactions that occurred through the date of issuance of the Funds’ financial statements. Effective November 14, 2022, Class C shares are available for purchase for First Trust Multi-Strategy Fund. There were no other events or transactions that occurred during this period that materially impacted the amounts or disclosures in the Funds’ financial statements.
REPORT OF INDEPENDENT REGISTERED PUBLIC ACCOUNTING FIRM
To the Board of Trustees of Investment Managers Series Trust II and
Shareholders of First Trust Capital Management Funds
Opinion on the Financial Statements
We have audited the accompanying statements of assets and liabilities of First Trust Merger Arbitrage Fund and First Trust Multi-Strategy Fund (the “Funds”), each a series of Investment Managers Series Trust II (the “Trust”), including the schedules of investments, as of September 30, 2022, the related statements of operations and cash flows for the year then ended, the statements of changes in net assets for each of the two years in the period then ended and the financial highlights for the periods indicated thereon, and the related notes (collectively referred to as the “financial statements”). In our opinion, the financial statements present fairly, in all material respects, the financial position of the Funds as of September 30, 2022, the results of their operations and their cash flows for the year then ended, the changes in their net assets for each of the two years in the period then ended and their financial highlights for the periods indicated thereon, in conformity with accounting principles generally accepted in the United States of America.
Basis for Opinion
These financial statements are the responsibility of the Funds’ management. Our responsibility is to express an opinion on the Funds’ financial statements based on our audits. We are a public accounting firm registered with the Public Company Accounting Oversight Board (United States) (“PCAOB”) and are required to be independent with respect to the Funds in accordance with the U.S. federal securities laws and the applicable rules and regulations of the Securities and Exchange Commission and the PCAOB. We have served as the auditor of one or more of the funds in the Trust since 2013.
We conducted our audits in accordance with the standards of the PCAOB. Those standards require that we plan and perform the audits to obtain reasonable assurance about whether the financial statements are free of material misstatement, whether due to error or fraud. The Funds are not required to have, nor were we engaged to perform, an audit of the Funds’ internal control over financial reporting. As part of our audits we are required to obtain an understanding of internal control over financial reporting, but not for the purpose of expressing an opinion on the effectiveness of the Funds’ internal control over financial reporting. Accordingly, we express no such opinion.
Our audits included performing procedures to assess the risks of material misstatement of the financial statements, whether due to error or fraud, and performing procedures that respond to those risks. Such procedures included examining, on a test basis, evidence regarding the amounts and disclosures in the financial statements. Our audits also included evaluating the accounting principles used and significant estimates made by management, as well as evaluating the overall presentation of the financial statements. Our procedures included confirmation of securities owned as of September 30, 2022 by correspondence with the custodian and brokers or by other appropriate auditing procedures where replies were not received. We believe that our audits provide a reasonable basis for our opinion.
| |  |
| TAIT, WELLER & BAKER LLP |
Philadelphia, Pennsylvania
November 29, 2022
First Trust Capital Management Funds
SUPPLEMENTAL INFORMATION (Unaudited)
Qualified Dividend Income
For the year ended September 30, 2022, 0% and 0% of dividends to be paid from net investment income, including short-term capital gains (if any) from the Merger Arbitrage Fund and Multi-Strategy Fund, respectively, are designated as qualified dividend income.
Corporate Dividends Received Deduction
For the year ended September 30, 2022, 0% and 0% of the dividends to be paid from net investment income, including short-term capital gains (if any) from the Merger Arbitrage Fund and Multi-Strategy Fund, respectively, are designated as dividends received deduction available to corporate shareholders.
Capital Gain Designation
For Federal income tax purposes, the Merger Arbitrage Fund designates long-term capital gain dividends of $5,940,117 for the year ended September 30, 2022.
Trustees and Officers Information
Additional information about the Trustees is included in the Funds’ Statement of Additional Information which is available, without charge, upon request by calling (877) 779-1999. The Trustees and officers of the Funds and their principal occupations during the past five years are as follows:
Name, Address, Year of Birth and Position(s) held with Trust | Term of Officec and Length of Time Served | Principal Occupation During the Past Five Years and Other Affiliations | Number of Portfolios in the Fund Complex Overseen by Trusteed | Other Directorships Held by Trustee During the Past Five Yearse |
| Independent Trustees: | | |
Thomas Knipper, CPA a (Born 1957) Trustee | Since September 2013 | Retired (April 2022 – present); Independent Consulting, financial services organizations (March 2021 – March 2022); Vice President and Chief Compliance Officer, Ameritas Investment Partners, a registered investment advisor (1995 – March 2021). | 2 | Monachil Credit Income Fund, a closed-end investment company. |
Kathleen K. Shkuda a
(born 1951) Trustee | Since September 2013 | Zigzag Consulting, a financial services consulting firm (2008 – present). Director, Managed Accounts, Merrill Lynch (2007-2008). | 2 | None. |
Larry D. Tashjian a (born 1953) Trustee and Chairman of the Board | Since September 2013 | Principal, CAM Capital Advisors, a family office (2001 – present). | 2 | General Finance Corporation. |
John P. Zader a (born 1961) Trustee | Since September 2013 | Retired (June 2014 – present); CEO, UMB Fund Services, Inc., a mutual fund and hedge fund service provider, and the transfer agent, fund accountant, and co-administrator for the Fund (December 2006 – June 2014); President, Investment Managers Series Trust (December 2007 - June 2014). | 2 | Investment Managers Series Trust, a registered investment company (includes 54 portfolios) |
First Trust Capital Management Funds
SUPPLEMENTAL INFORMATION (Unaudited) – Continued
Name, Address, Year of Birth and Position(s) held with Trust | Term of Officec and Length of Time Served | Principal Occupation During the Past Five Years and Other Affiliations | Number of Portfolios in the Fund Complex Overseen by Trusteed | Other Directorships Held by Trustee During the Past Five Yearse |
| Interested Trustees: | | |
Eric M. Banhazl b† (born 1957) Trustee | Since September 2013 | Chairman, Foothill Capital Management, LLC, a registered investment advisor (2018 – present); Chairman (2016 – present), and President (2006 – 2015), Mutual Fund Administration, LLC, co-administrator for the Fund. | 2 | Investment Managers Series Trust, a registered investment company (includes 54 portfolios) |
Terrance P. Gallagher a* (born 1958) Trustee and President | Since July 2019 | President, Investment Managers Series Trust II (September 2013 – present); Executive Vice President, UMB Fund Services, Inc. (2007 – present). Director of Compliance, Unified Fund Services Inc. (now Huntington Fund Services), a mutual fund service provider (2004 – 2007). | 2 | Cliffwater Corporate Lending Fund, Agility Multi-Asset Income Fund, Corbin Multi-Strategy Fund, LLC, Aspiriant Risk-Managed Real Asset Fund, Aspiriant Risk-Managed Capital Appreciation Fund, AFA Multi-Manager Credit Fund, The Optima Dynamic Alternatives Fund, Infinity Core Alternative Fund, Infinity Long/Short Equity Fund, LLC, Keystone Private Income Fund, First Trust Alternative Opportunities Fund, Variant Alternative Income Fund, Variant Impact Fund, First Trust Private Assets Fund, First Trust Private Credit Fund, First Trust Real Assets Fund, Destiny Alternative Fund LLC, Destiny Alternative Fund (Tax Exempt) LLC, and Pender Real Estate Credit Fund, each a closed-end investment company. |
First Trust Capital Management Funds
SUPPLEMENTAL INFORMATION (Unaudited) – Continued
Name, Address, Year of Birth and Position(s) held with Trust | Term of Officec and Length of Time Served | Principal Occupation During the Past Five Years and Other Affiliations | Number of Portfolios in the Fund Complex Overseen by Trusteed | Other Directorships Held by Trustee During the Past Five Yearse |
| Officers of the Trust: | | | | |
Rita Dam b (born 1966) Treasurer and Assistant Secretary | Since September 2013 | Co-Chief Executive Officer (2016 – present), and Vice President (2006 – 2015), Mutual Fund Administration, LLC; Co-President, Foothill Capital Management, LLC, a registered investment advisor (2018 – present). | N/A | N/A |
Joy Ausili b (born 1966) Vice President and Assistant Secretary | Since January 2016 | Co-Chief Executive Officer (2016 – present), and Vice President (2006 – 2015), Mutual Fund Administration, LLC; Co-President, Foothill Capital Management, LLC, a registered investment advisor (2018 – present); Secretary and Assistant Treasurer, Investment Managers Series Trust (September 2013 – January 2016). | N/A | N/A |
Diane Drake b (born 1967) Secretary | Since January 2016 | Senior Counsel, Mutual Fund Administration, LLC (October 2015 – present); Chief Compliance Officer, Foothill Capital Management, LLC, a registered investment advisor (2018 – 2019). | N/A | N/A |
Martin Dziura b (born 1959) Chief Compliance Officer | Since September 2013 | Principal, Dziura Compliance Consulting, LLC (October 2014 - present). Managing Director, Cipperman Compliance Services (2010 – September 2014). Chief Compliance Officer, Hanlon Investment Management (2009 - 2010). Vice President − Compliance, Morgan Stanley Investment Management (2000 − 2009). | N/A | N/A |
| a | Address for certain Trustees and certain officers: 235 West Galena Street, Milwaukee, Wisconsin 53212. |
| b | Address for Mr. Banhazl, Ms. Ausili, Ms. Dam and Ms. Drake: 2220 E. Route 66, Suite 226, Glendora, California 91740. Address for Mr. Dziura: 309 Woodridge Lane, Media, Pennsylvania 19063. |
| c | Trustees and officers serve until their successors have been duly elected. |
First Trust Capital Management Funds
SUPPLEMENTAL INFORMATION (Unaudited) – Continued
| d | The Trust is comprised of 62 series managed by unaffiliated investment advisors. Each Trustee serves as Trustee of each series of the Trust. The term “Fund Complex” applies only to the Funds managed by the same investment advisor. The Funds do not hold themselves out as related to any other series within the Trust, for purposes of investment and investor services, nor do they share the same investment advisor with any other series. |
| e | “Other Directorships Held” includes only directorship of companies required to register or file reports with the SEC under the Securities Exchange Act of 1934, as amended (that is, “public companies”) or other investment companies registered under the 1940 Act. |
| † | Mr. Banhazl is an “interested person” of the Trust by virtue of his position with Mutual Fund Administration, LLC and Foothill Capital Management, LLC. |
| * | Mr. Gallagher is an “interested person” of the Trust by virtue of his position with UMB Fund Services, Inc. |
First Trust Multi-Strategy Fund
SUPPLEMENTAL INFORMATION (Unaudited) - Continued
Board Consideration of Investment Advisory and Sub-Advisory Agreements
At a meeting held on April 20-21, 2022, the Board of Trustees (the “Board”) of Investment Managers Series Trust II (the “Trust”), including the trustees who are not “interested persons” of the Trust (the “Independent Trustees”) as defined in the Investment Company Act of 1940, as amended (the “1940 Act”), reviewed and unanimously approved the investment sub-advisory agreement (the “Sub-Advisory Agreement”) between First Trust Capital Management L.P. (the “Investment Advisor”) and Glenmede Investment Management, LP (the “Glenmede”) with respect to the First Trust Multi-Strategy Fund series of the Trust (the “Fund”), for an initial two-year term.
At a meeting held on May 18, 2022, the Board and the Independent Trustees reviewed and unanimously approved the ratification of the amended Sub-Advisory Agreement, which included a corrected sub-advisory fee. In approving and ratifying the Sub-Advisory Agreement, the Board, including the Independent Trustees, determined that such approval and ratification was in the best interests of the Fund and its shareholders.
Background
In advance of the meetings, the Board received information about the Fund and the Sub-Advisory Agreement from the Investment Advisor, Glenmede, and Mutual Fund Administration, LLC and UMB Fund Services, Inc., the Trust’s co-administrators, certain portions of which are discussed below. The materials, among other things, included information about the organization and financial condition of Glenmede; information regarding the background, experience, and compensation structure of relevant personnel who would be providing services to the Fund; information about Glenmede’s compliance policies and procedures, disaster recovery and contingency planning, and policies with respect to portfolio execution and trading; information regarding the performance of Glenmede’s secured put options strategy, which is the same strategy that Glenmede would utilize to manage its portion of the Fund; and information regarding the proposed sub-advisory fee under the Sub-Advisory Agreement. The Board also received a memorandum from legal counsel to the Trust and the Independent Trustees discussing the legal standards under the 1940 Act and other applicable law for their consideration of the proposed approval and ratification of the Sub-Advisory Agreement. In addition, the Board considered information reviewed by the Board during the year at other Board and Board committee meetings. No representatives of the Investment Advisor or Glenmede were present during the Board’s consideration of the Sub-Advisory Agreement, and the Independent Trustees were represented by their legal counsel with respect to the matters considered.
In approving and ratifying the Sub-Advisory Agreement, the Board and the Independent Trustees considered a variety of factors, including those discussed below. In their deliberations, the Board and the Independent Trustees did not identify any particular factor that was controlling, and each Trustee may have attributed different weights to the various factors.
Nature, Extent and Quality of Services
With respect to the relevant performance information, the meeting materials indicated that Glenmede’s secured put option composite performance for the period from June 30, 2010 (inception), through December 31, 2021, was above the CBOE S&P 500 PutWrite T-W Index by 1.3% on a gross basis and by 0.5% on a net basis. The Trustees considered the respective roles of the Investment Advisor and Glenmede, noting that the Investment Advisor would provide overall supervision of the general investment management and investment operations of the Fund and oversee Glenmede with respect to its management of its portion of the Fund, including monitoring the investment and trading activities of Glenmede, monitoring the Fund’s compliance with its investment policies, and providing general administrative services related to the Investment Advisor’s overall supervision of the Fund; and that Glenmede’s responsibilities would include day-to-day portfolio management of its portion of the Fund. The Trustees noted the qualifications, experience, and responsibilities of the personnel who would be involved in the activities of the Fund. The Board also considered the overall quality of the organization and operations of Glenmede, as well as its compliance structure and compliance procedures.
First Trust Multi-Strategy Fund
SUPPLEMENTAL INFORMATION (Unaudited) - Continued
The Board and the Independent Trustees concluded that based on the various factors they had reviewed, Glenmede would have the capabilities, resources, and personnel necessary to manage its portion of the Fund, and that Glenmede would provide the Fund with a reasonable potential for good investment results.
Sub-Advisory Fee
The Board reviewed information regarding the sub-advisory fee proposed to be charged by Glenmede with respect to the Fund. The Trustees noted that the proposed sub-advisory fee was the same as Glenmede’s standard fee schedule to manage its secured options strategy, which is the same strategy it would use to manage its portion of the Fund. The Board also noted that the Investment Advisor’s services include supervision and monitoring of the investment and trading activities of Glenmede, oversight of its use of derivatives, analysis of the Fund’s investment operations, and general administrative services related to the Investment Advisor’s overall supervision of the Fund. The Board also noted that the Investment Advisor would pay Glenmede’s sub-advisory fee out of the Investment Advisor’s advisory fee. In addition, the Board considered that the Investment Advisor was recommending the approval of the Sub-Advisory Agreement.
The Board and the Independent Trustees concluded that the proposed compensation payable to Glenmede under the Sub-Advisory Agreement would be fair and reasonable in light of the nature and quality of the services proposed to be provided by Glenmede to the Fund.
Benefits to the Sub-Advisor
The Board also considered that the potential benefits to be received by Glenmede as a result of its relationship with the Fund, other than the receipt of its sub-advisory fee, would include the usual types of “fall out” benefits received by sub-advisors to the Trust, including any research received from broker-dealers providing execution services to the Fund, the beneficial effects from the review by the Trust’s Chief Compliance Officer of the Sub-Advisor’s compliance program, and the intangible benefits of the Sub-Advisor’s association with the Fund generally and any favorable publicity arising in connection with the Fund’s performance.
Conclusion
Based on these and other factors, the Board and the Independent Trustees concluded that approval and ratification of the Sub-Advisory Agreement was in the best interests of the Fund and its shareholders and, accordingly, approved and ratified the Sub-Advisory Agreement.
First Trust Capital Management Funds
SUPPLEMENTAL INFORMATION (Unaudited) - Continued
Statement Regarding Liquidity Risk Management Program
The Securities and Exchange Commission adopted Rule 22e-4 under the Investment Company Act of 1940, as amended (the “Liquidity Rule”), to promote effective liquidity risk management throughout the open-end investment company industry, thereby reducing the risk that funds will be unable to meet their redemption obligations and mitigating dilution of the interests of fund shareholders.
The Board of Trustees (the “Board”) of Investment Managers Series Trust II (the “Trust”) met on April 20 -21, 2022 (the “Meeting”), to review the liquidity risk management program (the “Fund Program”) applicable to the following series of the Trust (each, a “Fund” and together, the “Funds”) pursuant to the Liquidity Rule:
First Trust Merger Arbitrage Fund
First Trust Multi-Strategy Fund
The Board has appointed First Trust Capital Management, L.P., the investment adviser to the Funds, as the program administrator (“Program Administrator”) for the Fund Program. Under the Trust’s liquidity risk management program (the “Trust Program”), the Board has delegated oversight of the Trust Program to the Liquidity Oversight Committee (the “Oversight Committee”). At the Meeting, the Oversight Committee, on behalf of Program Administrator and the Funds, provided the Board with a written report (the “Report”) that addressed the operation, adequacy, and effectiveness of implementation of the Fund Program, and any material changes to it for the period from February 1, 2021 through January 31, 2022 (the “Program Reporting Period”).
In assessing the adequacy and effectiveness of implementation of the Fund Program, the Report discussed the following, among other things:
| ● | The Fund Program’s liquidity classification methodology for categorizing each Fund’s investments (including derivative transactions); |
| ● | An overview of market liquidity for each Fund during the Program Reporting Period; |
| ● | Each Fund’s ability to meet redemption requests; |
| ● | Each Fund’s cash management; |
| ● | Each Fund’s borrowing activity, if any, in order to meet redemption requests; |
| ● | Each Fund’s compliance with the 15% limit of illiquid investments; and |
| ● | Each Fund’s status as a primarily highly liquid fund (“PHLF”), the effectiveness of the implementation of the PHLF standard, and whether it would be appropriate for each Fund to adopt a highly liquid investment minimum (“HLIM”). |
The Report stated that the Funds primarily hold assets that are defined under the Liquidity Rule as "highly liquid investments," and therefore each Fund is not required to establish an HLIM. Highly liquid investments are defined as cash and any investment reasonably expected to be convertible to cash in current market conditions in three business days or less without the conversion to cash significantly changing the market value of the investment. The Report also stated that there were no material changes made to the Fund Program during the Program Reporting Period.
In the Report, the Program Administrator concluded that (i) the Fund Program, as adopted and implemented, remains reasonably designed to assess and manage each Fund’s liquidity risk; (ii) each Fund continues to qualify as a PHLF and therefore is not required to adopt an HLIM; (iii) during the Program Reporting Period, each Fund was able to meet redemption requests without significant dilution of remaining investors’ interests; and (iv) there were no weaknesses in the design or implementation of the Fund Program during the Program Reporting Period.
There can be no assurance that the Fund Program will achieve its objectives in the future. Please refer to the Funds’ prospectus for more information regarding each Fund’s exposure to liquidity risk and other principal risks to which an investment in the Funds may be subject.
First Trust Capital Management Funds
EXPENSE EXAMPLES
For the Six Months Ended September 30, 2022 (Unaudited)
Expense Examples
As a shareholder of the Funds, you incur two types of costs: (1) transaction costs including sales charges (loads) on purchases within certain classes; and (2) ongoing costs, including management fees, distribution and/or service (12b-1) fees (Class A only) and other Fund expenses. The examples below are intended to help you understand your ongoing costs (in dollars) of investing in the Funds and to compare these costs with the ongoing costs of investing in other mutual funds.
These examples are based on an investment of $1,000 invested at the beginning of the period and held for the entire period from April 1, 2022 to September 30, 2022.
Actual Expenses
The information in the row titled “Actual Performance” of the table below provides actual account values and actual expenses. You may use the information in these columns, together with the amount you invested, to estimate the expenses that you paid over the period. Simply divide your account value by $1,000 (for example, an $8,600 account value divided by $1,000 = 8.6), then multiply the result by the number in the appropriate row under the column titled “Expenses Paid During Period” to estimate the expenses you paid on your account during this period.
Hypothetical Example for Comparison Purposes
The information in the row titled “Hypothetical (5% annual return before expenses)” of the table below provides hypothetical account values and hypothetical expenses based on the Fund’s actual expense ratios and an assumed rate of return of 5% per year before expenses, which is not the Fund’s actual return. The hypothetical account values and expenses may not be used to estimate the actual ending account balance or expenses you paid for the period. You may use this information to compare the ongoing costs of investing in the Funds and other funds. To do so, compare these 5% hypothetical examples with the 5% hypothetical examples that appear in the shareholder reports of the other funds.
Please note that the expenses shown in the table are meant to highlight your ongoing costs only and do not reflect any transaction costs, such as sales charges (load) or contingent deferred sales charges. Therefore, the information in the row titled “Hypothetical (5% annual return before expenses)” is useful in comparing ongoing costs only, and will not help you determine the relative total costs of owning different funds. In addition, if these transactional costs were included, your costs would have been higher.
| | | Beginning Account
Value | Ending Account
Value | Expenses Paid
During Period* |
| Merger Arbitrage Fund | 4/1/22 | 9/30/22 | 4/1/22 – 9/30/22 |
| Class A | Actual Performance | $1,000.00 | $997.10 | $10.34 |
| | Hypothetical (5% annual return before expenses) | 1,000.00 | 1,014.72 | 10.43 |
| Class I | Actual Performance | 1,000.00 | 999.10 | 9.08 |
| | Hypothetical (5% annual return before expenses) | 1,000.00 | 1,015.98 | 9.16 |
| * | Expenses are equal to the Fund’s annualized expense ratios of 2.07% and 1.81% for the Class A and Class I shares, respectively, multiplied by the average account values over the period, multiplied by 183/365 (to reflect the six-month period) for Class A shares and Class I shares. The expense ratios reflect a recovery of previously waived fees. Assumes all dividends and distributions were reinvested. |
First Trust Capital Management Funds
EXPENSE EXAMPLES - Continued
For the Six Months Ended September 30, 2022 (Unaudited)
| | | Beginning Account
Value | Ending Account
Value | Expenses Paid
During Period* |
| Multi-Strategy Fund | 4/1/22 | 9/30/22 | 4/1/22 – 9/30/22 |
| Class A | Actual Performance | $1,000.00 | $955.20 | $9.80 |
| | Hypothetical (5% annual return before expenses) | 1,000.00 | 1,015.04 | 10.10 |
| Class I | Actual Performance | 1,000.00 | 956.70 | 8.35 |
| | Hypothetical (5% annual return before expenses) | 1,000.00 | 1,016.53 | 8.61 |
| * | Expenses are equal to the Fund’s annualized expense ratios of 2.02% and 1.71% for the Class A and Class I shares, respectively, multiplied by the average account values over the period, multiplied by 183/365 (to reflect the six-month period) for Class A shares and Class I shares. Assumes all dividends and distributions were reinvested. |
This page is intentionally left blank
This page is intentionally left blank
This page is intentionally left blank
The First Trust Capital Management Funds
Each a series of Investment Managers Series Trust II
Investment Advisor
First Trust Capital Management L.P.
225 West Wacker Drive, Suite 2100
Chicago, Illinois 60606
Sub-Advisor
Angel Oak Capital Advisors, LLC
3344 Peachtree Road Northeast, Suite 1725
Atlanta, Georgia 30326
Sub-Advisor
Glenmede Investment Management, LP
1650 Market Street, Suite 1200
Philadelphia, Pennsylvania 19103
Independent Registered Public Accounting Firm
Tait, Weller & Baker LLP
Two Liberty Place
50 South 16th Street, Suite 2900
Philadelphia, Pennsylvania 19102
Custodian
UMB Bank, n.a.
928 Grand Boulevard, 5th Floor
Kansas City, Missouri 64106
Fund Co-Administrator
Mutual Fund Administration, LLC
2220 East Route 66, Suite 226
Glendora, California 91740
Fund Co-Administrator, Transfer Agent and Fund Accountant
UMB Fund Services, Inc.
235 West Galena Street
Milwaukee, Wisconsin 53212
Distributor
First Trust Portfolios L.P.
120 E. Liberty Drive, Suite 400
Wheaton, Illinois 60187
FUND INFORMATION
| | TICKER | CUSIP |
| First Trust Arbitrage Fund – Class A | VARAX | 46141T 877 |
| First Trust Arbitrage Fund – Class I | VARBX | 46141T 869 |
| First Trust Multi-Strategy Fund – Class A | OMOAX | 46141T 687 |
| First Trust Multi-Strategy Fund – Class I | OMOIX | 46141T 679 |
Privacy Principles of the First Trust Capital Management Funds for Shareholders
The Funds are committed to maintaining the privacy of their shareholders and to safeguarding their non-public personal information. The following information is provided to help you understand what personal information the Funds collect, how we protect that information and why, in certain cases, we may share information with select other parties.
Generally, the Funds do not receive any non-public personal information relating to their shareholders, although certain non-public personal information of their shareholders may become available to the Funds. The Funds do not disclose any non-public personal information about their shareholders or former shareholders to anyone, except as permitted by law or as is necessary in order to service shareholder accounts (for example, to a transfer agent or third party administrator).
This report is sent to shareholders of the First Trust Capital Management Funds for their information. It is not a Prospectus, circular or representation intended for use in the purchase or sale of shares of the Funds or of any securities mentioned in this report.
Proxy Voting
The Funds’ proxy voting policies and procedures, as well as information regarding how the Funds voted proxies for portfolio securities, if applicable, during the most recent 12-month period ended June 30, are available, without charge and upon request by calling (877) 779-1999 or on the SEC’s website at www.sec.gov.
Fund Portfolio Holdings
The Funds file a complete schedule of their portfolio holdings with the SEC for the first and third quarters of each fiscal year on Form N-PORT within 60 days of the end of such fiscal quarter. Shareholders may obtain the Funds’ Form N-PORT on the SEC’s website at www.sec.gov.
Prior to the use of Form N-PORT, the Funds filed their complete schedule of portfolio holdings with the SEC on Form N-Q, which is available online at www.sec.gov.
Householding
The Funds will mail only one copy of shareholder documents, including prospectuses, notice of annual and semi-annual reports availability and proxy statements, to shareholders with multiple accounts at the same address. This practice is commonly called “householding” and is intended to reduce expenses and eliminate duplicate mailings of shareholder documents. Mailings of your shareholder documents may be householded indefinitely unless you instruct us otherwise. If you do not want the mailing of these documents to be combined with those for other members of your household, please call the Funds at (877) 779-1999.
First Trust Capital Management Funds
P.O. Box 2175
Milwaukee, WI 53201
Toll Free: (877) 779-1999
Item 1. Report to Stockholders (Continued).
(b) Not applicable.
Item 2. Code of Ethics.
The registrant has adopted a code of ethics that applies to the registrant's principal executive officer and principal financial officer. The registrant has not made any amendments to its code of ethics during the period covered by this report. The registrant has not granted any waivers from any provisions of the code of ethics during the period covered by this report.
The registrant undertakes to provide to any person without charge, upon request, a copy of its code of ethics by mail when they call the registrant at 1-877-779-1999.
Item 3. Audit Committee Financial Expert.
The Board of Trustees of the Registrant has determined that the Registrant has the following “audit committee financial experts” as defined in Item 3(b) of Form N-CSR serving on its Audit Committee: Messrs. Thomas Knipper and John P. Zader. The audit committee financial experts are “independent” as that term is defined in Item 3(a)(2) of Form N-CSR.
Item 4. Principal Accountant Fees and Services.
The registrant has engaged its principal accountant to perform audit services, audit-related services, tax services and other services during the past two fiscal years. "Audit services" refer to performing an audit of the registrant's annual financial statements or services that are normally provided by the accountant in connection with statutory and regulatory filings or engagements for those fiscal years. "Audit-related services" refer to the assurance and related services by the principal accountant that are reasonably related to the performance of the audit. "Tax services" refer to professional services rendered by the principal accountant for tax compliance, tax advice, and tax planning. There were no "other services" provided by the principal accountant. The following table details the aggregate fees billed or expected to be billed for each of the last two fiscal years for audit fees, audit-related fees, tax fees and other fees by the principal accountant.
| First Trust Merger Arbitrage Fund | FYE 9/30/2022 | FYE 9/31/2021 |
| Audit Fees | $12,500 | $12,500 |
| Audit-Related Fees | N/A | N/A |
| Tax Fees | $2,500 | $2,500 |
| All Other Fees | N/A | N/A |
| First Trust Multi-Strategy Fund | FYE 9/30/2022 | FYE 9/30/2021 |
| Audit Fees | $12,500 | $12,500 |
| Audit-Related Fees | N/A | N/A |
| Tax Fees | $2,500 | $2,500 |
| All Other Fees | N/A | N/A |
The audit committee has adopted pre-approval policies and procedures that require the audit committee to pre-approve all audit and non-audit services of the registrant, including services provided to any entity affiliated with the registrant.
The percentage of fees billed by Tait, Weller, & Weller LLP applicable to non-audit services pursuant to waiver of pre-approval requirement were as follows:
| First Trust Merger Arbitrage Fund | FYE 9/30/2022 | FYE 9/30/2021 |
| Audit-Related Fees | 0% | 0% |
| Tax Fees | 0% | 0% |
| All Other Fees | 0% | 0% |
| First Trust Multi-Strategy Fund | FYE 9/30/2022 | FYE 9/30/2021 |
| Audit-Related Fees | 0% | 0% |
| Tax Fees | 0% | 0% |
| All Other Fees | 0% | 0% |
All of the principal accountant's hours spent on auditing the registrant's financial statements were attributed to work performed by full-time permanent employees of the principal accountant.
The following table indicates the non-audit fees billed or expected to be billed by the registrant's accountant for services to the registrant and to the registrant's investment advisor (and any other controlling entity, etc.—not sub-advisor) for the last two years. The audit committee of the Board of Trustees has considered whether the provision of non-audit services that were rendered to the registrant's investment advisor is compatible with maintaining the principal accountant's independence and has concluded that the provision of such non-audit services by the accountant has not compromised the accountant's independence.
| First Trust Merger Arbitrage Fund | | |
| Non-Audit Related Fees | FYE 9/30/2022 | FYE 9/30/2021 |
| Registrant | N/A | N/A |
| Registrant’s Investment Advisor | N/A | N/A |
| First Trust Multi-Strategy Fund | | |
| Non-Audit Related Fees | FYE 9/30/2022 | FYE 9/30/2021 |
| Registrant | N/A | N/A |
| Registrant’s Investment Advisor | N/A | N/A |
Item 5. Audit Committee of Listed Registrants.
| (a) | Not applicable to registrants who are not listed issuers (as defined in Rule 10A-3 under the Securities Exchange Act of 1934). |
Item 6. Schedule of Investments.
| (a) | Schedule of Investments is included as part of the report to shareholders filed under Item 1 of this Form. |
Item 7. Disclosure of Proxy Voting Policies and Procedures for Closed-End Management Investment Companies.
Not applicable to open-end investment companies.
Item 8. Portfolio Managers of Closed-End Management Investment Companies.
Not applicable to open-end investment companies.
Item 9. Purchases of Equity Securities by Closed-End Management Investment Company and Affiliated Purchasers.
Not applicable.
Item 10. Submission of Matters to a Vote of Security Holders.
The registrant has not made any material changes to the procedures by which shareholders may recommend nominees to the registrant’s Board of Trustees.
Item 11. Controls and Procedures.
| (a) | The Registrant’s President/Chief Executive Officer and Treasurer/Chief Financial Officer have reviewed the Registrant's disclosure controls and procedures (as defined in Rule 30a-3(c) under the Investment Company Act of 1940 (the “Act”)) as of a date within 90 days of the filing of this report, as required by Rule 30a-3(b) under the Act and Rules 13a-15(b) or 15d-15(b) under the Securities Exchange Act of 1934. Based on their review, such officers have concluded that the disclosure controls and procedures are effective in ensuring that information required to be disclosed in this report is appropriately recorded, processed, summarized and reported and made known to them by others within the Registrant and by the Registrant’s service provider. |
| (b) | There were no changes in the Registrant's internal control over financial reporting (as defined in Rule 30a-3(d) under the Act) that occurred during the period covered by this report that has materially affected, or is reasonably likely to materially affect, the Registrant's internal control over financial reporting. |
Item 12. Disclosure of Securities Lending Activities for Closed-End Management Investment Companies.
Not applicable to open-end investment companies.
Item 13. Exhibits.
| (2) | Certifications pursuant to Section 302 of the Sarbanes-Oxley Act of 2002. Filed herewith. |
| (3) | Any written solicitation to purchase securities under Rule 23c-1 under the Act sent or given during the period covered by the report by or on behalf of the registrant to 10 or more persons. Not applicable to open-end investment companies. |
| (4) | Change in the registrant’s independent public accountant. There was no change in the registrant’s independent public accountant for the period covered by this report. |
| (b) | Certification pursuant to Section 906 of the Sarbanes-Oxley Act of 2002. Filed herewith. |
SIGNATURES
Pursuant to the requirements of the Securities Exchange Act of 1934 and the Investment Company Act of 1940, the registrant has duly caused this report to be signed on its behalf by the undersigned, thereunto duly authorized.
| (Registrant) | Investment Managers Series Trust II | |
| | | |
| By (Signature and Title) | /s/ Terrance Gallagher | |
| | Terrance Gallagher, President/Chief Executive Officer | |
| | | |
| Date | 12/9/2022 | |
Pursuant to the requirements of the Securities Exchange Act of 1934 and the Investment Company Act of 1940, this report has been signed below by the following persons on behalf of the registrant and in the capacities and on the dates indicated.
| By (Signature and Title) | /s/ Terrance Gallagher | |
| | Terrance Gallagher, President/Chief Executive Officer | |
| | | |
| Date | 12/9/2022 | |
| | | |
| By (Signature and Title) | /s/ Rita Dam | |
| | Rita Dam, Treasurer/Chief Financial Officer | |
| | | |
| Date | 12/9/2022 | |