UNITED STATES
SECURITIES AND EXCHANGE COMMISSION
Washington, D.C. 20549
FORM N-CSR
CERTIFIED SHAREHOLDER REPORT OF REGISTERED
MANAGEMENT INVESTMENT COMPANIES
Investment Company Act file number 811-22894
INVESTMENT MANAGERS SERIES TRUST II
(Exact name of registrant as specified in charter)
235 W. Galena Street
Milwaukee, WI 53212
(Address of principal executive offices) (Zip code)
Diane J. Drake
Mutual Fund Administration, LLC
2220 E. Route 66, Suite 226
Glendora, CA 91740
(Name and address of agent for service)
(626) 385-5777
Registrant's telephone number, including area code
Date of fiscal year end: September 30
Date of reporting period: September 30, 2022
Item 1. Report to Stockholders.
The registrant’s annual report transmitted to shareholders pursuant to Rule 30e-1 under the Investment Company Act of 1940, as amended (the “Investment Company Act”), is as follows:
AXS Alternative Growth Fund
(Class A: EEHAX)
(Class I: EEHIX)
AXS Chesapeake Strategy Fund
(Class A: ECHAX)
(Class C: ECHCX)
(Class I: EQCHX)
AXS Multi-Strategy Alternatives Fund
(Class I: KCMIX)
(Investor Class: KCMTX)
AXS Sustainable Income Fund
(Class I: AXSKX)
AXS Thomson Reuters Private Equity Return Tracker Fund
(Class A: LDPAX)
(Class C: LDPCX)
(Class I: LDPIX)
AXS Thomson Reuters Venture Capital Return Tracker Fund
(Class A: LDVAX)
(Class C: LDVCX)
(Class I: LDVIX)
AXS All Terrain Opportunity Fund
(Class I: TERIX)
AXS Merger Fund
(Investor Class: GAKAX)
(Class I: GAKIX)
AXS Alternative Value Fund
(Investor Class: COGLX)
(Class I: COGVX)
AXS Market Neutral Fund
(Investor Class: COGMX)
(Class I: COGIX)
AXS Adaptive Plus Fund
(Class I: AXSPX)
ANNUAL REPORT
SEPTEMBER 30, 2022
AXS Funds
Each a series of Investment Managers Series Trust II
Table of Contents
| Shareholder Letters | 1 |
| Fund Performances | 32 |
| Consolidated Schedule of Investments | 53 |
| Consolidated Statements of Assets and Liabilities | 119 |
| Consolidated Statements of Operations | 125 |
| Consolidated Statements of Changes in Net Assets | 128 |
| Statement of Cash Flows | 139 |
| Consolidated Financial Highlights | 141 |
| Notes to Consolidated Financial Statements | 163 |
| Report of Independent Registered Public Accounting Firm | 210 |
| Supplemental Information | 213 |
| Expense Examples | 224 |
This report and the financial statements contained herein are provided for the general information of the shareholders of the AXS Funds. This report is not authorized for distribution to prospective investors in the Fund unless preceded or accompanied by an effective prospectus.
www.axsinvestments.com

AXS Alternative Growth Fund
Annual Letter to Shareholders for the year ended September 30, 2022
For the fiscal year ending September 30, 2022, the AXS Alternative Growth Fund’s Class I and Class A shares were down -24.66% and -24.87%, respectively, underperforming the S&P 500 Total Return Index® (“S&P 500®”), which was down -15.47%.
| | Annualized Rate of Return (AROR) | Annualized Standard Deviation |
| | 1 Year | 3 Year | 5 Year | Since
Inception | Since Inception |
| AXS Alternative Growth – Class I | -24.66% | -2.42% | 3.75% | 5.97% | 17.00% |
| AXS Alternative Growth – Class A | -24.87% | -2.60% | 3.44% | 5.70% | 16.89% |
| AXS Alternative Growth – Class A (w/ 5.75% max sales charge) | -29.18% | -4.50% | 2.23% | 5.01% | -- |
| S&P 500® | -15.47% | 8.16% | 9.24% | 10.90% | 14.89% |
Inception date is 9/9/2013. The performance data quoted represents past performance and is no guarantee of future results. Investment return and principal value of an investment will fluctuate so that an investor's shares, when redeemed, may be worth more or less than their original cost. Current performance may be lower or higher than the performance data quoted. For the most recent month-end performance, please call 833.AXS.ALTS or visit the Fund’s website at www.axsinvestments.com. Performance results with sales charges reflect the deduction of the maximum front-end sales charge. Class A shares are subject to a maximum front-end sales charge of 5.75%. The Gross/Net Expense Ratio for Class I is 5.37%/1.03% and for Class A is 5.62%/1.28%. The Adviser has contractually agreed to waive certain fees/expenses until January 31, 2023. Performance would have been lower without fee waivers in effect.
RATIONALE
Over the years, we have observed that many investor portfolios are inadequately diversified because of the perceived opportunity cost of selling equities to gain exposure to diversifying alternative assets. We believe an overlay strategy offers the potential for superior and meaningful diversification without the need to reduce exposure to core holdings. This is the concept implemented in the Alternative Growth Fund. The Fund provides futures-based exposure to the broad US equity market, while simultaneously seeking to diversify equity factor risk through strategic and meaningful exposure to a futures-based portfolio of (i) uncorrelated diversifiers and (ii) negatively correlated dynamic equity-hedging strategies.
ampersandinvestments.com • 609.454.5200
ANALYSIS OF PERFORMANCE
The Fund’s underperformance can be attributed mainly to the diversifier strategy, as shown in the Table below. Unfortunately, as well, during a down year for equity markets, the hedge strategy was also slightly down.
TABLE 1: FUND CONTRIBUTION BY STRATEGY
| Strategy | Oct-2021 to Sep-2022 |
| Long Only | -16.19% |
| Diversifier | -6.38% |
| Hedge | -2.51% |
| Fixed Income | 0.42% |
| Equityhedge I Total | -24.66% |
Six of our diversifying trading programs contributed positively, totaling 650 bps, but the remaining seven programs combined to yield negative performance of −1288 bps. The best performers were trend-following programs, while negative performance came from strategies across the board. During the year, some of the programs to which we allocate closed down, which did not help performance.
Performance attribution is estimated by Ampersand Investment Management and is net of fees. Past performance does not guarantee future results.
TABLE 2: PERFORMANCE ATTRIBUTION BY CTAS:
| Program | Commodity Trading Advisor | Oct-2021 to Sep-2022 |
| Diversifiers | | |
| Crabel Multi-Product | Crabel Capital Management | 0.38% |
| Emil Van Essen Spread Program | Emil van Essen | -5.10% |
| Fort Global Contrarian | FORT, L.P. | -3.29% |
| H2O Asset Management | H20 Asset Management | -2.03% |
| JEM CRV Program | JE Moody | -0.12% |
| Key Trends Financials Program | KeyQuant | 1.09% |
| LCJ | LCJ Investments | -0.47% |
| Cambridge Strategy Emerging Markets Alpha | Mesirow Financial (Currency Management) | -1.86% |
| QMS Financials Only Global Macro | QMS Capital Management | 1.31% |
| Quantica | Quantica Capital | 1.70% |
| QIM | Quantitative Investment Management | 0.40% |
| Quest QTI | Quest Partners | 1.62% |
| SCT Capital - AQT Program | SCT Capital Management | -0.01% |
| Total Diversifier | | -6.38% |
| Hedges | | |
| QDRA Dynamic Macro | QDRA Pty. Ltd | -8.45% |
| Quadriga | Quadriga Asset Managers | 0.05% |
| Quest Hedging Program | Quest Partners | 5.89% |
| Total Hedge | | -2.51% |
Performance attribution is estimated by Ampersand Investment Management and is net of fees. Past performance does not guarantee future results.
ampersandinvestments.com • 609.454.5200
At the sector level, equity indices and currencies were the biggest positive contributors to performance, followed by agricultural commodities and energy. Interest rates were the largest negative contributors, followed by metals.
TABLE 3: STRATEGY PERFORMANCE ATTRIBUTION BY SECTOR (10/1/2021 to 9/30/2022)
| Sector | Contribution |
| Currencies | 2.57% |
| Equity Indices | 2.36% |
| Interest Rates | -12.79% |
| Agricultural Commodities | 0.78% |
| Metals | -2.10% |
| Energy | 0.29% |
| Total | -8.89% |
FUND SECTOR DIVERSIFICATION
The overlay’s largest gross exposure as of fiscal year-end was to energy (about 31%), followed by agricultural commodities (about 26%), interest rates (about 24%), currencies (about 10%), equity indices (about 8%), and metals (about 1%). Together, the physical commodity sectors represented about 58% of the Fund’s exposure, lower than at the previous year-end.
At the end of September, the dynamic hedging strategies had a negative beta of about −0.17 with respect to the S&P 500 Index®. It is expected that this beta will be negative, on average and over time. Equity indices and currencies had the largest negative betas (−0.17 and −0.12, respectively) and energy had the largest positive beta (+0.21). Metals and agricultural commodities betas were negative, while that for interest rates was slightly positive.
ampersandinvestments.com • 609.454.5200
GROSS SECTOR EXPOSURE AS OF 9/30/2022

GROSS SECTOR EXPOSURE AS OF 9/30/2021

Source: Ampersand Investment Management and Bloomberg, LP. Reflects aggregate sector gross risk exposures. Sector exposures and positions held may vary depending on market conditions and may not be representative of the Fund’s current or future exposures. Portfolio positions are subject to change and should not be considered investment advice. Attribution numbers have been rounded for ease of use.
ampersandinvestments.com • 609.454.5200
CONCLUSION
We believe that concerns about the global economy and geopolitics have been exacerbated by the coronavirus crisis. Historically, futures trading programs have tended to perform well in a variety of market conditions, perhaps particularly so during periods of market turbulence and volatility expansion. A period of a few weeks or months is far too short to judge the long-term potential of any strategy or asset class.
The Fund seeks to provide returns that, in the long run, are comparable to the S&P 500® Total Return Index with comparable volatility, while seeking to mitigate downside risk. We continue to believe that a significant and strategic allocation to the Fund as a substitute for core equity exposure in a portfolio may provide “smarter” equity exposure: equity exposure that is dynamically hedged, coupled with the potential for uncorrelated alpha in the long run.
Definition of Terms
Alpha is a measure of performance on a risk-adjusted basis. Alpha takes the volatility (price risk) of a fund and compares its risk-adjusted performance to a benchmark index. The excess return of the fund relative to the return of the benchmark index is a fund’s alpha.
Annualized rate of return (AROR) is the geometric average return for a period greater than or equal to one year, expressed on an annual basis or as a return per year.
Beta is a measure of the volatility, or systematic risk, of a security or a portfolio in comparison to the market as a whole. A beta of 1 indicates that the security's return will move with the market. A beta of less than 1 means that the security’s return will be less volatile than the market. A beta of greater than 1 indicates that the security's return will be more volatile than the market. For example, if a stock's beta is 1.2, it's return is theoretically 20% more volatile than the market’s return.
Basis Points (bps) is a unit of measure used in quoting yields, changes in yields or differences between yields. One basis point is equal to 0.01%, or one one-hundredth of a percent of yield and 100 basis points equals 1%.
Commodity Trading Advisors (CTA) provide advice and services related to trading in futures contracts. They are responsible for the trading within managed futures accounts.
Correlation is a statistical measure of how two securities move in relation to each other.
Hedge is making an investment to reduce the risk of adverse price movements in an asset. Normally, a hedge consists of taking an offsetting position in a related security, such as a futures contract.
Long position refers to buying a security such as a stock, commodity, or currency, with the expectation that the asset will rise in value.
ampersandinvestments.com • 609.454.5200
The S&P 500 Total Return Index® is widely regarded as the best single gauge of the U.S. equities market. This world-renowned Index includes 500 leading companies in leading industries of the U.S. economy.
Short position is a position whereby an investor sells borrowed securities in anticipation of a price decline and is required to return an equal number of shares at some point in the future.
Standard Deviation (Volatility) is a measure of fluctuation in the value of an asset or investment. Lower volatility improves the stability and lowers the risk of an investment portfolio.
Yield is the income return on an investment. This refers to the interest or dividends received from a security and is usually expressed annually as a percentage based on the investment’s cost, its current market value or its face value.
Investors cannot directly invest in an index and unmanaged index returns do not reflect any fees, expenses or sales charges. The views in this letter were as of September 30, 2022 and may not necessarily reflect the same views on the date this letter is first published or any time thereafter. These views are intended to help shareholders in understanding the fund’s investment methodology and do not constitute investment advice.
Mutual funds involve risk including possible loss of principal. There is no assurance that the Fund will achieve its investment objective. Exposure to the commodities markets may subject the Fund to greater volatility than investments in traditional securities. Many of the derivative contracts entered into by the Fund, the Subsidiary or a trading company will be privately negotiated in the OTC market. These contracts also involve exposure to credit risk, since contract performance depends in part on the financial condition of the counterparty. Credit risk refers to the possibility that the issuer of the security will not be able to make principal and interest payments when due. Currency rates in foreign countries may fluctuate significantly over short periods of time for a number of reasons, including changes in interest rates and the imposition of currency controls or other political developments in the U.S. or abroad. Derivative instruments come in many varieties and have a wide range of potential risks and rewards, and may include futures contracts, options on futures contracts, options, swaps, and forward currency exchange contracts. Derivatives typically have economic leverage inherent in their terms. The use of leverage tends to exaggerate the effect of any increase or decrease in the value of the Fund’s portfolio securities or other investments. Furthermore, derivative instruments and futures contracts are highly volatile and are subject to occasional rapid and substantial fluctuations. Investments in foreign securities could subject the Fund to greater risks, including currency fluctuation, economic conditions, and different governmental and accounting standards. Derivative instruments and futures contracts are highly volatile and are subject to occasional rapid and substantial fluctuations.
ampersandinvestments.com • 609.454.5200
 | Annual Commentary
2022 |
AXS Chesapeake Strategy Fund
At Chesapeake Capital, we have steadfastly applied a systematic long-term trend following approach to help investors seek capital appreciation. Our model, now time-tested over 30 years, is to identify long-term price trends in futures contracts diversified across about 100 global markets. We go long when trends are up and short when they are down, cutting losses and letting profits run along the way. Our approach is reactionary, not predictive, and driven by a highly disciplined algorithmic process that removes emotion from the equation. The AXS Chesapeake Strategy Fund seeks to allow investors to benefit from long-term trends. For the fiscal year ending September 30, 2022, the AXS Chesapeake Strategy Fund Class I and Class A shares were up 26.58% and 26.21%, respectively, underperforming the SG Trend Index which was up 33.85%.
2021 – Q4
The fund was able capitalize on themes that carried over into the new year and benefitted on price movements that were further compounded by Geo-political events during the year. The fund started the year well positioned to post positive results on the global stock sell-off as well as the rise of commodity prices as the fund profited from long positions in the energy, agricultural and metals complexes.
2022 – Q1
The impact of the geo-political activity accentuated the moves that the fund was able to capitalize on the extended market trends. A lot was still unknown about how Russia’s latest aggression into Ukraine would play out, including the West’s response and the severity of the sanctions being put together. The broader market effects continue to evolve with the only certainty being increased volatility. A likely outcome would be a reduction in exports from Russia, which is a major source of the world’s energy, industrial metals and grain production. This decrease in global commodity supplies came at a time when US inflation is hitting four-decade highs, so continued price increases benefited the Fund and its Long commodity exposure. The Fund also profited from surging global interest rates.
2022 – Q2
The fund entered the third quarter well positioned to take advantage of the macroeconomic moves that were influencing the price movements across the four sectors, (Commodities, Currencies, Fixed Income and Equities), of the portfolio. Inflation concerns shifted to a fear of a global recession, the Fund experienced losses on long positions in the commodity complexes and the price movements caused an overall reduction in exposure as market volatility increased across the portfolio’s positions. However, the Fund more than offset these losses by its positioning in the global bond markets and being generally long the US dollar against various currencies.
2022 – Q3
The fund produced positive results on short US and global interest rate positions in the fixed income arena. Global central banks continue to raise interest rates and the potential for more rate hikes to combat inflation weighed heavily on the rates complex. The currency sector recorded gains for the quarter on the strengthening US Dollar particularly against its G7 counterparts. The commodity sector produced net losses for the quarter, led by losses from trend reversals in the energy and grain complexes.
308 Long Lane ♦ Richmond, Virginia 23221
Tel: 804.836.1617 ♦ Fax: 804.836.1610 ♦ E-mail: clientservices@chesapeakecapital.com
| | Annual Commentary
2022 |
Along with posting returns for the year, the fund also celebrated its 10th anniversary. The fund continues to hold net long commodity positions and short positions in US and global interest rates. It is long US Dollar vs. its G7 counterparts. Currently the fund ended the year with a short bias in global equities.
The impact of geopolitical activity on the world's markets continues to affect prices and trends. Chesapeake has continued to maintain a well-diversified portfolio to withstand the market volatility and benefit from price trends that develop.
Fund Performance as of 9/30/2022
| | | ANNUALIZED RATES OF RETURN |
| (%) | Q3 2022 | YTD | 1 YEAR | 3 YEAR | 5 YEAR | 10 YEAR | SINCE INCEPTION |
| Class I | 4.27 | 25.85 | 26.58 | 12.64 | 6.78 | 7.64 | 7.10 |
| Class A | 4.24 | 25.76 | 26.21 | 12.42 | 6.54 | - | 3.82 |
| Class A (with 5.75% max. sales charge) | -1.77 | 18.54 | 19.09 | 10.21 | 5.28 | - | 2.97 |
| Class C | 4.02 | 24.95 | 25.24 | 11.54 | 5.72 | - | 3.05 |
| SG Trend Index | 5.13 | 35.59 | 33.85 | 14.75 | 11.19 | 6.03 | 5.90 |
The performance data quoted represents past performance and is no guarantee of future results. Investment return and principal value of an investment will fluctuate so that an investor's shares, when redeemed, may be worth more or less than their original cost. Current performance may be lower or higher than the performance data quoted. For the most recent month-end performance, please call 833.AXS.ALTS or visit the Fund’s website at www.axsinvestments.com. Performance results with sales charges reflect the deduction of the maximum front-end sales charge. Class A shares are subject to a maximum front-end sales charge of 5.75%. The gross expense ratios are 2.31% (Class I), 2.56% (Class A) and 3.31% (Class C).
SG Trend Index – An index designed to track the 10 largest trend following CTAs (by AUM) to represent trend followers in the managed futures space. To qualify for inclusion in the index, a program must be open to new investment, report returns on a daily basis, be an industry recognized Trend Follower, and exhibit significant correlation to trend following peers and the SG Trend Indicator.
The views in this letter were as of September 30, 2022 and may not necessarily reflect the same views on the date this letter is first published or any time thereafter. These views are intended to help shareholders in understanding the fund’s investment methodology and do not constitute investment advice.
This report is for use by current clients, authorized selling agents and prospective clients who have received a current Chesapeake disclosure document.
308 Long Lane ♦ Richmond, Virginia 23221
Tel: 804.836.1617 ♦ Fax: 804.836.1610 ♦ E-mail: clientservices@chesapeakecapital.com
| | Annual Commentary
2022 |
Actual Performance for Individual Capital Accounts may vary from the rate of return for the Company overall depending on the timing of the initial investment and subsequent additions and/or withdrawals.
Investors can not directly invest in an index.
Mutual funds involve risk including possible loss of principal. There is no assurance that the Fund will achieve its investment objective. The Fund’s indirect and direct exposure to foreign currencies subjects the Fund to the risk that those currencies will decline in value relative to the U.S. Dollar, or, in the case of short positions, that the U.S. Dollar will decline in value relative to the currency that the Fund is short. Currency rates in foreign countries may fluctuate significantly over short periods for a number of reasons, including changes in interest rates and the imposition of currency controls or other political developments in the U.S. or abroad. In addition, the Fund may incur transaction costs in connection with conversions between various currencies. The Fund will invest a percentage of its assets in derivatives, such as futures and options contracts. The use of such derivatives may expose the Fund to additional risks that it would not be subject to if it invested directly in the securities and commodities underlying those derivatives. The Fund may experience greater losses than those experienced by funds that do not use futures contracts and options. There may be an imperfect correlation between the changes in market value of the securities held by the Fund and the prices of futures and options on futures. Although futures contracts are generally liquid instruments, under certain market conditions there may not always be a liquid secondary market for a futures contract. As a result, the Fund may be unable to close out its futures contracts at a time that is advantageous. Trading restrictions or limitations may be imposed by an exchange, and government regulations may restrict trading in futures contracts and options. Because option premiums paid or received by the Fund are small in relation to the market value of the investments underlying the options, buying and selling put and call options can be more speculative than investing directly in securities.
308 Long Lane ♦ Richmond, Virginia 23221
Tel: 804.836.1617 ♦ Fax: 804.836.1610 ♦ E-mail: clientservices@chesapeakecapital.com
 | Uniplan Investment Counsel, Inc.
22939 West Overson Road
Union Grove, WI 53182-9660
www.Uniplanic.com 262-534-3000 |
For the fiscal year ending September 30, 2022, the AXS Sustainable Income Fund’s Class I share has returned -12.06% vs the ICE BofA 1-3 Year US Corporate & Government Index return of -5.14%. However, this quarter the AXS Sustainable Income Fund outperformed the Fund’s benchmark by 0.88% net of fees for the quarter ended 9/30/2022. Relative to the Index, the Fund was primarily impacted from a widening of credit spreads particularly in the investment grade segment of the credit markets while the non-investment grade segment remained relatively flat, where 80% of the portfolio holdings are represented.
The fixed income markets continued to be pressured throughout the quarter, with corporate credit again more negatively impacted than municipal and government debt. High yield corporate debt continued to underperform, which constitutes the majority of the portfolio holdings. In tandem with higher rates from the Fed, a growing concern in the credit markets over a possible global recession added to volatility and repricing for additional risk across the cred markets with the non-investment grade segment showing the most widening of spreads.
On a sector basis, our returns were most negatively impacted by communications, which is experience pressures over ad revenue due to the weakening economic outlook going forward. Ad spending in particular is among the leading areas of corporate spending that are quickly adjusted downward in a slowing economic environment. This was evident across the Communications sector as many companies reported reduced ad spending. We were most benefited by Consumer Discretionary, where consumer spending remained strong despite some deterioration in consumer confidence. This was mainly driven by affluent consumers continuing to ramp up discretionary spending as the economy continues to reopen from the COVID situation and retail and travel traffic continue to expand.
The top contributors were BCPE Empire Holdings, a provider of foodservice and janitorial products, American Airlines, and Innophos Holdings, a producer of phosphate salts and acids for food, beverage, pharmaceuticals, and water treatment. The biggest detractors from performance were Audacy, an owner of radio stations across the US, FXI Holdings, a mattress manufacturer, and Titan Acquisition, a defense firm.
Continued upward pressure on both rates and spreads continued this quarter, though market volatility did provide some opportunities for divestment of non-thematic holdings, as well as initiation of some new positions within the portfolio. We exited positions in Mauser Packaging Solutions, which provides packaging to the chemical and industrial space, as well as Royal Caribbean Cruises. Three new holdings, Alexandria Real Estate, Hannon Armstrong Sustainable Infrastructure Capital, and Owens Corning had green bonds on the market offering attractive spreads relative to the market. Alexandria is a REIT focused heavily on life sciences spaces, and leases space to several large pharmaceutical companies, while Hannon Armstrong provides financing for climate solutions, including residential solar, grid-connected solar, as well as storage and renewable natural gas. Owens Corning focuses on roofing, insulation, and material innovation, all key to energy conservation and efficiency.
Two of our new entrants have shorter durations, with the Hannon Armstrong issue maturing 4/15/25 and the Alexandria issue maturing 4/15/26. As we continue to reshape the portfolio toward our sustainable income objectives, we remain selective and patient, being opportunistic as market volatility continues through the end of the calendar year. Our focus remains sharply on duration risk as well as credit quality, as higher rates continue to put pressure on the lower end of the credit spectrum.
Finally, given the higher cash levels seen recently in the portfolio, we have begun to ladder in some short-term treasuries, which currently provide an attractive yield yet also provide ample liquidity for portfolio changes as market opportunities arise.
Inflation remains the major concern for the federal reserve, with the Consumer Price Index (CPI) remaining stubborn, up 8.3% Y/Y for the August read. Similarly, the labor market remains historically strong with just 193k in weekly unemployment claims as of September 29th. Both data points would indicate that the Fed’s current rate hike trajectory is likely to continue unabated, potentially bringing the fed funds rate over 5% by early 2023.
These rate hikes are also having global effects, namely the strengthening of the US Dollar against global currencies, creating a significant headwind to earnings for companies with meaningful global exposure. The dollar index rose from 104.685 on 6/30 to 112.117 at the 9/30 close. Both of these compare to an index level of just 95.67 as of the 12/31/21 close, a significant increase as the rate hikes by the Fed outpace the hikes implemented globally.
Disclosures:
Duration is the measure of the price sensitivity of a bond to changes in interest rates.
The Consumer Price Index (CPI), as calculated by the Bureau of Labor Statistics, measures the monthly change in prices paid by U.S. consumers for a basket of goods and services representative of aggregate U.S. consumer spending.
The ICE U.S. Dollar Index is an index of the value of the U.S. dollar relative to a basket of foreign currencies.
The ICE BofA Merrill Lynch 1-3 Year US Corporate & Government Index is the performance of U.S. dollar denominated investment grade debt publicly issued in the U.S. domestic market, including U.S. Treasury, U.S. agency, foreign government, supranational and corporate securities. The index does not reflect expenses, fees or sales charge, which would lower performance. The index is unmanaged and is not available for investment. Investors cannot directly invest in an index.
Fund holdings and/or sector allocations are subject to change. Please see the Schedule of Investments for information on current holdings.
Mutual funds involve risk including possible loss of principal. There is no assurance that the Fund will achieve its investment objective. The market price of a security may decline due to general market conditions that are not specifically related to a particular company, changes in the general outlook for corporate earnings, changes in interest or currency rates, or adverse investor sentiment. The prices of fixed income securities respond to economic developments as well as to changes in an issuer’s credit rating or market perceptions about the creditworthiness of an issuer. High yield bonds are debt securities rated below investment grade and are speculative, involve greater risks of default, downgrade, or price declines and are more volatile and tend to be less liquid than investment-grade securities. If an issuer of a debt security held by the Fund defaults or is downgraded, or if the value of the assets underlying a security declines, the value of the Fund’s portfolio will typically decline. Generally fixed income securities decrease in value if interest rates rise and increase in value if interest rates fall, with longer-term securities being more sensitive than shorter-term securities. While the Sub-Adviser believes that the integration of ESG analysis as part of the investment process contributes to its risk management approach, the Fund’s consideration of ESG criteria in making its investment decisions may affect the Fund’s exposure to risks associated with certain issuers, industries and sectors, which may impact the Fund’s investment performance.
The views in this letter were as of September 30, 2022 and may not necessarily reflect the same views on the date this letter is first published or any time thereafter. These views are intended to help shareholders in understanding the fund’s investment methodology and do not constitute investment advice.

Dear Fellow Shareholders,
We write this annual shareholder letter for the AXS Multi-Strategy Alternatives Fund (“the Fund”) as of fiscal year end on September 30, 2022.
OVERVIEW
The fiscal year saw rising interest rates and inflation for much of the period, resulting in Federal Reserve tightening which roiled the equity markets in general and growth stocks in particular. This can be seen by the disparity in performance between the Dow Jones Industrials1 total return (-13.40%) and the Nasdaq2 total return (-26.25%). Equity markets were further spooked by the uncertainty of global conflict, in particular the Ukraine situation.
During the year, the Fund absorbed the assets of the Good Harbor Tactical Select Fund via merger. The Fund fluctuated from net 0% to 100% long equities3 throughout the period as the market declined.
INVESTMENT STRATEGY
The AXS Multi-Strategy Alternatives Fund is a liquid, equity-focused macro fund with the flexibility to invest globally and tactically, including long/short, across all asset classes. The Fund's flexible mandate gives it the ability to invest globally in a wide variety of asset classes, company sizes, industries and equity styles (e.g., growth vs. value). It can also employ leverage to accentuate market moves and hedge in an effort to control risk and manage volatility. Quantitative, top-down hedging and bottoms-up stock picking tools are used, which help reduce emotion and behavioral biases in investment decision-making.
INVESTMENT PHILOSOPHY
The AXS Multi-Strategy Alternatives Fund employs a risk-averse investment strategy predicated on the belief that strong long-term investment results are best achieved through the compounding of reasonable gains and the avoidance of major losses. The Fund strives to be nimble and responsive to significant market cycle changes by moving out of “harm’s way” during recessions and capitalizing on opportunistic equity strategies during stronger markets. Said another way, the Fund strives to both “manage and participate” by “de-risking” the portfolio in dangerous markets and “re-risking” or “re-engaging” the portfolio to return generating assets when markets are stronger.
| 1 | The Dow Jones Industrial index is a price-weighted average of 30 actively traded blue-chip stocks, primarily industrials including stocks that trade on the New York Stock Exchange. |
| 2 | The Nasdaq Composite index consists of approximately 3,000 stocks that are exclusively listed on the Nasdaq stock exchange. |
| 3 | Net long percentage is the Fund’s gross long exposure less its gross short exposure. When fully invested in equities, the Fund allocates 120% of its AUM to stock purchases (long) and 20% to stock sales (short selling). |
INVESTMENT PROCESS
| 1. | Long-term growth of capital |
The Fund’s mandate gives it the flexibility to invest globally in any asset class, long or short. The Fund is equity-focused, as historically owning common stocks and certain ETFs have offered the greatest opportunity to grow capital over time. The Fund determines whether to be invested in stocks via equity exposure rules. The Fund uses a "Risk On/Risk Off" hedging process. If Risk is On, the Fund employs several quantitative equity strategies (algorithms) to make buy/sell decisions. These algorithms are based on a variety of inputs and are designed to exploit opportunities in the marketplace. Each strategy may focus on fundamental factors (such as earnings, debt, free cash flow4, dividends and industry leadership) and technical factors (including price, momentum, volume, volatility and breadth). Each algorithm has its own ranking system and buy/sell rules. Most of the strategies set sector-based exposure ceilings, with individual stocks limited to about 3% of AUM at the Fund level. This diversification helps reduce sector and stock-specific risk. International allocations are made in the same manner and held in American Depositary Receipts (ADRs).
| 2. | Preservation of capital |
If Risk is Off, the Fund will hedge using three approaches: (a) buying index ETFs that act inversely to the stock market to create a market neutral or net short posture, (b) shorting index ETFs via total return swap trades, and (3) by investing in noncorrelated asset classes such as bonds, precious metals or currencies through the use of ETFs. The Fund can also use cash as a defensive position.
PERFORMANCE
Class I shares5 of the Fund (KCMIX) returned -21.34% for the period, outpacing the benchmark HFRX Equity Hedge Index6 which declined -2.27%.
Stock selections of Energy SPDR ETF, Tesla, United Health, Eli Lilly and the Palladium ETF drove upside performance. The largest detractors included Netflix, the Financial SPDR ETF, Moderna, Alphabet and the Emerging Markets ETF.
| 4 | Free cash flow is the cash a company generates after taking into consideration cash outflows that support its operations and maintain its capital assets. In other words, free cash flow is the cash left over after a company pays for its operating expenses and capital expenditures. |
| 5 | Investor class shares (KCMTX) returned -21.53% for the fiscal year. |
| 6 | The HFRX Equity Hedge index includes strategies maintain positions both long and short in primarily equity and equity derivative securities. A wide variety of investment processes can be employed to arrive at an investment decision, including both quantitative and fundamental techniques; strategies can be broadly diversified or narrowly focused on specific sectors and can range broadly in terms of levels of net exposure, leverage employed, holding period, concentrations of market capitalizations and valuation ranges of typical portfolios. Equity Hedge managers would typically maintain at least 50% and may in some cases be substantially entirely invested in equities, both long and short. Hedge Fund Research, Inc. (HFR) utilizes a UCITSIII compliant methodology to construct the HFRX Hedge Fund Indices. The methodology is based on defined and predetermined rules and objective criteria to select and rebalance components to maximize representation of the Hedge Fund Universe. HFRX Indices utilize state-of-the-art quantitative techniques and analysis; multi-level screening, cluster analysis, Monte-Carlo simulations and optimization techniques ensure that each Index is a pure representation of its corresponding investment focus. |
OUTLOOK
Going forward, the beleaguered market will be challenged as the nation faces a midterm election with inflationary pressures and a hawkish Fed. Whatever the stock market does, the Fund will attempt to adjust to the conditions.
Investors cannot directly invest in an index and unmanaged index returns do not reflect any fees, expenses or sales charges. The views in this letter were as of September 30, 2022 and may not necessarily reflect the same views on the date this letter is first published or any time thereafter. These views are intended to help shareholders in understanding the Fund’s investment methodology and do not constitute investment advice.
Faithfully yours,
Parker B. Binion
Head of Investments, AXS Investments LLC
Fund holdings and/or sector allocations are subject to change. Please see the Schedule of Investments for information on current holdings.
Past performance does not guarantee future results.
Mutual funds involve risk including possible loss of principal. There is no assurance that the Fund will achieve its investment objective. The Fund may invest in small, less well-known companies, which may be subject to more erratic market movements than large cap stocks; foreign securities, which are subject to currency fluctuations and political uncertainty; and derivative securities, which may carry market, credit and liquidity risks. The Fund may also engage in short selling activities, which are more risky than long positions because the potential loss on a short sale is unlimited. The Fund may use leveraging and/or hedging techniques that could fail if changes in the value of the derivative do not correlate with the securities being hedged. These risks may result in greater share price volatility. Risks of futures contracts may arise from an imperfect correlation between movements in the price of the instruments and the price of the underlying securities. The Fund’s use of futures contracts exposes the Fund to leverage risk because of small margin requirements relative to futures contract value. Swap transactions may alter the Fund’s exposure to long-term or short-term interest rates, foreign currency values, corporate borrowing rates, or other factors such as security prices or inflation rates and also may alter the Fund’s volatility. Selling covered calls limits the upside potential of the underlying security. Selling put options may require the Fund to purchase the underlying securities during periods of declining prices. Premiums paid to purchase options lose value over time and may be lost entirely, if the option expires before it is feasible to be exercised. The protection from selling puts is limited to the strike price minus the premium paid. Investing in REITs involves risks similar to those associated with investing in small capitalization companies. Generally, fixed income securities decrease in value if interest rates rise and increase in value if interest rates fall. Exposure to the commodities markets (including financial futures markets) may subject the Fund to greater volatility.
Dear Shareholders,
Thank you for your continued investment and interest in the AXS Thomson Reuters Venture Capital Return Tracker Fund and the AXS Thomson Reuters Private Equity Return Tracker Fund (collectively “Funds”). This letter addresses the fiscal year ending September 30, 2022.
Fund performance occurred with the backdrop of rising interest rates and inflation for much of the period, resulting in Federal Reserve tightening which roiled the equity markets in general and growth stocks in particular. This can be seen by the disparity in performance between the Dow Jones Industrials1 total return (-13.40%) and the Nasdaq2 total return (-26.25%).
As indexed-based strategies, the Funds are designed to track the performance of their underlying indices, both of which seek to replicate the aggregate risk and performance profile of the Venture Capital and Private Equity Buyout space, respectively.
AXS Thomson Reuters Venture Capital Return Tracker Fund (LDVAX, LDVIX, LDVCX)
The AXS Thomson Reuters Venture Capital Return Tracker Fund is available in class A, I, and C shares. For the fiscal year ended September 30, 2022, performance for the A share was -57.66% (-60.09% with load), the I share returned -57.56%, and the C share returned -57.99%. Fund performance was in line with the Thomson Reuters Venture Capital Index3 gross performance of -57.74%. The Fund’s prospectus benchmark NASDAQ Composite Total Return Index returned -26.25%.
The Fund replicates the exposures of its underlying index using U.S. listed equities and total return swaps to create economic leverage and to implement a relative-value overlay. U.S. listed equities provide exposures to the economic sectors represented by the universe of venture capital backed private companies.
The index is constructed using the Thomson Reuters Business Classification (TRBC) to classify and measure the direct economic exposures of the universe of venture capital backed companies. In certain instances, the economic sectors are more specific, as is the case for Software and Technology Equipment, rather than that more general Technology. During the period, Software, Heath Care Services, Industrials, Technology Equipment, and Non-Cyclical Consumer Goods & Services consistently ranked as the top 5 sectors of the underlying index to represent the primary exposures of the index. The aggregate sector weights are determined by the index and implemented by the fund.
| 1 | The Dow Jones Industrial index is a price-weighted average of 30 actively traded blue-chip stocks, primarily industrials including stocks that trade on the New York Stock Exchange. |
| 2 | The Nasdaq Composite index consists of approximately 3,000 stocks that are exclusively listed on the Nasdaq stock exchange. |
| 3 | The Thomson Reuters Venture Capital Index utilizes a prosperity model designed by DSC Quantitative Group, LLC (“DSC”). The index: 1) identifies a set of publicly-listed assets weighted in an attempt replicate the returns of the Venture Capital universe, 2) utilizes economic factors and market indicators to calculate optimal asset weights and 3) modifies the portfolio over time to reflect changes in the venture capital universe. |
The index selects U.S. listed large cap equities among the respective sectors and weights the membership according to their market value subject to a 4.5% (ex-cash) weight constraint. Each sector is diversified in the number of securities within each sector and through use of the weight constraint. In this manner, the intent is to reduce idiosyncratic risks and to isolate the systemic risks of each sector. The Fund implements the index membership in both the security and relative target weights.
AXS Thomson Reuters Private Equity Return Tracker Fund (LDPAX, LDPIX, LDPCX)
The AXS Thomson Reuters Private Equity Return Tracker Fund is available in class A, I, and C shares. For the fiscal year ended September 30, 2022, performance for the A share was -31.51% (-35.44% with load), the I share returned -31.33%, and the C share returned -32.02%. Fund performance was in line with the Thomson Reuters Private Equity Index4 gross performance of -41.71%. The Fund’s prospectus benchmark S&P 500 Total Return Index5 returned -15.47%.
The Fund replicates the exposures of its underlying index using U.S. listed equities and total return swaps to create economic leverage and to implement a relative-value overlay. U.S. listed equities provide exposures to the economic sectors represented by the universe of private equity buyout companies.
The index is constructed using the Thomson Reuters Business Classification (TRBC) to classify and measure the direct economic exposures of the universe of private equity buyout companies. During the period, the relative weights among the 10 sectors remained consistent with the largest sectors being Technology, Cyclical Consumer Goods & Services, and Industrials, and Non-Cyclical Consumer Goods & Services.
The index selects U.S. listed large cap equities among the respective sectors and weights the membership according to their market value subject to a 4.5% (ex-cash) weight constraint. Each sector is diversified in the number of securities within each sector and through use of the weight constraint. In this manner, the intent is to reduce idiosyncratic risks and to isolate the systemic risks of each sector. The Fund implements the index membership in both the security and relative target weights.
Outlook
As index-based strategies, the Funds are designed to track their underlying indexes and are passively managed. The indexes replicate the average returns of the venture capital and private equity space. Direct investment in these strategies have required large capital commitments and long lock-up periods in private LP structures resulting in the need for long-term investment horizons. Replication strategies using an open-end mutual fund structure address these hurdles by allowing lower investment minimums and offering daily liquidity.
| 4 | The Thomson Reuters Private Equity Index utilizes a prosperity model designed by DSC Quantitative Group, LLC (“DSC”). The index: 1) identifies a set of publicly-listed assets weighted in an attempt replicate the returns of the Private Equity universe, 2) utilizes economic factors and market indicators to calculate optimal asset weights and 3) modifies the portfolio over time to reflect changes in the private equity universe. |
| 5 | The S&P 500 Index measures the performance of large cap U.S. equities. It is weighted by market cap and comprised of 500 of the largest domestically listed companies which represent approximately 80% of domestically available market capitalization. |
Institutions have utilized these strategies as long-term strategic investments and we suggest the outlook for these strategies should undertake a similar approach. These strategies serve as tools to achieve a strategic allocation to the venture capital and private equity space. The passive, rules-based investment process is consistently applied throughout various market environments.
We thank you for your continued support and confidence in our implementation of these strategies.
Investors cannot directly invest in an index and unmanaged index returns do not reflect any fees, expenses or sales charges. The views in this letter were as of September 30, 2022 and may not necessarily reflect the same views on the date this letter is first published or any time thereafter. These views are intended to help shareholders in understanding the Fund’s investment methodology and do not constitute investment advice.
Faithfully yours,
Parker B. Binion
Head of Investments, AXS Investments LLC
Past performance does not guarantee future results.
Mutual funds involve risk including possible loss of principal. There is no assurance that the Funds will achieve their investment objective. Investments in equity securities are subject to overall market risks. To the extent that the Funds’ investments are concentrated in or significantly exposed to a particular sector, the Funds will be susceptible to loss due to adverse occurrences affecting that sector. Loss may result from the Funds’ investments in derivatives. These instruments may be illiquid, difficult to value and leveraged so that small changes may produce disproportionate losses to the Fund. Over the counter derivatives, such as swaps, are also subject to counterparty risk, which is the risk that the other party in the transaction will not fulfill its contractual obligation. In certain circumstances, it may be difficult for the Funds to purchase and sell particular derivative investments within a reasonable time at a fair price.
AXS Thomson Reuters Venture Capital Return Tracker Fund
Venture capital investments involve a greater degree of risk; as a result, the Fund’s returns may experience greater volatility than the overall market. The Fund does not invest in venture capital funds nor does it invest directly in the company funded by venture capital funds. The Fund seeks to generate returns that mimic the aggregate returns of U.S. venture capital backed companies as measured by the Thomson Reuters Venture Capital Index (TRVCI). There is a risk that Funds’ return many not match or achieve a higher degree of correlation with the return of the TRVCI. Additionally, the TRVCI’s return may not match or achieve a high degree of correlation with the return of the U.S. venture capital-based companies.
AXS Thomson Reuters Private Equity Return Tracker Fund
Private equity investments involve a greater degree of risk; as a result, the Fund’s returns may experience greater volatility than the overall market. The Fund does not invest in private equity funds nor does it invest directly in the company funded by private equity funds. The Fund seeks to generate returns that mimic the aggregate returns of U.S. private equity backed companies as measured by the Thomson Reuters Private Equity Buyout Index (TRPEI). There is a risk that Funds’ return many not match or achieve a higher degree of correlation with the return of the TRPEI. Additionally, the TRPEI’s return may not match or achieve a high degree of correlation with the return of the U.S. private equity-based companies.
Dear Shareholders,
We write this annual shareholder letter for the AXS All Terrain Opportunity Fund (“the Fund”) as of fiscal year end on September 30, 2022. On behalf of the entire team, we want to express our appreciation for the confidence you have placed in The AXS All Terrain Opportunity Fund.
The Fund is driven by a liquid multi-alternative strategy that seeks capital appreciation with positive returns in all market conditions by investing opportunistically across asset classes and strategies, including equities, fixed income, options and commodities. The Fund uses a tactical risk-on/risk-off process to shift allocations based on economic and market indicators. The Fund is actively managed with the flexibility to invest long or short to seek risk-controlled growth.
While AXS managed the fund directly throughout the fiscal year (i.e., without subadvisors), the AXS management team on this fund changed in July 2022 from Korey Bauer & Al Procaccino to Parker Binion & Matt Tuttle. For much of the period, the Fund was positioned defensively with a large allocation to cash as both the stock and bond markets were quite volatile and in general decline.
The Fund outperformed its benchmark during the fiscal year ending on September 30, 2022, declining 2.72% compared to a loss of 4.50% for HFRX Global Hedge Fund Index1.
Going forward, the beleaguered equity and bond markets will be challenged as the nation faces a midterm election with inflationary pressures and a hawkish Fed. Whatever the markets does, the Fund will attempt to adjust to the conditions.
We appreciate your investment in the AXS All Terrain Opportunity Fund.
Investors cannot directly invest in an index and unmanaged index returns do not reflect any fees, expenses or sales charges. The views in this letter were as of September 30, 2022 and may not necessarily reflect the same views on the date this letter is first published or any time thereafter. These views are intended to help shareholders in understanding the Fund’s investment methodology and do not constitute investment advice.
Faithfully yours,
Parker B. Binion
Head of Investments, AXS Investments LLC
| 1 | The HFRX Global Hedge Fund Index is designed to be representative of the overall composition of the hedge fund universe. It is comprised of all eligible hedge fund strategies; including but not limited to convertible arbitrage, distressed securities, equity hedge, equity market neutral, event driven, macro, merger arbitrage, and relative value arbitrage. The strategies are asset weighted based on the distribution of assets in the hedge fund industry. Hedge Fund Research, Inc. (HFR) utilizes a UCITSIII compliant methodology to construct the HFRX Hedge Fund Indices. The methodology is based on defined and predetermined rules and objective criteria to select and rebalance components to maximize representation of the Hedge Fund Universe. HFRX Indices utilize state-of-the-art quantitative techniques and analysis; multi-level screening, cluster analysis, Monte-Carlo simulations and optimization techniques ensure that each Index is a pure representation of its corresponding investment focus. |
Past performance does not guarantee future results.
Mutual funds involve risk including possible loss of principal. There is no assurance that the Fund will achieve its investment objective.
Stock and bond values fluctuate in price so the value of your investment can go down depending on market conditions. International investing involves special risks including, but not limited to political risks, currency fluctuations, illiquidity and volatility. These risks may be heightened for investments in emerging markets. Derivatives entail risks relating to liquidity, leverage and credit that may reduce returns and increase volatility.
The value of your investment depends on the judgment of the Fund’s advisor about the quality, relative yield, value or market trends affecting a particular security, industry, sector or region, which may prove to be incorrect. Purchasing and writing put and call options are highly specialized activities and entail greater than ordinary investment risks. The Fund’s use of futures contracts (and related options) expose the Fund to leverage and tracking risks because a small investment in futures contracts may produce large losses and futures contracts may not be perfect substitutes for securities.
Mortgage-backed securities represent interests in “pools” of mortgages. Mortgage-backed securities are subject to “prepayment risk” (the risk that borrowers will repay a loan more quickly in periods of falling interest rates) and “extension risk” (the risk that borrowers will repay a loan more slowly in periods of rising interest rates). High yield bonds are debt securities rated below investment grade (often called “junk bonds”). Junk bonds are speculative, involve greater risks of default, downgrade or price declines and are more volatile and tend to be less liquid than investment-grade securities.

September 30, 2022
Dear Fellow Shareholders:
The AXS Merger Fund (the “Fund”) returned 1.37% and 1.61% for the Investor Class and Institutional Class, respectively, for fiscal year ended September 30, 2022.
Portfolio Review
In 2022, despite the slowdown in merger activity, the Fund invested in approximately 119 different merger situations, up ~9% over last year, and was heavily concentrated in North America. Strategic deals made up between 80% and 85% of the Fund’s holdings, on average.
Deal volume was $642 billion in the quarter ending September 30th, breaking a streak of eight consecutive quarters over the $1 trillion mark. The absence of mega deals during the quarter (those valued at more than $10 billion) contributed to the overall decrease in volumes. As companies adjust to rising rates and the possibility of a slowing economy, we expect a pickup in activity to occur over the next few quarters. Healthcare was a bright spot with two of the largest strategic deals: CVS Health Corp.’s $5.4 billion deal with Signify Health Inc. and Pfizer Inc.’s $4.6 billion transaction with Global Blood Therapeutics Inc. Other deals in the space included Amgen Inc.’s $3.7 billion purchase of ChemoCentryx Inc. and Amazon.com Inc.’s continued push into healthcare with its acquisition of 1Life Healthcare Inc. Other notable deals included Unity Software Inc.’s $4.4 billion merger with ironSource Inc. and JetBlue Airway Corp.’s $3.6 billion deal for Spirit Airlines Inc. Activity in Europe was down 25% in the quarter driven by the strength in the U.S. dollar which may lead to more cross-border deals as the region becomes relatively cheaper. The largest deals for the year include Microsoft Corp.’s $73.9 billion deal for Activision Blizzard Inc., Broadcom Inc.’s $60.26 billion transaction with VMWare Inc. and Prologis Inc.’s $22.7 billion merger with Duke Realty Corp.
Through September, global leverage buyout activity is down approximately 26% to just over $600 billion. Deals worth $212 billion were announced in the quarter, the lightest since the second quarter of 2020. Despite the strong start to the year, the rapid increase in interest rates caused buyers to hit the pause button as we started the quarter. Rising rates have forced banks to take losses on existing loans they made earlier in the year, hindering their ability to make new loans. A group of lenders led by Bank of America and Credit Suisse absorbed over $600 million in losses when they sold the financing package of $8.55 billion for the buyout of Citrix Systems Inc. (which has subsequently closed). Banks are on the hook for billions more in commitments that they will have to work through over the next couple of months. One would think that this would grind activity to a halt, but it has not. Private credit has stepped up to fill that gap and can offer certainty that banks often cannot. Though they may require tougher terms, they do not have to pass on the debt to other buyers. Private debt funds, such as Blackstone, Blue Owl Capital and Sixth Street, have $1.25 trillion in AUM globally, up 50% from 2019. This will help maintain leveraged buyout activity for the foreseeable future. The largest buyouts of the year include Elon Musk’s $37.6 billion takeover of Twitter Inc., Elliot Management Co.’s $14.4 billion deal for Citrix Systems Inc. and Brookfield Asset Management’s $10.1 billion buyout of Nielsen Holdings Plc
P.O. Box 1627 | New York, NY 10150 | 212 350-0200 | www.kellnercap.com
Performance
As is typical for our strategy, there were many deals that contributed positively to the Fund’s performance. The biggest gain for the year came from our position in the $35.1 billion deal between Advanced Micro Devices Inc (AMD) and Xilinx Inc. (XLNX). This deal, announced in October of 2020, experienced heavy volatility at the end of the year and early in the first quarter while awaiting approval by the Chinese government. The companies believed the deal would close by the end of the year but pushed their expectation to the first quarter as they continued the process of gaining approval. The volatility in AMD’s stock caused by the “Reddit” crowd kept this spread wide as it traded close to 60 million shares a day on average versus XLNX, which traded around 2.5 million shares per day. The arbitrage community was simply unable to keep the spread in check. In late January, AMD finally received approval, but the companies were required to refile with U.S. regulators since its prior approval expired after a year. Once received, the deal closed in mid-February. China continues to approve transactions, but with little transparency or consistency in timing, making it difficult to estimate the ultimate close date. The closing of the Xilinx deal significantly reduced our exposure to these types of deals and future transactions will remain a smaller part of the portfolio.
Another positive contributor was the closing of the $38.4 billion stock deal between IHS Markit Ltd and S&P Global Inc. The deal was announced in November 2020 and was our largest position for most of 2021. The companies received conditional approval from the Department of Justice in mid-November, but the deal remained subject to final court approval of the divestitures they agreed to, which would occur in the first quarter. In late February, the UK CMA (Competition and Markets Authority) and the European Commission granted the final regulatory approvals and the transaction closed in late February.
Also contributing positively to performance was Rio Tinto Plc reaching an agreement with the special committee of Turquoise Hill Resources Ltd. (TRQ). Back in March, Rio offered C$34 per share in cash, or $2.7 billion, for the 49% of TRQ that it did not already own, representing a 32% premium to the prior days close. TRQ’s board established a special committee to review the offer and negotiated on behalf of minority shareholders. The largest minority shareholder wrote a letter to the committee encouraging them to reject the offer as too low based on the future value of a recently approved copper mine in Mongolia. In mid-August, the special committee, unexpectedly, terminated the review of the proposal of C$34 as not in the best interest of shareholders. Usually in situations like these there is a rejection of the original terms and a subsequent negotiation between the parties. The termination caught Rio by surprise. Nine days later Rio returned with an increased offer of C$40 per share. A week later the parties reached an agreement in principle at C$43, becoming a definitive deal a few days later. The large minority shareholder continues to say that it would not vote for the transaction and would explore its legal options for their shares. The shareholder vote is in November and requires a majority of the minority vote.
The Fund suffered a loss when Kohl’s Corp. (KSS), which had been subject to numerous buyout offers after an activist investor got involved with the company, fell victim to the turbulent credit markets and the price offered was not acceptable to the company’s board. After rejecting offers of approximately $65 per share in January as undervaluing the company, management fought a two-front battle: fending off an activist that thought the company was worth much more than the current offers and running an auction to possibly sell the company. It received offers from both strategic and private equity investors, but with market instability and financing costs rising, bids kept dropping and came down to a level that was unacceptable to the board and they decided to conclude the strategic review process.
P.O. Box 1627 | New York, NY 10150 | 212 350-0200 | www.kellnercap.com
Outlook
Despite the lower level of deal activity, in 2022 the Fund invested in the largest number of deals in several years. The Fund ended the fiscal year with 45 positions, also more than the 35 it has been averaging. The interest rate increases by the Federal Reserve have been working their way into spreads through increased rates of return and an increase in the short rebate we are receiving on deals with a stock component. This is allowing the Fund to own situations it may have avoided in the past due to the lack of a spread. While market volatility has caused a drop in overall activity, we believe this is temporary as the market finds its footing and buyers and sellers expectations better align. We should also see opportunistic buyers flush with cash start to appear as valuations continue to come down. We tend to welcome volatility as it allows us to invest at better rates of return for the Fund. With the increase in regulatory scrutiny and delays in foreign approvals, we came into 2022 with the intention of keeping the duration of the portfolio short with deals expected to close within the next 3-6 months. This has helped dampen the volatility of the Fund. With the Fed continuing to raise interest rates and plenty of deal inventory to work through, we are excited at the prospects of continued positive, uncorrelated returns for the Fund as we head into the new year.
We are grateful for your continued trust and support.
Sincerely,
The Investment Team at Kellner Management, LP
The views in this letter were as of September 30, 2022 and may not necessarily reflect the same views on the date this letter is first published or any time thereafter. These views are intended to help shareholders in understanding the fund’s investment methodology and do not constitute investment advice.
Performance data quoted represents past performance; past performance does not guarantee future results
The Funds’ holdings and sector allocations are subject to change at any time and should not be considered recommendations to buy and sell any security. Please refer to the Schedule of Investments in this report for complete list of Fund holdings.
Mutual funds involve risk including possible loss of principal. There is no assurance that the Fund will achieve investment objective.
P.O. Box 1627 | New York, NY 10150 | 212 350-0200 | www.kellnercap.com
Investments in companies that are the subject of a publicly announced transaction carry the risk that the proposed or expected transaction may not be completed or may be completed on less favorable terms than originally expected, which may lower the Fund’s performance. Investments in foreign securities involve greater volatility and political, economic and currency risks and difference in accounting methods. Investments in small and medium sized companies involve additional risks such as limited liquidity or greater volatility. Derivatives involve special risks including correlation, counterparty, liquidity, operational, accounting and tax risks. These risks, in certain cases, may be greater than the risks presented by more traditional investments. The Fund may make short sales of securities, which involves the risk that losses may exceed the original amount invested. The Fund may use leverage, which may exaggerate the effect of any increase or decrease in the value of portfolio securities or the Net Asset Value of the Fund, and money borrowed will be subject to interest costs. The Fund is non-diversified, meaning it may concentrate its assets in fewer individual holdings than a diversified fund. Therefore, the Fund is more exposed to individual stock volatility than diversified fund.
P.O. Box 1627 | New York, NY 10150 | 212 350-0200 | www.kellnercap.com

Dear Shareholder,
This Annual Report covers the AXS Alternative Value Fund (“the Value Fund”) and the AXS Market Neutral Fund (“the Market Neutral Fund”) for the fiscal year ending September 30, 2022. We appreciate this opportunity to offer insight into the funds’ investment strategies and to offer commentary on performance and evolving global market conditions.
Market Commentary
The trailing twelve months ended September 30, 2022 was a challenging period in the equity market as the S&P 500 declined 15.47% on a total return basis. Geopolitical risks, signs of economic slowing and forty-year high inflation led market participants to lower expectations for equity markets. Value stocks performed better than growth stocks during the trailing twelve months as the Russell 1000 Value Total Return Index declined 11.36% on a total return basis while the Russell 1000 Growth Total Return Index declined 22.59% on a total return basis.
The Value Fund
While value stocks outperformed growth stocks over the past twelve months, the wide valuation dispersion between growth and value stocks narrowed during the last year. The overall valuation of the market appears somewhat elevated, especially as rates rise on U.S. Treasuries. Valuations for growth stocks remain high. As of September 30, 2022, the quoted price to earnings ratio for the iShares Russell 1000 Growth ETF, an index fund that designed to replicate the performance of the Russell 1000 Growth Index, was 24.96x and the price to book ratio was 8.62 norms. The price-to-earnings ratio for the iShares Russell 1000 Value ETF, an index fund replicating the Russell 1000 Value Index, was 13.06x and the price to book ratio was 2.00x.
The macroeconomic view upon which our value strategies are based is what we consider to be a straightforward model of market behavior over time. This model is based on the belief that corporate profits, market multiples, and interest rates drive stock price returns over very long periods of time. Though the macroeconomic factors over the trailing twelve months have been challenging, we have been pleased that the positioning of the Value Fund and Market Neutral Fund generated outperformance to the broader market.
Performance Commentary
The Value Fund invests in high quality companies that trade at attractive valuations relative to the broader market. We utilize our proprietary ROTA/ROME® investment selection and portfolio construction methodology to execute this strategy. ROTA/ROME® focuses on a company’s Return on Total Assets (“ROTA”) and Return on Market Value of Equity (“ROME”) in order to identify companies whose per share intrinsic value has diverged significantly from the current market price of its stock. We believe that companies that exhibit sustainable long-term high ROTA are higher quality companies that most likely have a competitive advantage within the marketplace. ROME is a measure of profit yield, and like a yield on a bond, the higher the ROME, the more likely that shares in the company can be purchased at a better valuation compared to a company with a lower ROME.
| | Return 1-Yr |
| AXS Alternative Value Fund - CL I | 2.78% |
| AXS Alternative Value Fund - Investor Class | 2.57% |
| S&P 500 | -15.47% |
3965 West 83rd Street • #348 • Prairie Village, KS 66208
913.214.5001
www.cognios.com
During the fiscal year ended September 30, 2022, the total return for the Class I Shares (COGVX) was 2.78% and the total return for the Investor Class Shares (COGLX) was 2.57%, beating the Russell 1000 Value Index.
AXS Market Neutral Fund
The AXS Market Neutral Large Cap Fund employs a Beta -adjusted market neutral investment strategy that seeks to provide investors with returns that are non-correlated to, or independent of, the returns of the global equity and fixed income markets. By attempting to hedge out all of the market Beta, the Fund’s returns over time should be essentially “pure Alpha” (i.e., Alpha is the excess return of a portfolio after considering its Beta exposure).
Additionally, by hedging out the general market movements in this Beta-adjusted market neutral fashion, we believe that the total returns of the Fund will be independent of those broad “systemic” risk factors and macro events that move the entire stock market either positively or negatively over time.
Performance Commentary
The Market Neutral Fund invests long in high quality companies that trade at attractive valuations relative to the broader market. We utilize our proprietary ROTA/ROME® investment selection and portfolio construction methodology, very similar to the Value Fund. Conversely, The Market Neutral Fund sells short shares in companies that demonstrate poor qualities based on our proprietary ROTA/ROME® investment selection and portfolio construction methodology.
| | Return 1-Yr |
| AXS Market Neutral Fund - CL I | 15.57% |
| AXS Market Neutral Fund - Investor Class | 15.29% |
| S&P 500 | -15.47% |
For the twelve months ended September 30, 2022, the total return for the Class I Shares (COGIX) was 15.57% and the total return for the Investor Class Shares (COGMX) was 15.29%.
We look forward to future opportunities to connect with our shareholders. We strive to continuously add value to your investment experience by providing access to fund information, portfolio updates and straightforward commentary.
The views in this letter were as of September 30, 2022 and may not necessarily reflect the same views on the date this letter is first published or any time thereafter. These views are intended to help shareholders in understanding the fund’s investment methodology and do not constitute investment advice.
We thank you for investing with us and for the trust you have placed in us.
Sincerely,
 |  |
| Jonathan Angrist | Brian Machtley |
Portfolio Managers
Cognios Capital
Disclosures
The information provided herein represents the opinion of the Funds’ manager, is subject to change at any time, is not guaranteed and should not be considered investment advice.
Performance data quoted represents past performance; past performance does not guarantee future results.
The Funds’ holdings and sector allocations are subject to change at any time and should not be considered recommendations to buy and sell any security. Please refer to the Schedule of Investments in this report for a complete list of Fund holdings.
Mutual funds involve risk including possible loss of principal. There is no assurance that the Fund will achieve its investment objective.
The value of the Fund’s assets will fluctuate as the equity market fluctuates, although the beta-adjusted market neutral focus of the Fund should reduce the effect of general market fluctuations on the valuation of the Fund as a whole. Utilization of leverage, such as borrowings and shorting positions, involves certain risks to the Fund’s shareholders, including potential for higher volatility of the net asset value (“NAV”) of the Fund’s shares and the relatively greater effect of portfolio holdings on the NAV of the shares. The Fund may not always be able to close out a short position on favorable terms. Short sales involve the risk that the Fund will incur a loss by subsequently buying a security at a higher price than the price at which it sold the security short. Value investing is subject to the risk that the market will not recognize a security’s inherent value for a long time or at all, or that a stock judged to be undervalued may actually be appropriately priced or overvalued. The prices of foreign securities may be more volatile than the prices of securities of U.S. issuers because of economic and social conditions abroad, political developments and changes in the regulatory environments of foreign countries.
The Russell 1000® Value Total Return Index measures the performance of those Russell 1000 companies with lower price-to-book ratios and lower forecasted growth values. Please note that indices do not take into account any fees and expenses of investing in the individual securities that they track and individuals cannot invest directly in any index.
The Russell 1000® Growth Total Return Index measures the performance of those Russell 1000 companies with higher price-to-book ratios and higher forecasted growth values. Please note that indices do not take into account any fees and expenses of investing in the individual securities that they track and individuals cannot invest directly in any index.
Price-to-earnings ratio is a valuation metric of a company’s current share price compared to its earnings per share.
You cannot invest directly in an index.
Index performance is not indicative of a fund’s performance.
Must be preceded or accompanied by a prospectus.
Distributed by IMST Distributors, LLC, which is not affiliated with AXS.
Dear Shareholders,
We write this annual shareholder letter for the AXS Adaptive Plus Fund (“the Fund”) as of fiscal year end on September 30, 2022.
OVERVIEW
The Fund launched on September 15, 2022, just two weeks prior to fiscal year end. In just over two weeks the Fund had grown to $11,992,796 in assets by September 30, 2022.
INVESTMENT STRATEGY
The AXS Adaptive Plus Fund seeks capital appreciation in rising and falling U.S. equity markets. Under normal market conditions, the Fund seeks to achieve its investment objective by investing in equity-linked call options or swaps that provide exposure to the ProfitScore Capital Management, Inc. (“ProfitScore”) Regime Adaptive trading program (the “Trading Program”) that is designed to produce the returns of the ProfitScore Regime-Adaptive Equity Index (the “Index”)1. The Index reflects the returns of a highly liquid, systematic trading program that is calculated based on trades (long and short) of S&P 500 Index securities and cash equivalents.
The options and swaps in which the Fund invests are designed to produce returns similar to the Index. The Fund does not invest more than 25% of its net assets with any one option counterparty or swap contract counterparty. To generate additional income, Fund’s assets not invested in options or swaps or used as collateral for such investments may be allocated to money market funds and/or U.S. Government securities, such as bills, notes and bonds issued by the U.S. Treasury, and/or other investment grade fixed income securities or fixed income ETFs.
INVESTMENT PHILOSOPHY
The AXS Adaptive Plus Fund seeks exposure to the Trading Program’s investment strategy based on the concept that equity market efficiency is negatively correlated with volatility. When volatility increases, market efficiency declines, and vice versa. The volatility state of the market determines alpha/beta opportunities. Low volatility periods are commonly known as bull markets when longer term uptrends and the bulk of market gains occur. The Trading Program’s U.S. equity exposure will attempt to systematically capture beta, which is the return generated from a portfolio that can be attributable to the overall market returns, during low volatility regimes. When volatility is elevated, the Trading Program will adjust its U.S. equity exposure in an attempt to generate alpha, which is a measure of the amount that an investment has returned in comparison to the market or benchmark. The overall goal of the Trading Program is to minimize the effect of U.S. equity volatility on the Trading Program while generating gains in bull or bear markets
| 1 | The ProfitScore Regime-Adaptive Equity Index (the "Index") offers a dynamic (time-varying) exposure across a defined range of assets within (the "Opportunity Set") representing U.S. equity and cash equivalent assets: (U.S. Equity Equivalents), (Cash Equivalents). Allocations to each asset within the Opportunity Set are generated by a proprietary systematic methodology developed by ProfitScore Capital Management, Inc., the Index Sponsor. New allocations are generated as market conditions change. |
INVESTMENT PROCESS
The Fund’s seeks to meet or exceed the returns of Index via exposure to the Trading Program combined with cash management. The Trading Program and therefore the Fund seeks capital appreciation in both rising and falling US equity markets. The Trading Program determines its equity exposure long, neutral or short based on various rules including rules designed to measure the volatility state of the market. With the 75% or more of assets not allocated to swaps or option exposure of the Trading Program, the Fund seeks to grow assets with interest in the products mentioned above.
PERFORMANCE
Class I shares of the Fund (AXSPX) returned 3.10% from inception to fiscal year end. Intra-month data is not available for the ProfitScore Regime Adaptive Equity Index, but the S&P total return2 was down -8.05% in the same period.
OUTLOOK
Going forward, the beleaguered market will be challenged as the nation faces a midterm election with inflationary pressures and a hawkish Fed. Whatever the stock market does, the Fund will attempt to adjust to the conditions.
Investors cannot directly invest in an index and unmanaged index returns do not reflect any fees, expenses and sales charges. The views in this letter were as of September 30, 2022 and may not necessarily reflect the same views on the date this letter is first published or any time thereafter. These views are intended to help shareholders in understanding the Fund’s investment methodology and do not constitute investment advice.
Faithfully yours,
Parker B. Binion
Head of Investments, AXS Investments LLC
| 2 | The S&P 500 Index measures the performance of large cap U.S. equities. It is comprised of 500 of the largest domestically listed companies and represents approximately 80% of domestically available market capitalization. |
There are risks involved with investing including the possible loss of principal. The Fund can invest in derivatives, which include instruments and contracts that are based on and valued in relation to one or more underlying securities, financial benchmarks, indices or other reference obligations or measures of value. The Fund may enter into swap transactions. A swap contract is a commitment between two parties to make or receive payments based on agreed upon terms, and whose value and payments are derived by changes in the value of an underlying financial instrument. Certain Fund transactions, such as entering into futures contracts, options, and short sales, may give rise to a form of leverage. For additional information on risks of investing in the fund, please see the prospectus.
Past performance does not guarantee future results.
AXS Alternative Growth Fund
FUND PERFORMANCE at September 30, 2022 (Unaudited)

This graph compares a hypothetical $10,000 investment in the Fund’s Class I shares, made at its inception, with a similar investment in the S&P 500 Total Return Index. The performance graph above is shown for the Fund’s Class I shares. Class A shares performance may vary. Results include the reinvestment of all dividends and capital gains.
The S&P 500 Total Return Index is widely regarded as the best single gauge of the U.S. equities market. This world-renowned Index includes 500 leading companies in leading industries of the U.S. economy. The index does not reflect expenses, fees or sales charge, which would lower performance. The index is unmanaged and is not available for investment.
| Average Annual Total Returns as of September 30, 2022 | 1 Year | 5 Years | Since Inception | Inception Date |
| Before deducting maximum sales charge | | | | |
Class A1 | -24.87% | 3.44% | 5.70% | 09/09/13 |
| Class I | -24.66% | 3.75% | 5.97% | 09/09/13 |
| After deducting maximum sales charge | | | | |
Class A1 | -29.18% | 2.23% | 5.01% | 09/09/13 |
| S&P 500 Total Return Index | -15.47% | 9.24% | 10.90% | 09/09/13 |
| 1 | Maximum sales charge for Class A shares is 5.75%. |
The performance data quoted here represents past performance and past performance is not a guarantee of future results. Investment return and principal value will fluctuate so that an investor’s shares, when redeemed, may be worth more or less than their original cost. Current performance may be lower or higher than the performance information quoted. The most recent month end performance may be obtained by calling (833) 297-2587.
The Fund acquired the assets and liabilities of the Equinox Ampersand Strategy Fund, a series of the Equinox Funds Trust (the “Predecessor Fund”) on November 8, 2019. As a result of the reorganization, the Fund is the accounting successor of the Predecessor Fund. Performance results shown in the graph and the performance table above for the periods prior to November 9, 2019, reflect the performance of the Predecessor Fund.
AXS Alternative Growth Fund
FUND PERFORMANCE at September 30, 2022 (Unaudited) – Continued
Gross and net expense ratios for the Class A shares were 5.62% and 1.28%, respectively, and the Class I shares were 5.37% and 1.03%, respectively, which were stated in the current prospectus dated February 1, 2022. For the Fund’s current one year expense ratios, please refer to the Consolidated Financial Highlights section of this report. The Fund’s Advisor has contractually agreed to waive its fees and/or pay for operating expenses of the Fund to ensure that total annual fund operating expenses (excluding, as applicable, taxes, leverage interest, brokerage commissions, dividend and interest expenses on short sales, acquired fund fees and expenses as determined in accordance with Form N-1A, expenses incurred in connection with any merger or reorganization, or extraordinary expenses such as litigation expenses) do not exceed 1.24% and 0.99% of the average daily net assets of the Fund’s Class A and Class I shares, respectively. This agreement is in effect until January 31, 2023, and it may be terminated before that date only by the Trust’s Board of Trustees. In the absence of such waivers, the Fund’s returns would be lower.
Returns reflect the reinvestment of distributions made by the Fund, if any. The graph and the performance table above do not reflect the deduction of taxes that a shareholder would pay on Fund distributions or the redemption of the Fund shares. Shares redeemed within 30 days of purchase will be charged 1.00% redemption fee.
AXS Chesapeake Strategy Fund
FUND PERFORMANCE at September 30, 2022 (Unaudited)

This graph compares a hypothetical $10,000 investment in the Fund’s Class I shares, made at its inception, with a similar investment in the SG Trend Index during the periods shown. The performance graph above is shown for the Fund’s Class I shares. Class A shares and Class C shares performance may vary. Results include the reinvestment of all dividends and capital gains.
The SG Trend Index is designed to track the 10 largest (by AUM) trend following CTAs and be representative of the trend followers in the managed futures space. The SG Trend index is equally weighted, and rebalanced and reconstituted annually. The index does not reflect expenses, fees or sales charge, which would lower performance. The index is unmanaged and is not available for investment.
| Average Annual Total Returns as of September 30, 2022 | 1 Year | 5 Years | 10 Years | Since Inception | Inception Date |
| Before deducting maximum sales charge | | | | | |
Class A1 | 26.21% | 6.52% | N/A | 3.81% | 08/21/15 |
| Class C2 | 25.24% | 5.72% | N/A | 3.05% | 08/21/15 |
| Class I3 | 26.58% | 6.78% | 7.64% | 7.10% | 09/10/12 |
| After deducting maximum sales charge | | | | | |
Class A1 | 19.09% | 5.28% | N/A | 2.97% | 08/21/15 |
| Class C2 | 25.24% | 5.72% | N/A | 3.05% | 08/21/15 |
| SG Trend Index | 33.85% | 11.19% | 6.03% | 5.90% | 09/10/12 |
| 1 | Maximum sales charge for Class A shares is 5.75%. No initial sales charge applies to purchase of $1 million or more. |
| 2 | Class C Shares are subject to a contingent deferred sales charge (“CDSC”) of 1.00% on any shares sold within 12 months of the date of purchase. |
| 3 | Class I shares do not have any initial or contingent deferred sales charge. |
The performance data quoted here represents past performance and past performance is not a guarantee of future results. Investment return and principal value will fluctuate so that an investor’s shares, when redeemed, may be worth more or less than their original cost. Current performance may be lower or higher than the performance information quoted. The most recent month end performance may be obtained by calling (833) 297-2587.
The Fund acquired the assets and liabilities of the Equinox Chesapeake Strategy Fund, a series of the Equinox Funds Trust (the “Predecessor Fund”) on November 8, 2019. As a result of the reorganization, the Fund is the accounting successor of the Predecessor Fund. Performance results shown in the graph and the performance table above for the period prior to November 9, 2019, reflect the performance of the Predecessor Fund.
AXS Chesapeake Strategy Fund
FUND PERFORMANCE at September 30, 2022 (Unaudited) – Continued
Gross and net expense ratios for the Class A were 2.56% and 2.16%, respectively, for the Class C shares were 3.31% and 2.91%, respectively, and for the Class I shares were 2.31% and 1.91%, respectively, which were stated in the current prospectus dated February 1, 2022, and supplemented on July 29, 2022. For the Fund’s current one year expense ratios, please refer to the Consolidated Financial Highlights section of this report. The Fund’s Advisor has contractually agreed to waive its fees and/or pay for operating expenses of the Fund to ensure that total annual fund operating expenses (excluding, as applicable, taxes, leverage interest, brokerage commissions, dividend and interest expenses on short sales, acquired fund fees and expenses as determined in accordance with Form N-1A, expenses incurred in connection with any merger or reorganization, or extraordinary expenses such as litigation expenses) do not exceed 2.10%, 2.85%, and 1.85% of the average daily net assets of the Fund’s Class A, Class C, and Class I shares, respectively. This agreement is in effect until December 17, 2023, and it may be terminated before that date only by the Trust’s Board of Trustees. In the absence of such waivers, the Fund’s returns would be lower.
Returns reflect the reinvestment of distributions made by the Fund, if any. The graph and the performance table above do not reflect the deduction of taxes that a shareholder would pay on Fund distributions or the redemption of the Fund shares.
AXS Multi-Strategy Alternatives Fund
FUND PERFORMANCE at September 30, 2022 (Unaudited)
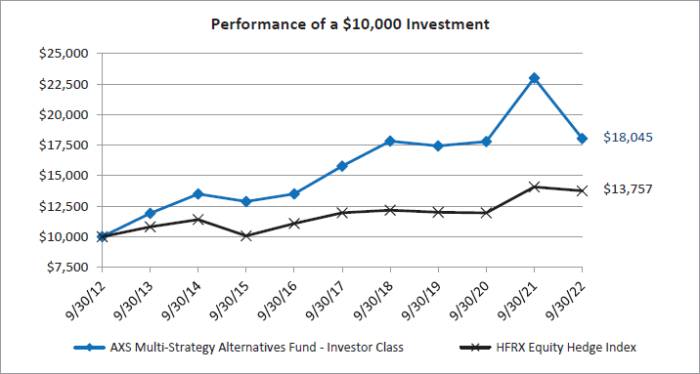
This graph compares a hypothetical $10,000 investment in the Fund’s Investor Class shares with a similar investment in the HFRX Equity Hedge Index during the periods shown. The performance graph above is shown for the Fund’s Investor Class shares. Class I shares performance may vary. Results include the reinvestment of all dividends and capital gains.
The HFRX Equity Hedge Index is an unmanaged index designed to measure daily performance representative of long-short equity hedge funds. The index does not reflect expenses, fees or sales charge, which would lower performance. The index is unmanaged and is not available for investment.
| Average Annual Total Returns as of September 30, 2022 | 1 Year | 5 Years | 10 Years |
| Investor Class* | -21.53% | 2.71% | 6.08% |
| Class I | -21.34% | 2.97% | N/A |
| HFRX Equity Hedge Index | -2.27% | 2.84% | 3.24% |
The performance data quoted here represents past performance and past performance is not a guarantee of future results. Investment return and principal value will fluctuate so that an investor’s shares, when redeemed, may be worth more or less than their original cost. Current performance may be lower or higher than the performance information quoted. The most recent month end performance may be obtained by calling (833) 297-2587.
The Fund acquired the assets and liabilities of the KCM Macro Trends Fund, a series of Northern Lights Fund Trust (the “Predecessor Fund”) on October 18, 2019. As a result of the reorganization, the Fund is the accounting successor of the Predecessor Fund. Performance results shown in the graph and the performance table above for the period prior to October 19, 2019, reflect the performance of the Predecessor Fund.
Gross and Net expense ratios for Investor Class were 2.28% and 1.82%, respectively, and for Class I shares were 2.03% and 1.65%, respectively, which were the amounts stated in the current prospectus dated February 1, 2022. For the Fund’s current one year expense ratios, please refer to the Financial Highlights section of this report. The Fund’s Advisor has contractually agreed to waive its fees and/or pay for operating expenses of the Fund to ensure that total annual fund operating expenses (excluding, as applicable, taxes, leverage interest, brokerage commissions, dividend and interest expenses on short sales, acquired fund fees and expenses as determined in accordance with Form N-1A, expenses incurred in connection with any merger or reorganization, or extraordinary expenses such as litigation expenses) do not exceed 1.68% and 1.51% of the average daily net assets of the Fund’s Investor Class shares and Class I shares, respectively. This agreement is in effect until January 31, 2023, and it may be terminated before that date only by the Trust’s Board of Trustees. In the absence of such waivers, the Fund’s returns would be lower.
AXS Multi-Strategy Alternatives Fund
FUND PERFORMANCE at September 30, 2022 (Unaudited) – Continued
Returns reflect the reinvestment of distributions made by the Fund, if any. The graph and the performance table shown do not reflect the deduction of taxes that a shareholder would pay on Fund distributions or the redemption of Fund shares.
AXS Sustainable Income Fund
FUND PERFORMANCE at September 30, 2022 (Unaudited)

This graph compares a hypothetical $10,000 investment in the Fund’s Class I shares, made at its inception, with a similar investment in the ICE BofA Merrill Lynch 1-3 Year US Corporate & Government Index. The performance graph above is shown for the Fund Class I shares. Results include the reinvestment of all dividends and capital gains.
The ICE BofA Merrill Lynch 1-3 Year US Corporate & Government Index is the performance of U.S. dollar denominated investment grade debt publicly issued in the U.S. domestic market, including U.S. Treasury, U.S. agency, foreign government, supranational and corporate securities. The index does not reflect expenses, fees or sales charge, which would lower performance. The index is unmanaged and is not available for investment.
| Average Annual Total Returns as of September 30, 2022 | 1 Year | 5 Years | Since Inception | Inception Date |
| Class I | -12.06% | 0.56% | 1.47% | 02/01/13 |
| ICE BofA Merrill Lynch 1-3 Year US Corporate & Government Index | -5.14% | 0.71% | 0.83% | 02/01/13 |
The performance data quoted here represents past performance and past performance is not a guarantee of future results. Investment return and principal value will fluctuate so that an investor’s shares, when redeemed, may be worth more or less than their original cost. Current performance may be lower or higher than the performance information quoted. The most recent month end performance may be obtained by calling (833) 297-2587.
The Fund acquired the assets and liabilities of the Sky Harbor Short Duration High Yield Partners, LP, a Delaware limited partnership which commenced operations on February 1, 2013 (the “Predecessor Fund”) on October 16, 2020. As a result of the reorganization, the Fund is the accounting successor of the Predecessor Fund. The Predecessor Fund was not registered under the Investment Company Act of 1940, as amended (the "1940 Act") and therefore was not subject to certain restrictions imposed by the 1940 Act on registered investment companies and by the Internal Revenue Code of 1986 on regulated investment companies. If the Predecessor Fund had been registered under the 1940 Act, the Predecessor Fund's performance may have been adversely affected. Performance results shown in the graph and the performance table above for the period prior to October 17, 2020, reflect the performance of the Predecessor Fund. The return was 8.42% for the period October 17, 2020 (commencement of operations) through September 30, 2021.
AXS Sustainable Income Fund
FUND PERFORMANCE at September 30, 2022 (Unaudited) – Continued
Gross and net expense ratios for the Class I shares were 1.11% and 0.99%, respectively, which were stated in the current prospectus dated February 1, 2022. For the Fund’s current one year expense ratios, please refer to the Financial Highlights section of this report. The Fund’s Advisor has contractually agreed to waive its fees and/or pay for operating expenses of the Fund to ensure that total annual fund operating expenses (excluding, as applicable, taxes, leverage interest, brokerage commissions, dividend and interest expenses on short sales, acquired fund fees and expenses as determined in accordance with Form N-1A, expenses incurred in connection with any merger or reorganization, or extraordinary expenses such as litigation expenses) do not exceed 0.99% of the average daily net assets of the Fund’s Class I shares. This agreement is in effect until January 31, 2023, and it may be terminated before that date only by the Trust’s Board of Trustees. In the absence of such waivers, the Fund’s returns would be lower.
Returns reflect the reinvestment of distributions made by the Fund, if any. The graph and the performance table above do not reflect the deduction of taxes that a shareholder would pay on Fund distributions or the redemption of the Fund shares. Shares redeemed within 30 days of purchase will be charged 1.00% redemption fee.
AXS Thomson Reuters Private Equity Return Tracker Fund
FUND PERFORMANCE at September 30, 2022 (Unaudited)

This graph compares a hypothetical $10,000 investment in the Fund’s Class I shares, made at its inception, with a similar investment in the S&P 500 Total Return Index. The performance graph above is shown for the Fund Class I shares. Class A shares and Class C shares performance may vary. Results include the reinvestment of all dividends and capital gains.
The S&P 500 Total Return Index is a broad unmanaged index of 500 stocks, which is widely recognized as representative of the equity market in general. The index does not reflect expenses, fees or sales charge, which would lower performance. The index is unmanaged and is not available for investment.
| Average Annual Total Returns as of September 30, 2022 | 1 Year | 5 Years | Since Inception | Inception Date |
| Before deducting maximum sales charge | | | | |
Class A1 | -31.51% | 3.46% | 5.79% | 09/18/15 |
| Class C2 | -32.02% | 2.68% | 5.07% | 09/18/15 |
| Class I3 | -31.33% | 3.71% | 6.03% | 09/18/15 |
| After deducting maximum sales charge | | | | |
Class A1 | -35.44% | 2.24% | 4.90% | 09/18/15 |
| Class C2 | -32.52% | 2.68% | 5.07% | 09/18/15 |
| S&P 500 Total Return Index | -15.47% | 9.24% | 11.05% | 09/18/15 |
| 1 | Maximum sales charge for Class A shares is 5.75%. No initial sales charge applies to purchase of $1 million or more. |
| 2 | Class C Shares are subject to a contingent deferred sales charge (“CDSC”) of 1.00% on any shares sold within 12 months of the date of purchase. |
| 3 | Class I shares do not have any initial or contingent deferred sales charge. |
The performance data quoted here represents past performance and past performance is not a guarantee of future results. Investment return and principal value will fluctuate so that an investor’s shares, when redeemed, may be worth more or less than their original cost. Current performance may be lower or higher than the performance information quoted. The most recent month end performance may be obtained by calling (833) 297-2587.
The Fund acquired the assets and liabilities of the Leland Thomson Reuters Private Equity Buyout Index Fund, a series of the Northern Lights Fund Trust III (the “Predecessor Fund”) on November 20, 2020. As a result of the reorganization, the Fund is the accounting successor of the Predecessor Fund. Performance results shown in the graph and the performance table above for the period prior to November 21, 2020, reflect the performance of the Predecessor Fund.
AXS Thomson Reuters Private Equity Return Tracker Fund
FUND PERFORMANCE at September 30, 2022 (Unaudited) – Continued
Gross and net expense ratios for the Class A were 2.32% and 1.75%, respectively, for the Class C shares were 3.07% and 2.50%, respectively, and for the Class I shares were 2.07% and 1.50%, respectively, which were stated in the current prospectus dated February 1, 2022. For the Fund’s current one year expense ratios, please refer to the Financial Highlights section of this report. The Fund’s Advisor has contractually agreed to waive its fees and/or pay for operating expenses of the Fund to ensure that total annual fund operating expenses (excluding, as applicable, taxes, leverage interest, brokerage commissions, dividend and interest expenses on short sales, acquired fund fees and expenses as determined in accordance with Form N-1A, expenses incurred in connection with any merger or reorganization, or extra ordinary expenses such as litigation expenses) do not exceed 1.75%, 2.50%, and 1.50% of the average daily net assets of the Fund’s Class A, Class C, and Class I shares, respectively. This agreement is in effect until January 31, 2023, and it may be terminated before that date only by the Trust’s Board of Trustees. In the absence of such waivers, the Fund’s returns would be lower.
Returns reflect the reinvestment of distributions made by the Fund, if any. The graph and the performance table above do not reflect the deduction of taxes that a shareholder would pay on Fund distributions or the redemption of the Fund shares. Shares redeemed within 30 days of purchase will be charged 1.00% redemption fee.
AXS Thomson Reuters Venture Capital Return Tracker Fund
FUND PERFORMANCE at September 30, 2022 (Unaudited)

This graph compares a hypothetical $10,000 investment in the Fund’s Class I shares, made at its inception, with a similar investment in the NASDAQ OTC Composite Index. The performance graph above is shown for the Fund Class I shares. Class A shares and Class C shares performance may vary. Results include the reinvestment of all dividends and capital gains.
The NASDAQ OTC Composite Index is the market capitalization-weighted index of over 2,500 common equities listed on the Nasdaq stock exchange. The index does not reflect expenses, fees or sales charge, which would lower performance. The index is unmanaged and is not available for investment.
| Average Annual Total Returns as of September 30, 2022 | 1 Year | 5 Years | Since Inception | Inception Date |
| Before deducting maximum sales charge | | | | |
Class A1 | -57.66% | 7.14% | 11.65% | 10/02/14 |
| Class C2 | -57.99% | 6.35% | 10.83% | 09/23/15 |
| Class I3 | -57.56% | 7.39% | 11.87% | 10/02/14 |
| After deducting maximum sales charge | | | | |
Class A1 | -60.09% | 5.88% | 10.91% | 10/02/14 |
| Class C2 | -58.33% | 6.35% | 10.83% | 09/23/15 |
| NASDAQ OTC Composite Index | -26.25% | 11.25% | 12.63% | 10/02/14 |
| 1 | Maximum sales charge for Class A shares is 5.75%. No initial sales charge applies to purchase of $1 million or more. |
| 2 | Class C Shares are subject to a contingent deferred sales charge (“CDSC”) of 1.00% on any shares sold within 12 months of the date of purchase. |
| 3 | Class I shares do not have any initial or contingent deferred sales charge. |
The performance data quoted here represents past performance and past performance is not a guarantee of future results. Investment return and principal value will fluctuate so that an investor’s shares, when redeemed, may be worth more or less than their original cost. Current performance may be lower or higher than the performance information quoted. The most recent month end performance may be obtained by calling (833) 297-2587.
The Fund acquired the assets and liabilities of the Leland Thomson Reuters Venture Capital Index Fund, a series of the Northern Lights Fund Trust III (the “Predecessor Fund”) on November 20, 2020. As a result of the reorganization, the Fund is the accounting successor of the Predecessor Fund. Performance results shown in the graph and the performance table above for the period prior to November 21, 2020, reflect the performance of the Predecessor Fund.
AXS Thomson Reuters Venture Capital Return Tracker Fund
FUND PERFORMANCE at September 30, 2022 (Unaudited) – Continued
Gross and net expense ratios for the Class A shares were 1.83% and 1.75%, respectively, the Class C shares were 2.58% and 2.50%, respectively, and the Class I shares were 1.58% and 1.50%, respectively, which were stated in the current prospectus dated February 1, 2022. For the Fund’s current one year expense ratios, please refer to the Financial Highlights section of this report. The Fund’s Advisor has contractually agreed to waive its fees and/or pay for operating expenses of the Fund to ensure that total annual fund operating expenses (excluding, as applicable, taxes, leverage interest, brokerage commissions, dividend and interest expenses on short sales, acquired fund fees and expenses as determined in accordance with Form N-1A, expenses incurred in connection with any merger or reorganization, or extraordinary expenses such as litigation expenses) do not exceed 1.75%, 2.50%, and 1.50% of the average daily net assets of the Fund’s Class A, Class C, and Class I shares, respectively. This agreement is in effect until January 31, 2023, and it may be terminated before that date only by the Trust’s Board of Trustees. In the absence of such waivers, the Fund’s returns would be lower.
Returns reflect the reinvestment of distributions made by the Fund, if any. The graph and the performance table above do not reflect the deduction of taxes that a shareholder would pay on Fund distributions or the redemption of the Fund shares. Shares redeemed within 30 days of purchase will be charged 1.00% redemption fee.
AXS All Terrain Opportunity Fund
FUND PERFORMANCE at September 30, 2022 (Unaudited)
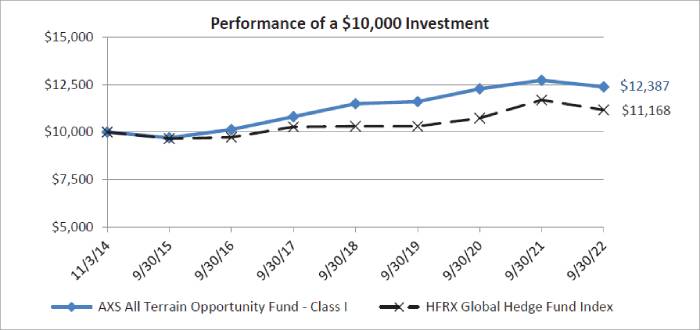
This graph compares a hypothetical $10,000 investment in the Fund’s Class I shares, made at its inception, with a similar investment in the HFRX Global Hedge Fund Index. Results include the reinvestment of all dividends and capital gains.
HFRX Global Hedge Fund Index is designed to be representative of the overall composition of the hedge fund universe. The index does not reflect expenses, fees, or sales charge, which would lower performance. The index is unmanaged and it is not available for investment.
| Average Annual Total Returns as of September 30, 2022 | 1 Year | 5 Years | Since Inception | Inception Date |
| Class I*, 1 | -2.72% | 2.75% | 2.74% | 11/03/14 |
| HFRX Global Hedge Fund Index | -4.50% | 1.67% | 1.41% | 11/03/14 |
| * | Formerly Institutional Class. |
| 1 | Prior to September 16, 2016, the Institutional Class shares of the Fund were designated as Class A shares and subject to a distribution fee pursuant to Rule 12b-1 Plan and a 5.75% sales charge. Returns would have been lower had sales charge been reflected. The distribution fee is reflected in the Fund’s performance for periods prior to September 16, 2016. |
The performance data quoted here represents past performance and past performance is not a guarantee of future results. Investment return and principal value will fluctuate so that an investor's shares, when redeemed, may be worth more or less than their original cost. Current performance may be lower or higher than the performance information quoted. The most recent month end performance may be obtained by calling (833) 297-2587.
Gross and net expense ratios for the Fund’s Class I shares were 2.46% and 2.01%, respectively, which were the amounts stated in the current prospectus dated February 1, 2022. For the Fund’s current one year expense ratios, please refer to the Financial Highlights section of this report. The Fund’s Advisor has contractually agreed to waive fees and/or pay for operating expenses of the Fund to ensure that total annual fund operating expenses (excluding any taxes, leverage interest, brokerage commissions, dividend and interest expenses on short sales, acquired fund fees and expenses as determined in accordance with Form N-1A, expenses incurred in connection with any merger or reorganization, or extraordinary expenses such as litigation expenses) do not exceed 1.60% of the average daily net assets of Class I shares of the Fund. This agreement is in effect until January 31, 2023, and may be terminated before that date only by the Trust’s Board of Trustees. In the absence of such waivers, the Fund’s returns would be lower.
AXS All Terrain Opportunity Fund
FUND PERFORMANCE at September 30, 2022 (Unaudited) - Continued
Returns reflect the reinvestment of distributions made by the Fund, if any. The graph and the performance table above do not reflect the deduction of taxes that a shareholder would pay on Fund distributions or the redemption of Fund shares. Shares redeemed within 30 days of purchase will be charged a redemption fee of 1.00%.
AXS Merger Fund
FUND PERFORMANCE at September 30, 2022 (Unaudited)
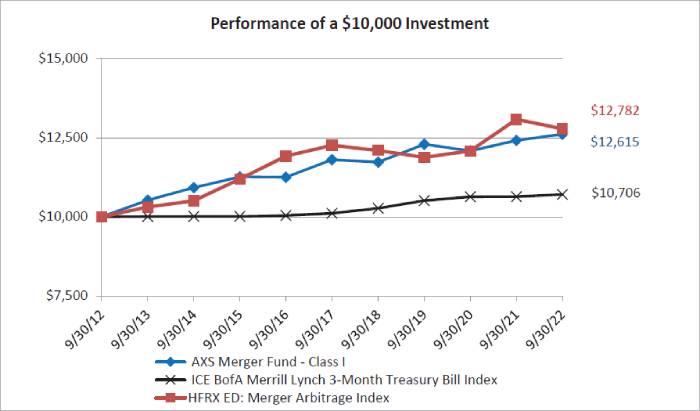
This graph compares a hypothetical $10,000 investment in the Fund’s Class I shares, made at its inception, with a similar investment in the ICE BofA Merrill Lynch 3-Month Treasury Bill Index and HFRX ED: Merger Arbitrage Index during the periods shown. The performance graph above is shown for the Fund’s Class I shares. Investor Class shares performance may vary. Results include the reinvestment of all dividends and capital gains.
The ICE BofA Merrill Lynch 3-Month Treasury Bill Index is an unmanaged index that measures returns of three-month Treasury Bills. The HFRX ED: Merger Arbitrage Index is an investment process primarily focused on opportunities in equity and equity related instruments of companies. The indexes do not reflect expenses, fees or sales charge, which would lower performance. The indexes are unmanaged and are not available for investment.
| Average Annual Total Returns as of September 30, 2022 | 1 Year | 5 Years | 10 Years |
| Class I | 1.61% | 1.34% | 2.35% |
| Investor Class | 1.37% | 1.08% | 2.04% |
| ICE BofA Merrill Lynch 3-Month Treasury Bill Index | 0.62% | 1.15% | 0.68% |
| HFRX ED: Merger Arbitrage Index | -2.28% | 0.84% | 2.48% |
The performance data quoted here represents past performance and past performance is not a guarantee of future results. Investment return and principal value will fluctuate so that an investor’s shares, when redeemed, may be worth more or less than their original cost. Current performance may be lower or higher than the performance information quoted. The most recent month end performance may be obtained by calling (833) 297-2587.
The Fund acquired the assets and liabilities of the Kellner Merger Fund, a series of the Advisors Series Trust (the “Predecessor Fund”) on January 22, 2021. As a result of the reorganization, the Fund is the accounting successor of the Predecessor Fund. Performance results shown in the graph and the performance table above for the periods prior to January 23, 2021, reflect the performance of the Predecessor Fund.
AXS Merger Fund
FUND PERFORMANCE at September 30, 2022 (Unaudited) – Continued
Gross and net expense ratios for the Investor Class shares were 2.83% and 2.63%, respectively, and the Class I shares were 2.58% and 2.38%, respectively, which were stated in the current prospectus dated February 1, 2022. For the Fund’s current one year expense ratios, please refer to the Financial Highlights section of this report. The Fund’s Advisor has contractually agreed to waive its fees and/or pay for operating expenses of the Fund to ensure that total annual fund operating expenses (excluding any taxes, leverage interest, brokerage commissions, dividend and interest expenses on short sales, acquired fund fees and expenses as determined in accordance with Form N-1A, expenses incurred in connection with any merger or reorganization, or extraordinary expenses such as litigation expenses) do not exceed 1.75% and 1.50% of the average daily net assets of the Fund’s Investor Class and Class I shares, respectively. This agreement is in effect until January 31, 2023, and it may be terminated before that date only by the Trust’s Board of Trustees. In the absence of such waivers, the Fund’s returns would be lower.
Returns reflect the reinvestment of distributions made by the Fund, if any. The graph and the performance table above do not reflect the deduction of taxes that a shareholder would pay on Fund distributions or the redemption of the Fund shares. Shares redeemed within 30 days of purchase will be charged 1.00% redemption fee.
AXS Alternative Value Fund
FUND PERFORMANCE at September 30, 2022 (Unaudited)

This graph compares a hypothetical $10,000 investment in the Fund’s Class I shares, made at its inception, with a similar investment in the S&P 500 Total Return Index. The performance graph above is shown for the Fund’s Class I shares. Investor Class shares performance may vary. Results include the reinvestment of all dividends and capital gains.
The S&P 500 Total Return Index is a broad unmanaged index of 500 stocks, which is widely recognized as representative of the equity market in general. The index does not reflect expenses, fees or sales charge, which would lower performance. The index is unmanaged and is not available for investment.
| Average Annual Total Returns as of September 30, 2022 | 1 Year | 5 Years | Since Inception | Inception Date |
| Class I | 2.78% | 11.17% | 11.17% | 10/03/16 |
| Investor Class | 2.57% | 10.99% | 10.99% | 10/03/16 |
| S&P 500 Total Return Index | -15.47% | 9.24% | 10.82% | 10/03/16 |
The performance data quoted here represents past performance and past performance is not a guarantee of future results. Investment return and principal value will fluctuate so that an investor’s shares, when redeemed, may be worth more or less than their original cost. Current performance may be lower or higher than the performance information quoted. The most recent month end performance may be obtained by calling (833) 297-2587.
The Fund acquired the assets and liabilities of the AXS Alternative Value Fund (formerly, Cognios Large Cap Value Fund), a series of the M3Sixty Funds Trust (the “Predecessor Fund”) on March 5, 2021. As a result of the reorganization, the Fund is the accounting successor of the Predecessor Fund. Performance results shown in the graph and the performance table above for the periods prior to March 6, 2021, reflect the performance of the Predecessor Fund.
AXS Alternative Value Fund
FUND PERFORMANCE at September 30, 2022 (Unaudited) – Continued
Gross and net expense ratios for the Investor Class shares were 8.13% and 1.57%, respectively, and the Class I shares were 7.88% and 1.32%, respectively, which were stated in the current prospectus dated February 1, 2022. For the Fund’s current one year expense ratios, please refer to the Financial Highlights section of this report. The Fund’s Advisor has contractually agreed to waive its fees and/or pay for operating expenses of the Fund to ensure that total annual fund operating expenses (excluding any taxes, leverage interest, brokerage commissions, dividend and interest expenses on short sales, acquired fund fees and expenses as determined in accordance with Form N-1A, expenses incurred in connection with any merger or reorganization, or extraordinary expenses such as litigation expenses) do not exceed 1.10% and 0.85% of the average daily net assets of the Fund’s Investor Class and Class I shares, respectively. This agreement is in effect until March 5, 2023, and it may be terminated before that date only by the Trust’s Board of Trustees. In the absence of such waivers, the Fund’s returns would be lower.
Returns reflect the reinvestment of distributions made by the Fund, if any. The graph and the performance table above do not reflect the deduction of taxes that a shareholder would pay on Fund distributions or the redemption of the Fund shares. Shares redeemed within 30 days of purchase will be charged 1.00% redemption fee.
AXS Market Neutral Fund
FUND PERFORMANCE at September 30, 2022 (Unaudited)

This graph compares a hypothetical $10,000 investment in the Fund’s Class I shares, made at its inception, with a similar investment in the S&P 500 Total Return Index. The performance graph above is shown for the Fund’s Class I shares. Investor Class shares performance may vary. Results include the reinvestment of all dividends and capital gains.
The S&P 500 Total Return Index is a broad unmanaged index of 500 stocks, which is widely recognized as representative of the equity market in general. The index does not reflect expenses, fees or sales charge, which would lower performance. The index is unmanaged and is not available for investment.
| Average Annual Total Returns as of September 30, 2022 | 1 Year | 5 Years | Since Inception | Inception Date |
| Class I | 15.57% | 4.44% | 3.80% | 12/31/12 |
| Investor Class | 15.29% | 4.22% | 3.56% | 12/31/12 |
| S&P 500 Total Return Index | -15.47% | 9.24% | 12.07% | 12/31/12 |
The performance data quoted here represents past performance and past performance is not a guarantee of future results. Investment return and principal value will fluctuate so that an investor’s shares, when redeemed, may be worth more or less than their original cost. Current performance may be lower or higher than the performance information quoted. The most recent month end performance may be obtained by calling (833) 297-2587.
The Fund acquired the assets and liabilities of the AXS Market Neutral Fund (formerly, Cognios Market Neutral Large Cap Fund), a series of the M3Sixty Funds Trust (the “Predecessor Fund”) on March 5, 2021. As a result of the reorganization, the Fund is the accounting successor of the Predecessor Fund. Performance results shown in the graph and the performance table above for the periods prior to March 6, 2021, reflect the performance of the Predecessor Fund.
Gross and net expense ratios for the Investor Class shares were 5.36% and 4.36%, respectively, and the Class I shares were 5.11% and 4.11%, respectively, which were stated in the current prospectus dated February 1, 2022. For the Fund’s current one year expense ratios, please refer to the Financial Highlights section of this report. The Fund’s Advisor has contractually agreed to waive its fees and/or pay for operating expenses of the Fund to ensure that total annual fund operating expenses (excluding any taxes, leverage interest, brokerage commissions, dividend and interest expenses on short sales, acquired fund fees and expenses as determined in accordance with Form N-1A, expenses incurred in connection with any merger or reorganization, or extraordinary expenses such as litigation expenses) do not exceed 1.70% and 1.45% of the average daily net assets of the Fund’s Investor Class and Class I shares, respectively. This agreement is in effect until March 5, 2023, and it may be terminated before that date only by the Trust’s Board of Trustees. In the absence of such waivers, the Fund’s returns would be lower.
AXS Market Neutral Fund
FUND PERFORMANCE at September 30, 2022 (Unaudited) – Continued
Returns reflect the reinvestment of distributions made by the Fund, if any. The graph and the performance table above do not reflect the deduction of taxes that a shareholder would pay on Fund distributions or the redemption of the Fund shares. Shares redeemed within 30 days of purchase will be charged 1.00% redemption fee.
AXS Adaptive Plus Fund
FUND PERFORMANCE at September 30, 2022 (Unaudited)
| Total Returns as of September 30, 2022 | Since Inception | Inception Date |
| Class I | 3.10% | 9/15/22 |
| S&P 500 Index | -8.05% | 9/15/22 |
The performance data quoted here represents past performance and past performance is not a guarantee of future results. Investment return and principal value will fluctuate so that an investor's shares, when redeemed, may be worth more or less than their original cost. Current performance may be lower or higher than the performance information quoted. The most recent month end performance may be obtained by calling (833) 297-2587.
Gross and net expense ratios for the Fund’s Class I shares were 2.36% and 1.99%, respectively, which were the amounts stated in the current prospectus dated September 14, 2022. For the Fund’s current period expense ratios, please refer to the Financial Highlights section of this report. The Fund’s Advisor has contractually agreed to waive fees and/or pay for operating expenses of the Fund to ensure that total annual fund operating expenses (excluding any taxes, leverage interest, brokerage commissions, dividend and interest expenses on short sales, acquired fund fees and expenses as determined in accordance with Form N-1A, expenses incurred in connection with any merger or reorganization, or extraordinary expenses such as litigation expenses) do not exceed 1.99% of the average daily net assets of Class I shares of the Fund. This agreement is in effect until September 14, 2023 and may be terminated before that date only by the Trust’s Board of Trustees. In the absence of such waivers, the Fund’s returns would be lower.
Returns reflect the reinvestment of distributions made by the Fund, if any. The graph and the performance table shown do not reflect the deduction of taxes that a shareholder would pay on Fund distributions or the redemption of Fund shares.
AXS Alternative Growth Fund
CONSOLIDATED SCHEDULE OF INVESTMENTS
As of September 30, 2022
Principal Amount | | | | | Value | |
| | | | | SHORT-TERM INVESTMENTS — 72.3% | | | | |
| $ | 9,500 | | | UMB Bank Demand Deposit, 0.01%1,2 | | $ | 9,500 | |
| | | | | | | | | |
| | Number
of Shares | | | | | | | |
| | 1,253,446 | | | Fidelity Investments Money Market Government Portfolio - Class I, 2.70%2 | | | 1,253,446 | |
| | | | | TOTAL SHORT-TERM INVESTMENTS | | | | |
| | | | | (Cost $1,262,946) | | | 1,262,946 | |
| | | | | TOTAL INVESTMENTS — 72.3% | | | | |
| | | | | (Cost $1,262,946) | | | 1,262,946 | |
| | | | | Other Assets in Excess of Liabilities — 27.7% | | | 484,015 | |
| | | | | TOTAL NET ASSETS — 100.0% | | $ | 1,746,961 | |
| 1 | All or a portion of this investment is a holding of AXS Alternative Growth Fund Limited. |
| 2 | The rate is the annualized seven-day yield at period end. |
See accompanying Notes to Consolidated Financial Statements.
AXS Alternative Growth Fund
CONSOLIDATED SCHEDULE OF INVESTMENTS - Continued
As of September 30, 2022
FUTURES CONTRACTS
| | | | | | | | | | | | | | | Unrealized | |
| Number of | | | | | Expiration | | | Notional | | | Value at | | | Appreciation | |
| Contracts | | | Description | | Date | | | Value | | | September 30, 2022 | | | (Depreciation) | |
| | | | | | | | | | | | | | | | |
| | 10 | | | S&P 500 E-Mini | | | December 2022 | | | $ | 1,998,378 | | | $ | 1,800,750 | | | $ | (197,628 | ) |
| | | | | | | | | | | | | | | | | | | | | |
| TOTAL FUTURES CONTRACTS | | | | | | $ | 1,998,378 | | | $ | 1,800,750 | | | $ | (197,628 | ) |
See accompanying Notes to Consolidated Financial Statements.
AXS Alternative Growth Fund
CONSOLIDATED SCHEDULE OF INVESTMENTS - Continued
As of September 30, 2022
SWAP CONTRACT
TOTAL RETURN SWAP
| | | | | Pay/Receive | | | | | | | | | | | Unrealized | |
| | | | | Total Return on | | Financing | | | Termination | | | Notional | | | Appreciation | |
| Counterparty | | Reference Entity | | Reference Entity | | Rate1 | | | Date | | | Value | | | (Depreciation) | |
| | | | | | | | | | | | | | | | | |
| Deutsche Bank | | AXS Alternative Growth Fund Custom Basket2 | | Receive | | | | 0.50% of Notional Value | | | | June 1, 2023 | | | $ | 3,722,928 | | | $ | (192,412 | ) |
| TOTAL SWAP CONTRACT | | | | | | | $ | (192,412 | ) |
| 1 | Financing rate is based upon predetermined notional amounts. |
| 2 | This investment is a holding of the AXS Alternative Growth Fund Limited. |
See accompanying Notes to Consolidated Financial Statements.
AXS Alternative Growth Fund
CONSOLIDATED SCHEDULE OF INVESTMENTS - Continued
As of September 30, 2022
Total Return Swap Top 50 Holdings^
FUTURES CONTRACTS
| Number of | | | | | | | | | | | Unrealized | |
| Long | | | | | Expiration | | | Notional | | | Appreciation | |
| Contracts | | | Description | | Date | | | Value | | | (Depreciation) | |
| | 18 | | | SOFR 3month Futures | | | Dec-23 | | | $ | 4,305,957 | | | $ | 7,825 | |
| | 16 | | | SOFR 3month Futures | | | Mar-24 | | | | 3,760,870 | | | | 391 | |
| | 12 | | | 3 month Euro (EURIBOR) | | | Sep-23 | | | | 2,823,950 | | | | (7,395 | ) |
| | 7 | | | 3 month Euro (EURIBOR) | | | Jun-23 | | | | 1,709,513 | | | | 14 | |
| | 8 | | | 90 Day Bank Accepted Bill Future | | | Sep-23 | | | | 1,229,742 | | | | (3,739 | ) |
| | 5 | | | 3 month Euro (EURIBOR) | | | Dec-23 | | | | 1,226,077 | | | | (9,384 | ) |
| | 4 | | | SOFR 3month Futures | | | Jun-25 | | | | 994,614 | | | | (175 | ) |
| | 4 | | | 3 month Euro (EURIBOR) | | | Mar-25 | | | | 982,215 | | | | 120 | |
| | 4 | | | Three Month Canadian Bankers Acceptance Future | | | Dec-23 | | | | 726,381 | | | | (866 | ) |
| | 3 | | | SOFR 3month Futures | | | Sep-23 | | | | 647,207 | | | | 41 | |
| | 4 | | | 90 Day Bank Accepted Bill Future | | | Jun-23 | | | | 618,459 | | | | (1,526 | ) |
| | 5 | | | 10 year US Treasury Notes | | | Dec-22 | | | | 548,648 | | | | (10,375 | ) |
| | 2 | | | SOFR 3month Futures | | | Mar-25 | | | | 447,251 | | | | (45 | ) |
| | 2 | | | Three Month Canadian Bankers Acceptance Future | | | Sep-23 | | | | 359,725 | | | | (1,090 | ) |
| | 1 | | | 3 month Euro (EURIBOR) | | | Jun-25 | | | | 349,795 | | | | 41 | |
| | 1 | | | 3 month Euro (EURIBOR) | | | Jun-24 | | | | 312,565 | | | | 82 | |
| | 8 | | | Lean Hog Future | | | Oct-22 | | | | 291,134 | | | | (730 | ) |
| | 2 | | | 10 year Italian Bond | | | Dec-22 | | | | 262,114 | | | | (10,273 | ) |
| | | | | | | | | | | | | | | | | |
| | Number of | | | | | | | | | | | | | | Unrealized | |
| | Short | | | | | | Expiration | | | | Notional | | | | Appreciation | |
| | Contracts | | | Description | | | Date | | | | Value | | | | (Depreciation) | |
| | (27) | | | SOFR 3month Futures | | | Sep-24 | | | $ | 6,445,101 | | | $ | 1,254 | |
| | (12) | | | 3 month Euro (EURIBOR) | | | Mar-23 | | | | 2,967,799 | | | | (355 | ) |
| | (8) | | | 3 month Euro (EURIBOR) | | | Dec-23 | | | | 1,790,380 | | | | 1,931 | |
| | (5) | | | 3 month Euro (EURIBOR) | | | Mar-25 | | | | 1,227,769 | | | | 1,802 | |
| | (8) | | | 90 Day Bank Accepted Bill Future | | | Mar-23 | | | | 1,212,169 | | | | 1,808 | |
| | (5) | | | SOFR 3month Futures | | | Jun-25 | | | | 1,193,536 | | | | (693 | ) |
| | (5) | | | SOFR 3month Futures | | | Mar-25 | | | | 1,099,397 | | | | (857 | ) |
| | (4) | | | Eurodollar | | | Sep-23 | | | | 954,551 | | | | 1,211 | |
| | (6) | | | 90 Day Bank Accepted Bill Future | | | Jun-24 | | | | 862,016 | | | | (172 | ) |
| | (3) | | | 3 month Euro (EURIBOR) | | | Dec-24 | | | | 785,762 | | | | 5,177 | |
| | (3) | | | SOFR 3month Futures | | | Dec-24 | | | | 744,618 | | | | 63 | |
| | (3) | | | 3 month Euro (EURIBOR) | | | Sep-23 | | | | 712,918 | | | | 1,976 | |
| | (4) | | | Three Month Canadian Bankers Acceptance Future | | | Dec-22 | | | | 696,835 | | | | 2,508 | |
| | (3) | | | Three Month Canadian Bankers Acceptance Future | | | Jun-24 | | | | 541,871 | | | | (197 | ) |
| | (2) | | | 3 month Euro (EURIBOR) | | | Dec-22 | | | | 494,421 | | | | (118 | ) |
| | (2) | | | 3 month Euro (EURIBOR) | | | Jun-25 | | | | 491,073 | | | | (300 | ) |
| | (9) | | | Cotton No.2 Future | | | Dec-22 | | | | 367,227 | | | | 87,747 | |
| | (1) | | | SOFR 3month Futures | | | Jun-24 | | | | 352,542 | | | | 96 | |
| | (2) | | | Three Month Canadian Bankers Acceptance Future | | | Sep-24 | | | | 325,511 | | | | (271 | ) |
| | (10) | | | Lean Hog Future | | | Dec-22 | | | | 300,010 | | | | 5,144 | |
| | (2) | | | 90 Day Bank Accepted Bill Future | | | Mar-24 | | | | 276,947 | | | | 795 | |
| | (8) | | | Lean Hog Future | | | Oct-22 | | | | 274,843 | | | | 5,883 | |
| | (1) | | | 3 Month SONIA Index Futures | | | Dec-23 | | | | 263,137 | | | | 3,160 | |
| | (2) | | | 10 year US Treasury Notes | | | Dec-22 | | | | 250,486 | | | | 5,497 | |
OPTIONS ON FUTURES CONTRACTS
| | | | | | | | | | Unrealized | |
| | | | | | | | | Expiration | | | Strike | | | Notional | | | Appreciation | |
| | | Put/Call | | | Description | | | Date | | | Price | | | Value | | | (Depreciation) | |
| Purchased | | | | | | | | | | | | | | | | | | |
| | | | Call | | | Eurodollar | | | | Mar-23 | | | $ | 98.75 | | | $ | 4,165,019 | | $ | 475 | |
| | | | | | | | | | | | | | | | | | | | | | | |
| Written | | | | | | | | | | | | | | | | | | | | | | |
| | | | Call | | | Eurodollar | | | | Mar-23 | | | $ | 99.50 | | | $ | (4,196,652 | ) | $ | (422 | ) |
| | | | Put | | | Eurodollar | | | | Mar-23 | | | | 95.13 | | | | (1,151,629 | ) | | (3,209 | ) |
| | | | Put | | | Eurodollar | | | | Mar-23 | | | | 95.44 | | | | (708,156 | ) | | (3,117 | ) |
FORWARD FOREIGN CURRENCY CONTRACTS
| | | | | | | | | | | | | | | Unrealized | |
| | | | | Currency Units to | | | | | | | | Appreciation | |
| Settlement Date | | Counterparty | | Deliver/(Receive) | | | In Exchange For | | | (Depreciation) | |
| Dec-22 | | Deutsche Bank | | 14,047,622 | | TWD | | | 461,000 | | USD | | | $ | 17,261 | |
| Oct-22 | | Deutsche Bank | | 33,786,840 | | INR | | | 429,585 | | USD | | | | 16,377 | |
| Oct-22 | | Deutsche Bank | | 429,586 | | USD | | | 33,782,544 | | INR | | | | (16,431 | ) |
| Dec-22 | | Deutsche Bank | | 397,000 | | USD | | | 12,128,845 | | TWD | | | | (13,879 | ) |
INR - Indian Rupee
TWD -New Taiwan Dollar
USD - U.S. Dollar
| ^ | These investments are not direct holdings of the Fund. The holdings were determined based on the absolute notional values of the positions within the underlying swap basket. |
See accompanying Notes to Consolidated Financial Statements.
AXS Alternative Growth Fund
CONSOLIDATED SUMMARY OF INVESTMENTS
As of September 30, 2022
| Security Type | Percent of Total
Net Assets |
| Short-Term Investments | 72.3% |
| Total Investments | 72.3% |
| Other Assets in Excess of Liabilities | 27.7% |
| Total Net Assets | 100.0% |
See accompanying Notes to Consolidated Financial Statements.
AXS Chesapeake Strategy Fund
CONSOLIDATED SCHEDULE OF INVESTMENTS
As of September 30, 2022
| Number of | | | | | | |
| Shares | | | SHORT-TERM INVESTMENTS — 94.3% | | Value | |
| | 45,651,054 | | | Fidelity Investments Money Market Government Portfolio - Class I, 2.70%1 | | $ | 45,651,054 | |
| | | | | | | | | |
| | Principal | | | | | | | |
| | Amount | | | | | | | |
| $ | 11,817,247 | | | UMB Bank Demand Deposit, 0.01%1, 2 | | | 11,817,247 | |
| | | | | TOTAL SHORT-TERM INVESTMENTS | | | | |
| | | | | (Cost $57,468,301) | | | 57,468,301 | |
| | | | | | | | | |
| | | | | TOTAL INVESTMENTS — 94.3% | | | | |
| | | | | (Cost $57,468,301) | | | 57,468,301 | |
| | | | | Other Assets in Excess of Liabilities — 5.7% | | | 3,458,411 | |
| | | | | TOTAL NET ASSETS — 100.0% | | $ | 60,926,712 | |
| 1 | The rate is the annualized seven-day yield at period end. |
| 2 | All or a portion of this investment is a holding of AXS Chesapeake Strategy Fund Limited. |
See accompanying Notes to Consolidated Financial Statements.
AXS Chesapeake Strategy Fund
CONSOLIDATED SCHEDULE OF INVESTMENTS - Continued
As of September 30, 2022
FUTURES CONTRACTS
| | | | | | | | | | | | | | | Unrealized | |
| | | Expiration | | | Number of | | | Notional | | | Value at | | | Appreciation | |
| Long Contracts | | Date | | | Contracts | | | Value* | | | September 30, 2022 | | | (Depreciation) | |
| Commodity Futures | | | | | | | | | | | | | | | | | | | |
| CBOT Corn1 | | December 2022 | | | | 12 | | | | 386,400 | | | | 406,500 | | | $ | 20,100 | |
| CME Lean Hogs1 | | October 2022 | | | | 6 | | | | 226,496 | | | | 214,140 | | | | (12,356 | ) |
| NYMEX Natural Gas1 | | November 2022 | | | | 6 | | | | 461,160 | | | | 405,960 | | | | (55,200 | ) |
| | | | | | | | | | | | | | | | | | | | |
| Currency Futures | | | | | | | | | | | | | | | | | | | |
| Brazil Real | | November 2022 | | | | 81 | | | | 1,509,030 | | | | 1,499,310 | | | | (9,720 | ) |
| CME Mexican Peso | | December 2022 | | | | 54 | | | | 1,334,070 | | | | 1,323,270 | | | | (10,800 | ) |
| Swedish Krona | | December 2022 | | | | 21 | | | | 21,927,528 | | | | 22,042,356 | | | | 114,828 | |
| Total Long Contracts | | | | | | | | | | 25,844,684 | | | | 25,891,536 | | | | 46,852 | |
| | | | | | | | | | | | | | | | | | | | |
| Short Contracts | | | | | | | | | | | | | | | | | | | |
| Commodity Futures | | | | | | | | | | | | | | | | | | | |
| CME Live Cattle1 | | October 2022 | | | | (17 | ) | | | (971,880 | ) | | | (974,270 | ) | | | (2,390 | ) |
| CMX Copper1 | | December 2022 | | | | (6 | ) | | | (549,900 | ) | | | (511,875 | ) | | | 38,025 | |
| CMX Gold1 | | December 2022 | | | | (7 | ) | | | (1,197,580 | ) | | | (1,170,400 | ) | | | 27,180 | |
| CMX Silver1 | | December 2022 | | | | (4 | ) | | | (378,800 | ) | | | (380,780 | ) | | | (1,980 | ) |
| LME Lead1 | | December 2022 | | | | (13 | ) | | | (628,225 | ) | | | (620,750 | ) | | | 7,475 | |
| LME Primary Aluminum1 | | December 2022 | | | | (10 | ) | | | (572,375 | ) | | | (540,250 | ) | | | 32,125 | |
| LME Zinc1 | | December 2022 | | | | (3 | ) | | | (218,100 | ) | | | (223,725 | ) | | | (5,625 | ) |
| NYBOT Cotton #21 | | December 2022 | | | | (4 | ) | | | (170,200 | ) | | | (170,680 | ) | | | (480 | ) |
| NYBOT Sugar #111 | | March 2023 | | | | (15 | ) | | | (301,224 | ) | | | (297,024 | ) | | | 4,200 | |
| NYMEX Platinum1 | | January 2023 | | | | (10 | ) | | | (452,504 | ) | | | (429,550 | ) | | | 22,954 | |
| | | | | | | | | | | | | | | | | | | | |
| Currency Futures | | | | | | | | | | | | | | | | | | | |
| Canadian Dollar | | December 2022 | | | | (41 | ) | | | (3,143,675 | ) | | | (2,968,195 | ) | | | 175,480 | |
| CME Australian Dollar | | December 2022 | | | | (29 | ) | | | (1,987,805 | ) | | | (1,860,495 | ) | | | 127,310 | |
| CME British Pound | | December 2022 | | | | (36 | ) | | | (2,608,650 | ) | | | (2,515,725 | ) | | | 92,925 | |
| CME Euro | | December 2022 | | | | (30 | ) | | | (3,794,963 | ) | | | (3,698,063 | ) | | | 96,900 | |
| CME Japanese Yen | | December 2022 | | | | (27 | ) | | | (2,394,934 | ) | | | (2,350,181 | ) | | | 44,753 | |
| CME Swiss Franc | | December 2022 | | | | (24 | ) | | | (3,152,850 | ) | | | (3,064,200 | ) | | | 88,650 | |
| Indian Rupee | | October 2022 | | | | (134 | ) | | | (8,246,381 | ) | | | (8,195,440 | ) | | | 50,941 | |
| New Zealand Dollar | | December 2022 | | | | (30 | ) | | | (1,834,213 | ) | | | (1,684,050 | ) | | | 150,163 | |
| | | | | | | | | | | | | | | | | | | | |
| Index Futures | | | | | | | | | | | | | | | | | | | |
| CAC 40 10 Euro | | October 2022 | | | | (6 | ) | | | (350,968 | ) | | | (345,913 | ) | | | 5,055 | |
| CME E-mini S&P 500 | | December 2022 | | | | (3 | ) | | | (603,383 | ) | | | (540,225 | ) | | | 63,158 | |
| CME NASDAQ 100 E-Mini | | December 2022 | | | | (1 | ) | | | (247,942 | ) | | | (220,710 | ) | | | 27,232 | |
| EUX DAX Index | | December 2022 | | | | (3 | ) | | | (984,675 | ) | | | (911,542 | ) | | | 73,133 | |
| FTSE China A50 | | October 2022 | | | | (79 | ) | | | (1,016,007 | ) | | | (1,020,364 | ) | | | (4,357 | ) |
| MSCI Emerging Markets | | December 2022 | | | | (7 | ) | | | (341,145 | ) | | | (305,025 | ) | | | 36,120 | |
| | | | | | | | | | | | | | | | | | | | |
| Interest Rate Futures | | | | | | | | | | | | | | | | | | | |
| CBOT 5-Year U.S. Treasury Note | | December 2022 | | | | (118 | ) | | | (13,055,405 | ) | | | (12,685,922 | ) | | | 369,483 | |
| CBOT 10-Year U.S. Treasury Note | | December 2022 | | | | (69 | ) | | | (8,004,125 | ) | | | (7,732,313 | ) | | | 271,812 | |
| CBOT U.S. Long Bond | | December 2022 | | | | (20 | ) | | | (2,752,813 | ) | | | (2,528,125 | ) | | | 224,688 | |
| CBOT Ultra Long-Term U.S. Treasury Bond | | December 2022 | | | | (11 | ) | | | (1,654,555 | ) | | | (1,507,000 | ) | | | 147,555 | |
| EUX Euro-BTP Italian Government Bond | | December 2022 | | | | (25 | ) | | | (2,851,650 | ) | | | (2,800,543 | ) | | | 51,107 | |
| EUX Euro-Bund | | December 2022 | | | | (42 | ) | | | (5,916,727 | ) | | | (5,818,582 | ) | | | 98,145 | |
| EUX Euro-Buxl 30-Year Bond | | December 2022 | | | | (7 | ) | | | (1,120,140 | ) | | | (1,028,352 | ) | | | 91,788 | |
| ICF Long Gilt | | December 2022 | | | | (35 | ) | | | (3,790,030 | ) | | | (3,325,503 | ) | | | 464,527 | |
| Total Short Contracts | | | | | | | | | | (75,293,824 | ) | | | (72,425,772 | ) | | | 2,868,052 | |
| | | | | | | | | | | | | | | | | | | | |
| TOTAL FUTURES CONTRACTS | | | | (49,449,140 | ) | | | (46,534,236 | ) | | $ | 2,914,904 | |
| 1 | This investment is a holding of AXS Chesapeake Strategy Fund Limited. |
See accompanying Notes to Consolidated Financial Statements.
AXS Chesapeake Strategy Fund
CONSOLIDATED SUMMARY OF INVESTMENTS
As of September 30, 2022
| Security Type | Percent of Total Net Assets |
| Short-Term Investments | 94.3% |
| Total Investments | 94.3% |
| Other Assets in Excess of Liabilities | 5.7% |
| Total Net Assets | 100.0% |
See accompanying Notes to Consolidated Financial Statements.
AXS Multi-Strategy Alternatives Fund
SCHEDULE OF INVESTMENTS
As of September 30, 2022
Number
of Shares | | | | | Value | |
| | | | COMMON STOCKS — 37.9% | | | |
| | | | AGRICULTURE — 1.5% | | | |
| | 3,715 | | | Archer-Daniels-Midland Co. | | $ | 298,872 | |
| | | | | | | | | |
| | | | | AIRLINES — 0.7% | | | | |
| | 3,430 | | | Alaska Air Group, Inc.* | | | 134,285 | |
| | | | | | | | | |
| | | | | APPAREL — 0.5% | | | | |
| | 3,890 | | | Tapestry, Inc. | | | 110,593 | |
| | | | | | | | | |
| | | | | AUTO MANUFACTURERS — 2.5% | | | | |
| | 575 | | | Cummins, Inc. | | | 117,018 | |
| | 1,480 | | | Tesla, Inc.* | | | 392,570 | |
| | | | | | | | 509,588 | |
| | | | | AUTO PARTS & EQUIPMENT — 0.6% | | | | |
| | 3,625 | | | BorgWarner, Inc. | | | 113,825 | |
| | | | | | | | | |
| | | | | BANKS — 2.5% | | | | |
| | 3,725 | | | Citizens Financial Group, Inc. | | | 127,991 | |
| | 12,130 | | | Regions Financial Corp. | | | 243,449 | |
| | 935 | | | Western Alliance Bancorp | | | 61,467 | |
| | 1,460 | | | Zions Bancorp N.A. | | | 74,256 | |
| | | | | | | | 507,163 | |
| | | | | BEVERAGES — 1.1% | | | | |
| | 1,385 | | | PepsiCo, Inc. | | | 226,115 | |
| | | | | | | | | |
| | | | | BIOTECHNOLOGY — 1.9% | | | | |
| | 2,155 | | | Corteva, Inc. | | | 123,158 | |
| | 4,090 | | | Gilead Sciences, Inc. | | | 252,312 | |
| | | | | | | | 375,470 | |
| | | | | BUILDING MATERIALS — 0.2% | | | | |
| | 565 | | | Builders FirstSource, Inc.* | | | 33,290 | |
| | | | | | | | | |
| | | | | CHEMICALS — 0.9% | | | | |
| | 1,300 | | | CF Industries Holdings, Inc. | | | 125,125 | |
| | 1,130 | | | Olin Corp. | | | 48,454 | |
| | | | | | | | 173,579 | |
| | | | | COMMERCIAL SERVICES — 1.4% | | | | |
| | 980 | | | Automatic Data Processing, Inc. | | | 221,666 | |
| | 150 | | | Avis Budget Group, Inc.* | | | 22,269 | |
| | 115 | | | United Rentals, Inc.* | | | 31,064 | |
| | | | | | | | 274,999 | |
AXS Multi-Strategy Alternatives Fund
SCHEDULE OF INVESTMENTS - Continued
As of September 30, 2022
Number
of Shares | | | | | Value | |
| | | | | COMMON STOCKS (Continued) | | | | |
| | | | | COMPUTERS — 1.6% | | | | |
| | 1,485 | | | Apple, Inc. | | $ | 205,227 | |
| | 3,490 | | | Western Digital Corp.* | | | 113,599 | |
| | | | | | | | 318,826 | |
| | | | | DIVERSIFIED FINANCIAL SERVICES — 0.8% | | | | |
| | 735 | | | Capital One Financial Corp. | | | 67,745 | |
| | 3,130 | | | Jefferies Financial Group, Inc. | | | 92,335 | |
| | | | | | | | 160,080 | |
| | | | | ELECTRONICS — 1.6% | | | | |
| | 1,305 | | | Garmin Ltd.1 | | | 104,804 | |
| | 1,275 | | | Honeywell International, Inc. | | | 212,887 | |
| | | | | | | | 317,691 | |
| | | | | FOOD — 0.6% | | | | |
| | 2,710 | | | Kroger Co. | | | 118,563 | |
| | | | | | | | | |
| | | | | HEALTHCARE-PRODUCTS — 1.0% | | | | |
| | 1,090 | | | Intuitive Surgical, Inc.* | | | 204,310 | |
| | | | | | | | | |
| | | | | HOME BUILDERS — 0.6% | | | | |
| | 1,845 | | | DR Horton, Inc. | | | 124,261 | |
| | | | | | | | | |
| | | | | INSURANCE — 2.2% | | | | |
| | 3,210 | | | American International Group, Inc. | | | 152,411 | |
| | 4,605 | | | Hartford Financial Services Group, Inc. | | | 285,233 | |
| | | | | | | | 437,644 | |
| | | | | INTERNET — 0.6% | | | | |
| | 1,080 | | | Baidu, Inc. - ADR*,1 | | | 126,889 | |
| | | | | | | | | |
| | | | | IRON/STEEL — 0.8% | | | | |
| | 1,955 | | | Cleveland-Cliffs, Inc.* | | | 26,334 | |
| | 410 | | | Nucor Corp. | | | 43,866 | |
| | 715 | | | Steel Dynamics, Inc. | | | 50,729 | |
| | 1,675 | | | United States Steel Corp. | | | 30,351 | |
| | | | | | | | 151,280 | |
| | | | | MACHINERY-DIVERSIFIED — 0.2% | | | | |
| | 140 | | | Deere & Co. | | | 46,745 | |
| | | | | | | | | |
| | | | | OIL & GAS — 5.4% | | | | |
| | 6,845 | | | APA Corp. | | | 234,031 | |
| | 1,185 | | | ConocoPhillips | | | 121,273 | |
| | 5,095 | | | Coterra Energy, Inc. | | | 133,081 | |
AXS Multi-Strategy Alternatives Fund
SCHEDULE OF INVESTMENTS - Continued
As of September 30, 2022
Number
of Shares | | | | | Value | |
| | | | | COMMON STOCKS (Continued) | | | | |
| | | | | OIL & GAS (Continued) | | | | |
| | 1,695 | | | Devon Energy Corp. | | $ | 101,920 | |
| | 1,025 | | | EOG Resources, Inc. | | | 114,523 | |
| | 4,820 | | | Marathon Oil Corp. | | | 108,836 | |
| | 2,440 | | | Valero Energy Corp. | | | 260,714 | |
| | | | | | | | 1,074,378 | |
| | | | | PACKAGING & CONTAINERS — 0.8% | | | | |
| | 4,890 | | | Westrock Co. | | | 151,052 | |
| | | | | | | | | |
| | | | | PHARMACEUTICALS — 1.9% | | | | |
| | 405 | | | Cigna Corp. | | | 112,375 | |
| | 1,575 | | | CVS Health Corp. | | | 150,208 | |
| | 375 | | | Eli Lilly & Co. | | | 121,256 | |
| | | | | | | | 383,839 | |
| | | | | | | | | |
| | | | | REITS — 0.7% | | | | |
| | 8,620 | | | Host Hotels & Resorts, Inc. - REIT | | | 136,886 | |
| | | | | | | | | |
| | | | | RETAIL — 1.0% | | | | |
| | 445 | | | Costco Wholesale Corp. | | | 210,160 | |
| | | | | | | | | |
| | | | | SEMICONDUCTORS — 1.0% | | | | |
| | 1,670 | | | NVIDIA Corp. | | | 202,721 | |
| | | | | | | | | |
| | | | | SOFTWARE — 2.6% | | | | |
| | 535 | | | Intuit, Inc. | | | 207,216 | |
| | 900 | | | Microsoft Corp. | | | 209,610 | |
| | 1,385 | | | NetEase, Inc. - ADR1 | | | 104,706 | |
| | | | | | | | 521,532 | |
| | | | | TELECOMMUNICATIONS — 0.7% | | | | |
| | 5,390 | | | Juniper Networks, Inc. | | | 140,787 | |
| | | | | TOTAL COMMON STOCKS | | | | |
| | | | | (Cost $8,414,641) | | | 7,585,423 | |
| | | | | EXCHANGE-TRADED FUNDS — 39.7% | | | | |
| | 3,525 | | | Aberdeen Bloomberg All Commodity Strategy K-1 Free ETF - ETF | | | 91,051 | |
| | 3,070 | | | Aberdeen Palladium ETF Trust - ETF* | | | 616,689 | |
| | 12,375 | | | Energy Select Sector SPDR Fund - ETF | | | 891,248 | |
| | 25,025 | | | Financial Select Sector SPDR Fund - ETF | | | 759,759 | |
| | 1,200 | | | Invesco KBW Bank ETF - ETF | | | 58,944 | |
| | 5,700 | | | Invesco Optimum Yield Diversified Commodity Strategy No. K-1 ETF - ETF | | | 92,226 | |
| | 11,000 | | | iShares 3-7 Year Treasury Bond ETF - ETF | | | 1,257,080 | |
| | 4,156 | | | iShares 7-10 Year Treasury Bond ETF - ETF | | | 398,935 | |
| | 17,273 | | | iShares MSCI Australia ETF - ETF | | | 338,896 | |
| | 10,699 | | | iShares MSCI Canada ETF - ETF | | | 329,101 | |
AXS Multi-Strategy Alternatives Fund
SCHEDULE OF INVESTMENTS - Continued
As of September 30, 2022
Number
of Shares | | | | | Value | |
| | | | | EXCHANGE-TRADED FUNDS (Continued) | | | | |
| | 1,248 | | | iShares MSCI China ETF - ETF | | $ | 53,115 | |
| | 19,039 | | | iShares MSCI Emerging Markets ETF - ETF | | | 664,080 | |
| | 4,218 | | | iShares MSCI France ETF - ETF | | | 113,042 | |
| | 11,906 | | | iShares MSCI Japan ETF - ETF | | | 581,608 | |
| | 1,239 | | | iShares MSCI Mexico ETF - ETF | | | 54,801 | |
| | 8,703 | | | iShares MSCI Pacific ex Japan ETF - ETF | | | 326,537 | |
| | 1,350 | | | iShares MSCI South Africa ETF - ETF | | | 48,654 | |
| | 947 | | | iShares MSCI South Korea ETF - ETF | | | 44,850 | |
| | 1,133 | | | iShares MSCI Taiwan ETF - ETF | | | 48,832 | |
| | 25,397 | | | iShares MSCI United Kingdom ETF - ETF | | | 665,655 | |
| | 955 | | | iShares U.S. Home Construction ETF - ETF | | | 49,698 | |
| | 585 | | | VanEck Agribusiness ETF - ETF | | | 47,198 | |
| | 6,377 | | | Vanguard Long-Term Treasury ETF - ETF | | | 401,368 | |
| | | | | TOTAL EXCHANGE-TRADED FUNDS | | | | |
| | | | | (Cost $8,895,252) | | | 7,933,367 | |
| | | | | | | | | |
| | | | | SHORT-TERM INVESTMENTS — 22.2% | | | | |
| | 4,435,787 | | | Fidelity Investments Money Market Government Portfolio - Class I, 2.70%2,3 | | | 4,435,787 | |
| | | | | TOTAL SHORT-TERM INVESTMENTS | | | | |
| | | | | (Cost $4,435,787) | | | 4,435,787 | |
| | | | | | | | | |
| | | | | TOTAL INVESTMENTS — 99.8% | | | | |
| | | | | (Cost $21,745,680) | | | 19,954,577 | |
| | | | | Other Assets in Excess of Liabilities — 0.2% | | | 48,523 | |
| | | | | TOTAL NET ASSETS — 100.0% | | $ | 20,003,100 | |
| ADR – American Depository Receipt |
| REIT – Real Estate Investment Trusts |
| ETF – Exchange-Traded Fund |
| * | Non-income producing security. |
| 1 | Foreign security denominated in U.S. Dollars. |
| 2 | All or a portion of this security is segregated as collateral for swap agreement. As of September 30, 2022, the aggregate value of those securities was $0, representing 0.0% of net assets. |
| 3 | The rate is the annualized seven-day yield at period end. |
See accompanying Notes to Consolidated Financial Statements.
AXS Multi-Strategy Alternatives Fund
SCHEDULE OF INVESTMENTS - Continued
As of September 30, 2022
SWAP CONTRACTS
EQUITY SWAP CONTRACTS
| Counterparty | | Reference Entity | | Pay/Receive
Equity on
Reference Entity | | Financing Rate | | Pay/Receive
Frequency | | Termination
Date | | Notional
Amount | | | Premium
Paid
(Received) | | | Unrealized
Appreciation
(Depreciation) | |
| Cowen | | Cowen Financial Product - AXS Multi-Strat Short | | Pay | | 2.07 OBRF01* - Spread | | Monthly | | 8/31/2023 | | | (2,255,520 | ) | | | - | | | $ | 215,192 | |
| TOTAL EQUITY SWAP CONTRACTS | | | | | | | | | | $ | 215,192 | |
| * | OBFR01 - Overnight Bank Funding Rate, 3.07% as of September 30, 2022. |
Equity Swap Top 50 Holdings^
| Cowen Financial Product - AXS Multi-Strat Short | | EQUITIES | | | | |
| | | | | | | | | | |
Number of
Shares | | | Description | | Notional
Value | | | Percentage of Equity
Swap's Notional Amount | |
| | (5,655 | ) | | First Trust US Equity Opportunities ETF | | $ | (458,225 | ) | | | 20.32 | % |
| | (3,130 | ) | | Invesco S&P 500 Pure Growth ETF | | | (452,473 | ) | | | 20.06 | % |
| | (3,525 | ) | | Invesco S&P Pure Equal Weight ETF | | | (448,661 | ) | | | 19.89 | % |
| | (2,760 | ) | | iShares S&P 100 ETF | | | (448,500 | ) | | | 19.88 | % |
| | (1,675 | ) | | Invesco QQQ Trust Series 1 ETF | | | (447,661 | ) | | | 19.85 | % |
| ^ | These investments are not direct holdings of the Fund. The holdings were determined based on the absolute notional values of the positions within the underlying swap basket. This basket contains only 5 investments. |
See accompanying Notes to Consolidated Financial Statements.
AXS Multi-Strategy Alternatives Fund
SUMMARY OF INVESTMENTS
As of September 30, 2022
| Security Type/Industry | Percent of Total
Net Assets |
| Common Stocks | |
| Oil & Gas | 5.4% |
| Software | 2.6% |
| Banks | 2.5% |
| Auto Manufacturers | 2.5% |
| Insurance | 2.2% |
| Pharmaceuticals | 1.9% |
| Biotechnology | 1.9% |
| Computers | 1.6% |
| Electronics | 1.6% |
| Agriculture | 1.5% |
| Commercial Services | 1.4% |
| Beverages | 1.1% |
| Retail | 1.0% |
| Semiconductors | 1.0% |
| Healthcare-Products | 1.0% |
| Chemicals | 0.9% |
| Iron/Steel | 0.8% |
| Packaging & Containers | 0.8% |
| Diversified Financial Services | 0.8% |
| REITS | 0.7% |
| Airlines | 0.7% |
| Telecommunications | 0.7% |
| Food | 0.6% |
| Home Builders | 0.6% |
| Internet | 0.6% |
| Auto Parts & Equipment | 0.6% |
| Apparel | 0.5% |
| Building Materials | 0.2% |
| Machinery-Diversified | 0.2% |
| Total Common Stocks | 37.9% |
| Exchange-Traded Funds | 39.7% |
| Short-Term Investments | 22.2% |
| Total Investments | 99.8% |
| Other Assets in Excess of Liabilities | 0.2% |
| Total Net Assets | 100.0% |
See accompanying Notes to Consolidated Financial Statements.
AXS Sustainable Income Fund
SCHEDULE OF INVESTMENTS
As of September 30, 2022
Principal
Amount | | | | | Value | |
| | | | CORPORATE BONDS — 84.3% | | | |
| | | | AEROSPACE/DEFENSE — 0.7% | | | |
| | | | | TransDigm, Inc. | | | | |
| $ | 10,000 | | | 6.250%, 3/15/20261,2 | | $ | 9,700 | |
| | | | | | | | | |
| | | | | AGRICULTURE — 0.3% | | | | |
| | | | | Darling Ingredients, Inc. | | | | |
| | 5,000 | | | 5.250%, 4/15/20271,2 | | | 4,716 | |
| | | | | | | | | |
| | | | | AIRLINES — 4.0% | | | | |
| | | | | American Airlines, Inc. | | | | |
| | 33,000 | | | 11.750%, 7/15/20252 | | | 34,463 | |
| | | | | Hawaiian Brand Intellectual Property Ltd. / HawaiianMiles Loyalty Ltd. | | | | |
| | 12,000 | | | 5.750%, 1/20/20261,2,3 | | | 10,584 | |
| | | | | United Airlines, Inc. | | | | |
| | 10,000 | | | 4.375%, 4/15/20261,2 | | | 8,925 | |
| | | | | | | | 53,972 | |
| | | | | AUTO PARTS & EQUIPMENT — 2.9% | | | | |
| | | | | American Axle & Manufacturing, Inc. | | | | |
| | 9,000 | | | 6.875%, 7/1/20281 | | | 7,746 | |
| | | | | Clarios Global LP | | | | |
| | 12,000 | | | 6.750%, 5/15/20251,2,3 | | | 11,751 | |
| | | | | Tenneco, Inc. | | | | |
| | 20,000 | | | 5.375%, 12/15/20241 | | | 19,510 | |
| | | | | | | | 39,007 | |
| | | | | BUILDING MATERIALS — 3.3% | | | | |
| | | | | CP Atlas Buyer, Inc. | | | | |
| | 18,000 | | | 7.000%, 12/1/20281,2 | | | 13,364 | |
| | | | | Koppers, Inc. | | | | |
| | 11,000 | | | 6.000%, 2/15/20251,2 | | | 9,845 | |
| | | | | Owens Corning | | | | |
| | 25,000 | | | 3.950%, 8/15/20291 | | | 22,367 | |
| | | | | | | | 45,576 | |
| | | | | CHEMICALS — 5.2% | | | | |
| | | | | CVR Partners LP / CVR Nitrogen Finance Corp. | | | | |
| 8,000 | | | 6.125%, 6/15/20281,2 | | | 6,975 | |
| | | | | GPD Cos., Inc. | | | | |
| | 24,000 | | | 10.125%, 4/1/20261,2 | | | 21,849 | |
| | | | | Innophos Holdings, Inc. | | | | |
| | 15,000 | | | 9.375%, 2/15/20281,2 | | | 14,427 | |
| | | | | Iris Holdings, Inc. | | | | |
| | 5,000 | | | 8.750%, 2/15/20261,2 | | | 4,600 | |
| | | | | Rayonier AM Products, Inc. | | | | |
| | 7,000 | | | 7.625%, 1/15/20261,2 | | | 6,164 | |
AXS Sustainable Income Fund
SCHEDULE OF INVESTMENTS - Continued
As of September 30, 2022
Principal
Amount | | | | | Value | |
| | | | | CORPORATE BONDS (Continued) | | | | |
| | | | | CHEMICALS (Continued) | | | | |
| | | | | Venator Finance Sarl / Venator Materials LLC | | | | |
| $ | 17,000 | | | 9.500%, 7/1/20251,2,3 | | $ | 16,278 | |
| | | | | | | | 70,293 | |
| | | | | COMMERCIAL SERVICES — 1.5% | | | | |
| | | | | Alta Equipment Group, Inc. | | | | |
| | 9,000 | | | 5.625%, 4/15/20261,2 | | | 7,542 | |
| | | | | Prime Security Services Borrower LLC / Prime Finance, Inc. | | | | |
| | 8,000 | | | 5.250%, 4/15/20242 | | | 7,782 | |
| | | | | WASH Multifamily Acquisition, Inc. | | | | |
| | 5,000 | | | 5.750%, 4/15/20261,2 | | | 4,611 | |
| | | | | | | | 19,935 | |
| | | | | COMPUTERS — 2.1% | | | | |
| | | | | NCR Corp. | | | | |
| | 6,000 | | | 5.750%, 9/1/20271,2 | | | 5,436 | |
| | | | | Unisys Corp. | | | | |
| | 12,000 | | | 6.875%, 11/1/20271,2 | | | 9,361 | |
| | | | | Virtusa Corp. | | | | |
| | 19,000 | | | 7.125%, 12/15/20281,2 | | | 13,965 | |
| | | | | | | | 28,762 | |
| | | | | DISTRIBUTION/WHOLESALE — 1.3% | | | | |
| | | | | BCPE Empire Holdings, Inc. | | | | |
| | 20,000 | | | 7.625%, 5/1/20271,2 | | | 17,342 | |
| | | | | | | | | |
| | | | | DIVERSIFIED FINANCIAL SERVICES — 3.9% | | | | |
| | | | | LFS Topco LLC | | | | |
| | 13,000 | | | 5.875%, 10/15/20261,2 | | | 10,335 | |
| | | | | Nationstar Mortgage Holdings, Inc. | | | | |
| | 15,000 | | | 6.000%, 1/15/20271,2 | | | 12,694 | |
| | | | | Navient Corp. | | | | |
| | 10,000 | | | 7.250%, 9/25/2023 | | | 9,961 | |
| | | | | OneMain Finance Corp. | | | | |
| | 8,000 | | | 5.625%, 3/15/2023 | | | 7,960 | |
| | 12,000 | | | 6.125%, 3/15/20241 | | | 11,558 | |
| | | | | | | | 52,508 | |
| | | | | ELECTRICAL COMPONENTS & EQUIPMENT — 0.7% | | | | |
| | | | | WESCO Distribution, Inc. | | | | |
| | 10,000 | | | 7.125%, 6/15/20251,2 | | | 10,005 | |
| | | | | | | | | |
| | | | | ENGINEERING & CONSTRUCTION — 1.5% | | | | |
| | | | | Artera Services LLC | | | | |
| | 8,000 | | | 9.033%, 12/4/20251,2 | | | 6,440 | |
AXS Sustainable Income Fund
SCHEDULE OF INVESTMENTS - Continued
As of September 30, 2022
Principal
Amount | | | | | Value | |
| | | | CORPORATE BONDS (Continued) | | | |
| | | | ENGINEERING & CONSTRUCTION (Continued) | | | |
| | | | | Railworks Holdings LP / Railworks Rally, Inc. | | | | |
| $ | 15,000 | | | 8.250%, 11/15/20281,2 | | $ | 13,955 | |
| | | | | | | | 20,395 | |
| | | | | ENTERTAINMENT — 2.4% | | | | |
| | | | | Cinemark USA, Inc. | | | | |
| | 7,000 | | | 5.875%, 3/15/20261,2 | | | 5,853 | |
| | 16,000 | | | 5.250%, 7/15/20281,2 | | | 12,306 | |
| | | | | Six Flags Entertainment Corp. | | | | |
| | 10,000 | | | 4.875%, 7/31/20241,2 | | | 9,526 | |
| | | | | Vail Resorts, Inc. | | | | |
| | 5,000 | | | 6.250%, 5/15/20251,2 | | | 4,941 | |
| | | | | | | | 32,626 | |
| | | | | FOOD — 0.4% | | | | |
| | | | | H-Food Holdings LLC / Hearthside Finance Co., Inc. | | | | |
| | 9,000 | | | 8.500%, 6/1/20261,2 | | | 5,713 | |
| | | | | | | | | |
| | | | | FOREST PRODUCTS & PAPER — 1.1% | | | | |
| | | | | Clearwater Paper Corp. | | | | |
| | 15,000 | | | 5.375%, 2/1/20252 | | | 14,792 | |
| | | | | | | | | |
| | | | | HEALTHCARE-SERVICES — 7.0% | | | | |
| | | | | CHS/Community Health Systems, Inc. | | | | |
| | 20,000 | | | 8.000%, 3/15/20261,2 | | | 17,323 | |
| | | | | Legacy LifePoint Health LLC | | | | |
| | 10,000 | | | 6.750%, 4/15/20251,2 | | | 9,525 | |
| | | | | ModivCare, Inc. | | | | |
| | 16,000 | | | 5.875%, 11/15/20251,2 | | | 14,767 | |
| | | | | RP Escrow Issuer LLC | | | | |
| | 15,000 | | | 5.250%, 12/15/20251,2 | | | 12,396 | |
| | | | | Select Medical Corp. | | | | |
| | 15,000 | | | 6.250%, 8/15/20261,2 | | | 14,114 | |
| | | | | Tenet Healthcare Corp. | | | | |
| | 4,000 | | | 4.625%, 7/15/20241 | | | 3,868 | |
| | 10,000 | | | 6.250%, 2/1/20271,2 | | | 9,331 | |
| | | | | U.S. Acute Care Solutions LLC | | | | |
| | 16,000 | | | 6.375%, 3/1/20261,2 | | | 13,440 | |
| | | | | | | | 94,764 | |
| | | | | HOME BUILDERS — 3.1% | | | | |
| | | | | New Home Co., Inc. | | | | |
| | 41,000 | | | 7.250%, 10/15/20251,2 | | | 33,052 | |
AXS Sustainable Income Fund
SCHEDULE OF INVESTMENTS - Continued
As of September 30, 2022
Principal
Amount | | | | | Value | |
| | | | CORPORATE BONDS (Continued) | | | |
| | | | HOME BUILDERS (Continued) | | | |
| | | | | Picasso Finance Sub, Inc. | | | | |
| $ | 10,000 | | | 6.125%, 6/15/20251,2 | | $ | 9,801 | |
| | | | | | | | 42,853 | |
| | | | | INTERNET — 2.0% | | | | |
| | | | | TripAdvisor, Inc. | | | | |
| | 10,000 | | | 7.000%, 7/15/20251,2 | | | 9,722 | |
| | | | | Uber Technologies, Inc. | | | | |
| | 18,000 | | | 8.000%, 11/1/20261,2 | | | 18,067 | |
| | | | | | | | 27,789 | |
| | | | | IRON/STEEL — 1.8% | | | | |
| | | | | Cleveland-Cliffs, Inc. | | | | |
| | 10,000 | | | 6.750%, 3/15/20261,2 | | | 9,835 | |
| | | | | TMS International Corp. | | | | |
| | 20,000 | | | 6.250%, 4/15/20291,2 | | | 14,197 | |
| | | | | | | | 24,032 | |
| | | | | LEISURE TIME — 1.0% | | | | |
| | | | | Carnival Corp. | | | | |
| | 18,000 | | | 7.625%, 3/1/20261,2,3 | | | 13,923 | |
| | | | | | | | | |
| | | | | LODGING — 2.7% | | | | |
| | | | | Hilton Domestic Operating Co., Inc. | | | | |
| | 10,000 | | | 5.375%, 5/1/20251,2 | | | 9,779 | |
| | | | | Marriott Ownership Resorts, Inc. | | | | |
| | 17,000 | | | 6.125%, 9/15/20251,2 | | | 16,622 | |
| | | | | Travel + Leisure Co. | | | | |
| | 10,000 | | | 5.650%, 4/1/20241 | | | 9,776 | |
| | | | | | | | 36,177 | |
| | | | | MACHINERY-CONSTRUCTION & MINING — 0.6% | | | | |
| | | | | Manitowoc Co., Inc. | | | | |
| | 9,000 | | | 9.000%, 4/1/20261,2 | | | 8,186 | |
| | | | | | | | | |
| | | | | MACHINERY-DIVERSIFIED — 0.6% | | | | |
| | | | | Titan Acquisition Ltd. / Titan Co.-Borrower LLC | | | | |
| | 11,000 | | | 7.750%, 4/15/20261,2,3 | | | 8,695 | |
| | | | | | | | | |
| | | | | MEDIA — 10.3% | | | | |
| | | | | Audacy Capital Corp. | | | | |
| | 14,000 | | | 6.500%, 5/1/20271,2 | | | 3,430 | |
| | 34,000 | | | 6.750%, 3/31/20291,2 | | | 8,191 | |
| | | | | CCO Holdings LLC / CCO Holdings Capital Corp. | | | | |
| | 20,000 | | | 5.500%, 5/1/20261,2 | | | 18,993 | |
AXS Sustainable Income Fund
SCHEDULE OF INVESTMENTS - Continued
As of September 30, 2022
Principal
Amount | | | | | Value | |
| | | | | CORPORATE BONDS (Continued) | | | | |
| | | | | MEDIA (Continued) | | | | |
| | | | | Cengage Learning, Inc. | | | | |
| $ | 14,000 | | | 9.500%, 6/15/20241,2 | | $ | 13,144 | |
| | | | | Directv Financing LLC / Directv Financing Co.-Obligor, Inc. | | | | |
| | 13,000 | | | 5.875%, 8/15/20271,2 | | | 11,207 | |
| | | | | Gannett Holdings LLC | | | | |
| | 21,000 | | | 6.000%, 11/1/20261,2 | | | 16,117 | |
| | | | | iHeartCommunications, Inc. | | | | |
| | 18,000 | | | 8.375%, 5/1/20271 | | | 15,187 | |
| | | | | McGraw-Hill Education, Inc. | | | | |
| | 5,000 | | | 5.750%, 8/1/20281,2 | | | 4,175 | |
| | | | | Townsquare Media, Inc. | | | | |
| | 40,000 | | | 6.875%, 2/1/20261,2 | | | 36,565 | |
| | | | | Univision Communications, Inc. | | | | |
| | 8,000 | | | 6.625%, 6/1/20271,2 | | | 7,550 | |
| | | | | Videotron Ltd. | | | | |
| | 5,000 | | | 5.375%, 6/15/20241,2,3 | | | 4,900 | |
| | | | | | | | 139,459 | |
| | | | | METAL FABRICATE/HARDWARE — 0.8% | | | | |
| | | | | Park-Ohio Industries, Inc. | | | | |
| | 15,000 | | | 6.625%, 4/15/20271 | | | 11,250 | |
| | | | | | | | | |
| | | | | MISCELLANEOUS MANUFACTURING — 2.7% | | | | |
| | | | | FXI Holdings, Inc. | | | | |
| | 9,000 | | | 7.875%, 11/1/20241,2 | | | 7,110 | |
| | 27,000 | | | 12.250%, 11/15/20261,2 | | | 21,398 | |
| | | | | LSB Industries, Inc. | | | | |
| | 10,000 | | | 6.250%, 10/15/20281,2 | | | 8,580 | |
| | | | | | | | 37,088 | |
| | | | | PACKAGING & CONTAINERS — 3.7% | | | | |
| | | | | Ball Corp. | | | | |
| | 5,000 | | | 5.250%, 7/1/2025 | | | 4,886 | |
| | | | | LABL, Inc. | | | | |
| | 10,000 | | | 6.750%, 7/15/20261,2 | | | 9,000 | |
| | | | | Mauser Packaging Solutions Holding Co. | | | | |
| | 18,000 | | | 8.500%, 4/15/20241,2 | | | 17,100 | |
| | | | | Sealed Air Corp. | | | | |
| | 10,000 | | | 5.125%, 12/1/20241,2 | | | 9,659 | |
| | 10,000 | | | 5.500%, 9/15/20251,2 | | | 9,550 | |
| | | | | | | | 50,195 | |
| | | | | PHARMACEUTICALS — 0.8% | | | | |
| | | | | AdaptHealth LLC | | | | |
| | 12,000 | | | 6.125%, 8/1/20281,2 | | | 10,748 | |
AXS Sustainable Income Fund
SCHEDULE OF INVESTMENTS - Continued
As of September 30, 2022
Principal
Amount | | | | | Value | |
| | | | | CORPORATE BONDS (Continued) | | | | |
| | | | | REITS — 6.4% | | | | |
| | | | | Alexandria Real Estate Equities, Inc. | | | | |
| $ | 25,000 | | | 3.800%, 4/15/20261 | | $ | 23,781 | |
| | | | | Apollo Commercial Real Estate Finance, Inc. | | | | |
| | 10,000 | | | 5.375%, 10/15/20234 | | | 9,731 | |
| | | | | HAT Holdings I LLC / HAT Holdings II LLC | | | | |
| | 25,000 | | | 6.000%, 4/15/20251,2 | | | 23,464 | |
| | | | | iStar, Inc. | | | | |
| | 14,000 | | | 4.750%, 10/1/20241 | | | 13,807 | |
| | | | | Park Intermediate Holdings LLC / PK Domestic Property LLC / PK Finance Co.-Issuer | | | | |
| | 5,000 | | | 7.500%, 6/1/20251,2 | | | 4,970 | |
| | | | | Starwood Property Trust, Inc. | | | | |
| | 12,000 | | | 3.750%, 12/31/20241,2 | | | 10,875 | |
| | | | | | | | 86,628 | |
| | | | | RETAIL — 2.8% | | | | |
| | | | | Dave & Buster's, Inc. | | | | |
| | 13,000 | | | 7.625%, 11/1/20251,2 | | | 12,805 | |
| | | | | Guitar Center, Inc. | | | | |
| | 12,000 | | | 8.500%, 1/15/20261,2 | | | 10,631 | |
| | | | | LSF9 Atlantis Holdings LLC / Victra Finance Corp. | | | | |
| | 16,000 | | | 7.750%, 2/15/20261,2 | | | 14,280 | |
| | | | | | | | 37,716 | |
| | | | | SEMICONDUCTORS — 0.7% | | | | |
| | | | | Amkor Technology, Inc. | | | | |
| | 10,000 | | | 6.625%, 9/15/20271,2 | | | 9,565 | |
| | | | | | | | | |
| | | | | SOFTWARE — 1.0% | | | | |
| | | | | Rocket Software, Inc. | | | | |
| | 5,000 | | | 6.500%, 2/15/20291,2 | | | 3,700 | |
| | | | | SS&C Technologies, Inc. | | | | |
| | 7,000 | | | 5.500%, 9/30/20271,2 | | | 6,386 | |
| | | | | Veritas US, Inc. / Veritas Bermuda Ltd. | | | | |
| | 5,000 | | | 7.500%, 9/1/20251,2 | | | 3,829 | |
| | | | | | | | 13,915 | |
| | | | | TELECOMMUNICATIONS — 5.0% | | | | |
| | | | | Avaya, Inc. | | | | |
| | 8,000 | | | 6.125%, 9/15/20281,2 | | | 3,980 | |
| | | | | CommScope Technologies LLC | | | | |
| | 18,000 | | | 6.000%, 6/15/20251,2 | | | 15,992 | |
| | | | | Lumen Technologies, Inc. | | | | |
| | 20,000 | | | 6.750%, 12/1/2023 | | | 20,391 | |
| | | | | Sprint Corp. | | | | |
| | 20,000 | | | 7.875%, 9/15/2023 | | | 20,241 | |
AXS Sustainable Income Fund
SCHEDULE OF INVESTMENTS - Continued
As of September 30, 2022
Principal
Amount | | | | | Value | |
| | | | CORPORATE BONDS (Continued) | | | |
| | | | TELECOMMUNICATIONS (Continued) | | | |
| | | | | Viasat, Inc. | | | | |
| $ | 9,000 | | | 5.625%, 4/15/20271,2 | | $ | 7,561 | |
| | | | | | | | 68,165 | |
| | | | | TOTAL CORPORATE BONDS | | | | |
| | | | | (Cost $1,325,295) | | | 1,146,490 | |
Number
of Shares | | | | | | |
| | | | MEDIUM TERM NOTES — 0.4% | | | |
| | | | DIVERSIFIED FINANCIAL SERVICES — 0.4% | | | |
| | 5,000 | | | Navient Corp. | | | 4,971 | |
| | | | | TOTAL MEDIUM TERM NOTES | | | | |
| | | | | (Cost $5,017) | | | 4,971 | |
Principal
Amount | | | | | | |
| | | | U.S. TREASURY BILLS — 1.8% | | | |
| | | | | United States Treasury Bill | | | | |
| $ | 25,000 | | | 0.000%, 11/15/2022 | | | 24,915 | |
| | | | | TOTAL U.S. TREASURY BILLS | | | | |
| | | | | (Cost $24,923) | | | 24,915 | |
| | | | | | | | | |
| | | | | SHORT-TERM INVESTMENTS — 16.9% | | | | |
| | 230,817 | | | UMB Bank Demand Deposit, 0.01%5 | | | 230,817 | |
| | | | | TOTAL SHORT-TERM INVESTMENTS | | | | |
| | | | | (Cost $230,817) | | | 230,817 | |
| | | | | | | | | |
| | | | | TOTAL INVESTMENTS — 103.4% | | | | |
| | | | | (Cost $1,586,052) | | | 1,407,193 | |
| | | | | Liabilities in Excess of Other Assets — (3.4)% | | | (46,612 | ) |
| | | | | TOTAL NET ASSETS — 100.0% | | $ | 1,360,581 | |
| LP – Limited Partnership |
| LLC – Limited Liability Company |
| 2 | Security exempt from registration under Rule 144A of the Securities Act of 1933. These securities are restricted and may be resold in transactions exempt from registration normally to qualified institutional buyers. The total value of these securities is $934,470, which represents 68.7% of total net assets of the Fund. |
| 3 | Foreign security denominated in U.S. Dollars. |
| 5 | The rate is the annualized seven-day yield at period end. |
See accompanying Notes to Consolidated Financial Statements.
AXS Sustainable Income Fund
SUMMARY OF INVESTMENTS
As of September 30, 2022
| Security Type/Industry | Percent of Total
Net Assets |
| Corporate Bonds | |
| Media | 10.3% |
| Healthcare-Services | 7.0% |
| REITS | 6.4% |
| Chemicals | 5.2% |
| Telecommunications | 5.0% |
| Airlines | 4.0% |
| Diversified Financial Services | 3.9% |
| Packaging & Containers | 3.7% |
| Building Materials | 3.3% |
| Home Builders | 3.1% |
| Auto Parts & Equipment | 2.9% |
| Retail | 2.8% |
| Lodging | 2.7% |
| Miscellaneous Manufacturing | 2.7% |
| Entertainment | 2.4% |
| Computers | 2.1% |
| Internet | 2.0% |
| Iron/Steel | 1.8% |
| Commercial Services | 1.5% |
| Engineering & Construction | 1.5% |
| Distribution/Wholesale | 1.3% |
| Forest Products & Paper | 1.1% |
| Software | 1.0% |
| Leisure Time | 1.0% |
| Pharmaceuticals | 0.8% |
| Metal Fabricate/Hardware | 0.8% |
| Aerospace/Defense | 0.7% |
| Electrical Components & Equipment | 0.7% |
| Semiconductors | 0.7% |
| Machinery-Construction & Mining | 0.6% |
| Machinery-Diversified | 0.6% |
| Food | 0.4% |
| Agriculture | 0.3% |
| Total Corporate Bonds | 84.3% |
| U.S. Treasury Bills | 1.8% |
| Medium Term Notes | |
| Diversified Financial Services | 0.4% |
| Total Medium Term Notes | 0.4% |
| Short-Term Investments | 16.9% |
| Total Investments | 103.4% |
| Liabilities in Excess of Other Assets | (3.4)% |
| Total Net Assets | 100.0% |
See accompanying Notes to Consolidated Financial Statements.
AXS Thomson Reuters Private Equity Return Tracker Fund
SCHEDULE OF INVESTMENTS
As of September 30, 2022
Number
of Shares | | | | | Value | |
| | | | | COMMON STOCKS — 101.7% | | | | |
| | | | | AEROSPACE/DEFENSE — 2.2% | | | | |
| | 534 | | | Boeing Co.* | | $ | 64,657 | |
| | 229 | | | Lockheed Martin Corp.1 | | | 88,460 | |
| | 130 | | | Northrop Grumman Corp. | | | 61,142 | |
| | 1,347 | | | Raytheon Technologies Corp.1 | | | 110,265 | |
| | | | | | | | 324,524 | |
| | | | | AGRICULTURE — 1.3% | | | | |
| | 1,390 | | | Altria Group, Inc. | | | 56,128 | |
| | 389 | | | Archer-Daniels-Midland Co. | | | 31,295 | |
| | 1,199 | | | Philip Morris International, Inc.1 | | | 99,529 | |
| | | | | | | | 186,952 | |
| | | | | APPAREL — 0.4% | | | | |
| | 682 | | | NIKE, Inc. - Class B | | | 56,688 | |
| | | | | | | | | |
| | | | | AUTO MANUFACTURERS — 2.8% | | | | |
| | 2,083 | | | Ford Motor Co. | | | 23,330 | |
| | 677 | | | General Motors Co. | | | 21,725 | |
| | 1,374 | | | Tesla, Inc.*,1 | | | 364,453 | |
| | | | | | | | 409,508 | |
| | | | | BANKS — 5.2% | | | | |
| | 4,654 | | | Bank of America Corp.1 | | | 140,551 | |
| | 1,308 | | | Citigroup, Inc. | | | 54,504 | |
| | 224 | | | Goldman Sachs Group, Inc. | | | 65,643 | |
| | 1,958 | | | JPMorgan Chase & Co.1 | | | 204,611 | |
| | 933 | | | Morgan Stanley | | | 73,716 | |
| | 278 | | | PNC Financial Services Group, Inc. | | | 41,539 | |
| | 871 | | | Truist Financial Corp. | | | 37,923 | |
| | 886 | | | U.S. Bancorp | | | 35,724 | |
| | 2,521 | | | Wells Fargo & Co. | | | 101,395 | |
| | | | | | | | 755,606 | |
| | | | | BEVERAGES — 3.1% | | | | |
| | 3,211 | | | Coca-Cola Co.1 | | | 179,880 | |
| | 125 | | | Constellation Brands, Inc. - Class A | | | 28,710 | |
| | 703 | | | Keurig Dr Pepper, Inc. | | | 25,181 | |
| | 305 | | | Monster Beverage Corp.* | | | 26,523 | |
| | 1,126 | | | PepsiCo, Inc.1 | | | 183,831 | |
| | | | | | | | 444,125 | |
| | | | | BIOTECHNOLOGY — 0.5% | | | | |
| | 175 | | | Amgen, Inc. | | | 39,445 | |
| | 592 | | | Corteva, Inc. | | | 33,833 | |
| | | | | | | | 73,278 | |
AXS Thomson Reuters Private Equity Return Tracker Fund
SCHEDULE OF INVESTMENTS - Continued
As of September 30, 2022
Number
of Shares | | | | | Value | |
| | | | | COMMON STOCKS (Continued) | | | | |
| | | | | BUILDING MATERIALS — 0.4% | | | | |
| | 75 | | | Martin Marietta Materials, Inc. | | $ | 24,157 | |
| | 171 | | | Vulcan Materials Co. | | | 26,968 | |
| | | | | | | | 51,125 | |
| | | | | CHEMICALS — 3.8% | | | | |
| | 288 | | | Air Products and Chemicals, Inc. | | | 67,026 | |
| | 162 | | | Albemarle Corp. | | | 42,839 | |
| | 1,016 | | | Dow, Inc. | | | 44,633 | |
| | 708 | | | DuPont de Nemours, Inc. | | | 35,683 | |
| | 352 | | | Ecolab, Inc. | | | 50,836 | |
| | 701 | | | Linde PLC2 | | | 188,983 | |
| | 312 | | | LyondellBasell Industries N.V. - Class A2 | | | 23,488 | |
| | 290 | | | PPG Industries, Inc. | | | 32,100 | |
| | 331 | | | Sherwin-Williams Co. | | | 67,772 | |
| | | | | | | | 553,360 | |
| | | | | COMMERCIAL SERVICES — 2.0% | | | | |
| | 416 | | | Automatic Data Processing, Inc. | | | 94,095 | |
| | 1,153 | | | PayPal Holdings, Inc.* | | | 99,239 | |
| | 314 | | | S&P Global, Inc. | | | 95,880 | |
| | | | | | | | 289,214 | |
| | | | | COMPUTERS — 6.4% | | | | |
| | 656 | | | Accenture PLC 2 | | | 168,789 | |
| | 4,687 | | | Apple, Inc.1 | | | 647,743 | |
| | 890 | | | International Business Machines Corp. | | | 105,741 | |
| | | | | | | | 922,273 | |
| | | | | COSMETICS/PERSONAL CARE — 2.3% | | | | |
| | 684 | | | Colgate-Palmolive Co. | | | 48,051 | |
| | 189 | | | Estee Lauder Cos., Inc. - Class A | | | 40,805 | |
| | 1,951 | | | Procter & Gamble Co.1 | | | 246,314 | |
| | | | | | | | 335,170 | |
| | | | | DIVERSIFIED FINANCIAL SERVICES — 5.1% | | | | |
| | 402 | | | American Express Co. | | | 54,234 | |
| | 91 | | | BlackRock, Inc. | | | 50,076 | |
| | 951 | | | Charles Schwab Corp. | | | 68,348 | |
| | 214 | | | CME Group, Inc. | | | 37,906 | |
| | 854 | | | Mastercard, Inc. - Class A1 | | | 242,826 | |
| | 1,642 | | | Visa, Inc. - Class A1 | | | 291,701 | |
| | | | | | | | 745,091 | |
| | | | | ELECTRIC — 1.9% | | | | |
| | 238 | | | American Electric Power Co., Inc. | | | 20,575 | |
AXS Thomson Reuters Private Equity Return Tracker Fund
SCHEDULE OF INVESTMENTS - Continued
As of September 30, 2022
Number
of Shares | | | | | Value | |
| | | | | COMMON STOCKS (Continued) | | | | |
| | | | | ELECTRIC (Continued) | | | | |
| | 162 | | | Consolidated Edison, Inc. | | $ | 13,893 | |
| | 403 | | | Dominion Energy, Inc. | | | 27,851 | |
| | 383 | | | Duke Energy Corp. | | | 35,627 | |
| | 434 | | | Exelon Corp. | | | 16,258 | |
| | 976 | | | NextEra Energy, Inc. | | | 76,528 | |
| | 235 | | | Public Service Enterprise Group, Inc. | | | 13,214 | |
| | 130 | | | Sempra Energy | | | 19,492 | |
| | 527 | | | Southern Co. | | | 35,836 | |
| | 254 | | | Xcel Energy, Inc. | | | 16,256 | |
| | | | | | | | 275,530 | |
| | | | | ELECTRICAL COMPONENTS & EQUIPMENT — 0.3% | | | | |
| | 537 | | | Emerson Electric Co. | | | 39,319 | |
| | | | | | | | | |
| | | | | ELECTRONICS — 0.7% | | | | |
| | 620 | | | Honeywell International, Inc.1 | | | 103,521 | |
| | | | | | | | | |
| | | | | ENERGY-ALTERNATE SOURCES — 0.2% | | | | |
| | 92 | | | Enphase Energy, Inc.* | | | 25,527 | |
| | 42 | | | SolarEdge Technologies, Inc.* | | | 9,722 | |
| | | | | | | | 35,249 | |
| | | | | ENVIRONMENTAL CONTROL — 0.4% | | | | |
| | 356 | | | Waste Management, Inc. | | | 57,035 | |
| | | | | | | | | |
| | | | | FOOD — 1.2% | | | | |
| | 429 | | | General Mills, Inc. | | | 32,866 | |
| | 108 | | | Hershey Co. | | | 23,811 | |
| | 492 | | | Kroger Co. | | | 21,525 | |
| | 1,130 | | | Mondelez International, Inc. | | | 61,958 | |
| | 406 | | | Sysco Corp. | | | 28,708 | |
| | | | | | | | 168,868 | |
| | | | | HEALTHCARE-PRODUCTS — 1.5% | | | | |
| | 589 | | | Abbott Laboratories | | | 56,992 | |
| | 225 | | | Danaher Corp. | | | 58,115 | |
| | 448 | | | Medtronic PLC2 | | | 36,176 | |
| | 131 | | | Thermo Fisher Scientific, Inc. | | | 66,442 | |
| | | | | | | | 217,725 | |
| | | | | HEALTHCARE-SERVICES — 1.3% | | | | |
| | 81 | | | Elevance Health, Inc. | | | 36,793 | |
| | 314 | | | UnitedHealth Group, Inc.1 | | | 158,583 | |
| | | | | | | | 195,376 | |
AXS Thomson Reuters Private Equity Return Tracker Fund
SCHEDULE OF INVESTMENTS - Continued
As of September 30, 2022
Number
of Shares | | | | | Value | |
| | | | COMMON STOCKS (Continued) | | | |
| | | | HOUSEHOLD PRODUCTS/WARES — 0.2% | | | |
| | 261 | | | Kimberly-Clark Corp. | | $ | 29,373 | |
| | | | | | | | | |
| | | | | INSURANCE — 3.9% | | | | |
| | 1,561 | | | Berkshire Hathaway, Inc.*,1 | | | 416,818 | |
| | 269 | | | Chubb Ltd.2 | | | 48,926 | |
| | 317 | | | Marsh & McLennan Cos., Inc. | | | 47,325 | |
| | 388 | | | Progressive Corp. | | | 45,089 | |
| | | | | | | | 558,158 | |
| | | | | INTERNET — 11.3% | | | | |
| | 6,809 | | | Alphabet, Inc. - Class A*,1 | | | 651,281 | |
| | 4,892 | | | Amazon.com, Inc.*,1 | | | 552,796 | |
| | 22 | | | Booking Holdings, Inc.* | | | 36,150 | |
| | 2,172 | | | Meta Platforms, Inc.*,1 | | | 294,697 | |
| | 413 | | | Netflix, Inc.* | | | 97,237 | |
| | | | | | | | 1,632,161 | |
| | | | | IRON/STEEL — 0.2% | | | | |
| | 293 | | | Nucor Corp. | | | 31,348 | |
| | | | | | | | | |
| | | | | LODGING — 0.1% | | | | |
| | 154 | | | Marriott International, Inc. - Class A | | | 21,582 | |
| | | | | | | | | |
| | | | | MACHINERY-CONSTRUCTION & MINING — 0.5% | | | | |
| | 484 | | | Caterpillar, Inc.1 | | | 79,415 | |
| | | | | | | | | |
| | | | | MACHINERY-DIVERSIFIED — 0.6% | | | | |
| | 252 | | | Deere & Co. | | | 84,140 | |
| | | | | | | | | |
| | | | | MEDIA — 1.3% | | | | |
| | 79 | | | Charter Communications, Inc. - Class A* | | | 23,965 | |
| | 2,416 | | | Comcast Corp. - Class A | | | 70,861 | |
| | 359 | | | Liberty Global PLC*,2 | | | 5,597 | |
| | 972 | | | Walt Disney Co.*,1 | | | 91,689 | |
| | | | | | | | 192,112 | |
| | | | | MINING — 0.6% | | | | |
| | 1,768 | | | Freeport-McMoRan, Inc. | | | 48,319 | |
| | 1,029 | | | Newmont Corp. | | | 43,249 | |
| | | | | | | | 91,568 | |
| | | | | MISCELLANEOUS MANUFACTURING — 1.4% | | | | |
| | 514 | | | 3M Co. | | | 56,797 | |
| | 361 | | | Eaton Corp. PLC2 | | | 48,143 | |
| | 837 | | | General Electric Co. | | | 51,819 | |
AXS Thomson Reuters Private Equity Return Tracker Fund
SCHEDULE OF INVESTMENTS - Continued
As of September 30, 2022
Number
of Shares | | | | | Value | |
| | | | COMMON STOCKS (Continued) | | | |
| | | | MISCELLANEOUS MANUFACTURING (Continued) | | | |
| | 240 | | | Illinois Tool Works, Inc. | | $ | 43,356 | |
| | | | | | | | 200,115 | |
| | | | | OIL & GAS — 5.9% | | | | |
| | 1,445 | | | Chevron Corp.1 | | | 207,603 | |
| | 961 | | | ConocoPhillips | | | 98,349 | |
| | 463 | | | Devon Energy Corp. | | | 27,840 | |
| | 128 | | | Diamondback Energy, Inc. | | | 15,419 | |
| | 356 | | | EOG Resources, Inc. | | | 39,776 | |
| | 3,140 | | | Exxon Mobil Corp.1 | | | 274,153 | |
| | 184 | | | Hess Corp. | | | 20,054 | |
| | 385 | | | Marathon Petroleum Corp. | | | 38,242 | |
| | 695 | | | Occidental Petroleum Corp. | | | 42,708 | |
| | 357 | | | Phillips 66 | | | 28,817 | |
| | 169 | | | Pioneer Natural Resources Co. | | | 36,594 | |
| | 285 | | | Valero Energy Corp. | | | 30,452 | |
| | | | | | | | 860,007 | |
| | | | | OIL & GAS SERVICES — 0.4% | | | | |
| | 635 | | | Halliburton Co. | | | 15,634 | |
| | 996 | | | Schlumberger N.V.2 | | | 35,756 | |
| | | | | | | | 51,390 | |
| | | | | PACKAGING & CONTAINERS — 0.1% | | | | |
| | 386 | | | Ball Corp. | | | 18,652 | |
| | | | | | | | | |
| | | | | PHARMACEUTICALS — 4.3% | | | | |
| | 590 | | | AbbVie, Inc. | | | 79,184 | |
| | 675 | | | Bristol-Myers Squibb Co. | | | 47,986 | |
| | 439 | | | CVS Health Corp. | | | 41,867 | |
| | 264 | | | Eli Lilly & Co. | | | 85,364 | |
| | 879 | | | Johnson & Johnson1 | | | 143,594 | |
| | 116 | | | McKesson Corp. | | | 39,425 | |
| | 845 | | | Merck & Co., Inc. | | | 72,771 | |
| | 1,887 | | | Pfizer, Inc. | | | 82,575 | |
| | 158 | | | Zoetis, Inc. | | | 23,430 | |
| | | | | | | | 616,196 | |
| | | | | PIPELINES — 0.7% | | | | |
| | 189 | | | Cheniere Energy, Inc. | | | 31,357 | |
| | 1,497 | | | Kinder Morgan, Inc. | | | 24,910 | |
| | 315 | | | ONEOK, Inc. | | | 16,141 | |
| | 857 | | | Williams Cos., Inc. | | | 24,536 | |
| | | | | | | | 96,944 | |
AXS Thomson Reuters Private Equity Return Tracker Fund
SCHEDULE OF INVESTMENTS - Continued
As of September 30, 2022
Number
of Shares | | | | | Value | |
| | | | | COMMON STOCKS (Continued) | | | | |
| | | | | REITS — 1.0% | | | | |
| | 302 | | | American Tower Corp. - REIT | | $ | 64,839 | |
| | 269 | | | Crown Castle, Inc. - REIT | | | 38,884 | |
| | 461 | | | Prologis, Inc. - REIT | | | 46,838 | |
| | | | | | | | 150,561 | |
| | | | | RETAIL — 5.4% | | | | |
| | 9 | | | AutoZone, Inc.* | | | 19,277 | |
| | 14 | | | Chipotle Mexican Grill, Inc.* | | | 21,039 | |
| | 237 | | | Costco Wholesale Corp.1 | | | 111,928 | |
| | 103 | | | Dollar General Corp. | | | 24,705 | |
| | 552 | | | Home Depot, Inc.1 | | | 152,319 | |
| | 350 | | | Lowe’s Cos., Inc. | | | 65,733 | |
| | 397 | | | McDonald’s Corp. | | | 91,604 | |
| | 34 | | | O’Reilly Automotive, Inc.* | | | 23,914 | |
| | 609 | | | Starbucks Corp. | | | 51,314 | |
| | 230 | | | Target Corp. | | | 34,130 | |
| | 622 | | | TJX Cos., Inc. | | | 38,639 | |
| | 1,187 | | | Walmart, Inc.1 | | | 153,954 | |
| | | | | | | | 788,556 | |
| | | | | SEMICONDUCTORS — 7.1% | | | | |
| | 1,611 | | | Advanced Micro Devices, Inc.* | | | 102,073 | |
| | 518 | | | Analog Devices, Inc. | | | 72,178 | |
| | 831 | | | Applied Materials, Inc. | | | 68,084 | |
| | 311 | | | Broadcom, Inc. | | | 138,087 | |
| | 3,845 | | | Intel Corp. | | | 99,085 | |
| | 2,336 | | | NVIDIA Corp.1 | | | 283,567 | |
| | 1,116 | | | QUALCOMM, Inc. | | | 126,086 | |
| | 868 | | | Texas Instruments, Inc. | | | 134,349 | |
| | | | | | | | 1,023,509 | |
| | | | | SOFTWARE — 8.4% | | | | |
| | 444 | | | Adobe, Inc.* | | | 122,189 | |
| | 513 | | | Fiserv, Inc.* | | | 48,001 | |
| | 249 | | | Intuit, Inc. | | | 96,443 | |
| | 2,818 | | | Microsoft Corp.1 | | | 656,312 | |
| | 1,506 | | | Oracle Corp. | | | 91,972 | |
| | 911 | | | Salesforce, Inc.* | | | 131,038 | |
| | 184 | | | ServiceNow, Inc.* | | | 69,480 | |
| | | | | | | | 1,215,435 | |
| | | | | TELECOMMUNICATIONS — 2.8% | | | | |
| | 4,838 | | | AT&T, Inc. | | | 74,215 | |
| | 3,907 | | | Cisco Systems, Inc.1 | | | 156,280 | |
| | 476 | | | T-Mobile US, Inc.* | | | 63,865 | |
AXS Thomson Reuters Private Equity Return Tracker Fund
SCHEDULE OF INVESTMENTS - Continued
As of September 30, 2022
Number
of Shares | | | | | Value | |
| | | | COMMON STOCKS (Continued) | | | |
| | | | TELECOMMUNICATIONS (Continued) | | | |
| | 2,994 | | | Verizon Communications, Inc. | | $ | 113,682 | |
| | | | | | | | 408,042 | |
| | | | | TRANSPORTATION — 2.2% | | | | |
| | 1,693 | | | CSX Corp. | | | 45,101 | |
| | 234 | | | Norfolk Southern Corp. | | | 49,058 | |
| | 568 | | | Union Pacific Corp.1 | | | 110,658 | |
| | 663 | | | United Parcel Service, Inc. - Class B1 | | | 107,101 | |
| | | | | | | | 311,918 | |
| | | | | VENTURE CAPITAL — 0.3% | | | | |
| | 459 | | | Blackstone, Inc. | | | 38,418 | |
| | | | | TOTAL COMMON STOCKS | | | | |
| | | | | (Cost $15,588,506) | | | 14,739,137 | |
Principal
Amount | | | | | | |
| | | | SHORT-TERM INVESTMENTS — 0.8% | | | |
| $ | 113,285 | | | UMB Bank Demand Deposit, 0.01%3 | | | 113,285 | |
| | | | | TOTAL SHORT-TERM INVESTMENTS | | | | |
| | | | | (Cost $113,285) | | | 113,285 | |
| | | | | | | | | |
| | | | | TOTAL INVESTMENTS — 102.5% | | | | |
| | | | | (Cost $15,701,791) | | | 14,852,422 | |
| | | | | Liabilities in Excess of Other Assets — (2.5)% | | | (358,020 | ) |
| | | | | TOTAL NET ASSETS — 100.0% | | $ | 14,494,402 | |
PLC – Public Limited Company
REIT – Real Estate Investment Trusts
| * | Non-income producing security. |
| 1 | All or a portion of this security is segregated as collateral for swap agreement. As of September 30, 2022, the aggregate value of those securities was $3,509,818, representing 24.2% of net assets. |
| 2 | Foreign security denominated in U.S. Dollars. |
| 3 | The rate is the annualized seven-day yield at period end. |
See accompanying Notes to Consolidated Financial Statements.
AXS Thomson Reuters Private Equity Return Tracker Fund
SCHEDULE OF INVESTMENTS - Continued
As of September 30, 2022
SWAP CONTRACTS
EQUITY SWAP CONTRACTS
| Counterparty | | Reference Entity | | Fund Pays | | Fund Receives | | Pay/Receive
Frequency | | Termination
Date | | Notional
Amount | | | Premium
Paid
(Received) | | | Unrealized
Appreciation
(Depreciation) | |
| BNP Paribas | | BNP Paribas Index Swap1 | | 1-Month Federal Funds + 0.57% | | Index Return | | Monthly | | 10/3/22 | | $ | 16,349,268 | | | $ | 1,278 | | | $ | (25,842 | ) |
| BNP Paribas | | BNP Paribas Equity Basket Swap2 | | 1-Month Federal Funds + 0.57% | | Basket Return | | Monthly | | 10/3/22 | | | 2,973,206 | | | | 229 | | | $ | (335,689 | ) |
| TOTAL EQUITY SWAP CONTRACTS | | | | | | | | | | | | | | | | $ | (361,531 | ) |
| 1 | The BNP Paribas Index Swap is made up of the NASDAQ 100 Total Return Index, Dow Jones Industrial Average Total Return Index, and S&P 500 Total Return Index and exposure to each index was (106.26)%, 106.26%, and 15.04%, respectively. |
| | |
| 2 | BNP Paribas Equity Basket Swap Top 50 Holdings^ |
Number of
Shares | | | Description | | Value | | | Percentage of Equity
Swap's Notional Amount | |
| | 570 | | | Microsoft Corp. | | $ | 132,753 | | | | 4.46 | % |
| | 1,376 | | | Alphabet, Inc. - Class A | | | 131,614 | | | | 4.43 | % |
| | 947 | | | Apple, Inc. | | | 130,875 | | | | 4.40 | % |
| | 989 | | | Amazon.com, Inc. | | | 111,757 | | | | 3.76 | % |
| | 315 | | | Berkshire Hathaway, Inc. | | | 84,111 | | | | 2.83 | % |
| | 278 | | | Tesla, Inc. | | | 73,740 | | | | 2.48 | % |
| | 439 | | | Meta Platforms, Inc. | | | 59,564 | | | | 2.00 | % |
| | 332 | | | Visa, Inc. - Class A | | | 58,980 | | | | 1.98 | % |
| | 472 | | | NVIDIA Corp. | | | 57,296 | | | | 1.93 | % |
| | 635 | | | Exxon Mobil Corp. | | | 55,442 | | | | 1.86 | % |
| | 394 | | | Procter & Gamble Co. | | | 49,743 | | | | 1.67 | % |
| | 173 | | | Mastercard, Inc. - Class A | | | 49,191 | | | | 1.65 | % |
| | 292 | | | Chevron Corp. | | | 41,952 | | | | 1.41 | % |
| | 396 | | | JPMorgan Chase & Co. | | | 41,382 | | | | 1.39 | % |
| | 142 | | | Linde PLC | | | 38,282 | | | | 1.29 | % |
| | 228 | | | PepsiCo, Inc. | | | 37,223 | | | | 1.25 | % |
| | 649 | | | Coca-Cola Co. | | | 36,357 | | | | 1.22 | % |
| | 133 | | | Accenture PLC | | | 34,221 | | | | 1.15 | % |
| | 63 | | | UnitedHealth Group, Inc. | | | 31,818 | | | | 1.07 | % |
| | 790 | | | Cisco Systems, Inc. | | | 31,600 | | | | 1.06 | % |
| | 240 | | | Walmart, Inc. | | | 31,128 | | | | 1.05 | % |
| | 112 | | | Home Depot, Inc. | | | 30,905 | | | | 1.04 | % |
| | 177 | | | Johnson & Johnson | | | 28,915 | | | | 0.97 | % |
| | 940 | | | Bank of America Corp. | | | 28,388 | | | | 0.95 | % |
| | 63 | | | Broadcom, Inc. | | | 27,973 | | | | 0.94 | % |
| | 175 | | | Texas Instruments, Inc. | | | 27,087 | | | | 0.91 | % |
| | 184 | | | Salesforce, Inc. | | | 26,467 | | | | 0.89 | % |
| | 225 | | | QUALCOMM, Inc. | | | 25,421 | | | | 0.85 | % |
| | 90 | | | Adobe, Inc. | | | 24,768 | | | | 0.83 | % |
| | 605 | | | Verizon Communications, Inc. | | | 22,972 | | | | 0.77 | % |
| | 48 | | | Costco Wholesale Corp. | | | 22,669 | | | | 0.76 | % |
| | 115 | | | Union Pacific Corp. | | | 22,404 | | | | 0.75 | % |
| | 272 | | | Raytheon Technologies Corp. | | | 22,266 | | | | 0.75 | % |
| | 134 | | | United Parcel Service, Inc. - Class B | | | 21,646 | | | | 0.73 | % |
| | 180 | | | International Business Machines Corp. | | | 21,386 | | | | 0.72 | % |
| | 125 | | | Honeywell International, Inc. | | | 20,871 | | | | 0.70 | % |
| | 326 | | | Advanced Micro Devices, Inc. | | | 20,655 | | | | 0.69 | % |
| | 510 | | | Wells Fargo & Co. | | | 20,512 | | | | 0.69 | % |
| | 242 | | | Philip Morris International, Inc. | | | 20,088 | | | | 0.68 | % |
| | 233 | | | PayPal Holdings, Inc. | | | 20,054 | | | | 0.67 | % |
| | 777 | | | Intel Corp. | | | 20,023 | | | | 0.67 | % |
| | 194 | | | ConocoPhillips | | | 19,854 | | | | 0.67 | % |
| | 83 | | | Netflix, Inc. | | | 19,542 | | | | 0.66 | % |
| | 50 | | | Intuit, Inc. | | | 19,366 | | | | 0.65 | % |
| | 63 | | | S&P Global, Inc. | | | 19,237 | | | | 0.65 | % |
| | 84 | | | Automatic Data Processing, Inc. | | | 19,000 | | | | 0.64 | % |
| | 197 | | | Walt Disney Co. | | | 18,583 | | | | 0.63 | % |
| | 304 | | | Oracle Corp. | | | 18,565 | | | | 0.62 | % |
| | 80 | | | McDonald's Corp. | | | 18,459 | | | | 0.62 | % |
| | 46 | | | Lockheed Martin Corp. | | | 17,769 | | | | 0.60 | % |
| ^ | These investments are not direct holdings of the Fund. The holdings were determined based on the absolute notional values of the positions within the underlying swap basket. |
See accompanying Notes to Consolidated Financial Statements.
AXS Thomson Reuters Private Equity Return Tracker Fund
SUMMARY OF INVESTMENTS
As of September 30, 2022
| Security Type/Industry | Percent of Total
Net Assets |
| Common Stocks | |
| Internet | 11.3% |
| Software | 8.4% |
| Semiconductors | 7.1% |
| Computers | 6.4% |
| Oil & Gas | 5.9% |
| Retail | 5.4% |
| Banks | 5.2% |
| Diversified Financial Services | 5.1% |
| Pharmaceuticals | 4.3% |
| Insurance | 3.9% |
| Chemicals | 3.8% |
| Beverages | 3.1% |
| Telecommunications | 2.8% |
| Auto Manufacturers | 2.8% |
| Cosmetics/Personal Care | 2.3% |
| Aerospace/Defense | 2.2% |
| Transportation | 2.2% |
| Commercial Services | 2.0% |
| Electric | 1.9% |
| Healthcare-Products | 1.5% |
| Miscellaneous Manufacturing | 1.4% |
| Media | 1.3% |
| Agriculture | 1.3% |
| Healthcare-Services | 1.3% |
| Food | 1.2% |
| REITS | 1.0% |
| Pipelines | 0.7% |
| Electronics | 0.7% |
| Machinery-Diversified | 0.6% |
| Mining | 0.6% |
| Biotechnology | 0.5% |
| Machinery-Construction & Mining | 0.5% |
| Environmental Control | 0.4% |
| Oil & Gas Services | 0.4% |
| Building Materials | 0.4% |
| Apparel | 0.4% |
| Venture Capital | 0.3% |
| Electrical Components & Equipment | 0.3% |
| Iron/Steel | 0.2% |
| Household Products/Wares | 0.2% |
| Energy-Alternate Sources | 0.2% |
AXS Thomson Reuters Private Equity Return Tracker Fund
SUMMARY OF INVESTMENTS - Continued
As of September 30, 2022
| Security Type/Industry | Percent of Total
Net Assets |
| Lodging | 0.1% |
| Packaging & Containers | 0.1% |
| Total Common Stocks | 101.7% |
| Short-Term Investments | 0.8% |
| Total Investments | 102.5% |
| Liabilities in Excess of Other Assets | (2.5)% |
| Total Net Assets | 100.0% |
See accompanying Notes to Consolidated Financial Statements.
AXS Thomson Reuters Venture Capital Return Tracker Fund
SCHEDULE OF INVESTMENTS
As of September 30, 2022
Number
of Shares | | | | | Value | |
| | | | | COMMON STOCKS — 105.0% | | | | |
| | | | | AEROSPACE/DEFENSE — 1.3% | | | | |
| | 2,917 | | | Boeing Co.* | | $ | 353,190 | |
| | 1,251 | | | Lockheed Martin Corp. | | | 483,249 | |
| | 7,364 | | | Raytheon Technologies Corp. | | | 602,817 | |
| | | | | | | | 1,439,256 | |
| | | | | AGRICULTURE — 0.5% | | | | |
| | 4,493 | | | Altria Group, Inc. | | | 181,427 | |
| | 3,865 | | | Philip Morris International, Inc. | | | 320,834 | |
| | | | | | | | 502,261 | |
| | | | | AUTO MANUFACTURERS — 0.1% | | | | |
| | 582 | | | Tesla, Inc.* | | | 154,376 | |
| | | | | | | | | |
| | | | | BANKS — 2.6% | | | | |
| | 20,497 | | | Bank of America Corp. | | | 619,009 | |
| | 5,755 | | | Citigroup, Inc. | | | 239,811 | |
| | 986 | | | Goldman Sachs Group, Inc. | | | 288,947 | |
| | 8,627 | | | JPMorgan Chase & Co. | | | 901,522 | |
| | 4,105 | | | Morgan Stanley | | | 324,336 | |
| | 11,105 | | | Wells Fargo & Co. | | | 446,643 | |
| | | | | | | | 2,820,268 | |
| | | | | BEVERAGES — 1.1% | | | | |
| | 10,356 | | | Coca-Cola Co. | | | 580,143 | |
| | 3,630 | | | PepsiCo, Inc. | | | 592,634 | |
| | | | | | | | 1,172,777 | |
| | | | | BIOTECHNOLOGY — 0.1% | | | | |
| | 561 | | | Illumina, Inc.* | | | 107,033 | |
| | | | | | | | | |
| | | | | CHEMICALS — 0.9% | | | | |
| | 582 | | | Air Products and Chemicals, Inc. | | | 135,449 | |
| | 328 | | | Albemarle Corp. | | | 86,736 | |
| | 2,058 | | | Dow, Inc. | | | 90,408 | |
| | 1,434 | | | DuPont de Nemours, Inc. | | | 72,274 | |
| | 713 | | | Ecolab, Inc. | | | 102,971 | |
| | 1,420 | | | Linde PLC1 | | | 382,818 | |
| | 671 | | | Sherwin-Williams Co. | | | 137,387 | |
| | | | | | | | 1,008,043 | |
| | | | | COMMERCIAL SERVICES — 7.6% | | | | |
| | 12,979 | | | Automatic Data Processing, Inc.2 | | | 2,935,720 | |
| | 11,352 | | | CoStar Group, Inc.* | | | 790,667 | |
| | 36,001 | | | PayPal Holdings, Inc.*,2 | | | 3,098,606 | |
| | 1,715 | | | S&P Global, Inc. | | | 523,675 | |
AXS Thomson Reuters Venture Capital Return Tracker Fund
SCHEDULE OF INVESTMENTS - Continued
As of September 30, 2022
Number
of Shares | | | | | Value | |
| | | | COMMON STOCKS (Continued) | | | |
| | | | COMMERCIAL SERVICES (Continued) | | | |
| | 4,984 | | | Verisk Analytics, Inc. - Class A | | $ | 849,922 | |
| | | | | | | | 8,198,590 | |
| | | | | COMPUTERS — 12.4% | | | | |
| | 19,640 | | | Accenture PLC 1 | | | 5,053,372 | |
| | 14,785 | | | Apple, Inc.2 | | | 2,043,287 | |
| | 16,209 | | | Cognizant Technology Solutions Corp. - Class A2 | | | 931,045 | |
| | 6,492 | | | Crowdstrike Holdings, Inc. - Class A*,2 | | | 1,069,946 | |
| | 18,636 | | | Fortinet, Inc.*,2 | | | 915,587 | |
| | 27,791 | | | International Business Machines Corp.2 | | | 3,301,849 | |
| | | | | | | | 13,315,086 | |
| | | | | COSMETICS/PERSONAL CARE — 1.0% | | | | |
| | 2,211 | | | Colgate-Palmolive Co. | | | 155,323 | |
| | 611 | | | Estee Lauder Cos., Inc. - Class A | | | 131,915 | |
| | 6,292 | | | Procter & Gamble Co. | | | 794,365 | |
| | | | | | | | 1,081,603 | |
| | | | | DIVERSIFIED FINANCIAL SERVICES — 9.3% | | | | |
| | 17,465 | | | Mastercard, Inc. - Class A2 | | | 4,965,998 | |
| | 28,511 | | | Visa, Inc. - Class A2 | | | 5,064,979 | |
| | | | | | | | 10,030,977 | |
| | | | | ELECTRIC — 0.0% | | | | |
| | 78 | | | Duke Energy Corp. | | | 7,255 | |
| | 199 | | | NextEra Energy, Inc. | | | 15,604 | |
| | 108 | | | Southern Co. | | | 7,344 | |
| | | | | | | | 30,203 | |
| | | | | ELECTRONICS — 0.6% | | | | |
| | 1,071 | | | Agilent Technologies, Inc. | | | 130,180 | |
| | 3,387 | | | Honeywell International, Inc. | | | 565,527 | |
| | | | | | | | 695,707 | |
| | | | | FOOD — 0.2% | | | | |
| | 3,651 | | | Mondelez International, Inc. | | | 200,184 | |
| | | | | | | | | |
| | | | | HEALTHCARE-PRODUCTS — 3.7% | | | | |
| | 7,236 | | | Abbott Laboratories | | | 700,155 | |
| | 1,857 | | | Baxter International, Inc. | | | 100,018 | |
| | 5,513 | | | Boston Scientific Corp.* | | | 213,518 | |
| | 2,761 | | | Danaher Corp. | | | 713,139 | |
| | 2,422 | | | Edwards Lifesciences Corp.* | | | 200,130 | |
| | 306 | | | IDEXX Laboratories, Inc.* | | | 99,695 | |
| | 1,370 | | | Intuitive Surgical, Inc.* | | | 256,793 | |
AXS Thomson Reuters Venture Capital Return Tracker Fund
SCHEDULE OF INVESTMENTS - Continued
As of September 30, 2022
Number
of Shares | | | | | Value | |
| | | | | COMMON STOCKS (Continued) | | | | |
| | | | | HEALTHCARE-PRODUCTS (Continued) | | | | |
| | 5,504 | | | Medtronic PLC1 | | $ | 444,448 | |
| | 528 | | | ResMed, Inc. | | | 115,262 | |
| | 1,379 | | | Stryker Corp. | | | 279,303 | |
| | 1,605 | | | Thermo Fisher Scientific, Inc. | | | 814,040 | |
| | | | | | | | 3,936,501 | |
| | | | | HEALTHCARE-SERVICES — 2.8% | | | | |
| | 2,080 | | | Centene Corp.* | | | 161,845 | |
| | 989 | | | Elevance Health, Inc. | | | 449,243 | |
| | 868 | | | HCA Healthcare, Inc. | | | 159,530 | |
| | 442 | | | Humana, Inc. | | | 214,454 | |
| | 364 | | | Laboratory Corp. of America Holdings | | | 74,551 | |
| | 3,862 | | | UnitedHealth Group, Inc.2 | | | 1,950,464 | |
| | | | | | | | 3,010,087 | |
| | | | | INSURANCE — 2.1% | | | | |
| | 8,534 | | | Berkshire Hathaway, Inc.*,2 | | | 2,278,749 | |
| | | | | | | | | |
| | | | | INTERNET — 18.8% | | | | |
| | 8,372 | | | Airbnb, Inc. - Class A* | | | 879,395 | |
| | 52,348 | | | Alphabet, Inc. - Class A*,2 | | | 5,007,086 | |
| | 2,074 | | | Amazon.com, Inc.* | | | 234,362 | |
| | 3,961 | | | CDW Corp. | | | 618,233 | |
| | 17,248 | | | eBay, Inc.2 | | | 634,899 | |
| | 1,137 | | | MercadoLibre, Inc.* | | | 941,186 | |
| | 34,770 | | | Meta Platforms, Inc.*,2 | | | 4,717,594 | |
| | 12,896 | | | Netflix, Inc.*,2 | | | 3,036,234 | |
| | 9,129 | | | Palo Alto Networks, Inc.*,2 | | | 1,495,239 | |
| | 24,742 | | | Twitter, Inc.*,2 | | | 1,084,689 | |
| | 60,412 | | | Uber Technologies, Inc.*,2 | | | 1,600,918 | |
| | | | | | | | 20,249,835 | |
| | | | | IRON/STEEL — 0.1% | | | | |
| | 593 | | | Nucor Corp. | | | 63,445 | |
| | | | | | | | | |
| | | | | MACHINERY-CONSTRUCTION & MINING — 0.4% | | | | |
| | 2,648 | | | Caterpillar, Inc. | | | 434,484 | |
| | | | | | | | | |
| | | | | MACHINERY-DIVERSIFIED — 0.4% | | | | |
| | 1,379 | | | Deere & Co. | | | 460,434 | |
| | | | | | | | | |
| | | | | MEDIA — 0.1% | | | | |
| | 502 | | | Altice USA, Inc. - Class A* | | | 2,927 | |
| | 5 | | | Cable One, Inc. | | | 4,265 | |
| | 132 | | | Charter Communications, Inc. - Class A* | | | 40,042 | |
AXS Thomson Reuters Venture Capital Return Tracker Fund
SCHEDULE OF INVESTMENTS - Continued
As of September 30, 2022
Number
of Shares | | | | | Value | |
| | | | COMMON STOCKS (Continued) | | | |
| | | | MEDIA (Continued) | | | |
| | 606 | | | Liberty Global PLC*,1 | | $ | 9,448 | |
| | | | | | | | 56,682 | |
| | | | | MINING — 0.2% | | | | |
| | 3,580 | | | Freeport-McMoRan, Inc. | | | 97,841 | |
| | 2,083 | | | Newmont Corp. | | | 87,549 | |
| | | | | | | | 185,390 | |
| | | | | OIL & GAS — 0.8% | | | | |
| | 1,660 | | | Chevron Corp. | | | 238,492 | |
| | 1,106 | | | ConocoPhillips | | | 113,188 | |
| | 409 | | | EOG Resources, Inc. | | | 45,698 | |
| | 3,611 | | | Exxon Mobil Corp. | | | 315,276 | |
| | 443 | | | Marathon Petroleum Corp. | | | 44,003 | |
| | 799 | | | Occidental Petroleum Corp. | | | 49,099 | |
| | 415 | | | Phillips 66 | | | 33,499 | |
| | 194 | | | Pioneer Natural Resources Co. | | | 42,007 | |
| | 332 | | | Valero Energy Corp. | | | 35,474 | |
| | | | | | | | 916,736 | |
| | | | | OIL & GAS SERVICES — 0.0% | | | | |
| | 1,145 | | | Schlumberger N.V.1 | | | 41,106 | |
| | | | | | | | | |
| | | | | PHARMACEUTICALS — 2.0% | | | | |
| | 896 | | | AbbVie, Inc. | | | 120,252 | |
| | 618 | | | AmerisourceBergen Corp. | | | 83,634 | |
| | 1,028 | | | Becton, Dickinson and Co. | | | 229,069 | |
| | 1,228 | | | Cigna Corp. | | | 340,733 | |
| | 5,385 | | | CVS Health Corp. | | | 513,568 | |
| | 1,498 | | | Dexcom, Inc.* | | | 120,649 | |
| | 400 | | | Eli Lilly & Co. | | | 129,340 | |
| | 1,334 | | | Johnson & Johnson | | | 217,922 | |
| | 374 | | | McKesson Corp. | | | 127,111 | |
| | 1,282 | | | Merck & Co., Inc. | | | 110,406 | |
| | 2,864 | | | Pfizer, Inc. | | | 125,329 | |
| | | | | | | | 2,118,013 | |
| | | | | REITS — 0.3% | | | | |
| | 1,330 | | | American Tower Corp. - REIT | | | 285,551 | |
| | | | | | | | | |
| | | | | RETAIL — 0.6% | | | | |
| | 101 | | | Costco Wholesale Corp. | | | 47,699 | |
| | 234 | | | Home Depot, Inc. | | | 64,570 | |
| | 3,828 | | | Walmart, Inc. | | | 496,492 | |
| | | | | | | | 608,761 | |
AXS Thomson Reuters Venture Capital Return Tracker Fund
SCHEDULE OF INVESTMENTS - Continued
As of September 30, 2022
Number
of Shares | | | | | Value | |
| | | | | COMMON STOCKS (Continued) | | | | |
| | | | | SEMICONDUCTORS — 0.9% | | | | |
| | 1,552 | | | Advanced Micro Devices, Inc.* | | $ | 98,335 | |
| | 500 | | | Analog Devices, Inc. | | | 69,670 | |
| | 801 | | | Applied Materials, Inc. | | | 65,626 | |
| | 301 | | | Broadcom, Inc. | | | 133,647 | |
| | 3,704 | | | Intel Corp. | | | 95,452 | |
| | 2,249 | | | NVIDIA Corp. | | | 273,006 | |
| | 1,075 | | | QUALCOMM, Inc. | | | 121,453 | |
| | 836 | | | Texas Instruments, Inc. | | | 129,396 | |
| | | | | | | | 986,585 | |
| | | | | SOFTWARE — 32.5% | | | | |
| | 22,925 | | | Activision Blizzard, Inc.2 | | | 1,704,244 | |
| | 13,870 | | | Adobe, Inc.*,2 | | | 3,817,024 | |
| | 2,420 | | | ANSYS, Inc.* | | | 536,514 | |
| | 3,576 | | | Atlassian Corp. PLC - Class A*,1 | | | 753,070 | |
| | 6,715 | | | Autodesk, Inc.*,2 | | | 1,254,362 | |
| | 8,087 | | | Cadence Design Systems, Inc.*,2 | | | 1,321,658 | |
| | 7,106 | | | Datadog, Inc. - Class A* | | | 630,871 | |
| | 7,821 | | | Electronic Arts, Inc. | | | 904,968 | |
| | 17,707 | | | Fidelity National Information Services, Inc.2 | | | 1,338,118 | |
| | 7,777 | | | Intuit, Inc.2 | | | 3,012,188 | |
| | 21,666 | | | Microsoft Corp.2 | | | 5,046,011 | |
| | 46,996 | | | Oracle Corp.2 | | | 2,870,046 | |
| | 2,937 | | | Roper Technologies, Inc.2 | | | 1,056,263 | |
| | 28,451 | | | Salesforce, Inc.*,2 | | | 4,092,392 | |
| | 5,747 | | | ServiceNow, Inc.*,2 | | | 2,170,125 | |
| | 8,944 | | | Snowflake, Inc.*,2 | | | 1,520,122 | |
| | 4,163 | | | Synopsys, Inc.*,2 | | | 1,271,838 | |
| | 496 | | | Veeva Systems, Inc. - Class A* | | | 81,780 | |
| | 6,505 | | | VMware, Inc. - Class A | | | 692,522 | |
| �� | 6,058 | | | Workday, Inc. - Class A*,2 | | | 922,149 | |
| | | | | | | | 34,996,265 | |
| | | | | TELECOMMUNICATIONS — 0.5% | | | | |
| | 7,927 | | | AT&T, Inc. | | | 121,600 | |
| | 3,763 | | | Cisco Systems, Inc. | | | 150,520 | |
| | 297 | | | Frontier Communications Parent, Inc.* | | | 6,959 | |
| | 106 | | | Iridium Communications, Inc.* | | | 4,703 | |
| | 1,068 | | | Lumen Technologies, Inc. | | | 7,775 | |
| | 773 | | | T-Mobile US, Inc.* | | | 103,713 | |
| | 4,906 | | | Verizon Communications, Inc. | | | 186,281 | |
| | | | | | | | 581,551 | |
| | | | | TRANSPORTATION — 1.1% | | | | |
| | 3,106 | | | Union Pacific Corp. | | | 605,111 | |
AXS Thomson Reuters Venture Capital Return Tracker Fund
SCHEDULE OF INVESTMENTS - Continued
As of September 30, 2022
Number
of Shares | | | | | Value | |
| | | | COMMON STOCKS (Continued) | | | |
| | | | TRANSPORTATION (Continued) | | | |
| | 3,623 | | | United Parcel Service, Inc. - Class B | | $ | 585,259 | |
| | | | | | | | 1,190,370 | |
| | | | | TOTAL COMMON STOCKS | | | | |
| | | | | (Cost $147,294,151) | | | 113,156,909 | |
Principal
Amount | | | | | | |
| | | | SHORT-TERM INVESTMENTS — 0.7% | | | |
| $ | 805,963 | | | UMB Bank Demand Deposit, 0.01%3 | | | 805,963 | |
| | | | | TOTAL SHORT-TERM INVESTMENTS | | | | |
| | | | | (Cost $805,963) | | | 805,963 | |
| | | | | | | | | |
| | | | | TOTAL INVESTMENTS — 105.7% | | | | |
| | | | | (Cost $148,100,114) | | | 113,962,872 | |
| | | | | Liabilities in Excess of Other Assets — (5.7)% | | | (6,167,461 | ) |
| | | | | TOTAL NET ASSETS — 100.0% | | $ | 107,795,411 | |
PLC – Public Limited Company
REIT – Real Estate Investment Trusts
| * | Non-income producing security. |
| 1 | Foreign security denominated in U.S. Dollars. |
| 2 | All or a portion of this security is segregated as collateral for swap agreement. As of September 30, 2022, the aggregate value of those securities was $42,556,510, representing 39.5% of net assets. |
| 3 | The rate is the annualized seven-day yield at period end. |
See accompanying Notes to Consolidated Financial Statements.
AXS Thomson Reuters Venture Capital Return Tracker Fund
SCHEDULE OF INVESTMENTS - Continued
As of September 30, 2022
SWAP CONTRACTS
EQUITY SWAP CONTRACTS
| Counterparty | | Reference Entity | | Fund Pays | | Fund Receives | | Pay/Receive
Frequency | | Termination
Date | | Notional
Amount | | | Premium
Paid
(Received) | | | Unrealized
Appreciation
(Depreciation) | |
| BNP Paribas | | BNP Paribas Index Swap1 | | 0.50% | | Index Return | | Monthly | | 10/3/22 | | $ | 125,191,370 | | | $ | 2,809 | | | $ | (235,656 | ) |
| BNP Paribas | | BNP Paribas Equity Basket Swap2 | | 1-Month Federal Funds + 0.57% | | Basket Return | | Monthly | | 10/3/22 | | | 46,459,737 | | | | 9,518 | | | | (5,313,134 | ) |
| TOTAL EQUITY SWAP CONTRACTS | | | | | | | | | | | | | | | | $ | (5,548,790 | ) |
| 1 | The BNP Paribas Index Swap is made up of the NASDAQ 100 Total Return Index and the S&P 500 Total Return Index and exposure to each index was 8.35% and (8.35)%, respectively. |
| | |
| 2 | BNP Paribas Equity Basket Swap Top 50 Holdings^ |
Number of
Shares | | | Description | | Value | | | Percentage of Equity
Swap's Notional Amount | |
| | 11,738 | | | Visa, Inc. - Class A | | $ | 2,085,256 | | | | 4.49 | % |
| | 8,086 | | | Accenture PLC | | | 2,080,528 | | | | 4.48 | % |
| | 8,921 | | | Microsoft Corp. | | | 2,077,701 | | | | 4.47 | % |
| | 21,555 | | | Alphabet, Inc. - Class A | | | 2,061,736 | | | | 4.44 | % |
| | 7,191 | | | Mastercard, Inc. - Class A | | | 2,044,689 | | | | 4.40 | % |
| | 14,317 | | | Meta Platforms, Inc. | | | 1,942,531 | | | | 4.18 | % |
| | 11,716 | | | Salesforce, Inc. | | | 1,685,229 | | | | 3.63 | % |
| | 5,712 | | | Adobe, Inc. | | | 1,571,942 | | | | 3.38 | % |
| | 11,443 | | | International Business Machines Corp. | | | 1,359,543 | | | | 2.93 | % |
| | 14,824 | | | PayPal Holdings, Inc. | | | 1,275,902 | | | | 2.75 | % |
| | 5,311 | | | Netflix, Inc. | | | 1,250,422 | | | | 2.69 | % |
| | 3,203 | | | Intuit, Inc. | | | 1,240,586 | | | | 2.67 | % |
| | 5,345 | | | Automatic Data Processing, Inc. | | | 1,208,986 | | | | 2.60 | % |
| | 19,352 | | | Oracle Corp. | | | 1,181,827 | | | | 2.54 | % |
| | 3,515 | | | Berkshire Hathaway, Inc. | | | 938,575 | | | | 2.02 | % |
| | 2,367 | | | ServiceNow, Inc. | | | 893,803 | | | | 1.92 | % |
| | 6,088 | | | Apple, Inc. | | | 841,362 | | | | 1.81 | % |
| | 1,589 | | | UnitedHealth Group, Inc. | | | 802,509 | | | | 1.73 | % |
| | 9,441 | | | Activision Blizzard, Inc. | | | 701,844 | | | | 1.51 | % |
| | 24,876 | | | Uber Technologies, Inc. | | | 659,214 | | | | 1.42 | % |
| | 3,683 | | | Snowflake, Inc. | | | 625,963 | | | | 1.35 | % |
| | 3,759 | | | Palo Alto Networks, Inc. | | | 615,687 | | | | 1.33 | % |
| | 7,291 | | | Fidelity National Information Services, Inc. | | | 550,981 | | | | 1.19 | % |
| | 3,330 | | | Cadence Design Systems, Inc. | | | 544,222 | | | | 1.17 | % |
| | 1,714 | | | Synopsys, Inc. | | | 523,644 | | | | 1.13 | % |
| | 2,766 | | | Autodesk, Inc. | | | 516,689 | | | | 1.11 | % |
| | 10,187 | | | Twitter, Inc. | | | 446,598 | | | | 0.96 | % |
| | 2,673 | | | Crowdstrike Holdings, Inc. - Class A | | | 440,537 | | | | 0.95 | % |
| | 1,209 | | | Roper Technologies, Inc. | | | 434,805 | | | | 0.94 | % |
| | 468 | | | MercadoLibre, Inc. | | | 387,401 | | | | 0.83 | % |
| | 6,675 | | | Cognizant Technology Solutions Corp. - Class A | | | 383,412 | | | | 0.83 | % |
| | 2,494 | | | Workday, Inc. - Class A | | | 379,637 | | | | 0.82 | % |
| | 7,673 | | | Fortinet, Inc. | | | 376,974 | | | | 0.81 | % |
| | 3,221 | | | Electronic Arts, Inc. | | | 372,702 | | | | 0.80 | % |
| | 3,552 | | | JPMorgan Chase & Co. | | | 371,184 | | | | 0.80 | % |
| | 3,449 | | | Airbnb, Inc. - Class A | | | 362,283 | | | | 0.78 | % |
| | 2,053 | | | Verisk Analytics, Inc. - Class A | | | 350,098 | | | | 0.75 | % |
| | 661 | | | Thermo Fisher Scientific, Inc. | | | 335,253 | | | | 0.72 | % |
| | 2,591 | | | Procter & Gamble Co. | | | 327,114 | | | | 0.70 | % |
| | 4,673 | | | CoStar Group, Inc. | | | 325,474 | | | | 0.70 | % |
| | 1,473 | | | Atlassian Corp. PLC - Class A | | | 310,199 | | | | 0.67 | % |
| | 1,137 | | | Danaher Corp. | | | 293,676 | | | | 0.63 | % |
| | 2,980 | | | Abbott Laboratories | | | 288,345 | | | | 0.62 | % |
| | 2,679 | | | VMware, Inc. - Class A | | | 285,206 | | | | 0.61 | % |
| | 7,102 | | | eBay, Inc. | | | 261,425 | | | | 0.56 | % |
| | 2,925 | | | Datadog, Inc. - Class A | | | 259,682 | | | | 0.56 | % |
| | 8,440 | | | Bank of America Corp. | | | 254,888 | | | | 0.55 | % |
| | 1,632 | | | CDW Corp. | | | 254,723 | | | | 0.55 | % |
| | 1,278 | | | Union Pacific Corp. | | | 248,980 | | | | 0.54 | % |
| | 3,033 | | | Raytheon Technologies Corp. | | | 248,281 | | | | 0.53 | % |
| ^ | These investments are not direct holdings of the Fund. The holdings were determined based on the absolute notional values of the positions within the underlying swap basket. |
See accompanying Notes to Consolidated Financial Statements.
AXS Thomson Reuters Venture Capital Return Tracker Fund
SUMMARY OF INVESTMENTS
As of September 30, 2022
| Security Type/Industry | Percent of Total
Net Assets |
| Common Stocks | |
| Software | 32.5% |
| Internet | 18.8% |
| Computers | 12.4% |
| Diversified Financial Services | 9.3% |
| Commercial Services | 7.6% |
| Healthcare-Products | 3.7% |
| Healthcare-Services | 2.8% |
| Banks | 2.6% |
| Insurance | 2.1% |
| Pharmaceuticals | 2.0% |
| Aerospace/Defense | 1.3% |
| Beverages | 1.1% |
| Transportation | 1.1% |
| Cosmetics/Personal Care | 1.0% |
| Semiconductors | 0.9% |
| Chemicals | 0.9% |
| Oil & Gas | 0.8% |
| Retail | 0.6% |
| Electronics | 0.6% |
| Telecommunications | 0.5% |
| Agriculture | 0.5% |
| Machinery-Diversified | 0.4% |
| Machinery-Construction & Mining | 0.4% |
| REITS | 0.3% |
| Mining | 0.2% |
| Food | 0.2% |
| Iron/Steel | 0.1% |
| Media | 0.1% |
| Biotechnology | 0.1% |
| Auto Manufacturers | 0.1% |
| Electric | 0.0% |
| Oil & Gas Services | 0.0% |
| Total Common Stocks | 105.0% |
| Short-Term Investments | 0.7% |
| Total Investments | 105.7% |
| Liabilities in Excess of Other Assets | (5.7)% |
| Total Net Assets | 100.0% |
See accompanying Notes to Consolidated Financial Statements.
AXS All Terrain Opportunity Fund
SCHEDULE OF INVESTMENTS
As of September 30, 2022
Number
of Shares | | | | | Value | |
| | | | | COMMON STOCKS — 0.6% | | | | |
| | | | | MATERIALS — 0.6% | | | | |
| | 2,500 | | | Gold Fields Ltd. – ADR | | $ | 20,225 | |
| | | | | TOTAL COMMON STOCKS | | | | |
| | | | | (Cost $20,099) | | | 20,225 | |
| | | | | SHORT-TERM INVESTMENTS — 93.4% | | | | |
| | 3,011,133 | | | Fidelity Investments Money Market Treasury Portfolio – Class I, 2.786%1 | | | 3,011,133 | |
| | | | | TOTAL SHORT-TERM INVESTMENTS | | | | |
| | | | | (Cost $3,011,133) | | | 3,011,133 | |
| | | | | | | | | |
| | | | | TOTAL INVESTMENTS — 94.0% | | | | |
| | | | | (Cost $3,031,232) | | | 3,031,358 | |
| | | | | Other Assets in Excess of Liabilities — 6.0% | | | 192,703 | |
| | | | | TOTAL NET ASSETS — 100.0% | | $ | 3,224,061 | |
ADR – American Depository Receipt
| 1 | The rate is the annualized seven-day yield at period end. |
See accompanying Notes to Consolidated Financial Statements.
AXS All Terrain Opportunity Fund
SUMMARY OF INVESTMENTS
As of September 30, 2022
| Security Type/Sector | Percent of Total
Net Assets |
| Common Stocks | |
| Materials | 0.6% |
| Total Common Stocks | 0.6% |
| Short-Term Investments | 93.4% |
| Total Investments | 94.0% |
| Other Assets in Excess of Liabilities | 6.0% |
| Total Net Assets | 100.0% |
See accompanying Notes to Consolidated Financial Statements.
AXS Merger Fund
SCHEDULE OF INVESTMENTS
As of September 30, 2022
Number
of Shares | | | | | Value | |
| | | | COMMON STOCKS — 75.1% | | | |
| | | | AIRLINES — 0.1% | | | |
| | 3,100 | | | Spirit Airlines, Inc.* | | $ | 58,342 | |
| | | | | | | | | |
| | | | | AUTO PARTS & EQUIPMENT — 1.0% | | | | |
| | 32,000 | | | Tenneco, Inc. - Class A* | | | 556,480 | |
| | | | | | | | | |
| | | | | BANKS — 0.7% | | | | |
| | 24,700 | | | Umpqua Holdings Corp. | | | 422,123 | |
| | | | | | | | | |
| | | | | BIOTECHNOLOGY — 3.3% | | | | |
| | 4,300 | | | Biohaven Pharmaceutical Holding Co., Ltd.* | | | 650,031 | |
| | 16,600 | | | ChemoCentryx, Inc.* | | | 857,556 | |
| | 6,000 | | | Global Blood Therapeutics, Inc.* | | | 408,600 | |
| | | | | | | | 1,916,187 | |
| | | | | COMMERCIAL SERVICES — 4.6% | | | | |
| | 27,200 | | | Evo Payments, Inc. - Class A* | | | 905,760 | |
| | 62,000 | | | Nielsen Holdings PLC | | | 1,718,640 | |
| | | | | | | | 2,624,400 | |
| | | | | COMPUTERS — 3.6% | | | | |
| | 15,800 | | | Computer Services, Inc. | | | 880,850 | |
| | 41,200 | | | Ping Identity Holding Corp.* | | | 1,156,484 | |
| | | | | | | | 2,037,334 | |
| | | | | DIVERSIFIED FINANCIAL SERVICES — 2.4% | | | | |
| | 5,400 | | | Cowen, Inc. - Class A | | | 208,656 | |
| | 9,100 | | | Pzena Investment Management, Inc. - Class A | | | 86,268 | |
| | 10,925 | | | Raymond James Financial, Inc. | | | 1,079,609 | |
| | | | | | | | 1,374,533 | |
| | | | | ELECTRONICS — 2.1% | | | | |
| | 9,191 | | | Coherent Corp.* | | | 320,306 | |
| | 16,300 | | | CyberOptics Corp.* | | | 876,614 | |
| | | | | | | | 1,196,920 | |
| | | | | ENTERTAINMENT — 0.4% | | | | |
| | 30,900 | | | Cineplex, Inc.* | | | 203,554 | |
| | | | | | | | | |
| | | | | HEALTHCARE-PRODUCTS — 0.4% | | | | |
| | 13,600 | | | Hanger, Inc.* | | | 254,592 | |
| | | | | | | | | |
| | | | | HEALTHCARE-SERVICES — 0.7% | | | | |
| | 1,600 | | | LHC Group, Inc.* | | | 261,856 | |
| | 4,600 | | | Signify Health, Inc. - Class A* | | | 134,090 | |
| | | | | | | | 395,946 | |
AXS Merger Fund
SCHEDULE OF INVESTMENTS - Continued
As of September 30, 2022
Number
of Shares | | | | | Value | |
| | | | COMMON STOCKS (Continued) | | | |
| | | | HOME FURNISHINGS — 0.3% | | | |
| | 3,300 | | | iRobot Corp.* | | $ | 185,889 | |
| | | | | | | | | |
| | | | | INSURANCE — 7.7% | | | | |
| | 4,300 | | | Alleghany Corp.* | | | 3,609,291 | |
| | 4,015 | | | Willis Towers Watson PLC | | | 806,774 | |
| | | | | | | | 4,416,065 | |
| | | | | INTERNET — 5.8% | | | | |
| | 7,300 | | | ChannelAdvisor Corp.* | | | 165,418 | |
| | 15,100 | | | Twitter, Inc.* | | | 661,984 | |
| | 32,700 | | | Zendesk, Inc.* | | | 2,488,470 | |
| | | | | | | | 3,315,872 | |
| | | | | MINING — 1.4% | | | | |
| | 27,800 | | | Turquoise Hill Resources Ltd.* | | | 823,093 | |
| | | | | | | | | |
| | | | | PHARMACEUTICALS — 1.4% | | | | |
| | 22,400 | | | Aerie Pharmaceuticals, Inc.* | | | 338,912 | |
| | 21,700 | | | Covetrus, Inc.* | | | 453,096 | |
| | | | | | | | 792,008 | |
| | | | | PIPELINES — 11.3% | | | | |
| | 132,501 | | | PBF Logistics LP | | | 2,502,944 | |
| | 250,000 | | | Shell Midstream Partners LP | | | 3,952,500 | |
| | | | | | | | 6,455,444 | |
| | | | | REITS — 6.8% | | | | |
| | 65,600 | | | Duke Realty Corp. - REIT | | | 3,161,920 | |
| | 7,500 | | | Healthcare Realty Trust, Inc. - REIT | | | 156,375 | |
| | 17,900 | | | STORE Capital Corp. - REIT | | | 560,807 | |
| | | | | | | | 3,879,102 | |
| | | | | RETAIL — 0.2% | | | | |
| | 99,600 | | | Fresh Market Inc. Escrow Shares1 | | | - | |
| | 4,100 | | | Kohl's Corp. | | | 103,115 | |
| | | | | | | | 103,115 | |
| | | | | SOFTWARE — 15.3% | | | | |
| | 7,200 | | | 1Life Healthcare, Inc.* | | | 123,480 | |
| | 20,400 | | | Activision Blizzard, Inc. | | | 1,516,536 | |
| | 32,000 | | | Avalara, Inc.* | | | 2,937,600 | |
| | 2,300 | | | Black Knight, Inc.* | | | 148,879 | |
| | 10,000 | | | BTRS Holdings, Inc.* | | | 92,600 | |
| | 25,200 | | | Change Healthcare, Inc.* | | | 692,748 | |
| | 21,400 | | | Citrix Systems, Inc. | | | 2,225,600 | |
AXS Merger Fund
SCHEDULE OF INVESTMENTS - Continued
As of September 30, 2022
Number
of Shares | | | | | Value | |
| | | | | COMMON STOCKS (Continued) | | | | |
| | | | | SOFTWARE (Continued) | | | | |
| | 60,200 | | | ironSource Ltd. - Class A* | | $ | 207,088 | |
| | 20,200 | | | Momentive Global, Inc.* | | | 117,362 | |
| | 2,217 | | | Take-Two Interactive Software, Inc.* | | | 241,653 | |
| | 4,600 | | | VMware, Inc. - Class A | | | 489,716 | |
| | | | | | | | 8,793,262 | |
| | | | | TELECOMMUNICATIONS — 2.3% | | | | |
| | 4,100 | | | Sierra Wireless, Inc.* | | | 124,804 | |
| | 36,200 | | | Switch, Inc. - Class A | | | 1,219,578 | |
| | | | | | | | 1,344,382 | |
| | | | | TRANSPORTATION — 3.3% | | | | |
| | 19,700 | | | Atlas Air Worldwide Holdings, Inc.* | | | 1,882,729 | |
| | | | | TOTAL COMMON STOCKS | | | | |
| | | | | (Cost $44,284,167) | | | 43,031,372 | |
| | | | | | | | | |
| | | | | SHORT-TERM INVESTMENTS — 19.3% | | | | |
| | 11,075,778 | | | Fidelity Investments Money Market Funds - Treasury Portfolio - Class I, 2.82%2 | | | 11,075,778 | |
| | | | | TOTAL SHORT-TERM INVESTMENTS | | | | |
| | | | | (Cost $11,075,778) | | | 11,075,778 | |
| | | | | | | | | |
| | | | | TOTAL INVESTMENTS — 94.4% | | | | |
| | | | | (Cost $55,359,945) | | | 54,107,150 | |
| | | | | Other Assets in Excess of Liabilities — 5.6% | | | 3,229,634 | |
| | | | | TOTAL NET ASSETS — 100.0% | | $ | 57,336,784 | |
| | | | | | | | | |
| | | | | SECURITIES SOLD SHORT — (12.3)% | | | | |
| | | | | COMMON STOCKS — (12.3)% | | | | |
| | | | | BANKS — (0.7)% | | | | |
| | (14,715 | ) | | Columbia Banking System, Inc. | | | (425,116 | ) |
| | | | | | | | | |
| | | | | DIVERSIFIED FINANCIAL SERVICES — (1.9)% | | | | |
| | (10,925 | ) | | Raymond James Financial, Inc. | | | (1,079,609 | ) |
| | | | | | | | | |
| | | | | ELECTRONICS — (0.6)% | | | | |
| | (9,191 | ) | | Coherent Corp.* | | | (320,306 | ) |
| | | | | | | | | |
| | | | | OIL & GAS — (2.2)% | | | | |
| | (35,712 | ) | | PBF Energy, Inc. - Class A* | | | (1,255,634 | ) |
| | | | | | | | | |
| | | | | REITS — (5.7)% | | | | |
| | (5,800 | ) | | Healthcare Realty Trust, Inc. - REIT | | | (120,930 | ) |
AXS Merger Fund
SCHEDULE OF INVESTMENTS - Continued
As of September 30, 2022
Number
of Shares | | | | | Value | |
| | | | SECURITIES SOLD SHORT (Continued) | | | |
| | | | COMMON STOCKS (Continued) | | | |
| | | | REITS (Continued) | | | |
| | (31,161 | ) | | Prologis, Inc. - REIT | | $ | (3,165,958 | ) |
| | | | | | | | (3,286,888 | ) |
| | | | | SEMICONDUCTORS — (0.4)% | | | | |
| | (580 | ) | | Broadcom, Inc. | | | (257,526 | ) |
| | | | | | | | | |
| | | | | SOFTWARE — (0.8)% | | | | |
| | (2,217 | ) | | Take-Two Interactive Software, Inc.* | | | (241,653 | ) |
| | (6,555 | ) | | Unity Software, Inc.* | | | (208,842 | ) |
| | | | | | | | (450,495 | ) |
| | | | | TOTAL COMMON STOCKS | | | | |
| | | | | (Proceeds $8,195,735) | | | (7,075,574 | ) |
| | | | | | | | | |
| | | | | TOTAL SECURITIES SOLD SHORT | | | | |
| | | | | (Proceeds $8,195,735) | | $ | (7,075,574 | ) |
| PLC – Public Limited Company |
| LP – Limited Partnership |
| REIT – Real Estate Investment Trusts |
| * | Non-income producing security. |
| 1 | Level 3 securities fair valued under procedures established by the Board of Trustees, represents 0.00% of Net Assets. The total value of these securities is $0. |
| 2 | The rate is the annualized seven-day yield at period end. |
See accompanying Notes to Consolidated Financial Statements.
AXS Merger Fund
SUMMARY OF INVESTMENTS
As of September 30, 2022
| Security Type/Industry | Percent of Total
Net Assets |
| Common Stocks | |
| Software | 15.3% |
| Pipelines | 11.3% |
| Insurance | 7.7% |
| REITS | 6.8% |
| Internet | 5.8% |
| Commercial Services | 4.6% |
| Computers | 3.6% |
| Transportation | 3.3% |
| Biotechnology | 3.3% |
| Diversified Financial Services | 2.4% |
| Telecommunications | 2.3% |
| Electronics | 2.1% |
| Pharmaceuticals | 1.4% |
| Mining | 1.4% |
| Auto Parts & Equipment | 1.0% |
| Healthcare-Services | 0.7% |
| Banks | 0.7% |
| Healthcare-Products | 0.4% |
| Entertainment | 0.4% |
| Home Furnishings | 0.3% |
| Retail | 0.2% |
| Airlines | 0.1% |
| Total Common Stocks | 75.1% |
| Short-Term Investments | 19.3% |
| Total Investments | 94.4% |
| Other Assets in Excess of Liabilities | 5.6% |
| Total Net Assets | 100.0% |
See accompanying Notes to Consolidated Financial Statements.
AXS Alternative Value Fund
SCHEDULE OF INVESTMENTS
As of September 30, 2022
Number
of Shares | | | | | Value | |
| | | | | COMMON STOCKS — 139.2% | | | | |
| | | | | ADVERTISING — 0.7% | | | | |
| | 2,091 | | | Omnicom Group, Inc.1 | | $ | 131,921 | |
| | | | | | | | | |
| | | | | AEROSPACE/DEFENSE — 2.9% | | | | |
| | 329 | | | General Dynamics Corp.1 | | | 69,804 | |
| | 321 | | | L3Harris Technologies, Inc.1 | | | 66,713 | |
| | 335 | | | Lockheed Martin Corp.1 | | | 129,407 | |
| | 580 | | | Northrop Grumman Corp.1 | | | 272,786 | |
| | | | | | | | 538,710 | |
| | | | | AGRICULTURE — 2.6% | | | | |
| | 7,632 | | | Altria Group, Inc.1 | | | 308,180 | |
| | 801 | | | Archer-Daniels-Midland Co.1 | | | 64,440 | |
| | 1,454 | | | Philip Morris International, Inc.1 | | | 120,697 | |
| | | | | | | | 493,317 | |
| | | | | BEVERAGES — 5.5% | | | | |
| | 4,504 | | | Brown-Forman Corp. - Class B1 | | | 299,831 | |
| | 6,372 | | | Coca-Cola Co.1 | | | 356,960 | |
| | 2,300 | | | PepsiCo, Inc.1 | | | 375,498 | |
| | | | | | | | 1,032,289 | |
| | | | | BIOTECHNOLOGY — 10.8% | | | | |
| | 1,612 | | | Amgen, Inc.1 | | | 363,345 | |
| | 1,620 | | | Biogen, Inc.*,1 | | | 432,540 | |
| | 5,597 | | | Gilead Sciences, Inc.1 | | | 345,279 | |
| | 617 | | | Regeneron Pharmaceuticals, Inc.*,1 | | | 425,033 | |
| | 1,634 | | | Vertex Pharmaceuticals, Inc.*,1 | | | 473,108 | |
| | | | | | | | 2,039,305 | |
| | | | | COMMERCIAL SERVICES — 2.1% | | | | |
| | 294 | | | MarketAxess Holdings, Inc.1 | | | 65,412 | |
| | 1,961 | | | Rollins, Inc.1 | | | 68,007 | |
| | 1,571 | | | Verisk Analytics, Inc. - Class A1 | | | 267,903 | |
| | | | | | | | 401,322 | |
| | | | | COMPUTERS — 1.0% | | | | |
| | 584 | | | International Business Machines Corp.1 | | | 69,385 | |
| | 1,460 | | | Leidos Holdings, Inc.1 | | | 127,706 | |
| | | | | | | | 197,091 | |
| | | | | COSMETICS/PERSONAL CARE — 3.5% | | | | |
| | 4,704 | | | Colgate-Palmolive Co.1 | | | 330,456 | |
| | 2,590 | | | Procter & Gamble Co.1 | | | 326,988 | |
| | | | | | | | 657,444 | |
AXS Alternative Value Fund
SCHEDULE OF INVESTMENTS - Continued
As of September 30, 2022
Number
of Shares | | | | | Value | |
| | | | | COMMON STOCKS (Continued) | | | | |
| | | | | DISTRIBUTION/WHOLESALE — 0.3% | | | | |
| | 157 | | | Pool Corp.1 | | $ | 49,959 | |
| | | | | | | | | |
| | | | | DIVERSIFIED FINANCIAL SERVICES — 4.3% | | | | |
| | 2,544 | | | Cboe Global Markets, Inc.1 | | | 298,589 | |
| | 1,816 | | | CME Group, Inc.1 | | | 321,668 | |
| | 1,887 | | | Intercontinental Exchange, Inc.1 | | | 170,490 | |
| | 492 | | | Nasdaq, Inc.1 | | | 27,887 | |
| | | | | | | | 818,634 | |
| | | | | ELECTRIC — 2.9% | | | | |
| | 9,549 | | | AES Corp.1 | | | 215,807 | |
| | 1,859 | | | DTE Energy Co.1 | | | 213,878 | |
| | 1,769 | | | NRG Energy, Inc.1 | | | 67,700 | |
| | 2,338 | | | PPL Corp.1 | | | 59,268 | |
| | | | | | | | 556,653 | |
| | | | | ENVIRONMENTAL CONTROL — 4.2% | | | | |
| | 2,936 | | | Republic Services, Inc.1 | | | 399,413 | |
| | 2,408 | | | Waste Management, Inc.1 | | | 385,786 | |
| | | | | | | | 785,199 | |
| | | | | FOOD — 17.9% | | | | |
| | 8,190 | | | Campbell Soup Co.1 | | | 385,913 | |
| | 9,325 | | | Conagra Brands, Inc.1 | | | 304,275 | |
| | 5,657 | | | General Mills, Inc.1 | | | 433,383 | |
| | 1,937 | | | Hershey Co.1 | | | 427,050 | |
| | 6,479 | | | Hormel Foods Corp.1 | | | 294,406 | |
| | 1,068 | | | J M Smucker Co.1 | | | 146,754 | |
| | 5,621 | | | Kellogg Co.1 | | | 391,559 | |
| | 3,839 | | | Kroger Co.1 | | | 167,956 | |
| | 3,349 | | | Lamb Weston Holdings, Inc.1 | | | 259,145 | |
| | 4,293 | | | McCormick & Co., Inc.1 | | | 305,962 | |
| | 3,813 | | | Tyson Foods, Inc. - Class A1 | | | 251,391 | |
| | | | | | | | 3,367,794 | |
| | | | | HEALTHCARE-PRODUCTS — 3.8% | | | | |
| | 791 | | | Danaher Corp.1 | | | 204,308 | |
| | 327 | | | ResMed, Inc.1 | | | 71,384 | |
| | 343 | | | STERIS PLC1,2 | | | 57,034 | |
| | 552 | | | Thermo Fisher Scientific, Inc.1 | | | 279,969 | |
| | 372 | | | Waters Corp.*,1 | | | 100,265 | |
| | | | | | | | 712,960 | |
| | | | | HEALTHCARE-SERVICES — 4.1% | | | | |
| | 4,937 | | | Centene Corp.*,1 | | | 384,148 | |
AXS Alternative Value Fund
SCHEDULE OF INVESTMENTS - Continued
As of September 30, 2022
Number
of Shares | | | | | Value | |
| | | | | COMMON STOCKS (Continued) | | | | |
| | | | | HEALTHCARE-SERVICES (Continued) | | | | |
| | 463 | | | Molina Healthcare, Inc.*,1 | | $ | 152,716 | |
| | 479 | | | UnitedHealth Group, Inc.1 | | | 241,914 | |
| | | | | | | | 778,778 | |
| | | | | HOUSEHOLD PRODUCTS/WARES — 4.9% | | | | |
| | 4,268 | | | Church & Dwight Co., Inc.1 | | | 304,906 | |
| | 2,355 | | | Clorox Co.1 | | | 302,359 | |
| | 2,821 | | | Kimberly-Clark Corp.1 | | | 317,475 | |
| | | | | | | | 924,740 | |
| | | | | INSURANCE — 16.4% | | | | |
| | 546 | | | Allstate Corp.1 | | | 67,993 | |
| | 2,363 | | | Arthur J. Gallagher & Co.1 | | | 404,593 | |
| | 1,454 | | | Assurant, Inc.1 | | | 211,222 | |
| | 3,733 | | | Brown & Brown, Inc.1 | | | 225,772 | |
| | 1,988 | | | Chubb Ltd.1,2 | | | 361,577 | |
| | 3,268 | | | Cincinnati Financial Corp.1 | | | 292,715 | |
| | 1,123 | | | Everest Re Group Ltd.1,2 | | | 294,720 | |
| | 1,327 | | | Loews Corp.1 | | | 66,138 | |
| | 2,875 | | | Progressive Corp.1 | | | 334,104 | |
| | 2,299 | | | Travelers Cos., Inc.1 | | | 352,207 | |
| | 3,074 | | | W R Berkley Corp.1 | | | 198,519 | |
| | 1,404 | | | Willis Towers Watson PLC1,2 | | | 282,120 | |
| | | | | | | | 3,091,680 | |
| | | | | INTERNET — 0.6% | | | | |
| | 609 | | | VeriSign, Inc.*,1 | | | 105,783 | |
| | | | | | | | | |
| | | | | MEDIA — 1.2% | | | | |
| | 568 | | | FactSet Research Systems, Inc.1 | | | 227,262 | |
| | | | | | | | | |
| | | | | OIL & GAS — 2.3% | | | | |
| | 16,603 | | | Coterra Energy, Inc.1 | | | 433,670 | |
| | | | | | | | | |
| | | | | PACKAGING & CONTAINERS — 0.9% | | | | |
| | 5,629 | | | Amcor PLC1,2 | | | 60,399 | |
| | 982 | | | Packaging Corp. of America1 | | | 110,269 | |
| | | | | | | | 170,668 | |
| | | | | PHARMACEUTICALS — 16.7% | | | | |
| | 2,944 | | | AbbVie, Inc.1 | | | 395,114 | |
| | 1,754 | | | AmerisourceBergen Corp.1 | | | 237,369 | |
| | 4,503 | | | Bristol-Myers Squibb Co.1 | | | 320,118 | |
| | 532 | | | Cigna Corp.1 | | | 147,614 | |
| | 3,064 | | | CVS Health Corp.1 | | | 292,214 | |
AXS Alternative Value Fund
SCHEDULE OF INVESTMENTS - Continued
As of September 30, 2022
Number
of Shares | | | | | Value | |
| | | | | COMMON STOCKS (Continued) | | | | |
| | | | | PHARMACEUTICALS (Continued) | | | | |
| | 999 | | | Eli Lilly & Co.1 | | $ | 323,027 | |
| | 2,228 | | | Johnson & Johnson1 | | | 363,966 | |
| | 800 | | | McKesson Corp.1 | | | 271,896 | |
| | 2,827 | | | Merck & Co., Inc.1 | | | 243,461 | |
| | 9,450 | | | Organon & Co.1 | | | 221,130 | |
| | 6,141 | | | Pfizer, Inc.1 | | | 268,730 | |
| | 377 | | | Zoetis, Inc.1 | | | 55,906 | |
| | | | | | | | 3,140,545 | |
| | | | | REITS — 1.8% | | | | |
| | 1,155 | | | Public Storage - REIT1 | | | 338,196 | |
| | | | | | | | | |
| | | | | RETAIL — 9.9% | | | | |
| | 34 | | | AutoZone, Inc.*,1 | | | 72,826 | |
| | 796 | | | Costco Wholesale Corp.1 | | | 375,927 | |
| | 1,677 | | | Dollar General Corp.1 | | | 402,245 | |
| | 880 | | | Domino's Pizza, Inc.1 | | | 272,976 | |
| | 1,518 | | | McDonald's Corp.1 | | | 350,263 | |
| | 913 | | | Starbucks Corp.1 | | | 76,929 | |
| | 8,178 | | | Walgreens Boots Alliance, Inc.1 | | | 256,789 | |
| | 464 | | | Walmart, Inc.1 | | | 60,181 | |
| | | | | | | | 1,868,136 | |
| | | | | SEMICONDUCTORS — 1.1% | | | | |
| | 8,251 | | | Intel Corp.1 | | | 212,628 | |
| | | | | | | | | |
| | | | | SHIPBUILDING — 0.4% | | | | |
| | 331 | | | Huntington Ingalls Industries, Inc.1 | | | 73,317 | |
| | | | | | | | | |
| | | | | SOFTWARE — 10.2% | | | | |
| | 3,948 | | | Activision Blizzard, Inc.1 | | | 293,494 | |
| | 3,567 | | | Akamai Technologies, Inc.*,1 | | | 286,501 | |
| | 3,125 | | | Citrix Systems, Inc.1 | | | 325,000 | |
| | 1,105 | | | Electronic Arts, Inc.1 | | | 127,860 | |
| | 2,156 | | | Jack Henry & Associates, Inc.1 | | | 392,974 | |
| | 494 | | | Microsoft Corp.1 | | | 115,053 | |
| | 3,696 | | | Oracle Corp.1 | | | 225,715 | |
| | 1,417 | | | Take-Two Interactive Software, Inc.*,1 | | | 154,453 | |
| | | | | | | | 1,921,050 | |
| | | | | TELECOMMUNICATIONS — 4.3% | | | | |
| | 16,247 | | | AT&T, Inc.1 | | | 249,229 | |
| | 2,505 | | | Juniper Networks, Inc.1 | | | 65,431 | |
| | 984 | | | Motorola Solutions, Inc.1 | | | 220,386 | |
AXS Alternative Value Fund
SCHEDULE OF INVESTMENTS - Continued
As of September 30, 2022
Number
of Shares | | | | | Value | |
| | | | | COMMON STOCKS (Continued) | | | | |
| | | | | TELECOMMUNICATIONS (Continued) | | | | |
| | 7,433 | | | Verizon Communications, Inc.1 | | $ | 282,231 | |
| | | | | | | | 817,277 | |
| | | | | TOYS/GAMES/HOBBIES — 0.3% | | | | |
| | 807 | | | Hasbro, Inc.1 | | | 54,408 | |
| | | | | | | | | |
| | | | | TRANSPORTATION — 1.6% | | | | |
| | 684 | | | C.H. Robinson Worldwide, Inc.1 | | | 65,876 | |
| | 2,589 | | | Expeditors International of Washington, Inc.1 | | | 228,635 | |
| | | | | | | | 294,511 | |
| | | | | TOTAL COMMON STOCKS | | | | |
| | | | | (Cost $28,230,667) | | | 26,235,247 | |
Principal Amount | | | | | | |
| | | | | SHORT-TERM INVESTMENTS — 0.0% | | | | |
| $ | 5,680 | | | UMB Bank Demand Deposit, 0.01%3 | | | 5,680 | |
| | | | | TOTAL SHORT-TERM INVESTMENTS | | | | |
| | | | | (Cost $5,680) | | | 5,680 | |
| | | | | | | | | |
| | | | | TOTAL INVESTMENTS — 139.2% | | | | |
| | | | | (Cost $28,236,347) | | | 26,240,927 | |
| | | | | Liabilities in Excess of Other Assets — (39.2)% | | | (7,389,748 | ) |
| | | | | TOTAL NET ASSETS — 100.0% | | $ | 18,851,179 | |
| PLC – Public Limited Company |
| REIT – Real Estate Investment Trusts |
| * | Non-income producing security. |
| 1 | All or a portion of the security is segregated as collateral for line of credit borrowings. As of September 30, 2022, the aggregate value of those securities was $26,235,247, representing 139.2% of net assets. |
| 2 | Foreign security denominated in U.S. Dollars. |
| 3 | The rate is the annualized seven-day yield at period end. |
See accompanying Notes to Consolidated Financial Statements.
AXS Alternative Value Fund
SUMMARY OF INVESTMENTS
As of September 30, 2022
| Security Type/Industry | Percent of Total
Net Assets |
| Common Stocks | |
| Food | 17.9% |
| Pharmaceuticals | 16.7% |
| Insurance | 16.4% |
| Biotechnology | 10.8% |
| Software | 10.2% |
| Retail | 9.9% |
| Beverages | 5.5% |
| Household Products/Wares | 4.9% |
| Diversified Financial Services | 4.3% |
| Telecommunications | 4.3% |
| Environmental Control | 4.2% |
| Healthcare-Services | 4.1% |
| Healthcare-Products | 3.8% |
| Cosmetics/Personal Care | 3.5% |
| Aerospace/Defense | 2.9% |
| Electric | 2.9% |
| Agriculture | 2.6% |
| Oil & Gas | 2.3% |
| Commercial Services | 2.1% |
| REITS | 1.8% |
| Transportation | 1.6% |
| Media | 1.2% |
| Semiconductors | 1.1% |
| Computers | 1.0% |
| Packaging & Containers | 0.9% |
| Advertising | 0.7% |
| Internet | 0.6% |
| Shipbuilding | 0.4% |
| Distribution/Wholesale | 0.3% |
| Toys/Games/Hobbies | 0.3% |
| Total Common Stocks | 139.2% |
| Short-Term Investments | 0.0% |
| Total Investments | 139.2% |
| Liabilities in Excess of Other Assets | (39.2)% |
| Total Net Assets | 100.0% |
See accompanying Notes to Consolidated Financial Statements.
AXS Market Neutral Fund
SCHEDULE OF INVESTMENTS
As of September 30, 2022
Number
of Shares | | | | | Value | |
| | | | COMMON STOCKS — 120.8% | | | |
| | | | ADVERTISING — 1.6% | | | |
| | 5,256 | | | Omnicom Group, Inc.1 | | $ | 331,601 | |
| | | | | | | | | |
| | | | | AEROSPACE/DEFENSE — 3.1% | | | | |
| | 1,537 | | | L3Harris Technologies, Inc.1 | | | 319,434 | |
| | 858 | | | Lockheed Martin Corp.1 | | | 331,437 | |
| | | | | | | | 650,871 | |
| | | | | AGRICULTURE — 3.1% | | | | |
| | 8,374 | | | Altria Group, Inc.1 | | | 338,142 | |
| | 3,777 | | | Philip Morris International, Inc.1 | | | 313,529 | |
| | | | | | | | 651,671 | |
| | | | | BEVERAGES — 6.4% | | | | |
| | 4,876 | | | Brown-Forman Corp. - Class B1 | | | 324,595 | |
| | 5,863 | | | Coca-Cola Co.1 | | | 328,445 | |
| | 9,594 | | | Keurig Dr Pepper, Inc.1 | | | 343,657 | |
| | 2,113 | | | PepsiCo, Inc.1 | | | 344,969 | |
| | | | | | | | 1,341,666 | |
| | | | | BIOTECHNOLOGY — 9.3% | | | | |
| | 1,502 | | | Amgen, Inc.1 | | | 338,551 | |
| | 1,698 | | | Biogen, Inc.*,1 | | | 453,366 | |
| | 5,953 | | | Gilead Sciences, Inc.1 | | | 367,241 | |
| | 598 | | | Regeneron Pharmaceuticals, Inc.*,1 | | | 411,944 | |
| | 1,348 | | | Vertex Pharmaceuticals, Inc.*,1 | | | 390,300 | |
| | | | | | | | 1,961,402 | |
| | | | | COMMERCIAL SERVICES — 3.0% | | | | |
| | 1,366 | | | MarketAxess Holdings, Inc.1 | | | 303,922 | |
| | 1,876 | | | Verisk Analytics, Inc. - Class A1 | | | 319,914 | |
| | | | | | | | 623,836 | |
| | | | | COMPUTERS — 3.1% | | | | |
| | 2,809 | | | International Business Machines Corp.1 | | | 333,738 | |
| | 3,707 | | | Leidos Holdings, Inc.1 | | | 324,251 | |
| | | | | | | | 657,989 | |
| | | | | COSMETICS/PERSONAL CARE — 3.1% | | | | |
| | 4,571 | | | Colgate-Palmolive Co.1 | | | 321,113 | |
| | 2,555 | | | Procter & Gamble Co.1 | | | 322,568 | |
| | | | | | | | 643,681 | |
| | | | | DIVERSIFIED FINANCIAL SERVICES — 1.5% | | | | |
| | 1,830 | | | CME Group, Inc.1 | | | 324,148 | |
AXS Market Neutral Fund
SCHEDULE OF INVESTMENTS - Continued
As of September 30, 2022
Number
of Shares | | | | | Value | |
| | | | | COMMON STOCKS (Continued) | | | | |
| | | | | ENVIRONMENTAL CONTROL — 3.4% | | | | |
| | 2,605 | | | Republic Services, Inc.1 | | $ | 354,384 | |
| | 2,199 | | | Waste Management, Inc.1 | | | 352,302 | |
| | | | | | | | 706,686 | |
| | | | | FOOD — 12.9% | | | | |
| | 7,528 | | | Campbell Soup Co.1 | | | 354,719 | |
| | 10,820 | | | Conagra Brands, Inc.1 | | | 353,057 | |
| | 4,892 | | | General Mills, Inc.1 | | | 374,776 | |
| | 1,631 | | | Hershey Co.1 | | | 359,587 | |
| | 7,496 | | | Hormel Foods Corp.1 | | | 340,618 | |
| | 4,974 | | | Kellogg Co.1 | | | 346,489 | |
| | 4,191 | | | McCormick & Co., Inc.1 | | | 298,693 | |
| | 4,251 | | | Tyson Foods, Inc. - Class A1 | | | 280,268 | |
| | | | | | | | 2,708,207 | |
| | | | | HEALTHCARE-PRODUCTS — 2.9% | | | | |
| | 630 | | | Thermo Fisher Scientific, Inc.1 | | | 319,530 | |
| | 1,102 | | | Waters Corp.*,1 | | | 297,022 | |
| | | | | | | | 616,552 | |
| | | | | HEALTHCARE-SERVICES — 4.9% | | | | |
| | 3,987 | | | Centene Corp.*,1 | | | 310,228 | |
| | 1,143 | | | Molina Healthcare, Inc.*,1 | | | 377,007 | |
| | 693 | | | UnitedHealth Group, Inc.1 | | | 349,993 | |
| | | | | | | | 1,037,228 | |
| | | | | HOUSEHOLD PRODUCTS/WARES — 4.5% | | | | |
| | 4,227 | | | Church & Dwight Co., Inc.1 | | | 301,977 | |
| | 2,686 | | | Clorox Co.1 | | | 344,856 | |
| | 2,775 | | | Kimberly-Clark Corp.1 | | | 312,298 | |
| | | | | | | | 959,131 | |
| | | | | INSURANCE — 17.0% | | | | |
| | 2,092 | | | Arthur J. Gallagher & Co.1 | | | 358,192 | |
| | 2,419 | | | Assurant, Inc.1 | | | 351,408 | |
| | 5,759 | | | Brown & Brown, Inc.1 | | | 348,304 | |
| | 1,985 | | | Chubb Ltd.1 | | | 361,032 | |
| | 3,850 | | | Cincinnati Financial Corp.1 | | | 344,845 | |
| | 1,462 | | | Everest Re Group Ltd.1 | | | 383,687 | |
| | 6,713 | | | Loews Corp.1 | | | 334,576 | |
| | 2,331 | | | Travelers Cos., Inc.1 | | | 357,109 | |
| | 5,992 | | | W R Berkley Corp.1 | | | 386,963 | |
| | 1,774 | | | Willis Towers Watson PLC1 | | | 356,468 | |
| | | | | | | | 3,582,584 | |
AXS Market Neutral Fund
SCHEDULE OF INVESTMENTS - Continued
As of September 30, 2022
Number
of Shares | | | | | Value | |
| | | | COMMON STOCKS (Continued) | | | |
| | | | MEDIA — 1.7% | | | |
| | 873 | | | FactSet Research Systems, Inc.1 | | $ | 349,296 | |
| | | | | | | | | |
| | | | | OIL & GAS — 1.7% | | | | |
| | 13,372 | | | Coterra Energy, Inc.1 | | | 349,277 | |
| | | | | | | | | |
| | | | | PACKAGING & CONTAINERS — 1.4% | | | | |
| | 2,669 | | | Packaging Corp. of America1 | | | 299,702 | |
| | | | | | | | | |
| | | | | PHARMACEUTICALS — 16.6% | | | | |
| | 2,643 | | | AbbVie, Inc.1 | | | 354,717 | |
| | 5,121 | | | Bristol-Myers Squibb Co.1 | | | 364,052 | |
| | 1,320 | | | Cigna Corp.1 | | | 366,260 | |
| | 3,602 | | | CVS Health Corp.1 | | | 343,523 | |
| | 1,208 | | | Eli Lilly & Co.1 | | | 390,607 | |
| | 2,139 | | | Johnson & Johnson1 | | | 349,427 | |
| | 1,075 | | | McKesson Corp.1 | | | 365,360 | |
| | 4,247 | | | Merck & Co., Inc.1 | | | 365,752 | |
| | 11,400 | | | Organon & Co.1 | | | 266,760 | |
| | 7,456 | | | Pfizer, Inc.1 | | | 326,274 | |
| | | | | | | | 3,492,732 | |
| | | | | REITS — 1.5% | | | | |
| | 1,115 | | | Public Storage - REIT1 | | | 326,483 | |
| | | | | | | | | |
| | | | | RETAIL — 9.3% | | | | |
| | 170 | | | AutoZone, Inc.*,1 | | | 364,128 | |
| | 684 | | | Costco Wholesale Corp.1 | | | 323,033 | |
| | 1,474 | | | Dollar General Corp.1 | | | 353,554 | |
| | 943 | | | Domino's Pizza, Inc.1 | | | 292,518 | |
| | 1,427 | | | McDonald's Corp.1 | | | 329,266 | |
| | 9,450 | | | Walgreens Boots Alliance, Inc.1 | | | 296,730 | |
| | | | | | | | 1,959,229 | |
| | | | | SEMICONDUCTORS — 1.3% | | | | |
| | 10,439 | | | Intel Corp.1 | | | 269,013 | |
| | | | | | | | | |
| | | | | SOFTWARE — 4.5% | | | | |
| | 3,855 | | | Akamai Technologies, Inc.*,1 | | | 309,634 | |
| | 2,795 | | | Electronic Arts, Inc.1 | | | 323,409 | |
| | 1,778 | | | Jack Henry & Associates, Inc.1 | | | 324,076 | |
| | | | | | | | 957,119 | |
| | | | | TELECOMMUNICATIONS — 3.0% | | | | |
| | 20,229 | | | AT&T, Inc.1 | | | 310,313 | |
AXS Market Neutral Fund
SCHEDULE OF INVESTMENTS - Continued
As of September 30, 2022
Number
of Shares | | | | | Value | |
| | | | COMMON STOCKS (Continued) | | | |
| | | | TELECOMMUNICATIONS (Continued) | | | |
| | 8,290 | | | Verizon Communications, Inc.1 | | $ | 314,771 | |
| | | | | | | | 625,084 | |
| | | | | TOTAL COMMON STOCKS | | | | |
| | | | | (Cost $25,987,320) | | | 25,425,188 | |
Principal
Amount | | | | | | |
| | | | SHORT-TERM INVESTMENTS — 3.3% | | | |
| $ | 709,679 | | | UMB Bank Demand Deposit, 0.01%2 | | | 709,679 | |
| | | | | TOTAL SHORT-TERM INVESTMENTS | | | | |
| | | | | (Cost $709,679) | | | 709,679 | |
| | | | | | | | | |
| | | | | TOTAL INVESTMENTS — 124.1% | | | | |
| | | | | (Cost $26,696,999) | | | 26,134,867 | |
| | | | | Liabilities in Excess of Other Assets — (24.1)% | | | (5,082,757 | ) |
| | | | | TOTAL NET ASSETS — 100.0% | | $ | 21,052,110 | |
Number
of Shares | | | | | | |
| | | | | SECURITIES SOLD SHORT — (80.0)% | | | | |
| | | | | COMMON STOCKS — (80.0)% | | | | |
| | | | | AEROSPACE/DEFENSE — (1.7)% | | | | |
| | (267 | ) | | Northrop Grumman Corp. | | | (125,575 | ) |
| | (1,366 | ) | | Raytheon Technologies Corp. | | | (111,821 | ) |
| | (324 | ) | | Teledyne Technologies, Inc.* | | | (109,340 | ) |
| | | | | | | | (346,736 | ) |
| | | | | AGRICULTURE — (0.6)% | | | | |
| | (1,575 | ) | | Archer-Daniels-Midland Co. | | | (126,709 | ) |
| | | | | | | | | |
| | | | | AIRLINES — (1.0)% | | | | |
| | (3,290 | ) | | Southwest Airlines Co.* | | | (101,464 | ) |
| | (3,336 | ) | | United Airlines Holdings, Inc.* | | | (108,520 | ) |
| | | | | | | | (209,984 | ) |
| | | | | AUTO MANUFACTURERS — (1.1)% | | | | |
| | (586 | ) | | Cummins, Inc. | | | (119,257 | ) |
| | (1,414 | ) | | PACCAR, Inc. | | | (118,338 | ) |
| | | | | | | | (237,595 | ) |
| | | | | BANKS — (1.1)% | | | | |
| | (791 | ) | | First Republic Bank | | | (103,265 | ) |
AXS Market Neutral Fund
SCHEDULE OF INVESTMENTS - Continued
As of September 30, 2022
Number
of Shares | | | | | Value | |
| | | | SECURITIES SOLD SHORT (Continued) | | | |
| | | | COMMON STOCKS (Continued) | | | |
| | | | BANKS (Continued) | | | |
| | (732 | ) | | M&T Bank Corp. | | $ | (129,066 | ) |
| | | | | | | | (232,331 | ) |
| | | | | BEVERAGES — (0.5)% | | | | |
| | (2,391 | ) | | Molson Coors Beverage Co. - Class B | | | (114,744 | ) |
| | | | | | | | | |
| | | | | BIOTECHNOLOGY — (2.2)% | | | | |
| | (238 | ) | | Bio-Rad Laboratories, Inc. - Class A* | | | (99,279 | ) |
| | (2,325 | ) | | Corteva, Inc. | | | (132,874 | ) |
| | (581 | ) | | Illumina, Inc.* | | | (110,849 | ) |
| | (1,790 | ) | | Incyte Corp.* | | | (119,286 | ) |
| | | | | | | | (462,288 | ) |
| | | | | BUILDING MATERIALS — (2.1)% | | | | |
| | (2,396 | ) | | Johnson Controls International plc | | | (117,931 | ) |
| | (355 | ) | | Martin Marietta Materials, Inc. | | | (114,342 | ) |
| | (1,066 | ) | | Mohawk Industries, Inc.* | | | (97,209 | ) |
| | (748 | ) | | Vulcan Materials Co. | | | (117,967 | ) |
| | | | | | | | (447,449 | ) |
| | | | | CHEMICALS — (3.7)% | | | | |
| | (497 | ) | | Air Products and Chemicals, Inc. | | | (115,667 | ) |
| | (2,178 | ) | | DuPont de Nemours, Inc. | | | (109,771 | ) |
| | (1,201 | ) | | FMC Corp. | | | (126,946 | ) |
| | (1,008 | ) | | International Flavors & Fragrances, Inc. | | | (91,556 | ) |
| | (425 | ) | | Linde PLC | | | (114,576 | ) |
| | (1,003 | ) | | PPG Industries, Inc. | | | (111,022 | ) |
| | (529 | ) | | Sherwin-Williams Co. | | | (108,313 | ) |
| | | | | | | | (777,851 | ) |
| | | | | COMMERCIAL SERVICES — (1.7)% | | | | |
| | (529 | ) | | Automatic Data Processing, Inc. | | | (119,654 | ) |
| | (994 | ) | | Global Payments, Inc. | | | (107,402 | ) |
| | (961 | ) | | Quanta Services, Inc. | | | (122,422 | ) |
| | | | | | | | (349,478 | ) |
| | | | | DIVERSIFIED FINANCIAL SERVICES — (1.8)% | | | | |
| | (822 | ) | | American Express Co. | | | (110,896 | ) |
| | (1,859 | ) | | Charles Schwab Corp. | | | (133,606 | ) |
| | (1,283 | ) | | Raymond James Financial, Inc. | | | (126,786 | ) |
| | | | | | | | (371,288 | ) |
AXS Market Neutral Fund
SCHEDULE OF INVESTMENTS - Continued
As of September 30, 2022
Number
of Shares | | | | | Value | |
| | | | | SECURITIES SOLD SHORT (Continued) | | | | |
| | | | | COMMON STOCKS (Continued) | | | | |
| | | | | ELECTRIC — (13.5)% | | | | |
| | (5,665 | ) | | AES Corp. | | $ | (128,029 | ) |
| | (2,095 | ) | | Alliant Energy Corp. | | | (111,014 | ) |
| | (1,391 | ) | | Ameren Corp. | | | (112,045 | ) |
| | (1,288 | ) | | American Electric Power Co., Inc. | | | (111,348 | ) |
| | (4,056 | ) | | CenterPoint Energy, Inc. | | | (114,298 | ) |
| | (1,860 | ) | | CMS Energy Corp. | | | (108,326 | ) |
| | (1,310 | ) | | Consolidated Edison, Inc. | | | (112,346 | ) |
| | (1,919 | ) | | Constellation Energy Corp. | | | (159,642 | ) |
| | (1,542 | ) | | Dominion Energy, Inc. | | | (106,568 | ) |
| | (984 | ) | | DTE Energy Co. | | | (113,209 | ) |
| | (1,162 | ) | | Duke Energy Corp. | | | (108,089 | ) |
| | (1,867 | ) | | Edison International | | | (105,635 | ) |
| | (1,089 | ) | | Entergy Corp. | | | (109,586 | ) |
| | (1,877 | ) | | Evergy, Inc. | | | (111,494 | ) |
| | (1,409 | ) | | Eversource Energy | | | (109,846 | ) |
| | (2,862 | ) | | Exelon Corp. | | | (107,210 | ) |
| | (3,310 | ) | | FirstEnergy Corp. | | | (122,470 | ) |
| | (1,471 | ) | | NextEra Energy, Inc. | | | (115,341 | ) |
| | (1,688 | ) | | Pinnacle West Capital Corp. | | | (108,893 | ) |
| | (4,451 | ) | | PPL Corp. | | | (112,833 | ) |
| | (1,967 | ) | | Public Service Enterprise Group, Inc. | | | (110,604 | ) |
| | (788 | ) | | Sempra Energy | | | (118,153 | ) |
| | (1,644 | ) | | Southern Co. | | | (111,792 | ) |
| | (1,231 | ) | | WEC Energy Group, Inc. | | | (110,088 | ) |
| | (1,716 | ) | | Xcel Energy, Inc. | | | (109,824 | ) |
| | | | | | | | (2,848,683 | ) |
| | | | | ELECTRICAL COMPONENTS & EQUIPMENT — (0.5)% | | | | |
| | (527 | ) | | Generac Holdings, Inc.* | | | (93,880 | ) |
| | | | | | | | | |
| | | | | ENERGY-ALTERNATE SOURCES — (0.5)% | | | | |
| | (415 | ) | | SolarEdge Technologies, Inc.* | | | (96,056 | ) |
| | | | | | | | | |
| | | | | ENGINEERING & CONSTRUCTION — (0.5)% | | | | |
| | (1,006 | ) | | Jacobs Solutions, Inc. | | | (109,141 | ) |
| | | | | | | | | |
| | | | | FOOD — (3.4)% | | | | |
| | (960 | ) | | J M Smucker Co. | | | (131,914 | ) |
| | (3,466 | ) | | Kraft Heinz Co. | | | (115,591 | ) |
| | (2,729 | ) | | Kroger Co. | | | (119,394 | ) |
| | (1,601 | ) | | Lamb Weston Holdings, Inc. | | | (123,885 | ) |
| | (1,990 | ) | | Mondelez International, Inc. - Class A | | | (109,112 | ) |
AXS Market Neutral Fund
SCHEDULE OF INVESTMENTS - Continued
As of September 30, 2022
Number
of Shares | | | | | Value | |
| | | | SECURITIES SOLD SHORT (Continued) | | | |
| | | | COMMON STOCKS (Continued) | | | |
| | | | FOOD (Continued) | | | |
| | (1,488 | ) | | Sysco Corp. | | $ | (105,216 | ) |
| | | | | | | | (705,112 | ) |
| | | | | FOREST PRODUCTS & PAPER — (0.5)% | | | | |
| | (3,036 | ) | | International Paper Co. | | | (96,241 | ) |
| | | | | | | | | |
| | | | | GAS — (1.0)% | | | | |
| | (1,086 | ) | | Atmos Energy Corp. | | | (110,609 | ) |
| | (4,280 | ) | | NiSource, Inc. | | | (107,813 | ) |
| | | | | | | | (218,422 | ) |
| | | | | HAND/MACHINE TOOLS — (0.5)% | | | | |
| | (1,351 | ) | | Stanley Black & Decker, Inc. | | | (101,609 | ) |
| | | | | | | | | |
| | | | | HEALTHCARE-PRODUCTS — (7.2)% | | | | |
| | (1,170 | ) | | Abbott Laboratories | | | (113,209 | ) |
| | (2,202 | ) | | Baxter International, Inc. | | | (118,600 | ) |
| | (338 | ) | | Bio-Techne Corp. | | | (95,992 | ) |
| | (3,089 | ) | | Boston Scientific Corp.* | | | (119,637 | ) |
| | (393 | ) | | Cooper Cos., Inc. | | | (103,713 | ) |
| | (3,572 | ) | | DENTSPLY SIRONA, Inc. | | | (101,266 | ) |
| | (1,702 | ) | | Henry Schein, Inc.* | | | (111,941 | ) |
| | (534 | ) | | Intuitive Surgical, Inc.* | | | (100,093 | ) |
| | (1,378 | ) | | Medtronic PLC | | | (111,273 | ) |
| | (629 | ) | | STERIS PLC | | | (104,590 | ) |
| | (600 | ) | | Stryker Corp. | | | (121,524 | ) |
| | (507 | ) | | Teleflex, Inc. | | | (102,140 | ) |
| | (379 | ) | | West Pharmaceutical Services, Inc. | | | (93,264 | ) |
| | (1,129 | ) | | Zimmer Biomet Holdings, Inc. | | | (118,037 | ) |
| | | | | | | | (1,515,279 | ) |
| | | | | HEALTHCARE-SERVICES — (1.0)% | | | | |
| | (1,189 | ) | | Catalent, Inc.* | | | (86,036 | ) |
| | (268 | ) | | Humana, Inc. | | | (130,031 | ) |
| | | | | | | | (216,067 | ) |
| | | | | HOUSEWARES — (0.4)% | | | | |
| | (6,484 | ) | | Newell Brands, Inc. | | | (90,063 | ) |
| | | | | | | | | |
| | | | | INSURANCE — (1.2)% | | | | |
| | (1,116 | ) | | Allstate Corp. | | | (138,975 | ) |
| | (2,014 | ) | | MetLife, Inc. | | | (122,411 | ) |
| | | | | | | | (261,386 | ) |
AXS Market Neutral Fund
SCHEDULE OF INVESTMENTS - Continued
As of September 30, 2022
Number
of Shares | | | | | Value | |
| | | | SECURITIES SOLD SHORT (Continued) | | | |
| | | | COMMON STOCKS (Continued) | | | |
| | | | INTERNET — (0.7)% | | | |
| | (3,149 | ) | | Twitter, Inc.* | | $ | (138,052 | ) |
| | | | | | | | | |
| | | | | LODGING — (1.2)% | | | | |
| | (989 | ) | | Hilton Worldwide Holdings, Inc. | | | (119,293 | ) |
| | (3,274 | ) | | Las Vegas Sands Corp.* | | | (122,841 | ) |
| | | | | | | | (242,134 | ) |
| | | | | MACHINERY-CONSTRUCTION & MINING — (0.5)% | | | | |
| | (694 | ) | | Caterpillar, Inc. | | | (113,872 | ) |
| | | | | | | | | |
| | | | | MACHINERY-DIVERSIFIED — (1.1)% | | | | |
| | (375 | ) | | Deere & Co. | | | (125,209 | ) |
| | (1,320 | ) | | Xylem, Inc. | | | (115,315 | ) |
| | | | | | | | (240,524 | ) |
| | | | | MEDIA — (0.5)% | | | | |
| | (1,189 | ) | | Walt Disney Co.* | | | (112,158 | ) |
| | | | | | | | | |
| | | | | MISCELLANEOUS MANUFACTURING — (1.1)% | | | | |
| | (860 | ) | | Eaton Corp. PLC | | | (114,690 | ) |
| | (1,744 | ) | | General Electric Co. | | | (107,971 | ) |
| | | | | | | | (222,661 | ) |
| | | | | PACKAGING & CONTAINERS — (1.5)% | | | | |
| | (10,086 | ) | | Amcor PLC | | | (108,223 | ) |
| | (2,130 | ) | | Ball Corp. | | | (102,921 | ) |
| | (3,109 | ) | | Westrock Co. | | | (96,037 | ) |
| | | | | | | | (307,181 | ) |
| | | | | PHARMACEUTICALS — (2.9)% | | | | |
| | (893 | ) | | AmerisourceBergen Corp. | | | (120,850 | ) |
| | (517 | ) | | Becton, Dickinson and Co. | | | (115,203 | ) |
| | (2,109 | ) | | Cardinal Health, Inc. | | | (140,628 | ) |
| | (1,453 | ) | | Dexcom, Inc.* | | | (117,024 | ) |
| | (13,215 | ) | | Viatris, Inc. | | | (112,592 | ) |
| | | | | | | | (606,297 | ) |
| | | | | PIPELINES — (0.5)% | | | | |
| | (3,991 | ) | | Williams Cos., Inc. | | | (114,262 | ) |
| | | | | | | | | |
| | | | | REITS — (13.4)% | | | | |
| | (806 | ) | | Alexandria Real Estate Equities, Inc. - REIT | | | (112,993 | ) |
| | (476 | ) | | American Tower Corp. - REIT | | | (102,197 | ) |
AXS Market Neutral Fund
SCHEDULE OF INVESTMENTS - Continued
As of September 30, 2022
Number
of Shares | | | | | Value | |
| | | | | SECURITIES SOLD SHORT (Continued) | | | | |
| | | | | COMMON STOCKS (Continued) | | | | |
| | | | | REITS (Continued) | | | | |
| | (635 | ) | | AvalonBay Communities, Inc. - REIT | | $ | (116,961 | ) |
| | (1,470 | ) | | Boston Properties, Inc. - REIT | | | (110,206 | ) |
| | (939 | ) | | Camden Property Trust - REIT | | | (112,164 | ) |
| | (720 | ) | | Crown Castle, Inc. - REIT | | | (104,076 | ) |
| | (993 | ) | | Digital Realty Trust, Inc. - REIT | | | (98,486 | ) |
| | (2,087 | ) | | Duke Realty Corp. - REIT | | | (100,593 | ) |
| | (185 | ) | | Equinix, Inc. - REIT | | | (105,235 | ) |
| | (1,729 | ) | | Equity Residential - REIT | | | (116,223 | ) |
| | (465 | ) | | Essex Property Trust, Inc. - REIT | | | (112,637 | ) |
| | (658 | ) | | Extra Space Storage, Inc. - REIT | | | (113,643 | ) |
| | (1,199 | ) | | Federal Realty Investment Trust - REIT | | | (108,054 | ) |
| | (4,737 | ) | | Healthpeak Properties, Inc. - REIT | | | (108,572 | ) |
| | (7,271 | ) | | Host Hotels & Resorts, Inc. - REIT | | | (115,464 | ) |
| | (2,633 | ) | | Iron Mountain, Inc. - REIT | | | (115,773 | ) |
| | (721 | ) | | Mid-America Apartment Communities, Inc. - REIT | | | (111,806 | ) |
| | (985 | ) | | Prologis, Inc. - REIT | | | (100,076 | ) |
| | (1,775 | ) | | Realty Income Corp. - REIT | | | (103,305 | ) |
| | (2,033 | ) | | Regency Centers Corp. - REIT | | | (109,477 | ) |
| | (371 | ) | | SBA Communications Corp. - REIT | | | (105,605 | ) |
| | (2,771 | ) | | UDR, Inc. - REIT | | | (115,578 | ) |
| | (2,516 | ) | | Ventas, Inc. - REIT | | | (101,068 | ) |
| | (3,754 | ) | | VICI Properties, Inc. - REIT | | | (112,057 | ) |
| | (4,439 | ) | | Vornado Realty Trust - REIT | | | (102,807 | ) |
| | (1,579 | ) | | Welltower, Inc. - REIT | | | (101,561 | ) |
| | | | | | | | (2,816,617 | ) |
| | | | | RETAIL — (2.2)% | | | | |
| | (662 | ) | | Advance Auto Parts, Inc. | | | (103,497 | ) |
| | (784 | ) | | Dollar Tree, Inc.* | | | (106,702 | ) |
| | (856 | ) | | Genuine Parts Co. | | | (127,818 | ) |
| | (1,008 | ) | | Walmart, Inc. | | | (130,738 | ) |
| | | | | | | | (468,755 | ) |
| | | | | SHIPBUILDING — (0.6)% | | | | |
| | (551 | ) | | Huntington Ingalls Industries, Inc. | | | (122,047 | ) |
| | | | | | | | | |
| | | | | SOFTWARE — (2.5)% | | | | |
| | (773 | ) | | Broadridge Financial Solutions, Inc. | | | (111,559 | ) |
| | (1,317 | ) | | Fidelity National Information Services, Inc. | | | (99,525 | ) |
| | (1,210 | ) | | Fiserv, Inc.* | | | (113,220 | ) |
| | (683 | ) | | Salesforce, Inc.* | | | (98,243 | ) |
| | (1,015 | ) | | Take-Two Interactive Software, Inc.* | | | (110,635 | ) |
| | | | | | | | (533,182 | ) |
AXS Market Neutral Fund
SCHEDULE OF INVESTMENTS - Continued
As of September 30, 2022
Number
of Shares | | | | | Value | |
| | | | | SECURITIES SOLD SHORT (Continued) | | | | |
| | | | | COMMON STOCKS (Continued) | | | | |
| | | | | TELECOMMUNICATIONS — (1.6)% | | | | |
| | (3,544 | ) | | Corning, Inc. | | $ | (102,847 | ) |
| | (4,590 | ) | | Juniper Networks, Inc. | | | (119,891 | ) |
| | (897 | ) | | T-Mobile US, Inc.* | | | (120,350 | ) |
| | | | | | | | (343,088 | ) |
| | | | | TOYS/GAMES/HOBBIES — (0.5)% | | | | |
| | (1,635 | ) | | Hasbro, Inc. | | | (110,232 | ) |
| | | | | | | | | |
| | | | | TRANSPORTATION — (1.0)% | | | | |
| | (1,189 | ) | | C.H. Robinson Worldwide, Inc. | | | (114,512 | ) |
| | (3,920 | ) | | CSX Corp. | | | (104,429 | ) |
| | | | | | | | (218,941 | ) |
| | | | | WATER — (0.5)% | | | | |
| | (814 | ) | | American Water Works Co., Inc. | | | (105,950 | ) |
| | | | | TOTAL COMMON STOCKS | | | | |
| | | | | (Proceeds $18,792,519) | | | (16,844,345 | ) |
| | | | | | | | | |
| | | | | TOTAL SECURITIES SOLD SHORT | | | | |
| | | | | (Proceeds $18,792,519) | | $ | (16,844,345 | ) |
PLC – Public Limited Company
REIT – Real Estate Investment Trusts
| * | Non-income producing security. |
| 1 | All or a portion of the security is segregated as collateral for securities sold short. As of September 30, 2022, the aggregate value of those securities was $25,425,188, representing 120.8% of net assets. |
| 2 | The rate is the annualized seven-day yield at period end. |
See accompanying Notes to Consolidated Financial Statements.
AXS Market Neutral Fund
SUMMARY OF INVESTMENTS
As of September 30, 2022
| Security Type/Industry | Percent of Total
Net Assets |
| Common Stocks | |
| Insurance | 17.0% |
| Pharmaceuticals | 16.6% |
| Food | 12.9% |
| Retail | 9.3% |
| Biotechnology | 9.3% |
| Beverages | 6.4% |
| Healthcare-Services | 4.9% |
| Household Products/Wares | 4.5% |
| Software | 4.5% |
| Environmental Control | 3.4% |
| Aerospace/Defense | 3.1% |
| Cosmetics/Personal Care | 3.1% |
| Agriculture | 3.1% |
| Computers | 3.1% |
| Telecommunications | 3.0% |
| Commercial Services | 3.0% |
| Healthcare-Products | 2.9% |
| Media | 1.7% |
| Oil & Gas | 1.7% |
| Advertising | 1.6% |
| Diversified Financial Services | 1.5% |
| REITS | 1.5% |
| Packaging & Containers | 1.4% |
| Semiconductors | 1.3% |
| Total Common Stocks | 120.8% |
| Short-Term Investments | 3.3% |
| Total Investments | 124.1% |
| Liabilities in Excess of Other Assets | (24.1)% |
| Total Net Assets | 100.0% |
See accompanying Notes to Consolidated Financial Statements.
AXS Adaptive Plus Fund
SCHEDULE OF INVESTMENTS
As of September 30, 2022
Number
of Contracts | | | | | Value | |
| | | | PURCHASED OPTIONS CONTRACTS — 15.9% | | | |
| | | | CALL OPTIONS — 15.9% | | | |
| | 1,664 | | | Nomura Galaxy Option - ProfitScore Regime - Adaptive Equity Index
Counterparty: Nomura Securities, Current Price: $1,143.98,
Exercise Price: $0.0001, Notional Amount: $17,
Expiration Date: September 15, 20241 | | $ | 1,903,959 | |
| | | | | TOTAL CALL OPTIONS | | | | |
| | | | | (Cost $1,755,247) | | | 1,903,959 | |
| | | | | | | | | |
| | | | | TOTAL PURCHASED OPTIONS CONTRACTS | | | | |
| | | | | (Cost $1,755,247) | | | 1,903,959 | |
Number
of Shares | | | | | | |
| | | | SHORT-TERM INVESTMENTS — 51.8% | | | |
| | 6,220,839 | | | Fidelity Investments Money Market Funds - Treasury Portfolio - Class I, 2.82%2 | | | 6,220,839 | |
| | | | | TOTAL SHORT-TERM INVESTMENTS | | | | |
| | | | | (Cost $6,220,839) | | | 6,220,839 | |
| | | | | | | | | |
| | | | | TOTAL INVESTMENTS — 67.7% | | | | |
| | | | | (Cost $7,976,086) | | | 8,124,798 | |
| | | | | Other Assets in Excess of Liabilities — 32.3% | | | 3,867,998 | |
| | | | | TOTAL NET ASSETS — 100.0% | | $ | 11,992,796 | |
| 1 | The Nomura Call Option is issued by Nomura Securities Ltd. and provides AXS Adaptive Plus Fund exposure to the ProfitScore Trading Program that is designed to produce the returns of Adaptive Equity Index. |
| 2 | The rate is the annualized seven-day yield at period end. |
See accompanying Notes to Consolidated Financial Statements.
AXS Adaptive Plus Fund
SUMMARY OF INVESTMENTS
As of September 30, 2022
| Security Type | Percent of Total
Net Assets |
| Purchased Options Contracts | 15.9% |
| Short-Term Investments | 51.8% |
| Total Investments | 67.7% |
| Other Assets in Excess of Liabilities | 32.3% |
| Total Net Assets | 100.0% |
See accompanying Notes to Consolidated Financial Statements.
AXS Funds
CONSOLIDATED STATEMENTS OF ASSETS AND LIABILITIES
As of September 30, 2022
| | | Alternative Growth Fund | | | Chesapeake Strategy Fund | | | Multi-Strategy Alternatives Fund1 | | | Sustainable Income Fund1 | |
| Assets: | | | | | | | | | | | | |
| Investments, at value (cost $1,262,946, $57,468,301, $21,745,878 and $1,586,052, respectively) | | $ | 1,262,946 | | | $ | 57,468,301 | | | $ | 19,954,577 | | | $ | 1,407,193 | |
| Purchased options contracts, at value (cost $0, $0, $0 and $0, respectively) | | | - | | | | - | | | | - | | | | - | |
| Foreign currency, at value (cost $0, $0, $0 and $0, respectively) | | | - | | | | - | | | | - | | | | - | |
| Cash | | | - | | | | 20,028 | | | | - | | | | - | |
| Cash deposited with brokers for investments | | | - | | | | - | | | | - | | | | - | |
| Cash deposited with brokers for open futures contracts | | | 321,657 | | | | 511,045 | | | | - | | | | - | |
| Cash deposited with brokers for open swap contracts | | | 2,323,518 | | | | - | | | | - | | | | - | |
| Unrealized appreciation on open swap contracts | | | - | | | | - | | | | 215,192 | | | | - | |
| Variation margin on futures contracts | | | - | | | | 2,914,904 | | | | - | | | | - | |
| Receivables: | | | | | | | | | | | | | | | | |
| Investment securities sold | | | - | | | | - | | | | - | | | | - | |
| Fund shares sold | | | - | | | | 201,115 | | | | 1 | | | | - | |
| Due from fund merger (Note 1) | | | - | | | | 1,924 | | | | - | | | | - | |
| Due from Advisor | | | 9,469 | | | | - | | | | 6,331 | | | | 2,000 | |
| Dividends and interest | | | 2,407 | | | | 76,519 | | | | 16,970 | | | | 25,790 | |
| Prepaid expenses and other assets | | | 1,993 | | | | 17,632 | | | | 12,793 | | | | 12,148 | |
| Total assets | | | 3,921,990 | | | | 61,211,468 | | | | 20,205,864 | | | | 1,447,131 | |
| | | | | | | | | | | | | | | | | |
| Liabilities: | | | | | | | | | | | | | | | | |
| Foreign currency due to custodian, at value (proceeds $0, $0, $0 and $0, respectively) | | | - | | | | - | | | | - | | | | - | |
| Securities sold short, at value (proceeds $0, $0, $0 and $0, respectively) | | | - | | | | - | | | | - | | | | - | |
| Unrealized depreciation on open swap contracts | | | 192,412 | | | | - | | | | - | | | | - | |
| Variation margin on futures contracts | | | 224,003 | | | | - | | | | - | | | | - | |
| Variation margin on swap contracts | | | 1,402,781 | | | | - | | | | - | | | | - | |
| Payables: | | | | | | | | | | | | | | | | |
| Investment securities purchased | | | - | | | | - | | | | - | | | | - | |
| Fund shares redeemed | | | - | | | | 145,672 | | | | 4,114 | | | | - | |
| Due to Broker - Swap contract | | | 290,271 | | | | - | | | | 157,466 | | | | - | |
| Due to Broker | | | - | | | | - | | | | - | | | | - | |
| Advisory fees | | | - | | | | 30,997 | | | | - | | | | - | |
| Distribution fees - Class A & Class C (Note 8) | | | 74 | | | | 7,035 | | | | - | | | | - | |
| Distribution fees - Investor Class (Note 8) | | | - | | | | - | | | | 3,289 | | | | - | |
| Shareholder servicing fees (Note 7) | | | - | | | | - | | | | - | | | | - | |
| Dividends on securities sold short | | | - | | | | - | | | | - | | | | - | |
| Auditing fees | | | 30,478 | | | | 24,464 | | | | 20,000 | | | | 18,498 | |
| Fund administration and accounting fees | | | 9,161 | | | | 18,109 | | | | 751 | | | | 19,489 | |
| Custody fees | | | 7,991 | | | | 6,351 | | | | 2,235 | | | | 6,276 | |
| Legal fees | | | 4,434 | | | | 2,512 | | | | 731 | | | | 9,720 | |
| Shareholder reporting fees | | | 3,755 | | | | 3,730 | | | | 1,200 | | | | 4,011 | |
| Chief Compliance Officer fees | | | 2,359 | | | | 3,723 | | | | 1,204 | | | | 5,801 | |
| Trustees' deferred compensation (Note 3) | | | 1,248 | | | | 20,216 | | | | 6,264 | | | | 3,963 | |
| Transfer agent fees and expenses | | | 1,239 | | | | 7,848 | | | | - | | | | 8,836 | |
| Sub-transfer agent fees and expenses | | | 510 | | | | 5,598 | | | | 2,008 | | | | 3,776 | |
| Trustees' fees and expenses | | | 471 | | | | 5,427 | | | | 880 | | | | 1,702 | |
| Interest Expense | | | - | | | | - | | | | - | | | | - | |
| Accrued other expenses | | | 3,842 | | | | 3,074 | | | | 2,622 | | | | 4,478 | |
| Total liabilities | | | 2,175,029 | | | | 284,756 | | | | 202,764 | | | | 86,550 | |
| | | | | | | | | | | | | | | | | |
| Net Assets | | $ | 1,746,961 | | | $ | 60,926,712 | | | $ | 20,003,100 | | | $ | 1,360,581 | |
See accompanying Notes to Consolidated Financial Statements.
AXS Funds
CONSOLIDATED STATEMENTS OF ASSETS AND LIABILITIES - Continued
As of September 30, 2022
| | | Alternative Growth Fund | | | Chesapeake Strategy Fund | | | Multi-Strategy Alternatives Fund1 | | | Sustainable Income Fund1 | |
| Components of Net Assets: | | | | | | | | | | | | | | | | |
| Paid-in capital (par value of $0.01 per share with an unlimited number of shares authorized) | | $ | 4,996,945 | | | $ | 77,800,636 | | | $ | 23,155,673 | | | $ | 2,011,854 | |
| Total distributable earnings (accumulated deficit) | | | (3,249,984 | ) | | | (16,873,924 | ) | | | (3,152,573 | ) | | | (651,273 | ) |
| Net Assets | | $ | 1,746,961 | | | $ | 60,926,712 | | | $ | 20,003,100 | | | $ | 1,360,581 | |
| | | | | | | | | | | | | | | | | |
| Maximum Offering Price per Share: | | | | | | | | | | | | | | | | |
| Class A Shares: | | | | | | | | | | | | | | | | |
| Net assets applicable to shares outstanding | | $ | 289,213 | | | $ | 8,859,061 | | | | | | | | | |
| Shares of beneficial interest issued and outstanding | | | 27,836 | | | | 692,976 | | | | | | | | | |
| Redemption price per share2 | | $ | 10.39 | | | $ | 12.78 | | | | | | | | | |
| Maximum sales charge (5.75% of offering price)3 | | | 0.63 | | | | 0.78 | | | | | | | | | |
| Maximum offering price to public | | $ | 11.02 | | | $ | 13.56 | | | | | | | | | |
| | | | | | | | | | | | | | | | | |
| Class C Shares: | | | | | | | | | | | | | | | | |
| Net assets applicable to shares outstanding | | | | | | $ | 6,411,947 | | | | | | | | | |
| Shares of beneficial interest issued and outstanding | | | | | | | 475,993 | | | | | | | | | |
| Redemption price per share2,4 | | | | | | $ | 13.47 | | | | | | | | | |
| | | | | | | | | | | | | | | | | |
| Investor Class Shares5: | | | | | | | | | | | | | | | | |
| Net assets applicable to shares outstanding | | | | | | | | | | $ | 12,612,229 | | | | | |
| Shares of beneficial interest issued and outstanding | | | | | | | | | | | 1,403,858 | | | | | |
| Redemption price per share2 | | | | | | | | | | $ | 8.98 | | | | | |
| | | | | | | | | | | | | | | | | |
| Class I Shares: | | | | | | | | | | | | | | | | |
| Net assets applicable to shares outstanding | | $ | 1,457,748 | | | $ | 45,655,704 | | | $ | 7,390,871 | | | $ | 1,360,581 | |
| Shares of beneficial interest issued and outstanding | | | 137,919 | | | | 3,525,296 | | | | 816,945 | | | | 181,188 | |
| Redemption price per share2 | | $ | 10.57 | | | $ | 12.95 | | | $ | 9.05 | | | $ | 7.51 | |
| 1 | Financial statements are not consolidated. |
| 2 | Redemptions made within 30 days of purchase may be assessed a redemption fee of 1.00%. |
| 3 | No sales charge applies on investments of $1 million or more. |
| 4 | A contingent deferred sales charge ("CDSC") of 1.00% may be charged on purchases that are redeemed within 12 months of purchase. |
| 5 | Previously R-1 Class Shares for the Multi-Strategy Alternative Fund. |
See accompanying Notes to Consolidated Financial Statements.
AXS Funds
CONSOLIDATED STATEMENTS OF ASSETS AND LIABILITIES - Continued
As of September 30, 2022
| | | Thomson Reuters Private Equity Return Tracker Fund6 | | | Thomson Reuters Venture Capital Return Tracker Fund6 | | | All Terrain Opportunity Fund6 | | | Merger Fund6 | |
| Assets: | | | | | | | | | | | | |
| Investments, at value (cost $15,701,791, $148,100,114, $3,031,232, and $55,359,945, respectively) | | $ | 14,852,422 | | | $ | 113,962,872 | | | $ | 3,031,358 | | | $ | 54,107,150 | |
| Purchased options contracts, at value (cost $0, $0, $0 and $0, respectively) | | | - | | | | - | | | | - | | | | - | |
| Foreign currency, at value (cost $0, $0, $0 and $21, respectively) | | | - | | | | - | | | | - | | | | 18 | |
| Cash | | | 18,786 | | | | 81,592 | | | | - | | | | 7,058,383 | |
| Cash deposited with brokers for investments | | | - | | | | - | | | | - | | | | 5,536,941 | |
| Cash deposited with brokers for open futures contracts | | | - | | | | - | | | | - | | | | - | |
| Cash deposited with brokers for open swap contracts | | | - | | | | - | | | | - | | | | - | |
| Unrealized appreciation on open swap contracts | | | - | | | | - | | | | - | | | | - | |
| Variation margin on futures contracts | | | - | | | | - | | | | - | | | | - | |
| Receivables: | | | | | | | | | | | | | | | | |
| Investment securities sold | | | - | | | | - | | | | 1,181,444 | | | | - | |
| Fund shares sold | | | 646 | | | | 65,286 | | | | - | | | | 595 | |
| Due from fund merger (Note 1) | | | - | | | | - | | | | - | | | | - | |
| Due from Advisor | | | 3,397 | | | | - | | | | 4,733 | | | | - | |
| Dividends and interest | | | 10,862 | | | | 42,324 | | | | 5,344 | | | | 286,720 | |
| Prepaid expenses and other assets | | | 27,274 | | | | 43,903 | | | | 14,422 | | | | 29,026 | |
| Total assets | | | 14,913,387 | | | | 114,195,977 | | | | 4,237,301 | | | | 67,018,833 | |
| | | | | | | | | | | | | | | | | |
| Liabilities: | | | | | | | | | | | | | | | | |
| Foreign currency due to custodian, at value (proceeds $0, $0, $0, and $1,090,110, respectively) | | | - | | | | - | | | | - | | | | 997,879 | |
| Securities sold short, at value (proceeds $0, $0, $0 and $8,195,735, respectively) | | | - | | | | - | | | | - | | | | 7,075,574 | |
| Unrealized depreciation on open swap contracts | | | 361,531 | | | | 5,548,790 | | | | - | | | | - | |
| Variation margin on futures contracts | | | - | | | | - | | | | - | | | | - | |
| Variation margin on swap contracts | | | - | | | | 107,635 | | | | - | | | | - | |
| Payables: | | | | | | | | | | | | | | | | |
| Investment securities purchased | | | - | | | | - | | | | 946,049 | | | | 1,473,800 | |
| Fund shares redeemed | | | 1,090 | | | | 385,347 | | | | 12,765 | | | | 26,903 | |
| Due to Broker - Swap contracts | | | - | | | | - | | | | - | | | | - | |
| Due to Broker | | | - | | | | - | | | | - | | | | - | |
| Advisory fees | | | - | | | | 43,270 | | | | - | | | | 20,382 | |
| Distribution fees - Class A & Class C (Note 8) | | | 214 | | | | 12,085 | | | | - | | | | - | |
| Distribution fees - Investor Class (Note 8) | | | - | | | | - | | | | - | | | | 239 | |
| Shareholder servicing fees (Note 7) | | | - | | | | - | | | | 339 | | | | - | |
| Dividends on securities sold short | | | - | | | | - | | | | - | | | | 3,715 | |
| Auditing fees | | | 20,000 | | | | 20,000 | | | | 15,001 | | | | 15,002 | |
| Fund administration and accounting fees | | | 8,449 | | | | 78,210 | | | | 6,199 | | | | 18,306 | |
| Custody fees | | | 7,547 | | | | 28,235 | | | | 4,239 | | | | 6,945 | |
| Legal fees | | | 2,145 | | | | 17,084 | | | | 1,230 | | | | 5,462 | |
| Shareholder reporting fees | | | 1,489 | | | | 22,006 | | | | 525 | | | | 4,652 | |
| Chief Compliance Officer fees | | | 362 | | | | 7,090 | | | | 1,307 | | | | 2,147 | |
| Trustees' deferred compensation (Note 3) | | | 2,740 | | | | 30,223 | | | | 19,815 | | | | 6,965 | |
| Transfer agent fees and expenses | | | 3,851 | | | | 30,966 | | | | 2,437 | | | | 4,526 | |
| Sub-transfer agent fees and expenses | | | 4,278 | | | | 48,593 | | | | - | | | | 7,385 | |
| Trustees' fees and expenses | | | 1,722 | | | | 10,367 | | | | 2,253 | | | | 2,962 | |
| Interest Expense | | | - | | | | - | | | | - | | | | 3,811 | |
| Accrued other expenses | | | 3,567 | | | | 10,665 | | | | 1,081 | | | | 5,394 | |
| Total liabilities | | | 418,985 | | | | 6,400,566 | | | | 1,013,240 | | | | 9,682,049 | |
| | | | | | | | | | | | | | | | | |
| Net Assets | | $ | 14,494,402 | | | $ | 107,795,411 | | | $ | 3,224,061 | | | $ | 57,336,784 | |
See accompanying Notes to Consolidated Financial Statements.
AXS Funds
CONSOLIDATED STATEMENTS OF ASSETS AND LIABILITIES - Continued
As of September 30, 2022
| | | Thomson Reuters Private Equity Return Tracker Fund6 | | | Thomson Reuters Venture Capital Return Tracker Fund6 | | | All Terrain Opportunity Fund6 | | | Merger Fund6 | |
| Components of Net Assets: | | | | | | | | | | | | | | | | |
| Paid-in capital (par value of $0.01 per share with an unlimited number of shares authorized) | | $ | 17,873,920 | | | $ | 260,785,780 | | | $ | 4,067,700 | | | $ | 57,909,502 | |
| Total distributable earnings (accumulated deficit) | | | (3,379,518 | ) | | | (152,990,369 | ) | | | (843,639 | ) | | | (572,718 | ) |
| Net Assets | | $ | 14,494,402 | | | $ | 107,795,411 | | | $ | 3,224,061 | | | $ | 57,336,784 | |
| | | | | | | | | | | | | | | | | |
| Maximum Offering Price per Share: | | | | | | | | | | | | | | | | |
| Class A Shares: | | | | | | | | | | | | | | | | |
| Net assets applicable to shares outstanding | | $ | 364,431 | | | $ | 34,823,892 | | | | | | | | | |
| Shares of beneficial interest issued and outstanding | | | 41,515 | | | | 2,904,044 | | | | | | | | | |
| Redemption price per share7 | | $ | 8.78 | | | $ | 11.99 | | | | | | | | | |
| Maximum sales charge (5.75% of offering price)8 | | | 0.54 | | | | 0.73 | | | | | | | | | |
| Maximum offering price to public | | $ | 9.32 | | | $ | 12.72 | | | | | | | | | |
| | | | | | | | | | | | | | | | | |
| Class C Shares: | | | | | | | | | | | | | | | | |
| Net assets applicable to shares outstanding | | $ | 141,057 | | | $ | 4,210,070 | | | | | | | | | |
| Shares of beneficial interest issued and outstanding | | | 16,559 | | | | 375,150 | | | | | | | | | |
| Redemption price per share7,9 | | $ | 8.52 | | | $ | 11.22 | | | | | | | | | |
| | | | | | | | | | | | | | | | | |
| Investor Class Shares: | | | | | | | | | | | | | | | | |
| Net assets applicable to shares outstanding | | | | | | | | | | | | | | $ | 1,142,209 | |
| Shares of beneficial interest issued and outstanding | | | | | | | | | | | | | | | 110,689 | |
| Redemption price per share7 | | | | | | | | | | | | | | $ | 10.32 | |
| | | | | | | | | | | | | | | | | |
| Class I Shares10: | | | | | | | | | | | | | | | | |
| Net assets applicable to shares outstanding | | $ | 13,988,914 | | | $ | 68,761,449 | | | $ | 3,224,061 | | | $ | 56,194,575 | |
| Shares of beneficial interest issued and outstanding | | | 1,563,200 | | | | 5,634,643 | | | | 137,054 | | | | 5,271,685 | |
| Redemption price per share7 | | $ | 8.95 | | | $ | 12.20 | | | $ | 23.52 | | | $ | 10.66 | |
| 6 | Financial statements are not consolidated. |
| 7 | Redemptions made within 30 days of purchase may be assessed a redemption fee of 1.00%. |
| 8 | No sales charge applies on investments of $1 million or more. |
| 9 | A contingent deferred sales charge ("CDSC") of 1.00% may be charged on purchases that are redeemed within 12 months of purchase. |
| 10 | Previously Institutional Class Shares for the All Terrain Opportunity Fund. |
See accompanying Notes to Consolidated Financial Statements.
AXS Funds
CONSOLIDATED STATEMENTS OF ASSETS AND LIABILITIES - Continued
As of September 30, 2022
| | | Alternative Value Fund11 | | | Market Neutral Fund11 | | | Adaptive Plus Fund11,12 | |
| Assets: | | | | | | | | | |
| Investments, at value (cost $28,236,347, $26,696,999 and $6,220,839, respectively) | | $ | 26,240,927 | | | $ | 26,134,867 | | | $ | 6,220,839 | |
| Purchased options contracts, at value (cost $0, $0 and $1,755,247, respectively) | | | - | | | | - | | | | 1,903,959 | |
| Foreign currency, at value (cost $0, $0 and $0, respectively) | | | - | | | | - | | | | - | |
| Cash | | | 16,067 | | | | 165,874 | | | | - | |
| Cash deposited with brokers for investments | | | - | | | | 16,978,475 | | | | - | |
| Cash deposited with brokers for open futures contracts | | | - | | | | - | | | | - | |
| Cash deposited with brokers for open swap contracts | | | - | | | | - | | | | - | |
| Unrealized appreciation on open swap contracts | | | - | | | | - | | | | - | |
| Variation margin on futures contracts | | | - | | | | - | | | | - | |
| Receivables: | | | | | | | | | | | | |
| Investment securities sold | | | 1,701,972 | | | | - | | | | - | |
| Fund shares sold | | | 7,000 | | | | 18,700 | | | | 3,866,976 | |
| Due from fund merger (Note 1) | | | - | | | | - | | | | - | |
| Due from Advisor | | | - | | | | - | | | | 21,442 | |
| Dividends and interest | | | 34,233 | | | | 47,920 | | | | 2,599 | |
| Prepaid expenses | | | 850 | | | | 16,130 | | | | - | |
| Total assets | | | 28,001,049 | | | | 43,361,966 | | | | 12,015,815 | |
| | | | | | | | | | | | | |
| Liabilities: | | | | | | | | | | | | |
| Foreign currency due to custodian, at value (proceeds $0, $0 and $0, respectively) | | | - | | | | - | | | | - | |
| Securities sold short, at value (proceeds $0, $18,792,518 and $0, respectively) | | | - | | | | 16,844,345 | | | | - | |
| Unrealized depreciation on open swap contracts | | | - | | | | - | | | | - | |
| Variation margin on futures contracts | | | - | | | | - | | | | - | |
| Variation margin on swap contracts | | | - | | | | - | | | | - | |
| Payables: | | | | | | | | | | | | |
| Investment securities purchased | | | - | | | | - | | | | - | |
| Fund shares redeemed | | | 9,036 | | | | 46,157 | | | | - | |
| Due to Broker - Swap contracts | | | - | | | | - | | | | - | |
| Due to Broker | | | 9,071,369 | | | | 5,320,633 | | | | - | |
| Advisory fees | | | 2,586 | | | | 5,893 | | | | - | |
| Distribution fees - Class A & Class C (Note 8) | | | - | | | | - | | | | - | |
| Distribution fees - Investor Class (Note 8) | | | 460 | | | | 418 | | | | - | |
| Shareholder servicing fees (Note 7) | | | - | | | | - | | | | - | |
| Dividends on securities sold short | | | - | | | | 32,015 | | | | - | |
| Auditing fees | | | 15,000 | | | | 15,000 | | | | 18,000 | |
| Fund administration and accounting fees | | | 5,908 | | | | 8,028 | | | | 1,958 | |
| Custody fees | | | 4,326 | | | | 4,638 | | | | 267 | |
| Legal fees | | | 2,142 | | | | 6,802 | | | | 408 | |
| Shareholder reporting fees | | | 1,493 | | | | 6,440 | | | | 177 | |
| Chief Compliance Officer fees | | | 2,081 | | | | 2,493 | | | | 168 | |
| Trustees' deferred compensation (Note 3) | | | 775 | | | | 1,282 | | | | - | |
| Transfer agent fees and expenses | | | 4,747 | | | | 6,289 | | | | 1,291 | |
| Sub-transfer agent fees and expenses | | | 1,992 | | | | 1,157 | | | | 93 | |
| Trustees' fees and expenses | | | 1,831 | | | | 1,996 | | | | 296 | |
| Interest Expense | | | 21,542 | | | | - | | | | - | |
| Accrued other expenses | | | 4,582 | | | | 6,270 | | | | 361 | |
| Total liabilities | | | 9,149,870 | | | | 22,309,856 | | | | 23,019 | |
| | | | | | | | | | | | | |
| Net Assets | | $ | 18,851,179 | | | $ | 21,052,110 | | | $ | 11,992,796 | |
See accompanying Notes to Consolidated Financial Statements.
AXS Funds
CONSOLIDATED STATEMENTS OF ASSETS AND LIABILITIES - Continued
As of September 30, 2022
| | | Alternative Value Fund11 | | | Market Neutral Fund11 | | | Adaptive Plus Fund11,12 | |
| Components of Net Assets: | | | | | | | | | | | | |
| Paid-in capital (par value of $0.01 per share with an unlimited number of shares authorized) | | $ | 20,689,343 | | | $ | 24,966,218 | | | $ | 11,843,910 | |
| Total distributable earnings (accumulated deficit) | | | (1,838,164 | ) | | | (3,914,108 | ) | | | 148,886 | |
| Net Assets | | $ | 18,851,179 | | | $ | 21,052,110 | | | $ | 11,992,796 | |
| | | | | | | | | | | | | |
| Maximum Offering Price per Share: | | | | | | | | | | | | |
| Investor Class Shares: | | | | | | | | | | | | |
| Net assets applicable to shares outstanding | | $ | 2,009,732 | | | $ | 2,031,352 | | | | | |
| Shares of beneficial interest issued and outstanding | | | 196,471 | | | | 177,296 | | | | | |
| Redemption price per share13 | | $ | 10.23 | | | $ | 11.46 | | | | | |
| | | | | | | | | | | | | |
| Class I Shares: | | | | | | | | | | | | |
| Net assets applicable to shares outstanding | | $ | 16,841,447 | | | $ | 19,020,758 | | | $ | 11,992,796 | |
| Shares of beneficial interest issued and outstanding | | | 1,648,529 | | | | 1,620,881 | | | | 1,162,911 | |
| Redemption price per share13 | | $ | 10.22 | | | $ | 11.73 | | | $ | 10.31 | |
| 11 | Financial statements are not consolidated. |
| 12 | Commenced operations on September 15, 2022. |
| 13 | Redemptions made within 30 days of purchase may be assessed a redemption fee of 1.00%. Does not apply to the Adaptive Plus Fund. |
See accompanying Notes to Consolidated Financial Statements.
AXS Funds
CONSOLIDATED STATEMENTS OF OPERATIONS
For the Periods Ended September 30, 2022
| | | Alternative Growth Fund | | | Chesapeake Strategy Fund | | | Multi-Strategy Alternatives Fund1 | | | Sustainable Income Fund1 | |
| Investment Income: | | | | | | | | | | | | | | | | |
| Dividends (net of foreign withholding taxes of $0, $0, $0 and $0, respectively) | | $ | 26 | | | $ | - | | | $ | 272,254 | | | $ | - | |
| Interest | | | 10,872 | | | | 219,690 | | | | 37,091 | | | | 1,046,056 | |
| Total investment income | | | 10,898 | | | | 219,690 | | | | 309,345 | | | | 1,046,056 | |
| | | | | | | | | | | | | | | | | |
| Expenses: | | | | | | | | | | | | | | | | |
| Fund administration and accounting fees | | | 60,062 | | | | 111,029 | | | | 47,320 | | | | 67,397 | |
| Registration fees | | | 59,440 | | | | 60,499 | | | | 40,202 | | | | 29,999 | |
| Advisory fees | | | 30,703 | | | | 518,086 | | | | 198,341 | | | | 129,918 | |
| Auditing fees | | | 30,478 | | | | 14,751 | | | | 15,500 | | | | 18,498 | |
| Custody fees | | | 18,754 | | | | 5,069 | | | | 17,014 | | | | 10,933 | |
| Legal fees | | | 13,260 | | | | 18,293 | | | | 6,501 | | | | 24,878 | |
| Transfer agent fees and expenses | | | 10,797 | | | | 27,053 | | | | 12,738 | | | | 12,395 | |
| Miscellaneous | | | 10,001 | | | | 6,001 | | | | 3,500 | | | | 3,300 | |
| Chief Compliance Officer fees | | | 7,668 | | | | 10,017 | | | | 2,195 | | | | 16,110 | |
| Shareholder reporting fees | | | 6,745 | | | | 8,622 | | | | - | | | | 5,501 | |
| Sub-transfer agent fees and expenses | | | 6,147 | | | | 26,190 | | | | 21,099 | | | | 1,772 | |
| Insurance fees | | | 2,299 | | | | 9,320 | | | | 1,624 | | | | 4,073 | |
| Trustees' fees and expenses | | | 1,777 | | | | 5,264 | | | | 5,170 | | | | 11,262 | |
| Shareholder servicing fees (Note 7) | | | - | | | | - | | | | 5,339 | | | | | |
| Interest expense | | | 12 | | | | - | | | | - | | | | - | |
| Dividends on securities sold short | | | - | | | | - | | | | - | | | | - | |
| Distribution fees - Class A (Note 8) | | | 1,528 | | | | 13,677 | | | | - | | | | - | |
| Distribution fees - Class C (Note 8) | | | - | | | | 25,751 | | | | - | | | | - | |
| Distribution fees - Investor Class (Note 8) | | | - | | | | - | | | | 27,147 | | | | - | |
| Total expenses | | | 259,671 | | | | 859,622 | | | | 403,690 | | | | 336,036 | |
| Advisory fees waived | | | (30,703 | ) | | | (172,227 | ) | | | (84,473 | ) | | | (129,918 | ) |
| Other expenses absorbed | | | (186,562 | ) | | | - | | | | - | | | | (20,757 | ) |
| Fees paid indirectly (Note 3) | | | (340 | ) | | | (2,264 | ) | | | (1,252 | ) | | | (1,651 | ) |
| Net expenses | | | 42,066 | | | | 685,131 | | | | 317,965 | | | | 183,710 | |
| Net investment income (loss) | | | (31,168 | ) | | | (465,441 | ) | | | (8,620 | ) | | | 862,346 | |
| | | | | | | | | | | | | | | | | |
| Realized and Unrealized Gain (Loss): | | | | | | | | | | | | | | | | |
| Net realized gain (loss) on: | | | | | | | | | | | | | | | | |
| Investments | | | - | | | | - | | | | (1,195,754 | ) | | | (443,262 | ) |
| Purchased options contracts | | | - | | | | - | | | | - | | | | - | |
| Futures contracts | | | (673,118 | ) | | | 6,307,720 | | | | - | | | | - | |
| Written options contracts | | | - | | | | - | | | | - | | | | - | |
| Foreign currency transactions | | | - | | | | (150,143 | ) | | | - | | | | - | |
| Securities sold short | | | - | | | | - | | | | - | | | | - | |
| Swap contracts | | | (834,388 | ) | | | (2,086 | ) | | | (45,491 | ) | | | - | |
| Net realized gain (loss) | | | (1,507,506 | ) | | | 6,155,491 | | | | (1,241,245 | ) | | | (443,262 | ) |
| Capital gain distribution from portfolio funds | | | - | | | | - | | | | - | | | | - | |
| Net change in unrealized appreciation (depreciation) on: | | | | | | | | | | | | | | | | |
| Investments | | | - | | | | - | | | | (4,232,702 | ) | | | (1,043,251 | ) |
| Purchased options contracts | | | - | | | | - | | | | - | | | | - | |
| Futures contracts | | | (64,558 | ) | | | 2,277,148 | | | | - | | | | - | |
| Securities sold short | | | - | | | | - | | | | - | | | | - | |
| Written options contracts | | | - | | | | - | | | | - | | | | - | |
| Foreign currency translations | | | - | | | | 3,784 | | | | - | | | | - | |
| Swap contracts | | | 442,948 | | | | - | | | | 194,852 | | | | - | |
| Net change in unrealized appreciation (depreciation) | | | 378,390 | | | | 2,280,932 | | | | (4,037,850 | ) | | | (1,043,251 | ) |
| Net increase from payment by affiliates (Note 3) | | | - | | | | - | | | | - | | | | - | |
| Net realized and unrealized gain (loss) | | | (1,129,116 | ) | | | 8,436,423 | | | | (5,279,095 | ) | | | (1,486,513 | ) |
| Net Increase (Decrease) in Net Assets from Operations | | $ | (1,160,284 | ) | | $ | 7,970,982 | | | $ | (5,287,715 | ) | | $ | (624,167 | ) |
| 1 | Financial statements are not consolidated. |
See accompanying Notes to Consolidated Financial Statements.
AXS Funds
CONSOLIDATED STATEMENTS OF OPERATIONS - Continued
For the Periods Ended September 30, 2022
| | | Thomson Reuters Private Equity Return Tracker Fund2 | | | Thomson Reuters Venture Capital Return Tracker Fund2 | | | All Terrain Opportunity Fund2 | | | Merger Fund2 | |
| Investment Income: | | | | | | | | | | | | | | | | |
| Dividends (net of foreign withholding taxes of $0, $0, $0 and $654, respectively) | | $ | 335,269 | | | $ | 1,865,353 | | | $ | 64,469 | | | $ | 574,128 | |
| Interest | | | 77 | | | | 403 | | | | 30,224 | | | | 166,898 | |
| Total investment income | | | 335,346 | | | | 1,865,756 | | | | 94,693 | | | | 741,026 | |
| | | | | | | | | | | | | | | | | |
| Expenses: | | | | | | | | | | | | | | | | |
| Fund administration and accounting fees | | | 63,524 | | | | 438,573 | | | | 42,691 | | | | 123,320 | |
| Registration fees | | | 71,720 | | | | 120,870 | | | | 26,101 | | | | 40,200 | |
| Advisory fees | | | 270,875 | | | | 2,977,528 | | | | 256,864 | | | | 823,858 | |
| Auditing fees | | | 20,000 | | | | 20,000 | | | | 15,001 | | | | 15,001 | |
| Custody fees | | | 31,353 | | | | 89,395 | | | | 10,709 | | | | 16,214 | |
| Legal fees | | | 10,001 | | | | 104,556 | | | | 20,190 | | | | 31,999 | |
| Transfer agent fees and expenses | | | 26,880 | | | | 152,775 | | | | 8,050 | | | | 22,077 | |
| Miscellaneous | | | 7,501 | | | | 16,001 | | | | 2,000 | | | | 6,501 | |
| Chief Compliance Officer fees | | | 3,000 | | | | 34,080 | | | | 2,800 | | | | 17,672 | |
| Shareholder reporting fees | | | 7,679 | | | | 49,430 | | | | 5,500 | | | | 10,501 | |
| Sub-transfer agent fees and expenses | | | 25,712 | | | | 233,445 | | | | - | | | | 54,890 | |
| Insurance fees | | | 1,602 | | | | 21,433 | | | | 2,001 | | | | 6,172 | |
| Trustees' fees and expenses | | | 8,784 | | | | 80,044 | | | | 6,455 | | | | 19,692 | |
| Shareholder servicing fees (Note 7) | | | - | | | | - | | | | 18,574 | | | | - | |
| Interest expense | | | - | | | | - | | | | - | | | | 116,130 | |
| Dividends on securities sold short | | | - | | | | - | | | | - | | | | 213,608 | |
| Distribution fees - Class A (Note 8) | | | 1,293 | | | | 171,084 | | | | - | | | | - | |
| Distribution fees - Class C (Note 8) | | | 2,144 | | | | 87,956 | | | | - | | | | - | |
| Distribution fees - Investor Class (Note 8) | | | - | | | | - | | | | - | | | | 3,439 | |
| Total expenses | | | 552,068 | | | | 4,597,170 | | | | 416,936 | | | | 1,521,274 | |
| Advisory fees waived | | | (222,008 | ) | | | (746,554 | ) | | | (121,690 | ) | | | (194,688 | ) |
| Other expenses absorbed | | | - | | | | - | | | | - | | | | - | |
| Fees paid indirectly (Note 3) | | | (1,655 | ) | | | (18,545 | ) | | | (1,688 | ) | | | (4,780 | ) |
| Net expenses | | | 328,405 | | | | 3,832,071 | | | | 293,558 | | | | 1,321,806 | |
| Net investment income (loss) | | | 6,941 | | | | (1,966,315 | ) | | | (198,865 | ) | | | (580,780 | ) |
| | | | | | | | | | | | | | | | | |
| Realized and Unrealized Gain (Loss): | | | | | | | | | | | | | | | | |
| Net realized gain (loss) on: | | | | | | | | | | | | | | | | |
| Investments | | | 2,304,055 | | | | 6,545,354 | | | | (517,450 | ) | | | 8,011,030 | |
| Purchased options contracts | | | - | | | | - | | | | (26,328 | ) | | | (37,416 | ) |
| Futures contracts | | | - | | | | - | | | | - | | | | - | |
| Written options contracts | | | - | | | | - | | | | - | | | | 44,090 | |
| Foreign currency transactions | | | - | | | | - | | | | - | | | | 35,217 | |
| Securities sold short | | | - | | | | - | | | | - | | | | (6,343,974 | ) |
| Swap contracts | | | (4,014,353 | ) | | | (117,970,833 | ) | | | - | | | | - | |
| Net realized gain (loss) | | | (1,710,298 | ) | | | (111,425,479 | ) | | | (543,778 | ) | | | 1,708,947 | |
| Capital gain distribution from portfolio funds | | | - | | | | - | | | | 4,159 | | | | - | |
| Net change in unrealized appreciation (depreciation) on: | | | | | | | | | | | | | | | | |
| Investments | | | (5,501,460 | ) | | | (93,738,807 | ) | | | 228,130 | | | | (6,189,825 | ) |
| Purchased options contracts | | | - | | | | - | | | | 19,004 | | | | 6,911 | |
| Futures contracts | | | - | | | | - | | | | - | | | | - | |
| Securities sold short | | | - | | | | - | | | | - | | | | 6,203,531 | |
| Written options contracts | | | - | | | | - | | | | - | | | | 837 | |
| Foreign currency translations | | | - | | | | - | | | | - | | | | 8,626 | |
| Swap contracts | | | 583,058 | | | | 14,656,775 | | | | - | | | | - | |
| Net change in unrealized appreciation (depreciation) | | | (4,918,402 | ) | | | (79,082,032 | ) | | | 247,134 | | | | 30,080 | |
| Net increase from payment by affiliates (Note 3) | | | - | | | | 8,347 | | | | 8,830 | | | | - | |
| Net realized and unrealized gain (loss) | | | (6,628,700 | ) | | | (190,499,164 | ) | | | (283,655 | ) | | | 1,739,027 | |
| Net Increase (Decrease) in Net Assets from Operations | | $ | (6,621,759 | ) | | $ | (192,465,479 | ) | | $ | (482,520 | ) | | $ | 1,158,247 | |
| 2 | Financial statements are not consolidated. |
See accompanying Notes to Consolidated Financial Statements.
AXS Funds
CONSOLIDATED STATEMENTS OF OPERATIONS - Continued
For the Periods Ended September 30, 2022
| | | Alternative Value Fund3 | | | Market Neutral Fund3 | | | Adaptive Plus Fund3,4 | |
| Investment Income: | | | | | | | | | | | | |
| Dividends (net of foreign withholding taxes of $0, $0 and $0, respectively) | | $ | 313,155 | | | $ | 433,991 | | | $ | - | |
| Interest | | | 31 | | | | 38 | | | | 2,599 | |
| Total investment income | | | 313,186 | | | | 434,029 | | | | 2,599 | |
| | | | | | | | | | | | | |
| Expenses: | | | | | | | | | | | | |
| Fund administration and accounting fees | | | 7,235 | | | | 21,153 | | | | 1,958 | |
| Registration fees | | | 37,000 | | | | 29,698 | | | | 1,089 | |
| Advisory fees | | | 74,170 | | | | 193,864 | | | | 2,018 | |
| Auditing fees | | | 13,749 | | | | 13,749 | | | | 18,000 | |
| Custody fees | | | 6,271 | | | | 4,475 | | | | 267 | |
| Legal fees | | | 1,000 | | | | 2,500 | | | | 408 | |
| Transfer agent fees and expenses | | | 394 | | | | 3,906 | | | | 1,291 | |
| Miscellaneous | | | 3,501 | | | | 2,000 | | | | 254 | |
| Chief Compliance Officer fees | | | 6,809 | | | | 6,902 | | | | 167 | |
| Shareholder reporting fees | | | 6,515 | | | | 11,954 | | | | 177 | |
| Sub-transfer agent fees and expenses | | | 10,223 | | | | 13,435 | | | | 93 | |
| Insurance fees | | | 958 | | | | 1,350 | | | | 118 | |
| Trustees' fees and expenses | | | 1,892 | | | | 2,729 | | | | 296 | |
| Shareholder servicing fees (Note 7) | | | - | | | | - | | | | - | |
| Interest expense | | | 77,381 | | | | 39,927 | | | | - | |
| Dividends on securities sold short | | | - | | | | 262,128 | | | | - | |
| Distribution fees - Class A (Note 8) | | | - | | | | - | | | | - | |
| Distribution fees - Class C (Note 8) | | | - | | | | - | | | | - | |
| Distribution fees - Investor Class (Note 8) | | | 2,933 | | | | 4,293 | | | | - | |
| Total expenses | | | 250,031 | | | | 614,063 | | | | 26,136 | |
| Advisory fees waived | | | (72,072 | ) | | | (106,381 | ) | | | (2,018 | ) |
| Other expenses absorbed | | | - | | | | - | | | | (21,441 | ) |
| Fees paid indirectly (Note 3) | | | (650 | ) | | | (853 | ) | | | - | |
| Net expenses | | | 177,309 | | | | 506,829 | | | | 2,677 | |
| Net investment income (loss) | | | 135,877 | | | | (72,800 | ) | | | (78 | ) |
| | | | | | | | | | | | | |
| Realized and Unrealized Gain (Loss): | | | | | | | | | | | | |
| Net realized gain (loss) on: | | | | | | | | | | | | |
| Investments | | | 50,474 | | | | 910,669 | | | | - | |
| Purchased options contracts | | | - | | | | - | | | | - | |
| Futures contracts | | | - | | | | - | | | | - | |
| Written options contracts | | | - | | | | - | | | | - | |
| Foreign currency transactions | | | - | | | | - | | | | - | |
| Securities sold short | | | - | | | | 76,606 | | | | - | |
| Swap contracts | | | - | | | | - | | | | - | |
| Net realized gain (loss) | | | 50,474 | | | | 987,275 | | | | - | |
| Capital gain distribution from portfolio funds | | | - | | | | - | | | | - | |
| Net change in unrealized appreciation (depreciation) on: | | | | | | | | | | | | |
| Investments | | | (2,162,759 | ) | | | (2,057,829 | ) | | | - | |
| Purchased options contracts | | | - | | | | - | | | | 148,712 | |
| Futures contracts | | | - | | | | - | | | | - | |
| Securities sold short | | | - | | | | 2,636,476 | | | | - | |
| Written options contracts | | | - | | | | - | | | | - | |
| Foreign currency translations | | | - | | | | - | | | | - | |
| Swap contracts | | | - | | | | - | | | | - | |
| Net change in unrealized appreciation (depreciation) | | | (2,162,759 | ) | | | 578,647 | | | | 148,712 | |
| Net increase from payment by affiliates (Note 3) | | | - | | | | - | | | | - | |
| Net realized and unrealized gain (loss) | | | (2,112,285 | ) | | | 1,565,922 | | | | 148,712 | |
| Net Increase (Decrease) in Net Assets from Operations | | $ | (1,976,408 | ) | | $ | 1,493,122 | | | $ | 148,634 | |
| 3 | Financial statements are not consolidated. |
| 4 | Commenced operations on September 15, 2022. |
See accompanying Notes to Consolidated Financial Statements.
AXS Alternative Growth Fund
CONSOLIDATED STATEMENTS OF CHANGES IN NET ASSETS
| | | For the Year Ended September 30, 2022 | | | For the Year Ended September 30, 2021 | |
| Increase (Decrease) in Net Assets from: | | | | | | | | |
| Operations: | | | | | | | | |
| Net investment income (loss) | | $ | (31,168 | ) | | $ | (38,423 | ) |
| Net realized gain (loss) on investments, futures contracts and swap contract | | | (1,507,506 | ) | | | 1,134,562 | |
| Net change in unrealized appreciation/depreciation on investments, futures contracts and swap contract | | | 378,390 | | | | 104,334 | |
| Net increase (decrease) in net assets resulting from operations | | | (1,160,284 | ) | | | 1,200,473 | |
| | | | | | | | | |
| Capital Transactions: | | | | | | | | |
| Net proceeds from shares sold: | | | | | | | | |
| Class A | | | 128,671 | | | | 162,430 | |
| Class I | | | 6,173,116 | | | | 1,225,609 | |
| Cost of shares redeemed: | | | | | | | | |
| Class A1 | | | (409,380 | ) | | | (605,943 | ) |
| Class I2 | | | (6,400,655 | ) | | | (6,539,009 | ) |
| Net increase (decrease) in net assets from capital transactions | | | (508,248 | ) | | | (5,756,913 | ) |
| | | | | | | | | |
| Total increase (decrease) in net assets | | | (1,668,532 | ) | | | (4,556,440 | ) |
| | | | | | | | | |
| Net Assets: | | | | | | | | |
| Beginning of period | | | 3,415,493 | | | | 7,971,933 | |
| End of period | | $ | 1,746,961 | | | $ | 3,415,493 | |
| | | | | | | | | |
| Capital Share Transactions: | | | | | | | | |
| Shares sold: | | | | | | | | |
| Class A | | | 8,728 | | | | 11,852 | |
| Class I | | | 396,114 | | | | 95,457 | |
| Shares redeemed: | | | | | | | | |
| Class A | | | (29,822 | ) | | | (48,304 | ) |
| Class I | | | (453,330 | ) | | | (526,727 | ) |
| Net increase (decrease) in capital share transactions | | | (78,310 | ) | | | (467,722 | ) |
| 1 | Net of redemption fee proceeds of $22 and $69, respectively. |
| 2 | Net of redemption fee proceeds of $153 and $1,738, respectively. |
See accompanying Notes to Consolidated Financial Statements.
AXS Chesapeake Strategy Fund
CONSOLIDATED STATEMENTS OF CHANGES IN NET ASSETS
| | | For the Year Ended September 30, 20221,2 | | | For the Year Ended September 30, 2021 | |
| Increase (Decrease) in Net Assets from: | | | | | | | | |
| Operations: | | | | | | | | |
| Net investment income (loss) | | $ | (465,441 | ) | | $ | (265,660 | ) |
| Net realized gain (loss) on investments, futures contracts, foreign currency transactions and swap contracts | | | 6,155,491 | | | | 3,770,890 | |
| Net change in unrealized appreciation/depreciation on futures contracts and foreign currency transactions | | | 2,280,932 | | | | 686,271 | |
| Net increase (decrease) in net assets resulting from operations | | | 7,970,982 | | | | 4,191,501 | |
| | | | | | | | | |
| Distributions to Shareholders: | | | | | | | | |
| Distributions: | | | | | | | | |
| Class A | | | (651,094 | ) | | | - | |
| Class C | | | (15,388 | ) | | | - | |
| Class I | | | (2,485,912 | ) | | | - | |
| Total distributions to shareholders | | | (3,152,394 | ) | | | - | |
| | | | | | | | | |
| Capital Transactions: | | | | | | | | |
| Net proceeds from shares sold: | | | | | | | | |
| Class A | | | 632,501 | | | | 630,452 | |
| Class C | | | 129,589 | | | | 39,312 | |
| Class I | | | 29,326,728 | | | | 4,336,958 | |
| Reinvestment of distributions: | | | | | | | | |
| Class A | | | 628,759 | | | | - | |
| Class C | | | 14,657 | | | | - | |
| Class I | | | 2,321,839 | | | | - | |
| Cost of shares redeemed: | | | | | | | | |
| Class A | | | (1,339,769 | ) | | | (1,136,715 | ) |
| Class C | | | (779,138 | ) | | | (159,981 | ) |
| Class I | | | (12,430,192 | ) | | | (4,748,821 | ) |
| Capital Contribution from Plan of Reorganization (Note 1): | | | | | | | | |
| Class A | | | 4,397,705 | | | | - | |
| Class C | | | 6,023,468 | | | | - | |
| Class I | | | 8,389,210 | | | | - | |
| Net increase (decrease) in net assets from capital transactions | | | 37,315,357 | | | | (1,038,795 | ) |
| | | | | | | | | |
| Total increase (decrease) in net assets | | | 42,133,945 | | | | 3,152,706 | |
| | | | | | | | | |
| Net Assets: | | | | | | | | |
| Beginning of period | | | 18,792,767 | | | | 15,640,061 | |
| End of period | | $ | 60,926,712 | | | $ | 18,792,767 | |
| | | | | | | | | |
| Capital Share Transactions: | | | | | | | | |
| Shares sold: | | | | | | | | |
| Class A | | | 53,255 | | | | 54,343 | |
| Class C | | | 10,098 | | | | 3,316 | |
| Class I | | | 2,410,007 | | | | 362,604 | |
| Shares reinvested: | | | | | | | | |
| Class A | | | 62,439 | | | | - | |
| Class C | | | 1,372 | | | | - | |
| Class I | | | 228,078 | | | | - | |
| Shares redeemed: | | | | | | | | |
| Class A | | | (112,625 | ) | | | (101,613 | ) |
| Class C | | | (61,450 | ) | | | (14,039 | ) |
| Class I | | | (1,042,674 | ) | | | (428,122 | ) |
| Capital Contribution from Plan of Reorganization (Note 1): | | | | | | | | |
| Class A | | | 378,798 | | | | - | |
| Class C | | | 503,116 | | | | - | |
| Class I | | | 737,113 | | | | - | |
| Net increase (decrease) in capital share transactions | | | 3,167,527 | | | | (123,511 | ) |
| 1 | With the Plan of Reorganization with respect to the AXS Aspect Core Diversified Strategy Fund, Class A, Class C and Class I shareholders received Class A, Class C and Class I shares of the AXS Chesapeake Strategy Fund, respectively, effective as of the close of business on December 17, 2021. See Note 1 in the accompanying Notes to Consolidate Financial Statements. |
| 2 | With the Plan of Reorganization with respect to the AXS Managed Futures Strategy Fund, Class A, Class C and Class I shareholders received Class A, Class C and Class I shares of the AXS Chesapeake Strategy Fund, respectively, effective as of the close of business on July 22, 2022. See Note 1 in the accompanying Notes to Consolidate Financial Statements. |
See accompanying Notes to Consolidated Financial Statements.
AXS Multi-Strategy Alternatives Fund
STATEMENTS OF CHANGES IN NET ASSETS
| | | For the Year Ended September 30, 2022 | | | For the Year Ended September 30, 2021 | |
| Increase (Decrease) in Net Assets from: | | | | | | | | |
| Operations: | | | | | | | | |
| Net investment income (loss) | | $ | (8,620 | ) | | $ | (203,469 | ) |
| Net realized gain (loss) on investments and swap contracts | | | (1,241,245 | ) | | | 7,850,070 | |
| Net change in unrealized appreciation/depreciation on investments and swap contracts | | | (4,037,850 | ) | | | (2,321,016 | ) |
| Net increase (decrease) in net assets resulting from operations | | | (5,287,715 | ) | | | 5,325,585 | |
| | | | | | | | | |
| Distributions to Shareholders: | | | | | | | | |
| Distributions: | | | | | | | | |
| Investor Class | | | (1,996,507 | ) | | | - | |
| Class I | | | (2,049,477 | ) | | | - | |
| Total distributions to shareholders | | | (4,045,984 | ) | | | - | |
| | | | | | | | | |
| Capital Transactions: | | | | | | | | |
| Net proceeds from shares sold: | | | | | | | | |
| Investor Class | | | 4,249,291 | | | | 4,296,537 | |
| Class I | | | 2,804,191 | | | | 3,478,805 | |
| Reinvestment of distributions: | | | | | | | | |
| Investor Class | | | 1,875,222 | | | | - | |
| Class I | | | 1,793,047 | | | | - | |
| Cost of shares redeemed: | | | | | | | | |
| Investor Class | | | (8,524,558 | ) | | | (9,622,259 | ) |
| Class I | | | (7,103,457 | ) | | | (46,307,874 | ) |
| Capital contribution from Plan of Reorganization (Note 1): | | | | | | | | |
| Investor Class | | | 9,738,840 | | | | - | |
| Class I | | | 4,467,783 | | | | - | |
| Net increase (decrease) in net assets from capital transactions | | | 9,300,359 | | | | (48,154,791 | ) |
| | | | | | | | | |
| Total increase (decrease) in net assets | | | (33,340 | ) | | | (42,829,206 | ) |
| | | | | | | | | |
| Net Assets: | | | | | | | | |
| Beginning of period | | | 20,036,440 | | | | 62,865,646 | |
| End of period | | $ | 20,003,100 | | | $ | 20,036,440 | |
| | | | | | | | | |
| Capital Share Transactions: | | | | | | | | |
| Shares sold: | | | | | | | | |
| Investor Class | | | 339,118 | | | | 314,196 | |
| Class I | | | 232,169 | | | | 255,045 | |
| Shares reinvested: | | | | | | | | |
| Investor Class | | | 156,138 | | | | - | |
| Class I | | | 148,431 | | | | - | |
| Shares redeemed: | | | | | | | | |
| Investor Class | | | (726,759 | ) | | | (743,673 | ) |
| Class I | | | (632,425 | ) | | | (4,069,561 | ) |
| Capital contribution from Plan of Reorganization (Note 1): | | | | | | | | |
| Investor Class | | | 901,427 | | | | - | |
| Class I | | | 410,906 | | | | - | |
| Net increase (decrease) in capital share transactions | | | 829,005 | | | | (4,243,993 | ) |
See accompanying Notes to Consolidated Financial Statements.
AXS Sustainable Income Fund
STATEMENTS OF CHANGES IN NET ASSETS
| | | For the Year Ended September 30, 2022 | | | For the Period October 17, 2020* through September 30, 2021 | |
| Increase (decrease) in Net Assets from: | | | | | | | | |
| Operations: | | | | | | | | |
| Net investment income (loss) | | $ | 862,346 | | | $ | 2,342,473 | |
| Net realized gain (loss) on investments | | | (443,262 | ) | | | 951,695 | |
| Net change in unrealized appreciation/depreciation on investments | | | (1,043,251 | ) | | | 864,392 | |
| Net increase (decrease) in net assets resulting from operations | | | (624,167 | ) | | | 4,158,560 | |
| | | | | | | | | |
| Distributions to Shareholders: | | | | | | | | |
| Distributions: | | | | | | | | |
| Class I | | | (1,840,610 | ) | | | (2,357,551 | ) |
| Total distributions to shareholders | | | (1,840,610 | ) | | | (2,357,551 | ) |
| | | | | | | | | |
| Capital Transactions: | | | | | | | | |
| Net proceeds from shares sold: | | | | | | | | |
| Class I | | | 823,480 | | | | 52,140,340 | |
| Reinvestment of distributions: | | | | | | | | |
| Class I | | | 222,630 | | | | 67,580 | |
| Cost of shares redeemed: | | | | | | | | |
| Class I | | | (50,061,015 | ) | | | (1,168,666 | ) |
| Net increase (decrease) in net assets from capital transactions | | | (49,014,905 | ) | | | 51,039,254 | |
| | | | | | | | | |
| Total increase (decrease) in net assets | | | (51,479,682 | ) | | | 52,840,263 | |
| | | | | | | | | |
| Net Assets: | | | | | | | | |
| Beginning of period | | | 52,840,263 | | | | - | |
| End of period | | $ | 1,360,581 | | | $ | 52,840,263 | |
| | | | | | | | | |
| Capital Share Transactions: | | | | | | | | |
| Shares sold: | | | | | | | | |
| Class I | | | 90,430 | | | | 5,199,789 | |
| Shares reinvested: | | | | | | | | |
| Class I | | | 25,652 | | | | 6,576 | |
| Shares redeemed: | | | | | | | | |
| Class I | | | (5,029,703 | ) | | | (111,556 | ) |
| Net increase (decrease) in capital share transactions | | | (4,913,621 | ) | | | 5,094,809 | |
| * | Commencement of operations. |
See accompanying Notes to Consolidated Financial Statements.
AXS Thomson Reuters Private Equity Return Tracker Fund
STATEMENTS OF CHANGES IN NET ASSETS
| | | For the Year Ended September 30, 2022 | | | For the Year Ended September 30, 20211 | |
| Increase (Decrease) in Net Assets from: | | | | | | | | |
| Operations: | | | | | | | | |
| Net investment income (loss) | | $ | 6,941 | | | $ | (36,582 | ) |
| Net realized gain (loss) on investments and swap contracts | | | (1,710,298 | ) | | | 5,615,745 | |
| Net change in unrealized appreciation/depreciation on investments and swap contracts | | | (4,918,402 | ) | | | 45,453 | |
| Net increase (decrease) in net assets resulting from operations | | | (6,621,759 | ) | | | 5,624,616 | |
| | | | | | | | | |
| Distributions to Shareholders: | | | | | | | | |
| Distributions: | | | | | | | | |
| Class A | | | (187,364 | ) | | | (11,023 | ) |
| Class C | | | (61,607 | ) | | | (53,502 | ) |
| Class I | | | (7,060,546 | ) | | | (890,391 | ) |
| Total distributions to shareholders | | | (7,309,517 | ) | | | (954,916 | ) |
| | | | | | | | | |
| Capital Transactions: | | | | | | | | |
| Net proceeds from shares sold: | | | | | | | | |
| Class A | | | 151,931 | | | | 365,919 | |
| Class C | | | 429,809 | | | | 23,000 | |
| Class I | | | 2,781,619 | | | | 11,879,384 | |
| Reinvestment of distributions: | | | | | | | | |
| Class A | | | 187,364 | | | | 11,023 | |
| Class C | | | 61,607 | | | | 53,502 | |
| Class I | | | 6,710,716 | | | | 844,151 | |
| Cost of shares redeemed: | | | | | | | | |
| Class A2 | | | (204,062 | ) | | | (84,414 | ) |
| Class C | | | (406,039 | ) | | | (1,201,610 | ) |
| Class I3 | | | (7,130,093 | ) | | | (13,112,031 | ) |
| Net increase (decrease) in net assets from capital transactions | | | 2,582,852 | | | | (1,221,076 | ) |
| | | | | | | | | |
| Total increase (decrease) in net assets | | | (11,348,424 | ) | | | 3,448,624 | |
| | | | | | | | | |
| Net Assets: | | | | | | | | |
| Beginning of period | | | 25,842,826 | | | | 22,394,202 | |
| End of period | | $ | 14,494,402 | | | $ | 25,842,826 | |
| | | | | | | | | |
| Capital Share Transactions: | | | | | | | | |
| Shares sold: | | | | | | | | |
| Class A | | | 11,012 | | | | 20,524 | |
| Class C | | | 29,043 | | | | 1,317 | |
| Class I | | | 210,119 | | | | 682,158 | |
| Shares reinvested: | | | | | | | | |
| Class A | | | 12,824 | | | | 697 | |
| Class C | | | 4,320 | | | | 3,485 | |
| Class I | | | 451,596 | | | | 52,726 | |
| Shares redeemed: | | | | | | | | |
| Class A | | | (15,561 | ) | | | (4,850 | ) |
| Class C | | | (29,073 | ) | | | (71,834 | ) |
| Class I | | | (516,859 | ) | | | (800,862 | ) |
| Net increase (decrease) in capital share transactions | | | 157,421 | | | | (116,639 | ) |
| 1 | With the Plan of Reorganization with respect to the Leland Thomson Reuters Private Equity Buyout Index Fund, Class A, Class C, and Class I shareholders received Class A, Class C, and Class I shares of the AXS Thomson Reuters Private Equity Return Tracker Fund, respectively, effective as of the close of business on November 20, 2020. See Note 1 in the accompanying Notes to Consolidated Financial Statements. |
| 2 | Net of redemption fee proceeds of $0 and $3, respectively. |
| 3 | Net of redemption fee proceeds of $2,347 and $3,470, respectively. |
See accompanying Notes to Consolidated Financial Statements.
AXS Thomson Reuters Venture Capital Return Tracker Fund
STATEMENTS OF CHANGES IN NET ASSETS
| | | For the Year Ended September 30, 2022 | | | For the Year Ended September 30, 20211 | |
| Increase (Decrease) in Net Assets from: | | | | | | | | |
| Operations: | | | | | | | | |
| Net investment income (loss) | | $ | (1,966,315 | ) | | $ | (2,520,842 | ) |
| Net realized gain (loss) on investments and swap contracts | | | (111,425,479 | ) | | | 63,177,785 | |
| | | | | | | | | |
| Net change in unrealized appreciation/depreciation on investments and swap contracts | | | (79,082,032 | ) | | | 8,094,089 | |
| Net increase from payment by affiliates (Note 3) | | | 8,347 | | | | 3,927 | |
| Net increase (decrease) in net assets resulting from operations | | | (192,465,479 | ) | | | 68,754,959 | |
| | | | | | | | | |
| Distributions to Shareholders: | | | | | | | | |
| Distributions: | | | | | | | | |
| Class A | | | (20,127,174 | ) | | | (13,240,552 | ) |
| Class C | | | (2,991,249 | ) | | | (1,962,054 | ) |
| Class I | | | (48,306,816 | ) | | | (23,679,428 | ) |
| Total distributions to shareholders | | | (71,425,239 | ) | | | (38,882,034 | ) |
| | | | | | | | | |
| Capital Transactions: | | | | | | | | |
| Net proceeds from shares sold: | | | | | | | | |
| Class A | | | 17,586,330 | | | | 37,247,911 | |
| Class C | | | 2,499,264 | | | | 7,619,615 | |
| Class I | | | 92,488,359 | | | | 153,482,443 | |
| Reinvestment of distributions: | | | | | | | | |
| Class A | | | 19,793,050 | | | | 13,091,280 | |
| Class C | | | 2,888,966 | | | | 1,886,193 | |
| Class I | | | 46,839,363 | | | | 22,996,333 | |
| Cost of shares redeemed: | | | | | | | | |
| Class A2 | | | (30,417,448 | ) | | | (39,974,916 | ) |
| Class C3 | | | (6,108,419 | ) | | | (6,828,995 | ) |
| Class I4 | | | (149,058,854 | ) | | | (86,311,291 | ) |
| Net increase (decrease) in net assets from capital transactions | | | (3,489,389 | ) | | | 103,208,573 | |
| | | | | | | | | |
| Total increase (decrease) in net assets | | | (267,380,107 | ) | | | 133,081,498 | |
| | | | | | | | | |
| Net Assets: | | | | | | | | |
| Beginning of period | | | 375,175,518 | | | | 242,094,020 | |
| End of period | | $ | 107,795,411 | | | $ | 375,175,518 | |
| | | | | | | | | |
| Capital Share Transactions: | | | | | | | | |
| Shares sold: | | | | | | | | |
| Class A | | | 714,887 | | | | 1,095,729 | |
| Class C | | | 108,445 | | | | 229,902 | |
| Class I | | | 3,861,384 | | | | 4,378,995 | |
| Shares reinvested: | | | | | | | | |
| Class A | | | 713,778 | | | | 438,275 | |
| Class C | | | 110,646 | | | | 66,182 | |
| Class I | | | 1,663,330 | | | | 760,461 | |
| Shares redeemed: | | | | | | | | |
| Class A | | | (1,462,829 | ) | | | (1,250,854 | ) |
| Class C | | | (287,326 | ) | | | (226,413 | ) |
| Class I | | | (7,107,072 | ) | | | (2,634,485 | ) |
| Net increase (decrease) in capital share transactions | | | (1,684,757 | ) | | | 2,857,792 | |
| 1 | With the Plan of Reorganization with respect to the Leland Thomson Reuters Venture Capital Index Fund, Class A, Class C, and Class I shareholders received Class A, Class C, and Class I shares of the AXS Thomson Reuters Venture Capital Return Tracker Fund, respectively, effective as of the close of business on November 20, 2020. See Note 1 in the accompanying Notes to Consolidated Financial Statements. |
| 2 | Net of redemption fee proceeds of $6,718 and $25,603, respectively. |
| 3 | Net of redemption fee proceeds of $1,400 and $4,547, respectively. |
| 4 | Net of redemption fee proceeds of $42,702 and $36,967, respectively. |
See accompanying Notes to Consolidated Financial Statements.
AXS All Terrain Opportunity Fund
STATEMENTS OF CHANGES IN NET ASSETS
| | | For the
Year Ended
September 30,
2022 | | | For the
Period
November 1, 2020 through
September 30, 2021* | | | For the
Year Ended
October 31,
2020 | |
| Increase (Decrease) in Net Assets from: | | | | | | | | | | | | |
| Operations: | | | | | | | | | | | | |
| Net investment income (loss) | | $ | (198,865 | ) | | $ | 42,215 | | | $ | 137,311 | |
| Total realized gain (loss) on investments and purchased options contracts | | | (543,778 | ) | | | 1,450,528 | | | | 1,458,302 | |
| Capital gain distributions from regulated investment companies | | | 4,159 | | | | 165,743 | | | | 660 | |
Net change in unrealized appreciation (depreciation) on investments and purchased options contracts
| | | 247,134 | | | | (405,574 | ) | | | 30,202 | |
| Net increase from payment by affiliates (Note 3) | | | 8,830 | | | | - | | | | - | |
Net increase (decrease) in net assets resulting from operations | | | (482,520 | ) | | | 1,252,912 | | | | 1,626,475 | |
| | | | | | | | | | | | | |
| Distributions to Shareholders: | | | | | | | | | | | | |
| Total distributions to shareholders | | | (1,356,128 | ) | | | (897,554 | ) | | | (1,401,286 | ) |
| | | | | | | | | | | | | |
| Capital Transactions: | | | | | | | | | | | | |
| Net proceeds from shares sold | | | 2,707,248 | | | | 3,946,940 | | | | 5,214,149 | |
| Reinvestment of distributions | | | 1,356,129 | | | | 897,554 | | | | 1,401,286 | |
| Cost of shares redeemed1 | | | (26,212,253 | ) | | | (7,621,418 | ) | | | (5,507,744 | ) |
Net increase (decrease) in net assets from capital transactions | | | (22,148,876 | ) | | | (2,776,924 | ) | | | 1,107,691 | |
| | | | | | | | | | | | | |
| Total increase (decrease) in net assets | | | (23,987,524 | ) | | | (2,421,566 | ) | | | 1,332,880 | |
| | | | | | | | | | | | | |
| Net Assets: | | | | | | | | | | | | |
| Beginning of period | | | 27,211,585 | | | | 29,633,151 | | | | 28,300,271 | |
| End of period | | $ | 3,224,061 | | | $ | 27,211,585 | | | $ | 29,633,151 | |
| | | | | | | | | | | | | |
| Capital Share Transactions: | | | | | | | | | | | | |
| Shares sold | | | 112,539 | | | | 151,259 | | | | 215,089 | |
| Shares reinvested | | | 54,202 | | | | 35,561 | | | | 56,145 | |
| Shares redeemed | | | (1,096,778 | ) | | | (293,938 | ) | | | (218,036 | ) |
Net increase (decrease) in capital share transactions | | | (930,037 | ) | | | (107,118 | ) | | | 53,198 | |
| * | Fiscal year end changed to September 30, effective August 1, 2021. |
| 1 | Net of redemption fee proceeds of $398, $50, and $0, respectively. |
See accompanying Notes to Consolidated Financial Statements.
AXS Merger Fund
STATEMENTS OF CHANGES IN NET ASSETS
| | | For the Year Ended September 30,
2022 | | | For the Period January 1, 2021 through September 30,
2021*1 | | | For the Year Ended December 31,
2020 | |
| | | |
| | | |
| | | |
| Increase (Decrease) in Net Assets from: | | | | | | | | | | | | |
| Operations: | | | | | | | | | | | | |
| Net investment income (loss) | | $ | (580,780 | ) | | $ | (742,324 | ) | | $ | (1,312,820 | ) |
| Net realized gain (loss) on investments, securities sold short, written options contracts and foreign currency transactions | | | 1,708,947 | | | | 707,495 | | | | 268,751 | |
| Net change in unrealized appreciation/depreciation on investments, securities sold shorts, written options contracts and foreign currency translations | | | 30,080 | | | | (114,162 | ) | | | (895,160 | ) |
| Net increase (decrease) in net assets resulting from operations | | | 1,158,247 | | | | (148,991 | ) | | | (1,939,229 | ) |
| | | | | | | | | | | | | |
| Distributions to Shareholders: | | | | | | | | | | | | |
| Distributions: | | | | | | | | | | | | |
| Investor Class | | | (15,978 | ) | | | - | | | | (31,165 | ) |
| Class I | | | (727,558 | ) | | | - | | | | (1,951,033 | ) |
| Total distributions to shareholders | | | (743,536 | ) | | | - | | | | (1,982,198 | ) |
| | | | | | | | | | | | | |
| Capital Transactions: | | | | | | | | | | | | |
| Net proceeds from shares sold: | | | | | | | | | | | | |
| Investor Class | | | 64,896 | | | | 70,194 | | | | 108,500 | |
| Class I | | | 13,814,359 | | | | 20,103,472 | | | | 20,017,461 | |
| Reinvestment of distributions: | | | | | | | | | | | | |
| Investor Class | | | 13,905 | | | | - | | | | 27,882 | |
| Class I | | | 724,168 | | | | - | | | | 1,922,593 | |
| Cost of shares redeemed: | | | | | | | | | | | | |
| Investor Class2 | | | (471,900 | ) | | | (166,376 | ) | | | (453,638 | ) |
| Class I3 | | | (34,170,375 | ) | | | (41,313,519 | ) | | | (85,346,652 | ) |
| Net increase (decrease) in net assets from capital transactions | | | (20,024,947 | ) | | | (21,306,229 | ) | | | (63,723,854 | ) |
| | | | | | | | | | | | | |
| Total increase (decrease) in net assets | | | (19,610,236 | ) | | | (21,455,220 | ) | | | (67,645,281 | ) |
| | | | | | | | | | | | | |
| Net Assets: | | | | | | | | | | | | |
| Beginning of period | | | 76,947,020 | | | | 98,402,240 | | | | 166,047,521 | |
| End of period | | $ | 57,336,784 | | | $ | 76,947,020 | | | $ | 98,402,240 | |
| | | | | | | | | | | | | |
| Capital Share Transactions: | | | | | | | | | | | | |
| Shares sold: | | | | | | | | | | | | |
| Investor Class | | | 6,260 | | | | 6,790 | | | | 10,557 | |
| Class I | | | 1,306,739 | | | | 1,887,493 | | | | 1,910,931 | |
| Shares reinvested: | | | | | | | | | | | | |
| Investor Class | | | 1,373 | | | | - | | | | 2,696 | |
| Class I | | | 69,298 | | | | - | | | | 180,865 | |
| Shares redeemed: | | | | | | | | | | | | |
| Investor Class | | | (45,905 | ) | | | (16,027 | ) | | | (44,219 | ) |
| Class I | | | (3,222,242 | ) | | | (3,885,449 | ) | | | (8,179,672 | ) |
| Net increase (decrease) in capital share transactions | | | (1,884,477 | ) | | | (2,007,193 | ) | | | (6,118,842 | ) |
| * | Fiscal year end changed to September 30, effective January 1, 2021. |
| 1 | With the Plan of Reorganization with respect to the Kellner Merger Fund, Investor Class and Institutional Class shareholders received Investor Class and Class I shares of the AXS Merger Fund, respectively, effective as of the close of business on January 22, 2021. See Note 1 in the accompanying Notes to Financial Statements. |
| 2 | Net of redemption fee proceeds of $0, $25 and $0, respectively. |
| 3 | Net of redemption fee proceeds of $14,612, $1,492 and $0, respectively. |
See accompanying Notes to Consolidated Financial Statements.
AXS Alternative Value Fund
STATEMENTS OF CHANGES IN NET ASSETS
| | | For the Year Ended September 30,
2022 | | | For the Period July 1, 2021 through September 30,
2021* | | | For the Year Ended June 30,
20211 | |
| Increase (Decrease) in Net Assets From: | | | | | | | | | | | | |
| Operations: | | | | | | | | | | | | |
| Net investment income (loss) | | $ | 135,877 | | | $ | 3,959 | | | $ | 22,232 | |
| Net realized gain (loss) on investments | | | 50,474 | | | | 37,247 | | | | 663,466 | |
| Net change in unrealized appreciation/depreciation on investments | | | (2,162,759 | ) | | | (79,850 | ) | | | 850,401 | |
| Net increase (decrease) in net assets resulting from operations | | | (1,976,408 | ) | | | (38,644 | ) | | | 1,536,099 | |
| | | | | | | | | | | | | |
| Distributions to shareholders: | | | | | | | | | | | | |
| Distributions: | | | | | | | | | | | | |
| Investor Class | | | (24,234 | ) | | | - | | | | (47,914 | ) |
| Class I | | | (32,671 | ) | | | - | | | | (89,850 | ) |
| Total distributions to shareholders | | | (56,905 | ) | | | - | | | | (137,764 | ) |
| | | | | | | | | | | | | |
| Capital Transactions: | | | | | | | | | | | | |
| Net proceeds from shares sold: | | | | | | | | | | | | |
| Investor Class | | | 2,047,597 | | | | 264,789 | | | | 285,324 | |
| Class I | | | 21,256,340 | | | | 105,200 | | | | 168,778 | |
| Reinvestment of distributions: | | | | | | | | | | | | |
| Investor Class | | | 24,234 | | | | - | | | | 47,914 | |
| Class I | | | 28,440 | | | | - | | | | 89,850 | |
| Cost of shares redeemed: | | | | | | | | | | | | |
| Investor Class2 | | | (512,317 | ) | | | (199,094 | ) | | | (428,995 | ) |
| Class I3 | | | (3,359,852 | ) | | | - | | | | (11,599,747 | ) |
| Net increase (decrease) in net assets from capital transactions | | | 19,484,442 | | | | 170,895 | | | | (11,436,876 | ) |
| | | | | | | | | | | | | |
| Total increase (decrease) in net assets | | | 17,451,129 | | | | 132,251 | | | | (10,038,541 | ) |
| | | | | | | | | | | | | |
| Net Assets: | | | | | | | | | | | | |
| Beginning of year | | | 1,400,050 | | | | 1,267,799 | | | | 11,306,340 | |
| End of year | | $ | 18,851,179 | | | $ | 1,400,050 | | | $ | 1,267,799 | |
| | | | | | | | | | | | | |
| Capital Share Transactions: | | | | | | | | | | | | |
| Shares sold: | | | | | | | | | | | | |
| Investor Class | | | 179,941 | | | | 24,431 | | | | 30,434 | |
| Class I | | | 1,880,490 | | | | 10,013 | | | | 16,895 | |
| Shares reinvested: | | | | | | | | | | | | |
| Investor Class | | | 2,115 | | | | - | | | | 5,342 | |
| Class I | | | 2,490 | | | | - | | | | 10,039 | |
| Shares redeemed: | | | | | | | | | | | | |
| Investor Class | | | (46,503 | ) | | | (18,707 | ) | | | (46,740 | ) |
| Class I | | | (309,067 | ) | | | - | | | | (1,281,710 | ) |
| Net increase (decrease) in capital share transactions | | | 1,709,466 | | | | 15,737 | | | | (1,265,740 | ) |
| * | Fiscal year end changed to September 30, effective July 1, 2021. |
| 1 | With the Plan of Reorganization with respect to the AXS Alternative Value Fund (formerly, Cognios Large Cap Value Fund), Investor Class and Institutional Class shareholders received Investor Class and Class I shares of the AXS Alternative Value Fund, respectively, effective as of the close of business on March 5, 2021. See Note 1 in the accompanying Notes to Financial Statements. |
| 2 | Net of redemption fees of $623, $997, and $0, respectively. |
| 3 | Net of redemption fees of $736, $0, and $382, respectively. |
See accompanying Notes to Consolidated Financial Statements.
AXS Market Neutral Fund
STATEMENTS OF CHANGES IN NET ASSETS
| | For the Year Ended September 30,
2022 | | | For the Period July 1, 2021 through September 30,
2021* | | | For the Year Ended June 30,
20211 | |
| Increase (Decrease) in Net Assets From: | | | | | | | | | | | | |
| Operations: | | | | | | | | | | | | |
| Net investment income (loss) | | $ | (72,800 | ) | | $ | (40,580 | ) | | $ | (277,333 | ) |
| Net realized gain (loss) | | | 987,275 | | | | 348,182 | | | | (195,353 | ) |
| Net change in unrealized appreciation/depreciation on investments and securities sold short | | | 578,647 | | | | (437,472 | ) | | | (172,391 | ) |
| Net increase (decrease) in net assets resulting from operations | | | 1,493,122 | | | | (129,870 | ) | | | (645,077 | ) |
| | | | | | | | | | | | | |
| Capital Transactions: | | | | | | | | | | | | |
| Net proceeds from shares sold: | | | | | | | | | | | | |
| Investor Class | | | 1,174,780 | | | | 45,663 | | | | 1,461,001 | |
| Class I | | | 13,045,609 | | | | 76,582 | | | | 1,537,662 | |
| Cost of shares redeemed: | | | | | | | | | | | | |
| Investor Class2 | | | (1,410,515 | ) | | | (165,881 | ) | | | (6,188,254 | ) |
| Class I3 | | | (2,786,148 | ) | | | (2,016,018 | ) | | | (23,029,121 | ) |
| Net increase (decrease) in net assets from capital transactions | | | 10,023,726 | | | | (2,059,654 | ) | | | (26,218,712 | ) |
| | | | | | | | | | | | | |
| Total increase (decrease) in net assets | | | 11,516,848 | | | | (2,189,524 | ) | | | (26,863,789 | ) |
| | | | | | | | | | | | | |
| Net Assets: | | | | | | | | | | | | |
| Beginning of period | | | 9,535,262 | | | | 11,724,786 | | | | 38,588,575 | |
| End of period | | $ | 21,052,110 | | | $ | 9,535,262 | | | $ | 11,724,786 | |
| | | | | | | | | | | | | |
| Capital Share Transactions: | | | | | | | | | | | | |
| Shares sold: | | | | | | | | | | | | |
| Investor Class | | | 102,741 | | | | 4,524 | | | | 144,466 | |
| Class I | | | 1,123,975 | | | | 7,459 | | | | 151,780 | |
| Shares redeemed: | | | | | | | | | | | | |
| Investor Class | | | (130,942 | ) | | | (16,543 | ) | | | (631,680 | ) |
| Class I | | | (241,025 | ) | | | (197,603 | ) | | | (2,261,339 | ) |
| Net increase (decrease) in capital share transactions | | | 854,749 | | | | (202,163 | ) | | | (2,596,773 | ) |
| * | Fiscal year end changed to September 30, effective July 1, 2021. |
| 1 | With the Plan of Reorganization with respect to the AXS Market Neutral Fund (formerly, Cognios Market Neutral Large Cap Fund), Investor Class and Institutional Class shareholders received Investor Class and Class I shares of the AXS Market Neutral Fund, respectively, effective as of the close of business on March 5, 2021. See Note 1 in the accompanying Notes to Financial Statements. |
| 2 | Net of redemption fees of $626, $0, and $1,032, respectively. |
| 3 | Net of redemption fees of $2,591, $0, and $1,374, respectively. |
See accompanying Notes to Consolidated Financial Statements.
AXS Adaptive Plus Fund
STATEMENT OF CHANGES IN NET ASSETS
| | For the Period September 15,
2022* through September 30,
2022 | |
| Increase (Decrease) in Net Assets From: | | | | |
| Operations: | | | | |
| Net investment income (loss) | | $ | (78 | ) |
| Net change in unrealized appreciation/depreciation on investments | | | 148,712 | |
| Net increase (decrease) in net assets resulting from operations | | | 148,634 | |
| | | | | |
| Capital Transactions: | | | | |
| Net proceeds from shares sold: | | | | |
| Class I | | | 12,060,438 | |
| Cost of shares redeemed: | | | | |
| Class I | | | (216,276 | ) |
| Net increase (decrease) in net assets from capital transactions | | | 11,844,162 | |
| | | | | |
| Total increase (decrease) in net assets | | | 11,992,796 | |
| | | | | |
| Net Assets: | | | | |
| Beginning of period | | | - | |
| End of period | | $ | 11,992,796 | |
| | | | | |
| Capital Share Transactions: | | | | |
| Shares sold: | | | | |
| Class I | | | 1,184,198 | |
| Shares redeemed: | | | | |
| Class I | | | (21,287 | ) |
| Net increase (decrease) in capital share transactions | | | 1,162,911 | |
| * | Commencement of operations. |
See accompanying Notes to Consolidated Financial Statements.
AXS Merger Fund
STATEMENT OF CASH FLOWS
For the Year Ended September 30, 2022
| Increase (Decrease) in Cash: | | |
| Cash flows provided by (used for) operating activities: | | | | |
| Net increase (decrease) in net assets resulting from operations | | $ | 1,158,247 | |
| Adjustments to reconcile net increase (decrease) in net assets from operations to | | | | |
| Net cash provided by (used for) operating activities: | | | | |
| Purchases of long-term investments | | | (119,451,986 | ) |
| Sales of long-term investments | | | 141,086,036 | |
| Return of capital dividends received | | | 982,296 | |
| Purchased options contracts | | | (615 | ) |
| Proceeds from securities sold short | | | 19,136,195 | |
| Cover short securities | | | (55,203,107 | ) |
| Proceeds from written options contracts | | | 7,857 | |
| Closed written options contracts | | | (905 | ) |
| Purchase/Sale of short-term investments, net | | | 9,630,601 | |
| (Increase) Decrease in Assets: | | | | |
| Investment securities sold receivable | | | 579,001 | |
| Dividends and interest receivables | | | 62,968 | |
| Other assets | | | (7,691 | ) |
| Increase (Decrease) in Liabilities: | | | | |
| Foreign currency payable | | | (1,522,310 | ) |
| Payables for securities purchased | | | 1,336,933 | |
| Advisory fees payable | | | (12,467 | ) |
| Payables for dividends and interest on securities sold short | | | (27,306 | ) |
| Accrued expenses | | | (7,942 | ) |
| Net realized (gain)/loss | | | (1,587,433 | ) |
| Net change in unrealized appreciation/depreciation | | | (21,454 | ) |
| Net cash provided by (used for) operating activities | | | (3,863,081 | ) |
| | | | | |
| Cash flows provided by (used for) financing activities: | | | | |
| Proceeds from shares sold | | | 13,964,489 | |
| Cost of shares redeemed | | | (34,655,444 | ) |
| Dividends paid to shareholders, net of reinvestments | | | (5,463 | ) |
| Net cash provided by (used for) financing activities | | | (20,696,418 | ) |
| | | | | |
| Net increase (decrease) in cash | | | (24,559,499 | ) |
| | | | | |
| Cash and cash equivalents | | | | |
| Beginning cash balance | | | 36,640 | |
| Beginning cash held at broker | | | 37,118,183 | |
| Total beginning cash and cash equivalents | | | 37,154,823 | |
| | | | | |
| Ending cash balance | | | 7,058,383 | |
| Ending cash held at broker broker | | | 5,536,941 | |
| Total ending cash and cash equivalents | | $ | 12,595,324 | |
| Supplemental disclosure of interest expense paid | | $ | 116,813 | |
| Supplemental disclosure of reinvested distributions | | $ | 738,073 | |
See accompanying Notes to Consolidated Financial Statements.
AXS Market Neutral Fund
STATEMENT OF CASH FLOWS
For the Year Ended September 30, 2022
| Increase (Decrease) in Cash: | | | |
| Cash flows provided by (used for) operating activities: | | | | |
| Net increase (decrease) in net assets resulting from operations | | $ | 1,493,122 | |
| Adjustments to reconcile net increase (decrease) in net assets from operations to | | | | |
| Net cash provided by (used for) operating activities: | | | | |
| Purchases of long-term investments | | | (21,438,272 | ) |
| Sales of long-term investments | | | 7,891,911 | |
| Return of capital dividends received | | | 1,094 | |
| Proceeds from securities sold short | | | 15,635,156 | |
| Cover short securities | | | (4,805,315 | ) |
| Purchase/Sale of short-term investments, net | | | (650,277 | ) |
| (Increase) Decrease in Assets: | | | | |
| Dividends and interest receivables | | | (32,034 | ) |
| Prepaid expenses and other assets | | | (10,602 | ) |
| Increase (Decrease) in Liabilities: | | | | |
| Payables for dividends on securities sold short | | | 11,841 | |
| Advisory fees payable | | | 4,844 | |
| Accrued expenses | | | (53,630 | ) |
| Net realized (gain)/loss | | | (803,768 | ) |
| Net change in unrealized appreciation/depreciation | | | (578,647 | ) |
| Net cash provided by (used for) operating activities | | | (3,334,577 | ) |
| | | | | |
| Cash flows provided by (used for) financing activities: | | | | |
| Borrowings from Broker | | | 1,426,065 | |
| Proceeds from shares sold | | | 14,202,689 | |
| Cost of shares redeemed | | | (4,150,506 | ) |
| Net cash provided (used for) by financing activities | | | 11,478,248 | |
| | | | | |
| Net increase (decrease) in cash | | | 8,143,671 | |
| | | | | |
| Cash and cash equivalents | | | | |
| Beginning cash held at broker | | | 8,585 | |
| Beginning segregated cash held by custodian | | | 8,992,093 | |
| Total beginning cash and cash equivalents | | | 9,000,678 | |
| | | | | |
| Ending cash balance | | | 165,874 | |
| Ending cash held at broker | | | 16,978,475 | |
| Total ending cash and cash equivalents | | $ | 17,144,349 | |
| Supplemental disclosure of interest expense paid | | $ | 39,927 | |
See accompanying Notes to Consolidated Financial Statements.
AXS Alternative Growth Fund
CONSOLIDATED FINANCIAL HIGHLIGHTS
Class A*
Per share operating performance.
For a capital share outstanding throughout each period.
| | | For the Year Ended September 30, | | | For the Period July 1, 2020 through September 30,
2020** | | | |
| | | | For the Year Ended June 30, |
| | 2022 | | | 2021 | | | 2020 | | | 2019 | | | 2018 | |
| | | | | | |
| Net asset value, beginning of period | | $ | 13.83 | | | $ | 11.08 | | | $ | 10.33 | | | $ | 11.47 | | | $ | 10.42 | | | $ | 10.36 | |
| Income from Investment Operations: | | | | | | | | | | | | | | | | | | | | | | | | |
| Net investment income (loss)1 | | | (0.14 | ) | | | (0.13 | ) | | | (0.01 | ) | | | 0.01 | | | | 0.09 | | | | (0.07 | ) |
| Net realized and unrealized gain (loss) | | | (3.30 | ) | | | 2.88 | | | | 0.76 | | | | (0.44 | ) | | | 1.41 | | | | 1.05 | |
| Total from investment operations | | | (3.44 | ) | | | 2.75 | | | | 0.75 | | | | (0.43 | ) | | | 1.50 | | | | 0.98 | |
| | | | | | | | | | | | | | | | | | | | | | | | | |
| Less Distributions: | | | | | | | | | | | | | | | | | | | | | | | | |
| From net investment income | | | - | | | | - | | | | - | | | | (0.34 | ) | | | - | 2 | | | - | |
| From net realized gain | | | - | | | | - | | | | - | | | | (0.41 | ) | | | (0.45 | ) | | | (0.92 | ) |
| Total distributions | | | - | | | | - | | | | - | | | | (0.75 | ) | | | (0.45 | ) | | | (0.92 | ) |
| | | | | | | | | | | | | | | | | | | | | | | | | |
| Redemption fee proceeds1 | | | - | 2 | | | - | 2 | | | - | | | | 0.04 | | | | - | 2 | | | - | 2 |
| | | | | | | | | | | | | | | | | | | | | | | | | |
| Net asset value, end of period | | $ | 10.39 | | | $ | 13.83 | | | $ | 11.08 | | | $ | 10.33 | | | $ | 11.47 | | | $ | 10.42 | |
| | | | | | | | | | | | | | | | | | | | | | | | | |
| Total return3 | | | (24.87 | )% | | | 24.82 | % | | | 7.26 | %7 | | | (4.05 | )% | | | 15.75 | % | | | 9.50 | % |
| | | | | | | | | | | | | | | | | | | | | | | | | |
| Ratios and Supplemental Data: | | | | | | | | | | | | | | | | | | | | | | | | |
| Net assets, end of period (in thousands) | | $ | 289 | | | $ | 677 | | | $ | 946 | | | $ | 1,282 | | | $ | 1,163 | | | $ | 4,029 | |
| | | | | | | | | | | | | | | | | | | | | | | | | |
| Ratio of expenses to average net assets (including interest expense): | | | | | | | | | | | | | | | | | | | | | | | | |
| Before fees waived and expenses absorbed | | | 6.56 | %9 | | | 5.58 | %9 | | | 4.83 | %8 | | | 2.33 | %4 | | | 3.98 | %5 | | | 3.36 | % |
| After fees waived and expenses absorbed | | | 1.24 | %9 | | | 1.24 | %9 | | | 1.24 | %8 | | | 1.25 | %4 | | | 1.24 | %5 | | | 1.45 | % |
| Ratio of net investment income (loss) to average net assets (including interest expense): | | | | | | | | | | | | | | | | | | | | | | | | |
| Before fees waived and expenses absorbed | | | (6.29 | )% | | | (5.33 | )% | | | (4.05 | )%8 | | | (0.95 | )% | | | (1.86 | )%5,6 | | | (2.61 | )% |
| After fees waived and expenses absorbed | | | (0.97 | )% | | | (0.99 | )% | | | (0.46 | )%8 | | | 0.13 | % | | | 0.88 | %5,6 | | | (0.70 | )% |
| | | | | | | | | | | | | | | | | | | | | | | | | |
| Portfolio turnover rate | | | 0 | % | | | 0 | % | | | 0 | %7 | | | 99 | % | | | 80 | % | | | 69 | % |
| * | Financial information from June 30, 2018 through November 8, 2019 is for the Equinox Ampersand Strategy Fund, which was reorganized into the AXS Alternative Growth Fund as of the close of business on November 8, 2019. See Note 1 in the accompanying Notes to Consolidated Financial Statements. |
| ** | Fiscal year end changed to September 30, effective July 1, 2020. |
| 1 | Based on average shares outstanding for the period. |
| 2 | Amount represents less than $0.01 per share. |
| 3 | Total returns would have been lower had expenses not been waived and absorbed by the Advisor. Returns shown include Rule 12b-1 fees of up to 0.25% and do not reflect the deduction of taxes that a shareholder would pay on Fund distributions or the redemption of Fund shares. Returns shown do not include payment of sales load of 5.75% of offering price which will not apply on sales of $1 million or more. If the sales charge was included total returns would be lower. |
| 4 | If expenses not included in the expense cap had been excluded, the expense ratios would have been lower by 0.01% for the year ended June 30, 2020. |
| 5 | Does not include the expenses of other investment companies in which the Fund invests. |
| 6 | Recognition of net investment income by the Fund is affected by the timing of the declaration of dividends by the underlying exchange traded funds in which the Fund invests. |
| 9 | If interest expense had been excluded, the expense ratios would have remained unchanged for the years ended September 30, 2022 and 2021. |
See accompanying Notes to Consolidated Financial Statements.
AXS Alternative Growth Fund
CONSOLIDATED FINANCIAL HIGHLIGHTS
Class I*
Per share operating performance.
For a capital share outstanding throughout each period.
| | | | | For the Period July 1, 2020 through September 30,
2020** | | | | |
| | For the Year Ended September 30, | | | For the Year Ended June 30, | |
| | 2022 | | | 2021 | | | 2020 | | | 2019 | | | 2018 |
| | | | | | |
| Net asset value, beginning of period | | $ | 14.03 | | | $ | 11.22 | | | $ | 10.44 | | | $ | 11.62 | | | $ | 10.56 | | | $ | 10.43 | |
| Income from Investment Operations: | | | | | | | | | | | | | | | | | | | | | | | | |
| Net investment income (loss)1 | | | (0.10 | ) | | | (0.09 | ) | | | (0.01 | ) | | | 0.04 | | | | 0.11 | | | | (0.04 | ) |
| Net realized and unrealized gain (loss) | | | (3.36 | ) | | | 2.89 | | | | 0.79 | | | | (0.44 | ) | | | 1.45 | | | | 1.05 | |
| Total from investment operations | | | (3.46 | ) | | | 2.80 | | | | 0.78 | | | | (0.40 | ) | | | 1.56 | | | | 1.01 | |
| | | | | | | | | | | | | | | | | | | | | | | | | |
| Less Distributions: | | | | | | | | | | | | | | | | | | | | | | | | |
| From net investment income | | | - | | | | - | | | | - | | | | (0.37 | ) | | | (0.05 | ) | | | - | |
| From net realized gain | | | - | | | | - | | | | - | | | | (0.41 | ) | | | (0.45 | ) | | | (0.92 | ) |
| Total distributions | | | - | | | | - | | | | - | | | | (0.78 | ) | | | (0.50 | ) | | | (0.92 | ) |
| | | | | | | | | | | | | | | | | | | | | | | | | |
| Redemption fee proceeds1 | | | - | 2 | | | 0.01 | | | | - | 2 | | | - | 2 | | | - | 2 | | | 0.04 | |
| | | | | | | | | | | | | | | | | | | | | | | | | |
| Net asset value, end of period | | $ | 10.57 | | | $ | 14.03 | | | $ | 11.22 | | | $ | 10.44 | | | $ | 11.62 | | | $ | 10.56 | |
| | | | | | | | | | | | | | | | | | | | | | | | | |
| Total return3 | | | (24.66 | )% | | | 25.04 | % | | | 7.47 | %7 | | | (4.13 | )% | | | 16.19 | % | | | 10.15 | % |
| | | | | | | | | | | | | | | | | | | | | | | | | |
| Ratios and Supplemental Data: | | | | | | | | | | | | | | | | | | | | | | | | |
| Net assets, end of period (in thousands) | | $ | 1,458 | | | $ | 2,739 | | | $ | 7,026 | | | $ | 5,770 | | | $ | 5,503 | | | $ | 7,758 | |
| | | | | | | | | | | | | | | | | | | | | | | | | |
| Ratio of expenses to average net assets (including interest expense): | | | | | | | | | | | | | | | | | | | | | | | | |
| Before fees waived and expenses absorbed | | | 6.31 | %9 | | | 5.33 | %9 | | | 4.58 | %8 | | | 2.08 | %4 | | | 3.57 | %5 | | | 3.32 | % |
| After fees waived and expenses absorbed | | | 0.99 | %9 | | | 0.99 | %9 | | | 0.99 | %8 | | | 1.00 | %4 | | | 0.99 | %5 | | | 1.20 | % |
| Ratio of net investment income (loss) to average net assets (including interest expense): | | | | | | | | | | | | | | | | | | | | | | | | |
| Before fees waived and expenses absorbed | | | (6.04 | )% | | | (5.08 | )% | | | (3.80 | )%8 | | | (0.70 | )% | | | (1.50 | )%5,6 | | | (2.53 | )% |
| After fees waived and expenses absorbed | | | (0.72 | )% | | | (0.74 | )% | | | (0.21 | )%8 | | | 0.38 | % | | | 1.08 | %5,6 | | | (0.41 | )% |
| | | | | | | | | | | | | | | | | | | | | | | | | |
| Portfolio turnover rate | | | 0 | % | | | 0 | % | | | 0 | %7 | | | 99 | % | | | 80 | % | | | 69 | % |
| * | Financial information from June 30, 2018 through November 8, 2019 is for the Equinox Ampersand Strategy Fund, which was reorganized into the AXS Alternative Growth Fund as of the close of business on November 8, 2019. See Note 1 in the accompanying Notes to Consolidated Financial Statements. |
| ** | Fiscal year end changed to September 30, effective July 1, 2020. |
| 1 | Based on average shares outstanding for the period. |
| 2 | Amount represents less than $0.01 per share. |
| 3 | Total returns would have been lower had expenses not been waived and absorbed by the Advisor. Returns shown do not reflect the deduction of taxes that a shareholder would pay on Fund distributions or the redemption of Fund shares. |
| 4 | If expenses not included in the expense cap had been excluded, the expense ratios would have been lower by 0.01% for the year ended June 30, 2020. |
| 5 | Does not include the expenses of other investment companies in which the Fund invests. |
| 6 | Recognition of net investment income by the Fund is affected by the timing of the declaration of dividends by the underlying exchange traded funds in which the Fund invests. |
| 9 | If interest expense had been excluded, the expense ratios would have remained unchanged for the years ended September 30, 2022 and 2021. |
See accompanying Notes to Consolidated Financial Statements.
AXS Chesapeake Strategy Fund
CONSOLIDATED FINANCIAL HIGHLIGHTS
Class A*
Per share operating performance.
For a capital share outstanding throughout each period.
| | | For the Year Ended September 30, | |
| | | 2022 | | | 2021 | | | 2020 | | | 2019 | | | 2018 | |
| Net asset value, beginning of period | | $ | 12.21 | | | $ | 9.42 | | | $ | 11.26 | | | $ | 12.54 | | | $ | 11.77 | |
| Income from Investment Operations: | | | | | | | | | | | | | | | | | | | | |
| Net investment income (loss)1 | | | (0.18 | ) | | | (0.20 | ) | | | (0.02 | ) | | | 0.03 | | | | (0.11 | ) |
| Net realized and unrealized gain (loss) | | | 2.82 | | | | 2.99 | | | | (1.45 | ) | | | (1.21 | ) | | | 0.88 | |
| Total from investment operations | | | 2.64 | | | | 2.79 | | | | (1.47 | ) | | | (1.18 | ) | | | 0.77 | |
| | | | | | | | | | | | | | | | | | | | | |
| Less Distributions: | | | | | | | | | | | | | | | | | | | | |
| From net investment income | | | (2.07 | ) | | | - | | | | (0.37 | ) | | | (0.05 | ) | | | - | |
| From net realized gain | | | - | | | | - | | | | - | | | | (0.05 | ) | | | - | |
| Total distributions | | | (2.07 | ) | | | - | | | | (0.37 | ) | | | (0.10 | ) | | | - | |
| | | | | | | | | | | | | | | | | | | | | |
| Net increase from payment by affiliates | | | - | | | | - | | | | 0.00 | 2,5 | | | - | | | | - | |
| | | | | | | | | | | | | | | | | | | | | |
| Net asset value, end of period | | $ | 12.78 | | | $ | 12.21 | | | $ | 9.42 | | | $ | 11.26 | | | $ | 12.54 | |
| | | | | | | | | | | | | | | | | | | | | |
| Total return3 | | | 26.21 | % | | | 29.62 | % | | | (13.31 | )% | | | (9.40 | )% | | | 6.54 | % |
| | | | | | | | | | | | | | | | | | | | | |
| Ratios and Supplemental Data: | | | | | | | | | | | | | | | | | | | | |
| Net assets, end of period (in thousands) | | $ | 8,859 | | | $ | 3,799 | | | $ | 3,376 | | | $ | 5,048 | | | $ | 5,799 | |
| | | | | | | | | | | | | | | | | | | | | |
| Ratio of expenses to average net assets: | | | | | | | | | | | | | | | | | | | | |
| Before fees waived and expenses absorbed4 | | | 2.60 | % | | | 3.36 | % | | | 2.35 | % | | | 2.24 | % | | | 2.04 | % |
| After fees waived and expenses absorbed4 | | | 2.10 | % | | | 2.10 | % | | | 2.12 | % | | | 2.10 | % | | | 2.10 | % |
| Ratio of net investment income (loss) to average net assets: | | | | | | | | | | | | | | | | | | | | |
| Before fees waived and expenses absorbed | | | (1.97 | )% | | | (2.96 | )% | | | (0.44 | )% | | | 0.11 | % | | | (0.84 | )% |
| After fees waived and expenses absorbed | | | (1.47 | )% | | | (1.70 | )% | | | (0.21 | )% | | | 0.25 | % | | | (0.90 | )% |
| | | | | | | | | | | | | | | | | | | | | |
| Portfolio turnover rate | | | 0 | % | | | 0 | % | | | 0 | % | | | 36 | % | | | 13 | % |
| * | Financial information from November 8, 2019 and prior is for the Equinox Chesapeake Strategy Fund, which was reorganized into the AXS Chesapeake Strategy Fund as of the close of business on November 8, 2019. See Note 1 in the accompanying Notes to Consolidated Financial Statements. |
| 1 | Based on average shares outstanding for the period. |
| 2 | Amount represents less than $0.005 per share. |
| 3 | Total returns would have been higher/lower had expenses not been recovered/waived and absorbed by the Advisor. Returns shown include Rule 12b-1 fees of up to 0.25% and do not reflect the deduction of taxes that a shareholder would pay on Fund distributions or the redemption of Fund shares. Returns shown do not include payment of sales load of 5.75% of offering price which will not apply on sales of $1 million or more. If the sales charge was included total returns would be lower. |
| 4 | If reorganizational costs and interest expense had been excluded, the expense ratios would have been lower by 0%, 0%, 0.02%, 0% and 0% for years ended September 30, 2022, 2021, 2020, 2019 and 2018, respectively. |
| 5 | The Advisor reimbursed the Fund $457 for losses from a trade error. The payment had no impact to the total return. |
See accompanying Notes to Consolidated Financial Statements.
AXS Chesapeake Strategy Fund
CONSOLIDATED FINANCIAL HIGHLIGHTS
Class C*
Per share operating performance.
For a capital share outstanding throughout each period.
| | | For the Year Ended September 30, | |
| | | 2022 | | | 2021 | | | 2020 | | | 2019 | | | 2018 | |
| Net asset value, beginning of period | | $ | 11.85 | | | $ | 9.21 | | | $ | 10.98 | | | $ | 12.26 | | | $ | 11.59 | |
| Income from Investment Operations: | | | | | | | | | | | | | | | | | | | | |
| Net investment income (loss)1 | | | (0.28 | ) | | | (0.27 | ) | | | (0.10 | ) | | | (0.05 | ) | | | (0.20 | ) |
| Net realized and unrealized gain (loss) | | | 2.99 | | | | 2.91 | | | | (1.41 | ) | | | (1.18 | ) | | | 0.87 | |
| Total from investment operations | | | 2.71 | | | | 2.64 | | | | (1.51 | ) | | | (1.23 | ) | | | 0.67 | |
| | | | | | | | | | | | | | | | | | | | | |
| Less Distributions: | | | | | | | | | | | | | | | | | | | | |
| From net investment income | | | (1.09 | ) | | | - | | | | (0.26 | ) | | | - | | | | - | |
| From net realized gain | | | - | | | | - | | | | - | | | | (0.05 | ) | | | - | |
| Total distributions | | | (1.09 | ) | | | - | | | | (0.26 | ) | | | (0.05 | ) | | | - | |
| | | | | | | | | | | | | | | | | | | | | |
| Net increase from payment by affiliates | | | - | | | | - | | | | 0.00 | 2,5 | | | - | | | | - | |
| | | | | | | | | | | | | | | | | | | | | |
| Net asset value, end of period | | $ | 13.47 | | | $ | 11.85 | | | $ | 9.21 | | | $ | 10.98 | | | $ | 12.26 | |
| | | | | | | | | | | | | | | | | | | | | |
| Total return3 | | | 25.24 | % | | | 28.66 | % | | | (13.96 | )% | | | (10.04 | )% | | | 5.78 | % |
| | | | | | | | | | | | | | | | | | | | | |
| Ratios and Supplemental Data: | | | | | | | | | | | | | | | | | | | | |
| Net assets, end of period (in thousands) | | $ | 6,412 | | | $ | 271 | | | $ | 309 | | | $ | 592 | | | $ | 931 | |
| | | | | | | | | | | | | | | | | | | | | |
| Ratio of expenses to average net assets: | | | | | | | | | | | | | | | | | | | | |
| Before fees waived and expenses absorbed4 | | | 3.35 | % | | | 4.11 | % | | | 3.10 | % | | | 2.99 | % | | | 2.81 | % |
| After fees waived and expenses absorbed4 | | | 2.85 | % | | | 2.85 | % | | | 2.87 | % | | | 2.85 | % | | | 2.85 | % |
| Ratio of net investment income (loss) to average net assets: | | | | | | | | | | | | | | | | | | | | |
| Before fees waived and expenses absorbed | | | (2.72 | )% | | | (3.71 | )% | | | (1.19 | )% | | | (0.63 | )% | | | (1.61 | )% |
| After fees waived and expenses absorbed | | | (2.22 | )% | | | (2.45 | )% | | | (0.96 | )% | | | (0.49 | )% | | | (1.65 | )% |
| | | | | | | | | | | | | | | | | | | | | |
| Portfolio turnover rate | | | 0 | % | | | 0 | % | | | 0 | % | | | 36 | % | | | 13 | % |
| * | Financial information from November 8, 2019 and prior is for the Equinox Chesapeake Strategy Fund, which was reorganized into the AXS Chesapeake Strategy Fund as of the close of business on November 8, 2019. See Note 1 in the accompanying Notes to Consolidated Financial Statements. |
| 1 | Based on average shares outstanding for the period. |
| 2 | Amount represents less than $0.005 per share. |
| 3 | Total returns would have been higher/lower had expenses not been recovered/waived and absorbed by the Advisor. Returns shown do not reflect the deduction of taxes that a shareholder would pay on Fund distributions or the redemption of Fund shares. |
| 4 | If reorganizational costs and interest expense had been excluded, the expense ratios would have been lower by 0%, 0%, 0.02%, 0% and 0% for years ended September 30, 2022, 2021, 2020, 2019 and 2018, respectively. |
| 5 | The Advisor reimbursed the Fund $457 for losses from a trade error. The payment had no impact to the total return. |
See accompanying Notes to Consolidated Financial Statements.
AXS Chesapeake Strategy Fund
CONSOLIDATED FINANCIAL HIGHLIGHTS
Class I*
Per share operating performance.
For a capital share outstanding throughout each period.
| | | For the Year Ended September 30, | |
| | | 2022 | | | 2021 | | | 2020 | | | 2019 | | | 2018 | |
| Net asset value, beginning of period | | $ | 12.34 | | | $ | 9.50 | | | $ | 11.35 | | | $ | 12.65 | | | $ | 11.83 | |
| Income from Investment Operations: | | | | | | | | | | | | | | | | | | | | |
| Net investment income (loss)1 | | | (0.15 | ) | | | (0.17 | ) | | | 0.00 | 2 | | | 0.05 | | | | (0.08 | ) |
| Net realized and unrealized gain (loss) | | | 2.86 | | | | 3.01 | | | | (1.45 | ) | | | (1.22 | ) | | | 0.90 | |
| Total from investment operations | | | 2.71 | | | | 2.84 | | | | (1.45 | ) | | | (1.17 | ) | | | 0.82 | |
| | | | | | | | | | | | | | | | | | | | | |
| Less Distributions: | | | | | | | | | | | | | | | | | | | | |
| From net investment income | | | (2.10 | ) | | | - | | | | (0.40 | ) | | | (0.08 | ) | | | - | |
| From net realized gain | | | - | | | | - | | | | - | | | | (0.05 | ) | | | - | |
| Total distributions | | | (2.10 | ) | | | - | | | | (0.40 | ) | | | (0.13 | ) | | | - | |
| | | | | | | | | | | | | | | | | | | | | |
| Net increase from payment by affiliates | | | - | | | | - | | | | 0.00 | 2,5 | | | - | | | | - | |
| | | | | | | | | | | | | | | | | | | | | |
| Net asset value, end of period | | $ | 12.95 | | | $ | 12.34 | | | $ | 9.50 | | | $ | 11.35 | | | $ | 12.65 | |
| | | | | | | | | | | | | | | | | | | | | |
| Total return3 | | | 26.58 | % | | | 29.89 | % | | | (13.07 | )% | | | (9.23 | )% | | | 6.93 | % |
| | | | | | | | | | | | | | | | | | | | | |
| Ratios and Supplemental Data: | | | | | | | | | | | | | | | | | | | | |
| Net assets, end of period (in thousands) | | $ | 45,656 | | | $ | 14,723 | | | $ | 11,955 | | | $ | 90,105 | | | $ | 158,876 | |
| | | | | | | | | | | | | | | | | | | | | |
| Ratio of expenses to average net assets: | | | | | | | | | | | | | | | | | | | | |
| Before fees waived and expenses absorbed4 | | | 2.35 | % | | | 3.11 | % | | | 2.10 | % | | | 1.98 | % | | | 1.81 | % |
| After fees waived and expenses absorbed4 | | | 1.85 | % | | | 1.85 | % | | | 1.87 | % | | | 1.85 | % | | | 1.85 | % |
| Ratio of net investment income (loss) to average net assets: | | | | | | | | | | | | | | | | | | | | |
| Before fees waived and expenses absorbed | | | (1.72 | )% | | | (2.71 | )% | | | (0.19 | )% | | | 0.36 | % | | | (0.56 | )% |
| After fees waived and expenses absorbed | | | (1.22 | )% | | | (1.45 | )% | | | 0.04 | % | | | 0.49 | % | | | (0.60 | )% |
| | | | | | | | | | | | | | | | | | | | | |
| Portfolio turnover rate | | | 0 | % | | | 0 | % | | | 0 | % | | | 36 | % | | | 13 | % |
| * | Financial information from November 8, 2019 and prior is for the Equinox Chesapeake Strategy Fund, which was reorganized into the AXS Chesapeake Strategy Fund as of the close of business on November 8, 2019. See Note 1 in the accompanying Notes to Consolidated Financial Statements. |
| 1 | Based on average shares outstanding for the period. |
| 2 | Amount represents less than $0.005 per share. |
| 3 | Total returns would have been higher/lower had expenses not been recovered/waived and absorbed by the Advisor. Returns shown do not reflect the deduction of taxes that a shareholder would pay on Fund distributions or the redemption of Fund shares. |
| 4 | If reorganizational costs and interest expense had been excluded, the expense ratios would have been lower by 0%, 0%, 0.02%, 0% and 0% for years ended September 30, 2022, 2021, 2020, 2019 and 2018, respectively. |
| 5 | The Advisor reimbursed the Fund $457 for losses from a trade error. The payment had no impact to the total return. |
See accompanying Notes to Consolidated Financial Statements.
AXS Multi-Strategy Alternatives Fund
FINANCIAL HIGHLIGHTS
Investor Class*
Per share operating performance.
For a capital share outstanding throughout each period.
| | For the Year Ended September 30, | | | For the Period May 1, 2020
through September 30,
2020** | | | For the Year Ended April 30, | |
| | 2022 | | | 2021 | | | | 2020 | | | 2019 | | | 2018 | |
| | | | | | |
| Net asset value, beginning of period | | $ | 14.37 | | | $ | 11.12 | | | $ | 9.95 | | | $ | 11.49 | | | $ | 13.28 | | | $ | 12.80 | |
| Income from Investment Operations: | | | | | | | | | | | | | | | | | | | | | | | | |
| Net investment income (loss)1 | | | (0.01 | ) | | | (0.11 | ) | | | (0.03 | ) | | | (0.03 | ) | | | - | 2 | | | 0.03 | |
| Net realized and unrealized gain (loss) | | | (2.31 | ) | | | 3.36 | | | | 1.20 | | | | (1.41 | ) | | | 0.61 | | | | 2.15 | |
| Total from investment operations | | | (2.32 | ) | | | 3.25 | | | | 1.17 | | | | (1.44 | ) | | | 0.61 | | | | 2.18 | |
| | | | | | | | | | | | | | | | | | | | | | | | | |
| Less Distributions: | | | | | | | | | | | | | | | | | | | | | | | | |
| From net investment income | | | - | | | | - | | | | - | | | | - | | | | - | | | | (0.05 | ) |
| From net realized gain | | | (3.07 | ) | | | - | | | | - | | | | (0.10 | ) | | | (2.40 | ) | | | (1.65 | ) |
| Total distributions | | | (3.07 | ) | | | - | | | | - | | | | (0.10 | ) | | | (2.40 | ) | | | (1.70 | ) |
| | | | | | | | | | | | | | | | | | | | | | | | | |
| Net asset value, end of period | | $ | 8.98 | | | $ | 14.37 | | | $ | 11.12 | | | $ | 9.95 | | | $ | 11.49 | | | $ | 13.28 | |
| | | | | | | | | | | | | | | | | | | | | | | | | |
| Total return3 | | | (21.53 | )% | | | 29.23 | % | | | 11.76 | %5 | | | (12.66 | )%4 | | | 5.34 | % | | | 17.25 | % |
| | | | | | | | | | | | | | | | | | | | | | | | | |
| Ratios and Supplemental Data: | | | | | | | | | | | | | | | | | | | | | | | | |
| Net assets, end of period (in thousands) | | $ | 12,612 | | | $ | 10,546 | | | $ | 12,941 | | | $ | 14,586 | | | $ | 97,281 | | | $ | 84,790 | |
| | | | | | | | | | | | | | | | | | | | | | | | | |
| Ratio of expenses to average net assets: | | | | | | | | | | | | | | | | | | | | | | | | |
| Before fees waived and expenses absorbed | | | 2.15 | % | | | 2.14 | % | | | 1.66 | %6 | | | 1.58 | % | | | 1.68 | % | | | 1.64 | % |
| After fees waived and expenses absorbed | | | 1.68 | % | | | 1.68 | % | | | 1.66 | %6 | | | 1.58 | % | | | 1.68 | % | | | 1.64 | % |
| Ratio of net investment income (loss) to average net assets: | | | | | | | | | | | | | | | | | | | | | | | | |
| Before fees waived and expenses absorbed | | | (0.59 | )% | | | (1.34 | )% | | | (0.75 | )%6 | | | (0.30 | )% | | | (0.02 | )% | | | 0.24 | % |
| After fees waived and expenses absorbed | | | (0.12 | )% | | | (0.88 | )% | | | (0.75 | )%6 | | | (0.30 | )% | | | (0.02 | )% | | | 0.24 | % |
| | | | | | | | | | | | | | | | | | | | | | | | | |
| Portfolio turnover rate | | | 456 | % | | | 419 | % | | | 193 | %5 | | | 727 | % | | | 838 | % | | | 534 | % |
| * | Financial information from April 30, 2017 through October 18, 2019 is for the KCM Macro Trends Fund, which was reorganized into the AXS Multi-Strategy Alternatives Fund as of the close of business on October 18, 2019. On February 1, 2022, Class R-1 shares were re-designated into Investor Class shares. See Note 1 in the accompanying Notes to Consolidated Financial Statements. |
| ** | Fiscal year end changed to September 30, effective May 1, 2020. |
| 1 | Based on average daily shares outstanding for the period. |
| 2 | Amount represents less than $0.005 per share. |
| 3 | Total returns would have been higher/lower had expenses not been recovered/waived and absorbed by the Advisor. Returns shown do not reflect the deduction of taxes that a shareholder would pay on Fund distributions or the redemption of Fund shares. |
| 4 | A predecessor affiliate reimbursed the Fund $43,948 for losses on pricing error. The payment had a positive 0.09% impact to the total return. |
See accompanying Notes to Consolidated Financial Statements.
AXS Multi-Strategy Alternatives Fund
FINANCIAL HIGHLIGHTS
Class I*
Per share operating performance.
For a capital share outstanding throughout each period.
| | For the Year Ended September 30, | | | For the Period May 1, 2020
through September 30,
2020** | | | For the Year Ended April 30, | |
| | 2022 | | | 2021 | | | | 2020 | | | 2019 | | | 2018 | |
| | | | | | | | |
| Net asset value, beginning of period | | $ | 14.43 | | | $ | 11.16 | | | $ | 9.97 | | | $ | 11.53 | | | $ | 13.28 | | | $ | 12.80 | |
| Income from Investment Operations: | | | | | | | | | | | | | | | | | | | | | | | | |
| Net investment income (loss)1 | | | 0.01 | | | | (0.09 | ) | | | (0.02 | ) | | | - | 2 | | | 0.02 | | | | 0.04 | |
| Net realized and unrealized gain (loss) | | | (2.32 | ) | | | 3.36 | | | | 1.21 | | | | (1.41 | ) | | | 0.63 | | | | 2.18 | |
| Total from investment operations | | | (2.31 | ) | | | 3.27 | | | | 1.19 | | | | (1.41 | ) | | | 0.65 | | | | 2.22 | |
| | | | | | | | | | | | | | | | | | | | | | | | | |
| Less Distributions: | | | | | | | | | | | | | | | | | | | | | | | | |
| From net investment income | | | - | | | | - | | | | - | | | | (0.05 | ) | | | - | | | | (0.09 | ) |
| From net realized gain | | | (3.07 | ) | | | - | | | | - | | | | (0.10 | ) | | | (2.40 | ) | | | (1.65 | ) |
| Total distributions | | | (3.07 | ) | | | - | | | | - | | | | (0.15 | ) | | | (2.40 | ) | | | (1.74 | ) |
| | | | | | | | | | | | | | | | | | | | | | | | | |
| Net asset value, end of period | | $ | 9.05 | | | $ | 14.43 | | | $ | 11.16 | | | $ | 9.97 | | | $ | 11.53 | | | $ | 13.28 | |
| | | | | | | | | | | | | | | | | | | | | | | | | |
| Total return3 | | | (21.34 | )% | | | 29.30 | % | | | 11.94 | %4 | | | (12.43 | )%6 | | | 5.65 | % | | | 17.49 | % |
| | | | | | | | | | | | | | | | | | | | | | | | | |
| Ratios and Supplemental Data: | | | | | | | | | | | | | | | | | | | | | | | | |
| Net assets, end of period (in thousands) | | $ | 7,391 | | | $ | 9,490 | | | $ | 49,925 | | | $ | 43,877 | | | $ | 467 | | | $ | 563 | |
| | | | | | | | | | | | | | | | | | | | | | | | | |
| Ratio of expenses to average net assets: | | | | | | | | | | | | | | | | | | | | | | | | |
| Before fees waived and expenses absorbed | | | 1.90 | % | | | 1.89 | % | | | 1.41 | %5 | | | 1.31 | % | | | 1.51 | % | | | 1.63 | % |
| After fees waived and expenses absorbed | | | 1.51 | % | | | 1.51 | % | | | 1.41 | %5 | | | 1.31 | % | | | 1.51 | % | | | 1.63 | % |
| Ratio of net investment income (loss) to average net assets: | | | | | | | | | | | | | | | | | | | | | | | | |
| Before fees waived and expenses absorbed | | | (0.34 | )% | | | (1.09 | )% | | | (0.50 | )%5 | | | (0.03 | )% | | | 0.18 | % | | | 0.31 | % |
| After fees waived and expenses absorbed | | | 0.05 | % | | | (0.71 | )% | | | (0.50 | )%5 | | | (0.03 | )% | | | 0.18 | % | | | 0.31 | % |
| | | | | | | | | | | | | | | | | | | | | | | | | |
| Portfolio turnover rate | | | 456 | % | | | 419 | % | | | 193 | %4 | | | 727 | % | | | 838 | % | | | 534 | % |
| * | Financial information from March 20, 2017 through October 18, 2019 is for the KCM Macro Trends Fund, which was reorganized into the AXS Multi-Strategy Alternatives Fund as of the close of business on October 18, 2019. On October 21, 2019, Institutional Class shares were re-designated into Class I Shares. See Note 1 in the accompanying Notes to Consolidated Financial Statements. |
| ** | Fiscal year end changed to September 30, effective May 1, 2020. |
| 1 | Based on average daily shares outstanding for the period. |
| 2 | Amount represents less than $0.005 per share. |
| 3 | Total returns would have been higher/lower had expenses not been recovered/waived and absorbed by the Advisor. Returns shown do not reflect the deduction of taxes that a shareholder would pay on Fund distributions or the redemption of Fund shares. |
| 6 | Payment by a predecessor affiliate had no impact to the total return. |
See accompanying Notes to Consolidated Financial Statements.
AXS Sustainable Income Fund
FINANCIAL HIGHLIGHTS
Class I
Per share operating performance.
For a capital share outstanding throughout each period.
| | For the Year Ended September 30,
2022 | | | For the Period October 17, 2020* through September 30,
2021 | |
| | |
| | |
| | |
| Net asset value, beginning of period | | $ | 10.37 | | | $ | 10.00 | |
| Income from Investment Operations: | | | | | | | | |
| Net investment income (loss)1 | | | 0.47 | | | | 0.47 | |
| Net realized and unrealized gain (loss) | | | (1.55 | ) | | | 0.36 | |
| Total from investment operations | | | (1.08 | ) | | | 0.83 | |
| | | | | | | | | |
| Less Distributions: | | | | | | | | |
| From net investment income | | | (1.59 | ) | | | (0.46 | ) |
| From net realized gain | | | (0.19 | ) | | | - | |
| Total distributions | | | (1.78 | ) | | | (0.46 | ) |
| | | | | | | | | |
| Net asset value, end of period | | $ | 7.51 | | | $ | 10.37 | |
| | | | | | | | | |
| Total return 2 | | | (12.06 | %) | | | 8.42 | %3 |
| | | | | | | | | |
| Ratios and Supplemental Data: | | | | | | | | |
| Net assets, end of period (in thousands) | | $ | 1,361 | | | $ | 52,840 | |
| | | | | | | | | |
| Ratio of expenses to average net assets: | | | | | | | | |
| Before fees waived and expenses absorbed | | | 1.81 | % | | | 1.11 | %4 |
| After fees waived and expenses absorbed | | | 0.99 | % | | | 0.99 | %4 |
| Ratio of net investment income to average net assets: | | | | | | | | |
| Before fees waived and expenses absorbed | | | 3.83 | % | | | 4.62 | %4 |
| After fees waived and expenses absorbed | | | 4.65 | % | | | 4.74 | %4 |
| | | | | | | | | |
| Portfolio turnover rate | | | 35 | % | | | 114 | %3 |
| * | Commencement of operations. |
| 1 | Based on average shares outstanding for the period. |
| 2 | Total returns would have been lower had expenses not been waived and absorbed by the Advisor. Returns shown do not reflect the deduction of taxes that a shareholder would pay on Fund distributions or the redemption of Fund shares. |
See accompanying Notes to Consolidated Financial Statements.
AXS Thomson Reuters Private Equity Return Tracker Fund
FINANCIAL HIGHLIGHTS
Class A*
Per share operating performance.
For a capital share outstanding throughout each period.
| | | For the Year Ended September 30, | |
| | | 2022 | | | 2021 | | | 2020 | | | 2019 | | | 2018 | |
| Net asset value, beginning of period | | $ | 17.43 | | | $ | 14.05 | | | $ | 12.70 | | | $ | 13.97 | | | $ | 11.83 | |
| Income from Investment Operations: | | | | | | | | | | | | | | | | | | | | |
| Net investment income (loss)1 | | | (0.03 | ) | | | (0.06 | ) | | | 0.03 | | | | 0.06 | | | | 0.04 | |
| Net realized and unrealized gain (loss) | | | (3.36 | ) | | | 4.11 | | | | 1.32 | | | | (0.46 | ) | | | 2.66 | |
| Total from investment operations | | | (3.39 | ) | | | 4.05 | | | | 1.35 | | | | (0.40 | ) | | | 2.70 | |
| | | | | | | | | | | | | | | | | | | | | |
| Less Distributions: | | | | | | | | | | | | | | | | | | | | |
| Return of capital | | | - | | | | - | | | | - | | | | (0.02 | ) | | | - | |
| From net investment income | | | (1.33 | ) | | | - | | | | - | | | | - | | | | (0.22 | ) |
| From net realized gain | | | (3.93 | ) | | | (0.67 | ) | | | - | | | | (0.85 | ) | | | (0.35 | ) |
| Total distributions | | | (5.26 | ) | | | (0.67 | ) | | | - | | | | (0.87 | ) | | | (0.57 | ) |
| | | | | | | | | | | | | | | | | | | | | |
| Redemption fee proceeds1 | | | - | | | | - | 2 | | | - | 2 | | | - | 2 | | | 0.01 | |
| | | | | | | | | | | | | | | | | | | | | |
| Net asset value, end of period | | $ | 8.78 | | | $ | 17.43 | | | $ | 14.05 | | | $ | 12.70 | | | $ | 13.96 | |
| | | | | | | | | | | | | | | | | | | | | |
| Total return3 | | | (31.51 | )% | | | 29.35 | % | | | 10.63 | % | | | (1.99 | )% | | | 23.41 | % |
| | | | | | | | | | | | | | | | | | | | | |
| Ratios and Supplemental Data: | | | | | | | | | | | | | | | | | | | | |
| Net assets, end of period4 | | $ | 364,431 | | | $ | 579,282 | | | $ | 237,027 | | | $ | 1,722,198 | | | $ | 1,123,625 | |
| | | | | | | | | | | | | | | | | | | | | |
| Ratio of expenses to average net assets: | | | | | | | | | | | | | | | | | | | | |
| Before fees waived and expenses absorbed | | | 2.78 | % | | | 2.29 | % | | | 1.94 | % | | | 2.05 | % | | | 2.05 | % |
| After fees waived and expenses absorbed | | | 1.75 | % | | | 1.78 | % | | | 1.75 | % | | | 1.75 | % | | | 1.75 | % |
| Ratio of net investment income (loss) to average net assets: | | | | | | | | | | | | | | | | | | | | |
| Before fees waived and expenses absorbed | | | (1.23 | )% | | | (0.87 | )% | | | 0.04 | % | | | 0.23 | % | | | 0.03 | % |
| After fees waived and expenses absorbed | | | (0.20 | )% | | | (0.36 | )% | | | 0.23 | % | | | 0.53 | % | | | 0.33 | % |
| | | | | | | | | | | | | | | | | | | | | |
| Portfolio turnover rate | | | 45 | % | | | 100 | % | | | 78 | % | | | 72 | % | | | 38 | % |
| * | Financial information from October 1, 2017 through November 20, 2020 is for the Leland Thomson Reuters Private Equity Buyout Index Fund, which was reorganized into the AXS Thomson Reuters Private Equity Return Tracker Fund as of the close of business on November 20, 2020. See Note 1 in the accompanying Notes to Consolidated Financial Statements. |
| 1 | Based on average daily shares outstanding for the period. |
| 2 | Amount represents less than $0.005 per share. |
| 3 | Total returns would have been lower had expenses not been waived and absorbed by the Advisor. Returns shown include Rule 12b-1 fees of up to 0.25% and do not reflect the deduction of taxes that a shareholder would pay on Fund distributions or the redemption of Fund shares. Returns shown do not include payment of sales load of 5.75% of offering price which will not apply on sales of $1 million or more. If the sales charge was included total returns would be lower. |
| 4 | Amount is actual; not presented in thousands. |
See accompanying Notes to Consolidated Financial Statements.
AXS Thomson Reuters Private Equity Return Tracker Fund
FINANCIAL HIGHLIGHTS
Class C*
Per share operating performance.
For a capital share outstanding throughout each period.
| | | For the Year Ended September 30, |
| | | 2022 | | | 2021 | | | 2020 | | | 2019 | | | 2018 | |
| Net asset value, beginning of period | | $ | 16.82 | | | $ | 13.67 | | | $ | 12.46 | | | $ | 13.82 | | | $ | 11.71 | |
| Income from Investment Operations: | | | | | | | | | | | | | | | | | | | | |
| Net investment income (loss)1 | | | (0.12 | ) | | | (0.18 | ) | | | (0.07 | ) | | | (0.03 | ) | | | (0.05 | ) |
| Net realized and unrealized gain (loss) | | | (3.30 | ) | | | 4.00 | | | | 1.28 | | | | (0.46 | ) | | | 2.63 | |
| Total from investment operations | | | (3.42 | ) | | | 3.82 | | | | 1.21 | | | | (0.49 | ) | | | 2.58 | |
| | | | | | | | | | | | | | | | | | | | | |
| Less Distributions: | | | | | | | | | | | | | | | | | | | | |
| Return of capital | | | - | | | | - | | | | - | | | | (0.02 | ) | | | - | |
| From net investment income | | | (0.95 | ) | | | - | | | | - | | | | - | | | | (0.12 | ) |
| From net realized gain | | | (3.93 | ) | | | (0.67 | ) | | | - | | | | (0.85 | ) | | | (0.35 | ) |
| Total distributions | | | (4.88 | ) | | | (0.67 | ) | | | - | | | | (0.87 | ) | | | (0.47 | ) |
| | | | | | | | | | | | | | | | | | | | | |
| Redemption fee proceeds1 | | | - | | | | - | | | | - | 2 | | | - | 2 | | | - | |
| | | | | | | | | | | | | | | | | | | | | |
| Net asset value, end of period | | $ | 8.52 | | | $ | 16.82 | | | $ | 13.67 | | | $ | 12.46 | | | $ | 13.82 | |
| | | | | | | | | | | | | | | | | | | | | |
| Total return3 | | | (32.02 | )% | | | 28.36 | % | | | 9.71 | % | | | (2.70 | )% | | | 22.42 | % |
| | | | | | | | | | | | | | | | | | | | | |
| Ratios and Supplemental Data: | | | | | | | | | | | | | | | | | | | | |
| Net assets, end of period4 | | $ | 141,057 | | | $ | 206,331 | | | $ | 1,084,258 | | | $ | 500,680 | | | $ | 664,524 | |
| | | | | | | | | | | | | | | | | | | | | |
| Ratio of expenses to average net assets: | | | | | | | | | | | | | | | | | | | | |
| Before fees waived and expenses absorbed | | | 3.53 | % | | | 3.04 | % | | | 2.69 | % | | | 2.80 | % | | | 2.80 | % |
| After fees waived and expenses absorbed | | | 2.50 | % | | | 2.53 | % | | | 2.50 | % | | | 2.50 | % | | | 2.50 | % |
| Ratio of net investment loss to average net assets: | | | | | | | | | | | | | | | | | | | | |
| Before fees waived and expenses absorbed | | | (1.98 | )% | | | (1.62 | )% | | | (0.71 | )% | | | (0.52 | )% | | | (0.70 | )% |
| After fees waived and expenses absorbed | | | (0.95 | )% | | | (1.11 | )% | | | (0.52 | )% | | | (0.22 | )% | | | (0.40 | )% |
| | | | | | | | | | | | | | | | | | | | | |
| Portfolio turnover rate | | | 45 | % | | | 100 | % | | | 78 | % | | | 72 | % | | | 38 | % |
| * | Financial information from October 1, 2017 through November 20, 2020 is for the Leland Thomson Reuters Private Equity Buyout Index Fund, which was reorganized into the AXS Thomson Reuters Private Equity Return Tracker Fund as of the close of business on November 20, 2020. See Note 1 in the accompanying Notes to Consolidated Financial Statements. |
| 1 | Based on average daily shares outstanding for the period. |
| 2 | Amount represents less than $0.005 per share. |
| 3 | Total returns would have been lower had expenses not been waived and absorbed by the Advisor. Returns shown include Rule 12b-1 fees of up to 1.00% and do not reflect the deduction of taxes that a shareholder would pay on Fund distributions or the redemption of Fund shares. Returns do not include payment of Contingent Deferred Sales Charge ("CDSC") of 1.00% on certain redemptions of Class C shares made within 12 months of purchase. If the Sales charge was included, total returns would be lower. |
| 4 | Amount is actual; not presented in thousands. |
See accompanying Notes to Consolidated Financial Statements.
AXS Thomson Reuters Private Equity Return Tracker Fund
FINANCIAL HIGHLIGHTS
Class I*
Per share operating performance.
For a capital share outstanding throughout each period.
| | | For the Year Ended September 30, |
| | | 2022 | | | 2021 | | | 2020 | | | 2019 | | | 2018 | |
| Net asset value, beginning of period | | $ | 17.67 | | | $ | 14.20 | | | $ | 12.81 | | | $ | 14.05 | | | $ | 11.88 | |
| Income from Investment Operations: | | | | | | | | | | | | | | | | | | | | |
| Net investment income (loss)1 | | | 0.01 | | | | (0.02 | ) | | | 0.06 | | | | 0.09 | | | | 0.08 | |
| Net realized and unrealized gain (loss) | | | (3.44 | ) | | | 4.16 | | | | 1.33 | | | | (0.46 | ) | | | 2.68 | |
| Total from investment operations | | | (3.43 | ) | | | 4.14 | | | | 1.39 | | | | (0.37 | ) | | | 2.76 | |
| | | | | | | | | | | | | | | | | | | | | |
| Less Distributions: | | | | | | | | | | | | | | | | | | | | |
| Return of capital | | | - | | | | - | | | | - | | | | (0.02 | ) | | | - | |
| From net investment income | | | (1.36 | ) | | | - | | | | - | | | | - | | | | (0.24 | ) |
| From net realized gain | | | (3.93 | ) | | | (0.67 | ) | | | - | | | | (0.85 | ) | | | (0.35 | ) |
| Total distributions | | | (5.29 | ) | | | (0.67 | ) | | | - | | | | (0.87 | ) | | | (0.59 | ) |
| | | | | | | | | | | | | | | | | | | | | |
| Redemption fee proceeds1 | | | - | 2 | | | - | 2 | | | - | 2 | | | - | 2 | | | - | 2 |
| | | | | | | | | | | | | | | | | | | | | |
| Net asset value, end of period | | $ | 8.95 | | | $ | 17.67 | | | $ | 14.20 | | | $ | 12.81 | | | $ | 14.05 | |
| | | | | | | | | | | | | | | | | | | | | |
| Total return3 | | | (31.33 | )% | | | 29.68 | % | | | 10.85 | % | | | (1.75 | )% | | | 23.71 | % |
| | | | | | | | | | | | | | | | | | | | | |
| Ratios and Supplemental Data: | | | | | | | | | | | | | | | | | | | | |
| Net assets, end of period (in thousands) | | $ | 13,989 | | | $ | 25,057 | | | $ | 21,073 | | | $ | 17,336 | | | $ | 18,108 | |
| | | | | | | | | | | | | | | | | | | | | |
| Ratio of expenses to average net assets: | | | | | | | | | | | | | | | | | | | | |
| Before fees waived and expenses absorbed | | | 2.53 | % | | | 2.04 | % | | | 1.69 | % | | | 1.80 | % | | | 1.80 | % |
| After fees waived and expenses absorbed | | | 1.50 | % | | | 1.53 | % | | | 1.50 | % | | | 1.50 | % | | | 1.50 | % |
| Ratio of net investment income (loss) to average net assets: | | | | | | | | | | | | | | | | | | | | |
| Before fees waived and expenses absorbed | | | (0.98 | )% | | | (0.62 | )% | | | 0.29 | % | | | 0.48 | % | | | 0.29 | % |
| After fees waived and expenses absorbed | | | 0.05 | % | | | (0.11 | )% | | | 0.48 | % | | | 0.78 | % | | | 0.59 | % |
| | | | | | | | | | | | | | | | | | | | | |
| Portfolio turnover rate | | | 45 | % | | | 100 | % | | | 78 | % | | | 72 | % | | | 38 | % |
| * | Financial information from October 1, 2017 through November 20, 2020 is for the Leland Thomson Reuters Private Equity Buyout Index Fund, which was reorganized into the AXS Thomson Reuters Private Equity Return Tracker Fund as of the close of business on November 20, 2020. See Note 1 in the accompanying Notes to Consolidated Financial Statements. |
| 1 | Based on average daily shares outstanding for the period. |
| 2 | Amount represents less than $0.005 per share. |
| 3 | Total returns would have been lower had expenses not been waived and absorbed by the Advisor. Returns shown do not reflect the deduction of taxes that a shareholder would pay on Fund distributions or the redemption of Fund shares. |
See accompanying Notes to Consolidated Financial Statements.
AXS Thomson Reuters Venture Capital Return Tracker Fund
FINANCIAL HIGHLIGHTS
Class A*
Per share operating performance.
For a capital share outstanding throughout each period.
| | | For the Year Ended September 30, | |
| | | 2022 | | | 2021 | | | 2020 | | | 2019 | | | 2018 | |
| Net asset value, beginning of period | | $ | 35.13 | | | $ | 31.14 | | | $ | 18.26 | | | $ | 19.88 | | | $ | 14.73 | |
| Income from Investment Operations: | | | | | | | | | | | | | | | | | | | | |
| Net investment income (loss)1 | | | (0.21 | ) | | | (0.34 | ) | | | (0.18 | ) | | | (0.09 | ) | | | (0.15 | ) |
| Net realized and unrealized gain (loss) | | | (16.26 | ) | | | 9.73 | | | | 13.04 | | | | (0.45 | ) | | | 6.87 | |
| Net increase from payment by affiliates (Note 3) | | | - | 2 | | | - | 2 | | | - | | | | - | | | | - | |
| Total from investment operations | | | (16.47 | ) | | | 9.39 | | | | 12.86 | | | | (0.54 | ) | | | 6.72 | |
| | | | | | | | | | | | | | | | | | | | | |
| Less Distributions: | | | | | | | | | | | | | | | | | | | | |
| From net investment income | | | (2.56 | ) | | | - | | | | - | | | | - | | | | (0.36 | ) |
| From net realized gain | | | (4.11 | ) | | | (5.41 | ) | | | - | | | | (1.08 | ) | | | (1.23 | ) |
| Total distributions | | | (6.67 | ) | | | (5.41 | ) | | | - | | | | (1.08 | ) | | | (1.59 | ) |
| | | | | | | | | | | | | | | | | | | | | |
| Redemption fee proceeds1 | | | - | 2 | | | 0.01 | | | | 0.02 | | | | - | 2 | | | 0.02 | |
| | | | | | | | | | | | | | | | | | | | | |
| Net asset value, end of period | | $ | 11.99 | | | $ | 35.13 | | | $ | 31.14 | | | $ | 18.26 | | | $ | 19.88 | |
| | | | | | | | | | | | | | | | | | | | | |
| Total return3 | | | (57.66 | )% | | | 33.23 | % | | | 70.54 | % | | | (1.84 | )% | | | 49.63 | % |
| | | | | | | | | | | | | | | | | | | | | |
| Ratios and Supplemental Data: | | | | | | | | | | | | | | | | | | | | |
| Net assets, end of period (in thousands) | | $ | 34,824 | | | $ | 103,229 | | | $ | 82,691 | | | $ | 37,779 | | | $ | 41,820 | |
| | | | | | | | | | | | | | | | | | | | | |
| Ratio of expenses to average net assets: | | | | | | | | | | | | | | | | | | | | |
| Before fees waived and expenses absorbed | | | 2.07 | % | | | 1.85 | % | | | 1.89 | % | | | 2.06 | % | | | 1.99 | % |
| After fees waived and expenses absorbed | | | 1.75 | % | | | 1.76 | % | | | 1.75 | % | | | 1.75 | % | | | 1.75 | % |
| Ratio of net investment loss to average net assets: | | | | | | | | | | | | | | | | | | | | |
| Before fees waived and expenses absorbed | | | (1.29 | )% | | | (1.11 | )% | | | (0.90 | )% | | | (0.83 | )% | | | (1.06 | )% |
| After fees waived and expenses absorbed | | | (0.97 | )% | | | (1.02 | )% | | | (0.76 | )% | | | (0.52 | )% | | | (0.82 | )% |
| | | | | | | | | | | | | | | | | | | | | |
| Portfolio turnover rate | | | 72 | % | | | 100 | % | | | 115 | % | | | 115 | % | | | 47 | % |
| * | Financial information from October 1, 2017 through November 20, 2020 is for the Leland Thomson Reuters Venture Capital Index Fund, which was reorganized into the AXS Thomson Reuters Venture Capital Return Tracker Fund as of the close of business on November 20, 2020. See Note 1 in the accompanying Notes to Consolidated Financial Statements. |
| 1 | Based on average daily shares outstanding for the period. |
| 2 | Amount represents less than $0.005 per share. |
| 3 | Total returns would have been lower had expenses not been waived and absorbed by the Advisor. Returns shown include Rule 12b-1 fees of up to 0.25% and do not reflect the deduction of taxes that a shareholder would pay on Fund distributions or the redemption of Fund shares. Returns shown do not include payment of sales load of 5.75% of offering price which will not apply on sales of $1 million or more. If the sales charge was included total returns would be lower. |
See accompanying Notes to Consolidated Financial Statements.
AXS Thomson Reuters Venture Capital Return Tracker Fund
FINANCIAL HIGHLIGHTS
Class C*
Per share operating performance.
For a capital share outstanding throughout each period.
| | | For the Year Ended September 30, | |
| | | 2022 | | | 2021 | | | 2020 | | | 2019 | | | 2018 | |
| Net asset value, beginning of period | | $ | 33.33 | | | $ | 29.98 | | | $ | 17.71 | | | $ | 19.46 | | | $ | 14.52 | |
| Income from Investment Operations: | | | | | | | | | | | | | | | | | | | | |
| Net investment income (loss)1 | | | (0.36 | ) | | | (0.57 | ) | | | (0.34 | ) | | | (0.22 | ) | | | (0.28 | ) |
| Net realized and unrealized gain (loss) | | | (15.28 | ) | | | 9.32 | | | | 12.60 | | | | (0.45 | ) | | | 6.78 | |
| Net increase from payment by affiliates (Note 3) | | | - | 2 | | | - | 2 | | | - | | | | - | | | | - | |
| Total from investment operations | | | (15.64 | ) | | | 8.75 | | | | 12.26 | | | | (0.67 | ) | | | 6.50 | |
| | | | | | | | | | | | | | | | | | | | | |
| Less Distributions: | | | | | | | | | | | | | | | | | | | | |
| From net investment income | | | (2.36 | ) | | | - | | | | - | | | | - | | | | (0.34 | ) |
| From net realized gain | | | (4.11 | ) | | | (5.41 | ) | | | - | | | | (1.08 | ) | | | (1.23 | ) |
| Total distributions | | | (6.47 | ) | | | (5.41 | ) | | | - | | | | (1.08 | ) | | | (1.57 | ) |
| | | | | | | | | | | | | | | | | | | | | |
| Redemption fee proceeds1 | | | - | 2 | | | 0.01 | | | | 0.01 | | | | - | 2 | | | 0.01 | |
| | | | | | | | | | | | | | | | | | | | | |
| Net asset value, end of period | | $ | 11.22 | | | $ | 33.33 | | | $ | 29.98 | | | $ | 17.71 | | | $ | 19.46 | |
| | | | | | | | | | | | | | | | | | | | | |
| Total return3 | | | (57.99 | )% | | | 32.26 | % | | | 69.28 | % | | | (2.59 | )% | | | 48.59 | % |
| | | | | | | | | | | | | | | | | | | | | |
| Ratios and Supplemental Data: | | | | | | | | | | | | | | | | | | | | |
| Net assets, end of period (in thousands) | | $ | 4,210 | | | $ | 14,776 | | | $ | 11,205 | | | $ | 5,315 | | | $ | 6,198 | |
| | | | | | | | | | | | | | | | | | | | | |
| Ratio of expenses to average net assets: | | | | | | | | | | | | | | | | | | | | |
| Before fees waived and expenses absorbed | | | 2.82 | % | | | 2.60 | % | | | 2.64 | % | | | 2.81 | % | | | 2.74 | % |
| After fees waived and expenses absorbed | | | 2.50 | % | | | 2.51 | % | | | 2.50 | % | | | 2.50 | % | | | 2.50 | % |
| Ratio of net investment loss to average net assets: | | | | | | | | | | | | | | | | | | | | |
| Before fees waived and expenses absorbed | | | (2.04 | )% | | | (1.86 | )% | | | (1.64 | )% | | | (1.58 | )% | | | (1.81 | )% |
| After fees waived and expenses absorbed | | | (1.72 | )% | | | (1.77 | )% | | | (1.50 | )% | | | (1.27 | )% | | | (1.57 | )% |
| | | | | | | | | | | | | | | | | | | | | |
| Portfolio turnover rate | | | 72 | % | | | 100 | % | | | 115 | % | | | 115 | % | | | 47 | % |
| * | Financial information from October 1, 2017 through November 20, 2020 is for the Leland Thomson Reuters Venture Capital Index Fund, which was reorganized into the AXS Thomson Reuters Venture Capital Return Tracker Fund as of the close of business on November 20, 2020. See Note 1 in the accompanying Notes to Consolidated Financial Statements. |
| 1 | Based on average daily shares outstanding for the period. |
| 2 | Amount represents less than $0.005 per share. |
| 3 | Total returns would have been lower had expenses not been waived and absorbed by the Advisor. Returns shown include Rule 12b-1 fees of up to 1.00% and do not reflect the deduction of taxes that a shareholder would pay on Fund distributions or the redemption of Fund shares. Returns do not include payment of Contingent Deferred Sales Charge ("CDSC") of 1.00% on certain redemptions of Class C shares made within 12 months of purchase. If the Sales charge was included, total returns would be lower. |
See accompanying Notes to Consolidated Financial Statements.
AXS Thomson Reuters Venture Capital Return Tracker Fund
FINANCIAL HIGHLIGHTS
Class I*
Per share operating performance.
For a capital share outstanding throughout each period.
| | | For the Year Ended September 30, | |
| | | 2022 | | | 2021 | | | 2020 | | | 2019 | | | 2018 | |
| Net asset value, beginning of period | | $ | 35.63 | | | $ | 31.45 | | | $ | 18.40 | | | $ | 19.97 | | | $ | 14.79 | |
| Income from Investment Operations: | | | | | | | | | | | | | | | | | | | | |
| Net investment income (loss)1 | | | (0.16 | ) | | | (0.26 | ) | | | (0.12 | ) | | | (0.05 | ) | | | (0.10 | ) |
| Net realized and unrealized gain (loss) | | | (16.53 | ) | | | 9.84 | | | | 13.16 | | | | (0.44 | ) | | | 6.88 | |
| Net increase from payment by affiliates (Note 3) | | | - | 2 | | | - | 2 | | | - | | | | - | | | | - | |
| Total from investment operations | | | (16.69 | ) | | | 9.58 | | | | 13.04 | | | | (0.49 | ) | | | 6.78 | |
| | | | | | | | | | | | | | | | | | | | | |
| Less Distributions: | | | | | | | | | | | | | | | | | | | | |
| From net investment income | | | (2.64 | ) | | | - | | | | - | | | | - | | | | (0.37 | ) |
| From net realized gain | | | (4.11 | ) | | | (5.41 | ) | | | - | | | | (1.08 | ) | | | (1.23 | ) |
| Total distributions | | | (6.75 | ) | | | (5.41 | ) | | | - | | | | (1.08 | ) | | | (1.60 | ) |
| | | | | | | | | | | | | | | | | | | | | |
| Redemption fee proceeds1 | | | 0.01 | | | | 0.01 | | | | 0.01 | | | | - | 2 | | | - | 2 |
| | | | | | | | | | | | | | | | | | | | | |
| Net asset value, end of period | | $ | 12.20 | | | $ | 35.63 | | | $ | 31.45 | | | $ | 18.40 | | | $ | 19.97 | |
| | | | | | | | | | | | | | | | | | | | | |
| Total return3 | | | (57.56 | )% | | | 33.54 | % | | | 70.92 | % | | | (1.57 | )% | | | 49.75 | % |
| | | | | | | | | | | | | | | | | | | | | |
| Ratios and Supplemental Data: | | | | | | | | | | | | | | | | | | | | |
| Net assets, end of period (in thousands) | | $ | 68,761 | | | $ | 257,170 | | | $ | 148,199 | | | $ | 59,881 | | | $ | 54,377 | |
| | | | | | | | | | | | | | | | | | | | | |
| Ratio of expenses to average net assets: | | | | | | | | | | | | | | | | | | | | |
| Before fees waived and expenses absorbed | | | 1.82 | % | | | 1.60 | % | | | 1.64 | % | | | 1.81 | % | | | 1.74 | % |
| After fees waived and expenses absorbed | | | 1.50 | % | | | 1.51 | % | | | 1.50 | % | | | 1.50 | % | | | 1.50 | % |
| Ratio of net investment loss to average net assets: | | | | | | | | | | | | | | | | | | | | |
| Before fees waived and expenses absorbed | | | (1.04 | )% | | | (0.86 | )% | | | (0.66 | )% | | | (0.59 | )% | | | (0.78 | )% |
| After fees waived and expenses absorbed | | | (0.72 | )% | | | (0.77 | )% | | | (0.52 | )% | | | (0.28 | )% | | | (0.54 | )% |
| | | | | | | | | | | | | | | | | | | | | |
| Portfolio turnover rate | | | 72 | % | | | 100 | % | | | 115 | % | | | 115 | % | | | 47 | % |
| * | Financial information from October 1, 2017 through November 20, 2020 is for the Leland Thomson Reuters Venture Capital Index Fund, which was reorganized into the AXS Thomson Reuters Venture Capital Return Tracker Fund as of the close of business on November 20, 2020. See Note 1 in the accompanying Notes to Consolidated Financial Statements. |
| 1 | Based on average daily shares outstanding for the period. |
| 2 | Amount represents less than $0.005 per share. |
| 3 | Total returns would have been lower had expenses not been waived and absorbed by the Advisor. Returns shown do not reflect the deduction of taxes that a shareholder would pay on Fund distributions or the redemption of Fund shares. |
See accompanying Notes to Consolidated Financial Statements.
All Terrain Opportunity Fund
FINANCIAL HIGHLIGHTS
Class I^
Per share operating performance.
For a capital share outstanding throughout each period.
| | | For the Year Ended
September 30, | | | For the Period
November 1,
2020
through
September 30, | | | For the Year Ended October 31, | |
| | | 2022 | | | 2021* | | | | 2020 | | | | 2019 | | | | 2018 | | | | 2017 | |
| Net asset value, beginning of period | | $ | 25.50 | | | $ | 25.24 | | | $ | 25.25 | | | $ | 26.04 | | | $ | 25.57 | | | $ | 24.23 | |
| Income from Investment Operations: | | | | | | | | | | | | | | | | | | | | | | | | |
| Net investment income (loss) | | | (0.27 | ) | | | 0.04 | | | | 0.12 | | | | 0.44 | | | | 0.37 | | | | 0.60 | |
| Net realized and unrealized gain (loss) | | | (0.35 | ) | | | 1.01 | | | | 1.16 | | | | 0.35 | | | | 0.47 | | | | 1.33 | |
| Net increase from payments by affiliates (Note 3) | | | 0.01 | | | | - | | | | - | | | | - | | | | - | | | | - | |
| Total from investment operations | | | (0.61 | ) | | | 1.05 | | | | 1.28 | | | | 0.79 | | | | 0.84 | | | | 1.93 | |
| | | | | | | | | | | | | | | | | | | | | | | | | |
| Less Distributions: | | | | | | | | | | | | | | | | | | | | | | | | |
| From net investment income | | | - | | | | (0.07 | ) | | | (0.69 | ) | | | (0.45 | ) | | | (0.37 | ) | | | (0.59 | ) |
| From net realized gain | | | (1.37 | ) | | | (0.72 | ) | | | (0.60 | ) | | | (1.13 | ) | | | - | | | | - | |
| Total distributions | | | (1.37 | ) | | | (0.79 | ) | | | (1.29 | ) | | | (1.58 | ) | | | (0.37 | ) | | | (0.59 | ) |
| | | | | | | | | | | | | | | | | | | | | | | | | |
| Redemption fee proceeds | | | - | | | | - | | | | - | | | | - | 1 | | | - | | | | - | 1 |
| | | | | | | | | | | | | | | | | | | | | | | | | |
| Net asset value, end of period | | $ | 23.52 | | | $ | 25.50 | | | $ | 25.24 | | | $ | 25.25 | | | $ | 26.04 | | | $ | 25.57 | |
| | | | | | | | | | | | | | | | | | | | | | | | | |
| Total return | | | (2.72 | )% | | | 4.21 | %2 | | | 5.24 | % | | | 3.28 | % | | | 3.23 | % | | | 8.05 | % |
| | | | | | | | | | | | | | | | | | | | | | | | | |
| Ratios and Supplemental Data: | | | | | | | | | | | | | | | | | | | | | | | | |
| Net assets, end of period (in thousands) | | $ | 3,224 | | | $ | 27,212 | | | $ | 29,633 | | | $ | 28,300 | | | $ | 31,485 | | | $ | 33,470 | |
| | | | | | | | | | | | | | | | | | | | | | | | | |
| Ratio of expenses to average net assets (including interest expense): | | | | | | | | | | | | | | | | | | | | | | | | |
| Before fees waived and expenses absorbed | | | 2.27 | % | | | 2.05 | %3 | | | 2.24 | % | | | 2.15 | % | | | 2.20 | % | | | 2.34 | % |
| After fees waived and expenses absorbed | | | 1.60 | % | | | 1.60 | %3 | | | 1.41 | % | | | 1.52 | % | | | 1.39 | % | | | 1.49 | %4 |
| Ratio of net investment income (loss) to average net assets (including interest expense): | | | | | | | | | | | | | | | | | | | | | | | | |
| Before fees waived and expenses absorbed | | | (1.76 | )% | | | (0.29 | )%3 | | | (0.34 | )% | | | 1.12 | % | | | 0.62 | % | | | 1.54 | % |
| After fees waived and expenses absorbed | | | (1.09 | )% | | | 0.16 | %3 | | | 0.49 | % | | | 1.75 | % | | | 1.43 | % | | | 2.39 | % |
| | | | | | | | | | | | | | | | | | | | | | | | | |
| Portfolio turnover rate | | | 1,359 | % | | | 655 | %2 | | | 1,445 | % | | | 799 | % | | | 550 | % | | | 280 | % |
| ^ | Prior to February 1, 2022, Class I Shares were named Institutional Class Shares. |
| * | Fiscal year end changed to September 30, effective August 1, 2021. |
| 1 | Amount represents less than $0.01 per share. |
| 4 | If interest expense on cash due to broker had been excluded, the expense ratio would have been lowered by 0.01% for the year ended October 31, 2017. |
See accompanying Notes to Consolidated Financial Statements.
AXS Merger Fund
FINANCIAL HIGHLIGHTS
Investor Class*
| Per share operating performance. |
| For a capital share outstanding throughout each period. |
| | For the
Year Ended
September 30,
2022 | | | For the Period January 1, 2021 through
September 30,
2021** | | | | | | | | | | | | | |
| | For the Year Ended December 31, | |
| | 2020 | | | 2019 | | | 2018 | | | 2017 | |
| Net asset value, beginning of period | | $ | 10.29 | | | $ | 10.33 | | | $ | 10.52 | | | $ | 10.54 | | | $ | 10.53 | | | $ | 10.22 | |
| Income from Investment Operations: | | | | | | | | | | | | | | | | | | | | | | | | |
| Net investment loss1 | | | (0.12 | ) | | | (0.12 | ) | | | (0.14 | ) | | | (0.08 | ) | | | (0.10 | ) | | | (0.15 | ) |
| Net realized and unrealized gain | | | 0.26 | | | | 0.08 | | | | 0.15 | | | | 0.55 | | | | 0.19 | | | | 0.46 | |
| Total from investment operations | | | 0.14 | | | | (0.04 | ) | | | 0.01 | | | | 0.47 | | | | 0.09 | | | | 0.31 | |
| | | | | | | | | | | | | | | | | | | | | | | | | |
| Less Distributions: | | | | | | | | | | | | | | | | | | | | | | | | |
| From net realized gain | | | (0.11 | ) | | | - | | | | (0.20 | ) | | | (0.49 | ) | | | (0.08 | ) | | | - | |
| Total distributions | | | (0.11 | ) | | | - | | | | (0.20 | ) | | | (0.49 | ) | | | (0.08 | ) | | | - | |
| | | | | | | | | | | | | | | | | | | | | | | | | |
| Redemption fee proceeds1 | | | - | | | | - | 2 | | | - | | | | - | | | | - | | | | - | |
| | | | | | | | | | | | | | | | | | | | | | | | | |
| Net asset value, end of period | | $ | 10.32 | | | $ | 10.29 | | | $ | 10.33 | | | $ | 10.52 | | | $ | 10.54 | | | $ | 10.53 | |
| | | | | | | | | | | | | | | | | | | | | | | | | |
| Total return3 | | | 1.37 | % | | | (0.39 | )%5 | | | 0.08 | % | | | 4.48 | % | | | 0.88 | % | | | 3.03 | % |
| | | | | | | | | | | | | | | | | | | | | | | | | |
| Ratios and Supplemental Data: | | | | | | | | | | | | | | | | | | | | | | | | |
| Net assets, end of period (in thousands) | | $ | 1,142 | | | $ | 1,532 | | | $ | 1,634 | | | $ | 1,990 | | | $ | 1,954 | | | $ | 4,306 | |
| | | | | | | | | | | | | | | | | | | | | | | | | |
| Ratio of expenses to average net assets (including dividends on securities sold short and interest expense): | | | | | | | | | | | | | | | | | | | | | | | | |
| Before fees waived and expenses absorbed/recovered | | | 2.55 | %6 | | | 2.81 | %4,6 | | | 2.31 | %6,7 | | | 2.53 | %6 | | | 2.28 | %6 | | | 2.38 | %6 |
| After fees waived and expenses absorbed/recovered | | | 2.25 | %6 | | | 2.61 | %4,6 | | | 2.26 | %6,7 | | | 2.53 | %6 | | | 2.31 | %6 | | | 2.38 | %6 |
| Ratio of net investment loss to average net assets (including dividends on securities sold short and interest expense): | | | | | | | | | | | | | | | | | | | | | | | | |
| Before fees waived and expenses absorbed/recovered | | | (1.43 | )% | | | (1.68 | )%4 | | | (1.39 | )% | | | (0.71 | )% | | | (0.88 | )% | | | (1.51 | )% |
| After fees waived and expenses absorbed/recovered | | | (1.13 | )% | | | (1.48 | )%4 | | | (1.34 | )% | | | (0.71 | )% | | | (0.91 | )% | | | (1.51 | )% |
| | | | | | | | | | | | | | | | | | | | | | | | | |
| Portfolio turnover rate | | | 218 | % | | | 184 | %5 | | | 256 | % | | | 298 | % | | | 285 | % | | | 218 | % |
| * | Financial information from January 1, 2017 through December 31, 2020 is for the Kellner Merger Fund, which was reorganized into the AXS Merger Fund as of the close of business on January 22, 2021. See Note 1 in the accompanying Notes to Financial Statements. |
| ** | Fiscal year end changed to September 30, effective January 1, 2021. |
| 1 | Based on average shares outstanding for the period. |
| 2 | Amount represents less than $0.01 per share. |
| 3 | Total returns would have been higher/lower had expenses not been recovered/waived and absorbed by the Advisor. Returns shown do not reflect the deduction of taxes that a shareholder would pay on Fund distributions or the redemption of Fund shares. |
| 4 | Annualized. |
| 5 | Not annualized. |
| 6 | If dividends on securities sold short, interest expense and extraordinary expenses had been excluded, the expense ratios would have been lowered by 0.50% for the year ended September 30, 2022 and 0.86% for the period January 1, 2021 through September 30, 2021. For the years ended December 31, 2020, 2019, 2018, and 2017, the ratios would have been lowered by 0.51%, 0.78%, 0.56%, and 0.63%, respectively. |
| 7 | Includes extraordinary expenses of 0.02% that occurred during the Fund’s fiscal year ended December 31, 2020. |
See accompanying Notes to Consolidated Financial Statements.
AXS Merger Fund
FINANCIAL HIGHLIGHTS
Class I*
| Per share operating performance. |
| For a capital share outstanding throughout each period. |
| | For the
Year Ended September 30,
2022 | | | For the Period January 1, 2021 through September 30,
2021** | | | | | | | | | | | | | |
| | For the Year Ended December 31, | |
| | | | | | | | | | | | |
| | 2020 | | | 2019 | | | 2018 | | | 2017 | |
| Net asset value, beginning of period | | $ | 10.60 | | | $ | 10.62 | | | $ | 10.79 | | | $ | 10.78 | | | $ | 10.74 | | | $ | 10.40 | |
| Income from Investment Operations: | | | | | | | | | | | | | | | | | | | | | | | | |
| Net investment loss1 | | | (0.09 | ) | | | (0.10 | ) | | | (0.11 | ) | | | (0.05 | ) | | | (0.07 | ) | | | (0.13 | ) |
| Net realized and unrealized gain | | | 0.26 | | | | 0.08 | | | | 0.15 | | | | 0.55 | | | | 0.19 | | | | 0.47 | |
| Total from investment operations | | | 0.17 | | | | (0.02 | ) | | | 0.04 | | | | 0.50 | | | | 0.12 | | | | 0.34 | |
| | | | | | | | | | | | | | | | | | | | | | | | | |
| Less Distributions: | | | | | | | | | | | | | | | | | | | | | | | | |
| From net investment income | | | - | | | | - | | | | (0.01 | ) | | | - | | | | - | | | | - | |
| From net realized gain | | | (0.11 | ) | | | - | | | | (0.20 | ) | | | (0.49 | ) | | | (0.08 | ) | | | - | |
| Total distributions | | | (0.11 | ) | | | - | | | | (0.21 | ) | | | (0.49 | ) | | | (0.08 | ) | | | - | |
| | | | | | | | | | | | | | | | | | | | | | | | | |
| Redemption fee proceeds1 | | | - | 2 | | | - | 2 | | | - | | | | - | | | | - | | | | - | |
| | | | | | | | | | | | | | | | | | | | | | | | | |
| Net asset value, end of period | | $ | 10.66 | | | $ | 10.60 | | | $ | 10.62 | | | $ | 10.79 | | | $ | 10.78 | | | $ | 10.74 | |
| | | | | | | | | | | | | | | | | | | | | | | | | |
| Total return3 | | | 1.61 | % | | | (0.19 | )%5 | | | 0.37 | % | | | 4.66 | % | | | 1.15 | % | | | 3.27 | % |
| | | | | | | | | | | | | | | | | | | | | | | | | |
| Ratios and Supplemental Data: | | | | | | | | | | | | | | | | | | | | | | | | |
| Net assets, end of period (in thousands) | | $ | 56,195 | | | $ | 75,415 | | | $ | 96,768 | | | $ | 164,058 | | | $ | 177,923 | | | $ | 147,941 | |
| | | | | | | | | | | | | | | | | | | | | | | | | |
| Ratio of expenses to average net assets (including dividends on securities sold short and interest expense): | | | | | | | | | | | | | | | | | | | | | | | | |
| Before fees waived and expenses absorbed/recovered | | | 2.30 | %6 | | | 2.56 | %4,6 | | | 2.06 | %6,7 | | | 2.28 | %6 | | | 2.06 | %6 | | | 2.09 | %6 |
| After fees waived and expenses absorbed/recovered | | | 2.00 | %6 | | | 2.36 | %4,6 | | | 2.01 | %6,7 | | | 2.28 | %6 | | | 2.09 | %6 | | | 2.09 | %6 |
| Ratio of net investment loss to average net assets (including dividends | | | | | | | | | | | | | | | | | | | | | | | | |
| on securities sold short and interest expense): | | | | | | | | | | | | | | | | | | | | | | | | |
| Before fees waived and expenses absorbed/recovered | | | (1.18 | )% | | | (1.43 | )%4 | | | (1.11 | )% | | | (0.45 | )% | | | (0.64 | )% | | | (1.21 | )% |
| After fees waived and expenses absorbed/recovered | | | (0.88 | )% | | | (1.23 | )%4 | | | (1.06 | )% | | | (0.45 | )% | | | (0.67 | )% | | | (1.21 | )% |
| | | | | | | | | | | | | | | | | | | | | | | | | |
| Portfolio turnover rate | | | 218 | % | | | 184 | %5 | | | 256 | % | | | 298 | % | | | 285 | % | | | 218 | % |
| * | Financial information from January 1, 2017 through December 31, 2020 is for the Kellner Merger Fund, which was reorganized into the AXS Merger Fund as of the close of business on January 22, 2021. See Note 1 in the accompanying Notes to Financial Statements. |
| ** | Fiscal year end changed to September 30, effective January 1, 2021. |
| 1 | Based on average shares outstanding for the period. |
| 2 | Amount represents less than $0.01 per share. |
| 3 | Total returns would have been higher/lower had expenses not been recovered/waived and absorbed by the Advisor. Returns shown do not reflect the deduction of taxes that a shareholder would pay on Fund distributions or the redemption of Fund shares. |
| 4 | Annualized. |
| 5 | Not annualized. |
| 6 | If dividends on securities sold short, interest expense and extraordinary expenses had been excluded, the expense ratios would have been lowered by 0.50% for the year ended September 30, 2022 and 0.86% for the period January 1, 2021 through September 30, 2021. For the years ended December 31, 2020, 2019, 2018, and 2017, the ratios would have been lowered by 0.51%, 0.78%, 0.59%, and 0.59%, respectively. |
| 7 | Includes extraordinary expenses of 0.02% that occurred during the Fund’s fiscal year ended December 31, 2020. |
See accompanying Notes to Consolidated Financial Statements.
AXS Alternative Value Fund
FINANCIAL HIGHLIGHTS
Investor Class*
| Per share operating performance. |
| For a capital share outstanding throughout each period. |
| | For the Year Ended September 30,
2022 | | | For the Period July 1, 2021 through September 30,
2021** | | | | | | | | | | | | | |
| | For the Year Ended June 30, | |
| | | | | | | | | | | | |
| | 2021 | | | 2020 | | | 2019 | | | 2018 | |
| Net asset value, beginning of period | | $ | 10.33 | | | $ | 10.58 | | | $ | 8.16 | | | $ | 9.44 | | | $ | 10.23 | | | $ | 10.79 | |
| Income from Investment Operations: | | | | | | | | | | | | | | | | | | | | | | | | |
| Net investment income (loss)1 | | | 0.11 | | | | 0.03 | | | | 0.07 | | | | 0.10 | | | | 0.11 | | | | 0.12 | |
| Net realized and unrealized gain (loss) | | | 0.19 | | | | (0.30 | ) | | | 3.39 | | | | (0.65 | ) | | | 0.92 | | | | 1.29 | |
| Total from investment operations | | | 0.30 | | | | (0.27 | ) | | | 3.46 | | | | (0.55 | ) | | | 1.03 | | | | 1.41 | |
| | | | | | | | | | | | | | | | | | | | | | | | | |
| Less Distributions: | | | | | | | | | | | | | | | | | | | | | | | | |
| From net investment income | | | (0.15 | ) | | | - | | | | (1.04 | ) | | | (0.08 | ) | | | (0.19 | ) | | | (0.18 | ) |
| From net realized gain | | | (0.26 | ) | | | - | | | | - | | | | (0.65 | ) | | | (1.63 | ) | | | (1.79 | ) |
| Total distributions | | | (0.41 | ) | | | - | | | | (1.04 | ) | | | (0.73 | ) | | | (1.82 | ) | | | (1.97 | ) |
| | | | | | | | | | | | | | | | | | | | | | | | | |
| Redemption fee proceeds1 | | | 0.01 | | | | 0.02 | | | | - | | | | - | | | | - | | | | - | |
| | | | | | | | | | | | | | | | | | | | | | | | | |
| Net asset value, end of period | | $ | 10.23 | | | $ | 10.33 | | | $ | 10.58 | | | $ | 8.16 | | | $ | 9.44 | | | $ | 10.23 | |
| | | | | | | | | | | | | | | | | | | | | | | | | |
| Total return2 | | | 2.57 | % | | | (2.36 | )%4 | | | 44.75 | % | | | (6.89 | )% | | | 12.90 | % | | | 13.58 | % |
| | | | | | | | | | | | | | | | | | | | | | | | | |
| Ratios and Supplemental Data: | | | | | | | | | | | | | | | | | | | | | | | | |
| Net assets, end of period (in thousands) | | $ | 2,010 | | | $ | 629 | | | $ | 584 | | | $ | 540 | | | $ | 545 | | | $ | 25 | |
| | | | | | | | | | | | | | | | | | | | | | | | | |
| Ratio of expenses to average net assets (including interest expense): | | | | | | | | | | | | | | | | | | | | | | | | |
| Before fees waived and expenses absorbed3 | | | 2.42 | % | | | 8.13 | %5 | | | 13.41 | % | | | 2.87 | % | | | 2.96 | % | | | 1.62 | % |
| After fees waived and expenses absorbed3 | | | 1.78 | % | | | 1.57 | %5 | | | 1.65 | % | | | 2.02 | % | | | 2.07 | % | | | 1.10 | % |
| Ratio of net investment income (loss) to average net assets (including interest expense): | | | | | | | | | | | | | | | | | | | | | | | | |
| Before fees waived and expenses absorbed | | | 0.33 | % | | | (5.55 | )%5 | | | (11.06 | )% | | | 2.01 | % | | | 2.28 | % | | | 1.37 | % |
| After fees waived and expenses absorbed | | | 0.97 | % | | | 1.01 | %5 | | | 0.70 | % | | | 1.16 | % | | | 1.39 | % | | | 0.85 | % |
| | | | | | | | | | | | | | | | | | | | | | | | | |
| Portfolio turnover rate | | | 26 | % | | | 6 | %4 | | | 50 | % | | | 74 | % | | | 64 | % | | | 84 | % |
| * | Financial information from October 3, 2016 through March 5, 2021 is for the AXS Alternative Value Fund (formerly, Cognios Large Cap Value Fund), which was reorganized into the AXS Alternative Value Fund as of the close of business on March 5, 2021. See Note 1 in the accompanying Notes to Financial Statements. |
| ** | Fiscal year end changed to September 30, effective July 1, 2021. |
| 1 | Based on average shares outstanding for the period. |
| 2 | Total returns would have been lower had expenses not been waived or absorbed by the Advisor. Returns shown include 12b-1 fees of up to 0.25% and do not reflect the deduction of taxes that a shareholder would pay on Fund distributions or the redemption of Fund shares. |
| 3 | If interest expense had been excluded, the expense ratios would have been lowered by 0.68% for the year ended September 30, 2022. For the periods ended September 30, 2021 and June 30, 2021, 2020, 2019 and 2018, the ratios would have been lowered by 0.47%, 0.55%, 0.92%, 0.97% and 0.00%, respectively. |
| 4 | Not annualized. |
| 5 | Annualized. |
| See accompanying Notes to Consolidated Financial Statements. |
AXS Alternative Value Fund
FINANCIAL HIGHLIGHTS
Class I*
| Per share operating performance. |
| For a capital share outstanding throughout each period. |
| | For the Year Ended September 30,
2022 | | | For the Period July 1, 2021 through September 30,
2021** | | | | | | | | | | | | | |
| | For the Year Ended June 30, | |
| | | | | | | | | | | | |
| | 2021 | | | 2020 | | | 2019 | | | 2018 | |
| Net asset value, beginning of period | | $ | 10.33 | | | $ | 10.58 | | | $ | 8.16 | | | $ | 9.43 | | | $ | 10.25 | | | $ | 10.80 | |
| Income from Investment Operations: | | | | | | | | | | | | | | | | | | | | | | | | |
| Net investment income (loss)1 | | | 0.14 | | | | 0.03 | | | | 0.08 | | | | 0.13 | | | | 0.18 | | | | 0.20 | |
| Net realized and unrealized gain (loss) | | | 0.19 | | | | (0.28 | ) | | | 3.42 | | | | (0.66 | ) | | | 0.82 | | | | 1.23 | |
| Total from investment operations | | | 0.33 | | | | (0.25 | ) | | | 3.50 | | | | (0.53 | ) | | | 1.00 | | | | 1.43 | |
| | | | | | | | | | | | | | | | | | | | | | | | | |
| Less Distributions: | | | | | | | | | | | | | | | | | | | | | | | | |
| From net investment income | | | (0.18 | ) | | | - | | | | (1.08 | ) | | | (0.09 | ) | | | (0.19 | ) | | | (0.19 | ) |
| From net realized gain | | | (0.26 | ) | | | - | | | | - | | | | (0.65 | ) | | | (1.63 | ) | | | (1.79 | ) |
| Total distributions | | | (0.44 | ) | | | - | | | | (1.08 | ) | | | (0.74 | ) | | | (1.82 | ) | | | (1.98 | ) |
| | | | | | | | | | | | | | | | | | | | | | | | | |
| Redemption fee proceeds1 | | | - | 2 | | | - | 2 | | | - | 2 | | | - | | | | - | | | | - | |
| | | | | | | | | | | | | | | | | | | | | | | | | |
| Net asset value, end of period | | $ | 10.22 | | | $ | 10.33 | | | $ | 10.58 | | | $ | 8.16 | | | $ | 9.43 | | | $ | 10.25 | |
| | | | | | | | | | | | | | | | | | | | | | | | | |
| Total return3 | | | 2.78 | % | | | (2.36 | )%5 | | | 45.36 | % | | | (6.67 | )% | | | 12.56 | % | | | 13.87 | % |
| | | | | | | | | | | | | | | | | | | | | | | | | |
| Ratios and Supplemental Data: | | | | | | | | | | | | | | | | | | | | | | | | |
| Net assets, end of period (in thousands) | | $ | 16,841 | | | $ | 771 | | | $ | 684 | | | $ | 10,766 | | | $ | 19,947 | | | $ | 25,014 | |
| | | | | | | | | | | | | | | | | | | | | | | | | |
| Ratio of expenses to average net assets (including interest expense): | | | | | | | | | | | | | | | | | | | | | | | | |
| Before fees waived and expenses absorbed4 | | | 2.17 | % | | | 7.88 | %6 | | | 13.16 | % | | | 2.62 | % | | | 2.71 | % | | | 1.37 | % |
| After fees waived and expenses absorbed4 | | | 1.53 | % | | | 1.32 | %6 | | | 1.40 | % | | | 1.77 | % | | | 1.82 | % | | | 0.85 | % |
| Ratio of net investment income (loss) to average net assets (including interest expense): | | | | | | | | | | | | | | | | | | | | | | | | |
| Before fees waived and expenses absorbed | | | 0.58 | % | | | (5.30 | )%6 | | | (10.81 | )% | | | 2.26 | % | | | 2.53 | % | | | 1.62 | % |
| After fees waived and expenses absorbed | | | 1.22 | % | | | 1.26 | %6 | | | 0.95 | % | | | 1.41 | % | | | 1.64 | % | | | 1.10 | % |
| | | | | | | | | | | | | | | | | | | | | | | | | |
| Portfolio turnover rate | | | 26 | % | | | 6 | %5 | | | 50 | % | | | 74 | % | | | 64 | % | | | 84 | % |
| * | Financial information from October 3, 2016 through March 5, 2021 is for the AXS Alternative Value Fund (formerly, Cognios Large Cap Value Fund), which was reorganized into the AXS Alternative Value Fund as of the close of business on March 5, 2021. See Note 1 in the accompanying Notes to Financial Statements. |
| ** | Fiscal year end changed to September 30, effective July 1, 2021. |
| 1 | Based on average shares outstanding for the period. |
| 2 | Amount represents less than $0.01 per share. |
| 3 | Total returns would have been lower had fees not been waived or absorbed by the Advisor. These returns do not reflect the deduction of taxes that a shareholder would pay on the Fund distributions or redemption of Fund shares. |
| 4 | If interest expense had been excluded, the expense ratios would have been lowered by 0.68% for the year ended September 30, 2022. For the periods ended September 30, 2021 and June 30, 2021, 2020, 2019 and 2018, the ratios would have been lowered by 0.47%, 0.55%, 0.92%, 0.97% and 0.00%, respectively. |
| 5 | Not annualized. |
| 6 | Annualized. |
| See accompanying Notes to Consolidated Financial Statements. |
AXS Market Neutral Fund
FINANCIAL HIGHLIGHTS
Investor Class*
| Per share operating performance. |
| For a capital share outstanding throughout each period. |
| | For the
Year Ended September 30,
2022 | | | For the Period July 1, 2021 through September 30,
2021** | | | | | | | | | | | | For the Period October 1, 2017 through June 30, 2018 | | | For the
Year Ended September 30,
2017 | |
| For the Year Ended June 30, | |
| | | | | | | | |
| 2021 | | | 2020 | | | 2019 | |
| Net asset value, beginning of period | | $ | 9.94 | | | $ | 10.06 | | | $ | 10.15 | | | $ | 10.00 | | | $ | 10.31 | | | $ | 9.32 | | | $ | 9.93 | |
| Income from Investment Operations: | | | | | | | | | | | | | | | | | | | | | | | | | | | | |
| Net investment income (loss)1 | | | (0.08 | ) | | | (0.04 | ) | | | (0.15 | ) | | | (0.11 | ) | | | (0.05 | ) | | | (0.08 | ) | | | (0.13 | ) |
| Net realized and unrealized gain (loss) | | | 1.60 | | | | (0.08 | ) | | | 0.06 | | | | 0.26 | | | | (0.26 | ) | | | 1.07 | | | | (0.33 | ) |
| Total from investment operations | | | 1.52 | | | | (0.12 | ) | | | (0.09 | ) | | | 0.15 | | | | (0.31 | ) | | | 0.99 | | | | (0.46 | ) |
| | | | | | | | | | | | | | | | | | | | | | | | | | | | | |
| Less Distributions: | | | | | | | | | | | | | | | | | | | | | | | | | | | | |
| From net realized gain | | | - | | | | - | | | | - | | | | - | | | | - | | | | - | | | | (0.15 | ) |
| Total distributions | | | - | | | | - | | | | - | | | | - | | | | - | | | | - | | | | (0.15 | ) |
| | | | | | | | | | | | | | | | | | | | | | | | | | | | | |
| Redemption fee proceeds1 | | | - | 2 | | | - | | | | - | 2 | | | - | | | | - | | | | - | | | | - | |
| | | | | | | | | | | | | | | | | | | | | | | | | | | | | |
| Net asset value, end of period | | $ | 11.46 | | | $ | 9.94 | | | $ | 10.06 | | | $ | 10.15 | | | $ | 10.00 | | | $ | 10.31 | | | $ | 9.32 | |
| | | | | | | | | | | | | | | | | | | | | | | | | | | | | |
| Total return3 | | | 15.29 | % | | | (1.19 | )%5 | | | (0.89 | )% | | | 1.50 | % | | | (3.01 | )% | | | 10.62 | %5 | | | (4.65 | )% |
| | | | | | | | | | | | | | | | | | | | | | | | | | | | | |
| Ratios and Supplemental Data: | | | | | | | | | | | | | | | | | | | | | | | | | | | | |
| Net assets, end of period (in thousands) | | $ | 2,031 | | | $ | 2,042 | | | $ | 2,188 | | | $ | 7,155 | | | $ | 17,931 | | | $ | 19,771 | | | $ | 22,997 | |
| | | | | | | | | | | | | | | | | | | | | | | | | | | | | |
| Ratio of expenses to average net assets (including dividends on securities sold short and interest expense): | | | | | | | | | | | | | | | | | | | | | | | | | | | | |
| Before fees waived and expenses absorbed4 | | | 4.65 | % | | | 5.36 | %6 | | | 5.97 | % | | | 4.86 | % | | | 4.27 | % | | | 4.09 | %6 | | | 3.87 | % |
| After fees waived and expenses absorbed4 | | | 3.88 | % | | | 4.36 | %6 | | | 4.22 | % | | | 4.34 | % | | | 3.88 | % | | | 3.66 | %6,7 | | | 3.72 | % |
| Ratio of net investment income (loss) to average net assets (including dividends on securities sold short and interest expense): | | | | | | | | | | | | | | | | | | | | | | | | | | | | |
| Before fees waived and expenses absorbed | | | (1.51 | )% | | | (2.67 | )%6 | | | (3.21 | )% | | | (1.61 | )% | | | (0.65 | )% | | | (1.41 | )%6 | | | (1.57 | )% |
| After fees waived and expenses absorbed | | | (0.74 | )% | | | (1.67 | )%6 | | | (1.46 | )% | | | (1.09 | )% | | | (0.26 | )% | | | (0.98 | )%6 | | | (1.42 | )% |
| | | | | | | | | | | | | | | | | | | | | | | | | | | | | |
| Portfolio turnover rate | | | 42 | % | | | 15 | %5 | | | 91 | % | | | 137 | % | | | 159 | % | | | 104 | %5 | | | 277 | % |
| * | Financial information for the year ended September 30, 2016 through March 5, 2021 is for the AXS Market Neutral Fund (formerly, Cognios Market Neutral Large Cap Fund), which was reorganized into the AXS Market Neutral Fund as of the close of business on March 5, 2021. See Note 1 in the accompanying Notes to Financial Statements. |
| ** | Fiscal year end changed to September 30, effective July 1, 2021. |
| 1 | Based on average shares outstanding for the period. |
| 2 | Amount represents less than $0.01 per share. |
| 3 | Total returns would have been lower had expenses not been waived or absorbed by the Advisor. Returns shown include 12b-1 fees of up to 0.25% and do not reflect the deduction of taxes that a shareholder would pay on Fund distributions or the redemption of Fund shares. |
| 4 | If interest expense and dividends on securities sold short had been excluded, the expense ratios would have been lowered by 2.18% for the year ended September 30, 2022. For the period ended September 30, 2021, the periods ended June 30, 2021, 2020, 2019, 2018 and the period ended September 30, 2017, the ratios would have been lowered by 2.66%, 2.52%, 2.64%, 2.19%, 1.79%, and 1.77%, respectively. |
| 5 | Not annualized. |
| 6 | Annualized. |
| 7 | Contractual expense limitation changed from 1.95% to 1.70% effective May 5, 2018. |
See accompanying Notes to Consolidated Financial Statements.
AXS Market Neutral Fund
FINANCIAL HIGHLIGHTS
Class I*
| Per share operating performance. |
| For a capital share outstanding throughout each period. |
| | For the
Year Ended September 30,
2022 | | | For the Period July 1, 2021 through September 30,
2021** | | | | | | | | | | | | For the Period October 1, 2017 through June 30,
2018 | | | For the
Year Ended September 30,
2017 | |
| For the Year Ended June 30, | |
| | | | | | | | |
| 2021 | | | 2020 | | | 2019 | |
| Net asset value, beginning of period | | $ | 10.15 | | | $ | 10.28 | | | $ | 10.35 | | | $ | 10.17 | | | $ | 10.46 | | | $ | 9.44 | | | $ | 10.02 | |
| Income from Investment Operations: | | | | | | | | | | | | | | | | | | | | | | | | | | | | |
| Net investment income (loss)1 | | | (0.06 | ) | | | (0.04 | ) | | | (0.12 | ) | | | (0.08 | ) | | | 0.01 | | | | (0.05 | ) | | | (0.11 | ) |
| Net realized and unrealized gain (loss) | | | 1.64 | | | | (0.09 | ) | | | 0.05 | | | | 0.26 | | | | (0.30 | ) | | | 1.07 | | | | (0.32 | ) |
| Total from investment operations | | | 1.58 | | | | (0.13 | ) | | | (0.07 | ) | | | 0.18 | | | | (0.29 | ) | | | 1.02 | | | | (0.43 | ) |
| | | | | | | | | | | | | | | | | | | | | | | | | | | | | |
| Less Distributions: | | | | | | | | | | | | | | | | | | | | | | | | | | | | |
| From net realized gain | | | - | | | | - | | | | - | | | | - | | | | - | | | | - | | | | (0.15 | ) |
| Total distributions | | | - | | | | - | | | | - | | | | - | | | | - | | | | - | | | | (0.15 | ) |
| | | | | | | | | | | | | | | | | | | | | | | | | | | | | |
| Redemption fee proceeds | | | - | 2 | | | - | | | | - | 2 | | | - | | | | - | | | | - | | | | - | |
| | | | | | | | | | | | | | | | | | | | | | | | | | | | | |
| Net asset value, end of period | | $ | 11.73 | | | $ | 10.15 | | | $ | 10.28 | | | $ | 10.35 | | | $ | 10.17 | | | $ | 10.46 | | | $ | 9.44 | |
| | | | | | | | | | | | | | | | | | | | | | | | | | | | | |
| Total return3 | | | 15.57 | % | | | (1.26 | )%5 | | | (0.68 | )% | | | 1.77 | % | | | (2.77 | )% | | | 10.81 | %5 | | | (4.31 | )% |
| | | | | | | | | | | | | | | | | | | | | | | | | | | | | |
| Ratios and Supplemental Data: | | | | | | | | | | | | | | | | | | | | | | | | | | | | |
| Net assets, end of period (in thousands) | | $ | 19,021 | | | $ | 7,493 | | | $ | 9,537 | | | $ | 31,433 | | | $ | 74,525 | | | $ | 44,363 | | | $ | 38,856 | |
| | | | | | | | | | | | | | | | | | | | | | | | | | | | | |
| Ratio of expenses to average net assets (including dividends on securities sold short and interest expense): | | | | | | | | | | | | | | | | | | | | | | | | | | | | |
| Before fees waived and expenses absorbed4 | | | 4.40 | % | | | 5.11 | %6 | | | 5.72 | % | | | 4.61 | % | | | 4.02 | % | | | 3.84 | %6 | | | 3.62 | % |
| After fees waived and expenses absorbed4 | | | 3.63 | % | | | 4.11 | %6 | | | 3.97 | % | | | 4.09 | % | | | 3.63 | % | | | 3.41 | %6,7 | | | 3.47 | % |
| Ratio of net investment income (loss) to average net assets (including dividends on securities sold short and interest expense): | | | | | | | | | | | | | | | | | | | | | | | | | | | | |
| Before fees waived and expenses absorbed | | | (1.26 | )% | | | (2.42 | )%6 | | | (2.96 | )% | | | (1.36 | )% | | | (0.40 | )% | | | (1.16 | )%6 | | | (1.29 | )% |
| After fees waived and expenses absorbed | | | (0.49 | )% | | | (1.42 | )%6 | | | (1.21 | )% | | | (0.84 | )% | | | (0.01 | )% | | | (0.73 | )%6 | | | (1.14 | )% |
| | | | | | | | | | | | | | | | | | | | | | | | | | | | | |
| Portfolio turnover rate | | | 42 | % | | | 15 | %5 | | | 91 | % | | | 137 | % | | | 159 | % | | | 104 | %5 | | | 277 | % |
| * | Financial information for the year ended September 30, 2016 through March 5, 2021 is for the AXS Market Neutral Fund (formerly, Cognios Market Neutral Large Cap Fund), which was reorganized into the AXS Market Neutral Fund as of the close of business on March 5, 2021. See Note 1 in the accompanying Notes to Financial Statements. |
| ** | Fiscal year end changed to September 30, effective July 1, 2021. |
| 1 | Based on average shares outstanding for the period. |
| 2 | Amount represents less than $0.01 per share. |
| 3 | Total returns would have been lower had fees not been waived or absorbed by the Advisor. These returns do not reflect the deduction of taxes that a shareholder would pay on the Fund distributions or redemption of Fund shares. |
| 4 | If interest expense and dividends on securities sold short had been excluded, the expense ratios would have been lowered by 2.18% for the year ended September 30, 2022. For the period ended September 30, 2021, the periods ended June 30, 2021, 2020, 2019, 2018 and the period ended September 30, 2017, the ratios would have been lowered by 2.66%, 2.52%, 2.64%, 2.19%, 1.79%, and 1.77%, respectively. |
| 5 | Not annualized. |
| 6 | Annualized. |
| 7 | Contractual expense limitation changed from 1.75% to 1.45% effective May 5, 2018. |
See accompanying Notes to Consolidated Financial Statements.
AXS Adaptive Plus Fund
FINANCIAL HIGHLIGHTS
Class I
| Per share operating performance. |
| For a capital share outstanding throughout the period. |
| | | For the Period September 15,
2022*
Through
September 30,
2022 | |
| Net asset value, beginning of period | | $ | 10.00 | |
| Income from Investment Operations: | | | | |
| Net investment income (loss) 1 | | | - | 2 |
| Net realized and unrealized gain (loss) on purchased options contracts | | | 0.31 | |
| Total from investment operations | | | 0.31 | |
| | | | | |
| Net asset value, end of period | | $ | 10.31 | |
| | | | | |
| Total return 3 | | | 3.10 | %4 |
| | | | | |
| Ratios and Supplemental Data: | | | | |
| Net assets, end of period (in thousands) | | $ | 11,993 | |
| | | | | |
| Ratio of expenses to average net assets: | | | | |
| Before fees waived and expenses absorbed | | | 19.43 | %5 |
| After fees waived and expenses absorbed | | | 1.99 | %5 |
| Ratio of net investment income (loss) to average net assets: | | | | |
| Before fees waived and expenses absorbed | | | (17.50 | )%5 |
| After fees waived and expenses absorbed | | | (0.06 | )%5 |
| | | | | |
| Portfolio turnover rate | | | - | %4 |
| * | Commencement of operations. |
| 1 | Based on average shares outstanding for the period. |
| 2 | Amount represents less than $0.01 per share. |
| 3 | Total return would have been lower had fees not been waived or absorbed by the Advisor. These returns do not reflect the deduction of taxes that a shareholder would pay on the Fund distributions or redemption of Fund shares. |
| 4 | Not annualized. |
| 5 | Annualized. |
See accompanying Notes to Consolidated Financial Statements.
AXS Funds
NOTES TO CONSOLIDATED FINANCIAL STATEMENTS
September 30, 2022
Note 1 – Organization
AXS Alternative Growth Fund (the ‘‘Alternative Growth Fund’’), AXS Chesapeake Strategy Fund (the “Chesapeake Strategy Fund”), AXS Multi-Strategy Alternatives Fund (the “Multi-Strategy Alternatives Fund”), AXS Sustainable Income Fund (the “Sustainable Income Fund”), AXS Thomson Reuters Private Equity Return Tracker Fund (the “Thomson Reuters Private Equity Return Tracker Fund”), AXS Thomson Reuters Venture Capital Return Tracker Fund (the “Thomson Reuters Venture Capital Return Tracker Fund”), AXS All Terrain Opportunity Fund (the “All Terrain Opportunity Fund”), AXS Merger Fund (the “Merger Fund”), AXS Alternative Value Fund (the ‘‘Alternative Value Fund’’), AXS Market Neutral Fund (the “Market Neutral Fund”) and AXS Adaptive Plus Fund (the “Adaptive Plus Fund”), (each a “Fund” and collectively the ‘‘Funds’’) are organized as a series of Investment Managers Series Trust II, a Delaware statutory trust (the “Trust”) which is registered as an open-end management investment company under the Investment Company Act of 1940, as amended (the “1940 Act”). Each Fund, other than the Adaptive Plus Fund and the Merger Fund, are diversified funds. The Adaptive Plus Fund and the Merger Fund are non-diversified funds.
The Alternative Growth Fund’s investment objective is to seek to achieve returns and volatility comparable to the S&P 500® Total Return Index, while seeking to avoid the full impact of downside risk. Effective July 1, 2020, the Alternative Growth Fund changed fiscal year end from June 30th to September 30th.
The Alternative Growth Fund commenced investment operations on November 11, 2019 with Class A shares and Class I shares. Prior to that date, the Alternative Growth Fund acquired the assets and assumed the liabilities of the Equinox Ampersand Strategy Fund (the "Alternative Growth Predecessor Fund"), a series of Equinox Funds Trust, which offered two classes of shares, Class A shares and Class I shares, in a tax-free reorganization as set out in the Agreement and Plan of Reorganization. The proposed Plan of Reorganization was approved by the Trust’s Board on June 14, 2019, by the Board of Equinox Funds Trust on July 1, 2019, and by beneficial owners of the Alternative Growth Predecessor Fund on October 17, 2019. The tax-free reorganization was accomplished on November 8, 2019. As a result of the reorganization, the Alternative Growth Fund assumed the performance and accounting history of the Alternative Growth Predecessor Fund. Financial information included for the dates prior to the reorganization is that of the Alternative Growth Predecessor Fund.
The reorganization was accomplished by the following tax-free exchange in which each shareholder of the Alternative Growth Predecessor Fund received the same aggregate share net asset value in the corresponding classes as noted below:
| | | Shares Issued | | | Net Assets | |
| Class A | | | 146,943 | | | $ | 1,754,296 | |
| Class I | | | 1,488,202 | | | | 18,014,396 | |
The net unrealized appreciation of investments transferred was $653,641 as of the date of the acquisition.
The Chesapeake Strategy Fund’s investment objective is to achieve long-term capital appreciation.
The Chesapeake Strategy Fund commenced investment operations on November 11, 2019 with Class A shares, Class C Shares and Class I shares. Prior to that date, the Chesapeake Strategy Fund acquired the assets and assumed the liabilities of the Equinox Chesapeake Strategy Fund (the “Chesapeake Strategy Predecessor Fund”), a series of Equinox Funds Trust, which offered three class of shares, Class A, Class C, and Class I shares. On November 6, 2019, beneficial owners of the Chesapeake Strategy Predecessor Fund approved a proposed Agreement and Plan of Reorganization that provided for the reorganization into the AXS Chesapeake Strategy Fund. The Plan of Reorganization was approved by the Trust’s Board on June 14, 2019 and by the Equinox Funds Trust Board on July 1, 2019. The tax-free reorganization was accomplished on November 8, 2019. As a result of the reorganization, the Chesapeake Strategy Fund assumed the performance and accounting history of the Chesapeake Strategy Predecessor Fund. Financial information included for the dates prior to the reorganization is that of the Chesapeake Strategy Predecessor Fund.
AXS Funds
NOTES TO CONSOLIDATED FINANCIAL STATEMENTS - Continued
September 30, 2022
The reorganization was accomplished by the following tax-free exchange in which each shareholder of the Chesapeake Strategy Predecessor Fund received the same aggregate share net asset value in the corresponding classes as noted below:
| | | Shares Issued | | | Net Assets | |
| Class A | | | 455,380 | | | $ | 4,835,786 | |
| Class C | | | 52,298 | | | | 541,044 | |
| Class I | | | 7,369,196 | | | | 78,929,398 | |
The net unrealized depreciation of investments transferred was $2,540,824 as of the date of the acquisition.
On November 3, 2021, based on the recommendation of the Advisor, the Trust’s Board approved the reorganization of the AXS Aspect Core Diversified Strategy Fund (the “Aspect Core Fund”) into the Chesapeake Strategy Fund. The Board called and held a meeting of shareholders of Aspect Core Fund on December 15, 2021, where shareholders approved the reorganization. The purpose of the reorganization was to combine two funds within the Trust with similar investment objectives and strategies. The reorganization provided for the transfer of assets of the Aspect Core Fund (the “Target Fund”) to the Chesapeake Strategy Fund (the Acquiring Fund”) and the assumption of the liabilities of the Aspect Core Fund by the Chesapeake Strategy Fund. Following the reorganization, the Chesapeake Strategy Fund held the assets of the Aspect Core Fund. The reorganization was effective as of the close of business on December 17, 2021. The reorganization was accomplished by the following tax-free exchange in which each shareholder of the Aspect Core Fund received the same aggregate share net asset value in the corresponding classes as noted below:
| | | Shares Issued | | | Net Assets | |
| Class A | | | 83,620 | | | $ | 839,543 | |
| Class C | | | 180,850 | | | | 1,924,244 | |
| Class I | | | 295,670 | | | | 3,001,051 | |
On April 21, 2022, based on the recommendation of the Advisor, the Trust’s Board approved the reorganization of the AXS Managed Futures Strategy Fund (the “Managed Futures Strategy Fund”) into the Chesapeake Strategy Fund. No vote of the shareholders of the Fund was required to approve the Reorganization. The purpose of the reorganization was to combine two funds within the Trust with similar investment objectives and strategies. The reorganization provided for the transfer of assets of the Managed Futures Strategy Fund (the “Target Fund”) to the Chesapeake Strategy Fund (the Acquiring Fund”) and the assumption of the liabilities of the Managed Futures Strategy Fund by the Chesapeake Strategy Fund. Following the reorganization, the Chesapeake Strategy Fund held the assets of the Managed Futures Strategy Fund. The reorganization was effective as of the close of business on July 22, 2022. The reorganization was accomplished by the following tax-free exchange in which each shareholder of the Managed Futures Strategy Fund received the same aggregate share net asset value in the corresponding classes as noted below:
AXS Funds
NOTES TO CONSOLIDATED FINANCIAL STATEMENTS - Continued
September 30, 2022
| | | Shares Issued | | | Net Assets | |
| Class A | | | 295,178 | | | $ | 3,558,162 | |
| Class C | | | 322,266 | | | | 4,099,223 | |
| Class I | | | 441,442 | | | | 5,388,160 | |
The Multi-Strategy Alternatives Fund’s investment objective is long-term growth of capital. As a secondary goal, the Fund seeks to manage volatility and market risk. Effective May 1, 2020, the Multi-Strategy Alternatives Fund changed fiscal year end from April 30th to September 30th.
The Multi-Strategy Alternatives Fund commenced investment operations on October 21, 2019 with Investor Class (previously R-1 Class Shares) and Class I shares. Prior to that date, the Multi-Strategy Alternatives Fund acquired the assets and assumed the liabilities of the KCM Macro Trends Fund (the "Multi-Strategy Alternatives Predecessor Fund"), a series of Northern Lights Fund Trust, which offered two classes of shares, Investor Class (previously R-1 Class Shares) and Institutional Class, in a tax-free reorganization as set out in the Agreement and Plan of Reorganization. The proposed Plan of Reorganization was approved by the Trusts Board on June 14, 2019, by the Board of Northern Lights Fund Trust on June 17, 2019, and by beneficial owners of the Multi-Strategy Alternatives Predecessor Fund on October 17, 2019. The tax-free reorganization was accomplished on October 18, 2019. Upon closing of the Plan of Reorganization, Institutional Class shares were designated to Class I shares. As a result of the reorganization, the Multi-Strategy Alternatives Fund assumed the performance and accounting history of the Multi-Strategy Alternatives Predecessor Fund. Financial information included for the dates prior to the reorganization is that of the Multi-Strategy Alternatives Predecessor Fund.
The reorganization was accomplished by the following tax-free exchange in which each shareholder of the Multi-Strategy Alternatives Predecessor Fund received the same aggregate share net asset value in the corresponding classes as noted below:
| | | Shares Issued | | | Net Assets | |
| Investor Class* | | | 7,643,433 | | | $ | 84,119,077 | |
| Class I | | | 67,002 | | | | 740,865 | |
| * | Previously R-1 Class Shares. |
The net unrealized appreciation of investments transferred was $2,594,449 as of the date of the acquisition.
The Multi-Strategy Alternatives Fund acquired the assets and assumed the liabilities of the Good Harbor Tactical Select Fund (the "Multi-Strategy Alternatives Predecessor Fund"), a series of Northern Lights Fund Trust III, which offered three classes of shares, Class A, Class C and Class I, in a tax-free reorganization as set out in the Agreement and Plan of Reorganization. The proposed Plan of Reorganization was approved by the Trusts Board on January 20, 2022, by the Board of Northern Lights Fund Trust on August 26, 2021, and by beneficial owners of the Multi-Strategy Alternatives Predecessor Fund on May 18, 2022. The tax-free reorganization was accomplished on June 3, 2022. Upon closing of the Plan of Reorganization, Class A and C shares were designated to Investor shares.
AXS Funds
NOTES TO CONSOLIDATED FINANCIAL STATEMENTS - Continued
September 30, 2022
The reorganization was accomplished by the following tax-free exchange in which each shareholder of the Multi-Strategy Alternatives Predecessor Fund received the same aggregate share net asset value in the corresponding classes as noted below:
| | | Shares Issued | | | Net Assets | |
| Investor Class* | | | 901,427 | | | $ | 9,738,840 | |
| Class I | | | 410,906 | | | | 4,467,783 | |
| * | Previously R-1 Class Shares. |
The net unrealized appreciation of investments transferred was $194,738 as of the date of the acquisition.
The Sustainable Income Fund’s investment objective is to seek to generate current income.
The Sustainable Income Fund commenced investment operations on October 19, 2020 with Class I shares. Prior to that date, its only activity was a transfer of 101,960 newly issued shares of the Fund’s Class I in exchange for the net assets of the SKY Harbor Short Duration High Yield Partners, LP, a Delaware limited liability company (the “Company”) valued at $1,019,596. This exchange was nontaxable. The primary assets received by the Fund were cash, interest receivable and securities of the Company with a fair value of $946,696 (identified cost of investments transferred were $951,387), totaling $1,019,596. For financial reporting purposes, assets received and shares issued by the Fund were recorded at fair value; however, the cost basis of the investments received from the Company was carried forward to align ongoing reporting of the Fund’s realized and unrealized gains and losses with amounts distributable to shareholders for tax purposes.
The Thomson Reuters Private Equity Return Tracker Fund’s investment objective is to provide investment results that, before fees and expenses, correspond generally to the price performance of a specific benchmark designed to track the aggregate performance of U.S. private equity-backed companies. The Fund’s current benchmark is the Thomson Reuters Private Equity Buyout Index.
The Thomson Reuters Private Equity Return Tracker Fund commenced investment operations on November 23, 2020 with Class A shares, Class C shares, and Class I shares. Prior to that date, the Thomson Reuters Private Equity Return Tracker Fund acquired the assets and assumed the liabilities of the Leland Thomson Reuters Private Equity Buyout Index Fund (the "Thomson Reuters Private Equity Return Tracker Predecessor Fund"), a series of Northern Lights Fund Trust III, which offered three classes of shares, Class A shares, Class C shares, and Class I shares, in a tax-free reorganization as set out in the Agreement and Plan of Reorganization. The proposed Plan of Reorganization was approved by the Trust’s Board on August 6, 2020, by the Board of Northern Lights Fund Trust III on August 5, 2020, and by beneficial owners of the Thomson Reuters Private Equity Return Tracker Predecessor Fund on November 18, 2020. The tax-free reorganization was accomplished on November 20, 2020. As a result of the reorganization, the Thomson Reuters Private Equity Return Tracker Fund assumed the performance and accounting history of the Thomson Reuters Private Equity Return Tracker Predecessor Fund. Financial information included for the dates prior to the reorganization is that of the Thomson Reuters Private Equity Return Tracker Predecessor Fund.
The reorganization was accomplished by the following tax-free exchange in which each shareholder of the Thomson Reuters Private Equity Return Tracker Predecessor Fund received the same aggregate share net asset value in the corresponding classes as noted below:
AXS Funds
NOTES TO CONSOLIDATED FINANCIAL STATEMENTS - Continued
September 30, 2022
| | | Shares Issued | | | Net Assets | |
| Class A | | | 16,123 | | | $ | 248,292 | |
| Class C | | | 79,301 | | | | 1,187,114 | |
| Class I | | | 1,342,937 | | | | 20,904,719 | |
The net unrealized appreciation of investments transferred was $7,553,217 as of the date of the acquisition.
The Thomson Reuters Venture Capital Return Tracker Fund’s investment objective is to provide investment results that, before fees and expenses, correspond generally to the price performance of a specific benchmark designed to track the aggregate performance of U.S. venture capital-backed companies. The Fund’s current benchmark is the Thomson Reuters Venture Capital Index.
The Thomson Reuters Venture Capital Return Tracker Fund commenced investment operations on November 23, 2020 with Class A shares, Class C shares, and Class I shares. Prior to that date, the Thomson Reuters Venture Capital Return Tracker Fund acquired the assets and assumed the liabilities of the Leland Thomson Reuters Venture Capital Index Fund (the " Thomson Reuters Venture Capital Return Tracker Predecessor Fund"), a series of Northern Lights Fund Trust III, which offered three classes of shares, Class A shares, Class C shares, and Class I shares, in a tax-free reorganization as set out in the Agreement and Plan of Reorganization. The proposed Plan of Reorganization was approved by the Trust’s Board on August 6, 2020, by the Board of Northern Lights Fund Trust III on August 5, 2020, and by beneficial owners of the Thomson Reuters Venture Capital Return Tracker Predecessor Fund on November 18, 2020. The tax-free reorganization was accomplished on November 20, 2020. As a result of the reorganization, the Thomson Reuters Venture Capital Return Tracker Fund assumed the performance and accounting history of the Thomson Reuters Venture Capital Return Tracker Predecessor Fund. Financial information included for the dates prior to the reorganization is that of the Thomson Reuters Venture Capital Return Tracker Predecessor Fund.
The reorganization was accomplished by the following tax-free exchange in which each shareholder of the Thomson Reuters Venture Capital Return Tracker Predecessor Fund received the same aggregate share net asset value in the corresponding classes as noted below:
| | | Shares Issued | | | Net Assets | |
| Class A | | | 2,543,961 | | | $ | 81,237,729 | |
| Class C | | | 382,538 | | | | 11,745,929 | |
| Class I | | | 4,326,594 | | | | 139,556,985 | |
The net unrealized appreciation of investments transferred was $64,795,988 as of the date of the acquisition.
The shares of each class of each Fund (other than the Sustainable Income Fund which currently only offers one class of shares) represent an interest in the same portfolio of investments of each particular Fund and have equal rights as to voting, redemptions, dividends and liquidation, subject to the approval of the Trustees. Income, expenses (other than expenses attributable to a specific class) and realized and unrealized gains and losses on investments are allocated to each class of shares in proportion to their relative net assets. Shareholders of a class that bears distribution and service expenses under the terms of a distribution plan have exclusive voting rights to that distribution plan.
The All Terrain Opportunity Fund seeks to provide capital appreciation with positive returns in all market conditions. Effective August 1, 2021, the All Terrain Opportunity Fund changed fiscal year end from October 31 to September 30.
AXS Funds
NOTES TO CONSOLIDATED FINANCIAL STATEMENTS - Continued
September 30, 2022
The All Terrain Opportunity Fund commenced investment operations on November 3, 2014, with three classes of shares: Class A, Class C and Class I. Class I shares were liquidated on December 4, 2015. Class C shares were re-designated to Class I shares on August 29, 2016 and were subsequently liquidated on September 30, 2016. Class A shares were re-designated to Institutional Class on September 16, 2016. Institutional Class shares were re-designated to Class I shares on February 1, 2022.
The Merger Fund’s investment objective seeks to achieve positive risk-adjusted returns with less volatility than in the equity markets. Effective January 1, 2021, the Merger Fund changed fiscal year end from December 31 to September 30.
The Merger Fund commenced investment operations on January 25, 2021 with Investor Class shares and Class I shares. Prior to that date, the Merger Fund acquired the assets and assumed the liabilities of the Kellner Merger Fund (the "Merger Predecessor Fund"), a series of Advisors Series Trust, which offered two classes of shares, Investor Class shares and Institutional Class shares, in a tax-free reorganization as set out in the Agreement and Plan of Reorganization. The proposed Plan of Reorganization was approved by the Trust’s Board on October 20, 2020, by the Board of Advisors Series Trust on October 23, 2020, and by beneficial owners of the Merger Predecessor Fund on January 15, 2021. The tax-free reorganization was accomplished on January 22, 2021. As a result of the reorganization, the Merger Fund assumed the performance and accounting history of the Merger Predecessor Fund. Financial information included for the dates prior to the reorganization is that of the Merger Predecessor Fund.
The reorganization was accomplished by the following tax-free exchange in which each shareholder of the Merger Predecessor Fund received the same aggregate share net asset value in the corresponding classes as noted below:
| | | Shares Issued | | | Net Assets | |
| Investor Class | | | 158,344 | | | $ | 1,639,685 | |
| Class I | | | 9,122,919 | | | $ | 97,119,730 | |
The net unrealized appreciation of investments transferred was $372,944 as of the date of the acquisition.
The Alternative Value Fund’s investment objective is to seek long-term growth of capital. Effective July 1, 2021, the Alternative Value Fund changed fiscal year end from June 30 to September 30.
The Alternative Value Fund commenced investment operations on March 8, 2021 with Class I shares and Investor Class shares. Prior to that date, the Alternative Value Fund acquired the assets and assumed the liabilities of the AXS Alternative Value Fund (formerly, Cognios Large Cap Value Fund) (the "Alternative Value Predecessor Fund"), a series of M3Sixty Funds Trust, which offered two classes of shares, Investor Class shares and Institutional Class shares, in a tax-free reorganization as set out in the Agreement and Plan of Reorganization. The proposed Plan of Reorganization was approved by the Trust’s Board on October 20, 2020, by the Board of M3Sixty Funds Trust on October 20, 2020, and by beneficial owners of the Alternative Value Predecessor Fund on February 26, 2021. The tax-free reorganization was accomplished on March 5, 2021. As a result of the reorganization, the Alternative Value Fund assumed the performance and accounting history of the Alternative Value Predecessor Fund. Financial information included for the dates prior to the reorganization is that of the Alternative Value Predecessor Fund.
The reorganization was accomplished by the following tax-free exchange in which each shareholder of the Alternative Value Predecessor Fund received the same aggregate share net asset value in the corresponding classes as noted below:
AXS Funds
NOTES TO CONSOLIDATED FINANCIAL STATEMENTS - Continued
September 30, 2022
| | | Shares Issued | | | Net Assets | |
| Investor Class | | | 53,742 | | | $ | 497,821 | |
| Institutional Class | | | 65,608 | | | $ | 606,912 | |
The net unrealized appreciation of investments transferred was $143,049 as of the date of the acquisition.
The Market Neutral Fund’s investment objective is to seek long-term growth of capital independent of stock market direction. Effective July 1, 2021, the Market Neutral Fund changed fiscal year end from June 30 to September 30.
The Market Neutral Fund commenced investment operations on March 8, 2021 with Class I shares and Investor Class shares. Prior to that date, the Market Neutral Fund acquired the assets and assumed the liabilities of the AXS Market Neutral Fund (formerly, Cognios Market Neutral Large Cap Fund) (the “Market Neutral Predecessor Fund”), a series of M3Sixty Funds Trust, which offered two class of shares, Investor Class shares and Institutional Class shares in a tax-free reorganization as set out in the Agreement and Plan of Reorganization. The proposed Plan of Reorganization was approved by the Trust’s Board on October 20, 2020, by the Board of M3Sixty Funds Trust on October 20, 2020, and by beneficial owners of the Market Neutral Predecessor Fund on March 3, 2021. The tax-free reorganization was accomplished on March 5, 2021. As a result of the reorganization, the Market Neutral Fund assumed the performance and accounting history of the Market Neutral Predecessor Fund. Financial information included for the dates prior to the reorganization is that of the Market Neutral Predecessor Fund.
The reorganization was accomplished by the following tax-free exchange in which each shareholder of the Market Neutral Predecessor Fund received the same aggregate share net asset value in the corresponding classes as noted below:
| | | Shares Issued | | | Net Assets | |
| Investor Class | | | 246,342 | | | $ | 2,334,398 | |
| Institutional Class | | | 1,189,884 | | | $ | 11,511,835 | |
The net unrealized appreciation of investments transferred was $735,813 as of the date of the acquisition.
The Adaptive Plus Fund’s investment objective is to seek capital appreciation in rising and falling U.S. equity markets. The Adaptive Plus Fund currently offers one class of shares, Class I. Investor Class Shares are not currently available. The Fund’s Class I shares commenced operations on September 15, 2022.
The shares of each class of each Fund represent an interest in the same portfolio of investments of each particular Fund and have equal rights as to voting, redemptions, dividends and liquidation, subject to the approval of the Trustees. Income, expenses (other than expenses attributable to a specific class) and realized and unrealized gains and losses on investments are allocated to each class of shares in proportion to their relative net assets. Shareholders of a class that bears distribution and service expenses under the terms of a distribution plan have exclusive voting rights to that distribution plan.
Each Fund is an investment company and accordingly follows the investment company accounting and reporting guidance of the Financial Accounting Standards Board (FASB) Accounting Standard Codification Topic 946 “Financial Services—Investment Companies.”
AXS Funds
NOTES TO CONSOLIDATED FINANCIAL STATEMENTS - Continued
September 30, 2022
(a) Consolidation of Subsidiary
The Alternative Growth Fund may invest up to 25% of its total assets in its subsidiary, AXS Alternative Growth Fund Limited, a wholly-owned and controlled subsidiary formed under the laws of the Cayman Islands. The Consolidated Schedule of Investments, Consolidated Statements of Assets and Liabilities, Consolidated Statements of Operations, Statements of Changes in Net Assets and Financial Highlights of the Fund include the accounts of the AXS Alternative Growth Fund Limited. All inter-company accounts and transactions have been eliminated in the consolidation for the Alternative Growth Fund. The AXS Alternative Growth Fund Limited is advised by Ampersand Investment Management LLC (“Ampersand” or the “Sub-Advisor”) and acts as an investment vehicle in order to effect certain investments consistent with the Alternative Growth Fund’s investment objectives and policies specified in the Alternative Growth Fund’s prospectus and statement of additional information. The AXS Alternative Growth Fund Limited will generally invest in derivatives, including swaps, and other investments intended to serve as margin or collateral for swap positions. The inception date of the AXS Alternative Growth Fund Limited was June 27, 2018. As of September 30, 2022, total assets of the Alternative Growth Fund were $3,921,990, of which $447,554, or approximately 11.4%, represented the Alternative Growth Fund’s ownership of the shares of the AXS Alternative Growth Fund Limited.
The Chesapeake Strategy Fund may invest up to 25% of its total assets in its subsidiary, AXS Chesapeake Strategy Fund Limited, a wholly-owned and controlled subsidiary formed under the laws of the Cayman Islands. The Consolidated Schedule of Investments, Consolidated Statements of Assets and Liabilities, Consolidated Statements of Operations, Statements of Changes in Net Assets and Financial Highlights of the Chesapeake Strategy Fund include the accounts of the AXS Chesapeake Strategy Fund Limited. All inter-company accounts and transactions have been eliminated in the consolidation for the Chesapeake Strategy Fund. The AXS Chesapeake Strategy Fund Limited is advised by Chesapeake Investment Management LLC (“Chesapeake” or the “Sub-Advisor”) and acts as an investment vehicle in order to effect certain investments consistent with the Chesapeake Strategy Fund’s investment objectives and policies specified in the Chesapeake Strategy Fund’s prospectus and statement of additional information. The AXS Chesapeake Strategy Fund Limited will generally invest in derivatives, including commodity futures, and other investments intended to serve as margin or collateral for derivative positions. The inception date of the AXS Chesapeake Strategy Fund Limited was April 19, 2012. As of September 30, 2022, total assets of the Chesapeake Strategy Fund were $61,211,468 of which $1,143,669, or approximately 1.87%, represented the Chesapeake Strategy Fund’s ownership of the shares of the AXS Chesapeake Strategy Fund Limited.
For tax purposes, the AXS Alternative Growth Fund Limited and AXS Chesapeake Strategy Fund Limited are each an exempted Cayman investment company. Each subsidiary has received an undertaking from the Government of the Cayman Islands exempting it from all local income, profits and capital gains taxes. No such taxes are levied in the Cayman Islands at the present time. For U.S. income tax purposes, each subsidiary is a Controlled Foreign Corporation (“CFC”) and as such is not subject to U.S. income tax. However, as a wholly-owned CFC, each subsidiary’s net income and capital gains, to the extent of its earnings and profits, will be included each year in the Funds’ investment company taxable income.
Note 2 – Accounting Policies
The following is a summary of the significant accounting policies consistently followed by the Funds in the preparation of their financial statements. The preparation of financial statements in conformity with accounting principles generally accepted in the United States of America (“GAAP”) requires management to make estimates and assumptions that affect the reported amounts and disclosures in the financial statements. Actual results could differ from these estimates.
AXS Funds
NOTES TO CONSOLIDATED FINANCIAL STATEMENTS - Continued
September 30, 2022
(a) Valuation of Investments
The Funds value equity securities at the last reported sale price on the principal exchange or in the principal over the counter (“OTC”) market in which such securities are traded, as of the close of regular trading on the NYSE on the day the securities are being valued or, if the last-quoted sales price is not readily available, the securities will be valued at the last bid or the mean between the last available bid and ask price. Securities traded on the NASDAQ are valued at the NASDAQ Official Closing Price (“NOCP”). Investments in open-end investment companies are valued at the daily closing net asset value of the respective investment company. Debt securities are valued by utilizing a price supplied by independent pricing service providers. The independent pricing service providers may use various valuation methodologies including matrix pricing and other analytical pricing models as well as market transactions and dealer quotations. These models generally consider such factors as yields or prices of bonds of comparable quality, type of issue, coupon, maturity, ratings and general market conditions. If a price is not readily available for a portfolio security, the security will be valued at fair value (the amount which the Funds might reasonably expect to receive for the security upon its current sale). The Board of Trustees has designated the Advisor as the Funds’ valuation designee (the “Valuation Designee”) to make all fair value determinations with respect to the Funds’ portfolio investments, subject to the Board’s oversight. As the Valuation Designee, the Advisor has adopted and implemented policies and procedures to be followed when the Funds must utilize fair value pricing. Prior to September 8, 2022, security valued at fair value as determined in good faith by the Fund’s advisor, subject to review and approval by the Valuation Committee, pursuant to procedures adopted by the Board of Trustees. The actions of the Valuation Committee were subsequently reviewed by the Board at its next regularly scheduled board meeting. The Valuation Committee met as needed. The Valuation Committee was comprised of all the Trustees, but action may had been taken by any one of the Trustees.
(b) Foreign Currency Translation
The Funds’ records are maintained in U.S. dollars. The value of securities, currencies and other assets and liabilities denominated in currencies other than U.S. dollars are translated into U.S. dollars based upon foreign exchange rates prevailing at the end of the reporting period. The currencies are translated into U.S. dollars by using the exchange rates quoted as of 4:00 PM Eastern Standard Time. Purchases and sales of investment securities, income and expenses are translated on the respective dates of such transactions.
The Funds do not isolate that portion of their net realized and unrealized gains and losses on investments resulting from changes in foreign exchange rates from the impact arising from changes in market prices. Such fluctuations are included with net realized and unrealized gain or loss from investments and foreign currency.
Net realized foreign currency transaction gains and losses arise from sales of foreign currencies, currency gains or losses realized between the trade and settlement dates on securities transactions, and the differences between the amounts of dividends, interest, and foreign withholding taxes recorded on the Funds’ books and the U.S. dollar equivalent of the amounts actually received or paid. Net unrealized foreign currency translation gains and losses arise from changes in the value of assets and liabilities, other than investments in securities, resulting from changes in the exchange rates.
(c) Exchange-Traded Funds (“ETFs”)
ETFs typically trade on securities exchanges and their shares may, at times, trade at a premium or discount to their net asset values. In addition, an ETF may not replicate exactly the performance of the benchmark index it seeks to track for a number of reasons, including transaction costs incurred by the ETF, the temporary unavailability of certain index securities in the secondary market or discrepancies between the ETF and the index with respect to the weighting of securities or the number of securities held. Investing in ETFs, which are investment companies, may involve duplication of advisory fees and certain other expenses. As a result, Fund shareholders indirectly bear their proportionate share of these incurred expenses. Therefore, the cost of investing in the Funds will be higher than the cost of investing directly in ETFs and may be higher than other mutual funds that invest directly in securities.
AXS Funds
NOTES TO CONSOLIDATED FINANCIAL STATEMENTS - Continued
September 30, 2022
Each ETF in which the Funds invest is subject to specific risks, depending on the nature of the ETF. Each ETF is subject to the risks associated with direct ownership of the securities comprising the index on which the ETF is based. These risks could include liquidity risk, sector risk, and risks associated with fixed-income securities.
(d) Total Return Swaps
The Alternative Growth Fund is subject to equity price risk, interest rate risk and/or commodity risk in the normal course of pursuing its investment objective. The Fund enters into various swap transactions for investment purposes and to manage interest rate, equity, foreign exchange (currency), or credit risk. These two-party contracts are entered into primarily to exchange the returns (or differentials in rates of returns) earned or realized on particular pre-determined investments or instruments.
To help to reduce counterparty risk on the Alternative Growth Fund, the Advisor has the right to reduce the Alternative Growth Fund’s exposure and remove cash from the Alternative Growth Fund’s total return swap with Deutsche Bank AG. This cash holding shall be in excess of $250,000 and may not exceed 40% of the Index exposure in total. The Alternative Growth Fund is charged interest on this cash holding and any amount removed will be offset against the final settlement value of the swap. As of September 30, 2022, the Alternative Growth Fund did not have such cash advance.
The gross returns exchanged or “swapped” between parties are calculated with respect to a notional amount, i.e., the return on or increase in value of a particular dollar amount invested at a particular interest rate, in a particular foreign currency, or in a “basket” of securities representing a particular index or market segment. Changes in the value of swap agreements are recognized as net change in unrealized appreciation or depreciation in the Consolidated Statements of Operations by “marking to market” on a daily basis to reflect the value of the swap agreement at the end of each trading day. A liquidation payment received or made at the termination of the swap agreement is recorded as a realized gain or loss on the Consolidated Statements of Operations. Realized gains and losses from a decrease in the notional value swap are recognized on trade date. Swap agreements may also involve fees, commissions and other costs that may reduce the value of the swap agreement. These costs are not reflected in the Consolidated Statements of Operations, are deducted from the return of any such derivative instrument and, therefore, represent an indirect cost of investment in the Fund.
(e) Equity Swaps (Total Return Swaps)
The Multi-Strategy Alternatives Fund, Thomson Reuters Private Equity Return Tracker Fund, Thomson Reuters Venture Capital Return Tracker Fund and Adaptive Plus Fund, may enter into equity swap contracts for hedging or investment purposes. Equity swap contracts may be structured in different ways. The counterparty may agree to pay the Funds the amount, if any, by which the notional amount of the equity swap contract would have increased in value had it been invested in particular stocks (or an index of stocks), plus the dividends that would have been received on those stocks. In these cases, the Funds may agree to pay to the counterparty a floating-rate of interest on the notional amount of the equity swap contract plus the amount, if any, by which that notional amount would have decreased in value had it been invested in such stocks. In these cases, the return to the Funds on any equity swap contract should be the gain or loss on the notional amount plus dividends on the stocks less the interest paid by the Funds on the notional amount. In other cases, the counterparty and the Fund may agree to pay the other the difference between the relative investment performance that would have been achieved if the notional amount of the equity swap contract had been invested in different stocks (or indices of stocks).
AXS Funds
NOTES TO CONSOLIDATED FINANCIAL STATEMENTS - Continued
September 30, 2022
Total return swap contracts are agreements between counterparties to exchange cash flow, one based on a market-linked return of an individual asset or group of assets (such as an index), and the other on a fixed or floating rate. As a total return swap, an equity swap may be structured in different ways. When the Funds enter into a “long” equity swap, the counterparty may agree to pay the Funds the amount, if any, by which the notional amount of the equity swap would have increased in value had it been invested in a particular referenced security or securities, plus the dividends that would have been received on those securities. In return, the Funds will generally agree to pay the counterparty interest on the notional amount of the equity swap plus the amount, if any, by which that notional amount would have decreased in value had it been invested in such referenced security or securities, plus, in certain instances, commissions or trading spreads on the notional amounts. Therefore, the Funds’ return on the equity swap generally should equal the gain or loss on the notional amount, plus dividends on the referenced security or securities less the interest paid by the Funds on the notional amount. Alternatively, when the Funds enter into a “short” equity swap, the counterparty will generally agree to pay the Funds the amount, if any, by which the notional amount of the equity swap would have decreased in value had the Funds sold a particular referenced security or securities short, less the dividend expense that the Funds would have incurred on the referenced security or securities, as adjusted for interest payments or other economic factors. In this situation, the Funds will generally be obligated to pay the amount, if any, by which the notional amount of the swap would have increased in value had they been invested directly in the referenced security or securities.
Equity swaps generally do not involve the delivery of securities or other referenced assets. Accordingly, the risk of loss with respect to equity swaps is normally limited to the net amount of payments that the Funds are contractually obligated to make. If the other party to an equity swap defaults, the Funds’ risk of loss consists of the net amount of payments that the Funds are contractually entitled to receive, if any. The Funds will segregate cash or liquid assets, enter into offsetting transactions or use other measures permitted by applicable law to “cover” the Funds’ current obligations.
Equity swaps are derivatives and their value can be very volatile. The Funds may engage in total return swaps to gain exposure to securities, along with offsetting long total return swap positions to maintain appropriate currency balances and risk exposures across all swap positions. To the extent that the Advisor does not accurately analyze and predict future market trends, the values or assets or economic factors, the Funds may suffer a loss, which may be substantial. As of September 30, 2022, open swap agreements are shown in the Schedules of Investments.
(f) Futures Contracts
The Funds purchase and sell futures contracts to pursue their investment objective and to gain exposure to, or hedge against, change in the value of equities, interest rates, foreign currency, or commodities. Initial margin deposits required upon entering into futures contracts are satisfied by the segregation of specific securities or cash as collateral for the account of the broker (the Portfolio’s agent in acquiring the futures position). During the period the futures contracts are open, changes in the value of the contracts are recognized as unrealized gains or losses by “marking to market” on a daily basis to reflect the market value of the contracts at the end of each day’s trading. Variation margin payments are received or made depending upon whether unrealized gains or losses are incurred. When the contracts are closed, the Fund recognizes a realized gain or loss equal to the difference between the proceeds from, or cost of, the closing transaction and the Fund’s basis in the contract. If a Fund was unable to liquidate a futures contract and/or enter into an offsetting closing transaction, the Fund would continue to be subject to market risk with respect to the value of the contracts and continue to be required to maintain the margin deposits on the futures contracts. The Funds segregate liquid securities having a value at least equal to the amount of the current obligation under any open futures contract. Risks may exceed amounts recognized in the Consolidated Statements of Assets and Liabilities. With futures, there is minimal counterparty credit risk to a Fund since futures are exchange traded and the exchange’s clearinghouse, as counterparty to all exchange traded futures, guarantees the futures against default.
AXS Funds
NOTES TO CONSOLIDATED FINANCIAL STATEMENTS - Continued
September 30, 2022
(g) Forward Foreign Currency Contracts
The Chesapeake Strategy Fund may enter into forward currency exchange contracts in order to hedge against foreign currency exchange rate risks. A forward involves an obligation to purchase or sell a specific currency at a future date, which may be any fixed number of days from the date of the contract agreed upon by the parties, at a price set at the time of the contract. The market value of the contract fluctuates with changes in currency exchange rates. The contract is marked-to-market daily and the change in market value is recorded by the Fund as an unrealized gain or loss. As foreign securities are sold, a portion of the contract is generally closed and the Funds record a realized gain or loss equal to the difference between the value of the contract at the time it was opened and the value at the time it was closed. Realized gains and losses from contract transactions are included as a component of net realized gains/(losses) from forward foreign currency contracts in the Consolidated Statements of Operations.
(h) Short-Term Investments
The Alternative Growth Fund invests a significant amount (71.8% of its net assets as of September 30, 2022) in the Fidelity Investments Money Market Government Portfolio – Class I (“FIGXX”). FIGXX Invests in U.S. Government securities and/or repurchase agreements that are collateralized fully, U.S. Government securities issued by entities that are chartered by Congress but whose securities are neither issued nor guaranteed by the U.S. Treasury and investing in compliance with industry-standard regulatory requirements for money market funds for the quality, maturity, liquidity and diversification of investments. FIGXX may invest at least 80% of its assets in U.S. Treasury securities and repurchase agreements for those securities.
The All Terrain Opportunity Fund invests a significant amount (93.4% of its net assets as of September 30, 2022) in the Fidelity Investments Money Market Funds – Treasury Portfolio – Class I (“FISXX”). FISXX invests exclusively in a portfolio of short-term U.S. Treasury securities, as well as repurchase agreements collateralized fully by U.S. Treasury securities. The Fund may also hold cash.
FIGXX and FISXX file complete Semi-Annual and Annual Reports with the U.S. Securities and Exchange Commission for semi-annual and annual periods of each fiscal year on Form N-CSR. The Forms N-CSR are available on the website of the U.S. Securities and Exchange Commission at www.sec.gov, and may also be viewed and copied at the Commission’s Public Reference Room in Washington, DC. Information on the operation of the Public Reference Room may be obtained by calling 1-800-SEC-0330. The net expense ratio per the March 31, 2022 Annual report of the FIGXX and FISXX was 0.08% and 0.08%, respectively.
(i) Short Sales
Short sales are transactions in which the Funds sell a security they do not own in anticipation of a decline in the value of that security. To complete such a transaction, the Funds must borrow the security to make delivery to the buyer. The Funds then are obligated to replace the security borrowed by purchasing the security at market price at the time of replacement. The price at such time may be more or less than the price at which the security was sold by the Funds. When a security is sold short, a decrease in the value of the security will be recognized as a gain and an increase in the value of the security will be recognized as a loss, which is potentially limitless. Until the security is replaced, the Funds are required to pay the lender amounts equal to dividend or interest that accrue during the period of the loan which is recorded as an expense. To borrow the security, the Funds also may be required to pay a premium or an interest fee, which are recorded as interest expense. Cash or securities are segregated for the broker to meet the necessary margin requirements. The Funds are subject to the risk that they may not always be able to close out a short position at a particular time or at an acceptable price.
AXS Funds
NOTES TO CONSOLIDATED FINANCIAL STATEMENTS - Continued
September 30, 2022
(j) Options
The Funds may write or purchase options contracts primarily to generate gains from option premiums or to reduce overall portfolio risk. When the Fund writes or purchases an option, an amount equal to the premium received or paid by the Fund is recorded as a liability or an asset and is subsequently adjusted to the current market value of the option written or purchased. Premiums received or paid from writing or purchasing options which expire unexercised are treated by the Fund on the expiration date as realized gains or losses. The difference between the premium and the amount paid or received on effecting a closing purchase or sale transaction, including brokerage commissions, is also treated as a realized gain or loss. If an option is exercised, the premium paid or received is added to the cost of the purchase or proceeds from the sale in determining whether the Fund has realized a gain or a loss on investment transactions. The Fund, as a writer of an option, may have no control over whether the underlying securities may be sold (call) or purchased (put) and as a result bears the market risk of an unfavorable change in the price of the security underlying the written option.
(k) Investment Transactions, Investment Income and Expenses
Investment transactions are accounted for on the trade date. Realized gains and losses on investments are determined on the identified cost basis. Dividend income is recorded net of applicable withholding taxes on the ex-dividend date and interest income is recorded on an accrual basis. Withholding taxes on foreign dividends, if applicable, are paid (a portion of which may be reclaimable) or provided for in accordance with the applicable country’s tax rules and rates and are disclosed in the Consolidated Statements of Operations. Withholding tax reclaims are filed in certain countries to recover a portion of the amounts previously withheld. The Funds record a reclaim receivable based on a number of factors, including a jurisdiction’s legal obligation to pay reclaims as well as payment history and market convention. Income and expenses of the Funds are allocated on a pro rata basis to each class of shares net relative assets, except for distribution and service fees which are unique to each class of shares. Expenses incurred by the Trust with respect to more than one fund are allocated in proportion to the net assets of each fund except where allocation of direct expenses to each fund or an alternative allocation method can be more appropriately made.
(l) Federal Income Tax
The Funds intend to comply with the requirements of Subchapter M of the Internal Revenue Code applicable to regulated investment companies and to distribute substantially all of their net investment income and any net realized gains to their shareholders. Therefore, no provision is made for federal income or excise taxes. Due to the timing of dividend distributions and the differences in accounting for income and realized gains and losses for financial statement and federal income tax purposes, the fiscal year in which amounts are distributed may differ from the year in which the income and realized gains and losses are recorded by the Funds.
Accounting for Uncertainty in Income Taxes (the “Income Tax Statement”) requires an evaluation of tax positions taken (or expected to be taken) in the course of preparing a Fund’s tax returns to determine whether these positions meet a “more-likely-than-not” standard that, based on the technical merits, have a more than fifty percent likelihood of being sustained by a taxing authority upon examination. A tax position that meets the “more-likely-than-not” recognition threshold is measured to determine the amount of benefit to recognize in the financial statements. The Funds recognize interest and penalties, if any, related to unrecognized tax benefits as income tax expense in the Consolidated Statements of Operations.
The Income Tax Statement requires management of the Funds to analyze tax positions taken in the prior three open tax years, if any, and tax positions expected to be taken in the Funds’ current tax year, as defined by the IRS statute of limitations for all major jurisdictions, including federal tax authorities and certain state tax authorities. As of September 30, 2021, and during the prior three open tax years, the Funds did not have a liability for any unrecognized tax benefits. The Funds have no examinations in progress and are not aware of any tax positions for which it is reasonably possible that the total amounts of unrecognized tax benefits will significantly change in the next twelve months.
AXS Funds
NOTES TO CONSOLIDATED FINANCIAL STATEMENTS - Continued
September 30, 2022
(m) Distributions to Shareholders
Dividends from net investment income, if any, are declared and paid at least annually, except for the Sustainable Income Fund and the All Terrain Opportunity Fund which will distribute net investment income, if any, quarterly. Distributable net realized capital gains, if any, are declared and distributed annually. Distributions to shareholders are recorded on the ex-dividend date. The amount and timing of distributions are determined in accordance with federal income tax regulations, which may differ from GAAP.
The character of distributions made during the year from net investment income or net realized gains may differ from the characterization for federal income tax purposes due to differences in the recognition of income, expense and gain (loss) items for financial statement and tax purposes.
(n) Illiquid Securities
Pursuant to Rule 22e-4 under the 1940 Act, the Funds have adopted a Liquidity Risk Management Program (“LRMP”) that requires, among other things, that the Funds limit their illiquid investments that are assets to no more than 15% of net assets. An illiquid investment is any security which may not reasonably be expected to be sold or disposed of in current market conditions in seven calendar days or less without the sale or disposition significantly changing the market value of the investment. If the Advisor, at any time, determines that the value of illiquid securities held by the Funds exceed 15% of its net asset value, the Advisor will take such steps as it considers appropriate to reduce them as soon as reasonably practicable in accordance with the Funds’ written LRMP.
Note 3 – Investment Advisory and Other Agreements
The Trust, on behalf of the Funds, entered into an Investment Advisory Agreement (the “Agreement”) with AXS Investments LLC (the “Advisor”). Under the terms of the Agreement, the Funds pay twice a month investment advisory fee to the Advisor. The annual rates are listed by Fund in the table below:
| Fund | Investment Advisory Fees | Investment Advisory Fees Tier 2 | Investment Advisory Fees Tier 3 |
| Alternative Growth Fund | 0.75% | - | - |
| Chesapeake Strategy Fund | 1.45%* | - | - |
| Multi-Strategy Alternatives Fund | 1.00% | - | - |
| Sustainable Income Fund | 0.70% | - | - |
| Thomson Reuters Private Equity Return Tracker Fund | 1.25% | - | - |
| Thomson Reuters Venture Capital Return Tracker Fund | 1.25% | - | - |
| All Terrain Opportunity Fund | 1.40% | - | - |
| Merger Fund | 1.25%** | 1.125%*** | 1.00%**** |
| Alternative Value Fund | 0.65% | - | - |
| Market Neutral Fund | 1.40% | - | - |
| Adaptive Plus Fund | 1.50% | - | - |
AXS Funds
NOTES TO CONSOLIDATED FINANCIAL STATEMENTS - Continued
September 30, 2022
| * | With respect to the AXS Chesapeake Strategy Fund, effective July 23, 2022, the Advisor agreed to lower its management fee from 1.50% to 1.45% of the average daily net assets of the Fund. |
| ** | Fund’s average daily net assets up to $2 billion. |
| *** | Fund’s average daily net assets between $2 billion and $4 billion. |
| **** | Fund’s average daily net assets in excess of $4 billion. |
| Subsidiary | Investment Advisory Fees |
| AXS Alternative Growth Fund Limited | 0.75% |
| AXS Chesapeake Strategy Fund Limited | 1.45%* |
| * | With respect to the AXS Chesapeake Strategy Fund Limited, effective July 23, 2022, the Advisor agreed to lower its management fee from 1.50% to 1.45% of the average daily net assets of the Fund. |
The investment management fees included a management fee paid to the Advisor by each Fund’s subsidiary at an annual rate listed above of the subsidiary’s average daily net assets. The Advisor had contractually agreed, for so long as each Fund invests in each subsidiary, to waive the management fee it received from the Fund in an amount equal to the management fee paid to the Advisor by each subsidiary. This undertaking may not be terminated by the advisor as long as the investment advisory agreement between the Subsidiary and the Advisor is in place unless the Advisor obtains the prior approval of the Fund’s Board of Trustees.
The Advisor has contractually agreed to waive its fee and, if necessary, to absorb other operating expenses of the Alternative Growth Fund, Chesapeake Strategy Fund, Sustainable Income Fund, Thomson Reuters Private Equity Return Tracker Fund, Thomson Reuters Venture Capital Return Tracker Fund, Alternative Value Fund, and Market Neutral Fund to ensure that total annual operating expenses (excluding any taxes, leverage interest, brokerage commissions, dividend and interest expenses on short sales, acquired fund fees and expenses (as determined in accordance with Form N-1A), expenses incurred in connection with any merger or reorganization, and extraordinary expenses such as litigation expenses) in order to limit total annual operating expenses of each fund. The Advisor has contractually agreed to waive its fee and, if necessary, to absorb other operating expenses of the Adaptive Plus Fund, Multi-Strategy Alternatives Fund, All Terrain Opportunity Fund, and Merger Fund to ensure that total annual operating expenses (excluding any taxes, leverage interest, brokerage commissions, dividend and interest expenses on short sales, acquired fund fees and expenses (as determined in accordance with Form N-1A), professional fees related to services for the collection of foreign tax reclaims, expenses incurred in connection with any merger or reorganization, and extraordinary expenses such as litigation expenses) in order to limit total annual operating expenses of each fund.
These agreements are in effect until January 31, 2023 for the Alternative Growth Fund, the Multi-Strategy Alternatives Fund, the Sustainable Income Fund, the Thomson Reuters Private Equity Return Tracker Fund, the Thomson Reuters Venture Capital Return Tracker Fund, the All Terrain Opportunity Fund and Merger Fund, March 5, 2023 for the Alternative Value Fund and the Market Neutral Fund, September 14, 2023 for the Adaptive Plus Fund and July 22, 2024 for the Chesapeake Strategy Fund and they may be terminated before that date only by the Trust’s Board of Trustees. The table below contains the expense cap by Fund and by Class:
AXS Funds
NOTES TO CONSOLIDATED FINANCIAL STATEMENTS - Continued
September 30, 2022
| | Total Limit on Annual |
| | Operating Expenses |
| | Class A Shares | Class C Shares | Class I Shares | Investor Class Shares |
| Alternative Growth Fund | 1.24% | - | 0.99% | - |
| Chesapeake Strategy Fund | 2.10% | 2.85% | 1.85% | - |
| Multi-Strategy Alternatives Fund | - | - | 1.51% | 1.68%* |
| Sustainable Income Fund | - | - | 0.99% | - |
| Thomson Reuters Private Equity Return Tracker Fund | 1.75% | 2.50% | 1.50% | - |
| Thomson Reuters Venture Capital Return Tracker Fund | 1.75% | 2.50% | 1.50% | - |
| All Terrain Opportunity Fund | - | - | 1.60%** | - |
| Merger Fund | - | - | 1.50% | 1.75% |
| Alternative Value Fund | - | - | 0.85% | 1.10% |
| Market Neutral Fund | - | - | 1.45% | 1.70% |
| Adaptive Plus Fund | - | - | 1.99% | - |
| * | Previously R-1 Class Shares. |
| ** | Previously Institutional Class Shares |
The Advisor has engaged Ampersand Investment Management LLC (the “Ampersand”), a Sub-Advisor, to manage the Alternative Growth Fund and pays Ampersand from its advisory fees.
The Advisor has engaged Chesapeake Capital Corporation (“Chesapeake”), a Sub-Advisor, to manage the Chesapeake Strategy Fund’s overall investment program, and pays Chesapeake from its advisory fees.
The Advisor has engaged Green Alpha Advisors, LLC (“Green Alpha”) and Uniplan Investment Counsel, Inc. (“Uniplan”) as Sub-Advisors, to manage the Sustainable Income Fund’s overall investment program, and pays Green Alpha and Uniplan from its advisory fees. Prior to the close of business on June 16, 2022 the Advisor engaged SKY Harbor Capital Management, LLC (“SKY Harbor”), as Sub-Advisor.
The Advisor has engaged Kellner Management, L.P. (“Kellner”) to manage the Merger Fund’s overall investment program and pays Kellner from its advisory fees. The Advisor has engaged Quantitative Value Technologies, LLC d/b/a Cognios Capital (the “Cognios”) to manage the Alternative Value Fund and the Market Neutral Fund and pays Cognios from its advisory fees.
Prior to the close of business on November 8, 2019, investment advisory services were provided to the Alternative Growth Predecessor Fund and the Chesapeake Strategy Predecessor Fund by Equinox Institutional Asset Management, LP (“Equinox”), which received investment management fees for its services pursuant to the terms of the investment advisory agreements for the Alternative Growth Predecessor Fund and the Chesapeake Strategy Predecessor Fund. The investment advisory fees were computed and accrued daily and paid monthly at an annual rate of 0.75% of the Alternative Growth Predecessor Fund’s average daily net assets and 1.50% of the Chesapeake Strategy Predecessor Fund’s, average daily net assets. Equinox had contractually agreed to waive its fee and, if necessary, to absorb other operating expenses to ensure that total annual operating expenses (excluding any taxes, leverage interest, brokerage commissions, dividend and interest expenses on short sales, acquired fund fees and expenses as determined in accordance with Form N-1A, expenses incurred in connection with any merger or reorganization, and extraordinary expenses such as litigation expenses) do not exceed 1.24% and 0.99% of the average daily net assets of Class A and Class I shares, respectively, of the Alternative Growth Predecessor Fund. Equinox had contractually agreed to waive its fee and, if necessary, to absorb other operating expenses to ensure that total annual operating expenses (excluding any taxes, leverage interest, brokerage commissions, dividend and interest expenses on short sales, acquired fund fees and expenses as determined in accordance with Form N-1A, expenses incurred in connection with any merger or reorganization, and extraordinary expenses such as litigation expenses) do not exceed 2.10%, 2.85% and 1.85% of the average daily net assets of Class A, Class C and Class I shares, respectively, of the Chesapeake Strategy Predecessor Fund.
AXS Funds
NOTES TO CONSOLIDATED FINANCIAL STATEMENTS - Continued
September 30, 2022
Prior to the close of business on October 18, 2019, investment advisory services were provided to the Multi-Strategy Alternatives Predecessor Fund by Kerns Capital Management, Inc., which received investment management fees for its services pursuant to the terms of the investment advisory agreements for the Multi-Strategy Alternatives Predecessor Fund. The investment advisory fees, which were computed and accrued daily and paid monthly, at an annual rate of 1.00% of the Fund’s average daily net assets.
Prior to the close of business on November 20, 2020, investment advisory services were provided to the Thomson Reuters Private Equity Return Tracker Predecessor Fund and the Thomson Reuters Venture Capital Return Tracker Predecessor Fund by Good Harbor Financial, LLC (“Good Harbor”) which received investment management fees for its services pursuant to the terms of the investment advisory agreements for the Thomson Reuters Private Equity Return Tracker Predecessor Fund and the Thomson Reuters Venture Capital Return Tracker Predecessor Fund. The investment advisory fees were computed and accrued daily and paid monthly at an annual rate of 1.25% of the Thomson Reuters Private Equity Return Tracker Predecessor Fund's average daily net assets and 1.25% of the Thomson Reuters Venture Capital Return Tracker Predecessor Fund's average daily net assets. Good Harbor had contractually agreed to waive its fee and, if necessary, to absorb other operating expenses to ensure that total annual operating expenses (excluding any taxes, leverage interest, brokerage commissions, dividend and interest expenses on short sales, acquired fund fees and expenses as determined in accordance with Form N-1A, expenses incurred in connection with any merger or reorganization, and extraordinary expenses such as litigation expenses) do not exceed 1.75%, 2.50%, and 1.50% of the average daily net assets of Class A, Class C, and Class I shares, respectively, of the Thomson Reuters Private Equity Return Tracker Predecessor Fund and the Thomson Reuters Venture Capital Return Tracker Predecessor Fund.
The Advisor may recover from the Fund’s fees and/or expenses previously waived and/or absorbed if the Funds’ expense ratio, including the recovered expenses, falls below the expense limit at which it was waived. The Advisor is permitted to seek reimbursement from the Fund, subject to certain limitations, of fees waived or payments made to the Fund for a period ending three full years after the date of the waiver or payment. This reimbursement may be requested from the Funds if the reimbursement will not cause the Funds’ annual expense ratio to exceed the lesser of (a) the expense limitation amount in effect at the time such fees were waived or payments made, or (b) the expense limitation amount in effect at the time of the reimbursement. The Advisor may recapture all or a portion of this amount no later than the dates stated below:
| | | Alternative Growth Fund | | | Chesapeake Strategy Fund | | | Multi-Strategy Alternatives Fund | |
| June 30, 2023 | | $ | 121,818 | | | $ | - | | | $ | - | |
| September 30, 2023 | | | 69,919 | | | | 120,589 | | | | - | |
| September 30, 2024 | | | 212,481 | | | | 217,024 | | | | 105,332 | |
| September 30, 2025 | | | 217,265 | | | | 172,227 | | | | 84,473 | |
| Total | | $ | 621,483 | | | $ | 509,840 | | | $ | 189,805 | |
AXS Funds
NOTES TO CONSOLIDATED FINANCIAL STATEMENTS - Continued
September 30, 2022
| | | Sustainable Income Fund | | | Thomson Reuters Private Equity Return Tracker Fund | | | Thomson Reuters Venture Capital Return Tracker Fund | |
| September 30, 2024 | | $ | 53,753 | | | $ | 114,282 | | | $ | 148,438 | |
| September 30, 2025 | | | 150,675 | | | | 222,008 | | | | 746,554 | |
| Total | | $ | 204,428 | | | $ | 336,290 | | | $ | 894,992 | |
| | | All Terrain Opportunity Fund | | | Merger Fund | | | Alternative Value Fund | |
| October 31, 2023 | | $ | 3,603 | | | $ | - | | | $ | - | |
| June 30, 2024 | | | - | | | | - | | | | 204,502 | |
| September 30, 2024 | | | 116,052 | | | | 91,243 | | | | 22,808 | |
| September 30, 2025 | | | 121,690 | | | | 194,688 | | | | 72,072 | |
| Total | | $ | 241,345 | | | $ | 285,931 | | | $ | 299,382 | |
| | | | Market Neutral Fund | | | AXS Adaptive Plus Fund | |
| June 30, 2024 | | | $ | 255,480 | | | $ | - | |
| September 30, 2024 | | | | 27,485 | | | | - | |
| September 30, 2025 | | | | 106,381 | | | | 23,459 | |
| Total | | | $ | 389,346 | | | $ | 23,459 | |
Equinox is permitted to seek reimbursement, subject to certain limitations, of fees waived or payments made by Equinox to the Alternative Growth Predecessor Fund prior to the Alternative Growth Predecessor Fund’s reorganization on November 8, 2019, for a period ending three years after the date of the waiver of payment for the Alternative Growth Fund. This reimbursement may be requested from the Alternative Growth Fund if the reimbursement will not cause the Alternative Growth Fund’s annual expense ratio to exceed the lesser of (a) the expense limitation amount in effect at the time such fees were waived or payments made, or (b) the expense limitation amount in effect at the time of the reimbursement. Reimbursements of fees waived or payments made will be made on a “first in, first out” basis so that the oldest fees waived or payments are satisfied first. Any reimbursement of fees waived, or payments made by Equinox to the Alternative Growth Predecessor Fund prior to the reorganization must be approved by the Trust’s Board of Trustees. Equinox may recapture all or a portion of this amount no later than June 30 of the years of the dates stated below for the Alternative Growth Fund:
| 2023 | | | $ | 45,463 | |
| Total | | | $ | 45,463 | |
Equinox is permitted to seek reimbursement, subject to certain limitations, of fees waived or payments made by Equinox to the Chesapeake Strategy Predecessor Fund prior to the Chesapeake Strategy Predecessor Fund’s reorganization on November 8, 2019, for a period ending three years after the date of the waiver of payment. This reimbursement may be requested from the Chesapeake Strategy Fund if the reimbursement will not cause the Chesapeake Strategy Fund’s annual expense ratio to exceed the lesser of (a) the expense limitation amount in effect at the time such fees were waived or payments made, or (b) the expense limitation amount in effect at the time of the reimbursement. Reimbursements of fees waived, or payments made will be made on a “first in, first out” basis so that the oldest fees waived, or payments are satisfied first. Any reimbursement of fees waived, or payments made by Equinox to the Chesapeake Strategy Predecessor Fund prior to the reorganization must be approved by the Trust’s Board of Trustees. Equinox may recapture all or a portion of this amount no later than September 30 of the years stated below for the Chesapeake Strategy Fund:
AXS Funds
NOTES TO CONSOLIDATED FINANCIAL STATEMENTS - Continued
September 30, 2022
Good Harbor is permitted to seek reimbursement, subject to certain limitations, of fees waived or payments made by Good Harbor to the Thomson Reuters Private Equity Return Tracker Predecessor Fund and Thomson Reuters Venture Capital Return Tracker Predecessor Fund prior to reorganization on November 20, 2020, for a period ending three years after the date of the waiver of payment. This reimbursement may be requested from the Thomson Reuters Private Equity Return Tracker Fund and Thomson Reuters Venture Capital Return Tracker Fund if the reimbursement will not cause the Thomson Reuters Private Equity Return Tracker’s annual expense ratio to exceed the lesser of (a) the expense limitation amount in effect at the time such fees were waived or payments made, or (b) the expense limitation amount in effect at the time of the reimbursement. Reimbursements of fees waived, or payments made will be made on a “first in, first out” basis so that the oldest fees waived, or payments are satisfied first. Any reimbursement of fees waived, or payments made by Good Harbor to the Thomson Reuters Private Equity Return Tracker Predecessor Fund prior to the reorganization must be approved by the Trust’s Board of Trustees. Good Harbor may recapture all or a portion of this amount no later than September 30 of the years stated below for the Thomson Reuters Private Equity Return Tracker Fund and Thomson Reuters Venture Capital Return Tracker Fund:
| | | | Thomson Reuters Private Equity Return Tracker Fund | |
| 2023 | | | $ | 38,717 | |
| 2024 | | | | 10,366 | |
| Total | | | $ | 49,083 | |
| | | | Thomson Reuters Venture Capital Return Tracker Fund | |
| 2023 | | | $ | 231,346 | |
| 2024 | | | | 98,415 | |
| Total | | | $ | 329,761 | |
During the period ended September 30, 2022, a service provider reimbursed the Thomson Reuters Venture Capital Return Tracker Fund $8,347 for losses from a pricing error. This amount is reported on the Thomson Reuters Venture Capital Return Tracker Fund’s Consolidated Statements of Operations and Statements of Changes under the caption “Net increase from payment by affiliates.” This reimbursement had no impact to the total return.
During the period ended September 30, 2021, a service provider reimbursed the Thomson Reuters Venture Capital Return Tracker Fund $3,927 for losses from a pricing error. This amount is reported on the Thomson Reuters Venture Capital Return Tracker Fund’s Statements of Changes under the caption “Net increase from payment by affiliates.” This reimbursement had no impact to the total return.
AXS Funds
NOTES TO CONSOLIDATED FINANCIAL STATEMENTS - Continued
September 30, 2022
The Advisor reimbursed the All Terrain Opportunity Fund $8,830 for losses from a trade error during the year ended September 30, 2022. This amount is reported on the Fund’s Consolidated Statements of Operations, Statements of Changes and Financial Highlights under the caption “Net increase from payment by affiliates.” This reimbursement had a positive 0.05% impact to the total return for the year ended September 30, 2022.
Prior to October 26, 2020, Castle Financial & Retirement Planning Associates, Inc. (“Castle Financial”) and Foothill Capital Management, LLC (“FCM”) served as co-investment advisors for the All Terrain Opportunity Fund. Under the terms of the prior co-advisory agreement, the All Terrain Opportunity Fund paid a monthly investment advisory fee to Castle Financial and FCM and at the annual rate of 0.56%, and 0.84%, respectively, of the All Terrain Opportunity Fund’s average daily net assets.
Prior to the close of business on January 22, 2021, investment advisory services were provided to the Merger Predecessor Fund by Kellner, which received investment management fees for its services pursuant to the terms of the investment advisory agreements for the Merger Predecessor Fund. The investment advisory fees were computed and accrued daily and paid monthly at an annual rate of 1.25% of the Merger Fund’s average daily net assets up to $2 billion in assets, 1.125% on assets between $2 billion to $4 billion, and 1.00% on assets in excess of $4 billion. The Merger Predecessor’s advisor had contractually agreed to waive its fees and/or pay for operating expenses of the Merger Predecessor Fund to ensure that total annual fund operating expenses (excluding any taxes, leverage interest, brokerage commissions, dividend and interest expenses on short sales, Rule 12b-1 fees, acquired fund fees and expenses (as determined in accordance with SEC Form N-1A), expenses incurred in connection with any merger or reorganization, and extraordinary expenses such as litigation expenses) do not exceed 1.50% of the average daily net assets of the Predecessor Fund.
Kellner is permitted to seek reimbursement, subject to certain limitations, of fees waived or payments made by Kellner to the Merger Predecessor Fund prior to the Merger Predecessor Fund’s reorganization on January 22, 2021, for a period ending three years after the date of the waiver of payment. This reimbursement may be requested from the Merger Fund if the reimbursement will not cause the Merger Fund’s annual expense ratio to exceed the lesser of (a) the expense limitation amount in effect at the time such fees were waived or payments made, or (b) the expense limitation amount in effect at the time of the reimbursement. Reimbursements of fees waived, or payments made will be made on a “first in, first out” basis so that the oldest fees waived, or payments are satisfied first. Any reimbursement of fees waived, or payments made by Kellner to the predecessor fund prior to the reorganization must be approved by the Trust’s Board of Trustees. Kellner may recapture all or a portion of this amount no later than the dates stated below:
| December 31, 2023 | | | $ | 53,286 | |
| January 31, 2024 | | | | 24,404 | |
| Total | | | $ | 77,690 | |
Prior to the close of business on March 5, 2021, investment advisory services were provided to the Alternative Value Predecessor Fund and Market Neutral Predecessor Fund by Cognios for the period July 1, 2020 through November 30, 2020, and by AXS Investments LLC for the period December 1, 2020 through March 5, 2021, which received investment management fees for their services pursuant to the terms of the investment advisory agreements for the Alternative Value Predecessor Fund and the Market Neutral Predecessor Fund. The investment advisory fees were computed and accrued daily and paid monthly at an annual rate of 0.65% of the Alternative Value Predecessor Fund’s average daily net assets and 1.40% of the Market Neutral Predecessor Fund’s average daily net assets. Cognios and AXS Investments LLC had contractually agreed to waive its fee and, if necessary, to absorb other operating expenses to ensure that total annual operating expenses (excluding any taxes, leverage interest, brokerage commissions, dividend and interest expenses on short sales, acquired fund fees and expenses as determined in accordance with Form N-1A, expenses incurred in connection with any merger or reorganization, and extraordinary expenses such as litigation expenses) do not exceed 1.10% and 0.85% of the average daily net assets of Investor Class and Institutional Class shares, respectively, of the Alternative Value Predecessor Fund and do not exceed 1.70% and 1.45% of the average daily net assets of Investor Class and Institutional Class shares, respectively, of the Market Neutral Predecessor Fund.
AXS Funds
NOTES TO CONSOLIDATED FINANCIAL STATEMENTS - Continued
September 30, 2022
Cognios is permitted to seek reimbursement, subject to certain limitations, of fees waived or payments made by Cognios to the Alternative Value Predecessor Fund and the Market Neutral Predecessor Fund prior to the reorganization on March 5, 2021, for a period ending three years after the date of the waiver of payment Such reimbursement may be requested from each Fund if the reimbursement will not cause the Fund’s annual expense ratios to exceed the lesser of (a) the expense limitation amount in effect at the time such fees were waived or payments made, or (b) the expense limitation amount in effect at the time of the reimbursements. Reimbursements of fees waived, or payments made will be made on a “first in, first out” basis so that the oldest fees waived, or payments are satisfied first. Any reimbursements of fees waived, or payments made by Cognios to the Alternative Value Predecessor Fund and Market Neutral Predecessor Fund prior to the reorganization must be approved by the Trust’s Board of Trustees. Cognios may recapture all or a portion of this amount no later than June 30 of the years stated below:
| | | | Alternative Value Fund | | | Market Neutral Fund | |
| 2023 | | | $ | 203,862 | | | $ | 336,109 | |
| 2024 | | | | 85,816 | | | | 130,522 | |
| Total | | | $ | 289,678 | | | $ | 466,631 | |
UMB Fund Services, Inc. (“UMBFS”) serves as the Funds’ fund accountant, transfer agent and co-administrator; and Mutual Fund Administration, LLC (“MFAC”) serves as the Funds’ other co-administrator. UMB Bank, N.A., an affiliate of UMBFS, serves as the Funds’ custodian. Deutsche Bank Trust Company America (“DBTCA”) acts as the custodian with respect to certain collateral arrangements between the Alternative Growth Fund and counter-parties. DBTCA also acts as the custodian for the Alternative Growth Fund’s subsidiaries, Alternative Growth Fund Limited, including certain collateral arrangements between the Subsidiaries and counter-parties. The Funds’ allocated fees incurred for fund accounting, fund administration, transfer agency and custody services for the periods ended September 30, 2022, are reported on the Consolidated Statements of Operations.
IMST Distributors, LLC serves as the Funds’ distributor (the “Distributor”). The Distributor does not receive compensation from the Funds for its distribution services; the Advisor pays the Distributor a fee for its distribution related services.
Certain trustees and officers of the Trust are employees of UMBFS or MFAC. The Funds do not compensate trustees and officers affiliated with the Funds’ co-administrators. For the periods ended September 30, 2022, the Funds’ allocated fees incurred to Trustees who are not affiliated with the Funds’ co-administrators are reported on the Consolidated Statements of Operations. The amount shown as “Fees paid indirectly” on the Consolidated Statements of Operations is a portion of the Trustees fees paid by the Trust’s Co-Administrators.
The Funds’ Board of Trustees has adopted a Deferred Compensation Plan (the “Plan”) for the Independent Trustees that enables Trustees to elect to receive payment in cash or the option to select various fund(s) in the Trust in which their deferred accounts shall be deemed to be invested. If a trustee elects to defer payment, the Plan provides for the creation of a deferred payment account. The Funds’ liability for these amounts is adjusted for market value changes in the invested fund and remains a liability to the Funds until distributed in accordance with the Plan. The Trustees’ Deferred compensation liability under the Plan constitutes a general unsecured obligation of the Funds and is disclosed in the Consolidated Statements of Assets and Liabilities. Contributions made under the plan and the change in unrealized appreciation/depreciation and income are included in the Trustees’ fees and expenses in the Statements of Operations.
AXS Funds
NOTES TO CONSOLIDATED FINANCIAL STATEMENTS - Continued
September 30, 2022
Dziura Compliance Consulting, LLC provides Chief Compliance Officer (“CCO”) services to the Trust. The Funds’ allocated fees incurred for CCO services for the periods ended September 30, 2022, are reported on the Consolidated Statements of Operations.
Note 4 – Federal Income Taxes
At September 30, 2022, gross unrealized appreciation (depreciation) of investments based on cost for federal income tax purposes were as follows:
| | | Alternative Growth Fund | | | Chesapeake Strategy Fund | | | Multi-Strategy Alternatives Fund | |
| Cost of investments | | $ | 1,262,946 | | | $ | 57,468,301 | | | $ | 19,954,577 | |
| | | | | | | | | | | | | |
| Gross unrealized appreciation | | $ | - | | | $ | - | | | $ | 399,903 | |
| Gross unrealized depreciation | | | - | | | | - | | | | (2,305,255 | ) |
| Net unrealized depreciation on investments | | $ | - | | | $ | - | | | $ | (1,905,352 | ) |
| | | Sustainable Income Fund | | | Thomson Reuters Private Equity Return Tracker Fund | | | Thomson Reuters Venture Capital Return Tracker Fund | |
| Cost of investments | | $ | 1,586,052 | | | $ | 15,770,197 | | | $ | 152,604,895 | |
| | | | | | | | | | | | | |
| Gross unrealized appreciation | | $ | 2,414 | | | $ | 1,676,976 | | | $ | 3,165,455 | |
| Gross unrealized depreciation | | | (181,273 | ) | | | (2,594,751 | ) | | | (41,807,478 | ) |
| Net unrealized depreciation on investments | | $ | (178,859 | ) | | $ | (917,775 | ) | | $ | (38,642,023 | ) |
| | | All Terrain Opportunity Fund | | | Merger Fund | | | Alternative Value Fund | |
| Cost of investments | | $ | 3,058,208 | | | $ | 47,163,531 | | | $ | 28,392,475 | |
| | | | | | | | | | | | | |
| Gross unrealized appreciation | | $ | - | | | $ | 1,858,282 | | | $ | 686,919 | |
| Gross unrealized depreciation | | | (26,850 | ) | | | (1,990,237 | ) | | | (2,838,467 | ) |
| Net unrealized depreciation on investments | | $ | (26,850 | ) | | $ | (131,955 | ) | | $ | (2,151,548 | ) |
AXS Funds
NOTES TO CONSOLIDATED FINANCIAL STATEMENTS - Continued
September 30, 2022
| | | Market Neutral Fund* | | | Adaptive Plus Fund | |
| Cost of investments | | $ | 8,824,315 | | | $ | 7,976,086 | |
| | | | | | | | | |
| Gross unrealized appreciation | | $ | 3,808,279 | | | $ | 148,712 | |
| Gross unrealized depreciation | | | (3,342,072 | ) | | | - | |
| Net unrealized appreciation on investments | | $ | 466,207 | | | $ | 148,712 | |
| * | Tax year end changed from June 30th to September 30th. |
At June 30, 2022, gross unrealized appreciation (depreciation) of investments based on cost for federal income tax purposes were as follows:
| | | Market Neutral Fund | |
| Cost of investments | | $ | 5,764,282 | |
| | | | | |
| Gross unrealized appreciation | | $ | 3,288,197 | |
| Gross unrealized depreciation | | | (2,032,736 | ) |
| Net unrealized appreciation on investments | | $ | 1,255,461 | |
The difference between cost amounts for financial statement and federal income tax purposes is due primarily to timing differences in recognizing certain gains and losses in security transactions.
GAAP requires that certain components of net assets be reclassified between financial and tax reporting. These reclassifications have no effect on net assets or net asset value per share. For the year ended September 30, 2022, permanent differences in book and tax accounting have been reclassified to paid-in capital and total distributable earnings (accumulated deficit) as follows:
AXS Funds
NOTES TO CONSOLIDATED FINANCIAL STATEMENTS - Continued
September 30, 2022
| | Increase (Decrease) |
| September 30, 2022 | Paid-in Capital | Total Distributable
Earnings
(Accumulated Deficit) |
| Alternative Growth Fund | $(42,653) | $42,653 |
| Chesapeake Strategy Fund | (1,355,501) | 1,355,501 |
| Multi-Strategy Alternatives Fund | (197) | 197 |
| Sustainable Income Fund | (26) | 26 |
| Thomson Reuters Private Equity Return Tracker Fund | - | - |
| Thomson Reuters Venture Capital Return Tracker Fund | - | - |
| All Terrain Opportunity Fund | (38,275) | 38,275 |
| Merger Fund | (222,808) | 222,808 |
| Alternative Value Fund | 4,170 | (4,170) |
| Market Neutral Fund | - | - |
| Adaptive Plus Fund | (252) | 252 |
| | | |
| June 30, 2022 | | |
| Market Neutral Fund | (112,946) | 112,946 |
The tax basis of the components of distributable net earnings (accumulated deficit) at September 30, 2022 were as follows:
| | | Alternative Growth Fund | | | Chesapeake Strategy Fund | | | Multi-Strategy
Alternatives Fund | |
| Undistributed ordinary income | | $ | - | | | $ | 765,589 | | | $ | - | |
| Undistributed long-term capital gains | | | - | | | | - | | | | - | |
| Tax accumulated earnings | | | - | | | | 765,589 | | | | - | |
| | | | | | | | | | | | | |
| Accumulated capital and other losses | | | (3,056,324 | ) | | | (17,702,925 | ) | | | (1,240,957 | ) |
| Unrealized depreciation on investments | | | - | | | | - | | | | (1,905,352 | ) |
| Unrealized depreciation on open swap contracts | | | (192,412 | ) | | | - | | | | - | |
| Unrealized appreciation on futures contracts | | | - | | | | 74,726 | | | | - | |
| Unrealized appreciation on foreign currency translations | | | - | | | | 8,902 | | | | - | |
| Unrealized Trustees’ deferred compensation | | | (1,248 | ) | | | (20,216 | ) | | | (6,264 | ) |
| Total accumulated deficit | | $ | (3,249,984 | ) | | $ | (16,873,924 | ) | | $ | (3,152,573 | ) |
AXS Funds
NOTES TO CONSOLIDATED FINANCIAL STATEMENTS - Continued
September 30, 2022
| | | Sustainable Income Fund | | | Thomson Reuters Private Equity Return Tracker Fund | | | Thomson Reuters Venture Capital Return Tracker Fund | |
| Undistributed ordinary income | | $ | - | | | $ | - | | | $ | - | |
| Undistributed long-term capital gains | | | - | | | | - | | | | - | |
| Tax accumulated earnings | | | - | | | | - | | | | - | |
| | | | | | | | | | | | | |
| Accumulated capital and other losses | | | (468,451 | ) | | | (2,459,003 | ) | | | (114,318,123 | ) |
| Unrealized depreciation on investments | | | (178,859 | ) | | | (917,775 | ) | | | (38,642,023 | ) |
| Unrealized Trustees’ deferred compensation | | | (3,963 | ) | | | (2,740 | ) | | | (30,223 | ) |
| Total accumulated deficit | | $ | (651,273 | ) | | $ | (3,379,518 | ) | | $ | (152,990,369 | ) |
| | | All Terrain Opportunity Fund | | | Merger Fund | | | Alternative Value Fund | |
| Undistributed ordinary income | | $ | - | | | $ | - | | | $ | 136,745 | |
| Undistributed long-term capital gains | | | - | | | | - | | | | 177,414 | |
| Tax accumulated earnings | | | - | | | | - | | | | 314,159 | |
| | | | | | | | | | | | | |
| Accumulated capital and other losses | | | (796,955 | ) | | | (514,432 | ) | | | - | |
| Unrealized depreciation on investments | | | (26,850 | ) | | | (131,955 | ) | | | (2,151,548 | ) |
| Unrealized appreciation on foreign currency translations | | | - | | | | 80,634 | | | | - | |
| Unrealized Trustees’ deferred compensation | | | (19,834 | ) | | | (6,965 | ) | | | (775 | ) |
| Total accumulated deficit | | $ | (843,639 | ) | | $ | (572,718 | ) | | $ | (1,838,164 | ) |
AXS Funds
NOTES TO CONSOLIDATED FINANCIAL STATEMENTS - Continued
September 30, 2022
| | | Market Neutral Fund* | | | Market Neutral Fund** | | | Adaptive Plus Fund | |
| Undistributed ordinary income | | $ | - | | | $ | 866 | | | $ | 174 | |
| Undistributed long-term capital gains | | | - | | | | - | | | | - | |
| Tax accumulated earnings | | | - | | | | 866 | | | | 174 | |
| | | | | | | | | | | | | |
| Accumulated capital and other losses | | | (4,675,288 | ) | | | (4,379,899 | ) | | | - | |
| Unrealized appreciation on investments | | | 1,255,461 | | | | 466,207 | | | | 148,712 | |
| Unrealized Trustees’ deferred compensation | | | (1,420 | ) | | | (1,282 | ) | | | - | |
| Total accumulated earnings (deficit) | | $ | (3,421,247 | ) | | $ | (3,914,108 | ) | | $ | 148,886 | |
| * | The Fund’s previous tax year was June 30, 2022 |
| ** | The Fund’s new tax year is September 30, 2022. |
The tax character of the distributions paid during the periods ended September 30, 2022 and September 30, 2021 were as follows:
| | | Alternative Growth Fund | |
| | | September 30, 2022 | | | September 30, 2021 | |
| Distributions paid from: | | | | | | | | |
| Ordinary income | | $ | - | | | $ | - | |
| Net long-term capital gains | | | - | | | | - | |
| Total distributions paid | | $ | - | | | $ | - | |
| | | | | | | | | |
| | | Chesapeake Strategy Fund | |
| | September 30, 2022 | | | September 30, 2021 | |
| Distributions paid from: | | | | | | |
| Ordinary income | | $ | 3,152,394 | | | $ | 3,146,191 | |
| Net long-term capital gains | | | - | | | | - | |
| Total distributions paid | | $ | 3,152,394 | | | $ | 3,146,191 | |
| | | | | | | | | |
| | | Multi-Strategy Alternatives Fund | |
| | | September 30, 2022 | | | September 30, 2021 | |
| Distributions paid from: | | | | | | | | |
| Ordinary income | | $ | 3,646,539 | | | $ | - | |
| Net long-term capital gains | | | 399,445 | | | | - | |
| Total distributions paid | | $ | 4,045,984 | | | $ | - | |
AXS Funds
NOTES TO CONSOLIDATED FINANCIAL STATEMENTS - Continued
September 30, 2022
| | | Sustainable Income Fund | |
| | | September 30, 2022 | | | September 30, 2021 | |
| Distributions paid from: | | | | | | | | |
| Ordinary income | | $ | 1,827,684 | | | $ | 2,357,551 | |
| Net long-term capital gains | | | 12,926 | | | | - | |
| Total distributions paid | | $ | 1,840,610 | | | $ | 2,357,551 | |
| | | Thomson Reuters Private Equity Return Tracker Fund | |
| | | September 30, 2022 | | | September 30, 2021 | |
| Distributions paid from: | | | | | | | | |
| Ordinary income | | $ | 1,941,908 | | | $ | 954,916 | |
| Net long-term capital gains | | | 5,367,609 | | | | - | |
| Total distributions paid | | $ | 7,309,517 | | | $ | 954,916 | |
| | | Thomson Reuters Venture Capital Return Tracker Fund | |
| | | September 30, 2022 | | | September 30, 2021 | |
| Distributions paid from: | | | | | | | | |
| Ordinary income | | $ | 27,678,206 | | | $ | 38,882,034 | |
| Net long-term capital gains | | | 43,747,033 | | | | - | |
| Total distributions paid | | $ | 71,425,239 | | | $ | 38,882,034 | |
| | | All Terrain Opportunity Fund | |
| | | September 30, 2022 | | | September 30, 2021 | |
| Distributions paid from: | | | | | | | | |
| Ordinary income | | $ | 1,253,423 | | | $ | 885,670 | |
| Net long-term capital gains | | | 102,705 | | | | 11,884 | |
| Total distributions paid | | $ | 1,356,128 | | | $ | 897,554 | |
| | | | | | | | | |
| | | Merger Fund | |
| | | September 30, 2022 | | | September 30, 2021 | |
| Distributions paid from: | | | | | | | | |
| Ordinary income | | $ | 550,151 | | | $ | - | |
| Net long-term capital gains | | | 193,385 | | | | - | |
| Total distributions paid | | $ | 743,536 | | | $ | - | |
| | | | | | | | | |
| | | Alternative Value Fund | |
| | | September 30, 2022 | | | September 30, 2021 | |
| Distributions paid from: | | | | | | | | |
| Ordinary income | | $ | 22,193 | | | $ | - | |
| Net long-term capital gains | | | 34,712 | | | | - | |
| Total distributions paid | | $ | 56,905 | | | $ | - | |
AXS Funds
NOTES TO CONSOLIDATED FINANCIAL STATEMENTS - Continued
September 30, 2022
| | | Market Neutral Fund | |
| | | September 30, 2022 | | | June 30, 2022 | | | June 30, 2021 | |
| Distributions paid from: | | | | | | | | | | | | |
| Ordinary income | | $ | - | | | $ | - | | | $ | - | |
| Net long-term capital gains | | | - | | | | - | | | | - | |
| Total distributions paid | | $ | - | | | $ | - | | | $ | - | |
| | | Adaptive Plus Fund | |
| | | September 30, 2022 | |
| Distributions paid from: | | | | |
| Ordinary income | | $ | - | |
| Net long-term capital gains | | | - | |
| Total distributions paid | | $ | - | |
As of September 30, 2022, the Funds had qualified late-year ordinary losses, which are deferred until fiscal year 2022 for tax purposes. Net late-year ordinary losses incurred after December 31, and within the taxable year, are deemed to arise on the first day of each Fund’s next taxable year.
| | | Late-Year Ordinary Losses | |
| Thomson Reuters Private Equity Return Tracker Fund | | $ | 588,237 | |
| Thomson Reuters Venture Capital Return Tracker Fund | | | 4,902,445 | |
| All Terrain Opportunity Fund | | | 137,688 | |
| Merger Fund | | | 445,675 | |
As of September 30, 2022, the Funds had post-October capital losses, which are deferred until fiscal year 2022 for tax purposes. Capital losses incurred after October 31, and within the year are deemed to arise on the first day of the Fund’s next taxable year.
| | | Post-October Capital Losses | |
| Multi-Strategy Alternatives Fund | | $ | 1,240,957 | |
| Sustainable Income Fund | | | 468,451 | |
| Thomson Reuters Private Equity Return Tracker Fund | | | 1,870,766 | |
| Thomson Reuters Venture Capital Return Tracker Fund | | | 109,415,678 | |
| All Terrain Opportunity Fund | | | 659,266 | |
| Merger Fund | | | 68,757 | |
As of September 30, 2022, the Funds had net capital loss carryovers as follows:
| | | Alternative Growth Fund | | | Chesapeake Strategy Fund | | | Market Neutral Fund | |
| Not subject to expiration: | | | | | | | | | | | | |
| Short-term | | $ | 108,841 | | | $ | 9,937,459 | | | $ | 4,379,899 | |
| Long-term | | | 251,678 | | | | - | | | | - | |
| Total | | $ | 360,519 | | | $ | 9,937,459 | | | $ | 4,379,899 | |
AXS Funds
NOTES TO CONSOLIDATED FINANCIAL STATEMENTS - Continued
September 30, 2022
As of June 30, 2022, the Market Neutral Fund had net capital loss carryovers as follows:
| | | Market Neutral Fund | |
| Not subject to expiration: | | | | |
| Short-term | | $ | 4,675,288 | |
| Long-term | | | - | |
| Total | | $ | 4,675,288 | |
The Chesapeake Strategy Fund and Market Neutral Fund had utilized non-expiring capital loss carry overs totaling $7,133,070 and $664,446, respectively.
Note 5 – Redemption Fee
The Alternative Growth Fund, Sustainable Income Fund, Thomson Reuters Private Equity Return Tracker Fund, Thomson Reuters Venture Capital Return Tracker Fund, All Terrain Opportunity Fund, Merger Fund, Alternative Value Fund and Market Neutral Fund may impose a redemption fee of 1.00% of the total redemption amount on all shares redeemed within 30 days of purchase. These Funds received redemption fees as follows:
| | | Year Ended
September 30, 2022 | | | Periods Ended September 30, 2021 | |
| Alternative Growth Fund | | $ | 175 | | | $ | 1,807 | |
| Sustainable Income Fund | | | - | | | | - | |
| Thomson Reuters Private Equity Return Tracker Fund | | | 2,347 | | | | 3,473 | |
| Thomson Reuters Venture Capital Return Tracker Fund | | | 50,820 | | | | 67,117 | |
| All Terrain Opportunity Fund | | | 398 | | | | 50 | |
| Merger Fund | | | 14,612 | | | | 1,517 | |
| Alternative Value Fund | | | 1,359 | | | | 997 | |
| Market Neutral Fund | | | 3,217 | | | | - | |
AXS Funds
NOTES TO CONSOLIDATED FINANCIAL STATEMENTS - Continued
September 30, 2022
Note 6 – Investment Transactions
For the periods ended September 30, 2022, cost of purchases and proceeds from sales of portfolio securities, other than short-term investments, option transactions and short-term U.S. Government securities were as follows:
| | | Purchases | | | Sales | | | Proceeds from Securities Sold Short | | | Cover Short Securities | |
| Alternative Growth Fund | | $ | - | | | $ | - | | | $ | - | | | $ | - | |
| Chesapeake Strategy Fund | | | - | | | | - | | | | - | | | | - | |
| Multi-Strategy Alternatives Fund | | | 70,068,792 | | | | 79,473,781 | | | | - | | | | - | |
| Sustainable Income Fund | | | 5,901,633 | | | | 54,940,350 | | | | - | | | | - | |
| Thomson Reuters Private Equity Return Tracker Fund | | | 9,581,647 | | | | 17,713,024 | | | | - | | | | - | |
| Thomson Reuters Venture Capital Return Tracker Fund | | | 177,855,422 | | | | 361,101,836 | | | | - | | | | - | |
| All Terrain Opportunity Fund | | | 89,359,130 | | | | 105,742,934 | | | | - | | | | - | |
| Merger Fund | | | 119,451,986 | | | | 141,086,036 | | | | 19,136,195 | | | | 55,203,107 | |
| Alternative Value Fund | | | 29,948,303 | | | | 3,684,487 | | | | - | | | | - | |
| Market Neutral Fund | | | 21,438,272 | | | | 7,891,911 | | | | 15,635,156 | | | | 4,805,315 | |
| Adaptive Plus Fund | | | - | | | | - | | | | - | | | | - | |
In accordance with the Funds’ registration statement, the Funds may pay all or a portion of a shareholder’s redemption proceeds in liquid securities (from the Fund’s portfolio) with a market value equal to the redemption amount (an in-kind redemption) in lieu of cash. An in-kind redemption is allowed by the Funds’ registration statement in order to protect the interests of the Funds’ remaining shareholders. On January 28, 2021, the Sustainable Income Fund had an in-kind redemption, whereby 4,944,439 shares were redeemed from the Fund. The Fund delivered investment securities with a fair value of $49,291,607 to this shareholder in lieu of cash. The fair market value of the investment securities delivered in this transaction are included in the Statements of Changes.
Note 7 – Shareholder Servicing Plan
The Trust, on behalf of the All Terrain Opportunity Fund, has adopted a Shareholder Servicing Plan to pay a fee at an annual rate of up to 0.10% of its average daily net assets to shareholder servicing agents who provide administrative and support services to their customers.
For the periods ended September 30, 2022, shareholder servicing fees incurred are disclosed on the Consolidated Statements of Operations.
Note 8 – Distribution Plan
The Trust, on behalf of each Fund, has adopted a Distribution Plan (the “Plan”) pursuant to Rule 12b-1 under the 1940 Act that allows each Fund to pay distribution fees for the sale and distribution of its shares. With respect to Investor Class shares, Class A shares and Class C shares, the Plan provides for the payment of distribution fees at the annual rate of up to 0.25%, 0.25% and 1.00%, respectively, of average daily net assets.
For the periods ended September 30, 2022, distribution fees incurred are disclosed on the Consolidated Statements of Operations.
AXS Funds
NOTES TO CONSOLIDATED FINANCIAL STATEMENTS - Continued
September 30, 2022
Note 9 – Indemnifications
In the normal course of business, the Funds enter into contracts that contain a variety of representations, which provide general indemnifications. The Funds’ maximum exposure under these arrangements is unknown, as this would involve future claims that may be made against the Funds that have not yet occurred. However, the Funds expect the risk of loss to be remote.
Note 10 – Fair Value Measurements and Disclosure
Fair Value Measurements and Disclosures defines fair value, establishes a framework for measuring fair value in accordance with GAAP, and expands disclosure about fair value measurements. It also provides guidance on determining when there has been a significant decrease in the volume and level of activity for an asset or a liability, when a transaction is not orderly, and how that information must be incorporated into a fair value measurement.
Under Fair Value Measurements and Disclosures, various inputs are used in determining the value of the Funds’ investments. These inputs are summarized into three broad Levels as described below:
| ● | Level 1 – Unadjusted quoted prices in active markets for identical assets or liabilities that the Funds have the ability to access. |
| ● | Level 2 – Observable inputs other than quoted prices included in level 1 that are observable for the asset or liability, either directly or indirectly. These inputs may include quoted prices for the identical instrument on an inactive market, prices for similar instruments, interest rates, prepayment speeds, credit risk, yield curves, default rates and similar data. |
| ● | Level 3 – Unobservable inputs for the asset or liability, to the extent relevant observable inputs are not available; representing the Funds’ own assumptions about the assumptions a market participant would use in valuing the asset or liability and would be based on the best information available. |
The availability of observable inputs can vary from security to security and is affected by a wide variety of factors, including, for example, the type of security, whether the security is new and not yet established in the marketplace, the liquidity of markets, and other characteristics particular to the security. To the extent that valuation is based on models or inputs that are less observable or unobservable in the market, the determination of fair value requires more judgment. Accordingly, the degree of judgment exercised in determining fair value is greatest for instruments categorized in Level 3.
Fund-linked options are stated at fair value based on the fair value of the ProfitScore Capital Management, Inc. Regime Adaptive Equity trading program, taking into account any fees and expenses associated with the fund-linked option. Fund-linked options are generally categorized in Level 2.
The inputs used to measure fair value may fall into different Levels of the fair value hierarchy. In such cases, for disclosure purposes, the Level in the fair value hierarchy within which the fair value measurement falls in its entirety, is determined based on the lowest Level input that is significant to the fair value measurement in its entirety.
The inputs or methodology used for valuing securities are not an indication of the risk associated with investing in those securities. The following is a summary of the inputs used, as of September 30, 2022, in valuing the Funds’ assets and liabilities carried at fair value:
AXS Funds
NOTES TO CONSOLIDATED FINANCIAL STATEMENTS - Continued
September 30, 2022
| Alternative Growth Fund | | Level 1 | | | Level 2 | | | Level 3** | | | Total | |
| Assets | | | | | | | | | | | | | | | | |
| Investments | | | | | | | | | | | | | | | | |
| Short-Term Investments | | $ | 1,262,946 | | | $ | - | | | $ | - | | | $ | 1,262,946 | |
| Total Assets | | $ | 1,262,946 | | | $ | - | | | $ | - | | | $ | 1,262,946 | |
| Liabilities | | | | | | | | | | | | | | | | |
| Other Financial Instruments*** | | | | | | | | | | | | | | | | |
| Futures Contracts | | $ | 197,628 | | | $ | - | | | $ | - | | | $ | 197,628 | |
| Swap Contract | | | - | | | | 192,412 | | | | - | | | | 192,412 | |
| Total Liabilities | | $ | 197,628 | | | $ | 192,412 | | | $ | - | | | $ | 390,040 | |
| | | | | | | | | | | | | | | | | |
| Chesapeake Strategy Fund | | Level 1 | | | Level 2* | | | Level 3* | | | Total | |
| Assets | | | | | | | | | | | | | | | | |
| Investments | | | | | | | | | | | | | | | | |
| Short-Term Investments | | $ | 57,468,301 | | | $ | - | | | $ | - | | | $ | 57,468,301 | |
| Total Investments | | | 57,468,301 | | | | - | | | | - | | | | 57,468,301 | |
| Other Financial Instruments*** | | | | | | | | | | | | | | | | |
| Futures Contracts | | | 2,914,904 | | | | - | | | | - | | | | 2,914,904 | |
| Total Assets | | $ | 60,383,205 | | | $ | - | | | $ | - | | | $ | 60,383,205 | |
| Multi-Strategy Alternatives Fund | | Level 1 | | | Level 2 | | | Level 3** | | | Total | |
| Assets | | | | | | | | | | | | | | | | |
| Investments | | | | | | | | | | | | | | | | |
| Common Stocks1 | | $ | 7,585,423 | | | $ | - | | | $ | - | | | $ | 7,585,423 | |
| Exchange-Traded Funds | | | 7,933,367 | | | | - | | | | - | | | | 7,933,367 | |
| Short-Term Investments | | | 4,435,787 | | | | - | | | | - | | | | 4,435,787 | |
| Total Investments | | $ | 19,954,577 | | | $ | - | | | $ | - | | | $ | 19,954,577 | |
| Other Financial Instruments*** | | | | | | | | | | | | | | | | |
| Swap Contracts | | $ | - | | | $ | 215,192 | | | $ | - | | | $ | 215,192 | |
| Total Assets | | $ | 19,954,577 | | | $ | 215,192 | | | $ | - | | | $ | 20,169,769 | |
Sustainable Income Fund | | Level 1 | | | Level 2 | | | Level 3** | | | Total | |
| Investments | | | | | | | | | | | | | | | | |
| Corporate Bonds1 | | $ | - | | | $ | 1,146,490 | | | $ | - | | | $ | 1,146,490 | |
| Medium Term Notes | | | - | | | | 4,971 | | | | - | | | | 4,971 | |
| U.S. Treasury Bills | | | - | | | | 24,915 | | | | - | | | | 24,915 | |
| Short-Term Investments | | | 230,817 | | | | - | | | | - | | | | 230,817 | |
| Total Investments | | $ | 230,817 | | | $ | 1,176,376 | | | $ | - | | | $ | 1,407,193 | |
AXS Funds
NOTES TO CONSOLIDATED FINANCIAL STATEMENTS - Continued
September 30, 2022
| Thomson Reuters Private Equity Return Tracker Fund | | Level 1 | | | Level 2 | | | Level 3** | | | Total | |
| Assets | | | | | | | | | | | | | | | | |
| Investments | | | | | | | | | | | | | | | | |
| Common Stocks1 | | $ | 14,739,137 | | | $ | - | | | $ | - | | | $ | 14,739,137 | |
| Short-Term Investments | | | 113,285 | | | | - | | | | - | | | | 113,285 | |
| Total Investments | | $ | 14,852,422 | | | $ | - | | | $ | - | | | $ | 14,852,422 | |
| | | | | | | | | | | | | | | | | |
| Liabilities | | | | | | | | | | | | | | | | |
| Other Financial Instruments*** | | | | | | | | | | | | | | | | |
| Swap Contracts | | $ | - | | | $ | 361,531 | | | $ | - | | | $ | 361,531 | |
| Total Liabilities | | $ | - | | | $ | 361,531 | | | $ | - | | | $ | 361,531 | |
| Thomson Reuters Venture Capital Return Tracker Fund | | Level 1 | | | Level 2 | | | Level 3** | | | Total | |
| Assets | | | | | | | | | | | | | | | | |
| Investments | | | | | | | | | | | | | | | | |
| Common Stocks1 | | $ | 113,156,909 | | | $ | - | | | $ | - | | | $ | 113,156,909 | |
| Short-Term Investments | | | 805,963 | | | | - | | | | - | | | | 805,963 | |
| Total Investments | | $ | 113,962,872 | | | $ | - | | | $ | - | | | $ | 113,962,872 | |
| | | | | | | | | | | | | | | | | |
| Liabilities | | | | | | | | | | | | | | | | |
| Other Financial Instruments*** | | | | | | | | | | | | | | | | |
| Swap Contracts | | $ | - | | | $ | 5,548,790 | | | $ | - | | | $ | 5,548,790 | |
| Total Liabilities | | $ | - | | | $ | 5,548,790 | | | $ | - | | | $ | 5,548,790 | |
| | | | | | | | | | | | | | | | | |
| All Terrain Opportunity Fund | | Level 1 | | | Level 2* | | | Level 3* | | | Total | |
| Investments | | | | | | | | | | | | | | | | |
| Common Stock1 | | $ | 20,225 | | | $ | - | | | $ | - | | | $ | 20,225 | |
| Short-Term Investments | | | 3,011,133 | | | | - | | | | - | | | | 3,011,133 | |
| Total Investments | | $ | 3,031,358 | | | $ | - | | | $ | - | | | $ | 3,031,358 | |
AXS Funds
NOTES TO CONSOLIDATED FINANCIAL STATEMENTS - Continued
September 30, 2022
| Merger Fund | | Level 1 | | | Level 2* | | | Level 3 | | | Total | |
| Assets | | | | | | | | | | | | | | | | |
| Investments | | | | | | | | | | | | | | | | |
| Common Stocks1 | | $ | 40,805,772 | | | $ | 2,225,600 | | | $ | - | | | $ | 43,031,372 | |
| Short-Term Investments | | | 11,075,778 | | | | - | | | | - | | | | 11,075,778 | |
| Total Investments | | $ | 51,881,550 | | | $ | 2,225,600 | | | $ | - | | | $ | 54,107,150 | |
| | | | | | | | | | | | | | | | | |
| Liabilities | | | | | | | | | | | | | | | | |
| Securities Sold Short | | | | | | | | | | | | | | | | |
| Common Stocks1 | | $ | 7,075,574 | | | $ | - | | | $ | - | | | $ | 7,075,574 | |
| Total Securities Sold Short | | $ | 7,075,574 | | | $ | - | | | $ | - | | | $ | 7,075,574 | |
| | | | | | | | | | | | | | | | | |
| Alternative Value Fund | | Level 1 | | | Level 2* | | | Level 3* | | | Total | |
| Investments | | | | | | | | | | | | | | | | |
| Common Stocks1 | | $ | 26,235,247 | | | $ | - | | | $ | - | | | $ | 26,235,247 | |
| Short-Term Investments | | | 5,680 | | | | - | | | | - | | | | 5,680 | |
| Total Investments | | $ | 26,240,927 | | | $ | - | | | $ | - | | | $ | 26,240,927 | |
| | | | | | | | | | | | | | | | | |
| Market Neutral Fund | | Level 1 | | | Level 2* | | | Level 3* | | | Total | |
| Assets | | | | | | | | | | | | | | | | |
| Investments | | | | | | | | | | | | | | | | |
| Common Stocks1 | | $ | 25,425,188 | | | $ | - | | | $ | - | | | $ | 25,425,188 | |
| Short-Term Investments | | | 709,679 | | | | - | | | | - | | | | 709,679 | |
| Total Investments | | $ | 26,134,867 | | | $ | - | | | $ | - | | | $ | 26,134,867 | |
| | | | | | | | | | | | | | | | | |
| Liabilities | | | | | | | | | | | | | | | | |
| Securities Sold Short | | | | | | | | | | | | | | | | |
| Common Stocks1 | | $ | 16,844,345 | | | $ | - | | | $ | - | | | $ | 16,844,345 | |
| Total Securities Sold Short | | $ | 16,844,345 | | | $ | - | | | $ | - | | | $ | 16,844,345 | |
| Adaptive Plus Fund | | Level 1 | | | Level 2 | | | Level 3** | | | Total | |
| Assets | | | | | | | | | | | | | | | | |
| Investments | | | | | | | | | | | | | | | | |
| Short-Term Investments | | $ | 6,220,839 | | | $ | - | | | $ | - | | | $ | 6,220,839 | |
| Total Investments | | | 6,220,839 | | | | - | | | | - | | | | 6,220,839 | |
| Purchased Options Contracts | | | - | | | | 1,903,959 | | | | - | | | | 1,903,959 | |
| Total Investments and Purchased Options Contracts | | $ | 6,220,839 | | | $ | 1,903,959 | | | $ | - | | | $ | 8,124,798 | |
| 1 | For a detailed break-out of common stocks, exchange-traded funds, mutual funds and securities sold short by major industry classification, please refer to the Schedules of Investments. |
| * | The Funds did not hold any Level 2 or 3 securities at period end. |
| ** | The Funds did not hold any Level 3 securities at period end. |
| *** | Other financial instruments are derivative instruments such as swap contracts, futures contracts and forward foreign currency contracts. Swap contracts, futures contracts and forward foreign currency contracts are valued at the unrealized appreciation (depreciation) on the instrument. |
AXS Funds
NOTES TO CONSOLIDATED FINANCIAL STATEMENTS - Continued
September 30, 2022
Note 11 – Derivatives and Hedging Disclosures
Derivatives and Hedging requires enhanced disclosures about the Funds’ derivative and hedging activities, including how such activities are accounted for and their effects on the Funds’ financial position and performance. The Funds invested in futures contracts, swap contracts and forward foreign currency contracts during the periods ended September 30, 2022.
The effects of these derivative instruments on the Funds’ financial position and financial performance as reflected in the Consolidated Statements of Assets and Liabilities and Consolidated Statements of Operations are presented in the tables below. The fair values of derivative instruments, as of September 30, 2022, by risk category are as follows:
| Alternative Growth Fund |
| | | Liability Derivatives | |
| Derivatives not designated as hedging instruments | | Consolidated
Statements of Assets and Liabilities | | | Value | |
| Equity contracts | | Unrealized depreciation on open futures contracts | | $ | 197,628 | |
| Mixed: Interest rate, equity and foreign exchange contracts | | Unrealized depreciation on open swap contracts | | | 192,412 | |
| Total | | | | $ | 390,040 | |
| Chesapeake Strategy Fund |
| | | Asset Derivatives |
| Derivatives not designated as hedging instruments | | Consolidated
Statements of Assets and Liabilities* | | | Value | |
| Commodity contracts | | Unrealized appreciation on open futures contracts | | $ | 74,028 | |
| Currency contracts | | Unrealized appreciation on open futures contracts | | | 921,430 | |
| Interest rate contracts | | Unrealized appreciation on open futures contracts | | | 1,719,105 | |
| Index contracts | | Unrealized appreciation on open futures contracts | | | 200,341 | |
| Total | | | | $ | 2,914,904 | |
AXS Funds
NOTES TO CONSOLIDATED FINANCIAL STATEMENTS - Continued
September 30, 2022
| Multi-Strategy Alternatives Fund |
| | | Asset Derivatives | | | Liability Derivatives | |
| Derivatives not designated as hedging instruments | | Consolidated
Statements of Assets and Liabilities | | | Value | | | Consolidated
Statements of Assets and Liabilities | | | Value | |
| Equity contracts | | Unrealized appreciation on open swap contracts | | $ | 215,192 | | | Unrealized depreciation on open swap contracts | | $ | - | |
| Thomson Reuters Private Equity Return Tracker Fund |
| | | Liability Derivatives | |
| Derivatives not designated as hedging instruments | | Consolidated
Statements of Assets and Liabilities | | | Value | |
| Equity contracts | | Unrealized depreciation on open swap contracts | | $ | 361,531 | |
| Thomson Reuters Venture Capital Return Tracker Fund |
| | | Liability Derivatives | |
| Derivatives not designated as hedging instruments | | Consolidated
Statements of Assets and Liabilities | | | Value | |
| Equity contracts | | Unrealized depreciation on open swap contracts | | $ | 5,548,790 | |
| Adaptive Plus Fund |
| | | Asset Derivatives | |
| Derivatives not designated as hedging instruments | | Consolidated
Statements of Assets and Liabilities | | | Value | |
| Equity contracts | | Purchased options contracts, at value | | $ | 1,903,959 | |
| * | Includes cumulative appreciation/depreciation on futures contracts as reported on the Schedule of Investments. Net unrealized appreciation/depreciation is shown as variation margin on futures contracts on the Consolidated Statements of Assets and Liabilities. |
AXS Funds
NOTES TO CONSOLIDATED FINANCIAL STATEMENTS - Continued
September 30, 2022
The effects of derivative instruments on the Consolidated Statements of Operations for the periods ended September 30, 2022, are as follows:
| Alternative Growth Fund |
| Amount of Realized Gain or (Loss) on Derivatives Recognized in the Consolidated Statements of Operations |
| Derivatives not designated as hedging instruments | | Futures
Contracts | | | Open Swap
Contracts | |
| Equity contracts | | $ | (673,118 | ) | | $ | - | |
| Mixed: Interest rate, equity and foreign exchange contracts | | | - | | | | (834,388 | ) |
| Total | | $ | (673,118 | ) | | $ | (834,388 | ) |
| Chesapeake Strategy Fund |
| Amount of Realized Gain or (Loss) on Derivatives Recognized in the Consolidated Statements of Operations |
| Derivatives not designated as hedging instruments | | Futures Contracts | | | Open Swap Contracts | |
| Commodity contracts | | $ | 1,663,942 | | | $ | - | |
| Currency contracts | | | 1,613,900 | | | | - | |
| Index contracts | | | (128,948 | ) | | | - | |
| Interest rate contracts | | | 3,158,826 | | | | - | |
| Mixed: Interest rate, equity and foreign exchange contracts | | | - | | | | (2,086 | ) |
| Total | | $ | 6,307,720 | | | $ | (2,086 | ) |
| Multi-Strategy Alternatives Fund |
| Amount of Realized Gain or (Loss) on Derivatives Recognized in the Consolidated Statements of Operations |
| Derivatives not designated as hedging instruments | | Open Swap Contracts | |
| Equity contracts | | $ | (45,491 | ) |
| Thomson Reuters Private Equity Return Tracker Fund |
| Amount of Realized Gain or (Loss) on Derivatives Recognized in the Consolidated Statements of Operations |
| Derivatives not designated as hedging instruments | | Open Swap Contracts | |
| Equity contracts | | $ | (4,014,353 | ) |
| Thomson Reuters Venture Capital Return Tracker Fund |
| Amount of Realized Gain or (Loss) on Derivatives Recognized in the Consolidated Statements of Operations |
| Derivatives not designated as hedging instruments | | Open Swap Contracts | |
| Equity contracts | | $ | (117,970,833 | ) |
AXS Funds
NOTES TO CONSOLIDATED FINANCIAL STATEMENTS - Continued
September 30, 2022
| All Terrain Opportunity Fund |
| Amount of Realized Gain or (Loss) on Derivatives Recognized in the Consolidated Statements of Operations |
| Derivatives not designated as hedging instruments | | Purchased Options Contracts | |
| Equity contracts | | $ | (26,328 | ) |
| Merger Fund |
| Amount of Realized Gain or (Loss) on Derivatives Recognized in the Consolidated Statements of Operations |
| Derivatives not designated as hedging instruments | | Written Options Contracts | | | Purchased Options Contracts | |
| Equity contracts | | $ | 44,090 | | | $ | (37,416 | ) |
| Alternative Growth Fund |
| Change in Unrealized Appreciation/Depreciation on Derivatives Recognized in the Consolidated Statements of Operations |
| Derivatives not designated as hedging instruments | | Futures Contracts | | | Open Swap Contracts | |
| Equity contracts | | $ | (64,558 | ) | | $ | - | |
| Mixed: Interest rate, equity and foreign exchange contracts | | | - | | | | 442,948 | |
| Total | | $ | (64,558 | ) | | $ | 442,948 | |
| Chesapeake Strategy Fund |
| Change in Unrealized Appreciation/Depreciation on Derivatives Recognized in the Consolidated Statements of Operations |
| Derivatives not designated as hedging instruments | | Futures Contracts | |
| Commodity contracts | | $ | (241,872 | ) |
| Currency contracts | | | 914,030 | |
| Index contracts | | | 276,934 | |
| Interest rate contracts | | | 1,328,056 | |
| Total | | $ | 2,277,148 | |
| Multi-Strategy Alternatives Fund |
| Change in Unrealized Appreciation/Depreciation on Derivatives Recognized in the Consolidated Statements of Operations |
| Derivatives not designated as hedging instruments | | Open Swap Contracts | |
| Equity contracts | | $ | 194,852 | |
AXS Funds
NOTES TO CONSOLIDATED FINANCIAL STATEMENTS - Continued
September 30, 2022
| Thomson Reuters Private Equity Return Tracker Fund |
| Change in Unrealized Appreciation/Depreciation on Derivatives Recognized in the Consolidated Statements of Operations |
| Derivatives not designated as hedging instruments | | Open Swap Contracts | |
| Equity contracts | | $ | 583,058 | |
| Thomson Reuters Venture Capital Return Tracker Fund |
| Change in Unrealized Appreciation/Depreciation on Derivatives Recognized in the Consolidated Statements of Operations |
| Derivatives not designated as hedging instruments | | Open Swap Contracts | |
| Equity contracts | | $ | 14,656,775 | |
| All Terrain Opportunity Fund |
| Change in Unrealized Appreciation/Depreciation on Derivatives Recognized in the Consolidated Statements of Operations |
| Derivatives not designated as hedging instruments | | Purchased Options Contracts | |
| Equity contracts | | $ | 19,004 | |
| Merger Fund |
| Change in Unrealized Appreciation/Depreciation on Derivatives Recognized in the Consolidated Statements of Operations |
| Derivatives not designated as hedging instruments | | Purchased Options Contracts | | | Written Options Contracts | |
| Equity contracts | | $ | 6,911 | | | $ | 837 | |
| Adaptive Plus Fund |
| Change in Unrealized Appreciation/Depreciation on Derivatives Recognized in the Consolidated Statements of Operations |
| Derivatives not designated as hedging instruments | | Purchased Options Contracts | |
| Equity contracts | | $ | 148,712 | |
The average quarterly volume of derivative instruments held by the Funds during the periods ended September 30, 2022, are as follows:
| Alternative Growth Fund |
| | | | | | | | Futures Contracts | | | | Open Swap Contract | |
| Equity contracts | | | Notional Value | | | $ | 4,524,325 | | | $ | - | |
| Mixed: Interest Rate, Equity and Foreign Exchange Contracts | | | Notional Value | | | | - | | | | 7,853,861 | |
AXS Funds
NOTES TO CONSOLIDATED FINANCIAL STATEMENTS - Continued
September 30, 2022
| Chesapeake Strategy Fund |
| | | | | | | | Long Futures Contracts* | | | | Short Futures Contracts* | |
| Commodity contracts | | | Notional Value | | | $ | 7,122,354 | | | $ | 1,646,741 | |
| Currency contracts | | | Notional Value | | | | 16,555,872 | | | | 15,122,450 | |
| Index contracts | | | Notional Value | | | | 47,114,701 | | | | 23,046,288 | |
| Interest rate contracts | | | Notional Value | | | | - | | | | 28,593,456 | |
| Multi-Strategy Alternatives Fund |
| | | | | | | | Open Swap Contracts - Long | | | | Open Swap Contracts - Short | |
| Equity contracts | | | Notional Value | | | $ | 2,657,624 | | | $ | 3,086,555 | |
| Thomson Reuters Private Equity Return Tracker Fund |
| | | | | | | Open Swap Contracts - Long | |
| Equity contracts | | | Notional Value | | | $ | 27,213,940 | |
| Thomson Reuters Venture Capital Return Tracker Fund |
| | | | | | | | Open Swap Contracts - Long | |
| Equity contracts | | | Notional Value | | | $ | 434,661,964 | |
| All Terrain Opportunity Fund |
| Derivatives not designated as hedging instruments | | | Purchased Options Contracts | |
| Equity contracts | | $ | 1,220,000 | |
| Merger Fund |
| Derivatives not designated as hedging instruments | | Purchased Options Contracts | | | Written Options Contracts | |
| Equity contracts | | $ | 166,600 | | | $ | (371,950 | ) |
| Adaptive Plus Fund |
| Derivatives not designated as hedging instruments | | Purchased Options Contracts | |
| Equity contracts | | $ | 17 | |
AXS Funds
NOTES TO CONSOLIDATED FINANCIAL STATEMENTS - Continued
September 30, 2022
Note 12 - Disclosures about Offsetting Assets and Liabilities
Disclosures about Offsetting Assets and Liabilities requires an entity to disclose information about offsetting and related arrangements to enable users of its financial statements to understand the effect of those arrangements on its financial position. The guidance requires retrospective application for all comparative periods presented.
A Fund mitigates credit risk with respect to OTC derivative counterparties through credit support annexes included with International Swaps and Derivative Association (“ISDA”) Master Agreements or other Master Netting Agreements which are the standard contracts governing most derivative transactions between the Funds and each of its counterparties. These agreements allow the Funds and each counterparty to offset certain derivative financial instruments’ payables and/or receivables against each other and/or with collateral, which is generally held by the Funds’ custodian. The amount of collateral moved to/from applicable counterparties is based upon minimum transfer amounts specified in the agreement. To the extent amounts due to the Funds from its counterparties are not fully collateralized contractually or otherwise, the Funds bear the risk of loss from counterparty non-performance.
It is the Funds’ policy to recognize a net asset or liability equal to the unrealized appreciation (depreciation) of futures, forward foreign currency exchange and swap contracts. As of September 30, 2022, the Funds are subject to a master netting arrangement for the futures, foreign forward currency exchange and swap contracts. The following table shows additional information regarding the offsetting of assets and liabilities, as of September 30, 2022:
| Alternative Growth Fund |
| | | | | | | | Amounts Not Offset in Consolidated Statements of Assets and Liabilities | | | | |
| Description | | Counterparty | | Gross Amounts Recognized in the Consolidated Statements of Assets and Liabilities | | | Financial Instruments** | | | Cash Collateral** | | | Net Amount | |
Unrealized depreciation
on open futures contracts* | | Morgan Stanley | | $ | (197,628 | ) | | $ | - | | | $ | 197,628 | | | $ | - | |
Unrealized depreciation
on open swap contracts | | Deutsche Bank | | | (192,412 | ) | | | - | | | | 192,412 | | | | - | |
AXS Funds
NOTES TO CONSOLIDATED FINANCIAL STATEMENTS - Continued
September 30, 2022
| Chesapeake Strategy Fund |
| | | | | | | | Amounts Not Offset in Consolidated
Statements of Assets and Liabilities | | | | |
| Description | | Counterparty | | Gross Amounts Recognized in the Consolidated Statements of Assets and Liabilities | | | Financial Instruments** | | | Cash Collateral** | | | Net Amount | |
Unrealized appreciation
on open futures contracts* | | Morgan Stanley | | $ | 2,914,904 | | | $ | - | | | $ | - | | | $ | 2,914,904 | |
| Multi-Strategy Alternatives Fund |
| | | | | | | | Amounts Not Offset in Consolidated Statements of Assets and Liabilities | | | | |
| Description | | Counterparty | | Gross Amounts Recognized in the Consolidated Statements of Assets and Liabilities | | | Financial Instruments** | | | Cash Collateral** | | | Net Amount | |
Unrealized appreciation on open swap contracts | | Cowen | | $ | 215,192 | | | $ | - | | | $ | - | | | $ | 215,192 | |
AXS Funds
NOTES TO CONSOLIDATED FINANCIAL STATEMENTS - Continued
September 30, 2022
| Thomson Reuters Private Equity Return Tracker Fund |
| | | | | | | | Amounts Not Offset in Consolidated Statements of Assets and Liabilities | | | | |
| Description | | Counterparty | | Gross Amounts Recognized in the Consolidated Statements of Assets and Liabilities | | | Financial Instruments** | | | Cash Collateral** | | | Net Amount | |
Unrealized depreciation on open swap contracts | | BNP Paribas | | $ | (361,531 | ) | | $ | 361,531 | | | $ | - | | | $ | - | |
| Thomson Reuters Venture Capital Return Tracker Fund |
| | | | | | | | Amounts Not Offset in Consolidated Statements of Assets and Liabilities | | | | |
| Description | | Counterparty | | Gross Amounts Recognized in the Consolidated Statements of Assets and Liabilities | | | Financial Instruments** | | | Cash Collateral** | | | Net Amount | |
Unrealized depreciation on open swap contracts | | BNP Paribas | | $ | (5,548,790 | ) | | $ | 5,548,790 | | | $ | - | | | $ | - | |
| * | Includes cumulative appreciation/depreciation on futures contracts as reported on the Schedule of Investments. Net unrealized appreciation/depreciation is shown as variation margin on futures contracts on the Consolidated Statements of Assets and Liabilities. |
| ** | Amounts relate to master netting agreements and collateral agreements which have been determined by the Advisor to be legally enforceable in the event of default but where certain other criteria are not met in accordance with applicable offsetting accounting guidance. The collateral amounts may exceed the related net amounts of financial assets and liabilities presented in the Consolidated Statements of Assets and Liabilities. Where this is the case, the total amount reported is limited to the net amounts of financial assets and liabilities with that counterparty. |
AXS Funds
NOTES TO CONSOLIDATED FINANCIAL STATEMENTS - Continued
September 30, 2022
Note 13 – Borrowing
The Alternative Value Fund and Market Neutral Fund have entered into a borrowing agreement with BNP Paribas (acting through its New York Branch). The Funds may borrow amounts up to one-third of the value of its assets. The Alternative Value Fund and Market Neutral Fund are charged interest of the bank’s prime rate plus 1.25% and 1.00%, respectively, for borrowing under this agreement. Interest expense for the year ended September 30, 2022, is disclosed on the Consolidated Statements of Operations, if applicable. The Market Neutral Fund did not borrow under the line of credit agreement during the year ended September 30, 2022. Credit facility activity for the year ended September 30, 2022, was as follows:
| | | Alternative Value Fund | |
| Maximum available credit as of September 30, 2022 | | $ | 9,318,539 | |
| Largest amount outstanding on an individual day | | | 9,071,288 | |
| Average daily loan outstanding | | | 2,993,195 | |
| Credit facility outstanding as of September 30, 2022 | | | 9,071,288 | |
| Average interest rate when in use | | | 2.024 | % |
| Interest | | $ | 77,381 | |
Note 14 – Market Disruption and Geopolitical Risks
Certain local, regional or global events such as war, acts of terrorism, the spread of infectious illness or other public health issues, or other events could have a significant impact on a security or instrument. Since 2020, the novel strain of coronavirus (COVID-19) has negatively affected the worldwide economy, as well as the economies of individual countries, the financial health of individual companies and the market in general in significant and unforeseen ways. Following Russia’s large-scale invasion of Ukraine, the President of the United States signed an Executive Order in February 2022 prohibiting U.S. persons from entering transactions with the Central Bank of Russia and Executive Orders in March 2022 prohibiting U.S. persons from importing oil and gas from Russia as well as other popular Russian exports, such as diamonds, seafood and vodka. There may also be restrictions on investments in Chinese companies. For example, the President of the United States of America signed an Executive Order in June 2021 affirming and expanding the U.S. policy prohibiting U.S. persons from purchasing or investing in publicly-traded securities of companies identified by the U.S. Government as “Chinese Military-Industrial Complex Companies.” The list of such companies can change from time to time, and as a result of forced selling or an inability to participate in an investment the Advisor otherwise believes is attractive, the Fund may incur losses. The duration of the coronavirus outbreak and the Russian-Ukraine conflict could adversely affect the Fund’s performance, the performance of the securities in which the Fund invests and may lead to losses on your investment. The ultimate impact of COVID-19 and Russia Invasion on the financial performance of the Fund’s investments is not reasonably estimable at this time. Management is actively monitoring these events.
AXS Funds
NOTES TO CONSOLIDATED FINANCIAL STATEMENTS - Continued
September 30, 2022
Note 15– Control Ownership
The beneficial ownership, either directly or indirectly, of more than 25% of the voting securities of a Fund creates presumption of control of the Fund, under Section 2(a) 9 of the Act. As of September 30, 2022, beneficial ownership in excess of 25% is as follows:
| Fund | Beneficial Owner | % of Outstanding Shares |
| Alternative Growth Fund | National Financial Services, LLC | 46.6% |
| Multi-Strategy Alternatives Fund | National Financial Services, LLC | 36.2% |
| Sustainable Income Fund | SEI Private Trust Company | 72.7% |
| Thomson Reuters Private Equity Return Tracker Fund | National Financial Services, LLC | 97.4% |
| Thomson Reuters Venture Capital Return Tracker Fund | National Financial Services, LLC | 94.4% |
| All Terrain Opportunity Fund | LPL Financial Holdings, Inc. | 28.0% |
| All Terrain Opportunity Fund | TD Ameritrade, Inc. | 34.7% |
| All Terrain Opportunity Fund | Charles Schwab & Co., Inc. | 32.4% |
| Merger Fund | Charles Schwab & Co., Inc. | 34.6% |
| Merger Fund | National Financial Services, LLC | 30.8% |
| Adaptive Plus Fund | TD Ameritrade, Inc. | 96.9% |
The Trust has no knowledge as to whether all or any portion of the shares owned of record are also owned beneficially.
Note 16 – New Accounting Pronouncements
In October 2020, the SEC adopted new regulations governing the use of derivatives by registered investment companies (“Rule 18f-4”). Rule 18f-4 will impose limits on the amount of derivatives a Fund can enter into, eliminate the asset segregation framework currently used by funds to comply with Section 18 of the 1940 Act, and require funds whose use of derivatives is greater than a limited specified amount to establish and maintain a comprehensive derivatives risk management program and appoint a derivatives risk manager. The Funds have adopted procedures in accordance with Rule 18f-4.
In December 2020, the SEC adopted a new rule providing a framework for fund valuation practices (“Rule 2a-5”). Rule 2a-5 establishes requirements for determining fair value in good faith for purposes of the 1940 Act. Rule 2a-5 will permit fund boards to designate certain parties to perform fair value determinations, subject to board oversight and certain other conditions. Rule 2a-5 also defines when market quotations are “readily available” for purposes of the 1940 Act and the threshold for determining whether a fund must fair value a security. In connection with Rule 2a-5, the SEC also adopted related recordkeeping requirements and is rescinding previously issued guidance, including with respect to the role of a board in determining fair value and the accounting and auditing of fund investments. The Funds have adopted procedures in accordance with Rule 2a-5.
In March 2020, FASB issued ASU 2020-04, Reference Rate Reform: Facilitation of the Effects of Reference Rate Reform on Financial Reporting. The main objective of the new guidance is to provide relief to companies that will be impacted by the expected change in benchmark interest rates at the end of 2021, when participating banks will no longer be required to submit London Interbank Offered Rate (“LIBOR”) quotes by the UK Financial Conduct Authority. The new guidance allows companies to, provided the only change to existing contracts are a change to an approved benchmark interest rate, account for modifications as a continuance of the existing contract without additional analysis. In addition, derivative contracts that qualified for hedge accounting prior to modification, will be allowed to continue to receive such treatment, even if critical terms change due to a change in the benchmark interest rate. For new and existing contracts, the Funds may elect to apply the amendments as of March 12, 2020 through December 31, 2022. Management is currently assessing the impact of the ASU’s adoption to the Funds’ financial statements and various filings.
AXS Funds
NOTES TO CONSOLIDATED FINANCIAL STATEMENTS - Continued
September 30, 2022
Note 17 – Change in Independent Public Accounting Firm
On July 20, 2022, The Trust selected Tait, Weller & Baker LLP (“TWB”) as the AXS Alternative Growth Fund, the AXS Chesapeake Strategy Fund, the AXS Multi-Strategy Alternatives Fund, the AXS Sustainable Income Fund, the AXS Thomson Reuters Private Equity Return Tracker Fund, and the AXS Thomson Reuters Venture Capital Return Tracker Fund’s (collectively, the “RSM Audited Funds”) independent registered public accounting firm for the fiscal year ended September 30, 2022. The decision to select TWB was recommended by the Trust’s Audit Committee and approved by the Trust’s Board of Trustees of the RSM Audited Funds. Previously, RSM US LLP (“RSM”) served as the independent registered public accounting firm to the RSM Audited Funds.
RSM issued audit opinions on the following Funds’ financial statements for the periods denoted in the table below:
| Fund | Reporting Period |
| AXS Alternative Growth Fund | Fiscal year ended September 30, 2021, For the period July 1, 2020 through September 30, 2020 and fiscal year ended June 30, 2020. |
| AXS Chesapeake Strategy Fund | Fiscal years ended September 30, 2021 and September 30, 2020. |
| AXS Multi-Strategy Alternatives Fund | Fiscal year ended September 30, 2021, For the period May 1, 2020 through September 30, 2020 and fiscal year ended April 30, 2020. |
| AXS Sustainable Income Fund | For the period October 17, 2020 through September 30, 2021. |
| AXS Thomson Reuters Private Equity Return Tracker Fund | Fiscal year ended September 30, 2021. |
| AXS Thomson Reuters Venture Capital Return Tracker Fund | Fiscal year ended September 30, 2021. |
RSM’s opinions on the above Funds’ audited financial statements for the periods denoted in the table above, did not contain any adverse opinions or any disclaimer of opinions, nor were such reports qualified or modified as to uncertainty, audit scope or accounting principles.
During the RSM Audited Funds’ fiscal periods ended September 30, 2021 and September 30, 2020 and the subsequent interim period through July 20, 2022, (i) there were no disagreements with RSM on any matter of accounting principles or practices, financial statement disclosure, or auditing scope or procedure, which disagreements, if not resolved to the satisfaction of RSM, would have caused them to make reference to the subject matter of the disagreements in connection with their reports on the RSM Audited Funds’ financial statements for such period; and (ii) there were no “reportable events” of the kind described in Item 304(a)(1)(v) of Regulation S-K.
During the RSM Audited Funds’ fiscal periods ended September 30, 2021 and September 30, 2020 and the subsequent interim period through July 20, 2022, neither the RSM Audited Funds, nor anyone on their behalf, consulted with TWB on items which; (i) concerned the application of accounting principles to a specified transaction, either completed or proposed, or the type of audit opinion that might be rendered on the Funds’ financial statements; or (ii) concerned the subject of a disagreement (as defined in paragraph (a)(1)(iv) of said Item 304). The selection of TWB does not reflect any disagreements with or dissatisfaction by the RSM Audited Funds or the Trust’s Board of Trustees with the performance of the RSM Audited Funds prior independent registered public accounting firm, RSM.
AXS Funds
NOTES TO CONSOLIDATED FINANCIAL STATEMENTS - Continued
September 30, 2022
Note 18 – Events Subsequent to the Fiscal Period End
The Funds have adopted financial reporting rules regarding subsequent events which require an entity to recognize in the financial statements the effects of all subsequent events that provide additional evidence about conditions that existed at the date of the balance sheet. Management has evaluated the Funds’ related events and transactions that occurred through the date of issuance of the Funds’ financial statements.
On November 4, 2022, the Board of Trustees of the Trust has approved a Plan of Liquidation for the AXS Alternative Growth Fund (the “Fund”). The Plan of Liquidation authorizes the termination, liquidation and dissolution of the Fund. In order to perform such liquidation, the Fund is closed to all new investment.
The Fund will be liquidated on or about November 30, 2022 (the “Liquidation Date”), and shareholders may redeem their shares until the Liquidation Date. On or promptly after the Liquidation Date, the Fund will make a liquidating distribution to its remaining shareholders equal to each shareholder’s proportionate interest in the net assets of the Fund, in complete redemption and cancellation of the Fund’s shares held by the shareholder, and the Fund will be dissolved.
In anticipation of the liquidation of the Fund, Ampersand Investment Management LLC, the Fund’s sub-Advisor, may manage the Fund in a manner intended to facilitate its orderly liquidation, such as by raising cash or making investments in other highly liquid assets. As a result, during this time, all or a portion of the Fund may not be invested in a manner consistent with its stated investment strategies, which may prevent the Fund from achieving its investment objective.
At a meeting held on July 19 & 20, 2022, the Board of Trustees approved an Agreement and Plan of Reorganization (the “Plan”) providing for the reorganization of the AXS All Terrain Opportunity Fund (the “Acquired Fund”) into the AXS All Terrain ETF (the “Acquiring Fund”), a newly formed series of the Trust, in exchange for shares of the Acquiring Fund and the assumption of all of the liabilities of the Acquired Fund by the Acquiring Fund as set forth in the Plan (the “Reorganization”). No Vote of the shareholders of the Acquired Fund is required to approve the Reorganization. The Reorganization is expected to take effect in the first quarter of 2023.
At a meeting held on October 26-27, 2022, the Board of Trustees of the Trust approved a change in the Funds’ distributor from IMST Distributors, LLC to ALPS Distributors, Inc. Such change will be effective January 1, 2023.
There were no other events or transactions that occurred during this period that materially impacted the amounts or disclosures in the Funds’ financial statements.
REPORT OF INDEPENDENT REGISTERED PUBLIC ACCOUNTING FIRM
To the Board of Trustees of Investment Managers Series Trust II and
Shareholders of AXS Funds
Opinion on the Financial Statements
We have audited the accompanying statements of assets and liabilities of AXS All Terrain Opportunity Fund, AXS Merger Fund, AXS Alternative Value Fund, AXS Market Neutral Fund, AXS Multi-Strategy Alternatives Fund, AXS Sustainable Income Fund, AXS Thomson Reuters Private Equity Return Tracker Fund, AXS Thomson Reuters Venture Capital Return Tracker Fund and AXS Adaptive Plus Fund and the accompanying consolidated statements of assets and liabilities of AXS Alternative Growth Fund and AXS Chesapeake Strategy Fund (the “Funds”), each a series of Investment Managers Series Trust II (the “Trust”), including the schedules of investments, as of September 30, 2022, the related statements of operations, the statements of cash flows, the statements of changes in net assets and the financial highlights for the periods indicated in the table below, and the related notes (collectively referred to as the “financial statements”). In our opinion, the financial statements present fairly, in all material respects, the financial position of the Funds as of September 30, 2022, the results of their operations and their cash flows for the period then ended, the changes in their net assets and their financial highlights for each of the periods indicated in the table below, in conformity with accounting principles generally accepted in the United States of America.
| Fund | Statement of
Operations | Statement of
Cash Flows | Statements of
Changes in Net Assets | Financial Highlights |
| AXS All Terrain Opportunity Fund | For the year ended September 30, 2022 | N/A | For the year ended September 30, 2022, the Period November 1, 2020 through September 30, 2021and for the year ended October 31, 2020 | For the year ended September 30, 2022, the Period November 1, 2020 through September 30, 2021and for each of the four years in the period ended October 31, 2020 |
| AXS Merger Fund | For the year ended September 30, 2022 | For the year ended September 30, 2022 | For the year ended September 30, 2022, the Period January 1, 2021 through September 30, 2021and for the year ended December 31, 2020 | For the year ended September 30, 2022, the Period January 1, 2021 through September 30, 2021and for each of the four years in the period ended December 31, 2020 |
AXS Alternative Value Fund | For the year ended September 30, 2022 | N/A | For the year ended September 30, 2022, the Period July 1, 2021 through September 30, 2021 and the year ended June 30, 2021 | For the year ended September 30, 2022, the Period July 1, 2021 through September 30, 2021 and the year ended June 30, 2021 |
| AXS Market Neutral Fund | For the year ended September 30, 2022 | For the year ended September 30, 2022 | For the year ended September 30, 2022, the Period July 1, 2021 through September 30, 2021 and the year ended June 30, 2021 | For the year ended September 30, 2022, the Period July 1, 2021 through September 30, 2021 and the year ended June 30, 2021 |
| AXS Multi-Strategy Alternatives Fund, AXS Sustainable Income Fund, AXS Thomson Reuters Private Equity Return Tracker Fund, AXS Thomson Reuters Venture Capital Return Tracker Fund | For the year ended September 30, 2022 | N/A | For the year ended September 30, 2022 | For the year ended September 30, 2022 |
| AXS Adaptive Plus Fund | For the Period September 15, 2022 (commencement of operations) through September 30, 2022 | N/A | For the Period September 15, 2022 (commencement of operations) through September 30, 2022 | For the Period September 15, 2022 (commencement of operations) through September 30, 2022 |
| Fund | Consolidated Statement of
Operations | Consolidated Statements of
Changes in Net Assets | Consolidated
Financial Highlights |
| AXS Alternative Growth Fund, AXS Chesapeake Strategy Fund | For the year ended September 30, 2022 | For the year ended September 30, 2022 | For the year ended September 30, 2022 |
With respect to the Funds financial statements and financial highlights indicated in the table below, were audited by other auditors and expressed unqualified opinions on said financial statements and financial highlights on their reports dated as outlined below.
| Fund | Other Auditor
Report Date | Statements of
Changes in Net Assets | Financial Highlights |
| AXS Alternative Value Fund | August 31, 2020 | N/A | For each of the three years in the period ended June 30, 2020 |
| AXS Market Neutral Fund | August 31, 2020 | N/A | For each of the two years in the period ended June 30, 2020 and for the Period October 1, 2017 through June 30, 2018 |
| | November 29, 2017 | N/A | For the year ended September 30, 2017 |
| AXS Multi-Strategy Alternatives Fund | November 29, 2021 | For the year ended September 30, 2021 | For the year ended September 30, 2021, for the Period May 1, 2020 through September 30, 2020 and for the two years in the period ended April 30, 2020 |
| | June 27, 2018 | N/A | For the year ended April 30, 2018 |
| AXS Thomson Reuters Private Equity Return Tracker Fund, AXS Thomson Reuters Venture Capital Return Tracker Fund | November 29, 2021 | For the year ended September 30, 2021 | For the year ended September 30, 2021 |
| | November 30, 2020 | N/A | For each of the three years in the period ended September 30, 2020 |
| AXS Sustainable Income Fund | November 29, 2021 | For the Period October 17, 2020 (commencement of operations) through September 30, 2021 | For the Period October 17, 2020 (commencement of operations) through September 30, 2021 |
| Fund | Other Auditor
Report Date | Consolidated Statements of
Changes in Net Assets | Consolidated Financial
Highlights |
| AXS Alternative Growth Fund | November 29, 2021 | For the year ended September 30, 2021 | For the year ended September 30, 2021, the Period July 1, 2020 through September 30, 2020 and for each of the three years in the period ended June 30, 2020 |
| AXS Chesapeake Strategy Fund | November 29, 2021 | For the year ended September 30, 2021 | For each of the four years in the period ended September 30, 2020 |
Basis for Opinion
These financial statements are the responsibility of the Funds’ management. Our responsibility is to express an opinion on the Funds’ financial statements based on our audits. We are a public accounting firm registered with the Public Company Accounting Oversight Board (United States) (“PCAOB”) and are required to be independent with respect to the Funds in accordance with the U.S. federal securities laws and the applicable rules and regulations of the Securities and Exchange Commission and the PCAOB. We have served as the auditor of one or more of the funds in the Trust since 2013.
We conducted our audits in accordance with the standards of the PCAOB. Those standards require that we plan and perform the audits to obtain reasonable assurance about whether the financial statements are free of material misstatement, whether due to error or fraud. The Funds are not required to have, nor were we engaged to perform, an audit of the Funds’ internal control over financial reporting. As part of our audits we are required to obtain an understanding of internal control over financial reporting, but not for the purpose of expressing an opinion on the effectiveness of the Funds’ internal control over financial reporting. Accordingly, we express no such opinion.
Our audits included performing procedures to assess the risks of material misstatement of the financial statements, whether due to error or fraud, and performing procedures that respond to those risks. Such procedures included examining, on a test basis, evidence regarding the amounts and disclosures in the financial statements. Our audits also included evaluating the accounting principles used and significant estimates made by management, as well as evaluating the overall presentation of the financial statements. Our procedures included confirmation of securities owned as of September 30, 2022 by correspondence with the custodian and brokers or by other appropriate auditing procedures where replies were not received. We believe that our audits provide a reasonable basis for our opinion.
| |  |
| | |
| | TAIT, WELLER & BAKER LLP |
Philadelphia, Pennsylvania
November 29, 2022
AXS Funds
SUPPLEMENTAL INFORMATION (Unaudited)
Corporate Dividends Received Deduction
For the year ended September 30, 2022, the Thomson Reuters Private Equity Return Tracker Fund and Thomson Reuters Venture Capital Return Tracker Fund had 28.15% and 10.67%, respectively, of the dividends to be paid from net investment income, including short-term capital gains from the Fund (if any), are designated as dividends received deduction available to corporate shareholders.
For the year ended September 30, 2022, the Thomson Reuters Private Equity Return Tracker Fund and Thomson Reuters Venture Capital Return Tracker Fund, designates $5,367,609 and $43,747,033, respectively, as long-term capital gain dividends.
Qualified Dividend Income
For the year ended September 30, 2022 the Thomson Reuters Private Equity Return Tracker Fund and Thomson Reuters Venture Capital Return Tracker Fund had 29.62% and 11.60%, respectively, of dividends paid from net investment income, including short-term capital gains from the Fund (if any), designated as qualified dividend income.
Trustees and Officers Information
Additional information about the Trustees is included in the Funds’ Statement of Additional Information which is available, without charge, upon request by calling (833) 297-2587. The Trustees and officers of the Funds and their principal occupations during the past five years are as follows:
Name, Address, Year of Birth and Position(s) held with Trust | Term of Officec and Length of Time Served | Principal Occupation During the Past Five Years and Other Affiliations | Number of
Portfolios in
the Fund
Complex Overseen by
Trusteed | Other
Directorships Held
by Trustee During
the Past Five
Yearse |
| Independent Trustees: | | |
Thomas Knipper, CPA a (Born 1957) Trustee | Since September 2013 | Vice President and Chief Compliance Officer, Ameritas Investment Partners, a registered investment advisor (1995 – present). | 11 | None. |
Kathleen K. Shkuda a
(born 1951) Trustee | Since September 2013 | Zigzag Consulting, a financial services consulting firm (2008 – present). Director, Managed Accounts, Merrill Lynch (2007-2008). | 11 | None. |
Larry D. Tashjian a (born 1953) Trustee and Chairman of the Board | Since September 2013 | Principal, CAM Capital Advisors, a family office (2001 – present). | 11 | General Finance Corporation. |
AXS Funds
SUPPLEMENTAL INFORMATION (Unaudited) – Continued
Name, Address, Year of Birth and Position(s) held with Trust | Term of Officec and Length of Time Served | Principal Occupation During the Past Five Years and Other Affiliations | Number of
Portfolios in
the Fund
Complex Overseen by
Trusteed | Other
Directorships Held
by Trustee During
the Past Five
Yearse |
| Independent Trustee: |
John P. Zader a (born 1961) Trustee | Since September 2013 | Retired (June 2014 – present); CEO, UMB Fund Services, Inc., a mutual fund and hedge fund service provider, and the transfer agent, fund accountant, and co-administrator for the Fund (December 2006 – June 2014); President, Investment Managers Series Trust (December 2007 - June 2014). | 11 | Investment Managers Series Trust, a registered investment company (includes 54 portfolios), and 361 Social Infrastructure Fund, a closed-end investment company. |
| Interested Trustee: | | |
Eric M. Banhazl b† (born 1957) Trustee | Since September 2013 | Chairman (2016 – present), and President (2006 – 2015), Mutual Fund Administration, LLC, co-administrator for the Fund. Chairman (2018 – present), Foothill Capital Management, LLC, a registered investment advisor. | 11 | Investment Managers Series Trust, a registered investment company (includes 54 portfolios), and 361 Social Infrastructure Fund, a closed-end investment company. |
AXS Funds
SUPPLEMENTAL INFORMATION (Unaudited) – Continued
Name, Address, Year of Birth and Position(s) held with Trust | Term of Officec and Length of Time Served | Principal Occupation During the Past Five Years and Other Affiliations | Number of
Portfolios in
the Fund
Complex Overseen by
Trusteed | Other
Directorships Held
by Trustee During
the Past Five
Yearse |
| Interested Trustee: | | | | |
Terrance P. Gallagher a*
(born 1958) Trustee and President | Since July 2019 | President, Investment Managers Series Trust II (September 2013 – present); Executive Vice President, UMB Fund Services, Inc. (2007 – present). Director of Compliance, Unified Fund Services Inc. (now Huntington Fund Services), a mutual fund service provider (2004 – 2007). | 11 | Cliffwater Corporate Lending Fund, Agility Multi-Asset Income Fund, Corbin Multi-Strategy Fund, Aspiriant Risk-Managed Real Asset Fund, Aspiriant Risk-Managed Capital Appreciation Fund, Infinity Core Alternative Fund, Infinity Long/Short Equity Fund, LLC, Keystone Private Income Fund, First Trust Alternative Opportunities Fund, and Variant Alternative Income Fund, each a closed-end investment company. |
| Officers of the Trust: | | | | |
Rita Dam b (born 1966) Treasurer and Assistant Secretary | Since September 2013 | Treasurer, 361 Social Infrastructure Fund (December 2019 – present); Co-President, Foothill Capital Management, LLC, a registered investment advisor (2018 – present); Co-Chief Executive Officer (2016 – present), and Vice President (2006 – 2015), Mutual Fund Administration, LLC. | N/A | N/A |
Joy Ausili b (born 1966) Vice President and Assistant Secretary | Since January 2016 | Vice President and Assistant Secretary, 361 Social Infrastructure Fund (December 2019 – present); Co-President, Foothill Capital Management, LLC, a registered investment advisor (2018 – present); Co-Chief Executive Officer (2016 – present), and Vice President (2006 – 2015), Mutual Fund Administration, LLC; Secretary and Assistant Treasurer, Investment Managers Series Trust (September 2013 – January 2016). | N/A | N/A |
AXS Funds
SUPPLEMENTAL INFORMATION (Unaudited) – Continued
Name, Address, Year of Birth and Position(s) held with Trust | Term of Officec and Length of Time Served | Principal Occupation During the Past Five Years and Other Affiliations | Number of
Portfolios in
the Fund
Complex Overseen by
Trusteed | Other
Directorships Held
by Trustee During
the Past Five
Yearse |
| Officers of the Trust: | | | | |
Diane Drake b (born 1967) Secretary | Since January 2016 | Secretary, 361 Social Infrastructure Fund (December 2019 – present); Senior Counsel, Mutual Fund Administration, LLC (October 2015 – present); Chief Compliance Officer, Foothill Capital Management, LLC, a registered investment advisor (2018 – 2019). | N/A | N/A |
Martin Dziura b (born 1959) Chief Compliance Officer | Since September 2013 | Principal, Dziura Compliance Consulting, LLC (October 2014 - present). Managing Director, Cipperman Compliance Services (2010 – September 2014). Chief Compliance Officer, Hanlon Investment Management (2009 - 2010). Vice President − Compliance, Morgan Stanley Investment Management (2000 − 2009). | N/A | N/A |
| a | Address for certain Trustees and certain officers: 235 West Galena Street, Milwaukee, Wisconsin 53212. |
| b | Address for Mr. Banhazl, Ms. Ausili, Ms. Dam and Ms. Drake: 2220 E. Route 66, Suite 226, Glendora, California 91740. Address for Mr. Dziura: 309 Woodridge Lane, Media, Pennsylvania 19063. |
| c | Trustees and officers serve until their successors have been duly elected. |
| d | The Trust is comprised of 62 series managed by unaffiliated investment advisors. The term “Fund Complex” applies only to the Funds managed by the same investment advisor. The Funds’ investment advisor also serves as the investment advisor to the AXS Alternative Growth Fund, AXS Multi-Strategy Alternatives Fund, AXS Chesapeake Strategy Fund, AXS All Terrain Opportunity Fund, AXS Sustainable Fund, AXS Thomson Reuters Venture Capital Return Tracker, AXS Thomson Reuters Private Equity Return Tracker Fund, AXS Merger Fund, AXS Alternative Value Fund, AXS Market Neutral Fund and AXS Adaptive Plus fund which are offered in separate prospectus. The Funds do not hold themselves out as related to any other series within the Trust, for purposes of investment and investor services. |
| e | “Other Directorships Held” includes only directorship of companies required to register or file reports with the SEC under the Securities Exchange Act of 1934, as amended (that is, “public companies”) or other investment companies registered under the 1940 Act. |
| † | Mr. Banhazl is an “interested person” of the Trust by virtue of his position with Mutual Fund Administration, LLC and Foothill Capital Management, LLC. |
| * | Mr. Gallagher is an “interested person” of the Trust by virtue of his position with UMB Fund Services, Inc. |
AXS Funds
SUPPLEMENTAL INFORMATION (Unaudited) – Continued
Board Consideration of Investment Advisory and Sub-Advisory Agreements
At a meeting held on April 20-21, 2022, the Board of Trustees (the “Board”) of Investment Managers Series Trust II (the “Trust”), including the trustees who are not “interested persons” of the Trust (the “Independent Trustees”) as defined in the Investment Company Act of 1940, as amended (the “1940 Act”), reviewed and unanimously approved an amended investment advisory agreement (the “Amended Chesapeake Advisory Agreement”) between the Trust and AXS Investments LLC (the “Investment Advisor”) and an amended sub-advisory agreement (the “Amended Chesapeake Sub-Advisory Agreement”) between the Investment Advisor and Chesapeake Capital Corporation (“Chesapeake”) with respect to the AXS Chesapeake Strategy Fund series of the Trust (the “Chesapeake Strategy Fund”), in connection with the reorganization of the AXS Managed Futures Strategy Fund series of the Trust into the Chesapeake Strategy Fund (the “Reorganization”) and a proposal by the Investment Advisor and Chesapeake to reduce the advisory fee paid to the Investment Advisor and modify the advisory and sub-advisory fee split between the Investment Advisor and Chesapeake. The Amended Chesapeake Advisory Agreement and the Amended Chesapeake Sub-Advisory Agreement are collectively referred to below as the “Amended Chesapeake Fund Advisory Agreements.” In approving each Amended Chesapeake Fund Advisory Agreement, the Board, including the Independent Trustees, determined that such approval was in the best interests of the Chesapeake Strategy Fund and its shareholders.
At a meeting held on May 18, 2022, the Board and the Independent Trustees reviewed and unanimously approved a new investment sub-advisory agreement (the “Green Alpha Sub-Advisory Agreement”) between the Investment Advisor and Green Alpha Advisors, LLC (“Green Alpha”), and a new investment sub-advisory agreement (the “Uniplan Sub-Advisory Agreement” and together with the Green Alpha Sub-Advisory Agreement, the “Sustainable Income Fund Sub-Advisory Agreements”) between the Investment Advisor and Uniplan Investment counsel, Inc. (“Uniplan” and, together with Green Alpha, the “Sub-Advisors”), each with respect to the AXS Sustainable Income Fund series of the Trust (the “Sustainable Income Fund”) and each for an initial two-year term. The Board and the Independent Trustees considered the Agreements in connection with a proposal by the Investment Advisor to appoint Green Alpha and Uniplan as sub-advisors to the Sustainable Income Fund pursuant to the Trust’s and the Investment Advisor’s “manager of managers” exemptive order. In approving each Sustainable Income Fund Sub-Advisory Agreement, the Board, including the Independent Trustees, determined that each such approval was in the best interests of the Sustainable Income Fund and its shareholders.
At an in-person meeting held on July 19-20, 2022, the Board and the Independent Trustees reviewed and unanimously approved the investment advisory agreement (the “Advisory Agreement”) between the Trust and the Investment Advisor with respect to the AXS Adaptive Plus Fund series of the Trust (the “Adaptive Plus Fund”) for an initial two-year term. In approving the Advisory Agreement, the Board, including the Independent Trustees, determined that such approval was in the best interests of the Adaptive Plus Fund and its shareholders.
AXS Chesapeake Strategy Fund
Background
In advance of the April meeting, the Board received information about the Chesapeake Strategy Fund, the existing advisory agreement and sub-advisory agreement, and the Amended Chesapeake Fund Advisory Agreements from the Investment Advisor, Chesapeake, and Mutual Fund Administration, LLC and UMB Fund Services, Inc., the Trust’s co-administrators, certain portions of which are discussed below. The materials, among other things, included information about the organization and financial condition of the Investment Advisor and Chesapeake; information regarding the background, experience, and compensation structure of relevant personnel who would continue providing services to the Chesapeake Strategy Fund; information about Chesapeake’s compliance policies and procedures, disaster recovery and contingency planning, and policies with respect to portfolio execution and trading; and information regarding the proposed advisory and sub-advisory fees under the Amended Chesapeake Advisory Agreement and Amended Chesapeake Sub-Advisory Agreement, respectively. The Board also received a memorandum from legal counsel to the Trust and the Independent Trustees discussing the legal standards under the 1940 Act and other applicable law for their consideration of the proposed approval of the Amended Chesapeake Fund Advisory Agreements. In addition, the Board considered information reviewed by the Board regarding other series of the Trust managed by the Investment Advisor during the year at other Board and Board committee meetings. No representatives of the Investment Advisor or Chesapeake were present during the Board’s consideration of the Amended Chesapeake Fund Advisory Agreements, and the Independent Trustees were represented by their legal counsel with respect to the matters considered.
AXS Funds
SUPPLEMENTAL INFORMATION (Unaudited) – Continued
In approving the Amended Chesapeake Fund Advisory Agreements, the Board and the Independent Trustees considered a variety of factors, including those discussed below. In their deliberations, the Board and the Independent Trustees did not identify any particular factor that was controlling, and each Trustee may have attributed different weights to the various factors.
AXS Investments LLC
Nature, Extent and Quality of Services
The Board considered the services that the Investment Advisor and Chesapeake currently provided and would continue to provide to the Chesapeake Strategy Fund. In doing so, the Board considered the Investment Advisor’s role as the Chesapeake Strategy Fund’s investment advisor, noting that the Investment Advisor would continue to provide overall supervision of the general investment management and investment operations of the Fund, and oversee Chesapeake with respect to the Fund’s operations, including monitoring Chesapeake’s investment and trading activities with respect to the Fund, monitoring the Fund’s compliance with its investment policies, and providing general administrative services related to the Investment Advisor’s overall supervision of the Fund; and that Chesapeake’s responsibilities would include day-to-day portfolio management for the Fund. The Board also considered the qualifications, experience, and responsibilities of the personnel of the Investment Advisor who would continue to be involved in the activities of the Chesapeake Strategy Fund. In addition, the Board considered the overall quality of the organization and operations of the Investment Advisor, as well as its compliance structure and compliance procedures.
Advisory Fees and Expense Ratios
The Board considered that the Amended Chesapeake Advisory Agreement would be identical in all material respects to the existing advisory agreement between the Trust and the Investment Advisor with respect to the Chesapeake Strategy Fund, except that under the existing advisory agreement, the advisory fee paid to the Investment Advisor was 1.50% of the Chesapeake Strategy Fund’s average daily net assets, and under the Amended Chesapeake Advisory Agreement, which would become effective on the date of the Reorganization, the advisory fee paid to the Investment Advisor would be 1.45% of the Chesapeake Strategy Fund’s average daily net assets.
The Board and the Independent Trustees concluded that the proposed compensation payable to the Investment Advisor under the Amended Chesapeake Advisory Agreement would be fair and reasonable in light of the nature and quality of the services that would continue to be provided by the Investment Advisor to the Chesapeake Strategy Fund.
Chesapeake Capital Corporation
Nature, Extent and Quality of Services
The Board considered the overall quality of services that would continue to be provided by Chesapeake to the Chesapeake Strategy Fund. In doing so, the Board noted that as the sole sub-advisor to the Chesapeake Strategy Fund, the Sub-Advisor would continue to be primarily responsible for the day-to-day management of the Fund and its investment results. The Board also considered the qualifications, experience, and responsibilities of the personnel of the Sub-Advisor who would continue to be involved in the activities of the Fund. In addition, the Board considered the overall quality of the organization and operations of the Sub-Advisor, as well as its compliance structure and compliance procedures.
AXS Funds
SUPPLEMENTAL INFORMATION (Unaudited) – Continued
Sub-Advisory Fee
The Board considered that the Amended Chesapeake Sub-Advisory Agreement would be identical in all material respects to the existing sub-advisory agreement between the Investment Advisor and Chesapeake with respect to the Chesapeake Strategy Fund, except that under the existing sub-advisory agreement, the sub-advisory fee paid to Chesapeake was 0.75% of the Chesapeake Strategy Fund’s average daily net assets, and under the Amended Chesapeake Sub-Advisory Agreement, which would become effective on the date of the Reorganization, the sub-advisory fee paid to Chesapeake would be 0.725% of the Chesapeake Strategy Fund’s average daily net assets. The Board also noted that the Investment Advisor would continue to pay Chesapeake’s sub-advisory fees from the Investment Advisor’s advisory fees.
The Board and the Independent Trustees concluded that the proposed compensation payable to Chesapeake under the Amended Chesapeake Sub-Advisory Agreement would be fair and reasonable in light of the nature and quality of the services that would continue to be provided by Chesapeake to the Chesapeake Strategy Fund.
Conclusion
Based on these and other factors, the Board and the Independent Trustees concluded that approval of each Amended Chesapeake Fund Advisory Agreement was in the best interests of the Chesapeake Strategy Fund and its shareholders and, accordingly, approved each Amended Chesapeake Fund Advisory Agreement with respect to the Fund.
AXS Sustainable Income Fund
Background
In advance of the May meeting, the Board received information about the Sustainable Income Fund and the Sustainable Income Fund Sub-Advisory Agreements from the Investment Advisor, the Sub-Advisors, and Mutual Fund Administration, LLC and UMB Fund Services, Inc., the Trust’s co-administrators, certain portions of which are discussed below. The materials, among other things, included information about the organization and financial condition of each Sub-Advisor; information regarding the background, experience, and compensation structure of relevant personnel who would be providing services to the Sustainable Income Fund; information about each Sub-Advisor’s compliance policies and procedures, disaster recovery and contingency planning, and policies with respect to portfolio execution and trading; information regarding back-tested performance of a hypothetical portfolio constructed by Uniplan from issuers included in the investible universe selected by Green Alpha (the “Hypothetical Portfolio”); and information regarding the proposed sub-advisory fees under the Sustainable Income Fund Sub-Advisory Agreements. The Board also received a memorandum from legal counsel to the Trust and the Independent Trustees discussing the legal standards under the 1940 Act and other applicable law for their consideration of the proposed approval of the Advisory Agreement. In addition, the Board considered information reviewed by the Board regarding other series of the Trust managed by the Investment Advisor during the year at other Board and Board committee meetings. No representatives of the Investment Advisor or the Sub-Advisors were present during the Board’s consideration of the Sustainable Income Fund Sub-Advisory Agreements, and the Independent Trustees were represented by their legal counsel with respect to the matters considered.
In approving the Sustainable Income Fund Sub-Advisory Agreements, the Board and the Independent Trustees considered a variety of factors, including those discussed below. In their deliberations, the Board and the Independent Trustees did not identify any particular factor that was controlling, and each Trustee may have attributed different weights to the various factors.
AXS Funds
SUPPLEMENTAL INFORMATION (Unaudited) – Continued
Nature, Extent and Quality of Services
The Board considered that Green Alpha’s role would be to provide a universe of environmental, social, and governance (“ESG”) companies and that Uniplan would select fixed income securities from the ESG investment universe identified by Green Alpha based on Uniplan’s investment process. The Board noted that Green Alpha and Uniplan have worked together in similar capacities and that they were familiar with each other’s investment processes and approaches. With respect to the relevant performance information, the meeting materials indicated that the Hypothetical Portfolio outperformed the Bloomberg Aggregate Bond Index and the Sustainable Income Fund in each of 2019, 2020 and 2021, except that the Hypothetical Portfolio underperformed relative to the Fund in 2021 by 2.19%. The Trustees observed, however, that the annualized performance of the Hypothetical Portfolio for the three-year period was higher than those of the Index and the Fund.
The Board considered the overall quality of services to be provided by the Sub-Advisors to the Sustainable Income Fund. In doing so, the Board considered the respective roles of the Investment Advisor and the Sub-Advisors, noting that the Investment Advisor would provide overall supervision of the general investment management and investment operations of the Sustainable Income Fund and oversee the Sub-Advisors with respect to the Fund’s operations, including monitoring the provision of the investible universe by Green Alpha and the investment and trading activities of Uniplan, monitoring the Fund’s compliance with its investment policies, and providing general administrative services related to the Investment Advisor’s overall supervision of the Fund; and that Green Alpha’s responsibilities would include using its ESG selection criteria to generate the Fund’s investible universe, and Uniplan’s responsibilities would include selection of the investments for the Fund from that investible universe. The Board also noted the qualifications, experience, and responsibilities of the personnel of the Sub-Advisors who would be involved in the activities of the Sustainable Income Fund. In addition, the Board considered the overall quality of the organization and operations of each Sub-Advisor, as well as its compliance structure and compliance procedures.
The Board and the Independent Trustees concluded that based on the various factors they had reviewed, the Sub-Advisors would each have the capabilities, resources, and personnel necessary to manage the Fund, and that the Sub-Advisors would each provide the Fund with a reasonable potential for good investment results.
Sub-Advisory Fees
The Trustees discussed the sub-advisory fees proposed to be charged by each Sub-Advisor with respect to the Sustainable Income Fund. The Trustees noted that the Investment Advisor, Green Alpha, and Uniplan would each receive 33.3% of the Investment Advisor’s net revenue from the Sustainable Income Fund. The Trustees considered that Green Alpha did not provide the types of services it would provide to the Sustainable Income Fund to any other clients, and that Uniplan did not manage assets for any other clients using the investment strategies it would use to manage the Fund, and that therefore the Trustees were not able to meaningfully compare the proposed sub-advisory fees to fees charged by the Sub-Advisors to other clients. The Board did, however, review the standard management fee schedules charged by each Sub-Advisor to its clients, and noted that management of mutual fund assets requires compliance with certain requirements under the 1940 Act that do not apply to other types of clients. The Board also noted that the Investment Advisor would pay the Sub-Advisors’ sub-advisory fees out of the Investment Advisor’s advisory fees. In addition, the Board considered that the Investment Advisor was recommending the approval of the Sustainable Income Fund Sub-Advisory Agreements.
The Board and the Independent Trustees concluded that the proposed compensation payable to Green Alpha and Uniplan under the Green Alpha Sub-Advisory Agreement and Uniplan Sub-Advisory Agreement, respectively, would be fair and reasonable in light of the nature and quality of the services proposed to be provided by the Sub-Advisors to the Fund.
AXS Funds
SUPPLEMENTAL INFORMATION (Unaudited) – Continued
Benefits to the Sub-Advisors
The Board also considered that the potential benefits to be received by each Sub-Advisor as a result of its relationship with the Fund, other than the receipt of its sub-advisory fee, would include the usual types of “fall out” benefits received by sub-advisors to the Trust, including, as applicable, research received from broker-dealers providing execution services to the Sustainable Income Fund, the beneficial effects from the review by the Trust’s Chief Compliance Officer of the Sub-Advisor’s compliance program, the intangible benefits of the Sub-Advisor’s association with the Fund generally, and any favorable publicity arising in connection with the Fund’s performance.
Conclusion
Based on these and other factors, the Board and the Independent Trustees concluded that approval of each Sustainable Income Fund Sub-Advisory Agreement was in the best interests of the Sustainable Income Fund and its shareholders and, accordingly, approved each Sustainable Income Fund Sub-Advisory Agreement with respect to the Fund.
AXS Adaptive Plus Fund
Background
In advance of the July meeting, the Board received information about the Adaptive Plus Fund and the Advisory Agreement from the Investment Advisor and from Mutual Fund Administration, LLC and UMB Fund Services, Inc., the Trust’s co-administrators, certain portions of which are discussed below. The materials, among other things, included information about the organization and financial condition of the Investment Advisor; information regarding the background, experience, and compensation structure of relevant personnel who would be providing services to the Fund; information about the Investment Advisor’s compliance policies and procedures, disaster recovery and contingency planning, and policies with respect to portfolio execution and trading; information regarding the estimated profitability of the Investment Advisor’s overall relationship with the Fund; and a report prepared by Broadridge comparing the proposed advisory fee and estimated total expenses of the Fund with those of the Peer Group and Morningstar, Inc.’s Long-Short Equity Fund Universe. The Board also received a memorandum from legal counsel to the Trust and the Independent Trustees discussing the legal standards under the 1940 Act and other applicable law for their consideration of the proposed approval of the Advisory Agreement. In addition, the Board considered information reviewed by the Board regarding other series of the Trust managed by the Investment Advisor during the year at other Board and Board committee meetings. No representatives of the Investment Advisor were present during the Board’s consideration of the Advisory Agreement, and the Independent Trustees were represented by their legal counsel with respect to the matters considered.
In approving the Advisory Agreement, the Board and the Independent Trustees considered a variety of factors, including those discussed below. In their deliberations, the Board and the Independent Trustees did not identify any particular factor that was controlling, and each Trustee may have attributed different weights to the various factors.
Nature, Extent and Quality of Services
The Board noted that although there was no relevant performance information for it to review with respect to the Adaptive Plus Fund, it was familiar with the Investment Advisor as the investment advisor for many other series of the Trust. The Board considered the overall quality of the services to be provided by the Investment Advisor to the Adaptive Plus Fund. In doing so, the Board considered the Investment Advisor’s specific responsibilities in day-to-day management and oversight of the Adaptive Plus Fund, as well as the qualifications, experience, and responsibilities of the personnel who would be involved in the activities of the Fund. The Board also considered the overall quality of the organization and operations of the Investment Advisor, as well as its compliance structure and compliance procedures.
AXS Funds
SUPPLEMENTAL INFORMATION (Unaudited) – Continued
The Board and the Independent Trustees concluded that based on the various factors they had reviewed, the Investment Advisor would have the capabilities, resources, and personnel necessary to manage the Adaptive Plus Fund, and that the Investment Advisor would provide the Fund with a reasonable potential for good investment results.
Advisory Fee and Expense Ratio
The Board reviewed information regarding the Adaptive Plus Fund’s proposed advisory fee and estimated total expenses. The meeting materials indicated that the advisory fee proposed to be paid by the Adaptive Plus Fund (gross of fee waivers) was higher than the Peer Group and Fund Universe medians by 0.225% and 0.275%, respectively. The Trustees considered the Investment Advisor’s observation that the Adaptive Plus Fund is actively managed, and that the Peer Group included several low cost, passively managed exchange-traded funds that are significantly larger than the Fund. The Trustees noted the Investment Advisor’s assertions that the Adaptive Plus Fund is more specialized, innovative, and unique compared to many of the funds in the Peer Group; that the Fund employs a long-short equity strategy using futures contracts; and that funds managed using similar strategies are typically hedge funds that charge a 2% management fee with an incentive fee of 20% of profits made above a certain predefined benchmark. The Trustees also noted that the Investment Advisor does not manage any other accounts with the same objectives and policies as the Adaptive Plus Fund, and therefore they did not have a good basis for comparing the Fund’s proposed advisory fee with those of other similar client accounts of the Investment Advisor. The Trustees also considered that the Adaptive Plus Fund’s proposed advisory fee was within the range of advisory fees paid by other series of the Trust managed by the Investment Advisor.
The meeting materials indicated that the estimated annual total expenses (net of fee waivers) of the Adaptive Plus Fund were higher than the Fund Universe and Peer Group medians by 0.33% and 0.34%, respectively. The Trustees considered that the Adaptive Plus Fund’s higher estimated total expenses were, in part, attributable to the Fund’s higher proposed advisory fee. The Trustees also considered the Investment Advisor’s observation that although the Adaptive Plus Fund’s estimated net expenses were in the highest quartile of funds in the Peer Group, some of the funds in the Peer Group are part of larger fund complexes and therefore could have lower expenses and/or support lower expense caps. The Board noted the Investment Advisor’s assertion that the larger fund complexes allow those funds in the Peer Group to pass along economies of scale that the Investment Advisor is currently unable to match. The Board also noted that the Investment Advisor set the net expenses for the Adaptive Plus Fund at a level at which the Investment Advisor can maintain the viability of the Fund.
The Board and the Independent Trustees concluded that the proposed compensation payable to the Investment Advisor under the Advisory Agreement would be fair and reasonable in light of the nature and quality of the services proposed to be provided by the Investment Advisor to the Adaptive Plus Fund.
Profitability and Economies of Scale
The Board next reviewed the estimated profitability to the Investment Advisor of its relationship with the Adaptive Plus Fund in the Fund’s first year of operations, taking into account estimated assets of $25 million. The Board observed that the Investment Advisor anticipated waiving a significant portion of its advisory fee for the Adaptive Plus Fund, and determined that the Investment Advisor’s anticipated profits with respect to the Fund were reasonable.
The Board noted that the potential benefits received by the Investment Advisor as a result of its relationship with the Adaptive Plus Fund, other than the receipt of its advisory fee, would include the usual types of “fall out” benefits received by advisors to the Trust, including any research received from broker-dealers providing execution services to the Fund, the beneficial effects from the review by the Trust’s Chief Compliance Officer of the Investment Advisor’s compliance program, the intangible benefits of its association with the Fund generally, and any favorable publicity arising in connection with the Fund’s performance. The Board also noted that although the Advisory Agreement does not provide for any advisory fee breakpoints, the Adaptive Plus Fund’s asset level would likely be too low to achieve significant economies of scale during the Fund’s initial startup period, and that any such economies would be considered in the future as the Fund’s assets grow.
AXS Funds
SUPPLEMENTAL INFORMATION (Unaudited) – Continued
Conclusion
Based on these and other factors, the Board and the Independent Trustees concluded that approval of the Advisory Agreement was in the best interests of the Adaptive Plus Fund and its shareholders and, accordingly, approved the Advisory Agreement.
AXS Funds
EXPENSE EXAMPLES
For the Periods Ended September 30, 2022 (Unaudited)
Expense Examples
As a shareholder of the Funds, you incur two types of costs: (1) transaction costs; and (2) ongoing costs, including management fees; distribution and/or 12b-1 fees (Class A, Class C, and Investor Class shares only) and other Fund expenses. The examples below are intended to help you understand your ongoing costs (in dollars) of investing in the Funds and to compare these costs with the ongoing costs of investing in other mutual funds.
These examples are based on an investment of $1,000 invested at the beginning of the period and held for the entire period from April 1, 2022 to September 30, 2022.
The Adaptive Plus Fund’s Actual Performance example is based on an investment of $1,000 invested at the beginning of the period and held for the entire period from September 15, 2022 (commencement of operations) to September 30, 2022.
Actual Expenses
The information in the row titled “Actual Performance” of the table below provides actual account values and actual expenses. You may use the information in these columns, together with the amount you invested, to estimate the expenses that you paid over the period. Simply divide your account value by $1,000 (for example, an $8,600 account value divided by $1,000 = 8.6), then multiply the result by the number in the appropriate row for your share class, under the column titled “Expenses Paid During Period” to estimate the expenses you paid on your account during this period.
Hypothetical Example for Comparison Purposes
The information in the row titled “Hypothetical (5% annual return before expenses)” of the table below provides hypothetical account values and hypothetical expenses based on the Fund’s actual expense ratios and an assumed rate of return of 5% per year before expenses, which is not the Fund’s actual return. The hypothetical account values and expenses may not be used to estimate the actual ending account balance or expenses you paid for the period. You may use this information to compare the ongoing costs of investing in the Fund and other funds. To do so, compare these 5% hypothetical examples with the 5% hypothetical examples that appear in the shareholder reports of the other funds.
Please note that the expenses shown in the table are meant to highlight your ongoing costs only and do not reflect any transaction costs, such as sales charges (load) or contingent deferred sales charges. Therefore, the information in the row titled “Hypothetical (5% annual return before expenses)” is useful in comparing ongoing costs only and will not help you determine the relative total costs of owning different funds. In addition, if these transactional costs were included, your costs would have been higher.
| Alternative Growth Fund | Beginning Account Value | Ending Account Value | Expenses Paid During Period* |
| 4/1/22 | 9/30/22 | 4/1/22 – 9/30/22 |
| Class A | Actual Performance | $1,000.00 | $740.00 | $5.41 |
| | Hypothetical (5% annual return before expenses) | 1,000.00 | 1,018.86 | 6.27 |
| Class I | Actual Performance | 1,000.00 | 740.70 | 4.31 |
| | Hypothetical (5% annual return before expenses) | 1,000.00 | 1,020.11 | 5.01 |
| * | Expenses are equal to the Fund’s annualized expense ratios of 1.24% and 0.99% for Class A shares and Class I shares, respectively, multiplied by the average account values over the period, multiplied by 183/365 (to reflect the six-month period). The expense ratios reflect an expense waiver and other expenses absorbed. Assumes all dividends and distributions were reinvested. |
AXS Funds
EXPENSE EXAMPLES - Continued
For the Periods Ended September 30, 2022 (Unaudited)
| Chesapeake Strategy Fund | Beginning Account Value | Ending Account Value | Expenses Paid During Period* |
| 4/1/22 | 9/30/22 | 4/1/22 – 9/30/22 |
| Class A | Actual Performance | $1,000.00 | $1,102.70 | $11.07 |
| | Hypothetical (5% annual return before expenses) | 1,000.00 | 1,014.54 | 10.61 |
| Class C | Actual Performance | 1,000.00 | 1,098.70 | 15.00 |
| | Hypothetical (5% annual return before expenses) | 1,000.00 | 1,010.78 | 14.37 |
| Class I | Actual Performance | 1,000.00 | 1,104.00 | 9.76 |
| | Hypothetical (5% annual return before expenses) | 1,000.00 | 1,015.79 | 9.35 |
| * | Expenses are equal to the Fund’s annualized expense ratios of 2.10%, 2.85% and 1.85% for Class A shares, Class C shares and Class I shares, respectively, multiplied by the average account values over the period, multiplied by 183/365 (to reflect the six-month period). The expense ratios reflect an expense waiver. Assumes all dividends and distributions were reinvested. |
| Multi-Strategy Alternatives Fund | Beginning Account Value | Ending Account Value | Expenses Paid During Period** |
| 4/1/22 | 9/30/22 | 4/1/22 – 9/30/22 |
| Investor Class* | Actual Performance | $1,000.00 | $786.80 | $7.52 |
| | Hypothetical (5% annual return before expenses) | 1,000.00 | 1,016.65 | 8.49 |
| Class I | Actual Performance | 1,000.00 | 787.30 | 6.77 |
| | Hypothetical (5% annual return before expenses) | 1,000.00 | 1,017.50 | 7.64 |
| * | Previously R-1 Class Shares. |
| ** | Expenses are equal to the Fund’s annualized expense ratios of 1.68% and 1.51% for Investor Class shares and Class I shares, respectively, multiplied by the average account values over the period, multiplied by 183/365 (to reflect the six-month period). The expense ratios reflect an expense waiver. Assumes all dividends and distributions were reinvested. |
| Sustainable Income Fund | Beginning Account Value | Ending Account Value | Expenses Paid During Period* |
| 4/1/22 | 9/30/22 | 4/1/22 – 9/30/22 |
| Class I | Actual Performance | $1,000.00 | $897.90 | $4.71 |
| | Hypothetical (5% annual return before expenses) | 1,000.00 | 1,020.10 | 5.01 |
| * | Expenses are equal to the Fund’s annualized expense ratio of 0.99% for Class I shares, multiplied by the average account values over the period, multiplied by 183/365 (to reflect the six-month period). The expense ratios reflect an expense waiver. Assumes all dividends and distributions were reinvested. |
AXS Funds
EXPENSE EXAMPLES - Continued
For the Periods Ended September 30, 2022 (Unaudited)
| Thomson Reuters Private Equity Return Tracker Fund | Beginning Account Value | Ending Account Value | Expenses Paid During Period* |
| 4/1/22 | 9/30/22 | 4/1/22 – 9/30/22 |
| Class A | Actual Performance | $1,000.00 | $664.10 | $7.30 |
| | Hypothetical (5% annual return before expenses) | 1,000.00 | 1,016.29 | 8.85 |
| Class C | Actual Performance | 1,000.00 | 662.00 | 10.42 |
| | Hypothetical (5% annual return before expenses) | 1,000.00 | 1,012.53 | 12.62 |
| Class I | Actual Performance | 1,000.00 | 665.40 | 6.26 |
| | Hypothetical (5% annual return before expenses) | 1,000.00 | 1,017.55 | 7.59 |
| * | Expenses are equal to the Fund’s annualized expense ratios of 1.75%, 2.50% and 1.50% for Class A shares, Class C shares and Class I shares, respectively, multiplied by the average account values over the period, multiplied by 183/365 (to reflect the six-month period). The expense ratio reflects an expense waiver. Assumes all dividends and distributions were reinvested. |
| Thomson Reuters Venture Capital Return Tracker Fund | Beginning Account Value | Ending Account Value | Expenses Paid During Period* |
| 4/1/22 | 9/30/22 | 4/1/22 – 9/30/22 |
| Class A | Actual Performance | $1,000.00 | $585.40 | $6.96 |
| | Hypothetical (5% annual return before expenses) | 1,000.00 | 1,016.29 | 8.85 |
| Class C | Actual Performance | 1,000.00 | 583.20 | 9.92 |
| | Hypothetical (5% annual return before expenses) | 1,000.00 | 1,012.53 | 12.61 |
| Class I | Actual Performance | 1,000.00 | 586.30 | 5.96 |
| | Hypothetical (5% annual return before expenses) | 1,000.00 | 1,017.55 | 7.59 |
| * | Expenses are equal to the Fund’s annualized expense ratios of 1.75%, 2.50% and 1.50% for Class A shares, Class C shares and Class I shares, respectively, multiplied by the average account values over the period, multiplied by 183/365 (to reflect the six-month period). The expense ratio reflects an expense waiver. Assumes all dividends and distributions were reinvested. |
| All Terrain Opportunity Fund | Beginning Account Value | Ending Account Value | Expenses Paid During Period* |
| 4/1/22 | 9/30/22 | 4/1/22 – 9/30/22 |
| Class I** | Actual Performance | $ 1,000.00 | $ 960.00 | $7.86 |
| | Hypothetical (5% annual return before expenses) | 1,000.00 | 1,017.05 | 8.09 |
| * | Expenses are equal to the Fund’s annualized expense ratio of 1.60%, multiplied by the average account values over the period, multiplied by 183/365 (to reflect the six month period). The expense ratio reflects an expense waiver. Assumes all dividends and distributions were reinvested. |
| ** | Previously Institutional Class Shares. |
AXS Funds
EXPENSE EXAMPLES - Continued
For the Periods Ended September 30, 2022 (Unaudited)
Merger Fund | Beginning Account Value | Ending Account Value | Expenses Paid During Period* |
| | 4/1/22 | 9/30/22 | 4/1/22 – 9/30/22 |
| Investor Class | Actual Performance | $ 1,000.00 | $994.20 | $9.66 |
| | Hypothetical (5% annual return before expenses) | 1,000.00 | 1,015.24 | 9.77 |
| Class I | Actual Performance | 1,000.00 | 995.30 | 8.39 |
| | Hypothetical (5% annual return before expenses) | 1,000.00 | 1,016.66 | 8.48 |
| * | Expenses are equal to the Fund’s annualized expense ratios of 1.93% and 1.68% for Investor Class shares and Class I shares, respectively, multiplied by the average account values over the period, multiplied by 183/365 (to reflect the six-month period). The expense ratios reflect an expense waiver. Assumes all dividends and distributions were reinvested. |
| Alternative Value Fund | Beginning Account Value | Ending Account Value | Expenses Paid During Period* |
| 4/1/22 | 9/30/22 | 4/1/22 – 9/30/22 |
| Investor Class | Actual Performance | $1,000.00 | $869.90 | $8.93 |
| | Hypothetical (5% annual return before expenses) | 1,000.00 | 1,015.51 | 9.63 |
| Class I | Actual Performance | 1,000.00 | 871.30 | 7.56 |
| | Hypothetical (5% annual return before expenses) | 1,000.00 | 1,016.99 | 8.15 |
| * | Expenses are equal to the Fund’s annualized expense ratio of 1.91% and 1.61% for Investor Class shares and Class I shares, respectively, multiplied by the average account value over the period, multiplied by 183/365 (to reflect the six-month period). The expense ratios reflect an expense waiver. Assumes all dividends and distributions were reinvested. |
| Market Neutral Fund | Beginning Account Value | Ending Account Value | Expenses Paid During Period* |
| 4/1/22 | 9/30/22 | 4/1/22 – 9/30/22 |
| Investor Class | Actual Performance | $1,000.00 | $1,028.70 | $16.85 |
| | Hypothetical (5% annual return before expenses) | 1,000.00 | 1,008.45 | 16.69 |
| Class I | Actual Performance | 1,000.00 | 1,028.90 | 16.84 |
| | Hypothetical (5% annual return before expenses) | 1,000.00 | 1,008.47 | 16.67 |
| * | Expenses are equal to the Fund’s annualized expense ratio of 4.48% and 4.23% for Investor Class shares and Class I shares, respectively, multiplied by the average account value over the period, multiplied by 183/365 (to reflect the six-month period). The expense ratios reflect an expense waiver. Assumes all dividends and distributions were reinvested. |
AXS Funds
EXPENSE EXAMPLES - Continued
For the Periods Ended September 30, 2022 (Unaudited)
| Adaptive Plus Fund | Beginning Account Value | Ending Account Value | Expenses Paid During Period |
| 9/15/22* | 9/30/22 | 9/15/22* – 9/30/22 |
| Class I | Actual Performance** | $1,000.00 | $1,031.00 | $0.83 |
| | | 4/1/22 | 9/30/22 | 4/1/22 – 9/30/22 |
| | Hypothetical (5% annual return before expenses)*** | 1,000.00 | 1,015.09 | 10.05 |
| * | Commencement of operations. |
| ** | Expenses are equal to the Fund’s annualized expense ratio of 1.99% for Class I shares multiplied by the average account value over the period, multiplied by 16/365 (to reflect the period ended). The expense ratios reflect an expense waiver. Assumes all dividends and distributions were reinvested. |
| *** | Expenses are equal to the Fund’s annualized expense ratio of 1.99% multiplied by the average account value over the period, multiplied by 183/365 (to reflect the six-month period). The expense ratios reflect an expense waiver. Assumes all dividends and distributions were reinvested. |
AXS Funds
Each a series of Investment Managers Series Trust II
Investment Advisor
AXS Investments LLC
181 Westchester Avenue, Unit 402
Port Chester, New York 10573
Sub-Advisor
Quantitative Value Technologies, LLC dba Cognios Capital
3965 West 83rd Street, Suite 348
Prairie Village, Kansas 66208
Sub-Advisor
Kellner Management, L.P.
900 Third Avenue, Suite 1401
New York, New York 10022
Sub-Advisor
Ampersand Investment Management, LLC
10 Canal Street, Suite 336
Bristol, Pennsylvania 19007
Sub-Advisor
Green Alpha Advisors, LLC
287 Century Circle, Suite 201
Louisville, Colorado 80027
Sub-Advisor
Chesapeake Capital Corporation
1721 Summit Avenue
Richmond, Virginia 23220
Sub-Advisor
Uniplan Investment Counsel, Inc
22939 West Overson Road
Union Grove, Wisconsin 53182
Independent Registered Public Accounting Firm
Tait, Weller & Baker LLP
Two Liberty Place
50 South 16th Street, Suite 2900
Philadelphia, Pennsylvania 19102
Custodian
UMB Bank, n.a.
928 Grand Boulevard, 5th Floor
Kansas City, Missouri 64106
Fund Co-Administrator
Mutual Fund Administration, LLC
2220 East Route 66, Suite 226
Glendora, California 91740
Fund Co-Administrator, Transfer Agent and Fund Accountant
UMB Fund Services, Inc.
235 West Galena Street
Milwaukee, Wisconsin 53212
Distributor
IMST Distributors, LLC
Three Canal Plaza, Suite 100
Portland, Maine 04101
www.acaglobal.com
FUND INFORMATION
| | TICKER | CUSIP |
| AXS Alternative Growth Fund – Class A | EEHAX | 46141T 430 |
| AXS Alternative Growth Fund – Class I | EEHIX | 46141T 380 |
| AXS Chesapeake Strategy Fund – Class A | ECHAX | 46141T 471 |
| AXS Chesapeake Strategy Fund – Class C | ECHCX | 46141T 463 |
| AXS Chesapeake Strategy Fund – Class I | EQCHX | 46141T 372 |
| AXS Sustainable Income Fund – Class I | AXSKX | 46141T 349 |
| AXS Multi-Strategy Alternatives Fund – Class I | KCMIX | 46141T 455 |
| AXS Multi-Strategy Alternatives Fund – Investor Class | KCMTX | 46141T 448 |
| AXS Thomson Reuters Private Equity Return Tracker Fund – Class A | LDPAX | 46141T 323 |
| AXS Thomson Reuters Private Equity Return Tracker Fund – Class C | LDPCX | 46141T 315 |
| AXS Thomson Reuters Private Equity Return Tracker Fund – Class I | LDPIX | 46141T 299 |
| AXS Thomson Reuters Venture Capital Return Tracker Fund – Class A | LDVAX | 46141T 281 |
| AXS Thomson Reuters Venture Capital Return Tracker Fund – Class C | LDVCX | 46141T 273 |
| AXS Thomson Reuters Venture Capital Return Tracker Fund – Class I | LDVIX | 46141T 265 |
| AXS All Terrain Opportunity Fund – Class I | TERIX | 46141T 406 |
| AXS Merger Fund – Investor Class | GAKAX | 46141T 216 |
| AXS Merger Fund – Class I | GAKIX | 46141T 190 |
| AXS Alternative Value Fund – Investor Class | COGLX | 46141T 240 |
| AXS Alternative Value Fund – Class I | COGVX | 46141T 257 |
| AXS Market Neutral Fund – Investor Class | COGMX | 46141T 224 |
| AXS Market Neutral Fund – Class I | COGIX | 46141T 232 |
| AXS Adaptive Plus Fund – Class I | AXSPX | 46144X552 |
Privacy Principles of the AXS Funds for Shareholders
The Funds are committed to maintaining the privacy of their shareholders and to safeguarding their non-public personal information. The following information is provided to help you understand what personal information the Funds collect, how we protect that information and why, in certain cases, we may share information with select other parties.
Generally, the Funds do not receive any non-public personal information relating to their shareholders, although certain non-public personal information of their shareholders may become available to the Funds. The Funds do not disclose any non-public personal information about their shareholders or former shareholders to anyone, except as permitted by law or as is necessary in order to service shareholder accounts (for example, to a transfer agent or third party administrator).
This report is sent to shareholders of the AXS Funds for their information. It is not a Prospectus, circular or representation intended for use in the purchase or sale of shares of the Funds or of any securities mentioned in this report.
Proxy Voting
The Funds’ proxy voting policies and procedures, as well as information regarding how the Funds voted proxies for portfolio securities, if applicable, during the most recent 12-month period ended June 30, are available, without charge and upon request by calling (833) 297-2587 or on the SEC’s website at www.sec.gov.
Fund Portfolio Holdings
The Funds file a complete schedule of their portfolio holdings with the SEC for the first and third quarters of each fiscal year on Form N-PORT within 60 days of the end of such fiscal quarter. Shareholders may obtain the Funds’ Form N-PORT on the SEC’s website at www.sec.gov.
Prior to the use of Form N-PORT, the Funds file their complete schedule of portfolio holdings with the SEC on Form N-Q, which is available online at www.sec.gov.
Householding
The Funds will mail only one copy of shareholder documents, including prospectuses notice of annual and semi-annual reports availability and proxy statements, to shareholders with multiple accounts at the same address. This practice is commonly called “householding” and is intended to reduce expenses and eliminate duplicate mailings of shareholder documents. Mailings of your shareholder documents may be householded indefinitely unless you instruct us otherwise. If you do not want the mailing of these documents to be combined with those for other members of your household, please call the Funds at (833) 297-2587.
AXS Funds
P.O. Box 2175
Milwaukee, WI 53201
Toll Free: (833) 297-2587
Item 1. Report to Stockholders (Continued).
(b) Not applicable.
Item 2. Code of Ethics.
The registrant has adopted a code of ethics that applies to the registrant's principal executive officer and principal financial officer. The registrant has not made any amendments to its code of ethics during the period covered by this report. The registrant has not granted any waivers from any provisions of the code of ethics during the period covered by this report.
The registrant undertakes to provide to any person without charge, upon request, a copy of its code of ethics by mail when they call the registrant at 1-833-297-2587.
Item 3. Audit Committee Financial Expert.
The Board of Trustees of the Registrant has determined that the Registrant has the following “audit committee financial experts” as defined in Item 3(b) of Form N-CSR serving on its Audit Committee: Messrs. Thomas Knipper and John P. Zader. The audit committee financial experts are “independent” as that term is defined in Item 3(a)(2) of Form N-CSR.
Item 4. Principal Accountant Fees and Services.
The registrant has engaged its principal accountant to perform audit services, audit-related services, tax services and other services during the past two fiscal years. "Audit services" refer to performing an audit of the registrant's annual financial statements or services that are normally provided by the accountant in connection with statutory and regulatory filings or engagements for those fiscal years. "Audit-related services" refer to the assurance and related services by the principal accountant that are reasonably related to the performance of the audit. "Tax services" refer to professional services rendered by the principal accountant for tax compliance, tax advice, and tax planning. There were no "other services" provided by the principal accountant. The following table details the aggregate fees billed or expected to be billed for each of the last two fiscal years for audit fees, audit-related fees, tax fees and other fees by the principal accountant.
| | FYE 9/30/2022 | FYE 9/30/2021 |
| Audit Fees | $173,500 | $156,000 |
| Audit-Related Fees | N/A | N/A |
| Tax Fees | $27,500 | $28,000 |
| All Other Fees | N/A | N/A |
The audit committee has adopted pre-approval policies and procedures that require the audit committee to pre-approve all audit and non-audit services of the registrant, including services provided to any entity affiliated with the registrant.
The percentage of fees billed by Tait, Weller, & Weller LLP applicable to non-audit services pursuant to waiver of pre-approval requirement were as follows:
| | FYE 9/30/2022 | FYE 9/30/2021 |
| Audit-Related Fees | 0% | 0% |
| Tax Fees | 0% | 0% |
| All Other Fees | 0% | 0% |
All of the principal accountant's hours spent on auditing the registrant's financial statements were attributed to work performed by full-time permanent employees of the principal accountant.
The following table indicates the non-audit fees billed or expected to be billed by the registrant's accountant for services to the registrant and to the registrant's investment advisor (and any other controlling entity, etc.—not sub-advisor) for the last two years. The audit committee of the Board of Trustees has considered whether the provision of non-audit services that were rendered to the registrant's investment advisor is compatible with maintaining the principal accountant's independence and has concluded that the provision of such non-audit services by the accountant has not compromised the accountant's independence.
| | FYE 9/30/2022 | FYE 9/30/2021 |
| Non-Audit Related Fees | N/A | N/A |
| Registrant | N/A | N/A |
| Registrant’s Investment Advisor | N/A | N/A |
Item 5. Audit Committee of Listed Registrants.
| (a) | Not applicable to registrants who are not listed issuers (as defined in Rule 10A-3 under the Securities Exchange Act of 1934). |
Item 6. Schedule of Investments.
| (a) | Schedule of Investments is included as part of the report to shareholders filed under Item 1 of this Form. |
Item 7. Disclosure of Proxy Voting Policies and Procedures for Closed-End Management Investment Companies.
Not applicable to open-end investment companies.
Item 8. Portfolio Managers of Closed-End Management Investment Companies.
Not applicable to open-end investment companies.
Item 9. Purchases of Equity Securities by Closed-End Management Investment Company and Affiliated Purchasers.
Not applicable.
Item 10. Submission of Matters to a Vote of Security Holders.
The registrant has not made any material changes to the procedures by which shareholders may recommend nominees to the registrant’s Board of Trustees.
Item 11. Controls and Procedures.
| (a) | The Registrant’s President/Chief Executive Officer and Treasurer/Chief Financial Officer have reviewed the Registrant's disclosure controls and procedures (as defined in Rule 30a-3(c) under the Investment Company Act of 1940 (the “Act”)) as of a date within 90 days of the filing of this report, as required by Rule 30a-3(b) under the Act and Rules 13a-15(b) or 15d-15(b) under the Securities Exchange Act of 1934. Based on their review, such officers have concluded that the disclosure controls and procedures are effective in ensuring that information required to be disclosed in this report is appropriately recorded, processed, summarized and reported and made known to them by others within the Registrant and by the Registrant’s service provider. |
| (b) | There were no changes in the Registrant's internal control over financial reporting (as defined in Rule 30a-3(d) under the Act) that occurred during the period covered by this report that has materially affected, or is reasonably likely to materially affect, the Registrant's internal control over financial reporting. |
Item 12. Disclosure of Securities Lending Activities for Closed-End Management Investment Companies.
Not applicable to open-end investment companies.
Item 13. Exhibits.
(2) Certifications pursuant to Section 302 of the Sarbanes-Oxley Act of 2002. Filed herewith.
(3) Any written solicitation to purchase securities under Rule 23c-1 under the Act sent or given during the period covered by the report by or on behalf of the registrant to 10 or more persons. Not applicable to open-end investment companies.
(4) Change in independent public accountant. File herewith.
SIGNATURES
Pursuant to the requirements of the Securities Exchange Act of 1934 and the Investment Company Act of 1940, the registrant has duly caused this report to be signed on its behalf by the undersigned, thereunto duly authorized.
| (Registrant) | Investment Managers Series Trust II | |
| | | |
| By (Signature and Title) | /s/ Terrance Gallagher | |
| | Terrance Gallagher, President/Chief Executive Officer | |
| | | |
| Date | 12/9/2022 | |
Pursuant to the requirements of the Securities Exchange Act of 1934 and the Investment Company Act of 1940, this report has been signed below by the following persons on behalf of the registrant and in the capacities and on the dates indicated.
| By (Signature and Title) | /s/ Terrance Gallagher | |
| | Terrance Gallagher, President/Chief Executive Officer | |
| | | |
| Date | 12/9/2022 | |
| | | |
| By (Signature and Title) | /s/ Rita Dam | |
| | Rita Dam, Treasurer/Chief Financial Officer | |
| | | |
| Date | 12/9/2022 | |