UNITED STATES
SECURITIES AND EXCHANGE COMMISSION
Washington, D.C. 20549
FORM N-CSR
CERTIFIED SHAREHOLDER REPORT OF REGISTERED
MANAGEMENT INVESTMENT COMPANIES
Investment Company Act file number 811-22894
INVESTMENT MANAGERS SERIES TRUST II
(Exact name of registrant as specified in charter)
235 W. Galena Street
Milwaukee, WI 53212
(Address of principal executive offices) (Zip code)
Diane J. Drake
Mutual Fund Administration, LLC
2220 E. Route 66, Suite 226
Glendora, CA 91740
(Name and address of agent for service)
(626) 385-5777
Registrant's telephone number, including area code
Date of fiscal year end: March 31
Date of reporting period: March 31, 2023
Item 1. Report to Stockholders.
The registrant’s annual report transmitted to shareholders pursuant to Rule 30e-1 under the Investment Company Act of 1940, as amended (the “Investment Company Act”), is as follows:

| AXS 2X Innovation ETF | | AXS 1.5X PYPL Bull Daily ETF |
| (TARK) | | (PYPT) |
| | | |
| AXS Short China Internet ETF | | AXS TSLA Bear Daily ETF |
| (SWEB) | | (TSLQ) |
| | | |
| AXS 1.25X NVDA Bear Daily ETF | | AXS 2X NKE Bear Daily ETF |
| (NVDS) | | (NKEQ) |
| | | |
| AXS 2X PFE Bear Daily ETF | | AXS 2X NKE Bull Daily ETF |
| (PFES) | | (NKEL) |
| | | |
| AXS 2X PFE Bull Daily ETF | | AXS Short De-SPAC Daily ETF |
| (PFEL) | | (SOGU) |
| | | |
| AXS 1.5X PYPL Bear Daily ETF | | AXS Short Innovation Daily ETF |
| (PYPS) | | (SARK) |
ANNUAL REPORT
MARCH 31, 2023
AXS ETFs
Each a series of Investment Managers Series Trust II
Table of Contents
| Shareholder Letter | 1 |
| Fund Performance | 25 |
| Schedule of Investments | 49 |
| Statements of Assets and Liabilities | 61 |
| Statements of Operations | 65 |
| Statements of Changes in Net Assets | 77 |
| Financial Highlights | 89 |
| Notes to Financial Statements | 101 |
| Report of Independent Registered Public Accounting Firm | 123 |
| Supplemental Information | 125 |
| Expense Examples | 130 |
This report and the financial statements contained herein are provided for the general information of the shareholders of the AXS ETFs. This report is not authorized for distribution to prospective investors in the ETFs unless preceded or accompanied by an effective prospectus.
www.axsinvestments.com

Dear Shareholders,
On behalf of the entire team, we want to express our appreciation for the confidence you have placed in The AXS 2X Innovation ETF (“TARK” or the “Fund”). The following information pertains to the period from inception on April 28, 2022, through fiscal year end on March 31, 2023. The Fund seeks daily investment results, before fees and expenses, of 200% of the daily performance of the ARK Innovation ETF Index. The Fund does not seek to achieve its stated investment objective for a period different than one trading day.
The Fund had negative performance during the fiscal period ending on March 31, 2023. The market price for TARK decreased 57.11% and the NAV decreased 57.11%, while the ARK Innovation ETF Index lost 17.45%.
The Fund uses swaps to target the desired 200% daily NAV exposure to the underlying ARK Innovation ETF Index. The Fund met its investment objectives. Over the 230 trading days in the fiscal period, the Fund beat twice the ARK Innovation ETF Index daily performance 43 days, came within 5 basis points 163 days, came within 10 basis points 211 days, and came within 15 basis points 227 days. The three days where Fund NAV deviated more than 15 basis points were days where the Fund was substantially up or down.
Looking forward, we continue to strive to improve Fund NAV tracking of the twice the daily ARK Innovation ETF Index return. We appreciate your investment in TARK.
The views in this letter were as of March 31, 2023, and may not necessarily reflect the same views on the date this letter is first published or any time thereafter. These views are intended to help shareholders in understanding the fund’s investment methodology and do not constitute investment advice.
Faithfully yours,
| Parker B. Binion | |
| Head of Investments, AXS Investments LLC | |
IMPORTANT RISK DISCLOSURE
ETFs involve risk including possible loss of principal. There is no assurance that the Fund will achieve its investment objective.
The Fund is designed to be utilized only by knowledgeable investors who understand the potential consequences of seeking daily leveraged (2X) investment results, understand the risks associated with the use of leverage and are willing to monitor their portfolios frequently. The Fund is not intended to be used by, and is not appropriate for, investors who do not intend to actively monitor and manage their portfolios. For periods longer than a single day, the Fund will lose money if the ARK Innovation ETF’s performance is flat, and it is possible that the Fund will lose money even if the ARK Innovation ETF’s performance increases over a period longer than a single day. An investor could lose the full principal value of his/her investment within a single day if the ARK Innovation ETF loses more than 50% in one day.
Compounding risk: The Fund has a single day investment objective, and performance for any other period is the result of its return for each day compounded over the period. Performance for periods longer than a single day will very likely differ in amount, and possibly even direction, from 200% of the daily return of the ARK Innovation ETF for the same period, before accounting for fees and expenses. Compounding affects all investments but has a more significant impact on a leveraged fund. This effect becomes more pronounced as the ARK Innovation ETF volatility and holding periods increase.
Leverage risk: Leveraged ETFs pursue daily leveraged investment objectives, which means they are riskier than alternatives that do not use leverage. They seek daily goals and should not be expected to track the underlying index over periods longer than one day.
Swap agreement risk: The Fund’s use of derivatives may be considered aggressive and may expose the Fund to greater risks and larger losses or smaller gains than investing directly in the reference asset(s) underlying those derivatives. The use of swap agreements are subject to additional risks such as the lack of regulation, counterparty risk, liquidity risk and could expose investors to significant losses.
Equity securities risk: The value of the equity securities the Fund holds may fall due to general market and economic conditions.
Foreign securities risk: Investments in the securities of foreign issuers involve risks beyond those associated with investments in U.S. securities.
Health care sector risk: The health care sector may be adversely affected by government regulations and government health care programs.
Communications sector risk: Companies in this sector may be adversely affected by potential obsolescence of products/services, pricing competition, research and development costs, substantial capital requirements and government regulation.
Information technology sector risk: Information technology companies face intense competition, both domestically and internationally, which may have an adverse effect on profit margins.
Shares are bought and sold at market price (not NAV) and are not individually redeemed from the ETF. There can be no guarantee that an active trading market for ETF shares will develop or be maintained, or that their listing will continue or remain unchanged. Buying or selling ETF shares on an exchange may require the payment of brokerage commissions and frequent trading may incur brokerage costs that detract significantly from investment returns.
Investors should carefully consider the investment objectives, risks, charges and expenses of AXS 2X Innovation ETF . This and other important information about the Fund is contained in the Prospectus, which can be obtained by visiting www.axsinvestments.com. The Prospectus should be read carefully before investing.
Distributed by ALPS Distributors, Inc, which is not affiliated with AXS Investments.
Dear Shareholders,
On behalf of the entire team, we want to express our appreciation for the confidence you have placed in The AXS Short China Internet ETF (“SWEB” or the “Fund”). The following information pertains to the period from inception on April 28, 2022, through fiscal year end on March 31, 2023. The Fund seeks daily investment results, before fees and expenses, of -100% of the daily performance of the China Internet ETF Index. The Fund does not seek to achieve its stated investment objective for a period different than one trading day.
The Fund had negative performance during the fiscal period ending on March 31, 2023. The market price for SWEB decreased 35.68% and the NAV decreased 35.62%, while the China Internet ETF Index gained 18.95%.
The Fund uses swaps to target the desired -100% daily NAV exposure to the underlying China Internet ETF Index. The Fund met its investment objectives. Over the 230 trading days in the fiscal period, the Fund beat the inverse China Internet ETF Index daily performance 127 days and came within 5 basis points 224 days and within 10 bps 228 days. The two days where Fund NAV deviated more than 10 basis points were days where the Fund was substantially up or down.
Looking forward, we continue to strive to improve Fund NAV tracking of the inverse of the daily China Internet ETF Index return. We appreciate your investment in SWEB.
The views in this letter were as of March 31, 2023, and may not necessarily reflect the same views on the date this letter is first published or any time thereafter. These views are intended to help shareholders in understanding the fund’s investment methodology and do not constitute investment advice.
Faithfully yours,
| Parker B. Binion | |
| Head of Investments, AXS Investments LLC | |
IMPORTANT RISK DISCLOSURE
ETFs involve risk including possible loss of principal. There is no assurance that the Fund will achieve its investment objective.
The Fund is not suitable for all investors and should be used only by knowledgeable investors who understand the consequences of seeking daily inverse (-1x) investment results, including the impact of compounding on Fund performance. Investors in the Fund should actively manage and monitor their investments, as frequently as daily. An investor in the Fund could potentially lose the full principal value of their investment within a single day.
China risk: The China Internet ETF invests in Chinese companies. The Chinese economy is generally considered an emerging market and can be significantly affected by economic and political conditions in China and surrounding Asian countries.
Compounding risk: The Fund has a single day investment objective, and performance for any other period is the result of its return for each day compounded over the period. Performance for periods longer than a single day will very likely differ in amount, and possibly even direction, from the inverse (-1x) of the daily return of the China Internet ETF for the same period, before accounting for fees and expenses. Compounding affects all investments but has a more significant impact on an inverse fund. This effect becomes more pronounced as the China Internet ETF volatility and holding periods increase.
Correlation risk: There is no guarantee that the Fund will achieve a high degree of inverse correlation with the China Internet ETF, and failure to do so may prevent the Fund from achieving its investment objective.
Derivatives risk: The Fund’s use of derivatives, which may be considered aggressive and may expose the Fund to greater risks and larger losses or smaller gains than investing directly in the reference asset(s) underlying those derivatives.
Foreign securities risk: The China Internet ETF's investments in foreign securities can be riskier than U.S. securities investments. Investments in emerging markets are subject to even greater risks.
Internet company risk: Many Internet-related companies have incurred large losses since their inception and may continue to incur large losses in the hope of capturing market share and generating future revenues.
Inverse correlation risk: Short (inverse) positions are designed to profit from a decline in the price of a particular reference asset. Investors will lose money when the China Internet ETF rises, which is the opposite result from that of traditional funds.
Leverage risk: Leverage increases the risk of a total loss of an investor’s investment, may increase the volatility of the Fund, and may magnify any differences between the performance of the Fund and the China Internet ETF.
Short sale exposure risk: Seeking inverse or “short” exposure may expose the Fund to risks under certain market conditions of an increase in the volatility and decrease in the liquidity of the instruments underlying the short position, which may lower the Fund’s return.
Small and medium company risk: Small and medium sized companies normally have a lower trading volume than larger companies, which may tend to make their market price fall more disproportionately than larger companies.
Swap agreement risk: The Fund expects to use swap agreements as a means to achieve its investment objective. The lack of regulation in swap markets could expose investors to significant losses under certain circumstances, including in the event of trading abuses or financial failure by participants.
Shares are bought and sold at market price (not NAV) and are not individually redeemed from the ETF. There can be no guarantee that an active trading market for ETF shares will develop or be maintained, or that their listing will continue or remain unchanged. Buying or selling ETF shares on an exchange may require the payment of brokerage commissions and frequent trading may incur brokerage costs that detract significantly from investment returns.
Investors should carefully consider the investment objectives, risks, charges and expenses of AXS Short China Internet ETF . This and other important information about the Fund is contained in the Prospectus, which can be obtained by visiting www.axsinvestments.com. The Prospectus should be read carefully before investing.
Distributed by ALPS Distributors, Inc, which is not affiliated with AXS Investments.
Dear Shareholders,
On behalf of the entire team, we want to express our appreciation for the confidence you have placed in The AXS 1.25X NVDA Bear Daily ETF (“NVDS” or the “Fund”). The following information pertains to the period from inception on July 13, 2022, through fiscal year end on March 31, 2023. The Fund seeks daily investment results, before fees and expenses, of -125% of the daily performance of Nvidia Corp. stock (“NVDA”). The Fund does not seek to achieve its stated investment objective for a period different than one trading day.
The Fund had negative performance during the fiscal period ending on March 31, 2023. The market price for NVDS decreased 66.14% and the NAV decreased 66.14%, while the S&P 500 Index was up 9.45% and shares of NVDA gained 84.31%.
The Fund uses swaps to target the desired -125% daily NAV exposure to the underlying NVDA stock. The Fund met its investment objectives. Over the 181 trading days in the fiscal period, the Fund beat the inverse NVDA daily performance 123 days and came within 5 basis points 177 days. The four days where Fund NAV deviated more than 5 basis points were days where the Fund was substantially up or down.
Looking forward, we continue strive to improve Fund NAV tracking of -125% of the daily NVDA return. We appreciate your investment in NVDS.
The views in this letter were as of March 31, 2023, and may not necessarily reflect the same views on the date this letter is first published or any time thereafter. These views are intended to help shareholders in understanding the fund’s investment methodology and do not constitute investment advice.
Faithfully yours,
| Parker B. Binion | |
| Head of Investments, AXS Investments LLC | |
Important Risk Information
ETFs involve risk including possible loss of principal. There is no assurance that the Fund will achieve its investment objective. The Funds pose risks that are unique and complex.
Derivatives Risk: The Funds’ use of derivatives may be considered aggressive and may expose the Funds to greater risks and larger losses or smaller gains than investing directly in the reference asset(s) underlying those derivatives. A derivative refers to any financial instrument whose value is derived, at least in part, from the price of an underlying security, asset, rate or index.
Leverage Risk: Leverage increases the risk of a total loss of an investor’s investment, may increase the volatility of the Funds, and may magnify any differences between the performance of the Funds and their underlying stocks. Because the Funds include positive and/or negative multipliers of the performance of the underlying stock, a single day movement in that stock approaching 50% at any point in the day could result in the total loss of an investor’s investment if that movement is contrary to the investment objective of the given Fund, even if the underlying stock subsequently moves in an opposite direction, eliminating all or a portion of the earlier movement. This would be the case with any such single day movements in the stock, even if the stock maintains a level greater than zero at all times.
Compounding Risk: The Funds have a single day investment objective, and performance for any other period is the result of their returns for each day compounded over the period. The performance of the Funds for periods longer than a single day will very likely differ in amount, and possibly even direction, from the intended leverage multiplier of the daily return of the underlying stock for the same period, before accounting for fees and expenses.
Swap agreement risk: A swap is an agreement between two parties to exchange an asset's benefits on a specific date, in an exchange of a series of payments. It is not limited to one type of investment. A swap can be agreed on for stocks, bonds, ETFs, commodities, foreign currencies, or even interest rates. The Fund expects to use swap agreements as a means to achieve its investment objective, which may expose the Fund to greater risks and larger losses or smaller gains than investing directly in the reference asset(s) underlying those derivatives. Swaps are also subject to the risk of imperfect correlation between the value of the reference asset underlying the swap and the swap. The use of swap agreements are also subject to additional risks such as the lack of regulation, counterparty risk, liquidity risk and could expose investors to significant losses.
Concentration Risk: The Fund will be concentrated in the industry assigned to NVIDIA Corporation (i.e., hold more than 25% of its total assets in investments that provide inverse exposure to the industry). A portfolio concentrated in a particular industry may present more risks than a portfolio broadly diversified over several industries.
Shares are bought and sold at market price (not NAV) and are not individually redeemed from the ETF. There can be no guarantee that an active trading market for ETF shares will develop or be maintained, or that their listing will continue or remain unchanged. Buying or selling ETF shares on an exchange may require the payment of brokerage commissions and frequent trading may incur brokerage costs that detract significantly from investment returns.
Investors should carefully consider the investment objectives, risks, charges, and expenses of the Fund. This and other important information about the Fund are contained in the Prospectus, which can be obtained by visiting www.axsinvestments.com. The Prospectus should be read carefully before investing.
Dear Shareholders,
On behalf of the entire team, we want to express our appreciation for the confidence you have placed in The AXS 2X PFE Bear Daily ETF (“PFES” or the “Fund”). The following information pertains to the period from inception on July 13, 2022, through fiscal year end on March 31, 2023. The Fund seeks daily investment results, before fees and expenses, of -200% of the daily performance of Pfizer Inc. stock (“PFE”). The Fund does not seek to achieve its stated investment objective for a period different than one trading day.
The Fund had positive performance during the fiscal period ending on March 31, 2023. The market price for PFES increased 28.58% and the NAV increased 28.33%, while the S&P 500 Index was up 9.45% and shares of PFE lost 19.58%.
The Fund uses swaps to target the desired -200% daily NAV exposure to the underlying PFE stock. The Fund met its investment objectives. Over the 181 trading days in the fiscal period, the Fund beat the -200% PFE daily performance 143 days and came within 5 basis points 174 days and 15 basis points 176 days. The five days where Fund NAV deviated more than 15 basis points were days where the Fund was substantially up or down.
Looking forward, we continue to strive to improve Fund NAV tracking of -200% of the daily PFE return. We appreciate your investment in PFES.
The views in this letter were as of March 31, 2023, and may not necessarily reflect the same views on the date this letter is first published or any time thereafter. These views are intended to help shareholders in understanding the fund’s investment methodology and do not constitute investment advice.
Faithfully yours,
Parker B. Binion
Head of Investments, AXS Investments LLC
Important Risk Information
AXS Bull & Bear Daily ETFs are not suitable for all investors. The Funds are designed to be utilized only by traders and sophisticated investors who understand the potential consequences of seeking daily inverse and/or leveraged investment results, understand the risks associated with the use of leverage and are willing to monitor their portfolios frequently. The Funds are not intended to be used by, and are not appropriate for, investors who do not intend to actively monitor and manage their portfolios. For periods longer than a single day, the Funds will lose money if the underlying stock’s performance is flat, and it is possible that the Fund will lose money even if the underlying stock’s performance decreases over a period longer than a single day. An investor could lose the full principal value of his/her investment within a single day. The Funds track the price of a single stock rather than an index, eliminating the benefits of diversification that most mutual funds and exchange-traded funds offer. Although the Funds will be listed and traded on an exchange, an investment in a Fund may not be suitable for every investor. The Funds pose risks that are unique and complex. To learn more about the additional risks of investing, please see the Important Risk Information section below.
ETFs involve risk including possible loss of principal. There is no assurance that the Fund will achieve its investment objective. The Funds pose risks that are unique and complex.
Derivatives Risk: The Funds’ use of derivatives may be considered aggressive and may expose the Funds to greater risks and larger losses or smaller gains than investing directly in the reference asset(s) underlying those derivatives. A derivative refers to any financial instrument whose value is derived, at least in part, from the price of an underlying security, asset, rate or index.
Leverage Risk: Leverage increases the risk of a total loss of an investor’s investment, may increase the volatility of the Funds, and may magnify any differences between the performance of the Funds and their underlying stocks. Because the Funds include positive and/or negative multipliers of the performance of the underlying stock, a single day movement in that stock approaching 50% at any point in the day could result in the total loss of an investor’s investment if that movement is contrary to the investment objective of the given Fund, even if the underlying stock subsequently moves in an opposite direction, eliminating all or a portion of the earlier movement. This would be the case with any such single day movements in the stock, even if the stock maintains a level greater than zero at all times.
Compounding Risk: The Funds have a single day investment objective, and performance for any other period is the result of their returns for each day compounded over the period. The performance of the Funds for periods longer than a single day will very likely differ in amount, and possibly even direction, from the intended leverage multiplier of the daily return of the underlying stock for the same period, before accounting for fees and expenses.
Swap agreement risk: A swap is an agreement between two parties to exchange an asset's benefits on a specific date, in an exchange of a series of payments. It is not limited to one type of investment. A swap can be agreed on for stocks, bonds, ETFs, commodities, foreign currencies, or even interest rates. The Fund expects to use swap agreements as a means to achieve its investment objective, which may expose the Fund to greater risks and larger losses or smaller gains than investing directly in the reference asset(s) underlying those derivatives. Swaps are also subject to the risk of imperfect correlation between the value of the reference asset underlying the swap and the swap. The use of swap agreements are also subject to additional risks such as the lack of regulation, counterparty risk, liquidity risk and could expose investors to significant losses.
Concentration Risk: The Fund will be concentrated in the industry assigned to Pfizer Inc. (i.e., hold more than 25% of its total assets in investments that provide inverse exposure to the industry). A portfolio concentrated in a particular industry may present more risks than a portfolio broadly diversified over several industries.
Shares are bought and sold at market price (not NAV) and are not individually redeemed from the ETF. There can be no guarantee that an active trading market for ETF shares will develop or be maintained, or that their listing will continue or remain unchanged. Buying or selling ETF shares on an exchange may require the payment of brokerage commissions and frequent trading may incur brokerage costs that detract significantly from investment returns.
Investors should carefully consider the investment objectives, risks, charges, and expenses of the Fund. This and other important information about the Fund are contained in the Prospectus, which can be obtained by visiting www.axsinvestments.com. The Prospectus should be read carefully before investing.
Distributed by ALPS Distributors, Inc, which is not affiliated with AXS Investments.
Dear Shareholders,
On behalf of the entire team, we want to express our appreciation for the confidence you have placed in The AXS 2X PFE Bull Daily ETF (“PFEL” or the “Fund”). The following information pertains to the period from inception on July 13, 2022, through fiscal year end on March 31, 2023. The Fund seeks daily investment results, before fees and expenses, of 200% of the daily performance of Pfizer Inc. stock (“PFE”). The Fund does not seek to achieve its stated investment objective for a period different than one trading day.
The Fund had negative performance during the fiscal period ending on March 31, 2023. The market price for PFEL decreased 35.83% and the NAV decreased 35.87%, while the S&P 500 Index was up 9.45% and shares of PFE lost 19.58%.
The Fund uses swaps to target the desired 200% daily NAV exposure to the underlying PFE stock. The Fund met its investment objectives. Over the 181 trading days in the fiscal period, the Fund beat 200% of PFE’s daily performance 27 days and came within 10 basis points 163 days and 15 basis points 180 days. The day where Fund NAV deviated more than 15 basis points was one where the Fund was substantially down.
Looking forward, we continue to strive to improve Fund NAV tracking of 200% of the daily PFE return. We appreciate your investment in PFEL.
The views in this letter were as of March 31, 2023, and may not necessarily reflect the same views on the date this letter is first published or any time thereafter. These views are intended to help shareholders in understanding the fund’s investment methodology and do not constitute investment advice.
Faithfully yours,
Parker B. Binion
Head of Investments, AXS Investments LLC
Important Risk Information
AXS Bull & Bear Daily ETFs are not suitable for all investors. The Funds are designed to be utilized only by traders and sophisticated investors who understand the potential consequences of seeking daily inverse and/or leveraged investment results, understand the risks associated with the use of leverage and are willing to monitor their portfolios frequently. The Funds are not intended to be used by, and are not appropriate for, investors who do not intend to actively monitor and manage their portfolios. For periods longer than a single day, the Funds will lose money if the underlying stock’s performance is flat, and it is possible that the Fund will lose money even if the underlying stock’s performance decreases over a period longer than a single day. An investor could lose the full principal value of his/her investment within a single day. The Funds track the price of a single stock rather than an index, eliminating the benefits of diversification that most mutual funds and exchange-traded funds offer. Although the Funds will be listed and traded on an exchange, an investment in a Fund may not be suitable for every investor. The Funds pose risks that are unique and complex. To learn more about the additional risks of investing, please see the Important Risk Information section below.
ETFs involve risk including possible loss of principal. There is no assurance that the Fund will achieve its investment objective. The Funds pose risks that are unique and complex.
Derivatives Risk: The Funds’ use of derivatives may be considered aggressive and may expose the Funds to greater risks and larger losses or smaller gains than investing directly in the reference asset(s) underlying those derivatives. A derivative refers to any financial instrument whose value is derived, at least in part, from the price of an underlying security, asset, rate or index.
Leverage Risk: Leverage increases the risk of a total loss of an investor’s investment, may increase the volatility of the Funds, and may magnify any differences between the performance of the Funds and their underlying stocks. Because the Funds include positive and/or negative multipliers of the performance of the underlying stock, a single day movement in that stock approaching 50% at any point in the day could result in the total loss of an investor’s investment if that movement is contrary to the investment objective of the given Fund, even if the underlying stock subsequently moves in an opposite direction, eliminating all or a portion of the earlier movement. This would be the case with any such single day movements in the stock, even if the stock maintains a level greater than zero at all times.
Compounding Risk: The Funds have a single day investment objective, and performance for any other period is the result of their returns for each day compounded over the period. The performance of the Funds for periods longer than a single day will very likely differ in amount, and possibly even direction, from the intended leverage multiplier of the daily return of the underlying stock for the same period, before accounting for fees and expenses.
Swap agreement risk: A swap is an agreement between two parties to exchange an asset's benefits on a specific date, in an exchange of a series of payments. It is not limited to one type of investment. A swap can be agreed on for stocks, bonds, ETFs, commodities, foreign currencies, or even interest rates. The Fund expects to use swap agreements as a means to achieve its investment objective, which may expose the Fund to greater risks and larger losses or smaller gains than investing directly in the reference asset(s) underlying those derivatives. Swaps are also subject to the risk of imperfect correlation between the value of the reference asset underlying the swap and the swap. The use of swap agreements are also subject to additional risks such as the lack of regulation, counterparty risk, liquidity risk and could expose investors to significant losses.
Concentration Risk: The Fund will be concentrated in the industry assigned to Pfizer Inc. (i.e., hold more than 25% of its total assets in investments that provide inverse exposure to the industry). A portfolio concentrated in a particular industry may present more risks than a portfolio broadly diversified over several industries.
Shares are bought and sold at market price (not NAV) and are not individually redeemed from the ETF. There can be no guarantee that an active trading market for ETF shares will develop or be maintained, or that their listing will continue or remain unchanged. Buying or selling ETF shares on an exchange may require the payment of brokerage commissions and frequent trading may incur brokerage costs that detract significantly from investment returns.
Investors should carefully consider the investment objectives, risks, charges, and expenses of the Fund. This and other important information about the Fund are contained in the Prospectus, which can be obtained by visiting www.axsinvestments.com. The Prospectus should be read carefully before investing.
Distributed by ALPS Distributors, Inc, which is not affiliated with AXS Investments.
Dear Shareholders,
On behalf of the entire team, we want to express our appreciation for the confidence you have placed in The AXS 1.5X PYPL Bear Daily ETF (“PYPS” or the “Fund”). The following information pertains to the period from inception on July 13, 2022, through fiscal year end on March 31, 2023. The Fund seeks daily investment results, before fees and expenses, of -150% of the daily performance of Paypal Inc. stock (“PYPL”). The Fund does not seek to achieve its stated investment objective for a period different than one trading day.
The Fund had negative performance during the fiscal period ending on March 31, 2023. The market price for PYPS decreased 30.52% and the NAV decreased 30.62%, while the S&P 500 Index was up 9.45% and shares of PYPL gained 6.31%.
The Fund uses swaps to target the desired -150% daily NAV exposure to the underlying PYPL stock. The Fund met its investment objectives. Over the 181 trading days in the fiscal period, the Fund beat the -150% PYPL daily performance 138 days and came within 5 basis points 175 days and 15 basis points 179 days. The two days where Fund NAV deviated more than 15 basis points were days where the Fund was substantially up or down.
Looking forward, we continue to strive to improve Fund NAV tracking of -150% of the daily PYPL return. We appreciate your investment in PYPS.
The views in this letter were as of March 31, 2023, and may not necessarily reflect the same views on the date this letter is first published or any time thereafter. These views are intended to help shareholders in understanding the fund’s investment methodology and do not constitute investment advice.
Faithfully yours,
Parker B. Binion
Head of Investments, AXS Investments LLC
Important Risk Information
AXS Bull & Bear Daily ETFs are not suitable for all investors. The Funds are designed to be utilized only by traders and sophisticated investors who understand the potential consequences of seeking daily inverse and/or leveraged investment results, understand the risks associated with the use of leverage and are willing to monitor their portfolios frequently. The Funds are not intended to be used by, and are not appropriate for, investors who do not intend to actively monitor and manage their portfolios. For periods longer than a single day, the Funds will lose money if the underlying stock’s performance is flat, and it is possible that the Fund will lose money even if the underlying stock’s performance decreases over a period longer than a single day. An investor could lose the full principal value of his/her investment within a single day. The Funds track the price of a single stock rather than an index, eliminating the benefits of diversification that most mutual funds and exchange-traded funds offer. Although the Funds will be listed and traded on an exchange, an investment in a Fund may not be suitable for every investor. The Funds pose risks that are unique and complex. To learn more about the additional risks of investing, please see the Important Risk Information section below.
ETFs involve risk including possible loss of principal. There is no assurance that the Fund will achieve its investment objective. The Funds pose risks that are unique and complex.
Derivatives Risk: The Funds’ use of derivatives may be considered aggressive and may expose the Funds to greater risks and larger losses or smaller gains than investing directly in the reference asset(s) underlying those derivatives. A derivative refers to any financial instrument whose value is derived, at least in part, from the price of an underlying security, asset, rate or index.
Leverage Risk: Leverage increases the risk of a total loss of an investor’s investment, may increase the volatility of the Funds, and may magnify any differences between the performance of the Funds and their underlying stocks. Because the Funds include positive and/or negative multipliers of the performance of the underlying stock, a single day movement in that stock approaching 50% at any point in the day could result in the total loss of an investor’s investment if that movement is contrary to the investment objective of the given Fund, even if the underlying stock subsequently moves in an opposite direction, eliminating all or a portion of the earlier movement. This would be the case with any such single day movements in the stock, even if the stock maintains a level greater than zero at all times.
Compounding Risk: The Funds have a single day investment objective, and performance for any other period is the result of their returns for each day compounded over the period. The performance of the Funds for periods longer than a single day will very likely differ in amount, and possibly even direction, from the intended leverage multiplier of the daily return of the underlying stock for the same period, before accounting for fees and expenses.
Swap agreement risk: A swap is an agreement between two parties to exchange an asset's benefits on a specific date, in an exchange of a series of payments. It is not limited to one type of investment. A swap can be agreed on for stocks, bonds, ETFs, commodities, foreign currencies, or even interest rates. The Fund expects to use swap agreements as a means to achieve its investment objective, which may expose the Fund to greater risks and larger losses or smaller gains than investing directly in the reference asset(s) underlying those derivatives. Swaps are also subject to the risk of imperfect correlation between the value of the reference asset underlying the swap and the swap. The use of swap agreements are also subject to additional risks such as the lack of regulation, counterparty risk, liquidity risk and could expose investors to significant losses.
Concentration Risk: The Fund will be concentrated in the industry assigned to PayPal Holdings, Inc. (i.e., hold more than 25% of its total assets in investments that provide inverse exposure to the industry). A portfolio concentrated in a particular industry may present more risks than a portfolio broadly diversified over several industries.
Shares are bought and sold at market price (not NAV) and are not individually redeemed from the ETF. There can be no guarantee that an active trading market for ETF shares will develop or be maintained, or that their listing will continue or remain unchanged. Buying or selling ETF shares on an exchange may require the payment of brokerage commissions and frequent trading may incur brokerage costs that detract significantly from investment returns.
Investors should carefully consider the investment objectives, risks, charges, and expenses of the Fund. This and other important information about the Fund are contained in the Prospectus, which can be obtained by visiting www.axsinvestments.com. The Prospectus should be read carefully before investing.
Distributed by ALPS Distributors, Inc, which is not affiliated with AXS Investments.
Dear Shareholders,
On behalf of the entire team, we want to express our appreciation for the confidence you have placed in The AXS 1.5X PYPL Bull Daily ETF (“PYPT” or the “Fund”). The following information pertains to the period from inception on July 13, 2022, through fiscal year end on March 31, 2023. The Fund seeks daily investment results, before fees and expenses, of 150% of the daily performance of Paypal Inc. stock (“PYPL”). The Fund does not seek to achieve its stated investment objective for a period different than one trading day.
The Fund had positive performance during the fiscal period ending on March 31, 2023. The market price for PYPT increased 2.64% and the NAV increased 2.55%, while the S&P 500 Index was up 9.45% and shares of PYPL gained 6.31%.
The Fund uses swaps to target the desired 150% daily NAV exposure to the underlying PYPL stock. The Fund met its investment objectives. Over the 181 trading days in the fiscal period, the Fund beat 150% of PYPL’s daily performance 27 days and came within 10 basis points 174 days and 15 basis points 178 days. The three days where Fund NAV deviated more than 15 basis points were days where the Fund was substantially up or down.
Looking forward, we continue to strive to improve Fund NAV tracking of 150% of the daily PYPL return. We appreciate your investment in PYPT.
The views in this letter were as of March 31, 2023, and may not necessarily reflect the same views on the date this letter is first published or any time thereafter. These views are intended to help shareholders in understanding the fund’s investment methodology and do not constitute investment advice.
Faithfully yours,
Parker B. Binion
Head of Investments, AXS Investments LLC
Important Risk Information
AXS Bull & Bear Daily ETFs are not suitable for all investors. The Funds are designed to be utilized only by traders and sophisticated investors who understand the potential consequences of seeking daily inverse and/or leveraged investment results, understand the risks associated with the use of leverage and are willing to monitor their portfolios frequently. The Funds are not intended to be used by, and are not appropriate for, investors who do not intend to actively monitor and manage their portfolios. For periods longer than a single day, the Funds will lose money if the underlying stock’s performance is flat, and it is possible that the Fund will lose money even if the underlying stock’s performance decreases over a period longer than a single day. An investor could lose the full principal value of his/her investment within a single day. The Funds track the price of a single stock rather than an index, eliminating the benefits of diversification that most mutual funds and exchange-traded funds offer. Although the Funds will be listed and traded on an exchange, an investment in a Fund may not be suitable for every investor. The Funds pose risks that are unique and complex. To learn more about the additional risks of investing, please see the Important Risk Information section below.
ETFs involve risk including possible loss of principal. There is no assurance that the Fund will achieve its investment objective. The Funds pose risks that are unique and complex.
Derivatives Risk: The Funds’ use of derivatives may be considered aggressive and may expose the Funds to greater risks and larger losses or smaller gains than investing directly in the reference asset(s) underlying those derivatives. A derivative refers to any financial instrument whose value is derived, at least in part, from the price of an underlying security, asset, rate or index.
Leverage Risk: Leverage increases the risk of a total loss of an investor’s investment, may increase the volatility of the Funds, and may magnify any differences between the performance of the Funds and their underlying stocks. Because the Funds include positive and/or negative multipliers of the performance of the underlying stock, a single day movement in that stock approaching 50% at any point in the day could result in the total loss of an investor’s investment if that movement is contrary to the investment objective of the given Fund, even if the underlying stock subsequently moves in an opposite direction, eliminating all or a portion of the earlier movement. This would be the case with any such single day movements in the stock, even if the stock maintains a level greater than zero at all times.
Compounding Risk: The Funds have a single day investment objective, and performance for any other period is the result of their returns for each day compounded over the period. The performance of the Funds for periods longer than a single day will very likely differ in amount, and possibly even direction, from the intended leverage multiplier of the daily return of the underlying stock for the same period, before accounting for fees and expenses.
Swap agreement risk: A swap is an agreement between two parties to exchange an asset's benefits on a specific date, in an exchange of a series of payments. It is not limited to one type of investment. A swap can be agreed on for stocks, bonds, ETFs, commodities, foreign currencies, or even interest rates. The Fund expects to use swap agreements as a means to achieve its investment objective, which may expose the Fund to greater risks and larger losses or smaller gains than investing directly in the reference asset(s) underlying those derivatives. Swaps are also subject to the risk of imperfect correlation between the value of the reference asset underlying the swap and the swap. The use of swap agreements are also subject to additional risks such as the lack of regulation, counterparty risk, liquidity risk and could expose investors to significant losses.
Concentration Risk: The Fund will be concentrated in the industry assigned to PayPal Holdings, Inc. (i.e., hold more than 25% of its total assets in investments that provide inverse exposure to the industry). A portfolio concentrated in a particular industry may present more risks than a portfolio broadly diversified over several industries.
Shares are bought and sold at market price (not NAV) and are not individually redeemed from the ETF. There can be no guarantee that an active trading market for ETF shares will develop or be maintained, or that their listing will continue or remain unchanged. Buying or selling ETF shares on an exchange may require the payment of brokerage commissions and frequent trading may incur brokerage costs that detract significantly from investment returns.
Investors should carefully consider the investment objectives, risks, charges, and expenses of the Fund. This and other important information about the Fund are contained in the Prospectus, which can be obtained by visiting www.axsinvestments.com. The Prospectus should be read carefully before investing.
Distributed by ALPS Distributors, Inc, which is not affiliated with AXS Investments.
Dear Shareholders,
On behalf of the entire team, we want to express our appreciation for the confidence you have placed in The AXS TSLA Bear Daily ETF (“TSLQ” or the “Fund”). The following information pertains to the period from inception on July 13, 2022, through fiscal year end on March 31, 2023. The Fund seeks daily investment results, before fees and expenses, of -100% of the daily performance of Tesla, Inc. stock (“TSLA”). The Fund does not seek to achieve its stated investment objective for a period different than one trading day.
The Fund had negative performance during the fiscal period ending on March 31, 2023. The market price for TSLQ decreased 13.02% and the NAV decreased 12.97%, while the S&P 500 Index was up 9.45% and shares of TSLA lost 10.99%.
The Fund uses swaps to target the desired -100% daily NAV exposure to the underlying TSLA stock. The Fund met its investment objectives. Over the 181 trading days in the fiscal period, the Fund beat the inverse TSLA daily performance 141 days and came within 5 basis points 179 days. The two days where Fund NAV deviated more than 5 basis points were days where the Fund was substantially up or down.
Looking forward, we continue strive to improve Fund NAV tracking of the inverse of the daily TSLA return. We appreciate your investment in TSLQ.
The views in this letter were as of March 31, 2023, and may not necessarily reflect the same views on the date this letter is first published or any time thereafter. These views are intended to help shareholders in understanding the fund’s investment methodology and do not constitute investment advice.
Faithfully yours,
Parker B. Binion
Head of Investments, AXS Investments LLC
Important Risk Information
ETFs involve risk including possible loss of principal. There is no assurance that the Fund will achieve its investment objective. The Funds pose risks that are unique and complex.
Derivatives Risk: The Funds’ use of derivatives may be considered aggressive and may expose the Funds to greater risks and larger losses or smaller gains than investing directly in the reference asset(s) underlying those derivatives. A derivative refers to any financial instrument whose value is derived, at least in part, from the price of an underlying security, asset, rate or index.
Leverage Risk: Leverage increases the risk of a total loss of an investor’s investment, may increase the volatility of the Funds, and may magnify any differences between the performance of the Funds and their underlying stocks. Because the Funds include positive and/or negative multipliers of the performance of the underlying stock, a single day movement in that stock approaching 50% at any point in the day could result in the total loss of an investor’s investment if that movement is contrary to the investment objective of the given Fund, even if the underlying stock subsequently moves in an opposite direction, eliminating all or a portion of the earlier movement. This would be the case with any such single day movements in the stock, even if the stock maintains a level greater than zero at all times.
Compounding Risk: The Funds have a single day investment objective, and performance for any other period is the result of their returns for each day compounded over the period. The performance of the Funds for periods longer than a single day will very likely differ in amount, and possibly even direction, from the intended leverage multiplier of the daily return of the underlying stock for the same period, before accounting for fees and expenses.
Swap agreement risk: A swap is an agreement between two parties to exchange an asset's benefits on a specific date, in an exchange of a series of payments. It is not limited to one type of investment. A swap can be agreed on for stocks, bonds, ETFs, commodities, foreign currencies, or even interest rates. The Fund expects to use swap agreements as a means to achieve its investment objective, which may expose the Fund to greater risks and larger losses or smaller gains than investing directly in the reference asset(s) underlying those derivatives. Swaps are also subject to the risk of imperfect correlation between the value of the reference asset underlying the swap and the swap. The use of swap agreements are also subject to additional risks such as the lack of regulation, counterparty risk, liquidity risk and could expose investors to significant losses.
Concentration Risk: The Fund will be concentrated in the industry assigned to Tesla, Inc. (i.e., hold more than 25% of its total assets in investments that provide inverse exposure to the industry). A portfolio concentrated in a particular industry may present more risks than a portfolio broadly diversified over several industries.
Shares are bought and sold at market price (not NAV) and are not individually redeemed from the ETF. There can be no guarantee that an active trading market for ETF shares will develop or be maintained, or that their listing will continue or remain unchanged. Buying or selling ETF shares on an exchange may require the payment of brokerage commissions and frequent trading may incur brokerage costs that detract significantly from investment returns.
Investors should carefully consider the investment objectives, risks, charges, and expenses of the Fund. This and other important information about the Fund are contained in the Prospectus, which can be obtained by visiting www.axsinvestments.com. The Prospectus should be read carefully before investing.
Dear Shareholders,
On behalf of the entire team, we want to express our appreciation for the confidence you have placed in The AXS 2X NKE Bear Daily ETF (“NKEQ” or the “Fund”). The following information pertains to the period from inception on July 13, 2022, through fiscal year end on March 31, 2023. The Fund seeks daily investment results, before fees and expenses, of -200% of the daily performance of Nike Inc. stock (“NKE”). The Fund does not seek to achieve its stated investment objective for a period different than one trading day.
The Fund had negative performance during the fiscal period ending on March 31, 2023. The market price for NKEQ decreased 47.94% and the NAV decreased 47.88%, while the S&P 500 Index was up 9.45% and shares of NKE gained 19.24%.
The Fund uses swaps to target the desired -200% daily NAV exposure to the underlying NKE stock. The Fund met its investment objectives. Over the 181 trading days in the fiscal period, the Fund beat the -200% NKE daily performance 136 days and came within 5 basis points 170 days and 15 basis points 176 days. The five days where Fund NAV deviated more than 15 basis points were days where the Fund was substantially up or down.
Looking forward, we continue to strive to improve Fund NAV tracking of -200% of the daily NKE return. We appreciate your investment in NKEQ.
The views in this letter were as of March 31, 2023, and may not necessarily reflect the same views on the date this letter is first published or any time thereafter. These views are intended to help shareholders in understanding the fund’s investment methodology and do not constitute investment advice.
Faithfully yours,
Parker B. Binion
Head of Investments, AXS Investments LLC
Important Risk Information
AXS Bull & Bear Daily ETFs are not suitable for all investors. The Funds are designed to be utilized only by traders and sophisticated investors who understand the potential consequences of seeking daily inverse and/or leveraged investment results, understand the risks associated with the use of leverage and are willing to monitor their portfolios frequently. The Funds are not intended to be used by, and are not appropriate for, investors who do not intend to actively monitor and manage their portfolios. For periods longer than a single day, the Funds will lose money if the underlying stock’s performance is flat, and it is possible that the Fund will lose money even if the underlying stock’s performance decreases over a period longer than a single day. An investor could lose the full principal value of his/her investment within a single day. The Funds track the price of a single stock rather than an index, eliminating the benefits of diversification that most mutual funds and exchange-traded funds offer. Although the Funds will be listed and traded on an exchange, an investment in a Fund may not be suitable for every investor. The Funds pose risks that are unique and complex. To learn more about the additional risks of investing, please see the Important Risk Information section below.
ETFs involve risk including possible loss of principal. There is no assurance that the Fund will achieve its investment objective. The Funds pose risks that are unique and complex.
Derivatives Risk: The Funds’ use of derivatives may be considered aggressive and may expose the Funds to greater risks and larger losses or smaller gains than investing directly in the reference asset(s) underlying those derivatives. A derivative refers to any financial instrument whose value is derived, at least in part, from the price of an underlying security, asset, rate or index.
Leverage Risk: Leverage increases the risk of a total loss of an investor’s investment, may increase the volatility of the Funds, and may magnify any differences between the performance of the Funds and their underlying stocks. Because the Funds include positive and/or negative multipliers of the performance of the underlying stock, a single day movement in that stock approaching 50% at any point in the day could result in the total loss of an investor’s investment if that movement is contrary to the investment objective of the given Fund, even if the underlying stock subsequently moves in an opposite direction, eliminating all or a portion of the earlier movement. This would be the case with any such single day movements in the stock, even if the stock maintains a level greater than zero at all times.
Compounding Risk: The Funds have a single day investment objective, and performance for any other period is the result of their returns for each day compounded over the period. The performance of the Funds for periods longer than a single day will very likely differ in amount, and possibly even direction, from the intended leverage multiplier of the daily return of the underlying stock for the same period, before accounting for fees and expenses.
Swap agreement risk: A swap is an agreement between two parties to exchange an asset's benefits on a specific date, in an exchange of a series of payments. It is not limited to one type of investment. A swap can be agreed on for stocks, bonds, ETFs, commodities, foreign currencies, or even interest rates. The Fund expects to use swap agreements as a means to achieve its investment objective, which may expose the Fund to greater risks and larger losses or smaller gains than investing directly in the reference asset(s) underlying those derivatives. Swaps are also subject to the risk of imperfect correlation between the value of the reference asset underlying the swap and the swap. The use of swap agreements are also subject to additional risks such as the lack of regulation, counterparty risk, liquidity risk and could expose investors to significant losses.
Concentration Risk: The Fund will be concentrated in the industry assigned to Nike Inc. (i.e., hold more than 25% of its total assets in investments that provide inverse exposure to the industry). A portfolio concentrated in a particular industry may present more risks than a portfolio broadly diversified over several industries.
Shares are bought and sold at market price (not NAV) and are not individually redeemed from the ETF. There can be no guarantee that an active trading market for ETF shares will develop or be maintained, or that their listing will continue or remain unchanged. Buying or selling ETF shares on an exchange may require the payment of brokerage commissions and frequent trading may incur brokerage costs that detract significantly from investment returns.
Investors should carefully consider the investment objectives, risks, charges, and expenses of the Fund. This and other important information about the Fund are contained in the Prospectus, which can be obtained by visiting www.axsinvestments.com. The Prospectus should be read carefully before investing.
Distributed by ALPS Distributors, Inc, which is not affiliated with AXS Investments.
Dear Shareholders,
On behalf of the entire team, we want to express our appreciation for the confidence you have placed in The AXS 2X NKE Bull Daily ETF (“NKEL” or the “Fund”). The following information pertains to the period from inception on July 13, 2022, through fiscal year end on March 31, 2023. The Fund seeks daily investment results, before fees and expenses, of 200% of the daily performance of Nike Inc. stock (“NKE”). The Fund does not seek to achieve its stated investment objective for a period different than one trading day.
The Fund had positive performance during the fiscal period ending on March 31, 2023. The market price for NKEL increased 20.07% and the NAV increased 19.95%, while the S&P 500 Index was up 9.45% and shares of NKE gained 19.24%.
The Fund uses swaps to target the desired 200% daily NAV exposure to the underlying NKE stock. The Fund met its investment objectives. Over the 181 trading days in the fiscal period, the Fund beat 200% of NKE’s daily performance 22 days and came within 10 basis points 166 days and 15 basis points 179 days. The two days where Fund NAV deviated more than 15 basis points were days where the Fund was substantially up or down.
Looking forward, we continue to strive to improve Fund NAV tracking of 200% of the daily NKE return. We appreciate your investment in NKEL.
The views in this letter were as of March 31, 2023, and may not necessarily reflect the same views on the date this letter is first published or any time thereafter. These views are intended to help shareholders in understanding the fund’s investment methodology and do not constitute investment advice.
Faithfully yours,
Parker B. Binion
Head of Investments, AXS Investments LLC
Important Risk Information
AXS Bull & Bear Daily ETFs are not suitable for all investors. The Funds are designed to be utilized only by traders and sophisticated investors who understand the potential consequences of seeking daily inverse and/or leveraged investment results, understand the risks associated with the use of leverage and are willing to monitor their portfolios frequently. The Funds are not intended to be used by, and are not appropriate for, investors who do not intend to actively monitor and manage their portfolios. For periods longer than a single day, the Funds will lose money if the underlying stock’s performance is flat, and it is possible that the Fund will lose money even if the underlying stock’s performance decreases over a period longer than a single day. An investor could lose the full principal value of his/her investment within a single day. The Funds track the price of a single stock rather than an index, eliminating the benefits of diversification that most mutual funds and exchange-traded funds offer. Although the Funds will be listed and traded on an exchange, an investment in a Fund may not be suitable for every investor. The Funds pose risks that are unique and complex. To learn more about the additional risks of investing, please see the Important Risk Information section below.
ETFs involve risk including possible loss of principal. There is no assurance that the Fund will achieve its investment objective. The Funds pose risks that are unique and complex.
Derivatives Risk: The Funds’ use of derivatives may be considered aggressive and may expose the Funds to greater risks and larger losses or smaller gains than investing directly in the reference asset(s) underlying those derivatives. A derivative refers to any financial instrument whose value is derived, at least in part, from the price of an underlying security, asset, rate or index.
Leverage Risk: Leverage increases the risk of a total loss of an investor’s investment, may increase the volatility of the Funds, and may magnify any differences between the performance of the Funds and their underlying stocks. Because the Funds include positive and/or negative multipliers of the performance of the underlying stock, a single day movement in that stock approaching 50% at any point in the day could result in the total loss of an investor’s investment if that movement is contrary to the investment objective of the given Fund, even if the underlying stock subsequently moves in an opposite direction, eliminating all or a portion of the earlier movement. This would be the case with any such single day movements in the stock, even if the stock maintains a level greater than zero at all times.
Compounding Risk: The Funds have a single day investment objective, and performance for any other period is the result of their returns for each day compounded over the period. The performance of the Funds for periods longer than a single day will very likely differ in amount, and possibly even direction, from the intended leverage multiplier of the daily return of the underlying stock for the same period, before accounting for fees and expenses.
Swap agreement risk: A swap is an agreement between two parties to exchange an asset's benefits on a specific date, in an exchange of a series of payments. It is not limited to one type of investment. A swap can be agreed on for stocks, bonds, ETFs, commodities, foreign currencies, or even interest rates. The Fund expects to use swap agreements as a means to achieve its investment objective, which may expose the Fund to greater risks and larger losses or smaller gains than investing directly in the reference asset(s) underlying those derivatives. Swaps are also subject to the risk of imperfect correlation between the value of the reference asset underlying the swap and the swap. The use of swap agreements are also subject to additional risks such as the lack of regulation, counterparty risk, liquidity risk and could expose investors to significant losses.
Concentration Risk: The Fund will be concentrated in the industry assigned to Nike Inc. (i.e., hold more than 25% of its total assets in investments that provide inverse exposure to the industry). A portfolio concentrated in a particular industry may present more risks than a portfolio broadly diversified over several industries.
Shares are bought and sold at market price (not NAV) and are not individually redeemed from the ETF. There can be no guarantee that an active trading market for ETF shares will develop or be maintained, or that their listing will continue or remain unchanged. Buying or selling ETF shares on an exchange may require the payment of brokerage commissions and frequent trading may incur brokerage costs that detract significantly from investment returns.
Investors should carefully consider the investment objectives, risks, charges, and expenses of the Fund. This and other important information about the Fund are contained in the Prospectus, which can be obtained by visiting www.axsinvestments.com. The Prospectus should be read carefully before investing.
Distributed by ALPS Distributors, Inc, which is not affiliated with AXS Investments.
Dear Shareholders,
On behalf of the entire team, we want to express our appreciation for the confidence you have placed in The AXS Short De-SPAC Daily ETF (“SOGU” or the “Fund”). The following information pertains to the fiscal year ending on March 31, 2023. The Fund seeks daily investment results, before fees and expenses, of -100% of the daily performance of the De-SPAC Index. The Fund does not seek to achieve its stated investment objective for a period different than one trading day.
The De-SPAC Index is a rules-based index developed to capture the performance of a group of 25 companies that came public as a result of a business combination with a Special Purpose Acquisition Company (“SPAC”). Over half of the companies in the index have a market cap of less than $1 billion.
The Fund had negative performance during the period ending on March 31, 2023. The market price for SOGU decreased 6.84% and the NAV decreased 7.18%, while the De-SPAC Index lost 14.76%.
The Fund uses swaps to target the desired -100% daily NAV exposure to the underlying De-SPAC Index. The Fund met its investment objectives, adjusting exposures in the underlying stocks to match the index where possible. Some true-up swap trades would have to be postponed until the following day if one or more of the index stocks ended the day short sale restricted. This can occur when a stock is down 10% or more, after which the stock can only be shorted on an uptick in price.
Looking forward, we continue strive to improve Fund NAV tracking of the inverse of the daily De-SPAC Index return. We appreciate your investment in SOGU.
The views in this letter were as of March 31, 2023, and may not necessarily reflect the same views on the date this letter is first published or any time thereafter. These views are intended to help shareholders in understanding the fund’s investment methodology and do not constitute investment advice.
Faithfully yours,
Parker B. Binion
Head of Investments, AXS Investments LLC
IMPORTANT RISK DISCLOSURE
Investing involves risk. Principal loss is possible. As an ETF, the Fund may trade at a premium or discount to NAV. The Fund is new with a limited operating history.
Inverse ETFs seek to provide the opposite of the single day performance of the index they track and are subject to substantial volatility.
The Fund is designed to be utilized only by knowledgeable investors who understand the potential consequences of seeking daily inverse (-1x) investment results, understand the risks associated with the use of shorting and are willing to monitor their portfolios frequently. The Fund is not intended to be used by, and is not appropriate for, investors who do not intend to actively monitor and manage their portfolios. For periods longer than a single day, the Fund will lose money if the Index's performance is flat, and it is possible that the Fund will lose money even if the Index's performance decreases over a period longer than a single day. An investor could lose the full principal value of his/her investment within a single day.
The Fund invests in companies that have completed a business combination transaction with a SPAC. SPACs are companies that may be unseasoned and lack a trading or operational history, a track record of reporting to investors, and widely available research coverage. Public stockholders of SPACs may not be afforded a meaningful opportunity to vote on a proposed initial business combination because certain stockholders, including stockholders affiliated with the management of the SPAC, may have sufficient voting power, and a financial incentive, to approve such a transaction without support from public stockholders. As a result, a SPAC may complete a business combination even though a majority of its public stockholders do not support such a combination. In addition, SPAC-derived companies may share similar illiquidity risks of private equity and venture capital. The free float shares held by the public in a SPAC-derived company are typically a small percentage of the market capitalization. The ownership of many SPAC-derived companies often includes large holdings by venture capital and private equity investors who seek to sell their shares in the public market in the months following a business combination transaction when shares restricted by lock-up are released, causing greater volatility and possible downward pressure during the time that locked-up shares are released.
Inverse Risk: Short (inverse) positions are designed to profit from a decline in the price of particular securities, investments in securities or indices. The Fund will lose value if and when the Index’s price rises – a result that is the opposite from traditional mutual funds and ETFs. Leverage Risk: Certain Fund transactions, such as entering into futures contracts, options and short sales, may give rise to a form of leverage. Leverage can magnify the effects of changes in the value of the Fund’s investments and make the Fund more volatile.
Purchasing and writing put and call options are highly specialized activities and entail greater than ordinary investment risks. The Fund may not fully benefit from or may lose money on an option if changes in its value do not correspond as anticipated to changes in the value of the underlying securities. The Fund expects to use swap agreements, which could expose investors to significant losses under certain circumstances, including in the event of trading abuses or financial failure by participants. The Fund is subject to increased counterparty risk with respect to the amount it expects to receive from counterparties to uncleared swaps. A swap is an agreement between two parties to exchange an asset's benefits on a specific date, in an exchange of a series of payments. It is not limited to one type of investment. A swap can be agreed on for stocks, bonds, ETFs, commodities, foreign currencies or even interest rates.
The AXS Short De-SPAC Daily ETF seeks daily inverse investment results in pursuit of its investment goals. This means that the Fund’s return for a period longer than a full trading day may have no resemblance to -100% of the return of the De-SPAC Index and that longer holding periods and higher volatility of the De-SPAC Index may increase the impact of compounding on an investor’s returns.
The Shares will change in value, and you could lose money by investing in the Fund. The Fund may not achieve its investment objective.
Shares of ETFs are bought and sold at market price (not NAV) and are not individually redeemed from the ETF. Brokerage commissions will reduce returns. NAVs are calculated using prices as of 4:00 PM Eastern Time. The closing price is the midpoint between the bid and ask price as of the close of exchange. Closing price returns do not represent the returns you would receive if you traded shares at other times.
Investors should carefully consider the investment objectives, risks, charges and expenses of the AXS Short De-SPAC Daily ETF. This and other important information about the Fund is contained in the Prospectus, which can be obtained by visiting www.axsinvestments.com. The Prospectus should be read carefully before investing.
Distributed by ALPS Distributors, Inc, which is not affiliated with AXS Investments.
Dear Shareholders,
On behalf of the entire team, we want to express our appreciation for the confidence you have placed in The AXS Short Innovation Daily ETF (“SARK” or the “Fund”). The following information pertains to the fiscal year ending on March 31, 2023. The Fund seeks daily investment results, before fees and expenses, of -100% of the daily performance of the ARK Innovation ETF Index. The Fund does not seek to achieve its stated investment objective for a period different than one trading day.
The Fund had negative performance during the period ending on March 31, 2023. The market price for SARK decreased 19.69% and the NAV decreased 19.82%, while the ARK Innovation ETF Index gained 6.92%.
The Fund uses swaps to target the desired -100% daily NAV exposure to the underlying ARK Innovation ETF Index. The Fund met its investment objectives. Over the 251 trading days in the fiscal year, the Fund beat the inverse ARK Innovation ETF Index daily performance 100 days and came within 5 basis points 232 days and within 10 bps 247 days. The four days where Fund NAV deviated more than 10 basis points were days where the Fund was substantially up or down.
Looking forward, we continue strive to improve Fund NAV tracking of the inverse of the daily ARK Innovation ETF Index return. We appreciate your investment in SARK.
The views in this letter were as of March 31, 2023, and may not necessarily reflect the same views on the date this letter is first published or any time thereafter. These views are intended to help shareholders in understanding the fund’s investment methodology and do not constitute investment advice.
Faithfully yours,
Parker B. Binion
Head of Investments, AXS Investments LLC
IMPORTANT RISK INFORMATION
There is no guarantee that this, or any investment strategy will succeed.
Effects of Compounding and Market Volatility Risk: The Fund has a daily investment objective and the Fund’s performance for periods greater than a trading day will be the result of each day's returns compounded over the period, which is very likely to differ from -100% of the ARK Innovation ETF's performance, before fees and expenses. The impact of compounding will impact each shareholder differently depending on the period of time an investment in the Fund is held and the volatility of the ARK Innovation ETF during shareholder's holding period of an investment in the Fund.
Correlation Risk: A number of factors may impact the Fund’s ability to achieve a high degree of inverse correlation with the ETF. There is no guarantee that the Fund will achieve a high degree of correlation with the ETF.
Counterparty Risk: The Fund may engage in transactions in securities and financial instruments that involve counterparties. Counterparty risk is the risk that a counterparty (the other party to a transaction or an agreement or the party with whom the Fund executes transactions) to a transaction with the Fund may be unable or unwilling to make timely principal, interest or settlement payments, or otherwise honor its obligations. To limit the counterparty risk associated with such transactions, the Fund conducts business only with financial institutions judged by the Adviser to present acceptable credit risk.
Derivatives Risk: The Fund’s use of derivative instruments involves risks different from, or possibly greater than, the risks associated with investing directly in securities and other traditional investments. These risks include (i) the risk that the counterparty to a derivative transaction may not fulfill its contractual obligations; (ii) risk of mispricing or improper valuation; and (iii) the risk that changes in the value of the derivative may not correlate perfectly with the underlying asset, rate or index. Derivative prices are highly volatile and may fluctuate substantially during a short period of time. Such prices are influenced by numerous factors that affect the markets, including, but not limited to: changing supply and demand relationships; government programs and policies; national and international political and economic events; changes in interest rates, inflation and deflation and changes in supply and demand relationships.
Inverse Risk: Short (inverse) positions are designed to profit from a decline in the price of particular securities, investments in securities or indices. The Fund will lose value if and when the Index’s price rises – a result that is the opposite from traditional mutual funds and exchange traded funds. Like leveraged investments, inverse positions may be considered aggressive. Inverse positions may also be leveraged. Such instruments may experience imperfect negative correlation between the price of the investment and the underlying security or index. The use of inverse instruments may expose the Fund to additional risks that it would not be subject to if it invested only in “long” positions.
Leverage Risk: Derivative contracts ordinarily have leverage inherent in their terms. The low margin deposits normally required in trading derivatives, including futures contracts, permit a high degree of leverage. Accordingly, a relatively small price movement may result in an immediate and substantial loss to the Fund. The use of leverage may also cause the Fund to liquidate portfolio positions when it would not be advantageous to do so in order to satisfy its obligations or to meet collateral segregation requirements. The use of leveraged derivatives can magnify the Fund’s potential for gain or loss and, therefore, amplify the effects of market volatility on the Fund’s share price.
Non-Diversified Risk: The Fund is non-diversified. This means that it may invest a larger portion of its assets in a limited number of companies than a diversified fund. Because a relatively high percentage of the Fund’s assets may be invested in the securities of a limited number of companies that could be in the same or related economic sectors, the Fund’s portfolio may be more susceptible to any single economic, technological or regulatory occurrence than the portfolio of a diversified fund.
Swap Risk: The Fund expects to use swap agreements as a means to achieve its investment objective. Swap agreements are generally traded in over-the-counter (“OTC”) markets and have only recently become subject to regulation by the CFTC. CFTC rules, however, do not cover all types of swap agreements. Investors, therefore, may not receive the protection of CFTC regulation or the statutory scheme of the Commodity Exchange Act in connection with the Fund’s swap agreements. Swaps are also subject to the risk of imperfect correlation between the value of the reference asset underlying the swap and the swap. Leverage inherent in derivatives will tend to magnify the Fund’s gains and losses. A swap is an agreement between two parties to exchange an asset's benefits on a specific date, in an exchange of a series of payments. It is not limited to one type of investment. A swap can be agreed on for stocks, bonds, ETFs, commodities, foreign currencies or even interest rates.
Shares of ETFs are bought and sold at market price (not NAV) and are not individually redeemed from the ETF. Brokerage commissions will reduce returns. NAVs are calculated using prices as of 4:00 PM Eastern Time. The closing price is the midpoint between the bid and ask price as of the close of exchange. Closing price returns do not represent the returns you would receive if you traded shares at other times.
Investors should carefully consider the investment objectives, risks, charges and expenses of the AXS Short Innovation Daily ETF. This and other important information about the Fund is contained in the Prospectus, which can be obtained by visiting www.axsinvestments.com. The Prospectus should be read carefully before investing.
Distributed by ALPS Distributors, Inc, which is not affiliated with AXS Investments.
AXS 2X Innovation ETF
ETF PERFORMANCE at March 31, 2023 (Unaudited)
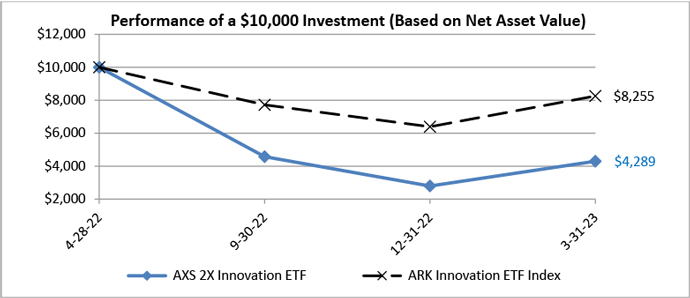
This graph compares a hypothetical $10,000 investment in the ETF, made at its inception, with a similar investment in the ARK Innovation ETF Index. Results include the reinvestment of all dividends and capital gains.
The ARK Innovation ETF Index is an actively-managed exchange-traded fund ("ETF") that will invest under normal circumstances primarily (at least 65% of its assets) in domestic and foreign equity securities of companies that are relevant to the fund's investment theme of disruptive innovation. The index does not reflect expenses, fees, or sales charge, which would lower performance. The index is unmanaged and is not available for investment.
| Total Returns as of March 31, 2023 | 3 Months (Actual) | 6 Months (Actual) | Since Inception (Cumulative) | Inception Date |
| AXS 2X Innovation ETF (Net Asset Value) | 53.59% | -6.28% | -57.11% | 4/28/22 |
| AXS 2X Innovation ETF (Market Price) | 54.49% | -6.84% | -57.11% | 4/28/22 |
| ARK Innovation ETF Index | 29.13% | 6.92% | -17.45% | 4/28/22 |
The performance data quoted here represents past performance and past performance is not a guarantee of future results. Investment return and principal value will fluctuate so that an investor's shares, when redeemed, may be worth more or less than their original cost. Current performance may be lower or higher than the performance information quoted. The most recent month end performance may be obtained by calling (866) 984-2510.
The ETF’s shares are listed on an exchange. The price of the ETF’s shares is based on market price, and because exchange-traded fund shares trade at market prices rather than net asset value, shares may trade at a price greater than net asset value (premium) or less than net asset value (discount).
Gross and net expense ratios were 1.35% and 1.15%, respectively, which were stated in the current prospectus dated April 13, 2022. For the ETF’s current period ended March 31, 2023 expense ratios, please refer to the Financial Highlights section of this report. The ETF’s Advisor has contractually agreed to waive its fees and/or pay for operating expenses of the ETF to ensure that total annual etf operating expenses (exclusive of any (i) front-end or contingent deferred loads, (ii) brokerage fees and commission, (iii) acquired etf fees and expenses, (iv) fees and expenses associated with instruments in other collective investment vehicles or derivative instruments (including for example options and swap fees and expenses), (v) borrowing costs (such as interest and dividend expense on securities sold short), (vi) taxes, (vii) other fees related to underlying investments (such as option fees and expenses or swap fees and expenses), or (viii) extraordinary expenses such as litigation (which may include indemnification of Acquiring ETF officers and trustees or contractual indemnification of ETF service providers (other than the Acquiring ETF’s advisor)) will not exceed 1.15%. This agreement is in effect until July 31, 2023, and it may be terminated before that date only by the Trust’s Board of Trustees. In the absence of such waivers, the ETF’s returns would be lower.
AXS 2X Innovation ETF
ETF PERFORMANCE at March 31, 2023 (Unaudited) - Continued
Returns reflect the reinvestment of distributions made by the ETF, if any. The graph and the performance table shown do not reflect the deduction of taxes that a shareholder would pay on ETF distributions or the redemption of ETF shares.
AXS Short China Internet ETF
ETF PERFORMANCE at March 31, 2023 (Unaudited)

This graph compares a hypothetical $10,000 investment in the ETF, made at its inception, with a similar investment in the CSI Overseas China Internet Index. Results include the reinvestment of all dividends and capital gains.
The CSI Overseas China Internet Index is designed to measure the performance of the investable universe of publicly traded China-based companies whose primary business or businesses are in the Internet and Internet-related sectors. The index does not reflect expenses, fees, or sales charge, which would lower performance. The index is unmanaged and is not available for investment.
| Total Returns as of March 31, 2023 | 3 Months (Actual) | 6 Months (Actual) | Since Inception (Cumulative) | Inception Date |
| AXS Short China Internet ETF (Net Asset Value) | -5.79% | -31.70% | -35.62% | 4/28/22 |
| AXS Short China Internet ETF (Market Price) | -6.36% | -32.11% | -35.68% | 4/28/22 |
| CSI Overseas China Internet Index | 2.76% | 26.71% | 18.95% | 4/28/22 |
The performance data quoted here represents past performance and past performance is not a guarantee of future results. Investment return and principal value will fluctuate so that an investor's shares, when redeemed, may be worth more or less than their original cost. Current performance may be lower or higher than the performance information quoted. The most recent month end performance may be obtained by calling (866) 984-2510.
The ETF’s shares are listed on an exchange. The price of the ETF’s shares is based on market price, and because exchange-traded fund shares trade at market prices rather than net asset value, shares may trade at a price greater than net asset value (premium) or less than net asset value (discount).
Gross and net expense ratios were 1.15% and 0.95%, respectively, which were stated in the current prospectus dated April 13, 2022. For the ETF’s current period ended March 31, 2023 expense ratios, please refer to the Financial Highlights section of this report. The ETF’s Advisor has contractually agreed to waive its fees and/or pay for operating expenses of the ETF to ensure that total annual etf operating expenses (exclusive of any (i) front-end or contingent deferred loads, (ii) brokerage fees and commission, (iii) acquired etf fees and expenses, (iv) fees and expenses associated with instruments in other collective investment vehicles or derivative instruments (including for example options and swap fees and expenses), (v) borrowing costs (such as interest and dividend expense on securities sold short), (vi) taxes, (vii) other fees related to underlying investments (such as option fees and expenses or swap fees and expenses), or (viii) extraordinary expenses such as litigation (which may include indemnification of Acquiring ETF officers and trustees or contractual indemnification of ETF service providers (other than the Acquiring ETF’s advisor)) will not exceed 0.95%. This agreement is in effect until July 31, 2023, and it may be terminated before that date only by the Trust’s Board of Trustees. In the absence of such waivers, the ETF’s returns would be lower.
AXS Short China Internet ETF
ETF PERFORMANCE at March 31, 2023 (Unaudited) - Continued
Returns reflect the reinvestment of distributions made by the ETF, if any. The graph and the performance table shown do not reflect the deduction of taxes that a shareholder would pay on ETF distributions or the redemption of ETF shares.
AXS 1.25X NVDA Bear Daily ETF
ETF PERFORMANCE at March 31, 2023 (Unaudited)
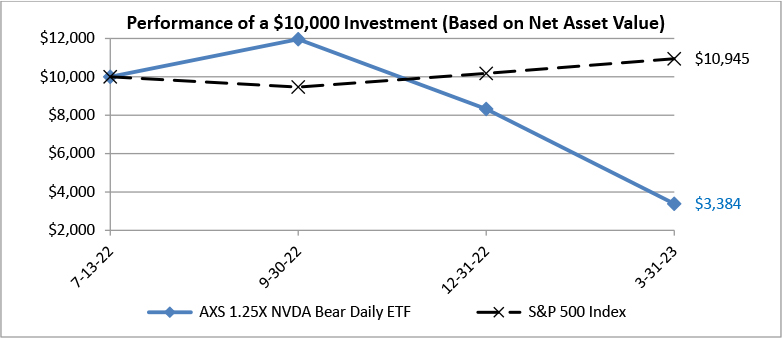
This graph compares a hypothetical $10,000 investment in the ETF, made at its inception, with a similar investment in the S&P 500 Index. Results include the reinvestment of all dividends and capital gains.
The S&P 500 Index is a broad unmanaged index of 500 stocks, which is widely recognized as representative of the equity market in general. The index does not reflect expenses, fees, or sales charge, which would lower performance. The index is unmanaged and is not available for investment.
| Total Returns as of March 31, 2023 | 3 Months (Actual) | 6 Months (Actual) | Since Inception (Cumulative) | Inception Date |
| AXS 1.25X NVDA Bear Daily ETF (Net Asset Value) | -59.35% | -71.70% | -66.14% | 7/13/22 |
| AXS 1.25X NVDA Bear Daily ETF (Market Price) | -59.37% | -71.69% | -66.14% | 7/13/22 |
| S&P 500 Index | 7.50% | 15.62% | 9.45% | 7/13/22 |
The performance data quoted here represents past performance and past performance is not a guarantee of future results. Investment return and principal value will fluctuate so that an investor's shares, when redeemed, may be worth more or less than their original cost. Current performance may be lower or higher than the performance information quoted. The most recent month end performance may be obtained by calling (866) 984-2510.
The ETF’s shares are listed on an exchange. The price of the ETF’s shares is based on market price, and because exchange-traded fund shares trade at market prices rather than net asset value, shares may trade at a price greater than net asset value (premium) or less than net asset value (discount).
Gross and net expense ratios were 1.57% and 1.15%, respectively, which were stated in the current prospectus dated July 11, 2022. For the ETF’s current period ended March 31, 2023 expense ratios, please refer to the Financial Highlights section of this report. The ETF’s Advisor has contractually agreed to waive its fees and/or pay for operating expenses of the ETF to ensure that total annual etf operating expenses (exclusive of any (i) leverage interest, (ii) brokerage fees and commission, (iii) acquired etf fees and expenses, (iv) fees and expenses associated with instruments in other collective investment vehicles or derivative instruments (including for example options and swap fees and expenses), (v) interest and dividend expense on short sales, (vi) taxes, (vii) other fees related to underlying investments (such as option fees and expenses or swap fees and expenses), (viii) expenses incurred in connection with any merger or reorganization or (ix) extraordinary expenses such as litigation) will not exceed 1.15%. This agreement is in effect until July 31, 2023, and it may be terminated before that date only by the Trust’s Board of Trustees. In the absence of such waivers, the ETF’s returns would be lower.
AXS 1.25X NVDA Bear Daily ETF
ETF PERFORMANCE at March 31, 2023 (Unaudited) - Continued
Returns reflect the reinvestment of distributions made by the ETF, if any. The graph and the performance table shown do not reflect the deduction of taxes that a shareholder would pay on ETF distributions or the redemption of ETF shares.
AXS 2X PFE Bear Daily ETF
ETF PERFORMANCE at March 31, 2023 (Unaudited)

This graph compares a hypothetical $10,000 investment in the ETF, made at its inception, with a similar investment in the S&P 500 Index. Results include the reinvestment of all dividends and capital gains.
The S&P 500 Index is a broad unmanaged index of 500 stocks, which is widely recognized as representative of the equity market in general. The index does not reflect expenses, fees, or sales charge, which would lower performance. The index is unmanaged and is not available for investment.
| Total Returns as of March 31, 2023 | 3 Months (Actual) | 6 Months (Actual) | Since Inception (Cumulative) | Inception Date |
| AXS 2X PFE Bear Daily ETF (Net Asset Value) | 54.25% | 6.18% | 28.33% | 7/13/22 |
| AXS 2X PFE Bear Daily ETF (Market Price) | 54.60% | 6.44% | 28.58% | 7/13/22 |
| S&P 500 Index | 7.50% | 15.62% | 9.45% | 7/13/22 |
The performance data quoted here represents past performance and past performance is not a guarantee of future results. Investment return and principal value will fluctuate so that an investor's shares, when redeemed, may be worth more or less than their original cost. Current performance may be lower or higher than the performance information quoted. The most recent month end performance may be obtained by calling (866) 984-2510.
The ETF’s shares are listed on an exchange. The price of the ETF’s shares is based on market price, and because exchange-traded fund shares trade at market prices rather than net asset value, shares may trade at a price greater than net asset value (premium) or less than net asset value (discount).
Gross and net expense ratios were 1.57% and 1.15%, respectively, which were stated in the current prospectus dated July 11, 2022. For the ETF’s current period ended March 31, 2023 expense ratios, please refer to the Financial Highlights section of this report. The ETF’s Advisor has contractually agreed to waive its fees and/or pay for operating expenses of the ETF to ensure that total annual etf operating expenses (exclusive of any (i) leverage interest, (ii) brokerage fees and commission, (iii) acquired etf fees and expenses, (iv) fees and expenses associated with instruments in other collective investment vehicles or derivative instruments (including for example options and swap fees and expenses), (v) interest and dividend expense on short sales, (vi) taxes, (vii) other fees related to underlying investments (such as option fees and expenses or swap fees and expenses), (viii) expenses incurred in connection with any merger or reorganization or (ix) extraordinary expenses such as litigation) will not exceed 1.15%. This agreement is in effect until July 31, 2023, and it may be terminated before that date only by the Trust’s Board of Trustees. In the absence of such waivers, the ETF’s returns would be lower.
AXS 2X PFE Bear Daily ETF
ETF PERFORMANCE at March 31, 2023 (Unaudited) - Continued
Returns reflect the reinvestment of distributions made by the ETF, if any. The graph and the performance table shown do not reflect the deduction of taxes that a shareholder would pay on ETF distributions or the redemption of ETF shares.
AXS 2X PFE Bull Daily ETF
ETF PERFORMANCE at March 31, 2023 (Unaudited)
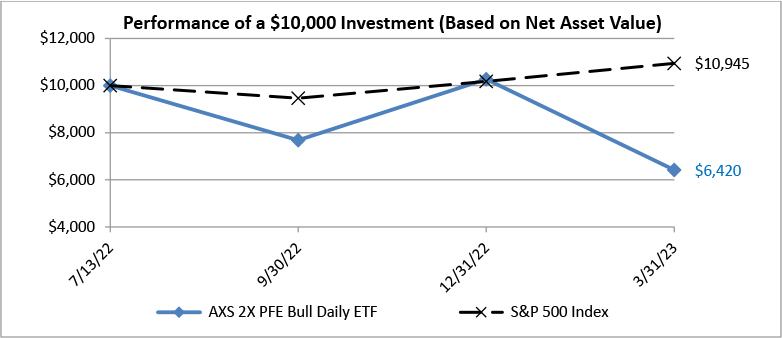
This graph compares a hypothetical $10,000 investment in the ETF, made at its inception, with a similar investment in the S&P 500 Index. Results include the reinvestment of all dividends and capital gains.
The S&P 500 Index is a broad unmanaged index of 500 stocks, which is widely recognized as representative of the equity market in general. The index does not reflect expenses, fees, or sales charge, which would lower performance. The index is unmanaged and is not available for investment.
| Total Returns as of March 31, 2023 | 3 Months (Actual) | 6 Months (Actual) | Since Inception (Cumulative) | Inception Date |
| AXS 2X PFE Bull Daily ETF (Net Asset Value) | -37.57% | -16.57% | -35.87% | 7/13/22 |
| AXS 2X PFE Bull Daily ETF (Market Price) | -37.54% | -16.59% | -35.83% | 7/13/22 |
| S&P 500 Index | 7.50% | 15.62% | 9.45% | 7/13/22 |
The performance data quoted here represents past performance and past performance is not a guarantee of future results. Investment return and principal value will fluctuate so that an investor's shares, when redeemed, may be worth more or less than their original cost. Current performance may be lower or higher than the performance information quoted. The most recent month end performance may be obtained by calling (866) 984-2510.
The ETF’s shares are listed on an exchange. The price of the ETF’s shares is based on market price, and because exchange-traded fund shares trade at market prices rather than net asset value, shares may trade at a price greater than net asset value (premium) or less than net asset value (discount).
Gross and net expense ratios were 1.57% and 1.15%, respectively, which were stated in the current prospectus dated July 11, 2022. For the ETF’s current period ended March 31, 2023 expense ratios, please refer to the Financial Highlights section of this report. The ETF’s Advisor has contractually agreed to waive its fees and/or pay for operating expenses of the ETF to ensure that total annual etf operating expenses (exclusive of any (i) leverage interest, (ii) brokerage fees and commission, (iii) acquired etf fees and expenses, (iv) fees and expenses associated with instruments in other collective investment vehicles or derivative instruments (including for example options and swap fees and expenses), (v) interest and dividend expense on short sales, (vi) taxes, (vii) other fees related to underlying investments (such as option fees and expenses or swap fees and expenses), (viii) expenses incurred in connection with any merger or reorganization or (ix) extraordinary expenses such as litigation) will not exceed 1.15%. This agreement is in effect until July 31, 2023, and it may be terminated before that date only by the Trust’s Board of Trustees. In the absence of such waivers, the ETF’s returns would be lower.
AXS 2X PFE Bull Daily ETF
ETF PERFORMANCE at March 31, 2023 (Unaudited) - Continued
Returns reflect the reinvestment of distributions made by the ETF, if any. The graph and the performance table shown do not reflect the deduction of taxes that a shareholder would pay on ETF distributions or the redemption of ETF shares.
AXS 1.5X PYPL Bear Daily ETF
ETF PERFORMANCE at March 31, 2023 (Unaudited)
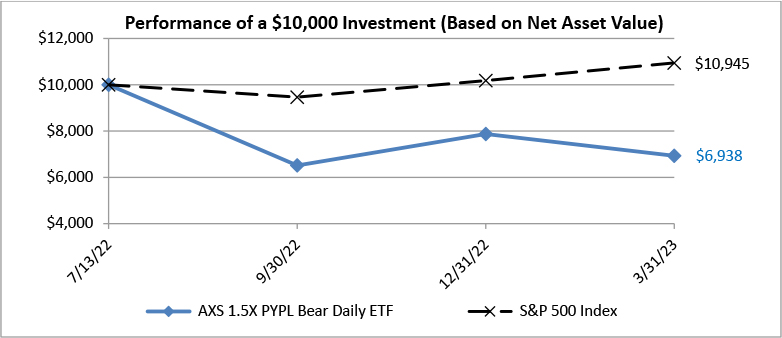
This graph compares a hypothetical $10,000 investment in the ETF, made at its inception, with a similar investment in the S&P 500 Index. Results include the reinvestment of all dividends and capital gains.
The S&P 500 Index is a broad unmanaged index of 500 stocks, which is widely recognized as representative of the equity market in general. The index does not reflect expenses, fees, or sales charge, which would lower performance. The index is unmanaged and is not available for investment.
| Total Returns as of March 31, 2023 | 3 Months (Actual) | 6 Months (Actual) | Since Inception (Cumulative) | Inception Date |
| AXS 1.5X PYPL Bear Daily ETF (Net Asset Value) | -11.86% | 6.51% | -30.62% | 7/13/22 |
| AXS 1.5X PYPL Bear Daily ETF (Market Price) | -11.66% | 6.63% | -30.52% | 7/13/22 |
| S&P 500 Index | 7.50% | 15.62% | 9.45% | 7/13/22 |
The performance data quoted here represents past performance and past performance is not a guarantee of future results. Investment return and principal value will fluctuate so that an investor's shares, when redeemed, may be worth more or less than their original cost. Current performance may be lower or higher than the performance information quoted. The most recent month end performance may be obtained by calling (866) 984-2510.
The ETF’s shares are listed on an exchange. The price of the ETF’s shares is based on market price, and because exchange-traded fund shares trade at market prices rather than net asset value, shares may trade at a price greater than net asset value (premium) or less than net asset value (discount).
Gross and net expense ratios were 1.57% and 1.15%, respectively, which were stated in the current prospectus dated July 11, 2022. For the ETF’s current period ended March 31, 2023 expense ratios, please refer to the Financial Highlights section of this report. The ETF’s Advisor has contractually agreed to waive its fees and/or pay for operating expenses of the ETF to ensure that total annual etf operating expenses (exclusive of any (i) leverage interest, (ii) brokerage fees and commission, (iii) acquired etf fees and expenses, (iv) fees and expenses associated with instruments in other collective investment vehicles or derivative instruments (including for example options and swap fees and expenses), (v) interest and dividend expense on short sales, (vi) taxes, (vii) other fees related to underlying investments (such as option fees and expenses or swap fees and expenses), (viii) expenses incurred in connection with any merger or reorganization or (ix) extraordinary expenses such as litigation) will not exceed 1.15%. This agreement is in effect until July 31, 2023, and it may be terminated before that date only by the Trust’s Board of Trustees. In the absence of such waivers, the ETF’s returns would be lower.
AXS 1.5X PYPL Bear Daily ETF
ETF PERFORMANCE at March 31, 2023 (Unaudited) - Continued
Returns reflect the reinvestment of distributions made by the ETF, if any. The graph and the performance table shown do not reflect the deduction of taxes that a shareholder would pay on ETF distributions or the redemption of ETF shares.
AXS 1.5X PYPL Bull Daily ETF
ETF PERFORMANCE at March 31, 2023 (Unaudited)

This graph compares a hypothetical $10,000 investment in the ETF, made at its inception, with a similar investment in the S&P 500 Index. Results include the reinvestment of all dividends and capital gains.
The S&P 500 Index is a broad unmanaged index of 500 stocks, which is widely recognized as representative of the equity market in general. The index does not reflect expenses, fees, or sales charge, which would lower performance. The index is unmanaged and is not available for investment.
| Total Returns as of March 31, 2023 | 3 Months (Actual) | 6 Months (Actual) | Since Inception (Cumulative) | Inception Date |
| AXS 1.5X PYPL Bull Daily ETF (Net Asset Value) | 7.40% | -22.00% | 2.55% | 7/13/22 |
| AXS 1.5X PYPL Bull Daily ETF (Market Price) | 7.56% | -21.91% | 2.64% | 7/13/22 |
| S&P 500 Index | 7.50% | 15.62% | 9.45% | 7/13/22 |
The performance data quoted here represents past performance and past performance is not a guarantee of future results. Investment return and principal value will fluctuate so that an investor's shares, when redeemed, may be worth more or less than their original cost. Current performance may be lower or higher than the performance information quoted. The most recent month end performance may be obtained by calling (866) 984-2510.
The ETF’s shares are listed on an exchange. The price of the ETF’s shares is based on market price, and because exchange-traded fund shares trade at market prices rather than net asset value, shares may trade at a price greater than net asset value (premium) or less than net asset value (discount).
Gross and net expense ratios were 1.57% and 1.15%, respectively, which were stated in the current prospectus dated July 11, 2022. For the ETF’s current period ended March 31, 2023 expense ratios, please refer to the Financial Highlights section of this report. The ETF’s Advisor has contractually agreed to waive its fees and/or pay for operating expenses of the ETF to ensure that total annual etf operating expenses (exclusive of any (i) leverage interest, (ii) brokerage fees and commission, (iii) acquired etf fees and expenses, (iv) fees and expenses associated with instruments in other collective investment vehicles or derivative instruments (including for example options and swap fees and expenses), (v) interest and dividend expense on short sales, (vi) taxes, (vii) other fees related to underlying investments (such as option fees and expenses or swap fees and expenses), (viii) expenses incurred in connection with any merger or reorganization or (ix) extraordinary expenses such as litigation) will not exceed 1.15%. This agreement is in effect until July 31, 2023, and it may be terminated before that date only by the Trust’s Board of Trustees. In the absence of such waivers, the ETF’s returns would be lower.
AXS 1.5X PYPL Bull Daily ETF
ETF PERFORMANCE at March 31, 2023 (Unaudited) - Continued
Returns reflect the reinvestment of distributions made by the ETF, if any. The graph and the performance table shown do not reflect the deduction of taxes that a shareholder would pay on ETF distributions or the redemption of ETF shares.
AXS TSLA Bear Daily ETF
ETF PERFORMANCE at March 31, 2023 (Unaudited)
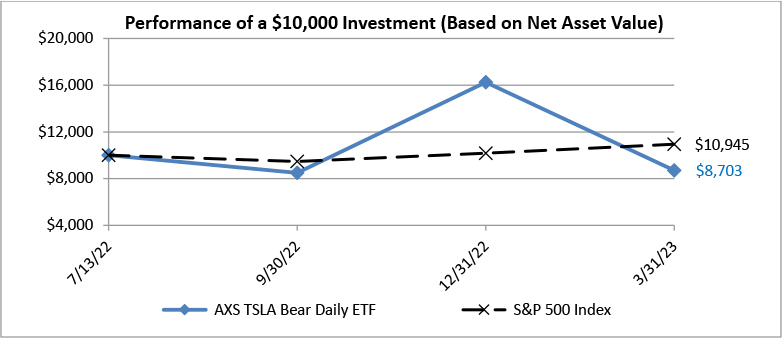
This graph compares a hypothetical $10,000 investment in the ETF, made at its inception, with a similar investment in the S&P 500 Index. Results include the reinvestment of all dividends and capital gains.
The S&P 500 Index is a broad unmanaged index of 500 stocks, which is widely recognized as representative of the equity market in general. The index does not reflect expenses, fees, or sales charge, which would lower performance. The index is unmanaged and is not available for investment.
| Total Returns as of March 31, 2023 | 3 Months (Actual) | 6 Months (Actual) | Since Inception (Cumulative) | Inception Date |
| AXS TSLA Bear Daily ETF (Net Asset Value) | -46.45% | 2.48% | -12.97% | 7/13/22 |
| AXS TSLA Bear Daily ETF (Market Price) | -46.37% | 2.50% | -13.02% | 7/13/22 |
| S&P 500 Index | 7.50% | 15.62% | 9.45% | 7/13/22 |
The performance data quoted here represents past performance and past performance is not a guarantee of future results. Investment return and principal value will fluctuate so that an investor's shares, when redeemed, may be worth more or less than their original cost. Current performance may be lower or higher than the performance information quoted. The most recent month end performance may be obtained by calling (866) 984-2510.
The ETF’s shares are listed on an exchange. The price of the ETF’s shares is based on market price, and because exchange-traded fund shares trade at market prices rather than net asset value, shares may trade at a price greater than net asset value (premium) or less than net asset value (discount).
Gross and net expense ratios were 1.57% and 1.15%, respectively, which were stated in the current prospectus dated July 11, 2022. For the ETF’s current period ended March 31, 2023 expense ratios, please refer to the Financial Highlights section of this report. The ETF’s Advisor has contractually agreed to waive its fees and/or pay for operating expenses of the ETF to ensure that total annual etf operating expenses (exclusive of any (i) leverage interest, (ii) brokerage fees and commission, (iii) acquired etf fees and expenses, (iv) fees and expenses associated with instruments in other collective investment vehicles or derivative instruments (including for example options and swap fees and expenses), (v) interest and dividend expense on short sales, (vi) taxes, (vii) other fees related to underlying investments (such as option fees and expenses or swap fees and expenses), (viii) expenses incurred in connection with any merger or reorganization or (ix) extraordinary expenses such as litigation) will not exceed 1.15%. This agreement is in effect until July 31, 2023, and it may be terminated before that date only by the Trust’s Board of Trustees. In the absence of such waivers, the ETF’s returns would be lower.
AXS TSLA Bear Daily ETF
ETF PERFORMANCE at March 31, 2023 (Unaudited) - Continued
Returns reflect the reinvestment of distributions made by the ETF, if any. The graph and the performance table shown do not reflect the deduction of taxes that a shareholder would pay on ETF distributions or the redemption of ETF shares.
AXS 2X NKE Bear Daily ETF
ETF PERFORMANCE at March 31, 2023 (Unaudited)

This graph compares a hypothetical $10,000 investment in the ETF, made at its inception, with a similar investment in the S&P 500 Index. Results include the reinvestment of all dividends and capital gains.
The S&P 500 Index is a broad unmanaged index of 500 stocks, which is widely recognized as representative of the equity market in general. The index does not reflect expenses, fees, or sales charge, which would lower performance. The index is unmanaged and is not available for investment.
| Total Returns as of March 31, 2023 | 3 Months (Actual) | 6 Months (Actual) | Since Inception (Cumulative) | Inception Date |
| AXS 2X NKE Bear Daily ETF (Net Asset Value) | -10.77% | -61.45% | -47.88% | 7/13/22 |
| AXS 2X NKE Bear Daily ETF (Market Price) | -12.30% | -61.55% | -47.94% | 7/13/22 |
| S&P 500 Index | 7.50% | 15.62% | 9.45% | 7/13/22 |
The performance data quoted here represents past performance and past performance is not a guarantee of future results. Investment return and principal value will fluctuate so that an investor's shares, when redeemed, may be worth more or less than their original cost. Current performance may be lower or higher than the performance information quoted. The most recent month end performance may be obtained by calling (866) 984-2510.
The ETF’s shares are listed on an exchange. The price of the ETF’s shares is based on market price, and because exchange-traded fund shares trade at market prices rather than net asset value, shares may trade at a price greater than net asset value (premium) or less than net asset value (discount).
Gross and net expense ratios were 1.57% and 1.15%, respectively, which were stated in the current prospectus dated July 11, 2022. For the ETF’s current period ended March 31, 2023 expense ratios, please refer to the Financial Highlights section of this report. The ETF’s Advisor has contractually agreed to waive its fees and/or pay for operating expenses of the ETF to ensure that total annual etf operating expenses (exclusive of any (i) leverage interest, (ii) brokerage fees and commission, (iii) acquired etf fees and expenses, (iv) fees and expenses associated with instruments in other collective investment vehicles or derivative instruments (including for example options and swap fees and expenses), (v) interest and dividend expense on short sales, (vi) taxes, (vii) other fees related to underlying investments (such as option fees and expenses or swap fees and expenses), (viii) expenses incurred in connection with any merger or reorganization or (ix) extraordinary expenses such as litigation) will not exceed 1.15%. This agreement is in effect until July 31, 2023, and it may be terminated before that date only by the Trust’s Board of Trustees. In the absence of such waivers, the ETF’s returns would be lower.
AXS 2X NKE Bear Daily ETF
ETF PERFORMANCE at March 31, 2023 (Unaudited) - Continued
Returns reflect the reinvestment of distributions made by the ETF, if any. The graph and the performance table shown do not reflect the deduction of taxes that a shareholder would pay on ETF distributions or the redemption of ETF shares.
AXS 2X NKE Bull Daily ETF
ETF PERFORMANCE at March 31, 2023 (Unaudited)

This graph compares a hypothetical $10,000 investment in the ETF, made at its inception, with a similar investment in the S&P 500 Index. Results include the reinvestment of all dividends and capital gains.
The S&P 500 Index is a broad unmanaged index of 500 stocks, which is widely recognized as representative of the equity market in general. The index does not reflect expenses, fees, or sales charge, which would lower performance. The index is unmanaged and is not available for investment.
| Total Returns as of March 31, 2023 | 3 Months (Actual) | 6 Months (Actual) | Since Inception (Cumulative) | Inception Date |
| AXS 2X NKE Bull Daily ETF (Net Asset Value) | 6.62% | 97.07% | 19.95% | 7/13/22 |
| AXS 2X NKE Bull Daily ETF (Market Price) | 6.72% | 97.48% | 20.07% | 7/13/22 |
| S&P 500 Index | 7.50% | 15.62% | 9.45% | 7/13/22 |
The performance data quoted here represents past performance and past performance is not a guarantee of future results. Investment return and principal value will fluctuate so that an investor's shares, when redeemed, may be worth more or less than their original cost. Current performance may be lower or higher than the performance information quoted. The most recent month end performance may be obtained by calling (866) 984-2510.
The ETF’s shares are listed on an exchange. The price of the ETF’s shares is based on market price, and because exchange-traded fund shares trade at market prices rather than net asset value, shares may trade at a price greater than net asset value (premium) or less than net asset value (discount).
Gross and net expense ratios were 1.57% and 1.15%, respectively, which were stated in the current prospectus dated July 11, 2022. For the ETF’s current period ended March 31, 2023 expense ratios, please refer to the Financial Highlights section of this report. The ETF’s Advisor has contractually agreed to waive its fees and/or pay for operating expenses of the ETF to ensure that total annual etf operating expenses (exclusive of any (i) leverage interest, (ii) brokerage fees and commission, (iii) acquired etf fees and expenses, (iv) fees and expenses associated with instruments in other collective investment vehicles or derivative instruments (including for example options and swap fees and expenses), (v) interest and dividend expense on short sales, (vi) taxes, (vii) other fees related to underlying investments (such as option fees and expenses or swap fees and expenses), (viii) expenses incurred in connection with any merger or reorganization or (ix) extraordinary expenses such as litigation) will not exceed 1.15%. This agreement is in effect until July 31, 2023, and it may be terminated before that date only by the Trust’s Board of Trustees. In the absence of such waivers, the ETF’s returns would be lower.
AXS 2X NKE Bull Daily ETF
ETF PERFORMANCE at March 31, 2023 (Unaudited) - Continued
Returns reflect the reinvestment of distributions made by the ETF, if any. The graph and the performance table shown do not reflect the deduction of taxes that a shareholder would pay on ETF distributions or the redemption of ETF shares.
AXS Short De-SPAC Daily ETF
ETF PERFORMANCE at March 31, 2023 (Unaudited)
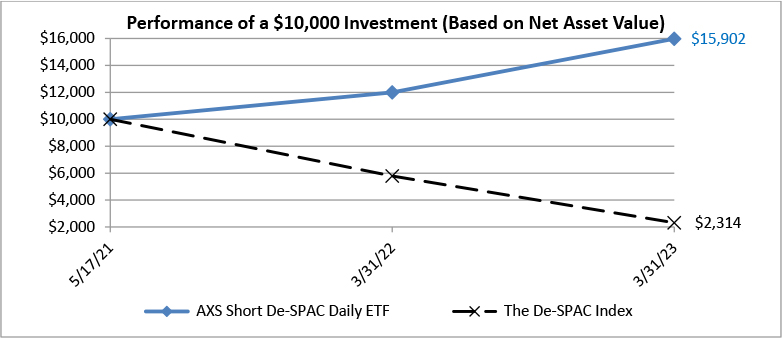
This graph compares a hypothetical $10,000 investment in the ETF, made at its inception, with a similar investment in The De-SPAC Index. Results include the reinvestment of all dividends and capital gains.
The De-SPAC Index is an equally weighted portfolio of 25 of the largest de-SPAC stocks on a rolling 12-month basis. The index does not reflect expenses, fees, or sales charge, which would lower performance. The index is unmanaged and is not available for investment.
| Average Annual Total Returns as of March 31, 2023 | 6 Months* | 1 Year | Since Inception | Inception Date |
| AXS Short De-SPAC Daily ETF (Net Asset Value) | -7.18% | 32.93% | 28.33% | 05/17/21 |
| AXS Short De-SPAC Daily ETF (Market Price) | -6.84% | 34.63% | 28.87% | 05/17/21 |
| The De-SPAC Index | -14.76% | -59.98% | -54.26% | 05/17/21 |
| * | For the period October 1, 2022 through March 31, 2023. Not annualized. |
The performance data quoted here represents past performance and past performance is not a guarantee of future results. Investment return and principal value will fluctuate so that an investor's shares, when redeemed, may be worth more or less than their original cost. Current performance may be lower or higher than the performance information quoted. The most recent month end performance may be obtained by calling (866) 984-2510.
The ETF acquired the assets and liabilities of The Short De-SPAC ETF, a series of the Collaborative Investment Series Trust (the “Predecessor ETF”) at the close of business on August 5, 2022. As a result of the reorganization, the ETF is the accounting successor of the Predecessor ETF. Performance results shown in the graph and the performance table above for the periods prior to August 6, 2022, reflect the performance of the Predecessor ETF.
The ETF’s shares are listed on an exchange. The price of the ETF’s shares is based on market price, and because exchange-traded fund shares trade at market prices rather than net asset value, shares may trade at a price greater than net asset value (premium) or less than net asset value (discount).
Gross and net expense ratios were 1.29% and 0.95%, respectively, which were stated in the current prospectus dated February 1, 2023. For the ETF’s current one year expense ratios, please refer to the Financial Highlights section of this report. The ETF’s Advisor has contractually agreed to waive its fees and/or pay for operating expenses of the ETF to ensure that total annual etf operating expenses (excluding any taxes, leverage interest, brokerage commissions, dividend and interest expenses on short sales, acquired ETF fees and expenses (as determined in accordance with SEC Form N-1A), other fees related to underlying investments, (such as option fees and expenses or swap fees and expenses), expenses incurred in connection with any merger or reorganization, and extraordinary expenses such as litigation expenses) does not exceed 0.95% of the ETF's average daily net assets. This agreement is in effect until August 5, 2024, and it may be terminated before that date only by the Trust’s Board of Trustees. In the absence of such waivers, the ETF’s returns would be lower.
AXS Short De-SPAC Daily ETF
ETF PERFORMANCE at March 31, 2023 (Unaudited) - Continued
Returns reflect the reinvestment of distributions made by the ETF, if any. The graph and the performance table shown do not reflect the deduction of taxes that a shareholder would pay on ETF distributions or the redemption of ETF shares.
AXS Short Innovation Daily ETF
ETF PERFORMANCE at March 31, 2023 (Unaudited)
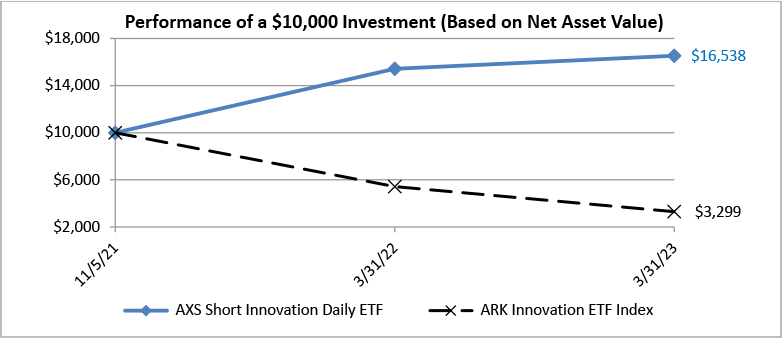
This graph compares a hypothetical $10,000 investment in the ETF, made at its inception, with a similar investment in the ARK Innovation ETF Index. Results include the reinvestment of all dividends and capital gains.
The ARK Innovation ETF Index is an actively-managed exchange-traded fund ("ETF") that will invest under normal circumstances primarily (at least 65% of its assets) in domestic and foreign equity securities of companies that are relevant to the fund's investment theme of disruptive innovation. The index does not reflect expenses, fees, or sales charge, which would lower performance. The index is unmanaged and is not available for investment.
| Average Annual Total Returns as of March 31, 2023 | 6 Months* | 1 Year | Since Inception | Inception Date |
| AXS Short Innovation Daily ETF (Net Asset Value) | -19.82% | 7.23% | 43.24% | 11/5/21 |
| AXS Short Innovation Daily ETF (Market Price) | -19.69% | 7.41% | 43.39% | 11/5/21 |
| ARK Innovation ETF Index | 6.92% | -39.15% | -54.71% | 11/5/21 |
| * | For the period October 1, 2022 through March 31, 2023. Not annualized. |
The performance data quoted here represents past performance and past performance is not a guarantee of future results. Investment return and principal value will fluctuate so that an investor's shares, when redeemed, may be worth more or less than their original cost. Current performance may be lower or higher than the performance information quoted. The most recent month end performance may be obtained by calling (866) 984-2510.
The ETF acquired the assets and liabilities of the Tuttle Capital Short Innovation ETF, a series of the Collaborative Investment Series Trust (the “Predecessor ETF”) at the close of business on August 5, 2022. As a result of the reorganization, the ETF is the accounting successor of the Predecessor ETF. Performance results shown in the graph and the performance table above for the periods prior to August 6, 2022, reflect the performance of the Predecessor ETF.
The ETF’s shares are listed on an exchange. The price of the ETF’s shares is based on market price, and because exchange-traded fund shares trade at market prices rather than net asset value, shares may trade at a price greater than net asset value (premium) or less than net asset value (discount).
AXS Short Innovation Daily ETF
ETF PERFORMANCE at March 31, 2023 (Unaudited) - Continued
Gross and net expense ratios were 1.06% and 0.75%, respectively, which were stated in the current prospectus dated February 1, 2023. For the ETF’s current one year expense ratios, please refer to the Financial Highlights section of this report. The ETF’s Advisor has contractually agreed to waive its fees and/or pay for operating expenses of the ETF to ensure that total annual etf operating expenses (excluding any taxes, leverage interest, brokerage commissions, dividend and interest expenses on short sales, acquired ETF fees and expenses (as determined in accordance with SEC Form N-1A), other fees related to underlying investments, (such as option fees and expenses or swap fees and expenses), expenses incurred in connection with any merger or reorganization, and extraordinary expenses such as litigation expenses) does not exceed 0.75% of the ETF's average daily net assets. This agreement is in effect until August 5, 2024, and it may be terminated before that date only by the Trust’s Board of Trustees. In the absence of such waivers, the ETF’s returns would be lower.
Returns reflect the reinvestment of distributions made by the ETF, if any. The graph and the performance table shown do not reflect the deduction of taxes that a shareholder would pay on ETF distributions or the redemption of ETF shares.
| AXS 2X Innovation ETF |
| SCHEDULE OF INVESTMENTS |
| As of March 31, 2023 |
| | | Value | |
| | | | |
| Other Assets in Excess of Liabilities — 100.0% | | $ | 50,870,976 | |
| TOTAL NET ASSETS — 100.0% | | $ | 50,870,976 | |
SWAP CONTRACTS
EQUITY SWAP CONTRACTS
| Counterparty | | Description | | Pay/Receive Equity on Reference Entity | | Financing Rate | | Pay/Receive Frequency | | Termination Date | | Notional Amount | | | Premium Paid (Received) | | | Unrealized Appreciation (Depreciation) | |
| | | | | | | | | | | | | | | | | | | | |
| Cowen | | ARK Innovation ETF | | Receive | | 5.82% (OBRF01* + 100bps) | | At Maturity | | 5/3/2023 | | $ | 99,148,975 | | | $ | - | | | $ | 2,428,794 | |
| TOTAL EQUITY SWAP CONTRACTS | | | | | | | | | | | | | | $ | 2,428,794 | |
| * | OBFR01 - Overnight Bank Funding Rate, 4.82% as of March 31, 2023. |
See accompanying Notes to Financial Statements.
| AXS Short China Internet ETF |
| SCHEDULE OF INVESTMENTS |
| As of March 31, 2023 |
| | | Value | |
| | | | |
| Other Assets in Excess of Liabilities — 100.0% | | $ | 655,264 | |
| TOTAL NET ASSETS — 100.0% | | $ | 655,264 | |
SWAP CONTRACTS
EQUITY SWAP CONTRACTS
| Counterparty | | Description | | Pay/Receive Equity on Reference Entity | | Financing Rate | | Payment Frequency | | Termination Date | | Notional Amount | | | Premium Paid (Received) | | | Unrealized Appreciation (Depreciation) | |
| | | | | | | | | | | | | | | | | | | | |
| Cowen | | Kraneshares CSI China Internet ETF | | Pay | | 3.82% (OBRF01* - 100bps) | | At Maturity | | 5/3/2023 | | $ | (634,433 | ) | | $ | - | | | $ | (17,672 | ) |
| TOTAL EQUITY SWAP CONTRACTS | | | | | | | | | | | | | | $ | (17,672 | ) |
| * | OBFR01 - Overnight Bank Funding Rate, 4.82% as of March 31, 2023. |
See accompanying Notes to Financial Statements.
| AXS 1.25X NVDA Bear Daily ETF |
| SCHEDULE OF INVESTMENTS |
| As of March 31, 2023 |
| | | Value | |
| | | | |
| Other Assets in Excess of Liabilities — 100.0% | | $ | 91,473,872 | |
| TOTAL NET ASSETS — 100.0% | | $ | 91,473,872 | |
SWAP CONTRACTS
EQUITY SWAP CONTRACTS
| Counterparty | | Description | | Pay/Receive Equity on Reference Entity | | Financing Rate | | Pay/Receive Frequency | | Termination Date | | Notional Amount | | | Premium Paid (Received) | | | Unrealized Appreciation (Depreciation) | |
| | | | | | | | | | | | | | | | | | | | |
| Cowen | | NVIDIA Corp. | | Pay | | 4.32% (OBRF01* - 50bps) | | At Maturity | | 7/13/2023 | | $ | (102,146,042 | ) | | $ | - | | | $ | (17,183,903 | ) |
| TOTAL EQUITY SWAP CONTRACTS | | | | | | | | | | | | | | $ | (17,183,903 | ) |
| * | OBFR01 - Overnight Bank Funding Rate, 4.82% as of March 31, 2023. |
See accompanying Notes to Financial Statements.
| AXS 2X PFE Bear Daily ETF |
| SCHEDULE OF INVESTMENTS |
| As of March 31, 2023 |
| | | Value | |
| | | | |
| Other Assets in Excess of Liabilities — 100.0% | | $ | 1,595,986 | |
| TOTAL NET ASSETS — 100.0% | | $ | 1,595,986 | |
SWAP CONTRACTS
EQUITY SWAP CONTRACTS
| Counterparty | | Description | | Pay/Receive Equity on Reference Entity | | Financing Rate | | Pay/Receive Frequency | | Termination Date | | Notional Amount | | | Premium Paid (Received) | | | Unrealized Appreciation (Depreciation) | |
| | | | | | | | | | | | | | | | | | | | |
| Cowen | | Pfizer, Inc. | | Pay | | 4.32% (OBRF01* -50bps) | | At Maturity | | 7/17/2023 | | $ | (3,347,947 | ) | | $ | - | | | $ | 423,269 | |
| TOTAL EQUITY SWAP CONTRACTS | | | | | | | | | | | | | | $ | 423,269 | |
* OBFR01 - Overnight Bank Funding Rate, 4.82% as of March 31, 2023.
See accompanying Notes to Financial Statements.
| AXS 2X PFE Bull Daily ETF |
| SCHEDULE OF INVESTMENTS |
| As of March 31, 2023 |
| | | Value | |
| | | | |
| Other Assets in Excess of Liabilities — 100.0% | | $ | 865,687 | |
| TOTAL NET ASSETS — 100.0% | | $ | 865,687 | |
SWAP CONTRACTS
EQUITY SWAP CONTRACTS
| Counterparty | | Description | | Pay/Receive Equity on Reference Entity | | Financing Rate | | Pay/Receive Frequency | | Termination Date | | Notional Amount | | | Premium Paid (Received) | | | Unrealized Appreciation (Depreciation) | |
| | | | | | | | | | | | | | | | | | | | |
| Cowen | | Pfizer, Inc. | | Receive | | 6.07% (OBRF01* +125bps) | | At Maturity | | 7/13/2023 | | $ | 2,036,986 | | | $ | - | | | $ | (339,299 | ) |
| TOTAL EQUITY SWAP CONTRACTS | | | | | | | | | | | | | | $ | (339,299 | ) |
| * | OBFR01 - Overnight Bank Funding Rate, 4.82% as of March 31, 2023. |
See accompanying Notes to Financial Statements.
| AXS 1.5X PYPL Bear Daily ETF |
| SCHEDULE OF INVESTMENTS |
| As of March 31, 2023 |
| | | Value | |
| | | | |
| Other Assets in Excess of Liabilities — 100.0% | | $ | 854,812 | |
| TOTAL NET ASSETS — 100.0% | | $ | 854,812 | |
SWAP CONTRACTS
EQUITY SWAP CONTRACTS
| Counterparty | | Description | | Pay/Receive Equity on Reference Entity | | Financing Rate | | Pay/Receive Frequency | | Termination Date | | Notional Amount | | | Premium Paid (Received) | | | Unrealized Appreciation (Depreciation) | |
| | | | | | | | | | | | | | | | | | | | |
| Cowen | | Paypal Holdings, Inc. | | Pay | | 4.32% (OBRF01*-50bps) | | At Maturity | | 7/13/2023 | | $ | (1,281,138 | ) | | $ | - | | | $ | (11,631 | ) |
| TOTAL EQUITY SWAP CONTRACTS | | | | | | | | | | | | | | $ | (11,631 | ) |
| * | OBFR01 - Overnight Bank Funding Rate, 4.82% as of March 31, 2023. |
See accompanying Notes to Financial Statements.
| AXS 1.5X PYPL Bull Daily ETF |
| SCHEDULE OF INVESTMENTS |
| As of March 31, 2023 |
| | | Value | |
| | | | |
| Other Assets in Excess of Liabilities — 100.0% | | $ | 1,348,916 | |
| TOTAL NET ASSETS — 100.0% | | $ | 1,348,916 | |
SWAP CONTRACTS
EQUITY SWAP CONTRACTS
| Counterparty | | Description | | Pay/Receive Equity on Reference Entity | | Financing Rate | | Pay/Receive Frequency | | Termination Date | | Notional Amount | | | Premium Paid (Received) | | | Unrealized Appreciation (Depreciation) | |
| | | | | | | | | | | | | | | | | | | | |
| Cowen | | Paypal Holdings, Inc. | | Receive | | 6.07% (OBRF01* + 125bps) | | At Maturity | | 7/13/2023 | | $ | 2,080,706 | | | $ | - | | | $ | (103,810 | ) |
| TOTAL EQUITY SWAP CONTRACTS | | | | | | | | | | | | | | $ | (103,810 | ) |
| * | OBFR01 - Overnight Bank Funding Rate, 4.82% as of March 31, 2023. |
See accompanying Notes to Financial Statements.
| AXS TSLA Bear Daily ETF |
| SCHEDULE OF INVESTMENTS |
| As of March 31, 2023 |
| | | Value | |
| | | | |
| Other Assets in Excess of Liabilities — 100.0% | | $ | 112,370,518 | |
| TOTAL NET ASSETS — 100.0% | | $ | 112,370,518 | |
SWAP CONTRACTS
EQUITY SWAP CONTRACTS
| Counterparty | | Description | | Pay/Receive Equity on Reference Entity | | Financing Rate | | Pay/Receive Frequency | | Termination Date | | Notional Amount | | | Premium Paid (Received) | | | Unrealized Appreciation (Depreciation) | |
| | | | | | | | | | | | | | | | | | | | |
| Cowen | | Tesla, Inc. | | Pay | | 4.07% (OBRF01* - 75bps) | | At Maturity | | 7/13/2023 | | $ | (101,276,356 | ) | | $ | - | | | $ | (5,895,911 | ) |
| TOTAL EQUITY SWAP CONTRACTS | | | | | | | | | | | | | | $ | (5,895,911 | ) |
| * | OBFR01 - Overnight Bank Funding Rate, 4.82% as of March 31, 2023. |
See accompanying Notes to Financial Statements.
| AXS 2X NKE Bear Daily ETF |
| SCHEDULE OF INVESTMENTS |
| As of March 31, 2023 |
| | | Value | |
| | | | |
| Other Assets in Excess of Liabilities — 100.0% | | $ | 1,027,758 | |
| TOTAL NET ASSETS — 100.0% | | $ | 1,027,758 | |
SWAP CONTRACTS
EQUITY SWAP CONTRACTS
| Counterparty | | Description | | Pay/Receive Equity on Reference Entity | | Financing Rate | | Pay/Receive Frequency | | Termination Date | | Notional Amount | | | Premium Paid (Received) | | | Unrealized Appreciation (Depreciation) | |
| | | | | | | | | | | | | | | | | | | | |
| Cowen | | Nike, Inc. - Class B | | Pay | | 4.32% (OBRF01* - 50bps) | | At Maturity | | 7/13/2023 | | $ | (2,038,114 | ) | | $ | - | | | $ | (26,966 | ) |
| TOTAL EQUITY SWAP CONTRACTS | | | | | | | | | | | | | | $ | (26,966 | ) |
| * | OBFR01 - Overnight Bank Funding Rate, 4.82% as of March 31, 2023. |
See accompanying Notes to Financial Statements.
| AXS 2X NKE Bull Daily ETF |
| SCHEDULE OF INVESTMENTS |
| As of March 31, 2023 |
| | | Value | |
| | | | |
| Other Assets in Excess of Liabilities — 100.0% | | $ | 805,149 | |
| TOTAL NET ASSETS — 100.0% | | $ | 805,149 | |
SWAP CONTRACTS
EQUITY SWAP CONTRACTS
| Counterparty | | Description | | Pay/Receive Equity on Reference Entity | | Financing Rate | | Pay/Receive Frequency | | Termination Date | | Notional Amount | | | Premium Paid (Received) | | | Unrealized Appreciation (Depreciation) | |
| | | | | | | | | | | | | | | | | | | | |
| Cowen | | Nike, Inc. - Class B | | Receive | | 6.07% (OBRF01* +125bps) | | At Maturity | | 7/13/2023 | | $ | 1,588,134 | | | $ | - | | | $ | 35,441 | |
| TOTAL EQUITY SWAP CONTRACTS | | | | | | | | | | | | | | $ | 35,441 | |
| * | OBFR01 - Overnight Bank Funding Rate, 4.82% as of March 31, 2023. |
See accompanying Notes to Financial Statements.
| AXS Short De-SPAC Daily ETF |
| SCHEDULE OF INVESTMENTS |
| As of March 31, 2023 |
| | | Value | |
| Other Assets in Excess of Liabilities — 100.0% | | $ | 10,706,336 | |
| TOTAL NET ASSETS — 100.0% | | $ | 10,706,336 | |
SWAP CONTRACTS
EQUITY SWAP CONTRACTS
| Counterparty | | Description | | Pay/Receive Equity on Reference Entity | | Financing Rate | | Pay/Receive Frequency | | Termination Date | | Notional Amount | | | Premium Paid (Received) | | | Unrealized Appreciation (Depreciation) | |
| | | | | | | | | | | | | | | | | | | | |
| Cowen | | Aurora Innovation, Inc. | | Pay | | 2.82% (OBFR01* -200bps) | | At Maturity | | 8/8/2023 | | $ | (475,913 | ) | | $ | - | | | $ | 1,449 | |
| Cowen | | BRC, Inc. - Class A | | Pay | | -5.18% (OBFR01* -1000bps) | | At Maturity | | 8/8/2023 | | | (444,321 | ) | | | - | | | | 72,981 | |
| Cowen | | Docgo, Inc. | | Pay | | 1.82% (OBFR01* -300bps) | | At Maturity | | 8/8/2023 | | | (448,861 | ) | | | - | | | | 5,366 | |
| Cowen | | Energy Vault Holdings, Inc. | | Pay | | -4.18% (OBFR01* -900bps) | | At Maturity | | 8/8/2023 | | | (448,600 | ) | | | - | | | | 128,497 | |
| Cowen | | Evolv Technologies Holdings | | Pay | | 0.32% (OBFR01* -450bps) | | At Maturity | | 8/8/2023 | | | (474,143 | ) | | | - | | | | (67,402 | ) |
| Cowen | | Forge Global Holdings, Inc. | | Pay | | -6.93% (OBFR01* -1175bps) | | At Maturity | | 8/8/2023 | | | (441,285 | ) | | | - | | | | (18,130 | ) |
| Cowen | | Global Business Travel Group | | Pay | | -15.68% (OBFR01* -2050bps) | | At Maturity | | 8/8/2023 | | | (423,515 | ) | | | - | | | | (30,906 | ) |
| Cowen | | Gogoro, Inc. | | Pay | | -14.93% (OBFR01* -1975bps) | | At Maturity | | 8/8/2023 | | | (468,113 | ) | | | - | | | | (14,169 | ) |
| Cowen | | Grab Holdings Ltd. - Class A | | Pay | | 2.32% (OBFR01* -250bps) | | At Maturity | | 8/8/2023 | | | (470,000 | ) | | | - | | | | 21,024 | |
| Cowen | | Grindr, Inc. | | Pay | | -84.68% (OBFR01* -8950bps) | | At Maturity | | 8/8/2023 | | | (430,327 | ) | | | - | | | | (17,183 | ) |
| Cowen | | Nextdoor Holdings, Inc. | | Pay | | 1.82% (OBFR01* -300bps) | | At Maturity | | 8/8/2023 | | | (463,199 | ) | | | - | | | | (24,493 | ) |
| Cowen | | Nuscale Power Corp. | | Pay | | -13.18% (OBFR01* -1800bps) | | At Maturity | | 8/8/2023 | | | (444,277 | ) | | | - | | | | 26,104 | |
| Cowen | | Omniab, Inc. | | Pay | | 0.82% (OBFR01* -400bps) | | At Maturity | | 8/8/2023 | | | (476,335 | ) | | | - | | | | (7,144 | ) |
| Cowen | | Pagaya Technologies Ltd. - Class A | | Pay | | -68.18% (OBFR01* -7300bps) | | At Maturity | | 8/8/2023 | | | (452,036 | ) | | | - | | | | (28,265 | ) |
| Cowen | | Polestar Automotive - Class A ADS | | Pay | | -6.68% (OBFR01* -1150bps) | | At Maturity | | 8/8/2023 | | | (442,495 | ) | | | - | | | | 74,241 | |
| Cowen | | Prokidney Corp. | | Pay | | -23.18% (OBFR01* -2800bps) | | At Maturity | | 8/8/2023 | | | (441,013 | ) | | | - | | | | 28,508 | |
| Cowen | | Rumble, Inc. | | Pay | | -19.68% (OBFR01* -2450bps) | | At Maturity | | 8/8/2023 | | | (428,094 | ) | | | - | | | | (73,323 | ) |
| Cowen | | SES AI Corp. | | Pay | | -1.68% (OBFR01* -650bps) | | At Maturity | | 8/8/2023 | | | (461,483 | ) | | | - | | | | 6,614 | |
| Cowen | | Sonder Holdings, Inc. | | Pay | | -0.93% (OBFR01* -575bps) | | At Maturity | | 8/8/2023 | | | (466,115 | ) | | | - | | | | 120,986 | |
| Cowen | | Super Group Ltd. | | Pay | | -17.18% (OBFR01* -2200bps) | | At Maturity | | 8/8/2023 | | | (420,253 | ) | | | - | | | | (55,644 | ) |
| Cowen | | Symbotic, Inc. | | Pay | | -31.18% (OBFR01* -3600bps) | | At Maturity | | 8/8/2023 | | | (433,862 | ) | | | - | | | | (146,960 | ) |
| Cowen | | Terran Orbital Corp. | | Pay | | -17.68% (OBFR01* -2250bps) | | At Maturity | | 8/8/2023 | | | (396,758 | ) | | | - | | | | 11,417 | |
| Cowen | | TH International Ltd. | | Pay | | -65.18% (OBFR01* -7000bps) | | At Maturity | | 8/8/2023 | | | (431,336 | ) | | | - | | | | (44,812 | ) |
| Cowen | | Vacasa, Inc. - Class A | | Pay | | 0.82% (OBFR01* -400bps) | | At Maturity | | 8/8/2023 | | | (436,078 | ) | | | - | | | | 114,985 | |
| Cowen | | Westrock Coffee Co. | | Pay | | -36.18% (OBFR01* -4100bps) | | At Maturity | | 8/8/2023 | | | (454,375 | ) | | | - | | | | (34,606 | ) |
| TOTAL EQUITY SWAP CONTRACTS | | | | | | | | | | | | | | $ | 49,135 | |
* OBFR01 - Overnight Bank Funding Rate, 4.82% as of March 31, 2023.
See accompanying Notes to Financial Statements.
| AXS Short Innovation Daily ETF |
| SCHEDULE OF INVESTMENTS |
| As of March 31, 2023 |
| | | Value | |
| | | | |
| Other Assets in Excess of Liabilities — 100.0% | | $ | 310,157,838 | |
| TOTAL NET ASSETS — 100.0% | | $ | 310,157,838 | |
SWAP CONTRACTS
EQUITY SWAP CONTRACTS
| Counterparty | | Description | | Pay/Receive Equity on Reference Entity | | Financing Rate | | Pay/Receive Frequency | | Termination Date | | Notional Amount | | | Premium Paid (Received) | | | Unrealized Appreciation (Depreciation) | |
| | | | | | | | | | | | | | | | | | | | |
| Cowen | | Ark Innovation ETF | | Pay | | 0.82% (OBFR01* -400bps) | | At Maturity | | 8/8/2023 | | $ | (283,394,015 | ) | | $ | - | | | $ | (16,345,966 | ) |
| Clear Street | | Ark Innovation ETF | | Pay | | 0.62% (OBFR01* -420bps) | | At Maturity | | 4/1/2024 | | | (11,566,592 | ) | | | - | | | | (984,867 | ) |
| TOTAL EQUITY SWAP CONTRACTS | | | | | | | | | | | | | | $ | (17,330,833 | ) |
| * | OBFR01 - Overnight Bank Funding Rate, 4.82% as of March 31, 2023. |
See accompanying Notes to Financial Statements.
| AXS Funds |
| STATEMENTS OF ASSETS AND LIABILITIES |
| As of March 31, 2023 |
| | | AXS 2X Innovation ETF | | | AXS Short China Internet ETF | | | AXS 1.25X NVDA Bear Daily ETF | |
| Assets: | | | | | | | | | |
| Cash | | $ | 18,361,613 | | | $ | 252,062 | | | $ | 59,216,708 | |
| Cash collateral held for open swap contracts | | | 31,672,947 | | | | 537,781 | | | | 47,683,460 | |
| Unrealized appreciation on open swap contracts | | | 2,428,794 | | | | - | | | | - | |
| Receivables: | | | | | | | | | | | | |
| Fund shares sold | | | - | | | | - | | | | 5,313,250 | |
| Due from Advisor | | | - | | | | 2,115 | | | | - | |
| Prepaid expenses | | | 3,798 | | | | - | | | | 991 | |
| Total assets | | | 52,467,152 | | | | 791,958 | | | | 112,214,409 | |
| | | | | | | | | | | | | |
| Liabilities: | | | | | | | | | | | | |
| Unrealized depreciation on open swap contracts | | | - | | | | 17,672 | | | | 17,183,903 | |
| Payables: | | | | | | | | | | | | |
| Fund shares redeemed | | | 1,496,457 | | | | - | | | | 3,429,174 | |
| Advisory fees | | | 29,105 | | | | - | | | | 64,067 | |
| Fund administration fees | | | 12,398 | | | | 9,362 | | | | 5,814 | |
| Transfer agent fees and expenses | | | 7,756 | | | | 13,057 | | | | 9,926 | |
| Custody fees | | | 6,396 | | | | 17,411 | | | | 8,714 | |
| Auditing fees | | | 15,590 | | | | 15,590 | | | | 15,500 | |
| Fund accounting fees | | | 10,449 | | | | 36,458 | | | | 13,750 | |
| Shareholder reporting fees | | | 4,464 | | | | 6,587 | | | | 1,205 | |
| Trustees' fees and expenses | | | 3,243 | | | | 1,557 | | | | 1,356 | |
| Chief Compliance Officer fees | | | 3,048 | | | | 5,244 | | | | 1,828 | |
| Trustees' deferred compensation (Note 3) | | | 2,074 | | | | 737 | | | | 588 | |
| Legal fees | | | 1,854 | | | | 5,243 | | | | 1,690 | |
| Accrued other expenses | | | 3,342 | | | | 7,776 | | | | 3,022 | |
| Total liabilities | | | 1,596,176 | | | | 136,694 | | | | 20,740,537 | |
| | | | | | | | | | | | | |
| Net Assets | | $ | 50,870,976 | | | $ | 655,264 | | | $ | 91,473,872 | |
| | | | | | | | | | | | | |
| Components of Net Assets: | | | | | | | | | | | | |
| Paid-in capital (par value of $0.01 per share with an unlimited number of shares authorized) | | $ | 55,037,252 | | | $ | 1,549,271 | | | $ | 114,041,145 | |
| Total distributable earnings (accumulated deficit) | | | (4,166,276 | ) | | | (894,007 | ) | | | (22,567,273 | ) |
| Net Assets | | | 50,870,976 | | | | 655,264 | | | | 91,473,872 | |
| | | | | | | | | | | | | |
| Shares of beneficial interest issued and outstanding | | | 790,690 | | | | 35,000 | | | | 5,700,000 | |
| | | | | | | | | | | | | |
| Net asset value per share | | $ | 64.34 | | | $ | 18.72 | | | $ | 16.05 | |
See accompanying Notes to Financial Statements.
| AXS Funds |
| STATEMENTS OF ASSETS AND LIABILITIES - Continued |
| As of March 31, 2023 |
| | | AXS 2X PFE Bear Daily ETF | | | AXS 2X PFE Bull Daily ETF | | | AXS 1.5X PYPL Bear Daily ETF | |
| Assets: | | | | | | | | | |
| Cash | | $ | 315,535 | | | $ | 252,713 | | | $ | 433,523 | |
| Cash collateral held for open swap contracts | | | 919,751 | | | | 1,014,607 | | | | 495,251 | |
| Unrealized appreciation on open swap contracts | | | 423,269 | | | | - | | | | - | |
| Receivables: | | | | | | | | | | | | |
| Fund shares sold | | | - | | | | - | | | | - | |
| Due from Advisor | | | 1,275 | | | | 3,021 | | | | 3,479 | |
| Prepaid expenses | | | - | | | | - | | | | - | |
| Total assets | | | 1,659,830 | | | | 1,270,341 | | | | 932,253 | |
| | | | | | | | | | | | | |
| Liabilities: | | | | | | | | | | | | |
| Unrealized depreciation on open swap contracts | | | - | | | | 339,299 | | | | 11,631 | |
| Payables: | | | | | | | | | | | | |
| Fund shares redeemed | | | - | | | | - | | | | - | |
| Advisory fees | | | - | | | | - | | | | - | |
| Fund administration fees | | | 3,490 | | | | 3,381 | | | | 3,032 | |
| Transfer agent fees and expenses | | | 8,926 | | | | 8,926 | | | | 10,653 | |
| Custody fees | | | 12,214 | | | | 11,714 | | | | 12,214 | |
| Auditing fees | | | 15,500 | | | | 15,500 | | | | 15,500 | |
| Fund accounting fees | | | 12,146 | | | | 13,782 | | | | 14,250 | |
| Shareholder reporting fees | | | 3,628 | | | | 3,647 | | | | 1,570 | |
| Trustees' fees and expenses | | | 1,544 | | | | 1,552 | | | | 1,596 | |
| Chief Compliance Officer fees | | | 1,211 | | | | 1,231 | | | | 1,238 | |
| Trustees' deferred compensation (Note 3) | | | 761 | | | | 742 | | | | 745 | |
| Legal fees | | | 884 | | | | 1,338 | | | | 1,472 | |
| Accrued other expenses | | | 3,540 | | | | 3,542 | | | | 3,540 | |
| Total liabilities | | | 63,844 | | | | 404,654 | | | | 77,441 | |
| | | | | | | | | | | | | |
| Net Assets | | $ | 1,595,986 | | | $ | 865,687 | | | $ | 854,812 | |
| | | | | | | | | | | | | |
| Components of Net Assets: | | | | | | | | | | | | |
| Paid-in capital (par value of $0.01 per share with an unlimited number of shares authorized) | | $ | 1,423,441 | | | $ | 1,349,307 | | | $ | 1,790,053 | |
| Total distributable earnings (accumulated deficit) | | | 172,545 | | | | (483,620 | ) | | | (935,241 | ) |
| Net Assets | | | 1,595,986 | | | | 865,687 | | | | 854,812 | |
| | | | | | | | | | | | | |
| Shares of beneficial interest issued and outstanding | | | 30,000 | | | | 45,000 | | | | 25,000 | |
| | | | | | | | | | | | | |
| Net asset value per share | | $ | 53.20 | | | $ | 19.24 | | | $ | 34.19 | |
See accompanying Notes to Financial Statements.
| AXS Funds |
| STATEMENTS OF ASSETS AND LIABILITIES - Continued |
| As of March 31, 2023 |
| | | AXS 1.5X PYPL Bull Daily ETF | | | AXS TSLA Bear Daily ETF | | | AXS 2X NKE Bear Daily ETF | |
| Assets: | | | | | | | | | |
| Cash | | $ | 392,687 | | | $ | 57,608,681 | | | $ | 319,016 | |
| Cash collateral held for open swap contracts | | | 1,122,111 | | | | 58,128,455 | | | | 797,837 | |
| Unrealized appreciation on open swap contracts | | | - | | | | - | | | | - | |
| Receivables: | | | | | | | | | | | | |
| Fund shares sold | | | - | | | | 4,254,460 | | | | - | |
| Due from Advisor | | | 1,066 | | | | - | | | | 1,749 | |
| Prepaid expenses | | | - | | | | 18,343 | | | | - | |
| Total assets | | | 1,515,864 | | | | 120,009,939 | | | | 1,118,602 | |
| | | | | | | | | | | | | |
| Liabilities: | | | | | | | | | | | | |
| Unrealized depreciation on open swap contracts | | | 103,810 | | | | 5,895,911 | | | | 26,966 | |
| Payables: | | | | | | | | | | | | |
| Fund shares redeemed | | | - | | | | 1,599,010 | | | | - | |
| Advisory fees | | | - | | | | 96,146 | | | | - | |
| Fund administration fees | | | 4,167 | | | | 11,076 | | | | 3,550 | |
| Transfer agent fees and expenses | | | 9,926 | | | | 1,926 | | | | 8,926 | |
| Custody fees | | | 10,714 | | | | 714 | | | | 12,714 | |
| Auditing fees | | | 15,500 | | | | 15,500 | | | | 15,500 | |
| Fund accounting fees | | | 13,145 | | | | 2,750 | | | | 12,271 | |
| Shareholder reporting fees | | | 1,518 | | | | 2,737 | | | | 2,581 | |
| Trustees' fees and expenses | | | 1,578 | | | | 2,031 | | | | 1,557 | |
| Chief Compliance Officer fees | | | 1,199 | | | | 3,578 | | | | 1,211 | |
| Trustees' deferred compensation (Note 3) | | | 749 | | | | 2,351 | | | | 758 | |
| Legal fees | | | 1,087 | | | | 2,530 | | | | 1,268 | |
| Accrued other expenses | | | 3,555 | | | | 3,161 | | | | 3,542 | |
| Total liabilities | | | 166,948 | | | | 7,639,421 | | | | 90,844 | |
| | | | | | | | | | | | | |
| Net Assets | | $ | 1,348,916 | | | $ | 112,370,518 | | | $ | 1,027,758 | |
| | | | | | | | | | | | | |
| Components of Net Assets: | | | | | | | | | | | | |
| Paid-in capital (par value of $0.01 per share with an unlimited number of shares authorized) | | $ | 1,594,378 | | | $ | 138,979,526 | | | $ | 2,036,366 | |
| Total distributable earnings (accumulated deficit) | | | (245,462 | ) | | | (26,609,008 | ) | | | (1,008,608 | ) |
| Net Assets | | | 1,348,916 | | | | 112,370,518 | | | | 1,027,758 | |
| | | | | | | | | | | | | |
| Shares of beneficial interest issued and outstanding | | | 65,000 | | | | 2,640,000 | | | | 40,000 | |
| | | | | | | | | | | | | |
| Net asset value per share | | $ | 20.75 | | | $ | 42.56 | | | $ | 25.69 | |
See accompanying Notes to Financial Statements.
| AXS Funds |
| STATEMENTS OF ASSETS AND LIABILITIES - Continued |
| As of March 31, 2023 |
| | | AXS 2X NKE Bull Daily ETF | | | AXS Short De-SPAC Daily ETF | | | AXS Short Innovation Daily ETF | |
| Assets: | | | | | | | | | |
| Cash | | $ | 246,722 | | | $ | 2,034,899 | | | $ | 212,575,585 | |
| Cash collateral held for open swap contracts | | | 585,282 | | | | 8,688,752 | | | | 127,281,092 | |
| Unrealized appreciation on open swap contracts | | | 35,441 | | | | 612,173 | | | | - | |
| Receivables: | | | | | | | | | | | | |
| Fund shares sold | | | - | | | | - | | | | 5,001,663 | |
| Due from Advisor | | | 2,124 | | | | 7,455 | | | | - | |
| Prepaid expenses | | | 2 | | | | 971 | | | | 8,698 | |
| Total assets | | | 869,571 | | | | 11,344,250 | | | | 344,867,038 | |
| | | | | | | | | | | | | |
| Liabilities: | | | | | | | | | | | | |
| Unrealized depreciation on open swap contracts | | | - | | | | 563,038 | | | | 17,330,833 | |
| Payables: | | | | | | | | | | | | |
| Fund shares redeemed | | | - | | | | - | | | | 16,815,320 | |
| Advisory fees | | | - | | | | - | | | | 206,579 | |
| Fund administration fees | | | 3,968 | | | | 4,942 | | | | 64,209 | |
| Transfer agent fees and expenses | | | 8,926 | | | | 10,239 | | | | 15,219 | |
| Custody fees | | | 12,214 | | | | 8,055 | | | | 55,657 | |
| Auditing fees | | | 15,500 | | | | 15,500 | | | | 15,500 | |
| Fund accounting fees | | | 12,782 | | | | 18,969 | | | | 153,417 | |
| Shareholder reporting fees | | | 2,589 | | | | 3,579 | | | | 7,739 | |
| Trustees' fees and expenses | | | 1,560 | | | | 1,231 | | | | 10,150 | |
| Chief Compliance Officer fees | | | 1,242 | | | | 4,909 | | | | 7,095 | |
| Trustees' deferred compensation (Note 3) | | | 741 | | | | 866 | | | | 4,195 | |
| Legal fees | | | 1,358 | | | | 2,317 | | | | 15,363 | |
| Accrued other expenses | | | 3,542 | | | | 4,269 | | | | 7,924 | |
| Total liabilities | | | 64,422 | | | | 637,914 | | | | 34,709,200 | |
| | | | | | | | | | | | | |
| Net Assets | | $ | 805,149 | | | $ | 10,706,336 | | | $ | 310,157,838 | |
| | | | | | | | | | | | | |
| Components of Net Assets: | | | | | | | | | | | | |
| Paid-in capital (par value of $0.01 per share with an unlimited number of shares authorized) | | $ | 644,056 | | | $ | 10,469,610 | | | $ | 327,492,866 | |
| Total distributable earnings (accumulated deficit) | | | 161,093 | | | | 236,726 | | | | (17,335,028 | ) |
| Net Assets | | | 805,149 | | | | 10,706,336 | | | | 310,157,838 | |
| | | | | | | | | | | | | |
| Shares of beneficial interest issued and outstanding | | | 25,000 | | | | 350,000 | | | | 7,750,000 | |
| | | | | | | | | | | | | |
| Net asset value per share | | $ | 32.21 | | | $ | 30.59 | | | $ | 40.02 | |
See accompanying Notes to Financial Statements.
| AXS 2X Innovation ETF |
| STATEMENTS OF OPERATIONS |
| | | For the Period Ended March 31, 2023* | |
| Investment Income: | | | |
| Interest | | $ | 689,045 | |
| Total investment income | | | 689,045 | |
| | | | | |
| Expenses: | | | | |
| Advisory fees | | | 364,521 | |
| Fund administration fees | | | 74,265 | |
| Transfer agent fees and expenses | | | 7,867 | |
| Custody fees | | | 10,445 | |
| Legal fees | | | 15,892 | |
| Auditing fees | | | 15,590 | |
| Shareholder reporting fees | | | 15,028 | |
| Fund accounting fees | | | 14,428 | |
| Miscellaneous | | | 12,564 | |
| Trustees' fees and expenses | | | 10,527 | |
| Chief Compliance Officer fees | | | 7,454 | |
| Insurance fees | | | 2,111 | |
| Total expenses | | | 550,692 | |
| Advisory fees (waived) recovered | | | (109,366 | ) |
| Net expenses | | | 441,326 | |
| Net investment income (loss) | | | 247,719 | |
| | | | | |
| Realized and Unrealized Gain (Loss) on: | | | | |
| Net realized gain (loss) on: | | | | |
| Swap contracts | | | (9,070,819 | ) |
| Net realized gain (loss) | | | (9,070,819 | ) |
| Net change in unrealized appreciation/depreciation on: | | | | |
| Swap contracts | | | 2,428,794 | |
| Net change in unrealized appreciation/depreciation | | | 2,428,794 | |
| Net realized and unrealized gain (loss) | | | (6,642,025 | ) |
| | | | | |
| Net Increase (Decrease) in Net Assets from Operations | | $ | (6,394,306 | ) |
| * | The Fund commenced operations on April 28, 2022. |
See accompanying Notes to Financial Statements.
| AXS Short China Internet ETF |
| STATEMENTS OF OPERATIONS |
| | | For the Period Ended March 31, 2023* | |
| Investment Income: | | | |
| Interest | | $ | 23,115 | |
| Total investment income | | | 23,115 | |
| | | | | |
| Expenses: | | | | |
| Advisory fees | | | 11,267 | |
| Fund administration fees | | | 24,056 | |
| Transfer agent fees and expenses | | | 14,867 | |
| Custody fees | | | 20,945 | |
| Fund accounting fees | | | 40,303 | |
| Miscellaneous | | | 16,064 | |
| Auditing fees | | | 15,590 | |
| Shareholder reporting fees | | | 13,628 | |
| Legal fees | | | 5,801 | |
| Chief Compliance Officer fees | | | 5,454 | |
| Trustees' fees and expenses | | | 3,728 | |
| Insurance fees | | | 111 | |
| Total expenses | | | 171,814 | |
| Advisory fees (waived) recovered | | | (11,267 | ) |
| Other expenses absorbed | | | (146,286 | ) |
| Net expenses | | | 14,261 | |
| Net investment income (loss) | | | 8,854 | |
| | | | | |
| Realized and Unrealized Gain (Loss) on: | | | | |
| Net realized gain (loss) on: | | | | |
| Swap contracts | | | (839,191 | ) |
| Net realized gain (loss) | | | (839,191 | ) |
| Net change in unrealized appreciation/depreciation on: | | | | |
| Swap contracts | | | (17,672 | ) |
| Net change in unrealized appreciation/depreciation | | | (17,672 | ) |
| Net realized and unrealized gain (loss) | | | (856,863 | ) |
| | | | | |
| Net Increase (Decrease) in Net Assets from Operations | | $ | (848,009 | ) |
| * | The Fund commenced operations on April 28, 2022. |
See accompanying Notes to Financial Statements.
| AXS 1.25X NVDA Bear Daily ETF |
| STATEMENTS OF OPERATIONS |
| | | For the Period Ended March 31, 2023* | |
| Investment Income: | | | |
| Interest | | $ | 385,943 | |
| Total investment income | | | 385,943 | |
| | | | | |
| Expenses: | | | | |
| Advisory fees | | | 104,713 | |
| Fund administration fees | | | 20,131 | |
| Transfer agent fees and expenses | | | 11,012 | |
| Custody fees | | | 9,794 | |
| Auditing fees | | | 15,500 | |
| Fund accounting fees | | | 13,806 | |
| Miscellaneous | | | 10,782 | |
| Trustees' fees and expenses | | | 3,776 | |
| Shareholder reporting fees | | | 3,288 | |
| Legal fees | | | 2,955 | |
| Chief Compliance Officer fees | | | 2,576 | |
| Insurance fees | | | 788 | |
| Total expenses | | | 199,121 | |
| Advisory fees (waived) recovered | | | (72,363 | ) |
| Net expenses | | | 126,758 | |
| Net investment income (loss) | | | 259,185 | |
| | | | | |
| Realized and Unrealized Gain (Loss) on: | | | | |
| Net realized gain (loss) on: | | | | |
| Swap contracts | | | (5,190,735 | ) |
| Net realized gain (loss) | | | (5,190,735 | ) |
| Net change in unrealized appreciation/depreciation on: | | | | |
| Swap contracts | | | (17,183,903 | ) |
| Net change in unrealized appreciation/depreciation | | | (17,183,903 | ) |
| Net realized and unrealized gain (loss) | | | (22,374,638 | ) |
| | | | | |
| Net Increase (Decrease) in Net Assets from Operations | | $ | (22,115,453 | ) |
| * | The Fund commenced operations on July 13, 2022. |
See accompanying Notes to Financial Statements.
| AXS 2X PFE Bear Daily ETF |
| STATEMENTS OF OPERATIONS |
| | | For the Period Ended March 31, 2023* | |
| Investment Income: | | | |
| Interest | | $ | 17,901 | |
| Total investment income | | | 17,901 | |
| | | | | |
| Expenses: | | | | |
| Advisory fees | | | 9,796 | |
| Fund administration fees | | | 13,668 | |
| Transfer agent fees and expenses | | | 10,012 | |
| Custody fees | | | 13,294 | |
| Auditing fees | | | 15,500 | |
| Fund accounting fees | | | 12,181 | |
| Miscellaneous | | | 11,382 | |
| Shareholder reporting fees | | | 4,788 | |
| Trustees' fees and expenses | | | 3,776 | |
| Chief Compliance Officer fees | | | 1,576 | |
| Legal fees | | | 1,323 | |
| Insurance fees | | | 133 | |
| Total expenses | | | 97,429 | |
| Advisory fees (waived) recovered | | | (9,796 | ) |
| Other expenses absorbed | | | (75,773 | ) |
| Net expenses | | | 11,860 | |
| Net investment income (loss) | | | 6,041 | |
| | | | | |
| Realized and Unrealized Gain (Loss) on: | | | | |
| Net realized gain (loss) on: | | | | |
| Swap contracts | | | (57,462 | ) |
| Net realized gain (loss) | | | (57,462 | ) |
| Net change in unrealized appreciation/depreciation on: | | | | |
| Swap contracts | | | 423,269 | |
| Net change in unrealized appreciation/depreciation | | | 423,269 | |
| Net realized and unrealized gain (loss) | | | 365,807 | |
| | | | | |
| Net Increase (Decrease) in Net Assets from Operations | | $ | 371,848 | |
| * | The Fund commenced operations on July 13, 2022. |
See accompanying Notes to Financial Statements.
| AXS 2X PFE Bull Daily ETF |
| STATEMENTS OF OPERATIONS |
| | | For the Period Ended March 31, 2023* | |
| Investment Income: | | | |
| Interest | | $ | 15,892 | |
| Total investment income | | | 15,892 | |
| | | | | |
| Expenses: | | | | |
| Advisory fees | | | 7,078 | |
| Fund administration fees | | | 13,218 | |
| Transfer agent fees and expenses | | | 10,012 | |
| Custody fees | | | 12,794 | |
| Auditing fees | | | 15,500 | |
| Fund accounting fees | | | 13,806 | |
| Miscellaneous | | | 11,381 | |
| Shareholder reporting fees | | | 4,788 | |
| Trustees' fees and expenses | | | 3,726 | |
| Legal fees | | | 1,698 | |
| Chief Compliance Officer fees | | | 1,576 | |
| Insurance fees | | | 108 | |
| Total expenses | | | 95,685 | |
| Advisory fees (waived) recovered | | | (7,078 | ) |
| Other expenses absorbed | | | (80,041 | ) |
| Net expenses | | | 8,566 | |
| Net investment income (loss) | | | 7,326 | |
| | | | | |
| Realized and Unrealized Gain (Loss) on: | | | | |
| Net realized gain (loss) on: | | | | |
| Swap contracts | | | (158,014 | ) |
| Net realized gain (loss) | | | (158,014 | ) |
| Net change in unrealized appreciation/depreciation on: | | | | |
| Swap contracts | | | (339,299 | ) |
| Net change in unrealized appreciation/depreciation | | | (339,299 | ) |
| Net realized and unrealized gain (loss) | | | (497,313 | ) |
| | | | | |
| Net Increase (Decrease) in Net Assets from Operations | | $ | (489,987 | ) |
| * | The Fund commenced operations on July 13, 2022. |
See accompanying Notes to Financial Statements.
| AXS 1.5X PYPL Bear Daily ETF |
| STATEMENTS OF OPERATIONS |
| | | For the Period Ended March 31, 2023* | |
| Investment Income: | | | |
| Interest | | $ | 13,280 | |
| Total investment income | | | 13,280 | |
| | | | | |
| Expenses: | | | | |
| Advisory fees | | | 6,594 | |
| Fund administration fees | | | 12,816 | |
| Transfer agent fees and expenses | | | 11,739 | |
| Custody fees | | | 13,294 | |
| Auditing fees | | | 15,500 | |
| Fund accounting fees | | | 14,306 | |
| Miscellaneous | | | 11,381 | |
| Trustees' fees and expenses | | | 3,776 | |
| Shareholder reporting fees | | | 2,788 | |
| Legal fees | | | 1,823 | |
| Chief Compliance Officer fees | | | 1,576 | |
| Insurance fees | | | 108 | |
| Total expenses | | | 95,701 | |
| Advisory fees (waived) recovered | | | (6,594 | ) |
| Other expenses absorbed | | | (81,121 | ) |
| Net expenses | | | 7,986 | |
| Net investment income (loss) | | | 5,294 | |
| | | | | |
| Realized and Unrealized Gain (Loss) on: | | | | |
| Net realized gain (loss) on: | | | | |
| Swap contracts | | | (913,747 | ) |
| Net realized gain (loss) | | | (913,747 | ) |
| Net change in unrealized appreciation/depreciation on: | | | | |
| Swap contracts | | | (11,631 | ) |
| Net change in unrealized appreciation/depreciation | | | (11,631 | ) |
| Net realized and unrealized gain (loss) | | | (925,378 | ) |
| | | | | |
| Net Increase (Decrease) in Net Assets from Operations | | $ | (920,084 | ) |
| * | The Fund commenced operations on July 13, 2022. |
See accompanying Notes to Financial Statements.
| AXS 1.5X PYPL Bull Daily ETF |
| STATEMENTS OF OPERATIONS |
| | | For the Period Ended March 31, 2023* | |
| Investment Income: | | | |
| Interest | | $ | 21,637 | |
| Total investment income | | | 21,637 | |
| | | | | |
| Expenses: | | | | |
| Advisory fees | | | 10,230 | |
| Fund administration fees | | | 14,441 | |
| Transfer agent fees and expenses | | | 11,012 | |
| Custody fees | | | 11,794 | |
| Auditing fees | | | 15,500 | |
| Fund accounting fees | | | 13,181 | |
| Miscellaneous | | | 11,381 | |
| Trustees' fees and expenses | | | 3,776 | |
| Shareholder reporting fees | | | 2,788 | |
| Chief Compliance Officer fees | | | 1,576 | |
| Legal fees | | | 1,550 | |
| Insurance fees | | | 103 | |
| Total expenses | | | 97,332 | |
| Advisory fees (waived) recovered | | | (10,230 | ) |
| Other expenses absorbed | | | (74,707 | ) |
| Net expenses | | | 12,395 | |
| Net investment income (loss) | | | 9,242 | |
| | | | | |
| Realized and Unrealized Gain (Loss) on: | | | | |
| Net realized gain (loss) on: | | | | |
| Swap contracts | | | 244,151 | |
| Net realized gain (loss) | | | 244,151 | |
| Net change in unrealized appreciation/depreciation on: | | | | |
| Swap contracts | | | (103,810 | ) |
| Net change in unrealized appreciation/depreciation | | | (103,810 | ) |
| Net realized and unrealized gain (loss) | | | 140,341 | |
| | | | | |
| Net Increase (Decrease) in Net Assets from Operations | | $ | 149,583 | |
| * | The Fund commenced operations on July 13, 2022. |
See accompanying Notes to Financial Statements.
| AXS TSLA Bear Daily ETF |
| STATEMENTS OF OPERATIONS |
| | | For the Period Ended March 31, 2023* | |
| Investment Income: | | | |
| Interest | | $ | 2,091,754 | |
| Total investment income | | | 2,091,754 | |
| | | | | |
| Expenses: | | | | |
| Advisory fees | | | 581,590 | |
| Fund administration fees | | | 81,190 | |
| Transfer agent fees and expenses | | | 3,012 | |
| Custody fees | | | 1,794 | |
| Auditing fees | | | 15,500 | |
| Legal fees | | | 13,581 | |
| Miscellaneous | | | 11,382 | |
| Trustees' fees and expenses | | | 11,276 | |
| Shareholder reporting fees | | | 9,288 | |
| Chief Compliance Officer fees | | | 9,076 | |
| Fund accounting fees | | | 2,806 | |
| Insurance fees | | | 2,583 | |
| Total expenses | | | 743,078 | |
| Advisory fees (waived) recovered | | | (39,147 | ) |
| Net expenses | | | 703,931 | |
| Net investment income (loss) | | | 1,387,823 | |
| | | | | |
| Realized and Unrealized Gain (Loss) on: | | | | |
| Net realized gain (loss) on: | | | | |
| Swap contracts | | | (19,129,211 | ) |
| Net realized gain (loss) | | | (19,129,211 | ) |
| Net change in unrealized appreciation/depreciation on: | | | | |
| Swap contracts | | | (5,895,911 | ) |
| Net change in unrealized appreciation/depreciation | | | (5,895,911 | ) |
| Net realized and unrealized gain (loss) | | | (25,025,122 | ) |
| | | | | |
| Net Increase (Decrease) in Net Assets from Operations | | $ | (23,637,299 | ) |
| * | The Fund commenced operations on July 13, 2022. |
See accompanying Notes to Financial Statements.
| AXS 2X NKE Bear Daily ETF |
| STATEMENTS OF OPERATIONS |
| | | For the Period Ended March 31, 2023* | |
| Investment Income: | | | |
| Interest | | $ | 17,694 | |
| Total investment income | | | 17,694 | |
| | | | | |
| Expenses: | | | | |
| Advisory fees | | | 8,952 | |
| Fund administration fees | | | 13,668 | |
| Transfer agent fees and expenses | | | 10,012 | |
| Custody fees | | | 13,794 | |
| Auditing fees | | | 15,500 | |
| Fund accounting fees | | | 12,306 | |
| Miscellaneous | | | 11,382 | |
| Shareholder reporting fees | | | 3,788 | |
| Trustees' fees and expenses | | | 3,776 | |
| Legal fees | | | 1,698 | |
| Chief Compliance Officer fees | | | 1,576 | |
| Insurance fees | | | 158 | |
| Total expenses | | | 96,610 | |
| Advisory fees (waived) recovered | | | (8,952 | ) |
| Other expenses absorbed | | | (76,821 | ) |
| Net expenses | | | 10,837 | |
| Net investment income (loss) | | | 6,857 | |
| | | | | |
| Realized and Unrealized Gain (Loss) on: | | | | |
| Net realized gain (loss) on: | | | | |
| Swap contracts | | | (974,061 | ) |
| Net realized gain (loss) | | | (974,061 | ) |
| Net change in unrealized appreciation/depreciation on: | | | | |
| Swap contracts | | | (26,966 | ) |
| Net change in unrealized appreciation/depreciation | | | (26,966 | ) |
| Net realized and unrealized gain (loss) | | | (1,001,027 | ) |
| | | | | |
| Net Increase (Decrease) in Net Assets from Operations | | $ | (994,170 | ) |
| * | The Fund commenced operations on July 13, 2022. |
See accompanying Notes to Financial Statements.
| AXS 2X NKE Bull Daily ETF |
| STATEMENTS OF OPERATIONS |
| | | For the Period Ended March 31, 2023* | |
| Investment Income: | | | |
| Interest | | $ | 11,480 | |
| Total investment income | | | 11,480 | |
| | | | | |
| Expenses: | | | | |
| Advisory fees | | | 6,360 | |
| Fund administration fees | | | 13,718 | |
| Transfer agent fees and expenses | | | 10,012 | |
| Custody fees | | | 13,294 | |
| Auditing fees | | | 15,500 | |
| Fund accounting fees | | | 12,806 | |
| Miscellaneous | | | 11,381 | |
| Shareholder reporting fees | | | 3,788 | |
| Trustees' fees and expenses | | | 3,726 | |
| Legal fees | | | 1,698 | |
| Chief Compliance Officer fees | | | 1,575 | |
| Insurance fees | | | 138 | |
| Total expenses | | | 93,996 | |
| Advisory fees (waived) recovered | | | (6,360 | ) |
| Other expenses absorbed | | | (79,938 | ) |
| Net expenses | | | 7,698 | |
| Net investment income (loss) | | | 3,782 | |
| | | | | |
| Realized and Unrealized Gain (Loss) on: | | | | |
| Net realized gain (loss) on: | | | | |
| Swap contracts | | | 432,839 | |
| Net realized gain (loss) | | | 432,839 | |
| Net change in unrealized appreciation/depreciation on: | | | | |
| Swap contracts | | | 35,441 | |
| Net change in unrealized appreciation/depreciation | | | 35,441 | |
| Net realized and unrealized gain (loss) | | | 468,280 | |
| | | | | |
| Net Increase (Decrease) in Net Assets from Operations | | $ | 472,062 | |
| * | The Fund commenced operations on July 13, 2022. |
See accompanying Notes to Financial Statements.
| AXS Short De-SPAC Daily ETF |
| STATEMENTS OF OPERATIONS |
| | | For the Period Ended March 31, 2023* | | | For the Year Ended September 30, 2022 | |
| Investment Income: | | | | | | |
| Interest | | $ | 192,455 | | | $ | 25,373 | |
| Total investment income | | | 192,455 | | | | 25,373 | |
| | | | | | | | | |
| Expenses: | | | | | | | | |
| Advisory fees | | | 76,420 | | | | 211,790 | |
| Fund administration fees | | | 26,662 | | | | 25,679 | |
| Fund accounting fees | | | 13,407 | | | | 34,394 | |
| Transfer agent fees and expenses | | | 10,239 | | | | - | |
| Custody fees | | | 5,976 | | | | 3,440 | |
| Shareholder reporting fees | | | 3,636 | | | | 6,512 | |
| Legal fees | | | 2,480 | | | | 15,124 | |
| Auditing fees | | | 15,221 | | | | 17,779 | |
| Trustees' fees and expenses | | | 4,561 | | | | 3,342 | |
| Insurance fees | | | 2,569 | | | | 1,275 | |
| Chief Compliance Officer fees | | | 1,491 | | | | 9,347 | |
| Miscellaneous | | | 6,772 | | | | 15,043 | |
| Total expenses | | | 169,434 | | | | 343,725 | |
| Advisory fees (waived) recovered | | | (76,420 | ) | | | (120,096 | ) |
| Other expenses absorbed | | | (12,244 | ) | | | - | |
| Net expenses | | | 80,770 | | | | 223,629 | |
| Net investment income (loss) | | | 111,685 | | | | (198,256 | ) |
| | | | | | | | | |
| Realized and Unrealized Gain (Loss) on: | | | | | | | | |
| Net realized gain (loss) on: | | | | | | | | |
| Swap contracts | | | 4,472,175 | | | | 10,654,262 | |
| Net realized gain (loss) | | | 4,472,175 | | | | 10,654,262 | |
| Net change in unrealized appreciation/depreciation on: | | | | | | | | |
| Swap contracts | | | (3,684,467 | ) | | | 2,891,100 | |
| Net change in unrealized appreciation/depreciation | | | (3,684,467 | ) | | | 2,891,100 | |
| Net realized and unrealized gain (loss) | | | 787,708 | | | | 13,545,362 | |
| | | | | | | | | |
| Net Increase (Decrease) in Net Assets from Operations | | $ | 899,393 | | | $ | 13,347,106 | |
| * | Fiscal year end changed to March 31, effective October 1, 2022. |
See accompanying Notes to Financial Statements.
| AXS Short Innovation Daily ETF |
| STATEMENTS OF OPERATIONS |
| | | For the Period Ended March 31, 2023* | | | For the Period Ended September 30, 2022** | |
| Investment Income: | | | | | | |
| Interest | | $ | 5,401,487 | | | $ | 771,770 | |
| Total investment income | | | 5,401,487 | | | | 771,770 | |
| | | | | | | | | |
| Expenses: | | | | | | | | |
| Advisory fees | | | 1,152,117 | | | | 1,958,335 | |
| Fund administration fees | | | 292,614 | | | | 263,686 | |
| Fund accounting fees | | | 95,834 | | | | 136,029 | |
| Transfer agent fees and expenses | | | 15,219 | | | | - | |
| Custody fees | | | 28,723 | | | | 31,782 | |
| Shareholder reporting fees | | | 19,707 | | | | 14,075 | |
| Legal fees | | | 72,104 | | | | 51,499 | |
| Auditing fees | | | 17,046 | | | | 13,954 | |
| Trustees' fees and expenses | | | 27,604 | | | | 10,517 | |
| Insurance fees | | | 24,254 | | | | 9,817 | |
| Chief Compliance Officer fees | | | 19,945 | | | | 9,729 | |
| Miscellaneous | | | 26,980 | | | | 21,251 | |
| Total expenses | | | 1,792,147 | | | | 2,520,674 | |
| Advisory fees (waived) recovered | | | (462,957 | ) | | | (251,311 | ) |
| Net expenses | | | 1,329,190 | | | | 2,269,363 | |
| Net investment income (loss) | | | 4,072,297 | | | | (1,497,593 | ) |
| | | | | | | | | |
| Realized and Unrealized Gain (Loss) on: | | | | | | | | |
| Net realized gain (loss) on: | | | | | | | | |
| Swap contracts | | | 22,851,036 | | | | 153,123,322 | |
| Net realized gain (loss) | | | 22,851,036 | | | | 153,123,322 | |
| Net change in unrealized appreciation/depreciation on: | | | | | | | | |
| Swap contracts | | | (54,085,126 | ) | | | 36,754,293 | |
| Net change in unrealized appreciation/depreciation | | | (54,085,126 | ) | | | 36,754,293 | |
| Net realized and unrealized gain (loss) | | | (31,234,090 | ) | | | 189,877,615 | |
| | | | | | | | | |
| Net Increase (Decrease) in Net Assets from Operations | | $ | (27,161,793 | ) | | $ | 188,380,022 | |
| * | Fiscal year end changed to March 31, effective October 1, 2022. |
| ** | The Fund commenced operations on November 5, 2021. |
See accompanying Notes to Financial Statements.
| AXS 2X Innovation ETF |
| STATEMENTS OF CHANGES IN NET ASSETS |
| | | For the Period Ended March 31, 2023* | |
| Increase (Decrease) in Net Assets from: | | | |
| Operations: | | | |
| Net investment income (loss) | | $ | 247,719 | |
| Net realized gain (loss) on swap contracts | | | (9,070,819 | ) |
| Net change in unrealized appreciation/depreciation on swap contracts | | | 2,428,794 | |
| Net increase (decrease) in net assets resulting from operations | | | (6,394,306 | ) |
| | | | | |
| Capital Transactions: | | | | |
| Net proceeds from shares sold | | | 301,733,016 | |
| Cost of shares redeemed | | | (244,467,734 | ) |
| Net increase (decrease) in net assets from capital transactions | | | 57,265,282 | |
| | | | | |
| Total increase (decrease) in net assets | | | 50,870,976 | |
| | | | | |
| Net Assets: | | | | |
| Beginning of period | | | - | |
| End of period | | $ | 50,870,976 | |
| | | | | |
| Capital Share Transactions: | | | | |
| Shares sold | | | 4,243,000 | |
| Shares redeemed | | | (3,452,310 | ) |
| Net increase (decrease) in capital share transactions | | | 790,690 | |
| * | The Fund commenced operations on April 28, 2022. |
See accompanying Notes to Financial Statements.
| AXS Short China Internet ETF |
| STATEMENTS OF CHANGES IN NET ASSETS |
| | | For the Period Ended March 31, 2023* | |
| Increase (Decrease) in Net Assets from: | | | |
| Operations: | | | |
| Net investment income (loss) | | $ | 8,854 | |
| Net realized gain (loss) on swap contracts | | | (839,191 | ) |
| Net change in unrealized appreciation/depreciation on swap contracts | | | (17,672 | ) |
| Net increase (decrease) in net assets resulting from operations | | | (848,009 | ) |
| | | | | |
| Distributions to Shareholders: | | | | |
| Total distributions to shareholders | | | (45,998 | ) |
| | | | | |
| Capital Transactions: | | | | |
| Net proceeds from shares sold | | | 2,336,929 | |
| Cost of shares redeemed | | | (787,658 | ) |
| Net increase (decrease) in net assets from capital transactions | | | 1,549,271 | |
| | | | | |
| Total increase (decrease) in net assets | | | 655,264 | |
| | | | | |
| Net Assets: | | | | |
| Beginning of period | | | - | |
| End of period | | $ | 655,264 | |
| | | | | |
| Capital Share Transactions: | | | | |
| Shares sold | | | 80,000 | |
| Shares redeemed | | | (45,000 | ) |
| Net increase (decrease) in capital share transactions | | | 35,000 | |
| * | The Fund commenced operations on April 28, 2022. |
See accompanying Notes to Financial Statements.
| AXS 1.25X NVDA Bear Daily ETF |
| STATEMENTS OF CHANGES IN NET ASSETS |
| | | For the Period Ended March 31, 2023* | |
| Increase (Decrease) in Net Assets from: | | | |
| Operations: | | | |
| Net investment income (loss) | | $ | 259,185 | |
| Net realized gain (loss) on swap contracts | | | (5,190,735 | ) |
| Net change in unrealized appreciation/depreciation on swap contracts | | | (17,183,903 | ) |
| Net increase (decrease) in net assets resulting from operations | | | (22,115,453 | ) |
| | | | | |
| Distributions to Shareholders: | | | | |
| Total distributions to shareholders | | | (451,820 | ) |
| | | | | |
| Capital Transactions: | | | | |
| Net proceeds from shares sold | | | 167,901,773 | |
| Cost of shares redeemed | | | (53,860,628 | ) |
| Net increase (decrease) in net assets from capital transactions | | | 114,041,145 | |
| | | | | |
| Total increase (decrease) in net assets | | | 91,473,872 | |
| | | | | |
| Net Assets: | | | | |
| Beginning of period | | | - | |
| End of period | | $ | 91,473,872 | |
| | | | | |
| Capital Share Transactions: | | | | |
| Shares sold | | | 8,015,000 | |
| Shares redeemed | | | (2,315,000 | ) |
| Net increase (decrease) in capital share transactions | | | 5,700,000 | |
| * | The Fund commenced operations on July 13, 2022. |
See accompanying Notes to Financial Statements.
| AXS 2X PFE Bear Daily ETF |
| STATEMENTS OF CHANGES IN NET ASSETS |
| | | For the Period Ended March 31, 2023* | |
| Increase (Decrease) in Net Assets from: | | | |
| Operations: | | | |
| Net investment income (loss) | | $ | 6,041 | |
| Net realized gain (loss) on swap contracts | | | (57,462 | ) |
| Net change in unrealized appreciation/depreciation on swap contracts | | | 423,269 | |
| Net increase (decrease) in net assets resulting from operations | | | 371,848 | |
| | | | | |
| Distributions to Shareholders: | | | | |
| Total distributions to shareholders | | | (178,360 | ) |
| | | | | |
| Capital Transactions: | | | | |
| Net proceeds from shares sold | | | 2,846,783 | |
| Cost of shares redeemed | | | (1,444,285 | ) |
| Net increase (decrease) in net assets from capital transactions | | | 1,402,498 | |
| | | | | |
| Total increase (decrease) in net assets | | | 1,595,986 | |
| | | | | |
| Net Assets: | | | | |
| Beginning of period | | | - | |
| End of period | | $ | 1,595,986 | |
| | | | | |
| Capital Share Transactions: | | | | |
| Shares sold | | | 60,000 | |
| Shares redeemed | | | (30,000 | ) |
| Net increase (decrease) in capital share transactions | | | 30,000 | |
| * | The Fund commenced operations on July 13, 2022. |
See accompanying Notes to Financial Statements.
| AXS 2X PFE Bull Daily ETF |
| STATEMENTS OF CHANGES IN NET ASSETS |
| | | For the Period Ended March 31, 2023* | |
| Increase (Decrease) in Net Assets from: | | | |
| Operations: | | | |
| Net investment income (loss) | | $ | 7,326 | |
| Net realized gain (loss) on swap contracts | | | (158,014 | ) |
| Net change in unrealized appreciation/depreciation on swap contracts | | | (339,299 | ) |
| Net increase (decrease) in net assets resulting from operations | | | (489,987 | ) |
| | | | | |
| Capital Transactions: | | | | |
| Net proceeds from shares sold | | | 2,131,109 | |
| Cost of shares redeemed | | | (775,435 | ) |
| Net increase (decrease) in net assets from capital transactions | | | 1,355,674 | |
| | | | | |
| Total increase (decrease) in net assets | | | 865,687 | |
| | | | | |
| Net Assets: | | | | |
| Beginning of period | | | - | |
| End of period | | $ | 865,687 | |
| | | | | |
| Capital Share Transactions: | | | | |
| Shares sold | | | 70,000 | |
| Shares redeemed | | | (25,000 | ) |
| Net increase (decrease) in capital share transactions | | | 45,000 | |
| * | The Fund commenced operations on July 13, 2022. |
See accompanying Notes to Financial Statements.
| AXS 1.5X PYPL Bear Daily ETF |
| STATEMENTS OF CHANGES IN NET ASSETS |
| | | For the Period Ended March 31, 2023* | |
| Increase (Decrease) in Net Assets from: | | | |
| Operations: | | | |
| Net investment income (loss) | | $ | 5,294 | |
| Net realized gain (loss) on swap contracts | | | (913,747 | ) |
| Net change in unrealized appreciation/depreciation on swap contracts | | | (11,631 | ) |
| Net increase (decrease) in net assets resulting from operations | | | (920,084 | ) |
| | | | | |
| Distributions to Shareholders: | | | | |
| Total distributions to shareholders | | | (15,157 | ) |
| | | | | |
| Capital Transactions: | | | | |
| Net proceeds from shares sold | | | 2,621,489 | |
| Cost of shares redeemed | | | (831,436 | ) |
| Net increase (decrease) in net assets from capital transactions | | | 1,790,053 | |
| | | | | |
| Total increase (decrease) in net assets | | | 854,812 | |
| | | | | |
| Net Assets: | | | | |
| Beginning of period | | | - | |
| End of period | | $ | 854,812 | |
| | | | | |
| Capital Share Transactions: | | | | |
| Shares sold | | | 55,000 | |
| Shares redeemed | | | (30,000 | ) |
| Net increase (decrease) in capital share transactions | | | 25,000 | |
| * | The Fund commenced operations on July 13, 2022. |
See accompanying Notes to Financial Statements.
| AXS 1.5X PYPL Bull Daily ETF |
| STATEMENTS OF CHANGES IN NET ASSETS |
| | | For the Period Ended March 31, 2023* | |
| Increase (Decrease) in Net Assets from: | | | |
| Operations: | | | |
| Net investment income (loss) | | $ | 9,242 | |
| Net realized gain (loss) on swap contracts | | | 244,151 | |
| Net change in unrealized appreciation/depreciation on swap contracts | | | (103,810 | ) |
| Net increase (decrease) in net assets resulting from operations | | | 149,583 | |
| | | | | |
| Distributions to Shareholders: | | | | |
| Total distributions to shareholders | | | (395,045 | ) |
| | | | | |
| Capital Transactions: | | | | |
| Net proceeds from shares sold | | | 2,703,956 | |
| Cost of shares redeemed | | | (1,109,578 | ) |
| Net increase (decrease) in net assets from capital transactions | | | 1,594,378 | |
| | | | | |
| Total increase (decrease) in net assets | | | 1,348,916 | |
| | | | | |
| Net Assets: | | | | |
| Beginning of period | | | - | |
| End of period | | $ | 1,348,916 | |
| | | | | |
| Capital Share Transactions: | | | | |
| Shares sold | | | 90,000 | |
| Shares redeemed | | | (25,000 | ) |
| Net increase (decrease) in capital share transactions | | | 65,000 | |
| * | The Fund commenced operations on July 13, 2022. |
See accompanying Notes to Financial Statements.
| AXS TSLA Bear Daily ETF |
| STATEMENTS OF CHANGES IN NET ASSETS |
| | | For the Period Ended March 31, 2023* | |
| Increase (Decrease) in Net Assets from: | | | |
| Operations: | | | |
| Net investment income (loss) | | $ | 1,387,823 | |
| Net realized gain (loss) on swap contracts | | | (19,129,211 | ) |
| Net change in unrealized appreciation/depreciation on swap contracts | | | (5,895,911 | ) |
| Net increase (decrease) in net assets resulting from operations | | | (23,637,299 | ) |
| | | | | |
| Distributions to Shareholders: | | | | |
| Total distributions to shareholders | | | (2,971,709 | ) |
| | | | | |
| Capital Transactions: | | | | |
| Net proceeds from shares sold | | | 778,730,406 | |
| Cost of shares redeemed | | | (639,750,880 | ) |
| Net increase (decrease) in net assets from capital transactions | | | 138,979,526 | |
| | | | | |
| Total increase (decrease) in net assets | | | 112,370,518 | |
| | | | | |
| Net Assets: | | | | |
| Beginning of period | | | - | |
| End of period | | $ | 112,370,518 | |
| | | | | |
| Capital Share Transactions: | | | | |
| Shares sold | | | 14,955,000 | |
| Shares redeemed | | | (12,315,000 | ) |
| Net increase (decrease) in capital share transactions | | | 2,640,000 | |
| * | The Fund commenced operations on July 13, 2022. |
See accompanying Notes to Financial Statements.
| AXS 2X NKE Bear Daily ETF |
| STATEMENTS OF CHANGES IN NET ASSETS |
| | | For the Period Ended March 31, 2023* | |
| Increase (Decrease) in Net Assets from: | | | |
| Operations: | | | |
| Net investment income (loss) | | $ | 6,857 | |
| Net realized gain (loss) on swap contracts | | | (974,061 | ) |
| Net change in unrealized appreciation/depreciation on swap contracts | | | (26,966 | ) |
| Net increase (decrease) in net assets resulting from operations | | | (994,170 | ) |
| | | | | |
| Distributions to Shareholders: | | | | |
| Total distributions to shareholders | | | (14,438 | ) |
| | | | | |
| Capital Transactions: | | | | |
| Net proceeds from shares sold | | | 3,636,364 | |
| Cost of shares redeemed | | | (1,599,998 | ) |
| Net increase (decrease) in net assets from capital transactions | | | 2,036,366 | |
| | | | | |
| Total increase (decrease) in net assets | | | 1,027,758 | |
| | | | | |
| Net Assets: | | | | |
| Beginning of period | | | - | |
| End of period | | $ | 1,027,758 | |
| | | | | |
| Capital Share Transactions: | | | | |
| Shares sold | | | 85,000 | |
| Shares redeemed | | | (45,000 | ) |
| Net increase (decrease) in capital share transactions | | | 40,000 | |
| * | The Fund commenced operations on July 13, 2022. |
See accompanying Notes to Financial Statements.
| AXS 2X NKE Bull Daily ETF |
| STATEMENTS OF CHANGES IN NET ASSETS |
| | | For the Period Ended March 31, 2023* | |
| Increase (Decrease) in Net Assets from: | | | |
| Operations: | | | |
| Net investment income (loss) | | $ | 3,782 | |
| Net realized gain (loss) on swap contracts | | | 432,839 | |
| Net change in unrealized appreciation/depreciation on swap contracts | | | 35,441 | |
| Net increase (decrease) in net assets resulting from operations | | | 472,062 | |
| | | | | |
| Distributions to Shareholders: | | | | |
| Total distributions to shareholders | | | (125,360 | ) |
| | | | | |
| Capital Transactions: | | | | |
| Net proceeds from shares sold | | | 2,266,838 | |
| Cost of shares redeemed | | | (1,808,391 | ) |
| Net increase (decrease) in net assets from capital transactions | | | 458,447 | |
| | | | | |
| Total increase (decrease) in net assets | | | 805,149 | |
| | | | | |
| Net Assets: | | | | |
| Beginning of period | | | - | |
| End of period | | $ | 805,149 | |
| | | | | |
| Capital Share Transactions: | | | | |
| Shares sold | | | 75,000 | |
| Shares redeemed | | | (50,000 | ) |
| Net increase (decrease) in capital share transactions | | | 25,000 | |
| * | The Fund commenced operations on July 13, 2022. |
See accompanying Notes to Financial Statements.
| AXS Short De-SPAC Daily ETF^ |
| STATEMENTS OF CHANGES IN NET ASSETS |
| | | For the Period Ended March 31, 2023* | | | For the Year Ended September 30, 2022 | | | For the Period Ended September 30, 2021** | |
| Increase (Decrease) in Net Assets from: | | | | | | | | | |
| Operations: | | | | | | | | | |
| Net investment income (loss) | | $ | 111,685 | | | $ | (198,256 | ) | | $ | (56,457 | ) |
| Net realized gain (loss) on investments and swap contracts | | | 4,472,175 | | | | 10,654,262 | | | | 156,805 | |
| Net change in unrealized appreciation/depreciation on investments and swap contracts | | | (3,684,467 | ) | | | 2,891,100 | | | | 842,502 | |
| | | | | | | | | | | | | |
| Net increase (decrease) in net assets resulting from operations | | | 899,393 | | | | 13,347,106 | | | | 942,850 | |
| | | | | | | | | | | | | |
| Distributions to Shareholders: | | | | | | | | | | | | |
| Total distributions to shareholders | | | (6,951,403 | ) | | | (865,916 | ) | | | - | |
| | | | | | | | | | | | | |
| Capital Transactions: | | | | | | | | | | | | |
| Net proceeds from shares sold | | | 827,888 | | | | 37,027,337 | | | | 29,854,425 | |
| Cost of shares redeemed | | | (10,172,370 | ) | | | (43,240,719 | ) | | | (10,962,255 | ) |
| Net increase (decrease) in net assets from capital transactions | | | (9,344,482 | ) | | | (6,213,382 | ) | | | 18,892,170 | |
| | | | | | | | | | | | | |
| Total increase (decrease) in net assets | | | (15,396,492 | ) | | | 6,267,808 | | | | 19,835,020 | |
| | | | | | | | | | | | | |
| Net Assets: | | | | | | | | | | | | |
| Beginning of period | | | 26,102,828 | | | | 19,835,020 | | | | - | |
| End of period | | $ | 10,706,336 | | | $ | 26,102,828 | | | $ | 19,835,020 | |
| | | | | | | | | | | | | |
| Capital Share Transactions: | | | | | | | | | | | | |
| Shares sold | | | 25,000 | | | | 950,000 | | | | 1,150,000 | |
| Shares redeemed | | | (200,000 | ) | | | (1,125,000 | ) | | | (450,000 | ) |
| Net increase (decrease) in capital share transactions | | | (175,000 | ) | | | (175,000 | ) | | | 700,000 | |
| ^ | With the Plan of Reorganization with respect to the AXS Short De-SPAC ETF (formerly, The Short De-SPAC ETF), shareholders received shares of the AXS Short De-SPAC ETF effective as of the close of business on August 5, 2022. See Note 1 in the accompanying Notes to Financial Statements. |
| * | Fiscal year end changed to March 31, effective October 1, 2022. |
| ** | The Fund commenced operations on May 17, 2021. |
See accompanying Notes to Financial Statements.
| AXS Short Innovation Daily ETF^ |
| STATEMENTS OF CHANGES IN NET ASSETS |
| | | For the Period Ended March 31, 2023* | | | For the Period Ended September 30, 2022** | |
| Increase (Decrease) in Net Assets from: | | | | | | |
| Operations: | | | | | | |
| Net investment income (loss) | | $ | 4,072,297 | | | $ | (1,497,593 | ) |
| Net realized gain (loss) on swap contracts | | | 22,851,036 | | | | 153,123,322 | |
| Net change in unrealized appreciation/depreciation on swap contracts | | | (54,085,126 | ) | | | 36,754,293 | |
| Net increase (decrease) in net assets resulting from operations | | | (27,161,793 | ) | | | 188,380,022 | |
| | | | | | | | | |
| Distributions to Shareholders: | | | | | | | | |
| Total distributions to shareholders | | | (65,646,748 | ) | | | - | |
| | | | | | | | | |
| Capital Transactions: | | | | | | | | |
| Net proceeds from shares sold | | | 573,256,103 | | | | 1,579,155,899 | |
| Cost of shares redeemed | | | (544,694,243 | ) | | | (1,393,131,402 | ) |
| Net increase (decrease) in net assets from capital transactions | | | 28,561,860 | | | | 186,024,497 | |
| | | | | | | | | |
| Total increase (decrease) in net assets | | | (64,246,681 | ) | | | 374,404,519 | |
| | | | | | | | | |
| Net Assets: | | | | | | | | |
| Beginning of period | | | 374,404,519 | | | | - | |
| End of period | | $ | 310,157,838 | | | $ | 374,404,519 | |
| | | | | | | | | |
| Capital Share Transactions: | | | | | | | | |
| Shares sold | | | 13,100,000 | | | | 31,250,000 | |
| Shares redeemed | | | (11,400,000 | ) | | | (25,200,000 | ) |
| Net increase (decrease) in capital share transactions | | | 1,700,000 | | | | 6,050,000 | |
| ^ | With the Plan of Reorganization with respect to the AXS Short Innovation Daily ETF (formerly, Tuttle Capital Short Innovation ETF), shareholders received shares of the AXS Short Innovation Daily ETF effective as of the close of business on August 5, 2022. See Note 1 in the accompanying Notes to Financial Statements. |
| * | Fiscal year end changed to March 31, effective October 1, 2022. |
| ** | The Fund commenced operations on November 5, 2021. |
See accompanying Notes to Financial Statements.
| AXS 2X Innovation ETF |
| FINANCIAL HIGHLGHTS |
Per share operating performance.
For a capital share outstanding throughout each period.
| | | For the Period Ended March 31, 2023*,** | |
| Net asset value, beginning of period | | $ | 150.00 | |
| Income from Investment Operations: | | | | |
| Net investment income (loss)1 | | | 0.41 | |
| Net realized and unrealized gain (loss) | | | (86.07 | ) |
| Total from investment operations | | | (85.66 | ) |
| | | | | |
| Net asset value, end of period | | $ | 64.34 | |
| | | | | |
| Total return2,3 | | | (57.11 | )%4 |
| | | | | |
| Total return at market price3,5 | | | (57.11 | )%4 |
| | | | | |
| Ratios and Supplemental Data: | | | | |
| Net assets, end of period (in thousands) | | $ | 50,871 | |
| | | | | |
| Ratio of expenses to average net assets: | | | | |
| Before fees waived and expenses absorbed/recovered | | | 1.43 | %6 |
| After fees waived and expenses absorbed/recovered | | | 1.15 | %6 |
| Ratio of net investment income (loss) to average net assets: | | | | |
| Before fees waived and expenses absorbed/recovered | | | 0.36 | %6 |
| After fees waived and expenses absorbed/recovered | | | 0.64 | %6 |
| | | | | |
| Portfolio turnover rate7 | | | - | %4 |
| * | The Fund commenced operations on April 28, 2022. |
| ** | The Fund had a 1-5 reverse stock split after the close of business November 30, 2022. See Note 1 in the accompanying Notes to Financial Statements. |
| 1 | Based on average shares outstanding during the period. |
| 2 | Net asset value total return is calculated assuming an initial investment made at the net asset value at the beginning of the period, reinvestment of all dividends and distributions at net asset value during the period, if any, and redemption on the last day of the period at net asset value. This percentage is not an indication of the performance of a shareholder's investment in the Fund based on market value due to the differences between the market price of the shares and the net asset value per share of the Fund. |
| 3 | Total return would have been lower had fees not been waived or absorbed by the Advisor. These returns do not reflect the deduction of taxes that a shareholder would pay on the Fund distributions or redemption of Fund shares. |
| 5 | Market value total return is calculated assuming an initial investment made at market value at the beginning of the period, reinvestment of all dividends and distributions at net asset value during the period, if any, and redemption on the last day of the period at market value. Market value is determined by the composite closing price. Composite closing security price is defined as the last reported sale price on Nasdaq. The composite closing price is the last reported sale, regardless of volume, and not an average price, and may have occurred on a date prior to the close of the reporting period. Market value may be greater or less than net asset value, depending on the Fund's closing price on Nasdaq. |
| 7 | Excludes the impact of in-kind transactions related to the processing of capital share transactions in Creation Units. |
See accompanying Notes to Financial Statements.
| AXS Short China Internet ETF |
| FINANCIAL HIGHLGHTS |
Per share operating performance.
For a capital share outstanding throughout each period.
| | | For the Period Ended March 31, 2023* | |
| Net asset value, beginning of period | | $ | 30.00 | |
| Income from Investment Operations: | | | | |
| Net investment income (loss)1 | | | 0.13 | |
| Net realized and unrealized gain (loss) | | | (10.79 | ) |
| Total from investment operations | | | (10.66 | ) |
| | | | | |
| Less Distributions: | | | | |
| From net investment income | | | (0.24 | ) |
| From net realized gain | | | (0.38 | ) |
| Total distributions | | | (0.62 | ) |
| Net asset value, end of period | | $ | 18.72 | |
| | | | | |
| Total return2,3 | | | (35.62 | )%4 |
| | | | | |
| Total return at market price3,5 | | | (35.68 | )%4 |
| | | | | |
| Ratios and Supplemental Data: | | | | |
| Net assets, end of period (in thousands) | | $ | 655 | |
| | | | | |
| Ratio of expenses to average net assets: | | | | |
| Before fees waived and expenses absorbed/recovered | | | 11.45 | %6 |
| After fees waived and expenses absorbed/recovered | | | 0.95 | %6 |
| Ratio of net investment income (loss) to average net assets: | | | | |
| Before fees waived and expenses absorbed/recovered | | | (9.91 | )%6 |
| After fees waived and expenses absorbed/recovered | | | 0.59 | %6 |
| | | | | |
| Portfolio turnover rate7 | | | - | %4 |
| * | The Fund commenced operations on April 28, 2022. |
| 1 | Based on average shares outstanding during the period. |
| 2 | Net asset value total return is calculated assuming an initial investment made at the net asset value at the beginning of the period, reinvestment of all dividends and distributions at net asset value during the period, if any, and redemption on the last day of the period at net asset value. This percentage is not an indication of the performance of a shareholder's investment in the Fund based on market value due to the differences between the market price of the shares and the net asset value per share of the Fund. |
| 3 | Total return would have been lower had fees not been waived or absorbed by the Advisor. These returns do not reflect the deduction of taxes that a shareholder would pay on the Fund distributions or redemption of Fund shares. |
| 5 | Market value total return is calculated assuming an initial investment made at market value at the beginning of the period, reinvestment of all dividends and distributions at net asset value during the period, if any, and redemption on the last day of the period at market value. Market value is determined by the composite closing price. Composite closing security price is defined as the last reported sale price on Nasdaq. The composite closing price is the last reported sale, regardless of volume, and not an average price, and may have occurred on a date prior to the close of the reporting period. Market value may be greater or less than net asset value, depending on the Fund's closing price on Nasdaq. |
| 7 | Excludes the impact of in-kind transactions related to the processing of capital share transactions in Creation Units. |
See accompanying Notes to Financial Statements.
| AXS 1.25X NVDA Bear Daily ETF |
| FINANCIAL HIGHLGHTS |
Per share operating performance.
For a capital share outstanding throughout each period.
| | | For the Period Ended March 31, 2023* | |
| Net asset value, beginning of period | | $ | 50.00 | |
| Income from Investment Operations: | | | | |
| Net investment income (loss)1 | | | 0.37 | |
| Net realized and unrealized gain (loss) | | | (32.06 | ) |
| Total from investment operations | | | (31.69 | ) |
| | | | | |
| Less Distributions: | | | | |
| From net investment income | | | (0.27 | ) |
| From net realized gain | | | (1.99 | ) |
| Total distributions | | | (2.26 | ) |
| Net asset value, end of period | | $ | 16.05 | |
| | | | | |
| Total return2,3 | | | (66.14 | )%4 |
| | | | | |
| Total return at market price3,5 | | | (66.14 | )%4 |
| | | | | |
| Ratios and Supplemental Data: | | | | |
| Net assets, end of period (in thousands) | | $ | 91,474 | |
| | | | | |
| Ratio of expenses to average net assets: | | | | |
| Before fees waived and expenses absorbed/recovered | | | 1.81 | %6 |
| After fees waived and expenses absorbed/recovered | | | 1.15 | %6 |
| Ratio of net investment income (loss) to average net assets: | | | | |
| Before fees waived and expenses absorbed/recovered | | | 1.69 | %6 |
| After fees waived and expenses absorbed/recovered | | | 2.35 | %6 |
| | | | | |
| Portfolio turnover rate7 | | | - | %4 |
| * | The Fund commenced operations on July 13, 2022. |
| 1 | Based on average shares outstanding during the period. |
| 2 | Net asset value total return is calculated assuming an initial investment made at the net asset value at the beginning of the period, reinvestment of all dividends and distributions at net asset value during the period, if any, and redemption on the last day of the period at net asset value. This percentage is not an indication of the performance of a shareholder's investment in the Fund based on market value due to the differences between the market price of the shares and the net asset value per share of the Fund. |
| 3 | Total return would have been lower had fees not been waived or absorbed by the Advisor. These returns do not reflect the deduction of taxes that a shareholder would pay on the Fund distributions or redemption of Fund shares. |
| 5 | Market value total return is calculated assuming an initial investment made at market value at the beginning of the period, reinvestment of all dividends and distributions at net asset value during the period, if any, and redemption on the last day of the period at market value. Market value is determined by the composite closing price. Composite closing security price is defined as the last reported sale price on Nasdaq. The composite closing price is the last reported sale, regardless of volume, and not an average price, and may have occurred on a date prior to the close of the reporting period. Market value may be greater or less than net asset value, depending on the Fund's closing price on Nasdaq. |
| 7 | Excludes the impact of in-kind transactions related to the processing of capital share transactions in Creation Units. |
See accompanying Notes to Financial Statements.
| AXS 2X PFE Bear Daily ETF |
| FINANCIAL HIGHLGHTS |
Per share operating performance.
For a capital share outstanding throughout each period.
| | | For the Period Ended March 31, 2023* | |
| Net asset value, beginning of period | | $ | 50.00 | |
| Income from Investment Operations: | | | | |
| Net investment income (loss)1 | | | 0.21 | |
| Net realized and unrealized gain (loss) | | | 10.12 | |
| Total from investment operations | | | 10.33 | |
| | | | | |
| Less Distributions: | | | | |
| From net realized gain | | | (7.13 | ) |
| Total distributions | | | (7.13 | ) |
| Net asset value, end of period | | $ | 53.20 | |
| | | | | |
| Total return2,3 | | | 28.33 | %4 |
| | | | | |
| Total return at market price3,5 | | | 28.58 | %4 |
| | | | | |
| Ratios and Supplemental Data: | | | | |
| Net assets, end of period (in thousands) | | $ | 1,596 | |
| | | | | |
| Ratio of expenses to average net assets: | | | | |
| Before fees waived and expenses absorbed/recovered | | | 9.44 | %6 |
| After fees waived and expenses absorbed/recovered | | | 1.15 | %6 |
| Ratio of net investment income (loss) to average net assets: | | | | |
| Before fees waived and expenses absorbed/recovered | | | (7.70 | )%6 |
| After fees waived and expenses absorbed/recovered | | | 0.59 | %6 |
| | | | | |
| Portfolio turnover rate7 | | | - | %4 |
| * | The Fund commenced operations on July 13, 2022. |
| 1 | Based on average shares outstanding during the period. |
| 2 | Net asset value total return is calculated assuming an initial investment made at the net asset value at the beginning of the period, reinvestment of all dividends and distributions at net asset value during the period, if any, and redemption on the last day of the period at net asset value. This percentage is not an indication of the performance of a shareholder's investment in the Fund based on market value due to the differences between the market price of the shares and the net asset value per share of the Fund. |
| 3 | Total return would have been lower had fees not been waived or absorbed by the Advisor. These returns do not reflect the deduction of taxes that a shareholder would pay on the Fund distributions or redemption of Fund shares. |
| 5 | Market value total return is calculated assuming an initial investment made at market value at the beginning of the period, reinvestment of all dividends and distributions at net asset value during the period, if any, and redemption on the last day of the period at market value. Market value is determined by the composite closing price. Composite closing security price is defined as the last reported sale price on Nasdaq. The composite closing price is the last reported sale, regardless of volume, and not an average price, and may have occurred on a date prior to the close of the reporting period. Market value may be greater or less than net asset value, depending on the Fund's closing price on Nasdaq. |
| 7 | Excludes the impact of in-kind transactions related to the processing of capital share transactions in Creation Units. |
See accompanying Notes to Financial Statements.
| AXS 2X PFE Bull Daily ETF |
| FINANCIAL HIGHLGHTS |
Per share operating performance.
For a capital share outstanding throughout each period.
| | | For the Period Ended March 31, 2023* | |
| Net asset value, beginning of period | | $ | 30.00 | |
| Income from Investment Operations: | | | | |
| Net investment income (loss)1 | | | 0.18 | |
| Net realized and unrealized gain (loss) | | | (10.94 | ) |
| Total from investment operations | | | (10.76 | ) |
| Net asset value, end of period | | $ | 19.24 | |
| | | | | |
| Total return2,3 | | | (35.87 | )%4 |
| | | | | |
| Total return at market price3,5 | | | (35.83 | )%4 |
| | | | | |
| Ratios and Supplemental Data: | | | | |
| Net assets, end of period (in thousands) | | $ | 866 | |
| | | | | |
| Ratio of expenses to average net assets: | | | | |
| Before fees waived and expenses absorbed/recovered | | | 12.84 | %6 |
| After fees waived and expenses absorbed/recovered | | | 1.15 | %6 |
| Ratio of net investment income (loss) to average net assets: | | | | |
| Before fees waived and expenses absorbed/recovered | | | (10.71 | )%6 |
| After fees waived and expenses absorbed/recovered | | | 0.98 | %6 |
| | | | | |
| Portfolio turnover rate7 | | | - | %4 |
| * | The Fund commenced operations on July 13, 2022. |
| 1 | Based on average shares outstanding during the period. |
| 2 | Net asset value total return is calculated assuming an initial investment made at the net asset value at the beginning of the period, reinvestment of all dividends and distributions at net asset value during the period, if any, and redemption on the last day of the period at net asset value. This percentage is not an indication of the performance of a shareholder's investment in the Fund based on market value due to the differences between the market price of the shares and the net asset value per share of the Fund. |
| 3 | Total return would have been lower had fees not been waived or absorbed by the Advisor. These returns do not reflect the deduction of taxes that a shareholder would pay on the Fund distributions or redemption of Fund shares. |
| 5 | Market value total return is calculated assuming an initial investment made at market value at the beginning of the period, reinvestment of all dividends and distributions at net asset value during the period, if any, and redemption on the last day of the period at market value. Market value is determined by the composite closing price. Composite closing security price is defined as the last reported sale price on Nasdaq. The composite closing price is the last reported sale, regardless of volume, and not an average price, and may have occurred on a date prior to the close of the reporting period. Market value may be greater or less than net asset value, depending on the Fund's closing price on Nasdaq. |
| 7 | Excludes the impact of in-kind transactions related to the processing of capital share transactions in Creation Units. |
See accompanying Notes to Financial Statements.
| AXS 1.5X PYPL Bear Daily ETF |
| FINANCIAL HIGHLGHTS |
Per share operating performance.
For a capital share outstanding throughout each period.
| | | For the Period Ended March 31, 2023* | |
| Net asset value, beginning of period | | $ | 50.00 | |
| Income from Investment Operations: | | | | |
| Net investment income (loss)1 | | | 0.19 | |
| Net realized and unrealized gain (loss) | | | (15.39 | ) |
| Total from investment operations | | | (15.20 | ) |
| | | | | |
| Less Distributions: | | | | |
| From net investment income | | | (0.61 | ) |
| Total distributions | | | (0.61 | ) |
| Net asset value, end of period | | $ | 34.19 | |
| | | | | |
| Total return2,3 | | | (30.62 | )%4 |
| | | | | |
| Total return at market price3,5 | | | (30.52 | )%4 |
| | | | | |
| Ratios and Supplemental Data: | | | | |
| Net assets, end of period (in thousands) | | $ | 855 | |
| | | | | |
| Ratio of expenses to average net assets: | | | | |
| Before fees waived and expenses absorbed/recovered | | | 13.78 | %6 |
| After fees waived and expenses absorbed/recovered | | | 1.15 | %6 |
| Ratio of net investment income (loss) to average net assets: | | | | |
| Before fees waived and expenses absorbed/recovered | | | (11.87 | )%6 |
| After fees waived and expenses absorbed/recovered | | | 0.76 | %6 |
| | | | | |
| Portfolio turnover rate7 | | | - | %4 |
| * | The Fund commenced operations on July 13, 2022. |
| 1 | Based on average shares outstanding during the period. |
| 2 | Net asset value total return is calculated assuming an initial investment made at the net asset value at the beginning of the period, reinvestment of all dividends and distributions at net asset value during the period, if any, and redemption on the last day of the period at net asset value. This percentage is not an indication of the performance of a shareholder's investment in the Fund based on market value due to the differences between the market price of the shares and the net asset value per share of the Fund. |
| 3 | Total return would have been lower had fees not been waived or absorbed by the Advisor. These returns do not reflect the deduction of taxes that a shareholder would pay on the Fund distributions or redemption of Fund shares. |
| 5 | Market value total return is calculated assuming an initial investment made at market value at the beginning of the period, reinvestment of all dividends and distributions at net asset value during the period, if any, and redemption on the last day of the period at market value. Market value is determined by the composite closing price. Composite closing security price is defined as the last reported sale price on Nasdaq. The composite closing price is the last reported sale, regardless of volume, and not an average price, and may have occurred on a date prior to the close of the reporting period. Market value may be greater or less than net asset value, depending on the Fund's closing price on Nasdaq. |
| 7 | Excludes the impact of in-kind transactions related to the processing of capital share transactions in Creation Units. |
See accompanying Notes to Financial Statements.
| AXS 1.5X PYPL Bull Daily ETF |
| FINANCIAL HIGHLGHTS |
Per share operating performance.
For a capital share outstanding throughout each period.
| | | For the Period Ended March 31, 2023* | |
| Net asset value, beginning of period | | $ | 30.00 | |
| Income from Investment Operations: | | | | |
| Net investment income (loss)1 | | | 0.20 | |
| Net realized and unrealized gain (loss) | | | (0.67 | ) |
| Total from investment operations | | | (0.47 | ) |
| | | | | |
| Less Distributions: | | | | |
| From net realized gain | | | (8.78 | ) |
| Total distributions | | | (8.78 | ) |
| Net asset value, end of period | | $ | 20.75 | |
| | | | | |
| Total return2,3 | | | 2.55 | %4 |
| | | | | |
| Total return at market price3,5 | | | 2.64 | %4 |
| | | | | |
| Ratios and Supplemental Data: | | | | |
| Net assets, end of period (in thousands) | | $ | 1,349 | |
| | | | | |
| Ratio of expenses to average net assets: | | | | |
| Before fees waived and expenses absorbed/recovered | | | 9.03 | %6 |
| After fees waived and expenses absorbed/recovered | | | 1.15 | %6 |
| Ratio of net investment income (loss) to average net assets: | | | | |
| Before fees waived and expenses absorbed/recovered | | | (7.02 | )%6 |
| After fees waived and expenses absorbed/recovered | | | 0.86 | %6 |
| | | | | |
| Portfolio turnover rate7 | | | - | %4 |
| * | The Fund commenced operations on July 13, 2022. |
| 1 | Based on average shares outstanding during the period. |
| 2 | Net asset value total return is calculated assuming an initial investment made at the net asset value at the beginning of the period, reinvestment of all dividends and distributions at net asset value during the period, if any, and redemption on the last day of the period at net asset value. This percentage is not an indication of the performance of a shareholder's investment in the Fund based on market value due to the differences between the market price of the shares and the net asset value per share of the Fund. |
| 3 | Total return would have been lower had fees not been waived or absorbed by the Advisor. These returns do not reflect the deduction of taxes that a shareholder would pay on the Fund distributions or redemption of Fund shares. |
| 5 | Market value total return is calculated assuming an initial investment made at market value at the beginning of the period, reinvestment of all dividends and distributions at net asset value during the period, if any, and redemption on the last day of the period at market value. Market value is determined by the composite closing price. Composite closing security price is defined as the last reported sale price on Nasdaq. The composite closing price is the last reported sale, regardless of volume, and not an average price, and may have occurred on a date prior to the close of the reporting period. Market value may be greater or less than net asset value, depending on the Fund's closing price on Nasdaq. |
| 7 | Excludes the impact of in-kind transactions related to the processing of capital share transactions in Creation Units. |
See accompanying Notes to Financial Statements.
| AXS TSLA Bear Daily ETF |
| FINANCIAL HIGHLGHTS |
Per share operating performance.
For a capital share outstanding throughout each period.
| | | For the Period Ended March 31, 2023* | |
| Net asset value, beginning of period | | $ | 50.00 | |
| Income from Investment Operations: | | | | |
| Net investment income (loss)1 | | | 0.82 | |
| Net realized and unrealized gain (loss) | | | (6.23 | ) |
| Total from investment operations | | | (5.41 | ) |
| | | | | |
| Less Distributions: | | | | |
| From net investment income | | | (0.46 | ) |
| From net realized gain | | | (1.57 | ) |
| Total distributions | | | (2.03 | ) |
| | | | | |
| Net asset value, end of period | | $ | 42.56 | |
| | | | | |
| Total return2,3 | | | (12.97 | )%4 |
| | | | | |
| Total return at market price3,5 | | | (13.02 | )%4 |
| | | | | |
| Ratios and Supplemental Data: | | | | |
| Net assets, end of period (in thousands) | | $ | 112,371 | |
| | | | | |
| Ratio of expenses to average net assets: | | | | |
| Before fees waived and expenses absorbed/recovered | | | 1.21 | %6 |
| After fees waived and expenses absorbed/recovered | | | 1.15 | %6 |
| Ratio of net investment income (loss) to average net assets: | | | | |
| Before fees waived and expenses absorbed/recovered | | | 2.21 | %6 |
| After fees waived and expenses absorbed/recovered | | | 2.27 | %6 |
| | | | | |
| Portfolio turnover rate7 | | | - | %4 |
| * | The Fund commenced operations on July 13, 2022. |
| 1 | Based on average shares outstanding during the period. |
| 2 | Net asset value total return is calculated assuming an initial investment made at the net asset value at the beginning of the period, reinvestment of all dividends and distributions at net asset value during the period, if any, and redemption on the last day of the period at net asset value. This percentage is not an indication of the performance of a shareholder's investment in the Fund based on market value due to the differences between the market price of the shares and the net asset value per share of the Fund. |
| 3 | Total return would have been lower had fees not been waived or absorbed by the Advisor. These returns do not reflect the deduction of taxes that a shareholder would pay on the Fund distributions or redemption of Fund shares. |
| 5 | Market value total return is calculated assuming an initial investment made at market value at the beginning of the period, reinvestment of all dividends and distributions at net asset value during the period, if any, and redemption on the last day of the period at market value. Market value is determined by the composite closing price. Composite closing security price is defined as the last reported sale price on Nasdaq. The composite closing price is the last reported sale, regardless of volume, and not an average price, and may have occurred on a date prior to the close of the reporting period. Market value may be greater or less than net asset value, depending on the Fund's closing price on Nasdaq. |
| 7 | Excludes the impact of in-kind transactions related to the processing of capital share transactions in Creation Units. |
See accompanying Notes to Financial Statements.
| AXS 2X NKE Bear Daily ETF |
| FINANCIAL HIGHLGHTS |
Per share operating performance.
For a capital share outstanding throughout each period.
| | | For the Period Ended March 31, 2023* | |
| Net asset value, beginning of period | | $ | 50.00 | |
| Income from Investment Operations: | | | | |
| Net investment income (loss)1 | | | 0.19 | |
| Net realized and unrealized gain (loss) | | | (24.08 | ) |
| Total from investment operations | | | (23.89 | ) |
| | | | | |
| Less Distributions: | | | | |
| From net investment income | | | (0.34 | ) |
| From net realized gain | | | (0.08 | ) |
| Total distributions | | | (0.42 | ) |
| Net asset value, end of period | | $ | 25.69 | |
| | | | | |
| Total return2,3 | | | (47.88 | )%4 |
| | | | | |
| Total return at market price3,5 | | | (47.94 | )%4 |
| | | | | |
| Ratios and Supplemental Data: | | | | |
| Net assets, end of period (in thousands) | | $ | 1,028 | |
| | | | | |
| Ratio of expenses to average net assets: | | | | |
| Before fees waived and expenses absorbed/recovered | | | 10.25 | %6 |
| After fees waived and expenses absorbed/recovered | | | 1.15 | %6 |
| Ratio of net investment income (loss) to average net assets: | | | | |
| Before fees waived and expenses absorbed/recovered | | | (8.37 | )%6 |
| After fees waived and expenses absorbed/recovered | | | 0.73 | %6 |
| | | | | |
| Portfolio turnover rate7 | | | - | %4 |
| * | The Fund commenced operations on July 13, 2022. |
| 1 | Based on average shares outstanding during the period. |
| 2 | Net asset value total return is calculated assuming an initial investment made at the net asset value at the beginning of the period, reinvestment of all dividends and distributions at net asset value during the period, if any, and redemption on the last day of the period at net asset value. This percentage is not an indication of the performance of a shareholder's investment in the Fund based on market value due to the differences between the market price of the shares and the net asset value per share of the Fund. |
| 3 | Total return would have been lower had fees not been waived or absorbed by the Advisor. These returns do not reflect the deduction of taxes that a shareholder would pay on the Fund distributions or redemption of Fund shares. |
| 5 | Market value total return is calculated assuming an initial investment made at market value at the beginning of the period, reinvestment of all dividends and distributions at net asset value during the period, if any, and redemption on the last day of the period at market value. Market value is determined by the composite closing price. Composite closing security price is defined as the last reported sale price on Nasdaq. The composite closing price is the last reported sale, regardless of volume, and not an average price, and may have occurred on a date prior to the close of the reporting period. Market value may be greater or less than net asset value, depending on the Fund's closing price on Nasdaq. |
| 7 | Excludes the impact of in-kind transactions related to the processing of capital share transactions in Creation Units. |
See accompanying Notes to Financial Statements.
| AXS 2X NKE Bull Daily ETF |
| FINANCIAL HIGHLGHTS |
Per share operating performance.
For a capital share outstanding throughout each period.
| | | For the Period Ended March 31, 2023* | |
| Net asset value, beginning of period | | $ | 30.00 | |
| Income from Investment Operations: | | | | |
| Net investment income (loss)1 | | | 0.13 | |
| Net realized and unrealized gain (loss) | | | 5.66 | |
| Total from investment operations | | | 5.79 | |
| | | | | |
| Less Distributions: | | | | |
| From net realized gain | | | (3.58 | ) |
| Total distributions | | | (3.58 | ) |
| Net asset value, end of period | | $ | 32.21 | |
| | | | | |
| Total return2,3 | | | 19.95 | %4 |
| | | | | |
| Total return at market price3,5 | | | 20.07 | %4 |
| | | | | |
| Ratios and Supplemental Data: | | | | |
| Net assets, end of period (in thousands) | | $ | 805 | |
| | | | | |
| Ratio of expenses to average net assets: | | | | |
| Before fees waived and expenses absorbed/recovered | | | 14.03 | %6 |
| After fees waived and expenses absorbed/recovered | | | 1.15 | %6 |
| Ratio of net investment income (loss) to average net assets: | | | | |
| Before fees waived and expenses absorbed/recovered | | | (12.32 | )%6 |
| After fees waived and expenses absorbed/recovered | | | 0.56 | %6 |
| | | | | |
| Portfolio turnover rate7 | | | - | %4 |
| * | The Fund commenced operations on July 13, 2022. |
| 1 | Based on average shares outstanding during the period. |
| 2 | Net asset value total return is calculated assuming an initial investment made at the net asset value at the beginning of the period, reinvestment of all dividends and distributions at net asset value during the period, if any, and redemption on the last day of the period at net asset value. This percentage is not an indication of the performance of a shareholder's investment in the Fund based on market value due to the differences between the market price of the shares and the net asset value per share of the Fund. |
| 3 | Total return would have been lower had fees not been waived or absorbed by the Advisor. These returns do not reflect the deduction of taxes that a shareholder would pay on the Fund distributions or redemption of Fund shares. |
| 5 | Market value total return is calculated assuming an initial investment made at market value at the beginning of the period, reinvestment of all dividends and distributions at net asset value during the period, if any, and redemption on the last day of the period at market value. Market value is determined by the composite closing price. Composite closing security price is defined as the last reported sale price on Nasdaq. The composite closing price is the last reported sale, regardless of volume, and not an average price, and may have occurred on a date prior to the close of the reporting period. Market value may be greater or less than net asset value, depending on the Fund's closing price on Nasdaq. |
| 7 | Excludes the impact of in-kind transactions related to the processing of capital share transactions in Creation Units. |
See accompanying Notes to Financial Statements.
| AXS Short De-SPAC Daily ETF^ |
| FINANCIAL HIGHLGHTS |
Per share operating performance.
For a capital share outstanding throughout each period.
| | | For the Period Ended March 31, 2023* | | | For the Year Ended September 30, 2022 | | | For the Period Ended September 30, 2021** | |
| Net asset value, beginning of period | | $ | 49.72 | | | $ | 28.34 | | | $ | 30.00 | |
| Income from Investment Operations: | | | | | | | | | | | | |
| Net investment income (loss)1 | | | 0.27 | | | | (0.33 | ) | | | (0.08 | ) |
| Net realized and unrealized gain (loss) | | | 0.46 | | | | 23.63 | | | | (1.58 | ) |
| Total from investment operations | | | 0.73 | | | | 23.30 | | | | (1.66 | ) |
| | | | | | | | | | | | | |
| Less Distributions: | | | | | | | | | | | | |
| From net investment income | | | - | | | | (1.92 | ) | | | - | |
| From net realized gain | | | (19.86 | ) | | | - | | | | - | |
| Total distributions | | | (19.86 | ) | | | (1.92 | ) | | | - | |
| Net asset value, end of period | | $ | 30.59 | | | $ | 49.72 | | | $ | 28.34 | |
| | | | | | | | | | | | | |
| Total return2,3 | | | (7.18 | )%4 | | | 81.37 | % | | | (5.55 | )%4 |
| | | | | | | | | | | | | |
| Total return at market price3,5 | | | (6.84 | )%4 | | | 82.72 | % | | | (5.57 | )%4 |
| | | | | | | | | | | | | |
| Ratios and Supplemental Data: | | | | | | | | | | | | |
| Net assets, end of period (in thousands) | | $ | 10,706 | | | $ | 26,103 | | | $ | 19,835 | |
| | | | | | | | | | | | | |
| Ratio of expenses to average net assets: | | | | | | | | | | | | |
| Before fees waived and expenses absorbed/recovered | | | 2.00 | %6 | | | 1.46 | % | | | 1.89 | %6 |
| After fees waived and expenses absorbed/recovered | | | 0.95 | %6 | | | 0.95 | % | | | 0.95 | %6 |
| Ratio of net investment income (loss) to average net assets: | | | | | | | | | | | | |
| Before fees waived and expenses absorbed/recovered | | | 0.27 | %6 | | | (1.35 | )% | | | (1.89 | )%6 |
| After fees waived and expenses absorbed/recovered | | | 1.32 | %6 | | | (0.84 | )% | | | (0.95 | )%6 |
| | | | | | | | | | | | | |
| Portfolio turnover rate7 | | | - | %4 | | | -% | | | | - | %4 |
| ^ | Financial information from May 17, 2021 through August 5, 2022 is for the Short De-SPAC Daily ETF, which was reorganized into the AXS Short De-SPAC Daily ETF as of the close of business on August 5, 2022. See Note 1 in the accompanying Notes to Financial Statements. |
| * | Fiscal year end changed to March 31, effective October 1, 2022. |
| ** | The Fund commenced operations on May 17, 2021. |
| 1 | Based on average shares outstanding during the period. |
| 2 | Net asset value total return is calculated assuming an initial investment made at the net asset value at the beginning of the period, reinvestment of all dividends and distributions at net asset value during the period, if any, and redemption on the last day of the period at net asset value. This percentage is not an indication of the performance of a shareholder's investment in the Fund based on market value due to the differences between the market price of the shares and the net asset value per share of the Fund. |
| 3 | Total return would have been lower had fees not been waived or absorbed by the Advisor. These returns do not reflect the deduction of taxes that a shareholder would pay on the Fund distributions or redemption of Fund shares. |
| 5 | Market value total return is calculated assuming an initial investment made at market value at the beginning of the period, reinvestment of all dividends and distributions at net asset value during the period, if any, and redemption on the last day of the period at market value. Market value is determined by the composite closing price. Composite closing security price is defined as the last reported sale price on The NASDAQ Stock Market LLC. The composite closing price is the last reported sale, regardless of volume, and not an average price, and may have occurred on a date prior to the close of the reporting period. Market value may be greater or less than net asset value, depending on the Fund's closing price on The NASDAQ Stock Market LLC. |
| 7 | Excludes the impact of in-kind transactions related to the processing of capital share transactions in Creation Units. |
See accompanying Notes to Financial Statements.
| AXS Short Innovation Daily ETF^ |
| FINANCIAL HIGHLGHTS |
Per share operating performance.
For a capital share outstanding throughout each period.
| | | For the Period Ended March 31, 2023* | | | For the Period Ended September 30, 2022** | |
| Net asset value, beginning of period | | $ | 61.89 | | | $ | 30.00 | |
| Income from Investment Operations: | | | | | | | | |
| Net investment income (loss)1 | | | 0.57 | | | | (0.24 | ) |
| Net realized and unrealized gain (loss) | | | (8.69 | ) | | | 32.13 | |
| Total from investment operations | | | (8.12 | ) | | | 31.89 | |
| | | | | | | | | |
| Less Distributions: | | | | | | | | |
| From net realized gain | | | (13.75 | ) | | | - | |
| Total distributions | | | (13.75 | ) | | | - | |
| Net asset value, end of period | | $ | 40.02 | | | $ | 61.89 | |
| | | | | | | | | |
| Total return2,3 | | | (19.82 | )%4 | | | 106.28 | %4 |
| | | | | | | | | |
| Total return at market price2,5 | | | (19.69 | )%4 | | | 106.23 | %4 |
| | | | | | | | | |
| Ratios and Supplemental Data: | | | | | | | | |
| Net assets, end of period (in thousands) | | $ | 310,158 | | | $ | 374,405 | |
| | | | | | | | | |
| Ratio of expenses to average net assets: | | | | | | | | |
| Before fees waived and expenses absorbed/recovered | | | 1.01 | %6 | | | 0.83 | %6 |
| After fees waived and expenses absorbed/recovered | | | 0.75 | %6 | | | 0.75 | %6 |
| Ratio of net investment income (loss) to average net assets: | | | | | | | | |
| Before fees waived and expenses absorbed/recovered | | | 2.03 | %6 | | | (0.58 | )%6 |
| After fees waived and expenses absorbed/recovered | | | 2.29 | %6 | | | (0.50 | )%6 |
| | | | | | | | | |
| Portfolio turnover rate7 | | | - | %4 | | | - | %4 |
| ^ | Financial information from November 5, 2021 through August 5, 2022 is for Tuttle Capital Short Innovation ETF, which was reorganized into the AXS Short Innovation Daily ETF as of the close of business on August 5, 2022. See Note 1 in the accompanying Notes to Financial Statements. |
| * | Fiscal year end changed to March 31, effective October 1, 2022. |
| ** | The Fund commenced operations on November 5, 2021. |
| 1 | Based on average shares outstanding during the period. |
| 2 | Net asset value total return is calculated assuming an initial investment made at the net asset value at the beginning of the period, reinvestment of all dividends and distributions at net asset value during the period, if any, and redemption on the last day of the period at net asset value. This percentage is not an indication of the performance of a shareholder's investment in the Fund based on market value due to the differences between the market price of the shares and the net asset value per share of the Fund. |
| 3 | Total return would have been lower had fees not been waived or absorbed by the Advisor. These returns do not reflect the deduction of taxes that a shareholder would pay on the Fund distributions or redemption of Fund shares. |
| 5 | Market value total return is calculated assuming an initial investment made at market value at the beginning of the period, reinvestment of all dividends and distributions at net asset value during the period, if any, and redemption on the last day of the period at market value. Market value is determined by the composite closing price. Composite closing security price is defined as the last reported sale price on Nasdaq. The composite closing price is the last reported sale, regardless of volume, and not an average price, and may have occurred on a date prior to the close of the reporting period. Market value may be greater or less than net asset value, depending on the Fund's closing price on Nasdaq. |
| 7 | Excludes the impact of in-kind transactions related to the processing of capital share transactions in Creation Units. |
See accompanying Notes to Financial Statements.
| AXS Funds |
| NOTES TO FINANCIAL STATEMENTS |
| March 31, 2023 |
Note 1 – Organization
AXS 2X Innovation ETF (the “2X Innovation ETF”), AXS Short China Internet ETF (the “Short China Internet ETF”), AXS 1.25X NVDA Bear Daily ETF (the “1.25X NVDA Bear Daily ETF”), AXS 2X PFE Bear Daily ETF (the “2X PFE Bear Daily ETF”), AXS 2X PFE Bull Daily ETF (the “2X PFE Bull Daily ETF”), AXS 1.5X PYPL Bear Daily ETF (the “1.5X PYPL Bear Daily ETF”), AXS 1.5X PYPL Bull Daily ETF (the “1.5X PYPL Bull Daily ETF”), AXS TSLA Bear Daily ETF (the “TSLA Bear Daily ETF”), AXS 2X NKE Bear Daily ETF (the “2X NKE Bear Daily ETF”), AXS 2X NKE Bull Daily ETF (the “2X NKE Bull Daily ETF”), AXS Short De-SPAC Daily ETF (the “Short De-SPAC Daily ETF”) and AXS Short Innovation Daily ETF (the “Short Innovation Daily ETF”) (each a “Fund” and collectively the ‘‘Funds’’) are organized as a non-diversified series of Investment Managers Series Trust II, a Delaware statutory trust (the “Trust”) which is registered as an open-end management investment company under the Investment Company Act of 1940, as amended (the “1940 Act”).
The 2X Innovation ETF seeks daily investment results, before fees and expenses, of 200% of the daily performance of the ARK Innovation ETF. The Fund is an actively managed exchange-traded fund (“ETF”). The Fund commenced operations on April 28, 2022.
On November 15, 2022, the Trust’s Board approved a one-for-five reverse share split for shares of the 2X Innovation ETF, effective after the close of business on November 30, 2022. On December 1, 2022, shareholders will be deemed to hold one Fund share for every five Fund shares previously held as of the close of business on November 30, 2022. The reverse share split did not change the total value of the shareholders’ investments in the Fund.
The Short China Internet ETF seeks daily investment results, before fees and expenses, that correspond to the inverse (-1x) of the daily performance of the China Internet ETF. The Fund is an actively managed ETF. The Fund commenced operations on April 28, 2022.
The 1.25X NVDA Bear Daily ETF seeks daily investment results, before fees and expenses, that correspond to one and a quarter times the inverse (-125%) of the daily performance of the common shares of NVIDIA Corporation. The Fund is an actively managed ETF. The Fund commenced operations on July 13, 2022.
The 2X PFE Bear Daily ETF seeks daily investment results, before fees and expenses, that correspond to two times the inverse (-200%) of the daily performance of the common shares of Pfizer, Inc. The Fund is an actively managed ETF. The Fund commenced operations on July 13, 2022.
The 2X PFE Bull Daily ETF seeks daily investment results, before fees and expenses, that correspond to two times (200%) of the daily performance of the common shares of Pfizer, Inc. The Fund is an actively managed ETF. The Fund commenced operations on July 13, 2022.
The 1.5X PYPL Bear Daily ETF seeks daily investment results, before fees and expenses, that correspond to one and a half times the inverse (-150%) of the daily performance of the common shares of PayPal Holdings, Inc. The Fund is an actively managed ETF. The Fund commenced operations on July 13, 2022.
The 1.5X PYPL Bull Daily ETF seeks daily investment results, before fees and expenses, that correspond to one and a half times (150%) of the daily performance of the common shares of PayPal Holdings, Inc. The Fund is an actively managed ETF. The Fund commenced operations on July 13, 2022.
The TSLA Bear Daily ETF seeks daily investment results, before fees and expenses, that correspond to the inverse (-100%) of the daily performance of the common shares of Tesla, Inc. The Fund is an actively managed ETF. The Fund commenced operations on July 13, 2022.
| AXS Funds |
| NOTES TO FINANCIAL STATEMENTS - Continued |
| March 31, 2023 |
The 2X NKE Bear Daily ETF seeks daily investment results, before fees and expenses, that correspond to two times the inverse (-200%) of the daily performance of the common shares of NIKE, Inc – Class B. The Fund is an actively managed ETF. The Fund commenced operations on July 13, 2022.
The 2X NKE Bull Daily ETF seeks daily investment results, before fees and expenses, that correspond to two times (200%) of the daily performance of the common shares of NIKE, Inc – Class B. The Fund is an actively managed ETF. The Fund commenced operations on July 13, 2022.
The Short De-SPAC Daily ETF seeks daily investment results, before fees and expenses, that correspond to the inverse (-1x) of the daily performance of the De-SPAC Index. The Fund does not seek to achieve its stated investment objective over a period of time greater than a single day. The Fund is classified as a non-diversified fund. Effective October 1, 2022, the Short De-SPAC Daily ETF changed fiscal year end from September 30th to March 31st.
The Short De-SPAC Daily ETF commenced investment operations on August 8, 2022. Prior to that date, the Fund acquired the assets and assumed the liabilities of The Short De-SPAC ETF (the "Short De-SPAC Daily ETF Predecessor Fund"), a series of Collaborative Investment Series Trust in a tax-free reorganization as set out in the Agreement and Plan of Reorganization. The proposed Plan of Reorganization was approved by the Trust’s Board on April 4, 2022, by the Board of Collaborative Investment Series Trust on February 16, 2022, and by beneficial owners of the Short De-SPAC Daily ETF Predecessor Fund on July 29, 2022. The tax-free reorganization was accomplished on August 5, 2022. As a result of the reorganization, the Fund assumed the performance and accounting history of the Short De-SPAC Daily ETF Predecessor Fund. Financial information included for the dates prior to the reorganization is that of the Short De-SPAC Daily ETF Predecessor Fund.
The reorganization was accomplished by the following tax-free exchange in which each shareholder of the Short De-SPAC Daily ETF Predecessor Fund received the same aggregate share net asset value in the corresponding class as noted below:
| Shares Issued | | | Net Assets | |
| | 500,000 | | | $ | 22,193,806 | |
The net unrealized depreciation of investments transferred was $4,420,048 as of the date of the acquisition.
The Short Innovation Daily ETF seeks to provide investment results that are approximately the inverse (or opposite) of, before fees and expenses, to the daily price and yield performance of the ARK Innovation ETF. The Fund does not seek to achieve its stated investment objective for a period of time different than a trading day. The Fund is classified as a non-diversified fund. Effective October 1, 2022, the Short Innovation Daily ETF changed fiscal year end from September 30th to March 31st.
The Short Innovation Daily ETF commenced investment operations on August 8, 2022. Prior to that date, the Fund acquired the assets and assumed the liabilities of the Tuttle Capital Short Innovation ETF (the "Short Innovation Daily ETF Predecessor Fund"), a series of Collaborative Investment Series Trust in a tax-free reorganization as set out in the Agreement and Plan of Reorganization. The proposed Plan of Reorganization was approved by the Trust’s Board on April 4, 2022, by the Board of Collaborative Investment Series Trust on February 16, 2022, and by beneficial owners of the Short Innovation Daily ETF Predecessor Fund on July 29, 2022. The tax-free reorganization was accomplished on August 5, 2022. As a result of the reorganization, the Fund assumed the performance and accounting history of the Short Innovation Daily ETF Predecessor Fund. Financial information included for the dates prior to the reorganization is that of the Short Innovation Daily ETF Predecessor Fund.
| AXS Funds |
| NOTES TO FINANCIAL STATEMENTS - Continued |
| March 31, 2023 |
The reorganization was accomplished by the following tax-free exchange in which each shareholder of the Short Innovation Daily ETF Predecessor Fund received the same aggregate share net asset value in the corresponding classes as noted below:
| Shares Issued | | | Net Assets | |
| | 6,925,000 | | | $ | 339,852,874 | |
The net unrealized depreciation of investments transferred was $41,087,479 as of the date of the acquisition.
Each Fund is an investment company and accordingly follows the investment company accounting and reporting guidance of the Financial Accounting Standards Board (FASB) Accounting Standard Codification Topic 946 “Financial Services—Investment Companies.”
Note 2 – Accounting Policies
The following is a summary of the significant accounting policies consistently followed by the Funds in the preparation of their financial statements. The preparation of financial statements in conformity with accounting principles generally accepted in the United States of America (“GAAP”) requires management to make estimates and assumptions that affect the reported amounts and disclosures in the financial statements. Actual results could differ from these estimates.
(a) Valuation of Investments
The Funds value equity securities at the last reported sale price on the principal exchange or in the principal over the counter (“OTC”) market in which such securities are traded, as of the close of regular trading on the NYSE on the day the securities are being valued or, if the last-quoted sales price is not readily available, the securities will be valued at the last bid or the mean between the last available bid and ask price. Securities traded on the NASDAQ are valued at the NASDAQ Official Closing Price (“NOCP”). Investments in open-end investment companies are valued at the daily closing net asset value of the respective investment company. Debt securities are valued by utilizing a price supplied by independent pricing service providers. The independent pricing service providers may use various valuation methodologies including matrix pricing and other analytical pricing models as well as market transactions and dealer quotations. These models generally consider such factors as yields or prices of bonds of comparable quality, type of issue, coupon, maturity, ratings and general market conditions. If a price is not readily available for a portfolio security, the security will be valued at fair value (the amount which the Funds might reasonably expect to receive for the security upon its current sale). The Board of Trustees has designated the Advisor as the Funds’ valuation designee (the “Valuation Designee”) to make all fair value determinations with respect to the Funds’ portfolio investments, subject to the Board’s oversight. As the Valuation Designee, the Advisor has adopted and implemented policies and procedures to be followed when the Funds must utilize fair value pricing. Prior to September 8, 2022, security valued at fair value as determined in good faith by the Funds’ advisor, subject to review and approval by the Valuation Committee, pursuant to procedures adopted by the Board of Trustees. The actions of the Valuation Committee were subsequently reviewed by the Board at its next regularly scheduled board meeting. The Valuation Committee met as needed. The Valuation Committee was comprised of all the Trustees, but action may had been taken by any one of the Trustees.
(b) Swap Agreements
Each Fund will enter into swap agreements to pursue its investment objective of delivering a specific multiple (e.g. 200% or -200%) return to its underlying common stock or ETF for a single day. The swap agreements may include as a reference asset investment vehicle that seek exposure to the underlying common stock or ETF.
Swap agreements are contracts entered into primarily with major financial institutions for a specified period ranging from a day to more than one year. In a standard “swap” transaction, two parties agree to exchange the return (or differentials in rates of return) earned or realized on particular predetermined investments or instruments. The gross return to be exchanged or “swapped” between the parties is calculated with respect to a “notional amount,” e.g., the return on or change in value of a particular dollar amount invested in a “basket” of securities or an ETF representing a particular index. A Fund may use a combination of swaps on the underlying ETF and swaps on various investment vehicles that are designed to track the performance of the underlying ETF. The underlying investment vehicle may not track the performance of the underlying ETF due to embedded costs and other factors, which may increase a Fund’s correlation risk and impact a Fund’s ability to correlate with the underlying common stock or ETF.
| AXS Funds |
| NOTES TO FINANCIAL STATEMENTS - Continued |
| March 31, 2023 |
With respect to the use of swap agreements, if the underlying common stock or ETF has a dramatic intraday move that causes a material decline in net assets, the terms of a swap agreement between a Fund and its counterparty may permit the counterparty to immediately close out the transaction with the Fund. In that event, a Fund may be unable to enter into another swap agreement or invest in other derivatives to achieve the desired exposure consistent with its investment objective. This, in turn, may prevent the Fund from achieving its investment objective, even if the reference asset reverses all or a portion of its intraday move by the end of the day. Any costs associated with using swap agreements may also have the effect of lowering each Fund’s return.
(c) Investment Transactions, Investment Income and Expenses
Investment transactions are accounted for on the trade date. Realized gains and losses on investments are determined on the identified cost basis. Dividend income is recorded net of applicable withholding taxes on the ex-dividend date and interest income is recorded on an accrual basis. Withholding taxes on foreign dividends, if applicable, are paid (a portion of which may be reclaimable) or provided for in accordance with the applicable country’s tax rules and rates and are disclosed in the Statement of Operations. Withholding tax reclaims are filed in certain countries to recover a portion of the amounts previously withheld. The Funds record a reclaim receivable based on a number of factors, including a jurisdiction’s legal obligation to pay reclaims as well as payment history and market convention. Income and expenses of the Funds are allocated on a pro rata basis to each class of shares net relative assets, except for distribution and service fees which are unique to each class of shares. Expenses incurred by the Trust with respect to more than one fund are allocated in proportion to the net assets of each fund except where allocation of direct expenses to each fund or an alternative allocation method can be more appropriately made.
(d) Capital Share Transactions
Fund Shares are listed and traded on the Exchange on each day that the Exchange is open for business (“Business Day”). Individual Fund Shares may only be purchased and sold on the Exchange through a broker-dealer. Because the Funds’ Shares trade at market prices rather than at their NAV, Shares may trade at a price equal to the NAV, greater than NAV (premium) or less than NAV (discount).
The Funds offer and redeem Shares on a continuous basis at NAV only in large blocks of Shares, currently 5,000 Shares for the AXS 2X Innovation ETF, AXS Short China Internet ETF, AXS 1.25X NVDA Bear Daily ETF, AXS 2X PFE Bear Daily ETF, AXS 2X PFE Bull Daily ETF, AXS 1.5X PYPL Bear Daily ETF, AXS 1.5X PYPL Bull Daily ETF, AXS TSLA Bear Daily ETF, AXS 2X NKE Bear Daily ETF and AXS 2X NKE Bull Daily ETF and 25,000 Shares for the AXS Short De-SPAC Daily ETF and AXS Short Innovation Daily ETF, respectively (“Creation Unit”). Except when aggregated in Creation Units, Shares are not redeemable securities of the Funds. Fund Shares may only be purchased from or redeemed to the Funds by certain financial institutions (“Authorized Participants”). An Authorized Participant is either (i) a broker-dealer or other participant in the clearing process through the Continuous Net Settlement System of the National Securities Clearing Corporation or (ii) a Depository Trust Company (“DTC”) participant and, in each case, must have executed a Participant Agreement with the Distributor. Creation Units are available for purchase and redemption on each Business Day and are offered and redeemed on an in-kind basis, together with the specified cash amount, or for an all cash amount.
To the extent contemplated by a participant agreement, in the event an Authorized Participant has submitted a redemption request in proper form but is unable to transfer all or part of the shares comprising a Creation Unit to be redeemed by the Distributor, on behalf of the Funds, by the time as set forth in a participant agreement, the Distributor may nonetheless accept the redemption request in reliance on the undertaking by the Authorized Participant to deliver the missing shares as soon as possible, which undertaking shall be secured by the Authorized Participant’s delivery and maintenance of collateral equal to a percentage of the market value as set forth in the Participant Agreement. A participant agreement may permit the Funds to use such collateral to purchase the missing shares and could subject an Authorized Participant to liability for any shortfall between the cost of the Funds acquiring such shares and the value of the collateral.
| AXS Funds |
| NOTES TO FINANCIAL STATEMENTS - Continued |
| March 31, 2023 |
Most retail investors will not qualify as Authorized Participants or have the resources to buy and sell whole Creation Units. Therefore, they will be unable to purchase or redeem the Shares directly from the Funds. Rather, most retail investors will purchase Shares in the secondary market with the assistance of a broker, which will be subject to customary brokerage commissions or fees.
A fixed purchase (i.e., creation) transaction fee is imposed for the transfer and other transaction costs associated with the purchase of Creation Units, and investors will be required to pay a creation transaction fee regardless of the number of Creation Units created in the transaction. The Funds may adjust the creation transaction fee from time to time based upon actual experience. In addition, a variable fee may be imposed for cash purchases, non-standard orders, or partial cash purchases of Creation Units. The variable fee is primarily designed to cover non-standard charges, e.g., brokerage, taxes, foreign exchange, execution, market impact, and other costs and expenses, related to the execution of trades resulting from such transaction. The Funds may adjust the non-standard charge from time to time based upon actual experience. Investors who use the services of an Authorized Participant, broker or other such intermediary may be charged a fee for such services which may include an amount for the creation transaction fee and non-standard charges. Investors are responsible for the costs of transferring the securities constituting the deposit securities to the account of the Trust. The Adviser may retain all or a portion of the transaction fee to the extent the Adviser bears the expenses that otherwise would be borne by the Trust in connection with the issuance of a Creation Unit, which the transaction fee is designed to cover. The standard Creation Unit transaction fee for the Funds is $100, regardless of the number of Creation Units created in the transaction.
A fixed redemption transaction fee may be imposed for the transfer and other transaction costs associated with the redemption of Creation Units, and Authorized Participants will be required to pay a redemption transaction fee regardless of the number of Creation Units created in the transaction. The redemption transaction fee is the same no matter how many Creation Units are being redeemed pursuant to any one redemption request. The Funds may adjust the redemption transaction fee from time to time based upon actual experience. In addition, a variable fee, payable to the Funds, may be imposed for cash redemptions, non-standard orders, or partial cash redemptions for the Funds. The variable fee is primarily designed to cover non-standard charges, e.g., brokerage, taxes, foreign exchange, execution, market impact, and other costs and expenses, related to the execution of trades resulting from such transaction. Investors who use the services of an Authorized Participant, broker or other such intermediary may be charged a fee for such services which may include an amount for the redemption transaction fees and non-standard charges. Investors are responsible for the costs of transferring the securities constituting the Funds securities to the account of the Trust. The non-standard charges are payable to the Funds as it incurs costs in connection with the redemption of Creation Units, the receipt of Funds securities and the cash redemption amount and other transactions costs. The standard redemption transaction fee for Funds is $100, regardless of the number of Creation Units created in the transaction.
(e) Federal Income Taxes
The Funds intend to comply with the requirements of Subchapter M of the Internal Revenue Code applicable to regulated investment companies and to distribute substantially all of their net investment income and any net realized gains to their shareholders. Therefore, no provision is made for federal income or excise taxes. Due to the timing of dividend distributions and the differences in accounting for income and realized gains and losses for financial statement and federal income tax purposes, the fiscal year in which amounts are distributed may differ from the year in which the income and realized gains and losses are recorded by the Funds.
Accounting for Uncertainty in Income Taxes (the “Income Tax Statement”) requires an evaluation of tax positions taken (or expected to be taken) in the course of preparing a Fund’s tax returns to determine whether these positions meet a “more-likely-than-not” standard that, based on the technical merits, have a more than fifty percent likelihood of being sustained by a taxing authority upon examination. A tax position that meets the “more-likely-than-not” recognition threshold is measured to determine the amount of benefit to recognize in the financial statements. The Funds recognize interest and penalties, if any, related to unrecognized tax benefits as income tax expense in the Statements of Operations.
| AXS Funds |
| NOTES TO FINANCIAL STATEMENTS - Continued |
| March 31, 2023 |
The Income Tax Statement requires management of the Funds to analyze tax positions taken in the prior three open tax years, if any, and tax positions expected to be taken in the Funds’ current tax year, as defined by the IRS statute of limitations for all major jurisdictions, including federal tax authorities and certain state tax authorities. As of March 31, 2023, and during the prior three open tax years, the Funds did not have a liability for any unrecognized tax benefits. The Funds have no examinations in progress and are not aware of any tax positions for which it is reasonably possible that the total amounts of unrecognized tax benefits will significantly change in the next twelve months.
(f) Distributions to Shareholders
The Funds will make distributions of net investment income and net capital gains, if any, at least annually. Distributions to shareholders are recorded on the ex-dividend date. The amount and timing of distributions are determined in accordance with federal income tax regulations, which may differ from GAAP.
The character of distributions made during the year from net investment income or net realized gains may differ from the characterization for federal income tax purposes due to differences in the recognition of income, expense and gain (loss) items for financial statement and tax purposes.
(g) Illiquid Securities
Pursuant to Rule 22e-4 under the 1940 Act, the Funds have adopted a Liquidity Risk Management Program (“LRMP”) that requires, among other things, that the Funds limit their illiquid investments that are assets to no more than 15% of net assets. An illiquid investment is any security which may not reasonably be expected to be sold or disposed of in current market conditions in seven calendar days or less without the sale or disposition significantly changing the market value of the investment. If the Advisor, at any time, determines that the value of illiquid securities held by the Funds exceed 15% of its net asset value, the Advisor will take such steps as it considers appropriate to reduce them as soon as reasonably practicable in accordance with the Funds’ written LRMP.
Note 3 – Investment Advisory and Other Agreements
The Trust, on behalf of each Fund, entered into an Investment Advisory Agreement (the “Agreement”) with AXS Investments LLC (the “Advisor”). Under the terms of the Agreement, each Fund pays a monthly investment advisory fee to the Advisor at the following annual rates based on the average daily net assets of each Fund:
| | | Investment Advisory Fee | |
| 2X Innovation ETF | | | 0.95 | % |
| Short China Internet ETF | | | 0.75 | % |
| 1.25X NVDA Bear Daily ETF | | | 0.95 | % |
| 2X PFE Bear Daily ETF | | | 0.95 | % |
| 2X PFE Bull Daily ETF | | | 0.95 | % |
| 1.5X PYPL Bear Daily ETF | | | 0.95 | % |
| 1.5X PYPL Bull Daily ETF | | | 0.95 | % |
| TSLA Bear Daily ETF | | | 0.95 | % |
| 2X NKE Bear Daily ETF | | | 0.95 | % |
| 2X NKE Bull Daily ETF | | | 0.95 | % |
| Short De-SPAC Daily ETF | | | 0.90 | % |
| Short Innovation Daily ETF | | | 0.65 | %* |
| * | The Advisor has agreed to cap the investment advisory fees for the Short Innovation Daily ETF to 0.65% for a period of two years ending on August 5, 2024. After the two-year period from the date of the reorganization, the Fund’s investment advisory fees will be 0.75%. |
| AXS Funds |
| NOTES TO FINANCIAL STATEMENTS - Continued |
| March 31, 2023 |
The Advisor has contractually agreed to waive its fee and, if necessary, to absorb other operating expenses to ensure that total annual operating expenses (excluding any front-end or contingent deferred loads, brokerage fees and commission, acquired fund fees and expenses, fees and expenses associated with instruments in other collective investment vehicles or derivative instruments (including for example options and swap fees and expenses), borrowing costs (such as interest and dividend expense on securities sold short), taxes, other fees related to underlying investments (such as option fees and expenses or swap fees and expenses), or extraordinary expenses such as litigation (which may include indemnification of Acquiring Fund officers and trustees or contractual indemnification of Fund service providers) in order to limit total annual operating expenses of each fund. These agreements are in effect until July 31, 2023 for the 2X Innovation ETF, Short China Internet ETF, 1.25X NVDA Bear Daily ETF, 2X PFE Bear Daily ETF, 2X PFE Bull Daily ETF, 1.5X PYPL Bear Daily ETF, 1.5X PYPL Bull Daily ETF, TSLA Bear Daily ETF, 2X NKE Bear Daily ETF and 2X NKE Bull Daily ETF. These agreements are in effect until August 8, 2024 for the Short De-SPAC Daily ETF and Short Innovation Daily ETF. They may be terminated before that date only by the Trust’s Board of Trustees. The table below contains the expense cap by Fund:
| | | Total Limit on Annual Operating Expenses | |
| 2X Innovation ETF | | | 1.15 | % |
| Short China Internet ETF | | | 0.95 | % |
| 1.25X NVDA Bear Daily ETF | | | 1.15 | % |
| 2X PFE Bear Daily ETF | | | 1.15 | % |
| 2X PFE Bull Daily ETF | | | 1.15 | % |
| 1.5X PYPL Bear Daily ETF | | | 1.15 | % |
| 1.5X PYPL Bull Daily ETF | | | 1.15 | % |
| TSLA Bear Daily ETF | | | 1.15 | % |
| 2X NKE Bear Daily ETF | | | 1.15 | % |
| 2X NKE Bull Daily ETF | | | 1.15 | % |
| Short De-SPAC Daily ETF | | | 0.95 | % |
| Short Innovation Daily ETF | | | 0.75 | % |
| AXS Funds |
| NOTES TO FINANCIAL STATEMENTS - Continued |
| March 31, 2023 |
The Advisor may recover from each Fund’s fees and/or expenses previously waived and/or absorbed if each Fund’s expense ratio, including the recovered expenses, falls below the expense limit at which it was waived. The Advisor is permitted to seek reimbursement from each Fund, subject to certain limitations, of fees waived or payments made to each Fund for a period ending three full years after the date of the waiver or payment. This reimbursement may be requested from each Fund if the reimbursement will not cause each Fund’s annual expense ratio to exceed the lesser of (a) the expense limitation amount in effect at the time such fees were waived or payments made, or (b) the expense limitation amount in effect at the time of the reimbursement. The Advisor may recapture all or a portion of this amount no later than the dates stated below:
| | | 2X Innovation ETF | | | Short China Internet ETF | | | 1.25X NVDA Bear Daily ETF | |
| March 31, 2026 | | $ | 109,366 | | | $ | 157,553 | | | $ | 72,363 | |
| Total | | $ | 109,366 | | | $ | 157,553 | | | $ | 72,363 | |
| | | 2X PFE Bear Daily ETF | | | 2X PFE Bull Daily ETF | | | 1.5X PYPL Bear Daily ETF | |
| March 31, 2026 | | $ | 85,569 | | | $ | 87,119 | | | $ | 87,715 | |
| Total | | $ | 85,569 | | | $ | 87,119 | | | $ | 87,715 | |
| | | 1.5X PYPL Bull Daily ETF | | | TSLA Bear Daily ETF | | | 2X NKE Bear Daily ETF | |
| March 31, 2026 | | $ | 84,937 | | | $ | 39,147 | | | $ | 85,773 | |
| Total | | $ | 84,937 | | | $ | 39,147 | | | $ | 85,773 | |
| | | 2X NKE Bull Daily ETF | | | Short De-SPAC Daily ETF | | | Short Innovation Daily ETF | |
| September 30, 2025 | | $ | - | | | $ | 20,911 | | | $ | 168,590 | |
| March 31, 2026 | | | 86,298 | | | | 88,664 | | | | 462,957 | |
| Total | | $ | 86,298 | | | $ | 109,575 | | | $ | 631,547 | |
Brown Brothers Harriman & Co. serves as the Funds’ fund accountant, transfer agent and custodian. UMB Fund Services (���UMBFS”) and Mutual Fund Administration, LLC (“MFAC”) serve as the Funds’ co-administrators.
Certain trustees and officers of the Trust are employees of UMBFS or MFAC. The Funds do not compensate trustees and officers affiliated with the Funds’ co-administrators. For the periods ended March 31, 2023, the Funds’ allocated fees incurred to Trustees who are not affiliated with the Funds’ co-administrators are reported on the Statements of Operations.
The Funds’ Board of Trustees has adopted a Deferred Compensation Plan (the “Plan”) for the Independent Trustees that enables Trustees to elect to receive payment in cash or the option to select various Fund in the Trust in which their deferred accounts shall be deemed to be invested. If a trustee elects to defer payment, the Plan provides for the creation of a deferred payment account. The Funds’ liability for these amounts are adjusted for market value changes in the invested Fund and remains a liability to the Fund until distributed in accordance with the Plan. The Trustees Deferred compensation liability under the Plan constitutes a general unsecured obligation of the Funds and are disclosed in the Statements of Assets and Liabilities. Contributions made under the plan and the change in unrealized appreciation (depreciation) and income are included in the Trustees' fees and expenses in the Statements of Operations.
| AXS Funds |
| NOTES TO FINANCIAL STATEMENTS - Continued |
| March 31, 2023 |
ALPS Distributors, Inc. serves as the Funds’ Distributor (the “Distributor”). Prior to January 1, 2023, IMST Distributors, LLC served as the Funds’ Distributor. The Distributor does not receive compensation from the Funds for its distribution services; the Advisor pays the Distributor a fee for its distribution-related services.
Note 4 – Federal Income Taxes
At March 31, 2023, cost of investments, gross unrealized appreciation, and gross unrealized depreciation on investments owned by the Funds, based on cost for federal income tax purposes were $0.
GAAP requires that certain components of net assets be reclassified between financial and tax reporting. These reclassifications have no effect on net assets or net asset value per share. For the periods ended March 31, 2023, permanent differences in book and tax accounting have been reclassified to paid-in capital and total distributable earnings (accumulated deficit) as follows:
| | | Increase (Decrease) | |
| | | Paid-in Capital | | | Total Distributable Earnings (Loss) | |
| 2X Innovation ETF | | $ | (2,228,030 | ) | | $ | 2,228,030 | |
| Short China Internet ETF | | | - | | | | - | |
| 1.25X NVDA Bear Daily ETF | | | - | | | | - | |
| 2X PFE Bear Daily ETF | | | 20,943 | | | | (20,943 | ) |
| 2X PFE Bull Daily ETF | | | (6,367 | ) | | | 6,367 | |
| 1.5X PYPL Bear Daily ETF | | | - | | | | - | |
| 1.5X PYPL Bull Daily ETF | | | - | | | | - | |
| TSLA Bear Daily ETF | | | - | | | | - | |
| 2X NKE Bear Daily ETF | | | - | | | | - | |
| 2X NKE Bull Daily ETF | | | 185,609 | | | | (185,609 | ) |
| Short De-SPAC Daily ETF | | | 7,058,370 | | | | (7,058,370 | ) |
| Short Innovation Daily ETF | | | 112,906,509 | | | | (112,906,509 | ) |
The tax basis of the components of distributable net earnings (deficit) at March 31, 2023 were as follows:
| | | 2X Innovation ETF | | | Short China Internet ETF | | | 1.25X NVDA Bear Daily ETF | |
| Undistributed ordinary income | | $ | - | | | $ | 16,624 | | | $ | 713,659 | |
| Undistributed long-term capital gains | | | - | | | | - | | | | - | |
| Tax accumulated earnings | | | - | | | | 16,624 | | | | 713,659 | |
| | | | | | | | | | | | | |
| Accumulated capital and other losses | | | (6,592,966 | ) | | | (892,222 | ) | | | (6,096,441 | ) |
| Unrealized appreciation (depreciation) on swap contracts | | | 2,428,794 | | | | (17,672 | ) | | | (17,183,903 | ) |
| Unrealized deferred compensation | | | (2,074 | ) | | | (737 | ) | | | (588 | ) |
| Total distributable earnings (accumulated deficit) | | $ | (4,166,276 | ) | | $ | (894,007 | ) | | $ | (22,567,273 | ) |
| AXS Funds |
| NOTES TO FINANCIAL STATEMENTS - Continued |
| March 31, 2023 |
| | | 2X PFE Bear Daily ETF | | | 2X PFE Bull Daily ETF | | | 1.5X PYPL Bear Daily ETF | |
| Undistributed ordinary income | | $ | 48,537 | | | $ | - | | | $ | 20,767 | |
| Undistributed long-term capital gains | | | - | | | | - | | | | - | |
| Tax accumulated earnings | | | 48,537 | | | | - | | | | 20,767 | |
| | | | | | | | | | | | | |
| Accumulated capital and other losses | | | (298,500 | ) | | | (143,579 | ) | | | (943,632 | ) |
| Unrealized appreciation (depreciation) on swap contracts | | | 423,269 | | | | (339,299 | ) | | | (11,631 | ) |
| Unrealized deferred compensation | | | (761 | ) | | | (742 | ) | | | (745 | ) |
| Total distributable earnings (accumulated deficit) | | $ | 172,545 | | | $ | (483,620 | ) | | $ | (935,241 | ) |
| | | 1.5X PYPL Bull Daily ETF | | | TSLA Bear Daily ETF | | | 2X NKE Bear Daily ETF | |
| Undistributed ordinary income | | $ | - | | | $ | 402,080 | | | $ | 49,201 | |
| Undistributed long-term capital gains | | | - | | | | - | | | | - | |
| Tax accumulated earnings | | | - | | | | 402,080 | | | | 49,201 | |
| | | | | | | | | | | | | |
| Accumulated capital and other losses | | | (140,903 | ) | | | (21,112,826 | ) | | | (1,030,085 | ) |
| Unrealized appreciation (depreciation) on swap contracts | | | (103,810 | ) | | | (5,895,911 | ) | | | (26,966 | ) |
| Unrealized deferred compensation | | | (749 | ) | | | (2,351 | ) | | | (758 | ) |
| Total distributable earnings (accumulated deficit) | | $ | (245,462 | ) | | $ | (26,609,008 | ) | | $ | (1,008,608 | ) |
| AXS Funds |
| NOTES TO FINANCIAL STATEMENTS - Continued |
| March 31, 2023 |
| | | 2X NKE Bull Daily ETF | | | Short De-SPAC Daily ETF | | | Short Innovation Daily ETF | |
| Undistributed ordinary income | | $ | 126,393 | | | $ | 188,457 | | | $ | - | |
| Undistributed long-term capital gains | | | - | | | | - | | | | - | |
| Tax accumulated earnings | | | 126,393 | | | | 188,457 | | | | - | |
| | | | | | | | | | | | | |
| Accumulated capital and other losses | | | - | | | | - | | | | - | |
| Unrealized appreciation (depreciation) on swap contracts | | | 35,441 | | | | 49,135 | | | | (17,330,833 | ) |
| Unrealized deferred compensation | | | (741 | ) | | | (866 | ) | | | (4,195 | ) |
| Total distributable earnings (accumulated deficit) | | $ | 161,093 | | | $ | 236,726 | | | $ | (17,335,028 | ) |
The tax character of the distributions paid during the periods ended March 31, 2023 and September 30, 2022 (if applicable) were as follows:
| | | 2X Innovation ETF March 31, 2023 | | | Short China Internet ETF March 31, 2023 | |
| Distribution paid from: | | | | | | |
| Ordinary income | | $ | - | | | $ | 45,998 | |
| Net long-term capital gains | | | - | | | | - | |
| Total distributions paid | | $ | - | | | $ | 45,998 | |
| | | 1.25X NVDA Bear Daily ETF
March 31, 2023 | | | 2X PFE Bear Daily ETF
March 31, 2023 | |
| Distribution paid from: | | | | | | |
| Ordinary income | | $ | 451,820 | | | $ | 178,360 | |
| Net long-term capital gains | | | - | | | | - | |
| Total distributions paid | | $ | 451,820 | | | $ | 178,360 | |
| | | 2X PFE Bull Daily ETF
March 31, 2023 | | | 1.5X PYPL Bear Daily ETF
March 31, 2023 | |
| Distribution paid from: | | | | | | |
| Ordinary income | | $ | - | | | $ | 15,157 | |
| Net long-term capital gains | | | - | | | | - | |
| Total distributions paid | | $ | - | | | $ | 15,157 | |
| | | 1.5X PYPL Bull Daily ETF
March 31, 2023 | | | TSLA Bear Daily ETF
March 31, 2023 | |
| Distribution paid from: | | | | | | |
| Ordinary income | | $ | 395,045 | | | $ | 2,971,709 | |
| Net long-term capital gains | | | - | | | | - | |
| Total distributions paid | | $ | 395,045 | | | $ | 2,971,709 | |
| AXS Funds |
| NOTES TO FINANCIAL STATEMENTS - Continued |
| March 31, 2023 |
| | | 2X NKE Bear Daily ETF
March 31, 2023 | | | 2X NKE Bull Daily ETF
March 31, 2023 | |
| Distribution paid from: | | | | | | |
| Ordinary income | | $ | 14,438 | | | $ | 125,360 | |
| Net long-term capital gains | | | - | | | | - | |
| Total distributions paid | | $ | 14,438 | | | $ | 125,360 | |
| | | Short De-SPAC Daily ETF | | | Short Innovation Daily ETF | |
| | | March 31, 2023 | | | September 30, 2022 | | | March 31, 2023 | | | September 30, 2022 | |
| Distribution paid from: | | | | | | | | | | | | | | | | |
| Ordinary income | | $ | 6,951,403 | | | $ | 865,916 | | | $ | 65,646,748 | | | $ | - | |
| Net long-term capital gains | | | - | | | | - | | | | - | | | | - | |
| Total distributions paid | | $ | 6,951,403 | | | $ | 865,916 | | | $ | 65,646,748 | | | $ | - | |
As of March 31, 2023, the Funds had qualified late-year ordinary losses, which are deferred until fiscal year 2023 for tax purposes. Net late-year ordinary losses incurred after December 31 and within the taxable year and net late-year specified losses incurred after October 31 and within the taxable year, are deemed to arise on the first day of each Fund’s next taxable year.
| | | Late-Year Ordinary Losses | |
| 2X Innovation ETF | | $ | 864,576 | |
| 1.5X PYPL Bull Daily ETF | | | 15,790 | |
As of March 31, 2023, the Funds had post-October capital losses, which are deferred until fiscal year 2023 for tax purposes. Capital losses incurred after October 31, and within the year are deemed to arise on the first day of the Fund’s next taxable year.
| | | Post-October Capital Losses | |
| Short China Internet ETF | | $ | 892,222 | |
| 1.25X NVDA Bear Daily ETF | | | 6,096,441 | |
| 2X PFE Bear Daily ETF | | | 298,500 | |
| 1.5X PYPL Bull Daily ETF | | | 125,113 | |
| TSLA Bear Daily ETF | | | 21,112,826 | |
| 2X NKE Bear Daily ETF | | | 1,030,085 | |
As of March 31, 2023, the Funds had net capital loss carryovers as follows:
| | | 2X Innovation ETF | | | 2X PFE Bull Daily ETF | | | 1.5X PYPL Bear Daily ETF | |
| Not subject to expiration: | | | | | | | | | |
| Short-term | | $ | 5,728,420 | | | $ | 143,579 | | | $ | 943,632 | |
| Long-term | | | - | | | | - | | | | - | |
| Total | | $ | 5,728,420 | | | $ | 143,579 | | | $ | 943,632 | |
To the extent that a fund may realize future net capital gains, those gains will be offset by any of its unused capital loss carryforward. Future capital loss carryover utilization in any given year may be subject to Internal Revenue Code limitations.
| AXS Funds |
| NOTES TO FINANCIAL STATEMENTS - Continued |
| March 31, 2023 |
Note 5 – Investment Transactions
There were no purchases and sales of investments for the periods ended March 31, 2023.
There were no purchases and sales of in-kind transactions for the periods ended March 31, 2023.
Note 6 – Distribution Plan
The Trust has adopted a Distribution and Service Plan pursuant to Rule 12b-1 under the 1940 Act. In accordance with its Rule 12b-1 plan, the Funds, except for the Short De-SPAC Daily ETF and Short Innovation Daily ETF, are authorized to pay an amount up to 0.25% of their average daily net assets each year to reimburse the Distributor for amounts expended to finance activities primarily intended to result in the sale of Creation Units or the provision of investor services. The Distributor may also use this amount to compensate securities dealers or other persons that are APs for providing distribution assistance, including broker-dealer and shareholder support and educational and promotional services. The Funds do not and have no current intention of paying 12b-1 fees. However, in the event 12b-1 fees are charged in the future, because these fees are paid out of a Fund’s assets, over time these fees will increase the cost of your investment and may cost you more than certain other types of sales charges.
For the periods ended March 31, 2023, distribution and service fees, if any, incurred are disclosed on the Statements of Operations.
Note 7 – Indemnifications
In the normal course of business, the Funds enter into contracts that contain a variety of representations which provide general indemnifications. The Funds’ maximum exposure under these arrangements is unknown, as this would involve future claims that may be made against the Funds that have not yet occurred. However, the Funds expect the risk of loss to be remote.
Note 8 – Fair Value Measurements and Disclosure
Fair Value Measurements and Disclosures defines fair value, establishes a framework for measuring fair value in accordance with GAAP, and expands disclosure about fair value measurements. It also provides guidance on determining when there has been a significant decrease in the volume and level of activity for an asset or a liability, when a transaction is not orderly, and how that information must be incorporated into a fair value measurement.
Under Fair Value Measurements and Disclosures, various inputs are used in determining the value of the Funds’ investments. These inputs are summarized into three broad Levels as described below:
| • | Level 1 – Unadjusted quoted prices in active markets for identical assets or liabilities that the Fund has the ability to access. |
| • | Level 2 – Observable inputs other than quoted prices included in Level 1 that are observable for the asset or liability, either directly or indirectly. These inputs may include quoted prices for the identical instrument on an inactive market, prices for similar instruments, interest rates, prepayment speeds, credit risk, yield curves, default rates and similar data. |
| • | Level 3 – Unobservable inputs for the asset or liability, to the extent relevant observable inputs are not available, representing the Funds’ own assumptions about the assumptions a market participant would use in valuing the asset or liability, and would be based on the best information available. |
| AXS Funds |
| NOTES TO FINANCIAL STATEMENTS - Continued |
| March 31, 2023 |
The availability of observable inputs can vary from security to security and is affected by a wide variety of factors, including, for example, the type of security, whether the security is new and not yet established in the marketplace, the liquidity of markets, and other characteristics particular to the security. To the extent that valuation is based on models or inputs that are less observable or unobservable in the market, the determination of fair value requires more judgment. Accordingly, the degree of judgment exercised in determining fair value is greatest for instruments categorized in Level 3.
The inputs used to measure fair value may fall into different Levels of the fair value hierarchy. In such cases, for disclosure purposes, the Level in the fair value hierarchy within which the fair value measurement falls in its entirety, is determined based on the lowest Level input that is significant to the fair value measurement in its entirety.
The inputs or methodology used for valuing securities are not an indication of the risk associated with investing in those securities. The following is a summary of the inputs used, as of March 31, 2023, in valuing the Funds’ assets and liabilities carried at fair value:
| 2X Innovation ETF | | Level 1* | | | Level 2 | | | Level 3* | | | Total | |
| Assets | | | | | | | | | | | | |
| Other Financial Instruments** | | | | | | | | | | | | |
| Swap Contracts | | $ | - | | | $ | 2,428,794 | | | $ | - | | | $ | 2,428,794 | |
| Total Assets | | $ | - | | | $ | 2,428,794 | | | $ | - | | | $ | 2,428,794 | |
| Short China Internet ETF | | Level 1* | | | Level 2 | | | Level 3* | | | Total | |
| Liabilities | | | | | | | | | | | | |
| Other Financial Instruments** | | | | | | | | | | | | |
| Swap Contracts | | $ | - | | | $ | 17,672 | | | $ | - | | | $ | 17,672 | |
| Total Liabilities | | $ | - | | | $ | 17,672 | | | $ | - | | | $ | 17,672 | |
| 1.25X NVDA Bear Daily ETF | | Level 1* | | | Level 2 | | | Level 3* | | | Total | |
| Liabilities | | | | | | | | | | | | |
| Other Financial Instruments** | | | | | | | | | | | | |
| Swap Contracts | | $ | - | | | $ | 17,183,903 | | | $ | - | | | $ | 17,183,903 | |
| Total Liabilities | | $ | - | | | $ | 17,183,903 | | | $ | - | | | $ | 17,183,903 | |
| 2X PFE Bear Daily ETF | | Level 1* | | | Level 2 | | | Level 3* | | | Total | |
| Assets | | | | | | | | | | | | |
| Other Financial Instruments** | | | | | | | | | | | | |
| Swap Contracts | | $ | - | | | $ | 423,269 | | | $ | - | | | $ | 423,269 | |
| Total Assets | | $ | - | | | $ | 423,269 | | | $ | - | | | $ | 423,269 | |
| AXS Funds |
| NOTES TO FINANCIAL STATEMENTS - Continued |
| March 31, 2023 |
| 2X PFE Bull Daily ETF | | Level 1* | | | Level 2 | | | Level 3* | | | Total | |
| Liabilities | | | | | | | | | | | | |
| Other Financial Instruments** | | | | | | | | | | | | |
| Swap Contracts | | $ | - | | | $ | 339,299 | | | $ | - | | | $ | 339,299 | |
| Total Liabilities | | $ | - | | | $ | 339,299 | | | $ | - | | | $ | 339,299 | |
| 1.5X PYPL Bear Daily ETF | | Level 1* | | | Level 2 | | | Level 3* | | | Total | |
| Liabilities | | | | | | | | | | | | |
| Other Financial Instruments** | | | | | | | | | | | | |
| Swap Contracts | | $ | - | | | $ | 11,631 | | | $ | - | | | $ | 11,631 | |
| Total Liabilities | | $ | - | | | $ | 11,631 | | | $ | - | | | $ | 11,631 | |
| 1.5X PYPL Bull Daily ETF | | Level 1* | | | Level 2 | | | Level 3* | | | Total | |
| Liabilities | | | | | | | | | | | | |
| Other Financial Instruments** | | | | | | | | | | | | |
| Swap Contracts | | $ | - | | | $ | 103,810 | | | $ | - | | | $ | 103,810 | |
| Total Liabilities | | $ | - | | | $ | 103,810 | | | $ | - | | | $ | 103,810 | |
| TSLA Bear Daily ETF | | Level 1* | | | Level 2 | | | Level 3* | | | Total | |
| Liabilities | | | | | | | | | | | | |
| Other Financial Instruments** | | | | | | | | | | | | |
| Swap Contracts | | $ | - | | | $ | 5,895,911 | | | $ | - | | | $ | 5,895,911 | |
| Total Liabilities | | $ | - | | | $ | 5,895,911 | | | $ | - | | | $ | 5,895,911 | |
| 2X NKE Bear Daily ETF | | Level 1* | | | Level 2 | | | Level 3* | | | Total | |
| Liabilities | | | | | | | | | | | | |
| Other Financial Instruments** | | | | | | | | | | | | |
| Swap Contracts | | $ | - | | | $ | 26,966 | | | $ | - | | | $ | 26,966 | |
| Total Liabilities | | $ | - | | | $ | 26,966 | | | $ | - | | | $ | 26,966 | |
| 2X NKE Bull Daily ETF | | Level 1* | | | Level 2 | | | Level 3* | | | Total | |
| Assets | | | | | | | | | | | | |
| Other Financial Instruments** | | | | | | | | | | | | |
| Swap Contracts | | $ | - | | | $ | 35,441 | | | $ | - | | | $ | 35,441 | |
| Total Assets | | $ | - | | | $ | 35,441 | | | $ | - | | | $ | 35,441 | |
| AXS Funds |
| NOTES TO FINANCIAL STATEMENTS - Continued |
| March 31, 2023 |
| Short De-SPAC Daily ETF | | Level 1* | | | Level 2 | | | Level 3* | | | Total | |
| Assets | | | | | | | | | | | | |
| Other Financial Instruments** | | | | | | | | | | | | |
| Swap Contracts | | $ | - | | | $ | 612,173 | | | $ | - | | | $ | 612,173 | |
| Total Assets | | $ | - | | | $ | 612,173 | | | $ | - | | | $ | 612,173 | |
| | | | | | | | | | | | | | | | | |
| Liabilities | | | | | | | | | | | | | | | | |
| Other Financial Instruments** | | | | | | | | | | | | | | | | |
| Swap Contracts | | $ | - | | | $ | 563,038 | | | $ | - | | | $ | 563,038 | |
| Total Liabilities | | $ | - | | | $ | 563,038 | | | $ | - | | | $ | 563,038 | |
| Short Innovation Daily ETF | | Level 1* | | | Level 2 | | | Level 3* | | | Total | |
| Liabilities | | | | | | | | | | | | |
| Other Financial Instruments** | | | | | | | | | | | | |
| Swap Contracts | | $ | - | | | $ | 17,330,833 | | | $ | - | | | $ | 17,330,833 | |
| Total Liabilities | | $ | - | | | $ | 17,330,833 | | | $ | - | | | $ | 17,330,833 | |
* The Funds did not hold any Level 1 or 3 securities at period end.
** Other financial instruments are derivative instruments such as swap contracts. Swap contracts are valued at the unrealized appreciation (depreciation) on the instrument.
Note 9 – Derivative and Hedging Disclosure
Derivatives and Hedging requires enhanced disclosures about the Funds’ derivative and hedging activities, including how such activities are accounted for and their effects on the Funds’ financial position and performance. The Funds invested in swap contracts during the periods ended March 31, 2023.
The effects of these derivative instruments on the Funds’ financial position and financial performance as reflected in the Statements of Assets and Liabilities and Statements of Operations are presented in the tables below. The fair values of derivative instruments, as of March 31, 2023, by risk category are as follows:
| Fund | | Statement of Asset and Liabilities Location | | Derivatives not designated as hedging instruments | | Asset Derivatives Value | | | Liability Derivatives Value | |
| 2X Innovation ETF | | Unrealized appreciation/ depreciation on open swap contracts | | Equity contracts | | $ | 2,428,794 | | | $ | - | |
| Short China Internet ETF | | Unrealized appreciation/ depreciation on open swap contracts | | Equity contracts | | | - | | | | 17,672 | |
| 1.25X NVDA Bear Daily ETF | | Unrealized appreciation/ depreciation on open swap contracts | | Equity contracts | | | - | | | | 17,183,903 | |
| 2X PFE Bear Daily ETF | | Unrealized appreciation/ depreciation on open swap contracts | | Equity contracts | | | 423,269 | | | | - | |
| 2X PFE Bull Daily ETF | | Unrealized appreciation/ depreciation on open swap contracts | | Equity contracts | | | - | | | | 339,299 | |
| 1.5X PYPL Bear Daily ETF | | Unrealized appreciation/ depreciation on open swap contracts | | Equity contracts | | | - | | | | 11,631 | |
| 1.5X PYPL Bull Daily ETF | | Unrealized appreciation/ depreciation on open swap contracts | | Equity contracts | | | - | | | | 103,810 | |
| TSLA Bear Daily ETF | | Unrealized appreciation/ depreciation on open swap contracts | | Equity contracts | | | - | | | | 5,895,911 | |
| AXS Funds |
| NOTES TO FINANCIAL STATEMENTS - Continued |
| March 31, 2023 |
| Fund | | Statement of Asset and Liabilities Location | | Derivatives not designated as hedging instruments | | Asset Derivatives Value | | | Liability Derivatives Value | |
| 2X NKE Bear Daily ETF | | Unrealized appreciation/ depreciation on open swap contracts | | Equity contracts | | $ | - | | | $ | 26,966 | |
| 2X NKE Bull Daily ETF | | Unrealized appreciation/ depreciation on open swap contracts | | Equity contracts | | | 35,441 | | | | - | |
| Short De-SPAC Daily ETF | | Unrealized appreciation/ depreciation on open swap contracts | | Equity contracts | | | 612,173 | | | | 563,038 | |
| Short Innovation Daily ETF | | Unrealized appreciation/ depreciation on open swap contracts | | Equity contracts | | | - | | | | 17,330,833 | |
The effects of derivative instruments on the Statements of Operations for the period ended March 31, 2023, are as follows:
| Amount of Realized Gain or (Loss) on Derivatives Recognized in the Statements of Operations |
| Fund | | Derivatives not designated as hedging instruments | | Open Swap Contracts | |
| 2X Innovation ETF | | Equity contracts | | $ | (9,070,819 | ) |
| Short China Internet ETF | | Equity contracts | | | (839,191 | ) |
| 1.25X NVDA Bear Daily ETF | | Equity contracts | | | (5,190,735 | ) |
| 2X PFE Bear Daily ETF | | Equity contracts | | | (57,462 | ) |
| 2X PFE Bull Daily ETF | | Equity contracts | | | (158,014 | ) |
| 1.5X PYPL Bear Daily ETF | | Equity contracts | | | (913,747 | ) |
| 1.5X PYPL Bull Daily ETF | | Equity contracts | | | 244,151 | |
| TSLA Bear Daily ETF | | Equity contracts | | | (19,129,211 | ) |
| 2X NKE Bear Daily ETF | | Equity contracts | | | (974,061 | ) |
| 2X NKE Bull Daily ETF | | Equity contracts | | | 432,839 | |
| Short De-SPAC Daily ETF | | Equity contracts | | | 4,472,175 | |
| Short Innovation Daily ETF | | Equity contracts | | | 22,851,036 | |
| AXS Funds |
| NOTES TO FINANCIAL STATEMENTS - Continued |
| March 31, 2023 |
| Change in Unrealized Appreciation/Depreciation on Derivatives Recognized in the Statements of Operations |
| Fund | | Derivatives not designated as hedging instruments | | Open Swap Contracts | |
| 2X Innovation ETF | | Equity contracts | | $ | 2,428,794 | |
| Short China Internet ETF | | Equity contracts | | | (17,672 | ) |
| 1.25X NVDA Bear Daily ETF | | Equity contracts | | | (17,183,903 | ) |
| 2X PFE Bear Daily ETF | | Equity contracts | | | 423,269 | |
| 2X PFE Bull Daily ETF | | Equity contracts | | | (339,299 | ) |
| 1.5X PYPL Bear Daily ETF | | Equity contracts | | | (11,631 | ) |
| 1.5X PYPL Bull Daily ETF | | Equity contracts | | | (103,810 | ) |
| TSLA Bear Daily ETF | | Equity contracts | | | (5,895,911 | ) |
| 2X NKE Bear Daily ETF | | Equity contracts | | | (26,966 | ) |
| 2X NKE Bull Daily ETF | | Equity contracts | | | 35,441 | |
| Short De-SPAC Daily ETF | | Equity contracts | | | (3,684,467 | ) |
| Short Innovation Daily ETF | | Equity contracts | | | (54,085,126 | ) |
The average quarterly volume of derivative instruments held by the Funds during the periods ended March 31, 2023 are as follows:
| Fund | | Derivatives not designated as hedging instruments | | Investment | | Notional Value | |
| 2X Innovation ETF | | Equity contracts | | Open Swap Contracts | | $ | 99,659,548 | |
| Short China Internet ETF | | Equity contracts | | Open Swap Contracts | | | (1,454,964 | ) |
| 1.25X NVDA Bear Daily ETF | | Equity contracts | | Open Swap Contracts | | | (40,066,159 | ) |
| 2X PFE Bear Daily ETF | | Equity contracts | | Open Swap Contracts | | | (2,725,047 | ) |
| 2X PFE Bull Daily ETF | | Equity contracts | | Open Swap Contracts | | | 2,051,859 | |
| 1.5X PYPL Bear Daily ETF | | Equity contracts | | Open Swap Contracts | | | (1,378,189 | ) |
| 1.5X PYPL Bull Daily ETF | | Equity contracts | | Open Swap Contracts | | | 2,066,935 | |
| TSLA Bear Daily ETF | | Equity contracts | | Open Swap Contracts | | | (77,119,553 | ) |
| 2X NKE Bear Daily ETF | | Equity contracts | | Open Swap Contracts | | | (2,632,576 | ) |
| 2X NKE Bull Daily ETF | | Equity contracts | | Open Swap Contracts | | | 1,561,501 | |
| Short De-SPAC Daily ETF | | Equity contracts | | Open Swap Contracts | | | (17,980,306 | ) |
| Short Innovation Daily ETF | | Equity contracts | | Open Swap Contracts | | | (328,963,427 | ) |
Note 10 - Disclosures about Offsetting Assets and Liabilities
Disclosures about Offsetting Assets and Liabilities requires an entity to disclose information about offsetting and related arrangements to enable users of its financial statements to understand the effect of those arrangements on its financial position. The guidance requires retrospective application for all comparative periods presented.
A Fund mitigates credit risk with respect to OTC derivative counterparties through credit support annexes included with International Swaps and Derivative Association (“ISDA”) Master Agreements or other Master Netting Agreements which are the standard contracts governing most derivative transactions between the Funds and each of its counterparties. These agreements allow the Funds and each counterparty to offset certain derivative financial instruments’ payables and/or receivables against each other and/or with collateral, which is generally held by the Funds’ custodian. The amount of collateral moved to/from applicable counterparties is based upon minimum transfer amounts specified in the agreement. To the extent amounts due to the Funds from its counterparties are not fully collateralized contractually or otherwise, the Funds bear the risk of loss from counterparty non-performance.
| AXS Funds |
| NOTES TO FINANCIAL STATEMENTS - Continued |
| March 31, 2023 |
It is the Funds’ policy to recognize a net asset or liability equal to the unrealized appreciation (depreciation) of swap contracts. As of March 31, 2023, the Funds are subject to a master netting arrangement for swap contracts. The following table shows additional information regarding the offsetting of assets and liabilities, as of March 31, 2023:
| | | | | | | | Amounts Not Offset in Statement of Assets and Liabilities | | | | |
Fund/ Description | | Counterparty | | Gross Amounts Recognized in the Statements of Assets and Liabilities | | | Financial Instruments* | | | Cash Collateral* | | | Net Amount | |
| 2X Innovation ETF | | | | | | | | | | | | | | | | | | |
| Unrealized appreciation on open swap contracts - asset receivable | | Cowen | | $ | 2,428,794 | | | $ | - | | | $ | - | | | $ | 2,428,794 | |
| Short China Internet ETF | | | | | | | | | | | | | | | | | | |
| Unrealized depreciation on open swap contracts -liability payable | | Cowen | | | 17,672 | | | | - | | | | (17,672 | ) | | | - | |
| 1.25X NVDA Bear Daily ETF | | | | | | | | | | | | | | | | | | |
| Unrealized depreciation on open swap contracts -liability payable | | Cowen | | | 17,183,903 | | | | - | | | | (17,183,903 | ) | | | - | |
| 2X PFE Bear Daily ETF | | | | | | | | | | | | | | | | | | |
| Unrealized appreciation on open swap contracts - asset receivable | | Cowen | | | 423,269 | | | | - | | | | - | | | | 423,269 | |
| 2X PFE Bull Daily ETF | | | | | | | | | | | | | | | | | | |
| Unrealized depreciation on open swap contracts -liability payable | | Cowen | | | 339,299 | | | | - | | | | (339,299 | ) | | | - | |
| 1.5X PYPL Bear Daily ETF | | | | | | | | | | | | | | | | | | |
| Unrealized depreciation on open swap contracts -liability payable | | Cowen | | | 11,631 | | | | - | | | | (11,631 | ) | | | - | |
| AXS Funds |
| NOTES TO FINANCIAL STATEMENTS - Continued |
| March 31, 2023 |
| | | | | | | | Amounts Not Offset in Statement of Assets and Liabilities | | | | |
Fund/ Description | | Counterparty | | Gross Amounts Recognized in the Statements of Assets and Liabilities | | | Financial Instruments* | | | Cash Collateral* | | | Net Amount | |
| 1.5X PYPL Bull Daily ETF | | | | | | | | | | | | | | | | | | |
| Unrealized depreciation on open swap contracts -liability payable | | Cowen | | $ | 103,810 | | | $ | - | | | $ | (103,810 | ) | | $ | - | |
| TSLA Bear Daily ETF | | | | | | | | | | | | | | | | | | |
| Unrealized depreciation on open swap contracts -liability payable | | Cowen | | | 5,895,911 | | | | - | | | | (5,895,911 | ) | | | - | |
| 2X NKE Bear Daily ETF | | | | | | | | | | | | | | | | | | |
| Unrealized depreciation on open swap contracts -liability payable | | Cowen | | | 26,966 | | | | - | | | | (26,966 | ) | | | - | |
| 2X NKE Bull Daily ETF | | | | | | | | | | | | | | | | | | |
| Unrealized appreciation on open swap contracts - asset receivable | | Cowen | | | 35,441 | | | | - | | | | - | | | | 35,441 | |
| Short De-SPAC Daily ETF | | | | | | | | | | | | | | | | | | |
| Unrealized appreciation on open swap contracts - asset receivable | | Cowen | | | 612,173 | | | | - | | | | (563,038 | ) | | | 49,135 | |
| Unrealized depreciation on open swap contracts - liability receivable | | Cowen | | | 563,038 | | | | - | | | | (563,038 | ) | | | - | |
| Short Innovation Daily ETF | | | | | | | | | | | | | | | | | | |
| Unrealized depreciation on open swap contracts -liability payable | | Cowen | | | 16,345,966 | | | | - | | | | (16,345,966 | ) | | | - | |
| Unrealized depreciation on open swap contracts -liability payable | | Clear Street | | | 984,867 | | | | - | | | | (984,867 | ) | | | - | |
* Amounts relate to master netting agreements and collateral agreements which have been determined by the Advisor to be legally enforceable in the event of default but where certain other criteria are not met in accordance with applicable offsetting accounting guidance. The collateral amounts may exceed the related net amounts of financial assets and liabilities presented in the Statements of Assets and Liabilities. Where this is the case, the total amount reported is limited to the net amounts of financial assets and liabilities with that counterparty.
| AXS Funds |
| NOTES TO FINANCIAL STATEMENTS - Continued |
| March 31, 2023 |
Note 11 – Market Disruption and Geopolitical Risks
Certain local, regional or global events such as war, acts of terrorism, the spread of infectious illness or other public health issues, or other events could have a significant impact on a security or instrument. Since 2020, the novel strain of coronavirus (COVID-19) has negatively affected the worldwide economy, as well as the economies of individual countries, the financial health of individual companies and the market in general in significant and unforeseen ways. Following Russia’s large-scale invasion of Ukraine, the President of the United States signed an Executive Order in February 2022 prohibiting U.S. persons from entering transactions with the Central Bank of Russia and Executive Orders in March 2022 prohibiting U.S. persons from importing oil and gas from Russia as well as other popular Russian exports, such as diamonds, seafood and vodka. There may also be restrictions on investments in Chinese companies. For example, the President of the United States of America signed an Executive Order in June 2021 affirming and expanding the U.S. policy prohibiting U.S. persons from purchasing or investing in publicly-traded securities of companies identified by the U.S. Government as “Chinese Military-Industrial Complex Companies.” The list of such companies can change from time to time, and as a result of forced selling or an inability to participate in an investment the Advisor otherwise believes is attractive, the Funds may incur losses. The duration of the coronavirus outbreak and the Russian-Ukraine conflict could adversely affect the Funds’ performance, the performance of the securities in which the Funds invest and may lead to losses on your investment. The ultimate impact of COVID-19 and Russia Invasion on the financial performance of the Funds’ investments is not reasonably estimable at this time. Management is actively monitoring these events.
Note 12 – New Accounting Pronouncements and Regulatory Updates
Effective January 24, 2023, the SEC adopted rule and form amendments to require mutual funds and ETFs to transmit concise and visually engaging streamlined annual and semiannual reports to shareholders that highlight key information deemed important for retail investors to assess and monitor their fund investments. Other information, including financial statements, will no longer appear in the funds’ streamlined shareholder reports but must be available online, delivered free of charge upon request, and filed on a semiannual basis on Form N-CSR. The rule and form amendments have a compliance date of July 24, 2024. At this time, management is evaluating the impact of these rule and form amendment changes on the content of the current shareholder report and the newly created annual and semiannual streamlined shareholder reports.
In October 2020, the SEC adopted new regulations governing the use of derivatives by registered investment companies (“Rule 18f-4”). Rule 18f-4 will impose limits on the amount of derivatives a Fund can enter into, eliminate the asset segregation framework currently used by funds to comply with Section 18 of the 1940 Act, and require funds whose use of derivatives is greater than a limited specified amount to establish and maintain a comprehensive derivatives risk management program and appoint a derivatives risk manager. The Funds have adopted procedures in accordance with Rule 18f-4.
In December 2020, the SEC adopted a new rule providing a framework for fund valuation practices (“Rule 2a-5”). Rule 2a-5 establishes requirements for determining fair value in good faith for purposes of the 1940 Act. Rule 2a-5 will permit fund boards to designate certain parties to perform fair value determinations, subject to board oversight and certain other conditions. Rule 2a-5 also defines when market quotations are “readily available” for purposes of the 1940 Act and the threshold for determining whether a fund must fair value a security. In connection with Rule 2a-5, the SEC also adopted related recordkeeping requirements and is rescinding previously issued guidance, including with respect to the role of a board in determining fair value and the accounting and auditing of fund investments. The Funds have adopted procedures in accordance with Rule 2a-5.
Note 13 – Events Subsequent to the Fiscal Period End
The Funds have adopted financial reporting rules regarding subsequent events which require an entity to recognize in the financial statements the effects of all subsequent events that provide additional evidence about conditions that existed at the date of the balance sheet. Management has evaluated the Funds’ related events and transactions that occurred through the date of issuance of the Funds’ financial statements.
| AXS Funds |
| NOTES TO FINANCIAL STATEMENTS - Continued |
| March 31, 2023 |
On May 23, 2023, the Board of Trustees of the Trust has approved a Plan of Liquidation for each of the 2X NKE Bear Daily ETF, 2X NKE Bull Daily ETF, 2X PFE Bear Daily ETF, 2X PFE Bull Daily ETF, 1.5X PYPL Bear Daily ETF, Short China Internet ETF and Short De-SPAC Daily ETF. Each Plan of Liquidation authorizes the termination, liquidation and dissolution of the respective Fund.
Each Fund will create and redeem creation units through June 16, 2023 (the “Closing Date”), which will also be the last day of trading on The NASDAQ Stock Market LLC, each Fund’s principal U.S. listing exchange. On or about June 26, 2023 (the “Liquidation Date”), each Fund will cease operations, liquidate its assets, and prepare to distribute proceeds to shareholders of record as of the Liquidation Date. Shareholders of record on the Liquidation Date will receive cash at the net asset value of their shares as of such date. While Fund shareholders remaining on the Liquidation Date will not incur transaction fees, any liquidation proceeds paid to shareholders should generally be treated as received in exchange for shares and will therefore generally give rise to a capital gain or loss depending on a shareholder’s tax basis.
In anticipation of the liquidation of each Fund, AXS Investments LLC, the Funds’ advisor, may manage each Fund in a manner intended to facilitate its orderly liquidation, such as by raising cash or making investments in other highly liquid assets. As a result, during this time, all or a portion of each Fund may not be invested in a manner consistent with its stated investment strategies, which may prevent each Fund from achieving its investment objective. Shareholders of each Fund may sell their holdings on The NASDAQ Stock Market LLC, on or prior to the Closing Date. Customary brokerage charges may apply to such transactions. After the Closing Date, shareholders of each Fund are not assured that there will be a market for their shares.
There were no other events or transactions that occurred during this period that materially impacted the amounts or disclosures in the Funds’ financial statements.
REPORT OF INDEPENDENT REGISTERED PUBLIC ACCOUNTING FIRM
To the Shareholders of AXS ETFs and
the Board of Trustees of Investment Managers Series Trust II
Opinion on the Financial Statements
We have audited the accompanying statements of assets and liabilities of AXS 2X Innovation ETF, AXS Short China Internet ETF, AXS 1.25X NVDA Bear Daily ETF, AXS 2X PFE Bear Daily ETF, AXS 2X PFE Bull Daily ETF, AXS 1.5X PYPL Bear Daily ETF, AXS 1.5X PYPL Bull Daily ETF, AXS TSLA Bear Daily ETF, AXS 2X NKE Bear Daily ETF, AXS 2X NKE Bull Daily ETF, AXS Short De-SPAC Daily ETF, and AXS Short Innovation Daily ETF (the “Funds”), each a series of Investment Managers Series Trust II (the “Trust”), including the schedules of investments, as of March 31, 2023, the related statements of operations, the statements of changes in net assets, and the financial highlights for each of the periods indicated in the table below, and the related notes (collectively referred to as the “financial statements”). In our opinion, the financial statements present fairly, in all material respects, the financial position of the Funds as of March 31, 2023, the results of their operations, the changes in their net assets and their financial highlights for each of the periods indicated in the table below, in conformity with accounting principles generally accepted in the United States of America.
Individual Funds constituting
AXS ETFs | | Statements of
operations | | Statements of
changes in net assets | | Financial highlights |
AXS 2X Innovation ETF and AXS Short China Internet ETF | | For the period April 28, 2022 (commencement of operations) through March 31, 2023 | | For the period April 28, 2022 (commencement of operations) through March 31, 2023 | | For the period April 28, 2022 (commencement of operations) through March 31, 2023 |
| AXS 1.25X NVDA Bear Daily ETF, AXS 2X PFE Bear Daily ETF, AXS 2X PFE Bull Daily ETF, AXS 1.5X PYPL Bear Daily ETF, AXS 1.5X PYPL Bull Daily ETF, AXS TSLA Bear Daily ETF, AXS 2X NKE Bear Daily ETF and AXS 2X NKE Bull Daily ETF | | For the period July 13, 2022 (commencement of operations) through March 31, 2023 | | For the period July 13, 2022 (commencement of operations) through March 31, 2023 | | For the period July 13, 2022 (commencement of operations) through March 31, 2023 |
| AXS Short De-SPAC Daily ETF | | For the 6 months period ended March 31, 2023, and for the year ended September 30, 2022 | | For the 6 months period ended March 31, 2023, and for the year ended September 30, 2022 | | For the 6 months period ended March 31, 2023, and for the year ended September 30, 2022 |
| AXS Short Innovation Daily ETF | | For the 6 months period ended March 31, 2023, and for the period November 5, 2021 (commencement of operations) through September 30, 2022 | | For the 6 months period ended March 31, 2023, and for the period November 5, 2021 (commencement of operations) through September 30, 2022 | | For the 6 months period ended March 31, 2023, and for the period November 5, 2021 (commencement of operations) through September 30, 2022 |
To the Shareholders of AXS ETFs and
the Board of Trustees of Investment Managers Series Trust II
With respect to AXS Short De-SPAC Daily ETF, the statement of changes in net assets and the financial highlights for the period May 17, 2021 (commencement of operations) through September 30, 2021, were audited by other auditors, whose report dated December 9, 2021 expressed an unqualified opinion on such statement and financial highlights.
Basis for Opinion
These financial statements are the responsibility of the Funds’ management. Our responsibility is to express an opinion on the Funds’ financial statements based on our audits. We are a public accounting firm registered with the Public Company Accounting Oversight Board (United States) (“PCAOB”) and are required to be independent with respect to the Funds in accordance with the U.S. federal securities laws and the applicable rules and regulations of the Securities and Exchange Commission and the PCAOB. We have served as the auditor of one or more of the funds in the Trust since 2013.
We conducted our audits in accordance with the standards of the PCAOB. Those standards require that we plan and perform the audits to obtain reasonable assurance about whether the financial statements are free of material misstatement, whether due to error or fraud. The Funds are not required to have, nor were we engaged to perform, an audit of the Funds’ internal control over financial reporting. As part of our audits, we are required to obtain an understanding of internal control over financial reporting, but not for the purpose of expressing an opinion on the effectiveness of the Funds’ internal control over financial reporting. Accordingly, we express no such opinion.
Our audits included performing procedures to assess the risks of material misstatement of the financial statements, whether due to error or fraud, and performing procedures that respond to those risks. Such procedures included examining, on a test basis, evidence regarding the amounts and disclosures in the financial statements. Our audits also included evaluating the accounting principles used and significant estimates made by management, as well as evaluating the overall presentation of the financial statements. Our procedures included confirmation of securities owned as of March 31, 2023 by correspondence with the custodian and brokers. We believe that our audits provide a reasonable basis for our opinion.
| |  |
| | TAIT, WELLER & BAKER LLP |
| Philadelphia, Pennsylvania | |
| May 30, 2023 | |
AXS Funds
SUPPLEMENTAL INFORMATION (Unaudited)
Trustees and Officers Information
Additional information about the Trustees is included in the Funds’ Statement of Additional Information which is available, without charge, upon request by calling (866) 984-2510. The Trustees and officers of the Funds and its principal occupations during the past five years are as follows:
| Name, Address, Year of Birth and Position(s) held with Trust | Term of Officec and Length of Time Served | Principal Occupation During the Past Five Years and Other Affiliations | Number of Portfolios in the Fund Complex Overseen by Trusteed | Other Directorships Held by Trusteee |
| Independent Trustees: | | |
Thomas Knipper, CPA a (Born 1957) Trustee | Since September 2013 | Retired (April 2022 – present); Independent Consulting, financial services organizations (March 2021 – March 2022); Vice President and Chief Compliance Officer, Ameritas Investment Partners, a registered investment advisor (1995 – March 2021). | 30 | Monachil Credit Income Fund, a closed-end investment company. |
Kathleen K. Shkuda a (born 1951) Trustee | Since September 2013 | Zigzag Consulting, a financial services consulting firm (2008 – present). Director, Managed Accounts, Merrill Lynch (2007-2008). | 30 | None. |
Larry D. Tashjian a (born 1953) Trustee and Chairman of the Board | Since September 2013 | Principal, CAM Capital Advisors, a family office (2001 – present). | 30 | General Finance Corporation. |
John P. Zader a (born 1961) Trustee | Since September 2013 | Retired (June 2014 – present); CEO, UMB Fund Services, Inc., a mutual fund and hedge fund service provider, and the transfer agent, fund accountant, and co-administrator for the Funds (December 2006 – June 2014); President, Investment Managers Series Trust (December 2007 - June 2014). | 30 | None. |
| Interested Trustees: | | | | |
Terrance P. Gallagher a* (born 1958) Trustee and President | Since July 2019 | President, Investment Managers Series Trust II (September 2013 – present); Executive Vice President, UMB Fund Services, Inc. (2007 – present). Director of Compliance, Unified Fund Services Inc. (now Huntington Fund Services), a mutual fund service provider (2004 – 2007). | 30 | Cliffwater Corporate Lending Fund, Agility Multi-Asset Income Fund, Corbin Multi-Strategy Fund, LLC, Aspiriant Risk-Managed Real Asset Fund, Aspiriant Risk-Managed Capital Appreciation Fund, AFA Multi-Manager Credit Fund, The Optima Dynamic Alternatives Fund, Infinity Core Alternative Fund, Infinity Long/Short Equity Fund, LLC, Keystone Private Income Fund, First Trust Alternative Opportunities Fund, Variant Alternative Income Fund, Variant Impact Fund, First Trust Private Assets Fund, First Trust Private Credit Fund, and First Trust Real Assets Fund, each a closed-end investment company. |
AXS Funds
SUPPLEMENTAL INFORMATION (Unaudited) – Continued
| Name, Address, Year of Birth and Position(s) held with Trust | Term of Officec and Length of Time Served | Principal Occupation During the Past Five Years and Other Affiliations | Number of Portfolios in the Fund Complex Overseen by Trusteed | Other Directorships Held by Trusteee |
Joy Ausili b† (born 1966) Trustee, Vice President and Assistant Secretary | January 2023 | Co-Chief Executive Officer (2016 – present), and Vice President (2006 – 2015), Mutual Fund Administration, LLC; Vice President and Assistant Secretary (January 2016 – present), Investment Managers Series Trust II; Vice President and Secretary, Investment Managers Series Trust (March 2016 – present); Co-President, Foothill Capital Management, LLC, a registered investment advisor (2018 – 2022). | 30 | None. |
| Officers of the Trust: | | | | |
Rita Dam b (born 1966) Treasurer and Assistant Secretary | Since September 2013 | Co-Chief Executive Officer (2016 – present), and Vice President (2006 – 2015), Mutual Fund Administration, LLC; Co-President, Foothill Capital Management, LLC, a registered investment advisor (2018 – 2022). | N/A | N/A |
Diane Drake b (born 1967) Secretary | Since January 2016 | Senior Counsel, Mutual Fund Administration, LLC (October 2015 – present); Chief Compliance Officer, Foothill Capital Management, LLC, a registered investment advisor (2018 – 2019). | N/A | N/A |
AXS Funds
SUPPLEMENTAL INFORMATION (Unaudited) – Continued
| Name, Address, Year of Birth and Position(s) held with Trust | Term of Officec and Length of Time Served | Principal Occupation During the Past Five Years and Other Affiliations | Number of Portfolios in the Fund Complex Overseen by Trusteed | Other Directorships Held by Trusteee |
| Officer of the Trust: | | | | |
Martin Dziura b (born 1959) Chief Compliance Officer | Since September 2013 | Principal, Dziura Compliance Consulting, LLC (October 2014 - present). Managing Director, Cipperman Compliance Services (2010 – September 2014). Chief Compliance Officer, Hanlon Investment Management (2009 - 2010). Vice President − Compliance, Morgan Stanley Investment Management (2000 − 2009). | N/A | N/A |
| a | Address for certain Trustees and certain officers: 235 West Galena Street, Milwaukee, Wisconsin 53212. |
| b | Address for Ms. Ausili, Ms. Dam and Ms. Drake: 2220 E. Route 66, Suite 226, Glendora, California 91740. Address for Mr. Dziura: 309 Woodridge Lane, Media, Pennsylvania 19063. |
| c | Trustees and officers serve until their successors have been duly elected. |
| d | The Trust is comprised of 58 series managed by unaffiliated investment advisors. The term “Fund Complex” applies only to the Funds managed by the same investment advisor. The Fund’s investment advisor also serves as the investment advisor to the AXS All Terrain Opportunity Fund, AXS Alternative Value Fund, AXS Adaptive Plus Fund, AXS Multi-Strategy Alternatives Fund, AXS Chesapeake Strategy Fund, AXS Market Neutral Fund, AXS Income Opportunities Fund, AXS Merger Fund, AXS Sustainable Fund, AXS Thomson Reuters Private Equity Return Tracker, AXS Thomson Reuters Venture Capital Return Tracker Fund, AXS Astoria Inflation Sensitive ETF, AXS Brendan Wood TopGun Index ETF, AXS Change Finance ESG ETF, AXS Cannabis ETF, AXS Esoterica NextG Economy ETF, AXS First Priority CLO Bond ETF and AXS Green Alpha ETF, which are offered in separate prospectus. The Funds do not hold themselves out as related to any other series within the Trust, for purposes of investment and investor services. |
| e | “Other Directorships Held” includes only directorship of companies required to register or file reports with the SEC under the Securities Exchange Act of 1934, as amended (that is, “public companies”) or other investment companies registered under the 1940 Act. |
| † | Ms. Ausili is an “interested person” of the Trust by virtue of her position with Mutual Fund Administration, LLC. |
| * | Mr. Gallagher is an “interested person” of the Trust by virtue of his position with UMB Fund Services, Inc. |
AXS Funds
SUPPLEMENTAL INFORMATION (Unaudited) – Continued
Statement Regarding Liquidity Risk Management Program
The Securities and Exchange Commission adopted Rule 22e-4 under the Investment Company Act of 1940, as amended (the “Liquidity Rule”), to promote effective liquidity risk management throughout the open-end investment company industry, thereby reducing the risk that funds will be unable to meet their redemption obligations and mitigating dilution of the interests of fund shareholders.
The Board of Trustees (the “Board”) of Investment Managers Series Trust II (the “Trust”) met on January 18-19, 2023 (the “Meeting”), to review the liquidity risk management program (the “Fund Program”) applicable to the following series of the Trust (each, a “Fund” and together, the “Funds”) pursuant to the Liquidity Rule:
Reporting Period – April 28, 2022 through October 31, 2022
AXS 2X Innovation ETF1
AXS Short China Internet ETF1
Reporting Period – July 13, 2022 through October 31, 2022
AXS 1.25X NVDA Bear Daily ETF2
AXS 1.5X PYPL Bear Daily ETF2
AXS 1.5X PYPL Bull Daily ETF2
AXS 2X NKE Bear Daily ETF2
AXS 2X NKE Bull Daily ETF2
AXS 2X PFE Bear Daily ETF2
AXS 2X PFE Bull Daily ETF2
AXS TSLA Bear Daily ETF2
Reporting Period – August 6, 2022 through October 31, 2022
AXS Short De-SPAC Daily ETF3
AXS Short Innovation Daily ETF3
The Board has appointed AXS Investments LLC, the investment adviser to the Funds, as the program administrator (“Program Administrator”) for the Fund Program. Under the Trust’s liquidity risk management program (the “Trust Program”), the Board has delegated oversight of the Trust Program to the Liquidity Oversight Committee (the “Oversight Committee”). At the Meeting, the Oversight Committee, on behalf of Program Administrator and the Funds, provided the Board with a written report (the “Report”) that addressed the operation, adequacy, and effectiveness of implementation of the Fund Program, and any material changes to it for the periods detailed above (the “Program Reporting Periods”).
In assessing the adequacy and effectiveness of implementation of the Fund Program, the Report discussed the following, among other things:
| • | The Fund Program’s liquidity classification methodology for categorizing each Fund’s investments (including derivative transactions); |
| • | An overview of market liquidity for each Fund during the Program Reporting Periods; |
| • | Each Fund’s ability to meet redemption requests; |
| • | Each Fund’s cash management; |
| • | Each Fund’s borrowing activity, if any, in order to meet redemption requests; |
| • | Each Fund’s compliance with the 15% limit of illiquid investments; and |
| • | Each Fund’s status as a primarily highly liquid fund (“PHLF”), the effectiveness of the implementation of the PHLF standard, and whether it would be appropriate for each Fund to adopt a highly liquid investment minimum (“HLIM”). |
1 Fund reorganized into the Trust on April 28, 2022.
2 Fund reorganized into the Trust on July 13, 2022.
3 Fund reorganized into the Trust on August 6, 2022.
AXS Funds
SUPPLEMENTAL INFORMATION (Unaudited) – Continued
The Report stated that the Funds primarily hold assets that are defined under the Liquidity Rule as "highly liquid investments," and therefore each Fund is not required to establish an HLIM. Highly liquid investments are defined as cash and any investment reasonably expected to be convertible to cash in current market conditions in three business days or less without the conversion to cash significantly changing the market value of the investment. The Report also stated that there were no material changes made to the Fund Program during the Program Reporting Periods.
In the Report, the Program Administrator concluded that (i) the Fund Program, as adopted and implemented, remains reasonably designed to assess and manage each Fund’s liquidity risk; (ii) each Fund continues to qualify as a PHLF and therefore is not required to adopt an HLIM; (iii) during the Program Reporting Periods, each Fund was able to meet redemption requests without significant dilution of remaining investors’ interests; and (iv) there were no weaknesses in the design or implementation of the Fund Program during the Program Reporting Periods.
There can be no assurance that the Fund Program will achieve its objectives in the future. Please refer to the Funds’ prospectus for more information regarding each Fund’s exposure to liquidity risk and other principal risks to which an investment in the Funds may be subject.
AXS Funds
EXPENSE EXAMPLES
For the Six Months Ended March 31, 2023 (Unaudited)
Expense Examples
As a shareholder of the Funds, you incur two types of costs: (1) transaction costs; and (2) ongoing costs, including management fees and other Fund expenses. It is important for you to understand the impact of these ongoing costs on your investment returns. Shareholders may incur brokerage commissions on their purchases and sales of Fund shares, which are not reflected in these examples.
The Funds’ Hypothetical Performance is based on an investment of $1,000 invested at the beginning of the period and held for the entire period from October 1, 2022 to March 31, 2023.
Actual Expenses
The information in the row titled “Actual Performance” of the table below provides actual account values and actual expenses. You may use the information in these columns, together with the amount you invested, to estimate the expenses that you paid over the period. Simply divide your account value by $1,000 (for example, an $8,600 account value divided by $1,000 = 8.6), then multiply the result by the number in the appropriate row under the column titled “Expenses Paid During Period” to estimate the expenses you paid on your account during this period.
Hypothetical Example for Comparison Purposes
The information in the row titled “Hypothetical (5% annual return before expenses)” of the table below provides hypothetical account values and hypothetical expenses based on the Funds’ actual expense ratio and an assumed rate of return of 5% per year before expenses, which is not the Funds’ actual return. The hypothetical account values and expenses may not be used to estimate the actual ending account balance or expenses you paid for the period. You may use this information to compare the ongoing costs of investing in the Funds and other funds. To do so, compare these 5% hypothetical examples with the 5% hypothetical examples that appear in the shareholder reports of the other funds.
Please note that the expenses shown in the table are meant to highlight your ongoing costs only and do not reflect any transaction costs, such as sales charges (load) or contingent deferred sales charges. Therefore, the information in the row titled “Hypothetical (5% annual return before expenses)” is useful in comparing ongoing costs only, and will not help you determine the relative total costs of owning different funds. In addition, if these transactional costs were included, your costs would have been higher.
| 2X Innovation ETF | Beginning Account Value | Ending Account Value | Expenses Paid During Period* |
| | 10/1/22 | 3/31/23 | 10/1/22 – 3/31/23 |
| Actual Performance | $1,000.00 | $937.20 | $5.55 |
| Hypothetical (5% annual return before expenses) | 1,000.00 | 1,019.20 | 5.79 |
| * | Expenses are equal to the Fund’s annualized expense ratio of 1.15% multiplied by the average account value over the period, multiplied by 182/365 (to reflect the six-month period). The expense ratio reflects an expense waiver. Assumes all dividends and distributions were reinvested. |
AXS Funds
EXPENSE EXAMPLES - Continued
For the Six Months Ended March 31, 2023 (Unaudited)
| Short China Internet ETF | Beginning Account Value | Ending Account Value | Expenses Paid During Period* |
| | 10/1/22 | 3/31/23 | 10/1/22 – 3/31/23 |
| Actual Performance | $1,000.00 | $683.00 | $3.99 |
| Hypothetical (5% annual return before expenses) | 1,000.00 | 1,020.19 | 4.79 |
| * | Expenses are equal to the Fund’s annualized expense ratio of 0.95% multiplied by the average account value over the period, multiplied by 182/365 (to reflect the six-month period). The expense ratio reflects an expense waiver and expenses absorbed. Assumes all dividends and distributions were reinvested. |
| 1.25X NVDA Bear Daily ETF | Beginning Account Value | Ending Account Value | Expenses Paid During Period* |
| | 10/1/22 | 3/31/23 | 10/1/22 – 3/31/23 |
| Actual Performance | $1,000.00 | $283.00 | $3.68 |
| Hypothetical (5% annual return before expenses) | 1,000.00 | 1,019.20 | 5.79 |
| * | Expenses are equal to the Fund’s annualized expense ratio of 1.15% multiplied by the average account value over the period, multiplied by 182/365 (to reflect the six-month period). The expense ratio reflects an expense waiver . Assumes all dividends and distributions were reinvested. |
| 2X PFE Bear Daily ETF | Beginning Account Value | Ending Account Value | Expenses Paid During Period* |
| | 10/1/22 | 3/31/23 | 10/1/22 – 3/31/23 |
| Actual Performance | $1,000.00 | $1,061.80 | $5.91 |
| Hypothetical (5% annual return before expenses) | 1,000.00 | 1,019.20 | 5.79 |
| * | Expenses are equal to the Fund’s annualized expense ratio of 1.15% multiplied by the average account value over the period, multiplied by 182/365 (to reflect the six-month period). The expense ratio reflects an expense waiver and expenses absorbed. Assumes all dividends and distributions were reinvested. |
| 2X PFE Bull Daily ETF | Beginning Account Value | Ending Account Value | Expenses Paid During Period* |
| | 10/1/22 | 3/31/23 | 10/1/22 – 3/31/23 |
| Actual Performance | $1,000.00 | $834.30 | $5.26 |
| Hypothetical (5% annual return before expenses) | 1,000.00 | 1,019.20 | 5.79 |
| * | Expenses are equal to the Fund’s annualized expense ratio of 1.15% multiplied by the average account value over the period, multiplied by 182/365 (to reflect the six-month period). The expense ratio reflects an expense waiver and expenses absorbed. Assumes all dividends and distributions were reinvested. |
AXS Funds
EXPENSE EXAMPLES - Continued
For the Six Months Ended March 31, 2023 (Unaudited)
| 1.5X PYPL Bear Daily ETF | Beginning Account Value | Ending Account Value | Expenses Paid During Period* |
| | 10/1/22 | 3/31/23 | 10/1/22 – 3/31/23 |
| Actual Performance | $1,000.00 | $1,065.10 | $5.92 |
| Hypothetical (5% annual return before expenses) | 1,000.00 | 1,019.20 | 5.79 |
| * | Expenses are equal to the Fund’s annualized expense ratio of 1.15% multiplied by the average account value over the period, multiplied by 182/365 (to reflect the six-month period). The expense ratio reflects an expense waiver and expenses absorbed. Assumes all dividends and distributions were reinvested. |
| 1.5X PYPL Bull Daily ETF | Beginning Account Value | Ending Account Value | Expenses Paid During Period* |
| | 10/1/22 | 3/31/23 | 10/1/22 – 3/31/23 |
| Actual Performance | $1,000.00 | $780.00 | $5.10 |
| Hypothetical (5% annual return before expenses) | 1,000.00 | 1,019.20 | 5.79 |
| * | Expenses are equal to the Fund’s annualized expense ratio of 1.15% multiplied by the average account value over the period, multiplied by 182/365 (to reflect the six-month period). The expense ratio reflects an expense waiver and expenses absorbed. Assumes all dividends and distributions were reinvested. |
| TSLA Bear Daily ETF | Beginning Account Value | Ending Account Value | Expenses Paid During Period* |
| | 10/1/22 | 3/31/23 | 10/1/22 – 3/31/23 |
| Actual Performance | $1,000.00 | $1,024.80 | $5.81 |
| Hypothetical (5% annual return before expenses) | 1,000.00 | 1,019.20 | 5.79 |
| * | Expenses are equal to the Fund’s annualized expense ratio of 1.15% multiplied by the average account value over the period, multiplied by 182/365 (to reflect the six-month period). The expense ratio reflects an expense waiver. Assumes all dividends and distributions were reinvested. |
| 2X NKE Bear Daily ETF | Beginning Account Value | Ending Account Value | Expenses Paid During Period* |
| | 10/1/22 | 3/31/23 | 10/1/22 – 3/31/23 |
| Actual Performance | $1,000.00 | $385.50 | $3.98 |
| Hypothetical (5% annual return before expenses) | 1,000.00 | 1,019.20 | 5.79 |
* Expenses are equal to the Fund’s annualized expense ratio of 1.15% multiplied by the average account value over the period, multiplied by 182/365 (to reflect the six-month period). The expense ratio reflects an expense waiver and expenses absorbed. Assumes all dividends and distributions were reinvested.
AXS Funds
EXPENSE EXAMPLES - Continued
For the Six Months Ended March 31, 2023 (Unaudited)
| 2X NKE Bull Daily ETF | Beginning Account Value | Ending Account Value | Expenses Paid During Period* |
| | 10/1/22 | 3/31/23 | 10/1/22 – 3/31/23 |
| Actual Performance | $1,000.00 | $1,970.70 | $8.50 |
| Hypothetical (5% annual return before expenses) | 1,000.00 | 1,019.20 | 5.79 |
| * | Expenses are equal to the Fund’s annualized expense ratio of 1.15% multiplied by the average account value over the period, multiplied by 182/365 (to reflect the six-month period). The expense ratio reflects an expense waiver and expenses absorbed. Assumes all dividends and distributions were reinvested. |
| Short De-SPAC Daily ETF | Beginning Account Value | Ending Account Value | Expenses Paid During Period* |
| | 10/1/22 | 3/31/23 | 10/1/22 – 3/31/23 |
| Actual Performance | $1,000.00 | $931.00 | $4.58 |
| Hypothetical (5% annual return before expenses) | 1,000.00 | 1,020.19 | 4.79 |
| * | Expenses are equal to the Fund’s annualized expense ratio of 0.95% multiplied by the average account value over the period, multiplied by 182/365 (to reflect the six-month period). The expense ratio reflects an expense waiver and expenses absorbed. Assumes all dividends and distributions were reinvested. |
| Short Innovation Daily ETF | Beginning Account Value | Ending Account Value | Expenses Paid During Period* |
| | 10/1/22 | 3/31/23 | 10/1/22 – 3/31/23 |
| Actual Performance | $1,000.00 | $801.80 | $3.37 |
| Hypothetical (5% annual return before expenses) | 1,000.00 | 1,021.19 | 3.78 |
| * | Expenses are equal to the Fund’s annualized expense ratio of 0.75% multiplied by the average account value over the period, multiplied by 182/365 (to reflect the six-month period). The expense ratio reflects an expense waiver. Assumes all dividends and distributions were reinvested. |
FUND INFORMATION
| | TICKER | CUSIP |
| AXS 2X Innovation ETF | TARK | 46141X 883 |
| AXS Short China Internet ETF | SWEB | 46144X 875 |
| AXS 1.25X NVDA Bear Daily ETF | NVDS | 46144X 842 |
| AXS 2X PFE Bear Daily ETF | PFES | 46144X 727 |
| AXS 2X PFE Bull Daily ETF | PFEL | 46144X 735 |
| AXS 1.5X PYPL Bear Daily ETF | PYPS | 46144X 776 |
| AXS 1.5X PYPL Bull Daily ETF | PYPT | 46144X 768 |
| AXS TSLA Bear Daily ETF | TSLQ | 46144X 867 |
| AXS 2X NKE Bear Daily ETF | NKEQ | 46144X 685 |
| AXS 2X NKE Bull Daily ETF | NKEL | 46144X 677 |
| AXS Short De-SPAC Daily ETF | SOGU | 46144X 644 |
| AXS Short Innovation Daily ETF | SARK | 46144X 628 |
Privacy Principles of the AXS ETFs for Shareholders
The ETFs are committed to maintaining the privacy of their shareholders and to safeguarding their non-public personal information. The following information is provided to help you understand what personal information the ETFs collect, how we protect that information and why, in certain cases, we may share information with select other parties.
Generally, the ETFs do not receive any non-public personal information relating to their shareholders, although certain non-public personal information of their shareholders may become available to the ETFs. The ETFs do not disclose any non-public personal information about its shareholders or former shareholders to anyone, except as permitted by law or as is necessary in order to service shareholder accounts (for example, to a transfer agent or third party administrator).
This report is sent to shareholders of the AXS ETFs for their information. It is not a Prospectus, circular or representation intended for use in the purchase or sale of shares of the Fund or of any securities mentioned in this report.
Proxy Voting
The ETFs’ proxy voting policies and procedures, as well as information regarding how the ETFs voted proxies for portfolio securities, if applicable, during the most recent 12-month period ended June 30, are available, without charge and upon request by calling (866) 984-2510 or on the SEC’s website at www.sec.gov.
Fund Portfolio Holdings
The ETFs file a complete schedule of their portfolio holdings with the SEC for the first and third quarters of each fiscal year on Form N-PORT within 60 days of the end of such fiscal quarter. Shareholders may obtain the ETFs’ Form N-PORT on the SEC’s website at www.sec.gov.
Householding
The ETFs will mail only one copy of shareholder documents, including prospectuses and notice of annual and semi-annual reports availability and proxy statements, to shareholders with multiple accounts at the same address. This practice is commonly called “householding” and is intended to reduce expenses and eliminate duplicate mailings of shareholder documents. Mailings of your shareholder documents may be householded indefinitely unless you instruct us otherwise. If you do not want the mailing of these documents to be combined with those for other members of your household, please call the ETFs at (866) 984-2510.
AXS ETFs
P.O. Box 2175
Milwaukee, WI 53201
Toll Free: (866) 984-2510
Item 1. Report to Stockholders (Continued).
(b) Not applicable.
Item 2. Code of Ethics.
The registrant has adopted a code of ethics that applies to the registrant's principal executive officer and principal financial officer. The registrant has not made any amendments to its code of ethics during the period covered by this report. The registrant has not granted any waivers from any provisions of the code of ethics during the period covered by this report.
The registrant undertakes to provide to any person without charge, upon request, a copy of its code of ethics by mail when they call the registrant at 1-833-297-2587.
Item 3. Audit Committee Financial Expert.
The Board of Trustees of the Registrant has determined that the Registrant has the following “audit committee financial experts” as defined in Item 3(b) of Form N-CSR serving on its Audit Committee: Messrs. Thomas Knipper and John P. Zader. The audit committee financial experts are “independent” as that term is defined in Item 3(a)(2) of Form N-CSR.
Item 4. Principal Accountant Fees and Services.
The registrant has engaged its principal accountant to perform audit services, audit-related services, tax services and other services during the past two fiscal years. "Audit services" refer to performing an audit of the registrant's annual financial statements or services that are normally provided by the accountant in connection with statutory and regulatory filings or engagements for those fiscal years. "Audit-related services" refer to the assurance and related services by the principal accountant that are reasonably related to the performance of the audit. "Tax services" refer to professional services rendered by the principal accountant for tax compliance, tax advice, and tax planning. There were no "other services" provided by the principal accountant. The following table details the aggregate fees billed or expected to be billed for each of the last two fiscal years for audit fees, audit-related fees, tax fees and other fees by the principal accountant.
| AXS ETFs | | FYE 3/31/2023 | | FYE 3/31/2022 |
| Audit Fees | | $ | 105,000 | | | | N/A | |
| Audit-Related Fees | | | N/A | | | | N/A | |
| Tax Fees | | $ | 25,000 | | | | N/A | |
| All Other Fees | | | N/A | | | | N/A | |
| AXS Short De-SPAC Daily ETF & AXS Short Innovation Daily ETF | | FYE 3/31/2023 | | FYE 9/30/2022 |
| Audit Fees | | $ | 19,000 | | | $ | 26,000 | |
| Audit-Related Fees | | | N/A | | | | N/A | |
| Tax Fees | | $ | 5,000 | | | $ | 5,000 | |
| All Other Fees | | | N/A | | | | N/A | |
The audit committee has adopted pre-approval policies and procedures that require the audit committee to pre-approve all audit and non-audit services of the registrant, including services provided to any entity affiliated with the registrant.
The percentage of fees billed by Tait, Weller, & Weller LLP applicable to non-audit services pursuant to waiver of pre-approval requirement were as follows:
| AXS ETFs | | FYE 3/31/2023 | | FYE 3/31/2022 |
| Audit-Related Fees | | | 0 | % | | | 0 | % |
| Tax Fees | | | 0 | % | | | 0 | % |
| All Other Fees | | | 0 | % | | | 0 | % |
| AXS Short De-SPAC Daily ETF & AXS Short Innovation Daily ETF | | FYE 3/31/2023 | | FYE 9/30/2022 |
| Audit-Related Fees | | | 0 | % | | | 0 | % |
| Tax Fees | | | 0 | % | | | 0 | % |
| All Other Fees | | | 0 | % | | | 0 | % |
All of the principal accountant's hours spent on auditing the registrant's financial statements were attributed to work performed by full-time permanent employees of the principal accountant.
The following table indicates the non-audit fees billed or expected to be billed by the registrant's accountant for services to the registrant and to the registrant's investment advisor (and any other controlling entity, etc.—not sub-advisor) for the last two years. The audit committee of the Board of Trustees has considered whether the provision of non-audit services that were rendered to the registrant's investment advisor is compatible with maintaining the principal accountant's independence and has concluded that the provision of such non-audit services by the accountant has not compromised the accountant's independence.
| AXS ETFs | | | FYE 3/31/2023 | | | | FYE 3/31/2022 | |
| Non-Audit Related Fees | | | N/A | | | | N/A | |
| Registrant | | | N/A | | | | N/A | |
| Registrant’s Investment Advisor | | | N/A | | | | N/A | |
| AXS Short De-SPAC Daily ETF & AXS Short Innovation Daily ETF | | | FYE 3/31/2023 | | | | FYE 9/30/2022 | |
| Non-Audit Related Fees | | | N/A | | | | N/A | |
| Registrant | | | N/A | | | | N/A | |
| Registrant’s Investment Advisor | | | N/A | | | | N/A | |
Item 5. Audit Committee of Listed Registrants.
| (a) | Not applicable to registrants who are not listed issuers (as defined in Rule 10A-3 under the Securities Exchange Act of 1934). |
Item 6. Schedule of Investments.
| (a) | Schedule of Investments is included as part of the report to shareholders filed under Item 1 of this Form. |
Item 7. Disclosure of Proxy Voting Policies and Procedures for Closed-End Management Investment Companies.
Not applicable to open-end investment companies.
Item 8. Portfolio Managers of Closed-End Management Investment Companies.
Not applicable to open-end investment companies.
Item 9. Purchases of Equity Securities by Closed-End Management Investment Company and Affiliated Purchasers.
Not applicable.
Item 10. Submission of Matters to a Vote of Security Holders.
The registrant has not made any material changes to the procedures by which shareholders may recommend nominees to the registrant’s Board of Trustees.
Item 11. Controls and Procedures.
| (a) | The Registrant’s President/Chief Executive Officer and Treasurer/Chief Financial Officer have reviewed the Registrant's disclosure controls and procedures (as defined in Rule 30a-3(c) under the Investment Company Act of 1940 (the “Act”)) as of a date within 90 days of the filing of this report, as required by Rule 30a-3(b) under the Act and Rules 13a-15(b) or 15d-15(b) under the Securities Exchange Act of 1934. Based on their review, such officers have concluded that the disclosure controls and procedures are effective in ensuring that information required to be disclosed in this report is appropriately recorded, processed, summarized and reported and made known to them by others within the Registrant and by the Registrant’s service provider. |
| (b) | There were no changes in the Registrant's internal control over financial reporting (as defined in Rule 30a-3(d) under the Act) that occurred during the period covered by this report that has materially affected, or is reasonably likely to materially affect, the Registrant's internal control over financial reporting. |
Item 12. Disclosure of Securities Lending Activities for Closed-End Management Investment Companies.
Not applicable to open-end investment companies.
Item 13. Exhibits.
(2) Certifications pursuant to Section 302 of the Sarbanes-Oxley Act of 2002. Filed herewith.
(3) Any written solicitation to purchase securities under Rule 23c-1 under the Act sent or given during the period covered by the report by or on behalf of the registrant to 10 or more persons. Not applicable to open-end investment companies.
(4) Change in the registrant’s independent public accountant. There was no change in the registrant’s independent public accountant for the period covered by this report.
SIGNATURES
Pursuant to the requirements of the Securities Exchange Act of 1934 and the Investment Company Act of 1940, the registrant has duly caused this report to be signed on its behalf by the undersigned, thereunto duly authorized.
| (Registrant) | Investment Managers Series Trust II | |
| | | |
| By (Signature and Title) | /s/ Terrance Gallagher | |
| | Terrance Gallagher, President/Chief Executive Officer | |
| | | |
| Date | 6/9/2023 | |
Pursuant to the requirements of the Securities Exchange Act of 1934 and the Investment Company Act of 1940, this report has been signed below by the following persons on behalf of the registrant and in the capacities and on the dates indicated.
| By (Signature and Title) | /s/ Terrance Gallagher | |
| | Terrance Gallagher, President/Chief Executive Officer | |
| | | |
| Date | 6/9/2023 | |
| | | |
| By (Signature and Title) | /s/ Rita Dam | |
| | Rita Dam, Treasurer/Chief Financial Officer | |
| | | |
| Date | 6/9/2023 | |