As filed with the Securities and Exchange Commission on September 4, 2015
UNITED STATES
SECURITIES AND EXCHANGE COMMISSION
Washington, D.C. 20549
FORM N-CSR
CERTIFIED SHAREHOLDER REPORT OF REGISTERED MANAGEMENT INVESTMENT COMPANIES
Investment Company Act file number 811-22917
Absolute Shares Trust
(Exact name of registrant as specified in charter)
Millington Securities, Inc.
331 Newman Springs Rd Suite 122
Red Bank, New Jersey 07701
(Address of principal executive offices) (Zip code)
Don Schreiber, Jr.
Millington Securities, Inc.
331 Newman Springs Rd Suite 122
Red Bank, New Jersey 07701
(Name and address of agent for service)
(732) 842-4920
Registrant's telephone number, including area code
Date of fiscal year end: June 30
Date of reporting period: June 30, 2015
Updated June 15, 2015
Item 1. Reports to Stockholders.

WBI SMID Tactical Growth Shares | WBIA
WBI SMID Tactical Value Shares | WBIB
WBI SMID Tactical Yield Shares | WBIC
WBI SMID Tactical Select Shares | WBID
WBI Large Cap Tactical Growth Shares | WBIE
WBI Large Cap Tactical Value Shares | WBIF
WBI Large Cap Tactical Yield Shares | WBIG
WBI Large Cap Tactical Select Shares | WBIL
WBI Tactical Income Shares | WBII
WBI Tactical High Income Shares | WBIH
 | Absolute Shares Trust
Table of Contents |
| Absolute Shares Trust
Managers Discussion of Fund Performance
June 30, 2015 |
Dear Fellow Shareholder:
We would like to welcome our fellow shareholders who have invested in the WBI Shares ETFs during the inaugural year of their operations. We consider the launch of these ten funds to have been a resounding success. As of the close of their first full day of trading on August 27, 2014, the assets under management of the ten Funds amounted to more than $1 billion. The Funds have continued to attract assets since then, and as of the end of their fiscal reporting period have added approximately $475 million, bringing total assets across all of the Funds to more than $1.5 billion. We appreciate your confidence.
While the Funds are new, the investment philosophy and strategies used in their management have been developed over more than 20 years, and are based on those used for WBI’s separately managed accounts and mutual funds.
Investment Philosophy
The goal of the WBI Funds is to provide consistent, attractive returns with less volatility and risk to capital than traditional approaches. We believe capital preservation is essential to providing long-term portfolio growth and a consistent stream of income. Our focus on value, dividends, and risk management has become fundamental to our investment process.
Performance Overview
The Funds have not yet completed one full year of operation, however, from inception to the fiscal period ended June 30, 2015:
The WBI SMID Tactical Growth Shares (NYSE Arca: WBIA) returned 0.94% on a NAV basis, and 1.13% based on market value, versus the 4.15% return of the Russell Global SMID Growth Index, the Fund’s benchmark.
The WBI SMID Tactical Value Shares (NYSE Arca: WBIB) returned –0.84% on a NAV basis, and –0.60% based on market value, versus the –0.27% return of the Russell Global SMID Value Index, the Fund’s benchmark.
The WBI SMID Tactical Yield Shares (NYSE Arca: WBIC) returned –2.60% on a NAV basis, and –2.37% based on market value, versus the –4.23% return of the MSCI World High Dividend Yield Index, the Fund’s benchmark.
The WBI SMID Tactical Select Shares (NYSE Arca: WBID) returned –5.40% on a NAV basis, and –5.20% based on market value, versus the 1.87% return of the Russell Global SMID Defensive Index, the Fund’s benchmark.
The WBI Large Cap Tactical Growth Shares (NYSE Arca: WBIE) returned –1.25% on a NAV basis, and –1.12% based on market value, versus the 2.62% return of the Russell Global Large Cap Growth Index, the Fund’s benchmark.
The WBI LARGE CAP Tactical Value Shares (NYSE Arca: WBIF) returned –3.29% on a NAV basis, and –3.07% based on market value, versus the –1.34% return of the Russell Global Large Cap Value Index, the Fund’s benchmark.
The WBI LARGE CAP Tactical Yield Shares (NYSE Arca: WBIG) returned –4.96% on a NAV basis, and –4.71% based on market value, versus the –4.23% return of the MSCI World High Dividend Yield Index, the Fund’s benchmark.
The WBI Large Cap Tactical Select Shares (NYSE Arca: WBIL) returned –4.41% on a NAV basis, and –4.20% based on market value, versus the –0.46% return of the Russell Global Large Cap Defensive Index, the Fund’s benchmark.
The WBI Tactical Income Shares (NYSE Arca: WBII) returned 2.77% on a NAV basis, and 2.84% based on market value, versus the –2.81% return of the 50% Barclays Global Aggregate Bond/50% Russell Global Index, the Fund’s custom benchmark.
The WBI Tactical High Income Shares (NYSE Arca: WBIH) returned –0.64% on a NAV basis, and –0.47% based on market value, versus the –2.81% return of the 50% Barclays Global Aggregate Bond/50% Russell Global Index, the Fund’s custom benchmark.
Net asset value total return is calculated assuming an initial investment made at the net asset value at the beginning of the period, reinvestment of all dividends and distributions at net asset value during the period, and the redemption on the last day of the period. Net asset value total return includes adjustments in accordance with accounting principles generally accepted in the United States of America and as such, the net asset value for financial reporting purposes and the returns based upon those net asset values may differ from the net asset value and returns for shareholder transactions. Market price total return is calculated assuming an initial investment made at the market price at the beginning of the period, reinvestment of all dividends and distributions at market price during the period, and sale at the market price on the last day of the period. Total investment returns calculated for a period of less than one year are not annualized.
The strategies used in the management of the Funds do not attempt to replicate or track the performance of any index, and differ significantly from the methods used to construct and maintain the indices that serve as their respective benchmarks. Each of the Funds uses active management processes to screen, rank, and purchase securities with particular attributes and sells securities when certain thresholds are reached, while benchmark indices are unmanaged and consist of a passive representation of all securities that meet the definition of the index constituents. In addition, each Fund uses strategies intended to mitigate volatility and protect capital, and as a result the Funds will often have
| Absolute Shares Trust
Managers Discussion of Fund Performance (continued)
June 30, 2015 |
a significant allocation to cash equivalents. Therefore, while each Fund’s performance includes the effect of an investment in cash equivalents from the proceeds of sales when certain thresholds are met, benchmark indices do not include an allocation to cash equivalents. A distinguishing characteristic of cash equivalents is that their prices are extremely stable and not subject to the levels of price volatility generally exhibited by other investments. Therefore, in periods during which the prices of the securities represented in benchmark indices are falling, an allocation to cash equivalents may contribute to Fund performance that is superior to their benchmarks. In periods during which the prices of the securities represented in benchmark indices are rising, an allocation to cash equivalents in a Fund may cause its performance to trail that of its benchmark. During the fiscal period since their inception, the Funds held material allocations to cash equivalents, which contributed to deviations in performance between each Fund and its respective benchmark. You cannot invest directly in an index, including a benchmark index, and benchmark performance does not include the deduction of transaction and operational expenses, or the deduction of an investment management fee, which would alter their indicated historical results.
Despite the limitations of benchmarks in assessing the performance of the Funds, indices can provide some context for understanding how market conditions and active management may have affected Fund performance. A benchmark for each of the Funds is shown because they provide a reference to investments that are similar to the types of investments that may appear from time to time in the Funds. However, none of the benchmarks are, or are likely to become, representative of past or expected Fund holdings or performance.
Review of Fund Trading Activity
The Funds attempt to provide consistent, attractive returns net of expenses with potentially less volatility and risk to capital than traditional approaches, whatever market conditions may be. This is the Funds’ definition of an absolute return approach to investment management. The investment process for each Fund includes a buy discipline and a sell discipline. Each Fund’s trading activity reflects this disciplined investment process as described in its prospectus, and summarized briefly below.
The Funds use quantitative computer screening of fundamental stock information to evaluate domestic and foreign equity securities in an attempt to find companies with attractive characteristics for the selected universe of securities. Dividend payments may be considered as part of the evaluation process. Once securities are identified, an overlay of technical analysis confirms timeliness of security purchases. The Funds then add qualifying securities using available cash within the parameters of each Fund’s investment objective and security selection criteria.
The Funds use a proprietary bond model to assess the appropriate duration of their exposure to debt securities. Duration is a measure of a fixed income security’s expected price sensitivity to changes in interest rates. Securities with longer durations are expected to experience greater price movements than securities with shorter duration for the same change in prevailing interest rates. A portion of a Fund’s bond exposure may also be invested to pursue perceived opportunities in varying segments of the debt market. This systematic process of identifying, evaluating, and purchasing securities constitutes the Sub-Advisor’s buy discipline for the Funds.
Once a security is purchased for a given Fund, a strict sell discipline with a dynamic stop loss and goal setting process attempts to control the effects of the volatility of each invested position on the Fund’s value. An initial stop percentage and goal price is established at the time a security is purchased. Once that security’s specified goal price has been achieved, a tightened goal stop replaces the initial stops set for each security. If a security stays within its acceptable price channel relative to either the initial stop or goal stop, it remains in the Fund’s portfolio. If the security moves below the acceptable price channel, a stop is triggered and the Fund will sell the security. This results in a responsive process that actively adjusts the Fund’s allocation by causing it to become more fully invested or by raising cash with the intention of protecting capital. This process is likely to result in a Fund holding meaningful allocations to cash equivalents during periods of market volatility.
The investment process has been built on the assumption that future events involve varying degrees of uncertainty. Therefore, the appearance of qualifying stock candidates in the screen results will be respected as a possible indication of the start of a durable price advance, and each stop loss trigger will result in a sale of the relevant security to help prevent losses to capital that could result if the security continued to be held and the price of the security continued to fall. As per this disciplined investment process, during the fiscal period securities identified by the screening and ranking process as attractive were purchased with available cash, and trailing stops were implemented for all securities purchased.
The security selection process has continued to uncover what we believe to be very attractive investment opportunities for each of the Funds. As would be expected, securities sold after hitting a goal stop were generally profitable, and those sold on an initial stop generally were not.
WBI SMID Tactical Growth Shares (WBIA)
As of June 30, 2015, WBIA held 31 securities in addition to a position in a money market fund which served as a cash equivalent. From the time of their purchase, 16 of these positions had unrealized gains of between 1.34% and 28.57%, while 15 had unrealized losses ranging from –1.26% to –18.50%. The aggregate unrealized gain amounted to 1.72% of the Fund’s period ending net asset value.
| Absolute Shares Trust
Managers Discussion of Fund Performance (continued)
June 30, 2015 |
Approximately 75% of the securities held by WBIA at any time during the fiscal period were sold. Approximately 27% of the Fund’s holdings were sold on goal stops for an average realized gain of 14.43%, and approximately 39% were sold after initial stops were hit for an average realized loss of –10.60%. Other dispositions (generally involving option activity and adjustments to short-term Treasury note positions) affected approximately 9% of the Fund’s positions, resulting in an average gain of 1.03%.
Examples of securities that made positive contributions to WBIA’s performance during the fiscal period include C&J Energy Services Inc., Community Health Systems Inc., Broadcom Corp., Zions Bancorporation, and GNC Holdings Inc. Examples of securities that detracted from the Fund’s performance during the fiscal period include Altisource Portfolio Solutions, Basic Energy Services Inc., Unit Corp., Century Aluminum Co., and Alcoa Inc.
Thirteen options hedges intended to reduce risk were implemented in WBIA during the fiscal period, resulting in an aggregate gain of approximately 0.31%. Examples of positions that were hedged with positive return contributions arising from the hedge itself include Informatica Corp., GNC Holdings, Inc., and Pilgrim’s Price Corp. There were no negative contributions to performance arising from the option hedges.
High turnover in WBIA’s holdings has the potential to result in the realization and distribution to shareholders of higher capital gains. If Fund shares are held in a taxable account, this may increase your tax liability. To the extent portfolio turnover increases transaction costs, it may also reduce Fund performance. Of course, selling a security in a timely fashion may also improve performance if a subsequent loss is avoided that exceeds the cost of executing the sale.
WBI SMID Tactical Value Shares (WBIB)
As of June 30, 2015, WBIB held 28 securities in addition to a position in a money market fund which served as a cash equivalent. From the time of their purchase, 15 of these positions had unrealized gains of between 0.87% and 30.01%, while 13 had unrealized losses ranging from –0.58% to –9.09%. The aggregate unrealized gain amounted to 3.00% of the Fund’s period ending net asset value.
Approximately 76% of the securities held by WBIB at any time during the fiscal period were sold. Approximately 24% of the Fund’s holdings were sold on goal stops for an average realized gain of 15.04%, and approximately 42% were sold after initial stops were hit for an average realized loss of –11.44%. Other dispositions (generally involving option activity and adjustments to short-term Treasury note positions) affected approximately 11% of the Fund’s positions, resulting in an average gain of 0.13%.
Examples of securities that made positive contributions to WBIB’s performance during the fiscal period include Centene Corp., Sina Corp., Manpowergroup Inc., World Fuel Services Corp., and Comerica Inc. Examples of securities that detracted from the Fund’s performance during the fiscal period include Basic Energy Services Inc., MRC Global Inc., Vista Outdoor, Superior Energy Services Inc., and C&J Energy Services Inc.
Eleven options hedges intended to reduce risk were implemented in WBIB during the fiscal period, resulting in an aggregate gain of approximately 0.11%. Examples of positions that were hedged with positive return contributions arising from the hedge itself include Centene Corp., Pilgrim’s Pride Corp., and Gannett Co Inc. Examples of positions that were hedged resulting in hedging costs include The Boeing Co. and a separate instance of hedging Centene Corp.
High turnover in the WBIB’s holdings has the potential to result in the realization and distribution to shareholders of higher capital gains. If Fund shares are held in a taxable account, this may increase your tax liability. To the extent portfolio turnover increases transaction costs, it may also reduce Fund performance. Of course, selling a security in a timely fashion may also improve performance if a subsequent loss is avoided that exceeds the cost of executing the sale.
WBI SMID Tactical Yield Shares (WBIC)
As of June 30, 2015, WBIC held 28 securities in addition to a position in a money market fund which served as a cash equivalent. From the time of their purchase, 11 of these positions had unrealized gains of between 0.72% and 20.41%, while 17 had unrealized losses ranging from –0.05% to –20.00%. The aggregate unrealized gain amounted to 0.14% of the Fund’s period ending net asset value.
Approximately 74% of the securities held by WBIC at any time during the fiscal period were sold. Approximately 21% of the Fund’s holdings were sold on goal stops for an average realized gain of 11.20%, and approximately 44% were sold after initial stops were hit for an average realized loss of –8.72%. Other dispositions (generally involving option activity and adjustments to short-term Treasury note positions) affected approximately 9% of the Fund’s positions, resulting in an average gain of 1.84%.
Examples of securities that made positive contributions to WBIC’s performance during the fiscal period include Cal-Maine Foods Inc., Gamestop Corp., Janus Capital Group Inc., Prosperity Bancshares Inc., and Cullen/Frost Bankers Inc. Examples of securities that detracted from the Fund’s performance during the fiscal period include International Game Technology PLC, Abercrombie & Fitch Class A Shares, Denbury Resources Inc., Mobile Telesystems PJSC Sponsored ADR, and Avon Products Inc.
| Absolute Shares Trust
Managers Discussion of Fund Performance (continued)
June 30, 2015 |
Seven options hedges intended to reduce risk were implemented in WBIC during the fiscal period, resulting in an aggregate gain of approximately 0.12%. Examples of positions that were hedged with positive return contributions arising from the hedge itself include Stifel Financial Corp., Pilgrim’s Pride Corp., and Xerox Corp. Only the hedge on The Boeing Co. resulted in hedging costs.
High turnover in the WBIC’s holdings has the potential to result in the realization and distribution to shareholders of higher capital gains. If Fund shares are held in a taxable account, this may increase your tax liability. To the extent portfolio turnover increases transaction costs, it may also reduce Fund performance. Of course, selling a security in a timely fashion may also improve performance if a subsequent loss is avoided that exceeds the cost of executing the sale.
WBI SMID Tactical Select Shares (WBID)
As of June 30, 2015, WBID held 31 securities in addition to a position in a money market fund which served as a cash equivalent. From the time of their purchase, 16 of these positions had unrealized gains of between 0.21% and 27.34%, while 15 had unrealized losses ranging from –0.03% to –14.31%. The aggregate unrealized loss amounted to –0.10% of the Fund’s period ending net asset value.
Approximately 76% of the securities held by WBID at any time during the fiscal period were sold. Approximately 22% of the Fund’s holdings were sold on goal stops for an average realized gain of 14.34%, and approximately 46% were sold after initial stops were hit for an average realized loss of –8.63%. Other dispositions (generally involving option activity and adjustments to short-term Treasury note positions) affected approximately 8% of the Fund’s positions, resulting in an average loss of –0.17%.
Examples of securities that made positive contributions to WBID’s performance during the fiscal period include Rite Aid Corp., Wabash National Corp., Freescale Semiconductor Ltd., Orbital ATK Inc., and GNC Holdings Inc. Examples of securities that detracted from the Fund’s performance during the fiscal period include International Game Technology PLC, Denbury Resources Inc., Vista Outdoor Inc., and SPX Corp., and Forum Energy Technologies Inc.
Ten options hedges intended to reduce risk were implemented in WBID during the fiscal period, resulting in an aggregate gain of approximately 0.31%. Examples of positions that were hedged with positive return contributions arising from the hedge itself include Freescale Semiconductor Ltd., Xerox Corp., and Gannett Co Inc. There were no negative contributions to performance arising from the option hedges.
High turnover in the WBID’s holdings has the potential to result in the realization and distribution to shareholders of higher capital gains. If Fund shares are held in a taxable account, this may increase your tax liability. To the extent portfolio turnover increases transaction costs, it may also reduce Fund performance. Of course, selling a security in a timely fashion may also improve performance if a subsequent loss is avoided that exceeds the cost of executing the sale.
WBI Large Cap Tactical Growth Shares (WBIE)
As of June 30, 2015, WBIE held 28 securities in addition to a position in a money market fund which served as a cash equivalent. From the time of their purchase, 13 of these positions had unrealized gains of between 0.21% and 11.65%, while 15 had unrealized losses ranging from –0.75% to –20.18%. The aggregate unrealized gain amounted to 1.99% of the Fund’s period ending net asset value.
Approximately 75% of the securities held by WBIE at any time during the fiscal period were sold. Approximately 26% of the Fund’s holdings were sold on goal stops for an average realized gain of 11.96%, and approximately 41% were sold after initial stops were hit for an average realized loss of –8.08%. Other dispositions (generally involving option activity and adjustments to short-term Treasury note positions) affected approximately 8% of the Fund’s positions, resulting in an average gain of 0.54%.
Examples of securities that made positive contributions to WBIE’s performance during the fiscal period include BHP Billiton Ltd Sponsored ADR, Valeant Pharmaceuticals International Inc., General Motors Co., The Boeing Co., and Walgreen Co. Examples of securities that detracted from the Fund’s performance during the fiscal period include South32 Ltd., Century Aluminum Co., World Acceptance Corp., Altisource Portfolio Solutions SA, and Bancolombia SA.
Twelve options hedges intended to reduce risk were implemented in WBIE during the fiscal period, resulting in an aggregate gain of approximately 0.32%. Examples of positions that were hedged with positive return contributions arising from the hedge itself include Marathon Petroleum Corp., Applied Materials Inc., and General Motors Co. There were two positions hedged that resulted in hedging costs, The Boeing Co. and salesforce.com inc.
High turnover in the WBIE’s holdings has the potential to result in the realization and distribution to shareholders of higher capital gains. If Fund shares are held in a taxable account, this may increase your tax liability. To the extent portfolio turnover increases transaction costs, it may also reduce Fund performance. Of course, selling a security in a timely fashion may also improve performance if a subsequent loss is avoided that exceeds the cost of executing the sale.
| Absolute Shares Trust
Managers Discussion of Fund Performance (continued)
June 30, 2015 |
WBI Large Cap Tactical Value Shares (WBIF)
As of June 30, 2015, WBIF held 30 securities in addition to a position in a money market fund which served as a cash equivalent. From the time of their purchase, 16 of these positions had unrealized gains of between 0.30% and 15.80%, while 14 had unrealized losses ranging from –0.39% to –14.20%. The aggregate unrealized gain amounted to 0.76% of the Fund’s period ending net asset value.
Approximately 76% of the securities held by WBIF at any time during the fiscal period were sold. Approximately 22% of the Fund’s holdings were sold on goal stops for an average realized gain of 13.30%, and approximately 60% were sold after initial stops were hit for an average realized loss of –7.80%. Other dispositions (generally involving option activity and adjustments to short-term Treasury note positions) affected approximately 6% of the Fund’s positions, resulting in an average loss of –1.33%.
Examples of securities that made positive contributions to WBIF’s performance during the fiscal period include Tencent Holdings Ltd., General Motors Co., The Boeing Co., Sumitomo Mitsui ADR, and Shire PLC ADR. Examples of securities that detracted from the Fund’s performance during the fiscal period include Copa Holdings SA Class A, Sasol Ltd. ADR, Bancolombia SA ADR, National Oilwell Varco Inc., and Tenaris SA ADR.
Thirteen options hedges intended to reduce risk were implemented in WBIF during the fiscal period, resulting in an aggregate gain of approximately 0.18%. Examples of positions that were hedged with positive return contributions arising from the hedge itself include Marathon Petroleum Corp., GNC Holdings Inc., and General Motors Co. Examples of positions that were hedged resulting in hedging costs include The Boeing Co., salesforce.com inc., and a separate instance of hedging GNC Holdings Inc.
High turnover in the WBIF’s holdings has the potential to result in the realization and distribution to shareholders of higher capital gains. If Fund shares are held in a taxable account, this may increase your tax liability. To the extent portfolio turnover increases transaction costs, it may also reduce Fund performance. Of course, selling a security in a timely fashion may also improve performance if a subsequent loss is avoided that exceeds the cost of executing the sale.
WBI Large Cap Tactical Yield Shares (WBIG)
As of June 30, 2015, WBIG held 28 securities in addition to a position in a money market fund which served as a cash equivalent. From the time of their purchase, 8 of these positions had unrealized gains of between 0.07% and 16.06%, while 20 had unrealized losses ranging from –0.59% to –14.55%. The aggregate unrealized loss amounted to –2.26% of the Fund’s period ending net asset value.
Approximately 75% of the securities held by WBIG at any time during the fiscal period were sold. Approximately 22% of the Fund’s holdings were sold on goal stops for an average realized gain of 12.74%, and approximately 45% were sold after initial stops were hit for an average realized loss of –9.26%. Other dispositions (generally involving option activity and adjustments to short-term Treasury note positions) affected approximately 8% of the Fund’s positions, resulting in an average loss of –0.25%.
Examples of securities that made positive contributions to WBIG’s performance during the fiscal period include Yum! Brands Inc., Prudential Financial Inc., General Motors Co., The Boeing Co., and Sumitomo Mitsui ASR. Examples of securities that detracted from the Fund’s performance during the fiscal period include Abercrombie & Fitch Co. Class A, Mobile Telesystems ADR, Tenaris SA ADR, Bancolombia SA ADR, and Sasol Ltd. ADR.
Twelve options hedges intended to reduce risk were implemented in WBIG during the fiscal period, resulting in an aggregate gain of approximately 0.23%. Examples of positions that were hedged with positive return contributions arising from the hedge itself include Marathon Petroleum Corp., General Motors Co., and Baxter International Inc. Examples of positions that were hedged resulting in hedging costs include The Hershey Co., Best Buy Company Inc., and The Boeing Co.
High turnover in the WBIG’s holdings has the potential to result in the realization and distribution to shareholders of higher capital gains. If Fund shares are held in a taxable account, this may increase your tax liability. To the extent portfolio turnover increases transaction costs, it may also reduce Fund performance. Of course, selling a security in a timely fashion may also improve performance if a subsequent loss is avoided that exceeds the cost of executing the sale.
WBI Large Cap Tactical Select Shares (WBIL)
As of June 30, 2015, WBIL held 25 securities in addition to a position in a money market fund which served as a cash equivalent. From the time of their purchase, 12 of these positions had unrealized gains of between 0.26% and 19.29%, while 13 had unrealized losses ranging from –0.24% to –11.58%. The aggregate unrealized gain amounted to 0.35% of the Fund’s period ending net asset value.
Approximately 74% of the securities held by WBIL at any time during the fiscal period were sold. Approximately 21% of the Fund’s holdings were sold on goal stops for an average realized gain of 9.46%, and approximately 40% were sold after initial stops were hit for an average realized loss of –8.64%. Other dispositions (generally involving option activity and adjustments to short-term Treasury note positions) affected approximately 13% of the Fund’s positions, resulting in an average gain of 0.86%.
| Absolute Shares Trust
Managers Discussion of Fund Performance (continued)
June 30, 2015 |
Examples of securities that made positive contributions to WBIL’s performance during the fiscal period include HCA Holdings Inc., The Boeing Co., Gilead Sciences Inc., iPath S&P 500 VIX Short-Term Futures ETN, and Baker Hughes Inc. Examples of securities that detracted from the Fund’s performance during the fiscal period include Altisource Portfolio Solutions SA, Southwest Airlines Co., Viacom Inc. Class B, Discovery Communications Class A, and Banco Bradesco ADR.
Fifteen options hedges intended to reduce risk were implemented in WBIL during the fiscal period, resulting in an aggregate gain of approximately 0.35%. Examples of positions that were hedged with positive return contributions arising from the hedge itself include Marathon Petroleum Corp., Applied Materials Inc., and Express Scripts Holding Co. Examples of positions that were hedged resulting in hedging costs include The Boeing Co., GNC Holdings Inc., and salesforce.com inc.
High turnover in the WBIL’s holdings has the potential to result in the realization and distribution to shareholders of higher capital gains. If Fund shares are held in a taxable account, this may increase your tax liability. To the extent portfolio turnover increases transaction costs, it may also reduce Fund performance. Of course, selling a security in a timely fashion may also improve performance if a subsequent loss is avoided that exceeds the cost of executing the sale.
WBI Tactical Income Shares (WBII)
As of June 30, 2015, WBII held 29 securities in addition to a position in a money market fund which served as a cash equivalent. From the time of their purchase, 15 of these positions had unrealized gains of between 0.01% and 9.95%, while 14 had unrealized losses ranging from –0.08% to –9.99%. The aggregate unrealized gain amounted to 0.003% of the Fund’s period ending net asset value.
Approximately 70% of the securities held by WBII at any time during the fiscal period were sold. Approximately 12% of the Fund’s holdings were sold on goal stops for an average realized gain of 18.06%, and approximately 22% were sold after initial stops were hit for an average realized loss of –8.05%. Other dispositions (generally involving option activity and adjustments to short-term Treasury note positions) affected approximately 36% of the Fund’s positions, resulting in an average gain of 2.16%.
Examples of securities that made positive contributions to WBII’s performance during the fiscal period include General Motors Co., Prudential Financial Inc., Cullen/Frost Bankers Inc., Orbital ATK Inc., and Vista Outdoor Inc. Examples of securities that detracted from the Fund’s performance during the fiscal period include Tenaris SA ADR, Vanguard Long-Term Corporate Bond ETF, Greenbrier Companies Inc., iShares iBoxx Investment Grade Corporate Bond ETF, and Valero Energy Corp.
Six options hedges intended to reduce risk were implemented in WBII during the fiscal period, resulting in an aggregate gain of approximately 0.13%. Examples of positions that were hedged with positive return contributions arising from the hedge itself include Marathon Petroleum Corp., General Motors Co., and Orbital ATK Inc. There were two positions hedged that resulted in hedging costs, The Hershey Co. and Best Buy Company Inc.
High turnover in the WBII’s holdings has the potential to result in the realization and distribution to shareholders of higher capital gains. If Fund shares are held in a taxable account, this may increase your tax liability. To the extent portfolio turnover increases transaction costs, it may also reduce Fund performance. Of course, selling a security in a timely fashion may also improve performance if a subsequent loss is avoided that exceeds the cost of executing the sale.
WBI Tactical High Income Shares (WBIH)
As of June 30, 2015, WBIH held 27 securities in addition to a position in a money market fund which served as a cash equivalent. From the time of their purchase, 11 of these positions had unrealized gains of between 0.01% and 13.59%, while 16 had unrealized losses ranging from –0.30% to –8.30%. The aggregate unrealized loss amounted to –0.18% of the Fund’s period ending net asset value.
Approximately 70% of the securities held by WBIH at any time during the fiscal period were sold. Approximately 12% of the Fund’s holdings were sold on goal stops for an average realized gain of 17.18%, and approximately 28% were sold after initial stops were hit for an average realized loss of –6.83%. Other dispositions (generally involving option activity and adjustments to short-term Treasury note positions) affected approximately 30% of the Fund’s positions, resulting in an average gain of 0.61%.
Examples of securities that made positive contributions to WBIH’s performance during the fiscal period include Comerica Inc., General Motors Co., Cullen/Frost Bankers Inc., Cyberonics Inc., and Abbvie Inc. Examples of securities that detracted from the Fund’s performance during the fiscal period include Avon Products Inc., Greenbrier Companies Inc., Entergy Corp., First Niagara Financial Group, and Valero Energy Corp.
Eight options hedges intended to reduce risk were implemented in WBIH during the fiscal period, resulting in an aggregate gain of approximately 0.15%. Examples of positions that were hedged with positive return contributions arising from the hedge itself include Marathon Petroleum Corp., General Motors Co., and Best Buy Company Inc. There were two positions hedged that resulted in hedging costs, The Hershey Co. and a separate instance of hedging Best Buy Company Inc.
| Absolute Shares Trust
Managers Discussion of Fund Performance (continued)
June 30, 2015 |
High turnover in the WBIH’s holdings has the potential to result in the realization and distribution to shareholders of higher capital gains. If Fund shares are held in a taxable account, this may increase your tax liability. To the extent portfolio turnover increases transaction costs, it may also reduce Fund performance. Of course, selling a security in a timely fashion may also improve performance if a subsequent loss is avoided that exceeds the cost of executing the sale.
Market Conditions
Quarter by quarter review of fiscal period market conditions 2014-2015
3rd Quarter 2014
The Funds were launched during the last week of August 2014, more than halfway through the year and nearly two-thirds through the third calendar quarter. Large company U.S. stocks had enjoyed solid gains in August. Unfortunately, those gains were sandwiched between negative returns in both July and September. Still, the Dow Jones Industrial Average (DJIA), S&P 500, and NASDAQ had enough gain left over to finish the third quarter of 2014 with slightly positive results.
The broader market didn’t fare nearly as well. The NYSE Composite, which measures the performance of all securities traded on the New York Stock Exchange, fell 2.52% for the quarter despite August’s gains. Small company stocks were especially hard hit. The Russell 2000 lost more than 6% in both July and September to end the quarter solidly in negative territory for both the quarter and year-to-date. The high closing value of the Russell 2000 came on July 1, and from there it fell 9.22% to end with a quarterly loss of 7.65%. From high to low it fell nearly the 10% commonly called a correction. Whatever anyone chooses to call it, the broad market’s summer weakness cast a pall over a huge swath of the investment landscape in the U.S.
Things weren’t much better in other equity markets around the world. With the exception of Japan, which continued its bounce-back from a more than 12% decline in the first four months of the year, most of the developed economies saw their stock markets end the quarter lower, with the EAFE down 6.39%.
Bonds on the other hand held up well during the quarter, although the prospect of higher rates in the not too distant future may have contributed to some weakness in September. As interest rates rise, existing bonds issued with lower rates become less attractive by comparison and their prices adjust accordingly. The Federal Reserve scheduled an end to its long-running bond buying program, or Quantitative Easing, for October. The imminent loss of a deep pocket buyer may also have had something to do with September’s softness in fixed income prices.
Commodities took a beating during the quarter. The U.S economy was showing signs of continuing recovery, but economies elsewhere in the world appeared to be faltering—or in outright contraction. Slower global growth translates into a reduced demand for a broad range of commodities, including oil, and reduced demand tends to take down prices. The comparative strength of the U.S. economy was accompanied by strength in the U.S. dollar, which surged 7.71%. What’s good for the dollar is often bad for gold, which fell 7.65% during the quarter—almost exactly as much as the dollar rose.
4th Quarter 2014
By the end of December, calendar year returns for 2014 looked pretty good. The Dow Jones Industrial Average (DJIA) gained 7.52%, the S&P 500 Index gained 11.39%, the NASDAQ Composite Index gained 13.40%, and the small company Russell 2000 Index gained 3.53%.
But that year-end snapshot doesn’t fully capture the way most of 2014 may have felt to stock investors. In mid-October, after about 80% of the year had already gone by, the S&P 500 and NASDAQ were only up 0.78% and 0.89% respectively, the Dow Jones Industrial Average was down –2.77% for the year, and the small company Russell 2000 was actually down –9.83%. A nice “Santa Claus” rally over eight trading days around Christmas tacked 6% onto the suddenly attractive year-end index results.
Many forecasters had predicted 2014 would be the year interest rates would finally rise, as the Federal Reserve phased out its Quantitative Easing bond buying program. Instead, the yield on the benchmark 10 year Treasury Note fell from 3.03% to as low as 2.06% before closing the year at 2.17%. Early in 2015, the Fed indicated that it expects to begin to “normalize” (that is—raise) interest rates sometime this year, but at a “patient” pace.
1st Quarter 2015
For the major U.S. equity indices, the first quarter of 2015 brought a lot of motion, but very little movement. The Dow Jones Industrial Average (DJIA) had daily moves of more than 100 points on 36 of the quarter’s 61 trading days; 18 up and 18 down. The average gain on the up days was 210 points while the average of the big down days was –195 points. There were four days with DJIA moves of more than 300 points; also evenly split with two up and two down. Still, by quarter’s end the DJIA had barely changed with a drop of –0.26%. The S&P 500 followed a similar pattern—down in January, up in February, down again in March—to end the quarter with a gain of just 0.44% (0.95% with dividends). The NASDAQ and small company Russell 2000 indices also had their ups and downs, but closed the quarter with gains of 3.48% and 3.99% respectively.
| Absolute Shares Trust
Managers Discussion of Fund Performance (continued)
June 30, 2015 |
Most of the early movement in stocks prices in 2015 took place in foreign markets. Equities seemed to celebrate the European Central Bank’s version of QE, or Quantitative Easing, with the DAX in Germany jumping 22.03%, and the CAC 40 in France gaining 17.81%. Monetary policy in the U.K. is determined by the Bank of England rather than the European Central Bank, and the FTSE’s gain was a relatively more modest 3.15%. Japan’s version of monetary easing was likely a contributing factor to the Nikkei’s quarterly gain of 10.06%.
While the gains in foreign markets were quite impressive in terms of their local currencies, for investors in the U.S. those gains were reduced in dollar terms by the dollar’s ongoing rally. The U.S. Dollar Index, which measures the dollar’s value against a basket of foreign currencies, jumped nearly 9% in the first three months of this year, adding to last year’s 12.79% gain. Converting foreign gains into increasingly expensive dollars means getting less bang for your Euro or Yen.
Since rising bond prices cause yields to fall, Central Banks perform Quantitative Easing by buying bonds, with the expectation that the added buying pressure will drive interest rates down, and the resulting cheap money will help to revive economic growth. Yields have not only fallen, but have fallen to levels that may have been unimaginable in the past. By the end of the first quarter, Swiss government bond yields fell below 0%. At that yield, investor must actually pay for the privilege of lending cash to the Swiss government for the next 10 years. The 10 year German government bond yield of 0.18% made the 1.92% yield U.S. 10 year Treasury was offering seem downright generous. It’s little wonder that U.S. bonds continued to attract buyers in the first quarter, adding to last year’s gains in Corporate and Treasury bond indices.
2nd Quarter 2015
After a lackluster first quarter, U.S. equity markets spent much of the second quarter of 2015 enjoying a respectable advance. That enjoyment came to an abrupt halt, however, as worries about possible contagion from the Greek debt crisis appeared to spread. As recently as one week before the end of the quarter the three major market indices were posting solid gains, with the S&P 500 ahead by 2.72%, the Dow Jones Industrial Average (DJIA) up by 2.07%, and the NASDAQ Composite up 5.29% for the quarter through June 23. The next four trading days saw those indices drop 3.13%, 3.02% and 3.91% respectively, with most of the damage coming in just one day. The DJIA lost 350 points, or 1.95% on the 29th, while the S&P 500 fell 2.09% and the NASDAQ lost 2.40% that day. When it was over, what had been a promising month and quarter for the U.S. stock indices had suddenly slipped away.
Stock markets around the world also slipped on the news from Greece. The heightened possibility of a Greek exit from the Eurozone took stocks down across Europe. For the quarter, the German DAX fell 8.53%, the CAC 40 in France dropped 4.84%, and the U.K.’s FTSE fell 3.72%.
On the other side of the globe, the Shanghai Composite began a dramatic slide that took it down more than 17% from its June 12th high, but nevertheless left it up 14.71% for the quarter and more than 30% higher for the year so far. According to data from The World Bank, in 2014 China’s economy was the second largest in the world, trailing only that of the U.S. It was also more than 43 times larger than the economy of Greece. It’s understandable that concerns about the Greek economy would ripple through global markets, but those concerns could be swamped by the waves of concern that could wash over global markets if Chinese stocks continue to sink.
The notion that interest rates would have to start rising someday has been drifting around bond markets for some time now. The drop in bond prices during the second quarter suggests investors are starting to believe that “someday” is someday soon. Comments from the Federal Reserve seemed to crystallize the loose idea of higher rates into the hard reality that rate hikes could be coming before the end of the year. While the Fed has yet to move on rates, some investors apparently decided not to wait before moving on from their bond holdings. Dow Jones Equal Weight U.S. Issued Corporate Bond Index slid throughout the second quarter, losing 3.35% for the period. Long term bonds were hit harder, with the Barclays Capital U.S. 20+ Year Treasury Bond Index falling 9.09% over that period.
Savers, who have been stuck with miniscule interest on their bank deposits, money market accounts and CDs for years, probably shouldn’t get too excited about the prospect of finally getting higher rates on their money. While the U.S. economy has been in recovery for a while now and employment here has improved, important economies around the world are still struggling. In fact, the global slowdown in economic activity is a prime suspect in the on-going dramatic slide in commodity prices (including oil). Falling prices can lead to a deflationary spiral that can stifle an economy. Japan is still fighting the deflation dragon it’s been battling for decades, and Europe is battling to keep from teetering toward deflation. With global conditions worrisome and no sign of inflation in the U.S., the Fed may be reluctant to risk making matters worse by raising interest rates too much. Demand from foreign investors for U.S. bonds may also help support bond prices and keep yields relatively low.
As for stocks, the bull market’s performance has already been running for more than 6 years now (since March 2009). For investors just joining the show, the good seats may already be taken. Market corrections of 20% are not all that rare, and this 6 year bull market started after a plunge in the S&P 500 of more than 50%. We believe diversification, value, careful stock selection, and a responsive risk management approach are always important, but are especially timely ideas after a lengthy bull market. The major U.S. stock indices may end up posting some positive numbers by the time we get to this time next year—but that doesn’t mean there won’t be some negative numbers between now and then.
| Absolute Shares Trust
Managers Discussion of Fund Performance (continued)
June 30, 2015 |
Investment Commentary
Caveat Emptor (“Let the buyer beware”)
Imagine a very nice family living in a very nice neighborhood in an especially beautiful and very nice home. They have lived there for a little over seven years now, and have been very happy. A few years ago they invested in finishing the basement, turning it into a beautiful family space with an entertainment center, exercise equipment, and separate room for the furnace and hot water heater. They even added a pair of sump pumps to protect their investment. Because their home made up a big part of their family wealth, they paid for homeowners’ insurance every month. It felt good to know that if something bad happened, they would be protected from a catastrophic financial loss.
Then the storm came. Wind and falling trees took down power lines, leaving their neighborhood very much in the dark for two weeks. Although they didn’t live near any lakes or rivers, the sudden deluge flooded the streets—and their once beautiful basement. Without electricity, the sump pumps sat quietly under four feet of water, with the ruined entertainment center, exercise equipment, furnace and hot water heater.
At least they had insurance. The insurance covered damage to all kinds of property from a great variety of causes, but unfortunately for the family, flooding from a backup of groundwater was not among them. The protection they thought they had been paying for all those years just wasn’t there. They were not alone. While some of their neighbors had been advised to add a groundwater rider to their policies, others had not and found themselves in the same sad situation. While they all understood the big picture benefits of homeowners’ insurance, some didn’t fully understand the details and limitations of the policies they owned. If only they had known…
One of the ways investors aim to protect themselves from unacceptable losses in their portfolios is through diversification. The big picture concept of the potential benefit of diversification is simple: owning a large number of stocks is intended to reduce the negative impact on a portfolio if something bad happens to one of them. An increasingly popular way to “buy” this kind of protection is through the use of index funds. According to the 2015 Investment Company Fact Book published by the Investment Company Institute (ICI):
| • | At the end of 2014 there were 382 index funds with $2.1 trillion in assets under management |
| • | In 2014 investors added $148 billion in new money to these funds |
| • | 31% of the households who owned mutual funds owned at least one equity index fund |
| • | One third of all index fund assets—approximately $693 billion—track the S&P 500 Index |
Just how much diversification protection does an index fund that holds around 500 stocks really offer? Let’s take a closer look at how the S&P 500 Index is put together to see if we can get a fuller understanding of the kind of equity exposure a fund designed to track this very popular index might offer.
The S&P 500 is a capitalization weighted index, which means each stock in the index is weighted based on the value of its stock price multiplied by its number of shares. The market capitalization is essentially the market value “footprint” of the company—the value the market has placed on the company.
Using data from our Bloomberg terminal to examine the details of the S&P 500 Index, we find that as of June 30:
| • | The five largest companies by market capitalization (Apple, Google, Microsoft, Exxon Mobil, and Berkshire Hathaway) accounted for 10.8% of the index weight |
| • | The 217 smallest companies by market capitalization (too many to list) also represented 10.8% of the index weight |
| • | Half the weight of the index was carried by just 54 companies; the other half was carried by the remaining 447 stocks in the index (there were 501 stocks in the index on 06/30) |
| • | More than 25% of the index weight was held by the biggest 18 stocks |
| • | The smallest 18 stocks had an average weight of 0.02% in the index |
| Absolute Shares Trust
Managers Discussion of Fund Performance (continued)
June 30, 2015 |
The notion that good news at a small company like QEP Resources will diversify away bad news at a big company like Apple that has 221 times its weight in the index just doesn’t add up.

Of course, worrying about how an index, and the hundreds of billions of dollars invested to track an index, might fare in a stormy market may seem out of step with what’s popular now. After all, the S&P 500 has been on the rise for years without a serious correction. Why prepare for a flooded basement on a sunny day?
Maybe the answer depends on how many disasters you’ve already lived through, and how much damage you’ve had to recover from. Investors who were tracking the S&P 500 on March 24, 2000 saw the index plummet 49% by October 9, 2002. Over the next five years the S&P clawed its way back to a 2.5% gain by October 9, 2007. It had been 71/2 years since it peaked in 2000.
And then it plunged again, this time losing 57% by March 9, 2009. If investors had been tracking the index throughout that decline, they would have watched each $100,000 invested reduced to $43,000 by the time it was over. If only they had known…
It’s hard to say whether the flood of cash into index investments today is a testament to investors’ confidence that markets will never have to weather another serious decline, or a belief that index funds will behave differently this time if conditions take a turn for the worse.
Maybe investors have simply forgotten what it feels like to have so much money washed away. After all, it’s been a little over 71/2 years since the last market peak.
| Absolute Shares Trust
Managers Discussion of Fund Performance (continued)
June 30, 2015 |
Of course, passively following an index is not the only way to invest, and mimicking the S&P 500—or any index—is not the approach we have taken with the client assets under our care. We don’t know when the next deluge of bad news will rain down on the market, or whether the account values of index-following investors will be left seriously under water when it does. But we do know that we will continue to follow the disciplined, responsive, risk-managed process we’ve used for our clients for more than 20 years, because trying our best to protect the value of our clients’ accounts under any conditions has always been our policy.

The Bottom Line
We believe that the appropriate approach to investing in a volatile world is one that’s responsive to continually changing conditions and opportunities. We think that process should be focused on managing risk as well as on pursuing return. It should be disciplined and have a track record that spans both good times and bad. In short, our opinion is that it should be just like the process we have used for our investment management clients for the last 23 years—and continue to use to manage the Funds today.
Sincerely,
 |  |
| Gary E. Stroik | Don Schreiber, Jr. |
| Co-Portfolio Manager | Co-Portfolio Manager |
| Vice President & Chief Investment Officer | Founder & CEO |
Past performance is not a guarantee of future results.
Opinions expressed are those of WBI Investments, Inc. (“WBI”), the Funds’ investment adviser, are subject to change, are not guaranteed, and should not be construed as recommendations or investment advice.
| Absolute Shares Trust
Managers Discussion of Fund Performance (continued)
June 30, 2015 |
Exchange Traded Fund investing involves risk. Principal loss is possible. The Funds invest in emerging market and foreign securities which involve political, economic and currency risks, greater volatility and differences in accounting methods. These risks can be greater in emerging markets. The Funds invest in smaller and medium sized companies, which involve additional risks such as limited liquidity and greater volatility. Investments in debt securities typically decrease in value when interest rates rise. This risk is usually greater for longer-term debt securities. Investment by the Fund in lower-rated and non-rated securities presents a greater risk of loss to principal and interest than higher-rated securities. Investments in mortgage-backed securities may involve additional risks, such as credit risk, prepayment risk, possible illiquidity and default, and susceptibility to adverse economic developments. Because the Funds invest in other exchange-traded funds (“ETFs”), they are subject to additional risks that do not apply to conventional mutual funds, including the risks that the market price of an ETF’s shares may trade at a discount to its net asset value ("NAV"), an active secondary trading market may not develop or be maintained, or trading may be halted by the exchange in which they trade, which may impact a Fund’s ability to sell its shares. The Funds may invest in exchange-traded notes (“ETN”), which are subject to the credit risk of the issuer. Additional risks include volatility, lack of liquidity, and sensitivity to currencies, commodities markets, and interest rate changes. The Funds may invest in master limited partnerships (“MLP”), which are subject to certain risks inherent in the structure of MLPs, including complex tax structure risks, the limited ability for election or removal of management, limited voting rights, potential dependence on parent companies or sponsors for revenues to satisfy obligations, and potential conflicts of interest between partners, members and affiliates. The Funds may also use options and future contracts, which have the risks of unlimited losses of the underlying holdings due to unanticipated market movements and failure to correctly predict the direction of securities prices, interest rates and currency exchange rates. The investment in options is not suitable for all investors.
Investments in absolute return strategies are not intended to outperform stocks and bonds during strong market rallies. Diversification does not assure a profit or protect against a loss in a declining market.
Fund holdings and sector allocations are subject to change and should not be considered a recommendation to buy or sell any security. References to other funds should not be interpreted as an offer of these securities. For a complete list of Fund holdings, please refer to the Schedule of Investments in this report.
While the Funds are no-load, commission charges on the purchase of shares, management fees and other expenses will apply. Please refer to the prospectus for additional information.
A stop loss order directs a brokerage firm to sell the specified security at the prevailing market price should that security’s price fall to or below a stipulated price. A stop limit order directs a brokerage firm to sell the specified security should that security’s price fall to or below a stipulated price, but only if the transaction can be executed at or above the limit price given as part of the order. The Funds use WBI’s proprietary Dynamic Trailing Stop/Loss System (DTSTM), which is designed to help control the risk to invested capital when investing in volatile securities and markets. The DTSTM is not a stop loss order or stop limit order placed with a brokerage firm, but an internal process for monitoring price movements. While the DTSTM may be used to initiate the process for selling a security, it does not assure that a particular execution price will be received.
The source for index price and performance data used in the discussion of market conditions and market commentary is Bloomberg. The S&P 500® Index is a capitalization weighted index of 500 large capitalization stocks which is designed to measure broad domestic securities markets.
An investment in money market funds is not insured or guaranteed by the Federal Deposit Insurance Corporation or any other governmental agency. Although money market funds seek to preserve the value of your investment at $1.00 per share, it is possible to lose money by investing in these funds.
Any tax or legal information provided is merely a summary of our understanding and interpretation of some of the current income tax regulations and is not exhaustive. Investors must consult their tax advisor or legal counsel for advice and information concerning their particular situation. Neither the Funds nor any of their representatives may give legal or tax advice.
Must be preceded or accompanied by a prospectus.
WBI Shares Exchange Traded Funds are distributed by Foreside Fund Services, LLC.
| Absolute Shares Trust
Managers Discussion of Fund Performance (continued)
June 30, 2015 |
Benchmark Definitions
The Russell Global SMID Growth Index measures the growth segment for small and mid-size securities in the global equity universe.
The Russell Global SMID Value Index measures the value segment of the small to mid-cap global equity universe, which represents companies that are considered less expensive than the overall market.
The MSCI World High Dividend Yield Index is designed to reflect performance of equities in the parent index (excluding REITs) with higher dividend income and quality characteristics than average, and dividend yields that are sustainable and persistent.
The Russell Global SMID Defensive Index measures the performance of the investable securities in the Global SMID Defensive segment of the market.
The Russell Global Large Cap Growth Index measures the growth segment for the largest securities in the global equity universe.
The Russell Global Large Cap Value Index measures the value segment of the large cap global equity universe, which represents companies that are considered less expensive than the overall market.
The Russell Global Large Cap Defensive Index measures the performance of the investable securities in the Global Large Cap Defensive segment of the market.
The 50% Barclays Global Aggregate Bond & 50% Russell Global Index is a custom index combining the Barclays Global Aggregate High-Yield Bond Index and Russell Global Index. The Barclays Global Aggregate High-Yield Bond Index is an unmanaged index considered representative of fixed-rate, noninvestment-grade debt of companies in the U.S., developed markets and emerging markets. The Russell Global Index measures the performance of the global equity market based on all investable equity securities.
| Absolute Shares Trust
Portfolio Allocations |
As of June 30, 2015 (Unaudited)
| WBI SMID Tactical Growth Shares | | WBI Large Cap Tactical Growth Shares | | WBI Tactical Income Shares |
| | Percentage of | | | Percentage of | | | Percentage of |
| Sector | Net Assets | | Sector | Net Assets | | Sector | Net Assets |
| Consumer Discretionary | 28.8% | | Information Technology | 19.4% | | Exchange Traded Funds | 42.1% |
| Health Care | 15.8% | | Energy | 14.5% | | US Government Notes | 35.9% |
| Industrials | 10.5% | | Consumer Discretionary | 10.1% | | Health Care | 3.8% |
| Financials | 9.6% | | Health Care | 9.7% | | Financials | 3.6% |
| Information Technology | 9.1% | | Industrials | 9.4% | | Energy | 3.0% |
| Materials | 7.1% | | Financials | 6.7% | | Industrials | 1.1% |
| Energy | 4.9% | | Materials | 6.4% | | Short-Term Investments and | | |
| Utilities | 4.2% | | Consumer Staples | 4.5% | | Other Assets and Liabilities | 10.5% |
| Consumer Staples | 2.2% | | Utilities | 4.1% | | TOTAL | 100.0% |
| Short-Term Investments and | | | | Short-Term Investments and | | | | | |
| Other Assets and Liabilities | 7.8% | | Other Assets and Liabilities | 15.2% | | WBI Tactical High Income Shares | |
| TOTAL | 100.0% | | TOTAL | 100.0% | | | Percentage of |
| | | | | | | | | Sector | Net Assets |
| WBI SMID Tacal Value Shares | | | WBI Large Cap Tactical Value Shares | | | Exchange Traded Funds | 43.6% |
| | Percentage of | | | Percentage of | | US Government Notes | 20.5% |
| Sector | Net Assets | | Sector | Net Assets | | Health Care | 11.9% |
| Information Technology | 19.4% | | Consumer Discretionary | 16.4% | | Financials | 4.1% |
| Consumer Discretionary | 18.4% | | Information Technology | 15.1% | | Consumer Staples | 3.6% |
| Financials | 17.2% | | Health Care | 13.7% | | Energy | 3.1% |
| Industrials | 16.8% | | Industrials | 13.7% | | Information Technology | 0.6% |
| Health Care | 14.5% | | Energy | 12.4% | | Short-Term Investments and | | |
| Energy | 4.2% | | Consumer Staples | 7.5% | | Other Assets and Liabilities | 12.6% |
| Materials | 2.7% | | Materials | 5.9% | | TOTAL | 100.0% |
| Short-Term Investments and | | | | Financials | 5.4% | | | | |
| Other Assets and Liabilities | 6.8% | | Short-Term Investments and | | | | | | |
| TOTAL | 100.0% | | Other Assets and Liabilities | 9.9% | | | | |
| | | | | TOTAL | 100.0% | | | | |
| WBI SMID Tactical Yield Shares | | | | | | | | | |
| | Percentage of | | WBI Large Cap Tactical Yield Shares | | | | | |
| Sector | Net Assets | | | Percentage of | | | | |
| Consumer Discretionary | 29.9% | | Sector | Net Assets | | | | |
| Industrials | 18.9% | | Health Care | 13.4% | | | | |
| Financials | 14.4% | | Industrials | 12.6% | | | | |
| Materials | 10.6% | | Information Technology | 12.2% | | | | |
| Utilities | 7.4% | | Consumer Staples | 12.1% | | | | |
| Information Technology | 2.5% | | Consumer Discretionary | 10.6% | | | | |
| Energy | 2.0% | | Energy | 10.1% | | | | |
| Short-Term Investments and | | | | Financials | 5.7% | | | | |
| Other Assets and Liabilities | 14.3% | | Real Estate Investment Trusts | 3.8% | | | | |
| TOTAL | 100.0% | | Utilities | 3.7% | | | | |
| | | | | Materials | 3.5% | | | | |
| WBI SMID Tactical Select Shares | | | Short-Term Investments and | | | | | | |
| | Percentage of | | Other Assets and Liabilities | 12.3% | | | | |
| Sector | Net Assets | | TOTAL | 100% | | | | |
| Consumer Discretionary | 17.7% | | | | | | | | |
| Industrials | 15.2% | | WBI Large Cap Tactical Select Shares | | | | | |
| Financials | 12.8% | | | Percentage of | | | | |
| Information Technology | 8.8% | | Sector | Net Assets | | | | |
| Energy | 7.8% | | Health Care | 18.4% | | | | |
| Materials | 6.7% | | Information Technology | 18.2% | | | | |
| Health Care | 5.9% | | Consumer Discretionary | 12.4% | | | | |
| Utilities | 5.8% | | Energy | 10.1% | | | | |
| Short-Term Investments and | | | | Consumer Staples | 7.6% | | | | |
| Other Assets and Liabilities | 19.3% | | Real Estate Investment Trusts | 7.4% | | | | |
| TOTAL | 100.0% | | Industrials | 5.4% | | | | |
| | | | | Utilities | 4.8% | | | | |
| | | | | Materials | 3.3% | �� | | | |
| | | | | Short-Term Investments and | | | | | | |
| | | | | Other Assets and Liabilities | 12.4% | | | | |
| | | | | TOTAL | 100.0% | | | | |
| Absolute Shares Trust
WBI SMID Tactical Growth Shares
Performance Summary (Unaudited) |

Total Returns
Period Ended June 30, 2015 | Since
Inception (8/25/14) |
|
| WBI SMID Tactical Growth Shares — NAV | 0.94 | % |
| WBI SMID Tactical Growth Shares — Market | 1.13 | % |
| Russell Global SMID Growth Index | 4.15 | % |
This chart illustrates the performance of a hypothetical $10,000 investment made on August 25, 2014, and is not intended to imply any future performance. The returns shown do not reflect the deduction of taxes that a shareholder would pay on fund distributions or the redemption of fund shares. The chart assumes reinvestment of capital gains and dividends.
The performance data quoted represents past performance and is not a guarantee of future results. Investment return and principal value of an investment will fluctuate so that an investor’s shares, when redeemed, may be worth more or less than their original cost. Current performance may be lower or higher than the performance data quoted. For most recent month-end performance, please visit www.wbishares.com.
Per the Prospectus, the Fund’s annual operating expense (gross) is 1.00%. The Fund’s Sub-Advisor has contractually agreed to waive the fees and reimburse expenses of the Fund such that total annual operating expenses are limited to 1.25% of average net assets until at least September 30, 2016. (Actual expenses can be referenced in the Financial Highlights section later in this report.)
| Absolute Shares Trust
WBI SMID Tactical Value Shares
Performance Summary (Unaudited) |

| Total Returns | Since |
| Period Ended June 30, 2015 | Inception (8/25/14) |
| WBI SMID Tactical Value Shares — NAV | (0.84 | %) |
| WBI SMID Tactical Value Shares — Market | (0.60 | %) |
| Russell Global SMID Value Index | (0.27 | %) |
This chart illustrates the performance of a hypothetical $10,000 investment made on August 25, 2014, and is not intended to imply any future performance. The returns shown do not reflect the deduction of taxes that a shareholder would pay on fund distributions or the redemption of fund shares. The chart assumes reinvestment of capital gains and dividends.
The performance data quoted represents past performance and is not a guarantee of future results. Investment return and principal value of an investment will fluctuate so that an investor’s shares, when redeemed, may be worth more or less than their original cost. Current performance may be lower or higher than the performance data quoted. For most recent month-end performance, please visit www.wbishares.com.
Per the Prospectus, the Fund’s annual operating expense (gross) is 1.00%. The Fund’s Sub-Advisor has contractually agreed to waive the fees and reimburse expenses of the Fund such that total annual operating expenses are limited to 1.25% of average net assets until at least September 30, 2016. (Actual expenses can be referenced in the Financial Highlights section later in this report.)
| Absolute Shares Trust
WBI SMID Tactical Yield Shares
Performance Summary (Unaudited) |
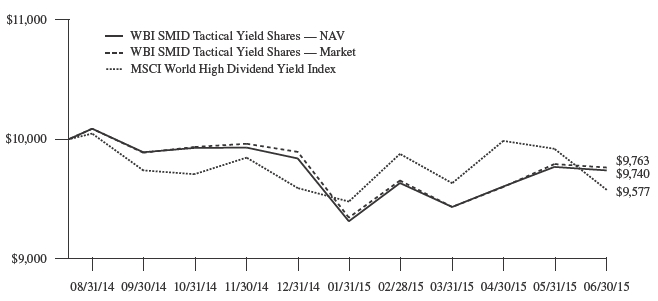
| Total Returns | Since |
| Period Ended June 30, 2015 | Inception (8/25/14) |
| WBI SMID Tactical Yield Shares — NAV | (2.60 | %) |
| WBI SMID Tactical Yield Shares — Market | (2.37 | %) |
| MSCI World High Dividend Yield Index | (4.23 | %) |
This chart illustrates the performance of a hypothetical $10,000 investment made on August 25, 2014, and is not intended to imply any future performance. The returns shown do not reflect the deduction of taxes that a shareholder would pay on fund distributions or the redemption of fund shares. The chart assumes reinvestment of capital gains and dividends.
The performance data quoted represents past performance and is not a guarantee of future results. Investment return and principal value of an investment will fluctuate so that an investor’s shares, when redeemed, may be worth more or less than their original cost. Current performance may be lower or higher than the performance data quoted. For most recent month-end performance, please visit www.wbishares.com.
Per the Prospectus, the Fund’s annual operating expense (gross) is 1.00%. The Fund’s Sub-Advisor has contractually agreed to waive the fees and reimburse expenses of the Fund such that total annual operating expenses are limited to 1.25% of average net assets until at least September 30, 2016. (Actual expenses can be referenced in the Financial Highlights section later in this report.)
| Absolute Shares Trust
WBI SMID Tactical Select Shares
Performance Summary (Unaudited) |

| Total Returns | Since |
| Period Ended June 30, 2015 | Inception (8/25/14) |
| WBI SMID Tactical Select Shares — NAV | (5.40 | %) |
| WBI SMID Tactical Select Shares — Market | (5.20 | %) |
| Russell Global SMID Defensive Index | 1.87 | % |
This chart illustrates the performance of a hypothetical $10,000 investment made on August 25, 2014, and is not intended to imply any future performance. The returns shown do not reflect the deduction of taxes that a shareholder would pay on fund distributions or the redemption of fund shares. The chart assumes reinvestment of capital gains and dividends.
The performance data quoted represents past performance and is not a guarantee of future results. Investment return and principal value of an investment will fluctuate so that an investor’s shares, when redeemed, may be worth more or less than their original cost. Current performance may be lower or higher than the performance data quoted. For most recent month-end performance, please visit www.wbishares.com.
Per the Prospectus, the Fund’s annual operating expense (gross) is 1.00%. The Fund’s Sub-Advisor has contractually agreed to waive the fees and reimburse expenses of the Fund such that total annual operating expenses are limited to 1.25% of average net assets until at least September 30, 2016. (Actual expenses can be referenced in the Financial Highlights section later in this report.)
| Absolute Shares Trust
WBI Large Cap Tactical Growth Shares
Performance Summary (Unaudited) |
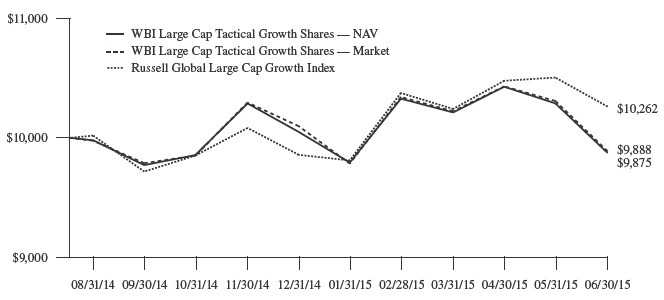
| Total Returns | Since |
| Period Ended June 30, 2015 | Inception (8/25/14) |
| WBI Large Cap Tactical Growth Shares — NAV | (1.25 | %) |
| WBI Large Cap Tactical Growth Shares — Market | (1.12 | %) |
| Russell Global Large Cap Growth Index | 2.62 | % |
This chart illustrates the performance of a hypothetical $10,000 investment made on August 25, 2014, and is not intended to imply any future performance. The returns shown do not reflect the deduction of taxes that a shareholder would pay on fund distributions or the redemption of fund shares. The chart assumes reinvestment of capital gains and dividends.
The performance data quoted represents past performance and is not a guarantee of future results. Investment return and principal value of an investment will fluctuate so that an investor’s shares, when redeemed, may be worth more or less than their original cost. Current performance may be lower or higher than the performance data quoted. For most recent month-end performance, please visit www.wbishares.com.
Per the Prospectus, the Fund’s annual operating expense (gross) is 1.00%. The Fund’s Sub-Advisor has contractually agreed to waive the fees and reimburse expenses of the Fund such that total annual operating expenses are limited to 1.25% of average net assets until at least September 30, 2016. (Actual expenses can be referenced in the Financial Highlights section later in this report.)
| Absolute Shares Trust
WBI Large Cap Tactical Value Shares
Performance Summary (Unaudited) |

| Total Returns | Since |
| Period Ended June 30, 2015 | Inception (8/25/14) |
| WBI Large Cap Tactical Value Shares — NAV | (3.29 | %) |
| WBI Large Cap Tactical Value Shares — Market | (3.07 | %) |
| Russell Global Large Cap Value Index | (1.34 | %) |
This chart illustrates the performance of a hypothetical $10,000 investment made on August 25, 2014, and is not intended to imply any future performance. The returns shown do not reflect the deduction of taxes that a shareholder would pay on fund distributions or the redemption of fund shares. The chart assumes reinvestment of capital gains and dividends.
The performance data quoted represents past performance and is not a guarantee of future results. Investment return and principal value of an investment will fluctuate so that an investor’s shares, when redeemed, may be worth more or less than their original cost. Current performance may be lower or higher than the performance data quoted. For most recent month-end performance, please visit www.wbishares.com.
Per the Prospectus, the Fund’s annual operating expense (gross) is 1.00%. The Fund’s Sub-Advisor has contractually agreed to waive the fees and reimburse expenses of the Fund such that total annual operating expenses are limited to 1.25% of average net assets until at least September 30, 2016. (Actual expenses can be referenced in the Financial Highlights section later in this report.)
| Absolute Shares Trust
WBI Large Cap Tactical Yield Shares
Performance Summary (Unaudited) |
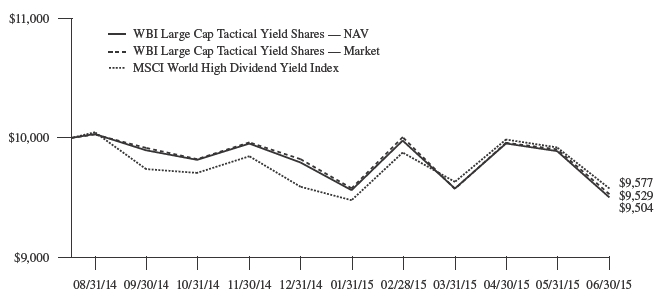
| Total Returns | Since |
| Period Ended June 30, 2015 | Inception (8/25/14) |
| WBI Large Cap Tactical Yield Shares — NAV | (4.96 | %) |
| WBI Large Cap Tactical Yield Shares — Market | (4.71 | %) |
| MSCI World High Dividend Yield Index | (4.23 | %) |
This chart illustrates the performance of a hypothetical $10,000 investment made on August 25, 2014, and is not intended to imply any future performance. The returns shown do not reflect the deduction of taxes that a shareholder would pay on fund distributions or the redemption of fund shares. The chart assumes reinvestment of capital gains and dividends.
The performance data quoted represents past performance and is not a guarantee of future results. Investment return and principal value of an investment will fluctuate so that an investor’s shares, when redeemed, may be worth more or less than their original cost. Current performance may be lower or higher than the performance data quoted. For most recent month-end performance, please visit www.wbishares.com.
Per the Prospectus, the Fund’s annual operating expense (gross) is 1.00%. The Fund’s Sub-Advisor has contractually agreed to waive the fees and reimburse expenses of the Fund such that total annual operating expenses are limited to 1.25% of average net assets until at least September 30, 2016. (Actual expenses can be referenced in the Financial Highlights section later in this report.)
| Absolute Shares Trust
WBI Large Cap Tactical Select Shares
Performance Summary (Unaudited) |
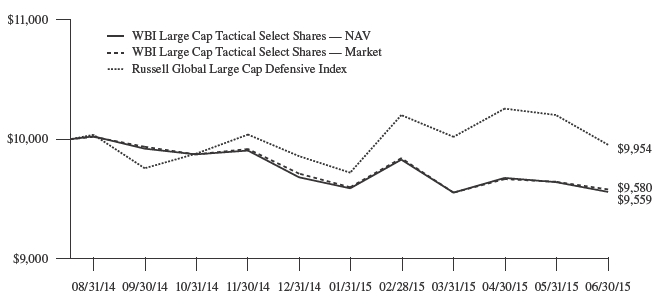
| Total Returns | Since |
| Period Ended June 30, 2015 | Inception (8/25/14) |
| WBI Large Cap Tactical Select Shares — NAV | (4.41 | %) |
| WBI Large Cap Tactical Select Shares — Market | (4.20 | %) |
| Russell Global Large Cap Defensive Index | (0.46 | %) |
This chart illustrates the performance of a hypothetical $10,000 investment made on August 25, 2014, and is not intended to imply any future performance. The returns shown do not reflect the deduction of taxes that a shareholder would pay on fund distributions or the redemption of fund shares. The chart assumes reinvestment of capital gains and dividends.
The performance data quoted represents past performance and is not a guarantee of future results. Investment return and principal value of an investment will fluctuate so that an investor’s shares, when redeemed, may be worth more or less than their original cost. Current performance may be lower or higher than the performance data quoted. For most recent month-end performance, please visit www.wbishares.com.
Per the Prospectus, the Fund’s annual operating expense (gross) is 1.00%. The Fund’s Sub-Advisor has contractually agreed to waive the fees and reimburse expenses of the Fund such that total annual operating expenses are limited to 1.25% of average net assets until at least September 30, 2016. (Actual expenses can be referenced in the Financial Highlights section later in this report.)
| Absolute Shares Trust
WBI Tactical Income Shares
Performance Summary (Unaudited) |
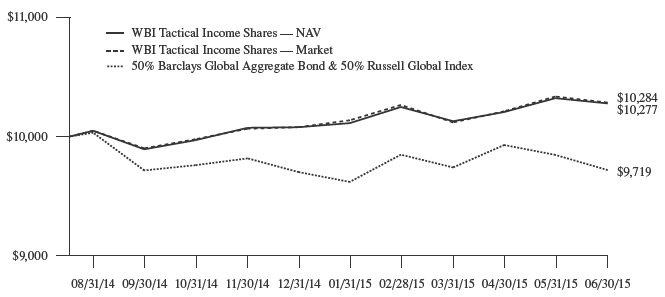
| Total Returns | Since |
| Period Ended June 30, 2015 | Inception (8/25/14) |
| WBI Tactical Income Shares — NAV | 2.77 | % |
| WBI Tactical Income Shares — Market | 2.84 | % |
| 50% Barclays Global Aggregate Bond & 50% Russell Global Index | (2.81 | %) |
This chart illustrates the performance of a hypothetical $10,000 investment made on August 25, 2014, and is not intended to imply any future performance. The returns shown do not reflect the deduction of taxes that a shareholder would pay on fund distributions or the redemption of fund shares. The chart assumes reinvestment of capital gains and dividends.
The performance data quoted represents past performance and is not a guarantee of future results. Investment return and principal value of an investment will fluctuate so that an investor’s shares, when redeemed, may be worth more or less than their original cost. Current performance may be lower or higher than the performance data quoted. For most recent month-end performance, please visit www.wbishares.com.
Per the Prospectus, the Fund’s annual operating expense (gross) is 1.00%. The Fund’s Sub-Advisor has contractually agreed to waive the fees and reimburse expenses of the Fund such that total annual operating expenses are limited to 1.25% of average net assets until at least September 30, 2016. (Actual expenses can be referenced in the Financial Highlights section later in this report.)
| Absolute Shares Trust
WBI Tactical High Income Shares
Performance Summary (Unaudited) |

| Total Returns | Since |
| Period Ended June 30, 2015 | Inception (8/25/14) |
| WBI Tactical High Income Shares — NAV | (0.64 | %) |
| WBI Tactical High Income Shares — Market | (0.47 | %) |
| 50% Barclays Global Aggregate Bond & 50% Russell Global Index | (2.81 | %) |
This chart illustrates the performance of a hypothetical $10,000 investment made on August 25, 2014, and is not intended to imply any future performance. The returns shown do not reflect the deduction of taxes that a shareholder would pay on fund distributions or the redemption of fund shares. The chart assumes reinvestment of capital gains and dividends.
| Absolute Shares Trust
WBI SMID Tactical Growth Shares
Schedule of Investments
June 30, 2015 |
| Shares | | Security Description | | Value |
| COMMON STOCKS—92.2% | | | | |
| Consumer Discretionary—28.8% | | | | |
| 111,590 | | | Big Lots, Inc.+ | | $ | 5,020,434 | |
| 139,582 | | | DeVry Education Group, Inc.+ | | | 4,184,668 | |
| 55,348 | | | Group 1 Automotive, Inc. | | | 5,027,259 | |
| 202,452 | | | Guess?, Inc.+ | | | 3,881,005 | |
| 617,757 | | | J. C. Penney Company, Inc.* | | | 5,232,402 | |
| 21,097 | | | Morningstar, Inc. | | | 1,678,266 | |
| 76,692 | | | Movado Group, Inc.+ | | | 2,082,955 | |
| 43,568 | | | Nexstar Broadcasting Group, Inc. | | | 2,439,808 | |
| 105,617 | | | The Gap, Inc. | | | 4,031,401 | |
| 39,390 | | | The Walt Disney Company+ | | | 4,495,974 | |
| | | | | | | 38,074,172 | |
| Consumer Staples—2.2% | | | | |
| 57,062 | | | Amira Nature Foods Ltd.*+ | | | 655,642 | |
| 28,935 | | | Coca-Cola FEMSA S.A.B de C.V.—ADR | | | 2,298,886 | |
| | | | | | | 2,954,528 | |
| Energy—4.9% | | | | |
| 22,956 | | | Western Refining, Inc. | | | 1,001,341 | |
| 443,803 | | | WPX Energy, Inc.*+ | | | 5,449,901 | |
| | | | | | | 6,451,242 | |
| Financials—9.6% | | | | |
| 13,484 | | | American National Insurance Company | | | 1,379,683 | |
| 119,009 | | | Comerica, Inc. | | | 6,107,542 | |
| 686,226 | | | Genworth Financial, Inc.* | | | 5,194,731 | |
| | | | | | | 12,681,956 | |
| Health Care—15.8% | | | | |
| 112,638 | | | Community Health Systems, Inc.* | | | 7,092,815 | |
| 49,674 | | | Patterson Companies, Inc. | | | 2,416,640 | |
| 341,833 | | | Select Medical Holdings Corporation | | | 5,537,694 | |
| 24,461 | | | Shire plc—ADR | | | 5,907,087 | |
| | | | | | | 20,954,236 | |
| Industrials—10.5% | | | | |
| 5,794 | | | Precision Castparts Corporation | | | 1,158,047 | |
| 20,614 | | | Rolls Royce Holdings Plc—ADR | | | 1,414,533 | |
| 96,956 | | | Spirit AeroSystems Holdings, Inc.* | | | 5,343,245 | |
| 89,850 | | | Triumph Group, Inc. | | | 5,929,201 | |
| | | | | | | 13,845,026 | |
| Shares | | Security Description | | Value |
| Information Technology—9.1% | | | | |
| 48,434 | | | Caci International, Inc.* | | $ | 3,917,826 | |
| 150,530 | | | Ingram Micro, Inc.* | | | 3,767,766 | |
| 76,193 | | | Tech Data Corporation* | | | 4,385,669 | |
| | | | | | | 12,071,261 | |
| Materials—7.1% | | | | |
| 385,323 | | | Alcoa, Inc. | | | 4,296,351 | |
| 138,867 | | | Boise Cascade Company* | | | 5,093,642 | |
| | | | | | | 9,389,993 | |
| Utilities—4.2% | | | | |
| 190,652 | | | Dynegy, Inc.* | | | 5,576,571 | |
| TOTAL COMMON STOCKS | | |
| (Cost $119, 852, 799) | | | 121,998,985 | |
| | | | | |
| SHORT-TERM INVESTMENTS—25.2% | | | | |
| 14,384,735 | | | Invesco STIT-Treasury Portfolio— | | | | |
| | | | Institutional Class, 0.02% (a) | | | 14,384,735 | |
| 18,935,761 | | | Mount Vernon Prime Portfolio, 0.25% (a)^ | | | 18,935,761 | |
| TOTAL SHORT-TERM INVESTMENTS | | | | |
| (Cost $33,320,496) | | | 33,320,496 | |
| TOTAL INVESTMENTS—117.4% | | | | |
| (Cost $153,173,295) | | | 155,319,481 | |
| Liabilities in Excess of Other Assets—(17.4)% | | | (23,050,789 | ) |
| NET ASSETS—100.0% | | $ | 132,268,692 | |
| (a) | The rate quoted is the annualized seven-day yield at June 30, 2015. |
| * | Non-income producing security. |
| ADR | American Depository Receipt. |
| + | All or a portion of this security is out on loan as of June 30, 2015. Total value of securities out on loan is $18,283,780. |
| ^ | Investments purchased with cash proceeds from securities lending. Total cash collateral has a value of $18,935,761 as of June 30, 2015. |
The accompanying notes are an integral part of these financial statements.
| Absolute Shares Trust
WBI SMID Tactical Value Shares
Schedule of Investments
June 30, 2015 |
| Shares | | | Security Description | | Value |
| COMMON STOCKS—93.2% | | | | |
| Consumer Discretionary—18.4% | | | | |
| 70,446 | | | BorgWarner, Inc. | | $ | 4,004,150 | |
| 36,500 | | | Cinemark Holdings, Inc. | | | 1,466,205 | |
| 27,762 | | | Cracker Barrel Old Country Store, Inc.+ | | | 4,140,980 | |
| 36,942 | | | Domino’s Pizza, Inc.+ | | | 4,189,223 | |
| 12,089 | | | Foot Locker, Inc. | | | 810,084 | |
| 118,592 | | | iRobot Corporation*+ | | | 3,780,713 | |
| | | | | | | 18,391,355 | |
| Energy—4.2% | |
| 79,908 | | | Cameron International Corporation* | | | 4,184,782 | |
| Financials—17.2% | |
| 97,581 | | | Aspen Insurance Holdings Ltd. | | | 4,674,130 | |
| 90,427 | | | Comerica, Inc. | | | 4,640,713 | |
| 57,210 | | | Cullen/Frost Bankers, Inc. | | | 4,495,562 | |
| 81,465 | | | The Bank New York Mellon Corporation | | | 3,419,086 | |
| | | | | | | 17,229,491 | |
| Health Care—14.5% | |
| 21,644 | | | CR Bard, Inc. | | | 3,694,631 | |
| 90,931 | | | Hanger, Inc.* | | | 2,131,423 | |
| 29,174 | | | Henry Schein, Inc.*+ | | | 4,146,209 | |
| 25,997 | | | Johnson & Johnson | | | 2,533,668 | |
| 8,393 | | | Shire plc—ADR | | | 2,026,825 | |
| | | | | | | 14,532,756 | |
| Industrials—16.8% | |
| 41,171 | | | Equifax, Inc. | | | 3,997,292 | |
| 8,184 | | | FedEx Corporation | | | 1,394,554 | |
| 48,268 | | | Kirby Corporation* | | | 3,700,225 | |
| 45,554 | | | ManpowerGroup, Inc. | | | 4,071,616 | |
| 29,080 | | | Towers Watson & Company | | | 3,658,264 | |
| | | | | | | 16,821,951 | |
| Shares | | Security Description | | Value |
| Information Technology—19.4% | | | | |
| 71,316 | | | Amdocs Ltd | | $ | 3,893,141 | |
| 111,021 | | | Cisco Systems, Inc. | | | 3,048,637 | |
| 24,512 | | | FactSet Research Systems, Inc. | | | 3,983,445 | |
| 62,174 | | | Jack Henry & Associates, Inc. | | | 4,022,658 | |
| 100,408 | | | WebMD Health Corporation*+ | | | 4,446,066 | |
| | | | | | | 19,393,947 | |
| Materials—2.7% | | | | |
| 10,136 | | | Eastman Chemical Company | | | 829,328 | |
| 39,226 | | | RPM International, Inc. | | | 1,920,897 | |
| | | | | | | 2,750,225 | |
| TOTAL COMMON STOCKS | | | | |
| (Cost $90,368,935) | | | 93,304,507 | |
| | | | | |
| SHORT-TERM INVESTMENTS—17.0% | | | | |
| 7,434,234 | | | Invesco STIT-Treasury Portfolio— | | | | |
| | | | Institutional Class, 0.02% (a) | | | 7,434,234 | |
| 9,541,984 | | | Mount Vernon Prime Portfolio, 0.25% (a)^ | | | 9,541,984 | |
| TOTAL SHORT-TERM INVESTMENTS | | | | |
| (Cost $16,976,218) | | | 16,976,218 | |
| TOTAL INVESTMENTS—110.2% | | | | |
| (Cost $107,345,153) | | | 110,280,725 | |
| Liabilities in Excess of Other Assets—(10.2)% | | | (10,164,086 | ) |
| NET ASSETS—100.0% | | $ | 100,116,639 | |
| (a) | The rate quoted is the annualized seven-day yield at June 30, 2015. |
| * | Non-income producing security. |
| ADR | American Depository Receipt. |
| + | All or a portion of this security is out on loan as of June 30, 2015. Total value of securities out on loan is $9,329,425. |
| ^ | Investments purchased with cash proceeds from securities lending. Total cash collateral has a value of $9,541,984 as of June 30, 2015. |
The accompanying notes are an integral part of these financial statements.
| Absolute Shares Trust
WBI SMID Tactical Yield Shares
Schedule of Investments
June 30, 2015 |
| Shares | | | Security Description | | Value |
| COMMON STOCKS—85.7% | | | | |
| Consumer Discretionary—29.9% | | | | |
| 252,187 | | | Abercrombie & Fitch Company | | $ | 5,424,542 | |
| 32,407 | | | Bob Evans Farms, Inc.+ | | | 1,654,377 | |
| 38,549 | | | Cracker Barrel Old Country Store, Inc.+ | | | 5,749,969 | |
| 164,794 | | | GameStop Corp.—Class A+ | | | 7,079,550 | |
| 169,136 | | | H&R Block, Inc. | | | 5,014,883 | |
| 16,201 | | | Kohl’s Corporation+ | | | 1,014,345 | |
| 116,031 | | | The Gap, Inc. | | | 4,428,903 | |
| 51,499 | | | The Walt Disney Company+ | | | 5,878,096 | |
| 54,075 | | | Vail Resorts, Inc. | | | 5,904,990 | |
| | | | | | | 42,149,655 | |
| Energy—2.0% | | | | |
| 34,001 | | | National Oilwell Varco, Inc.+ | | | 1,641,568 | |
| 44,124 | | | Tenaris S.A.—ADR+ | | | 1,192,231 | |
| | | | | | | 2,833,799 | |
| Financials—14.4% | | | | |
| 81,523 | | | Cullen/Frost Bankers, Inc.+ | | | 6,406,077 | |
| 60,672 | | | First Interstate BancSystem, Inc. | | | 1,683,041 | |
| 112,440 | | | Prosperity Bancshares, Inc. | | | 6,492,286 | |
| 120,633 | | | Waddell & Reed Financial, Inc.—Class A | | | 5,707,147 | |
| | | | | | | 20,288,551 | |
| Industrials—18.9% | | | | |
| 42,880 | | | CH Robinson Worldwide, Inc. | | | 2,675,283 | |
| 129,409 | | | Fastenal Company+ | | | 5,458,472 | |
| 54,574 | | | KAR Auction Services, Inc. | | | 2,041,067 | |
| 70,889 | | | Kirby Corporation* | | | 5,434,351 | |
| 134,682 | | | Nielsen N.V. | | | 6,029,713 | |
| 244,189 | | | Pitney Bowes, Inc. | | | 5,081,573 | |
| | | | | | | 26,720,459 | |
| Shares | | Security Description | | Value |
| Information Technology—2.5% | | |
| 20,826 | | | KLA-Tencor Corporation | | $ | 1,170,629 | |
| 44,596 | | | Texas Instruments, Inc. | | | 2,297,140 | |
| | | | | | | 3,467,769 | |
| Materials—10.6% | | |
| 283,874 | | | Alcoa, Inc. | | | 3,165,195 | |
| 75,621 | | | Eastman Chemical Company | | | 6,187,311 | |
| 268,052 | | | Steel Dynamics, Inc.+ | | | 5,552,697 | |
| | | | | | | 14,905,203 | |
| Utilities—7.4% | | |
| 102,313 | | | Cleco Corporation | | | 5,509,555 | |
| 71,065 | | | Entergy Corporation | | | 5,010,083 | |
| | | | | | | 10,519,638 | |
| TOTAL COMMON STOCKS | | | | |
| (Cost $120,719,170) | | | 120,885,074 | |
| | | | | |
| SHORT-TERM INVESTMENTS—25.7% | | | | |
| 5,400,077 | | | Invesco STIT-Treasury Portfolio— | | | | |
| | | | Institutional Class, 0.02% (a) | | | 5,400,077 | |
| 30,811,302 | | | Mount Vernon Prime Portfolio, 0.25% (a)^ | | | 30,811,302 | |
| TOTAL SHORT-TERM INVESTMENTS | | | | |
| (Cost $36,211,379) | | | 36,211,379 | |
| TOTAL INVESTMENTS—111.4% | | | | |
| (Cost $156,930,549) | | | 157,096,453 | |
| Liabilities in Excess of Other Assets—(11.4)% | | | (16,032,815 | ) |
| NET ASSETS—100.0% | | $ | 141,063,638 | |
| (a) | The rate quoted is the annualized seven-day yield at June 30, 2015. |
| ADR | American Depository Receipt. |
| * | Non-income producing security. |
| + | All or a portion of this security is out on loan as of June 30, 2015. Total value of securities out on loan is $30,064,354. |
| ^ | Investments purchased with cash proceeds from securities lending. Total cash collateral has a value of $30,811,302 as of June 30, 2015. |
The accompanying notes are an integral part of these financial statements.
| Absolute Shares Trust
WBI SMID Tactical Select Shares
Schedule of Investments
June 30, 2015 |
| Shares | | | Security Description | | Value |
| COMMON STOCKS—80.7% | | | | |
| Consumer Discretionary—17.7% | | | | |
| 37,824 | | | Bloomin’ Brands, Inc. | | $ | 807,542 | |
| 42,857 | | | Bob Evans Farms, Inc.+ | | | 2,187,850 | |
| 63,167 | | | Foot Locker, Inc. | | | 4,232,821 | |
| 76,098 | | | Nexstar Broadcasting Group, Inc. | | | 4,261,488 | |
| 9,612 | | | PVH Corporation | | | 1,107,302 | |
| 81,952 | | | The Gap, Inc. | | | 3,128,108 | |
| 16,087 | | | The Walt Disney Company+ | | | 1,836,170 | |
| | | | | | | 17,561,281 | |
| Energy—7.8% | | | | |
| 211,197 | | | Forum Energy Technologies, Inc.* | | | 4,283,075 | |
| 162,525 | | | Superior Energy Services, Inc.+ | | | 3,419,526 | |
| | | | | | | 7,702,601 | |
| Financials—12.8% | | | | |
| 12,913 | | | Cullen/Frost Bankers, Inc. | | | 1,014,703 | |
| 43,147 | | | Glacier Bancorp, Inc. | | | 1,269,385 | |
| 226,287 | | | Janus Capital Group, Inc. | | | 3,874,033 | |
| 14,950 | | | Jones Lang LaSalle, Inc. | | | 2,556,450 | |
| 76,520 | | | Legg Mason, Inc. | | | 3,943,076 | |
| | | | | | | 12,657,647 | |
| Health Care—5.9% | | | | |
| 343,674 | | | Affymetrix, Inc.* | | | 3,752,920 | |
| 5,615 | | | CR Bard, Inc. | | | 958,481 | |
| 8,493 | | | Omnicare, Inc. | | | 800,465 | |
| 14,701 | | | Triple-S Management Corporation* | | | 377,228 | |
| | | | | | | 5,889,094 | |
| Industrials—15.2% | | | | |
| 25,784 | | | CEB, Inc. | | | 2,244,755 | |
| 24,003 | | | Equifax, Inc. | | | 2,330,451 | |
| 15,031 | | | FedEx Corporation | | | 2,561,282 | |
| 177,280 | | | Pitney Bowes, Inc. | | | 3,689,197 | |
| 91,405 | | | Waste Connections, Inc. | | | 4,307,004 | |
| | | | | | | 15,132,689 | |
| Shares | | Security Description | | Value |
| Information Technology—8.8% | | | | |
| 32,642 | | | Cisco Systems, Inc. | | $ | 896,349 | |
| 10,440 | | | Fiserv, Inc.* | | | 864,745 | |
| 69,999 | | | InterDigital, Inc. | | | 3,982,243 | |
| 34,913 | | | VMware, Inc.*+ | | | 2,993,441 | |
| | | | | | | 8,736,778 | |
| Materials—6.7% | | | | |
| 53,791 | | | Eagle Materials, Inc.+ | | | 4,105,867 | |
| 185,960 | | | Graphic Packaging Holding Company | | | 2,590,423 | |
| | | | | | | 6,696,290 | |
| Utilities—5.8% | | |
| 134,580 | | | Dynegy, Inc.* | | | 3,936,465 | |
| 51,430 | | | Ugi Corp New | | | 1,771,764 | |
| | | | | | | 5,708,229 | |
| TOTAL COMMON STOCKS | | | | |
| (Cost $80,264,932) | | | 80,084,609 | |
| | | | | |
| SHORT-TERM INVESTMENTS—13.6% | | | | |
| 6,060,845 | | | Invesco STIT-Treasury Portfolio— | | | | |
| | | | Institutional Class, 0.02% (a) | | | 6,060,845 | |
| 7,425,752 | | | Mount Vernon Prime Portfolio, 0.25% (a)^ | | | 7,425,752 | |
| TOTAL SHORT-TERM INVESTMENTS | | | | |
| (Cost $13,486,597) | | | 13,486,597 | |
| TOTAL INVESTMENTS—94.3% | | | | |
| (Cost $93,751,529) | | | 93,571,206 | |
| Other Assets in Excess of Liabilities—5.7% | | | 5,652,383 | |
| NET ASSETS—100.0% | | $ | 99,223,589 | |
| (a) | The rate quoted is the annualized seven-day yield at June 30, 2015. |
| * | Non-income producing security. |
| + | All or a portion of this security is out on loan as of June 30, 2015. Total value of securities out on loan is $7,269,848. |
| ^ | Investments purchased with cash proceeds from securities lending. Total cash collateral has a value of $7,425,752 as of June 30, 2015. |
The accompanying notes are an integral part of these financial statements.
| Absolute Shares Trust
WBI Large Cap Tactical Growth Shares
Schedule of Investments
June 30, 2015 |
| Shares | | | Security Description | | Value |
| COMMON STOCKS—84.8% | | | |
| Consumer Discretionary—10.1% | | | | |
| 57,049 | | | Guess?, Inc. | | $ | 1,093,629 | |
| 441,184 | | | J. C. Penney Company, Inc.* | | | 3,736,829 | |
| 64,178 | | | Las Vegas Sands Corporation | | | 3,373,837 | |
| 33,094 | | | NIKE, Inc. | | | 3,574,814 | |
| 19,116 | | | The Walt Disney Company+ | | | 2,181,900 | |
| | | | | | | 13,961,009 | |
| Consumer Staples—4.5% | | | | |
| 62,364 | | | Brown-Forman Corporation | | | 6,247,626 | |
| Energy—14.5% | | | | |
| 61,259 | | | Cameron International Corporation* | | | 3,208,134 | |
| 102,095 | | | Halliburton Company | | | 4,397,232 | |
| 26,027 | | | National Oilwell Varco, Inc.+ | | | 1,256,583 | |
| 68,485 | | | Schlumberger Limited | | | 5,902,722 | |
| 195,809 | | | Tenaris S.A.—ADR+ | | | 5,290,759 | |
| | | | | | | 20,055,430 | |
| Financials—6.7% | | | | |
| 39,843 | | | Berkshire Hathaway, Inc.* | | | 5,423,031 | |
| 66,585 | | | Discover Financial Services | | | 3,836,627 | |
| | | | | | | 9,259,658 | |
| Health Care—9.7% | | | | |
| 29,344 | | | Becton, Dickinson and Company | | | 4,156,578 | |
| 34,401 | | | Johnson & Johnson | | | 3,352,721 | |
| 61,566 | | | Stryker Corporation+ | | | 5,883,863 | |
| | | | | | | 13,393,162 | |
| Industrials—9.4% | | | | |
| 34,556 | | | FedEx Corporation | | | 5,888,342 | |
| 33,479 | | | General Dynamics Corporation | | | 4,743,640 | |
| 11,590 | | | Precision Castparts Corporation | | | 2,316,493 | |
| | | | | | | 12,948,475 | |
| Shares | | Security Description | | Value |
| Information Technology—19.4% | | | | |
| 55,803 | | | Fiserv, Inc.* | | $ | 4,622,162 | |
| 9,592 | | | Google, Inc.* | | | 5,180,064 | |
| 171,963 | | | Intel Corporation | | | 5,230,255 | |
| 80,490 | | | SAP SE—ADR+ | | | 5,652,813 | |
| 90,421 | | | Visa, Inc.+ | | | 6,071,770 | |
| | | | | | | 26,757,064 | |
| Materials—6.4% | | | | |
| 197,453 | | | Alcoa, Inc. | | | 2,201,602 | |
| 89,065 | | | BHP Billiton Ltd—ADR+ | | | 3,625,836 | |
| 39,649 | | | Eagle Materials, Inc. | | | 3,026,408 | |
| | | | | | | 8,853,846 | |
| Utilities—4.1% | | | | |
| 193,096 | | | Dynegy, Inc.* | | | 5,648,058 | |
| TOTAL COMMON STOCKS | | | | |
| (Cost $118,615,781) | | | 117,124,328 | |
| | | | | |
| SHORT-TERM INVESTMENTS—19.2% | | | | |
| 5,073,729 | | | Invesco STIT-Treasury Portfolio— | | | | |
| | | | Institutional Class, 0.02% (a) | | | 5,073,729 | |
| 21,525,857 | | | Mount Vernon Prime Portfolio, 0.25% (a)^ | | | 21,525,857 | |
| TOTAL SHORT-TERM INVESTMENTS | | | | |
| (Cost $26,599,586) | | | 26,599,586 | |
| TOTAL INVESTMENTS—104.0% | | | | |
| (Cost $145,215,367) | | | 143,723,914 | |
| Liabilities in Excess of Other Assets—(4.0)% | | | (5,571,692 | ) |
| NET ASSETS—100.0% | | $ | 138,152,222 | |
| (a) | The rate quoted is the annualized seven-day yield at June 30, 2015. |
| * | Non-income producing security. |
| ADR | American Depository Receipt. |
| + | All or a portion of this security is out on loan as of June 30, 2015. Total value of securities out on loan is $20,788,794. |
| ^ | Investments purchased with cash proceeds from securities lending. Total cash collateral has a value of $21,525,857 as of June 30, 2015. |
The accompanying notes are an integral part of these financial statements.
| Absolute Shares Trust
WBI Large Cap Tactical Value Shares
Schedule of Investments
June 30, 2015 |
| Shares | | | Security Description | | Value |
| COMMON STOCKS—90.1% | | | | |
| Consumer Discretionary—16.4% | | | | |
| 46,810 | | | NIKE, Inc. | | $ | 5,056,416 | |
| 34,294 | | | Target Corporation | | | 2,799,419 | |
| 16,920 | | | The Home Depot, Inc. | | | 1,880,320 | |
| 68,582 | | | The TJX Companies, Inc. | | | 4,538,071 | |
| 47,856 | | | Time Warner, Inc.+ | | | 4,183,093 | |
| | | | | | | 18,457,319 | |
| Consumer Staples—7.5% | | | | |
| 95,577 | | | Archer-Daniels-Midland Company | | | 4,608,723 | |
| 38,643 | | | Brown-Forman Corporation | | | 3,871,256 | |
| | | | | | | 8,479,979 | |
| Energy—12.4% | | | | |
| 23,652 | | | Cameron International Corporation* | | | 1,238,655 | |
| 70,602 | | | Halliburton Company+ | | | 3,040,828 | |
| 16,552 | | | Schlumberger Limited | | | 1,426,617 | |
| 155,604 | | | Tenaris S.A.—ADR+ | | | 4,204,420 | |
| 94,432 | | | Western Refining, Inc. | | | 4,119,124 | |
| | | | | | | 14,029,644 | |
| Financials—5.4% | | | | |
| 29,471 | | | Ameriprise Financial, Inc. | | | 3,681,812 | |
| 58,767 | | | The Hartford Financial Services Group, Inc. | | | 2,442,944 | |
| | | | | | | 6,124,756 | |
| Health Care—13.7% | | | | |
| 75,261 | | | AbbVie, Inc.+ | | | 5,056,787 | |
| 73,435 | | | Sanofi-Aventis—ADR | | | 3,637,235 | |
| 16,959 | | | Shire plc—ADR | | | 4,095,429 | |
| 21,270 | | | UnitedHealth Group, Inc. | | | 2,594,940 | |
| | | | | | | 15,384,391 | |
| Industrials—13.7% | | | | |
| 33,394 | | | General Dynamics Corporation | | | 4,731,596 | |
| 9,040 | | | Northrop Grumman Corporation | | | 1,434,015 | |
| 45,593 | | | PACCAR, Inc. | | | 2,909,289 | |
| 21,695 | | | Precision Castparts Corporation | | | 4,336,180 | |
| 115,460 | | | R. R. Donnelley & Sons Company+ | | | 2,012,468 | |
| | | | | | | 15,423,548 | |
| Shares | | Security Description | | Value |
| Information Technology—15.1% | | | | |
| 73,400 | | | Cognizant Technology Solutions | | | | |
| | | | Corporation* | | $ | 4,484,006 | |
| 44,503 | | | Facebook, Inc.* | | | 3,816,800 | |
| 139,097 | | | Intel Corporation | | | 4,230,635 | |
| 19,135 | | | Texas Instruments, Inc. | | | 985,644 | |
| 41,030 | | | VMware, Inc.*+ | | | 3,517,912 | |
| | | | | | | 17,034,997 | |
| Materials—5.9% | | | | |
| 71,722 | | | BHP Billiton Ltd—ADR+ | | | 2,919,803 | |
| 32,493 | | | Ecolab, Inc. | | | 3,673,983 | |
| | | | | | | 6,593,786 | |
| TOTAL COMMON STOCKS | | | | |
| (Cost $100,955,422) | | | 101,528,420 | |
| | | | | |
| SHORT-TERM INVESTMENTS—15.1% | | | | |
| 5,523,213 | | | Invesco STIT-Treasury Portfolio— | | | | |
| | | | Institutional Class, 0.02% (a) | | | 5,523,213 | |
| 11,513,975 | | | Mount Vernon Prime Portfolio, 0.25% (a)^ | | | 11,513,975 | |
| TOTAL SHORT-TERM INVESTMENTS | | | | |
| (Cost $17,037,188) | | | 17,037,188 | |
| TOTAL INVESTMENTS—105.2% | | | | |
| (Cost $117,992,610) | | | 118,565,608 | |
| Liabilities in Excess of Other Assets—(5.2)% | | | (5,874,928 | ) |
| NET ASSETS—100.0% | | $ | 112,690,680 | |
| (a) | The rate quoted is the annualized seven-day yield at June 30, 2015. |
| * | Non-income producing security. |
| ADR | American Depository Receipt. |
| + | All or a portion of this security is out on loan as of June 30, 2015. Total value of securities out on loan is $11,126,188. |
| ^ | Investments purchased with cash proceeds from securities lending. Total cash collateral has a value of $11,513,975 as of June 30, 2015. |
The accompanying notes are an integral part of these financial statements.
| Absolute Shares Trust
WBI Large Cap Tactical Yield Shares
Schedule of Investments
June 30, 2015 |
| Shares | | | Security Description | | Value |
| COMMON STOCKS—83.9% | | | | |
| Consumer Discretionary—10.6% | | | | |
| 379,694 | | | J. C. Penney Company, Inc.* | | $ | 3,216,008 | |
| 65,912 | | | L Brands, Inc. | | | 5,650,636 | |
| 73,632 | | | Target Corporation | | | 6,010,580 | |
| | | | | | | 14,877,224 | |
| Consumer Staples—12.1% | | | | |
| 115,982 | | | Altria Group, Inc. | | | 5,672,680 | |
| 120,368 | | | Archer-Daniels-Midland Company | | | 5,804,145 | |
| 62,586 | | | The Hershey Company | | | 5,559,514 | |
| | | | | | | 17,036,339 | |
| Energy—10.1% | | | | |
| 122,041 | | | National Oilwell Varco, Inc.+ | | | 5,892,139 | |
| 204,382 | | | Tenaris S.A.—ADR+ | | | 5,522,402 | |
| 64,867 | | | Western Refining, Inc. | | | 2,829,498 | |
| | | | | | | 14,244,039 | |
| Financials—5.7% | | | | |
| 41,468 | | | ACE Ltd | | | 4,216,466 | |
| 148,742 | | | Allianz SE—ADR | | | 2,330,787 | |
| 18,214 | | | Cullen/Frost Bankers, Inc. | | | 1,431,256 | |
| | | | | | | 7,978,509 | |
| Health Care—13.4% | | | | |
| 95,222 | | | AbbVie, Inc.+ | | | 6,397,966 | |
| 10,952 | | | Novartis AG—ADR | | | 1,077,020 | |
| 122,342 | | | Sanofi-Aventis—ADR | | | 6,059,599 | |
| 22,165 | | | Shire plc—ADR | | | 5,352,626 | |
| | | | | | | 18,887,211 | |
| Industrials—12.6% | | | |
| 57,223 | | | Fastenal Company+ | | | 2,413,666 | |
| 12,159 | | | Precision Castparts Corporation | | | 2,430,219 | |
| 87,751 | | | R. R. Donnelley & Sons Company+ | | | 1,529,500 | |
| 55,297 | | | Siemens AG—ADR+ | | | 5,614,305 | |
| 41,561 | | | The Boeing Company | | | 5,765,342 | |
| | | | | | | 17,753,032 | |
| Shares | | Security Description | | Value |
| Information Technology—12.2% | | | | |
| 175,717 | | | Intel Corporation | | $ | 5,344,434 | |
| 135,540 | | | Microsoft Corporation | | | 5,984,091 | |
| 26,292 | | | Tech Data Corporation* | | | 1,513,367 | |
| 84,813 | | | Texas Instruments, Inc. | | | 4,368,718 | |
| | | | | | | 17,210,610 | |
| Materials—3.5% | | | | |
| 121,632 | | | BHP Billiton Ltd—ADR+ | | | 4,951,639 | |
| Utilities—3.7% | | | | |
| 179,935 | | | Dynegy, Inc.*+ | | | 5,263,099 | |
| TOTAL COMMON STOCKS | | | | |
| (Cost $121,272,117) | | | 118,201,702 | |
| REAL ESTATE INVESTMENT TRUSTS—3.8% | | | | |
| Financials—3.8% | | | | |
| 270,350 | | | Host Hotels & Resorts, Inc.+ | | | 5,361,040 | |
| TOTAL REAL ESTATE INVESTMENT TRUSTS | | |
| (Cost $5,600,025) | | | 5,361,040 | |
| | | | | |
| SHORT-TERM INVESTMENTS—26.4% | | | | |
| 12,519,325 | | | Invesco STIT-Treasury Portfolio— | | | | |
| | | | Institutional Class, 0.02% (a) | | | 12,519,325 | |
| 24,706,724 | | | Mount Vernon Prime Portfolio, 0.25% (a)^ | | | 24,706,724 | |
| TOTAL SHORT-TERM INVESTMENTS | | | | |
| (Cost $37,226,049) | | | 37,226,049 | |
| TOTAL INVESTMENTS—114.1% | | | | |
| (Cost $164,098,191) | | | 160,788,791 | |
| Liabilities in Excess of Other Assets—(14.1)% | | | (19,912,434 | ) |
| NET ASSETS—100.0% | | $ | 140,876,357 | |
| (a) | The rate quoted is the annualized seven-day yield at June 30, 2015. |
| * | Non-income producing security. |
| ADR | American Depository Receipt. |
| + | All or a portion of this security is out on loan as of June 30, 2015. Total value of securities out on loan is $23,853,222. |
| ^ | Investments purchased with cash proceeds from securities lending. Total cash collateral has a value of $24,706,724 as of June 30, 2015. |
The accompanying notes are an integral part of these financial statements.
| Absolute Shares Trust
WBI Large Cap Tactical Select Shares
Schedule of Investments
June 30, 2015 |
| Shares | | | Security Description | | Value |
| COMMON STOCKS—80.2% | | | | |
| Consumer Discretionary—12.4% | | | | |
| 51,845 | | | L Brands, Inc. | | $ | 4,444,672 | |
| 68,248 | | | Lowe’s Companies, Inc. | | | 4,570,568 | |
| 6,569 | | | O’ Reilly Automotive , Inc .*+ | | | 1,484,463 | |
| 69,532 | | | The TJX Companies, Inc. | | | 4,600,932 | |
| | | | | | | 15,100,635 | |
| Consumer Staples—7.6% | | | | |
| 103,589 | | | Archer-Daniels-Midland Company | | | 4,995,062 | |
| 42,052 | | | Brown-Forman Corporation | | | 4,212,769 | |
| | | | | | | 9,207,831 | |
| Energy—10.1% | | | | |
| 74,761 | | | Cameron International Corporation* | | | 3,915,233 | |
| 91,318 | | | National Oilwell Varco, Inc.+ | | | 4,408,833 | |
| 20,741 | | | Schlumberger Limited | | | 1,787,667 | |
| 49,495 | | | Western Refining, Inc. | | | 2,158,972 | |
| | | | | | | 12,270,705 | |
| Health Care—18.4% | | | | |
| 79,915 | | | AbbVie, Inc. | | | 5,369,489 | |
| 34,910 | | | Becton, Dickinson and Company | | | 4,945,001 | |
| 73,357 | | | Bristol-Myers Squibb Company | | | 4,881,175 | |
| 63,477 | | | HCA Holdings, Inc.* | | | 5,758,633 | |
| 5,693 | | | Shire plc—ADR | | | 1,374,803 | |
| | | | | | | 22,329,101 | |
| Industrials—5.4% | | | | |
| 36,035 | | | General Dynamics Corporation | | | 5,105,799 | |
| 18,919 | | | Kirby Corporation* | | | 1,450,331 | |
| | | | | | | 6,556,130 | |
| Shares | | Security Description | | Value |
| Information Technology—18.2% | | | | |
| 199,140 | | | Activision Blizzard, Inc. | | $ | 4,821,179 | |
| 50,843 | | | Fiserv, Inc.* | | | 4,211,326 | |
| 87,141 | | | Texas Instruments, Inc. | | | 4,488,633 | |
| 72,414 | | | Visa, Inc.+ | | | 4,862,600 | |
| 44,263 | | | VMware, Inc.*+ | | | 3,795,110 | |
| | | | | | | 22,178,848 | |
| Materials—3.3% | | | | |
| 35,188 | | | Ecolab, Inc.+ | | | 3,978,707 | |
| Utilities—4.8% | | | | |
| 108,715 | | | Dynegy, Inc.* | | | 3,179,914 | |
| 38,300 | | | Entergy Corporation | | | 2,700,150 | |
| | | | | | | 5,880,064 | |
| TOTAL COMMON STOCKS | | | | |
| (Cost $96,686,262) | | | 97,502,021 | |
| REAL ESTATE INVESTMENT TRUSTS—7.4% | | | | |
| Financials—7.4% | | | | |
| 229,750 | | | Host Hotels & Resorts, Inc.+ | | | 4,555,942 | |
| 141,647 | | | Weyerhaeuser Company | | | 4,461,881 | |
| TOTAL REAL ESTATE INVESTMENT TRUSTS | | | | |
| (Cost $9,548,842) | | | 9,017,823 | |
| SHORT-TERM INVESTMENTS—20.1% | | |
| 4,739,024 | | | Invesco STIT-Treasury Portfolio— | | | | |
| | | | Institutional Class, 0.02% (a) | | | 4,739,024 | |
| 19,773,168 | | | Mount Vernon Prime Portfolio, 0.25% (a)^ | | | 19,773,168 | |
| TOTAL SHORT-TERM INVESTMENTS | | | | |
| (Cost $24,512,192) | | | 24,512,192 | |
| TOTAL INVESTMENTS—107.7% | | | | |
| (Cost $130,747,296) | | | 131,032,036 | |
| Liabilities in Excess of Other Assets—(7.7)% | | | (9,402,853 | ) |
| NET ASSETS—100.0% | | $ | 121,629,183 | |
| (a) | The rate quoted is the annualized seven-day yield at June 30, 2015. |
| * | Non-income producing security. |
| ADR | American Depository Receipt. |
| + | All or a portion of this security is out on loan as of June 30, 2015. Total value of securities out on loan is $19,299,773. |
| ^ | Investments purchased with cash proceeds from securities lending. Total cash collateral has a value of $19,773,168 as of June 30, 2015. |
The accompanying notes are an integral part of these financial statements.
| Absolute Shares Trust
WBI Tactical Income Shares
Schedule of Investments
June 30, 2015 |
| Shares | | | Security Description | | Value |
| COMMON STOCKS—11.5% | | | | |
| Energy—3.0% | | | | |
| 340,722 | | | Tenaris S.A.—ADR | | $ | 9,206,309 | |
| Financials—3.6% | | | | |
| 140,833 | | | Cullen/Frost Bankers, Inc. | | | 11,066,657 | |
| Health Care—3.8% | | | | |
| 171,980 | | | AbbVie, Inc.+ | | | 11,555,336 | |
| Industrials—1.1% | | | | |
| 25,549 | | | The Boeing Company | | | 3,544,157 | |
| TOTAL COMMON STOCKS | | | | |
| (Cost $34,757,253) | | | 35,372,459 | |
| | | | | |
| EXCHANGE TRADED FUNDS—42.1% | | | | |
| 1,230,535 | | | Guggenheim Bullet Shares 2016 | | | | |
| | | | Corporate Bond ETF+ | | | 27,342,488 | |
| 1,061,915 | | | Guggenheim Bullet Shares 2017 | | | | |
| | | | Corporate Bond ETF+ | | | 24,137,328 | |
| 556,257 | | | Guggenheim Bullet Shares 2020 | | | | |
| | | | Corporate Bond ETF+ | | | 11,809,336 | |
| 194,145 | | | Guggenheim Bullet Shares 2022 | | | | |
| | | | Corporate Bond ETF+ | | | 4,009,094 | |
| 296,498 | | | iShares 0-5 Year High Yield | | | | |
| | | | Corporate Bond ETF | | | 14,415,733 | |
| 42,715 | | | iShares 3-7 Year Treasury Bond ETF+ | | | 5,252,236 | |
| 46,993 | | | iShares Core U.S. Aggregate Bond ETF | | | 5,111,899 | |
| 187,214 | | | iShares Core U.S. Treasury Bond ETF+ | | | 4,684,094 | |
| 44,209 | | | iShares MBS ETF | | | 4,801,982 | |
| 78,929 | | | PIMCO Investment Grade Corporate Bond ETF | | | 7,947,361 | |
| 65,213 | | | PIMCO Total Return Active ETF+ | | | 6,977,791 | |
| 249,253 | | | Vanguard Mortgage-Backed Securities ETF | | | 13,168,036 | |
| TOTAL EXCHANGE TRADED FUNDS | | | | |
| (Cost $130,325,693) | | | 129,657,378 | |
| Par Value | | Security Description | | Value |
| US GOVERNMENT NOTES—35.9% | | |
| 10,700,000 | | | 05/15/2016, 0.250% | | $ | 10,697,496 | |
| 6,900,000 | | | 10/31/2016, 0.375% | | | 6,896,226 | |
| 10,700,000 | | | 04/30/2017, 0.500% | | | 10,683,287 | |
| 10,800,000 | | | 07/31/2017, 0.500% | | | 10,762,870 | |
| 10,800,000 | | | 08/31/2017, 0.625% | | | 10,782,277 | |
| 8,300,000 | | | 09/30/2017, 0.625% | | | 8,276,005 | |
| 10,700,000 | | | 10/31/2017, 0.750% | | | 10,691,643 | |
| 11,200,000 | | | 11/30/2017, 0.625% | | | 11,152,747 | |
| 10,700,000 | | | 12/31/2017, 0.750% | | | 10,678,268 | |
| 5,000,000 | | | 02/28/2018, 0.750% | | | 4,980,470 | |
| 5,000,000 | | | 03/31/2018, 0.750% | | | 4,975,000 | |
| 5,200,000 | | | 04/15/2018, 0.750%+ | | | 5,173,189 | |
| 5,100,000 | | | 04/30/2018, 0.625% | | | 5,054,579 | |
| TOTAL US GOVERNMENT NOTES | | | | |
| (Cost $110,678,311) | | | 110,804,057 | |
| | | | | | | | |
| Shares | | | Security Description | | | Value | |
| SHORT-TERM INVESTMENTS—18.9% | | | | |
| 39,915,935 | | | Invesco STIT-Treasury Portfolio— | | | | |
| | | | Institutional Class, 0.02% (a) | | | 39,915,935 | |
| 18,176,703 | | | Mount Vernon Prime Portfolio, 0.25% (a)^ | | | 18,176,703 | |
| TOTAL SHORT-TERM INVESTMENTS | | | | |
| (Cost $58,092,638) | | | 58,092,638 | |
| TOTAL INVESTMENTS—108.4% | | | | |
| (Cost $333,853,895) | | | 333,926,532 | |
| Liabilities in Excess of Other Assets—(8.4)% | | | (25,864,628 | ) |
| NET ASSETS—100.0% | | $ | 308,061,904 | |
| (a) | The rate quoted is the annualized seven-day yield at June 30, 2015. |
| ADR | American Depository Receipt. |
| + | All or a portion of this security is out on loan as of June 30, 2015. Total value of securities out on loan is $17,673,795. |
| ^ | Investments purchased with cash proceeds from securities lending. Total cash collateral has a value of $18,176,703 as of June 30, 2015. |
The accompanying notes are an integral part of these financial statements.
| Absolute Shares Trust
WBI Tactical High Income Shares
Schedule of Investments
June 30, 2015 |
| Shares | | | Security Description | | Value |
| COMMON STOCKS—23.3% | | | | |
| Consumer Staples—3.6% | | | | |
| 160,435 | | | Archer-Daniels-Midland Company | | $ | 7,736,176 | |
| Energy—3.1% | |
| 248,026 | | | Tenaris S.A.—ADR+ | | | 6,701,662 | |
| Financials—4.1% | | | | |
| 111,767 | | | Cullen/Frost Bankers, Inc. | | | 8,782,651 | |
| Health Care—11.9% | | | | |
| 130,509 | | | AbbVie, Inc.+ | | | 8,768,900 | |
| 43,560 | | | Amgen, Inc. | | | 6,687,331 | |
| 75,906 | | | Johnson & Johnson | | | 7,397,799 | |
| 24,976 | | | UnitedHealth Group, Inc. | | | 3,047,072 | |
| | | | | | | 25,901,102 | |
| Information Technology—0.6% | | | | |
| 46,140 | | | Intel Corporation | | | 1,403,348 | |
| TOTAL COMMON STOCKS | | | | |
| (Cost $50,203,418) | | | 50,524,939 | |
| EXCHANGE TRADED FUNDS—43.6% | | | | |
| 337,217 | | | Guggenheim Bullet Shares 2019 High Yield | | | | |
| | | | Corporate Bond ETF+ | | | 8,464,147 | |
| 334,546 | | | Guggenheim Bullet Shares 2020 High Yield | | | | |
| | | | Corporate Bond ETF | | | 8,487,432 | |
| 572,089 | | | Guggenheim Bullet Shares 2016 High Yield | | | | |
| | | | Corporate Bond ETF+ | | | 15,034,499 | |
| 488,004 | | | Guggenheim Bullet Shares 2017 High Yield | | | | |
| | | | Corporate Bond ETF | | | 12,878,426 | |
| 137,542 | | | Guggenheim Bullet Shares 2022 | | | | |
| | | | Corporate Bond ETF | | | 2,840,242 | |
| 272,303 | | | iShares S&P U.S. Preferred Stock Index Fund+ | | | 10,666,109 | |
| 119,913 | | | iShares 0-5 Year High Yield | | | | |
| | | | Corporate Bond ETF | | | 5,830,170 | |
| 32,740 | | | iShares 3-7 Year Treasury Bond ETF+ | | | 4,025,710 | |
| 44,953 | | | iShares Core U.S. Aggregate Bond ETF | | | 4,889,987 | |
| 31,951 | | | PIMCO Investment Grade | | | | |
| | | | Corporate Bond ETF | | | 3,217,146 | |
| 770,272 | | | PowerShares Preferred ETF | | | 11,192,052 | |
| 132,989 | | | Vanguard Mortgage-Backed Securities ETF | | | 7,025,809 | |
| TOTAL EXCHANGE TRADED FUNDS | | | | |
| (Cost $95,758,262) | | | 94,551,729 | |
| Par Value | | Security Description | | Value |
| US GOVERNMENT NOTES—20.5% | | | | |
| 4,500,000 | | | 05/15/2016, 0.250% | | $ | 4,498,947 | |
| 6,700,000 | | | 10/31/2016, 0.375% | | | 6,696,335 | |
| 7,800,000 | | | 04/30/2017, 0.500% | | | 7,787,816 | |
| 4,500,000 | | | 10/31/2017, 0.750% | | | 4,496,486 | |
| 6,700,000 | | | 11/30/2017, 0.625% | | | 6,671,733 | |
| 7,800,000 | | | 12/31/2017, 0.750% | | | 7,784,158 | |
| 6,600,000 | | | 04/30/2018, 0.625% | | | 6,541,220 | |
| TOTAL US GOVERNMENT NOTES | | | | |
| (Cost $44,411,809) | | | 44,476,695 | |
| | | | | |
| Shares | | | Security Description | | | Value | |
| SHORT-TERM INVESTMENTS—25.0% | | | | |
| 24,934,194 | | | Invesco STIT-Treasury Portfolio— | | | | |
| | | | Institutional Class, 0.02% (a) | | | 24,934,194 | |
| 29,215,735 | | | Mount Vernon Prime Portfolio, 0.25% (a)^ | | | 29,215,735 | |
| TOTAL SHORT-TERM INVESTMENTS | | | | |
| (Cost $54,149,929) | | | 54,149,929 | |
| TOTAL INVESTMENTS—112.4% | | | | |
| (Cost $244,523,418) | | | 243,703,292 | |
| Liabilities in Excess of Other Assets—(12.4)% | | | (26,922,283 | ) |
| NET ASSETS—100.0% | | $ | 216,781,009 | |
| (a) | The rate quoted is the annualized seven-day yield at June 30, 2015. |
| ADR | American Depository Receipt. |
| + | All or a portion of this security is out on loan as of June 30, 2015. Total value of securities out on loan is $28,454,015. |
| ^ | Investments purchased with cash proceeds from securities lending. Total cash collateral has a value of $29,215,735 as of June 30, 2015. |
The accompanying notes are an integral part of these financial statements.
| Absolute Shares Trust
Statements of Assets and Liabilities |
June 30, 2015
| | | WBI SMID Tactical
Growth Shares | | WBI SMID Tactical
Value Shares | | WBI SMID Tactical
Yield Shares | | WBI SMID Tactical
Select Shares |
| ASSETS | | | | | | | | | | | | | | | | |
| Investments in securities, at value*+ (Note 2) | | $ | 155,319,481 | | | $ | 110,280,725 | | | $ | 157,096,453 | | | $ | 93,571,206 | |
| Cash | | | — | | | | — | | | | — | | | | 9,425 | |
| Dividends and interest receivable | | | 92,778 | | | | 53,027 | | | | 246,539 | | | | 35,459 | |
| Prepaid expenses and other assets | | | 9,446 | | | | 9,445 | | | | 9,445 | | | | 9,446 | |
| Receivable for investments sold | | | 15,098,393 | | | | 5,566,370 | | | | 14,641,107 | | | | 18,879,091 | |
| Securities lending income receivable | | | 18,637 | | | | 4,078 | | | | 25,050 | | | | 4,053 | |
| Total Assets | | | 170,538,735 | | | | 115,913,645 | | | | 172,018,594 | | | | 112,508,680 | |
| | | | | | | | | | | | | | | | | |
| LIABILITIES | | | | | | | | | | | | | | | | |
| Payables | | | | | | | | | | | | | | | | |
| Collateral received for securities loaned (Note 7) | | | 18,935,761 | | | | 9,541,984 | | | | 30,811,302 | | | | 7,425,752 | |
| Investments purchased | | | 19,195,403 | | | | 6,145,302 | | | | — | | | | 5,749,060 | |
| Management fees (Note 3) | | | 95,213 | | | | 70,595 | | | | 97,868 | | | | 70,378 | |
| Administration and fund accounting fees | | | 7,240 | | | | 6,135 | | | | 7,852 | | | | 6,446 | |
| Chief Compliance Officer fee | | | 1,566 | | | | 1,567 | | | | 1,567 | | | | 1,565 | |
| Audit fees | | | 14,493 | | | | 14,493 | | | | 14,493 | | | | 14,493 | |
| Registration fees | | | 15,113 | | | | 11,377 | | | | 16,139 | | | | 11,815 | |
| Legal fees | | | 1,540 | | | | 1,540 | | | | 1,540 | | | | 1,540 | |
| Custody fees | | | 1,422 | | | | 1,264 | | | | 1,439 | | | | 1,283 | |
| Directors fees | | | 85 | | | | 85 | | | | 85 | | | | 85 | |
| Accrued other expenses | | | 2,207 | | | | 2,664 | | | | 2,671 | | | | 2,674 | |
| Total Liabilities | | | 38,270,043 | | | | 15,797,006 | | | | 30,954,956 | | | | 13,285,091 | |
| NET ASSETS | | $ | 132,268,692 | | | $ | 100,116,639 | | | $ | 141,063,638 | | | $ | 99,223,589 | |
| | | | | | | | | | | | | | | | | |
| NET ASSETS CONSIST OF: | | | | | | | | | | | | | | | | |
| Paid-in Capital | | $ | 134,565,609 | | | $ | 102,335,517 | | | $ | 146,567,111 | | | $ | 106,505,541 | |
| Undistributed (Accumulated) Net Investment Income (Loss) | | | — | | | | — | | | | 98,369 | | | | (56,078 | ) |
| Accumulated Net Realized Gain (Loss) on Investments | | | (4,443,103 | ) | | | (5,154,450 | ) | | | (5,767,746 | ) | | | (7,045,551 | ) |
| Net Unrealized Appreciation (Depreciation) on: | | | | | | | | | | | | | | | | |
| Investments in securities | | | 2,146,186 | | | | 2,935,572 | | | | 165,904 | | | | (180,323 | ) |
| Net Assets | | $ | 132,268,692 | | | $ | 100,116,639 | | | $ | 141,063,638 | | | $ | 99,223,589 | |
| *Cost | | | | | | | | | | | | | | | | |
| Investments in securities | | $ | 153,173,295 | | | $ | 107,345,153 | | | $ | 156,930,549 | | | $ | 93,751,529 | |
| Net Asset Value (unlimited shares authorized): | | | | | | | | | | | | | | | | |
| Net Assets | | $ | 132,268,692 | | | $ | 100,116,639 | | | $ | 141,063,638 | | | $ | 99,223,589 | |
| Shares Outstanding^ | | | 5,250,000 | | | | 4,050,000 | | | | 5,850,000 | | | | 4,200,000 | |
| Net Asset Value, Offering and Redemption Price per Share | | $ | 25.19 | | | $ | 24.72 | | | $ | 24.11 | | | $ | 23.62 | |
| + | Including securities on loan of $18,283,780, $9,329,425, $30,064,354, $7,269,848, $20,788,794, $11,126,188, $23,853,222, $19,299,773, $17,673,795 and $28,454,015, respectively. |
The accompanying notes are an integral part of these financial statements.
| Absolute Shares Trust
Statements of Assets and Liabilities (concluded) |
June 30, 2015
WBI Large Cap
Tactical Growth Shares | | WBI Large Cap
Tactical Value Shares | | WBI Large Cap
Tactical Yield Shares | | WBI Large Cap
Tactical Select Shares | | WBI Tactical
Income Shares | | WBI Tactical
High Income Shares |
| |
| $ | 143,723,914 | | | $ | 118,565,608 | | | $ | 160,788,791 | | | $ | 131,032,036 | | | $ | 333,926,532 | | | $ | 243,703,292 | |
| | — | | | | — | | | | — | | | | — | | | | — | | | | — | |
| | 172,941 | | | | 132,479 | | | | 237,130 | | | | 109,315 | | | | 171,818 | | | | 75,033 | |
| | 9,445 | | | | 9,446 | | | | 9,446 | | | | 9,447 | | | | 9,447 | | | | 9,446 | |
| | 19,761,788 | | | | 5,616,409 | | | | 14,836,718 | | | | 10,380,790 | | | | 15,405,154 | | | | 15,823,817 | |
| | 4,059 | | | | 2,228 | | | | 3,891 | | | | 2,022 | | | | 38,901 | | | | 20,562 | |
| | 163,672,147 | | | | 124,326,170 | | | | 175,875,976 | | | | 141,533,610 | | | | 349,551,852 | | | | 259,632,150 | |
| | | | | | | | | | | | | | | | | | | | | | | |
| | | | | | | | | | | | | | | | | | | | | | | |
| | | | | | | | | | | | | | | | | | | | | | | |
| | 21,525,857 | | | | 11,513,975 | | | | 24,706,724 | | | | 19,773,168 | | | | 18,176,703 | | | | 29,215,735 | |
| | 3,847,685 | | | | — | | | | 10,144,403 | | | | — | | | | 23,031,484 | | | | 13,429,797 | |
| | 99,633 | | | | 79,584 | | | | 100,360 | | | | 86,389 | | | | 213,041 | | | | 148,914 | |
| | 9,008 | | | | 7,019 | | | | 9,384 | | | | 8,225 | | | | 12,038 | | | | 10,197 | |
| | 1,567 | | | | 1,567 | | | | 1,567 | | | | 1,567 | | | | 1,567 | | | | 1,567 | |
| | 14,493 | | | | 14,493 | | | | 14,493 | | | | 14,493 | | | | 14,493 | | | | 14,493 | |
| | 16,017 | | | | 13,168 | | | | 16,718 | | | | 14,682 | | | | 33,795 | | | | 23,827 | |
| | 1,540 | | | | 1,540 | | | | 1,540 | | | | 1,540 | | | | 1,540 | | | | 1,540 | |
| | 1,739 | | | | 1,427 | | | | 1,714 | | | | 1,607 | | | | 2,049 | | | | 1,711 | |
| | 85 | | | | 85 | | | | 85 | | | | 85 | | | | 85 | | | | 85 | |
| | 2,301 | | | | 2,632 | | | | 2,631 | | | | 2,671 | | | | 3,153 | | | | 3,275 | |
| | 25,519,925 | | | | 11,635,490 | | | | 34,999,619 | | | | 19,904,427 | | | | 41,489,948 | | | | 42,851,141 | |
| $ | 138,152,222 | | | $ | 112,690,680 | | | $ | 140,876,357 | | | $ | 121,629,183 | | | $ | 308,061,904 | | | $ | 216,781,009 | |
| | | | | | | | | | | | | | | | | | | | | | | |
| | | | | | | | | | | | | | | | | | | | | | | |
| $ | 146,031,547 | | | $ | 119,159,429 | | | $ | 150,176,820 | | | $ | 128,061,028 | | | $ | 307,369,326 | | | $ | 222,741,794 | |
| | 65,722 | | | | 39,380 | | | | 69,206 | | | | — | | | | — | | | | — | |
| | (6,453,594 | ) | | | (7,081,127 | ) | | | (6,060,269 | ) | | | (6,716,585 | ) | | | 619,941 | | | | (5,140,659 | ) |
| | | | | | | | | | | | | | | | | | | | | | | |
| | (1,491,453 | ) | | | 572,998 | | | | (3,309,400 | ) | | | 284,740 | | | | 72,637 | | | | (820,126 | ) |
| $ | 138,152,222 | | | $ | 112,690,680 | | | $ | 140,876,357 | | | $ | 121,629,183 | | | $ | 308,061,904 | | | $ | 216,781,009 | |
| | | | | | | | | | | | | | | | | | | | | | | |
| $ | 145,215,367 | | | $ | 117,992,610 | | | $ | 164,098,191 | | | $ | 130,747,296 | | | $ | 333,853,895 | | | $ | 244,523,418 | |
| | | | | | | | | | | | | | | | | | | | | | | |
| $ | 138,152,222 | | | $ | 112,690,680 | | | $ | 140,876,357 | | | $ | 121,629,183 | | | $ | 308,061,904 | | | $ | 216,781,009 | |
| | 5,650,000 | | | | 4,700,000 | | | | 6,000,000 | | | | 5,100,000 | | | | 12,100,000 | | | | 8,850,000 | |
| $ | 24.45 | | | $ | 23.98 | | | $ | 23.48 | | | $ | 23.85 | | | $ | 25.46 | | | $ | 24.50 | |
The accompanying notes are an integral part of these financial statements.
| Absolute Shares Trust
Statements of Operations |
Period August 25, 2014 through June 30, 2015
| | | WBI SMID Tactical
Growth Shares* | | WBI SMID Tactical
Value Shares* | | WBI SMID Tactical
Yield Shares* | | WBI SMID Tactical
Select Shares* |
| INVESTMENT INCOME | | | | | | | | | | | | | | | | |
| Income: | | | | | | | | | | | | | | | | |
| Dividends (Net of withholding taxes of $15,388, | | | | | | | | | | | | | | | | |
| $12,376, $14,349, $7,117, $63,449, $62,322, $90,619, | | | | | | | | | | | | | | | | |
| $13,771, $5,826 and $0, respectively) | | $ | 1,024,793 | | | $ | 952,142 | | | $ | 2,020,688 | | | $ | 729,337 | |
| Interest | | | 33,548 | | | | 15,504 | | | | 35,175 | | | | 17,009 | |
| Securities lending income (Note 7) | | | 90,931 | | | | 29,734 | | | | 160,794 | | | | 27,417 | |
| Total Investment Income | | | 1,149,272 | | | | 997,380 | | | | 2,216,657 | | | | 773,763 | |
| | | | | | | | | | | | | | | | | |
| Expenses: | | | | | | | | | | | | | | | | |
| Management fees (Note 3) | | | 807,170 | | | | 620,726 | | | | 813,413 | | | | 645,878 | |
| Administration, fund accounting and custodian fees (Note 6) | | | 47,032 | | | | 37,677 | | | | 47,539 | | | | 39,366 | |
| Offering costs | | | 40,987 | | | | 40,987 | | | | 40,987 | | | | 40,987 | |
| Professional fees | | | 30,736 | | | | 30,736 | | | | 30,736 | | | | 30,734 | |
| Exchange fees | | | 10,191 | | | | 10,191 | | | | 10,191 | | | | 10,191 | |
| Director’s fees and expenses | | | 10,085 | | | | 10,085 | | | | 10,085 | | | | 10,085 | |
| Registration fees | | | 15,113 | | | | 11,377 | | | | 16,139 | | | | 11,815 | |
| Shareholder reporting expenses | | | 4,672 | | | | 4,672 | | | | 4,672 | | | | 4,672 | |
| Insurance expense | | | 6,195 | | | | 6,195 | | | | 6,195 | | | | 6,195 | |
| Miscellaneous Expenses | | | 3,401 | | | | 3,657 | | | | 4,336 | | | | 3,687 | |
| Total Expenses | | | 975,582 | | | | 776,303 | | | | 984,293 | | | | 803,610 | |
| Net Investment Income | | | 173,690 | | | | 221,077 | | | | 1,232,364 | | | | (29,847 | ) |
| | | | | | | | | | | | | | | | | |
| REALIZED & UNREALIZED GAIN (LOSS) | | | | | | | | | | | | | | | | |
| ON INVESTMENTS | | | | | | | | | | | | | | | | |
| Net Realized Gain (Loss) on: | | | | | | | | | | | | | | | | |
| Investments in securities | | | (1,219,697 | ) | | | (3,902,281 | ) | | | (4,476,922 | ) | | | (5,290,851 | ) |
| Purchased options | | | (172,589 | ) | | | (72,814 | ) | | | 23,212 | | | | (72,144 | ) |
| Written options | | | 224,629 | | | | 75,894 | | | | 129,625 | | | | 140,418 | |
| Net Change in Unrealized Appreciation (Depreciation) of: | | | | | | | | | | | | | | | | |
| Investments in securities | | | 2,146,186 | | | | 2,935,572 | | | | 165,904 | | | | (180,323 | ) |
| Net Realized and Unrealized Gain (Loss) on Investments | | | 978,529 | | | | (963,629 | ) | | | (4,158,181 | ) | | | (5,402,900 | ) |
| NET INCREASE (DECREASE) IN NET ASSETS | | | | | | | | | | | | | | | | |
| RESULTING FROM OPERATIONS | | $ | 1,152,219 | | | $ | (742,552 | ) | | $ | (2,925,817 | ) | | $ | (5,432,747 | ) |
| * | Fund commenced operations on August 25, 2014. The information presented is for the period from August 25, 2014 to June 30, 2015. |
The accompanying notes are an integral part of these financial statements.
| Absolute Shares Trust
Statements of Operations (concluded) |
Period August 25, 2014 through June 30, 2015
WBI Large Cap
Tactical Growth Shares* | | WBI Large Cap
Tactical Value Shares* | | WBI Large Cap
Tactical Yield Shares* | | WBI Large Cap
Tactical Select Shares* | | WBI Tactical
Income Shares* | | WBI Tactical
High Income Shares* |
| |
| |
| |
| |
| $ | 2,457,027 | | | $ | 1,895,252 | | | $ | 2,782,908 | | | $ | 1,205,198 | | | $ | 2,510,048 | | | $ | 3,592,899 | |
| | 14,101 | | | | 17,040 | | | | 37,304 | | | | 35,408 | | | | 333,652 | | | | 311,431 | |
| | 34,452 | | | | 23,554 | | | | 46,139 | | | | 15,288 | | | | 169,314 | | | | 203,248 | |
| | 2,505,580 | | | | 1,935,846 | | | | 2,866,351 | | | | 1,255,894 | | | | 3,013,014 | | | | 4,107,578 | |
| | | | | | | | | | | | | | | | | | | | | | | |
| | | | | | | | | | | | | | | | | | | | | | | |
| | 922,565 | | | | 744,642 | | | | 907,333 | | | | 821,086 | | | | 1,235,423 | | | | 1,291,497 | |
| | 55,230 | | | | 44,630 | | | | 54,705 | | | | 49,515 | | | | 68,565 | | | | 70,623 | |
| | 40,987 | | | | 40,987 | | | | 40,987 | | | | 40,987 | | | | 40,987 | | | | 40,987 | |
| | 30,736 | | | | 30,736 | | | | 30,736 | | | | 30,736 | | | | 30,736 | | | | 30,736 | |
| | 10,191 | | | | 10,191 | | | | 10,191 | | | | 10,191 | | | | 10,191 | | | | 10,191 | |
| | 10,085 | | | | 10,085 | | | | 10,085 | | | | 10,085 | | | | 10,085 | | | | 10,085 | |
| | 16,017 | | | | 13,168 | | | | 16,718 | | | | 14,682 | | | | 33,795 | | | | 23,827 | |
| | 4,672 | | | | 4,672 | | | | 4,672 | | | | 4,672 | | | | 4,672 | | | | 4,672 | |
| | 6,195 | | | | 6,195 | | | | 6,195 | | | | 6,195 | | | | 6,195 | | | | 6,195 | |
| | 3,413 | | | | 3,665 | | | | 4,327 | | | | 3,822 | | | | 3,877 | | | | 3,968 | |
| | 1,100,091 | | | | 908,971 | | | | 1,085,949 | | | | 991,971 | | | | 1,444,526 | | | | 1,492,781 | |
| | 1,405,489 | | | | 1,026,875 | | | | 1,780,402 | | | | 263,923 | | | | 1,568,488 | | | | 2,614,797 | |
| | | | | | | | | | | | | | | | | | | | | | | |
| | | | | | | | | | | | | | | | | | | | | | | |
| | | | | | | | | | | | | | | | | | | | | | | |
| | | | | | | | | | | | | | | | | | | | | | | |
| | (1,599,399 | ) | | | (4,351,472 | ) | | | (5,758,661 | ) | | | (5,989,864 | ) | | | 1,742,958 | | | | (3,313,398 | ) |
| | (289,840 | ) | | | (147,753 | ) | | | (81,385 | ) | | | (76,220 | ) | | | (89,252 | ) | | | (60,235 | ) |
| | 242,737 | | | | 149,518 | | | | 214,775 | | | | 353,644 | | | | 114,830 | | | | 122,233 | |
| | | | | | | | | | | | | | | | | | | | | | | |
| | (1,491,453 | ) | | | 572,998 | | | | (3,309,400 | ) | | | 284,740 | | | | 72,637 | | | | (820,126 | ) |
| | (3,137,955 | ) | | | (3,776,709 | ) | | | (8,934,671 | ) | | | (5,427,700 | ) | | | 1,841,173 | | | | (4,071,526 | ) |
| | | | | | | | | | | | | | | | | | | | | | | |
| $ | (1,732,466 | ) | | $ | (2,749,834 | ) | | $ | (7,154,269 | ) | | $ | (5,163,777 | ) | | $ | 3,409,661 | | | $ | (1,456,729 | ) |
The accompanying notes are an integral part of these financial statements.
| Absolute Shares Trust
Statements of Changes in Net Assets |
Period August 25, 2014 through June 30, 2015
| | | | WBI SMID Tactical
Growth Shares1,3 | | WBI SMID Tactical
Value Shares1,3 | | WBI SMID Tactical
Yield Shares1,3 | | WBI SMID Tactical
Select Shares1,3 |
| INCREASE (DECREASE) IN NET ASSETS: | | | | | | | | | | | | | | | | | |
| | | | | | | | | | | | | | | | | | |
| OPERATIONS | | | | | | | | | | | | | | | | | |
| Net investment income | | | $ | 173,690 | | | $ | 221,077 | | | $ | 1,232,364 | | | $ | (29,847 | ) |
| Net realized gain (loss) on investments | | | | (1,167,657 | ) | | | (3,899,201 | ) | | | (4,324,085 | ) | | | (5,222,577 | ) |
| Change in unrealized appreciation (depreciation) of investments | | | | 2,146,186 | | | | 2,935,572 | | | | 165,904 | | | | (180,323 | ) |
| Net increase (decrease) in net assets resulting from operations | | | | 1,152,219 | | | | (742,552 | ) | | | (2,925,817 | ) | | | (5,432,747 | ) |
| | | | | | | | | | | | | | | | | | |
| DISTRIBUTIONS TO SHAREHOLDERS | | | | | | | | | | | | | | | | | |
| From net investment income | | | | (185,087 | ) | | | (236,514 | ) | | | (1,133,995 | ) | | | (72,104 | ) |
| Total distributions to Shareholders | | | | (185,087 | ) | | | (236,514 | ) | | | (1,133,995 | ) | | | (72,104 | ) |
| | | | | | | | | | | | | | | | | | |
| CAPITAL SHARE TRANSACTIONS | | | | | | | | | | | | | | | | | |
| Proceeds from shares sold (Note 10) | | | | 131,301,560 | | | | 101,095,705 | | | | 145,123,450 | | | | 104,728,440 | |
| Net increase in net assets from capital share transactions | | | | 131,301,560 | | | | 101,095,705 | | | | 145,123,450 | | | | 104,728,440 | |
| Net increase in net assets | | | $ | 132,268,692 | | | $ | 100,116,639 | | | $ | 141,063,638 | | | $ | 99,223,589 | |
| | | | | | | | | | | | | | | | | | |
| NET ASSETS | | | | | | | | | | | | | | | | | |
| Beginning of Period | | | $ | — | | | $ | — | | | $ | — | | | $ | — | |
| End of Period | | | $ | 132,268,692 | | | $ | 100,116,639 | | | $ | 141,063,638 | | | $ | 99,223,589 | |
| Undistributed net investment income (loss) | | | $ | — | | | $ | — | | | $ | 98,369 | | | $ | (56,078 | ) |
| 1 | Fund commenced operations on August 25, 2014. The information presented is for the period from August 25, 2014 to June 30, 2015. |
| 2 | On July 15, 2014 WBI Tactical Income Shares issued 4,000 shares to the Sub-Advisor at $25 per share totaling $100,000. The Sub-Advisor redeemed these shares at $25 per share prior to the listing of the Fund’s shares on NYSE ARCA, Inc. (see Note 10). |
| 3 | Subsequent to the Fund’s shares listing on NYSE ARCA, Inc., the Sub-Advisor purchased $10,000 of shares of the Fund. The Sub-Advisor’s total investment (at cost) in all Funds at June 30, 2015 totaled $100,000. |
The accompanying notes are an integral part of these financial statements.
| Absolute Shares Trust
Statements of Changes in Net Assets (concluded) |
Period August 25, 2014 through June 30, 2015
WBI Large Cap
Tactical Growth Shares1,3 | | WBI Large Cap
Tactical Value Shares1,3 | | WBI Large Cap
Tactical Yield Shares1,3 | | WBI Large Cap
Tactical Select Shares1,3 | | WBI Tactical
Income Shares1,2,3 | | WBI Tactical
High Income Shares1,3 |
| |
| |
| $ | 1,405,489 | | | $ | 1,026,875 | | | $ | 1,780,402 | | | $ | 263,923 | | | $ | 1,568,488 | | | $ | 2,614,797 | |
| | (1,646,502 | ) | | | (4,349,707 | ) | | | (5,625,271 | ) | | | (5,712,440 | ) | | | 1,768,536 | | | | (3,251,400 | ) |
| | (1,491,453 | ) | | | 572,998 | | | | (3,309,400 | ) | | | 284,740 | | | | 72,637 | | | | (820,126 | ) |
| | (1,732,466 | ) | | | (2,749,834 | ) | | | (7,154,269 | ) | | | (5,163,777 | ) | | | 3,409,661 | | | | (1,456,729 | ) |
| | | | | | | | | | | | | | | | | | | | | | | |
| | (1,339,767 | ) | | | (979,971 | ) | | | (1,675,154 | ) | | | (257,370 | ) | | | (1,611,762 | ) | | | (2,626,317 | ) |
| | (1,339,767 | ) | | | (979,971 | ) | | | (1,675,154 | ) | | | (257,370 | ) | | | (1,611,762 | ) | | | (2,626,317 | ) |
| | | | | | | | | | | | | | | | | | | | | | | |
| | 141,224,455 | | | | 116,420,485 | | | | 149,705,780 | | | | 127,050,330 | | | | 306,264,005 | | | | 220,864,055 | |
| | 141,224,455 | | | | 116,420,485 | | | | 149,705,780 | | | | 127,050,330 | | | | 306,264,005 | | | | 220,864,055 | |
| $ | 138,152,222 | | | $ | 112,690,680 | | | $ | 140,876,357 | | | $ | 121,629,183 | | | $ | 308,061,904 | | | $ | 216,781,009 | |
| | | | | | | | | | | | | | | | | | | | | | | |
| $ | — | | | $ | — | | | $ | — | | | $ | — | | | $ | — | | | $ | — | |
| $ | 138,152,222 | | | $ | 112,690,680 | | | $ | 140,876,357 | | | $ | 121,629,183 | | | $ | 308,061,904 | | | $ | 216,781,009 | |
| $ | 65,722 | | | $ | 39,380 | | | $ | 69,206 | | | $ | — | | | $ | — | | | $ | — | |
The accompanying notes are an integral part of these financial statements.
| Absolute Shares Trust
Financial Highlights
Period August 25, 2014 through June 30, 2015
(for a share outstanding throughout the period) |
| | | WBI SMID Tactical
Growth Shares1 | | WBI SMID Tactical
Value Shares1 | | WBI SMID Tactical
Yield Shares1 | | WBI SMID Tactical
Select Shares1 |
| Net Asset Value, Beginning of Period | | $ | 25.00 | | | $ | 25.00 | | | $ | 25.00 | | | $ | 25.00 | |
| Income (Loss) from Investment Operations: | | | | | | | | | | | | | | | | |
| Net investment income2 | | | 0.04 | | | | 0.06 | | | | 0.26 | | | | (0.01 | ) |
| Net realized and unrealized gain (loss) on investments6 | | | 0.19 | | | | (0.27 | ) | | | (0.92 | ) | | | (1.35 | ) |
| Total from investment operations | | | 0.23 | | | | (0.21 | ) | | | (0.66 | ) | | | (1.36 | ) |
| Less Distributions: | | | | | | | | | | | | | | | | |
| Distributions from net investment income | | | (0.04 | ) | | | (0.07 | ) | | | (0.23 | ) | | | (0.02 | ) |
| Total Distributions | | | (0.04 | ) | | | (0.07 | ) | | | (0.23 | ) | | | (0.02 | ) |
| Net asset value, end of period | | $ | 25.19 | | | $ | 24.72 | | | $ | 24.11 | | | $ | 23.62 | |
| Market price, end of period | | | 25.27 | | | | 24.77 | | | | 24.14 | | | | 23.68 | |
| Net Asset Total Return3,7 | | | 0.94 | % | | | (0.84 | )% | | | (2.60 | )% | | | (5.40 | )% |
| | | | | | | | | | | | | | | | | |
| Supplemental Data: | | | | | | | | | | | | | | | | |
| Net assets at end of period (000’s) | | $ | 132,269 | | | $ | 100,117 | | | $ | 141,064 | | | $ | 99,224 | |
| Ratios to Average Net Assets: | | | | | | | | | | | | | | | | |
| Expenses to Average Net Assets4 | | | 1.03 | % | | | 1.07 | % | | | 1.03 | % | | | 1.06 | % |
| Net Investment Income to Average Net Assets4 | | | 0.18 | % | | | 0.30 | % | | | 1.29 | % | | | (0.04 | )% |
| Portfolio turnover rate3,5 | | | 255 | % | | | 278 | % | | | 264 | % | | | 311 | % |
| 1 | The Fund commenced operations on August 25, 2014. The information presented is for the period August 25, 2014 through June 30, 2015. |
| 2 | Calculated based on average shares outstanding during the period. |
| 5 | Excludes securities received or delivered as a result of processing capital share transactions in Creation units. |
| 6 | The amount for a share outstanding throughout the period may not be in accordance with the aggregate net realized and unrealized gain (loss) on investment for the period because of the timing of capital share transactions in relation to fluctuating market values of the Funds underlying securities. |
| 7 | Net asset value total return is calculated assuming an initial investment made at the net asset value at the beginning of the period, reinvestment of all dividends and distributions at net asset value during the period, and the redemption on the last day of the period. Net asset value total return includes adjustments in accordance with accounting principles generally accepted in the United States of America and as such, the net asset value for financial reporting purposes and the returns based upon those net asset values may differ from the net asset value and returns for shareholder transactions. |
The accompanying notes are an integral part of these financial statements.
| Absolute Shares Trust
Financial Highlights (concluded)
Period August 25, 2014 through June 30, 2015
(for a share outstanding throughout the period) |
WBI Large Cap
Tactical Growth Shares1 | | WBI Large Cap
Tactical Value Shares1 | | WBI Large Cap
Tactical Yield Shares1 | | WBI Large Cap
Tactical Select Shares1 | | WBI Tactical
Income Shares1 | | WBI Tactical
High Income Shares1 |
| $ | 25.00 | | | $ | 25.00 | | | $ | 25.00 | | | $ | 25.00 | | | $ | 25.00 | | | $ | 25.00 | |
| | | | | | | | | | | | | | | | | | | | | | | |
| | 0.28 | | | | 0.24 | | | | 0.35 | | | | 0.06 | | | | 0.23 | | | | 0.36 | |
| | (0.59 | ) | | | (1.04 | ) | | | (1.58 | ) | | | (1.16 | ) | | | 0.46 | | | | (0.51 | ) |
| | (0.31 | ) | | | (0.80 | ) | | | (1.23 | ) | | | (1.10 | ) | | | 0.69 | | | | (0.15 | ) |
| | | | | | | | | | | | | | | | | | | | | | | |
| | (0.24 | ) | | | (0.22 | ) | | | (0.29 | ) | | | (0.05 | ) | | | (0.23 | ) | | | (0.35 | ) |
| | (0.24 | ) | | | (0.22 | ) | | | (0.29 | ) | | | (0.05 | ) | | | (0.23 | ) | | | (0.35 | ) |
| $ | 24.45 | | | $ | 23.98 | | | $ | 23.48 | | | $ | 23.85 | | | $ | 25.46 | | | $ | 24.50 | |
| | 24.51 | | | | 23.98 | | | | 23.50 | | | | 23.88 | | | | 25.48 | | | | 24.56 | |
| | (1.25 | )% | | | (3.29 | )% | | | (4.98 | )% | | | (4.41 | )% | | | 2.77 | % | | | (0.65 | )% |
| | | | | | | | | | | | | | | | | | | | | | | |
| $ | 138,152 | | | $ | 112,691 | | | $ | 140,876 | | | $ | 121,629 | | | $ | 308,062 | | | $ | 216,781 | |
| | | | | | | | | | | | | | | | | | | | | | | |
| | 1.02 | % | | | 1.04 | % | | | 1.02 | % | | | 1.02 | % | | | 0.99 | % | | | 0.98 | % |
| | 1.30 | % | | | 1.17 | % | | | 1.67 | % | | | 0.27 | % | | | 1.08 | % | | | 1.72 | % |
| | 240 | % | | | 294 | % | | | 277 | % | | | 296 | % | | | 308 | % | | | 293 | % |
The accompanying notes are an integral part of these financial statements.
| Absolute Shares Trust
Notes to Financial Statements
June 30, 2015 |
NOTE 1 — ORGANIZATION
Absolute Shares Trust (the “Trust”) was organized as a Delaware statutory trust on November 7, 2013 and is authorized to have multiple segregated series or portfolios. The Trust is an open-end management investment company registered under the Investment Company Act of 1940 (the “1940 Act”). The Trust currently consists of the following ten separate investment portfolios (each, a “Fund” or, individually and, together, the “Funds”):
WBI SMID Tactical Growth Shares
WBI SMID Tactical Value Shares
WBI SMID Tactical Yield Shares
WBI SMID Tactical Select Shares
WBI Large Cap Tactical Growth Shares
WBI Large Cap Tactical Value Shares
WBI Large Cap Tactical Yield Shares
WBI Large Cap Tactical Select Shares
WBI Tactical Income Shares
WBI Tactical High Income Shares
The Funds’ investment adviser, Millington Securities, Inc. (“Advisor”), has selected its affiliate, WBI Investments, Inc. (“Sub-Advisor”), to act as Sub-Advisor. Both the Advisor and Sub-Advisor are registered as investment advisers with the Securities and Exchange Commission (“SEC”). The Advisor is also registered as a broker-dealer with the SEC and is a member of the Financial Industry Regulatory Authority. The Board of Trustees (the “Board” and each member a “Trustee”) supervises the conduct of the Funds.
NOTE 2 — SIGNIFICANT ACCOUNTING POLICIES
The following is a summary of significant accounting policies consistently followed by the Funds. The financial statements are prepared in accordance with accounting principles generally accepted in the United States of America (“U.S. GAAP”) and are stated in U.S. dollars.
The preparation of the financial statements in accordance with U.S. GAAP requires management to make estimates and assumptions that affect the reported amount of assets, liabilities and the disclosure of contingent assets and liabilities at June 30, 2015. Actual results could differ from these estimates.
A. Valuation. All equity securities, including domestic common stocks, preferred stocks, real estate investment trusts, exchange traded funds and exchange traded notes, that are traded on a national securities exchange, except those listed on the NASDAQ Global Market, NASDAQ Select Market and NASDAQ Capital Market (collectively “NASDAQ”) are valued at the last reported sale price on the exchange on which the security is principally traded. Securities traded on NASDAQ are valued at the NASDAQ Official Closing Price (“NOCP”). If, on a particular day, an exchange-traded or NASDAQ security does not trade, then the mean between the most recent quoted bid and asked prices is used. All equity securities that are not traded on a listed exchange are valued at the last sale price in the over-the-counter market. If a non-exchange traded security does not trade on a particular day, then the mean between the last quoted closing bid and asked price is used.
Debt securities are valued in accordance with prices supplied by an approved pricing service. Pricing services may use various valuation methodologies such as the mean between the bid and asked prices, matrix pricing and other analytical pricing models as well as market transactions and dealer quotations.
Exchange traded options are valued at the composite mean price, which calculates the mean of the highest bid price and lowest ask price across the exchanges where the option is principally traded. On the last trading day prior to expiration, expiring options will be priced at intrinsic value. The Trust’s valuation committee may also use other valuation methods in certain instances.
The decision whether to fair value a portfolio security or other asset will be made by the Trust’s valuation committee based on the valuation procedures adopted by the Board (the “Valuation Procedures”) and information it receives from the Sub-Advisor and U.S. Bancorp Fund Services, LLC (“USBFS”). When a security is “fair valued”, consideration is given to the facts and circumstances relevant to the particular situation, including a review of various factors set forth in the Valuation Procedures. The use of fair value pricing by the Funds may cause the NAV of their shares to differ significantly from the NAV that would be calculated without regard to such considerations.
As described above, the Funds utilize various methods to measure the fair value of their investments on a recurring basis. U.S. GAAP establishes a hierarchy that prioritizes inputs to valuations methods. The three levels of inputs are:
Level 1 — Unadjusted quoted prices in active markets for identical assets or liabilities that the Funds have the ability to access.
Level 2 — Observable inputs other than quoted prices included in Level 1 that are observable for the asset or liability, either directly or indirectly. These inputs may include quoted prices for the identical instrument on an inactive market, prices for similar instruments, interest rates, prepayment speeds, credit risk, yield curves, default rates and similar data.
| Absolute Shares Trust
Notes to Financial Statements (continued)
June 30, 2015 |
Level 3 — Unobservable inputs for the asset or liability, to the extent relevant observable inputs are not available; including the Funds’ Valuation Committee’s assumptions used in determining the fair value of investments. The availability of observable inputs can vary from security to security and is affected by a wide variety of factors, including, for example, the type of security, whether the security is new and not yet established in the marketplace, the liquidity of markets, and other characteristics particular to the security. To the extent that valuation is based on models or inputs that are less observable or unobservable in the market, the determination of fair value requires more judgment. Accordingly, the degree of judgment exercised in determining fair value is greatest for instruments categorized in Level 3.
The inputs used to measure fair value may fall into different levels of the fair value hierarchy. In such cases, for disclosure purposes, the level in the fair value hierarchy within which the fair value measurement falls in its entirety, is determined based on the lowest level input that is significant to the fair value measurement in its entirety.
The following is a summary of the inputs used to value the Funds’ investments as of June 30, 2015:
| WBI SMID Tactical Growth Shares | | | | | | | | |
| Assets^ | | Level 1 | | Level 2 | | Level 3 | | Total |
| Common Stocks | | $ | 121,998,985 | | | $ | — | | | $ | — | | | $ | 121,998,985 | |
| Short-Term Investments | | | 33,320,496 | | | | — | | | | — | | | | 33,320,496 | |
| Total Investments in Securities, at value | | $ | 155,319,481 | | | $ | — | | | $ | — | | | $ | 155,319,481 | |
| | | | | | | | | | | | | | | | | |
| WBI SMID Tactical Value Shares | | | | | | | | | | | | | | | | |
| Assets^ | | | Level 1 | | | | Level 2 | | | | Level 3 | | | | Total | |
| Common Stocks | | $ | 93,304,507 | | | $ | — | | | $ | — | | | $ | 93,304,507 | |
| Short-Term Investments | | | 16,976,218 | | | | — | | | | — | | | | 16,976,218 | |
| Total Investments in Securities, at value | | $ | 110,280,725 | | | $ | — | | | $ | — | | | $ | 110,280,725 | |
| | | | | | | | | | | | | | | | | |
| WBI SMID Tactical Yield Shares | | | | | | | | | | | | | | | | |
| Assets^ | | | Level 1 | | | | Level 2 | | | | Level 3 | | | | Total | |
| Common Stocks | | $ | 120,885,074 | | | $ | — | | | $ | — | | | $ | 120,885,074 | |
| Short-Term Investments | | | 36,211,379 | | | | — | | | | — | | | | 36,211,379 | |
| Total Investments in Securities, at value | | $ | 157,096,453 | | | $ | — | | | $ | — | | | $ | 157,096,453 | |
| | | | | | | | | | | | | | | | | |
| WBI SMID Tactical Select Shares | | | | | | | | | | | | | | | | |
| Assets^ | | | Level 1 | | | | Level 2 | | | | Level 3 | | | | Total | |
| Common Stocks | | $ | 80,084,609 | | | $ | — | | | $ | — | | | $ | 80,084,609 | |
| Short-Term Investments | | | 13,486,597 | | | | — | | | | — | | | | 13,486,597 | |
| Total Investments in Securities, at value | | $ | 93,571,206 | | | $ | — | | | $ | — | | | $ | 93,571,206 | |
| | | | | | | | | | | | | | | | | |
| WBI Large Cap Tactical Growth Shares | | | | | | | | | | | | | | | | |
| Assets^ | | | Level 1 | | | | Level 2 | | | | Level 3 | | | | Total | |
| Common Stocks | | $ | 117,124,328 | | | $ | — | | | $ | — | | | $ | 117,124,328 | |
| Short-Term Investments | | | 26,599,586 | | | | — | | | | — | | | | 26,599,586 | |
| Total Investments in Securities, at value | | $ | 143,723,914 | | | $ | — | | | $ | — | | | $ | 143,723,914 | |
| | | | | | | | | | | | | | | | | |
| WBI Large Cap Tactical Value Shares | | | | | | | | | | | | | | | | |
| Assets^ | | | Level 1 | | | | Level 2 | | | | Level 3 | | | | Total | |
| Common Stocks | | $ | 101,528,420 | | | $ | — | | | $ | — | | | $ | 101,528,420 | |
| Short-Term Investments | | | 17,037,188 | | | | — | | | | — | | | | 17,037,188 | |
| Total Investments in Securities, at value | | $ | 118,565,608 | | | $ | — | | | $ | — | | | $ | 118,565,608 | |
| Absolute Shares Trust
Notes to Financial Statements (continued)
June 30, 2015 |
WBI Large Cap Tactical Yield Shares
| Assets^ | | Level 1 | | Level 2 | | Level 3 | | Total |
| Common Stocks | | $ | 118,201,702 | | | $ | — | | | $ | — | | | $ | 118,201,702 | |
| Real Estate Investment Trusts | | | 5,361,040 | | | | — | | | | — | | | | 5,361,040 | |
| Short-Term Investments | | | 37,226,049 | | | | — | | | | — | | | | 37,226,049 | |
| Total Investments in Securities, at value | | $ | 160,788,791 | | | $ | — | | | $ | — | | | $ | 160,788,791 | |
| | | | | | | | | | | | | | | | | |
| WBI Large Cap Tactical Select Shares | | | | | | | | | | | | | | | | |
| Assets^ | | | Level 1 | | | | Level 2 | | | | Level 3 | | | | Total | |
| Common Stocks | | $ | 97,502,021 | | | $ | — | | | $ | — | | | $ | 97,502,021 | |
| Real Estate Investment Trusts | | | 9,017,823 | | | | — | | | | | | | | 9,017,823 | |
| Short-Term Investments | | | 24,512,192 | | | | — | | | | — | | | | 24,512,192 | |
| Total Investments in Securities, at value | | $ | 131,032,036 | | | $ | — | | | $ | — | | | $ | 131,032,036 | |
| | | | | | | | | | | | | | | | | |
| WBI Tactical Income Shares | | | | | | | | | | | | | | | | |
| Assets^ | | | Level 1 | | | | Level 2 | | | | Level 3 | | | | Total | |
| Common Stocks | | $ | 35,372,459 | | | $ | — | | | $ | — | | | $ | 35,372,459 | |
| Exchange Traded Funds | | | 129,657,378 | | | | — | | | | — | | | | 129,657,378 | |
| US Government Notes | | | 110,804,057 | | | | — | | | | — | | | | 110,804,057 | |
| Short-Term Investments | | | 58,092,638 | | | | — | | | | — | | | | 58,092,638 | |
| Total Investments in Securities, at value | | $ | 333,926,532 | | | $ | — | | | $ | — | | | $ | 333,926,532 | |
| | | | | | | | | | | | | | | | | |
| WBI Tactical High Income Shares | | | | | | | | | | | | | | | | |
| Assets^ | | | Level 1 | | | | Level 2 | | | | Level 3 | | | | Total | |
| Common Stocks | | $ | 50,524,939 | | | $ | — | | | $ | — | | | $ | 50,524,939 | |
| Exchange Traded Funds | | | 94,551,729 | | | | — | | | | — | | | | 94,551,729 | |
| US Government Notes | | | 44,476,695 | | | | — | | | | — | | | | 44,476,695 | |
| Short-Term Investments | | | 54,149,929 | | | | — | | | | — | | | | 54,149,929 | |
| Total Investments in Securities, at value | | $ | 243,703,292 | | | $ | — | | | $ | — | | | $ | 243,703,292 | |
| ^ | See Schedules of Investments for breakout of investments by industry classification. |
Transfers between levels are recognized at the end of the reporting period. During the period ended June 30, 2015, the Funds recognized no transfers to or from Level 1, 2 or 3.
B. Certain Risks:
Some risks apply to all Funds, while others are specific to the investment strategy of certain Funds. Each Fund maybe subject to other risks in addition to these identified risk. This section discusses certain common principal risks encountered by the Funds.
Active Management Risk — An investment in each Fund varies with the success and failure of the Sub-Advisor’s investment strategies and the Sub-Advisor’s research, analysis, and determination of portfolio securities. If the Sub-Advisor’s investment strategies, including its models, stop loss and goal setting process, do not produce the expected results, the market value or NAV of a Fund’s shares would decrease.
Counterparty Risk — Many of the protections afforded to participants on some organized exchanges, such as the performance guarantee of an exchange clearing house, are not available in connection with the over-the-counter (“OTC”) derivatives transactions. In those instances, another ETF holding such derivatives will be subject to the risk that its direct counterparty will not perform its obligations under the transactions and that such ETF will sustain losses.
Debt Securities Risk — Interest rates may go up resulting in a decrease in the value of the debt securities held directly by a Fund or indirectly through ETPs in which a Fund invests. Credit risk is the risk that an issuer will not make timely payments of principal and interest. There is also the risk that an issuer may “call,” or repay, its high yielding bonds before their maturity dates. Debt securities subject to prepayment can offer less potential for gains during a declining interest rate environment and similar or greater potential for loss in a rising interest rate environment. Limited trading opportunities for certain debt securities may make it more difficult to sell or buy a security at a favorable price or time.
Equity Options Risk — Options on securities may be subject to greater fluctuations in value than an investment in the underlying securities. Purchasing and writing put and call options are highly specialized activities and entail greater than ordinary investment risks, including limiting potential gains, increased sensitivity to changes in interest rates or to sudden fluctuations in market prices than conventional securities, and transaction costs.
| Absolute Shares Trust
Notes to Financial Statements (continued)
June 30, 2015 |
Market Risk — Either the stock market as a whole, or the value of an investment held by a Fund, goes down resulting in a decrease in the market value or NAV of a Fund’s Shares.
C. Federal Income Taxes. The Funds’ policy is to comply with the provisions of Subchapter M of the Internal Revenue Code of 1986, as amended, applicable to regulated investment companies and to distribute substantially all of its net investment income and net capital gains to its shareholders. Therefore, no federal income tax provision is required. The Funds plan to file U.S. Federal and various state and local tax returns.
Each Fund recognizes the tax benefits of uncertain tax positions only when the position is more likely than not to be sustained. Management has analyzed each Fund’s uncertain tax positions and concluded that no liability for unrecognized tax benefits should be recorded related to uncertain tax positions. Management is not aware of any tax positions for which it is reasonably possible that the total amounts of unrecognized tax benefits will change materially in the next 12 months. Income and capital gain distributions are determined in accordance with federal income tax regulations, which may differ from GAAP. These timing differences are primarily due to differing book and tax treatments for in-kind transactions, losses deferred due to wash sales, and passive foreign investment company adjustments, if any.
Net capital losses incurred after October 31, 2014, and within the taxable year are deemed to arise on the first business day of each Fund’s next taxable year. At June 30, 2015, the following funds deferred, on a tax basis, late year losses of:
| | Capital | Ordinary |
| WBI SMID Tactical Growth Shares | 2,060,669 | |
| WBI SMID Tactical Value Shares | 1,390,663 | |
| WBI SMID Tactical Yield Shares | 2,110,831 | |
| WBI SMID Tactical Select Shares | 3,564,632 | 56,078 |
| WBI Large Cap Tactical Growth Shares | 2,461,065 | |
| WBI Large Cap Tactical Value Shares | 3,028,627 | |
| WBI Large Cap Tactical Yield Shares | 3,067,794 | |
| WBI Large Cap Tactical Select Shares | 4,172,927 | |
| WBI Tactical Income Shares | — | |
| WBI Tactical High Income Shares | 2,549,776 | |
At June 30, 2015 the Funds had the following short-term capital loss carryforward available for federal income tax purposes, with an indefinite expiration:
| WBI SMID Tactical Growth Shares | (2,382,434) | |
| WBI SMID Tactical Value Shares | (3,763,787) | |
| WBI SMID Tactical Yield Shares | (3,656,915) | |
| WBI SMID Tactical Select Shares | (3,480,919) | |
| WBI Large Cap Tactical Growth Shares | (3,992,529) | |
| WBI Large Cap Tactical Value Shares | (4,052,500) | |
| WBI Large Cap Tactical Yield Shares | (2,992,475) | |
| WBI Large Cap Tactical Select Shares | (2,543,658) | |
| WBI Tactical Income Shares | — | |
| WBI Tactical High Income Shares | (2,590,883) | |
D. Security Transactions and Investment Income. Investment securities transactions are accounted for on the trade date. Gains and losses realized on sales of securities are determined on a specific identification basis. Dividend income is recorded on the ex-dividend date, net of any foreign taxes withheld at source. Interest income is recorded on an accrual basis. Withholding taxes on foreign dividends have been provided for in accordance with the Funds’ understanding of the applicable tax rules and regulations. Premiums and discounts are amortized/accreted using the effective interest method over the lives of the respective debt instruments.
E. Distributions to Shareholders. Distributions to shareholders from net investment income for the Funds are declared and paid on a monthly basis and net realized gains on securities normally are declared and paid on an annual basis. Distributions are recorded on the ex-dividend date.
F. Options Contracts. When the Funds write an option, an amount equal to the premium received by each Fund is recorded as a liability and is subsequently adjusted to the current value of the option written. Premiums received from writing options that expire unexercised are treated by the Funds on the expiration date as realized gain from investments. The difference between the premium and the amount paid on effecting a closing purchase transaction, including brokerage commission, is also treated as a realized gain, or if the premium is less than the amount paid for the closing purchase transaction, as a realized loss. If a call option is exercised, the premium is added to the proceeds from the sale of the underlying security or currency in determining whether the Funds have a realized gain or loss. If a put option is exercised, the premium reduces the cost basis of the securities purchased by the Funds. The Funds, as writer of an option, bear the market risk of an unfavorable change in the price of the security underlying the written option.
When the Funds purchase an option, an amount equal to the premium paid by the Fund is recorded as an investment and is subsequently adjusted to the current value of the option purchased. If an option expires on the stipulated expiration date or if the Funds enter into a closing sale transaction, a gain or loss is realized. If a call option is exercised, the cost of the security acquired is increased by the premium paid for
| Absolute Shares Trust
Notes to Financial Statements (continued)
June 30, 2015 |
the call. If a put option is exercised, a gain or loss is realized from the sale of the underlying security, and the proceeds from such sale are decreased by the premium originally paid. Written and purchased options are non-income producing securities.
The activity in written options during the period ended June 30, 2015, is as follows:
| | WBI SMID
Tactical
Growth Shares | | WBI SMID
Tactical
Value Shares | | WBI SMID
Tactical
Yield Shares | | WBI SMID
Tactical
Select Shares | | WBI Large Cap
Tactical
Growth Shares | |
| | Contracts | | Premiums | | Contracts | | Premiums | | Contracts | | Premiums | | Contracts | | Premiums | | Contracts | | Premiums | |
| Options outstanding, | | | | | | | | | | | | | | | | | | | | | | | | | |
| beginning of period | — | | $ | — | | — | | $ | — | | — | | $ | — | | — | | $ | — | | — | | $ | — | |
| Options written | 9,723 | | | 558,103 | | 4,623 | | | 198,036 | | 4,878 | | | 181,490 | | 8,811 | | | 376,599 | | 8,308 | | | 719,574 | |
| Options exercised | (2,405 | ) | | (272,646 | ) | (238 | ) | | (32,368 | ) | — | | | — | | (1,914 | ) | | (194,700 | ) | (2,799 | ) | | (416,483 | ) |
| Options expired | (2,500 | ) | | (93,868 | ) | (1,900 | ) | | (56,478 | ) | (1,300 | ) | | (35,749 | ) | (1,700 | ) | | (50,978 | ) | (2,500 | ) | | (125,698 | ) |
| Options closed | (4,818 | ) | | (191,589 | ) | (2,485 | ) | | (109,190 | ) | (3,578 | ) | | (145,741 | ) | (5,197 | ) | | (130,921 | ) | (3,009 | ) | | (177,393 | ) |
| Options outstanding, | | | | | | | | | | | | | | | | | | | | | | | | | |
| end of period | — | | $ | — | | — | | $ | — | | — | | $ | — | | — | | $ | — | | — | | $ | — | |
| |
| | WBI
Large Cap Tactical
Value Shares | | WBI
Large Cap Tactical
Yield Shares | | WBI
Large Cap Tactical
Select Shares | | WBI
Tactical
Income Shares | | WBI
Tactical
High Income Shares | |
| | Contracts | | Premiums | | Contracts | | Premiums | | Contracts | | Premiums | | Contracts | | Premiums | | Contracts | | Premiums | |
| Options outstanding, | | | | | | | | | | | | | | | | | | | | | | | | | |
| beginning of period | — | | $ | — | | — | | $ | — | | — | | $ | — | | — | | $ | — | | — | | $ | — | |
| Options written | 7,229 | | | 559,026 | | 6,401 | | | 473,445 | | 9,967 | | | 808,931 | | 4,142 | | | 245,073 | | 3,658 | | | 223,100 | |
| Options exercised | (1,576 | ) | | (158,990 | ) | (1,778 | ) | | (129,114 | ) | (316 | ) | | (92,902 | ) | (2,438 | ) | | (172,745 | ) | (2,362 | ) | | (146,527 | ) |
| Options expired | (1,000 | ) | | (113,997 | ) | (1,000 | ) | | (40,999 | ) | (1,500 | ) | | (84,498 | ) | — | | | — | | — | | | — | |
| Options closed | (4,653 | ) | | (286,039 | ) | (3,623 | ) | | (303,332 | ) | (8,151 | ) | | (631,531 | ) | (1,704 | ) | | (72,328 | ) | (1,296 | ) | | (76,573 | ) |
| Options outstanding, | | | | | | | | | | | | | | | | | | | | | | | | | |
| end of period | — | | $ | — | | — | | $ | — | | — | | $ | — | | — | | $ | — | | — | | $ | — | |
The Funds have adopted financial reporting rules and regulations that require enhanced disclosure regarding derivatives and hedging activity intending to improve financial reporting of derivative instruments by enabling investors to understand how and why an entity uses derivatives, how derivatives are accounted for, and how derivative instruments affect an entity’s results of operations and financial position.
The Funds may engage in option strategies, which are a type of derivatives, to enhance the Fund’s returns or to mitigate risk and volatility. Equity option strategies used by the Funds for individual securities include writing (selling) covered calls, buying puts, using combinations of calls and puts, and using combinations of calls and combinations of puts. The Funds may also use options on indices. Other than when used for hedging, these techniques may be riskier than many investment strategies and may result in greater volatility for the Funds, particularly in periods of market declines. As a hedging tool, options may help cushion the impact of market declines but may reduce the Funds’ participation in a market advance.
Statements of Assets and Liabilities — The funds held no derivative instruments as of June 30, 2015.
Statements of Operations — The effect of derivative instruments on the Statements of Operations for the period end June 30, 2015 were as follows:
Amount of realized gain (loss) on derivative instruments recognized in income:
| | Purchased Options | | Written Options |
| WBI SMID Tactical Growth Shares | $ | (172,589 | ) | | $ | 224,629 | |
| WBI SMID Tactical Value Shares | | (72,814 | ) | | | 75,894 | |
| WBI SMID Tactical Yield Share | | 23,212 | | | | 129,625 | |
| WBI SMID Tactical Select Shares | | (72,144 | ) | | | 140,418 | |
| WBI Large Cap Tactical Growth Shares | | (289,840 | ) | | | 242,737 | |
| WBI Large Cap Tactical Value Shares | | (147,753 | ) | | | 149,518 | |
| WBI Large Cap Tactical Yield Shares | | (81,385 | ) | | | 214,775 | |
| WBI Large Cap Tactical Select Shares | | (76,220 | ) | | | 353,644 | |
| WBI Tactical Income Shares | | (89,252 | ) | | | 114,830 | |
| WBI Tactical High Income Shares | | (60,235 | ) | | | 122,233 | |
| Absolute Shares Trust
Notes to Financial Statements (continued)
June 30, 2015 |
G. Share Valuation. The NAV per share of each Fund is calculated by dividing the sum of the value of the securities held by the Fund, plus cash and other assets, minus all liabilities (including estimated accrued expenses) by the total number of shares outstanding for the Fund, rounded to the nearest cent. The Funds’ shares will not be priced on the days on which the NYSE ARCA, Inc., the exchange where the Funds’ shares are listed, is closed for trading. The offering and redemption price per share for each Fund is equal to the Fund’s NAV per share.
H. Guarantees and Indemnifications. The Funds’ officers and trustees are indemnified against certain liabilities that may arise out of the performance of their duties to the Funds. Additionally, in the normal course of business the Funds enter into contracts with service providers that contain general indemnification clauses. Each Fund’s maximum exposure under these arrangements is unknown as this would involve future claims that may be against the Fund that have not yet occurred.
I. Reclassification of Capital Accounts. GAAP requires that certain components of net assets relating to permanent differences be reclassified between financial and tax reporting. These reclassifications have no effect on net assets or net asset value per share. For the period ended June 30, 2015, the following table shows the reclassifications made:
| | | Undistributed Net
Investment Income/(Loss) | | Accumulated Net
Realized Gain/(Loss) | | Paid In Capital |
| WBI SMID Tactical Growth Shares | | | 11,397 | | | | (3,275,446 | ) | | | 3,264,049 | |
| WBI SMID Tactical Value Shares | | | 15,437 | | | | (1,255,249 | ) | | | 1,239,812 | |
| WBI SMID Tactical Yield Shares | | | — | | | | (1,443,661 | ) | | | 1,443,661 | |
| WBI SMID Tactical Select Shares | | | 45,873 | | | | (1,822,974 | ) | | | 1,777,101 | |
| WBI Large Cap Tactical Growth Shares | | | — | | | | (4,807,092 | ) | | | 4,807,092 | |
| WBI Large Cap Tactical Value Shares | | | (7,524 | ) | | | (2,731,420 | ) | | | 2,738,944 | |
| WBI Large Cap Tactical Yield Shares | | | (36,042 | ) | | | (434,998 | ) | | | 471,040 | |
| WBI Large Cap Tactical Select Shares | | | (6,553 | ) | | | (1,004,145 | ) | | | 1,010,698 | |
| WBI Tactical Income Shares | | | 43,274 | | | | (1,148,595 | ) | | | 1,105,321 | |
| WBI Tactical High Income Shares | | | 11,520 | | | | (1,889,259 | ) | | | 1,877,739 | |
During the period ended June 30, 2015 the Funds realized capital gains resulting from in-kind redemptions, in which shareholders exchanged Fund Shares for securities held by a Fund rather than for cash. Because the gains are not taxable to the Funds, and are not distributed to shareholders, they have been reclassified from accumulated net realized gains/losses to paid-in capital. The following table shows the impact to each Fund:
| WBI SMID Tactical Growth Shares | | | 3,275,446 | |
| WBI SMID Tactical Value Shares | | | 1,255,249 | |
| WBI SMID Tactical Yield Shares | | | 1,443,661 | |
| WBI SMID Tactical Select Shares | | | 1,822,974 | |
| WBI Large Cap Tactical Growth Shares | | | 4,807,092 | |
| WBI Large Cap Tactical Value Shares | | | 2,738,944 | |
| WBI Large Cap Tactical Yield Shares | | | 471,040 | |
| WBI Large Cap Tactical Select Shares | | | 1,084,713 | |
| WBI Tactical Income Shares | | | 1,105,321 | |
| WBI Tactical High Income Shares | | | 1,889,259 | |
J. Subsequent Events. In preparing these financial statements, the Advisor has evaluated events and transactions for potential recognition or disclosure through the date the financial statements were available to be issued. On May 14, 2015, the Board of Trustees voted to approve the following name changes, along with changes in principal investment strategies to remove the 80% policies, to be effective on or about October 27, 2015:
| Old Name | | New Name |
| WBI SMID Tactical Growth Shares | | WBI Tactical SMG Shares |
| WBI SMID Tactical Value Shares | | WBI Tactical SMV Shares |
| WBI SMID Tactical Yield Shares | | WBI Tactical SMY Shares |
| WBI SMID Tactical Select Shares | | WBI Tactical SMS Shares |
| WBI Large Cap Tactical Growth Shares | | WBI Tactical LCG Shares |
| WBI Large Cap Tactical Value Shares | | WBI Tactical LCV Shares |
| WBI Large Cap Tactical Yield Shares | | WBI Tactical LCY Shares |
| WBI Large Cap Tactical Select Shares | | WBI Tactical LCS Shares |
| Absolute Shares Trust
Notes to Financial Statements (continued)
June 30, 2015 |
There were no other events or transactions that occurred during the period subsequent to June 30, 2015, that materially impacted the amounts or disclosures in the Funds’ financial statements.
K. Recent Accounting Pronouncement. In June 2014, the Financial Accounting Standard Board issued ASU No. 2014-11 “Repurchase-to-Maturity Transactions, Repurchase Financings, and Disclosures.” ASU No. 2014-11 makes limited changes to the accounting for repurchase agreements, clarifies when repurchase agreements and securities lending transactions should be accounted for as secured borrowings, and requires additional disclosures regarding these types of transactions. The guidance is effective for fiscal years beginning on or after December 15, 2014, and for interim periods within those fiscal years. Management is currently evaluating the impact these changes will have, if any, on the Funds’ financial statement disclosures.
NOTE 3 — MANAGEMENT FEE
Pursuant to an investment advisory agreement (“Advisory Agreement”) between the Trust, on behalf of the Funds, and the Advisor, the Advisor serves as the investment adviser, makes investment decisions for each Fund, and manages the investment portfolios of the Funds, subject to the supervision of, and policies of the Board. Under the Advisory Agreement, the Advisor may retain an investment sub-adviser for the Funds, subject to approval by the Board and Fund shareholders. Under a sub-advisory agreement, (“Sub-Advisory Agreement”) the Sub-Advisor serves as the investment sub-adviser and is responsible for the day to day management of the Funds, subject to the supervision of the Advisor and the Board. For the services the Sub-Advisor provides to each Fund, the Sub-Advisor receives a fee that is equal to 0.85% per year of the average daily net assets of such Fund, calculated daily and paid monthly. The Advisor is paid 0.04% of each Fund’s average daily net assets (calculated daily and paid monthly) from the management fees collected by the Sub-Advisor.
NOTE 4 — PORTFOLIO TRANSACTIONS AND BROKERAGE
Pursuant to the Sub-Advisory Agreement, the Sub-Advisor determines which securities are to be purchased and sold by the Funds and which broker-dealers are eligible to execute the Funds’ portfolio transactions. The Sub-Advisor may determine to execute portfolio transactions through the Advisor, which is a registered broker-dealer.
NOTE 5 — EXPENSE LIMITATION AND REIMBURSEMENT
The Sub-Advisor has entered into an Expense Limitation Agreement (the “Agreement”) with the Trust to waive the fees and reimburse expenses of the Funds until at least October 31, 2016 so that the total operating expenses (exclusive of interest, taxes, brokerage commissions, acquired fund fees, dividend payments on short sales, other expenditures which are capitalized in accordance with U.S. GAAP, other extraordinary expenses not incurred in the ordinary course of a Fund’s business, and amounts, if any, payable pursuant to a plan adopted in accordance with Rule 12b-1 under the Investment Company Act of 1940) and organizational costs (the “Operating Expenses”) of the Funds are limited to 1.25% of average net assets (the “Expense Cap”). The Sub-Advisor may discontinue its obligations under the Agreement at any time in its sole discretion after October 31, 2016. The Funds have agreed to repay the amounts borne by the Sub-Advisor under the Agreement within the three year period after the Sub-Advisor bears the expense, when and if requested by the Sub-Advisor, to the extent the Operating Expenses of the Funds are less than the lower of the Expense Cap and any expense limitation agreement then in effect with respect to the Operating Expenses. The repayment may not raise the level of Operating Expenses of the Funds in the month of repayment to exceed the Expense Cap. The Sub-Advisor has not currently waived any expenses under this agreement for any Funds.
NOTE 6 — COMPLIANCE AND ADMINISTRATION SERVICING AGREEMENTS
The Trust has entered into an agreement with Foreside Compliance Services, LLC (“Foreside”), whereby Foreside agrees to provide a Chief Compliance Officer (“CCO”), as described in Rule 38a-1 of the 1940 Act.
U.S. Bancorp Fund Services, LLC (the “Administrator”) serves as the independent administrator and U.S. Bank National Association (the “Custodian”) serves as the custodian to the Funds. Under the Fund Administration Servicing, Fund Accounting Servicing and Transfer Agent Servicing Agreements, the Administrator is responsible for keeping financial books and records of the Funds and generally managing the administrative affairs and transfer agency services.
NOTE 7 — SECURITIES LENDING
The Funds may lend up to 331/3% of the value of the securities in their portfolios to brokers, dealers and financial institutions (but not individuals) under terms of participation in a securities lending program administered by U.S Bank N.A (“the Custodian”). The securities lending agreement requires that loans are collateralized at all times in an amount equal to at least 102% of the value of any loaned securities at the time of the loan, plus accrued interest. The Funds receive compensation in the form of fees and earn interest on the cash collateral. The amount of fees depends on a number of factors including the type of security and length of the loan. The Funds continue to receive interest payments or dividends on the securities loaned during the borrowing period. Gain or loss in the fair value of securities loaned that may occur during the term of the loan will be for the account of the Funds. The Funds have the right under the terms of the securities lending agreement to recall the securities from the borrower on demand. As of June 30, 2015, Funds had loaned securities that were collateralized by cash equivalents. The cash collateral is
| Absolute Shares Trust
Notes to Financial Statements (continued)
June 30, 2015 |
invested by the Custodian in accordance with approved investment guidelines. Those guidelines require the cash collateral to be invested in readily marketable, high quality, short-term obligations; however, such investments are subject to risk of payment delays or default on the part of the issuer or counterparty or otherwise may not generate sufficient interest to support the costs associated with securities lending. The Funds could also experience delays in recovering its securities and possible loss of income or value if the borrower fails to return the borrowed securities, although the Fund is indemnified from this risk by contract with the securities lending agent.
As of June 30, 2015, the value of the securities on loan and payable for collateral due to broker were as follows:
| Fund | | Value of Securities on loan | | Collateral Received |
| WBI SMID Tactical Growth Shares | | $ | 18,283,780 | | | $ | 18,935,761 | |
| WBI SMID Tactical Value Shares | | | 9,329,425 | | | | 9,541,984 | |
| WBI SMID Tactical Yield Shares | | | 30,064,354 | | | | 30,811,302 | |
| WBI SMID Tactical Select Shares | | | 7,269,848 | | | | 7,425,752 | |
| WBI Large Cap Tactical Growth Shares | | | 20,788,794 | | | | 21,525,857 | |
| WBI Large Cap Tactical Value Shares | | | 11,126,188 | | | | 11,513,975 | |
| WBI Large Cap Tactical Yield Shares | | | 23,853,222 | | | | 24,706,724 | |
| WBI Large Cap Tactical Select Shares | | | 19,299,773 | | | | 19,773,168 | |
| WBI Tactical Income Shares | | | 17,673,795 | | | | 18,176,703 | |
| WBI Tactical High Income Shares | | | 28,454,015 | | | | 29,215,735 | |
Fees and interest income earned on collateral investments and recognized by the Funds during the period ended June 30, 2015, was as follows:
Fees and Interest Income Earned
| Fund | | Fees and Interest Income Earned | |
| WBI SMID Tactical Growth Shares | | $ | 90,931 | | | |
| WBI SMID Tactical Value Shares | | | 29,734 | | | |
| WBI SMID Tactical Yield Shares | | | 160,794 | | | |
| WBI SMID Tactical Select Shares | | | 27,417 | | | |
| WBI Large Cap Tactical Growth Shares | | | 34,452 | | | |
| WBI Large Cap Tactical Value Shares | | | 23,554 | | | |
| WBI Large Cap Tactical Yield Shares | | | 46,139 | | | |
| WBI Large Cap Tactical Select Shares | | | 15,288 | | | |
| WBI Tactical Income Shares | | | 169,314 | | | |
| WBI Tactical High Income Shares | | | 203,248 | | | |
Offsetting Assets and Liabilities. The Funds are subject to various netting arrangements, which govern the terms of certain transactions with counterparties. The arrangements allow the Funds to close out and net their total exposure to a counterparty in the event of a default with respect to all transactions governed under a single agreement with a counterparty. The following is a summary of the arrangements subject to offsetting as of June 30, 2015.
| Fund | | Description | | Gross Amounts
of Recognized
Liabilities | | Gross Amounts
Offset in the
Statement of
Assets & Liabilities | | Net Amounts
Presented in the
Statement of
Assets & Liabilities | | Collateral
Received | | Net Amount |
| WBI SMID Tactical Growth Shares | | Securities Lending | | $ | 18,935,761 | | | $ | — | | | $ | 18,935,761 | | | $ | 18,935,761 | | | $ | — | |
| WBI SMID Tactical Value Shares | | Securities Lending | | | 9,541,984 | | | | — | | | | 9,541,984 | | | | 9,541,984 | | | | — | |
| WBI SMID Tactical Yield Shares | | Securities Lending | | | 30,811,302 | | | | — | | | | 30,811,302 | | | | 30,811,302 | | | | — | |
| WBI SMID Tactical Select Shares | | Securities Lending | | | 7,425,752 | | | | — | | | | 7,425,752 | | | | 7,425,752 | | | | — | |
| WBI Large Cap Tactical Growth Shares | | Securities Lending | | | 21,525,857 | | | | — | | | | 21,525,857 | | | | 21,525,857 | | | | — | |
| WBI Large Cap Tactical Value Shares | | Securities Lending | | | 11,513,975 | | | | — | | | | 11,513,975 | | | | 11,513,975 | | | | — | |
| WBI Large Cap Tactical Yield Shares | | Securities Lending | | | 24,706,724 | | | | — | | | | 24,706,724 | | | | 24,706,724 | | | | — | |
| WBI Large Cap Tactical Select Shares | | Securities Lending | | | 19,773,168 | | | | — | | | | 19,773,168 | | | | 19,773,168 | | | | — | |
| WBI Tactical Income Shares | | Securities Lending | | | 18,176,703 | | | | — | | | | 18,176,703 | | | | 18,176,703 | | | | — | |
| WBI Tactical High Income Shares | | Securities Lending | | | 29,215,735 | | | | — | | | | 29,215,735 | | | | 29,215,735 | | | | — | |
| Absolute Shares Trust
Notes to Financial Statements (continued)
June 30, 2015 |
NOTE 8 — TAX INFORMATION
The components of distributable earnings (losses) and cost basis of investments for federal income tax purposes at June 30, 2015 were as follows:
| | | WBI SMID
Tactical
Growth Shares | | WBI SMID
Tactical
Value Shares | | WBI SMID
Tactical
Yield Shares | | WBI SMID
Tactical
Select Shares | | WBI Large
Cap Tactical
Growth Shares |
| Cost of investments | | $ | 153,173,295 | | | $ | 107,345,153 | | | $ | 156,930,549 | | | $ | 93,751,529 | | | $ | 145,215,367 | |
| Gross tax unrealized appreciation | | | 5,906,250 | | | | 4,456,298 | | | | 4,380,186 | | | | 2,677,452 | | | | 2,664,221 | |
| Gross tax unrealized depreciation | | | (3,760,064 | ) | | | (1,520,726 | ) | | | (4,214,282 | ) | | | (2,857,775 | ) | | | (4,155,674 | ) |
| Net tax unrealized appreciation | | | 2,146,186 | | | | 2,935,572 | | | | 165,904 | | | | (180,323 | ) | | | (1,491,453 | ) |
| Undistributed ordinary income | | | — | | | | — | | | | 98,369 | | | | — | | | | 65,722 | |
| Undistributed long term gain | | | — | | | | — | | | | — | | | | — | | | | — | |
| Total distributable earnings | | | — | | | | — | | | | 98,369 | | | | — | | | | 65,722 | |
| Other accumulated (loss) | | | (4,443,103 | ) | | | (5,154,450 | ) | | | (5,767,746 | ) | | | (7,101,629 | ) | | | (6,453,594 | ) |
| Total accumulated gain | | | (2,296,917 | ) | | | (2,218,878 | ) | | | (5,503,473 | ) | | | (7,281,952 | ) | | | (7,879,325 | ) |
| | | | | | | | | | | | | | | | | | | | | |
| | | | WBI Large
Cap Tactical
Value Shares | | | | WBI Large
Cap Tactical
Yield Shares | | | | WBI Large
Cap Tactical
Select Shares | | | | WBI Tactical
Income
Shares | | | | WBI Tactical
High Income
Shares | |
| Cost of investments | | $ | 117,992,610 | | | $ | 164,098,191 | | | $ | 130,747,296 | | | $ | 334,108,814 | | | $ | 244,523,418 | |
| Gross tax unrealized appreciation | | | 3,253,343 | | | | 2,395,308 | | | | 3,423,256 | | | | 1,763,966 | | | | 1,960,953 | |
| Gross tax unrealized depreciation | | | (2,680,345 | ) | | | (5,704,708 | ) | | | (3,138,516 | ) | | | (1,946,248 | ) | | | (2,781,079 | ) |
| Net tax unrealized appreciation | | | 572,998 | | | | (3,309,400 | ) | | | 284,740 | | | | (182,282 | ) | | | (820,126 | ) |
| Undistributed ordinary income | | | 39,380 | | | | 69,206 | | | | — | | | | 868,010 | | | | — | |
| Undistributed long term gain | | | — | | | | — | | | | — | | | | 6,850 | | | | — | |
| Total distributable earnings | | | 39,380 | | | | 69,206 | | | | — | | | | 874,860 | | | | — | |
| Other accumulated (loss) | | | (7,081,127 | ) | | | (6,060,269 | ) | | | (6,716,585 | ) | | | — | | | | (5,140,659 | ) |
| Total accumulated gain | | | (6,468,749 | ) | | | (9,300,463 | ) | | | (6,431,845 | ) | | | 692,578 | | | | (5,960,785 | ) |
The difference between the cost of investments amount for financial statement and federal income tax purposes is due primarily to timing differences in recognizing wash sale losses in security transactions.
NOTE 9 — PURCHASES AND SALES OF SECURITIES
For the period ended June 30, 2015, purchases and sales of securities by the Funds, excluding short-term securities and in-kind transactions, are as follows:
| | | All Other | | US Government |
| Fund | | Purchases | | Sales | | Purchases | | Sales |
| WBI SMID Tactical Growth Shares | $ | 258,524,364 | $ | 251,440,053 | $ | 13,799,375 | $ | 13,867,891 |
| WBI SMID Tactical Value Shares | | 215,763,033 | | 202,666,774 | | 9,863,711 | | 9,842,070 |
| WBI SMID Tactical Yield Shares | | 233,760,017 | | 231,919,138 | | 13,732,500 | | 13,723,125 |
| WBI SMID Tactical Select Shares | | 230,932,146 | | 229,045,892 | | 11,920,469 | | 11,930,508 |
| WBI Large Cap Tactical Growth Shares | | 310,887,869 | | 272,171,370 | | 11,766,563 | | 11,687,891 |
| WBI Large Cap Tactical Value Shares | | 297,314,355 | | 258,692,552 | | 7,880,313 | | 7,878,359 |
| WBI Large Cap Tactical Yield Share | | 303,349,349 | | 264,419,156 | | 13,787,031 | | 13,786,484 |
| WBI Large Cap Tactical Select Shares | | 254,642,306 | | 222,889,936 | | 16,858,945 | | 16,841,250 |
| WBI Tactical Income Shares | | 347,811,030 | | 417,749,186 | | 197,798,320 | | 87,539,266 |
| WBI Tactical High Income Shares | | 367,756,995 | | 395,856,808 | | 117,776,438 | | 74,024,996 |
| Absolute Shares Trust
Notes to Financial Statements (continued)
June 30, 2015 |
For the period ended June 30, 2015 the value of the in-kind security transactions were as follows:
| Fund | | Subscriptions | | Redemptions | |
| WBI SMID Tactical Growth Shares | | $ | 136,504,018 | | | $ | 22,177,437 | | |
| WBI SMID Tactical Value Shares | | | 91,373,145 | | | | 10,190,548 | | |
| WBI SMID Tactical Yield Shares | | | 134,650,054 | | | | 7,350,163 | | |
| WBI SMID Tactical Select Shares | | | 105,037,963 | | | | 17,920,510 | | |
| WBI Large Cap Tactical Growth Shares | | | 126,184,637 | | | | 43,659,038 | | |
| WBI Large Cap Tactical Value Shares | | | 94,065,169 | | | | 27,224,865 | | |
| WBI Large Cap Tactical Yield Shares | | | 109,146,489 | | | | 15,342,241 | | |
| WBI Large Cap Tactical Select Shares | | | 97,174,180 | | | | 16,632,738 | | |
| WBI Tactical Income Shares | | | 254,723,425 | | | | 20,922,770 | | |
| WBI Tactical High Income Shares | | | 247,433,312 | | | | 69,299,999 | | |
NOTE 10 — SHARE TRANSACTIONSThe Funds currently offer one class of shares, which have no front-end sales load, no deferred sales charge, and no redemption fee. The Funds may issue an unlimited number of shares of beneficial interest, with no par value. All shares of each Fund have equal rights and privileges as the other shares of such Fund.
The Trust has entered into an agreement with NYSE Group, Inc. to list shares of the Funds’ (“Shares”) on NYSE Arca, Inc., an indirect wholly-owned subsidiary of NYSE Group, Inc. Market prices for the Shares may be different from their net asset value (“NAV”). The Funds will issue and redeem Shares on a continuous basis at NAV only in large blocks of Shares, typically 50,000 Shares, called “Creation Units.” Creation Units will be issued and redeemed principally in-kind, however, the Trust reserves the right to offer a cash option for creations and redemptions of Shares. Once created, Shares generally will trade in the secondary market at market prices that change throughout the day in amounts less than a Creation Unit. Except when aggregated in Creation Units, shares are not redeemable securities of a Fund. Shares of a Fund may only be purchased or redeemed by certain financial institutions (“Authorized Participants”). An Authorized Participant is either (i) a broker-dealer or other participant in the clearing process through the Continuous Net Settlement System of the National Securities Clearing Corporation or (ii) a Depository Trust Corporation participant and, in each case, must have executed a participant agreement with Foreside Fund Services, LLC, the Funds’ distributor (the “Distributor”). Most retail investors will not qualify as Authorized Participants or have the resources to buy and sell whole Creation Units. Therefore, they will be unable to purchase or redeem the shares directly from a Fund. Rather, most retail investors will purchase shares in the secondary market with the assistance of a broker and will be subject to customary brokerage commissions or fees.
| Absolute Shares Trust
Notes to Financial Statements (concluded)
June 30, 2015 |
Transactions in each Fund’s shares were as follows:
| | WBI SMID
Tactical Growth
Shares | | WBI SMID
Tactical Value
Shares | | WBI SMID
Tactical Yield
Shares | | WBI SMID
Tactical Select
Shares | |
| | Shares | | | Amount | | Shares | | | Amount | | Shares | | | Amount | | Shares | | | Amount | |
| Shares Sold | 6,150,000 | | $ | 154,470,400 | | 4,500,000 | | $ | 112,289,770 | | 6,200,000 | | $ | 153,603,500 | | 5,000,000 | | $ | 124,416,250 | |
| Shares Redeemed | (900,000 | ) | | (23,168,840 | ) | (450,000 | ) | | (11,194,065 | ) | (350,000 | ) | | (8,480,050 | ) | (800,000 | ) | | (19,687,810 | ) |
| | 5,250,000 | | $ | 131,301,560 | | 4,050,000 | | $ | 101,095,705 | | 5,850,000 | | $ | 145,123,450 | | 4,200,000 | | $ | 104,728,440 | |
| Beginning Shares | — | | | | | — | | | | | — | | | | | — | | | | |
| Ending Shares | 5,250,000 | | | | | 4,050,000 | | | | | 5,850,000 | | | | | 4,200,000 | | | | |
| | | | | | | | | | | | | | | | | | | | | |
| | WBI Large Cap
Tactical Growth Shares | | WBI Large Cap
Tactical Value Shares | | WBI Large Cap
Tactical Yield Shares | | | | | | |
| | Shares | | | Amount | | Shares | | | Amount | | Shares | | | Amount | | | | | | |
| Shares Sold | 7,450,000 | | $ | 187,768,750 | | 5,850,000 | | $ | 144,793,650 | | 6,700,000 | | $ | 166,637,540 | | | | | | |
| Shares Redeemed | (1,800,000 | ) | | (46,544,295 | ) | (1,150,000 | ) | | (28,373,165 | ) | (700,000 | ) | | (16,931,760 | ) | | | | | |
| | 5,650,000 | | $ | 141,224,455 | | 4,700,000 | | $ | 116,420,485 | | 6,000,000 | | $ | 149,705,780 | | | | | | |
| Beginning Shares | — | | | | | — | | | | | — | | | | | | | | | |
| Ending Shares | 5,650,000 | | | | | 4,700,000 | | | | | 6,000,000 | | | | | | | | | |
| | | | | | | | | | | | | | | | | | | | | |
| | WBI Large Cap
Tactical Select Shares | | WBI Tactical
Income Shares | | WBI Tactical
High Income Shares | | | | | | |
| | Shares | | | Amount | | Shares | | | Amount | | Shares | | | Amount | | | | | | |
| Shares Sold | 5,800,000 | | $ | 144,090,055 | | 13,000,000 | | $ | 329,009,775 | | 12,050,000 | | $ | 300,417,755 | | | | | | |
| Shares Redeemed | (700,000 | ) | | (17,039,725 | ) | (900,000 | ) | | (22,745,770 | ) | (3,200,000 | ) | | (79,553,700 | ) | | | | | |
| | 5,100,000 | | $ | 127,050,330 | | 12,100,000 | | $ | 306,264,005 | | 8,850,000 | | $ | 220,864,055 | | | | | | |
| Beginning Shares | — | | | | | — | | | | | — | | | | | | | | | |
| Ending Shares | 5,100,000 | | | | | 12,100,000 | | | | | 8,850,000 | | | | | | | | | |
NOTE 11 — DISTRIBUTIONS TO SHAREHOLDERS
The tax character of distributions declared by the Funds during the period August 25, 2014 through June 30, 2015 was as follows:
| Fund | | Ordinary Income | | Long Term Capital Gains | | Return of Capital |
| WBI SMID Tactical Growth Shares | | $ | 173,690 | | | $ | — | | | $ | 11,397 | |
| WBI SMID Tactical Value Shares | | | 221,077 | | | | — | | | | 15,437 | |
| WBI SMID Tactical Yield Shares | | | 1,133,995 | | | | — | | | | — | |
| WBI SMID Tactical Select Shares | | | 26,231 | | | | — | | | | 45,873 | |
| WBI Large Cap Tactical Growth Shares | | | 1,339,767 | | | | — | | | | — | |
| WBI Large Cap Tactical Value Shares | | | 979,971 | | | | — | | | | — | |
| WBI Large Cap Tactical Yield Shares | | | 1,675,154 | | | | — | | | | — | |
| WBI Large Cap Tactical Select Shares | | | 183,355 | | | | — | | | | 74,015 | |
| WBI Tactical Income Shares | | | 1,611,762 | | | | — | | | | — | |
| WBI Tactical High Income Shares | | | 2,614,797 | | | | — | | | | 11,520 | |
| Absolute Shares Trust
Report of Independent Registered Public Accounting Firm |
To the Shareholders and Board of Trustees of Absolute Shares Trust:
We have audited the accompanying statements of assets and liabilities, including the schedules of investments, of WBI SMID Tactical Growth Shares, WBI SMID Tactical Value Shares, WBI SMID Tactical Yield Shares, WBI SMID Tactical Select Shares, WBI Large Cap Tactical Growth Shares, WBI Large Cap Tactical Value Shares, WBI Large Cap Tactical Yield Shares, WBI Large Cap Tactical Select Shares, WBI Tactical Income Shares, and WBI Tactical High Income Shares (ten of the portfolios constituting Absolute Shares Trust (the “Trust”), as of June 30, 2015, and the related statements of operations, changes in net assets, and financial highlights for the period August 25, 2014 (commencement of operations) through June 30, 2015. The financial statements and financial highlights are the responsibility of the Trust’s management. Our responsibility is to express an opinion on the financial statements based on our audit.
We conducted our audit in accordance with the standards of the Public Company Accounting Oversight Board (United States). Those standards require that we plan and perform the audit to obtain reasonable assurance about whether the financial statements and financial highlights are free of material misstatement. An audit includes examining, on a test basis, evidence supporting the amounts and disclosures in the financial statements. Our procedures included confirmation of securities owned as of June 30, 2015, by correspondence with the custodian and brokers or other appropriate auditing procedures where replies from brokers were not received. An audit also includes assessing the accounting principles used and significant estimates made by management, as well as evaluating the overall financial statement presentation. We believe that our audit provides a reasonable basis for our opinion.
In our opinion, the financial statements and financial highlights referred to above present fairly, in all material respects, the financial position of each of the respective ten portfolios constituting Absolute Shares Trust as of June 30, 2015, the results of its operations, changes in net assets, and financial highlights for the period August 25, 2014 (commencement of operations) through June 30, 2015, in conformity with accounting principles generally accepted in the United States of America.
KPMG LLP
Roseland, New Jersey
August 26, 2015
| Absolute Shares Trust
Trustees and Officers (Unaudited) |
Name and Year of
Birth (1) | Position(s) Held
with Trust | Term of Office
and Length of
Time Served(2) | | Principal Occupation(s)
During Past 5 Years | | Number of
Portfolios
in Fund
Complex
Overseen
by Trustee (3) | Other
Directorships
Held by Trustee
During Past
5 Years |
| |
| Independent Trustees | | | | | | | |
| Jude T. Depko, 1946 | Trustee | Since | | Technical Consultant, Michael Baker Jr., | | 10 | None |
| | | June 2014 | | Inc. (consulting) (2009 to present) | | | |
| |
| John A. Flanagan, 1946 | Trustee | Since | | Chief Financial Officer, Exchange Traded | | 10 | None |
| | | June 2014 | | Managers Group, LLC (since 2015); | | | |
| | | | | President, John A. Flanagan CPA, LLC | | | |
| | | | | (accounting services) (2010 to present); | | | |
| | | | | Chief Financial Officer, Macromarkets | | | |
| | | | | LLC (exchange traded funds) (2007 | | | |
| | | | | to 2010) | | | |
| |
| Andrew Putterman, 1959 | Trustee | Since | | Principal, 1812 Park, LLC (financial | | 10 | The Private |
| | | June 2014 | | consulting) (2014 to present); Chairman | | | Trust Company |
| | | | | Emeritus, Fortigent LLC (financial | | | (January 2013 to |
| | | | | services) (2013 to president); Managing | | | December 2013) |
| | | | | Director, LPL Financial (financial | | | |
| | | | | services) (2012 to present); President and | | | |
| | | | | Chief Executive Officer, Fortigent LLC | | | |
| | | | | (2006 to 2012 and 2013, respectively) | | | |
| |
| |
| Interested Trustees | | | | | | | |
| Don Schreiber, Jr., 1955(4) | Trustee, President | Since | | Chief Executive Officer, Treasurer and | | 10 | None |
| | and Principal | November | | Co-Portfolio Manager, WBI Investments, | | | |
| | Executive Officer | 2013 | | Inc. (registered investment adviser) (1984 to | | | |
| | | | | present); President, Director and Treasurer, | | | |
| | | | | WBI Trading, Inc., (financial services) | | | |
| | | | | (2011 to present), Chief Executive Officer, | | | |
| | | | | Director and Treasurer, Hartshorne Group, | | | |
| | | | | Inc. (wealth management services) (2010 to | | | |
| | | | | present); Chief Executive Officer and | | | |
| | | | | Treasurer, Millington Securities, Inc. | | | |
| | | | | (registered investment adviser and broker | | | |
| | | | | dealer) (2013 to present) | | | |
| |
| Matthew Schreiber, 1980(4) | Trustee | Since | | President of WBI Investments, Inc. | | 10 | None |
| | | June 2014 | | (registered investment adviser) (2013 to | | | |
| | | | | present); Vice-President of Business | | | |
| | | | | Development, WBI Investments, Inc. | | | |
| | | | | (2007 to 2013) | | | |
| | | | | | | | |
| Absolute Shares Trust
Trustees and Officers (Unaudited) (concluded) |
| Name and Year of Birth (1) | Position(s) Held
with Trust | Term of Office
and Length of
Time Served (2) | Principal Occupation(s) During Past 5 Years |
| Officers of the Trust | | | |
| |
| Ann Schreiber, 1984 | Secretary | Since | Chief Marketing Officer, WBI Investments, Inc. (2015-present); Corporate |
| | | June 2014 | Secretary, WBI Investments, Inc. (2011-present); Director of Marketing and |
| | | | Executive Services, WBI Investments, Inc. (registered investment adviser) |
| | | | (2011-2014); Secretary, Millington Securities, Inc. (2013 to present); |
| | | | Secretary, Hartshorne Group, Inc. (2012 to present); Consultant, Advisor |
| | | | Toolbox, Inc. (2009-2011) |
| |
| Tracey Crespo, 1970(5) | Treasurer and | Since | Chief Operating Officer, WBI Investments, Inc. (registered investment |
| | Principal | August 2015 | adviser) (2011 to present); Director of Centralized Operations & Director of |
| | Financial Officer | | Fund Accounting and Hedge Fund Services, SEI, Inc. (fund administrative |
| | | | services) (2007-2011) |
| |
| Kerri E. Cain, 1973(5) | Treasurer and | Since | Chief Financial Officer, WBI Investments, Inc. (registered investment |
| | Principal | June 2014 | adviser) (2013 to present); Chief Financial Officer, Millington Securities, |
| | Financial Officer | | Inc. (registered investment adviser and broker dealer) (2013 to present); |
| | | | Guggenheim Partners, LLC (financial services) (2012 to 2013); Consultant, |
| | | | Caxton Alternative Management LP (2012); President, LGMT, Inc. |
| | | | (children’s fitness) (2007 to 2012) |
| |
| Cynthia R. Bonna, 1984 | Chief Legal | Since | Chief Compliance Officer, WBI Investments, Inc. (registered investment |
| | Officer | June 2014 | adviser) (2013 to present); Chief Compliance Officer, Hartshorne Group, |
| | | | Inc. (registered investment adviser) (2013 to present); Compliance Officer, |
| | | | Millington Securities, Inc. (registered investment adviser and broker dealer) |
| | | | (2013 to present); Compliance Officer, WBI Investments, Inc. (registered |
| | | | investment adviser) (2010 to 2013); Compliance Officer, Hartshorne Group, |
| | | | Inc. (registered investment adviser) (2010 to 2013) |
| |
| Donna M. Rogers, 1966 | Chief Compliance | Since | Managing Director, Foreside Compliance Services, LLC (financial services) |
| | Officer | June 2014 | (2010 to present); Senior Vice President, State Street Bank (financial |
| | | | services) (formerly Investors Bank & Trust Company) (2004 to 2010) |
| | | | |
| (1) | The address of each Trustee or officer is c/o Absolute Shares Trust, 331 Newman Springs Road, Suite 122, Red Bank, New Jersey 07701. (2) Trustees and Officers serve until their successors are duly elected and qualified. |
| (3) | The Fund is part of a “Fund Complex” as defined in the 1940 Act. The Fund Complex includes all open-end funds (including all of their portfolios) advised by the Advisor or the Sub-Advisor and any funds that have an investment advisor that is an affiliated person of the Advisor. As of the date of this report, the Fund Complex consists of the 11 Funds of the Trust and four mutual funds separately advised by the Sub-Advisor. |
| (4) | Don Schreiber Jr. and Matthew Schreiber are each an “interested person” of the Trust (as that term is defined in the 1940 Act) because of their affiliations with the Advisor and the Sub-Advisor. |
| (5) | Effective August 11, 2015, Mr. Crespo replaced Ms. Cain as the Treasurer and Principal Financial Officer. |
| Absolute Shares Trust
Expense Example
For the Six-Months Ended June 30, 2015 (Unaudited) |
As a shareholder you incur two types of costs: (1) transaction costs, including brokerage commissions on purchases and sales of Fund shares, and (2) ongoing costs, including management fees and other Fund expenses. This example is intended to help you understand your ongoing costs (in dollars) of investing in the Fund and to compare these costs with the ongoing costs of investing in other funds. The example is based on an investment of $1,000 invested at the beginning of the period and held for the entire period (December 31, 2014 — June 30, 2015).
Actual Expenses
The first line of the table provides information about actual account values based on actual returns and actual expenses. You may use the information in this line, together with the amount you invested, to estimate the expenses that you paid over the period. Simply divide your account value by $1,000 (for example, an $8,600 account value divided by $1,000 = 8.6), then, multiply the result by the number in the first line under the heading entitled “Expenses Paid During Period’’ to estimate the expenses you paid on your account during this period.
Hypothetical Example for Comparison Purposes
The second line of the table provides information about hypothetical account values based on a hypothetical return and hypothetical expenses based on the Fund’s actual expense ratio and an assumed rate of return of 5% per year before expenses, which is not the Fund’s actual return. The hypothetical account values and expenses may not be used to estimate the actual ending account balance or expenses you paid for the period. You may use this information to compare the ongoing costs of investing in the Fund and other funds. To do so, compare this 5% hypothetical example with the 5% hypothetical examples that appear in the shareholder reports of the other funds. Please note that the expenses shown in the table are meant to highlight your ongoing costs only and do not reflect any transactional costs, such as brokerage commissions paid on purchases and sales of Fund shares. Therefore, the second line of the table is useful in comparing ongoing costs only and will not help you determine the relative total costs of owning different funds. If these transactional costs were included, your costs would have been higher.
WBI SMID Tactical Growth Shares
| | | Beginning
Account Value
December 31, 2014 | | Ending
Account Value
June 30, 2015 | | Expenses Paid
During the Period^ |
| Actual | | $ | 1,000.00 | | | $ | 1,007.40 | | | $ | 5.13 | |
| Hypothetical (5% annual return before expenses) | | $ | 1,000.00 | | | $ | 1,019.69 | | | $ | 5.16 | |
| | | | | | | | | | | | | |
| WBI SMID Tactical Value Shares | | | | | | | | | | | | |
| | | Beginning
Account Value
December 31, 2014 | | Ending
Account Value
June 30, 2015 | | Expenses Paid
During the Period^ |
| Actual | | $ | 1,000.00 | | | $ | 1,023.20 | | | $ | 5.37 | |
| Hypothetical (5% annual return before expenses) | | $ | 1,000.00 | | | $ | 1,019.49 | | | $ | 5.36 | |
| | | | | | | | | | | | | |
| WBI SMID Tactical Yield Shares | | | | | | | | | | | | |
| | | Beginning
Account Value
December 31, 2014 | | Ending
Account Value
June 30, 2015 | | Expenses Paid
During the Period^ |
| Actual | | $ | 1,000.00 | | | $ | 989.90 | | | $ | 5.08 | |
| Hypothetical (5% annual return before expenses) | | $ | 1,000.00 | | | $ | 1,019.69 | | | $ | 5.16 | |
| | | | | | | | | | | | | |
| WBI SMID Tactical Select Shares | | | | | | | | | | | | |
| | | Beginning
Account Value
December 31, 2014 | | Ending
Account Value
June 30, 2015 | | Expenses Paid
During the Period^ |
| Actual | | $ | 1,000.00 | | | $ | 986.20 | | | $ | 5.22 | |
| Hypothetical (5% annual return before expenses) | | $ | 1,000.00 | | | $ | 1,019.54 | | | $ | 5.31 | |
| Absolute Shares Trust
Expense Example (concluded)
For the Six-Months Ended June 30, 2015 (Unaudited) |
WBI Large Cap Tactical Growth Shares
| | | Beginning
Account Value
December 31, 2014 | | Ending
Account Value
June 30, 2015 | | Expenses Paid
During the Period^ |
| Actual | | $ | 1,000.00 | | | $ | 982.60 | | | $ | 5.01 | |
| Hypothetical (5% annual return before expenses) | | $ | 1,000.00 | | | $ | 1,019.74 | | | $ | 5.11 | |
| | | | | | | | | | | | | |
| WBI Large Cap Tactical Value Shares | | | | | | | | | | | | |
| | | Beginning
Account Value
December 31, 2014 | | Ending
Account Value
June 30, 2015 | | Expenses Paid
During the Period^ |
| Actual | | $ | 1,000.00 | | | $ | 1,001.90 | | | $ | 5.16 | |
| Hypothetical (5% annual return before expenses) | | $ | 1,000.00 | | | $ | 1,019.64 | | | $ | 5.21 | |
| | | | | | | | | | | | | |
| WBI Large Cap Tactical Yield Shares | | | | | | | | | | | | |
| | | Beginning
Account Value
December 31, 2014 | | Ending
Account Value
June 30, 2015 | | Expenses Paid
During the Period^ |
| Actual | | $ | 1,000.00 | | | $ | 970.30 | | | $ | 4.98 | |
| Hypothetical (5% annual return before expenses) | | $ | 1,000.00 | | | $ | 1,019.74 | | | $ | 5.11 | |
| | | | | | | | | | | | | |
| WBI Large Cap Tactical Select Shares | | | | | | | | | | | | |
| | | Beginning
Account Value
December 31, 2014 | | Ending
Account Value
June 30, 2015 | | Expenses Paid
During the Period^ |
| Actual | | $ | 1,000.00 | | | $ | 987.40 | | | $ | 5.03 | |
| Hypothetical (5% annual return before expenses) | | $ | 1,000.00 | | | $ | 1,019.74 | | | $ | 5.11 | |
| | | | | | | | | | | | | |
| WBI Tactical Income Shares | | | | | | | | | | | | |
| | | Beginning
Account Value
December 31, 2014 | | Ending
Account Value
June 30, 2015 | | Expenses Paid
During the Period^ |
| Actual | | $ | 1,000.00 | | | $ | 1,019.70 | | | $ | 4.96 | |
| Hypothetical (5% annual return before expenses) | | $ | 1,000.00 | | | $ | 1,019.89 | | | $ | 4.96 | |
| | | | | | | | | | | | | |
| WBI Tactical High Income Shares | | | | | | | | | | | | |
| | | Beginning
Account Value
December 31, 2014 | | Ending
Account Value
June 30, 2015 | | Expenses Paid
During the Period^ |
| Actual | | $ | 1,000.00 | | | $ | 996.30 | | | $ | 4.85 | |
| Hypothetical (5% annual return before expenses) | | $ | 1,000.00 | | | $ | 1,019.93 | | | $ | 4.91 | |
| ^ | The dollar amounts shown as expenses paid during the period are equal to the annualized six-month expense ratio multiplied by the average account value during the period, multiplied by the number of days in the most recent six-month period and divided by the number of days in the most recent twelve month period |
| Absolute Shares Trust
Federal Tax Information (Unaudited) |
For the fiscal year ended June 30, 2015, certain dividends paid by the Funds may be subject to a maximum tax rate of 15%, as provided for by the Jobs and Growth Tax Relief Reconciliation Act of 2003. The percentage of dividends declared from ordinary income designated as qualified dividend income was as follows:
| WBI SMID Tactical Growth Shares | 100.00 | % |
| WBI SMID Tactical Value Shares | 100.00 | % |
| WBI SMID Tactical Yield Shares | 100.00 | % |
| WBI SMID Tactical Select Shares | 100.00 | % |
| WBI Large Cap Tactical Growth Shares | 100.00 | % |
| WBI Large Cap Tactical Value Shares | 100.00 | % |
| WBI Large Cap Tactical Yield Shares | 100.00 | % |
| WBI Large Cap Tactical Select Shares | 100.00 | % |
| WBI Tactical Income Shares | 45.63 | % |
| WBI Tactical High Income Shares | 62.84 | % |
For corporate shareholders, the percent of ordinary income distributions qualifying for the corporate dividends received deduction for the fiscal year ended June 30, 2015 was as follows:
| WBI SMID Tactical Growth Shares | 100.00 | % |
| WBI SMID Tactical Value Shares | 100.00 | % |
| WBI SMID Tactical Yield Shares | 100.00 | % |
| WBI SMID Tactical Select Shares | 100.00 | % |
| WBI Large Cap Tactical Growth Shares | 74.50 | % |
| WBI Large Cap Tactical Value Shares | 72.00 | % |
| WBI Large Cap Tactical Yield Shares | 65.85 | % |
| WBI Large Cap Tactical Select Shares | 100.00 | % |
| WBI Tactical Income Shares | 35.10 | % |
| WBI Tactical High Income Shares | 37.00 | % |
The Percentage of taxable ordinary income distributions that are designated as short-term capital gain distributions under Internal Revenue Section 871(k)(2)(C) for each Fund were as follows:
| WBI SMID Tactical Growth Shares | 0.00 | % |
| WBI SMID Tactical Value Shares | 0.00 | % |
| WBI SMID Tactical Yield Shares | 0.00 | % |
| WBI SMID Tactical Select Shares | 0.00 | % |
| WBI Large Cap Tactical Growth Shares | 0.00 | % |
| WBI Large Cap Tactical Value Shares | 0.00 | % |
| WBI Large Cap Tactical Yield Shares | 0.00 | % |
| WBI Large Cap Tactical Select Shares | 0.00 | % |
| WBI Tactical Income Shares | 2.69 | % |
| WBI Tactical High Income Shares | 0.00 | % |
| Absolute Shares Trust |
Information About the Portfolio Holdings
(Unaudited)
The Trust files it’s complete schedules of portfolio holdings for its first and third fiscal quarters with the Securities and Exchange Commission (“SEC”) on Form N-Q. The Trust’s Form N-Q is available without charge, upon request, by calling toll-free at (800) 772-5810. Furthermore, you may obtain the Form N-Q on the SEC’s website at www.sec.gov. The funds’ portfolio holdings are updated daily and posted on their website at www.wbishares.com.
Information About Proxy Voting
(Unaudited)
A description of the polices and procedures the Trust uses to determine how to vote proxies relating to portfolio securities is provided in the Statement of Additional Information (“SAI”). The SAI is available without charge upon request by calling toll-free at (800) 772-5810, by accessing the SEC’s website at www.sec.gov, or by accessing the funds’ website at www.wbishares.com.
When available, information regarding how the Funds voted proxies relating to portfolio securities during the twelve months ending June 30 will be (1) available by calling toll-free at (800) 772-5810 and (2) the SEC’s website at www.sec.gov.
Privacy Policy
(Unaudited)
The Funds collect non-public information about you from the following sources:
| • Information we receive about you on applications or other forms; |
| • Information you give us orally; and |
| • Information about your transactions with us or others. |
The Trust does not disclose any non-public personal information about our customers or former customers without the customer’s authorization, except as permitted by law or in response to inquiries from governmental authorities. The Trust may share information with affiliated parties and unaffiliated third parties with whom we have contracts for servicing the Funds. The Trust will provide unaffiliated third parties with only the information necessary to carry out their assigned responsibilities. The Funds maintain physical, electronic and procedural safeguards to guard your non-public personal information and require third parties to treat your non-public information with the same high degree of confidentially.
In the event that you hold shares of the Funds through a financial intermediary, including, but not limited to, a broker-dealer, bank, or trust company, the privacy policy of your financial intermediary would govern how your nonpublic personal information would be shared by those entities with unaffiliated third parties.
| Absolute Shares Trust |
Advisor
Millington Securities
331 Newman Springs Rd Suite 122
Red Bank, New Jersey 07701
Sub-Advisor
WBI Investments, Inc
331 Newman Springs Rd Suite 122
Red Bank, New Jersey 07701
Distributor
Foreside Fund Services, LLC
Three Canal Plaza, Suite 100
Portland, ME 04101
Custodian
U.S. Bank National Association
Custody Operations
1555 North River Center Drive, Suite 302
Milwaukee, Wisconsin 53212
Transfer Agent
U.S. Bancorp Fund Services, LLC
615 East Michigan Street
Milwaukee, Wisconsin 53202
Securities Lending Agent
U.S Bank, National Association
Securities Lending
800 Nicolet Mall
Minneapolis, MN 55402-7020
Independent Registered Public Accounting Firm
KPMG, LLP
4 Becker Farm Road
Roseland, NJ 07068
Legal Counsel
Katten Muchin Rosenman LLP
575 Madison Avenue
New York, NY 10022-2585
| Absolute Shares Trust |
| WBI SMID Tactical Growth Shares | WBIA |
| WBI SMID Tactical Value Shares | WBIB |
| WBI SMID Tactical Yield Shares | WBIC |
| WBI SMID Tactical Select Shares | WBID |
| WBI Large Cap Tactical Growth Shares | WBIE |
| WBI Large Cap Tactical Value Shares | WBIF |
| WBI Large Cap Tactical Yield Shares | WBIG |
| WBI Large Cap Tactical Select Shares | WBIL |
| WBI Tactical Income Shares | WBII |
| WBI Tactical High Income Shares | WBIH |
Item 2. Code of Ethics.
The registrant has adopted a code of ethics that applies to the registrant’s principal executive officer and principal financial officer. The registrant has not made any substantive amendments to its code of ethics during the period covered by this report. The registrant has not granted any waivers from any provisions of the code of ethics during the period covered by this report.
A copy of the registrant’s Code of Ethics is filed herewith.
Item 3. Audit Committee Financial Expert.
The registrant’s board of trustees has determined that there is at least one audit committee financial expert serving on its audit committee. John A.Flanagan is the “audit committee financial expert” and is considered to be “independent” as each term is defined in Item 3 of Form N-CSR.
Item 4. Principal Accountant Fees and Services.
The registrant has engaged its principal accountant to perform audit services, audit-related services, tax services and other services during the past two fiscal years. “Audit services” refer to performing an audit of the registrant's annual financial statements or services that are normally provided by the accountant in connection with statutory and regulatory filings or engagements for those fiscal years. “Audit-related services” refer to the assurance and related services by the principal accountant that are reasonably related to the performance of the audit. “Tax services” refer to professional services rendered by the principal accountant for tax compliance, tax advice, and tax planning. There were no “Other services” provided by the principal accountant. The following table details the aggregate fees billed or expected to be billed for each of the last two fiscal years for audit fees, audit-related fees, tax fees and other fees by the principal accountant.
| WBI SMID Tactical Growth Shares | FYE 06/30/2015 | FYE 06/30/2014 |
| Audit Fees | $11,040 | N/A |
| Audit-Related Fees | N/A | N/A |
| Tax Fees | $2,000* | N/A |
| All Other Fees | N/A | N/A |
| WBI SMID Tactical Value Shares | FYE 06/30/2015 | FYE 06/30/2014 |
| Audit Fees | $11,040 | N/A |
| Audit-Related Fees | N/A | N/A |
| Tax Fees | $2,000* | N/A |
| All Other Fees | N/A | N/A |
| WBI SMID Tactical Yield Shares | FYE 06/30/2015 | FYE 06/30/2014 |
| Audit Fees | $11,040 | N/A |
| Audit-Related Fees | N/A | N/A |
| Tax Fees | $2,000* | N/A |
| All Other Fees | N/A | N/A |
| WBI SMID Tactical Select Shares | FYE 06/30/2015 | FYE 06/30/2014 |
| Audit Fees | $11,040 | N/A |
| Audit-Related Fees | N/A | N/A |
| Tax Fees | $2,000* | N/A |
| All Other Fees | N/A | N/A |
| WBI Large Cap Tactical Growth Shares | FYE 06/30/2015 | FYE 06/30/2014 |
| Audit Fees | $11,040 | N/A |
| Audit-Related Fees | N/A | N/A |
| Tax Fees | $2,000* | N/A |
| All Other Fees | N/A | N/A |
| WBI Large Cap Tactical Value Shares | FYE 06/30/2015 | FYE 06/30/2014 |
| Audit Fees | $11,040 | N/A |
| Audit-Related Fees | N/A | N/A |
| Tax Fees | $2,000* | N/A |
| All Other Fees | N/A | N/A |
| WBI SMID Tactical Growth Shares | FYE 06/30/2015 | FYE 06/30/2014 |
| Audit Fees | $11,040 | N/A |
| Audit-Related Fees | N/A | N/A |
| Tax Fees | $2,000* | N/A |
| All Other Fees | N/A | N/A |
| WBI Large Cap Tactical Yield Shares | FYE 06/30/2015 | FYE 06/30/2014 |
| Audit Fees | $11,040 | N/A |
| Audit-Related Fees | N/A | N/A |
| Tax Fees | $2,000* | N/A |
| All Other Fees | N/A | N/A |
| WBI Large Cap Tactical Select Shares | FYE 06/30/2015 | FYE 06/30/2014 |
| Audit Fees | $11,040 | N/A |
| Audit-Related Fees | N/A | N/A |
| Tax Fees | $2,000* | N/A |
| All Other Fees | N/A | N/A |
| WBI Tactical Income Shares | FYE 06/30/2015 | FYE 06/30/2014 |
| Audit Fees | $11,040 | N/A |
| Audit-Related Fees | N/A | N/A |
| Tax Fees | $2,000* | N/A |
| All Other Fees | N/A | N/A |
| WBI Tactical High Income Shares | FYE 06/30/2015 | FYE 06/30/2014 |
| Audit Fees | $11,040 | N/A |
| Audit-Related Fees | N/A | N/A |
| Tax Fees | $2,000* | N/A |
| All Other Fees | N/A | N/A |
*This amount includes invoices that covered services associated with the fiscal year which were not received until the following fiscal year
The audit committee has adopted pre-approval policies and procedures that require the audit committee to pre-approve all audit and non-audit services of the registrant, including services provided to any entity affiliated with the registrant.
The percentage of fees billed by KPMG LLP applicable to non-audit services pursuant to waiver of pre-approval requirement were as follows:
| | FYE 06/30/2015 | FYE 06/30/2014 |
| Audit-Related Fees | 0% | 0% |
| Tax Fees | 0% | 0% |
| All Other Fees | 0% | 0% |
All of the principal accountant’s hours spent on auditing the registrant’s financial statements were attributed to work performed by full-time permanent employees of the principal accountant. (If more than 50 percent of the accountant’s hours were spent to audit the registrant's financial statements for the most recent fiscal year, state how many hours were attributed to work performed by persons other than the principal accountant's full-time, permanent employees.)
The following table indicates the non-audit fees billed or expected to be billed by the registrant’s accountant for services to the registrant and to the registrant’s investment adviser (and any other controlling entity, etc.—not sub-adviser) for the last two years. The audit committee of the board of trustees/directors has considered whether the provision of non-audit services that were rendered to the registrant's investment adviser is compatible with maintaining the principal accountant's independence and has concluded that the provision of such non-audit services by the accountant has not compromised the accountant’s independence.
| Non-Audit Related Fees | FYE 06/30/2015 | FYE 06/30/2014 |
| Registrant | N/A | N/A |
| Registrant’s Investment Adviser | | |
Item 5. Audit Committee of Listed Registrants.
The registrant is an issuer as defined in Rule 10A-3 under the Securities Exchange Act of 1934, (the “Act”) and has a separately-designated standing audit committee established in accordance with Section 3(a)(58)(A) of the Act. The independent members of the committee are as follows: Andrew Putterman, John A. Flanagan.
Item 6. Investments.
Schedule of Investments is included as part of the report to shareholders filed under Item 1 of this Form.
Item 7. Disclosure of Proxy Voting Policies and Procedures for Closed-End Management Investment Companies.
Not applicable to open-end investment companies.
Item 8. Portfolio Managers of Closed-End Management Investment Companies.
Not applicable to open-end investment companies.
Item 9. Purchases of Equity Securities by Closed-End Management Investment Company and Affiliated Purchasers.
Not applicable to open-end investment companies.
Item 10. Submission of Matters to a Vote of Security Holders.
There have been no material changes to the procedures by which shareholders may recommend nominees to the registrant’s board of Trustees.
Item 11. Controls and Procedures.
| (a) | The Registrant’s Principal Executive Officer and Treasurer have reviewed the Registrant's disclosure controls and procedures (as defined in Rule 30a-3(c) under the Investment Company Act of 1940 (the “Act”)) as of a date within 90 days of the filing of this report, as required by Rule 30a-3(b) under the Act and Rules 13a-15(b) or 15d-15(b) under the Securities Exchange Act of 1934. Based on their review, such officers have concluded that the disclosure controls and procedures are effective in ensuring that information required to be disclosed in this report is appropriately recorded, processed, summarized and reported and made known to them by others within the Registrant and by the Registrant’s service provider. |
| (b) | There were no changes in the Registrant's internal control over financial reporting (as defined in Rule 30a-3(d) under the Act) that occurred during the second fiscal quarter of the period covered by this report that has materially affected, or is reasonably likely to materially affect, the Registrant's internal control over financial reporting. |
Item 12. Exhibits.
| (a) | (1) Any code of ethics or amendment thereto, that is the subject of the disclosure required by Item 2, to the extent that the registrant intends to satisfy Item 2 requirements through filing an exhibit. Filed herewith |
(2) A separate certification for each principal executive officer and principal financial officer pursuant to Section 302 of the Sarbanes-Oxley Act of 2002. Filed herewith.
(3) Any written solicitation to purchase securities under Rule 23c-1 under the Act sent or given during the period covered by the report by or on behalf of the registrant to 10 or more persons. Not applicable to open-end investment companies.
| (b) | Certifications pursuant to Section 906 of the Sarbanes-Oxley Act of 2002. Furnished herewith. |
SIGNATURES
Pursuant to the requirements of the Securities Exchange Act of 1934 and the Investment Company Act of 1940, the registrant has duly caused this report to be signed on its behalf by the undersigned, thereunto duly authorized.
(Registrant) Absolute Shares Trust
By (Signature and Title)*_/s/ Don Schreiber, Jr.
Don Shcreiber, Jr. President and Principal Executive Officer
Date September 3, 2015
Pursuant to the requirements of the Securities Exchange Act of 1934 and the Investment Company Act of 1940, this report has been signed below by the following persons on behalf of the registrant and in the capacities and on the dates indicated.
By (Signature and Title)* _/s/ Don Schreiber, Jr.
Don Schreiber, Jr. President and Principal Executive Officer
Date__September 3, 2015
By (Signature and Title)* _/s/ Tracey Crespo
Tracey Crespo, Principal Financial Officer
Date__September 3, 2015
* Print the name and title of each signing officer under his or her signature.