As filed with the Securities and Exchange Commission on September 7, 2018
UNITED STATES
SECURITIES AND EXCHANGE COMMISSION
Washington, D.C. 20549
FORM N-CSR
CERTIFIED SHAREHOLDER REPORT OF REGISTERED
MANAGEMENT INVESTMENT COMPANIES
Investment Company Act file number 811-22917
Absolute Shares Trust
(Exact name of registrant as specified in charter)
Millington Securities, Inc.
331 Newman Springs Rd Suite 122
Red Bank, New Jersey 07701
(Address of principal executive offices) (Zip code)
Don Schreiber, Jr.
Millington Securities, Inc.
331 Newman Springs Rd Suite 122
Red Bank, New Jersey 07701
(Name and address of agent for service)
(732) 842-4920
Registrant's telephone number, including area code
Date of fiscal year end: June 30
Date of reporting period: June 30, 2018
Item 1. Reports to Stockholders.
ANNUAL REPORT
June 30, 2018
WBI BullBear Rising Income 2000 ETF | WBIA
WBI BullBear Value 2000 ETF | WBIB
WBI BullBear Yield 2000 ETF | WBIC
WBI BullBear Quality 2000 ETF | WBID
WBI BullBear Rising Income 1000 ETF | WBIE
WBI BullBear Value 1000 ETF | WBIF
WBI BullBear Yield 1000 ETF | WBIG
WBI BullBear Quality 1000 ETF | WBIL
WBI BullBear Global Income ETF | WBII
WBI BullBear Global High Income ETF | WBIH
WBI BullBear Global Rotation ETF | WBIR
WBI Power Factor™ High Dividend ETF | WBIY
 | Absolute Shares Trust | |
| Table of Contents | |
| Management’s Discussion of Fund Performance | 1 |
| Performance Summaries | 14 |
| Portfolio Allocations | 26 |
| Schedules of Investments | 28 |
| Statements of Assets and Liabilities | 41 |
| Statements of Operations | 44 |
| Statements of Changes in Net Assets | 47 |
| Financial Highlights | 53 |
| Notes to Financial Statements | 64 |
| Report of Independent Registered Public Accounting Firm | 76 |
| Trustees and Officers | 77 |
| Approval of Advisory Agreements and Board Considerations | 80 |
| Expense Examples | 82 |
| Federal Tax Information | 84 |
| Information About the Portfolio Holdings | 85 |
| Information About Proxy Voting | 85 |
| Frequency Distributions of Premiums and Discounts | 85 |
(This page intentionally left blank.)
| | Absolute Shares Trust | |
Management’s Discussion of Fund Performance (Unaudited) | |
| June 30, 2018 | |
Dear Fellow Shareholder:
As discussed in greater detail below, the story of the Funds’ fiscal year was a tale of two markets: one strong and steady; one volatile and uncertain. It may not have been the best of times or the worst of times, but the times have certainly been changing.
In our experience, the conditions that affect investments are consistently subject to the possibility of uncertainty and change. We believe that the appropriate approach to investing in a volatile world is one that’s responsive to continually changing conditions and opportunities. We think that process should be focused on managing risk as well as on pursuing return. It should be disciplined and have a track record that spans both good times and bad. In short, our opinion is that it should be just like the process we have used for our investment management clients for the last 26 years – and continue to use to manage the Funds today. We believe the consistent application of this disciplined approach will continue to prove to be extremely valuable and attractive to current and prospective shareholders.
We appreciate the continuing confidence of our existing shareholders, and welcome our new shareholders to the Funds.
Investment Philosophy
The goal of the WBI Funds is to provide consistent, attractive returns with less volatility and risk to capital than traditional approaches. We believe capital preservation is essential to providing long-term portfolio growth and a consistent stream of income. Our focus on value, dividends, and risk management has become fundamental to our investment process.
Performance Overview
In response to market volatility during the most recent fiscal period, the actively managed equity-focused Funds periodically held significant allocations to cash equivalents, contributing to differences in performance between each Active Fund and its respective benchmark. The income Funds generated monthly distributions, but were affected by actual and prospective interest rate increases.
The WBI BullBear Rising Income 2000 ETF (NYSE Arca: WBIA) returned 1.62% on a NAV basis, and 1.39% based on market value, versus the 13.10% return of the Russell 2000 Value Total Return Index, the Fund’s benchmark.
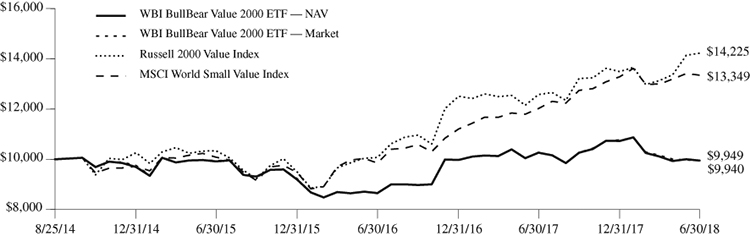
The WBI BullBear Value 2000 ETF (NYSE Arca: WBIB) returned -3.06% on a NAV basis, and -3.32% based on market value, versus the 13.10% return of the Russell 2000 Value Total Return Index, the Fund’s benchmark.
The WBI BullBear Yield 2000 ETF (NYSE Arca: WBIC) returned 3.34% on a NAV basis, and 3.11% based on market value, versus the 13.10% return of the Russell 2000 Value Total Return Index, the Fund’s benchmark.
The WBI BullBear Quality 2000 ETF (NYSE Arca: WBID) returned 1.43% on a NAV basis, and 1.39% based on market value, versus the 13.10% return of the Russell 2000 Value Total Return Index, the Fund’s benchmark.
The WBI BullBear Rising Income 1000 ETF (NYSE Arca: WBIE) returned 6.52% on a NAV basis, and 6.02% based on market value, versus the 6.77% return of the Russell 1000 Value Total Return Index, the Fund’s benchmark.
The WBI BullBear Value 1000 ETF (NYSE Arca: WBIF) returned 8.40% on a NAV basis, and 7.92% based on market value, versus the 6.77% return of the Russell 1000 Value Total Return Index, the Fund’s benchmark.
The WBI BullBear Yield 1000 ETF (NYSE Arca: WBIG) returned 14.14% on a NAV basis, and 13.68% based on market value, versus the 6.77% return of the Russell 1000 Value Total Return Index, the Fund’s benchmark.
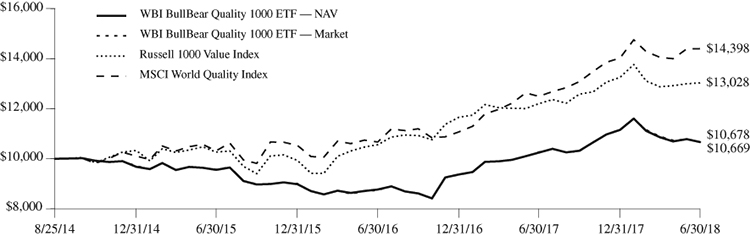
The WBI BullBear Quality 1000 ETF (NYSE Arca: WBIL) returned 4.11% on a NAV basis, and 3.95% based on market value, versus the 6.77% return of the Russell 1000 Value Total Return Index, the Fund’s benchmark.
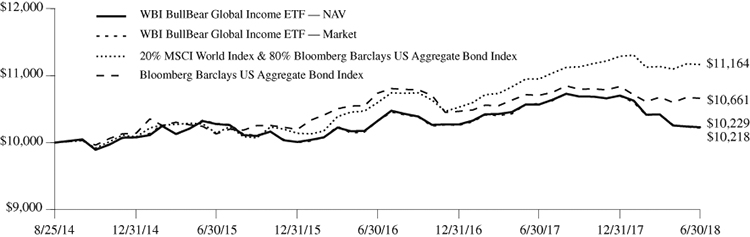
The WBI BullBear Global Income ETF (NYSE Arca: WBII) returned -3.20% on a NAV basis, and -3.43% based on market value, versus the -0.40% return of the Bloomberg Barclays US Aggregate Bond Total Return Index, the Fund’s benchmark.
The WBI BullBear Global High Income ETF (NYSE Arca: WBIH) returned 0.47% on a NAV basis, and 0.36% based on market value, versus the 2.70% return of the 15% Russell 1000 Value Total Return Index/15% Russell 2000 Value Total Return Index/70% Bloomberg Barclays US Aggregate Bond Total Return Index, the Fund’s custom benchmark.
The WBI BullBear Global Rotation ETF (NYSE Arca: WBIR) returned 2.69% on a NAV basis, and 2.54% based on market value, versus the 6.44% return of the 50% Russell Global Total Return Index/50% Bloomberg Barclays Global Aggregate Total Return Index, the Fund’s custom benchmark.
The WBI Power Factor™ High Dividend ETF (NYSE Arca: WBIY) returned 18.51% on a NAV basis, and 17.89% based on market value, versus the 7.25% return of the Russell 3000 Value Total Return Index, the Fund’s benchmark, and 21.50% return of the Solactive Power FactorTM High Dividend GTR Index, the Fund’s underlying index.
| | Absolute Shares Trust | |
Management’s Discussion of Fund Performance (Unaudited) (continued) | |
| June 30, 2018 | |
Net asset value total return is calculated assuming an initial investment made at the net asset value at the beginning of the period, reinvestment of all dividends and distributions at net asset value during the period, and the redemption on the last day of the period. Net asset value total return includes adjustments in accordance with accounting principles generally accepted in the United States of America. As such, returns based on the net asset value for financial reporting purposes may differ from the returns on shareholder transactions as well as returns based on unadjusted net asset values. Market price total return is calculated assuming an initial investment made at the market price at the beginning of the period, reinvestment of all dividends and distributions at market price during the period, and sale at the market price on the last day of the period. Total investment returns calculated for a period of less than one year are not annualized.
With the exception of the index Fund, the WBI Power FactorTM High Dividend ETF, the strategies used in the management of the Funds do not attempt to replicate or track the performance of any index, and differ significantly from the methods used to construct and maintain the indices that serve as their respective benchmarks. The eleven actively managed Funds (“Active Funds”) use proprietary processes to screen, rank, and purchase securities with particular attributes, and sell securities when certain thresholds are reached, while benchmark indices are unmanaged, and consist of a passive representation of all securities that meet the definition of the index constituents. In addition, each Active Fund uses strategies intended to mitigate volatility and protect capital, and as a result these Funds will often have a significant allocation to cash equivalents. Therefore, while each Active Fund’s performance includes the effect of an investment in cash equivalents from the proceeds of sales when certain thresholds are met, benchmark indices do not include an allocation to cash equivalents.
A distinguishing characteristic of cash equivalents is that their prices are extremely stable and not subject to the levels of price volatility generally exhibited by other investments. Therefore, in periods during which the prices of the securities represented in benchmark indices are falling, an allocation to cash equivalents may contribute to Active Fund performance that is superior to that of their benchmarks. In periods during which the prices of the securities represented in benchmark indices are rising, an allocation to cash equivalents in an Active Fund may cause its performance to trail that of its benchmark. You cannot invest directly in an index, including a benchmark index, and benchmark performance does not include the deduction of transaction and operational expenses, or the deduction of an investment management fee, which would alter their indicated historical results.
The WBI Power FactorTM High Dividend ETF is intended to track its benchmark index, the Solactive Power Factor™ High Dividend GTR Index, and can reasonably be compared to its benchmark in evaluating its performance. Despite the limitations of using benchmarks to assess the performance of the Active Funds, indices can still provide some context for understanding how market conditions and active management may have affected Fund performance. A benchmark for each of the Active Funds is shown because they provide a reference to investments that are similar to the types of investments that may appear from time to time in the Funds. However, none of the benchmarks are, or are likely to become, representative of past or expected Active Fund holdings or performance.
Review of Active Fund Trading Activity
The Active Funds attempt to provide consistent, attractive returns net of expenses with potentially less volatility and risk to capital than traditional approaches, whatever market conditions may be. The investment process for each Fund includes a buy discipline and a sell discipline. Each Fund’s trading activity reflects this disciplined investment process as described in its prospectus, and summarized below.
The Active Funds that invest in individual equities use quantitative computer screening of fundamental stock information to evaluate domestic and foreign equity securities in an attempt to find companies with attractive characteristics for the selected universe of securities. Dividend payments may be considered as part of the evaluation process. Once securities are identified, an overlay of technical analysis confirms timeliness of security purchases. The Funds then add qualifying securities using available cash within the parameters of each Fund’s investment objective and security selection criteria.
The Active Funds that invest in fixed income securities and bond ETFs use a proprietary bond model to assess the appropriate duration of their exposure to debt securities. Duration is a measure of a fixed income security’s expected price sensitivity to changes in interest rates. Securities with longer durations are expected to experience greater price movements than securities with shorter duration for the same change in prevailing interest rates. A portion of a Fund’s bond exposure may also be invested to pursue perceived opportunities in varying segments of the debt market. This systematic process of identifying, evaluating, and purchasing securities constitutes the Sub-Advisor’s buy discipline for the Funds.
The WBI BullBear Global Rotation ETF uses proprietary global asset rotation models intended to identify investment opportunities with superior risk-adjusted return potential across a broad array of global asset classes, sectors, industries, geographic regions, indices, or security styles. The Fund’s allocation will change as the models’ assessments of the risk-adjusted attractiveness of investment opportunities change with respect to the other opportunities being evaluated.
Once a security is purchased for a given Active Fund, a strict sell discipline with a dynamic stop loss and goal setting process attempts to control the effects of the volatility of each invested position on the Fund’s value. An initial stop percentage and goal price is established at the time a security is purchased. As that security’s specified goal price is approached, the initial stop tolerance set for each security is tightened. If a security stays within its acceptable price channel relative to its current stop, it remains in the Fund’s portfolio. If the security moves below the acceptable price channel, a stop is triggered and the Fund will sell the security. This results in a responsive process that actively adjusts the Fund’s allocation by causing it to
| | Absolute Shares Trust | |
Management’s Discussion of Fund Performance (Unaudited) (continued) | |
| June 30, 2018 | |
become more fully invested or by raising cash with the intention of protecting capital. This process is likely to result in a Fund holding meaningful allocations to cash equivalents during periods of market volatility.
The investment process has been built on the assumption that future events involve varying degrees of uncertainty. Therefore, the appearance of qualifying candidates in the selection process will be respected as a possible indication of the start of a durable price advance, and each stop loss trigger will result in a sale of the relevant security to help prevent losses to capital that could result if the security continued to be held and the price of the security continued to fall. As per this disciplined investment process, during the fiscal period securities identified by the various ranking and selection processes as attractive were purchased with available cash, and trailing stops were implemented for all securities purchased.
The security selection process has continued to uncover what we believe to be very attractive investment opportunities for each of the Funds.
WBI BullBear Rising Income 2000 ETF (WBIA)
As of June 30, 2018, WBIA held 30 securities in addition to a position in a money market fund which served as a cash equivalent. From the time of their purchase, 14 of these positions had unrealized gains of between 2.03% and 13.93%, while 16 had unrealized losses ranging from -0.07% to -9.04%. The aggregate unrealized gain amounted to 0.94% of the Fund’s period ending net asset value.
Approximately 84% of the securities held by WBIA at any time during the fiscal period were sold. Approximately 45% of the Fund’s holdings were sold for gains, with an average realized gain of 11.9%, and approximately 55% were sold for an average realized loss of -7.4%. The Fund had no holdings in other dispositions (generally involving option and other hedging activity).
Examples of securities that made positive contributions to WBIA’s performance during the fiscal period include Insperity Inc., The Ensign Group Inc., SEI Investments Company, Ralph Lauren Corp., and Pultegroup Inc. Examples of securities that detracted from the Fund’s performance during the fiscal period include Barnes Group Inc., LA-Z-BOY Inc., Lincoln Electric Holdings, Interface Inc., and Ingredion Inc.
No option/volatility hedges were implemented in WBIA during the fiscal period.
High turnover in WBIA’s holdings has the potential to result in the realization and distribution to shareholders of higher capital gains. If Fund shares are held in a taxable account, this may increase your tax liability. To the extent portfolio turnover increases transaction costs, it may also reduce Fund performance. Of course, selling a security in a timely fashion may also improve performance if a subsequent loss is avoided that exceeds the cost of executing the sale.
WBI BullBear Value 2000 ETF (WBIB)
As of June 30, 2018, WBIB held 34 securities in addition to a position in a money market fund which served as a cash equivalent. From the time of their purchase, 20 of these positions had unrealized gains of between 0.48% and 17.47%, while 14 had unrealized losses ranging from -0.33% to -9.55%. The aggregate unrealized gain amounted to 2.22% of the Fund’s period ending net asset value.
Approximately 83% of the securities held by WBIB at any time during the fiscal period were sold. Approximately 38% of the Fund’s holdings were sold for gains, with an average realized gain of 9.5%, and approximately 62% were sold for an average realized loss of -7.3%. The Fund had no holdings in other dispositions (generally involving option and other hedging activity).
Examples of securities that made positive contributions to WBIB’s performance during the fiscal period include Tractor Supply Company, Ralph Lauren Corp., Dana Inc., Tailored Brands Inc., and ITT Inc. Examples of securities that detracted from the Fund’s performance during the fiscal period include Manpowergroup Inc., Vishay Intertechnology Inc., Herman Miller Inc., Hanesbrands Inc., and Popular Inc.
No option/volatility hedges were implemented in WBIB during the fiscal period.
High turnover in WBIB’s holdings has the potential to result in the realization and distribution to shareholders of higher capital gains. If Fund shares are held in a taxable account, this may increase your tax liability. To the extent portfolio turnover increases transaction costs, it may also reduce Fund performance. Of course, selling a security in a timely fashion may also improve performance if a subsequent loss is avoided that exceeds the cost of executing the sale.
WBI BullBear Yield 2000 ETF (WBIC)
As of June 30, 2018, WBIC held 31 securities in addition to a position in a money market fund which served as a cash equivalent. From the time of their purchase, 20 of these positions had unrealized gains of between 0.30% and 17.47%, while 11 had unrealized losses ranging from -0.16% to -14.99%. The aggregate unrealized gain amounted to 2.21% of the Fund’s period ending net asset value.
Approximately 82% of the securities held by WBIC at any time during the fiscal period were sold. Approximately 41% of the Fund’s holdings were sold for gains, with an average realized gain of 11.5%, and approximately 59% were sold for an average realized loss of -7.1%. The Fund had no holdings in other dispositions (generally involving option and other hedging activity).
| | Absolute Shares Trust | |
Management’s Discussion of Fund Performance (Unaudited) (continued) | |
| June 30, 2018 | |
Examples of securities that made positive contributions to WBIC’s performance during the fiscal period include Hollyfrontier Corp., Ralph Lauren Corp., Tailored Brands Inc., Avery Dennison Corp., and Eaton Vance Corp. Examples of securities that detracted from the Fund’s performance during the fiscal period include H&R Block Inc., Manpowergroup Inc., Hanesbrands Inc., Axis Capital Holdings Ltd., and Darden Restaurant Inc.
No option/volatility hedges were implemented in WBIC during the fiscal period.
High turnover in WBIC’s holdings has the potential to result in the realization and distribution to shareholders of higher capital gains. If Fund shares are held in a taxable account, this may increase your tax liability. To the extent portfolio turnover increases transaction costs, it may also reduce Fund performance. Of course, selling a security in a timely fashion may also improve performance if a subsequent loss is avoided that exceeds the cost of executing the sale.
WBI BullBear Quality 2000 ETF (WBID)
As of June 30, 2018, WBID held 25 securities in addition to a position in a money market fund which served as a cash equivalent. From the time of their purchase, 12 of these positions had unrealized gains of between 0.36% and 11.49%, while 13 had unrealized losses ranging from -0.35% to -5.14%. The aggregate unrealized gain amounted to 1.29% of the Fund’s period ending net asset value.
Approximately 85% of the securities held by WBID at any time during the fiscal period were sold. Approximately 36% of the Fund’s holdings were sold for gains, with an average realized gain of 10.7%, and approximately 64% were sold for an average realized loss of -7.4%. The Fund had no holdings in other dispositions (generally involving option and other hedging activity).
Examples of securities that made positive contributions to WBID’s performance during the fiscal period include Tractor Supply Company, Ralph Lauren Corp., Tailored Brands Inc., SEI Investments Company, and Evercore Inc. – Class A Shares. Examples of securities that detracted from the Fund’s performance during the fiscal period include H&R Block Inc., LA-Z-BOY Inc., Manpowergroup Inc., Interpublic Group of Companies Inc., and Fluor Corp.
No option/volatility hedges were implemented in WBID during the fiscal period.
High turnover in WBID’s holdings has the potential to result in the realization and distribution to shareholders of higher capital gains. If Fund shares are held in a taxable account, this may increase your tax liability. To the extent portfolio turnover increases transaction costs, it may also reduce Fund performance. Of course, selling a security in a timely fashion may also improve performance if a subsequent loss is avoided that exceeds the cost of executing the sale.
WBI BullBear Rising Income 1000 ETF (WBIE)
As of June 30, 2018, WBIE held 27 securities in addition to a position in a money market fund which served as a cash equivalent. From the time of their purchase, 16 of these positions had unrealized gains of between 0.43% and 16.18%, while 11 had unrealized losses ranging from -0.31% to -13.09%. The aggregate unrealized gain amounted to 3.41% of the Fund’s period ending net asset value.
Approximately 79% of the securities held by WBIE at any time during the fiscal period were sold. Approximately 38% of the Fund’s holdings were sold for gains, with an average realized gain of 11.6%, and approximately 62% were sold for an average realized loss of -7.1%. The Fund had no holdings in other dispositions (generally involving option and other hedging activity).
Examples of securities that made positive contributions to WBIE’s performance during the fiscal period include Hilton Worldwide Holdings Inc., Ross Stores Inc., Ameriprise Financial Inc., Home Depot Inc., and CNH Industrial NV. Examples of securities that detracted from the Fund’s performance during the fiscal period include Packaging Corp of America, Comerica Inc., Expedia Group Inc., Discover Financial Services, and CBS Corp – Class B Shares.
No option/volatility hedges were implemented in WBIE during the fiscal period.
High turnover in WBIE’s holdings has the potential to result in the realization and distribution to shareholders of higher capital gains. If Fund shares are held in a taxable account, this may increase your tax liability. To the extent portfolio turnover increases transaction costs, it may also reduce Fund performance. Of course, selling a security in a timely fashion may also improve performance if a subsequent loss is avoided that exceeds the cost of executing the sale.
WBI BullBear Value 1000 ETF (WBIF)
As of June 30, 2018, WBIF held 25 securities in addition to a position in a money market fund which served as a cash equivalent. From the time of their purchase, 14 of these positions had unrealized gains of between 1.10% and 16.18%, while 11 had unrealized losses ranging from -0.35% to -3.34%. The aggregate unrealized gain amounted to 2.76% of the Fund’s period ending net asset value.
Approximately 79% of the securities held by WBIF at any time during the fiscal period were sold. Approximately 40% of the Fund’s holdings were sold for gains, with an average realized gain of 11.3%, and approximately 60% were sold for an average realized loss of -5.9%. The Fund had no holdings in other dispositions (generally involving option and other hedging activity).
| | Absolute Shares Trust | |
Management’s Discussion of Fund Performance (Unaudited) (continued) | |
| June 30, 2018 | |
Examples of securities that made positive contributions to WBIF’s performance during the fiscal period include Blackrock Inc., Parker Hannifin Corp., Home Depot Inc., Tiffany & Co., and Raymond James Financial Inc. Examples of securities that detracted from the Fund’s performance during the fiscal period include Interpublic Group of Companies Inc., Oracle Corp., Church & Dwight Co Inc., Quest Diagnostics Inc., and Johnson & Johnson.
No option/volatility hedges were implemented in WBIF during the fiscal period.
High turnover in WBIF’s holdings has the potential to result in the realization and distribution to shareholders of higher capital gains. If Fund shares are held in a taxable account, this may increase your tax liability. To the extent portfolio turnover increases transaction costs, it may also reduce Fund performance. Of course, selling a security in a timely fashion may also improve performance if a subsequent loss is avoided that exceeds the cost of executing the sale.
WBI BullBear Yield 1000 ETF (WBIG)
As of June 30, 2018, WBIG held 25 securities in addition to a position in a money market fund which served as a cash equivalent. From the time of their purchase, 19 of these positions had unrealized gains of between 0.08% and 16.18%, while 6 had unrealized losses ranging from -1.61% to -5.04%. The aggregate unrealized gain amounted to 3.91% of the Fund’s period ending net asset value.
Approximately 76% of the securities held by WBIG at any time during the fiscal period were sold. Approximately 35% of the Fund’s holdings were sold for gains, with an average realized gain of 9.0%, and approximately 65% were sold for an average realized loss of -7.0%. The Fund had no holdings in other dispositions (generally involving option and other hedging activity).
Examples of securities that made positive contributions to WBIG’s performance during the fiscal period include Ameriprise Financial Inc., Hollyfrontier Corp., The Boeing Co., Automatic Data Processing, and Wyndham Worldwide Corp. Examples of securities that detracted from the Fund’s performance during the fiscal period include Packaging Corp of America, Lockheed Martin Corp., Starbucks Corp., The GAP Inc., and Waste Management Inc.
No option/volatility hedges were implemented in WBIG during the fiscal period.
High turnover in WBIG’s holdings has the potential to result in the realization and distribution to shareholders of higher capital gains. If Fund shares are held in a taxable account, this may increase your tax liability. To the extent portfolio turnover increases transaction costs, it may also reduce Fund performance. Of course, selling a security in a timely fashion may also improve performance if a subsequent loss is avoided that exceeds the cost of executing the sale.
WBI BullBear Quality 1000 ETF (WBIL)
As of June 30, 2018, WBIL held 26 securities in addition to a position in a money market fund which served as a cash equivalent. From the time of their purchase, 15 of these positions had unrealized gains of between 0.71% and 16.18%, while 11 had unrealized losses ranging from -0.35% to -15.94%. The aggregate unrealized gain amounted to 1.15% of the Fund’s period ending net asset value.
Approximately 77% of the securities held by WBIL at any time during the fiscal period were sold. Approximately 35% of the Fund’s holdings were sold for gains, with an average realized gain of 9.8%, and approximately 65% were sold for an average realized loss of -6.3%. The Fund had no holdings in other dispositions (generally involving option and other hedging activity).
Examples of securities that made positive contributions to WBIL’s performance during the fiscal period include Citizens Financial Group, Ameriprize Financial Inc., Tiffany & Co., Wyndham Worldwide Corp., and Automatic Data Processing. Examples of securities that detracted from the Fund’s performance during the fiscal period include Equifax Inc., Stanley Black & Decker Inc., The GAP Inc., Dollar General Corp., and Packaging Corp of America.
No option/volatility hedges were implemented in WBIL during the fiscal period.
High turnover in WBIL’s holdings has the potential to result in the realization and distribution to shareholders of higher capital gains. If Fund shares are held in a taxable account, this may increase your tax liability. To the extent portfolio turnover increases transaction costs, it may also reduce Fund performance. Of course, selling a security in a timely fashion may also improve performance if a subsequent loss is avoided that exceeds the cost of executing the sale.
WBI BullBear Global Income ETF (WBII)
As of June 30, 2018, WBII held 9 securities in addition to a position in a money market fund which served as a cash equivalent. From the time of their purchase, 3 of these positions had unrealized gains of between 0.05% and 0.91%, while 6 had unrealized losses ranging from -0.14% to -6.69%. The aggregate unrealized loss amounted to -0.86% of the Fund’s period ending net asset value.
Approximately 83% of the securities held by WBII at any time during the fiscal period were sold. Approximately 36% of the Fund’s holdings were sold for gains, with an average realized gain of 0.7%, and approximately 64% were sold for an average realized loss of -1.3%. The Fund had no holdings in other dispositions (generally involving option and other hedging activity).
| | Absolute Shares Trust | |
Management’s Discussion of Fund Performance (Unaudited) (continued) | |
| June 30, 2018 | |
Examples of securities that made positive contributions to WBII’s performance during the fiscal period include Invesco International Corporate Bond ETF, SPDR Bloomberg Barclays Short Term International Treasury Bond ETF, SPDR Bloomberg Barclays Short Term High Yield Bond ETF, SPDR Portfolio Long Term Treasury ETF, and iShares 20+ Year Treasury Bond ETF. Examples of securities that detracted from the Fund’s performance during the fiscal period include Vanguard Long-Term Corporate Bond ETF, SPDR Portfolio Long Term Corporate Bond ETF, iShares U.S. Preferred Stock ETF, iShares Core 10+ Year USD Bond ETF, and iShares Core U.S. Aggregate Bond ETF.
No option/volatility hedges were implemented in WBII during the fiscal period.
High turnover in WBII’s holdings has the potential to result in the realization and distribution to shareholders of higher capital gains. If Fund shares are held in a taxable account, this may increase your tax liability. To the extent portfolio turnover increases transaction costs, it may also reduce Fund performance. Of course, selling a security in a timely fashion may also improve performance if a subsequent loss is avoided that exceeds the cost of executing the sale.
WBI BullBear Global High Income ETF (WBIH)
As of June 30, 2018, WBIH held 26 securities in addition to a position in a money market fund which served as a cash equivalent. From the time of their purchase, 11 of these positions had unrealized gains of between 0.05% and 13.26%, while 15 had unrealized losses ranging from -0.14% to -6.82%. The aggregate unrealized loss amounted to -0.10% of the Fund’s period ending net asset value.
Approximately 80% of the securities held by WBIH at any time during the fiscal period were sold. Approximately 37% of the Fund’s holdings were sold for gains, with an average realized gain of 8.5%, and approximately 63% were sold for an average realized loss of -4.2%. The Fund had no holdings in other dispositions (generally involving option and other hedging activity).
Examples of securities that made positive contributions to WBIH’s performance during the fiscal period include Texas Instruments Inc., Signet Jewelers Ltd., Arthur J Gallagher & Co., Hollyfrontier Corp., and Suntrust Banks Inc. Examples of securities that detracted from the Fund’s performance during the fiscal period include Vanguard Long-Term Corporate Bond ETF, SPDR Bloomberg Barclays Short Term High Yield Bond ETF, Maxim Integrated Products, International Business Machines Corp., and KLA-Tencor Corp.
No option/volatility hedges were implemented in WBIH during the fiscal period.
High turnover in WBIH’s holdings has the potential to result in the realization and distribution to shareholders of higher capital gains. If Fund shares are held in a taxable account, this may increase your tax liability. To the extent portfolio turnover increases transaction costs, it may also reduce Fund performance. Of course, selling a security in a timely fashion may also improve performance if a subsequent loss is avoided that exceeds the cost of executing the sale.
WBI BullBear Global Rotation ETF (WBIR)
As of June 30, 2018, WBIR held 14 securities in addition to a position in a money market fund which served as a cash equivalent. From the time of their purchase, 5 of these positions had unrealized gains of between 0.28% and 4.26%, while 9 had unrealized losses ranging from -0.99% to -6.14%. The aggregate unrealized gain amounted to 1.03% of the Fund’s period ending net asset value.
Approximately 86% of the securities held by WBIR at any time during the fiscal period were sold. Approximately 42% of the Fund’s holdings were sold for gains, with an average realized gain of 3.0%, and approximately 58% were sold for an average realized loss of -2.9%. The Fund had no holdings in other dispositions (generally involving option and other hedging activity).
Examples of securities that made positive contributions to WBIR’s performance during the fiscal period include iShares China Large-Cap ETF, First Trust Germany AlphaDEX Fund, Invesco S&P SmallCap Low Volatility ETF, SPDR S&P Health Care Equipment ETF, and Vanguard Financials ETF. Examples of securities that detracted from the Fund’s performance during the fiscal period include VanEck Vectors Biotech ETF, Xtrackers MSCI South Korea Hedged Equity ETF, First Trust NYSE Arca Biotechnology Index Fund, Invesco Variable Rate Preferred ETF, and iShares MSCI All Country Asia ex Japan ETF.
No option/volatility hedges were implemented in WBIR during the fiscal period.
High turnover in WBIR’s holdings has the potential to result in the realization and distribution to shareholders of higher capital gains. If Fund shares are held in a taxable account, this may increase your tax liability. To the extent portfolio turnover increases transaction costs, it may also reduce Fund performance. Of course, selling a security in a timely fashion may also improve performance if a subsequent loss is avoided that exceeds the cost of executing the sale.
| | Absolute Shares Trust | |
Management’s Discussion of Fund Performance (Unaudited) (continued) | |
| June 30, 2018 | |
Review of Index Fund Trading Activity
WBI Power Factor™ High Dividend ETF (WBIY)
WBIY is intended to track the Solactive Power Factor™ High Dividend Index, and its trading activity results from changes to the holdings of this underlying index. The composition of the underlying index is adjusted quarterly and screened monthly for dividend cuts or an overall negative outlook concerning the member companies’ dividend policy.
As of June 30, 2018, WBIY held 50 securities in addition to a position in a money market fund which served as a cash equivalent. From the time of their purchase, 28 of these positions had unrealized gains of between 0.14% and 75.66%, while 22 had unrealized losses ranging from -0.29% to -34.67%. The aggregate unrealized gain amounted to 1.01% of the Fund’s period ending net asset value.
Approximately 49% of the securities held by WBIY at any time during the fiscal period were sold as a result of changes to the underlying index. Approximately 47% of the Fund’s holdings were sold for gains, with an average realized gain of 23.5%, and approximately 53% were sold for an average realized loss of -16.6%.
Examples of securities that made positive contributions to WBIY’s performance during the fiscal period include Valero Energy Corp., Tailored Brands Inc., Cisco Systems Inc., Foot Locker Inc., and International Game Technology PLC. Examples of securities that detracted from the Fund’s performance during the fiscal period include Tupperware Brands Corp., General Mills Inc., CenturyLink Inc., Pitney Bowes Inc., and SCANA Corp.
No option/volatility hedges were implemented in WBIY during the fiscal period.
High turnover in WBIY’s holdings has the potential to result in the realization and distribution to shareholders of higher capital gains. If Fund shares are held in a taxable account, this may increase your tax liability. To the extent portfolio turnover increases transaction costs, it may also reduce Fund performance. Of course, selling a security in a timely fashion may also improve performance if a subsequent loss is avoided that exceeds the cost of executing the sale.
Market Conditions
Quarter by quarter review of fiscal period market conditions 2017-2018
3rd Quarter 2017
The Funds’ fiscal year covered the period from July 1, 2017 to June 30, 2018. It began with devastating hurricanes, floods, earthquakes, escalating tensions with North Korea, and continuing dysfunction in Washington – but stock markets seemed to shrug it all off as the third quarter of 2017 began. Tragedy on Main Street didn’t stir up much of a storm on Wall Street, as major U.S. equity indices posted solidly positive returns. For the quarter, the Dow Jones Industrial Average (DJIA) added 4.94%, the S&P 500 Index gained 3.96% (4.48% including dividends), and the NASDAQ Composite Index rose by 5.79%. September has historically offered up the weakest stock market returns of any month, but that was not the case in 2017. A relatively quiet August was followed up by solid equity index returns in September – especially for small company stocks as represented by the Russell 2000 Index. It gained 6.09% as summer turned to autumn, which turned its two-month loss of -0.81% into a three month gain of 5.33%.
International equity markets, as measured by the EAFE, had uneven returns over the same three months, but also posted solid gains by the end of the quarter. The Japanese Nikkei was down slightly in July and August, but rallied in September to finish the quarter in positive territory.
The CRB Commodity Index followed an up and down pattern similar to that of U.S. and international equity indices, and finished the quarter with a gain of 4.76%. Oil prices climbed from $46.02 per barrel to $51.67 (West Texas Intermediate), a gain of 12.23%. Gold spiked from $1,241.61/oz. to $1,349.22/oz. before sliding back to $1,279.75/oz. for a quarterly gain of 3.07%.
The monthly returns in the bond markets were almost the exact opposite of those in equity and commodity markets. A soft July was followed by a strong rally in August which was almost completely offset by a slide in September. During the quarter, the Federal Reserve clarified its plans to begin reducing its balance sheet, gradually withdrawing the cash it had pumped into the economy during three rounds of Quantitative Easing, or QE. QE was intended to help stimulate the economy and prevent the Great Recession from becoming something even worse.
The Federal Reserve had never performed an operation like QE before, and there are a wide range of opinions about the program’s effectiveness. Some believe all QE accomplished was to artificially boost stock and bond prices. Others are convinced it saved us all from an economic apocalypse.
Unless otherwise indicated, the source for all price and index data used in charts, tables and discussion is Bloomberg. You cannot invest directly in an index. |
|
| | Absolute Shares Trust | |
Management’s Discussion of Fund Performance (Unaudited) (continued) | |
| June 30, 2018 | |
Whatever positive effects Quantitative Easing may have had, the Fed’s decision to gradually unload many of the bonds it bought introduced uncertainty about the negative effects this Quantitative Tightening may have. The longer-term effect of the “QT” program on bond prices and yields remains to be seen, but the third quarter’s gyrations in 10-year U.S. Government note prices left their yield at 2.33%, which is essentially the same as the 2.31% yield they had at the start of the quarter – and down from their 2.45% yield at the start of the year.
Still, the signature feature of the initial quarter of the Funds’ fiscal year was the remarkable calm of the financial markets in the face of all the storms, conflict and dysfunction during the period.
4th Quarter 2017
The fourth quarter of 2017 was kind to investors across a wide range of markets and asset types. Stock indices tacked on further gains in both the U.S. and international markets, bond indices handily outpaced inflation, and commodities continued their rebound from their declines in the first half of the year.
For 2017 as a whole, stocks enjoyed the strongest performance among the various classes of investments. Large company U.S. stocks, as represented by the Dow Jones Industrial Average, the S&P 500 Index, and the NASDAQ Composite finished the year with returns of 25.08%, 21.83%, and 28.24% respectively. The Russell 2000 Index of smaller company U.S. stocks did less well, but still posted a very respectable 13.14% for the year.
International equity indices also gave investors reason to cheer, with the EAFE up by 21.78%. Some regions were stronger than others. The Hang Seng Index of Hong Kong rose by 35.99%, while Germany’s DAX index gained 12.51%.
Commodities, as measured by the CRB Commodity Index, finished the year with a solid quarterly gain of 5.89%. Combined with the third quarter’s results, the rebound from the first half’s losses left the index in positive territory – if just barely – by the end of the year.
The U.S. Dollar did not enjoy a rebound, however, and the U.S. Dollar Index fell in each quarter of 2017 to end the year with a loss in of 9.87%.
In December, the Federal Reserve hiked short term interest rates for the third time in 2017, and the fifth time since it began its campaign of “normalization” in December 2015. The Fed’s actions might have been expected to take a toll on a wide range of interest rates, and hurt bond prices as a result. Not in 2017. The yield on the benchmark 10-year Treasury note got as high as 2.63% during the year and as low as 2.04%, but ended the year at 2.41%, almost exactly at the 2.44% level where it began it. The Dow Jones Equal Weight Corporate Bond Index added 0.94% during the quarter to bring its gain for the calendar year to 5.99%, and the Barclays U.S. Treasury 20+ Year Index tacked on 2.55% for the quarter to end the year with a gain of 8.98%.
The aging bull market that began in March of 2009 got a second wind in 2017, and nearly nine years after it started running, it showed no signs of getting tired as the first half of the Fund’s fiscal year ended.
1st Quarter 2018
Equity markets in the U.S. and around the world got off to a great start in 2018, as major stock market indices hit new all-time highs in January. Unfortunately, February and March brought with them declines of more than 10% in the S&P 500 Index and Dow Jones Industrial Average, and nearly 10% in the NASDAQ Composite as well. The familiar calm of markets characterized by steady gains month after month were replaced by markets being jolted by violent moves up and down – sometimes within the same day. For all of 2017 there were eight days with moves of more than 1% up or down in the S&P 500 Index. During just the first quarter of 2018 there were twenty-three. The first quarter saw six days with moves of more than 2%, five down and one up; in 2017 there were none.
The late winter months brought a chill to international stock markets as well, as indices in Europe, Asia, and Latin America gave back January gains to finish the first quarter of 2018 in the red.
As stock markets fell, bonds and the U.S. Dollar didn’t appear to benefit from a flight to safety. The Dow Jones Equal Weight Corporate Bond Index and the Barclays U.S. Treasury 20+ Year Bond Index ended the quarter with losses of -2.63% and -3.36% respectively, and the U.S. Dollar Index shed -2.33%.
2nd Quarter 2018
Volatility continued in the second quarter, but at a somewhat more subdued pace than earlier in the year. The S&P 500 index still had thirteen one-day moves of more than 1% during the three month period, but just two were of more than 2% - though both were down. Still, the market’s tone was generally more positive for stocks during the quarter. The relatively muted results of April and June combined with respectable gains in May to help the S&P 500 Index and Dow Jones Industrial Average to returns of 0.70% and 2.93% respectively for the quarter. The Russell 2000 Index of small company stocks and the technology heavy NASDAQ Composite did even better during the quarter, gaining 7.43% and 6.33% respectively. Still, by the end of the quarter the S&P 500 and DJIA were still well below their January highs, the S&P 500 by -5.38% and the DJIA by -8.81%. The NASDAQ Composite, however, had climbed all the way back to hit a new high on June 20, and closed the quarter 0.06% above its January peak.
| | Absolute Shares Trust | |
Management’s Discussion of Fund Performance (Unaudited) (continued) | |
| June 30, 2018 | |
International stocks posted varying results during the quarter, with the German DAX Index and Japanese Nikkei gaining, while the Hang Seng in Hong Kong and the broader EAFE index of international equities falling.
Another interest rate hike by the Federal Reserve in June didn’t seem to have much lasting effect on bond prices, as corporate bonds fell a bit but treasuries finished the quarter slightly higher. The rise in short-term rates may have helped boost the attractiveness of the U.S. Dollar however. The Dollar Index gained in April, May, and June to finish the quarter 5.00% higher.
Investment Commentary
Rhyme or Reason
As investment managers, we are often asked our opinion about what the future holds for the economy and investments. While that’s the question we’re asked, we suspect what people really want to know is what the future holds for them, and for their plans to meet their important financial needs and goals.
Some goals require the accumulation of capital, some require a reliable supply of current income, and many require a measure of both. For some goals, the important time frame is right now. There’s a large expense looming – perhaps the purchase of a home, or the start of college education expenses. Some goals may be 5 to 10 years down the road, and some may still be decades away. Some will require lump sum outlays, and some – like retirement – may involve outflows that stretch over 20 years or more. (According to the U.S. Department of Health and Human Services, the average life expectancy at age 65 is 20.6 years for females and 18.0 years for males.1)
As much as we would like to believe otherwise, none of us know exactly how the future will unfold – although we all may have our predictions, forecasts, estimates, and guesses. After all, we still have to make our plans based on something. But as Mark Twain once quipped, “The future doesn’t repeat itself. At best, it rhymes.” Still if you’re trying to plan for your future, you may want to consider what the past has to tell you.
We understand that history can’t give us a precise timetable about what’s going to happen, or when. We do believe, however that the lessons of history can teach us about what can happen, and how we should think about the kinds of decisions we are making about our actions today.
Let’s listen in on what history is whispering to investors with varying needs and time horizons about the economy, the stock market, and bonds.
The Economy
The National Bureau of Economic Research (NBER) is charged with determining whether the U.S. economy is in an expansion or recession. A recession is defined as “a significant decline in economic activity spread across the economy, lasting more than a few months, normally visible in real GDP, real income, employment, industrial production, and wholesale-retail sales”. The Great Depression is referenced in NBER reports, but there’s no definition of what constitutes a depression. (A rather grim quip says that a recession is when your neighbors lose their jobs – and a depression is when you lose yours.)
According to the NBER, since 1929 the U.S. economy has been through 14 recessions (including the Great Depression). This is an average of one recession about every 5 ¾ years. From the time a recession begins until it reaches its lowest point has averaged just over 13 months. It has taken an average of 57 months of recovery, or nearly 5 years, for the economy to climb back to a new peak.
Recessions tend to be hard on home prices, consumer spending, company profits, stock prices, job security, and paychecks. Lending standards also tend to become stricter as loan defaults rise, making it harder to qualify for credit and mortgages.
The most recent “Great Recession” ended in June 2009. Many folks still seem to be clawing back from that decline. Based on past expansions, the current recovery should have ended sometime back in 2015, so the current recovery is breaking records for longevity, if not for strength. They say records are made to be broken, so the expansion could continue indefinitely, but history suggests that one of these days it will definitely end.
Someone making plans for five years from now may want to figure out how they are going to keep those plans on track while going through the next recession. Someone planning for goals 15 to 20 years out may want to plan on getting through two or three.
We constantly monitor a wide variety of economic data as part of our investment process in an effort to assess how the portfolios under our management should respond as the economy cycles through expansions and recessions.
The Stock Market
On March 9, 2009, the S&P 500 Index closed at 676.53. On January 26 of this year, it closed at an all-time high of 2872.87 – a gain of nearly 325%, not including dividends. By February 8, just 9 trading days later, it had fallen by more than 10% to 2581.
Shocking? Maybe, for anyone accustomed to the kind of calm, steady climb stocks had been experiencing over the last few years. But history suggests declines in stock indices of 10% or more are part of the price for holding stocks as markets fall. Since January 2000 there have been at least
| | Absolute Shares Trust | |
Management’s Discussion of Fund Performance (Unaudited) (continued) | |
| June 30, 2018 | |
15 instances of the S&P 500 Index dropping 10% or more from its previous high – an average of about once every 15 months. We can also find 5 declines of more than 20% over that same period – an average of once every 3.8 years. There have even been two cases of declines in the neighborhood of 50%: -49.15% from March 24, 2000 to October 9, 2002, and a whopping -56.78% from October 9, 2007 to March 9, 2009. How many plans will hold up through a loss of around half of the nest egg every 9 ½ years or so?
Of course, history also tells us that the market has always come back from its big declines, but it can take a while. After the 2000 – 2002 decline attributed to the bursting of the “dot com” bubble, it took the S&P 500 Index more than 4 ½ years to get back to where it started. It took just over 4 years for the S&P 500 to recover from the 2007 – 2009 crash precipitated by the collapse of the housing market. Spending year after year just recovering lost funds can wreak havoc on the timing of future goals, and may force significant lifestyle compromises in others.
Attempting to avoid the big declines in the first place is a driving principle of our investment philosophy. Not only do we use a robust screening and ranking process to select stocks, but each stock held in our actively managed portfolios is subject to a daily risk management review. Stocks are a useful vehicle for meeting future goals, but we believe conserving capital during market declines is critical to investors trying to accumulate wealth or generate income.
Interest Rates and Bonds
For what seems like a very long time, because it has been a very long time, bonds have enjoyed a tailwind. Falling yields lead to higher bond prices, as existing high rate bonds become more attractive than the new lower rate versions. On September 30, 1981, the yield on the benchmark 10-year U.S. Treasury note hit 15.84%. From that high, the yields spent nearly 36 years in a persistent, if uneven, march lower, reaching a low of 1.36% on July 8, 2016.
This past June the Federal Reserve hiked interest rates for the seventh time. As the Fed continues its program of raising interest rates, the 1.36% yields of a few years ago are quickly receding into history. The yield on the 10-year Treasury bumped up against 3% in February, and ended the Funds’ fiscal year on June 30th at 2.86%. While these yields are still low by historical standards, the tailwinds of yesteryear may be tomorrow’s headwinds for bond prices if interest rates continue to move higher.
In a world of low yields, investors have sought to fill the income gap with high yield bonds, or “junk bonds”. As appealing as the high rates on junk bonds may be, history suggests these investments should be marked “handle with care”. On May 29, 2007, high yield bonds2 offered a yield of 7.45% compared to yields of 4.88% on the 10-year Treasury or 4.90% on the 2-year Treasury. By December of 2008, a little more than a year and a half later, the high yield index had lost 34.50% of its value – a high price to pay for an extra 2½% in yield.
Finding ways to provide high current income from bonds is important. Protecting the investment capital that’s producing that income – the value of the account – is just as important. We rely on the bond models we have developed to adjust the credit quality, duration, and market segment of any Fund bond holdings as we look for attractive levels of income consistent with the risks income investors face.
A Multiple-Choice History Test
So, what should we do with all this information about the past? There are several approaches we could take:
a) We could decide that the future will differ from the past so much that the “lessons of history” have nothing to teach us. This is a very popular view that we have heard many times before. There was the “New Paradigm” of the internet that would change the economy and markets forever. The internet has certainly changed things, but it didn’t prevent the “dot com” stock market bust. There was the rush into real estate, because “they aren’t making any more land.” True, no more land was created, but the housing collapse and the resulting banking crisis plunged the global economy into the deepest recession since the 1930s anyway. Today investors are pouring money in unprecedented amounts into passive index funds, in what looks very similar to crowded trades of the past. What could go wrong?
b) We could accept that we may be able to learn from history, but that if trouble ever comes again we’ll be able to see it coming in plenty of time to avoid it. After all, the economy has been expanding for years, recent dips in stock prices have turned out to be buying opportunities, and if things really start to fall apart then we’ll do something about it. Of course, the track record of investors making sound, unemotional decisions about their investments “on the fly” has not been good. Yesterday’s investors somehow managed to miss or dismiss the warning signs that today seem obvious to us in retrospect. Is there evidence to suggest that next time will be different?
c) Another possible way to proceed is to simply “grin and bear it”; allow any future calamities to do what they will to our investments – and to our financial plans. During our careers as investment managers and advisors, we have met precious few real-life people who were able to follow through on this kind of passive, buy and hold approach as they watched their account values plummet.
d) None of the above.
The debate about how to invest in an uncertain world is often framed as being between active versus passive. We believe it would be better to think about the approaches as being between responsive and unresponsive.
| | Absolute Shares Trust | |
Management’s Discussion of Fund Performance (Unaudited) (continued) | |
| June 30, 2018 | |
We’ve devoted a good part of our company’s history to developing a disciplined, responsive approach to investing that’s intended to take both the rewards of investing – and the risks – into account. It’s an approach we designed with the goal of helping investors grow and protect their serious money – the money they can’t afford to lose.
For nearly 30 years, we have had the good fortune of being trusted by our investors to help them meet their goals, whether that meant providing current income or growth of capital, as we have lived through many of the events described above. Their success stories are the favorite parts of our history. As every passing day writes another page of history, we look forward to helping our current and future investors enjoy many more satisfying chapters.
1 NCHS Data Brief No. 293, December 2017
2 Bloomberg Barclays US Corporate High Yield
Sincerely,
 |  |
| Gary E. Stroik | Don Schreiber, Jr. |
| Portfolio Manager | Co-Portfolio Manager |
| Co-Chief Investment Officer | Co-Chief Investment Officer |
| Vice President | Founder & CEO |
Past performance is not a guarantee of future results.
Opinions expressed are those of WBI Investments, Inc. (“WBI”), the Funds’ investment sub-adviser, are subject to change, are not guaranteed, and should not be construed as recommendations or investment advice or a solicitation to purchase or sell securities referenced in the Investment Commentary.
Exchange Traded Fund investing involves risk. Principal loss is possible. The Funds invest in emerging market and foreign securities which involve political, economic and currency risks, greater volatility and differences in accounting methods. These risks can be greater in emerging markets. The Funds invest in smaller and medium sized companies, which involve additional risks such as limited liquidity and greater volatility. Investments in debt securities typically decrease in value when interest rates rise. This risk is usually greater for longer-term debt securities. Investment by the Fund in lower-rated and non-rated securities presents a greater risk of loss to principal and interest than higher-rated securities. Investments in mortgage-backed securities may involve additional risks, such as credit risk, prepayment risk, possible illiquidity and default, and susceptibility to adverse economic developments. Because the Funds invest in other exchange-traded funds (“ETFs”), they are subject to additional risks that do not apply to conventional mutual funds, including the risks that the market price of an ETF’s shares may trade at a discount to its net asset value (“NAV”), an active secondary trading market may not develop or be maintained, or trading may be halted by the exchange in which they trade, which may impact a Fund’s ability to sell its shares. The Funds may invest in exchange-traded notes (“ETN”), which are subject to the credit risk of the issuer. Additional risks include volatility, lack of liquidity, and sensitivity to currencies, commodities markets, and interest rate changes. The Funds may invest in Real Estate Investment Trusts (REIT). Risks commonly associated with the direct ownership of real estate include fluctuations in the value of underlying properties, defaults by borrowers or tenants, changes in interest rates and risks related to general or local economic conditions. The Funds may invest in master limited partnerships (“MLP”), which are subject to certain risks inherent in the structure of MLPs, including complex tax structure risks, the limited ability for election or removal of management, limited voting rights, potential dependence on parent companies or sponsors for revenues to satisfy obligations, and potential conflicts of interest between partners, members and affiliates. The Funds may also use options and future contracts, which have the risks of unlimited losses of the underlying holdings due to unanticipated market movements and failure to correctly predict the direction of securities prices, interest rates and currency exchange rates. The investment in options is not suitable for all investors.
Investments in absolute return strategies are not intended to outperform stocks and bonds during strong market rallies. Diversification does not assure a profit or protect against a loss in a declining market.
| | Absolute Shares Trust | |
Management’s Discussion of Fund Performance (Unaudited) (continued) | |
| June 30, 2018 | |
Fund holdings and sector allocations are subject to change and should not be considered a recommendation to buy or sell any security. References to other funds should not be interpreted as an offer of these securities. For a complete list of Fund holdings, please refer to the Schedule of Investments in this report.
While the Funds are no-load, commission charges on the purchase of shares, management fees and other expenses will apply. Please refer to the prospectus for additional information.
A stop loss order directs a brokerage firm to sell the specified security at the prevailing market price should that security’s price fall to or below a stipulated price. A stop limit order directs a brokerage firm to sell the specified security should that security’s price fall to or below a stipulated price, but only if the transaction can be executed at or above the limit price given as part of the order. The Funds use WBI’s proprietary Dynamic Trailing Stop/Loss System (DTS™), which is designed to help control the risk to invested capital when investing in volatile securities and markets. The DTS™ is not a stop loss order or stop limit order placed with a brokerage firm, but an internal process for monitoring price movements. While the DTS™ may be used to initiate the process for selling a security, it does not assure that a particular execution price will be received.
Unless otherwise indicated, the source for index price and performance data used in the discussion of market conditions and market commentary is Bloomberg. The S&P 500® Index is a capitalization weighted index of 500 large capitalization stocks which is designed to measure broad domestic securities markets.
An investment in money market funds is not insured or guaranteed by the Federal Deposit Insurance Corporation or any other governmental agency. Although money market funds seek to preserve the value of your investment at $1.00 per share, it is possible to lose money by investing in these funds.
Any tax or legal information provided is merely a summary of our understanding and interpretation of some of the current income tax regulations and is not exhaustive. Investors must consult their tax advisor or legal counsel for advice and information concerning their particular situation. Neither the Funds nor any of their representatives may give legal or tax advice.
Must be preceded or accompanied by a prospectus.
WBI Shares Exchange Traded Funds are distributed by Foreside Fund Services, LLC.
Benchmark Definitions
The Russell 3000 Value Total Return Index is comprised of Russell 3000 companies with lower predicted and historical growth rates.
The Russell 2000 Value Total Return Index is comprised of Russell 2000 companies with lower predicted and historical growth rates.
The Russell 1000 Value Total Return Index is comprised of Russell 1000 companies with lower predicted and historical growth rates.
The Russell Global Total Return Index measures the performance of the global equity market based on all investable equity securities.
The Bloomberg Barclays US Aggregate Bond Total Return Index is a component of the US Universal Index and covers the USD–denominated, investment-grade, fixed-rate, taxable bond market of SEC-registered securities.
The MSCI ACWI Index Gross captures large and mid-cap representation across 23 Developed Markets (DM) and 24 Emerging Markets (EM) countries. With 2,780 constituents, the index covers approximately 85% of the global investable equity opportunity set.
The Bloomberg Barclays Global Aggregate TR Index is a multi-currency benchmark that includes treasury, government-related, corporate and securitized fixed-rate bonds from both developed and emerging markets issuers.
The 15% Russell 1000 Value Total Return Index/15% Russell 2000 Value Total Return Index/70% Bloomberg Barclays US Aggregate Bond Total Return Index is a custom index combining the performance of these indices in the proportions indicated.
The 50% MSCI ACWI Index Gross/50% Bloomberg Barclays Global Aggregate Bond Total Return Index is a custom index combining the performance of these indices in the proportions indicated.
The 50% Russell Global Total Return Index/50% Bloomberg Barclays Global Aggregate Total Return Index is a custom index combining the performance of these indices in the proportions indicated.
Other Index Definitions
The Solactive Power FactorTM High Dividend GTR Index is constructed by scoring each ordinary dividend paying, common stock constituent from the 3,000 largest U.S. companies both directly and relative to industry peers using the three Power Factors and ranking those securities in descending order according to their dividend indicated yield. The 50 companies with the largest dividend indicated yield are chosen as Index components.
| | Absolute Shares Trust | |
Management’s Discussion of Fund Performance (Unaudited) (concluded) | |
| June 30, 2018 | |
The Dow Jones Industrial Average (DJIA) is a price-weighted average of 30 of the largest blue chip issues traded on the New York Stock Exchange.
The S&P 500 Index includes a representative sample of large-cap U.S. companies in leading industries. The S&P 500 Total Return Index includes the performance effect of the dividends paid by the stocks in the index.
NASDAQ Composite Index is a market-value weight index of all common stocks listed on NASDAQ.
The Russell 2000 Index includes the smallest 2,000 stocks in the Russell 3000 Index (approximately 8% of the total market capitalization of the Russell 3000 Index) of the Russell data series.
The MSCI EAFE Index (EAFE) is an unmanaged index based on share prices of approximately 1,470 companies listed on stock exchanges around the world. The stocks of twenty countries are included in the index.
The Japanese Nikkei 225 Stock Average (Nikkei) is a price-weighted index of 225 blue chip Japanese companies listed in the First Section of the Tokyo Stock Exchange.
The CRB Commodity Index provides a broad measure of commodity price trends by averaging prices of seventeen commodities from energy, grain, industrial material, livestock, and precious metal groups.
The Hang Seng Index is a capitalization-weighted index of 33 companies that represent approximately 70% of the total market capitalization of the Stock Exchange of Hong Kong.
The Deutsche Boerse AG German Stock Index (DAX) is an index of the total return of 30 German stocks that trade on the Frankfurt Stock Exchange.
The Dow Jones Equal Weight Corporate Bond Index consists of 96 bonds issued by leading U.S. companies designed to represent the market performance, on a total-return basis, of investment-grade bonds.
The Barclays U.S. Treasury 20+ Year Index is an unmanaged index that includes public obligations of the U.S. Treasury that have remaining maturities greater than 20 years.
The Barclays US Corporate High-Yield Bond Index is an unmanaged index considered representative of fixed-rate, noninvestment-grade debt of companies in the U.S.
The U.S. Dollar Index is computed using a trade-weighted geometric average of six currencies. The six currencies and their trade weights are: Euro 57.6%; Japanese Yen 13.6%; UK Pound 11.9%; Canadian Dollar 9.1%; Swedish Krona 4.2%; Swiss Franc 3.6%. These specifications are subject to change.
| | Absolute Shares Trust | |
| WBI BullBear Rising Income 2000 ETF | |
Performance Summary (Unaudited) | |
| | | | Since |
| Average Annual Returns | | | Inception |
| Period Ending June 30, 2018 | 1 Year | 3 Years | (8/25/14) |
| WBI BullBear Rising Income 2000 ETF — NAV | 1.62% | (0.68)% | (0.29)% |
| WBI BullBear Rising Income 2000 ETF — Market | 1.39% | (0.78)% | (0.32)% |
| Russell 2000 Value Index | 13.10% | 11.22% | 9.59% |
| MSCI World Small Growth Index | 19.56% | 11.42% | 10.56% |
This chart illustrates the performance of a hypothetical $10,000 investment made on August 25, 2014, and is not intended to imply any future performance. The returns shown do not reflect the deduction of taxes that a shareholder would pay on fund distributions or the redemption of fund shares. The chart assumes reinvestment of capital gains and dividends.
On October 31, 2017, the Fund changed its benchmark index from the MSCI World Small Growth Index to the Russell 2000 Value Index (the “New Index”). While the Fund’s strategy involves active management of a potentially wide range of assets, and no widely recognized benchmark is likely to be representative of the performance of the Fund, the Advisor believes that the New Index is more relevant to the Fund’s investment strategies and more commonly used by investors investing in similar funds.
The performance data quoted represents past performance and is not a guarantee of future results. Investment return and principal value of an investment will fluctuate so that an investor’s shares, when redeemed, may be worth more or less than their original cost. Current performance may be lower or higher than the performance data quoted. For most recent month-end performance, please visit www.wbishares.com.
Per the Prospectus, the Fund’s annual operating expense (gross) is 1.06%. The Fund’s Sub-Advisor has contractually agreed to waive the fees and reimburse expenses of the Fund such that total annual operating expenses are limited to 1.25% of average net assets until at least October 31, 2019. (Actual expenses can be referenced in the Financial Highlights section later in this report.)
| | Absolute Shares Trust | |
| WBI BullBear Value 2000 ETF | |
Performance Summary (Unaudited) | |
| | | | Since |
| Average Annual Returns | | | Inception |
| Period Ending June 30, 2018 | 1 Year | 3 Years | (8/25/14) |
| WBI BullBear Value 2000 ETF — NAV | (3.06)% | 0.11% | (0.13)% |
| WBI BullBear Value 2000 ETF — Market | (3.32)% | 0.00% | (0.16)% |
| Russell 2000 Value Index | 13.10% | 11.22% | 9.59% |
| MSCI World Small Value Index | 11.05% | 9.80% | 7.80% |
This chart illustrates the performance of a hypothetical $10,000 investment made on August 25, 2014, and is not intended to imply any future performance. The returns shown do not reflect the deduction of taxes that a shareholder would pay on fund distributions or the redemption of fund shares. The chart assumes reinvestment of capital gains and dividends.
On October 31, 2017, the Fund changed its benchmark index from the MSCI World Small Value Index to the Russell 2000 Value Index (the “New Index”). While the Fund’s strategy involves active management of a potentially wide range of assets, and no widely recognized benchmark is likely to be representative of the performance of the Fund, the Advisor believes that the New Index is more relevant to the Fund’s investment strategies and more commonly used by investors investing in similar funds.
The performance data quoted represents past performance and is not a guarantee of future results. Investment return and principal value of an investment will fluctuate so that an investor’s shares, when redeemed, may be worth more or less than their original cost. Current performance may be lower or higher than the performance data quoted. For most recent month-end performance, please visit www.wbishares.com.
Per the Prospectus, the Fund’s annual operating expense (gross) is 1.05%. The Fund’s Sub-Advisor has contractually agreed to waive the fees and reimburse expenses of the Fund such that total annual operating expenses are limited to 1.25% of average net assets until at least October 31, 2019. (Actual expenses can be referenced in the Financial Highlights section later in this report.)
| | Absolute Shares Trust | |
| WBI BullBear Yield 2000 ETF | |
Performance Summary (Unaudited) | |
| | | | Since |
| Average Annual Returns | | | Inception |
| Period Ending June 30, 2018 | 1 Year | 3 Years | (8/25/14) |
| WBI BullBear Yield 2000 — NAV | 3.34% | (0.64)% | (1.18)% |
| WBI BullBear Yield 2000 — Market | 3.11% | (0.78)% | (1.23)% |
| Russell 2000 Value Index | 13.10% | 11.22% | 9.59% |
| MSCI World High Dividend Yield Index | 5.39% | 7.68% | 4.76% |
This chart illustrates the performance of a hypothetical $10,000 investment made on August 25, 2014, and is not intended to imply any future performance. The returns shown do not reflect the deduction of taxes that a shareholder would pay on fund distributions or the redemption of fund shares. The chart assumes reinvestment of capital gains and dividends.
On October 31, 2017, the Fund changed its benchmark index from the MSCI World High Dividend Yield Index to the Russell 2000 Value Index (the “New Index”). While the Fund’s strategy involves active management of a potentially wide range of assets, and no widely recognized benchmark is likely to be representative of the performance of the Fund, the Advisor believes that the New Index is more relevant to the Fund’s investment strategies and more commonly used by investors investing in similar funds.
The performance data quoted represents past performance and is not a guarantee of future results. Investment return and principal value of an investment will fluctuate so that an investor’s shares, when redeemed, may be worth more or less than their original cost. Current performance may be lower or higher than the performance data quoted. For most recent month-end performance, please visit www.wbishares.com.
Per the Prospectus, the Fund’s annual operating expense (gross) is 1.05%. The Fund’s Sub-Advisor has contractually agreed to waive the fees and reimburse expenses of the Fund such that total annual operating expenses are limited to 1.25% of average net assets until at least October 31, 2019. (Actual expenses can be referenced in the Financial Highlights section later in this report.)
| | Absolute Shares Trust | |
| WBI BullBear Quality 2000 ETF | |
Performance Summary (Unaudited) | |
| | | | Since |
| Average Annual Returns | | | Inception |
| Period Ending June 30, 2018 | 1 Year | 3 Years | (8/25/14) |
| WBI BullBear Quality 2000 ETF — NAV | 1.43% | 0.38% | (1.14)% |
| WBI BullBear Quality 2000 ETF — Market | 1.39% | 0.43% | (1.05)% |
| Russell 2000 Value Index | 13.10% | 11.22% | 9.59% |
| MSCI World Quality Index | 15.24% | 11.74% | 9.94% |
This chart illustrates the performance of a hypothetical $10,000 investment made on August 25, 2014, and is not intended to imply any future performance. The returns shown do not reflect the deduction of taxes that a shareholder would pay on fund distributions or the redemption of fund shares. The chart assumes reinvestment of capital gains and dividends.
On October 31, 2017, the Fund changed its benchmark index from the MSCI World Quality Index to the Russell 2000 Value Index (the “New Index”). While the Fund’s strategy involves active management of a potentially wide range of assets, and no widely recognized benchmark is likely to be representative of the performance of the Fund, the Advisor believes that the New Index is more relevant to the Fund’s investment strategies and more commonly used by investors investing in similar funds.
The performance data quoted represents past performance and is not a guarantee of future results. Investment return and principal value of an investment will fluctuate so that an investor’s shares, when redeemed, may be worth more or less than their original cost. Current performance may be lower or higher than the performance data quoted. For most recent month-end performance, please visit www.wbishares.com.
Per the Prospectus, the Fund’s annual operating expense (gross) is 1.06%. The Fund’s Sub-Advisor has contractually agreed to waive the fees and reimburse expenses of the Fund such that total annual operating expenses are limited to 1.25% of average net assets until at least October 31, 2019. (Actual expenses can be referenced in the Financial Highlights section later in this report.)
| | Absolute Shares Trust | |
| WBI BullBear Rising Income 1000 ETF | |
Performance Summary (Unaudited) | |
| | | | Since |
| Average Annual Returns | | | Inception |
| Period Ending June 30, 2018 | 1 Year | 3 Years | (8/25/14) |
| WBI BullBear Rising Income 1000 ETF — NAV | 6.52% | 2.61% | 1.70% |
| WBI BullBear Rising Income 1000 ETF — Market | 6.02% | 2.48% | 1.63% |
| Russell 1000 Value Index | 6.77% | 8.26% | 7.12% |
| MSCI World Large Growth Index | 17.78% | 11.38% | 10.30% |
This chart illustrates the performance of a hypothetical $10,000 investment made on August 25, 2014, and is not intended to imply any future performance. The returns shown do not reflect the deduction of taxes that a shareholder would pay on fund distributions or the redemption of fund shares. The chart assumes reinvestment of capital gains and dividends.
On October 31, 2017, the Fund changed its benchmark index from the MSCI World Large Growth Index to the Russell 1000 Value Index (the “New Index”). While the Fund’s strategy involves active management of a potentially wide range of assets, and no widely recognized benchmark is likely to be representative of the performance of the Fund, the Advisor believes that the New Index is more relevant to the Fund’s investment strategies and more commonly used by investors investing in similar funds.
The performance data quoted represents past performance and is not a guarantee of future results. Investment return and principal value of an investment will fluctuate so that an investor’s shares, when redeemed, may be worth more or less than their original cost. Current performance may be lower or higher than the performance data quoted. For most recent month-end performance, please visit www.wbishares.com.
Per the Prospectus, the Fund’s annual operating expense (gross) is 1.06%. The Fund’s Sub-Advisor has contractually agreed to waive the fees and reimburse expenses of the Fund such that total annual operating expenses are limited to 1.25% of average net assets until at least October 31, 2019. (Actual expenses can be referenced in the Financial Highlights section later in this report.)
| | Absolute Shares Trust | |
| WBI BullBear Value 1000 ETF | |
Performance Summary (Unaudited) | |
| | | | Since |
| Average Annual Returns | | | Inception |
| Period Ending June 30, 2018 | 1 Year | 3 Years | (8/25/14) |
| WBI BullBear Value 1000 ETF — NAV | 8.40% | 6.32% | 3.99% |
| WBI BullBear Value 1000 ETF — Market | 7.92% | 6.19% | 3.95% |
| Russell 1000 Value Index | 6.77% | 8.26% | 7.12% |
| MSCI World Large Value Index | 6.05% | 7.01% | 4.73% |
This chart illustrates the performance of a hypothetical $10,000 investment made on August 25, 2014, and is not intended to imply any future performance. The returns shown do not reflect the deduction of taxes that a shareholder would pay on fund distributions or the redemption of fund shares. The chart assumes reinvestment of capital gains and dividends.
On October 31, 2017, the Fund changed its benchmark index from the MSCI World Large Value Index to the Russell 1000 Value Index (the “New Index”). While the Fund’s strategy involves active management of a potentially wide range of assets, and no widely recognized benchmark is likely to be representative of the performance of the Fund, the Advisor believes that the New Index is more relevant to the Fund’s investment strategies and more commonly used by investors investing in similar funds.
The performance data quoted represents past performance and is not a guarantee of future results. Investment return and principal value of an investment will fluctuate so that an investor’s shares, when redeemed, may be worth more or less than their original cost. Current performance may be lower or higher than the performance data quoted. For most recent month-end performance, please visit www.wbishares.com.
Per the Prospectus, the Fund’s annual operating expense (gross) is 1.04%. The Fund’s Sub-Advisor has contractually agreed to waive the fees and reimburse expenses of the Fund such that total annual operating expenses are limited to 1.25% of average net assets until at least October 31, 2019. (Actual expenses can be referenced in the Financial Highlights section later in this report.)
| | Absolute Shares Trust | |
| WBI BullBear Yield 1000 ETF | |
Performance Summary (Unaudited) | |
| | | | Since |
| Average Annual Returns | | | Inception |
| Period Ending June 30, 2018 | 1 Year | 3 Years | (8/25/14) |
| WBI BullBear Yield 1000 ETF — NAV | 14.14% | 4.32% | 2.00% |
| WBI BullBear Yield 1000 ETF — Market | 13.68% | 4.17% | 1.95% |
| Russell 1000 Value Index | 6.77% | 8.26% | 7.12% |
| MSCI World High Dividend Yield Index | 5.39% | 7.68% | 4.76% |
This chart illustrates the performance of a hypothetical $10,000 investment made on August 25, 2014, and is not intended to imply any future performance. The returns shown do not reflect the deduction of taxes that a shareholder would pay on fund distributions or the redemption of fund shares. The chart assumes reinvestment of capital gains and dividends.
On October 31, 2017, the Fund changed its benchmark index from the MSCI World High Dividend Yield Index to the Russell 1000 Value Index (the “New Index”). While the Fund’s strategy involves active management of a potentially wide range of assets, and no widely recognized benchmark is likely to be representative of the performance of the Fund, the Advisor believes that the New Index is more relevant to the Fund’s investment strategies and more commonly used by investors investing in similar funds.
The performance data quoted represents past performance and is not a guarantee of future results. Investment return and principal value of an investment will fluctuate so that an investor’s shares, when redeemed, may be worth more or less than their original cost. Current performance may be lower or higher than the performance data quoted. For most recent month-end performance, please visit www.wbishares.com.
Per the Prospectus, the Fund’s annual operating expense (gross) is 1.04%. The Fund’s Sub-Advisor has contractually agreed to waive the fees and reimburse expenses of the Fund such that total annual operating expenses are limited to 1.25% of average net assets until at least October 31, 2019. (Actual expenses can be referenced in the Financial Highlights section later in this report.)
| | Absolute Shares Trust | |
| WBI BullBear Quality 1000 ETF | |
Performance Summary (Unaudited) | |
| | | | Since |
| Average Annual Returns | | | Inception |
| Period Ending June 30, 2017 | 1 Year | 3 Years | (8/25/14) |
| WBI BullBear Quality 1000 ETF — NAV | 4.11% | 3.73% | 1.70% |
| WBI BullBear Quality 1000 ETF — Market | 3.95% | 3.68% | 1.72% |
| Russell 1000 Value Index | 6.77% | 8.26% | 7.12% |
| MSCI World Quality Index | 15.24% | 11.74% | 9.94% |
This chart illustrates the performance of a hypothetical $10,000 investment made on August 25, 2014, and is not intended to imply any future performance. The returns shown do not reflect the deduction of taxes that a shareholder would pay on fund distributions or the redemption of fund shares. The chart assumes reinvestment of capital gains and dividends.
On October 31, 2017, the Fund changed its benchmark index from the MSCI World Quality Index to the Russell 1000 Value Index (the “New Index”). While the Fund’s strategy involves active management of a potentially wide range of assets, and no widely recognized benchmark is likely to be representative of the performance of the Fund, the Advisor believes that the New Index is more relevant to the Fund’s investment strategies and more commonly used by investors investing in similar funds.
The performance data quoted represents past performance and is not a guarantee of future results. Investment return and principal value of an investment will fluctuate so that an investor’s shares, when redeemed, may be worth more or less than their original cost. Current performance may be lower or higher than the performance data quoted. For most recent month-end performance, please visit www.wbishares.com.
Per the Prospectus, the Fund’s annual operating expense (gross) is 1.05%. The Fund’s Sub-Advisor has contractually agreed to waive the fees and reimburse expenses of the Fund such that total annual operating expenses are limited to 1.25% of average net assets until at least October 31, 2019. (Actual expenses can be referenced in the Financial Highlights section later in this report.)
| | Absolute Shares Trust | |
| WBI BullBear Global Income ETF | |
Performance Summary (Unaudited) | |
| | | | Since |
| Average Annual Returns | | | Inception |
| Period Ending June 30, 2018 | 1 Year | 3 Years | (8/25/14) |
| WBI BullBear Global Income ETF — NAV | (3.20)% | (0.16)% | 0.59% |
| WBI BullBear Global Income ETF — Market | (3.43)% | (0.21)% | 0.56% |
| 20% MSCI World Index & 80% Bloomberg Barclays US Aggregate Bond Index | 1.98% | 3.25% | 2.90% |
| Bloomberg Barclays US Aggregate Bond Index | (0.40)% | 1.72% | 1.68% |
This chart illustrates the performance of a hypothetical $10,000 investment made on August 25, 2014, and is not intended to imply any future performance. The returns shown do not reflect the deduction of taxes that a shareholder would pay on fund distributions or the redemption of fund shares. The chart assumes reinvestment of capital gains and dividends.
On October 31, 2017, the Fund changed its benchmark index from the 20% MSCI World Index & 80% Bloomberg Barclays US Aggregate Bond Index to the Bloomberg Barclays US Aggregate Bond Index (the “New Index”). While the Fund’s strategy involves active management of a potentially wide range of assets, and no widely recognized benchmark is likely to be representative of the performance of the Fund, the Advisor believes that the New Index is more relevant to the Fund’s investment strategies and more commonly used by investors investing in similar funds.
The performance data quoted represents past performance and is not a guarantee of future results. Investment return and principal value of an investment will fluctuate so that an investor’s shares, when redeemed, may be worth more or less than their original cost. Current performance may be lower or higher than the performance data quoted. For most recent month-end performance, please visit www.wbishares.com.
Per the Prospectus, the Fund’s annual operating expense (gross) is 1.17%. The Fund’s Sub-Advisor has contractually agreed to waive the fees and reimburse expenses of the Fund such that total annual operating expenses are limited to 1.25% of average net assets until at least October 31, 2019. (Actual expenses can be referenced in the Financial Highlights section later in this report.)
| | Absolute Shares Trust | |
| WBI BullBear Global High Income ETF | |
Performance Summary (Unaudited) | |
| | | | Since |
| Average Annual Returns | | | Inception |
| Period Ending June 30, 2018 | 1 Year | 3 Years | (8/25/14) |
| WBI BullBear Global High Income ETF — NAV | 0.47% | 1.43% | 0.94% |
| WBI BullBear Global High Income ETF — Market | 0.36% | 1.41% | 0.97% |
| 15% Russell 1000 Value Index/ 15% Russell 2000 Value Index/ | | | |
| 70% Bloomberg Barclays US Aggregate Bond Index | 2.70% | 4.26% | 3.83% |
| 30% MSCI World Index & 70% Bloomberg Barclays US Aggregate Bond Index | 3.18% | 4.01% | 3.50% |
| Bloomberg Barclays US Aggregate Bond Index | (0.40)% | 1.72% | 1.68% |
This chart illustrates the performance of a hypothetical $10,000 investment made on August 25, 2014, and is not intended to imply any future performance. The returns shown do not reflect the deduction of taxes that a shareholder would pay on fund distributions or the redemption of fund shares. The chart assumes reinvestment of capital gains and dividends.
On October 31, 2017, the Fund changed its benchmark indices from the 30% MSCI World Index & 70% Bloomberg Barclays US Aggregate Bond Index and Bloomberg Barclays US Aggregate Bond Index to the 15% Russell 1000 Value Index/15% Russell 2000 Value Index/70% Bloomberg Barclays US Aggregate Bond Index (the “New Index”). While the Fund’s strategy involves active management of a potentially wide range of assets, and no widely recognized benchmark is likely to be representative of the performance of the Fund, the Advisor believes that the New Index is more relevant to the Fund’s investment strategies and more commonly used by investors investing in similar funds.
The performance data quoted represents past performance and is not a guarantee of future results. Investment return and principal value of an investment will fluctuate so that an investor’s shares, when redeemed, may be worth more or less than their original cost. Current performance may be lower or higher than the performance data quoted. For most recent month-end performance, please visit www.wbishares.com.
Per the Prospectus, the Fund’s annual operating expense (gross) is 1.21%. The Fund’s Sub-Advisor has contractually agreed to waive the fees and reimburse expenses of the Fund such that total annual operating expenses are limited to 1.25% of average net assets until at least October 31, 2019. (Actual expenses can be referenced in the Financial Highlights section later in this report.)
| | Absolute Shares Trust | |
| WBI BullBear Global Rotation ETF | |
Performance Summary (Unaudited) | |
| | | Since |
| Average Annual Returns | | Inception |
| Period Ending June 30, 2018 | 1 Year | (7/25/16) |
| WBI BullBear Global Rotation ETF — NAV | 2.69% | 0.62% |
| WBI BullBear Global Rotation ETF — Market | 2.54% | 0.65% |
| Bloomberg Barclays US Aggregate Bond Index | (0.40)% | (0.43)% |
| 50% MSCI World Index & 50% Bloomberg Barclays US Aggregate Bond Index | 5.59% | 6.60% |
| MSCI World Index | 11.70% | 13.96% |
| 50% MSCI ACWI Index & 50% Bloomberg Barclays Global Aggregate Index | 6.31% | 6.84% |
| 50% Russell Global Index/50% Bloomberg Barclays Global Aggregate Index | 6.44% | 6.97% |
This chart illustrates the performance of a hypothetical $10,000 investment made on July 25, 2016, and is not intended to imply any future performance. The returns shown do not reflect the deduction of taxes that a shareholder would pay on fund distributions or the redemption of fund shares. The chart assumes reinvestment of capital gains and dividends.
During the period, the Fund changed its benchmark index from the 50% MSCI ACWI/50% Bloomberg Barclays Global Aggregate Index to the 50% Russell Global Index/50% Bloomberg Barclays Global Aggregate Index (the “New Index”). While the Fund’s strategy involves active management of a potentially wide range of assets, and no widely recognized benchmark is likely to be representative of the performance of the Fund, the Advisor believes that the New Index is more relevant to the Fund’s investment strategies and more commonly used by investors investing in similar funds.
The performance data quoted represents past performance and is not a guarantee of future results. Investment return and principal value of an investment will fluctuate so that an investor’s shares, when redeemed, may be worth more or less than their original cost. Current performance may be lower or higher than the performance data quoted. For most recent month-end performance, please visit www.wbishares.com.
Per the Prospectus, the Fund’s annual operating expense (gross) is 2.26%. The Fund’s Sub-Advisor has contractually agreed to waive the fees and reimburse expenses of the Fund such that total annual operating expenses are limited to 1.25% of average net assets until at least October 31, 2019. (Actual expenses can be referenced in the Financial Highlights section later in this report.)
| | Absolute Shares Trust | |
WBI Power FactorTM High Dividend ETF | |
Performance Summary (Unaudited) | |
| | | Since |
| Average Annual Returns | | Inception |
| Period Ending June 30, 2018 | 1 Year | (12/19/16) |
| WBI Power Factor™ High Dividend ETF — NAV | 18.51% | 10.55% |
| WBI Power Factor™ High Dividend ETF — Market | 17.89% | 10.52% |
| Solactive Power Factor™ High Dividend Index | 21.50% | 12.78% |
| Russell 3000 Value Index | 7.25% | 7.07% |
| MSCI US Investable Market High Dividend Index | 9.86% | 10.70% |
This chart illustrates the performance of a hypothetical $10,000 investment made on December 19, 2016, and is not intended to imply any future performance. The returns shown do not reflect the deduction of taxes that a shareholder would pay on fund distributions or the redemption of fund shares. The chart assumes reinvestment of capital gains and dividends.
During the period, the Fund changed its benchmark index from the MSCI US Investable Market High Dividend Index to the Russell 3000 Value Index (the “New Index”). While the Fund’s strategy involves passive management, the Advisor believes that the New Index is more relevant to the Fund’s investment strategies and more commonly used by investors investing in similar funds.
The performance data quoted represents past performance and is not a guarantee of future results. Investment return and principal value of an investment will fluctuate so that an investor’s shares, when redeemed, may be worth more or less than their original cost. Current performance may be lower or higher than the performance data quoted. For most recent month-end performance, please visit www.wbishares.com.
Per the Prospectus, the Fund’s annual operating expense (gross) is 1.37%. The Fund’s Sub-Advisor has contractually agreed to waive the fees and reimburse expenses of the Fund such that total annual operating expenses are limited to 0.70% of average net assets until at least October 31, 2019. (Actual expenses can be referenced in the Financial Highlights section later in this report.)
| | Absolute Shares Trust | |
| Portfolio Allocations | |
As of June 30, 2018 (Unaudited)
| WBI BullBear Rising Income 2000 ETF | |
| | Percentage of |
| Industry Group | Net Assets |
| Utilities | 20.1% |
| Short-Term Investments and | |
| Other Assets and Liabilities | 16.0% |
| Materials | 11.3% |
| Banks | 8.5% |
| Capital Goods | 7.0% |
| Retailing | 7.0% |
| Commercial & Professional Services | 4.6% |
| Diversified Financials | 4.1% |
| Consumer Services | 4.0% |
| Health Care Equipment & Services | 4.0% |
| Transportation | 4.0% |
| Media | 3.7% |
| Consumer Durables & Apparel | 3.6% |
| Household & Personal Products | 0.9% |
| Insurance | 0.7% |
| Food & Staples Retailing | 0.5% |
| TOTAL | 100.0% |
| | |
| WBI BullBear Value 2000 ETF | |
| | Percentage of |
| Industry Group | Net Assets |
| Materials | 19.0% |
| Banks | 17.9% |
| Utilities | 15.0% |
| Consumer Services | 14.7% |
| Capital Goods | 8.3% |
| Commercial & Professional Services | 6.7% |
| Retailing | 6.3% |
| Insurance | 3.9% |
| Short-Term Investments and | |
| Other Assets and Liabilities | 3.5% |
| Food, Beverage & Tobacco | 2.6% |
| Diversified Financials | 2.1% |
| TOTAL | 100.0% |
| | |
| WBI BullBear Yield 2000 ETF | |
| | Percentage of |
| Industry Group | Net Assets |
| Short-Term Investments and | |
| Other Assets and Liabilities | 17.9% |
| Utilities | 17.0% |
| Retailing | 12.1% |
| Materials | 11.6% |
| Banks | 11.0% |
| Diversified Financials | 5.2% |
| Insurance | 4.4% |
| Media | 3.8% |
| Consumer Services | 3.7% |
| Food, Beverage & Tobacco | 3.1% |
| Household & Personal Products | 3.0% |
| Commercial & Professional Services | 2.3% |
| Software & Services | 2.1% |
| Food & Staples Retailing | 2.0% |
| Semiconductors & | |
| Semiconductor Equipment | 0.8% |
| TOTAL | 100.0% |
| | |
| WBI BullBear Quality 2000 ETF | |
| | Percentage of |
| Industry Group | Net Assets |
| Short-Term Investments and | |
| Other Assets and Liabilities | 21.0% |
| Banks | 13.1% |
| Software & Services | 11.4% |
| Insurance | 9.8% |
| Materials | 8.3% |
| Retailing | 7.6% |
| Capital Goods | 7.4% |
| Consumer Services | 7.2% |
| Commercial & Professional Services | 4.2% |
| Diversified Financials | 4.0% |
| Semiconductors & | |
| Semiconductor Equipment | 2.8% |
| Food, Beverage & Tobacco | 2.6% |
| Health Care Equipment & Services | 0.6% |
| TOTAL | 100.0% |
| | |
| WBI BullBear Rising Income 1000 ETF | |
| | Percentage of |
| Industry Group | Net Assets |
| Software & Services | 15.7% |
| Technology Hardware & Equipment | 15.5% |
| Semiconductors & | |
| Semiconductor Equipment | 8.2% |
| Commercial & Professional Services | 7.9% |
| Food, Beverage & Tobacco | 7.4% |
| Capital Goods | 5.9% |
| Consumer Durables & Apparel | 5.6% |
| Diversified Financials | 5.3% |
| Consumer Services | 4.6% |
| Food & Staples Retailing | 4.5% |
| Health Care Equipment & Services | 4.1% |
| Retailing | 4.0% |
| Short-Term Investments and | |
| Other Assets and Liabilities | 3.9% |
| Household & Personal Products | 3.4% |
| Media | 2.6% |
| Insurance | 1.4% |
| TOTAL | 100.0% |
| | |
| | |
| WBI BullBear Value 1000 ETF | |
| | Percentage of |
| Industry Group | Net Assets |
| Capital Goods | 13.0% |
| Diversified Financials | 11.9% |
| Short-Term Investments and | |
| Other Assets and Liabilities | 10.0% |
| Retailing | 8.5% |
| Consumer Services | 8.4% |
| Commercial & Professional Services | 8.0% |
| Consumer Durables & Apparel | 7.5% |
| Software & Services | 6.4% |
| Technology Hardware & Equipment | 4.8% |
| Food & Staples Retailing | 4.6% |
| Transportation | 4.2% |
| Semiconductors & | |
| Semiconductor Equipment | 4.0% |
| Food, Beverage & Tobacco | 3.9% |
| Insurance | 3.7% |
| Health Care Equipment & Services | 1.1% |
| TOTAL | 100.0% |
| | |
| WBI BullBear Yield 1000 ETF | |
| | Percentage of |
| Industry Group | Net Assets |
| Food, Beverage & Tobacco | 12.6% |
| Software & Services | 12.1% |
| Technology Hardware & Equipment | 11.7% |
| Diversified Financials | 8.9% |
| Consumer Durables & Apparel | 8.2% |
| Retailing | 8.2% |
| Semiconductors & | |
| Semiconductor Equipment | 7.9% |
| Consumer Services | 4.5% |
| Food & Staples Retailing | 4.5% |
| Media | 4.0% |
| Capital Goods | 3.9% |
| Energy | 3.9% |
| Commercial & Professional Services | 3.8% |
| Telecommunication Services | 3.0% |
| Short-Term Investments and | |
| Other Assets and Liabilities | 2.8% |
| TOTAL | 100.0% |
| | Absolute Shares Trust | |
| Portfolio Allocations | |
As of June 30, 2018 (Unaudited) (concluded)
| WBI BullBear Quality 1000 ETF | |
| | Percentage of |
| Industry Group | Net Assets |
| Software & Services | 16.5% |
| Capital Goods | 15.4% |
| Health Care Equipment & Services | 11.8% |
| Retailing | 8.4% |
| Diversified Financials | 8.2% |
| Insurance | 7.8% |
| Semiconductors & | |
| Semiconductor Equipment | 7.7% |
| Consumer Durables & Apparel | 5.3% |
| Short-Term Investments and | |
| Other Assets and Liabilities | 4.9% |
| Food, Beverage & Tobacco | 4.6% |
| Commercial & Professional Services | 4.1% |
| Banks | 3.8% |
| Consumer Services | 1.5% |
| TOTAL | 100.0% |
| | |
| WBI BullBear Global Income ETF | |
| | Percentage of |
| Industry Group | Net Assets |
| Exchange Traded Funds | 99.5% |
| Short-Term Investments and | |
| Other Assets and Liabilities | 0.5% |
| TOTAL | 100.0% |
| | |
| WBI BullBear Global High Income ETF | |
| | Percentage of |
| Industry Group | Net Assets |
| Exchange Traded Funds | 49.7% |
| Banks | 7.8% |
| Utilities | 7.5% |
| Food, Beverage & Tobacco | 6.4% |
| Materials | 5.1% |
| Telecommunication Services | 4.6% |
| Diversified Financials | 4.5% |
| Pharmaceuticals, Biotechnology | |
| & Life Sciences | 4.5% |
| Technology Hardware & Equipment | 4.4% |
| Automobiles & Components | 4.3% |
| Short-Term Investments and | |
| Other Assets and Liabilities | 1.2% |
| TOTAL | 100.0% |
| | |
| WBI BullBear Global Rotation ETF | |
| | Percentage of |
| Industry Group | Net Assets |
| Exchange Traded Funds | 80.0% |
| Short-Term Investments and | |
| Other Assets and Liabilities | 20.0% |
| TOTAL | 100.0% |
| | |
| WBI Power Factor™ High Dividend ETF | |
| | Percentage of |
| Industry Group | Net Assets |
| Retailing | 17.3% |
| Energy | 11.9% |
| Automobiles & Components | 9.2% |
| Materials | 9.2% |
| Utilities | 9.1% |
| Telecommunication Services | 5.9% |
| Consumer Durables & Apparel | 5.4% |
| Technology Hardware & Equipment | 4.6% |
| Consumer Services | 3.5% |
| Health Care Equipment & Services | 3.5% |
| Media | 3.2% |
| Pharmaceuticals, Biotechnology | |
| & Life Sciences | 3.2% |
| Banks | 2.7% |
| Food, Beverage & Tobacco | 2.5% |
| Software & Services | 2.3% |
| Diversified Financials | 2.1% |
| Household & Personal Products | 1.4% |
| Insurance | 1.1% |
| Real Estate | 0.8% |
| Commercial & Professional Services | 0.6% |
| Short-Term Investments and | |
| Other Assets and Liabilities | 0.5% |
| TOTAL | 100.0% |
| | Absolute Shares Trust | |
| WBI BullBear Rising Income 2000 ETF | |
| Schedule of Investments | |
| | June 30, 2018 | |
| Shares | | Security Description | | Value | |
| COMMON STOCKS—84.0% | | | |
| | | | |
| Banks—8.5% | | | |
| | 22,044 | | Banner Corporation | | $ | 1,325,506 | |
| | 102,400 | | First Commonwealth | | | | |
| | | | Financial Corporation | | | 1,588,224 | |
| | 10,259 | | First Defiance Financial Corporation | | | 687,968 | |
| | 8,863 | | Lakeland Financial Corporation | | | 427,108 | |
| | 13,617 | | Peoples Bancorp, Inc. | | | 514,450 | |
| | | | | | | 4,543,256 | |
| Capital Goods—7.0% | | | | |
| | 33,890 | | Comfort Systems USA, Inc. | | | 1,552,162 | |
| | 12,188 | | Watsco, Inc. | | | 2,172,877 | |
| | | | | | | 3,725,039 | |
| Commercial & Professional Services—4.6% | | | | |
| | 15,447 | | Barrett Business Services, Inc. | | | 1,491,717 | |
| | 17,424 | | KAR Auction Services, Inc.+ | | | 954,835 | |
| | | | | | | 2,446,552 | |
| Consumer Durables & Apparel—3.6% | | | | |
| | 15,605 | | Polaris Industries, Inc. | | | 1,906,619 | |
| | | | | |
| Consumer Services—4.0% | | | | |
| | 13,640 | | Cracker Barrel Old Country Store, Inc. | | | 2,130,704 | |
| | | | | |
| Diversified Financials—4.1% | | | | |
| | 106,730 | | Western Union Company | | | 2,169,821 | |
| | | | | |
| Food & Staples Retailing—0.5% | | | | |
| | 10,661 | | SpartanNash Company | | | 272,069 | |
| | | | | |
| Health Care Equipment & Services—4.0% | | | | |
| | 24,621 | | Hill-Rom Holdings, Inc. | | | 2,150,398 | |
| | | | | |
| Household & Personal Products—0.9% | | | | |
| | 6,512 | | Nu Skin Enterprises, Inc.—Class A | | | 509,173 | |
| | | | | |
| Insurance—0.7% | | | | |
| | 3,323 | | American National Insurance Company | | | 397,397 | |
| | | | | |
| Materials—11.3% | | | | |
| | 17,940 | | Materion Corporation | | | 971,451 | |
| | 44,028 | | PolyOne Corporation | | | 1,902,890 | |
| | 42,240 | | Sonoco Products Company+ | | | 2,217,600 | |
| | 22,631 | | Worthington Industries, Inc. | | | 949,823 | |
| | | | | | | 6,041,764 | |
| Media—3.7% | | | | |
| | 27,168 | | Nexstar Media Group, Inc.—Class A | | | 1,994,131 | |
| | | | | |
| Retailing—7.0% | | | | |
| | 39,980 | | Aaron’s, Inc. | | | 1,737,131 | |
| | 21,312 | | Lithia Motors, Inc.—Class A | | | 2,015,476 | |
| | | | | | | 3,752,607 | |
| Transportation—4.0% | | | | |
| | 19,718 | | Landstar System, Inc. | | | 2,153,206 | |
| | | | | | | | |
| Utilities—20.1% | | | | |
| | 184,206 | | AES Corporation | | | 2,470,203 | |
| | 75,831 | | MDU Resources Group, Inc.+ | | | 2,174,833 | |
| | 21,209 | | National Fuel Gas Company | | | 1,123,229 | |
| | 43,936 | | OGE Energy Corporation | | | 1,546,987 | |
| | 31,860 | | SCANA Corporation | | | 1,227,247 | |
| | 28,907 | | Southwest Gas Holdings, Inc. | | | 2,204,737 | |
| | | | | | | 10,747,236 | |
| TOTAL COMMON STOCKS | | | | |
| (Cost $44,542,923) | | | 44,939,972 | |
| | | | | | | | |
| Shares/ | | | | | | |
| Amount | | Security Description | | Value | |
| SHORT-TERM INVESTMENTS—1.3% | | | | |
| | 694,304 | | U.S. Bank Money Market | | | | |
| | | | Deposit Account, 1.77% | | | 694,304 | |
| TOTAL SHORT-TERM INVESTMENTS | | | | |
| (Cost $694,304) | | | 694,304 | |
| | | | | | | | |
| INVESTMENTS PURCHASED WITH PROCEEDS | | | | |
| FROM SECURITIES LENDING—5.0% | | | | |
| | 2,666,112 | | Mount Vernon Liquid Assets | | | | |
| | | | Portfolio, LLC, 2.20% (a)* | | | 2,666,112 | |
| TOTAL INVESTMENTS PURCHASED WITH | | | | |
| PROCEEDS FROM SECURITIES LENDING | | | | |
| (Cost $2,666,112) | | | 2,666,112 | |
| TOTAL INVESTMENTS—90.3% | | | | |
| (Cost $47,903,339) | | | 48,300,388 | |
| Other Assets in Excess of Liabilities—9.7% | | | 5,223,793 | |
| NET ASSETS—100.0% | | $ | 53,524,181 | |
| (a) | The rate quoted is the annualized seven-day yield as of June 30, 2018. |
| + | All or portion of this security is on loan as of June 30, 2018. Total value of securities on loan is $2,633,727. |
| * | Privately offered liquidity fund. |
The Global Industry Classification Standard (GICS®) was developed by and/or is the exclusive property of MSCI, Inc. and Standard & Poor Financial Services LLC (“S&P”). GICS is a service mark of MSCI and S&P and has been licensed for use by U.S. Bancorp Fund Services, LLC.
The accompanying notes are an integral part of these financial statements.
| | Absolute Shares Trust | |
| WBI BullBear Value 2000 ETF | |
| Schedule of Investments | |
| | June 30, 2018 | |
| Shares | | Security Description | | Value | |
| COMMON STOCKS—96.5% | | | |
| | | | |
| Banks—17.9% | | | |
| | 55,522 | | Associated Banc-Corporation | | $ | 1,515,751 | |
| | 27,909 | | Chemical Financial Corporation | | | 1,553,694 | |
| | 19,773 | | Financial Institutions, Inc. | | | 650,532 | |
| | 70,551 | | First Commonwealth | | | | |
| | | | Financial Corporation | | | 1,094,246 | |
| | 25,412 | | Old Second Bancorp, Inc. | | | 365,933 | |
| | 13,758 | | Opus Bank | | | 394,854 | |
| | 35,275 | | Peapack-Gladstone | | | | |
| | | | Financial Corporation | | | 1,220,162 | |
| | 9,203 | | Peoples Bancorp, Inc. | | | 347,689 | |
| | 19,991 | | S&T Bancorp, Inc. | | | 864,411 | |
| | | | | | | 8,007,272 | |
| Capital Goods—8.3% | | | | |
| | 22,515 | | Allegion plc | | | 1,741,761 | |
| | 8,191 | | Hurco Companies, Inc. | | | 366,547 | |
| | 38,700 | | Terex Corporation | | | 1,632,753 | |
| | | | | | | 3,741,061 | |
| Commercial & Professional Services—6.7% | | | | |
| | 71,154 | | ACCO Brands Corporation | | | 985,483 | |
| | 34,235 | | Matthews International | | | | |
| | | | Corporation—Class A+ | | | 2,013,018 | |
| | | | | | | 2,998,501 | |
| Consumer Services—14.7% | | | | |
| | 178,997 | | BBX Capital Corporation | | | 1,616,343 | |
| | 11,712 | | Cracker Barrel Old Country Store, Inc. | | | 1,829,531 | |
| | 2,996 | | Graham Holdings Company | | | 1,755,956 | |
| | 31,740 | | International Speedway | | | | |
| | | | Corporation—Class A | | | 1,418,778 | |
| | | | | | | 6,620,608 | |
| Diversified Financials—2.1% | | | | |
| | 22,170 | | Santander Consumer USA Holdings, Inc. | | | 423,225 | |
| | 25,192 | | Western Union Company | | | 512,154 | |
| | | | | | | 935,379 | |
| Food, Beverage & Tobacco—2.6% | | | | |
| | 8,414 | | Lancaster Colony Corporation | | | 1,164,666 | |
| | | | | |
| Insurance—3.9% | | | | |
| | 14,672 | | American National Insurance Company | | | 1,754,624 | |
| | | | | |
| Materials—19.0% | | | | |
| | 17,390 | | Innospec, Inc. | | | 1,331,205 | |
| | 22,287 | | Minerals Technologies, Inc. | | | 1,679,325 | |
| | 34,695 | | Sonoco Products Company | | | 1,821,487 | |
| | 21,542 | | Trinseo S.A. | | | 1,528,405 | |
| | 13,799 | | Worthington Industries, Inc. | | | 579,144 | |
| | 21,398 | | WR Grace & Company | | | 1,568,687 | |
| | | | | | | 8,508,253 | |
| Retailing—6.3% | | | | |
| | 23,226 | | Aaron’s, Inc. | | | 1,009,170 | |
| | 52,617 | | Caleres, Inc.+ | | | 1,809,498 | |
| | | | | | | 2,818,668 | |
| Utilities—15.0% | | | | |
| | 147,602 | | AES Corporation | | | 1,979,343 | |
| | 25,809 | | National Fuel Gas Company | | | 1,366,845 | |
| | 45,215 | | OGE Energy Corporation | | | 1,592,020 | |
| | 46,327 | | SCANA Corporation | | | 1,784,516 | |
| | | | | | | 6,722,724 | |
| TOTAL COMMON STOCKS | | | | |
| (Cost $42,506,418) | | | 43,271,756 | |
| | | | | | | | |
| Shares/ | | | | | | |
| Amount | | Security Description | | Value | |
| SHORT-TERM INVESTMENTS—1.6% | | | | |
| | 706,160 | | U.S. Bank Money Market | | | | |
| | | | Deposit Account, 1.77% | | | 706,160 | |
| TOTAL SHORT-TERM INVESTMENTS | | | | |
| (Cost $706,160) | | | 706,160 | |
| | | | | | | | |
| INVESTMENTS PURCHASED WITH PROCEEDS | | | | |
| FROM SECURITIES LENDING—0.9% | | | | |
| | 421,150 | | Mount Vernon Liquid Assets | | | | |
| | | | Portfolio, LLC, 2.20% (a)* | | | 421,150 | |
| TOTAL INVESTMENTS PURCHASED WITH | | | | |
| PROCEEDS FROM SECURITIES LENDING | | | | |
| (Cost $421,150) | | | 421,150 | |
| TOTAL INVESTMENTS—99.0% | | | | |
| (Cost $43,633,728) | | | 44,399,066 | |
| Other Assets in Excess of Liabilities—1.0% | | | 461,335 | |
| NET ASSETS—100.0% | | $ | 44,860,401 | |
| (a) | The rate quoted is the annualized seven-day yield as of June 30, 2018. |
| + | All or portion of this security is on loan as of June 30, 2018. Total value of securities on loan is $408,040. |
| * | Privately offered liquidity fund. |
The Global Industry Classification Standard (GICS®) was developed by and/or is the exclusive property of MSCI, Inc. and Standard & Poor Financial Services LLC (“S&P”). GICS is a service mark of MSCI and S&P and has been licensed for use by U.S. Bancorp Fund Services, LLC.
The accompanying notes are an integral part of these financial statements.
| | Absolute Shares Trust | |
| WBI BullBear Yield 2000 ETF | |
| Schedule of Investments | |
| | June 30, 2018 | |
| Shares | | Security Description | | Value | |
| COMMON STOCKS—82.1% | | | |
| | | | |
| Banks—11.0% | | | |
| | 10,567 | | Camden National Corporation | | $ | 483,018 | |
| | 8,908 | | Chemical Financial Corporation | | | 495,908 | |
| | 29,185 | | Dime Community Bancshares, Inc. | | | 569,108 | |
| | 3,678 | | Federal Agricultural Mortgage | | | | |
| | | | Corporation—Class C | | | 329,107 | |
| | 102,412 | | First Commonwealth | | | | |
| | | | Financial Corporation | | | 1,588,410 | |
| | 14,400 | | Lakeland Financial Corporation | | | 693,936 | |
| | 18,513 | | Mercantile Bank Corporation | | | 684,241 | |
| | 33,449 | | OFG Bancorp | | | 469,959 | |
| | 24,215 | | TCF Financial Corporation | | | 596,173 | |
| | | | | | | 5,909,860 | |
| Commercial & Professional Services—2.3% | | | | |
| | 21,155 | | Matthews International | | | | |
| | | | Corporation—Class A | | | 1,243,914 | |
| | | | | |
| Consumer Services—3.7% | | | | |
| | 12,810 | | Cracker Barrel Old Country Store, Inc. | | | 2,001,050 | |
| | | | | |
| Diversified Financials—5.2% | | | | |
| | 107,280 | | Western Union Company | | | 2,181,002 | |
| | 9,880 | | Westwood Holdings Group, Inc. | | | 588,255 | |
| | | | | | | 2,769,257 | |
| Food & Staples Retailing—2.0% | | | | |
| | 42,457 | | SpartanNash Company | | | 1,083,503 | |
| | | | | |
| Food, Beverage & Tobacco—3.1% | | | | |
| | 12,070 | | Lancaster Colony Corporation | | | 1,670,729 | |
| | | | | |
| Household & Personal Products—3.0% | | | | |
| | 20,636 | | Nu Skin Enterprises, Inc.—Class A | | | 1,613,529 | |
| | | | | |
| Insurance—4.4% | | | | |
| | 67,086 | | Universal Insurance Holdings, Inc. | | | 2,354,718 | |
| | | | | |
| Materials—11.6% | | | | |
| | 13,883 | | Domtar Corporation | | | 662,774 | |
| | 44,249 | | PolyOne Corporation | | | 1,912,442 | |
| | 36,890 | | Sonoco Products Company+ | | | 1,936,725 | |
| | 24,068 | | Trinseo S.A. | | | 1,707,625 | |
| | | | | | | 6,219,566 | |
| Media—3.8% | | | | |
| | 27,427 | | Nexstar Media Group, Inc.—Class A | | | 2,013,142 | |
| | | | | |
| Retailing—12.1% | | | | |
| | 81,421 | | Abercrombie & Fitch Company | | | 1,993,186 | |
| | 43,854 | | Nordstrom, Inc.+ | | | 2,270,760 | |
| | 29,398 | | Tractor Supply Company+ | | | 2,248,653 | |
| | | | | | | 6,512,599 | |
| Semiconductors & Semiconductor Equipment—0.8% | | | | |
| | 18,741 | | Kulicke & Soffa Industries, Inc. | | | 446,411 | |
| | | | | | | | |
| Software & Services—2.1% | | | | |
| | 13,886 | | Science Applications | | | | |
| | | | International Corporation | | | 1,123,794 | |
| | | | | |
| Utilities—17.0% | | | | |
| | 179,517 | | AES Corporation | | | 2,407,323 | |
| | 38,005 | | Black Hills Corporation+ | | | 2,326,286 | |
| | 39,363 | | National Fuel Gas Company+ | | | 2,084,664 | |
| | 64,508 | | OGE Energy Corporation | | | 2,271,327 | |
| | | | | | | 9,089,600 | |
| TOTAL COMMON STOCKS | | | | |
| (Cost $43,022,876) | | | 44,051,672 | |
| | | | | | | | |
| Shares/ | | | | | | |
| Amount | | Security Description | | Value | |
| SHORT-TERM INVESTMENTS—1.9% | | | | |
| | 1,012,384 | | U.S. Bank Money Market | | | | |
| | | | Deposit Account, 1.77% | | | 1,012,384 | |
| TOTAL SHORT-TERM INVESTMENTS | | | | |
| (Cost $1,012,384) | | | 1,012,384 | |
| | | | | | | | |
| INVESTMENTS PURCHASED WITH PROCEEDS | | | | |
| FROM SECURITIES LENDING—11.8% | | | | |
| | 6,337,683 | | Mount Vernon Liquid Assets | | | | |
| | | | Portfolio, LLC, 2.20% (a)* | | | 6,337,683 | |
| TOTAL INVESTMENTS PURCHASED WITH | | | | |
| PROCEEDS FROM SECURITIES LENDING | | | | |
| (Cost $6,337,683) | | | 6,337,683 | |
| TOTAL INVESTMENTS—95.8% | | | | |
| (Cost $50,372,943) | | | 51,401,739 | |
| Other Assets in Excess of Liablities—4.2% | | | 2,235,208 | |
| NET ASSETS—100.0% | | $ | 53,636,947 | |
| (a) | The rate quoted is the annualized seven-day yield as of June 30, 2018. |
| + | All or portion of this security is on loan as of June 30, 2018. Total value of securities on loan is $6,212,398. |
| * | Privately offered liquidity fund. |
The Global Industry Classification Standard (GICS®) was developed by and/or is the exclusive property of MSCI, Inc. and Standard & Poor Financial Services LLC (“S&P”). GICS is a service mark of MSCI and S&P and has been licensed for use by U.S. Bancorp Fund Services, LLC.
The accompanying notes are an integral part of these financial statements.
| | Absolute Shares Trust | |
| WBI BullBear Quality 2000 ETF | |
| Schedule of Investments | |
| | June 30, 2018 | |
| Shares | | Security Description | | Value | |
| COMMON STOCKS—79.0% | | | |
| | | | |
| Banks—13.1% | | | |
| | 11,505 | | Chemical Financial Corporation | | $ | 640,483 | |
| | 27,809 | | Commerce Bancshares, Inc. | | | 1,799,521 | |
| | 32,463 | | First Merchants Corporation | | | 1,506,283 | |
| | 26,432 | | Great Western Bancorp, Inc. | | | 1,109,880 | |
| | 106,778 | | TrustCo Bank Corporation | | | 950,324 | |
| | | | | | | 6,006,491 | |
| Capital Goods—7.4% | | | | |
| | 20,481 | | Allegion plc | | | 1,584,410 | |
| | 10,001 | | Watsco, Inc. | | | 1,782,978 | |
| | | | | | | 3,367,388 | |
| Commercial & Professional Services—4.2% | | | | |
| | 10,822 | | Unifirst Corporation | | | 1,914,412 | |
| | | | | |
| Consumer Services—7.2% | | | | |
| | 11,752 | | Cracker Barrel Old Country Store, Inc. | | | 1,835,780 | |
| | 32,457 | | International Speedway | | | | |
| | | | Corporation—Class A | | | 1,450,828 | |
| | | | | | | 3,286,608 | |
| Diversified Financials—4.0% | | | | |
| | 90,548 | | Western Union Company | | | 1,840,841 | |
| | | | | |
| Food, Beverage & Tobacco—2.6% | | | | |
| | 8,644 | | Lancaster Colony Corporation | | | 1,196,502 | |
| | | | | |
| Health Care Equipment & Services—0.6% | | | | |
| | 2,360 | | Utah Medical Products, Inc. | | | 259,954 | |
| | | | | |
| Insurance—9.8% | | | | |
| | 3,913 | | American National Insurance Company | | | 467,956 | |
| | 71,076 | | Brown & Brown, Inc. | | | 1,970,937 | |
| | 58,422 | | Universal Insurance Holdings, Inc. | | | 2,050,612 | |
| | | | | | | 4,489,505 | |
| Materials—8.3% | | | | |
| | 20,288 | | Innospec, Inc. | | | 1,553,046 | |
| | 35,184 | | Sonoco Products Company+ | | | 1,847,160 | |
| | 5,476 | | WR Grace & Company | | | 401,446 | |
| | | | | | | 3,801,652 | |
| Retailing—7.6% | | | | |
| | 41,797 | | Aaron’s, Inc. | | | 1,816,080 | |
| | 48,564 | | Caleres, Inc. | | | 1,670,116 | |
| | | | | | | 3,486,196 | |
| Semiconductors & Semiconductor Equipment—2.8% | | | | |
| | 53,259 | | Kulicke & Soffa Industries, Inc. | | | 1,268,629 | |
| | | | | |
| Software & Services—11.4% | | | | |
| | 27,613 | | Amdocs, Ltd. | | | 1,827,705 | |
| | 23,149 | | Ebix, Inc.+ | | | 1,765,111 | |
| | 20,314 | | Science Applications | | | | |
| | | | International Corporation+ | | | 1,644,012 | |
| | | | | | | 5,236,828 | |
| TOTAL COMMON STOCKS | | | | |
| (Cost $35,610,210) | | | 36,155,006 | |
| | | | | | | | |
| Shares/ | | | | | | |
| Amount | | Security Description | | Value | |
| SHORT-TERM INVESTMENTS—6.6% | | | | |
| | 3,039,337 | | U.S. Bank Money Market | | | | |
| | | | Deposit Account, 1.77% | | | 3,039,337 | |
| TOTAL SHORT-TERM INVESTMENTS | | | | |
| (Cost $3,039,337) | | | 3,039,337 | |
| | | | | | | | |
| INVESTMENTS PURCHASED WITH PROCEEDS | | | | |
| FROM SECURITIES LENDING—3.5% | | | | |
| | 1,603,941 | | Mount Vernon Liquid Assets | | | | |
| | | | Portfolio, LLC, 2.20% (a)* | | | 1,603,941 | |
| TOTAL INVESTMENTS PURCHASED WITH | | | | |
| PROCEEDS FROM SECURITIES LENDING | | | | |
| (Cost $1,603,941) | | | 1,603,941 | |
| TOTAL INVESTMENTS—89.1% | | | | |
| (Cost $40,253,488) | | | 40,798,284 | |
| Other Assets in Excess of Liabilities—10.9% | | | 4,998,274 | |
| NET ASSETS—100.0% | | $ | 45,796,558 | |
| (a) | The rate quoted is the annualized seven-day yield as of June 30, 2018. |
| + | All or portion of this security is on loan as of June 30, 2018. Total value of securities on loan is $1,588,090. |
| * | Privately offered liquidity fund. |
The Global Industry Classification Standard (GICS®) was developed by and/or is the exclusive property of MSCI, Inc. and Standard & Poor Financial Services LLC (“S&P”). GICS is a service mark of MSCI and S&P and has been licensed for use by U.S. Bancorp Fund Services, LLC.
The accompanying notes are an integral part of these financial statements.
| | Absolute Shares Trust | |
| WBI BullBear Rising Income 1000 ETF | |
| Schedule of Investments | |
| | June 30, 2018 | |
| Shares | | Security Description | | Value | |
| COMMON STOCKS—96.1% | | | |
| | | | |
| Capital Goods—5.9% | | | |
| | 24,021 | | AMETEK, Inc. | | $ | 1,733,355 | |
| | 38,747 | | Emerson Electric Company+ | | | 2,678,968 | |
| | | | | | | 4,412,323 | |
| Commercial & Professional Services—7.9% | | | | |
| | 44,773 | | Republic Services, Inc.+ | | | 3,060,682 | |
| | 35,434 | | Waste Management, Inc. | | | 2,882,202 | |
| | | | | | | 5,942,884 | |
| Consumer Durables & Apparel—5.6% | | | | |
| | 40,618 | | Garmin, Ltd. | | | 2,477,698 | |
| | 20,949 | | VF Corporation | | | 1,707,762 | |
| | | | | | | 4,185,460 | |
| Consumer Services—4.6% | | | | |
| | 32,085 | | Darden Restaurants, Inc. | | | 3,435,020 | |
| | | | | |
| Diversified Financials—5.3% | | | | |
| | 20,919 | | Bank of New York Mellon Corporation | | | 1,128,162 | |
| | 27,831 | | Northern Trust Corporation | | | 2,863,531 | |
| | | | | | | 3,991,693 | |
| Food & Staples Retailing—4.5% | | | | |
| | 50,199 | | Sysco Corporation+ | | | 3,428,090 | |
| | | | | |
| Food, Beverage & Tobacco—7.4% | | | | |
| | 47,621 | | Archer Daniels Midland Company+ | | | 2,182,470 | |
| | 91,814 | | Hormel Foods Corporation+ | | | 3,416,399 | |
| | | | | | | 5,598,869 | |
| Health Care Equipment & Services—4.1% | | | | |
| | 12,619 | | UnitedHealth Group, Inc. | | | 3,095,945 | |
| | | | | |
| Household & Personal Products—3.4% | | | | |
| | 47,853 | | Church & Dwight Company, Inc.+ | | | 2,543,865 | |
| | | | | |
| Insurance—1.4% | | | | |
| | 13,249 | | Marsh & McLennan Companies, Inc. | | | 1,086,020 | |
| | | | | |
| Media—2.6% | | | | |
| | 26,169 | | Omnicom Group, Inc.+ | | | 1,995,910 | |
| | | | | |
| Retailing—4.0% | | | | |
| | 40,543 | | Best Buy Company, Inc. | | | 3,023,697 | |
| | | | | |
| Semiconductors & Semiconductor Equipment—8.2% | | | | |
| | 52,664 | | Maxim Integrated Products, Inc. | | | 3,089,270 | |
| | 27,669 | | Texas Instruments, Inc. | | | 3,050,508 | |
| | | | | | | 6,139,778 | |
| Software & Services—15.7% | | | | |
| | 14,747 | | Accenture plc—Class A | | | 2,412,462 | |
| | 83,172 | | CA, Inc. | | | 2,965,082 | |
| | 31,088 | | Microsoft Corporation | | | 3,065,588 | |
| | 25,550 | | Visa, Inc.—Class A | | | 3,384,097 | |
| | | | | | | 11,827,229 | |
| Technology Hardware & Equipment—15.5% | | | | |
| | 14,128 | | Apple, Inc. | | | 2,615,234 | |
| | 139,186 | | HP, Inc. | | | 3,158,130 | |
| | 27,803 | | Motorola Solutions, Inc. | | | 3,235,435 | |
| | 47,014 | | Seagate Technology plc | | | 2,654,881 | |
| | | | | | | 11,663,680 | |
| TOTAL COMMON STOCKS | | | | |
| (Cost $69,951,683) | | | | | 72,370,463 | |
| | | | | | | | |
| Shares/ | | | | | | |
| Amount | | Security Description | | Value | |
| SHORT-TERM INVESTMENTS—0.6% | | | | |
| | 429,270 | | U.S. Bank Money Market | | | | |
| | | | Deposit Account, 1.77% | | | 429,270 | |
| TOTAL SHORT-TERM INVESTMENTS | | | | |
| (Cost $429,270) | | | 429,270 | |
| | | | | | | | |
| INVESTMENTS PURCHASED WITH PROCEEDS | | | | |
| FROM SECURITIES LENDING—16.4% | | | | |
| | 12,310,651 | | Mount Vernon Liquid Assets | | | | |
| | | | Portfolio, LLC, 2.20% (a)* | | | 12,310,651 | |
| TOTAL INVESTMENTS PURCHASED WITH | | | | |
| PROCEEDS FROM SECURITIES LENDING | | | | |
| (Cost $12,310,651) | | | 12,310,651 | |
| TOTAL INVESTMENTS—113.1% | | | | |
| (Cost $82,691,604) | | | 85,110,384 | |
| Liabilities in Excess of Other Assets—(13.1)% | | | (9,826,929 | ) |
| NET ASSETS—100.0% | | $ | 75,283,455 | |
| (a) | The rate quoted is the annualized seven-day yield as of June 30, 2018. |
| + | All or portion of this security is on loan as of June 30, 2018. Total value of securities on loan is $12,034,787. |
| * | Privately offered liquidity fund. |
The Global Industry Classification Standard (GICS®) was developed by and/or is the exclusive property of MSCI, Inc. and Standard & Poor Financial Services LLC (“S&P”). GICS is a service mark of MSCI and S&P and has been licensed for use by U.S. Bancorp Fund Services, LLC.
The accompanying notes are an integral part of these financial statements.
| | Absolute Shares Trust | |
| WBI BullBear Value 1000 ETF | |
| Schedule of Investments | |
| | June 30, 2018 | |
| Shares | | Security Description | | Value | |
| COMMON STOCKS—90.0% | | | |
| | | | |
| Capital Goods—13.0% | | | |
| | 36,034 | | AMETEK, Inc. | | $ | 2,600,213 | |
| | 8,177 | | Emerson Electric Company+ | | | 565,358 | |
| | 9,368 | | Roper Technologies, Inc. | | | 2,584,725 | |
| | 40,826 | | Textron, Inc. | | | 2,690,842 | |
| | | | | | | 8,441,138 | |
| Commercial & Professional Services—8.0% | | | | |
| | 38,786 | | Republic Services, Inc.+ | | | 2,651,411 | |
| | 47,871 | | Rollins, Inc. | | | 2,517,057 | |
| | | | | | | 5,168,468 | |
| Consumer Durables & Apparel—7.5% | | | | |
| | 35,040 | | Garmin, Ltd. | | | 2,137,440 | |
| | 33,580 | | VF Corporation | | | 2,737,442 | |
| | | | | | | 4,874,882 | |
| Consumer Services—8.4% | | | | |
| | 27,448 | | Darden Restaurants, Inc. | | | 2,938,583 | |
| | 32,608 | | Las Vegas Sands Corporation | | | 2,489,947 | |
| | | | | | | 5,428,530 | |
| Diversified Financials—11.9% | | | | |
| | 26,215 | | American Express Company | | | 2,569,070 | |
| | 28,750 | | Nasdaq, Inc. | | | 2,624,012 | |
| | 24,303 | | Northern Trust Corporation | | | 2,500,536 | |
| | | | | | | 7,693,618 | |
| Food & Staples Retailing—4.6% | | | | |
| | 43,601 | | Sysco Corporation+ | | | 2,977,512 | |
| | | | | |
| Food, Beverage & Tobacco—3.9% | | | | |
| | 68,216 | | Hormel Foods Corporation+ | | | 2,538,317 | |
| | | | | |
| Health Care Equipment & Services—1.1% | | | | |
| | 2,876 | | Becton, Dickinson and Company | | | 688,975 | |
| | | | | |
| Insurance—3.7% | | | | |
| | 29,471 | | Marsh & McLennan Companies, Inc. | | | 2,415,738 | |
| | | | | |
| Retailing—8.5% | | | | |
| | 34,284 | | Best Buy Company, Inc. | | | 2,556,901 | |
| | 30,807 | | TJX Companies, Inc. | | | 2,932,210 | |
| | | | | | | 5,489,111 | |
| Semiconductors & Semiconductor Equipment—4.0% | | | | |
| | 44,105 | | Maxim Integrated Products, Inc. | | | 2,587,199 | |
| | | | | |
| Software & Services—6.4% | | | | |
| | 16,749 | | Accenture plc—Class A | | | 2,739,969 | |
| | 39,713 | | CA, Inc. | | | 1,415,768 | |
| | | | | | | 4,155,737 | |
| Technology Hardware & Equipment—4.8% | | | | |
| | 57,270 | | Cisco Systems, Inc. | | | 2,464,328 | |
| | 12,087 | | Seagate Technology plc | | | 682,553 | |
| | | | | | | 3,146,881 | |
| Transportation—4.2% | | | | |
| | 19,484 | | Union Pacific Corporation | | | 2,760,493 | |
| TOTAL COMMON STOCKS | | | | |
| (Cost $56,627,056) | | | 58,366,599 | |
| | | | | | | | |
| Shares/ | | | | | | |
| Amount | | Security Description | | Value | |
| SHORT-TERM INVESTMENTS—0.6% | | | | |
| | 371,373 | | U.S. Bank Money Market | | | | |
| | | | Deposit Account, 1.77% | | | 371,373 | |
| TOTAL SHORT-TERM INVESTMENTS | | | | |
| (Cost $371,373) | | | 371,373 | |
| | | | | | | | |
| INVESTMENTS PURCHASED WITH PROCEEDS | | | | |
| FROM SECURITIES LENDING—12.6% | | | | |
| | 8,174,206 | | Mount Vernon Liquid Assets | | | | |
| | | | Portfolio, LLC, 2.20% (a)* | | | 8,174,206 | |
| TOTAL INVESTMENTS PURCHASED WITH | | | | |
| PROCEEDS FROM SECURITIES LENDING | | | | |
| (Cost $8,174,206) | | | 8,174,206 | |
| TOTAL INVESTMENTS—103.2% | | | | |
| (Cost $65,172,635) | | | 66,912,178 | |
| Liabilities in Excess of Other Assets—(3.2)% | | | (2,069,363 | ) |
| NET ASSETS—100.0% | | $ | 64,842,815 | |
| (a) | The rate quoted is the annualized seven-day yield as of June 30, 2018. |
| + | All or portion of this security is on loan as of June 30, 2018. Total value of securities on loan is $7,992,699. |
| * | Privately offered liquidity fund. |
The Global Industry Classification Standard (GICS®) was developed by and/or is the exclusive property of MSCI, Inc. and Standard & Poor Financial Services LLC (“S&P”). GICS is a service mark of MSCI and S&P and has been licensed for use by U.S. Bancorp Fund Services, LLC.
The accompanying notes are an integral part of these financial statements.
| | Absolute Shares Trust | |
| WBI BullBear Yield 1000 ETF | |
| Schedule of Investments | |
| | June 30, 2018 | |
| Shares | | Security Description | | Value | |
| COMMON STOCKS—97.2% | | | |
| | | | |
| Capital Goods—3.9% | | | |
| | 46,432 | | Emerson Electric Company+ | | $ | 3,210,308 | |
| | | | | |
| Commercial & Professional Services—3.8% | | | | |
| | 46,458 | | Republic Services, Inc.+ | | | 3,175,869 | |
| | | | | |
| Consumer Durables & Apparel—8.2% | | | | |
| | 54,506 | | Garmin, Ltd. | | | 3,324,866 | |
| | 42,001 | | VF Corporation | | | 3,423,922 | |
| | | | | | | 6,748,788 | |
| Consumer Services—4.5% | | | | |
| | 34,614 | | Darden Restaurants, Inc. | | | 3,705,775 | |
| | | | | |
| Diversified Financials—8.9% | | | | |
| | 12,306 | | Bank of New York Mellon Corporation | | | 663,662 | |
| | 38,097 | | Nasdaq, Inc. | | | 3,477,113 | |
| | 31,330 | | Northern Trust Corporation | | | 3,223,544 | |
| | | | | | | 7,364,319 | |
| Energy—3.9% | | | | |
| | 29,030 | | Phillips 66 | | | 3,260,359 | |
| | | | | |
| Food & Staples Retailing—4.5% | | | | |
| | 54,661 | | Sysco Corporation+ | | | 3,732,800 | |
| | | | | |
| Food, Beverage & Tobacco—12.6% | | | | |
| | 70,080 | | Archer Daniels Midland Company | | | 3,211,766 | |
| | 99,231 | | Hormel Foods Corporation+ | | | 3,692,386 | |
| | 30,570 | | McCormick & Company, Inc.+ | | | 3,548,871 | |
| | | | | | | 10,453,023 | |
| Media—4.0% | | | | |
| | 43,118 | | Omnicom Group, Inc.+ | | | 3,288,610 | |
| | | | | |
| Retailing—8.2% | | | | |
| | 44,068 | | Best Buy Company, Inc. | | | 3,286,592 | |
| | 18,142 | | Home Depot, Inc. | | | 3,539,504 | |
| | | | | | | 6,826,096 | |
| Semiconductors & Semiconductor Equipment—7.9% | | | | |
| | 54,977 | | Maxim Integrated Products, Inc. | | | 3,224,951 | |
| | 30,238 | | Texas Instruments, Inc. | | | 3,333,740 | |
| | | | | | | 6,558,691 | |
| Software & Services—12.1% | | | | |
| | 20,772 | | Accenture plc—Class A | | | 3,398,091 | |
| | 92,218 | | CA, Inc. | | | 3,287,572 | |
| | 34,002 | | Microsoft Corporation | | | 3,352,937 | |
| | | | | | | 10,038,600 | |
| Technology Hardware & Equipment—11.7% | | | | |
| | 149,065 | | HP, Inc. | | | 3,382,285 | |
| | 30,273 | | Motorola Solutions, Inc.+ | | | 3,522,869 | |
| | 48,847 | | Seagate Technology plc | | | 2,758,390 | |
| | | | | | | 9,663,544 | |
| Telecommunication Services—3.0% | | | | |
| | 49,075 | | Verizon Communications, Inc.+ | | | 2,468,963 | |
| TOTAL COMMON STOCKS | | | | |
| (Cost $77,467,072) | | | 80,495,745 | |
| | | | | | | | |
| Shares/ | | | | | | |
| Amount | | Security Description | | Value | |
| SHORT-TERM INVESTMENTS—4.7% | | | | |
| | 3,850,918 | | U.S. Bank Money Market | | | | |
| | | | Deposit Account, 1.77% | | | 3,850,918 | |
| TOTAL SHORT-TERM INVESTMENTS | | | | |
| (Cost $3,850,918) | | | 3,850,918 | |
| | | | | | | | |
| INVESTMENTS PURCHASED WITH PROCEEDS | | | | |
| FROM SECURITIES LENDING—24.3% | | | | |
| | 20,124,796 | | Mount Vernon Liquid Assets | | | | |
| | | | Portfolio, LLC, 2.20% (a)* | | | 20,124,796 | |
| TOTAL INVESTMENTS PURCHASED WITH | | | | |
| PROCEEDS FROM SECURITIES LENDING | | | | |
| (Cost $20,124,796) | | | 20,124,796 | |
| TOTAL INVESTMENTS—126.2% | | | | |
| (Cost $101,442,786) | | | 104,471,459 | |
| Liabilities in Excess of Other Assets—(26.2)% | | | (21,692,410 | ) |
| NET ASSETS—100.0% | | $ | 82,779,049 | |
| (a) | The rate quoted is the annualized seven-day yield as of June 30, 2018. |
| + | All or portion of this security is on loan as of June 30, 2018. Total value of securities on loan is $19,716,826. |
| * | Privately offered liquidity fund. |
The Global Industry Classification Standard (GICS®) was developed by and/or is the exclusive property of MSCI, Inc. and Standard & Poor Financial Services LLC (“S&P”). GICS is a service mark of MSCI and S&P and has been licensed for use by U.S. Bancorp Fund Services, LLC.
The accompanying notes are an integral part of these financial statements.
| | Absolute Shares Trust | |
| WBI BullBear Quality 1000 ETF | |
| Schedule of Investments | |
| | June 30, 2018 | |
| Shares | | Security Description | | Value | |
| COMMON STOCKS—95.1% | | | |
| | | | |
| Banks—3.8% | | | |
| | 130,014 | | Regions Financial Corporation | | $ | 2,311,649 | |
| | | | | |
| Capital Goods—15.4% | | | | |
| | 32,948 | | AMETEK, Inc. | | | 2,377,528 | |
| | 34,308 | | Emerson Electric Company | | | 2,372,055 | |
| | 6,848 | | Ingersoll-Rand plc | | | 614,471 | |
| | 8,668 | | Roper Technologies, Inc. | | | 2,391,588 | |
| | 22,940 | | Textron, Inc. | | | 1,511,975 | |
| | | | | | | 9,267,617 | |
| Commercial & Professional Services—4.1% | | | | |
| | 35,912 | | Republic Services, Inc.+ | | | 2,454,944 | |
| | | | | |
| Consumer Durables & Apparel—5.3% | | | | |
| | 9,549 | | Garmin, Ltd.+ | | | 582,489 | |
| | 31,843 | | VF Corporation | | | 2,595,841 | |
| | | | | | | 3,178,330 | |
| Consumer Services—1.5% | | | | |
| | 8,193 | | Darden Restaurants, Inc.+ | | | 877,143 | |
| | | | | |
| Diversified Financials—8.2% | | | | |
| | 28,704 | | Nasdaq, Inc. | | | 2,619,814 | |
| | 22,343 | | Northern Trust Corporation | | | 2,298,871 | |
| | | | | | | 4,918,685 | |
| Food, Beverage & Tobacco—4.6% | | | | |
| | 74,612 | | Hormel Foods Corporation+ | | | 2,776,313 | |
| | | | | |
| Health Care Equipment & Services—11.8% | | | | |
| | 8,814 | | Anthem, Inc. | | | 2,097,996 | |
| | 24,988 | | Danaher Corporation | | | 2,465,816 | |
| | 10,228 | | UnitedHealth Group, Inc. | | | 2,509,338 | |
| | | | | | | 7,073,150 | |
| Insurance—7.8% | | | | |
| | 53,525 | | Aflac, Inc. | | | 2,302,645 | |
| | 21,903 | | American Financial Group, Inc. | | | 2,350,849 | |
| | | | | | | 4,653,494 | |
| Retailing—8.4% | | | | |
| | 31,721 | | Best Buy Company, Inc. | | | 2,365,752 | |
| | 13,681 | | Home Depot, Inc. | | | 2,669,163 | |
| | | | | | | 5,034,915 | |
| Semiconductors & Semiconductor Equipment—7.7% | | | | |
| | 38,038 | | Maxim Integrated Products, Inc. | | | 2,231,309 | |
| | 21,656 | | Texas Instruments, Inc. | | | 2,387,574 | |
| | | | | | | 4,618,883 | |
| Software & Services—16.5% | | | | |
| | 14,589 | | Accenture plc—Class A | | | 2,386,615 | |
| | 22,690 | | Broadridge Financial Solutions, Inc. | | | 2,611,619 | |
| | 69,759 | | CA, Inc. | | | 2,486,908 | |
| | 24,580 | | Microsoft Corporation | | | 2,423,834 | |
| | | | | | | 9,908,976 | |
| TOTAL COMMON STOCKS | | | | |
| (Cost $56,445,503) | | | 57,074,099 | |
| | | | | | | | |
| Shares/ | | | | | | |
| Amount | | Security Description | | Value | |
| SHORT-TERM INVESTMENTS—0.6% | | | | |
| | 345,379 | | U.S. Bank Money Market | | | | |
| | | | Deposit Account, 1.77% | | | 345,379 | |
| TOTAL SHORT-TERM INVESTMENTS | | | | |
| (Cost $345,379) | | | 345,379 | |
| | | | | | | | |
| INVESTMENTS PURCHASED WITH PROCEEDS | | | | |
| FROM SECURITIES LENDING—9.0% | | | | |
| | 5,375,591 | | Mount Vernon Liquid Assets | | | | |
| | | | Portfolio, LLC, 2.20% (a)* | | | 5,375,591 | |
| TOTAL INVESTMENTS PURCHASED WITH | | | | |
| PROCEEDS FROM SECURITIES LENDING | | | | |
| (Cost $5,375,591) | | | 5,375,591 | |
| TOTAL INVESTMENTS—104.7% | | | | |
| (Cost $62,166,473) | | | 62,795,069 | |
| Liabilities in Excess of Other Assets—(4.7)% | | | (2,839,927 | ) |
| NET ASSETS—100.0% | | $ | 59,955,142 | |
| (a) | The rate quoted is the annualized seven-day yield as of June 30, 2018. |
| + | All or portion of this security is on loan as of June 30, 2018. Total value of securities on loan is $5,249,221. |
| * | Privately offered liquidity fund. |
The Global Industry Classification Standard (GICS®) was developed by and/or is the exclusive property of MSCI, Inc. and Standard & Poor Financial Services LLC (“S&P”). GICS is a service mark of MSCI and S&P and has been licensed for use by U.S. Bancorp Fund Services, LLC.
The accompanying notes are an integral part of these financial statements.
| | Absolute Shares Trust | |
| WBI BullBear Global Income ETF | |
| Schedule of Investments | |
| | June 30, 2018 | |
| Shares | | Security Description | | Value | |
| EXCHANGE TRADED FUNDS—99.5% | | | |
| | 192,980 | | Invesco BulletShares 2022 | | | |
| | | | Corporate Bond ETF+ | | $ | 3,985,037 | |
| | 192,877 | | iShares Emerging Markets | | | | |
| | | | High Yield Bond ETF | | | 8,870,413 | |
| | 341,007 | | iShares iBoxx $High Yield | | | | |
| | | | Corporate Bond ETF+ | | | 29,012,876 | |
| | 23,232 | | iShares iBoxx $Investment Grade | | | | |
| | | | Corporate Bond ETF | | | 2,661,690 | |
| | 47,385 | | iShares Intermediate Credit Bond ETF | | | 5,034,182 | |
| | 37,750 | | iShares TIPS Bond ETF | | | 4,260,843 | |
| | 789,995 | | SPDR Bloomberg Barclays | | | | |
| | | | High Yield Bond ETF+ | | | 28,029,023 | |
| | 290,629 | | VanEck Vectors International | | | | |
| | | | High Yield Bond ETF | | | 7,084,082 | |
| | 91,288 | | Vanguard Short-Term Bond ETF+ | | | 7,139,634 | |
| TOTAL EXCHANGE TRADED FUNDS | | | | |
| (Cost $96,755,360) | | | 96,077,780 | |
| | | | | | | | |
| Shares/ | | | | | | |
| Amount | | Security Description | | Value | |
| SHORT-TERM INVESTMENTS—0.6% | | | | |
| | 610,217 | | U.S. Bank Money Market | | | | |
| | | | Deposit Account, 1.77% | | | 610,217 | |
| TOTAL SHORT-TERM INVESTMENTS | | | | |
| (Cost $610,217) | | | 610,217 | |
| | | | | | | | |
| INVESTMENTS PURCHASED WITH PROCEEDS | | | | |
| FROM SECURITIES LENDING—32.4% | | | | |
| | 31,332,013 | | Mount Vernon Liquid Assets | | | | |
| | | | Portfolio, LLC, 2.20% (a)* | | | 31,332,013 | |
| TOTAL INVESTMENTS PURCHASED WITH | | | | |
| PROCEEDS FROM SECURITIES LENDING | | | | |
| (Cost $31,332,013) | | | 31,332,013 | |
| TOTAL INVESTMENTS—132.5% | | | | |
| (Cost $128,697,590) | | | 128,020,010 | |
| Liabilities in Excess of Other Assets—(32.5)% | | | (31,394,131 | ) |
| NET ASSETS—100.0% | | $ | 96,625,879 | |
| (a) | The rate quoted is the annualized seven-day yield as of June 30, 2018. |
| + | All or portion of this security is on loan as of June 30, 2018. Total value of securities on loan is $30,637,853. |
| * | Privately offered liquidity fund. |
The Global Industry Classification Standard (GICS®) was developed by and/or is the exclusive property of MSCI, Inc. and Standard & Poor Financial Services LLC (“S&P”). GICS is a service mark of MSCI and S&P and has been licensed for use by U.S. Bancorp Fund Services, LLC.
The accompanying notes are an integral part of these financial statements.
| | Absolute Shares Trust | |
| WBI BullBear Global High Income ETF | |
| Schedule of Investments | |
| | June 30, 2018 | |
| Shares | | Security Description | | Value | |
| COMMON STOCKS—49.1% | | | |
| | | | |
| Automobiles & Components—4.3% | | | |
| | 1,071,954 | | Ford Motor Company | | $ | 11,866,530 | |
| | | | | |
| Banks—7.8% | | | | |
| | 648,498 | | People’s United Financial, Inc. | | | 11,731,329 | |
| | 270,953 | | United Bankshares, Inc. | | | 9,862,689 | |
| | | | | | | 21,594,018 | |
| Diversified Financials—4.5% | | | | |
| | 603,388 | | Western Union Company | | | 12,266,878 | |
| | | | | |
| Food, Beverage & Tobacco—6.4% | | | | |
| | 266,659 | | Dean Foods Company | | | 2,802,586 | |
| | 273,959 | | General Mills, Inc. | | | 12,125,425 | |
| | 38,812 | | Universal Corporation | | | 2,563,533 | |
| | | | | | | 17,491,544 | |
| Materials—5.1% | | | | |
| | 133,287 | | Domtar Corporation | | | 6,363,121 | |
| | 46,370 | | Innophos Holdings, Inc. | | | 2,207,212 | |
| | 27,553 | | LyondellBasell | | | | |
| | | | Industries N.V.—Class A | | | 3,026,697 | |
| | 55,320 | | Schweitzer-Mauduit | | | | |
| | | | International, Inc. | | | 2,418,591 | |
| | | | | | | 14,015,621 | |
| Pharmaceuticals, Biotechnology & Life Sciences—4.5% | | | | |
| | 343,593 | | Pfizer, Inc. | | | 12,465,554 | |
| | | | | |
| Technology Hardware & Equipment—4.4% | | | | |
| | 213,070 | | Seagate Technology plc | | | 12,032,063 | |
| | | | | |
| Telecommunication Services—4.6% | | | | |
| | 253,232 | | Verizon Communications, Inc. | | | 12,740,102 | |
| | | | | |
| Utilities—7.5% | | | | |
| | 1,022,383 | | AES Corporation | | | 13,710,156 | |
| | 176,365 | | SCANA Corporation | | | 6,793,580 | |
| | | | | | | 20,503,736 | |
| TOTAL COMMON STOCKS | | | | |
| (Cost $134,723,022) | | | 134,976,046 | |
| | | | | | | | |
| EXCHANGE TRADED FUNDS—49.7% | | | | |
| | 135,060 | | Invesco BulletShares 2022 | | | | |
| | | | Corporate Bond ETF+ | | | 2,788,989 | |
| | 50,868 | | iShares Emerging Markets | | | | |
| | | | High Yield Bond ETF | | | 2,339,419 | |
| | 674,667 | | iShares iBoxx $High Yield | | | | |
| | | | Corporate Bond ETF+ | | | 57,400,668 | |
| | 25,560 | | iShares iBoxx $Investment Grade | | | | |
| | | | Corporate Bond ETF | | | 2,928,409 | |
| | 33,160 | | iShares Intermediate Credit Bond ETF | | | 3,522,919 | |
| | 26,431 | | iShares TIPS Bond ETF | | | 2,983,267 | |
| | 1,462,939 | | SPDR Bloomberg Barclays | | | | |
| | | | High Yield Bond ETF+ | | | 51,905,076 | |
| | 107,274 | | VanEck Vectors Emerging Markets | | | | |
| | | | High Yield Bond ETF | | | 2,459,793 | |
| | 208,464 | | VanEck Vectors International | | | | |
| | | | High Yield Bond ETF | | | 5,081,310 | |
| | 64,499 | | Vanguard Short-Term Bond ETF | | | 5,044,467 | |
| TOTAL EXCHANGE TRADED FUNDS | | | | |
| (Cost $137,218,606) | | | 136,454,317 | |
| | | | | | | | |
| Shares/ | | | | | | |
| Amount | | Security Description | | Value | |
| SHORT-TERM INVESTMENTS—1.2% | | | | |
| | 3,183,408 | | U.S. Bank Money Market | | | | |
| | | | Deposit Account, 1.77% | | | 3,183,408 | |
| TOTAL SHORT-TERM INVESTMENTS | | | | |
| (Cost $3,183,408) | | | 3,183,408 | |
| | | | | | | | |
| INVESTMENTS PURCHASED WITH PROCEEDS | | | | |
| FROM SECURITIES LENDING—31.3% | | | | |
| | 86,105,083 | | Mount Vernon Liquid Assets | | | | |
| | | | Portfolio, LLC, 2.20% (a)* | | | 86,105,083 | |
| TOTAL INVESTMENTS PURCHASED WITH | | | | |
| PROCEEDS FROM SECURITIES LENDING | | | | |
| (Cost $86,105,083) | | | 86,105,083 | |
| TOTAL INVESTMENTS—131.3% | | | | |
| (Cost $361,230,119) | | | 360,718,854 | |
| Liabilities in Excess of Other Assets—(31.3)% | | | (85,910,331 | ) |
| NET ASSETS—100.0% | | $ | 274,808,523 | |
| (a) | The rate quoted is the annualized seven-day yield as of June 30, 2018. |
| + | All or portion of this security is on loan as of June 30, 2018. Total value of securities on loan is $84,042,425. |
| * | Privately offered liquidity fund. |
The Global Industry Classification Standard (GICS®) was developed by and/or is the exclusive property of MSCI, Inc. and Standard & Poor Financial Services LLC (“S&P”). GICS is a service mark of MSCI and S&P and has been licensed for use by U.S. Bancorp Fund Services, LLC.
The accompanying notes are an integral part of these financial statements.
| | Absolute Shares Trust | |
| WBI BullBear Global Rotation ETF | |
| Schedule of Investments | |
| | June 30, 2018 | |
| Shares | | Security Description | | Value | |
| EXCHANGE TRADED FUNDS—80.0% | | | |
| | 41,791 | | First Trust Europe AlphaDEX Fund | | $ | 1,604,357 | |
| | 28,205 | | First Trust Natural Gas ETF+ | | | 658,869 | |
| | 12,361 | | Industrial Select Sector SPDR Fund | | | 885,418 | |
| | 11,961 | | Invesco DWA Consumer Staples | | | | |
| | | | Momentum ETF | | | 846,958 | |
| | 19,409 | | Invesco Russell MidCap | | | | |
| | | | Pure Growth ETF^ | | | 949,876 | |
| | 28,332 | | Invesco S&P 500 ex-Rate Sensitive | | | | |
| | | | Low Volatility ETF | | | 958,472 | |
| | 23,936 | | iShares Emerging Markets | | | | |
| | | | High Yield Bond ETF | | | 1,100,817 | |
| | 20,265 | | iShares MSCI EAFE Small-Cap ETF | | | 1,271,426 | |
| | 11,206 | | iShares Nasdaq Biotechnology ETF | | | 1,230,643 | |
| | 5,561 | | iShares Russell 2000 Growth ETF+ | | | 1,136,279 | |
| | 22,245 | | iShares U.S. Real Estate ETF+ | | | 1,792,502 | |
| | 28,718 | | SPDR Bloomberg Barclays | | | | |
| | | | International Treasury Bond ETF | | | 796,925 | |
| | 72,564 | | VanEck Vectors High Income MLP | | | 1,571,736 | |
| | 41,438 | | VanEck Vectors International | | | | |
| | | | High Yield Bond ETF | | | 1,010,051 | |
| TOTAL EXCHANGE TRADED FUNDS | | | | |
| (Cost $15,967,875) | | | 15,814,329 | |
| | | | | | | | |
| Shares/ | | | | | | |
| Amount | | Security Description | | Value | |
| SHORT-TERM INVESTMENTS—20.0% | | | | |
| | 3,941,504 | | U.S. Bank Money Market | | | | |
| | | | Deposit Account, 1.77% | | | 3,941,504 | |
| TOTAL SHORT-TERM INVESTMENTS | | | | |
| (Cost $3,941,504) | | | 3,941,504 | |
| | | | | | | | |
| INVESTMENTS PURCHASED WITH PROCEEDS | | | | |
| FROM SECURITIES LENDING—17.3% | | | | |
| | 3,408,924 | | Mount Vernon Liquid Assets | | | | |
| | | | Portfolio, LLC, 2.20% (a)* | | | 3,408,924 | |
| TOTAL INVESTMENTS PURCHASED WITH | | | | |
| PROCEEDS FROM SECURITIES LENDING | | | | |
| (Cost $3,408,924) | | | 3,408,924 | |
| TOTAL INVESTMENTS—117.3% | | | | |
| (Cost $23,318,303) | | | 23,164,757 | |
| Liabilities in Excess of Other Assets—(17.3)% | | | (3,415,615 | ) |
| NET ASSETS—100.0% | | $ | 19,749,142 | |
| (a) | The rate quoted is the annualized seven-day yield as of June 30, 2018. |
| + | All or portion of this security is on loan as of June 30, 2018. Total value of securities on loan is $3,341,171. |
| * | Privately offered liquidity fund. |
| ^ | Non-income producing security. |
The Global Industry Classification Standard (GICS®) was developed by and/or is the exclusive property of MSCI, Inc. and Standard & Poor Financial Services LLC (“S&P”). GICS is a service mark of MSCI and S&P and has been licensed for use by U.S. Bancorp Fund Services, LLC.
The accompanying notes are an integral part of these financial statements.
| | Absolute Shares Trust | |
WBI Power FactorTM High Dividend ETF | |
| Schedule of Investments | |
| | June 30, 2018 | |
| Shares | | Security Description | | Value | |
| COMMON STOCKS—99.5% | | | |
| | | | |
| Automobiles & Components—9.2% | | | |
| | 233,098 | | Ford Motor Company | | $ | 2,580,395 | |
| | 53,124 | | Harley-Davidson, Inc. | | | 2,235,458 | |
| | | | | | | 4,815,853 | |
| Banks—2.7% | | | | |
| | 10,077 | | Northwest Bancshares, Inc. | | | 175,239 | |
| | 35,863 | | People’s United Financial, Inc. | | | 648,761 | |
| | 49,967 | | Valley National Bancorp | | | 607,599 | |
| | | | | | | 1,431,599 | |
| Commercial & Professional Services—0.6% | | | | |
| | 6,295 | | Quad/Graphics, Inc. | | | 131,125 | |
| | 12,803 | | Steelcase, Inc.—Class A | | | 172,840 | |
| | | | | | | 303,965 | |
| Consumer Durables & Apparel—5.4% | | | | |
| | 14,712 | | M.D.C. Holdings, Inc. | | | 452,688 | |
| | 92,228 | | Newell Brands, Inc. | | | 2,378,560 | |
| | | | | | | 2,831,248 | |
| Consumer Services—3.5% | | | | |
| | 25,915 | | Brinker International, Inc.+ | | | 1,233,554 | |
| | 25,892 | | H&R Block, Inc. | | | 589,820 | |
| | | | | | | 1,823,374 | |
| Diversified Financials—2.1% | | | | |
| | 7,223 | | Aircastle, Ltd. | | | 148,071 | |
| | 8,591 | | Artisan Partners Asset | | | | |
| | | | Management, Inc.—Class A | | | 259,019 | |
| | 52,075 | | Navient Corporation | | | 678,537 | |
| | | | | | | 1,085,627 | |
| Energy—11.9% | | | | |
| | 7,783 | | CVR Energy, Inc.+ | | | 287,893 | |
| | 31,282 | | Exxon Mobil Corporation | | | 2,587,960 | |
| | 16,375 | | PBF Energy, Inc.—Class A | | | 686,604 | |
| | 98,868 | | Williams Companies, Inc. | | | 2,680,311 | |
| | | | | | | 6,242,768 | |
| Food, Beverage & Tobacco—2.5% | | | | |
| | 27,875 | | B&G Foods, Inc.+ | | | 833,463 | |
| | 42,724 | | Dean Foods Company | | | 449,029 | |
| | | | | | | 1,282,492 | |
| Health Care Equipment & Services—3.5% | | | | |
| | 33,650 | | Owens & Minor, Inc. | | | 562,292 | |
| | 56,927 | | Patterson Companies, Inc.+ | | | 1,290,535 | |
| | | | | | | 1,852,827 | |
| Household & Personal Products—1.4% | | | | |
| | 7,165 | | Kimberly-Clark Corporation | | | 754,761 | |
| | | | | |
| Insurance—1.1% | | | | |
| | 29,801 | | Old Republic International Corporation | | | 593,338 | |
| | | | | | | | |
| Materials—9.2% | | | | |
| | 44,320 | | International Paper Company | | | 2,308,185 | |
| | 22,949 | | LyondellBasell Industries N.V.—Class A | | | 2,520,948 | |
| | | | | | | 4,829,133 | |
| Media—3.2% | | | | |
| | 25,633 | | Gannett Company, Inc. | | | 274,273 | |
| | 14,426 | | Meredith Corporation+ | | | 735,726 | |
| | 28,612 | | Interpublic Group of Companies, Inc.+ | | | 670,665 | |
| | | | | | | 1,680,664 | |
| Pharmaceuticals, Biotechnology & Life Sciences—3.2% | | | | |
| | 46,724 | | Pfizer, Inc. | | | 1,695,147 | |
| | | | | |
| Real Estate—0.8% | | | | |
| | 18,637 | | Kennedy-Wilson Holdings, Inc. | | | 394,173 | |
| | | | | |
| Retailing—17.3% | | | | |
| | 39,632 | | Bed Bath & Beyond, Inc. | | | 789,668 | |
| | 55,292 | | Chico’s FAS, Inc. | | | 450,077 | |
| | 32,626 | | DSW, Inc.—Class A | | | 842,403 | |
| | 14,632 | | Kohl’s Corporation | | | 1,066,673 | |
| | 41,425 | | L Brands, Inc. | | | 1,527,754 | |
| | 38,188 | | Macy’s, Inc. | | | 1,429,377 | |
| | 117,707 | | Office Depot, Inc. | | | 300,153 | |
| | 21,312 | | Signet Jewelers, Ltd. | | | 1,188,144 | |
| | 9,401 | | Target Corporation+ | | | 715,604 | |
| | 12,675 | | Williams-Sonoma, Inc.+ | | | 777,991 | |
| | | | | | | 9,087,844 | |
| Software & Services—2.3% | | | | |
| | 8,526 | | International Business | | | | |
| | | | Machines Corporation | | | 1,191,082 | |
| | | | | |
| Technology Hardware & Equipment—4.6% | | | | |
| | 42,289 | | Seagate Technology plc+ | | | 2,388,060 | |
| | | | | |
| Telecommunication Services—5.9% | | | | |
| | 44,292 | | AT&T, Inc. | | | 1,422,216 | |
| | 19,931 | | Consolidated Communications | | | | |
| | | | Holdings, Inc. | | | 246,347 | |
| | 27,918 | | Verizon Communications, Inc.+ | | | 1,404,555 | |
| | | | | | | 3,073,118 | |
| Utilities—9.1% | | | | |
| | 13,522 | | Black Hills Corporation | | | 827,681 | |
| | 90,339 | | CenterPoint Energy, Inc. | | | 2,503,294 | |
| | 6,384 | | DTE Energy Company | | | 661,574 | |
| | 17,785 | | Exelon Corporation | | | 757,641 | |
| | | | | | | 4,750,190 | |
| TOTAL COMMON STOCKS | | | | |
| (Cost $49,035,418) | | | 52,107,263 | |
The accompanying notes are an integral part of these financial statements.
| | Absolute Shares Trust | |
WBI Power FactorTM High Dividend ETF | |
| Schedule of Investments | |
| | June 30, 2018 (concluded) | |
| Shares/ | | | | | |
| Amount | | Security Description | | Value | |
| SHORT-TERM INVESTMENTS—0.4% | | | |
| | 230,697 | | U.S. Bank Money Market | | | |
| | | | Deposit Account, 1.77% | | $ | 230,697 | |
| TOTAL SHORT-TERM INVESTMENTS | | | | |
| (Cost $230,697) | | | 230,697 | |
| | | | | | | | |
| INVESTMENTS PURCHASED WITH PROCEEDS | | | | |
| FROM SECURITIES LENDING—15.9% | | | | |
| | 8,340,373 | | Mount Vernon Liquid Assets | | | | |
| | | | Portfolio, LLC, 2.20% (a)* | | | 8,340,373 | |
| TOTAL INVESTMENTS PURCHASED WITH | | | | |
| PROCEEDS FROM SECURITIES LENDING | | | | |
| (Cost $8,340,373) | | | 8,340,373 | |
| TOTAL INVESTMENTS—115.8% | | | | |
| (Cost $57,606,488) | | | 60,678,333 | |
| Liabilities in Excess of Other Assets—(15.8)% | | | (8,275,971 | ) |
| NET ASSETS—100.0% | | $ | 52,402,362 | |
| (a) | The rate quoted is the annualized seven-day yield as of June 30, 2018. |
| + | All or portion of this security is on loan as of June 30, 2018. Total value of securities on loan is $8,021,648. |
| * | Privately offered liquidity fund. |
The Global Industry Classification Standard (GICS®) was developed by and/or is the exclusive property of MSCI, Inc. and Standard & Poor Financial Services LLC (“S&P”). GICS is a service mark of MSCI and S&P and has been licensed for use by U.S. Bancorp Fund Services, LLC.
The accompanying notes are an integral part of these financial statements.
| | Absolute Shares Trust | |
| Statements of Assets and Liabilities | |
| | |
June 30, 2018
| | | WBI BullBear | | | | | | | | | | |
| | | Rising Income | | | WBI BullBear | | | WBI BullBear | | | WBI BullBear | |
| | | 2000 ETF | | | Value 2000 ETF | | | Yield 2000 ETF | | | Quality 2000 ETF | |
| ASSETS | | | | | | | | | | | | |
| Investments in securities, at value*+ (Note 2) | | $ | 48,300,388 | | | $ | 44,399,066 | | | $ | 51,401,739 | | | $ | 40,798,284 | |
| Receivable for investments sold | | | 13,363,748 | | | | 6,896,090 | | | | 9,017,611 | | | | 10,176,978 | |
| Dividends and interest receivable | | | 55,303 | | | | 31,475 | | | | 45,108 | | | | 34,056 | |
| Prepaid expenses and other assets | | | 5,070 | | | | 5,934 | | | | 5,987 | | | | 5,642 | |
| Securities lending income receivable | | | 1,008 | | | | 689 | | | | 2,279 | | | | 1,196 | |
| Total Assets | | | 61,725,517 | | | | 51,333,254 | | | | 60,472,724 | | | | 51,016,156 | |
| | | | | | | | | | | | | | | | | |
| LIABILITIES | | | | | | | | | | | | | | | | |
| Payables | | | | | | | | | | | | | | | | |
| Collateral received for securities loaned (Note 7) | | | 2,666,112 | | | | 421,150 | | | | 6,337,683 | | | | 1,603,941 | |
| Investments purchased | | | 4,257,668 | | | | 5,997,843 | | | | 439,793 | | | | 3,561,014 | |
| Fund shares redeemed | | | 1,217,015 | | | | — | | | | — | | | | — | |
| Management fees (Note 3) | | | 39,356 | | | | 32,017 | | | | 36,634 | | | | 32,543 | |
| Administration and fund accounting fees | | | 6,173 | | | | 6,364 | | | | 6,630 | | | | 6,734 | |
| Audit fees | | | 11,658 | | | | 11,661 | | | | 11,659 | | | | 11,662 | |
| Chief Compliance Officer fee | | | 556 | | | | 570 | | | | 562 | | | | 571 | |
| Custody fees | | | 1,066 | | | | 1,001 | | | | 1,007 | | | | 960 | |
| Legal fees | | | 497 | | | | 972 | | | | 294 | | | | 943 | |
| Accrued other expenses | | | 1,235 | | | | 1,275 | | | | 1,515 | | | | 1,230 | |
| Total Liabilities | | | 8,201,336 | | | | 6,472,853 | | | | 6,835,777 | | | | 5,219,598 | |
| NET ASSETS | | $ | 53,524,181 | | | $ | 44,860,401 | | | $ | 53,636,947 | | | $ | 45,796,558 | |
| | | | | | | | | | | | | | | | | |
| NET ASSETS CONSIST OF: | | | | | | | | | | | | | | | | |
| Paid-in Capital | | $ | 71,852,063 | | | $ | 55,785,256 | | | $ | 76,552,734 | | | $ | 60,644,927 | |
| Undistributed (Accumulated) Net Investment Income (Loss) | | | 11,315 | | | | 16,328 | | | | 32,110 | | | | 19,316 | |
| Accumulated Net Realized Gain (Loss) on Investments | | | (18,736,246 | ) | | | (11,706,521 | ) | | | (23,976,693 | ) | | | (15,412,481 | ) |
| Net Unrealized Appreciation (Depreciation) on: | | | | | | | | | | | | | | | | |
| Investments in Securities | | | 397,049 | | | | 765,338 | | | | 1,028,796 | | | | 544,796 | |
| Net Assets | | $ | 53,524,181 | | | $ | 44,860,401 | | | $ | 53,636,947 | | | $ | 45,796,558 | |
| *Cost | | | | | | | | | | | | | | | | |
| Investments in securities | | $ | 47,903,339 | | | $ | 43,633,728 | | | $ | 50,372,943 | | | $ | 40,253,488 | |
| Net Asset Value (unlimited shares authorized): | | | | | | | | | | | | | | | | |
| Net Assets | | $ | 53,524,181 | | | $ | 44,860,401 | | | $ | 53,636,947 | | | $ | 45,796,558 | |
| Shares Outstanding^ | | | 2,200,000 | | | | 1,850,000 | | | | 2,350,000 | | | | 1,950,000 | |
| Net Asset Value, Offering and Redemption Price per Share | | $ | 24.33 | | | $ | 24.25 | | | $ | 22.82 | | | $ | 23.49 | |
| ^ | No Par Value |
| + | Including securities on loan of $2,633,727, $408,040, $6,212,398 and $1,588,090 respectively. |
The accompanying notes are an integral part of these financial statements.
| | Absolute Shares Trust | |
Statements of Assets and Liabilities (continued) | |
| | |
June 30, 2018
| | | WBI BullBear | | | | | | | | | | |
| | | Rising Income | | | WBI BullBear | | | WBI BullBear | | | WBI BullBear | |
| | | 1000 ETF | | | Value 1000 ETF | | | Yield 1000 ETF | | | Quality 1000 ETF | |
| ASSETS | | | | | | | | | | | | |
| Investments in securities, at value*+ (Note 2) | | $ | 85,110,384 | | | $ | 66,912,178 | | | $ | 104,471,459 | | | $ | 62,795,069 | |
| Receivable for investments sold | | | 13,200,123 | | | | 14,590,782 | | | | 3,091,587 | | | | 11,263,491 | |
| Dividends and interest receivable | | | 86,324 | | | | 43,308 | | | | 118,382 | | | | 54,813 | |
| Prepaid expenses and other assets | | | 5,341 | | | | 6,177 | | | | 6,201 | | | | 4,927 | |
| Securities lending income receivable | | | 1,742 | | | | 1,196 | | | | 1,731 | | | | 707 | |
| Total Assets | | | 98,403,914 | | | | 81,553,641 | | | | 107,689,360 | | | | 74,119,007 | |
| | | | | | | | | | | | | | | | | |
| LIABILITIES | | | | | | | | | | | | | | | | |
| Payables | | | | | | | | | | | | | | | | |
| Collateral received for securities loaned (Note 7) | | | 12,310,651 | | | | 8,174,206 | | | | 20,124,796 | | | | 5,375,591 | |
| Investments purchased | | | 9,433,681 | | | | 8,466,206 | | | | 4,704,076 | | | | 8,722,387 | |
| Fund shares redeemed | | | 1,299,510 | | | | — | | | | — | | | | — | |
| Management fees (Note 3) | | | 54,313 | | | | 46,185 | | | | 56,409 | | | | 43,102 | |
| Administration and fund accounting fees | | | 7,015 | | | | 8,670 | | | | 9,272 | | | | 7,501 | |
| Audit fees | | | 11,656 | | | | 11,663 | | | | 11,663 | | | | 11,656 | |
| Chief Compliance Officer fee | | | 723 | | | | 716 | | | | 799 | | | | 617 | |
| Custody fees | | | 1,318 | | | | 1,138 | | | | 1,349 | | | | 1,104 | |
| Legal fees | | | 784 | | | | 909 | | | | 772 | | | | 495 | |
| Accrued other expenses | | | 808 | | | | 1,133 | | | | 1,175 | | | | 1,412 | |
| Total Liabilities | | | 23,120,459 | | | | 16,710,826 | | | | 24,910,311 | | | | 14,163,865 | |
| NET ASSETS | | $ | 75,283,455 | | | $ | 64,842,815 | | | $ | 82,779,049 | | | $ | 59,955,142 | |
| | | | | | | | | | | | | | | | | |
| NET ASSETS CONSIST OF: | | | | | | | | | | | | | | | | |
| Paid-in Capital | | $ | 91,914,507 | | | $ | 66,183,300 | | | $ | 94,050,093 | | | $ | 70,048,682 | |
| Undistributed (Accumulated) Net Investment Income (Loss) | | | 7,511 | | | | 7,046 | | | | 9,941 | | | | 8,248 | |
| Accumulated Net Realized Gain (Loss) on Investments | | | (19,057,343 | ) | | | (3,087,074 | ) | | | (14,309,658 | ) | | | (10,730,384 | ) |
| Net Unrealized Appreciation (Depreciation) on: | | | | | | | | | | | | | | | | |
| Investments in Unaffiliated Securities | | | 2,418,780 | | | | 1,739,543 | | | | 3,028,673 | | | | 628,596 | |
| Net Assets | | $ | 75,283,455 | | | $ | 64,842,815 | | | $ | 82,779,049 | | | $ | 59,955,142 | |
| *Cost | | | | | | | | | | | | | | | | |
| Investments in securities | | $ | 82,691,604 | | | $ | 65,172,635 | | | $ | 101,442,786 | | | $ | 62,166,473 | |
| Net Asset Value (unlimited shares authorized): | | | | | | | | | | | | | | | | |
| Net Assets | | $ | 75,283,455 | | | $ | 64,842,815 | | | $ | 82,779,049 | | | $ | 59,955,142 | |
| Shares Outstanding^ | | | 2,900,000 | | | | 2,300,000 | | | | 3,200,000 | | | | 2,300,000 | |
| Net Asset Value, Offering and Redemption Price per Share | | $ | 25.96 | | | $ | 28.19 | | | $ | 25.87 | | | $ | 26.07 | |
| ^ | No Par Value |
| + | Including securities on loan of $12,034,787, $7,992,699, $19,716,826 and $5,249,221 respectively. |
The accompanying notes are an integral part of these financial statements.
| | Absolute Shares Trust | |
Statements of Assets and Liabilities (concluded) | |
| | |
June 30, 2018
| | | WBI BullBear | | | WBI BullBear | | | WBI BullBear | | | WBI Power | |
| | | Global | | | Global High | | | Global | | | Factor™ High | |
| | | Income ETF | | | Income ETF | | | Rotation ETF | | | Dividend ETF | |
| ASSETS | | | | | | | | | | | | |
| Investments in securities, at value*+ (Note 2) | | $ | 128,020,010 | | | $ | 360,718,854 | | | $ | 23,164,757 | | | $ | 60,678,333 | |
| Receivable for investments sold | | | — | | | | — | | | | — | | | | — | |
| Dividends and interest receivable | | | 4,459 | | | | 337,831 | | | | 22,050 | | | | 102,232 | |
| Prepaid expenses and other assets | | | 8,533 | | | | 11,588 | | | | 4,503 | | | | 2,546 | |
| Securities lending income receivable | | | 37,525 | | | | 87,651 | | | | 3,580 | | | | 5,464 | |
| Total Assets | | | 128,070,527 | | | | 361,155,924 | | | | 23,194,890 | | | | 60,788,575 | |
| | | | | | | | | | | | | | | | | |
| LIABILITIES | | | | | | | | | | | | | | | | |
| Payables | | | | | | | | | | | | | | | | |
| Collateral received for securities loaned (Note 7) | | | 31,332,013 | | | | 86,105,083 | | | | 3,408,924 | | | | 8,340,373 | |
| Investments purchased | | | — | | | | — | | | | — | | | | — | |
| Fund shares redeemed | | | — | | | | — | | | | — | | | | — | |
| Management fees (Note 3) | | | 77,006 | | | | 192,024 | | | | 20,039 | | | | 27,698 | |
| Administration and fund accounting fees | | | 15,325 | | | | 27,016 | | | | 3,018 | | | | 4,098 | |
| Audit fees | | | 11,680 | | | | 11,703 | | | | 11,658 | | | | 11,420 | |
| Chief Compliance Officer fee | | | 1,220 | | | | 2,428 | | | | 293 | | | | 488 | |
| Custody fees | | | 1,673 | | | | 3,865 | | | | 329 | | | | 779 | |
| Legal fees | | | 3,924 | | | | 2,917 | | | | 262 | | | | 366 | |
| Accrued other expenses | | | 1,807 | | | | 2,365 | | | | 1,225 | | | | 991 | |
| Total Liabilities | | | 31,444,648 | | | | 86,347,401 | | | | 3,445,748 | | | | 8,386,213 | |
| NET ASSETS | | $ | 96,625,879 | | | $ | 274,808,523 | | | $ | 19,749,142 | | | $ | 52,402,362 | |
| | | | | | | | | | | | | | | | | |
| NET ASSETS CONSIST OF: | | | | | | | | | | | | | | | | |
| Paid-in Capital | | $ | 108,441,744 | | | $ | 291,371,799 | | | $ | 19,996,159 | | | $ | 48,825,575 | |
| Undistributed (Accumulated) Net Investment Income (Loss) | | | — | | | | — | | | | 11,666 | | | | 40,254 | |
| Accumulated Net Realized Gain (Loss) on Investments | | | (11,138,285 | ) | | | (16,052,011 | ) | | | (105,137 | ) | | | 464,688 | |
| Net Unrealized Appreciation (Depreciation) on: | | | | | | | | | | | | | | | | |
| Investments in Unaffiliated Securities | | | (677,580 | ) | | | (511,265 | ) | | | (153,546 | ) | | | 3,071,845 | |
| Net Assets | | $ | 96,625,879 | | | $ | 274,808,523 | | | $ | 19,749,142 | | | $ | 52,402,362 | |
| *Cost | | | | | | | | | | | | | | | | |
| Investments in securities | | $ | 128,697,590 | | | $ | 361,230,119 | | | $ | 23,318,303 | | | $ | 57,606,488 | |
| Net Asset Value (unlimited shares authorized): | | | | | | | | | | | | | | | | |
| Net Assets | | $ | 96,625,879 | | | $ | 274,808,523 | | | $ | 19,749,142 | | | $ | 52,402,362 | |
| Shares Outstanding^ | | | 4,050,000 | | | | 11,500,000 | | | | 800,000 | | | | 1,950,000 | |
| Net Asset Value, Offering and Redemption Price per Share | | $ | 23.86 | | | $ | 23.90 | | | $ | 24.69 | | | $ | 26.87 | |
| ^ | No Par Value |
| + | Including securities on loan of $30,637,853, $84,042,425, $3,341,171 and $8,021,648 respectively. |
The accompanying notes are an integral part of these financial statements.
| | Absolute Shares Trust | |
| Statements of Operations | |
| | |
For the Year Ended June 30, 2018
| | | WBI BullBear | | | | | | | | | | |
| | | Rising Income | | | WBI BullBear | | | WBI BullBear | | | WBI BullBear | |
| | | 2000 ETF | | | Value 2000 ETF | | | Yield 2000 ETF | | | Quality 2000 ETF | |
| INVESTMENT INCOME | | | | | | | | | | | | |
| Income: | | | | | | | | | | | | |
| Dividends+ | | $ | 679,187 | | | $ | 780,878 | | | $ | 908,042 | | | $ | 918,314 | |
| Interest | | | 63,554 | | | | 82,648 | | | | 112,828 | | | | 84,388 | |
| Securities lending income (Note 7) | | | 18,200 | | | | 18,045 | | | | 20,718 | | | | 19,293 | |
| Total Investment Income | | | 760,941 | | | | 881,571 | | | | 1,041,588 | | | | 1,021,995 | |
| | | | | | | | | | | | | | | | | |
| Expenses: | | | | | | | | | | | | | | | | |
| Management fees (Note 3) | | | 395,494 | | | | 536,772 | | | | 497,475 | | | | 553,253 | |
| Administration, fund accounting and custodian fees (Note 6) | | | 39,328 | | | | 53,948 | | | | 49,020 | | | | 55,059 | |
| Offering costs | | | — | | | | — | | | | — | | | | — | |
| Professional fees | | | 33,197 | | | | 41,151 | | | | 37,975 | | | | 41,701 | |
| Exchange fees | | | 11,398 | | | | 10,427 | | | | 10,620 | | | | 11,695 | |
| Director’s fees and expenses | | | 5,987 | | | | 8,542 | | | | 8,030 | | | | 8,693 | |
| Shareholder reporting expenses | | | 5,891 | | | | 7,436 | | | | 6,465 | | | | 6,645 | |
| Insurance expenses | | | 5,848 | | | | 8,877 | | | | 8,844 | | | | 9,346 | |
| Miscellaneous expenses | | | 3,356 | | | | 4,258 | | | | 3,662 | | | | 4,152 | |
| Total Expenses | | | 500,499 | | | | 671,411 | | | | 622,091 | | | | 690,544 | |
| Less: Fees (Waived)/Recouped | | | — | | | | — | | | | — | | | | — | |
| Net Expenses | | | 500,499 | | | | 671,411 | | | | 622,091 | | | | 690,544 | |
| Net Investment Income | | | 260,442 | | | | 210,160 | | | | 419,497 | | | | 331,451 | |
| | | | | | | | | | | | | | | | | |
| REALIZED & UNREALIZED GAIN (LOSS) ON INVESTMENTS | | | | | | | | | | | | | | | | |
| Net realized gain (loss) on: | | | | | | | | | | | | | | | | |
| Investments in securities | | | 1,261,758 | | | | 372,028 | | | | 2,481,097 | | | | 3,892,645 | |
| Capital gain distributions from regulated investment companies | | | — | | | | — | | | | — | | | | — | |
| Net change in unrealized appreciation (depreciation) of: | | | | | | | | | | | | | | | | |
| Investments in securities | | | (1,173,833 | ) | | | (1,965,525 | ) | | | (1,521,910 | ) | | | (2,472,670 | ) |
| Net realized and unrealized gain (loss) on investments | | | 87,925 | | | | (1,593,497 | ) | | | 959,187 | | | | 1,419,975 | |
| NET INCREASE (DECREASE) IN NET ASSETS | | | | | | | | | | | | | | | | |
| RESULTING FROM OPERATIONS | | $ | 348,367 | | | $ | (1,383,337 | ) | | $ | 1,378,684 | | | $ | 1,751,426 | |
| + | Net of withholding taxes of $0, $0, $201, and $0, respectively. |
The accompanying notes are an integral part of these financial statements.
| | Absolute Shares Trust | |
Statements of Operations (continued) | |
| | |
For the Year Ended June 30, 2018
| | | WBI BullBear | | | | | | | | | | |
| | | Rising Income | | | WBI BullBear | | | WBI BullBear | | | WBI BullBear | |
| | | 1000 ETF | | | Value 1000 ETF | | | Yield 1000 ETF | | | Quality 1000 ETF | |
| INVESTMENT INCOME | | | | | | | | | | | | |
| Income: | | | | | | | | | | | | |
| Dividends+ | | $ | 918,669 | | | $ | 1,211,204 | | | $ | 1,530,639 | | | $ | 949,445 | |
| Interest | | | 43,245 | | | | 60,816 | | | | 116,968 | | | | 73,158 | |
| Securities lending income (Note 7) | | | 12,670 | | | | 11,350 | | | | 16,088 | | | | 7,564 | |
| Total Investment Income | | | 974,584 | | | | 1,283,370 | | | | 1,663,695 | | | | 1,030,167 | |
| | | | | | | | | | | | | | | | | |
| Expenses: | | | | | | | | | | | | | | | | |
| Management fees (Note 3) | | | 509,892 | | | | 647,410 | | | | 694,835 | | | | 454,490 | |
| Administration, fund accounting and custodian fees (Note 6) | | | 48,078 | | | | 63,107 | | | | 65,959 | | | | 45,054 | |
| Offering costs | | | — | | | | — | | | | — | | | | — | |
| Professional fees | | | 37,802 | | | | 45,006 | | | | 45,933 | | | | 35,664 | |
| Exchange fees | | | 11,005 | | | | 11,594 | | | | 11,374 | | | | 11,648 | |
| Director’s fees and expenses | | | 7,633 | | | | 9,958 | | | | 10,708 | | | | 7,082 | |
| Shareholder reporting expenses | | | 4,978 | | | | 6,267 | | | | 6,867 | | | | 6,077 | |
| Insurance expenses | | | 6,751 | | | | 9,690 | | | | 10,400 | | | | 6,752 | |
| Miscellaneous expenses | | | 3,561 | | | | 4,430 | | | | 4,381 | | | | 3,564 | |
| Total Expenses | | | 629,700 | | | | 797,462 | | | | 850,457 | | | | 570,331 | |
| Less: Fees (Waived)/Recouped | | | — | | | | — | | | | — | | | | — | |
| Net Expenses | | | 629,700 | | | | 797,462 | | | | 850,457 | | | | 570,331 | |
| Net Investment Income | | | 344,884 | | | | 485,908 | | | | 813,238 | | | | 459,836 | |
| | | | | | | | | | | | | | | | | |
| REALIZED & UNREALIZED GAIN (LOSS) ON INVESTMENTS | | | | | | | | | | | | | | | | |
| Net realized gain (loss) on: | | | | | | | | | | | | | | | | |
| Investments in securities | | | 1,720,324 | | | | 7,309,514 | | | | 9,971,337 | | | | 2,275,816 | |
| Capital gain distributions from regulated investment companies | | | — | | | | — | | | | — | | | | — | |
| Net change in unrealized appreciation (depreciation) of: | | | | | | | | | | | | | | | | |
| Investments in securities | | | 118,750 | | | | (1,117,074 | ) | | | (125,438 | ) | | | (1,534,072 | ) |
| Net realized and unrealized gain (loss) on investments | | | 1,839,074 | | | | 6,192,440 | | | | 9,845,899 | | | | 741,744 | |
| NET INCREASE (DECREASE) IN NET ASSETS | | | | | | | | | | | | | | | | |
| RESULTING FROM OPERATIONS | | $ | 2,183,958 | | | $ | 6,678,348 | | | $ | 10,659,137 | | | $ | 1,201,580 | |
| + | Net of withholding taxes of $0, $0, $5,128, and $0 respectively. |
The accompanying notes are an integral part of these financial statements.
| | Absolute Shares Trust | |
Statements of Operations (concluded) | |
| | |
For the Year Ended June 30, 2018
| | | WBI BullBear | | | WBI BullBear | | | WBI BullBear | | | WBI Power | |
| | | Global | | | Global High | | | Global | | | Factor™ High | |
| | | Income ETF | | | Income ETF | | | Rotation ETF | | | Dividend ETF | |
| INVESTMENT INCOME | | | | | | | | | | | | |
| Income: | | | | | | | | | | | | |
| Dividends+ | | $ | 5,054,470 | | | $ | 10,163,586 | | | $ | 532,449 | | | $ | 2,236,919 | |
| Interest | | | 79,698 | | | | 106,790 | | | | 10,686 | | | | 4,449 | |
| Securities lending income (Note 7) | | | 295,907 | | | | 490,154 | | | | 46,984 | | | | 48,005 | |
| Total Investment Income | | | 5,430,075 | | | | 10,760,530 | | | | 590,119 | | | | 2,289,373 | |
| | | | | | | | | | | | | | | | | |
| Expenses: | | | | | | | | | | | | | | | | |
| Management fees (Note 3) | | | 1,237,726 | | | | 2,326,672 | | | | 172,888 | | | | 231,877 | |
| Administration, fund accounting and custodian fees (Note 6) | | | 105,692 | | | | 203,119 | | | | 19,527 | | | | 36,988 | |
| Offering costs | | | — | | | | — | | | | 9,876 | | | | 49,484 | |
| Professional fees | | | 69,353 | | | | 112,851 | | | | 21,599 | | | | 24,272 | |
| Exchange fees | | | 11,046 | | | | 11,196 | | | | 7,085 | | | | 2,003 | |
| Director’s fees and expenses | | | 20,768 | | | | 34,709 | | | | 2,475 | | | | 4,918 | |
| Shareholder reporting expenses | | | 10,721 | | | | 12,610 | | | | 3,689 | | | | 2,089 | |
| Insurance expenses | | | 25,975 | | | | 32,884 | | | | 2,080 | | | | 2,464 | |
| Miscellaneous expenses | | | 4,550 | | | | 10,170 | | | | 2,958 | | | | 3,653 | |
| Total Expenses | | | 1,485,831 | | | | 2,744,211 | | | | 242,177 | | | | 357,748 | |
| Less: Fees (Waived)/Recouped | | | — | | | | — | | | | 12,070 | | | | (62,633 | ) |
| Net Expenses | | | 1,485,831 | | | | 2,744,211 | | | | 254,247 | | | | 295,115 | |
| Net Investment Income | | | 3,944,244 | | | | 8,016,319 | | | | 335,872 | | | | 1,994,258 | |
| | | | | | | | | | | | | | | | | |
| REALIZED & UNREALIZED GAIN (LOSS) ON INVESTMENTS | | | | | | | | | | | | | | | | |
| Net realized gain (loss) on: | | | | | | | | | | | | | | | | |
| Investments in securities | | | (5,651,905 | ) | | | (3,494,535 | ) | | | 554,562 | | | | 1,635,776 | |
| Capital gain distributions from regulated investment companies | | | — | | | | 2,200 | | | | — | | | | — | |
| Net change in unrealized appreciation (depreciation) of: | | | | | | | | | | | | | | | | |
| Investments in securities | | | (2,445,214 | ) | | | (3,338,872 | ) | | | (415,294 | ) | | | 3,565,744 | |
| Net realized and unrealized gain (loss) on investments | | | (8,097,119 | ) | | | (6,831,207 | ) | | | 139,268 | | | | 5,201,520 | |
| NET INCREASE (DECREASE) IN NET ASSETS | | | | | | | | | | | | | | | | |
| RESULTING FROM OPERATIONS | | $ | (4,152,875 | ) | | $ | 1,185,112 | | | $ | 475,140 | | | $ | 7,195,778 | |
| + | Net of withholding taxes of $0, $3,707, $0 and $0 respectively. |
The accompanying notes are an integral part of these financial statements.
| | Absolute Shares Trust | |
| Statements of Changes in Net Assets | |
| | |
| | | WBI BullBear Rising Income 2000 ETF | | | WBI BullBear Value 2000 ETF | |
| | | Year Ended | | | Year Ended | | | Year Ended | | | Year Ended | |
| | | June 30, 2018 | | | June 30, 2017 | | | June 30, 2018 | | | June 30, 2017 | |
| INCREASE (DECREASE) IN NET ASSETS: | | | | | | | | | | | | |
| | | | | | | | | | | | | |
| OPERATIONS | | | | | | | | | | | | |
| Net investment income | | $ | 260,442 | | | $ | 330,437 | | | $ | 210,160 | | | $ | 704,719 | |
| Net realized gain (loss) on investments | | | 1,261,758 | | | | 8,458,111 | | | | 372,028 | | | | 10,248,873 | |
| Net change in unrealized appreciation (depreciation) | | | | | | | | | | | | | | | | |
| of investments | | | (1,173,833 | ) | | | (2,495,795 | ) | | | (1,965,525 | ) | | | 106,794 | |
| Net increase (decrease) in net assets | | | | | | | | | | | | | | | | |
| resulting from operations | | | 348,367 | | | | 6,292,753 | | | | (1,383,337 | ) | | | 11,060,386 | |
| | | | | | | | | | | | | | | | | |
| DISTRIBUTIONS TO SHAREHOLDERS | | | | | | | | | | | | | | | | |
| From net investment income | | | (249,127 | ) | | | (272,949 | ) | | | (218,969 | ) | | | (731,430 | ) |
| Tax return of capital to shareholders | | | — | | | | (40,198 | ) | | | — | | | | — | |
| From net realized gain | | | — | | | | — | | | | — | | | | — | |
| Total distributions to shareholders | | | (249,127 | ) | | | (313,147 | ) | | | (218,969 | ) | | | (731,430 | ) |
| | | | | | | | | | | | | | | | | |
| CAPITAL SHARE TRANSACTIONS | | | | | | | | | | | | | | | | |
| Net increase (decrease) in net assets | | | | | | | | | | | | | | | | |
| from capital share transactions | | | 11,303,095 | | | | (39,772,320 | ) | | | (26,469,535 | ) | | | (10,345,790 | ) |
| Total increase (decrease) in net assets | | $ | 11,402,335 | | | $ | (33,792,714 | ) | | $ | (28,071,841 | ) | | $ | (16,834 | ) |
| | | | | | | | | | | | | | | | | |
| NET ASSETS | | | | | | | | | | | | | | | | |
| Beginning of Year | | $ | 42,121,846 | | | $ | 75,914,560 | | | $ | 72,932,242 | | | $ | 72,949,076 | |
| End of Year | | $ | 53,524,181 | | | $ | 42,121,846 | | | $ | 44,860,401 | | | $ | 72,932,242 | |
| Undistributed (accumulated) | | | | | | | | | | | | | | | | |
| net investment income (loss) | | $ | 11,315 | | | $ | — | | | $ | 16,328 | | | $ | 24,949 | |
The accompanying notes are an integral part of these financial statements.
| | Absolute Shares Trust | |
Statements of Changes in Net Assets (continued) | |
| | |
| | | WBI BullBear Yield 2000 ETF | | | WBI BullBear Quality 2000 ETF | |
| | | Year Ended | | | Year Ended | | | Year Ended | | | Year Ended | |
| | | June 30, 2018 | | | June 30, 2017 | | | June 30, 2018 | | | June 30, 2017 | |
| INCREASE (DECREASE) IN NET ASSETS: | | | | | | | | | | | | |
| | | | | | | | | | | | | |
| OPERATIONS | | | | | | | | | | | | |
| Net investment income | | $ | 419,497 | | | $ | 1,388,484 | | | $ | 331,451 | | | $ | 551,764 | |
| Net realized gain (loss) on investments | | | 2,481,097 | | | | 7,742,409 | | | | 3,892,645 | | | | 8,870,301 | |
| Net change in unrealized appreciation (depreciation) | | | | | | | | | | | | | | | | |
| of investments | | | (1,521,910 | ) | | | 466,683 | | | | (2,472,670 | ) | | | (951,665 | ) |
| Net increase (decrease) in net assets | | | | | | | | | | | | | | | | |
| resulting from operations | | | 1,378,684 | | | | 9,597,576 | | | | 1,751,426 | | | | 8,470,400 | |
| | | | | | | | | | | | | | | | | |
| DISTRIBUTIONS TO SHAREHOLDERS | | | | | | | | | | | | | | | | |
| From net investment income | | | (401,663 | ) | | | (1,503,220 | ) | | | (317,572 | ) | | | (553,895 | ) |
| Tax return of capital to shareholders | | | — | | | | — | | | | — | | | | — | |
| From net realized gain | | | — | | | | — | | | | — | | | | — | |
| Total distributions to shareholders | | | (401,663 | ) | | | (1,503,220 | ) | | | (317,572 | ) | | | (553,895 | ) |
| | | | | | | | | | | | | | | | | |
| CAPITAL SHARE TRANSACTIONS | | | | | | | | | | | | | | | | |
| Net increase (decrease) in net assets | | | | | | | | | | | | | | | | |
| from capital share transactions | | | (12,958,225 | ) | | | (40,454,750 | ) | | | (30,119,010 | ) | | | (13,160,955 | ) |
| Total increase (decrease) in net assets | | $ | (11,981,204 | ) | | $ | (32,360,394 | ) | | $ | (28,685,156 | ) | | $ | (5,244,450 | ) |
| | | | | | | | | | | | | | | | | |
| NET ASSETS | | | | | | | | | | | | | | | | |
| Beginning of Year | | $ | 65,618,151 | | | $ | 97,978,545 | | | $ | 74,481,714 | | | $ | 79,726,164 | |
| End of Year | | $ | 53,636,947 | | | $ | 65,618,151 | | | $ | 45,796,558 | | | $ | 74,481,714 | |
| Undistributed (accumulated) | | | | | | | | | | | | | | | | |
| net investment income (loss) | | $ | 32,110 | | | $ | 24,874 | | | $ | 19,316 | | | $ | 5,381 | |
The accompanying notes are an integral part of these financial statements.
| | Absolute Shares Trust | |
Statements of Changes in Net Assets (continued) | |
| | |
| | | WBI BullBear Rising Income 1000 ETF | | | WBI BullBear Value 1000 ETF | |
| | | Year Ended | | | Year Ended | | | Year Ended | | | Year Ended | |
| | | June 30, 2018 | | | June 30, 2017 | | | June 30, 2018 | | | June 30, 2017 | |
| INCREASE (DECREASE) IN NET ASSETS: | | | | | | | | | | | | |
| | | | | | | | | | | | | |
| OPERATIONS | | | | | | | | | | | | |
| Net investment income | | $ | 344,884 | | | $ | 435,840 | | | $ | 485,908 | | | $ | 777,421 | |
| Net realized gain (loss) on investments | | | 1,720,324 | | | | 7,402,750 | | | | 7,309,514 | | | | 11,057,971 | |
| Net change in unrealized appreciation (depreciation) | | | | | | | | | | | | | | | | |
| of investments | | | 118,750 | | | | (992,755 | ) | | | (1,117,074 | ) | | | 171,844 | |
| Net increase (decrease) in net assets | | | | | | | | | | | | | | | | |
| resulting from operations | | | 2,183,958 | | | | 6,845,835 | | | | 6,678,348 | | | | 12,007,236 | |
| | | | | | | | | | | | | | | | | |
| DISTRIBUTIONS TO SHAREHOLDERS | | | | | | | | | | | | | | | | |
| From net investment income | | | (337,373 | ) | | | (496,341 | ) | | | (484,790 | ) | | | (787,660 | ) |
| Tax return of capital to shareholders | | | — | | | | — | | | | — | | | | — | |
| From net realized gain | | | — | | | | — | | | | — | | | | — | |
| Total distributions to shareholders | | | (337,373 | ) | | | (496,341 | ) | | | (484,790 | ) | | | (787,660 | ) |
| | | | | | | | | | | | | | | | | |
| CAPITAL SHARE TRANSACTIONS | | | | | | | | | | | | | | | | |
| Net increase (decrease) in net assets | | | | | | | | | | | | | | | | |
| from capital share transactions | | | 23,145,975 | | | | (29,485,990 | ) | | | (19,951,920 | ) | | | (4,715,635 | ) |
| Total increase (decrease) in net assets | | $ | 24,992,560 | | | $ | (23,136,496 | ) | | $ | (13,758,362 | ) | | $ | 6,503,941 | |
| | | | | | | | | | | | | | | | | |
| NET ASSETS | | | | | | | | | | | | | | | | |
| Beginning of Year | | $ | 50,290,895 | | | $ | 73,427,391 | | | $ | 78,601,177 | | | $ | 72,097,236 | |
| End of Year | | $ | 75,283,455 | | | $ | 50,290,895 | | | $ | 64,842,815 | | | $ | 78,601,177 | |
| Undistributed (accumulated) | | | | | | | | | | | | | | | | |
| net investment income (loss) | | $ | 7,511 | | | $ | — | | | $ | 7,046 | | | $ | 5,928 | |
The accompanying notes are an integral part of these financial statements.
| | Absolute Shares Trust | |
Statements of Changes in Net Assets (continued) | |
| | |
| | | WBI BullBear Yield 1000 ETF | | | WBI BullBear Quality 1000 ETF | |
| | | Year Ended | | | Year Ended | | | Year Ended | | | Year Ended | |
| | | June 30, 2018 | | | June 30, 2017 | | | June 30, 2018 | | | June 30, 2017 | |
| INCREASE (DECREASE) IN NET ASSETS: | | | | | | | | | | | | |
| | | | | | | | | | | | | |
| OPERATIONS | | | | | | | | | | | | |
| Net investment income | | $ | 813,238 | | | $ | 1,240,646 | | | $ | 459,836 | | | $ | 637,428 | |
| Net realized gain (loss) on investments | | | 9,971,337 | | | | 8,464,398 | | | | 2,275,816 | | | | 10,202,631 | |
| Net change in unrealized appreciation (depreciation) | | | | | | | | | | | | | | | | |
| of investments | | | (125,438 | ) | | | 1,183,815 | | | | (1,534,072 | ) | | | (1,044,062 | ) |
| Net increase (decrease) in net assets | | | | | | | | | | | | | | | | |
| resulting from operations | | | 10,659,137 | | | | 10,888,859 | | | | 1,201,580 | | | | 9,795,997 | |
| | | | | | | | | | | | | | | | | |
| DISTRIBUTIONS TO SHAREHOLDERS | | | | | | | | | | | | | | | | |
| From net investment income | | | (826,348 | ) | | | (1,264,487 | ) | | | (464,405 | ) | | | (673,087 | ) |
| Tax return of capital to shareholders | | | — | | | | — | | | | — | | | | — | |
| From net realized gain | | | — | | | | — | | | | — | | | | — | |
| Total distributions to shareholders | | | (826,348 | ) | | | (1,264,487 | ) | | | (464,405 | ) | | | (673,087 | ) |
| | | | | | | | | | | | | | | | | |
| CAPITAL SHARE TRANSACTIONS | | | | | | | | | | | | | | | | |
| Net increase (decrease) in net assets | | | | | | | | | | | | | | | | |
| from capital share transactions | | | (6,036,115 | ) | | | (29,877,810 | ) | | | 11,235,350 | | | | (42,049,190 | ) |
| Total increase (decrease) in net assets | | $ | 3,796,674 | | | $ | (20,253,438 | ) | | $ | 11,972,525 | | | $ | (32,926,280 | ) |
| | | | | | | | | | | | | | | | | |
| NET ASSETS | | | | | | | | | | | | | | | | |
| Beginning of Year | | $ | 78,982,375 | | | $ | 99,235,813 | | | $ | 47,982,617 | | | $ | 80,908,897 | |
| End of Year | | $ | 82,779,049 | | | $ | 78,982,375 | | | $ | 59,955,142 | | | $ | 47,982,617 | |
| Undistributed (accumulated) | | | | | | | | | | | | | | | | |
| net investment income (loss) | | $ | 9,941 | | | $ | 23,051 | | | $ | 8,248 | | | $ | 12,817 | |
The accompanying notes are an integral part of these financial statements.
| | Absolute Shares Trust | |
Statements of Changes in Net Assets (continued) | |
| | |
| | | WBI BullBear Global Income ETF | | | WBI BullBear Global High Income ETF | |
| | | Year Ended | | | Year Ended | | | Year Ended | | | Year Ended | |
| | | June 30, 2018 | | | June 30, 2017 | | | June 30, 2018 | | | June 30, 2017 | |
| INCREASE (DECREASE) IN NET ASSETS: | | | | | | | | | | | | |
| | | | | | | | | | | | | |
| OPERATIONS | | | | | | | | | | | | |
| Net investment income | | $ | 3,944,244 | | | $ | 4,515,811 | | | $ | 8,016,319 | | | $ | 4,545,434 | |
| Net realized gain (loss) on investments | | | (5,651,905 | ) | | | 12,033,708 | | | | (3,492,335 | ) | | | 11,938,723 | |
| Net change in unrealized appreciation (depreciation) | | | | | | | | | | | | | | | | |
| of investments | | | (2,445,214 | ) | | | (10,734,390 | ) | | | (3,338,872 | ) | | | (3,441,929 | ) |
| Net increase (decrease) in net assets | | | | | | | | | | | | | | | | |
| resulting from operations | | | (4,152,875 | ) | | | 5,815,129 | | | | 1,185,112 | | | | 13,042,228 | |
| | | | | | | | | | | | | | | | | |
| DISTRIBUTIONS TO SHAREHOLDERS | | | | | | | | | | | | | | | | |
| From net investment income | | | (3,955,836 | ) | | | (4,509,305 | ) | | | (8,057,793 | ) | | | (4,510,220 | ) |
| Tax return of capital to shareholders | | | �� | | | | — | | | | — | | | | — | |
| From net realized gain | | | — | | | | — | | | | — | | | | — | |
| Total distributions to shareholders | | | (3,955,836 | ) | | | (4,509,305 | ) | | | (8,057,793 | ) | | | (4,510,220 | ) |
| | | | | | | | | | | | | | | | | |
| CAPITAL SHARE TRANSACTIONS | | | | | | | | | | | | | | | | |
| Net increase (decrease) in net assets | | | | | | | | | | | | | | | | |
| from capital share transactions | | | (57,508,535 | ) | | | (235,620,235 | ) | | | 12,231,815 | | | | 32,815,920 | |
| Total increase (decrease) in net assets | | $ | (65,617,246 | ) | | $ | (234,314,411 | ) | | $ | 5,359,134 | | | $ | 41,347,928 | |
| | | | | | | | | | | | | | | | | |
| NET ASSETS | | | | | | | | | | | | | | | | |
| Beginning of Year | | $ | 162,243,125 | | | $ | 396,557,536 | | | $ | 269,449,389 | | | $ | 228,101,461 | |
| End of Year | | $ | 96,625,879 | | | $ | 162,243,125 | | | $ | 274,808,523 | | | $ | 269,449,389 | |
| Undistributed (accumulated) | | | | | | | | | | | | | | | | |
| net investment income (loss) | | $ | — | | | $ | 16,669 | | | $ | — | | | $ | 37,038 | |
The accompanying notes are an integral part of these financial statements.
| | Absolute Shares Trust | |
Statements of Changes in Net Assets (concluded) | |
| | |
| | | WBI BullBear Global Rotation ETF | | | WBI Power Factor™ High Dividend ETF | |
| | | Year Ended | | | Period Ended | | | Year Ended | | | Period Ended | |
| | | June 30, 2018 | | | June 30, 20171 | | | June 30, 2018 | | | June 30, 20172 | |
| INCREASE (DECREASE) IN NET ASSETS: | | | | | | | | | | | | |
| | | | | | | | | | | | | |
| OPERATIONS | | | | | | | | | | | | |
| Net investment income | | $ | 335,872 | | | $ | 159,944 | | | $ | 1,994,258 | | | $ | 450,111 | |
| Net realized gain (loss) on investments | | | 554,562 | | | | (632,496 | ) | | | 1,635,776 | | | | (205,933 | ) |
| Net change in unrealized appreciation (depreciation) | | | | | | | | | | | | | | | | |
| of investments | | | (415,294 | ) | | | 261,748 | | | | 3,565,744 | | | | (493,899 | ) |
| Net increase (decrease) in net assets | | | | | | | | | | | | | | | | |
| resulting from operations | | | 475,140 | | | | (210,804 | ) | | | 7,195,778 | | | | (249,721 | ) |
| | | | | | | | | | | | | | | | | |
| DISTRIBUTIONS TO SHAREHOLDERS | | | | | | | | | | | | | | | | |
| From net investment income | | | (317,818 | ) | | | (152,271 | ) | | | (1,973,737 | ) | | | (435,085 | ) |
| Tax return of capital to shareholders | | | — | | | | — | | | | — | | | | — | |
| From net realized gain | | | — | | | | — | | | | (960,448 | ) | | | — | |
| Total distributions to shareholders | | | (317,818 | ) | | | (152,271 | ) | | | (2,934,185 | ) | | | (435,085 | ) |
| | | | | | | | | | | | | | | | | |
| CAPITAL SHARE TRANSACTIONS | | | | | | | | | | | | | | | | |
| Net increase (decrease) in net assets | | | | | | | | | | | | | | �� | | |
| from capital share transactions | | | 1,275,310 | | | | 18,679,585 | | | | 14,237,490 | | | | 34,588,085 | |
| Total increase (decrease) in net assets | | $ | 1,432,632 | | | $ | 18,316,510 | | | $ | 18,499,083 | | | $ | 33,903,279 | |
| | | | | | | | | | | | | | | | | |
| NET ASSETS | | | | | | | | | | | | | | | | |
| Beginning of Year/Period | | $ | 18,316,510 | | | $ | — | | | $ | 33,903,279 | | | $ | — | |
| End of Year/Period | | $ | 19,749,142 | | | $ | 18,316,510 | | | $ | 52,402,362 | | | $ | 33,903,279 | |
| Undistributed (accumulated) | | | | | | | | | | | | | | | | |
| net investment income (loss) | | $ | 11,666 | | | $ | 7,673 | | | $ | 40,254 | | | $ | 19,733 | |
1 | Fund commenced operations on July 25, 2016. The information presented is for the period from July 25, 2016 to June 30, 2017. |
2 | Fund commenced operations on December 19, 2016. The information presented is for the period from December 19, 2016 to June 30, 2017. |
The accompanying notes are an integral part of these financial statements.
| | Absolute Shares Trust | |
| Financial Highlights | |
| | |
For capital share outstanding throughout each year/period
| | | WBI BullBear Rising Income 2000 ETF | |
| | | Year Ended | | | Year Ended | | | Year Ended | | | Period Ended | |
| | | June 30, 2018 | | | June 30, 2017 | | | June 30, 2016 | | | June 30, 20151 | |
| Net Asset Value, Beginning of Year/Period | | $ | 24.07 | | | $ | 21.69 | | | $ | 25.19 | | | $ | 25.00 | |
| Income (Loss) from Investment Operations: | | | | | | | | | | | | | | | | |
Net investment income (loss)2 | | | 0.14 | | | | 0.12 | | | | 0.06 | | | | 0.04 | |
Net gain (loss) on investments (realized and unrealized)6 | | | 0.24 | | | | 2.41 | | | | (3.49 | ) | | | 0.19 | |
| Total from investment operations | | | 0.38 | | | | 2.53 | | | | (3.43 | ) | | | 0.23 | |
| Less Distributions: | | | | | | | | | | | | | | | | |
| Distributions from net investment income | | | (0.12 | ) | | | (0.13 | ) | | | (0.07 | ) | | | (0.04 | ) |
| Tax return of capital to shareholders | | | — | | | | (0.02 | ) | | | — | | | | (0.00 | )8 |
| Distributions from net realized gain | | | — | | | | — | | | | — | | | | — | |
| Total Distributions | | | (0.12 | ) | | | (0.15 | ) | | | (0.07 | ) | | | (0.04 | ) |
| Net asset value, end of year/period | | $ | 24.33 | | | $ | 24.07 | | | $ | 21.69 | | | $ | 25.19 | |
| Market price, end of year/period | | $ | 24.31 | | | $ | 24.09 | | | $ | 21.57 | | | $ | 25.27 | |
Net Assets Total Return7 | | | 1.62 | % | | | 11.74 | % | | | (13.72 | )% | | | 0.94 | %3 |
| | | | | | | | | | | | | | | | | |
| Supplemental Data: | | | | | | | | | | | | | | | | |
| Net assets, end of year/period (000’s) | | $ | 53,524 | | | $ | 42,122 | | | $ | 75,915 | | | $ | 132,269 | |
| Ratios to Average Net Assets: | | | | | | | | | | | | | | | | |
| Expenses before fees (waived)/recouped | | | 1.08 | % | | | 1.05 | % | | | 0.99 | % | | | 1.03 | %4 |
| Expenses after fees (waived)/recouped | | | 1.08 | % | | | 1.05 | % | | | 0.99 | % | | | 1.03 | %4 |
| Net investment income (loss) to average net assets | | | 0.56 | % | | | 0.53 | % | | | 0.26 | % | | | 0.18 | %4 |
Portfolio turnover rate5 | | | 529 | % | | | 331 | % | | | 531 | % | | | 255 | %3 |
1 | Fund commenced operations on August 25, 2014. The information presented is for the period from August 25, 2014 to June 30, 2015. |
2 | Calculated based on average shares outstanding during the period. |
3 | Not annualized. |
4 | Annualized. |
5 | Excludes securities received or delivered as a result of processing capital share transactions in creation units. |
6 | The amount for a share outstanding throughout the period may not be in accordance with the aggregate net realized and unrealized gain (loss) on investment for the period because of the timing of capital share transactions in relation to fluctuating market values of the Fund’s underlying securities. |
7 | Net asset value total return is calculated assuming an initial investment made at the net asset value at the beginning of the period, reinvestment of all dividends and distributions at net asset value during the period, and the redemption on the last day of the period. Net asset value total return includes adjustments in accordance with accounting principles generally accepted in the United States of America and as such, the net asset value for financial reporting purposes and the returns based upon those net asset values may differ from the net asset value and returns for shareholder transactions. |
8 | Less than $0.01. |
The accompanying notes are an integral part of these financial statements.
| | Absolute Shares Trust | |
Financial Highlights (continued) | |
| | |
For capital share outstanding throughout each year/period
| | | WBI BullBear Value 2000 ETF | |
| | | Year Ended | | | Year Ended | | | Year Ended | | | Period Ended | |
| | | June 30, 2018 | | | June 30, 2017 | | | June 30, 2016 | | | June 30, 20151 | |
| Net Asset Value, Beginning of Year/Period | | $ | 25.15 | | | $ | 21.46 | | | $ | 24.72 | | | $ | 25.00 | |
| Income (Loss) from Investment Operations: | | | | | | | | | | | | | | | | |
Net investment income (loss)2 | | | 0.08 | | | | 0.25 | | | | 0.17 | | | | 0.06 | |
Net gain (loss) on investments (realized and unrealized)6 | | | (0.88 | ) | | | 3.71 | | | | (3.28 | ) | | | (0.27 | ) |
| Total from investment operations | | | (0.80 | ) | | | 3.96 | | | | (3.11 | ) | | | (0.21 | ) |
| Less Distributions: | | | | | | | | | | | | | | | | |
| Distributions from net investment income | | | (0.10 | ) | | | (0.27 | ) | | | (0.15 | ) | | | (0.07 | ) |
| Tax return of capital to shareholders | | | — | | | | — | | | | — | | | | (0.00 | )8 |
| Distributions from net realized gain | | | — | | | | — | | | | — | | | | — | |
| Total Distributions | | | (0.10 | ) | | | (0.27 | ) | | | (0.15 | ) | | | (0.07 | ) |
| Net asset value, end of year/period | | $ | 24.25 | | | $ | 25.15 | | | $ | 21.46 | | | $ | 24.72 | |
| Market price, end of year/period | | $ | 24.26 | | | $ | 25.19 | | | $ | 21.40 | | | $ | 24.77 | |
Net Assets Total Return7 | | | (3.06 | )% | | | 18.55 | % | | | (12.71 | )% | | | (0.84 | )%3 |
| | | | | | | | | | | | | | | | | |
| Supplemental Data: | | | | | | | | | | | | | | | | |
| Net assets, end of year/period (000’s) | | $ | 44,860 | | | $ | 72,932 | | | $ | 72,949 | | | $ | 100,117 | |
| Ratios to Average Net Assets: | | | | | | | | | | | | | | | | |
| Expenses before fees (waived)/recouped | | | 1.06 | % | | | 1.04 | % | | | 0.99 | % | | | 1.07 | %4 |
| Expenses after fees (waived)/recouped | | | 1.06 | % | | | 1.04 | % | | | 0.99 | % | | | 1.07 | %4 |
| Net investment income (loss) to average net assets | | | 0.33 | % | | | 1.07 | % | | | 0.75 | % | | | 0.30 | %4 |
Portfolio turnover rate5 | | | 564 | % | | | 405 | % | | | 565 | % | | | 278 | %3 |
1 | Fund commenced operations on August 25, 2014. The information presented is for the period from August 25, 2014 to June 30, 2015. |
2 | Calculated based on average shares outstanding during the period. |
3 | Not annualized. |
4 | Annualized. |
5 | Excludes securities received or delivered as a result of processing capital share transactions in creation units. |
6 | The amount for a share outstanding throughout the period may not be in accordance with the aggregate net realized and unrealized gain (loss) on investment for the period because of the timing of capital share transactions in relation to fluctuating market values of the Fund’s underlying securities. |
7 | Net asset value total return is calculated assuming an initial investment made at the net asset value at the beginning of the period, reinvestment of all dividends and distributions at net asset value during the period, and the redemption on the last day of the period. Net asset value total return includes adjustments in accordance with accounting principles generally accepted in the United States of America and as such, the net asset value for financial reporting purposes and the returns based upon those net asset values may differ from the net asset value and returns for shareholder transactions. |
8 | Less than $0.01. |
The accompanying notes are an integral part of these financial statements.
| | Absolute Shares Trust | |
Financial Highlights (continued) | |
| | |
For capital share outstanding throughout each year/period
| | | WBI BullBear Yield 2000 ETF | |
| | | Year Ended | | | Year Ended | | | Year Ended | | | Period Ended | |
| | | June 30, 2018 | | | June 30, 2017 | | | June 30, 2016 | | | June 30, 20151 | |
| Net Asset Value, Beginning of Year/Period | | $ | 22.24 | | | $ | 20.20 | | | $ | 24.11 | | | $ | 25.00 | |
| Income (Loss) from Investment Operations: | | | | | | | | | | | | | | | | |
Net investment income (loss)2 | | | 0.16 | | | | 0.35 | | | | 0.24 | | | | 0.26 | |
Net gain (loss) on investments (realized and unrealized)6 | | | 0.58 | | | | 2.09 | | | | (3.92 | ) | | | (0.92 | ) |
| Total from investment operations | | | 0.74 | | | | 2.44 | | | | (3.68 | ) | | | (0.66 | ) |
| Less Distributions: | | | | | | | | | | | | | | | | |
| Distributions from net investment income | | | (0.16 | ) | | | (0.40 | ) | | | (0.23 | ) | | | (0.23 | ) |
| Tax return of capital to shareholders | | | — | | | | — | | | | — | | | | — | |
| Distributions from net realized gain | | | — | | | | — | | | | — | | | | — | |
| Total Distributions | | | (0.16 | ) | | | (0.40 | ) | | | (0.23 | ) | | | (0.23 | ) |
| Net asset value, end of year/period | | $ | 22.82 | | | $ | 22.24 | | | $ | 20.20 | | | $ | 24.11 | |
| Market price, end of year/period | | $ | 22.78 | | | $ | 22.25 | | | $ | 20.12 | | | $ | 24.14 | |
Net Assets Total Return7 | | | 3.34 | % | | | 12.26 | % | | | (15.44 | )% | | | (2.60 | )%3 |
| | | | | | | | | | | | | | | | | |
| Supplemental Data: | | | | | | | | | | | | | | | | |
| Net assets, end of year/period (000’s) | | $ | 53,637 | | | $ | 65,618 | | | $ | 97,979 | | | $ | 141,064 | |
| Ratios to Average Net Assets: | | | | | | | | | | | | | | | | |
| Expenses before fees (waived)/recouped | | | 1.06 | % | | | 1.03 | % | | | 0.98 | % | | | 1.03 | %4 |
| Expenses after fees (waived)/recouped | | | 1.06 | % | | | 1.03 | % | | | 0.98 | % | | | 1.03 | %4 |
| Net investment income (loss) to average net assets | | | 0.72 | % | | | 1.64 | % | | | 1.11 | % | | | 1.29 | %4 |
Portfolio turnover rate5 | | | 528 | % | | | 355 | % | | | 553 | % | | | 264 | %3 |
1 | Fund commenced operations on August 25, 2014. The information presented is for the period from August 25, 2014 to June 30, 2015. |
2 | Calculated based on average shares outstanding during the period. |
3 | Not annualized. |
4 | Annualized. |
5 | Excludes securities received or delivered as a result of processing capital share transactions in creation units. |
6 | The amount for a share outstanding throughout the period may not be in accordance with the aggregate net realized and unrealized gain (loss) on investment for the period because of the timing of capital share transactions in relation to fluctuating market values of the Fund’s underlying securities. |
7 | Net asset value total return is calculated assuming an initial investment made at the net asset value at the beginning of the period, reinvestment of all dividends and distributions at net asset value during the period, and the redemption on the last day of the period. Net asset value total return includes adjustments in accordance with accounting principles generally accepted in the United States of America and as such, the net asset value for financial reporting purposes and the returns based upon those net asset values may differ from the net asset value and returns for shareholder transactions. |
The accompanying notes are an integral part of these financial statements.
| | Absolute Shares Trust | |
Financial Highlights (continued) | |
| | |
For capital share outstanding throughout each year/period
| | | WBI BullBear Quality 2000 ETF | |
| | | Year Ended | | | Year Ended | | | Year Ended | | | Period Ended | |
| | | June 30, 2018 | | | June 30, 2017 | | | June 30, 2016 | | | June 30, 20151 | |
| Net Asset Value, Beginning of Year/Period | | $ | 23.28 | | | $ | 20.71 | | | $ | 23.62 | | | $ | 25.00 | |
| Income (Loss) from Investment Operations: | | | | | | | | | | | | | | | | |
Net investment income (loss)2 | | | 0.12 | | | | 0.18 | | | | 0.12 | | | | (0.01 | ) |
Net gain (loss) on investments (realized and unrealized)6 | | | 0.22 | | | | 2.57 | | | | (2.94 | ) | | | (1.35 | ) |
| Total from investment operations | | | 0.34 | | | | 2.75 | | | | (2.82 | ) | | | (1.36 | ) |
| Less Distributions: | | | | | | | | | | | | | | | | |
| Distributions from net investment income | | | (0.13 | ) | | | (0.18 | ) | | | (0.09 | ) | | | (0.00 | )8 |
| Tax return of capital to shareholders | | | — | | | | — | | | | — | | | | (0.02 | ) |
| Distributions from net realized gain | | | — | | | | — | | | | — | | | | — | |
| Total Distributions | | | (0.13 | ) | | | (0.18 | ) | | | (0.09 | ) | | | (0.02 | ) |
| Net asset value, end of year/period | | $ | 23.49 | | | $ | 23.28 | | | $ | 20.71 | | | $ | 23.62 | |
| Market price, end of year/period | | $ | 23.57 | | | $ | 23.37 | | | $ | 20.60 | | | $ | 23.68 | |
Net Assets Total Return7 | | | 1.43 | % | | | 13.32 | % | | | (12.01 | )% | | | (5.40 | )%3 |
| | | | | | | | | | | | | | | | | |
| Supplemental Data: | | | | | | | | | | | | | | | | |
| Net assets, end of year/period (000’s) | | $ | 45,797 | | | $ | 74,482 | | | $ | 79,726 | | | $ | 99,224 | |
| Ratios to Average Net Assets: | | | | | | | | | | | | | | | | |
| Expenses before fees (waived)/recouped | | | 1.06 | % | | | 1.04 | % | | | 0.99 | % | | | 1.06 | %4 |
| Expenses after fees (waived)/recouped | | | 1.06 | % | | | 1.04 | % | | | 0.99 | % | | | 1.06 | %4 |
| Net investment income (loss) to average net assets | | | 0.51 | % | | | 0.79 | % | | | 0.56 | % | | | (0.04 | )%4 |
Portfolio turnover rate5 | | | 485 | % | | | 383 | % | | | 569 | % | | | 311 | %3 |
1 | Fund commenced operations on August 25, 2014. The information presented is for the period from August 25, 2014 to June 30, 2015. |
2 | Calculated based on average shares outstanding during the period. |
3 | Not annualized. |
4 | Annualized. |
5 | Excludes securities received or delivered as a result of processing capital share transactions in creation units. |
6 | The amount for a share outstanding throughout the period may not be in accordance with the aggregate net realized and unrealized gain (loss) on investment for the period because of the timing of capital share transactions in relation to fluctuating market values of the Fund’s underlying securities. |
7 | Net asset value total return is calculated assuming an initial investment made at the net asset value at the beginning of the period, reinvestment of all dividends and distributions at net asset value during the period, and the redemption on the last day of the period. Net asset value total return includes adjustments in accordance with accounting principles generally accepted in the United States of America and as such, the net asset value for financial reporting purposes and the returns based upon those net asset values may differ from the net asset value and returns for shareholder transactions. |
8 | Less than $0.01. |
The accompanying notes are an integral part of these financial statements.
| | Absolute Shares Trust | |
Financial Highlights (continued) | |
| | |
For capital share outstanding throughout each year/period
| | | WBI BullBear Rising Income 1000 ETF | |
| | | Year Ended | | | Year Ended | | | Year Ended | | | Period Ended | |
| | | June 30, 2018 | | | June 30, 2017 | | | June 30, 2016 | | | June 30, 20151 | |
| Net Asset Value, Beginning of Year/Period | | $ | 24.53 | | | $ | 21.92 | | | $ | 24.45 | | | $ | 25.00 | |
| Income (Loss) from Investment Operations: | | | | | | | | | | | | | | | | |
Net investment income (loss)2 | | | 0.15 | | | | 0.16 | | | | 0.06 | | | | 0.28 | |
Net gain (loss) on investments (realized and unrealized)6 | | | 1.41 | | | | 2.64 | | | | (2.53 | ) | | | (0.59 | ) |
| Total from investment operations | | | 1.56 | | | | 2.80 | | | | (2.47 | ) | | | (0.31 | ) |
| Less Distributions: | | | | | | | | | | | | | | | | |
| Distributions from net investment income | | | (0.13 | ) | | | (0.19 | ) | | | (0.06 | ) | | | (0.24 | ) |
| Tax return of capital to shareholders | | | — | | | | — | | | | — | | | | — | |
| Distributions from net realized gain | | | — | | | | — | | | | — | | | | — | |
| Total Distributions | | | (0.13 | ) | | | (0.19 | ) | | | (0.06 | ) | | | (0.24 | ) |
| Net asset value, end of year/period | | $ | 25.96 | | | $ | 24.53 | | | $ | 21.92 | | | $ | 24.45 | |
| Market price, end of year/period | | $ | 25.93 | | | $ | 24.58 | | | $ | 21.83 | | | $ | 24.51 | |
Net Assets Total Return7 | | | 6.52 | % | | | 12.88 | % | | | (10.14 | )% | | | (1.25 | )%3 |
| | | | | | | | | | | | | | | | | |
| Supplemental Data: | | | | | | | | | | | | | | | | |
| Net assets, end of year/period (000’s) | | $ | 75,283 | | | $ | 50,291 | | | $ | 73,427 | | | $ | 138,152 | |
| Ratios to Average Net Assets: | | | | | | | | | | | | | | | | |
| Expenses before fees (waived)/recouped | | | 1.05 | % | | | 1.05 | % | | | 0.99 | % | | | 1.02 | %4 |
| Expenses after fees (waived)/recouped | | | 1.05 | % | | | 1.05 | % | | | 0.99 | % | | | 1.02 | %4 |
| Net investment income (loss) to average net assets | | | 0.57 | % | | | 0.72 | % | | | 0.25 | % | | | 1.30 | %4 |
Portfolio turnover rate5 | | | 496 | % | | | 279 | % | | | 571 | % | | | 240 | %3 |
1 | Fund commenced operations on August 25, 2014. The information presented is for the period from August 25, 2014 to June 30, 2015. |
2 | Calculated based on average shares outstanding during the period. |
3 | Not annualized. |
4 | Annualized. |
5 | Excludes securities received or delivered as a result of processing capital share transactions in creation units. |
6 | The amount for a share outstanding throughout the period may not be in accordance with the aggregate net realized and unrealized gain (loss) on investment for the period because of the timing of capital share transactions in relation to fluctuating market values of the Fund’s underlying securities. |
7 | Net asset value total return is calculated assuming an initial investment made at the net asset value at the beginning of the period, reinvestment of all dividends and distributions at net asset value during the period, and the redemption on the last day of the period. Net asset value total return includes adjustments in accordance with accounting principles generally accepted in the United States of America and as such, the net asset value for financial reporting purposes and the returns based upon those net asset values may differ from the net asset value and returns for shareholder transactions. |
The accompanying notes are an integral part of these financial statements.
| | Absolute Shares Trust | |
Financial Highlights (continued) | |
| | |
For capital share outstanding throughout each year/period
| | | WBI BullBear Value 1000 ETF | |
| | | Year Ended | | | Year Ended | | | Year Ended | | | Period Ended | |
| | | June 30, 2018 | | | June 30, 2017 | | | June 30, 2016 | | | June 30, 20151 | |
| Net Asset Value, Beginning of Year/Period | | $ | 26.20 | | | $ | 21.85 | | | $ | 23.98 | | | $ | 25.00 | |
| Income (Loss) from Investment Operations: | | | | | | | | | | | | | | | | |
Net investment income (loss)2 | | | 0.18 | | | | 0.29 | | | | 0.04 | | | | 0.24 | |
Net gain (loss) on investments (realized and unrealized)6 | | | 2.00 | | | | 4.35 | | | | (2.12 | ) | | | (1.04 | ) |
| Total from investment operations | | | 2.18 | | | | 4.64 | | | | (2.08 | ) | | | (0.80 | ) |
| Less Distributions: | | | | | | | | | | | | | | | | |
| Distributions from net investment income | | | (0.19 | ) | | | (0.29 | ) | | | (0.05 | ) | | | (0.22 | ) |
| Tax return of capital to shareholders | | | — | | | | — | | | | — | | | | — | |
| Distributions from net realized gain | | | — | | | | — | | | | — | | | | — | |
| Total Distributions | | | (0.19 | ) | | | (0.29 | ) | | | (0.05 | ) | | | (0.22 | ) |
| Net asset value, end of year/period | | $ | 28.19 | | | $ | 26.20 | | | $ | 21.85 | | | $ | 23.98 | |
| Market price, end of year/period | | $ | 28.17 | | | $ | 26.28 | | | $ | 21.77 | | | $ | 23.98 | |
Net Assets Total Return7 | | | 8.40 | % | | | 21.34 | % | | | (8.63 | )% | | | (3.29 | )%3 |
| | | | | | | | | | | | | | | | | |
| Supplemental Data: | | | | | | | | | | | | | | | | |
| Net assets, end of year/period (000’s) | | $ | 64,843 | | | $ | 78,601 | | | $ | 72,097 | | | $ | 112,691 | |
| Ratios to Average Net Assets: | | | | | | | | | | | | | | | | |
| Expenses before fees (waived)/recouped | | | 1.05 | % | | | 1.03 | % | | | 0.99 | % | | | 1.04 | %4 |
| Expenses after fees (waived)/recouped | | | 1.05 | % | | | 1.03 | % | | | 0.99 | % | | | 1.04 | %4 |
| Net investment income (loss) to average net assets | | | 0.64 | % | | | 1.19 | % | | | 0.19 | % | | | 1.17 | %4 |
Portfolio turnover rate5 | | | 527 | % | | | 388 | % | | | 573 | % | | | 294 | %3 |
1 | Fund commenced operations on August 25, 2014. The information presented is for the period from August 25, 2014 to June 30, 2015. |
2 | Calculated based on average shares outstanding during the period. |
3 | Not annualized. |
4 | Annualized. |
5 | Excludes securities received or delivered as a result of processing capital share transactions in creation units. |
6 | The amount for a share outstanding throughout the period may not be in accordance with the aggregate net realized and unrealized gain (loss) on investment for the period because of the timing of capital share transactions in relation to fluctuating market values of the Fund’s underlying securities. |
7 | Net asset value total return is calculated assuming an initial investment made at the net asset value at the beginning of the period, reinvestment of all dividends and distributions at net asset value during the period, and the redemption on the last day of the period. Net asset value total return includes adjustments in accordance with accounting principles generally accepted in the United States of America and as such, the net asset value for financial reporting purposes and the returns based upon those net asset values may differ from the net asset value and returns for shareholder transactions. |
The accompanying notes are an integral part of these financial statements.
| | Absolute Shares Trust | |
Financial Highlights (continued) | |
| | |
For capital share outstanding throughout each year/period
| | | WBI BullBear Yield 1000 ETF | |
| | | Year Ended | | | Year Ended | | | Year Ended | | | Period Ended | |
| | | June 30, 2018 | | | June 30, 2017 | | | June 30, 2016 | | | June 30, 20151 | |
| Net Asset Value, Beginning of Year/Period | | $ | 22.89 | | | $ | 20.25 | | | $ | 23.48 | | | $ | 25.00 | |
| Income (Loss) from Investment Operations: | | | | | | | | | | | | | | | | |
Net investment income (loss)2 | | | 0.25 | | | | 0.31 | | | | 0.08 | | | | 0.35 | |
Net gain (loss) on investments (realized and unrealized)6 | | | 2.98 | | | | 2.66 | | | | (3.22 | ) | | | (1.58 | ) |
| Total from investment operations | | | 3.23 | | | | 2.97 | | | | (3.14 | ) | | | (1.23 | ) |
| Less Distributions: | | | | | | | | | | | | | | | | |
| Distributions from net investment income | | | (0.25 | ) | | | (0.33 | ) | | | (0.09 | ) | | | (0.29 | ) |
| Tax return of capital to shareholders | | | — | | | | — | | | | — | | | | — | |
| Distributions from net realized gain | | | — | | | | — | | | | — | | | | — | |
| Total Distributions | | | (0.25 | ) | | | (0.33 | ) | | | (0.09 | ) | | | (0.29 | ) |
| Net asset value, end of year/period | | $ | 25.87 | | | $ | 22.89 | | | $ | 20.25 | | | $ | 23.48 | |
| Market price, end of year/period | | $ | 25.83 | | | $ | 22.95 | | | $ | 20.19 | | | $ | 23.50 | |
Net Assets Total Return7 | | | 14.14 | % | | | 14.82 | % | | | (13.37 | )% | | | (4.98 | )%3 |
| | | | | | | | | | | | | | | | | |
| Supplemental Data: | | | | | | | | | | | | | | | | |
| Net assets, end of year/period (000’s) | | $ | 82,779 | | | $ | 78,982 | | | $ | 99,236 | | | $ | 140,876 | |
| Ratios to Average Net Assets: | | | | | | | | | | | | | | | | |
| Expenses before fees (waived)/recouped | | | 1.04 | % | | | 1.02 | % | | | 0.98 | % | | | 1.02 | %4 |
| Expenses after fees (waived)/recouped | | | 1.04 | % | | | 1.02 | % | | | 0.98 | % | | | 1.02 | %4 |
| Net investment income (loss) to average net assets | | | 0.99 | % | | | 1.47 | % | | | 0.38 | % | | | 1.67 | %4 |
Portfolio turnover rate5 | | | 491 | % | | | 352 | % | | | 584 | % | | | 277 | %3 |
1 | Fund commenced operations on August 25, 2014. The information presented is for the period from August 25, 2014 to June 30, 2015. |
2 | Calculated based on average shares outstanding during the period. |
3 | Not annualized. |
4 | Annualized. |
5 | Excludes securities received or delivered as a result of processing capital share transactions in creation units. |
6 | The amount for a share outstanding throughout the period may not be in accordance with the aggregate net realized and unrealized gain (loss) on investment for the period because of the timing of capital share transactions in relation to fluctuating market values of the Fund’s underlying securities. |
7 | Net asset value total return is calculated assuming an initial investment made at the net asset value at the beginning of the period, reinvestment of all dividends and distributions at net asset value during the period, and the redemption on the last day of the period. Net asset value total return includes adjustments in accordance with accounting principles generally accepted in the United States of America and as such, the net asset value for financial reporting purposes and the returns based upon those net asset values may differ from the net asset value and returns for shareholder transactions. |
The accompanying notes are an integral part of these financial statements.
| | Absolute Shares Trust | |
Financial Highlights (continued) | |
| | |
For capital share outstanding throughout each year/period
| | | WBI BullBear Quality 1000 ETF | |
| | | Year Ended | | | Year Ended | | | Year Ended | | | Period Ended | |
| | | June 30, 2018 | | | June 30, 2017 | | | June 30, 2016 | | | June 30, 20151 | |
| Net Asset Value, Beginning of Year/Period | | $ | 25.25 | | | $ | 21.87 | | | $ | 23.85 | | | $ | 25.00 | |
| Income (Loss) from Investment Operations: | | | | | | | | | | | | | | | | |
Net investment income (loss)2 | | | 0.23 | | | | 0.22 | | | | 0.04 | | | | 0.06 | |
Net gain (loss) on investments (realized and unrealized)6 | | | 0.81 | | | | 3.42 | | | | (2.00 | ) | | | (1.16 | ) |
| Total from investment operations | | | 1.04 | | | | 3.64 | | | | (1.96 | ) | | | (1.10 | ) |
| Less Distributions: | | | | | | | | | | | | | | | | |
| Distributions from net investment income | | | (0.22 | ) | | | (0.26 | ) | | | (0.02 | ) | | | (0.04 | ) |
| Tax return of capital to shareholders | | | — | | | | — | | | | — | | | | (0.01 | ) |
| Distributions from net realized gain | | | — | | | | — | | | | — | | | | — | |
| Total Distributions | | | (0.22 | ) | | | (0.26 | ) | | | (0.02 | ) | | | (0.05 | ) |
| Net asset value, end of year/period | | $ | 26.07 | | | $ | 25.25 | | | $ | 21.87 | | | $ | 23.85 | |
| Market price, end of year/period | | $ | 26.10 | | | $ | 25.32 | | | $ | 21.79 | | | $ | 23.88 | |
Net Assets Total Return7 | | | 4.11 | % | | | 16.80 | % | | | (8.22 | )% | | | (4.41 | )%3 |
| | | | | | | | | | | | | | | | | |
| Supplemental Data: | | | | | | | | | | | | | | | | |
| Net assets, end of year/period (000’s) | | $ | 59,955 | | | $ | 47,983 | | | $ | 80,909 | | | $ | 121,629 | |
| Ratios to Average Net Assets: | | | | | | | | | | | | | | | | |
| Expenses before fees (waived)/recouped | | | 1.07 | % | | | 1.04 | % | | | 0.98 | % | | | 1.02 | %4 |
| Expenses after fees (waived)/recouped | | | 1.07 | % | | | 1.04 | % | | | 0.98 | % | | | 1.02 | %4 |
| Net investment income (loss) to average net assets | | | 0.86 | % | | | 0.94 | % | | | 0.17 | % | | | 0.27 | %4 |
Portfolio turnover rate5 | | | 553 | % | | | 320 | % | | | 493 | % | | | 296 | %3 |
1 | Fund commenced operations on August 25, 2014. The information presented is for the period from August 25, 2014 to June 30, 2015. |
2 | Calculated based on average shares outstanding during the period. |
3 | Not annualized. |
4 | Annualized. |
5 | Excludes securities received or delivered as a result of processing capital share transactions in creation units. |
6 | The amount for a share outstanding throughout the period may not be in accordance with the aggregate net realized and unrealized gain (loss) on investment for the period because of the timing of capital share transactions in relation to fluctuating market values of the Fund’s underlying securities. |
7 | Net asset value total return is calculated assuming an initial investment made at the net asset value at the beginning of the period, reinvestment of all dividends and distributions at net asset value during the period, and the redemption on the last day of the period. Net asset value total return includes adjustments in accordance with accounting principles generally accepted in the United States of America and as such, the net asset value for financial reporting purposes and the returns based upon those net asset values may differ from the net asset value and returns for shareholder transactions. |
The accompanying notes are an integral part of these financial statements.
| | Absolute Shares Trust | |
Financial Highlights (continued) | |
| | |
For capital share outstanding throughout each year/period
| | | WBI BullBear Global Income ETF | |
| | | Year Ended | | | Year Ended | | | Year Ended | | | Period Ended | |
| | | June 30, 2018 | | | June 30, 2017 | | | June 30, 2016 | | | June 30, 20151 | |
| Net Asset Value, Beginning of Year/Period | | $ | 25.35 | | | $ | 25.18 | | | $ | 25.46 | | | $ | 25.00 | |
| Income (Loss) from Investment Operations: | | | | | | | | | | | | | | | | |
Net investment income (loss)2 | | | 0.68 | | | | 0.38 | | | | 0.34 | | | | 0.23 | |
Net gain (loss) on investments (realized and unrealized)6 | | | (1.47 | ) | | | 0.20 | | | | (0.23 | ) | | | 0.46 | |
| Total from investment operations | | | (0.79 | ) | | | 0.58 | | | | 0.11 | | | | 0.69 | |
| Less Distributions: | | | | | | | | | | | | | | | | |
| Distributions from net investment income | | | (0.70 | ) | | | (0.41 | ) | | | (0.33 | ) | | | (0.23 | ) |
| Tax return of capital to shareholders | | | — | | | | — | | | | — | | | | — | |
| Distributions from net realized gain | | | — | | | | — | | | | (0.06 | ) | | | — | |
| Total Distributions | | | (0.70 | ) | | | (0.41 | ) | | | (0.39 | ) | | | (0.23 | ) |
| Net asset value, end of year/period | | $ | 23.86 | | | $ | 25.35 | | | $ | 25.18 | | | $ | 25.46 | |
| Market price, end of year/period | | $ | 23.83 | | | $ | 25.38 | | | $ | 25.16 | | | $ | 25.48 | |
Net Assets Total Return7 | | | (3.20 | )% | | | 2.36 | % | | | 0.45 | % | | | 2.77 | %3 |
| | | | | | | | | | | | | | | | | |
| Supplemental Data: | | | | | | | | | | | | | | | | |
| Net assets, end of year/period (000’s) | | $ | 96,626 | | | $ | 162,243 | | | $ | 396,558 | | | $ | 308,062 | |
| Ratios to Average Net Assets: | | | | | | | | | | | | | | | | |
| Expenses before fees (waived)/recouped | | | 1.02 | % | | | 1.00 | % | | | 0.95 | % | | | 0.99 | %4 |
| Expenses after fees (waived)/recouped | | | 1.02 | % | | | 1.00 | % | | | 0.95 | % | | | 0.99 | %4 |
| Net investment income (loss) to average net assets | | | 2.71 | % | | | 1.53 | % | | | 1.35 | % | | | 1.08 | %4 |
Portfolio turnover rate5 | | | 551 | % | | | 479 | % | | | 364 | % | | | 308 | %3 |
1 | Fund commenced operations on August 25, 2014. The information presented is for the period from August 25, 2014 to June 30, 2015. |
2 | Calculated based on average shares outstanding during the period. |
3 | Not annualized. |
4 | Annualized. |
5 | Excludes securities received or delivered as a result of processing capital share transactions in creation units. |
6 | The amount for a share outstanding throughout the period may not be in accordance with the aggregate net realized and unrealized gain (loss) on investment for the period because of the timing of capital share transactions in relation to fluctuating market values of the Fund’s underlying securities. |
7 | Net asset value total return is calculated assuming an initial investment made at the net asset value at the beginning of the period, reinvestment of all dividends and distributions at net asset value during the period, and the redemption on the last day of the period. Net asset value total return includes adjustments in accordance with accounting principles generally accepted in the United States of America and as such, the net asset value for financial reporting purposes and the returns based upon those net asset values may differ from the net asset value and returns for shareholder transactions. |
The accompanying notes are an integral part of these financial statements.
| | Absolute Shares Trust | |
Financial Highlights (continued) | |
| | |
For capital share outstanding throughout each year/period
| | | WBI BullBear Global High Income ETF | |
| | | Year Ended | | | Year Ended | | | Year Ended | | | Period Ended | |
| | | June 30, 2018 | | | June 30, 2017 | | | June 30, 2016 | | | June 30, 20151 | |
| Net Asset Value, Beginning of Year/Period | | $ | 24.50 | | | $ | 23.40 | | | $ | 24.50 | | | $ | 25.00 | |
| Income (Loss) from Investment Operations: | | | | | | | | | | | | | | | | |
Net investment income (loss)2 | | | 0.72 | | | | 0.53 | | | | 0.39 | | | | 0.36 | |
Net gain (loss) on investments (realized and unrealized)6 | | | (0.60 | ) | | | 1.09 | | | | (1.11 | ) | | | (0.51 | ) |
| Total from investment operations | | | 0.12 | | | | 1.62 | | | | (0.72 | ) | | | (0.15 | ) |
| Less Distributions: | | | | | | | | | | | | | | | | |
| Distributions from net investment income | | | (0.72 | ) | | | (0.52 | ) | | | (0.38 | ) | | | (0.35 | ) |
| Tax return of capital to shareholders | | | — | | | | — | | | | — | | | | (0.00 | )8 |
| Distributions from net realized gain | | | — | | | | — | | | | — | | | | — | |
| Total Distributions | | | (0.72 | ) | | | (0.52 | ) | | | (0.38 | ) | | | (0.35 | ) |
| Net asset value, end of year/period | | $ | 23.90 | | | $ | 24.50 | | | $ | 23.40 | | | $ | 24.50 | |
| Market price, end of year/period | | $ | 23.92 | | | $ | 24.55 | | | $ | 23.34 | | | $ | 24.56 | |
Net Assets Total Return7 | | | 0.47 | % | | | 7.04 | % | | | (2.97 | )% | | | (0.65 | )%3 |
| | | | | | | | | | | | | | | | | |
| Supplemental Data: | | | | | | | | | | | | | | | | |
| Net assets, end of year/period (000’s) | | $ | 274,809 | | | $ | 269,449 | | | $ | 228,101 | | | $ | 216,781 | |
| Ratios to Average Net Assets: | | | | | | | | | | | | | | | | |
| Expenses before fees (waived)/recouped | | | 1.00 | % | | | 1.00 | % | | | 0.95 | % | | | 0.98 | %4 |
| Expenses after fees (waived)/recouped | | | 1.00 | % | | | 1.00 | % | | | 0.95 | % | | | 0.98 | %4 |
| Net investment income (loss) to average net assets | | | 2.93 | % | | | 2.22 | % | | | 1.64 | % | | | 1.72 | %4 |
Portfolio turnover rate5 | | | 557 | % | | | 396 | % | | | 328 | % | | | 293 | %3 |
1 | Fund commenced operations on August 25, 2014. The information presented is for the period from August 25, 2014 to June 30, 2015. |
2 | Calculated based on average shares outstanding during the period. |
3 | Not annualized. |
4 | Annualized. |
5 | Excludes securities received or delivered as a result of processing capital share transactions in creation units. |
6 | The amount for a share outstanding throughout the period may not be in accordance with the aggregate net realized and unrealized gain (loss) on investment for the period because of the timing of capital share transactions in relation to fluctuating market values of the Fund’s underlying securities. |
7 | Net asset value total return is calculated assuming an initial investment made at the net asset value at the beginning of the period, reinvestment of all dividends and distributions at net asset value during the period, and the redemption on the last day of the period. Net asset value total return includes adjustments in accordance with accounting principles generally accepted in the United States of America and as such, the net asset value for financial reporting purposes and the returns based upon those net asset values may differ from the net asset value and returns for shareholder transactions. |
8 | Less than $0.01. |
The accompanying notes are an integral part of these financial statements.
| | Absolute Shares Trust | |
Financial Highlights (concluded) | |
| | |
For capital share outstanding throughout each year/period
| | | WBI BullBear Global Rotation ETF | | | WBI Power Factor™ High Dividend ETF | |
| | | Year Ended | | | Period Ended | | | Year Ended | | | Period Ended | |
| | | June 30, 2018 | | | June 30, 20171 | | | June 30, 2018 | | | June 30, 20172 | |
| Net Asset Value, Beginning of Year/Period | | $ | 24.42 | | | $ | 25.00 | | | $ | 24.22 | | | $ | 25.00 | |
| Income (Loss) from Investment Operations: | | | | | | | | | | | | | | | | |
Net investment income (loss)3 | | | 0.42 | | | | 0.25 | | | | 1.21 | | | | 0.53 | |
Net gain (loss) on investments (realized and unrealized)7 | | | 0.25 | | | | (0.62 | ) | | | 3.19 | | | | (0.94 | ) |
| Total from investment operations | | | 0.67 | | | | (0.37 | ) | | | 4.40 | | | | (0.41 | ) |
| Less Distributions: | | | | | | | | | | | | | | | | |
| Distributions from net investment income | | | (0.40 | ) | | | (0.21 | ) | | | (1.15 | ) | | | (0.37 | ) |
| Tax return of capital to shareholders | | | — | | | | — | | | | — | | | | — | |
| Distributions from net realized gain | | | — | | | | — | | | | (0.60 | ) | | | — | |
| Total Distributions | | | (0.40 | ) | | | (0.21 | ) | | | (1.75 | ) | | | (0.37 | ) |
| Net asset value, end of year/period | | $ | 24.69 | | | $ | 24.42 | | | $ | 26.87 | | | $ | 24.22 | |
| Market price, end of year/period | | $ | 24.70 | | | $ | 24.47 | | | $ | 26.87 | | | $ | 24.34 | |
Net Assets Total Return8 | | | 2.69 | % | | | (1.44 | )%4 | | | 18.51 | % | | | (1.64 | )%4 |
| | | | | | | | | | | | | | | | | |
| Supplemental Data: | | | | | | | | | | | | | | | | |
| Net assets, end of year/period (000’s) | | $ | 19,749 | | | $ | 18,317 | | | $ | 52,402 | | | $ | 33,903 | |
| Ratios to Average Net Assets: | | | | | | | | | | | | | | | | |
| Expenses before fees (waived)/recouped | | | 1.19 | % | | | 1.92 | %5 | | | 0.85 | % | | | 1.37 | %5 |
| Expenses after fees (waived)/recouped | | | 1.25 | % | | | 1.25 | %5 | | | 0.70 | % | | | 0.70 | %5 |
| Net investment income (loss) to average net assets | | | 1.65 | % | | | 1.08 | %5 | | | 4.73 | % | | | 3.81 | %5 |
Portfolio turnover rate6 | | | 700 | % | | | 683 | %4 | | | 171 | % | | | 78 | %4 |
1 | Fund commenced operations on July 25, 2016. The information presented is for the period from July 25, 2016 to June 30, 2017. |
2 | Fund commenced operations on December 19, 2016. The information presented is for the period from December 19, 2016 to June 30, 2017. |
3 | Calculated based on average shares outstanding during the period. |
4 | Not annualized. |
5 | Annualized. |
6 | Excludes securities received or delivered as a result of processing capital share transactions in creation units. |
7 | The amount for a share outstanding throughout the period may not be in accordance with the aggregate net realized and unrealized gain (loss) on investment for the period because of the timing of capital share transactions in relation to fluctuating market values of the Fund’s underlying securities. |
8 | Net asset value total return is calculated assuming an initial investment made at the net asset value at the beginning of the period, reinvestment of all dividends and distributions at net asset value during the period, and the redemption on the last day of the period. Net asset value total return includes adjustments in accordance with accounting principles generally accepted in the United States of America and as such, the net asset value for financial reporting purposes and the returns based upon those net asset values may differ from the net asset value and returns for shareholder transactions. |
The accompanying notes are an integral part of these financial statements.
| | Absolute Shares Trust | |
| Notes to Financial Statements | |
| June 30, 2018 | |
NOTE 1 — ORGANIZATION
Absolute Shares Trust (the “Trust”) was organized as a Delaware statutory trust on November 7, 2013 and is authorized to have multiple segregated series or portfolios. The Trust is an open-end management investment company registered under the Investment Company Act of 1940 (the “1940 Act”). The Trust currently consists of the following twelve separate investment portfolios (each, a “Fund” or, individually and, together, the “Funds”):
WBI BullBear Rising Income 2000 ETF
WBI BullBear Value 2000 ETF
WBI BullBear Yield 2000 ETF
WBI BullBear Quality 2000 ETF
WBI BullBear Rising Income 1000 ETF
WBI BullBear Value 1000 ETF
WBI BullBear Yield 1000 ETF
WBI BullBear Quality 1000 ETF
WBI BullBear Global Income ETF
WBI BullBear Global High Income ETF
WBI BullBear Global Rotation ETF
WBI Power Factor™ High Dividend ETF
Each Fund is classified as a diversified portfolio except WBI BullBear Global Rotation ETF, which is non-diversified.
The Funds’ investment advisor, Millington Securities, Inc. (“Advisor” or “Affiliated Broker Dealer”), has selected its affiliate, WBI Investments, Inc. (“Sub-Advisor”), to act as Sub-Advisor. Both the Advisor and Sub-Advisor are registered as investment advisors with the Securities and Exchange Commission (“SEC”). The Advisor is also registered as a broker-dealer with the SEC and is a member of the Financial Industry Regulatory Authority. The Board of Trustees (the “Board” and each member a “Trustee”) supervises the conduct of the Funds.
NOTE 2 — SIGNIFICANT ACCOUNTING POLICIES
The following is a summary of significant accounting policies consistently followed by the Funds. The financial statements are prepared in accordance with accounting principles generally accepted in the United States of America (“U.S. GAAP”) and are stated in U.S. dollars. The Funds are investment companies and accordingly follow the investment company accounting and reporting guidance for the Financial Accounting Standards Board (“FASB”) Accounting Standards Codification Topic 946 Financial Services – Investment Companies.
The preparation of the financial statements in accordance with U.S. GAAP requires management to make estimates and assumptions that affect the reported amount of assets, liabilities and the disclosure of contingent assets and liabilities at June 30, 2018. Actual results could differ from these estimates.
A. Valuation. All equity securities, including domestic common stocks, preferred stocks, exchange traded funds and exchange traded notes, that are traded on a national securities exchange, except those listed on the Nasdaq Global Market, Nasdaq Select Market and Nasdaq Capital Market (collectively “Nasdaq”) are valued at the last reported sale price on the exchange on which the security is principally traded. Securities traded on Nasdaq are valued at the Nasdaq Official Closing Price (“NOCP”). If, on a particular day, an exchange-traded or Nasdaq security does not trade, then the mean between the most recent quoted bid and asked prices is used. All equity securities that are not traded on a listed exchange are valued at the last sale price in the over-the-counter market. If a non-exchange traded security does not trade on a particular day, then the mean between the last quoted closing bid and asked price is used.
Debt securities are valued in accordance with prices supplied by an approved pricing service. Pricing services may use various valuation methodologies such as the mean between the bid and asked prices, matrix pricing and other analytical pricing models as well as market transactions and dealer quotations.
Exchange traded options are valued at the composite mean price, which calculates the mean of the highest bid price and lowest ask price across the exchanges where the option is principally traded. On the last trading day prior to expiration, expiring options will be priced at intrinsic value. The Trust’s valuation committee may also use other valuation methods in certain instances.
Investments in mutual funds, including money market funds, are valued at their net asset value (“NAV”) per share.
Shares in privately offered liquidity funds are valued at their NAV per share.
Short-term securities that have maturities of less than 60 days at the time of purchase are valued at amortized cost, which, when combined with accrued interest, approximates fair value.
Securities for which quotations are not readily available are valued by the Trust’s valuation committee based on the valuation procedures adopted by the Board (the “Valuation Procedures”) and information it receives from the Sub-Advisor and U.S. Bancorp Fund Services, LLC (“USBFS”). When a security is “fair valued”, consideration is given to the facts and circumstances relevant to the particular situation, including a review of various factors set forth in the Valuation Procedures. The use of fair value pricing by the Funds may cause the NAV of their shares to differ significantly from the NAV that would be calculated without regard to such considerations.
| | Absolute Shares Trust | |
Notes to Financial Statements (continued) | |
| June 30, 2018 | |
As described above, the Funds utilize various methods to measure the fair value of their investments on a recurring basis. U.S. GAAP establishes a hierarchy that prioritizes inputs to valuations methods. The three levels of inputs are:
Level 1 — Unadjusted quoted prices in active markets for identical assets or liabilities that the Funds have the ability to access.
Level 2 — Observable inputs other than quoted prices included in Level 1 that are observable for the asset or liability, either directly or indirectly. These inputs may include quoted prices for the identical instrument on an inactive market, prices for similar instruments, interest rates, prepayment speeds, credit risk, yield curves, default rates and similar data.
Level 3 — Unobservable inputs for the asset or liability, to the extent relevant observable inputs are not available; including the Funds’ Valuation Committee’s assumptions used in determining the fair value of investments. The availability of observable inputs can vary from security to security and is affected by a wide variety of factors, including, for example, the type of security, whether the security is new and not yet established in the marketplace, the liquidity of markets, and other characteristics particular to the security. To the extent that valuation is based on models or inputs that are less observable or unobservable in the market, the determination of fair value requires more judgment. Accordingly, the degree of judgment exercised in determining fair value is greatest for instruments categorized in Level 3.
The inputs used to measure fair value may fall into different levels of the fair value hierarchy. In such cases, for disclosure purposes, the level in the fair value hierarchy within which the fair value measurement falls in its entirety, is determined based on the lowest level input that is significant to the fair value measurement in its entirety.
The following is a summary of the inputs used to value the Funds’ investments as of June 30, 2018:
| WBI BullBear Rising Income 2000 ETF | | | | | | | | | | | | |
| Assets^ | | Level 1 | | | Level 2 | | | Level 3 | | | Total | |
| Common Stocks | | $ | 44,939,972 | | | $ | — | | | $ | — | | | $ | 44,939,972 | |
| Short-Term Investments | | | — | | | | 694,304 | | | | — | | | | 694,304 | |
| Investments Purchased With Proceeds From Securities Lending | | | — | | | | 2,666,112 | | | | — | | | | 2,666,112 | |
| Total Investments in Securities, at value | | $ | 44,939,972 | | | $ | 3,360,416 | | | $ | — | | | $ | 48,300,388 | |
| | | | | | | | | | | | | | | | | |
| WBI BullBear Value 2000 ETF | | | | | | | | | | | | | | | | |
| Assets^ | | Level 1 | | | Level 2 | | | Level 3 | | | Total | |
| Common Stocks | | $ | 43,271,756 | | | $ | — | | | $ | — | | | $ | 43,271,756 | |
| Short-Term Investments | | | — | | | | 706,160 | | | | — | | | | 706,160 | |
| Investments Purchased With Proceeds From Securities Lending | | | — | | | | 421,150 | | | | — | | | | 421,150 | |
| Total Investments in Securities, at value | | $ | 43,271,756 | | | $ | 1,127,310 | | | $ | — | | | $ | 44,399,066 | |
| | | | | | | | | | | | | | | | | |
| WBI BullBear Yield 2000 ETF | | | | | | | | | | | | | | | | |
| Assets^ | | Level 1 | | | Level 2 | | | Level 3 | | | Total | |
| Common Stocks | | $ | 44,051,672 | | | $ | — | | | $ | — | | | $ | 44,051,672 | |
| Short-Term Investments | | | — | | | | 1,012,384 | | | | — | | | | 1,012,384 | |
| Investments Purchased With Proceeds From Securities Lending | | | — | | | | 6,337,683 | | | | — | | | | 6,337,683 | |
| Total Investments in Securities, at value | | $ | 44,051,672 | | | $ | 7,350,067 | | | $ | — | | | $ | 51,401,739 | |
| | | | | | | | | | | | | | | | | |
| WBI BullBear Quality 2000 ETF | | | | | | | | | | | | | | | | |
| Assets^ | | Level 1 | | | Level 2 | | | Level 3 | | | Total | |
| Common Stocks | | $ | 36,155,006 | | | $ | — | | | $ | — | | | $ | 36,155,006 | |
| Short-Term Investments | | | — | | | | 3,039,337 | | | | — | | | | 3,039,337 | |
| Investments Purchased With Proceeds From Securities Lending | | | — | | | | 1,603,941 | | | | — | | | | 1,603,941 | |
| Total Investments in Securities, at value | | $ | 36,155,006 | | | $ | 4,643,278 | | | $ | — | | | $ | 40,798,284 | |
| | | | | | | | | | | | | | | | | |
| WBI BullBear Rising Income 1000 ETF | | | | | | | | | | | | | | | | |
| Assets^ | | Level 1 | | | Level 2 | | | Level 3 | | | Total | |
| Common Stocks | | $ | 72,370,463 | | | $ | — | | | $ | — | | | $ | 72,370,463 | |
| Short-Term Investments | | | — | | | | 429,270 | | | | — | | | | 429,270 | |
| Investments Purchased With Proceeds From Securities Lending | | | — | | | | 12,310,651 | | | | — | | | | 12,310,651 | |
| Total Investments in Securities, at value | | $ | 72,370,463 | | | $ | 12,739,921 | | | $ | — | | | $ | 85,110,384 | |
| | Absolute Shares Trust | |
Notes to Financial Statements (continued) | |
| June 30, 2018 | |
| WBI BullBear Value 1000 ETF | | | | | | | | | | | | |
| Assets^ | | Level 1 | | | Level 2 | | | Level 3 | | | Total | |
| Common Stocks | | $ | 58,366,599 | | | $ | — | | | $ | — | | | $ | 58,366,599 | |
| Short-Term Investments | | | — | | | | 371,373 | | | | — | | | | 371,373 | |
| Investments Purchased With Proceeds From Securities Lending | | | — | | | | 8,174,206 | | | | — | | | | 8,174,206 | |
| Total Investments in Securities, at value | | $ | 58,366,599 | | | $ | 8,545,579 | | | $ | — | | | $ | 66,912,178 | |
| | | | | | | | | | | | | | | | | |
| WBI BullBear Yield 1000 ETF | | | | | | | | | | | | | | | | |
| Assets^ | | Level 1 | | | Level 2 | | | Level 3 | | | Total | |
| Common Stocks | | $ | 80,495,745 | | | $ | — | | | $ | — | | | $ | 80,495,745 | |
| Short-Term Investments | | | — | | | | 3,850,918 | | | | — | | | | 3,850,918 | |
| Investments Purchased With Proceeds From Securities Lending | | | — | | | | 20,124,796 | | | | — | | | | 20,124,796 | |
| Total Investments in Securities, at value | | $ | 80,495,745 | | | $ | 23,975,714 | | | $ | — | | | $ | 104,471,459 | |
| | | | | | | | | | | | | | | | | |
| WBI BullBear Quality 1000 ETF | | | | | | | | | | | | | | | | |
| Assets^ | | Level 1 | | | Level 2 | | | Level 3 | | | Total | |
| Common Stocks | | $ | 57,074,099 | | | $ | — | | | $ | — | | | $ | 57,074,099 | |
| Short-Term Investments | | | — | | | | 345,379 | | | | — | | | | 345,379 | |
| Investments Purchased With Proceeds From Securities Lending | | | — | | | | 5,375,591 | | | | — | | | | 5,375,591 | |
| Total Investments in Securities, at value | | $ | 57,074,099 | | | $ | 5,720,970 | | | $ | — | | | $ | 62,795,069 | |
| | | | | | | | | | | | | | | | | |
| WBI BullBear Global Income ETF | | | | | | | | | | | | | | | | |
| Assets^ | | Level 1 | | | Level 2 | | | Level 3 | | | Total | |
| Exchange Traded Funds | | $ | 96,077,780 | | | $ | — | | | $ | — | | | $ | 96,077,780 | |
| Short-Term Investments | | | — | | | | 610,217 | | | | — | | | | 610,217 | |
| Investments Purchased With Proceeds From Securities Lending | | | — | | | | 31,332,013 | | | | — | | | | 31,332,013 | |
| Total Investments in Securities, at value | | $ | 96,077,780 | | | $ | 31,942,230 | | | $ | — | | | $ | 128,020,010 | |
| | | | | | | | | | | | | | | | | |
| WBI BullBear Global High Income ETF | | | | | | | | | | | | | | | | |
| Assets^ | | Level 1 | | | Level 2 | | | Level 3 | | | Total | |
| Common Stocks | | $ | 134,976,046 | | | $ | — | | | $ | — | | | $ | 134,976,046 | |
| Exchange Traded Funds | | | 136,454,317 | | | | — | | | | — | | | | 136,454,317 | |
| Short-Term Investments | | | — | | | | 3,183,408 | | | | — | | | | 3,183,408 | |
| Investments Purchased With Proceeds From Securities Lending | | | — | | | | 86,105,083 | | | | — | | | | 86,105,083 | |
| Total Investments in Securities, at value | | $ | 271,430,363 | | | $ | 89,288,491 | | | $ | — | | | $ | 360,718,854 | |
| | | | | | | | | | | | | | | | | |
| WBI BullBear Global Rotation ETF | | | | | | | | | | | | | | | | |
| Assets^ | | Level 1 | | | Level 2 | | | Level 3 | | | Total | |
| Exchange Traded Funds | | $ | 15,814,329 | | | $ | — | | | $ | — | | | $ | 15,814,329 | |
| Short-Term Investments | | | — | | | | 3,941,504 | | | | — | | | | 3,941,504 | |
| Investments Purchased With Proceeds From Securities Lending | | | — | | | | 3,408,924 | | | | — | | | | 3,408,924 | |
| Total Investments in Securities, at value | | $ | 15,814,329 | | | $ | 7,350,428 | | | $ | — | | | $ | 23,164,757 | |
| | | | | | | | | | | | | | | | | |
| WBI Power Factor™ High Dividend ETF | | | | | | | | | | | | | | | | |
| Assets^ | | Level 1 | | | Level 2 | | | Level 3 | | | Total | |
| Common Stocks | | $ | 52,107,263 | | | $ | — | | | $ | — | | | $ | 52,107,263 | |
| Short-Term Investments | | | — | | | | 230,697 | | | | — | | | | 230,697 | |
| Investments Purchased With Proceeds From Securities Lending | | | — | | | | 8,340,373 | | | | — | | | | 8,340,373 | |
| Total Investments in Securities, at value | | $ | 52,107,263 | | | $ | 8,571,070 | | | $ | — | | | $ | 60,678,333 | |
^ See Schedules of Investments for breakout of investments by industry group classification.
Transfers between levels are recognized at the end of the reporting period. During the period ended June 30, 2018, the Funds recognized no transfers to or from Levels 1, 2 or 3.
B. Certain Risks. Some risks apply to all Funds, while others are specific to the investment strategy of certain Funds. Each Fund may be subject to other risks in addition to these identified risks. This section discusses certain common principal risks encountered by the Funds. The shares of the Funds are referred to herein as “Fund Shares” or “Shares”.
| | Absolute Shares Trust | |
Notes to Financial Statements (continued) | |
| June 30, 2018 | |
Counterparty Risk — Many of the protections afforded to participants on some organized exchanges, such as the performance guarantee of an exchange clearing house, are not available in connection with the over-the-counter (“OTC”) derivatives transactions. In those instances, another ETF holding such derivatives in which the Funds invest will be subject to the risk that its direct counterparty will not perform its obligations under the transactions and that such ETF will sustain losses.
Debt Securities Risk — The market value of debt securities held by the Funds typically changes as interest rates change, as demand for the instruments changes, and as actual or perceived creditworthiness of an issuer changes. During periods of rising interest rates, the market value of the debt securities held by the Funds will generally decline. Credit risk is the risk that an issuer will not make timely payments of principal and interest. There is also the risk that an issuer may “call,” or repay, its high-yielding bonds before their maturity dates. Debt securities subject to prepayment can offer less potential for gains during a declining interest rate environment and similar or greater potential for loss in a rising interest rate environment. Limited trading opportunities for certain debt securities may make it more difficult to sell or buy a security at a favorable price or time. Because interest rates in the United States are at historical lows, the Funds may have an increased risk associated with debt securities and rising interest rates. Also, the risk of rising interest rates may result in less liquidity in debt markets overall, making it more difficult for a Fund to sell the instruments at or near the market value used to compute the Fund’s NAV.
Equity Options Risk — Options on securities may be subject to greater fluctuations in value than an investment in the underlying securities. Purchasing and writing put and call options are highly specialized activities and entail greater than ordinary investment risks, including limiting potential gains, increased sensitivity to changes in interest rates or to sudden fluctuations in market prices than conventional securities, and transaction costs.
ETF and Other Investment Companies Risk — When a Fund invests in another ETF or other investment company (e.g., mutual fund, closed-end fund, business development company), it will bear additional expenses based on its pro rata share of such investment company’s operating expenses, including the potential duplication of management fees. The risk of owning an ETF or other investment company generally reflects the risks of owning the underlying securities and other assets held by the ETF or other investment company. A Fund also will incur brokerage costs when it purchases ETFs and other exchange-listed investment companies. Additionally, a Fund will be indirectly exposed to the risks of the portfolio assets held by an ETF or other investment company, including but not limited to those of ETNs, equity options, derivatives, currencies, index, leverage, and replication management.
Market Risk — Either the stock market as a whole or the value of a Fund asset or an investment held by an exchange-traded product (“ETP”) in which a Fund invests may go down, resulting in a decrease in the NAV of the Fund or its Shares or a decrease in the market price of the Shares.
Equity Securities Risk — Common stocks are susceptible to general stock market fluctuations and to volatile increases and decreases in value as market confidence in and perceptions of their issuers change. If a Fund or an ETP holds common stock equivalents of any given issuer, the Fund or ETP will generally be exposed to greater risk than if the Fund or ETP held preferred stocks and debt obligations of such issuer.
Foreign and Emerging Market Securities Risk — Foreign investments may carry risks associated with investing outside the United States, such as currency fluctuation, economic or financial instability, lack of timely or reliable financial information, or unfavorable political or legal developments. Foreign securities can be more volatile than domestic (U.S.) securities. Securities markets of other countries are generally smaller than U.S. securities markets. Many foreign securities may also be less liquid than U.S. securities, which could affect the Funds’ investments. Investments in emerging markets may have more risk because the markets are less developed and less liquid as well as being subject to increased economic, political, regulatory, or other uncertainties. Also, as foreign and emerging markets decline, investors tend to exit these markets in unison.
Fluctuation of Net Asset Value — The NAV of the Shares will fluctuate with changes in market value of the Funds’ holdings.
Shares are Not Individually Redeemable — Shares are only redeemable by the Funds at NAV if they are tendered in large blocks known as “Creation Units” which are expected to be worth in excess of $1 million each. Only Authorized Participants (“APs”) may engage in such creation and redemption transactions directly with the Funds. Individual Shares may be sold on a stock exchange at their current market prices, which may be less, more, or equal to their NAV. There can be no assurance that an active trading market will be maintained for the Shares.
C. Federal Income Taxes. The Funds’ policy is to comply with the provisions of Subchapter M of the Internal Revenue Code of 1986, as amended, applicable to regulated investment companies and to distribute substantially all of their net investment income and net capital gains to shareholders. Therefore, no federal income tax provision is required. The Funds plan to file U.S. Federal and various state and local tax returns.
Each Fund recognizes the tax benefits of uncertain tax positions only when the position is more likely than not to be sustained. Management has analyzed each Fund’s uncertain tax positions and concluded that no liability for unrecognized tax benefits should be recorded related to uncertain tax positions. Management is not aware of any tax positions for which it is reasonably possible that the total amounts of unrecognized tax benefits will change materially in the next 12 months. Income and capital gain distributions are determined in accordance with federal income tax regulations, which may differ from U.S. GAAP. These timing differences are primarily due to differing book and tax treatments for in-kind transactions, losses deferred due to wash sales, and passive foreign investment company adjustments, if any.
| | Absolute Shares Trust | |
Notes to Financial Statements (continued) | |
| June 30, 2018 | |
Net capital losses incurred after October 31, 2017, and within the taxable year are deemed to arise on the first business day of each Fund’s next taxable year. As of June 30, 2018, the Funds deferred, on a tax basis, no late year losses.
As of June 30, 2018, the Funds had the following capital loss carryforward available for federal income tax purposes, with an indefinite expiration:
| | Short-Term | Long-Term |
| WBI BullBear Rising Income 2000 ETF | $18,736,246 | — |
| WBI BullBear Value 2000 ETF | 11,706,521 | — |
| WBI BullBear Yield 2000 ETF | 23,974,223 | — |
| WBI BullBear Quality 2000 ETF | 15,412,481 | — |
| WBI BullBear Rising Income 1000 ETF | 19,057,343 | — |
| WBI BullBear Value 1000 ETF | 3,086,432 | 642 |
| WBI BullBear Yield 1000 ETF | 14,309,658 | — |
| WBI BullBear Quality 1000 ETF | 10,730,384 | — |
| WBI BullBear Global Income ETF | 11,130,917 | — |
| WBI BullBear Global High Income ETF | 14,783,887 | 1,267,868 |
| WBI BullBear Global Rotation ETF | 97,708 | — |
| WBI Power Factor™ High Dividend ETF | — | — |
D. Security Transactions and Investment Income. Investment securities transactions are accounted for on the trade date. Gains and losses realized on sales of securities are determined on a specific identification basis. Dividend income is recorded on the ex-dividend date, net of any foreign taxes withheld at source. Interest income is recorded on an accrual basis. Withholding taxes on foreign dividends have been provided for in accordance with the Funds’ understanding of the applicable tax rules and regulations. Premiums and discounts are amortized/accreted using the effective interest method over the lives of the respective debt instruments.
E. Distributions to Shareholders. Distributions to shareholders from net investment income are declared and paid by WBI BullBear Rising Income 2000 ETF, WBI BullBear Value 2000 ETF, WBI BullBear Quality 2000 ETF, WBI BullBear Rising Income 1000 ETF, WBI BullBear Value 1000 ETF, WBI BullBear Quality 1000 ETF, WBI Global Rotation ETF and WBI Power Factor™ High Dividend ETF on a quarterly basis. Distributions to shareholders from net investment income are declared and paid by WBI BullBear Yield 2000 ETF, WBI BullBear Yield 1000 ETF, WBI BullBear Global Income ETF and WBI BullBear Global High Income ETF on a monthly basis. Distributions from net realized gains on securities are normally declared and paid by all Funds on an annual basis. Distributions are recorded on the ex-dividend date.
F. Derivative Transactions. The Funds have adopted the financial accounting reporting rules as required by the Derivatives and Hedging Topic of the FASB Accounting Standards Codification. The Funds are required to include enhanced disclosure that enables investors to understand how and why an entity uses derivatives, how derivatives are accounted for, and how derivative instruments affect an entity’s results of operations and financial position.
The Funds may utilize options for economic hedging purposes as well as direct investment. Some options strategies, including buying puts, tend to economically hedge the Funds’ investments against price fluctuations. Other strategies, such as writing puts and calls and buying calls, tend to increase market exposure. Options contracts may be combined with each other in order to adjust the risk and return characteristics of each Fund’s overall strategy in a manner deemed appropriate to the Advisor and consistent with each Fund’s investment objective and policies. When a Fund writes an option, an amount equal to the premium received by the Fund is reflected as an asset and an equivalent liability. The amount of the liability is subsequently marked to market to reflect the current market value of the option written. When a security is purchased or sold through an exercise of an option, the related premium paid (or received) is added (or deducted from) the basis of the security acquired or deducted from (or added to) the proceeds of the security sold. When an option expires, the Fund realizes a gain or loss on the option to the extent of the premiums received or paid.
When a Fund enters into a closing transaction, the Fund realizes a gain or loss to the extent the cost of the closing transactions exceeds the premiums paid or received. Written uncovered call options subject the Funds to unlimited risk of loss. Written covered call options limit the upside potential of a security above the strike price. Put options written subject the Funds to risk of loss if the value of the security declines below the exercise price minus the put premium.
With exchange-traded options, there is minimal counterparty credit risk to the Funds since the options are covered or secured, which means that the Funds will own the underlying security or, to the extent they do not hold the security, will maintain liquid assets consisting of cash, short-term securities, or equity or debt securities equal to the market value of the security underlying the option, marked-to-market daily.
Options purchased are recorded as investments and marked-to-market daily to reflect the current fair value of the option contract. If an option purchased expires, a loss is realized in the amount of the cost of the option contract. If a closing transaction is entered into, a gain or loss is realized to the extent that the proceeds from the sale are greater or less than the cost of the option. If a purchase put option is exercised, a gain or loss is realized from the sale of the underlying security by adjusting the proceeds from such sale by the amount of the premium originally paid. If a purchased call option is exercised, the cost of the security purchased upon exercise is increased by the premium originally paid. If a purchased call option is exercised, the cost of the security purchased upon exercise is increased by the premium originally paid. During the year ended June 30, 2018 the Funds did not make any derivative transactions.
| | Absolute Shares Trust | |
Notes to Financial Statements (continued) | |
| June 30, 2018 | |
G. Share Valuation. The NAV per share of each Fund is calculated by dividing the sum of the value of the securities held by the Fund, plus cash and other assets, minus all liabilities (including estimated accrued expenses) by the total number of shares outstanding for the Fund, rounded to the nearest cent. The Funds’ shares will not be priced on the days on which the NYSE ARCA, Inc., the exchange where the Funds’ shares are listed, is closed for trading. The offering and redemption price per share for each Fund is equal to the Fund’s NAV per share.
H. Guarantees and Indemnifications. The Funds’ officers and trustees are indemnified against certain liabilities that may arise out of the performance of their duties to the Funds. Additionally, in the normal course of business the Funds enter into contracts with service providers that contain general indemnification clauses. Each Fund’s maximum exposure under these arrangements is unknown as this would involve future claims that may be against the Fund that have not yet occurred.
I. Reclassification of Capital Accounts. U.S. GAAP requires that certain components of net assets relating to permanent differences be reclassified between financial and tax reporting. These reclassifications have no effect on net assets or net asset value per share. For the year ended June 30, 2018, the following table shows the reclassifications made:
| | | Undistributed Net | | | Accumulated Net | | | | |
| | | Investment Income/(Loss) | | | Realized Gain/(Loss) | | | Paid In Capital | |
| WBI BullBear Rising Income 2000 ETF | | $ | — | | | $ | (369,659 | ) | | $ | 369,659 | |
| WBI BullBear Value 2000 ETF | | | 188 | | | | (327,442 | ) | | | 327,254 | |
| WBI BullBear Yield 2000 ETF | | | (10,598 | ) | | | (319,500 | ) | | | 330,098 | |
| WBI BullBear Quality 2000 ETF | | | 56 | | | | (462,868 | ) | | | 462,812 | |
| WBI BullBear Rising Income 1000 ETF | | | — | | | | (488,123 | ) | | | 488,123 | |
| WBI BullBear Value 1000 ETF | | | — | | | | (438,569 | ) | | | 438,569 | |
| WBI BullBear Yield 1000 ETF | | | — | | | | (391,341 | ) | | | 391,341 | |
| WBI BullBear Quality 1000 ETF | | | — | | | | (272,227 | ) | | | 272,227 | |
| WBI BullBear Global Income ETF | | | (5,077 | ) | | | 107,352 | | | | (102,275 | ) |
| WBI BullBear Global High Income ETF | | | 4,436 | | | | (361,458 | ) | | | 357,022 | |
| WBI BullBear Global Rotation ETF | | | (14,061 | ) | | | (7,705 | ) | | | 21,766 | |
| WBI Power Factor™ High Dividend ETF | | | — | | | | — | | | | — | |
During the year ended June 30, 2018 the Funds realized capital gains resulting from in-kind redemptions, in which shareholders exchanged Fund Shares for securities held by a Fund rather than for cash. Because the gains are not taxable to the Funds, and are not distributed to shareholders, they have been reclassified from accumulated net realized gains/losses to paid-in capital. The following table shows the impact to each Fund:
| WBI BullBear Rising Income 2000 ETF | | $ | 368,162 | | |
| WBI BullBear Value 2000 ETF | | | 330,388 | | |
| WBI BullBear Yield 2000 ETF | | | 352,561 | | |
| WBI BullBear Quality 2000 ETF | | | 462,868 | | |
| WBI BullBear Rising Income 1000 ETF | | | 495,843 | | |
| WBI BullBear Value 1000 ETF | | | 441,435 | | |
| WBI BullBear Yield 1000 ETF | | | 398,156 | | |
| WBI BullBear Quality 1000 ETF | | | 275,027 | | |
| WBI BullBear Global Income ETF | | | (86,747 | ) | |
| WBI BullBear Global High Income ETF | | | 400,345 | | |
| WBI BullBear Global Rotation ETF | | | 21,766 | | |
| WBI Power Factor™ High Dividend ETF | | | — | | |
J. Expenses. Expenses directly attributable to the Fund are charged directly to the Fund, while expenses which are attributable to the Fund and other investment companies advised by the Adviser are allocated among the respective investment companies, including the Fund, based either upon relative average net assets or evenly among the Funds.
K. Subsequent Events. In preparing these financial statements, the Advisor has evaluated events and transactions for potential recognition or disclosure through the date the financial statements were available to be issued. There were no events or transactions that occurred during the period subsequent to June 30, 2018, that materially impacted the amounts or disclosures in the Funds’ financial statements.
NOTE 3 — MANAGEMENT FEE
Pursuant to an investment advisory agreement (“Advisory Agreement”) between the Trust, on behalf of the Funds, and the Advisor, the Advisor serves as the investment advisor, makes investment decisions for each Fund, and manages the investment portfolios of the Funds, subject to the supervision of and policies of the Board. Under the Advisory Agreement, the Advisor may retain an investment sub-advisor for the Funds, subject to approval by the Board and Fund shareholders. Under a sub-advisory agreement, (“Sub-Advisory Agreement”) the Sub-Advisor serves as the investment sub-advisor and is responsible for the day to day management of the Funds, subject to the supervision of the Advisor and the Board. For the services the Sub- Advisor provides to each Fund, the Sub-Advisor receives a fee that is equal to 0.85% per year of the average daily net assets of each Fund except WBI Power Factor™ High Dividend ETF, which pays a fee that is equal to 0.55% per year, calculated daily and paid monthly. The Advisor is paid 0.04% of each Fund’s average daily net assets (calculated daily and paid monthly) from the management fees collected by the Sub-Advisor.
| | Absolute Shares Trust | |
Notes to Financial Statements (continued) | |
| June 30, 2018 | |
NOTE 4 — PORTFOLIO TRANSACTIONS AND BROKERAGE
Pursuant to the Sub-Advisory Agreement, the Sub-Advisor determines which securities are to be purchased and sold by the Funds and which broker- dealers are eligible to execute the Funds’ portfolio transactions. The Sub-Advisor typically determines to execute portfolio transactions through the Advisor in its capacity as a registered broker-dealer. For the year ended June 30, 2018, the Funds paid the Affiliated Broker Dealer, $0 for brokerage commissions. However, the Affiliated Broker Dealer did receive indirect compensation in the form of payment for order flow (“PFOF”). PFOF is compensation that the Affiliated Broker Dealer receives for providing liquidity to certain market destinations related to the Sub- Advisor’s customer orders routed to these market destinations.
NOTE 5 — EXPENSE LIMITATION AND REIMBURSEMENT
The Sub-Advisor has entered into an Expense Limitation Agreement (an “Agreement”) with the Trust to waive the fees and reimburse expenses of each Fund until at least October 31, 2019 (the “Expiration Date”) so that the total operating expenses (exclusive of interest, taxes, brokerage commissions, acquired fund fees, dividend payments on short sales, other expenditures which are capitalized in accordance with U.S. GAAP, other extraordinary expenses not incurred in the ordinary course of the Fund’s business, and amounts, if any, payable pursuant to a plan adopted in accordance with Rule 12b-1 under the Investment Company Act of 1940) and organizational costs (the “Operating Expenses”) of WBI Power Factor™ High Dividend ETF is limited to 0.70% and each of the remaining Funds is limited to 1.25% of average net assets (the “Expense Cap”). The Sub-Advisor may discontinue its obligations under the Agreements at any time in its sole discretion after the Expiration Date. The Funds have agreed to repay the amounts borne by the Sub-Advisor under the Agreements within the three year period after the Sub-Advisor bears the expense, when and if requested by the Sub-Advisor, to the extent the Operating Expenses of the Funds are less than the lower of the Expense Cap and any expense limitation agreement then in effect with respect to the Operating Expenses. The repayment may not raise the level of Operating Expenses of the Funds in the month of repayment to exceed the Expense Cap.
The following table shows the remaining waived and/or reimbursed expenses subject to potential recovery as of June 30, 2018. The Sub-Advisor may recapture a portion of the unreimbursed amounts no later than the dates stated:
| | | Expiration | |
| | | June 30, 2020 | | | June 30, 2021 | |
| WBI BullBear Global Rotation ETF | | $ | 53,934 | | | $ | 33,290 | |
WBI Power FactorTM High Dividend ETF | | | 70,839 | | | | 71,269 | |
During the year ended June 30, 2018, the Sub-Advisor recouped the amounts shown from the following Funds:
| | | Amount | | |
| WBI BullBear Global Rotation ETF | | $ | 45,360 | | |
WBI Power FactorTM High Dividend ETF | | | 8,637 | | |
The Funds must pay their current ordinary operating expense before the Sub-Advisor is entitled to any reimbursement of fees and/or expenses. Any such reimbursement is also contingent upon the Board of Trustees’ review and approval.
NOTE 6 — COMPLIANCE AND ADMINISTRATION SERVICING AGREEMENTS
The Trust has entered into an agreement with Foreside Compliance Services, LLC (“Foreside”), whereby Foreside agrees to provide a Chief Compliance Officer (“CCO”), as described in Rule 38a-1 of the 1940 Act.
U.S. Bancorp Fund Services, LLC (the “Administrator”) serves as the independent administrator and U.S. Bank National Association (the “Custodian”) serves as the custodian to the Funds. Under the Fund Administration Servicing, Fund Accounting Servicing, and Transfer Agent Servicing Agreements, the Administrator is responsible for keeping financial books and records of the Funds and generally managing the administrative affairs and transfer agency services.
NOTE 7 — SECURITIES LENDING
The Funds may lend up to 331⁄3% of the value of the securities in their portfolios to brokers, dealers and financial institutions (but not individuals) under terms of participation in a securities lending program administered by U.S Bank N.A (“the Custodian” and “Securities Lending Agent”). The securities lending agreement requires that loans are collateralized at all times in an amount equal to at least 102% of the value of any loaned securities at the time of the loan, plus accrued interest, except in the case of loans of foreign securities which are denominated and payable in U.S. dollars shall be in the amount equal to 105% of the value of any loaned securities at the time of the loan plus accrued interest. The Funds receive compensation in the form of fees and earn interest on the cash collateral. The amount of fees depends on a number of factors including the type of security and length of the loan. The Funds continue to receive interest payments or dividends on the securities loaned during the borrowing period. Gain or loss in the fair value of securities loaned that may occur during the term of the loan will be for the account of the Funds. The Funds have the right under the terms of the securities lending agreement to recall the securities from the borrower on demand. As of June 30, 2018, Funds had loaned securities that were collateralized by cash equivalents. The cash collateral is invested by the Custodian in accordance with approved investment guidelines. Those guidelines require the cash collateral to be invested in readily marketable, high quality, short-term obligations; however, such investments are subject
| | Absolute Shares Trust | |
Notes to Financial Statements (continued) | |
| June 30, 2018 | |
to risk of payment delays or default on the part of the issuer or counterparty or otherwise may not generate sufficient interest to support the costs associated with securities lending. The Funds could also experience delays in recovering its securities and possible loss of income or value if the borrower fails to return the borrowed securities, although the Fund is indemnified from this risk by contract with the Securities Lending Agent.
As of June 30, 2018, the value of the securities on loan and payable for collateral due to broker were as follows:
| Fund | | Value of Securities on Loan | | | Collateral Received* | |
| WBI BullBear Rising Income 2000 ETF | | $ | 2,633,727 | | | $ | 2,666,112 | |
| WBI BullBear Value 2000 ETF | | | 408,040 | | | | 421,150 | |
| WBI BullBear Yield 2000 ETF | | | 6,212,398 | | | | 6,337,683 | |
| WBI BullBear Quality 2000 ETF | | | 1,588,090 | | | | 1,603,941 | |
| WBI BullBear Rising Income 1000 ETF | | | 12,034,787 | | | | 12,310,651 | |
| WBI BullBear Value 1000 ETF | | | 7,992,699 | | | | 8,174,206 | |
| WBI BullBear Yield 1000 ETF | | | 19,716,826 | | | | 20,124,796 | |
| WBI BullBear Quality 1000 ETF | | | 5,249,221 | | | | 5,375,591 | |
| WBI BullBear Global Income ETF | | | 30,637,853 | | | | 31,332,013 | |
| WBI BullBear Global High Income ETF | | | 84,042,425 | | | | 86,105,083 | |
| WBI BullBear Global Rotation ETF | | | 3,341,171 | | | | 3,408,924 | |
| WBI Power Factor™ High Dividend ETF | | | 8,021,648 | | | | 8,340,373 | |
| * | The cash collateral received was invested in the Mount Vernon Liquid Assets Portfolio as shown on the Schedule of Investments, a short-term investment portfolio with an overnight and continuous maturity. |
Fees and interest income earned on collateral investments and recognized by the Funds during the year ended June 30, 2018, was as follows:
Fees and Interest Income Earned
| Fund | | Fees and Interest Income Earned | | |
| WBI BullBear Rising Income 2000 ETF | | $ | 18,200 | | |
| WBI BullBear Value 2000 ETF | | | 18,045 | | |
| WBI BullBear Yield 2000 ETF | | | 20,718 | | |
| WBI BullBear Quality 2000 ETF | | | 19,293 | | |
| WBI BullBear Rising Income 1000 ETF | | | 12,670 | | |
| WBI BullBear Value 1000 ETF | | | 11,350 | | |
| WBI BullBear Yield 1000 ETF | | | 16,088 | | |
| WBI BullBear Quality 1000 ETF | | | 7,564 | | |
| WBI BullBear Global Income ETF | | | 295,907 | | |
| WBI BullBear Global High Income ETF | | | 490,154 | | |
| WBI BullBear Global Rotation ETF | | | 46,984 | | |
| WBI Power Factor™ High Dividend ETF | | | 48,005 | | |
Offsetting Assets and Liabilities. The Funds are subject to various netting arrangements, which govern the terms of certain transactions with counterparties. The arrangements allow the Funds to close out and net their total exposure to counterparty in the event of a default with respect to all transactions governed under a single agreement with a counterparty. The following is a summary of the arrangements subject to offsetting as of June 30, 2018.
| | | | | | | Gross Amounts | | | Net Amounts | | | | | | | |
| | | | Gross Amounts | | | Offset in the | | | Presented in the | | | | | | | |
| | | | of Recognized | | | Statement of | | | Statement of | | | Collateral | | | Net | |
| Fund | Description | | Liabilities | | | Assets & Liabilities | | | Assets & Liabilities | | | Received | | | Amount | |
| WBI BullBear Rising Income 2000 ETF | Securities Lending | | $ | 2,666,112 | | | $ | — | | | $ | 2,666,112 | | | $ | 2,666,112 | | | $ | — | |
| WBI BullBear Value 2000 ETF | Securities Lending | | | 421,150 | | | | — | | | | 421,150 | | | | 421,150 | | | | — | |
| WBI BullBear Yield 2000 ETF | Securities Lending | | | 6,337,683 | | | | — | | | | 6,337,683 | | | | 6,337,683 | | | | — | |
| WBI BullBear Quality 2000 ETF | Securities Lending | | | 1,603,941 | | | | — | | | | 1,603,941 | | | | 1,603,941 | | | | — | |
| WBI BullBear Rising Income 1000 ETF | Securities Lending | | | 12,310,651 | | | | — | | | | 12,310,651 | | | | 12,310,651 | | | | — | |
| WBI BullBear Value 1000 ETF | Securities Lending | | | 8,174,206 | | | | — | | | | 8,174,206 | | | | 8,174,206 | | | | — | |
| WBI BullBear Yield 1000 ETF | Securities Lending | | | 20,124,796 | | | | — | | | | 20,124,796 | | | | 20,124,796 | | | | — | |
| WBI BullBear Quality 1000 ETF | Securities Lending | | | 5,375,591 | | | | — | | | | 5,375,591 | | | | 5,375,591 | | | | — | |
| WBI BullBear Global Income ETF | Securities Lending | | | 31,332,013 | | | | — | | | | 31,332,013 | | | | 31,332,013 | | | | — | |
| WBI BullBear Global High Income ETF | Securities Lending | | | 86,105,083 | | | | — | | | | 86,105,083 | | | | 86,105,083 | | | | — | |
| WBI BullBear Global Rotation ETF | Securities Lending | | | 3,408,924 | | | | — | | | | 3,408,924 | | | | 3,408,924 | | | | — | |
| WBI Power Factor™ High Dividend ETF | Securities Lending | | | 8,340,373 | | | | — | | | | 8,340,373 | | | | 8,340,373 | | | | — | |
| | Absolute Shares Trust | |
Notes to Financial Statements (continued) | |
| June 30, 2018 | |
NOTE 8 — TAX INFORMATION
The components of distributable earnings (losses) and cost basis of investments for federal income tax purposes as of June 30, 2018 were as follows:
| | | WBI BullBear | | | | | | | | | | | | WBI BullBear | | | | |
| | | Rising Income | | | WBI BullBear | | | WBI BullBear | | | WBI BullBear | | | Rising Income | | | WBI BullBear | |
| | | 2000 ETF | | | Value 2000 ETF | | | Yield 2000 ETF | | | Quality 2000 ETF | | | 1000 ETF | | | Value 1000 ETF | |
| Cost of investments | | $ | 47,903,339 | | | $ | 43,633,728 | | | $ | 50,375,413 | | | $ | 40,253,488 | | | $ | 82,691,604 | | | $ | 65,172,635 | |
| Gross tax unrealized appreciation | | | 999,248 | | | | 1,308,195 | | | | 1,557,007 | | | | 1,077,644 | | | | 2,975,216 | | | | 2,143,543 | |
| Gross tax unrealized depreciation | | | (602,199 | ) | | | (542,857 | ) | | | (530,681 | ) | | | (532,848 | ) | | | (556,436 | ) | | | (404,000 | ) |
| Net tax unrealized | | | | | | | | | | | | | | | | | | | | | | | | |
| appreciation (depreciation) | | | 397,049 | | | | 765,338 | | | | 1,026,326 | | | | 544,796 | | | | 2,418,780 | | | | 1,739,543 | |
| Undistributed ordinary income | | | 11,315 | | | | 16,328 | | | | 32,110 | | | | 19,316 | | | | 7,511 | | | | 7,046 | |
| Undistributed long term gain (loss) | | | — | | | | — | | | | — | | | | — | | | | — | | | | — | |
| Total distributable earnings | | | 11,315 | | | | 16,328 | | | | 32,110 | | | | 19,316 | | | | 7,511 | | | | 7,046 | |
| Other accumulated gain (loss) | | | (18,736,246 | ) | | | (11,706,521 | ) | | | (23,974,223 | ) | | | (15,412,481 | ) | | | (19,057,343 | ) | | | (3,087,074 | ) |
| Total accumulated gain (loss) | | $ | (18,327,882 | ) | | $ | (10,924,855 | ) | | $ | (22,915,787 | ) | | $ | (14,848,369 | ) | | $ | (16,631,052 | ) | | $ | (1,340,485 | ) |
| | | | | | | | | | | | | | | | | | | | |
| | | | | | | WBI BullBear | | | WBI BullBear | | | WBI BullBear | | | WBI BullBear | | | WBI Power | |
| | | WBI BullBear | | | Quality | | | Global | | | Global High | | | Global | | | Factor™ High | |
| | | Yield 1000 ETF | | | 1000 ETF | | | Income ETF | | | Income ETF | | | Rotation ETF | | | Dividend ETF | |
| Cost of investments | | $ | 101,442,786 | | | $ | 62,166,473 | | | $ | 128,704,958 | | | $ | 361,230,375 | | | $ | 23,325,732 | | | $ | 57,730,094 | |
| Gross tax unrealized appreciation | | | 3,486,328 | | | | 1,462,498 | | | | 56,291 | | | | 2,462,591 | | | | 182,933 | | | | 4,310,421 | |
| Gross tax unrealized depreciation | | | (457,655 | ) | | | (833,902 | ) | | | (741,239 | ) | | | (2,974,112 | ) | | | (343,908 | ) | | | (1,362,182 | ) |
| Net tax unrealized | | | | | | | | | | | | | | | | | | | | | | | | |
| appreciation (depreciation) | | | 3,028,673 | | | | 628,596 | | | | (684,948 | ) | | | (511,521 | ) | | | (160,975 | ) | | | 2,948,239 | |
| Undistributed ordinary income | | | 9,941 | | | | 8,248 | | | | — | | | | — | | | | 11,666 | | | | 628,548 | |
| Undistributed long term gain (loss) | | | — | | | | — | | | | — | | | | — | | | | — | | | | — | |
| Total distributable earnings | | | 9,941 | | | | 8,248 | | | | — | | | | — | | | | 11,666 | | | | 628,548 | |
| Other accumulated gain (loss) | | | (14,309,658 | ) | | | (10,730,384 | ) | | | (11,130,917 | ) | | | (16,051,755 | ) | | | (97,708 | ) | | | — | |
| Total accumulated gain (loss) | | $ | (11,271,044 | ) | | $ | (10,093,540 | ) | | $ | (11,815,865 | ) | | $ | (16,563,276 | ) | | $ | (247,017 | ) | | $ | 3,576,787 | |
The difference between the cost of investments amount for financial statement and federal income tax purposes is due primarily to timing differences in recognizing wash sale losses in security transactions.
NOTE 9 — PURCHASES AND SALES OF SECURITIES
During the year ended June 30, 2018, purchases and sales of securities by the Funds, excluding short-term securities and in-kind transactions, were as follows:
| | | All Other | | | US Government | |
| Fund | | Purchases | | | Sales | | | Purchases | | | Sales | |
| WBI BullBear Rising Income 2000 ETF | | $ | 222,059,852 | | | $ | 217,089,584 | | | $ | — | | | $ | — | |
| WBI BullBear Value 2000 ETF | | | 318,805,251 | | | | 329,481,210 | | | | — | | | | — | |
| WBI BullBear Yield 2000 ETF | | | 257,968,977 | | | | 267,824,417 | | | | — | | | | — | |
| WBI BullBear Quality 2000 ETF | | | 277,910,597 | | | | 304,897,123 | | | | — | | | | — | |
| WBI BullBear Rising Income 1000 ETF | | | 283,774,003 | | | | 279,667,473 | | | | — | | | | — | |
| WBI BullBear Value 1000 ETF | | | 364,191,334 | | | | 369,383,875 | | | | — | | | | — | |
| WBI BullBear Yield 1000 ETF | | | 352,728,086 | | | | 354,945,745 | | | | — | | | | — | |
| WBI BullBear Quality 1000 ETF | | | 267,889,318 | | | | 261,604,149 | | | | — | | | | — | |
| WBI BullBear Global Income ETF | | | 775,362,860 | | | | 740,461,825 | | | | — | | | | 35,815,781 | |
| WBI BullBear Global High Income ETF | | | 1,475,125,671 | | | | 1,476,174,900 | | | | — | | | | — | |
| WBI BullBear Global Rotation ETF | | | 133,750,469 | | | | 137,317,651 | | | | — | | | | — | |
| WBI Power Factor™ High Dividend ETF | | | 71,644,578 | | | | 72,187,342 | | | | — | | | | — | |
| | Absolute Shares Trust | |
Notes to Financial Statements (continued) | |
| June 30, 2018 | |
For the year ended June 30, 2018, the values of the in kind security transactions were as follows:
| Fund | | Subscriptions | | | Redemptions | |
| WBI BullBear Rising Income 2000 ETF | | $ | 5,719,003 | | | $ | 7,031,741 | |
| WBI BullBear Value 2000 ETF | | | — | | | | 14,401,499 | |
| WBI BullBear Yield 2000 ETF | | | 3,303,721 | | | | 9,103,777 | |
| WBI BullBear Quality 2000 ETF | | | 2,372,655 | | | | 14,701,959 | |
| WBI BullBear Rising Income 1000 ETF | | | 28,687,102 | | | | 10,333,279 | |
| WBI BullBear Value 1000 ETF | | | — | | | | 17,919,021 | |
| WBI BullBear Yield 1000 ETF | | | 5,568,549 | | | | 10,944,143 | |
| WBI BullBear Quality 1000 ETF | | | 8,835,098 | | | | 6,532,928 | |
| WBI BullBear Global Income ETF | | | 1,189,714 | | | | 57,997,479 | |
| WBI BullBear Global High Income ETF | | | 39,606,254 | | | | 27,242,175 | |
| WBI BullBear Global Rotation ETF | | | 2,538,438 | | | | 1,271,639 | |
| WBI Power Factor™ High Dividend ETF | | | 14,046,337 | | | | — | |
NOTE 10 — SHARE TRANSACTIONS
The Funds currently offer one class of shares, which has no front-end sales load, no deferred sales charge, and no redemption fee. The Funds may issue an unlimited number of shares of beneficial interest, with no par value. All shares of each Fund have equal rights and privileges as the other shares of such Fund.
The Trust has entered into an agreement with NYSE Group, Inc. to list the Funds’ (“Shares”) on NYSE Arca, Inc., an indirect wholly-owned subsidiary of NYSE Group, Inc. Market prices for the Shares may be different from their NAV. The Funds will issue and redeem Shares on a continuous basis at NAV only in large blocks of Shares, typically 50,000 Shares, called “Creation Units.” Creation Units will be issued and redeemed principally in-kind, however, the Trust reserves the right to offer a cash option for creations and redemptions of Shares. Once created, Shares generally will trade in the secondary market at market prices that change throughout the day in amounts less than a Creation Unit. Except when aggregated in Creation Units, Shares are not redeemable securities of a Fund. Shares of a Fund may only be purchased or redeemed by certain financial institutions (“Authorized Participants”). An Authorized Participant is either (i) a broker-dealer or other participant in the clearing process through the Continuous Net Settlement System of the National Securities Clearing Corporation or (ii) a Depository Trust Corporation participant and, in each case, must have executed a participant agreement with Foreside Fund Services, LLC, the Funds’ distributor (the “Distributor”). Most retail investors will not qualify as Authorized Participants or have the resources to buy and sell whole Creation Units. Therefore, they will be unable to purchase or redeem the Shares directly from a Fund. Rather, most retail investors will purchase Shares in the secondary market with the assistance of a broker and will be subject to customary brokerage commissions or fees.
| | | WBI BullBear Rising Income 2000 ETF | | | WBI BullBear Value 2000 ETF | |
| | | Year Ended | | | Year Ended | | | Year Ended | | | Year Ended | |
| | | June 30, 2018 | | | June 30, 2017 | | | June 30, 2018 | | | June 30, 2017 | |
| | | Shares | | | Amount | | | Shares | | | Amount | | | Shares | | | Amount | | | Shares | | | Amount | |
| Shares Sold | | | 750,000 | | | $ | 18,647,555 | | | | — | | | $ | — | | | | — | | | $ | — | | | | 500,000 | | | $ | 12,422,300 | |
| Shares Redeemed | | | (300,000 | ) | | | (7,344,460 | ) | | | (1,750,000 | ) | | | (39,772,320 | ) | | | (1,050,000 | ) | | | (26,469,535 | ) | | | (1,000,000 | ) | | | (22,768,090 | ) |
| | | | 450,000 | | | $ | 11,303,095 | | | | (1,750,000 | ) | | $ | (39,772,320 | ) | | | (1,050,000 | ) | | $ | (26,469,535 | ) | | | (500,000 | ) | | $ | (10,345,790 | ) |
| Beginning Shares | | | 1,750,000 | | | | | | | | 3,500,000 | | | | | | | | 2,900,000 | | | | | | | | 3,400,000 | | | | | |
| Ending Shares | | | 2,200,000 | | | | | | | | 1,750,000 | | | | | | | | 1,850,000 | | | | | | | | 2,900,000 | | | | | |
| | | | | | | | | | | | | | | | | | | | | | | | | | | | | | | | | |
| | | WBI BullBear Yield 2000 ETF | | | WBI BullBear Quality 2000 ETF | |
| | | Year Ended | | | Year Ended | | | Year Ended | | | Year Ended | |
| | | June 30, 2018 | | | June 30, 2017 | | | June 30, 2018 | | | June 30, 2017 | |
| | | Shares | | | Amount | | | Shares | | | Amount | | | Shares | | | Amount | | | Shares | | | Amount | |
| Shares Sold | | | 150,000 | | | $ | 3,488,160 | | | | 200,000 | | | $ | 4,407,500 | | | | 100,000 | | | $ | 2,394,885 | | | | 500,000 | | | $ | 11,627,000 | |
| Shares Redeemed | | | (750,000 | ) | | | (16,446,385 | ) | | | (2,100,000 | ) | | | (44,862,250 | ) | | | (1,350,000 | ) | | | (32,513,895 | ) | | | (1,150,000 | ) | | | (24,787,955 | ) |
| | | | (600,000 | ) | | $ | (12,958,225 | ) | | | (1,900,000 | ) | | $ | (40,454,750 | ) | | | (1,250,000 | ) | | $ | (30,119,010 | ) | | | (650,000 | ) | | $ | (13,160,955 | ) |
| Beginning Shares | | | 2,950,000 | | | | | | | | 4,850,000 | | | | | | | | 3,200,000 | | | | | | | | 3,850,000 | | | | | |
| Ending Shares | | | 2,350,000 | | | | | | | | 2,950,000 | | | | | | | | 1,950,000 | | | | | | | | 3,200,000 | | | | | |
| | Absolute Shares Trust | |
Notes to Financial Statements (continued) | |
| June 30, 2018 | |
| | | WBI BullBear Rising Income 1000 ETF | | | WBI BullBear Value 1000 ETF | |
| | | Year Ended | | | Year Ended | | | Year Ended | | | Year Ended | |
| | | June 30, 2018 | | | June 30, 2017 | | | June 30, 2018 | | | June 30, 2017 | |
| | | Shares | | | Amount | | | Shares | | | Amount | | | Shares | | | Amount | | | Shares | | | Amount | |
| Shares Sold | | | 1,300,000 | | | $ | 34,677,960 | | | | 150,000 | | | $ | 3,566,580 | | | | — | | | $ | — | | | | 700,000 | | | $ | 18,084,665 | |
| Shares Redeemed | | | (450,000 | ) | | | (11,531,985 | ) | | | (1,450,000 | ) | | | (33,052,570 | ) | | | (700,000 | ) | | | (19,951,920 | ) | | | (1,000,000 | ) | | | (22,800,300 | ) |
| | | | 850,000 | | | $ | 23,145,975 | | | | (1,300,000 | ) | | $ | (29,485,990 | ) | | | (700,000 | ) | | $ | (19,951,920 | ) | | | (300,000 | ) | | $ | (4,715,635 | ) |
| Beginning Shares | | | 2,050,000 | | | | | | | | 3,350,000 | | | | | | | | 3,000,000 | | | | | | | | 3,300,000 | | | | | |
| Ending Shares | | | 2,900,000 | | | | | | | | 2,050,000 | | | | | | | | 2,300,000 | | | | | | | | 3,000,000 | | | | | |
| | | | | | | | | | | | | | | | | | | | | | | | | | | | | | | | | |
| | | WBI BullBear Yield 1000 ETF | | | WBI BullBear Quality 1000 ETF | |
| | Year Ended | | | Year Ended | | | Year Ended | | | Year Ended | |
| | | June 30, 2018 | | | June 30, 2017 | | | June 30, 2018 | | | June 30, 2017 | |
| | | Shares | | | Amount | | | Shares | | | Amount | | | Shares | | | Amount | | | Shares | | | Amount | |
| Shares Sold | | | 300,000 | | | $ | 7,832,870 | | | | 200,000 | | | $ | 4,369,930 | | | | 650,000 | | | $ | 17,842,840 | | | | 150,000 | | | $ | 3,705,120 | |
| Shares Redeemed | | | (550,000 | ) | | | (13,868,985 | ) | | | (1,650,000 | ) | | | (34,247,740 | ) | | | (250,000 | ) | | | (6,607,490 | ) | | | (1,950,000 | ) | | | (45,754,310 | ) |
| | | | (250,000 | ) | | $ | (6,036,115 | ) | | | (1,450,000 | ) | | $ | (29,877,810 | ) | | | 400,000 | | | $ | 11,235,350 | | | | (1,800,000 | ) | | $ | (42,049,190 | ) |
| Beginning Shares | | | 3,450,000 | | | | | | | | 4,900,000 | | | | | | | | 1,900,000 | | | | | | | | 3,700,000 | | | | | |
| Ending Shares | | | 3,200,000 | | | | | | | | 3,450,000 | | | | | | | | 2,300,000 | | | | | | | | 1,900,000 | | | | | |
| | | | | | | | | | | | | | | | | | | | | | | | | | | | | | | | | |
| | | WBI BullBear Global Income ETF | | | WBI BullBear Global High Income ETF | |
| | | Year Ended | | | Year EndeD | | | Year Ended | | | Year Ended | |
| | | June 30, 2018 | | | June 30, 2017 | | | June 30, 2018 | | | June 30, 2017 | |
| | | Shares | | | Amount | | | Shares | | | Amount | | | Shares | | | Amount | | | Shares | | | Amount | |
| Shares Sold | | | 50,000 | | | $ | 1,206,990 | | | | — | | | $ | — | | | | 1,650,000 | | | $ | 40,399,690 | | | | 4,200,000 | | | $ | 102,949,825 | |
| Shares Redeemed | | | (2,400,000 | ) | | | (58,715,525 | ) | | | (9,350,000 | ) | | | (235,620,235 | ) | | | (1,150,000 | ) | | | (28,167,875 | ) | | | (2,950,000 | ) | | | (70,133,905 | ) |
| | | | (2,350,000 | ) | | $ | (57,508,535 | ) | | | (9,350,000 | ) | | $ | (235,620,235 | ) | | | 500,000 | | | $ | 12,231,815 | | | | 1,250,000 | | | $ | 32,815,920 | |
| Beginning Shares | | | 6,400,000 | | | | | | | | 15,750,000 | | | | | | | | 11,000,000 | | | | | | | | 9,750,000 | | | | | |
| Ending Shares | | | 4,050,000 | | | | | | | | 6,400,000 | | | | | | | | 11,500,000 | | | | | | | | 11,000,000 | | | | | |
| | | | | | | | | | | | | | | | | | | | | | | | | | | | | | | | | |
| | | WBI BullBear Global Rotation ETF | | | WBI Power Factor™ High Dividend ETF | |
| | | Year Ended | | | Period Ended | | | Year Ended | | | Period Ended | |
| | | June 30, 2018 | | | June 30, 2017 | | | June 30, 2018 | | | June 30, 2017 | |
| | | Shares | | | Amount | | | Shares | | | Amount | | | Shares | | | Amount | | | Shares | | | Amount | |
| Shares Sold | | | 100,000 | | | $ | 2,563,295 | | | | 900,000 | | | $ | 22,189,040 | | | | 550,000 | | | $ | 14,237,490 | | | | 1,400,000 | | | $ | 34,588,085 | |
| Shares Redeemed | | | (50,000 | ) | | | (1,287,985 | ) | | | (150,000 | ) | | | (3,509,455 | ) | | | — | | | | — | | | | — | | | | — | |
| | | | 50,000 | | | $ | 1,275,310 | | | | 750,000 | | | $ | 18,679,585 | | | | 550,000 | | | $ | 14,237,490 | | | | 1,400,000 | | | $ | 34,588,085 | |
| Beginning Shares | | | 750,000 | | | | | | | | — | | | | | | | | 1,400,000 | | | | | | | | — | | | | | |
| Ending Shares | | | 800,000 | | | | | | | | 750,000 | | | | | | | | 1,950,000 | | | | | | | | 1,400,000 | | | | | |
| | Absolute Shares Trust | |
Notes to Financial Statements (concluded) | |
| June 30, 2018 | |
NOTE 11 — DISTRIBUTIONS TO SHAREHOLDERS
The tax character of distributions declared by the Funds during the year ended June 30, 2018 and year/period ended June 30, 2017 were as follows:
| | | Year Ended June 30, 2018 | | | Year/Period1 Ended June 30, 2017 | |
| | | Ordinary | | | Long Term | | | Return of | | | Ordinary | | | Long Term | | | Return of | |
| Fund | | Income | | | Capital Gain | | | Capital | | | Income | | | Capital Gain | | | Capital | |
| WBI BullBear Rising Income 2000 ETF | | $ | 249,127 | | | $ | — | | | $ | — | | | $ | 272,949 | | | $ | — | | | $ | 40,198 | |
| WBI BullBear Value 2000 ETF | | | 218,969 | | | | — | | | | — | | | | 731,430 | | | | — | | | | — | |
| WBI BullBear Yield 2000 ETF | | | 401,663 | | | | — | | | | — | | | | 1,503,220 | | | | — | | | | — | |
| WBI BullBear Quality 2000 ETF | | | 317,572 | | | | — | | | | — | | | | 553,895 | | | | — | | | | — | |
| WBI BullBear Rising Income 1000 ETF | | | 337,373 | | | | — | | | | — | | | | 496,341 | | | | — | | | | — | |
| WBI BullBear Value 1000 ETF | | | 484,790 | | | | — | | | | — | | | | 787,660 | | | | — | | | | — | |
| WBI BullBear Yield 1000 ETF | | | 826,348 | | | | — | | | | — | | | | 1,264,487 | | | | — | | | | — | |
| WBI BullBear Quality 1000 ETF | | | 464,405 | | | | — | | | | — | | | | 673,087 | | | | — | | | | — | |
| WBI BullBear Global Income ETF | | | 3,955,836 | | | | — | | | | — | | | | 4,509,305 | | | | — | | | | — | |
| WBI BullBear Global High Income ETF | | | 8,057,793 | | | | — | | | | — | | | | 4,510,220 | | | | — | | | | — | |
| WBI BullBear Global Rotation ETF | | | 317,818 | | | | — | | | | — | | | | 152,271 | | | | — | | | | — | |
| WBI Power Factor™ High Dividend ETF | | | 2,934,185 | | | | — | | | | — | | | | 435,085 | | | | — | | | | — | |
1 | Information for WBI BullBear Global Rotation ETF and WBI Power Factor™ High Dividend ETF are for the period from July 25, 2016 to June 30, 2017 and December 19, 2016 to June 30, 2017, respectively. |
| | Absolute Shares Trust | |
| Report of Independent Registered Public Accounting Firm | |
| | |
To the Shareholders and Board of Trustees of Absolute Shares Trust:
Opinion on the Financial Statements
We have audited the accompanying statements of assets and liabilities of WBI BullBear Rising Income 2000 ETF, WBI BullBear Value 2000 ETF, WBI BullBear Yield 2000 ETF, WBI BullBear Quality 2000 ETF, WBI BullBear Rising Income 1000 ETF, WBI BullBear Value 1000 ETF, WBI BullBear Yield 1000 ETF, WBI BullBear Quality 1000 ETF, WBI BullBear Global Income ETF, WBI BullBear Global High Income ETF (each of which commenced operations August 25, 2014),WBI BullBear Global Rotation ETF (commenced operations July 25, 2016), WBI Power Factor High Dividend ETF (commenced operations December 19, 2016), twelve of the portfolios constituting Absolute Shares Trust (the “Trust”), including the schedules of investments, as of June 30, 2018, the related statements of operations for the year then ended, the statements of changes in net assets for each of the years or aforementioned period since commencement of operations in the two-year period then ended and the related notes (collectively, the financial statements) and the financial highlights for each of the years or aforementioned period since commencement of operations in the four-year period then ended. In our opinion, the financial statements and financial highlights present fairly, in all material respects, the financial position of each of the respective twelve portfolios constituting Absolute Shares Trust as of June 30, 2018, the results of its operations for the year then ended, the changes in its net assets for each of the years or aforementioned period since commencement of operations in the two-year period then ended and the financial highlights for each of the years or aforementioned period since commencement of operations in the four-year period then ended, in conformity with U.S. generally accepted accounting principles.
Basis for Opinion
These financial statements and financial highlights are the responsibility of the Trust’s management. Our responsibility is to express an opinion on these financial statements and financial highlights based on our audits. We are a public accounting firm registered with the Public Company Accounting Oversight Board (United States) (PCAOB) and are required to be independent with respect to the Trust in accordance with the U.S. federal securities laws and the applicable rules and regulations of the Securities and Exchange Commission and the PCAOB.
We conducted our audits in accordance with the standards of the PCAOB. Those standards require that we plan and perform the audit to obtain reasonable assurance about whether the financial statements and financial highlights are free of material misstatement, whether due to error or fraud. Our audits included performing procedures to assess the risks of material misstatement of the financial statements and financial highlights, whether due to error or fraud, and performing procedures that respond to those risks. Such procedures included examining, on a test basis, evidence regarding the amounts and disclosures in the financial statements and financial highlights. Such procedures also included confirmation of securities owned as of June 30, 2018, by correspondence with custodians and brokers.
Our audits also included evaluating the accounting principles used and significant estimates made by management, as well as evaluating the overall presentation of the financial statements and financial highlights. We believe that our audits provide a reasonable basis for our opinion.
We have served as the Trust’s auditor since 2014.
Short Hills, New Jersey
August 24, 2018
| | Absolute Shares Trust | |
Trustees and Officers (Unaudited) | |
| | |
| | | | | Number of | |
| | | | | Portfolios | Other |
| | | | | in Fund | Directorships |
| | Position(s) | Term of Office | | Complex | Held by |
| | Held | and Length of | Principal Occupation(s) | Overseen by | Trustee During |
Name and Year of Birth(1) | with Trust | Time Served(2) | During Past 5 Years | Trustee(3) | Past 5 Years |
| Independent Trustees: | | | | | |
| | | | | | |
| Jude T. Depko, 1946 | Trustee | Since | Technical Consultant, | 12 | None |
| | | June 2014 | Michael Baker Jr., Inc. | | |
| | | | (consulting) (2009 to present) | | |
| | | | | | |
| John A. Flanagan, 1946 | Trustee | Since | Treasurer, ETF Managers Trust | 12 | None |
| | | June 2014 | (investment company) (2015 to | | |
| | | | present); Principal Financial | | |
| | | | Officer, ETF Managers Capital, | | |
| | | | LLC (commodity pool operator) | | |
| | | | (2014 to present); President, | | |
| | | | John A. Flanagan CPA, LLC | | |
| | | | (accounting services) (2010 to | | |
| | | | present); Chief Financial Officer, | | |
| | | | Macromarkets LLC (exchange | | |
| | | | traded funds) (2007 to 2010) | | |
| | | | | | |
| Andrew Putterman, 1959 | Trustee | Since | Principal, 1812 Park, LLC | 12 | Independent Board |
| | | June 2014 | (financial consulting) (2014 to | | Member of Steben |
| | | | present); Advisory Board | | Select Multi-Strategy |
| | | | Member, Vestigo Ventures 1 GP, | | Fund (2018 to |
| | | | LLC (2016 to present); Advisory | | present); Independent |
| | | | Board Member, Silver Lane | | Board Member of |
| | | | Advisors (2016 to present); | | Steben Select |
| | | | Managing Director, B+ Institutional | | Managed Futures |
| | | | Services, LLC (2014 to present); | | Strategy Fund |
| | | | Independent Board Member, | | (2018 to present); |
| | | | Princeton Private Equity Fund | | Independent Board |
| | | | (2014 to 2015); Chairman Emeritus, | | Member of Steben |
| | | | Fortigent LLC (financial services) | | Alternative |
| | | | (2013 to 2014); Managing Director, | | Investment Funds |
| | | | LPL Financial (financial services) | | (2018 to present) |
| | | | (2012 to 2014); The Private Trust | | |
| | | | Company (January 2013 to | | |
| | | | December 2013); President and | | |
| | | | Chief Executive Officer, | | |
| | | | Fortigent LLC (2006 to 2012 | | |
| | | | and 2013, respectively) | | |
| | Absolute Shares Trust | |
Trustees and Officers (Unaudited) (continued) | |
| | |
| | | | | Number of | |
| | | | | Portfolios | Other |
| | | | | in Fund | Directorships |
| | Position(s) | Term of Office | | Complex | Held by |
| | Held | and Length of | Principal Occupation(s) | Overseen by | Trustee During |
Name and Year of Birth(1) | with Trust | Time Served(2) | During Past 5 Years | Trustee(3) | Past 5 Years |
| Interested Trustees: | | | | | |
| | | | | | |
Don Schreiber, Jr., 1955(4) | Trustee, | Since | Chief Executive Officer, Treasurer | 12 | None |
| | President and | November 2013 | and Co-Portfolio Manager, | | |
| | Principal | | WBI Investments, Inc. (registered | | |
| | Executive | | investment adviser) (1984 to | | |
| | Officer | | present); Co-Chief Investment | | |
| | | | Officer, WBI Investments, Inc. | | |
| | | | (March 2018 to present); Chief | | |
| | | | Executive Officer and Treasurer | | |
| | | | of Millington Securities, Inc. | | |
| | | | (registered investment adviser | | |
| | | | and broker- dealer) (2013 to | | |
| | | | present); Chief Executive Officer, | | |
| | | | Vice President, and Treasurer, | | |
| | | | WBI Trading Company, Inc. | | |
| | | | (financial services) (2011 to | | |
| | | | present); Chief Executive Officer, | | |
| | | | Vice President, and Treasurer, | | |
| | | | Hartshorne Group, Inc. | | |
| | | | (wealth management services) | | |
| | | | (2008 to present); Chief Executive | | |
| | | | Officer, President, Secretary, | | |
| | | | Treasurer and Managing Member, | | |
| | | | WBI Technologies LLC | | |
| | | | (May 2018 to present) | | |
| | | | | | |
Matthew Schreiber, 1980(4) | Trustee | Since | President and Vice President of | 12 | None |
| | | June 2014 | WBI Investments, Inc. (2013 to | | |
| | | | present); Chief Investment | | |
| | | | Strategist of WBI Investments, Inc. | | |
| | | | (March 2017 to Present); Vice | | |
| | | | President of Business Development, | | |
| | | | WBI Investments, Inc. (2007 to 2013) | | |
| | Absolute Shares Trust | |
Trustees and Officers (Unaudited) (concluded) | |
| | |
| | | Term of Office | |
| | Position(s) Held | and Length | |
| Name and Year of Birth | with Trust | of Time Served | Principal Occupation(s) During Past 5 Years |
| Other Officers: | | | |
| | | | |
| Ann Schreiber, 1984 | Secretary | Since | Chief Marketing Officer, WBI Investments, Inc. (2015 to present); |
| | | June 2014 | Secretary, WBI Trading Company, Inc. (2012 to present); Secretary, |
| | | | Millington Securities, Inc. (2013 to present); Secretary, Hartshorne |
| | | | Group, Inc. (2012 to present); Corporate Secretary, WBI Investments, |
| | | | Inc. (2012 to present); Director of Marketing and Executive Services, |
| | | | WBI Investments, Inc. (2011 to 2014); Consultant, Advisor Toolbox, |
| | | | Inc. (2009 to 2011) |
| | | | |
| Tracey Crespo, 1970 | Treasurer and | Since | Chief Operating Officer, WBI Investments, Inc. (2011 to present); |
| | Principal Financial | July 2018 | Assistant Treasurer of Absolute Shares Trust (November 2015 to |
| | Officer | | July 2018) Treasurer and Principal Financial Officer of Absolute |
| | | | Shares Trust (August 2015 to November 2015); Director of |
| | | | Centralized Operations & Director of Fund Accounting and Hedge |
| | | | Fund Services, SEI, Inc. (fund administrative services)(2007-2011). |
| | | | |
| Steven Van Solkema, 1970 | Assistant | Since | Chief Operating Officer, Millington Securities, Inc. (2014 to present); |
| | Treasurer | November 2015 | Chief Compliance Officer, Millington Securities, Inc. (2014 to |
| | | | May 2018); Managing Director, Ally Financial, Inc. (financial |
| | | | services) (2010 to 2013) |
| | | | |
| Alyson Kest, 1974 | Assistant | Since | Chief Compliance Officer, Millington Securities, Inc. (June 2018 to |
| | Secretary | February 2016 | present); Counsel, at Millington Securities, Inc. (July 2017 to |
| | | | present);Compliance Officer at Millington Securities, Inc. (2015 to |
| | | | May 2018); Legal and Compliance at XL Catlin (fka Catlin, Inc.) |
| | | | (2014 to 2015); Compliance at Macquarie (2011 to 2014); |
| | | | Compliance and Risk at Morgan Stanley (2006 to 2011) |
| | | | |
| Rodney L. Ruehle, 1968 | Chief Compliance | Since | Director, Foreside Fund Officer Services, LLC (formerly Foreside |
| | Officer | November 2017 | Compliance Services, LLC) (financial services) (August 2016 to |
| | | | present); Director, Beacon Hill Fund Services, LLC (financial |
| | | | services)(April 2008 to July 2016) |
| | | | |
| Cynthia R. Bonna, 1984 | Chief Legal | Since | Chief Compliance Officer, WBI Investments, Inc. (2013 to present); |
| | Officer | June 2014 | Chief Compliance Officer, Hartshorne Group, Inc. (2013 to present); |
| | | | Counsel at WBI Investments, Inc. (July 2017 to present): Compliance |
| | | | Officer, Millington Securities, Inc. (2013 to 2014); Compliance |
| | | | Officer, WBI Investments, Inc. (2010 to 2013); Compliance Officer, |
| | | | Hartshorne Group, Inc. (2010 to 2013) |
(1) | The address of each Trustee or officer is c/o Absolute Shares Trust, 331 Newman Springs Road, Suite 122, Red Bank, New Jersey 07701. |
(2) | Trustees and Officers serve until their successors are duly elected and qualified. |
(3) | The Fund is part of a “Fund Complex” as defined in the 1940 Act. The Fund Complex includes all open-end funds (including all of their portfolios) advised by the Advisor or the Sub-Advisor and any funds that have an investment advisor that is an affiliated person of the Advisor. As of the date of this SAI, the Fund Complex consists of the 12 Funds of the Trust and three mutual funds separately advised by the Sub-Advisor. |
(4) | Don Schreiber Jr. and Matthew Schreiber are each an “interested person” of the Trust (as that term is defined in the 1940 Act) because of their affiliations with the Advisor and the Sub-Advisor. |
The Statement of Additional Information includes additional information about the Trustees as is available without charge, up on request, by calling toll free at (800)-772-5810, by accessing the SEC’s website at www.sec.gov, or by accessing the Fund’s website at www.wbishares.com.
| | Absolute Shares Trust | |
| Approval of Advisory Agreements and Board Considerations | |
| (Unaudited) | |
The Board (the members of which are referred to as “Trustees”) of the Trust met in person on May 17, 2018 to consider whether to renew: (1) the investment advisory agreement (“Advisory Agreement”) between the Trust, on behalf of the Funds, and the Advisor and (2) the investment sub- advisory agreement (the “Sub-Advisory Agreement”) between the Advisor and the Sub-Advisor. The Board considered renewing the Advisory Agreement and the Sub-Advisory Agreement and the engagement of the Advisor and the Sub-Advisor separately, although the advisers are affiliates.
In accordance with Section 15(c) of the Investment Company Act of 1940 (“1940 Act”), as amended, the Board requested, reviewed and considered materials furnished by the Advisor and the Sub-Advisor relevant to the Board’s consideration of whether to renew the Advisory Agreement and the Sub-Advisory Agreement. In connection with considering whether to renew the Advisory Agreement and Sub-Advisory Agreement, the Trustees who are not “interested persons” of the Trust, as that term is defined in the 1940 Act (the “Independent Trustees”), met in executive session with counsel to the Trust, who provided assistance and advice. The consideration of renewing the Advisory Agreement and Sub-Advisory Agreement was conducted by both the full Board and the Independent Trustees, who also voted separately.
During their review and consideration, the Board and the Independent Trustees focused on and analyzed the factors they deemed relevant, including, but not limited to: (1) the nature, extent and quality of the services provided by each of the Advisor and the Sub-Advisor; (2) the investment performance of each of the Advisor and the Sub-Advisor; (3) the costs of the services provided and profits realized by each of the Advisor and the Sub-Advisor and their affiliates from the relationship with the Trust; (4) the extent to which economies of scale have been realized as the Funds have grown; (5) any benefits derived or to be derived by each of the Advisor and the Sub-Advisor from the relationship with the Trust; and (6) potential conflicts of interest.
In reviewing such factors, the Board relied on certain information, including (1) copies of the Advisory Agreement, the Sub-Advisory Agreement and the Expense Limitation Agreement; (2) information describing the Advisor, the Sub-Advisor and the services provided thereby; (3) information regarding the compliance programs of the Advisor and the Sub-Advisor; (4) copies of the Forms ADV for the Advisor and the Sub-Advisor; and (5) memoranda and guidance from K&L Gates LLP on the fiduciary responsibilities of trustees, including Independent Trustees, in considering advisory and distribution agreements under the 1940 Act. In addition, the Board was provided data and information comparing the advisory fees and expenses of the Funds with expenses and performance of other exchange-traded funds (“ETFs”) with similar investment objectives and policies. The Trustees also considered their personal experiences as Trustees and participants in the ETF and mutual fund industry, as applicable.
In particular, the Trustees, including the Independent Trustees, considered and discussed the following with respect to the Funds:
1. The nature, extent and quality of the facilities and services provided by each of the Advisor and the Sub-Advisor. The Board received information on and considered the division of responsibility of services provided by the Advisor and the Sub-Advisor, including the fact that portfolio management would continue to be conducted by the Sub-Advisor. In addition to the Sub-Advisor’s performance managing the Funds, the Board reviewed the experience and resources that the Sub-Advisor had in managing strategies similar to those utilized by the Funds, including information regarding the education and experience of management and investment personnel.
The Board determined that the Funds would continue to benefit from the services and resources available from the Advisor and the Sub-Advisor, with respect to their responsibilities under the Advisory and Sub-Advisory Agreements. In particular, they noted the extensive experience of the Sub-Advisor’s management personnel in developing and administering strategies utilized by the Funds, as well as the performance history of the Sub-Advisor since its inception. The Board also noted the compliance regimes of the Advisor and the Sub-Advisor and their effectiveness.
2. The advisory fees paid by and overall expenses of the Funds. The Board considered comprehensive data and information comparing the advisory fees and expense ratios (taking into consideration the Expense Limitation Agreement) of the Funds. Although the Board determined that the Funds were distinct in ways from their peer group of ETFs, the Board determined that the advisory fees charged and overall expenses of the Funds were competitive and in line with the related universe of funds. In light of the nature, quality, and extent of services provided by the Advisor and Sub-Advisor and the costs incurred by the Advisor and Sub-Advisor in rendering those services, the Board concluded, taking into consideration indirect “fall-out” benefits the Advisor or the Sub-Advisor derive from its relationship to the Trust and the Funds, that the level of fees paid to the Advisor and Sub-Advisor with respect to each Fund were fair and reasonable.
3. Brokerage and portfolio transactions. The Board was presented with materials and a thorough discussion of the brokerage practices of the Advisor, in its capacity as an affiliated broker-dealer, and Sub-Advisor, including a walk-through of the Advisor’s ability to continue providing commission-free trading to the Funds and the Advisor’s track record for delivering effective brokerage execution services for the benefit of the Funds compared to services that could otherwise be expected from unaffiliated broker-dealers. The Advisor presented on its execution services and policies and the Sub-Advisor discussed its policies and procedures for allocating brokerage. Additionally, the Board considered information relating to the amount, sources and transactions generating payments for order flow that the Advisor received in its capacity as an affiliated broker-dealer the last year, in light of both the advisory fees paid and generally as related to the Advisor and/or Sub-Advisor obtaining the best net results upon execution of portfolio transactions for each of the Funds. The Independent Trustees determined the brokerage policies of both the Advisor and Sub-Advisor would continue to benefit the Funds.
4. Financial condition of each of the Advisor and the Sub-Advisor. After considering information relating to the financial condition of the Advisor and Sub-Advisor, as well as the fees and operating costs relating to the management of the Funds, the Board determined that each of the Advisor and Sub-Advisor continue to be capable of providing services to the Funds. In this determination, the Board considered the existence of the Expense Limitation Agreement (including the level of the expense limit for each Fund) and its impact on the profitability of the Sub-Advisor.
| | Absolute Shares Trust | |
| Approval of Advisory Agreements and Board Considerations | |
| (Unaudited) (concluded) | |
5. Possible conflicts of interest. The Board considered the experience and ability of the advisory personnel assigned to the Funds, soft-dollar arrangements and the brokerage policies of the Advisor (including a discussion of the execution policies and total compensation earned by the Advisor in its capacity as affiliated broker-dealer, in the form of commissions, fees and other remuneration received, including payment for order flow), and the substance and administration of the Codes of Ethics of the Trust, the Advisor and the Sub-Advisor. The Board determined that the compliance policies of the Trust, Advisor and Sub-Advisor were each reasonably designed to monitor for and prevent violations of the federal securities laws and breaches of fiduciary duties.
6. Effect of the Funds’ growth and size on its investment performance and expenses. The Board considered information relating to the year- over-year trading of the Funds. It determined that the expense ratios of the Funds were well suited in light of expectations for continued asset accumulation and projected growth therefrom.
Based on the foregoing and such other matters as were deemed relevant, and while no single factor was determinative in the decision, all of the Trustees, including the Independent Trustees, concluded that the advisory fee rates and total expense ratios are reasonable in relation to the services provided by the Advisor to the Funds, as well as the costs incurred and the benefits gained by the Advisor in providing such services. The Board also found the investment advisory fees, paid to the Advisor to be reasonable in comparison to the fees charged by advisers to other comparable funds of similar size. As a result, all of the Board members, including the Independent Trustees, approved the Advisory Agreement.
With respect to the Sub-Advisor and based on the foregoing analysis and such other matters as were deemed relevant, and while no single factor was determinative in the decision, all of the Trustees, including the Independent Trustees, concluded that the sub-advisory fee rates and total expense ratios are reasonable in relation to the services provided by the Sub-Advisor to the Funds, as well as the costs incurred and the benefits gained by the Sub-Advisor in providing such services. As a result, all of the Trustees, including the Independent Trustees, approved the Sub- Advisory Agreement.
| | Absolute Shares Trust | |
| Expense Examples | |
For the Six-Months Ended June 30, 2018 (Unaudited) | |
| | |
As a shareholder you incur two types of costs: (1) transaction costs, including brokerage commissions on purchases and sales of Fund shares, and (2) ongoing costs, including management fees and other Fund expenses. This example is intended to help you understand your ongoing costs (in dollars) of investing in the Fund and to compare these costs with the ongoing costs of investing in other funds. The example is based on an investment of $1,000 invested at the beginning of the period and held for the entire period (January 1, 2018 – June 30, 2018).
Actual Expenses
The first line of the table provides information about actual account values based on actual returns and actual expenses. You may use the information in this line, together with the amount you invested, to estimate the expenses that you paid over the period. Simply divide your account value by $1,000 (for example, an $8,600 account value divided by $1,000 = 8.6), then, multiply the result by the number in the first line under the heading entitled “Expenses Paid During the Period” to estimate the expenses you paid on your account during this period.
Hypothetical Example for Comparison Purposes
The second line of the table provides information about hypothetical account values based on a hypothetical return and hypothetical expenses based on the Fund’s actual expense ratio and an assumed rate of return of 5% per year before expenses, which is not the Fund’s actual return. The hypothetical account values and expenses may not be used to estimate the actual ending account balance or expenses you paid for the period. You may use this information to compare the ongoing costs of investing in the Fund and other funds. To do so, compare this 5% hypothetical example with the 5% hypothetical examples that appear in the shareholder reports of the other funds. Please note that the expenses shown in the table are meant to highlight your ongoing costs only and do not reflect any transactional costs, such as brokerage commissions paid on purchases and sales of Fund shares. Therefore, the second line of the table is useful in comparing ongoing costs only and will not help you determine the relative total costs of owning different funds. If these transactional costs were included, your costs would have been higher.
| WBI BullBear Rising Income 2000 ETF | | | |
| | Beginning | Ending | |
| | Account Value | Account Value | Expenses Paid |
| | January 1, 2018 | June 30, 2018 | During the Period^ |
| Actual | $1,000.00 | $ 975.70 | $5.10 |
| Hypothetical (5% annual return before expenses) | $1,000.00 | $1,019.63 | $5.22 |
| | | | |
| WBI BullBear Value 2000 ETF | | | |
| | Beginning | Ending | |
| | Account Value | Account Value | Expenses Paid |
| | January 1, 2018 | June 30, 2018 | During the Period^ |
| Actual | $1,000.00 | $ 927.30 | $5.20 |
| Hypothetical (5% annual return before expenses) | $1,000.00 | $1,019.40 | $5.45 |
| | | | |
| WBI BullBear Yield 2000 ETF | | | |
| | Beginning | Ending | |
| | Account Value | Account Value | Expenses Paid |
| | January 1, 2018 | June 30, 2018 | During the Period^ |
| Actual | $1,000.00 | $1,026.80 | $5.27 |
| Hypothetical (5% annual return before expenses) | $1,000.00 | $1,019.60 | $5.25 |
| | | | |
| WBI BullBear Quality 2000 ETF | | | |
| | Beginning | Ending | |
| | Account Value | Account Value | Expenses Paid |
| | January 1, 2018 | June 30, 2018 | During the Period^ |
| Actual | $1,000.00 | $ 965.20 | $5.27 |
| Hypothetical (5% annual return before expenses) | $1,000.00 | $1,019.43 | $5.42 |
| | | | |
| WBI BullBear Rising Income 1000 ETF | | | |
| | Beginning | Ending | |
| | Account Value | Account Value | Expenses Paid |
| | January 1, 2018 | June 30, 2018 | During the Period^ |
| Actual | $1,000.00 | $1,004.00 | $5.09 |
| Hypothetical (5% annual return before expenses) | $1,000.00 | $1,019.72 | $5.13 |
| | Absolute Shares Trust | |
Expense Examples (concluded) | |
| For the Six-Months Ended June 30, 2018 (Unaudited) | |
| WBI BullBear Value 1000 ETF | | | |
| | Beginning | Ending | |
| | Account Value | Account Value | Expenses Paid |
| | January 1, 2018 | June 30, 2018 | During the Period^ |
| Actual | $1,000.00 | $ 983.10 | $5.21 |
| Hypothetical (5% annual return before expenses) | $1,000.00 | $1,019.54 | $5.31 |
| | | | |
| WBI BullBear Yield 1000 ETF | | | |
| | Beginning | Ending | |
| | Account Value | Account Value | Expenses Paid |
| | January 1, 2018 | June 30, 2018 | During the Period^ |
| Actual | $1,000.00 | $1,007.10 | $5.14 |
| Hypothetical (5% annual return before expenses) | $1,000.00 | $1,019.67 | $5.17 |
| | | | |
| WBI BullBear Quality 1000 ETF | | | |
| | Beginning | Ending | |
| | Account Value | Account Value | Expenses Paid |
| | January 1, 2018 | June 30, 2018 | During the Period^ |
| Actual | $1,000.00 | $ 956.40 | $4.97 |
| Hypothetical (5% annual return before expenses) | $1,000.00 | $1,019.71 | $5.13 |
| | | | |
| WBI BullBear Global Income ETF | | | |
| | Beginning | Ending | |
| | Account Value | Account Value | Expenses Paid |
| | January 1, 2018 | June 30, 2018 | During the Period^ |
| Actual | $1,000.00 | $ 955.90 | $4.95 |
| Hypothetical (5% annual return before expenses) | $1,000.00 | $1,019.73 | $5.11 |
| | | | |
| WBI BullBear Global High Income ETF | | | |
| | Beginning | Ending | |
| | Account Value | Account Value | Expenses Paid |
| | January 1, 2018 | June 30, 2018 | During the Period^ |
| Actual | $1,000.00 | $ 970.10 | $5.00 |
| Hypothetical (5% annual return before expenses) | $1,000.00 | $1,019.72 | $5.12 |
| | | | |
| WBI BullBear Global Rotation ETF | | | |
| | Beginning | Ending | |
| | Account Value | Account Value | Expenses Paid |
| | January 1, 2018 | June 30, 2018 | During the Period^ |
| Actual | $1,000.00 | $ 977.60 | $6.13 |
| Hypothetical (5% annual return before expenses) | $1,000.00 | $1,018.60 | $6.26 |
| | | | |
| WBI Power Factor™ High Dividend ETF | | | |
| | Beginning | Ending | |
| | Account Value | Account Value | Expenses Paid |
| | January 1, 2018 | June 30, 2018 | During the Period^ |
| Actual | $1,000.00 | $1,035.70 | $3.53 |
| Hypothetical (5% annual return before expenses) | $1,000.00 | $1,021.32 | $3.51 |
| ^ | The dollar amounts shown as expenses paid during the period are equal to the annualized six-month expense ratio multiplied by the average account value during the period, multiplied by the number of days in the most recent six-month period, 181 days, and divided by the number of days in the most recent fiscal twelve-month period, 365 days. |
| | Absolute Shares Trust | |
Federal Tax Information (Unaudited) | |
| | |
QUALIFIED DIVIDEND INCOME/DIVIDENDS RECEIVED DEDUCTION
For the fiscal year ended June 30, 2018, certain dividends paid by the Funds may be subject to a maximum tax rate of 15%, as provided for by the Jobs and Growth Tax Relief Reconciliation Act of 2003.
The percentage of dividends declared from ordinary income designated as qualified dividend income was as follows:
| WBI BullBear Rising Income 2000 ETF | 100.00% |
| WBI BullBear Value 2000 ETF | 100.00% |
| WBI BullBear Yield 2000 ETF | 100.00% |
| WBI BullBear Quality 2000 ETF | 100.00% |
| WBI BullBear Rising Income 1000 ETF | 100.00% |
| WBI BullBear Value 1000 ETF | 100.00% |
| WBI BullBear Yield 1000 ETF | 100.00% |
| WBI BullBear Quality 1000 ETF | 100.00% |
| WBI BullBear Global Income ETF | 21.36% |
| WBI BullBear Global High Income ETF | 29.03% |
| WBI BullBear Global Rotation ETF | 58.03% |
| WBI Power Factor™ High Dividend ETF | 62.52% |
For corporate shareholders, the percent of ordinary income distributions qualifying for the corporate dividends received deduction for the fiscal year ended June 30, 2018 was as follows:
| WBI BullBear Rising Income 2000 ETF | 100.00% |
| WBI BullBear Value 2000 ETF | 100.00% |
| WBI BullBear Yield 2000 ETF | 100.00% |
| WBI BullBear Quality 2000 ETF | 100.00% |
| WBI BullBear Rising Income 1000 ETF | 100.00% |
| WBI BullBear Value 1000 ETF | 100.00% |
| WBI BullBear Yield 1000 ETF | 100.00% |
| WBI BullBear Quality 1000 ETF | 100.00% |
| WBI BullBear Global Income ETF | 21.30% |
| WBI BullBear Global High Income ETF | 28.40% |
| WBI BullBear Global Rotation ETF | 57.60% |
| WBI Power Factor™ High Dividend ETF | 56.30% |
The Percentage of taxable ordinary income distributions that are designated as short-term capital gain distributions under Internal Revenue Section 871(k)(2)(C) for each Fund were as follows:
| WBI BullBear Rising Income 2000 ETF | 0.00% |
| WBI BullBear Value 2000 ETF | 0.00% |
| WBI BullBear Yield 2000 ETF | 0.00% |
| WBI BullBear Quality 2000 ETF | 0.00% |
| WBI BullBear Rising Income 1000 ETF | 0.00% |
| WBI BullBear Value 1000 ETF | 0.00% |
| WBI BullBear Yield 1000 ETF | 0.00% |
| WBI BullBear Quality 1000 ETF | 0.00% |
| WBI BullBear Global Income ETF | 0.00% |
| WBI BullBear Global High Income ETF | 0.00% |
| WBI BullBear Global Rotation ETF | 0.00% |
| WBI Power Factor™ High Dividend ETF | 32.73% |
| | Absolute Shares Trust | |
| | |
| | |
Information About the Portfolio Holdings
(Unaudited)
The Trust files its complete schedules of portfolio holdings for its first and third fiscal quarters with the Securities and Exchange Commission (“SEC”) on Form N-Q. The Trust’s Form N-Q is available without charge, upon request, by calling toll-free at (800) 772-5810. Furthermore, you may obtain the Form N-Q on the SEC’s website at www.sec.gov. The Funds’ portfolio holdings are updated daily and posted on its website at www.wbishares.com.
Information About Proxy Voting
(Unaudited)
A description of the policies and procedures the Trust uses to determine how to vote proxies relating to portfolio securities is provided in the Statement of Additional Information (“SAI”). The SAI is available without charge, upon request, by calling toll-free at (800) 772-5810, by accessing the SEC’s website at www.sec.gov, or by accessing the Funds’ website at www.wbishares.com.
When available, information regarding how the Funds voted proxies relating to portfolio securities during the twelve-months ending June 30 will be available (1) by calling toll-free at (800) 772-5810 and (2) by accessing the SEC’s website at www.sec.gov.
Frequency Distributions of Premiums and Discounts
(Unaudited)
Information regarding how often shares of the Funds trade on an exchange at a price above (i.e., at a premium) or below (i.e., at a discount) the NAV of the Funds is available, without charge, on the Funds’ website at www.wbishares.com.
(This page intentionally left blank.)
| | Absolute Shares Trust | |
| | |
| | |
Advisor
Millington Securities, Inc.
331 Newman Springs Rd Suite 101
Red Bank, New Jersey 07701
Sub-Advisor
WBI Investments, Inc.
331 Newman Springs Rd Suite 122
Red Bank, New Jersey 07701
Index Provider
Solactive AG
60325 Frankfurt am Main, Germany
Distributor
Foreside Fund Services, LLC
Three Canal Plaza, Suite 100
Portland, Maine 04101
Custodian
U.S. Bank National Association
Custody Operations
1555 North Rivercenter Drive, Suite 302
Milwaukee, Wisconsin 53212
Transfer Agent
U.S. Bancorp Fund Services, LLC
615 East Michigan Street
Milwaukee, Wisconsin 53202
Securities Lending Agent
U.S. Bank, National Association
Securities Lending
800 Nicolet Mall
Minneapolis, Minnesota 55402-7020
Independent Registered Public Accounting Firm
KPMG LLP
51 John F. Kennedy Parkway
Short Hills, New Jersey 07078
Legal Counsel
K&L Gates LLP
599 Lexington Avenue
New York, New York 10022
| | Absolute Shares Trust | |
| | |
| | |
| | WBI BullBear Rising Income 2000 ETF | WBIA |
| | WBI BullBear Value 2000 ETF | WBIB |
| | WBI BullBear Yield 2000 ETF | WBIC |
| | WBI BullBear Quality 2000 ETF | WBID |
| | WBI BullBear Rising Income 1000 ETF | WBIE |
| | WBI BullBear Value 1000 ETF | WBIF |
| | WBI BullBear Yield 1000 ETF | WBIG |
| | WBI BullBear Quality 1000 ETF | WBIL |
| | WBI BullBear Global Income ETF | WBII |
| | WBI BullBear Global High Income ETF | WBIH |
| | WBI BullBear Global Rotation ETF | WBIR |
| | WBI Power Factor™ High Dividend ETF | WBIY |
Item 2. Code of Ethics.
The registrant has adopted a code of ethics that applies to the registrant’s principal executive officer and principal financial officer. The registrant has not made any substantive amendments to its code of ethics during the period covered by this report. The registrant has not granted any waivers from any provisions of the code of ethics during the period covered by this report.
A copy of the registrant’s Code of Ethics is filed herewith.
Item 3. Audit Committee Financial Expert.
The registrant’s board of trustees has determined that there is at least one audit committee financial expert serving on its audit committee. John A. Flanagan is the “audit committee financial expert” and is considered to be “independent” as each term is defined in Item 3 of Form N‑CSR.
Item 4. Principal Accountant Fees and Services.
The registrant has engaged its principal accountant to perform audit services, audit-related services, tax services and other services during the past two fiscal years. “Audit services” refer to performing an audit of the registrant's annual financial statements or services that are normally provided by the accountant in connection with statutory and regulatory filings or engagements for those fiscal years. “Audit-related services” refer to the assurance and related services by the principal accountant that are reasonably related to the performance of the audit. “Tax services” refer to professional services rendered by the principal accountant for tax compliance, tax advice, and tax planning. There were no “Other services” provided by the principal accountant. The following table details the aggregate fees billed or expected to be billed for each of the last two fiscal years for audit fees, audit-related fees, tax fees and other fees by the principal accountant.
| WBI BullBear Rising Income 2000 ETF | FYE 06/30/2018 | FYE 06/30/2017 |
| Audit Fees | $12,200 | $12,000 |
| Audit-Related Fees | N/A | N/A |
| Tax Fees | $5,100 | $5,000 |
| All Other Fees | N/A | N/A |
| WBI BullBear Value 2000 ETF | FYE 06/30/2018 | FYE 06/30/2017 |
| Audit Fees | $12,200 | $12,000 |
| Audit-Related Fees | N/A | N/A |
| Tax Fees | $5,100 | $5,000 |
| All Other Fees | N/A | N/A |
| WBI BullBear Yield 2000 ETF | FYE 06/30/2018 | FYE 06/30/2017 |
| Audit Fees | $12,200 | $12,000 |
| Audit-Related Fees | N/A | N/A |
| Tax Fees | $5,100 | $5,000 |
| All Other Fees | N/A | N/A |
| WBI BullBear Quality 2000 ETF | FYE 06/30/2018 | FYE 06/30/2017 |
| Audit Fees | $12,200 | $12,000 |
| Audit-Related Fees | N/A | N/A |
| Tax Fees | $5,100 | $5,000 |
| All Other Fees | N/A | N/A |
| WBI BullBear Rising Income 1000 ETF | FYE 06/30/2018 | FYE 06/30/2017 |
| Audit Fees | $12,200 | $12,000 |
| Audit-Related Fees | N/A | N/A |
| Tax Fees | $5,100 | $5,000 |
| All Other Fees | N/A | N/A |
| WBI BullBear Value 1000 ETF | FYE 06/30/2018 | FYE 06/30/2017 |
| Audit Fees | $12,200 | $12,000 |
| Audit-Related Fees | N/A | N/A |
| Tax Fees | $5,100 | $5,000 |
| All Other Fees | N/A | N/A |
| WBI BullBear Yield 1000 ETF | FYE 06/30/2018 | FYE 06/30/2017 |
| Audit Fees | $12,200 | $12,000 |
| Audit-Related Fees | N/A | N/A |
| Tax Fees | $5,100 | $5,000 |
| All Other Fees | N/A | N/A |
| WBI BullBear Quality 1000 ETF | FYE 06/30/2018 | FYE 06/30/2017 |
| Audit Fees | $12,200 | $12,000 |
| Audit-Related Fees | N/A | N/A |
| Tax Fees | $5,100 | $5,000 |
| All Other Fees | N/A | N/A |
| WBI BullBear Global Income ETF | FYE 06/30/2018 | FYE 06/30/2017 |
| Audit Fees | $12,200 | $12,000 |
| Audit-Related Fees | N/A | N/A |
| Tax Fees | $5,100 | $5,000 |
| All Other Fees | N/A | N/A |
| WBI BullBear Global High Income ETF | FYE 06/30/2018 | FYE 06/30/2017 |
| Audit Fees | $12,200 | $12,000 |
| Audit-Related Fees | N/A | N/A |
| Tax Fees | $5,100 | $5,000 |
| All Other Fees | N/A | N/A |
| | | |
| WBI BullBear Global Rotation ETF | FYE 06/30/2018 | FYE 06/30/2017 |
| Audit Fees | $10,000 | $10,000 |
| Audit-Related Fees | N/A | N/A |
| Tax Fees | $5,100 | $5,000 |
| All Other Fees | N/A | N/A |
WBI Power FactorTM High Dividend ETF | FYE 06/30/2018 | FYE 06/30/2017 |
| Audit Fees | $10,000 | $7,500 |
| Audit-Related Fees | N/A | N/A |
| Tax Fees | $5,100 | $5,000 |
| All Other Fees | N/A | N/A |
The audit committee has adopted pre-approval policies and procedures that require the audit committee to pre‑approve all audit and non‑audit services of the registrant, including services provided to any entity affiliated with the registrant.
The percentage of fees billed by KPMG LLP applicable to non-audit services pursuant to waiver of pre-approval requirement were as follows:
| | FYE 06/30/2018 | FYE 06/30/2017 |
| Audit-Related Fees | 0% | 0% |
| Tax Fees | 0% | 0% |
| All Other Fees | 0% | 0% |
All of the principal accountant’s hours spent on auditing the registrant’s financial statements were attributed to work performed by full‑time permanent employees of the principal accountant. (If more than 50 percent of the accountant’s hours were spent to audit the registrant's financial statements for the most recent fiscal year, state how many hours were attributed to work performed by persons other than the principal accountant's full-time, permanent employees.)
The following table indicates the non-audit fees billed or expected to be billed by the registrant’s accountant for services to the registrant and to the registrant’s investment adviser (and any other controlling entity, etc.—not sub-adviser) for the last two years. The audit committee of the board of trustees/directors has considered whether the provision of non-audit services that were rendered to the registrant's investment adviser is compatible with maintaining the principal accountant's independence and has concluded that the provision of such non-audit services by the accountant has not compromised the accountant’s independence.
| Non-Audit Related Fees | FYE 06/30/2018 | FYE 06/30/2017 |
| Registrant | N/A | N/A |
| Registrant’s Investment Adviser | | |
Item 5. Audit Committee of Listed Registrants.
The registrant is an issuer as defined in Rule 10A-3 under the Securities Exchange Act of 1934, (the “Act”) and has a separately-designated standing audit committee established in accordance with Section 3(a)(58)(A) of the Act. The independent members of the committee are as follows: Andrew Putterman, Jude T. Depko, John A. Flanagan.
Item 6. Investments.
Schedule of Investments is included as part of the report to shareholders filed under Item 1 of this Form.
Item 7. Disclosure of Proxy Voting Policies and Procedures for Closed-End Management Investment Companies.
Not applicable to open-end investment companies.
Item 8. Portfolio Managers of Closed-End Management Investment Companies.
Not applicable to open-end investment companies.
Item 9. Purchases of Equity Securities by Closed‑End Management Investment Company and Affiliated Purchasers.
Not applicable to open-end investment companies.
Item 10. Submission of Matters to a Vote of Security Holders.
There have been no material changes to the procedures by which shareholders may recommend nominees to the registrant’s Board of Trustees.
Item 11. Controls and Procedures.
| (a) | The Registrant’s Principal Executive Officer and Principal Financial Officer have reviewed the Registrant's disclosure controls and procedures (as defined in Rule 30a-3(c) under the Investment Company Act of 1940 (the “Act”)) as of a date within 90 days of the filing of this report, as required by Rule 30a-3(b) under the Act and Rules 13a-15(b) or 15d‑15(b) under the Securities Exchange Act of 1934. Based on their review, such officers have concluded that the disclosure controls and procedures are effective in ensuring that information required to be disclosed in this report is appropriately recorded, processed, summarized and reported and made known to them by others within the Registrant and by the Registrant’s service provider. |
| (b) | There were no changes in the Registrant's internal control over financial reporting (as defined in Rule 30a-3(d) under the Act) that occurred during the second fiscal quarter of the period covered by this report that has materially affected, or is reasonably likely to materially affect, the Registrant's internal control over financial reporting. |
Item 12. Disclosure of Securities Lending Activities for Closed-End Management Investment Companies
Not applicable to open-end investment companies.
Item 13. Exhibits.
| (a) | (1) Any code of ethics or amendment thereto, that is the subject of the disclosure required by Item 2, to the extent that the registrant intends to satisfy Item 2 requirements through filing an exhibit. Filed herewith |
(2) A separate certification for each principal executive officer and principal financial officer pursuant to Section 302 of the Sarbanes-Oxley Act of 2002. Filed herewith.
(3) Any written solicitation to purchase securities under Rule 23c‑1 under the Act sent or given during the period covered by the report by or on behalf of the registrant to 10 or more persons. Not applicable to open-end investment companies.
(4) Change in the registrant’s independent public accountant. There was no change in the registrant’s independent public accountant for the period covered by this report.
| (b) | Certifications pursuant to Section 906 of the Sarbanes‑Oxley Act of 2002. Furnished herewith. |
SIGNATURES
Pursuant to the requirements of the Securities Exchange Act of 1934 and the Investment Company Act of 1940, the registrant has duly caused this report to be signed on its behalf by the undersigned, thereunto duly authorized.
(Registrant) Absolute Shares Trust
By (Signature and Title)* /s/ Don Schreiber, Jr.
Don Schreiber, Jr., President and Principal Executive Officer
Date September 5, 2018
Pursuant to the requirements of the Securities Exchange Act of 1934 and the Investment Company Act of 1940, this report has been signed below by the following persons on behalf of the registrant and in the capacities and on the dates indicated.
By (Signature and Title)* /s/ Don Schreiber, Jr.
Don Schreiber, Jr., President and Principal Executive Officer
Date September 5, 2018
By (Signature and Title)* /s/ Tracey Crespo
Tracey Crespo, Treasurer and Principal Financial Officer
Date September 5, 2018
* Print the name and title of each signing officer under his or her signature.