ANNUAL REPORT
June 30, 2020
WBI BullBear Rising Income 3000 ETF | WBIE
WBI BullBear Value 3000 ETF | WBIF
WBI BullBear Yield 3000 ETF | WBIG
WBI BullBear Quality 3000 ETF | WBIL
WBI BullBear Global Income ETF | WBII
WBI Power Factor® High Dividend ETF | WBIY
WBI BullBear Trend Switch US 3000 Total Return ETF | WBIT
WBI BullBear Trend Switch US Total Return ETF | WBIN
Beginning on January 1, 2021, as permitted by regulations adopted by the U.S. Securities and Exchange Commission, paper copies of the Fund’s shareholder reports will no longer be sent by mail, unless you specifically request paper copies of the Fund’s reports from your financial intermediary, such as a broker-dealer or bank. Instead, the reports will be made available on a website, and you will be notified by mail each time a report is posted and provided with a website link to access the report.
If you already elected to receive shareholder reports electronically, you will not be affected by this change and you need not take any action. Please contact your financial intermediary to elect to receive shareholder reports and other Fund communications electronically.
You may elect to receive all future reports in paper free of charge. Please contact your financial intermediary to inform them that you wish to continue receiving paper copies of shareholder reports and for details about whether your election to receive reports in paper will apply to all funds held with your financial intermediary.
 | Absolute Shares Trust |
|
| |
| |
Management’s Discussion of Fund Performance | | | 1 |
Performance Summaries | | | 11 |
Portfolio Allocations | | | 19 |
Schedules of Investments | | | 20 |
Statements of Assets and Liabilities | | | 29 |
Statements of Operations | | | 31 |
Statements of Changes in Net Assets | | | 33 |
Financial Highlights | | | 35 |
Notes to Financial Statements | | | 39 |
Report of Independent Registered Public Accounting Firm | | | 50 |
Trustees and Officers | | | 51 |
Approval of Advisory Agreements and Board Considerations | | | 54 |
Expense Examples | | | 56 |
Federal Tax Information | | | 58 |
Information About the Portfolio Holdings | | | 59 |
Information About Proxy Voting | | | 59 |
Information About the Funds’ Trustees | | | 59 |
Frequency Distributions of Premiums and Discounts | | | 59 |
(This page intentionally left blank.)
| Absolute Shares Trust |
| |
| Management’s Discussion of Fund Performance |
| June 30, 2020 (Unaudited) |
|
Dear Fellow Shareholder:
In our experience, the conditions that affect investments are consistently subject to the possibility of uncertainty and change. We believe that the appropriate approach to investing in a volatile world is one that is responsive to continually changing conditions and opportunities. We think that process should be focused on managing risk as well as on pursuing return. It should be disciplined and have a track record that spans both good times and bad. In short, our opinion is that it should be just like the process we have used for our investment management clients for nearly 30 years and continue to use to manage the Funds today. We believe the consistent application of this disciplined approach will continue to be extremely valuable and attractive to current and prospective shareholders.
We appreciate the continuing confidence of our existing shareholders and welcome our new shareholders to the Funds.
Investment Philosophy
WBI’s general investment philosophy is primarily based on our belief that protecting capital is essential to providing long-term portfolio growth or a consistent stream of income. We believe it is important to offer a variety of alternatives that investors can choose from as they address changing circumstances. The ability to adapt and evolve as risks and opportunities appear is the key to pursuing a stable outcome in an uncertain world. The goal of the WBI Funds is to provide consistent, attractive returns with less volatility and risk to capital than traditional approaches.
WBI Funds include actively managed, passive (“smart-beta”) and trend-switch based portfolio strategies. Actively managed strategies include multifactor security selection models with our advanced dynamic trailing stop process to protect capital. The passively managed smart-beta strategy is designed to provide an investment alternative for clients seeking returns based on multifactor security selection models in a portfolio that is generally fully invested and rebalances quarterly. The trend-switch strategies utilize quantitative trend models to optimize risk and return for domestic stock and fixed income exposure.
Performance Overview
In response to market volatility during the most recent fiscal period, the actively managed equity-focused Funds periodically held significant allocations to cash equivalents, contributing to differences in performance between each Fund and its respective benchmark.
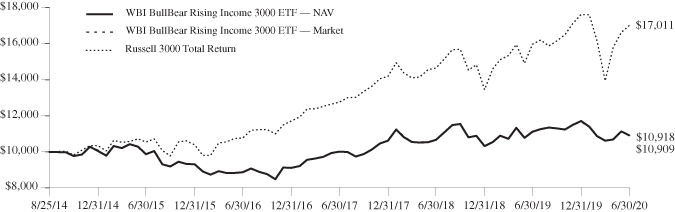
The WBI BullBear Rising Income 3000 ETF (NYSE Arca: WBIE) returned -1.89% on a NAV basis, and -1.73% based on market value, versus the 6.53% return of the Russell 3000 Total Return Index, the Fund’s benchmark.
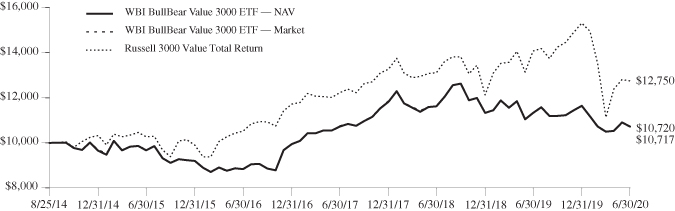
The WBI BullBear Value 3000 ETF (NYSE Arca: WBIF) returned -5.40% on a NAV basis, and -5.30% based on market value, versus the -9.42% return of the Russell 3000 Value Total Return Index, the Fund’s benchmark.
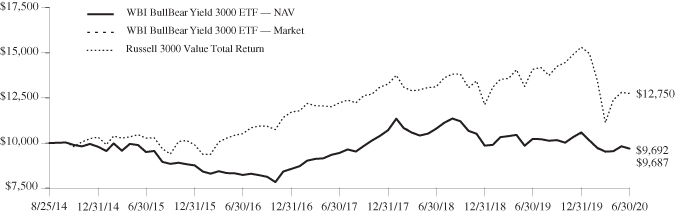
The WBI BullBear Yield 3000 ETF (NYSE Arca: WBIG) returned -5.22% on a NAV basis, and -5.07% based on market value, versus the -9.42% return of the Russell 3000 Value Total Return Index, the Fund’s benchmark.
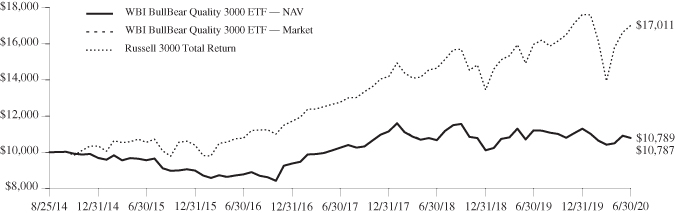
The WBI BullBear Quality 3000 ETF (NYSE Arca: WBIL) returned -3.79% on a NAV basis, and -3.69% based on market value, versus the 6.53% return of the Russell 3000 Total Return Index, the Fund’s benchmark.
The WBI BullBear Global Income ETF (NYSE Arca: WBII) returned -2.97% on a NAV basis, and -2.87% based on market value, versus the 8.74% return of the Bloomberg Barclays US Aggregate Bond Total Return Index, the Fund’s benchmark.
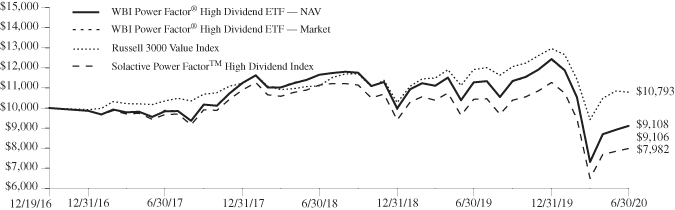
The WBI Power Factor® High Dividend ETF (NYSE Arca: WBIY) returned -19.24% on a NAV basis, and -19.08% based on market value, versus the -9.42% return of the Russell 3000 Value Total Return Index, the Fund’s benchmark, and versus the -18.98% return of the Solactive Power FactorTM High Dividend GTR Index, the Fund’s underlying index.
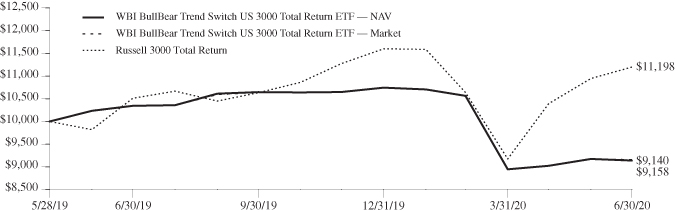
The WBI BullBear Trend Switch US 3000 Total Return ETF (NYSE Arca: WBIT) returned -11.65% on a NAV basis, and -11.55% based on market value, versus the 6.53% of the Russell 3000 Total Return Index, the Fund’s benchmark.
The WBI BullBear Trend Switch US Total Return ETF (NYSE Arca: WBIN) returned, since the Fund’s inception date of 7/18/2019, -11.49% on a NAV basis, and -11.64% based on market value, versus the 8.69% return of the Bloomberg Barclays US Aggregate Bond Total Return Index, the Fund’s benchmark.
Net asset value total return is calculated assuming an initial investment made at the net asset value at the beginning of the period, reinvestment of all dividends and distributions at net asset value during the period, and the redemption on the last day of the period. Net asset value total return includes adjustments in accordance with accounting principles generally accepted in the United States of America and as such, the net asset value for financial reporting purposes and the returns based upon those net asset values may differ from the net asset value and returns for shareholder transactions. Market price total return is calculated assuming an initial investment made at the market price at the beginning of the period, reinvestment of all dividends and distributions at market price during the period, and sale at the market price on the last day of the period. Total investment returns calculated for a period of less than one year are not annualized.
| Absolute Shares Trust |
| |
Management’s Discussion of Fund Performance (continued) |
| June 30, 2020 (Unaudited) |
|
With the exception of the passive index Fund, the WBI Power Factor® High Dividend ETF, the strategies used in the management of the Funds do not attempt to replicate or track the performance of any index and differ significantly from the methods used to construct and maintain the indices that serve as their respective benchmarks. The four actively managed equity-focused Funds (“Active Equity Funds”) use proprietary processes to screen, rank, and purchase securities with particular attributes, and sell securities when certain thresholds are reached, while benchmark indices are unmanaged, and consist of a passive representation of all securities that meet the definition of the index constituents. In addition, each Active Equity Fund uses strategies intended to mitigate volatility and protect capital, and as a result these Funds will often have a significant allocation to cash equivalents. Therefore, while each Active Equity Fund’s performance includes the effect of an investment in cash equivalents from the proceeds of sales when certain thresholds are met, benchmark indices do not include an allocation to cash equivalents.
A distinguishing characteristic of cash equivalents is that their prices are extremely stable and not subject to the levels of price volatility generally exhibited by other investments. Therefore, in periods during which the prices of the securities represented in benchmark indices are falling, an allocation to cash equivalents may contribute to Active Equity Fund performance that is superior to that of their benchmarks. In periods during which the prices of the securities represented in benchmark indices are rising, an allocation to cash equivalents in an Active Equity Fund may cause its performance to trail that of its benchmark. You cannot invest directly in an index, including a benchmark index, and benchmark performance does not include the deduction of transaction and operational expenses, or the deduction of an investment management fee, which would alter their indicated historical results.
Similarly, the WBI BullBear Global Income ETF (the “Active Income Fund”), as well as both the WBI BullBear Trend Switch US 3000 Total Return ETF and the WBI BullBear Trend Switch US Total Return ETF (the “Trend Switch Funds”) do not attempt to replicate or track the performance of any index and differ significantly from the methods used to construct and maintain the index that serves as their respective benchmarks. The Trend Switch Funds aim to optimize risk and return by utilizing either a quantitative equity model (the “Equity Model”) to evaluate when conditions are deemed favorable for equity market exposure, and/or a quantitative bond model (the “Bond Model”) which is used to identify the credit quality and duration exposure that will be implemented in a Fund. The WBI BullBear Global Income ETF strategy currently relies upon a combination of the Bond Model’s recommended exposure along with tactical investments in perceived lower risk and higher return opportunities in varying segments of the fixed income or equity markets.
The WBI Power Factor® High Dividend ETF (the “Passive Index Fund”) is intended to track its underlying index, the Solactive Power Factor™ High Dividend GTR Index, and can reasonably be compared to the index in evaluating its performance.
Review of Fund Trading Activity
The Active Funds attempt to provide consistent, attractive returns net of expenses with potentially less volatility and risk to capital than traditional approaches, whatever market conditions may be. The investment process for each Fund includes a buy discipline and a sell discipline. Each Fund’s trading activity reflects this disciplined investment process as described in its prospectus and summarized below.
The Active Equity Funds that invest in individual equities primarily use quantitative computer screening of fundamental stock information to evaluate domestic and foreign equity securities in an attempt to find companies with attractive characteristics for the selected universe of securities. Dividend payments may be considered as part of the evaluation process. Once securities are identified, an overlay of technical analysis confirms timeliness of security purchases. The Funds then add qualifying securities using available cash within the parameters of each Fund’s investment objective and security selection criteria.
Typically, once a security is purchased for a given Active Equity Fund, a strict sell discipline with a dynamic trailing stop loss and goal setting process attempts to control the effects of volatility for each invested position on the Fund’s value. An initial stop percentage and goal price is established at the time a security is purchased. As that security’s specified goal price is approached, the initial stop tolerance set for each security is tightened. If a security stays within its acceptable price channel relative to its current stop, it remains in the Fund’s portfolio. If the security moves below the acceptable price channel, a stop is triggered, and the Fund will sell the security. This results in a responsive process that actively adjusts the Fund’s allocation by causing it to become more fully invested or by raising cash with the intention of protecting capital. This process is likely to result in a Fund holding meaningful allocations to cash equivalents during periods of market volatility.
The WBI BullBear Global Income ETF uses proprietary quantitative models to assess the appropriate credit quality and duration of its exposure to debt securities. Credit quality is a measure of a borrower’s creditworthiness or risk of default. Duration is a measure of a fixed income security’s expected price sensitivity to changes in interest rates. Securities with longer durations are expected to experience greater price movements than securities with shorter duration for the same change in prevailing interest rates. A portion of the Fund’s exposure will also be invested to pursue perceived opportunities for high income and/or return in varying segments of the fixed income or equity market.
The WBI BullBear Trend Switch US 3000 Total Return ETF uses proprietary quantitative models to assess the perceived risk and return opportunities for both the equity and fixed income markets. The Equity Model is first used to determine whether conditions for risk are perceived to be low in which case the Fund will implement exposure to equity markets. However, if the Equity Model suggests that conditions for risk are high in the equity market, the Fund eliminates any equity exposure and relies upon the Bond Model to identify the appropriate credit quality and duration exposure to debt securities that it will implement.
The WBI BullBear Trend Switch US Total Return ETF uses the Bond Model to identify the appropriate credit quality and duration exposure to debt securities that it will implement.
| Absolute Shares Trust |
| |
Management’s Discussion of Fund Performance (continued)
|
| June 30, 2020 (Unaudited) |
|
The WBI Power Factor® High Dividend ETF seeks to achieve its investment objective by attempting to track the investment results of the Solactive Power Factor™ High Dividend GTR Index. The index is designed to select securities from the Solactive US Broad Market Index that exhibit certain yield and fundamental value characteristics. In particular, the Solactive Power Factor™ High Dividend GTR Index is designed to select equity securities with an above-average forecasted dividend yield, scored on the basis of three fundamental value characteristics (the “Power Factors®”). Quarterly rebalancing of the Passive Index Fund helps enforce a buy low – sell high discipline by locking in gains on stocks that have had outsized appreciation and seeks to confirm the strongest quality fundamentals for its constituents on a quarterly basis.
WBI BullBear Rising Income 3000 ETF (WBIE)
As of June 30, 2020, WBIE held 17 securities in addition to a position in a money market fund which served as a cash equivalent. Ebay Inc., Microsoft Corp, Amazon.com Inc. Clorox Company and NVIDIA Corp. were some of the largest positions in the Fund on this date.
Examples of securities that made positive contributions to WBIE’s performance during the fiscal period include Ebay Inc., AbbVie Inc., NVIDIA Corp, Microsoft Corp and Ross Stores Inc. Examples of securities that detracted from the Fund’s performance during the fiscal period include Hasbro Inc., Citizens Financial Group, Bank of America Corp and Synchrony Financial.
As the equity market began its rapid decline in February and March of 2020 due to COVID-19, the Fund’s sell discipline worked well and liquidated positions quickly to raise cash and protect investor capital.
High turnover in WBIE’s holdings has the potential to result in the realization and distribution to shareholders of higher capital gains. If Fund shares are held in a taxable account, this may increase your tax liability. To the extent portfolio turnover increases transaction costs, it may also reduce Fund performance. Of course, selling a security in a timely fashion may also improve performance if a subsequent loss is avoided that exceeds the cost of executing the sale.
WBI BullBear Value 3000 ETF (WBIF)
As of June 30, 2020, WBIF held 17 securities in addition to a position in a money market fund which served as a cash equivalent. Accenture, Ebay Inc., Illinois Tool Works, Amazon.com Inc. and Clorox Company were some of the largest positions in the Fund on this date.
Examples of securities that made positive contributions to WBIF’s performance during the fiscal period include NXP Semiconductors, NVIDIA Corp, Ebay Inc., Microsoft Corp, and Bristol-Myers Squibb Co. Examples of securities that detracted from the Fund’s performance during the fiscal period include Ameriprise Financial Inc., Cisco Systems Inc., Emerson Electric Co., Fifth Third Bancorp, and Qualcomm Inc.
As the equity market began its rapid decline in February and March of 2020 due to COVID-19, the Fund’s sell discipline worked well and liquidated positions quickly to raise cash and protect investor capital.
High turnover in WBIF’s holdings has the potential to result in the realization and distribution to shareholders of higher capital gains. If Fund shares are held in a taxable account, this may increase your tax liability. To the extent portfolio turnover increases transaction costs, it may also reduce Fund performance. Of course, selling a security in a timely fashion may also improve performance if a subsequent loss is avoided that exceeds the cost of executing the sale.
WBI BullBear Yield 3000 ETF (WBIG)
As of June 30, 2020, WBIG held 15 securities in addition to a position in a money market fund which served as a cash equivalent. Amazon.com Inc., Ebay Inc., Adobe Inc., Accenture, and Visa Inc. were some of the largest positions in the Fund on this date.
Examples of securities that made positive contributions to WBIG’s performance during the fiscal period include Ebay Inc., NVIDIA Corp, Target Corp, and Bristol-Myers Squibb Co. Examples of securities that detracted from the Fund’s performance during the fiscal period include Principal Financial Group, IBM Corp, Fifth Third Bancorp, and Emerson Electric Co.
As the equity market began its rapid decline in February and March of 2020 due to COVID-19, the Fund’s sell discipline worked well and liquidated positions quickly to raise cash and protect investor capital.
High turnover in WBIG’s holdings has the potential to result in the realization and distribution to shareholders of higher capital gains. If Fund shares are held in a taxable account, this may increase your tax liability. To the extent portfolio turnover increases transaction costs, it may also reduce Fund performance. Of course, selling a security in a timely fashion may also improve performance if a subsequent loss is avoided that exceeds the cost of executing the sale.
WBI BullBear Quality 3000 ETF (WBIL)
As of June 30, 2020, WBIL held 16 securities in addition to a position in a money market fund which served as a cash equivalent. Adobe Inc., Amazon.com Inc., Amgen Inc., Church & Dwight Co Inc., and Clorox Co. were some of the largest positions in the Fund on this date.
Examples of securities that made positive contributions to WBIL’s performance during the fiscal period include Ebay Inc., NVIDIA Corp, Microsoft Corp, AbbVie Inc., and Bristol-Myers Squibb Co. Examples of securities that detracted from the Fund’s performance during the fiscal period include Hasbro Inc., Northrop Grumman Corp, Darden Restaurants Inc., Navient Corp, and LPL Financial Holdings Inc.
As the equity market began its rapid decline in February and March of 2020 due to COVID-19, the Fund’s sell discipline worked well and liquidated positions quickly to raise cash and protect investor capital.
| Absolute Shares Trust |
| |
Management’s Discussion of Fund Performance (continued)
|
| June 30, 2020 (Unaudited) |
|
High turnover in WBIL’s holdings has the potential to result in the realization and distribution to shareholders of higher capital gains. If Fund shares are held in a taxable account, this may increase your tax liability. To the extent portfolio turnover increases transaction costs, it may also reduce Fund performance. Of course, selling a security in a timely fashion may also improve performance if a subsequent loss is avoided that exceeds the cost of executing the sale.
WBI BullBear Global Income ETF (WBII)
As of June 30, 2020, WBII held 5 securities in addition to a position in a money market fund which served as a cash equivalent. The SPDR Bloomberg Barclays High Yield Bond Fund and the iShares iBoxx High Yield Corporate Bond Fund were some of the largest positions in the Fund on this date.
Examples of securities that made positive contributions to WBII’s performance during the fiscal period include the Vanguard Long-Term Corporate Bond Fund, the SPDR Portfolio Long Term Treasury Fund, and the iShares iBoxx High Yield Corporate Bond Fund. Examples of securities that detracted from the Fund’s performance during the fiscal period include the Vanguard Long-Term Treasury Fund, the iShares 20+ Year Treasury Bond Fund and the Xtrackers USD High Yield Corporate Bond Fund.
A significant detraction from Fund performance during the fiscal period occurred over a two-day timespan as the equity market sold off rapidly and there was a significant rotation in fixed-income markets combined with a temporary liquidity crunch. The “perfect storm” occurred on the same day the Bond Model indicated that a switch from High Yield to Treasury exposure was required on March 9, 2020. Although the switch to a safer asset class was considered appropriate as the market would eventually decline rapidly until its March 23rd low, the fact that the switch occurred on the same day as record-breaking market volatility was an unfortunate coincidence. That day, global equity markets dropped the most since the Great Recession in 2008 as the COVID-19 pandemic response was exacerbated by an oil price war between Russia and Saudi Arabia. Before trading even started on March 9, equity and high yield bond markets were already down significantly in overnight activity (the S&P 500 Index was down more than -5%), and safe-haven assets like U.S. Treasuries were skyrocketing from a “flight to quality”. Fund management had to sell High Yield positions after they already had record breaking moves down in overnight activity, and, simultaneously buy Treasury positions after they already had record breaking moves up in overnight activity. Subsequently, on March 10, the government and Federal Reserve stepped in and a complete reversal in all markets occurred (so the Treasury positions now held in the Fund immediately dropped from their all-time highs). The Bond Model signal provided a good indicator; however, the timing of the market activity caused the Fund to drop by approximately -7% in just two days, which may have been avoided if the violent market moves occurred just one day later.
High turnover in WBII’s holdings has the potential to result in the realization and distribution to shareholders of higher capital gains. If Fund shares are held in a taxable account, this may increase your tax liability. To the extent portfolio turnover increases transaction costs, it may also reduce Fund performance. Of course, selling a security in a timely fashion may also improve performance if a subsequent loss is avoided that exceeds the cost of executing the sale.
WBI Power Factor® High Dividend (WBIY)
WBIY is intended to track the Solactive Power Factor™ High Dividend Index, and its trading activity results from changes to the holdings of this underlying index. The composition of the underlying index is adjusted quarterly and screened monthly for dividend cuts or an overall negative outlook concerning the member companies’ dividend policy.
As of June 30, 2020, WBIY held 50 securities in addition to a position in a money market fund which served as a cash equivalent. Santander Consumer USA, Marathon Petroleum Corp, AbbVie Inc., Lyondell Basell Industries, and Foot Locker Inc. were some of the largest positions in the Fund on that date.
Examples of securities that made positive contributions to WBIY’s performance during the fiscal period include Marathon Petroleum Corp, Big Lots Inc., AbbVie Inc., Foot Locker Inc., and Schlumberger Ltd. Examples of securities that detracted from the Fund’s performance during the fiscal period include Macy’s Inc., Ford Motor Co, Cadence Bancorp, Kohls Corp and The Gap Inc.
High turnover in WBIY’s holdings has the potential to result in the realization and distribution to shareholders of higher capital gains. If Fund shares are held in a taxable account, this may increase your tax liability. To the extent portfolio turnover increases transaction costs, it may also reduce Fund performance. Of course, selling a security in a timely fashion may also improve performance if a subsequent loss is avoided that exceeds the cost of executing the sale.
WBI BullBear Trend Switch 3000 Total Return ETF (WBIT)
As of June 30, 2020, WBIT held 3 securities in addition to a position in a money market fund which served as a cash equivalent. The iShares Russell 3000 Fund and the Vanguard Total Stock Market Fund were some of the largest positions in the Fund on this date.
Examples of securities that made positive contributions to WBIT’s performance during the fiscal period include the SPDR Bloomberg Barclays High Yield Bond Fund, the iShares iBoxx High Yield Corporate Bond Fund and the Vaneck Fallen Angels High Yield Bond Fund. Examples of securities that detracted from the Fund’s performance during the fiscal period include the SPDR Portfolio Long Term Treasury Fund, the Vanguard Long-Term Treasury Fund, and the iShares Russell 3000 Fund.
| Absolute Shares Trust |
| |
Management’s Discussion of Fund Performance (continued)
|
| June 30, 2020 (Unaudited) |
|
A significant detraction from Fund performance during the fiscal period occurred over a two-day timespan as the equity market sold off rapidly and there was a significant rotation in fixed-income markets combined with a temporary liquidity crunch. The “perfect storm” occurred on the same day the Bond Model indicated that a switch from High Yield to Treasury exposure was required on March 9, 2020. Although the switch to a safer asset class was considered appropriate as the market would eventually decline rapidly until its March 23rd low, the fact that the switch occurred on the same day as record-breaking market volatility was an unfortunate coincidence. That day, global equity markets dropped the most since the Great Recession in 2008 as the COVID-19 pandemic response was exacerbated by an oil price war between Russia and Saudi Arabia. Before trading even started on March 9, equity and high yield bond markets were already down significantly in overnight activity (the S&P 500 Index was down more than -5%), and safe-haven assets like U.S. Treasuries were skyrocketing from a “flight to quality”. Fund management had to sell High Yield positions after they already had record breaking moves down in overnight activity, and, simultaneously buy Treasury positions after they already had record breaking moves up in overnight activity. Subsequently, on March 10, the government and Federal Reserve stepped in and a complete reversal in all markets occurred (so the Treasury positions now held in the Fund immediately dropped from their all-time highs). The Bond Model signal provided a good indicator; however, the timing of the market activity caused the Fund to drop by approximately -12% in just two days, which may have been avoided if the violent market moves occurred just one day later.
High turnover in WBIT’s holdings has the potential to result in the realization and distribution to shareholders of higher capital gains. If Fund shares are held in a taxable account, this may increase your tax liability. To the extent portfolio turnover increases transaction costs, it may also reduce Fund performance. Of course, selling a security in a timely fashion may also improve performance if a subsequent loss is avoided that exceeds the cost of executing the sale.
WBI BullBear Trend Switch Total Return ETF (WBIN)
As of June 30, 2020, WBIN held 3 securities in addition to a position in a money market fund which served as a cash equivalent. The SPDR Bloomberg Barclays High Yield Bond Fund and the iShares iBoxx High Yield Corporate Bond Fund were some of the largest positions in the Fund on this date.
Examples of securities that made positive contributions to WBIN’s performance during the fiscal period include the SPDR Bloomberg Barclays High Yield Bond Fund, the iShares iBoxx High Yield Corporate Bond Fund and the Vanguard Long-Term Corporate Bond Fund. Examples of securities that detracted from the Fund’s performance during the fiscal period include the SPDR Portfolio Long Term Treasury Fund, the Vanguard Long-Term Treasury Fund, and the iShares 20+ Year Treasury Bond Fund.
A significant detraction from Fund performance during the fiscal period occurred over a two-day timespan as the equity market sold off rapidly and there was a significant rotation in fixed-income markets combined with a temporary liquidity crunch. The “perfect storm” occurred on the same day the Bond Model indicated that a switch from High Yield to Treasury exposure was required on March 9, 2020. Although the switch to a safer asset class was considered appropriate as the market would eventually decline rapidly until its March 23rd low, the fact that the switch occurred on the same day as record-breaking market volatility was an unfortunate coincidence. That day, global equity markets dropped the most since the Great Recession in 2008 as the COVID-19 pandemic response was exacerbated by an oil price war between Russia and Saudi Arabia. Before trading even started on March 9, equity and high yield bond markets were already down significantly in overnight activity (the S&P 500 Index was down more than -5%), and safe-haven assets like U.S. Treasuries were skyrocketing from a “flight to quality”. Fund management had to sell High Yield positions after they already had record breaking moves down in overnight activity, and, simultaneously buy Treasury positions after they already had record breaking moves up in overnight activity. Subsequently, on March 10, the government and Federal Reserve stepped in and a complete reversal in all markets occurred (so the Treasury positions now held in the Fund immediately dropped from their all-time highs). The Bond Model signal provided a good indicator; however, the timing of the market activity caused the Fund to drop by approximately -12% in just two days, which may have been avoided if the violent market moves occurred just one day later.
High turnover in WBIN’s holdings has the potential to result in the realization and distribution to shareholders of higher capital gains. If Fund shares are held in a taxable account, this may increase your tax liability. To the extent portfolio turnover increases transaction costs, it may also reduce Fund performance. Of course, selling a security in a timely fashion may also improve performance if a subsequent loss is avoided that exceeds the cost of executing the sale.
Quarter by Quarter Review of Market Conditions
3rd Quarter 2019
The third quarter of 2019 was eerily similar to the second quarter in many ways. Looking only at the S&P 500 Index for a moment, May produced a significant -6.58% decline followed by a June rebound of 6.89%. During the third quarter, an August decline was sandwiched between two slightly positive months. The result was a 1.19% return for the quarter and highlights once more that the year’s return at that point came almost entirely from the first quarter and especially the month of January. Volatility continued throughout the third quarter as new trade tariffs and Fed concerns set up a rapid 6% decline in the beginning of August followed by three failed attempts to rally back higher.
Although mainstream media continued to focus on relatively attractive year to date returns, one must remember that on a trailing 12-month basis, the S&P 500 was up only 2.15% since September of 2018. Pushing the point even further, the S&P 500 was up only 3.62% since a peak reached in January of 2018. Looking back over those previous 612 days, the S&P 500 was negative, or below that January 2018 watermark, almost 70% of the
| Absolute Shares Trust |
| |
Management’s Discussion of Fund Performance (continued)
|
| June 30, 2020 (Unaudited) |
|
time. Indices focused on stocks with strong value characteristics performed even worse. Large company value stocks, as represented by the Russell 1000 Value Total Return Index, were up only 1.98% since that January 2018 peak. Small and mid-sized company (“SMID”) value stocks, as represented by the Russell 2000 Value Total Return Index, were down -4.99%, and on a trailing 12-month basis, they were down -8.24%. In short, equity markets certainly had demonstrated periods of high volatility for almost two years already, but they really hadn’t moved higher to the degree that most people assumed.
In contrast, lower interest rates and a flight to quality helped fixed income assets perform well with the Bloomberg Barclays US Aggregate index returning 2.27% in Q3 and 10.30% over the prior 12 months.
An increase in volatility combined with the lack of a sustained trend continued to make this quarter quite challenging. The markets were constantly at the mercy of rapid fire “tweets” and other news fragments, many of which were later revealed as fake or at least questionable. But that didn’t stop the lemmings from running full speed ahead in one direction or another. The result was sudden spasms and market movements that diminished the efficacy of value-added money management.
Looking at the performance of the S&P 500 during the quarter, we can almost see the anxious herd making convictionless trades as markets were affected more by random psychological forces rather than fundamentals. The quarter started with the firm expectation that the Federal Reserve would lower interest rates for the first time since the Great Recession at its July meeting. They did cut the fed funds rate by 25 basis points (a basis point is 1/100th of one percent), but the market was very unhappy with the surrounding commentary. Fed Chairman Powell declared that this cut was a “midcycle adjustment to policy” rather than suggest this was the beginning of a new cycle of rate cutting. The market sold off significantly as it became concerned that getting what you want isn’t good enough.
Things only got worse from there. On August 1st, President Trump announced new 10% trade tariffs on the remaining $250 billion of Chinese goods that were not yet taxed to begin on September 1st. The week of July 29 through August 2nd became the worst week of 2019 as the S&P 500 lost almost 100 points or 3% of its value. On August 5th, another huge selloff occurred as China hit back with what many viewed as “currency manipulation” and threats that it would suspend imports of U.S. agricultural products. On the same day, the ISM Non-Manufacturing Index reported a decline to a three-year low of 53.7. This suggested the weakness already noted in the export-focused manufacturing sector might be spreading into the country’s much larger services sector.
The rest of August was a full-blown roller coaster ride. Markets were happy one day as some trade tariffs were delayed until December 1st but terrified the next day as protests in Hong Kong became more violent. More yield curve inversions startled many market participants who suddenly felt that the next recession was imminent. Weaker than forecast Chinese retail sales and industrial output, signs of German economic contraction and other gloomy global data sent investors running for cover worldwide. But then Fed officials or President Trump would say something that sent the market rocketing higher once again.
4th Quarter 2019
Although the third quarter of 2019 was filled with volatility and concern, most market indices produced solid returns in the fourth quarter to round out the year. Looking only at the S&P 500 Index for a moment, the third quarter’s 1.19% return was followed by an 8.53% return in the fourth quarter. New market highs were achieved, and investors celebrated a 29% return for the year while easily forgetting the -20% decline in Q4 of 2018.
Similar results were achieved in large capitalization companies, represented by the Russell 1000, as well as small and mid-sized capitalization companies represented by the Russell 2000. Volatility seemed to disappear as the markets pushed higher. The S&P 500 didn’t have more than a 1% up or down daily move since mid-October. As a result of lower volatility and bullish equity markets, U.S. fixed income assets didn’t perform quite as well in Q4 as they did in Q3 with the Bloomberg Barclays US Aggregate index returning just 0.18% in Q4 vs. its 2.27% return in Q3.
At the end of 2018, the Federal Reserve was raising rates, there was a government shutdown, and increasing tariffs on both Chinese and U.S. products were creating a great deal of uncertainty and investor pessimism. Once again, this resulted in significant volatility and close to a bear market as the S&P 500 sank almost 20% in the fourth quarter. In contrast, 2019 came to a close with a great deal of investor optimism demonstrated by a slow and steady grind upwards that was certainly due in large part to discussions surrounding an initial U.S. – China trade deal. The trade war was far from over and remains one of the core geo-political risks to this day. However, the “Phase One” trade deal that was officially signed on January 15 helped quell investor fears for the moment.
1st Quarter 2020
At the end of 2019, we were cautiously optimistic that markets would continue to grind higher for a while longer. However, we feared that downside risk potential was greater than it was throughout the previous year and noted that any signs of economic weakness or new uncertainty might cause a violent reaction to the downside. What an understatement!
Not since the Crash of 1929 have equities plunged so quickly into a bear market. During this quarter, the S&P 500 Index lost 34% of its value between the all time high reached on February 19th and the bottom reached on March 23rd. The Index did recover approximately 15% off that bottom by the end of the first quarter. However, it’s important to remember that a passive S&P 500 portfolio worth $100 on February 19 was worth only $66 one month later on March 23rd. At that point, an investor needed a 52% positive return before their portfolio breaks even at $100 again. This highlights the critical importance of capital preservation and is the reason WBI Investments remains so focused on risk mitigation and avoiding catastrophic losses like that which occurred in the first quarter.
| Absolute Shares Trust |
| |
Management’s Discussion of Fund Performance (continued)
|
| June 30, 2020 (Unaudited) |
|
Looking back in time while the record-breaking bull market continued to grind higher last year, most investors were keeping a close eye on the impact of trade wars, easy monetary policy, weaker corporate earnings, ballooning corporate debt, global economic slowdowns and inverted yield curves. Equities seemed to be priced for perfection, so many analysts looked for any indications that a market correction and economic recession might loom on the horizon. At the same time, there were still forecasters out there claiming “this time will be different” and “we will never again experience devastating recessions”. Of course, history did repeat itself and showed markets can still drop by 30% or more in just a few weeks, and devastating recessions are not a thing of the past.
However, history books will note the catalyst for this crisis was certainly different this time. We have never faced a global pandemic that caused so many economies to completely shut down or potentially face enormous loss of life. Furthermore, the devastating impact on global economies is just starting to reveal itself. Although COVID-19 was the catalyst for this crisis, the negative trends and indicators we were concerned about last year didn’t disappear. Unfortunately, the virus simply accelerated and exacerbated the market selloff and economic slow-down that many were already expecting.
The market’s 30%+ drop was only its seventh since 1928 and the quickest by more than two weeks. There were only two other instances where the speed of the decline was anywhere near as fast – 1929 and 1987. Furthermore, the S&P 500 lost 12.5% in March in its biggest monthly decline since the 16.9% slide of October 2008.
Due to a late quarter rebound, the year to date returns do not tell the whole story. Although the S&P 500 was down -20% year to date, the index lost -34% from its all-time high during the quarter. Similarly, although the Dow Jones Industrial Average was down -23% year to date, the index lost -37% from its all-time high during the quarter.
Value based investments demonstrated even worse results, on a relative basis, as the Russell 3000 Value Index lost -28% year to date including a -39% peak to trough decline during the quarter. Small and mid-sized capitalization companies also suffered worse than large-capitalization firms as the Russell 2000 dropped -31% year to date with a -42% peak to trough decline during the quarter.
U.S. fixed income assets benefitted from positive performance in January and February but enormous problems with liquidity and forced liquidations caused volatile gyrations even in the “safe haven” U.S Treasury market during March.
Certainly, this crisis is unique in so many ways. The speed with which it took hold and the fact that it impacted the entire world is mind numbing. The fear of sickness and death spread even faster than the illness itself. In February, we watched China build temporary hospitals in days and saw pictures of empty city streets as they brought their entire economy to a grinding halt. Social distancing became the only way to avoid catastrophic loss of life predictions, so China was forced to shut it all down and have people shelter-in-place. At the time, we realized that the hit to their economy would be massive, but it still seemed to be a relatively distant problem that was possibly already under control. Just a few weeks later, our country and so many others across the globe were forced to do the same thing. Shut down the economic engines, take the key out of the ignition, and bunker down.
2nd Quarter 2020
After the S&P 500 fell by -34% from the February 19th high to the March 23rd low, it then reversed course to post a 38.57% gain by the end of Q2, leaving the index down just -4.04% YTD. The Dow fared a bit worse, following the market roller coaster down and then up with a YTD decline of -9.55%. Growth and technology stocks, as measured by the NASDAQ, fared much better after falling slightly less than the S&P 500, -30.11% from the February high to March low, but rallying strong to a gain of 12.11% YTD through June 30. Value-based investments continued to underperform both growth and broader-based market indices. The Russell 1000 Value large-cap index ended the 2nd quarter down approximately -17% and the Russell 2000 Value small and mid-cap index held onto larger losses of -24.38%.
U.S. fixed-income assets as measured by the Bloomberg Barclays US Aggregate TR Index benefitted from the Fed’s easy monetary policy and stimulus, ending the second quarter up 6.14% for the year.
A massive tug of war is raging between the Federal Reserve and COVID-19 on a daily basis to influence markets and investor psyche. The economic recovery hinges on consumer spending, which is, in turn, dependent on a resumption of normal life for people all over the world. Flattening infection curves in the U.S. helped provide some optimism, allowing shelter-in-place and social distancing to be brushed aside by many who were cooped up for three months or more. However, in June, markets experienced a roller coaster decline of 5-10%, depending on the tracking index, caused by new increasing numbers of COVID-19 cases. Florida and Texas had cases surge a month after relaxing lockdown restrictions and cases began to rise again in other states as well.
For Fed and government stimulus efforts to take hold and give the economy a much needed boost in growth, people need to feel safe to resume normal activity. In the meantime, protecting capital from additional large potential losses should be an investor’s first priority. Before we get a clear indication that the danger from the virus has been contained, we would expect significant continued volatility. Markets will need to digest shutdown-induced economic and corporate profit declines not seen since The Great Depression.
With so much to worry about, we fully expect there to be significant risk to the downside, but markets could enter a new powerful bull market cycle by year end or early next year fueled by massive monetary and fiscal stimulus. This is probably the greatest “don’t fight the Fed” moment in history. With unprecedented stimulus that may exceed $10 trillion when all is said and done, you won’t want to miss the bull market that follows.
| Absolute Shares Trust |
| |
Management’s Discussion of Fund Performance (continued)
|
| June 30, 2020 (Unaudited) |
|
What Lies Ahead?
Nobody knows just how long this will last and how much damage will occur. Even acknowledging the enormous amount of monetary and fiscal stimulus that was injected into the market so far, John Williams (President of the New York Federal Reserve Bank) explained, “The coronavirus pandemic has created circumstances we have never experienced before in our lifetimes, and the reality is that the full scale of the economic consequences is still unknown.” He noted further “To put the current situation in context, we are running more open market operations, for greater sums, than at any time in our history.” So, although the markets have already bounced back quite a bit on news of drug trials, slowing infection rates, and prospects of returning the country back to “normal” again, the real economic impact is just starting to be revealed and it will be many months, if not years, before the full impact is truly understood.
The evolution of the pandemic, as well as the extent and duration of government measures to contain it, will largely determine the direction of markets in coming months, even considering the impact of central banks and fiscal emergency packages. COVID-19 still poses extensive challenges for professional virologists and the scientific community. However, politicians, economists and investors face their own significant questions and challenges. Everyone is still learning about the disease and the economic damage and so misjudgments are inevitable. Mistakes will be made in the markets, the economy and society. Hopefully they will be identified quickly and resolved.
Here at WBI, we continue to focus on risk mitigation and the protection of investor capital as we carefully monitor deteriorating economic data and the potential for additional market selloffs. Our strategies performed well as our active management system quickly moved out of equities and into cash and equivalents. However, our portfolio management system is also working to capture as much upside as possible even during these volatile times.
We appreciate your continued faith in our approach and wish you and your families both health and peace as we all navigate through these strange times together.
Sincerely,
 |  |
| | |
Steven Van Solkema, CFA | Don Schreiber, Jr. |
Co-Portfolio Manager | Co-Portfolio Manager |
Chief Investment Officer | Founder & CEO |
| Absolute Shares Trust |
| |
Management’s Discussion of Fund Performance (continued)
|
| June 30, 2020 (Unaudited) |
|
Past performance is not a guarantee of future results.
Opinions expressed are those of WBI Investments, Inc. (“WBI”), the Funds’ investment sub-adviser, are subject to change, are not guaranteed, and should not be construed as recommendations or investment advice or a solicitation to purchase or sell securities referenced in the Investment Commentary.
Exchange Traded Fund investing involves risk. Principal loss is possible. The Funds invest in emerging market and foreign securities which involve political, economic and currency risks, greater volatility and differences in accounting methods. These risks can be greater in emerging markets. The Funds invest in smaller and medium sized companies, which involve additional risks such as limited liquidity and greater volatility. Investments in debt securities typically decrease in value when interest rates rise. This risk is usually greater for longer-term debt securities. Investments by the Funds in lower-rated and non-rated securities presents a greater risk of loss to principal and interest than higher-rated securities. Investments in mortgage-backed securities may involve additional risks, such as credit risk, prepayment risk, possible illiquidity and default, and susceptibility to adverse economic developments. Because the Funds invest in other exchange-traded funds (“ETFs”), they are subject to additional risks that do not apply to conventional funds, including the risks that the market price of an ETF’s shares may trade at a discount to its net asset value (“NAV”), an active secondary trading market may not develop or be maintained, or trading may be halted by the exchange in which they trade, which may impact a Fund’s ability to sell its shares. The Funds may invest in exchange-traded notes (“ETN”), which are subject to the credit risk of the issuer. Additional risks include volatility, lack of liquidity, and sensitivity to currencies, commodities markets, and interest rate changes. The Funds may invest in Real Estate Investment Trusts (REIT). Risks commonly associated with the direct ownership of real estate include fluctuations in the value of underlying properties, defaults by borrowers or tenants, changes in interest rates and risks related to general or local economic conditions. The Funds may invest in master limited partnerships (“MLP”), which are subject to certain risks inherent in the structure of MLPs, including complex tax structure risks, the limited ability for election or removal of management, limited voting rights, potential dependence on parent companies or sponsors for revenues to satisfy obligations, and potential conflicts of interest between partners, members and affiliates. The Funds may also use options and future contracts, which have the risks of unlimited losses of the underlying holdings due to unanticipated market movements and failure to correctly predict the direction of securities prices, interest rates and currency exchange rates. The investment in options is not suitable for all investors. Investments in absolute return strategies are not intended to outperform stocks and bonds during strong market rallies. Diversification does not assure a profit or protect against a loss in a declining market.
An investment in money market funds is not insured or guaranteed by the Federal Deposit Insurance Corporation or any other governmental agency. Although money market funds seek to preserve the value of your investment at $1.00 per share, it is possible to lose money by investing in these funds.
A stop loss order directs a brokerage firm to sell the specified security at the prevailing market price should that security’s price fall to or below a stipulated price. A stop limit order directs a brokerage firm to sell the specified security should that security’s price fall to or below a stipulated price, but only if the transaction can be executed at or above the limit price given as part of the order. The Funds use the Sub Advisor’s proprietary Dynamic Trailing Stop/Loss System (DTS™), which is designed to help control the risk to invested capital when investing in volatile securities and markets. The DTS™ is not a stop loss order or stop limit order placed with a brokerage firm, but an internal process for monitoring price movements. While the DTS™ may be used to initiate the process for selling a security, it does not assure that a particular execution price will be received.
Fund holdings and sector allocations are subject to change and should not be considered a recommendation to buy or sell any security. References to other funds should not be interpreted as an offer of these securities. For a complete list of Fund holdings, please refer to the Schedule of Investments in this report.
Any tax or legal information provided is merely a summary of our understanding and interpretation of some of the current income tax regulations and is not exhaustive. Investors must consult their tax advisor or legal counsel for advice and information concerning their particular situation. Neither the Funds nor any of their representatives may give legal or tax advice.
Must be preceded or accompanied by a prospectus.
WBI Shares Exchange Traded Funds are distributed by Foreside Fund Services, LLC.
| Absolute Shares Trust |
| |
Management’s Discussion of Fund Performance (concluded)
|
| June 30, 2020 (Unaudited) |
|
Benchmark Definitions
Unless otherwise indicated, the source for index price and performance data used in the discussion of market conditions and market commentary is Bloomberg.
The Russell 3000 Total Return Index is a float-adjusted market-cap weighted index that includes 3,000 stocks and covers 98% of the U.S. equity investable universe.
The Russell 3000 Value Total Return Index uses the value characteristic book-to-price ratio to create a style index based upon the Russell 3000 that contains companies with lower predicted and historical growth rates.
The Bloomberg Barclays US Aggregate Bond Total Return Index is calculated based on the U.S. dollar denominated, investment grade fixed-rate taxable bond market including treasury, government-related, corporate, MBS, ABS and CMBS debt, and includes the performance effect of income earned by securities in the index.
The Solactive Power FactorTM High Dividend GTR Index is constructed by scoring each ordinary dividend paying, common stock constituent from the 3,000 largest U.S. companies both directly and relative to industry peers using the three Power Factors and ranking those securities in descending order according to their dividend indicated yield. The 50 companies with the largest dividend indicated yield are chosen as Index components.
Other Index Definitions
The Dow Jones Industrial Average (DJIA or “The Dow”) is a price-weighted average of 30 of the largest blue-chip issues traded on the New York Stock Exchange.
The S&P 500 Index is a float-market-cap-weighted average of 500 large-cap U.S. companies in all major sectors.
The NASDAQ Composite Index is a market-value weighted index of all common stocks listed on NASDAQ.
The Russell 1000 Index is a float-adjusted market-cap weighted index that includes the largest 1,000 stocks by market-cap of the Russell 3000 Index.
The Russell 2000 Index is a float-adjusted market-cap weighted index that includes the smallest 2,000 stocks by market-cap of the Russell 3000 Index.
The Russell 1000 Value Index uses the value characteristic book-to-price ratio to create a style index based upon the Russell 1000 that contains companies with lower predicted and historical growth rates.
The Russell 2000 Value Index uses the value characteristic book-to-price ratio to create a style index based upon the Russell 2000 that contains companies with lower predicted and historical growth rates.
| Absolute Shares Trust |
| |
WBI BullBear Rising Income 3000 ETF |
Performance Summary (Unaudited) |
|
| | | | Since |
| Average Annual Returns | | | Inception |
| Period Ending June 30, 2020 | 1 Year | 5 Years | (8/25/14) |
WBI BullBear Rising Income 3000 ETF — NAV | (1.89)% | 2.01% | 1.50% |
WBI BullBear Rising Income 3000 ETF — Market | (1.73)% | 1.99% | 1.51% |
Russell 3000 Total Return | 6.53% | 10.03% | 9.51% |
This chart illustrates the performance of a hypothetical $10,000 investment made on August 25, 2014, and is not intended to imply any future performance. The returns shown do not reflect the deduction of taxes that a shareholder would pay on fund distributions or the redemption of fund shares. The chart assumes reinvestment of capital gains and dividends.
The performance data quoted represents past performance and is not a guarantee of future results. Investment return and principal value of an investment will fluctuate so that an investor’s shares, when redeemed, may be worth more or less than their original cost. Current performance may be lower or higher than the performance data quoted. For most recent month-end performance, please visit www.wbishares.com.
Per the Prospectus, the Fund’s annual operating expense (gross) is 1.24%. The Fund’s Sub-Advisor has contractually agreed to waive the fees and reimburse expenses of the Fund such that total annual operating expenses are limited to 1.25% of average net assets until at least October 31, 2021. (Actual expenses can be referenced in the Financial Highlights section later in this report.)
| Absolute Shares Trust |
| |
WBI BullBear Value 3000 ETF |
Performance Summary (Unaudited) |
|
| | | | Since |
| Average Annual Returns | | | Inception |
| Period Ending June 30, 2020 | 1 Year | 5 Years | (8/25/14) |
WBI BullBear Value 3000 ETF — NAV | (5.40)% | 2.08% | 1.19% |
WBI BullBear Value 3000 ETF — Market | (5.30)% | 2.03% | 1.20% |
Russell 3000 Value Total Return | (9.42)% | 4.41% | 4.24% |
This chart illustrates the performance of a hypothetical $10,000 investment made on August 25, 2014, and is not intended to imply any future performance. The returns shown do not reflect the deduction of taxes that a shareholder would pay on fund distributions or the redemption of fund shares. The chart assumes reinvestment of capital gains and dividends.
The performance data quoted represents past performance and is not a guarantee of future results. Investment return and principal value of an investment will fluctuate so that an investor’s shares, when redeemed, may be worth more or less than their original cost. Current performance may be lower or higher than the performance data quoted. For most recent month-end performance, please visit www.wbishares.com.
Per the Prospectus, the Fund’s annual operating expense (gross) is 1.25%. The Fund’s Sub-Advisor has contractually agreed to waive the fees and reimburse expenses of the Fund such that total annual operating expenses are limited to 1.25% of average net assets until at least October 31, 2021. (Actual expenses can be referenced in the Financial Highlights section later in this report.)
| Absolute Shares Trust |
| |
WBI BullBear Value 3000 ETF |
Performance Summary (Unaudited) |
|
| | | | Since |
| Average Annual Returns | | | Inception |
| Period Ending June 30, 2020 | 1 Year | 5 Years | (8/25/14) |
WBI BullBear Yield 3000 ETF — NAV | (5.22)% | 0.39% | (0.53)% |
WBI BullBear Yield 3000 ETF — Market | (5.07)% | 0.33% | (0.54)% |
Russell 3000 Value Total Return | (9.42)% | 4.41% | 4.24% |
This chart illustrates the performance of a hypothetical $10,000 investment made on August 25, 2014, and is not intended to imply any future performance. The returns shown do not reflect the deduction of taxes that a shareholder would pay on fund distributions or the redemption of fund shares. The chart assumes reinvestment of capital gains and dividends.
The performance data quoted represents past performance and is not a guarantee of future results. Investment return and principal value of an investment will fluctuate so that an investor’s shares, when redeemed, may be worth more or less than their original cost. Current performance may be lower or higher than the performance data quoted. For most recent month-end performance, please visit www.wbishares.com.
Per the Prospectus, the Fund’s annual operating expense (gross) is 1.14%. The Fund’s Sub-Advisor has contractually agreed to waive the fees and reimburse expenses of the Fund such that total annual operating expenses are limited to 1.25% of average net assets until at least October 31, 2021. (Actual expenses can be referenced in the Financial Highlights section later in this report.)
| Absolute Shares Trust |
| |
WBI BullBear Quality 3000 ETF |
Performance Summary (Unaudited) |
|
| | | | Since |
| Average Annual Returns | | | Inception |
| Period Ending June 30, 2020 | 1 Year | 5 Years | (8/25/14) |
WBI BullBear Quality 3000 ETF — NAV | (3.79)% | 2.45% | 1.30% |
WBI BullBear Quality 3000 ETF — Market | (3.69)% | 2.40% | 1.31% |
Russell 3000 Total Return | 6.53% | 10.03% | 9.51% |
This chart illustrates the performance of a hypothetical $10,000 investment made on August 25, 2014, and is not intended to imply any future performance. The returns shown do not reflect the deduction of taxes that a shareholder would pay on fund distributions or the redemption of fund shares. The chart assumes reinvestment of capital gains and dividends.
The performance data quoted represents past performance and is not a guarantee of future results. Investment return and principal value of an investment will fluctuate so that an investor’s shares, when redeemed, may be worth more or less than their original cost. Current performance may be lower or higher than the performance data quoted. For most recent month-end performance, please visit www.wbishares.com.
Per the Prospectus, the Fund’s annual operating expense (gross) is 1.23%. The Fund’s Sub-Advisor has contractually agreed to waive the fees and reimburse expenses of the Fund such that total annual operating expenses are limited to 1.25% of average net assets until at least October 31, 2021. (Actual expenses can be referenced in the Financial Highlights section later in this report.)
| Absolute Shares Trust |
| |
WBI BullBear Global Income ETF |
Performance Summary (Unaudited) |
|
| | | | Since |
| Average Annual Returns | | | Inception |
| Period Ending June 30, 2020 | 1 Year | 5 Years | (8/25/14) |
WBI BullBear Global Income ETF — NAV | (2.97)% | 1.17% | 1.47% |
WBI BullBear Global Income ETF — Market | (2.87)% | 1.15% | 1.47% |
Bloomberg Barclays US Aggregate Bond Index | 8.74% | 4.30% | 3.90% |
This chart illustrates the performance of a hypothetical $10,000 investment made on August 25, 2014, and is not intended to imply any future performance. The returns shown do not reflect the deduction of taxes that a shareholder would pay on fund distributions or the redemption of fund shares. The chart assumes reinvestment of capital gains and dividends.
The performance data quoted represents past performance and is not a guarantee of future results. Investment return and principal value of an investment will fluctuate so that an investor’s shares, when redeemed, may be worth more or less than their original cost. Current performance may be lower or higher than the performance data quoted. For most recent month-end performance, please visit www.wbishares.com.
Per the Prospectus, the Fund’s annual operating expense (gross) is 1.03%. The Fund’s Sub-Advisor has contractually agreed to waive the fees and reimburse expenses of the Fund such that total annual operating expenses are limited to 1.25% of average net assets until at least October 31, 2021. (Actual expenses can be referenced in the Financial Highlights section later in this report.)
| Absolute Shares Trust |
| |
WBI Power Factor® High Dividend ETF |
Performance Summary (Unaudited) |
|
| | | Since |
| Average Annual Returns | | Inception |
| Period Ending June 30, 2020 | 1 Year | (12/21/16) |
WBI Power Factor® High Dividend ETF — NAV | (19.24)% | (2.61)% |
WBI Power Factor® High Dividend ETF — Market | (19.08)% | (2.62)% |
Russell 3000 Value Index | (9.42)% | 2.19% |
Solactive Power FactorTM High Dividend Index | (23.51)% | (6.19)% |
This chart illustrates the performance of a hypothetical $10,000 investment made on December 21, 2016, and is not intended to imply any future performance. The returns shown do not reflect the deduction of taxes that a shareholder would pay on fund distributions or the redemption of fund shares. The chart assumes reinvestment of capital gains and dividends.
The performance data quoted represents past performance and is not a guarantee of future results. Investment return and principal value of an investment will fluctuate so that an investor’s shares, when redeemed, may be worth more or less than their original cost. Current performance may be lower or higher than the performance data quoted. For most recent month-end performance, please visit www.wbishares.com.
Per the Prospectus, the Fund’s annual operating expense (gross) is 0.77%. The Fund’s Sub-Advisor has contractually agreed to waive the fees and reimburse expenses of the Fund such that total annual operating expenses are limited to 0.70% of average net assets until at least October 31, 2021. (Actual expenses can be referenced in the Financial Highlights section later in this report.)
| Absolute Shares Trust |
| |
WBI BullBear Trend Switch US 3000 Total Return ETF |
Performance Summary (Unaudited) |
|
| | | Since |
| Average Annual Returns | | Inception |
| Period Ending June 30, 2020 | 1 Year | (5/28/2019) |
WBI BullBear Trend Switch US 3000 Total Return ETF — NAV | (11.65)% | (7.91)% |
WBI BullBear Trend Switch US 3000 Total Return ETF — Market | (11.55)% | (7.75)% |
Russell 3000 Total Return | 6.53% | 10.93% |
This chart illustrates the performance of a hypothetical $10,000 investment made on May 28, 2019, and is not intended to imply any future performance. The returns shown do not reflect the deduction of taxes that a shareholder would pay on fund distributions or the redemption of fund shares. The chart assumes reinvestment of capital gains and dividends.
The performance data quoted represents past performance and is not a guarantee of future results. Investment return and principal value of an investment will fluctuate so that an investor’s shares, when redeemed, may be worth more or less than their original cost. Current performance may be lower or higher than the performance data quoted. For most recent month-end performance, please visit www.wbishares.com.
Per the Prospectus, the Fund’s annual operating expense (gross) is 0.70%. (Actual expenses can be referenced in the Financial Highlights section later in this report.)
| Absolute Shares Trust |
| |
WBI BullBear Trend Switch US Total Return ETF |
Performance Summary (Unaudited) |
|
| | Since |
| Average Annual Returns | Inception |
| Period Ending June 30, 2020 | (7/18/2019) |
WBI BullBear Trend Switch US Total Return ETF — NAV | (11.49)% |
WBI BullBear Trend Switch US Total Return ETF — Market | (11.64)% |
Bloomberg Barclays US Aggregate Bond Index | 8.69% |
This chart illustrates the performance of a hypothetical $10,000 investment made on July 18, 2019, and is not intended to imply any future performance. The returns shown do not reflect the deduction of taxes that a shareholder would pay on fund distributions or the redemption of fund shares. The chart assumes reinvestment of capital gains and dividends.
The performance data quoted represents past performance and is not a guarantee of future results. Investment return and principal value of an investment will fluctuate so that an investor’s shares, when redeemed, may be worth more or less than their original cost. Current performance may be lower or higher than the performance data quoted. For most recent month-end performance, please visit www.wbishares.com.
Per the Prospectus, the Fund’s annual operating expense (gross) is 0.73%. (Actual expenses can be referenced in the Financial Highlights section later in this report.)
| Absolute Shares Trust |
|
|
|
As of June 30, 2020 (Unaudited)
| WBI BullBear Rising Income 3000 ETF | | | |
| | | Percentage of |
| Industry Group | | Net Assets |
Short-Term Investments and | | | |
Other Assets and Liabilities | | | 38.1 | % |
Retailing | | | 16.9 | % |
Software & Services | | | 15.8 | % |
Household & Personal Products | | | 9.2 | % |
Semiconductors & | | | | |
Semiconductor Equipment | | | 4.4 | % |
Capital Goods | | | 4.1 | % |
Pharmaceuticals, Biotechnology | | | | |
& Life Sciences | | | 3.7 | % |
Food, Beverage & Tobacco | | | 3.0 | % |
Transportation | | | 2.9 | % |
Food & Staples Retailing | | | 1.9 | % |
TOTAL | | | 100.0 | % |
| | | | | |
| WBI BullBear Value 3000 ETF | | | | |
| | | Percentage of |
| Industry Group | | Net Assets |
Short-Term Investments and | | | | |
Other Assets and Liabilities | | | 34.7 | % |
Software & Services | | | 20.7 | % |
Retailing | | | 17.4 | % |
Household & Personal Products | | | 8.4 | % |
Capital Goods | | | 4.6 | % |
Semiconductors & | | | | |
Semiconductor Equipment | | | 4.3 | % |
Pharmaceuticals, Biotechnology | | | | |
& Life Sciences | | | 3.2 | % |
Food, Beverage & Tobacco | | | 2.9 | % |
Food & Staples Retailing | | | 1.9 | % |
Transportation | | | 1.9 | % |
TOTAL | | | 100.0 | % |
| | | | | |
| WBI BullBear Yield 3000 ETF | | | | |
| | | Percentage of |
| Industry Group | | Net Assets |
Short-Term Investments and | | | | |
Other Assets and Liabilities | | | 35.0 | % |
Software & Services | | | 18.5 | % |
Retailing | | | 18.4 | % |
Household & Personal Products | | | 8.4 | % |
Capital Goods | | | 4.6 | % |
Semiconductors & | | | | |
Semiconductor Equipment | | | 4.6 | % |
Food, Beverage & Tobacco | | | 4.4 | % |
Pharmaceuticals, Biotechnology | | | | |
& Life Sciences | | | 4.2 | % |
Food & Staples Retailing | | | 1.9 | % |
TOTAL | | | 100.0 | % |
| | | | | |
| WBI BullBear Quality 3000 ETF | | | | |
| | | Percentage of |
| Industry Group | | Net Assets |
Short-Term Investments and | | | | |
Other Assets and Liabilities | | | 38.8 | % |
Retailing | | | 18.1 | % |
Software & Services | | | 17.2 | % |
Household & Personal Products | | | 8.7 | % |
Capital Goods | | | 4.6 | % |
Semiconductors & | | | | |
Semiconductor Equipment | | | 4.6 | % |
Pharmaceuticals, Biotechnology | | | | |
& Life Sciences | | | 4.2 | % |
Food, Beverage & Tobacco | | | 1.9 | % |
Food & Staples Retailing | | | 1.9 | % |
TOTAL | | | 100.0 | % |
| | | | | |
| WBI BullBear Global Income ETF | | | | |
| | | Percentage of |
| Industry Group | | Net Assets |
Exchange Traded Funds | | | 99.5 | % |
Short-Term Investments and | | | | |
Other Assets and Liabilities | | | 0.5 | % |
TOTAL | | | 100.0 | % |
| | | | | |
WBI Power Factor® High Dividend ETF | | | | |
| | | Percentage of |
| Industry Group | | Net Assets |
Banks | | | 18.1 | % |
Energy | | | 17.6 | % |
Materials | | | 8.6 | % |
Consumer Durables & Apparel | | | 8.0 | % |
Diversified Financials | | | 6.4 | % |
Media & Entertainment | | | 4.9 | % |
Pharmaceuticals, Biotechnology | | | | |
& Life Sciences | | | 4.7 | % |
Food, Beverage & Tobacco | | | 4.5 | % |
Insurance | | | 4.3 | % |
Media | | | 4.1 | % |
Telecommunication Services | | | 4.1 | % |
Consumer Services | | | 3.9 | % |
Retailing | | | 2.7 | % |
Software & Services | | | 2.2 | % |
Household & Personal Products | | | 1.5 | % |
Technology Hardware | | | | |
& Equipment | | | 1.3 | % |
Food & Staples Retailing | | | 1.1 | % |
Short-Term Investments and | | | | |
Other Assets and Liabilities | | | 0.8 | % |
Capital Goods | | | 0.6 | % |
Commercial & | | | | |
Professional Services | | | 0.6 | % |
TOTAL | | | 100.0 | % |
| | | | | |
| WBI BullBear Trend Switch | | | | |
| US 3000 Total Return ETF | | | | |
| | | Percentage of |
| Industry Group | | Net Assets |
Exchange Traded Funds | | | 99.5 | % |
Short-Term Investments and | | | | |
Other Assets and Liabilities | | | 0.5 | % |
TOTAL | | | 100.0 | % |
| | | | | |
| WBI BullBear Trend Switch | | | | |
| US Total Return ETF | | | | |
| | | Percentage of |
| Industry Group | | Net Assets |
Exchange Traded Funds | | | 99.4 | % |
Short-Term Investments and | | | | |
Other Assets and Liabilities | | | 0.6 | % |
TOTAL | | | 100.0 | % |
| Absolute Shares Trust |
|
WBI BullBear Rising Income 3000 ETF |
|
| | June 30, 2020 |
| Shares | | Security Description | | Value | |
| COMMON STOCKS — 61.9% | |
| | |
| Capital Goods — 4.1% | |
| | 9,998 | | Illinois Tool Works, Inc. | | $ | 1,748,150 | |
| | |
| Food & Staples Retailing — 1.9% | |
| | 2,730 | | Costco Wholesale Corp. | | | 827,763 | |
| | |
| Food, Beverage & Tobacco — 3.0% | |
| | 18,303 | | Monster Beverage Corp.* | | | 1,268,764 | |
| | |
| Household & Personal Products — 9.2% | |
| | 7,285 | | Church & Dwight Company, Inc. | | | 563,131 | |
| | 8,705 | | Clorox Company | | | 1,909,616 | |
| | 12,589 | | Procter & Gamble Company | | | 1,505,267 | |
| | | | | | | 3,978,014 | |
| | | | | |
| Pharmaceuticals, Biotechnology & Life Sciences — 3.7% | | | | |
| | 6,712 | | Amgen, Inc. | | | 1,583,092 | |
| | |
| Retailing — 16.9% | |
| | 706 | | Amazon.com, Inc.* | | | 1,947,727 | |
| | 37,685 | | eBay, Inc. + | | | 1,976,578 | |
| | 13,818 | | Lowe’s Companies, Inc. | | | 1,867,088 | |
| | 12,444 | | Target Corp. | | | 1,492,409 | |
| | | | | | | 7,283,802 | |
| | |
| Semiconductors & Semiconductor Equipment — 4.4% | |
| | 4,934 | | NVIDIA Corp. | | | 1,874,476 | |
| | |
| Software & Services — 15.8% | |
| | 4,158 | | Adobe Systems, Inc.* | | | 1,810,019 | |
| | 5,965 | | Intuit, Inc. | | | 1,766,773 | |
| | 9,700 | | Microsoft Corp. | | | 1,974,047 | |
| | 6,495 | | Visa, Inc. — Class A | | | 1,254,639 | |
| | | | | | | 6,805,478 | |
| | |
| Transportation — 2.9% | |
| | 7,467 | | Union Pacific Corp. | | | 1,262,446 | |
| | | | | |
| TOTAL COMMON STOCKS | | | | |
(Cost $25,462,749) | | | 26,631,985 | |
| | | | | | | | |
| Shares/ | | | | | | |
| Amount | |
| |
| |
| SHORT-TERM INVESTMENTS — 30.7% | | | | |
| | 13,215,965 | | U.S. Bank Money Market | | | | |
| | | | Deposit Account, 0.05% | |
| 13,215,965 | |
| TOTAL SHORT-TERM INVESTMENTS | |
(Cost $13,215,965) | | | 13,215,965 | |
| | | | | | | | |
| | |
| INVESTMENTS PURCHASED WITH PROCEEDS | |
| FROM SECURITIES LENDING — 0.9% | |
| | 367,290 | | Mount Vernon Liquid Assets | | | | |
| | | | Portfolio, LLC, 0.34% (a)(b) | | | 367,290 | |
| TOTAL INVESTMENTS PURCHASED WITH | |
| PROCEEDS FROM SECURITIES LENDING | |
(Cost $367,290) | | | 367,290 | |
| TOTAL INVESTMENTS — 93.4% | |
(Cost $39,046,004) | | | 40,215,240 | |
Other Assets in Excess of Liabilities — 6.6% | | | 2,804,600 | |
| NET ASSETS — 100.0% | | $ | 43,019,840 | |
_________
+ | All or portion of this security is on loan as of June 30, 2020. Total value of securities on loan is $366,940. |
* | Non-income producing security. |
(a) | The rate quoted is the annualized seven-day yield as of June 30, 2020. |
(b) | Privately offered liquidity fund. |
The Global Industry Classification Standard (GICS®) was developed by and/or is the exclusive property of MSCI, Inc. and Standard & Poor Financial Services LLC (“S&P”). GICS is a service mark of MSCI and S&P and has been licensed for use by U.S. Bancorp Fund Services, LLC.
The accompanying notes are an integral part of these financial statements.
| Absolute Shares Trust |
| |
WBI BullBear Value 3000 ETF |
|
|
| Shares | | Security Description | | Value | |
| COMMON STOCKS — 65.3% | |
| | |
| Capital Goods — 4.6% | |
| | 11,281 | | Illinois Tool Works, Inc. | | $ | 1,972,483 | |
| | |
| Food & Staples Retailing — 1.9% | |
| | 2,753 | | Costco Wholesale Corp. | | | 834,737 | |
| | | | | |
| Food, Beverage & Tobacco — 2.9% | | | | |
| | 18,347 | | Monster Beverage Corp.* | | | 1,271,814 | |
| | |
| Household & Personal Products — 8.4% | |
| | 8,685 | | Clorox Company | | | 1,905,229 | |
| | 14,418 | | Procter & Gamble Company | | | 1,723,960 | |
| | | | | | | 3,629,189 | |
| | |
| Pharmaceuticals, Biotechnology & Life Sciences — 3.2% | |
| | 5,778 | | Amgen, Inc. | | | 1,362,799 | |
| | |
| Retailing — 17.4% | |
| | 712 | | Amazon.com, Inc.* | | | 1,964,280 | |
| | 37,762 | | eBay, Inc. | | | 1,980,617 | |
| | 13,621 | | Lowe’s Companies, Inc. | | | 1,840,470 | |
| | 14,390 | | Target Corp. | | | 1,725,793 | |
| | | | | | | 7,511,160 | |
| | |
| Semiconductors & Semiconductor Equipment — 4.3% | |
| | 4,944 | | NVIDIA Corp. | | | 1,878,275 | |
| | |
| Software & Services — 20.7% | |
| | 10,641 | | Accenture plc — Class A | | | 2,284,836 | |
| | 4,167 | | Adobe Systems, Inc.* | | | 1,813,937 | |
| | 6,071 | | Intuit, Inc. | | | 1,798,169 | |
| | 8,802 | | Microsoft Corp. | | | 1,791,295 | |
| | 6,508 | | Visa, Inc. — Class A | | | 1,257,150 | |
| | | | | | | 8,945,387 | |
| | |
| Transportation — 1.9% | |
| | 4,990 | | Union Pacific Corp. | | | 843,659 | |
| TOTAL COMMON STOCKS | |
(Cost $26,982,039) | | | 28,249,503 | |
| | | | | | | | |
| Shares/ | | | | | | |
| Amount | |
| |
| |
| SHORT-TERM INVESTMENTS — 27.1% | |
| | 11,705,833 | | U.S. Bank Money Market | | | | |
| | | | Deposit Account, 0.05% | |
| 11,705,833 | |
| TOTAL SHORT-TERM INVESTMENTS | |
(Cost $11,705,833) | | | 11,705,833 | |
| TOTAL INVESTMENTS — 92.4% | | | | |
(Cost $38,687,872) | | | 39,955,336 | |
Other Assets in Excess of Liabilities — 7.6% | | | 3,262,796 | |
| NET ASSETS — 100.0% | | $ | 43,218,132 | |
_________
* | Non-income producing security. |
The Global Industry Classification Standard (GICS®) was developed by and/or is the exclusive property of MSCI, Inc. and Standard & Poor Financial Services LLC (“S&P”). GICS is a service mark of MSCI and S&P and has been licensed for use by U.S. Bancorp Fund Services, LLC.
The accompanying notes are an integral part of these financial statements.
| Absolute Shares Trust |
|
WBI BullBear Yield 3000 ETF |
| Schedule of Investments |
| | June 30, 2020 |
| Shares | | Security Description | | Value | |
| COMMON STOCKS — 65.0% | |
| | | | |
| Capital Goods — 4.6% | | | |
| | 15,444 | | Illinois Tool Works, Inc. | | $ | 2,700,383 | |
| | |
| Food & Staples Retailing — 1.9% | |
| | 3,790 | | Costco Wholesale Corp. | | | 1,149,166 | |
| | |
| Food, Beverage & Tobacco — 4.4% | |
| | 39,499 | | Kellogg Company | | | 2,609,304 | |
| | |
| Household & Personal Products — 8.4% | |
| | 11,861 | | Clorox Company | | | 2,601,948 | |
| | 19,765 | | Procter & Gamble Company | | | 2,363,301 | |
| | | | | | | 4,965,249 | |
| Pharmaceuticals, Biotechnology & Life Sciences — 4.2% | | | | |
| | 10,521 | | Amgen, Inc. | | | 2,481,483 | |
| | |
| Retailing — 18.4% | |
| | 1,099 | | Amazon.com, Inc.* | | | 3,031,943 | |
| | 54,812 | | eBay, Inc. | | | 2,874,890 | |
| | 18,718 | | Lowe’s Companies, Inc. | | | 2,529,176 | |
| | 20,757 | | Target Corp. | | | 2,489,387 | |
| | | | | | | 10,925,396 | |
| | |
| Semiconductors & Semiconductor Equipment — 4.6% | |
| | 7,176 | | NVIDIA Corp. | | | 2,726,234 | |
| | |
| Software & Services — 18.5% | |
| | 12,925 | | Accenture plc — Class A | | | 2,775,256 | |
| | 6,427 | | Adobe Systems, Inc.* | | | 2,797,737 | |
| | 8,807 | | Intuit, Inc. | | | 2,608,545 | |
| | 14,226 | | Visa, Inc. — Class A | | | 2,748,037 | |
| | | | | | | 10,929,575 | |
| TOTAL COMMON STOCKS | |
(Cost $36,790,200) | | | 38,486,790 | |
| | | | | | | | |
| Shares/ | | | | | | |
| Amount | |
| |
| |
| SHORT-TERM INVESTMENTS — 26.7% | |
| | 15,828,035 | | U.S. Bank Money Market | | | | |
| | | | Deposit Account, 0.05% | |
| 15,828,035 | |
| TOTAL SHORT-TERM INVESTMENTS | |
(Cost $15,828,035) | | | 15,828,035 | |
| TOTAL INVESTMENTS — 91.7% | |
(Cost $52,618,235) | | | 54,314,825 | |
Other Assets in Excess of Liabilities — 8.3% | | | 4,932,265 | |
| NET ASSETS — 100.0% | | $ | 59,247,090 | |
_________
* | Non-income producing security. |
The Global Industry Classification Standard (GICS®) was developed by and/or is the exclusive property of MSCI, Inc. and Standard & Poor Financial Services LLC (“S&P”). GICS is a service mark of MSCI and S&P and has been licensed for use by U.S. Bancorp Fund Services, LLC.
The accompanying notes are an integral part of these financial statements.
| Absolute Shares Trust |
|
WBI BullBear Quality 3000 ETF |
| Schedule of Investments |
| June 30, 2020 |
| Shares | | Security Description | | Value | |
| COMMON STOCKS — 61.2% | | | |
| |
| Capital Goods — 4.6% |
| | 14,165 | | Illinois Tool Works, Inc. | | $ | 2,476,750 | |
| |
| Food & Staples Retailing — 1.9% |
| | 3,412 | | Costco Wholesale Corp. | | | 1,034,553 | |
| |
| Food, Beverage & Tobacco — 1.9% |
| | 15,358 | | Monster Beverage Corp.* | | | 1,064,617 | |
| |
| Household & Personal Products — 8.7% |
| | 2,022 | | Church & Dwight Company, Inc. | | | 156,301 | |
| | 10,946 | | Clorox Company | | | 2,401,224 | |
| | 18,112 | | Procter & Gamble Company | | | 2,165,652 | |
| | | | | | | 4,723,177 | |
| |
| Pharmaceuticals, Biotechnology & Life Sciences — 4.2% |
| | 9,641 | | Amgen, Inc. | | | 2,273,926 | |
| | |
| Retailing — 18.1% | |
| | 885 | | Amazon.com, Inc.* | | | 2,441,556 | |
| | 50,228 | | eBay, Inc. | | | 2,634,459 | |
| | 16,896 | | Lowe’s Companies, Inc. | | | 2,282,987 | |
| | 20,222 | | Target Corp. | | | 2,425,224 | |
| | | | | | | 9,784,226 | |
| | |
| Semiconductors & Semiconductor Equipment — 4.6% | |
| | 6,576 | | NVIDIA Corp. | | | 2,498,288 | |
| | |
| Software & Services — 17.2% | |
| | 5,562 | | Adobe Systems, Inc.* | | | 2,421,194 | |
| | 7,458 | | Intuit, Inc. | | | 2,208,985 | |
| | 11,051 | | Microsoft Corp. | | | 2,248,989 | |
| | 12,593 | | Visa, Inc. — Class A | | | 2,432,590 | |
| | | | | | | 9,311,758 | |
| TOTAL COMMON STOCKS |
(Cost $31,833,384) | | 33,167,295 | |
| | | | | | | | |
| Shares/ | | | | | | |
| Amount | |
| |
| |
| SHORT-TERM INVESTMENTS — 31.0% | |
| | 16,771,455 | | U.S. Bank Money Market | | | | |
| | | | Deposit Account, 0.05% | |
| 16,771,455 | |
| | |
| TOTAL SHORT-TERM INVESTMENTS | |
(Cost $16,771,455) | | | 16,771,455 | |
| TOTAL INVESTMENTS — 92.2% | |
(Cost $48,604,839) | | 49,938,750 | |
Other Assets in Excess of Liabilities — 7.8% | | 4,195,422 | |
| NET ASSETS — 100.0% | | $ | 54,134,172 | |
_________
* | Non-income producing security. |
The Global Industry Classification Standard (GICS®) was developed by and/or is the exclusive property of MSCI, Inc. and Standard & Poor Financial Services LLC (“S&P”). GICS is a service mark of MSCI and S&P and has been licensed for use by U.S. Bancorp Fund Services, LLC.
The accompanying notes are an integral part of these financial statements.
| Absolute Shares Trust |
| |
WBI BullBear Global Income ETF |
|
| June 30, 2020 |
| Shares | | Security Description | | Value | |
| |
| EXCHANGE TRADED FUNDS — 99.5% | |
| | 273,583 | | iShares iBoxx $ High Yield | | | |
| | | | Corporate Bond ETF + | | $ | 22,329,844 | |
| | 221,484 | | SPDR Bloomberg Barclays | | | | |
| | | | High Yield Bond ETF | | | 22,405,321 | |
| | 56,611 | | Vanguard Intermediate-Term | | | | |
| | | | Corporate Bond ETF | | | 5,385,971 | |
| | 246,635 | | iShares Broad USD | | | | |
| | | | High Yield Corporate Bond ETF | | | 9,426,390 | |
| | 292,613 | | VanEck Vectors Fallen Angel | | | | |
| | | | High Yield Bond ETF + | | | 8,397,993 | |
| | |
| TOTAL EXCHANGE TRADED FUNDS | |
(Cost $67,407,239) | | | 67,945,519 | |
| | | | | | | | |
| Shares/ | | | | | | |
| Amount | |
| |
| |
| SHORT-TERM INVESTMENTS — 0.6% | |
| | 400,928 | | U.S. Bank Money Market | | | | |
| | | | Deposit Account, 0.05% | |
| 400,928 | |
| TOTAL SHORT-TERM INVESTMENTS | |
(Cost $400,928) | | | 400,928 | |
| | | | | | | | |
| INVESTMENTS PURCHASED WITH PROCEEDS | |
| FROM SECURITIES LENDING — 26.8% | |
| | 18,318,167 | | Mount Vernon Liquid Assets | | | | |
| | | | Portfolio, LLC, 0.34% (a)(b) | | | 18,318,167 | |
| TOTAL INVESTMENTS PURCHASED WITH | |
| PROCEEDS FROM SECURITIES LENDING | |
(Cost $18,318,167) | | | 18,318,167 | |
| TOTAL INVESTMENTS — 126.9% | |
(Cost $86,126,334) | | | 86,664,614 | |
Liabilities in Excess of Other Assets — (26.9)% | | | (18,393,561 | ) |
| NET ASSETS — 100.0% | | $ | 68,271,053 | |
_________
+ | All or portion of this security is on loan as of June 30, 2020. Total value of securities on loan is $18,123,662. |
(a) | The rate quoted is the annualized seven-day yield as of June 30, 2020. |
(b) | Privately offered liquidity fund. |
The Global Industry Classification Standard (GICS®) was developed by and/or is the exclusive property of MSCI, Inc. and Standard & Poor Financial Services LLC (“S&P”). GICS is a service mark of MSCI and S&P and has been licensed for use by U.S. Bancorp Fund Services, LLC.
The accompanying notes are an integral part of these financial statements.
| Absolute Shares Trust |
|
WBI Power Factor® High Dividend ETF |
| Schedule of Investments |
| | June 30, 2020 |
| Shares | | Security Description | | Value | |
| COMMON STOCKS — 99.2% | |
| | |
| Banks — 18.1% | |
| | 51,123 | | Bank of the Ozarks | | $ | 1,199,857 | |
| | 19,674 | | Berkshire Hills Bancorp, Inc. | | | 216,807 | |
| | 24,571 | | Boston Private Financial Holdings, Inc. | | | 169,048 | |
| | 21,004 | | CIT Group, Inc. | | | 435,413 | |
| | 22,292 | | Citizens Financial Group, Inc. | | | 562,650 | |
| | 17,119 | | Comerica, Inc. | | | 652,234 | |
| | 24,529 | | Fifth Third Bancorp | | | 472,919 | |
| | 51,465 | | First Financial Bancorp | | | 714,849 | |
| | 25,167 | | Hope Bancorp, Inc. | | | 232,040 | |
| | 54,379 | | Huntington Bancshares, Inc. | | | 491,314 | |
| | 37,914 | | KeyCorp | | | 461,793 | |
| | 61,916 | | Regions Financial Corp. | | | 688,506 | |
| | 25,225 | | Synovus Financial Corp. | | | 517,869 | |
| | 16,579 | | Webster Financial Corp. | | | 474,325 | |
| | 13,603 | | Wells Fargo & Company | | | 348,237 | |
| | | | | | | 7,637,861 | |
| | |
| Capital Goods — 0.6% | |
| | 13,109 | | H&E Equipment Services, Inc. | | | 242,254 | |
| | |
| Commercial & Professional Services — 0.6% | |
| | 97,541 | | Pitney Bowes, Inc. | | | 253,607 | |
| | |
| Consumer Durables & Apparel — 8.0% | |
| | 152,104 | | Hanesbrands, Inc. | | | 1,717,254 | |
| | 47,646 | | Leggett & Platt, Inc. | | | 1,674,757 | |
| | | | | | | 3,392,011 | |
| | |
| Consumer Services — 3.9% | |
| | 70,285 | | H&R Block, Inc. | | | 1,003,670 | |
| | 22,157 | | Wyndham Destinations, Inc. | | | 624,384 | |
| | | | | | | 1,628,054 | |
| | | | | |
| Diversified Financials — 6.4% | | | | |
| | 56,047 | | Navient Corp. | | | 394,010 | |
| | 125,909 | | Santander Consumer | | | | |
| | | | USA Holdings, Inc. + | | | 2,317,985 | |
| | | | | | | 2,711,995 | |
| | |
| Energy — 17.6% | |
| | 46,949 | | Archrock, Inc. | | | 304,699 | |
| | 37,268 | | Delek US Holdings, Inc. | | | 648,836 | |
| | 31,054 | | Exxon Mobil Corp. | | | 1,388,735 | |
| | 35,116 | | HollyFrontier Corp. | | | 1,025,387 | |
| | 55,871 | | Marathon Petroleum Corp. | | | 2,088,458 | |
| | 8,008 | | Phillips 66 | | | 575,775 | |
| | 24,021 | | Valero Energy Corp. | | | 1,412,915 | |
| | | | | | | 7,444,805 | |
| | |
| Food & Staples Retailing — 1.1% | |
| | 22,197 | | SpartanNash Company | | | 471,686 | |
| | | | | | | | |
| | |
| Food, Beverage & Tobacco — 4.5% | |
| | 8,951 | | The Kraft Heinz Company + | |
| 285,447 | |
| | 22,877 | | Philip Morris International, Inc. | | | 1,602,763 | |
| | | | | | | 1,888,210 | |
| | |
| Household & Personal Products — 1.5% | |
| | 16,971 | | Nu Skin Enterprises, Inc. — Class A | | | 648,801 | |
| | | | | |
| Insurance — 4.3% | | | | |
| | 5,953 | | Mercury General Corp. | | | 242,585 | |
| | 13,995 | | Principal Financial Group, Inc. | | | 581,352 | |
| | 8,182 | | Prudential Financial, Inc. | | | 498,284 | |
| | 29,030 | | Unum Group | | | 481,608 | |
| | | | | | | 1,803,829 | |
| | |
| Materials — 8.6% | |
| | 6,467 | | Greif, Inc. — Class A | | | 222,529 | |
| | 37,388 | | International Paper Company | | | 1,316,432 | |
| | 26,983 | | LyondellBasell | | | | |
| | | | Industries N.V. — Class A | | | 1,773,323 | |
| | 13,448 | | Trinseo S.A. + | | | 298,008 | |
| | | | | | | 3,610,292 | |
| Media — 4.1% | |
| | 94,696 | | Sinclair Broadcast Group, Inc. | | | 1,748,088 | |
| Media & Entertainment — 4.9% | |
| | 84,393 | | Interpublic Group of Companies, Inc. | | | 1,448,184 | |
| | 26,063 | | ViacomCBS, Inc. | | | 607,789 | |
| | | | | | | 2,055,973 | |
| | |
| Pharmaceuticals, Biotechnology & Life Sciences — 4.7% | |
| | 20,112 | | AbbVie, Inc. | | | 1,974,596 | |
| | |
| Retailing — 2.7% | |
| | 27,228 | | Big Lots, Inc. | | | 1,143,576 | |
| | |
| Software & Services — 2.2% | |
| | 7,559 | | International Business Machines Corp. | | | 912,901 | |
| | |
| Technology Hardware & Equipment — 1.3% | |
| | 11,700 | | Seagate Technology plc | | | 566,397 | |
| | | | | |
| Telecommunication Services — 4.1% | | | | |
| | 57,177 | | AT&T, Inc. | | | 1,728,461 | |
| TOTAL COMMON STOCKS | |
(Cost $43,712,942) | | | 41,863,397 | |
The accompanying notes are an integral part of these financial statements.
| Absolute Shares Trust |
|
WBI Power Factor® High Dividend ETF |
|
| | June 30, 2020 (concluded) |
| Shares/ | | | | | |
| Amount | | Security Description | | Value | |
| SHORT-TERM INVESTMENTS — 0.6% | |
| | 270,002 | | U.S. Bank Money Market | | | |
| | | | Deposit Account, 0.05% | | $ | 270,002 | |
| | |
| TOTAL SHORT-TERM INVESTMENTS | |
(Cost $270,002) | | | | | 270,002 | |
| | | | | | | | |
| | |
| INVESTMENTS PURCHASED WITH PROCEEDS | |
| FROM SECURITIES LENDING — 3.8% | |
| | 1,600,788 | | Mount Vernon Liquid Assets | | | | |
| | | | Portfolio, LLC, 0.34% (a)(b) | | | 1,600,788 | |
| TOTAL INVESTMENTS PURCHASED WITH | |
| PROCEEDS FROM SECURITIES LENDING | |
(Cost $1,600,788) | | | 1,600,788 | |
| TOTAL INVESTMENTS — 103.6% | |
(Cost $45,583,732) | | | 43,734,187 | |
Liabilities in Excess of Other Assets — (3.6)% | | | (1,532,235 | ) |
| NET ASSETS — 100.0% | | $ | 42,201,952 | |
_________
+ | All or portion of this security is on loan as of June 30, 2020. Total value of securities on loan is $1,545,342. |
(a) | The rate quoted is the annualized seven-day yield as of June 30, 2020. |
(b) | Privately offered liquidity fund. |
The Global Industry Classification Standard (GICS®) was developed by and/or is the exclusive property of MSCI, Inc. and Standard & Poor Financial Services LLC (“S&P”). GICS is a service mark of MSCI and S&P and has been licensed for use by U.S. Bancorp Fund Services, LLC.
The accompanying notes are an integral part of these financial statements.
| Absolute Shares Trust |
| |
WBI BullBear Trend Switch US 3000 Total Return ETF |
|
|
| Shares | | Security Description | | Value | |
| EXCHANGE TRADED FUNDS — 99.5% | |
| | 71,430 | | iShares Russell 3000 ETF | | $ | 12,861,686 | |
| | 134,639 | | Schwab US Broad Market ETF | | | 9,891,927 | |
| | 78,987 | | Vanguard Total Stock Market ETF | | | 12,363,835 | |
| TOTAL EXCHANGE TRADED FUNDS | |
(Cost $36,497,427) | | | 35,117,448 | |
| | | | | | | | |
| Shares/ | | | | | | |
| Amount | |
| |
| |
| SHORT-TERM INVESTMENTS — 0.4% | |
| | 124,818 | | U.S. Bank Money Market | | | | |
| | | | Deposit Account, 0.05% | |
| 124,818 | |
| TOTAL SHORT-TERM INVESTMENTS | |
(Cost $124,818) | | | 124,818 | |
| TOTAL INVESTMENTS — 99.9% | |
(Cost $36,622,245) | | | 35,242,266 | |
Other Assets in Excess of Liabilities — 0.1% | | | 38,210 | |
| NET ASSETS — 100.0% | | $ | 35,280,476 | |
_________
The Global Industry Classification Standard (GICS®) was developed by and/or is the exclusive property of MSCI, Inc. and Standard & Poor Financial Services LLC (“S&P”). GICS is a service mark of MSCI and S&P and has been licensed for use by U.S. Bancorp Fund Services, LLC.
The accompanying notes are an integral part of these financial statements.
| Absolute Shares Trust |
| |
WBI BullBear Trend Switch US Total Return ETF |
|
June 30, 2020
|
| Shares | | Security Description | | Value | |
| EXCHANGE TRADED FUNDS — 99.4% | |
| | 136,652 | | iShares iBoxx $ High Yield | | | |
| | | | Corporate Bond ETF + | | $ | 11,153,536 | |
| | 110,630 | | SPDR Bloomberg Barclays | | | | |
| | | | High Yield Bond ETF | | | 11,191,331 | |
| | 145,864 | | VanEck Vectors Fallen Angel | | | | |
| | | | High Yield Bond ETF + | | | 4,186,297 | |
| TOTAL EXCHANGE TRADED FUNDS | |
(Cost $26,517,219) | | | 26,531,164 | |
| | | | | | | | |
| Shares/ | | | | | | |
| Amount | |
| |
| |
| SHORT-TERM INVESTMENTS — 0.7% | |
| | 172,251 | | U.S. Bank Money Market | | | | |
| | | | Deposit Account, 0.05% | |
| 172,251 | |
| TOTAL SHORT-TERM INVESTMENTS | |
(Cost $172,251) | | | 172,251 | |
| | | | | | | | |
| INVESTMENTS PURCHASED WITH PROCEEDS | |
| FROM SECURITIES LENDING — 33.5% | |
| | 8,945,738 | | Mount Vernon Liquid Assets | | | | |
| | | | Portfolio, LLC, 0.34% (a)(b) | | | 8,945,738 | |
| TOTAL INVESTMENTS PURCHASED WITH | |
| PROCEEDS FROM SECURITIES LENDING | |
(Cost $8,945,738) | | | 8,945,738 | |
| TOTAL INVESTMENTS — 133.6% | |
(Cost $35,635,208) | | | 35,649,153 | |
Liabilities in Excess of Other Assets — (33.6)% | | | (8,956,940 | ) |
| NET ASSETS — 100.0% | | $ | 26,692,213 | |
_________
+ | All or portion of this security is on loan as of June 30, 2020. Total value of securities on loan is $8,851,569. |
(a) | The rate quoted is the annualized seven-day yield as of June 30, 2020. |
(b) | Privately offered liquidity fund. |
The Global Industry Classification Standard (GICS®) was developed by and/or is the exclusive property of MSCI, Inc. and Standard & Poor Financial Services LLC (“S&P”). GICS is a service mark of MSCI and S&P and has been licensed for use by U.S. Bancorp Fund Services, LLC.
The accompanying notes are an integral part of these financial statements.
| Absolute Shares Trust |
| |
Statements of Assets and Liabilities |
|
June 30, 2020 |
| | | WBI BullBear | | | | | | | | | | |
| | | Rising Income | | | WBI BullBear | | | WBI BullBear | | | WBI BullBear | |
| | | 3000 ETF | | | Value 3000 ETF | | | Yield 3000 ETF | | | Quality 3000 ETF | |
| ASSETS | | | | | | | | | | | | |
Investments in securities, at value *+ (Note 2) | | $ | 40,215,240 | | | $ | 39,955,336 | | | $ | 54,314,825 | | | $ | 49,938,750 | |
Receivable for investments sold | | | 3,218,526 | | | | 3,335,613 | | | | 4,981,739 | | | | 4,270,276 | |
Dividends and interest receivable | | | 47,995 | | | | 19,904 | | | | 37,974 | | | | 21,833 | |
Prepaid expenses and other assets | | | 7,008 | | | | 7,395 | | | | 7,419 | | | | 7,420 | |
Securities lending income receivable | | | 198 | | | | 210 | | | | 364 | | | | 298 | |
| Total Assets | | | 43,488,967 | | | | 43,318,458 | | | | 59,342,321 | | | | 54,238,577 | |
| | | | | | | | | | | | | | | | | |
| LIABILITIES | | | | | | | | | | | | | | | | |
Payables | | | | | | | | | | | | | | | | |
| Collateral received for securities loaned (Note 7) | | | 367,290 | | | | — | | | | — | | | | — | |
| Management fees (Note 3) | | | 54,027 | | | | 51,939 | | | | 46,356 | | | | 56,520 | |
| Administration and fund accounting fees | | | 15,188 | | | | 15,174 | | | | 15,180 | | | | 15,166 | |
| Audit fees | | | 23,585 | | | | 23,586 | | | | 23,586 | | | | 23,585 | |
| Chief Compliance Officer fee | | | 1,028 | | | | 1,196 | | | | 1,196 | | | | 1,052 | |
| Custody fees | | | 2,008 | | | | 2,028 | | | | 2,525 | | | | 2,171 | |
| Directors fees | | | 10 | | | | 10 | | | | 10 | | | | 10 | |
| Legal fees | | | 2,973 | | | | 2,974 | | | | 2,974 | | | | 2,985 | |
| Accrued other expenses | | | 3,018 | | | | 3,419 | | | | 3,404 | | | | 2,916 | |
| Total Liabilities | | | 469,127 | | | | 100,326 | | | | 95,231 | | | | 104,405 | |
| NET ASSETS | | $ | 43,019,840 | | | $ | 43,218,132 | | | $ | 59,247,090 | | | $ | 54,134,172 | |
| | | | | | | | | | | | | | | | | |
| NET ASSETS CONSIST OF: | | | | | | | | | | | | | | | | |
Paid-in Capital | | $ | 85,412,479 | | | $ | 65,192,733 | | | $ | 122,175,434 | | | $ | 85,339,114 | |
Total distributable earnings (accumulated deficit) | | | (42,392,639 | ) | | | (21,974,601 | ) | | | (62,928,344 | ) | | | (31,204,943 | ) |
| Net Assets | | $ | 43,019,840 | | | $ | 43,218,132 | | | $ | 59,247,090 | | | $ | 54,134,172 | |
*Cost | | | | | | | | | | | | | | | | |
| Investments in securities | | $ | 39,046,004 | | | $ | 38,687,872 | | | $ | 52,618,235 | | | $ | 48,604,839 | |
Net Asset Value (unlimited shares authorized): | | | | | | | | | | | | | | | | |
Net Assets | | $ | 43,019,840 | | | $ | 43,218,132 | | | $ | 59,247,090 | | | $ | 54,134,172 | |
Shares Outstanding^ | | | 1,646,278 | | | | 1,688,315 | | | | 2,630,183 | | | | 2,077,182 | |
Net Asset Value, Offering and Redemption Price per Share | | $ | 26.13 | | | $ | 25.60 | | | $ | 22.53 | | | $ | 26.06 | |
^ | No Par Value |
+ | Including securities on loan of $366,940, $0, $0, and $0, respectively. |
The accompanying notes are an integral part of these financial statements.
| Absolute Shares Trust |
|
Statements of Assets and Liabilities (concluded) |
|
| | June 30, 2020 |
| | | | | | | | | WBI BullBear | | | WBI BullBear | |
| | | WBI BullBear | | | WBI Power | | | Trend Switch | | | Trend Switch | |
| | | Global | | | Factor® High | | | US 3000 Total | | | US Total | |
| | | Income ETF | | | Dividend ETF | | | Return ETF | | | Return ETF | |
| ASSETS | | | | | | | | | | | | |
Investments in securities, at value *+ (Note 2) | | $ | 86,664,614 | | | $ | 43,734,187 | | | $ | 35,242,266 | | | $ | 35,649,153 | |
Receivable for investments sold | | | — | | | | 1,739,175 | | | | — | | | | — | |
Dividends and interest receivable | | | 45 | | | | 131,947 | | | | 55,304 | | | | 18 | |
Prepaid expenses and other assets | | | 5,053 | | | | 4,300 | | | | — | | | | — | |
Securities lending income receivable | | | 12,630 | | | | 283 | | | | 3,111 | | | | 4,058 | |
| Total Assets | | | 86,682,342 | | | | 45,609,892 | | | | 35,300,681 | | | | 35,653,229 | |
| | | | | | | | | | | | | | | | | |
| LIABILITIES | | | | | | | | | | | | | | | | |
| Payables | | | | | | | | | | | | | | | | |
| Collateral received for securitizes loaned (Note 7) | | | 18,318,167 | | | | 1,600,788 | | | | — | | | | 8,945,738 | |
| Investments purchased | | | — | | | | 1,750,456 | | | | — | | | | — | |
| Management fees (Note 3) | | | 51,887 | | | | 14,246 | | | | 19,361 | | | | 14,458 | |
| Administration and fund accounting fees | | | 15,381 | | | | 15,376 | | | | — | | | | — | |
| Audit fees | | | 17,559 | | | | 17,528 | | | | — | | | | — | |
| Chief Compliance Officer fee | | | 1,196 | | | | 1,196 | | | | — | | | | — | |
| Custody fees | | | 2,133 | | | | 2,166 | | | | — | | | | — | |
| Directors fees | | | 10 | | | | 10 | | | | 10 | | | | — | |
| Legal fees | | | 2,700 | | | | 2,700 | | | | 834 | | | | 820 | |
| Accrued other expenses | | | 2,256 | | | | 3,474 | | | | — | | | | — | |
| Total Liabilities | | | 18,411,289 | | | | 3,407,940 | | | | 20,205 | | | | 8,961,016 | |
| NET ASSETS | | $ | 68,271,053 | | | $ | 42,201,952 | | | $ | 35,280,476 | | | $ | 26,692,213 | |
| | | | | | | | | | | | | | | | | |
| NET ASSETS CONSIST OF: | | | | | | | | | | | | | | | | |
Paid-in capital | | $ | 79,429,634 | | | $ | 65,702,374 | | | $ | 42,954,473 | | | $ | 32,288,201 | |
Total distributable earnings (accumulated deficit) | | | (11,158,581 | ) | | | (23,500,422 | ) | | | (7,673,997 | ) | | | (5,595,988 | ) |
| Net Assets | | $ | 68,271,053 | | | $ | 42,201,952 | | | $ | 35,280,476 | | | $ | 26,692,213 | |
*Cost | | | | | | | | | | | | | | | | |
| Investments in securities | | $ | 86,126,334 | | | $ | 45,583,732 | | | $ | 36,622,245 | | | $ | 35,635,208 | |
Net Asset Value (unlimited shares authorized): | | | | | | | | | | | | | | | | |
Net Assets | | $ | 68,271,053 | | | $ | 42,201,952 | | | $ | 35,280,476 | | | $ | 26,692,213 | |
Shares Outstanding^ | | | 2,900,000 | | | | 2,250,000 | | | | 2,075,000 | | | | 1,625,000 | |
Net Asset Value, Offering and Redemption Price per Share | | $ | 23.54 | | | $ | 18.76 | | | $ | 17.00 | | | $ | 16.43 | |
^ | No Par Value |
+ | Including securities on loan of $18,123,662, $1,545,342, $0, and $8,851,569, respectively. |
The accompanying notes are an integral part of these financial statements.
| Absolute Shares Trust |
|
|
|
| | For the Year Ended June 30, 2020 |
| | | WBI BullBear | | | | | | | | | | |
| | | Rising Income | | | WBI BullBear | | | WBI BullBear | | | WBI BullBear | |
| | | 3000 ETF | | | Value 3000 ETF | | | Yield 3000 ETF | | | Quality 3000 ETF | |
| INVESTMENT INCOME | | | | | | | | | | | | |
Income: | | | | | | | | | | | | |
| Dividends + | | $ | 768,861 | | | $ | 649,106 | | | $ | 1,267,010 | | | $ | 668,915 | |
| Interest | | | 98,969 | | | | 118,518 | | | | 156,807 | | | | 115,464 | |
| Securities lending income (Note 7) | | | 8,477 | | | | 8,399 | | | | 11,653 | | | | 8,093 | |
| Total Investment Income | | | 876,307 | | | | 776,023 | | | | 1,435,470 | | | | 792,472 | |
| | | | | | | | | | | | | | | | | |
Expenses: | | | | | | | | | | | | | | | | |
| Management fees (Note 3) | | | 442,940 | | | | 434,683 | | | | 604,216 | | | | 446,989 | |
| Administration, fund accounting and custodian fees (Note 6) | | | 88,052 | | | | 87,920 | | | | 89,429 | | | | 87,831 | |
| Professional fees | | | 61,668 | | | | 61,828 | | | | 61,831 | | | | 61,703 | |
| Exchange fees | | | 11,359 | | | | 10,208 | | | | 10,183 | | | | 10,196 | |
| Director’s fees and expenses | | | 14,015 | | | | 14,015 | | | | 14,015 | | | | 14,015 | |
| Shareholder reporting expenses | | | 6,885 | | | | 8,049 | | | | 8,081 | | | | 6,657 | |
| Insurance expenses | | | 13,828 | | | | 13,828 | | | | 13,828 | | | | 13,828 | |
| Miscellaneous expenses | | | 6,852 | | | | 6,852 | | | | 6,867 | | | | 6,866 | |
| Net Expenses | | | 645,599 | | | | 637,383 | | | | 808,450 | | | | 648,085 | |
| Net Investment Income | | | 230,708 | | | | 138,640 | | | | 627,020 | | | | 144,387 | |
| | | | | | | | | | | | | | | | | |
| REALIZED & UNREALIZED GAIN (LOSS) ON INVESTMENTS | | | | | | | | | | | | | | | | |
| Net realized gain (loss) on: | | | | | | | | | | | | | | | | |
| Investments in securities | | | 757,141 | | | | (2,930,985 | ) | | | (2,736,843 | ) | | | 86,761 | |
Net change in unrealized appreciation (depreciation) of: | | | | | | | | | | | | | | | | |
| Investments in securities | | | (1,435,816 | ) | | | 340,176 | | | | (1,041,124 | ) | | | (1,423,422 | ) |
Net realized and unrealized loss on investments | | | (678,675 | ) | | | (2,590,809 | ) | | | (3,777,967 | ) | | | (1,336,661 | ) |
| NET DECREASE IN NET ASSETS | | | | | | | | | | | | | | | | |
| RESULTING FROM OPERATIONS | | $ | (447,967 | ) | | $ | (2,452,169 | ) | | $ | (3,150,947 | ) | | $ | (1,192,274 | ) |
+ Net of withholding taxes of $24,665, $(3,015), $0, and $0, respectively.
The accompanying notes are an integral part of these financial statements.
| Absolute Shares Trust |
|
Statements of Operations (concluded) |
|
| | For the Year/Period Ended June 30, 2020 |
| | | | | | | | | WBI BullBear | | | WBI BullBear | |
| | | WBI BullBear | | | WBI Power | | | Trend Switch | | | Trend Switch | |
| | | Global | | | Factor® High | | | US 3000 Total | | | US Total | |
| | | Income ETF | | | Dividend ETF | | | Return ETF | | | Return ETF* | |
| INVESTMENT INCOME | | | | | | | | | | | | |
Income: | | | | | | | | | | | | |
| Dividends + | | $ | 4,703,620 | | | $ | 4,246,525 | | | $ | 2,279,620 | | | $ | 1,206,665 | |
| Interest | | | 15,423 | | | | 12,984 | | | | 6,273 | | | | 2,762 | |
| Securities lending income (Note 7) | | | 131,898 | | | | 43,428 | | | | 23,092 | | | | 18,895 | |
| Total Investment Income | | | 4,850,941 | | | | 4,302,937 | | | | 2,308,985 | | | | 1,228,322 | |
| | | | | | | | | | | | | | | | | |
Expenses: | | | | | | | | | | | | | | | | |
| Management fees (Note 3) | | | 817,558 | | | | 427,977 | | | | 262,666 | | | | 154,954 | |
| Administration, fund accounting and custodian fees (Note 6) | | | 89,630 | | | | 90,885 | | | | — | | | | — | |
| Professional fees | | | 38,805 | | | | 39,033 | | | | 7,327 | | | | 7,681 | |
| Exchange fees | | | 10,763 | | | | 7,123 | | | | — | | | | — | |
| Director’s fees and expenses | | | 12,184 | | | | 12,184 | | | | 12,184 | | | | 12,162 | |
| Shareholder reporting expenses | | | 3,078 | | | | 7,445 | | | | — | | | | — | |
| Insurance expenses | | | 8,519 | | | | 8,520 | | | | — | | | | — | |
| Miscellaneous expenses | | | 6,750 | | | | 6,571 | | | | — | | | | — | |
| Total Expenses | | | 987,287 | | | | 599,738 | | | | 282,177 | | | | 174,797 | |
| Less: Fees (Waived)/Recouped | | | — | | | | (55,039 | ) | | | — | | | | — | �� |
| Net Expenses | | | 987,287 | | | | 544,699 | | | | 282,177 | | | | 174,797 | |
| Net Investment Income | | | 3,863,654 | | | | 3,758,238 | | | | 2,026,808 | | | | 1,053,525 | |
| | | | | | | | | | | | | | | | | |
| REALIZED & UNREALIZED GAIN (LOSS) ON INVESTMENTS | | | | | | | | | | | | | | | | |
Net realized loss on: | | | | | | | | | | | | | | | | |
| Investments in securities | | | (4,662,930 | ) | | | (22,486,976 | ) | | | (5,324,834 | ) | | | (4,962,308 | ) |
Net change in unrealized appreciation (depreciation) of: | | | | | | | | | | | | | | | | |
| Investments in securities | | | (691,493 | ) | | | 1,078,651 | | | | (1,872,826 | ) | | | 13,945 | |
| Net realized and unrealized loss on investments | | | (5,354,423 | ) | | | (21,408,325 | ) | | | (7,197,660 | ) | | | (4,948,363 | ) |
| NET DECREASE IN NET ASSETS | | | | | | | | | | | | | | | | |
| RESULTING FROM OPERATIONS | | $ | (1,490,769 | ) | | $ | (17,650,087 | ) | | $ | (5,170,852 | ) | | $ | (3,894,838 | ) |
* | Fund commenced operations on July 18, 2019. This information presented is for the period from July 18, 2019 to June 30, 2020. |
+ | Net of withholding taxes of $0, $878, $0, and $0, respectively. |
The accompanying notes are an integral part of these financial statements.
| Absolute Shares Trust |
|
Statements of Changes in Net Assets |
|
| | | WBI BullBear Rising Income 3000 ETF | | | WBI BullBear Value 3000 ETF | |
| | | Year Ended | | | Year Ended | | | Year Ended | | | Year Ended | |
| | | June 30, 2020 | | | June 30, 2019 | | | June 30, 2020 | | | June 30, 2019 | |
| INCREASE (DECREASE) IN NET ASSETS: | | | | | | | | | | | | |
| OPERATIONS | | | | | | | | | | | | |
| Net investment income | | $ | 230,708 | | | $ | 547,760 | | | $ | 138,640 | | | $ | 499,486 | |
| Net realized gain (loss) on investments | | | 757,141 | | | | 4,030,831 | | | | (2,930,985 | ) | | | 1,567,690 | |
| Net change in unrealized appreciation (depreciation) | | | | | | | | | | | | | | | | |
| of investments | | | (1,435,816 | ) | | | (242,722 | ) | | | 340,176 | | | | (1,054,522 | ) |
| Net increase (decrease) in net assets | | | | | | | | | | | | | | | | |
| resulting from operations | | | (447,967 | ) | | | 4,335,869 | | | | (2,452,169 | ) | | | 1,012,654 | |
| DISTRIBUTIONS TO SHAREHOLDERS | | | | | | | | | | | | | | | | |
| Net distributions to shareholders | | | (230,708 | ) | | | (561,691 | ) | | | (242,901 | ) | | | (485,571 | ) |
| From return of capital | | | (55,918 | ) | | | — | | | | — | | | | — | |
| Total distributions to shareholders | | | (286,626 | ) | | | (561,691 | ) | | | (242,901 | ) | | | (485,571 | ) |
| CAPITAL SHARE TRANSACTIONS | | | | | | | | | | | | | | | | |
| Net decrease in net assets | | | | | | | | | | | | | | | | |
| from capital share transactions | | | (17,850,085 | ) | | | (17,453,115 | ) | | | (4,384,166 | ) | | | (15,072,530 | ) |
| Total decrease in net assets | | $ | (18,584,678 | ) | | $ | (13,678,937 | ) | | $ | (7,079,236 | ) | | $ | (14,545,447 | ) |
| NET ASSETS | | | | | | | | | | | | | | | | |
| Beginning of Period/Year | | $ | 61,604,518 | | | $ | 75,283,455 | | | $ | 50,297,368 | | | $ | 64,842,815 | |
| End of Period/Year | | $ | 43,019,840 | | | $ | 61,604,518 | | | $ | 43,218,132 | | | $ | 50,297,368 | |
| | | | | | | | | | | | | | | | | |
| | | | | | | | | | | | | | | | | |
| | | WBI BullBear Yield 3000 ETF | | | WBI BullBear Quality 3000 ETF | |
| | | Year Ended | | | Year Ended | | | Year Ended | | | Year Ended | |
| | | June 30, 2020 | | | June 30, 2019 | | | June 30, 2020 | | | June 30, 2019 | |
| INCREASE (DECREASE) IN NET ASSETS: | | | | | | | | | | | | | | | | |
| OPERATIONS | | | | | | | | | | | | | | | | |
| Net investment income | | $ | 627,020 | | | $ | 1,651,835 | | | $ | 144,387 | | | $ | 303,446 | |
| Net realized gain (loss) on investments | | | (2,736,843 | ) | | | (5,767,435 | ) | | | 86,761 | | | | 1,920,255 | |
| Net change in unrealized appreciation (depreciation) | | | | | | | | | | | | | | | | |
| of investments | | | (1,041,124 | ) | | | (702,154 | ) | | | (1,423,422 | ) | | | 1,936,011 | |
| Net increase (decrease) in net assets | | | | | | | | | | | | | | | | |
| resulting from operations | | | (3,150,947 | ) | | | (4,817,754 | ) | | | (1,192,274 | ) | | | 4,159,712 | |
| DISTRIBUTIONS TO SHAREHOLDERS | | | | | | | | | | | | | | | | |
| Net distributions to shareholders | | | (686,952 | ) | | | (1,601,703 | ) | | | (170,658 | ) | | | (322,761 | ) |
| From return of capital | | | (84,576 | ) | | | — | | | | (44,276 | ) | | | — | |
| Total distributions to shareholders | | | (771,528 | ) | | | (1,601,703 | ) | | | (214,934 | ) | | | (322,761 | ) |
| CAPITAL SHARE TRANSACTIONS | | | | | | | | | | | | | | | | |
| Net decrease in net assets | | | | | | | | | | | | | | | | |
| from capital share transactions | | | (11,302,452 | ) | | | (1,887,575 | ) | | | (5,660,263 | ) | | | (2,590,450 | ) |
| Total increase (decrease) in net assets | | $ | (15,224,927 | ) | | $ | (8,307,032 | ) | | $ | (7,067,471 | ) | | $ | 1,246,501 | |
| NET ASSETS | | | | | | | | | | | | | | | | |
| Beginning of Period/Year | | $ | 74,472,017 | | | $ | 82,779,049 | | | $ | 61,201,643 | | | $ | 59,955,142 | |
| End of Period/Year | | $ | 59,247,090 | | | $ | 74,472,017 | | | $ | 54,134,172 | | | $ | 61,201,643 | |
The accompanying notes are an integral part of these financial statements.
| Absolute Shares Trust |
|
Statements of Changes in Net Assets (concluded) |
|
| | | WBI BullBear Global Income ETF | | | WBI Power Factor® High Dividend ETF | |
| | | Year Ended | | | Year Ended | | | Year Ended | | | Year Ended | |
| | | June 30, 2020 | | | June 30, 2019 | | | June 30, 2020 | | | June 30, 2019 | |
| INCREASE (DECREASE) IN NET ASSETS: | | | | | | | | | | | | |
| OPERATIONS | | | | | | | | | | | | |
| Net investment income | | $ | 3,863,654 | | | $ | 3,905,081 | | | $ | 3,758,238 | | | $ | 4,565,044 | |
| Net realized gain (loss) on investments | | | (4,662,930 | ) | | | 5,105,961 | | | | (22,486,976 | ) | | | (9,985,413 | ) |
| Net change in unrealized appreciation (depreciation) | | | | | | | | | | | | | | | | |
| of investments | | | (691,493 | ) | | | 1,907,353 | | | | 1,078,651 | | | | (6,000,041 | ) |
| Net increase (decrease) in net assets | | | | | | | | | | | | | | | | |
| resulting from operations | | | (1,490,769 | ) | | | 10,918,395 | | | | (17,650,087 | ) | | | (11,420,410 | ) |
| DISTRIBUTIONS TO SHAREHOLDERS | | | | | | | | | | | | | | | | |
| Net distributions to shareholders | | | (3,857,876 | ) | | | (3,929,336 | ) | | | (3,729,916 | ) | | | (5,384,656 | ) |
| Total distributions to shareholders | | | (3,857,876 | ) | | | (3,929,336 | ) | | | (3,729,916 | ) | | | (5,384,656 | ) |
| CAPITAL SHARE TRANSACTIONS | | | | | | | | | | | | | | | | |
| Net increase (decrease) in net assets | | | | | | | | | | | | | | | | |
| from capital share transactions | | | (62,668,770 | ) | | | 32,673,530 | | | | (39,578,465 | ) | | | 67,563,125 | |
| Total increase (decrease) in net assets | | $ | (68,017,415 | ) | | $ | 39,662,589 | | | $ | (60,958,468 | ) | | $ | 50,758,059 | |
| NET ASSETS | | | | | | | | | | | | | | | | |
| Beginning of Period/Year | | $ | 136,288,468 | | | $ | 96,625,879 | | | $ | 103,160,421 | | | $ | 52,402,362 | |
| End of Period/Year | | $ | 68,271,053 | | | $ | 136,288,468 | | | $ | 42,201,952 | | | $ | 103,160,421 | |
| | | WBI BullBear Trend Switch | | | WBI BullBear Trend Switch | |
| | | US 3000 Total Return ETF | | | US Total Return ETF | |
| | | Year Ended | | | Period Ended | | | Period Ended | |
| | | June 30, 2020 | | | June 30, 20191 | | | June 30, 20202 | |
| INCREASE (DECREASE) IN NET ASSETS: | | | | | | | | | |
| OPERATIONS | | | | | | | | | |
| Net investment income | | $ | 2,026,808 | | | $ | 36,225 | | | $ | 1,053,525 | |
| Net realized gain (loss) on investments | | | (5,324,834 | ) | | | 77,409 | | | | (4,962,308 | ) |
| Net change in unrealized appreciation (depreciation) | | | | | | | | | | | | |
| of investments | | | (1,872,826 | ) | | | 492,848 | | | | 13,945 | |
| Net increase (decrease) in net assets | | | | | | | | | | | | |
| resulting from operations | | | (5,170,852 | ) | | | 606,482 | | | | (3,894,838 | ) |
| DISTRIBUTIONS TO SHAREHOLDERS | | | | | | | | | | | | |
| Net distributions to shareholders | | | (1,930,968 | ) | | | (40,995 | ) | | | (1,050,048 | ) |
| From net realized gain | | | (964,261 | ) | | | — | | | | (649,594 | ) |
| Total distributions to shareholders | | | (2,895,229 | ) | | | (40,995 | ) | | | (1,699,642 | ) |
| CAPITAL SHARE TRANSACTIONS | | | | | | | | | | | | |
| Net increase (decrease) in net assets | | | | | | | | | | | | |
| from capital share transactions | | | (3,683,280 | ) | | | 46,464,350 | | | | 32,286,693 | |
| Total increase (decrease) in net assets | | $ | (11,749,361 | ) | | $ | 47,029,837 | | | $ | 26,692,213 | |
| NET ASSETS | | | | | | | | | | | | |
| Beginning of Period/Year | | $ | 47,029,837 | | | $ | — | | | $ | — | |
| End of Period/Year | | $ | 35,280,476 | | | $ | 47,029,837 | | | $ | 26,692,213 | |
1 | Fund commenced operations on May 28, 2019. The information presented is for the period from May 28, 2019 to June 30, 2019. |
2 | Fund commenced operations on July 18, 2019. The information presented is for the period from July 18, 2019 to June 30, 2020. |
The accompanying notes are an integral part of these financial statements.
| Absolute Shares Trust |
|
|
|
For capital share outstanding throughout each year
| | | | | | WBI BullBear Rising Income 3000 ETF | | | | |
| | | Year Ended | | | Year Ended | | | Year Ended | | | Year Ended | | | Year Ended | |
| | | June 30, 2020 | | | June 30, 2019 | | | June 30, 2018 | | | June 30, 2017 | | | June 30, 2016 | |
| Net Asset Value, Beginning of Year | | $ | 26.78 | | | $ | 25.96 | | | $ | 24.53 | | | $ | 21.92 | | | $ | 24.45 | |
| Income (Loss) from Investment Operations: | | | | | | | | | | | | | | | | | | | | |
Net investment income1 | | | 0.12 | | | | 0.27 | | | | 0.15 | | | | 0.16 | | | | 0.06 | |
Net gain (loss) on investments (realized and unrealized)3 | | | (0.62 | ) | | | 0.85 | | | | 1.41 | | | | 2.64 | | | | (2.53 | ) |
| Total from investment operations | | | (0.50 | ) | | | 1.12 | | | | 1.56 | | | | 2.80 | | | | (2.47 | ) |
| Less Distributions: | | | | | | | | | | | | | | | | | | | | |
Distributions from net investment income | | | (0.12 | ) | | | (0.30 | ) | | | (0.13 | ) | | | (0.19 | ) | | | (0.06 | ) |
Tax return of capital to shareholders | | | (0.03 | ) | | | — | | | | — | | | | — | | | | — | |
Distributions from net realized gain | | | — | | | | — | | | | — | | | | — | | | | — | |
| Total Distributions | | | (0.15 | ) | | | (0.30 | ) | | | (0.13 | ) | | | (0.19 | ) | | | (0.06 | ) |
Net asset value, end of year | | $ | 26.13 | | | $ | 26.78 | | | $ | 25.96 | | | $ | 24.53 | | | $ | 21.92 | |
Market price, end of year | | $ | 26.15 | | | $ | 26.75 | | | $ | 25.93 | | | $ | 24.58 | | | $ | 21.83 | |
Net Assets Total Return4 | | | -1.89 | % | | | 4.22 | % | | | 6.52 | % | | | 12.88 | % | | | -10.14 | % |
| | | | | | | | | | | | | | | | | | | | | |
| Supplemental Data: | | | | | | | | | | | | | | | | | | | | |
Net assets, end of year (000’s) | | $ | 43,020 | | | $ | 61,605 | | | $ | 75,283 | | | $ | 50,291 | | | $ | 73,427 | |
| Ratios to Average Net Assets: | | | | | | | | | | | | | | | | | | | | |
| Expenses before fees (waived)/recouped | | | 1.24 | % | | | 1.13 | % | | | 1.05 | % | | | 1.05 | % | | | 0.99 | % |
| Expenses after fees (waived)/recouped | | | 1.24 | % | | | 1.13 | % | | | 1.05 | % | | | 1.05 | % | | | 0.99 | % |
| Net investment income to average net assets | | | 0.44 | % | | | 1.01 | % | | | 0.57 | % | | | 0.72 | % | | | 0.25 | % |
Portfolio turnover rate2 | | | 790 | % | | | 512 | % | | | 496 | % | | | 279 | % | | | 571 | % |
| | | | | | | | | | | | | | | | | | | | | |
| | | | | | | | | | | | | | | | | | | | | |
| | | | | | | WBI BullBear Value 3000 ETF | | | | | |
| | | Year Ended | | | Year Ended | | | Year Ended | | | Year Ended | | | Year Ended | |
| | | June 30, 2020 | | | June 30, 2019 | | | June 30, 2018 | | | June 30, 2017 | | | June 30, 2016 | |
Net Asset Value, Beginning of Year | | $ | 27.19 | | | $ | 28.19 | | | $ | 26.20 | | | $ | 21.85 | | | $ | 23.98 | |
| Income (Loss) from Investment Operations: | | | | | | | | | | | | | | | | | | | | |
Net investment income1 | | | 0.07 | | | | 0.32 | | | | 0.18 | | | | 0.29 | | | | 0.04 | |
Net gain (loss) on investments (realized and unrealized)3 | | | (1.54 | ) | | | (0.99 | ) | | | 2.00 | | | | 4.35 | | | | (2.12 | ) |
| Total from investment operations | | | (1.47 | ) | | | (0.67 | ) | | | 2.18 | | | | 4.64 | | | | (2.08 | ) |
| Less Distributions: | | | | | | | | | | | | | | | | | | | | |
Distributions from net investment income | | | (0.12 | ) | | | (0.33 | ) | | | (0.19 | ) | | | (0.29 | ) | | | (0.05 | ) |
Tax return of capital to shareholders | | | — | | | | — | | | | — | | | | — | | | | — | |
Distributions from net realized gain | | | — | | | | — | | | | — | | | | — | | | | — | |
| Total Distributions | | | (0.12 | ) | | | (0.33 | ) | | | (0.19 | ) | | | (0.29 | ) | | | (0.05 | ) |
Net asset value, end of year | | $ | 25.60 | | | $ | 27.19 | | | $ | 28.19 | | | $ | 26.20 | | | $ | 21.85 | |
Market price, end of year | | $ | 25.61 | | | $ | 27.16 | | | $ | 28.17 | | | $ | 26.28 | | | $ | 21.77 | |
Net Assets Total Return4 | | | -5.40 | % | | | -2.53 | % | | | 8.40 | % | | | 21.34 | % | | | -8.63 | % |
| | | | | | | | | | | | | | | | | | | | | |
| Supplemental Data: | | | | | | | | | | | | | | | | | | | | |
Net assets, end of year (000’s) | | $ | 43,218 | | | $ | 50,297 | | | $ | 64,843 | | | $ | 78,601 | | | $ | 72,097 | |
| Ratios to Average Net Assets: | | | | | | | | | | | | | | | | | | | | |
| Expenses before fees (waived)/recouped | | | 1.25 | % | | | 1.18 | % | | | 1.05 | % | | | 1.03 | % | | | 0.99 | % |
| Expenses after fees (waived)/recouped | | | 1.25 | % | | | 1.18 | % | | | 1.05 | % | | | 1.03 | % | | | 0.99 | % |
| Net investment income to average net assets | | | 0.27 | % | | | 1.11 | % | | | 0.64 | % | | | 1.19 | % | | | 0.19 | % |
Portfolio turnover rate2 | | | 894 | % | | | 567 | % | | | 527 | % | | | 388 | % | | | 573 | % |
1 | Calculated based on average shares outstanding during the period. |
2 | Excludes securities received or delivered as a result of processing capital share transactions in creation units. |
3 | The amount for a share outstanding throughout the period may not be in accordance with the aggregate net realized and unrealized gain (loss) on investment for the period because of the timing of capital share transactions in relation to fluctuating market values of the Funds’ underlying securities. |
4 | Net asset value total return is calculated assuming an initial investment made at the net asset value at the beginning of the period, reinvestment of all dividends and distributions at net asset value during the period, and the redemption on the last day of the period. Net asset value total return includes adjustments in accordance with accounting principles generally accepted in the United States of America and as such, the net asset value for financial reporting purposes and the returns based upon those net asset values may differ from the net asset value and returns for shareholder transactions. |
The accompanying notes are an integral part of these financial statements.
| Absolute Shares Trust |
|
Financial Highlights (continued) |
|
For capital share outstanding throughout each year
| | | | | | WBI BullBear Yield 3000 ETF | | | | |
| | | Year Ended | | | Year Ended | | | Year Ended | | | Year Ended | | | Year Ended | |
| | | June 30, 2020 | | | June 30, 2019 | | | June 30, 2018 | | | June 30, 2017 | | | June 30, 2016 | |
| Net Asset Value, Beginning of Year | | $ | 24.02 | | | $ | 25.87 | | | $ | 22.89 | | | $ | 20.25 | | | $ | 23.48 | |
| Income (Loss) from Investment Operations: | | | | | | | | | | | | | | | | | | | | |
Net investment income1 | | | 0.21 | | | | 0.51 | | | | 0.25 | | | | 0.31 | | | | 0.08 | |
Net gain (loss) on investments (realized and unrealized)3 | | | (1.46 | ) | | | (1.84 | ) | | | 2.98 | | | | 2.66 | | | | (3.22 | ) |
| Total from investment operations | | | (1.25 | ) | | | (1.33 | ) | | | 3.23 | | | | 2.97 | | | | (3.14 | ) |
| Less Distributions: | | | | | | | | | | | | | | | | | | | | |
Distributions from net investment income | | | (0.21 | ) | | | (0.52 | ) | | | (0.25 | ) | | | (0.33 | ) | | | (0.09 | ) |
Tax return of capital to shareholders | | | (0.03 | ) | | | — | | | | — | | | | — | | | | — | |
Distributions from net realized gain | | | — | | | | — | | | | — | | | | — | | | | — | |
| Total Distributions | | | (0.24 | ) | | | (0.52 | ) | | | (0.25 | ) | | | (0.33 | ) | | | (0.09 | ) |
Net asset value, end of year | | $ | 22.53 | | | $ | 24.02 | | | $ | 25.87 | | | $ | 22.89 | | | $ | 20.25 | |
Market price, end of year | | $ | 22.52 | | | $ | 23.96 | | | $ | 25.83 | | | $ | 22.95 | | | $ | 20.19 | |
Net Assets Total Return4 | | | -5.22 | % | | | -5.22 | % | | | 14.14 | % | | | 14.82 | % | | | -13.37 | % |
| | | | | | | | | | | | | | | | | | | | | |
| Supplemental Data: | | | | | | | | | | | | | | | | | | | | |
Net assets, end of year (000’s) | | $ | 59,247 | | | $ | 74,472 | | | $ | 82,779 | | | $ | 78,982 | | | $ | 99,236 | |
| Ratios to Average Net Assets: | | | | | | | | | | | | | | | | | | | | |
| Expenses before fees (waived)/recouped | | | 1.14 | % | | | 1.04 | % | | | 1.04 | % | | | 1.02 | % | | | 0.98 | % |
| Expenses after fees (waived)/recouped | | | 1.14 | % | | | 1.04 | % | | | 1.04 | % | | | 1.02 | % | | | 0.98 | % |
| Net investment income to average net assets | | | 0.88 | % | | | 2.04 | % | | | 0.99 | % | | | 1.47 | % | | | 0.38 | % |
Portfolio turnover rate2 | | | 895 | % | | | 610 | % | | | 491 | % | | | 352 | % | | | 584 | % |
| | | | | | | | | | | | | | | | | | | | | |
| | | | | | | | | | | | | | | | | | | | | |
| | | | | | | WBI BullBear Quality 3000 ETF | | | | | |
| | | Year Ended | | | Year Ended | | | Year Ended | | | Year Ended | | | Year Ended | |
| | | June 30, 2020 | | | June 30, 2019 | | | June 30, 2018 | | | June 30, 2017 | | | June 30, 2016 | |
| Net Asset Value, Beginning of Year | | $ | 27.20 | | | $ | 26.07 | | | $ | 25.25 | | | $ | 21.87 | | | $ | 23.85 | |
| Income (Loss) from Investment Operations: | | | | | | | | | | | | | | | | | | | | |
Net investment income1 | | | 0.07 | | | | 0.20 | | | | 0.23 | | | | 0.22 | | | | 0.04 | |
Net gain (loss) on investments (realized and unrealized)3 | | | (1.10 | ) | | | 1.13 | | | | 0.81 | | | | 3.42 | | | | (2.00 | ) |
| Total from investment operations | | | (1.03 | ) | | | 1.33 | | | | 1.04 | | | | 3.64 | | | | (1.96 | ) |
| Less Distributions: | | | | | | | | | | | | | | | | | | | | |
Distributions from net investment income | | | (0.09 | ) | | | (0.20 | ) | | | (0.22 | ) | | | (0.26 | ) | | | (0.02 | ) |
Tax return of capital to shareholders | | | (0.02 | ) | | | — | | | | — | | | | — | | | | — | |
Distributions from net realized gain | | | — | | | | — | | | | — | | | | — | | | | — | |
| Total Distributions | | | (0.11 | ) | | | (0.20 | ) | | | (0.22 | ) | | | (0.26 | ) | | | (0.02 | ) |
Net asset value, end of year | | $ | 26.06 | | | $ | 27.20 | | | $ | 26.07 | | | $ | 25.25 | | | $ | 21.87 | |
Market price, end of year | | $ | 26.07 | | | $ | 27.18 | | | $ | 26.10 | | | $ | 25.32 | | | $ | 21.79 | |
Net Assets Total Return4 | | | -3.79 | % | | | 5.08 | % | | | 4.11 | % | | | 16.80 | % | | | -8.22 | % |
| | | | | | | | | | | | | | | | | | | | | |
| Supplemental Data: | | | | | | | | | | | | | | | | | | | | |
Net assets, end of year (000’s) | | $ | 54,134 | | | $ | 61,202 | | | $ | 59,955 | | | $ | 47,983 | | | $ | 80,909 | |
| Ratios to Average Net Assets: | | | | | | | | | | | | | | | | | | | | |
| Expenses before fees (waived)/recouped | | | 1.23 | % | | | 1.21 | % | | | 1.07 | % | | | 1.04 | % | | | 0.98 | % |
| Expenses after fees (waived)/recouped | | | 1.23 | % | | | 1.21 | % | | | 1.07 | % | | | 1.04 | % | | | 0.98 | % |
| Net investment income to average net assets | | | 0.27 | % | | | 0.74 | % | | | 0.86 | % | | | 0.94 | % | | | 0.17 | % |
Portfolio turnover rate2 | | | 886 | % | | | 477 | % | | | 553 | % | | | 320 | % | | | 493 | % |
1 | Calculated based on average shares outstanding drung the period. |
2 | Excludes securities received or delivered as a result of processing capital share transactions in creation units. |
3 | The amount for a share outstanding throughout the period may not be in accordance with the aggregate net realized and unrealized gain (loss) on investment for the period because of the timing of capital share transactions in relation to fluctuating market values of the Funds’ underlying securities. |
4 | Net asset value total return is calculated assuming an initial investment made at the net asset value at the beginning of the period, reinvestment of all dividends and distributions at net asset value during the period, and the redemption on the last day of the period. Net asset value total return includes adjustments in accordance with accounting principles generally accepted in the United States of America and as such, the net asset value for financial reporting purposes and the returns based upon those net asset values may differ from the net asset value and returns for shareholder transactions. |
The accompanying notes are an integral part of these financial statements.
| Absolute Shares Trust |
|
Financial Highlights (continued) |
|
For capital share outstanding throughout each year/period
| | | | | | WBI BullBear Global Income ETF | | | | |
| | | Year Ended | | | Year Ended | | | Year Ended | | | Year Ended | | | Year Ended | |
| | | June 30, 2020 | | | June 30, 2019 | | | June 30, 2018 | | | June 30, 2017 | | | June 30, 2016 | |
| Net Asset Value, Beginning of Year | | $ | 25.24 | | | $ | 23.86 | | | $ | 25.35 | | | $ | 25.18 | | | $ | 25.46 | |
| Income (Loss) from Investment Operations: | | | | | | | | | | | | | | | | | | | | |
Net investment income2 | | | 1.00 | | | | 0.87 | | | | 0.68 | | | | 0.38 | | | | 0.34 | |
Net gain (loss) on investments (realized and unrealized)6 | | | (1.72 | ) | | | 1.40 | | | | (1.47 | ) | | | 0.20 | | | | (0.23 | ) |
| Total from investment operations | | | (0.72 | ) | | | 2.27 | | | | (0.79 | ) | | | 0.58 | | | | 0.11 | |
| Less Distributions: | | | | | | | | | | | | | | | | | | | | |
Distributions from net investment income | | | (0.98 | ) | | | (0.89 | ) | | | (0.70 | ) | | | (0.41 | ) | | | (0.33 | ) |
Tax return of capital to shareholders | | | — | | | | — | | | | — | | | | — | | | | — | |
Distributions from net realized gain | | | — | | | | — | | | | — | | | | — | | | | (0.06 | ) |
| Total Distributions | | | (0.98 | ) | | | (0.89 | ) | | | (0.70 | ) | | | (0.41 | ) | | | (0.39 | ) |
Net asset value, end of year | | $ | 23.54 | | | $ | 25.24 | | | $ | 23.86 | | | $ | 25.35 | | | $ | 25.18 | |
Market price, end of year | | $ | 23.53 | | | $ | 25.20 | | | $ | 23.83 | | | $ | 25.38 | | | $ | 25.16 | |
Net Assets Total Return7 | | | -2.97 | % | | | 9.75 | % | | | -3.20 | % | | | 2.36 | % | | | 0.45 | % |
| | | | | | | | | | | | | | | | | | | | | |
| Supplemental Data: | | | | | | | | | | | | | | | | | | | | |
Net assets, end of year (000’s) | | $ | 68,271 | | | $ | 136,288 | | | $ | 96,626 | | | $ | 162,243 | | | $ | 396,558 | |
| Ratios to Average Net Assets: | | | | | | | | | | | | | | | | | | | | |
| Expenses before fees (waived)/recouped | | | 1.03 | % | | | 0.99 | % | | | 1.02 | % | | | 1.00 | % | | | 0.95 | % |
| Expenses after fees (waived)/recouped | | | 1.03 | % | | | 0.99 | % | | | 1.02 | % | | | 1.00 | % | | | 0.95 | % |
| Net investment income to average net assets | | | 4.02 | % | | | 3.60 | % | | | 2.71 | % | | | 1.53 | % | | | 1.35 | % |
Portfolio turnover rate5 | | | 1,116 | % | | | 686 | % | | | 551 | % | | | 479 | % | | | 364 | % |
| | | WBI Power Factor® High Dividend ETF | |
| | | Year Ended | | | Year Ended | | | Year Ended | | | Period Ended | |
| | | June 30, 2020 | | | June 30, 2019 | | | June 30, 2018 | | | June 30, 20171 | |
| Net Asset Value, Beginning of Period/Year | | $ | 24.56 | | | $ | 26.87 | | | $ | 24.22 | | | $ | 25.00 | |
| Income (Loss) from Investment Operations: | | | | | | | | | | | | | | | | |
Net investment income2 | | | 1.12 | | | | 1.12 | | | | 1.21 | | | | 0.53 | |
Net gain (loss) on investments (realized and unrealized)6 | | | (5.76 | ) | | | (2.08 | ) | | | 3.19 | | | | (0.94 | ) |
| Total from investment operations | | | (4.64 | ) | | | (0.96 | ) | | | 4.40 | | | | (0.41 | ) |
| Less Distributions: | | | | | | | | | | | | | | | | |
Distributions from net investment income | | | (1.16 | ) | | | (1.13 | ) | | | (1.15 | ) | | | (0.37 | ) |
Tax return of capital to shareholders | | | — | | | | — | | | | — | | | | — | |
Distributions from net realized gain | | | — | | | | (0.22 | ) | | | (0.60 | ) | | | — | |
| Total Distributions | | | (1.16 | ) | | | (1.35 | ) | | | (1.75 | ) | | | (0.37 | ) |
Net asset value, end of period/year | | $ | 18.76 | | | $ | 24.56 | | | $ | 26.87 | | | $ | 24.22 | |
Market price, end of period/year | | $ | 18.75 | | | $ | 24.53 | | | $ | 26.87 | | | $ | 24.34 | |
Net Assets Total Return7 | | | -19.24 | % | | | -3.25 | % | | | 18.51 | % | | | -1.64 | %3 |
| | | | | | | | | | | | | | | | | |
| Supplemental Data: | | | | | | | | | | | | | | | | |
Net assets, end of period/year (000’s) | | $ | 42,202 | | | $ | 103,160 | | | $ | 52,402 | | | $ | 33,903 | |
| Ratios to Average Net Assets: | | | | | | | | | | | | | | | | |
| Expenses before fees (waived)/recouped | | | 0.77 | % | | | 0.70 | % | | | 0.85 | % | | | 1.37 | %4 |
| Expenses after fees (waived)/recouped | | | 0.70 | % | | | 0.70 | % | | | 0.70 | % | | | 0.70 | %4 |
| Net investment income to average net assets | | | 4.83 | % | | | 4.46 | % | | | 4.73 | % | | | 3.81 | %4 |
Portfolio turnover rate5 | | | 196 | % | | | 163 | % | | | 171 | % | | | 78 | %3 |
1 | Fund commenced operations on December 19, 2016. The information presented is for the period from December 19, 2016 to June 30, 2017. |
2 | Calculated based on average shares outstanding during the period. |
3 | Not annualized. |
4 | Annualized. |
5 | Excludes securities received or delivered as a result of processing capital share transactions in creation units. |
6 | The amount for a share outstanding throughout the period may not be in accordance with the aggregate net realized and unrealized gain (loss) on investment for the period because of the timing of capital share transactions in relation to fluctuating market values of the Funds’ underlying securities. |
7 | Net asset value total return is calculated assuming an initial investment made at the net asset value at the beginning of the period, reinvestment of all dividends and distributions at net asset value during the period, and the redemption on the last day of the period. Net asset value total return includes adjustments in accordance with accounting principles generally accepted in the United States of America and as such, the net asset value for financial reporting purposes and the returns based upon those net asset values may differ from the net asset value and returns for shareholder transactions. |
The accompanying notes are an integral part of these financial statements.
| Absolute Shares Trust |
|
Financial Highlights (concluded) |
|
For capital share outstanding throughout each year/period
| | | | | | | | | WBI BullBear | |
| | | WBI BullBear Trend Switch | | | Trend Switch US | |
| | | US 3000 Total Return ETF | | | Total Return ETF | |
| | | Year Ended | | | Period Ended | | | Period Ended | |
| | | June 30, 2020 | | | June 30, 20191 | | | June 30, 20202 | |
| Net Asset Value, Beginning of Year/Period | | $ | 20.67 | | | $ | 20.00 | | | $ | 20.00 | |
| Income (Loss) from Investment Operations: | | | | | | | | | | | | |
Net investment income3 | | | 0.98 | | | | 0.02 | | | | 0.78 | |
Net gain (loss) on investments (realized and unrealized)7 | | | (3.25 | ) | | | 0.67 | | | | (2.90 | ) |
| Total from investment operations | | | (2.27 | ) | | | 0.69 | | | | (2.12 | ) |
| Less Distributions: | | | | | | | | | | | | |
Distributions from net investment income | | | (0.95 | ) | | | (0.02 | ) | | | (0.82 | ) |
Tax return of capital to shareholders | | | — | | | | — | | | | — | |
Distributions from net realized gain | | | (0.45 | ) | | | — | | | | (0.63 | ) |
| Total Distributions | | | (1.40 | ) | | | (0.02 | ) | | | (1.45 | ) |
Net asset value, end of year/period | | $ | 17.00 | | | $ | 20.67 | | | $ | 16.43 | |
Market price, end of year/period | | $ | 17.04 | | | $ | 20.69 | | | $ | 16.40 | |
Net Assets Total Return8 | | | -11.65 | % | | | 3.45 | %4 | | | -11.49 | %4 |
| | | | | | | | | | | | | |
| Supplemental Data: | | | | | | | | | | | | |
Net assets, end of period/year (000’s) | | $ | 35,280 | | | $ | 47,030 | | | $ | 26,692 | |
| Ratios to Average Net Assets: | | | | | | | | | | | | |
| Expenses before fees (waived)/recouped | | | 0.70 | % | | | 0.66 | %5 | | | 0.73 | %5 |
| Expenses after fees (waived)/recouped | | | 0.70 | % | | | 0.66 | %5 | | | 0.73 | %5 |
| Net investment income to average net assets | | | 5.02 | % | | | 1.07 | %5 | | | 4.42 | %5 |
Portfolio turnover rate5 | | | 1,393 | % | | | 126 | %4 | | | 1,366 | %4 |
1 | Fund commenced operations on May 28, 2019. The information presented is for the period from May 28, 2019 to June 30, 2019. |
2 | Fund commenced operations on July 18, 2019. The information presented is for the period from July 18, 2019 to June 30, 2020. |
3 | Calculated based on average shares outstanding during the period. |
4 | Not annualized. |
5 | Annualized. The ratios to average net assets shown for the WBI BullBear Trend Switch US 3000 Total Return ETF were amended to be annualized after the issuance of the June 30, 2019 annual report. |
6 | Excludes securities received or delivered as a result of processing capital share transactions in creation units. |
7 | The amount for a share outstanding throughout the period may not be in accordance with the aggregate net realized and unrealized gain (loss) on investment for the period because of the timing of capital share transactions in relation to fluctuating market values of the Funds’ underlying securities. |
8 | Net asset value total return is calculated assuming an initial investment made at the net asset value at the beginning of the period, reinvestment of all dividends and distributions at net asset value during the period, and the redemption on the last day of the period. Net asset value total return includes adjustments in accordance with accounting principles generally accepted in the United States of America and as such, the net asset value for financial reporting purposes and the returns based upon those net asset values may differ from the net asset value and returns for shareholder transactions. |
The accompanying notes are an integral part of these financial statements.
| Absolute Shares Trust |
|
Notes to Financial Statements |
June 30, 2020
NOTE 1 — ORGANIZATION
Absolute Shares Trust (the “Trust”) was organized as a Delaware statutory trust on November 7, 2013 and is authorized to have multiple segregated series or portfolios. The Trust is an open-end management investment company registered under the Investment Company Act of 1940 (the “1940 Act”). The Trust currently consists of the following eight separate investment portfolios (each, a “Fund” or, individually and, together, the “Funds”):
WBI BullBear Rising Income 3000 ETF
WBI BullBear Value 3000 ETF
WBI BullBear Yield 3000 ETF
WBI BullBear Quality 3000 ETF
WBI BullBear Global Income ETF
WBI Power Factor® High Dividend ETF
WBI BullBear Trend Switch US 3000 Total Return ETF
WBI BullBear Trend Switch US Total Return ETF
Each Fund is classified as a diversified fund for purposes of the 1940 Act.
The Funds’ investment advisor, Millington Securities, Inc. (“Advisor” or “Affiliated Broker Dealer”), has selected its affiliate, WBI Investments, Inc. (“Sub-Advisor”), to act as Sub-Advisor. Both the Advisor and Sub-Advisor are registered as investment advisors with the Securities and Exchange Commission (“SEC”). The Advisor is also registered as a broker-dealer with the SEC and is a member of the Financial Industry Regulatory Authority. The Board of Trustees (the “Board” and each member a “Trustee”) supervises the conduct of the Funds.
The end of the reporting period for the Funds is June 30, 2020, and the period covered by these Notes to Financial Statements is the fiscal period from July 1, 2019 through June 30, 2020 for all funds except WBI BullBear Trend Switch US Total Return ETF, where the period covered is July 18, 2019 through June 30, 2020 (each, respectively, the “current fiscal period”).
NOTE 2 — SIGNIFICANT ACCOUNTING POLICIES
The following is a summary of significant accounting policies consistently followed by the Funds. The financial statements are prepared in accordance with accounting principles generally accepted in the United States of America (“U.S. GAAP”) and are stated in U.S. dollars. The Funds are investment companies and accordingly follow the investment company accounting and reporting guidance for the Financial Accounting Standards Board (“FASB”) Accounting Standards Codification Topic 946 Financial Services – Investment Companies.
The preparation of the financial statements in accordance with U.S. GAAP requires management to make estimates and assumptions that affect the reported amount of assets, liabilities and the disclosure of contingent assets and liabilities at June 30, 2020. Actual results could differ from these estimates.
A. Valuation. All equity securities, including domestic common stocks, preferred stocks, exchange traded funds and exchange traded notes, that are traded on a national securities exchange, except those listed on the Nasdaq Global Market, Nasdaq Select Market and Nasdaq Capital Market (collectively “Nasdaq”) are valued at the last reported sale price on the exchange on which the security is principally traded. Securities traded on Nasdaq are valued at the Nasdaq Official Closing Price (“NOCP”). If, on a particular day, an exchange-traded or Nasdaq security does not trade, then the mean between the most recent quoted bid and asked prices is used. All equity securities that are not traded on a listed exchange are valued at the last sale price in the over-the-counter market. If a non-exchange traded security does not trade on a particular day, then the mean between the last quoted closing bid and asked price is used.
Investments in mutual funds, including money market funds, are valued at their net asset value (“NAV”) per share.
Shares in privately offered liquidity funds are valued at their NAV per share.
Short-term securities that have maturities of less than 60 days at the time of purchase are valued at amortized cost, which, when combined with accrued interest, approximates fair value.
Securities for which quotations are not readily available are valued by the Trust’s valuation committee based on the valuation procedures adopted by the Board (the “Valuation Procedures”) and information it receives from the Sub-Advisor and U.S. Bancorp Fund Services, LLC (“Fund Services”). When a security is “fair valued”, consideration is given to the facts and circumstances relevant to the particular situation, including a review of various factors set forth in the Valuation Procedures. The use of fair value pricing by the Funds may cause the NAV of their shares to differ significantly from the NAV that would be calculated without regard to such considerations.
| Absolute Shares Trust |
|
Notes to Financial Statements (continued) |
June 30, 2020
As described above, the Funds utilize various methods to measure the fair value of their investments on a recurring basis. U.S. GAAP establishes a hierarchy that prioritizes inputs to valuations methods. The three levels of inputs are:
Level 1 — Unadjusted quoted prices in active markets for identical assets or liabilities that the Funds have the ability to access.
Level 2 — Observable inputs other than quoted prices included in Level 1 that are observable for the asset or liability, either directly or indirectly. These inputs may include quoted prices for the identical instrument on an inactive market, prices for similar instruments, interest rates, prepayment speeds, credit risk, yield curves, default rates and similar data.
Level 3 — Unobservable inputs for the asset or liability, to the extent relevant observable inputs are not available; including the Funds’ Valuation Committee’s assumptions used in determining the fair value of investments. The availability of observable inputs can vary from security to security and is affected by a wide variety of factors, including, for example, the type of security, whether the security is new and not yet established in the marketplace, the liquidity of markets, and other characteristics particular to the security. To the extent that valuation is based on models or inputs that are less observable or unobservable in the market, the determination of fair value requires more judgment. Accordingly, the degree of judgment exercised in determining fair value is greatest for instruments categorized in Level 3.
The inputs used to measure fair value may fall into different levels of the fair value hierarchy. In such cases, for disclosure purposes, the level in the fair value hierarchy within which the fair value measurement falls in its entirety, is determined based on the lowest level input that is significant to the fair value measurement in its entirety.
The following is a summary of the inputs used to value the Funds’ investments as of the end of the current fiscal period:
| WBI BullBear Rising Income 3000 ETF | | | | | | | | | | | | |
Assets^ | | Level 1 | | | Level 2 | | | Level 3 | | | Total | |
Common Stocks | | $ | 26,631,985 | | | $ | — | | | $ | — | | | $ | 26,631,985 | |
Short-Term Investments | | | 13,215,965 | | | | — | | | | — | | | | 13,215,965 | |
Investments Purchased With Proceeds From Securities Lending | | | — | | | | 367,290 | | | | — | | | | 367,290 | |
Total Investments in Securities, at value | | $ | 39,847,950 | | | $ | 367,290 | | | $ | — | | | $ | 40,215,240 | |
| | | | | | | | | | | | | | | | | |
| WBI BullBear Value 3000 ETF | | | | | | | | | | | | | | | | |
Assets^ | | Level 1 | | | Level 2 | | | Level 3 | | | Total | |
Common Stocks | | $ | 28,249,503 | | | $ | — | | | $ | — | | | $ | 28,249,503 | |
Short-Term Investments | | | 11,705,833 | | | | — | | | | — | | | | 11,705,833 | |
Total Investments in Securities, at value | | $ | 39,955,336 | | | $ | — | | | $ | — | | | $ | 39,955,336 | |
| | | | | | | | | | | | | | | | | |
| WBI BullBear Yield 3000 ETF | | | | | | | | | | | | | | | | |
Assets^ | | Level 1 | | | Level 2 | | | Level 3 | | | Total | |
Common Stocks | | $ | 38,486,790 | | | $ | — | | | $ | — | | | $ | 38,486,790 | |
Short-Term Investments | | | 15,828,035 | | | | — | | | | — | | | | 15,828,035 | |
Total Investments in Securities, at value | | $ | 54,314,825 | | | $ | — | | | $ | — | | | $ | 54,314,825 | |
| | | | | | | | | | | | | | | | | |
| WBI BullBear Quality 3000 ETF | | | | | | | | | | | | | | | | |
Assets^ | | Level 1 | | | Level 2 | | | Level 3 | | | Total | |
Common Stocks | | $ | 33,167,295 | | | $ | — | | | $ | — | | | $ | 33,167,295 | |
Short-Term Investments | | | 16,771,455 | | | | — | | | | — | | | | 16,771,455 | |
Total Investments in Securities, at value | | $ | 49,938,750 | | | $ | — | | | $ | — | | | $ | 49,938,750 | |
| | | | | | | | | | | | | | | | | |
| WBI BullBear Global Income ETF | | | | | | | | | | | | | | | | |
Assets^ | | Level 1 | | | Level 2 | | | Level 3 | | | Total | |
Exchange Traded Funds | | $ | 67,945,519 | | | $ | — | | | $ | — | | | $ | 67,945,519 | |
Short-Term Investments | | | 400,928 | | | | — | | | | — | | | | 400,928 | |
Investments Purchased With Proceeds From Securities Lending | | | — | | | | 18,318,167 | | | | — | | | | 18,318,167 | |
Total Investments in Securities, at value | | $ | 68,346,447 | | | $ | 18,318,167 | | | $ | — | | | $ | 86,664,614 | |
| | | | | | | | | | | | | | | | | |
WBI Power Factor® High Dividend ETF | | | | | | | | | | | | | | | | |
Assets^ | | Level 1 | | | Level 2 | | | Level 3 | | | Total | |
Common Stocks | | $ | 41,863,397 | | | $ | — | | | $ | — | | | $ | 41,863,397 | |
Short-Term Investments | | | 270,002 | | | | — | | | | — | | | | 270,002 | |
Investments Purchased With Proceeds From Securities Lending | | | — | | | | 1,600,788 | | | | — | | | | 1,600,788 | |
Total Investments in Securities, at value | | $ | 42,133,399 | | | $ | 1,600,788 | | | $ | — | | | $ | 43,734,187 | |
| Absolute Shares Trust |
|
Notes to Financial Statements (continued) |
June 30, 2020
| WBI BullBear Trend Switch US 3000 Total Return ETF | | | | | | | | | | | | |
Assets^ | | Level 1 | | | Level 2 | | | Level 3 | | | Total | |
Exchange Traded Funds | | $ | 35,117,448 | | | $ | — | | | $ | — | | | $ | 35,117,448 | |
Short-Term Investments | | | 124,818 | | | | — | | | | — | | | | 124,818 | |
Total Investments in Securities, at value | | $ | 35,242,266 | | | $ | — | | | $ | — | | | $ | 35,242,266 | |
| | | | | | | | | | | | | | | | | |
| WBI BullBear Trend Switch US Total Return ETF | | | | | | | | | | | | | | | | |
Assets^ | | Level 1 | | | Level 2 | | | Level 3 | | | Total | |
Exchange Traded Funds | | $ | 26,531,164 | | | $ | — | | | $ | — | | | $ | 26,531,164 | |
Short-Term Investments | | | 172,251 | | | | — | | | | — | | | | 172,251 | |
Investments Purchased With Proceeds From Securities Lending | | | — | | | | 8,945,738 | | | | — | | | | 8,945,738 | |
Total Investments in Securities, at value | | $ | 26,703,415 | | | $ | 8,945,738 | | | $ | — | | | $ | 35,649,153 | |
^ See Schedules of Investments for breakout of investments by industry group classification.
During the reporting period, the Fund did not recognize any transfers to or from Level 3.
B. Certain Risks. Some risks apply to all Funds, while others are specific to the investment strategy of certain Funds. Each Fund may be subject to other risks in addition to these identified risks. This section discusses certain common principal risks encountered by the Funds. The shares of the Funds are referred to herein as “Fund Shares” or “Shares”.
ETF and Other Investment Companies Risk — When a Fund invests in another ETF or other investment company (e.g., mutual fund, closed-end fund, business development company), it will bear additional expenses based on its pro rata share of such investment company’s operating expenses, including the potential duplication of management fees. The risk of owning an ETF or other investment company generally reflects the risks of owning the underlying securities and other assets held by the ETF or other investment company. A Fund also will incur brokerage costs when it purchases ETFs and other exchange-listed investment companies. Additionally, a Fund will be indirectly exposed to the risks of the portfolio assets held by an ETF or other investment company, including but not limited to those of ETNs, equity options, derivatives, currencies, index, leverage, and replication management.
Market Risk — Either the stock market as a whole or the value of a Fund asset or an investment held by an exchange-traded product (“ETP”) in which a Fund invests may go down, resulting in a decrease in the NAV of the Fund or its Shares or a decrease in the market price of the Shares.
Equity Securities Risk — Common stocks are susceptible to general stock market fluctuations and to volatile increases and decreases in value as market confidence in and perceptions of their issuers change. If a Fund or an ETP holds common stock equivalents of any given issuer, the Fund or ETP will generally be exposed to greater risk than if the Fund or ETP held preferred stocks and debt obligations of such issuer.
Foreign and Emerging Market Securities Risk — Foreign investments may carry risks associated with investing outside the United States, such as currency fluctuation, economic or financial instability, lack of timely or reliable financial information, or unfavorable political or legal developments. Foreign securities can be more volatile than domestic (U.S.) securities. Securities markets of other countries are generally smaller than U.S. securities markets. Many foreign securities may also be less liquid than U.S. securities, which could affect the Funds’ investments. Investments in emerging markets may have more risk because the markets are less developed and less liquid as well as being subject to increased economic, political, regulatory, or other uncertainties. Also, as foreign and emerging markets decline, investors tend to exit these markets in unison.
Fluctuation of Net Asset Value — The NAV of the Shares will fluctuate with changes in market value of the Funds’ holdings.
Shares are Not Individually Redeemable — Shares are only redeemable by the Funds at NAV if they are tendered in large blocks known as “Creation Units” which are expected to be worth in excess of $1 million each. Only Authorized Participants (“APs”) may engage in such creation and redemption transactions directly with the Funds. Individual Shares may be sold on a stock exchange at their current market prices, which may be less, more, or equal to their NAV. There can be no assurance that an active trading market will be maintained for the Shares.
C. Federal Income Taxes. The Funds’ policy is to comply with the provisions of Subchapter M of the Internal Revenue Code of 1986, as amended, applicable to regulated investment companies and to distribute substantially all of their net investment income and net capital gains to shareholders. Therefore, no federal income tax provision is required. The Funds plan to file U.S. Federal and various state and local tax returns.
Each Fund recognizes the tax benefits of uncertain tax positions only when the position is more likely than not to be sustained. Management has analyzed each Fund’s uncertain tax positions and concluded that no liability for unrecognized tax benefits should be recorded related to uncertain tax positions. Management is not aware of any tax positions for which it is reasonably possible that the total amounts of unrecognized tax benefits will change materially in the next 12 months. Income and capital gain distributions are
| Absolute Shares Trust |
|
Notes to Financial Statements (continued) |
June 30, 2020
determined in accordance with federal income tax regulations, which may differ from U.S. GAAP. These timing differences are primarily due to differing book and tax treatments for in-kind transactions, losses deferred due to wash sales, and passive foreign investment company adjustments, if any.
D. Security Transactions and Investment Income. Investment securities transactions are accounted for on the trade date. Gains and losses realized on sales of securities are determined on a specific identification basis. Dividend income is recorded on the ex-dividend date, net of any foreign taxes withheld at source. Interest income is recorded on an accrual basis. Withholding taxes on foreign dividends have been provided for in accordance with the Funds’ understanding of the applicable tax rules and regulations. Premiums and discounts are amortized/accreted using the effective interest method over the lives of the respective debt instruments.
E. Distributions to Shareholders. Distributions to shareholders from net investment income are declared and paid by WBI BullBear Rising Income 3000 ETF, WBI BullBear Value 3000 ETF, WBI BullBear Quality 3000 ETF, WBI Power Factor® High Dividend ETF, and WBI BullBear Trend Switch US 3000 Total Return ETF, on a quarterly basis. Distributions to shareholders from net investment income are declared and paid by WBI BullBear Yield 3000 ETF, WBI BullBear Global Income ETF, and WBI BullBear Trend Switch US Total Return ETF on a monthly basis. Distributions from net realized gains on securities are normally declared and paid by all Funds on an annual basis. Distributions are recorded on the ex-dividend date.
F. Share Valuation. The NAV per share of each Fund is calculated by dividing the sum of the value of the securities held by the Fund, plus cash and other assets, minus all liabilities (including estimated accrued expenses) by the total number of shares outstanding for the Fund, rounded to the nearest cent. The Funds’ shares will not be priced on the days on which the NYSE ARCA, Inc., the exchange where the Funds’ shares are listed, is closed for trading. The offering and redemption price per share for each Fund is equal to the Fund’s NAV per share.
G. Guarantees and Indemnifications. The Funds’ officers and trustees are indemnified against certain liabilities that may arise out of the performance of their duties to the Funds. Additionally, in the normal course of business the Funds enter into contracts with service providers that contain general indemnification clauses. Each Fund’s maximum exposure under these arrangements is unknown as this would involve future claims that may be against the Fund that have not yet occurred.
H. Reclassification of Capital Accounts. U.S. GAAP requires that certain components of net assets relating to permanent differences be reclassified between financial and tax reporting. These reclassifications have no effect on net assets or net asset value per share. For the year/period ended June 30, 2020, the following table shows the reclassifications made:
| | | Distributable Earnings | | | | |
| | | (Accumulated Deficit) | | | Paid-In Capital | |
WBI BullBear Rising Income 3000 ETF | | $ | (1,354,900 | ) | | $ | 1,354,900 | |
WBI BullBear Value 3000 ETF | | | (1,020,008 | ) | | | 1,020,008 | |
WBI BullBear Yield 3000 ETF | | | (1,733,667 | ) | | | 1,733,667 | |
WBI BullBear Quality 3000 ETF | | | (1,062,459 | ) | | | 1,062,459 | |
WBI BullBear Global Income ETF | | | (502,643 | ) | | | 502,643 | |
WBI PowerFactor® High Dividend ETF | | | 7,317,603 | | | | (7,317,603 | ) |
WBI BullBear Trend Switch US 3000 Total Return ETF | | | (173,403 | ) | | | 173,403 | |
WBI BullBear Trend Switch US Total Return ETF* | | | (1,508 | ) | | | 1,508 | |
* | Fund commenced operations on July 18, 2019. |
During the year/period ended June 30, 2020, the Funds realized capital gains resulting from in-kind redemptions, in which shareholders exchanged Fund Shares for securities held by a Fund rather than for cash. Because the gains are not taxable to the Funds, and are not distributed to shareholders, they have been reclassified from accumulated net realized gains/losses to paid-in capital. The following table shows the impact to each Fund:
WBI BullBear Rising Income 3000 ETF | | $ | 1,434,394 | |
WBI BullBear Value 3000 ETF | | | 1,071,007 | |
WBI BullBear Yield 3000 ETF | | | 1,802,811 | |
WBI BullBear Quality 3000 ETF | | | 1,153,500 | |
WBI BullBear Global Income ETF | | | 648,267 | |
WBI Power Factor® High Dividend ETF | | | (6,661,712 | ) |
WBI BullBear Trend Switch US 3000 Total Return ETF | | | 171,265 | |
WBI BullBear Trend Switch US Total Return ETF | | | 1,508 | |
I. Expenses. Expenses directly attributable to the Fund are charged directly to the Fund, while expenses which are attributable to the Fund and other investment companies advised by the Adviser are allocated among the respective investment companies, including the Fund, based either upon relative average net assets or evenly among the Funds.
| Absolute Shares Trust |
|
Notes to Financial Statements (continued) |
June 30, 2020
J. Subsequent Events. In preparing these financial statements, the Advisor has evaluated events and transactions for potential recognition or disclosure through the date the financial statements were available to be issued. There were no events or transactions that occurred during the period subsequent to June 30, 2020 that materially impacted that amounts or disclosures in the Funds financial statements.
K. New Accounting Pronouncements and Other Matters. In August 2018, FASB issued ASU 2018-13, Fair Value Measurement (Topic 820): Disclosure Framework—Changes to the Disclosure Requirements for Fair Value Measurement (“ASU 2018-13”). The primary focus of ASU 2018-13 is to improve the effectiveness of the disclosure requirements for fair value measurements. The changes affect all companies that are required to include fair value measurement disclosures. In general, the amendments in ASU 2018-13 are effective for all entities for fiscal years and interim periods within those fiscal years, beginning after December 15, 2019. An entity is permitted to early adopt the removed or modified disclosures upon the issuance of ASU 2018-13 and may delay adoption of the additional disclosures, which are required for public companies only, until their effective date. Management has evaluated ASU 2018-13 and has adopted the disclosure framework.
NOTE 3 — MANAGEMENT FEE
Pursuant to an investment advisory agreement (“Advisory Agreement”) between the Trust, on behalf of the Funds, and the Advisor, the Advisor serves as the investment advisor, makes investment decisions for each Fund, and manages the investment portfolios of the Funds, subject to the supervision of and policies of the Board. Under the Advisory Agreement for the Funds the Advisor may retain an investment sub-advisor for the Funds, subject to approval by the Board and Fund shareholders. Under a sub-advisory agreement, (“Sub-Advisory Agreement”) the Sub-Advisor serves as the investment sub-advisor and is responsible for the day to day management of the Funds, subject to the supervision of the Advisor and the Board. For the services the Sub-Advisor provides to each Fund, the Sub-Advisor receives a fee that is equal to 0.85% per year of the average daily net assets (calculated daily and paid monthly) of WBI Bullbear Rising Income 3000 ETF, WBI BullBear Value 3000 ETF, WBI BullBear Yield 3000 ETF, WBI BullBear Quality 3000 ETF, and WBI Global Income ETF. For the services the Sub-Adviser provides to WBI Power Factor® High Dividend ETF, the Sub-Advisor receives a fee that is equal to 0.55% per year of average daily net assets, which is calculated daily and paid monthly. The Advisor is paid 0.04% of each Fund’s average daily net assets (calculated daily and paid monthly) from the management fees collected by the Sub-Advisor.
Separately, under the Advisory Agreement, for the WBI BullBear Trend Switch US 3000 Total Return ETF and for the WBI BullBear Trend Switch US Total Return ETF (the “Funds”), the Advisor has agreed to pay or will cause its affiliated Sub-Advisor to pay, all of the expenses of the Funds, except for: the fee payment under the Advisory Agreement, payments under each Fund’s 12b-1 plan, brokerage expenses, acquired fund fees and expenses, taxes, interest (including borrowing costs and dividend expenses on securities sold short), compensation and expenses of the independent Trustees (including independent Trustee counsel fees), litigation expenses and other extraordinary expenses (including litigation to which the Trust or a Fund may be a party and indemnification of the Trustees and officers with respect thereto). For the services the Sub-Advisor provides to the Funds, the Sub-Advisor receives a fee that is equal to 0.65% per year of the average daily net assets of the Funds which is calculated daily and paid monthly. The Advisor is paid 0.04% of the Funds’ average daily net assets (calculated daily and paid monthly) from the management fees collected by the Sub-Advisor.
NOTE 4 — PORTFOLIO TRANSACTIONS AND BROKERAGE
Pursuant to the Sub-Advisory Agreement, the Sub-Advisor determines which securities are to be purchased and sold by the Funds and which broker-dealers are eligible to execute the Funds’ portfolio transactions. The Sub-Advisor typically determines to execute portfolio transactions through the Advisor in its capacity as a registered broker-dealer (the “Affiliated Broker Dealer”). For the current fiscal period, the Affiliated Broker Dealer did not receive any explicit brokerage commissions paid by the Funds. However, the Affiliated Broker Dealer did receive compensation in connection with Fund portfolio transactions in the form of payment for order flow (“PFOF”). PFOF is compensation that the Affiliated Broker Dealer receives for routing orders to certain market destinations. The PFOF paid by market centers to the Affiliated Broker Dealer impacts the “net” transaction prices ultimately received by customers of the Affiliated Broker Dealer, including the Sub-Advisor and the Funds, as the market centers utilized by the Affiliated Broker Dealer will generally adjust execution prices to account for the PFOF arrangements (higher for purchases, lower for sales). Currently, the Affiliated Broker Dealer receives the following monetary payments which are paid, at the same level, by all market centers that receive orders routed by the Affiliated Broker Dealer: $0.0125 per share for all equity security executions and $0.0150 per share for all exchange traded product (“ETP”) executions, subject to certain limited exceptions.
NOTE 5 — EXPENSE LIMITATION AND REIMBURSEMENT
The Sub-Advisor has entered into an Expense Limitation Agreement (an “Agreement”) with the Trust to waive the fees and reimburse expenses of each Fund until at least October 31, 2021 (the “Expiration Date”) so that the total operating expenses (exclusive of interest, taxes, brokerage commissions, acquired fund fees, dividend payments on short sales, other expenditures which are capitalized in accordance with U.S. GAAP, other extraordinary expenses not incurred in the ordinary course of the Fund’s business, and amounts,
| Absolute Shares Trust |
|
Notes to Financial Statements (continued) |
June 30, 2020
if any, payable pursuant to a plan adopted in accordance with Rule 12b-1 under the Investment Company Act of 1940) and organizational costs (the “Operating Expenses”) of WBI Power Factor® High Dividend ETF is limited to 0.70% and each of the remaining Funds is limited to 1.25% of average net assets (the “Expense Cap”). The Sub-Advisor may discontinue its obligations under the Agreements at any time in its sole discretion after the Expiration Date. The Funds have agreed to repay the amounts borne by the Sub-Advisor under the Agreements within the three year period after the Sub-Advisor bears the expense, when and if requested by the Sub-Advisor, to the extent the Operating Expenses of the Funds are less than the lower of the Expense Cap and any expense limitation agreement then in effect with respect to the Operating Expenses. The repayment may not raise the level of Operating Expenses of the Funds in the month of repayment to exceed the Expense Cap.
The following table shows the remaining waived and/or reimbursed expenses subject to potential recovery during the current fiscal period. The Sub-Advisor may recapture a portion of the unreimbursed amounts no later than the dates stated:
| | Expiration |
| | June 30, 2021 | June 30, 2022 | June 30, 2023 |
WBI Power Factor® High Dividend ETF | $71,269 | $17,864 | $55,416 |
The Funds must pay their current ordinary operating expense before the Sub-Advisor is entitled to any reimbursement of fees and/or expenses. Any such reimbursement is also contingent upon the Board of Trustees’ review and approval.
NOTE 6 — COMPLIANCE AND ADMINISTRATION SERVICING AGREEMENTS
The Trust has entered into an agreement with Foreside Compliance Services, LLC (“Foreside”), whereby Foreside agrees to provide a Chief Compliance Officer (“CCO”), as described in Rule 38a-1 of the 1940 Act.
U.S. Bancorp Fund Services, LLC, doing business as U.S. Bank Global Fund Services (the “Administrator”) serves as the independent administrator and U.S. Bank National Association (the “Custodian”) serves as the custodian to the Funds. Under the Fund Administration Servicing, Fund Accounting Servicing, and Transfer Agent Servicing Agreements, the Administrator is responsible for keeping financial books and records of the Funds and generally managing the administrative affairs and transfer agency services.
NOTE 7 — SECURITIES LENDING
The Funds may lend up to 331⁄3% of the value of the securities in their portfolios to brokers, dealers and financial institutions (but not individuals) under terms of participation in a securities lending program administered by U.S Bank N.A. (the “Custodian” and “Securities Lending Agent”). The securities lending agreement requires that loans are collateralized at all times in an amount equal to at least 102% of the value of any loaned securities at the time of the loan, plus accrued interest, except in the case of loans of foreign securities which are denominated and payable in U.S. dollars and shall be collateralized in the amount equal to 105% of the value of any loaned securities at the time of the loan plus accrued interest. The Funds receive compensation in the form of fees and earn interest on the cash collateral. The amount of fees depends on a number of factors including the type of security and length of the loan. The Funds continue to receive interest payments or dividends on the securities loaned during the borrowing period. Gain or loss in the fair value of securities loaned that may occur during the term of the loan will be for the account of the Funds. The Funds have the right under the terms of the securities lending agreement to recall the securities from the borrower on demand. During the current fiscal period, Funds had loaned securities that were collateralized by cash equivalents. The cash collateral is invested by the Custodian in accordance with approved investment guidelines. Those guidelines require the cash collateral to be invested in readily marketable, high quality, short-term obligations; however, such investments are subject to risk of payment delays or default on the part of the issuer or counterparty or otherwise may not generate sufficient interest to support the costs associated with securities lending. A Fund could also experience delays in recovering its securities and possible loss of income or value if the borrower fails to return the borrowed securities, although the Fund is indemnified from this risk by contract with the Securities Lending Agent.
At period end, the value of the securities on loan and payable for collateral due to broker were as follows:
| Fund | | Value of Securities on Loan | | | Collateral Received* | |
WBI BullBear Rising Income 3000 ETF | | $ | 366,940 | | | $ | 367,290 | |
WBI BullBear Value 3000 ETF | | __ | | | __ | |
WBI BullBear Yield 3000 ETF | | __ | | | __ | |
WBI BullBear Quality 3000 ETF | | __ | | | __ | |
WBI BullBear Global Income ETF | | | 18,123,662 | | | | 18,318,167 | |
WBI Power Factor® High Dividend ETF | | | 1,545,342 | | | | 1,600,788 | |
WBI BullBear Trend Switch US 3000 Total Return ETF | | | — | | | | — | |
WBI BullBear Trend Switch US Total Return ETF | | | 8,851,569 | | | | 8,945,738 | |
________
* | The cash collateral received was invested in the Mount Vernon Liquid Assets Portfolio as shown on the Schedule of Investments, a short-term investment portfolio with an overnight and continuous maturity. |
| Absolute Shares Trust |
|
Notes to Financial Statements (continued) |
June 30, 2020
Fees and interest income earned on collateral investments and recognized by the Funds during the current fiscal period was as follows:
| Fees and Interest Income Earned | | | |
| Fund | | | |
WBI BullBear Rising Income 3000 ETF | | $ | 8,477 | |
WBI BullBear Value 3000 ETF | | | 8,399 | |
WBI BullBear Yield 3000 ETF | | | 11,653 | |
WBI BullBear Quality 3000 ETF | | | 8,093 | |
WBI BullBear Global Income ETF | | | 131,898 | |
WBI Power Factor® High Dividend ETF | | | 43,428 | |
WBI BullBear Trend Switch US 3000 Total Return ETF | | | 23,092 | |
WBI BullBear Trend Switch US Total Return ETF | | | 18,895 | |
Offsetting Assets and Liabilities. The Funds are subject to various netting arrangements, which govern the terms of certain transactions with counterparties. The arrangements allow the Funds to close out and net their total exposure to counterparty in the event of a default with respect to all transactions governed under a single agreement with a counterparty. The following is a summary of the arrangements subject to offsetting during the current fiscal period.
| | | | | | | Gross Amounts | | | Net Amounts
| | | | | | | |
| | | | Value of | | | Offset in the | | | Presented in the
| | | | | | | |
| | | | Securities | | | Statement of | | | Statement of | | | Collateral | | | Net | |
| Fund | Description | | on Loan | | | Assets & Liabilities | | | Assets & Liabilities | | | Received | | | Amount | |
WBI BullBear Rising Income 3000 ETF | Securities Lending | | $ | 366,940 | | | $ | — | | | $ | 366,940 | | | $ | 366,940 | | | $ | — | |
WBI BullBear Global Income ETF | Securities Lending | | | 18,123,662 | | | | — | | | | 18,123,662 | | | | 18,123,662 | | | | — | |
WBI Power Factor® High Dividend ETF | Securities Lending | | | 1,545,342 | | | | — | | | | 1,545,342 | | | | 1,545,342 | | | | — | |
WBI BullBear Trend Switch | | | | | | | | | | | | | | | | | | | | | |
US Total Return ETF | Securities Lending | | | 8,851,569 | | | | — | | | | 8,851,569 | | | | 8,851,569 | | | | — | |
NOTE 8 — TAX INFORMATION
The tax character of distributions declared by the Funds was as follows:
| | | Year/Period Ended June 30, 2020 | | | Year/Period Ended June 30, 2019 | |
| | | Ordinary | | | Long Term | | | Return of | | | Ordinary | | | Long Term | | | Return of | |
| Fund | | Income | | | Capital Gain | | | Capital | | | Income | | | Capital Gain | | | Capital | |
WBI BullBear Rising Income 2000 ETF | | $ | — | | | $ | — | | | $ | — | | | $ | 337,978 | | | $ | — | | | $ | — | |
WBI BullBear Value 2000 ETF | | | — | | | | — | | | | — | | | | 390,733 | | | | — | | | | — | |
WBI BullBear Yield 2000 ETF | | | — | | | | — | | | | — | | | | 1,320,104 | | | | — | | | | — | |
WBI BullBear Quality 2000 ETF | | | — | | | | — | | | | — | | | | 319,836 | | | | — | | | | — | |
WBI BullBear Rising Income 3000 ETF | | | 230,708 | | | | — | | | | 55,918 | | | | 561,691 | | | | — | | | | — | |
WBI BullBear Value 3000 ETF | | | 242,901 | | | | — | | | | — | | | | 485,571 | | | | — | | | | — | |
WBI BullBear Yield 3000 ETF | | | 686,952 | | | | — | | | | 84,576 | | | | 1,601,703 | | | | — | | | | — | |
WBI BullBear Quality 3000 ETF | | | 170,658 | | | | — | | | | 44,276 | | | | 322,761 | | | | — | | | | — | |
WBI BullBear Global Income ETF | | | 3,857,876 | | | | — | | | | — | | | | 3,929,336 | | | | — | | | | — | |
WBI PowerFactor® High Dividend ETF | | | 3,729,916 | | | | — | | | | — | | | | 5,130,398 | | | | 254,258 | | | | — | |
WBI BullBear Trend Switch US 3000 Total Return ETF1 | 2,895,229 | | | | — | | | | — | | | | 40,995 | | | | — | | | | — | |
WBI BullBear Trend Switch US Total Return ETF2 | 1,699,642 | | | | — | | | | — | | | | — | | | | — | | | | — | |
1 | Information for WBI BullBear Trend Switch US 3000 Total Return ETF is for the period from May 28, 2019 to June 30, 2019. |
2 | Information for WBI BullBear Trend Switch US Total Return ETF is for the period from July 18, 2019, to June 30, 2020. |
The Funds designated as long-term capital gain dividend, pursuant to Internal Revenue Code Section 852(b)(3), the amount necessary to reduce the earnings and profits of the Funds related to net capital gain to zero.
Each Fund’s cost basis of investments for federal income tax purposes as of June 30, 2020 was as follows:
| | | WBI BullBear | | | | | | | | | | |
| | | Rising Income | | | WBI BullBear | | | WBI BullBear | | | WBI BullBear | |
| | | 3000 ETF | | | Value 3000 ETF | | | Yield 3000 ETF | | | Quality 3000 ETF | |
Cost of investments | | $ | 39,167,766 | | | $ | 38,776,608 | | | $ | 52,689,956 | | | $ | 48,811,931 | |
Gross tax unrealized appreciation | | | 1,247,271 | | | | 1,340,967 | | | | 1,765,775 | | | | 1,374,306 | |
Gross tax unrealized depreciation | | | (199,797 | ) | | | (162,240 | ) | | | (140,906 | ) | | | (247,488 | ) |
Net tax unrealized appreciation | | | 1,047,474 | | | | 1,178,727 | | | | 1,624,869 | | | | 1,126,818 | |
| Absolute Shares Trust |
|
Notes to Financial Statements (continued) |
June 30, 2020
| | | | | | | | | WBI BullBear | | | WBI BullBear | |
| | | WBI BullBear | | | WBI Power | | | Trend Switch | | | Trend Switch | |
| | | Global | | | Factor® High | | | US 3000 Total | | | US Total | |
| | | Income ETF | | | Dividend ETF | | | Return ETF | | | Return ETF* | |
Cost of investments | | $ | 86,163,936 | | | $ | 45,680,623 | | | $ | 36,624,382 | | | $ | 35,655,605 | |
Gross tax unrealized appreciation | | | 729,908 | | | | 3,349,925 | | | | — | | | | 109,303 | |
Gross tax unrealized depreciation | | | (229,230 | ) | | | (5,296,361 | ) | | | (1,382,116 | ) | | | (115,755 | ) |
Net tax unrealized appreciation (depreciation) | | | 500,678 | | | | (1,946,436 | ) | | | (1,382,116 | ) | | | (6,452 | ) |
The components of distributable earnings (losses) for federal income tax purposes as of June 30, 2020 were as follows:
| | | WBI BullBear | | | | | | | | | | |
| | | Rising Income | | | WBI BullBear | | | WBI BullBear | | | WBI BullBear | |
| | | 3000 ETF | | | Value 3000 ETF | | | Yield 3000 ETF | | | Quality 3000 ETF | |
Net tax unrealized appreciation (depreciation) | | | 1,047,474 | | | | 1,178,727 | | | | 1,624,869 | | | | 1,126,818 | |
Undistributed ordinary income | | | — | | | | 33 | | | | — | | | | — | |
Undistributed long term gain (loss) | | | — | | | | — | | | | — | | | | — | |
Total distributable earnings | | | — | | | | 33 | | | | — | | | | — | |
Other accumulated gain (loss) | | | (43,440,113 | ) | | | (23,153,361 | ) | | | (64,553,213 | ) | | | (32,331,761 | ) |
Total accumulated gain (loss) | | $ | (42,392,639 | ) | | $ | (21,974,601 | ) | | $ | (62,928,344 | ) | | $ | (31,204,943 | ) |
| | | | | | | | | | | | | | | | | |
| | | | | | | | | | WBI BullBear | | | WBI BullBear | |
| | | WBI BullBear | | | WBI Power | | | Trend Switch | | | Trend Switch | |
| | | Global | | | Factor® High | | | US 3000 Total | | | US Total | |
| | | Income ETF | | | Dividend ETF | | | Return ETF | | | Return ETF* | |
Net tax unrealized appreciation (depreciation) | | | 500,678 | | | | (1,946,436 | ) | | | (1,382,116 | ) | | | (6,452 | ) |
Undistributed ordinary income | | | 5,778 | | | | 99,181 | | | | — | | | | — | |
Undistributed long term gain (loss) | | | — | | | | — | | | | — | | | | — | |
Total distributable earnings | | | 5,778 | | | | 99,181 | | | | — | | | | — | |
Other accumulated gain (loss) | | | (11,665,037 | ) | | | (21,653,167 | ) | | | (6,291,881 | ) | | | (5,589,536 | ) |
Total accumulated gain (loss) | | $ | (11,158,581 | ) | | $ | (23,500,422 | ) | | $ | (7,673,997 | ) | | $ | (5,595,988 | ) |
* | Fund commenced operations on July 18, 2019. |
Net capital losses incurred after October 31, 2019, and within the taxable year are deemed to arise on the first business day of each Fund’s next taxable year.
As of June 30, 2020, the Funds had the following short-term and long-term capital loss carryforwards available for federal income tax purposes, with an indefinite expiration:
| | | Short-Term | | | Long-Term | |
WBI BullBear Rising Income 3000 ETF+ | | $ | 43,440,113 | | | $ | — | |
WBI BullBear Value 3000 ETF+ | | | 23,069,386 | | | | 642 | |
WBI BullBear Yield 3000 ETF+ | | | 64,553,213 | | | | — | |
WBI BullBear Quality 3000 ETF+ | | | 32,305,489 | | | | — | |
WBI BullBear Global Income ETF | | | 11,665,037 | | | | — | |
WBI Power Factor® High Dividend ETF | | | 15,043,936 | | | | 6,609,231 | |
WBI BullBear Trend Switch US 3000 Total Return ETF | | | — | | | | — | |
WBI BullBear Trend Switch US Total Return ETF* | | | — | | | | — | |
+ | Annual limitation may apply to a portion of the losses under IRC 382. |
* | Fund commenced operations on July 18, 2019. |
As of June 30, 2020, the Funds deferred, on a tax basis, late year losses as follows:
| | | Capital | | | Ordinary | |
WBI BullBear Rising Income 3000 ETF | | $ | — | | | $ | — | |
WBI BullBear Value 3000 ETF | | | — | | | | 83,333 | |
WBI BullBear Yield 3000 ETF | | | — | | | | — | |
WBI BullBear Quality 3000 ETF | | | — | | | | 26,271 | |
WBI BullBear Global Income ETF | | | — | | | | — | |
WBI Power Factor® High Dividend ETF | | | — | | | | — | |
WBI BullBear Trend Switch US 3000 Total Return ETF | | | 6,291,881 | | | | — | |
WBI BullBear Trend Switch US Total Return ETF* | | | 5,589,536 | | | | — | |
* | Fund commenced operations on July 18, 2019. |
| Absolute Shares Trust |
|
Notes to Financial Statements (continued) |
June 30, 2020
NOTE 9 — PURCHASES AND SALES OF SECURITIES
During the current fiscal period, purchases and sales of securities by the Funds, excluding short-term securities and in-kind transactions, were as follows:
| | | All Other | |
| Fund | | Purchases | | | Sales | |
WBI BullBear Rising Income 3000 ETF | | $ | 322,431,997 | | | $ | 331,819,911 | |
WBI BullBear Value 3000 ETF | | | 348,299,577 | | | | 357,331,633 | |
WBI BullBear Yield 3000 ETF | | | 481,381,259 | | | | 491,203,078 | |
WBI BullBear Quality 3000 ETF | | | 361,825,915 | | | | 365,585,617 | |
WBI BullBear Global Income ETF | | | 1,059,447,201 | | | | 1,059,478,911 | |
WBI BullBear Power Factor® High Dividend ETF | | | 149,342,708 | | | | 149,402,358 | |
WBI BullBear Trend Switch US 3000 Total Return ETF | | | 552,753,218 | | | | 552,866,091 | |
WBI BullBear Trend Switch US Total Return ETF | | | 315,684,512 | | | | 316,185,012 | |
During the current fiscal period, the values of the in-kind security transactions were as follows:
| Fund | | Subscriptions | | | Redemptions | |
WBI BullBear Rising Income 3000 ETF | | $ | 2,607,805 | | | $ | 25,866,662 | |
WBI BullBear Value 3000 ETF | | | 11,633,800 | | | | 22,315,971 | |
WBI BullBear Yield 3000 ETF | | | 16,230,736 | | | | 34,681,316 | |
WBI BullBear Quality 3000 ETF | | | 293,883 | | | | 22,354,803 | |
WBI BullBear Global Income ETF | | | — | | | | 61,996,134 | |
WBI Power Factor® High Dividend ETF | | | 3,406,023 | | | | 42,302,891 | |
WBI BullBear Trend Switch US 3000 Total Return ETF | | | 17,744,535 | | | | 21,371,324 | |
WBI Bull Bear Trend Switch US Total Return ETF | | | 35,515,499 | | | | 3,535,473 | |
During the current fiscal period, there were no purchases or sales of U.S. Government securities.
NOTE 10 — SHARE TRANSACTIONS
The Funds each currently offer one class of shares, which has no front-end sales load, no deferred sales charge, and no redemption fee. The Funds may issue an unlimited number of shares of beneficial interest, with no par value. All shares of each Fund have equal rights and privileges as the other shares of such Fund.
The Trust has entered into an agreement with NYSE Group, Inc. to list the Funds’ (“Shares”) on NYSE Arca, Inc., an indirect wholly-owned subsidiary of NYSE Group, Inc. Market prices for the Shares may be different from their NAV. The Funds will issue and redeem Shares on a continuous basis at NAV only in large blocks of Shares, typically 50,000 Shares, called “Creation Units.” Each Fund’s typical creation unit size Is as follows:
| Fund | | Creation Unit | |
WBI BullBear Rising Income 3000 ETF | | | 50,000 | |
WBI BullBear Value 3000 ETF | | | 50,000 | |
WBI BullBear Yield 3000 ETF | | | 50,000 | |
WBI BullBear Quality 3000 ETF | | | 50,000 | |
WBI BullBear Global Income ETF | | | 50,000 | |
WBI Power Factor® High Dividend ETF | | | 50,000 | |
WBI BullBear Trend Switch US 3000 Total Return ETF | | | 25,000 | |
WBI Bull Bear Trend Switch US Total Return ETF | | | 25,000 | |
Creation Units will be issued and redeemed principally in-kind, however, the Trust reserves the right to offer a cash option for creations and redemptions of Shares. Once created, Shares generally will trade in the secondary market at market prices that change throughout the day in amounts less than a Creation Unit. Except when aggregated in Creation Units, Shares are not redeemable securities of a Fund. Shares of a Fund may only be purchased or redeemed by certain financial institutions (“Authorized Participants”). An Authorized Participant is either (i) a broker-dealer or other participant in the clearing process through the Continuous Net Settlement System of the National Securities Clearing Corporation or (ii) a Depository Trust Corporation participant and, in each case, must have executed a participant agreement with Foreside Fund Services, LLC, the Funds’ distributor (the “Distributor”). Most retail investors will not qualify as Authorized Participants or have the resources to buy and sell whole Creation Units. Therefore, they will be unable to purchase or redeem the Shares directly from a Fund. Rather, most retail investors will purchase Shares in the secondary market with the assistance of a broker and will be subject to customary brokerage commissions or fees.
| Absolute Shares Trust |
|
Notes to Financial Statements (continued) |
June 30, 2020
| | | WBI BullBear Rising Income 3000 ETF | | | WBI BullBear Value 3000 ETF | |
| | | Year Ended | | | Year Ended | | | Year Ended | | | Year Ended | |
| | | June 30, 2020 | | | June 30, 2019 | | | June 30, 2020 | | | June 30, 2019 | |
| | | Shares | | | Amount | | | Shares | | | Amount | | | Shares | | | Amount | | | Shares | | | Amount | |
Shares Sold | | | 100,000 | | | $ | 2,715,525 | | | | 1,050,000 | | | $ | 27,672,385 | | | | 500,000 | | | $ | 13,545,824 | | | | 750,000 | | | $ | 20,272,680 | |
Shares Issued in Connection | | | | | | | | | | | | | | | | | | | | | | | | | | | | | | | | |
with Acquisition | | | 246,279 | | | | 6,605,265 | | | | — | | | | — | | | | 288,316 | | | | 7,730,719 | | | | — | | | | — | |
Shares Redeemed | | | (1,000,001 | ) | | | (27,170,875 | ) | | | (1,650,000 | ) | | | (45,125,500 | ) | | | (950,001 | ) | | | (25,660,709 | ) | | | (1,200,000 | ) | | | (35,345,210 | ) |
| | | | (653,722 | ) | | $ | (17,850,085 | ) | | | (600,000 | ) | | $ | (17,453,115 | ) | | | (161,685 | ) | | $ | (4,384,166 | ) | | | (450,000 | ) | | $ | (15,072,530 | ) |
| Beginning Shares | | | 2,300,000 | | | | | | | | 2,900,000 | | | | | | | | 1,850,000 | | | | | | | | 2,300,000 | | | | | |
| Ending Shares | | | 1,646,278 | | | | | | | | 2,300,000 | | | | | | | | 1,688,315 | | | | | | | | 1,850,000 | | | | | |
| | | | | | | |
| | | WBI BullBear Yield 3000 ETF | | | WBI BullBear Quality 3000 ETF | |
| | | Year Ended | | | Year Ended | | | Year Ended | | | Year Ended | |
| | | June 30, 2020 | | | June 30, 2019 | | | June 30, 2020 | | | June 30, 2019 | |
| | | Shares | | | Amount | | | Shares | | | Amount | | | Shares | | | Amount | | | Shares | | | Amount | |
Shares Sold | | | 750,000 | | | $ | 17,952,857 | | | | 1,900,000 | | | $ | 46,859,775 | | | | 550,001 | | | $ | 13,827,837 | | | | 1,550,000 | | | $ | 40,419,805 | |
Shares Issued in Connection | | | | | | | | | | | | | | | | | | | | | | | | | | | | | | | | |
with Acquisition | | | 430,183 | | | | 10,042,053 | | | | — | | | | — | | | | 227,182 | | | | 5,906,637 | | | | — | | | | — | |
Shares Redeemed | | | (1,650,000 | ) | | | (39,297,362 | ) | | | (2,000,000 | ) | | | (48,747,350 | ) | | | (950,000 | ) | | | (25,394,737 | ) | | | (1,600,000 | ) | | | (43,010,255 | ) |
| | | | (469,817 | ) | | $ | (11,302,452 | ) | | | (100,000 | ) | | $ | (1,887,575 | ) | | | (172,817 | ) | | $ | (5,660,263 | ) | | | (50,000 | ) | | $ | (2,590,450 | ) |
| Beginning Shares | | | 3,100,000 | | | | | | | | 3,200,000 | | | | | | | | 2,250,000 | | | | | | | | 2,300,000 | | | | | |
| Ending Shares | | | 2,630,183 | | | | | | | | 3,100,000 | | | | | | | | 2,077,183 | | | | | | | | 2,250,000 | | | | | |
| | | | | | | |
| | | WBI BullBear Global Income ETF | | | WBI Power Factor High Dividend ETF | |
| | | Year Ended | | | Year Ended | | | Year Ended | | | Year Ended | |
| | | June 30, 2020 | | | June 30, 2019 | | | June 30, 2020 | | | June 30, 2019 | |
| | | Shares | | | Amount | | | Shares | | | Amount | | | Shares | | | Amount | | | Shares | | | Amount | |
Shares Sold | | | — | | | $ | — | | | | 3,350,000 | | | $ | 81,459,125 | | | | 150,000 | | | $ | 3,460,740 | | | | 4,650,000 | | | $ | 123,161,665 | |
Shares Redeemed | | | (2,500,000 | ) | | | (62,668,770 | ) | | | (2,000,000 | ) | | | (48,785,595 | ) | | | (2,100,000 | ) | | | (43,039,205 | ) | | | (2,400,000 | ) | | | (55,598,540 | ) |
| | | | (2,500,000 | ) | | $ | (62,668,770 | ) | | | 1,350,000 | | | $ | 32,673,530 | | | | (1,950,000 | ) | | $ | (39,578,465 | ) | | | 2,250,000 | | | $ | 67,563,125 | |
| Beginning Shares | | | 5,400,000 | | | | | | | | 4,050,000 | | | | | | | | 4,200,000 | | | | | | | | 1,950,000 | | | | | |
| Ending Shares | | | 2,900,000 | | | | | | | | 5,400,000 | | | | | | | | 2,250,000 | | | | | | | | 4,200,000 | | | | | |
| | | WBI BullBear Trend Switch US 3000 Total Return ETF | | | WBI BullBear Trend Switch US Total Return ETF | |
| | | Year Ended | | | Period Ended | | | Period Ended | |
| | | June 30, 2020 | | | June 30, 2019 | | | June 30, 2020 | |
| | | Shares | | | Amount | | | Shares | | | Amount | | | Shares | | | Amount | |
Shares Sold | | | 900,000 | | | $ | 17,998,358 | | | | 2,275,000 | | | $ | 46,464,350 | | | | 1,800,000 | | | $ | 35,853,810 | |
Shares Redeemed | | | (1,100,000 | ) | | | (21,681,638 | ) | | | — | | | | — | | | | (175,000 | ) | | | (3,567,117 | ) |
| | | | (200,000 | ) | | $ | (3,683,280 | ) | | | 2,275,000 | | | $ | 46,464,350 | | | | 1,625,000 | | | $ | 32,286,693 | |
| Beginning Shares | | | 2,275,000 | | | | | | | | — | | | | | | | | — | | | | | |
| Ending Shares | | | 2,075,000 | | | | | | | | 2,275,000 | | | | | | | | 1,625,000 | | | | | |
NOTE 11 — PLAN OF REORGANIZATION
On July 31, 2019, the Board of Trustees of the Trust approved a plan of reorganization pursuant to which (1) each “Acquired Fund” was reorganized into the “Acquiring Fund,” as identified in the table below; and (2) each Acquired Fund was dissolved subsequent to this reorganization, effective October 25, 2019.
| Acquired Fund | Acquiring Fund | Acquiring Fund (Former Name) |
WBI BullBear Rising | WBI BullBear Rising | WBI BullBear Rising |
Income 2000 ETF (WBIA) | Income 3000 ETF (WBIE) | Income 1000 ETF |
WBI BullBear Value 2000 ETF (WBIB) | WBI BullBear Value 3000 ETF (WBIF) | WBI BullBear Value 1000 ETF |
WBI BullBear Yield 2000 ETF (WBIC) | WBI BullBear Yield 3000 ETF (WBIG) | WBI BullBear Yield 1000 ETF |
WBI BullBear Quality 2000 ETF (WBID) | WBI BullBear Quality 3000 ETF (WBIL) | WBI BullBear Quality 1000 ETF |
| Absolute Shares Trust |
|
Notes to Financial Statements (concluded) |
June 30, 2020
The tax free reorganization was effected by transferring all of the assets and liabilities of the Acquired Funds to the respective Acquiring Fund, in exchange for shares of the Acquiring Fund.
| | | Shares Issued by | Value of Shares Issued |
| Acquired Fund | Acquiring Fund | Exchange Ratio | Acquiring Fund | by Acquiring Fund |
WBI BullBear Rising | WBI BullBear Rising | 0.82092975 | 246,278 | $6,605,263 |
Income 2000 ETF (WBIA) | Income 3000 ETF (WBIE) | | | |
WBI BullBear | WBI BullBear | 0.82375976 | 288,315 | 7,730,719 |
Value 2000 ETF (WBIB) | Value 3000 ETF (WBIF) | | | |
WBI BullBear | WBI BullBear | 0.78215107 | 430,183 | 10,042,052 |
Yield 2000 ETF (WBIC) | Yield 3000 ETF (WBIG) | | | |
WBI BullBear | WBI BullBear | 0.75727610 | 227,182 | 5,906,637 |
Quality 2000 ETF (WBID) | Quality 3000 ETF (WBIL) | | | |
| | | | | |
| | | Acquired Fund | Acquiring Fund | Acquiring Fund |
| | | Net Assets | Net Assets | Net Assets |
| | | Immediately | Immediately | Immediately |
| | | Before the | Before the | After the |
| Acquired Fund | Acquiring Fund | Acquisition | Acquisition | Acquisition |
WBI BullBear Rising | WBI BullBear Rising | $ 6,605,263 | $52,299,452 | $58,904,715 |
Income 2000 ETF (WBIA) | Income 3000 ETF (WBIE) | | | |
WBI BullBear Value | WBI BullBear Value | 7,730,719 | 53,626,747 | 61,357,466 |
2000 ETF (WBIB) | 3000 ETF (WBIF) | | | |
WBI BullBear | WBI BullBear | 10,042,052 | 78,201,237 | 88,243,289 |
Yield 2000 ETF (WBIC) | Yield 3000 ETF (WBIG) | | | |
WBI BullBear Quality | WBI BullBear Quality | 5,906,637 | 48,099,108 | 54,005,745 |
2000 ETF (WBID) | 3000 ETF (WBIL) | | | |
Assuming the acquisition had completed on July 1, 2019, the beginning of the Funds’ fiscal year, pro forma results of operations would have been as follows:
| | | | | | | | | Net Increase | |
| | | Net | | | Net Realized | | | (Decrease) in | |
| | | Investment | | | and Unrealized | | | Net Assets from | |
| | | Income (Loss) | | | Gains (Losses) | | | Operations | |
WBI BullBear Rising Income 3000 ETF (WBIE) | | $ | 251,014 | | | $ | (607,750 | ) | | $ | (356,736 | ) |
WBI BullBear Value 3000 ETF (WBIF) | | | 145,522 | | | | (3,838,578 | ) | | | (3,693,056 | ) |
WBI BullBear Yield 3000 ETF (WBIG) | | | 693,697 | | | | (5,025,559 | ) | | | (4,331,862 | ) |
WBI BullBear Quality 3000 ETF (WBIL) | | | 144,515 | | | | (1,566,437 | ) | | | (1,421,922 | ) |
Because the combined investment portfolios have been managed as single integrated portfolios since the acquisition was completed, it is not practicable to separate the amounts of revenue and earnings of the Acquired and Acquiring Funds that have been included in the Acquiring Funds’ statements of operations since October 25, 2019.
| Absolute Shares Trust |
|
Report of Independent Registered Public Accounting Firm |
|
To the Shareholders and Board of Trustees of Absolute Shares Trust:
Opinion on the Financial Statements
We have audited the accompanying statements of assets and liabilities of WBI BullBear Rising Income 3000 ETF, WBI BullBear Value 3000 ETF, WBI BullBear Yield 3000 ETF, WBI BullBear Quality 3000 ETF, WBI BullBear Global Income ETF, WBI Power Factor High Dividend ETF (commenced operations on December 19, 2016), WBI BullBear Trend Switch US 3000 Total Return ETF (commenced operations May 28, 2019), and WBI BullBear Trend Switch US Total Return ETF (commenced operations July 18, 2019), eight funds constituting Absolute Shares Trust (the “Trust”), including the schedules of investments, as of June 30, 2020, the related statements of operations for the year then ended or period since commencement of operations, the statements of changes in net assets for each of the years or period since commencement of operations in the two-year period then ended and the related notes (collectively, the financial statements) and the financial highlights for each of the years or period since commencement of operations in the five-year period then ended. In our opinion, the financial statements and financial highlights present fairly, in all material respects, the financial position of each fund constituting Absolute Shares Trust as of June 30, 2020, the results of its operations for the year then ended or period since commencement of operations, the changes in its net assets for each of the years or period since commencement of operations in the two-year period then ended and the financial highlights for each of the years or period since commencement of operations in the five-year period then ended, in conformity with U.S. generally accepted accounting principles.
Basis for Opinion
These financial statements and financial highlights are the responsibility of the Trust’s management. Our responsibility is to express an opinion on these financial statements and financial highlights based on our audits. We are a public accounting firm registered with the Public Company Accounting Oversight Board (United States) (PCAOB) and are required to be independent with respect to the Trust in accordance with the U.S. federal securities laws and the applicable rules and regulations of the Securities and Exchange Commission and the PCAOB.
We conducted our audits in accordance with the standards of the PCAOB. Those standards require that we plan and perform the audit to obtain reasonable assurance about whether the financial statements and financial highlights are free of material misstatement, whether due to error or fraud. Our audits included performing procedures to assess the risks of material misstatement of the financial statements and financial highlights, whether due to error or fraud, and performing procedures that respond to those risks. Such procedures included examining, on a test basis, evidence regarding the amounts and disclosures in the financial statements and financial highlights. Such procedures also included confirmation of securities owned as of June 30, 2020, by correspondence with custodians and brokers. Our audits also included evaluating the accounting principles used and significant estimates made by management, as well as evaluating the overall presentation of the financial statements and financial highlights. We believe that our audits provide a reasonable basis for our opinion.

We have served as the Trust’s auditor since 2014.
New York, New York
August 27, 2020
| Absolute Shares Trust |
|
|
| (Unaudited) |
| | | | | Number of | |
| | | | | Portfolios | Other |
| | | | | in Fund | Directorships |
| | Position(s) | Term of Office | | Complex | Held by |
| | Held | and Length of | Principal Occupation(s) | Overseen by | Trustee During |
Name and Year of Birth(1) | with Trust | Time Served(2) | During Past 5 Years | Trustee(3) | Past 5 Years |
| | | | | | |
| Independent Trustees: | | | | | |
Jude T. Depko | Trustee | Since | Technical Consultant, | 8 | None |
1946 | | June 2014 | Michael Baker Jr., Inc. | | |
| | | | (consulting) (2009 to present). | | |
| | | | | | |
John A. Flanagan | Trustee | Since | Treasurer, ETF Managers Trust | 8 | None |
1946 | | June 2014 | (investment company) (2015 to | | |
| | | | present); Principal Financial | | |
| | | | Officer, ETF Managers Capital, | | |
| | | | LLC (commodity pool operator) | | |
| | | | (2014 to present); President, | | |
| | | | John A. Flanagan CPA, LLC | | |
| | | | (accounting services) | | |
| | | | (2010 to present). | | |
| | | | | | |
Andrew Putterman | Trustee | Since | Principal, 1812 Park, LLC | 8 | Independent Board |
1959 | | June 2014 | (financial consulting) (2014 to | | Member of Steben |
| | | | present); Advisory Board Member, | | Select Multi-Strategy |
| | | | Silver Lane Advisors (2016 to | | Fund (2018 to |
| | | | present); Advisory Board Member, | | present); Independent |
| | | | Vestigo Ventures 1 GP, LLC (2016 | | Board Member of |
| | | | to present); Managing Director, B+ | | Steben Select |
| | | | Institutional Services, LLC (2014 to | | Managed Futures |
| | | | present); Independent Board Member, | Strategy Fund |
| | | | Princeton Private Equity Fund (2014 | | (2018 to present); |
| | | | to 2015); Chairman Emeritus, | | Independent Board |
| | | | Fortigent LLC (financial services) | | Member of Steben |
| | | | (2013 to 2014); Managing Director, | | Alternative |
| | | | LPL Financial (financial services) | | Investment Funds |
| | | | (2012 to 2014). | | (2018 to present) |
| Absolute Shares Trust |
|
Trustees and Officers (continued) |
| (Unaudited) |
| | | | | Number of | |
| | | | | Portfolios | Other |
| | | | | in Fund | Directorships |
| | Position(s) | Term of Office | | Complex | Held by |
| | Held | and Length of | Principal Occupation(s) | Overseen by | Trustee During |
Name and Year of Birth(1) | with Trust | Time Served(2) | During Past 5 Years | Trustee(3) | Past 5 Years |
| | | | | | |
| Interested Trustees: | | | | | |
Don Schreiber, Jr. | Trustee, | Since | Chief Executive Officer, Co-Chief | 8 | None |
1955(4) | President and | November 2013 | Investment Officer, Director, | | |
| | Principal | | Treasurer and Co-Portfolio Manager, | | |
| | Executive | | WBI Investments, Inc. (registered | | |
| | Officer | | investment advisor) (1984 to | | |
| | | | present); Chief Executive Officer, | | |
| | | | Treasurer, Director Millington | | |
| | | | Securities, Inc. (registered | | |
| | | | investment advisor and broker- | | |
| | | | dealer) (2013 to present); Chief | | |
| | | | Executive Officer, Vice President, | | |
| | | | Director and Treasurer, WBI Trading, | | |
| | | | Inc. (financial services) (2011 to | | |
| | | | present); Chief Executive Officer, | | |
| | | | Vice President, Director and | | |
| | | | Treasurer, Hartshorne Group, Inc. | | |
| | | | (wealth management services) | | |
| | | | (2008 to present); Managing Member, | | |
| | | | Secretary, Treasurer, and Chief | | |
| | | | Visionary Officer, WBI Technologies, | | |
| | | | LLC (October 2019 to Present); | | |
| | | | Chief Executive Officer , | | |
| | | | WBI Technologies, LLC (May 2018 | | |
| | | | to September 2019) | | |
| | | | | | |
Matthew Schreiber | Trustee | Since | Co-Chief Executive Officer of | 8 | None |
1980(4) | | June 2014 | WBI Investments, Inc. (present); | | |
| | | | Chief Investment Strategist of WBI | | |
| | | | Investments, Inc. (March 2017 to | | |
| | | | present), Chief Executive Officer of | | |
| | | | WBI Technologies, LLC | | |
| | | | (October 2019 to present) | | |
| Absolute Shares Trust |
|
Trustees and Officers (concluded) |
| (Unaudited) |
| | | Term of Office | |
| | Position(s) Held | and Length | |
Name and Year of Birth(1) | with Trust | of Time Served(2) | Principal Occupation(s) During Past 5 Years |
| | | | |
| Other Officers: | | | |
Ann Schreiber | Secretary | Since | President, WBI Technologies, LLC. (October 2019 to present); |
1984(5) | | June 2014 | Chief Marketing Officer, WBI Investments, Inc. (2015 to present); |
| | | | Secretary, WBI Trading, Inc. (2012 to present); Secretary, Millington |
| | | | Securities, Inc. (2013 to present); Secretary, Hartshorne Group, Inc. |
| | | | (2012 to present); Corporate Secretary, WBI Investments, Inc. |
| | | | (2012 to present); Director of Marketing and Executive Services, |
| | | | WBI Investments, Inc. (2011 to 2014) |
| | | | |
Steven Van Solkema | Treasurer & | Since | President, WBI Investments Inc. (March 2020 to present); Co-Chief |
1970 | Principal | November 2015 | Investment Officer, WBI Investments Inc. (March 2019 to present); |
| | Financial Officer | | Chief Operating Officer, Millington Securities, Inc. (June 2014 to |
| | | | February 2019); Chief Compliance Officer, Millington Securities, |
| | | | Inc. (June 2014 to June 2018) |
| | | | |
Scott F. Kreitz | Assistant | Since | Chief Operating Officer, WBI Investments, Inc. (present); |
1973 | Treasurer | March 2019 | Chief Operating Officer, Millington Securities, Inc. (March 2019 to |
| | | | Present); Chief Operating Officer, WBI Technologies, LLC |
| | | | (October 2019 to present); Vice President of Operations, Millington |
| | | | Securities, Inc. (2018 to February 2019); Associate Director, Model |
| | | | Risk Governance, RBC Capital Markets (2016 to 2018); |
| | | | Vice President, CCAR Process Oversight & Control Model Risk |
| | | | Management (2015 to 2016), Vice President, Product Control – |
| | | | Independent Valuations (2013 to 2015) |
| | | | |
Alyson Kest | Assistant | Since | Chief Compliance Officer and Counsel WBI Investments, Inc. |
1974 | Secretary, | February 2016 | (2019 to present); Chief Compliance Officer and Counsel, Hartshorne |
| | Principal | | Group, Inc. (2019 to present); Chief Compliance Officer and Counsel |
| | Legal Officer | | at Millington Securities, Inc. (2018 to present); Counsel, Millington |
| | | | Securities, Inc. (2017 to present); Senior Compliance Officer, |
| | | | Millington Securities, Inc. (2015-2018); Legal and Compliance at |
| | | | XL Catlin (fka Catlin, Inc.) (2014 to 2015) |
| | | | |
Rodney L. Ruehle | Chief | Since | Director, Foreside Fund Officer Services, LLC (formerly Foreside |
1968 | Compliance | November 2017 | Compliance Services, LLC) (financial services) (2016 to present); |
| | Officer | | Director, Beacon Hill Fund Services, LLC (April 2008 to July 2016) |
(1) | The address of each Trustee or officer is c/o Absolute Shares Trust, 331 Newman Springs Road, Suite 122, Red Bank, New Jersey 07701. |
(2) | Trustees and Officers serve until their successors are duly elected and qualified. |
(3) | The Fund is part of a “Fund Complex” as defined in the 1940 Act. The Fund Complex includes all open-end funds (including all of their portfolios) advised by the Advisor or the Sub-Advisor and any funds that have an investment advisor that is an affiliated person of the Advisor. As of the date of this SAI, the Fund Complex consists of the 8 Funds of the Trust. |
(4) | Don Schreiber Jr. and Matthew Schreiber are each an “interested person” of the Trust (as that term is defined in the 1940 Act) because of their affiliations with the Advisor and the Sub-Advisor. Don Schreiber, Jr. is the father of Matthew Schreiber. |
(5) | Ann Schreiber is the daughter of Don Schreiber, Jr., and the sister of Matthew Schreiber. |
The Statement of Additional Information includes additional information about the Trustees as is available without charge, up on request, by calling toll free at (800)-772-5810, by accessing the SEC’s website at www.sec.gov, or by accessing the Fund’s website at www.wbishares.com.
| Absolute Shares Trust |
|
Approval of Advisory Agreements and Board Considerations |
| (Unaudited) |
The Board (the members of which are referred to as “Trustees”) of the Trust met telephonically on June 11, 2020 to consider whether to renew: (1) the investment advisory agreements (collectively, the “Advisory Agreement”) between the Trust, on behalf of the Funds, and the Advisor, and (2) the investment sub-advisory agreements (collectively, the “Sub-Advisory Agreement”) between the Advisor and the Sub-Advisor.
The Board considered renewing the Advisory Agreement and the Sub-Advisory Agreement and the engagement of the Advisor and the Sub-Advisor separately, although the advisers are affiliates.
In accordance with Section 15(c) of the Investment Company Act of 1940, as amended (“1940 Act”), the Board requested, reviewed and considered materials furnished by the Advisor and the Sub-Advisor relevant to the Board’s consideration of whether to renew the Advisory Agreement and the Sub-Advisory Agreement. In connection with considering whether to renew the Advisory Agreement and Sub-Advisory Agreement, the Trustees who are not “interested persons” of the Trust, as that term is defined in the 1940 Act (the “Independent Trustees”), met in executive session with counsel to the Trust, who provided assistance and advice. The consideration of renewing the Advisory Agreement and Sub-Advisory Agreement was conducted by both the full Board and the Independent Trustees, who also voted separately.
During their review and consideration, the Board and the Independent Trustees focused on and analyzed the factors they deemed relevant, including, but not limited to: (1) the nature, extent and quality of the services provided by each of the Advisor and the Sub-Advisor; (2) the investment advice and performance of each of the Advisor and the Sub-Advisor; (3) the fees of the services provided and profits realized by each of the Advisor and the Sub-Advisor from their relationships with the Trust; (4) the expenses of the Funds and the extent to which economies of scale have been realized and are expected to reduce Fund expenses; (5) any benefits derived or to be derived by each of the Advisor and the Sub-Advisor from the relationship with the Trust; and (6) potential conflicts of interest and associated compliance regimes adopted by the Advisor and Sub-Advisor.
In reviewing such factors, the Board relied on certain information, including (1) copies of the Advisory Agreement, the Sub-Advisory Agreement and the Expense Limitation Agreement; (2) information describing the Advisor, the Sub-Advisor and the services provided thereby; (3) information regarding the compliance programs of the Advisor and the Sub-Advisor; (4) copies of the Forms ADV for the Advisor and the Sub-Advisor; and (5) memoranda and guidance from K&L Gates LLP on the fiduciary responsibilities of trustees, including Independent Trustees, in considering advisory and distribution agreements under the 1940 Act. In addition, as part of the Advisor and Sub-Advisor’s responses to submitted questions, the Board was provided with data and information comparing the advisory fees and expenses of the Funds with expenses and performance of other exchange-traded funds (“ETFs”) with similar investment objectives and policies (namely, active equity ETFs). The Trustees also considered their personal experiences as Trustees and participants in the ETF and mutual fund industry, as applicable.
In particular, the Trustees, including the Independent Trustees, considered and discussed the following with respect to the Funds:
1. The nature, extent and quality of the facilities and services provided by each of the Advisor and the Sub-Advisor. The Board received information on and considered the division of responsibility of services provided by the Advisor and the Sub-Advisor, including the fact that portfolio management would continue to be conducted by the Sub-Advisor. In addition to the Sub-Advisor’s performance managing the Funds, the Board reviewed the experience and resources that the Sub-Advisor had in managing strategies similar to those utilized by the Funds, including information regarding the education and experience of management and investment personnel.
The Board determined that the Funds would continue to benefit from the services and resources available from the Advisor and the Sub-Advisor, with respect to their responsibilities under the Advisory and Sub-Advisory Agreements. In particular, they noted the extensive experience of the Sub-Advisor’s management personnel in developing and administering strategies utilized by the Funds, as well as the performance history of the Sub-Advisor since its inception. The Board also noted the compliance regimes of the Advisor and the Sub-Advisor and their effectiveness.
2. The advisory fees paid by and overall expenses of the Funds. The Board considered comprehensive data and information comparing the advisory fees and expense ratios (taking into consideration the Expense Limitation Agreement) of the Funds. The Board acknowledged that the Funds were distinct in ways from their peer group of ETFs and that the universe of comparable funds had reduced in the prior year due to the withdrawal from the market by several active equity ETFs. Nevertheless, the Sub-Advisor’s peer group analysis and methodology had not substantially changed from the prior year. The Board determined that the advisory fees charged and overall expenses of the Funds were competitive and in line with the related universe of funds. The Advisor and Sub-Advisor also presented the Board with several “fall-out” benefits the Advisor or the Sub-Advisor derive from its relationship to the Trust and the Funds, such as the Sub-Advisor’s offering of the Funds to help expand the Sub-Advisor’s distribution channels for its other investment products. In light of the nature, quality, and extent of services provided by the Advisor and Sub-Advisor and the costs incurred by the Advisor and Sub-Advisor in rendering those services, and taking into account the “fall-out” benefits inured, the Board concluded that the level of fees paid to the Advisor and Sub-Advisor with respect to each Fund were fair and reasonable.
3. Brokerage and portfolio transactions. The Board was presented with materials and a thorough discussion of the brokerage practices of the Advisor, in its capacity as an affiliated broker-dealer, and Sub-Advisor, including a walk-through of the Advisor’s ability to continue providing commission-free trading to the Funds and the Advisor’s track record for delivering effective brokerage execution services for the benefit of the Funds compared to services that could otherwise be expected from unaffiliated broker-dealers. The Advisor presented on its execution services and policies and the Sub-Advisor discussed its policies and procedures for allocating brokerage. Additionally, the Board considered information relating to the amount, sources and transactions generating payments for order flow that the Advisor received in its capacity as an affiliated broker-dealer the last year, in light of both the advisory fees paid and generally as related to the Advisor and/or Sub-Advisor adhering to their best execution obligations and Rule 17e-1 procedures, upon execution of portfolio transactions for each of the Funds. The Independent Trustees determined the brokerage policies of both the Advisor and Sub-Advisor would continue to benefit the Funds.
| Absolute Shares Trust |
|
Approval of Advisory Agreements and Board Considerations |
| (Unaudited) (concluded) |
4. Financial condition of each of the Advisor and the Sub-Advisor. After considering information relating to the financial condition of the Advisor and Sub-Advisor, as well as the fees and operating costs relating to the management of the Funds, the Board determined that each of the Advisor and Sub-Advisor continue to be capable of providing services to the Funds. In this determination, the Board considered the existence of the Expense Limitation Agreement (including the level of the expense limit for each Fund) and its impact on the profitability of the Sub-Advisor.
5. Possible conflicts of interest. The Board considered the experience and ability of the advisory personnel assigned to the Funds, soft-dollar arrangements and the brokerage policies of the Advisor (including a discussion of the execution policies and total compensation earned by the Advisor in its capacity as affiliated broker-dealer, in the form of commissions, fees and other remuneration received, including payment for order flow), and the substance and administration of the Codes of Ethics of the Trust, the Advisor and the Sub-Advisor. The Board determined that the compliance policies of the Trust, Advisor and Sub-Advisor were each reasonably designed to monitor for and prevent violations of the federal securities laws and breaches of fiduciary duties.
6. Effect of the Funds’ growth and size on its investment performance and expenses. The Board considered information relating to the year- over-year trading of the Funds. It determined that the expense ratios of the Funds were well suited in light of expectations for continued asset accumulation and projected growth therefrom.
With respect to all WBI BullBear Trend Switch ETFs (NYSE Arca: WBIT, WBIK, WBIQ, WBIM, WBIS, and WBIN), the Board further noted that the Advisor and Sub-Advisor proposed charging a unitary advisory fee. The Advisor and Sub-Advisor noted that under the unitary fee structure, the Advisor, and not the WBI BullBear Trend Switch ETFs, would be responsible for paying almost all of the expenses necessary to service the WBI BullBear Trend Switch ETFs, including those of other service providers, and that the Advisor would bear the risk of these expenses increasing. The Board noted that the WBI BullBear Trend Switch ETFs were not expected to incur additional expenses besides the unitary advisory fee, and received information regarding the WBI BullBear Trend Switch ETFs’ anticipated expense ratios. The Board considered that the unitary fee structure is becoming more prevalent among other active equity ETFs as a way to rationalize expenses for shareholders and obviate the need for an expense limitation agreement, and its subsequent annual renewals. The Board also observed that the unitary fee provides predictability in WBI BullBear Trend Switch ETF expenses at various asset levels and also protects the WBI BullBear Trend Switch ETFs against the risks of increases in third-party service provider fees and other expenses covered under the unitary fee.
Based on the foregoing and such other matters as were deemed relevant, and while no single factor was determinative in the decision, all of the Trustees, including the Independent Trustees, concluded that the advisory fee rates and total expense ratios are reasonable in relation to the services provided by the Advisor to the Funds, as well as the costs incurred and the benefits gained by the Advisor in providing such services. The Board also found the investment advisory fees paid to the Advisor to be reasonable in comparison to the fees charged by advisers to other comparable funds of similar size. Based on these and other considerations, the Board, in the exercise of its reasonable judgment, determined that the fees and expenses proposed for each Fund were fair and reasonable. As a result, all of the Board members, including the Independent Trustees, approved the Advisory Agreement.
With respect to the Sub-Advisor and based on the foregoing analysis and such other matters as were deemed relevant, and while no single factor was determinative in the decision, all of the Trustees, including the Independent Trustees, concluded that the sub-advisory fee rates and total expense ratios are reasonable in relation to the services provided by the Sub-Advisor to the Funds, as well as the costs incurred and the benefits gained by the Sub-Advisor in providing such services. Based on these and other considerations, the Board, in the exercise of its reasonable judgment, determined that the fees and expenses proposed for each Fund were fair and reasonable. As a result, all of the Trustees, including the Independent Trustees, approved the Sub-Advisory Agreement.
| Absolute Shares Trust |
|
|
| For the Period Ended June 30, 2020 (Unaudited) |
As a shareholder you incur two types of costs: (1) transaction costs, including brokerage commissions on purchases and sales of Fund shares, and (2) ongoing costs, including management fees and other Fund expenses. This example is intended to help you understand your ongoing costs (in dollars) of investing in the Fund and to compare these costs with the ongoing costs of investing in other funds. The example is based on an investment of $1,000 invested at the beginning of the period and held for the entire period (January 1, 2020 – June 30, 2020).
Actual Expenses
The first line of the table provides information about actual account values based on actual returns and actual expenses. You may use the information in this line, together with the amount you invested, to estimate the expenses that you paid over the period. Simply divide your account value by $1,000 (for example, an $8,600 account value divided by $1,000 = 8.6), then, multiply the result by the number in the first line under the heading entitled “Expenses Paid During the Period” to estimate the expenses you paid on your account during this period.
Hypothetical Example for Comparison Purposes
The second line of the table provides information about hypothetical account values based on a hypothetical return and hypothetical expenses based on the Fund’s actual expense ratio and an assumed rate of return of 5% per year before expenses, which is not the Fund’s actual return. The hypothetical account values and expenses may not be used to estimate the actual ending account balance or expenses you paid for the period. You may use this information to compare the ongoing costs of investing in the Fund and other funds. To do so, compare this 5% hypothetical example with the 5% hypothetical examples that appear in the shareholder reports of the other funds. Please note that the expenses shown in the table are meant to highlight your ongoing costs only and do not reflect any transactional costs, such as brokerage commissions paid on purchases and sales of Fund shares. Therefore, the second line of the table is useful in comparing ongoing costs only and will not help you determine the relative total costs of owning different funds. If these transactional costs were included, your costs would have been higher.
| WBI BullBear Rising Income 3000 ETF | | | |
| | Beginning | Ending | |
| | Account Value | Account Value | Expenses Paid |
| | January 1, 2020 | June 30, 2020 | During the Period^ |
Actual | $1,000.00 | $ 931.10 | $6.00 |
Hypothetical (5% annual return before expenses) | $1,000.00 | $1,018.65 | $6.27 |
| | | | |
| WBI BullBear Value 3000 ETF | | | |
| | Beginning | Ending | |
| | Account Value | Account Value | Expenses Paid |
| | January 1, 2020 | June 30, 2020 | During the Period^ |
Actual | $1,000.00 | $ 920.30 | $5.97 |
Hypothetical (5% annual return before expenses) | $1,000.00 | $1,018.65 | $6.27 |
| | | | |
| WBI BullBear Yield 3000 ETF | | | |
| | Beginning | Ending | |
| | Account Value | Account Value | Expenses Paid |
| | January 1, 2020 | June 30, 2020 | During the Period^ |
Actual | $1,000.00 | $ 915.20 | $5.76 |
Hypothetical (5% annual return before expenses) | $1,000.00 | $1,018.85 | $6.07 |
| | | | |
| WBI BullBear Quality 3000 ETF | | | |
| | Beginning | Ending | |
| | Account Value | Account Value | Expenses Paid |
| | January 1, 2020 | June 30, 2020 | During the Period^ |
Actual | $1,000.00 | $ 954.30 | $6.07 |
Hypothetical (5% annual return before expenses) | $1,000.00 | $1,018.65 | $6.27 |
| Absolute Shares Trust |
|
Expense Examples (concluded) |
For the Period Ended June 30, 2020 (Unaudited) |
| WBI BullBear Global Income ETF | | | |
| | Beginning | Ending | |
| | Account Value | Account Value | Expenses Paid |
| | January 1, 2020 | June 30, 2020 | During the Period^ |
Actual | $1,000.00 | $ 941.10 | $5.21 |
Hypothetical (5% annual return before expenses) | $1,000.00 | $1,019.50 | $5.42 |
| | | | |
WBI Power Factor® High Dividend ETF | | | |
| | Beginning | Ending | |
| | Account Value | Account Value | Expenses Paid |
| | January 1, 2020 | June 30, 2020 | During the Period^ |
Actual | $1,000.00 | $ 732.40 | $3.02 |
Hypothetical (5% annual return before expenses) | $1,000.00 | $1,021.38 | $3.52 |
| | | | |
| WBI BullBear Trend Switch US 3000 Total Return ETF | | | |
| | Beginning | Ending | |
| | Account Value | Account Value | Expenses Paid |
| | January 1, 2020 | June 30, 2020 | During the Period^ |
Actual | $1,000.00 | $ 850.60 | $3.27 |
Hypothetical (5% annual return before expenses) | $1,000.00 | $1,021.33 | $3.57 |
_________
^ | The dollar amounts shown as expenses paid during the period are equal to the annualized expense ratio multiplied by the average account value during the period, multiplied by the number of days in the most recent six-month period, multiplied by 182/366 to reflect the one-half year period. |
| Absolute Shares Trust |
|
|
|
QUALIFIED DIVIDEND INCOME/DIVIDENDS RECEIVED DEDUCTION
For the fiscal year ended June 30, 2020, certain dividends paid by the Funds may be subject to a maximum tax rate of 15%, as provided for by the Jobs and Growth Tax Relief Reconciliation Act of 2003.
The percentage of dividends declared from ordinary income designated as qualified dividend income was as follows:
BullBear Rising Income 3000 ETF | | | 100.00 | % |
BullBear Value 3000 ETF | | | 100.00 | % |
BullBear Yield 3000 ETF | | | 100.00 | % |
BullBear Quality 3000 ETF | | | 100.00 | % |
BullBear Global Income ETF | | | 0.00 | % |
Power Factor® High Dividend ETF | | | 100.00 | % |
BullBear Trend Switch US 3000 Total Return ETF | | | 4.49 | % |
BullBear Trend Switch US Total Return ETF | | | 0.00 | % |
For corporate shareholders, the percent of ordinary income distributions qualifying for the corporate dividends received deduction for the fiscal year ended June 30, 2019 was as follows:
BullBear Rising Income 1000 ETF | | | 100.00 | % |
BullBear Value 1000 ETF | | | 100.00 | % |
BullBear Yield 1000 ETF | | | 100.00 | % |
BullBear Quality 1000 ETF | | | 100.00 | % |
BullBear Global Income ETF | | | 0.00 | % |
Power Factor® High Dividend ETF | | | 99.19 | % |
BullBear Trend Switch US 3000 Total Return ETF | | | 2.65 | % |
BullBear Trend Switch US Total Return ETF | | | 0.00 | % |
The Percentage of taxable ordinary income distributions that are designated as short-term capital gain distributions under Internal Revenue Section 871(k)(2)(C) for each Fund were as follows (unaudited).
BullBear Rising Income 3000 ETF | | | 0.00 | % |
BullBear Value 3000 ETF | | | 0.00 | % |
BullBear Yield 3000 ETF | | | 0.00 | % |
BullBear Quality 3000 ETF | | | 0.00 | % |
BullBear Global Income ETF | | | 0.00 | % |
Power Factor® High Dividend ETF | | | 0.00 | % |
BullBear Trend Switch US 3000 Total Return ETF | | | 33.31 | % |
BullBear Trend Switch US Total Return ETF | | | 38.22 | % |
| Absolute Shares Trust |
|
|
|
Information About the Portfolio Holdings
(Unaudited)
The Trust files its complete schedules of portfolio holdings for its first and third fiscal quarters with the Securities and Exchange Commission (“SEC”) on Form N-Q or Part F of Form N-PORT (beginning with filings after March 31, 2020). The Trust’s Form N-Q or Part F of Form N-PORT is available without charge, upon request, by calling toll-free at (800) 772-5810. Furthermore, you may obtain the Form N-Q or Part F of Form N-PORT on the SEC’s website at www.sec.gov. The Funds’ portfolio holdings are updated daily and posted on its website at www.wbietfs.com.
Information About Proxy Voting
(Unaudited)
A description of the policies and procedures the Trust uses to determine how to vote proxies relating to portfolio securities is provided in the Statement of Additional Information (“SAI”). The SAI is available without charge, upon request, by calling toll-free at (800) 772-5810, by accessing the SEC’s website at www.sec.gov, or by accessing the Funds’ website at www.wbietfs.com.
When available, information regarding how the Funds voted proxies relating to portfolio securities during the period ending June 30 will be available by calling toll-free at (800) 772-5810 or by accessing the SEC’s website at www.sec.gov.
Information About the Funds’ Trustees
(Unaudited)
The SAI includes additional information about the Trustees and is available without charge, upon request, by calling toll free at (800) 772-5810, or by accessing the SEC’s website at www.sec.gov, or by accessing the Fund’s website at www.wbietfs.com.
Frequency Distributions of Premiums and Discounts
(Unaudited)
Information regarding how often shares of the Funds trade on an exchange at a price above (i.e., at a premium) or below (i.e., at a discount) the NAV of the Funds is available, without charge, on the Funds’ website at www.wbietfs.com.
| Absolute Shares Trust |
|
|
|
Advisor
Millington Securities
331 Newman Springs Road Suite 101
Red Bank, New Jersey 07701
Sub-Advisor
WBI Investments, Inc
331 Newman Springs Road Suite 122
Red Bank, New Jersey 07701
Index Provider (WBIY only)
Solactive AG
Guiollettstraβe 54
60325 Frankfurt am Main, Germany
Distributor
Foreside Fund Services, LLC
Three Canal Plaza, Suite 100
Portland, Maine 04101
Custodian
U.S. Bank National Association
1555 North Rivercenter Drive, Suite 302
Milwaukee, Wisconsin 53212
Transfer Agent
U.S. Bancorp Fund Services, LLC
615 East Michigan Street
Milwaukee, Wisconsin 53202
Securities Lending Agent
U.S. Bank, National Association
Securities Lending
800 Nicolet Mall
Minneapolis, Minnesota 55402-7020
Independent Registered
Public Accounting Firm
KPMG LLP
51 John F. Kennedy Parkway
Short Hills, New Jersey 07078
Legal Counsel
K&L Gates LLP
599 Lexington Avenue
New York, New York 10022
| WBI BullBear Rising Income 3000 ETF | WBIE |
| WBI BullBear Value 3000 ETF | WBIF |
| WBI BullBear Yield 3000 ETF | WBIG |
| WBI BullBear Quality 3000 ETF | WBIL |
| WBI BullBear Global Income ETF | WBII |
WBI Power Factor® High Dividend ETF | WBIY |
| WBI BullBear Trend Switch US 3000 Total Return ETF | WBIT |
| WBI BullBear Trend Switch US Total Return ETF | WBIN |
Item 2. Code of Ethics.
The registrant has adopted a code of ethics that applies to the registrant’s principal executive officer and principal financial officer. The registrant has not made any substantive amendments to its code of ethics during the period covered by this report. The registrant has not granted any waivers from any provisions of the code of ethics during the period covered by this report.
A copy of the registrant’s Code of Ethics is filed herewith.
Item 3. Audit Committee Financial Expert.
The registrant’s board of trustees has determined that there is at least one audit committee financial expert serving on its audit committee. John A. Flanagan is the “audit committee financial expert” and is considered to be “independent” as each term is defined in Item 3 of Form N‑CSR.
Item 4. Principal Accountant Fees and Services.
The registrant has engaged its principal accountant to perform audit services, audit-related services, tax services and other services during the past two fiscal years. “Audit services” refer to performing an audit of the registrant's annual financial statements or services that are normally provided by the accountant in connection with statutory and regulatory filings or engagements for those fiscal years. “Audit-related services” refer to the assurance and related services by the principal accountant that are reasonably related to the performance of the audit. “Tax services” refer to professional services rendered by the principal accountant for tax compliance, tax advice, and tax planning. There were no “Other services” provided by the principal accountant. The following table details the aggregate fees billed or expected to be billed for each of the last two fiscal years for audit fees, audit-related fees, tax fees and other fees by the principal accountant.
| WBI BullBear Rising Income 3000 ETF | FYE 06/30/2020 | FYE 06/30/2019 |
| Audit Fees | $14,413 | $12,450 |
| Audit-Related Fees | N/A | N/A |
| Tax Fees | $6,720 | $5,350 |
| All Other Fees | N/A | N/A |
| WBI BullBear Value 3000 ETF | FYE 06/30/2020 | FYE 06/30/2019 |
| Audit Fees | $14,413 | $12,450 |
| Audit-Related Fees | N/A | N/A |
| Tax Fees | | $5,350 |
| All Other Fees | N/A | N/A |
| WBI BullBear Yield 3000 ETF | FYE 06/30/2020 | FYE 06/30/2019 |
| Audit Fees | $14,413 | $12,450 |
| Audit-Related Fees | N/A | N/A |
| Tax Fees | | $5,350 |
| All Other Fees | N/A | N/A |
| WBI BullBear Quality 3000 ETF | FYE 06/30/2020 | FYE 06/30/2019 |
| Audit Fees | $14,413 | $12,450 |
| Audit-Related Fees | N/A | N/A |
| Tax Fees | | $5,350 |
| All Other Fees | N/A | N/A |
| WBI BullBear Global Income ETF | FYE 06/30/2020 | FYE 06/30/2019 |
| Audit Fees | $13,412 | $12,450 |
| Audit-Related Fees | N/A | N/A |
| Tax Fees | $5,520 | $5,350 |
| All Other Fees | N/A | N/A |
WBI Power FactorTM High Dividend ETF | FYE 06/30/2020 | FYE 06/30/2019 |
| Audit Fees | $13,412 | $12,450 |
| Audit-Related Fees | N/A | N/A |
| Tax Fees | $5,520 | $5,350 |
| All Other Fees | N/A | N/A |
| WBI BullBear Trend Switch US 3000 Total Return ETF | FYE 06/30/2020 | FYE 06/30/2019 |
| Audit Fees | $13,412 | $7,500 |
| Audit-Related Fees | N/A | N/A |
| Tax Fees | $5,520 | $5,350 |
| All Other Fees | N/A | N/A |
| WBI BullBear Trend Switch US Total Return ETF | FYE 06/30/2020 | FYE 06/30/2019 |
| Audit Fees | $13,412 | N/A |
| Audit-Related Fees | N/A | N/A |
| Tax Fees | $5,520 | |
| All Other Fees | N/A | N/A |
The audit committee has adopted pre-approval policies and procedures that require the audit committee to pre‑approve all audit and non‑audit services of the registrant, including services provided to any entity affiliated with the registrant.
The percentage of fees billed by KPMG LLP applicable to non-audit services pursuant to waiver of pre-approval requirement were as follows:
| | FYE 06/30/2020 | FYE 06/30/2019 |
Audit-Related Fees | 0% | 0% |
Tax Fees | 0% | 0% |
All Other Fees | 0% | 0% |
All of the principal accountant’s hours spent on auditing the registrant’s financial statements were attributed to work performed by full‑time permanent employees of the principal accountant. (If more than 50 percent of the accountant’s hours were spent to audit the registrant's financial statements for the most recent fiscal year, state how many hours were attributed to work performed by persons other than the principal accountant's full-time, permanent employees.)
The following table indicates the non-audit fees billed or expected to be billed by the registrant’s accountant for services to the registrant and to the registrant’s investment adviser (and any other controlling entity, etc.—not sub-adviser) for the last two years. The audit committee of the board of trustees/directors has considered whether the provision of non-audit services that were rendered to the registrant's investment adviser is compatible with maintaining the principal accountant's independence and has concluded that the provision of such non-audit services by the accountant has not compromised the accountant’s independence.
Non-Audit Related Fees | FYE 06/30/2020 | FYE 06/30/2019 |
Registrant | N/A | N/A |
Registrant’s Investment Adviser | | |
Item 5. Audit Committee of Listed Registrants.
The registrant is an issuer as defined in Rule 10A-3 under the Securities Exchange Act of 1934, (the “Act”) and has a separately-designated standing audit committee established in accordance with Section 3(a)(58)(A) of the Act. The independent members of the committee are as follows: Andrew Putterman, Jude T. Depko, John A. Flanagan.
Item 6. Investments.
Schedule of Investments is included as part of the report to shareholders filed under Item 1 of this Form.
Item 7. Disclosure of Proxy Voting Policies and Procedures for Closed-End Management Investment Companies.
Not applicable to open-end investment companies.
Item 8. Portfolio Managers of Closed-End Management Investment Companies.
Not applicable to open-end investment companies.
Item 9. Purchases of Equity Securities by Closed‑End Management Investment Company and Affiliated Purchasers.
Not applicable to open-end investment companies.
Item 10. Submission of Matters to a Vote of Security Holders.
There have been no material changes to the procedures by which shareholders may recommend nominees to the registrant’s Board of Trustees.
Item 11. Controls and Procedures.
(a) | The Registrant’s Principal Executive Officer and Principal Financial Officer have reviewed the Registrant's disclosure controls and procedures (as defined in Rule 30a-3(c) under the Investment Company Act of 1940 (the “Act”)) as of a date within 90 days of the filing of this report, as required by Rule 30a-3(b) under the Act and Rules 13a-15(b) or 15d‑15(b) under the Securities Exchange Act of 1934. Based on their review, such officers have concluded that the disclosure controls and procedures are effective in ensuring that information required to be disclosed in this report is appropriately recorded, processed, summarized and reported and made known to them by others within the Registrant and by the Registrant’s service provider. |
(b) | There were no changes in the Registrant's internal control over financial reporting (as defined in Rule 30a-3(d) under the Act) that occurred during the second fiscal quarter of the period covered by this report that has materially affected, or is reasonably likely to materially affect, the Registrant's internal control over financial reporting. |
Item 12. Disclosure of Securities Lending Activities for Closed-End Management Investment Companies
Not applicable to open-end investment companies.
Item 13. Exhibits.
(3) Any written solicitation to purchase securities under Rule 23c‑1 under the Act sent or given during the period covered by the report by or on behalf of the registrant to 10 or more persons. Not applicable to open-end investment companies.
(4) Change in the registrant’s independent public accountant. There was no change in the registrant’s independent public accountant for the period covered by this report.
SIGNATURES
Pursuant to the requirements of the Securities Exchange Act of 1934 and the Investment Company Act of 1940, the registrant has duly caused this report to be signed on its behalf by the undersigned, thereunto duly authorized.
(Registrant) Absolute Shares Trust
By (Signature and Title)* /s/Don Schreiber, Jr.
Don Schreiber, Jr., President and Principal Executive Officer
Date September 1, 2020
Pursuant to the requirements of the Securities Exchange Act of 1934 and the Investment Company Act of 1940, this report has been signed below by the following persons on behalf of the registrant and in the capacities and on the dates indicated.
By (Signature and Title)* /s/Don Schreiber, Jr.
Don Schreiber, Jr., President and Principal Executive Officer
Date September 1, 2020
By (Signature and Title)* /s/Steven Van Solkema
Steven Van Solkema, Treasurer and Principal Financial Officer
Date September 1, 2020
* Print the name and title of each signing officer under his or her signature.