ANNUAL REPORT
June 30, 2019
WBI BullBear Rising Income 2000 ETF | WBIA
WBI BullBear Value 2000 ETF | WBIB
WBI BullBear Yield 2000 ETF | WBIC
WBI BullBear Quality 2000 ETF | WBID
WBI BullBear Rising Income 1000 ETF | WBIE
WBI BullBear Value 1000 ETF | WBIF
WBI BullBear Yield 1000 ETF | WBIG
WBI BullBear Quality 1000 ETF | WBIL
WBI BullBear Global Income ETF | WBII
WBI Power Factor™ High Dividend ETF | WBIY
WBI BullBear Trend Switch US 3000 Total Return ETF | WBIT
Beginning on January 1, 2021, as permitted by regulations adopted by the U.S. Securities and Exchange Commission, paper copies of the Funds’ shareholder reports will no longer be sent by mail, unless you specifically request paper copies of the Funds’ reports from your financial intermediary, such as a broker-dealer or bank. Instead, the reports will be made available on a website, and you will be notified by mail each time a report is posted and provided with a website link to access the report.
If you already elected to receive shareholder reports electronically, you will not be affected by this change and you need not take any action. Please contact your financial intermediary to elect to receive shareholder reports and other Fund communications electronically.
You may elect to receive all future reports in paper free of charge. Please contact your financial intermediary to inform them that you wish to continue receiving paper copies of shareholder reports and for details about whether your election to receive reports in paper will apply to all funds held with your financial intermediary.
Absolute Shares Trust
Table of Contents
Management’s Discussion of Fund Performance | 1 |
| | |
Performance Summaries | 12 |
| | |
Portfolio Allocations | 23 |
| | |
Schedules of Investments | 25 |
| | |
Statements of Assets and Liabilities | 37 |
| | |
Statements of Operations | 40 |
| | |
Statements of Changes in Net Assets | 43 |
| | |
Financial Highlights | 46 |
| | |
Notes to Financial Statements | 51 |
| | |
Report of Independent Registered Public Accounting Firm | 62 |
| | |
Trustees and Officers | 63 |
| | |
Approval of Advisory Agreements and Board Considerations | 66 |
| | |
Expense Examples | 68 |
| | |
Federal Tax Information | 70 |
| | |
Information About the Portfolio Holdings | 71 |
| | |
Information About Proxy Voting | 71 |
| | |
Frequency Distributions of Premiums and Discounts | 71 |
(This page intentionally left blank.)
Absolute Shares Trust
Management’s Discussion of Fund Performance
June 30, 2019 (Unaudited)
Dear Fellow Shareholder:
In our experience, the conditions that affect investments are consistently subject to the possibility of uncertainty and change. We believe that the appropriate approach to investing in a volatile world is one that is responsive to continually changing conditions and opportunities. We think that process should be focused on managing risk as well as on pursuing return. It should be disciplined and have a track record that spans both good times and bad. In short, our opinion is that it should be just like the process we have used for our investment management clients for nearly 30 years and continue to use to manage the Funds today. We believe the consistent application of this disciplined approach will continue to be extremely valuable and attractive to current and prospective shareholders.
We appreciate the continuing confidence of our existing shareholders and welcome our new shareholders to the Funds.
Investment Philosophy
WBI’s general investment philosophy is primarily based on our belief that protecting capital is essential to providing long term portfolio growth or a consistent stream of income. We believe it is important to offer a variety of alternatives that investors can choose from as they address changing circumstances. The ability to adapt and evolve as risks and opportunities appear is the key to pursuing a stable outcome in an uncertain world. The goal of the WBI Funds is to provide consistent, attractive returns with less volatility and risk to capital than traditional approaches.
WBI Funds include actively managed, passive (“smart-beta”) and trend-switch based portfolio strategies. Actively managed strategies include multifactor security selection models with our advanced dynamic trailing stop process to protect capital. The passively managed smart-beta strategy is designed to provide an investment alternative for clients seeking returns based on multifactor security selection models in a portfolio that is generally fully invested and rebalances quarterly. The trend-switch strategy utilizes quantitative trend models to optimize risk and return for domestic stock and fixed income exposure.
Performance Overview
In response to market volatility during the most recent fiscal period, the actively managed equity-focused Funds periodically held significant allocations to cash equivalents, contributing to differences in performance between each Fund and its respective benchmark.
The WBI BullBear Rising Income 2000 ETF (NYSE Arca: WBIA) returned -9.83% on a NAV basis, and -9.84% based on market value, versus the -6.24% return of the Russell 2000 Value Total Return Index, the Fund’s benchmark.
The WBI BullBear Value 2000 ETF (NYSE Arca: WBIB) returned -2.87% on a NAV basis, and -2.90% based on market value, versus the -6.24% return of the Russell 2000 Value Total Return Index, the Fund’s benchmark.
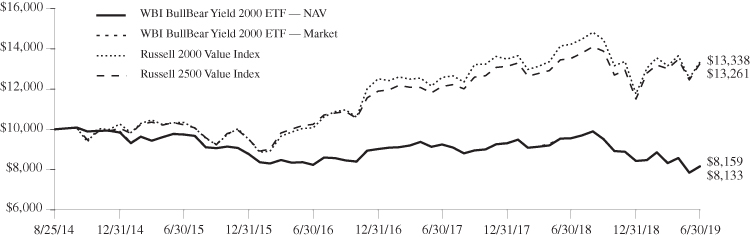
The WBI BullBear Yield 2000 ETF (NYSE Arca: WBIC) returned -14.61% on a NAV basis, and -14.71% based on market value, versus the -6.24% return of the Russell 2000 Value Total Return Index, the Fund’s benchmark.
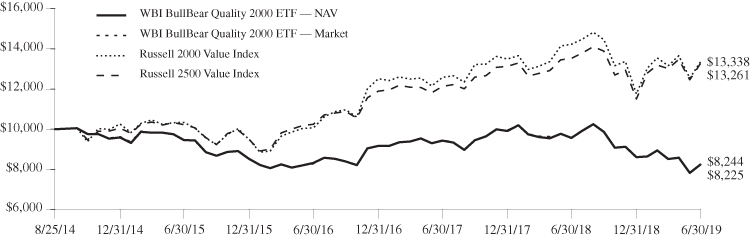
The WBI BullBear Quality 2000 ETF (NYSE Arca: WBID) returned -13.84% on a NAV basis, and -14.16% based on market value, versus the -6.24% return of the Russell 2000 Value Total Return Index, the Fund’s benchmark.
The WBI BullBear Rising Income 1000 ETF (NYSE Arca: WBIE) returned 4.22% on a NAV basis, and 4.35% based on market value, versus the 8.46% return of the Russell 1000 Value Total Return Index, the Fund’s benchmark.
The WBI BullBear Value 1000 ETF (NYSE Arca: WBIF) returned -2.53% on a NAV basis, and -2.47% based on market value, versus the 8.46% return of the Russell 1000 Value Total Return Index, the Fund’s benchmark.
The WBI BullBear Yield 1000 ETF (NYSE Arca: WBIG) returned -5.22% on a NAV basis, and -5.26% based on market value, versus the 8.46% return of the Russell 1000 Value Total Return Index, the Fund’s benchmark.
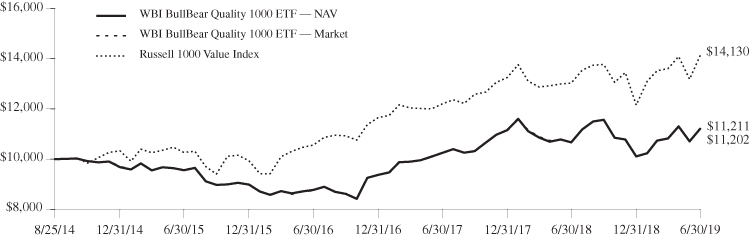
The WBI BullBear Quality 1000 ETF (NYSE Arca: WBIL) returned 5.08% on a NAV basis, and 4.91% based on market value, versus the 8.46% return of the Russell 1000 Value Total Return Index, the Fund’s benchmark.
The WBI BullBear Global Income ETF (NYSE Arca: WBII) returned 9.75% on a NAV basis, and 9.68% based on market value, versus the 7.87% return of the Bloomberg Barclays US Aggregate Bond Total Return Index, the Fund’s benchmark.
The WBI Power Factor™ High Dividend ETF (NYSE Arca: WBIY) returned -3.25% on a NAV basis, and -3.42% based on market value, versus the 7.34% return of the Russell 3000 Value Total Return Index, the Fund’s benchmark, and versus the -1.45% return of the Solactive Power FactorTM High Dividend GTR Index, the Fund’s underlying index.
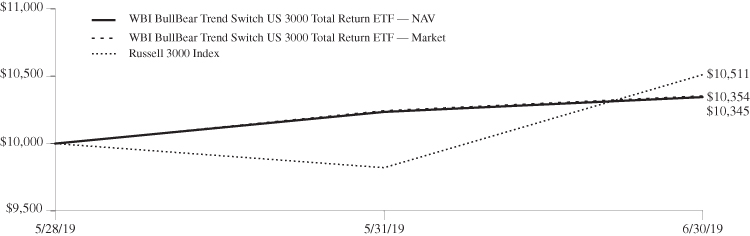
The WBI BullBear Trend Switch US 3000 Total Return ETF (NYSE Arca: WBIT) returned, since the Fund’s inception date of 5/28/2019, 3.45% on a NAV basis, and 3.54% based on market value, versus the 5.11% of the Russell 3000 Total Return Index, the Fund’s benchmark.
Net asset value total return is calculated assuming an initial investment made at the net asset value at the beginning of the period, reinvestment of all dividends and distributions at net asset value during the period, and the redemption on the last day of the period. Net asset value total return includes adjustments in accordance with accounting principles generally accepted in the United States of America and as such, the net asset value for financial
Absolute Shares Trust
Management’s Discussion of Fund Performance (continued)
June 30, 2019 (Unaudited)
reporting purposes and the returns based upon those net asset values may differ from the net asset value and returns for shareholder transactions. Market price total return is calculated assuming an initial investment made at the market price at the beginning of the period, reinvestment of all dividends and distributions at market price during the period, and sale at the market price on the last day of the period. Total investment returns calculated for a period of less than one year are not annualized.
With the exception of the passive index Fund, the WBI Power Factor™ High Dividend ETF, the strategies used in the management of the Funds do not attempt to replicate or track the performance of any index and differ significantly from the methods used to construct and maintain the indices that serve as their respective benchmarks. The eight actively managed equity-focused Funds (“Active Equity Funds”) use proprietary processes to screen, rank, and purchase securities with particular attributes, and sell securities when certain thresholds are reached, while benchmark indices are unmanaged, and consist of a passive representation of all securities that meet the definition of the index constituents. In addition, each Active Equity Fund uses strategies intended to mitigate volatility and protect capital, and as a result these Funds will often have a significant allocation to cash equivalents. Therefore, while each Active Equity Fund’s performance includes the effect of an investment in cash equivalents from the proceeds of sales when certain thresholds are met, benchmark indices do not include an allocation to cash equivalents.
A distinguishing characteristic of cash equivalents is that their prices are extremely stable and not subject to the levels of price volatility generally exhibited by other investments. Therefore, in periods during which the prices of the securities represented in benchmark indices are falling, an allocation to cash equivalents may contribute to Active Equity Fund performance that is superior to that of their benchmarks. In periods during which the prices of the securities represented in benchmark indices are rising, an allocation to cash equivalents in an Active Equity Fund may cause its performance to trail that of its benchmark. You cannot invest directly in an index, including a benchmark index, and benchmark performance does not include the deduction of transaction and operational expenses, or the deduction of an investment management fee, which would alter their indicated historical results.
Similarly, the WBI BullBear Global Income ETF (the “Active Income Fund”) and the WBI BullBear Trend Switch US 3000 Total Return ETF (the “Trend Switch Fund”) do not attempt to replicate or track the performance of any index and differ significantly from the methods used to construct and maintain the index that serves as their respective benchmarks. The recently launched Trend Switch Fund aims to optimize risk and return by looking first to a quantitative equity model (the “Equity Model”) to evaluate when conditions are deemed favorable for equity market exposure. If the model indicates conditions for risk are low in equities, the Fund will implement exposure to equity markets. If the model indicates conditions for risk are high in equities, a quantitative bond model (the “Bond Model”) is used to identify the credit quality and duration exposure that will be implemented in the Fund instead of employing exposure to equity markets. The WBI BullBear Global Income ETF strategy currently relies upon a combination of the Bond Model’s recommended exposure along with tactical investments in perceived lower risk and higher return opportunities in varying segments of the fixed income or equity markets.
The WBI Power Factor™ High Dividend ETF (the “Passive Index Fund”) is intended to track its benchmark index, the Solactive Power Factor™ High Dividend GTR Index, and can reasonably be compared to its benchmark in evaluating its performance.
Review of Fund Trading Activity
The Active Funds attempt to provide consistent, attractive returns net of expenses with potentially less volatility and risk to capital than traditional approaches, whatever market conditions may be. The investment process for each Fund includes a buy discipline and a sell discipline. Each Fund’s trading activity reflects this disciplined investment process as described in its prospectus and summarized below.
The Active Equity Funds that invest in individual equities primarily use quantitative computer screening of fundamental stock information to evaluate domestic and foreign equity securities in an attempt to find companies with attractive characteristics for the selected universe of securities. Dividend payments may be considered as part of the evaluation process. Once securities are identified, an overlay of technical analysis confirms timeliness of security purchases. The Funds then add qualifying securities using available cash within the parameters of each Fund’s investment objective and security selection criteria.
Once a security is purchased for a given Active Equity Fund, a strict sell discipline with a dynamic stop loss and goal setting process attempts to control the effects of volatility for each invested position on the Fund’s value. An initial stop percentage and goal price is established at the time a security is purchased. As that security’s specified goal price is approached, the initial stop tolerance set for each security is tightened. If a security stays within its acceptable price channel relative to its current stop, it remains in the Fund’s portfolio. If the security moves below the acceptable price channel, a stop is triggered, and the Fund will sell the security. This results in a responsive process that actively adjusts the Fund’s allocation by causing it to become more fully invested or by raising cash with the intention of protecting capital. This process is likely to result in a Fund holding meaningful allocations to cash equivalents during periods of market volatility and is intended to prevent loss of capital.
The WBI BullBear Global Income ETF uses proprietary quantitative models to assess the appropriate credit quality and duration of its exposure to debt securities. Credit quality is a measure of a borrower’s creditworthiness or risk of default. Duration is a measure of a fixed income security’s expected price sensitivity to changes in interest rates. Securities with longer durations are expected to experience greater price movements than securities with shorter duration for the same change in prevailing interest rates. A portion of the Fund’s exposure will also be invested to pursue perceived opportunities for high income and/or return in varying segments of the fixed income or equity market.
Management’s Discussion of Fund Performance (continued)
June 30, 2019 (Unaudited)
The WBI BullBear Trend Switch US 3000 Total Return ETF uses proprietary quantitative models to assess the perceived risk and return opportunities for both the equity and fixed income markets. The Equity Model is first used to determine whether conditions for risk are perceived to be low in which case the Fund will implement exposure to equity markets. However, if the Equity Model suggests that conditions for risk are high in the equity market, the Fund eliminates any equity exposure and relies upon the Bond Model to identify the appropriate credit quality and duration exposure to debt securities that it will implement.
The WBI Power Factor™ High Dividend ETF seeks to achieve its investment objective by attempting to track the investment results of the Solactive Power Factor™ High Dividend GTR Index. The index is designed to select securities from the Solactive US Broad Market Index that exhibit certain yield and fundamental value characteristics. In particular, the Solactive Power Factor™ High Dividend GTR Index is designed to select equity securities with an above-average forecasted dividend yield, scored on the basis of three fundamental value characteristics (the “Power Factors™”). Quarterly rebalancing of the Passive Index Fund helps enforce a buy low – sell high discipline by locking in gains on stocks that have had outsized appreciation and seeks to confirm the strongest quality fundamentals for its constituents on a quarterly basis.
WBI BullBear Rising Income 2000 ETF (WBIA)
As of June 30, 2019, WBIA held 24 securities in addition to a position in a money market fund which served as a cash equivalent. From the time of their purchase, 20 of these positions had unrealized gains of between 0.32% and 19.49%, while 4 had unrealized losses ranging from -0.11% to -2.57%. The aggregate unrealized gain amounted to 4.93% of the Fund’s period ending net asset value.
Approximately 81% of the securities held by WBIA at any time during the fiscal period were sold. Approximately 36% of the Fund’s holdings were sold for gains, with an average realized gain of 8.5%, and approximately 64% were sold for an average realized loss of -6.6%.
Examples of securities that made positive contributions to WBIA’s performance during the fiscal period include Insperity, Inc., Toro Company, Woodward, Inc., and Comfort Systems USA, Inc. Examples of securities that detracted from the Fund’s performance during the fiscal period include Cimarex Energy Company, Packaging Corporation of America, Bank Ozk, and Oxford Industries, Inc.
High turnover in WBIA’s holdings has the potential to result in the realization and distribution to shareholders of higher capital gains. If Fund shares are held in a taxable account, this may increase your tax liability. To the extent portfolio turnover increases transaction costs, it may also reduce Fund performance. Of course, selling a security in a timely fashion may also improve performance if a subsequent loss is avoided that exceeds the cost of executing the sale.
WBI BullBear Value 2000 ETF (WBIB)
As of June 30, 2019, WBIB held 24 securities in addition to a position in a money market fund which served as a cash equivalent. From the time of their purchase, 23 of these positions had unrealized gains of between 0.46% and 30.01%, while 1 had an unrealized loss of -0.11. The aggregate unrealized gain amounted to 7.51% of the Fund’s period ending net asset value.
Approximately 84% of the securities held by WBIB at any time during the fiscal period were sold. Approximately 37% of the Fund’s holdings were sold for gains, with an average realized gain of 10.4%, and approximately 63% were sold for an average realized loss of -6.8%.
Examples of securities that made positive contributions to WBIB’s performance during the fiscal period include Consan, Ltd, Lithia Motors, Inc., Core-Mark Holdings Company, Inc., and Radian Group, Inc. Examples of securities that detracted from the Fund’s performance during the fiscal period include Trinseo SA, BBX Capital Corporation, Whirlpool Corporation, and H.B. Fuller Company.
High turnover in WBIB’s holdings has the potential to result in the realization and distribution to shareholders of higher capital gains. If Fund shares are held in a taxable account, this may increase your tax liability. To the extent portfolio turnover increases transaction costs, it may also reduce Fund performance. Of course, selling a security in a timely fashion may also improve performance if a subsequent loss is avoided that exceeds the cost of executing the sale.
WBI BullBear Yield 2000 ETF (WBIC)
As of June 30, 2019, WBIC held 21 securities in addition to a position in a money market fund which served as a cash equivalent. From the time of their purchase, 18 of these positions had unrealized gains of between 0.15% and 31.84%, while 3 had unrealized losses ranging from -0.24% to -2.73%. The aggregate unrealized gain amounted to 3.15% of the Fund’s period ending net asset value.
Approximately 84% of the securities held by WBIC at any time during the fiscal period were sold. Approximately 29% of the Fund’s holdings were sold for gains, with an average realized gain of 9.2%, and approximately 71% were sold for an average realized loss of -7.8%.
Examples of securities that made positive contributions to WBIC’s performance during the fiscal period include Universal Insurance Holdings, Sinclair Broadcast Group, Tegna, Inc. and Tractor Supply Company. Examples of securities that detracted from the Fund’s performance during the fiscal period include Nordstrom, Inc., Camping World Holdings, Inc., Delek US Holdings, Inc., and Guess, Inc.
High turnover in WBIC’s holdings has the potential to result in the realization and distribution to shareholders of higher capital gains. If Fund shares are held in a taxable account, this may increase your tax liability. To the extent portfolio turnover increases transaction costs, it may also reduce Fund performance. Of course, selling a security in a timely fashion may also improve performance if a subsequent loss is avoided that exceeds the cost of executing the sale.
Management’s Discussion of Fund Performance (continued)
June 30, 2019 (Unaudited)
WBI BullBear Quality 2000 ETF (WBID)
As of June 30, 2019, WBID held 24 securities in addition to a position in a money market fund which served as a cash equivalent. From the time of their purchase, 18 of these positions had unrealized gains of between 0.54% and 16.32%, while 6 had unrealized losses ranging from -0.63% to -4.37%. The aggregate unrealized gain amounted to 4.54% of the Fund’s period ending net asset value.
Approximately 83% of the securities held by WBID at any time during the fiscal period were sold. Approximately 27% of the Fund’s holdings were sold for gains, with an average realized gain of 7.3%, and approximately 73% were sold for an average realized loss of -7.3%.
Examples of securities that made positive contributions to WBID’s performance during the fiscal period include Shoe Carnival, Inc., Allison Transmission Holding, Ubiquiti Networks, Inc., and NRG Energy, Inc. Examples of securities that detracted from the Fund’s performance during the fiscal period include Dave & Buster’s Entertainment, Nordstrom, Inc, Trinseo SA, and Hanesbrands, Inc.
High turnover in WBID’s holdings has the potential to result in the realization and distribution to shareholders of higher capital gains. If Fund shares are held in a taxable account, this may increase your tax liability. To the extent portfolio turnover increases transaction costs, it may also reduce Fund performance. Of course, selling a security in a timely fashion may also improve performance if a subsequent loss is avoided that exceeds the cost of executing the sale.
WBI BullBear Rising Income 1000 ETF (WBIE)
As of June 30, 2019, WBIE held 21 securities in addition to a position in a money market fund which served as a cash equivalent. From the time of their purchase, 15 of these positions had unrealized gains of between 0.33% and 16.06%, while 6 had unrealized losses ranging from -0.52% to -2.02%. The aggregate unrealized gain amounted to 3.82% of the Fund’s period ending net asset value.
Approximately 78% of the securities held by WBIE at any time during the fiscal period were sold. Approximately 36% of the Fund’s holdings were sold for gains, with an average realized gain of 11.0%, and approximately 64% were sold for an average realized loss of -6.2%.
Examples of securities that made positive contributions to WBIE’s performance during the fiscal period include Hershey Company, Boeing Company, Cisco Systems, Inc., and Applied Materials, Inc. Examples of securities that detracted from the Fund’s performance during the fiscal period include Abbvie, Inc., Broadcom, Inc., Netapp, Inc., and Starbucks Corporation.
High turnover in WBIE’s holdings has the potential to result in the realization and distribution to shareholders of higher capital gains. If Fund shares are held in a taxable account, this may increase your tax liability. To the extent portfolio turnover increases transaction costs, it may also reduce Fund performance. Of course, selling a security in a timely fashion may also improve performance if a subsequent loss is avoided that exceeds the cost of executing the sale.
WBI BullBear Value 1000 ETF (WBIF)
As of June 30, 2019, WBIF held 22 securities in addition to a position in a money market fund which served as a cash equivalent. From the time of their purchase, 14 of these positions had unrealized gains of between 0.40% and 8.94%, while 8 had unrealized losses ranging from -0.34% to -3.41%. The aggregate unrealized gain amounted to 1.44% of the Fund’s period ending net asset value.
Approximately 80% of the securities held by WBIF at any time during the fiscal period were sold. Approximately 39% of the Fund’s holdings were sold for gains, with an average realized gain of 9.9%, and approximately 61% were sold for an average realized loss of -5.7%.
Examples of securities that made positive contributions to WBIF’s performance during the fiscal period include Tyson Foods Inc., TJX Companies Inc., Intel Corporation, and VF Corporation. Examples of securities that detracted from the Fund’s performance during the fiscal period include Cognizant Tech Solutions, Netapp, Inc., Carnival Corporation, and TD Ameritrade Holding Corporation.
High turnover in WBIF’s holdings has the potential to result in the realization and distribution to shareholders of higher capital gains. If Fund shares are held in a taxable account, this may increase your tax liability. To the extent portfolio turnover increases transaction costs, it may also reduce Fund performance. Of course, selling a security in a timely fashion may also improve performance if a subsequent loss is avoided that exceeds the cost of executing the sale.
WBI BullBear Yield 1000 ETF (WBIG)
As of June 30, 2019, WBIG held 22 securities in addition to a position in a money market fund which served as a cash equivalent. From the time of their purchase, 18 of these positions had unrealized gains of between 0.39% and 19.59%, while 4 had unrealized losses ranging from -0.30% to -6.03%. The aggregate unrealized gain amounted to 3.27% of the Fund’s period ending net asset value.
Approximately 78% of the securities held by WBIG at any time during the fiscal period were sold. Approximately 35% of the Fund’s holdings were sold for gains, with an average realized gain of 9.8%, and approximately 65% were sold for an average realized loss of -6.5%.
Examples of securities that made positive contributions to WBIG’s performance during the fiscal period include Cincinnati Financial Corporation, Coca-Cola European Partners, Intel Corporation, and Hormel Foods Corporation. Examples of securities that detracted from the Fund’s performance during the fiscal period include Nordstrom, Inc., Macy’s, Inc., HP, Inc., and International Paper Company.
Management’s Discussion of Fund Performance (continued)
June 30, 2019 (Unaudited)
High turnover in WBIG’s holdings has the potential to result in the realization and distribution to shareholders of higher capital gains. If Fund shares are held in a taxable account, this may increase your tax liability. To the extent portfolio turnover increases transaction costs, it may also reduce Fund performance. Of course, selling a security in a timely fashion may also improve performance if a subsequent loss is avoided that exceeds the cost of executing the sale.
WBI BullBear Quality 1000 ETF (WBIL)
As of June 30, 2019, WBIL held 22 securities in addition to a position in a money market fund which served as a cash equivalent. From the time of their purchase, 19 of these positions had unrealized gains of between 0.59% and 16.99%, while 3 had unrealized losses ranging from -0.45% to -3.83%. The aggregate unrealized gain amounted to 4.81% of the Fund’s period ending net asset value.
Approximately 75% of the securities held by WBIL at any time during the fiscal period were sold. Approximately 45% of the Fund’s holdings were sold for gains, with an average realized gain of 10.5%, and approximately 55% were sold for an average realized loss of -6.0%.
Examples of securities that made positive contributions to WBIL’s performance during the fiscal period include Cisco Systems, Inc., Intuit, Inc., Mastercard, Inc., and Coca-Cola European Partners. Examples of securities that detracted from the Fund’s performance during the fiscal period include Nordstrom, Inc., Starbucks Corporation, TD Ameritrade Holding Corporation, and Lowe’s Companies, Inc.
High turnover in WBIL’s holdings has the potential to result in the realization and distribution to shareholders of higher capital gains. If Fund shares are held in a taxable account, this may increase your tax liability. To the extent portfolio turnover increases transaction costs, it may also reduce Fund performance. Of course, selling a security in a timely fashion may also improve performance if a subsequent loss is avoided that exceeds the cost of executing the sale.
WBI BullBear Global Income ETF (WBII)
As of June 30, 2019, WBII held 5 securities in addition to a position in a money market fund which served as a cash equivalent. From the time of their purchase, 5 of these positions had unrealized gains of between 0.26% and 1.14%, while 0 had unrealized losses. The aggregate unrealized gain amounted to 0.89% of the Fund’s period ending net asset value.
Approximately 87% of the securities held by WBII at any time during the fiscal period were sold. Approximately 58% of the Fund’s holdings were sold for gains, with an average realized gain of 1.4%, and approximately 42% were sold for an average realized loss of -1.4%.
Examples of securities that made positive contributions to WBII’s performance during the fiscal period include iShares Iboxx High Yield Corp ETF, Vanguard Long-Term Treasury ETF, SPDR Portfolio Long Term Treasury ETF and iShares 20+ Year Treasury Bond ETF. Examples of securities that detracted from the Fund’s performance during the fiscal period include FT-Preferred Security & Income ETF, Invesco 1-30 Laddered Treasury ETF, Invesco Chinese Yuan Dim Sum ETF, and PIMCO Investment Grade Corporate Bond ETF.
High turnover in WBII’s holdings has the potential to result in the realization and distribution to shareholders of higher capital gains. If Fund shares are held in a taxable account, this may increase your tax liability. To the extent portfolio turnover increases transaction costs, it may also reduce Fund performance. Of course, selling a security in a timely fashion may also improve performance if a subsequent loss is avoided that exceeds the cost of executing the sale.
WBI BullBear Trend Switch 3000 Total Return ETF (WBIT)
As of June 30, 2019, WBIT held 3 securities in addition to a position in a money market fund which served as a cash equivalent. From the time of their purchase, 3 of these positions had unrealized gains of between 1.03% and 1.14%, while 0 had unrealized losses.
Approximately 50% of the securities held by WBIT at any time during the fiscal period were sold. Approximately 100% of the Fund’s holdings were sold for gains, with an average realized gain of 2.27%.
An example of securities that made positive a contribution to WBIT’s performance during the fiscal period include the SPDR Portfolio Long Term Treasury ETF, iShares 20+ Year Treasury Bond ETF, and Vanguard Long-Term Treasury ETF.
High turnover in WBIT’s holdings has the potential to result in the realization and distribution to shareholders of higher capital gains. If Fund shares are held in a taxable account, this may increase your tax liability. To the extent portfolio turnover increases transaction costs, it may also reduce Fund performance. Of course, selling a security in a timely fashion may also improve performance if a subsequent loss is avoided that exceeds the cost of executing the sale.
WBI Power Factor™ High Dividend (WBIY)
WBIY is intended to track the Solactive Power Factor™ High Dividend Index, and its trading activity results from changes to the holdings of this underlying index. The composition of the underlying index is adjusted quarterly and screened monthly for dividend cuts or an overall negative outlook concerning the member companies’ dividend policy.
As of June 30, 2019, WBIY held 50 securities in addition to a position in a money market fund which served as a cash equivalent. From the time of their purchase, 23 of these positions had unrealized gains of between 1.07% and 27.00%, while 27 had unrealized losses ranging from -0.35% to -50.81%.
Management’s Discussion of Fund Performance (continued)
June 30, 2019 (Unaudited)
Examples of securities that made positive contributions to WBIY’s performance during the fiscal period include General Mills, Inc., Ford Motor Company, Philip Morris International and Las Vegas Sands Corporation. Examples of securities that detracted from the Fund’s performance during the fiscal period include Centurylink, Inc., Macy’s, Inc., Chico’s FAS, Inc., and Harley-Davidson, Inc.
High turnover in WBIY’s holdings has the potential to result in the realization and distribution to shareholders of higher capital gains. If Fund shares are held in a taxable account, this may increase your tax liability. To the extent portfolio turnover increases transaction costs, it may also reduce Fund performance. Of course, selling a security in a timely fashion may also improve performance if a subsequent loss is avoided that exceeds the cost of executing the sale.
Quarter by Quarter Review of Market Conditions
3rd Quarter 2018
Records were broken this quarter as volatility continued to quiet down. Anyone who considers the start of the current bull market to be March 9, 2009, which was the low of the last bear market, viewed August 22nd, 2018 as the record-breaking date that marked the longest bull market in history for U.S. stocks. As of the end of the third quarter, the S&P 500® Index gained 331% since that March 2009 low. Also, on September 20th, the S&P 500® Index closed at its all time high as did the Dow Jones Industrial Average the following day. The Nasdaq Composite also closed at an all time high on August 29th.
Solid economic growth and strong corporate earnings results, boosted in part by tax cuts, helped fuel this quarter’s rally. In a September speech, Federal Reserve Bank of Chicago President Charles Evans said, “The U.S. economy is firing on all cylinders, with strong growth, low unemployment, and inflation approaching our 2% symmetric target on a sustained basis.”1
In contrast to the second quarter of 2018, large capitalization value stocks significantly outperformed small and mid-cap (“SMID”) value stocks. The Russell 1000 Value Total Return Index, which tracks large-cap value stocks, returned 5.70% for the period whereas the Russell 2000 Value Total Return Index, which tracks SMIDs, returned only 1.60%.
The global expansion continued as well but at a much slower pace and began to show signs of weakness due in large part to the impact of ongoing trade risks that directly affect China and several Emerging markets. Europe also experienced the greatest slowdown in economic growth among developed regions.
Fixed income investors also struggled with a small 0.02% increase in the Barclays US Aggregate Total Return Index as strong economic data and another September hike in interest rates by the Federal Open Market Committee (“FOMC”) put upward pressure on yields which move in the opposite direction of bond prices.
Many investors probably saw these all-time record-breaking highs in the U.S. stock market and reports of economic strength as a sign that they should “push all their chips in” and avoid missing out on potential gains that lie ahead.
However, risks to both the economy and market remained on the horizon. The FOMC appeared ready to raise interest rates again one more time this year with several additional hikes expected in 2019. Higher interest rates will likely create a drag on corporate profits as the cost of borrowing increases for companies which have enjoyed a long period of low-cost debt issuance. Mid-term elections could result in significant changes to the political landscape that will be viewed poorly by the markets. Increasing trade tensions between the US and China also remain as trade tariffs went into effect on $250 billion of Chinese products this quarter and the possibility of a full-blown trade war seems more likely than it did just a few months ago.
4th Quarter 2018
Stocks started the year carrying the strong momentum from 2017 into January before starting to stumble. For a while it looked like, despite their weak start, a rally that started in April would carry equity indices to the same sort of gains they enjoyed in 2017. But the promising middle of the year ended up being sandwiched between a weak first quarter and, after hitting new highs in September, a tough year end.
The worst of the damage came in the fourth quarter, and the bad news bookends left major U.S. indices and equity markets around the world in negative territory for all of 2018. Markets in the United Kingdom, Germany, France, Japan, Hong Kong, and Mexico were among those hit with significant declines in the fourth quarter, and all ended with double digit percentage losses for the year. In U.S. equity markets, the Dow Jones Industrial average fell -11.83%, the S&P 500® Index lost -13.97%, and the Nasdaq plummeted -17.54% during the fourth quarter, bringing their returns for the full year to -5.63%, -6.24%, and -3.88% respectively.
Indices focused on stocks with strong value characteristics were especially hard hit, falling further into value territory as the prices of the stocks they track became even cheaper. Large company value stocks, as represented by the Russell 1000 Value Total Return Index, dropped -12.32% for the quarter and -10.55% for the year. Small and mid-sized company value stocks, as represented by the Russell 2500 Value Total Return Index fell by -17.65% during the quarter to end the year down -14.25%.
Management’s Discussion of Fund Performance (continued)
June 30, 2019 (Unaudited)
The year-end drama in the stock market seemed to spark a flight to the perceived safety of bonds. Bond prices move higher as yields fall, and between November 8th and the end of the year, the yield on the benchmark 10-year U.S. Treasury Note fell from 3.23% to 2.69%, resulting in a gain of 4.19% for the full quarter. Other bonds benefitted as well, and the Barclays U.S. and Global Aggregate Bond Total Return Indices gained 1.64% and 1.20% respectively during the quarter.
1st Quarter 2019
There was a substantial reversal in the markets between the end of 2018 and the beginning of 2019. We closed the books at the end of Q4 2018 with the Dow Jones Industrial Average (DJIA) falling -11.83%, the S&P 500® Index losing -13.97%, and the Nasdaq plummeting -17.54%. Indices focused on stocks with strong value characteristics were hit especially hard. Large company value stocks, as represented by the Russell 1000 Value Total Return Index, dropped -11.72% for the quarter. Small and mid-sized company value stocks, as represented by the Russell 2500 Value Total Return Index, fell by -17.12% during the quarter.
However, in stark contrast to the end of last year, equity markets started this year significantly well in the first quarter with the DJIA up 11.15%, the S&P 500® up 13.07%, and the Nasdaq up 16.49%. The Russell Value indices also came back nicely although the Russell 2500 small and mid-sized company index did not recover its full loss from Q4. Fixed income produced some nice gains as well this quarter with the Bloomberg Barclays U.S. Aggregate index returning 2.94% in Q1.
2nd Quarter 2019
The longest equity bull market in history kept on running in the second quarter, albeit with more volatility and significantly less return than the first quarter. The first half of 2019 marked the best six-month start to a year in over two decades for the S&P 500® which returned 17.35%, although the second quarter’s 3.79% return paled in comparison to the 13.07% return achieved in the first quarter. In contrast to the first quarter which included a significant rebound in January with three months of positive returns, things started to look scary again in the second quarter as May produced a significant -6.58% decline. In the end, the quarter was saved by another rebound in June. However, even though the market performed well in the first half, we ended June only +0.38% higher than where we were last September when the market hit its previous all-time high. Furthermore, while news reporters are all celebrating the new record highs and excellent first half of the year, we need to keep in mind on December 24th, the S&P 500® was down -19.71% from its high and we were only 0.29% away from an official bear market that would have ended the current bull market run.
Indices focused on stocks with strong value characteristics performed well throughout the first half, although not as well as the S&P 500® Large company value stocks, as represented by the Russell 1000 Value Total Return Index, gained 3.84% for the quarter. Small and mid-sized company (“SMID”) value stocks, as represented by the Russell 2000 Value Total Return Index, were also positive but did not perform as well producing only a 1.37% gain during the quarter. SMID value has recovered somewhat from its -25% selloff at the end of last year but remains in “correction territory” meaning that, unlike the S&P 500® mentioned above, it is still more than 10% below the all-time high it achieved last August.
A flight to quality and the prospect of FOMC rate cuts helped produce some solid fixed income gains this year with the Bloomberg Barclays U.S. Aggregate index returning 3.08% in Q2.
Investment Commentary
Power of Powell: The Fed is Now Driving the Rally
Although all Fed members give frequent speeches, investors often listen most closely to the words of Mr. Powell to determine the likelihood of any material policy changes that may help or hurt the markets. There were two key moments in the first half of the year when Mr. Powell clearly helped change the direction of the market. First, on January 4th he said, “We’re always prepared to shift the stance of policy and to shift it significantly if necessary in order to promote our statutory goals of maximum employment and stable prices.” Second, on June 4th he said, “We are closely monitoring the implications of these developments for the U.S. economic outlook and, as always, we will act as appropriate to sustain the expansion.”
If you review a chart of the S&P 500® since last November you’ll clearly note that, on the two days when Mr. Powell made the market boosting remarks mentioned above, his comments helped reverse a negative trend and send the market rallying higher. Furthermore, the market’s reaction to his words on those two days alone contributed a significant amount of the first half’s gains. The S&P 500® rallied 84.05 points on January 4th and 58.82 points on June 4th for a total “Powell Boost” of 142.87 points. The index increased by a total of 434.91 points during the first six months of the year which means almost 33% of the gains occurred thanks to those two “Powell Boost” days without even considering the gains that followed as a result of his change in tone or reassurance of action.
Certainly, Mr. Powell’s words and Fed policy always have the power to change market direction and give investors hope that more economic growth still lies ahead. The question we need to ask ourselves is whether market increases this year are justified by a true continuation of quality fundamentals in a record-breaking economic expansion, or, whether the Fed is just doing everything they possibly can to use monetary policy to push the market higher. Do the U.S. and global economies still show consistent signs of strength and positive momentum, or are we actually seeing signs of economic deterioration or even asset bubbles which might lead us towards the next recession?
Management’s Discussion of Fund Performance (continued)
June 30, 2019 (Unaudited)
Trade Wars
One of the primary crosscurrents in the markets this year is the uncertainty surrounding a U.S.-China trade war as well as trade conflicts with other areas of the world. We came into the first half feeling like things were going to work out. Talks and negotiations were progressing, and it appeared that a resolution was possible. This ended abruptly when the U.S. received a copy of the 150-page draft trade agreement back from the Chinese on May 3rd with material edits to the document. Apparently, core demands from the U.S. were deleted. Commitments initially made regarding the theft of U.S. intellectual property and trade secrets, forced technology transfers, competition policy, access to financial services and currency manipulation were eliminated by China and this yearlong conflict suddenly escalated again.
On May 5th President Trump tweeted “For 10 months, China has been paying tariffs to the USA of 25% on 50 billion dollars of high tech, and 10% on 200 billion dollars of other goods … the 10% will go up to 25% on Friday [and] 325 billion of additional goods sent to us by China remain untaxed, but will be shortly, at a rate of 25%.” This weighed heavily on markets and we saw a significant decline throughout the month of May as investors considered the effect on domestic and global growth that trade uncertainties could have.
These trade risks were not limited to China. The U.S. raised the potential for tariffs on autos and other goods with the Eurozone and Japan. At the beginning of June, President Trump threatened Mexico with tariffs as well because of concerns regarding border security, immigration and NAFTA. The markets rejoiced when a deal was reached with Mexico, however, and President Trump agreed to indefinitely suspend the implementation of tariffs on that country’s goods.
With rare broad support from both political parties, Trump headed to the G20 meeting to meet with China’s President Xi at the end of June. Throughout most of the month, investors considered whether a trade deal would be reached at the meeting or, at a minimum, would there be some type of truce that would allow negotiations to start again. In the end, things cooled off a bit at the G20 meeting as both sides agreed to start working together once more, and markets celebrated briefly.
Looking forward, it seems that although many in the U.S. hope the trade uncertainties will go away soon, the Chinese appear to be digging in for a much longer confrontation. Trump recently said the U.S. “still has a long way to go” on trade talks with China, and once again threatened to impose tariffs on the remaining $325 billion of Chinese goods if the two sides cannot come to a deal. These trade uncertainties have evolved into a new type of “cold war” that is primarily focused on technology but will likely impact global growth and spending across many industries for the rest of this year and potentially for many years to come.
Weakening Demand
Signs of slowing domestic and global demand started to become more frequent in the first half of the year. The Institute for Supply Management (ISM) Manufacturing Index came in weaker than expected and declined to a 31-month low in May. This index is based on a survey of purchasing managers from more than 300 manufacturing firms and helps indicate the amount of demand and economic activity. Another similar indicator, the Markit U.S. Manufacturing Purchasing Managers Index, dropped to a level not seen since 2016. The MNI Chicago Business Barometer, yet another summary of current business activity considered to be a leading indicator of the U.S. economy, plunged from 54.2 to 49.7 (50 is the line of demarcation between economic growth and contraction). This too was the lowest reading since February 2016.
These manufacturing related indicators suggest a slowdown in growth due to tariff-related concerns and trade uncertainty, but there were other signs of trouble as well. The Markit U.S. Services index also fell in May to its fourth weakest level since late 2009. During a speech in late June, Fed Chair Powell discussed the incoming data and acknowledged that investment by U.S. businesses, or capital expenditures, has appeared to slow since the beginning of the year.2 He explained the outlook for the U.S. economy is cloudier now due to questions about the strength of the global economy, the decrease in capital expenditures as well as business confidence in general.
Corporate Debt: Possible Asset Bubble?
With a record-breaking bull market and economic expansion, several pundits out there are saying this time will be different, there are no signs of any asset bubbles, and we should not expect a recession for years to come. Must we remind them about the definition of insanity as repeating the same actions over and over again with the expectation of different results? The Great Recession of 2008 – 2009 was primarily caused by the housing bubble in which lending standards became too loose as banks struggled to keep up with insatiable investor demand for yield. Back then, individuals with poor credit and no documented income were issued mortgages that exceeded the value of the property they were buying. Those mortgages were then packaged and sold to investors who were looking for high yield assets in a relatively low yield world.
Are we are seeing the same scenario play out in corporate borrowing, rather than individual borrowing, this time? Chair Powell said during a speech on May 20th, “Many measures confirm that the business sector has significantly increased its borrowing as the economy has expanded over the past decade. Business debt relative to the size of the economy is at historic highs. Corporate debt relative to the book value of assets is at the upper end of its range over the past few decades. And investment-grade corporate debt has shifted closer to the edge of speculative grade.”3 He continued to explain that not only is business debt at record levels and recently concentrated in the riskiest segments, but this highly leveraged business sector could amplify any economic downturn.
Management’s Discussion of Fund Performance (continued)
June 30, 2019 (Unaudited)
Another ominous sign occurred when, on May 30th, the Financial Stability Oversight Council met secretly “in executive session” to discuss the recent surge in corporate borrowing and leveraged lending.4 Leveraged lending is another term for loans issued to companies with poor credit ratings. This type of borrowing hit a record amount of issuance in 2018 topping $125 billion, and the frenzy continued into the first half of this year.5 One analyst noted, “Increased [leveraged loan] demand will support issuance and refinancing activities” but that “highly-leveraged businesses could face severe financial stress in the next downturn”.6
With historically low rates over the past decade, businesses have loaded up their balance sheets with debt. This certainly helped fuel the expansion, but we are once again seeing record amounts of borrowers with poor credit quality leveraging up as much as possible thanks to insatiable investor demand. Sounds familiar.
Turbulent Waters Ahead?
Chair Powell definitely has one thing right: crosscurrents are everywhere. Large-cap stocks ended the first half of the year only +0.38% higher than last September and small-cap stocks remain in a correction. Equity investors are favoring less risky assets. We might be on the verge of a full-blown trade war that could last for many years to come. Both manufacturing and servicing industries are showing signs of severe stress. Businesses are preparing investors for the worst reporting season in a long time. The yield curve continues to predict a U.S. recession is on the horizon. Highly leveraged companies with poor credit continue to issue more debt. And a global economic slowdown is already well underway.
Against this backdrop, the Fed is clearly doing anything it can to keep the party going. The problem is this time, they don’t have as much “dry ammo” as they had in previous cycles. The Fed Funds Rate was at 6% in 2001 and 5.25% in 2006 before the last two recessions, but today it sits at 2.5% with a 0.25% cut likely at the end of July. Furthermore, ongoing market momentum appears to be supported almost entirely by Fed activity, corporate buybacks and investor fear of missing out on any remaining upside, rather than fundamentals and growth.
We have entered another period where bad news is good news for the market. The market rallies on bad economic data because it solidifies the likelihood the Fed will start cutting rates. However, this underscores a disconnect between what is pushing the market higher and what should be pushing the market higher. With all of these crosscurrents, investors should be lowering their expectations for earnings and growth right now and identifying the best way to prepare their portfolio for the turbulent waters ahead.
Here at WBI, we have managed risk to capital for institutions and private investors for over 30 years. Our time-tested active portfolio management process has no mandate to be fully invested. For us, cash is a tactical weapon that can help protect investor capital during market corrections. We believe preserving capital to unleash the power of compounding is the most important element of a successful investment approach. WBI also uses its high-quality security selection process as another weapon in both our actively managed and passively managed strategies with the goal of participating in market rallies as much as possible when conditions are right. With all the crosscurrents in the market, we believe it is even more critical at this time to work with a manager that is specifically focused on protecting investor capital and navigating through the turbulent waters that lie ahead.
Sincerely,
| | |
 |  |
| | |
Steven Van Solkema, CFA | Don Schreiber, Jr. |
Co-Portfolio Manager | Co-Portfolio Manager |
Chief Investment Officer | Founder & CEO |
1 | https://www.wsj.com/articles/feds-evans-u-s-economy-firing-on-all-cylinders-1536930039 |
2 | https://www.federalreserve.gov/newsevents/speech/powell20190625a.htm |
3 | https://www.federalreserve.gov/newsevents/speech/powell20190520a.htm |
4 | https://home.treasury.gov/system/files/261/May302019_readout.pdf |
5 | https://www.spglobal.com/marketintelligence/en/news-insights/latest-news-headlines/leveraged-loan-news/us-clo-issuance-hits-record-volume-topping-125b |
6 | https://www.bloomberg.com/news/articles/2019-07-12/new-clo-buyers-set-up-clash-of-titans-in-600-billion-market |
Management’s Discussion of Fund Performance (continued)
June 30, 2019 (Unaudited)
Past performance is not a guarantee of future results.
Opinions expressed are those of WBI Investments, Inc. (“WBI”), the Funds’ investment sub-adviser, are subject to change, are not guaranteed, and should not be construed as recommendations or investment advice or a solicitation to purchase or sell securities referenced in the Investment Commentary.
Exchange Traded Fund investing involves risk. Principal loss is possible. The Funds invest in emerging market and foreign securities which involve political, economic and currency risks, greater volatility and differences in accounting methods. These risks can be greater in emerging markets. The Funds invest in smaller and medium sized companies, which involve additional risks such as limited liquidity and greater volatility. Investments in debt securities typically decrease in value when interest rates rise. This risk is usually greater for longer-term debt securities. Investment by the Fund in lower-rated and non-rated securities presents a greater risk of loss to principal and interest than higher-rated securities. Investments in mortgage-backed securities may involve additional risks, such as credit risk, prepayment risk, possible illiquidity and default, and susceptibility to adverse economic developments. Because the Funds invest in other exchange-traded funds (“ETFs”), they are subject to additional risks that do not apply to conventional mutual funds, including the risks that the market price of an ETF's shares may trade at a discount to its net asset value (“NAV”), an active secondary trading market may not develop or be maintained, or trading may be halted by the exchange in which they trade, which may impact a Fund's ability to sell its shares. The Funds may invest in exchange-traded notes (“ETNs”), which are subject to the credit risk of the issuer. Additional risks include volatility, lack of liquidity, and sensitivity to currencies, commodities markets, and interest rate changes. The Funds may invest in Real Estate Investment Trusts (“REITs”). Risks commonly associated with the direct ownership of real estate include fluctuations in the value of underlying properties, defaults by borrowers or tenants, changes in interest rates and risks related to general or local economic conditions. The Funds may invest in master limited partnerships (“MLPs”), which are subject to certain risks inherent in the structure of MLPs, including complex tax structure risks, the limited ability for election or removal of management, limited voting rights, potential dependence on parent companies or sponsors for revenues to satisfy obligations, and potential conflicts of interest between partners, members and affiliates. The Funds may also use options and future contracts, which have the risks of unlimited losses of the underlying holdings due to unanticipated market movements and failure to correctly predict the direction of securities prices, interest rates and currency exchange rates. The investment in options is not suitable for all investors.
Investments in absolute return strategies are not intended to outperform stocks and bonds during strong market rallies. Diversification does not assure a profit or protect against a loss in a declining market.
Fund holdings and sector allocations are subject to change and should not be considered a recommendation to buy or sell any security. References to other funds should not be interpreted as an offer of these securities. For a complete list of Fund holdings, please refer to the Schedule of Investments in this report.
While the Funds are no-load, commission charges on the purchase of shares, management fees and other expenses will apply. Please refer to the prospectus for additional information.
A stop loss order directs a brokerage firm to sell the specified security at the prevailing market price should that security’s price fall to or below a stipulated price. A stop limit order directs a brokerage firm to sell the specified security should that security’s price fall to or below a stipulated price, but only if the transaction can be executed at or above the limit price given as part of the order. The Funds use WBI’s proprietary Dynamic Trailing Stop/Loss System (DTSTM), which is designed to help control the risk to invested capital when investing in volatile securities and markets. The DTSTM is not a stop loss order or stop limit order placed with a brokerage firm, but an internal process for monitoring price movements. While the DTSTM may be used to initiate the process for selling a security, it does not assure that a particular execution price will be received.
Unless otherwise indicated, the source for index price and performance data used in the discussion of market conditions and market commentary is Bloomberg.
An investment in money market funds is not insured or guaranteed by the Federal Deposit Insurance Corporation or any other governmental agency. Although money market funds seek to preserve the value of your investment at $1.00 per share, it is possible to lose money by investing in these funds.
Any tax or legal information provided is merely a summary of our understanding and interpretation of some of the current income tax regulations and is not exhaustive. Investors must consult their tax advisor or legal counsel for advice and information concerning their particular situation. Neither the Funds nor any of their representatives may give legal or tax advice.
Must be preceded or accompanied by a prospectus.
WBI Shares Exchange Traded Funds are distributed by Foreside Fund Services, LLC.
Management’s Discussion of Fund Performance (concluded)
June 30, 2019 (Unaudited)
Benchmark Definitions
The Russell 2000 Value Total Return Index is comprised of Russell 2000 companies with lower predicted and historical growth rates.
The Russell 1000 Value Total Return Index is comprised of Russell 1000 companies with lower predicted and historical growth rates.
The Russell 3000 Value Total Return Index is comprised of Russell 3000 companies with lower predicted and historical growth rates.
The Bloomberg Barclays US Aggregate Bond Total Return Index is a component of the US Universal Index and covers the USD-denominated, investment-grade, fixed-rate, taxable bond market of SEC‐registered securities.
The Solactive Power FactorTM High Dividend GTR Index is constructed by scoring each ordinary dividend paying, common stock constituent from the 3,000 largest U.S. companies both directly and relative to industry peers using the three Power Factors and ranking those securities in descending order according to their dividend indicated yield. The 50 companies with the largest dividend indicated yield are chosen as Index components.
Other Index Definitions
The Dow Jones Industrial Average (DJIA) is a price-weighted average of 30 of the largest blue-chip issues traded on the New York Stock Exchange.
The S&P 500® Index includes a representative sample of large-cap U.S. companies in leading industries.
The Nasdaq Composite Index is a market-value weighted index of all common stocks listed on Nasdaq.
The Russell 1000 Index includes the largest 1,000 stocks in the Russell 3000 Index (approximately 92% of the total market capitalization of the Russell 3000 Index) of the Russell data series.
The Russell 2000 Index includes the smallest 2,000 stocks in the Russell 3000 Index (approximately 8% of the total market capitalization of the Russell 3000 Index) of the Russell data series.
The Russell 2500 Value Total Return Index is comprised of Russell 2500 Companies with lower predicted and historical growth rates.
WBI BullBear Rising Income 2000 ETF
Performance Summary (Unaudited)
| | | | Since |
| Average Annual Returns | | | Inception |
| Period Ending June 30, 2019 | 1 Year | 3 Years | (8/25/14) |
WBI BullBear Rising Income 2000 ETF — NAV | (9.83)% | 0.79% | (2.34)% |
WBI BullBear Rising Income 2000 ETF — Market | (9.84)% | 0.90% | (2.36)% |
Russell 2000 Value Index | (6.24)% | 9.81% | 6.12% |
Russell 2500 Value Index | (1.92)% | 8.98% | 6.00% |
This chart illustrates the performance of a hypothetical $10,000 investment made on August 25, 2014, and is not intended to imply any future performance. The returns shown do not reflect the deduction of taxes that a shareholder would pay on fund distributions or the redemption of fund shares. The chart assumes reinvestment of capital gains and dividends.
The performance data quoted represents past performance and is not a guarantee of future results. Investment return and principal value of an investment will fluctuate so that an investor’s shares, when redeemed, may be worth more or less than their original cost. Current performance may be lower or higher than the performance data quoted. For most recent month-end performance, please visit www.wbishares.com.
Per the Prospectus, the Fund’s annual operating expense (gross) is 1.08%. The Fund’s Sub-Advisor has contractually agreed to waive the fees and reimburse expenses of the Fund such that total annual operating expenses are limited to 1.25% of average net assets until at least October 31, 2020. (Actual expenses can be referenced in the Financial Highlights section later in this report.)
WBI BullBear Value 2000 ETF
Performance Summary (Unaudited)
| | | | Since |
| Average Annual Returns | | | Inception |
| Period Ending June 30, 2019 | 1 Year | 3 Years | (8/25/14) |
WBI BullBear Value 2000 ETF — NAV | (2.87)% | 3.73% | (0.70)% |
WBI BullBear Value 2000 ETF — Market | (2.90)% | 3.77% | (0.73)% |
Russell 2000 Value Index | (6.24)% | 9.81% | 6.12% |
Russell 2500 Value Index | (1.92)% | 8.98% | 6.00% |
This chart illustrates the performance of a hypothetical $10,000 investment made on August 25, 2014, and is not intended to imply any future performance. The returns shown do not reflect the deduction of taxes that a shareholder would pay on fund distributions or the redemption of fund shares. The chart assumes reinvestment of capital gains and dividends.
The performance data quoted represents past performance and is not a guarantee of future results. Investment return and principal value of an investment will fluctuate so that an investor’s shares, when redeemed, may be worth more or less than their original cost. Current performance may be lower or higher than the performance data quoted. For most recent month-end performance, please visit www.wbishares.com.
Per the Prospectus, the Fund’s annual operating expense (gross) is 1.06%. The Fund’s Sub-Advisor has contractually agreed to waive the fees and reimburse expenses of the Fund such that total annual operating expenses are limited to 1.25% of average net assets until at least October 31, 2020. (Actual expenses can be referenced in the Financial Highlights section later in this report.)
WBI BullBear Yield 2000 ETF
Performance Summary (Unaudited)
| | | | Since |
| Average Annual Returns | | | Inception |
| Period Ending June 30, 2019 | 1 Year | 3 Years | (8/25/14) |
WBI BullBear Yield 2000 ETF — NAV | (14.61)% | (0.31)% | (4.11)% |
WBI BullBear Yield 2000 ETF — Market | (14.71)% | (0.31)% | (4.17)% |
Russell 2000 Value Index | (6.24)% | 9.81% | 6.12% |
Russell 2500 Value Index | (1.92)% | 8.98% | 6.00% |
This chart illustrates the performance of a hypothetical $10,000 investment made on August 25, 2014, and is not intended to imply any future performance. The returns shown do not reflect the deduction of taxes that a shareholder would pay on fund distributions or the redemption of fund shares. The chart assumes reinvestment of capital gains and dividends.
The performance data quoted represents past performance and is not a guarantee of future results. Investment return and principal value of an investment will fluctuate so that an investor’s shares, when redeemed, may be worth more or less than their original cost. Current performance may be lower or higher than the performance data quoted. For most recent month-end performance, please visit www.wbishares.com.
Per the Prospectus, the Fund’s annual operating expense (gross) is 1.06%. The Fund’s Sub-Advisor has contractually agreed to waive the fees and reimburse expenses of the Fund such that total annual operating expenses are limited to 1.25% of average net assets until at least October 31, 2020. (Actual expenses can be referenced in the Financial Highlights section later in this report.)
WBI BullBear Quality 2000 ETF
Performance Summary (Unaudited)
| | | | Since |
| Average Annual Returns | | | Inception |
| Period Ending June 30, 2019 | 1 Year | 3 Years | (8/25/14) |
WBI BullBear Quality 2000 ETF — NAV | (13.84)% | (0.32)% | (3.91)% |
WBI BullBear Quality 2000 ETF — Market | (14.16)% | (0.24)% | (3.95)% |
Russell 2000 Value Index | (6.24)% | 9.81% | 6.12% |
Russell 2500 Value Index | (1.92)% | 8.98% | 6.00% |
This chart illustrates the performance of a hypothetical $10,000 investment made on August 25, 2014, and is not intended to imply any future performance. The returns shown do not reflect the deduction of taxes that a shareholder would pay on fund distributions or the redemption of fund shares. The chart assumes reinvestment of capital gains and dividends.
The performance data quoted represents past performance and is not a guarantee of future results. Investment return and principal value of an investment will fluctuate so that an investor’s shares, when redeemed, may be worth more or less than their original cost. Current performance may be lower or higher than the performance data quoted. For most recent month-end performance, please visit www.wbishares.com.
Per the Prospectus, the Fund’s annual operating expense (gross) is 1.06%. The Fund’s Sub-Advisor has contractually agreed to waive the fees and reimburse expenses of the Fund such that total annual operating expenses are limited to 1.25% of average net assets until at least October 31, 2020. (Actual expenses can be referenced in the Financial Highlights section later in this report.)
WBI BullBear Rising Income 1000 ETF
Performance Summary (Unaudited)
| | | | Since |
| Average Annual Returns | | | Inception |
| Period Ending June 30, 2019 | 1 Year | 3 Years | (8/25/14) |
WBI BullBear Rising Income 1000 ETF — NAV | 4.22% | 7.81% | 2.21% |
WBI BullBear Rising Income 1000 ETF — Market | 4.35% | 7.90% | 2.19% |
Russell 1000 Value Index | 8.46% | 10.19% | 7.39% |
This chart illustrates the performance of a hypothetical $10,000 investment made on August 25, 2014, and is not intended to imply any future performance. The returns shown do not reflect the deduction of taxes that a shareholder would pay on fund distributions or the redemption of fund shares. The chart assumes reinvestment of capital gains and dividends.
The performance data quoted represents past performance and is not a guarantee of future results. Investment return and principal value of an investment will fluctuate so that an investor’s shares, when redeemed, may be worth more or less than their original cost. Current performance may be lower or higher than the performance data quoted. For most recent month-end performance, please visit www.wbishares.com.
Per the Prospectus, the Fund’s annual operating expense (gross) is 1.05%. The Fund’s Sub-Advisor has contractually agreed to waive the fees and reimburse expenses of the Fund such that total annual operating expenses are limited to 1.25% of average net assets until at least October 31, 2020. (Actual expenses can be referenced in the Financial Highlights section later in this report.)
WBI BullBear Value 1000 ETF
Performance Summary (Unaudited)
| | | | Since |
| Average Annual Returns | | | Inception |
| Period Ending June 30, 2019 | 1 Year | 3 Years | (8/25/14) |
WBI BullBear Value 1000 ETF — NAV | (2.53)% | 8.63% | 2.61% |
WBI BullBear Value 1000 ETF — Market | (2.47)% | 8.72% | 2.59% |
Russell 1000 Value Index | 8.46% | 10.19% | 7.39% |
This chart illustrates the performance of a hypothetical $10,000 investment made on August 25, 2014, and is not intended to imply any future performance. The returns shown do not reflect the deduction of taxes that a shareholder would pay on fund distributions or the redemption of fund shares. The chart assumes reinvestment of capital gains and dividends.
The performance data quoted represents past performance and is not a guarantee of future results. Investment return and principal value of an investment will fluctuate so that an investor’s shares, when redeemed, may be worth more or less than their original cost. Current performance may be lower or higher than the performance data quoted. For most recent month-end performance, please visit www.wbishares.com.
Per the Prospectus, the Fund’s annual operating expense (gross) is 1.05%. The Fund’s Sub-Advisor has contractually agreed to waive the fees and reimburse expenses of the Fund such that total annual operating expenses are limited to 1.25% of average net assets until at least October 31, 2020. (Actual expenses can be referenced in the Financial Highlights section later in this report.)
WBI BullBear Yield 1000 ETF
Performance Summary (Unaudited)
| | | | Since |
| Average Annual Returns | | | Inception |
| Period Ending June 30, 2019 | 1 Year | 3 Years | (8/25/14) |
WBI BullBear Yield 1000 ETF — NAV | (5.22)% | 7.50% | 0.46% |
WBI BullBear Yield 1000 ETF — Market | (5.26)% | 7.53% | 0.42% |
Russell 1000 Value Index | 8.46% | 10.19% | 7.39% |
This chart illustrates the performance of a hypothetical $10,000 investment made on August 25, 2014, and is not intended to imply any future performance. The returns shown do not reflect the deduction of taxes that a shareholder would pay on fund distributions or the redemption of fund shares. The chart assumes reinvestment of capital gains and dividends.
The performance data quoted represents past performance and is not a guarantee of future results. Investment return and principal value of an investment will fluctuate so that an investor’s shares, when redeemed, may be worth more or less than their original cost. Current performance may be lower or higher than the performance data quoted. For most recent month-end performance, please visit www.wbishares.com.
Per the Prospectus, the Fund’s annual operating expense (gross) is 1.04%. The Fund’s Sub-Advisor has contractually agreed to waive the fees and reimburse expenses of the Fund such that total annual operating expenses are limited to 1.25% of average net assets until at least October 31, 2020. (Actual expenses can be referenced in the Financial Highlights section later in this report.)
WBI BullBear Quality 1000 ETF
Performance Summary (Unaudited)
| | | | Since |
| Average Annual Returns | | | Inception |
| Period Ending June 30, 2019 | 1 Year | 3 Years | (8/25/14) |
WBI BullBear Quality 1000 ETF — NAV | 5.08% | 8.51% | 2.39% |
WBI BullBear Quality 1000 ETF — Market | 4.91% | 8.61% | 2.37% |
Russell 1000 Value Index | 8.46% | 10.19% | 7.39% |
This chart illustrates the performance of a hypothetical $10,000 investment made on August 25, 2014, and is not intended to imply any future performance. The returns shown do not reflect the deduction of taxes that a shareholder would pay on fund distributions or the redemption of fund shares. The chart assumes reinvestment of capital gains and dividends.
The performance data quoted represents past performance and is not a guarantee of future results. Investment return and principal value of an investment will fluctuate so that an investor’s shares, when redeemed, may be worth more or less than their original cost. Current performance may be lower or higher than the performance data quoted. For most recent month-end performance, please visit www.wbishares.com.
Per the Prospectus, the Fund’s annual operating expense (gross) is 1.07%. The Fund’s Sub-Advisor has contractually agreed to waive the fees and reimburse expenses of the Fund such that total annual operating expenses are limited to 1.25% of average net assets until at least October 31, 2020. (Actual expenses can be referenced in the Financial Highlights section later in this report.)
WBI BullBear Global Income ETF
Performance Summary (Unaudited)
| | | | Since |
| Average Annual Returns | | | Inception |
| Period Ending June 30, 2019 | 1 Year | 3 Years | (8/25/14) |
WBI BullBear Global Income ETF — NAV | 9.75% | 2.83% | 2.42% |
WBI BullBear Global Income ETF — Market | 9.68% | 2.80% | 2.38% |
Bloomberg Barclays US Aggregate Bond Index | 7.87% | 2.31% | 2.93% |
This chart illustrates the performance of a hypothetical $10,000 investment made on August 25, 2014, and is not intended to imply any future performance. The returns shown do not reflect the deduction of taxes that a shareholder would pay on fund distributions or the redemption of fund shares. The chart assumes reinvestment of capital gains and dividends.
The performance data quoted represents past performance and is not a guarantee of future results. Investment return and principal value of an investment will fluctuate so that an investor’s shares, when redeemed, may be worth more or less than their original cost. Current performance may be lower or higher than the performance data quoted. For most recent month-end performance, please visit www.wbishares.com.
Per the Prospectus, the Fund’s annual operating expense (gross) is 1.28%. The Fund’s Sub-Advisor has contractually agreed to waive the fees and reimburse expenses of the Fund such that total annual operating expenses are limited to 1.25% of average net assets until at least October 31, 2020. (Actual expenses can be referenced in the Financial Highlights section later in this report.)
WBI Power FactorTM High Dividend ETF
Performance Summary (Unaudited)
| | | Since |
| Average Annual Returns | | Inception |
| Period Ending June 30, 2019 | 1 Year | (12/19/16) |
WBI Power Factor™ High Dividend ETF — NAV | (3.25)% | 4.87% |
WBI Power Factor™ High Dividend ETF — Market | (3.42)% | 4.78% |
Solactive Power Factor™ High Dividend Index | (1.45)% | 6.92% |
Russell 3000 Value Index | 7.34% | 7.18% |
This chart illustrates the performance of a hypothetical $10,000 investment made on December 19, 2016, and is not intended to imply any future performance. The returns shown do not reflect the deduction of taxes that a shareholder would pay on fund distributions or the redemption of fund shares. The chart assumes reinvestment of capital gains and dividends.
The performance data quoted represents past performance and is not a guarantee of future results. Investment return and principal value of an investment will fluctuate so that an investor’s shares, when redeemed, may be worth more or less than their original cost. Current performance may be lower or higher than the performance data quoted. For most recent month-end performance, please visit www.wbishares.com.
Per the Prospectus, the Fund’s annual operating expense (gross) is 0.85%. The Fund’s Sub-Advisor has contractually agreed to waive the fees and reimburse expenses of the Fund such that total annual operating expenses are limited to 0.70% of average net assets until at least October 31, 2020. (Actual expenses can be referenced in the Financial Highlights section later in this report.)
WBI BullBear Trend Switch US 3000 Total Return ETF
Performance Summary (Unaudited)
| | Since |
| Total Returns | Inception |
| Period Ending June 30, 2019 | (5/28/19) |
WBI BullBear Trend Switch US 3000 Total Return ETF — NAV | 3.45% |
WBI BullBear Trend Switch US 3000 Total Return ETF — Market | 3.54% |
Russell 3000 Index | 5.11% |
This chart illustrates the performance of a hypothetical $10,000 investment made on May 28, 2019, and is not intended to imply any future performance. The returns shown do not reflect the deduction of taxes that a shareholder would pay on fund distributions or the redemption of fund shares. The chart assumes reinvestment of capital gains and dividends.
The performance data quoted represents past performance and is not a guarantee of future results. Investment return and principal value of an investment will fluctuate so that an investor’s shares, when redeemed, may be worth more or less than their original cost. Current performance may be lower or higher than the performance data quoted. For most recent month-end performance, please visit www.wbishares.com.
Per the Prospectus, the Fund’s annual operating expense (gross) is 0.68%. (Actual expenses can be referenced in the Financial Highlights section later in this report.)
Portfolio Allocations
As of June 30, 2019 (Unaudited)
| WBI BullBear Rising Income 2000 ETF | |
| | Percentage of |
| Industry Group | Net Assets |
Capital Goods | 21.5% |
Banks | 16.3% |
Short-Term Investments and | |
Other Assets and Liabilities | 9.8% |
Software & Services | 9.0% |
Consumer Services | 8.8% |
Materials | 8.1% |
Consumer Durables & Apparel | 7.8% |
Retailing | 7.5% |
Food & Staples Retailing | 4.0% |
Insurance | 3.8% |
Media & Entertainment | 2.0% |
Food, Beverage & Tobacco | 1.4% |
TOTAL | 100.0% |
| | |
| WBI BullBear Value 2000 ETF | |
| | Percentage of |
| Industry Group | Net Assets |
Capital Goods | 20.2% |
Materials | 16.1% |
Automobiles & Components | 8.7% |
Short-Term Investments and | |
Other Assets and Liabilities | 8.6% |
Insurance | 8.1% |
Commercial & | |
Professional Services | 7.0% |
Media & Entertainment | 6.3% |
Software & Services | 4.8% |
Diversified Financials | 4.6% |
Technology Hardware | |
& Equipment | 4.3% |
Retailing | 4.2% |
Consumer Durables & Apparel | 4.0% |
Banks | 3.1% |
TOTAL | 100.0% |
| | |
| WBI BullBear Yield 2000 ETF | |
| | Percentage of |
| Industry Group | Net Assets |
Short-Term Investments and | |
Other Assets and Liabilities | 24.5% |
Materials | 13.8% |
Banks | 10.1% |
Consumer Services | 9.2% |
Insurance | 8.9% |
Media & Entertainment | 8.4% |
Consumer Durables & Apparel | 8.2% |
Food, Beverage & Tobacco | 4.5% |
Commercial & Professional Services | 4.3% |
Retailing | 4.2% |
Health Care Equipment & Services | 2.6% |
Diversified Financials | 1.3% |
TOTAL | 100.0% |
| | |
| WBI BullBear Quality 2000 ETF | |
| | Percentage of |
| Industry Group | Net Assets |
Capital Goods | 19.0% |
Banks | 12.3% |
Commercial & | |
Professional Services | 11.0% |
Short-Term Investments and | |
Other Assets and Liabilities | 9.6% |
Health Care Equipment & Services | 9.3% |
Automobiles & Components | 7.6% |
Diversified Financials | 6.0% |
Materials | 5.7% |
Software & Services | 5.2% |
Consumer Services | 4.7% |
Consumer Durables & Apparel | 4.2% |
Semiconductors & | |
Semiconductor Equipment | 3.9% |
Insurance | 1.5% |
TOTAL | 100.0% |
| | |
| WBI BullBear Rising Income 1000 ETF | |
| | Percentage of |
| Industry Group | Net Assets |
Retailing | 16.9% |
Capital Goods | 13.0% |
Short-Term Investments and | |
Other Assets and Liabilities | 12.2% |
Technology Hardware | |
& Equipment | 9.6% |
Insurance | 8.6% |
Consumer Services | 7.9% |
Media & Entertainment | 7.9% |
Banks | 6.3% |
Food, Beverage & Tobacco | 4.8% |
Diversified Financials | 4.7% |
Utilities | 4.2% |
Health Care Equipment | |
& Services | 3.9% |
TOTAL | 100.0% |
| | |
| WBI BullBear Value 1000 ETF | |
| | Percentage of |
| Industry Group | Net Assets |
Capital Goods | 19.9% |
Diversified Financials | 16.7% |
Banks | 13.7% |
Short-Term Investments and | |
Other Assets and Liabilities | 11.2% |
Transportation | 8.7% |
Health Care Equipment & Services | 8.0% |
Semiconductors & | |
Semiconductor Equipment | 4.7% |
Consumer Services | 4.4% |
Media & Entertainment | 4.4% |
Technology Hardware | |
& Equipment | 4.4% |
Food & Staples Retailing | 3.9% |
TOTAL | 100.0% |
| | |
| WBI BullBear Yield 1000 ETF | |
| | Percentage of |
| Industry Group | Net Assets |
Insurance | 16.7% |
Short-Term Investments and | |
Other Assets and Liabilities | 14.9% |
Capital Goods | 13.2% |
Banks | 9.3% |
Media & Entertainment | 8.4% |
Consumer Services | 8.0% |
Utilities | 7.8% |
Telecommunication Services | 5.1% |
Pharmaceuticals, | |
Biotechnology & Life Sciences | 4.5% |
Transportation | 4.4% |
Diversified Financials | 4.0% |
Food, Beverage & Tobacco | 3.7% |
TOTAL | 100.0% |
| | |
| WBI BullBear Quality 1000 ETF | |
| | Percentage of |
| Industry Group | Net Assets |
Software & Services | 17.0% |
Retailing | 15.9% |
Food, Beverage & Tobacco | 11.9% |
Insurance | 11.5% |
Short-Term Investments and | |
Other Assets and Liabilities | 9.8% |
Media & Entertainment | 8.8% |
Capital Goods | 8.3% |
Pharmaceuticals, | |
Biotechnology & Life Sciences | 4.5% |
Food & Staples Retailing | 4.3% |
Technology Hardware | |
& Equipment | 4.1% |
Diversified Financials | 3.9% |
TOTAL | 100.0% |
| | |
| WBI BullBear Global Income ETF | |
| | Percentage of |
| Industry Group | Net Assets |
Exchange Traded Funds | 99.3% |
Short-Term Investments and | |
Other Assets and Liabilities | 0.7% |
TOTAL | 100.0% |
Portfolio Allocations
As of June 30, 2019 (Unaudited) (concluded)
WBI Power Factor™ High Dividend ETF | |
| | Percentage of |
| Industry Group | Net Assets |
Energy | 12.2% |
Materials | 12.0% |
Banks | 10.9% |
Telecommunication Services | 10.2% |
Technology Hardware & Equipment | 7.9% |
Automobiles & Components | 6.8% |
Software & Services | 6.1% |
Retailing | 5.9% |
Diversified Financials | 4.8% |
Pharmaceuticals, | |
Biotechnology & Life Sciences | 4.8% |
Media & Entertainment | 4.2% |
Insurance | 3.6% |
Consumer Services | 3.3% |
Food, Beverage & Tobacco | 3.1% |
Consumer Durables & Apparel | 2.5% |
Health Care Equipment & Services | 1.0% |
Short-Term Investments and | |
Other Assets and Liabilities | 0.7% |
TOTAL | 100.0% |
| | |
| WBI BullBear Trend Switch | |
| US 3000 Total Return ETF | |
| | Percentage of |
| Industry Group | Net Assets |
Exchange Traded Funds | 98.9% |
Short-Term Investments and | |
Other Assets and Liabilities | 1.1% |
TOTAL | 100.0% |
WBI BullBear Rising Income 2000 ETF
Schedule of Investments
June 30, 2019
| Shares | | Security Description | | Value | |
| COMMON STOCKS — 90.2% | | | |
| Banks — 16.3% | | | |
| | 12,227 | | CIT Group, Inc. + | | $ | 642,407 | |
| | 26,838 | | Home BancShares, Inc. + | | | 516,900 | |
| | 19,631 | | ServisFirst Bancshares, Inc. + | | | 672,558 | |
| | 6,353 | | Wintrust Financial Corporation | | | 464,785 | |
| | | | | | | 2,296,650 | |
| Capital Goods — 21.5% | | | | |
| | 5,773 | | Allegion plc + | | | 638,205 | |
| | 7,609 | | BWX Technologies, Inc. + | | | 396,429 | |
| | 2,675 | | Fortune Brands Home & Security, Inc. | | | 152,823 | |
| | 4,810 | | Hubbell, Inc. | | | 627,224 | |
| | 7,425 | | Oshkosh Corporation | | | 619,913 | |
| | 6,505 | | Watts Water Technologies, Inc. | | | 606,136 | |
| | | | | | | 3,040,730 | |
| Consumer Durables & Apparel — 7.8% | | | | |
| | 16,992 | | M.D.C. Holdings, Inc. | | | 556,998 | |
| | 17,136 | | PulteGroup, Inc. + | | | 541,840 | |
| | | | | | | 1,098,838 | |
| Consumer Services — 8.8% | | | | |
| | 3,659 | | Cracker Barrel Old Country Store, Inc. + | | | 624,701 | |
| | 31,838 | | Wendy’s Company | | | 623,388 | |
| | | | | | | 1,248,089 | |
| Food & Staples Retailing — 4.0% | | | | |
| | 3,622 | | Casey’s General Stores, Inc. + | | | 564,996 | |
| | | | | |
| Food, Beverage & Tobacco — 1.4% | | | | |
| | 3,280 | | Universal Corporation | | | 199,326 | |
| | | | | | | | |
| Insurance — 3.8% | |
| | | | |
| | 4,493 | | Primerica, Inc. + | | | 538,935 | |
| | | | | | | | |
| Materials — 8.1% | | | | |
| | 6,201 | | Reliance Steel & Aluminum Company | | | 586,739 | |
| | 18,302 | | Silgan Holdings, Inc. | | | 560,041 | |
| | | | | | | 1,146,780 | |
| Media & Entertainment — 2.0% | | | | |
| | 12,355 | | Interpublic Group of Companies, Inc. | | | 279,099 | |
| | | | | | | | |
| Retailing — 7.5% | | | | |
| | 9,938 | | Aaron’s, Inc. | | | 610,293 | |
| | 6,875 | | Williams-Sonoma, Inc. | | | 446,875 | |
| | | | | | | 1,057,168 | |
| Software & Services — 9.0% | | | | |
| | 9,457 | | Amdocs, Ltd. | | | 587,185 | |
| | 10,400 | | Booz Allen Hamilton | | | | |
| | | | Holding Corporation + | | | 688,584 | |
| | | | | | | 1,275,769 | |
| TOTAL COMMON STOCKS | | | | |
(Cost $12,113,695) | | | 12,746,380 | |
| | | | | | | | |
| Shares/ | | | | | | |
| Amount | |
| | | | |
| | | | SHORT-TERM INVESTMENTS — 5.1% | | | | |
| | 719,726 | | U.S. Bank Money Market | | | | |
| | | | Deposit Account, 2.22% | | | 719,726 | |
| TOTAL SHORT-TERM INVESTMENTS | | | | |
(Cost $719,726) | | | 719,726 | |
| | | | | | | | |
| INVESTMENTS PURCHASED WITH PROCEEDS | | | | |
| FROM SECURITIES LENDING — 31.3% | | | | |
| | 4,421,748 | | Mount Vernon Liquid Assets | | | | |
| | | | Portfolio, LLC, 2.54% (a)* | | | 4,421,748 | |
| TOTAL INVESTMENTS PURCHASED WITH | | | | |
| PROCEEDS FROM SECURITIES LENDING | | | | |
(Cost $4,421,748) | | | 4,421,748 | |
| TOTAL INVESTMENTS — 126.6% | | | | |
(Cost $17,255,169) | | | 17,887,854 | |
Liabilities in Excess of Other Assets — (26.6)% | | | (3,760,751 | ) |
| NET ASSETS — 100.0% | | $ | 14,127,103 | |
_________
+ | All or a portion of this security is on loan as of June 30, 2019. Total value of securities on loan is $4,359,592. |
(a) | The rate quoted is the annualized seven-day yield as of June 30, 2019. |
* | Privately offered liquidity fund. |
The Global Industry Classification Standard (GICS®) was developed by and/or is the exclusive property of MSCI, Inc. and Standard & Poor Financial Services LLC (“S&P”). GICS is a service mark of MSCI and S&P and has been licensed for use by U.S. Bancorp Fund Services, LLC.
The accompanying notes are an integral part of these financial statements.
WBI BullBear Value 2000 ETF
Schedule of Investments
June 30, 2019
| Shares | | Security Description | | Value | |
| COMMON STOCKS — 91.4% | | | |
| Automobiles & Components — 8.7% | | | |
| | 66,934 | | Dana, Inc. | | $ | 1,334,664 | |
| | 31,167 | | Winnebago Industries, Inc. + | | | 1,204,605 | |
| | | | | | | 2,539,269 | |
| Banks — 3.1% | | | | |
| | 42,600 | | Hilltop Holdings, Inc. | | | 906,102 | |
| | | | | | | | |
| Capital Goods — 20.2% | | | | |
| | 16,026 | | AGCO Corporation | | | 1,243,137 | |
| | 18,764 | | Barnes Group, Inc. | | | 1,057,164 | |
| | 14,580 | | Oshkosh Corporation | | | 1,217,284 | |
| | 6,874 | | Snap-on, Inc. + | | | 1,138,609 | |
| | 23,909 | | Timken Company | | | 1,227,488 | |
| | | | | | | 5,883,682 | |
| Commercial & Professional Services — 7.0% | | | | |
| | 28,648 | | ABM Industries, Inc. | | | 1,145,920 | |
| | 39,160 | | Knoll, Inc. | | | 899,897 | |
| | | | | | | 2,045,817 | |
| Consumer Durables & Apparel — 4.0% | | | | |
| | 68,032 | | Hanesbrands, Inc. + | | | 1,171,511 | |
| | | | | | | | |
| Diversified Financials — 4.6% | | | | |
| | 35,196 | | Legg Mason, Inc. + | | | 1,347,303 | |
| | | | | | | | |
| Insurance — 8.1% | | | | |
| | 51,916 | | Old Republic International Corporation | | | 1,161,880 | |
| | 7,719 | | Reinsurance Group of America, Inc. | | | 1,204,396 | |
| | | | | | | 2,366,276 | |
| Materials — 16.1% | | | | |
| | 45,982 | | Mercer International, Inc. | | | 711,341 | |
| | 4,144 | | Packaging Corporation of America | | | 395,006 | |
| | 12,680 | | Reliance Steel & Aluminum Company | | | 1,199,781 | |
| | 38,386 | | Silgan Holdings, Inc. | | | 1,174,612 | |
| | 18,490 | | Sonoco Products Company | | | 1,208,137 | |
| | | | | | | 4,688,877 | |
| Media & Entertainment — 6.3% | | | | |
| | 25,238 | | Interpublic Group of Companies, Inc. + | | | 570,126 | |
| | 82,370 | | TEGNA, Inc. | | | 1,247,906 | |
| | | | | | | 1,818,032 | |
| Retailing — 4.2% | | | | |
| | 14,764 | | Group 1 Automotive, Inc. + | | | 1,209,024 | |
| | | | | | | | |
| Software & Services — 4.8% | | | | |
| | 17,611 | | Leidos Holdings, Inc. | | | 1,406,238 | |
| | | | | | | | |
| Technology Hardware & Equipment — 4.3% | | | | |
| | 35,323 | | Xerox Corporation | | | 1,250,787 | |
| TOTAL COMMON STOCKS | | | | |
(Cost $24,672,503) | | | 26,632,918 | |
| | | | | | | | |
| Shares/ | | | | | | |
| Amount | |
| | | | |
| SHORT-TERM INVESTMENTS— 4.9% | | | | |
| | 1,427,770 | | U.S. Bank Money Market | | | | |
| | | | Deposit Account, 2.22% | | | 1,427,770 | |
| TOTAL SHORT-TERM INVESTMENTS | | | | |
(Cost $1,427,770) | | | 1,427,770 | |
| | | | | | | | |
| INVESTMENTS PURCHASED WITH PROCEEDS | | | | |
| FROM SECURITIES LENDING — 16.1% | | | | |
| | 4,707,196 | | Mount Vernon Liquid Assets | | | | |
| | | | Portfolio, LLC, 2.54% (a)* | | | 4,707,196 | |
| TOTAL INVESTMENTS PURCHASED WITH | | | | |
| PROCEEDS FROM SECURITIES LENDING | | | | |
(Cost $4,707,196) | | | 4,707,196 | |
| TOTAL INVESTMENTS — 112.4% | | | | |
(Cost $30,807,469) | | | 32,767,884 | |
Liabilities in Excess of Other Assets — (12.4)% | | | (3,611,431 | ) |
| NET ASSETS — 100.0% | | $ | 29,156,453 | |
_________
+ | All or a portion of this security is on loan as of June 30, 2019. Total value of securities on loan is $4,671,950. |
(a) | The rate quoted is the annualized seven-day yield as of June 30, 2019. |
* | Privately offered liquidity fund. |
The Global Industry Classification Standard (GICS®) was developed by and/or is the exclusive property of MSCI, Inc. and Standard & Poor Financial Services LLC (“S&P”). GICS is a service mark of MSCI and S&P and has been licensed for use by U.S. Bancorp Fund Services, LLC.
The accompanying notes are an integral part of these financial statements.
WBI BullBear Yield 2000 ETF
Schedule of Investments
June 30, 2019
| Shares | | Security Description | | Value | |
| COMMON STOCKS — 75.5% | | | |
| Banks — 10.1% | | | |
| | 62,460 | | First Horizon National Corporation | | $ | 932,528 | |
| | 80,111 | | FNB Corporation | | | 942,907 | |
| | 47,800 | | PacWest Bancorp + | | | 1,856,074 | |
| | 1,219 | | Park National Corporation | | | 121,156 | |
| | | | | | | 3,852,665 | |
| Commercial & Professional Services — 4.3% | | | | |
| | 70,748 | | Knoll, Inc. | | | 1,625,789 | |
| | | | | | | | |
| Consumer Durables & Apparel — 8.2% | | | | |
| | 92,049 | | Hanesbrands, Inc. + | | | 1,585,084 | |
| | 47,017 | | M.D.C. Holdings, Inc. | | | 1,541,217 | |
| | | | | | | 3,126,301 | |
| Consumer Services — 9.2% | | | | |
| | 17,124 | | Dine Brands Global, Inc. + | | | 1,634,828 | |
| | 43,048 | | Wyndham Destinations, Inc. | | | 1,889,807 | |
| | | | | | | 3,524,635 | |
| Diversified Financials — 1.3% | | | | |
| | 35,367 | | Navient Corporation | | | 482,760 | |
| | | | | | | | |
| Food, Beverage & Tobacco — 4.5% | | | | |
| | 28,010 | | Universal Corporation | | | 1,702,168 | |
| | | | | | | | |
| Health Care Equipment & Services — 2.6% | | | | |
| | 12,041 | | National HealthCare Corporation + | | | 977,127 | |
| | | | | | | | |
| Insurance — 8.9% | | | | |
| | 7,362 | | Everest Re Group, Ltd. | | | 1,819,739 | |
| | 24,896 | | Mercury General Corporation | | | 1,556,000 | |
| | | | | | | 3,375,739 | |
| Materials — 13.8% | | | | |
| | 18,720 | | Ardagh Group SA | | | 327,600 | |
| | 33,341 | | Cabot Corporation + | | | 1,590,699 | |
| | 98,465 | | Mercer International, Inc. | | | 1,523,254 | |
| | 27,480 | | Sonoco Products Company | | | 1,795,543 | |
| | | | | | | 5,237,096 | |
| Media & Entertainment — 8.4% | | | | |
| | 73,840 | | Interpublic Group of Companies, Inc. + | | | 1,668,046 | |
| | 33,468 | | John Wiley & Sons, Inc. — Class A | | | 1,534,842 | |
| | | | | | | 3,202,888 | |
| Retailing — 4.2% | | | | |
| | 24,697 | | Williams-Sonoma, Inc. + | | | 1,605,305 | |
| TOTAL COMMON STOCKS | | | | |
(Cost $27,604,548) | | | 28,712,473 | |
| | | | | | | | |
| Shares/ | | | | | | |
| Amount | |
| |
| |
| SHORT-TERM INVESTMENTS — 19.9% | | | | |
| | 7,567,963 | | U.S. Bank Money Market | | | | |
| | | | Deposit Account, 2.22% | | | 7,567,963 | |
| TOTAL SHORT-TERM INVESTMENTS | | | | |
(Cost $7,567,963) | | | 7,567,963 | |
| INVESTMENTS PURCHASED WITH PROCEEDS | | | | |
| FROM SECURITIES LENDING — 20.6% | | | | |
| | 7,851,481 | | Mount Vernon Liquid Assets | | | | |
| | | | Portfolio, LLC, 2.54% (a)* | | | 7,851,481 | |
| TOTAL INVESTMENTS PURCHASED WITH | | | | |
| PROCEEDS FROM SECURITIES LENDING | | | | |
(Cost $7,851,481) | | | 7,851,481 | |
| TOTAL INVESTMENTS — 116.0% | | | | |
(Cost $43,023,992) | | | 44,131,917 | |
Liabilities in Excess of Other Assets — (16.0)% | | | (6,093,119 | ) |
| NET ASSETS — 100.0% | | $ | 38,038,798 | |
_________
+ | All or a portion of this security is on loan as of June 30, 2019. Total value of securities on loan is $7,793,634. |
(a) | The rate quoted is the annualized seven-day yield as of June 30, 2019. |
* | Privately offered liquidity fund. |
The Global Industry Classification Standard (GICS®) was developed by and/or is the exclusive property of MSCI, Inc. and Standard & Poor Financial Services LLC (“S&P”). GICS is a service mark of MSCI and S&P and has been licensed for use by U.S. Bancorp Fund Services, LLC.
The accompanying notes are an integral part of these financial statements.
WBI BullBear Quality 2000 ETF
Schedule of Investments
June 30, 2019
| Shares | | Security Description | | Value | |
| COMMON STOCKS — 90.4% | | | |
| Automobiles & Components — 7.6% | | | |
| | 14,952 | | Dana, Inc. | | $ | 298,143 | |
| | 11,940 | | Winnebago Industries, Inc. + | | | 461,481 | |
| | | | | | | 759,624 | |
| Banks — 12.3% | | | | |
| | 16,864 | | Radian Group, Inc. | | | 385,343 | |
| | 9,918 | | TriCo Bancshares | | | 374,900 | |
| | 16,450 | | United Community Banks, Inc. + | | | 469,812 | |
| | | | | | | 1,230,055 | |
| Capital Goods — 19.0% | | | | |
| | 3,302 | | Acuity Brands, Inc. | | | 455,379 | |
| | 2,907 | | CSW Industrials, Inc. | | | 198,112 | |
| | 4,730 | | EMCOR Group, Inc. | | | 416,713 | |
| | 6,594 | | ITT, Inc. | | | 431,775 | |
| | 2,400 | | Snap-on, Inc. + | | | 397,536 | |
| | | | | | | 1,899,515 | |
| Commercial & Professional Services — 11.0% | | | | |
| | 3,698 | | Insperity, Inc. | | | 451,674 | |
| | 6,276 | | Knoll, Inc. | | | 144,222 | |
| | 6,489 | | Tetra Tech, Inc. | | | 509,711 | |
| | | | | | | 1,105,607 | |
| Consumer Durables & Apparel — 4.2% | | | | |
| | 13,154 | | PulteGroup, Inc. + | | | 415,929 | |
| | | | | | | | |
| Consumer Services — 4.7% | | | | |
| | 2,740 | | Cracker Barrel Old Country Store, Inc. + | | | 467,800 | |
| | | | | | | | |
| Diversified Financials — 6.0% | | | | |
| | 3,022 | | Houlihan Lokey, Inc. | | | 134,570 | |
| | 5,686 | | LPL Financial Holdings, Inc. | | | 463,807 | |
| | | | | | | 598,377 | |
| Health Care Equipment & Services — 9.3% | | | | |
| | 1,279 | | Chemed Corporation | | | 461,514 | |
| | 7,354 | | Encompass Health Corporation | | | 465,950 | |
| | | | | | | 927,464 | |
| Insurance — 1.5% | | | | |
| | 1,655 | | Torchmark Corporation | | | 148,056 | |
| | | | | | | | |
| Materials — 5.7% | | | | |
| | 1,720 | | Innospec, Inc. | | | 156,933 | |
| | 4,400 | | Reliance Steel & Aluminum Company | | | 416,328 | |
| | | | | | | 573,261 | |
| Semiconductors & Semiconductor Equipment — 3.9% | | | | |
| | 8,245 | | Teradyne, Inc. | | | 395,018 | |
| | | | | | | | |
| Software & Services — 5.2% | | | | |
| | 16,057 | | EVERTEC, Inc. | | | 525,064 | |
| TOTAL COMMON STOCKS | | | | |
(Cost $8,630,766) | | | 9,045,770 | |
| | | | | | | | |
| Shares/ | | | | | | |
| Amount | |
| | | | |
| SHORT-TERM INVESTMENTS — 5.1% | | | | |
| | 507,580 | | U.S. Bank Money Market | | | | |
| | | | Deposit Account, 2.22% | | | 507,580 | |
| TOTAL SHORT-TERM INVESTMENTS | | | | |
(Cost $507,580) | | | 507,580 | |
| | | | | | | | |
| INVESTMENTS PURCHASED WITH PROCEEDS | | | | |
| FROM SECURITIES LENDING — 23.0% | | | | |
| | 2,297,700 | | Mount Vernon Liquid Assets | | | | |
| | | | Portfolio, LLC, 2.54% (a) * | | | 2,297,700 | |
| TOTAL INVESTMENTS PURCHASED WITH | | | | |
| PROCEEDS FROM SECURITIES LENDING | | | | |
(Cost $2,297,700) | | | 2,297,700 | |
| TOTAL INVESTMENTS — 118.5% | | | | |
(Cost $11,436,046) | | | 11,851,050 | |
Liabilities in Excess of Other Assets — (18.5)% | | | (1,851,323 | ) |
| NET ASSETS — 100.0% | | $ | 9,999,727 | |
_________
+ | All or a portion of this security is on loan as of June 30, 2019. Total value of securities on loan is $2,269,548. |
(a) | The rate quoted is the annualized seven-day yield as of June 30, 2019. |
* | Privately offered liquidity fund. |
The Global Industry Classification Standard (GICS®) was developed by and/or is the exclusive property of MSCI, Inc. and Standard & Poor Financial Services LLC (“S&P”). GICS is a service mark of MSCI and S&P and has been licensed for use by U.S. Bancorp Fund Services, LLC.
The accompanying notes are an integral part of these financial statements.
WBI BullBear Rising Income 1000 ETF
Schedule of Investments
June 30, 2019
| Shares | | Security Description | | Value | |
| COMMON STOCKS — 87.8% | | | |
| Banks — 6.3% | | | |
| | 75,132 | | KeyCorp | | $ | 1,333,593 | |
| | 18,786 | | PNC Financial Services Group, Inc. | | | 2,578,942 | |
| | | | | | | 3,912,535 | |
| Capital Goods — 13.0% | | | | |
| | 24,845 | | Allegion plc | | | 2,746,615 | |
| | 14,839 | | Honeywell International, Inc. | | | 2,590,741 | |
| | 8,238 | | Northrop Grumman Corporation + | | | 2,661,780 | |
| | | | | | | 7,999,136 | |
| Consumer Services — 7.9% | | | | |
| | 20,128 | | Darden Restaurants, Inc. | | | 2,450,181 | |
| | 9,785 | | Royal Caribbean Cruises, Ltd. | | | 2,398,140 | |
| | | | | | | 4,848,321 | |
| Diversified Financials — 4.7% | | | | |
| | 30,427 | | Nasdaq, Inc. + | | | 2,926,165 | |
| | | | | | | | |
| Food, Beverage & Tobacco — 4.8% | | | | |
| | 36,311 | | Tyson Foods, Inc. — Class A | | | 2,931,750 | |
| | | | | | | | |
| Health Care Equipment & Services — 3.9% | | | | |
| | 9,872 | | UnitedHealth Group, Inc. | | | 2,408,867 | |
| | | | | | | | |
| Insurance — 8.6% | | | | |
| | 60,439 | | Fidelity National Financial, Inc. | | | 2,435,692 | |
| | 36,170 | | Progressive Corporation | | | 2,891,068 | |
| | | | | | | 5,326,760 | |
| Media & Entertainment — 7.9% | | | | |
| | 51,630 | | Activision Blizzard, Inc. | | | 2,436,936 | |
| | 57,716 | | Comcast Corporation — Class A | | | 2,440,233 | |
| | | | | | | 4,877,169 | |
| Retailing — 16.9% | | | | |
| | 18,828 | | Expedia Group, Inc. + | | | 2,504,689 | |
| | 12,324 | | Home Depot, Inc. | | | 2,563,022 | |
| | 24,740 | | Ross Stores, Inc. + | | | 2,452,229 | |
| | 26,425 | | Tractor Supply Company + | | | 2,875,040 | |
| | | | | | | 10,394,980 | |
| Technology Hardware & Equipment — 9.6% | | | | |
| | 27,807 | | CDW Corporation | | | 3,086,577 | |
| | 16,896 | | Motorola Solutions, Inc. | | | 2,817,070 | |
| | | | | | | 5,903,647 | |
| Utilities — 4.2% | | | | |
| | 12,606 | | NextEra Energy, Inc. + | | | 2,582,464 | |
| TOTAL COMMON STOCKS | | | | |
(Cost $51,935,736) | | | 54,111,794 | |
| | | | | | | | |
| Shares/ | | | | | | |
| Amount | |
| | | | |
| SHORT-TERM INVESTMENTS — 8.2% | | | | |
| | 5,023,329 | | U.S. Bank Money Market | | | | |
| | | | Deposit Account, 2.22% | | | 5,023,329 | |
| TOTAL SHORT-TERM INVESTMENTS | | | | |
(Cost $5,023,329) | | | 5,023,329 | |
| | | | | | | | |
| INVESTMENTS PURCHASED WITH PROCEEDS | | | | |
| FROM SECURITIES LENDING — 16.1% | | | | |
| | 9,896,761 | | Mount Vernon Liquid Assets | | | | |
| | | | Portfolio, LLC, 2.54% (a)* | | | 9,896,761 | |
| TOTAL INVESTMENTS PURCHASED WITH | | | | |
| PROCEEDS FROM SECURITIES LENDING | | | | |
(Cost $9,896,761) | | | 9,896,761 | |
| TOTAL INVESTMENTS — 112.1% | | | | |
(Cost $66,855,826) | | | 69,031,884 | |
Liabilities in Excess of Other Assets — (12.1)% | | | (7,427,366 | ) |
| NET ASSETS — 100.0% | | $ | 61,604,518 | |
_________
+ | All or a portion of this security is on loan as of June 30, 2019. Total value of securities on loan is $9,723,877. |
(a) | The rate quoted is the annualized seven-day yield as of June 30, 2019. |
* | Privately offered liquidity fund. |
The Global Industry Classification Standard (GICS®) was developed by and/or is the exclusive property of MSCI, Inc. and Standard & Poor Financial Services LLC (“S&P”). GICS is a service mark of MSCI and S&P and has been licensed for use by U.S. Bancorp Fund Services, LLC.
The accompanying notes are an integral part of these financial statements.
WBI BullBear Value 1000 ETF
Schedule of Investments
June 30, 2019
| Shares | | Security Description | | Value | |
| COMMON STOCKS — 88.8% | | | |
| Banks — 13.7% | | | |
| | 52,728 | | Fifth Third Bancorp + | | $ | 1,471,111 | |
| | 115,388 | | Huntington Bancshares, Inc. + | | | 1,594,662 | |
| | 110,237 | | KeyCorp | | | 1,956,707 | |
| | 35,242 | | US Bancorp | | | 1,846,681 | |
| | | | | | | 6,869,161 | |
| Capital Goods — 19.9% | | | | |
| | 11,733 | | Caterpillar, Inc. | | | 1,599,091 | |
| | 12,534 | | Cummins, Inc. + | | | 2,147,576 | |
| | 7,049 | | Northrop Grumman Corporation | | | 2,277,602 | |
| | 11,720 | | Parker-Hannifin Corporation + | | | 1,992,517 | |
| | 11,333 | | Raytheon Company | | | 1,970,582 | |
| | | | | | | 9,987,368 | |
| Consumer Services — 4.4% | | | | |
| | 18,270 | | Darden Restaurants, Inc. | | | 2,224,007 | |
| | | | | | | | |
| Diversified Financials — 16.7% | | | | |
| | 15,221 | | Ameriprise Financial, Inc. | | | 2,209,480 | |
| | 25,739 | | Discover Financial Services + | | | 1,997,089 | |
| | 36,159 | | Interactive Brokers Group, Inc. | | | 1,959,818 | |
| | 63,849 | | Synchrony Financial | | | 2,213,645 | |
| | | | | | | 8,380,032 | |
| Food & Staples Retailing — 3.9% | | | | |
| | 27,961 | | Sysco Corporation + | | | 1,977,402 | |
| | | | | | | | |
| Health Care Equipment & Services — 8.0% | | | | |
| | 8,194 | | UnitedHealth Group, Inc. | | | 1,999,418 | |
| | 15,511 | | Universal Health | | | | |
| | | | Services, Inc. — Class B | | | 2,022,479 | |
| | | | | | | 4,021,897 | |
| Media & Entertainment — 4.4% | | | | |
| | 27,307 | | Omnicom Group, Inc. + | | | 2,237,809 | |
| | | | | | | | |
| Semiconductors & Semiconductor Equipment — 4.7% | | | | |
| | 24,243 | | NXP Semiconductors NV + | | | 2,366,359 | |
| | | | | | | | |
| Technology Hardware & Equipment — 4.4% | | | | �� |
| | 22,888 | | TE Connectivity, Ltd. + | | | 2,192,213 | |
| | | | | | | | |
| Transportation — 8.7% | | | | |
| | 36,436 | | Delta Air Lines, Inc . + | | | 2,067,742 | |
| | 30,355 | | Expeditors International | | | | |
| | | | of Washington, Inc. + | | | 2,302,730 | |
| | | | | | | 4,370,472 | |
| TOTAL COMMON STOCKS | | | | |
(Cost $43,941,699) | | | 44,626,720 | |
| | | | | | | | |
| Shares/ | | | | | | |
| Amount | |
| | | | |
| SHORT-TERM INVESTMENTS — 4.5% | | | | |
| | 2,279,765 | | U.S. Bank Money Market | | | | |
| | | | Deposit Account, 2.22% | | | 2,279,765 | |
| TOTAL SHORT-TERM INVESTMENTS | | | | |
(Cost $2,279,765) | | | 2,279,765 | |
| | | | | | | | |
| INVESTMENTS PURCHASED WITH PROCEEDS | | | | |
| FROM SECURITIES LENDING — 30.3% | | | | |
| | 15,255,216 | | Mount Vernon Liquid Assets | | | | |
| | | | Portfolio, LLC, 2.54% (a)* | | | 15,255,216 | |
| TOTAL INVESTMENTS PURCHASED WITH | | | | |
| PROCEEDS FROM SECURITIES LENDING | | | | |
(Cost $15,255,216) | | | 15,255,216 | |
| TOTAL INVESTMENTS — 123.6% | | | | |
(Cost $61,476,680) | | | 62,161,701 | |
Liabilities in Excess of Other Assets — (23.6)% | | | (11,864,333 | ) |
| NET ASSETS — 100.0% | | $ | 50,297,368 | |
_________
+ | All or a portion of this security is on loan as of June 30, 2019. Total value of securities on loan is $15,027,203. |
(a) | The rate quoted is the annualized seven-day yield as of June 30, 2019. |
* | Privately offered liquidity fund. |
The Global Industry Classification Standard (GICS®) was developed by and/or is the exclusive property of MSCI, Inc. and Standard & Poor Financial Services LLC (“S&P”). GICS is a service mark of MSCI and S&P and has been licensed for use by U.S. Bancorp Fund Services, LLC.
The accompanying notes are an integral part of these financial statements.
WBI BullBear Yield 1000 ETF
Schedule of Investments
June 30, 2019
| Shares | | Security Description | | Value | |
| COMMON STOCKS — 85.1% | | | |
| Banks — 9.3% | | | |
| | 105,012 | | Fifth Third Bancorp + | | $ | 2,929,835 | |
| | 10,253 | | PNC Financial Services Group, Inc. | | | 1,407,532 | |
| | 49,539 | | US Bancorp | | | 2,595,843 | |
| | | | | | | 6,933,210 | |
| Capital Goods — 13.2% | | | | |
| | 22,308 | | Caterpillar, Inc. | | | 3,040,357 | |
| | 89,322 | | Johnson Controls International plc | | | 3,689,892 | |
| | 8,543 | | Lockheed Martin Corporation | | | 3,105,722 | |
| | | | | | | 9,835,971 | |
| Consumer Services — 8.0% | | | | |
| | 24,331 | | Darden Restaurants, Inc. + | | | 2,961,813 | |
| | 24,597 | | Royal Caribbean Cruises, Ltd. | | | 2,981,402 | |
| | | | | | | 5,943,215 | |
| Diversified Financials — 4.0% | | | | |
| | 85,342 | | Synchrony Financial | | | 2,958,807 | |
| | | | | | | | |
| Food, Beverage & Tobacco — 3.7% | | | | |
| | 24,023 | | JM Smucker Company | | | 2,767,209 | |
| | | | | | | | |
| Insurance — 16.7% | | | | |
| | 27,298 | | Fidelity National Financial, Inc. | | | 1,100,109 | |
| | 62,593 | | Hartford Financial Services Group, Inc. | | | 3,487,682 | |
| | 59,028 | | Principal Financial Group, Inc. | | | 3,418,902 | |
| | 12,690 | | Prudential Financial, Inc. | | | 1,281,690 | |
| | 21,200 | | Travelers Companies, Inc. + | | | 3,169,824 | |
| | | | | | | 12,458,207 | |
| Media & Entertainment — 8.4% | | | | |
| | 39,976 | | Omnicom Group, Inc. + | | | 3,276,033 | |
| | 100,335 | | Viacom, Inc. — Class B | | | 2,997,007 | |
| | | | | | | 6,273,040 | |
| Pharmaceuticals, Biotechnology & Life Sciences — 4.5% | | | | |
| | 49,185 | | Gilead Sciences, Inc. | | | 3,322,939 | |
| | | | | | | | |
| Telecommunication Services — 5.1% | | | | |
| | 112,176 | | AT&T, Inc. + | | | 3,759,018 | |
| | | | | | | | |
| Transportation — 4.4% | | | | |
| | 57,396 | | Delta Air Lines, Inc. | | | 3,257,223 | |
| | | | | | | | |
| Utilities — 7.8% | | | | |
| | 178,315 | | AES Corporation | | | 2,988,559 | |
| | 59,214 | | Exelon Corporation | | | 2,838,719 | |
| | | | | | | 5,827,278 | |
| TOTAL COMMON STOCKS | | | | |
(Cost $61,009,598) | | | 63,336,117 | |
| | | | | | | | |
| Shares/ | | | | | | |
| Amount | |
| | | | |
| SHORT-TERM INVESTMENTS — 13.6% | | | | |
| | 10,149,778 | | U.S. Bank Money Market | | | | |
| | | | Deposit Account, 2.22% | | | 10,149,778 | |
| TOTAL SHORT-TERM INVESTMENTS | | | | |
(Cost $10,149,778) | | | 10,149,778 | |
| | | | | | | | |
| INVESTMENTS PURCHASED WITH PROCEEDS | | | | |
| FROM SECURITIES LENDING — 14.0% | | | | |
| | 10,439,624 | | Mount Vernon Liquid Assets | | | | |
| | | | Portfolio, LLC, 2.54% (a)* | | | 10,439,624 | |
| TOTAL INVESTMENTS PURCHASED WITH | | | | |
| PROCEEDS FROM SECURITIES LENDING | | | | |
(Cost $10,439,624) | | | 10,439,624 | |
| TOTAL INVESTMENTS — 112.7% | | | | |
(Cost $81,599,000) | | | 83,925,519 | |
Liabilities in Excess of Other Assets — (12.7)% | | | (9,453,502 | ) |
| NET ASSETS — 100.0% | | $ | 74,472,017 | |
_________
+ | All or a portion of this security is on loan as of June 30, 2019. Total value of securities on loan is $10,325,501. |
(a) | The rate quoted is the annualized seven-day yield as of June 30, 2019. |
* | Privately offered liquidity fund. |
The Global Industry Classification Standard (GICS®) was developed by and/or is the exclusive property of MSCI, Inc. and Standard & Poor Financial Services LLC (“S&P”). GICS is a service mark of MSCI and S&P and has been licensed for use by U.S. Bancorp Fund Services, LLC.
The accompanying notes are an integral part of these financial statements.
WBI BullBear Quality 1000 ETF
Schedule of Investments
June 30, 2019
| Shares | | Security Description | | Value | |
| COMMON STOCKS — 90.2% | | | |
| Capital Goods — 8.3% | | | |
| | 15,436 | | IDEX Corporation + | | $ | 2,657,153 | |
| | 12,888 | | L3Harris Technologies, Inc. | | | 2,437,507 | |
| | | | | | | 5,094,660 | |
| Diversified Financials — 3.9% | | | | |
| | 8,289 | | FactSet Research Systems, Inc. | | | 2,375,296 | |
| | | | | | | | |
| Food & Staples Retailing — 4.3% | | | | |
| | 23,942 | | Walmart, Inc. | | | 2,645,352 | |
| | | | | | | | |
| Food, Beverage & Tobacco — 11.9% | | | | |
| | 57,068 | | Coca-Cola Company | | | 2,905,903 | |
| | 61,518 | | Hormel Foods Corporation + | | | 2,493,940 | |
| | 14,326 | | PepsiCo, Inc. | | | 1,878,568 | |
| | | | | | | 7,278,411 | |
| Insurance — 11.5% | | | | |
| | 9,483 | | Erie Indemnity Corporation — Class A + | | | 2,411,337 | |
| | 25,166 | | Marsh & McLennan Companies, Inc. | | | 2,510,309 | |
| | 14,049 | | Travelers Companies, Inc. + | | | 2,100,606 | |
| | | | | | | 7,022,252 | |
| Media & Entertainment — 8.8% | | | | |
| | 35,912 | | Omnicom Group, Inc. + | | | 2,942,988 | |
| | 82,423 | | Viacom, Inc. — Class B | | | 2,461,975 | |
| | | | | | | 5,404,963 | |
| Pharmaceuticals, Biotechnology & Life Sciences — 4.5% | | | | |
| | 63,636 | | Pfizer, Inc. | | | 2,756,712 | |
| | | | | | | | |
| Retailing — 15.9% | | | | |
| | 18,153 | | Dollar General Corporation + | | | 2,453,559 | |
| | 12,252 | | Home Depot, Inc. | | | 2,548,048 | |
| | 23,672 | | Ross Stores, Inc. + | | | 2,346,369 | |
| | 27,644 | | Target Corporation + | | | 2,394,247 | |
| | | | | | | 9,742,223 | |
| Software & Services — 17.0% | | | | |
| | 14,452 | | Accenture plc — Class A | | | 2,670,296 | |
| | 19,989 | | Broadridge Financial Solutions, Inc. | | | 2,552,196 | |
| | 18,980 | | Microsoft Corporation | | | 2,542,561 | |
| | 15,268 | | Visa, Inc. — Class A + | | | 2,649,761 | |
| | | | | | | 10,414,814 | |
| Technology Hardware & Equipment — 4.1% | | | | |
| | 22,511 | | CDW Corporation + | | | 2,498,721 | |
| TOTAL COMMON STOCKS | | | | |
(Cost $52,668,797) | | | 55,233,404 | |
| | | | | | | | |
| Shares/ | | | | | | |
| Amount | |
| | | | |
| SHORT-TERM INVESTMENTS — 1.1% | | | | |
| | 640,348 | | U.S. Bank Money Market | | | | |
| | | | Deposit Account, 2.22% | | | 640,348 | |
| TOTAL SHORT-TERM INVESTMENTS | | | | |
(Cost $640,348) | | | 640,348 | |
| | | | | | | | |
| INVESTMENTS PURCHASED WITH PROCEEDS | | | | |
| FROM SECURITIES LENDING — 23.3% | | | | |
| | 14,275,417 | | Mount Vernon Liquid Assets | | | | |
| | | | Portfolio, LLC, 2.54% (a)* | | | 14,275,417 | |
| TOTAL INVESTMENTS PURCHASED WITH | | | | |
| PROCEEDS FROM SECURITIES LENDING | | | | |
(Cost $14,275,417) | | | 14,275,417 | |
| TOTAL INVESTMENTS — 114.6% | | | | |
(Cost $67,584,562) | | | 70,149,169 | |
Liabilities in Excess of Other Assets — (14.6)% | | | (8,947,526 | ) |
| NET ASSETS — 100.0% | | $ | 61,201,643 | |
_________
+ | All or a portion of this security is on loan as of June 30, 2019. Total value of securities on loan is $14,017,889. |
(a) | The rate quoted is the annualized seven-day yield as of June 30, 2019. |
* | Privately offered liquidity fund. |
The Global Industry Classification Standard (GICS®) was developed by and/or is the exclusive property of MSCI, Inc. and Standard & Poor Financial Services LLC (“S&P”). GICS is a service mark of MSCI and S&P and has been licensed for use by U.S. Bancorp Fund Services, LLC.
The accompanying notes are an integral part of these financial statements.
WBI BullBear Global Income ETF
Schedule of Investments
June 30, 2019
| Shares | | Security Description | | Value | |
| EXCHANGE TRADED FUNDS — 99.3% | | | |
| | 1,000,296 | | iShares Broad USD High Yield | | | |
| | | | Corporate Bond ETF + | | $ | 40,952,119 | |
| | 294,617 | | iShares 0-5 Year High Yield | | | | |
| | | | Corporate Bond ETF + | | | 13,758,614 | |
| | 504,942 | | SPDR Bloomberg Barclays | | | | |
| | | | Short-Term High Yield Bond ETF + | | | 13,749,571 | |
| | 238,150 | | SPDR Bloomberg Barclays | | | | |
| | | | High Yield Bond ETF + | | | 25,944,061 | |
| | 815,370 | | Xtrackers USD High Yield | | | | |
| | | | Corporate Bond ETF | | | 40,923,420 | |
| TOTAL EXCHANGE TRADED FUNDS | | | | |
(Cost $134,098,012) | | | 135,327,785 | |
| | | | | | | | |
| Shares/ | | | | | | |
| Amount | |
| | | | |
| SHORT-TERM INVESTMENTS — 0.8% | | | | |
| | 1,077,691 | | U.S. Bank Money Market | | | | |
| | | | Deposit Account, 2.22% | | | 1,077,691 | |
| TOTAL SHORT-TERM INVESTMENTS | | | | |
(Cost $1,077,691) | | | 1,077,691 | |
| INVESTMENTS PURCHASED WITH PROCEEDS | | | | |
| FROM SECURITIES LENDING — 7.0% | | | | |
| | 9,491,696 | | Mount Vernon Liquid Assets | | | | |
| | | | Portfolio, LLC, 2.54% (a)* | | | 9,491,696 | |
| TOTAL INVESTMENTS PURCHASED WITH | | | | |
| PROCEEDS FROM SECURITIES LENDING | | | | |
(Cost $9,491,696) | | | 9,491,696 | |
| TOTAL INVESTMENTS — 107.1% | | | | |
(Cost $144,667,399) | | | 145,897,172 | |
Liabilities in Excess of Other Assets — (7.1)% | | | (9,608,704 | ) |
| NET ASSETS — 100.0% | | $ | 136,288,468 | |
_________
+ | All or a portion of this security is on loan as of June 30, 2019. Total value of securities on loan is $9,286,531. |
(a) | The rate quoted is the annualized seven-day yield as of June 30, 2019. |
* | Privately offered liquidity fund. |
The Global Industry Classification Standard (GICS®) was developed by and/or is the exclusive property of MSCI, Inc. and Standard & Poor Financial Services LLC (“S&P”). GICS is a service mark of MSCI and S&P and has been licensed for use by U.S. Bancorp Fund Services, LLC.
The accompanying notes are an integral part of these financial statements.
WBI Power FactorTM High Dividend ETF
Schedule of Investments
June 30, 2019
| Shares | | Security Description | | Value | |
| COMMON STOCKS — 99.3% | | | |
| Automobiles & Components — 6.8% | | | |
| | 547,809 | | Ford Motor Company | | $ | 5,604,086 | |
| | 38,118 | | Harley-Davidson, Inc. + | | | 1,365,768 | |
| | | | | | | 6,969,854 | |
| Banks — 10.9% | | | | |
| | 46,045 | | Boston Private Financial Holdings, Inc. | | | 555,763 | |
| | 112,400 | | FNB Corporation | | | 1,322,948 | |
| | 23,389 | | Hanmi Financial Corporation + | | | 520,873 | |
| | 48,020 | | Hope Bancorp, Inc. + | | | 661,716 | |
| | 90,974 | | Huntington Bancshares, Inc. | | | 1,257,261 | |
| | 71,459 | | KeyCorp | | | 1,268,397 | |
| | 141,626 | | New York Community Bancorp, Inc. + | | | 1,413,427 | |
| | 43,008 | | PacWest Bancorp | | | 1,670,001 | |
| | 72,281 | | People’s United Financial, Inc. + | | | 1,212,875 | |
| | 80,522 | | Umpqua Holdings Corporation | | | 1,335,860 | |
| | | | | | | 11,219,121 | |
| Consumer Durables & Apparel — 2.5% | | | | |
| | 82,873 | | Tapestry, Inc. | | | 2,629,560 | |
| | | | | | | | |
| Consumer Services — 3.3% | | | | |
| | 117,411 | | H&R Block, Inc. + | | | 3,440,142 | |
| | | | | | | | |
| Diversified Financials — 4.8% | | | | |
| | 23,860 | | Artisan Partners Asset | | | | |
| | | | Management, Inc. — Class A | | | 656,627 | |
| | 74,362 | | Invesco, Ltd. | | | 1,521,447 | |
| | 85,811 | | Navient Corporation | | | 1,171,320 | |
| | 35,974 | | Virtu Financial, Inc. — Class A + | | | 783,514 | |
| | 48,366 | | Waddell & Reed | | | | |
| | | | Financial, Inc. — Class A + | | | 806,261 | |
| | | | | | | 4,939,169 | |
| Energy — 12.2% | | | | |
| | 40,862 | | Chevron Corporation | | | 5,084,867 | |
| | 23,362 | | CVR Energy, Inc. | | | 1,167,867 | |
| | 55,973 | | Plains GP Holdings LP — Class A | | | 1,397,646 | |
| | 57,910 | | Valero Energy Corporation | | | 4,957,675 | |
| | | | | | | 12,608,055 | |
| Food, Beverage & Tobacco — 3.1% | | | | |
| | 43,767 | | B&G Foods, Inc. + | | | 910,354 | |
| | 30,749 | | General Mills, Inc. | | | 1,614,937 | |
| | 13,174 | | Kellogg Company + | | | 705,731 | |
| | | | | | | 3,231,022 | |
| Health Care Equipment & Services — 1.0% | | | | |
| | 45,024 | | Patterson Companies, Inc. + | | | 1,031,050 | |
| | | | | | | | |
| Insurance — 3.6% | | | | |
| | 25,183 | | MetLife, Inc. | | | 1,250,839 | |
| | 21,841 | | Principal Financial Group, Inc. | | | 1,265,031 | |
| | 11,620 | | Prudential Financial, Inc. | | | 1,173,620 | |
| | | | | | | 3,689,490 | |
| Materials — 12.0% | | | | |
| | 15,717 | | Greif, Inc. — Class A | | | 511,588 | |
| | 80,236 | | International Paper Company | | | 3,475,824 | |
| | 35,042 | | Kronos Worldwide, Inc. | | | 536,844 | |
| | 39,713 | | LyondellBasell | | | | |
| | | | Industries N.V. — Class A | | | 3,420,481 | |
| | 14,519 | | Schweitzer-Mauduit International, Inc. | | | 481,740 | |
| | 107,930 | | Westrock Company | | | 3,936,207 | |
| | | | | | | 12,362,684 | |
| Media & Entertainment — 4.2% | | | | |
| | 172,945 | | Interpublic Group of Companies, Inc. | | | 3,906,828 | |
| | 49,883 | | New Media Investment Group, Inc. + | | | 470,895 | |
| | | | | | | 4,377,723 | |
| Pharmaceuticals, Biotechnology & Life Sciences — 4.8% | | | | |
| | 67,408 | | AbbVie, Inc. | | | 4,901,910 | |
| | | | | | | | |
| Retailing — 5.9% | | | | |
| | 242,967 | | Chico’s FAS, Inc. + | | | 818,799 | |
| | 148,522 | | Macy’s, Inc. | | | 3,187,282 | |
| | 394,816 | | Office Depot, Inc. | | | 813,321 | |
| | 34,932 | | PetMed Express, Inc. + | | | 547,385 | |
| | 117,538 | | Tailored Brands, Inc. + | | | 678,194 | |
| | | | | | | 6,044,981 | |
| Software & Services — 6.1% | | | | |
| | 36,325 | | International Business | | | | |
| | | | Machines Corporation | | | 5,009,217 | |
| | 65,265 | | Western Union Company + | | | 1,298,121 | |
| | | | | | | 6,307,338 | |
| Technology Hardware & Equipment — 7.9% | | | | |
| | 104,623 | | Seagate Technology plc | | | 4,929,836 | |
| | 68,606 | | Western Digital Corporation + | | | 3,262,215 | |
| | | | | | | 8,192,051 | |
| Telecommunication Services — 10.2% | | | | |
| | 163,820 | | AT&T, Inc. | | | 5,489,608 | |
| | 87,886 | | Verizon Communications, Inc. | | | 5,020,927 | |
| | | | | | | 10,510,535 | |
| TOTAL COMMON STOCKS | | | | |
(Cost $105,382,881) | | | 102,454,685 | |
The accompanying notes are an integral part of these financial statements.
WBI Power FactorTM High Dividend ETF
Schedule of Investments
June 30, 2019 (concluded)
| Shares/ | | | | | |
| Amount | | Security Description | | Value | |
| SHORT-TERM INVESTMENTS — 0.5% | | | |
| | 473,335 | | U.S. Bank Money Market | | | |
| | | | Deposit Account, 2.22% | | $ | 473,335 | |
| TOTAL SHORT-TERM INVESTMENTS | | | | |
(Cost $473,335) | | | 473,335 | |
| | | | | | | | |
| INVESTMENTS PURCHASED WITH | | | | |
| PROCEEDS FROM SECURITIES LENDING — 16.3% | | | | |
| | 16,817,874 | | Mount Vernon Liquid Assets | | | | |
| | | | Portfolio, LLC, 2.54% (a)* | | | 16,817,874 | |
| TOTAL INVESTMENTS PURCHASED WITH | | | | |
| PROCEEDS FROM SECURITIES LENDING | | | | |
(Cost $16,817,874) | | | 16,817,874 | |
| TOTAL INVESTMENTS — 116.1% | | | | |
(Cost $122,674,090) | | | 119,745,894 | |
Liabilities in Excess of Other Assets — (16.1)% | | | (16,585,473 | ) |
| NET ASSETS — 100.0% | | $ | 103,160,421 | |
_________
+ | All or a portion of this security is on loan as of June 30, 2019. Total value of securities on loan is $16,646,146. |
(a) | The rate quoted is the annualized seven-day yield as of June 30, 2019. |
* | Privately offered liquidity fund. |
The Global Industry Classification Standard (GICS®) was developed by and/or is the exclusive property of MSCI, Inc. and Standard & Poor Financial Services LLC (“S&P”). GICS is a service mark of MSCI and S&P and has been licensed for use by U.S. Bancorp Fund Services, LLC.
The accompanying notes are an integral part of these financial statements.
WBI BullBear Trend Switch US 3000 Total Return ETF
Schedule of Investments
June 30, 2019 (concluded)
| Shares | | Security Description | | Value | |
| EXCHANGE TRADED FUNDS — 98.9% | | | |
| | 482,329 | | iShares Broad USD High Yield | | | |
| | | | Corporate Bond ETF | | $ | 19,746,549 | |
| | 64,755 | | SPDR Bloomberg Barclays | | | | |
| | | | High Yield Bond ETF | | | 7,054,410 | |
| | 393,159 | | Xtrackers USD High Yield | | | | |
| | | | Corporate Bond ETF | | | 19,732,650 | |
| TOTAL EXCHANGE TRADED FUNDS | | | | |
(Cost $46,040,761) | | | 46,533,609 | |
| | | | | | | | |
| | | | | | | | |
| Shares/ | | | | | | |
| Amount | |
| | | | |
| SHORT-TERM INVESTMENTS — 1.1% | | | | |
| | 517,881 | | U.S. Bank Money Market | | | | |
| | | | Deposit Account, 2.22% | | | 517,881 | |
| TOTAL SHORT-TERM INVESTMENTS | | | | |
(Cost $517,881) | | | 517,881 | |
| TOTAL INVESTMENTS — 100.0% | | | | |
(Cost $46,558,642) | | | 47,051,490 | |
Liabilities in Excess of Other Assets — 0.0% (b) | | | (21,653 | ) |
| NET ASSETS — 100.0% | | $ | 47,029,837 | |
_________
(b) | Represents less than 0.05% of net assets. |
The Global Industry Classification Standard (GICS®) was developed by and/or is the exclusive property of MSCI, Inc. and Standard & Poor Financial Services LLC (“S&P”). GICS is a service mark of MSCI and S&P and has been licensed for use by U.S. Bancorp Fund Services, LLC.
The accompanying notes are an integral part of these financial statements.
Statements of Assets and Liabilities
June 30, 2019
| | | WBI BullBear | | | | | | | | | | |
| | | Rising Income | | | WBI BullBear | | | WBI BullBear | | | WBI BullBear | |
| | | 2000 ETF | | | Value 2000 ETF | | | Yield 2000 ETF | | | Quality 2000 ETF | |
| ASSETS | | | | | | | | | | | | |
Investments in securities, at value *+ (Note 2) | | $ | 17,887,854 | | | $ | 32,767,884 | | | $ | 44,131,917 | | | $ | 11,851,050 | |
Receivable for investments sold | | | 1,392,361 | | | | 1,098,415 | | | | 2,745,798 | | | | 1,504,517 | |
Dividends and interest receivable | | | 12,783 | | | | 40,016 | | | | 65,878 | | | | 16,914 | |
Prepaid expenses and other assets | | | 4,066 | | | | 4,164 | | | | 4,164 | | | | 4,066 | |
Securities lending income receivable | | | 257 | | | | 248 | | | | 320 | | | | 54 | |
| Total Assets | | | 19,297,321 | | | | 33,910,727 | | | | 46,948,077 | | | | 13,376,601 | |
| | | | | | | | | | | | | | | | | |
| LIABILITIES | | | | | | | | | | | | | | | | |
Payables | | | | | | | | | | | | | | | | |
| Collateral received for securities loaned (Note 7) | | | 4,421,748 | | | | 4,707,196 | | | | 7,851,481 | | | | 2,297,700 | |
| Investments purchased | | | 708,437 | | | | — | | | | 48,111 | | | | 49,922 | |
| Fund Shares redeemed | | | — | | | | — | | | | 950,870 | | | | 999,860 | |
| Management fees (Note 3) | | | 10,971 | | | | 17,786 | | | | 29,022 | | | | 326 | |
| Administration and fund accounting fees | | | 9,765 | | | | 9,787 | | | | 9,763 | | | | 9,771 | |
| Audit fees | | | 16,480 | | | | 16,483 | | | | 16,481 | | | | 16,484 | |
| Chief Compliance Officer fee | | | 784 | | | | 784 | | | | 784 | | | | 784 | |
| Custody fees | | | 509 | | | | 715 | | | | 1,246 | | | | 517 | |
| Legal fees | | | 1,068 | | | | 1,068 | | | | 1,068 | | | | 1,068 | |
| Accrued other expenses | | | 456 | | | | 455 | | | | 453 | | | | 442 | |
| Total Liabilities | | | 5,170,218 | | | | 4,754,274 | | | | 8,909,279 | | | | 3,376,874 | |
| NET ASSETS | | $ | 14,127,103 | | | $ | 29,156,453 | | | $ | 38,038,798 | | | $ | 9,999,727 | |
| | | | | | | | | | | | | | | | | |
| NET ASSETS CONSIST OF: | | | | | | | | | | | | | | | | |
Paid-in Capital | | $ | 38,417,238 | | | $ | 42,704,006 | | | $ | 74,586,795 | | | $ | 30,206,854 | |
Total distributable earnings (accumulated deficit) | | | (24,290,135 | ) | | | (13,547,553 | ) | | | (36,547,997 | ) | | | (20,207,127 | ) |
| Net Assets | | $ | 14,127,103 | | | $ | 29,156,453 | | | $ | 38,038,798 | | | $ | 9,999,727 | |
*Cost | | | | | | | | | | | | | | | | |
| Investments in securities | | $ | 17,255,169 | | | $ | 30,807,469 | | | $ | 43,023,992 | | | $ | 11,436,046 | |
Net Asset Value (unlimited shares authorized): | | | | | | | | | | | | | | | | |
Net Assets | | $ | 14,127,103 | | | $ | 29,156,453 | | | $ | 38,038,798 | | | $ | 9,999,727 | |
Shares Outstanding ^ | | | 650,000 | | | | 1,250,000 | | | | 2,000,000 | | | | 500,000 | |
Net Asset Value, Offering and Redemption Price per Share | | $ | 21.73 | | | $ | 23.33 | | | $ | 19.02 | | | $ | 20.00 | |
^ | No Par Value |
+ | Including securities on loan of $4,359,592, $4,671,950, $7,793,634 and $2,269,548, respectively. |
The accompanying notes are an integral part of these financial statements.
Statements of Assets and Liabilities (continued)
June 30, 2019
| | | WBI BullBear | | | | | | | | | | |
| | | Rising Income | | | WBI BullBear | | | WBI BullBear | | | WBI BullBear | |
| | | 1000 ETF | | | Value 1000 ETF | | | Yield 1000 ETF | | | Quality 1000 ETF | |
| ASSETS | | | | | | | | | | | | |
Investments in securities, at value *+ (Note 2) | | $ | 69,031,884 | | | $ | 62,161,701 | | | $ | 83,925,519 | | | $ | 70,149,169 | |
Receivable for investments sold | | | 6,272,806 | | | | 4,677,542 | | | | 3,827,528 | | | | 5,299,084 | |
Dividends and interest receivable | | | 49,027 | | | | 101,373 | | | | 183,355 | | | | 92,636 | |
Prepaid expenses and other assets | | | 4,066 | | | | 4,066 | | | | 4,066 | | | | 4,066 | |
Securities lending income receivable | | | 437 | | | | 541 | | | | 682 | | | | 745 | |
| Total Assets | | | 75,358,220 | | | | 66,945,223 | | | | 87,941,150 | | | | 75,545,700 | |
| | | | | | | | | | | | | | | | | |
| LIABILITIES | | | | | | | | | | | | | | | | |
Payables | | | | | | | | | | | | | | | | |
| Collateral received for securities loaned (Note 7) | | | 9,896,761 | | | | 15,255,216 | | | | 10,439,624 | | | | 14,275,417 | |
| Investments purchased | | | 3,785,498 | | | | 1,329,501 | | | | 2,945,636 | | | | — | |
| Fund shares redeemed | | | — | | | | — | | | | — | | | | — | |
| Management fees (Note 3) | | | 42,073 | | | | 33,844 | | | | 53,863 | | | | 39,550 | |
| Administration and fund accounting fees | | | 9,777 | | | | 9,765 | | | | 9,780 | | | | 9,769 | |
| Audit fees | | | 16,478 | | | | 16,485 | | | | 16,485 | | | | 16,478 | |
| Chief Compliance Officer fee | | | 784 | | | | 784 | | | | 784 | | | | 783 | |
| Custody fees | | | 822 | | | | 751 | | | | 1,452 | | | | 550 | |
| Legal fees | | | 1,068 | | | | 1,068 | | | | 1,068 | | | | 1,068 | |
| Accrued other expenses | | | 441 | | | | 441 | | | | 441 | | | | 442 | |
| Total Liabilities | | | 13,753,702 | | | | 16,647,855 | | | | 13,469,133 | | | | 14,344,057 | |
| NET ASSETS | | $ | 61,604,518 | | | $ | 50,297,368 | | | $ | 74,472,017 | | | $ | 61,201,643 | |
| | | | | | | | | | | | | | | | | |
| NET ASSETS CONSIST OF: | | | | | | | | | | | | | | | | |
Paid-in Capital | | $ | 77,333,373 | | | $ | 53,040,617 | | | $ | 93,243,541 | | | $ | 69,478,036 | |
Total distributable earnings (accumulated deficit) | | | (15,728,855 | ) | | | (2,743,249 | ) | | | (18,771,524 | ) | | | (8,276,393 | ) |
| Net Assets | | $ | 61,604,518 | | | $ | 50,297,368 | | | $ | 74,472,017 | | | $ | 61,201,643 | |
*Cost | | | | | | | | | | | | | | | | |
| Investments in securities | | $ | 66,855,826 | | | $ | 61,476,680 | | | $ | 81,599,000 | | | $ | 67,584,562 | |
Net Asset Value (unlimited shares authorized): | | | | | | | | | | | | | | | | |
Net Assets | | $ | 61,604,518 | | | $ | 50,297,368 | | | $ | 74,472,017 | | | $ | 61,201,643 | |
Shares Outstanding ^ | | | 2,300,000 | | | | 1,850,000 | | | | 3,100,000 | | | | 2,250,000 | |
Net Asset Value, Offering and Redemption Price per Share | | $ | 26.78 | | | $ | 27.19 | | | $ | 24.02 | | | $ | 27.20 | |
^ | No Par Value |
+ | Including securities on loan of $9,723,877, $15,027,203, $10,325,501 and $14,017,889, respectively. |
The accompanying notes are an integral part of these financial statements.
Statements of Assets and Liabilities (concluded)
June 30, 2019
| | | | | | | | | WBI BullBear | |
| | | WBI BullBear | | | WBI Power | | | Trend Switch | |
| | | Global | | | FactorTM High | | | US 3000 Total | |
| | | Income ETF | | | Dividend ETF | | | Return ETF | |
| ASSETS | | | | | | | | | |
Investments in securities, at value *+ (Note 2) | | $ | 145,897,172 | | | $ | 119,745,894 | | | $ | 47,051,490 | |
Receivable for investments sold | | | — | | | | — | | | | — | |
Dividends and interest receivable | | | 2,094 | | | | 302,539 | | | | 599 | |
Prepaid expenses and other assets | | | 4,066 | | | | 2,799 | | | | — | |
Securities lending income receivable | | | 8,018 | | | | 4,952 | | | | — | |
| Total Assets | | | 145,911,350 | | | | 120,056,184 | | | | 47,052,089 | |
| | | | | | | | | | | | | |
| LIABILITIES | | | | | | | | | | | | |
Payables | | | | | | | | | | | | |
| Collateral received for securities loaned (Note 7) | | | 9,491,696 | | | | 16,817,874 | | | | — | |
| Investments purchased | | | — | | | | — | | | | — | |
| Fund shares redeemed | | | — | | | | — | | | | — | |
| Management fees (Note 3) | | | 98,062 | | | | 46,263 | | | | 21,897 | |
| Administration and fund accounting fees | | | 9,642 | | | | 9,958 | | | | — | |
| Audit fees | | | 16,501 | | | | 16,242 | | | | — | |
| Chief Compliance Officer fee | | | 784 | | | | 784 | | | | — | |
| Custody fees | | | 1,980 | | | | 1,812 | | | | — | |
| Legal fees | | | 1,068 | | | | 1,068 | | | | 355 | |
| Accrued other expenses | | | 3,149 | | | | 1,762 | | | | — | |
| Total Liabilities | | | 9,622,882 | | | | 16,895,763 | | | | 22,252 | |
NET ASSETS | | $ | 136,288,468 | | | $ | 103,160,421 | | | $ | 47,029,837 | |
| | | | | | | | | | | | | |
| NET ASSETS CONSIST OF: | | | | | | | | | | | | |
Paid-in Capital | | $ | 141,595,761 | | | $ | 112,598,442 | | | $ | 46,464,350 | |
Total distributable earnings (accumulated deficit) | | | (5,307,293 | ) | | | (9,438,021 | ) | | | 565,487 | |
| Net Assets | | $ | 136,288,468 | | | $ | 103,160,421 | | | $ | 47,029,837 | |
*Cost | | | | | | | | | | | | |
| Investments in securities | | $ | 144,667,399 | | | $ | 122,674,090 | | | $ | 46,558,642 | |
Net Asset Value (unlimited shares authorized): | | | | | | | | | | | | |
Net Assets | | $ | 136,288,468 | | | $ | 103,160,421 | | | $ | 47,029,837 | |
Shares Outstanding ^ | | | 5,400,000 | | | | 4,200,000 | | | | 2,275,000 | |
Net Asset Value, Offering and Redemption Price per Share | | $ | 25.24 | | | $ | 24.56 | | | $ | 20.67 | |
^ | No Par Value |
+ | Including securities on loan of $9,286,531, $16,646,146, and $0, respectively. |
The accompanying notes are an integral part of these financial statements.
Statements of Operations
For the Year Ended June 30, 2019
| | | WBI BullBear | | | | | | | | | | |
| | | Rising Income | | | WBI BullBear | | | WBI BullBear | | | WBI BullBear | |
| | | 2000 ETF | | | Value 2000 ETF | | | Yield 2000 ETF | | | Quality 2000 ETF | |
| INVESTMENT INCOME | | | | | | | | | | | | |
Income: | | | | | | | | | | | | |
| Dividends + | | $ | 577,535 | | | $ | 652,255 | | | $ | 1,555,718 | | | $ | 516,133 | |
| Interest | | | 211,896 | | | | 175,006 | | | | 374,747 | | | | 166,996 | |
| Securities lending income (Note 7) | | | 7,074 | | | | 6,690 | | | | 36,452 | | | | 11,797 | |
| Total Investment Income | | | 796,505 | | | | 833,951 | | | | 1,966,917 | | | | 694,926 | |
| | | | | | | | | | | | | | | | | |
Expenses: | | | | | | | | | | | | | | | | |
| Management fees (Note 3) | | | 321,169 | | | | 305,864 | | | | 507,789 | | | | 265,484 | |
| Administration, fund accounting and custodian fees (Note 6) | | | 66,995 | | | | 67,339 | | | | 69,324 | | | | 66,181 | |
| Professional fees | | | 43,196 | | | | 42,706 | | | | 43,393 | | | | 42,734 | |
| Exchange fees | | | 11,688 | | | | 11,590 | | | | 11,843 | | | | 11,318 | |
| Directors’ fees and expenses | | | 10,667 | | | | 10,667 | | | | 10,667 | | | | 10,666 | |
| Dividend expense | | | — | | | | — | | | | — | | | | 3,324 | |
| Shareholder reporting expenses | | | 5,155 | | | | 5,189 | | | | 4,799 | | | | 5,153 | |
| Insurance expenses | | | 7,774 | | | | 8,638 | | | | 8,438 | | | | 8,715 | |
| Miscellaneous expenses | | | 5,564 | | | | 5,470 | | | | 5,512 | | | | 5,476 | |
| Total Expenses | | | 472,208 | | | | 457,463 | | | | 661,765 | | | | 419,051 | |
| Less: Fees (Waived)/Recouped | | | — | | | | (7,663 | ) | | | — | | | | (25,309 | ) |
| Net Expenses | | | 472,208 | | | | 449,800 | | | | 661,765 | | | | 393,742 | |
| Net Investment Income | | | 324,297 | | | | 384,151 | | | | 1,305,152 | | | | 301,184 | |
| | | | | | | | | | | | | | | | | |
| REALIZED & UNREALIZED GAIN (LOSS) ON INVESTMENTS | | | | | | | | | | | | | | | | |
Net realized gain (loss) on: | | | | | | | | | | | | | | | | |
| Investments in securities | | | (5,299,513 | ) | | | (3,316,498 | ) | | | (13,529,361 | ) | | | (4,289,612 | ) |
| Capital gain distributions from regulated investment companies | | | — | | | | — | | | | — | | | | — | |
Net change in unrealized appreciation (depreciation) of: | | | | | | | | | | | | | | | | |
| Investments in securities | | | 235,636 | | | | 1,195,077 | | | | 79,129 | | | | (129,792 | ) |
| Net realized and unrealized gain (loss) on investments | | | (5,063,877 | ) | | | (2,121,421 | ) | | | (13,450,232 | ) | | | (4,419,404 | ) |
| NET INCREASE (DECREASE) IN NET ASSETS | | | | | | | | | | | | | | | | |
| RESULTING FROM OPERATIONS | | $ | (4,739,580 | ) | | $ | (1,737,270 | ) | | $ | (12,145,080 | ) | | $ | (4,118,220 | ) |
+ | Net of withholding taxes of $0, $707, $1,045 and $0, respectively. |
The accompanying notes are an integral part of these financial statements.
Statements of Operations (continued)
For the Year Ended June 30, 2019
| | | WBI BullBear | | | | | | | | | | |
| | | Rising Income | | | WBI BullBear | | | WBI BullBear | | | WBI BullBear | |
| | | 1000 ETF | | | Value 1000 ETF | | | Yield 1000 ETF | | | Quality 1000 ETF | |
| INVESTMENT INCOME | | | | | | | | | | | | |
Income: | | | | | | | | | | | | |
| Dividends + | | $ | 929,213 | | | $ | 790,540 | | | $ | 2,129,417 | | | $ | 611,342 | |
| Interest | | | 219,536 | | | | 232,343 | | | | 350,367 | | | | 181,246 | |
| Securities lending income (Note 7) | | | 10,304 | | | | 8,114 | | | | 14,075 | | | | 7,420 | |
| Total Investment Income | | | 1,159,053 | | | | 1,030,997 | | | | 2,493,859 | | | | 800,008 | |
| | | | | | | | | | | | | | | | | |
Expenses: | | | | | | | | | | | | | | | | |
| Management fees (Note 3) | | | 460,008 | | | | 382,390 | | | | 689,752 | | | | 347,887 | |
| Administration, fund accounting and custodian fees (Note 6) | | | 66,888 | | | | 64,538 | | | | 67,356 | | | | 65,101 | |
| Professional fees | | | 42,742 | | | | 42,624 | | | | 42,678 | | | | 43,135 | |
| Exchange fees | | | 11,688 | | | | 11,695 | | | | 11,695 | | | | 11,318 | |
| Directors’ fees and expenses | | | 10,666 | | | | 10,667 | | | | 10,667 | | | | 10,667 | |
| Dividend expense | | | — | | | | — | | | | — | | | | — | |
| Shareholder reporting expenses | | | 5,529 | | | | 5,271 | | | | 5,540 | | | | 4,911 | |
| Insurance expenses | | | 8,045 | | | | 8,874 | | | | 8,898 | | | | 8,001 | |
| Miscellaneous expenses | | | 5,727 | | | | 5,452 | | | | 5,438 | | | | 5,542 | |
| Total Expenses | | | 611,293 | | | | 531,511 | | | | 842,024 | | | | 496,562 | |
| Less: Fees (Waived)/Recouped | | | — | | | | — | | | | — | | | | — | |
| Net Expenses | | | 611,293 | | | | 531,511 | | | | 842,024 | | | | 496,562 | |
| Net Investment Income | | | 547,760 | | | | 499,486 | | | | 1,651,835 | | | | 303,446 | |
| | | | | | | | | | | | | | | | | |
| REALIZED & UNREALIZED GAIN (LOSS) ON INVESTMENTS | | | | | | | | | | | | | | | | |
Net realized gain (loss) on: | | | | | | | | | | | | | | | | |
| Investments in securities | | | 4,030,831 | | | | 1,567,690 | | | | (5,767,435 | ) | | | 1,920,255 | |
| Capital gain distributions from regulated investment companies | | | — | | | | — | | | | — | | | | — | |
Net change in unrealized appreciation (depreciation) of: | | | | | | | | | | | | | | | | |
| Investments in securities | | | (242,722 | ) | | | (1,054,522 | ) | | | (702,154 | ) | | | 1,936,011 | |
| Net realized and unrealized gain (loss) on investments | | | 3,788,109 | | | | 513,168 | | | | (6,469,589 | ) | | | 3,856,266 | |
| NET INCREASE (DECREASE) IN NET ASSETS | | | | | | | | | | | | | | | | |
| RESULTING FROM OPERATIONS | | $ | 4,335,869 | | | $ | 1,012,654 | | | $ | (4,817,754 | ) | | $ | 4,159,712 | |
+ | Net of withholding taxes of $0, $1,146, $0 and $0, respectively. |
The accompanying notes are an integral part of these financial statements.
Statements of Operations (concluded)
For the Year/Period Ended June 30, 2019
| | | | | | | | | WBI BullBear | |
| | | WBI BullBear | | | WBI Power | | | Trend Switch | |
| | | Global | | | FactorTM High | | | US 3000 Total | |
| | | Income ETF | | | Dividend ETF | | | Return ETF^ | |
| INVESTMENT INCOME | | | | | | | | | |
Income: | | | | | | | | | |
| Dividends + | | $ | 4,689,353 | | | $ | 5,217,799 | | | $ | 57,949 | |
| Interest | | | 39,756 | | | | 26,342 | | | | 600 | |
| Securities lending income (Note 7) | | | 244,876 | | | | 37,260 | | | | — | |
| Total Investment Income | | | 4,973,985 | | | | 5,281,401 | | | | 58,549 | |
| | | | | | | | | | | | | |
Expenses: | | | | | | | | | | | | |
| Management fees (Note 3) | | | 922,320 | | | | 562,853 | | | | 21,969 | |
| Administration, fund accounting and custodian fees (Note 6) | | | 61,580 | | | | 76,100 | | | | — | |
| Professional fees | | | 39,105 | | | | 43,394 | | | | 355 | |
| Exchange fees | | | 11,695 | | | | 8,955 | | | | — | |
| Directors’ fees and expenses | | | 10,667 | | | | 10,667 | | | | — | |
| Dividend expense | | | — | | | | — | | | | — | |
| Shareholder reporting expenses | | | 7,083 | | | | 7,083 | | | | — | |
| Insurance expenses | | | 11,230 | | | | 6,750 | | | | — | |
| Miscellaneous expenses | | | 5,224 | | | | 5,432 | | | | — | |
| Total Expenses | | | 1,068,904 | | | | 721,234 | | | | 22,324 | |
| Less: Fees (Waived)/Recouped | | | — | | | | (4,877 | ) | | | — | |
| Net Expenses | | | 1,068,904 | | | | 716,357 | | | | 22,324 | |
| Net Investment Income | | | 3,905,081 | | | | 4,565,044 | | | | 36,225 | |
| | | | | | | | | | | | | |
| REALIZED & UNREALIZED GAIN (LOSS) ON INVESTMENTS | | | | | | | | | | | | |
Net realized gain (loss) on: | | | | | | | | | | | | |
| Investments in securities | | | 5,102,458 | | | | (9,985,413 | ) | | | 77,409 | |
| Capital gain distributions from regulated investment companies | | | 3,503 | | | | — | | | | — | |
Net change in unrealized appreciation (depreciation) of: | | | | | | | | | | | | |
| Investments in securities | | | 1,907,353 | | | | (6,000,041 | ) | | | 492,848 | |
| Net realized and unrealized gain (loss) on investments | | | 7,013,314 | | | | (15,985,454 | ) | | | 570,257 | |
| NET INCREASE (DECREASE) IN NET ASSETS | | | | | | | | | | | | |
| RESULTING FROM OPERATIONS | | $ | 10,918,395 | | | $ | (11,420,410 | ) | | $ | 606,482 | |
^ | Fund commenced operations on May 28, 2019. The information presented is for the period from May 28, 2019 to June 30, 2019. |
+ | Net of withholding taxes of $0, $0, and $0, respectively. |
The accompanying notes are an integral part of these financial statements.
Statements of Changes in Net Assets
| | | WBI BullBear Rising Income 2000 ETF | | | WBI BullBear Value 2000 ETF | |
| | | Year Ended | | | Year Ended | | | Year Ended | | | Year Ended | |
| | | June 30, 2019 | | | June 30, 2018 | | | June 30, 2019 | | | June 30, 2018 | |
| INCREASE (DECREASE) IN NET ASSETS: | | | | | | | | | | | | |
| OPERATIONS | | | | | | | | | | | | |
| Net investment income | | $ | 324,297 | | | $ | 260,442 | | | $ | 384,151 | | | $ | 210,160 | |
| Net realized gain (loss) on investments | | | (5,299,513 | ) | | | 1,261,758 | | | | (3,316,498 | ) | | | 372,028 | |
| Net change in unrealized appreciation (depreciation) | | | | | | | | | | | | | | | | |
| of investments | | | 235,636 | | | | (1,173,833 | ) | | | 1,195,077 | | | | (1,965,525 | ) |
| Net increase (decrease) in net assets | | | | | | | | | | | | | | | | |
| resulting from operations | | | (4,739,580 | ) | | | 348,367 | | | | (1,737,270 | ) | | | (1,383,337 | ) |
| DISTRIBUTIONS TO SHAREHOLDERS | | | | | | | | | | | | | | | | |
| Net distributions to shareholders | | | (337,978 | ) | | | (249,127 | )1 | | | (390,733 | ) | | | (218,969 | )1 |
| Total distributions to shareholders | | | (337,978 | ) | | | (249,127 | ) | | | (390,733 | ) | | | (218,969 | ) |
| CAPITAL SHARE TRANSACTIONS | | | | | | | | | | | | | | | | |
| Net increase (decrease) in net assets | | | | | | | | | | | | | | | | |
| from capital share transactions | | | (34,319,520 | ) | | | 11,303,095 | | | | (13,575,945 | ) | | | (26,469,535 | ) |
| Total increase (decrease) in net assets | | $ | (39,397,078 | ) | | $ | 11,402,335 | | | $ | (15,703,948 | ) | | $ | (28,071,841 | ) |
| NET ASSETS | | | | | | | | | | | | | | | | |
| Beginning of Year | | $ | 53,524,181 | | | $ | 42,121,846 | | | $ | 44,860,401 | | | $ | 72,932,242 | |
| End of Year | | $ | 14,127,103 | | | $ | 53,524,181 | 2 | | $ | 29,156,453 | | | $ | 44,860,401 | 3 |
1 | Distribution is derived entirely from net investment income. |
2 | Includes undistributed net investment income of $11,315. |
3 | Includes undistributed net investment income of $16,328. |
| | | WBI BullBear Yield 2000 ETF | | | WBI BullBear Quality 2000 ETF | |
| | | Year Ended | | | Year Ended | | | Year Ended | | | Year Ended | |
| | | June 30, 2019 | | | June 30, 2018 | | | June 30, 2019 | | | June 30, 2018 | |
| INCREASE (DECREASE) IN NET ASSETS: | | | | | | | | | | | | |
| OPERATIONS | | | | | | | | | | | | |
| Net investment income | | $ | 1,305,152 | | | $ | 419,497 | | | $ | 301,184 | | | $ | 331,451 | |
| Net realized gain (loss) on investments | | | (13,529,361 | ) | | | 2,481,097 | | | | (4,289,612 | ) | | | 3,892,645 | |
| Net change in unrealized appreciation (depreciation) | | | | | | | | | | | | | | | | |
| of investments | | | 79,129 | | | | (1,521,910 | ) | | | (129,792 | ) | | | (2,472,670 | ) |
| Net increase (decrease) in net assets | | | | | | | | | | | | | | | | |
| resulting from operations | | | (12,145,080 | ) | | | 1,378,684 | | | | (4,118,220 | ) | | | 1,751,426 | |
| DISTRIBUTIONS TO SHAREHOLDERS | | | | | | | | | | | | | | | | |
| Net distributions to shareholders | | | (1,320,104 | ) | | | (401,663 | )1 | | | (319,836 | ) | | | (317,572 | )1 |
| Total distributions to shareholders | | | (1,320,104 | ) | | | (401,663 | ) | | | (319,836 | ) | | | (317,572 | ) |
| CAPITAL SHARE TRANSACTIONS | | | | | | | | | | | | | | | | |
| Net increase (decrease) in net assets | | | | | | | | | | | | | | | | |
| from capital share transactions | | | (2,132,965 | ) | | | (12,958,225 | ) | | | (31,358,775 | ) | | | (30,119,010 | ) |
| Total increase (decrease) in net assets | | $ | (15,598,149 | ) | | $ | (11,981,204 | ) | | $ | (35,796,831 | ) | | $ | (28,685,156 | ) |
| NET ASSETS | | | | | | | | | | | | | | | | |
| Beginning of Year | | $ | 53,636,947 | | | $ | 65,618,151 | | | $ | 45,796,558 | | | $ | 74,481,714 | |
| End of Year | | $ | 38,038,798 | | | $ | 53,636,947 | 2 | | $ | 9,999,727 | | | $ | 45,796,558 | 3 |
1 | Distribution is derived entirely from net investment income. |
2 | Includes undistributed net investment income of $32,110. |
3 | Includes undistributed net investment income of $19,316. |
The accompanying notes are an integral part of these financial statements.
Statements of Changes in Net Assets (continued)
| | | WBI BullBear Rising Income 1000 ETF | | | WBI BullBear Value 1000 ETF | |
| | | Year Ended | | | Year Ended | | | Year Ended | | | Year Ended | |
| | | June 30, 2019 | | | June 30, 2018 | | | June 30, 2019 | | | June 30, 2018 | |
| INCREASE (DECREASE) IN NET ASSETS: | | | | | | | | | | | | |
| OPERATIONS | | | | | | | | | | | | |
| Net investment income | | $ | 547,760 | | | $ | 344,884 | | | $ | 499,486 | | | $ | 485,908 | |
| Net realized gain (loss) on investments | | | 4,030,831 | | | | 1,720,324 | | | | 1,567,690 | | | | 7,309,514 | |
| Net change in unrealized appreciation (depreciation) | | | | | | | | | | | | | | | | |
| of investments | | | (242,722 | ) | | | 118,750 | | | | (1,054,522 | ) | | | (1,117,074 | ) |
| Net increase (decrease) in net assets | | | | | | | | | | | | | | | | |
| resulting from operations | | | 4,335,869 | | | | 2,183,958 | | | | 1,012,654 | | | | 6,678,348 | |
| DISTRIBUTIONS TO SHAREHOLDERS | | | | | | | | | | | | | | | | |
| Net distributions to shareholders | | | (561,691 | ) | | | (337,373 | )1 | | | (485,571 | ) | | | (484,790 | )1 |
| Total distributions to shareholders | | | (561,691 | ) | | | (337,373 | ) | | | (485,571 | ) | | | (484,790 | ) |
| CAPITAL SHARE TRANSACTIONS | | | | | | | | | | | | | | | | |
| Net increase (decrease) in net assets | | | | | | | | | | | | | | | | |
| from capital share transactions | | | (17,453,115 | ) | | | 23,145,975 | | | | (15,072,530 | ) | | | (19,951,920 | ) |
| Total increase (decrease) in net assets | | $ | (13,678,937 | ) | | $ | 24,992,560 | | | $ | (14,545,447 | ) | | $ | (13,758,362 | ) |
| NET ASSETS | | | | | | | | | | | | | | | | |
| Beginning of Year | | $ | 75,283,455 | | | $ | 50,290,895 | | | $ | 64,842,815 | | | $ | 78,601,177 | |
| End of Year | | $ | 61,604,518 | | | $ | 75,283,455 | 2 | | $ | 50,297,368 | | | $ | 64,842,815 | 3 |
1 | Distribution is derived entirely from net investment income. |
2 | Includes undistributed net investment income of $7,511. |
3 | Includes undistributed net investment income of $7,046. |
| | | WBI BullBear Yield 1000 ETF | | | WBI BullBear Quality 1000 ETF | |
| | | Year Ended | | | Year Ended | | | Year Ended | | | Year Ended | |
| | | June 30, 2019 | | | June 30, 2018 | | | June 30, 2019 | | | June 30, 2018 | |
| INCREASE (DECREASE) IN NET ASSETS: | | | | | | | | | | | | |
| OPERATIONS | | | | | | | | | | | | |
| Net investment income | | $ | 1,651,835 | | | $ | 813,238 | | | $ | 303,446 | | | $ | 459,836 | |
| Net realized gain (loss) on investments | | | (5,767,435 | ) | | | 9,971,337 | | | | 1,920,255 | | | | 2,275,816 | |
| Net change in unrealized appreciation (depreciation) | | | | | | | | | | | | | | | | |
| of investments | | | (702,154 | ) | | | (125,438 | ) | | | 1,936,011 | | | | (1,534,072 | ) |
| Net increase (decrease) in net assets | | | | | | | | | | | | | | | | |
| resulting from operations | | | (4,817,754 | ) | | | 10,659,137 | | | | 4,159,712 | | | | 1,201,580 | |
| DISTRIBUTIONS TO SHAREHOLDERS | | | | | | | | | | | | | | | | |
| Net distributions to shareholders | | | (1,601,703 | ) | | | (826,348 | )1 | | | (322,761 | ) | | | (464,405 | )1 |
| Total distributions to shareholders | | | (1,601,703 | ) | | | (826,348 | ) | | | (322,761 | ) | | | (464,405 | ) |
| CAPITAL SHARE TRANSACTIONS | | | | | | | | | | | | | | | | |
| Net increase (decrease) in net assets | | | | | | | | | | | | | | | | |
| from capital share transactions | | | (1,887,575 | ) | | | (6,036,115 | ) | | | (2,590,450 | ) | | | 11,235,350 | |
| Total increase (decrease) in net assets | | $ | (8,307,032 | ) | | $ | 3,796,674 | | | $ | 1,246,501 | | | $ | 11,972,525 | |
| NET ASSETS | | | | | | | | | | | | | | | | |
| Beginning of Year | | $ | 82,779,049 | | | $ | 78,982,375 | | | $ | 59,955,142 | | | $ | 47,982,617 | |
| End of Year | | $ | 74,472,017 | | | $ | 82,779,049 | 2 | | $ | 61,201,643 | | | $ | 59,955,142 | 3 |
1 | Distribution is derived entirely from net investment income. |
2 | Includes undistributed net investment income of $9,941. |
3 | Includes undistributed net investment income of $8,248. |
The accompanying notes are an integral part of these financial statements.
Statements of Changes in Net Assets (concluded)
| | | WBI BullBear Global Income ETF | | | WBI Power FactorTM High Dividend ETF | |
| | | Year Ended | | | Year Ended | | | Year Ended | | | Year Ended | |
| | | June 30, 2019 | | | June 30, 2018 | | | June 30, 2019 | | | June 30, 2018 | |
| INCREASE (DECREASE) IN NET ASSETS: | | | | | | | | | | | | |
| OPERATIONS | | | | | | | | | | | | |
| Net investment income | | $ | 3,905,081 | | | $ | 3,944,244 | | | $ | 4,565,044 | | | $ | 1,994,258 | |
| Net realized gain (loss) on investments | | | 5,105,961 | | | | (5,651,905 | ) | | | (9,985,413 | ) | | | 1,635,776 | |
| Net change in unrealized appreciation (depreciation) | | | | | | | | | | | | | | | | |
| of investments | | | 1,907,353 | | | | (2,445,214 | ) | | | (6,000,041 | ) | | | 3,565,744 | |
| Net increase (decrease) in net assets | | | | | | | | | | | | | | | | |
| resulting from operations | | | 10,918,395 | | | | (4,152,875 | ) | | | (11,420,410 | ) | | | 7,195,778 | |
| DISTRIBUTIONS TO SHAREHOLDERS | | | | | | | | | | | | | | | | |
| Net distributions to shareholders | | | (3,929,336 | ) | | | (3,955,836 | )1 | | | (5,384,656 | ) | | | (2,934,185 | )2 |
| Total distributions to shareholders | | | (3,929,336 | ) | | | (3,955,836 | ) | | | (5,384,656 | ) | | | (2,934,185 | ) |
| CAPITAL SHARE TRANSACTIONS | | | | | | | | | | | | | | | | |
| Net increase (decrease) in net assets | | | | | | | | | | | | | | | | |
| from capital share transactions | | | 32,673,530 | | | | (57,508,535 | ) | | | 67,563,125 | | | | 14,237,490 | |
| Total increase (decrease) in net assets | | $ | 39,662,589 | | | $ | (65,617,246 | ) | | $ | 50,758,059 | | | $ | 18,499,083 | |
| NET ASSETS | | | | | | | | | | | | | | | | |
| Beginning of Year | | $ | 96,625,879 | | | $ | 162,243,125 | | | $ | 52,402,362 | | | $ | 33,903,279 | |
| End of Year | | $ | 136,288,468 | | | $ | 96,625,879 | | | $ | 103,160,421 | | | $ | 52,402,362 | 3 |
1 | Distribution is derived entirely from net investment income. |
2 | Distribution is derived from $1,973,737 of net investment income and $960,448 of net realized gain. |
3 | Includes undistributed net investment income of $40,254. |
| | | WBI BullBear | |
| | | Trend Switch | |
| | | US 3000 | |
| | | Total Return ETF | |
| | | Period Ended | |
| | | June 30, 20191 | |
| INCREASE (DECREASE) IN NET ASSETS: | | | |
| OPERATIONS | | | |
| Net investment income | | $ | 36,225 | |
| Net realized gain (loss) on investments | | | 77,409 | |
| Net change in unrealized appreciation (depreciation) of investments | | | 492,848 | |
| Net increase (decrease) in net assets resulting from operations | | | 606,482 | |
| DISTRIBUTIONS TO SHAREHOLDERS | | | | |
| Net distributions to shareholders | | | (40,995 | ) |
| Total distributions to shareholders | | | (40,995 | ) |
| CAPITAL SHARE TRANSACTIONS | | | | |
| Net increase (decrease) in net assets from capital share transactions | | | 46,464,350 | |
| Total increase (decrease) in net assets | | $ | 47,029,837 | |
| NET ASSETS | | | | |
| Beginning of Period | | $ | — | |
| End of Period | | $ | 47,029,837 | |
1 | Fund commenced operations on May 28, 2019. The information presented is for the period from May 28, 2019 to June 30, 2019. |
The accompanying notes are an integral part of these financial statements.
Financial Highlights
For capital share outstanding throughout each year/period
| | | WBI BullBear Rising Income 2000 ETF | |
| | | Year Ended | | | Year Ended | | | Year Ended | | | Year Ended | | | Period Ended | |
| | | June 30, 2019 | | | June 30, 2018 | | | June 30, 2017 | | | June 30, 2016 | | | June 30, 20151 | |
| Net Asset Value, Beginning of Year/Period | | $ | 24.33 | | | $ | 24.07 | | | $ | 21.69 | | | $ | 25.19 | | | $ | 25.00 | |
| Income (Loss) from Investment Operations: | | | | | | | | | | | | | | | | | | | | |
Net investment income (loss)2 | | | 0.20 | | | | 0.14 | | | | 0.12 | | | | 0.06 | | | | 0.04 | |
Net gain (loss) on investments (realized and unrealized)6 | | | (2.58 | ) | | | 0.24 | | | | 2.41 | | | | (3.49 | ) | | | 0.19 | |
| Total from investment operations | | | (2.38 | ) | | | 0.38 | | | | 2.53 | | | | (3.43 | ) | | | 0.23 | |
| Less Distributions: | | | | | | | | | | | | | | | | | | | | |
Distributions from net investment income | | | (0.22 | ) | | | (0.12 | ) | | | (0.13 | ) | | | (0.07 | ) | | | (0.04 | ) |
Tax return of capital to shareholders | | | — | | | | — | | | | (0.02 | ) | | | — | | | | (0.00 | )8 |
Distributions from net realized gain | | | — | | | | — | | | | — | | | | — | | | | — | |
| Total Distributions | | | (0.22 | ) | | | (0.12 | ) | | | (0.15 | ) | | | (0.07 | ) | | | (0.04 | ) |
Net asset value, end of year/period | | $ | 21.73 | | | $ | 24.33 | | | $ | 24.07 | | | $ | 21.69 | | | $ | 25.19 | |
Market price, end of year/period | | $ | 21.71 | | | $ | 24.31 | | | $ | 24.09 | | | $ | 21.57 | | | $ | 25.27 | |
Net Assets Total Return7 | | | -9.83 | % | | | 1.62 | % | | | 11.74 | % | | | -13.72 | % | | | 0.94 | %3 |
| | | | | | | | | | | | | | | | | | | | | |
| Supplemental Data: | | | | | | | | | | | | | | | | | | | | |
Net assets, end of year/period (000’s) | | $ | 14,127 | | | $ | 53,524 | | | $ | 42,122 | | | $ | 75,915 | | | $ | 132,269 | |
| Ratios to Average Net Assets: | | | | | | | | | | | | | | | | | | | | |
| Expenses before fees (waived)/recouped | | | 1.25 | % | | | 1.08 | % | | | 1.05 | % | | | 0.99 | % | | | 1.03 | %4 |
| Expenses after fees (waived)/recouped | | | 1.25 | % | | | 1.08 | % | | | 1.05 | % | | | 0.99 | % | | | 1.03 | %4 |
| Net investment income (loss) to average net assets | | | 0.86 | % | | | 0.56 | % | | | 0.53 | % | | | 0.26 | % | | | 0.18 | %4 |
Portfolio turnover rate5 | | | 718 | % | | | 529 | % | | | 331 | % | | | 531 | % | | | 255 | %3 |
| | | | | | | | | | | | | | | | | | | | | |
| | | | |
| | | WBI BullBear Value 2000 ETF | |
| | | Year Ended | | | Year Ended | | | Year Ended | | | Year Ended | | | Period Ended | |
| | | June 30, 2019 | | | June 30, 2018 | | | June 30, 2017 | | | June 30, 2016 | | | June 30, 20151 | |
| Net Asset Value, Beginning of Year/Period | | $ | 24.25 | | | $ | 25.15 | | | $ | 21.46 | | | $ | 24.72 | | | $ | 25.00 | |
| Income (Loss) from Investment Operations: | | | | | | | | | | | | | | | | | | | | |
Net investment income (loss)2 | | | 0.24 | | | | 0.08 | | | | 0.25 | | | | 0.17 | | | | 0.06 | |
Net gain (loss) on investments (realized and unrealized)6 | | | (0.91 | ) | | | (0.88 | ) | | | 3.71 | | | | (3.28 | ) | | | (0.27 | ) |
| Total from investment operations | | | (0.67 | ) | | | (0.80 | ) | | | 3.96 | | | | (3.11 | ) | | | (0.21 | ) |
| Less Distributions: | | | | | | | | | | | | | | | | | | | | |
Distributions from net investment income | | | (0.25 | ) | | | (0.10 | ) | | | (0.27 | ) | | | (0.15 | ) | | | (0.07 | ) |
Tax return of capital to shareholders | | | — | | | | — | | | | — | | | | — | | | | (0.00 | )8 |
Distributions from net realized gain | | | — | | | | — | | | | — | | | | — | | | | — | |
| Total Distributions | | | (0.25 | ) | | | (0.10 | ) | | | (0.27 | ) | | | (0.15 | ) | | | (0.07 | ) |
Net asset value, end of year/period | | $ | 23.33 | | | $ | 24.25 | | | $ | 25.15 | | | $ | 21.46 | | | $ | 24.72 | |
Market price, end of year/period | | $ | 23.30 | | | $ | 24.26 | | | $ | 25.19 | | | $ | 21.40 | | | $ | 24.77 | |
Net Assets Total Return7 | | | -2.87 | % | | | -3.06 | % | | | 18.55 | % | | | -12.71 | % | | | -0.84 | %3 |
| | | | | | | | | | | | | | | | | | | | | |
| Supplemental Data: | | | | | | | | | | | | | | | | | | | | |
Net assets, end of year/period (000’s) | | $ | 29,156 | | | $ | 44,860 | | | $ | 72,932 | | | $ | 72,949 | | | $ | 100,117 | |
| Ratios to Average Net Assets: | | | | | | | | | | | | | | | | | | | | |
| Expenses before fees (waived)/recouped | | | 1.27 | % | | | 1.06 | % | | | 1.04 | % | | | 0.99 | % | | | 1.07 | %4 |
| Expenses after fees (waived)/recouped | | | 1.25 | % | | | 1.06 | % | | | 1.04 | % | | | 0.99 | % | | | 1.07 | %4 |
| Net investment income (loss) to average net assets | | | 1.07 | % | | | 0.33 | % | | | 1.07 | % | | | 0.75 | % | | | 0.30 | %4 |
Portfolio turnover rate5 | | | 640 | % | | | 564 | % | | | 405 | % | | | 565 | % | | | 278 | %3 |
1 | Fund commenced operations on August 25, 2014. The information presented is for the period from August 25, 2014 to June 30, 2015. |
2 | Calculated based on average shares outstanding during the period. |
3 | Not annualized. |
4 | Annualized. |
5 | Excludes securities received or delivered as a result of processing capital share transactions in creation units. |
6 | The amount for a share outstanding throughout the period may not be in accordance with the aggregate net realized and unrealized gain (loss) on investments for the period because of the timing of capital share transactions in relation to fluctuating market values of the Fund’s underlying securities. |
7 | Net asset value total return is calculated assuming an initial investment made at the net asset value at the beginning of the period, reinvestment of all dividends and distributions at net asset value during the period, and the redemption on the last day of the period. Net asset value total return includes adjustments in accordance with accounting principles generally accepted in the United States of America and as such, the net asset value for financial reporting purposes and the returns based upon those net asset values may differ from the net asset value and returns for shareholder transactions. |
8 | Less than $0.01. |
The accompanying notes are an integral part of these financial statements.
Financial Highlights (continued)
For capital share outstanding throughout each year/period
| | | WBI BullBear Yield 2000 ETF | |
| | | Year Ended | | | Year Ended | | | Year Ended | | | Year Ended | | | Period Ended | |
| | | June 30, 2019 | | | June 30, 2018 | | | June 30, 2017 | | | June 30, 2016 | | | June 30, 20151 | |
| Net Asset Value, Beginning of Year/Period | | $ | 22.82 | | | $ | 22.24 | | | $ | 20.20 | | | $ | 24.11 | | | $ | 25.00 | |
| Income (Loss) from Investment Operations: | | | | | | | | | | | | | | | | | | | | |
Net investment income (loss)2 | | | 0.46 | | | | 0.16 | | | | 0.35 | | | | 0.24 | | | | 0.26 | |
Net gain (loss) on investments (realized and unrealized)6 | | | (3.76 | ) | | | 0.58 | | | | 2.09 | | | | (3.92 | ) | | | (0.92 | ) |
| Total from investment operations | | | (3.30 | ) | | | 0.74 | | | | 2.44 | | | | (3.68 | ) | | | (0.66 | ) |
| Less Distributions: | | | | | | | | | | | | | | | | | | | | |
Distributions from net investment income | | | (0.50 | ) | | | (0.16 | ) | | | (0.40 | ) | | | (0.23 | ) | | | (0.23 | ) |
Tax return of capital to shareholders | | | — | | | | — | | | | — | | | | — | | | | — | |
Distributions from net realized gain | | | — | | | | — | | | | — | | | | — | | | | — | |
| Total Distributions | | | (0.50 | ) | | | (0.16 | ) | | | (0.40 | ) | | | (0.23 | ) | | | (0.23 | ) |
Net asset value, end of year/period | | $ | 19.02 | | | $ | 22.82 | | | $ | 22.24 | | | $ | 20.20 | | | $ | 24.11 | |
Market price, end of year/period | | $ | 18.96 | | | $ | 22.78 | | | $ | 22.25 | | | $ | 20.12 | | | $ | 24.14 | |
Net Assets Total Return7 | | | -14.61 | % | | | 3.34 | % | | | 12.26 | % | | | -15.44 | % | | | -2.60 | %3 |
| | | | | | | | | | | | | | | | | | | | | |
| Supplemental Data: | | | | | | | | | | | | | | | | | | | | |
Net assets, end of year/period (000’s) | | $ | 38,039 | | | $ | 53,637 | | | $ | 65,618 | | | $ | 97,979 | | | $ | 141,064 | |
| Ratios to Average Net Assets: | | | | | | | | | | | | | | | | | | | | |
| Expenses before fees (waived)/recouped | | | 1.11 | % | | | 1.06 | % | | | 1.03 | % | | | 0.98 | % | | | 1.03 | %4 |
| Expenses after fees (waived)/recouped | | | 1.11 | % | | | 1.06 | % | | | 1.03 | % | | | 0.98 | % | | | 1.03 | %4 |
| Net investment income (loss) to average net assets | | | 2.18 | % | | | 0.72 | % | | | 1.64 | % | | | 1.11 | % | | | 1.29 | %4 |
Portfolio turnover rate5 | | | 762 | % | | | 528 | % | | | 355 | % | | | 553 | % | | | 264 | %3 |
| | | | | | | | | | | | | | | | | | | | | |
| | | | |
| | | WBI BullBear Quality 2000 ETF | |
| | | Year Ended | | | Year Ended | | | Year Ended | | | Year Ended | | | Period Ended | |
| | | June 30, 2019 | | | June 30, 2018 | | | June 30, 2017 | | | June 30, 2016 | | | June 30, 20151 | |
| Net Asset Value, Beginning of Year/Period | | $ | 23.49 | | | $ | 23.28 | | | $ | 20.71 | | | $ | 23.62 | | | $ | 25.00 | |
| Income (Loss) from Investment Operations: | | | | | | | | | | | | | | | | | | | | |
Net investment income (loss)2 | | | 0.22 | | | | 0.12 | | | | 0.18 | | | | 0.12 | | | | (0.01 | ) |
Net gain (loss) on investments (realized and unrealized)6 | | | (3.46 | ) | | | 0.22 | | | | 2.57 | | | | (2.94 | ) | | | (1.35 | ) |
| Total from investment operations | | | (3.24 | ) | | | 0.34 | | | | 2.75 | | | | (2.82 | ) | | | (1.36 | ) |
| Less Distributions: | | | | | | | | | | | | | | | | | | | | |
Distributions from net investment income | | | (0.25 | ) | | | (0.13 | ) | | | (0.18 | ) | | | (0.09 | ) | | | (0.00 | )8 |
Tax return of capital to shareholders | | | — | | | | — | | | | — | | | | — | | | | (0.02 | ) |
Distributions from net realized gain | | | — | | | | — | | | | — | | | | — | | | | | |
| Total Distributions | | | (0.25 | ) | | | (0.13 | ) | | | (0.18 | ) | | | (0.09 | ) | | | (0.02 | ) |
Net asset value, end of year/period | | $ | 20.00 | | | $ | 23.49 | | | $ | 23.28 | | | $ | 20.71 | | | $ | 23.62 | |
Market price, end of year/period | | $ | 19.95 | | | $ | 23.57 | | | $ | 23.37 | | | $ | 20.60 | | | $ | 23.68 | |
Net Assets Total Return7 | | | -13.84 | % | | | 1.43 | % | | | 13.32 | % | | | -12.01 | % | | | -5.40 | %3 |
| | | | | | | | | | | | | | | | | | | | | |
| Supplemental Data: | | | | | | | | | | | | | | | | | | | | |
Net assets, end of year/period (000’s) | | $ | 10,000 | | | $ | 45,797 | | | $ | 74,482 | | | $ | 79,726 | | | $ | 99,224 | |
| Ratios to Average Net Assets: | | | | | | | | | | | | | | | | | | | | |
| Expenses before fees (waived)/recouped | | | 1.34 | % | | | 1.06 | % | | | 1.04 | % | | | 0.99 | % | | | 1.06 | %4 |
| Expenses after fees (waived)/recouped | | | 1.26 | % | | | 1.06 | % | | | 1.04 | % | | | 0.99 | % | | | 1.06 | %4 |
| Net investment income (loss) to average net assets | | | 0.96 | % | | | 0.51 | % | | | 0.79 | % | | | 0.56 | % | | | (0.04 | )%4 |
Portfolio turnover rate5 | | | 828 | % | | | 485 | % | | | 383 | % | | | 569 | % | | | 311 | %3 |
1 | Fund commenced operations on August 25, 2014. The information presented is for the period from August 25, 2014 to June 30, 2015. |
2 | Calculated based on average shares outstanding during the period. |
3 | Not annualized. |
4 | Annualized. |
5 | Excludes securities received or delivered as a result of processing capital share transactions in creation units. |
6 | The amount for a share outstanding throughout the period may not be in accordance with the aggregate net realized and unrealized gain (loss) on investments for the period because of the timing of capital share transactions in relation to fluctuating market values of the Fund’s underlying securities. |
7 | Net asset value total return is calculated assuming an initial investment made at the net asset value at the beginning of the period, reinvestment of all dividends and distributions at net asset value during the period, and the redemption on the last day of the period. Net asset value total return includes adjustments in accordance with accounting principles generally accepted in the United States of America and as such, the net asset value for financial reporting purposes and the returns based upon those net asset values may differ from the net asset value and returns for shareholder transactions. |
8 | Less than $0.01. |
The accompanying notes are an integral part of these financial statements.
Financial Highlights (continued)
For capital share outstanding throughout each year/period
| | | WBI BullBear Rising Income 1000 ETF | |
| | | Year Ended | | | Year Ended | | | Year Ended | | | Year Ended | | | Period Ended | |
| | | June 30, 2019 | | | June 30, 2018 | | | June 30, 2017 | | | June 30, 2016 | | | June 30, 20151 | |
| Net Asset Value, Beginning of Year/Period | | $ | 25.96 | | | $ | 24.53 | | | $ | 21.92 | | | $ | 24.45 | | | $ | 25.00 | |
| Income (Loss) from Investment Operations: | | | | | | | | | | | | | | | | | | | | |
Net investment income (loss)2 | | | 0.27 | | | | 0.15 | | | | 0.16 | | | | 0.06 | | | | 0.28 | |
Net gain (loss) on investments (realized and unrealized)6 | | | 0.85 | | | | 1.41 | | | | 2.64 | | | | (2.53 | ) | | | (0.59 | ) |
| Total from investment operations | | | 1.12 | | | | 1.56 | | | | 2.80 | | | | (2.47 | ) | | | (0.31 | ) |
| Less Distributions: | | | | | | | | | | | | | | | | | | | | |
Distributions from net investment income | | | (0.30 | ) | | | (0.13 | ) | | | (0.19 | ) | | | (0.06 | ) | | | (0.24 | ) |
Tax return of capital to shareholders | | | — | | | | — | | | | — | | | | — | | | | — | |
Distributions from net realized gain | | | — | | | | — | | | | — | | | | — | | | | — | |
| Total Distributions | | | (0.30 | ) | | | (0.13 | ) | | | (0.19 | ) | | | (0.06 | ) | | | (0.24 | ) |
Net asset value, end of year/period | | $ | 26.78 | | | $ | 25.96 | | | $ | 24.53 | | | $ | 21.92 | | | $ | 24.45 | |
Market price, end of year/period | | $ | 26.75 | | | $ | 25.93 | | | $ | 24.58 | | | $ | 21.83 | | | $ | 24.51 | |
Net Assets Total Return7 | | | 4.22 | % | | | 6.52 | % | | | 12.88 | % | | | -10.14 | % | | | -1.25 | %3 |
| | | | | | | | | | | | | | | | | | | | | |
| Supplemental Data: | | | | | | | | | | | | | | | | | | | | |
Net assets, end of year/period (000’s) | | $ | 61,605 | | | $ | 75,283 | | | $ | 50,291 | | | $ | 73,427 | | | $ | 138,152 | |
| Ratios to Average Net Assets: | | | | | | | | | | | | | | | | | | | | |
| Expenses before fees (waived)/recouped | | | 1.13 | % | | | 1.05 | % | | | 1.05 | % | | | 0.99 | % | | | 1.02 | %4 |
| Expenses after fees (waived)/recouped | | | 1.13 | % | | | 1.05 | % | | | 1.05 | % | | | 0.99 | % | | | 1.02 | %4 |
| Net investment income (loss) to average net assets | | | 1.01 | % | | | 0.57 | % | | | 0.72 | % | | | 0.25 | % | | | 1.30 | %4 |
Portfolio turnover rate5 | | | 512 | % | | | 496 | % | | | 279 | % | | | 571 | % | | | 240 | %3 |
| | | | | | | | | | | | | | | | | | | | | |
| | | | |
| | | WBI BullBear Value 1000 ETF | |
| | | Year Ended | | | Year Ended | | | Year Ended | | | Year Ended | | | Period Ended | |
| | | June 30, 2019 | | | June 30, 2018 | | | June 30, 2017 | | | June 30, 2016 | | | June 30, 20151 | |
| Net Asset Value, Beginning of Year/Period | | $ | 28.19 | | | $ | 26.20 | | | $ | 21.85 | | | $ | 23.98 | | | $ | 25.00 | |
| Income (Loss) from Investment Operations: | | | | | | | | | | | | | | | | | | | | |
Net investment income (loss)2 | | | 0.32 | | | | 0.18 | | | | 0.29 | | | | 0.04 | | | | 0.24 | |
Net gain (loss) on investments (realized and unrealized)6 | | | (0.99 | ) | | | 2.00 | | | | 4.35 | | | | (2.12 | ) | | | (1.04 | ) |
| Total from investment operations | | | (0.67 | ) | | | 2.18 | | | | 4.64 | | | | (2.08 | ) | | | (0.80 | ) |
| Less Distributions: | | | | | | | | | | | | | | | | | | | | |
Distributions from net investment income | | | (0.33 | ) | | | (0.19 | ) | | | (0.29 | ) | | | (0.05 | ) | | | (0.22 | ) |
Tax return of capital to shareholders | | | — | | | | — | | | | — | | | | — | | | | — | |
Distributions from net realized gain | | | — | | | | — | | | | — | | | | — | | | | — | |
| Total Distributions | | | (0.33 | ) | | | (0.19 | ) | | | (0.29 | ) | | | (0.05 | ) | | | (0.22 | ) |
Net asset value, end of year/period | | $ | 27.19 | | | $ | 28.19 | | | $ | 26.20 | | | $ | 21.85 | | | $ | 23.98 | |
Market price, end of year/period | | $ | 27.16 | | | $ | 28.17 | | | $ | 26.28 | | | $ | 21.77 | | | $ | 23.98 | |
Net Assets Total Return7 | | | -2.53 | % | | | 8.40 | % | | | 21.34 | % | | | -8.63 | % | | | -3.29 | %3 |
| | | | | | | | | | | | | | | | | | | | | |
| Supplemental Data: | | | | | | | | | | | | | | | | | | | | |
Net assets, end of year/period (000’s) | | $ | 50,297 | | | $ | 64,843 | | | $ | 78,601 | | | $ | 72,097 | | | $ | 112,691 | |
| Ratios to Average Net Assets: | | | | | | | | | | | | | | | | | | | | |
| Expenses before fees (waived)/recouped | | | 1.18 | % | | | 1.05 | % | | | 1.03 | % | | | 0.99 | % | | | 1.04 | %4 |
| Expenses after fees (waived)/recouped | | | 1.18 | % | | | 1.05 | % | | | 1.03 | % | | | 0.99 | % | | | 1.04 | %4 |
| Net investment income (loss) to average net assets | | | 1.11 | % | | | 0.64 | % | | | 1.19 | % | | | 0.19 | % | | | 1.17 | %4 |
Portfolio turnover rate5 | | | 567 | % | | | 527 | % | | | 388 | % | | | 573 | % | | | 294 | %3 |
1 | Fund commenced operations on August 25, 2014. The information presented is for the period from August 25, 2014 to June 30, 2015. |
2 | Calculated based on average shares outstanding during the period. |
3 | Not annualized. |
4 | Annualized. |
5 | Excludes securities received or delivered as a result of processing capital share transactions in creation units. |
6 | The amount for a share outstanding throughout the period may not be in accordance with the aggregate net realized and unrealized gain (loss) on investments for the period because of the timing of capital share transactions in relation to fluctuating market values of the Fund’s underlying securities. |
7 | Net asset value total return is calculated assuming an initial investment made at the net asset value at the beginning of the period, reinvestment of all dividends and distributions at net asset value during the period, and the redemption on the last day of the period. Net asset value total return includes adjustments in accordance with accounting principles generally accepted in the United States of America and as such, the net asset value for financial reporting purposes and the returns based upon those net asset values may differ from the net asset value and returns for shareholder transactions. |
The accompanying notes are an integral part of these financial statements.
Financial Highlights (continued)
For capital share outstanding throughout each year/period
| | | WBI BullBear Yield 1000 ETF | |
| | | Year Ended | | | Year Ended | | | Year Ended | | | Year Ended | | | Period Ended | |
| | | June 30, 2019 | | | June 30, 2018 | | | June 30, 2017 | | | June 30, 2016 | | | June 30, 20151 | |
| Net Asset Value, Beginning of Year/Period | | $ | 25.87 | | | $ | 22.89 | | | $ | 20.25 | | | $ | 23.48 | | | $ | 25.00 | |
| Income (Loss) from Investment Operations: | | | | | | | | | | | | | | | | | | | | |
Net investment income (loss)2 | | | 0.51 | | | | 0.25 | | | | 0.31 | | | | 0.08 | | | | 0.35 | |
Net gain (loss) on investments (realized and unrealized)6 | | | (1.84 | ) | | | 2.98 | | | | 2.66 | | | | (3.22 | ) | | | (1.58 | ) |
| Total from investment operations | | | (1.33 | ) | | | 3.23 | | | | 2.97 | | | | (3.14 | ) | | | (1.23 | ) |
| Less Distributions: | | | | | | | | | | | | | | | | | | | | |
Distributions from net investment income | | | (0.52 | ) | | | (0.25 | ) | | | (0.33 | ) | | | (0.09 | ) | | | (0.29 | ) |
Tax return of capital to shareholders | | | — | | | | — | | | | — | | | | — | | | | — | |
Distributions from net realized gain | | | — | | | | — | | | | — | | | | — | | | | — | |
| Total Distributions | | | (0.52 | ) | | | (0.25 | ) | | | (0.33 | ) | | | (0.09 | ) | | | (0.29 | ) |
Net asset value, end of year/period | | $ | 24.02 | | | $ | 25.87 | | | $ | 22.89 | | | $ | 20.25 | | | $ | 23.48 | |
Market price, end of year/period | | $ | 23.96 | | | $ | 25.83 | | | $ | 22.95 | | | $ | 20.19 | | | $ | 23.50 | |
Net Assets Total Return7 | | | -5.22 | % | | | 14.14 | % | | | 14.82 | % | | | -13.37 | % | | | -4.98 | %3 |
| | | | | | | | | | | | | | | | | | | | | |
| Supplemental Data: | | | | | | | | | | | | | | | | | | | | |
Net assets, end of year/period (000’s) | | $ | 74,472 | | | $ | 82,779 | | | $ | 78,982 | | | $ | 99,236 | | | $ | 140,876 | |
| Ratios to Average Net Assets: | | | | | | | | | | | | | | | | | | | | |
| Expenses before fees (waived)/recouped | | | 1.04 | % | | | 1.04 | % | | | 1.02 | % | | | 0.98 | % | | | 1.02 | %4 |
| Expenses after fees (waived)/recouped | | | 1.04 | % | | | 1.04 | % | | | 1.02 | % | | | 0.98 | % | | | 1.02 | %4 |
| Net investment income (loss) to average net assets | | | 2.04 | % | | | 0.99 | % | | | 1.47 | % | | | 0.38 | % | | | 1.67 | %4 |
Portfolio turnover rate5 | | | 610 | % | | | 491 | % | | | 352 | % | | | 584 | % | | | 277 | %3 |
| | | | | | | | | | | | | | | | | | | | | |
| | | | |
| | | WBI BullBear Quality 1000 ETF | |
| | | Year Ended | | | Year Ended | | | Year Ended | | | Year Ended | | | Period Ended | |
| | | June 30, 2019 | | | June 30, 2018 | | | June 30, 2017 | | | June 30, 2016 | | | June 30, 20151 | |
| Net Asset Value, Beginning of Year/Period | | $ | 26.07 | | | $ | 25.25 | | | $ | 21.87 | | | $ | 23.85 | | | $ | 25.00 | |
| Income (Loss) from Investment Operations: | | | | | | | | | | | | | | | | | | | | |
Net investment income (loss)2 | | | 0.20 | | | | 0.23 | | | | 0.22 | | | | 0.04 | | | | 0.06 | |
Net gain (loss) on investments (realized and unrealized)6 | | | 1.13 | | | | 0.81 | | | | 3.42 | | | | (2.00 | ) | | | (1.16 | ) |
| Total from investment operations | | | 1.33 | | | | 1.04 | | | | 3.64 | | | | (1.96 | ) | | | (1.10 | ) |
| Less Distributions: | | | | | | | | | | | | | | | | | | | | |
Distributions from net investment income | | | (0.20 | ) | | | (0.22 | ) | | | (0.26 | ) | | | (0.02 | ) | | | (0.04 | ) |
Tax return of capital to shareholders | | | — | | | | — | | | | — | | | | — | | | | (0.01 | ) |
Distributions from net realized gain | | | — | | | | — | | | | — | | | | — | | | | — | |
| Total Distributions | | | (0.20 | ) | | | (0.22 | ) | | | (0.26 | ) | | | (0.02 | ) | | | (0.05 | ) |
Net asset value, end of year/period | | $ | 27.20 | | | $ | 26.07 | | | $ | 25.25 | | | $ | 21.87 | | | $ | 23.85 | |
Market price, end of year/period | | $ | 27.18 | | | $ | 26.10 | | | $ | 25.32 | | | $ | 21.79 | | | $ | 23.88 | |
Net Assets Total Return7 | | | 5.08 | % | | | 4.11 | % | | | 16.80 | % | | | -8.22 | % | | | -4.41 | %3 |
| | | | | | | | | | | | | | | | | | | | | |
| Supplemental Data: | | | | | | | | | | | | | | | | | | | | |
Net assets, end of year/period (000’s) | | $ | 61,202 | | | $ | 59,955 | | | $ | 47,983 | | | $ | 80,909 | | | $ | 121,629 | |
| Ratios to Average Net Assets: | | | | | | | | | | | | | | | | | | | | |
| Expenses before fees (waived)/recouped | | | 1.21 | % | | | 1.07 | % | | | 1.04 | % | | | 0.98 | % | | | 1.02 | %4 |
| Expenses after fees (waived)/recouped | | | 1.21 | % | | | 1.07 | % | | | 1.04 | % | | | 0.98 | % | | | 1.02 | %4 |
| Net investment income (loss) to average net assets | | | 0.74 | % | | | 0.86 | % | | | 0.94 | % | | | 0.17 | % | | | 0.27 | %4 |
Portfolio turnover rate5 | | | 477 | % | | | 553 | % | | | 320 | % | | | 493 | % | | | 296 | %3 |
1 | Fund commenced operations on August 25, 2014. The information presented is for the period from August 25, 2014 to June 30, 2015. |
2 | Calculated based on average shares outstanding during the period. |
3 | Not annualized. |
4 | Annualized. |
5 | Excludes securities received or delivered as a result of processing capital share transactions in creation units. |
6 | The amount for a share outstanding throughout the period may not be in accordance with the aggregate net realized and unrealized gain (loss) on investments for the period because of the timing of capital share transactions in relation to fluctuating market values of the Fund’s underlying securities. |
7 | Net asset value total return is calculated assuming an initial investment made at the net asset value at the beginning of the period, reinvestment of all dividends and distributions at net asset value during the period, and the redemption on the last day of the period. Net asset value total return includes adjustments in accordance with accounting principles generally accepted in the United States of America and as such, the net asset value for financial reporting purposes and the returns based upon those net asset values may differ from the net asset value and returns for shareholder transactions. |
The accompanying notes are an integral part of these financial statements.
Financial Highlights (continued)
For capital share outstanding throughout each year/period
| | | WBI BullBear Global Income ETF | |
| | | Year Ended | | | Year Ended | | | Year Ended | | | Year Ended | | | Period Ended | |
| | | June 30, 2019 | | | June 30, 2018 | | | June 30, 2017 | | | June 30, 2016 | | | June 30, 20151 | |
| Net Asset Value, Beginning of Year/Period | | $ | 23.86 | | | $ | 25.35 | | | $ | 25.18 | | | $ | 25.46 | | | $ | 25.00 | |
| Income (Loss) from Investment Operations: | | | | | | | | | | | | | | | | | | | | |
Net investment income (loss)2 | | | 0.87 | | | | 0.68 | | | | 0.38 | | | | 0.34 | | | | 0.23 | |
Net gain (loss) on investments (realized and unrealized)6 | | | 1.40 | | | | (1.47 | ) | | | 0.20 | | | | (0.23 | ) | | | 0.46 | |
| Total from investment operations | | | 2.27 | | | | (0.79 | ) | | | 0.58 | | | | 0.11 | | | | 0.69 | |
| Less Distributions: | | | | | | | | | | | | | | | | | | | | |
Distributions from net investment income | | | (0.89 | ) | | | (0.70 | ) | | | (0.41 | ) | | | (0.33 | ) | | | (0.23 | ) |
Tax return of capital to shareholders | | | — | | | | — | | | | — | | | | — | | | | — | |
Distributions from net realized gain | | | — | | | | — | | | | — | | | | (0.06 | ) | | | — | |
| Total Distributions | | | (0.89 | ) | | | (0.70 | ) | | | (0.41 | ) | | | (0.39 | ) | | | (0.23 | ) |
Net asset value, end of year/period | | $ | 25.24 | | | $ | 23.86 | | | $ | 25.35 | | | $ | 25.18 | | | $ | 25.46 | |
Market price, end of year/period | | $ | 25.20 | | | $ | 23.83 | | | $ | 25.38 | | | $ | 25.16 | | | $ | 25.48 | |
Net Assets Total Return7 | | | 9.75 | % | | | -3.20 | % | | | 2.36 | % | | | 0.45 | % | | | 2.77 | %3 |
| | | | | | | | | | | | | | | | | | | | | |
| Supplemental Data: | | | | | | | | | | | | | | | | | | | | |
Net assets, end of year/period (000’s) | | $ | 136,288 | | | $ | 96,626 | | | $ | 162,243 | | | $ | 396,558 | | | $ | 308,062 | |
| Ratios to Average Net Assets: | | | | | | | | | | | | | | | | | | | | |
| Expenses before fees (waived)/recouped | | | 0.99 | % | | | 1.02 | % | | | 1.00 | % | | | 0.95 | % | | | 0.99 | %4 |
| Expenses after fees (waived)/recouped | | | 0.99 | % | | | 1.02 | % | | | 1.00 | % | | | 0.95 | % | | | 0.99 | %4 |
| Net investment income (loss) to average net assets | | | 3.60 | % | | | 2.71 | % | | | 1.53 | % | | | 1.35 | % | | | 1.08 | %4 |
Portfolio turnover rate5 | | | 686 | % | | | 551 | % | | | 479 | % | | | 364 | % | | | 308 | %3 |
| | | | | | | | | | | | WBI BullBear | |
| | | | | | | | | | | | Trend Switch US | |
| | | WBI Power Factor™ High Dividend ETF | | | 3000 Total Return ETF | |
| | | Year Ended | | | Year Ended | | | Period Ended | | | Period Ended | |
| | | June 30, 2019 | | | June 30, 2018 | | | June 30, 20178 | | | June 30, 20199 | |
| Net Asset Value, Beginning of Year/Period | | $ | 26.87 | | | $ | 24.22 | | | $ | 25.00 | | | $ | 20.00 | |
| Income (Loss) from Investment Operations: | | | | | | | | | | | | | | | | |
Net investment income (loss)2 | | | 1.12 | | | | 1.21 | | | | 0.53 | | | | 0.02 | |
Net gain (loss) on investments (realized and unrealized)6 | | | (2.08 | ) | | | 3.19 | | | | (0.94 | ) | | | 0.67 | |
| Total from investment operations | | | (0.96 | ) | | | 4.40 | | | | (0.41 | ) | | | 0.69 | |
| Less Distributions: | | | | | | | | | | | | | | | | |
Distributions from net investment income | | | (1.13 | ) | | | (1.15 | ) | | | (0.37 | ) | | | (0.02 | ) |
Tax return of capital to shareholders | | | — | | | | — | | | | — | | | | — | |
Distributions from net realized gain | | | (0.22 | ) | | | (0.60 | ) | | | — | | | | — | |
| Total Distributions | | | (1.35 | ) | | | (1.75 | ) | | | (0.37 | ) | | | (0.02 | ) |
Net asset value, end of period/year | | $ | 24.56 | | | $ | 26.87 | | | $ | 24.22 | | | $ | 20.67 | |
Market price, end of period/year | | $ | 24.53 | | | $ | 26.87 | | | $ | 24.34 | | | $ | 20.69 | |
Net Assets Total Return7 | | | -3.25 | % | | | 18.51 | % | | | -1.64 | %3 | | | 3.45 | %3 |
| | | | | | | | | | | | | | | | | |
| Supplemental Data: | | | | | | | | | | | | | | | | |
Net assets, end of period/year (000’s) | | $ | 103,160 | | | $ | 52,402 | | | $ | 33,903 | | | $ | 47,030 | |
| Ratios to Average Net Assets: | | | | | | | | | | | | | | | | |
| Expenses before fees (waived)/recouped | | | 0.70 | % | | | 0.85 | % | | | 1.37 | %4 | | | 0.06 | %4 |
| Expenses after fees (waived)/recouped | | | 0.70 | % | | | 0.70 | % | | | 0.70 | %4 | | | 0.06 | %4 |
| Net investment income (loss) to average net assets | | | 4.46 | % | | | 4.73 | % | | | 3.81 | %4 | | | 0.10 | %4 |
Portfolio turnover rate5 | | | 163 | % | | | 171 | % | | | 78 | %3 | | | 126 | %3 |
1 | Fund commenced operations on August 25, 2014. The information presented is for the period from August 25, 2014 to June 30, 2015. |
2 | Calculated based on average shares outstanding during the period. |
3 | Not annualized. |
4 | Annualized. |
5 | Excludes securities received or delivered as a result of processing capital share transactions in creation units. |
6 | The amount for a share outstanding throughout the period may not be in accordance with the aggregate net realized and unrealized gain (loss) on investments for the period because of the timing of capital share transactions in relation to fluctuating market values of the Fund’s underlying securities. |
7 | Net asset value total return is calculated assuming an initial investment made at the net asset value at the beginning of the period, reinvestment of all dividends and distributions at net asset value during the period, and the redemption on the last day of the period. Net asset value total return includes adjustments in accordance with accounting principles generally accepted in the United States of America and as such, the net asset value for financial reporting purposes and the returns based upon those net asset values may differ from the net asset value and returns for shareholder transactions. |
8 | Fund commenced operations on December 19, 2016. The information presented is for the period from December 19, 2016 to June 30, 2017. |
9 | Fund commenced operations on May 28, 2019. The information presented is for the period from May 28, 2019 to June 30, 2019. |
The accompanying notes are an integral part of these financial statements.
Notes to Financial Statements
June 30, 2019
NOTE 1 — ORGANIZATION
Absolute Shares Trust (the “Trust”) was organized as a Delaware statutory trust on November 7, 2013 and is authorized to have multiple segregated series or portfolios. The Trust is an open-end management investment company registered under the Investment Company Act of 1940 (the “1940 Act”). The Trust currently consists of the following eleven separate investment portfolios (each, a “Fund” or, individually and, together, the “Funds”):
WBI BullBear Rising Income 2000 ETF
WBI BullBear Value 2000 ETF
WBI BullBear Yield 2000 ETF
WBI BullBear Quality 2000 ETF
WBI BullBear Rising Income 1000 ETF
WBI BullBear Value 1000 ETF
WBI BullBear Yield 1000 ETF
WBI BullBear Quality 1000 ETF
WBI BullBear Global Income ETF
WBI Power Factor™ High Dividend ETF
WBI BullBear Trend Switch US 3000 Total Return ETF
Each Fund is classified as a diversified.
The Funds’ investment advisor, Millington Securities, Inc. (“Advisor” or “Affiliated Broker Dealer”), has selected its affiliate, WBI Investments, Inc. (“Sub-Advisor”), to act as Sub-Advisor. Both the Advisor and Sub-Advisor are registered as investment advisors with the Securities and Exchange Commission (“SEC”). The Advisor is also registered as a broker-dealer with the SEC and is a member of the Financial Industry Regulatory Authority. The Board of Trustees (the “Board” and each member a “Trustee”) supervises the conduct of the Funds.
The end of the reporting period for the Funds is June 30, 2019, and the period covered by these Notes to Financial Statements is the fiscal year or period ended June 30, 2019 (the “current fiscal period”).
NOTE 2 — SIGNIFICANT ACCOUNTING POLICIES
The following is a summary of significant accounting policies consistently followed by the Funds. The financial statements are prepared in accordance with accounting principles generally accepted in the United States of America (“U.S. GAAP”) and are stated in U.S. dollars. The Funds are investment companies and accordingly follow the investment company accounting and reporting guidance for the Financial Accounting Standards Board (“FASB”) Accounting Standards Codification Topic 946 Financial Services – Investment Companies.
The preparation of the financial statements in accordance with U.S. GAAP requires management to make estimates and assumptions that affect the reported amount of assets, liabilities and the disclosure of contingent assets and liabilities at the end of the current fiscal period. Actual results could differ from these estimates.
A. Valuation. All equity securities, including domestic common stocks, preferred stocks, exchange traded funds and exchange traded notes, that are traded on a national securities exchange, except those listed on the Nasdaq Global Market®, Nasdaq Select Market® and Nasdaq Capital Market® (collectively, “Nasdaq”) are valued at the last reported sale price on the exchange on which the security is principally traded. Securities traded on Nasdaq are valued at the Nasdaq Official Closing Price (“NOCP”). If, on a particular day, an exchange-traded or Nasdaq security does not trade, then the mean between the most recent quoted bid and asked prices is used. All equity securities that are not traded on a listed exchange are valued at the last sale price in the over-the-counter market. If a non-exchange traded security does not trade on a particular day, then the mean between the last quoted closing bid and asked price is used.
Investments in mutual funds, including money market funds, are valued at their net asset value (“NAV”) per share.
Shares in privately offered liquidity funds are valued at their NAV per share.
Short-term securities that have maturities of less than 60 days at the time of purchase are valued at amortized cost, which, when combined with accrued interest, approximates fair value.
Securities for which quotations are not readily available are valued by the Trust’s valuation committee based on the valuation procedures adopted by the Board (the “Valuation Procedures”) and information it receives from the Sub-Advisor and U.S. Bancorp Fund Services, LLC (“Fund Services”). When a security is “fair valued”, consideration is given to the facts and circumstances relevant to the particular situation, including a review of various factors set forth in the Valuation Procedures. The use of fair value pricing by the Funds may cause the NAV of their shares to differ significantly from the NAV that would be calculated without regard to such considerations.
Notes to Financial Statements (continued)
June 30, 2019
As described above, the Funds utilize various methods to measure the fair value of their investments on a recurring basis. U.S. GAAP establishes a hierarchy that prioritizes inputs to valuations methods. The three levels of inputs are:
Level 1 — Unadjusted quoted prices in active markets for identical assets or liabilities that the Funds have the ability to access. |
Level 2 — Observable inputs other than quoted prices included in Level 1 that are observable for the asset or liability, either directly or indirectly. These inputs may include quoted prices for the identical instrument on an inactive market, prices for similar instruments, interest rates, prepayment speeds, credit risk, yield curves, default rates and similar data. |
Level 3 — Unobservable inputs for the asset or liability, to the extent relevant observable inputs are not available; including the Funds’ Valuation Committee’s assumptions used in determining the fair value of investments. The availability of observable inputs can vary from security to security and is affected by a wide variety of factors, including, for example, the type of security, whether the security is new and not yet established in the marketplace, the liquidity of markets, and other characteristics particular to the security. To the extent that valuation is based on models or inputs that are less observable or unobservable in the market, the determination of fair value requires more judgment. Accordingly, the degree of judgment exercised in determining fair value is greatest for instruments categorized in Level 3. |
The inputs used to measure fair value may fall into different levels of the fair value hierarchy. In such cases, for disclosure purposes, the level in the fair value hierarchy within which the fair value measurement falls in its entirety, is determined based on the lowest level input that is significant to the fair value measurement in its entirety.
The following is a summary of the inputs used to value the Funds’ investments as of the end of the current fiscal period:
| WBI BullBear Rising Income 2000 ETF | | | | | | | | | | | | |
Assets^ | | Level 1 | | | Level 2 | | | Level 3 | | | Total | |
Common Stocks | | $ | 12,746,380 | | | $ | — | | | $ | — | | | $ | 12,746,380 | |
Short-Term Investments | | | — | | | | 719,726 | | | | — | | | | 719,726 | |
Investments Purchased With Proceeds From Securities Lending | | | — | | | | 4,421,748 | | | | — | | | | 4,421,748 | |
Total Investments in Securities, at value | | $ | 12,746,380 | | | $ | 5,141,474 | | | $ | — | | | $ | 17,887,854 | |
| | | | | | | | | | | | | | | | | |
| WBI BullBear Value 2000 ETF | | | | | | | | | | | | | | | | |
Assets^ | | Level 1 | | | Level 2 | | | Level 3 | | | Total | |
Common Stocks | | $ | 26,632,918 | | | $ | — | | | $ | — | | | $ | 26,632,918 | |
Short-Term Investments | | | — | | | | 1,427,770 | | | | — | | | | 1,427,770 | |
Investments Purchased With Proceeds From Securities Lending | | | — | | | | 4,707,196 | | | | — | | | | 4,707,196 | |
Total Investments in Securities, at value | | $ | 26,632,918 | | | $ | 6,134,966 | | | $ | — | | | $ | 32,767,884 | |
| | | | | | | | | | | | | | | | | |
| WBI BullBear Yield 2000 ETF | | | | | | | | | | | | | | | | |
Assets^ | | Level 1 | | | Level 2 | | | Level 3 | | | Total | |
Common Stocks | | $ | 28,712,473 | | | $ | — | | | $ | — | | | $ | 28,712,473 | |
Short-Term Investments | | | — | | | | 7,567,963 | | | | — | | | | 7,567,963 | |
Investments Purchased With Proceeds From Securities Lending | | | — | | | | 7,851,481 | | | | — | | | | 7,851,481 | |
Total Investments in Securities, at value | | $ | 28,712,473 | | | $ | 15,419,444 | | | $ | — | | | $ | 44,131,917 | |
| | | | | | | | | | | | | | | | | |
| WBI BullBear Quality 2000 ETF | | | | | | | | | | | | | | | | |
Assets^ | | Level 1 | | | Level 2 | | | Level 3 | | | Total | |
Common Stocks | | $ | 9,045,770 | | | $ | — | | | $ | — | | | $ | 9,045,770 | |
Short-Term Investments | | | — | | | | 507,580 | | | | — | | | | 507,580 | |
Investments Purchased With Proceeds From Securities Lending | | | — | | | | 2,297,700 | | | | — | | | | 2,297,700 | |
Total Investments in Securities, at value | | $ | 9,045,770 | | | $ | 2,805,280 | | | $ | — | | | $ | 11,851,050 | |
| | | | | | | | | | | | | | | | | |
| WBI BullBear Rising Income 1000 ETF | | | | | | | | | | | | | | | | |
Assets^ | | Level 1 | | | Level 2 | | | Level 3 | | | Total | |
Common Stocks | | $ | 54,111,794 | | | $ | — | | | $ | — | | | $ | 54,111,794 | |
Short-Term Investments | | | — | | | | 5,023,329 | | | | — | | | | 5,023,329 | |
Investments Purchased With Proceeds From Securities Lending | | | — | | | | 9,896,761 | | | | — | | | | 9,896,761 | |
Total Investments in Securities, at value | | $ | 54,111,794 | | | $ | 14,920,090 | | | $ | — | | | $ | 69,031,884 | |
| | | | | | | | | | | | | | | | | |
| WBI BullBear Value 1000 ETF | | | | | | | | | | | | | | | | |
Assets^ | | Level 1 | | | Level 2 | | | Level 3 | | | Total | |
Common Stocks | | $ | 44,626,720 | | | $ | — | | | $ | — | | | $ | 44,626,720 | |
Short-Term Investments | | | — | | | | 2,279,765 | | | | — | | | | 2,279,765 | |
Investments Purchased With Proceeds From Securities Lending | | | — | | | | 15,255,216 | | | | — | | | | 15,255,216 | |
Total Investments in Securities, at value | | $ | 44,626,720 | | | $ | 17,534,981 | | | $ | — | | | $ | 62,161,701 | |
Notes to Financial Statements (continued)
June 30, 2019
| WBI BullBear Yield 1000 ETF | | | | | | | | | | | | |
Assets^ | | Level 1 | | | Level 2 | | | Level 3 | | | Total | |
Common Stocks | | $ | 63,336,117 | | | $ | — | | | $ | — | | | $ | 63,336,117 | |
Short-Term Investments | | | — | | | | 10,149,778 | | | | — | | | | 10,149,778 | |
Investments Purchased With Proceeds From Securities Lending | | | — | | | | 10,439,624 | | | | — | | | | 10,439,624 | |
Total Investments in Securities, at value | | $ | 63,336,117 | | | $ | 20,589,402 | | | $ | — | | | $ | 83,925,519 | |
| | | | | | | | | | | | | | | | | |
| WBI BullBear Quality 1000 ETF | | | | | | | | | | | | | | | | |
Assets^ | | Level 1 | | | Level 2 | | | Level 3 | | | Total | |
Common Stocks | | $ | 55,233,404 | | | $ | — | | | $ | — | | | $ | 55,233,404 | |
Short-Term Investments | | | — | | | | 640,348 | | | | — | | | | 640,348 | |
Investments Purchased With Proceeds From Securities Lending | | | — | | | | 14,275,417 | | | | — | | | | 14,275,417 | |
Total Investments in Securities, at value | | $ | 55,233,404 | | | $ | 14,915,765 | | | $ | — | | | $ | 70,149,169 | |
| | | | | | | | | | | | | | | | | |
| WBI BullBear Global Income ETF | | | | | | | | | | | | | | | | |
Assets^ | | Level 1 | | | Level 2 | | | Level 3 | | | Total | |
Exchange Traded Funds | | $ | 135,327,785 | | | $ | — | | | $ | — | | | $ | 135,327,785 | |
Short-Term Investments | | | — | | | | 1,077,691 | | | | — | | | | 1,077,691 | |
Investments Purchased With Proceeds From Securities Lending | | | — | | | | 9,491,696 | | | | — | | | | 9,491,696 | |
Total Investments in Securities, at value | | $ | 135,327,785 | | | $ | 10,569,387 | | | $ | — | | | $ | 145,897,172 | |
| | | | | | | | | | | | | | | | | |
WBI Power Factor™ High Dividend ETF | | | | | | | | | | | | | | | | |
Assets^ | | Level 1 | | | Level 2 | | | Level 3 | | | Total | |
Common Stocks | | $ | 102,454,685 | | | $ | — | | | $ | — | | | $ | 102,454,685 | |
Short-Term Investments | | | — | | | | 473,335 | | | | — | | | | 473,335 | |
Investments Purchased With Proceeds From Securities Lending | | | — | | | | 16,817,874 | | | | — | | | | 16,817,874 | |
Total Investments in Securities, at value | | $ | 102,454,685 | | | $ | 17,291,209 | | | $ | — | | | $ | 119,745,894 | |
| | | | | | | | | | | | | | | | | |
| WBI BullBear Trend Switch US 3000 Total Return ETF | | | | | | | | | | | | | | | | |
Assets^ | | Level 1 | | | Level 2 | | | Level 3 | | | Total | |
Exchange Traded Funds | | $ | 46,533,609 | | | $ | — | | | $ | — | | | $ | 46,533,609 | |
Short-Term Investments | | | — | | | | 517,881 | | | | — | | | | 517,881 | |
Total Investments in Securities, at value | | $ | 46,533,609 | | | $ | 517,881 | | | $ | — | | | $ | 47,051,490 | |
^ See Schedules of Investments for breakout of investments by industry group classification.
As of the end of the reporting period, the Funds did not recognize any transfers to or from Level 3.
B. Certain Risks. Some risks apply to all Funds, while others are specific to the investment strategy of certain Funds. Each Fund may be subject to other risks in addition to these identified risks. This section discusses certain common principal risks encountered by the Funds. The shares of the Funds are referred to herein as “Fund Shares” or “Shares”.
ETF and Other Investment Companies Risk — When a Fund invests in another ETF or other investment company (e.g., mutual fund, closed-end fund, business development company), it will bear additional expenses based on its pro rata share of such investment company’s operating expenses, including the potential duplication of management fees. The risk of owning an ETF or other investment company generally reflects the risks of owning the underlying securities and other assets held by the ETF or other investment company. A Fund also will incur brokerage costs when it purchases ETFs and other exchange-listed investment companies. Additionally, a Fund will be indirectly exposed to the risks of the portfolio assets held by an ETF or other investment company, including but not limited to those of ETNs, equity options, derivatives, currencies, index, leverage, and replication management.
Market Risk — Either the stock market as a whole or the value of a Fund asset or an investment held by an exchange-traded product (“ETP”) in which a Fund invests may go down, resulting in a decrease in the NAV of the Fund or its Shares or a decrease in the market price of the Shares.
Equity Securities Risk — Common stocks are susceptible to general stock market fluctuations and to volatile increases and decreases in value as market confidence in and perceptions of their issuers change. If a Fund or an ETP holds common stock equivalents of any given issuer, the Fund or ETP will generally be exposed to greater risk than if the Fund or ETP held preferred stocks and debt obligations of such issuer.
Foreign and Emerging Market Securities Risk — Foreign investments may carry risks associated with investing outside the United States, such as currency fluctuation, economic or financial instability, lack of timely or reliable financial information, or unfavorable political or legal developments. Foreign securities can be more volatile than domestic (U.S.) securities. Securities markets of other countries are generally smaller than U.S. securities markets. Many foreign securities may also be less liquid than U.S. securities,
Notes to Financial Statements (continued)
June 30, 2019
which could affect the Funds’ investments. Investments in emerging markets may have more risk because the markets are less developed and less liquid as well as being subject to increased economic, political, regulatory, or other uncertainties. Also, as foreign and emerging markets decline, investors tend to exit these markets in unison.
Fluctuation of Net Asset Value — The NAV of the Shares will fluctuate with changes in market value of the Funds’ holdings.
Shares are Not Individually Redeemable — Shares are only redeemable by the Funds at NAV if they are tendered in large blocks known as “Creation Units” which are expected to be worth in excess of $1 million each. Only Authorized Participants (“APs”) may engage in such creation and redemption transactions directly with the Funds. Individual Shares may be sold on a stock exchange at their current market prices, which may be less, more, or equal to their NAV. There can be no assurance that an active trading market will be maintained for the Shares.
C. Federal Income Taxes. The Funds’ policy is to comply with the provisions of Subchapter M of the Internal Revenue Code of 1986, as amended, applicable to regulated investment companies and to distribute substantially all of their net investment income and net capital gains to shareholders. Therefore, no federal income tax provision is required. The Funds plan to file U.S. Federal and various state and local tax returns.
Each Fund recognizes the tax benefits of uncertain tax positions only when the position is more likely than not to be sustained. Management has analyzed each Fund’s uncertain tax positions and concluded that no liability for unrecognized tax benefits should be recorded related to uncertain tax positions. Management is not aware of any tax positions for which it is reasonably possible that the total amounts of unrecognized tax benefits will change materially in the next 12 months. Income and capital gain distributions are determined in accordance with federal income tax regulations, which may differ from U.S. GAAP. These timing differences are primarily due to differing book and tax treatments for in-kind transactions and losses deferred due to wash sales.
Net capital losses incurred after October 31, 2018, and within the taxable year are deemed to arise on the first business day of each Fund’s next taxable year. As of June 30, 2019, the funds deferred, on a tax basis no late year losses, except for WBI Power Factor™ High Dividend ETF that deferred $5,782,198.
As of June 30, 2019, the Funds had the following capital loss carryforwards available for federal income tax purposes, with an indefinite expiration:
| | Short-Term | Long-Term |
WBI BullBear Rising Income 2000 ETF | $24,919,991 | $ — |
WBI BullBear Value 2000 ETF | 15,517,714 | — |
WBI BullBear Yield 2000 ETF | 37,663,769 | — |
WBI BullBear Quality 2000 ETF | 20,620,224 | — |
WBI BullBear Rising Income 1000 ETF | 17,885,556 | — |
WBI BullBear Value 1000 ETF | 3,433,673 | 642 |
WBI BullBear Yield 1000 ETF | 21,139,629 | — |
WBI BullBear Quality 1000 ETF | 10,840,526 | — |
WBI BullBear Global Income ETF | 6,357,538 | — |
WBI Power Factor™ High Dividend ETF | — | — |
WBI BullBear Trend Switch US 3000 Total Return ETF | — | — |
D. Security Transactions and Investment Income. Investment securities transactions are accounted for on the trade date. Gains and losses realized on sales of securities are determined on a specific identification basis. Dividend income is recorded on the ex-dividend date, net of any foreign taxes withheld at source. Interest income is recorded on an accrual basis. Withholding taxes on foreign dividends have been provided for in accordance with the Funds’ understanding of the applicable tax rules and regulations. Premiums and discounts are amortized/accreted using the effective interest method over the lives of the respective debt instruments.
E. Distributions to Shareholders. Distributions to shareholders from net investment income are declared and paid by WBI BullBear Rising Income 2000 ETF, WBI BullBear Value 2000 ETF, WBI BullBear Quality 2000 ETF, WBI BullBear Rising Income 1000 ETF, WBI BullBear Value 1000 ETF, WBI BullBear Quality 1000 ETF, WBI Power Factor™ High Dividend ETF, and WBI BullBear Trend Switch US 3000 Total Return ETF on a quarterly basis. Distributions to shareholders from net investment income are declared and paid by WBI BullBear Yield 2000 ETF, WBI BullBear Yield 1000 ETF, and WBI BullBear Global Income ETF on a monthly basis. Distributions from net realized gains on securities are normally declared and paid by all Funds on an annual basis. Distributions are recorded on the ex-dividend date.
F. Share Valuation. The NAV per share of each Fund is calculated by dividing the sum of the value of the securities held by the Fund, plus cash and other assets, minus all liabilities (including estimated accrued expenses) by the total number of shares outstanding for the Fund, rounded to the nearest cent. The Funds’ shares will not be priced on the days on which the NYSE ARCA, Inc., the exchange where the Funds’ shares are listed, is closed for trading. The offering and redemption price per share for each Fund is equal to the Fund’s NAV per share.
Notes to Financial Statements (continued)
June 30, 2019
G. Guarantees and Indemnifications. The Funds’ officers and trustees are indemnified against certain liabilities that may arise out of the performance of their duties to the Funds. Additionally, in the normal course of business the Funds enter into contracts with service providers that contain general indemnification clauses. Each Fund’s maximum exposure under these arrangements is unknown as this would involve future claims that may be against the Fund that have not yet occurred.
H. Reclassification of Capital Accounts. U.S. GAAP requires that certain components of net assets relating to permanent differences be reclassified between financial and tax reporting. These reclassifications have no effect on net assets or net asset value per share. As of the current fiscal period, the following table shows the reclassifications made:
| | Distributable Earnings | |
| | (Accumulated Deficit) | Paid In Capital |
WBI BullBear Rising Income 2000 ETF | $ (884,695) | $ 884,695 |
WBI BullBear Value 2000 ETF | (494,695) | 494,695 |
WBI BullBear Yield 2000 ETF | (167,026) | 167,026 |
WBI BullBear Quality 2000 ETF | (920,702) | 920,702 |
WBI BullBear Rising Income 1000 ETF | (2,871,981) | 2,871,981 |
WBI BullBear Value 1000 ETF | (1,929,847) | 1,929,847 |
WBI BullBear Yield 1000 ETF | (1,081,023) | 1,081,023 |
WBI BullBear Quality 1000 ETF | (2,019,804) | 2,019,804 |
WBI BullBear Global Income ETF | (480,487) | 480,487 |
WBI Power FactorTM High Dividend ETF | 3,790,258 | (3,790,258) |
WBI BullBear Trend Switch US 3000 Total Return ETF | — | — |
During the year/period ended June 30, 2019, the Funds realized capital gains resulting from in-kind redemptions, in which shareholders exchanged Fund Shares for securities held by a Fund rather than for cash. Because the gains are not taxable to the Funds, and are not distributed to shareholders, they have been reclassified from accumulated net realized gains/losses to paid-in capital. The following table shows the impact to each Fund:
WBI BullBear Rising Income 2000 ETF | $ 954,992 | |
WBI BullBear Value 2000 ETF | 502,174 | |
WBI BullBear Yield 2000 ETF | 369,503 | |
WBI BullBear Quality 2000 ETF | 957,388 | |
WBI BullBear Rising Income 1000 ETF | 2,899,294 | |
WBI BullBear Value 1000 ETF | 1,936,816 | |
WBI BullBear Yield 1000 ETF | 1,217,885 | |
WBI BullBear Quality 1000 ETF | 2,046,601 | |
WBI BullBear Global Income ETF | 523,607 | |
WBI Power Factor™ High Dividend ETF | (2,914,343) | |
WBI BullBear Trend Switch US 3000 Total Return ETF | — | |
I. Expenses. Expenses directly attributable to a Fund are charged directly to the Fund, while expenses which are attributable to the Fund and other investment companies advised by the Adviser are allocated among the respective investment companies, including the Fund, based either upon relative average net assets or evenly among the Funds.
J. Subsequent Events. In preparing these financial statements, the Advisor has evaluated events and transactions for potential recognition or disclosure through the date the financial statements were available to be issued. On July 18, 2019, the Advisor launched a new Fund in the Trust, WBI BullBear Trend Switch US Total Return ETF (ticker WBIN). On July 31, 2019, the Board of Trustees (the “Board”) of the Trust approved a plan of reorganization pursuant to which (1) each “Acquired Fund” will be reorganized into the “Acquiring Fund”, as identified in the table below; and (2) subsequent to this reorganization each Acquired Fund will be dissolved, effective on or about October 25, 2019. The reorganization, which is expected to be tax free to the shareholders of the Acquired Funds and is subject to customary closing conditions, will be effected by transferring of all of the assets and liabilities of the Acquired Funds to the respective Acquiring Fund, in exchange for shares of the Acquiring Fund.
| Acquired Fund | Acquiring Fund | Acquiring Fund (Former Name) |
| WBI BullBear Rising | WBI BullBear Rising | |
| Income 2000 ETF (WBIA) | Income 3000 ETF (WBIE) | WBI BullBear Rising Income 1000 ETF |
| WBI BullBear Value 2000 ETF (WBIB) | WBI BullBear Value 3000 ETF (WBIF) | WBI BullBear Value 1000 ETF |
| WBI BullBear Yield 2000 ETF (WBIC) | WBI BullBear Yield 3000 ETF (WBIG) | WBI BullBear Yield 1000 ETF |
| WBI BullBear Quality 2000 ETF (WBID) | WBI BullBear Quality 3000 ETF (WBIL) | WBI BullBear Quality 1000 ETF |
In preparing these financial statements, the Trust has evaluated events and transactions for potential recognition or disclosure resulting from subsequent events after the Statements of Assets and Liabilities date of June 30, 2019 through the date the financial statements were available for issue. This evaluation did not result in any subsequent events, other than those noted above, that necessitated
Notes to Financial Statements (continued)
June 30, 2019
disclosure and/or adjustments. There were no other events or transactions that occurred during the period subsequent to June 30, 2019, that materially impacted that amounts or disclosures in the Funds financial statements.
K. New Accounting Pronouncements and Other Matters. In August 2018, FASB issued ASU 2018-13, Fair Value Measurement (Topic 820): Disclosure Framework—Changes to the Disclosure Requirements for Fair Value Measurement (“ASU 2018-13”). The primary focus of ASU 2018-13 is to improve the effectiveness of the disclosure requirements for fair value measurements. The changes affect all companies that are required to include fair value measurement disclosures. In general, the amendments in ASU 2018-13 are effective for all entities for fiscal years and interim periods within those fiscal years, beginning after December 15, 2019. An entity is permitted to early adopt the removed or modified disclosures upon the issuance of ASU 2018-13 and may delay adoption of the additional disclosures, which are required for public companies only, until their effective date. Management has evaluated ASU 2018-13 and has adopted the disclosure framework.
NOTE 3 — MANAGEMENT FEE
Pursuant to an investment advisory agreement (“Advisory Agreement”) between the Trust, on behalf of the Funds, and the Advisor, the Advisor serves as the investment advisor, makes investment decisions for each Fund, and manages the investment portfolios of the Funds, subject to the supervision of and policies of the Board. Under the Advisory Agreement for the Funds the Advisor may retain an investment sub-advisor for the Funds, subject to approval by the Board and Fund shareholders. Under a sub-advisory agreement, (“Sub-Advisory Agreement”) the Sub-Advisor serves as the investment sub-advisor and is responsible for the day to day management of the Funds, subject to the supervision of the Advisor and the Board. For the services the Sub-Advisor provides to each Fund, the Sub-Advisor receives a fee that is equal to 0.85% per year of the average daily net assets (calculated daily and paid monthly) of WBI BullBear Rising Income 2000 ETF, WBI BullBear Value 2000 ETF, WBI BullBear Yield 2000 ETF, WBI BullBear Quality 2000 ETF, WBI BullBear Rising Income 1000 ETF, WBI BullBear Value 1000 ETF, WBI BullBear Yield 1000 ETF, WBI BullBear Quality 1000 ETF, and WBI BullBear Global Income ETF. For the services the Sub-Advisor provides to WBI Power FactorTM High Dividend ETF, the Sub-Advisor receives a fee that is equal to 0.55% per year of average daily net assets, which is calculated daily and paid monthly. The Advisor is paid 0.04% of each Fund’s average daily net assets (calculated daily and paid monthly) from the management fees collected by the Sub-Advisor.
Separately, under the Advisory Agreement, for the WBI BullBear Trend Switch US 3000 Total Return ETF (the “Fund”), the Advisor has agreed to pay or will cause its affiliated Sub-Advisor to pay, all of the expenses of the Fund, except for: the fee payment under the Advisory Agreement, payments under the Fund’s 12b-1 plan, brokerage expenses, acquired fund fees and expenses, taxes, interest (including borrowing costs and dividend expenses on securities sold short), compensation and expenses of the independent Trustees (including independent Trustee counsel fees), litigation expenses and other extraordinary expenses (including litigation to which the Trust or a Fund may be a party and indemnification of the Trustees and officers with respect thereto). For the services the Sub-Advisor provides to the Fund, the Sub-Advisor receives a fee that is equal to 0.65% per year of the average daily net assets of the Fund which is calculated daily and paid monthly. The Advisor is paid 0.04% of the Fund's average daily net assets (calculated daily and paid monthly) from the management fees collected by the Sub-Advisor.
NOTE 4 — PORTFOLIO TRANSACTIONS AND BROKERAGE
Pursuant to the Sub-Advisory Agreement, the Sub-Advisor determines which securities are to be purchased and sold by the Funds and which broker-dealers are eligible to execute the Funds’ portfolio transactions. The Sub-Advisor typically determines to execute portfolio transactions through the Advisor in its capacity as a registered broker-dealer. For the current fiscal period, the Funds paid the Affiliated Broker Dealer, $0 for brokerage commissions. However, the Affiliated Broker Dealer did receive indirect compensation in the form of payment for order flow (“PFOF”). PFOF is compensation that the Affiliated Broker Dealer receives for providing liquidity to certain market destinations related to the Sub-Advisor’s customer orders routed to these market destinations.
NOTE 5 — EXPENSE LIMITATION AND REIMBURSEMENT
The Sub-Advisor has entered into an Expense Limitation Agreement (an “Agreement”) with the Trust to waive the fees and reimburse expenses of each Fund until at least October 31, 2020 (the “Expiration Date”) so that the total operating expenses (exclusive of interest, taxes, brokerage commissions, acquired fund fees, dividend payments on short sales, other expenditures which are capitalized in accordance with U.S. GAAP, other extraordinary expenses not incurred in the ordinary course of the Fund's business, and amounts, if any, payable pursuant to a plan adopted in accordance with Rule 12b-1 under the Investment Company Act of 1940) and organizational costs (the “Operating Expenses”) of WBI Power Factor™ High Dividend ETF is limited to 0.70% and WBI BullBear Rising Income 2000 ETF, WBI BullBear Value 2000 ETF, WBI BullBear Yield 2000 ETF, WBI BullBear Quality 2000 ETF, WBI BullBear Rising Income 1000 ETF, WBI BullBear Value 1000 ETF, WBI BullBear Yield 1000 ETF, WBI BullBear Quality 1000 ETF, and WBI BullBear Global Income ETF is limited to 1.25% of average net assets (the “Expense Caps”). The Sub-Advisor may discontinue its obligations under the Agreements at any time in its sole discretion after the Expiration Date. The Funds have agreed to repay the amounts borne by the Sub-Advisor under the Agreements within the three year period after the Sub-Advisor bears the expense, when and if requested by the Sub-Advisor, to the extent the Operating Expenses of the Funds are less than the lower of the
Notes to Financial Statements (continued)
June 30, 2019
Expense Cap and any expense limitation agreement then in effect with respect to the Operating Expenses. The repayment may not raise the level of Operating Expenses of the Funds in the month of repayment to exceed the Expense Cap.
The following table shows the remaining waived and/or reimbursed expenses subject to potential recovery during the current fiscal period. The Sub-Advisor may recapture a portion of the unreimbursed amounts no later than the dates stated:
| | | Expiration | |
| | | June 30, 2020 | | | June 30, 2021 | | | June 30, 2022 | |
WBI BullBear Value 2000 ETF | | $ | — | | | $ | — | | | $ | 7,663 | |
WBI BullBear Quality 2000 ETF | | | — | | | | — | | | | 25,309 | |
WBI Power Factor™ High Dividend ETF | | | 57,852 | | | | 71,269 | | | | 17,864 | |
During the year ended June 30, 2019, the Sub-Advisor recouped the amounts shown from the following Funds:
| | | Amount | | |
WBI BullBear Value 2000 ETF | | $ | — | | |
WBI BullBear Quality 2000 ETF | | | — | | |
WBI Power Factor™ High Dividend ETF | | | 12,987 | | |
The Funds must pay their current ordinary operating expense before the Sub-Advisor is entitled to any reimbursement of fees and/or expenses. Any such reimbursement is also contingent upon the Board of Trustees’ review and approval.
NOTE 6 — COMPLIANCE AND ADMINISTRATION SERVICING AGREEMENTS
The Trust has entered into an agreement with Foreside Compliance Services, LLC (“Foreside”), whereby Foreside agrees to provide a Chief Compliance Officer (“CCO”), as described in Rule 38a-1 of the 1940 Act.
U.S. Bancorp Fund Services, LLC, doing business as U.S. Bank Global Fund Services (the “Administrator”) serves as the independent administrator and U.S. Bank National Association (the “Custodian”) serves as the custodian to the Funds. Under the Fund Administration Servicing, Fund Accounting Servicing, and Transfer Agent Servicing Agreements, the Administrator is responsible for keeping financial books and records of the Funds and generally managing the administrative affairs and transfer agency services.
NOTE 7 — SECURITIES LENDING
The Funds may lend up to 331⁄3% of the value of the securities in their portfolios to brokers, dealers and financial institutions (but not individuals) under terms of participation in a securities lending program administered by U.S Bank N.A (“the Custodian” and “Securities Lending Agent”). The securities lending agreement requires that loans are collateralized at all times in an amount equal to at least 102% of the value of any loaned securities at the time of the loan, plus accrued interest, except in the case of loans of foreign securities which are denominated and payable in U.S. dollars and shall be collateralized in the amount equal to 105% of the value of any loaned securities at the time of the loan plus accrued interest. The Funds receive compensation in the form of fees and earn interest on the cash collateral. The amount of fees depends on a number of factors including the type of security and length of the loan. The Funds continue to receive interest payments or dividends on the securities loaned during the borrowing period. Gain or loss in the fair value of securities loaned that may occur during the term of the loan will be for the account of the Funds. The Funds have the right under the terms of the securities lending agreement to recall the securities from the borrower on demand. During the current fiscal period, Funds had loaned securities that were collateralized by cash equivalents. The cash collateral is invested by the Custodian in accordance with approved investment guidelines. Those guidelines require the cash collateral to be invested in readily marketable, high quality, short-term obligations; however, such investments are subject to risk of payment delays or default on the part of the issuer or counterparty or otherwise may not generate sufficient interest to support the costs associated with securities lending. The Funds could also experience delays in recovering its securities and possible loss of income or value if the borrower fails to return the borrowed securities, although the Funds are indemnified from this risk by contract with the Securities Lending Agent.
As of the end of the current fiscal period, the value of the securities on loan and payable for collateral due to broker were as follows:
| Fund | Value of Securities on Loan | Collateral Received* |
WBI BullBear Rising Income 2000 ETF | $ 4,359,592 | $ 4,421,748 |
WBI BullBear Value 2000 ETF | 4,671,950 | 4,707,196 |
WBI BullBear Yield 2000 ETF | 7,793,634 | 7,851,481 |
WBI BullBear Quality 2000 ETF | 2,269,548 | 2,297,700 |
WBI BullBear Rising Income 1000 ETF | 9,723,877 | 9,896,761 |
WBI BullBear Value 1000 ETF | 15,027,203 | 15,255,216 |
WBI BullBear Yield 1000 ETF | 10,325,501 | 10,439,624 |
WBI BullBear Quality 1000 ETF | 14,017,889 | 14,275,417 |
WBI BullBear Global Income ETF | 9,286,531 | 9,491,696 |
WBI Power Factor™ High Dividend ETF | 16,646,146 | 16,817,874 |
WBI BullBear Trend Switch US 3000 Total Return ETF | — | — |
________
* | The cash collateral received was invested in the Mount Vernon Liquid Assets Portfolio as shown on the Schedule of Investments, a short-term investment portfolio with an overnight and continuous maturity. |
Notes to Financial Statements (continued)
June 30, 2019
Fees and interest income earned on collateral investments and recognized by the Funds during the current fiscal year, was as follows:
Fees and Interest Income Earned
| Fund | Fees and Interest Income Earned | |
WBI BullBear Rising Income 2000 ETF | $ 7,074 | |
WBI BullBear Value 2000 ETF | 6,690 | |
WBI BullBear Yield 2000 ETF | 36,452 | |
WBI BullBear Quality 2000 ETF | 11,797 | |
WBI BullBear Rising Income 1000 ETF | 10,304 | |
WBI BullBear Value 1000 ETF | 8,114 | |
WBI BullBear Yield 1000 ETF | 14,075 | |
WBI BullBear Quality 1000 ETF | 7,420 | |
WBI BullBear Global Income ETF | 244,876 | |
WBI Power Factor™ High Dividend ETF | 37,260 | |
WBI BullBear Trend Switch US 3000 Total Return ETF | — | |
Offsetting Assets and Liabilities. The Funds are subject to various netting arrangements, which govern the terms of certain transactions with counterparties. The arrangements allow the Funds to close out and net their total exposure to counterparty in the event of a default with respect to all transactions governed under a single agreement with a counterparty. The following is a summary of the arrangements subject to offsetting during the current fiscal period.
| | | | Gross Amounts | Net Amounts | | |
| | | Gross Amounts | Offset in the | Presented in the | | |
| | | of Recognized | Statement of | Statement of | Collateral | Net |
| Fund | Description | Liabilities | Assets & Liabilities | Assets & Liabilities | Received | Amount |
WBI BullBear Rising Income 2000 ETF | Securities Lending | $ 4,421,748 | $ — | $ 4,421,748 | $ 4,421,748 | $ — |
WBI BullBear Value 2000 ETF | Securities Lending | 4,707,196 | — | 4,707,196 | 4,707,196 | — |
WBI BullBear Yield 2000 ETF | Securities Lending | 7,851,481 | — | 7,851,481 | 7,851,481 | — |
WBI BullBear Quality 2000 ETF | Securities Lending | 2,297,700 | — | 2,297,700 | 2,297,700 | — |
WBI BullBear Rising Income 1000 ETF | Securities Lending | 9,896,761 | — | 9,896,761 | 9,896,761 | — |
WBI BullBear Value 1000 ETF | Securities Lending | 15,255,216 | — | 15,255,216 | 15,255,216 | — |
WBI BullBear Yield 1000 ETF | Securities Lending | 10,439,624 | — | 10,439,624 | 10,439,624 | — |
WBI BullBear Quality 1000 ETF | Securities Lending | 14,275,417 | — | 14,275,417 | 14,275,417 | — |
WBI BullBear Global Income ETF | Securities Lending | 9,491,696 | — | 9,491,696 | 9,491,696 | — |
WBI Power Factor™ High Dividend ETF | Securities Lending | 16,817,874 | — | 16,817,874 | 16,817,874 | — |
WBI BullBear Trend Switch | | | | | | |
US 3000 Total Return ETF | Securities Lending | — | — | — | — | — |
NOTE 8 — TAX INFORMATION
The components of distributable earnings (accumulated deficit) and cost basis of investments for federal income tax purposes as of June 30, 2019 were as follows:
| | | WBI BullBear | | | | | | | | | | | | WBI BullBear | | | | |
| | | Rising Income | | | WBI BullBear | | | WBI BullBear | | | WBI BullBear | | | Rising Income | | | WBI BullBear | |
| | | 2000 ETF | | | Value 2000 ETF | | | Yield 2000 ETF | | | Quality 2000 ETF | | | 1000 ETF | | | Value 1000 ETF | |
Cost of investments | | $ | 17,258,498 | | | $ | 30,807,469 | | | $ | 43,033,303 | | | $ | 11,438,617 | | | $ | 66,875,183 | | | $ | 61,491,596 | |
Gross tax unrealized appreciation | | | 661,536 | | | | 1,961,041 | | | | 1,186,139 | | | | 457,035 | | | | 2,413,019 | | | | 921,544 | |
Gross tax unrealized depreciation | | | (32,180 | ) | | | (626 | ) | | | (87,525 | ) | | | (44,602 | ) | | | (256,318 | ) | | | (251,439 | ) |
Net tax unrealized appreciation | | | 629,356 | | | | 1,960,415 | | | | 1,098,614 | | | | 412,433 | | | | 2,156,701 | | | | 670,105 | |
Undistributed ordinary income | | | — | | | | 9,746 | | | | 17,158 | | | | 664 | | | | — | | | | 20,961 | |
Undistributed long term gain (loss) | | | — | | | | — | | | | — | | | | — | | | | — | | | | — | |
Total distributable earnings | | | — | | | | 9,746 | | | | 17,158 | | | | 664 | | | | — | | | | 20,961 | |
Other accumulated gain (loss) | | | (24,919,491 | ) | | | (15,517,714 | ) | | | (37,663,769 | ) | | | (20,620,224 | ) | | | (17,885,556 | ) | | | (3,434,315 | ) |
Total accumulated gain (loss) | | $ | (24,290,135 | ) | | $ | (13,547,553 | ) | | $ | (36,547,997 | ) | | $ | (20,207,127 | ) | | $ | (15,728,855 | ) | | $ | (2,743,249 | ) |
Notes to Financial Statements (continued)
June 30, 2019
| | | | | | | | | WBI BullBear | | | WBI Power | | | WBI BullBear | |
| | | WBI BullBear | | | WBI BullBear | | | Global | | | Factor™ High | | | Trend Switch US 3000 | |
| | | Yield 1000 ETF | | | Quality 1000 ETF | | | Income ETF | | | Dividend ETF | | | Total Return ETF | |
Cost of investments | | $ | 81,617,346 | | | $ | 67,585,036 | | | $ | 144,846,927 | | | $ | 123,472,576 | | | $ | 46,558,642 | |
Gross tax unrealized appreciation | | | 2,783,358 | | | | 2,727,309 | | | | 1,229,773 | | | | 2,907,373 | | | | 492,848 | |
Gross tax unrealized depreciation | | | (475,185 | ) | | | (163,176 | ) | | | (179,528 | ) | | | (6,634,055 | ) | | | — | |
Net tax unrealized appreciation | | | 2,308,173 | | | | 2,564,133 | | | | 1,050,245 | | | | (3,726,682 | ) | | | 492,848 | |
Undistributed ordinary income | | | 59,932 | | | | — | | | | — | | | | 70,859 | | | | 72,639 | |
Undistributed long term gain | | | — | | | | — | | | | — | | | | — | | | | — | |
Total distributable earnings | | | 59,932 | | | | — | | | | — | | | | 70,859 | | | | 72,639 | |
Other accumulated (loss) | | | (21,139,629 | ) | | | (10,840,526 | ) | | | (6,357,538 | ) | | | (5,782,198 | ) | | | — | |
Total accumulated gain | | $ | (18,771,524 | ) | | $ | (8,276,393 | ) | | $ | (5,307,293 | ) | | $ | (9,438,021 | ) | | $ | 565,487 | |
The difference between the cost of investments amount for financial statement and federal income tax purposes is due primarily to timing differences in recognizing wash sale losses in security transactions.
NOTE 9 — PURCHASES AND SALES OF SECURITIES
During the current fiscal period, purchases and sales of securities by the Funds, excluding short-term securities and in-kind transactions, were as follows:
| | All Other |
| Fund | Purchases | Sales |
WBI BullBear Rising Income 2000 ETF | $199,240,700 | $198,722,727 |
WBI BullBear Value 2000 ETF | 186,761,428 | 191,144,157 |
WBI BullBear Yield 2000 ETF | 307,006,266 | 315,706,203 |
WBI BullBear Quality 2000 ETF | 195,902,791 | 192,680,287 |
WBI BullBear Rising Income 1000 ETF | 230,755,191 | 231,087,112 |
WBI BullBear Value 1000 ETF | 203,978,021 | 199,048,150 |
WBI BullBear Yield 1000 ETF | 381,315,372 | 400,653,686 |
WBI BullBear Quality 1000 ETF | 166,639,196 | 170,143,405 |
WBI BullBear Global Income ETF | 745,820,856 | 744,253,924 |
WBI Power Factor™ High Dividend ETF | 158,477,600 | 159,471,363 |
WBI BullBear Trend Switch US 3000 Total Return ETF | 46,040,761 | 46,375,500 |
During the current fiscal period, the values of the in kind security transactions were as follows:
| Fund | Subscriptions | Redemptions |
WBI BullBear Rising Income 2000 ETF | $ 3,680,919 | $31,341,200 |
WBI BullBear Value 2000 ETF | 2,166,377 | 12,301,065 |
WBI BullBear Yield 2000 ETF | 37,096,816 | 30,247,541 |
WBI BullBear Quality 2000 ETF | — | 25,850,335 |
WBI BullBear Rising Income 1000 ETF | 19,448,714 | 41,139,235 |
WBI BullBear Value 1000 ETF | 12,354,489 | 31,510,249 |
WBI BullBear Yield 1000 ETF | 45,945,202 | 37,234,638 |
WBI BullBear Quality 1000 ETF | 35,832,316 | 37,989,950 |
WBI BullBear Global Income ETF | 78,822,866 | 48,149,604 |
WBI Power Factor™ High Dividend ETF | 121,809,565 | 54,442,504 |
WBI BullBear Trend Switch US 3000 Total Return ETF | 46,298,092 | — |
NOTE 10 — SHARE TRANSACTIONS
The Funds each currently offer one class of shares, which has no front-end sales load, no deferred sales charge, and no redemption fee. The Funds may issue an unlimited number of shares of beneficial interest, with no par value. All shares of each Fund have equal rights and privileges as the other shares of such Fund.
The Trust has entered into an agreement with NYSE Group, Inc. to list the Funds’ shares (“Shares”) on NYSE Arca, Inc., an indirect wholly-owned subsidiary of NYSE Group, Inc. Market prices for the Shares may be different from their NAV. The Funds will issue and redeem Shares on a continuous basis at NAV only in large blocks of Shares, typically 50,000 Shares, called “Creation Units.” Creation Units will be issued and redeemed principally in-kind, however, the Trust reserves the right to offer a cash option for creations and redemptions of Shares. Once created, Shares generally will trade in the secondary market at market prices that change throughout the day in amounts less than a Creation Unit. Except when aggregated in Creation Units, Shares are not redeemable securities of a Fund. Shares of a Fund may only be purchased or redeemed by certain financial institutions (“Authorized Participants”). An Authorized Participant is either (i) a broker-dealer or other participant in the clearing process through the Continuous Net Settlement System of the National Securities Clearing Corporation or (ii) a Depository Trust Corporation participant and, in each case,
Notes to Financial Statements (continued)
June 30, 2019
must have executed a participant agreement with Foreside Fund Services, LLC, the Funds’ distributor (the “Distributor”). Most retail investors will not qualify as Authorized Participants nor have the resources to buy and sell whole Creation Units. Therefore, they will be unable to purchase or redeem the Shares directly from a Fund. Rather, most retail investors will purchase Shares in the secondary market with the assistance of a broker and will be subject to customary brokerage commissions or fees.
| | | WBI BullBear Rising Income 2000 ETF | | | WBI BullBear Value 2000 ETF | |
| | | Year Ended | | | Year Ended | | | Year Ended | | | Year Ended | |
| | | June 30, 2019 | | | June 30, 2018 | | | June 30, 2019 | | | June 30, 2018 | |
| | | Shares | | | Amount | | | Shares | | | Amount | | | Shares | | | Amount | | | Shares | | | Amount | |
Shares Sold | | | 200,000 | | | $ | 4,331,750 | | | | 750,000 | | | $ | 18,647,555 | | | | 100,000 | | | $ | 2,333,170 | | | | — | | | $ | — | |
Shares Redeemed | | | (1,750,000 | ) | | | (38,651,270 | ) | | | (300,000 | ) | | | (7,344,460 | ) | | | (700,000 | ) | | | (15,909,115 | ) | | | (1,050,000 | ) | | | (26,469,535 | ) |
| | | | (1,550,000 | ) | | $ | (34,319,520 | ) | | | 450,000 | | | $ | 11,303,095 | | | | (600,000 | ) | | $ | (13,575,945 | ) | | | (1,050,000 | ) | | $ | (26,469,535 | ) |
| Beginning Shares | | | 2,200,000 | | | | | | | | 1,750,000 | | | | | | | | 1,850,000 | | | | | | | | 2,900,000 | | | | | |
| Ending Shares | | | 650,000 | | | | | | | | 2,200,000 | | | | | | | | 1,250,000 | | | | | | | | 1,850,000 | | | | | |
| | | | | | | |
| | | WBI BullBear Yield 2000 ETF | | | WBI BullBear Quality 2000 ETF | |
| | | Year Ended | | | Year Ended | | | Year Ended | | | Year Ended | |
| | | June 30, 2019 | | | June 30, 2018 | | | June 30, 2019 | | | June 30, 2018 | |
| | | Shares | | | Amount | | | Shares | | | Amount | | | Shares | | | Amount | | | Shares | | | Amount | |
Shares Sold | | | 1,850,000 | | | $ | 40,837,255 | | | | 150,000 | | | $ | 3,488,160 | | | | — | | | $ | — | | | | 100,000 | | | $ | 2,394,885 | |
Shares Redeemed | | | (2,200,000 | ) | | | (42,970,220 | ) | | | (750,000 | ) | | | (16,446,385 | ) | | | (1,450,000 | ) | | | (31,358,775 | ) | | | (1,350,000 | ) | | | (32,513,895 | ) |
| | | | (350,000 | ) | | $ | (2,132,965 | ) | | | (600,000 | ) | | $ | (12,958,225 | ) | | | (1,450,000 | ) | | $ | (31,358,775 | ) | | | (1,250,000 | ) | | $ | (30,119,010 | ) |
| Beginning Shares | | | 2,350,000 | | | | | | | | 2,950,000 | | | | | | | | 1,950,000 | | | | | | | | 3,200,000 | | | | | |
| Ending Shares | | | 2,000,000 | | | | | | | | 2,350,000 | | | | | | | | 500,000 | | | | | | | | 1,950,000 | | | | | |
| | | | | | | |
| | | WBI BullBear Rising Income 1000 ETF | | | WBI BullBear Value 1000 ETF | |
| | | Year Ended | | | Year Ended | | | Year Ended | | | Year Ended | |
| | | June 30, 2019 | | | June 30, 2018 | | | June 30, 2019 | | | June 30, 2018 | |
| | | Shares | | | Amount | | | Shares | | | Amount | | | Shares | | | Amount | | | Shares | | | Amount | |
Shares Sold | | | 1,050,000 | | | $ | 27,672,385 | | | | 1,300,000 | | | $ | 34,677,960 | | | | 750,000 | | | $ | 20,272,680 | | | | — | | | $ | — | |
Shares Redeemed | | | (1,650,000 | ) | | | (45,125,500 | ) | | | (450,000 | ) | | | (11,531,985 | ) | | | (1,200,000 | ) | | | (35,345,210 | ) | | | (700,000 | ) | | | (19,951,920 | ) |
| | | | (600,000 | ) | | $ | (17,453,115 | ) | | | 850,000 | | | $ | 23,145,975 | | | | (450,000 | ) | | $ | (15,072,530 | ) | | | (700,000 | ) | | $ | (19,951,920 | ) |
| Beginning Shares | | | 2,900,000 | | | | | | | | 2,050,000 | | | | | | | | 2,300,000 | | | | | | | | 3,000,000 | | | | | |
| Ending Shares | | | 2,300,000 | | | | | | | | 2,900,000 | | | | | | | | 1,850,000 | | | | | | | | 2,300,000 | | | | | |
| | | | | | | |
| | | WBI BullBear Yield 1000 ETF | | | WBI BullBear Quality 1000 ETF | |
| | | Year Ended | | | Year Ended | | | Year Ended | | | Year Ended | |
| | | June 30, 2019 | | | June 30, 2018 | | | June 30, 2019 | | | June 30, 2018 | |
| | | Shares | | | Amount | | | Shares | | | Amount | | | Shares | | | Amount | | | Shares | | | Amount | |
Shares Sold | | | 1,900,000 | | | $ | 46,859,775 | | | | 300,000 | | | $ | 7,832,870 | | | | 1,550,000 | | | $ | 40,419,805 | | | | 650,000 | | | $ | 17,842,840 | |
Shares Redeemed | | | (2,000,000 | ) | | | (48,747,350 | ) | | | (550,000 | ) | | | (13,868,985 | ) | | | (1,600,000 | ) | | | (43,010,255 | ) | | | (250,000 | ) | | | (6,607,490 | ) |
| | | | (100,000 | ) | | $ | (1,887,575 | ) | | | (250,000 | ) | | $ | (6,036,115 | ) | | | (50,000 | ) | | $ | (2,590,450 | ) | | | 400,000 | | | $ | 11,235,350 | |
| Beginning Shares | | | 3,200,000 | | | | | | | | 3,450,000 | | | | | | | | 2,300,000 | | | | | | | | 1,900,000 | | | | | |
| Ending Shares | | | 3,100,000 | | | | | | | | 3,200,000 | | | | | | | | 2,250,000 | | | | | | | | 2,300,000 | | | | | |
| | | | | | | |
| | | WBI BullBear Global Income ETF | | | WBI Power Factor™ High Dividend ETF | |
| | | Year Ended | | | Year Ended | | | Year Ended | | | Year Ended | |
| | | June 30, 2019 | | | June 30, 2018 | | | June 30, 2019 | | | June 30, 2018 | |
| | | Shares | | | Amount | | | Shares | | | Amount | | | Shares | | | Amount | | | Shares | | | Amount | |
Shares Sold | | | 3,350,000 | | | $ | 81,459,125 | | | | 50,000 | | | $ | 1,206,990 | | | | 4,650,000 | | | $ | 123,161,665 | | | | 550,000 | | | $ | 14,237,490 | |
Shares Redeemed | | | (2,000,000 | ) | | | (48,785,595 | ) | | | (2,400,000 | ) | | | (58,715,525 | ) | | | (2,400,000 | ) | | | (55,598,540 | ) | | | — | | | | — | |
| | | | 1,350,000 | | | $ | 32,673,530 | | | | (2,450,000 | ) | | $ | (57,508,535 | ) | | | 2,250,000 | | | $ | 67,563,125 | | | | 550,000 | | | $ | 14,237,490 | |
| Beginning Shares | | | 4,050,000 | | | | | | | | 6,400,000 | | | | | | | | 1,950,000 | | | | | | | | 1,400,000 | | | | | |
| Ending Shares | | | 5,400,000 | | | | | | | | 4,050,000 | | | | | | | | 4,200,000 | | | | | | | | 1,950,000 | | | | | |
| | | | | | | | | | | | | | | | | | | | | | | | | | | | | | | | | |
| | | WBI BullBear Trend Switch US 3000 Total Return ETF | | |
| | | Period Ended | | |
| | | June 30, 2019 | | |
| | | Shares | | | Amount | | |
Shares Sold | | | 2,275,000 | | | $ | 46,464,350 | | |
Shares Redeemed | | | — | | | | — | | |
| | | | 2,275,000 | | | $ | 46,464,350 | | |
| Beginning Shares | | | — | | | | | | |
| Ending Shares | | | 2,275,000 | | | | | | |
Notes to Financial Statements (concluded)
June 30, 2019
NOTE 11 — DISTRIBUTIONS TO SHAREHOLDERS
The tax character of distributions declared by the Funds during the year/period ended June 30, 2019 and year ended June 30, 2018 were as follows:
| | | Year/Period1 Ended June 30, 2019 | | | Year Ended June 30, 2018 | |
| | | Ordinary | | | Long Term | | | Ordinary | | | Long Term | |
| Fund | | Income | | | Capital Gain | | | Income | | | Capital Gain | |
WBI BullBear Rising Income 2000 ETF | | $ | 337,978 | | | $ | — | | | $ | 249,127 | | | $ | — | |
WBI BullBear Value 2000 ETF | | | 390,733 | | | | — | | | | 218,969 | | | | — | |
WBI BullBear Yield 2000 ETF | | | 1,320,104 | | | | — | | | | 401,663 | | | | — | |
WBI BullBear Quality 2000 ETF | | | 319,836 | | | | — | | | | 317,572 | | | | — | |
WBI BullBear Rising Income 1000 ETF | | | 561,691 | | | | — | | | | 337,373 | | | | — | |
WBI BullBear Value 1000 ETF | | | 485,571 | | | | — | | | | 484,790 | | | | — | |
WBI BullBear Yield 1000 ETF | | | 1,601,703 | | | | — | | | | 826,348 | | | | — | |
WBI BullBear Quality 1000 ETF | | | 322,761 | | | | — | | | | 464,405 | | | | — | |
WBI BullBear Global Income ETF | | | 3,929,336 | | | | — | | | | 3,955,836 | | | | — | |
WBI Power Factor™ High Dividend ETF | | | 5,130,398 | | | | 254,258 | | | | 2,934,185 | | | | — | |
WBI BullBear Trend Switch | | | | | | | | | | | | | | | | |
US 3000 Total Return ETF | | | 40,995 | | | | — | | | | — | | | | — | |
1 | Information for WBI BullBear Trend Switch US 3000 Total Return ETF is for the period from May 28, 2019 to June 30, 2019. |
Report of Independent Registered Public Accounting Firm
To the Shareholders and Board of Trustees of Absolute Shares Trust:
Opinion on the Financial Statements
We have audited the accompanying statements of assets and liabilities of WBI BullBear Rising Income 2000 ETF, WBI BullBear Value 2000 ETF, WBI BullBear Yield 2000 ETF, WBI BullBear Quality 2000 ETF, WBI BullBear Rising Income 1000 ETF, WBI BullBear Value 1000 ETF, WBI BullBear Yield 1000 ETF, WBI BullBear Quality 1000 ETF, WBI BullBear Global Income ETF (each of which commenced operations August 25, 2014), WBI Power FactorTM High Dividend ETF (commenced operations on December 19, 2016), WBI BullBear Trend Switch US 3000 Total Return ETF (commenced operations May 28, 2019), eleven of the portfolios constituting Absolute Shares Trust (the “Trust”), including the schedules of investments, as of June 30, 2019, the related statements of operations for the year then ended or aforementioned period since commencement of operations, the statements of changes in net assets for each of the years or aforementioned period since commencement of operations in the two-year period then ended and the related notes (collectively, the financial statements) and the financial highlights for each of the years or aforementioned period since commencement of operations in the five-year period then ended. In our opinion, the financial statements and financial highlights present fairly, in all material respects, the financial position of each of the respective eleven portfolios constituting Absolute Shares Trust as of June 30, 2019, the results of its operations for the year then ended or aforementioned period since commencement of operations, the changes in its net assets for each of the years or aforementioned period since commencement of operations in the two-year period then ended and the financial highlights for each of the years or aforementioned period since commencement of operations in the five-year period then ended, in conformity with U.S. generally accepted accounting principles.
Basis for Opinion
These financial statements and financial highlights are the responsibility of the Trust’s management. Our responsibility is to express an opinion on these financial statements and financial highlights based on our audits. We are a public accounting firm registered with the Public Company Accounting Oversight Board (United States) (PCAOB) and are required to be independent with respect to the Trust in accordance with the U.S. federal securities laws and the applicable rules and regulations of the Securities and Exchange Commission and the PCAOB.
We conducted our audits in accordance with the standards of the PCAOB. Those standards require that we plan and perform the audit to obtain reasonable assurance about whether the financial statements and financial highlights are free of material misstatement, whether due to error or fraud. Our audits included performing procedures to assess the risks of material misstatement of the financial statements and financial highlights, whether due to error or fraud, and performing procedures that respond to those risks. Such procedures included examining, on a test basis, evidence regarding the amounts and disclosures in the financial statements and financial highlights. Such procedures also included confirmation of securities owned as of June 30, 2019, by correspondence with custodians and brokers. Our audits also included evaluating the accounting principles used and significant estimates made by management, as well as evaluating the overall presentation of the financial statements and financial highlights. We believe that our audits provide a reasonable basis for our opinion.

We have served as the Trust’s auditor since 2014.
Short Hills, New Jersey
August 29, 2019
Trustees and Officers
(Unaudited)
| | | | | Number of | |
| | | | | Portfolios | Other |
| | | | | in Fund | Directorships |
| | Position(s) | Term of Office | | Complex | Held by |
| | Held | and Length of | Principal Occupation(s) | Overseen by | Trustee During |
Name and Year of Birth(1) | with Trust | Time Served(2) | During Past 5 Years | Trustee(3) | Past 5 Years |
| Independent Trustees: | | | | | |
Jude T. Depko, 1946 | Trustee | Since | Technical Consultant, | 12 | None |
| | | June 2014 | Michael Baker Jr., Inc. | | |
| | | | (consulting) (2009 to 2016) | | |
| | | | | | |
John A. Flanagan, 1946 | Trustee | Since | Treasurer, ETF Managers Trust | 12 | None |
| | | June 2014 | (investment company) (2015 to | | |
| | | | present); Principal Financial | | |
| | | | Officer, ETF Managers Capital, | | |
| | | | LLC (commodity pool operator) | | |
| | | | (2014 to present); President, | | |
| | | | John A. Flanagan CPA, LLC | | |
| | | | (accounting services) (2010 to | | |
| | | | present); Chief Financial Officer, | | |
| | | | Macromarkets LLC (exchange | | |
| | | | traded funds) (2007 to 2010) | | |
| | | | | | |
Andrew Putterman, 1959 | Trustee | Since | Principal, 1812 Park, LLC | 12 | Independent Board |
| | | June 2014 | (financial consulting) (2014 to | | Member of Steben |
| | | | present); Advisory Board | | Select Multi-Strategy |
| | | | Member, Vestigo Ventures 1 GP, | | Fund (2018 to |
| | | | LLC (2016 to present); Advisory | | present); Independent |
| | | | Board Member, Silver Lane | | Board Member of |
| | | | Advisors (2016 to present); | | Steben Select |
| | | | Managing Director, B+ Institutional | | Managed Futures |
| | | | Services, LLC (2014 to present); | | Strategy Fund |
| | | | Independent Board Member, | | (2018 to present); |
| | | | Princeton Private Equity Fund | | Independent Board |
| | | | (2014 to 2015); Chairman Emeritus, | | Member of Steben |
| | | | Fortigent LLC (financial services) | | Alternative |
| | | | (2013 to 2014); Managing Director, | | Investment Funds |
| | | | LPL Financial (financial services) | | (2018 to present) |
| | | | (2012 to 2014); The Private Trust | | |
| | | | Company (January 2013 to | | |
| | | | December 2013); President and | | |
| | | | Chief Executive Officer, | | |
| | | | Fortigent LLC (2006 to 2012 | | |
| | | | and 2013, respectively) | | |
Trustees and Officers (continued)
(Unaudited)
| | | | | Number of | |
| | | | | Portfolios | Other |
| | | | | in Fund | Directorships |
| | Position(s) | Term of Office | | Complex | Held by |
| | Held | and Length of | Principal Occupation(s) | Overseen by | Trustee During |
Name and Year of Birth(1) | with Trust | Time Served(2) | During Past 5 Years | Trustee(3) | Past 5 Years |
| Interested Trustees: | | | | | |
Don Schreiber, Jr., 1955(4) | Trustee, | Since | Chief Executive Officer, Treasurer | 12 | None |
| | President and | November 2013 | and Co-Portfolio Manager, | | |
| | Principal | | WBI Investments, Inc. (registered | | |
| | Executive | | investment adviser) (1984 to | | |
| | Officer | | present); Co-Chief Investment | | |
| | | | Officer, WBI Investments, Inc. | | |
| | | | (March 2018 to present); Chief | | |
| | | | Executive Officer and Treasurer | | |
| | | | of Millington Securities, Inc. | | |
| | | | (registered investment adviser | | |
| | | | and broker- dealer) (2013 to | | |
| | | | present); Chief Executive Officer, | | |
| | | | Vice President, and Treasurer, | | |
| | | | WBI Trading Company, Inc. | | |
| | | | (financial services) (2011 to | | |
| | | | present); Chief Executive Officer, | | |
| | | | Vice President, and Treasurer, | | |
| | | | Hartshorne Group, Inc. | | |
| | | | (wealth management services) | | |
| | | | (2008 to present); Chief Executive | | |
| | | | Officer, President, Secretary, | | |
| | | | Treasurer and Managing Member, | | |
| | | | WBI Technologies LLC | | |
| | | | (May 2018 to present) | | |
| | | | | | |
Matthew Schreiber, 1980(4) | Trustee | Since | President and Vice President of | 12 | None |
| | | June 2014 | WBI Investments, Inc. (2013 to | | |
| | | | present); Chief Investment | | |
| | | | Strategist of WBI Investments, Inc. | | |
| | | | (March 2017 to Present); Vice | | |
| | | | President of Business Development, | | |
| | | | WBI Investments, Inc. (2007 to 2013) | | |
Trustees and Officers (concluded)
(Unaudited)
| | | Term of Office | |
| | Position(s) Held | and Length | |
| Name and Year of Birth | with Trust | of Time Served | Principal Occupation(s) During Past 5 Years |
| Other Officers: | | | |
Ann Schreiber, 1984 | Secretary | Since | Chief Marketing Officer, WBI Investments, Inc. (2015 to present); |
| | | June 2014 | Secretary, WBI Trading Company, Inc. (2012 to present); Secretary, |
| | | | Millington Securities, Inc. (2013 to present); Secretary, Hartshorne |
| | | | Group, Inc. (2012 to present); Corporate Secretary, WBI Investments, |
| | | | Inc. (2012 to present); Director of Marketing and Executive Services, |
| | | | WBI Investments, Inc. (2011 to 2014); Consultant, Advisor Toolbox, |
| | | | Inc. (2009 to 2011) |
| | | | |
Tracey Crespo, 1970 | Treasurer and | Since | Chief Operating Officer, WBI Investments, Inc. (2011 to present); |
| | Principal Financial | July 2018 | Assistant Treasurer of Absolute Shares Trust (November 2015 to |
| | Officer | | July 2018) Treasurer and Principal Financial Officer of Absolute |
| | | | Shares Trust (August 2015 to November 2015); Director of |
| | | | Centralized Operations & Director of Fund Accounting and Hedge |
| | | | Fund Services, SEI, Inc. (fund administrative services)(2007-2011) |
| | | | |
Steven Van Solkema, 1970 | Assistant | Since | Co-Chief Investment Officer and Co-Portfolio Manager, WBI |
| | Treasurer | November 2015 | Investments, Inc. (March 2019 to Present); Chief Operating Officer, |
| | | | Millington Securities, Inc. (2014 to February 2019); |
| | | | Chief Compliance Officer, Millington Securities, Inc. (2014 to |
| | | | May 2018); Managing Director, Ally Financial, Inc. (financial |
| | | | services) (2010 to 2013) |
| | | | |
Alyson Kest, 1974 | Assistant | Since | Chief Compliance Officer, Millington Securities, Inc. (June 2018 to |
| | Secretary | February 2016 | present); Counsel, at Millington Securities, Inc. (July 2017 to |
| | | | present);Compliance Officer at Millington Securities, Inc. (2015 to |
| | | | May 2018); Legal and Compliance at Catlin (2014 to 2015) |
| | | | |
Rodney L. Ruehle, 1968 | Chief Compliance | Since | Director, Foreside Fund Officer Services, LLC (formerly Foreside |
| | Officer | November 2017 | Compliance Services, LLC) (financial services) (August 2016 to |
| | | | present); Director, Beacon Hill Fund Services, LLC (financial |
| | | | services)(April 2008 to July 2016) |
| | | | |
Matthew Bromberg | Chief Legal | Since | General Counsel, WBI Investments, Inc., Millington Securities, Inc., |
| | Officer | July 2019 | & Hartshorne Group (2016 to present); Partner, Reed Smith (2015 to |
| | | | 2016); Senior Managing Counsel, BNY Mellon (2014 to 2015) |
(1) | The address of each Trustee or officer is c/o Absolute Shares Trust, 331 Newman Springs Road, Suite 122, Red Bank, New Jersey 07701. |
(2) | Trustees and Officers serve until their successors are duly elected and qualified. |
(3) | The Fund is part of a “Fund Complex” as defined in the 1940 Act. The Fund Complex includes all open-end funds (including all of their portfolios) advised by the Advisor or the Sub-Advisor and any funds that have an investment advisor that is an affiliated person of the Advisor. As of the date of this SAI, the Fund Complex consists of the 12 Funds of the Trust and three mutual funds separately advised by the Sub-Advisor. |
(4) | Don Schreiber Jr. and Matthew Schreiber are each an “interested person” of the Trust (as that term is defined in the 1940 Act) because of their affiliations with the Advisor and the Sub-Advisor. |
The Statement of Additional Information includes additional information about the Trustees as is available without charge, up on request, by calling toll free at (800)-772-5810, by accessing the SEC’s website at www.sec.gov, or by accessing the Fund’s website at www.wbishares.com.
Approval of Advisory Agreements and Board Considerations
(Unaudited)
The Board (the members of which are referred to as “Trustees”) of the Trust met in person on March 5, 2019 to consider whether to approve, with respect to WBIT, and, at a meeting on May 22, 2019, to renew, with respect to the rest of the Funds: (1) the investment advisory agreements (collectively, the “Advisory Agreement”) between the Trust, on behalf of the Fund(s), and the Advisor, and (2) the investment sub-advisory agreements (collectively, the “Sub-Advisory Agreement”) between the Advisor and the Sub-Advisor.
The Board considered approving and renewing the Advisory Agreement and the Sub-Advisory Agreement and the engagement of the Advisor and the Sub-Advisor separately, although the advisers are affiliates.
In accordance with Section 15(c) of the Investment Company Act of 1940, as amended (“1940 Act”), the Board requested, reviewed and considered materials furnished by the Advisor and the Sub-Advisor relevant to the Board’s consideration of whether to renew the Advisory Agreement and the Sub-Advisory Agreement. In connection with considering whether to renew the Advisory Agreement and Sub-Advisory Agreement, the Trustees who are not “interested persons” of the Trust, as that term is defined in the 1940 Act (the “Independent Trustees”), met in executive session with counsel to the Trust, who provided assistance and advice. The consideration of renewing the Advisory Agreement and Sub-Advisory Agreement was conducted by both the full Board and the Independent Trustees, who also voted separately.
During their review and consideration, the Board and the Independent Trustees focused on and analyzed the factors they deemed relevant, including, but not limited to: (1) the nature, extent and quality of the services provided by each of the Advisor and the Sub-Advisor; (2) the investment advice and performance of each of the Advisor and the Sub-Advisor, including the reorganization plan with respect to the planned merging of several Funds; (3) the fees of the services provided and profits realized by each of the Advisor and the Sub-Advisor from their relationships with the Trust; (4) the expenses of the Funds and the extent to which economies of scale have been realized and are expected to reduce Fund expenses; (5) any benefits derived or to be derived by each of the Advisor and the Sub-Advisor from the relationship with the Trust; and (6) potential conflicts of interest and associated compliance regimes adopted by the Advisor and Sub-Advisor.
In reviewing such factors, the Board relied on certain information, including (1) copies of the Advisory Agreement, the Sub-Advisory Agreement and the Expense Limitation Agreement; (2) information describing the Advisor, the Sub-Advisor and the services provided thereby; (3) information regarding the compliance programs of the Advisor and the Sub-Advisor; (4) copies of the Forms ADV for the Advisor and the Sub-Advisor; and (5) memoranda and guidance from K&L Gates LLP on the fiduciary responsibilities of trustees, including Independent Trustees, in considering advisory and distribution agreements under the 1940 Act. In addition, as part of the Advisor and Sub-Advisor’s responses to submitted questions, the Board was provided with data and information comparing the advisory fees and expenses of the Funds with expenses and performance of other exchange-traded funds (“ETFs”) with similar investment objectives and policies (namely, active equity ETFs). The Trustees also considered their personal experiences as Trustees and participants in the ETF and mutual fund industry, as applicable.
In particular, the Trustees, including the Independent Trustees, considered and discussed the following with respect to the Funds:
1. The nature, extent and quality of the facilities and services provided by each of the Advisor and the Sub-Advisor. The Board received information on and considered the division of responsibility of services provided by the Advisor and the Sub-Advisor, including the fact that portfolio management would continue to be conducted by the Sub-Advisor. In addition to the Sub-Advisor’s performance managing the Funds, the Board reviewed the experience and resources that the Sub-Advisor had in managing strategies similar to those utilized by the Funds, including information regarding the education and experience of management and investment personnel, particularly with respect to personnel and role changes at the Sub-Advisor.
The Board determined that the Funds would continue to benefit from the services and resources available from the Advisor and the Sub-Advisor, with respect to their responsibilities under the Advisory and Sub-Advisory Agreements. In particular, they noted the extensive experience of the Sub-Advisor’s management personnel in developing and administering strategies utilized by the Funds, as well as the performance history of the Sub-Advisor since its inception. The Board also noted the compliance regimes of the Advisor and the Sub-Advisor and their effectiveness.
2. The advisory fees paid by and overall expenses of the Funds. The Board considered comprehensive data and information comparing the advisory fees and expense ratios (taking into consideration the Expense Limitation Agreement) of the Funds. The Board acknowledged that the Funds were distinct in ways from their peer group of ETFs and that the universe of comparable funds had reduced in the prior year due to the withdrawal from the market by several active equity ETFs. Nevertheless, the Sub-Advisor’s peer group analysis and methodology had not substantially changed from the prior year. The Board determined that the advisory fees charged and overall expenses of the Funds were competitive and in line with the related universe of funds. The Advisor and Sub-Advisor also presented the Board with several “fall-out” benefits the Advisor or the Sub-Advisor derive from its relationship to the Trust and the Funds, such as the Sub-Advisor’s offering of the Funds to help expand the Sub-Advisor’s distribution channels for its other investment products. In light of the nature, quality, and extent of services provided by the Advisor and Sub-Advisor and the costs incurred by the Advisor and Sub-Advisor in rendering those services, and taking into account the “fall-out” benefits inured, the Board concluded that the level of fees paid to the Advisor and Sub-Advisor with respect to each Fund were fair and reasonable.
3. Brokerage and portfolio transactions. The Board was presented with materials and a thorough discussion of the brokerage practices of the Advisor, in its capacity as an affiliated broker-dealer, and Sub-Advisor, including a walk-through of the Advisor’s ability to continue providing commission-free trading to the Funds and the Advisor’s track record for delivering effective brokerage execution services for the benefit of the Funds compared to services that could otherwise be expected from unaffiliated broker-dealers. The Advisor presented on its execution services and policies and the Sub-Advisor discussed its policies and procedures for allocating brokerage. Additionally, the Board considered information relating to the
Approval of Advisory Agreements and Board Considerations
(Unaudited) (concluded)
amount, sources and transactions generating payments for order flow that the Advisor received in its capacity as an affiliated broker-dealer the last year, in light of both the advisory fees paid and generally as related to the Advisor and/or Sub-Advisor adhering to their best execution obligations and Rule 17e-1 procedures, upon execution of portfolio transactions for each of the Funds. The Independent Trustees determined the brokerage policies of both the Advisor and Sub-Advisor would continue to benefit the Funds.
4. Financial condition of each of the Advisor and the Sub-Advisor. After considering information relating to the financial condition of the Advisor and Sub-Advisor, as well as the fees and operating costs relating to the management of the Funds, the Board determined that each of the Advisor and Sub-Advisor continue to be capable of providing services to the Funds. In this determination, the Board considered the existence of the Expense Limitation Agreement (including the level of the expense limit for each Fund) and its impact on the profitability of the Sub-Advisor. The Board also considered the Sub-Advisor’s plan to reorganize several Funds and determined that such plan was in the best interest of each of the Funds.
5. Possible conflicts of interest. The Board considered the experience and ability of the advisory personnel assigned to the Funds, soft-dollar arrangements and the brokerage policies of the Advisor (including a discussion of the execution policies and total compensation earned by the Advisor in its capacity as affiliated broker-dealer, in the form of commissions, fees and other remuneration received, including payment for order flow), and the substance and administration of the Codes of Ethics of the Trust, the Advisor and the Sub-Advisor. The Board determined that the compliance policies of the Trust, Advisor and Sub-Advisor were each reasonably designed to monitor for and prevent violations of the federal securities laws and breaches of fiduciary duties.
6. Effect of the Funds’ growth and size on its investment performance and expenses. The Board considered information relating to the year- over-year trading of the Funds. It determined that the expense ratios of the Funds were well suited in light of expectations for continued asset accumulation and projected growth therefrom.
With respect to WBIT, the Board further noted that the Advisor and Sub-Advisor proposed charging a unitary advisory fee. The Advisor and Sub-Advisor noted that under the unitary fee structure, the Advisor, and not WBIT, would be responsible for paying almost all of the expenses necessary to service WBIT, including those of other service providers, and that the Advisor would bear the risk of these expenses increasing. The Board noted that WBIT was not expected to incur material additional expenses besides the unitary advisory fee, and received information regarding WBIT’s anticipated expense ratios. The Board considered that the unitary fee structure is becoming more prevalent among other active equity ETFs as a way to rationalize expenses for shareholders and obviate the need for an expense limitation agreement, and its subsequent annual renewals. The Board also observed that the unitary fee provides predictability in Fund expenses at various asset levels and also protects WBIT against the risks of increases in third-party service provider fees and other expenses covered under the unitary fee.
Based on the foregoing and such other matters as were deemed relevant, and while no single factor was determinative in the decision, all of the Trustees, including the Independent Trustees, concluded that the advisory fee rates and total expense ratios are reasonable in relation to the services provided by the Advisor to the Funds, as well as the costs incurred and the benefits gained by the Advisor in providing such services. The Board also found the investment advisory fees paid to the Advisor to be reasonable in comparison to the fees charged by advisers to other comparable funds of similar size. Based on these and other considerations, the Board, in the exercise of its reasonable judgment, determined that the fees and expenses proposed for each Fund were fair and reasonable. As a result, all of the Board members, including the Independent Trustees, approved the Advisory Agreement.
With respect to the Sub-Advisor and based on the foregoing analysis and such other matters as were deemed relevant, and while no single factor was determinative in the decision, all of the Trustees, including the Independent Trustees, concluded that the sub-advisory fee rates and total expense ratios are reasonable in relation to the services provided by the Sub-Advisor to the Funds, as well as the costs incurred and the benefits gained by the Sub-Advisor in providing such services. Based on these and other considerations, the Board, in the exercise of its reasonable judgment, determined that the fees and expenses proposed for each Fund were fair and reasonable. As a result, all of the Trustees, including the Independent Trustees, approved the Sub-Advisory Agreement.
Expense Examples
For the Period Ended June 30, 2019 (Unaudited)
As a shareholder you incur two types of costs: (1) transaction costs, including brokerage commissions on purchases and sales of Fund shares, and (2) ongoing costs, including management fees and other Fund expenses. This example is intended to help you understand your ongoing costs (in dollars) of investing in the Fund and to compare these costs with the ongoing costs of investing in other funds. The example is based on an investment of $1,000 invested at the beginning of the period and held for the entire six-month period (January 1, 2019 – June 30, 2019) for all Funds except WBI BullBear Trend Switch US 3000 Total Return ETF, which is based on the current period (May 28, 2019 – June 30, 2019).
Actual Expenses
The first line of the table provides information about actual account values based on actual returns and actual expenses. You may use the information in this line, together with the amount you invested, to estimate the expenses that you paid over the period. Simply divide your account value by $1,000 (for example, an $8,600 account value divided by $1,000 = 8.6), then, multiply the result by the number in the first line under the heading entitled “Expenses Paid During the Period” to estimate the expenses you paid on your account during this period.
Hypothetical Example for Comparison Purposes
The second line of the table provides information about hypothetical account values based on a hypothetical return and hypothetical expenses based on the Fund’s actual expense ratio and an assumed rate of return of 5% per year before expenses, which is not the Fund’s actual return. The hypothetical account values and expenses may not be used to estimate the actual ending account balance or expenses you paid for the period. You may use this information to compare the ongoing costs of investing in the Fund and other funds. To do so, compare this 5% hypothetical example with the 5% hypothetical examples that appear in the shareholder reports of the other funds. Please note that the expenses shown in the table are meant to highlight your ongoing costs only and do not reflect any transactional costs, such as brokerage commissions paid on purchases and sales of Fund shares. Therefore, the second line of the table is useful in comparing ongoing costs only and will not help you determine the relative total costs of owning different funds. If these transactional costs were included, your costs would have been higher.
| WBI BullBear Rising Income 2000 ETF | | | |
| | Beginning | Ending | |
| | Account Value | Account Value | Expenses Paid |
| | January 1, 2019 | June 30, 2019 | During the Period^ |
Actual | $1,000.00 | $1,031.40 | $16.86 |
Hypothetical (5% annual return before expenses) | $1,000.00 | $1,008.19 | $16.67 |
| | | | |
| WBI BullBear Value 2000 ETF | | | |
| | Beginning | Ending | |
| | Account Value | Account Value | Expenses Paid |
| | January 1, 2019 | June 30, 2019 | During the Period^ |
Actual | $1,000.00 | $1,120.00 | $14.76 |
Hypothetical (5% annual return before expenses) | $1,000.00 | $1,010.87 | $14.00 |
| | | | |
| WBI BullBear Yield 2000 ETF | | | |
| | Beginning | Ending | |
| | Account Value | Account Value | Expenses Paid |
| | January 1, 2019 | June 30, 2019 | During the Period^ |
Actual | $1,000.00 | $ 968.10 | $11.15 |
Hypothetical (5% annual return before expenses) | $1,000.00 | $1,013.46 | $11.41 |
| | | | |
| WBI BullBear Quality 2000 ETF | | | |
| | Beginning | Ending | |
| | Account Value | Account Value | Expenses Paid |
| | January 1, 2019 | June 30, 2019 | During the Period^ |
Actual | $1,000.00 | $ 957.30 | $18.12 |
Hypothetical (5% annual return before expenses) | $1,000.00 | $1,006.28 | $18.57 |
| | | | |
| WBI BullBear Rising Income 1000 ETF | | | |
| | Beginning | Ending | |
| | Account Value | Account Value | Expenses Paid |
| | January 1, 2019 | June 30, 2019 | During the Period^ |
Actual | $1,000.00 | $1,077.10 | $12.96 |
Hypothetical (5% annual return before expenses) | $1,000.00 | $1,012.32 | $12.55 |
Expense Examples (concluded)
For the Period Ended June 30, 2019 (Unaudited)
| WBI BullBear Value 1000 ETF | | | |
| | Beginning | Ending | |
| | Account Value | Account Value | Expenses Paid |
| | January 1, 2019 | June 30, 2019 | During the Period^ |
Actual | $1,000.00 | $ 999.70 | $13.31 |
Hypothetical (5% annual return before expenses) | $1,000.00 | $1,011.49 | $13.38 |
| | | | |
| WBI BullBear Yield 1000 ETF | | | |
| | Beginning | Ending | |
| | Account Value | Account Value | Expenses Paid |
| | January 1, 2019 | June 30, 2019 | During the Period^ |
Actual | $1,000.00 | $1,037.30 | $10.44 |
Hypothetical (5% annual return before expenses) | $1,000.00 | $1,014.54 | $10.33 |
| | | | |
| WBI BullBear Quality 1000 ETF | | | |
| | Beginning | Ending | |
| | Account Value | Account Value | Expenses Paid |
| | January 1, 2019 | June 30, 2019 | During the Period^ |
Actual | $1,000.00 | $1,109.00 | $15.16 |
Hypothetical (5% annual return before expenses) | $1,000.00 | $1,010.42 | $14.45 |
| | | | |
| WBI BullBear Global Income ETF | | | |
| | Beginning | Ending | |
| | Account Value | Account Value | Expenses Paid |
| | January 1, 2019 | June 30, 2019 | During the Period^ |
Actual | $1,000.00 | $1,064.40 | $8.45 |
Hypothetical (5% annual return before expenses) | $1,000.00 | $1,016.61 | $8.26 |
WBI Power Factor™ High Dividend ETF | | | |
| | Beginning | Ending | |
| | Account Value | Account Value | Expenses Paid |
| | January 1, 2019 | June 30, 2019 | During the Period^ |
Actual | $1,000.00 | $1,130.10 | $7.27 |
Hypothetical (5% annual return before expenses) | $1,000.00 | $1,017.97 | $6.89 |
| | | | |
| WBI BullBear Trend Switch US 3000 Total Return ETF | | | |
| | Beginning | Ending | |
| | Account Value | Account Value | Expenses Paid |
| | May 28, 2019 | June 30, 2019 | During the Period |
Actual | $1,000.00 | $1,034.50 | $0.61* |
Hypothetical (5% annual return before expenses) | $1,000.00 | $1,024.20 | $0.60^ |
_________
^ | The dollar amounts shown as expenses paid during the period are equal to the annualized expense ratio multiplied by the average account value during the period, multiplied by 181/365 to reflect the one-half year period. |
* | The dollar amount shown as expenses paid during the period is equal to the annualized expense ratio multiplied by the average value during the period, multiplied by 33/165 to reflect the current period. |
Federal Tax Information
(Unaudited)
QUALIFIED DIVIDEND INCOME/DIVIDENDS RECEIVED DEDUCTION
For the fiscal year ended June 30, 2019, certain dividends paid by the Funds may be subject to a maximum tax rate of 15%, as provided for by the Jobs and Growth Tax Relief Reconciliation Act of 2003.
The percentage of dividends declared from ordinary income designated as qualified dividend income was as follows:
WBI BullBear Rising Income 2000 ETF | 100.00% | |
WBI BullBear Value 2000 ETF | 100.00% | |
WBI BullBear Yield 2000 ETF | 63.37% | |
WBI BullBear Quality 2000 ETF | 89.98% | |
WBI BullBear Rising Income 1000 ETF | 100.00% | |
WBI BullBear Value 1000 ETF | 100.00% | |
WBI BullBear Yield 1000 ETF | 100.00% | |
WBI BullBear Quality 1000 ETF | 100.00% | |
WBI BullBear Global Income ETF | 1.75% | |
WBI Power Factor™ High Dividend ETF | 95.30% | |
WBI BullBear Trend Switch US 3000 Total Return ETF | 0.00% | |
For corporate shareholders, the percent of ordinary income distributions qualifying for the corporate dividends received deduction for the fiscal year ended June 30, 2019 was as follows:
WBI BullBear Rising Income 2000 ETF | 100.00% | |
WBI BullBear Value 2000 ETF | .100.00% | |
WBI BullBear Yield 2000 ETF | 78.30% | |
WBI BullBear Quality 2000 ETF | 100.00% | |
WBI BullBear Rising Income 1000 ETF | 100.00% | |
WBI BullBear Value 1000 ETF | 100.00% | |
WBI BullBear Yield 1000 ETF | 100.00% | |
WBI BullBear Quality 1000 ETF | 100.00% | |
WBI BullBear Global Income ETF | 2.00% | |
WBI Power Factor™ High Dividend ETF | 92.00% | |
WBI BullBear Trend Switch US 3000 Total Return ETF | 0.00% | |
The Percentage of taxable ordinary income distributions that are designated as short-term capital gain distributions under Internal Revenue Section 871(k)(2)(C) for each Fund were as follows (unaudited).
WBI BullBear Rising Income 2000 ETF | 0.00% | |
WBI BullBear Value 2000 ETF | 0.00% | |
WBI BullBear Yield 2000 ETF | 0.00% | |
WBI BullBear Quality 2000 ETF | 0.00% | |
WBI BullBear Rising Income 1000 ETF | 0.00% | |
WBI BullBear Value 1000 ETF | 0.00% | |
WBI BullBear Yield 1000 ETF | 0.00% | |
WBI BullBear Quality 1000 ETF | 0.00% | |
WBI BullBear Global Income ETF | 0.00% | |
WBI Power Factor™ High Dividend ETF | 11.38% | |
WBI BullBear Trend Switch US 3000 Total Return ETF | 0.00% | |
Information About the Portfolio Holdings
(Unaudited)
The Trust files its complete schedules of portfolio holdings for its first and third fiscal quarters with the Securities and Exchange Commission (“SEC”) on Form N-Q. The Trust’s Form N-Q is available without charge, upon request, by calling toll-free at (800) 772-5810. Furthermore, you may obtain the Form N-Q on the SEC’s website at www.sec.gov. The Funds’ portfolio holdings are updated daily and posted on its website at www.wbishares.com.
Information About Proxy Voting
(Unaudited)
A description of the policies and procedures the Trust uses to determine how to vote proxies relating to portfolio securities is provided in the Statement of Additional Information (“SAI”). The SAI is available without charge, upon request, by calling toll-free at (800) 772-5810, by accessing the SEC’s website at www.sec.gov, or by accessing the Funds’ website at www.wbishares.com.
When available, information regarding how the Funds voted proxies relating to portfolio securities during the period ending June 30 will be available by calling toll-free at (800) 772-5810 or by accessing the SEC’s website at www.sec.gov.
Frequency Distributions of Premiums and Discounts
(Unaudited)
Information regarding how often shares of the Funds trade on an exchange at a price above (i.e., at a premium) or below (i.e., at a discount) the NAV of the Funds is available, without charge, on the Funds’ website at www.wbishares.com.
Advisor
Millington Securities
331 Newman Springs Road, Suite 101
Red Bank, New Jersey 07701
Sub-Advisor
WBI Investments, Inc
331 Newman Springs Road, Suite 122
Red Bank, New Jersey 07701
Index Provider
Solactive AG
Guiollettstraβe 54
60325 Frankfurt am Main, Germany
Distributor
Foreside Fund Services, LLC
Three Canal Plaza, Suite 100
Portland, Maine 04101
Custodian
U.S. Bank National Association
Custody Operations
1555 North Rivercenter Drive, Suite 302
Milwaukee, Wisconsin 53212
Transfer Agent
U.S. Bancorp Fund Services, LLC
615 East Michigan Street
Milwaukee, Wisconsin 53202
Securities Lending Agent
U.S. Bank, National Association
Securities Lending
800 Nicolet Mall
Minneapolis, Minnesota 55402-7020
Independent Registered
Public Accounting Firm
KPMG LLP
51 John F. Kennedy Parkway
Short Hills, New Jersey 07078
Legal Counsel
K&L Gates LLP
599 Lexington Avenue
New York, New York 10022
| | WBI BullBear Rising Income 2000 ETF | WBIA | |
| | WBI BullBear Value 2000 ETF | WBIB | |
| | WBI BullBear Yield 2000 ETF | WBIC | |
| | WBI BullBear Quality 2000 ETF | WBID | |
| | WBI BullBear Rising Income 1000 ETF | WBIE | |
| | WBI BullBear Value 1000 ETF | WBIF | |
| | WBI BullBear Yield 1000 ETF | WBIG | |
| | WBI BullBear Quality 1000 ETF | WBIL | |
| | WBI BullBear Global Income ETF | WBII | |
| | WBI Power Factor™ High Dividend ETF | WBIY | |
| | WBI BullBear Trend Switch US 3000 Total Return ETF | WBIT | |
Item 2. Code of Ethics.
The registrant has adopted a code of ethics that applies to the registrant’s principal executive officer and principal financial officer. The registrant has not made any substantive amendments to its code of ethics during the period covered by this report. The registrant has not granted any waivers from any provisions of the code of ethics during the period covered by this report.
A copy of the registrant’s Code of Ethics is filed herewith.
Item 3. Audit Committee Financial Expert.
The registrant’s board of trustees has determined that there is at least one audit committee financial expert serving on its audit committee. John A. Flanagan is the “audit committee financial expert” and is considered to be “independent” as each term is defined in Item 3 of Form N‑CSR.
Item 4. Principal Accountant Fees and Services.
The registrant has engaged its principal accountant to perform audit services, audit-related services, tax services and other services during the past two fiscal years. “Audit services” refer to performing an audit of the registrant's annual financial statements or services that are normally provided by the accountant in connection with statutory and regulatory filings or engagements for those fiscal years. “Audit-related services” refer to the assurance and related services by the principal accountant that are reasonably related to the performance of the audit. “Tax services” refer to professional services rendered by the principal accountant for tax compliance, tax advice, and tax planning. There were no “Other services” provided by the principal accountant. The following table details the aggregate fees billed or expected to be billed for each of the last two fiscal years for audit fees, audit-related fees, tax fees and other fees by the principal accountant.
WBI BullBear Rising Income 2000 ETF | FYE 06/30/2019 | FYE 06/30/2018 |
Audit Fees | $12,450 | $12,200 |
Audit-Related Fees | N/A | N/A |
Tax Fees | $5,350 | $5,100 |
All Other Fees | N/A | N/A |
WBI BullBear Value 2000 ETF | FYE 06/30/2019 | FYE 06/30/2018 |
Audit Fees | $12,450 | $12,200 |
Audit-Related Fees | N/A | N/A |
Tax Fees | $5,350 | $5,100 |
All Other Fees | N/A | N/A |
| WBI BullBear Yield 2000 ETF | FYE 06/30/2019 | FYE 06/30/2018 |
| Audit Fees | $12,450 | $12,200 |
| Audit-Related Fees | N/A | N/A |
| Tax Fees | $5,350 | $5,100 |
| All Other Fees | N/A | N/A |
| WBI BullBear Quality 2000 ETF | FYE 06/30/2019 | FYE 06/30/2018 |
| Audit Fees | $12,450 | $12,200 |
| Audit-Related Fees | N/A | N/A |
| Tax Fees | $5,350 | $5,100 |
| All Other Fees | N/A | N/A |
| WBI BullBear Rising Income 1000 ETF | FYE 06/30/2019 | FYE 06/30/2018 |
| Audit Fees | $12,450 | $12,200 |
| Audit-Related Fees | N/A | N/A |
| Tax Fees | $5,350 | $5,100 |
| All Other Fees | N/A | N/A |
| WBI BullBear Value 1000 ETF | FYE 06/30/2019 | FYE 06/30/2018 |
| Audit Fees | $12,450 | $12,200 |
| Audit-Related Fees | N/A | N/A |
| Tax Fees | $5,350 | $5,100 |
| All Other Fees | N/A | N/A |
| WBI BullBear Yield 1000 ETF | FYE 06/30/2019 | FYE 06/30/2018 |
| Audit Fees | $12,450 | $12,200 |
| Audit-Related Fees | N/A | N/A |
| Tax Fees | $5,350 | $5,100 |
| All Other Fees | N/A | N/A |
| WBI BullBear Quality 1000 ETF | FYE 06/30/2019 | FYE 06/30/2018 |
| Audit Fees | $12,450 | $12,200 |
| Audit-Related Fees | N/A | N/A |
| Tax Fees | $5,350 | $5,100 |
| All Other Fees | N/A | N/A |
| WBI BullBear Global Income ETF | FYE 06/30/2019 | FYE 06/30/2018 |
| Audit Fees | $12,450 | $12,200 |
| Audit-Related Fees | N/A | N/A |
| Tax Fees | $5,350 | $5,100 |
| All Other Fees | N/A | N/A |
WBI Power FactorTM High Dividend ETF | FYE 06/30/2019 | FYE 06/30/2018 |
| Audit Fees | $12,450 | $10,000 |
| Audit-Related Fees | N/A | N/A |
| Tax Fees | $5,350 | $5,100 |
| All Other Fees | N/A | N/A |
| WBI BullBear Trend Switch US 3000 Total Return ETF | FYE 06/30/2019 | FYE 06/30/2018 |
| Audit Fees | $7,500 | N/A |
| Audit-Related Fees | N/A | N/A |
| Tax Fees | $5,350 | N/A |
| All Other Fees | N/A | N/A |
The audit committee has adopted pre-approval policies and procedures that require the audit committee to pre‑approve all audit and non‑audit services of the registrant, including services provided to any entity affiliated with the registrant.
The percentage of fees billed by KPMG LLP applicable to non-audit services pursuant to waiver of pre-approval requirement were as follows:
| | FYE 06/30/2019 | FYE 06/30/2018 |
Audit-Related Fees | 0% | 0% |
Tax Fees | 0% | 0% |
All Other Fees | 0% | 0% |
All of the principal accountant’s hours spent on auditing the registrant’s financial statements were attributed to work performed by full‑time permanent employees of the principal accountant. (If more than 50 percent of the accountant’s hours were spent to audit the registrant's financial statements for the most recent fiscal year, state how many hours were attributed to work performed by persons other than the principal accountant's full-time, permanent employees.)
The following table indicates the non-audit fees billed or expected to be billed by the registrant’s accountant for services to the registrant and to the registrant’s investment adviser (and any other controlling entity, etc.—not sub-adviser) for the last two years. The audit committee of the board of trustees/directors has considered whether the provision of non-audit services that were rendered to the registrant's investment adviser is compatible with maintaining the principal accountant's independence and has concluded that the provision of such non-audit services by the accountant has not compromised the accountant’s independence.
Non-Audit Related Fees | FYE 06/30/2019 | FYE 06/30/2018 |
Registrant | N/A | N/A |
Registrant’s Investment Adviser | | |
Item 5. Audit Committee of Listed Registrants.
The registrant is an issuer as defined in Rule 10A-3 under the Securities Exchange Act of 1934, (the “Act”) and has a separately-designated standing audit committee established in accordance with Section 3(a)(58)(A) of the Act. The independent members of the committee are as follows: Andrew Putterman, Jude T. Depko, John A. Flanagan.
Item 6. Investments.
Schedule of Investments is included as part of the report to shareholders filed under Item 1 of this Form.
Item 7. Disclosure of Proxy Voting Policies and Procedures for Closed-End Management Investment Companies.
Not applicable to open-end investment companies.
Item 8. Portfolio Managers of Closed-End Management Investment Companies.
Not applicable to open-end investment companies.
Item 9. Purchases of Equity Securities by Closed‑End Management Investment Company and Affiliated Purchasers.
Not applicable to open-end investment companies.
Item 10. Submission of Matters to a Vote of Security Holders.
There have been no material changes to the procedures by which shareholders may recommend nominees to the registrant’s Board of Trustees.
Item 11. Controls and Procedures.
(a) | The Registrant’s Principal Executive Officer and Principal Financial Officer have reviewed the Registrant's disclosure controls and procedures (as defined in Rule 30a-3(c) under the Investment Company Act of 1940 (the “Act”)) as of a date within 90 days of the filing of this report, as required by Rule 30a-3(b) under the Act and Rules 13a-15(b) or 15d‑15(b) under the Securities Exchange Act of 1934. Based on their review, such officers have concluded that the disclosure controls and procedures are effective in ensuring that information required to be disclosed in this report is appropriately recorded, processed, summarized and reported and made known to them by others within the Registrant and by the Registrant’s service provider. |
(b) | There were no changes in the Registrant's internal control over financial reporting (as defined in Rule 30a-3(d) under the Act) that occurred during the second fiscal quarter of the period covered by this report that has materially affected, or is reasonably likely to materially affect, the Registrant's internal control over financial reporting. |
Item 12. Disclosure of Securities Lending Activities for Closed-End Management Investment Companies
Not applicable to open-end investment companies.
Item 13. Exhibits.
| (a) | (1) Any code of ethics or amendment thereto, that is the subject of the disclosure required by Item 2, to the extent that the registrant intends to satisfy Item 2 requirements through filing an exhibit. Filed herewith. |
(2) A separate certification for each principal executive officer and principal financial officer pursuant to Section 302 of the Sarbanes-Oxley Act of 2002. Filed herewith.
(3) Any written solicitation to purchase securities under Rule 23c‑1 under the Act sent or given during the period covered by the report by or on behalf of the registrant to 10 or more persons. Not applicable to open-end investment companies.
(4) Change in the registrant’s independent public accountant. There was no change in the registrant’s independent public accountant for the period covered by this report.
| (b) | Certifications pursuant to Section 906 of the Sarbanes‑Oxley Act of 2002. Furnished herewith. |
SIGNATURES
Pursuant to the requirements of the Securities Exchange Act of 1934 and the Investment Company Act of 1940, the registrant has duly caused this report to be signed on its behalf by the undersigned, thereunto duly authorized.
(Registrant) Absolute Shares Trust
By (Signature and Title)* /s/ Don Schreiber, Jr.
Don Schreiber, Jr., President and Principal Executive Officer
Date September 5, 2019
Pursuant to the requirements of the Securities Exchange Act of 1934 and the Investment Company Act of 1940, this report has been signed below by the following persons on behalf of the registrant and in the capacities and on the dates indicated.
By (Signature and Title)* /s/ Don Schreiber, Jr.
Don Schreiber, Jr., President and Principal Executive Officer
Date September 5, 2019
By (Signature and Title)* /s/ Tracey Crespo
Tracey Crespo, Treasurer and Principal Financial Officer
Date September 5, 2019
* Print the name and title of each signing officer under his or her signature.