Millington Securities, Inc.
Don Schreiber, Jr.
Millington Securities, Inc.

ANNUAL REPORT
June 30, 2017
WBI Tactical SMG Shares | WBIA
WBI Tactical SMV Shares | WBIB
WBI Tactical SMY Shares | WBIC
WBI Tactical SMS Shares | WBID
WBI Tactical LCG Shares | WBIE
WBI Tactical LCV Shares | WBIF
WBI Tactical LCY Shares | WBIG
WBI Tactical LCS Shares | WBIL
WBI Tactical Income Shares | WBII
WBI Tactical High Income Shares | WBIH
WBI Tactical Rotation Shares | WBIR
WBI Power FactorTM High Dividend ETF | WBIY
| Absolute Shares Trust Table of Contents |
Management’s Discussion of Fund Performance | 1 |
Performance Summaries | 14 |
Portfolio Allocations | 26 |
Schedules of Investments | 27 |
Statements of Assets and Liabilities | 39 |
Statements of Operations | 42 |
Statements of Changes in Net Assets | 45 |
Financial Highlights | 51 |
Notes to Financial Statements | 57 |
Report of Independent Registered Public Accounting Firm | 71 |
Trustees and Officers | 72 |
Approval of Advisory Agreements and Board Considerations | 74 |
Expense Example | 76 |
Federal Tax Information | 79 |
Information About the Portfolio Holdings | 80 |
Information About Proxy Voting | 80 |
Frequency Distribution of Premiums and Discounts | 80 |
(This page intentionally left blank.)
| Absolute Shares Trust Management’s Discussion of Fund Performance (Unaudited) June 30, 2017 |
Dear Fellow Shareholder:
Two new funds joined the family of ten existing WBI Exchange Traded Funds (ETFs) during the fiscal year ended June 30, 2017. The WBI Tactical Rotation Shares launched on July 27, 2016, and the WBI Power Factor High Dividend ETF launched on December 22, 2016. The WBI Tactical Rotation Shares uses proprietary global asset rotation models covering a wide range of potential investment opportunities in an attempt to identify those with attractive prospects for risk-adjusted total return. The WBI Power Factor High Dividend ETF is designed to track the Solactive Power FactorTM High Dividend Index. The Solactive Power FactorTM High Dividend Index uses a rules-based methodology to select U.S. stocks ranked by certain fundamental value characteristics (Power FactorsTM) that have above average forecasted dividend yields.
Despite a few ups and downs, the twelve-month period ended June 30th was a generally favorable one for many investment markets. As discussed in more detail below, the underlying performance trends of the security types from which each fund’s selections are made varied, and the performance among the Funds reflected their participation in those trends. Favorable conditions may not continue indefinitely for every type of investment, but we believe the consistent application of the disciplined process used to manage the Funds will continue to prove to be extremely valuable and attractive to current and prospective shareholders.
We appreciate the continuing confidence of our existing shareholders, and welcome our new shareholders to the Funds.
Investment Philosophy
The goal of the WBI Funds is to provide consistent, attractive returns with less volatility and risk to capital than traditional approaches. We believe capital preservation is essential to providing long-term portfolio growth and a consistent stream of income. Our focus on value, dividends, and risk management has become fundamental to our investment process.
Performance Overview
The actively managed equity-focused Funds enjoyed double digit positive returns during the fiscal year ended June 30, 2017. The income Funds generated monthly distributions and gained during the period as well, although their significant allocation to fixed income investments moderated their appreciation.
The two new Funds have less than a full year of performance. The per share value of the WBI Tactical Rotation Shares slid during the first five months after its launch, but has made up much of that ground over the six months that followed. In its first six months of existence, the WBI Power Factor High Yield Dividend ETF has outperformed the index it is designed to track. This has nevertheless led to a slightly negative return, as a portion of the high-yielding dividend-paying stocks that comprise the index have fallen out of favor during the period.
The WBI Tactical SMG Shares (NYSE Arca: WBIA) returned 11.74% on a NAV basis, and 12.38% based on market value, versus the 20.86% return of the MSCI World Small Growth GROSS USD Index, the Fund’s benchmark.
The WBI Tactical SMV Shares (NYSE Arca: WBIB) returned 18.55% on a NAV basis, and 19.01% based on market value, versus the 22.04% return of the MSCI World Small Value GROSS USD Index, the Fund’s benchmark.
The WBI Tactical SMY Shares (NYSE Arca: WBIC) returned 12.26% on a NAV basis, and 12.65% based on market value, versus the 12.77% return of the MSCI World High Dividend Yield Gross TR Index, the Fund’s benchmark.
The WBI Tactical SMS Shares (NYSE Arca: WBID) returned 13.32% on a NAV basis, and 14.34% based on market value, versus the 17.08% return of the MSCI World Quality GROSS USD Index, the Fund’s benchmark.
The WBI Tactical LCG Shares (NYSE Arca: WBIE) returned 12.88% on a NAV basis, and 13.54% based on market value, versus the 18.68% return of the MSCI World Large Growth GROSS USD Index, the Fund’s benchmark.
The WBI Tactical LCV Shares (NYSE Arca: WBIF) returned 21.34% on a NAV basis, and 22.10% based on market value, versus the 18.99% return of the MSCI World Large Value GROSS USD Index, the Fund’s benchmark.
The WBI Tactical LCY Shares (NYSE Arca: WBIG) returned 14.82% on a NAV basis, and 15.43% based on market value, versus the 12.77% return of the MSCI World High Dividend Yield Gross TR Index, the Fund’s benchmark.
The WBI Tactical LCS Shares (NYSE Arca: WBIL) returned 16.80% on a NAV basis, and 17.46% based on market value, versus the 17.08% return of the MSCI World Quality GROSS USD Index, the Fund’s benchmark.
The WBI Tactical Income Shares (NYSE Arca: WBII) returned 2.36% on a NAV basis, and 2.54% based on market value, versus the 3.29% return of the 20% MSCI World TR/80% Barclays Capital Aggregate Bond Index, the Fund’s custom benchmark.
1
| Absolute Shares Trust Management’s Discussion of Fund Performance (Unaudited) (continued) June 30, 2017 |
The WBI Tactical High Income Shares (NYSE Arca: WBIH) returned 7.04% on a NAV basis, and 7.40% based on market value, versus the 5.14% return of the 30% MSCI World TR/70% Barclays Capital Aggregate Bond Index and the -0.31% return of the Bloomberg Barclays Aggregate Bond Index, the Fund’s custom benchmarks.
The WBI Tactical Rotation Shares ETF (NYSE Arca: WBIR) returned -1.44% on a NAV basis, and -1.25% based on market value, versus the return of 7.16% of the 50% MSCI World TR/50% Barclays Capital Aggregate Bond Index, the Fund’s custom benchmark.
The WBI Power Factor High Yield Dividend ETF (NYSE Arca: WBIY) returned -1.64% on a NAV basis, and -1.16% based on market value, versus the return of 6.33% of the MSCI US Investable Market High Dividend Index, the Fund’s benchmark.
Net asset value total return is calculated assuming an initial investment made at the net asset value at the beginning of the period, reinvestment of all dividends and distributions at net asset value during the period, and the redemption on the last day of the period. Net asset value total return includes adjustments in accordance with accounting principles generally accepted in the United States of America and as such, the net asset value for financial reporting purposes and the returns based upon those net asset values may differ from the net asset value and returns for shareholder transactions. Market price total return is calculated assuming an initial investment made at the market price at the beginning of the period, reinvestment of all dividends and distributions at market price during the period, and sale at the market price on the last day of the period. Total investment returns calculated for a period of less than one year are not annualized.
With the exception of the index Fund, the WBI Power Factor High Yield Dividend ETF, the strategies used in the management of the Funds do not attempt to replicate or track the performance of any index, and differ significantly from the methods used to construct and maintain the indices that serve as their respective benchmarks. The eleven actively managed Funds (“Active Funds”) use proprietary processes to screen, rank, and purchase securities with particular attributes, and sell securities when certain thresholds are reached, while benchmark indices are unmanaged, and consist of a passive representation of all securities that meet the definition of the index constituents. In addition, each Active Fund uses strategies intended to mitigate volatility and protect capital, and as a result these Funds will often have a significant allocation to cash equivalents. Therefore, while each Active Fund’s performance includes the effect of an investment in cash equivalents from the proceeds of sales when certain thresholds are met, benchmark indices do not include an allocation to cash equivalents. A distinguishing characteristic of cash equivalents is that their prices are extremely stable and not subject to the levels of price volatility generally exhibited by other investments. Therefore, in periods during which the prices of the securities represented in benchmark indices are falling, an allocation to cash equivalents may contribute to Active Fund performance that outperforms their benchmarks. In periods during which the prices of the securities represented in benchmark indices are rising, an allocation to cash equivalents in an Active Fund may cause its performance to trail that of its benchmark. During the most recent fiscal period, the Funds generally did not hold persistently large allocations to cash equivalents, so deviations in performance between each Active Fund and its respective benchmark was primarily due to differences between the securities held by the Fund and those that make up the benchmark’s constituents. You cannot invest directly in an index, including a benchmark index, and benchmark performance does not include the deduction of transaction and operational expenses, or the deduction of an investment management fee, which would alter their indicated historical results.
The WBI Power Factor High Yield Dividend ETF is intended to track its benchmark index, the Solactive Power FactorTM High Dividend Index, and can reasonably be compared to its benchmark in evaluating its performance. Despite the limitations of using benchmarks to assess the performance of the Active Funds, indices can still provide some context for understanding how market conditions and active management may have affected Fund performance. A benchmark for each of the Active Funds is shown because they provide a reference to investments that are similar to the types of investments that may appear from time to time in the Funds. However, none of the benchmarks are, or are likely to become, representative of past or expected Active Fund holdings or performance.
Review of Active Fund Trading Activity
The Active Funds attempt to provide consistent, attractive returns net of expenses with potentially less volatility and risk to capital than traditional approaches, whatever market conditions may be. The investment process for each Fund includes a buy discipline and a sell discipline. Each Fund’s trading activity reflects this disciplined investment process as described in its prospectus, and summarized below.
The Active Funds that invest in individual equities use quantitative computer screening of fundamental stock information to evaluate domestic and foreign equity securities in an attempt to find companies with attractive characteristics for the selected universe of securities. Dividend payments may be considered as part of the evaluation process. Once securities are identified, an overlay of technical analysis confirms timeliness of security purchases. The Funds then add qualifying securities using available cash within the parameters of each Fund’s investment objective and security selection criteria.
The Active Funds that invest in fixed income securities and bond ETFs use a proprietary bond model to assess the appropriate duration of their exposure to debt securities. Duration is a measure of a fixed income security’s expected price sensitivity to changes in interest rates. Securities with longer durations are expected to experience greater price movements than securities with shorter duration for the same change in prevailing interest rates. A portion of a Fund’s bond exposure may also be invested to pursue perceived opportunities in varying segments
2
| Absolute Shares Trust Management’s Discussion of Fund Performance (Unaudited) (continued) June 30, 2017 |
of the debt market. This systematic process of identifying, evaluating, and purchasing securities constitutes the Sub-Advisor’s buy discipline for the Funds.
The WBI Tactical Rotation Shares uses proprietary global asset rotation models intended to identify investment opportunities with superior risk-adjusted return potential across a broad array of global asset classes, sectors, industries, geographic regions, indices, or security styles. The Fund’s allocation will change as the models’ assessments of the attractiveness of investment opportunities change with respect to the other opportunities being evaluated.
Once a security is purchased for a given Active Fund, a strict sell discipline with a dynamic stop loss and goal setting process attempts to control the effects of the volatility of each invested position on the Fund’s value. An initial stop percentage and goal price is established at the time a security is purchased. As that security’s specified goal price is approached, the initial stop tolerance set for each security is tightened. If a security stays within its acceptable price channel relative to its current stop, it remains in the Fund’s portfolio. If the security moves below the acceptable price channel, a stop is triggered and the Fund will sell the security. This results in a responsive process that actively adjusts the Fund’s allocation by causing it to become more fully invested or by raising cash with the intention of protecting capital. This process is likely to result in a Fund holding meaningful allocations to cash equivalents during periods of market volatility.
The investment process has been built on the assumption that future events involve varying degrees of uncertainty. Therefore, the appearance of qualifying candidates in the selection process will be respected as a possible indication of the start of a durable price advance, and each stop loss trigger will result in a sale of the relevant security to help prevent losses to capital that could result if the security continued to be held and the price of the security continued to fall. As per this disciplined investment process, during the fiscal period securities identified by the various ranking and selection processes as attractive were purchased with available cash, and trailing stops were implemented for all securities purchased.
The security selection process has continued to uncover what we believe to be very attractive investment opportunities for each of the Funds.
WBI Tactical SMG Shares (WBIA)
As of June 30, 2017, WBIA held 41 securities in addition to a position in a money market fund which served as a cash equivalent. From the time of their purchase, 29 of these positions had unrealized gains of between 0.19% and 20.96%, while 12 had unrealized losses ranging from -0.05% to -8.84%. The aggregate unrealized gain amounted to 3.86% of the Fund’s period ending net asset value.
Approximately 73% of the securities held by WBIA at any time during the fiscal period were sold. Approximately 48% of the Fund’s holdings were sold for gains, with an average realized gain of 14.4%, and approximately 51% were sold for an average realized loss of -7.1%. Other dispositions (generally involving option and other hedging activity) affected approximately 0.03% of the Fund’s positions, resulting in a loss of -0.29%.
Examples of securities that made positive contributions to WBIA’s performance during the fiscal period include Cognex Corporation, Group 1 Automotive Incorporated, Robert Half International Incorporated, Brown & Brown Incorporated, and Manpowergroup Incorporated. Examples of securities that detracted from the Fund’s performance during the fiscal period include Dollar General Corporation, Texas Roadhouse Incorporated, Apogee Enterprises Incorporated, Glacier Bancorp Incorporated, and Provident Financial Services.
Six option/volatility hedges intended to reduce risk were implemented in WBIA during the fiscal period, resulting in a loss of -0.29%. The only hedged position that resulted in a positive return was Broadcom Ltd. Examples of positions that were hedged with negative return contributions arising from the hedge itself include two separate instances of Russell 2000 Index, two separate instances of S&P 500 Index, and a separate instance of hedging Broadcom Ltd.
High turnover in WBIA’s holdings has the potential to result in the realization and distribution to shareholders of higher capital gains. If Fund shares are held in a taxable account, this may increase your tax liability. To the extent portfolio turnover increases transaction costs, it may also reduce Fund performance. Of course, selling a security in a timely fashion may also improve performance if a subsequent loss is avoided that exceeds the cost of executing the sale.
WBI Tactical SMV Shares (WBIB)
As of June 30, 2017, WBIB held 41 securities in addition to a position in a money market fund which served as a cash equivalent. From the time of their purchase, 28 of these positions had unrealized gains of between 0.07% and 24.44%, while 13 had unrealized losses ranging from -0.09% to -18.97%. The aggregate unrealized gain amounted to 4.21% of the Fund’s period ending net asset value.
Approximately 77% of the securities held by WBIB at any time during the fiscal period were sold. Approximately 47% of the Fund’s holdings were sold for gains, with an average realized gain of 16.3%, and approximately 53% were sold for an average realized loss of -8.8%. Other dispositions (generally involving option and other hedging activity) affected approximately 0.02% of the Fund’s positions, resulting in an average loss of -0.27%.
3
| Absolute Shares Trust Management’s Discussion of Fund Performance (Unaudited) (continued) June 30, 2017 |
Examples of securities that made positive contributions to WBIB’s performance during the fiscal period include Cosan Ltd. Class A Shares, Dana Incorporated, Kapstone Paper and Packaging, Citizens Financial Group, and Morgan Stanley. Examples of securities that detracted from the Fund’s performance during the fiscal period include The Geo Group Incorporated, Ingredion Incorporated, Pitney Bowes Incorporated, Targa Resources Corporation, and Kindred Healthcare Incorporated.
Four option/volatility hedges intended to reduce risk were implemented in WBIB during the fiscal period, resulting in an aggregate loss of approximately -0.27%. No hedged position resulted in a positive return contribution. Examples of positions that were hedged with negative return contributions arising from the hedge itself include two separate instances of Russell 2000 Index and two separate instances of S&P 500 Index.
High turnover in WBIB’s holdings has the potential to result in the realization and distribution to shareholders of higher capital gains. If Fund shares are held in a taxable account, this may increase your tax liability. To the extent portfolio turnover increases transaction costs, it may also reduce Fund performance. Of course, selling a security in a timely fashion may also improve performance if a subsequent loss is avoided that exceeds the cost of executing the sale.
WBI Tactical SMY Shares (WBIC)
As of June 30, 2017, WBIC held 34 securities in addition to a position in a money market fund which served as a cash equivalent. From the time of their purchase, 24 of these positions had unrealized gains of between 0.27% and 27.40%, while 10 had unrealized losses ranging from -0.08% to -3.55%. The aggregate unrealized gain amounted to 4.27% of the Fund’s period ending net asset value.
Approximately 80% of the securities held by WBIC at any time during the fiscal period were sold. Approximately 41% of the Fund’s holdings were sold for gains, with an average realized gain of 15.4%, and approximately 59% were sold for an average realized loss of -8.5%. Other dispositions (generally involving option and other hedging activity) affected approximately 0.03% of the Fund’s positions, resulting in an average loss of -0.28%.
Examples of securities that made positive contributions to WBIC’s performance during the fiscal period include DeVry Education Group Incorporated, ILG Incorporated, Webster Financial Corporation, Time Warner Incorporated, and The Boeing Company. Examples of securities that detracted from the Fund’s performance during the fiscal period include Quad Graphics Incorporated, Hollyfrontier Corporation, Pitney Bowes Incorporated, Cinemark Holdings Incorporated, and Time Incorporated.
Five option/volatility hedges intended to reduce risk were implemented in WBIC during the fiscal period, resulting in an aggregate loss of approximately -0.28%. The only hedged position that resulted in a positive return was Time Warner Incorporated. Examples of positions that were hedged with negative return contributions arising from the hedge itself two separate instances of Russell 2000 Index and two separate instances of S&P 500 Index.
High turnover in WBIC’s holdings has the potential to result in the realization and distribution to shareholders of higher capital gains. If Fund shares are held in a taxable account, this may increase your tax liability. To the extent portfolio turnover increases transaction costs, it may also reduce Fund performance. Of course, selling a security in a timely fashion may also improve performance if a subsequent loss is avoided that exceeds the cost of executing the sale.
WBI Tactical SMS Shares (WBID)
As of June 30, 2017, WBID held 39 securities in addition to a position in a money market fund which served as a cash equivalent. From the time of their purchase, 28 of these positions had unrealized gains of between 0.33% and 29.18%, while 11 had unrealized losses ranging from -0.39% to -10.51%. The aggregate unrealized gain amounted to 4.64% of the Fund’s period ending net asset value.
Approximately 77% of the securities held by WBID at any time during the fiscal period were sold. Approximately 43% of the Fund’s holdings were sold for gains, with an average realized gain of 14.1%, and approximately 57% were sold for an average realized loss of -8.4%. Other dispositions (generally involving option and other hedging activity) affected approximately 0.03% of the Fund’s positions, resulting in an average loss of -0.29%.
Examples of securities that made positive contributions to WBID’s performance during the fiscal period include Steel Dynamics Incorporated, Evercore Partners Incorporated – Class A Shares, Greif Incorporated – Class A Shares, Alaska Air Group Incorporated, and Vail Resorts Incorporated. Examples of securities that detracted from the Fund’s performance during the fiscal period include Essendant Incorporated, Ingredion Incorporated, LA-Z-BOY Incorporated, Nordstrom Incorporated, and Sturm Ruger & Co Incorporated.
Four option/volatility hedges intended to reduce risk were implemented in WBID during the fiscal period, resulting in an aggregate loss of approximately -0.29%. No hedged position resulted in a positive return contribution. Examples of positions that resulted in negative return contributions include two separate instances of Russell 2000 Index and two separate instances of S&P 500 Index.
High turnover in WBID’s holdings has the potential to result in the realization and distribution to shareholders of higher capital gains. If Fund shares are held in a taxable account, this may increase your tax liability. To the extent portfolio turnover increases transaction costs, it may
4
| Absolute Shares Trust Management’s Discussion of Fund Performance (Unaudited) (continued) June 30, 2017 |
also reduce Fund performance. Of course, selling a security in a timely fashion may also improve performance if a subsequent loss is avoided that exceeds the cost of executing the sale.
WBI Tactical LCG Shares (WBIE)
As of June 30, 2017, WBIE held 30 securities in addition to a position in a money market fund which served as a cash equivalent. From the time of their purchase, 26 of these positions had unrealized gains of between 0.58% and 36.51%, while 4 had unrealized losses ranging from -1.34% to -7.55%. The aggregate unrealized gain amounted to 4.89% of the Fund’s period ending net asset value.
Approximately 75% of the securities held by WBIE at any time during the fiscal period were sold. Approximately 45% of the Fund’s holdings were sold for gains, with an average realized gain of 14.5%, and approximately 55% were sold for an average realized loss of -7.2%. Other dispositions (generally involving option and other hedging activity) affected approximately 0.03% of the Fund’s positions, resulting in an average loss of -0.23%.
Examples of securities that made positive contributions to WBIE’s performance during the fiscal period include Applied Materials Incorporated, Regions Financial Corporation, Quest Diagnostics Incorporated, Apple Incorporated, and Republic Services Incorporated. Examples of securities that detracted from the Fund’s performance during the fiscal period include The Geo Group Incorporated, Dollar General Corporation, Mid-America Apartment Communities, Prologis Incorporated, and Nielsen Holdings Plc.
Six option/volatility hedges intended to reduce risk were implemented in WBIE during the fiscal period, resulting in an aggregate loss of approximately -0.23%. Examples of positions that were hedged with positive return contributions arising from the hedge itself include Time Warner Incorporated, CBS Corporation, and Conagra Brands. Examples of hedged positions that resulted in a negative return contribution were two separate instances of hedging the S&P 500 Index.
High turnover in WBIE’s holdings has the potential to result in the realization and distribution to shareholders of higher capital gains. If Fund shares are held in a taxable account, this may increase your tax liability. To the extent portfolio turnover increases transaction costs, it may also reduce Fund performance. Of course, selling a security in a timely fashion may also improve performance if a subsequent loss is avoided that exceeds the cost of executing the sale.
WBI Tactical LCV Shares (WBIF)
As of June 30, 2017, WBIF held 27 securities in addition to a position in a money market fund which served as a cash equivalent. From the time of their purchase, 24 of these positions had unrealized gains of between 0.14% and 13.49%, while 3 had unrealized losses ranging from -0.56% to -14.29%. The aggregate unrealized gain amounted to 4.31% of the Fund’s period ending net asset value.
Approximately 79% of the securities held by WBIF at any time during the fiscal period were sold. Approximately 51% of the Fund’s holdings were sold for gains, with an average realized gain of 14.1%, and approximately 49% were sold for an average realized loss of -6.2%. Other dispositions (generally involving option and other hedging activity) affected approximately 0.03% of the Fund’s positions, resulting in an average loss of -0.24%.
Examples of securities that made positive contributions to WBIF’s performance during the fiscal period include Copa Holdings SA – Class A Shares, Lincoln National Corporation, Best Buy Co Incorporated, Nucor Corporation, and Regions Financial Corporation. Examples of securities that detracted from the Fund’s performance during the fiscal period include Conagra Brands Incorporated, Bunge Ltd., Targa Resources Corporation, Digital Realty Trust Incorporated, and Bancolombia S.A. – Sponsored ADR.
Four option/volatility hedges intended to reduce risk were implemented in WBIF during the fiscal period, resulting in an aggregate loss of approximately -0.24%. The only hedged position that resulted in a positive return was Conagra Brands. Examples of hedged positions that resulted in a negative return contribution were two separate instances of hedging the S&P 500 Index.
High turnover in WBIF’s holdings has the potential to result in the realization and distribution to shareholders of higher capital gains. If Fund shares are held in a taxable account, this may increase your tax liability. To the extent portfolio turnover increases transaction costs, it may also reduce Fund performance. Of course, selling a security in a timely fashion may also improve performance if a subsequent loss is avoided that exceeds the cost of executing the sale.
WBI Tactical LCY Shares (WBIG)
As of June 30, 2017, WBIG held 28 securities in addition to a position in a money market fund which served as a cash equivalent. From the time of their purchase, 25 of these positions had unrealized gains of between 0.20% and 17.36%, while 3 had unrealized losses ranging from -0.55% to -4.54%. The aggregate unrealized gain amounted to 4.18% of the Fund’s period ending net asset value.
Approximately 77% of the securities held by WBIG at any time during the fiscal period were sold. Approximately 47% of the Fund’s holdings were sold for gains, with an average realized gain of 15.1%, and approximately 53% were sold for an average realized loss of -6.9%. Other
5
| Absolute Shares Trust Management’s Discussion of Fund Performance (Unaudited) (continued) June 30, 2017 |
dispositions (generally involving option and other hedging activity) affected approximately 0.03% of the Fund’s positions, resulting in an average loss of -0.26%.
Examples of securities that made positive contributions to WBIG’s performance during the fiscal period include Nucor Corporation, Regions Financial Corporation, Microchip Technology Incorporated, HP Incorporated, and ILG Incorporated. Examples of securities that detracted from the Fund’s performance during the fiscal period include Targa Resources Corporation, Nielsen Holdings Plc., SYSCO Corporation, LS Technologies Incorporated, and The Geo Group Incorporated.
Four option/volatility hedges intended to reduce risk were implemented in WBIF during the fiscal period, resulting in an aggregate loss of approximately -0.26%. The only hedged position that resulted in a positive return was Conagra Brands. Examples of hedged positions that resulted in a negative return contribution were two separate instances of hedging the S&P 500 Index.
High turnover in WBIG’s holdings has the potential to result in the realization and distribution to shareholders of higher capital gains. If Fund shares are held in a taxable account, this may increase your tax liability. To the extent portfolio turnover increases transaction costs, it may also reduce Fund performance. Of course, selling a security in a timely fashion may also improve performance if a subsequent loss is avoided that exceeds the cost of executing the sale.
WBI Tactical LCS Shares (WBIL)
As of June 30, 2017, WBIL held 30 securities in addition to a position in a money market fund which served as a cash equivalent. From the time of their purchase, 23 of these positions had unrealized gains of between 0.50% and 17.97%, while 7 had unrealized losses ranging from -0.57% to -5.34%. The aggregate unrealized gain amounted to 5.09% of the Fund’s period ending net asset value.
Approximately 75% of the securities held by WBIL at any time during the fiscal period were sold. Approximately 49% of the Fund’s holdings were sold for gains, with an average realized gain of 14.5%, and approximately 51% were sold for an average realized loss of -7.4%. Other dispositions (generally involving option and other hedging activity) affected approximately 0.03% of the Fund’s positions, resulting in an average loss of -0.25%.
Examples of securities that made positive contributions to WBIL’s performance during the fiscal period include Keycorp, Steel Dynamics Incorporated, Nucor Corporation, Regions Financial Corporation, and Lincoln National Corporation. Examples of securities that detracted from the Fund’s performance during the fiscal period include Conagra Brands Incorporated, Nielsen Holdings Plc., Cardinal Health Incorporated, Comcast Corporation – Class A Shares, and One Gas Incorporated.
Four option/volatility hedges intended to reduce risk were implemented in WBIL during the fiscal period, resulting in an aggregate loss of approximately -0.25%. The only hedged position that resulted in a positive return was Conagra Brands. Examples of hedged positions that resulted in a negative return contribution were two separate instances of hedging the S&P 500 Index.
High turnover in WBIL’s holdings has the potential to result in the realization and distribution to shareholders of higher capital gains. If Fund shares are held in a taxable account, this may increase your tax liability. To the extent portfolio turnover increases transaction costs, it may also reduce Fund performance. Of course, selling a security in a timely fashion may also improve performance if a subsequent loss is avoided that exceeds the cost of executing the sale.
WBI Tactical Income Shares (WBII)
As of June 30, 2017, WBII held 21 securities in addition to a position in a money market fund which served as a cash equivalent. From the time of their purchase, 19 of these positions had unrealized gains of between 0.08% and 7.36%, while 2 had unrealized losses ranging from -0.10% to -7.97%. The aggregate unrealized gain amounted to 1.46% of the Fund’s period ending net asset value.
Approximately 81% of the securities held by WBII at any time during the fiscal period were sold. Approximately 54% of the Fund’s holdings were sold for gains, with an average realized gain of 5.3%, and approximately 46% were sold for an average realized loss of -3.0%. Other dispositions (generally involving option and other hedging activity) affected approximately 15.31% of the Fund’s positions, resulting in an average loss of -0.05%.
Examples of securities that made positive contributions to WBII’s performance during the fiscal period include Lincoln National Corporation, Keycorp, Manpowergroup Incorporated, Morgan Stanley, and Regions Financial Corporation. Examples of securities that detracted from the Fund’s performance during the fiscal period include iShares 10-20 Year Treasury ETF, iShares 20+ Year Treasury Bond ETF, Invesco Ltd., SPDR Bloomberg Barclays International Treasury ETF, and Time Incorporated.
Two option/volatility hedges intended to reduce risk were implemented in WBII during the fiscal period, resulting in an aggregate loss of approximately -0.05%. No hedged position resulted in a positive return contribution. Examples of hedged positions that resulted in a negative return contribution were two separate instances of hedging the S&P 500 Index.
6
| Absolute Shares Trust Management’s Discussion of Fund Performance (Unaudited) (continued) June 30, 2017 |
High turnover in WBII’s holdings has the potential to result in the realization and distribution to shareholders of higher capital gains. If Fund shares are held in a taxable account, this may increase your tax liability. To the extent portfolio turnover increases transaction costs, it may also reduce Fund performance. Of course, selling a security in a timely fashion may also improve performance if a subsequent loss is avoided that exceeds the cost of executing the sale.
WBI Tactical High Income Shares (WBIH)
As of June 30, 2017, WBIH held 22 securities in addition to a position in a money market fund which served as a cash equivalent. From the time of their purchase, 14 of these positions had unrealized gains of between 0.68% and 14.60%, while 8 had unrealized losses ranging from -0.02% to -7.97%. The aggregate unrealized gain amounted to 2.02% of the Fund’s period ending net asset value.
Approximately 81% of the securities held by WBIH at any time during the fiscal period were sold. Approximately 51% of the Fund’s holdings were sold for gains, with an average realized gain of 8.0%, and approximately 49% were sold for an average realized loss of -4.5%. Other dispositions (generally involving option and other hedging activity) affected approximately 3.34% of the Fund’s positions, resulting in an average loss of -0.04%.
Examples of securities that made positive contributions to WBIH’s performance during the fiscal period include Regions Financial Corporation, Lincoln National Corporation, HP Incorporated, Morgan Stanley, and Keycorp. Examples of securities that detracted from the Fund’s performance during the fiscal period include Mid-America Apartment Communities, Targa Resources Corporation, Conagra Brands Incorporated, Extra Space Storage Incorporated, and Invesco Ltd.
Four option/volatility hedges intended to reduce risk were implemented in WBIH during the fiscal period, resulting in an aggregate loss of approximately -0.04%. The only hedged position that resulted in a positive return was Conagra Brands. Examples of hedged positions that resulted in a negative return contribution were two separate instances of hedging the S&P 500 Index.
High turnover in WBIH’s holdings has the potential to result in the realization and distribution to shareholders of higher capital gains. If Fund shares are held in a taxable account, this may increase your tax liability. To the extent portfolio turnover increases transaction costs, it may also reduce Fund performance. Of course, selling a security in a timely fashion may also improve performance if a subsequent loss is avoided that exceeds the cost of executing the sale.
WBI Tactical Rotation Shares (WBIR)
As of June 30, 2017, WBIR held 13 securities in addition to a position in a money market fund which served as a cash equivalent. From the time of their purchase, 12 of these positions had unrealized gains of between 0.30% and 4.92%, while 1 had unrealized losses of -0.43%. The aggregate unrealized gain amounted to 1.86% of the Fund’s period ending net asset value.
Approximately 87% of the securities held by WBIR at any time during the fiscal period were sold. Approximately 55% of the Fund’s holdings were sold for gains, with an average realized gain of 2.9%, and approximately 45% were sold for an average realized loss of -3.9%. The Fund had no holdings in other dispositions (generally involving option and other hedging activity).
Examples of securities that made positive contributions to WBIR’s performance during the fiscal period include iShares Latin America 40 ETF, iShares China Large-Cap ETF, Wisdomtree India Earnings ETF, iShares Russell 1000 Value ETF, and SPDR S&P 600 Small Cap Growth ETF. Examples of securities that detracted from the Fund’s performance during the fiscal period include First Trust Latin America ETF, iShares MSCI Global Silver Miners ETF, Etracs CMCI LNG Platinum TR ETN, Velocityshares VIX Short-Term ETN, and Vanguard Telecom Service ETF.
No option/volatility hedges were implemented in WBIR during the fiscal period.
High turnover in WBIR’s holdings has the potential to result in the realization and distribution to shareholders of higher capital gains. If Fund shares are held in a taxable account, this may increase your tax liability. To the extent portfolio turnover increases transaction costs, it may also reduce Fund performance. Of course, selling a security in a timely fashion may also improve performance if a subsequent loss is avoided that exceeds the cost of executing the sale.
Review of Index Fund Trading Activity
WBI Power Factor High Yield Dividend (WBIY)
WBIY is intended to track the Solactive Power FactorTM High Dividend Index, and its trading activity results from changes to the holdings of this underlying index. The composition of the underlying index is adjusted quarterly and screened monthly for dividend cuts or an overall negative outlook concerning the member companies’ dividend policy.
7
| Absolute Shares Trust Management’s Discussion of Fund Performance (Unaudited) (continued) June 30, 2017 |
As of June 30, 2017, WBIY held 50 securities in addition to a position in a money market fund which served as a cash equivalent. From the time of their purchase, 19 of these positions had unrealized gains of between 0.86% and 33.42%, while 31 had unrealized losses ranging from -0.29% to -46.95%. The aggregate unrealized loss amounted to -3.18% of the Fund’s period ending net asset value.
Approximately 41% of the securities held by WBIY at any time during the fiscal period were sold as a result of changes to the underlying index. Approximately 54% of the Fund’s holdings were sold for gains, with an average realized gain of 5.3%, and approximately 46% were sold for an average realized loss of -6.3%.
Examples of securities that made positive contributions to WBIY’s performance during the fiscal period include HP Incorporated, PPL Corporation, Emerson Electric Company, Great Plains Energy Incorporated, and Entergy Corporation. Examples of securities that detracted from the Fund’s performance during the fiscal period include Verizon Communications Incorporated, GNC Holdings Incorporated – Class A Shares, Seagate Technology, Western Refining Incorporated, and Cracker Barrel Old Country.
No option/volatility hedges were implemented in WBIY during the fiscal period.
High turnover in WBIY’s holdings has the potential to result in the realization and distribution to shareholders of higher capital gains. If Fund shares are held in a taxable account, this may increase your tax liability. To the extent portfolio turnover increases transaction costs, it may also reduce Fund performance. Of course, selling a security in a timely fashion may also improve performance if a subsequent loss is avoided that exceeds the cost of executing the sale.
Market Conditions
Quarter by quarter review of fiscal period market conditions 2016-2017
3rd Quarter 2016
U.S. equity returns trailed off a bit in August and September after a strong July, but still posted solidly positive numbers for the third quarter of 2016. For the Dow Jones Industrial Average (DJIA), its 2.80% July return slipped a bit to 2.11% by the end of the quarter, and the S&P 500 Index gave back a little of its 3.56% July gain to finish the quarter up by 3.31%. The NASDAQ Composite and small company Russell 2000 Index each cooled off from their torrid July pace as the summer wore on, but still added to their 6.60% and 5.90% starts for first quarter gains of 9.69% and 8.66% respectively.
International stock markets followed a similar pattern, with strong July returns leading to a good third quarter outcome. For the full three-month period, the EAFE gained 5.80%, the Nikkei in Japan was up 5.61%, German DAX rose 8.58%, and the Hang Seng Index in Hong Kong leapt 12.04%.
July was also the best month for bonds in the third quarter, but the returns were more modest. September was particularly harsh for long-term U.S. government bonds, as the August -0.94% slide in the Barclays U.S. Treasury 20+ Year Total Return Index picked up speed with a decline of -1.74%.
While stocks were enjoying a good July, commodities were heading the other way. The CRB Index sank -6.00% that month, then slid another -0.45% in August before bouncing back with a 3.39% September gain to end the quarter down by -3.25%
4th Quarter 2016
A weak October gave way to a strong November and December in U.S. equity markets. The Dow Jones Industrial Average (DJIA) and the S&P 500 Index each tacked on more in the fourth quarter than they had gained during the first three quarters of the year. The small company Russell 2000 Index added 8.43% in the quarter, almost as much as the 8.66% return it had achieved for the year up until then. The NASDAQ also enjoyed positive returns, but its 1.34% lagged the other major U.S. indices, and trailed its strong third quarter return.
International equity market results were mixed during the quarter, leaving the EAFE Index down by -1.88% for the calendar year. Japan’s Nikkei posted a 16.20% rise in the fourth quarter, but that was only just enough to recover losses earlier in the year, and eke out a small 0.42% positive return for all of 2016.
While stocks were enjoying a strong year-end, bonds were taking it on the chin. Bond prices fall as interest rates rise, and interest rates have been generally rising since summer. The yield on 10 year U.S. Treasuries has jumped from a low of 1.36% on July 8th to a high of 2.60% by December 15th, before settling to 2.44% by the end of the year. At the end of their two-day meeting on December 13-14, the Federal Reserve Board hiked the target for the federal funds rate by 0.25%, and suggested that it expected to raise rates three more times in 2017. Bond prices across the board were affected by rising rates, but the damage was especially pronounced in U.S. Treasuries with long maturities. The Bloomberg Barclays U.S. Treasury 20+ Year Total Return Index plummeted -12.16% for the quarter, and has lost -15.65% since its July high.
Gold started the fourth quarter up 24.01% for the year, but fell -12.80% over the last three months to end the year with a gain of 8.14%. Like gold, crude oil also started the year strong, up more than 30% at the end of September. Unlike gold, however, oil continued higher through year-end, gaining another 11.36% to finish the year with a gain of 45%.
8
| Absolute Shares Trust Management’s Discussion of Fund Performance (Unaudited) (continued) June 30, 2017 |
One year-long trend that was not reversed in the fourth quarter was the continuing reminder that forecasts and expectations often miss the mark. If fact, 2016 may be remembered mostly as the year when many expectations were overturned, from Britain’s decision to leave the European Union, to the U.S. election results. The forecasts about what would happen in the financial markets if these events were to occur proved to be almost a perfect inverse of the actual reactions. Rather than collapsing, equity prices sprinted higher. Of course, these newly unfolding events have spawned a new collection of forecasts and expectations about 2017 and beyond, and these new forecasts came with the same air of confidence as the old, stunningly wrong forecasts once enjoyed.
Rising stock prices, commodity prices, and interest rates were all indicative of expectations for robust economic growth in 2017.
1st Quarter 2017
The strong finish to 2016 for the major U.S. stock market indices carried over into the first two months of 2017 before cooling off in March, but still held on for solid first quarter gains. Large company stocks generally fared better than their smaller counterparts in the first quarter of the year, as the Dow Jones Industrial Average (DJIA) gained 4.56%, the S&P 500 Index was higher by 5.53% (6.07% including dividends), and the NASDAQ jumped 9.82%, The Russell 2000 index of smaller company stocks gained 2.12%.
International equities also generally enjoyed a solid first quarter, with the EAFE up by 6.47%, the German DAX ahead by 7.25%, and the Hang Seng in Hong Kong gaining 9.6%. Stocks in Japan, the world’s third largest economy, took a breather, posting a drop of -1.07%.
Despite the Federal Reserve’s decision to raise short-term interest rates in December and again in March, longer term government and corporate bonds generally held on for gains by quarter’s end.
Oil prices, as measured by the West Texas Intermediate Cushing Crude Oil Spot Price Index, dropped -12.51% from $53.72/barrel at the end of last year to as low as $47/barrel in March before bouncing back a bit to $50.60 for a decline of -5.81% by quarter’s end. Gold, on the other hand, enjoyed a solid 8.86% gain for the quarter, rising from $1,147.50/ounce to $1,249.20/ounce.
Much of the rally since last November in U.S. equity prices has been attributed to expectations that a pro-business agenda would be quickly forthcoming from the Republican controlled House of Representatives and Senate for prompt signature by the Republican President. The anticipation of swift enactment of laws to lower corporate taxes, reduce regulation, and increase military and infrastructure spending was widely expected to give a meaningful boost to corporate profits – and justify high and rising stock prices. Struggles with the process of enacting a Republican alternative to the Affordable Care Act appear to have raised doubts about those expectations. If there isn’t sufficient agreement among members of the majority party to address heath care, will there be enough consensus to reform the tax code, or pay for infrastructure plans? The first quarter of the year ended with many investors wondering if Congress will be able to enact enough of a pro-growth agenda to make a difference to the economy anytime soon.
2nd Quarter 2017
If businesses can grow their earnings without the benefit of legislative initiatives, stock prices can still reflect that growth. Continued optimism about the economy helped the U.S. equity markets follow up a strong first quarter with solid returns in the second quarter as well. The pace of gains slowed a bit, but the first half of 2017 ended with solid year-to-date results. The Dow Jones Industrial Average (DJIA) and S&P 500 Index posted gains in each of the last three months, resulting in quarterly gains of 3.32% and 2.57% respectively. The high-flying NASDAQ dipped a bit in June as technology stocks hit a pocket of weakness, but still landed a 3.87% gain for the quarter. For the first half of 2017, the DJIA is up 8.03%, the S&P 500 is ahead by 8.24%, and the NASDAQ stands 14.07% higher. Small companies also posted positive, but somewhat lower returns. The Russell 2000 Index of small companies gained 2.12% for the quarter, bringing its first half return to 4.29%.
Strength in international equity markets sputtered a bit in June, but held on to post positive returns for the quarter and for the first half of the year. The EAFE gained 5.03% over the last three months and is ahead by 11.83% for the year. Hong Kong’s Hang Seng index added 6.86% to its strong first quarter to bring its year-to-date return to 17.11%. Japan’s Nikkei turned around a negative first quarter to post a 5.95% second quarter return.
Falling oil prices contributed to commodities’ continued slump, with the CRB Index dropping -5.98% for the quarter, and -9.21% so far this year.
Rising interest rates can pressure the prices of existing bonds, as new bonds with higher rates become available. However, despite three hikes from the Federal Reserve since December and the suggestion of more to come, bonds have performed remarkably well. The Dow Jones Equal Weight Corporate Bond Index gained 2.63% for the quarter, and long-term Treasury bonds, which are typically very sensitive to changing rates, rose even more, with the Barclays U.S. Treasury 20+ Year Bond Index jumping 4.18%. How can these gains be consistent with the Fed’s moves? Here’s one way to connect the dots:
| | ● | a strong and growing economy can lead to an increase in inflation, |
| | ● | inflation erodes the purchasing power of the income and principal repayment from bonds, reducing their appeal, and |
| | ● | the Federal Reserve attacks inflation by hiking interest rates to slow the economy, hurting the value of existing bonds. |
9
| Absolute Shares Trust Management’s Discussion of Fund Performance (Unaudited) (continued) June 30, 2017 |
Therefore, if bond prices are holding relatively firm, it suggests bond investors believe:
| | ● | the economy is not going to grow quickly enough to spark inflation, |
| | ● | there’s virtually no inflation now for the Federal Reserve to fight, and |
| | ● | more rate hikes may hurt economic growth and corporate profits, driving investors from stocks to the perceived safety of bonds. |
It seems stock and bond investors have a difference of opinion about what’s coming next. The second half of the year may settle the question of which view is closer to the truth.
In the coming fiscal year, we expect companies to be tested against investment reality, whatever that reality turns out to be. How many pass that test could determine whether the recent rally in U.S. equity markets continues to make the grade.
Investment Commentary
Risk is for the birds!
Have you ever heard the expression “A canary in the coal mine”? Until remarkably recently, canaries were taken into coal mines as an early warning system. Canaries are more sensitive to poisonous gases than humans are, including colorless and odorless killers like carbon monoxide. Miners knew the air they were breathing was safe as long as the canaries were doing fine in their little cages. If the canary died, the miners knew trouble was in the air. While canary lovers may find this treatment of the little birds cruel, the miners preferred this “early warning system” to the alternative “too late warning system” of succumbing to the poisonous gases themselves. Fortunately for canaries, modern detection systems have relieved the birds of this responsibility, but the little yellow heroes undoubtedly saved many lives before winging their way into history.
Of course, warnings are only effective if you heed them. If, instead of heading for safety, the miners had called up to the surface “We’re gonna need more canaries down here!”, the world would have had far fewer canaries – and far fewer miners. Today, the expression “canary in the coal mine” has come to mean any early indication that trouble may be may seeping into our environment. As we continue to mine for investment opportunities, are there any early signs of a buildup of potentially toxic risks?
Valuation: One way investors assess the health of the stock market is by observing valuation. The notion is that if stocks become too expensive, investors with cash to invest will stop buying because they don’t want to overpay. Stock owners may decide to start taking profits at high prices before those prices get away from them. Less buying and more selling is not a healthy combination for prices. One popular measure of whether stocks are cheap or expensive is the P/E, or price earnings ratio. It measures how many years’ worth of earnings it would take to recoup the current price of a stock. In his book “Irrational Exuberance”, Yale Economics Professor and Nobel Prize winner Robert Shiller introduced the Cyclically Adjusted Price Earnings Ratio, or CAPE, which uses 10 years of earnings as a way of assessing value by smoothing out the short-term ups and downs in earnings. Since the year 1900, the CAPE of the S&P 500 has averaged 16.76. (Data Source: www.econ.yale.edu/~shiller/data.htm.) Since 1900 it’s only been above 29 three times. The first time was in July through September of 1929 at the end of the “Roaring Twenties” shortly before the stock market crash and Great Depression. It crossed 29 again in 1997, and then crossed 39 in 1999 on its way to topping out at 44.20 in December of that year, just before the “Dot Com” bubble burst and stocks tumbled. As of the end of this past quarter, the CAPE of the S&P 500 Index was 30.06.
Sentiment: Several sentiment polls suggest investors and consumers are as optimistic as they have been in years. What’s wrong with that? Historically, too much happiness has been a contrarian sign of trouble ahead. According to recent commentary from Ned Davis Research, the Conference Board’s Consumer Confidence Index is at its highest level since December 2000, the Bloomberg Consumer Comfort Index hit its highest level since August 2001, and the NDR Crowd Sentiment Poll hit a level in March that was above the average of peaks hit before other bear markets. Investors Intelligence Advisors Sentiment measure in March showed the most bulls since 1987, a year that included the infamous one-day -23% plunge in the Dow Jones Industrial Average.
Consumer Debt: There are signs that optimistic consumer sentiment may not continue to fuel robust consumer spending. The Federal Reserve’s most recent report on Consumer Debt shows consumers are carrying more than $3.8 trillion in outstanding debt, with more than $1 trillion each in student loans, car loans, and credit card balances. Consumer spending contributes significantly to U.S. economic growth, so consumers’ ability to borrow and service their debt is something to watch. The March data for the S&P/Experian Consumer Credit Default Indices show bank card default rates rising for five months in a row, with the national rate hitting a 45-month high. In what may be a related development, both Ford and General Motors recently reported disappointing sales.
Unless otherwise indicated, the source for all price and index data used in charts, tables and discussion is Bloomberg. You cannot invest directly in an index. |
10
| Absolute Shares Trust Management’s Discussion of Fund Performance (Unaudited) (continued) June 30, 2017 |

Interest Rates: The cost of borrowing money is the interest rate on the debt. Rising interest rates affect the affordability of mortgages, car loans, and credit card balances – all important contributors to the economy. The U.S. Federal Reserve Bank (the Fed) raised a key interest rate in June for the fourth time, with more rate hikes to come if recent comments from Fed decision makers is to be believed.
Quantitative Tightening or QT: In response to the financial crisis and Great Recession, The Fed began a process dubbed “Quantitative Easing” or QE. It involved month after month of buying billions of dollars worth of government and mortgage backed bonds in the open market. The goal was to drive down interest rates and stimulate economic growth by pumping billions in newly printed cash into the system. After three rounds of QE, the Federal Reserves’ balance sheet – the inventory of its assets including these bonds – has grown from under $900 billion before the crisis to approximately $4.5 trillion today. At their meeting in March, members of the Fed’s governing board began discussing reducing the size of its balance sheet – by beginning to reduce the supply of bonds it is holding in its inventory of assets. The Fed’s aggressive buying during each round of QE amounted to billions every month, and draining Fed’s inventory of these bonds will almost certainly be much more gradual and restrained. There is little doubt the Fed intends to make QT as painless as possible to avoid causing disruption in the financial markets as the cash they pumped into the economy is sucked back out. Still, the opposite of easing is tightening, and if easing delivered a tailwind to the economy, tightening could become a bit of a headwind.
Government Policy: Where are the tax cuts, infrastructure spending, and regulatory reforms investors appeared to be counting on? The kinds of changes that were widely expected to boost corporate profits seem to be mired in a dysfunctional congressional morass. What if the rancorous atmosphere in Washington doesn’t freshen? There’s even some uncertainty about whether Congress can cooperate enough to pass the legislation needed to prevent a government shutdown before the next deadline.
World events: As if domestic political issues weren’t problematic enough, geopolitical risks are also in the air. The threat from North Korea, the tragic civil war in Syria, and the specter of more terror attacks have the potential to drive investors from equities into investments they hope will be safe havens in a crisis.
The fluttering of all these canaries may be just a disquieting coincidence. After all, stocks have a history of being expensive for years before feeling the effects of overvaluation. Current levels of optimism may prompt consumers to dig down and spend more – despite current levels of debt. The Fed may be able to accurately gauge the right mix of interest rate hikes and Quantitative Tightening they can administer and yet keep the economy working. Some form of helpful legislative action may someday emerge from Washington, and the risks from world events may dissipate. Still, ignoring the warning signs may leave investors gasping should stocks someday succumb to these risks – or others that have yet to be detected.
11
| Absolute Shares Trust Management’s Discussion of Fund Performance (Unaudited) (continued) June 30, 2017 |
We believe that the disciplined process we have used for decades to closely monitor the portfolios under our care will help our clients achieve the returns they need at the level of risk they are willing to assume. To us, calling for more caution makes a lot more sense than calling for more canaries.

The Bottom Line
We believe that the appropriate approach to investing in a volatile world is one that’s responsive to continually changing conditions and opportunities. We think that process should be focused on managing risk as well as on pursuing return. It should be disciplined and have a track record that spans both good times and bad. In short, our opinion is that it should be just like the process we have used for our investment management clients for the last 24 years – and continue to use to manage the Funds today.
Sincerely,

| 
|
Gary E. Stroik | Don Schreiber, Jr. |
Co-Portfolio Manager | Co-Portfolio Manager |
Vice President & Chief Investment Officer | Founder & CEO |
Past performance is not a guarantee of future results.
Opinions expressed are those of WBI Investments, Inc. (“WBI”), the Funds’ investment sub-adviser, are subject to change, are not guaranteed, and should not be construed as recommendations or investment advice or a solicitation to purchase or sell securities referenced in the Investment Commentary.
Exchange Traded Fund investing involves risk. Principal loss is possible. The Funds invest in emerging market and foreign securities which involve political, economic and currency risks, greater volatility and differences in accounting methods. These risks can be greater in emerging markets. The Funds invest in smaller and medium sized companies, which involve additional risks such as limited liquidity and greater volatility. Investments in debt securities typically decrease in value when interest rates rise. This risk is usually greater for longer-term debt securities. Investment by the Fund in lower-rated and non-rated securities presents a greater risk of loss to principal and interest than higher-rated securities. Investments in mortgage-backed securities may involve additional risks, such as credit risk, prepayment risk, possible illiquidity and default, and susceptibility to adverse economic developments. Because the Funds invest in other exchange-traded funds (“ETFs”), they are subject to additional risks that do not apply to conventional mutual funds, including the risks that the market price of an ETF's shares may trade at a discount to its net asset value ("NAV"), an active secondary trading market may not develop or be maintained, or trading may be halted by the exchange in which they trade, which may impact a Fund's ability to sell its shares. The Funds may invest in exchange-traded notes (“ETN”), which are subject to the credit risk of the issuer. Additional risks include volatility, lack of liquidity, and sensitivity to currencies, commodities markets, and interest rate changes. The Funds may invest in Real Estate Investment Trusts (REIT). Risks commonly associated with the direct ownership of real estate include fluctuations in the value of underlying properties, defaults by borrowers or tenants, changes in interest rates and risks related to general or local economic conditions. The Funds may invest in master limited partnerships (“MLP”), which are subject to certain risks inherent in the structure of
12
| Absolute Shares Trust Management’s Discussion of Fund Performance (Unaudited) (concluded) June 30, 2017 |
MLPs, including complex tax structure risks, the limited ability for election or removal of management, limited voting rights, potential dependence on parent companies or sponsors for revenues to satisfy obligations, and potential conflicts of interest between partners, members and affiliates. The Funds may also use options and future contracts, which have the risks of unlimited losses of the underlying holdings due to unanticipated market movements and failure to correctly predict the direction of securities prices, interest rates and currency exchange rates. The investment in options is not suitable for all investors.
Investments in absolute return strategies are not intended to outperform stocks and bonds during strong market rallies. Diversification does not assure a profit or protect against a loss in a declining market.
Fund holdings and sector allocations are subject to change and should not be considered a recommendation to buy or sell any security. References to other funds should not be interpreted as an offer of these securities. For a complete list of Fund holdings, please refer to the Schedule of Investments in this report.
While the Funds are no-load, commission charges on the purchase of shares, management fees and other expenses will apply. Please refer to the prospectus for additional information.
A stop loss order directs a brokerage firm to sell the specified security at the prevailing market price should that security’s price fall to or below a stipulated price. A stop limit order directs a brokerage firm to sell the specified security should that security’s price fall to or below a stipulated price, but only if the transaction can be executed at or above the limit price given as part of the order. The Funds use WBI’s proprietary Dynamic Trailing Stop/Loss System (DTSTM), which is designed to help control the risk to invested capital when investing in volatile securities and markets. The DTSTM is not a stop loss order or stop limit order placed with a brokerage firm, but an internal process for monitoring price movements. While the DTSTM may be used to initiate the process for selling a security, it does not assure that a particular execution price will be received.
Unless otherwise indicated, the source for index price and performance data used in the discussion of market conditions and market commentary is Bloomberg. The S&P 500® Index is a capitalization weighted index of 500 large capitalization stocks which is designed to measure broad domestic securities markets.
An investment in money market funds is not insured or guaranteed by the Federal Deposit Insurance Corporation or any other governmental agency. Although money market funds seek to preserve the value of your investment at $1.00 per share, it is possible to lose money by investing in these funds.
Any tax or legal information provided is merely a summary of our understanding and interpretation of some of the current income tax regulations and is not exhaustive. Investors must consult their tax advisor or legal counsel for advice and information concerning their particular situation. Neither the Funds nor any of their representatives may give legal or tax advice.
Must be preceded or accompanied by a prospectus.
WBI Shares Exchange Traded Funds are distributed by Foreside Fund Services, LLC.
Benchmark Definitions
The Russell Global SMID Growth Index measures the growth segment for small and mid-size securities in the global equity universe.
The Russell Global SMID Value Index measures the value segment of the small to mid-cap global equity universe, which represents companies that are considered less expensive than the overall market.
The MSCI World High Dividend Yield Index is designed to reflect performance of equities in the parent index (excluding REITs) with higher dividend income and quality characteristics than average, and dividend yields that are sustainable and persistent.
The Russell Global SMID Defensive Index measures the performance of the investable securities in the Global SMID Defensive segment of the market.
The Russell Global Large Cap Growth Index measures the growth segment for the largest securities in the global equity universe.
The Russell Global Large Cap Value Index measures the value segment of the large cap global equity universe, which represents companies that are considered less expensive than the overall market.
The Russell Global Large Cap Defensive Index measures the performance of the investable securities in the Global Large Cap Defensive segment of the market.
The 50% Barclays Global Aggregate Bond & 50% Russell Global Index is a custom index combining the Barclays Global Aggregate High-Yield Bond Index and Russell Global Index. The Barclays Global Aggregate High-Yield Bond Index is an unmanaged index considered representative of fixed-rate, noninvestment-grade debt of companies in the U.S., developed markets and emerging markets. The Russell Global Index measures the performance of the global equity market based on all investable equity securities.
The Financial Times Stock Exchange 100 Index (FTSE) is an index composed of the 100 largest companies listed on the London Stock Exchange.
13
| Absolute Shares Trust WBI Tactical SMG Shares Performance Summary (Unaudited) |
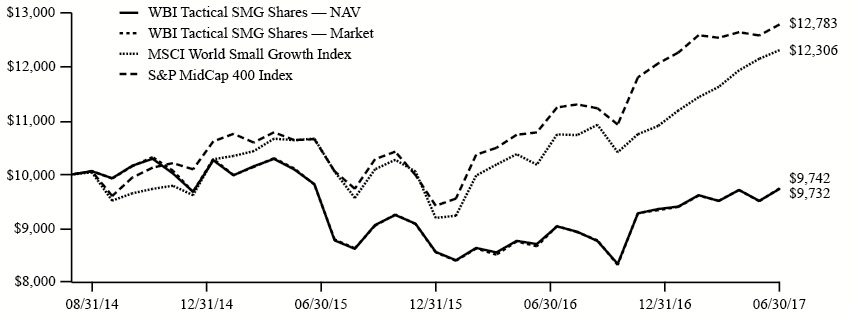
Average Annual Returns Period Ended June 30, 2017 | 1 Year | Since Inception (8/25/14) |
WBI Tactical SMG Shares — NAV | 11.74% | (0.95)% |
WBI Tactical SMG Shares — Market | 12.38% | (0.91)% |
MSCI World Small Growth Index | 20.86% | 7.56% |
S&P MidCap 400 Index | 18.57% | 9.01% |
This chart illustrates the performance of a hypothetical $10,000 investment made on August 25, 2014, and is not intended to imply any future performance. The returns shown do not reflect the deduction of taxes that a shareholder would pay on fund distributions or the redemption of fund shares. The chart assumes reinvestment of capital gains and dividends.
On October 31, 2016, the Fund changed its benchmark index from the S&P MidCap 400 Index to MSCI World Small Growth Index (the “New Index”). While the Fund’s strategy involves active management of a potentially wide range of assets, and no widely recognized benchmark is likely to be representative of the performance of the Fund, the Advisor believes that the New Index is more relevant to the Fund’s investment strategies and more commonly used by investors investing in similar funds.
The performance data quoted represents past performance and is not a guarantee of future results. Investment return and principal value of an investment will fluctuate so that an investor’s shares, when redeemed, may be worth more or less than their original cost. Current performance may be lower or higher than the performance data quoted. For most recent month-end performance, please visit www.wbishares.com.
Per the Prospectus, the Fund’s annual operating expense (gross) is 1.01%. The Fund’s Sub-Advisor has contractually agreed to waive the fees and reimburse expenses of the Fund such that total annual operating expenses are limited to 1.25% of average net assets until at least October 31, 2018. (Actual expenses can be referenced in the Financial Highlights section later in this report.)
14
| Absolute Shares Trust WBI Tactical SMV Shares Performance Summary (Unaudited) |
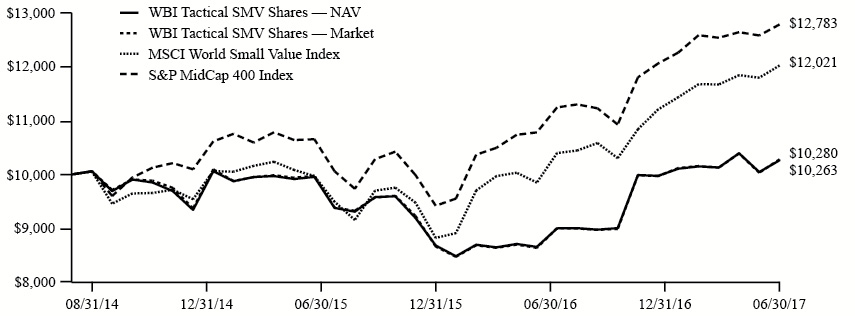
Average Annual Returns Period Ended June 30, 2017 | 1 Year | Since Inception (8/25/14) |
WBI Tactical SMV Shares — NAV | 18.55% | 0.91% |
WBI Tactical SMV Shares — Market | 19.01% | 0.98% |
MSCI World Small Value Index | 22.04% | 6.68% |
S&P MidCap 400 Index | 18.57% | 9.01% |
This chart illustrates the performance of a hypothetical $10,000 investment made on August 25, 2014, and is not intended to imply any future performance. The returns shown do not reflect the deduction of taxes that a shareholder would pay on fund distributions or the redemption of fund shares. The chart assumes reinvestment of capital gains and dividends.
On October 31, 2016, the Fund changed its benchmark index from the S&P MidCap 400 Index to MSCI World Small Value Index (the“New Index”). While the Fund’s strategy involves active management of a potentially wide range of assets, and no widely recognized benchmark is likely to be representative of the performance of the Fund, the Advisor believes that the New Index is more relevant to the Fund’s investment strategies and more commonly used by investors investing in similar funds.
The performance data quoted represents past performance and is not a guarantee of future results. Investment return and principal value of an investment will fluctuate so that an investor’s shares, when redeemed, may be worth more or less than their original cost. Current performance may be lower or higher than the performance data quoted. For most recent month-end performance, please visit www.wbishares.com.
Per the Prospectus, the Fund’s annual operating expense (gross) is 1.02%. The Fund’s Sub-Advisor has contractually agreed to waive the fees and reimburse expenses of the Fund such that total annual operating expenses are limited to 1.25% of average net assets until at least October 31, 2018. (Actual expenses can be referenced in the Financial Highlights section later in this report.)
15
| Absolute Shares Trust WBI Tactical SMY Shares Performance Summary (Unaudited) |
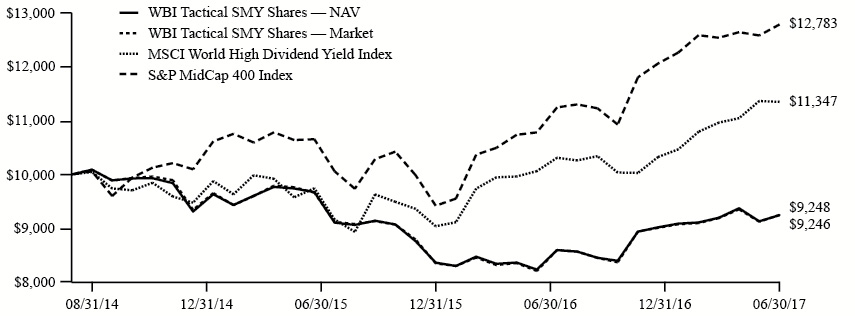
Average Annual Returns Period Ended June 30, 2017 | 1 Year | Since Inception (8/25/14) |
WBI Tactical SMY Shares — NAV | 12.26% | (2.72)% |
WBI Tactical SMY Shares — Market | 12.65% | (2.71)% |
MSCI World High Dividend Yield Index | 12.77% | 4.54% |
S&P MidCap 400 Index | 18.57% | 9.01% |
This chart illustrates the performance of a hypothetical $10,000 investment made on August 25, 2014, and is not intended to imply any future performance. The returns shown do not reflect the deduction of taxes that a shareholder would pay on fund distributions or the redemption of fund shares. The chart assumes reinvestment of capital gains and dividends.
On October 31, 2016, the Fund changed its benchmark index from the S&P MidCap 400 Index to MSCI World High Dividend Yield Index (the “New Index”). While the Fund’s strategy involves active management of a potentially wide range of assets, and no widely recognized benchmark is likely to be representative of the performance of the Fund, the Advisor believes that the New Index is more relevant to the Fund’s investment strategies and more commonly used by investors investing in similar funds.
The performance data quoted represents past performance and is not a guarantee of future results. Investment return and principal value of an investment will fluctuate so that an investor’s shares, when redeemed, may be worth more or less than their original cost. Current performance may be lower or higher than the performance data quoted. For most recent month-end performance, please visit www.wbishares.com.
Per the Prospectus, the Fund’s annual operating expense (gross) is 1.05%. The Fund’s Sub-Advisor has contractually agreed to waive the fees and reimburse expenses of the Fund such that total annual operating expenses are limited to 1.25% of average net assets until at least October 31, 2018. (Actual expenses can be referenced in the Financial Highlights section later in this report.)
16
| Absolute Shares Trust WBI Tactical SMS Shares Performance Summary (Unaudited) |

Average Annual Returns Period Ended June 30, 2017 | 1 Year | Since Inception (8/25/14) |
WBI Tactical SMS Shares — NAV | 13.32% | (2.03)% |
WBI Tactical SMS Shares — Market | 14.34% | (1.89)% |
MSCI World Quality Index | 17.08% | 8.13% |
S&P MidCap 400 Index | 18.57% | 9.01% |
This chart illustrates the performance of a hypothetical $10,000 investment made on August 25, 2014, and is not intended to imply any future performance. The returns shown do not reflect the deduction of taxes that a shareholder would pay on fund distributions or the redemption of fund shares. The chart assumes reinvestment of capital gains and dividends.
On October 31, 2016, the Fund changed its benchmark index from the S&P MidCap 400 Index to MSCI World Quality Index (the “New Index”). While the Fund’s strategy involves active management of a potentially wide range of assets, and no widely recognized benchmark is likely to be representative of the performance of the Fund, the Advisor believes that the New Index is more relevant to the Fund’s investment strategies and more commonly used by investors investing in similar funds.
The performance data quoted represents past performance and is not a guarantee of future results. Investment return and principal value of an investment will fluctuate so that an investor’s shares, when redeemed, may be worth more or less than their original cost. Current performance may be lower or higher than the performance data quoted. For most recent month-end performance, please visit www.wbishares.com.
Per the Prospectus, the Fund’s annual operating expense (gross) is 1.03%. The Fund’s Sub-Advisor has contractually agreed to waive the fees and reimburse expenses of the Fund such that total annual operating expenses are limited to 1.25% of average net assets until at least October 31, 2018. (Actual expenses can be referenced in the Financial Highlights section later in this report.)
17
| Absolute Shares Trust WBI Tactical LCG Shares Performance Summary (Unaudited) |

Average Annual Returns Period Ended June 30, 2017 | 1 Year | Since Inception (8/25/14) |
WBI Tactical LCG Shares — NAV | 12.88% | 0.06% |
WBI Tactical LCG Shares — Market | 13.54% | 0.14% |
MSCI World Large Growth Index | 18.68% | 7.79% |
S&P 500 Index | 17.90% | 9.30% |
This chart illustrates the performance of a hypothetical $10,000 investment made on August 25, 2014, and is not intended to imply any future performance. The returns shown do not reflect the deduction of taxes that a shareholder would pay on fund distributions or the redemption of fund shares. The chart assumes reinvestment of capital gains and dividends.
On October 31, 2016, the Fund changed its benchmark index from the S&P 500 Index to MSCI World Large Growth Index (the “New Index”). While the Fund’s strategy involves active management of a potentially wide range of assets, and no widely recognized benchmark is likely to be representative of the performance of the Fund, the Advisor believes that the New Index is more relevant to the Fund’s investment strategies and more commonly used by investors investing in similar funds.
The performance data quoted represents past performance and is not a guarantee of future results. Investment return and principal value of an investment will fluctuate so that an investor’s shares, when redeemed, may be worth more or less than their original cost. Current performance may be lower or higher than the performance data quoted. For most recent month-end performance, please visit www.wbishares.com.
Per the Prospectus, the Fund’s annual operating expense (gross) is 1.03%. The Fund’s Sub-Advisor has contractually agreed to waive the fees and reimburse expenses of the Fund such that total annual operating expenses are limited to 1.25% of average net assets until at least October 31, 2018. (Actual expenses can be referenced in the Financial Highlights section later in this report.)
18
| Absolute Shares Trust WBI Tactical LCV Shares Performance Summary (Unaudited) |
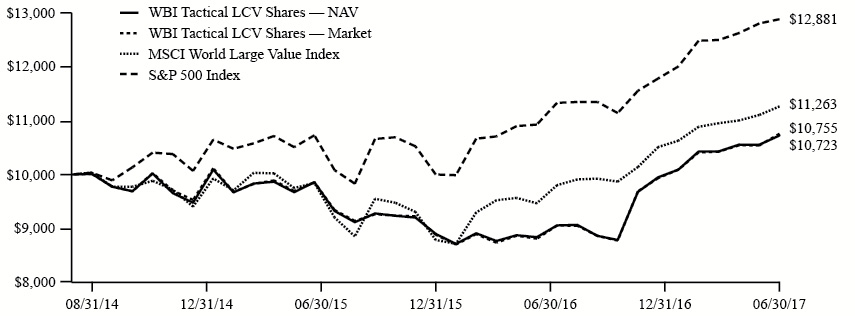
Average Annual Returns Period Ended June 30, 2017 | 1 Year | Since Inception (8/25/14) |
WBI Tactical LCV Shares — NAV | 21.34% | 2.48% |
WBI Tactical LCV Shares — Market | 22.10% | 2.59% |
MSCI World Large Value Index | 18.99% | 4.27% |
S&P 500 Index | 17.90% | 9.30% |
This chart illustrates the performance of a hypothetical $10,000 investment made on August 25, 2014, and is not intended to imply any future performance. The returns shown do not reflect the deduction of taxes that a shareholder would pay on fund distributions or the redemption of fund shares. The chart assumes reinvestment of capital gains and dividends.
On October 31, 2016, the Fund changed its benchmark index from the S&P 500 Index to MSCI World Large Value Index (the “New Index”). While the Fund’s strategy involves active management of a potentially wide range of assets, and no widely recognized benchmark is likely to be representative of the performance of the Fund, the Advisor believes that the New Index is more relevant to the Fund’s investment strategies and more commonly used by investors investing in similar funds.
The performance data quoted represents past performance and is not a guarantee of future results. Investment return and principal value of an investment will fluctuate so that an investor’s shares, when redeemed, may be worth more or less than their original cost. Current performance may be lower or higher than the performance data quoted. For most recent month-end performance, please visit www.wbishares.com.
Per the Prospectus, the Fund’s annual operating expense (gross) is 1.05%. The Fund’s Sub-Advisor has contractually agreed to waive the fees and reimburse expenses of the Fund such that total annual operating expenses are limited to 1.25% of average net assets until at least October 31, 2018. (Actual expenses can be referenced in the Financial Highlights section later in this report.)
19
| Absolute Shares Trust WBI Tactical LCY Shares Performance Summary (Unaudited) |

Average Annual Returns Period Ended June 30, 2017 | 1 Year | Since Inception (8/25/14) |
WBI Tactical LCY Shares — NAV | 14.82% | (1.96)% |
WBI Tactical LCY Shares — Market | 15.43% | (1.88)% |
MSCI World High Dividend Yield Index | 12.77% | 4.54% |
S&P 500 Index | 17.90% | 9.30% |
This chart illustrates the performance of a hypothetical $10,000 investment made on August 25, 2014, and is not intended to imply any future performance. The returns shown do not reflect the deduction of taxes that a shareholder would pay on fund distributions or the redemption of fund shares. The chart assumes reinvestment of capital gains and dividends.
On October 31, 2016, the Fund changed its benchmark index from the S&P 500 Index to MSCI World High Dividend Yield Index (the “New Index”). While the Fund’s strategy involves active management of a potentially wide range of assets, and no widely recognized benchmark is likely to be representative of the performance of the Fund, the Advisor believes that the New Index is more relevant to the Fund’s investment strategies and more commonly used by investors investing in similar funds.
The performance data quoted represents past performance and is not a guarantee of future results. Investment return and principal value of an investment will fluctuate so that an investor’s shares, when redeemed, may be worth more or less than their original cost. Current performance may be lower or higher than the performance data quoted. For most recent month-end performance, please visit www.wbishares.com.
Per the Prospectus, the Fund’s annual operating expense (gross) is 1.05%. The Fund’s Sub-Advisor has contractually agreed to waive the fees and reimburse expenses of the Fund such that total annual operating expenses are limited to 1.25% of average net assets until at least October 31, 2018. (Actual expenses can be referenced in the Financial Highlights section later in this report.)
20
| Absolute Shares Trust WBI Tactical LCS Shares Performance Summary (Unaudited) |

Average Annual Returns Period Ended June 30, 2017 | 1 Year | Since Inception (8/25/14) |
WBI Tactical LCS Shares — NAV | 16.80% | 0.86% |
WBI Tactical LCS Shares — Market | 17.46% | 0.95% |
MSCI World Quality Index | 17.08% | 8.13% |
S&P 500 Index | 17.90% | 9.30% |
This chart illustrates the performance of a hypothetical $10,000 investment made on August 25, 2014, and is not intended to imply any future performance. The returns shown do not reflect the deduction of taxes that a shareholder would pay on fund distributions or the redemption of fund shares. The chart assumes reinvestment of capital gains and dividends.
On October 31, 2016, the Fund changed its benchmark index from the S&P 500 Index to MSCI World Quality Index (the “New Index”). While the Fund’s strategy involves active management of a potentially wide range of assets, and no widely recognized benchmark is likely to be representative of the performance of the Fund, the Advisor believes that the New Index is more relevant to the Fund’s investment strategies and more commonly used by investors investing in similar funds.
The performance data quoted represents past performance and is not a guarantee of future results. Investment return and principal value of an investment will fluctuate so that an investor’s shares, when redeemed, may be worth more or less than their original cost. Current performance may be lower or higher than the performance data quoted. For most recent month-end performance, please visit www.wbishares.com.
Per the Prospectus, the Fund’s annual operating expense (gross) is 1.05%. The Fund’s Sub-Advisor has contractually agreed to waive the fees and reimburse expenses of the Fund such that total annual operating expenses are limited to 1.25% of average net assets until at least October 31, 2018. (Actual expenses can be referenced in the Financial Highlights section later in this report.)
21
| Absolute Shares Trust WBI Tactical Income Shares Performance Summary (Unaudited) |

Average Annual Returns Period Ended June 30, 2017 | 1 Year | Since Inception (8/25/14) |
WBI Tactical Income Shares — NAV | 2.36% | 1.96% |
WBI Tactical Income Shares — Market | 2.54% | 2.00% |
20% MSCI World Index & 80% Barclays U.S. Aggregate Bond Index | 3.29% | 3.23% |
Barclays US Aggregate Bond Index | (0.31)% | 2.42% |
50% Barclays U.S. Capital Aggregate Bond Index & 50% S&P 500 Index | 8.50% | 5.96% |
This chart illustrates the performance of a hypothetical $10,000 investment made on August 25, 2014, and is not intended to imply any future performance. The returns shown do not reflect the deduction of taxes that a shareholder would pay on fund distributions or the redemption of fund shares. The chart assumes reinvestment of capital gains and dividends.
On October 31, 2016, the Fund changed its benchmark indices from the 50% Barclays U.S. Capital Aggregate Bond Index & 50% S&P 500 Index to 20% MSCI World Index & 80% Barclays U.S. Aggregate Bond Index and Barclays U.S. Aggregate Bond Index (the “New Indices”). While the Fund’s strategy involves active management of a potentially wide range of assets, and no widely recognized benchmark is likely to be representative of the performance of the Fund, the Advisor believes that the New Index is more relevant to the Fund’s investment strategies and more commonly used by investors investing in similar funds.
The performance data quoted represents past performance and is not a guarantee of future results. Investment return and principal value of an investment will fluctuate so that an investor’s shares, when redeemed, may be worth more or less than their original cost. Current performance may be lower or higher than the performance data quoted. For most recent month-end performance, please visit www.wbishares.com.
Per the Prospectus, the Fund’s annual operating expense (gross) is 1.10%. The Fund’s Sub-Advisor has contractually agreed to waive the fees and reimburse expenses of the Fund such that total annual operating expenses are limited to 1.25% of average net assets until at least October 31, 2018. (Actual expenses can be referenced in the Financial Highlights section later in this report.)
22
| Absolute Shares Trust WBI Tactical High Income Shares Performance Summary (Unaudited) |
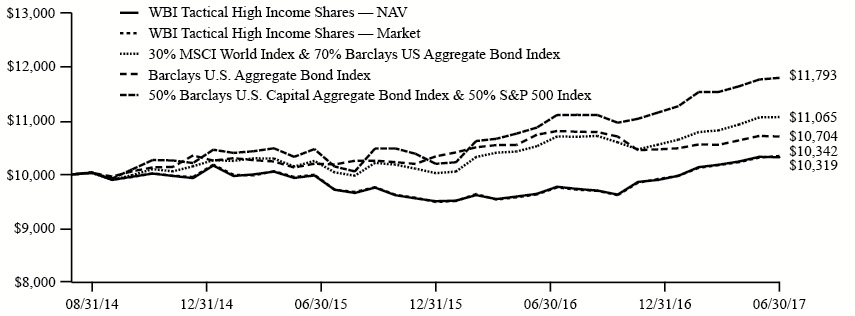
Average Annual Returns Period Ended June 30, 2017 | 1 Year | Since Inception (8/25/14) |
WBI Tactical High Income Shares — NAV | 7.04% | 1.11% |
WBI Tactical High Income Shares — Market | 7.40% | 1.19% |
30% MSCI World Index & 70% Barclays U.S. Aggregate Bond Index | 5.14% | 3.62% |
Barclays US Aggregate Bond Index | (0.31)% | 2.42% |
50% Barclays U.S. Capital Aggregate Bond Index & 50% S&P 500 Index | 8.50% | 5.96% |
This chart illustrates the performance of a hypothetical $10,000 investment made on August 25, 2014, and is not intended to imply any future performance. The returns shown do not reflect the deduction of taxes that a shareholder would pay on fund distributions or the redemption of fund shares. The chart assumes reinvestment of capital gains and dividends.
On October 31, 2016, the Fund changed its benchmark indices from the 50% Barclays U.S. Capital Aggregate Bond Index & 50% S&P 500 Index to 30% MSCI World Index & 70% Barclays U.S. Aggregate Bond Index and Barclays U.S. Aggregate Bond Index (the “New Indices”). While the Fund’s strategy involves active management of a potentially wide range of assets, and no widely recognized benchmark is likely to be representative of the performance of the Fund, the Advisor believes that the New Index is more relevant to the Fund’s investment strategies and more commonly used by investors investing in similar funds.
The performance data quoted represents past performance and is not a guarantee of future results. Investment return and principal value of an investment will fluctuate so that an investor’s shares, when redeemed, may be worth more or less than their original cost. Current performance may be lower or higher than the performance data quoted. For most recent month-end performance, please visit www.wbishares.com.
Per the Prospectus, the Fund’s annual operating expense (gross) is 1.12%. The Fund’s Sub-Advisor has contractually agreed to waive the fees and reimburse expenses of the Fund such that total annual operating expenses are limited to 1.25% of average net assets until at least October 31, 2018. (Actual expenses can be referenced in the Financial Highlights section later in this report.)
23
| Absolute Shares Trust WBI Tactical Rotation Shares Performance Summary (Unaudited) |

Total Returns Period Ended June 30, 2017 | Since Inception
(7/25/16) |
WBI Tactical Rotation Shares — NAV | (1.44)% |
WBI Tactical Rotation Shares — Market | (1.25)% |
50% MSCI World Index & 50% Barclays U.S. Capital Aggregate Bond Index | 7.16% |
Barclays U.S. Aggregate Bond Index | (0.43)% |
MSCI World Index | 15.23% |
This chart illustrates the performance of a hypothetical $10,000 investment made on July 25, 2016, and is not intended to imply any future performance. The returns shown do not reflect the deduction of taxes that a shareholder would pay on fund distributions or the redemption of fund shares. The chart assumes reinvestment of capital gains and dividends.
The performance data quoted represents past performance and is not a guarantee of future results. Investment return and principal value of an investment will fluctuate so that an investor’s shares, when redeemed, may be worth more or less than their original cost. Current performance may be lower or higher than the performance data quoted. For most recent month-end performance, please visit www.wbishares.com.
Per the Prospectus, the Fund’s annual operating expense (gross) is 1.43%. The Fund’s Sub-Advisor has contractually agreed to waive the fees and reimburse expenses of the Fund such that total annual operating expenses are limited to 1.25% of average net assets until at least October 31, 2018. (Actual expenses can be referenced in the Financial Highlights section later in this report.)
24
| Absolute Shares Trust WBI Power FactorTM High Dividend ETF Performance Summary (Unaudited) |

Total Returns Period Ended June 30, 2017 | Since Inception (12/21/16) |
WBI Power FactorTM High Dividend ETF — NAV | (1.64)% |
WBI Power FactorTM High Dividend ETF — Market | (1.16)% |
Solactive Power Factor™ High Dividend Index | (3.27)% |
MSCI US Investable Market High Dividend Index | 6.33% |
This chart illustrates the performance of a hypothetical $10,000 investment made on December 21, 2016, and is not intended to imply any future performance. The returns shown do not reflect the deduction of taxes that a shareholder would pay on fund distributions or the redemption of fund shares. The chart assumes reinvestment of capital gains and dividends.
The performance data quoted represents past performance and is not a guarantee of future results. Investment return and principal value of an investment will fluctuate so that an investor’s shares, when redeemed, may be worth more or less than their original cost. Current performance may be lower or higher than the performance data quoted. For most recent month-end performance, please visit www.wbishares.com.
Per the Prospectus, the Fund’s annual operating expense (gross) is 0.67%. The Fund’s Sub-Advisor has contractually agreed to waive the fees and reimburse expenses of the Fund such that total annual operating expenses are limited to 0.70% of average net assets until at least October 31, 2018. (Actual expenses can be referenced in the Financial Highlights section later in this report.)
25
| Absolute Shares Trust Portfolio Allocations As of June 30, 2017 (Unaudited) |
WBI Tactical SMG Shares |
Sector | Percentage of
Net Assets |
Consumer Discretionary | 24.0% |
Financials | 20.0% |
Information Technology | 18.9% |
Materials | 17.2% |
Industrials | 13.8% |
Health Care | 3.9% |
Short-Term Investments and Other Assets and Liabilities | 2.2% |
TOTAL | 100.0% |
WBI Tactical SMV Shares |
Sector | Percentage of
Net Assets |
Consumer Discretionary | 26.5% |
Financials | 26.5% |
Industrials | 22.6% |
Materials | 13.0% |
Information Technology | 4.3% |
Health Care | 2.1% |
Utilities | 1.0% |
Short-Term Investments and Other Assets and Liabilities | 4.0% |
TOTAL | 100.0% |
WBI Tactical SMY Shares |
Sector | Percentage of
Net Assets |
Financials | 32.2% |
Consumer Discretionary | 21.6% |
Materials | 15.3% |
Industrials | 5.9% |
Real Estate | 5.8% |
Utilities | 4.9% |
Health Care | 3.1% |
Energy | 0.8% |
Short-Term Investments and Other Assets and Liabilities | 10.4% |
TOTAL | 100.0% |
WBI Tactical SMS Shares |
Sector | Percentage of
Net Assets |
Financials | 40.3% |
Consumer Discretionary | 20.2% |
Industrials | 18.8% |
Information Technology | 6.3% |
Health Care | 6.1% |
Materials | 5.4% |
Utilities | 2.3% |
Short-Term Investments and Other Assets and Liabilities | 0.6% |
TOTAL | 100.0% |
WBI Tactical LCG Shares |
Sector | Percentage of
Net Assets |
Information Technology | 22.7% |
Financials | 22.1% |
Industrials | 20.2% |
Consumer Discretionary | 15.7% |
Health Care | 8.0% |
Materials | 6.9% |
Short-Term Investments and Other Assets and Liabilities | 4.4% |
TOTAL | 100.0% |
WBI Tactical LCV Shares |
Sector | Percentage of
Net Assets |
Industrials | 26.8% |
Information Technology | 17.4% |
Materials | 16.1% |
Consumer Staples | 12.7% |
Health Care | 10.8% |
Financials | 8.2% |
Consumer Discretionary | 3.9% |
Short-Term Investments and Other Assets and Liabilities | 4.1% |
TOTAL | 100.0% |
WBI Tactical LCY Shares |
Sector | Percentage of
Net Assets |
Industrials | 25.0% |
Financials | 24.7% |
Information Technology | 20.6% |
Consumer Discretionary | 11.2% |
Materials | 10.3% |
Consumer Staples | 3.9% |
Energy | 3.6% |
Short-Term Investments and Other Assets and Liabilities | 0.7% |
TOTAL | 100.0% |
WBI Tactical LCS Shares |
Sector | Percentage of
Net Assets |
Financials | 38.8% |
Industrials | 20.3% |
Health Care | 13.2% |
Consumer Discretionary | 11.7% |
Information Technology | 11.5% |
Materials | 4.1% |
Short-Term Investments and Other Assets and Liabilities | 0.4% |
TOTAL | 100.0% |
WBI Tactical Income Shares |
Sector | Percentage of
Net Assets |
Exchange Traded Funds | 77.7% |
US Government Notes | 22.0% |
Short-Term Investments and Other Assets and Liabilities | 0.3% |
TOTAL | 100.0% |
WBI Tactical High Income Shares |
Sector | Percentage of
Net Assets |
Exchange Traded Funds | 69.8% |
Financials | 10.3% |
Consumer Staples | 5.8% |
Health Care | 3.6% |
Information Technology | 3.5% |
Real Estate | 5.3% |
Energy | 0.8% |
Short-Term Investments and Other Assets and Liabilities | 0.9% |
TOTAL | 100.0% |
WBI Tactical Rotation Shares |
Sector | Percentage of
Net Assets |
Exchange Traded Funds | 98.1% |
Short-Term Investments and Other Assets and Liabilities | 1.9% |
TOTAL | 100.0% |
WBI PowerTM Factor High Dividend ETF |
Sector | Percentage of
Net Assets |
Consumer Discretionary | 31.2% |
Information Technology | 15.0% |
Financials | 10.2% |
Telecommunication Services | 9.9% |
Energy | 6.9% |
Materials | 6.8% |
Industrials | 6.6% |
Utilities | 5.7% |
Health Care | 5.5% |
Consumer Staples | 0.8% |
Short-Term Investments and Other Assets and Liabilities | 1.4% |
TOTAL | 100.0% |
26
| Absolute Shares Trust WBI Tactical SMG Shares Schedule of Investments June 30, 2017 |
Shares | | Security Description | | Value | |
COMMON STOCKS—97.8% | | | |
Consumer Discretionary—24.0% | | | |
| | 23,208 | | Brunswick Corporation | | $ | 1,455,838 | |
| | 29,449 | | Garmin, Ltd. + | | | 1,502,782 | |
| | 15,520 | | Hooker Furniture Corporation | | | 638,648 | |
| | 67,044 | | Interpublic Group of Companies, Inc. + | | | 1,649,282 | |
| | 10,858 | | Johnson Outdoors, Inc. | | | 523,464 | |
| | 30,375 | | M.D.C. Holdings, Inc. + | | | 1,073,149 | |
| | 9,765 | | PetMed Express, Inc. + | | | 396,459 | |
| | 26,537 | | Winnebago Industries, Inc. + | | | 928,795 | |
| | 50,294 | | Wolverine World Wide, Inc. + | | | 1,408,735 | |
| | 5,487 | | Wyndham Worldwide Corporation | | | 550,950 | |
| | | | | | | 10,128,102 | |
Financials—20.0% | | | | |
| | 11,329 | | City Holding Company + | | | 746,241 | |
| | 14,609 | | Cullen/Frost Bankers, Inc. + | | | 1,371,931 | |
| | 24,622 | | East West Bancorp, Inc. + | | | 1,442,357 | |
| | 9,030 | | Eaton Vance Corporation + | | | 427,300 | |
| | 19,868 | | Lakeland Bancorp, Inc. + | | | 374,512 | |
| | 15,687 | | Lakeland Financial Corporation + | | | 719,719 | |
| | 16,769 | | Peapack-Gladstone Financial Corporation | | | 524,702 | |
| | 40,532 | | Synovus Financial Corporation | | | 1,793,136 | |
| | 37,429 | | United Community Banks, Inc. | | | 1,040,526 | |
| | | | | | | 8,440,424 | |
Health Care—3.9% | | | | |
| | 34,049 | | HealthSouth Corporation + | | | 1,647,972 | |
Industrials—13.8% | | | | |
| | 37,336 | | Allison Transmission Holdings, Inc. | | | 1,400,473 | |
| | 10,472 | | Altra Industrial Motion Corporation | | | 416,786 | |
| | 9,817 | | Barnes Group, Inc. + | | | 574,589 | |
| | 11,106 | | Crane Company | | | 881,594 | |
| | 22,824 | | Kimball International, Inc. | | | 380,933 | |
| | 5,868 | | Lincoln Electric Holdings, Inc. | | | 540,384 | |
| | 3,209 | | Raytheon Company | | | 518,189 | |
| | 7,208 | | Valmont Industries, Inc. | | | 1,078,317 | |
| | | | | | | 5,791,265 | |
Information Technology—18.9% | | | | |
| | 14,473 | | Cabot Microelectronics Corporation | | | 1,068,542 | |
| | 8,411 | | Cass Information Systems, Inc. | | | 552,098 | |
| | 16,946 | | CDW Corporation + | | | 1,059,633 | |
| | 23,555 | | Dolby Laboratories, Inc. | | | 1,153,253 | |
| | 22,399 | | DST Systems, Inc. | | | 1,382,018 | |
| | 10,315 | | Littelfuse, Inc. | | | 1,701,975 | |
| | 25,811 | | Methode Electronics, Inc. | | | 1,063,413 | |
| | | | | | | 7,980,932 | |
Materials—17.2% | | | | |
| | 19,694 | | Avery Dennison Corporation | | | 1,740,359 | |
| | 6,231 | | Chase Corporation | | | 664,848 | |
| | 39,246 | | Huntsman Corporation + | | | 1,014,117 | |
| | 13,480 | | Packaging Corporation of America + | | | 1,501,537 | |
| | 7,881 | | Quaker Chemical Corporation | | | 1,144,557 | |
| | 32,303 | | Steel Dynamics, Inc. | | | 1,156,771 | |
| | | | | | | 7,222,189 | |
TOTAL COMMON STOCKS (Cost $39,640,002) | | | 41,210,884 | |
| | | | | | | | |
SHORT-TERM INVESTMENTS—34.3% | | | | |
Share/
Amount | | Security Description | | Value | |
| | 218,338 | | U.S. Bank Money Market Deposit Account, 0.70% | | | 218,338 | |
| | 14,211,521 | | Mount Vernon Liquid Assets Portfolio, LLC 1.33% (a)^* | | | 14,211,521 | |
TOTAL SHORT-TERM INVESTMENTS (Cost $14,429,859) | | | 14,429,859 | |
TOTAL INVESTMENTS—132.1% (Cost $54,069,861) | | | 55,640,743 | |
Liabilities in excess of Other Assets—(32.1)% | | | (13,518,897 | ) |
NET ASSETS—100.0% | | $ | 42,121,846 | |
(a) | The rate quoted is the annualized seven-day yield as of June 30, 2017. |
+ | All or portion of this security is on loan as of June 30, 2017. Total value of securities on loan is $13,917,702. |
^ | Investment purchased with cash proceeds from securities lending. Total cash collateral has a value of $14,211,521 as of June 30, 2017. |
* | This represents a privately offered liquidity fund. |
The Global Industry Classification Standard (GICS®) was developed by and/or is the exclusive property of MSCI, Inc. and Standard & Poor Financial Services LLC (“S&P”). GICS is a service mark of MSCI and S&P and has been licensed for use by U.S. Bancorp Fund Services, LLC.
The accompanying notes are an integral part of these financial statements.
27
| Absolute Shares Trust WBI Tactical SMV Shares Schedule of Investments June 30, 2017 |
Shares | | Security Description | | Value | |
COMMON STOCKS—96.0% | | | |
Consumer Discretionary—26.5% | | | |
| | 24,605 | | Brunswick Corporation | | $ | 1,543,472 | |
| | 14,522 | | Darden Restaurants, Inc. + | | | 1,313,370 | |
| | 6,159 | | Flexsteel Industries, Inc. | | | 333,263 | |
| | 76,394 | | Hanesbrands, Inc. + | | | 1,769,285 | |
| | 49,458 | | International Speedway Corporation | | | 1,857,148 | |
| | 76,326 | | Interpublic Group of Companies, Inc. + | | | 1,877,620 | |
| | 63,463 | | La-Z-Boy, Inc. + | | | 2,062,547 | |
| | 55,854 | | Leggett & Platt, Inc. + | | | 2,934,011 | |
| | 26,046 | | Standard Motor Products, Inc. + | | | 1,360,122 | |
| | 33,028 | | Tupperware Brands Corporation | | | 2,319,556 | |
| | 69,519 | | Wolverine World Wide, Inc. | | | 1,947,227 | |
| | | | | | | 19,317,621 | |
Financials—26.5% | | | | |
| | 19,011 | | Berkshire Hills Bancorp, Inc. | | | 668,237 | |
| | 45,716 | | East West Bancorp, Inc. + | | | 2,678,043 | |
| | 47,981 | | Eaton Vance Corporation + | | | 2,270,461 | |
| | 37,488 | | Employers Holdings, Inc. | | | 1,585,742 | |
| | 30,892 | | Enterprise Financial Services Corporation | | | 1,260,394 | |
| | 10,960 | | First Defiance Financial Corporation | | | 577,373 | |
| | 79,063 | | First Midwest Bancorp, Inc. | | | 1,842,959 | |
| | 32,517 | | LPL Financial Holdings, Inc. | | | 1,380,672 | |
| | 14,817 | | Peoples Bancorp, Inc. | | | 476,070 | |
| | 20,859 | | Reinsurance Group of America, Inc. | | | 2,678,087 | |
| | 41,479 | | Renasant Corporation | | | 1,814,291 | |
| | 41,884 | | Selective Insurance Group, Inc. | | | 2,096,294 | |
| | | | | | | 19,328,623 | |
Health Care—2.1% | | | | |
| | 31,611 | | HealthSouth Corporation + | | | 1,529,972 | |
Industrials—22.6% | | | | |
| | 49,066 | | Barnes Group, Inc. | | | 2,871,833 | |
| | 33,562 | | Deluxe Corporation | | | 2,323,162 | |
| | 48,193 | | Hillenbrand, Inc. | | | 1,739,767 | |
| | 17,078 | | Hubbell, Inc. | | | 1,932,717 | |
| | 22,407 | | ManpowerGroup, Inc. | | | 2,501,742 | |
| | 67,106 | | Masco Corporation | | | 2,564,120 | |
| | 65,585 | | Quad/Graphics, Inc. | | | 1,503,208 | |
| | 6,864 | | Valmont Industries, Inc. | | | 1,026,855 | |
| | | | | | | 16,463,404 | |
Information Technology—4.3% | | | | |
| | 15,971 | | Accenture plc | | | 1,975,293 | |
| | 37,100 | | AVX Corporation | | | 606,214 | |
| | 11,606 | | Dolby Laboratories, Inc. | | | 568,230 | |
| | | | | | | 3,149,737 | |
Materials—13.0% | | | | |
| | 33,902 | | Avery Dennison Corporation | | | 2,995,920 | |
| | 42,023 | | Greif, Inc. | | | 2,344,043 | |
| | 10,353 | | Kaiser Aluminum Corporation | | | 916,447 | |
| | 23,084 | | PolyOne Corporation | | | 894,274 | |
| | 66,360 | | Steel Dynamics, Inc. | | | 2,376,352 | |
| | | | | | | 9,527,036 | |
Utilities—1.0% | | | | |
| | 63,837 | | AES Corporation | | | 709,229 | |
TOTAL COMMON STOCKS (Cost $67,294,759) | | | 70,025,622 | |
| | | | | | | | |
SHORT-TERM INVESTMENTS—20.1% | | | | |
Share/
Amount | | Security Description | | Value | |
| | 1,200,688 | | U.S. Bank Money Market Deposit Account, 0.70% | | | 1,200,688 | |
| | 13,418,409 | | Mount Vernon Liquid Assets Portfolio, LLC, 1.33% (a)^* | | | 13,418,409 | |
TOTAL SHORT-TERM INVESTMENTS (Cost $14,619,097) | | | 14,619,097 | |
TOTAL INVESTMENTS—116.1% (Cost $81,913,856) | | | 84,644,719 | |
Liabilities in excess of Other Assets—(16.1)% | | | (11,712,477 | ) |
NET ASSETS—100.0% | | $ | 72,932,242 | |
(a) | The rate quoted is the annualized seven-day yield as of June 30, 2017. |
+ | All or portion of this security is on loan as of June 30, 2017. Total value of securities on loan is $13,143,071. |
^ | Investment purchased with cash proceeds from securities lending. Total cash collateral has a value of $13,418,409 as of June 30, 2017. |
* | This represents a privately offered liquidity fund. |
The Global Industry Classification Standard (GICS®) was developed by and/or is the exclusive property of MSCI, Inc. and Standard & Poor Financial Services LLC (“S&P”). GICS is a service mark of MSCI and S&P and has been licensed for use by U.S. Bancorp Fund Services, LLC.
The accompanying notes are an integral part of these financial statements.
28
| Absolute Shares Trust WBI Tactical SMY Shares Schedule of Investments June 30, 2017 |
Shares | | Security Description | | Value | |
COMMON STOCKS—89.6% | | | |
Consumer Discretionary—21.6% | | | |
| | 35,518 | | Darden Restaurants, Inc. + | | $ | 3,212,248 | |
| | 36,152 | | Garmin, Ltd. + | | | 1,844,837 | |
| | 75,107 | | H&R Block, Inc. + | | | 2,321,557 | |
| | 123,243 | | Hanesbrands, Inc. + | | | 2,854,308 | |
| | 110,489 | | Interpublic Group of Companies, Inc. + | | | 2,718,029 | |
| | 17,225 | | Tupperware Brands Corporation | | | 1,209,712 | |
| | | | | | | 14,160,691 | |
Energy—0.8% | | | | |
| | 7,809 | | Valero Energy Corporation + | | | 526,795 | |
Financials—32.2% | | | | |
| | 9,312 | | Aflac, Inc. | | | 723,356 | |
| | 45,824 | | Arthur J. Gallagher & Company | | | 2,623,424 | |
| | 42,728 | | Berkshire Hills Bancorp, Inc. | | | 1,501,889 | |
| | 8,690 | | City Holding Company | | | 572,410 | |
| | 103,099 | | CNO Financial Group, Inc. | | | 2,152,707 | |
| | 27,379 | | IBERIABANK Corporation | | | 2,231,389 | |
| | 43,349 | | Legg Mason, Inc. | | | 1,654,198 | |
| | 8,030 | | LPL Financial Holdings, Inc. | | | 340,954 | |
| | 119,873 | | Old Republic International Corporation | | | 2,341,120 | |
| | 32,824 | | Popular, Inc. | | | 1,369,089 | |
| | 27,381 | | Sandy Spring Bancorp, Inc. | | | 1,113,311 | |
| | 44,972 | | Stewart Information Services Corporation + | | | 2,040,829 | |
| | 29,778 | | Universal Insurance Holdings, Inc. + | | | 750,406 | |
| | 36,369 | | Unum Group + | | | 1,695,887 | |
| | | | | | | 21,110,969 | |
Health Care—3.1% | | | | |
| | 42,308 | | HealthSouth Corporation + | | | 2,047,707 | |
Industrials—5.9% | | | | |
| | 7,952 | | Deluxe Corporation | | | 550,437 | |
| | 8,885 | | Hubbell, Inc. | | | 1,005,516 | |
| | 20,480 | | ManpowerGroup, Inc. | | | 2,286,592 | |
| | | | | | | 3,842,545 | |
Materials—15.3% | | | | |
| | 38,111 | | Greif, Inc. | | | 2,125,831 | |
| | 68,232 | | Huntsman Corporation | | | 1,763,115 | |
| | 24,231 | | Packaging Corporation of America + | | | 2,699,091 | |
| | 58,968 | | Steel Dynamics, Inc. | | | 2,111,644 | |
| | 19,528 | | Trinseo S.A. | | | 1,341,574 | |
| | | | | | | 10,041,255 | |
Real Estate—5.8% | | | | |
| | 30,332 | | Ryman Hospitality Properties, Inc. + | | | 1,941,551 | |
| | 89,541 | | Piedmont Office Realty Trust, Inc. | | | 1,887,524 | |
| | | | | | | 3,829,075 | |
Utilities—4.9% | | | | |
| | 46,546 | | AES Corporation | | | 517,126 | |
| | 84,332 | | Hawaiian Electric Industries, Inc. | | | 2,730,670 | |
| | | | | | | 3,247,796 | |
TOTAL COMMON STOCKS (Cost $56,256,127) | | | 58,806,833 | |
| | | | | | | | |
SHORT-TERM INVESTMENTS—29.7% | | | | |
Share/
Amount | | Security Description | | Value | |
| | 923,201 | | U.S. Bank Money Market Deposit Account, 0.70% | | $ | 923,201 | |
| | 18,566,389 | | Mount Vernon Liquid Assets Portfolio, LLC, 1.33% (a)^* | | | 18,566,389 | |
TOTAL SHORT-TERM INVESTMENTS (Cost $19,489,590) | | | 19,489,590 | |
TOTAL INVESTMENTS—119.3% (Cost $75,745,717) | | | 78,296,423 | |
Liabilities in excess of Other Assets—(19.3)% | | | (12,678,272 | ) |
NET ASSETS—100.0% | | $ | 65,618,151 | |
(a) | The rate quoted is the annualized seven-day yield as of June 30, 2017. |
+ | All or portion of this security is on loan as of June 30, 2017. Total value of securities on loan is $18,078,717. |
^ | Investment purchased with cash proceeds from securities lending. Total cash collateral has a value of $18,566,389 as of June 30, 2017. |
* | This represents a privately offered liquidity fund. |
The Global Industry Classification Standard (GICS®) was developed by and/or is the exclusive property of MSCI, Inc. and Standard & Poor Financial Services LLC (“S&P”). GICS is a service mark of MSCI and S&P and has been licensed for use by U.S. Bancorp Fund Services, LLC.
The accompanying notes are an integral part of these financial statements.
29
| Absolute Shares Trust WBI Tactical SMS Shares Schedule of Investments June 30, 2017 |
Shares | | Security Description | | Value | |
COMMON STOCKS—99.4% | | | |
Consumer Discretionary—20.2% | | | |
| | 23,792 | | Caleres, Inc. | | $ | 660,942 | |
| | 51,606 | | H&R Block, Inc. + | | | 1,595,141 | |
| | 76,369 | | Hanesbrands, Inc. + | | | 1,768,706 | |
| | 124,187 | | Interpublic Group of Companies, Inc. + | | | 3,055,000 | |
| | 33,552 | | Leggett & Platt, Inc. | | | 1,762,487 | |
| | 57,845 | | M.D.C. Holdings, Inc. + | | | 2,043,664 | |
| | 30,855 | | Tupperware Brands Corporation | | | 2,166,947 | |
| | 71,718 | | Wolverine World Wide, Inc. + | | | 2,008,821 | |
| | | | | | | 15,061,708 | |
Financials—40.3% | | | | |
| | 28,256 | | 1st Source Corporation | | | 1,354,593 | |
| | 54,336 | | American Equity Investment Life Holding Company | | | 1,427,950 | |
| | 29,770 | | American Financial Group, Inc. | | | 2,958,245 | |
| | 52,769 | | Arthur J. Gallagher & Company | | | 3,021,025 | |
| | 68,339 | | Brown & Brown, Inc. | | | 2,943,361 | |
| | 47,811 | | Columbia Banking System, Inc. + | | | 1,905,268 | |
| | 43,915 | | Commerce Bancshares, Inc. + | | | 2,495,689 | |
| | 26,432 | | Cullen/Frost Bankers, Inc. + | | | 2,482,229 | |
| | 46,279 | | East West Bancorp, Inc. + | | | 2,711,024 | |
| | 8,617 | | Employers Holdings, Inc. | | | 364,499 | |
| | 12,801 | | Everest Re Group, Ltd. | | | 3,259,007 | |
| | 7,693 | | IBERIABANK Corporation | | | 626,979 | |
| | 12,800 | | Independent Bank Corporation | | | 853,120 | |
| | 66,830 | | Lakeland Bancorp, Inc. + | | | 1,259,746 | |
| | 33,841 | | Renasant Corporation + | | | 1,480,205 | |
| | 35,570 | | Universal Insurance Holdings, Inc. + | | | 896,364 | |
| | | | | | | 30,039,304 | |
Health Care—6.1% | | | | |
| | 30,118 | | Quest Diagnostics, Inc. | | | 3,347,917 | |
| | 6,352 | | UnitedHealth Group, Inc. | | | 1,177,788 | |
| | | | | | | 4,525,705 | |
Industrials—18.8% | | | | |
| | 33,080 | | Barnes Group, Inc. | | | 1,936,172 | |
| | 30,103 | | Deluxe Corporation | | | 2,083,730 | |
| | 47,848 | | Hillenbrand, Inc. | | | 1,727,313 | |
| | 19,031 | | Hubbell, Inc. | | | 2,153,738 | |
| | 19,656 | | ITT, Inc. | | | 789,778 | |
| | 15,088 | | Kelly Services, Inc. | | | 338,726 | |
| | 23,231 | | ManpowerGroup, Inc. | | | 2,593,741 | |
| | 15,979 | | Valmont Industries, Inc. | | | 2,390,458 | |
| | | | | | | 14,013,656 | |
Information Technology—6.3% | | | | |
| | 40,465 | | DST Systems, Inc. | | | 2,496,691 | |
| | 28,167 | | InterDigital, Inc. | | | 2,177,309 | |
| | | | | | | 4,674,000 | |
Materials—5.4% | | | | |
| | 35,142 | | Avery Dennison Corporation | | $ | 3,105,499 | |
| | 18,186 | | H.B. Fuller Company | | | 929,486 | |
| | | | | | | 4,034,985 | |
Utilities—2.3% | | | | |
| | 52,548 | | Hawaiian Electric Industries, Inc. | | | 1,701,504 | |
TOTAL COMMON STOCKS (Cost $71,033,396) | | | 74,050,862 | |
| | | | | | | | |
SHORT-TERM INVESTMENTS—25.7% | | | | |
Share/
Amount | | Security Description | | Value | |
| | 2,615,972 | | U.S. Bank Money Market Deposit Account, 0.70% | | | 2,615,972 | |
| | 16,514,023 | | Mount Vernon Liquid Assets Portfolio, LLC, 1.33% (a)^* | | | 16,514,023 | |
TOTAL SHORT-TERM INVESTMENTS (Cost $19,129,995) | | | 19,129,995 | |
TOTAL INVESTMENTS—125.1% (Cost $90,163,391) | | | 93,180,857 | |
Liabilities in excess of Other Assets—(25.1)% | | | (18,699,143 | ) |
NET ASSETS—100.0% | | $ | 74,481,714 | |
(a) | The rate quoted is the annualized seven-day yield as of June 30, 2017. |
+ | All or portion of this security is on loan as of June 30, 2017. Total value of securities on loan is $16,102,240. |
^ | Investment purchased with cash proceeds from securities lending. Total cash collateral has a value of $16,514,023 as of June 30, 2017. |
* | This represents a privately offered liquidity fund. |
The Global Industry Classification Standard (GICS®) was developed by and/or is the exclusive property of MSCI, Inc. and Standard & Poor Financial Services LLC (“S&P”). GICS is a service mark of MSCI and S&P and has been licensed for use by U.S. Bancorp Fund Services, LLC.
The accompanying notes are an integral part of these financial statements.
30
| Absolute Shares Trust WBI Tactical LCG Shares Schedule of Investments June 30, 2017 |
Shares | | Security Description | | Value | |
COMMON STOCKS—95.6% | | | |
Consumer Discretionary—15.7% | | | |
| | 35,671 | | Best Buy Company, Inc. + | | $ | 2,045,018 | |
| | 13,403 | | Expedia, Inc. | | | 1,996,377 | |
| | 10,314 | | Garmin, Ltd. + | | | 526,323 | |
| | 59,703 | | Interpublic Group of Companies, Inc. + | | | 1,468,694 | |
| | 18,676 | | Time Warner, Inc. | | | 1,875,257 | |
| | | | | | | 7,911,669 | |
Financials—22.1% | | | | |
| | 5,002 | | BlackRock, Inc. + | | | 2,112,895 | |
| | 27,237 | | Comerica, Inc. + | | | 1,994,838 | |
| | 35,724 | | East West Bancorp, Inc. + | | | 2,092,712 | |
| | 30,891 | | Hartford Financial Services Group, Inc. | | | 1,623,940 | |
| | 4,208 | | Marsh & McLennan Companies, Inc. | | | 328,056 | |
| | 30,543 | | Principal Financial Group, Inc. + | | | 1,956,890 | |
| | 6,840 | | S&P Global, Inc. | | | 998,571 | |
| | | | | | | 11,107,902 | |
Health Care—8.0% | | | | |
| | 10,732 | | Anthem, Inc. + | | | 2,019,011 | |
| | 15,051 | | Johnson & Johnson | | | 1,991,097 | |
| | | | | | | 4,010,108 | |
Industrials—20.2% | | | | |
| | 12,653 | | Cummins, Inc. + | | | 2,052,570 | |
| | 28,685 | | Emerson Electric Company + | | | 1,710,200 | |
| | 22,255 | | Ingersoll-Rand plc | | | 2,033,884 | |
| | 3,053 | | Parker-Hannifin Corporation + | | | 487,931 | |
| | 30,970 | | Toro Company | | | 2,145,911 | |
| | 16,009 | | Union Pacific Corporation | | | 1,743,540 | |
| | | | | | | 10,174,036 | |
Information Technology—22.7% | | | | |
| | 1,603 | | Alliance Data Systems Corporation + | | | 411,474 | |
| | 23,437 | | Analog Devices, Inc. | | | 1,823,398 | |
| | 57,129 | | CA, Inc. | | | 1,969,237 | |
| | 63,699 | | Corning, Inc. | | | 1,914,155 | |
| | 37,541 | | Maxim Integrated Products, Inc. | | | 1,685,591 | |
| | 16,763 | | Skyworks Solutions, Inc. + | | | 1,608,410 | |
| | 52,641 | | SS&C Technologies Holdings, Inc. | | | 2,021,941 | |
| | | | | | | 11,434,206 | |
Materials—6.9% | | | | |
| | 24,395 | | Air Liquide S.A. - ADR | | | 607,557 | |
| | 9,117 | | Packaging Corporation of America | | | 1,015,543 | |
| | 5,172 | | Sherwin-Williams Company | | | 1,815,165 | |
| | | | | | | 3,438,265 | |
TOTAL COMMON STOCKS (Cost $45,776,156) | | | 48,076,186 | |
| | | | | | | | |
SHORT-TERM INVESTMENTS—21.0% | | | | |
Share/
Amount | | Security Description | | Value | |
| | 2,828,768 | | U.S. Bank Money Market Deposit Account, 0.70% | | $ | 2,828,768 | |
| | 7,711,768 | | Mount Vernon Liquid Assets Portfolio, LLC, 1.33% (a)^* | | | 7,711,768 | |
TOTAL SHORT-TERM INVESTMENTS (Cost $10,540,536) | | | 10,540,536 | |
TOTAL INVESTMENTS—116.6% (Cost $56,316,692) | | | 58,616,722 | |
Liabilities in excess of Other Assets—(16.6)% | | | (8,325,827 | ) |
NET ASSETS—100.0% | | $ | 50,290,895 | |
(a) | The rate quoted is the annualized seven-day yield as of June 30, 2017. |
ADR | American Depositary Receipt |
+ | All or portion of this security is on loan as of June 30, 2017. Total value of securities on loan is $7,534,879. |
^ | Investment purchased with cash proceeds from securities lending. Total cash collateral has a value of $7,711,768 as of June 30, 2017. |
* | This represents a privately offered liquidity fund. |
The Global Industry Classification Standard (GICS®) was developed by and/or is the exclusive property of MSCI, Inc. and Standard & Poor Financial Services LLC (“S&P”). GICS is a service mark of MSCI and S&P and has been licensed for use by U.S. Bancorp Fund Services, LLC.
The accompanying notes are an integral part of these financial statements.
31
| Absolute Shares Trust WBI Tactical LCV Shares Schedule of Investments June 30, 2017 |
Shares | | Security Description | | Value | |
COMMON STOCKS—95.9% | | | |
Consumer Discretionary—3.9% | | | |
| | 125,213 | | Interpublic Group of Companies, Inc. + | | $ | 3,080,240 | |
Consumer Staples—12.7% | | | | |
| | 60,114 | | Church & Dwight Company, Inc. | | | 3,118,714 | |
| | 4,870 | | Clorox Company | | | 648,879 | |
| | 32,768 | | Estee Lauder Companies, Inc. | | | 3,145,073 | |
| | 26,306 | | Pepsico, Inc. | | | 3,038,080 | |
| | | | | | | 9,950,746 | |
Financials—8.2% | | | | |
| | 71,382 | | Franklin Resources, Inc. | | | 3,197,200 | |
| | 61,141 | | Hartford Financial Services Group, Inc. | | | 3,214,182 | |
| | | | | | | 6,411,382 | |
Health Care—10.8% | | | | |
| | 40,106 | | Abbott Laboratories | | | 1,949,552 | |
| | 17,999 | | Anthem, Inc. | | | 3,386,152 | |
| | 38,090 | | Eli Lilly and Company | | | 3,134,807 | |
| | | | | | | 8,470,511 | |
Industrials—26.8% | | | | |
| | 12,293 | | 3M Company | | | 2,559,280 | |
| | 11,274 | | Lockheed Martin Corporation + | | | 3,129,775 | |
| | 21,188 | | ManpowerGroup, Inc. | | | 2,365,640 | |
| | 19,430 | | Parker-Hannifin Corporation + | | | 3,105,303 | |
| | 22,397 | | Stanley Black & Decker, Inc. | | | 3,151,930 | |
| | 13,861 | | Union Pacific Corporation | | | 1,509,601 | |
| | 18,045 | | United Technologies Corporation | | | 2,203,475 | |
| | 41,562 | | Waste Management, Inc. | | | 3,048,573 | |
| | | | | | | 21,073,577 | |
Information Technology—17.4% | | | | |
| | 24,097 | | Accenture plc | | | 2,980,317 | |
| | 30,899 | | Automatic Data Processing, Inc. + | | | 3,165,912 | |
| | 21,797 | | Maxim Integrated Products, Inc. | | | 978,685 | |
| | 67,882 | | Oracle Corporation | | | 3,403,603 | |
| | 40,194 | | TE Connectivity, Ltd. | | | 3,162,464 | |
| | | | | | | 13,690,981 | |
Materials—16.1% | | | | |
| | 38,213 | | Avery Dennison Corporation | | | 3,376,883 | |
| | 33,966 | | Celanese Corporation - Series A | | | 3,224,732 | |
| | 37,683 | | E. I. du Pont de Nemours and Company | | | 3,041,395 | |
| | 22,542 | | International Flavors & Fragrances, Inc. | | | 3,043,170 | |
| | | | | | | 12,686,180 | |
TOTAL COMMON STOCKS (Cost $72,507,000) | | | 75,363,617 | |
| | | | | | | | |
SHORT-TERM INVESTMENTS—7.9% | | | | |
Share/
Amount | | Security Description | | Value | |
| | 541,487 | | U.S. Bank Money Market Deposit Account, 0.70% | | $ | 541,487 | |
| | 5,706,410 | | Mount Vernon Liquid Assets Portfolio, LLC, 1.33% (a)^* | | | 5,706,410 | |
TOTAL SHORT-TERM INVESTMENTS (Cost $6,247,897) | | | 6,247,897 | |
TOTAL INVESTMENTS—103.8% (Cost $78,754,897) | | | 81,611,514 | |
Liabilities in excess of Other Assets—(3.8)% | | | (3,010,337 | ) |
NET ASSETS—100.0% | | $ | 78,601,177 | |
(a) | The rate quoted is the annualized seven-day yield as of June 30, 2017. |
+ | All or portion of this security is on loan as of June 30, 2017. Total value of securities on loan is $5,607,443. |
^ | Investment purchased with cash proceeds from securities lending. Total cash collateral has a value of $5,706,410 as of June 30, 2017. |
* | This represents a privately offered liquidity fund. |
The Global Industry Classification Standard (GICS®) was developed by and/or is the exclusive property of MSCI, Inc. and Standard & Poor Financial Services LLC (“S&P”). GICS is a service mark of MSCI and S&P and has been licensed for use by U.S. Bancorp Fund Services, LLC.
The accompanying notes are an integral part of these financial statements.
32
| Absolute Shares Trust WBI Tactical LCY Shares Schedule of Investments June 30, 2017 |
Shares | | Security Description | | Value | |
COMMON STOCKS—99.3% | | | |
Consumer Discretionary—11.2% | | | |
| | 62,034 | | Coach, Inc. | | $ | 2,936,690 | |
| | 25,636 | | Hasbro, Inc. + | | | 2,858,670 | |
| | 30,050 | | Wyndham Worldwide Corporation | | | 3,017,320 | |
| | | | | | | 8,812,680 | |
Consumer Staples—3.9% | | | | |
| | 26,693 | | Pepsico, Inc. | | | 3,082,775 | |
Energy—3.6% | | | | |
| | 55,134 | | Marathon Petroleum Corporation | | | 2,885,162 | |
Financials—24.7% | | | | |
| | 38,803 | | Aflac, Inc. | | | 3,014,217 | |
| | 54,716 | | Arthur J. Gallagher & Company | | | 3,132,491 | |
| | 474,000 | | Banco Santander S.A. - ADR | | | 3,171,060 | |
| | 22,218 | | Chubb, Ltd. | | | 3,230,053 | |
| | 18,414 | | KB Financial Group, Inc. - ADR | | | 929,723 | |
| | 53,358 | | MetLife, Inc. + | | | 2,931,488 | |
| | 70,286 | | Morgan Stanley + | | | 3,131,944 | |
| | | | | | | 19,540,976 | |
Industrials—25.0% | | | | |
| | 20,428 | | Cummins, Inc. + | | | 3,313,830 | |
| | 53,075 | | Emerson Electric Company | | | 3,164,332 | |
| | 18,917 | | Honeywell International, Inc. + | | | 2,521,447 | |
| | 11,431 | | Lockheed Martin Corporation | | | 3,173,360 | |
| | 48,728 | | Republic Services, Inc. | | | 3,105,435 | |
| | 12,270 | | Union Pacific Corporation | | | 1,336,326 | |
| | 42,208 | | Waste Management, Inc. | | | 3,095,957 | |
| | | | | | | 19,710,687 | |
Information Technology—20.6% | | | | |
| | 40,189 | | Analog Devices, Inc. | | | 3,126,704 | |
| | 30,619 | | Automatic Data Processing, Inc. | | | 3,137,223 | |
| | 33,516 | | CA, Inc. | | | 1,155,297 | |
| | 70,570 | | Maxim Integrated Products, Inc. | | | 3,168,593 | |
| | 31,533 | | Motorola Solutions, Inc. + | | | 2,735,172 | |
| | 37,368 | | TE Connectivity, Ltd. | | | 2,940,114 | |
| | | | | | | 16,263,103 | |
Materials—10.3% | | | | |
| | 20,933 | | E. I. du Pont de Nemours and Company | | | 1,689,502 | |
| | 35,151 | | Eastman Chemical Company | | | 2,952,333 | |
| | 31,201 | | Packaging Corporation of America + | | | 3,475,480 | |
| | | | | | | 8,117,315 | |
TOTAL COMMON STOCKS (Cost $75,258,587) | | | 78,412,698 | |
| | | | | | | | |
SHORT-TERM INVESTMENTS—21.5% | | | | |
Share/
Amount | | Security Description | | Value | |
| | 1,761,838 | | U.S. Bank Money Market Deposit Account, 0.70% | | $ | 1,761,838 | |
| | 15,217,170 | | Mount Vernon Liquid Assets Portfolio, LLC, 1.33% (a)^* | | | 15,217,170 | |
TOTAL SHORT-TERM INVESTMENTS (Cost $16,979,008) | | | 16,979,008 | |
TOTAL INVESTMENTS—120.8% (Cost $92,237,595) | | | 95,391,706 | |
Liabilities in excess of Other Assets—(20.8)% | | | (16,409,331 | ) |
NET ASSETS—100.0% | | $ | 78,982,375 | |
(a) | The rate quoted is the annualized seven-day yield as of June 30, 2017. |
ADR | American Depositary Receipt |
+ | All or portion of this security is on loan as of June 30, 2017. Total value of securities on loan is $14,907,594. |
^ | Investment purchased with cash proceeds from securities lending. Total cash collateral has a value of $15,217,170 as of June 30, 2017. |
* | This represents a privately offered liquidity fund. |
The Global Industry Classification Standard (GICS®) was developed by and/or is the exclusive property of MSCI, Inc. and Standard & Poor Financial Services LLC (“S&P”). GICS is a service mark of MSCI and S&P and has been licensed for use by U.S. Bancorp Fund Services, LLC.
The accompanying notes are an integral part of these financial statements.
33
| Absolute Shares Trust WBI Tactical LCS Shares Schedule of Investments June 30, 2017 |
Shares | | Security Description | | Value | |
COMMON STOCKS—99.6% | | | |
Consumer Discretionary—11.7% | | | |
| | 34,749 | | Best Buy Company, Inc. + | | $ | 1,992,160 | |
| | 21,645 | | Omnicom Group, Inc. + | | | 1,794,371 | |
| | 18,405 | | Wyndham Worldwide Corporation | | | 1,848,046 | |
| | | | | | | 5,634,577 | |
Financials—38.8% | | | | |
| | 25,196 | | Aflac, Inc. | | | 1,957,225 | |
| | 9,914 | | Allstate Corporation + | | | 876,794 | |
| | 43,693 | | BB&T Corporation | | | 1,984,099 | |
| | 36,548 | | Brown & Brown, Inc. | | | 1,574,123 | |
| | 13,424 | | Chubb, Ltd. | | | 1,951,581 | |
| | 7,905 | | Credicorp, Ltd. | | | 1,418,078 | |
| | 44,032 | | Franklin Resources, Inc. + | | | 1,972,193 | |
| | 30,898 | | Intercontinental Exchange, Inc. + | | | 2,036,796 | |
| | 11,951 | | M&T Bank Corporation | | | 1,935,465 | |
| | 15,304 | | Principal Financial Group, Inc. | | | 980,527 | |
| | 15,154 | | Travelers Companies, Inc. | | | 1,917,436 | |
| | | | | | | 18,604,317 | |
Health Care—13.2% | | | | |
| | 2,175 | | Amgen, Inc. + | | | 374,600 | |
| | 10,443 | | Anthem, Inc. | | | 1,964,642 | |
| | 17,492 | | Quest Diagnostics, Inc. + | | | 1,944,411 | |
| | 11,120 | | UnitedHealth Group, Inc. | | | 2,061,870 | |
| | | | | | | 6,345,523 | |
Industrials—20.3% | | | | |
| | 12,225 | | Equifax, Inc. | | | 1,679,960 | |
| | 21,172 | | Ingersoll-Rand plc | | | 1,934,909 | |
| | 18,218 | | ManpowerGroup, Inc. + | | | 2,034,040 | |
| | 11,220 | | Masco Corporation | | | 428,716 | |
| | 4,815 | | Rockwell Automation, Inc. | | | 779,837 | |
| | 14,737 | | Stanley Black & Decker, Inc. | | | 2,073,938 | |
| | 10,855 | | Waste Management, Inc. | | | 796,214 | |
| | | | | | | 9,727,614 | |
Information Technology—11.5% | | | | |
| | 12,521 | | Accenture plc | | | 1,548,597 | |
| | 9,270 | | Automatic Data Processing, Inc. + | | | 949,804 | |
| | 9,576 | | Harris Corporation | | | 1,044,550 | |
| | 24,784 | | TE Connectivity, Ltd. | | | 1,950,005 | |
| | | | | | | 5,492,956 | |
Materials—4.1% | | | | |
| | 22,316 | | Avery Dennison Corporation | | | 1,972,065 | |
TOTAL COMMON STOCKS (Cost $45,614,384) | | | 47,777,052 | |
| | | | | | | | |
SHORT-TERM INVESTMENTS—22.5% | | | | |
Share/
Amount | | Security Description | | Value | |
| | 1,921,714 | | U.S. Bank Money Market Deposit Account, 0.70% | | $ | 1,921,714 | |
| | 8,880,840 | | Mount Vernon Liquid Assets Portfolio, LLC, 1.33% (a)^* | | | 8,880,840 | |
TOTAL SHORT-TERM INVESTMENTS (Cost $10,802,554) | | | 10,802,554 | |
TOTAL INVESTMENTS—122.1% (Cost $56,416,938) | | | 58,579,606 | |
Liabilities in excess of Other Assets—(22.1)% | | | (10,596,989 | ) |
NET ASSETS—100.0% | | $ | 47,982,617 | |
(a) | The rate quoted is the annualized seven-day yield as of June 30, 2017. |
+ | All or portion of this security is on loan as of June 30, 2017. Total value of securities on loan is $8,706,767. |
^ | Investment purchased with cash proceeds from securities lending. Total cash collateral has a value of $8,880,840 as of June 30, 2017. |
* | This represents a privately offered liquidity fund. |
The Global Industry Classification Standard (GICS®) was developed by and/or is the exclusive property of MSCI, Inc. and Standard & Poor Financial Services LLC (“S&P”). GICS is a service mark of MSCI and S&P and has been licensed for use by U.S. Bancorp Fund Services, LLC.
The accompanying notes are an integral part of these financial statements.
34
| Absolute Shares Trust WBI Tactical Income Shares Schedule of Investments June 30, 2017 |
Shares | | Security Description | | Value | |
EXCHANGE TRADED FUNDS—77.7% | | | |
| | 87,644 | | iShares 10+ Year Credit Bond ETF | | $ | 5,402,376 | |
| | 61,970 | | iShares Agency Bond ETF | | | 7,045,989 | |
| | 183,489 | | iShares Emerging Markets High Yield Bond ETF | | | 9,203,808 | |
| | 182,921 | | iShares iBoxx $ High Yield Corporate Bond ETF + | | | 16,168,387 | |
| | 34,532 | | iShares Intermediate Government/Credit Bond ETF | | | 3,822,002 | |
| | 134,718 | | iShares U.S. Preferred Stock ETF + | | | 5,276,904 | |
| | 122,339 | | PIMCO Enhanced Short Maturity Active ETF | | | 12,444,323 | |
| | 175,763 | | PowerShares Chinese Yuan Dim Sum Bond Portfolio ETF | | | 3,968,729 | |
| | 479,467 | | PowerShares International Corporate Bond ETF | | | 12,595,598 | |
| | 575,874 | | SPDR Bloomberg Barclays Short Term High Yield Bond ETF | | | 16,107,196 | |
| | 178,523 | | Vanguard Long-Term Corporate Bond ETF | | | 16,656,196 | |
| | 184,805 | | Vanguard Intermediate-Term Corporate Bond ETF | | | 16,175,982 | |
| | 27,985 | | WisdomTree Asia Local Debt ETF | | | 1,257,085 | |
TOTAL EXCHANGE TRADED FUNDS (Cost $124,519,718) | | | 126,124,575 | |
| | | | | | | | |
Par Value | | | | | | |
US GOVERNMENT NOTES—22.0% | | | | |
$ | 4,200,000 | | 07/31/2023, 1.250% | | | 4,010,673 | |
| | 3,900,000 | | 08/31/2023, 1.375% | | | 3,746,898 | |
| | 3,900,000 | | 09/30/2023, 1.375% | | | 3,743,087 | |
| | 3,500,000 | | 11/15/2025, 2.250% | | | 3,501,435 | |
| | 5,400,000 | | 02/15/2026, 1.625% | | | 5,133,057 | |
| | 5,500,000 | | 05/15/2026, 1.625% | | | 5,215,226 | |
| | 5,600,000 | | 08/15/2026, 1.500% | | | 5,239,063 | |
| | 5,200,000 | | 02/15/2027, 2.250% | | | 5,176,740 | |
TOTAL US GOVERNMENT NOTES (Cost $35,603,402) | | | 35,766,179 | |
| | | | | | | | |
SHORT-TERM INVESTMENTS—12.1% | | | | |
Share/
Amount | | Security Description | | Value | |
| | 269,341 | | U.S. Bank Money Market Deposit Account, 0.70% | | $ | 269,341 | |
| | 19,362,820 | | Mount Vernon Liquid Assets Portfolio, LLC, 1.33% (a)^* | | | 19,362,820 | |
TOTAL SHORT-TERM INVESTMENTS (Cost $19,632,161) | | | 19,632,161 | |
TOTAL INVESTMENTS -111.8% (Cost $179,755,281) | | | 181,522,915 | |
Liabilities in excess of Other Assets—(11.8)% | | | (19,279,790 | ) |
NET ASSETS—100.0% | | $ | 162,243,125 | |
(a) | The rate quoted is the annualized seven-day yield as of June 30, 2017. |
+ | All or portion of this security is on loan as of June 30, 2017. Total value of securities on loan is $19,005,788. |
^ | Investment purchased with cash proceeds from securities lending. Total cash collateral has a value of $19,362,820 as of June 30, 2017. |
* | This represents a privately offered liquidity fund. |
The Global Industry Classification Standard (GICS®) was developed by and/or is the exclusive property of MSCI, Inc. and Standard & Poor Financial Services LLC (“S&P”). GICS is a service mark of MSCI and S&P and has been licensed for use by U.S. Bancorp Fund Services, LLC.
The accompanying notes are an integral part of these financial statements.
35
| Absolute Shares Trust WBI Tactical High Income Shares Schedule of Investments June 30, 2017 |
Shares | | Security Description | | Value | |
COMMON STOCKS—29.3% | | | |
Consumer Staples—5.8% | | | |
| | 113,871 | | British American Tobacco plc - ADR + | | $ | 7,804,718 | |
| | 67,489 | | Pepsico, Inc. | | | 7,794,305 | |
| | | | | | | 15,599,023 | |
Energy—0.8% | | | | |
| | 42,567 | | Marathon Petroleum Corporation | | | 2,227,531 | |
Financials—10.3% | | | | |
| | 144,846 | | Aflac, Inc. + | | | 11,251,637 | |
| | 193,206 | | Arthur J. Gallagher & Company | | | 11,061,044 | |
| | 30,186 | | KB Financial Group, Inc. - ADR | | | 1,524,091 | |
| | 37,410 | | CoreSite Realty Corporation | | | 3,873,057 | |
| | | | | | | 27,709,829 | |
Health Care—3.6% | | | | |
| | 132,224 | | AbbVie, Inc. | | | 9,587,562 | |
Information Technology—3.5% | | | | |
| | 25,284 | | Canon, Inc. - ADR + | | | 860,162 | |
| | 110,467 | | Texas Instruments, Inc. | | | 8,498,226 | |
| | | | | | | 9,358,388 | |
Real Estate—5.3% | | | | |
| | 234,405 | | Piedmont Office Realty Trust, Inc. + | | | 4,941,257 | |
| | 83,740 | | Ryman Hospitality Properties, Inc. + | | | 5,360,198 | |
| | 128,900 | | Washington Real Estate Investment Trust | | | 4,111,910 | |
| | | | | | | 14,413,365 | |
TOTAL COMMON STOCKS (Cost $77,878,180) | | | 78,895,698 | |
| | | | | | | | |
EXCHANGE TRADED FUNDS—69.8% | | | | |
| | 107,907 | | iShares 10+ Year Credit Bond ETF + | | | 6,651,387 | |
| | 285,260 | | iShares Emerging Markets High Yield Bond ETF | | | 14,308,642 | |
| | 528,953 | | iShares iBoxx $ High Yield Corporate Bond ETF + | | | 46,754,156 | |
| | 330,944 | | iShares U.S. Preferred Stock ETF | | | 12,963,077 | |
| | 363,464 | | PowerShares Emerging Markets Sovereign Debt ETF + | | | 10,638,591 | |
| | 300,031 | | PowerShares Fundamental High Yield Corporation Bond ETF | | | 5,706,590 | |
| | 1,667,505 | | SPDR Bloomberg Barclays Short Term High Yield Bond ETF | | | 46,640,115 | |
| | 191,603 | | Vanguard Intermediate-Term Corporate Bond ETF | | | 16,771,010 | |
| | 297,090 | | Vanguard Long-Term Corporate Bond ETF | | | 27,718,497 | |
TOTAL EXCHANGE TRADED FUNDS (Cost $186,341,976) | | | 188,152,065 | |
| | | | | | | | |
SHORT-TERM INVESTMENTS—28.5% | | | | |
Share/
Amount | | Security Description | | Value | |
| | 2,406,258 | | U.S. Bank Money Market Deposit Account, 0.70% | | $ | 2,406,258 | |
| | 74,463,618 | | Mount Vernon Liquid Assets Portfolio, LLC, 1.33% (a)^* | | | 74,463,618 | |
TOTAL SHORT-TERM INVESTMENTS (Cost $76,869,876) | | | 76,869,876 | |
TOTAL INVESTMENTS—127.6% (Cost $341,090,032) | | | 343,917,639 | |
Liabilities in excess of Other Assets—(27.6)% | | | (74,468,250 | ) |
NET ASSETS—100.0% | | $ | 269,449,389 | |
(a) | The rate quoted is the annualized seven-day yield as of June 30, 2017. |
ADR | American Depositary Receipt |
+ | All or portion of this security is on loan as of June 30, 2017. Total value of securities on loan is $72,943,776. |
^ | Investment purchased with cash proceeds from securities lending. Total cash collateral has a value of $74,463,618 as of June 30, 2017. |
* | This represents a privately offered liquidity fund. |
The Global Industry Classification Standard (GICS®) was developed by and/or is the exclusive property of MSCI, Inc. and Standard & Poor Financial Services LLC (“S&P”). GICS is a service mark of MSCI and S&P and has been licensed for use by U.S. Bancorp Fund Services, LLC.
The accompanying notes are an integral part of these financial statements.
36
| Absolute Shares Trust WBI Tactical Rotation Shares Schedule of Investments June 30, 2017 |
Shares | | Security Description | | Value | |
EXCHANGE TRADED FUNDS—98.1% | | | |
| | 22,226 | | First Trust Consumer Discretionary AlphaDEX ETF + | | $ | 822,362 | |
| | 40,876 | | First Trust Germany AlphaDEX ETF | | | 1,771,975 | |
| | 7,335 | | iShares Agency Bond ETF | | | 833,990 | |
| | 25,894 | | iShares Global Infrastructure ETF | | | 1,138,559 | |
| | 16,992 | | iShares MSCI China ETF | | | 929,292 | |
| | 5,467 | | iShares Nasdaq Biotechnology ETF | | | 1,695,207 | |
| | 9,021 | | iShares Russell 1000 ETF + | | | 1,220,270 | |
| | 55,708 | | iShares U.S. Preferred Stock ETF | | | 2,182,082 | |
| | 46,929 | | PowerShares Chinese Yuan Dim Sum Bond Portfolio ETF | | | 1,059,657 | |
| | 50,074 | | PowerShares S&P SmallCap Low Volatility ETF + | | | 2,184,458 | |
| | 26,918 | | SPDR Bloomberg Barclays International Corporate Bond ETF | | | 895,293 | |
| | 29,876 | | Vanguard Financials ETF + | | | 1,868,744 | |
| | 11,037 | | Vanguard Total Stock Market ETF | | | 1,373,555 | |
TOTAL EXCHANGE TRADED FUNDS (Cost $17,713,696) | | | 17,975,444 | |
| | | | | | | | |
SHORT-TERM INVESTMENTS—18.0% | | | | |
Share/
Amount | | Security Description | | Value | |
| | 298,895 | | U.S. Bank Money Market Deposit Account, 0.70% | | | 298,895 | |
| | 2,996,575 | | Mount Vernon Liquid Assets Portfolio, LLC, 1.33% (a)^* | | | 2,996,575 | |
TOTAL SHORT-TERM INVESTMENTS (Cost $3,295,470) | | | 3,295,470 | |
TOTAL INVESTMENTS—116.1% (Cost $21,009,166) | | | 21,270,914 | |
Liabilities in excess of Other Assets—(16.1)% | | | (2,954,404 | ) |
NET ASSETS—100.0% | | $ | 18,316,510 | |
(a) | The rate quoted is the annualized seven-day yield as of June 30, 2017. |
+ | All or portion of this security is on loan as of June 30, 2017. Total value of securities on loan is $2,933,567. |
^ | Investment purchased with cash proceeds from securities lending. Total cash collateral has a value of $2,996,575 as of June 30, 2017. |
* | This represents a privately offered liquidity fund. |
The Global Industry Classification Standard (GICS®) was developed by and/or is the exclusive property of MSCI, Inc. and Standard & Poor Financial Services LLC (“S&P”). GICS is a service mark of MSCI and S&P and has been licensed for use by U.S. Bancorp Fund Services, LLC.
The accompanying notes are an integral part of these financial statements.
37
| Absolute Shares Trust WBI Power FactorTM High Dividend ETF Schedule of Investments June 30, 2017 |
Shares | | Security Description | | Value | |
COMMON STOCKS—98.6% | | | |
Consumer Discretionary—31.2% | | | |
| | 10,658 | | Big 5 Sporting Goods Corporation | | $ | 139,087 | |
| | 9,238 | | Buckle, Inc. + | | | 164,436 | |
| | 7,863 | | Cato Corporation | | | 138,310 | |
| | 5,218 | | DineEquity, Inc. | | | 229,853 | |
| | 24,186 | | DSW, Inc. - Class A | | | 428,092 | |
| | 163,414 | | Ford Motor Company | | | 1,828,603 | |
| | 35,957 | | GameStop Corporation - Class A + | | | 777,031 | |
| | 19,442 | | Gannett Company, Inc. | | | 169,534 | |
| | 48,607 | | General Motors Company | | | 1,697,842 | |
| | 39,167 | | H&R Block, Inc. + | | | 1,210,652 | |
| | 17,192 | | Kohl's Corporation + | | | 664,815 | |
| | 12,483 | | L Brands, Inc. | | | 672,709 | |
| | 6,075 | | M.D.C. Holdings, Inc. | | | 214,630 | |
| | 21,601 | | Macy's, Inc. | | | 502,007 | |
| | 12,331 | | New Media Investment Group, Inc. | | | 166,222 | |
| | 34,152 | | Pier 1 Imports, Inc. | | | 177,249 | |
| | 30,152 | | Tailored Brands, Inc. + | | | 336,496 | |
| | 10,069 | | Target Corporation | | | 526,508 | |
| | 7,596 | | Tupperware Brands Corporation | | | 533,467 | |
| | | | | | | 10,577,543 | |
Consumer Staples—0.8% | | | | |
| | 7,915 | | B&G Foods, Inc. + | | | 281,774 | |
Energy—6.9% | | | | |
| | 10,280 | | CVR Energy, Inc. + | | | 223,693 | |
| | 29,296 | | PBF Energy, Inc. + | | | 652,129 | |
| | 21,735 | | Valero Energy Corporation | | | 1,466,243 | |
| | | | | | | 2,342,065 | |
Financials—10.2% | | | | |
| | 36,731 | | AmTrust Financial Services, Inc. + | | | 556,107 | |
| | 6,174 | | Artisan Partners Asset Management, Inc. + | | | 189,542 | |
| | 7,266 | | First American Financial Corporation | | | 324,717 | |
| | 6,336 | | Greenhill & Company, Inc. + | | | 127,354 | |
| | 16,155 | | Invesco, Ltd. | | | 568,494 | |
| | 14,118 | | Maiden Holdings, Ltd. | | | 156,710 | |
| | 4,534 | | Moelis & Company | | | 176,146 | |
| | 29,915 | | Navient Corporation | | | 498,085 | |
| | 49,567 | | New York Community Bancorp, Inc. + | | | 650,815 | |
| | 10,990 | | Virtu Financial, Inc. + | | | 193,973 | |
| | | | | | | 3,441,943 | |
Health Care—5.5% | | | | |
| | 25,822 | | AbbVie, Inc. | | | 1,872,353 | |
Industrials—6.6% | | | | |
| | 4,788 | | Boeing Company | | | 946,827 | |
| | 63,533 | | Pitney Bowes, Inc. | | | 959,348 | |
| | 7,200 | | Quad/Graphics, Inc. | | | 165,024 | |
| | 10,736 | | Steelcase, Inc. | | | 150,304 | |
| | | | | | | 2,221,503 | |
Information Technology—15.0% | | | | |
| | 50,264 | | Cisco Systems, Inc. | | $ | 1,573,263 | |
| | 10,275 | | International Business Machines Corporation | | | 1,580,603 | |
| | 35,275 | | QUALCOMM, Inc. | | | 1,947,886 | |
| | | | | | | 5,101,752 | |
Materials—6.8% | | | | |
| | 7,066 | | Domtar Corporation | | | 271,476 | |
| | 3,845 | | Innophos Holdings, Inc. | | | 168,565 | |
| | 19,305 | | LyondellBasell Industries N.V. | | | 1,629,149 | |
| | 9,386 | | Schnitzer Steel Industries, Inc. | | | 236,527 | |
| | | | | | | 2,305,717 | |
Telecommunication Services—9.9% | | | | |
| | 42,838 | | AT&T, Inc. + | | | 1,616,278 | |
| | 73,015 | | CenturyLink, Inc. + | | | 1,743,598 | |
| | | | | | | 3,359,876 | |
Utilities—5.7% | | | | |
| | 19,670 | | Consolidated Edison, Inc. | | | 1,589,730 | |
| | 10,104 | | NRG Yield, Inc. | | | 177,830 | |
| | 9,502 | | Spark Energy, Inc. + | | | 178,638 | |
| | | | | | | 1,946,198 | |
TOTAL COMMON STOCKS (Cost $33,944,623) | | | 33,450,724 | |
| | | | | | | | |
SHORT-TERM INVESTMENTS—23.6% | | | | |
Share/
Amount | | Security Description | | Value | |
| | 397,734 | | U.S. Bank Money Market Deposit Account, 0.70% | | | 397,734 | |
| | 7,592,912 | | Mount Vernon Liquid Assets Portfolio, LLC, 1.33% (a)^* | | | 7,592,912 | |
TOTAL SHORT-TERM INVESTMENTS (Cost $7,990,646) | | | 7,990,646 | |
TOTAL INVESTMENTS—122.2% (Cost $41,935,269) | | | 41,441,370 | |
Liabilities in excess of Other Assets—(22.2)% | | | (7,538,091 | ) |
NET ASSETS—100.0% | | $ | 33,903,279 | |
(a) | The rate quoted is the annualized seven-day yield as of June 30, 2017. |
+ | All or portion of this security is on loan as of June 30, 2017. Total value of securities on loan is $7,376,524. |
^ | Investment purchased with cash proceeds from securities lending. Total cash collateral has a value of $7,592,912 as of June 30, 2017. |
* | This represents a privately offered liquidity fund. |
The Global Industry Classification Standard (GICS®) was developed by and/or is the exclusive property of MSCI, Inc. and Standard & Poor Financial Services LLC (“S&P”). GICS is a service mark of MSCI and S&P and has been licensed for use by U.S. Bancorp Fund Services, LLC.
The accompanying notes are an integral part of these financial statements.
38
| Absolute Shares Trust Statements of Assets and Liabilities June 30, 2017 |
| | WBI Tactical
SMG Shares | | | WBI Tactical
SMV Shares | | | WBI Tactical
SMY Shares | | | WBI Tactical
SMS Shares | |
ASSETS | | | | | | | | | | | | |
Investments in securities, at value *+ (Note 2) | | $ | 55,640,743 | | | $ | 84,644,719 | | | $ | 78,296,423 | | | $ | 93,180,857 | |
Cash | | | — | | | | — | | | | — | | | | — | |
Receivable for investments sold | | | 2,023,911 | | | | 2,426,392 | | | | 7,136,802 | | | | — | |
Receivable for fund shares sold | | | — | | | | — | | | | — | | | | — | |
Dividends and interest receivable | | | 51,764 | | | | 78,595 | | | | 131,003 | | | | 31,217 | |
Prepaid expenses and other assets | | | 5,847 | | | | 5,452 | | | | 6,080 | | | | 5,420 | |
Securities lending income receivable | | | 936 | | | | 1,399 | | | | 1,655 | | | | 1,526 | |
Due from advisor | | | — | | | | — | | | | — | | | | — | |
Total Assets | | | 57,723,201 | | | | 87,156,557 | | | | 85,571,963 | | | | 93,219,020 | |
| | | | | | | | | | | | | | | | | |
LIABILITIES | | | | | | | | | | | | | | | | |
Payables | | | | | | | | | | | | | | | | |
Collateral received for securities loaned (Note 7) | | | 14,211,521 | | | | 13,418,409 | | | | 18,566,389 | | | | 16,514,023 | |
Investments purchased | | | 1,335,133 | | | | 735,230 | | | | 1,313,408 | | | | 2,151,011 | |
Management fees (Note 3) | | | 32,667 | | | | 49,113 | | | | 48,915 | | | | 49,479 | |
Administration and fund accounting fees | | | 7,551 | | | | 7,813 | | | | 9,432 | | | | 8,080 | |
Audit fees | | | 8,230 | | | | 8,227 | | | | 8,151 | | | | 8,212 | |
Chief Compliance Officer fee | | | 611 | | | | 619 | | | | 767 | | | | 654 | |
Custody fees | | | 1,011 | | | | 1,158 | | | | 1,374 | | | | 1,172 | |
Legal fees | | | 1,593 | | | | 1,575 | | | | 2,117 | | | | 1,705 | |
Accrued other expenses | | | 3,038 | | | | 2,171 | | | | 3,259 | | | | 2,970 | |
Total Liabilities | | | 15,601,355 | | | | 14,224,315 | | | | 19,953,812 | | | | 18,737,306 | |
NET ASSETS | | $ | 42,121,846 | | | $ | 72,932,242 | | | $ | 65,618,151 | | | $ | 74,481,714 | |
| | | | | | | | | | | | | | | | | |
NET ASSETS CONSIST OF: | | | | | | | | | | | | | | | | |
Paid-in Capital | | $ | 60,179,309 | | | $ | 81,927,537 | | | $ | 89,180,861 | | | $ | 90,301,125 | |
Undistributed (Accumulated) Net Investment Income (Loss) | | | — | | | | 24,949 | | | | 24,874 | | | | 5,381 | |
Accumulated Net Realized Gain (Loss) on Investments | | | (19,628,345 | ) | | | (11,751,107 | ) | | | (26,138,290 | ) | | | (18,842,258 | ) |
Net Unrealized Appreciation (Depreciation) on: | | | | | | | | | | | | | | | | |
Investments in Securities | | | 1,570,882 | | | | 2,730,863 | | | | 2,550,706 | | | | 3,017,466 | |
Net Assets | | $ | 42,121,846 | | | $ | 72,932,242 | | | $ | 65,618,151 | | | $ | 74,481,714 | |
*Cost | | | | | | | | | | | | | | | | |
Investments in securities | | $ | 54,069,861 | | | $ | 81,913,856 | | | $ | 75,745,717 | | | $ | 90,163,391 | |
Net Asset Value (unlimited shares authorized): | | | | | | | | | | | | | | | | |
Net Assets | | $ | 42,121,846 | | | $ | 72,932,242 | | | $ | 65,618,151 | | | $ | 74,481,714 | |
Shares Outstanding^ | | | 1,750,000 | | | | 2,900,000 | | | | 2,950,000 | | | | 3,200,000 | |
Net Asset Value, Offering and Redemption Price per Share | | $ | 24.07 | | | $ | 25.15 | | | $ | 22.24 | | | $ | 23.28 | |
+ | Including securities on loan of $13,917,702, $13,143,071, $18,078,717, and $16,102,240 respectively. |
The accompanying notes are an integral part of these financial statements.
39
| Absolute Shares Trust Statements of Assets and Liabilities (continued) June 30, 2017 |
| | WBI Tactical
LCG Shares | | | WBI Tactical
LCV Shares | | | WBI Tactical
LCY Shares | | | WBI Tactical
LCS Shares | |
ASSETS | | | | | | | | | | | | |
Investments in securities, at value *+ (Note 2) | | $ | 58,616,722 | | | $ | 81,611,514 | | | $ | 95,391,706 | | | $ | 58,579,606 | |
Cash | | | 10,860 | | | | — | | | | — | | | | 12,479 | |
Receivable for investments sold | | | 3,541,375 | | | | 5,266,361 | | | | 5,200,985 | | | | 1,530,000 | |
Receivable for fund shares sold | | | — | | | | — | | | | — | | | | — | |
Dividends and interest receivable | | | 48,953 | | | | 60,502 | | | | 154,982 | | | | 37,315 | |
Prepaid expenses and other assets | | | 5,395 | | | | 5,598 | | | | 6,005 | | | | 5,823 | |
Securities lending income receivable | | | 1,043 | | | | 1,099 | | | | 1,522 | | | | 879 | |
Due from advisor | | | — | | | | — | | | | — | | | | — | |
Total Assets | | | 62,224,348 | | | | 86,945,074 | | | | 100,755,200 | | | | 60,166,102 | |
| | | | | | | | | | | | | | | | | |
LIABILITIES | | | | | | | | | | | | | | | | |
Payables | | | | | | | | | | | | | | | | |
Collateral received for securities loaned (Note 7) | | | 7,711,768 | | | | 5,706,410 | | | | 15,217,170 | | | | 8,880,840 | |
Investments purchased | | | 4,161,800 | | | | 2,563,110 | | | | 6,474,035 | | | | 3,241,932 | |
Management fees (Note 3) | | | 38,019 | | | | 52,118 | | | | 57,368 | | | | 38,454 | |
Administration and fund accounting fees | | | 6,915 | | | | 7,504 | | | | 8,998 | | | | 7,735 | |
Audit fees | | | 8,243 | | | | 8,239 | | | | 8,167 | | | | 8,222 | |
Chief Compliance Officer fee | | | 514 | | | | 581 | | | | 685 | | | | 585 | |
Custody fees | | | 904 | | | | 993 | | | | 1,235 | | | | 955 | |
Legal fees | | | 1,562 | | | | 1,573 | | | | 2,044 | | | | 1,687 | |
Accrued other expenses | | | 3,728 | | | | 3,369 | | | | 3,123 | | | | 3,075 | |
Total Liabilities | | | 11,933,453 | | | | 8,343,897 | | | | 21,772,825 | | | | 12,183,485 | |
NET ASSETS | | $ | 50,290,895 | | | $ | 78,601,177 | | | $ | 78,982,375 | | | $ | 47,982,617 | |
| | | | | | | | | | | | | | | | | |
NET ASSETS CONSIST OF: | | | | | | | | | | | | | | | | |
Paid-in Capital | | $ | 68,280,409 | | | $ | 85,696,651 | | | $ | 99,694,867 | | | $ | 58,541,105 | |
Undistributed (Accumulated) Net Investment Income (Loss) | | | — | | | | 5,928 | | | | 23,051 | | | | 12,817 | |
Accumulated Net Realized Gain (Loss) on Investments | | | (20,289,544 | ) | | | (9,958,019 | ) | | | (23,889,654 | ) | | | (12,733,973 | ) |
Net Unrealized Appreciation (Depreciation) on: | | | | | | | | | | | | | | | | |
Investments in Securities | | | 2,300,030 | | | | 2,856,617 | | | | 3,154,111 | | | | 2,162,668 | |
Net Assets | | $ | 50,290,895 | | | $ | 78,601,177 | | | $ | 78,982,375 | | | $ | 47,982,617 | |
*Cost | | | | | | | | | | | | | | | | |
Investments in securities | | $ | 56,316,692 | | | $ | 78,754,897 | | | $ | 92,237,595 | | | $ | 56,416,938 | |
Net Asset Value (unlimited shares authorized): | | | | | | | | | | | | | | | | |
Net Assets | | $ | 50,290,895 | | | $ | 78,601,177 | | | $ | 78,982,375 | | | $ | 47,982,617 | |
Shares Outstanding^ | | | 2,050,000 | | | | 3,000,000 | | | | 3,450,000 | | | | 1,900,000 | |
Net Asset Value, Offering and Redemption Price per Share | | $ | 24.53 | | | $ | 26.20 | | | $ | 22.89 | | | $ | 25.25 | |
+ | Including securities on loan of $7,534,879, $5,607,443, $14,907,594, and $8,706,767 respectively. |
The accompanying notes are an integral part of these financial statements.
40
| Absolute Shares Trust Statements of Assets and Liabilities (concluded) June 30, 2017 |
| | WBI Tactical Income Shares | | | WBI Tactical High Income Shares | | | WBI Tactical Rotation Shares | | | WBI Power FactorTM High Dividend ETF | |
ASSETS | | | | | | | | | | | | |
Investments in securities, at value *+ (Note 2) | | $ | 181,522,915 | | | $ | 343,917,639 | | | $ | 21,270,914 | | | $ | 41,441,370 | |
Cash | | | — | | | | 2,615 | | | | — | | | | — | |
Receivable for investments sold | | | — | | | | — | | | | — | | | | — | |
Receivable for fund shares sold | | | — | | | | 1,223,640 | | | | — | | | | — | |
Dividends and interest receivable | | | 192,578 | | | | 107,468 | | | | 41,092 | | | | 46,350 | |
Prepaid expenses and other assets | | | 12,943 | | | | 9,120 | | | | 12,454 | | | | 26,853 | |
Securities lending income receivable | | | 60,172 | | | | 67,410 | | | | 1,537 | | | | 4,011 | |
Due from advisor | | | — | | | | — | | | | 1,805 | | | | — | |
Total Assets | | | 181,788,608 | | | | 345,327,892 | | | | 21,327,802 | | | | 41,518,584 | |
| | | | | | | | | | | | | | | | | |
LIABILITIES | | | | | | | | | | | | | | | | |
Payables | | | | | | | | | | | | | | | | |
Collateral received for securities loaned (Note 7) | | | 19,362,820 | | | | 74,463,618 | | | | 2,996,575 | | | | 7,592,912 | |
Investments purchased | | | — | | | | 1,208,531 | | | | — | | | | — | |
Management fees (Note 3) | | | 130,346 | | | | 166,616 | | | | — | | | | 2,074 | |
Administration and fund accounting fees | | | 27,131 | | | | 20,210 | | | | 3,134 | | | | 3,906 | |
Audit fees | | | 7,217 | | | | 7,724 | | | | 7,269 | | | | 9,763 | |
Chief Compliance Officer fee | | | 2,461 | | | | 1,754 | | | | 366 | | | | 272 | |
Custody fees | | | 3,566 | | | | 2,672 | | | | 218 | | | | 3 | |
Legal fees | | | 8,167 | | | | 4,869 | | | | 704 | | | | 1,644 | |
Accrued other expenses | | | 3,775 | | | | 2,509 | | | | 3,026 | | | | 4,731 | |
Total Liabilities | | | 19,545,483 | | | | 75,878,503 | | | | 3,011,292 | | | | 7,615,305 | |
NET ASSETS | | $ | 162,243,125 | | | $ | 269,449,389 | | | $ | 18,316,510 | | | $ | 33,903,279 | |
| | | | | | | | | | | | | | | | | |
NET ASSETS CONSIST OF: | | | | | | | | | | | | | | | | |
Paid-in Capital | | $ | 166,052,554 | | | $ | 278,782,962 | | | $ | 18,699,083 | | | $ | 34,588,085 | |
Undistributed (Accumulated) Net Investment Income (Loss) | | | 16,669 | | | | 37,038 | | | | 7,673 | | | | 19,733 | |
Accumulated Net Realized Gain (Loss) on Investments | | | (5,593,732 | ) | | | (12,198,218 | ) | | | (651,994 | ) | | | (210,640 | ) |
Net Unrealized Appreciation (Depreciation) on: | | | | | | | | | | | | | | | | |
Investments in Securities | | | 1,767,634 | | | | 2,827,607 | | | | 261,748 | | | | (493,899 | ) |
Net Assets | | $ | 162,243,125 | | | $ | 269,449,389 | | | $ | 18,316,510 | | | $ | 33,903,279 | |
*Cost | | | | | | | | | | | | | | | | |
Investments in securities | | $ | 179,755,281 | | | $ | 341,090,032 | | | $ | 21,009,166 | | | $ | 41,935,269 | |
Net Asset Value (unlimited shares authorized): | | | | | | | | | | | | | | | | |
Net Assets | | $ | 162,243,125 | | | $ | 269,449,389 | | | $ | 18,316,510 | | | $ | 33,903,279 | |
Shares Outstanding^ | | | 6,400,000 | | | | 11,000,000 | | | | 750,000 | | | | 1,400,000 | |
Net Asset Value, Offering and Redemption Price per Share | | $ | 25.35 | | | $ | 24.50 | | | $ | 24.42 | | | $ | 24.22 | |
+ | Including securities on loan of $19,005,788, $72,943,776, $2,933,567, and $7,376,524 respectively. |
The accompanying notes are an integral part of these financial statements.
41
| Absolute Shares Trust Statements of Operations For the Year Ended June 30, 2017 |
| | WBI Tactical
SMG Shares | | | WBI Tactical
SMV Shares | | | WBI Tactical
SMY Shares | | | WBI Tactical
SMS Shares | |
INVESTMENT INCOME | | | | | | | | | | | | |
Income: | | | | | | | | | | | | |
Dividends+ | | $ | 937,353 | | | $ | 1,345,670 | | | $ | 2,194,919 | | | $ | 1,225,252 | |
Interest | | | 11,748 | | | | 14,228 | | | | 17,387 | | | | 11,902 | |
Securities lending income (Note 7) | | | 34,421 | | | | 30,759 | | | | 47,537 | | | | 38,509 | |
Total Investment Income | | | 983,522 | | | | 1,390,657 | | | | 2,259,843 | | | | 1,275,663 | |
| | | | | | | | | | | | | | | | | |
Expenses: | | | | | | | | | | | | | | | | |
Management fees (Note 3) | | | 527,847 | | | | 560,066 | | | | 718,370 | | | | 591,412 | |
Administration, fund accounting and custodian fees (Note 6) | | | 49,312 | | | | 50,469 | | | | 62,744 | | | | 52,953 | |
Offering costs | | | — | | | | — | | | | — | | | | — | |
Professional Fees | | | 38,681 | | | | 39,476 | | | | 47,475 | | | | 41,071 | |
Exchange fees | | | 11,829 | | | | 12,145 | | | | 12,686 | | | | 12,636 | |
Trustee’s fees and expenses | | | 5,795 | | | | 5,705 | | | | 7,528 | | | | 6,207 | |
Registration fees | | | — | | | | — | | | | — | | | | — | |
Shareholder reporting expenses | | | 7,258 | | | | 6,355 | | | | 7,422 | | | | 7,270 | |
Insurance expenses | | | 8,121 | | | | 7,466 | | | | 10,340 | | | | 8,076 | |
Miscellaneous expenses | | | 4,242 | | | | 4,256 | | | | 4,794 | | | | 4,274 | |
Total Expenses | | | 653,085 | | | | 685,938 | | | | 871,359 | | | | 723,899 | |
Less: Fees (Waived)/Recouped | | | — | | | | — | | | | — | | | | — | |
Net Expenses | | | 653,085 | | | | 685,938 | | | | 871,359 | | | | 723,899 | |
Net Investment Income | | | 330,437 | | | | 704,719 | | | | 1,388,484 | | | | 551,764 | |
| | | | | | | | | | | | | | | | | |
REALIZED & UNREALIZED GAIN (LOSS)
ON INVESTMENTS | | | | | | | | | | | | | | | | |
Net realized gain (loss) on: | | | | | | | | | | | | | | | | |
Investments in securities | | | 8,636,032 | | | | 10,427,619 | | | | 7,975,856 | | | | 9,070,576 | |
Purchased options | | | (180,049 | ) | | | (178,746 | ) | | | (253,088 | ) | | | (200,275 | ) |
Written options | | | 2,128 | | | | — | | | | 19,641 | | | | — | |
Capital gain distributions from regulated investment companies | | | — | | | | — | | | | — | | | | — | |
Net change in unrealized appreciation (depreciation) of: | | | | | | | | | | | | | | | | |
Investments in securities | | | (2,495,795 | ) | | | 106,794 | | | | 466,683 | | | | (951,665 | ) |
Written options | | | — | | | | — | | | | — | | | | — | |
Net realized and unrealized gain (loss) on investments | | | 5,962,316 | | | | 10,355,667 | | | | 8,209,092 | | | | 7,918,636 | |
NET INCREASE (DECREASE) IN NET ASSETS RESULTING FROM OPERATIONS | | $ | 6,292,753 | | | $ | 11,060,386 | | | $ | 9,597,576 | | | $ | 8,470,400 | |
+ | Net of withholding taxes of $0, $0, $974, and $0, respectively. |
The accompanying notes are an integral part of these financial statements.
42
| Absolute Shares Trust Statements of Operations (continued) For the Year Ended June 30, 2017 |
| | WBI Tactical
LCG Shares | | | WBI Tactical
LCV Shares | | | WBI Tactical
LCY Shares | | | WBI Tactical
LCS Shares | |
INVESTMENT INCOME | | | | | | | | | | | | |
Income: | | | | | | | | | | | | |
Dividends+ | | $ | 1,032,721 | | | $ | 1,403,553 | | | $ | 2,038,412 | | | $ | 1,298,582 | |
Interest | | | 12,770 | | | | 15,183 | | | | 24,318 | | | | 15,347 | |
Securities lending income (Note 7) | | | 25,689 | | | | 30,068 | | | | 39,463 | | | | 28,656 | |
Total Investment Income | | | 1,071,180 | | | | 1,448,804 | | | | 2,102,193 | | | | 1,342,585 | |
| | | | | | | | | | | | | | | | | |
Expenses: | | | | | | | | | | | | | | | | |
Management fees (Note 3) | | | 515,815 | | | | 553,284 | | | | 715,126 | | | | 576,844 | |
Administration, fund accounting and custodian fees (Note 6) | | | 46,275 | | | | 43,500 | | | | 60,189 | | | | 50,552 | |
Offering costs | | | — | | | | — | | | | — | | | | — | |
Professional Fees | | | 36,727 | | | | 38,731 | | | | 46,738 | | | | 40,677 | |
Exchange fees | | | 12,217 | | | | 10,959 | | | | 11,692 | | | | 11,168 | |
Trustee’s fees and expenses | | | 5,350 | | | | 5,659 | | | | 7,390 | | | | 6,041 | |
Registration fees | | | — | | | | — | | | | — | | | | — | |
Shareholder reporting expenses | | | 7,187 | | | | 7,490 | | | | 7,401 | | | | 7,255 | |
Insurance expenses | | | 8,049 | | | | 7,595 | | | | 10,080 | | | | 8,312 | |
Miscellaneous expenses | | | 3,720 | | | | 4,165 | | | | 2,931 | | | | 4,308 | |
Total Expenses | | | 635,340 | | | | 671,383 | | | | 861,547 | | | | 705,157 | |
Less: Fees (Waived)/Recouped | | | — | | | | — | | | | — | | | | — | |
Net Expenses | | | 635,340 | | | | 671,383 | | | | 861,547 | | | | 705,157 | |
Net Investment Income | | | 435,840 | | | | 777,421 | | | | 1,240,646 | | | | 637,428 | |
| | | | | | | | | | | | | | | | | |
REALIZED & UNREALIZED GAIN (LOSS)
ON INVESTMENTS | | | | | | | | | | | | | | | | |
Net realized gain (loss) on: | | | | | | | | | | | | | | | | |
Investments in securities | | | 7,538,455 | | | | 11,201,993 | | | | 8,673,459 | | | | 10,361,684 | |
Purchased options | | | (167,068 | ) | | | (165,123 | ) | | | (220,226 | ) | | | (182,256 | ) |
Written options | | | 31,363 | | | | 21,101 | | | | 11,165 | | | | 23,203 | |
Capital gain distributions from regulated investment companies | | | — | | | | — | | | | — | | | | — | |
Net change in unrealized appreciation (depreciation) of: | | | | | | | | | | | | | | | | |
Investments in securities | | | (997,925 | ) | | | 154,993 | | | | 1,175,167 | | | | (1,062,205 | ) |
Written options | | | 5,170 | | | | 16,851 | | | | 8,648 | | | | 18,143 | |
Net realized and unrealized gain (loss) on investments | | | 6,409,995 | | | | 11,229,815 | | | | 9,648,213 | | | | 9,158,569 | |
NET INCREASE (DECREASE) IN NET ASSETS RESULTING FROM OPERATIONS | | $ | 6,845,835 | | | $ | 12,007,236 | | | $ | 10,888,859 | | | $ | 9,795,997 | |
+ | Net of withholding taxes of $2,581, $0, $2,908, and $0 respectively. |
The accompanying notes are an integral part of these financial statements.
43
| Absolute Shares Trust Statements of Operations (concluded) For the Year/Period Ended June 30, 2017 |
| | WBI Tactical Income Shares | | | WBI Tactical High Income Shares | | | WBI Tactical Rotation Shares1 | | | WBI Power FactorTM High Dividend ETF2 | |
INVESTMENT INCOME | | | | | | | | | | | | |
Income: | | | | | | | | | | | | |
Dividends+ | | $ | 6,390,792 | | | $ | 6,145,722 | | | $ | 324,903 | | | $ | 523,233 | |
Interest | | | 754,154 | | | | 137,489 | | | | 3,820 | | | | 624 | |
Securities lending income (Note 7) | | | 323,207 | | | | 298,548 | | | | 15,666 | | | | 9,053 | |
Total Investment Income | | | 7,468,153 | | | | 6,581,759 | | | | 344,389 | | | | 532,910 | |
| | | | | | | | | | | | | | | | | |
Expenses: | | | | | | | | | | | | | | | | |
Management fees (Note 3) | | | 2,512,667 | | | | 1,736,661 | | | | 125,423 | | | | 65,055 | |
Administration, fund accounting and custodian fees (Note 6) | | | 202,090 | | | | 138,299 | | | | 19,686 | | | | 14,008 | |
Offering costs | | | — | | | | — | | | | 96,751 | | | | 36,166 | |
Professional Fees | | | 138,638 | | | | 93,771 | | | | 23,279 | | | | 34,539 | |
Exchange fees | | | 11,975 | | | | 11,867 | | | | 8,447 | | | | 4,178 | |
Trustee’s fees and expenses | | | 27,798 | | | | 17,747 | | | | 1,582 | | | | 902 | |
Registration fees | | | — | | | | — | | | | 1,692 | | | | 2,592 | |
Shareholder reporting expenses | | | 9,695 | | | | 8,402 | | | | 4,193 | | | | 2,665 | |
Insurance expenses | | | 36,566 | | | | 22,097 | | | | 1,253 | | | | 1,928 | |
Miscellaneous expenses | | | 12,913 | | | | 7,481 | | | | 1,433 | | | | 241 | |
Total Expenses | | | 2,952,342 | | | | 2,036,325 | | | | 283,739 | | | | 162,274 | |
Less: Fees (Waived)/Recouped | | | — | | | | — | | | | (99,294 | ) | | | (79,475 | ) |
Net Expenses | | | 2,952,342 | | | | 2,036,325 | | | | 184,445 | | | | 82,799 | |
Net Investment Income | | | 4,515,811 | | | | 4,545,434 | | | | 159,944 | | | | 450,111 | |
| | | | | | | | | | | | | | | | | |
REALIZED & UNREALIZED GAIN (LOSS)
ON INVESTMENTS | | | | | | | | | | | | | | | | |
Net realized gain (loss) on: | | | | | | | | | | | | | | | | |
Investments in securities | | | 12,166,510 | | | | 11,982,601 | | | | (628,501 | ) | | | (205,933 | ) |
Purchased options | | | (132,802 | ) | | | (119,745 | ) | | | (4,080 | ) | | | — | |
Written options | | | — | | | | 75,867 | | | | — | | | | — | |
Capital gain distributions from regulated investment companies | | | — | | | | — | | | | 85 | | | | — | |
Net change in unrealized appreciation (depreciation) of: | | | | | | | | | | | | | | | | |
Investments in securities | | | (10,734,390 | ) | | | (3,491,728 | ) | | | 261,748 | | | | (493,899 | ) |
Written options | | | — | | | | 49,799 | | | | — | | | | — | |
Net realized and unrealized gain (loss) on investments | | | 1,299,318 | | | | 8,496,794 | | | | (370,748 | ) | | | (699,832 | ) |
NET INCREASE (DECREASE) IN NET ASSETS RESULTING FROM OPERATIONS | | $ | 5,815,129 | | | $ | 13,042,228 | | | $ | (210,804 | ) | | $ | (249,721 | ) |
+ | Net of withholding taxes of $0, $0, $0 and $0 respectively. |
1 | Fund commenced operations July 25, 2016. The information presented is for the period from July 25, 2016 to June 30, 2017. |
2 | Fund commenced operations December 19, 2016. The information presented is for the period from December 19, 2016 to June 30, 2017. |
The accompanying notes are an integral part of these financial statements.
44
| Absolute Shares Trust Statements of Changes in Net Assets |
| | WBI Tactical SMG Shares | | | WBI Tactical SMV Shares | |
| | Year Ended
June 30, 2017 | | | Year Ended
June 30, 2016 | | | Year Ended
June 30, 2017 | | | Year Ended
June 30, 2016 | |
INCREASE (DECREASE) IN NET ASSETS: | | | | | | | | | | | | |
| | | | | | | | | | | | | |
OPERATIONS | | | | | | | | | | | | |
Net investment income | | $ | 330,437 | | | $ | 267,399 | | | $ | 704,719 | | | $ | 726,487 | |
Net realized gain (loss) on investments | | | 8,458,111 | | | | (20,768,005 | ) | | | 10,248,873 | | | | (14,913,234 | ) |
Net change in unrealized appreciation (depreciation) of investments | | | (2,495,795 | ) | | | 1,920,491 | | | | 106,794 | | | | (311,503 | ) |
Net increase (decrease) in net assets resulting from operations | | | 6,292,753 | | | | (18,580,115 | ) | | | 11,060,386 | | | | (14,498,250 | ) |
| | | | | | | | | | | | | | | | | |
DISTRIBUTIONS TO SHAREHOLDERS | | | | | | | | | | | | | | | | |
From net investment income | | | (272,949 | ) | | | (325,192 | ) | | | (731,430 | ) | | | (644,333 | ) |
Tax return of capital to shareholders | | | (40,198 | ) | | | — | | | | — | | | | — | |
From net realized gain | | | — | | | | — | | | | — | | | | — | |
Total distributions to shareholders | | | (313,147 | ) | | | (325,192 | ) | | | (731,430 | ) | | | (644,333 | ) |
| | | | | | | | | | | | | | | | | |
CAPITAL SHARE TRANSACTIONS | | | | | | | | | | | | | | | | |
Net increase (decrease) in net assets from capital share transactions | | | (39,772,320 | ) | | | (37,448,825 | ) | | | (10,345,790 | ) | | | (12,024,980 | ) |
Total increase (decrease) in net assets | | $ | (33,792,714 | ) | | $ | (56,354,132 | ) | | $ | (16,834 | ) | | $ | (27,167,563 | ) |
| | | | | | | | | | | | | | | | | |
NET ASSETS | | | | | | | | | | | | | | | | |
Beginning of Year | | $ | 75,914,560 | | | $ | 132,268,692 | | | $ | 72,949,076 | | | $ | 100,116,639 | |
End of Year | | $ | 42,121,846 | | | $ | 75,914,560 | | | $ | 72,932,242 | | | $ | 72,949,076 | |
Undistributed (accumulated) net investment income (loss) | | $ | — | | | $ | (57,549 | ) | | $ | 24,949 | | | $ | 59,747 | |
The accompanying notes are an integral part of these financial statements.
45
| Absolute Shares Trust Statements of Changes in Net Assets (continued) |
| | WBI Tactical SMY Shares | | | WBI Tactical SMS Shares | |
| | Year Ended
June 30, 2017 | | | Year Ended
June 30, 2016 | | | Year Ended
June 30, 2017 | | | Year Ended
June 30, 2016 | |
INCREASE (DECREASE) IN NET ASSETS: | | | | | | | | | | | | |
| | | | | | | | | | | | | |
OPERATIONS | | | | | | | | | | | | |
Net investment income | | $ | 1,388,484 | | | $ | 1,425,263 | | | $ | 551,764 | | | $ | 539,789 | |
Net realized gain (loss) on investments | | | 7,742,409 | | | | (25,710,152 | ) | | | 8,870,301 | | | | (18,719,566 | ) |
Net change in unrealized appreciation (depreciation) of investments | | | 466,683 | | | | 1,918,119 | | | | (951,665 | ) | | | 4,149,454 | |
Net increase (decrease) in net assets resulting from operations | | | 9,597,576 | | | | (22,366,770 | ) | | | 8,470,400 | | | | (14,030,323 | ) |
| | | | | | | | | | | | | | | | | |
DISTRIBUTIONS TO SHAREHOLDERS | | | | | | | | | | | | | | | | |
From net investment income | | | (1,503,220 | ) | | | (1,343,813 | ) | | | (553,895 | ) | | | (439,882 | ) |
Tax return of capital to shareholders | | | — | | | | — | | | | — | | | | — | |
From net realized gain | | | — | | | | — | | | | — | | | | — | |
Total distributions to shareholders | | | (1,503,220 | ) | | | (1,343,813 | ) | | | (553,895 | ) | | | (439,882 | ) |
| | | | | | | | | | | | | | | | | |
CAPITAL SHARE TRANSACTIONS | | | | | | | | | | | | | | | | |
Net increase (decrease) in net assets from capital share transactions | | | (40,454,750 | ) | | | (19,374,510 | ) | | | (13,160,955 | ) | | | (5,027,220 | ) |
Total increase (decrease) in net assets | | $ | (32,360,394 | ) | | $ | (43,085,093 | ) | | $ | (5,244,450 | ) | | $ | (19,497,425 | ) |
| | | | | | | | | | | | | | | | | |
NET ASSETS | | | | | | | | | | | | | | | | |
Beginning of Year | | $ | 97,978,545 | | | $ | 141,063,638 | | | $ | 79,726,164 | | | $ | 99,223,589 | |
End of Year | | $ | 65,618,151 | | | $ | 97,978,545 | | | $ | 74,481,714 | | | $ | 79,726,164 | |
Undistributed (accumulated) net investment income (loss) | | $ | 24,874 | | | $ | 156,933 | | | $ | 5,381 | | | $ | 17,464 | |
The accompanying notes are an integral part of these financial statements.
46
| Absolute Shares Trust Statements of Changes in Net Assets (continued) |
| | WBI Tactical LCG Shares | | | WBI Tactical LCV Shares | |
| | Year Ended
June 30, 2017 | | | Year Ended
June 30, 2016 | | | Year Ended
June 30, 2017 | | | Year Ended
June 30, 2016 | |
INCREASE (DECREASE) IN NET ASSETS: | | | | | | | | | | | | |
| | | | | | | | | | | | | |
OPERATIONS | | | | | | | | | | | | |
Net investment income | | $ | 435,840 | | | $ | 277,511 | | | $ | 777,421 | | | $ | 198,909 | |
Net realized gain (loss) on investments | | | 7,402,750 | | | | (18,375,823 | ) | | | 11,057,971 | | | | (12,537,112 | ) |
Net change in unrealized appreciation (depreciation) of investments | | | (992,755 | ) | | | 4,784,238 | | | | 171,844 | | | | 2,111,775 | |
Net increase (decrease) in net assets resulting from operations | | | 6,845,835 | | | | (13,314,074 | ) | | | 12,007,236 | | | | (10,226,428 | ) |
| | | | | | | | | | | | | | | | | |
DISTRIBUTIONS TO SHAREHOLDERS | | | | | | | | | | | | | | | | |
From net investment income | | | (496,341 | ) | | | (270,327 | ) | | | (787,660 | ) | | | (208,386 | ) |
Tax return of capital to shareholders | | | — | | | | — | | | | — | | | | — | |
From net realized gain | | | — | | | | — | | | | — | | | | — | |
Total distributions to shareholders | | | (496,341 | ) | | | (270,327 | ) | | | (787,660 | ) | | | (208,386 | ) |
| | | | | | | | | | | | | | | | | |
CAPITAL SHARE TRANSACTIONS | | | | | | | | | | | | | | | | |
Net increase (decrease) in net assets from capital share transactions | | | (29,485,990 | ) | | | (51,140,430 | ) | | | (4,715,635 | ) | | | (30,158,630 | ) |
Total increase (decrease) in net assets | | $ | (23,136,496 | ) | | $ | (64,724,831 | ) | | $ | 6,503,941 | | | $ | (40,593,444 | ) |
| | | | | | | | | | | | | | | | | |
NET ASSETS | | | | | | | | | | | | | | | | |
Beginning of Year | | $ | 73,427,391 | | | $ | 138,152,222 | | | $ | 72,097,236 | | | $ | 112,690,680 | |
End of Year | | $ | 50,290,895 | | | $ | 73,427,391 | | | $ | 78,601,177 | | | $ | 72,097,236 | |
Undistributed (accumulated) net investment income (loss) | | $ | — | | | $ | 72,868 | | | $ | 5,928 | | | $ | 20,710 | |
The accompanying notes are an integral part of these financial statements.
47
| Absolute Shares Trust Statements of Changes in Net Assets (continued) |
| | WBI Tactical LCY Shares | | | WBI Tactical LCS Shares | |
| | Year Ended
June 30, 2017 | | | Year Ended
June 30, 2016 | | | Year Ended
June 30, 2017 | | | Year Ended
June 30, 2016 | |
INCREASE (DECREASE) IN NET ASSETS: | | | | | | | | | | | | |
| | | | | | | | | | | | | |
OPERATIONS | | | | | | | | | | | | |
Net investment income | | $ | 1,240,646 | | | $ | 493,611 | | | $ | 637,428 | | | $ | 183,130 | |
Net realized gain (loss) on investments | | | 8,464,398 | | | | (24,900,650 | ) | | | 10,202,631 | | | | (13,708,705 | ) |
Net change in unrealized appreciation (depreciation) of investments | | | 1,183,815 | | | | 5,279,696 | | | | (1,044,062 | ) | | | 2,921,990 | |
Net increase (decrease) in net assets resulting from operations | | | 10,888,859 | | | | (19,127,343 | ) | | | 9,795,997 | | | | (10,603,585 | ) |
| | | | | | | | | | | | | | | | | |
DISTRIBUTIONS TO SHAREHOLDERS | | | | | | | | | | | | | | | | |
From net investment income | | | (1,264,487 | ) | | | (515,591 | ) | | | (673,087 | ) | | | (101,176 | ) |
Tax return of capital to shareholders | | | — | | | | — | | | | — | | | | — | |
From net realized gain | | | — | | | | — | | | | — | | | | — | |
Total distributions to shareholders | | | (1,264,487 | ) | | | (515,591 | ) | | | (673,087 | ) | | | (101,176 | ) |
| | | | | | | | | | | | | | | | | |
CAPITAL SHARE TRANSACTIONS | | | | | | | | | | | | | | | | |
Net increase (decrease) in net assets from capital share transactions | | | (29,877,810 | ) | | | (21,997,610 | ) | | | (42,049,190 | ) | | | (30,015,525 | ) |
Total increase (decrease) in net assets | | $ | (20,253,438 | ) | | $ | (41,640,544 | ) | | $ | (32,926,280 | ) | | $ | (40,720,286 | ) |
| | | | | | | | | | | | | | | | | |
NET ASSETS | | | | | | | | | | | | | | | | |
Beginning of Year | | $ | 99,235,813 | | | $ | 140,876,357 | | | $ | 80,908,897 | | | $ | 121,629,183 | |
End of Year | | $ | 78,982,375 | | | $ | 99,235,813 | | | $ | 47,982,617 | | | $ | 80,908,897 | |
Undistributed (accumulated) net investment income (loss) | | $ | 23,051 | | | $ | 48,277 | | | $ | 12,817 | | | $ | 58,871 | |
The accompanying notes are an integral part of these financial statements.
48
| Absolute Shares Trust Statements of Changes in Net Assets (continued) |
| | WBI Tactical Income Shares | | | WBI Tactical High Income Shares | |
| | Year Ended
June 30, 2017 | | | Year Ended
June 30, 2016 | | | Year Ended
June 30, 2017 | | | Year Ended
June 30, 2016 | |
INCREASE (DECREASE) IN NET ASSETS: | | | | | | | | | | | | |
| | | | | | | | | | | | | |
OPERATIONS | | | | | | | | | | | | |
Net investment income | | $ | 4,515,811 | | | $ | 4,658,702 | | | $ | 4,545,434 | | | $ | 3,622,267 | |
Net realized gain (loss) on investments | | | 12,033,708 | | | | (14,988,033 | ) | | | 11,938,723 | | | | (17,726,051 | ) |
Net change in unrealized appreciation (depreciation) of investments | | | (10,734,390 | ) | | | 12,429,387 | | | | (3,441,929 | ) | | | 7,089,662 | |
Net increase (decrease) in net assets resulting from operations | | | 5,815,129 | | | | 2,100,056 | | | | 13,042,228 | | | | (7,014,122 | ) |
| | | | | | | | | | | | | | | | | |
DISTRIBUTIONS TO SHAREHOLDERS | | | | | | | | | | | | | | | | |
From net investment income | | | (4,509,305 | ) | | | (4,648,394 | ) | | | (4,510,220 | ) | | | (3,612,331 | ) |
Tax return of capital to shareholders | | | — | | | | — | | | | — | | | | — | |
From net realized gain | | | — | | | | (876,555 | ) | | | — | | | | — | |
Total distributions to shareholders | | | (4,509,305 | ) | | | (5,524,949 | ) | | | (4,510,220 | ) | | | (3,612,331 | ) |
| | | | | | | | | | | | | | | | | |
CAPITAL SHARE TRANSACTIONS | | | | | | | | | | | | | | | | |
Net increase (decrease) in net assets from capital share transactions | | | (235,620,235 | ) | | | 91,920,525 | | | | 32,815,920 | | | | 21,946,905 | |
Total increase (decrease) in net assets | | $ | (234,314,411 | ) | | $ | 88,495,632 | | | $ | 41,347,928 | | | $ | 11,320,452 | |
| | | | | | | | | | | | | | | | | |
NET ASSETS | | | | | | | | | | | | | | | | |
Beginning of Year | | $ | 396,557,536 | | | $ | 308,061,904 | | | $ | 228,101,461 | | | $ | 216,781,009 | |
End of Year | | $ | 162,243,125 | | | $ | 396,557,536 | | | $ | 269,449,389 | | | $ | 228,101,461 | |
Undistributed (accumulated) net investment income (loss) | | $ | 16,669 | | | $ | 10,163 | | | $ | 37,038 | | | $ | 9,936 | |
The accompanying notes are an integral part of these financial statements.
49
| Absolute Shares Trust Statements of Changes in Net Assets (concluded) |
| | WBI Tactical Rotation Shares1 | | | WBI Power FactorTM High Dividend ETF2 | |
| | Period Ended June 30, 2017 | | | Period Ended June 30, 2017 | |
INCREASE (DECREASE) IN NET ASSETS: | | | | | | |
| | | | | | | |
OPERATIONS | | | | | | |
Net investment income | | $ | 159,944 | | | $ | 450,111 | |
Net realized gain (loss) on investments | | | (632,496 | ) | | | (205,933 | ) |
Net change in unrealized appreciation (depreciation) of investments | | | 261,748 | | | | (493,899 | ) |
Net increase (decrease) in net assets resulting from operations | | | (210,804 | ) | | | (249,721 | ) |
| | | | | | | | | |
DISTRIBUTIONS TO SHAREHOLDERS | | | | | | | | |
From net investment income | | | (152,271 | ) | | | (435,085 | ) |
Tax return of capital to shareholders | | | — | | | | — | |
From net realized gain | | | — | | | | — | |
Total distributions to shareholders | | | (152,271 | ) | | | (435,085 | ) |
| | | | | | | | | |
CAPITAL SHARE TRANSACTIONS | | | | | | | | |
Net increase (decrease) in net assets from capital share transactions | | | 18,679,585 | | | | 34,588,085 | |
Total increase (decrease) in net assets | | $ | 18,316,510 | | | $ | 33,903,279 | |
| | | | | | | | | |
NET ASSETS | | | | | | | | |
Beginning of Period | | $ | — | | | $ | — | |
End of Period | | $ | 18,316,510 | | | $ | 33,903,279 | |
Undistributed (accumulated) net investment income (loss) | | $ | 7,673 | | | $ | 19,733 | |
1 | Fund commenced operations on July 25, 2016. The information presented is for the period from July 25, 2016 to June 30, 2017. |
2 | Fund commenced operations on December 19, 2016. The information presented is for the period from December 19, 2016 to June 30, 2017. |
The accompanying notes are an integral part of these financial statements.
50
| Absolute Shares Trust Financial Highlights For capital share outstanding throughout each year/period |
| | WBI Tactical SMG Shares | | | WBI Tactical SMV Shares | |
| | Year Ended June 30, 2017 | | | Year Ended June 30, 2016 | | | Period Ended
June 30, 20151 | | | Year Ended June 30, 2017 | | | Year Ended June 30, 2016 | | | Period Ended June 30, 20151 | |
Net Asset Value, Beginning of Year/Period | | $ | 21.69 | | | $ | 25.19 | | | $ | 25.00 | | | $ | 21.46 | | | $ | 24.72 | | | $ | 25.00 | |
Income (Loss) from Investment Operations: | | | | | | | | | | | | | | | | | | | | | | | | |
Net investment income (loss)2 | | | 0.12 | | | | 0.06 | | | | 0.04 | | | | 0.25 | | | | 0.17 | | | | 0.06 | |
Net gain (loss) on investments (realized and unrealized)6 | | | 2.41 | | | | (3.49 | ) | | | 0.19 | | | | 3.71 | | | | (3.28 | ) | | | (0.27 | ) |
Total from investment operations | | | 2.53 | | | | (3.43 | ) | | | 0.23 | | | | 3.96 | | | | (3.11 | ) | | | (0.21 | ) |
Less Distributions: | | | | | | | | | | | | | | | | | | | | | | | | |
Distributions from net investment income | | | (0.13 | ) | | | (0.07 | ) | | | (0.04 | ) | | | (0.27 | ) | | | (0.15 | ) | | | (0.07 | ) |
Tax return of capital to shareholders | | | (0.02 | ) | | | — | | | | (0.00 | )8 | | | — | | | | — | | | | (0.00 | )8 |
Distributions from net realized gain | | | — | | | | — | | | | — | | | | — | | | | — | | | | — | |
Total Distributions | | | (0.15 | ) | | | (0.07 | ) | | | (0.04 | ) | | | (0.27 | ) | | | (0.15 | ) | | | (0.07 | ) |
Net asset value, end of year/period | | $ | 24.07 | | | $ | 21.69 | | | $ | 25.19 | | | $ | 25.15 | | | $ | 21.46 | | | $ | 24.72 | |
Market price, end of year/period | | $ | 24.09 | | | $ | 21.57 | | | $ | 25.27 | | | $ | 25.19 | | | $ | 21.40 | | | $ | 24.77 | |
Net Assets Total Return7 | | | 11.74 | % | | | (13.72 | )% | | | 0.94 | %3 | | | 18.55 | % | | | (12.71 | )% | | | (0.84 | )%3 |
| | | | | | | | | | | | | | | | | | | | | | | | | |
Supplemental Data: | | | | | | | | | | | | | | | | | | | | | | | | |
Net assets, end of year/period (000's) | | $ | 42,122 | | | $ | 75,915 | | | $ | 132,269 | | | $ | 72,932 | | | $ | 72,949 | | | $ | 100,117 | |
Ratios to Average Net Assets: | | | | | | | | | | | | | | | | | | | | | | | | |
Expenses before fees (waived)/recouped | | | 1.05 | % | | | 0.99 | % | | | 1.03 | %4 | | | 1.04 | % | | | 0.99 | % | | | 1.07 | %4 |
Expenses after fees (waived)/recouped | | | 1.05 | % | | | 0.99 | % | | | 1.03 | %4 | | | 1.04 | % | | | 0.99 | % | | | 1.07 | %4 |
Net investment income (loss) | | | 0.53 | % | | | 0.26 | % | | | 0.18 | %4 | | | 1.07 | % | | | 0.75 | % | | | 0.30 | %4 |
Portfolio turnover rate5 | | | 331 | % | | | 531 | % | | | 255 | %3 | | | 405 | % | | | 565 | % | | | 278 | %3 |
1 | Fund commenced operations on August 25, 2014. The information presented is for the period from August 25, 2014 to June 30, 2015. |
2 | Calculated based on average shares outstanding during the period. |
5 | Excludes securities received or delivered as a result of processing capital share transactions in creation units |
6 | The amount for a share outstanding throughout the period may not be in accordance with the aggregate net realized and unrealized gain (loss) on investments for the period because of the timing of capital share transactions in relation to fluctuating market values of the Fund’s underlying securities. |
7 | Net asset value total return is calculated assuming an initial investment made at the net asset value at the beginning of the period, reinvestment of all dividends and distributions at net asset value during the period, and the redemption on the last day of the period. Net asset value total return includes adjustments in accordance with accounting principles generally accepted in the United States of America and as such, the net asset value for financial reporting purposes and the returns based upon those net asset values may differ from the net asset value and returns for shareholder transactions. |
The accompanying notes are an integral part of these financial statements.
51
| Absolute Shares Trust Financial Highlights (continued) For capital share outstanding throughout each year/period |
| | WBI Tactical SMY Shares | | | WBI Tactical SMS Shares | |
| | Year Ended June 30, 2017 | | | Year Ended June 30, 2016 | | | Period Ended
June 30, 20151 | | | Year Ended June 30, 2017 | | | Year Ended June 30, 2016 | | | Period Ended June 30, 20151 | |
Net Asset Value, Beginning of Year/Period | | $ | 20.20 | | | $ | 24.11 | | | $ | 25.00 | | | $ | 20.71 | | | $ | 23.62 | | | $ | 25.00 | |
Income (Loss) from Investment Operations: | | | | | | | | | | | | | | | | | | | | | | | | |
Net investment income (loss)2 | | | 0.35 | | | | 0.24 | | | | 0.26 | | | | 0.18 | | | | 0.12 | | | | (0.01 | ) |
Net gain (loss) on investments (realized and unrealized)6 | | | 2.09 | | | | (3.92 | ) | | | (0.92 | ) | | | 2.57 | | | | (2.94 | ) | | | (1.35 | ) |
Total from investment operations | | | 2.44 | | | | (3.68 | ) | | | (0.66 | ) | | | 2.75 | | | | (2.82 | ) | | | (1.36 | ) |
Less Distributions: | | | | | | | | | | | | | | | | | | | | | | | | |
Distributions from net investment income | | | (0.40 | ) | | | (0.23 | ) | | | (0.23 | ) | | | (0.18 | ) | | | (0.09 | ) | | | (0.00 | )8 |
Tax return of capital to shareholders | | | — | | | | — | | | | — | | | | — | | | | — | | | | (0.02 | ) |
Distributions from net realized gain | | | — | | | | — | | | | — | | | | — | | | | — | | | | — | |
Total Distributions | | | (0.40 | ) | | | (0.23 | ) | | | (0.23 | ) | | | (0.18 | ) | | | (0.09 | ) | | | (0.02 | ) |
Net asset value, end of year/period | | $ | 22.24 | | | $ | 20.20 | | | $ | 24.11 | | | $ | 23.28 | | | $ | 20.71 | | | $ | 23.62 | |
Market price, end of year/period | | $ | 22.25 | | | $ | 20.12 | | | $ | 24.14 | | | $ | 23.37 | | | $ | 20.60 | | | $ | 23.68 | |
Net Assets Total Return7 | | | 12.26 | % | | | (15.44 | )% | | | (2.60 | )%3 | | | 13.32 | % | | | (12.01 | )% | | | (5.40 | )%3 |
| | | | | | | | | | | | | | | | | | | | | | | | | |
Supplemental Data: | | | | | | | | | | | | | | | | | | | | | | | | |
Net assets, end of year/period (000's) | | $ | 65,618 | | | $ | 97,979 | | | $ | 141,064 | | | $ | 74,482 | | | $ | 79,726 | | | $ | 99,224 | |
Ratios to Average Net Assets: | | | | | | | | | | | | | | | | | | | | | | | | |
Expenses before fees (waived)/recouped | | | 1.03 | % | | | 0.98 | % | | | 1.03 | %4 | | | 1.04 | % | | | 0.99 | % | | | 1.06 | %4 |
Expenses after fees (waived)/recouped | | | 1.03 | % | | | 0.98 | % | | | 1.03 | %4 | | | 1.04 | % | | | 0.99 | % | | | 1.06 | %4 |
Net investment income (loss) | | | 1.64 | % | | | 1.11 | % | | | 1.29 | %4 | | | 0.79 | % | | | 0.56 | % | | | (0.04 | )%4 |
Portfolio turnover rate5 | | | 355 | % | | | 553 | % | | | 264 | %3 | | | 383 | % | | | 569 | % | | | 311 | %3 |
1 | Fund commenced operations on August 25, 2014. The information presented is for the period from August 25, 2014 to June 30, 2015. |
2 | Calculated based on average shares outstanding during the period. |
5 | Excludes securities received or delivered as a result of processing capital share transactions in creation units |
6 | The amount for a share outstanding throughout the period may not be in accordance with the aggregate net realized and unrealized gain (loss) on investments for the period because of the timing of capital share transactions in relation to fluctuating market values of the Fund’s underlying securities. |
7 | Net asset value total return is calculated assuming an initial investment made at the net asset value at the beginning of the period, reinvestment of all dividends and distributions at net asset value during the period, and the redemption on the last day of the period. Net asset value total return includes adjustments in accordance with accounting principles generally accepted in the United States of America and as such, the net asset value for financial reporting purposes and the returns based upon those net asset values may differ from the net asset value and returns for shareholder transactions. |
The accompanying notes are an integral part of these financial statements.
52
| Absolute Shares Trust Financial Highlights (continued) For capital share outstanding throughout each year/period |
| | WBI Tactical LCG Shares | | | WBI Tactical LCV Shares | |
| | Year Ended June 30, 2017 | | | Year Ended June 30, 2016 | | | Period Ended
June 30, 20151 | | | Year Ended June 30, 2017 | | | Year Ended June 30, 2016 | | | Period Ended June 30, 20151 | |
Net Asset Value, Beginning of Year/Period | | $ | 21.92 | | | $ | 24.45 | | | $ | 25.00 | | | $ | 21.85 | | | $ | 23.98 | | | $ | 25.00 | |
Income (Loss) from Investment Operations: | | | | | | | | | | | | | | | | | | | | | | | | |
Net investment income (loss)2 | | | 0.16 | | | | 0.06 | | | | 0.28 | | | | 0.29 | | | | 0.04 | | | | 0.24 | |
Net gain (loss) on investments (realized and unrealized)6 | | | 2.64 | | | | (2.53 | ) | | | (0.59 | ) | | | 4.35 | | | | (2.12 | ) | | | (1.04 | ) |
Total from investment operations | | | 2.80 | | | | (2.47 | ) | | | (0.31 | ) | | | 4.64 | | | | (2.08 | ) | | | (0.80 | ) |
Less Distributions: | | | | | | | | | | | | | | | | | | | | | | | | |
Distributions from net investment income | | | (0.19 | ) | | | (0.06 | ) | | | (0.24 | ) | | | (0.29 | ) | | | (0.05 | ) | | | (0.22 | ) |
Tax return of capital to shareholders | | | — | | | | — | | | | — | | | | — | | | | — | | | | — | |
Distributions from net realized gain | | | — | | | | — | | | | — | | | | — | | | | — | | | | — | |
Total Distributions | | | (0.19 | ) | | | (0.06 | ) | | | (0.24 | ) | | | (0.29 | ) | | | (0.05 | ) | | | (0.22 | ) |
Net asset value, end of year/period | | $ | 24.53 | | | $ | 21.92 | | | $ | 24.45 | | | $ | 26.20 | | | $ | 21.85 | | | $ | 23.98 | |
Market price, end of year/period | | $ | 24.58 | | | $ | 21.83 | | | $ | 24.51 | | | $ | 26.28 | | | $ | 21.77 | | | $ | 23.98 | |
Net Assets Total Return7 | | | 12.88 | % | | | (10.14 | )% | | | (1.25 | )%3 | | | 21.34 | % | | | (8.63 | )% | | | (3.29 | )%3 |
| | | | | | | | | | | | | | | | | | | | | | | | | |
Supplemental Data: | | | | | | | | | | | | | | | | | | | | | | | | |
Net assets, end of year/period (000's) | | $ | 50,291 | | | $ | 73,427 | | | $ | 138,152 | | | $ | 78,601 | | | $ | 72,097 | | | $ | 112,691 | |
Ratios to Average Net Assets: | | | | | | | | | | | | | | | | | | | | | | | | |
Expenses before fees (waived)/recouped | | | 1.05 | % | | | 0.99 | % | | | 1.02 | %4 | | | 1.03 | % | | | 0.99 | % | | | 1.04 | %4 |
Expenses after fees (waived)/recouped | | | 1.05 | % | | | 0.99 | % | | | 1.02 | %4 | | | 1.03 | % | | | 0.99 | % | | | 1.04 | %4 |
Net investment income (loss) | | | 0.72 | % | | | 0.25 | % | | | 1.30 | %4 | | | 1.19 | % | | | 0.19 | % | | | 1.17 | %4 |
Portfolio turnover rate5 | | | 279 | % | | | 571 | % | | | 240 | %3 | | | 388 | % | | | 573 | % | | | 294 | %3 |
1 | Fund commenced operations on August 25, 2014. The information presented is for the period from August 25, 2014 to June 30, 2015. |
2 | Calculated based on average shares outstanding during the period. |
5 | Excludes securities received or delivered as a result of processing capital share transactions in creation units |
6 | The amount for a share outstanding throughout the period may not be in accordance with the aggregate net realized and unrealized gain (loss) on investments for the period because of the timing of capital share transactions in relation to fluctuating market values of the Fund’s underlying securities. |
7 | Net asset value total return is calculated assuming an initial investment made at the net asset value at the beginning of the period, reinvestment of all dividends and distributions at net asset value during the period, and the redemption on the last day of the period. Net asset value total return includes adjustments in accordance with accounting principles generally accepted in the United States of America and as such, the net asset value for financial reporting purposes and the returns based upon those net asset values may differ from the net asset value and returns for shareholder transactions. |
The accompanying notes are an integral part of these financial statements.
53
| Absolute Shares Trust Financial Highlights (continued) For capital share outstanding throughout each year/period |
| | WBI Tactical LCY Shares | | | WBI Tactical LCS Shares | |
| | Year Ended June 30, 2017 | | | Year Ended June 30, 2016 | | | Period Ended
June 30, 20151 | | | Year Ended June 30, 2017 | | | Year Ended June 30, 2016 | | | Period Ended June 30, 20151 | |
Net Asset Value, Beginning of Year/Period | | $ | 20.25 | | | $ | 23.48 | | | $ | 25.00 | | | $ | 21.87 | | | $ | 23.85 | | | $ | 25.00 | |
Income (Loss) from Investment Operations: | | | | | | | | | | | | | | | | | | | | | | | | |
Net investment income (loss)2 | | | 0.31 | | | | 0.08 | | | | 0.35 | | | | 0.22 | | | | 0.04 | | | | 0.06 | |
Net gain (loss) on investments (realized and unrealized)6 | | | 2.66 | | | | (3.22 | ) | | | (1.58 | ) | | | 3.42 | | | | (2.00 | ) | | | (1.16 | ) |
Total from investment operations | | | 2.97 | | | | (3.14 | ) | | | (1.23 | ) | | | 3.64 | | | | (1.96 | ) | | | (1.10 | ) |
Less Distributions: | | | | | | | | | | | | | | | | | | | | | | | | |
Distributions from net investment income | | | (0.33 | ) | | | (0.09 | ) | | | (0.29 | ) | | | (0.26 | ) | | | (0.02 | ) | | | (0.04 | ) |
Tax return of capital to shareholders | | | — | | | | — | | | | — | | | | — | | | | — | | | | (0.01 | ) |
Distributions from net realized gain | | | — | | | | — | | | | — | | | | — | | | | — | | | | — | |
Total Distributions | | | (0.33 | ) | | | (0.09 | ) | | | (0.29 | ) | | | (0.26 | ) | | | (0.02 | ) | | | (0.05 | ) |
Net asset value, end of year/period | | $ | 22.89 | | | $ | 20.25 | | | $ | 23.48 | | | $ | 25.25 | | | $ | 21.87 | | | $ | 23.85 | |
Market price, end of year/period | | $ | 22.95 | | | $ | 20.19 | | | $ | 23.50 | | | $ | 25.32 | | | $ | 21.79 | | | $ | 23.88 | |
Net Assets Total Return7 | | | 14.82 | % | | | (13.37 | )% | | | (4.98 | )%3 | | | 16.80 | % | | | (8.22 | )% | | | (4.41 | )%3 |
| | | | | | | | | | | | | | | | | | | | | | | | | |
Supplemental Data: | | | | | | | | | | | | | | | | | | | | | | | | |
Net assets, end of year/period (000's) | | $ | 78,982 | | | $ | 99,236 | | | $ | 140,876 | | | $ | 47,983 | | | $ | 80,909 | | | $ | 121,629 | |
Ratios to Average Net Assets: | | | | | | | | | | | | | | | | | | | | | | | | |
Expenses before fees (waived)/recouped | | | 1.02 | % | | | 0.98 | % | | | 1.02 | %4 | | | 1.04 | % | | | 0.98 | % | | | 1.02 | %4 |
Expenses after fees (waived)/recouped | | | 1.02 | % | | | 0.98 | % | | | 1.02 | %4 | | | 1.04 | % | | | 0.98 | % | | | 1.02 | %4 |
Net investment income (loss) | | | 1.47 | % | | | 0.38 | % | | | 1.67 | %4 | | | 0.94 | % | | | 0.17 | % | | | 0.27 | %4 |
Portfolio turnover rate5 | | | 352 | % | | | 584 | % | | | 277 | %3 | | | 320 | % | | | 493 | % | | | 296 | %3 |
1 | Fund commenced operations on August 25, 2014. The information presented is for the period from August 25, 2014 to June 30, 2015. |
2 | Calculated based on average shares outstanding during the period. |
5 | Excludes securities received or delivered as a result of processing capital share transactions in creation units |
6 | The amount for a share outstanding throughout the period may not be in accordance with the aggregate net realized and unrealized gain (loss) on investments for the period because of the timing of capital share transactions in relation to fluctuating market values of the Fund’s underlying securities. |
7 | Net asset value total return is calculated assuming an initial investment made at the net asset value at the beginning of the period, reinvestment of all dividends and distributions at net asset value during the period, and the redemption on the last day of the period. Net asset value total return includes adjustments in accordance with accounting principles generally accepted in the United States of America and as such, the net asset value for financial reporting purposes and the returns based upon those net asset values may differ from the net asset value and returns for shareholder transactions. |
The accompanying notes are an integral part of these financial statements.
54
| Absolute Shares Trust Financial Highlights (continued) For capital share outstanding throughout each year/period |
| | WBI Tactical Income Shares | | | WBI Tactical High Income Shares | |
| | Year Ended June 30, 2017 | | | Year Ended June 30, 2016 | | | Period Ended
June 30, 20151 | | | Year Ended June 30, 2017 | | | Year Ended June 30, 2016 | | | Period Ended June 30, 20151 | |
Net Asset Value, Beginning of Year/Period | | $ | 25.18 | | | $ | 25.46 | | | $ | 25.00 | | | $ | 23.40 | | | $ | 24.50 | | | $ | 25.00 | |
Income (Loss) from Investment Operations: | | | | | | | | | | | | | | | | | | | | | | | | |
Net investment income (loss)2 | | | 0.38 | | | | 0.34 | | | | 0.23 | | | | 0.53 | | | | 0.39 | | | | 0.36 | |
Net gain (loss) on investments (realized and unrealized)6 | | | 0.20 | | | | (0.23 | ) | | | 0.46 | | | | 1.09 | | | | (1.11 | ) | | | (0.51 | ) |
Total from investment operations | | | 0.58 | | | | 0.11 | | | | 0.69 | | | | 1.62 | | | | (0.72 | ) | | | (0.15 | ) |
Less Distributions: | | | | | | | | | | | | | | | | | | | | | | | | |
Distributions from net investment income | | | (0.41 | ) | | | (0.33 | ) | | | (0.23 | ) | | | (0.52 | ) | | | (0.38 | ) | | | (0.35 | ) |
Tax return of capital to shareholders | | | — | | | | — | | | | — | | | | — | | | | — | | | | (0.00 | )8 |
Distributions from net realized gain | | | — | | | | (0.06 | ) | | | — | | | | — | | | | — | | | | — | |
Total Distributions | | | (0.41 | ) | | | (0.39 | ) | | | (0.23 | ) | | | (0.52 | ) | | | (0.38 | ) | | | (0.35 | ) |
Net asset value, end of year/period | | $ | 25.35 | | | $ | 25.18 | | | $ | 25.46 | | | $ | 24.50 | | | $ | 23.40 | | | $ | 24.50 | |
Market price, end of year/period | | $ | 25.38 | | | $ | 25.16 | | | $ | 25.48 | | | $ | 24.55 | | | $ | 23.34 | | | $ | 24.56 | |
Net Assets Total Return7 | | | 2.36 | % | | | 0.45 | % | | | 2.77 | %3 | | | 7.04 | % | | | (2.97 | )% | | | (0.65 | )%3 |
| | | | | | | | | | | | | | | | | | | | | | | | | |
Supplemental Data: | | | | | | | | | | | | | | | | | | | | | | | | |
Net assets, end of year/period (000's) | | $ | 162,243 | | | $ | 396,558 | | | $ | 308,062 | | | $ | 269,449 | | | $ | 228,101 | | | $ | 216,781 | |
Ratios to Average Net Assets: | | | | | | | | | | | | | | | | | | | | | | | | |
Expenses before fees (waived)/recouped | | | 1.00 | % | | | 0.95 | % | | | 0.99 | %4 | | | 1.00 | % | | | 0.95 | % | | | 0.98 | %4 |
Expenses after fees (waived)/recouped | | | 1.00 | % | | | 0.95 | % | | | 0.99 | %4 | | | 1.00 | % | | | 0.95 | % | | | 0.98 | %4 |
Net investment income (loss) | | | 1.53 | % | | | 1.35 | % | | | 1.08 | %4 | | | 2.22 | % | | | 1.64 | % | | | 1.72 | %4 |
Portfolio turnover rate5 | | | 479 | % | | | 364 | % | | | 308 | %3 | | | 396 | % | | | 328 | % | | | 293 | %3 |
1 | Fund commenced operations on August 25, 2014. The information presented is for the period from August 25, 2014 to June 30, 2015. |
2 | Calculated based on average shares outstanding during the period. |
5 | Excludes securities received or delivered as a result of processing capital share transactions in creation units |
6 | The amount for a share outstanding throughout the period may not be in accordance with the aggregate net realized and unrealized gain (loss) on investments for the period because of the timing of capital share transactions in relation to fluctuating market values of the Fund’s underlying securities. |
7 | Net asset value total return is calculated assuming an initial investment made at the net asset value at the beginning of the period, reinvestment of all dividends and distributions at net asset value during the period, and the redemption on the last day of the period. Net asset value total return includes adjustments in accordance with accounting principles generally accepted in the United States of America and as such, the net asset value for financial reporting purposes and the returns based upon those net asset values may differ from the net asset value and returns for shareholder transactions. |
The accompanying notes are an integral part of these financial statements.
55
| Absolute Shares Trust Financial Highlights (concluded) For capital share outstanding throughout each period |
| | WBI Tactical Rotation Shares | | | WBI Power FactorTM High Dividend ETF | |
| | Period Ended June 30, 20171 | | | Period Ended June 30, 20172 | |
Net Asset Value, Beginning of Year/Period | | $ | 25.00 | | | $ | 25.00 | |
Income (Loss) from Investment Operations: | | | | | | | | |
Net investment income (loss)3 | | | 0.25 | | | | 0.53 | |
Net gain (loss) on investments (realized and unrealized)7 | | | (0.62 | ) | | | (0.94 | ) |
Total from investment operations | | | (0.37 | ) | | | (0.41 | ) |
Less Distributions: | | | | | | | | |
Distributions from net investment income | | | (0.21 | ) | | | (0.37 | ) |
Tax return of capital to shareholders | | | — | | | | — | |
Distributions from net realized gain | | | — | | | | — | |
Total Distributions | | | (0.21 | ) | | | (0.37 | ) |
Net asset value, end of year/period | | $ | 24.42 | | | $ | 24.22 | |
Market price, end of year/period | | $ | 24.47 | | | $ | 24.34 | |
Net Assets Total Return8 | | | (1.44 | )%4 | | | (1.64 | )%4 |
| | | | | | | | | |
Supplemental Data: | | | | | | | | |
Net assets, end of year/period (000's) | | $ | 18,317 | | | $ | 33,903 | |
Ratios to Average Net Assets: | | | | | | | | |
Expenses before fees (waived)/recouped | | | 1.92 | %5 | | | 1.37 | %5 |
Expenses after fees (waived)/recouped | | | 1.25 | %5 | | | 0.70 | %5 |
Net investment income (loss) | | | 1.08 | %5 | | | 3.81 | %5 |
Portfolio turnover rate6 | | | 683 | %4 | | | 78 | %4 |
1 | Fund commenced operations on July 25, 2016. The information presented is for the period from July 25, 2016 to June 30, 2017. |
2 | Fund commenced operations on December 19, 2016. The information presented is for the period from December 19, 2016 to June 30, 2017. |
3 | Calculated based on average shares outstanding during the period. |
6 | Excludes securities received or delivered as a result of processing capital share transactions in creation units |
7 | The amount for a share outstanding throughout the period may not be in accordance with the aggregate net realized and unrealized gain (loss) on investments for the period because of the timing of capital share transactions in relation to fluctuating market values of the Fund’s underlying securities. |
8 | Net asset value total return is calculated assuming an initial investment made at the net asset value at the beginning of the period, reinvestment of all dividends and distributions at net asset value during the period, and the redemption on the last day of the period. Net asset value total return includes adjustments in accordance with accounting principles generally accepted in the United States of America and as such, the net asset value fodr financial reporting purposes and the returns based upon those net asset values may differ from the net asset value and returns for shareholder transactions. |
The accompanying notes are an integral part of these financial statements.
56
| Absolute Shares Trust Notes to Financial Statements June 30, 2017 |
NOTE 1 — ORGANIZATION
Absolute Shares Trust (the “Trust”) was organized as a Delaware statutory trust on November 7, 2013 and is authorized to have multiple segregated series or portfolios. The Trust is an open-end management investment company registered under the Investment Company Act of 1940 (the “1940 Act”). As of June 30, 2017, the Trust consists of the following twelve separate investment portfolios (each, a “Fund” and, together, the “Funds”):
WBI Tactical SMG Shares
WBI Tactical SMV Shares
WBI Tactical SMY Shares
WBI Tactical SMS Shares
WBI Tactical LCG Shares
WBI Tactical LCV Shares
WBI Tactical LCY Shares
WBI Tactical LCS Shares
WBI Tactical Income Shares
WBI Tactical High Income Shares
WBI Tactical Rotation Shares
WBI Power Factor™ High Dividend ETF
Each Fund is classified as a diversified portfolio except WBI Tactical Rotation Shares, which is non-diversified.
The Funds’ investment advisor, Millington Securities, Inc. (“Advisor” or “Affiliated Broker Dealer”), has selected its affiliate, WBI Investments, Inc. (“Sub-Advisor”), to act as Sub-Advisor. Both the Advisor and Sub-Advisor are registered as investment advisors with the Securities and Exchange Commission (“SEC”). The Advisor is also registered as a broker-dealer with the SEC and is a member of the Financial Industry Regulatory Authority. The Board of Trustees (the “Board” and each member a “Trustee”) supervises the conduct of the Funds.
NOTE 2 — SIGNIFICANT ACCOUNTING POLICIES
The following is a summary of significant accounting policies consistently followed by the Funds. The financial statements are prepared in accordance with accounting principles generally accepted in the United States of America (“U.S. GAAP”) and are stated in U.S. dollars. The Funds are investment companies and accordingly follow the investment company accounting and reporting guidance for the Financial Accounting Standards Board (“FASB”) Accounting Standards Codification Topic 946 Financial Services- Investment Companies.
The preparation of the financial statements in accordance with U.S. GAAP requires management to make estimates and assumptions that affect the reported amount of assets, liabilities and the disclosure of contingent assets and liabilities at June 30, 2017. Actual results could differ from these estimates.
A. Valuation. All equity securities, including domestic common stocks, preferred stocks, exchange traded funds and exchange traded notes, that are traded on a national securities exchange, except those listed on the NASDAQ Global Market, NASDAQ Select Market and NASDAQ Capital Market (collectively “NASDAQ”) are valued at the last reported sale price on the exchange on which the security is principally traded. Securities traded on NASDAQ are valued at the NASDAQ Official Closing Price (“NOCP”). If, on a particular day, an exchange-traded or NASDAQ security does not trade, then the mean between the most recent quoted bid and asked prices is used. All equity securities that are not traded on a listed exchange are valued at the last sale price in the over-the-counter market. If a non-exchange traded security does not trade on a particular day, then the mean between the last quoted closing bid and asked price is used.
Debt securities are valued in accordance with prices supplied by an approved pricing service. Pricing services may use various valuation methodologies such as the mean between the bid and asked prices, matrix pricing and other analytical pricing models as well as market transactions and dealer quotations.
Exchange traded options are valued at the composite mean price, which calculates the mean of the highest bid price and lowest ask price across the exchanges where the option is principally traded. On the last trading day prior to expiration, expiring options will be priced at intrinsic value. The Trust’s valuation committee may also use other valuation methods in certain instances.
Investments in mutual funds, including money market funds, are valued at their net asset value (“NAV”) per share.
Shares in privately offered liquidity funds are valued at their NAV per share.
Short-term securities that have maturities of less than 60 days at the time of purchase are valued at amortized cost, which, when combined with accrued interest, approximates fair value.
Securities for which quotations are not readily available are valued by the Trust’s valuation committee based on the valuation procedures adopted by the Board (the “Valuation Procedures”) and information it receives from the Sub-Advisor and U.S. Bancorp Fund Services,
57
| Absolute Shares Trust Notes to Financial Statements (continued) June 30, 2017 |
LLC (“USBFS”). When a security is “fair valued”, consideration is given to the facts and circumstances relevant to the particular situation, including a review of various factors set forth in the Valuation Procedures. The use of fair value pricing by the Funds may cause the NAV of their shares to differ significantly from the NAV that would be calculated without regard to such considerations.
As described above, the Funds utilize various methods to measure the fair value of their investments on a recurring basis. U.S. GAAP establishes a hierarchy that prioritizes inputs to valuations methods. The three levels of inputs are:
Level 1 — Unadjusted quoted prices in active markets for identical assets or liabilities that the Funds have the ability to access.
Level 2 — Observable inputs other than quoted prices included in Level 1 that are observable for the asset or liability, either directly or indirectly. These inputs may include quoted prices for the identical instrument on an inactive market, prices for similar instruments, interest rates, prepayment speeds, credit risk, yield curves, default rates and similar data.
Level 3 — Unobservable inputs for the asset or liability, to the extent relevant observable inputs are not available, including the Funds’ Valuation Committee’s assumptions used in determining the fair value of investments. The availability of observable inputs can vary from security to security and is affected by a wide variety of factors, including, for example, the type of security, whether the security is new and not yet established in the marketplace, the liquidity of markets, and other characteristics particular to the security. To the extent that valuation is based on models or inputs that are less observable or unobservable in the market, the determination of fair value requires more judgment. Accordingly, the degree of judgment exercised in determining fair value is greatest for instruments categorized in Level 3.
The inputs used to measure fair value may fall into different levels of the fair value hierarchy. In such cases, for disclosure purposes, the level in the fair value hierarchy within which the fair value measurement falls in its entirety, is determined based on the lowest level input that is significant to the fair value measurement in its entirety.
The following is a summary of the inputs used to value the Funds’ investments as of June 30, 2017:
WBI Tactical SMG Shares
Assets^ | | Level 1 | | | Level 2 | | | Level 3 | | | Total | |
Common Stocks | | $ | 41,210,884 | | | $ | — | | | $ | — | | | $ | 41,210,884 | |
Short-Term Investments | | | — | | | | 14,429,859 | | | | — | | | | 14,429,859 | |
Total Investments in Securities, at value | | $ | 41,210,884 | | | $ | 14,429,859 | | | $ | — | | | $ | 55,640,743 | |
WBI Tactical SMV Shares
Assets^ | | Level 1 | | | Level 2 | | | Level 3 | | | Total | |
Common Stocks | | $ | 70,025,622 | | | $ | — | | | $ | — | | | $ | 70,025,622 | |
Short-Term Investments | | | — | | | | 14,619,097 | | | | — | | | | 14,619,097 | |
Total Investments in Securities, at value | | $ | 70,025,622 | | | $ | 14,619,097 | | | $ | — | | | $ | 84,644,719 | |
WBI Tactical SMY Shares
Assets^ | | Level 1 | | | Level 2 | | | Level 3 | | | Total | |
Common Stocks | | $ | 58,806,833 | | | $ | — | | | $ | — | | | $ | 58,806,833 | |
Short-Term Investments | | | — | | | | 19,489,590 | | | | — | | | | 19,489,590 | |
Total Investments in Securities, at value | | $ | 58,806,833 | | | $ | 19,489,590 | | | $ | — | | | $ | 78,296,423 | |
WBI Tactical SMS Shares
Assets^ | | Level 1 | | | Level 2 | | | Level 3 | | | Total | |
Common Stocks | | $ | 74,050,862 | | | $ | — | | | $ | — | | | $ | 74,050,862 | |
Short-Term Investments | | | — | | | | 19,489,590 | | | | — | | | | 19,129,995 | |
Total Investments in Securities, at value | | $ | 74,050,862 | | | $ | 19,489,590 | | | $ | — | | | $ | 93,180,857 | |
WBI Tactical LCG Shares
Assets^ | | Level 1 | | | Level 2 | | | Level 3 | | | Total | |
Common Stocks | | $ | 48,076,186 | | | $ | — | | | $ | — | | | $ | 48,076,186 | |
Short-Term Investments | | | — | | | | 10,540,536 | | | | — | | | | 10,540,536 | |
Total Investments in Securities, at value | | $ | 48,076,186 | | | $ | 10,540,536 | | | $ | — | | | $ | 58,616,722 | |
58
| Absolute Shares Trust Notes to Financial Statements (continued) June 30, 2017 |
WBI Tactical LCV Shares
Assets^ | | Level 1 | | | Level 2 | | | Level 3 | | | Total | |
Common Stocks | | $ | 75,363,617 | | | $ | — | | | $ | — | | | $ | 75,363,617 | |
Short-Term Investments | | | — | | | | 6,247,897 | | | | — | | | | 6,247,897 | |
Total Investments in Securities, at value | | $ | 75,363,617 | | | $ | 6,247,897 | | | $ | — | | | $ | 81,611,514 | |
WBI Tactical LCY Shares
Assets^ | | Level 1 | | | Level 2 | | | Level 3 | | | Total | |
Common Stocks | | $ | 78,412,698 | | | $ | — | | | $ | — | | | $ | 78,412,698 | |
Short-Term Investments | | | — | | | | 16,979,008 | | | | — | | | | 16,979,008 | |
Total Investments in Securities, at value | | $ | 78,412,698 | | | $ | 16,979,008 | | | $ | — | | | $ | 95,391,706 | |
WBI Tactical LCS Shares
Assets^ | | Level 1 | | | Level 2 | | | Level 3 | | | Total | |
Common Stocks | | $ | 47,777,052 | | | $ | — | | | $ | — | | | $ | 47,777,052 | |
Short-Term Investments | | | — | | | | 10,802,554 | | | | — | | | | 10,802,554 | |
Total Investments in Securities, at value | | $ | 47,777,052 | | | $ | 10,802,554 | | | $ | — | | | $ | 58,579,606 | |
WBI Tactical Income Shares
Assets^ | | Level 1 | | | Level 2 | | | Level 3 | | | Total | |
Exchange Traded Funds | | $ | 126,124,575 | | | $ | — | | | $ | — | | | $ | 126,124,575 | |
US Government Notes | | | 35,766,179 | | | | — | | | | — | | | | 35,766,179 | |
Short-Term Investments | | | — | | | | 19,632,161 | | | | — | | | | 19,632,161 | |
Total Investments in Securities, at value | | $ | 161,890,754 | | | $ | 19,632,161 | | | $ | — | | | $ | 181,522,915 | |
WBI Tactical High Income Shares
Assets^ | | Level 1 | | | Level 2 | | | Level 3 | | | Total | |
Common Stocks | | $ | 78,895,698 | | | $ | — | | | $ | — | | | $ | 78,895,698 | |
Exchange Traded Funds | | | 188,152,065 | | | | — | | | | — | | | | 188,152,065 | |
Short-Term Investments | | | — | | | | 76,869,876 | | | | — | | | | 76,869,876 | |
Total Investments in Securities, at value | | $ | 267,047,763 | | | $ | 76,869,876 | | | $ | — | | | $ | 343,917,639 | |
WBI Tactical Rotation Shares
Assets^ | | Level 1 | | | Level 2 | | | Level 3 | | | Total | |
Exchange Traded Funds | | $ | 17,975,444 | | | $ | — | | | $ | — | | | $ | 17,975,444 | |
Short-Term Investments | | | — | | | | 3,295,470 | | | | — | | | | 3,295,470 | |
Total Investments in Securities, at value | | $ | 17,975,444 | | | $ | 3,295,470 | | | $ | — | | | $ | 21,270,914 | |
WBI Power Factor™ High Dividend ETF
Assets^ | | Level 1 | | | Level 2 | | | Level 3 | | | Total | |
Common Stocks | | $ | 33,450,724 | | | $ | — | | | $ | — | | | $ | 33,450,724 | |
Short-Term Investments | | | — | | | | 7,990,646 | | | | — | | | | 7,990,646 | |
Total Investments in Securities, at value | | $ | 33,450,724 | | | $ | 7,990,646 | | | $ | — | | | $ | 41,441,370 | |
^ | See Schedules of Investments for breakout of investments by sector classification. |
Transfers between levels are recognized at the end of the reporting period. During the year ended June 30, 2017, the Funds recognized no transfers to or from Levels 1, 2 or 3.
59
| Absolute Shares Trust Notes to Financial Statements (continued) June 30, 2017 |
B. Certain Risks. Some risks apply to all Funds, while others are specific to the investment strategy of certain Funds. Each Fund may be subject to other risks in addition to these identified risks. This section discusses certain common principal risks encountered by the Funds.
Counterparty Risk — Many of the protections afforded to participants on some organized exchanges, such as the performance guarantee of an exchange clearing house, are not available in connection with the over-the-counter (“OTC”) derivatives transactions. In those instances, another ETF holding such derivatives in which the Funds invest will be subject to the risk that its direct counterparty will not perform its obligations under the transactions and that such ETF will sustain losses.
Debt Securities Risk — The market value of debt securities held by the Funds typically changes as interest rates change, as demand for the instruments changes, and as actual or perceived creditworthiness of an issuer changes. During periods of rising interest rates, the market value of the debt securities held by the Funds will generally decline. Credit risk is the risk that an issuer will not make timely payments of principal and interest. There is also the risk that an issuer may “call,” or repay, its high-yielding bonds before their maturity dates. Debt securities subject to prepayment can offer less potential for gains during a declining interest rate environment and similar or greater potential for loss in a rising interest rate environment. Limited trading opportunities for certain debt securities may make it more difficult to sell or buy a security at a favorable price or time. Because interest rates in the United States are at historical lows, the Funds may have an increased risk associated with debt securities and rising interest rates. Also, the risk of rising interest rates may result in less liquidity in debt markets overall, making it more difficult for a Fund to sell the instruments at or near the market value used to compute the Fund’s NAV.
Equity Options Risk — Options on securities may be subject to greater fluctuations in value than an investment in the underlying securities. Purchasing and writing put and call options are highly specialized activities and entail greater than ordinary investment risks, including limiting potential gains, increased sensitivity to changes in interest rates or to sudden fluctuations in market prices than conventional securities, and transaction costs.
ETF and Other Investment Companies Risk — When a Fund invests in another ETF or other investment company (e.g., mutual fund, closed-end fund, business development company), it will bear additional expenses based on its pro rata share of such investment company’s operating expenses, including the potential duplication of management fees. The risk of owning an ETF or other investment company generally reflects the risks of owning the underlying securities and other assets held by the ETF or other investment company. A Fund also will incur brokerage costs when it purchases ETFs and other exchange-listed investment companies. Additionally, a Fund will be indirectly exposed to the risks of the portfolio assets held by an ETF or other investment company, including but not limited to those of ETNs, equity options, derivatives, currencies, index, leverage, and replication management.
Market Risk — Either the stock market as a whole or the value of a Fund asset or an investment held by an exchange-traded product (“ETP”) in which a Fund invests may go down, resulting in a decrease in the NAV of the Fund or its Shares or a decrease in the market price of the Shares.
Equity Securities Risk — Common stocks are susceptible to general stock market fluctuations and to volatile increases and decreases in value as market confidence in and perceptions of their issuers change. If a Fund or an ETP holds common stock equivalents of any given issuer, the Fund or ETP will generally be exposed to greater risk than if the Fund or ETP held preferred stocks and debt obligations of such issuer.
Foreign and Emerging Market Securities Risk — Foreign investments may carry risks associated with investing outside the United States, such as currency fluctuation, economic or financial instability, lack of timely or reliable financial information, or unfavorable political or legal developments. Foreign securities can be more volatile than domestic (U.S.) securities. Securities markets of other countries are generally smaller than U.S. securities markets. Many foreign securities may also be less liquid than U.S. securities, which could affect the Funds’ investments. Investments in emerging markets may have more risk because the markets are less developed and less liquid as well as being subject to increased economic, political, regulatory, or other uncertainties. Also, as foreign and emerging markets decline, investors tend to exit these markets in unison.
Fluctuation of Net Asset Value — The NAV of the shares will fluctuate with changes in market value of the Funds’ holdings.
Shares are Not Individually Redeemable — Shares are only redeemable by the Funds at NAV if they are tendered in large blocks known as “Creation Units” which are expected to be worth in excess of $1 million each. Only Authorized Participants (“APs”) may engage in such creation and redemption transactions directly with the Funds. Individual shares may be sold on a stock exchange at their current market prices, which may be less, more, or equal to their NAV. There can be no assurance that an active trading market will be maintained for the shares.
C. Federal Income Taxes. The Funds’ policy is to comply with the provisions of Subchapter M of the Internal Revenue Code of 1986, as amended, applicable to regulated investment companies and to distribute substantially all of their net investment income and net capital gains to shareholders. Therefore, no federal income tax provision is required. The Funds plan to file U.S. Federal and various state and local tax returns.
Each Fund recognizes the tax benefits of uncertain tax positions only when the position is more likely than not to be sustained. Management has analyzed each Fund’s uncertain tax positions and concluded that no liability for unrecognized tax benefits should be recorded related
60
| Absolute Shares Trust Notes to Financial Statements (continued) June 30, 2017 |
to uncertain tax positions. Management is not aware of any tax positions for which it is reasonably possible that the total amounts of unrecognized tax benefits will change materially in the next 12 months. Income and capital gain distributions are determined in accordance with federal income tax regulations, which may differ from GAAP. These timing differences are primarily due to differing book and tax treatments for in-kind transactions, losses deferred due to wash sales, and passive foreign investment company adjustments, if any.
Net capital losses incurred after October 31, 2016, and within the taxable year are deemed to arise on the first business day of each Fund’s next taxable year. As of June 30, 2017, the following Funds deferred, on a tax basis, no late year losses.
As of June 30, 2017 the Funds had the following short-term capital loss carryforward available for federal income tax purposes, with an indefinite expiration:
| | Short-Term | | | Long-Term | |
WBI Tactical SMG Shares | | $ | 19,628,345 | | | $ | — | |
WBI Tactical SMV Shares | | | 11,751,107 | | | | — | |
WBI Tactical SMY Shares | | | 26,100,834 | | | | — | |
WBI Tactical SMS Shares | | | 18,839,761 | | | | — | |
WBI Tactical LCG Shares | | | 20,289,544 | | | | — | |
WBI Tactical LCV Shares | | | 9,930,579 | | | | 642 | |
WBI Tactical LCY Shares | | | 23,889,654 | | | | — | |
WBI Tactical LCS Shares | | | 12,733,973 | | | | — | |
WBI Tactical Income Shares | | | 5,375,581 | | | | — | |
WBI Tactical High Income Shares | | | 10,914,530 | | | | 1,239,742 | |
WBI Tactical Rotation Shares | | | 651,748 | | | | — | |
WBI Power FactorTM High Dividend ETF | | | — | | | | — | |
D. Security Transactions and Investment Income. Investment securities transactions are accounted for on the trade date. Gains and losses realized on sales of securities are determined on a specific identification basis. Dividend income is recorded on the ex-dividend date, net of any foreign taxes withheld at source. Interest income is recorded on an accrual basis. Withholding taxes on foreign dividends have been provided for in accordance with the Funds’ understanding of the applicable tax rules and regulations. Premiums and discounts are amortized/accreted using the effective interest method over the lives of the respective debt instruments.
E. Distributions to Shareholders. Distributions to shareholders from net investment income are declared and paid by WBI Tactical SMG Shares, WBI Tactical SMV Shares, WBI Tactical SMS Shares, WBI Tactical LCG Shares, WBI Tactical LCV Shares, WBI Tactical LCS Shares, WBI Tactical Rotation Shares and WBI Power Factor™ High Dividend ETF on a quarterly basis. Distributions to shareholders from net investment income are declared and paid by WBI Tactical SMY Shares, WBI Tactical LCY Shares, WBI Tactical Income Shares and WBI Tactical High Income Shares on a monthly basis. Distributions from net realized gains on securities are normally declared and paid by all Funds on an annual basis. Distributions are recorded on the ex-dividend date.
F. Derivative Transactions. The Funds have adopted the financial accounting reporting rules as required by the Derivatives and Hedging Topic of the FASB Accounting Standards Codification. The Funds are required to include enhanced disclosure that enables investors to understand how and why an entity uses derivatives, how derivatives are accounted for, and how derivative instruments affect an entity’s results of operations and financial position.
The Funds may utilize options for economic hedging purposes as well as direct investment. Some options strategies, including buying puts, tend to economically hedge the Funds’ investments against price fluctuations. Other strategies, such as writing puts and calls and buying calls, tend to increase market exposure. Options contracts may be combined with each other in order to adjust the risk and return characteristics of each Fund’s overall strategy in a manner deemed appropriate to the Advisor and consistent with each Fund’s investment objective and policies. When a Fund writes an option, an amount equal to the premium received by the Fund is reflected as an asset and an equivalent liability. The amount of the liability is subsequently marked to market to reflect the current market value of the option written. When a security is purchased or sold through an exercise of an option, the related premium paid (or received) is added (or deducted from) the basis of the security acquired or deducted from (or added to) the proceeds of the security sold. When an option expires, the Fund realizes a gain or loss on the option to the extent of the premiums received or paid.
When a Fund enters into a closing transaction, the Fund realizes a gain or loss to the extent the cost of the closing transactions exceeds the premiums paid or received. Written uncovered call options subject the Funds to unlimited risk of loss. Written covered call options limit the upside potential of a security above the strike price. Put options written subject the Funds to risk of loss if the value of the security declines below the exercise price minus the put premium.
61
| Absolute Shares Trust Notes to Financial Statements (continued) June 30, 2017 |
With exchange-traded options, there is minimal counterparty credit risk to the Funds since the options are covered or secured, which means that the Funds will own the underlying security or, to the extent they do not hold the security, will maintain liquid assets consisting of cash, short-term securities, or equity or debt securities equal to the market value of the security underlying the option, marked-to-market daily.
Options purchased are recorded as investments and marked-to-market daily to reflect the current fair value of the option contract. If an option purchased expires, a loss is realized in the amount of the cost of the option contract. If a closing transaction is entered into, a gain or loss is realized to the extent that the proceeds from the sale are greater or less than the cost of the option. If a purchased put option is exercised, a gain or loss is realized from the sale of the underlying security by adjusting the proceeds from such sale by the amount of the premium originally paid. If a purchased call option is exercised, the cost of the security purchased upon exercise is increased by the premium originally paid. If a purchased call option is exercised, the cost of the security purchased upon exercise is increased by the premium originally paid.
The average monthly volume of derivative activity during the year ended June 30, 2017 was as follows:
| Average Number of Contracts |
Fund | Purchased Options | Written Options |
WBI Tactical SMG Shares | 44 | 1 |
WBI Tactical SMV Shares | 40 | — |
WBI Tactical SMY Shares | 57 | 21 |
WBI Tactical SMS Shares | 45 | — |
WBI Tactical LCG Shares | 40 | 14 |
WBI Tactical LCV Shares | 40 | 42 |
WBI Tactical LCY Shares | 53 | 30 |
WBI Tactical LCS Shares | 44 | 46 |
WBI Tactical Income Shares | 32 | — |
WBI Tactical High Income Shares | 721 | 129 |
WBI Tactical Rotation Shares | 80 | — |
WBI Power FactorTM High Dividend ETF | — | — |
The activity in written options during the year ended June 30, 2017, was as follows:
| | WBI
Tactical
SMG Shares | | | WBI
Tactical
SMV Shares | | | WBI
Tactical
SMY Shares | | | WBI
Tactical
SMS Shares | | | WBI
Tactical
LCG Shares | |
| | Contracts | | | Premiums | | | Contracts | | | Premiums | | | Contracts | | | Premiums | | | Contracts | | | Premiums | | | Contracts | | | Premiums | |
Options outstanding,
beginning of period | | | — | | | $ | — | | | | — | | | $ | — | | | | — | | | $ | — | | | | — | | | $ | — | | | | 220 | | | $ | 10,780 | |
Options Written | | | 28 | | | | 7,434 | | | | — | | | | — | | | | 369 | | | | 25,545 | | | | — | | | | — | | | | 595 | | | | 35,784 | |
Options exercised | | | — | | | | — | | | | — | | | | — | | | | — | | | | — | | | | — | | | | — | | | | — | | | | — | |
Options expired | | | (14 | ) | | | (6,118 | ) | | | — | | | | — | | | | — | | | | — | | | | — | | | | — | | | | (210 | ) | | | (6,090 | ) |
Options closed | | | (14 | ) | | | (1,316 | ) | | | — | | | | — | | | | (369 | ) | | | (25,545 | ) | | | — | | | | — | | | | (605 | ) | | | (40,474 | ) |
Options outstanding,
end of period | | | — | | | $ | — | | | | — | | | $ | — | | | | — | | | $ | — | | | | — | | | $ | — | | | | — | | | $ | — | |
62
| Absolute Shares Trust Notes to Financial Statements (continued) June 30, 2017 |
| | WBI
Tactical
LCV Shares | | | WBI
Tactical
LCY Shares | | | WBI
Tactical
LCS Shares | | | WBI
Tactical
Income Shares | | | WBI
Tactical
High Income Shares | |
| | Contracts | | | Premiums | | | Contracts | | | Premiums | | | Contracts | | | Premiums | | | Contracts | | | Premiums | | | Contracts | | | Premiums | |
Options outstanding,
beginning of period | | | 717 | | | $ | 35,132 | | | | 368 | | | $ | 18,032 | | | | 772 | | | $ | 37,827 | | | | — | | | $ | — | | | | 2,119 | | | $ | 103,829 | |
Options Written | | | 644 | | | | 18,676 | | | | 349 | | | | 10,121 | | | | 720 | | | | 20,880 | | | | — | | | | — | | | | 2,032 | | | | 58,927 | |
Options exercised | | | — | | | | — | | | | — | | | | — | | | | — | | | | — | | | | — | | | | — | | | | — | | | | — | |
Options expired | | | — | | | | — | | | | — | | | | — | | | | — | | | | — | | | | — | | | | — | | | | — | | | | — | |
Options closed | | | (1,361 | ) | | | (53,808 | ) | | | (717 | ) | | | (28,153 | ) | | | (1,492 | ) | | | (58,707 | ) | | | — | | | | — | | | | (4,151 | ) | | | (162,756 | ) |
Options outstanding,
end of period | | | — | | | $ | — | | | | — | | | $ | — | | | | — | | | $ | — | | | | — | | | $ | — | | | | — | | | $ | — | |
| | WBI
Tactical
Rotation Shares | | | WBI
Power Factor™
High Dividend ETF | |
| | Contracts | | | Premiums | | | Contracts | | | Premiums | |
Options outstanding, beginning of period | | | — | | | $ | — | | | | — | | | $ | — | |
Options Written | | | — | | | | — | | | | — | | | | — | |
Options exercised | | | — | | | | — | | | | — | | | | — | |
Options expired | | | — | | | | — | | | | — | | | | — | |
Options closed | | | — | | | | — | | | | — | | | | — | |
Options outstanding, end of period | | | — | | | $ | — | | | | — | | | $ | — | |
Statements of Assets and Liabilities — There were no derivative instruments held by the Funds as of June 30, 2017.
Statements of Operations — The effects of derivative instruments on the Statements of Operations for the period end June 30, 2017 were as follows:
Amount of realized gain (loss) on derivative instruments recognized in income:
Fund | | Purchased Options | | | Written Options | |
WBI Tactical SMG Shares | | $ | (180,049 | ) | | $ | 2,128 | |
WBI Tactical SMV Shares | | | (178,746 | ) | | | — | |
WBI Tactical SMY Shares | | | (253,088 | ) | | | 19,641 | |
WBI Tactical SMS Shares | | | (200,275 | ) | | | — | |
WBI Tactical LCG Shares | | | (167,068 | ) | | | 31,363 | |
WBI Tactical LCV Shares | | | (165,123 | ) | | | 21,101 | |
WBI Tactical LCY Shares | | | (220,226 | ) | | | 11,165 | |
WBI Tactical LCS Shares | | | (182,256 | ) | | | 23,203 | |
WBI Tactical Income Shares | | | (132,802 | ) | | | — | |
WBI Tactical High Income Shares | | | (119,745 | ) | | | 75,867 | |
WBI Tactical Rotation Shares | | | (4,080 | ) | | | — | |
WBI Power FactorTM High Dividend ETF | | | — | | | | — | |
G. Share Valuation. The NAV per share of each Fund is calculated by dividing the sum of the value of the securities held by the Fund, plus cash and other assets, minus all liabilities (including estimated accrued expenses) by the total number of shares outstanding for the Fund, rounded to the nearest cent. The Funds’ shares will not be priced on the days on which the NYSE ARCA, Inc., the exchange where the Funds’ shares are listed, is closed for trading. The offering and redemption price per share for each Fund is equal to the Fund’s NAV per share.
H. Guarantees and Indemnifications. The Funds’ officers and Trustees are indemnified against certain liabilities that may arise out of the performance of their duties to the Funds. Additionally, in the normal course of business the Funds enter into contracts with service providers
63
| Absolute Shares Trust Notes to Financial Statements (continued) June 30, 2017 |
that contain general indemnification clauses. Each Fund’s maximum exposure under these arrangements is unknown as this would involve future claims that may be against the Fund that have not yet occurred.
I. Reclassification of Capital Accounts. U.S. GAAP requires that certain components of net assets relating to permanent differences be reclassified between financial and tax reporting. These reclassifications have no effect on net assets or net asset value per share. For the year ended June 30, 2017, the following table shows the reclassifications made:
| | Undistributed Net Investment Income/(Loss) | | | Accumulated Net Realized Gain/(Loss) | | | Paid In Capital | |
WBI Tactical SMG Shares | | $ | (29 | ) | | $ | (1,656,970 | ) | | $ | 1,656,999 | |
WBI Tactical SMV Shares | | | (8,087 | ) | | | (1,190,261 | ) | | | 1,198,348 | |
WBI Tactical SMY Shares | | | (17,323 | ) | | | (1,923,311 | ) | | | 1,940,634 | |
WBI Tactical SMS Shares | | | (9,952 | ) | | | (1,309,710 | ) | | | 1,319,662 | |
WBI Tactical LCG Shares | | | (12,367 | ) | | | (1,727,219 | ) | | | 1,739,586 | |
WBI Tactical LCV Shares | | | (4,543 | ) | | | (782,860 | ) | | | 787,403 | |
WBI Tactical LCY Shares | | | (1,385 | ) | | | (1,150,158 | ) | | | 1,151,543 | |
WBI Tactical LCS Shares | | | (10,395 | ) | | | (2,013,404 | ) | | | 2,023,799 | |
WBI Tactical Income Shares | | | — | | | | (1,967,816 | ) | | | 1,967,816 | |
WBI Tactical High Income Shares | | | (8,112 | ) | | | (1,254,293 | ) | | | 1,262,405 | |
WBI Tactical Rotation Shares | | | — | | | | (19,498 | ) | | | 19,498 | |
WBI Power FactorTM High Dividend ETF | | | 4,707 | | | | (4,707 | ) | | | — | |
During the year ended June 30, 2017 the Funds realized capital gains resulting from in-kind redemptions, in which shareholders exchanged Fund shares for securities held by a Fund rather than for cash. Because the gains are not taxable to the Funds, and are not distributed to shareholders, they have been reclassified from accumulated net realized gains/losses to paid-in capital. The following table shows the impact to each Fund:
WBI Tactical SMG Shares | | $ | 1,656,999 | |
WBI Tactical SMV Shares | | | 1,198,348 | |
WBI Tactical SMY Shares | | | 1,940,634 | |
WBI Tactical SMS Shares | | | 1,319,662 | |
WBI Tactical LCG Shares | | | 1,739,687 | |
WBI Tactical LCV Shares | | | 787,403 | |
WBI Tactical LCY Shares | | | 1,151,543 | |
WBI Tactical LCS Shares | | | 2,023,799 | |
WBI Tactical Income Shares | | | 1,967,816 | |
WBI Tactical High Income Shares | | | 1,262,405 | |
WBI Tactical Rotation Shares | | | 19,498 | |
WBI Power FactorTM High Dividend ETF | | | — | |
J. Subsequent Events. In preparing these financial statements, the Advisor has evaluated events and transactions for potential recognition or disclosure through the date the financial statements were available to be issued. There were no events or transactions that occurred during the period subsequent to June 30, 2017, that materially impacted the amounts or disclosures in the Funds’ financial statements.
K. Recent Accounting Pronouncement. In October 2016, the U.S. Securities and Exchange Commission adopted new rules and amended existing rules (together, “final rules”) intended to modernize the reporting and disclosure of information by registered investment companies. In part, the final rules amend Regulation S-X and require standardized, enhanced disclosure about derivatives in investment company financial statements, as well as other amendments. Amendments to Regulation S-X are applicable for reporting periods ending on or after August 1, 2017. Management is currently evaluating the impact that the adoption of the amendments to Regulation S-X will have on the financial statements and related disclosures.
64
| Absolute Shares Trust Notes to Financial Statements (continued) June 30, 2017 |
NOTE 3 — MANAGEMENT FEE
Pursuant to an investment advisory agreement (“Advisory Agreement”) between the Trust, on behalf of the Funds, and the Advisor, the Advisor serves as the investment advisor, makes investment decisions for each Fund, and manages the investment portfolios of the Funds, subject to the supervision of and policies of the Board. Under the Advisory Agreement, the Advisor may retain an investment sub-advisor for the Funds, subject to approval by the Board and Fund shareholders. Under a sub-advisory agreement, (“Sub-Advisory Agreement”) the Sub-Advisor serves as the investment sub-adviser and is responsible for the day to day management of the Funds, subject to the supervision of the Advisor and the Board. For the services the Sub-Advisor provides to each Fund, the Sub-Advisor receives a fee that is equal to 0.85% per year of the average daily net assets of each Fund except WBI Power Factor™ High Dividend ETF, which pays a fee that is equal to 0.55% per year, calculated daily and paid monthly. The Advisor is paid 0.04% of each Fund’s average daily net assets (calculated daily and paid monthly) from the management fees collected by the Sub-Advisor.
NOTE 4 — PORTFOLIO TRANSACTIONS AND BROKERAGE
Pursuant to the Sub-Advisory Agreement, the Sub-Advisor determines which securities are to be purchased and sold by the Funds and which broker-dealers are eligible to execute the Funds’ portfolio transactions. The Sub-Advisor typically determines to execute portfolio transactions through the Advisor in its capacity as a registered broker-dealer. For the year ended June 30, 2017, the Funds paid the Affiliated Broker Dealer, $0 for brokerage commissions. However, the Affiliated Broker Dealer did receive indirect compensation in the form of payment for order flow (“PFOF”). PFOF is compensation that the Affiliated Broker Dealer receives for providing liquidity to certain market destinations related to the Sub-Advisor’s customer orders routed to these market destinations.
NOTE 5 — EXPENSE LIMITATION AND REIMBURSEMENT
The Sub-Advisor has entered into an Expense Limitation Agreement (an “Agreement”) with the Trust to waive the fees and reimburse expenses of each Fund until at least October 31, 2018 (the “Expiration Date”) so that the total operating expenses (exclusive of interest, taxes, brokerage commissions, acquired fund fees, dividend payments on short sales, other expenditures which are capitalized in accordance with U.S. GAAP, other extraordinary expenses not incurred in the ordinary course of the Fund’s business, and amounts, if any, payable pursuant to a plan adopted in accordance with Rule 12b-1 under the Investment Company Act of 1940) and organizational costs (the “Operating Expenses”) of WBI Power FactorTM High Dividend ETF is limited to 0.70% and of each of the remaining Funds is limited to 1.25% of average net assets (the “Expense Caps”). The Sub-Advisor may discontinue its obligations under the Agreement at any time in its sole discretion after the Expiration Date. The Funds have agreed to repay the amounts borne by the Sub-Advisor under the Agreement within the three year period after the Sub-Advisor bears the expense, when and if requested by the Sub-Advisor, to the extent the Operating Expenses of the Funds are less than the lower of the Expense Cap and any expense limitation agreement then in effect with respect to the Operating Expenses. The repayment may not raise the level of Operating Expenses of the Funds in the month of repayment to exceed the Expense Cap.
As of June 30, 2017 the remaining cumulative unreimbursed amounts paid and/or waived by the Advisor on behalf of the Funds that may be recouped are shown in the tables below. The Advisor may recapture a portion of the unreimbursed amounts no later than the dates stated.
WBI Tactical Rotation Shares
Expiration | | Amount | |
December 31, 2019 | | $ | 99,294 | |
WBI Power FactorTM High Dividend ETF
Expiration | | Amount | |
December 31, 2019 | | $ | 79,475 | |
The Funds must pay their current ordinary operating expense before the Advisor is entitled to any reimbursement of fees and/or expenses. Any such reimbursement is also contingent upon the Board of Trustees’ review and approval.
NOTE 6 — COMPLIANCE AND ADMINISTRATION SERVICING AGREEMENTS
The Trust has entered into an agreement with Foreside Compliance Services, LLC (“Foreside”), whereby Foreside agrees to provide a Chief Compliance Officer (“CCO”), as described in Rule 38a-1 of the 1940 Act.
U.S. Bancorp Fund Services, LLC (the “Administrator”) serves as the independent administrator and U.S. Bank National Association (the “Custodian”) serves as the custodian to the Funds. Under the Fund Administration Servicing, Fund Accounting Servicing, and Transfer Agent Servicing Agreements, the Administrator is responsible for keeping financial books and records of the Funds and generally managing the administrative affairs and transfer agency services.
65
| Absolute Shares Trust Notes to Financial Statements (continued) June 30, 2017 |
NOTE 7 — SECURITIES LENDING
The Funds may lend up to 33 ⅓% of the value of the securities in their portfolios to brokers, dealers and financial institutions (but not individuals) under terms of participation in a securities lending program administered by U.S Bank N.A (“the Custodian”). The securities lending agreement requires that loans are collateralized at all times in an amount equal to at least 102% of the value of any loaned securities at the time of the loan, plus accrued interest, except in the case of loans of foreign securities which are denominated and payable in U.S. dollars shall be in the amount equal to 105% of the value of any loaned securities at the time of the loan plus accrued interest. The Funds receive compensation in the form of fees and earn interest on the cash collateral. The amount of fees depends on a number of factors including the type of security and length of the loan. The Funds continue to receive interest payments or dividends on the securities loaned during the borrowing period. Gain or loss in the fair value of securities loaned that may occur during the term of the loan will be for the account of the Funds. The Funds have the right under the terms of the securities lending agreement to recall the securities from the borrower on demand. As of June 30, 2017, the Funds had loaned securities that were collateralized by cash equivalents. The cash collateral is invested by the Custodian in accordance with approved investment guidelines. Those guidelines require the cash collateral to be invested in readily marketable, high quality, short-term obligations; however, such investments are subject to risk of payment delays or default on the part of the issuer or counterparty or otherwise may not generate sufficient interest to support the costs associated with securities lending. The Funds could also experience delays in recovering its securities and possible loss of income or value if the borrower fails to return the borrowed securities, although the Fund is indemnified from this risk by contract with U.S. Bank N.A. the securities lending agent.
As of June 30, 2017, the value of the securities on loan and payable for collateral due to broker were as follows:
Fund | | Values of
Securities on loan | | | Collateral Received* | |
WBI Tactical SMG Shares | | $ | 13,917,702 | | | $ | 14,211,521 | |
WBI Tactical SMV Shares | | | 13,143,071 | | | | 13,418,409 | |
WBI Tactical SMY Shares | | | 18,078,717 | | | | 18,566,389 | |
WBI Tactical SMS Shares | | | 16,102,240 | | | | 16,514,023 | |
WBI Tactical LCG Shares | | | 7,534,879 | | | | 7,711,768 | |
WBI Tactical LCV Shares | | | 5,607,443 | | | | 5,706,410 | |
WBI Tactical LCY Shares | | | 14,907,594 | | | | 15,217,170 | |
WBI Tactical LCS Shares | | | 8,706,767 | | | | 8,880,840 | |
WBI Tactical Income Shares | | | 19,005,788 | | | | 19,362,820 | |
WBI Tactical High Income Shares | | | 72,943,776 | | | | 74,463,618 | |
WBI Tactical Rotation Shares | | | 2,933,567 | | | | 2,996,575 | |
WBI Power FactorTM High Dividend ETF | | | 7,376,524 | | | | 7,592,912 | |
* | The cash collateral received was invested in the Mount Vernon Securities Lending Prime Portfolio as shown on the Schedule of Investments, a short-term investment portfolio with an overnight and continuous maturity. |
Fees and interest income earned on collateral investments and recognized by the Funds during the year ended June 30, 2017, was as follows:
Fees and Interest Income Earned
Fund | | Fees and Interest Income Earned | |
WBI Tactical SMG Shares | | $ | 34,421 | |
WBI Tactical SMV Shares | | | 30,759 | |
WBI Tactical SMY Shares | | | 47,537 | |
WBI Tactical SMS Shares | | | 38,509 | |
WBI Tactical LCG Shares | | | 25,689 | |
WBI Tactical LCV Shares | | | 30,068 | |
WBI Tactical LCY Shares | | | 39,463 | |
WBI Tactical LCS Shares | | | 28,656 | |
WBI Tactical Income Shares | | | 323,207 | |
WBI Tactical High Income Shares | | | 298,548 | |
WBI Tactical Rotation Shares | | | 15,666 | |
WBI Power FactorTM High Dividend ETF | | | 9,053 | |
66
| Absolute Shares Trust Notes to Financial Statements (continued) June 30, 2017 |
Offsetting Assets and Liabilities. The Funds are subject to various netting arrangements, which govern the terms of certain transactions with counterparties. The arrangements allow the Funds to close out and net their total exposure to counterparty in the event of a default with respect to all transactions governed under a single agreement with a counterparty. The following is a summary of the arrangements subject to offsetting as of June 30, 2017.
Fund | Description | | Gross Amounts of Recognized Liabilities | | | Gross Amounts Offset in the Statement of
Assets & Liabilities | | | Net Amounts Presented in the Statement
of Assets & Liabilities | | | Collateral Received | | | Net Amount | |
WBI Tactical SMG Shares | Securities Lending | | $ | 14,211,521 | | | $ | — | | | $ | 14,211,521 | | | $ | 14,211,521 | | | $ | — | |
WBI Tactical SMV Shares | Securities Lending | | | 13,418,409 | | | | — | | | | 13,418,409 | | | | 13,418,409 | | | | — | |
WBI Tactical SMY Shares | Securities Lending | | | 18,566,389 | | | | — | | | | 18,566,389 | | | | 18,566,389 | | | | — | |
WBI Tactical SMS Shares | Securities Lending | | | 16,514,023 | | | | — | | | | 16,514,023 | | | | 16,514,023 | | | | — | |
WBI Tactical LCG Shares | Securities Lending | | | 7,711,768 | | | | — | | | | 7,711,768 | | | | 7,711,768 | | | | — | |
WBI Tactical LCV Shares | Securities Lending | | | 5,706,410 | | | | — | | | | 5,706,410 | | | | 5,706,410 | | | | — | |
WBI Tactical LCY Shares | Securities Lending | | | 15,217,170 | | | | — | | | | 15,217,170 | | | | 15,217,170 | | | | — | |
WBI Tactical LCS Shares | Securities Lending | | | 8,880,840 | | | | — | | | | 8,880,840 | | | | 8,880,840 | | | | — | |
WBI Tactical Income Shares | Securities Lending | | | 19,362,820 | | | | — | | | | 19,362,820 | | | | 19,362,820 | | | | — | |
WBI Tactical High Income Shares | Securities Lending | | | 74,463,618 | | | | — | | | | 74,463,618 | | | | 74,463,618 | | | | — | |
WBI Tactical Rotation Shares | Securities Lending | | | 2,996,575 | | | | — | | | | 2,996,575 | | | | 2,996,575 | | | | — | |
WBI Power Factor™ High Dividend ETF | Securities Lending | | | 7,592,912 | | | | — | | | | 7,592,912 | | | | 7,592,912 | | | | — | |
NOTE 8 — TAX INFORMATION
The components of distributable earnings (losses) and cost basis of investments for federal income tax purposes as of June 30, 2017 were as follows:
| | WBI Tactical SMG Shares | | | WBI Tactical SMV Shares | | | WBI Tactical SMY Shares | | | WBI Tactical SMS Shares | | | WBI Tactical LCG Shares | | | WBI Tactical LCV Shares | |
Cost of investments | | | 54,069,861 | | | | 81,913,856 | | | | 75,754,942 | | | | 90,165,888 | | | | 56,316,692 | | | | 78,781,695 | |
Gross tax unrealized appreciation | | | 1,796,821 | | | | 3,355,720 | | | | 2,898,080 | | | | 3,600,166 | | | | 2,570,801 | | | | 3,015,209 | |
Gross tax unrealized depreciation | | | (225,939 | ) | | | (624,857 | ) | | | (356,599 | ) | | | (585,197 | ) | | | (270,771 | ) | | | (185,390 | ) |
Net tax unrealized appreciation | | | 1,570,882 | | | | 2,730,863 | | | | 2,541,481 | | | | 3,014,969 | | | | 2,300,030 | | | | 2,829,819 | |
Undistributed ordinary income | | | — | | | | 24,949 | | | | 24,874 | | | | 5,381 | | | | — | | | | 5,928 | |
Undistributed long term gain | | | — | | | | — | | | | — | | | | — | | | | — | | | | — | |
Total distributable earnings | | | — | | | | 24,949 | | | | 24,874 | | | | 5,381 | | | | — | | | | 5,928 | |
Other accumulated loss | | | (19,628,345 | ) | | | (11,751,107 | ) | | | (26,128,366 | ) | | | (18,839,791 | ) | | | (20,289,544 | ) | | | (9,931,221 | ) |
Total accumulated loss | | | (18,057,463 | ) | | | (8,995,295 | ) | | | (23,562,011 | ) | | | (15,819,411 | ) | | | (17,989,514 | ) | | | (7,095,474 | ) |
| | WBITactical LCY Shares | | | WBI Tactical LCS Shares | | | WBI Tactical Income Shares | | | WBI Tactical High Income Shares | | | WBI Tactical Rotation Shares | | | WBI Power Factor™ High Dividend ETF | |
Cost of investments | | | 92,237,595 | | | | 56,416,938 | | | | 179,973,432 | | | | 341,133,978 | | | | 21,009,412 | | | | 42,193,116 | |
Gross tax unrealized appreciation | | | 3,389,745 | | | | 2,435,815 | | | | 1,888,861 | | | | 4,195,168 | | | | 286,814 | | | | 1,188,870 | |
Gross tax unrealized depreciation | | | (235,634 | ) | | | (273,147 | ) | | | (339,378 | ) | | | (1,411,507 | ) | | | (25,312 | ) | | | (1,940,616 | ) |
Net tax unrealized appreciation | | | 3,154,111 | | | | 2,162,668 | | | | 1,549,483 | | | | 2,783,661 | | | | 261,502 | | | | (751,746 | ) |
Undistributed ordinary income | | | 23,051 | | | | 12,817 | | | | 16,669 | | | | 37,038 | | | | 7,673 | | | | 66,940 | |
Undistributed long term gain | | | | | | | | | | | — | | | | — | | | | — | | | | — | |
Total distributable earnings | | | 23,051 | | | | 12,817 | | | | 16,669 | | | | 37,038 | | | | 7,673 | | | | 66,940 | |
Other accumulated loss | | | (23,889,654 | ) | | | (12,733,973 | ) | | | (5,375,581 | ) | | | (12,154,272 | ) | | | (651,748 | ) | | | — | |
Total accumulated loss | | | (20,712,492 | ) | | | (10,558,488 | ) | | | (3,809,429 | ) | | | (9,333,573 | ) | | | (382,573 | ) | | | (684,806 | ) |
67
| Absolute Shares Trust Notes to Financial Statements (continued) June 30, 2017 |
The difference between the cost of investments amount for financial statement and federal income tax purposes is due primarily to timing differences in recognizing wash sale losses in security transactions.
NOTE 9 — PURCHASES AND SALES OF SECURITIES
During the period ended June 30, 2017, purchases and sales of securities by the Funds, excluding short-term securities and in-kind transactions, were as follows:
| | | All Other | | | US Government | |
Fund | | Purchases | | | Sales | | | Purchases | | | Sales | |
WBI Tactical SMG Shares | | $ | 197,450,444 | | | $ | 194,063,639 | | | $ | — | | | $ | — | |
WBI Tactical SMV Shares | | | 259,252,581 | | | | 249,547,882 | | | | — | | | | — | |
WBI Tactical SMY Shares | | | 284,020,793 | | | | 276,233,384 | | | | — | | | | — | |
WBI Tactical SMS Shares | | | 258,032,363 | | | | 252,065,660 | | | | — | | | | — | |
WBI Tactical LCG Shares | | | 172,196,520 | | | | 155,809,249 | | | | — | | | | — | |
WBI Tactical LCV Shares | | | 256,036,923 | | | | 236,974,907 | | | | — | | | | — | |
WBI Tactical LCY Shares | | | 311,838,049 | | | | 263,935,319 | | | | — | | | | — | |
WBI Tactical LCS Shares | | | 228,623,847 | | | | 201,417,356 | | | | — | | | | — | |
WBI Tactical Income Shares | | | 1,174,487,131 | | | | 1,219,323,077 | | | | 78,846,070 | | | | 61,184,617 | |
WBI Tactical High Income Shares | | | 781,743,358 | | | | 729,769,753 | | | | — | | | | 27,380,863 | |
WBI Tactical Rotation Shares | | | 98,765,806 | | | | 93,241,506 | | | | — | | | | — | |
WBI Power Factor™ High Dividend ETF | | | 18,668,616 | | | | 18,718,443 | | | | — | | | | — | |
For the period ended June 30, 2017 the values of the in-kind security transactions were as follows:
Fund | | Subscriptions | | | Redemptions | |
WBI Tactical SMG Shares | | $ | — | | | $ | 37,787,175 | |
WBI Tactical SMV Shares | | | 12,335,639 | | | | 21,364,564 | |
WBI Tactical SMY Shares | | | 4,373,213 | | | | 41,685,377 | |
WBI Tactical SMS Shares | | | 11,555,730 | | | | 23,178,832 | |
WBI Tactical LCG Shares | | | 3,422,573 | | | | 31,284,570 | |
WBI Tactical LCV Shares | | | 17,801,784 | | | | 20,971,353 | |
WBI Tactical LCY Shares | | | 4,143,052 | | | | 30,737,781 | |
WBI Tactical LCS Shares | | | 3,552,773 | | | | 42,889,291 | |
WBI Tactical Income Shares | | | — | | | | 179,074,685 | |
WBI Tactical High Income Shares | | | 96,475,457 | | | | 61,663,711 | |
WBI Tactical Rotation Shares | | | 15,680,924 | | | | 2,862,999 | |
WBI Power Factor™ High Dividend ETF | | | 34,200,383 | | | | — | |
NOTE 10 — SHARE TRANSACTIONS
The Funds each currently offer one class of shares, which has no front-end sales load, no deferred sales charge, and no redemption fee. The Funds may issue an unlimited number of shares of beneficial interest, with no par value. All shares of each Fund have equal rights and privileges as the other shares of such Fund.
68
| Absolute Shares Trust Notes to Financial Statements (continued) June 30, 2017 |
The Trust has entered into an agreement with NYSE Group, Inc. to list shares of the Funds’ (“Shares”) on NYSE Arca, Inc., an indirect whollyowned subsidiary of NYSE Group, Inc. Market prices for the Shares may be different from their NAV. The Funds will issue and redeem Shares on a continuous basis at NAV only in large blocks of Shares, typically 50,000 Shares, called “Creation Units.” Creation Units will be issued and redeemed principally in-kind, however, the Trust reserves the right to offer a cash option for creations and redemptions of Shares. Once created, Shares generally will trade in the secondary market at market prices that change throughout the day in amounts less than a Creation Unit. Except when aggregated in Creation Units, shares are not redeemable securities of a Fund. Shares of a Fund may only be purchased or redeemed by certain financial institutions (“Authorized Participants”). An Authorized Participant is either (i) a broker-dealer or other participant in the clearing process through the Continuous Net Settlement System of the National Securities Clearing Corporation or (ii) a Depository Trust Corporation participant and, in each case, must have executed a participant agreement with Foreside Fund Services, LLC, the Funds’ distributor (the “Distributor”). Most retail investors will not qualify as Authorized Participants or have the resources to buy and sell whole Creation Units. Therefore, they will be unable to purchase or redeem the shares directly from a Fund. Rather, most retail investors will purchase shares in the secondary market with the assistance of a broker and will be subject to customary brokerage commissions or fees.
| | WBI Tactical SMG Shares | | | WBI Tactical SMV Shares | |
| | Year Ended
June 30, 2017 | | | Year Ended
June 30, 2016 | | | Year Ended
June 30, 2017 | | | Year Ended
June 30, 2016 | |
| | Shares | | | Amount | | | Shares | | | Amount | | | Shares | | | Amount | | | Shares | | | Amount | |
Shares Sold | | | — | | | $ | — | | | | 100,000 | | | $ | 2,447,150 | | | | 500,000 | | | $ | 12,422,300 | | | | 850,000 | | | $ | 20,139,750 | |
Shares Redeemed | | | (1,750,000 | ) | | | (39,772,320 | ) | | | (1,850,000 | ) | | | (39,895,975 | ) | | | (1,000,000 | ) | | | (22,768,090 | ) | | | (1,500,000 | ) | | | (32,164,730 | ) |
| | | | (1,750,000 | ) | | $ | (39,772,320 | ) | | | (1,750,000 | ) | | $ | (37,448,825 | ) | | | (500,000 | ) | | $ | (10,345,790 | ) | | | (650,000 | ) | | $ | (12,024,980 | ) |
Beginning Shares | | | 3,500,000 | | | | | | | | 5,250,000 | | | | | | | | 3,400,000 | | | | | | | | 4,050,000 | | | | | |
Ending Shares | | | 1,750,000 | | | | | | | | 3,500,000 | | | | | | | | 2,900,000 | | | | | | | | 3,400,000 | | | | | |
| | WBI Tactical SMY Shares | | | WBI Tactical SMS Shares | |
| | Year Ended
June 30, 2017 | | | Year Ended
June 30, 2016 | | | Year Ended
June 30, 2017 | | | Year Ended
June 30, 2016 | |
| | Shares | | | Amount | | | Shares | | | Amount | | | Shares | | | Amount | | | Shares | | | Amount | |
Shares Sold | | | 200,000 | | | $ | 4,407,500 | | | | 600,000 | | | $ | 13,669,150 | | | | 500,000 | | | $ | 11,627,000 | | | | 1,150,000 | | | $ | 25,570,120 | |
Shares Redeemed | | | (2,100,000 | ) | | | (44,862,250 | ) | | | (1,600,000 | ) | | | (33,043,660 | ) | | | (1,150,000 | ) | | | (24,787,955 | ) | | | (1,500,000 | ) | | | (30,597,340 | ) |
| | | | (1,900,000 | ) | | $ | (40,454,750 | ) | | | (1,000,000 | ) | | $ | (19,374,510 | ) | | | (650,000 | ) | | $ | (13,160,955 | ) | | | (350,000 | ) | | $ | (5,027,220 | ) |
Beginning Shares | | | 4,850,000 | | | | | | | | 5,850,000 | | | | | | | | 3,850,000 | | | | | | | | 4,200,000 | | | | | |
Ending Shares | | | 2,950,000 | | | | | | | | 4,850,000 | | | | | | | | 3,200,000 | | | | | | | | 3,850,000 | | | | | |
| | WBI Tactical LCG Shares | | | WBI Tactical LCV Shares | |
| | Year Ended
June 30, 2017 | | | Year Ended
June 30, 2016 | | | Year Ended
June 30, 2017 | | | Year Ended
June 30, 2016 | |
| | Shares | | | Amount | | | Shares | | | Amount | | | Shares | | | Amount | | | Shares | | | Amount | |
Shares Sold | | | 150,000 | | | $ | 3,566,580 | | | | 250,000 | �� | | $ | 5,917,975 | | | | 700,000 | | | $ | 18,084,665 | | | | 350,000 | | | $ | 8,219,580 | |
Shares Redeemed | | | (1,450,000 | ) | | | (33,052,570 | ) | | | (2,550,000 | ) | | | (57,058,405 | ) | | | (1,000,000 | ) | | | (22,800,300 | ) | | | (1,750,000 | ) | | | (38,378,210 | ) |
| | | | (1,300,000 | ) | | $ | (29,485,990 | ) | | | (2,300,000 | ) | | $ | (51,140,430 | ) | | | (300,000 | ) | | $ | (4,715,635 | ) | | | (1,400,000 | ) | | $ | (30,158,630 | ) |
Beginning Shares | | | 3,350,000 | | | | | | | | 5,650,000 | | | | | | | | 3,300,000 | | | | | | | | 4,700,000 | | | | | |
Ending Shares | | | 2,050,000 | | | | | | | | 3,350,000 | | | | | | | | 3,000,000 | | | | | | | | 3,300,000 | | | | | |
69
| Absolute Shares Trust Notes to Financial Statements (continued) June 30, 2017 |
| | WBI Tactical LCY Shares | | | WBI Tactical LCS Shares | |
| | Year Ended
June 30, 2017 | | | Year Ended
June 30, 2016 | | | Year Ended
June 30, 2017 | | | Year Ended
June 30, 2016 | |
| | Shares | | | Amount | | | Shares | | | Amount | | | Shares | | | Amount | | | Shares | | | Amount | |
Shares Sold | | | 200,000 | | | $ | 4,369,930 | | | | 450,000 | | | $ | 10,093,995 | | | | 150,000 | | | $ | 3,705,120 | | | | 200,000 | | | $ | 4,747,860 | |
Shares Redeemed | | | (1,650,000 | ) | | | (34,247,740 | ) | | | (1,550,000 | ) | | | (32,091,605 | ) | | | (1,950,000 | ) | | | (45,754,310 | ) | | | (1,600,000 | ) | | | (34,763,385 | ) |
| | | | (1,450,000 | ) | | $ | (29,877,810 | ) | | | (1,100,000 | ) | | $ | (21,997,610 | ) | | | (1,800,000 | ) | | $ | (42,049,190 | ) | | | (1,400,000 | ) | | $ | (30,015,525 | ) |
Beginning Shares | | | 4,900,000 | | | | | | | | 6,000,000 | | | | | | | | 3,700,000 | | | | | | | | 5,100,000 | | | | | |
Ending Shares | | | 3,450,000 | | | | | | | | 4,900,000 | | | | | | | | 1,900,000 | | | | | | | | 3,700,000 | | | | | |
| | WBI Tactical Income Shares | | | WBI Tactical High Income Shares | |
| | Year Ended
June 30, 2017 | | | Year Ended
June 30, 2016 | | | Year Ended
June 30, 2017 | | | Year Ended
June 30, 2016 | |
| | Shares | | | Amount | | | Shares | | | Amount | | | Shares | | | Amount | | | Shares | | | Amount | |
Shares Sold | | | — | | | $ | — | | | | 4,900,000 | | | $ | 122,899,040 | | | | 4,200,000 | | | $ | 102,949,825 | | | | 3,700,000 | | | $ | 87,565,555 | |
Shares Redeemed | | | (9,350,000 | ) | | | (235,620,235 | ) | | | (1,250,000 | ) | | | (30,978,515 | ) | | | (2,950,000 | ) | | | (70,133,905 | ) | | | (2,800,000 | ) | | | (65,618,650 | ) |
| | | | (9,350,000 | ) | | $ | (235,620,235 | ) | | | 3,650,000 | | | $ | 91,920,525 | | | | 1,250,000 | | | $ | 32,815,920 | | | | 900,000 | | | $ | 21,946,905 | |
Beginning Shares | | | 15,750,000 | | | | | | | | 12,100,000 | | | | | | | | 9,750,000 | | | | | | | | 8,850,000 | | | | | |
Ending Shares | | | 6,400,000 | | | | | | | | 15,750,000 | | | | | | | | 11,000,000 | | | | | | | | 9,750,000 | | | | | |
| | WBI Tactical Rotation Shares | | | WBI Power Factor™ High Dividend ETF | |
| | Period Ended
June 30, 2017 | | | Year Ended
June 30, 2016 | | | Period Ended
June 30, 2017 | | | Year Ended
June 30, 2016 | |
| | Shares | | | Amount | | | Shares | | | Amount | | | Shares | | | Amount | | | Shares | | | Amount | |
Shares Sold | | | 900,000 | | | $ | 22,189,040 | | | | — | | | $ | — | | | | 1,400,000 | | | $ | 34,588,085 | | | | — | | | $ | — | |
Shares Redeemed | | | (150,000 | ) | | | (3,509,455 | ) | | | — | | | | — | | | | — | | | | — | | | | — | | | | — | |
| | | | 750,000 | | | $ | 18,679,585 | | | | — | | | $ | — | | | | 1,400,000 | | | $ | 34,588,085 | | | | — | | | $ | — | |
Beginning Shares | | | — | | | | | | | | — | | | | | | | | — | | | | | | | | — | | | | | |
Ending Shares | | | 750,000 | | | | | | | | — | | | | | | | | 1,400,000 | | | | | | | | — | | | | | |
NOTE 11 — DISTRIBUTIONS TO SHAREHOLDERS
The tax character of distributions declared by the Funds were as follows:
| | | Year Ended June 30, 2017 | | | Year Ended June 30, 2016 | |
Fund | | Ordinary
Income | | | Long Term Capital Gains | | | Return of Capital | | | Ordinary
Income | | | Long Term Capital Gains | | | Return of Capital | |
WBI Tactical SMG Shares | | $ | 272,949 | | | $ | — | | | $ | 40,198 | | | $ | 325,192 | | | $ | — | | | $ | — | |
WBI Tactical SMV Shares | | | 731,430 | | | | — | | | | — | | | | 664,333 | | | | — | | | | — | |
WBI Tactical SMY Shares | | | 1,503,220 | | | | — | | | | — | | | | 1,343,813 | | | | — | | | | — | |
WBI Tactical SMS Shares | | | 553,895 | | | | — | | | | — | | | | 439,882 | | | | — | | | | — | |
WBI Tactical LCG Shares | | | 496,341 | | | | — | | | | — | | | | 270,327 | | | | — | | | | — | |
WBI Tactical LCV Shares | | | 787,660 | | | | — | | | | — | | | | 208,386 | | | | — | | | | — | |
WBI Tactical LCY Shares | | | 1,264,487 | | | | — | | | | — | | | | 515,591 | | | | — | | | | — | |
WBI Tactical LCS Shares | | | 673,087 | | | | — | | | | — | | | | 101,176 | | | | — | | | | — | |
WBI Tactical Income Shares | | | 4,509,305 | | | | — | | | | — | | | | 5,518,099 | | | | 6,850 | | | | — | |
WBI Tactical High Income Shares | | | 4,510,220 | | | | — | | | | — | | | | 3,612,331 | | | | — | | | | — | |
WBI Tactical Rotation Shares | | | 152,271 | | | | — | | | | — | | | | N/A | | | | N/A | | | | N/A | |
WBI Power Factor™ High Dividend ETF | | | 435,085 | | | | — | | | | — | | | | N/A | | | | N/A | | | | N/A | |
70
| Absolute Shares Trust Report of Independent Registered Public Accounting Firm |
To the Shareholders and Board of Trustees of Absolute Shares Trust:
We have audited the accompanying statements of assets and liabilities, including the schedules of investments, of WBI Tactical SMG Shares, WBI Tactical SMV Shares, WBI Tactical SMY Shares, WBI Tactical SMS Shares, WBI Tactical LCG Shares, WBI Tactical LCV Shares, WBI Tactical LCY Shares, WBI Tactical LCS Shares, WBI Tactical Income Shares, WBI Tactical High Income Shares, WBI Tactical Rotation Shares, and WBI Power Factor High Dividend ETF (twelve of the portfolios constituting Absolute Shares Trust (the “Trust”), as of June 30, 2017, and the related statements of operations for the year then ended, changes in net assets for each of the two years in the period then ended and financial highlights for each of the two years in the period then ended and for the period August 24, 2014 through June 30, 2015. The financial statements and financial highlights are the responsibility of the Trust’s management. Our responsibility is to express an opinion on the financial statements based on our audit.
We conducted our audit in accordance with the standards of the Public Company Accounting Oversight Board (United States). Those standards require that we plan and perform the audit to obtain reasonable assurance about whether the financial statements and financial highlights are free of material misstatement. An audit includes examining, on a test basis, evidence supporting the amounts and disclosures in the financial statements. Our procedures included confirmation of securities owned as of June 30, 2017, by correspondence with the custodian and brokers or other appropriate auditing procedures where replies from brokers were not received. An audit also includes assessing the accounting principles used and significant estimates made by management, as well as evaluating the overall financial statement presentation. We believe that our audit provides a reasonable basis for our opinion.
In our opinion, the financial statements and financial highlights referred to above present fairly, in all material respects, the financial position of each of the respective twelve portfolios constituting Absolute Shares Trust as of June 30, 2017, the results of its operations for the year then ended, changes in its net assets for each of the two years in the period then ended, and financial highlights for each of the two years in the period then ended and for the period August 24, 2014 through June 30, 2015, in conformity with accounting principles generally accepted in the United States of America.
/s/ KPMG LLP
Short Hills, New Jersey
August 23, 2017
71
| Absolute Shares Trust Trustees and Officers (Unaudited) |
Name and Year of Birth(1) | Position(s) Held
with Trust | Term of Office
and Length of Time Served(2) | Principal Occupation(s)
During Past 5 Years | Number of Portfolios
in Fund Complex Overseen by Trustee(3) | Other Directorships
Held by Trustee During Past
5 Years |
Independent Trustees: | | | | | |
Jude T. Depko, 1946 | Trustee | Since
June 2014 | Technical Consultant, Michael Baker Jr., Inc. (consulting)(2009 to present) | 12 | None |
John A. Flanagan, 1946 | Trustee | Since
June 2014 | Treasurer, ETF Managers Trust (investment company)(2015 to present); Principal Financial Officer, ETF Managers Capital, LLC (commodity pool operator)(2014 to present); President, John A. Flanagan CPA, LLC (accounting services)(2010 to present); Chief Financial Officer, Macromarkets LLC (exchange traded funds)(2007 to 2010) | 12 | None |
Andrew Putterman, 1959 | Trustee | Since
June 2014 | Principal, 1812 Park, LLC (financial consulting)(2014 to present); Advisory Board Member, Vestigo Ventures 1 GP, LLC (2016 to present); Managing Director, B+ Institutional Services, LLC (2014 to present); Independent Board Member, Princeton Private Equity Fund (2014 to 2015); Chairman Emeritus, Fortigent LLC (financial services)(2013 to 2014); Managing Director, LPL Financial (financial services)(2012 to 2014); The Private Trust Company (January 2013 to December 2013); President and Chief Executive Officer, Fortigent LLC (2006 to 2012 and 2013, respectively) | 12 | None |
Interested Trustees: | | | | | |
Don Schreiber, Jr., 1955(4) | Trustee, President and Principal Executive Officer | Since November 2013 | Chief Executive Officer, Treasurer and Co-Portfolio Manager, WBI Investments, Inc. (registered investment adviser)(1984 to present); Chief Executive Officer and Treasurer of Millington Securities, Inc. (registered investment adviser and broker-dealer)(2013 to present); Chief Executive Officer, Vice President, and Treasurer, WBI Trading Company, Inc. (financial services)(2011 to present); Chief Executive Officer, Vice President, and Treasurer, Hartshorne Group, Inc. (wealth management services)(2008 to present) | 12 | None |
Matthew Schreiber, 1980(4) | Trustee | Since
June 2014 | President and Vice President of WBI Investments, Inc. (2013 to present); Chief Investment Strategist of WBI Investments, Inc. (March 2017 to Present); Vice President of Business Development, WBI Investments, Inc. (2007- to 2013) | 12 | None |
72
| Absolute Shares Trust Trustees and Officers (Unaudited) (concluded) |
Name and Year of Birth | Position(s) Held
with Trust | Term of Office
and Length of Time Served | Principal Occupation(s)
During Past 5 Years |
Other Officers: | | | |
Ann Schreiber, 1984 | Secretary | Since
June 2014 | Chief Marketing Officer, WBI Investments, Inc. (2015 to present); Secretary, WBI Trading Company, Inc. (2012 to present); Secretary, Millington Securities, Inc. (2013 to present); Secretary, Hartshorne Group, Inc. (2012 to present); Corporate Secretary, WBI Investments, Inc. (2012 to present); Director of Marketing and Executive Services, WBI Investments, Inc. (2011 to 2014); Consultant, Advisor Toolbox, Inc. (2009 to 2011) |
Paul Lagermasini, 1969 | Treasurer and Principal Financial Officer | Since November 2015 | Chief Financial Officer of WBI Investments, Inc., The Hartshorne Group Inc., and Millington Securities, Inc. (2015 to present); Head of SEC Reporting at RCS Capital Corporation (2013 to 2015); Chief Financial Officer of Ally Securities LLC (2011 to 2013) |
Tracey Crespo, 1970 | Assistant Treasurer | Since November 2015 | Chief Operating Officer, WBI Investments, Inc. (2011 to present); Treasurer and Principal Financial Officer of Absolute Shares Trust (August 2015 to November 2015); Director of Centralized Operations & Director of Fund Accounting and Hedge Fund Services, SEI, Inc. (fund administrative services)(2007-2011). |
Steven Van Solkema, 1970 | Assistant Treasurer | Since November 2015 | Chief Operating Officer and Chief Compliance Officer, Millington Securities, Inc. (2014 to present); Managing Director, Ally Financial, Inc. (financial services) (2010 to 2013) |
Alyson Kest, 1974 | Assistant Secretary | Since
February 2016 | Counsel, at Millington Securities, Inc. (July 2017 to present); Compliance at Millington Securities, Inc. (2015 to present); Legal and Compliance at XL Catlin (fka Catlin, Inc.) (2014 to 2015); Compliance at Macquarie (2011 to 2014); Compliance and Risk at Morgan Stanley (2006 to 2011) |
Donna M. Rogers, 1966 | Chief Compliance Officer | Since
June 2014 | Managing Director, Foreside Fund Officer Services, LLC (formerly Foreside Compliance Services, LLC) (financial services)(2010 to present); Senior Vice President, State Street Bank (formerly Investors Bank & Trust Company) (financial services)(2004 to 2010). |
Cynthia R. Bonna, 1984 | Chief Legal Officer | Since
June 2014 | Chief Compliance Officer, WBI Investments, Inc. (2013 to present); Chief Compliance Officer, Hartshorne Group, Inc. (2013 to present); Compliance Officer, Millington Securities, Inc. (2013 to present); Counsel at WBI Investments, Inc. (July 2017 to present); Compliance Officer, WBI Investments, Inc. (2010 to 2013); Compliance Officer, Hartshorne Group, Inc. (2010 to 2013) |
(1) | The address of each Trustee or officer is c/o Absolute Shares Trust, 331 Newman Springs Road, Suite 122, Red Bank, New Jersey 07701. |
(2) | Trustees and Officers serve until their successors are duly elected and qualified. |
(3) | The Fund is part of a “Fund Complex” as defined in the 1940 Act. The Fund Complex includes all open-end funds (including all of their portfolios) advised by the Advisor or the Sub-Advisor and any funds that have an investment advisor that is an affiliated person of the Advisor. As of the date of this SAI, the Fund Complex consists of the 12 Funds of the Trust and three mutual funds separately advised by the Sub-Advisor. |
(4) | Don Schreiber Jr. and Matthew Schreiber are each an “interested person” of the Trust (as that term is defined in the 1940 Act) because of their affiliations with the Advisor and the Sub-Advisor. |
The Statement of Additional Information includes additional information about the Trustees as is available without charge, up on request, by calling toll free at (800)-772-5810, by accessing the SEC’s website at www.sec.gov, or by accessing the Fund’s website at www.wbishares.com.
73
| Absolute Shares Trust Approval of Advisory Agreements and Board Considerations
(Unaudited) |
The Board (the members of which are referred to as “Trustees”) of the Trust met in person on May 18, 2017 to consider whether to renew: (1) the investment advisory agreement (“Advisory Agreement”) between the Trust, on behalf of the Funds, and the Advisor and (2) the investment sub-advisory agreement (the “Sub-Advisory Agreement”) between the Advisor and the Sub-Advisor. The Board considered renewing the Advisory Agreement and the Sub-Advisory Agreement and the engagement of the Advisor and the Sub-Advisor separately, although the advisers are affiliates.
In accordance with Section 15(c) of the Investment Company Act of 1940 (“1940 Act”), as amended, the Board requested, reviewed and considered materials furnished by the Advisor and the Sub-Advisor relevant to the Board’s consideration of whether to renew the Advisory Agreement and the Sub-Advisory Agreement. In connection with considering whether to renew the Advisory Agreement and Sub-Advisory Agreement, the Trustees who are not “interested persons” of the Trust, as that term is defined in the 1940 Act (the “Independent Trustees”), met in executive session with counsel to the Trust, who provided assistance and advice. The consideration of renewing the Advisory Agreement and Sub-Advisory Agreement was conducted by both the full Board and the Independent Trustees, who also voted separately.
During their review and consideration, the Board and the Independent Trustees focused on and analyzed the factors they deemed relevant, including, but not limited to: (1) the nature, extent and quality of the services provided by each of the Advisor and the Sub-Advisor; (2) the investment performance of each of the Advisor and the Sub-Advisor; (3) the costs of the services provided and profits realized by each of the Advisor and the Sub-Advisor and their affiliates from the relationship with the Trust; (4) the extent to which economies of scale have been realized as the Funds have grown; (5) any benefits derived or to be derived by each of the Advisor and the Sub-Advisor from the relationship with the Trust; and (6) potential conflicts of interest.
In reviewing such factors, the Board relied on certain information, including (1) copies of the Advisory Agreement, the Sub-Advisory Agreement and the Expense Limitation Agreement; (2) information describing the Advisor, the Sub-Advisor and the services provided thereby; (3) information regarding the compliance programs of the Advisor and the Sub-Advisor; (4) copies of the Forms ADV for the Advisor and the Sub-Advisor; and (5) memoranda and guidance from K&L Gates LLP on the fiduciary responsibilities of trustees, including Independent Trustees, in considering advisory and distribution agreements under the 1940 Act. In addition, the Board was provided data and information comparing the advisory fees and expenses of the Funds with expenses and performance of other exchange-traded funds (“ETFs”) with similar investment objectives and policies. The Trustees also considered their personal experiences as Trustees and participants in the ETF and mutual fund industry, as applicable.
In particular, the Trustees, including the Independent Trustees, considered and discussed the following with respect to the Funds:
1. The nature, extent and quality of the facilities and services provided by each of the Advisor and the Sub-Advisor. The Board received information on and considered the division of responsibility of services provided by the Advisor and the Sub-Advisor, including the fact that portfolio management would continue to be conducted by the Sub-Advisor. In addition to the Sub-Advisor’s performance managing the Funds, the Board reviewed the experience and resources that the Sub-Advisor had in managing strategies similar to those utilized by the Funds, including information regarding the education and experience of management and investment personnel.
The Board determined that the Funds would continue to benefit from the services and resources available from the Advisor and the Sub-Advisor, with respect to their responsibilities under the Advisory and Sub-Advisory Agreements. In particular, they noted the extensive experience of the Sub-Advisor’s management personnel in developing and administering strategies utilized by the Funds, as well as the performance history of the Sub-Advisor since its inception. The Board also noted the compliance regimes of the Advisor and the Sub-Advisor and their effectiveness.
2. The advisory fees paid by and overall expenses of the Funds. The Board considered comprehensive data and information comparing the advisory fees and expense ratios (taking into consideration the Expense Limitation Agreement) of the Funds. Although the Board determined that the Funds were distinct in ways from their peer group of ETFs, the Board determined that the advisory fees charged and overall expenses of the Funds were competitive and in line with the related universe of funds. In light of the nature, quality, and extent of services provided by the Advisor and Sub-Advisor and the costs incurred by the Advisor and Sub-Advisor in rendering those services, the Board concluded, taking into consideration indirect “fall-out” benefits the Advisor or the Sub-Advisor derive from its relationship to the Trust and the Funds, that the level of fees paid to the Advisor and Sub-Advisor with respect to each Fund were fair and reasonable.
3. Brokerage and portfolio transactions. The Board was presented with materials and a thorough discussion of the brokerage practices of the Advisor, in its capacity as an affiliated broker-dealer, and Sub-Advisor, including a walk-through of the Advisor’s ability to continue providing commission-free trading to the Funds and the Advisor’s track record for delivering effective brokerage execution services for the benefit of the Funds compared to services that could otherwise be expected from unaffiliated broker-dealers. The Advisor presented on its execution services and policies and the Sub-Advisor discussed its policies and procedures for allocating brokerage. Additionally, the Board considered information relating to the amount, sources and transactions generating payments for order flow that the Advisor received in its capacity as an affiliated broker-dealer the last year, in light of both the advisory fees paid and generally as related to the Advisor and/or Sub-Advisor obtaining the best net results upon execution of portfolio transactions for each of the Funds. The Independent Trustees determined the brokerage policies of both the Advisor and Sub-Advisor would continue to benefit the Funds.
74
| Absolute Shares Trust Approval of Advisory Agreements and Board Considerations
(Unaudited) (concluded) |
4. Financial condition of each of the Advisor and the Sub-Advisor. After considering information relating to the financial condition of the Advisor and Sub-Advisor, as well as the fees and operating costs relating to the management of the Funds, the Board determined that each of the Advisor and Sub-Advisor continue to be capable of providing services to the Funds. In this determination, the Board considered the existence of the Expense Limitation Agreement (including the level of the expense limit for each Fund) and its impact on the profitability of the Sub-Advisor.
5. Possible conflicts of interest. The Board considered the experience and ability of the advisory personnel assigned to the Funds, soft-dollar arrangements and the brokerage policies of the Advisor (including a discussion of the execution policies and total compensation earned by the Advisor in its capacity as affiliated broker-dealer, in the form of commissions, fees and other remuneration received, including payment for order flow), and the substance and administration of the Codes of Ethics of the Trust, the Advisor and the Sub-Advisor. The Board determined that the compliance policies of the Trust, Advisor and Sub-Advisor were each reasonably designed to monitor for and prevent violations of the federal securities laws and breaches of fiduciary duties.
6. Effect of the Funds’ growth and size on its investment performance and expenses. The Board considered information relating to the year-over-year trading of the Funds. It determined that the expense ratios of the Funds were well suited in light of expectations for continued asset accumulation and projected growth therefrom.
Based on the foregoing and such other matters as were deemed relevant, and while no single factor was determinative in the decision, all of the Trustees, including the Independent Trustees, concluded that the advisory fee rates and total expense ratios are reasonable in relation to the services provided by the Advisor to the Funds, as well as the costs incurred and the benefits gained by the Advisor in providing such services. The Board also found the investment advisory fees, paid to the Advisor to be reasonable in comparison to the fees charged by advisers to other comparable funds of similar size. As a result, all of the Board members, including the Independent Trustees, approved the Advisory Agreement.
With respect to the Sub-Advisor and based on the foregoing analysis and such other matters as were deemed relevant, and while no single factor was determinative in the decision, all of the Trustees, including the Independent Trustees, concluded that the sub-advisory fee rates and total expense ratios are reasonable in relation to the services provided by the Sub-Advisor to the Funds, as well as the costs incurred and the benefits gained by the Sub-Advisor in providing such services. As a result, all of the Trustees, including the Independent Trustees, approved the Sub-Advisory Agreement.
75
| Absolute Shares Trust Expense Example For the Six-Months Ended June 30, 2017 (Unaudited) |
As a shareholder you incur two types of costs: (1) transaction costs, including brokerage commissions on purchases and sales of Fund shares, and (2) ongoing costs, including management fees and other Fund expenses. This example is intended to help you understand your ongoing costs (in dollars) of investing in the Fund and to compare these costs with the ongoing costs of investing in other funds. The example is based on an investment of $1,000 invested at the beginning of the period and held for the entire period (January 1, 2017 - June 30, 2017).
Actual Expenses
The first line of the table provides information about actual account values based on actual returns and actual expenses. You may use the information in this line, together with the amount you invested, to estimate the expenses that you paid over the period. Simply divide your account value by $1,000 (for example, an $8,600 account value divided by $1,000 = 8.6), then, multiply the result by the number in the first line under the heading entitled “Expenses Paid During Period’’ to estimate the expenses you paid on your account during this period.
Hypothetical Example for Comparison Purposes
The second line of the table provides information about hypothetical account values based on a hypothetical return and hypothetical expenses based on the Fund’s actual expense ratio and an assumed rate of return of 5% per year before expenses, which is not the Fund’s actual return. The hypothetical account values and expenses may not be used to estimate the actual ending account balance or expenses you paid for the period. You may use this information to compare the ongoing costs of investing in the Fund and other funds. To do so, compare this 5% hypothetical example with the 5% hypothetical examples that appear in the shareholder reports of the other funds. Please note that the expenses shown in the table are meant to highlight your ongoing costs only and do not reflect any transactional costs, such as brokerage commissions paid on purchases and sales of Fund shares. Therefore, the second line of the table is useful in comparing ongoing costs only and will not help you determine the relative total costs of owning different funds. If these transactional costs were included, your costs would have been higher.
WBI Tactical SMG Shares
| Beginning
Account Value
January 1, 2017 | Ending
Account Value
June 30, 2017 | Expenses Paid
During the Period^ |
Actual | $ 1,000.00 | $ 1,039.80 | $5.43 |
Hypothetical (5% annual return before expenses) | $ 1,000.00 | $ 1,019.48 | $5.37 |
WBI Tactical SMV Shares
| Beginning
Account Value
January 1, 2017 | Ending
Account Value
June 30, 2017 | Expenses Paid
During the Period^ |
Actual | $ 1,000.00 | $ 1,028.90 | $5.26 |
Hypothetical (5% annual return before expenses) | $ 1,000.00 | $ 1,019.61 | $5.24 |
WBI Tactical SMY Shares
| Beginning
Account Value
January 1, 2017 | Ending
Account Value
June 30, 2017 | Expenses Paid
During the Period^ |
Actual | $ 1,000.00 | $ 1,025.00 | $5.24 |
Hypothetical (5% annual return before expenses) | $ 1,000.00 | $ 1,019.62 | $5.22 |
WBI Tactical SMS Shares
| Beginning
Account Value
January 1, 2017 | Ending
Account Value
June 30, 2017 | Expenses Paid
During the Period^ |
Actual | $ 1,000.00 | $ 1,028.40 | $5.31 |
Hypothetical (5% annual return before expenses) | $ 1,000.00 | $ 1,019.56 | $5.29 |
76
| Absolute Shares Trust Expense Example (continued) For the Six-Months Ended June 30, 2017 (Unaudited) |
WBI Tactical LCG Shares
| Beginning
Account Value
January 1, 2017 | Ending
Account Value
June 30, 2017 | Expenses Paid
During the Period^ |
Actual | $ 1,000.00 | $ 1,098.40 | $5.53 |
Hypothetical (5% annual return before expenses) | $ 1,000.00 | $ 1,019.53 | $5.32 |
WBI Tactical LCV Shares
| Beginning
Account Value
January 1, 2017 | Ending
Account Value
June 30, 2017 | Expenses Paid
During the Period^ |
Actual | $ 1,000.00 | $ 1,077.90 | $5.37 |
Hypothetical (5% annual return before expenses) | $ 1,000.00 | $ 1,019.63 | $5.22 |
WBI Tactical LCY Shares
| Beginning
Account Value
January 1, 2017 | Ending
Account Value
June 30, 2017 | Expenses Paid
During the Period^ |
Actual | $ 1,000.00 | $ 1,102.70 | $5.38 |
Hypothetical (5% annual return before expenses) | $ 1,000.00 | $ 1,019.68 | $5.17 |
WBI Tactical LCS Shares
| Beginning
Account Value
January 1, 2017 | Ending
Account Value
June 30, 2017 | Expenses Paid
During the Period^ |
Actual | $ 1,000.00 | $ 1,093.10 | $5.45 |
Hypothetical (5% annual return before expenses) | $ 1,000.00 | $ 1,019.58 | $5.26 |
WBI Tactical Income Shares
| Beginning
Account Value
January 1, 2017 | Ending
Account Value
June 30, 2017 | Expenses Paid
During the Period^ |
Actual | $ 1,000.00 | $ 1,028.80 | $5.19 |
Hypothetical (5% annual return before expenses) | $ 1,000.00 | $ 1,019.68 | $5.16 |
WBI Tactical High Income Shares
| Beginning
Account Value
January 1, 2017 | Ending
Account Value
June 30, 2017 | Expenses Paid
During the Period^ |
Actual | $ 1,000.00 | $ 1,042.40 | $5.13 |
Hypothetical (5% annual return before expenses) | $ 1,000.00 | $ 1,019.77 | $5.07 |
77
| Absolute Shares Trust Expense Example (concluded) For the Six-Months Ended June 30, 2017 (Unaudited) |
WBI Tactical Rotation Shares
| Beginning
Account Value
January 1, 2017 | Ending
Account Value
June 30, 2017 | Expenses Paid
During the Period^ |
Actual | $ 1,000.00 | $ 1,049.80 | $6.35 |
Hypothetical (5% annual return before expenses) | $ 1,000.00 | $ 1,018.60 | $6.26 |
WBI Power FactorTM High Dividend ETF
| Beginning
Account Value
January 1, 2017 | Ending
Account Value
June 30, 2017 | Expenses Paid
During the Period^ |
Actual | $ 1,000.00 | $ 997.60 | $3.47 |
Hypothetical (5% annual return before expenses) | $ 1,000.00 | $ 1,021.32 | $3.51 |
^ | The dollar amounts shown as expenses paid during the period are equal to the annualized six-month expense ratio multiplied by the average account value during the period, multiplied by the number of days in the most recent six-month period, 181 days, and divided by the number of days in the most recent fiscal twelve-month period, 365 days. |
78
| Absolute Shares Trust Federal Tax Information (Unaudited) |
QUALIFIED DIVIDEND INCOME/DIVIDENDS RECEIVED DEDUCTION
For the fiscal year ended June 30, 2017, certain dividends paid by the Funds may be subject to a maximum tax rate of 15%, as provided for by the Jobs and Growth Tax Relief Reconciliation Act of 2003.
The percentage of dividends declared from ordinary income designated as qualified dividend income was as follows:
WBI Tactical SMG Shares | 100.00% |
WBI Tactical SMV Shares | 100.00% |
WBI Tactical SMY Shares | 100.00% |
WBI Tactical SMS Shares | 100.00% |
WBI Tactical LCG Shares | 100.00% |
WBI Tactical LCV Shares | 100.00% |
WBI Tactical LCY Shares | 100.00% |
WBI Tactical LCS Shares | 100.00% |
WBI Tactical Income Shares | 46.34% |
WBI Tactical High Income Shares | 54.07% |
WBI Tactical Rotation Shares | 31.97% |
WBI Power FactorTM High Dividend ETF | 98.84% |
For corporate shareholders, the percent of ordinary income distributions qualifying for the corporate dividends received deduction for the fiscal year ended June 30, 2017 was as follows:
WBI Tactical SMG Shares | 100.00% |
WBI Tactical SMV Shares | 100.00% |
WBI Tactical SMY Shares | 100.00% |
WBI Tactical SMS Shares | 100.00% |
WBI Tactical LCG Shares | 100.00% |
WBI Tactical LCV Shares | 100.00% |
WBI Tactical LCY Shares | 100.00% |
WBI Tactical LCS Shares | 100.00% |
WBI Tactical Income Shares | 46.30% |
WBI Tactical High Income Shares | 42.80% |
WBI Tactical Rotation Shares | 15.50% |
WBI Power FactorTM High Dividend ETF | 94.50% |
The Percentage of taxable ordinary income distributions that are designated as short-term capital gain distributions under Internal Revenue Section 871(k)(2)(C) for each Fund were as follows (unaudited).
WBI Tactical SMG Shares | 0.00% |
WBI Tactical SMV Shares | 0.00% |
WBI Tactical SMY Shares | 0.00% |
WBI Tactical SMS Shares | 0.00% |
WBI Tactical LCG Shares | 0.00% |
WBI Tactical LCV Shares | 0.00% |
WBI Tactical LCY Shares | 0.00% |
WBI Tactical LCS Shares | 0.00% |
WBI Tactical Income Shares | 0.00% |
WBI Tactical High Income Shares | 0.00% |
WBI Tactical Rotation Shares | 0.00% |
WBI Power FactorTM High Dividend ETF | 0.00% |
79
Information About the Portfolio Holdings
(Unaudited)
The Trust files its complete schedules of portfolio holdings for its first and third fiscal quarters with the Securities and Exchange Commission (“SEC”) on Form N-Q. The Trust’s Form N-Q is available without charge, upon request, by calling toll-free at (800) 772-5810. Furthermore, you may obtain the Form N-Q on the SEC’s website at www.sec.gov. The Funds’ portfolio holdings are updated daily and posted on its website at www.wbishares.com.
Information About Proxy Voting
(Unaudited)
A description of the policies and procedures the Trust uses to determine how to vote proxies relating to portfolio securities is provided in the Statement of Additional Information (“SAI”). The SAI is available without charge, upon request, by calling toll-free at (800) 772-5810, by accessing the SEC’s website at www.sec.gov, or by accessing the Funds’ website at www.wbishares.com.
When available, information regarding how the Funds voted proxies relating to portfolio securities during the twelve-months ending June 30 will be (1) available by calling toll-free at (800) 772-5810 and (2) the SEC’s website at www.sec.gov.
Frequency Distribution of Premiums and Discounts
(Unaudited)
Information regarding how often shares of the Funds trade on an exchange at a price above (i.e., at a premium) or below (i.e., at a discount) NAV is available, without charge, on the Funds’ website at www.wbishares.com.
80
(This page intentionally left blank.)
(This page intentionally left blank.)
Advisor
Millington Securities
331 Newman Springs Rd Suite 122
Red Bank, New Jersey 07701
Sub-Advisor
WBI Investments, Inc
331 Newman Springs Rd Suite 122
Red Bank, New Jersey 07701
Index Provider
Solactive AG
Guiollettstraße 54
60325 Frankfurt am Main, Germany
Distributor
Foreside Fund Services, LLC
Three Canal Plaza, Suite 100
Portland, ME 04101
Custodian
U.S. Bank National Association
Custody Operations
1555 North Rivercenter Drive, Suite 302
Milwaukee, Wisconsin 53212
Transfer Agent
U.S. Bancorp Fund Services, LLC
615 East Michigan Street
Milwaukee, Wisconsin 53202
Securities Lending Agent
U.S Bank, National Association
Securities Lending
800 Nicolet Mall
Minneapolis, MN 55402-7020
Independent Registered Public Accounting Firm
KPMG, LLP
51 John F. Kennedy Parkway
Short Hills, NJ 07078
Legal Counsel
K&L Gates
599 Lexington Avenue
New York, NY 10022
WBI Tactical SMG Shares | WBIA |
WBI Tactical SMV Shares | WBIB |
WBI Tactical SMY Shares | WBIC |
WBI Tactical SMS Shares | WBID |
WBI Tactical LCG Shares | WBIE |
WBI Tactical LCV Shares | WBIF |
WBI Tactical LCY Shares | WBIG |
WBI Tactical LCS Shares | WBIL |
WBI Tactical Income Shares | WBII |
WBI Tactical High Income Shares | WBIH |
WBI Tactical Rotation Shares | WBIR |
WBI Power FactorTM High Dividend ETF | WBIY |
The registrant has adopted a code of ethics that applies to the registrant’s principal executive officer and principal financial officer. The registrant has not made any substantive amendments to its code of ethics during the period covered by this report. The registrant has not granted any waivers from any provisions of the code of ethics during the period covered by this report.
A copy of the registrant’s Code of Ethics is filed herewith.
The registrant’s board of trustees has determined that there is at least one audit committee financial expert serving on its audit committee. John A.Flanagan is the “audit committee financial expert” and is considered to be “independent” as each term is defined in Item 3 of Form N‑CSR.
The registrant has engaged its principal accountant to perform audit services, audit-related services, tax services and other services during the past two fiscal years. “Audit services” refer to performing an audit of the registrant's annual financial statements or services that are normally provided by the accountant in connection with statutory and regulatory filings or engagements for those fiscal years. “Audit-related services” refer to the assurance and related services by the principal accountant that are reasonably related to the performance of the audit. “Tax services” refer to professional services rendered by the principal accountant for tax compliance, tax advice, and tax planning. There were no “Other services” provided by the principal accountant. The following table details the aggregate fees billed or expected to be billed for each of the last two fiscal years for audit fees, audit-related fees, tax fees and other fees by the principal accountant.