Exhibit (c)(2)
Project Crayola SPECIAL COMMITTEE DISCUSSION MATERIALS DECEMBER 2020 CONFIDENTIAL
The information herein has been prepared by Lazard Frères & Co . LLC (“Lazard”) based upon information supplied by you (“Teal” or the “Company”) or publicly available information, and portions of the information herein may be based upon certain statements, estimates and forecasts provided by the Company with respect to the anticipated future performance of the Company . Lazard has relied upon the accuracy and completeness of the foregoing information, and has not assumed any responsibility for any independent verification of such information or any independent valuation or appraisal of any of the assets or liabilities of the Company or any other entity, or concerning solvency or fair value of the Company or any other entity . With respect to financial forecasts, Lazard has assumed that they have been reasonably prepared on bases reflecting the best currently available estimates and judgments as to the future financial performance of the relevant entity ; we assume no responsibility for and express no view as to such forecasts . The information set forth herein is based upon economic, monetary, market and other conditions as in effect on, and the information made available to us as of, the date hereof, unless indicated otherwise . These materials and the information contained herein are confidential and may not be disclosed publicly or made available to third parties without the prior written consent of Lazard ; provided, however, that you may disclose to any and all persons the U . S . federal income tax treatment and tax structure of any transaction described herein and the portions of these materials that relate to such tax treatment or structure . Lazard is acting as investment banker to the Special Committee of the Board of Directors of the Company (the “Special Committee”), and will not be responsible for and will not provide any tax, accounting, actuarial, legal or other specialist advice . These materials are preliminary and summary in nature and do not include all of the information that the Special Committee should evaluate in considering a possible transaction . Lazard has been retained only by the Special Committee in connection with the transaction described herein and has no duties to any third party . Nothing herein shall constitute a commitment or undertaking on the part of Lazard or any related party to provide any service . Disclaimer PROJECT CRAYOLA CONFIDENTIAL 1
Table of Contents PROJECT CRAYOLA CONFIDENTIAL I INTRODUCTION 2 II BUSINESS PLAN 3 III VALUATION 7 IV NEXT STEPS 10 APPENDIX A Appendix – Public Comparables 15 B Appendix – Precedent Transactions 21 C Appendix – Business Plan 24 D Appendix – DCF 30 E Appendix – WACC 36 F Appendix – Other Potential Parties 39 G Appendix – Teal Shareholders 43
CONFIDENTIAL I Introduction PROJECT CRAYOLA

Introduction I INTRODUCTION PROJECT CRAYOLA Last week, on December 22, the Special Committee met to review: The terms of the Amber proposal Public market benchmarks Precedent transaction benchmarks Teal history of strategic discussions Other potential counterparties On December 23, Lazard met with the Teal CEO to do due diligence on the Teal business and the projections Today, the Special Committee will review: Teal standalone business plans Initial views on Teal’s value Potential next steps 2

CONFIDENTIAL II Business Plan PROJECT CRAYOLA
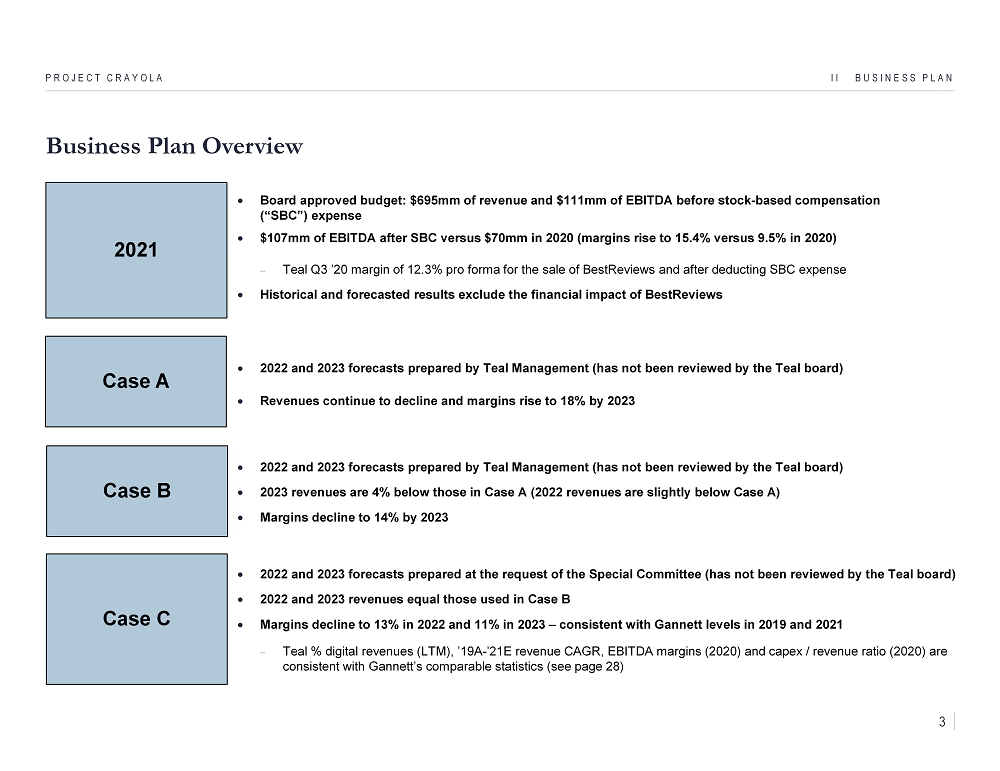
Business Plan Overview II BUSINESS PLAN PROJECT CRAYOLA 2021 Board approved budget: $695mm of revenue and $111mm of EBITDA before stock - based compensation (“SBC”) expense $107mm of EBITDA after SBC versus $70mm in 2020 (margins rise to 15.4% versus 9.5% in 2020 ) Teal Q3 ’20 margin of 12.3% pro forma for the sale of BestReviews and after deducting SBC expense Historical and forecasted results exclude the financial impact of BestReviews Case A Case B 2022 and 2023 forecasts prepared at the request of the Special Committee (has not been reviewed by the Teal board) 2022 and 2023 revenues equal those used in Case B Margins decline to 13% in 2022 and 11% in 2023 – consistent with Gannett levels in 2019 and 2021 Teal % digital revenues (LTM), ’19A - ’21E revenue CAGR, EBITDA margins (2020) and capex / revenue ratio (2020) are consistent with Gannett’s comparable statistics (see page 28) 2022 and 2023 forecasts prepared by Teal Management (has not been reviewed by the Teal board) 2023 revenues are 4% below those in Case A (2022 revenues are slightly below Case A) Margins decline to 14% by 2023 Case C 2022 and 2023 forecasts prepared by Teal Management (has not been reviewed by the Teal board) Revenues continue to decline and margins rise to 18% by 2023 3

$143 $167 $167 $145 $169 $200 $230 $196 $220 $196 $220 $1,013 $865 $779 $599 $526 $453 $392 $449 $377 $449 $377 $1,156 $1,032 $946 $744 $695 $653 $622 $645 $597 $645 $597 - 200 400 600 800 1,000 1,200 $1,400 2017A 2018A 2019A 2020E 2021E 2022E 2023E 2022E 2023E 2022E 2023E Digital Print Business Plan – Revenue & EBITDA ($ in millions) II BUSINESS PLAN PROJECT CRAYOLA Revenue Commentary ’21E - ’23E Print declines of 14% - 15% (CAGR) which are worse than ’17A - ’19A levels but better than ’19A - ’21E levels (23% decline in 2020) Digital growth driven by: ( i ) a recovery in digital advertising (recover to ’19A levels by ’22E / ’23E), and (ii) growth in digital circulation (subscriber and ARPU growth) Case A Case B Margins rise from 10% to 15% in ’21E (versus 11% for Gannett) Case A has margins rise to 18% in ’23E Case B has margins decline to 14% in ’23E (News Corp and NY Times level) Case C has margins decline to 11% in ’23E (Gannett levels) EBITDA (Post - SBC) $82 $80 $73 $70 $107 $110 $113 $102 $85 $84 $66 - 50 100 150 $200 2017A 2018A 2019A 2020E 2021E 2022E 2023E 2022E 2023E 2022E 2023E Post - SBC EBITDA Margin 7.8% 7.1% 7.7% 9.5% 15.4% 16.9% 18.1% 15.8% 14.3% Source: Teal Management. Note: Financials exclude the LA Times (sold in February 2018) and BestReviews (sold in December 2020). 1 2017 and 2018 normalized for the acquisitions of the Virginian - Pilot and the NY Daily News. 1 1 1 1 Case C Case A Case B Case C 13.0% 11.0% $952 $1,074 $873 $674 $589 $543 $509 $543 $512 $557 $527 Operating Expenses FTE 3,821 3,109 2,479 2,217 2,106 2,300 2,191 – – NA NA (12.3%) (17.8%) (13.7%) (15.3%) (15.3%) 2 - Year Trailing Print CAGR Budget Budget 4
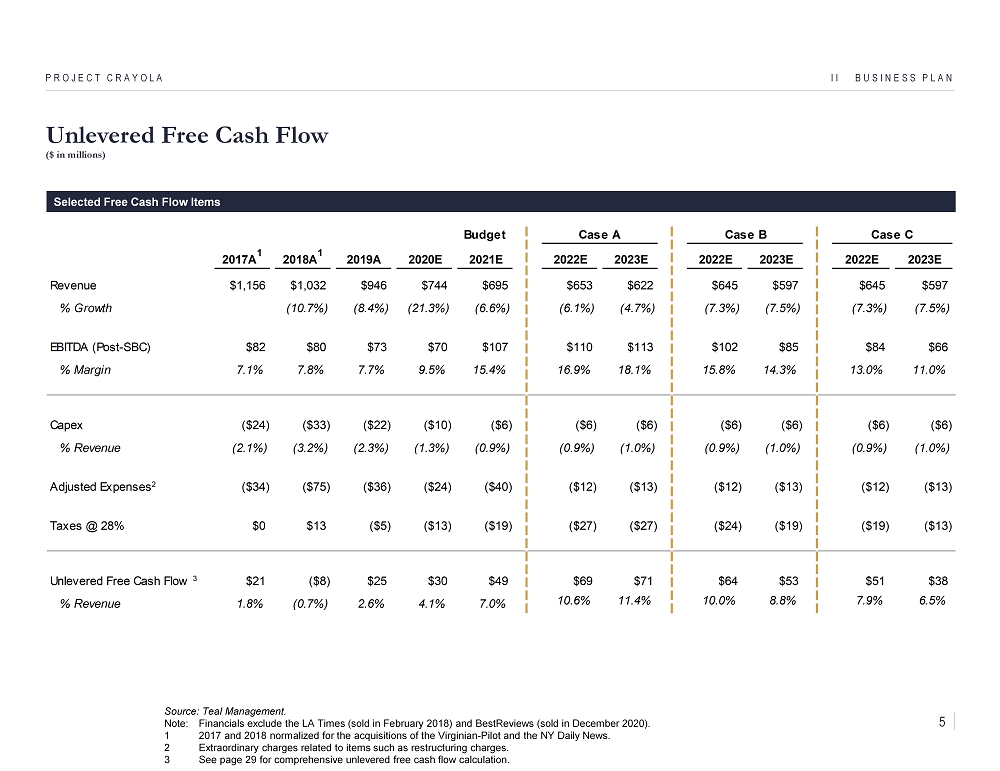
Unlevered Free Cash Flow ($ in millions) II BUSINESS PLAN PROJECT CRAYOLA Selected Free Cash Flow Items Budget Case A Case B Case C 2017A 1 2018A 1 2019A 2020E 2021E 2022E 2023E 2022E 2023E 2022E 2023E Revenue $1,156 $1,032 $946 $744 $695 $653 $622 $645 $597 $645 $597 % Growth (10.7%) (8.4%) (21.3%) (6.6%) (6.1%) (4.7%) (7.3%) (7.5%) (7.3%) (7.5%) EBITDA (Post-SBC) $82 $80 $73 $70 $107 $110 $113 $102 $85 $84 $66 % Margin 7.1% 7.8% 7.7% 9.5% 15.4% 16.9% 18.1% 15.8% 14.3% 13.0% 11.0% Capex ($24) ($33) ($22) ($10) ($6) ($6) ($6) ($6) ($6) ($6) ($6) % Revenue (2.1%) (3.2%) (2.3%) (1.3%) (0.9%) (0.9%) (1.0%) (0.9%) (1.0%) (0.9%) (1.0%) Adjusted Expenses2 ($34) ($75) ($36) ($24) ($40) ($12) ($13) ($12) ($13) ($12) ($13) Taxes @ 28% $0 $13 ($5) ($13) ($19) ($27) ($27) ($24) ($19) ($19) ($13) Unlevered Free Cash Flow 3 $21 ($8) $25 $30 $49 $69 $71 $64 $53 $51 $38 % Revenue 1.8% (0.7%) 2.6% 4.1% 7.0% 10.6% 11.4% 10.0% 8.8% 7.9% 6.5% Source: Teal Management. Note: Financials exclude the LA Times (sold in February 2018) and BestReviews (sold in December 2020). 1 2017 and 2018 normalized for the acquisitions of the Virginian - Pilot and the NY Daily News. 2 Extraordinary charges related to items such as restructuring charges. 3 See page 29 for comprehensive unlevered free cash flow calculation. 5

Cases A, B and C Versus Projections Prepared In February ($ in millions) II BUSINESS PLAN PROJECT CRAYOLA Revenue Capex EBITDA (Post - SBC) Unlevered Free Cash Flow $1,032 $946 $695 $653 $622 $645 $597 $859 $806 $762 $724 $738 $640 $1,156 $744 $695 500 600 700 800 900 1,000 1,100 $1,200 Dec-17 Dec-18 Dec-19 Dec-20 Dec-21 Dec-22 Dec-23 $110 $113 $70 $102 $85 $82 $80 $73 $107 $84 $66 $83 $75 $69 $64 $74 $77 50 60 70 80 90 100 110 $120 Dec-17 Dec-18 Dec-19 Dec-20 Dec-21 Dec-22 Dec-23 $69 $71 $30 $64 $53 $21 ($8) $25 $49 $51 $38 $42 $36 $38 $37 -20 - 20 40 60 80 $100 Dec-17 Dec-18 Dec-19 Dec-20 Dec-21 Dec-22 Dec-23 Source: Teal Management and Wall Street research. Note: Financials exclude the LA Times (sold in February 2018) and BestReviews (sold in December 2020). 2017 and 2018 normalized for the acquisitions of the Virginian - Pilot and the NY Daily News. 1 Noble broker estimates reduced by BestReviews results ($53mm of revenue and $23mm of EBITDA in 2020E and 2021E). (20) $6 $10 $6 $24 $33 $22 $6 $13 $14 $8 - 10 20 30 $40 Dec-17 Dec-18 Dec-19 Dec-20 Dec-21 Dec-22 Dec-23 Cases A, B, and C are equal Cases B and C are equal 2017 – 2019 Actual + 2020 Management Estimate + 2021 Budget February Case C Case B Case A Noble 1 6

CONFIDENTIAL III Valuation PROJECT CRAYOLA
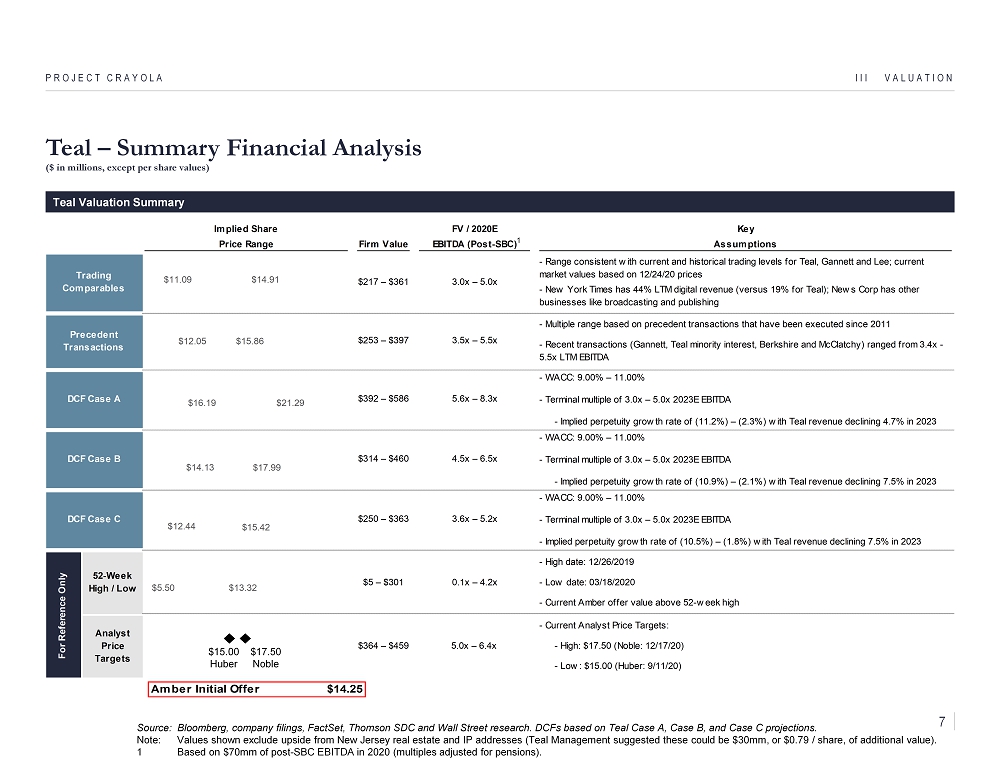
Implied Share FV / 2020E Key Price Range Firm Value EBITDA (Post-SBC) Assumptions - Range consistent with current and historical trading levels for Teal, Gannett and Lee; current market values based on 12/24/20 prices - New York Times has 44% LTM digital revenue (versus 19% for Teal); News Corp has other businesses like broadcasting and publishing - Multiple range based on precedent transactions that have been executed since 2011 - Recent transactions (Gannett, Teal minority interest, Berkshire and McClatchy) ranged from 3.4x - 5.5x LTM EBITDA - WACC: 9.00% – 11.00% - Terminal multiple of 3.0x – 5.0x 2023E EBITDA - Implied perpetuity growth rate of (11.2%) – (2.3%) with Teal revenue declining 4.7% in 2023 - WACC: 9.00% – 11.00% - Terminal multiple of 3.0x – 5.0x 2023E EBITDA - Implied perpetuity growth rate of (10.9%) – (2.1%) with Teal revenue declining 7.5% in 2023 - WACC: 9.00% – 11.00% - Terminal multiple of 3.0x – 5.0x 2023E EBITDA - Implied perpetuity growth rate of (10.5%) – (1.8%) with Teal revenue declining 7.5% in 2023 - High date: 12/26/2019 - Low date: 03/18/2020 - Current Amber offer value above 52-week high - Current Analyst Price Targets: - High: $17.50 (Noble: 12/17/20) - Low: $15.00 (Huber: 9/11/20) For Reference Only DCF Case A $250 – $363 4.5x – 6.5x$314 – $460 $392 – $586 5.6x – 8.3x Analyst Price Targets 0.1x – 4.2x 52-Week High / Low $5 – $301 $364 – $459 5.0x – 6.4x DCF Case C DCF Case B 3.6x – 5.2x Trading Comparables $217 – $361 3.0x – 5.0x Precedent Transactions $253 – $397 3.5x – 5.5x $5.50 $12.44 $14.13 $16.19 $12.05 $11.09 $13.32 $15.42 $17.99 $21.29 $15.86 $14.91 Teal – Summary Financial Analysis ($ in millions, except per share values) III VALUATION PROJECT CRAYOLA Source: Bloomberg, company filings, FactSet, Thomson SDC and Wall Street research. DCFs based on Teal Case A, Case B, and Case C projections. Note: Values shown exclude upside from New Jersey real estate and IP addresses (Teal Management suggested these could be $30mm, or $0.79 / share, of additional value). 1 Based on $70mm of post - SBC EBITDA in 2020 (multiples adjusted for pensions). $15.00 Huber $17.50 Noble Teal Valuation Summary Amber Initial Offer $14.25 1 7

III VALUATION PROJECT CRAYOLA Source: Company filings, FactSet and Wall Street research. Note: Market values as of December 24, 2020. 1 Metrics per Teal Management. Post - SBC EBITDA has $2mm of pension expense added back. 2 Pro forma for sale of BestReviews . Teal Mgmt. balance sheet as of Q4 2020. Teal Street balance sheet as of Q3 2020. 3 Current Net Debt / 2020E EBITDA (EBITDA is Pre - SBC and the ratio is not adjusted for pensions). 4 Multiple reflects pensions of $293mm. Implied Teal Prices – Public Comparables & Precedent Transactions ($ in millions, except per share values) Illustrative Valuation Reference Range Reference Range Low High Low High Teal Current Share Price $12.75 $12.75 $12.75 $12.75 Premium / (Discount) (13.0%) 17.0% (5.5%) 24.4% Implied Equity Value Per Share $11.09 $14.91 $12.05 $15.86 FDSO 37.770 37.890 37.770 37.890 Fully Diluted Equity Value $419 $565 $455 $601 (-) Cash Proceeds from Options – 2 – 2 Equity Value $419 $563 $455 $599 Plus: Total Debt – – – – Plus: Pensions 17 17 17 17 Less: Cash and Equivalents (219) (219) (219) (219) Less: Investments (0) (0) (0) (0) Implied Firm Value $217 $361 $253 $397 FV / EBITDA (post-SBC) Metric 2020E $72 3.0x 5.0x 3.5x 5.5x 2021E 109 2.0 3.3 2.3 3.7 Implied Multiple of Revenue Metric 2020E $744 0.3x 0.5x 0.3x 0.5x 2021E 695 0.3 0.5 0.4 0.6 Public Comparables Precedents Selected ranges based on Appendix Tab A and Tab B 1 1 FV / 2020E EBITDA (w/ Pensions) Teal (Street) 3.9x 4.2x 5.0x 5.1x 16.4x 31.6x Teal ( Mgmt ) 13.4% 11.8% 15.8% 8.9% 9.7% — — 3.9x — 3.8x ’20E Margin 9.5% 2 2 — ’20E Net Leverage 3 2019 / 2020 Newspaper Precedents – LTM EBITDA Multiples 4.8x 4.4x 3.6x 3.4x 0.5x 0.4x 0.6x 0.4x LTM Revenue 5.5x 4 Acquiror Target Chatham Asset Mgmt. (Michael Ferro 25% stake) Page 21 has the complete list of precedents Date August 2019 November 2019 January 2020 July 2020 8
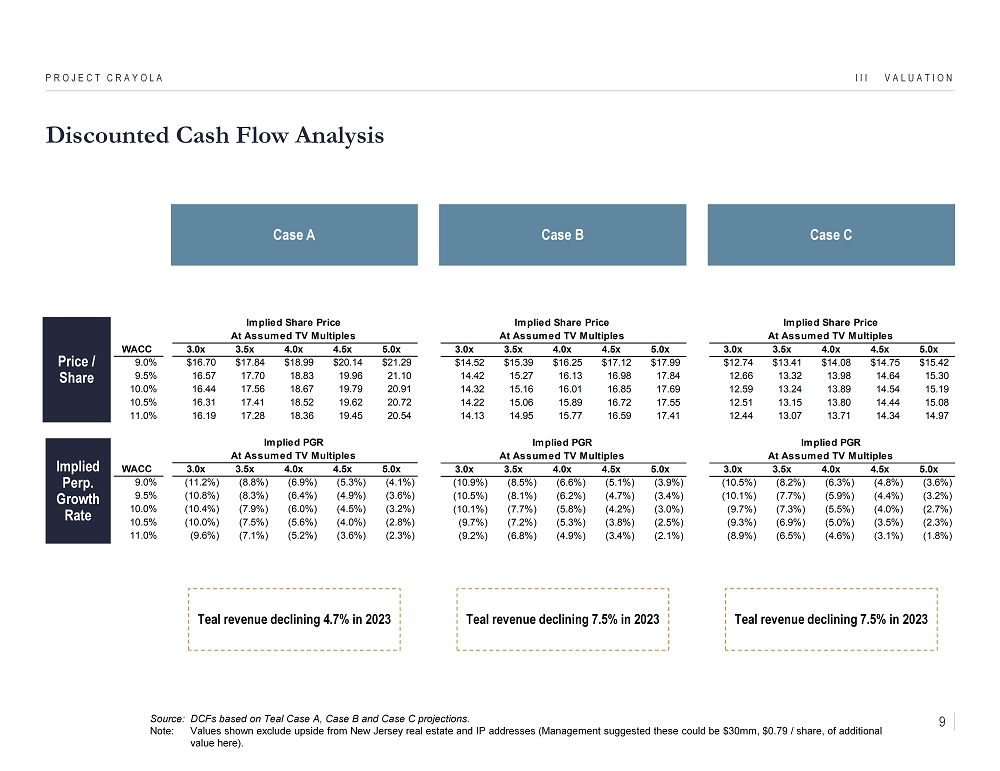
Discounted Cash Flow Analysis III VALUATION PROJECT CRAYOLA Source: DCFs based on Teal Case A, Case B and Case C projections. Note: Values shown exclude upside from New Jersey real estate and IP addresses (Management suggested these could be $30mm, $0.79 / share, of additional value here). Price / Share Implied Perp. Growth Rate Implied Share Price At Assumed TV Multiples 3.0x 3.5x 4.0x 4.5x 5.0x $14.52 $15.39 $16.25 $17.12 $17.99 14.42 15.27 16.13 16.98 17.84 14.32 15.16 16.01 16.85 17.69 14.22 15.06 15.89 16.72 17.55 14.13 14.95 15.77 16.59 17.41 Implied PGR At Assumed TV Multiples 3.0x 3.5x 4.0x 4.5x 5.0x (10.9%) (8.5%) (6.6%) (5.1%) (3.9%) (10.5%) (8.1%) (6.2%) (4.7%) (3.4%) (10.1%) (7.7%) (5.8%) (4.2%) (3.0%) (9.7%) (7.2%) (5.3%) (3.8%) (2.5%) (9.2%) (6.8%) (4.9%) (3.4%) (2.1%) Implied Share Price At Assumed TV Multiples 3.0x 3.5x 4.0x 4.5x 5.0x $12.74 $13.41 $14.08 $14.75 $15.42 12.66 13.32 13.98 14.64 15.30 12.59 13.24 13.89 14.54 15.19 12.51 13.15 13.80 14.44 15.08 12.44 13.07 13.71 14.34 14.97 Implied PGR At Assumed TV Multiples 3.0x 3.5x 4.0x 4.5x 5.0x (10.5%) (8.2%) (6.3%) (4.8%) (3.6%) (10.1%) (7.7%) (5.9%) (4.4%) (3.2%) (9.7%) (7.3%) (5.5%) (4.0%) (2.7%) (9.3%) (6.9%) (5.0%) (3.5%) (2.3%) (8.9%) (6.5%) (4.6%) (3.1%) (1.8%) Case A Case B Case C Teal revenue declining 4.7% in 2023 Teal revenue declining 7.5% in 2023 Teal revenue declining 7.5% in 2023 Implied Share Price At Assumed TV Multiples WACC 3.0x 3.5x 4.0x 4.5x 5.0x 9.0% $16.70 $17.84 $18.99 $20.14 $21.29 9.5% 16.57 17.70 18.83 19.96 21.10 10.0% 16.44 17.56 18.67 19.79 20.91 10.5% 16.31 17.41 18.52 19.62 20.72 11.0% 16.19 17.28 18.36 19.45 20.54 Implied PGR At Assumed TV Multiples WACC 3.0x 3.5x 4.0x 4.5x 5.0x 9.0% (11.2%) (8.8%) (6.9%) (5.3%) (4.1%) 9.5% (10.8%) (8.3%) (6.4%) (4.9%) (3.6%) 10.0% (10.4%) (7.9%) (6.0%) (4.5%) (3.2%) 10.5% (10.0%) (7.5%) (5.6%) (4.0%) (2.8%) 11.0% (9.6%) (7.1%) (5.2%) (3.6%) (2.3%) 9

CONFIDENTIAL IV Next Steps PROJECT CRAYOLA

Proposed Terms – Amber to Acquire Teal IV NEXT STEPS PROJECT CRAYOLA Buyer Amber Global Capital, LLC (“Amber”) submitted an offer on 12/14/20 Amber owns 32% of Teal and a majority interest in the MediaNews Group (“MNG”) Price Per Share [$14.25] per Teal share, subject to limited due diligence Premium Amber noted it was a 32% premium to the 1 - year VWAP The offer is a 12% premium to the 12/24/20 closing price, a 20% premium to the price the day prior to the offer and a 14% premium to the price 4 - weeks prior to the offer Form of Consideration Cash Financing Amber stated it can fully finance the transaction (~$374mm for the 68% not already owned) with cash on hand at Amber and MNG (no third - party financing or financing conditions) Requested approval to discuss a joint transaction with Stewart Bainum , Jr. (the “Investor”). The offer is not contingent on a joint proposal with the Investor Will Amber Sell Its Stake? Amber has stated that it is not interested in selling its Teal stock to another party and has no intention to vote in its capacity as a stockholder in favor of any such non - Amber transaction Process Amber non - binding proposal conditioned on approval by a special committee and approval by a vote of two - thirds of the outstanding non - Amber shares 10
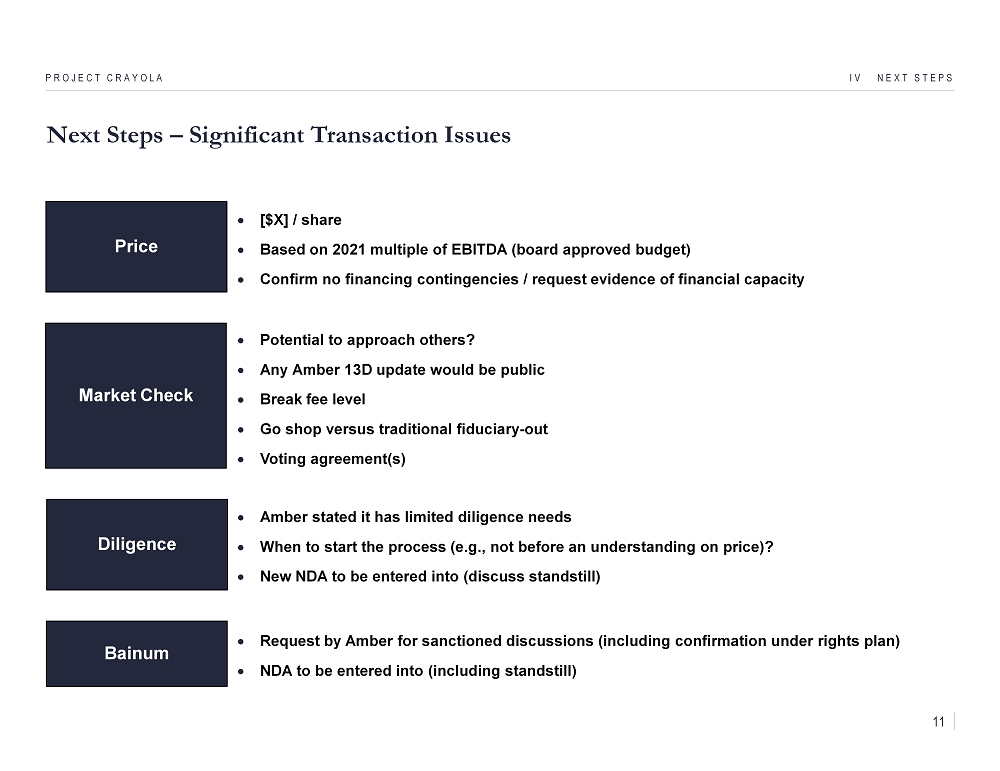
Next Steps – Significant Transaction Issues IV NEXT STEPS PROJECT CRAYOLA Price [$X] / share Based on 2021 multiple of EBITDA (board approved budget) Confirm no financing contingencies / request evidence of financial capacity Market Check Diligence Request by Amber for sanctioned discussions (including confirmation under rights plan) NDA to be entered into (including standstill) Amber stated it has limited diligence needs When to start the process (e.g ., not before an understanding on price )? New NDA to be entered into (discuss standstill) Bainum Potential to approach others? Any Amber 13D update would be public Break fee level Go shop versus traditional fiduciary - out Voting agreement(s) 11
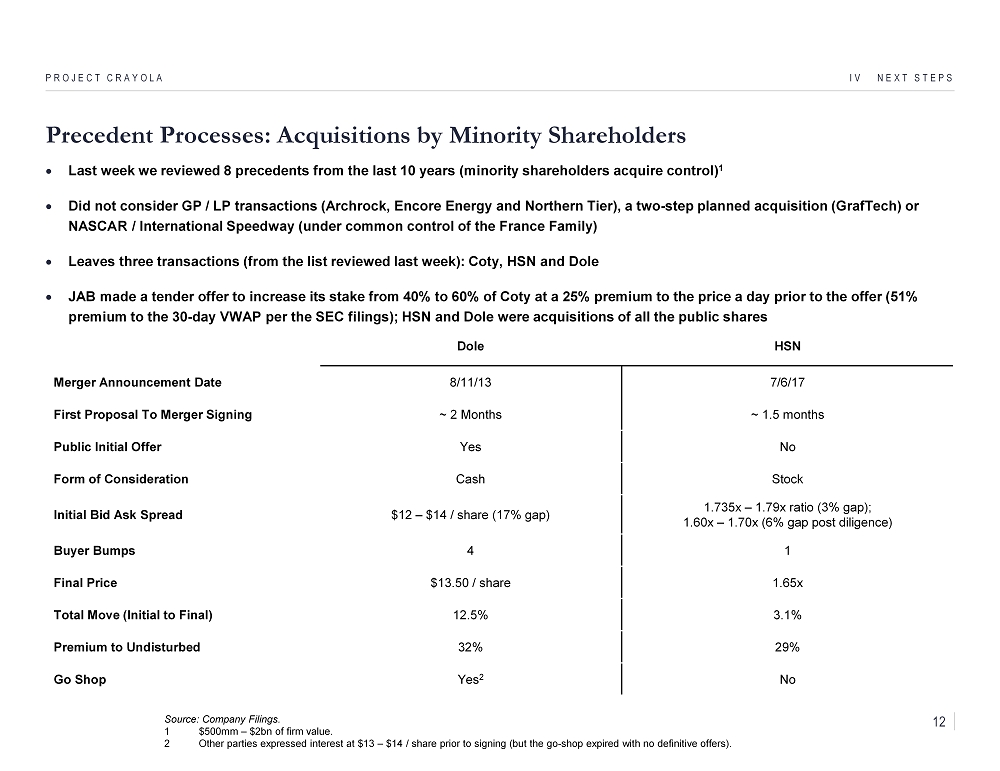
Precedent Processes: Acquisitions by Minority Shareholders IV NEXT STEPS PROJECT CRAYOLA Last week we reviewed 8 precedents from the last 10 years (minority shareholders acquire control) 1 Did not consider GP / LP transactions ( Archrock , Encore Energy and Northern Tier), a two - step planned acquisition ( GrafTech ) or NASCAR / International Speedway (under common control of the France Family) Leaves three transactions (from the list reviewed last week): Coty, HSN and Dole JAB made a tender offer to increase its stake from 40% to 60% of Coty at a 25% premium to the price a day prior to the offer (51% premium to the 30 - day VWAP per the SEC filings); HSN and Dole were acquisitions of all the public shares Dole HSN Merger Announcement Date 8/11/13 7/6/17 First Proposal To Merger Signing ~ 2 Months ~ 1.5 months Public Initial Offer Yes No Form of Consideration Cash Stock Initial Bid Ask Spread $12 – $14 / share (17% gap) 1.735x – 1.79x ratio (3% gap); 1.60x – 1.70x (6% gap post diligence) Buyer Bumps 4 1 Final Price $13.50 / share 1.65x Total Move (Initial to Final) 12.5% 3.1% Premium to Undisturbed 32% 29% Go Shop Yes 2 No Source: Company Filings. 1 $500mm – $2bn of firm value. 2 Other parties expressed interest at $13 – $14 / share prior to signing (but the go - shop expired with no definitive offers). 12
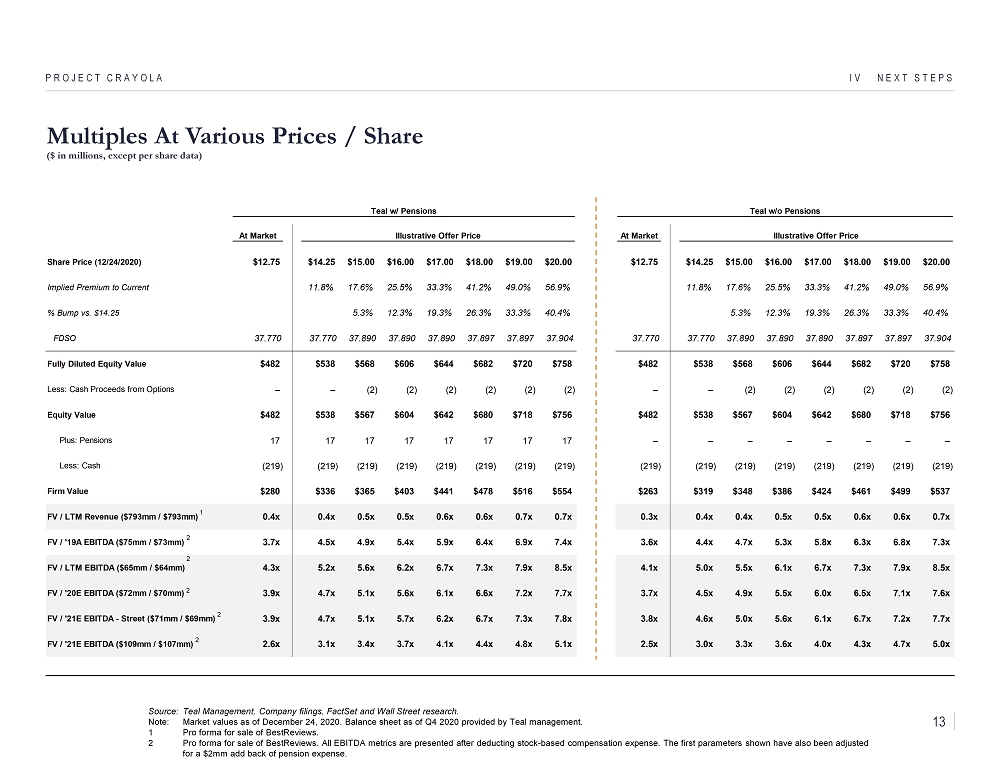
Teal w/ Pensions Teal w/o Pensions At Market Illustrative Offer Price At Market Illustrative Offer Price Share Price (12/24/2020) $12.75 $14.25 $15.00 $16.00 $17.00 $18.00 $19.00 $20.00 $12.75 $14.25 $15.00 $16.00 $17.00 $18.00 $19.00 $20.00 Implied Premium to Current 11.8% 17.6% 25.5% 33.3% 41.2% 49.0% 56.9% 11.8% 17.6% 25.5% 33.3% 41.2% 49.0% 56.9% % Bump vs. $14.25 5.3% 12.3% 19.3% 26.3% 33.3% 40.4% 5.3% 12.3% 19.3% 26.3% 33.3% 40.4% FDSO 37.770 37.770 37.890 37.890 37.890 37.897 37.897 37.904 37.770 37.770 37.890 37.890 37.890 37.897 37.897 37.904 Fully Diluted Equity Value $482 $538 $568 $606 $644 $682 $720 $758 $482 $538 $568 $606 $644 $682 $720 $758 Less: Cash Proceeds from Options – – (2) (2) (2) (2) (2) (2) – – (2) (2) (2) (2) (2) (2) Equity Value $482 $538 $567 $604 $642 $680 $718 $756 $482 $538 $567 $604 $642 $680 $718 $756 Plus: Pensions 17 17 17 17 17 17 17 17 – – – – – – – – Less: Cash (219) (219) (219) (219) (219) (219) (219) (219) (219) (219) (219) (219) (219) (219) (219) (219) Firm Value $280 $336 $365 $403 $441 $478 $516 $554 $263 $319 $348 $386 $424 $461 $499 $537 FV / LTM Revenue ($793mm / $793mm) 0.4x 0.4x 0.5x 0.5x 0.6x 0.6x 0.7x 0.7x 0.3x 0.4x 0.4x 0.5x 0.5x 0.6x 0.6x 0.7x FV / '19A EBITDA ($75mm / $73mm) 3.7x 4.5x 4.9x 5.4x 5.9x 6.4x 6.9x 7.4x 3.6x 4.4x 4.7x 5.3x 5.8x 6.3x 6.8x 7.3x FV / LTM EBITDA ($65mm / $64mm) 4.3x 5.2x 5.6x 6.2x 6.7x 7.3x 7.9x 8.5x 4.1x 5.0x 5.5x 6.1x 6.7x 7.3x 7.9x 8.5x FV / '20E EBITDA ($72mm / $70mm) 3.9x 4.7x 5.1x 5.6x 6.1x 6.6x 7.2x 7.7x 3.7x 4.5x 4.9x 5.5x 6.0x 6.5x 7.1x 7.6x FV / '21E EBITDA - Street ($71mm / $69mm) 3.9x 4.7x 5.1x 5.7x 6.2x 6.7x 7.3x 7.8x 3.8x 4.6x 5.0x 5.6x 6.1x 6.7x 7.2x 7.7x FV / '21E EBITDA ($109mm / $107mm) 2.6x 3.1x 3.4x 3.7x 4.1x 4.4x 4.8x 5.1x 2.5x 3.0x 3.3x 3.6x 4.0x 4.3x 4.7x 5.0x Multiples At Various Prices / Share ($ in millions, except per share data) IV NEXT STEPS PROJECT CRAYOLA Source: Teal Management, Company filings, FactSet and Wall Street research. Note: Market values as of December 24, 2020. Balance sheet as of Q4 2020 provided by Teal management. 1 Pro forma for sale of BestReviews . 2 Pro forma for sale of BestReviews . All EBITDA metrics are presented after deducting stock - based compensation expense. The first parameters shown have also been a djusted for a $2mm add back of pension expense. 1 2 2 2 2 2 13
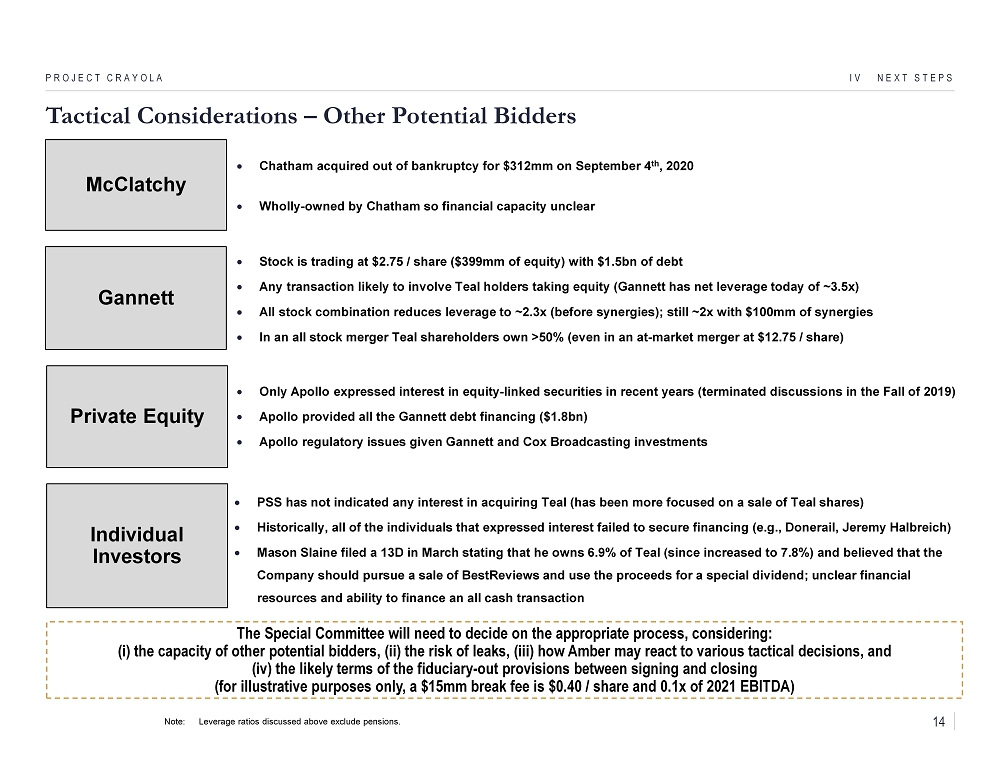
Tactical Considerations – Other Potential Bidders IV NEXT STEPS PROJECT CRAYOLA McClatchy Chatham acquired out of bankruptcy for $312mm on September 4 th , 2020 Wholly - owned by Chatham so financial capacity unclear Gannett Private Equity PSS has not indicated any interest in acquiring Teal (has been more focused on a sale of Teal shares) Historically, all of the individuals that expressed interest failed to secure financing (e.g., Donerail , Jeremy Halbreich) Mason Slaine filed a 13D in March stating that he owns 6.9% of Teal (since increased to 7.8%) and believed that the Company should pursue a sale of BestReviews and use the proceeds for a special dividend; unclear financial resources and ability to finance an all cash transaction Only Apollo expressed interest in equity - linked securities in recent years (terminated discussions in the Fall of 2019) Apollo provided all the Gannett debt financing ($1.8bn) Apollo regulatory issues given Gannett and Cox B roadcasting investments Individual Investors Stock is trading at $2.75 / share ($399mm of equity) with $1.5bn of debt Any transaction likely to involve Teal holders taking equity (Gannett has net leverage today of ~3.5x) All stock combination reduces leverage to ~2.3x (before synergies); still ~2x with $100mm of synergies In an all stock merger Teal shareholders own >50% (even in an at - market merger at $12.75 / share) The Special Committee will need to decide on the appropriate process, considering: ( i ) the capacity of other potential bidders, (ii) the risk of leaks, (iii) how Amber may react to various tactical decisions, a nd (iv) the likely terms of the fiduciary - out provisions between signing and closing (for illustrative purposes only, a $15mm break fee is $0.40 / share and 0.1x of 2021 EBITDA) Note: Leverage ratios discussed above exclude pensions. 14
CONFIDENTIAL Appendix PROJECT CRAYOLA
CONFIDENTIAL A Appendix – Public Comparables PROJECT CRAYOLA
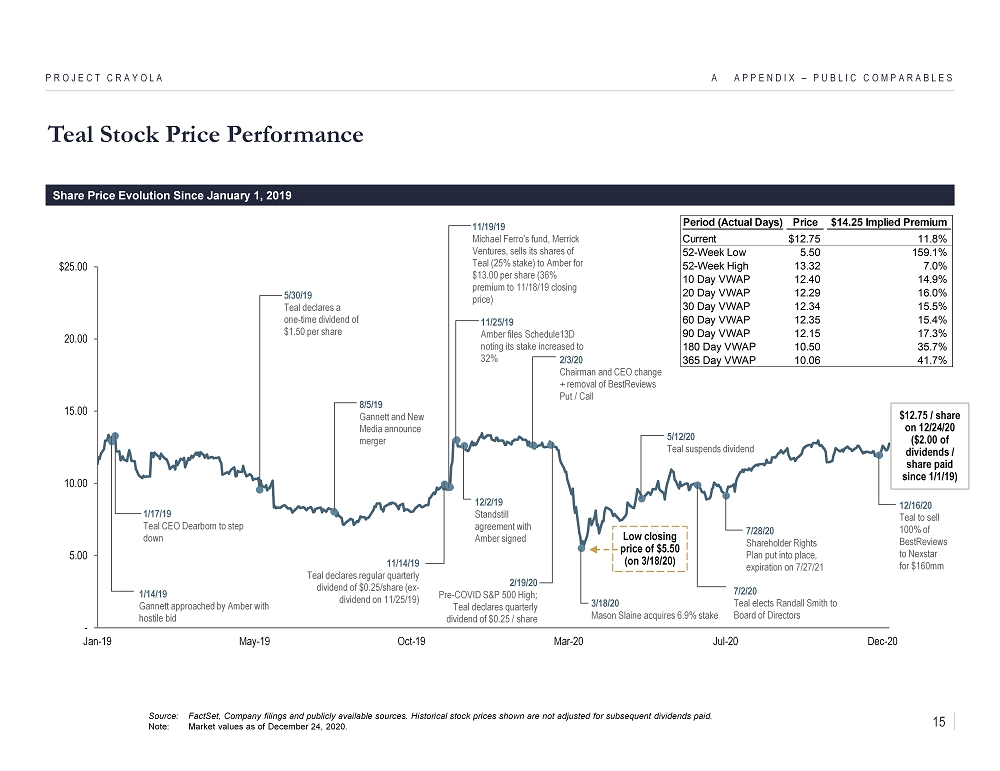
- 5.00 10.00 15.00 20.00 $25.00 Jan-19 May-19 Oct-19 Mar-20 Jul-20 Dec-20 Teal Stock Price Performance A APPENDIX – PUBLIC COMPARABLES PROJECT CRAYOLA Share Price Evolution Since January 1, 2019 $12.75 / share on 12/24/20 ($2.00 of dividends / share paid since 1/1/19) 5/30/19 Teal declares a one - time dividend of $1.50 per share Source: FactSet, Company filings and publicly available sources. Historical stock prices shown are not adjusted for subsequent d ividends paid. Note: Market values as of December 24, 2020. 1/14/19 Gannett approached by Amber with hostile bid 8/5/19 Gannett and New Media announce merger 1/17/19 Teal CEO Dearborn to step down 11/14/19 Teal declares regular quarterly dividend of $0.25/share (ex - dividend on 11/25/19) 11/19/19 Michael Ferro’s fund, Merrick Ventures, sells its shares of Teal (25% stake) to Amber for $13.00 per share (36% premium to 11/18/19 closing price) 11/25/19 Amber files Schedule13D noting its stake increased to 32% Low closing price of $5.50 (on 3/18/20) 12/2/19 Standstill agreement with Amber signed 2/3/20 Chairman and CEO change + removal of BestReviews Put / Call 2/19/20 Pre - COVID S&P 500 High; Teal declares quarterly dividend of $0.25 / share 7/28/20 Shareholder Rights Plan put into place, expiration on 7/27/21 7/2/20 Teal elects Randall Smith to Board of Directors 3/18/20 Mason Slaine acquires 6.9% stake 5/12/20 Teal suspends dividend 12/16/20 Teal to sell 100% of BestReviews to Nexstar for $160mm Period (Actual Days) Price $14.25 Implied Premium Current $12.75 11.8% 52-Week Low 5.50 159.1% 52-Week High 13.32 7.0% 10 Day VWAP 12.40 14.9% 20 Day VWAP 12.29 16.0% 30 Day VWAP 12.34 15.5% 60 Day VWAP 12.35 15.4% 90 Day VWAP 12.15 17.3% 180 Day VWAP 10.50 35.7% 365 Day VWAP 10.06 41.7% 15
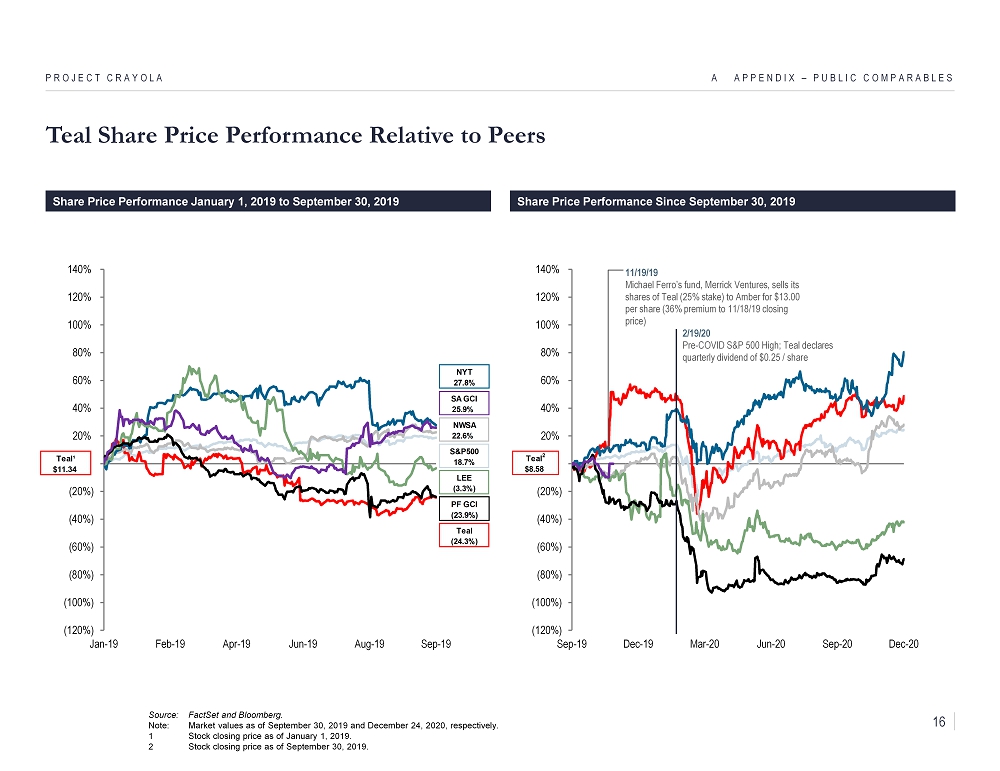
(120%) (100%) (80%) (60%) (40%) (20%) 0% 20% 40% 60% 80% 100% 120% 140% Jan-19 Feb-19 Apr-19 Jun-19 Aug-19 Sep-19 Teal Share Price Performance Relative to Peers A APPENDIX – PUBLIC COMPARABLES PROJECT CRAYOLA Source: FactSet and Bloomberg. Note: Market values as of September 30, 2019 and December 24, 2020, respectively. 1 Stock closing price as of January 1, 2019. 2 Stock closing price as of September 30, 2019. Share Price Performance January 1, 2019 to September 30, 2019 S&P500 18.7% NWSA 22.6% LEE (3.3%) PF GCI (23.9%) Teal (24.3%) Teal¹ $11.34 SA GCI 25.9% Share Price Performance Since September 30, 2019 (120%) (100%) (80%) (60%) (40%) (20%) 0% 20% 40% 60% 80% 100% 120% 140% Sep-19 Dec-19 Mar-20 Jun-20 Sep-20 Dec-20 11/19/19 Michael Ferro’s fund, Merrick Ventures, sells its shares of Teal (25% stake) to Amber for $13.00 per share (36% premium to 11/18/19 closing price) 2/19/20 Pre - COVID S&P 500 High; Teal declares quarterly dividend of $0.25 / share Teal 2 $8.58 NYT 27.8% 16
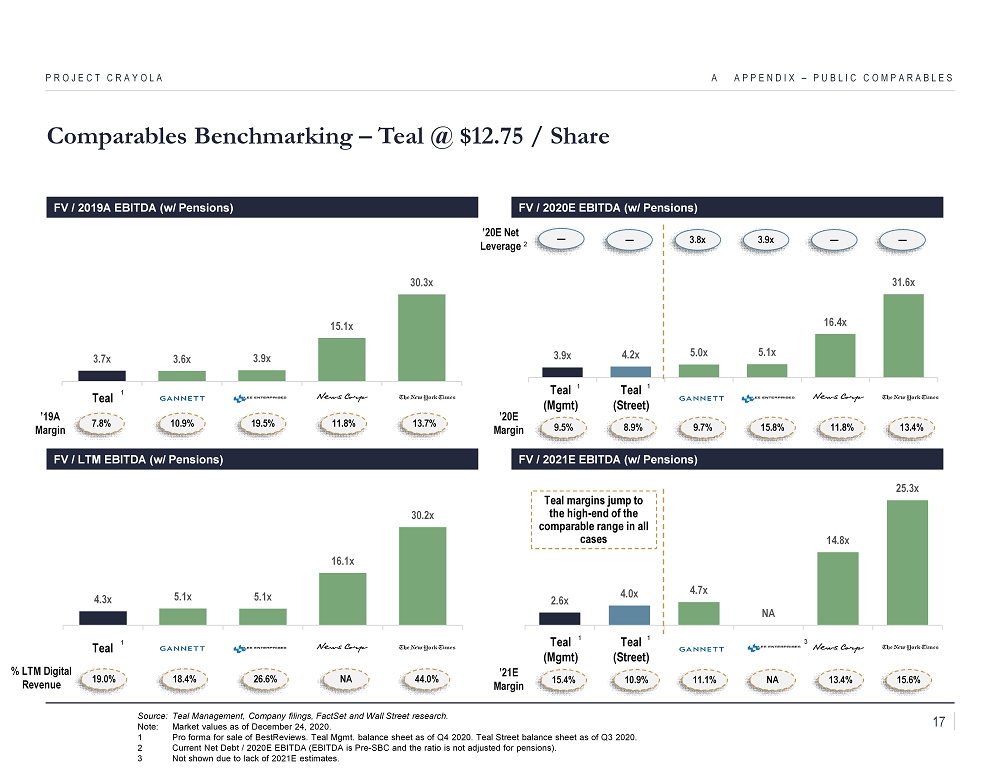
Teal (Street) Teal (Street) Comparables Benchmarking – Teal @ $12.75 / Share FV / 2019A EBITDA (w/ Pensions) A APPENDIX – PUBLIC COMPARABLES PROJECT CRAYOLA Source: Teal Management, Company filings, FactSet and Wall Street research. Note: Market values as of December 24, 2020. 1 Pro forma for sale of BestReviews . Teal Mgmt. balance sheet as of Q4 2020. Teal Street balance sheet as of Q3 2020. 2 Current Net Debt / 2020E EBITDA (EBITDA is Pre - SBC and the ratio is not adjusted for pensions). 3 Not shown due to lack of 2021E estimates. FV / 2020E EBITDA (w/ Pensions) 3.9x 4.2x 5.0x 5.1x 16.4x 31.6x FV / 2021E EBITDA (w/ Pensions) Teal ( Mgmt ) 2.6x 4.0x 4.7x NA 14.8x 25.3x 3 13.7% 11.8% 19.5% 7.8% 10.9% 13.4% 11.8% 15.8% 8.9% 9.7% 15.6% 13.4% NA 10.9% 11.1% — — 3.9x — 3.8x ’20E Net Leverage 3.7x 3.6x 3.9x 15.1x 30.3x FV / LTM EBITDA (w/ Pensions) 4.3x 5.1x 5.1x 16.1x 30.2x ’19A Margin ’20E Margin 9.5% ’21E Margin 15.4% Teal ( Mgmt ) 1 1 1 44.0% NA 26.6% 19.0% 18.4% % LTM Digital Revenue Teal 1 Teal Teal margins jump to the high - end of the comparable range in all cases 1 1 — 2 17

Min Median Max Lee LTM¹ 3.9x 5.1x 5.6x SA GCI LTM 3.2x 3.7x 4.5x SA GCI NTM 3.3x 4.0x 5.2x PF GCI LTM 4.1x 4.9x 6.2x PF GCI NTM 3.2x 4.1x 4.8x 2.0 3.0 4.0 5.0 6.0 7.0x Jan-18 Aug-18 Mar-19 Oct-19 May-20 Dec-20 Lee LTM SA GCI LTM PF GCI LTM SA GCI NTM PF GCI NTM 5.0x Gannett and Lee EBITDA Multiples Since January 1, 2018 A APPENDIX – PUBLIC COMPARABLES PROJECT CRAYOLA August 5, 2019 Gannett and New Media announce merger January 14, 2019 MNG announces hostile takeover bid November 19, 2019 New Media / Gannett merger closes May 16, 2019 Gannett shareholders reelect Gannett's independent director nominees after proxy fight with MNG Source: FactSet . Note: Market values as of December 24, 2020. Multiples reflect Adj. Firm Value incl. Pensions. 1 Forward looking projections for Lee not available. 3.0x January 28, 2020 Lee announces agreement to purchase Berkshire Hathaway's newspapers February 19, 2020 Market high before COVID - 19 18
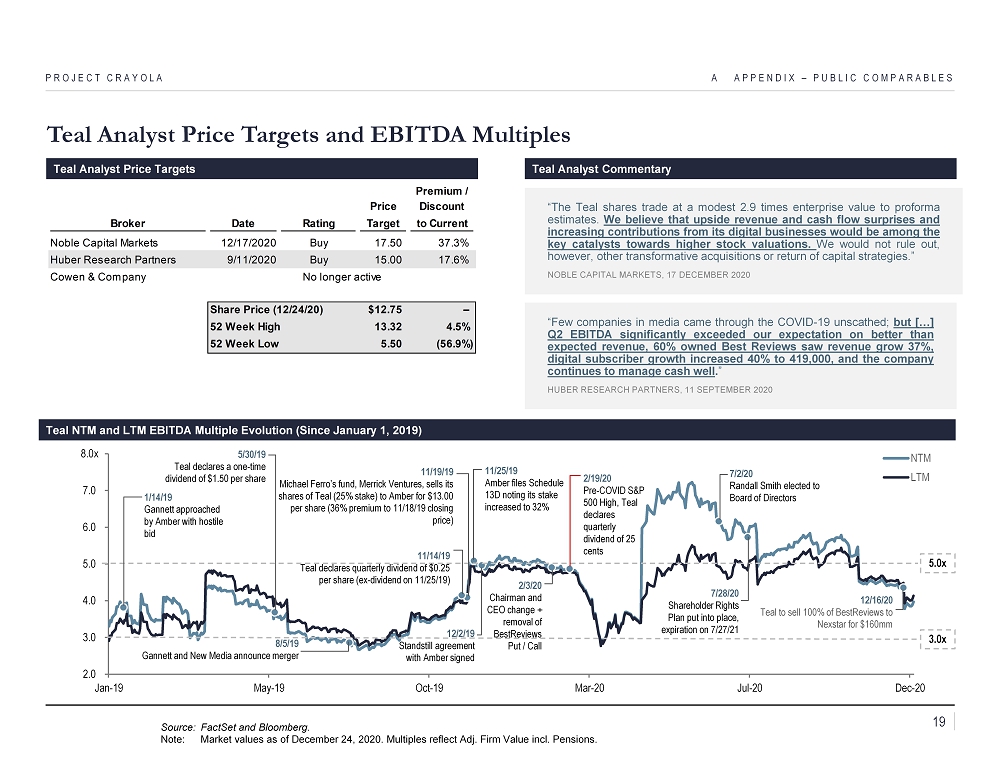
2.0 3.0 4.0 5.0 6.0 7.0 8.0x Jan-19 May-19 Oct-19 Mar-20 Jul-20 Dec-20 NTM LTM Teal Analyst Price Targets and EBITDA Multiples A APPENDIX – PUBLIC COMPARABLES PROJECT CRAYOLA Source: FactSet and Bloomberg. Note: Market values as of December 24, 2020. Multiples reflect Adj. Firm Value incl. Pensions. Teal NTM and LTM EBITDA Multiple Evolution (Since January 1, 2019) 5.0x 3.0x 5/30/19 Teal declares a one - time dividend of $1.50 per share Teal Analyst Price Targets Teal Analyst Commentary “Few companies in media came through the COVID - 19 unscathed ; but [ … ] Q 2 EBITDA significantly exceeded our expectation on better than expected revenue, 60 % owned Best Reviews saw revenue grow 37 % , digital subscriber growth increased 40 % to 419 , 000 , and the company continues to manage cash well . ” HUBER RESEARCH PARTNERS, 11 SEPTEMBER 2020 “The Teal shares trade at a modest 2 . 9 times enterprise value to proforma estimates . We believe that upside revenue and cash flow surprises and increasing contributions from its digital businesses would be among the key catalysts towards higher stock valuations . We would not rule out, however, other transformative acquisitions or return of capital strategies . ” NOBLE CAPITAL MARKETS, 17 DECEMBER 2020 Premium / Price Discount Broker Date Rating Target to Current Noble Capital Markets 12/17/2020 Buy 17.50 37.3% Huber Research Partners 9/11/2020 Buy 15.00 17.6% Cowen & Company Share Price (12/24/20) $12.75 – 52 Week High 13.32 4.5% 52 Week Low 5.50 (56.9%) No longer active 8/5/19 Gannett and New Media announce merger 11/19/19 Michael Ferro’s fund, Merrick Ventures, sells its shares of Teal (25% stake) to Amber for $13.00 per share (36% premium to 11/18/19 closing price) 1/14/19 Gannett approached by Amber with hostile bid 11/25/19 Amber files Schedule 13D noting its stake increased to 32% 12/2/19 Standstill agreement with Amber signed 11/14/19 Teal declares quarterly dividend of $0.25 per share (ex - dividend on 11/25/19) 2/3/20 Chairman and CEO change + removal of BestReviews Put / Call 2/19/20 Pre - COVID S&P 500 High, Teal declares quarterly dividend of 25 cents 7/2/20 Randall Smith elected to Board of Directors 7/28/20 Shareholder Rights Plan put into place, expiration on 7/27/21 12/16/20 Teal to sell 100% of BestReviews to Nexstar for $160mm 19
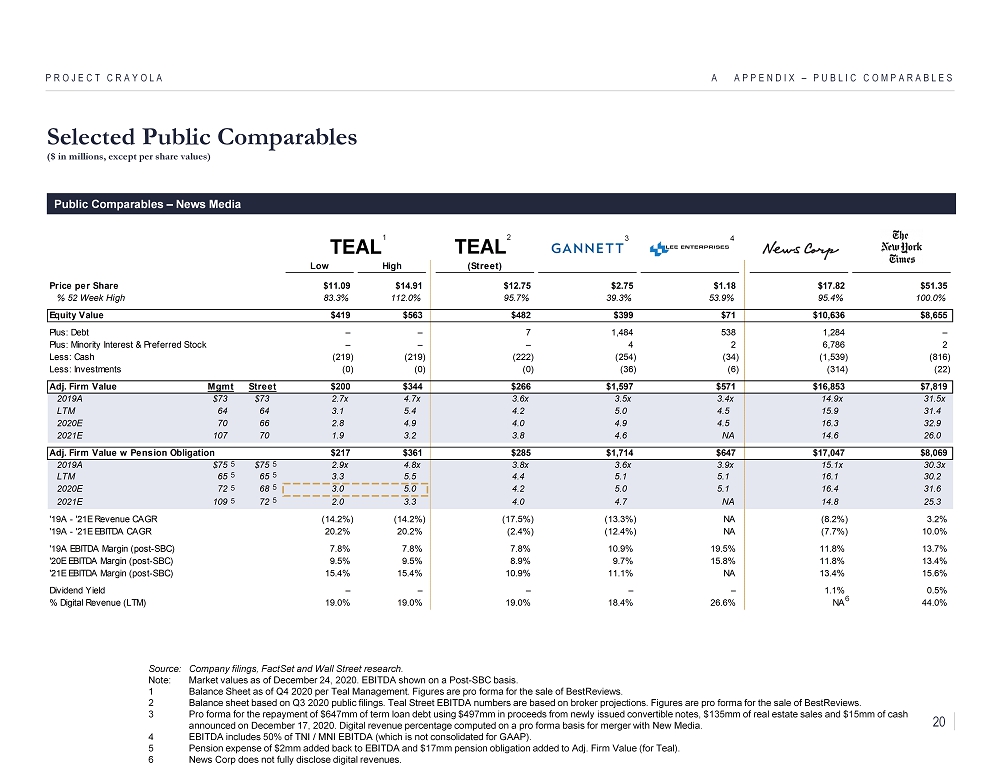
Low High (Street) Price per Share $11.09 $14.91 $12.75 $2.75 $1.18 $17.82 $51.35 % 52 Week High 83.3% 112.0% 95.7% 39.3% 53.9% 95.4% 100.0% Equity Value $419 $563 $482 $399 $71 $10,636 $8,655 Plus: Debt – – 7 1,484 538 1,284 – Plus: Minority Interest & Preferred Stock – – – 4 2 6,786 2 Less: Cash (219) (219) (222) (254) (34) (1,539) (816) Less: Investments (0) (0) (0) (36) (6) (314) (22) Adj. Firm Value Mgmt Street $200 $344 $266 $1,597 $571 $16,853 $7,819 2019A $73 $73 2.7x 4.7x 3.6x 3.5x 3.4x 14.9x 31.5x LTM 64 64 3.1 5.4 4.2 5.0 4.5 15.9 31.4 2020E 70 66 2.8 4.9 4.0 4.9 4.5 16.3 32.9 2021E 107 70 1.9 3.2 3.8 4.6 NA 14.6 26.0 Adj. Firm Value w Pension Obligation $217 $361 $285 $1,714 $647 $17,047 $8,069 2019A $75 $75 2.9x 4.8x 3.8x 3.6x 3.9x 15.1x 30.3x LTM 65 65 3.3 5.5 4.4 5.1 5.1 16.1 30.2 2020E 72 68 3.0 5.0 4.2 5.0 5.1 16.4 31.6 2021E 109 72 2.0 3.3 4.0 4.7 NA 14.8 25.3 '19A - '21E Revenue CAGR (14.2%) (14.2%) (17.5%) (13.3%) NA (8.2%) 3.2% '19A - '21E EBITDA CAGR 20.2% 20.2% (2.4%) (12.4%) NA (7.7%) 10.0% '19A EBITDA Margin (post-SBC) 7.8% 7.8% 7.8% 10.9% 19.5% 11.8% 13.7% '20E EBITDA Margin (post-SBC) 9.5% 9.5% 8.9% 9.7% 15.8% 11.8% 13.4% '21E EBITDA Margin (post-SBC) 15.4% 15.4% 10.9% 11.1% NA 13.4% 15.6% Dividend Yield – – – – – 1.1% 0.5% % Digital Revenue (LTM) 19.0% 19.0% 19.0% 18.4% 26.6% NA 44.0% TEAL TEAL Selected Public Comparables ($ in millions, except per share values) A APPENDIX – PUBLIC COMPARABLES PROJECT CRAYOLA Public Comparables – News Media 4 3 5 2 Source: Company filings, FactSet and Wall Street research. Note: Market values as of December 24, 2020. EBITDA shown on a Post - SBC basis. 1 Balance Sheet as of Q4 2020 per Teal Management. Figures are pro forma for the sale of BestReviews . 2 Balance sheet based on Q3 2020 public filings. Teal Street EBITDA numbers are based on broker projections. Figures are pro fo rma for the sale of BestReviews . 3 Pro forma for the repayment of $647mm of term loan debt using $497mm in proceeds from newly issued convertible notes, $135mm of real estate sales and $15mm of cash announced on December 17, 2020. Digital revenue percentage computed on a pro forma basis for merger with New Media. 4 EBITDA includes 50% of TNI / MNI EBITDA (which is not consolidated for GAAP). 5 Pension expense of $2mm added back to EBITDA and $17mm pension obligation added to Adj. Firm Value (for Teal). 6 News Corp does not fully disclose digital revenues. 1 5 5 6 5 5 5 5 5 20
CONFIDENTIAL B Appendix – Precedent Transactions PROJECT CRAYOLA
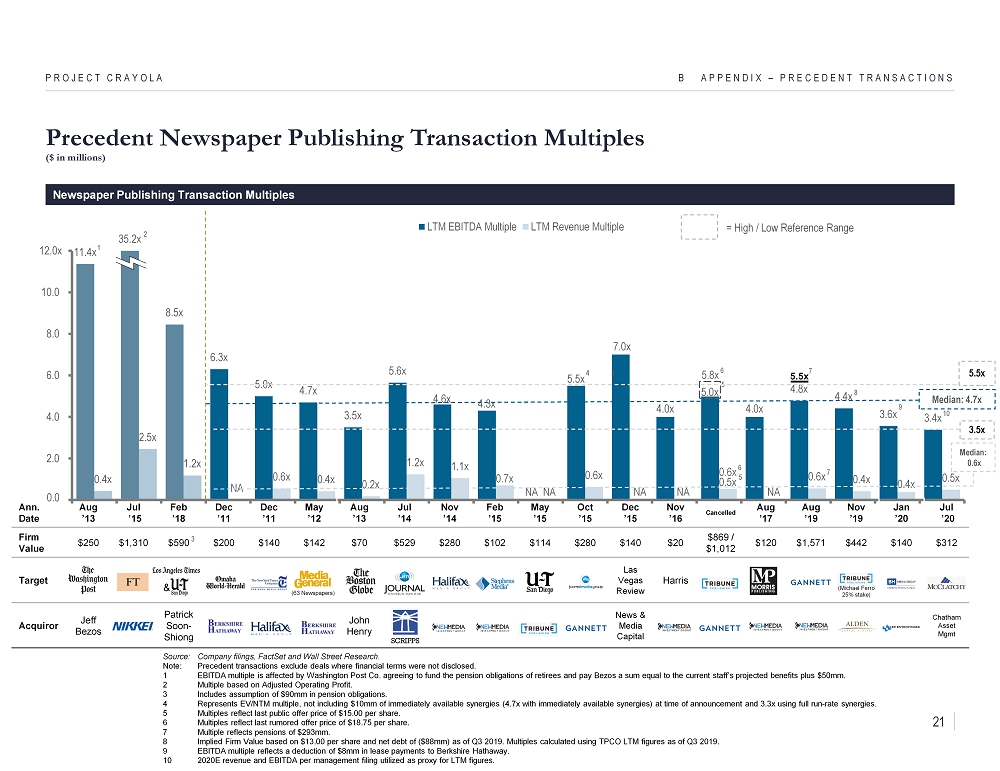
11.4x 35.2x 8.5x 6.3x 5.0x 4.7x 3.5x 5.6x 4.6x 4.3x NA 5.5x 7.0x 4.0x 5.0x 4.0x 4.8x 4.4x 3.6x 3.4x 0.4x 2.5x 1.2x NA 0.6x 0.4x 0.2x 1.2x 1.1x 0.7x NA 0.6x NA NA 0.5x NA 0.6x 0.4x 0.4x 0.5x 2.0 4.0 6.0 8.0 10.0 12.0x LTM EBITDA Multiple LTM Revenue Multiple 3.5x Precedent Newspaper Publishing Transaction Multiples ($ in millions) PROJECT CRAYOLA Newspaper Publishing Transaction Multiples Source: Company filings, FactSet and Wall Street Research. Note: Precedent transactions exclude deals where financial terms were not disclosed. 1 EBITDA multiple is affected by Washington Post Co. agreeing to fund the pension obligations of retirees and pay Bezos a sum e q ual to the current staff’s projected benefits plus $50mm. 2 Multiple based on Adjusted Operating Profit. 3 Includes assumption of $90mm in pension obligations. 4 Represents EV/NTM multiple, not including $10mm of immediately available synergies (4.7x with immediately available synergies ) a t time of announcement and 3.3x using full run - rate synergies. 5 Multiples reflect last public offer price of $15.00 per share. 6 Multiples reflect last rumored offer price of $18.75 per share. 7 Multiple reflects pensions of $293mm. 8 Implied Firm Value based on $13.00 per share and net debt of ($88mm) as of Q3 2019. Multiples calculated using TPCO LTM figur es as of Q3 2019. 9 EBITDA multiple reflects a deduction of $8mm in lease payments to Berkshire Hathaway. 10 2020E revenue and EBITDA per management filing utilized as proxy for LTM figures. 1 4 2 Ann. Date Aug ’13 Jul ’15 Feb ’18 Dec ’11 Dec ’11 May ’12 Aug ’13 Jul ’14 Nov ’14 Feb ’15 May ’15 Oct ’15 Dec ’15 Nov ’16 Cancelled Aug ’17 Aug ’19 Nov ’19 Jan ’20 Jul ’20 Firm Value $250 $1,310 $590 $200 $140 $142 $70 $529 $280 $102 $114 $280 $140 $20 $869 / $1,012 $120 $1,571 $442 $140 $312 Target Las Vegas Review Harris Acquiror Jeff Bezos Patrick Soon - Shiong John Henry News & Media Capital Chatham Asset Mgmt (63 Newspapers) B APPENDIX – PRECEDENT TRANSACTIONS 5.8x 6 5 0.6x 6 5 3 & 8 Median: 0.6x Median: 4.7x (Michael Ferro 25% stake) 5.5x 9 5.5x 7 7 = High / Low Reference Range 4 10 0.0 21
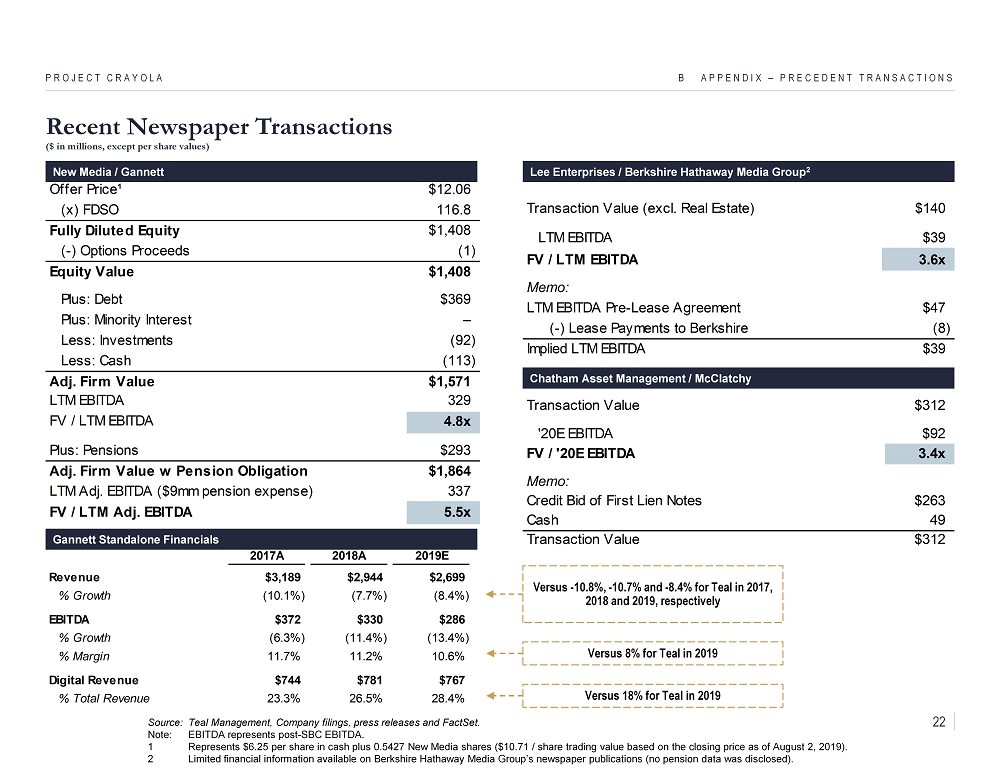
Recent Newspaper Transactions ($ in millions, except per share values) B APPENDIX – PRECEDENT TRANSACTIONS New Media / Gannett Source: Teal Management, Company filings, press releases and FactSet. Note: EBITDA represents post - SBC EBITDA. 1 Represents $6.25 per share in cash plus 0.5427 New Media shares ($10.71 / share trading value based on the closing price as o f A ugust 2, 2019). 2 Limited financial information available on Berkshire Hathaway Media Group’s newspaper publications (no pension data was discl ose d). PROJECT CRAYOLA Lee Enterprises / Berkshire Hathaway Media Group 2 Gannett Standalone Financials 2017A 2018A 2019E Revenue $3,189 $2,944 $2,699 % Growth (10.1%) (7.7%) (8.4%) EBITDA $372 $330 $286 % Growth (6.3%) (11.4%) (13.4%) % Margin 11.7% 11.2% 10.6% Digital Revenue $744 $781 $767 % Total Revenue 23.3% 26.5% 28.4% Offer Price¹ $12.06 (x) FDSO 116.8 Fully Diluted Equity $1,408 (-) Options Proceeds (1) Equity Value $1,408 Plus: Debt $369 Plus: Minority Interest – Less: Investments (92) Less: Cash (113) Adj. Firm Value $1,571 LTM EBITDA 329 FV / LTM EBITDA 4.8x Plus: Pensions $293 Adj. Firm Value w Pension Obligation $1,864 LTM Adj. EBITDA ($9mm pension expense) 337 FV / LTM Adj. EBITDA 5.5x Versus - 10.8%, - 10.7% and - 8.4% for Teal in 2017, 2018 and 2019, respectively Versus 8% for Teal in 2019 Versus 18% for Teal in 2019 Transaction Value (excl. Real Estate) $140 LTM EBITDA $39 FV / LTM EBITDA 3.6x Memo: LTM EBITDA Pre-Lease Agreement $47 (-) Lease Payments to Berkshire (8) Implied LTM EBITDA $39 Chatham Asset Management / McClatchy Transaction Value $312 '20E EBITDA $92 FV / '20E EBITDA 3.4x Memo: Credit Bid of First Lien Notes $263 Cash 49 Transaction Value $312 22
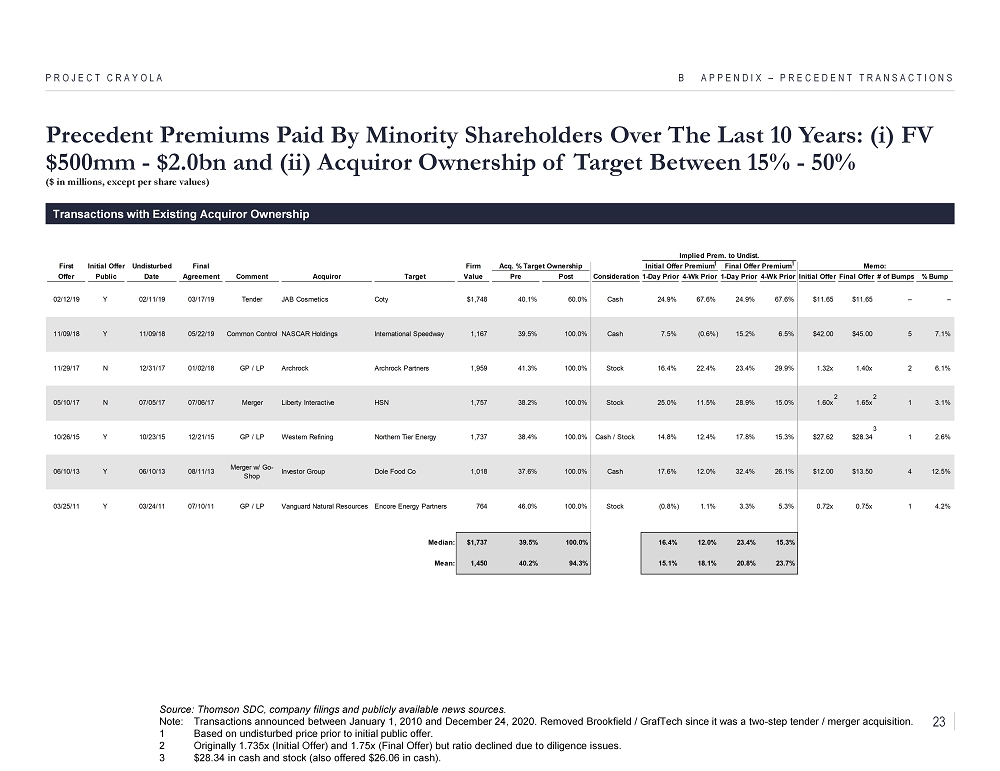
Precedent Premiums Paid By Minority Shareholders Over The Last 10 Years: ( i ) FV $500mm - $ 2.0bn and (ii) Acquiror Ownership of Target Between 15% - 50% ($ in millions, except per share values) B APPENDIX – PRECEDENT TRANSACTIONS PROJECT CRAYOLA Source: Thomson SDC, company filings and publicly available news sources. Note: Transactions announced between January 1, 2010 and December 24, 2020. Removed Brookfield / GrafTech since it was a two - step tender / merger acquisition. 1 Based on undisturbed price prior to initial public offer. 2 Originally 1.735x (Initial Offer) and 1.75x (Final Offer) but ratio declined due to diligence issues. 3 $28.34 in cash and stock (also offered $26.06 in cash). Transactions with Existing Acquiror Ownership 3 1 1 Implied Prem. to Undist. First Initial Offer Undisturbed Final Firm Acq. % Target Ownership Initial Offer Premium Final Offer Premium Memo: Offer Public Date Agreement Comment Acquiror Target Value Pre Post Consideration1-Day Prior 4-Wk Prior 1-Day Prior 4-Wk Prior Initial OfferFinal Offer# of Bumps % Bump 02/12/19 Y 02/11/19 03/17/19 Tender JAB Cosmetics Coty $1,748 40.1% 60.0% Cash 24.9% 67.6% 24.9% 67.6% $11.65 $11.65 – – 11/09/18 Y 11/09/18 05/22/19 Common Control NASCAR Holdings International Speedway 1,167 39.5% 100.0% Cash 7.5% (0.6%) 15.2% 6.5% $42.00 $45.00 5 7.1% 11/29/17 N 12/31/17 01/02/18 GP / LP Archrock Archrock Partners 1,959 41.3% 100.0% Stock 16.4% 22.4% 23.4% 29.9% 1.32x 1.40x 2 6.1% 05/10/17 N 07/05/17 07/06/17 Merger Liberty Interactive HSN 1,757 38.2% 100.0% Stock 25.0% 11.5% 28.9% 15.0% 1.60x 1.65x 1 3.1% 10/26/15 Y 10/23/15 12/21/15 GP / LP Western Refining Northern Tier Energy 1,737 38.4% 100.0% Cash / Stock 14.8% 12.4% 17.8% 15.3% $27.62 $28.34 1 2.6% 06/10/13 Y 06/10/13 08/11/13 Merger w/ Go- Shop Investor Group Dole Food Co 1,018 37.6% 100.0% Cash 17.6% 12.0% 32.4% 26.1% $12.00 $13.50 4 12.5% 03/25/11 Y 03/24/11 07/10/11 GP / LP Vanguard Natural Resources Encore Energy Partners 764 46.0% 100.0% Stock (0.8%) 1.1% 3.3% 5.3% 0.72x 0.75x 1 4.2% Median: $1,737 39.5% 100.0% 16.4% 12.0% 23.4% 15.3% Mean: 1,450 40.2% 94.3% 15.1% 18.1% 20.8% 23.7% 2 2 23
CONFIDENTIAL C Appendix – Business Plan PROJECT CRAYOLA
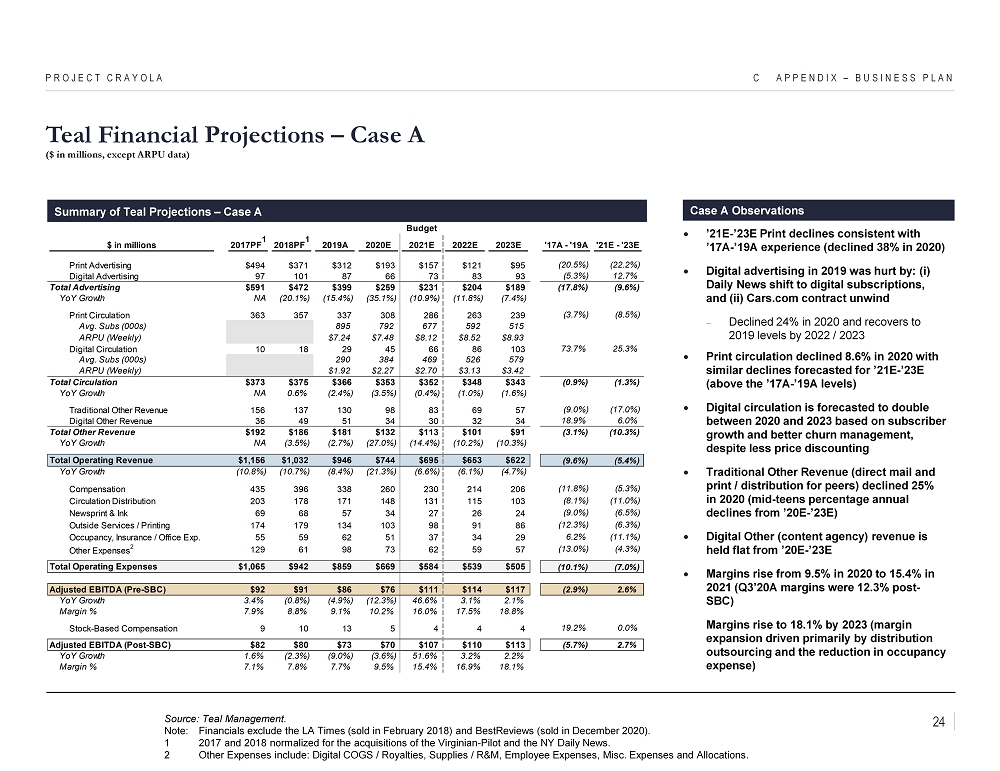
’21E - ’23E Print declines consistent with ’17A - ’19A experience (declined 38% in 2020) Digital advertising in 2019 was hurt by: ( i ) Daily News shift to digital subscriptions, and (ii) Cars.com contract unwind Declined 24% in 2020 and recovers to 2019 levels by 2022 / 2023 Print circulation declined 8.6% in 2020 with similar declines forecasted for ’21E - ’23E (above the ’17A - ’19A levels) Digital circulation is forecasted to double between 2020 and 2023 based on subscriber growth and better churn management, despite less price discounting Traditional Other Revenue (direct mail and print / distribution for peers) declined 25% in 2020 (mid - teens percentage annual declines from ’20E - ’23E) Digital Other (content agency) revenue is held flat from ’20E - ’23E Margins rise from 9.5% in 2020 to 15.4% in 2021 (Q3’20A margins were 12.3% post - SBC) Margins rise to 18.1% by 2023 (margin expansion driven primarily by distribution outsourcing and the reduction in occupancy expense) Teal Financial Projections – Case A ($ in millions, except ARPU data) C APPENDIX – BUSINESS PLAN PROJECT CRAYOLA Summary of Teal Projections – Case A Case A Observations Source: Teal Management. Note: Financials exclude the LA Times (sold in February 2018) and BestReviews (sold in December 2020). 1 2017 and 2018 normalized for the acquisitions of the Virginian - Pilot and the NY Daily News. 2 Other Expenses include: Digital COGS / Royalties, Supplies / R&M, Employee Expenses, Misc. Expenses and Allocations. Budget $ in millions 2017PF 1 2018PF 1 2019A 2020E 2021E 2022E 2023E '17A - '19A '21E - '23E Print Advertising $494 $371 $312 $193 $157 $121 $95 (20.5%) (22.2%) Digital Advertising 97 101 87 66 73 83 93 (5.3%) 12.7% Total Advertising $591 $472 $399 $259 $231 $204 $189 (17.8%) (9.6%) YoY Growth NA (20.1%) (15.4%) (35.1%) (10.9%) (11.8%) (7.4%) Print Circulation 363 357 337 308 286 263 239 (3.7%) (8.5%) Avg. Subs (000s) 895 792 677 592 515 ARPU (Weekly) $7.24 $7.48 $8.12 $8.52 $8.93 Digital Circulation 10 18 29 45 66 86 103 73.7% 25.3% Avg. Subs (000s) 290 384 469 526 579 ARPU (Weekly) $1.92 $2.27 $2.70 $3.13 $3.42 Total Circulation $373 $375 $366 $353 $352 $348 $343 (0.9%) (1.3%) YoY Growth NA 0.6% (2.4%) (3.5%) (0.4%) (1.0%) (1.6%) Traditional Other Revenue 156 137 130 98 83 69 57 (9.0%) (17.0%) Digital Other Revenue 36 49 51 34 30 32 34 18.9% 6.0% Total Other Revenue $192 $186 $181 $132 $113 $101 $91 (3.1%) (10.3%) YoY Growth NA (3.5%) (2.7%) (27.0%) (14.4%) (10.2%) (10.3%) Total Operating Revenue $1,156 $1,032 $946 $744 $695 $653 $622 (9.6%) (5.4%) YoY Growth (10.8%) (10.7%) (8.4%) (21.3%) (6.6%) (6.1%) (4.7%) Compensation 435 396 338 260 230 214 206 (11.8%) (5.3%) Circulation Distribution 203 178 171 148 131 115 103 (8.1%) (11.0%) Newsprint & Ink 69 68 57 34 27 26 24 (9.0%) (6.5%) Outside Services / Printing 174 179 134 103 98 91 86 (12.3%) (6.3%) Occupancy, Insurance / Office Exp. 55 59 62 51 37 34 29 6.2% (11.1%) Other Expenses 2 129 61 98 73 62 59 57 (13.0%) (4.3%) Total Operating Expenses $1,065 $942 $859 $669 $584 $539 $505 (10.1%) (7.0%) Adjusted EBITDA (Pre-SBC) $92 $91 $86 $76 $111 $114 $117 (2.9%) 2.6% YoY Growth 3.4% (0.8%) (4.9%) (12.3%) 46.6% 3.1% 2.1% Margin % 7.9% 8.8% 9.1% 10.2% 16.0% 17.5% 18.8% Stock-Based Compensation 9 10 13 5 4 4 4 19.2% 0.0% Adjusted EBITDA (Post-SBC) $82 $80 $73 $70 $107 $110 $113 (5.7%) 2.7% YoY Growth 1.6% (2.3%) (9.0%) (3.6%) 51.6% 3.2% 2.2% Margin % 7.1% 7.8% 7.7% 9.5% 15.4% 16.9% 18.1% 24
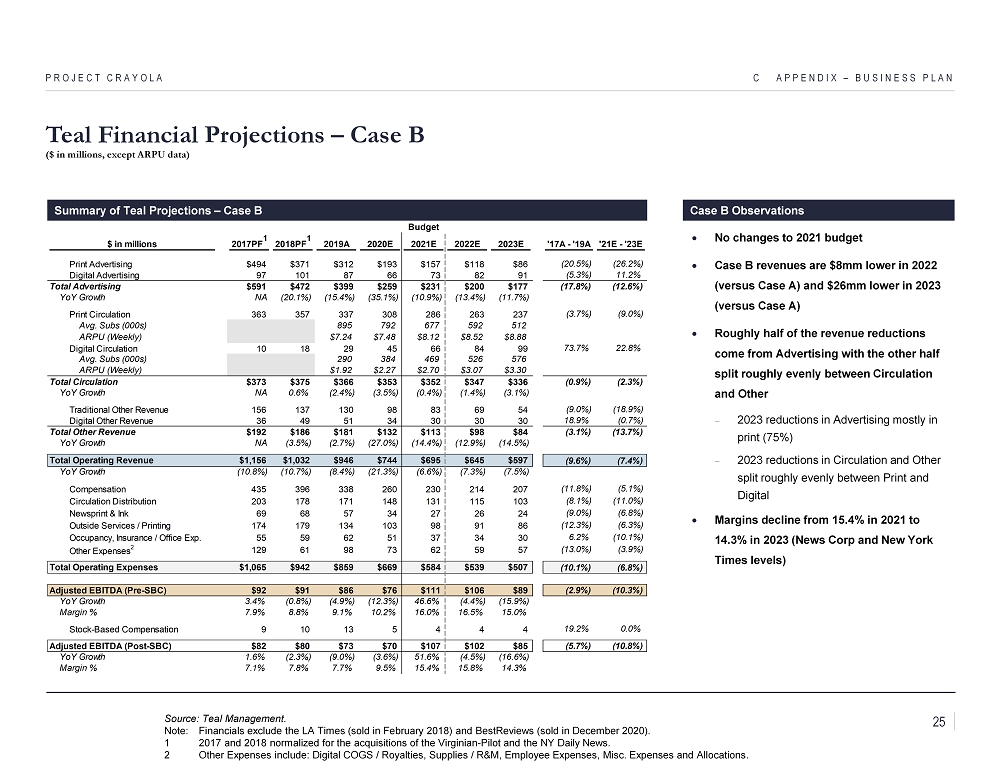
No changes to 2021 budget Case B revenues are $8mm lower in 2022 (versus Case A) and $26mm lower in 2023 (versus Case A) Roughly half of the revenue reductions come from Advertising with the other half split roughly evenly between Circulation and Other 2023 reductions in Advertising mostly in print (75%) 2023 reductions in Circulation and Other split roughly evenly between Print and Digital Margins decline from 15.4% in 2021 to 14.3% in 2023 (News Corp and New York Times levels) Teal Financial Projections – Case B ($ in millions, except ARPU data) C APPENDIX – BUSINESS PLAN PROJECT CRAYOLA Summary of Teal Projections – Case B Case B Observations Source: Teal Management. Note: Financials exclude the LA Times (sold in February 2018) and BestReviews (sold in December 2020). 1 2017 and 2018 normalized for the acquisitions of the Virginian - Pilot and the NY Daily News. 2 Other Expenses include: Digital COGS / Royalties, Supplies / R&M, Employee Expenses, Misc. Expenses and Allocations. Budget $ in millions 2017PF 1 2018PF 1 2019A 2020E 2021E 2022E 2023E '17A - '19A '21E - '23E Print Advertising $494 $371 $312 $193 $157 $118 $86 (20.5%) (26.2%) Digital Advertising 97 101 87 66 73 82 91 (5.3%) 11.2% Total Advertising $591 $472 $399 $259 $231 $200 $177 (17.8%) (12.6%) YoY Growth NA (20.1%) (15.4%) (35.1%) (10.9%) (13.4%) (11.7%) Print Circulation 363 357 337 308 286 263 237 (3.7%) (9.0%) Avg. Subs (000s) 895 792 677 592 512 ARPU (Weekly) $7.24 $7.48 $8.12 $8.52 $8.88 Digital Circulation 10 18 29 45 66 84 99 73.7% 22.8% Avg. Subs (000s) 290 384 469 526 576 ARPU (Weekly) $1.92 $2.27 $2.70 $3.07 $3.30 Total Circulation $373 $375 $366 $353 $352 $347 $336 (0.9%) (2.3%) YoY Growth NA 0.6% (2.4%) (3.5%) (0.4%) (1.4%) (3.1%) Traditional Other Revenue 156 137 130 98 83 69 54 (9.0%) (18.9%) Digital Other Revenue 36 49 51 34 30 30 30 18.9% (0.7%) Total Other Revenue $192 $186 $181 $132 $113 $98 $84 (3.1%) (13.7%) YoY Growth NA (3.5%) (2.7%) (27.0%) (14.4%) (12.9%) (14.5%) Total Operating Revenue $1,156 $1,032 $946 $744 $695 $645 $597 (9.6%) (7.4%) YoY Growth (10.8%) (10.7%) (8.4%) (21.3%) (6.6%) (7.3%) (7.5%) Compensation 435 396 338 260 230 214 207 (11.8%) (5.1%) Circulation Distribution 203 178 171 148 131 115 103 (8.1%) (11.0%) Newsprint & Ink 69 68 57 34 27 26 24 (9.0%) (6.8%) Outside Services / Printing 174 179 134 103 98 91 86 (12.3%) (6.3%) Occupancy, Insurance / Office Exp. 55 59 62 51 37 34 30 6.2% (10.1%) Other Expenses 2 129 61 98 73 62 59 57 (13.0%) (3.9%) Total Operating Expenses $1,065 $942 $859 $669 $584 $539 $507 (10.1%) (6.8%) Adjusted EBITDA (Pre-SBC) $92 $91 $86 $76 $111 $106 $89 (2.9%) (10.3%) YoY Growth 3.4% (0.8%) (4.9%) (12.3%) 46.6% (4.4%) (15.9%) Margin % 7.9% 8.8% 9.1% 10.2% 16.0% 16.5% 15.0% Stock-Based Compensation 9 10 13 5 4 4 4 19.2% 0.0% Adjusted EBITDA (Post-SBC) $82 $80 $73 $70 $107 $102 $85 (5.7%) (10.8%) YoY Growth 1.6% (2.3%) (9.0%) (3.6%) 51.6% (4.5%) (16.6%) Margin % 7.1% 7.8% 7.7% 9.5% 15.4% 15.8% 14.3% 25
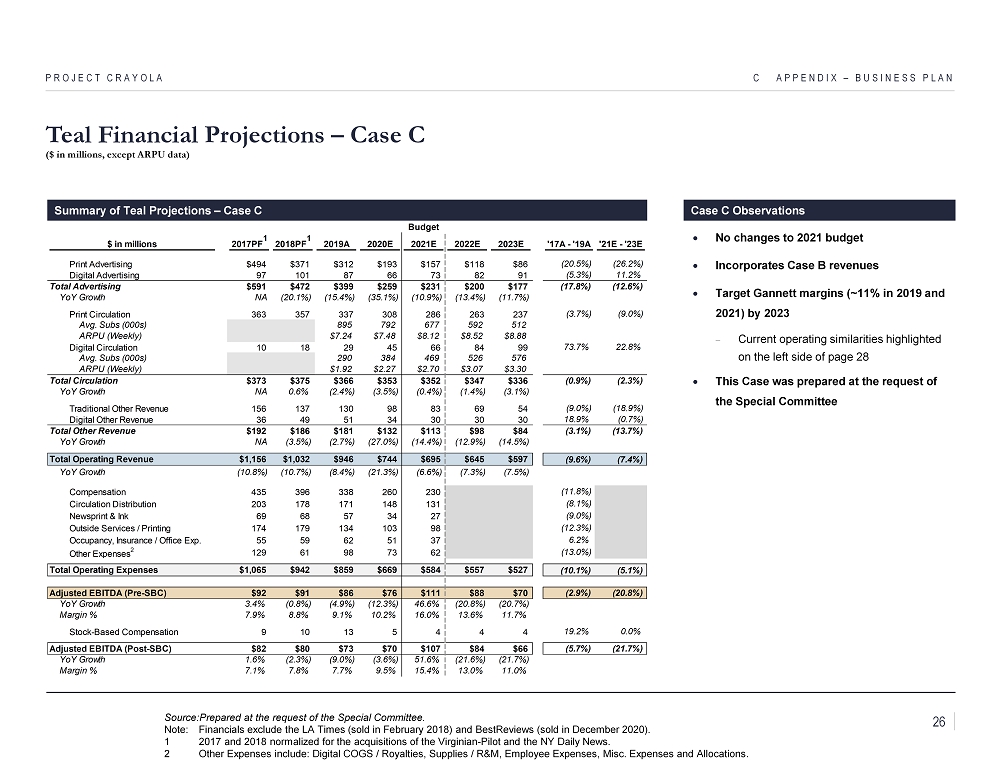
No changes to 2021 budget Incorporates Case B revenues Target Gannett margins (~11% in 2019 and 2021) by 2023 Current operating similarities highlighted on the left side of page 28 This Case was prepared at the request of the Special Committee Teal Financial Projections – Case C ($ in millions, except ARPU data) C APPENDIX – BUSINESS PLAN PROJECT CRAYOLA Summary of Teal Projections – Case C Case C Observations Source:Prepared at the request of the Special Committee. Note: Financials exclude the LA Times (sold in February 2018) and BestReviews (sold in December 2020). 1 2017 and 2018 normalized for the acquisitions of the Virginian - Pilot and the NY Daily News. 2 Other Expenses include: Digital COGS / Royalties, Supplies / R&M, Employee Expenses, Misc. Expenses and Allocations. Budget $ in millions 2017PF 1 2018PF 1 2019A 2020E 2021E 2022E 2023E '17A - '19A '21E - '23E Print Advertising $494 $371 $312 $193 $157 $118 $86 (20.5%) (26.2%) Digital Advertising 97 101 87 66 73 82 91 (5.3%) 11.2% Total Advertising $591 $472 $399 $259 $231 $200 $177 (17.8%) (12.6%) YoY Growth NA (20.1%) (15.4%) (35.1%) (10.9%) (13.4%) (11.7%) Print Circulation 363 357 337 308 286 263 237 (3.7%) (9.0%) Avg. Subs (000s) 895 792 677 592 512 ARPU (Weekly) $7.24 $7.48 $8.12 $8.52 $8.88 Digital Circulation 10 18 29 45 66 84 99 73.7% 22.8% Avg. Subs (000s) 290 384 469 526 576 ARPU (Weekly) $1.92 $2.27 $2.70 $3.07 $3.30 Total Circulation $373 $375 $366 $353 $352 $347 $336 (0.9%) (2.3%) YoY Growth NA 0.6% (2.4%) (3.5%) (0.4%) (1.4%) (3.1%) Traditional Other Revenue 156 137 130 98 83 69 54 (9.0%) (18.9%) Digital Other Revenue 36 49 51 34 30 30 30 18.9% (0.7%) Total Other Revenue $192 $186 $181 $132 $113 $98 $84 (3.1%) (13.7%) YoY Growth NA (3.5%) (2.7%) (27.0%) (14.4%) (12.9%) (14.5%) Total Operating Revenue $1,156 $1,032 $946 $744 $695 $645 $597 (9.6%) (7.4%) YoY Growth (10.8%) (10.7%) (8.4%) (21.3%) (6.6%) (7.3%) (7.5%) Compensation 435 396 338 260 230 (11.8%) Circulation Distribution 203 178 171 148 131 (8.1%) Newsprint & Ink 69 68 57 34 27 (9.0%) Outside Services / Printing 174 179 134 103 98 (12.3%) Occupancy, Insurance / Office Exp. 55 59 62 51 37 6.2% Other Expenses 2 129 61 98 73 62 (13.0%) Total Operating Expenses $1,065 $942 $859 $669 $584 $557 $527 (10.1%) (5.1%) Adjusted EBITDA (Pre-SBC) $92 $91 $86 $76 $111 $88 $70 (2.9%) (20.8%) YoY Growth 3.4% (0.8%) (4.9%) (12.3%) 46.6% (20.8%) (20.7%) Margin % 7.9% 8.8% 9.1% 10.2% 16.0% 13.6% 11.7% Stock-Based Compensation 9 10 13 5 4 4 4 19.2% 0.0% Adjusted EBITDA (Post-SBC) $82 $80 $73 $70 $107 $84 $66 (5.7%) (21.7%) YoY Growth 1.6% (2.3%) (9.0%) (3.6%) 51.6% (21.6%) (21.7%) Margin % 7.1% 7.8% 7.7% 9.5% 15.4% 13.0% 11.0% 26

Differences Between Cases – Cases B and C Relative to Case A ($ in millions) C APPENDIX – BUSINESS PLAN PROJECT CRAYOLA Gap in Revenue Analysis Gap in Revenue 2021E Versus 2020E 2022E Gap 2023E Gap $ in millions 2021E 2020E Gap Case A Case B Case C A to B A to C Case A Case B Case C A to B A to C Print Advertising $157 $193 ($36) $121 $118 $118 ($3) ($3) $95 $86 $86 ($9) ($9) Digital Advertising 73 66 7 83 82 $82 (0) (0) 93 91 91 (3) (3) Total Advertising $231 $259 ($28) $204 $200 $200 ($4) ($4) $189 $177 $177 ($12) ($12) Print Circulation 286 308 (22) 263 263 263 – – 239 237 237 (3) (3) Digital Circulation 66 45 21 86 84 84 (2) (2) 103 99 99 (4) (4) Total Circulation $352 $353 ($2) $348 $347 $347 ($2) ($2) $343 $336 $336 ($7) ($7) Traditional Other Revenue 83 98 (15) 69 69 69 (1) (1) 57 54 54 (3) (3) Digital Other Revenue 30 34 (4) 32 30 30 (2) (2) 34 30 30 (4) (4) Total Other Revenue $113 $132 ($19) $101 $98 $98 ($3) ($3) $91 $84 $84 ($7) ($7) Total Operating Revenue $695 $744 ($49) $653 $645 $645 ($8) ($8) $622 $597 $597 ($26) ($26) Operating Expenses Operating Expenses as a Percentage of Revenue 2021E Versus 2020E 2022E Gap 2023E Gap $ in millions 2021E 2020E Gap Case A Case B Case C A to B A to C Case A Case B Case C A to B A to C Compensation 33.0% 34.9% (1.9%) 32.8% 33.2% 0.4% 33.1% 34.7% 1.6% Circulation Distribution 18.8% 19.9% (1.1%) 17.6% 17.8% 0.2% 16.6% 17.3% 0.7% Newsprint & Ink 3.9% 4.5% (0.6%) 3.9% 4.0% 0.1% 3.8% 4.0% 0.1% Outside Services / Printing 14.1% 13.8% 0.3% 14.0% 14.2% 0.2% 13.8% 14.4% 0.6% Occupancy, Insurance / Office Exp. 5.3% 6.9% (1.5%) 5.2% 5.3% 0.1% 4.7% 5.0% 0.3% Other Expenses1 8.9% 9.8% (0.9%) 9.0% 9.1% 0.1% 9.1% 9.6% 0.5% Stock-Based Compensation 0.6% 0.7% (0.1%) 0.6% 0.6% 0.0% 0.7% 0.7% 0.0% Total Operating Expenses 84.6% 90.5% (5.9%) 83.1% 84.2% 87.0% 1.1% 3.9% 81.9% 85.7% 89.0% 3.9% 7.1% EBITDA (Post-SBC) $107 $70 $36 $110 $102 $84 ($8) ($27) $113 $85 $66 ($28) ($47) Margin % 15.4% 9.5% 16.9% 15.8% 13.0% 18.1% 14.3% 11.0% Source: Teal Management. 1 Other Expenses include: Digital COGS / Royalties, Supplies / R&M, Employee Expenses, Misc. Expenses and Allocations. 27
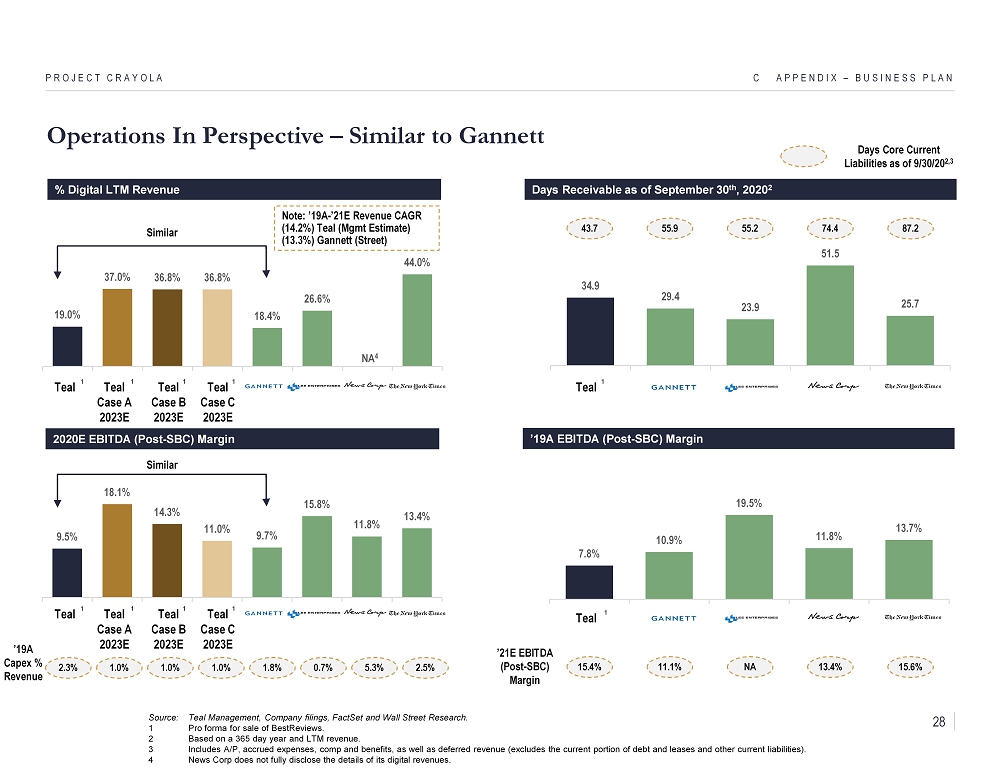
Operations In Perspective – Similar to Gannett C APPENDIX – BUSINESS PLAN PROJECT CRAYOLA % Digital LTM Revenue Days Receivable as of September 30 th , 2020 2 Source: Teal Management, Company filings, FactSet and Wall Street Research. 1 Pro forma for sale of BestReviews . 2 Based on a 365 day year and LTM revenue. 3 Includes A/P, accrued expenses, comp and benefits, as well as deferred revenue (excludes the current portion of debt and leas es and other current liabilities). 4 News Corp does not fully disclose the details of its digital revenues. 2020E EBITDA (Post - SBC) Margin ’19A EBITDA (Post - SBC) Margin 34.9 29.4 23.9 51.5 25.7 1 Teal 7.8% 10.9% 19.5% 11.8% 13.7% 1 Teal 19.0% 37.0% 36.8% 36.8% 18.4% 26.6% 44.0% Teal 1 9.5% 18.1% 14.3% 11.0% 9.7% 15.8% 11.8% 13.4% 2.5% 5.3% 0.7% 2.3% 1.8% ’19A Capex % Revenue Teal Case A 2023E 1 Teal Case B 2023E 1 1.0% 1.0% Teal Case C 2023E 1 87.2 74.4 55.2 Similar 43.7 55.9 Teal 1 Teal Case A 2023E 1 Teal Case B 2023E 1 Teal Case C 2023E 1 1.0% 15.6% 13.4% NA 15.4% 11.1% ’21E EBITDA (Post - SBC) Margin NA 4 Days Core Current Liabilities as of 9/30/20 2,3 Similar Note: ’19A - ’21E Revenue CAGR (14.2%) Teal ( Mgmt Estimate) (13.3%) Gannett (Street) 28
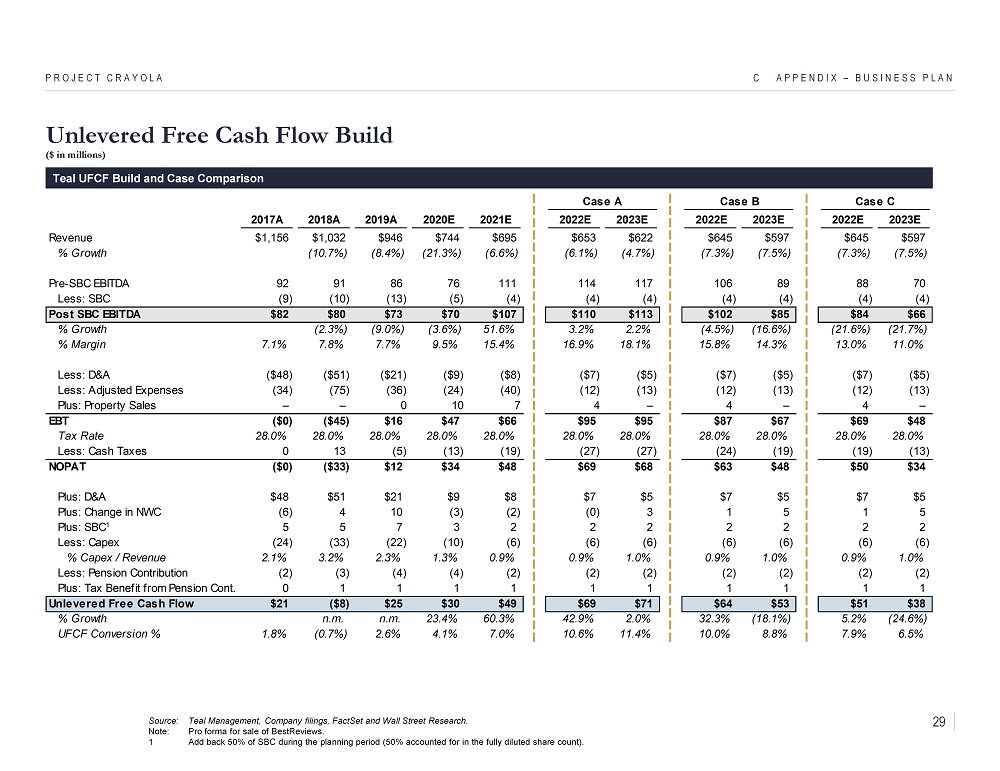
Unlevered Free Cash Flow Build ($ in millions) C APPENDIX – BUSINESS PLAN PROJECT CRAYOLA Case A Case B Case C February Model 2017A 2018A 2019A 2020E 2021E 2022E 2023E 2022E 2023E 2022E 2023E Revenue $1,156 $1,032 $946 $744 $695 $653 $622 $645 $597 $645 $597 % Growth (10.7%) (8.4%) (21.3%) (6.6%) (6.1%) (4.7%) (7.3%) (7.5%) (7.3%) (7.5%) Pre-SBC EBITDA 92 91 86 76 111 114 117 106 89 88 70 Less: SBC (9) (10) (13) (5) (4) (4) (4) (4) (4) (4) (4) Post SBC EBITDA $82 $80 $73 $70 $107 $110 $113 $102 $85 $84 $66 % Growth (2.3%) (9.0%) (3.6%) 51.6% 3.2% 2.2% (4.5%) (16.6%) (21.6%) (21.7%) % Margin 7.1% 7.8% 7.7% 9.5% 15.4% 16.9% 18.1% 15.8% 14.3% 13.0% 11.0% Less: D&A ($48) ($51) ($21) ($9) ($8) ($7) ($5) ($7) ($5) ($7) ($5) Less: Adjusted Expenses (34) (75) (36) (24) (40) (12) (13) (12) (13) (12) (13) Plus: Property Sales – – 0 10 7 4 – 4 – 4 – EBT ($0) ($45) $16 $47 $66 $95 $95 $87 $67 $69 $48 Tax Rate 28.0% 28.0% 28.0% 28.0% 28.0% 28.0% 28.0% 28.0% 28.0% 28.0% 28.0% Less: Cash Taxes 0 13 (5) (13) (19) (27) (27) (24) (19) (19) (13) NOPAT ($0) ($33) $12 $34 $48 $69 $68 $63 $48 $50 $34 Plus: D&A $48 $51 $21 $9 $8 $7 $5 $7 $5 $7 $5 Plus: Change in NWC (6) 4 10 (3) (2) (0) 3 1 5 1 5 Plus: SBC1 5 5 7 3 2 2 2 2 2 2 2 Less: Capex (24) (33) (22) (10) (6) (6) (6) (6) (6) (6) (6) % Capex / Revenue 2.1% 3.2% 2.3% 1.3% 0.9% 0.9% 1.0% 0.9% 1.0% 0.9% 1.0% Less: Pension Contribution (2) (3) (4) (4) (2) (2) (2) (2) (2) (2) (2) Plus: Tax Benefit from Pension Cont. 0 1 1 1 1 1 1 1 1 1 1 Unlevered Free Cash Flow $21 ($8) $25 $30 $49 $69 $71 $64 $53 $51 $38 % Growth n.m. n.m. 23.4% 60.3% 42.9% 2.0% 32.3% (18.1%) 5.2% (24.6%) UFCF Conversion % 1.8% (0.7%) 2.6% 4.1% 7.0% 10.6% 11.4% 10.0% 8.8% 7.9% 6.5% Source: Teal Management, Company filings, FactSet and Wall Street Research. Note: Pro forma for sale of BestReviews . 1 Add back 50% of SBC during the planning period (50% accounted for in the fully diluted share count). Teal UFCF Build and Case Comparison 29
CONFIDENTIAL D Appendix – DCF PROJECT CRAYOLA
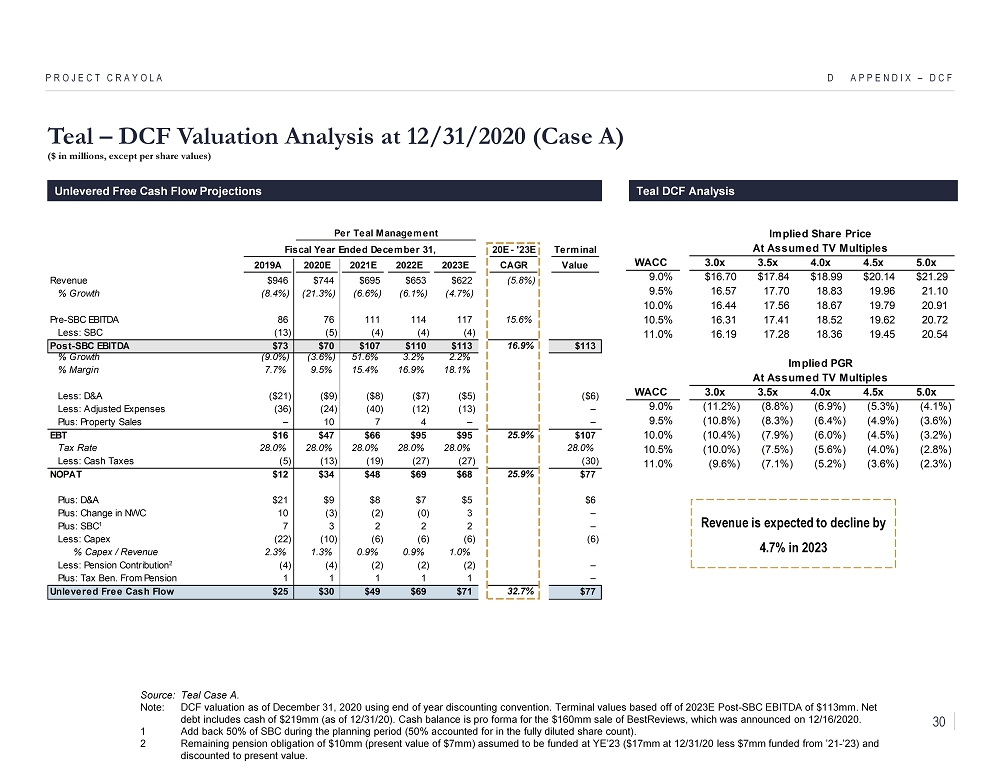
D APPENDIX – DCF PROJECT CRAYOLA Unlevered Free Cash Flow Projections Source: Teal Case A. Note: DCF valuation as of December 31, 2020 using end of year discounting convention. Terminal values based off of 2023E Post - SB C EBITDA of $113mm. Net debt includes cash of $219mm (as of 12/31/20). Cash balance is pro forma for the $160mm sale of BestReviews , which was announced on 12/16/2020. 1 Add back 50% of SBC during the planning period (50% accounted for in the fully diluted share count). 2 Remaining pension obligation of $10mm (present value of $7mm) assumed to be funded at YE’23 ($17mm at 12/31/20 less $7mm fund ed from ’21 - ’23) and discounted to present value. Teal – DCF Valuation Analysis at 12/31/2020 (Case A) ($ in millions, except per share values) Per Teal Management Fiscal Year Ended December 31, 20E - '23E Terminal 2019A 2020E 2021E 2022E 2023E CAGR Value Revenue $946 $744 $695 $653 $622 (5.8%) % Growth (8.4%) (21.3%) (6.6%) (6.1%) (4.7%) Pre-SBC EBITDA 86 76 111 114 117 15.6% Less: SBC (13) (5) (4) (4) (4) Post-SBC EBITDA $73 $70 $107 $110 $113 16.9% $113 % Growth (9.0%) (3.6%) 51.6% 3.2% 2.2% % Margin 7.7% 9.5% 15.4% 16.9% 18.1% Less: D&A ($21) ($9) ($8) ($7) ($5) ($6) Less: Adjusted Expenses (36) (24) (40) (12) (13) – Plus: Property Sales – 10 7 4 – – EBT $16 $47 $66 $95 $95 25.9% $107 Tax Rate 28.0% 28.0% 28.0% 28.0% 28.0% 28.0% Less: Cash Taxes (5) (13) (19) (27) (27) (30) NOPAT $12 $34 $48 $69 $68 25.9% $77 Plus: D&A $21 $9 $8 $7 $5 $6 Plus: Change in NWC 10 (3) (2) (0) 3 – Plus: SBC1 7 3 2 2 2 – Less: Capex (22) (10) (6) (6) (6) (6) % Capex / Revenue 2.3% 1.3% 0.9% 0.9% 1.0% Less: Pension Contribution2 (4) (4) (2) (2) (2) – Plus: Tax Ben. From Pension 1 1 1 1 1 – Unlevered Free Cash Flow $25 $30 $49 $69 $71 32.7% $77 Teal DCF Analysis Implied Share Price At Assumed TV Multiples WACC 3.0x 3.5x 4.0x 4.5x 5.0x 9.0% $16.70 $17.84 $18.99 $20.14 $21.29 9.5% 16.57 17.70 18.83 19.96 21.10 10.0% 16.44 17.56 18.67 19.79 20.91 10.5% 16.31 17.41 18.52 19.62 20.72 11.0% 16.19 17.28 18.36 19.45 20.54 Implied PGR At Assumed TV Multiples WACC 3.0x 3.5x 4.0x 4.5x 5.0x 9.0% (11.2%) (8.8%) (6.9%) (5.3%) (4.1%) 9.5% (10.8%) (8.3%) (6.4%) (4.9%) (3.6%) 10.0% (10.4%) (7.9%) (6.0%) (4.5%) (3.2%) 10.5% (10.0%) (7.5%) (5.6%) (4.0%) (2.8%) 11.0% (9.6%) (7.1%) (5.2%) (3.6%) (2.3%) Revenue is expected to decline by 4.7% in 2023 30
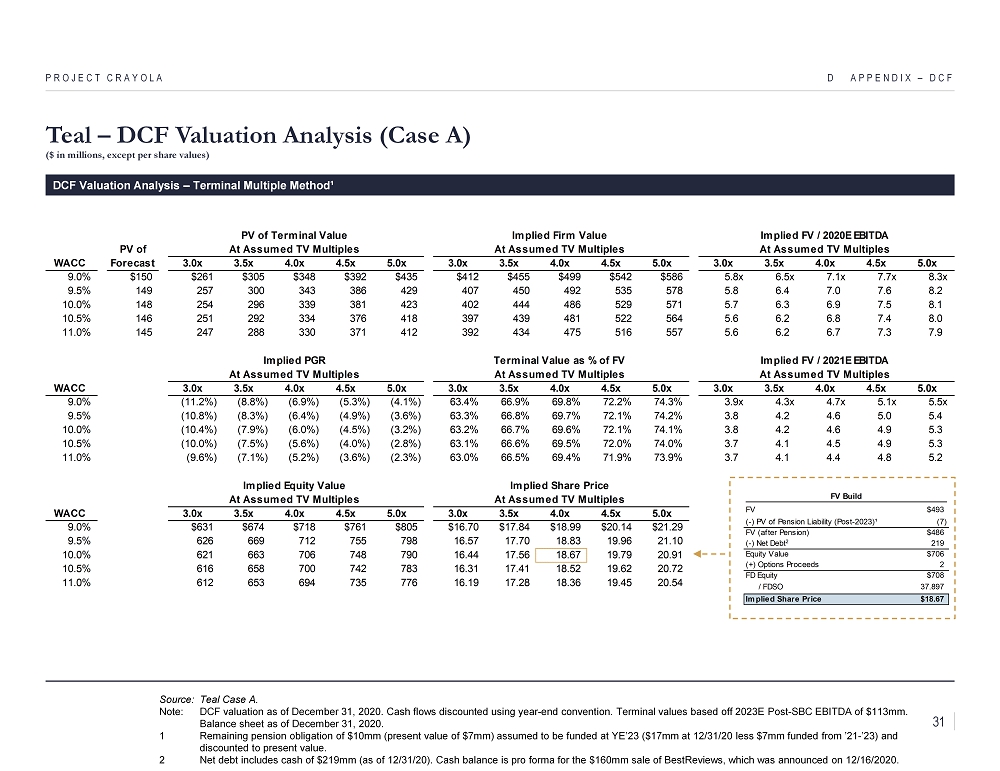
D APPENDIX – DCF PROJECT CRAYOLA DCF Valuation Analysis – Terminal Multiple Method¹ Source: Teal Case A. Note: DCF valuation as of December 31, 2020. Cash flows discounted using year - end convention. Terminal values based off 2023E Po st - SBC EBITDA of $113mm. Balance sheet as of December 31, 2020. 1 Remaining pension obligation of $10mm (present value of $7mm) assumed to be funded at YE’23 ($17mm at 12/31/20 less $7mm fund ed from ’21 - ’23) and discounted to present value. 2 Net debt includes cash of $219mm (as of 12/31/20). Cash balance is pro forma for the $160mm sale of BestReviews , which was announced on 12/16/2020. Teal – DCF Valuation Analysis (Case A) ($ in millions, except per share values) PV of Terminal Value Implied Firm Value Implied FV / 2020E EBITDA PV of At Assumed TV Multiples At Assumed TV Multiples At Assumed TV Multiples WACC Forecast 3.0x 3.5x 4.0x 4.5x 5.0x 3.0x 3.5x 4.0x 4.5x 5.0x 3.0x 3.5x 4.0x 4.5x 5.0x 9.0% $150 $261 $305 $348 $392 $435 $412 $455 $499 $542 $586 5.8x 6.5x 7.1x 7.7x 8.3x 9.5% 149 257 300 343 386 429 407 450 492 535 578 5.8 6.4 7.0 7.6 8.2 10.0% 148 254 296 339 381 423 402 444 486 529 571 5.7 6.3 6.9 7.5 8.1 10.5% 146 251 292 334 376 418 397 439 481 522 564 5.6 6.2 6.8 7.4 8.0 11.0% 145 247 288 330 371 412 392 434 475 516 557 5.6 6.2 6.7 7.3 7.9 Implied PGR Terminal Value as % of FV Implied FV / 2021E EBITDA At Assumed TV Multiples At Assumed TV Multiples At Assumed TV Multiples WACC 3.0x 3.5x 4.0x 4.5x 5.0x 3.0x 3.5x 4.0x 4.5x 5.0x 3.0x 3.5x 4.0x 4.5x 5.0x 9.0% (11.2%) (8.8%) (6.9%) (5.3%) (4.1%) 63.4% 66.9% 69.8% 72.2% 74.3% 3.9x 4.3x 4.7x 5.1x 5.5x 9.5% (10.8%) (8.3%) (6.4%) (4.9%) (3.6%) 63.3% 66.8% 69.7% 72.1% 74.2% 3.8 4.2 4.6 5.0 5.4 10.0% (10.4%) (7.9%) (6.0%) (4.5%) (3.2%) 63.2% 66.7% 69.6% 72.1% 74.1% 3.8 4.2 4.6 4.9 5.3 10.5% (10.0%) (7.5%) (5.6%) (4.0%) (2.8%) 63.1% 66.6% 69.5% 72.0% 74.0% 3.7 4.1 4.5 4.9 5.3 11.0% (9.6%) (7.1%) (5.2%) (3.6%) (2.3%) 63.0% 66.5% 69.4% 71.9% 73.9% 3.7 4.1 4.4 4.8 5.2 Implied Equity Value Implied Share Price At Assumed TV Multiples At Assumed TV Multiples WACC 3.0x 3.5x 4.0x 4.5x 5.0x 3.0x 3.5x 4.0x 4.5x 5.0x 9.0% $631 $674 $718 $761 $805 $16.70 $17.84 $18.99 $20.14 $21.29 9.5% 626 669 712 755 798 16.57 17.70 18.83 19.96 21.10 10.0% 621 663 706 748 790 16.44 17.56 18.67 19.79 20.91 10.5% 616 658 700 742 783 16.31 17.41 18.52 19.62 20.72 11.0% 612 653 694 735 776 16.19 17.28 18.36 19.45 20.54 FV Build Shares Outstanding FV $493 (-) PV of Pension Liability (Post-2023)¹ (7) FV (after Pension) $486 (-) Net Debt2 219 Equity Value $706 (+) Options Proceeds 2 FD Equity $708 / FDSO 37.897 Implied Share Price $18.67 31
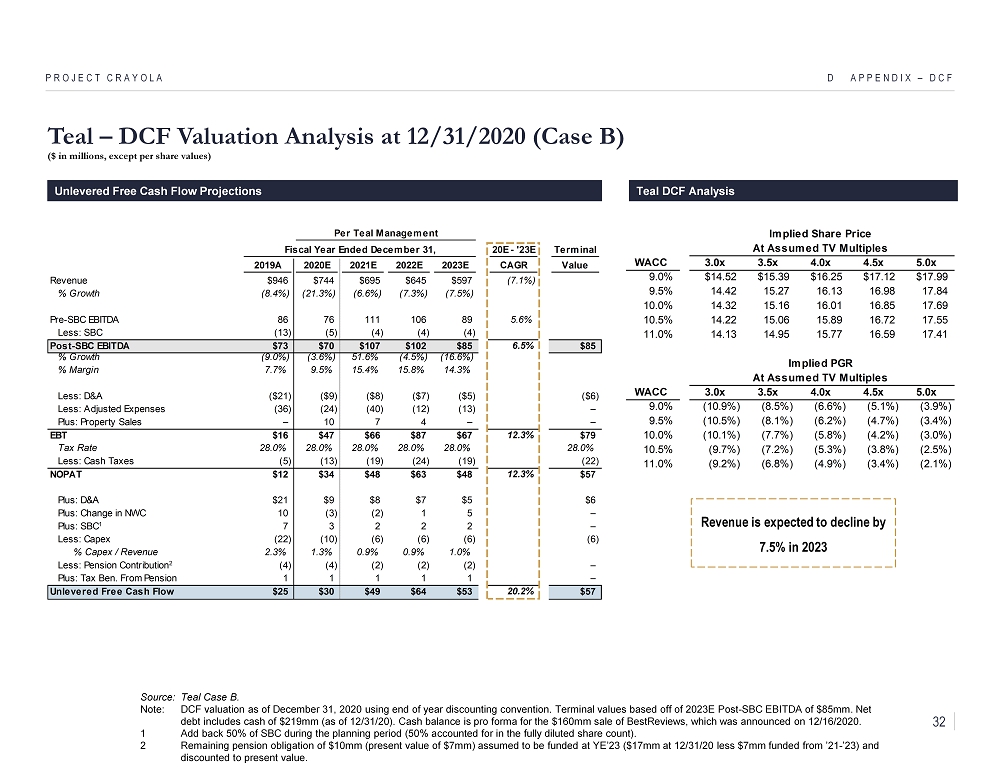
D APPENDIX – DCF PROJECT CRAYOLA Unlevered Free Cash Flow Projections Source: Teal Case B. Note: DCF valuation as of December 31, 2020 using end of year discounting convention. Terminal values based off of 2023E Post - SB C EBITDA of $85mm. Net debt includes cash of $219mm (as of 12/31/20). Cash balance is pro forma for the $160mm sale of BestReviews , which was announced on 12/16/2020. 1 Add back 50% of SBC during the planning period (50% accounted for in the fully diluted share count). 2 Remaining pension obligation of $10mm (present value of $7mm) assumed to be funded at YE’23 ($17mm at 12/31/20 less $7mm fund ed from ’21 - ’23) and discounted to present value. Teal – DCF Valuation Analysis at 12/31/2020 (Case B) ($ in millions, except per share values) Per Teal Management Fiscal Year Ended December 31, 20E - '23E Terminal 2019A 2020E 2021E 2022E 2023E CAGR Value Revenue $946 $744 $695 $645 $597 (7.1%) % Growth (8.4%) (21.3%) (6.6%) (7.3%) (7.5%) Pre-SBC EBITDA 86 76 111 106 89 5.6% Less: SBC (13) (5) (4) (4) (4) Post-SBC EBITDA $73 $70 $107 $102 $85 6.5% $85 % Growth (9.0%) (3.6%) 51.6% (4.5%) (16.6%) % Margin 7.7% 9.5% 15.4% 15.8% 14.3% Less: D&A ($21) ($9) ($8) ($7) ($5) ($6) Less: Adjusted Expenses (36) (24) (40) (12) (13) – Plus: Property Sales – 10 7 4 – – EBT $16 $47 $66 $87 $67 12.3% $79 Tax Rate 28.0% 28.0% 28.0% 28.0% 28.0% 28.0% Less: Cash Taxes (5) (13) (19) (24) (19) (22) NOPAT $12 $34 $48 $63 $48 12.3% $57 Plus: D&A $21 $9 $8 $7 $5 $6 Plus: Change in NWC 10 (3) (2) 1 5 – Plus: SBC1 7 3 2 2 2 – Less: Capex (22) (10) (6) (6) (6) (6) % Capex / Revenue 2.3% 1.3% 0.9% 0.9% 1.0% Less: Pension Contribution2 (4) (4) (2) (2) (2) – Plus: Tax Ben. From Pension 1 1 1 1 1 – Unlevered Free Cash Flow $25 $30 $49 $64 $53 20.2% $57 Teal DCF Analysis Implied Share Price At Assumed TV Multiples WACC 3.0x 3.5x 4.0x 4.5x 5.0x 9.0% $14.52 $15.39 $16.25 $17.12 $17.99 9.5% 14.42 15.27 16.13 16.98 17.84 10.0% 14.32 15.16 16.01 16.85 17.69 10.5% 14.22 15.06 15.89 16.72 17.55 11.0% 14.13 14.95 15.77 16.59 17.41 Implied PGR At Assumed TV Multiples WACC 3.0x 3.5x 4.0x 4.5x 5.0x 9.0% (10.9%) (8.5%) (6.6%) (5.1%) (3.9%) 9.5% (10.5%) (8.1%) (6.2%) (4.7%) (3.4%) 10.0% (10.1%) (7.7%) (5.8%) (4.2%) (3.0%) 10.5% (9.7%) (7.2%) (5.3%) (3.8%) (2.5%) 11.0% (9.2%) (6.8%) (4.9%) (3.4%) (2.1%) Revenue is expected to decline by 7.5% in 2023 32
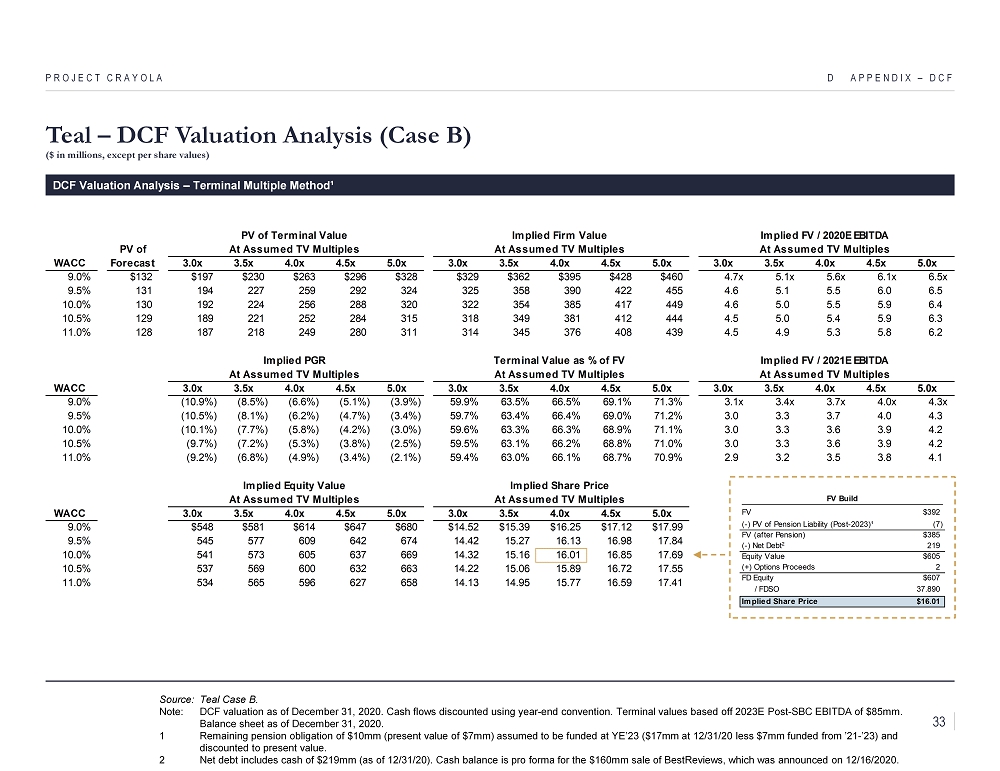
D APPENDIX – DCF PROJECT CRAYOLA DCF Valuation Analysis – Terminal Multiple Method¹ Source: Teal Case B. Note: DCF valuation as of December 31, 2020. Cash flows discounted using year - end convention. Terminal values based off 2023E Po st - SBC EBITDA of $85mm. Balance sheet as of December 31, 2020. 1 Remaining pension obligation of $10mm (present value of $7mm) assumed to be funded at YE’23 ($17mm at 12/31/20 less $7mm fund ed from ’21 - ’23) and discounted to present value. 2 Net debt includes cash of $219mm (as of 12/31/20). Cash balance is pro forma for the $160mm sale of BestReviews , which was announced on 12/16/2020. Teal – DCF Valuation Analysis (Case B) ($ in millions, except per share values) PV of Terminal Value Implied Firm Value Implied FV / 2020E EBITDA PV of At Assumed TV Multiples At Assumed TV Multiples At Assumed TV Multiples WACC Forecast 3.0x 3.5x 4.0x 4.5x 5.0x 3.0x 3.5x 4.0x 4.5x 5.0x 3.0x 3.5x 4.0x 4.5x 5.0x 9.0% $132 $197 $230 $263 $296 $328 $329 $362 $395 $428 $460 4.7x 5.1x 5.6x 6.1x 6.5x 9.5% 131 194 227 259 292 324 325 358 390 422 455 4.6 5.1 5.5 6.0 6.5 10.0% 130 192 224 256 288 320 322 354 385 417 449 4.6 5.0 5.5 5.9 6.4 10.5% 129 189 221 252 284 315 318 349 381 412 444 4.5 5.0 5.4 5.9 6.3 11.0% 128 187 218 249 280 311 314 345 376 408 439 4.5 4.9 5.3 5.8 6.2 Implied PGR Terminal Value as % of FV Implied FV / 2021E EBITDA At Assumed TV Multiples At Assumed TV Multiples At Assumed TV Multiples WACC 3.0x 3.5x 4.0x 4.5x 5.0x 3.0x 3.5x 4.0x 4.5x 5.0x 3.0x 3.5x 4.0x 4.5x 5.0x 9.0% (10.9%) (8.5%) (6.6%) (5.1%) (3.9%) 59.9% 63.5% 66.5% 69.1% 71.3% 3.1x 3.4x 3.7x 4.0x 4.3x 9.5% (10.5%) (8.1%) (6.2%) (4.7%) (3.4%) 59.7% 63.4% 66.4% 69.0% 71.2% 3.0 3.3 3.7 4.0 4.3 10.0% (10.1%) (7.7%) (5.8%) (4.2%) (3.0%) 59.6% 63.3% 66.3% 68.9% 71.1% 3.0 3.3 3.6 3.9 4.2 10.5% (9.7%) (7.2%) (5.3%) (3.8%) (2.5%) 59.5% 63.1% 66.2% 68.8% 71.0% 3.0 3.3 3.6 3.9 4.2 11.0% (9.2%) (6.8%) (4.9%) (3.4%) (2.1%) 59.4% 63.0% 66.1% 68.7% 70.9% 2.9 3.2 3.5 3.8 4.1 Implied Equity Value Implied Share Price At Assumed TV Multiples At Assumed TV Multiples WACC 3.0x 3.5x 4.0x 4.5x 5.0x 3.0x 3.5x 4.0x 4.5x 5.0x 9.0% $548 $581 $614 $647 $680 $14.52 $15.39 $16.25 $17.12 $17.99 9.5% 545 577 609 642 674 14.42 15.27 16.13 16.98 17.84 10.0% 541 573 605 637 669 14.32 15.16 16.01 16.85 17.69 10.5% 537 569 600 632 663 14.22 15.06 15.89 16.72 17.55 11.0% 534 565 596 627 658 14.13 14.95 15.77 16.59 17.41 FV Build Shares Outstanding FV $392 (-) PV of Pension Liability (Post-2023)¹ (7) FV (after Pension) $385 (-) Net Debt2 219 Equity Value $605 (+) Options Proceeds 2 FD Equity $607 / FDSO 37.890 Implied Share Price $16.01 33

D APPENDIX – DCF PROJECT CRAYOLA Unlevered Free Cash Flow Projections Source: Teal Case C. Note: DCF valuation as of December 31, 2020 using end of year discounting convention. Terminal values based off of 2023E Post - SB C EBITDA of $66mm. Net debt includes cash of $219mm (as of 12/31/20). Cash balance is pro forma for the $160mm sale of BestReviews , which was announced on 12/16/2020. 1 Add back 50% of SBC during the planning period (50% accounted for in the fully diluted share count). 2 Remaining pension obligation of $10mm (present value of $7mm) assumed to be funded at YE’23 ($17mm at 12/31/20 less $7mm fund ed from ’21 - ’23) and discounted to present value. Teal – DCF Valuation Analysis at 12/31/2020 (Case C) ($ in millions, except per share values) Per Teal Management Fiscal Year Ended December 31, 20E - '23E Terminal 2019A 2020E 2021E 2022E 2023E CAGR Value Revenue $946 $744 $695 $645 $597 (7.1%) % Growth (8.4%) (21.3%) (6.6%) (7.3%) (7.5%) Pre-SBC EBITDA 86 76 111 88 70 (2.7%) Less: SBC (13) (5) (4) (4) (4) Post-SBC EBITDA $73 $70 $107 $84 $66 (2.4%) $66 % Growth (9.0%) (3.6%) 51.6% (21.6%) (21.7%) % Margin 7.7% 9.5% 15.4% 13.0% 11.0% Less: D&A ($21) ($9) ($8) ($7) ($5) ($6) Less: Adjusted Expenses (36) (24) (40) (12) (13) – Plus: Property Sales – 10 7 4 – – EBT $16 $47 $66 $69 $48 0.1% $60 Tax Rate 28.0% 28.0% 28.0% 28.0% 28.0% 28.0% Less: Cash Taxes (5) (13) (19) (19) (13) (17) NOPAT $12 $34 $48 $50 $34 0.1% $43 Plus: D&A $21 $9 $8 $7 $5 $6 Plus: Change in NWC 10 (3) (2) 1 5 – Plus: SBC1 7 3 2 2 2 – Less: Capex (22) (10) (6) (6) (6) (6) % Capex / Revenue 2.3% 1.3% 0.9% 0.9% 1.0% Less: Pension Contribution2 (4) (4) (2) (2) (2) – Plus: Tax Ben. From Pension 1 1 1 1 1 – Unlevered Free Cash Flow $25 $30 $49 $51 $38 8.3% $43 Teal DCF Analysis Implied Share Price At Assumed TV Multiples WACC 3.0x 3.5x 4.0x 4.5x 5.0x 9.0% $12.74 $13.41 $14.08 $14.75 $15.42 9.5% 12.66 13.32 13.98 14.64 15.30 10.0% 12.59 13.24 13.89 14.54 15.19 10.5% 12.51 13.15 13.80 14.44 15.08 11.0% 12.44 13.07 13.71 14.34 14.97 Implied PGR At Assumed TV Multiples WACC 3.0x 3.5x 4.0x 4.5x 5.0x 9.0% (10.5%) (8.2%) (6.3%) (4.8%) (3.6%) 9.5% (10.1%) (7.7%) (5.9%) (4.4%) (3.2%) 10.0% (9.7%) (7.3%) (5.5%) (4.0%) (2.7%) 10.5% (9.3%) (6.9%) (5.0%) (3.5%) (2.3%) 11.0% (8.9%) (6.5%) (4.6%) (3.1%) (1.8%) Revenue is expected to decline by 7.5% in 2023 34
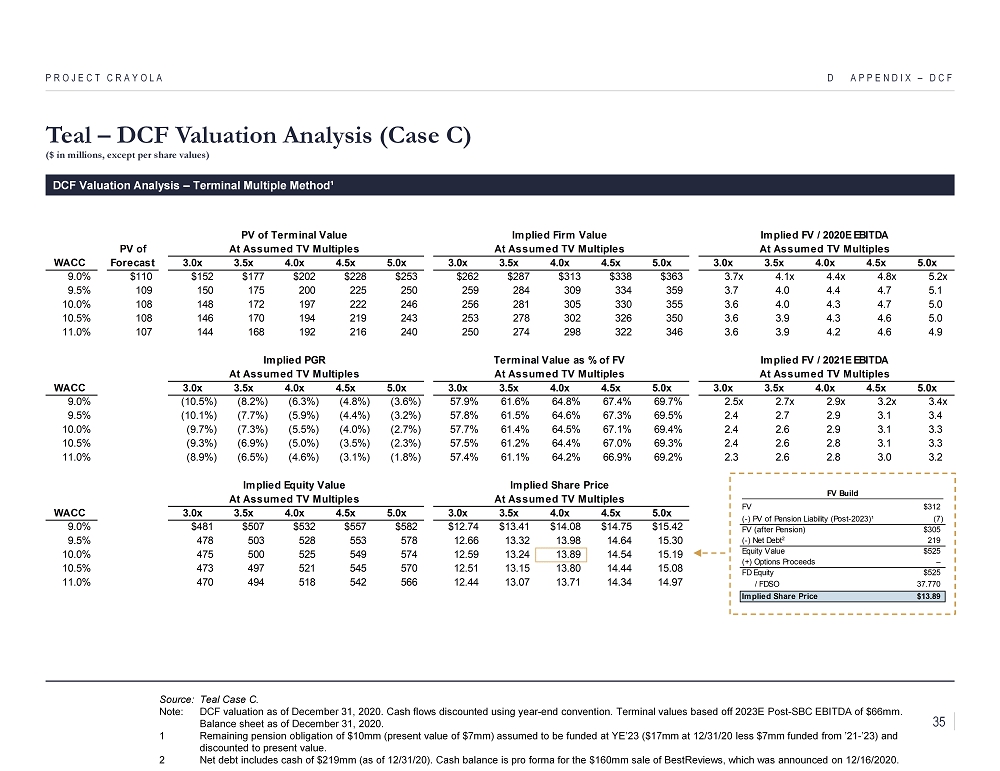
D APPENDIX – DCF PROJECT CRAYOLA DCF Valuation Analysis – Terminal Multiple Method¹ Source: Teal Case C. Note: DCF valuation as of December 31, 2020. Cash flows discounted using year - end convention. Terminal values based off 2023E Po st - SBC EBITDA of $66mm. Balance sheet as of December 31, 2020. 1 Remaining pension obligation of $10mm (present value of $7mm) assumed to be funded at YE’23 ($17mm at 12/31/20 less $7mm fund ed from ’21 - ’23) and discounted to present value. 2 Net debt includes cash of $219mm (as of 12/31/20). Cash balance is pro forma for the $160mm sale of BestReviews , which was announced on 12/16/2020. Teal – DCF Valuation Analysis (Case C) ($ in millions, except per share values) PV of Terminal Value Implied Firm Value Implied FV / 2020E EBITDA PV of At Assumed TV Multiples At Assumed TV Multiples At Assumed TV Multiples WACC Forecast 3.0x 3.5x 4.0x 4.5x 5.0x 3.0x 3.5x 4.0x 4.5x 5.0x 3.0x 3.5x 4.0x 4.5x 5.0x 9.0% $110 $152 $177 $202 $228 $253 $262 $287 $313 $338 $363 3.7x 4.1x 4.4x 4.8x 5.2x 9.5% 109 150 175 200 225 250 259 284 309 334 359 3.7 4.0 4.4 4.7 5.1 10.0% 108 148 172 197 222 246 256 281 305 330 355 3.6 4.0 4.3 4.7 5.0 10.5% 108 146 170 194 219 243 253 278 302 326 350 3.6 3.9 4.3 4.6 5.0 11.0% 107 144 168 192 216 240 250 274 298 322 346 3.6 3.9 4.2 4.6 4.9 Implied PGR Terminal Value as % of FV Implied FV / 2021E EBITDA At Assumed TV Multiples At Assumed TV Multiples At Assumed TV Multiples WACC 3.0x 3.5x 4.0x 4.5x 5.0x 3.0x 3.5x 4.0x 4.5x 5.0x 3.0x 3.5x 4.0x 4.5x 5.0x 9.0% (10.5%) (8.2%) (6.3%) (4.8%) (3.6%) 57.9% 61.6% 64.8% 67.4% 69.7% 2.5x 2.7x 2.9x 3.2x 3.4x 9.5% (10.1%) (7.7%) (5.9%) (4.4%) (3.2%) 57.8% 61.5% 64.6% 67.3% 69.5% 2.4 2.7 2.9 3.1 3.4 10.0% (9.7%) (7.3%) (5.5%) (4.0%) (2.7%) 57.7% 61.4% 64.5% 67.1% 69.4% 2.4 2.6 2.9 3.1 3.3 10.5% (9.3%) (6.9%) (5.0%) (3.5%) (2.3%) 57.5% 61.2% 64.4% 67.0% 69.3% 2.4 2.6 2.8 3.1 3.3 11.0% (8.9%) (6.5%) (4.6%) (3.1%) (1.8%) 57.4% 61.1% 64.2% 66.9% 69.2% 2.3 2.6 2.8 3.0 3.2 Implied Equity Value Implied Share Price At Assumed TV Multiples At Assumed TV Multiples WACC 3.0x 3.5x 4.0x 4.5x 5.0x 3.0x 3.5x 4.0x 4.5x 5.0x 9.0% $481 $507 $532 $557 $582 $12.74 $13.41 $14.08 $14.75 $15.42 9.5% 478 503 528 553 578 12.66 13.32 13.98 14.64 15.30 10.0% 475 500 525 549 574 12.59 13.24 13.89 14.54 15.19 10.5% 473 497 521 545 570 12.51 13.15 13.80 14.44 15.08 11.0% 470 494 518 542 566 12.44 13.07 13.71 14.34 14.97 FV Build Shares Outstanding FV $312 (-) PV of Pension Liability (Post-2023)¹ (7) FV (after Pension) $305 (-) Net Debt2 219 Equity Value $525 (+) Options Proceeds – FD Equity $525 / FDSO 37.770 Implied Share Price $13.89 35
CONFIDENTIAL E Appendix – WACC PROJECT CRAYOLA
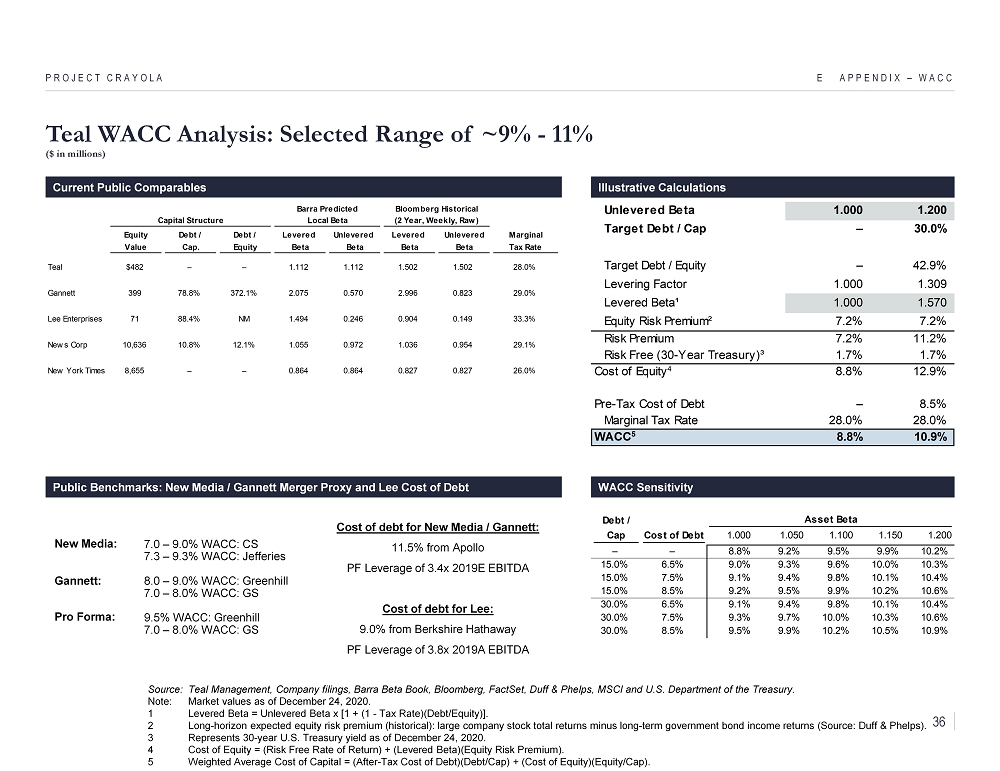
Teal WACC Analysis: Selected Range of ~9% - 11% ($ in millions) E APPENDIX – WACC Current Public Comparables Source: Teal Management, Company filings, Barra Beta Book, Bloomberg, FactSet, Duff & Phelps, MSCI and U.S. Department of the Tr easury. Note: Market values as of December 24, 2020. 1 Levered Beta = Unlevered Beta x [1 + (1 - Tax Rate)(Debt/Equity)]. 2 Long - horizon expected equity risk premium (historical): large company stock total returns minus long - term government bond income returns (Source: Duff & Phelps). 3 Represents 30 - year U.S. Treasury yield as of December 24, 2020. 4 Cost of Equity = (Risk Free Rate of Return) + (Levered Beta)(Equity Risk Premium). 5 Weighted Average Cost of Capital = (After - Tax Cost of Debt)(Debt/Cap) + (Cost of Equity)(Equity/Cap). PROJECT CRAYOLA Illustrative Calculations WACC Sensitivity 7.0 – 9.0% WACC: CS 7.3 – 9.3% WACC: Jefferies 8.0 – 9.0% WACC: Greenhill 7.0 – 8.0% WACC: GS 9.5% WACC: Greenhill 7.0 – 8.0% WACC: GS New Media: Gannett: Pro Forma: Unlevered Beta 1.000 1.200 Target Debt / Cap – 30.0% Target Debt / Equity – 42.9% Levering Factor 1.000 1.309 Levered Beta¹ 1.000 1.570 Equity Risk Premium² 7.2% 7.2% Risk Premium 7.2% 11.2% Risk Free (30-Year Treasury)³ 1.7% 1.7% Cost of Equity4 8.8% 12.9% Pre-Tax Cost of Debt – 8.5% Marginal Tax Rate 28.0% 28.0% WACC5 8.8% 10.9% Debt / Asset Beta Cap Cost of Debt 1.000 1.050 1.100 1.150 1.200 – – 8.8% 9.2% 9.5% 9.9% 10.2% 15.0% 6.5% 9.0% 9.3% 9.6% 10.0% 10.3% 15.0% 7.5% 9.1% 9.4% 9.8% 10.1% 10.4% 15.0% 8.5% 9.2% 9.5% 9.9% 10.2% 10.6% 30.0% 6.5% 9.1% 9.4% 9.8% 10.1% 10.4% 30.0% 7.5% 9.3% 9.7% 10.0% 10.3% 10.6% 30.0% 8.5% 9.5% 9.9% 10.2% 10.5% 10.9% Capital Structure Local Beta (2 Year, Weekly, Raw) Equity Debt / Debt / Levered Unlevered Levered Unlevered Marginal Value Cap. Equity Beta Beta Beta Beta Tax Rate Teal $482 – – 1.112 1.112 1.502 1.502 28.0% Gannett 399 78.8% 372.1% 2.075 0.570 2.996 0.823 29.0% Lee Enterprises 71 88.4% NM 1.494 0.246 0.904 0.149 33.3% News Corp 10,636 10.8% 12.1% 1.055 0.972 1.036 0.954 29.1% New York Times 8,655 – – 0.864 0.864 0.827 0.827 26.0% Barra Predicted Bloomberg Historical Public Benchmarks: New Media / Gannett Merger Proxy and Lee Cost of Debt Cost of debt for New Media / Gannett: 11.5% from Apollo PF Leverage of 3.4x 2019E EBITDA Cost of debt for Lee: 9.0% from Berkshire Hathaway PF Leverage of 3.8x 2019A EBITDA 36

Historical Betas – Last Five Years E APPENDIX – WACC PROJECT CRAYOLA Predicted Barra Local Beta FactSet 2 - Year Trailing Betas Teal Source: MSCI and FactSet. GCI NWSA NYT Teal Teal 1Yr. 3Yr. 5Yr. High 1.59 1.90 1.90 Median 1.51 0.54 0.76 Low 0.46 0.10 0.10 Teal Avg. 1.27 0.81 0.93 1Yr. 3Yr. 5Yr. High 1.33 1.35 1.74 Median 1.23 1.06 1.24 Low 0.91 0.77 0.77 Teal Avg. 1.20 1.09 1.25 0.00 0.50 1.00 1.50 2.00 2.50 3.00 Nov-15 Nov-16 Nov-17 Nov-18 Nov-19 Nov-20 0.00 0.50 1.00 1.50 2.00 2.50 3.00 Nov-15 Nov-16 Nov-17 Nov-18 Nov-19 Nov-20 LEE GCI LEE NWSA NYT GCI LEE NWSA NYT 1.57 1.00 1.57 1.00 37
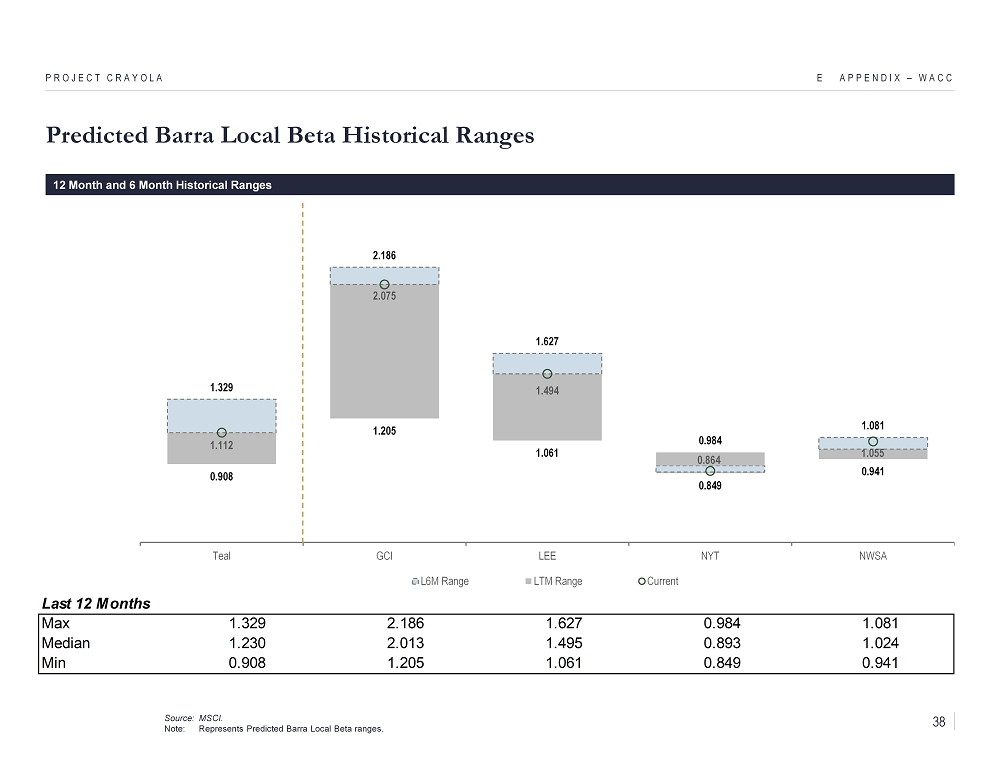
Predicted Barra Local Beta Historical Ranges E APPENDIX – WACC PROJECT CRAYOLA 0.908 1.205 1.061 0.849 0.941 1.329 2.186 1.627 0.984 1.081 1.112 2.075 1.494 0.864 1.055 Teal GCI LEE NYT NWSA L6M Range LTM Range Current 12 Month and 6 Month Historical Ranges Source: MSCI. Note: Represents Predicted Barra Local Beta ranges. Last 12 Months Max 1.329 2.186 1.627 0.984 1.081 Median 1.230 2.013 1.495 0.893 1.024 Min 0.908 1.205 1.061 0.849 0.941 38

CONFIDENTIAL F Appendix – Other Potential Parties PROJECT CRAYOLA
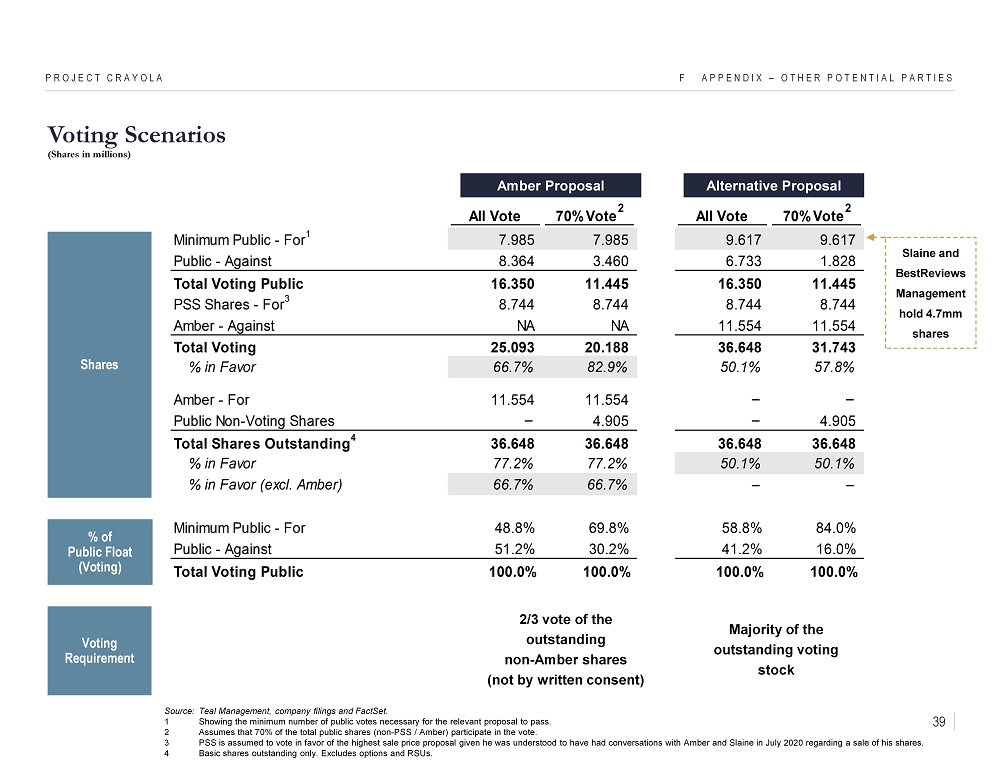
Voting Scenarios (Shares in millions) F APPENDIX – OTHER POTENTIAL PARTIES PROJECT CRAYOLA Amber Proposal Alternative Proposal Source: Teal Management, company filings and FactSet. 1 Showing the minimum number of public votes necessary for the relevant proposal to pass. 2 Assumes that 70% of the total public shares (non - PSS / Amber) participate in the vote. 3 PSS is assumed to vote in favor of the highest sale price proposal given he was understood to have had conversations with Amb er and Slaine in July 2020 regarding a sale of his shares. 4 Basic shares outstanding only. Excludes options and RSUs. Shares % of Public Float (Voting) Voting Requirement 2/3 vote of the outstanding non - Amber shares (not by written consent) Majority of the outstanding voting stock All Vote 70% Vote 2 All Vote 70% Vote 2 Minimum Public - For 1 7.985 7.985 9.617 9.617 Public - Against 8.364 3.460 6.733 1.828 Total Voting Public 16.350 11.445 16.350 11.445 PSS Shares - For 3 8.744 8.744 8.744 8.744 Amber - Against NA NA 11.554 11.554 Total Voting 25.093 20.188 36.648 31.743 % in Favor 66.7% 82.9% 50.1% 57.8% Amber - For 11.554 11.554 – – Public Non-Voting Shares – 4.905 – 4.905 Total Shares Outstanding 4 36.648 36.648 36.648 36.648 % in Favor 77.2% 77.2% 50.1% 50.1% % in Favor (excl. Amber) 66.7% 66.7% – – Minimum Public - For 48.8% 69.8% 58.8% 84.0% Public - Against 51.2% 30.2% 41.2% 16.0% Total Voting Public 100.0% 100.0% 100.0% 100.0% Slaine and BestReviews Management hold 4.7mm shares 39
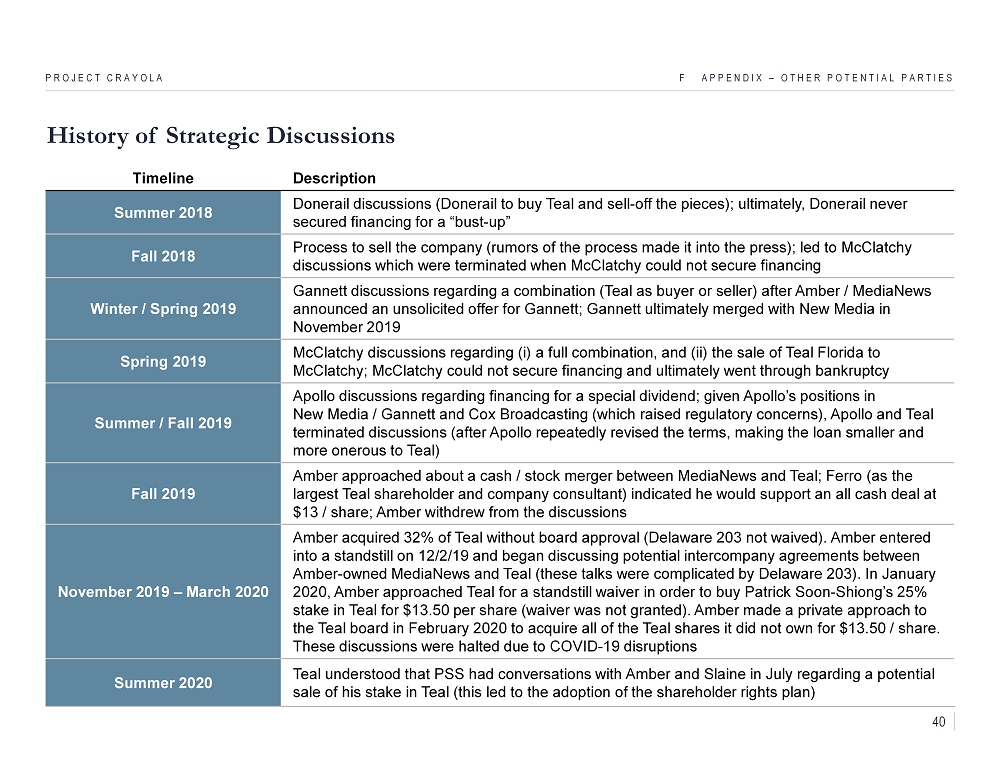
History of Strategic Discussions F APPENDIX – OTHER POTENTIAL PARTIES PROJECT CRAYOLA Timeline Description Summer 2018 Donerail discussions ( Donerail to buy Teal and sell - off the pieces); ultimately, Donerail never secured financing for a “bust - up” Fall 2018 Process to sell the company (rumors of the process made it into the press); led to McClatchy discussions which were terminated when McClatchy could not secure financing Winter / Spring 2019 Gannett discussions regarding a combination (Teal as buyer or seller) after Amber / MediaNews announced an unsolicited offer for Gannett; Gannett ultimately merged with New Media in November 2019 Spring 2019 McClatchy discussions regarding ( i ) a full combination, and (ii) the sale of Teal Florida to McClatchy; McClatchy could not secure financing and ultimately went through bankruptcy Summer / Fall 2019 Apollo discussions regarding financing for a special dividend; given Apollo’s positions in New Media / Gannett and Cox Broadcasting (which raised regulatory concerns), Apollo and Teal terminated discussions (after Apollo repeatedly revised the terms, making the loan smaller and more onerous to Teal) Fall 2019 Amber approached about a cash / stock merger between MediaNews and Teal; Ferro (as the largest Teal shareholder and company consultant) indicated he would support an all cash deal at $13 / share; Amber withdrew from the discussions November 2019 – March 2020 Amber acquired 32% of Teal without board approval (Delaware 203 not waived). Amber entered into a standstill on 12/2/19 and began discussing potential intercompany agreements between Amber - owned MediaNews and Teal (these talks were complicated by Delaware 203). In January 2020, Amber approached Teal for a standstill waiver in order to buy Patrick Soon - Shiong’s 25% stake in Teal for $13.50 per share (waiver was not granted). Amber made a private approach to the Teal board in February 2020 to acquire all of the Teal shares it did not own for $13.50 / share. These discussions were halted due to COVID - 19 disruptions Summer 2020 Teal understood that PSS had conversations with Amber and Slaine in July regarding a potential sale of his stake in Teal (this led to the adoption of the shareholder rights plan) 40
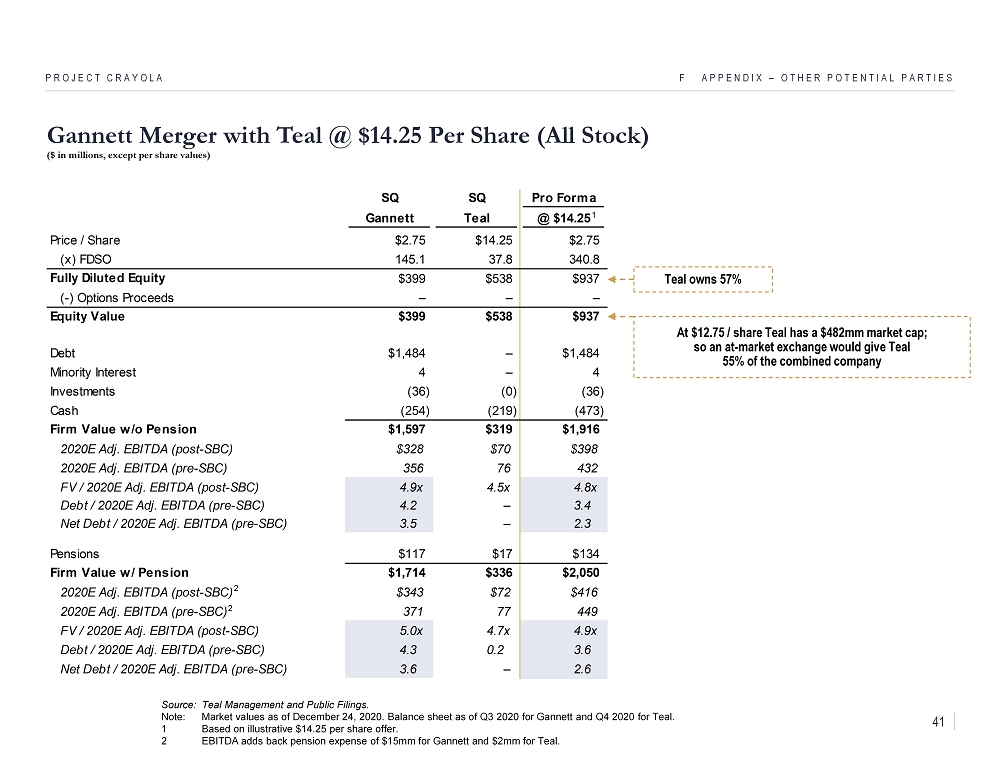
F APPENDIX – OTHER POTENTIAL PARTIES PROJECT CRAYOLA Source: Teal Management and Public Filings. Note: Market values as of December 24, 2020. Balance sheet as of Q3 2020 for Gannett and Q4 2020 for Teal. 1 Based on illustrative $14.25 per share offer. 2 EBITDA adds back pension expense of $15mm for Gannett and $2mm for Teal. Gannett Merger with Teal @ $14.25 Per Share (All Stock) ($ in millions, except per share values) SQ SQ Pro Forma Gannett Teal @ $14.25 Price / Share $2.75 $14.25 $2.75 (x) FDSO 145.1 37.8 340.8 Fully Diluted Equity $399 $538 $937 (-) Options Proceeds – – – Equity Value $399 $538 $937 Debt $1,484 – $1,484 Minority Interest 4 – 4 Investments (36) (0) (36) Cash (254) (219) (473) Firm Value w/o Pension $1,597 $319 $1,916 2020E Adj. EBITDA (post-SBC) $328 $70 $398 2020E Adj. EBITDA (pre-SBC) 356 76 432 FV / 2020E Adj. EBITDA (post-SBC) 4.9x 4.5x 4.8x Debt / 2020E Adj. EBITDA (pre-SBC) 4.2 – 3.4 Net Debt / 2020E Adj. EBITDA (pre-SBC) 3.5 – 2.3 Pensions $117 $17 $134 Firm Value w/ Pension $1,714 $336 $2,050 2020E Adj. EBITDA (post-SBC) $343 $72 $416 2020E Adj. EBITDA (pre-SBC) 371 77 449 FV / 2020E Adj. EBITDA (post-SBC) 5.0x 4.7x 4.9x Debt / 2020E Adj. EBITDA (pre-SBC) 4.3 0.2 3.6 Net Debt / 2020E Adj. EBITDA (pre-SBC) 3.6 – 2.6 1 2 2 Teal owns 57% At $12.75 / share Teal has a $482mm market cap; so an at - market exchange would give Teal 55% of the combined company 41

Currently holds a 7.8% stake in Teal, and is the third largest shareholder of the company Chairman of technology firm Cast & Crew Currently sits on the board of Reorg Inc. and Cetara LLC. Slaine is also executive chairman of information services firm MLM2 (Warburg committed $1bn in September 2020) and a principal investor in Varo Bank Former executive chairman of Interactive Data Corp., which was sold to the Intercontinental Exchange in 2015 Slaine was the President and CEO Investment Dealers’ Digest from 1982 – 1986, the chairman and CEO of Securities and Data Corp from 1987 – 1991, and involved with Thomson Financial from 1991 – 1994, when he became the President and CEO of Thomson Financial through 1996. Founded FT Media Holdings in 2005, with Warburg Pincus , which was acquired by Gannett in 2018 Slaine graduated from Amherst College and holds an M.B.A. from Harvard Business School Background On Relevant Individuals F APPENDIX – OTHER POTENTIAL PARTIES PROJECT CRAYOLA Chairman of Choice Hotels International since October 1998 Served as chairman and CEO of Manor Care until 1998, when it merged with Health Care and Retirement Corp Founder of Somerford Place Corporation in 1998 and Artis Senior Living in 2012 Politically involved and served as a senator in the Maryland General Assembly from 1979 to 1987, where he was a member of each House’s budget and tax committee . Bainum has remained active in Democratic politics and served as a delegate to the Democratic Conventions in 1984, 1992 and 2008 Currently a member of both the Real Estate Roundtable and the Board of Advisors of UCLA’s Anderson School of Business Bainum graduated from Pacific Union College and holds an M.B.A. from the UCLA Anderson School of Management. Bainum also holds a theology degree from Andrews University Stewart Bainum , Jr. Mason Slaine Source: FactSet and publicly available news sources. 42
CONFIDENTIAL G Appendix – Teal Shareholders PROJECT CRAYOLA

# Shareholder Ownership Stake and Cumulative Holdings Current Market Value 1yr ∆ in % O/S Total Ownership Breakdown 1 1 Amber Global Capital $147 (0.4%) 2 Patrick Soon - Shiong 111 (0.3%) 3 Mason Slaine 37 +7.8% 4 BestReviews 24 (0.1%) 5 Dimensional Holdings 20 +0.3% 6 Morgan Stanley 15 +3.0% 7 BlackRock 15 (0.4%) 8 Renaissance Technologies 11 +0.3% 9 BrightSphere Investment Group 10 (0.2%) Top 10 Shareholder Concentration Evolution 10 Vanguard 9 (1.0%) 11 State Street 7 +0.5% 12 Northern Trust 5 +0.4% 13 Geode Holdings Trust 4 -- 14 Grantham, Mayo, Van Otterloo & Co. 3 +0.1% 15 Quinn Opportunity Partners 3 -- 16 Arrowstreet Capital 3 +0.1% 17 Timothy Knight 3 +0.4% 18 PRIMECAP Management 3 (5.5%) 19 Terry Jimenez 2 +0.2% 20 Charles Schwab 2 +0.1% 21 Jacobs Levy Equity Management 2 +0.1% 22 David Dreier 2 -- 23 GFH HFEVA 1 +0.1% 24 Credit Suisse 1 (0.1%) 25 AXA SA 1 +0.3% Teal's Top 25 Shareholders ($ in millions) 23.9% 7.8% 5.2% 4.2% 3.2% 3.2% 2.4% 2.1% 2.0% 1.5% 1.0% 0.8% 0.7% 0.7% 0.6% 0.6% 0.6% 0.5% 0.4% 0.4% 0.4% 0.3% 0.3% 0.3% 31.6% 55.6% 63.4% 68.6% 72.9% 76.1% 79.3% 81.7% 83.8% 85.8% 87.3% 88.3% 89.1% 89.8% 90.4% 91.1% 91.7% 92.2% 92.7% 93.1% 93.5% 93.9% 94.2% 94.5% 94.7% Top 5 Top 10 Top 15 Top 20 Top 25 Source: FactSet as per most recent filings. Note: Market pricing as of December 24, 2020. Ownership stake based on basic shares outstanding, consolidated across funds. One - year prior date of December 31, 2019, and five - year prior date of December 31, 2015. 1 Reflects entire shareholder base, not just top 25 shareholders, as per FactSet holdings information. PROJECT CRAYOLA G APPENDIX – TEAL SHAREHOLDERS Insider 40% Passive 8% Active 52% 72.9% 85.8% 71.6% 83.7% 48.5% 67.7% 1 2 3 4 5 6 7 8 9 10 Shareholder # Cumulative % O/S Today 1 Year ago 5 Years ago 43