Exhibit (c)(5)
Project Alinea BUSINESS PLAN MATERIALS FEBRUARY 2021 CONFIDENTIAL

The information herein has been prepared by Lazard Frères & Co . LLC (“Lazard”) based upon information supplied by you (“Teal” or the “Company”) or publicly available information, and portions of the information herein may be based upon certain statements, estimates and forecasts provided by the Company with respect to the anticipated future performance of the Company . Lazard has relied upon the accuracy and completeness of the foregoing information, and has not assumed any responsibility for any independent verification of such information or any independent valuation or appraisal of any of the assets or liabilities of the Company or any other entity, or concerning solvency or fair value of the Company or any other entity . With respect to financial forecasts, Lazard has assumed that they have been reasonably prepared on bases reflecting the best currently available estimates and judgments as to the future financial performance of the relevant entity ; we assume no responsibility for and express no view as to such forecasts . The information set forth herein is based upon economic, monetary, market and other conditions as in effect on, and the information made available to us as of, the date hereof, unless indicated otherwise . These materials and the information contained herein are confidential and may not be disclosed publicly or made available to third parties without the prior written consent of Lazard ; provided, however, that you may disclose to any and all persons the U . S . federal income tax treatment and tax structure of any transaction described herein and the portions of these materials that relate to such tax treatment or structure . Lazard is acting as investment banker to the Special Committee of the Board of Directors of the Company (the “Special Committee”), and will not be responsible for and will not provide any tax, accounting, actuarial, legal or other specialist advice . These materials are preliminary and summary in nature and do not include all of the information that the Special Committee should evaluate in considering a possible transaction . Lazard has been retained only by the Special Committee in connection with the transaction described herein and has no duties to any third party . Nothing herein shall constitute a commitment or undertaking on the part of Lazard or any related party to provide any service . Disclaimer PROJECT ALINEA CONFIDENTIAL 1

Business Plan Overview PROJECT ALINEA 2021 Board approved budget: $695mm of revenue and $111mm of EBITDA before stock - based compensation (“SBC”) expense $107mm of EBITDA after SBC versus $67mm in 2020 (margins rise to 15.4% versus 9.0% in 2020) Teal Q3 ’20 margin of 12.3% pro forma for the sale of BestReviews and after deducting SBC expense Historical and forecasted results exclude the financial impact of BestReviews Case A Case B 2022 and 2023 forecasts prepared at the request of the Special Committee (has not been reviewed by the Teal board) 2022 and 2023 revenues equal those used in Case B Margins decline to 13% in 2022 and 11% in 2023 – consistent with Gannett levels in 2019 and 2021 Teal % digital revenues (LTM), ’19A - ’21E revenue CAGR, EBITDA margins (2020) and capex / revenue ratio (2020) are consistent with Gannett’s comparable statistics (see page 10) 2022 and 2023 forecasts prepared by Teal Management (has not been reviewed by the Teal board) 2023 revenues are 4% below those in Case A (2022 revenues are slightly below Case A) Margins decline to 14% by 2023 Case C 2022 and 2023 forecasts prepared by Teal Management (has not been reviewed by the Teal board) Revenues continue to decline and margins rise to 18% by 2023 Blended Case Composite view incorporating 25 % of Case A and 75% of Case B for each line item in 2022 and 2023 Prepared at the request of the Special Committee (has not been reviewed by the Teal board) 2023 revenue declines at 6.8% (same as 2021 revenue declines); EBITDA margins reach 15.3% (versus 15.4% in 2021) 2
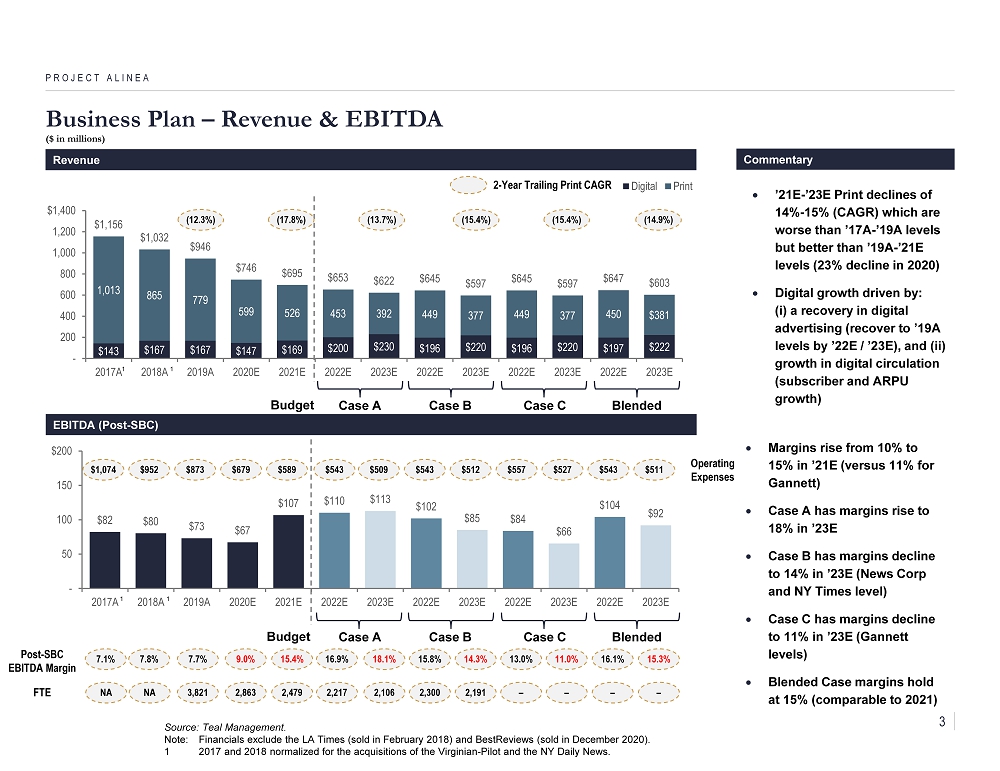
$143 $167 $167 $147 $169 $200 $230 $196 $220 $196 $220 $197 $222 1,013 865 779 599 526 453 392 449 377 449 377 450 $381 $1,156 $1,032 $946 $746 $695 $653 $622 $645 $597 $645 $597 $647 $603 - 200 400 600 800 1,000 1,200 $1,400 2017A 2018A 2019A 2020E 2021E 2022E 2023E 2022E 2023E 2022E 2023E 2022E 2023E Digital Print Business Plan – Revenue & EBITDA ($ in millions) PROJECT ALINEA Revenue Commentary ’21E - ’23E Print declines of 14% - 15% (CAGR) which are worse than ’17A - ’19A levels but better than ’19A - ’21E levels (23% decline in 2020) Digital growth driven by: ( i ) a recovery in digital advertising (recover to ’19A levels by ’22E / ’23E), and (ii) growth in digital circulation (subscriber and ARPU growth) Case A Case B Margins rise from 10% to 15% in ’21E (versus 11% for Gannett) Case A has margins rise to 18% in ’23E Case B has margins decline to 14% in ’23E (News Corp and NY Times level) Case C has margins decline to 11% in ’23E (Gannett levels ) Blended Case margins hold at 15% (comparable to 2021) EBITDA (Post - SBC) $82 $80 $73 $67 $107 $110 $113 $102 $85 $84 $66 $104 $92 - 50 100 150 $200 2017A 2018A 2019A 2020E 2021E 2022E 2023E 2022E 2023E 2022E 2023E 2022E 2023E Post - SBC EBITDA Margin 7.8% 7.1% 7.7% 9.0% 15.4% 16.9% 18.1% 15.8% 14.3% Source: Teal Management. Note: Financials exclude the LA Times (sold in February 2018) and BestReviews (sold in December 2020). 1 2017 and 2018 normalized for the acquisitions of the Virginian - Pilot and the NY Daily News. 1 1 1 1 Case C 13.0% 11.0% $952 $1,074 $873 $679 $589 $543 $509 $543 $512 $557 $527 Operating Expenses FTE 3,821 2,863 2,479 2,217 2,106 2,300 2,191 – – NA NA (12.3%) (17.8%) (13.7%) ( 15.4%) ( 15.4%) 2 - Year Trailing Print CAGR Budget Blended Case A Case B Case C Budget Blended $ 543 $ 511 16.1% – 15.3% – ( 14.9%) 3
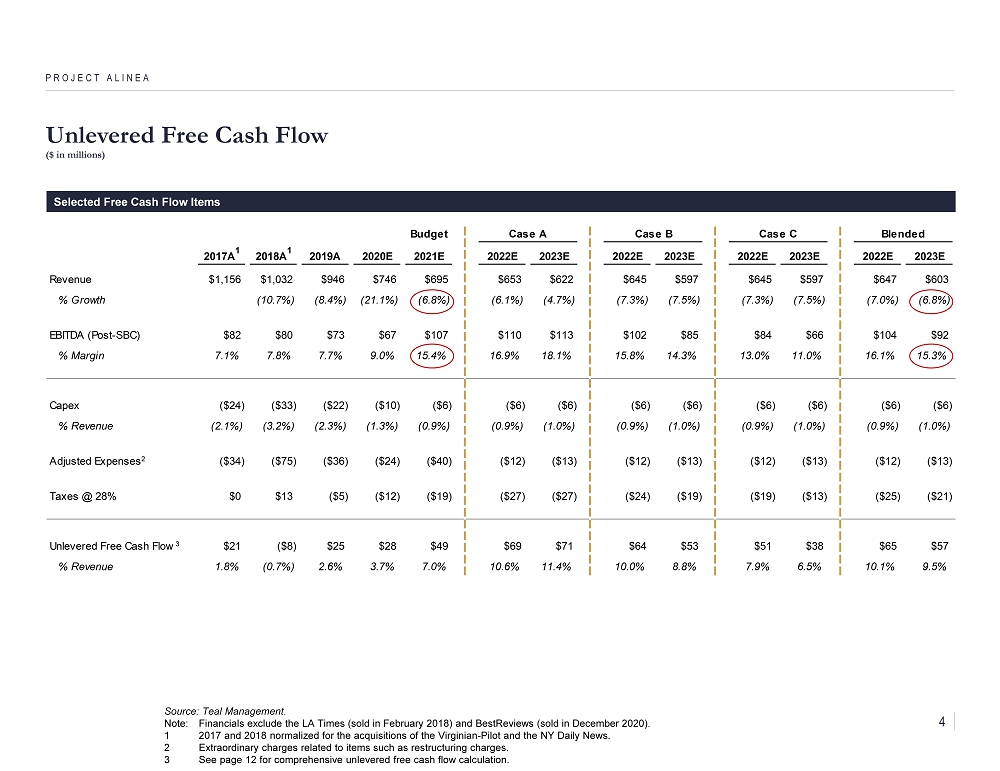
Unlevered Free Cash Flow ($ in millions) PROJECT ALINEA Selected Free Cash Flow Items Budget Case A Case B Case C Blended 2017A 1 2018A 1 2019A 2020E 2021E 2022E 2023E 2022E 2023E 2022E 2023E 2022E 2023E Revenue $1,156 $1,032 $946 $746 $695 $653 $622 $645 $597 $645 $597 $647 $603 % Growth (10.7%) (8.4%) (21.1%) (6.8%) (6.1%) (4.7%) (7.3%) (7.5%) (7.3%) (7.5%) (7.0%) (6.8%) EBITDA (Post-SBC) $82 $80 $73 $67 $107 $110 $113 $102 $85 $84 $66 $104 $92 % Margin 7.1% 7.8% 7.7% 9.0% 15.4% 16.9% 18.1% 15.8% 14.3% 13.0% 11.0% 16.1% 15.3% Capex ($24) ($33) ($22) ($10) ($6) ($6) ($6) ($6) ($6) ($6) ($6) ($6) ($6) % Revenue (2.1%) (3.2%) (2.3%) (1.3%) (0.9%) (0.9%) (1.0%) (0.9%) (1.0%) (0.9%) (1.0%) (0.9%) (1.0%) Adjusted Expenses2 ($34) ($75) ($36) ($24) ($40) ($12) ($13) ($12) ($13) ($12) ($13) ($12) ($13) Taxes @ 28% $0 $13 ($5) ($12) ($19) ($27) ($27) ($24) ($19) ($19) ($13) ($25) ($21) Unlevered Free Cash Flow3 $21 ($8) $25 $28 $49 $69 $71 $64 $53 $51 $38 $65 $57 % Revenue 1.8% (0.7%) 2.6% 3.7% 7.0% 10.6% 11.4% 10.0% 8.8% 7.9% 6.5% 10.1% 9.5% Source: Teal Management. Note: Financials exclude the LA Times (sold in February 2018) and BestReviews (sold in December 2020). 1 2017 and 2018 normalized for the acquisitions of the Virginian - Pilot and the NY Daily News. 2 Extraordinary charges related to items such as restructuring charges. 3 See page 12 for comprehensive unlevered free cash flow calculation. 4
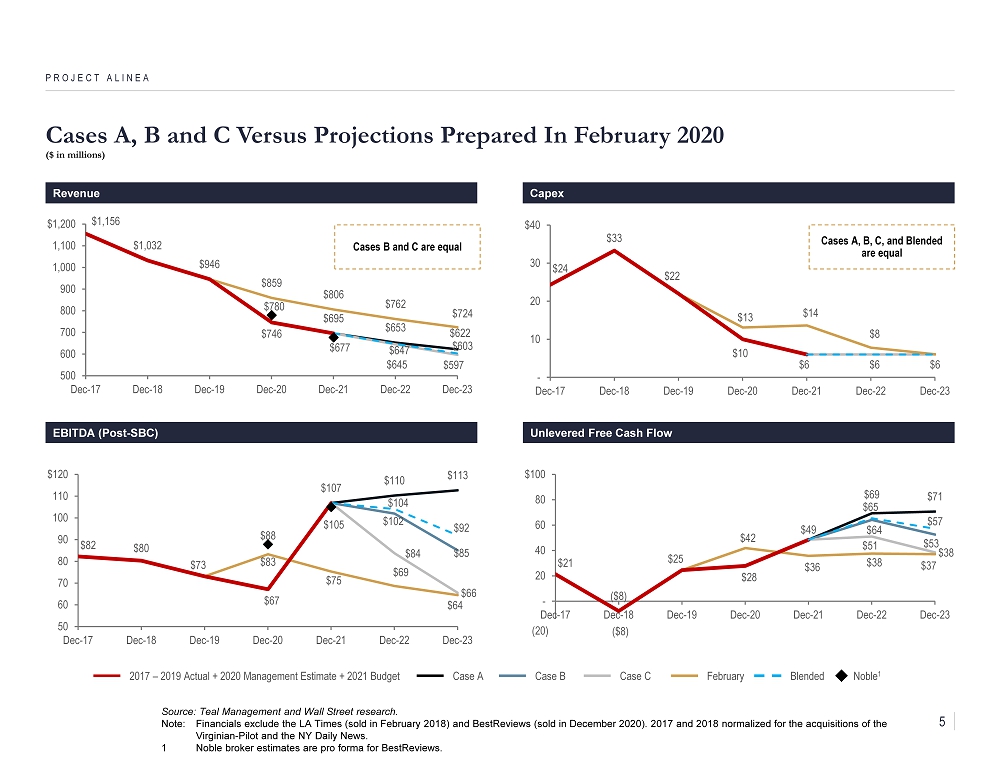
Cases A, B and C Versus Projections Prepared In February 2020 ($ in millions) PROJECT ALINEA Revenue Capex EBITDA (Post - SBC) Unlevered Free Cash Flow $1,032 $946 $695 $653 $622 $645 $597 $859 $806 $762 $724 $780 $677 $1,156 $746 $695 $647 $603 500 600 700 800 900 1,000 1,100 $1,200 Dec-17 Dec-18 Dec-19 Dec-20 Dec-21 Dec-22 Dec-23 $110 $113 $67 $102 $85 $82 $80 $73 $84 $66 $83 $75 $69 $64 $88 $105 $107 $104 $92 50 60 70 80 90 100 110 $120 Dec-17 Dec-18 Dec-19 Dec-20 Dec-21 Dec-22 Dec-23 $69 $71 $28 $64 $53 $21 ($8) $25 $49 $51 $38 $42 $36 $38 $37 ($8) $65 $57 -20 - 20 40 60 80 $100 Dec-17 Dec-18 Dec-19 Dec-20 Dec-21 Dec-22 Dec-23 Source: Teal Management and Wall Street research. Note: Financials exclude the LA Times (sold in February 2018) and BestReviews (sold in December 2020). 2017 and 2018 normalized for the acquisitions of the Virginian - Pilot and the NY Daily News. 1 Noble broker estimates are pro forma for BestReviews . (20) $6 $10 $6 $24 $33 $22 $6 $13 $14 $8 - 10 20 30 $40 Dec-17 Dec-18 Dec-19 Dec-20 Dec-21 Dec-22 Dec-23 Cases A, B, C, and Blended are equal Cases B and C are equal 2017 – 2019 Actual + 2020 Management Estimate + 2021 Budget February Case C Case B Case A Noble 1 Blended 5
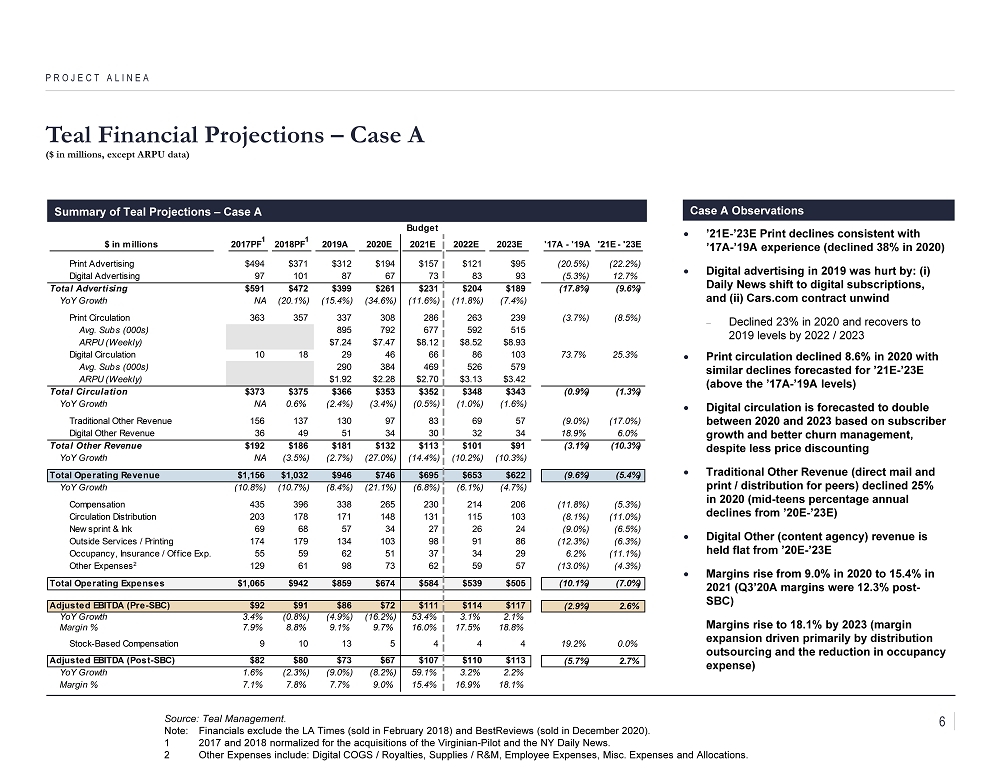
’21E - ’23E Print declines consistent with ’17A - ’19A experience (declined 38% in 2020) Digital advertising in 2019 was hurt by: ( i ) Daily News shift to digital subscriptions, and (ii) Cars.com contract unwind Declined 23% in 2020 and recovers to 2019 levels by 2022 / 2023 Print circulation declined 8.6% in 2020 with similar declines forecasted for ’21E - ’23E (above the ’17A - ’19A levels) Digital circulation is forecasted to double between 2020 and 2023 based on subscriber growth and better churn management, despite less price discounting Traditional Other Revenue (direct mail and print / distribution for peers) declined 25% in 2020 (mid - teens percentage annual declines from ’20E - ’23E) Digital Other (content agency) revenue is held flat from ’20E - ’23E Margins rise from 9.0% in 2020 to 15.4% in 2021 (Q3’20A margins were 12.3% post - SBC) Margins rise to 18.1% by 2023 (margin expansion driven primarily by distribution outsourcing and the reduction in occupancy expense) Teal Financial Projections – Case A ($ in millions, except ARPU data) PROJECT ALINEA Summary of Teal Projections – Case A Case A Observations Source: Teal Management. Note: Financials exclude the LA Times (sold in February 2018) and BestReviews (sold in December 2020). 1 2017 and 2018 normalized for the acquisitions of the Virginian - Pilot and the NY Daily News. 2 Other Expenses include: Digital COGS / Royalties, Supplies / R&M, Employee Expenses, Misc. Expenses and Allocations. Budget $ in millions 2017PF 1 2018PF 1 2019A 2020E 2021E 2022E 2023E '17A - '19A '21E - '23E Print Advertising $494 $371 $312 $194 $157 $121 $95 (20.5%) (22.2%) Digital Advertising 97 101 87 67 73 83 93 (5.3%) 12.7% Total Advertising $591 $472 $399 $261 $231 $204 $189 (17.8%) (9.6%) YoY Growth NA (20.1%) (15.4%) (34.6%) (11.6%) (11.8%) (7.4%) Print Circulation 363 357 337 308 286 263 239 (3.7%) (8.5%) Avg. Subs (000s) 895 792 677 592 515 ARPU (Weekly) $7.24 $7.47 $8.12 $8.52 $8.93 Digital Circulation 10 18 29 46 66 86 103 73.7% 25.3% Avg. Subs (000s) 290 384 469 526 579 ARPU (Weekly) $1.92 $2.28 $2.70 $3.13 $3.42 Total Circulation $373 $375 $366 $353 $352 $348 $343 (0.9%) (1.3%) YoY Growth NA 0.6% (2.4%) (3.4%) (0.5%) (1.0%) (1.6%) Traditional Other Revenue 156 137 130 97 83 69 57 (9.0%) (17.0%) Digital Other Revenue 36 49 51 34 30 32 34 18.9% 6.0% Total Other Revenue $192 $186 $181 $132 $113 $101 $91 (3.1%) (10.3%) YoY Growth NA (3.5%) (2.7%) (27.0%) (14.4%) (10.2%) (10.3%) Total Operating Revenue $1,156 $1,032 $946 $746 $695 $653 $622 (9.6%) (5.4%) YoY Growth (10.8%) (10.7%) (8.4%) (21.1%) (6.8%) (6.1%) (4.7%) Compensation 435 396 338 265 230 214 206 (11.8%) (5.3%) Circulation Distribution 203 178 171 148 131 115 103 (8.1%) (11.0%) Newsprint & Ink 69 68 57 34 27 26 24 (9.0%) (6.5%) Outside Services / Printing 174 179 134 103 98 91 86 (12.3%) (6.3%) Occupancy, Insurance / Office Exp. 55 59 62 51 37 34 29 6.2% (11.1%) Other Expenses2 129 61 98 73 62 59 57 (13.0%) (4.3%) Total Operating Expenses $1,065 $942 $859 $674 $584 $539 $505 (10.1%) (7.0%) Adjusted EBITDA (Pre-SBC) $92 $91 $86 $72 $111 $114 $117 (2.9%) 2.6% YoY Growth 3.4% (0.8%) (4.9%) (16.2%) 53.4% 3.1% 2.1% Margin % 7.9% 8.8% 9.1% 9.7% 16.0% 17.5% 18.8% Stock-Based Compensation 9 10 13 5 4 4 4 19.2% 0.0% Adjusted EBITDA (Post-SBC) $82 $80 $73 $67 $107 $110 $113 (5.7%) 2.7% YoY Growth 1.6% (2.3%) (9.0%) (8.2%) 59.1% 3.2% 2.2% Margin % 7.1% 7.8% 7.7% 9.0% 15.4% 16.9% 18.1% 6
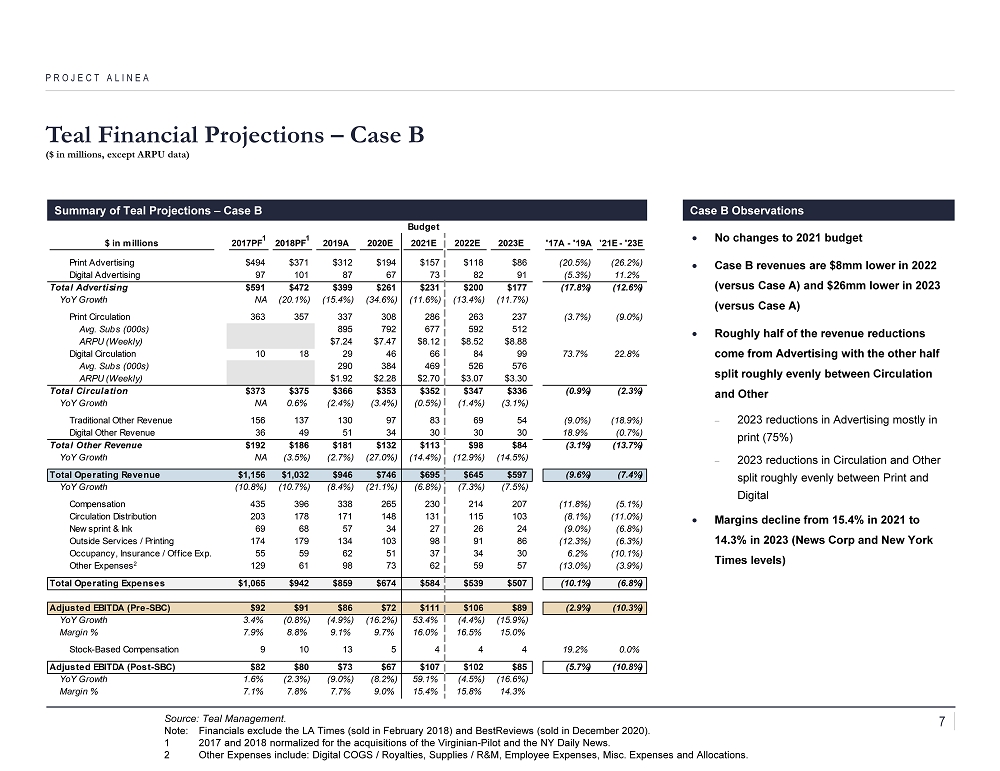
No changes to 2021 budget Case B revenues are $8mm lower in 2022 (versus Case A) and $26mm lower in 2023 (versus Case A) Roughly half of the revenue reductions come from Advertising with the other half split roughly evenly between Circulation and Other 2023 reductions in Advertising mostly in print (75%) 2023 reductions in Circulation and Other split roughly evenly between Print and Digital Margins decline from 15.4% in 2021 to 14.3% in 2023 (News Corp and New York Times levels) Teal Financial Projections – Case B ($ in millions, except ARPU data) PROJECT ALINEA Summary of Teal Projections – Case B Case B Observations Source: Teal Management. Note: Financials exclude the LA Times (sold in February 2018) and BestReviews (sold in December 2020). 1 2017 and 2018 normalized for the acquisitions of the Virginian - Pilot and the NY Daily News. 2 Other Expenses include: Digital COGS / Royalties, Supplies / R&M, Employee Expenses, Misc. Expenses and Allocations. Budget $ in millions 2017PF 1 2018PF 1 2019A 2020E 2021E 2022E 2023E '17A - '19A '21E - '23E Print Advertising $494 $371 $312 $194 $157 $118 $86 (20.5%) (26.2%) Digital Advertising 97 101 87 67 73 82 91 (5.3%) 11.2% Total Advertising $591 $472 $399 $261 $231 $200 $177 (17.8%) (12.6%) YoY Growth NA (20.1%) (15.4%) (34.6%) (11.6%) (13.4%) (11.7%) Print Circulation 363 357 337 308 286 263 237 (3.7%) (9.0%) Avg. Subs (000s) 895 792 677 592 512 ARPU (Weekly) $7.24 $7.47 $8.12 $8.52 $8.88 Digital Circulation 10 18 29 46 66 84 99 73.7% 22.8% Avg. Subs (000s) 290 384 469 526 576 ARPU (Weekly) $1.92 $2.28 $2.70 $3.07 $3.30 Total Circulation $373 $375 $366 $353 $352 $347 $336 (0.9%) (2.3%) YoY Growth NA 0.6% (2.4%) (3.4%) (0.5%) (1.4%) (3.1%) Traditional Other Revenue 156 137 130 97 83 69 54 (9.0%) (18.9%) Digital Other Revenue 36 49 51 34 30 30 30 18.9% (0.7%) Total Other Revenue $192 $186 $181 $132 $113 $98 $84 (3.1%) (13.7%) YoY Growth NA (3.5%) (2.7%) (27.0%) (14.4%) (12.9%) (14.5%) Total Operating Revenue $1,156 $1,032 $946 $746 $695 $645 $597 (9.6%) (7.4%) YoY Growth (10.8%) (10.7%) (8.4%) (21.1%) (6.8%) (7.3%) (7.5%) Compensation 435 396 338 265 230 214 207 (11.8%) (5.1%) Circulation Distribution 203 178 171 148 131 115 103 (8.1%) (11.0%) Newsprint & Ink 69 68 57 34 27 26 24 (9.0%) (6.8%) Outside Services / Printing 174 179 134 103 98 91 86 (12.3%) (6.3%) Occupancy, Insurance / Office Exp. 55 59 62 51 37 34 30 6.2% (10.1%) Other Expenses2 129 61 98 73 62 59 57 (13.0%) (3.9%) Total Operating Expenses $1,065 $942 $859 $674 $584 $539 $507 (10.1%) (6.8%) Adjusted EBITDA (Pre-SBC) $92 $91 $86 $72 $111 $106 $89 (2.9%) (10.3%) YoY Growth 3.4% (0.8%) (4.9%) (16.2%) 53.4% (4.4%) (15.9%) Margin % 7.9% 8.8% 9.1% 9.7% 16.0% 16.5% 15.0% Stock-Based Compensation 9 10 13 5 4 4 4 19.2% 0.0% Adjusted EBITDA (Post-SBC) $82 $80 $73 $67 $107 $102 $85 (5.7%) (10.8%) YoY Growth 1.6% (2.3%) (9.0%) (8.2%) 59.1% (4.5%) (16.6%) Margin % 7.1% 7.8% 7.7% 9.0% 15.4% 15.8% 14.3% 7
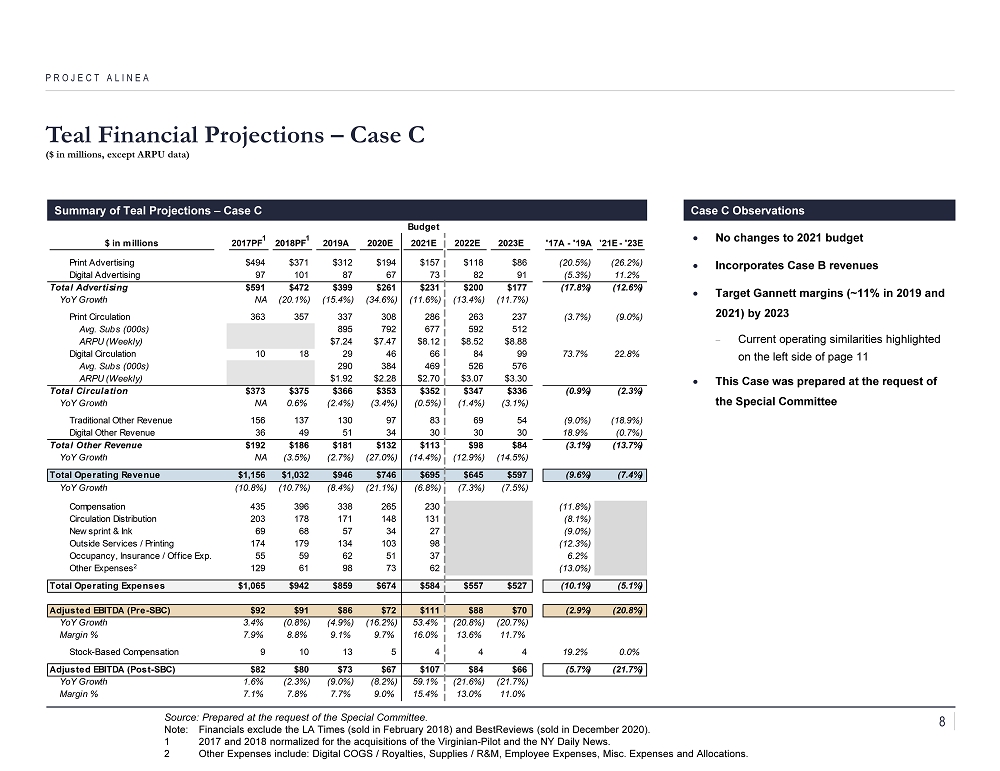
No changes to 2021 budget Incorporates Case B revenues Target Gannett margins (~11% in 2019 and 2021) by 2023 Current operating similarities highlighted on the left side of page 11 This Case was prepared at the request of the Special Committee Teal Financial Projections – Case C ($ in millions, except ARPU data) PROJECT ALINEA Summary of Teal Projections – Case C Case C Observations Source: Prepared at the request of the Special Committee. Note: Financials exclude the LA Times (sold in February 2018) and BestReviews (sold in December 2020). 1 2017 and 2018 normalized for the acquisitions of the Virginian - Pilot and the NY Daily News. 2 Other Expenses include: Digital COGS / Royalties, Supplies / R&M, Employee Expenses, Misc. Expenses and Allocations. Budget $ in millions 2017PF 1 2018PF 1 2019A 2020E 2021E 2022E 2023E '17A - '19A '21E - '23E Print Advertising $494 $371 $312 $194 $157 $118 $86 (20.5%) (26.2%) Digital Advertising 97 101 87 67 73 82 91 (5.3%) 11.2% Total Advertising $591 $472 $399 $261 $231 $200 $177 (17.8%) (12.6%) YoY Growth NA (20.1%) (15.4%) (34.6%) (11.6%) (13.4%) (11.7%) Print Circulation 363 357 337 308 286 263 237 (3.7%) (9.0%) Avg. Subs (000s) 895 792 677 592 512 ARPU (Weekly) $7.24 $7.47 $8.12 $8.52 $8.88 Digital Circulation 10 18 29 46 66 84 99 73.7% 22.8% Avg. Subs (000s) 290 384 469 526 576 ARPU (Weekly) $1.92 $2.28 $2.70 $3.07 $3.30 Total Circulation $373 $375 $366 $353 $352 $347 $336 (0.9%) (2.3%) YoY Growth NA 0.6% (2.4%) (3.4%) (0.5%) (1.4%) (3.1%) Traditional Other Revenue 156 137 130 97 83 69 54 (9.0%) (18.9%) Digital Other Revenue 36 49 51 34 30 30 30 18.9% (0.7%) Total Other Revenue $192 $186 $181 $132 $113 $98 $84 (3.1%) (13.7%) YoY Growth NA (3.5%) (2.7%) (27.0%) (14.4%) (12.9%) (14.5%) Total Operating Revenue $1,156 $1,032 $946 $746 $695 $645 $597 (9.6%) (7.4%) YoY Growth (10.8%) (10.7%) (8.4%) (21.1%) (6.8%) (7.3%) (7.5%) Compensation 435 396 338 265 230 (11.8%) Circulation Distribution 203 178 171 148 131 (8.1%) Newsprint & Ink 69 68 57 34 27 (9.0%) Outside Services / Printing 174 179 134 103 98 (12.3%) Occupancy, Insurance / Office Exp. 55 59 62 51 37 6.2% Other Expenses2 129 61 98 73 62 (13.0%) Total Operating Expenses $1,065 $942 $859 $674 $584 $557 $527 (10.1%) (5.1%) Adjusted EBITDA (Pre-SBC) $92 $91 $86 $72 $111 $88 $70 (2.9%) (20.8%) YoY Growth 3.4% (0.8%) (4.9%) (16.2%) 53.4% (20.8%) (20.7%) Margin % 7.9% 8.8% 9.1% 9.7% 16.0% 13.6% 11.7% Stock-Based Compensation 9 10 13 5 4 4 4 19.2% 0.0% Adjusted EBITDA (Post-SBC) $82 $80 $73 $67 $107 $84 $66 (5.7%) (21.7%) YoY Growth 1.6% (2.3%) (9.0%) (8.2%) 59.1% (21.6%) (21.7%) Margin % 7.1% 7.8% 7.7% 9.0% 15.4% 13.0% 11.0% 8
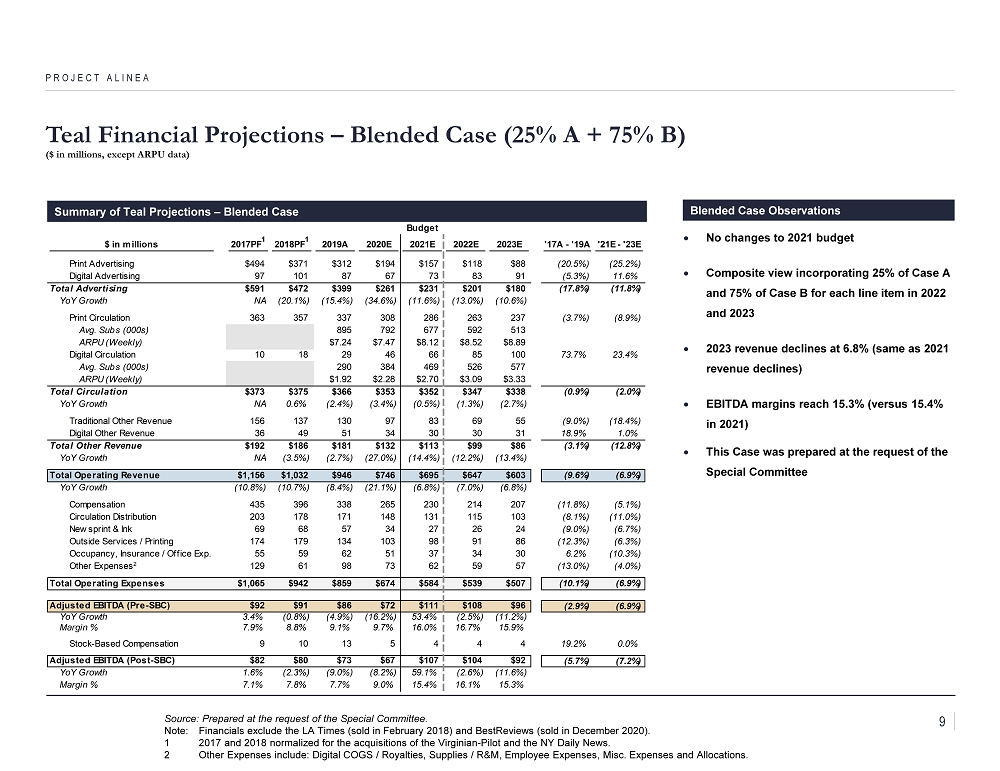
No changes to 2021 budget Composite view incorporating 25% of Case A and 75% of Case B for each line item in 2022 and 2023 2023 revenue declines at 6.8% (same as 2021 revenue declines) EBITDA margins reach 15.3% (versus 15.4% in 2021) This Case was prepared at the request of the Special Committee Teal Financial Projections – Blended Case (25% A + 75% B) ($ in millions, except ARPU data) PROJECT ALINEA Summary of Teal Projections – Blended Case Blended Case Observations Source: Prepared at the request of the Special Committee. Note: Financials exclude the LA Times (sold in February 2018) and BestReviews (sold in December 2020). 1 2017 and 2018 normalized for the acquisitions of the Virginian - Pilot and the NY Daily News. 2 Other Expenses include: Digital COGS / Royalties, Supplies / R&M, Employee Expenses, Misc. Expenses and Allocations. Budget $ in millions 2017PF 1 2018PF 1 2019A 2020E 2021E 2022E 2023E '17A - '19A '21E - '23E Print Advertising $494 $371 $312 $194 $157 $118 $88 (20.5%) (25.2%) Digital Advertising 97 101 87 67 73 83 91 (5.3%) 11.6% Total Advertising $591 $472 $399 $261 $231 $201 $180 (17.8%) (11.8%) YoY Growth NA (20.1%) (15.4%) (34.6%) (11.6%) (13.0%) (10.6%) Print Circulation 363 357 337 308 286 263 237 (3.7%) (8.9%) Avg. Subs (000s) 895 792 677 592 513 ARPU (Weekly) $7.24 $7.47 $8.12 $8.52 $8.89 Digital Circulation 10 18 29 46 66 85 100 73.7% 23.4% Avg. Subs (000s) 290 384 469 526 577 ARPU (Weekly) $1.92 $2.28 $2.70 $3.09 $3.33 Total Circulation $373 $375 $366 $353 $352 $347 $338 (0.9%) (2.0%) YoY Growth NA 0.6% (2.4%) (3.4%) (0.5%) (1.3%) (2.7%) Traditional Other Revenue 156 137 130 97 83 69 55 (9.0%) (18.4%) Digital Other Revenue 36 49 51 34 30 30 31 18.9% 1.0% Total Other Revenue $192 $186 $181 $132 $113 $99 $86 (3.1%) (12.8%) YoY Growth NA (3.5%) (2.7%) (27.0%) (14.4%) (12.2%) (13.4%) Total Operating Revenue $1,156 $1,032 $946 $746 $695 $647 $603 (9.6%) (6.9%) YoY Growth (10.8%) (10.7%) (8.4%) (21.1%) (6.8%) (7.0%) (6.8%) Compensation 435 396 338 265 230 214 207 (11.8%) (5.1%) Circulation Distribution 203 178 171 148 131 115 103 (8.1%) (11.0%) Newsprint & Ink 69 68 57 34 27 26 24 (9.0%) (6.7%) Outside Services / Printing 174 179 134 103 98 91 86 (12.3%) (6.3%) Occupancy, Insurance / Office Exp. 55 59 62 51 37 34 30 6.2% (10.3%) Other Expenses2 129 61 98 73 62 59 57 (13.0%) (4.0%) Total Operating Expenses $1,065 $942 $859 $674 $584 $539 $507 (10.1%) (6.9%) Adjusted EBITDA (Pre-SBC) $92 $91 $86 $72 $111 $108 $96 (2.9%) (6.9%) YoY Growth 3.4% (0.8%) (4.9%) (16.2%) 53.4% (2.5%) (11.2%) Margin % 7.9% 8.8% 9.1% 9.7% 16.0% 16.7% 15.9% Stock-Based Compensation 9 10 13 5 4 4 4 19.2% 0.0% Adjusted EBITDA (Post-SBC) $82 $80 $73 $67 $107 $104 $92 (5.7%) (7.2%) YoY Growth 1.6% (2.3%) (9.0%) (8.2%) 59.1% (2.6%) (11.6%) Margin % 7.1% 7.8% 7.7% 9.0% 15.4% 16.1% 15.3% 9
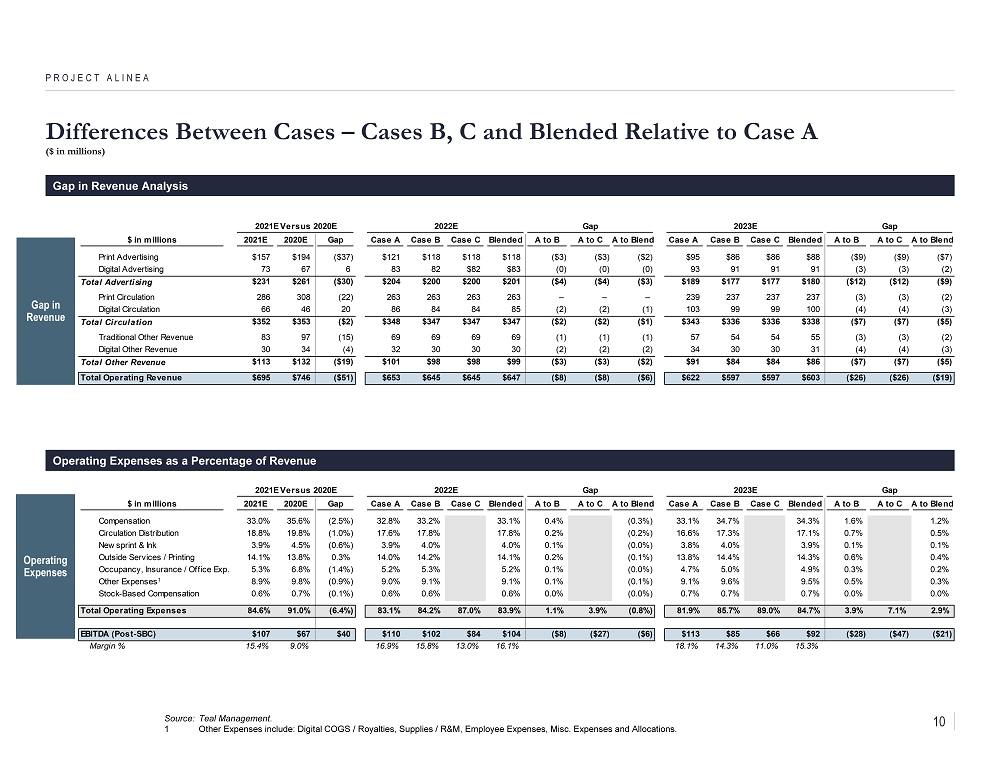
Differences Between Cases – Cases B, C and Blended Relative to Case A ($ in millions) PROJECT ALINEA Gap in Revenue Analysis Gap in Revenue 2021E Versus 2020E 2022E Gap 2023E Gap $ in millions 2021E 2020E Gap Case A Case B Case C Blended A to B A to C A to Blend Case A Case B Case C Blended A to B A to C A to Blend Print Advertising $157 $194 ($37) $121 $118 $118 $118 ($3) ($3) ($2) $95 $86 $86 $88 ($9) ($9) ($7) Digital Advertising 73 67 6 83 82 $82 $83 (0) (0) (0) 93 91 91 91 (3) (3) (2) Total Advertising $231 $261 ($30) $204 $200 $200 $201 ($4) ($4) ($3) $189 $177 $177 $180 ($12) ($12) ($9) Print Circulation 286 308 (22) 263 263 263 263 – – – 239 237 237 237 (3) (3) (2) Digital Circulation 66 46 20 86 84 84 85 (2) (2) (1) 103 99 99 100 (4) (4) (3) Total Circulation $352 $353 ($2) $348 $347 $347 $347 ($2) ($2) ($1) $343 $336 $336 $338 ($7) ($7) ($5) Traditional Other Revenue 83 97 (15) 69 69 69 69 (1) (1) (1) 57 54 54 55 (3) (3) (2) Digital Other Revenue 30 34 (4) 32 30 30 30 (2) (2) (2) 34 30 30 31 (4) (4) (3) Total Other Revenue $113 $132 ($19) $101 $98 $98 $99 ($3) ($3) ($2) $91 $84 $84 $86 ($7) ($7) ($5) Total Operating Revenue $695 $746 ($51) $653 $645 $645 $647 ($8) ($8) ($6) $622 $597 $597 $603 ($26) ($26) ($19) Operating Expenses Operating Expenses as a Percentage of Revenue 2021E Versus 2020E 2022E Gap 2023E Gap $ in millions 2021E 2020E Gap Case A Case B Case C Blended A to B A to C A to Blend Case A Case B Case C Blended A to B A to C A to Blend Compensation 33.0% 35.6% (2.5%) 32.8% 33.2% 33.1% 0.4% (0.3%) 33.1% 34.7% 34.3% 1.6% 1.2% Circulation Distribution 18.8% 19.8% (1.0%) 17.6% 17.8% 17.8% 0.2% (0.2%) 16.6% 17.3% 17.1% 0.7% 0.5% Newsprint & Ink 3.9% 4.5% (0.6%) 3.9% 4.0% 4.0% 0.1% (0.0%) 3.8% 4.0% 3.9% 0.1% 0.1% Outside Services / Printing 14.1% 13.8% 0.3% 14.0% 14.2% 14.1% 0.2% (0.1%) 13.8% 14.4% 14.3% 0.6% 0.4% Occupancy, Insurance / Office Exp. 5.3% 6.8% (1.4%) 5.2% 5.3% 5.2% 0.1% (0.0%) 4.7% 5.0% 4.9% 0.3% 0.2% Other Expenses1 8.9% 9.8% (0.9%) 9.0% 9.1% 9.1% 0.1% (0.1%) 9.1% 9.6% 9.5% 0.5% 0.3% Stock-Based Compensation 0.6% 0.7% (0.1%) 0.6% 0.6% 0.6% 0.0% (0.0%) 0.7% 0.7% 0.7% 0.0% 0.0% Total Operating Expenses 84.6% 91.0% (6.4%) 83.1% 84.2% 87.0% 83.9% 1.1% 3.9% (0.8%) 81.9% 85.7% 89.0% 84.7% 3.9% 7.1% 2.9% EBITDA (Post-SBC) $107 $67 $40 $110 $102 $84 $104 ($8) ($27) ($6) $113 $85 $66 $92 ($28) ($47) ($21) Margin % 15.4% 9.0% 16.9% 15.8% 13.0% 16.1% 18.1% 14.3% 11.0% 15.3% Source: Teal Management. 1 Other Expenses include: Digital COGS / Royalties, Supplies / R&M, Employee Expenses, Misc. Expenses and Allocations. 10
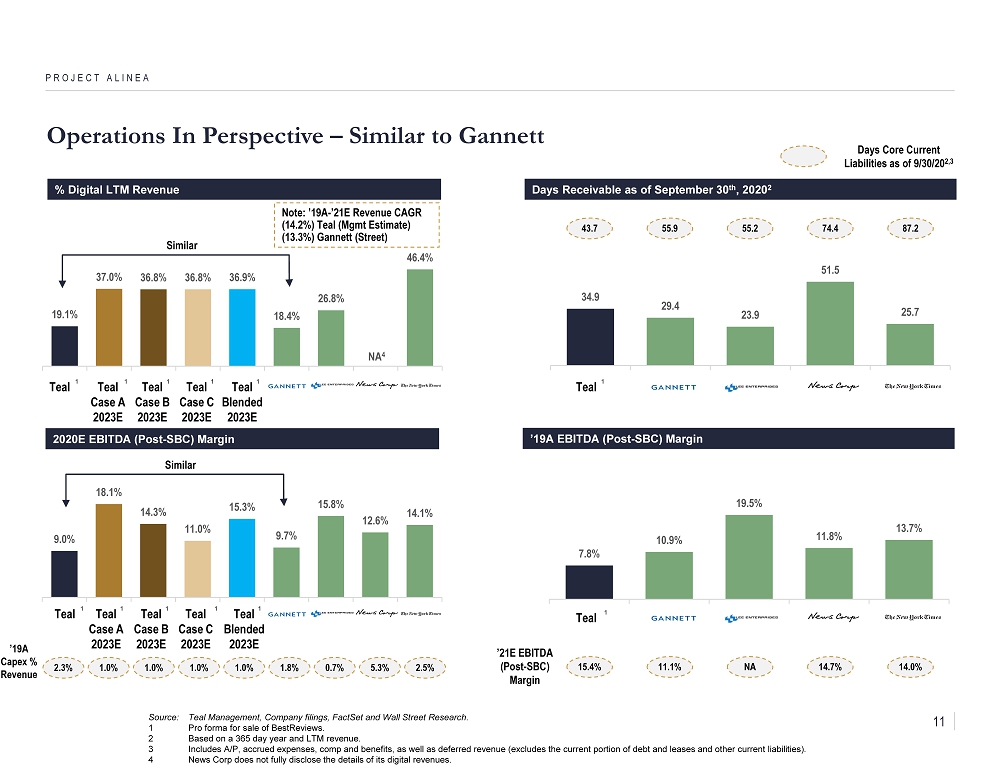
Operations In Perspective – Similar to Gannett PROJECT ALINEA % Digital LTM Revenue Days Receivable as of September 30 th , 2020 2 Source: Teal Management, Company filings, FactSet and Wall Street Research. 1 Pro forma for sale of BestReviews . 2 Based on a 365 day year and LTM revenue. 3 Includes A/P, accrued expenses, comp and benefits, as well as deferred revenue (excludes the current portion of debt and leas es and other current liabilities). 4 News Corp does not fully disclose the details of its digital revenues. 2020E EBITDA (Post - SBC) Margin ’19A EBITDA (Post - SBC) Margin 34.9 29.4 23.9 51.5 25.7 1 Teal 7.8% 10.9% 19.5% 11.8% 13.7% 1 Teal 19.1% 37.0% 36.8% 36.8% 36.9% 18.4% 26.8% 46.4% Teal 1 9.0% 18.1% 14.3% 11.0% 15.3% 9.7% 15.8% 12.6% 14.1% 2.5% 5.3% 0.7% 2.3% 1.8% ’19A Capex % Revenue Teal Case A 2023E 1 Teal Case B 2023E 1 1.0% 1.0% Teal Case C 2023E 1 87.2 74.4 55.2 Similar 43.7 55.9 Teal 1 Teal Case A 2023E 1 Teal Case B 2023E 1 Teal Case C 2023E 1 1.0% 14.0% 14.7% NA 15.4% 11.1% ’21E EBITDA (Post - SBC) Margin NA 4 Days Core Current Liabilities as of 9/30/20 2,3 Similar Note: ’19A - ’21E Revenue CAGR (14.2%) Teal ( Mgmt Estimate) (13.3%) Gannett (Street) Teal Blended 2023E 1 1.0% Teal Blended 2023E 1 11
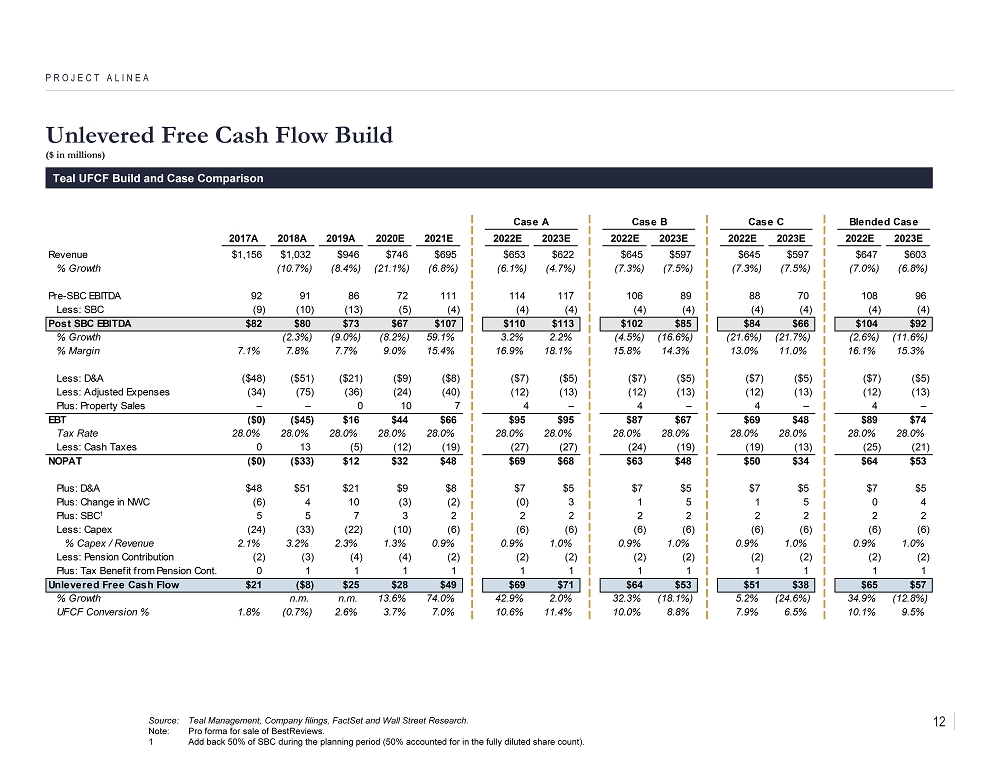
Unlevered Free Cash Flow Build ($ in millions) PROJECT ALINEA Case A Case B Case C Blended Case February Model 2017A 2018A 2019A 2020E 2021E 2022E 2023E 2022E 2023E 2022E 2023E 2022E 2023E Revenue $1,156 $1,032 $946 $746 $695 $653 $622 $645 $597 $645 $597 $647 $603 % Growth (10.7%) (8.4%) (21.1%) (6.8%) (6.1%) (4.7%) (7.3%) (7.5%) (7.3%) (7.5%) (7.0%) (6.8%) Pre-SBC EBITDA 92 91 86 72 111 114 117 106 89 88 70 108 96 Less: SBC (9) (10) (13) (5) (4) (4) (4) (4) (4) (4) (4) (4) (4) Post SBC EBITDA $82 $80 $73 $67 $107 $110 $113 $102 $85 $84 $66 $104 $92 % Growth (2.3%) (9.0%) (8.2%) 59.1% 3.2% 2.2% (4.5%) (16.6%) (21.6%) (21.7%) (2.6%) (11.6%) % Margin 7.1% 7.8% 7.7% 9.0% 15.4% 16.9% 18.1% 15.8% 14.3% 13.0% 11.0% 16.1% 15.3% Less: D&A ($48) ($51) ($21) ($9) ($8) ($7) ($5) ($7) ($5) ($7) ($5) ($7) ($5) Less: Adjusted Expenses (34) (75) (36) (24) (40) (12) (13) (12) (13) (12) (13) (12) (13) Plus: Property Sales – – 0 10 7 4 – 4 – 4 – 4 – EBT ($0) ($45) $16 $44 $66 $95 $95 $87 $67 $69 $48 $89 $74 Tax Rate 28.0% 28.0% 28.0% 28.0% 28.0% 28.0% 28.0% 28.0% 28.0% 28.0% 28.0% 28.0% 28.0% Less: Cash Taxes 0 13 (5) (12) (19) (27) (27) (24) (19) (19) (13) (25) (21) NOPAT ($0) ($33) $12 $32 $48 $69 $68 $63 $48 $50 $34 $64 $53 Plus: D&A $48 $51 $21 $9 $8 $7 $5 $7 $5 $7 $5 $7 $5 Plus: Change in NWC (6) 4 10 (3) (2) (0) 3 1 5 1 5 0 4 Plus: SBC1 5 5 7 3 2 2 2 2 2 2 2 2 2 Less: Capex (24) (33) (22) (10) (6) (6) (6) (6) (6) (6) (6) (6) (6) % Capex / Revenue 2.1% 3.2% 2.3% 1.3% 0.9% 0.9% 1.0% 0.9% 1.0% 0.9% 1.0% 0.9% 1.0% Less: Pension Contribution (2) (3) (4) (4) (2) (2) (2) (2) (2) (2) (2) (2) (2) Plus: Tax Benefit from Pension Cont. 0 1 1 1 1 1 1 1 1 1 1 1 1 Unlevered Free Cash Flow $21 ($8) $25 $28 $49 $69 $71 $64 $53 $51 $38 $65 $57 % Growth n.m. n.m. 13.6% 74.0% 42.9% 2.0% 32.3% (18.1%) 5.2% (24.6%) 34.9% (12.8%) UFCF Conversion % 1.8% (0.7%) 2.6% 3.7% 7.0% 10.6% 11.4% 10.0% 8.8% 7.9% 6.5% 10.1% 9.5% Source: Teal Management, Company filings, FactSet and Wall Street Research. Note: Pro forma for sale of BestReviews . 1 Add back 50% of SBC during the planning period (50% accounted for in the fully diluted share count). Teal UFCF Build and Case Comparison 12
Project Alinea FLASH UPDATE MATERIALS FEBRUARY 2021 CONFIDENTIAL
The information herein has been prepared by Lazard Frères & Co . LLC (“Lazard”) based upon information supplied by you (“Teal” or the “Company”) or publicly available information, and portions of the information herein may be based upon certain statements, estimates and forecasts provided by the Company with respect to the anticipated future performance of the Company . Lazard has relied upon the accuracy and completeness of the foregoing information, and has not assumed any responsibility for any independent verification of such information or any independent valuation or appraisal of any of the assets or liabilities of the Company or any other entity, or concerning solvency or fair value of the Company or any other entity . With respect to financial forecasts, Lazard has assumed that they have been reasonably prepared on bases reflecting the best currently available estimates and judgments as to the future financial performance of the relevant entity ; we assume no responsibility for and express no view as to such forecasts . The information set forth herein is based upon economic, monetary, market and other conditions as in effect on, and the information made available to us as of, the date hereof, unless indicated otherwise . These materials and the information contained herein are confidential and may not be disclosed publicly or made available to third parties without the prior written consent of Lazard ; provided, however, that you may disclose to any and all persons the U . S . federal income tax treatment and tax structure of any transaction described herein and the portions of these materials that relate to such tax treatment or structure . Lazard is acting as investment banker to the Special Committee of the Board of Directors of the Company (the “Special Committee”), and will not be responsible for and will not provide any tax, accounting, actuarial, legal or other specialist advice . These materials are preliminary and summary in nature and do not include all of the information that the Special Committee should evaluate in considering a possible transaction . Lazard has been retained only by the Special Committee in connection with the transaction described herein and has no duties to any third party . Nothing herein shall constitute a commitment or undertaking on the part of Lazard or any related party to provide any service . Disclaimer PROJECT ALINEA CONFIDENTIAL 1
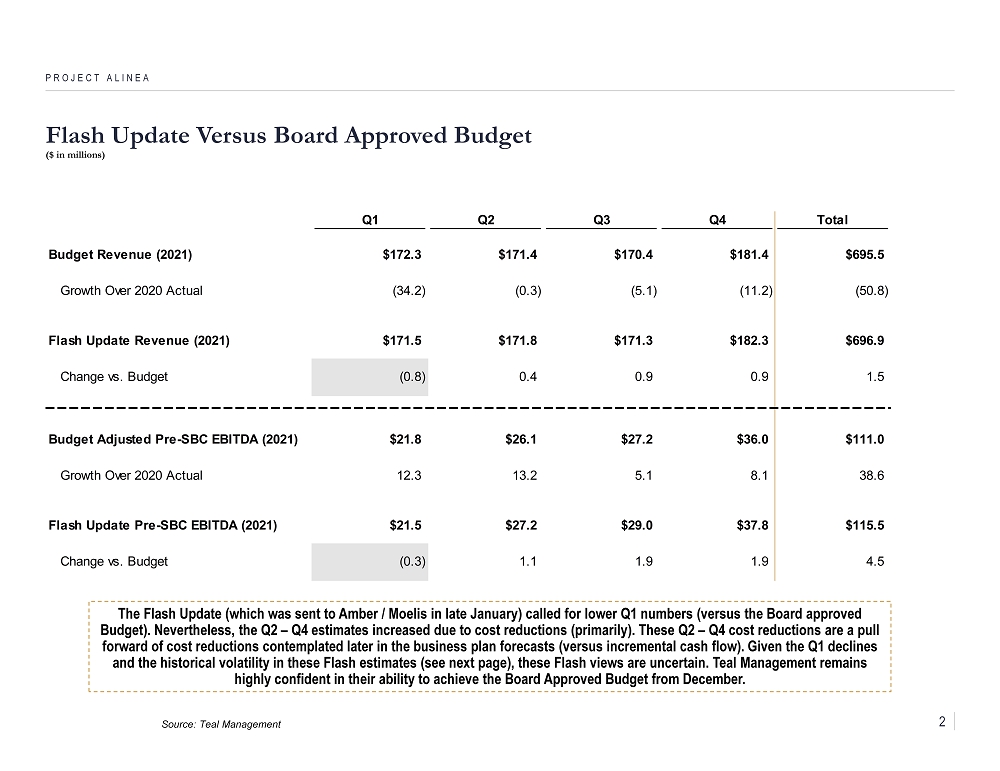
Flash Update Versus Board Approved Budget ($ in millions) PROJECT ALINEA Q1 Q2 Q3 Q4 Total Budget Revenue (2021) $172.3 $171.4 $170.4 $181.4 $695.5 Growth Over 2020 Actual (34.2) (0.3) (5.1) (11.2) (50.8) Flash Update Revenue (2021) $171.5 $171.8 $171.3 $182.3 $696.9 Change vs. Budget (0.8) 0.4 0.9 0.9 1.5 Budget Adjusted Pre-SBC EBITDA (2021) $21.8 $26.1 $27.2 $36.0 $111.0 Growth Over 2020 Actual 12.3 13.2 5.1 8.1 38.6 Flash Update Pre-SBC EBITDA (2021) $21.5 $27.2 $29.0 $37.8 $115.5 Change vs. Budget (0.3) 1.1 1.9 1.9 4.5 Source: Teal Management The Flash Update (which was sent to Amber / Moelis in late January) called for lower Q1 numbers (versus the Board approved Budget). Nevertheless, the Q2 – Q4 estimates increased due to cost reductions (primarily). These Q2 – Q4 cost reductions are a p ull forward of cost reductions contemplated later in the business plan forecasts (versus incremental cash flow). Given the Q1 dec lin es and the historical volatility in these Flash estimates (see next page), these Flash views are uncertain. Teal Management rema ins highly confident in their ability to achieve the Board Approved Budget from December. 2
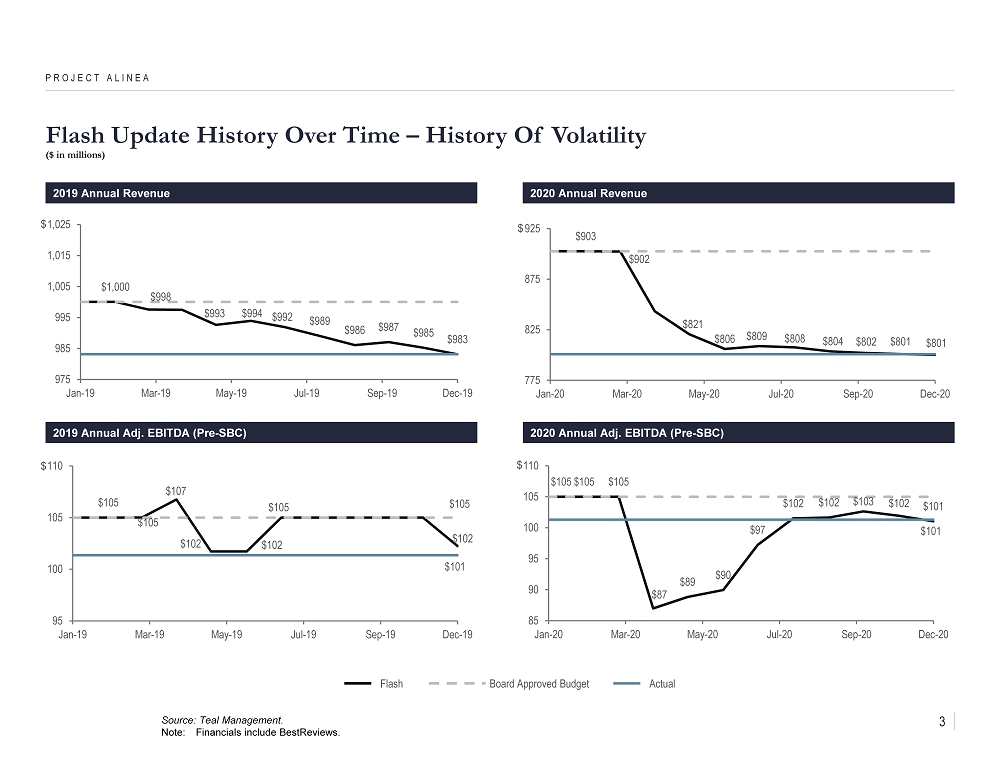
Flash Update History Over Time – History Of Volatility ($ in millions) PROJECT ALINEA 2019 Annual Revenue 2020 Annual Revenue 2019 Annual Adj . EBITDA (Pre - SBC) 2020 Annual Adj . EBITDA (Pre - SBC) $1,000 $998 $993 $994 $992 $989 $986 $987 $985 $983 975 985 995 1,005 1,015 1,025 Jan-19 Mar-19 May-19 Jul-19 Sep-19 Dec-19 Source: Teal Management. Note: Financials include BestReviews . Flash $903 $902 $821 $806 $809 $808 $804 $802 $801 $801 775 825 875 925 Jan-20 Mar-20 May-20 Jul-20 Sep-20 Dec-20 $105 $105 $107 $102 $102 $105 $105 $102 $101 95 100 105 110 Jan-19 Mar-19 May-19 Jul-19 Sep-19 Dec-19 $105 $105 $105 $87 $89 $90 $97 $102 $102 $103 $102 $101 $101 85 90 95 100 105 110 Jan-20 Mar-20 May-20 Jul-20 Sep-20 Dec-20 $ $ $ $ Board Approved Budget Actual 3