UNITED STATES
SECURITIES AND EXCHANGE COMMISSION
Washington, D.C. 20549
FORM N-CSR
CERTIFIED SHAREHOLDER REPORT OF REGISTERED MANAGEMENT
INVESTMENT COMPANIES
Investment Company Act File Number 811-22920
The Advisors’ Inner Circle Fund III
(Exact name of registrant as specified in charter)
SEI Investments
One Freedom Valley Drive
Oaks, PA 19456
(Address of principal executive offices) (Zip code)
SEI Investments
One Freedom Valley Drive
Oaks, PA 19456
(Name and address of agent for service)
Registrant’s telephone number, including area code: (877) 446-3863
Date of fiscal year end: December 31, 2022
Date of reporting period: December 31, 2022
Item 1. Reports to Stockholders.
A copy of the report transmitted to stockholders pursuant to Rule 30e-1 under the Investment Company Act of 1940, as amended (the “Act”) (17 CFR § 270.30e-1), is attached hereto.
The Advisors’ Inner Circle Fund III

FS Multi-Strategy Alternatives Fund
FS Managed Futures Fund
FS Chiron Real Asset Fund
| Annual Report | December 31, 2022 |
| THE ADVISORS’ INNER CIRCLE FUND III | FS INVESTMENTS | |||
| DECEMBER 31, 2022 |
| 1 | ||||
| 17 | ||||
| 116 | ||||
| 117 | ||||
| 121 | ||||
| 123 | ||||
| 129 | ||||
| 135 | ||||
| 163 | ||||
| 165 | ||||
| 167 | ||||
| 175 | ||||
The Funds file their complete schedule of portfolio holdings with the SEC for the first and third quarters of each fiscal year as an exhibit to its reports on Form N-PORT. The Funds’ Form N-PORT reports (and its predecessor form, Form N-Q) are available on the SEC’s website at www.sec.gov, and may be reviewed and copied at the SEC’s Public Reference Room in Washington, DC. Information on the operation of the Public Reference Room may be obtained by calling 202-551-8090.
A description of the policies and procedures that the Funds use to determine how to vote proxies relating to fund securities, as well as information relating to how a Fund voted proxies relating to fund securities during the most recent 12-month period ended June 30, will be available after August 30 (i) without charge, upon request, by calling 1-877-924-4766; and (ii) on the SEC’s website at http://www.sec.gov
| THE ADVISORS’ INNER CIRCLE FUND III | FS MULTI-STRATEGY | |||
| ALTERNATIVES FUND | ||||
| DECEMBER 31, 2022 |
FS Multi-Strategy Alternatives Fund
Dear Shareholder:
For the fiscal year ended December 31, 2022, FS Multi-Strategy Alternatives Fund (the “Fund”) returned 3.16% (Class I shares) with a realized 3.3% annualized monthly volatility and a 0.70 correlation to equities. The BofA Merrill Lynch 3-Month U.S. Treasury Bill Index (which tracks the performance of the U.S. dollar-denominated U.S. Treasury Bills publicly issued in the U.S. domestic market with remaining term to final maturity of less than 3 months), the primary benchmark for the Fund, had a positive return of 1.46% over this time period.
The Fund follows a “hybrid” investment approach — allocating to both skilled hedge fund managers for alpha and rules-based alternative beta strategies for long/short sources of return that can be captured systematically. These strategies trade long and short across different asset groups: stocks of major developed markets, country indices, bond futures, interest rate futures, currencies, bonds and credit securities.
The fund allocates to four hedge fund managers:
| • | Chilton Investment Company, LLC (“Chilton”). pursues a long/short equity strategy focused on high-quality companies with strong business models and growth potential at reasonable valuations. |
| • | Crabel Capital Management, LLC (“Crabel”): specializes in the systematic, automated trading of worldwide futures and foreign exchange designed to capture market anomalies implemented through a technologically advanced, low latency infrastructure to deliver uncorrelated return. |
| • | MidOcean Credit Fund Management, L.P. (“MidOcean”) implements an event driven long/short credit strategy which seeks to capture current income and growth from three primary pockets of inefficiencies in the credit market: callable bonds, short-dated credit and crossover credit. |
| • | Mariner Investment Group: executes a disciplined relative value strategy investing in interest-only Agency MBS seeking income with low duration and an asymmetric risk return profile. |
The Fund invests across four main alternative beta strategy categories:
| • | Equity: Investing in stocks seeking to generate returns less sensitive to market direction based on specific factors (e.g. size, quality) |
| • | Macro: Investing in bonds, currencies and commodities seeking to generate risk-adjusted returns through specific factors (e.g., value, carry) |
1
| THE ADVISORS’ INNER CIRCLE FUND III | FS MULTI-STRATEGY | |||
| ALTERNATIVES FUND | ||||
| DECEMBER 31, 2022 |
| • | Technical trading: Investing across asset classes seeking to generate uncorrelated returns-based on price trends and trading patterns (e.g., momentum, mean reversion) |
| • | Volatility: Investing in volatility markets seeking to profit from price inefficiencies and relative value opportunities (e.g., realized volatility vs implied volatility) |
The Fund uses derivatives to execute investment objectives for a variety of purposes, such as to seek economic exposure to one or more alternative strategies, enhance returns, increase investment flexibility, speculate on a targeted investment opportunity, or for hedging purposes. In attempting to achieve its investment objectives, the Fund primarily use total return basket swaps that seek both long and short exposure on variety of strategies, in a notional amount, that the Funds could not otherwise have exposure to on a name by name basis. The total return basket swaps include exposure to equity, foreign currency, commodity and interest rate risk.
Performance this year was driven primarily by positive contributions from the rules-based alternative beta strategies. The Fund’s best performing alternative beta strategies were Equity risk premia s and Macro risk premia strategies, particularly those strategies seeking to capture the value and volatility factors. The Fund’s hedge fund managers, Crabel and Mariner positively contributed, while Chilton and MidOcean negatively contributed to fund performance in 2022.
2022 was a challenging year for most traditional asset classes, as macro-level uncertainties including decades-high inflation, an ultra-hawkish Federal Reserve, rising interest rates and concerns over economic growth weighed heavily on markets. Many of these uncertainties remain in 2023 which may continue to drive volatility and heightened dispersion. This type of environment creates a great opportunity set for the Fund’s alternative risk premia strategies and alpha managers as our balanced, macro-aware portfolio allows us to navigate and capitalize on changing market conditions and the evolving economic backdrop. We continue to seek broad-based contribution from uncorrelated return streams to generate a differentiated return with diversification benefits like low correlation to stocks and bonds and capital preservation.
Sincerely,
| • | Michael Kelly |
| • | Scott Burr |
The FS Chiron Funds are distributed by SEI Investments Distribution Co. (SIDCo). SIDCo is not affiliated with FS Fund Advisor, LLC.
Investing involves risk, including possible loss of principal. Bonds and bond funds will decrease in value as interest rates rise. High yield bonds involve greater risks of default or downgrade and are more volatile than investment grade securities, due to the speculative nature of their investments. In addition to the normal risks
2
| THE ADVISORS’ INNER CIRCLE FUND III | FS MULTI-STRATEGY | |||
| ALTERNATIVES FUND | ||||
| DECEMBER 31, 2022 |
associated with investing, international investments may involve risk or capital loss from unfavorable fluctuation in currency values, differences in generally accepted accounting principles or from social, economic or political instability in other nations. Emerging markets involve heightened risks related to these factors as well as increased volatility and lower trading volume. REIT investments are subject to changes in economic conditions, credit risk and interest rate fluctuations. The Fund may invest in derivatives, which are often more volatile than other investments and may magnify the Fund’s gains or losses.
FS Fund Advisor, LLC is a registered investment adviser.
Information contained herein has been obtained from sources believed to be reliable, but not guaranteed. Forward-looking statements are not guarantees of future results. They involve risks, uncertainties and assumptions, there can be no assurance that actual results will not differ materially from expectations. Past performance is no guarantee of future results. No part of this material may be reproduced in any form, or referred to in any other publication, without express written permission from Chiron Investment Management, LLC.
| Not a Deposit | Not FDIC Insured | May Lose Value | No Bank Guarantee | Not Insured By Any Federal | ||||
| Government Agency |
3
| THE ADVISORS’ INNER CIRCLE FUND III | FS MULTI-STRATEGY | |||
| ALTERNATIVES FUND | ||||
| DECEMBER 31, 2022 |
Definition of Comparative Indices
The BofA Merrill Lynch 3-Month U.S. Treasury Bill Index is comprised of a single issue purchased at the beginning of the month and held for a month. At the end of the month, that issue is sold and rolled into a newly selected issue. The S&P 500 Index is a benchmark of large-cap U.S. equities. The index includes 500 leading companies and captures approximately 80% coverage of available market capitalization.
The HFRX Global Hedge Fund Index is designed to be representative of the overall composition of the hedge fund universe. It is comprised of all eligible hedge fund strategies.
4
| THE ADVISORS’ INNER CIRCLE FUND III | FS MANAGED | |||
| FUTURES FUND | ||||
| DECEMBER 31, 2022 |
FS Managed Futures Fund
Dear Shareholder:
For the fiscal year ended December 31, 2022, FS Managed Futures Fund (the “Fund”) returned 16.18% (Class I shares) with a realized 9.3% annualized monthly volatility and a -0.57 correlation to equities. The BofA Merrill Lynch 3-Month U.S. Treasury Bill Index (which tracks the performance of the U.S. dollar-denominated U.S. Treasury Bills publicly issued in the U.S. domestic market with remaining term to final maturity of less than 3 months), the primary benchmark for the Fund, had a positive return of 1.46% over this time period.
The Fund seeks to achieve its investment objective by allocating its assets across a broad spectrum of alternative investment strategies. The Fund may provide exposure to alternative strategies across the five major asset classes (commodities, currencies, fixed income, equities and credit). The strategy will normally be implemented through rules-based strategies that typically use historical price data to determine whether to take a long, short, or cash position in a given instrument. A rules-based strategy is a methodology based on a systematic approach. Principal strategies include “momentum/trend” based strategies that buy and sell securities in the same direction as the historical price movement and “counter-trend/mean reversion” based strategies that buy and sell securities in the opposite direction as the historical price movement. Other alternative strategies that do not rely on historical prices may also be utilized to enhance return.
The Fund uses derivatives to execute investment objectives for a variety of purposes, such as to seek economic exposure to one or more alternative strategies, enhance returns, increase investment flexibility, speculate on a targeted investment opportunity, or for hedging purposes. In attempting to achieve its investment objectives, the Fund primarily use total return basket swaps that seek both long and short exposure on variety of strategies, in a notional amount, that the Funds could not otherwise have exposure to on a name by name basis. The total return basket swaps include exposure to equity, foreign currency, and interest rate risk.
In 2022, the top performing strategies for the Fund were the time series momentum and trend strategies, particularly those across assets and over longer dated time periods. Commodity exposure also performed well for the fund. The bottom performing strategy for the Fund was an intraday trend following strategy.
Heightened velocity of market moves in 2022 with persistent trends in rates, equities and currencies were conducive to the Fund’s strategy. We expect a rangebound market in 2023, with periods of volatility and less persistent long-term trends. This environment creates a robust opportunity set for the Fund which is designed to monetize the market across time frames – intraday, weekly, and monthly. While the
5
| THE ADVISORS’ INNER CIRCLE FUND III | FS MANAGED | |||
| FUTURES FUND | ||||
| DECEMBER 31, 2022 |
fund has delivered its best returns during periods of market turbulence such as March 2020 and 2022, it has demonstrated an ability to generate returns in a variety of market environments while improving the overall risk adjusted return of traditional asset allocations.
Sincerely,
| • | Michael Kelly |
| • | Scott Burr |
The FS Chiron Funds are distributed by SEI Investments Distribution Co. (SIDCo). SIDCo is not affiliated with FS Fund Advisor, LLC.
Investing involves risk, including possible loss of principal. In addition to the normal risks associated with investing, investments in smaller companies typically exhibit higher volatility and lower trading volume; international investments may involve risk or capital loss from unfavorable fluctuation in currency values, differences in generally accepted accounting principles or from social, economic or political instability in other nations. Emerging markets involve heightened risks related to these factors as well as increased volatility and lower trading volume. REIT investments are subject to changes in economic conditions, credit risk and interest rate fluctuations. The Fund may invest in derivatives, which are often more volatile than other investments and may magnify the Fund’s gains or losses.
FS Fund Advisor, LLC is a registered investment adviser.
Information contained herein has been obtained from sources believed to be reliable, but not guaranteed. Forward-looking statements are not guarantees of future results. They involve risks, uncertainties and assumptions, there can be no assurance that actual results will not differ materially from expectations. Past performance is no guarantee of future results. No part of this material may be reproduced in any form, or referred to in any other publication, without express written permission from Chiron Investment Management, LLC.
Not a Deposit | Not FDIC Insured | May Lose Value | No Bank Guarantee | Not Insured By Any Federal | ||||
| Government Agency |
6
| THE ADVISORS’ INNER CIRCLE FUND III | FS MANAGED | |||
| FUTURES FUND | ||||
| DECEMBER 31, 2022 |
Definition of Comparative Indices
The BofA Merrill Lynch 3-Month U.S. Treasury Bill Index is comprised of a single issue purchased at the beginning of the month and held for a month. At the end of the month, that issue is sold and rolled into a newly selected issue. The S&P 500 Index is a benchmark of large-cap U.S. equities. The index includes 500 leading companies and captures approximately 80% coverage of available market capitalization.
7
| THE ADVISORS’ INNER CIRCLE FUND III | FS CHIRON | |||
| REAL ASSET FUND | ||||
| DECEMBER 31, 2022 |
FS Chiron Real Asset Fund
Dear Shareholder:
For the fiscal year ended December 31, 2022, FS Chiron Real Asset Fund (the “Fund”) returned -10.47% (Class I shares).
The Fund seeks to achieve its investment objective by actively allocating its assets across a broad spectrum of traditional real asset investments, , including energy and natural resources, real estate, basic materials, equipment, utilities and infrastructure, and commodities as well as next generation real assets which we believe will play a critical role in building and maintaining the world’s digital, physical and social infrastructure. Next generation real assets may include as companies with business activities in logistics, data centers, communication towers, life sciences office and lab space, cold storage and renewable power among others. The Fund also invests in various fixed income assets, including inflation-indexed securities that have historically generated returns in inflationary environments.
The Fund utilizes a “quantamental” approach, which combines quantitative and fundamental research. The quantitative process identifies opportunities for growth with the fundamental approach identifying changes not captured by the quantitative research, such as regulatory environment and industry dynamics. As markets are not static and go through various stages, the Fund seeks to identify the current stage in each market in which it invests and makes investment decisions accordingly, in order to capitalize on the underlying factors driving that particular market stage. The Fund aims to reduce volatility and risk through diversifying its investment choices across a range of industries.
The Fund uses derivatives to execute investment objectives for a variety of purposes, such as to seek economic exposure to one or more alternative strategies, enhance returns, increase investment flexibility, speculate on a targeted investment opportunity, or for hedging purposes.
Negative performance this year was driven primarily by long exposure to equities across the Information technology, real estate, and consumer discretionary sectors, as well as fixed income exposure to government inflation protection bonds.
Despite signs of cooling in recent months, inflation remains well above the Fed’s target and inflationary pressures have broadened to stickier areas of the economy like wages and rent. We expect markets to continue to focus on both inflation data and monetary policy and believe that the opportunity set for the fund is quite robust. The fund will continue to dynamically invest in global markets across a broad range of traditional (real estate, commodities, infrastructure and energy) and next generation real assets to generate differentiated total returns through economic and inflationary
8
| THE ADVISORS’ INNER CIRCLE FUND III | FS CHIRON | |||
| REAL ASSET FUND | ||||
| DECEMBER 31, 2022 |
cycles. This approach allows the fund to capitalize on cyclical and growth-oriented opportunities vs. traditional real asset funds which tend to be highly biased to value/cyclical assets. Finally, the fund’s focus on next generation real assets provides investors exposure to growth-oriented areas of the economy which may offer attractive returns regardless of the level or direction of inflation.
Sincerely,
| • | Ryan Caldwell |
| • | Scott Burr |
| • | Brian Cho |
The FS Chiron Real Asset Fund is distributed by SEI Investments Distribution Co. (SIDCo). SIDCo is not affiliated with Chiron Investment Management, LLC.
Investing involves risk, including possible loss of principal. In addition to the normal risks associated with investing, investments in smaller companies typically exhibit higher volatility and lower trading volume; international investments may involve risk or capital loss from unfavorable fluctuation in currency values, differences in generally accepted accounting principles or from social, economic or political instability in other nations. Emerging markets involve heightened risks related to these factors as well as increased volatility and lower trading volume. REIT investments are subject to changes in economic conditions, credit risk and interest rate fluctuations. The Fund may invest in derivatives, which are often more volatile than other investments and may magnify the Fund’s gains or losses.
Chiron Investment Management, LLC is a registered investment adviser.
Information contained herein has been obtained from sources believed to be reliable, but not guaranteed. Forward-looking statements are not guarantees of future results. They involve risks, uncertainties and assumptions, there can be no assurance that actual results will not differ materially from expectations. Past performance is no guarantee of future results. No part of this material may be reproduced in any form, or referred to in any other publication, without express written permission from Chiron Investment Management, LLC.
| Not a Deposit | Not FDIC Insured | May Lose Value | No Bank Guarantee | Not Insured By Any Federal | ||||
| Government Agency |
9
| THE ADVISORS’ INNER CIRCLE FUND III | FS CHIRON | |||
| REAL ASSET FUND | ||||
| DECEMBER 31, 2022 |
Definition of Comparative Indices
The MSCI ACWI Net Return Index is designed to represent performance of the full opportunity set of large and mid-cap stocks across 23 developed and 27 emerging markets. The Bloomberg Commodity Total Return Index reflects commodity futures price movements. The Bloomberg US Treasury Inflation-Linked Bond Index measures the performance of the US Treasury Inflation Protected Securities (TIPS) market.
The BofA Merrill Lynch 3-Month U.S. Treasury Bill Index is comprised of a single issue purchased at the beginning of the month and held for a month. At the end of the month, that issue is sold and rolled into a newly selected issue. The S&P 500 Index is a benchmark of large-cap U.S. equities. The index includes 500 leading companies and captures approximately 80% coverage of available market capitalization.
10
| THE ADVISORS’ INNER CIRCLE FUND III | FS MULTI-STRATEGY | |||
| ALTERNATIVES FUND | ||||
| DECEMBER 31, 2022 |
Comparison of Change in the Value of a $10,000 Investment in the FS Multi-Strategy Alternatives Fund Class I Shares, versus the BofA U.S. 3month T-Bill and HFRX Global Hedge Fund Index
| TOTAL RETURN FOR PERIODS ENDED DECEMBER 31, 2022 | ||||||||
| One Year Return | Three Year Return | Five Year Return | Annualized Inception to Date† | |||||
Class I | 3.16% | 4.24% | 3.26% | 3.24% | ||||
Class A with Full Sales Load | -2.17% | 2.19% | 1.96% | 2.06% | ||||
BofA Merril Lynch U.S. 3month T-Bill | 1.46% | 0.72% | 1.26% | 1.24% | ||||
HFRX Global Hedge Fund Index | -4.41% | 1.91% | 1.41% | 1.86% | ||||
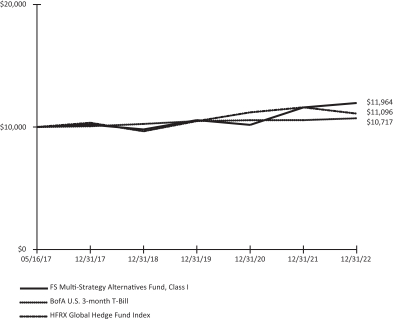
† The FS Multi-Strategy Alternatives Fund commenced operations on May 16. 2017.
The return for the period reflects fee waivers in effect for that period; absent fee waivers, performance would have been lower. The performance data quoted herein represents past performance and the return and value of an investment in the Fund will fluctuate so that, when redeemed, may be worth less than its original cost.
Past performance is no guarantee of future performance and should not be considered as a representation of the future results of the Fund.
11
| THE ADVISORS’ INNER CIRCLE FUND III | FS MULTI-STRATEGY | |||
| ALTERNATIVES FUND | ||||
| DECEMBER 31, 2022 |
The Fund’s performance assumes the reinvestment of dividends and capital gains. Index returns assume reinvestment of dividends and, unlike a portfolio’s returns, do not reflect any fees or expenses. If such fees and expenses were included in the index returns, the performance would have been lower. Please note that one cannot invest directly in an unmanaged index.
There are no assurances that the Fund will meet its stated objectives. The Fund’s holdings and allocations are subject to change because it is actively managed and should not be considered recommendations to buy individual securities.
Returns shown do not reflect the deduction of taxes that a shareholder would pay on Fund distributions or the redemption of Fund shares. See definition of comparative indices on page 5
12
| THE ADVISORS’ INNER CIRCLE FUND III | FS MANAGED | |||
| FUTURES FUND | ||||
| DECEMBER 31, 2022 |
Comparison of Change in the Value of a $10,000 Investment in the FS Managed Futures Fund, Class I Shares, versus the BofA U.S. 3 Month T-Bill
| TOTAL RETURN FOR PERIODS ENDED DECEMBER 31, 2022 | ||||||
| One Year Return | Three Year Return | Annualized Inception to Date† | ||||
Class I | 16.18% | 10.04% | 7.46% | |||
Class A with Full Sales Load | 15.91% | 9.77% | 7.20% | |||
BofA U.S. 3-Month T-Bill | 1.46% | 0.72% | 1.11% | |||
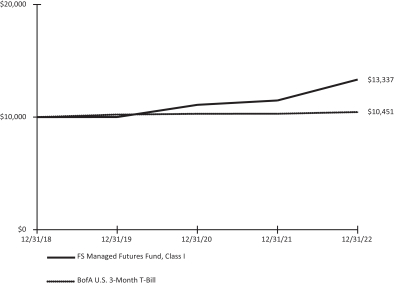
† The FS Managed Futures Fund commenced operations on December 31, 2018.
The return for the period reflects fee waivers in effect for that period; absent fee waivers, performance would have been lower. The performance data quoted herein represents past performance and the return and value of an investment in the Fund will fluctuate so that, when redeemed, may be worth less than its original cost.
Past performance is no guarantee of future performance and should not be considered as a representation of the future results of the Fund.
The Fund’s performance assumes the reinvestment of dividends and capital gains. Index returns assume reinvestment of dividends and, unlike a portfolio’s returns, do not reflect any fees or expenses. If such fees and expenses were included in the index returns, the performance would have been lower. Please note that one cannot invest directly in an unmanaged index.
There are no assurances that the Fund will meet its stated objectives. The Fund’s holdings and allocations are subject to change because it is actively managed and should not be considered recommendations to buy individual securities.
13
| THE ADVISORS’ INNER CIRCLE FUND III | FS MANAGED | |||
| FUTURES FUND | ||||
| DECEMBER 31, 2022 |
Returns shown do not reflect the deduction of taxes that a shareholder would pay on Fund distributions or the redemption of Fund shares. See definition of comparative indices on page 8
14
| THE ADVISORS’ INNER CIRCLE FUND III | FS CHIRON | |||
| REAL ASSET FUND | ||||
| DECEMBER 31, 2022 |
Comparison of Change in the Value of a $10,000 Investment in the FS Chiron Real Asset Fund, Class I Shares, versus the 35/32.5/32.5 Blend of MSCI ACWI Net Return Index, Bloomberg Commodity Total Return Index and Bloomberg US Treasury Inflation-Linked Bond Index
| TOTAL RETURN FOR PERIODS ENDED DECEMBER 31, 2022 | ||||||
One Year Return | Three Year Return | Annualized Inception to Date† | ||||
Class I | -10.47% | 4.55% | 5.92% | |||
Class A with Full Sales Load | -15.10% | 2.54% | 4.31% | |||
35% MSCI ACWI Net Return Index, 32.5% Bloomberg Commodity Total | -5.85% | 4.22% | 6.43% | |||
Return Index and 32.5% Bloomberg | ||||||
US Treasury Inflation-Linked Bond | ||||||
Index | ||||||
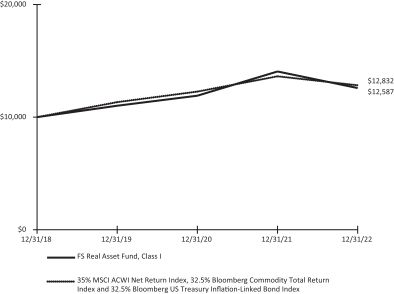
† The FS Chiron Real Asset Fund commenced operations on December 31. 2018.
The return for the period reflects fee waivers in effect for that period; absent fee waivers, performance would have been lower. The fee waiver discontinued in 2018. The performance data quoted herein represents past performance and the return and value of an investment in the Fund will fluctuate so that, when redeemed, may be worth less than its original cost.
Past performance is no guarantee of future performance and should not be considered as a representation of the future results of the Fund.
15
| THE ADVISORS’ INNER CIRCLE FUND III | FS CHIRON | |||
| REAL ASSET FUND | ||||
| DECEMBER 31, 2022 |
The Fund’s performance assumes the reinvestment of dividends and capital gains. Index returns assume reinvestment of dividends and, unlike a portfolio’s returns, do not reflect any fees or expenses. If such fees and expenses were included in the index returns, the performance would have been lower. Please note that one cannot invest directly in an unmanaged index.
There are no assurances that the Fund will meet its stated objectives. The Fund’s holdings and allocations are subject to change because it is actively managed and should not be considered recommendations to buy individual securities.
Returns shown do not reflect the deduction of taxes that a shareholder would pay on Fund distributions or the redemption of Fund shares. See definition of comparative indices on page 11
16
| THE ADVISORS’ INNER CIRCLE FUND III | FS MULTI-STRATEGY | |||
| ALTERNATIVES FUND | ||||
| DECEMBER 31, 2022 |
| |||
ASSET WEIGHTINGS (UNAUDITED) | ||||
| % of Net Assets | Value (000) | |||||||||||||
Corporate Obligations | 17.8 | % | $ | 127,714 | ||||||||||
Mortgage-Backed Securities | 16.8 | 119,861 | ||||||||||||
Common Stock | 6.7 | 48,009 | ||||||||||||
Asset-Backed Securities | 1.1 | 7,473 | ||||||||||||
Convertible Bond | 0.0 | 284 | ||||||||||||
Short-Term Investment | 48.7 | 348,819 | ||||||||||||
|
|
|
| |||||||||||
Total Investments | 91.1 | 652,160 | ||||||||||||
Securities Sold Short | (6.2 | ) | (43,850 | ) | ||||||||||
Total Other Assets and Liabilities | 15.1 | 107,624 | ||||||||||||
|
|
|
| |||||||||||
Net Assets | 100.0 | % | $ | 715,934 | ||||||||||
|
|
|
| |||||||||||
| *Percentages | are based on Net Assets. |
| CONSOLIDATED SCHEDULE OF INVESTMENTS | ||||
| (Percentages are based on Net Assets of $715,934 (000)) | ||||
| CORPORATE OBLIGATIONS — 17.8% | ||||||||
| Face Amount (000) | Fair Value (000) | |||||||
CANADA — 0.5% | ||||||||
Kronos Acquisition Holdings | ||||||||
7.000%, 12/31/27 (A) | $ | 1,261 | $ | 1,037 | ||||
5.000%, 12/31/26 (A) | 2,575 | 2,228 | ||||||
Open Text | 627 | 627 | ||||||
|
| |||||||
| 3,892 | ||||||||
|
| |||||||
LUXEMBOURG — 0.3% | ||||||||
Altice France Holding | 2,609 | 1,989 | ||||||
|
| |||||||
NETHERLANDS — 0.4% | ||||||||
Trivium Packaging Finance | 596 | 547 | ||||||
5.500%, 08/15/26 (A) | 2,410 | 2,210 | ||||||
|
| |||||||
| 2,757 | ||||||||
|
| |||||||
SWITZERLAND — 0.1% | ||||||||
VistaJet Malta Finance | 793 | 636 | ||||||
|
| |||||||
The accompanying notes are an integral part of the consolidated financial statements.
17
| THE ADVISORS’ INNER CIRCLE FUND III | FS MULTI-STRATEGY | |||
| ALTERNATIVES FUND | ||||
| DECEMBER 31, 2022 |
| |||
| CORPORATE OBLIGATIONS — continued | ||||||||
| Face Amount (000) | Fair Value (000) | |||||||
UNITED KINGDOM — 1.0% | ||||||||
Clear Channel International | $ | 4,048 | $ | 3,863 | ||||
eG Global Finance | 448 | 417 | ||||||
6.750%, 02/07/25 (A) | 3,542 | 3,092 | ||||||
|
| |||||||
| 7,372 | ||||||||
|
| |||||||
| UNITED STATES — 15.5% | ||||||||
Acrisure | 1,676 | 1,540 | ||||||
6.000%, 08/01/29 (A) | 471 | 385 | ||||||
4.250%, 02/15/29 (A) | 2,828 | 2,334 | ||||||
American Greetings | 1,694 | 1,626 | ||||||
ANGI Group | 1,000 | 742 | ||||||
Apollo Commercial Real Estate Finance | 112 | 90 | ||||||
APX Group | 37 | 31 | ||||||
B&G Foods | 1,737 | 1,523 | ||||||
Boxer Parent | 2,549 | 2,405 | ||||||
7.125%, 10/02/25 (A) | 500 | 486 | ||||||
Bread Financial Holdings | 5,505 | 4,881 | ||||||
BroadStreet Partners | 114 | 97 | ||||||
Caesars Entertainment | 2,231 | 2,168 | ||||||
CCO Holdings | 22 | 18 | ||||||
4.250%, 02/01/31 (A) | 500 | 401 | ||||||
CD&R Smokey Buyer | 1,771 | 1,520 | ||||||
Citgo Holding | 1,748 | 1,744 | ||||||
The accompanying notes are an integral part of the consolidated financial statements.
18
| THE ADVISORS’ INNER CIRCLE FUND III | FS MULTI-STRATEGY | |||
| ALTERNATIVES FUND | ||||
| DECEMBER 31, 2022 |
| |||
| CORPORATE OBLIGATIONS — continued | ||||||||
| Face Amount (000) | Fair Value (000) | |||||||
UNITED STATES — (continued) | ||||||||
CITGO Petroleum | $ | 2,554 | $ | 2,491 | ||||
CommScope | 764 | 705 | ||||||
CoreCivic | 236 | 205 | ||||||
CP Atlas Buyer | 568 | 422 | ||||||
CSC Holdings | 441 | 306 | ||||||
Dave & Buster’s | 809 | 813 | ||||||
Empire Resorts | 122 | 98 | ||||||
Five Point Operating | 4,495 | 3,779 | ||||||
Fortress Transportation and Infrastructure Investors | 561 | 562 | ||||||
Gates Global | 2,194 | 2,117 | ||||||
Genesis Energy | 2,114 | 2,040 | ||||||
GEO Group | 203 | 180 | ||||||
Getty Images | 1,346 | 1,329 | ||||||
Goodyear Tire & Rubber | 1,760 | 1,808 | ||||||
Hadrian Merger Sub | 683 | 601 | ||||||
H-Food Holdings | 807 | 468 | ||||||
Iron Mountain | 1,000 | 822 | ||||||
iStar | 825 | 808 | ||||||
JELD-WEN | 1,740 | 1,457 | ||||||
Ladder Capital Finance Holdings | 2,810 | 2,640 | ||||||
4.750%, 06/15/29 (A) | 2,304 | 1,860 | ||||||
The accompanying notes are an integral part of the consolidated financial statements.
19
| THE ADVISORS’ INNER CIRCLE FUND III | FS MULTI-STRATEGY | |||
| ALTERNATIVES FUND | ||||
| DECEMBER 31, 2022 |
| |||
| CORPORATE OBLIGATIONS — continued | ||||||||
| Face Amount (000) | Fair Value (000) | |||||||
UNITED STATES — (continued) | ||||||||
Lithia Motors | $ | 280 | $ | 230 | ||||
Madison IAQ | 1,000 | 685 | ||||||
Matthews International | 209 | 197 | ||||||
Mauser Packaging Solutions Holding | 469 | 434 | ||||||
5.500%, 04/15/24 (A) | 2,301 | 2,237 | ||||||
Maxim Crane Works Holdings Capital | 1,462 | 1,415 | ||||||
Medline Borrower | 1,000 | 794 | ||||||
Midcap Financial Issuer Trust | 609 | 493 | ||||||
Mohegan Tribal Gaming Authority | 1,001 | 936 | ||||||
MPT Operating Partnership | 1,819 | 1,657 | ||||||
3.500%, 03/15/31 | 4,232 | 2,901 | ||||||
New Home | 1,551 | 1,326 | ||||||
Nexstar Media | 627 | 575 | ||||||
NRG Energy | 346 | 263 | ||||||
Olympus Water US Holding | 1,752 | 1,669 | ||||||
6.250%, 10/01/29 (A) | 1,000 | 759 | ||||||
Oracle | 500 | 367 | ||||||
Outfront Media Capital | 1,233 | 1,020 | ||||||
Pactiv | 861 | 835 | ||||||
7.950%, 12/15/25 | 777 | 751 | ||||||
Paramount Global | 500 | 344 | ||||||
Prime Healthcare Services | 690 | 583 | ||||||
The accompanying notes are an integral part of the consolidated financial statements.
20
| THE ADVISORS’ INNER CIRCLE FUND III | FS MULTI-STRATEGY | |||
| ALTERNATIVES FUND | ||||
| DECEMBER 31, 2022 |
| |||
| CORPORATE OBLIGATIONS — continued | ||||||||
| Face Amount (000) | Fair Value (000) | |||||||
UNITED STATES — (continued) | ||||||||
Raptor Acquisition | $ | 2,507 | $ | 2,227 | ||||
RegionalCare Hospital Partners Holdings | 4,098 | 3,298 | ||||||
Rite Aid | 129 | 85 | ||||||
RLJ Lodging Trust | 793 | 706 | ||||||
RP Escrow Issuer | 611 | 467 | ||||||
Scotts Miracle-Gro | 1,254 | 945 | ||||||
Service Properties Trust | 2,499 | 2,381 | ||||||
Specialty Building Products Holdings | 2,553 | 2,056 | ||||||
Spectrum Brands | 352 | 348 | ||||||
3.875%, 03/15/31 (A) | 1,649 | 1,282 | ||||||
Spirit AeroSystems | 2,033 | 2,009 | ||||||
Spirit Loyalty Cayman | 1,045 | 1,050 | ||||||
SRS Distribution | 453 | 360 | ||||||
Starwood Property Trust | 1,360 | 1,277 | ||||||
3.625%, 07/15/26 (A) | 1,049 | 918 | ||||||
Stericycle | 325 | 320 | ||||||
Sunoco | 96 | 94 | ||||||
Surgery Center Holdings | 1,387 | 1,411 | ||||||
SWF Escrow Issuer | 750 | 435 | ||||||
TKC Holdings | 1,172 | 916 | ||||||
Triumph Group | 2,074 | 2,110 | ||||||
The accompanying notes are an integral part of the consolidated financial statements.
21
| THE ADVISORS’ INNER CIRCLE FUND III | FS MULTI-STRATEGY | |||
| ALTERNATIVES FUND | ||||
| DECEMBER 31, 2022 |
| |||
| CORPORATE OBLIGATIONS — continued | ||||||||
| Face Amount (000) | Fair Value (000) | |||||||
UNITED STATES — (continued) | ||||||||
U.S. Acute Care Solutions | $ | 2,702 | $ | 2,398 | ||||
Uniti Group | 700 | 678 | ||||||
Vector Group | 2,849 | 2,828 | ||||||
5.750%, 02/01/29 (A) | 1,495 | 1,296 | ||||||
Verscend Escrow | 3,859 | 3,781 | ||||||
Warnermedia Holdings | 500 | 383 | ||||||
WASH Multifamily Acquisition | 3,398 | 3,203 | ||||||
Waste Pro USA | 803 | 709 | ||||||
White Capital Parentcash/9.000% PIK | 2,863 | 2,475 | ||||||
XHR | 675 | 649 | ||||||
|
| |||||||
| 111,068 | ||||||||
|
| |||||||
| TOTAL CORPORATE OBLIGATIONS (Cost $136,977) (000) | 127,714 | |||||||
|
| |||||||
| MORTGAGE-BACKED SECURITIES — 16.8% | ||||||||
UNITED STATES — 16.8% | ||||||||
FHLMC, Ser 2019-4927, Cl IO, IO | 10,669 | 2,334 | ||||||
FHLMC, Ser 2020-4973, Cl IK, IO | 11,220 | 2,266 | ||||||
FHLMC, Ser 2020-4975, Cl EI, IO | 21,363 | 4,059 | ||||||
FHLMC, Ser 2021-5148, Cl EI, IO | 28,669 | 4,781 | ||||||
FHLMC, Ser 2021-5154, Cl GI, IO | 27,777 | 1,782 | ||||||
FHLMC, Ser 2021-5182, Cl IO, IO | 15,331 | 2,864 | ||||||
The accompanying notes are an integral part of the consolidated financial statements.
22
| THE ADVISORS’ INNER CIRCLE FUND III | FS MULTI-STRATEGY | |||
| ALTERNATIVES FUND | ||||
| DECEMBER 31, 2022 |
| |||
| MORTGAGE-BACKED SECURITIES — continued | ||||||||
| Face Amount (000) | Fair Value (000) | |||||||
UNITED STATES — (continued) | ||||||||
FHLMC, Ser 2022-5192, Cl PI, IO | $ | 36,315 | $ | 4,160 | ||||
FNMA TBA | 18,000 | 18,266 | ||||||
5.500%, 01/31/23 | 50,000 | 50,123 | ||||||
FNMA, Ser 2020-57, Cl IB, IO | 16,410 | 3,255 | ||||||
FNMA, Ser 2021-62, Cl HI, IO | 14,929 | 1,875 | ||||||
FNMA, Ser 2022-74, Cl SA, IO | 68,133 | 1,587 | ||||||
FNMA, Ser 2022-74, Cl US, IO | 74,701 | 2,429 | ||||||
GNMA, Ser 2010-35, Cl AS, IO | 12,879 | 1,007 | ||||||
GNMA, Ser 2010-37, Cl SG, IO | 10,099 | 768 | ||||||
GNMA, Ser 2011-70, Cl WI, IO | 11,102 | 535 | ||||||
GNMA, Ser 2019-133, Cl EI, IO | 11,259 | 1,974 | ||||||
GNMA, Ser 2020-4, Cl IO, IO | 20,258 | 3,996 | ||||||
GNMA, Ser 2020-61, Cl IO, IO | 20,673 | 4,166 | ||||||
GNMA, Ser 2022-153, Cl SG, IO | 49,765 | 1,761 | ||||||
GNMA, Ser 2022-193, Cl SA, IO | 99,802 | 2,055 | ||||||
GNMA, Ser 2022-212, Cl SA, IO | 50,000 | 1,926 | ||||||
GNMA, Ser 2022-23, Cl WI, IO | 11,478 | 1,892 | ||||||
TOTAL MORTGAGE-BACKED SECURITIES | ||||||||
|
| |||||||
(Cost $119,978) (000) | 119,861 | |||||||
|
| |||||||
The accompanying notes are an integral part of the consolidated financial statements.
23
| THE ADVISORS’ INNER CIRCLE FUND III | FS MULTI-STRATEGY | |||
| ALTERNATIVES FUND | ||||
| DECEMBER 31, 2022 |
| |||
| COMMON STOCK — 6.7% | ||||||||
| Shares | Fair Value (000) | |||||||
CANADA — 0.3% | ||||||||
Canadian Pacific Railway(C) | 30,005 | $ | 2,238 | |||||
|
| |||||||
FRANCE — 0.4% | ||||||||
Hermes International | 625 | 967 | ||||||
L’Oreal | 6,169 | 2,203 | ||||||
|
| |||||||
| 3,170 | ||||||||
|
| |||||||
ITALY — 0.1% | ||||||||
Davide Campari-Milano | 60,121 | 610 | ||||||
|
| |||||||
SWITZERLAND — 0.1% | ||||||||
Chocoladefabriken Lindt & Spruengli | 46 | 469 | ||||||
|
| |||||||
UNITED KINGDOM — 0.1% | ||||||||
Watches of Switzerland Group* | 89,131 | 884 | ||||||
|
| |||||||
UNITED STATES — 5.7% | ||||||||
Aon, Cl A | 2,240 | 672 | ||||||
Ball(C) | 52,434 | 2,682 | ||||||
Bank of America | 19,072 | 632 | ||||||
Berkshire Hathaway, Cl B* | 2,968 | 917 | ||||||
Brown & Brown | 14,770 | 842 | ||||||
Cintas(C) | 3,779 | 1,707 | ||||||
Costco Wholesale(C) | 5,753 | 2,626 | ||||||
CSX(C) | 50,630 | 1,568 | ||||||
Danaher | 6,464 | 1,716 | ||||||
Hershey | 3,196 | 740 | ||||||
Home Depot(C) | 10,133 | 3,201 | ||||||
Intuit | 1,629 | 634 | ||||||
Lands’ End* | 10,393 | 79 | ||||||
Mastercard, Cl A(C) | 4,128 | 1,435 | ||||||
Mettler-Toledo International*(C) | 2,321 | 3,355 | ||||||
Microsoft(C) | 12,509 | 3,000 | ||||||
Monster Beverage* | 8,928 | 907 | ||||||
Moody’s | 2,732 | 761 | ||||||
PepsiCo | 4,264 | 770 | ||||||
Pool(C) | 4,573 | 1,383 | ||||||
Republic Services, Cl A(C) | 18,746 | 2,418 | ||||||
Sherwin-Williams(C) | 12,697 | 3,013 | ||||||
Skyline Champion* | 23,362 | 1,203 | ||||||
Thermo Fisher Scientific | 1,604 | 883 | ||||||
Union Pacific(C) | 13,175 | 2,728 | ||||||
The accompanying notes are an integral part of the consolidated financial statements.
24
| THE ADVISORS’ INNER CIRCLE FUND III | FS MULTI-STRATEGY | |||
| ALTERNATIVES FUND | ||||
| DECEMBER 31, 2022 |
| |||
| COMMON STOCK — continued | ||||||||
| Shares | Fair Value (000) | |||||||
UNITED STATES — (continued) | ||||||||
W R Berkley | 10,560 | $ | 766 | |||||
|
| |||||||
| 40,638 | ||||||||
|
| |||||||
TOTAL COMMON STOCK | ||||||||
(Cost $49,542) (000) | 48,009 | |||||||
|
| |||||||
| ASSET-BACKED SECURITIES — 1.1% | ||||||||
| Face Amount (000) | ||||||||
CAYMAN ISLANDS — 1.1% | ||||||||
Bain Capital Credit CLO, Ser 2021-2A, Cl ER | ||||||||
10.837%, ICE LIBOR USD 3 Month + | $ | 360 | 300 | |||||
Bain Capital Credit CLO, Ser 2021-3A, Cl ER | ||||||||
11.378%, ICE LIBOR USD 3 Month + | 700 | 600 | ||||||
CARLYLE US CLO, Ser 2021-2A, Cl DR | ||||||||
10.579%, ICE LIBOR USD 3 Month + 6.500%, 07/15/32(A) (B) | 500 | 439 | ||||||
CIFC Funding, Ser 2017-2A, Cl E | ||||||||
10.193%, ICE LIBOR USD 3 Month + 5.950%, 04/20/30(A) (B) | 500 | 410 | ||||||
CIFC Funding, Ser 2017-4A, Cl D | ||||||||
10.425%, ICE LIBOR USD 3 Month + 6.100%, 10/24/30(A) (B) | 700 | 592 | ||||||
Dewolf Park CLO, Ser 2017-1A, Cl E | ||||||||
10.279%, ICE LIBOR USD 3 Month + 6.200%, 10/15/30(A) (B) | 300 | 260 | ||||||
Dryden 83 CLO, Ser 2021-83A, Cl E | ||||||||
9.744%, ICE LIBOR USD 3 Month + 5.550%, 01/18/32(A) (B) | 750 | 645 | ||||||
Empower CLO, Ser 2022-1A, Cl E | ||||||||
12.514%, TSFR3M + 8.550%, 10/20/34(A) (B) | 400 | 395 | ||||||
Fillmore Park CLO, Ser 2018-1A, Cl E | ||||||||
9.479%, ICE LIBOR USD 3 Month + 5.400%, 07/15/30(A) (B) | 250 | 215 | ||||||
Madison Park Funding LI, Ser 2021-51A, Cl E | ||||||||
10.497%, ICE LIBOR USD 3 Month + 6.270%, 07/19/34(A) (B) | 1,250 | 1,097 | ||||||
The accompanying notes are an integral part of the consolidated financial statements.
25
| THE ADVISORS’ INNER CIRCLE FUND III | FS MULTI-STRATEGY | |||
| ALTERNATIVES FUND | ||||
| DECEMBER 31, 2022 |
| |||
| ASSET-BACKED SECURITIES — continued | ||||||||
| Face Amount (000) | Fair Value (000) | |||||||
CAYMAN ISLANDS — (continued) | ||||||||
Madison Park Funding XXXV, Ser 2021-35A, | ||||||||
10.343%, ICE LIBOR USD 3 Month + 6.100%, 04/20/32(A) (B) | $ | 500 | $ | 448 | ||||
NYACK Park CLO, Ser 2021-1A, Cl E | ||||||||
10.343%, ICE LIBOR USD 3 Month + 6.100%, 10/20/34(A) (B) | 250 | 217 | ||||||
Octagon Investment Partners 49, Ser 2021-5A, | ||||||||
10.829%, ICE LIBOR USD 3 Month + 6.750%, 01/15/33(A) (B) | 500 | 452 | ||||||
OHA Credit Funding 3, Ser 2021-3A, Cl ER | ||||||||
10.493%, ICE LIBOR USD 3 Month + 6.250%, 07/02/35(A) (B) | 250 | 223 | ||||||
RR 6, Ser 2021-6A, Cl DR | ||||||||
9.929%, ICE LIBOR USD 3 Month + 5.850%, 04/15/36(A) (B) | 500 | 423 | ||||||
Thompson Park CLO, Ser 2021-1A, Cl E | ||||||||
10.389%, ICE LIBOR USD 3 Month + 6.310%, 04/15/34(A) (B) | 325 | 283 | ||||||
TIAA CLO I, Ser 2018-1A, Cl DR | ||||||||
7.743%, ICE LIBOR USD 3 Month + 3.500%, 07/20/31(A) (B) | 500 | 474 | ||||||
| TOTAL ASSET-BACKED SECURITIES | ||||||||
|
| |||||||
(Cost $7,640) (000) | 7,473 | |||||||
|
| |||||||
| CONVERTIBLE BOND — 0.0% | ||||||||
UNITED STATES — 0.0% | ||||||||
RWT Holdings | ||||||||
5.75%, 10/01/25 | 338 | 284 | ||||||
TOTAL CONVERTIBLE BONDS | ||||||||
|
| |||||||
(Cost $338) (000) | 284 | |||||||
|
| |||||||
The accompanying notes are an integral part of the consolidated financial statements.
26
| THE ADVISORS’ INNER CIRCLE FUND III | FS MULTI-STRATEGY | |||
| ALTERNATIVES FUND | ||||
| DECEMBER 31, 2022 |
| |||
| SHORT-TERM INVESTMENT — 48.7% | ||||||||
| Shares | Fair Value (000) | |||||||
State Street Institutional Liquid Reserves Fund - Premier Class | ||||||||
4.420%, (D) | 348,811 | $ | 348,819 | |||||
|
| |||||||
| TOTAL SHORT-TERM INVESTMENT | ||||||||
(Cost $348,819) (000) | 348,819 | |||||||
|
| |||||||
| TOTAL INVESTMENTS — 91.1% | ||||||||
(Cost $663,294) (000) | $ | 652,160 | ||||||
|
| |||||||
| SECURITIES SOLD SHORT | ||||||||
| CORPORATE OBLIGATIONS — (1.7)% | ||||||||
| Face Amount (000) | Fair Value (000) | |||||||
UNITED KINGDOM — (0.1)% | ||||||||
Merlin Entertainments | $ | (828 | ) | (775 | ) | |||
|
| |||||||
UNITED STATES — (1.6)% | ||||||||
Alliant Holdings Intermediate | (1,313 | ) | (1,176 | ) | ||||
Ardagh Packaging Finance | (200 | ) | (173 | ) | ||||
Blackstone Mortgage Trust | (1,111 | ) | (955 | ) | ||||
Central Garden & Pet | (627 | ) | (515 | ) | ||||
Covanta Holding | (352 | ) | (288 | ) | ||||
CWT Travel Group | (588 | ) | (497 | ) | ||||
Energizer Holdings | (1,205 | ) | (1,044 | ) | ||||
Frontier Communications Holdings | (616 | ) | (572 | ) | ||||
Gen Digital | (627 | ) | (615 | ) | ||||
Gray Television | (1,981 | ) | (1,757 | ) | ||||
Guitar Center | (1,108 | ) | (911 | ) | ||||
Lamar Media | (512 | ) | (447 | ) | ||||
The accompanying notes are an integral part of the consolidated financial statements.
27
| THE ADVISORS’ INNER CIRCLE FUND III | FS MULTI-STRATEGY | |||
| ALTERNATIVES FUND | ||||
| DECEMBER 31, 2022 |
| |||
| CORPORATE OBLIGATIONS — continued | ||||||||
| Face Amount (000) | Fair Value (000) | |||||||
UNITED STATES — (continued) | ||||||||
Omega Healthcare Investors | $ | (1,263 | ) | $ | (1,164 | ) | ||
United Rentals North America | (965 | ) | (907 | ) | ||||
|
| |||||||
| (11,021 | ) | |||||||
|
| |||||||
TOTAL CORPORATE OBLIGATIONS | ||||||||
(Proceeds $(11,934)) (000) | (11,796 | ) | ||||||
|
| |||||||
| COMMON STOCK — (1.1)% | ||||||||
| Shares | ||||||||
CANADA — 0.0% | ||||||||
Restaurant Brands International | (6,207 | ) | (402 | ) | ||||
|
| |||||||
CHINA — (0.1)% | ||||||||
Alibaba Group Holding ADR | (827 | ) | (73 | ) | ||||
JD.com ADR | (9,575 | ) | (537 | ) | ||||
|
| |||||||
| (610 | ) | |||||||
|
| |||||||
UNITED STATES — (1.0)% | ||||||||
Airbnb, Cl A | (4,959 | ) | (424 | ) | ||||
Align Technology | (124 | ) | (26 | ) | ||||
Amazon.com | (3,602 | ) | (303 | ) | ||||
Automatic Data Processing | (2,144 | ) | (512 | ) | ||||
AutoNation | (1,250 | ) | (134 | ) | ||||
Brinker International | (2,069 | ) | (66 | ) | ||||
Carvana, Cl A | (2,107 | ) | (10 | ) | ||||
Cheesecake Factory | (207 | ) | (7 | ) | ||||
Coca-Cola | (8,275 | ) | (526 | ) | ||||
Coinbase Global, Cl A | (1,225 | ) | (43 | ) | ||||
Etsy | (414 | ) | (50 | ) | ||||
Fair Isaac | (579 | ) | (347 | ) | ||||
Focus Financial Partners, Cl A | (4,583 | ) | (171 | ) | ||||
General Electric | (1,240 | ) | (104 | ) | ||||
Grocery Outlet Holding | (7,586 | ) | (222 | ) | ||||
H&R Block | (4,138 | ) | (151 | ) | ||||
Masco | (10,718 | ) | (500 | ) | ||||
Meta Platforms, Cl A | (208 | ) | (25 | ) | ||||
New York Times, Cl A | (4,171 | ) | (136 | ) | ||||
NIKE, Cl B | (1,655 | ) | (194 | ) | ||||
The accompanying notes are an integral part of the consolidated financial statements.
28
| THE ADVISORS’ INNER CIRCLE FUND III | FS MULTI-STRATEGY | |||
| ALTERNATIVES FUND | ||||
| DECEMBER 31, 2022 |
| |||
| COMMON STOCK — continued | ||||||||
| Shares | Fair Value (000) | |||||||
UNITED STATES — (continued) | ||||||||
PPG Industries | (4,138 | ) | $ | (520 | ) | |||
Robert Half International | (306 | ) | (23 | ) | ||||
ROBLOX, Cl A | (4,124 | ) | (117 | ) | ||||
Salesforce | (1,434 | ) | (190 | ) | ||||
SEI Investments | (756 | ) | (44 | ) | ||||
Shake Shack, Cl A | (3,202 | ) | (133 | ) | ||||
Snap-on | (461 | ) | (105 | ) | ||||
Snowflake, Cl A | (1,122 | ) | (161 | ) | ||||
Sprouts Farmers Market | (6,233 | ) | (202 | ) | ||||
Starbucks | (7,782 | ) | (772 | ) | ||||
Texas Roadhouse, Cl A | (2,489 | ) | (226 | ) | ||||
Ulta Beauty | (662 | ) | (310 | ) | ||||
Wayfair, Cl A | (2,652 | ) | (87 | ) | ||||
YETI Holdings | (6,199 | ) | (256 | ) | ||||
|
| |||||||
| (7,097 | ) | |||||||
|
| |||||||
TOTAL COMMON STOCK | (8,109 | ) | ||||||
|
| |||||||
| EXCHANGE TRADED FUNDS — (3.4)% | ||||||||
UNITED STATES — (3.4)% | ||||||||
ARK Innovation ETF | (6,376 | ) | (199 | ) | ||||
Invesco QQQ Trust Series 1 | (9,135 | ) | (2,432 | ) | ||||
iShares Russell 1000 ETF | (52,650 | ) | (11,084 | ) | ||||
SPDR S&P 500 ETF Trust | (25,774 | ) | (9,857 | ) | ||||
VanEck Semiconductor ETF | (1,837 | ) | (373 | ) | ||||
|
| |||||||
TOTAL EXCHANGE TRADED FUNDS | ||||||||
(Proceeds $(24,622)) (000) | (23,945 | ) | ||||||
|
| |||||||
TOTAL SECURITIES SOLD SHORT — (6.2)% | $ | (43,850 | ) | |||||
|
| |||||||
| * | Non-income producing security. |
| (A) | Securities sold within terms of a private placement memorandum, exempt from registration under Section 144A of the Securities Act of 1933, as amended, and may be sold only to dealers in that program or other “accredited investors.” On December 31, 2022, the value of these securities amounted $109,237 (000) and represented 15.3% of net assets. |
| (B) | Variable or floating rate security. The rate shown is the effective interest rate as of period end. The rates on certain securities are not based on published reference rates and spreads and are either determined by the issuer or agent based on current market conditions; by |
The accompanying notes are an integral part of the consolidated financial statements.
29
| THE ADVISORS’ INNER CIRCLE FUND III | FS MULTI-STRATEGY | |||
| ALTERNATIVES FUND | ||||
| DECEMBER 31, 2022 |
| |||
using a formula based on the rates of underlying loans; or by adjusting periodically based on prevailing interest rates. |
| (C) | Security or portion thereof is pledged as collateral supporting the amounts outstanding under the prime brokerage facility with Morgan Stanley & Co. (“MSC”). Securities may be rehypothecated from time to time as permitted under Rule 15c-1(a)(1) promulgated under the Securities Exchange Act of 1934, as amended, subject to terms and conditions governing the prime brokerage facility with MSC. As of December 31, 2022, there were no securities rehypothecated by MSC. |
| (D) | Rate shown is the 7-day effective yield as of December 31, 2022 |
Open futures contracts held by the Fund at December 31, 2022 are as follows:
| Type of Contract | Number of Contracts | Expiration Date | Notional Amount (000) | Value (000) | Unrealized Appreciation/ (Depreciation) (000) | |||||||||||||||
Long Contracts | ||||||||||||||||||||
3 Month Euribor | 4 | Jun-2023 | $ | 1,037 | $ | 1,032 | $ | (18 | ) | |||||||||||
Amsterdam Index | 4 | Jan-2023 | 605 | 591 | (19 | ) | ||||||||||||||
AUDUSD Currency | 1 | Mar-2023 | 67 | 68 | 1 | |||||||||||||||
Australian 10-Year Bond | 5 | Mar-2023 | 392 | 394 | (1 | ) | ||||||||||||||
BIST 30 Index | 22 | Feb-2023 | 72 | 74 | 2 | |||||||||||||||
Brent Crude | 1 | Feb-2023 | 84 | 86 | 2 | |||||||||||||||
Brent Crude | 7 | Jan-2023 | 595 | 601 | 6 | |||||||||||||||
British Pound | 1 | Mar-2023 | 75 | 76 | – | |||||||||||||||
CAC40 10 Euro Index | 2 | Jan-2023 | 139 | 139 | (2 | ) | ||||||||||||||
CBOE Volatility Index . | 1 | Feb-2023 | 25 | 25 | – | |||||||||||||||
CBOE Volatility Index . | 17 | Jan-2023 | 459 | 393 | (67 | ) | ||||||||||||||
CBOT Mini DJIA | 1 | Mar-2023 | 167 | 166 | (1 | ) | ||||||||||||||
Copper | 1 | Mar-2023 | 96 | 95 | (1 | ) | ||||||||||||||
Corn | 15 | Mar-2023 | 503 | 509 | 5 | |||||||||||||||
Corn | 2 | May-2023 | 68 | 68 | – | |||||||||||||||
Corn | 2 | Dec-2023 | 61 | 61 | – | |||||||||||||||
Corn | 1 | Jul-2023 | 33 | 34 | – | |||||||||||||||
Crude Palm Oil | 1 | Apr-2023 | 24 | 24 | – | |||||||||||||||
DAX Index | 1 | Mar-2023 | 382 | 374 | (11 | ) | ||||||||||||||
Euro STOXX 50 | 1 | Mar-2023 | 39 | 39 | (1 | ) | ||||||||||||||
Euro STOXX 50 | 1 | Mar-2023 | 40 | 41 | – | |||||||||||||||
Euro STOXX Banks | 15 | Mar-2023 | 77 | 77 | – | |||||||||||||||
Euro-Bund | 22 | Mar-2023 | 3,293 | 3,130 | (182 | ) | ||||||||||||||
FTSE 100 Index | 9 | Mar-2023 | 813 | 812 | 2 | |||||||||||||||
FTSE China A50 | 4 | Jan-2023 | 52 | 52 | – | |||||||||||||||
FTSE MIB Index | 3 | Mar-2023 | 378 | 381 | – | |||||||||||||||
FTSE MIB Index | 1 | Mar-2023 | 126 | 127 | (1 | ) | ||||||||||||||
ICE ECX Emission 2023 | 2 | Dec-2023 | 193 | 180 | (15 | ) | ||||||||||||||
Lean Hogs | 4 | Feb-2023 | 144 | 140 | (4 | ) | ||||||||||||||
Live Cattle | 6 | Feb-2023 | 377 | 379 | 2 | |||||||||||||||
LME Aluminum | 1 | Mar-2023 | 60 | 59 | – | |||||||||||||||
LME Aluminum | 1 | Mar-2023 | 63 | 59 | (4 | ) | ||||||||||||||
The accompanying notes are an integral part of the consolidated financial statements.
30
| THE ADVISORS’ INNER CIRCLE FUND III | FS MULTI-STRATEGY | |||
| ALTERNATIVES FUND | ||||
| DECEMBER 31, 2022 |
| |||
| Type of Contract | Number of Contracts | Expiration Date | Notional Amount (000) | Value (000) | Unrealized Appreciation/ (Depreciation) (000) | |||||||||||||
LME Aluminum | 1 | Mar-2023 | $ | 60 | $ | 59 | $ | – | ||||||||||
LME Aluminum | 1 | Mar-2023 | 60 | 59 | – | |||||||||||||
LME Aluminum | 2 | Feb-2023 | 126 | 118 | (7) | |||||||||||||
LME Aluminum | 2 | Feb-2023 | 121 | 118 | (3) | |||||||||||||
LME Aluminum | 1 | Feb-2023 | 61 | 59 | (1) | |||||||||||||
LME Aluminum | 1 | Feb-2023 | 60 | 59 | (1) | |||||||||||||
LME Aluminum | 2 | Feb-2023 | 122 | 118 | (4) | |||||||||||||
LME Aluminum | 2 | Feb-2023 | 121 | 118 | (3) | |||||||||||||
LME Aluminum | 3 | Feb-2023 | 176 | 177 | 1 | |||||||||||||
LME Aluminum | 1 | Feb-2023 | 59 | 59 | – | |||||||||||||
LME Aluminum | 2 | Jan-2023 | 120 | 118 | (2) | |||||||||||||
LME Aluminum | 2 | Feb-2023 | 119 | 118 | (1) | |||||||||||||
LME Copper | 2 | Feb-2023 | 415 | 419 | 4 | |||||||||||||
LME Copper | 1 | Mar-2023 | 213 | 209 | (3) | |||||||||||||
LME Copper | 3 | Mar-2023 | 641 | 628 | (13) | |||||||||||||
LME Copper | 1 | Mar-2023 | 208 | 209 | 1 | |||||||||||||
LME Copper | 2 | Feb-2023 | 412 | 419 | 7 | |||||||||||||
LME Copper | 2 | Feb-2023 | 402 | 419 | 16 | |||||||||||||
LME Copper | 2 | Feb-2023 | 410 | 419 | 9 | |||||||||||||
LME Lead | 4 | Mar-2023 | 217 | 230 | 13 | |||||||||||||
LME Lead | 1 | Mar-2023 | 55 | 57 | 2 | |||||||||||||
LME Lead | 1 | Mar-2023 | 56 | 57 | 2 | |||||||||||||
LME Lead | 1 | Feb-2023 | 55 | 58 | 3 | |||||||||||||
LME Lead | 1 | Feb-2023 | 53 | 58 | 5 | |||||||||||||
LME Nickle | 1 | Mar-2023 | 717 | 751 | 34 | |||||||||||||
LME Nickle | 1 | Mar-2023 | 712 | 751 | 39 | |||||||||||||
LME Nickle | 1 | Mar-2023 | 736 | 751 | 15 | |||||||||||||
LME Nickle | 1 | Mar-2023 | 719 | 751 | 32 | |||||||||||||
LME Zinc | 3 | Feb-2023 | 224 | 224 | – | |||||||||||||
LME Zinc | 1 | Feb-2023 | 75 | 74 | – | |||||||||||||
LME Zinc | 1 | Feb-2023 | 73 | 74 | 1 | |||||||||||||
LME Zinc | 1 | Feb-2023 | 73 | 75 | 2 | |||||||||||||
LME Zinc | 1 | Feb-2023 | 73 | 74 | 1 | |||||||||||||
LME Zinc | 1 | Jan-2023 | 69 | 75 | 6 | |||||||||||||
LME Zinc | 1 | Feb-2023 | 73 | 74 | 2 | |||||||||||||
LME Zinc | 2 | Feb-2023 | 163 | 149 | (14) | |||||||||||||
LME Zinc | 1 | Feb-2023 | 72 | 75 | 3 | |||||||||||||
LME Zinc | 1 | Feb-2023 | 76 | 75 | (1) | |||||||||||||
LME Zinc | 1 | Jan-2023 | 68 | 75 | 6 | |||||||||||||
LME Zinc | 2 | Jan-2023 | 146 | 149 | 3 | |||||||||||||
LME Zinc | 1 | Jan-2023 | 73 | 75 | 2 | |||||||||||||
LME Zinc | 1 | Jan-2023 | 79 | 75 | (4) | |||||||||||||
LME Zinc | 2 | Feb-2023 | 136 | 149 | 13 | |||||||||||||
LME Zinc | 2 | Mar-2023 | 161 | 149 | (12) | |||||||||||||
LME Zinc | 1 | Jan-2023 | 73 | 75 | 2 | |||||||||||||
The accompanying notes are an integral part of the consolidated financial statements.
31
| THE ADVISORS’ INNER CIRCLE FUND III | FS MULTI-STRATEGY | |||
| ALTERNATIVES FUND | ||||
| DECEMBER 31, 2022 |
| |||
| Type of Contract | Number of Contracts | Expiration Date | Notional Amount (000) | Value (000) | Unrealized Appreciation/ (Depreciation) (000) | |||||||||||||
LME Zinc | 1 | Mar-2023 | $ | 80 | $ | 74 | $ | (5 | ) | |||||||||
LME Zinc | 1 | Mar-2023 | 77 | 74 | (3 | ) | ||||||||||||
LME Zinc | 1 | Feb-2023 | 73 | 74 | 1 | |||||||||||||
LME Zinc | 1 | Mar-2023 | 75 | 74 | – | |||||||||||||
LME Zinc | 1 | Mar-2023 | 78 | 74 | (4 | ) | ||||||||||||
Long Gilt 10-Year Bond | 2 | Mar-2023 | 245 | 242 | (4 | ) | ||||||||||||
Low Sulphur Gasoil | 2 | Feb-2023 | 177 | 181 | 4 | |||||||||||||
Micro E-MINI | 2 | Mar-2023 | 18 | 18 | – | |||||||||||||
Milk | 1 | Jan-2023 | 40 | 39 | (1 | ) | ||||||||||||
Mill Wheat | 2 | Mar-2023 | 33 | 33 | (1 | ) | ||||||||||||
Mini H-shares Index | 1 | Jan-2023 | 9 | 9 | – | |||||||||||||
MSCI EAFE Index | 6 | Mar-2023 | 590 | 585 | (5 | ) | ||||||||||||
MSCI Emerging Markets | 14 | Mar-2023 | 681 | 672 | (10 | ) | ||||||||||||
NASDAQ 100 Index Micro E-MINI | 1 | Mar-2023 | 22 | 22 | – | |||||||||||||
New Zealand Dollar | 1 | Mar-2023 | 63 | 63 | 1 | |||||||||||||
Nikkei 225 Index | 6 | Mar-2023 | 592 | 594 | (6 | ) | ||||||||||||
NY Harbor ULSD | 1 | Jan-2023 | 135 | 138 | 3 | |||||||||||||
NY Harbor ULSD | 1 | Jan-2023 | 139 | 138 | (1 | ) | ||||||||||||
NYMEX Cocoa | 1 | May-2023 | 25 | 26 | 1 | |||||||||||||
NYMEX Cocoa | 2 | Mar-2023 | 50 | 50 | – | |||||||||||||
NYMEX Cocoa | 1 | May-2023 | 21 | 24 | 1 | |||||||||||||
NYMEX Cocoa | 3 | Mar-2023 | 77 | 78 | 1 | |||||||||||||
OMX Stockholm 30 | 1 | Jan-2023 | 20 | 20 | – | |||||||||||||
Palladium | 1 | Mar-2023 | 179 | 180 | 1 | |||||||||||||
Platinum | 3 | Apr-2023 | 156 | 162 | 6 | |||||||||||||
Red Wheat | 1 | Mar-2023 | 46 | 47 | 1 | |||||||||||||
Russell 2000 Index E-MINI | 7 | Mar-2023 | 621 | 620 | (1 | ) | ||||||||||||
S&P 500 Index E-MINI | 32 | Mar-2023 | 6,183 | 6,178 | (5 | ) | ||||||||||||
S&P 500 Index E-MINI | 1 | Mar-2023 | 19 | 19 | – | |||||||||||||
S&P 500 Index E-MINI | 1,982 | Dec-2024 | 30,325 | 31,266 | 941 | |||||||||||||
S&P Mid Cap 400 Index E-MINI | 1 | Mar-2023 | 245 | 244 | (1 | ) | ||||||||||||
S&P TSX 60 Index | 2 | Mar-2023 | 342 | 346 | 1 | |||||||||||||
SGX Iron Ore 62 | 1 | Feb-2023 | 12 | 12 | – | |||||||||||||
SGX Nifty 50 | 8 | Jan-2023 | 291 | 292 | 1 | |||||||||||||
Soybean | 13 | Mar-2023 | 974 | 991 | 17 | |||||||||||||
Soybean | 2 | May-2023 | 148 | 153 | 5 | |||||||||||||
Soybean | 1 | Jul-2023 | 74 | 77 | 3 | |||||||||||||
Soybean Meal | 2 | May-2023 | 88 | 92 | 4 | |||||||||||||
Soybean Meal | 6 | Mar-2023 | 271 | 283 | 11 | |||||||||||||
Soybean Oil | 1 | Mar-2023 | 38 | 38 | – | |||||||||||||
Soybean Oil | 3 | Dec-2023 | 115 | 111 | (4 | ) | ||||||||||||
Soybean Oil | 1 | Jul-2023 | 38 | 38 | – | |||||||||||||
SPI 200 Index | 4 | Mar-2023 | 478 | 476 | (8 | ) | ||||||||||||
The accompanying notes are an integral part of the consolidated financial statements.
32
| THE ADVISORS’ INNER CIRCLE FUND III | FS MULTI-STRATEGY | |||
| ALTERNATIVES FUND | ||||
| DECEMBER 31, 2022 |
| |||
| Type of Contract | Number of Contracts | Expiration Date | Notional Amount (000) | Value (000) | Unrealized Appreciation/ (Depreciation) (000) | |||||||||||||
STOXX Europe 600 | 1 | Mar-2023 | $ | 23 | $ | 23 | $ | – | ||||||||||
Sugar No. 11 | 35 | Feb-2023 | 782 | 786 | 4 | |||||||||||||
Technology E-Mini | 1 | Mar-2023 | 127 | 126 | – | |||||||||||||
TOPIX Index | 1 | Mar-2023 | 142 | 144 | 2 | |||||||||||||
Turkish Dollar | 7 | Feb-2023 | 7 | 7 | – | |||||||||||||
U.S. 10-Year Treasury Note | 14 | Mar-2023 | 1,572 | 1,572 | – | |||||||||||||
U.S. Ultra Long TreasuryL Bond | 4 | Mar-2023 | 538 | 537 | (1 | ) | ||||||||||||
WTI Crude Oil | 1 | Nov-2023 | 76 | 77 | 1 | |||||||||||||
|
|
|
|
|
| |||||||||||||
| 66,702 | 67,567 | 798 | ||||||||||||||||
Short Contracts | (1) | May-2023 | $ | (396 | ) | $ | (396 | ) | $ | – | ||||||||
3 Month Euribor | (6) | Jun-2023 | (1,534 | ) | (1,548 | ) | 24 | |||||||||||
3 Month Euribor | (2) | Mar-2024 | (512 | ) | (517 | ) | – | |||||||||||
90-Day Bank Bill | (1) | Dec-2023 | (176 | ) | (176 | ) | – | |||||||||||
90-Day Euro$ | (1) | Dec-2024 | (241 | ) | (241 | ) | – | |||||||||||
90-Day Euro$ | (3) | Dec-2023 | (716 | ) | (714 | ) | 1 | |||||||||||
90-Day Euro$ | (3) | Jun-2023 | (711 | ) | (711 | ) | (1 | ) | ||||||||||
90-Day Euro$ | (2) | Mar-2024 | (479 | ) | (478 | ) | 1 | |||||||||||
Australian 10-Year Bond | (6) | Mar-2023 | (486 | ) | (473 | ) | 17 | |||||||||||
Australian 3-Year Bond | (1) | Mar-2023 | (72 | ) | (73 | ) | – | |||||||||||
Brent Crude | (5) | Jan-2023 | (388 | ) | (430 | ) | (42 | ) | ||||||||||
Brent Crude | (1) | Mar-2023 | (81 | ) | (85 | ) | (4 | ) | ||||||||||
CAC40 10 Euro Index | (1) | Jan-2023 | (68 | ) | (69 | ) | – | |||||||||||
CAD Currency | (3) | Mar-2023 | (221 | ) | (222 | ) | – | |||||||||||
Canadian 5-Year Bond | (2) | Mar-2023 | (165 | ) | (165 | ) | – | |||||||||||
Canadian 10-Year Bond | (14) | Mar-2023 | (1,284 | ) | (1,267 | ) | 22 | |||||||||||
Canola | (1) | Mar-2023 | (13 | ) | (13 | ) | – | |||||||||||
CBOE Volatility Index . | (44) | Jan-2023 | (1,036 | ) | (1,016 | ) | 19 | |||||||||||
CBOE Volatility Index . | (12) | Feb-2023 | (295 | ) | (295 | ) | – | |||||||||||
Coffee C | (1) | May-2023 | (60 | ) | (63 | ) | (2 | ) | ||||||||||
Coffee C | (2) | Mar-2023 | (125 | ) | (125 | ) | (1 | ) | ||||||||||
Corn | (6) | Mar-2023 | (196 | ) | (204 | ) | (8 | ) | ||||||||||
Cotton No. 2 | (1) | Mar-2023 | (42 | ) | (42 | ) | – | |||||||||||
Crude Palm Oil | (1) | May-2023 | (22 | ) | (23 | ) | (1 | ) | ||||||||||
Crude Palm Oil | (1) | Mar-2023 | (22 | ) | (24 | ) | (1 | ) | ||||||||||
DAX Index | (2) | Mar-2023 | (749 | ) | (749 | ) | 7 | |||||||||||
Energy E-Mini | (2) | Mar-2023 | (181 | ) | (184 | ) | (3 | ) | ||||||||||
EUR E-Mini | (1) | Mar-2023 | (67 | ) | (67 | ) | – | |||||||||||
EUR/USD Micro | (1) | Mar-2023 | (13 | ) | (13 | ) | – | |||||||||||
Euro STOXX 50 | (4) | Mar-2023 | (163 | ) | (162 | ) | 2 | |||||||||||
Euro-Bobl | (25) | Mar-2023 | (3,099 | ) | (3,098 | ) | 20 | |||||||||||
Euro-BTP | (3) | Mar-2023 | (350 | ) | (350 | ) | 2 | |||||||||||
Euro-Bund | (78) | Mar-2023 | (11,190 | ) | (11,099 | ) | 173 | |||||||||||
The accompanying notes are an integral part of the consolidated financial statements.
33
| THE ADVISORS’ INNER CIRCLE FUND III | FS MULTI-STRATEGY | |||
| ALTERNATIVES FUND | ||||
| DECEMBER 31, 2022 |
| |||
| Type of Contract | Number of Contracts | Expiration Date | Notional Amount (000) | Value (000) | Unrealized Appreciation/ (Depreciation) (000) | |||||||||||||
Euro-Buxl | (4) | Mar-2023 | $ | (603 | ) | $ | (579 | ) | $ | 28 | ||||||||
Euro-OAT | (15) | Mar-2023 | (2,068 | ) | (2,044 | ) | 38 | |||||||||||
Euro-Schatz | (46) | Mar-2023 | (5,170 | ) | (5,191 | ) | 19 | |||||||||||
Feeder Cattle | (2) | Mar-2023 | (186 | ) | (186 | ) | – | |||||||||||
Frozen Concentrated Orange Juice | (1) | Mar-2023 | (30 | ) | (31 | ) | (1 | ) | ||||||||||
FTSE China A50 | (6) | Jan-2023 | (77 | ) | (79 | ) | (1 | ) | ||||||||||
FTSE Taiwan Index | (5) | Jan-2023 | (249 | ) | (248 | ) | 1 | |||||||||||
Gasoline | (2) | Feb-2023 | (196 | ) | (208 | ) | (13 | ) | ||||||||||
Gasoline | (4) | Jan-2023 | (390 | ) | (416 | ) | (26 | ) | ||||||||||
Hang Seng China Enterprises Index | (2) | Jan-2023 | (87 | ) | (87 | ) | 1 | |||||||||||
Hang Seng China Enterprises Index | (3) | Jan-2023 | (129 | ) | (130 | ) | (1 | ) | ||||||||||
Hang Seng Index | (7) | Jan-2023 | (890 | ) | (893 | ) | (3 | ) | ||||||||||
IBEX | (1) | Jan-2023 | (86 | ) | (88 | ) | (1 | ) | ||||||||||
IBEX | (2) | Jan-2023 | (175 | ) | (175 | ) | 1 | |||||||||||
ICE ECX Emission 2023 | (1) | Dec-2023 | (98 | ) | (90 | ) | 9 | |||||||||||
INR/USD Micro | (1) | Jan-2023 | (24 | ) | (24 | ) | – | |||||||||||
Japanese 10-Year Bond | (2) | Mar-2023 | (2,205 | ) | (2,217 | ) | 3 | |||||||||||
Japanese 10-Year Government Bond E-MINI | (1) | Mar-2023 | (111 | ) | (111 | ) | – | |||||||||||
KOSPI 200 Index | (6) | Mar-2023 | (349 | ) | (347 | ) | 2 | |||||||||||
Live Cattle | (1) | Feb-2023 | (62 | ) | (63 | ) | (2 | ) | ||||||||||
LME Aluminum | (1) | Mar-2023 | (62 | ) | (59 | ) | 3 | |||||||||||
LME Aluminum | (1) | Mar-2023 | (60 | ) | (59 | ) | – | |||||||||||
LME Aluminum | (1) | Mar-2023 | (61 | ) | (59 | ) | 1 | |||||||||||
LME Aluminum | (1) | Feb-2023 | (60 | ) | (59 | ) | – | |||||||||||
LME Aluminum | (1) | Feb-2023 | (60 | ) | (59 | ) | – | |||||||||||
LME Aluminum | (2) | Feb-2023 | (121 | ) | (118 | ) | 3 | |||||||||||
LME Aluminum | (1) | Feb-2023 | (60 | ) | (59 | ) | – | |||||||||||
LME Aluminum | (2) | Feb-2023 | (119 | ) | (118 | ) | 1 | |||||||||||
LME Aluminum | (2) | Feb-2023 | (120 | ) | (118 | ) | 2 | |||||||||||
LME Aluminum | (3) | Feb-2023 | (178 | ) | (177 | ) | 1 | |||||||||||
LME Aluminum | (1) | Feb-2023 | (59 | ) | (59 | ) | – | |||||||||||
LME Aluminum | (2) | Jan-2023 | (121 | ) | (118 | ) | 3 | |||||||||||
LME Copper | (1) | Mar-2023 | (214 | ) | (209 | ) | 5 | |||||||||||
LME Copper | (1) | Feb-2023 | (205 | ) | (209 | ) | (4 | ) | ||||||||||
LME Copper | (3) | Mar-2023 | (622 | ) | (628 | ) | (6 | ) | ||||||||||
LME Copper | (1) | Mar-2023 | (210 | ) | (209 | ) | 1 | |||||||||||
LME Copper | (2) | Feb-2023 | (406 | ) | (419 | ) | (13 | ) | ||||||||||
LME Copper | (2) | Feb-2023 | (403 | ) | (419 | ) | (15 | ) | ||||||||||
LME Copper | (1) | Mar-2023 | (208 | ) | (209 | ) | (2 | ) | ||||||||||
LME Copper | (1) | Mar-2023 | (209 | ) | (209 | ) | – | |||||||||||
The accompanying notes are an integral part of the consolidated financial statements.
34
| THE ADVISORS’ INNER CIRCLE FUND III | FS MULTI-STRATEGY | |||
| ALTERNATIVES FUND | ||||
| DECEMBER 31, 2022 |
| |||
| Type of Contract | Number of Contracts | Expiration Date | Notional Amount (000) | Value (000) | Unrealized Appreciation/ (Depreciation) (000) | |||||||||||||
LME Lead | (1) | Mar-2023 | $ | (54 | ) | $ | (58 | ) | $ | (4 | ) | |||||||
LME Lead | (2) | Mar-2023 | (113 | ) | (115 | ) | (2 | ) | ||||||||||
LME Lead | (2) | Mar-2023 | (111 | ) | (116 | ) | (4 | ) | ||||||||||
LME Lead | (1) | Mar-2023 | (56 | ) | (57 | ) | (1 | ) | ||||||||||
LME Lead | (1) | Mar-2023 | (54 | ) | (57 | ) | (4 | ) | ||||||||||
LME Nickle | (2) | Mar-2023 | (1,396 | ) | (1,502 | ) | (106 | ) | ||||||||||
LME Nickle | (1) | Feb-2023 | (640 | ) | (749 | ) | (110 | ) | ||||||||||
LME Nickle | (1) | Feb-2023 | (685 | ) | (750 | ) | (65 | ) | ||||||||||
LME Nickle | (1) | Mar-2023 | (759 | ) | (751 | ) | 8 | |||||||||||
LME Zinc | (1) | Feb-2023 | (79 | ) | (75 | ) | 5 | |||||||||||
LME Zinc | (3) | Feb-2023 | (231 | ) | (224 | ) | 8 | |||||||||||
LME Zinc | (1) | Feb-2023 | (81 | ) | (74 | ) | 7 | |||||||||||
LME Zinc | (1) | Feb-2023 | (73 | ) | (74 | ) | (2 | ) | ||||||||||
LME Zinc | (1) | Feb-2023 | (81 | ) | (74 | ) | 7 | |||||||||||
LME Zinc | (3) | Feb-2023 | (220 | ) | (223 | ) | (4 | ) | ||||||||||
LME Zinc | (1) | Jan-2023 | (73 | ) | (75 | ) | (2 | ) | ||||||||||
LME Zinc | (2) | Jan-2023 | (137 | ) | (149 | ) | (12 | ) | ||||||||||
LME Zinc | (1) | Jan-2023 | (72 | ) | (75 | ) | (3 | ) | ||||||||||
LME Zinc | (1) | Feb-2023 | (73 | ) | (75 | ) | (2 | ) | ||||||||||
LME Zinc | (1) | Jan-2023 | (78 | ) | (75 | ) | 4 | |||||||||||
LME Zinc | (1) | Jan-2023 | (73 | ) | (75 | ) | (2 | ) | ||||||||||
LME Zinc | (2) | Feb-2023 | (146 | ) | (149 | ) | (3 | ) | ||||||||||
LME Zinc | (1) | Feb-2023 | (72 | ) | (75 | ) | (3 | ) | ||||||||||
LME Zinc | (1) | Mar-2023 | (78 | ) | (74 | ) | 4 | |||||||||||
LME Zinc | (1) | Feb-2023 | (81 | ) | (74 | ) | 7 | |||||||||||
LME Zinc | (1) | Mar-2023 | (74 | ) | (74 | ) | – | |||||||||||
LME Zinc | (1) | Feb-2023 | (74 | ) | (74 | ) | (1 | ) | ||||||||||
LME Zinc | (1) | Mar-2023 | (73 | ) | (74 | ) | (1 | ) | ||||||||||
LME Zinc | (1) | Jan-2023 | (73 | ) | (75 | ) | (2 | ) | ||||||||||
LME Zinc | (1) | Mar-2023 | (78 | ) | (74 | ) | 3 | |||||||||||
LME Zinc | (1) | Mar-2023 | (83 | ) | (74 | ) | 9 | |||||||||||
Long Gilt 10-Year Bond | (2) | Mar-2023 | (244 | ) | (242 | ) | 2 | |||||||||||
Low Sulphur Gasoil | (1) | Feb-2023 | (84 | ) | (91 | ) | (7 | ) | ||||||||||
Mexican Peso | (1) | Mar-2023 | (25 | ) | (25 | ) | – | |||||||||||
Mill Wheat | (3) | Mar-2023 | (48 | ) | (50 | ) | (1 | ) | ||||||||||
Mill Wheat | (1) | Mar-2023 | (17 | ) | (17 | ) | 1 | |||||||||||
Mini DAX Index | (1) | Mar-2023 | (74 | ) | (75 | ) | – | |||||||||||
Mini Hang Seng Index | (1) | Jan-2023 | (26 | ) | (26 | ) | – | |||||||||||
Natural Gas | (1) | Jan-2023 | (47 | ) | (45 | ) | 3 | |||||||||||
Natural Gas | (5) | Jan-2023 | (406 | ) | (315 | ) | 93 | |||||||||||
Natural Gas | (2) | Feb-2023 | (89 | ) | (82 | ) | 7 | |||||||||||
Nikkei 225 Index | (3) | Mar-2023 | (296 | ) | (297 | ) | 3 | |||||||||||
Nikkei 225 Index | (1) | Mar-2023 | (132 | ) | (129 | ) | 3 | |||||||||||
Nikkei 225 Index | (16) | Mar-2023 | (314 | ) | (318 | ) | 2 | |||||||||||
Nikkei 225 Index | (2) | Mar-2023 | (390 | ) | (397 | ) | 2 | |||||||||||
The accompanying notes are an integral part of the consolidated financial statements.
35
| THE ADVISORS’ INNER CIRCLE FUND III | FS MULTI-STRATEGY | |||
| ALTERNATIVES FUND | ||||
| DECEMBER 31, 2022 |
| |||
| Type of Contract | Number of Contracts | Expiration Date | Notional Amount (000) | Value (000) | Unrealized Appreciation/ (Depreciation) (000) | |||||||||||||||
NY Harbor ULSD | (2) | Feb-2023 | $ | (264 | ) | $ | (267 | ) | $ | (3 | ) | |||||||||
Oat | (1) | Mar-2023 | (17 | ) | (18 | ) | (1 | ) | ||||||||||||
S&P TSX 60 Index | (2) | Mar-2023 | (360 | ) | (346 | ) | 15 | |||||||||||||
Short-Term Euro-BTP | (3) | Mar-2023 | (336 | ) | (338 | ) | 1 | |||||||||||||
Silver | (3) | Mar-2023 | (362 | ) | (361 | ) | 1 | |||||||||||||
Soybean | (5) | Mar-2023 | (359 | ) | (381 | ) | (22 | ) | ||||||||||||
Soybean Oil | (2) | May-2023 | (76 | ) | (77 | ) | (1 | ) | ||||||||||||
SPI 200 Index | (3) | Mar-2023 | (356 | ) | (357 | ) | 3 | |||||||||||||
Sugar No. 11 | (28) | Feb-2023 | (613 | ) | (628 | ) | (16 | ) | ||||||||||||
Three-Month SOFR | (1) | Dec-2023 | (238 | ) | (238 | ) | – | |||||||||||||
Three-Month SOFR | (2) | Sep-2023 | (477 | ) | (475 | ) | 2 | |||||||||||||
Tokyo Topix-Mini | (1) | Mar-2023 | (14 | ) | (14 | ) | – | |||||||||||||
TOPIX Index | (1) | Mar-2023 | (142 | ) | (144 | ) | – | |||||||||||||
U.S. 2-Year Treasury Note | (32) | Mar-2023 | (6,579 | ) | (6,563 | ) | 17 | |||||||||||||
U.S. 5-Year Treasury Note | (686) | Apr-2023 | (74,065 | ) | (74,040 | ) | 25 | |||||||||||||
U.S. 10-Year Treasury Note | (1) | Mar-2023 | (114 | ) | (112 | ) | 2 | |||||||||||||
U.S. Dollar Index | (5) | Jan-2023 | (50 | ) | (50 | ) | – | |||||||||||||
U.S. Long Treasury Bond | (23) | Mar-2023 | (2,878 | ) | (2,883 | ) | (4 | ) | ||||||||||||
Ultra 10-Year U.S. Treasury Note | (19) | Mar-2023 | (2,251 | ) | (2,247 | ) | 4 | |||||||||||||
Utilities E-Mini | (1) | Mar-2023 | (72 | ) | (72 | ) | – | |||||||||||||
Wheat | (2) | Dec-2023 | (81 | ) | (82 | ) | (1 | ) | ||||||||||||
WTI Crude Oil | (3) | Nov-2023 | (218 | ) | (232 | ) | (14 | ) | ||||||||||||
WTI Crude Oil | (1) | Feb-2023 | (79 | ) | (80 | ) | (1 | ) | ||||||||||||
Yen denom Nikkei | (1) | Mar-2023 | (97 | ) | (98 | ) | 1 | |||||||||||||
|
|
|
|
|
| |||||||||||||||
| (140,157 | ) | (140,324 | ) | 104 | ||||||||||||||||
|
|
|
|
|
| |||||||||||||||
| $ | (73,455 | ) | $ | (72,757 | ) | $ | 902 | |||||||||||||
|
|
|
|
|
| |||||||||||||||
A list of the open forward foreign currency contracts held by the Fund at December 31, 2022, is as follows:
Counterparty | Settlement Date | Currency to Deliver (000) | Currency to Receive (000) | Unrealized Appreciation/ (Depreciation) (000) | ||||||||||||||||||
Deutsche Bank | 01/03/23-01/04/23 | BRL | 6,322 | USD | 1,200 | $ | 3 | |||||||||||||||
Deutsche Bank | 01/03/23-01/23/23 | USD | 2,013 | CLP | 1,783,311 | 87 | ||||||||||||||||
Deutsche Bank | 01/03/23-01/19/23 | USD | 200 | TWD | 6,090 | (2 | ) | |||||||||||||||
Deutsche Bank | 01/03/23-01/19/23 | TWD | 9,167 | USD | 300 | 1 | ||||||||||||||||
Deutsche Bank | 01/03/23-01/04/23 | USD | 1,200 | BRL | 6,314 | (5 | ) | |||||||||||||||
Deutsche Bank | 01/03/23-01/20/23 | USD | 2,400 | INR | 198,713 | 1 | ||||||||||||||||
Deutsche Bank | 01/03/23-01/23/23 | INR | 264,515 | USD | 3,200 | 5 | ||||||||||||||||
Deutsche Bank | 01/03/23-01/19/23 | CLP | 1,592,589 | USD | 1,813 | (62 | ) | |||||||||||||||
Deutsche Bank | 01/06/23-02/03/23 | KRW | 2,589,376 | USD | 2,000 | (55 | ) | |||||||||||||||
The accompanying notes are an integral part of the consolidated financial statements.
36
| THE ADVISORS’ INNER CIRCLE FUND III | FS MULTI-STRATEGY | |||
| ALTERNATIVES FUND | ||||
| DECEMBER 31, 2022 |
| |||
Counterparty | Settlement Date | Currency to Deliver (000) | Currency to Receive (000) | Unrealized Appreciation/ (Depreciation) (000) | ||||||||||||||||||
Deutsche Bank | 01/06/23-01/31/23 | USD | 1,800 | KRW | 2,331,618 | $ | 50 | |||||||||||||||
Deutsche Bank | 01/19/23 | USD | 500 | SEK | 5,151 | (6 | ) | |||||||||||||||
Deutsche Bank | 01/19/23 | USD | 4,857 | CHF | 4,500 | 20 | ||||||||||||||||
Deutsche Bank | 01/19/23 | USD | 10,000 | CNH | 69,523 | 61 | ||||||||||||||||
Deutsche Bank | 01/19/23 | GBP | 17,186 | EUR | 19,800 | 435 | ||||||||||||||||
Deutsche Bank | 01/19/23 | NOK | 15,705 | EUR | 1,500 | 3 | ||||||||||||||||
Deutsche Bank | 01/19/23 | USD | 14,955 | JPY | 2,000,000 | 324 | ||||||||||||||||
Deutsche Bank | 01/19/23 | USD | 3,529 | MXN | 70,000 | 50 | ||||||||||||||||
Deutsche Bank | 01/19/23 | EUR | 875 | NOK | 9,135 | (4 | ) | |||||||||||||||
Deutsche Bank | 01/19/23 | EUR | 8,250 | USD | 8,732 | (111 | ) | |||||||||||||||
Deutsche Bank | 01/19/23 | USD | 1,971 | NZD | 3,100 | (2 | ) | |||||||||||||||
Deutsche Bank | 01/19/23 | CAD | 13,600 | USD | 9,981 | (64 | ) | |||||||||||||||
Deutsche Bank | 01/19/23 | MXN | 55,000 | USD | 2,779 | (33 | ) | |||||||||||||||
Deutsche Bank | 01/19/23 | NZD | 3,400 | USD | 2,166 | 6 | ||||||||||||||||
Deutsche Bank | 01/19/23 | USD | 7,879 | AUD | 11,600 | 25 | ||||||||||||||||
Deutsche Bank | 01/19/23 | GBP | 1,625 | AUD | 2,928 | 30 | ||||||||||||||||
Deutsche Bank | 01/19/23 | JPY | 1,438,666 | AUD | 16,000 | (89 | ) | |||||||||||||||
Deutsche Bank | 01/19/23 | JPY | 2,037,500 | USD | 15,119 | (447 | ) | |||||||||||||||
Deutsche Bank | 01/19/23 | USD | 500 | ZAR | 8,576 | 4 | ||||||||||||||||
Deutsche Bank | 01/19/23 | NZD | 2,983 | AUD | 2,800 | 13 | ||||||||||||||||
Deutsche Bank | 01/19/23 | CAD | 5,382 | EUR | 3,750 | 44 | ||||||||||||||||
Deutsche Bank | 01/19/23 | JPY | 2,754,380 | EUR | 19,100 | (569 | ) | |||||||||||||||
Deutsche Bank | 01/19/23 | AUD | 3,843 | GBP | 2,125 | (48 | ) | |||||||||||||||
Deutsche Bank | 01/19/23 | USD | 8,386 | CAD | 11,400 | 34 | ||||||||||||||||
Deutsche Bank | 01/19/23 | CHF | 3,875 | USD | 4,180 | (19 | ) | |||||||||||||||
Deutsche Bank | 01/19/23 | CAD | 3,400 | JPY | 337,758 | 69 | ||||||||||||||||
Deutsche Bank | 01/19/23 | EUR | 1,375 | CHF | 1,354 | (7 | ) | |||||||||||||||
Deutsche Bank | 01/19/23 | CHF | 1,559 | GBP | 1,375 | (27 | ) | |||||||||||||||
Deutsche Bank | 01/19/23 | AUD | 4,400 | NZD | 4,681 | (25 | ) | |||||||||||||||
Deutsche Bank | 01/19/23 | USD | 7,965 | EUR | 7,500 | 74 | ||||||||||||||||
Deutsche Bank | 01/19/23 | NZD | 3,800 | JPY | 320,347 | 34 | ||||||||||||||||
Deutsche Bank | 01/19/23 | JPY | 593,948 | GBP | 3,625 | (153 | ) | |||||||||||||||
Deutsche Bank | 01/19/23 | EUR | 17,800 | GBP | 15,449 | (394 | ) | |||||||||||||||
Deutsche Bank | 01/19/23 | GBP | 1,500 | CHF | 1,711 | 40 | ||||||||||||||||
Deutsche Bank | 01/19/23 | AUD | 15,400 | JPY | 1,407,191 | 257 | ||||||||||||||||
Deutsche Bank | 01/19/23 | CHF | 250 | JPY | 35,538 | 1 | ||||||||||||||||
Deutsche Bank | 01/19/23 | GBP | 3,625 | JPY | 595,585 | 165 | ||||||||||||||||
Deutsche Bank | 01/19/23 | JPY | 374,398 | NZD | 4,400 | (66 | ) | |||||||||||||||
Deutsche Bank | 01/19/23 | CNH | 56,288 | USD | 8,100 | (46 | ) | |||||||||||||||
Deutsche Bank | 01/19/23 | AUD | 11,800 | USD | 7,938 | (103 | ) | |||||||||||||||
Deutsche Bank | 01/19/23 | HUF | 236,443 | USD | 600 | (30 | ) | |||||||||||||||
Deutsche Bank | 01/19/23 | GBP | 3,438 | USD | 4,190 | 31 | ||||||||||||||||
Deutsche Bank | 01/19/23 | ZAR | 13,876 | USD | 800 | (15 | ) | |||||||||||||||
Deutsche Bank | 01/19/23 | EUR | 1,250 | AUD | 1,966 | — | ||||||||||||||||
Deutsche Bank | 01/19/23 | AUD | 2,600 | CAD | 2,384 | (11 | ) | |||||||||||||||
Deutsche Bank | 01/19/23 | EUR | 2,250 | CAD | 3,242 | (18 | ) | |||||||||||||||
Deutsche Bank | 01/19/23 | USD | 700 | HUF | 274,673 | 32 | ||||||||||||||||
Deutsche Bank | 01/19/23 | SEK | 12,312 | EUR | 1,125 | 25 | ||||||||||||||||
Deutsche Bank | 01/19/23 | USD | 200 | ILS | 693 | (3 | ) | |||||||||||||||
Deutsche Bank | 01/19/23 | EUR | 17,400 | JPY | 2,486,198 | 342 | ||||||||||||||||
Deutsche Bank | 01/19/23 | NOK | 500 | SEK | 527 | — | ||||||||||||||||
Deutsche Bank | 01/19/23 | JPY | 354,120 | CAD | 3,600 | (46 | ) | |||||||||||||||
The accompanying notes are an integral part of the consolidated financial statements.
37
| THE ADVISORS’ INNER CIRCLE FUND III | FS MULTI-STRATEGY | |||
| ALTERNATIVES FUND | ||||
| DECEMBER 31, 2022 |
| |||
Counterparty | Settlement Date | Currency to Deliver (000) | Currency to Receive (000) | Unrealized Appreciation/ (Depreciation) (000) | ||||||||||||||||||||
Deutsche Bank | 01/19/23 | EUR | 200 | HUF | 82,196 | $ | 5 | |||||||||||||||||
Deutsche Bank | 01/19/23 | AUD | 2,930 | EUR | 1,875 | 13 | ||||||||||||||||||
Deutsche Bank | 01/19/23 | CZK | 2,289 | USD | 100 | (1 | ) | |||||||||||||||||
Deutsche Bank | 01/19/23 | SEK | 7,210 | USD | 700 | 8 | ||||||||||||||||||
Deutsche Bank | 01/19/23 | USD | 100 | CZK | 2,279 | 1 | ||||||||||||||||||
Deutsche Bank | 01/19/23 | CHF | 862 | EUR | 875 | 3 | ||||||||||||||||||
Deutsche Bank | 01/19/23 | SEK | 5,274 | NOK | 5,000 | 5 | ||||||||||||||||||
Deutsche Bank | 01/19/23 | USD | 1,400 | SGD | 1,895 | 16 | ||||||||||||||||||
Deutsche Bank | 01/19/23 | NOK | 5,897 | USD | 600 | (2 | ) | |||||||||||||||||
Deutsche Bank | 01/19/23 | USD | 500 | NOK | 4,895 | — | ||||||||||||||||||
Deutsche Bank | 01/19/23 | CAD | 2,207 | AUD | 2,400 | 6 | ||||||||||||||||||
Deutsche Bank | 01/19/23 | PLN | 945 | EUR | 200 | (1 | ) | |||||||||||||||||
Deutsche Bank | 01/19/23 | PLN | 1,351 | USD | 300 | (8 | ) | |||||||||||||||||
Deutsche Bank | 01/19/23 | HUF | 41,751 | EUR | 100 | (4 | ) | |||||||||||||||||
Deutsche Bank | 01/19/23 | EUR | 100 | PLN | 475 | 1 | ||||||||||||||||||
Deutsche Bank | 01/19/23 | SGD | 943 | USD | 700 | (4 | ) | |||||||||||||||||
Deutsche Bank | 01/19/23 | ILS | 1,016 | USD | 300 | 11 | ||||||||||||||||||
Deutsche Bank | 01/19/23 | EUR | 125 | SEK | 1,362 | (3 | ) | |||||||||||||||||
Deutsche Bank | 01/19/23 | USD | 4,355 | GBP | 3,563 | (44 | ) | |||||||||||||||||
Deutsche Bank | 02/15/23 | USD | 2,000 | TRY | 38,534 | (12 | ) | |||||||||||||||||
Deutsche Bank | 02/15/23 | TRY | 48,108 | USD | 2,500 | 18 | ||||||||||||||||||
Morgan Stanley | 03/15/23 | USD | 118 | EUR | 111 | 1 | ||||||||||||||||||
Morgan Stanley | 03/15/23 | USD | 309 | CHF | 282 | (1 | ) | |||||||||||||||||
Morgan Stanley | 03/15/23 | USD | 164 | GBP | 135 | (1 | ) | |||||||||||||||||
Morgan Stanley | 03/15/23 | EUR | 3,636 | USD | 3,883 | (29 | ) | |||||||||||||||||
Morgan Stanley | 03/15/23 | CHF | 742 | USD | 806 | (3 | ) | |||||||||||||||||
Morgan Stanley | 03/15/23 | GBP | 922 | USD | 1,127 | 10 | ||||||||||||||||||
|
| |||||||||||||||||||||||
| $ | (209 | ) | ||||||||||||||||||||||
|
| |||||||||||||||||||||||
Open OTC Swap Contracts held by the Fund at December 31, 2022 are as follows:
| Total Return Swaps | ||||||||||||||||||||||||||||||
| Counterparty | Reference Entity/ Obligation | Fund Pays | Fund Receives | Payment Frequency | Termination Date | Currency | Notional Amount (000) | Fair Value (000) | Upfront Payments/ Receipts (000) | Net Unrealized Appreciation (Depreciation) (000) | ||||||||||||||||||||
Bank of America | **BAEIESPR INDEX | 0.15% | ASSET RETURN | Quarterly | 10/20/23 | USD | $ | 15,201 | $ | 135 | $ | – | $ | 135 | ||||||||||||||||
Bank of America | **MLBX3P23 INDEX | 0.00% | ASSET RETURN | Quarterly | 11/21/23 | USD | 49,405 | (14 | ) | – | (14 | ) | ||||||||||||||||||
Bank of America | **MLEISUVU INDEX | 0.20% | ASSET RETURN | Quarterly | 03/03/23 | USD | 38,764 | 399 | – | 399 | ||||||||||||||||||||
Bank of America | **RU10INTR INDEX | ASSET RETURN | 3M SOFR +0.30% | Quarterly | 04/12/23 | USD | 14,319 | (313 | ) | – | (313 | ) | ||||||||||||||||||
Bank of America | **RU10INTR INDEX | ASSET RETURN | 3M SOFR +0.395% | Quarterly | 04/12/23 | USD | 25,295 | (1,665 | ) | – | (1,665 | ) | ||||||||||||||||||
The accompanying notes are an integral part of the consolidated financial statements.
38
| THE ADVISORS’ INNER CIRCLE FUND III | FS MULTI-STRATEGY | |||
| ALTERNATIVES FUND | ||||
| DECEMBER 31, 2022 |
| |||
| Total Return Swaps | ||||||||||||||||||||||||||||||
| Counterparty | Reference Entity/ Obligation | Fund Pays | Fund Receives | Payment Frequency | Termination Date | Currency | Notional Amount (000) | Fair Value (000) | Upfront Payments/ Receipts (000) | Net Unrealized Appreciation (Depreciation) (000) | ||||||||||||||||||||
Bank of America | **RU20INTR INDEX | 3M SOFR +0.15% | ASSET RETURN | Quarterly | 04/12/23 | USD | $ | 14,719 | $ | 126 | $ | – | $ | 126 | ||||||||||||||||
Bank of America | **RU20INTR INDEX | 3M SOFR +0.22% | ASSET RETURN | Quarterly | 04/12/23 | USD | 25,980 | 1,033 | – | 1,033 | ||||||||||||||||||||
Bank of America | ASDZ23 INDEX | 0.00% | ASSET RETURN | N/A | 12/15/23 | USD | 15,060 | 816 | – | 816 | ||||||||||||||||||||
Barclays | **BEFSEB05 INDEX | 0.00% | ASSET RETURN | Quarterly | 04/14/23 | USD | 56,710 | – | – | – | ||||||||||||||||||||
BNP Paribas | **BNPUMFRL INDEX | 3M SOFR RATE +0.47% | ASSET RETURN | Quarterly | 05/04/23 | USD | 41,058 | (359 | ) | – | (359 | ) | ||||||||||||||||||
BNP Paribas | **BNPUMFRS INDEX | ASSET RETURN RATE +0.27% | 3M SOFR | Quarterly | 05/04/23 | USD | 42,239 | 1,968 | – | 1,968 | ||||||||||||||||||||
Credit Suisse | **CSVPDSPG INDEX | 0.50% | ASSET RETURN | Monthly | 05/19/23 | USD | 16,989 | (42 | ) | – | (42 | ) | ||||||||||||||||||
Credit Suisse | **CSVTBSK7 INDEX | 0.00% | ASSET RETURN | Quarterly | 05/12/23 | USD | 62,585 | 254 | – | 254 | ||||||||||||||||||||
Goldman Sachs | **GSVLR2B4 INDEX | 0.00% | ASSET RETURN | Quarterly | 08/03/23 | USD | 30,707 | 1,018 | – | 1,018 | ||||||||||||||||||||
Goldman Sachs | **GSXUCYCL INDEX | SOFR +0.40% | ASSET RETURN | Quarterly | 06/07/23 | USD | 11,428 | – | – | – | ||||||||||||||||||||
Goldman Sachs | **GSXUEDEF INDEX | ASSET RETURN | SOFR -0.35% | Quarterly | 06/07/23 | USD | 29,514 | – | – | – | ||||||||||||||||||||
Goldman Sachs | **GSXUSGRO INDEX | SOFR +0.40% | ASSET RETURN | Quarterly | 06/07/23 | USD | 11,702 | – | – | – | ||||||||||||||||||||
Goldman Sachs | **RCXTMGT3 INDEX | 0.00% | ASSET RETURN | Quarterly | 10/11/24 | USD | 40,000 | 676 | – | 676 | ||||||||||||||||||||
JPMorgan Chase | **IBOXHY INDEX | ASSET RETURN | 3M SOFR | Quarterly | 03/20/23 | USD | 7,070 | 139 | 46 | 93 | ||||||||||||||||||||
JPMorgan Chase | **IBXXLLTR INDEX | ASSET RETURN | 3M SOFR | Quarterly | 03/20/23 | USD | 15,666 | (345 | ) | 52 | (397 | ) | ||||||||||||||||||
JPMorgan Chase | **IBXXLLTR INDEX | ASSET RETURN | 3M SOFR | Quarterly | 06/20/23 | USD | 14,964 | (249 | ) | 105 | (354 | ) | ||||||||||||||||||
JPMorgan Chase | **JPQIFSL1 INDEX | FED FUNDS +0.64% | ASSET RETURN | Quarterly | 02/21/23 | USD | 39,829 | (589 | ) | – | (589 | ) | ||||||||||||||||||
JPMorgan Chase | **JPQIFSS1 INDEX | ASSET RETURN | FED FUNDS -0.21% | Quarterly | 02/21/23 | USD | 31,535 | 856 | – | 856 | ||||||||||||||||||||
JPMorgan Chase | **JPUS1MMC INDEX | 0.20% | ASSET RETURN | Quarterly | 09/26/23 | USD | 33,622 | 140 | – | 140 | ||||||||||||||||||||
JPMorgan Chase | ASDZ23 INDEX | 0.00% | ASSET RETURN | N/A | 12/15/23 | USD | 20,500 | 1,486 | – | 1,486 | ||||||||||||||||||||
Macquarie Bank Limited | **MQIS311 INDEX | 0.25% | ASSET RETURN | Quarterly | 03/24/23 | USD | 49,477 | (2 | ) | – | (2 | ) | ||||||||||||||||||
Macquarie Bank Limited | **MQIS331 INDEX | 0.25% | ASSET RETURN | Quarterly | 03/09/23 | USD | 30,879 | 35 | – | 35 | ||||||||||||||||||||
The accompanying notes are an integral part of the consolidated financial statements.
39
| THE ADVISORS’ INNER CIRCLE FUND III | FS MULTI-STRATEGY | |||
| ALTERNATIVES FUND | ||||
| DECEMBER 31, 2022 |
| |||
| Total Return Swaps | ||||||||||||||||||||||||||||||||
| Counterparty | Reference Entity/ Obligation | Fund Pays | Fund Receives | Payment Frequency | Termination Date | Currency | Notional Amount (000) | Fair Value (000) | Upfront Payments/ Receipts (000) | Net Unrealized Appreciation (Depreciation) (000) | ||||||||||||||||||||||
Nomura | **NMSY2RNU INDEX | 0.15% | ASSET RETURN | Quarterly | 07/29/23 | USD | $ | 25,670 | $ | 171 | $ | – | $ | 171 | ||||||||||||||||||
Societe Generale | **SGIXUSGC INDEX | 0.15% | ASSET RETURN | Quarterly | 01/21/23 | USD | 32,529 | 963 | – | 963 | ||||||||||||||||||||||
Societe Generale | **SGIXVR2U INDEX | SOFR +0.00% | ASSET RETURN | N/A | 04/05/23 | USD | 38,399 | 2,557 | 13 | 2,544 | ||||||||||||||||||||||
UBS | **UBCSSUN1 INDEX | 0.00% | ASSET RETURN | Quarterly | 10/24/23 | USD | 14,523 | (75 | ) | – | (75 | ) | ||||||||||||||||||||
UBS | **UBCSUFRR INDEX | 0.00% | ASSET RETURN | Quarterly | 11/29/23 | USD | 19,745 | (140 | ) | – | (140 | ) | ||||||||||||||||||||
|
|
|
|
|
|
|
| |||||||||||||||||||||||||
| $ | 916,083 | $ | 8,979 | $ | 216 | $ | 8,763 | |||||||||||||||||||||||||
|
|
|
|
|
|
|
| |||||||||||||||||||||||||
** The following tables represent the individual underlying components comprising the Total Return Swaps at December 31, 2022. All underlying notionals are in U.S. Dollar.
**BAEIESPR Index: A strategy that sells ultra-short options to buy midterm length options to profit from a US equity market that slowly trades lower as opposed to falls quickly.
| Top Underlying Components | Notional | Percentage of Notional | ||||||||
Futures | S&P 500 EMINI Futures Mar23 | $ | 16,622,708 | 108.36% | ||||||
Spot | US Dollar Spot | (1,325,320) | -8.64% | |||||||
Index Option | January 23 Puts on SPX | 6,219 | 0.04% | |||||||
| January 23 Puts on SPX | 5,442 | 0.04% | ||||||||
| January 23 Puts on SPX | 4,470 | 0.03% | ||||||||
| January 23 Puts on SPX | 3,887 | 0.03% | ||||||||
| January 23 Puts on SPX | 3,790 | 0.02% | ||||||||
| January 23 Puts on SPX | 3,498 | 0.02% | ||||||||
| January 23 Puts on SPX | 3,401 | 0.02% | ||||||||
| January 23 Puts on SPX | 3,110 | 0.02% | ||||||||
| January 23 Puts on SPX | 2,721 | 0.02% | ||||||||
| January 23 Puts on SPX | 2,527 | 0.02% | ||||||||
| January 23 Puts on SPX | 690 | 0.00% | ||||||||
| January 23 Puts on SPX | 690 | 0.00% | ||||||||
| January 23 Puts on SPX | 690 | 0.00% | ||||||||
| January 23 Puts on SPX | 789 | 0.01% | ||||||||
| January 23 Puts on SPX | 789 | 0.01% | ||||||||
**BEFSEB05 Index: Seeks to capture intraday momentum in global equity markets.
| Top Underlying Components | Notional | Percentage of Notional | ||||||||
Equity Index | Barclays EB05 Desk Strategy | $ | 56,710,495 | 100.00% | ||||||
**BNPUMFRL Index: An alpha oriented strategy using a propriety model to take long positions based on value, quality, and momemtum factors.
The accompanying notes are an integral part of the consolidated financial statements.
40
| THE ADVISORS’ INNER CIRCLE FUND III | FS MULTI-STRATEGY | |||
| ALTERNATIVES FUND | ||||
| DECEMBER 31, 2022 |
| |||
| Top Underlying Components | Notional | Percentage of Notional | ||||||||
Common Stock | Trean Insurance Group Inc | $ | 148,765 | 0.36% | ||||||
| Valvoline Inc | 69,360 | 0.17% | ||||||||
| PROS Holdings Inc | 69,360 | 0.17% | ||||||||
| Avidity Biosciences Inc | 132,484 | 0.32% | ||||||||
| Weatherford International PLC | 127,407 | 0.31% | ||||||||
| Rigel Pharmaceuticals Inc | 124,960 | 0.30% | ||||||||
| Cognex Corp | 62,356 | 0.15% | ||||||||
| MaxCyte Inc | 62,356 | 0.15% | ||||||||
| Murphy USA Inc | 61,240 | 0.15% | ||||||||
| Rimini Street Inc | 61,240 | 0.15% | ||||||||
| Tidewater Inc | 122,415 | 0.30% | ||||||||
| Select Energy Services Inc | 121,356 | 0.30% | ||||||||
| PBF Energy Inc | 119,719 | 0.29% | ||||||||
| ProFrac Holding Corp | 115,347 | 0.28% | ||||||||
| National Energy Services Reunited Corp | 114,670 | 0.28% | ||||||||
| Amplify Energy Corp | 113,916 | 0.28% | ||||||||
| Evergy Inc | 113,516 | 0.28% | ||||||||
| Artesian Resources Corp | 113,401 | 0.28% | ||||||||
| DMC Global Inc | 113,214 | 0.28% | ||||||||
| Par Pacific Holdings Inc | 112,349 | 0.27% | ||||||||
| ONE Gas Inc | 109,715 | 0.27% | ||||||||
| Teekay Corp | 108,522 | 0.26% | ||||||||
| Pardes Biosciences Inc | 107,658 | 0.26% | ||||||||
| Dominion Energy Inc | 107,025 | 0.26% | ||||||||
| Liberty Energy Inc | 106,964 | 0.26% | ||||||||
| Ameren Corp | 106,597 | 0.26% | ||||||||
| OGE Energy Corp | 105,302 | 0.26% | ||||||||
| Otter Tail Corp | 105,255 | 0.26% | ||||||||
| California Resources Corp | 104,819 | 0.26% | ||||||||
| Provident Bancorp Inc | 104,766 | 0.26% | ||||||||
| Montauk Renewables Inc | 104,406 | 0.25% | ||||||||
| National Fuel Gas Co | 104,078 | 0.25% | ||||||||
| Consolidated Edison Inc | 103,330 | 0.25% | ||||||||
| Talos Energy Inc | 102,671 | 0.25% | ||||||||
| Vistra Corp | 102,066 | 0.25% | ||||||||
| Murphy Oil Corp | 101,278 | 0.25% | ||||||||
| US Silica Holdings Inc | 101,171 | 0.25% | ||||||||
| ChampionX Corp | 100,819 | 0.25% | ||||||||
| EOG Resources Inc | 100,251 | 0.24% | ||||||||
| Berry Corp | 100,061 | 0.24% | ||||||||
| California Water Service Group | 99,534 | 0.24% | ||||||||
| NexTier Oilfield Solutions Inc | 99,390 | 0.24% | ||||||||
| HomeStreet Inc | 98,407 | 0.24% | ||||||||
| Magnolia Oil & Gas Corp | 97,882 | 0.24% | ||||||||
| SVB Financial Group | 97,479 | 0.24% | ||||||||
| ACNB Corp | 97,296 | 0.24% | ||||||||
| Southwestern Energy Co | 97,108 | 0.24% | ||||||||
| Texas Pacific Land Corp | 96,961 | 0.24% | ||||||||
| Coterra Energy Inc | 96,951 | 0.24% | ||||||||
| Ardmore Shipping Corp | 96,876 | 0.24% | ||||||||
| Crescent Energy Co | 96,680 | 0.24% | ||||||||
| Clearway Energy Inc | 96,434 | 0.24% | ||||||||
| First Foundation Inc | 95,334 | 0.23% | ||||||||
| Enterprise Bancorp Inc | 95,214 | 0.23% | ||||||||
The accompanying notes are an integral part of the consolidated financial statements.
41
| THE ADVISORS’ INNER CIRCLE FUND III | FS MULTI-STRATEGY | |||
| ALTERNATIVES FUND | ||||
| DECEMBER 31, 2022 |
| |||
| Top Underlying Components | Notional | Percentage of Notional | ||||||||
| Macatawa Bank Corp | $94,838 | 0.23% | ||||||||
| BayCom Corp | 94,669 | 0.23% | ||||||||
| PDC Energy Inc | 94,105 | 0.23% | ||||||||
| TrustCo Bank Corp NY | 92,847 | 0.23% | ||||||||
| Northern Oil and Gas Inc | 92,628 | 0.23% | ||||||||
| Babcock & Wilcox Enterprises Inc | 92,452 | 0.23% | ||||||||
| Brookfield Infrastructure Corp | 92,447 | 0.23% | ||||||||
| Parke Bancorp Inc | 92,114 | 0.22% | ||||||||
| Bankwell Financial Group Inc | 92,107 | 0.22% | ||||||||
| Independent Bank Corp | 91,924 | 0.22% | ||||||||
| OFG Bancorp | 91,835 | 0.22% | ||||||||
| Financial Institutions Inc | 91,692 | 0.22% | ||||||||
| First Financial Corp | 91,610 | 0.22% | ||||||||
| Central Pacific Financial Corp | 91,609 | 0.22% | ||||||||
| Civista Bancshares Inc | 91,326 | 0.22% | ||||||||
| Merchants Bancorp | 91,325 | 0.22% | ||||||||
| Westamerica BanCorp | 91,129 | 0.22% | ||||||||
| Capital Bancorp Inc | 91,052 | 0.22% | ||||||||
| Metropolitan Bank Holding Corp | 90,898 | 0.22% | ||||||||
| Comerica Inc | 90,825 | 0.22% | ||||||||
| HBT Financial Inc | 90,592 | 0.22% | ||||||||
| Simmons First National Corp | 90,328 | 0.22% | ||||||||
| Enterprise Financial Services Corp | 90,079 | 0.22% | ||||||||
| HomeTrust Bancshares Inc | 89,981 | 0.22% | ||||||||
| BCB Bancorp Inc | 89,967 | 0.22% | ||||||||
| National Western Life Group Inc | 89,952 | 0.22% | ||||||||
| Pulmonx Corp | 89,915 | 0.22% | ||||||||
| FNB Corp | 89,507 | 0.22% | ||||||||
| Hope Bancorp Inc | 89,405 | 0.22% | ||||||||
| Popular Inc | 89,239 | 0.22% | ||||||||
| RBB Bancorp | 89,193 | 0.22% | ||||||||
| Comstock Resources Inc | 89,161 | 0.22% | ||||||||
| Peoples Bancorp Inc | 88,969 | 0.22% | ||||||||
| CNB Financial Corp | 88,844 | 0.22% | ||||||||
| Home Bancorp Inc | 88,729 | 0.22% | ||||||||
| Quad/Graphics Inc | 88,324 | 0.22% | ||||||||
| Spirit AeroSystems Holdings Inc | 87,932 | 0.21% | ||||||||
| Hanmi Financial Corp | 87,849 | 0.21% | ||||||||
| Heritage Commerce Corp | 87,649 | 0.21% | ||||||||
| Stoke Therapeutics Inc | 87,078 | 0.21% | ||||||||
| MidWestOne Financial Group Inc | 87,068 | 0.21% | ||||||||
| Titan International Inc | 86,717 | 0.21% | ||||||||
| Kaman Corp | 86,683 | 0.21% | ||||||||
| Republic Bancorp Inc | 86,669 | 0.21% | ||||||||
| Eneti Inc | 86,382 | 0.21% | ||||||||
| Jounce Therapeutics Inc | 85,867 | 0.21% | ||||||||
| Customers Bancorp Inc | 85,466 | 0.21% | ||||||||
| Bioventus Inc | 85,084 | 0.21% | ||||||||
| Tactile Systems Technology Inc | 84,891 | 0.21% | ||||||||
| Carter Bankshares Inc | 84,745 | 0.21% | ||||||||
| Resideo Technologies Inc | 84,692 | 0.21% | ||||||||
| Columbia Banking System Inc | 84,598 | 0.21% | ||||||||
| Hancock Whitney Corp | 84,463 | 0.21% | ||||||||
| PacWest Bancorp | 84,449 | 0.21% | ||||||||
The accompanying notes are an integral part of the consolidated financial statements.
42
| THE ADVISORS’ INNER CIRCLE FUND III | FS MULTI-STRATEGY | |||
| ALTERNATIVES FUND | ||||
| DECEMBER 31, 2022 |
| |||
| Top Underlying Components | Notional | Percentage of Notional | ||||||||
| South Plains Financial Inc | $84,413 | 0.21% | ||||||||
| Rayonier Advanced Materials Inc | 84,074 | 0.21% | ||||||||
| Builders FirstSource Inc | 83,679 | 0.20% | ||||||||
| Karat Packaging Inc | 83,548 | 0.20% | ||||||||
| AGCO Corp | 83,294 | 0.20% | ||||||||
| Summit Financial Group Inc | 83,201 | 0.20% | ||||||||
| BlueLinx Holdings Inc | 82,972 | 0.20% | ||||||||
| BrightView Holdings Inc | 82,839 | 0.20% | ||||||||
| Republic First Bancorp Inc | 81,930 | 0.20% | ||||||||
| AerSale Corp | 81,902 | 0.20% | ||||||||
| Sterling Infrastructure Inc | 81,570 | 0.20% | ||||||||
| First Bank/Hamilton NJ | 81,523 | 0.20% | ||||||||
| Telos Corp | 81,038 | 0.20% | ||||||||
| CompX International Inc | 80,871 | 0.20% | ||||||||
| Emerson Electric Co | 80,716 | 0.20% | ||||||||
| Signature Bank/New York NY | 80,711 | 0.20% | ||||||||
| Kelly Services Inc | 80,397 | 0.20% | ||||||||
| Proto Labs Inc | 80,234 | 0.20% | ||||||||
| ADMA Biologics Inc | 80,183 | 0.20% | ||||||||
| Forrester Research Inc | 80,009 | 0.20% | ||||||||
| Otis Worldwide Corp | 79,927 | 0.20% | ||||||||
| Y-mAbs Therapeutics Inc | 79,917 | 0.19% | ||||||||
| R1 RCM Inc | 79,532 | 0.19% | ||||||||
| HNI Corp | 79,468 | 0.19% | ||||||||
| Coherus Biosciences Inc | 79,356 | 0.19% | ||||||||
| Lincoln Electric Holdings Inc | 79,343 | 0.19% | ||||||||
| Quanex Building Products Corp | 79,222 | 0.19% | ||||||||
| SP Plus Corp | 79,118 | 0.19% | ||||||||
| Rallybio Corp | 78,927 | 0.19% | ||||||||
| Matson Inc | 78,885 | 0.19% | ||||||||
| Argan Inc | 78,873 | 0.19% | ||||||||
| Donaldson Co Inc | 78,800 | 0.19% | ||||||||
| Ventyx Biosciences Inc | 78,565 | 0.19% | ||||||||
| Illinois Tool Works Inc | 78,548 | 0.19% | ||||||||
| Alpine Immune Sciences Inc | 78,516 | 0.19% | ||||||||
| Hub Group Inc | 78,341 | 0.19% | ||||||||
| EMCOR Group Inc | 78,339 | 0.19% | ||||||||
| Huntington Ingalls Industries Inc | 78,015 | 0.19% | ||||||||
| Graco Inc | 77,943 | 0.19% | ||||||||
| AZZ Inc | 77,890 | 0.19% | ||||||||
| Tennant Co | 77,880 | 0.19% | ||||||||
| Insperity Inc | 77,847 | 0.19% | ||||||||
| UFP Industries Inc | 77,523 | 0.19% | ||||||||
| Regal Rexnord Corp | 77,508 | 0.19% | ||||||||
| The Manitowoc Co Inc | 77,504 | 0.19% | ||||||||
| Verisk Analytics Inc | 77,437 | 0.19% | ||||||||
| Allied Motion Technologies Inc | 77,395 | 0.19% | ||||||||
| EnerSys | 77,184 | 0.19% | ||||||||
| Kforce Inc | 77,174 | 0.19% | ||||||||
| CH Robinson Worldwide Inc | 77,062 | 0.19% | ||||||||
| ManpowerGroup Inc | 77,010 | 0.19% | ||||||||
| Landstar System Inc | 76,858 | 0.19% | ||||||||
| Omega Flex Inc | 76,843 | 0.19% | ||||||||
| ON24 Inc | 76,696 | 0.19% | ||||||||
The accompanying notes are an integral part of the consolidated financial statements.
43
| THE ADVISORS’ INNER CIRCLE FUND III | FS MULTI-STRATEGY | |||
| ALTERNATIVES FUND | ||||
| DECEMBER 31, 2022 |
| |||
| Top Underlying Components | Notional | Percentage of Notional | ||||||||
| Vericel Corp | $76,686 | 0.19% | ||||||||
| Global Industrial Co | 76,488 | 0.19% | ||||||||
| Radiant Logistics Inc | 76,441 | 0.19% | ||||||||
| Boise Cascade Co | 76,380 | 0.19% | ||||||||
| Parsons Corp | 76,377 | 0.19% | ||||||||
| Barrett Business Services Inc | 76,308 | 0.19% | ||||||||
| Encore Wire Corp | 76,268 | 0.19% | ||||||||
| Heidrick & Struggles International Inc | 76,193 | 0.19% | ||||||||
| Owens Corning | 76,164 | 0.19% | ||||||||
| Atlas Technical Consultants Inc | 75,803 | 0.18% | ||||||||
| Preformed Line Products Co | 75,471 | 0.18% | ||||||||
| JELD-WEN Holding Inc | 75,165 | 0.18% | ||||||||
| PGT Innovations Inc | 75,084 | 0.18% | ||||||||
| SI-BONE Inc | 75,066 | 0.18% | ||||||||
| Point Biopharma Global Inc | 74,991 | 0.18% | ||||||||
| Delta Air Lines Inc | 74,900 | 0.18% | ||||||||
| Phibro Animal Health Corp | 74,851 | 0.18% | ||||||||
| Catalyst Pharmaceuticals Inc | 74,784 | 0.18% | ||||||||
| American Equity Investment Life Holding Co | 74,660 | 0.18% | ||||||||
| Unisys Corp | 74,636 | 0.18% | ||||||||
| Caesarstone Ltd | 74,245 | 0.18% | ||||||||
| GrafTech International Ltd | 74,224 | 0.18% | ||||||||
| SkyWest Inc | 74,164 | 0.18% | ||||||||
| American Airlines Group Inc | 74,114 | 0.18% | ||||||||
| Perrigo Co PLC | 74,110 | 0.18% | ||||||||
| Atkore Inc | 74,046 | 0.18% | ||||||||
| Ambac Financial Group Inc | 74,006 | 0.18% | ||||||||
| NV5 Global Inc | 73,689 | 0.18% | ||||||||
| Rollins Inc | 73,474 | 0.18% | ||||||||
| U-Haul Holding Co | 73,298 | 0.18% | ||||||||
| Expeditors International of Washington Inc | 73,223 | 0.18% | ||||||||
| Inspire Medical Systems Inc | 73,029 | 0.18% | ||||||||
| Syneos Health Inc | 72,936 | 0.18% | ||||||||
| Deciphera Pharmaceuticals Inc | 72,720 | 0.18% | ||||||||
| Rapid7 Inc | 72,661 | 0.18% | ||||||||
| Cushman & Wakefield PLC | 72,265 | 0.18% | ||||||||
| Hudson Technologies Inc | 72,131 | 0.18% | ||||||||
| Veritiv Corp | 72,097 | 0.18% | ||||||||
| Box Inc | 72,072 | 0.18% | ||||||||
| Transcontinental Realty Investors Inc | 71,863 | 0.18% | ||||||||
| Bluegreen Vacations Holding Corp | 71,800 | 0.18% | ||||||||
| SolarWinds Corp | 71,544 | 0.17% | ||||||||
| Genworth Financial Inc | 71,449 | 0.17% | ||||||||
| Acuity Brands Inc | 71,323 | 0.17% | ||||||||
| Diamond Hill Investment Group Inc | 71,229 | 0.17% | ||||||||
| Forestar Group Inc | 71,226 | 0.17% | ||||||||
| OrthofIndex Medical Inc | 71,205 | 0.17% | ||||||||
| Evolus Inc | 71,142 | 0.17% | ||||||||
| Johnson Outdoors Inc | 71,135 | 0.17% | ||||||||
| Kronos Worldwide Inc | 70,967 | 0.17% | ||||||||
| Donnelley Financial Solutions Inc | 70,947 | 0.17% | ||||||||
| Bruker Corp | 70,920 | 0.17% | ||||||||
| Array Technologies Inc | 70,810 | 0.17% | ||||||||
| Alector Inc | 70,428 | 0.17% | ||||||||
The accompanying notes are an integral part of the consolidated financial statements.
44
| THE ADVISORS’ INNER CIRCLE FUND III | FS MULTI-STRATEGY | |||
| ALTERNATIVES FUND | ||||
| DECEMBER 31, 2022 |
| |||
| Top Underlying Components | Notional | Percentage of Notional | ||||||||
| Zimvie Inc | $70,416 | 0.17% | ||||||||
| NMI Holdings Inc | 70,332 | 0.17% | ||||||||
| The Howard Hughes Corp | 70,241 | 0.17% | ||||||||
| Loews Corp | 70,218 | 0.17% | ||||||||
| Ideaya Biosciences Inc | 70,170 | 0.17% | ||||||||
| SunCoke Energy Inc | 70,143 | 0.17% | ||||||||
| ACADIA Pharmaceuticals Inc | 70,141 | 0.17% | ||||||||
| The Charles Schwab Corp | 70,097 | 0.17% | ||||||||
| AirSculpt Technologies Inc | 70,004 | 0.17% | ||||||||
| Zynex Inc | 69,990 | 0.17% | ||||||||
| Advanced Drainage Systems Inc | 69,989 | 0.17% | ||||||||
| American International Group Inc | 69,966 | 0.17% | ||||||||
| Legalzoom.com Inc | 69,923 | 0.17% | ||||||||
| United Airlines Holdings Inc | 69,917 | 0.17% | ||||||||
| Fidelity National Financial Inc | 69,794 | 0.17% | ||||||||
| Ryerson Holding Corp | 69,716 | 0.17% | ||||||||
| Radian Group Inc | 69,679 | 0.17% | ||||||||
| CinCor Pharma Inc | 69,436 | 0.17% | ||||||||
| United States Lime & Minerals Inc | 69,352 | 0.17% | ||||||||
| Squarespace Inc | 69,281 | 0.17% | ||||||||
| Napco Security Technologies Inc | 69,254 | 0.17% | ||||||||
| RLI Corp | 69,118 | 0.17% | ||||||||
| Aflac Inc | 69,040 | 0.17% | ||||||||
| Mueller Industries Inc | 69,000 | 0.17% | ||||||||
| O-I Glass Inc | 68,979 | 0.17% | ||||||||
| Tiptree Inc | 68,728 | 0.17% | ||||||||
| Valhi Inc | 68,688 | 0.17% | ||||||||
| The Travelers Cos Inc | 68,672 | 0.17% | ||||||||
| Organogenesis Holdings Inc | 68,670 | 0.17% | ||||||||
| Ryan Specialty Holdings Inc | 68,630 | 0.17% | ||||||||
| Molina Healthcare Inc | 68,615 | 0.17% | ||||||||
| Waters Corp | 68,479 | 0.17% | ||||||||
| The Chemours Co | 68,386 | 0.17% | ||||||||
| Emergent BioSolutions Inc | 68,337 | 0.17% | ||||||||
| VeriSign Inc | 68,297 | 0.17% | ||||||||
| Reinsurance Group of America Inc | 68,284 | 0.17% | ||||||||
| Commercial Metals Co | 68,239 | 0.17% | ||||||||
| Horace Mann Educators Corp | 68,183 | 0.17% | ||||||||
| Essent Group Ltd | 68,178 | 0.17% | ||||||||
| UserTesting Inc | 68,094 | 0.17% | ||||||||
| Silvercrest Asset Management Group Inc | 68,081 | 0.17% | ||||||||
| The RMR Group Inc | 68,050 | 0.17% | ||||||||
| Elevance Health Inc | 68,026 | 0.17% | ||||||||
| A-Mark Precious Metals Inc | 67,917 | 0.17% | ||||||||
| Cardiovascular Systems Inc | 67,891 | 0.17% | ||||||||
| Cboe Global Markets Inc | 67,876 | 0.17% | ||||||||
| eGain Corp | 67,863 | 0.17% | ||||||||
| Innovage Holding Corp | 67,830 | 0.17% | ||||||||
| MGIC Investment Corp | 67,806 | 0.17% | ||||||||
| Pactiv Evergreen Inc | 67,794 | 0.17% | ||||||||
| Enact Holdings Inc | 67,656 | 0.17% | ||||||||
| Cirrus Logic Inc | 67,541 | 0.16% | ||||||||
| Rogers Corp | 67,538 | 0.16% | ||||||||
| MacroGenics Inc | 67,524 | 0.16% | ||||||||
The accompanying notes are an integral part of the consolidated financial statements.
45
| THE ADVISORS’ INNER CIRCLE FUND III | FS MULTI-STRATEGY | |||
| ALTERNATIVES FUND | ||||
| DECEMBER 31, 2022 |
| |||
| Top Underlying Components | Notional | Percentage of Notional | ||||||||
| HealthStream Inc | $67,454 | 0.16% | ||||||||
| Evo Payments Inc | 67,366 | 0.16% | ||||||||
| Hims & Hers Health Inc | 67,335 | 0.16% | ||||||||
| McKesson Corp | 67,331 | 0.16% | ||||||||
| Silk Road Medical Inc | 67,310 | 0.16% | ||||||||
| Douglas Elliman Inc | 67,274 | 0.16% | ||||||||
| Bunge Ltd | 67,257 | 0.16% | ||||||||
| Navient Corp | 67,256 | 0.16% | ||||||||
| Enfusion Inc | 67,187 | 0.16% | ||||||||
| DocGo Inc | 67,157 | 0.16% | ||||||||
| Workiva Inc | 67,083 | 0.16% | ||||||||
| Constellium SE | 66,949 | 0.16% | ||||||||
| Olympic Steel Inc | 66,913 | 0.16% | ||||||||
| Concrete Pumping Holdings Inc | 66,878 | 0.16% | ||||||||
| Myers Industries Inc | 66,873 | 0.16% | ||||||||
| Chart Industries Inc | 66,785 | 0.16% | ||||||||
| Natera Inc | 66,665 | 0.16% | ||||||||
| Investors Title Co | 66,576 | 0.16% | ||||||||
| Treace Medical Concepts Inc | 66,542 | 0.16% | ||||||||
| Reliance Steel & Aluminum Co | 66,526 | 0.16% | ||||||||
| Vector Group Ltd | 66,506 | 0.16% | ||||||||
| Unum Group | 66,444 | 0.16% | ||||||||
| JetBlue Airways Corp | 66,430 | 0.16% | ||||||||
| Jones Lang LaSalle Inc | 66,335 | 0.16% | ||||||||
| Cohen & Steers Inc | 66,321 | 0.16% | ||||||||
| Ecovyst Inc | 66,319 | 0.16% | ||||||||
| Patrick Industries Inc | 66,246 | 0.16% | ||||||||
| American Software Inc | 66,239 | 0.16% | ||||||||
| Westlake Corp | 66,128 | 0.16% | ||||||||
| Capital One Financial Corp | 66,062 | 0.16% | ||||||||
| Marsh & McLennan Cos Inc | 66,058 | 0.16% | ||||||||
| OraSure Technologies Inc | 66,012 | 0.16% | ||||||||
| Cardinal Health Inc | 65,994 | 0.16% | ||||||||
| CompoSecure Inc | 65,978 | 0.16% | ||||||||
| Privia Health Group Inc | 65,924 | 0.16% | ||||||||
| iRadimed Corp | 65,874 | 0.16% | ||||||||
| Insight Enterprises Inc | 65,847 | 0.16% | ||||||||
| Arrow Electronics Inc | 65,840 | 0.16% | ||||||||
| Jackson Financial Inc | 65,775 | 0.16% | ||||||||
| Semtech Corp | 65,654 | 0.16% | ||||||||
| National Research Corp | 65,619 | 0.16% | ||||||||
| Viad Corp | 65,607 | 0.16% | ||||||||
| Olin Corp | 65,566 | 0.16% | ||||||||
| Open Lending Corp | 65,539 | 0.16% | ||||||||
| Lazard Ltd | 65,494 | 0.16% | ||||||||
| Ameriprise Financial Inc | 65,468 | 0.16% | ||||||||
| Aveanna Healthcare Holdings Inc | 65,459 | 0.16% | ||||||||
| NEurocrine Biosciences Inc | 65,401 | 0.16% | ||||||||
| Sealed Air Corp | 65,309 | 0.16% | ||||||||
| Sotera Health Co | 65,209 | 0.16% | ||||||||
| Inspired Entertainment Inc | 65,200 | 0.16% | ||||||||
| Westrock Co | 65,082 | 0.16% | ||||||||
| Ionis Pharmaceuticals Inc | 65,045 | 0.16% | ||||||||
| Humana Inc | 65,044 | 0.16% | ||||||||
The accompanying notes are an integral part of the consolidated financial statements.
46
| THE ADVISORS’ INNER CIRCLE FUND III | FS MULTI-STRATEGY | |||
| ALTERNATIVES FUND | ||||
| DECEMBER 31, 2022 |
| |||
| Top Underlying Components | Notional | Percentage of Notional | ||||||||
| Village Super Market Inc | $65,016 | 0.16% | ||||||||
| Ally Financial Inc | 64,985 | 0.16% | ||||||||
| United States Steel Corp | 64,905 | 0.16% | ||||||||
| Mastercard Inc | 64,886 | 0.16% | ||||||||
| Movado Group Inc | 64,830 | 0.16% | ||||||||
| Fair Isaac Corp | 64,728 | 0.16% | ||||||||
| Archer-Daniels-Midland Co | 64,722 | 0.16% | ||||||||
| Virtu Financial Inc | 64,700 | 0.16% | ||||||||
| Value Line Inc | 64,634 | 0.16% | ||||||||
| Synchrony Financial | 64,625 | 0.16% | ||||||||
| Coca-Cola Consolidated Inc | 64,467 | 0.16% | ||||||||
| Marine Products Corp | 64,456 | 0.16% | ||||||||
| Dropbox Inc | 64,451 | 0.16% | ||||||||
| Colgate-PalmoLive Co | 64,434 | 0.16% | ||||||||
| Cisco Systems Inc | 64,402 | 0.16% | ||||||||
| StoneX Group Inc | 64,277 | 0.16% | ||||||||
| Marcus & Millichap Inc | 64,153 | 0.16% | ||||||||
| Prudential Financial Inc | 64,124 | 0.16% | ||||||||
| Exelixis Inc | 64,046 | 0.16% | ||||||||
| Allegro MicroSystems Inc | 64,030 | 0.16% | ||||||||
| Target Hospitality Corp | 63,987 | 0.16% | ||||||||
| Nu Skin Enterprises Inc | 63,881 | 0.16% | ||||||||
| Jabil Inc | 63,845 | 0.16% | ||||||||
| Interactive Brokers Group Inc | 63,814 | 0.16% | ||||||||
| Lumentum Holdings Inc | 63,730 | 0.16% | ||||||||
| Computer Programs and Systems Inc | 63,724 | 0.16% | ||||||||
| LPL Financial Holdings Inc | 63,668 | 0.16% | ||||||||
| Keysight Technologies Inc | 63,666 | 0.16% | ||||||||
| Castle Biosciences Inc | 63,576 | 0.16% | ||||||||
| Vishay Precision Group Inc | 63,538 | 0.16% | ||||||||
| NextGen Healthcare Inc | 63,487 | 0.15% | ||||||||
| IBEX Holdings Ltd | 63,410 | 0.15% | ||||||||
| Ultra CLean Holdings Inc | 63,382 | 0.15% | ||||||||
| Viavi Solutions Inc | 63,331 | 0.15% | ||||||||
| Teradyne Inc | 63,330 | 0.15% | ||||||||
| FormFactor Inc | 63,314 | 0.15% | ||||||||
| Alignment Healthcare Inc | 63,300 | 0.15% | ||||||||
| Harmony Biosciences Holdings Inc | 63,260 | 0.15% | ||||||||
| TTM Technologies Inc | 63,245 | 0.15% | ||||||||
| Veeco Instruments Inc | 63,239 | 0.15% | ||||||||
| Principal Financial Group Inc | 63,203 | 0.15% | ||||||||
| Albertsons Cos Inc | 63,196 | 0.15% | ||||||||
| CommVault Systems Inc | 63,091 | 0.15% | ||||||||
| Jefferies Financial Group Inc | 63,075 | 0.15% | ||||||||
| Cadre Holdings Inc | 63,003 | 0.15% | ||||||||
| Vishay Intertechnology Inc | 62,900 | 0.15% | ||||||||
| Arlo Technologies Inc | 62,887 | 0.15% | ||||||||
| Brightcove Inc | 62,860 | 0.15% | ||||||||
| Rambus Inc | 62,738 | 0.15% | ||||||||
| Curo Group Holdings Corp | 62,711 | 0.15% | ||||||||
| F5 Inc | 62,635 | 0.15% | ||||||||
| Silvergate Capital Corp | 62,577 | 0.15% | ||||||||
| Axogen Inc | 62,487 | 0.15% | ||||||||
| Steel Dynamics Inc | 62,483 | 0.15% | ||||||||
The accompanying notes are an integral part of the consolidated financial statements.
47
| THE ADVISORS’ INNER CIRCLE FUND III | FS MULTI-STRATEGY | |||
| ALTERNATIVES FUND | ||||
| DECEMBER 31, 2022 |
| |||
| Top Underlying Components | Notional | Percentage of Notional | ||||||||
| Texas Instruments Inc | $62,482 | 0.15% | ||||||||
| Kiniksa Pharmaceuticals Ltd | 62,397 | 0.15% | ||||||||
| The Mosaic Co | 62,332 | 0.15% | ||||||||
| Kulicke & Soffa Industries Inc | 62,237 | 0.15% | ||||||||
| Bird Global Inc | 62,151 | 0.15% | ||||||||
| RingCentral Inc | 62,132 | 0.15% | ||||||||
| NVR Inc | 62,131 | 0.15% | ||||||||
| Warrior Met Coal Inc | 62,101 | 0.15% | ||||||||
| MasterCraft Boat Holdings Inc | 61,991 | 0.15% | ||||||||
| Winmark Corp | 61,903 | 0.15% | ||||||||
| Qualys Inc | 61,878 | 0.15% | ||||||||
| John B Sanfilippo & Son Inc | 61,865 | 0.15% | ||||||||
| WW International Inc | 61,859 | 0.15% | ||||||||
| Schnitzer Steel Industries Inc | 61,848 | 0.15% | ||||||||
| Foghorn Therapeutics Inc | 61,786 | 0.15% | ||||||||
| Rush Street Interactive Inc | 61,765 | 0.15% | ||||||||
| Nasdaq Inc | 61,744 | 0.15% | ||||||||
| Primo Water Corp | 61,742 | 0.15% | ||||||||
| Erie Indemnity Co | 61,652 | 0.15% | ||||||||
| Perdoceo Education Corp | 61,634 | 0.15% | ||||||||
| SIndex Flags Entertainment Corp | 61,631 | 0.15% | ||||||||
| Paychex Inc | 61,630 | 0.15% | ||||||||
| CTS Corp | 61,622 | 0.15% | ||||||||
| RE/MAX Holdings Inc | 61,621 | 0.15% | ||||||||
| Fresh Del Monte Produce Inc | 61,530 | 0.15% | ||||||||
| Brunswick Corporation of Delaware | 61,462 | 0.15% | ||||||||
| The Andersons Inc | 61,434 | 0.15% | ||||||||
| Nature’s Sunshine Products Inc | 61,417 | 0.15% | ||||||||
| Avis Budget Group Inc | 61,411 | 0.15% | ||||||||
| Whole Earth Brands Inc | 61,364 | 0.15% | ||||||||
| Paycom Software Inc | 61,343 | 0.15% | ||||||||
| Atlassian Corp | 61,316 | 0.15% | ||||||||
| Flowers Foods Inc | 61,283 | 0.15% | ||||||||
| Fortinet Inc | 61,272 | 0.15% | ||||||||
| Ingles Markets Inc | 61,186 | 0.15% | ||||||||
| Kronos Bio Inc | 61,134 | 0.15% | ||||||||
| Extreme Networks Inc | 61,113 | 0.15% | ||||||||
| Booking Holdings Inc | 61,017 | 0.15% | ||||||||
| Inari Medical Inc | 60,967 | 0.15% | ||||||||
| Ethan Allen Interiors Inc | 60,950 | 0.15% | ||||||||
| Skyline Champion Corp | 60,918 | 0.15% | ||||||||
| Medifast Inc | 60,877 | 0.15% | ||||||||
| Alpha Metallurgical Resources Inc | 60,836 | 0.15% | ||||||||
| The Home Depot Inc | 60,807 | 0.15% | ||||||||
| MarketWise Inc | 60,745 | 0.15% | ||||||||
| Avid Technology Inc | 60,724 | 0.15% | ||||||||
| Photronics Inc | 60,501 | 0.15% | ||||||||
| Biglari Holdings Inc | 60,450 | 0.15% | ||||||||
| Rent-A-Center Inc | 60,281 | 0.15% | ||||||||
| Tyson Foods Inc | 60,277 | 0.15% | ||||||||
| Post Holdings Inc | 60,261 | 0.15% | ||||||||
| GreenLight Biosciences Holdings PBC | 60,246 | 0.15% | ||||||||
| Seaboard Corp | 60,100 | 0.15% | ||||||||
| SomaLogic Inc | 60,098 | 0.15% | ||||||||
The accompanying notes are an integral part of the consolidated financial statements.
48
| THE ADVISORS’ INNER CIRCLE FUND III | FS MULTI-STRATEGY | |||
| ALTERNATIVES FUND | ||||
| DECEMBER 31, 2022 |
| |||
| Top Underlying Components | Notional | Percentage of Notional | ||||||||
| The Aaron’s Company Inc | $60,027 | 0.15% | ||||||||
| CareDx Inc | 59,929 | 0.15% | ||||||||
| Belden Inc | 59,890 | 0.15% | ||||||||
| Nucor Corp | 59,888 | 0.15% | ||||||||
| Catalent Inc | 59,815 | 0.15% | ||||||||
| Digi International Inc | 59,793 | 0.15% | ||||||||
| Sonic Automotive Inc | 59,792 | 0.15% | ||||||||
| Century Casinos Inc | 59,742 | 0.15% | ||||||||
| MarineMax Inc | 59,681 | 0.15% | ||||||||
| Bluerock Homes Trust Inc | 59,678 | 0.15% | ||||||||
| James River Group Holdings Ltd | 59,567 | 0.15% | ||||||||
| BorgWarner Inc | 59,547 | 0.15% | ||||||||
| Cavco Industries Inc | 59,524 | 0.15% | ||||||||
| Inogen Inc | 59,504 | 0.15% | ||||||||
| Automatic Data Processing Inc | 59,460 | 0.15% | ||||||||
| Haverty Furniture Cos Inc | 59,444 | 0.15% | ||||||||
| SMART Global Holdings Inc | 59,438 | 0.15% | ||||||||
| EverQuote Inc | 59,409 | 0.14% | ||||||||
| Paylocity Holding Corp | 59,407 | 0.14% | ||||||||
| Molson Coors Beverage Co | 59,268 | 0.14% | ||||||||
| Adaptive Biotechnologies Corp | 59,207 | 0.14% | ||||||||
| PROG Holdings Inc | 59,101 | 0.14% | ||||||||
| Modine Manufacturing Co | 59,095 | 0.14% | ||||||||
| Apple Inc | 59,060 | 0.14% | ||||||||
| SIGA Technologies Inc | 59,013 | 0.14% | ||||||||
| The Hackett Group Inc | 58,966 | 0.14% | ||||||||
| Verra Mobility Corp | 58,959 | 0.14% | ||||||||
| Fossil Group Inc | 58,905 | 0.14% | ||||||||
| eXp World Holdings Inc | 58,898 | 0.14% | ||||||||
| Adeia Inc | 58,866 | 0.14% | ||||||||
| Aurinia Pharmaceuticals Inc | 58,817 | 0.14% | ||||||||
| Beazer Homes USA Inc | 58,724 | 0.14% | ||||||||
| Cal-Maine Foods Inc | 58,708 | 0.14% | ||||||||
| Arcutis Biotherapeutics Inc | 58,690 | 0.14% | ||||||||
| A10 Networks Inc | 58,683 | 0.14% | ||||||||
| iRhythm Technologies Inc | 58,649 | 0.14% | ||||||||
| Monarch Casino & Resort Inc | 58,437 | 0.14% | ||||||||
| Identiv Inc | 58,396 | 0.14% | ||||||||
| Pilgrim’s Pride Corp | 58,189 | 0.14% | ||||||||
| La-Z-Boy Inc | 58,171 | 0.14% | ||||||||
| Dynavax Technologies Corp | 58,082 | 0.14% | ||||||||
| Adient PLC | 58,054 | 0.14% | ||||||||
| Amkor Technology Inc | 57,934 | 0.14% | ||||||||
| Paycor HCM Inc | 57,727 | 0.14% | ||||||||
| ACM Research Inc | 57,621 | 0.14% | ||||||||
| Malibu Boats Inc | 57,618 | 0.14% | ||||||||
| Steven Madden Ltd | 57,575 | 0.14% | ||||||||
| CommScope Holding Co Inc | 57,555 | 0.14% | ||||||||
| PC Connection Inc | 57,554 | 0.14% | ||||||||
| Anywhere Real Estate Inc | 57,463 | 0.14% | ||||||||
| ChimerIndex Inc | 57,401 | 0.14% | ||||||||
| NutanIndex Inc | 57,328 | 0.14% | ||||||||
| Domino’s Pizza Inc | 57,143 | 0.14% | ||||||||
| Dillard’s Inc | 57,135 | 0.14% | ||||||||
The accompanying notes are an integral part of the consolidated financial statements.
49
| THE ADVISORS’ INNER CIRCLE FUND III | FS MULTI-STRATEGY | |||
| ALTERNATIVES FUND | ||||
| DECEMBER 31, 2022 |
| |||
| Top Underlying Components | Notional | Percentage of Notional | ||||||||
| Shockwave Medical Inc | $57,132 | 0.14% | ||||||||
| Inotiv Inc | 57,074 | 0.14% | ||||||||
| Seer Inc | 57,044 | 0.14% | ||||||||
| The Goodyear Tire & Rubber Company | 56,968 | 0.14% | ||||||||
| Amneal Pharmaceuticals Inc | 56,863 | 0.14% | ||||||||
| MiMedx Group Inc | 56,775 | 0.14% | ||||||||
| Marriott International Inc | 56,760 | 0.14% | ||||||||
| Standard Motor Products Inc | 56,691 | 0.14% | ||||||||
| TravelCenters of America Inc | 56,595 | 0.14% | ||||||||
| Corcept Therapeutics Inc | 56,455 | 0.14% | ||||||||
| American Public Education Inc | 56,314 | 0.14% | ||||||||
| Tupperware Brands Corp | 56,096 | 0.14% | ||||||||
| EZCORP Inc | 55,634 | 0.14% | ||||||||
| YETI Holdings Inc | 55,509 | 0.14% | ||||||||
| Adtalem Global Education Inc | 55,442 | 0.14% | ||||||||
| Vacasa Inc | 55,249 | 0.13% | ||||||||
| Winnebago Industries Inc | 55,192 | 0.13% | ||||||||
| Harley-Davidson Inc | 55,125 | 0.13% | ||||||||
| Green Dot Corp | 54,532 | 0.13% | ||||||||
| Palo Alto Networks Inc | 54,289 | 0.13% | ||||||||
| Vivid Seats Inc | 54,228 | 0.13% | ||||||||
| Etsy Inc | 53,834 | 0.13% | ||||||||
| Herbalife Nutrition Ltd | 53,772 | 0.13% | ||||||||
| Hovnanian Enterprises Inc | 53,601 | 0.13% | ||||||||
| Penn Entertainment Inc | 53,534 | 0.13% | ||||||||
| Airbnb Inc | 53,452 | 0.13% | ||||||||
| Allbirds Inc | 53,427 | 0.13% | ||||||||
| Expedia Group Inc | 53,343 | 0.13% | ||||||||
| Wingstop Inc | 53,304 | 0.13% | ||||||||
| General Motors Co | 53,235 | 0.13% | ||||||||
| STAAR Surgical Co | 53,229 | 0.13% | ||||||||
| Sleep Number Corp | 53,174 | 0.13% | ||||||||
| Thor Industries Inc | 52,704 | 0.13% | ||||||||
| Relmada Therapeutics Inc | 52,681 | 0.13% | ||||||||
| Paysafe Ltd | 51,846 | 0.13% | ||||||||
| Caesars Entertainment Inc | 51,123 | 0.12% | ||||||||
| Oxford Industries Inc | 50,896 | 0.12% | ||||||||
| Multiplan Corp | 50,861 | 0.12% | ||||||||
| Camping World Holdings Inc | 50,841 | 0.12% | ||||||||
| Kohl’s Corp | 50,581 | 0.12% | ||||||||
| Cross Country Healthcare Inc | 50,353 | 0.12% | ||||||||
| Bally’s Corp | 49,683 | 0.12% | ||||||||
| Edgio Inc | 49,622 | 0.12% | ||||||||
| 908 Devices Inc | 49,370 | 0.12% | ||||||||
| Revolve Group Inc | 48,990 | 0.12% | ||||||||
| Talaris Therapeutics Inc | 48,845 | 0.12% | ||||||||
| American Axle & Manufacturing Holdings Inc | 48,361 | 0.12% | ||||||||
| IDT Corp | 48,170 | 0.12% | ||||||||
| The Beachbody Co Inc | 47,447 | 0.12% | ||||||||
| Vanda Pharmaceuticals Inc | 47,033 | 0.11% | ||||||||
| The RealReal Inc | 46,156 | 0.11% | ||||||||
| Thryv Holdings Inc | 46,069 | 0.11% | ||||||||
| Warby Parker Inc | 45,918 | 0.11% | ||||||||
| ZipRecruiter Inc | 45,808 | 0.11% | ||||||||
The accompanying notes are an integral part of the consolidated financial statements.
50
| THE ADVISORS’ INNER CIRCLE FUND III | FS MULTI-STRATEGY | |||
| ALTERNATIVES FUND | ||||
| DECEMBER 31, 2022 |
| |||
| Top Underlying Components | Notional | Percentage of Notional | ||||||||
| Invivyd Inc | $44,894 | 0.11% | ||||||||
| TechTarget Inc | 44,058 | 0.11% | ||||||||
| Live Nation Entertainment Inc | 43,349 | 0.11% | ||||||||
| Lulu’s Fashion Lounge Holdings Inc | 43,302 | 0.11% | ||||||||
| Novavax Inc | 43,208 | 0.11% | ||||||||
| Tricida Inc | 43,123 | 0.11% | ||||||||
| Playstudios Inc | 43,062 | 0.11% | ||||||||
| Gogo Inc | 42,734 | 0.10% | ||||||||
| Gambling.com Group Ltd | 42,169 | 0.10% | ||||||||
| Gelesis Holdings Inc | 42,009 | 0.10% | ||||||||
| Yelp Inc | 41,555 | 0.10% | ||||||||
| TrueCar Inc | 41,485 | 0.10% | ||||||||
| aka Brands Holding Corp | 41,335 | 0.10% | ||||||||
| Playtika Holding Corp | 41,202 | 0.10% | ||||||||
| Affimed NV | 41,197 | 0.10% | ||||||||
| Ooma Inc | 41,144 | 0.10% | ||||||||
| Tesla Inc | 39,915 | 0.10% | ||||||||
| Sinclair Broadcast Group Inc | 39,070 | 0.10% | ||||||||
| Stagwell Inc | 38,095 | 0.09% | ||||||||
| Leafly Holdings Inc | 37,915 | 0.09% | ||||||||
| The Trade Desk Inc | 37,802 | 0.09% | ||||||||
| PubMatic Inc | 37,158 | 0.09% | ||||||||
| Gannett Co Inc | 36,152 | 0.09% | ||||||||
| iHeartMedia Inc | 36,110 | 0.09% | ||||||||
| Core Scientific Inc | 36,041 | 0.09% | ||||||||
| IronNet Inc | 35,854 | 0.09% | ||||||||
| Instil Bio Inc | 34,996 | 0.09% | ||||||||
| Lions Gate Entertainment Corp | 33,722 | 0.08% | ||||||||
| Globalstar Inc | 32,679 | 0.08% | ||||||||
| Innovid Corp | 26,816 | 0.07% | ||||||||
| Skillz Inc | 23,706 | 0.06% | ||||||||
| Avaya Holdings Corp | 10,535 | 0.03% | ||||||||
REIT | Braemar Hotels & Resorts Inc | 77,116 | 0.19% | |||||||
| Weyerhaeuser Co | 66,382 | 0.16% | ||||||||
| Two Harbors Investment Corp | 66,032 | 0.16% | ||||||||
| Lamar Advertising Co | 66,011 | 0.16% | ||||||||
| iStar Inc | 65,883 | 0.16% | ||||||||
| Public Storage | 65,760 | 0.16% | ||||||||
| Equity Commonwealth | 64,974 | 0.16% | ||||||||
| Extra Space Storage Inc | 64,263 | 0.16% | ||||||||
| Ryman Hospitality Properties Inc | 63,055 | 0.15% | ||||||||
| Hersha Hospitality Trust | 62,459 | 0.15% | ||||||||
| Office Properties Income Trust | 62,453 | 0.15% | ||||||||
| Broadmark Realty Capital Inc | 62,254 | 0.15% | ||||||||
| BrightSpire Capital Inc | 61,875 | 0.15% | ||||||||
| Starwood Property Trust Inc | 60,568 | 0.15% | ||||||||
| Redwood Trust Inc | 59,556 | 0.15% | ||||||||
| Granite Point Mortgage Trust Inc | 56,638 | 0.14% | ||||||||
| Ashford Hospitality Trust Inc | 48,187 | 0.12% | ||||||||
**BNPUMFRS Index: An alpha oriented strategy using a propriety model to take short positions based on value, quality, and momemtum factors.
The accompanying notes are an integral part of the consolidated financial statements.
51
| THE ADVISORS’ INNER CIRCLE FUND III | FS MULTI-STRATEGY | |||
| ALTERNATIVES FUND | ||||
| DECEMBER 31, 2022 |
| |||
| Top Underlying Components | Notional | Percentage of Notional | ||||||||
Common Stock | Phreesia Inc | $(94,217) | 0.23% | |||||||
| ICF International Inc | (94,217) | 0.23% | ||||||||
| Alcoa Corp | (89,489) | 0.22% | ||||||||
| PAR Technology Corp | (89,489) | 0.22% | ||||||||
| Diamond Offshore Drilling Inc | (132,164) | 0.33% | ||||||||
| Uranium Energy Corp | (131,398) | 0.32% | ||||||||
| Valaris Ltd | (128,989) | 0.32% | ||||||||
| Noble Corp PLC | (126,587) | 0.31% | ||||||||
| Kinetik Holdings Inc | (124,697) | 0.31% | ||||||||
| CNX Resources Corp | (124,398) | 0.31% | ||||||||
| Expro Group Holdings NV | (123,525) | 0.30% | ||||||||
| Targa Resources Corp | (123,479) | 0.30% | ||||||||
| Helmerich & Payne Inc | (123,454) | 0.30% | ||||||||
| NextDecade Corp | (120,002) | 0.30% | ||||||||
| Permian Resources Corp | (119,336) | 0.29% | ||||||||
| Willdan Group Inc | (119,218) | 0.29% | ||||||||
| NOV Inc | (117,019) | 0.29% | ||||||||
| FTC Solar Inc | (116,126) | 0.29% | ||||||||
| Energy Fuels Inc | (115,869) | 0.29% | ||||||||
| CMS Energy Corp | (115,801) | 0.29% | ||||||||
| Ur-Energy Inc | (115,290) | 0.28% | ||||||||
| South Jersey Industries Inc | (115,269) | 0.28% | ||||||||
| Alta Equipment Group Inc | (114,119) | 0.28% | ||||||||
| Solaris Oilfield Infrastructure Inc | (113,412) | 0.28% | ||||||||
| Northwest Natural Holding Co | (112,820) | 0.28% | ||||||||
| Enviva Inc | (112,739) | 0.28% | ||||||||
| TG Therapeutics Inc | (112,717) | 0.28% | ||||||||
| Pure Cycle Corp | (112,161) | 0.28% | ||||||||
| Gevo Inc | (112,152) | 0.28% | ||||||||
| FirstEnergy Corp | (111,782) | 0.28% | ||||||||
| Markforged Holding Corp | (111,494) | 0.27% | ||||||||
| Golden Ocean Group Ltd | (111,366) | 0.27% | ||||||||
| Spire Inc | (110,855) | 0.27% | ||||||||
| The Boeing Co | (110,132) | 0.27% | ||||||||
| NiSource Inc | (110,060) | 0.27% | ||||||||
| Green Plains Inc | (109,889) | 0.27% | ||||||||
| Essential Utilities Inc | (109,311) | 0.27% | ||||||||
| Coupa Software Inc | (108,798) | 0.27% | ||||||||
| Cheniere Energy Inc | (108,417) | 0.27% | ||||||||
| Distribution Solutions Group Inc | (107,714) | 0.27% | ||||||||
| Heritage-Crystal CLean Inc | (107,615) | 0.27% | ||||||||
| Science Applications International Corp | (107,343) | 0.26% | ||||||||
| The AZEK Co Inc | (106,619) | 0.26% | ||||||||
| Atmos Energy Corp | (106,418) | 0.26% | ||||||||
| Atlas Air Worldwide Holdings Inc | (106,360) | 0.26% | ||||||||
| Herc Holdings Inc | (105,518) | 0.26% | ||||||||
| Alto Ingredients Inc | (105,144) | 0.26% | ||||||||
| Griffon Corp | (104,994) | 0.26% | ||||||||
| Lyft Inc | (104,965) | 0.26% | ||||||||
| Hayward Holdings Inc | (104,614) | 0.26% | ||||||||
| KBR Inc | (104,578) | 0.26% | ||||||||
| Air Lease Corp | (103,941) | 0.26% | ||||||||
| John Bean Technologies Corp | (103,761) | 0.26% | ||||||||
| Constellation Energy Corp | (103,653) | 0.26% | ||||||||
The accompanying notes are an integral part of the consolidated financial statements.
52
| THE ADVISORS’ INNER CIRCLE FUND III | FS MULTI-STRATEGY | |||
| ALTERNATIVES FUND | ||||
| DECEMBER 31, 2022 |
| |||
| Top Underlying Components | Notional | Percentage of Notional | ||||||||
| TFS Financial Corp | $(103,480) | 0.26% | ||||||||
| Parker-Hannifin Corp | (103,458) | 0.26% | ||||||||
| Nordic American Tankers Ltd | (103,076) | 0.25% | ||||||||
| Sempra Energy | (103,066) | 0.25% | ||||||||
| PureCycle Technologies Inc | (102,980) | 0.25% | ||||||||
| Fluor Corp | (102,762) | 0.25% | ||||||||
| Capitol Federal Financial Inc | (102,375) | 0.25% | ||||||||
| Equifax Inc | (102,041) | 0.25% | ||||||||
| Waterstone Financial Inc | (101,960) | 0.25% | ||||||||
| Pentair PLC | (101,942) | 0.25% | ||||||||
| Alteryx Inc | (101,627) | 0.25% | ||||||||
| CLean Energy Fuels Corp | (101,055) | 0.25% | ||||||||
| FedEx Corp | (100,942) | 0.25% | ||||||||
| Montrose Environmental Group Inc | (100,929) | 0.25% | ||||||||
| Akero Therapeutics Inc | (100,728) | 0.25% | ||||||||
| Texas Capital Bancshares Inc | (100,574) | 0.25% | ||||||||
| The Bank of New York Mellon Corp | (100,552) | 0.25% | ||||||||
| Mativ Holdings Inc | (100,421) | 0.25% | ||||||||
| Blue Foundry Bancorp | (100,046) | 0.25% | ||||||||
| Columbia Financial Inc | (99,982) | 0.25% | ||||||||
| ACV Auctions Inc | (99,887) | 0.25% | ||||||||
| GATX Corp | (99,267) | 0.24% | ||||||||
| Shift4 Payments Inc | (99,213) | 0.24% | ||||||||
| First Horizon Corp | (99,161) | 0.24% | ||||||||
| JPMorgan Chase & Co | (99,107) | 0.24% | ||||||||
| Northeast Bank | (98,741) | 0.24% | ||||||||
| BOK Financial Corp | (98,485) | 0.24% | ||||||||
| SiteOne Landscape Supply Inc | (98,365) | 0.24% | ||||||||
| Royal Gold Inc | (98,304) | 0.24% | ||||||||
| TriMas Corp | (98,216) | 0.24% | ||||||||
| UMB Financial Corp | (97,932) | 0.24% | ||||||||
| CoStar Group Inc | (97,898) | 0.24% | ||||||||
| International Money Express Inc | (97,823) | 0.24% | ||||||||
| Knight-Swift Transportation Holdings Inc | (97,693) | 0.24% | ||||||||
| Metrocity Bankshares Inc | (97,677) | 0.24% | ||||||||
| Outset Medical Inc | (97,538) | 0.24% | ||||||||
| Marten Transport Ltd | (97,314) | 0.24% | ||||||||
| Custom Truck One Source Inc | (97,263) | 0.24% | ||||||||
| Nicolet Bankshares Inc | (97,233) | 0.24% | ||||||||
| Allegion plc | (97,178) | 0.24% | ||||||||
| Heartland Express Inc | (97,059) | 0.24% | ||||||||
| Crown Holdings Inc | (96,955) | 0.24% | ||||||||
| Spirit Airlines Inc | (96,738) | 0.24% | ||||||||
| GXO Logistics Inc | (96,504) | 0.24% | ||||||||
| Community Bank System Inc | (96,443) | 0.24% | ||||||||
| Northern Trust Corp | (96,435) | 0.24% | ||||||||
| Hecla Mining Co | (96,398) | 0.24% | ||||||||
| Carriage Services Inc | (96,335) | 0.24% | ||||||||
| Commerce Bancshares Inc | (96,256) | 0.24% | ||||||||
| Tucows Inc | (96,218) | 0.24% | ||||||||
| Air Products and Chemicals Inc | (96,001) | 0.24% | ||||||||
| Werner Enterprises Inc | (95,977) | 0.24% | ||||||||
| Primis Financial Corp | (95,846) | 0.24% | ||||||||
| Coeur Mining Inc | (95,752) | 0.24% | ||||||||
The accompanying notes are an integral part of the consolidated financial statements.
53
| THE ADVISORS’ INNER CIRCLE FUND III | FS MULTI-STRATEGY | |||
| ALTERNATIVES FUND | ||||
| DECEMBER 31, 2022 |
| |||
| Top Underlying Components | Notional | Percentage of Notional | ||||||||
| Kirby Corp | $(95,703) | 0.24% | ||||||||
| Ambarella Inc | (95,678) | 0.24% | ||||||||
| Middlesex Water Co | (95,626) | 0.24% | ||||||||
| Hingham Institution For Savings The | (95,525) | 0.24% | ||||||||
| Alpha Teknova Inc | (95,401) | 0.24% | ||||||||
| The Bancorp Inc | (95,290) | 0.24% | ||||||||
| Bank First Corp | (95,271) | 0.23% | ||||||||
| Park National Corp | (95,035) | 0.23% | ||||||||
| Washington Trust Bancorp Inc | (94,882) | 0.23% | ||||||||
| F45 Training Holdings Inc | (94,445) | 0.23% | ||||||||
| Korn Ferry | (94,273) | 0.23% | ||||||||
| Vulcan Materials Co | (94,129) | 0.23% | ||||||||
| Helen of Troy Ltd | (94,003) | 0.23% | ||||||||
| Lakeland Financial Corp | (93,882) | 0.23% | ||||||||
| Cass Information Systems Inc | (93,762) | 0.23% | ||||||||
| Aris Water Solution Inc | (93,640) | 0.23% | ||||||||
| Tempur Sealy International Inc | (93,621) | 0.23% | ||||||||
| Okta Inc | (93,310) | 0.23% | ||||||||
| Saia Inc | (93,256) | 0.23% | ||||||||
| Tompkins Financial Corp | (93,042) | 0.23% | ||||||||
| Citizens & Northern Corp | (93,014) | 0.23% | ||||||||
| Chinook Therapeutics Inc | (92,924) | 0.23% | ||||||||
| The First Bancshares Inc | (92,627) | 0.23% | ||||||||
| Transcat Inc | (92,413) | 0.23% | ||||||||
| First Financial Bankshares Inc | (92,247) | 0.23% | ||||||||
| MVB Financial Corp | (92,148) | 0.23% | ||||||||
| Bloom Energy Corp | (91,970) | 0.23% | ||||||||
| NanoString Technologies Inc | (91,859) | 0.23% | ||||||||
| Bank of America Corp | (91,695) | 0.23% | ||||||||
| City Holding Co | (91,676) | 0.23% | ||||||||
| Martin Marietta Materials Inc | (91,644) | 0.23% | ||||||||
| Coastal Financial Corp | (91,389) | 0.23% | ||||||||
| Blue Bird Corp | (91,317) | 0.23% | ||||||||
| Universal Health Services Inc | (91,015) | 0.22% | ||||||||
| Uber Technologies Inc | (90,943) | 0.22% | ||||||||
| Ball Corp | (90,874) | 0.22% | ||||||||
| Origin Bancorp Inc | (90,831) | 0.22% | ||||||||
| 1-800-Flowers.com Inc | (90,515) | 0.22% | ||||||||
| Aspen Aerogels Inc | (90,288) | 0.22% | ||||||||
| Aemetis Inc | (90,130) | 0.22% | ||||||||
| Fulcrum Therapeutics Inc | (90,122) | 0.22% | ||||||||
| Amerant Bancorp Inc | (90,059) | 0.22% | ||||||||
| Zurn Elkay Water Solutions Corp | (89,840) | 0.22% | ||||||||
| MKS Instruments Inc | (89,793) | 0.22% | ||||||||
| Harsco Corp | (89,626) | 0.22% | ||||||||
| First Interstate BancSystem Inc | (89,597) | 0.22% | ||||||||
| ServisFirst Bancshares Inc | (89,383) | 0.22% | ||||||||
| Ameresco Inc | (89,315) | 0.22% | ||||||||
| Exact Sciences Corp | (89,238) | 0.22% | ||||||||
| Vaxcyte Inc | (89,217) | 0.22% | ||||||||
| Upwork Inc | (89,159) | 0.22% | ||||||||
| Infinera Corp | (89,136) | 0.22% | ||||||||
| Toast Inc | (89,069) | 0.22% | ||||||||
| Blackline Inc | (88,845) | 0.22% | ||||||||
The accompanying notes are an integral part of the consolidated financial statements.
54
| THE ADVISORS’ INNER CIRCLE FUND III | FS MULTI-STRATEGY | |||
| ALTERNATIVES FUND | ||||
| DECEMBER 31, 2022 |
| |||
| Top Underlying Components | Notional | Percentage of Notional | ||||||||
| Five9 Inc | $(88,623) | 0.22% | ||||||||
| National Bank Holdings Corp | (88,602) | 0.22% | ||||||||
| Burlington Stores Inc | (88,600) | 0.22% | ||||||||
| Compass Minerals International Inc | (88,566) | 0.22% | ||||||||
| Sunnova Energy International Inc | (88,226) | 0.22% | ||||||||
| Bank OZK | (88,219) | 0.22% | ||||||||
| Live Oak Bancshares Inc | (88,181) | 0.22% | ||||||||
| Penumbra Inc | (88,162) | 0.22% | ||||||||
| Newell Brands Inc | (88,092) | 0.22% | ||||||||
| Veritex Holdings Inc | (88,066) | 0.22% | ||||||||
| Allegiant Travel Co | (87,770) | 0.22% | ||||||||
| SentinelOne Inc | (87,729) | 0.22% | ||||||||
| Stellar Bancorp Inc | (87,687) | 0.22% | ||||||||
| Mohawk Industries Inc | (87,597) | 0.22% | ||||||||
| Stock Yards Bancorp Inc | (87,537) | 0.22% | ||||||||
| Confluent Inc | (87,378) | 0.22% | ||||||||
| Southern Missouri Bancorp Inc | (87,365) | 0.22% | ||||||||
| Oracle Corp | (87,155) | 0.21% | ||||||||
| Destination XL Group Inc | (87,098) | 0.21% | ||||||||
| SmartRent Inc | (87,080) | 0.21% | ||||||||
| Apollo Medical Holdings Inc | (87,062) | 0.21% | ||||||||
| Great Lakes Dredge & Dock Corp | (87,009) | 0.21% | ||||||||
| The Bank of NT Butterfield & Son Ltd | (86,662) | 0.21% | ||||||||
| The Pennant Group Inc | (86,638) | 0.21% | ||||||||
| ChargePoint Holdings Inc | (86,561) | 0.21% | ||||||||
| HCI Group Inc | (86,545) | 0.21% | ||||||||
| BancFirst Corp | (86,305) | 0.21% | ||||||||
| The Duckhorn Portfolio Inc | (86,017) | 0.21% | ||||||||
| Balchem Corp | (85,837) | 0.21% | ||||||||
| Wolverine World Wide Inc | (85,836) | 0.21% | ||||||||
| Kimball Electronics Inc | (85,795) | 0.21% | ||||||||
| The Cooper Cos Inc | (85,725) | 0.21% | ||||||||
| Century Aluminum Co | (85,662) | 0.21% | ||||||||
| Carpenter Technology Corp | (85,494) | 0.21% | ||||||||
| Guess? Inc | (85,461) | 0.21% | ||||||||
| Comtech Telecommunications Corp | (85,424) | 0.21% | ||||||||
| Krystal Biotech Inc | (85,415) | 0.21% | ||||||||
| NRG Energy Inc | (85,364) | 0.21% | ||||||||
| Orrstown Financial Services Inc | (85,273) | 0.21% | ||||||||
| Snowflake Inc | (85,192) | 0.21% | ||||||||
| Service Corp International | (85,158) | 0.21% | ||||||||
| Theravance Biopharma Inc | (85,077) | 0.21% | ||||||||
| Masimo Corp | (84,967) | 0.21% | ||||||||
| Gartner Inc | (84,869) | 0.21% | ||||||||
| Blucora Inc | (84,823) | 0.21% | ||||||||
| America’s Car-Mart Inc | (84,753) | 0.21% | ||||||||
| Whirlpool Corp | (84,695) | 0.21% | ||||||||
| PVH Corp | (84,678) | 0.21% | ||||||||
| The Honest Co Inc | (84,667) | 0.21% | ||||||||
| GoDaddy Inc | (84,415) | 0.21% | ||||||||
| Aviat Networks Inc | (84,406) | 0.21% | ||||||||
| FB Financial Corp | (84,366) | 0.21% | ||||||||
| Glacier Bancorp Inc | (84,213) | 0.21% | ||||||||
| Tellurian Inc | (84,212) | 0.21% | ||||||||
The accompanying notes are an integral part of the consolidated financial statements.
55
| THE ADVISORS’ INNER CIRCLE FUND III | FS MULTI-STRATEGY | |||
| ALTERNATIVES FUND | ||||
| DECEMBER 31, 2022 |
| |||
| Top Underlying Components | Notional | Percentage of Notional | ||||||||
| Bath & Body Works Inc | $(84,054) | 0.21% | ||||||||
| Five Below Inc | (84,022) | 0.21% | ||||||||
| Kaiser Aluminum Corp | (83,897) | 0.21% | ||||||||
| HCA Healthcare Inc | (83,886) | 0.21% | ||||||||
| National Vision Holdings Inc | (83,872) | 0.21% | ||||||||
| The Ensign Group Inc | (83,853) | 0.21% | ||||||||
| CTI BioPharma Corp | (83,839) | 0.21% | ||||||||
| LHC Group Inc | (83,540) | 0.21% | ||||||||
| Associated Capital Group Inc | (83,459) | 0.21% | ||||||||
| Signify Health Inc | (83,415) | 0.21% | ||||||||
| Innoviva Inc | (83,372) | 0.21% | ||||||||
| Frontier Group Holdings Inc | (83,332) | 0.21% | ||||||||
| Select Medical Holdings Corp | (83,326) | 0.21% | ||||||||
| Cloudflare Inc | (83,065) | 0.20% | ||||||||
| Churchill Downs Inc | (83,047) | 0.20% | ||||||||
| Cowen Inc | (82,806) | 0.20% | ||||||||
| Hanesbrands Inc | (82,799) | 0.20% | ||||||||
| Plug Power Inc | (82,722) | 0.20% | ||||||||
| Boot Barn Holdings Inc | (82,685) | 0.20% | ||||||||
| 1Life Healthcare Inc | (82,621) | 0.20% | ||||||||
| OrthoPediatrics Corp | (82,460) | 0.20% | ||||||||
| Moderna Inc | (82,310) | 0.20% | ||||||||
| BellRing Brands Inc | (82,293) | 0.20% | ||||||||
| PeGasystems Inc | (82,287) | 0.20% | ||||||||
| Rocket Pharmaceuticals Inc | (82,258) | 0.20% | ||||||||
| Church & Dwight Co Inc | (82,160) | 0.20% | ||||||||
| CONMED Corp | (82,043) | 0.20% | ||||||||
| Block Inc | (81,911) | 0.20% | ||||||||
| Wheels Up Experience Inc | (81,879) | 0.20% | ||||||||
| Prestige Consumer Healthcare Inc | (81,873) | 0.20% | ||||||||
| 4D Molecular Therapeutics Inc | (81,865) | 0.20% | ||||||||
| Brightsphere Investment Group Inc | (81,809) | 0.20% | ||||||||
| Grid Dynamics Holdings Inc | (81,599) | 0.20% | ||||||||
| Perella Weinberg Partners | (81,598) | 0.20% | ||||||||
| ICU Medical Inc | (81,511) | 0.20% | ||||||||
| Sonos Inc | (81,460) | 0.20% | ||||||||
| Reata Pharmaceuticals Inc | (81,438) | 0.20% | ||||||||
| Purple Innovation Inc | (81,370) | 0.20% | ||||||||
| LGI Homes Inc | (81,353) | 0.20% | ||||||||
| Vail Resorts Inc | (81,292) | 0.20% | ||||||||
| Oak Street Health Inc | (81,183) | 0.20% | ||||||||
| SoFi Technologies Inc | (81,178) | 0.20% | ||||||||
| RenaissanceRe Holdings Ltd | (81,173) | 0.20% | ||||||||
| Impinj Inc | (81,122) | 0.20% | ||||||||
| Genuine Parts Co | (81,053) | 0.20% | ||||||||
| Repay Holdings Corp | (81,021) | 0.20% | ||||||||
| Stem Inc | (80,855) | 0.20% | ||||||||
| 8x8 Inc | (80,657) | 0.20% | ||||||||
| The Simply Good Foods Co | (80,397) | 0.20% | ||||||||
| Marqeta Inc | (80,326) | 0.20% | ||||||||
| FuelCell Energy Inc | (80,306) | 0.20% | ||||||||
| US Foods Holding Corp | (80,301) | 0.20% | ||||||||
| Triumph Financial Inc | (80,224) | 0.20% | ||||||||
| Amplitude Inc | (80,177) | 0.20% | ||||||||
The accompanying notes are an integral part of the consolidated financial statements.
56
| THE ADVISORS’ INNER CIRCLE FUND III | FS MULTI-STRATEGY | |||
| ALTERNATIVES FUND | ||||
| DECEMBER 31, 2022 |
| |||
| Top Underlying Components | Notional | Percentage of Notional | ||||||||
| OneSpaWorld Holdings Ltd | $(80,023) | 0.20% | ||||||||
| Gen Digital Inc | (80,022) | 0.20% | ||||||||
| Everbridge Inc | (80,001) | 0.20% | ||||||||
| Leggett & Platt Inc | (79,854) | 0.20% | ||||||||
| Enova International Inc | (79,830) | 0.20% | ||||||||
| Matterport Inc | (79,756) | 0.20% | ||||||||
| Blue Owl Capital Inc | (79,754) | 0.20% | ||||||||
| Focus Financial Partners Inc | (79,726) | 0.20% | ||||||||
| iRobot Corp | (79,627) | 0.20% | ||||||||
| Stride Inc | (79,527) | 0.20% | ||||||||
| Planet Labs PBC | (79,432) | 0.20% | ||||||||
| Dave & Buster’s Entertainment Inc | (79,377) | 0.20% | ||||||||
| Mister Car Wash Inc | (79,243) | 0.20% | ||||||||
| Brown & Brown Inc | (79,217) | 0.20% | ||||||||
| Western Digital Corp | (79,094) | 0.20% | ||||||||
| First Solar Inc | (79,088) | 0.20% | ||||||||
| Sunrun Inc | (78,991) | 0.19% | ||||||||
| WD-40 Co | (78,893) | 0.19% | ||||||||
| Voya Financial Inc | (78,852) | 0.19% | ||||||||
| Compass Diversified Holdings | (78,787) | 0.19% | ||||||||
| Velocity Financial Inc | (78,764) | 0.19% | ||||||||
| Reynolds Consumer Products Inc | (78,757) | 0.19% | ||||||||
| Amylyx Pharmaceuticals Inc | (78,704) | 0.19% | ||||||||
| Acadia Healthcare Co Inc | (78,668) | 0.19% | ||||||||
| Franchise Group Inc | (78,579) | 0.19% | ||||||||
| Azenta Inc | (78,378) | 0.19% | ||||||||
| Universal Insurance Holdings Inc | (78,186) | 0.19% | ||||||||
| Hilton Worldwide Holdings Inc | (78,169) | 0.19% | ||||||||
| Liquidity Services Inc | (78,148) | 0.19% | ||||||||
| 10X Genomics Inc | (78,136) | 0.19% | ||||||||
| Integer Holdings Corp | (78,128) | 0.19% | ||||||||
| REGENXBIO Inc | (78,118) | 0.19% | ||||||||
| Kontoor Brands Inc | (78,110) | 0.19% | ||||||||
| Morphic Holding Inc | (78,101) | 0.19% | ||||||||
| Mesa Laboratories Inc | (78,013) | 0.19% | ||||||||
| Designer Brands Inc | (77,995) | 0.19% | ||||||||
| Hippo Holdings Inc | (77,949) | 0.19% | ||||||||
| Universal Corp | (77,911) | 0.19% | ||||||||
| Enovis Corp | (77,871) | 0.19% | ||||||||
| SunPower Corp | (77,838) | 0.19% | ||||||||
| RadNet Inc | (77,816) | 0.19% | ||||||||
| National Beverage Corp | (77,750) | 0.19% | ||||||||
| UiPath Inc | (77,740) | 0.19% | ||||||||
| Intercontinental Exchange Inc | (77,718) | 0.19% | ||||||||
| IVERIC bio Inc | (77,581) | 0.19% | ||||||||
| Neogen Corp | (77,457) | 0.19% | ||||||||
| Prothena Corp PLC | (77,454) | 0.19% | ||||||||
| Biogen Inc | (77,416) | 0.19% | ||||||||
| Elanco Animal Health Inc | (77,357) | 0.19% | ||||||||
| Hilton Grand Vacations Inc | (77,350) | 0.19% | ||||||||
| Mercury General Corp | (77,273) | 0.19% | ||||||||
| Brighthouse Financial Inc | (77,108) | 0.19% | ||||||||
| Vintage Wine Estates Inc | (77,099) | 0.19% | ||||||||
| Macy’s Inc | (77,007) | 0.19% | ||||||||
The accompanying notes are an integral part of the consolidated financial statements.
57
| THE ADVISORS’ INNER CIRCLE FUND III | FS MULTI-STRATEGY | |||
| ALTERNATIVES FUND | ||||
| DECEMBER 31, 2022 |
| |||
| Top Underlying Components | Notional | Percentage of Notional | ||||||||
| Seneca Foods Corp | $(76,953) | 0.19% | ||||||||
| Entegris Inc | (76,891) | 0.19% | ||||||||
| Zentalis Pharmaceuticals Inc | (76,880) | 0.19% | ||||||||
| 3D Systems Corp | (76,854) | 0.19% | ||||||||
| Ligand Pharmaceuticals Inc | (76,822) | 0.19% | ||||||||
| Advanced Micro Devices Inc | (76,770) | 0.19% | ||||||||
| Gentherm Inc | (76,598) | 0.19% | ||||||||
| HF Foods Group Inc | (76,559) | 0.19% | ||||||||
| Walgreens Boots Alliance Inc | (76,258) | 0.19% | ||||||||
| World Acceptance Corp | (75,745) | 0.19% | ||||||||
| NETGEAR Inc | (75,739) | 0.19% | ||||||||
| eHealth Inc | (75,723) | 0.19% | ||||||||
| Blade Air Mobility Inc | (75,701) | 0.19% | ||||||||
| Finance Of America Cos Inc | (75,618) | 0.19% | ||||||||
| Asana Inc | (75,587) | 0.19% | ||||||||
| Royalty Pharma PLC | (75,309) | 0.19% | ||||||||
| Cardlytics Inc | (74,998) | 0.18% | ||||||||
| C3.ai Inc | (74,660) | 0.18% | ||||||||
| Ares Management Corp | (74,560) | 0.18% | ||||||||
| Agios Pharmaceuticals Inc | (74,441) | 0.18% | ||||||||
| Spire Global Inc | (74,086) | 0.18% | ||||||||
| Lindblad Expeditions Holdings Inc | (73,945) | 0.18% | ||||||||
| KKR & Co Inc | (73,528) | 0.18% | ||||||||
| Cannae Holdings Inc | (73,413) | 0.18% | ||||||||
| MGP Ingredients Inc | (73,227) | 0.18% | ||||||||
| Microvast Holdings Inc | (73,196) | 0.18% | ||||||||
| Sana Biotechnology Inc | (72,862) | 0.18% | ||||||||
| Walker & Dunlop Inc | (72,809) | 0.18% | ||||||||
| Piper Sandler Cos | (72,720) | 0.18% | ||||||||
| VF Corp | (72,711) | 0.18% | ||||||||
| Trupanion Inc | (72,685) | 0.18% | ||||||||
| PMV Pharmaceuticals Inc | (72,480) | 0.18% | ||||||||
| Houlihan Lokey Inc | (72,411) | 0.18% | ||||||||
| Olaplex Holdings Inc | (72,314) | 0.18% | ||||||||
| Editas Medicine Inc | (72,310) | 0.18% | ||||||||
| Oscar Health Inc | (72,198) | 0.18% | ||||||||
| Porch Group Inc | (72,137) | 0.18% | ||||||||
| Piedmont Lithium Inc | (72,134) | 0.18% | ||||||||
| Blackstone Inc | (72,102) | 0.18% | ||||||||
| Cutera Inc | (72,028) | 0.18% | ||||||||
| Digital Turbine Inc | (71,966) | 0.18% | ||||||||
| Proterra Inc | (71,818) | 0.18% | ||||||||
| Virgin Galactic Holdings Inc | (71,582) | 0.18% | ||||||||
| LendingClub Corp | (71,544) | 0.18% | ||||||||
| Fastly Inc | (71,358) | 0.18% | ||||||||
| LivePerson Inc | (71,350) | 0.18% | ||||||||
| Berkeley Lights Inc | (71,093) | 0.18% | ||||||||
| OPKO Health Inc | (71,055) | 0.18% | ||||||||
| Digimarc Corp | (70,860) | 0.17% | ||||||||
| Lexicon Pharmaceuticals Inc | (70,620) | 0.17% | ||||||||
| Carnival Corp | (70,513) | 0.17% | ||||||||
| Tarsus Pharmaceuticals Inc | (70,443) | 0.17% | ||||||||
| AdaptHealth Corp | (70,255) | 0.17% | ||||||||
| Zuora Inc | (70,040) | 0.17% | ||||||||
| Freshpet Inc | (69,866) | 0.17% | ||||||||
The accompanying notes are an integral part of the consolidated financial statements.
58
| THE ADVISORS’ INNER CIRCLE FUND III | FS MULTI-STRATEGY | |||
| ALTERNATIVES FUND | ||||
| DECEMBER 31, 2022 |
| |||
| Top Underlying Components | Notional | Percentage of Notional | ||||||||
| OneMain Holdings Inc | $(69,811) | 0.17% | ||||||||
| Beam Therapeutics Inc | (69,801) | 0.17% | ||||||||
| Denny’s Corp | (69,701) | 0.17% | ||||||||
| Goosehead Insurance Inc | (69,557) | 0.17% | ||||||||
| AMMO Inc | (69,426) | 0.17% | ||||||||
| StepStone Group Inc | (69,350) | 0.17% | ||||||||
| Arvinas Inc | (69,065) | 0.17% | ||||||||
| Corsair Gaming Inc | (68,913) | 0.17% | ||||||||
| Codexis Inc | (68,676) | 0.17% | ||||||||
| Solid Power Inc | (68,373) | 0.17% | ||||||||
| BRP Group Inc | (68,152) | 0.17% | ||||||||
| Bluebird Bio Inc | (68,108) | 0.17% | ||||||||
| Veracyte Inc | (68,047) | 0.17% | ||||||||
| Traeger Inc | (67,964) | 0.17% | ||||||||
| Ollie’s Bargain Outlet Holdings Inc | (67,766) | 0.17% | ||||||||
| Teladoc Health Inc | (67,678) | 0.17% | ||||||||
| Robinhood Markets Inc | (67,437) | 0.17% | ||||||||
| Atomera Inc | (67,330) | 0.17% | ||||||||
| Precigen Inc | (67,202) | 0.17% | ||||||||
| Akoustis Technologies Inc | (67,010) | 0.17% | ||||||||
| 22nd Century Group Inc | (66,612) | 0.16% | ||||||||
| NeoGenomics Inc | (66,446) | 0.16% | ||||||||
| Inovio Pharmaceuticals Inc | (65,835) | 0.16% | ||||||||
| Lincoln National Corp | (65,494) | 0.16% | ||||||||
| Altice USA Inc | (65,405) | 0.16% | ||||||||
| Norwegian Cruise Line Holdings Ltd | (64,741) | 0.16% | ||||||||
| Pacific Biosciences of California Inc | (64,121) | 0.16% | ||||||||
| Turtle Beach Corp | (63,594) | 0.16% | ||||||||
| DigitalBridge Group Inc | (63,361) | 0.16% | ||||||||
| Inhibrx Inc | (63,352) | 0.16% | ||||||||
| Intellia Therapeutics Inc | (63,214) | 0.16% | ||||||||
| Veritone Inc | (62,887) | 0.16% | ||||||||
| Redfin Corp | (62,440) | 0.15% | ||||||||
| IonQ Inc | (62,066) | 0.15% | ||||||||
| Unity Software Inc | (62,062) | 0.15% | ||||||||
| NerdWallet Inc | (62,024) | 0.15% | ||||||||
| Vaxart Inc | (61,764) | 0.15% | ||||||||
| American Well Corp | (61,743) | 0.15% | ||||||||
| Coinbase Global Inc | (61,443) | 0.15% | ||||||||
| Smith & Wesson Brands Inc | (61,289) | 0.15% | ||||||||
| Qurate Retail Inc | (60,941) | 0.15% | ||||||||
| QuinStreet Inc | (60,728) | 0.15% | ||||||||
| The Interpublic Group of Cos Inc | (60,169) | 0.15% | ||||||||
| Butterfly Network Inc | (59,582) | 0.15% | ||||||||
| Liberty Latin America Ltd | (59,447) | 0.15% | ||||||||
| Liberty Media Corp-Liberty Formula One - Class A | (59,236) | 0.15% | ||||||||
| Liberty Media Corp-Liberty Braves | (59,170) | 0.15% | ||||||||
| Gray Television Inc | (59,163) | 0.15% | ||||||||
| Lemonade Inc | (59,154) | 0.15% | ||||||||
| Affirm Holdings Inc | (58,782) | 0.14% | ||||||||
| Sorrento Therapeutics Inc | (58,758) | 0.14% | ||||||||
| Ondas Holdings Inc | (58,633) | 0.14% | ||||||||
| Bionano Genomics Inc | (58,372) | 0.14% | ||||||||
| Outbrain Inc | (57,219) | 0.14% | ||||||||
| Cue Health Inc | (56,712) | 0.14% | ||||||||
The accompanying notes are an integral part of the consolidated financial statements.
59
| THE ADVISORS’ INNER CIRCLE FUND III | FS MULTI-STRATEGY | |||
| ALTERNATIVES FUND | ||||
| DECEMBER 31, 2022 |
| |||
| Top Underlying Components | Notional | Percentage of Notional | ||||||||
| PLBY Group Inc | $(56,475) | 0.14% | ||||||||
| Opendoor Technologies Inc | (56,144) | 0.14% | ||||||||
| Boston Omaha Corp | (56,073) | 0.14% | ||||||||
| Ouster Inc | (55,577) | 0.14% | ||||||||
| Allogene Therapeutics Inc | (55,560) | 0.14% | ||||||||
| Madison Square Garden Entertainment Corp | (55,499) | 0.14% | ||||||||
| Rite Aid Corp | (55,340) | 0.14% | ||||||||
| Workhorse Group Inc | (54,949) | 0.14% | ||||||||
| DISH Network Corp | (54,910) | 0.14% | ||||||||
| Invitae Corp | (54,726) | 0.13% | ||||||||
| Caribou Biosciences Inc | (54,606) | 0.13% | ||||||||
| Hydrofarm Holdings Group Inc | (53,907) | 0.13% | ||||||||
| Entravision Communications Corp | (53,206) | 0.13% | ||||||||
| The Walt Disney Co | (53,174) | 0.13% | ||||||||
| Advantage Solutions Inc | (52,522) | 0.13% | ||||||||
| Peloton Interactive Inc | (52,228) | 0.13% | ||||||||
| Luminar Technologies Inc | (51,987) | 0.13% | ||||||||
| Bumble Inc | (51,653) | 0.13% | ||||||||
| Ziff Davis Inc | (51,582) | 0.13% | ||||||||
| Paramount Global | (50,404) | 0.12% | ||||||||
| PFSweb Inc | (49,732) | 0.12% | ||||||||
| Root Inc | (49,350) | 0.12% | ||||||||
| Fate Therapeutics Inc | (40,322) | 0.10% | ||||||||
| Mirati Therapeutics Inc | (39,337) | 0.10% | ||||||||
| Cinemark Holdings Inc | (38,272) | 0.09% | ||||||||
REIT | AGNC Investment Corp | (85,574) | 0.21% | |||||||
| STORE Capital Corp | (83,335) | 0.21% | ||||||||
| Essential Properties Realty Trust Inc | (82,482) | 0.20% | ||||||||
| Veris Residential Inc | (81,233) | 0.20% | ||||||||
| Annaly Capital Management Inc | (80,067) | 0.20% | ||||||||
| Invesco Mortgage Capital Inc | (78,802) | 0.19% | ||||||||
| ARMOUR Residential REIT Inc | (78,709) | 0.19% | ||||||||
| Alexandria Real Estate Equities Inc | (78,634) | 0.19% | ||||||||
| CTO Realty Growth Inc | (78,389) | 0.19% | ||||||||
| Acadia Realty Trust | (78,341) | 0.19% | ||||||||
| Americold Realty Trust Inc | (78,127) | 0.19% | ||||||||
| NETSTREIT Corp | (78,078) | 0.19% | ||||||||
| Healthcare Realty Trust Inc | (78,064) | 0.19% | ||||||||
| Independence Realty Trust Inc | (77,781) | 0.19% | ||||||||
| InvenTrust Properties Corp | (77,217) | 0.19% | ||||||||
| PotlatchDeltic Corp | (76,342) | 0.19% | ||||||||
| Plymouth Industrial REIT Inc | (75,879) | 0.19% | ||||||||
| TPG RE Finance Trust Inc | (75,736) | 0.19% | ||||||||
| Hannon Armstrong Sustainable Infrastructure Capital Inc | (75,448) | 0.19% | ||||||||
| Thr Macerich Co | (74,434) | 0.18% | ||||||||
| Orion Office REIT Inc | (74,243) | 0.18% | ||||||||
| MFA Financial Inc | (73,179) | 0.18% | ||||||||
| Clipper Realty Inc | (71,098) | 0.18% | ||||||||
| Nexpoint Real Estate Finance Inc | (70,591) | 0.17% | ||||||||
| PennyMac Mortgage Investment Trust | (67,552) | 0.17% | ||||||||
| Chimera Investment Corp | (65,496) | 0.16% | ||||||||
**CSVPDSPG Index: Defensive S&P 500 vs. Top 50 dispersion strategy, combining a short position in index volatility with a long position in single stock volatility.
The accompanying notes are an integral part of the consolidated financial statements.
60
| THE ADVISORS’ INNER CIRCLE FUND III | FS MULTI-STRATEGY | |||
| ALTERNATIVES FUND | ||||
| DECEMBER 31, 2022 |
| |||
| Top Underlying Components | Notional | Percentage of Notional | ||||
Option | Put on SPDR S&P 500 ETF Trust | $(52,935,430) | -312.32% | |||
| Call on SPDR S&P 500 ETF Trust | (32,413,562) | -191.24% | ||||
| Put on Apple Inc | 7,767,984 | 45.83% | ||||
| Put on Microsoft Corp | 6,167,595 | 36.39% | ||||
| Call on Apple Inc | 5,303,788 | 31.29% | ||||
| Call on Microsoft Corp | 4,807,026 | 28.36% | ||||
| Put on Amazon.Com Inc | 2,555,102 | 15.08% | ||||
| Call on Amazon.Com Inc | 2,217,169 | 13.08% | ||||
| Put on Berkshire Hathaway Inc-Cl B | 1,981,992 | 11.69% | ||||
| Put on Alphabet Inc-Cl A | 1,919,846 | 11.33% | ||||
| Put on Alphabet Inc-Cl C | 1,740,706 | 10.27% | ||||
| Put on Unitedhealth Group Inc | 1,677,380 | 9.90% | ||||
| Put on Johnson & Johnson | 1,588,562 | 9.37% | ||||
| Call on Alphabet Inc-Cl A | 1,561,336 | 9.21% | ||||
| Put on Exxon Mobil Corp | 1,534,540 | 9.05% | ||||
| Put on JPMorgan Chase & Co | 1,507,026 | 8.89% | ||||
| Call on Alphabet Inc-Cl C | 1,363,762 | 8.05% | ||||
| Put on Procter & Gamble Co/The | 1,363,547 | 8.04% | ||||
| Call on Berkshire Hathaway Inc-Cl B | 1,347,999 | 7.95% | ||||
| Put on Tesla Inc | 1,335,374 | 7.88% | ||||
| Call on Exxon Mobil Corp | 1,283,596 | 7.57% | ||||
| Call on Unitedhealth Group Inc | 1,268,921 | 7.49% | ||||
| Call on Johnson & Johnson | 1,253,860 | 7.40% | ||||
| Put on NVIDIA Corp | 1,243,180 | 7.33% | ||||
| Call on Tesla Inc | 1,238,561 | 7.31% | ||||
| Put on Visa Inc-Class A Shares | 1,174,041 | 6.93% | ||||
| Put on Home Depot Inc | 1,117,495 | 6.59% | ||||
| Call on NVIDIA Corp | 1,094,873 | 6.46% | ||||
| Put on Chevron Corp | 1,088,317 | 6.42% | ||||
| Put on The Coca-Cola Co | 955,564 | 5.64% | ||||
| Put on Pepsico Inc | 948,139 | 5.59% | ||||
| Call on The Procter & Gamble Co | 925,685 | 5.46% | ||||
| Call on JPMorgan Chase & Co | 911,885 | 5.38% | ||||
| Put on Eli Lilly & Co | 909,884 | 5.37% | ||||
| Put on Merck & Co. Inc. | 903,382 | 5.33% | ||||
| Put on Abbvie Inc | 866,034 | 5.11% | ||||
| Put on Pfizer Inc | 861,589 | 5.08% | ||||
| Call on Home Depot Inc | 856,199 | 5.05% | ||||
| Call on Visa Inc-Class A Shares | 853,732 | 5.04% | ||||
| Put on Bank of America Corp | 848,574 | 5.01% | ||||
| Call on Eli Lilly & Co | 811,199 | 4.79% | ||||
| Put on Meta Platforms Inc-Class A | 807,009 | 4.76% | ||||
| Call on Chevron Corp | 804,414 | 4.75% | ||||
| Call on Meta Platforms Inc-Class A | 795,605 | 4.69% | ||||
| Call on Merck & Co. Inc. | 784,681 | 4.63% | ||||
| Put on Costco Wholesale Corp | 774,512 | 4.57% | ||||
| Put on Mcdonald’S Corp | 769,227 | 4.54% | ||||
| Call on Abbvie Inc | 751,520 | 4.43% | ||||
ETF | SPDR S&P 500 ETF Trust | (5,022,309) | -29.63% | |||
Common Stock | Apple Inc | 2,689,733 | 15.87% |
**CSVTBSK7 Index: Equally-weighted basket of 8 indices where for each, a variance swap is sold at a higher level than the Volatility Target that is systematically incorporated in the strategy to capture this spread.
The accompanying notes are an integral part of the consolidated financial statements.
61
| THE ADVISORS’ INNER CIRCLE FUND III | FS MULTI-STRATEGY | |||
| ALTERNATIVES FUND | ||||
| DECEMBER 31, 2022 |
| |||
| Top Underlying Components | Notional | Percentage of Notional | ||||||
Equity Index | Variance Swap on S&P 500 Daily Risk Control 5% Total Return (USD) Index | $7,854,883 | 12.50% | |||||
| Variance Swap on S&P 500 Low Volatility Daily Risk Control 5% USD Total Return Index | 7,854,883 | 12.50% | ||||||
| Variance Swap on S&P 500 Dividend Aristocrats Daily Risk Control 5% Index (USD) Total Return | 7,854,883 | 12.50% | ||||||
| Variance Swap on S&P MARC 5% Excess Return Index | 7,854,883 | 12.50% | ||||||
| Variance Swap on Credit Suisse Ravenpack AI Index | 7,854,883 | 12.50% | ||||||
| Variance Swap on Credit Suisse Tech Edge Index | 7,854,883 | 12.50% | ||||||
| Variance Swap on Credit Suisse Balanced Trend 5% Index | 7,854,883 | 12.50% | ||||||
| Variance Swap on Credit Suisse Momentum Index | 7,854,883 | 12.50% | ||||||
**GSVLR2B4 Index: The exposure is a custom index that is short Euro Rate Volatility and Long US Rate Volatility. The implementation is notional neutral and has a calendar spread – short 1y/2y Euro Rate Vol and long 10y US Rate Vol –with a long vega, positive carry profile.
| Top Underlying Components | Notional | Percentage of Notional | ||||||
Equity Index | Goldman Sachs USD Long Vol x2 Index | $31,369,775 | 98.88% | |||||
| Goldman Sachs USD Long Vol x2 Index | 31,369,775 | 98.88% | ||||||
| Goldman Sachs EUR Vol Carry Index | 31,344,395 | 98.80% | ||||||
| Goldman Sachs EUR Vol Carry Index | 31,344,395 | 98.80% | ||||||
**GSXUCYCL Index: This basket consists of S&P 500 names with a beta to US GDP growth higher than the S&P 500’s beta.
| Top Underlying Components | Notional | Percentage of Notional | ||||||||
Common Stock | The Boeing Co | $ | 312,456 | 2.43% | ||||||
| JPMorgan Chase & Co | 293,798 | 2.28% | ||||||||
| Morgan Stanley | 274,047 | 2.13% | ||||||||
| NIKE Inc | 267,870 | 2.08% | ||||||||
| Texas Instruments Inc | 252,684 | 1.96% | ||||||||
| Citigroup Inc | 249,629 | 1.94% | ||||||||
| Wells Fargo & Co | 245,963 | 1.91% | ||||||||
| S&P Global Inc | 240,008 | 1.87% | ||||||||
| Bank of America Corp | 234,712 | 1.82% | ||||||||
| Honeywell International Inc | 233,944 | 1.82% | ||||||||
| Ford Motor Co | 215,318 | 1.67% | ||||||||
| QUALCOMM Inc | 214,143 | 1.66% | ||||||||
| Applied Materials Inc | 204,968 | 1.59% | ||||||||
| The Walt Disney Co | 193,292 | 1.50% | ||||||||
| Micron Technology Inc | 193,154 | 1.50% | ||||||||
| American Express Co | 183,170 | 1.42% | ||||||||
| Activision Blizzard Inc | 182,825 | 1.42% | ||||||||
| General Motors Co | 181,922 | 1.41% | ||||||||
| United Airlines Holdings Inc | 167,496 | 1.30% | ||||||||
| Analog Devices Inc | 167,175 | 1.30% | ||||||||
| BlackRock Inc | 164,598 | 1.28% | ||||||||
| American Airlines Group Inc | 164,342 | 1.28% | ||||||||
| Delta Air Lines Inc | 164,100 | 1.28% | ||||||||
| General Electric Co | 161,217 | 1.25% | ||||||||
| The Charles Schwab Corp | 160,506 | 1.25% | ||||||||
| Intel Corp | 158,360 | 1.23% | ||||||||
The accompanying notes are an integral part of the consolidated financial statements.
62
| THE ADVISORS’ INNER CIRCLE FUND III | FS MULTI-STRATEGY | |||
| ALTERNATIVES FUND | ||||
| DECEMBER 31, 2022 |
| |||
| Top Underlying Components | Notional | Percentage of Notional | ||||||||
| Lam Research Corp | $155,514 | 1.21% | ||||||||
| KLA Corp | 151,192 | 1.18% | ||||||||
| United Parcel Service Inc | 141,245 | 1.10% | ||||||||
| 3M Co | 132,281 | 1.03% | ||||||||
| Chubb Ltd | 129,053 | 1.00% | ||||||||
| FedEx Corp | 121,332 | 0.94% | ||||||||
| Aon PLC | 114,433 | 0.89% | ||||||||
| Microchip Technology Inc | 113,355 | 0.88% | ||||||||
| US Bancorp | 110,430 | 0.86% | ||||||||
| Union Pacific Corp | 105,616 | 0.82% | ||||||||
| The PNC Financial Services Group Inc | 103,675 | 0.81% | ||||||||
| American International Group Inc | 102,229 | 0.79% | ||||||||
| Cummins Inc | 100,523 | 0.78% | ||||||||
| MetLife Inc | 97,722 | 0.76% | ||||||||
| DR Horton Inc | 94,053 | 0.73% | ||||||||
| Emerson Electric Co | 92,465 | 0.72% | ||||||||
| Capital One Financial Corp | 92,449 | 0.72% | ||||||||
| Marsh & McLennan Cos Inc | 91,549 | 0.71% | ||||||||
| The Bank of New York Mellon Corp | 91,515 | 0.71% | ||||||||
| Intercontinental Exchange Inc | 88,703 | 0.69% | ||||||||
| Eaton Corp PLC | 85,959 | 0.67% | ||||||||
| Southwest Airlines Co | 84,127 | 0.65% | ||||||||
| CSX Corp | 84,072 | 0.65% | ||||||||
| The Allstate Corp | 83,991 | 0.65% | ||||||||
| Johnson Controls International plc | 83,627 | 0.65% | ||||||||
| Advanced Micro Devices Inc | 83,124 | 0.65% | ||||||||
| MSCI Inc | 82,363 | 0.64% | ||||||||
| Truist Financial Corp | 81,093 | 0.63% | ||||||||
| Synchrony Financial | 81,090 | 0.63% | ||||||||
| Moody’s Corp | 80,273 | 0.62% | ||||||||
| CME Group Inc | 79,883 | 0.62% | ||||||||
| M&T Bank Corp | 79,132 | 0.62% | ||||||||
| The Progressive Corp | 78,762 | 0.61% | ||||||||
| Lennar Corp | 75,890 | 0.59% | ||||||||
| The Travelers Cos Inc | 75,676 | 0.59% | ||||||||
| Trane Technologies PLC | 74,768 | 0.58% | ||||||||
| Illinois Tool Works Inc | 73,188 | 0.57% | ||||||||
| Fortive Corp | 72,121 | 0.56% | ||||||||
| Aptiv PLC | 71,201 | 0.55% | ||||||||
| Fifth Third Bancorp | 70,431 | 0.55% | ||||||||
| Otis Worldwide Corp | 68,953 | 0.54% | ||||||||
| Parker-Hannifin Corp | 66,784 | 0.52% | ||||||||
| Electronic Arts Inc | 66,614 | 0.52% | ||||||||
| Willis Towers Watson PLC | 65,599 | 0.51% | ||||||||
| TransDigm Group Inc | 65,066 | 0.51% | ||||||||
| Regions Financial Corp | 64,278 | 0.50% | ||||||||
| Old Dominion Freight Line Inc | 63,026 | 0.49% | ||||||||
| United Rentals Inc | 62,766 | 0.49% | ||||||||
| Carrier Global Corp | 62,546 | 0.49% | ||||||||
| Discover Financial Services | 61,486 | 0.48% | ||||||||
| Stanley Black & Decker Inc | 59,749 | 0.46% | ||||||||
| Prudential Financial Inc | 58,768 | 0.46% | ||||||||
| Citizens Financial Group Inc | 58,627 | 0.46% | ||||||||
| Live Nation Entertainment Inc | 58,062 | 0.45% | ||||||||
The accompanying notes are an integral part of the consolidated financial statements.
63
| THE ADVISORS’ INNER CIRCLE FUND III | FS MULTI-STRATEGY | |||
| ALTERNATIVES FUND | ||||
| DECEMBER 31, 2022 |
| |||
| Top Underlying Components | Notional | Percentage of Notional | ||||||||
| Aflac Inc | $56,077 | 0.44% | ||||||||
| PACCAR Inc | 55,395 | 0.43% | ||||||||
| Ameriprise Financial Inc | 54,939 | 0.43% | ||||||||
| Paramount Global | 54,832 | 0.43% | ||||||||
| Roper Technologies Inc | 54,714 | 0.43% | ||||||||
| Norfolk Southern Corp | 53,437 | 0.42% | ||||||||
| First Republic Bank | 53,240 | 0.41% | ||||||||
| Arthur J Gallagher & Co | 52,139 | 0.41% | ||||||||
| Take-Two Interactive Software Inc | 51,843 | 0.40% | ||||||||
| Xylem Inc | 51,519 | 0.40% | ||||||||
| Skyworks Solutions Inc | 51,372 | 0.40% | ||||||||
| KeyCorp | 51,314 | 0.40% | ||||||||
| Rockwell Automation Inc | 51,008 | 0.40% | ||||||||
| Tapestry Inc | 50,786 | 0.39% | ||||||||
| Huntington Bancshares Inc | 50,011 | 0.39% | ||||||||
| T Rowe Price Group Inc | 49,083 | 0.38% | ||||||||
| The Hartford Financial Services Group Inc | 48,922 | 0.38% | ||||||||
| WW Grainger Inc | 47,272 | 0.37% | ||||||||
| Fastenal Co | 46,614 | 0.36% | ||||||||
| Whirlpool Corp | 46,058 | 0.36% | ||||||||
| Principal Financial Group Inc | 46,052 | 0.36% | ||||||||
| State Street Corp | 45,702 | 0.36% | ||||||||
| Nasdaq Inc | 44,596 | 0.35% | ||||||||
| Omnicom Group Inc | 44,423 | 0.35% | ||||||||
| Garmin Ltd | 44,354 | 0.34% | ||||||||
| AMETEK Inc | 43,767 | 0.34% | ||||||||
| Raymond James Financial Inc | 43,342 | 0.34% | ||||||||
| Monolithic Power Systems Inc | 42,267 | 0.33% | ||||||||
| Ingersoll Rand Inc | 41,510 | 0.32% | ||||||||
| Teradyne Inc | 41,481 | 0.32% | ||||||||
| The Interpublic Group of Cos Inc | 39,662 | 0.31% | ||||||||
| PulteGroup Inc | 38,784 | 0.30% | ||||||||
| Westinghouse Air Brake Technologies Corp | 38,470 | 0.30% | ||||||||
| Ralph Lauren Corp | 38,170 | 0.30% | ||||||||
| SVB Financial Group | 36,915 | 0.29% | ||||||||
| JB Hunt Transport Services Inc | 36,251 | 0.28% | ||||||||
| Howmet Aerospace Inc | 34,647 | 0.27% | ||||||||
| NVR Inc | 34,148 | 0.27% | ||||||||
| Masco Corp | 33,615 | 0.26% | ||||||||
| Canadian Pacific Railway Ltd | 33,351 | 0.26% | ||||||||
| Qorvo Inc | 32,545 | 0.25% | ||||||||
| Fox Corp | 32,255 | 0.25% | ||||||||
| Dover Corp | 32,100 | 0.25% | ||||||||
| VF Corp | 31,163 | 0.24% | ||||||||
| Mohawk Industries Inc | 30,349 | 0.24% | ||||||||
| BorgWarner Inc | 28,836 | 0.22% | ||||||||
| Everest Re Group Ltd | 28,561 | 0.22% | ||||||||
| Comerica Inc | 28,447 | 0.22% | ||||||||
| PVH Corp | 28,383 | 0.22% | ||||||||
| Unum Group | 28,129 | 0.22% | ||||||||
| IDEX Corp | 27,539 | 0.21% | ||||||||
| Invesco Ltd | 27,294 | 0.21% | ||||||||
| Alaska Air Group Inc | 27,160 | 0.21% | ||||||||
| Fortune Brands Innovations Inc | 25,518 | 0.20% | ||||||||
The accompanying notes are an integral part of the consolidated financial statements.
64
| THE ADVISORS’ INNER CIRCLE FUND III | FS MULTI-STRATEGY | |||
| ALTERNATIVES FUND | ||||
| DECEMBER 31, 2022 |
| |||
| Top Underlying Components | Notional | Percentage of Notional | ||||||||
| Cboe Global Markets Inc | $25,196 | 0.20% | ||||||||
| Snap-on Inc | 24,950 | 0.19% | ||||||||
| Warner Bros Discovery Inc | 24,833 | 0.19% | ||||||||
| Northern Trust Corp | 24,785 | 0.19% | ||||||||
| Zions Bancorp NA | 24,354 | 0.19% | ||||||||
| Franklin Resources Inc | 24,180 | 0.19% | ||||||||
| W R Berkley Corp | 23,572 | 0.18% | ||||||||
| MarketAxess Holdings Inc | 23,486 | 0.18% | ||||||||
| Under Armour Inc | 22,219 | 0.17% | ||||||||
| Globe Life Inc | 22,200 | 0.17% | ||||||||
| Allegion plc | 21,965 | 0.17% | ||||||||
| Hasbro Inc | 20,551 | 0.16% | ||||||||
| Cincinnati Financial Corp | 19,203 | 0.15% | ||||||||
| Pentair PLC | 19,189 | 0.15% | ||||||||
| A O Smith Corp | 16,871 | 0.13% | ||||||||
| Lincoln National Corp | 16,270 | 0.13% | ||||||||
| News Corp | 15,262 | 0.12% | ||||||||
| Loews Corp | 15,123 | 0.12% | ||||||||
| Assurant Inc | 13,367 | 0.10% | ||||||||
| Flowserve Corp | 13,155 | 0.10% | ||||||||
| Newell Brands Inc | 11,775 | 0.09% | ||||||||
| Leggett & Platt Inc | 11,075 | 0.09% | ||||||||
| Hanesbrands Inc | 10,086 | 0.08% | ||||||||
| Masterbrand Inc | 3,373 | 0.03% | ||||||||
**GSXUEDEF Index: This basket consists of defensive companies that are expensive relative to its own history, and/or expensive to Index level.
| Top Underlying Components | Notional | Percentage of Notional | ||||||||
Common Stock | Eli Lilly & Co | $ | (979,649) | 3.08% | ||||||
| McKesson Corp | (947,666) | 2.98% | ||||||||
| Waters Corp | (878,738) | 2.76% | ||||||||
| AmerisourceBergen Corp | (862,373) | 2.71% | ||||||||
| PepsiCo Inc | (834,508) | 2.62% | ||||||||
| UnitedHealth Group Inc | (820,076) | 2.58% | ||||||||
| Kellogg Co | (819,546) | 2.58% | ||||||||
| Elevance Health Inc | (800,685) | 2.52% | ||||||||
| Philip Morris International Inc | (795,590) | 2.50% | ||||||||
| The Coca-Cola Co | (777,043) | 2.44% | ||||||||
| Kimberly-Clark Corp | (773,421) | 2.43% | ||||||||
| Johnson & Johnson | (766,814) | 2.41% | ||||||||
| Waste Management Inc | (764,462) | 2.40% | ||||||||
| Republic Services Inc | (763,539) | 2.40% | ||||||||
| CVS Health Corp | (748,307) | 2.35% | ||||||||
| PPL Corp | (746,936) | 2.35% | ||||||||
| Consolidated Edison Inc | (744,174) | 2.34% | ||||||||
| The Procter & Gamble Co | (741,742) | 2.33% | ||||||||
| CenterPoint Energy Inc | (713,046) | 2.24% | ||||||||
| FirstEnergy Corp | (701,921) | 2.21% | ||||||||
| The Southern Co | (700,981) | 2.20% | ||||||||
| American Electric Power Co Inc | (695,195) | 2.19% | ||||||||
| Ameren Corp | (694,281) | 2.18% | ||||||||
| Entergy Corp | (684,955) | 2.15% | ||||||||
The accompanying notes are an integral part of the consolidated financial statements.
65
| THE ADVISORS’ INNER CIRCLE FUND III | FS MULTI-STRATEGY | |||
| ALTERNATIVES FUND | ||||
| DECEMBER 31, 2022 |
| |||
| Top Underlying Components | Notional | Percentage of Notional | ||||||||
| Duke Energy Corp | $(681,123) | 2.14% | ||||||||
| CMS Energy Corp | (671,202) | 2.11% | ||||||||
| Costco Wholesale Corp | (669,114) | 2.10% | ||||||||
| Exelon Corp | (665,934) | 2.09% | ||||||||
| DTE Energy Co | (656,363) | 2.06% | ||||||||
| McCormick & Co Inc | (655,669) | 2.06% | ||||||||
| The Kroger Co | (643,063) | 2.02% | ||||||||
| Public Service Enterprise Group Inc | (639,439) | 2.01% | ||||||||
| STERIS PLC | (639,029) | 2.01% | ||||||||
| Edwards Lifesciences Corp | (551,529) | 1.73% | ||||||||
| Illumina Inc | (520,792) | 1.64% | ||||||||
REIT | EquinIndex Inc | (722,390) | 2.27% | |||||||
| First Industrial Realty Trust Inc | (665,880) | 2.09% | ||||||||
| Equity LifeStyle Properties Inc | (665,542) | 2.09% | ||||||||
| EastGroup Properties Inc | (643,753) | 2.02% | ||||||||
| Ventas Inc | (626,986) | 1.97% | ||||||||
| UDR Inc | (579,829) | 1.82% | ||||||||
| Camden Property Trust | (576,717) | 1.81% | ||||||||
| AvalonBay Communities Inc | (566,259) | 1.78% | ||||||||
| Essex Property Trust Inc | (514,467) | 1.62% | ||||||||
| Independence Realty Trust Inc | (501,795) | 1.58% | ||||||||
**GSXUSGRO Index: This basket consists of companies in the Russell 3000 that were identified to grow regardless of how the economy performs.
| Top Underlying Components | Notional | Percentage of Notional | ||||
Common Stock | CoStar Group Inc | $340,164 | 3.04% | |||
| EPAM Systems Inc | 325,351 | 2.91% | ||||
| Insulet Corp | 325,218 | 2.91% | ||||
| Vertex Pharmaceuticals Inc | 322,151 | 2.88% | ||||
| Etsy Inc | 320,259 | 2.87% | ||||
| Pinterest Inc | 319,130 | 2.86% | ||||
| Dexcom Inc | 277,405 | 2.48% | ||||
| Lululemon Athletica Inc | 268,848 | 2.41% | ||||
| NetflIndex Inc | 258,903 | 2.32% | ||||
| Veeva Systems Inc | 255,393 | 2.29% | ||||
| Intuit Inc | 252,081 | 2.26% | ||||
| Adobe Inc | 235,587 | 2.11% | ||||
| ServiceNow Inc | 234,631 | 2.10% | ||||
| Coupa Software Inc | 233,920 | 2.09% | ||||
| Workday Inc | 228,534 | 2.05% | ||||
| Fortinet Inc | 225,666 | 2.02% | ||||
| Snowflake Inc | 215,232 | 1.93% | ||||
| Palo Alto Networks Inc | 214,024 | 1.92% | ||||
| Salesforce Inc | 209,712 | 1.88% | ||||
| Alphabet Inc | 205,618 | 1.84% | ||||
| The Trade Desk Inc | 205,347 | 1.84% | ||||
| HubSpot Inc | 205,277 | 1.84% | ||||
| PayPal Holdings Inc | 199,108 | 1.78% | ||||
| Paycom Software Inc | 199,012 | 1.78% | ||||
| Spotify Technology SA | 174,221 | 1.56% | ||||
| Datadog Inc | 170,560 | 1.53% | ||||
| DocuSign Inc | 169,954 | 1.52% |
The accompanying notes are an integral part of the consolidated financial statements.
66
| THE ADVISORS’ INNER CIRCLE FUND III | FS MULTI-STRATEGY | |||
| ALTERNATIVES FUND | ||||
| DECEMBER 31, 2022 |
| |||
| Top Underlying Components | Notional | Percentage of Notional | ||||
| Meta Platforms Inc | $168,487 | 1.51% | ||||
| Amazon.com Inc | 168,445 | 1.51% | ||||
| GoDaddy Inc | 165,648 | 1.48% | ||||
| Incyte Corp | 161,646 | 1.45% | ||||
| Palantir Technologies Inc | 156,605 | 1.40% | ||||
| Zscaler Inc | 153,436 | 1.37% | ||||
| Crowdstrike Holdings Inc | 151,125 | 1.35% | ||||
| Okta Inc | 149,181 | 1.34% | ||||
| MongoDB Inc | 147,221 | 1.32% | ||||
| Atlassian Corp | 145,642 | 1.30% | ||||
| DoorDash Inc | 142,967 | 1.28% | ||||
| Charles River Laboratories International Inc | 137,581 | 1.23% | ||||
| Floor & Decor Holdings Inc | 136,673 | 1.22% | ||||
| Exact Sciences Corp | 135,194 | 1.21% | ||||
| Wingstop Inc | 134,006 | 1.20% | ||||
| Five9 Inc | 132,892 | 1.19% | ||||
| Cloudflare Inc | 127,903 | 1.14% | ||||
| Asana Inc | 124,022 | 1.11% | ||||
| Tesla Inc | 111,489 | 1.00% | ||||
| Teladoc Health Inc | 110,552 | 0.99% | ||||
| Roku Inc | 110,438 | 0.99% | ||||
| Smartsheet Inc | 108,829 | 0.97% | ||||
| Twilio Inc | 103,752 | 0.93% |
**JPQIFSL1 Index: Uses factor-based stock selection to provide long exposure to the equity of natural resource, real estate, equipment and industrial, and infrastructure companies.
| Top Underlying Components | Notional | Percentage of Notional | ||||
Common Stock | Dominion Energy Inc | $964,127 | 2.45% | |||
| AGCO Corp | 957,476 | 2.43% | ||||
| Kinder Morgan Inc | 949,412 | 2.41% | ||||
| ONEOK Inc | 947,331 | 2.41% | ||||
| Emerson Electric Co | 934,522 | 2.38% | ||||
| LyondellBasell Industries NV | 933,990 | 2.37% | ||||
| Cummins Inc | 932,298 | 2.37% | ||||
| Newmont Corp | 932,128 | 2.37% | ||||
| Lockheed Martin Corp | 921,844 | 2.34% | ||||
| FedEx Corp | 920,955 | 2.34% | ||||
| Dow Inc | 919,798 | 2.34% | ||||
| Coterra Energy Inc | 919,699 | 2.34% | ||||
| Huntington Ingalls Industries Inc | 905,806 | 2.30% | ||||
| Pinnacle West Capital Corp | 899,067 | 2.29% | ||||
| Union Pacific Corp | 897,773 | 2.28% | ||||
| United Parcel Service Inc | 896,728 | 2.28% | ||||
| PACCAR Inc | 895,607 | 2.28% | ||||
| Robert Half International Inc | 889,353 | 2.26% | ||||
| Edison International | 886,106 | 2.25% | ||||
| CH Robinson Worldwide Inc | 880,369 | 2.24% | ||||
| International Paper Co | 879,504 | 2.24% | ||||
| Eastman Chemical Co | 876,199 | 2.23% | ||||
| 3M Co | 873,778 | 2.22% | ||||
| Stanley Black & Decker Inc | 868,796 | 2.21% | ||||
| Packaging Corp of America | 867,498 | 2.21% |
The accompanying notes are an integral part of the consolidated financial statements.
67
| THE ADVISORS’ INNER CIRCLE FUND III | FS MULTI-TRATEGY | |||
| ALTERNATIVES FUND | ||||
| DECEMBER 31, 2022 |
| |||
| Top Underlying Components | Notional | Percentage of Notional | ||||
| Fastenal Co | $850,878 | 2.16% | ||||
| Atlas Air Worldwide Holdings Inc | 787,291 | 2.00% | ||||
| Masco Corp | 751,338 | 1.91% | ||||
| The Chemours Co | 725,668 | 1.84% | ||||
| OGE Energy Corp | 680,373 | 1.73% | ||||
| Plains GP Holdings LP | 532,778 | 1.35% | ||||
| NRG Energy Inc | 531,505 | 1.35% | ||||
| Flowserve Corp | 514,264 | 1.31% | ||||
| FirstEnergy Corp | 483,829 | 1.23% | ||||
| Antero Midstream Corp | 464,340 | 1.18% | ||||
| ManpowerGroup Inc | 444,201 | 1.13% | ||||
| Equitrans Midstream Corp | 406,202 | 1.03% | ||||
| MSC Industrial Direct Co Inc | 368,403 | 0.94% | ||||
| Westrock Co | 328,755 | 0.84% | ||||
REIT | Gaming and Leisure Properties Inc | 916,154 | 2.33% | |||
| Weyerhaeuser Co | 902,358 | 2.29% | ||||
| Healthcare Realty Trust Inc | 869,837 | 2.21% | ||||
| Medical Properties Trust Inc | 865,077 | 2.20% | ||||
| Vornado Realty Trust | 863,233 | 2.19% | ||||
| Omega Healthcare Investors Inc | 859,155 | 2.18% | ||||
| SL Green Realty Corp | 628,594 | 1.60% | ||||
| Spirit Realty Capital Inc | 593,639 | 1.51% | ||||
| Boston Properties Inc | 535,473 | 1.36% | ||||
| Sabra Health Care REIT Inc | 514,570 | 1.31% | ||||
| Innovative Industrial Properties Inc | 430,614 | 1.09% | ||||
| Physicians Realty Trust | 408,856 | 1.04% | ||||
Unit | EnLink Midstream LLC | 331,282 | 0.84% |
**JPQIFSS1 Index: Uses factor-based stock selection to provide short exposure to the equity of natural resource, real estate, equipment and industrial, and infrastructure companies.
| Top Underlying Components | Notional | Percentage of Notional | ||||||||
Common Stock | United Rentals Inc | $ | (648,764) | 2.11% | ||||||
| Berry Global Group Inc | (647,960) | 2.11% | ||||||||
| Lyft Inc | (647,786) | 2.11% | ||||||||
| NextEra Energy Inc | (636,740) | 2.07% | ||||||||
| Textron Inc | (635,503) | 2.07% | ||||||||
| CenterPoint Energy Inc | (633,947) | 2.06% | ||||||||
| Chart Industries Inc | (632,851) | 2.06% | ||||||||
| Linde PLC | (631,988) | 2.06% | ||||||||
| American Water Works Co Inc | (628,336) | 2.04% | ||||||||
| Delta Air Lines Inc | (625,770) | 2.04% | ||||||||
| Old Dominion Freight Line Inc | (625,059) | 2.03% | ||||||||
| Quanta Services Inc | (619,165) | 2.01% | ||||||||
| Constellation Energy Corp | (618,490) | 2.01% | ||||||||
| Vulcan Materials Co | (617,776) | 2.01% | ||||||||
| Trex Co Inc | (613,662) | 2.00% | ||||||||
| Martin Marietta Materials Inc | (609,462) | 1.98% | ||||||||
| Cheniere Energy Inc | (608,875) | 1.98% | ||||||||
| American Airlines Group Inc | (605,136) | 1.97% | ||||||||
| The Sherwin-Williams Co | (604,091) | 1.97% | ||||||||
| Uber Technologies Inc | (599,547) | 1.95% | ||||||||
| Plug Power Inc | (595,974) | 1.94% | ||||||||
The accompanying notes are an integral part of the consolidated financial statements.
68
| THE ADVISORS’ INNER CIRCLE FUND III | FS MULTI-STRATEGY | |||
| ALTERNATIVES FUND | ||||
| DECEMBER 31, 2022 |
| |||
| Top Underlying Components | Notional | Percentage of Notional | ||||||||
| Saia Inc | $ | (591,122) | 1.92% | |||||||
| Southwest Airlines Co | (570,176) | 1.85% | ||||||||
| Albemarle Corp | (551,181) | 1.79% | ||||||||
| Sunrun Inc | (539,650) | 1.76% | ||||||||
| XPO Inc | (536,657) | 1.75% | ||||||||
| Axalta Coating Systems Ltd | (508,445) | 1.65% | ||||||||
| HEICO Corp | (454,066) | 1.48% | ||||||||
| GXO Logistics Inc | (449,479) | 1.46% | ||||||||
| Occidental Petroleum Corp | (442,824) | 1.44% | ||||||||
| Livent Corp | (429,376) | 1.40% | ||||||||
| The AZEK Co Inc | (389,678) | 1.27% | ||||||||
| TechnipFMC PLC | (296,502) | 0.96% | ||||||||
| Shoals Technologies Group Inc | (273,793) | 0.89% | ||||||||
| Summit Materials Inc | (190,242) | 0.62% | ||||||||
| SunPower Corp | (182,137) | 0.59% | ||||||||
| Sunnova Energy International Inc | (174,498) | 0.57% | ||||||||
| Univar Solutions Inc | (169,045) | 0.55% | ||||||||
| Fortive Corp | (158,772) | 0.52% | ||||||||
REIT | Sun Communities Inc | (646,792) | 2.10% | |||||||
| American Tower Corp | (637,711) | 2.07% | ||||||||
| SBA Communications Corp | (626,071) | 2.04% | ||||||||
| EquinIndex Inc | (623,888) | 2.03% | ||||||||
| Prologis Inc | (623,805) | 2.03% | ||||||||
| American Homes 4 Rent | (590,391) | 1.92% | ||||||||
| Host Hotels & Resorts Inc | (583,998) | 1.90% | ||||||||
| Rexford Industrial Realty Inc | (473,820) | 1.54% | ||||||||
| Park Hotels & Resorts Inc | (407,710) | 1.33% | ||||||||
| Sunstone Hotel Investors Inc | (327,542) | 1.07% | ||||||||
| Pebblebrook Hotel Trust | (303,548) | 0.99% | ||||||||
**JPUS1MMC Index: Seeks to monetize the tendency for the equity market to mean revert over short periods of time.
| Top Underlying Components | Notional | Percentage of Notional | ||||||
Equity Index | S&P 500 Total Return Index | $ | (185,701) | -0.55% | ||||
**MLBX3P23 Index: Basket of three commodity strategies: Cross-Maturity Seasonal Carry, Cross-Sectional Carry/Backwardation, and Spot Price Mean Reversion Value.
| Top Underlying Components | Notional | Percentage of Notional | ||||||||
Futures | Natural Gas Futures Jun23 | $ | 10,174,492 | 20.60% | ||||||
| Live Cattle Futures Apr23 | (4,939,074) | -10.00% | ||||||||
| Soybean Futures Mar23 | (4,939,074) | -10.00% | ||||||||
| Natural Gas Futures Mar23 | (9,334,850) | -18.90% | ||||||||
| Gold 100 OZ Futures Apr23 | (9,236,068) | -18.70% | ||||||||
| WTI Crude Futures Apr23 | 8,495,207 | 17.20% | ||||||||
| Corn Futures Mar23 | (8,347,035) | -16.90% | ||||||||
| Brent Crude Futures Mar23 | (7,655,565) | -15.50% | ||||||||
| Brent Crude Futures May23 | 7,507,392 | 15.20% | ||||||||
| Soybean Futures Jul23 | 6,568,968 | 13.30% | ||||||||
| Corn Futures Jul23 | 6,470,187 | 13.10% | ||||||||
| Sugar #11 (World) Jul23 | 3,062,226 | 6.20% | ||||||||
| Sugar #11 (World) May23 | (3,062,226) | -6.20% | ||||||||
The accompanying notes are an integral part of the consolidated financial statements.
69
| THE ADVISORS’ INNER CIRCLE FUND III | FS MULTI-STRATEGY | |||
| ALTERNATIVES FUND | ||||
| DECEMBER 31, 2022 |
| |||
| Top Underlying Components | Notional | Percentage of Notional | ||||||||
| WTI Crude Futures Mar23 | $ | (6,075,061) | -12.30% | |||||||
| Low Su Gasoil G Mar23 | (6,025,670) | -12.20% | ||||||||
| NY Harb ULSD Futures Apr23 | 2,765,881 | 5.60% | ||||||||
| LME Zinc Futures Mar23 | (2,765,881) | -5.60% | ||||||||
| NY Harb ULSD Futures Mar23 | (5,482,372) | -11.10% | ||||||||
| Soybean Oil Futures Mar23 | (5,284,809) | -10.70% | ||||||||
| Silver Futures Mar23 | 5,235,418 | 10.60% | ||||||||
| Cocoa Futures Mar23 | 2,568,318 | 5.20% | ||||||||
| Gasoline RBOB Futures Apr23 | 2,568,318 | 5.20% | ||||||||
| LME Copper Futures Mar23 | (4,988,465) | -10.10% | ||||||||
| LME Copper Futures Apr23 | 4,889,683 | 9.90% | ||||||||
| Lean Hogs Futures Apr23 | 4,790,902 | 9.70% | ||||||||
| Coffee ‘C’ Futures Mar23 | (4,593,339) | -9.30% | ||||||||
| Soybean Oil Futures Jul23 | 4,494,557 | 9.10% | ||||||||
| Corn Futures Dec23 | 2,173,193 | 4.40% | ||||||||
| Soybean Futures Nov23 | 2,173,193 | 4.40% | ||||||||
| Live Cattle Futures Feb23 | (4,346,385) | -8.80% | ||||||||
| LME Nickel Futures Mar23 | (4,198,213) | -8.50% | ||||||||
| LME Nickel Futures Apr23 | 4,148,822 | 8.40% | ||||||||
| KC HRW Wheat Futures Mar23 | (3,753,696) | -7.60% | ||||||||
| LME PRI ALUM Futures Mar23 | (3,605,524) | -7.30% | ||||||||
| LME PRI ALUM Futures Apr23 | 3,556,133 | 7.20% | ||||||||
| Low Su Gasoil G Apr23 | 3,457,352 | 7.00% | ||||||||
| LME Nickel Futures Dec23 | (1,086,596) | -2.20% | ||||||||
| WTI Crude Futures Dec23 | (1,086,596) | -2.20% | ||||||||
| Low Su Gasoil G Dec23 | 1,086,596 | 2.20% | ||||||||
| Live Cattle Futures Jun23 | 3,111,617 | 6.30% | ||||||||
| Soybean Meal Futures Jul23 | 2,963,444 | 6.00% | ||||||||
| Natural Gas Futures Dec23 | 2,914,054 | 5.90% | ||||||||
| Silver Futures May23 | (1,432,331) | -2.90% | ||||||||
| Wheat Future (CBT) Mar23 | (1,432,331) | -2.90% | ||||||||
| LME Zinc Futures Apr23 | 2,716,491 | 5.50% | ||||||||
| Brent Crude Futures Dec23 | 2,617,709 | 5.30% | ||||||||
| Cotton NO.2 Futures Mar23 | 1,284,159 | 2.60% | ||||||||
| LME Copper Futures Dec23 | (1,284,159) | -2.60% | ||||||||
| Sugar #11 (World) Mar23 | (2,518,928) | -5.10% | ||||||||
| Soybean Meal Futures Mar23 | (2,469,537) | -5.00% | ||||||||
| KC HRW Wheat Futures Jul23 | 2,370,755 | 4.80% | ||||||||
| Wheat Future (CBT) Jul23 | 2,271,974 | 4.60% | ||||||||
| Coffee ‘C’ Futures Jul23 | 2,025,020 | 4.10% | ||||||||
| Lean Hogs Futures Feb23 | (1,975,630) | -4.00% | ||||||||
| Lean Hogs Futures Jun23 | 1,728,676 | 3.50% | ||||||||
| Sugar #11 (World) Oct23 | 642,080 | 1.30% | ||||||||
| Gasoline RBOB Futures Jun23 | (642,080) | -1.30% | ||||||||
| Cotton NO.2 Futures May23 | 1,135,987 | 2.30% | ||||||||
| LME PRI ALUM Futures Dec23 | (938,424) | -1.90% | ||||||||
| Soybean Oil Futures Dec23 | 444,517 | 0.90% | ||||||||
| Soybean Meal Futures Dec23 | 444,517 | 0.90% | ||||||||
| NY Harb ULSD Futures Dec23 | 889,033 | 1.80% | ||||||||
| Cotton NO.2 Futures Jul23 | 246,954 | 0.50% | ||||||||
| KC HRW Wheat Futures Dec23 | 246,954 | 0.50% | ||||||||
| Gasoline RBOB Futures Mar23 | 246,954 | 0.50% | ||||||||
| LME Zinc Futures Dec23 | (691,470) | -1.40% | ||||||||
| Coffee ‘C’ Futures May23 | (543,298) | -1.10% | ||||||||
The accompanying notes are an integral part of the consolidated financial statements.
70
| THE ADVISORS’ INNER CIRCLE FUND III | FS MULTI-STRATEGY | |||
| ALTERNATIVES FUND | ||||
| DECEMBER 31, 2022 |
| |||
| Top Underlying Components | Notional | Percentage of Notional | ||||||||
| Sugar #11 (World) Mar24 | $ | 345,735 | 0.70% | |||||||
| Gold 100 OZ Futures Jun23 | 0 | 0.00% | ||||||||
| LME PRI ALUM Futures Jan23 | 0 | 0.00% | ||||||||
| LME Lead Futures Jan23 | 0 | 0.00% | ||||||||
| LME Lead Futures Mar23 | 0 | 0.00% | ||||||||
| LME Lead Futures Apr23 | 0 | 0.00% | ||||||||
| LME Nickel Futures Jan23 | 0 | 0.00% | ||||||||
| LME Zinc Futures Jan23 | 0 | 0.00% | ||||||||
| Low Su Gasoil G Jan23 | 0 | 0.00% | ||||||||
| Soybean Futures Jan23 | 0 | 0.00% | ||||||||
| Wheat Future (CBT) Dec23 | 0 | 0.00% | ||||||||
| Soybean Oil Futures Jan23 | 0 | 0.00% | ||||||||
| LME Lead Futures Dec23 | 0 | 0.00% | ||||||||
| Soybean Meal Futures Jan23 | 0 | 0.00% | ||||||||
**MLEISUVU Index: Seeks to monetize SPX upside implied-to-realized volatility by selling and delta hedging the out of the money options.
|
| |||||||||
| Top Underlying Components | Notional | Percentage of Notional | ||||||||
Spot | US Dollar Spot | $ | 38,676,465 | 98.74% | ||||||
Equity Index | S&P 500 Index | 659,583 | 1.68% | |||||||
Index Option | January 23 4005 Call on SPX | (7,104) | -0.02% | |||||||
| January 23 4010 Call on SPX | (6,638) | -0.02% | ||||||||
| January 23 4000 Call on SPX | (6,531) | -0.02% | ||||||||
| January 23 3995 Call on SPX | (6,274) | -0.02% | ||||||||
| January 23 4015 Call on SPX | (6,240) | -0.02% | ||||||||
| January 23 4020 Call on SPX | (5,778) | �� | -0.01% | |||||||
| January 23 4025 Call on SPX | (5,452) | -0.01% | ||||||||
| January 23 4030 Call on SPX | (5,060) | -0.01% | ||||||||
| January 23 4045 Call on SPX | (5,010) | -0.01% | ||||||||
| January 23 4040 Call on SPX | (4,912) | -0.01% | ||||||||
| January 23 4035 Call on SPX | (4,737) | -0.01% | ||||||||
| January 23 4050 Call on SPX | (4,594) | -0.01% | ||||||||
| January 23 4055 Call on SPX | (4,396) | -0.01% | ||||||||
| January 23 4060 Call on SPX | (4,064) | -0.01% | ||||||||
| January 23 4065 Call on SPX | (3,815) | -0.01% | ||||||||
| January 23 3985 Call on SPX | (3,754) | -0.01% | ||||||||
| January 23 3990 Call on SPX | (3,529) | -0.01% | ||||||||
| January 23 4070 Call on SPX | (3,512) | -0.01% | ||||||||
| January 23 4075 Call on SPX | (3,265) | -0.01% | ||||||||
| January 23 4080 Call on SPX | (3,018) | -0.01% | ||||||||
| January 23 4085 Call on SPX | (2,853) | -0.01% | ||||||||
| January 23 3980 Call on SPX | (2,782) | -0.01% | ||||||||
| January 23 4095 Call on SPX | (2,659) | -0.01% | ||||||||
| January 23 4090 Call on SPX | (2,582) | -0.01% | ||||||||
| January 23 4100 Call on SPX | (2,453) | -0.01% | ||||||||
| January 23 4105 Call on SPX | (2,276) | -0.01% | ||||||||
| January 23 4110 Call on SPX | (2,157) | -0.01% | ||||||||
| January 23 3935 Call on SPX | (2,054) | -0.01% | ||||||||
| January 23 3940 Call on SPX | (1,986) | -0.01% | ||||||||
| January 23 4115 Call on SPX | (1,981) | -0.01% | ||||||||
| January 23 4120 Call on SPX | (1,864) | 0.00% | ||||||||
| January 23 3945 Call on SPX | (1,835) | 0.00% | ||||||||
| January 23 3950 Call on SPX | (1,761) | 0.00% | ||||||||
The accompanying notes are an integral part of the consolidated financial statements.
71
| THE ADVISORS’ INNER CIRCLE FUND III | FS MULTI-STRATEGY | |||
| ALTERNATIVES FUND | ||||
| DECEMBER 31, 2022 |
| |||
| Top Underlying Components | Notional | Percentage of Notional | ||||||||
| January 23 3955 Call on SPX | $ | (1,661) | 0.00% | |||||||
| January 23 4125 Call on SPX | (1,648) | 0.00% | ||||||||
| January 23 4130 Call on SPX | (1,588) | 0.00% | ||||||||
| January 23 3960 Call on SPX | (1,585) | 0.00% | ||||||||
| January 23 3965 Call on SPX | (1,466) | 0.00% | ||||||||
| January 23 4135 Call on SPX | (1,458) | 0.00% | ||||||||
| January 23 3970 Call on SPX | (1,413) | 0.00% | ||||||||
| January 23 4140 Call on SPX | (1,371) | 0.00% | ||||||||
| January 23 3975 Call on SPX | (1,336) | 0.00% | ||||||||
| January 23 4145 Call on SPX | (1,270) | 0.00% | ||||||||
| January 23 4150 Call on SPX | (1,183) | 0.00% | ||||||||
| January 23 4155 Call on SPX | (1,083) | 0.00% | ||||||||
| January 23 4160 Call on SPX | (1,025) | 0.00% | ||||||||
| January 23 4165 Call on SPX | (989) | 0.00% | ||||||||
| January 23 4170 Call on SPX | (957) | 0.00% | ||||||||
| January 23 4175 Call on SPX | (953) | 0.00% | ||||||||
| January 23 4180 Call on SPX | (891) | 0.00% | ||||||||
| January 23 4185 Call on SPX | (872) | 0.00% | ||||||||
| January 23 4195 Call on SPX | (865) | 0.00% | ||||||||
| January 23 4190 Call on SPX | (858) | 0.00% | ||||||||
| January 23 4200 Call on SPX | (790) | 0.00% | ||||||||
| January 23 4205 Call on SPX | (751) | 0.00% | ||||||||
| January 23 4210 Call on SPX | (713) | 0.00% | ||||||||
| January 23 4215 Call on SPX | (693) | 0.00% | ||||||||
| January 23 4220 Call on SPX | (655) | 0.00% | ||||||||
| January 23 4230 Call on SPX | (646) | 0.00% | ||||||||
| January 23 4225 Call on SPX | (617) | 0.00% | ||||||||
| January 23 4300 Call on SPX | (303) | 0.00% | ||||||||
| January 23 4295 Call on SPX | (303) | 0.00% | ||||||||
| January 23 4235 Call on SPX | (603) | 0.00% | ||||||||
| January 23 4240 Call on SPX | (560) | 0.00% | ||||||||
| January 23 4250 Call on SPX | (537) | 0.00% | ||||||||
| January 23 4245 Call on SPX | (518) | 0.00% | ||||||||
| January 23 4255 Call on SPX | (495) | 0.00% | ||||||||
| January 23 4320 Call on SPX | (244) | 0.00% | ||||||||
| January 23 4315 Call on SPX | (244) | 0.00% | ||||||||
| January 23 4260 Call on SPX | (473) | 0.00% | ||||||||
| January 23 4265 Call on SPX | (431) | 0.00% | ||||||||
| January 23 4270 Call on SPX | (409) | 0.00% | ||||||||
| January 23 4275 Call on SPX | (388) | 0.00% | ||||||||
| January 23 4280 Call on SPX | (387) | 0.00% | ||||||||
| January 23 4340 Call on SPX | (376) | 0.00% | ||||||||
| January 23 4285 Call on SPX | (345) | 0.00% | ||||||||
| January 23 4290 Call on SPX | (324) | 0.00% | ||||||||
| January 23 4305 Call on SPX | (302) | 0.00% | ||||||||
| January 23 4330 Call on SPX | (283) | 0.00% | ||||||||
| January 23 4350 Call on SPX | (281) | 0.00% | ||||||||
| January 23 4360 Call on SPX | (279) | 0.00% | ||||||||
| January 23 4310 Call on SPX | (261) | 0.00% | ||||||||
| January 23 4325 Call on SPX | (225) | 0.00% | ||||||||
| January 23 4390 Call on SPX | (198) | 0.00% | ||||||||
| January 23 4400 Call on SPX | (197) | 0.00% | ||||||||
| January 23 4370 Call on SPX | (193) | 0.00% | ||||||||
| January 23 4380 Call on SPX | (170) | 0.00% | ||||||||
The accompanying notes are an integral part of the consolidated financial statements.
72
| THE ADVISORS’ INNER CIRCLE FUND III | FS MULTI-STRATEGY | |||
| ALTERNATIVES FUND | ||||
| DECEMBER 31, 2022 |
| |||
| Top Underlying Components | Notional | Percentage of Notional | ||||||||
| January 23 4410 Call on SPX | $ | (154) | 0.00% | |||||||
| January 23 4510 Call on SPX | (136) | 0.00% | ||||||||
| January 23 4375 Call on SPX | (128) | 0.00% | ||||||||
| January 23 4420 Call on SPX | (109) | 0.00% | ||||||||
| January 23 4480 Call on SPX | (52) | 0.00% | ||||||||
| January 23 4470 Call on SPX | (52) | 0.00% | ||||||||
| January 23 4440 Call on SPX | (97) | 0.00% | ||||||||
| January 23 4450 Call on SPX | (96) | 0.00% | ||||||||
| January 23 4460 Call on SPX | (87) | 0.00% | ||||||||
| January 23 4430 Call on SPX | (78) | 0.00% | ||||||||
| January 23 4490 Call on SPX | (69) | 0.00% | ||||||||
| January 23 4500 Call on SPX | (68) | 0.00% | ||||||||
| January 23 4425 Call on SPX | (65) | 0.00% | ||||||||
| January 23 4475 Call on SPX | (34) | 0.00% | ||||||||
| January 23 4520 Call on SPX | 0 | 0.00% | ||||||||
| January 23 4525 Call on SPX | 0 | 0.00% | ||||||||
| January 23 4530 Call on SPX | 0 | 0.00% | ||||||||
| January 23 4540 Call on SPX | 0 | 0.00% | ||||||||
| January 23 4550 Call on SPX | 0 | 0.00% | ||||||||
| January 23 4560 Call on SPX | 0 | 0.00% | ||||||||
| January 23 4570 Call on SPX | 0 | 0.00% | ||||||||
| January 23 4575 Call on SPX | 0 | 0.00% | ||||||||
| January 23 4580 Call on SPX | 0 | 0.00% | ||||||||
| January 23 4590 Call on SPX | 0 | 0.00% | ||||||||
| January 23 4600 Call on SPX | 0 | 0.00% | ||||||||
| January 23 4610 Call on SPX | 0 | 0.00% | ||||||||
| January 23 4620 Call on SPX | 0 | 0.00% | ||||||||
| January 23 4625 Call on SPX | 0 | 0.00% | ||||||||
| January 23 4650 Call on SPX | 0 | 0.00% | ||||||||
| January 23 4675 Call on SPX | 0 | 0.00% | ||||||||
| January 23 4700 Call on SPX | 0 | 0.00% | ||||||||
| January 23 4725 Call on SPX | 0 | 0.00% | ||||||||
| January 23 4750 Call on SPX | 0 | 0.00% | ||||||||
| January 23 4775 Call on SPX | 0 | 0.00% | ||||||||
| January 23 4800 Call on SPX | 0 | 0.00% | ||||||||
| January 23 4825 Call on SPX | 0 | 0.00% | ||||||||
**MQIS311 Index: An intra-day equity trading strategy that adjusts its exposure based on changes in the level of realized market volatility.
| Top Underlying Components | Notional | Percentage of Notional | ||||
Equity Index | Macquarie Equity Risk Control Congestion Strategy | $49,477,229 | 100.00% |
**MQIS331 Index: Seeks to monetize the tendency for the equity market to mean revert over short periods of time.
| Top Underlying Components | Notional | Percentage of Notional | ||||
Futures | S&P 500 EMINI Futures Mar23 | $0 | 0.00% |
**NMSY2RNU Index: Currency selection strategy using mean reversion signals.
The accompanying notes are an integral part of the consolidated financial statements.
73
| THE ADVISORS’ INNER CIRCLE FUND III | FS MULTI-STRATEGY | |||
| ALTERNATIVES FUND | ||||
| DECEMBER 31, 2022 |
| |||
| Top Underlying Components | Notional | Percentage of Notional | ||||||||
Spot | Japanese Yen Spot | $ | (7,219,379) | -27.93% | ||||||
| British Pound Spot | 3,891,927 | 15.06% | ||||||||
| Canadian Dollar Spot | 2,359,210 | 9.13% | ||||||||
| Euro Spot | (1,957,669) | -7.57% | ||||||||
| Swedish Krona Spot | 1,743,711 | 6.75% | ||||||||
| Swiss Franc Spot | (1,177,322) | -4.55% | ||||||||
| New Zealand Dollar Spot | 727,932 | 2.82% | ||||||||
| Norwegian Krone Spot | (389,696) | -1.51% | ||||||||
| Australian Dollar Spot | (5,322) | -0.02% | ||||||||
**RCXTMGT3 Index: A strategy designed to capture the premium paid by banks to hedge their structured product risk.
| Top Underlying Components | Notional | Percentage of Notional | ||||||||
Futures | TOPIX Index Futures Mar23 | $ | 9,404,243 | 23.12% | ||||||
| Euro STOXX 50 Mar23 | 3,380,158 | 8.31% | ||||||||
| S&P 500 EMINI Futures Mar23 | 0 | 0.00% | ||||||||
| Generic 1st ‘JB’ Future | 0 | 0.00% | ||||||||
| Euro-Bund Futures Mar23 | 0 | 0.00% | ||||||||
| US 10YR Note (CBT)Mar23 | 0 | 0.00% | ||||||||
**RU10INTR Index: Seeks exposure in a stock market index of the 1,000 largest market cap stocks in the Russell 3000 Index, which seeks to be a benchmark of the entire US stock market
| Top Underlying Components | Notional | Percentage of Notional | ||||||
Equity Index | Russell 1000 TR Index | $(41,867,585) | 100.00 | % | ||||
**RU20INTR Index: Seeks exposure in a stock market index of the 2,000 smallest market cap stocks in the Russell 3000 Index, which seeks to be a benchmark of the entire US stock market
| Top Underlying Components | Notional | Percentage of Notional | ||||||
Equity Index | Russell 2000 TR Index | $42,139,035 | 100.00% | |||||
**SGIXUSGC Index: Seeks to monetize the tendency for the equity market to mean revert over short periods of time
| Top Underlying Components | Notional | Percentage of Notional | ||||||
Equity Index | S&P 500 Index | $(2,620,443) | -7.82% | |||||
**SGIXVR2U Index: Systematic strategy that takes advantage of the volatility curve to generate positive carry.
| Top Underlying Components | Notional | Percentage of Notional | ||||||
Derivatives | 1y Forward 2y20y Straddle | $14,287,448 | 34.62% | |||||
| 1y Forward 1y20y Straddle | 13,493,701 | 32.69% | ||||||
| 1y Forward 3y20y Straddle | 5,556,230 | 13.46% | ||||||
| 1y Forward 7y20y Straddle | 3,968,736 | 9.62% | ||||||
| 1y Forward 5y20y Straddle | 2,381,241 | 5.77% | ||||||
| 1y Forward 1y10y Straddle | 396,874 | 0.96% | ||||||
The accompanying notes are an integral part of the consolidated financial statements.
74
| THE ADVISORS’ INNER CIRCLE FUND III | FS MULTI-STRATEGY | |||
| ALTERNATIVES FUND | ||||
| DECEMBER 31, 2022 |
| |||
| Top Underlying Components | Notional | Percentage of Notional | ||||||
| 1y Forward 1y5y Straddle | $396,874 | 0.96% | ||||||
| 1y Forward 10y20y Straddle | 793,747 | 1.92% | ||||||
| **UBCSSUN1 Index: An opportunistic exposure that seeks to take advantage of the high prices of fixed income volatility observed in rising interest rate enviroments. | ||||||||
| Top Underlying Components | Notional | Percentage of Notional | ||||||
Index | UBS Rolling Receiver Interest Rate Swap Index | $15,054,961 | 105.45% | |||||
Equity Index | UBS USD Gamma Spr01 | 14,277,131 | 100.00% | |||||
Swaption | SOFR Swaption USD 0.033306 30Y 01/20/2023 Exp Receive | (341,019) | -2.39% | |||||
| SOFR Swaption USD 0.030433 30Y 01/06/2023 Exp Pay | (334,602) | -2.34% | ||||||
| SOFR Swaption USD 0.03336 30Y 01/31/2023 Exp Receive | (292,453) | -2.05% | ||||||
| SOFR Swaption USD 0.031607 30Y 01/13/2023 Exp Pay | (261,867) | -1.83% | ||||||
| SOFR Swaption USD 0.034729 30Y 02/09/2023 Exp Receive | (257,663) | -1.80% | ||||||
| SOFR Swaption USD 0.031607 30Y 01/13/2023 Exp Receive | (230,635) | -1.62% | ||||||
| SOFR Swaption USD 0.030985 30Y 02/23/2023 Exp Pay | (209,647) | -1.47% | ||||||
| SOFR Swaption USD 0.037921 10Y 01/20/2023 Exp Receive | 206,471 | 1.45% | ||||||
| SOFR Swaption USD 0.036652 10Y 01/13/2023 Exp Receive | 196,785 | 1.38% | ||||||
| SOFR Swaption USD 0.034729 30Y 02/09/2023 Exp Pay | 186,043 | 1.30% | ||||||
| SOFR Swaption USD 0.037116 10Y 01/31/2023 Exp Receive | 166,443 | 1.17% | ||||||
| SOFR Swaption USD 0.029848 30Y 03/21/2023 Exp Receive | 164,535 | 1.15% | ||||||
| SOFR Swaption USD 0.034994 10Y 01/06/2023 Exp Receive | 158,607 | 1.11% | ||||||
| SOFR Swaption USD 0.034994 10Y 01/06/2023 Exp Pay | 148,102 | 1.04% | ||||||
| SOFR Swaption USD 0.029848 30Y 03/21/2023 Exp Pay | (134,345) | -0.94% | ||||||
| SOFR Swaption USD 0.038567 10Y 02/09/2023 Exp Receive | 125,235 | 0.88% | ||||||
| SOFR Swaption USD 0.030433 30Y 01/06/2023 Exp Receive | (112,702) | -0.79% | ||||||
| SOFR Swaption USD 0.034403 10Y 02/23/2023 Exp Pay | 95,573 | 0.67% | ||||||
| SOFR Swaption USD 0.034855 10Y 02/16/2023 Exp Pay | 93,127 | 0.65% | ||||||
| SOFR Swaption USD 0.033064 10Y 03/21/2023 Exp Receive | (91,644) | -0.64% | ||||||
| SOFR Swaption USD 0.032418 30Y 02/16/2023 Exp Pay | (89,412) | -0.63% | ||||||
| SOFR Swaption USD 0.036652 10Y 01/13/2023 Exp Pay | 83,474 | 0.58% | ||||||
| SOFR Swaption USD 0.033064 10Y 03/21/2023 Exp Pay | 73,599 | 0.52% | ||||||
| SOFR Swaption USD 0.038567 10Y 02/09/2023 Exp Pay | (69,406) | -0.49% | ||||||
| SOFR Swaption USD 0.030985 30Y 02/23/2023 Exp Receive | 67,189 | 0.47% | ||||||
| SOFR Swaption USD 0.032418 30Y 02/16/2023 Exp Receive | (64,893) | -0.45% | ||||||
| SOFR Swaption USD 0.033306 30Y 01/20/2023 Exp Pay | (24,197) | -0.17% | ||||||
| SOFR Swaption USD 0.034403 10Y 02/23/2023 Exp Receive | (16,281) | -0.11% | ||||||
| SOFR Swaption USD 0.037921 10Y 01/20/2023 Exp Pay | (13,725) | -0.10% | ||||||
| SOFR Swaption USD 0.035241 10Y 03/29/2023 Exp Receive | (7,426) | -0.05% | ||||||
| SOFR Swaption USD 0.03336 30Y 01/31/2023 Exp Pay | 3,615 | 0.03% | ||||||
| SOFR Swaption USD 0.032253 30Y 03/29/2023 Exp Receive | 3,465 | 0.02% | ||||||
| SOFR Swaption USD 0.035241 10Y 03/29/2023 Exp Pay | 2,419 | 0.02% | ||||||
| SOFR Swaption USD 0.032253 30Y 03/29/2023 Exp Pay | 2,187 | 0.02% | ||||||
| SOFR Swaption USD 0.034855 10Y 02/16/2023 Exp Receive | (1,893) | -0.01% | ||||||
| SOFR Swaption USD 0.037116 10Y 01/31/2023 Exp Pay | (887) | -0.01% | ||||||
**UBCSUFRR Index: A strategy that monetizes the higher prices of puts relative to calls given the preferences of investors for downside protection.
The accompanying notes are an integral part of the consolidated financial statements.
75
| THE ADVISORS’ INNER CIRCLE FUND III | FS MULTI-STRATEGY | |||
| ALTERNATIVES FUND | ||||
| DECEMBER 31, 2022 |
| |||
| Top Underlying Components | Notional | Percentage of Notional | ||||||||
Equity Index | Front End DH Risk Reverse | $ | 19,726,561 | 100.00% | ||||||
Index Option | SPXW UO 01/03/23 C3835 Index | 671,376 | 3.40% | |||||||
| SPXW UO 01/03/23 C3840 Index | 565,522 | 2.87% | ||||||||
| SPXW UO 01/03/23 C3830 Index | 377,588 | 1.91% | ||||||||
| SPXW UO 01/03/23 C3845 Index | 249,511 | 1.26% | ||||||||
| SPXW UO 01/03/23 P3685 Index | (51,822) | -0.26% | ||||||||
| SPXW UO 01/03/23 P3685 Index | (51,822) | -0.26% | ||||||||
| SPXW UO 01/03/23 P3700 Index | (67,368) | -0.34% | ||||||||
| SPXW UO 01/03/23 P3695 Index | (57,004) | -0.29% | ||||||||
| SPXW UO 01/03/23 P3695 Index | (36,292) | -0.18% | ||||||||
| SPXW UO 01/03/23 P3700 Index | (23,309) | -0.12% | ||||||||
The tables below set forth information about the Level within the fair value hierarchy at which the Fund’s investments and other financial instruments are measured at December 31, 2022:
| Investments in Securities | Level 1 (000) | Level 2 (000) | Level 3 (000) | Total (000) | ||||||||||||
Corporate Obligations | $ | — | $ | 127,714 | $ | — | $ | 127,714 | ||||||||
|
|
|
|
|
|
|
| |||||||||
Mortgage-Backed Securities | — | 119,861 | — | 119,861 | ||||||||||||
|
|
|
|
|
|
|
| |||||||||
Common Stock | 48,009 | — | — | 48,009 | ||||||||||||
|
|
|
|
|
|
|
| |||||||||
Asset-Backed Securities | — | 7,473 | — | 7,473 | ||||||||||||
|
|
|
|
|
|
|
| |||||||||
Convertible Bond | — | 284 | — | 284 | ||||||||||||
|
|
|
|
|
|
|
| |||||||||
Short-Term Investment | — | 348,819 | — | 348,819 | ||||||||||||
|
|
|
|
|
|
|
| |||||||||
Total Investments in Securities | $ | 48,009 | $ | 604,151 | $ | — | $ | 652,160 | ||||||||
|
|
|
|
|
|
|
| |||||||||
| Securities Sold Short, Not Yet Purchased | Level 1 (000) | Level 2 (000) | Level 3 (000) | Total (000) | ||||||||||||
Corporate Obligation | $ | — | $ | (11,796 | ) | $ | — | $ | (11,796 | ) | ||||||
|
|
|
|
|
|
|
| |||||||||
Common Stock | (8,109 | ) | — | — | (8,109 | ) | ||||||||||
|
|
|
|
|
|
|
| |||||||||
Exchange Traded Fund | (23,945 | ) | — | — | (23,945 | ) | ||||||||||
|
|
|
|
|
|
|
| |||||||||
Total Securities Sold Short, Not Yet Purchased | $ | (32,054 | ) | $ | (11,796 | ) | $ | — | $ | (43,850 | ) | |||||
|
|
|
|
|
|
|
| |||||||||
The accompanying notes are an integral part of the consolidated financial statements.
76
| THE ADVISORS’ INNER CIRCLE FUND III | FS MULTI-STRATEGY | |||
| ALTERNATIVES FUND | ||||
| DECEMBER 31, 2022 |
| |||
Other Financial Instruments | Level 1 (000) | Level 2 (000) | Level 3 (000) | Total (000) | ||||||||||||
Futures Contracts* | ||||||||||||||||
Unrealized Appreciation | $ | 1,912 | $ | — | $ | – | $ | 1,912 | ||||||||
Unrealized Depreciation | (1,010 | ) | — | — | (1,010 | ) | ||||||||||
Forwards Contracts* | ||||||||||||||||
Unrealized Appreciation | — | 2,364 | — | 2,364 | ||||||||||||
Unrealized Depreciation | — | (2,573 | ) | — | (2,573 | ) | ||||||||||
OTC Swaps | ||||||||||||||||
Total Return Swaps* | ||||||||||||||||
Unrealized Appreciation | — | 12,713 | — | 12,713 | ||||||||||||
Unrealized Depreciation | — | (3,950 | ) | — | (3,950 | ) | ||||||||||
|
|
|
|
|
|
|
| |||||||||
Total Other Financial Instruments | $ | 902 | $ | 8,554 | $ | – | $ | 9,456 | ||||||||
|
|
|
|
|
|
|
| |||||||||
* Futures contracts, forwards contracts and swap contracts are valued at the unrealized appreciation (depreciation) on the instrument.
Amounts designated as “—“ are either $0 or have been rounded to $0.
The accompanying notes are an integral part of the consolidated financial statements.
77
| THE ADVISORS’ INNER CIRCLE FUND III | FS MULTI-STRATEGY | |||
| ALTERNATIVES FUND | ||||
| DECEMBER 31, 2022 |
| |||
At December 31, 2022, sector weightings of the Fund are as follows (Unaudited).
Percentages based on total investments. Total investments do not include derivatives such as options, futures contracts, forward contracts, and swap contracts, if applicable.
| SECTOR WEIGHTINGS | ||
Short-Term Investments | 53.4% | |
Mortgage-Backed Security | 18.4% | |
Consumer Staples | 4.9% | |
Industrials | 4.8% | |
Financials | 4.7% | |
Consumer Discretionary | 3.9% | |
Real Estate | 1.9% | |
Communication Services | 1.5% | |
Energy | 1.5% | |
Information Technology | 1.5% | |
Materials | 1.3% | |
Asset-Backed Security | 1.1% | |
Health Care | 1.1% | |
Utilities | 0.0% | |
| ||
| 100.0% | ||
| ||
For more information on valuation inputs, see Note 2 – Significant Accounting Policies in the Notes to Financial Statements.
See “Glossary” for abbreviations.
The accompanying notes are an integral part of the consolidated financial statements.
78
| THE ADVISORS’ INNER CIRCLE FUND III | FS MANAGED | |||
| FUTURES FUND | ||||
| DECEMBER 31, 2022 |
| |||
| ASSET WEIGHTINGS (UNAUDITED) | |||||||||||||||
% of | Value (000) | ||||||||||||||
Short-Term Investment | 92.1% | $ | 1,766 | ||||||||||||
|
|
|
| ||||||||||||
Total Investments | 92.1 | 1,766 | |||||||||||||
Total Other Assets and Liabilities | 7.9 | 153 | |||||||||||||
|
|
|
| ||||||||||||
Net Assets | 100.0% | $ | 1,919 | ||||||||||||
|
|
|
| ||||||||||||
| *Percentages | are based on Net Assets. |
| CONSOLIDATED SCHEDULE OF INVESTMENTS | ||||||||||||
| (Percentages are based on Net Assets of $1,919 (000)) | ||||||||||||
| SHORT-TERM INVESTMENT — 92.1% | ||||||||||||
| Shares | Fair Value (000) | |||||||||||
State Street Institutional Liquid Reserves Fund - Premier Class | 1,766 | $ | 1,766 | |||||||||
|
| |||||||||||
TOTAL SHORT-TERM INVESTMENT | 1,766 | |||||||||||
|
| |||||||||||
TOTAL INVESTMENTS — 92.1% | $ | 1,766 | ||||||||||
|
| |||||||||||
| (A) | Rate shown is the 7-day effective yield as of December 31, 2022. The State Street Institutional Liquid Reserves Fund’s financial statements are available on the SEC’s website at http://www.sec.gov. |
Open OTC Swaps Contracts held by the Fund at December 31, 2022 are as follows:
| Total Return Swaps | ||||||||||||||||||||||||||||
| Counterparty | Reference Entity/ Obligation | Fund Pays | Fund Receives | Payment Frequency | Termination Date | Currency | Notional Amount (000) | Fair Value (000) | Upfront Payments/ Receipts (000) | Net Unrealized Appreciation (Depreciation) | ||||||||||||||||||
| Bank of America | GSG4 INDEX | SOFR +0.55% | ASSET RETURN | N/A | 04/18/23 | USD | $ | 258 | $ | (22) | $ | – | $ | (22) | ||||||||||||||
| Barclays | **BEFSEB05 INDEX | 0.00% | ASSET RETURN | N/A | 09/22/23 | USD | 452 | (1) | – | (1) | ||||||||||||||||||
Deutsche Bank | **DBVSCVP8 INDEX | 0.00% | ASSET RETURN | N/A | 08/07/23 | USD | 472 | (6) | – | (6) | ||||||||||||||||||
GoldmanBank | **GSXAT01C INDEX | 0.15% | ASSET RETURN | Quarterly | 09/06/23 | USD | 1,176 | 49 | – | 49 | ||||||||||||||||||
The accompanying notes are an integral part of the consolidated financial statements.
79
| THE ADVISORS’ INNER CIRCLE FUND III | FS MANAGED | |||
| FUTURES FUND | ||||
| DECEMBER 31, 2022 |
| |||
| Total Return Swaps | ||||||||||||||||||||||||||||
| Counterparty | Reference Entity/ Obligation | Fund Pays | Fund Receives | Payment Frequency | Termination Date | Currency | Notional Amount (000) | Fair Value (000) | Upfront Payments/ Receipts (000) | Net Unrealized Appreciation (Depreciation) | ||||||||||||||||||
| JPMorgan Chase | **JPQFMOW1 INDEX | 0.00% | ASSET RETURN | N/A | 04/24/23 | USD | $ | 450 | $ | – | $ | – | $ | – | ||||||||||||||
| JPMorgan Chase | **JPUS1MMC INDEX | 0.20% | ASSET RETURN | N/A | 03/06/23 | USD | 482 | 20 | – | 20 | ||||||||||||||||||
| Macquarie Bank Limited | **MQIS331 INDEX | 0.25% | ASSET RETURN | N/A | 03/09/23 | USD | 202 | (1) | – | (1) | ||||||||||||||||||
| Nomura | **NMSY2RNU INDEX | 0.15% | ASSET RETURN | N/A | 03/04/23 | USD | 300 | 6 | – | 6 | ||||||||||||||||||
|
|
|
|
|
|
|
| |||||||||||||||||||||
| $ | 3,792 | $ | 45 | $ | – | $ | 45 | |||||||||||||||||||||
|
|
|
|
|
|
|
| |||||||||||||||||||||
** The following tables represent the individual underlying components comprising the Total Return Swaps at December 31, 2022. All underlying notionals are in U.S. Dollar.
**BEFSEB05 Index: Seeks to capture intraday momentum in global equity markets.
| Top Underlying Components | Notional | Percentage of Notional | ||||||||
Equity Index | Barclays EB05 Desk Strategy | $ | 450,959 | 100.00% | ||||||
**DBVSCVP8 Index: Seeks to monetize short-term interest rate momentum by taking long or short positions in US and European rates markets.
| Top Underlying Components | Notional | Percentage of Notional | ||||||||
Swap | 6m Floating/10y Fixed EUR IRS Swap | $ | (76,143) | -16.33% | ||||||
| 1yr Floating/10yr Fixed USD OIS Swap | $3,231 | 0.69% | ||||||||
**GSXAT01C Index: Future and forward based liquid and fully transparent strategy that is composed of Goldman Sachs’ proprietary strategies across three asset classes – FX Trend, Rates & Bonds Trend, and Equity Trend.
| Top Underlying Components | Notional | Percentage of Notional | ||||||||
Futures | US 2YR Note (CBT) Mar23 | $ | (1,110,185) | -90.62% | ||||||
| Euro-SCHATZ Futures Mar23 | (864,316) | -70.55% | ||||||||
| 3 Month SOFR Futures Jun24 | (362,807) | -29.62% | ||||||||
| 3 Month SOFR Futures Mar24 | (361,269) | -29.49% | ||||||||
| 3 Month SOFR Futures Dec23 | (359,619) | -29.36% | ||||||||
| 3 Month SOFR Futures Sep23 | (358,364) | -29.25% | ||||||||
| 3 Month SOFR Futures Jun23 | (357,620) | -29.19% | ||||||||
| JPN 10Y Bond(OSE) Mar23 | (337,178) | -27.52% | ||||||||
| 3 Month Euro EURIBOR Jun24 | (279,693) | -22.83% | ||||||||
| 3 Month Euro EURIBOR Mar24 | (279,245) | -22.79% | ||||||||
| 3 Month Euro EURIBOR Jun23 | (278,954) | -22.77% | ||||||||
| 3 Month Euro EURIBOR Dec23 | (278,826) | -22.76% | ||||||||
| 3 Month Euro EURIBOR Sep23 | (278,637) | -22.75% | ||||||||
| US 5YR Note (CBT) Mar23 | (265,511) | -21.67% | ||||||||
| ICE 3 Month SONIA Futures Jun24 | (183,998) | -15.02% | ||||||||
| ICE 3 Month SONIA Futures Mar24 | (183,672) | -14.99% | ||||||||
| ICE 3 Month SONIA Futures Jun23 | (183,539) | -14.98% | ||||||||
| ICE 3 Month SONIA Futures Dec23 | (183,421) | -14.97% | ||||||||
The accompanying notes are an integral part of the consolidated financial statements.
80
| THE ADVISORS’ INNER CIRCLE FUND III | FS MANAGED | |||
| FUTURES FUND | ||||
| DECEMBER 31, 2022 |
| |||
| Top Underlying Components | Notional | Percentage of Notional | ||||||||
| ICE 3 Month SONIA Futures Sep23 | $(183,333) | -14.97% | ||||||||
| US 10YR Note (CBT)Mar23 | (181,237) | -14.79% | ||||||||
| Euro-BOBL Futures Mar23 | (174,240) | -14.22% | ||||||||
| SPI 200 Futures Jan23 | 99,885 | 8.15% | ||||||||
| Euro-Bund Futures Mar23 | (99,584) | -8.13% | ||||||||
| Euro-OAT Futures Mar23 | (91,145) | -7.44% | ||||||||
| KOSPI2 INX Futures Mar23 | (90,495) | -7.39% | ||||||||
| US LONG Bond(CBT) Mar23 | (88,253) | -7.20% | ||||||||
| CAN 10YR Bond Futures Mar23 | (80,095) | -6.54% | ||||||||
| FTSE 100 Index Futures Mar23 | 75,303 | 6.15% | ||||||||
| AUST 10Y Bond Futures Mar23 | (74,086) | -6.05% | ||||||||
| SET50 Futures Mar23 | 72,992 | 5.96% | ||||||||
| Euro-BTP Futures Mar23 | (65,735) | -5.37% | ||||||||
| FTSE/JSE TOP 40 Mar23 | 57,925 | 4.73% | ||||||||
| NASDAQ 100 E-MINI Mar23 | (56,194) | -4.59% | ||||||||
| E-Mini Russ 2000 Mar23 | (53,615) | -4.38% | ||||||||
| CAC40 10 Euro Futures Jan23 | 51,793 | 4.23% | ||||||||
| Long Gilt Futures Mar23 | (49,519) | -4.04% | ||||||||
| Euro STOXX 50 Mar23 | 49,279 | 4.02% | ||||||||
| MSCI EmgMarket Mar23 | (48,149) | -3.93% | ||||||||
| OMXS30 Index Futures Jan23 | 47,045 | 3.84% | ||||||||
| Swiss Market Index Futures Mar23 | (44,662) | -3.65% | ||||||||
| S&P 500 EMINI Futures Mar23 | (42,684) | -3.48% | ||||||||
| IBEX 35 Index Futures Jan23 | 42,323 | 3.45% | ||||||||
| FTSE/MIB Index Futures Mar23 | 42,191 | 3.44% | ||||||||
| AMSTERDAM Index Futures Jan23 | 42,078 | 3.43% | ||||||||
| S&P/TSX 60 Index Futures Mar23 | (41,325) | -3.37% | ||||||||
| DAX Index Futures Mar23 | 35,141 | 2.87% | ||||||||
| Hang Seng Index Futures Jan23 | 22,901 | 1.87% | ||||||||
| HSCEI Futures Jan23 | 18,023 | 1.47% | ||||||||
| TOPIX Index Futures Mar23 | 3,702 | 0.30% | ||||||||
FX Contract | USD/CAD 19 Jan 2023 | (12,076) | -0.99% | |||||||
| USD/CAD 10 Jan 2023 | (12,076) | -0.99% | ||||||||
| USD/CAD 09 Jan 2023 | (12,076) | -0.99% | ||||||||
| USD/CAD 11 Jan 2023 | (12,076) | -0.99% | ||||||||
| USD/CAD 18 Jan 2023 | (12,076) | -0.99% | ||||||||
| USD/CAD 20 Jan 2023 | (12,076) | -0.99% | ||||||||
| USD/CAD 23 Jan 2023 | (12,076) | -0.99% | ||||||||
| USD/CAD 06 Jan 2023 | (12,076) | -0.99% | ||||||||
| USD/CAD 17 Jan 2023 | (12,076) | -0.99% | ||||||||
| USD/CAD 24 Jan 2023 | (12,076) | -0.99% | ||||||||
| USD/SGD 19 Jan 2023 | 11,488 | 0.94% | ||||||||
| USD/SGD 27 Jan 2023 | 11,488 | 0.94% | ||||||||
| USD/SGD 30 Jan 2023 | 11,488 | 0.94% | ||||||||
| USD/SGD 05 Jan 2023 | 11,488 | 0.94% | ||||||||
| USD/SGD 25 Jan 2023 | 11,488 | 0.94% | ||||||||
| USD/SGD 18 Jan 2023 | 11,488 | 0.94% | ||||||||
| USD/SGD 26 Jan 2023 | 11,488 | 0.94% | ||||||||
| USD/SGD 01 Feb 2023 | 11,488 | 0.94% | ||||||||
| USD/CAD 16 Jan 2023 | (12,077) | -0.99% | ||||||||
| USD/CAD 13 Jan 2023 | (12,077) | -0.99% | ||||||||
| USD/CAD 05 Jan 2023 | (12,077) | -0.99% | ||||||||
| USD/CAD 12 Jan 2023 | (12,077) | -0.99% | ||||||||
| USD/CAD 25 Jan 2023 | (12,077) | -0.99% | ||||||||
The accompanying notes are an integral part of the consolidated financial statements.
81
| THE ADVISORS’ INNER CIRCLE FUND III | FS MANAGED | |||
| FUTURES FUND | ||||
| DECEMBER 31, 2022 |
| |||
| Top Underlying Components | Notional | Percentage of Notional | ||||||||
| USD/CAD 27 Jan 2023 | $ | (12,077) | -0.99% | |||||||
| USD/CAD 26 Jan 2023 | (12,077) | -0.99% | ||||||||
| USD/EUR 16 Jan 2023 | 4,949 | 0.40% | ||||||||
| USD/EUR 27 Jan 2023 | 4,949 | 0.40% | ||||||||
| USD/EUR 30 Jan 2023 | 4,949 | 0.40% | ||||||||
| USD/EUR 31 Jan 2023 | 4,949 | 0.40% | ||||||||
| USD/EUR 09 Jan 2023 | 4,949 | 0.40% | ||||||||
| USD/EUR 11 Jan 2023 | 4,949 | 0.40% | ||||||||
| USD/EUR 13 Jan 2023 | 4,949 | 0.40% | ||||||||
| USD/EUR 10 Jan 2023 | 4,949 | 0.40% | ||||||||
| USD/EUR 12 Jan 2023 | 4,949 | 0.40% | ||||||||
| USD/EUR 17 Jan 2023 | 4,949 | 0.40% | ||||||||
| USD/EUR 26 Jan 2023 | 4,949 | 0.40% | ||||||||
| USD/EUR 18 Jan 2023 | 4,949 | 0.40% | ||||||||
| USD/EUR 20 Jan 2023 | 4,949 | 0.40% | ||||||||
| USD/EUR 23 Jan 2023 | 4,949 | 0.40% | ||||||||
| USD/EUR 25 Jan 2023 | 4,949 | 0.40% | ||||||||
| USD/EUR 19 Jan 2023 | 4,949 | 0.40% | ||||||||
| USD/EUR 24 Jan 2023 | 4,949 | 0.40% | ||||||||
| USD/MXN 31 Jan 2023 | 6,283 | 0.51% | ||||||||
| USD/MXN 06 Jan 2023 | 6,283 | 0.51% | ||||||||
| USD/MXN 24 Jan 2023 | 6,283 | 0.51% | ||||||||
| USD/MXN 09 Jan 2023 | 6,283 | 0.51% | ||||||||
| USD/MXN 23 Jan 2023 | 6,283 | 0.51% | ||||||||
| USD/MXN 10 Jan 2023 | 6,283 | 0.51% | ||||||||
| USD/MXN 18 Jan 2023 | 6,283 | 0.51% | ||||||||
| USD/MXN 12 Jan 2023 | 6,283 | 0.51% | ||||||||
| USD/MXN 20 Jan 2023 | 6,283 | 0.51% | ||||||||
| USD/MXN 19 Jan 2023 | 6,283 | 0.51% | ||||||||
| USD/MXN 11 Jan 2023 | 6,283 | 0.51% | ||||||||
| USD/MXN 13 Jan 2023 | 6,283 | 0.51% | ||||||||
| USD/MXN 01 Feb 2023 | 6,283 | 0.51% | ||||||||
| USD/CNH 18 Jan 2023 | (6,788) | -0.55% | ||||||||
| USD/CNH 30 Jan 2023 | (6,788) | -0.55% | ||||||||
| USD/CNH 16 Jan 2023 | (6,788) | -0.55% | ||||||||
| USD/CNH 19 Jan 2023 | (6,788) | -0.55% | ||||||||
| USD/CNH 23 Jan 2023 | (6,788) | -0.55% | ||||||||
| USD/CNH 20 Jan 2023 | (6,788) | -0.55% | ||||||||
| USD/CNH 11 Jan 2023 | (6,788) | -0.55% | ||||||||
| USD/CNH 06 Jan 2023 | (6,788) | -0.55% | ||||||||
| USD/CNH 27 Jan 2023 | (6,788) | -0.55% | ||||||||
| USD/CNH 31 Jan 2023 | (6,788) | -0.55% | ||||||||
| USD/CNH 10 Jan 2023 | (6,788) | -0.55% | ||||||||
| USD/CNH 26 Jan 2023 | (6,788) | -0.55% | ||||||||
| USD/SGD 12 Jan 2023 | 11,489 | 0.94% | ||||||||
| USD/SGD 31 Jan 2023 | 11,489 | 0.94% | ||||||||
| USD/SGD 09 Jan 2023 | 11,489 | 0.94% | ||||||||
| USD/SGD 16 Jan 2023 | 11,489 | 0.94% | ||||||||
| USD/SGD 17 Jan 2023 | 11,489 | 0.94% | ||||||||
| USD/SGD 24 Jan 2023 | 11,489 | 0.94% | ||||||||
| USD/SGD 06 Jan 2023 | 11,489 | 0.94% | ||||||||
| USD/AUD 10 Jan 2023 | (3,454) | -0.28% | ||||||||
| USD/AUD 09 Jan 2023 | (3,454) | -0.28% | ||||||||
| USD/AUD 06 Jan 2023 | (3,454) | -0.28% | ||||||||
The accompanying notes are an integral part of the consolidated financial statements.
82
| THE ADVISORS’ INNER CIRCLE FUND III | FS MANAGED | |||
| FUTURES FUND | ||||
| DECEMBER 31, 2022 |
| |||
| Top Underlying Components | Notional | Percentage of Notional | ||||||||
| USD/AUD 11 Jan 2023 | $(3,454) | -0.28% | ||||||||
| USD/AUD 05 Jan 2023 | (3,454) | -0.28% | ||||||||
| USD/AUD 20 Jan 2023 | (3,454) | -0.28% | ||||||||
| USD/AUD 19 Jan 2023 | (3,454) | -0.28% | ||||||||
| USD/AUD 18 Jan 2023 | (3,454) | -0.28% | ||||||||
| USD/AUD 12 Jan 2023 | (3,454) | -0.28% | ||||||||
| USD/AUD 17 Jan 2023 | (3,454) | -0.28% | ||||||||
| USD/AUD 04 Jan 2023 | (3,454) | -0.28% | ||||||||
| USD/AUD 16 Jan 2023 | (3,454) | -0.28% | ||||||||
| USD/AUD 13 Jan 2023 | (3,454) | -0.28% | ||||||||
| USD/AUD 23 Jan 2023 | (3,454) | -0.28% | ||||||||
| USD/AUD 25 Jan 2023 | (3,454) | -0.28% | ||||||||
| USD/AUD 01 Feb 2023 | (3,454) | -0.28% | ||||||||
| USD/AUD 26 Jan 2023 | (3,454) | -0.28% | ||||||||
| USD/AUD 24 Jan 2023 | (3,454) | -0.28% | ||||||||
| USD/AUD 30 Jan 2023 | (3,454) | -0.28% | ||||||||
| USD/AUD 31 Jan 2023 | (3,454) | -0.28% | ||||||||
| USD/AUD 27 Jan 2023 | (3,454) | -0.28% | ||||||||
| USD/AUD 03 Jan 2023 | (3,454) | -0.28% | ||||||||
| USD/CHF 11 Jan 2023 | 6,212 | 0.51% | ||||||||
| USD/CHF 16 Jan 2023 | 6,212 | 0.51% | ||||||||
| USD/CHF 06 Jan 2023 | 6,212 | 0.51% | ||||||||
| USD/CHF 13 Jan 2023 | 6,212 | 0.51% | ||||||||
| USD/CHF 12 Jan 2023 | 6,212 | 0.51% | ||||||||
| USD/CHF 26 Jan 2023 | 6,212 | 0.51% | ||||||||
| USD/CHF 25 Jan 2023 | 6,212 | 0.51% | ||||||||
| USD/CHF 17 Jan 2023 | 6,212 | 0.51% | ||||||||
| USD/CHF 23 Jan 2023 | 6,212 | 0.51% | ||||||||
| USD/CHF 24 Jan 2023 | 6,212 | 0.51% | ||||||||
| USD/CHF 20 Jan 2023 | 6,212 | 0.51% | ||||||||
| USD/CNH 12 Jan 2023 | (6,787) | -0.55% | ||||||||
| USD/CNH 13 Jan 2023 | (6,787) | -0.55% | ||||||||
| USD/CNH 01 Feb 2023 | (6,787) | -0.55% | ||||||||
| USD/CNH 25 Jan 2023 | (6,787) | -0.55% | ||||||||
| USD/CNH 04 Jan 2023 | (6,787) | -0.55% | ||||||||
| USD/CNH 17 Jan 2023 | (6,787) | -0.55% | ||||||||
| USD/CNH 03 Jan 2023 | (6,787) | -0.55% | ||||||||
| USD/CNH 09 Jan 2023 | (6,787) | -0.55% | ||||||||
| USD/CNH 05 Jan 2023 | (6,787) | -0.55% | ||||||||
| USD/NZD 03 Jan 2023 | 4,102 | 0.33% | ||||||||
| USD/NZD 04 Jan 2023 | 4,102 | 0.33% | ||||||||
| USD/NZD 05 Jan 2023 | 4,102 | 0.33% | ||||||||
| USD/NZD 30 Jan 2023 | 4,102 | 0.33% | ||||||||
| USD/NZD 01 Feb 2023 | 4,102 | 0.33% | ||||||||
| USD/NZD 27 Jan 2023 | 4,102 | 0.33% | ||||||||
| USD/NZD 31 Jan 2023 | 4,102 | 0.33% | ||||||||
| USD/NZD 06 Jan 2023 | 4,102 | 0.33% | ||||||||
| USD/NZD 16 Jan 2023 | 4,102 | 0.33% | ||||||||
| USD/NZD 17 Jan 2023 | 4,102 | 0.33% | ||||||||
| USD/NZD 18 Jan 2023 | 4,102 | 0.33% | ||||||||
| USD/NZD 09 Jan 2023 | 4,102 | 0.33% | ||||||||
| USD/NZD 13 Jan 2023 | 4,102 | 0.33% | ||||||||
| USD/CHF 30 Jan 2023 | 6,213 | 0.51% | ||||||||
| USD/CHF 01 Feb 2023 | 6,213 | 0.51% | ||||||||
The accompanying notes are an integral part of the consolidated financial statements.
83
| THE ADVISORS’ INNER CIRCLE FUND III | FS MANAGED | |||
| FUTURES FUND | ||||
| DECEMBER 31, 2022 |
| |||
| Top Underlying Components | Notional | Percentage of Notional | ||||||||
| USD/CHF 04 Jan 2023 | $6,213 | 0.51% | ||||||||
| USD/CHF 31 Jan 2023 | 6,213 | 0.51% | ||||||||
| USD/CHF 27 Jan 2023 | 6,213 | 0.51% | ||||||||
| USD/CHF 10 Jan 2023 | 6,213 | 0.51% | ||||||||
| USD/CHF 09 Jan 2023 | 6,213 | 0.51% | ||||||||
| USD/CHF 05 Jan 2023 | 6,213 | 0.51% | ||||||||
| USD/ILS 26 Jan 2023 | (4,880) | -0.40% | ||||||||
| USD/ILS 25 Jan 2023 | (4,880) | -0.40% | ||||||||
| USD/ILS 24 Jan 2023 | (4,880) | -0.40% | ||||||||
| USD/ILS 17 Jan 2023 | (4,880) | -0.40% | ||||||||
| USD/ILS 23 Jan 2023 | (4,880) | -0.40% | ||||||||
| USD/ILS 30 Jan 2023 | (4,880) | -0.40% | ||||||||
| USD/ILS 16 Jan 2023 | (4,880) | -0.40% | ||||||||
| USD/ILS 27 Jan 2023 | (4,880) | -0.40% | ||||||||
| USD/ILS 13 Jan 2023 | (4,880) | -0.40% | ||||||||
| USD/ILS 12 Jan 2023 | (4,880) | -0.40% | ||||||||
| USD/INR 05 Jan 2023 | (14,509) | -1.18% | ||||||||
| USD/INR 13 Jan 2023 | (14,509) | -1.18% | ||||||||
| USD/INR 11 Jan 2023 | (14,509) | -1.18% | ||||||||
| USD/INR 19 Jan 2023 | (14,508) | -1.18% | ||||||||
| USD/INR 10 Jan 2023 | (14,508) | -1.18% | ||||||||
| USD/INR 09 Jan 2023 | (14,508) | -1.18% | ||||||||
| USD/SEK 12 Jan 2023 | (3,347) | -0.27% | ||||||||
| USD/SEK 13 Jan 2023 | (3,347) | -0.27% | ||||||||
| USD/SEK 11 Jan 2023 | (3,347) | -0.27% | ||||||||
| USD/SEK 30 Jan 2023 | (3,347) | -0.27% | ||||||||
| USD/SEK 27 Jan 2023 | (3,347) | -0.27% | ||||||||
| USD/SEK 17 Jan 2023 | (3,347) | -0.27% | ||||||||
| USD/SEK 16 Jan 2023 | (3,347) | -0.27% | ||||||||
| USD/SEK 01 Feb 2023 | (3,347) | -0.27% | ||||||||
| USD/SEK 10 Jan 2023 | (3,347) | -0.27% | ||||||||
| USD/SEK 09 Jan 2023 | (3,347) | -0.27% | ||||||||
| USD/SEK 04 Jan 2023 | (3,347) | -0.27% | ||||||||
| USD/SEK 06 Jan 2023 | (3,347) | -0.27% | ||||||||
| USD/SEK 05 Jan 2023 | (3,347) | -0.27% | ||||||||
| USD/MXN 04 Jan 2023 | 6,284 | 0.51% | ||||||||
| USD/MXN 27 Jan 2023 | 6,284 | 0.51% | ||||||||
| USD/MXN 26 Jan 2023 | 6,284 | 0.51% | ||||||||
| USD/MXN 30 Jan 2023 | 6,284 | 0.51% | ||||||||
| USD/MXN 05 Jan 2023 | 6,284 | 0.51% | ||||||||
| USD/MXN 25 Jan 2023 | 6,284 | 0.51% | ||||||||
| USD/NZD 10 Jan 2023 | 4,101 | 0.33% | ||||||||
| USD/NZD 19 Jan 2023 | 4,101 | 0.33% | ||||||||
| USD/NZD 11 Jan 2023 | 4,101 | 0.33% | ||||||||
| USD/NZD 12 Jan 2023 | 4,101 | 0.33% | ||||||||
| USD/NZD 23 Jan 2023 | 4,101 | 0.33% | ||||||||
| USD/NZD 26 Jan 2023 | 4,101 | 0.33% | ||||||||
| USD/NZD 24 Jan 2023 | 4,101 | 0.33% | ||||||||
| USD/NZD 20 Jan 2023 | 4,101 | 0.33% | ||||||||
| USD/NZD 25 Jan 2023 | 4,101 | 0.33% | ||||||||
| USD/CZK 10 Jan 2023 | 5,239 | 0.43% | ||||||||
| USD/CZK 11 Jan 2023 | 5,239 | 0.43% | ||||||||
| USD/CZK 05 Jan 2023 | 5,239 | 0.43% | ||||||||
| USD/CZK 06 Jan 2023 | 5,239 | 0.43% | ||||||||
The accompanying notes are an integral part of the consolidated financial statements.
84
| THE ADVISORS’ INNER CIRCLE FUND III | FS MANAGED | |||
| FUTURES FUND | ||||
| DECEMBER 31, 2022 |
| |||
| Top Underlying Components | Notional | Percentage of Notional | ||||||||
| USD/CZK 09 Jan 2023 | $5,239 | 0.43% | ||||||||
| USD/CZK 04 Jan 2023 | 5,239 | 0.43% | ||||||||
| USD/CZK 12 Jan 2023 | 5,239 | 0.43% | ||||||||
| USD/CAD 30 Jan 2023 | (12,078) | -0.99% | ||||||||
| USD/CAD 01 Feb 2023 | (12,078) | -0.99% | ||||||||
| USD/CAD 31 Jan 2023 | (12,078) | -0.99% | ||||||||
| USD/SGD 11 Jan 2023 | 11,490 | 0.94% | ||||||||
| USD/SGD 13 Jan 2023 | 11,490 | 0.94% | ||||||||
| USD/SGD 10 Jan 2023 | 11,490 | 0.94% | ||||||||
| USD/SGD 23 Jan 2023 | 11,487 | 0.94% | ||||||||
| USD/SGD 20 Jan 2023 | 11,487 | 0.94% | ||||||||
| USD/SGD 04 Jan 2023 | 11,487 | 0.94% | ||||||||
| USD/NOK 20 Jan 2023 | (1,673) | -0.14% | ||||||||
| USD/NOK 23 Jan 2023 | (1,673) | -0.14% | ||||||||
| USD/NOK 16 Jan 2023 | (1,673) | -0.14% | ||||||||
| USD/NOK 19 Jan 2023 | (1,673) | -0.14% | ||||||||
| USD/NOK 24 Jan 2023 | (1,673) | -0.14% | ||||||||
| USD/NOK 17 Jan 2023 | (1,673) | -0.14% | ||||||||
| USD/NOK 25 Jan 2023 | (1,673) | -0.14% | ||||||||
| USD/NOK 13 Jan 2023 | (1,673) | -0.14% | ||||||||
| USD/NOK 18 Jan 2023 | (1,673) | -0.14% | ||||||||
| USD/NOK 11 Jan 2023 | (1,673) | -0.14% | ||||||||
| USD/NOK 26 Jan 2023 | (1,673) | -0.14% | ||||||||
| USD/NOK 01 Feb 2023 | (1,673) | -0.14% | ||||||||
| USD/NOK 27 Jan 2023 | (1,673) | -0.14% | ||||||||
| USD/NOK 30 Jan 2023 | (1,673) | -0.14% | ||||||||
| USD/NOK 12 Jan 2023 | (1,673) | -0.14% | ||||||||
| USD/NOK 31 Jan 2023 | (1,673) | -0.14% | ||||||||
| USD/NOK 10 Jan 2023 | (1,673) | -0.14% | ||||||||
| USD/NOK 09 Jan 2023 | (1,673) | -0.14% | ||||||||
| USD/NOK 06 Jan 2023 | (1,673) | -0.14% | ||||||||
| USD/CZK 16 Jan 2023 | 5,237 | 0.43% | ||||||||
| USD/CZK 17 Jan 2023 | 5,237 | 0.43% | ||||||||
| USD/CZK 31 Jan 2023 | 5,237 | 0.43% | ||||||||
| USD/CZK 18 Jan 2023 | 5,237 | 0.43% | ||||||||
| USD/CZK 25 Jan 2023 | 5,237 | 0.43% | ||||||||
| USD/CZK 23 Jan 2023 | 5,237 | 0.43% | ||||||||
| USD/ILS 06 Jan 2023 | (4,882) | -0.40% | ||||||||
| USD/ILS 05 Jan 2023 | (4,882) | -0.40% | ||||||||
| USD/ILS 09 Jan 2023 | (4,882) | -0.40% | ||||||||
| USD/ILS 11 Jan 2023 | (4,882) | -0.40% | ||||||||
| USD/ILS 10 Jan 2023 | (4,882) | -0.40% | ||||||||
| USD/ILS 03 Jan 2023 | (4,882) | -0.40% | ||||||||
| USD/INR 16 Jan 2023 | (14,514) | -1.18% | ||||||||
| USD/INR 31 Jan 2023 | (14,514) | -1.18% | ||||||||
| USD/INR 24 Jan 2023 | (14,512) | -1.18% | ||||||||
| USD/INR 12 Jan 2023 | (14,512) | -1.18% | ||||||||
| USD/INR 25 Jan 2023 | (14,511) | -1.18% | ||||||||
| USD/INR 30 Jan 2023 | (14,511) | -1.18% | ||||||||
| USD/INR 27 Jan 2023 | (29,018) | -2.37% | ||||||||
| USD/INR 03 Jan 2023 | (14,506) | -1.18% | ||||||||
| USD/INR 17 Jan 2023 | (14,506) | -1.18% | ||||||||
| USD/INR 04 Jan 2023 | (14,504) | -1.18% | ||||||||
| USD/INR 06 Jan 2023 | (14,504) | -1.18% | ||||||||
The accompanying notes are an integral part of the consolidated financial statements.
85
| THE ADVISORS’ INNER CIRCLE FUND III | FS MANAGED | |||
| FUTURES FUND | ||||
| DECEMBER 31, 2022 |
| |||
| Top Underlying Components | Notional | Percentage of Notional | ||||||||
| USD/CLP 06 Jan 2023 | $2,567 | 0.21% | ||||||||
| USD/CLP 03 Jan 2023 | 2,567 | 0.21% | ||||||||
| USD/CLP 23 Jan 2023 | 2,567 | 0.21% | ||||||||
| USD/CLP 25 Jan 2023 | 2,567 | 0.21% | ||||||||
| USD/CLP 05 Jan 2023 | 2,567 | 0.21% | ||||||||
| USD/CLP 11 Jan 2023 | 2,567 | 0.21% | ||||||||
| USD/CLP 09 Jan 2023 | 2,567 | 0.21% | ||||||||
| USD/CLP 10 Jan 2023 | 2,567 | 0.21% | ||||||||
| USD/CLP 24 Jan 2023 | 2,567 | 0.21% | ||||||||
| USD/CLP 20 Jan 2023 | 2,567 | 0.21% | ||||||||
| USD/CLP 04 Jan 2023 | 2,567 | 0.21% | ||||||||
| USD/SEK 25 Jan 2023 | (3,346) | -0.27% | ||||||||
| USD/SEK 24 Jan 2023 | (3,346) | -0.27% | ||||||||
| USD/SEK 26 Jan 2023 | (3,346) | -0.27% | ||||||||
| USD/SEK 20 Jan 2023 | (3,346) | -0.27% | ||||||||
| USD/SEK 19 Jan 2023 | (3,346) | -0.27% | ||||||||
| USD/SEK 23 Jan 2023 | (3,346) | -0.27% | ||||||||
| USD/SEK 18 Jan 2023 | (3,346) | -0.27% | ||||||||
| USD/SEK 31 Jan 2023 | (3,346) | -0.27% | ||||||||
| USD/GBP 19 Jan 2023 | (1,220) | -0.10% | ||||||||
| USD/GBP 18 Jan 2023 | (1,220) | -0.10% | ||||||||
| USD/GBP 20 Jan 2023 | (1,220) | -0.10% | ||||||||
| USD/GBP 17 Jan 2023 | (1,220) | -0.10% | ||||||||
| USD/GBP 24 Jan 2023 | (1,220) | -0.10% | ||||||||
| USD/GBP 23 Jan 2023 | (1,220) | -0.10% | ||||||||
| USD/GBP 09 Jan 2023 | (1,220) | -0.10% | ||||||||
| USD/GBP 10 Jan 2023 | (1,220) | -0.10% | ||||||||
| USD/GBP 06 Jan 2023 | (1,220) | -0.10% | ||||||||
| USD/GBP 13 Jan 2023 | (1,220) | -0.10% | ||||||||
| USD/GBP 16 Jan 2023 | (1,220) | -0.10% | ||||||||
| USD/GBP 11 Jan 2023 | (1,220) | -0.10% | ||||||||
| USD/GBP 12 Jan 2023 | (1,220) | -0.10% | ||||||||
| USD/GBP 05 Jan 2023 | (1,220) | -0.10% | ||||||||
| USD/GBP 25 Jan 2023 | (1,220) | -0.10% | ||||||||
| USD/GBP 26 Jan 2023 | (1,220) | -0.10% | ||||||||
| USD/GBP 01 Feb 2023 | (1,220) | -0.10% | ||||||||
| USD/GBP 30 Jan 2023 | (1,220) | -0.10% | ||||||||
| USD/GBP 27 Jan 2023 | (1,220) | -0.10% | ||||||||
| USD/GBP 04 Jan 2023 | (1,220) | -0.10% | ||||||||
| USD/GBP 31 Jan 2023 | (1,220) | -0.10% | ||||||||
| USD/BRL 27 Jan 2023 | 2,780 | 0.23% | ||||||||
| USD/BRL 03 Jan 2023 | 2,780 | 0.23% | ||||||||
| USD/BRL 13 Jan 2023 | 2,780 | 0.23% | ||||||||
| USD/BRL 30 Jan 2023 | 2,780 | 0.23% | ||||||||
| USD/BRL 04 Jan 2023 | 2,780 | 0.23% | ||||||||
| USD/BRL 23 Jan 2023 | 2,780 | 0.23% | ||||||||
| USD/BRL 18 Jan 2023 | 2,780 | 0.23% | ||||||||
| USD/BRL 06 Jan 2023 | 2,780 | 0.23% | ||||||||
| USD/BRL 19 Jan 2023 | 2,780 | 0.23% | ||||||||
| USD/ILS 20 Jan 2023 | (4,881) | -0.40% | ||||||||
| USD/ILS 19 Jan 2023 | (4,881) | -0.40% | ||||||||
| USD/ILS 18 Jan 2023 | (4,881) | -0.40% | ||||||||
| USD/ILS 31 Jan 2023 | (4,881) | -0.40% | ||||||||
| USD/ILS 01 Feb 2023 | (4,881) | -0.40% | ||||||||
The accompanying notes are an integral part of the consolidated financial statements.
86
| THE ADVISORS’ INNER CIRCLE FUND III | FS MANAGED | |||
| FUTURES FUND | ||||
| DECEMBER 31, 2022 |
| |||
| Top Underlying Components | Notional | Percentage of Notional | ||||||||
| USD/ZAR 27 Jan 2023 | $1,434 | 0.12% | ||||||||
| USD/ZAR 19 Jan 2023 | 1,434 | 0.12% | ||||||||
| USD/ZAR 17 Jan 2023 | 1,434 | 0.12% | ||||||||
| USD/ZAR 18 Jan 2023 | 1,434 | 0.12% | ||||||||
| USD/ZAR 31 Jan 2023 | 1,434 | 0.12% | ||||||||
| USD/ZAR 01 Feb 2023 | 1,434 | 0.12% | ||||||||
| USD/ZAR 30 Jan 2023 | 1,434 | 0.12% | ||||||||
| USD/ZAR 16 Jan 2023 | 1,434 | 0.12% | ||||||||
| USD/ZAR 13 Jan 2023 | 1,434 | 0.12% | ||||||||
| USD/ZAR 12 Jan 2023 | 1,434 | 0.12% | ||||||||
| USD/ZAR 11 Jan 2023 | 1,434 | 0.12% | ||||||||
| USD/ZAR 06 Jan 2023 | 1,434 | 0.12% | ||||||||
| USD/ZAR 10 Jan 2023 | 1,434 | 0.12% | ||||||||
| USD/ZAR 05 Jan 2023 | 1,434 | 0.12% | ||||||||
| USD/ZAR 09 Jan 2023 | 1,434 | 0.12% | ||||||||
| USD/ZAR 04 Jan 2023 | 1,434 | 0.12% | ||||||||
| USD/ZAR 03 Jan 2023 | 1,434 | 0.12% | ||||||||
| USD/CAD 03 Jan 2023 | (12,079) | -0.99% | ||||||||
| USD/CAD 04 Jan 2023 | (12,079) | -0.99% | ||||||||
| USD/KRW 20 Jan 2023 | 3,965 | 0.32% | ||||||||
| USD/KRW 27 Jan 2023 | 3,965 | 0.32% | ||||||||
| USD/KRW 17 Jan 2023 | 3,965 | 0.32% | ||||||||
| USD/KRW 06 Jan 2023 | 3,965 | 0.32% | ||||||||
| USD/KRW 19 Jan 2023 | 3,965 | 0.32% | ||||||||
| USD/KRW 26 Jan 2023 | 3,965 | 0.32% | ||||||||
| USD/PLN 18 Jan 2023 | 3,943 | 0.32% | ||||||||
| USD/PLN 31 Jan 2023 | 3,943 | 0.32% | ||||||||
| USD/PLN 25 Jan 2023 | 3,943 | 0.32% | ||||||||
| USD/PLN 23 Jan 2023 | 3,943 | 0.32% | ||||||||
| USD/PLN 01 Feb 2023 | 3,943 | 0.32% | ||||||||
| USD/PLN 24 Jan 2023 | 3,943 | 0.32% | ||||||||
| USD/IDR 27 Jan 2023 | (3,810) | -0.31% | ||||||||
| USD/IDR 25 Jan 2023 | (3,810) | -0.31% | ||||||||
| USD/IDR 20 Jan 2023 | (3,810) | -0.31% | ||||||||
| USD/IDR 11 Jan 2023 | (3,810) | -0.31% | ||||||||
| USD/IDR 26 Jan 2023 | (3,810) | -0.31% | ||||||||
| USD/IDR 10 Jan 2023 | (3,810) | -0.31% | ||||||||
| USD/HUF 25 Jan 2023 | 2,500 | 0.20% | ||||||||
| USD/HUF 27 Jan 2023 | 2,500 | 0.20% | ||||||||
| USD/HUF 30 Jan 2023 | 2,500 | 0.20% | ||||||||
| USD/HUF 10 Jan 2023 | 2,500 | 0.20% | ||||||||
| USD/HUF 17 Jan 2023 | 2,500 | 0.20% | ||||||||
| USD/HUF 11 Jan 2023 | 2,500 | 0.20% | ||||||||
| USD/HUF 24 Jan 2023 | 2,500 | 0.20% | ||||||||
| USD/HUF 26 Jan 2023 | 2,500 | 0.20% | ||||||||
| USD/HUF 01 Feb 2023 | 2,500 | 0.20% | ||||||||
| USD/CZK 27 Jan 2023 | 5,238 | 0.43% | ||||||||
| USD/CZK 13 Jan 2023 | 5,238 | 0.43% | ||||||||
| USD/CZK 01 Feb 2023 | 5,238 | 0.43% | ||||||||
| USD/CZK 30 Jan 2023 | 5,238 | 0.43% | ||||||||
| USD/CZK 24 Jan 2023 | 5,236 | 0.43% | ||||||||
| USD/CZK 26 Jan 2023 | 5,236 | 0.43% | ||||||||
| USD/CZK 19 Jan 2023 | 5,236 | 0.43% | ||||||||
| USD/CZK 20 Jan 2023 | 5,236 | 0.43% | ||||||||
The accompanying notes are an integral part of the consolidated financial statements.
87
| THE ADVISORS’ INNER CIRCLE FUND III | FS MANAGED | |||
| FUTURES FUND | ||||
| DECEMBER 31, 2022 |
| |||
| Top Underlying Components | Notional | Percentage of Notional | ||||||||
| USD/EUR 05 Jan 2023 | $4,950 | 0.40% | ||||||||
| USD/EUR 04 Jan 2023 | 4,950 | 0.40% | ||||||||
| USD/EUR 06 Jan 2023 | 4,950 | 0.40% | ||||||||
| USD/EUR 01 Feb 2023 | 4,950 | 0.40% | ||||||||
| USD/PLN 04 Jan 2023 | 3,945 | 0.32% | ||||||||
| USD/PLN 16 Jan 2023 | 3,945 | 0.32% | ||||||||
| USD/PLN 20 Jan 2023 | 3,945 | 0.32% | ||||||||
| USD/PLN 26 Jan 2023 | 3,945 | 0.32% | ||||||||
| USD/PLN 17 Jan 2023 | 3,945 | 0.32% | ||||||||
| USD/BRL 09 Jan 2023 | 2,779 | 0.23% | ||||||||
| USD/BRL 25 Jan 2023 | 2,779 | 0.23% | ||||||||
| USD/BRL 26 Jan 2023 | 2,779 | 0.23% | ||||||||
| USD/BRL 24 Jan 2023 | 2,779 | 0.23% | ||||||||
| USD/BRL 10 Jan 2023 | 2,779 | 0.23% | ||||||||
| USD/BRL 12 Jan 2023 | 2,779 | 0.23% | ||||||||
| USD/PLN 11 Jan 2023 | 3,949 | 0.32% | ||||||||
| USD/PLN 09 Jan 2023 | 3,949 | 0.32% | ||||||||
| USD/PLN 10 Jan 2023 | 3,949 | 0.32% | ||||||||
| USD/PLN 06 Jan 2023 | 3,949 | 0.32% | ||||||||
| USD/IDR 13 Jan 2023 | (3,811) | -0.31% | ||||||||
| USD/IDR 18 Jan 2023 | (3,811) | -0.31% | ||||||||
| USD/IDR 17 Jan 2023 | (3,811) | -0.31% | ||||||||
| USD/IDR 16 Jan 2023 | (3,811) | -0.31% | ||||||||
| USD/HUF 13 Jan 2023 | 2,499 | 0.20% | ||||||||
| USD/HUF 16 Jan 2023 | 2,499 | 0.20% | ||||||||
| USD/HUF 23 Jan 2023 | 2,499 | 0.20% | ||||||||
| USD/HUF 12 Jan 2023 | 2,499 | 0.20% | ||||||||
| USD/HUF 18 Jan 2023 | 2,499 | 0.20% | ||||||||
| USD/HUF 03 Jan 2023 | 2,499 | 0.20% | ||||||||
| USD/INR 23 Jan 2023 | (14,516) | -1.18% | ||||||||
| USD/INR 01 Feb 2023 | (14,513) | -1.18% | ||||||||
| USD/INR 18 Jan 2023 | (14,507) | -1.18% | ||||||||
| USD/INR 20 Jan 2023 | (14,505) | -1.18% | ||||||||
| USD/MXN 17 Jan 2023 | 6,282 | 0.51% | ||||||||
| USD/MXN 16 Jan 2023 | 6,282 | 0.51% | ||||||||
| USD/HUF 20 Jan 2023 | 2,498 | 0.20% | ||||||||
| USD/HUF 09 Jan 2023 | 2,498 | 0.20% | ||||||||
| USD/HUF 19 Jan 2023 | 2,498 | 0.20% | ||||||||
| USD/HUF 06 Jan 2023 | 2,498 | 0.20% | ||||||||
| USD/HUF 05 Jan 2023 | 2,498 | 0.20% | ||||||||
| USD/CHF 18 Jan 2023 | 6,211 | 0.51% | ||||||||
| USD/CHF 19 Jan 2023 | 6,211 | 0.51% | ||||||||
| USD/KRW 25 Jan 2023 | 11,905 | 0.97% | ||||||||
| USD/KRW 18 Jan 2023 | 3,966 | 0.32% | ||||||||
| USD/KRW 09 Jan 2023 | 3,966 | 0.32% | ||||||||
| USD/KRW 31 Jan 2023 | 3,966 | 0.32% | ||||||||
| USD/SGD 03 Jan 2023 | 11,486 | 0.94% | ||||||||
| USD/IDR 19 Jan 2023 | (3,812) | -0.31% | ||||||||
| USD/IDR 12 Jan 2023 | (3,812) | -0.31% | ||||||||
| USD/IDR 09 Jan 2023 | (3,812) | -0.31% | ||||||||
| USD/IDR 31 Jan 2023 | (3,809) | -0.31% | ||||||||
| USD/IDR 01 Feb 2023 | (3,809) | -0.31% | ||||||||
| USD/IDR 30 Jan 2023 | (3,809) | -0.31% | ||||||||
| USD/CLP 13 Jan 2023 | 2,568 | 0.21% | ||||||||
The accompanying notes are an integral part of the consolidated financial statements.
88
| THE ADVISORS’ INNER CIRCLE FUND III | FS MANAGED | |||
| FUTURES FUND | ||||
| DECEMBER 31, 2022 |
| |||
| Top Underlying Components | Notional | Percentage of Notional | ||||||||
| USD/CLP 12 Jan 2023 | $2,568 | 0.21% | ||||||||
| USD/CLP 26 Jan 2023 | 2,568 | 0.21% | ||||||||
| USD/CLP 30 Jan 2023 | 2,568 | 0.21% | ||||||||
| USD/BRL 11 Jan 2023 | 2,778 | 0.23% | ||||||||
| USD/BRL 05 Jan 2023 | 2,778 | 0.23% | ||||||||
| USD/BRL 31 Jan 2023 | 2,778 | 0.23% | ||||||||
| USD/KRW 01 Feb 2023 | 3,967 | 0.32% | ||||||||
| USD/KRW 30 Jan 2023 | 3,967 | 0.32% | ||||||||
| USD/PLN 13 Jan 2023 | 3,947 | 0.32% | ||||||||
| USD/PLN 05 Jan 2023 | 3,947 | 0.32% | ||||||||
| USD/IDR 24 Jan 2023 | (7,620) | -0.62% | ||||||||
| USD/JPY 25 Jan 2023 | (337) | -0.03% | ||||||||
| USD/JPY 26 Jan 2023 | (337) | -0.03% | ||||||||
| USD/JPY 19 Jan 2023 | (337) | -0.03% | ||||||||
| USD/JPY 24 Jan 2023 | (337) | -0.03% | ||||||||
| USD/JPY 18 Jan 2023 | (337) | -0.03% | ||||||||
| USD/JPY 23 Jan 2023 | (337) | -0.03% | ||||||||
| USD/JPY 17 Jan 2023 | (337) | -0.03% | ||||||||
| USD/JPY 12 Jan 2023 | (337) | -0.03% | ||||||||
| USD/JPY 20 Jan 2023 | (337) | -0.03% | ||||||||
| USD/JPY 11 Jan 2023 | (337) | -0.03% | ||||||||
| USD/JPY 13 Jan 2023 | (337) | -0.03% | ||||||||
| USD/JPY 16 Jan 2023 | (337) | -0.03% | ||||||||
| USD/JPY 10 Jan 2023 | (337) | -0.03% | ||||||||
| USD/JPY 09 Jan 2023 | (337) | -0.03% | ||||||||
| USD/JPY 27 Jan 2023 | (337) | -0.03% | ||||||||
| USD/JPY 31 Jan 2023 | (337) | -0.03% | ||||||||
| USD/JPY 30 Jan 2023 | (337) | -0.03% | ||||||||
| USD/JPY 01 Feb 2023 | (337) | -0.03% | ||||||||
| USD/JPY 06 Jan 2023 | (337) | -0.03% | ||||||||
| USD/JPY 04 Jan 2023 | (337) | -0.03% | ||||||||
| USD/JPY 05 Jan 2023 | (337) | -0.03% | ||||||||
| USD/JPY 03 Jan 2023 | (337) | -0.03% | ||||||||
| USD/ZAR 24 Jan 2023 | 1,435 | 0.12% | ||||||||
| USD/ZAR 26 Jan 2023 | 1,435 | 0.12% | ||||||||
| USD/ZAR 23 Jan 2023 | 1,435 | 0.12% | ||||||||
| USD/ZAR 25 Jan 2023 | 1,435 | 0.12% | ||||||||
| USD/ZAR 20 Jan 2023 | 1,435 | 0.12% | ||||||||
| USD/CNH 24 Jan 2023 | (6,789) | -0.55% | ||||||||
| USD/MXN 03 Jan 2023 | 6,285 | 0.51% | ||||||||
| USD/CHF 03 Jan 2023 | 6,215 | 0.51% | ||||||||
| USD/BRL 17 Jan 2023 | 5,559 | 0.45% | ||||||||
| USD/CZK 03 Jan 2023 | 5,242 | 0.43% | ||||||||
| USD/CLP 17 Jan 2023 | 5,133 | 0.42% | ||||||||
| USD/CLP 19 Jan 2023 | 2,566 | 0.21% | ||||||||
| USD/CLP 18 Jan 2023 | 2,566 | 0.21% | ||||||||
| USD/CLP 31 Jan 2023 | 2,564 | 0.21% | ||||||||
| USD/CLP 01 Feb 2023 | 2,564 | 0.21% | ||||||||
| USD/NOK 05 Jan 2023 | (1,674) | -0.14% | ||||||||
| USD/NOK 03 Jan 2023 | (1,674) | -0.14% | ||||||||
| USD/NOK 04 Jan 2023 | (1,674) | -0.14% | ||||||||
| USD/EUR 03 Jan 2023 | 4,951 | 0.40% | ||||||||
| USD/ILS 04 Jan 2023 | (4,883) | -0.40% | ||||||||
| USD/KRW 12 Jan 2023 | 3,971 | 0.32% | ||||||||
The accompanying notes are an integral part of the consolidated financial statements.
89
| THE ADVISORS’ INNER CIRCLE FUND III | FS MANAGED | |||
| FUTURES FUND | ||||
| DECEMBER 31, 2022 |
| |||
| Top Underlying Components | Notional | Percentage of Notional | ||||||||
| USD/KRW 13 Jan 2023 | $3,970 | 0.32% | ||||||||
| USD/KRW 11 Jan 2023 | 3,969 | 0.32% | ||||||||
| USD/KRW 16 Jan 2023 | 3,968 | 0.32% | ||||||||
| USD/KRW 10 Jan 2023 | 3,964 | 0.32% | ||||||||
| USD/KRW 05 Jan 2023 | 3,962 | 0.32% | ||||||||
| USD/KRW 04 Jan 2023 | 3,955 | 0.32% | ||||||||
| USD/KRW 03 Jan 2023 | 3,952 | 0.32% | ||||||||
| USD/PLN 12 Jan 2023 | 3,948 | 0.32% | ||||||||
| USD/PLN 19 Jan 2023 | 3,944 | 0.32% | ||||||||
| USD/PLN 27 Jan 2023 | 3,942 | 0.32% | ||||||||
| USD/PLN 30 Jan 2023 | 3,941 | 0.32% | ||||||||
| USD/PLN 03 Jan 2023 | 3,937 | 0.32% | ||||||||
| USD/IDR 06 Jan 2023 | (3,814) | -0.31% | ||||||||
| USD/IDR 05 Jan 2023 | (3,813) | -0.31% | ||||||||
| USD/IDR 04 Jan 2023 | (3,808) | -0.31% | ||||||||
| USD/IDR 03 Jan 2023 | (3,806) | -0.31% | ||||||||
| USD/SEK 03 Jan 2023 | (3,348) | -0.27% | ||||||||
| USD/BRL 01 Feb 2023 | 2,783 | 0.23% | ||||||||
| USD/BRL 20 Jan 2023 | 2,781 | 0.23% | ||||||||
| USD/CLP 27 Jan 2023 | 2,569 | 0.21% | ||||||||
| USD/HUF 31 Jan 2023 | 2,501 | 0.20% | ||||||||
| USD/HUF 04 Jan 2023 | 2,497 | 0.20% | ||||||||
| USD/GBP 03 Jan 2023 | (1,221) | -0.10% | ||||||||
CDX | MARKIT CDX.NA.IG.39 12/27 | (951,293) | -77.65% | |||||||
| ITRX EUR CDSI GEN 5Y Corp | (457,938) | -37.38% | ||||||||
| MARKIT CDX.NA.HY.39 12/27 | (190,653) | -15.56% | ||||||||
| ITRX XOVER CDSI GEN 5Y Corp | (108,993) | -8.90% | ||||||||
Spot | US Dollar Spot | (100,130) | -8.17% | |||||||
| British Pound Spot | 75,303 | 6.15% | ||||||||
| Euro Spot | 45,908 | 3.75% | ||||||||
| Swiss Franc Spot | (44,662) | -3.65% | ||||||||
| Japanese Yen Spot | 3,702 | 0.30% | ||||||||
**JPQFMOW1Index: Market neutral strategy that seeks to provide exposure to Momentum risk premium.
|
| |||||||||
| Top Underlying Components | Notional | Percentage of Notional | ||||||||
Common Stock | Tyler Technologies Inc | $(2,328) | -0.52% | |||||||
| Church & Dwight Co Inc | (2,328) | -0.52% | ||||||||
| Netapp Inc | (2,328) | -0.52% | ||||||||
| Ball Corp | (2,328) | -0.52% | ||||||||
| Campbell Soup Co | 2,328 | 0.52% | ||||||||
| Occidental Petroleum Corp | 2,328 | 0.52% | ||||||||
| Aspen Technology Inc | 2,328 | 0.52% | ||||||||
| Glencore PLC | 2,302 | 0.51% | ||||||||
| Invesco Ltd | 2,302 | 0.51% | ||||||||
| Quanta Services Inc | 2,302 | 0.51% | ||||||||
| Mckesson Corp | 2,302 | 0.51% | ||||||||
| Wynn Resorts Ltd | 2,302 | 0.51% | ||||||||
| McCormick & Co-Non Vtg Shrs | (2,302) | -0.51% | ||||||||
| Enbridge Inc | (2,337) | -0.52% | ||||||||
| Colgate-Palmolive Co | (2,337) | -0.52% | ||||||||
| Tyson Foods Inc | (2,337) | -0.52% | ||||||||
| AES Corp | 2,337 | 0.52% | ||||||||
The accompanying notes are an integral part of the consolidated financial statements.
90
| THE ADVISORS’ INNER CIRCLE FUND III | FS MANAGED | |||
| FUTURES FUND | ||||
| DECEMBER 31, 2022 |
| |||
| Top Underlying Components | Notional | Percentage of Notional | ||||||||
| Bill.Com Holdings Inc | $ 2,337 | 0.52% | ||||||||
| Dynatrace Inc | (2,335) | -0.52% | ||||||||
| Credit Suisse Group AG | (2,335) | -0.52% | ||||||||
| Medtronic PLC | (2,335) | -0.52% | ||||||||
| Vivendi SA | (2,335) | -0.52% | ||||||||
| Verisign Inc | (2,335) | -0.52% | ||||||||
| Caixabank SA | 2,348 | 0.52% | ||||||||
| AT&T | 2,348 | 0.52% | ||||||||
| Lamb Weston Holding Inc | 2,348 | 0.52% | ||||||||
| Cboe Global Markets Inc | (2,348) | -0.52% | ||||||||
| Aflac Inc | 2,346 | 0.52% | ||||||||
| Beiersdorf AG | 2,346 | 0.52% | ||||||||
| Roper Technologies Inc | (2,346) | -0.52% | ||||||||
| Hang Seng Bank Ltd ADR | (2,346) | -0.52% | ||||||||
| Smith (A.O.) Corp | (2,342) | -0.52% | ||||||||
| Ferguson PLC | (2,342) | -0.52% | ||||||||
| Edwards Lifesciences Corp | (2,342) | -0.52% | ||||||||
| Dover Corp | (2,342) | -0.52% | ||||||||
| Activision Blizzard Inc | 2,325 | 0.52% | ||||||||
| Arch Capital Group Ltd | 2,325 | 0.52% | ||||||||
| General Mills Inc | 2,325 | 0.52% | ||||||||
| Brown-Forman Corp-Class B | (2,325) | -0.52% | ||||||||
| Johnson & Johnson | (2,318) | -0.52% | ||||||||
| Cisco Systems Inc | (2,318) | -0.52% | ||||||||
| UCB SA | (2,318) | -0.52% | ||||||||
| Transunion | (2,318) | -0.52% | ||||||||
| Takeda Pharmaceutical | 2,317 | 0.52% | ||||||||
| Cigna Corp | 2,317 | 0.52% | ||||||||
| Broadridge Finl Solutions I Com | (2,317) | -0.52% | ||||||||
| Oracle Corp | (2,317) | -0.52% | ||||||||
| International Business Machines Corp | 2,298 | 0.51% | ||||||||
| Marathon Oil Corp | 2,298 | 0.51% | ||||||||
| Costco Wholesale Corp | (2,298) | -0.51% | ||||||||
| Nortonlifelock Inc | (2,298) | -0.51% | ||||||||
| Keyera Corp | (2,379) | -0.53% | ||||||||
| Fortune Brands Innovations Inc | (2,379) | -0.53% | ||||||||
| Salesforce Inc | (2,379) | -0.53% | ||||||||
| Abbott Laboratories | (2,376) | -0.53% | ||||||||
| Okta Inc | (2,376) | -0.53% | ||||||||
| Dentsply Sirona Inc | (2,376) | -0.53% | ||||||||
| Computershare Ltd ADR | 2,369 | 0.53% | ||||||||
| Broadcom Inc | 2,369 | 0.53% | ||||||||
| Medibank Private | (2,369) | -0.53% | ||||||||
| Baxter Intl. | (2,353) | -0.52% | ||||||||
| Humana Inc | (2,353) | -0.52% | ||||||||
| Baker Hughes Co | (2,353) | -0.52% | ||||||||
| Ceridian HCM Holding Inc | 2,349 | 0.52% | ||||||||
| Hewlett Packard Enterprise Company | 2,349 | 0.52% | ||||||||
| Ecolab Inc | (2,349) | -0.52% | ||||||||
| Ares Management Corp | 2,340 | 0.52% | ||||||||
| Liberty Media Corp-Liberty Formula One - Class C | 2,340 | 0.52% | ||||||||
| Masimo Corporation | (2,340) | -0.52% | ||||||||
| OMV AG | (2,334) | -0.52% | ||||||||
The accompanying notes are an integral part of the consolidated financial statements.
91
| THE ADVISORS’ INNER CIRCLE FUND III | FS MANAGED | |||
| FUTURES FUND | ||||
| DECEMBER 31, 2022 |
| |||
| Top Underlying Components | Notional | Percentage of Notional | ||||||||
| Admiral Group PLC | $(2,334) | -0.52% | ||||||||
| Fair Isaac Corp | 2,334 | 0.52% | ||||||||
| Metlife Inc | 2,323 | 0.52% | ||||||||
| Edenred | 2,323 | 0.52% | ||||||||
| Block Inc | 2,323 | 0.52% | ||||||||
| Stanley Black & Decker | (2,320) | -0.52% | ||||||||
| Horizon Therapeutics PLC | (2,320) | -0.52% | ||||||||
| Teck Resources Limited Class B | 2,320 | 0.52% | ||||||||
| Lockheed Martin Corp | 2,306 | 0.51% | ||||||||
| Alnylam Pharmaceuticals Inc | 2,306 | 0.51% | ||||||||
| First Horizon Corp | 2,306 | 0.51% | ||||||||
| Equifax Inc | (2,299) | -0.51% | ||||||||
| Akamai Technologies Inc | (2,299) | -0.51% | ||||||||
| T-Mobile US Inc | 2,299 | 0.51% | ||||||||
| Sherwin-Williams Co | (2,293) | -0.51% | ||||||||
| Adobe Inc | (2,293) | -0.51% | ||||||||
| Borgwarner Inc | 2,293 | 0.51% | ||||||||
| Cme Group Inc | (2,291) | -0.51% | ||||||||
| Omron Corp ADR | (2,291) | -0.51% | ||||||||
| Kimberly-Clark Corp | (2,291) | -0.51% | ||||||||
| Mineral Resources Ltd ADR | 2,285 | 0.51% | ||||||||
| Progressive Corp | 2,285 | 0.51% | ||||||||
| Orange SA | (2,285) | -0.51% | ||||||||
| AbbVie Inc | 2,277 | 0.51% | ||||||||
| Monolithic Power Systems Inc | 2,277 | 0.51% | ||||||||
| Genuine Parts Co | 2,277 | 0.51% | ||||||||
| Renault SA | 2,270 | 0.50% | ||||||||
| Vertex Pharmaceuticals Inc | 2,270 | 0.50% | ||||||||
| Western Union Co | (2,270) | -0.50% | ||||||||
| Microsoft Corp | (2,246) | -0.50% | ||||||||
| Marketaxess Holdings Inc | (2,246) | -0.50% | ||||||||
| Synopsys Inc | 2,246 | 0.50% | ||||||||
| Mitsubishi Heavy Industries Ltd | 2,227 | 0.50% | ||||||||
| Mercadolibre Inc | 2,227 | 0.50% | ||||||||
| Seagen Inc | (2,227) | -0.50% | ||||||||
| Omnicom Group | 2,416 | 0.54% | ||||||||
| Bio-Rad Laboratories Inc | (2,416) | -0.54% | ||||||||
| Parkland Corp | (2,411) | -0.54% | ||||||||
| Telenor ASA | (2,411) | -0.54% | ||||||||
| Universal Health Services Class B | 2,395 | 0.53% | ||||||||
| Cognizant Technology Solutions Corp | (2,395) | -0.53% | ||||||||
| Clarivate PLC | (2,391) | -0.53% | ||||||||
| Zebra Technologies Corp | (2,391) | -0.53% | ||||||||
| Match Group Inc | 2,389 | 0.53% | ||||||||
| Las Vegas SAnds Corp | 2,389 | 0.53% | ||||||||
| Japan Exchange Group Inc | (2,387) | -0.53% | ||||||||
| Paypal Holdings Inc. | (2,387) | -0.53% | ||||||||
| Rheinmetall AG | 2,382 | 0.53% | ||||||||
| LPL Financial Holdings Inc | 2,382 | 0.53% | ||||||||
| Marathon Petroleum Corp | 2,374 | 0.53% | ||||||||
| Pentair PLC | (2,374) | -0.53% | ||||||||
| Dominion Energy Inc | (2,372) | -0.53% | ||||||||
| Robert Half Intl. | (2,372) | -0.53% | ||||||||
| Zoetis Inc | (2,371) | -0.53% | ||||||||
The accompanying notes are an integral part of the consolidated financial statements.
92
| THE ADVISORS’ INNER CIRCLE FUND III | FS MANAGED | |||
| FUTURES FUND | ||||
| DECEMBER 31, 2022 |
| |||
| Top Underlying Components | Notional | Percentage of Notional | ||||||||
| Bank Of America Corp | $(2,371) | -0.53% | ||||||||
| Telecom Italia SPA | (2,370) | -0.53% | ||||||||
| Teleflex Inc | (2,370) | -0.53% | ||||||||
| Kinder Morgan Inc | (2,366) | -0.53% | ||||||||
| First Republic Bank | (2,366) | -0.53% | ||||||||
| Brown & Brown Inc | (2,365) | -0.53% | ||||||||
| International Flavors & Fragrances | (2,365) | -0.53% | ||||||||
| Tenaris SA | 2,364 | 0.53% | ||||||||
| Interpublic Group Of Cos Inc | 2,364 | 0.53% | ||||||||
| Fairfax Financial Holdings Limited | 2,354 | 0.52% | ||||||||
| Paycom Software Inc | 2,354 | 0.52% | ||||||||
| Globe Life Inc | 2,351 | 0.52% | ||||||||
| Rakuten Group Inc | (2,351) | -0.52% | ||||||||
| Dish Network Corp-A | 2,341 | 0.52% | ||||||||
| Jacobs Solutions Inc | (2,341) | -0.52% | ||||||||
| Godaddy Inc | 2,339 | 0.52% | ||||||||
| Molson Coors Beverage Co | 2,339 | 0.52% | ||||||||
| Keppel Corp Ltd ADR | 2,333 | 0.52% | ||||||||
| Rockwell Automation Inc | (2,333) | -0.52% | ||||||||
| Pearson PLC | 2,322 | 0.52% | ||||||||
| Procter & Gamble Co | (2,322) | -0.52% | ||||||||
| American International Group Inc | 2,321 | 0.52% | ||||||||
| Hormel Foods Corp | (2,321) | -0.52% | ||||||||
| Aramark | 2,314 | 0.51% | ||||||||
| Dollarama Inc | 2,314 | 0.51% | ||||||||
| Us Bancorp | (2,312) | -0.51% | ||||||||
| TC Energy Corp | (2,312) | -0.51% | ||||||||
| Natwest Group PLC | 2,310 | 0.51% | ||||||||
| Fidelity National Information Services Inc | (2,310) | -0.51% | ||||||||
| Thales SA | 2,308 | 0.51% | ||||||||
| Paylocity Holding Corp | 2,308 | 0.51% | ||||||||
| Astrazeneca PLC | 2,303 | 0.51% | ||||||||
| Archer-Daniels-Midland Co | 2,303 | 0.51% | ||||||||
| Analog Devices Inc | 2,301 | 0.51% | ||||||||
| Pfizer Inc | (2,301) | -0.51% | ||||||||
| BAE Systems PLC | 2,297 | 0.51% | ||||||||
| Swisscom AG | (2,297) | -0.51% | ||||||||
| WR Berkley Corp | 2,295 | 0.51% | ||||||||
| Nomura Research Institute Ltd ADR | (2,295) | -0.51% | ||||||||
| Eli Lilly & Co | 2,290 | 0.51% | ||||||||
| Pinterest Inc | 2,290 | 0.51% | ||||||||
| Imperial Brands PLC | 2,289 | 0.51% | ||||||||
| Fastenal Co | (2,289) | -0.51% | ||||||||
| Standard Chartered PLC | 2,288 | 0.51% | ||||||||
| 3M Company | (2,288) | -0.51% | ||||||||
| The Hershey Co | 2,284 | 0.51% | ||||||||
| Newmont Corp | (2,284) | -0.51% | ||||||||
| Mondelez International Inc | (2,274) | -0.51% | ||||||||
| Ansys Inc | (2,274) | -0.51% | ||||||||
| Microchip Technology Inc | 2,273 | 0.51% | ||||||||
| Insulet Corp | 2,273 | 0.51% | ||||||||
| Nippon Yusen KK | 2,271 | 0.51% | ||||||||
| Mitsui O.S.K. Lines Ltd | 2,271 | 0.51% | ||||||||
| Nucor Corp | 2,268 | 0.50% | ||||||||
The accompanying notes are an integral part of the consolidated financial statements.
93
| THE ADVISORS’ INNER CIRCLE FUND III | FS MANAGED | |||
| FUTURES FUND | ||||
| DECEMBER 31, 2022 |
| |||
| Top Underlying Components | Notional | Percentage of Notional | ||||||||
| Arrow Electronics Inc | $(2,268) | -0.50% | ||||||||
| Bayer AG | 2,263 | 0.50% | ||||||||
| James Hardie Industries PLC | (2,263) | -0.50% | ||||||||
| Amerisourcebergen Corp | 2,258 | 0.50% | ||||||||
| Shimano Inc | (2,258) | -0.50% | ||||||||
| Fortum Oyj | (2,257) | -0.50% | ||||||||
| Dominos Pizza Inc | (2,257) | -0.50% | ||||||||
| MGM Resorts International | 2,248 | 0.50% | ||||||||
| Owens Corning Inc | 2,248 | 0.50% | ||||||||
| Garmin Ltd | (2,242) | -0.50% | ||||||||
| Ubisoft Entertainment | (2,242) | -0.50% | ||||||||
| Royal Caribbean Cruises Ltd | 2,239 | 0.50% | ||||||||
| Algonquin Power & Utilities | (2,239) | -0.50% | ||||||||
| Cognex Corp | (2,232) | -0.50% | ||||||||
| Elanco Animal Health Inc | (2,232) | -0.50% | ||||||||
| Cardinal Health Inc | 2,226 | 0.50% | ||||||||
| Sony Group Corp | (2,226) | -0.49% | ||||||||
| Datadog Inc | 2,129 | 0.47% | ||||||||
| Caesars Entertainment Inc | 2,129 | 0.47% | ||||||||
| Wolfspeed Inc | 2,107 | 0.47% | ||||||||
| Solaredge Technologies Inc | 2,107 | 0.47% | ||||||||
| Sysco Corp | 2,093 | 0.47% | ||||||||
| Hilton Worldwide Holdings Inc | 2,093 | 0.47% | ||||||||
| Enphase Energy Inc | 2,022 | 0.45% | ||||||||
| Aristocrat Leisure Ltd | (2,022) | -0.45% | ||||||||
| Best Buy Co Inc | 1,821 | 0.40% | ||||||||
| Pilbara Minerals Ltd | 1,821 | 0.40% | ||||||||
| Orion Oyj Class B | 1,771 | 0.39% | ||||||||
| Hess Corp | 1,771 | 0.39% | ||||||||
| Koninklijke Philips NV | (2,610) | -0.58% | ||||||||
| Puma SE | (2,580) | -0.57% | ||||||||
| Origin Energy Ltd | 2,557 | 0.57% | ||||||||
| SVB Financial Group | (2,497) | -0.56% | ||||||||
| Adidas AG | (2,491) | -0.55% | ||||||||
| Ulta Salon Cosmetics & Fragrance Inc. | 2,461 | 0.55% | ||||||||
| Black Knight Inc | (2,441) | -0.54% | ||||||||
| APA Corp | 2,438 | 0.54% | ||||||||
| Advance Auto Parts | (2,431) | -0.54% | ||||||||
| Davita Inc | (2,430) | -0.54% | ||||||||
| Fedex Corp | (2,429) | -0.54% | ||||||||
| Fresenius Medical Care AG & Co KGaA | (2,428) | -0.54% | ||||||||
| Tradeweb Markets Inc | (2,422) | -0.54% | ||||||||
| Lincoln National Corp | (2,421) | -0.54% | ||||||||
| Teleperformance SE | (2,413) | -0.54% | ||||||||
| Estee Lauder Companies Inc | (2,406) | -0.54% | ||||||||
| Twilio Inc | (2,403) | -0.53% | ||||||||
| Xero Ltd | (2,402) | -0.53% | ||||||||
| Quest Diagnostics Inc | (2,400) | -0.53% | ||||||||
| Valero Energy | 2,399 | 0.53% | ||||||||
| Target Corp | (2,398) | -0.53% | ||||||||
| Resona Holdings (Daiwa Bank) ADR | 2,397 | 0.53% | ||||||||
| Laboratory Crp Of Amer Hldgs | (2,393) | -0.53% | ||||||||
| Hong Kong Exchanges & Clearing ADR | (2,386) | -0.53% | ||||||||
| Oneok Inc | (2,385) | -0.53% | ||||||||
The accompanying notes are an integral part of the consolidated financial statements.
94
| THE ADVISORS’ INNER CIRCLE FUND III | FS MANAGED | |||
| FUTURES FUND | ||||
| DECEMBER 31, 2022 |
| |||
| Top Underlying Components | Notional | Percentage of Notional | ||||||||
| Avantor Inc | $(2,384) | -0.53% | ||||||||
| UBS Group AG | 2,383 | 0.53% | ||||||||
| Repligen Corp | 2,380 | 0.53% | ||||||||
| Howmet Aerospace Inc | 2,373 | 0.53% | ||||||||
| SS&C Technologies Holdings Inc | (2,368) | -0.53% | ||||||||
| Northrop Grumman Corp | 2,367 | 0.53% | ||||||||
| Assurant Inc | (2,362) | -0.53% | ||||||||
| Verisk Analytics Inc | (2,361) | -0.53% | ||||||||
| PG&E Corp | 2,360 | 0.52% | ||||||||
| Crown Holdings Inc | (2,359) | -0.52% | ||||||||
| Charles River Laboratories | (2,358) | -0.52% | ||||||||
| Intercontinental Exchange Inc | (2,355) | -0.52% | ||||||||
| UGI Corp | (2,350) | -0.52% | ||||||||
| Splunk Inc | 2,347 | 0.52% | ||||||||
| Williams Cos Inc | (2,344) | -0.52% | ||||||||
| American Water Works Co Inc | (2,338) | -0.52% | ||||||||
| United Rentals Inc | 2,336 | 0.52% | ||||||||
| Raymond James Finl. | 2,332 | 0.52% | ||||||||
| Merck & Co. Inc. | 2,331 | 0.52% | ||||||||
| Ameriprise Financial Inc | 2,330 | 0.52% | ||||||||
| Copart Inc | (2,329) | -0.52% | ||||||||
| Cellnex Telecom SA | (2,319) | -0.52% | ||||||||
| Nrg Energy Inc | (2,316) | -0.52% | ||||||||
| F5 Inc | (2,313) | -0.51% | ||||||||
| Philip Morris International | 2,311 | 0.51% | ||||||||
| Novartis AG | 2,307 | 0.51% | ||||||||
| Paramount Global | 2,305 | 0.51% | ||||||||
| Dropbox Inc | 2,304 | 0.51% | ||||||||
| Resmed Inc | (2,296) | -0.51% | ||||||||
| Mettler-Toledo Intl | 2,294 | 0.51% | ||||||||
| Hubbell Inc -Cl B | 2,292 | 0.51% | ||||||||
| Persimmon PLC | (2,283) | -0.51% | ||||||||
| Marriott International - Class A | 2,281 | 0.51% | ||||||||
| Principal Financial Group Inc | 2,279 | 0.51% | ||||||||
| Sempra Energy | 2,275 | 0.51% | ||||||||
| Everest Re Group Ltd | 2,269 | 0.50% | ||||||||
| Clorox Company | (2,264) | -0.50% | ||||||||
| Veeva Systems Inc | (2,262) | -0.50% | ||||||||
| British American Tobacco PLC | 2,261 | 0.50% | ||||||||
| Daiichi Sankyo Co Ltd | 2,260 | 0.50% | ||||||||
| Alimentation Couche-Tard Inc | 2,256 | 0.50% | ||||||||
| KLA Corp | 2,252 | 0.50% | ||||||||
| Union Pacific Corp | (2,251) | -0.50% | ||||||||
| Mitsubishi Chemical Group | (2,250) | -0.50% | ||||||||
| ON Semiconductor Corporation | 2,245 | 0.50% | ||||||||
| Novocure Ltd | 2,241 | 0.50% | ||||||||
| Z Holdings Corp | (2,238) | -0.50% | ||||||||
| Tourmaline Oil Corp | 2,235 | 0.50% | ||||||||
| Deutsche Lufthansa AG | 2,234 | 0.50% | ||||||||
| Gartner Inc | 2,230 | 0.50% | ||||||||
| OCI NV | 2,228 | 0.50% | ||||||||
| Yakult Honsha Co Ltd | 2,225 | 0.49% | ||||||||
| Keysight Technologies Inc | (2,221) | -0.49% | ||||||||
| The Trade Desk Inc -Class A | 2,218 | 0.49% | ||||||||
The accompanying notes are an integral part of the consolidated financial statements.
95
| THE ADVISORS’ INNER CIRCLE FUND III | FS MANAGED | |||
| FUTURES FUND | ||||
| DECEMBER 31, 2022 |
| |||
| Top Underlying Components | Notional | Percentage of Notional | ||||||||
| Zurich Insurance Group AG | $2,217 | 0.49% | ||||||||
| Lam Research Corp | 2,215 | 0.49% | ||||||||
| Disco Corp ADR | 2,213 | 0.49% | ||||||||
| Eisai | 2,211 | 0.49% | ||||||||
| First Solar Inc | 2,205 | 0.49% | ||||||||
| Tokyo Electric Power Co Holdings Inc | 2,190 | 0.49% | ||||||||
| S&P Global Inc | (2,186) | -0.49% | ||||||||
| Steel Dynamics Inc | 2,182 | 0.49% | ||||||||
| Carrier Global Corp | (2,181) | -0.48% | ||||||||
| Walgreens Boots Alliance Inc | (2,178) | -0.48% | ||||||||
| Zoom Video Communications Inc | (2,176) | -0.48% | ||||||||
| Qorvo Inc | (2,174) | -0.48% | ||||||||
| Walmart Inc | (2,172) | -0.48% | ||||||||
| Chewy Inc - Class A | 2,159 | 0.48% | ||||||||
| EQT Corp | 2,157 | 0.48% | ||||||||
| Japan Tobacco | 2,156 | 0.48% | ||||||||
| Texas Pacific Land Trust | 2,140 | 0.48% | ||||||||
| Ebay Inc | (2,139) | -0.48% | ||||||||
| Jd Sports Fashion PLC | (2,138) | -0.48% | ||||||||
| Carmax Inc | (2,131) | -0.47% | ||||||||
| The Mosaic Co | 2,121 | 0.47% | ||||||||
| Expeditors Intl Wash Inc | (2,120) | -0.47% | ||||||||
| Generac Holdings Inc | (2,118) | -0.47% | ||||||||
| Automatic Data Processing | 2,114 | 0.47% | ||||||||
| Equitable Holdings Inc | 2,106 | 0.47% | ||||||||
| Nvidia Corp | 2,094 | 0.47% | ||||||||
| Deere & Co | 2,090 | 0.46% | ||||||||
| Erie Indemnity Co | 2,089 | 0.46% | ||||||||
| Bristol-Myers Squibb Co | 2,077 | 0.46% | ||||||||
| Grifols SA Class A | (2,069) | -0.46% | ||||||||
| Arista Networks Inc | 2,068 | 0.46% | ||||||||
| Intel Corp | (2,063) | -0.46% | ||||||||
| Partners Group Holding AG | (2,062) | -0.46% | ||||||||
| Aegon NV | 2,028 | 0.45% | ||||||||
| Marvell Technology Inc | 2,001 | 0.44% | ||||||||
| Lululemon Athletica Inc | 1,998 | 0.44% | ||||||||
| Singapore Telecommunications Limited | (1,991) | -0.44% | ||||||||
| Ajinomoto Co Inc | 1,987 | 0.44% | ||||||||
| Evergy Inc | (1,975) | -0.44% | ||||||||
| Affirm Holdings Inc | (1,963) | -0.44% | ||||||||
| VAT Group AG | 1,941 | 0.43% | ||||||||
| Palantir Technologies Inc | (1,940) | -0.43% | ||||||||
| CF Industries Holdings Inc | 1,937 | 0.43% | ||||||||
| Genmab A/S | 1,935 | 0.43% | ||||||||
| Palo Alto Networks Inc | 1,931 | 0.43% | ||||||||
| Asx Ltd ADR | (1,917) | -0.43% | ||||||||
| Alcon Inc | 1,916 | 0.43% | ||||||||
| Burberry Group PLC | 1,904 | 0.42% | ||||||||
| Welcia Holdings Co Ltd | (1,843) | -0.41% | ||||||||
| Swire Pacific Ltd | 919 | 0.20% | ||||||||
| Next PLC | (919) | -0.20% | ||||||||
| Roku Inc | 1,834 | 0.41% | ||||||||
| Marubeni Corp | 1,831 | 0.41% | ||||||||
| Kinnevik AB Class B | (1,828) | -0.41% | ||||||||
The accompanying notes are an integral part of the consolidated financial statements.
96
| THE ADVISORS’ INNER CIRCLE FUND III | FS MANAGED | |||
| FUTURES FUND | ||||
| DECEMBER 31, 2022 |
| |||
| Top Underlying Components | Notional | Percentage of Notional | ||||||||
| Novo Nordisk A/S | $ 1,805 | 0.40% | ||||||||
| Epam Systems Inc | (1,804) | -0.40% | ||||||||
| Toast Inc-Class A | 1,803 | 0.40% | ||||||||
| Hargreaves Lansdown PLC ADR | (1,800) | -0.40% | ||||||||
| Roche Holding AG | (1,772) | -0.39% | ||||||||
| Koito Manufacturing Co Ltd ADR | (1,752) | -0.39% | ||||||||
| Thermo Fisher Scientific Inc | (1,720) | -0.38% | ||||||||
| Cameco Corp | (1,675) | -0.37% | ||||||||
| STMicroelectronics NV | 1,660 | 0.37% | ||||||||
| Chesapeake Energy Corp | 1,628 | 0.36% | ||||||||
| Temenos AG | (1,597) | -0.36% | ||||||||
| Bt Group PLC | (1,596) | -0.35% | ||||||||
| Givaudan SA | (1,570) | -0.35% | ||||||||
| Allstate Corp | 1,557 | 0.35% | ||||||||
| Hexagon AB Class B | 1,523 | 0.34% | ||||||||
| Ito En Ltd ADR | (1,501) | -0.33% | ||||||||
| Element Fleet Management Corp | 1,487 | 0.33% | ||||||||
| Hikma Pharmaceuticals PLC | (1,483) | -0.33% | ||||||||
| Barratt Developments PLC | (1,478) | -0.33% | ||||||||
| Pioneer Natural Resources Co | (1,473) | -0.33% | ||||||||
| Diamondback Energy Inc | (1,466) | -0.33% | ||||||||
| Zscaler Inc | 1,455 | 0.32% | ||||||||
| Venture Corporation Limited | (1,441) | -0.32% | ||||||||
| RWE AG | 1,438 | 0.32% | ||||||||
| Sbi Holdings Inc ADR | (1,433) | -0.32% | ||||||||
| Bank Of Ireland Group PLC | 1,428 | 0.32% | ||||||||
| PTC Inc | 1,405 | 0.31% | ||||||||
| Actividades De Construccion Y Servicios SA | 1,402 | 0.31% | ||||||||
| Oracle Corp Japan ADR | (1,388) | -0.31% | ||||||||
| Industria De Diseno Textil SA | (1,368) | -0.30% | ||||||||
| Western Digital | 1,365 | 0.30% | ||||||||
| Singapore Exchange (Sgx) Ltd ADR | (1,363) | -0.30% | ||||||||
| Argenx SE | 1,359 | 0.30% | ||||||||
| Atmos Energy Corp | 1,337 | 0.30% | ||||||||
| Euronext NV | (1,326) | -0.29% | ||||||||
| Nexi SPA | (1,318) | -0.29% | ||||||||
| Salmar ASA | (1,307) | -0.29% | ||||||||
| Kingfisher PLC | (1,279) | -0.28% | ||||||||
| WPP PLC | (1,270) | -0.28% | ||||||||
| Fisher & Paykel Healthcare Corporation Limited | (1,269) | -0.28% | ||||||||
| Vodafone Group PLC | (1,265) | -0.28% | ||||||||
| Hongkong Land Holdings Ltd ADR | (417) | -0.09% | ||||||||
| Workday Inc | (417) | -0.09% | ||||||||
| Caterpillar Inc | 417 | 0.09% | ||||||||
| Ovintiv Inc | 1,236 | 0.27% | ||||||||
| CNH Industrial NV | 1,233 | 0.27% | ||||||||
| Sands China Ltd | 1,227 | 0.27% | ||||||||
| Huntington Ingalls Industries | 1,222 | 0.27% | ||||||||
| Neurocrine Biosciences Inc | 1,214 | 0.27% | ||||||||
| Nn Group Nv | (1,200) | -0.27% | ||||||||
| Exact Sciences Corp | 1,194 | 0.27% | ||||||||
| Ipsen SA | 1,191 | 0.26% | ||||||||
| Nextera Energy Inc | (1,182) | -0.26% | ||||||||
| Truist Financial Corp | (1,166) | -0.26% | ||||||||
The accompanying notes are an integral part of the consolidated financial statements.
97
| THE ADVISORS’ INNER CIRCLE FUND III | FS MANAGED | |||
| FUTURES FUND | ||||
| DECEMBER 31, 2022 |
| |||
| Top Underlying Components | Notional | Percentage of Notional | ||||||||
| Dassault Aviation SA | $1,165 | 0.26% | ||||||||
| Boliden AB | 1,159 | 0.26% | ||||||||
| Sharp Corp | (1,156) | -0.26% | ||||||||
| Iida Group Holdings Co Ltd | (1,142) | -0.25% | ||||||||
| Kikkoman Corp ADR | (1,141) | -0.25% | ||||||||
| Constellation Brands Inc Cl A | (1,135) | -0.25% | ||||||||
| Intact Financial Corp. | 1,130 | 0.25% | ||||||||
| ASML Holding NV | 1,127 | 0.25% | ||||||||
| Washington H Soul Pattinson & Co Ltd ADR | (1,110) | -0.25% | ||||||||
| United Internet AG | (1,094) | -0.24% | ||||||||
| Restaurant Brands International Inc | 1,078 | 0.24% | ||||||||
| Kongsberg Gruppen ASA | 1,074 | 0.24% | ||||||||
| BRP Inc | 1,070 | 0.24% | ||||||||
| SEB SA | (1,045) | -0.23% | ||||||||
| Signature Bank | (1,029) | -0.23% | ||||||||
| Novozymes AS Class B | (1,025) | -0.23% | ||||||||
| Jazz Pharmaceuticals PLC | 992 | 0.22% | ||||||||
| Aeroports De Paris SA | 984 | 0.22% | ||||||||
| Pandora A/S | (961) | -0.21% | ||||||||
| KBC Groupe SA | (958) | -0.21% | ||||||||
| Booking Holdings Inc | 935 | 0.21% | ||||||||
| Treasury Wine Estates Limited | 931 | 0.21% | ||||||||
| Elisa Oyj Class A | (928) | -0.21% | ||||||||
| Sodexo SA | 905 | 0.20% | ||||||||
| ESR Group Limited | (901) | -0.20% | ||||||||
| Sofina SA | (899) | -0.20% | ||||||||
| Wesfarmers Ltd | (892) | -0.20% | ||||||||
| Tower Semiconductor Ltd | 882 | 0.20% | ||||||||
| Banque Cantonale Vaudoise | 874 | 0.19% | ||||||||
| Pembina Pipeline Corp | (841) | -0.19% | ||||||||
| Atlas Copco AB | 829 | 0.18% | ||||||||
| Catalent Inc | (810) | -0.18% | ||||||||
| JSR Corp | (798) | -0.18% | ||||||||
| Valeo SA | (769) | -0.17% | ||||||||
| Apple Inc | 764 | 0.17% | ||||||||
| Wisetech Global Ltd | 762 | 0.17% | ||||||||
| Jeronimo Martins SGPS SA | 754 | 0.17% | ||||||||
| Swedish Orphan Biovitrum AB | 752 | 0.17% | ||||||||
| Bachem Holding AG-Reg B | (751) | -0.17% | ||||||||
| Eurazeo SE | (747) | -0.17% | ||||||||
| Cheniere Energy Inc | (365) | -0.08% | ||||||||
| Moderna Inc | (365) | -0.08% | ||||||||
| Prudential PLC | (688) | -0.15% | ||||||||
| JDE Peets NV | 665 | 0.15% | ||||||||
| Otsuka Corp ADR | (632) | -0.14% | ||||||||
| Home Depot Inc | (593) | -0.13% | ||||||||
| AP Moller Maersk A/S | 570 | 0.13% | ||||||||
| O Reilly Automotive Inc | 555 | 0.12% | ||||||||
| Sensata Technologies Holding PLC | (550) | -0.12% | ||||||||
| Johnson Controls International PLC | (529) | -0.12% | ||||||||
| Telia Co AB | (521) | -0.12% | ||||||||
| Neste Corporation | (519) | -0.12% | ||||||||
| Bechtle AG | (474) | -0.11% | ||||||||
| Poste Italiane SPA | (473) | -0.11% | ||||||||
The accompanying notes are an integral part of the consolidated financial statements.
98
| THE ADVISORS’ INNER CIRCLE FUND III | FS MANAGED | |||
| FUTURES FUND | ||||
| DECEMBER 31, 2022 |
| |||
| Top Underlying Components | Notional | Percentage of Notional | ||||||||
| Hong Kong & China Gas Ltd ADR | $(471) | -0.10% | ||||||||
| HP Inc | 453 | 0.10% | ||||||||
| Ono Pharmaceutical Co Ltd ADR | 440 | 0.10% | ||||||||
| Eurofins Scientific SE | (439) | -0.10% | ||||||||
| Azbil (Yamatake) Corp ADR | (426) | -0.09% | ||||||||
| Carrefour SA | 420 | 0.09% | ||||||||
| Elia Group SA/NV | 416 | 0.09% | ||||||||
| Equinor Asa | 411 | 0.09% | ||||||||
| Engie SA | 394 | 0.09% | ||||||||
| Applied Materials Inc | 378 | 0.08% | ||||||||
| Cincinnati Financial Corp | (375) | -0.08% | ||||||||
| Nemetschek Se | (373) | -0.08% | ||||||||
| Compagnie Financiere Richemont SA | 358 | 0.08% | ||||||||
| Kesko Oyj Class B | (341) | -0.08% | ||||||||
| Ampol Ltd | (340) | -0.08% | ||||||||
| Woodside Energy Group Ltd | 320 | 0.07% | ||||||||
| HKT Trust And HKT Ltd | (309) | -0.07% | ||||||||
| Akzo Nobel NV | (284) | -0.06% | ||||||||
| Wendel SA | (273) | -0.06% | ||||||||
| Sagax AB-B | 261 | 0.06% | ||||||||
| Bank Of New York Mellon Corp | (250) | -0.06% | ||||||||
| Indutrade AB | 249 | 0.06% | ||||||||
| Logitech International SA | 238 | 0.05% | ||||||||
| Compass Group PLC | 236 | 0.05% | ||||||||
| Tele2 AB | (235) | -0.05% | ||||||||
| Unity Software Inc | (192) | -0.04% | ||||||||
| Open House Group Co Ltd | (178) | -0.04% | ||||||||
| Schroders PLC | (171) | -0.04% | ||||||||
| Snowflake Inc | 162 | 0.04% | ||||||||
| Amundi SA | (156) | -0.03% | ||||||||
| Keyence Corp | (143) | -0.03% | ||||||||
| Jardine Cycle & Carriage Ltd | 133 | 0.03% | ||||||||
| Verizon Communications Inc | (109) | -0.02% | ||||||||
| Sirius Xm Holdings Inc | 52 | 0.01% | ||||||||
| Roche Holding AG ADR Brr | 52 | 0.01% | ||||||||
| Iqvia Holdings Inc | 98 | 0.02% | ||||||||
| Straumann Holding AG | 82 | 0.02% | ||||||||
| Roblox Corp | 67 | 0.01% | ||||||||
| La Francaise Des Jeux SAEM | (51) | -0.01% | ||||||||
| Erste Group Bank AG | (39) | -0.01% | ||||||||
| Open Text Corp | (25) | -0.01% | ||||||||
| West Pharmaceutical Services Inc | (11) | 0.00% | ||||||||
| Incyte Corp | (3) | 0.00% | ||||||||
REIT | Medical Properties Trust Inc | (2,360) | -0.52% | |||||||
| Klepierre SA | 2,358 | 0.52% | ||||||||
| Essex Property Trust Inc | (2,354) | -0.52% | ||||||||
| Camden Property Trust | (2,348) | -0.52% | ||||||||
| Gaming And Leisure Properties Inc | 2,306 | 0.51% | ||||||||
| Iron Mountain Inc | 2,293 | 0.51% | ||||||||
| VICI Properties Inc | 2,255 | 0.50% | ||||||||
| Host Hotels & Resorts Inc | 2,188 | 0.49% | ||||||||
| Boston Properties Inc | (1,414) | -0.31% | ||||||||
| Sun Communities Inc | (360) | -0.08% | ||||||||
| Healthpeak Properties Inc | (354) | -0.08% | ||||||||
The accompanying notes are an integral part of the consolidated financial statements.
99
| THE ADVISORS’ INNER CIRCLE FUND III | FS MANAGED | |||
| FUTURES FUND | ||||
| DECEMBER 31, 2022 |
| |||
| Top Underlying Components | Notional | Percentage of Notional | ||||||||
| Digital Realty Trust Inc | $(34) | -0.01% | ||||||||
Depositary Receipt | Futu Holdings Ltd-ADR | 1,536 | 0.34% | |||||||
| Teva Pharmaceutical-Sp ADR | 520 | 0.12% | ||||||||
Preferred Shares | Bayerische Motoren Werke BMW Pfd | 487 | 0.11% | |||||||
| **JPUS1MMC Index: Seeks to monetize the tendency for the equity market to mean revert over short periods of time. |
| |||||||||
| Top Underlying Components | Notional | Percentage of Notional | ||||||||
Equity Index | S&P 500 Total Return Index | $(2,764) | -0.55% | |||||||
| **MQIS331 Index: Seeks to monetize the tendency for the equity market to mean revert over short periods of time. |
| |||||||||
| Top Underlying Components | Notional | Percentage of Notional | ||||||||
Futures | S&P 500 EMINI Futures Mar23 | $0 | 0.00% | |||||||
| **NMSY2RNU Index: Currency selection strategy using mean reversion signals. |
| |||||||||
| Top Underlying Components | Notional | Percentage of Notional | ||||||||
Spot | Japanese Yen Spot | $(85,415) | -27.93% | |||||||
| British Pound Spot | 46,046 | 15.06% | ||||||||
| Canadian Dollar Spot | 27,912 | 9.13% | ||||||||
| Euro Spot | (23,162) | -7.57% | ||||||||
| Swedish Krona Spot | 20,630 | 6.75% | ||||||||
| Swiss Franc Spot | (13,929) | -4.55% | ||||||||
| New Zealand Dollar Spot | 8,612 | 2.82% | ||||||||
| Norwegian Krone Spot | (4,611) | -1.51% | ||||||||
| Australian Dollar Spot | (63) | -0.02% | ||||||||
The tables below set forth information about the Level within the fair value hierarchy at which the Fund’s investments and other financial instruments are measured at December 31, 2022:
As of December 31, 2022, all of the Fund’s investments in securities were considered level 2, in accordance with the authoritative guidance on fair value measurements and disclosure under U.S. GAAP.
Other Financial Instruments | Level 1 (000) | Level 2 (000) | Level 3 (000) | Total (000) | ||||||||||||
OTC Swaps | ||||||||||||||||
Total Return Swaps* | ||||||||||||||||
Unrealized | ||||||||||||||||
Appreciation | $ | – | $ | 75 | $ | – | $ | 75 | ||||||||
Unrealized | ||||||||||||||||
Depreciation | – | (30) | – | (30) | ||||||||||||
|
|
|
|
|
|
|
| |||||||||
Total Other Financial Instruments | $ | – | $ | 45 | $ | – | $ | 45 | ||||||||
|
|
|
|
|
|
|
| |||||||||
* Swap contracts are valued at the unrealized appreciation (depreciation) on the instrument.
The accompanying notes are an integral part of the consolidated financial statements.
100
| THE ADVISORS’ INNER CIRCLE FUND III | FS MANAGED | |||
| FUTURES FUND | ||||
| DECEMBER 31, 2022 |
| |||
Amounts designated as “—“ are either $0 or have been rounded to $0.
For more information on valuation inputs, see Note 2 – Significant Accounting Policies in the Notes to Financial Statements.
See “Glossary” for abbreviations.
The accompanying notes are an integral part of the consolidated financial statements.
101
| THE ADVISORS’ INNER CIRCLE FUND III | FS CHIRON | |||
| REAL ASSET FUND | ||||
| DECEMBER 31, 2022 |
| |||
| ASSET WEIGHTINGS (UNAUDITED) | ||||||||||||||||
| % of Net Assets | Value (000) | |||||||||||||||
Common Stock | 33.4 | % | $ | 12,130 | ||||||||||||
U.S. Treasury Obligations | 19.7 | 7,134 | ||||||||||||||
Corporate Obligations | 9.4 | 3,396 | ||||||||||||||
Sovereign Bonds | 2.5 | 914 | ||||||||||||||
Preferred Stock | 0.4 | 136 | ||||||||||||||
Convertible Bond | 0.1 | 40 | ||||||||||||||
|
|
|
| |||||||||||||
Total Investments | 65.5 | 23,750 | ||||||||||||||
Total Other Assets and Liabilities | 34.5 | 12,530 | ||||||||||||||
|
|
|
| |||||||||||||
Net Assets | 100.0 | % | $ | 36,280 | ||||||||||||
|
|
|
| |||||||||||||
*Percentages are based on Net Assets.
| CONSOLIDATED SCHEDULE OF INVESTMENTS |
| (Percentages are based on Net Assets of $36,280 (000)) |
| COMMON STOCK — 33.4% |
| Shares | Fair Value (000) | |||||||||||
AUSTRALIA — 1.1% | ||||||||||||
Glencore | 23,133 | $ | 155 | |||||||||
National Australia Bank | 11,248 | 230 | ||||||||||
|
| |||||||||||
| 385 | ||||||||||||
|
| |||||||||||
CHILE — 0.2% | ||||||||||||
AntarChile | 9,423 | 80 | ||||||||||
|
| |||||||||||
CHINA — 0.7% | ||||||||||||
CGN Power, Cl H | 32,000 | 8 | ||||||||||
China BlueChemical | 31,000 | 7 | ||||||||||
China Communications Services, Cl H | 22,000 | 8 | ||||||||||
China Datang Renewable Power, Cl H | 27,000 | 8 | ||||||||||
China Everbright | 10,000 | 7 | ||||||||||
China Hongqiao Group | 8,000 | 8 | ||||||||||
China International Marine Containers Group, Cl H | 10,000 | 8 | ||||||||||
China Medical System Holdings | 4,000 | 6 | ||||||||||
China National Building Material, Cl H | 9,000 | 7 | ||||||||||
China Railway Group, Cl H | 13,000 | 7 | ||||||||||
China Railway Signal & Communication, Cl H | 23,000 | 8 | ||||||||||
China Resources Land | 2,000 | 9 | ||||||||||
China Resources Pharmaceutical Group | 9,000 | 7 | ||||||||||
China Tower, Cl H | 69,000 | 7 | ||||||||||
The accompanying notes are an integral part of the consolidated financial statements.
102
| THE ADVISORS’ INNER CIRCLE FUND III | FS CHIRON | |||
| REAL ASSET FUND | ||||
| DECEMBER 31, 2022 |
| |||
| COMMON STOCK — continued |
| Shares | Fair Value (000) | |||||||||||
CHINA — (continued) | ||||||||||||
CITIC | 8,000 | $ | 9 | |||||||||
CRRC | 18,000 | 7 | ||||||||||
Dongfeng Motor Group, Cl H | 13,000 | 8 | ||||||||||
Dongyue Group | 7,000 | 8 | ||||||||||
Fosun International | 9,000 | 7 | ||||||||||
Fufeng Group | 12,000 | 7 | ||||||||||
Guangzhou Baiyunshan Pharmaceutical Holdings, Cl H | 2,000 | 6 | ||||||||||
Hengan International Group | 2,000 | 11 | ||||||||||
Kingboard Holdings | 2,000 | 6 | ||||||||||
Lenovo Group | 10,000 | 8 | ||||||||||
Metallurgical Corp of China, Cl H | 32,000 | 7 | ||||||||||
Shanghai Industrial Holdings | 6,000 | 7 | ||||||||||
Shanghai Pharmaceuticals Holding, Cl H | 4,000 | 7 | ||||||||||
Shougang Fushan Resources Group | 23,000 | 7 | ||||||||||
Sinopec Engineering Group, Cl H | 17,000 | 8 | ||||||||||
TCL Electronics Holdings | 18,000 | 7 | ||||||||||
Uni-President China Holdings | 9,000 | 9 | ||||||||||
Zhengzhou Coal Mining Machinery Group, Cl H | 7,000 | 6 | ||||||||||
ZTE, Cl H | 3,000 | 7 | ||||||||||
|
| |||||||||||
| 247 | ||||||||||||
|
| |||||||||||
FRANCE — 0.3% | ||||||||||||
Orange | 12,002 | 119 | ||||||||||
|
| |||||||||||
HONG KONG — 0.3% | ||||||||||||
ASMPT | 1,000 | 7 | ||||||||||
CK Asset Holdings | 1,000 | 6 | ||||||||||
CK Infrastructure Holdings | 1,000 | 5 | ||||||||||
Grand Pharmaceutical Group | 13,000 | 8 | ||||||||||
HKT Trust & HKT | 6,000 | 7 | ||||||||||
Kerry Properties | 4,000 | 9 | ||||||||||
Kingboard Laminates Holdings | 7,000 | 8 | ||||||||||
Link REIT | 1,000 | 7 | ||||||||||
PCCW | 17,000 | 8 | ||||||||||
Sino Land | 6,000 | 7 | ||||||||||
SSY Group | 14,000 | 8 | ||||||||||
Sun Hung Kai Properties | 1,000 | 14 | ||||||||||
The accompanying notes are an integral part of the consolidated financial statements.
103
| THE ADVISORS’ INNER CIRCLE FUND III | FS CHIRON | |||
| REAL ASSET FUND | ||||
| DECEMBER 31, 2022 |
| |||
| COMMON STOCK — continued |
| Shares | Fair Value (000) | |||||||||||
HONG KONG — (continued) | ||||||||||||
Swire Pacific, Cl A | 1,000 | $ | 9 | |||||||||
Vinda International Holdings | 3,000 | 9 | ||||||||||
WH Group | 13,000 | 7 | ||||||||||
|
| |||||||||||
| 119 | ||||||||||||
|
| |||||||||||
| HUNGARY — 0.1% | ||||||||||||
MOL Hungarian Oil & Gas | 3,638 | 25 | ||||||||||
|
| |||||||||||
INDONESIA — 0.4% | ||||||||||||
Indofood Sukses Makmur | 185,310 | 80 | ||||||||||
Perusahaan Gas Negara | 757,752 | 86 | ||||||||||
|
| |||||||||||
| 166 | ||||||||||||
|
| |||||||||||
ITALY — 0.4% | ||||||||||||
Ferrari | 665 | 143 | ||||||||||
|
| |||||||||||
JAPAN — 0.6% | ||||||||||||
Japan Post Holdings | 3,630 | 31 | ||||||||||
Japan Tobacco | 5,088 | 103 | ||||||||||
Taisei | 2,631 | 85 | ||||||||||
|
| |||||||||||
| 219 | ||||||||||||
|
| |||||||||||
LUXEMBOURG — 0.4% | ||||||||||||
SES, Cl A | 20,160 | 131 | ||||||||||
|
| |||||||||||
NORWAY — 0.2% | ||||||||||||
Equinor | 2,449 | 88 | ||||||||||
|
| |||||||||||
SINGAPORE — 1.3% | ||||||||||||
Jardine Cycle & Carriage | 9,541 | 204 | ||||||||||
UOL Group | 50,434 | 253 | ||||||||||
|
| |||||||||||
| 457 | ||||||||||||
|
| |||||||||||
SOUTH KOREA — 1.5% | ||||||||||||
HL Mando | 3,985 | 127 | ||||||||||
Kia | 2,563 | 120 | ||||||||||
Pan Ocean | 23,172 | 105 | ||||||||||
SK Hynix | 2,548 | 151 | ||||||||||
SK Telecom | 1,363 | 51 | ||||||||||
|
| |||||||||||
| 554 | ||||||||||||
|
| |||||||||||
The accompanying notes are an integral part of the consolidated financial statements.
104
| THE ADVISORS’ INNER CIRCLE FUND III | FS CHIRON | |||
| REAL ASSET FUND | ||||
| DECEMBER 31, 2022 |
| |||
| COMMON STOCK — continued | ||||||||||||
| Shares | Fair Value (000) | |||||||||||
SPAIN — 0.6% | ||||||||||||
Repsol | 5,873 | $ | 93 | |||||||||
Telefonica | 32,833 | 119 | ||||||||||
|
| |||||||||||
| 212 | ||||||||||||
|
| |||||||||||
SWEDEN — 0.4% | ||||||||||||
Evolution | 1,529 | 149 | ||||||||||
|
| |||||||||||
TAIWAN — 0.3% | ||||||||||||
Catcher Technology | 5,108 | 28 | ||||||||||
Hon Hai Precision Industry | 26,620 | 87 | ||||||||||
|
| |||||||||||
| 115 | ||||||||||||
|
| |||||||||||
UNITED KINGDOM — 0.5% | ||||||||||||
BAE Systems | 17,507 | 181 | ||||||||||
CK Hutchison Holdings | 1,000 | 6 | ||||||||||
|
| |||||||||||
| 187 | ||||||||||||
|
| |||||||||||
UNITED STATES — 24.1% | ||||||||||||
AbbVie | 223 | 36 | ||||||||||
Altria Group | 3,703 | 169 | ||||||||||
Amdocs | 3,946 | 359 | ||||||||||
American International Group | 3,074 | 194 | ||||||||||
Bank of New York Mellon | 4,092 | 186 | ||||||||||
Bristol-Myers Squibb | 4,824 | 347 | ||||||||||
Broadcom | 675 | 377 | ||||||||||
CACI International, Cl A* | 878 | 264 | ||||||||||
Campbell Soup | 3,527 | 200 | ||||||||||
Cardinal Health | 3,311 | 255 | ||||||||||
CF Industries Holdings | 637 | 54 | ||||||||||
Citigroup | 3,682 | 167 | ||||||||||
ConocoPhillips | 482 | 57 | ||||||||||
Dick’s Sporting Goods | 1,194 | 143 | ||||||||||
Dow | 1,364 | 69 | ||||||||||
Energy Transfer | 5,009 | 59 | ||||||||||
Exxon Mobil | 679 | 75 | ||||||||||
Fair Isaac* | 303 | 181 | ||||||||||
Fox | 3,767 | 115 | ||||||||||
General Mills | 2,231 | 187 | ||||||||||
The accompanying notes are an integral part of the consolidated financial statements.
105
| THE ADVISORS’ INNER CIRCLE FUND III | FS CHIRON | |||
| REAL ASSET FUND | ||||
| DECEMBER 31, 2022 |
| |||
| COMMON STOCK — continued | ||||||||||||
| Shares | Fair Value (000) | |||||||||||
UNITED STATES —(continued) | ||||||||||||
Gilead Sciences | 415 | $ | 36 | |||||||||
Goldman Sachs Group | 518 | 178 | ||||||||||
Hologic* | 4,989 | 373 | ||||||||||
Huntsman | 2,538 | 70 | ||||||||||
Jabil | 6,313 | 430 | ||||||||||
Jazz Pharmaceuticals* | 230 | 37 | ||||||||||
JPMorgan Chase | 1,538 | 206 | ||||||||||
Kellogg | 1,117 | 80 | ||||||||||
Lennar, Cl A | 874 | 79 | ||||||||||
Lockheed Martin | 582 | 283 | ||||||||||
Loews | 2,324 | 136 | ||||||||||
Louisiana-Pacific | 1,225 | 73 | ||||||||||
Lowe’s | 670 | 134 | ||||||||||
LyondellBasell Industries, Cl A | 820 | 68 | ||||||||||
Marathon Petroleum | 604 | 70 | ||||||||||
Micron Technology | 6,517 | 326 | ||||||||||
Morgan Stanley | 4,099 | 348 | ||||||||||
Newmont | 6,193 | 292 | ||||||||||
Nucor | 494 | 65 | ||||||||||
Paychex | 2,904 | 336 | ||||||||||
Pfizer | 695 | 35 | ||||||||||
Phillips 66 | 692 | 72 | ||||||||||
Plains All American Pipeline | 5,061 | 60 | ||||||||||
Post Holdings* | 935 | 85 | ||||||||||
QUALCOMM | 2,847 | 313 | ||||||||||
Regeneron Pharmaceuticals* | 49 | 35 | ||||||||||
Science Applications International | 3,275 | 363 | ||||||||||
Toll Brothers | 1,548 | 77 | ||||||||||
Universal Health Services, Cl B | 2,527 | 356 | ||||||||||
Vertex Pharmaceuticals* | 118 | 34 | ||||||||||
Victoria’s Secret* | 3,351 | 120 | ||||||||||
Westlake | 682 | 70 | ||||||||||
|
| |||||||||||
| 8,734 | ||||||||||||
|
| |||||||||||
TOTAL COMMON STOCK | ||||||||||||
(Cost $11,585) (000) | 12,130 | |||||||||||
|
| |||||||||||
The accompanying notes are an integral part of the consolidated financial statements.
106
| THE ADVISORS’ INNER CIRCLE FUND III | FS CHIRON | |||
| REAL ASSET FUND | ||||
| DECEMBER 31, 2022 |
| |||
| U.S. TREASURY OBLIGATIONS — 19.7% | ||||||||||||
| Face Amount (000) | Fair Value (000) | |||||||||||
U.S. Treasury Bills | $ | 840 | $ | 825 | ||||||||
3.933%, 04/06/23(A) | 830 | 821 | ||||||||||
U.S. Treasury Inflation Indexed Bonds | 6,110 | 5,488 | ||||||||||
|
| |||||||||||
| TOTAL U.S. TREASURY OBLIGATIONS | ||||||||||||
(Cost $7,550) (000) | 7,134 | |||||||||||
|
| |||||||||||
| CORPORATE OBLIGATIONS — 9.4% | ||||||||||||
FINLAND — 0.6% | ||||||||||||
Nordea Bank | 200 | 199 | ||||||||||
|
| |||||||||||
GERMANY — 0.6% | ||||||||||||
Volkswagen International Finance MTN | EUR | 200 | 210 | |||||||||
|
| |||||||||||
MEXICO — 0.4% | ||||||||||||
Petroleos Mexicanos | $ | 200 | 157 | |||||||||
|
| |||||||||||
NORWAY — 0.5% | ||||||||||||
Equinor MTN | GBP | 140 | 192 | |||||||||
|
| |||||||||||
SAUDI ARABIA — 0.5% | ||||||||||||
Saudi Arabian Oil MTN | $ | 200 | 183 | |||||||||
|
| |||||||||||
SOUTH KOREA — 0.5% | ||||||||||||
SK Hynix | 200 | 173 | ||||||||||
|
| |||||||||||
TAIWAN — 0.5% | ||||||||||||
TSMC Arizona | 200 | 178 | ||||||||||
|
| |||||||||||
UNITED ARAB EMIRATES — 0.4% | ||||||||||||
Galaxy Pipeline Assets Bidco | 193 | 155 | ||||||||||
|
| |||||||||||
The accompanying notes are an integral part of the consolidated financial statements.
107
| THE ADVISORS’ INNER CIRCLE FUND III | FS CHIRON | |||
| REAL ASSET FUND | ||||
| DECEMBER 31, 2022 |
| |||
| CORPORATE OBLIGATIONS — continued | ||||||||||||
| Face Amount (000) | Fair Value (000) | |||||||||||
UNITED KINGDOM — 0.5% | ||||||||||||
HSBC Holdings | ||||||||||||
3.973%, ICE LIBOR USD 3 Month + 1.610%, 05/22/30 (C) | $ | 200 | $ | 175 | ||||||||
|
| |||||||||||
UNITED STATES — 4.9% | ||||||||||||
Broadcom | 420 | 370 | ||||||||||
Cadence Design Systems | 50 | 50 | ||||||||||
Gilead Sciences | 50 | 49 | ||||||||||
Jabil | 70 | 66 | ||||||||||
Marathon Oil | 200 | 206 | ||||||||||
Micron Technology | 260 | 195 | ||||||||||
Nexstar Media | 70 | 64 | ||||||||||
Philip Morris International | EUR | 230 | 206 | |||||||||
Plains All American Pipeline | $ | 200 | 197 | |||||||||
Regeneron Pharmaceuticals | 250 | 193 | ||||||||||
Schlumberger Finance Canada | 70 | 64 | ||||||||||
Take-Two Interactive Software | 50 | 49 | ||||||||||
UNITED STATES — (continued) | ||||||||||||
VMware | 70 | 65 | ||||||||||
|
| |||||||||||
| 1,774 | ||||||||||||
|
| |||||||||||
TOTAL CORPORATE OBLIGATIONS | ||||||||||||
(Cost $3,431) (000) | 3,396 | |||||||||||
|
| |||||||||||
The accompanying notes are an integral part of the consolidated financial statements.
108
| THE ADVISORS’ INNER CIRCLE FUND III | FS CHIRON | |||
| REAL ASSET FUND | ||||
| DECEMBER 31, 2022 |
| |||
| SOVEREIGN BONDS — 2.5% | ||||||||||||
| Face Amount (000) | Fair Value (000) | |||||||||||
Brazilian Government International Bond 4.250%, 01/07/25 | $ | 200 | $ | 196 | ||||||||
|
| |||||||||||
Hungary Government International Bond 2.125%, 09/22/31(B) | 200 | 148 | ||||||||||
|
| |||||||||||
Qatar Government International Bond 5.103%, 04/23/48(B) | 200 | 201 | ||||||||||
|
| |||||||||||
Republic of Poland Government International Bond 3.250%, 04/06/26 | 200 | 192 | ||||||||||
|
| |||||||||||
Saudi Government International Bond MTN 4.500%, 10/26/46(B) | 200 | 177 | ||||||||||
|
| |||||||||||
TOTAL SOVEREIGN BONDS | ||||||||||||
(Cost $909) (000) | 914 | |||||||||||
|
| |||||||||||
| PREFERRED STOCK — 0.4% | ||||||||||||
| Shares | ||||||||||||
GERMANY — 0.4% | ||||||||||||
Dr Ing hc F Porsche, 0.000%(D) | 1,345 | 136 | ||||||||||
|
| |||||||||||
Total Preferred Stock | ||||||||||||
(Cost $135) (000) | 136 | |||||||||||
|
| |||||||||||
| CONVERTIBLE BOND — 0.1% | ||||||||||||
| Face Amount (000) | Fair Value (000) | |||||||||||
UNITED STATES — 0.1% | ||||||||||||
Palo Alto Networks | $ | 25 | 40 | |||||||||
|
| |||||||||||
Total Convertible Bond | ||||||||||||
(Cost $36) (000) | 40 | |||||||||||
|
| |||||||||||
TOTAL INVESTMENTS — 65.5% | ||||||||||||
(Cost $23,646) (000) | $ | 23,750 | ||||||||||
|
| |||||||||||
| * | Non-income producing security. |
| (A) | Interest rate represents the security’s effective yield at the time of purchase. |
The accompanying notes are an integral part of the consolidated financial statements.
109
| THE ADVISORS’ INNER CIRCLE FUND III | FS CHIRON | |||
| REAL ASSET FUND | ||||
| DECEMBER 31, 2022 |
| |||
| (B) | Securities sold within terms of a private placement memorandum, exempt from registration under Section 144A of the Securities Act of 1933, as amended, and may be sold only to dealers in that program or other “accredited investors.” On December 31, 2022, the value of these securities amounted $1,300 (000) and represented 3.6% of net assets. |
| (C) | Variable or floating rate security. The rate shown is the effective interest rate as of period end. The rates on certain securities are not based on published reference rates and spreads and are either determined by the issuer or agent based on current market conditions; by using a formula based on the rates of underlying loans; or by adjusting periodically based on prevailing interest rates. |
| (D) | No rate available. |
Open futures contracts held by the Fund at December 31, 2022 are as follows:
| Type of Contract | Number of Contracts | Expiration Date | Notional Amount (000) | Value (000) | Unrealized Appreciation (000) | |||||||||||||||
Long Contracts | ||||||||||||||||||||
Gold | 2 | Feb-2023 | $ | 352 | $ | 365 | $ | 13 | ||||||||||||
|
|
|
|
|
| |||||||||||||||
Open OTC Swap Contracts held by the Fund at December 31, 2022 are as follows:
| Total Return Swaps | ||||||||||||||||||||||||||||||||
| Counterparty | Reference Entity/ Obligation | Fund Pays | Fund Receives | Payment Frequency | Termination Date | Currency | Notional Amount (000) | Fair Value (000) | Upfront Payments/ Receipts (000) | Net Unrealized Appreciation (Depreciation) (000) | ||||||||||||||||||||||
Goldman Sachs | **GSCHEMBA INDEX | SOFR +0.35% | ASSET RETURN | N/A | 11/26/25 | USD | $ | 724 | $ | 5 | $ | – | $ | 5 | ||||||||||||||||||
Goldman Sachs | **GSCHEULG INDEX | SOFR +0.78% | ASSET RETURN | N/A | 12/03/25 | USD | 1,209 | (3 | ) | – | (3 | ) | ||||||||||||||||||||
Goldman Sachs | **GSCHJMFA INDEX | SOFR +0.45% | ASSET RETURN | N/A | 11/03/25 | USD | 675 | 78 | – | 78 | ||||||||||||||||||||||
JPMorgan Chase | **JMABCID3 INDEX | 0.00% | ASSET RETURN | Quarterly | 10/12/23 | USD | 3,248 | (38 | ) | – | (38 | ) | ||||||||||||||||||||
Macquarie Bank Limited | **BCOM INDEX | 0.0025% | ASSET RETURN | N/A | 12/30/23 | USD | 4,872 | – | – | – | ||||||||||||||||||||||
|
|
|
|
|
|
|
| |||||||||||||||||||||||||
| $ | 10,728 | $ | 42 | $ | – | $ | 42 | |||||||||||||||||||||||||
|
|
|
|
|
|
|
| |||||||||||||||||||||||||
** The following tables represent the individual underlying components comprising the Total Return Swaps at December 31, 2022. All underlying notionals are in U.S. Dollar.
**GSCHEMBA Index: Seeks to add exposure to Emerging Markets using factor-based stock selection
| Top Underlying Components | Notional | Percentage of Notional | ||||||||
Common Stock | The United Laboratories International Holdings Ltd | $ | 26,339 | 3.61% | ||||||
| CJ Corp | 24,512 | 3.36% | ||||||||
| Metallurgical Corp of China Ltd | 23,352 | 3.20% | ||||||||
| POSCO Holdings Inc | 23,112 | 3.17% | ||||||||
The accompanying notes are an integral part of the consolidated financial statements.
110
| THE ADVISORS’ INNER CIRCLE FUND III | FS CHIRON | |||
| REAL ASSET FUND | ||||
| DECEMBER 31, 2022 |
| |||
| Top Underlying Components | Notional | Percentage of Notional | ||||||||
| CRRC Corp Ltd | $ | 22,961 | 3.15% | |||||||
| Tianneng Power International Ltd | 22,785 | 3.12% | ||||||||
| Korea Investment Holdings Co Ltd | 21,790 | 2.99% | ||||||||
| KT&G Corp | 21,565 | 2.96% | ||||||||
| China Minsheng Banking Corp Ltd | 21,392 | 2.93% | ||||||||
| Shanghai Industrial Holdings Ltd | 21,212 | 2.91% | ||||||||
| BNK Financial Group Inc | 21,116 | 2.90% | ||||||||
| Agricultural Bank of China Ltd | 21,050 | 2.89% | ||||||||
| Powertech Technology Inc | 20,952 | 2.87% | ||||||||
| Samsung Securities Co Ltd | 20,727 | 2.84% | ||||||||
| The People’s Insurance Co Group of China Ltd | 20,610 | 2.83% | ||||||||
| CITIC Ltd | 20,541 | 2.82% | ||||||||
| AMMB Holdings Bhd | 20,378 | 2.79% | ||||||||
| China CITIC Bank Corp Ltd | 20,273 | 2.78% | ||||||||
| China Everbright Bank Co Ltd | 20,266 | 2.78% | ||||||||
| Industrial & Commercial Bank of China Ltd | 19,960 | 2.74% | ||||||||
| Industrial Bank of Korea | 19,923 | 2.73% | ||||||||
| Bank of China Ltd | 19,905 | 2.73% | ||||||||
| Samsung Card Co Ltd | 19,886 | 2.73% | ||||||||
| Shinsegae Inc | 19,882 | 2.73% | ||||||||
| Seegene Inc | 19,819 | 2.72% | ||||||||
| Chongqing Rural Commercial Bank Co Ltd | 18,932 | 2.60% | ||||||||
| Alpek SAB de CV | 18,703 | 2.56% | ||||||||
| EDP - Energias do Brasil SA | 16,781 | 2.30% | ||||||||
| Indo Tambangraya Megah Tbk PT | 16,628 | 2.28% | ||||||||
| PICC Property & Casualty Co Ltd | 16,056 | 2.20% | ||||||||
Depositary Receipt | PTT Global Chemical PCL | 23,033 | 3.16% | |||||||
| Bangkok Bank PCL | 21,280 | 2.92% | ||||||||
Preferred Shares | Cia Paranaense de Energia | 22,317 | 3.06% | |||||||
| Metalurgica Gerdau SA | 20,892 | 2.86% | ||||||||
Unit | Coca-Cola Femsa SAB de CV | 20,418 | 2.80% | |||||||
| **GSCHEULG Index: Seeks to add exposure to European Markets using factor-based stock selection |
| |||||||||
| Top Underlying Components | Notional | Percentage of Notional | ||||||||
Common Stock | Orion Oyj | $ | 33,637 | 2.79% | ||||||
| Talanx AG | 33,595 | 2.79% | ||||||||
| Dassault Aviation SA | 33,278 | 2.76% | ||||||||
| E.ON SE | 32,973 | 2.74% | ||||||||
| Helvetia Holding AG | 32,864 | 2.73% | ||||||||
| Fresenius Medical Care AG & Co KGaA | 32,818 | 2.72% | ||||||||
| DS Smith PLC | 32,612 | 2.71% | ||||||||
| Novartis AG | 32,545 | 2.70% | ||||||||
| Logitech International SA | 32,486 | 2.70% | ||||||||
| Rubis SCA | 32,476 | 2.69% | ||||||||
| TotalEnergies SE | 32,332 | 2.68% | ||||||||
| GSK PLC | 32,274 | 2.68% | ||||||||
| HeidelbergCement AG | 32,271 | 2.68% | ||||||||
| Bayerische Motoren Werke AG | 32,055 | 2.66% | ||||||||
| Assicurazioni Generali SpA | 31,636 | 2.63% | ||||||||
| Wendel SE | 31,626 | 2.62% | ||||||||
| Mercedes-Benz Group AG | 31,622 | 2.62% | ||||||||
The accompanying notes are an integral part of the consolidated financial statements.
111
| THE ADVISORS’ INNER CIRCLE FUND III | FS CHIRON | |||
| REAL ASSET FUND | ||||
| DECEMBER 31, 2022 |
| |||
| Top Underlying Components | Notional | Percentage of Notional | ||||||||
| ING Groep NV | $ | 31,514 | 2.61% | |||||||
| ArcelorMittal SA | 31,017 | 2.57% | ||||||||
| Mapfre SA | 30,978 | 2.57% | ||||||||
| 3i Group PLC | 30,886 | 2.56% | ||||||||
| Zurich Insurance Group AG | 30,867 | 2.56% | ||||||||
| Taylor Wimpey PLC | 30,583 | 2.54% | ||||||||
| Alten SA | 30,500 | 2.53% | ||||||||
| Eurazeo SE | 30,343 | 2.52% | ||||||||
| Kuehne + Nagel International AG | 30,037 | 2.49% | ||||||||
| Roche Holding AG | 29,877 | 2.48% | ||||||||
| Eni SpA | 29,875 | 2.48% | ||||||||
| Engie SA | 29,862 | 2.48% | ||||||||
| NN Group NV | 29,756 | 2.47% | ||||||||
| Ipsen SA | 29,524 | 2.45% | ||||||||
| Stellantis NV | 29,104 | 2.42% | ||||||||
| Telefonaktiebolaget LM Ericsson | 29,067 | 2.41% | ||||||||
| Infineon Technologies AG | 28,974 | 2.40% | ||||||||
| Yara International ASA | 28,967 | 2.40% | ||||||||
| Naturgy Energy Group SA | 28,655 | 2.38% | ||||||||
| Aker BP ASA | 28,325 | 2.35% | ||||||||
| BT Group PLC | 27,630 | 2.29% | ||||||||
| Volkswagen AG | 25,704 | 2.13% | ||||||||
| **GSCHJMFA INDEX: Seeks to add exposure to Japanese Markets using factor-based stock selection |
| |||||||||
| Top Underlying Components | Notional | Percentage of Notional | ||||||||
Common Stock | Resona Holdings Inc | $ | 26,663 | 3.54% | ||||||
| Dai-ichi Life Holdings Inc | 26,238 | 3.49% | ||||||||
| Sumitomo Mitsui Financial Group Inc | 26,232 | 3.48% | ||||||||
| Morinaga Milk Industry Co Ltd | 24,131 | 3.21% | ||||||||
| Mebuki Financial Group Inc | 23,947 | 3.18% | ||||||||
| Mizuho Financial Group Inc | 23,859 | 3.17% | ||||||||
| Marubeni Corp | 23,657 | 3.14% | ||||||||
| Sankyu Inc | 23,195 | 3.08% | ||||||||
| Sumitomo Metal Mining Co Ltd | 22,311 | 2.96% | ||||||||
| Sumitomo Mitsui Trust Holdings Inc | 22,307 | 2.96% | ||||||||
| Shimamura Co Ltd | 22,138 | 2.94% | ||||||||
| Japan Post Insurance Co Ltd | 22,012 | 2.92% | ||||||||
| Takeda Pharmaceutical Co Ltd | 21,988 | 2.92% | ||||||||
| Mitsubishi Corp | 21,587 | 2.87% | ||||||||
| Zenkoku Hosho Co Ltd | 21,400 | 2.84% | ||||||||
| Seino Holdings Co Ltd | 21,326 | 2.83% | ||||||||
| Kuraray Co Ltd | 21,121 | 2.81% | ||||||||
| Nomura Holdings Inc | 21,016 | 2.79% | ||||||||
| Fuji Media Holdings Inc | 20,911 | 2.78% | ||||||||
| Mitsubishi Chemical Group Corp | 20,893 | 2.78% | ||||||||
| SoftBank Corp | 20,824 | 2.77% | ||||||||
| Daiwa Securities Group Inc | 20,808 | 2.76% | ||||||||
| Oji Holdings Corp | 20,793 | 2.76% | ||||||||
| Mitsui Mining & Smelting Co Ltd | 20,769 | 2.76% | ||||||||
| Izumi Co Ltd | 20,349 | 2.70% | ||||||||
| GungHo Online Entertainment Inc | 20,101 | 2.67% | ||||||||
The accompanying notes are an integral part of the consolidated financial statements.
112
| THE ADVISORS’ INNER CIRCLE FUND III | FS CHIRON | |||
| REAL ASSET FUND | ||||
| DECEMBER 31, 2022 |
| |||
| Top Underlying Components | Notional | Percentage of Notional | ||||||||
| Haseko Corp | $ | 19,837 | 2.63% | |||||||
| Toyo Seikan Group Holdings Ltd | 19,647 | 2.61% | ||||||||
| Kinden Corp | 19,575 | 2.60% | ||||||||
| Medipal Holdings Corp | 19,467 | 2.59% | ||||||||
| Teijin Ltd | 19,427 | 2.58% | ||||||||
| Nippon Telegraph & Telephone Corp | 18,914 | 2.51% | ||||||||
| Nippon Television Holdings Inc | 18,726 | 2.49% | ||||||||
| Cosmo Energy Holdings Co Ltd | 18,434 | 2.45% | ||||||||
| TOPPAN INC | 18,234 | 2.42% | ||||||||
**JMABCID3 Index: The Index aims to provide convex exposure to the commodities sector, via the delta replication of call options on J.P. Morgan Beta Select Index. |
| |||||||||
| Top Underlying Components | Notional | Percentage of Notional | ||||||||
Futures | Gold 100 OZ Futures Feb23 | $ | 48,481 | 1.51% | ||||||
| Natural Gas Futures Apr23 | 33,391 | 1.04% | ||||||||
| Copper Futures May23 | 15,732 | 0.49% | ||||||||
| Silver Futures Mar23 | 15,732 | 0.49% | ||||||||
| WTI Crude Futures Dec23 | 27,933 | 0.87% | ||||||||
| Brent Crude Futures Dec23 | 24,722 | 0.77% | ||||||||
| Soybean Futures Jul23 | 23,759 | 0.74% | ||||||||
| Corn Futures Jul23 | 22,796 | 0.71% | ||||||||
| NY Harb ULSD Futures Apr23 | 11,237 | 0.35% | ||||||||
| LME PRI ALUM Futures Feb23 | 11,237 | 0.35% | ||||||||
| Soybean Meal Futures Jul23 | 15,090 | 0.47% | ||||||||
| Low Su Gasoil G Apr23 | 14,127 | 0.44% | ||||||||
| Soybean Oil Futures Jul23 | 13,164 | 0.41% | ||||||||
| LME Nickel Futures Mar23 | 12,201 | 0.38% | ||||||||
| KC HRW Wheat Futures Dec23 | 6,100 | 0.19% | ||||||||
| Live Cattle Futures Apr23 | 6,100 | 0.19% | ||||||||
| Wheat Future (CBT) Dec23 | 9,632 | 0.30% | ||||||||
| Live Cattle Futures Jun23 | 4,816 | 0.15% | ||||||||
| Sugar #11 (World) Mar24 | 4,816 | 0.15% | ||||||||
| LME Zinc Futures Dec23 | 9,311 | 0.29% | ||||||||
| Gasoline RBOB Futures Jun23 | 8,027 | 0.25% | ||||||||
| Coffee ‘C’ Futures May23 | 6,742 | 0.21% | ||||||||
| Sugar #11 (World) Mar23 | 5,458 | 0.17% | ||||||||
| Cotton NO.2 Futures Mar23 | 2,248 | 0.07% | ||||||||
| Cotton NO.2 Futures Mar24 | 2,248 | 0.07% | ||||||||
| Lean Hogs Futures Apr23 | 2,569 | 0.08% | ||||||||
| Lean Hogs Futures Jun23 | 1,926 | 0.06% | ||||||||
| Lean Hogs Futures Jul23 | 963 | 0.03% | ||||||||
| Lean Hogs Futures Aug23 | 963 | 0.03% | ||||||||
| Live Cattle Futures Aug23 | 1,605 | 0.05% | ||||||||
| Lean Hogs Futures Oct23 | 321 | 0.01% | ||||||||
| Cocoa Futures Mar23 | 0 | 0.00% | ||||||||
| Cocoa Futures Mar24 | 0 | 0.00% | ||||||||
| Cattle Feeder Futures Apr23 | 0 | 0.00% | ||||||||
| Cattle Feeder Futures May23 | 0 | 0.00% | ||||||||
The accompanying notes are an integral part of the consolidated financial statements.
113
| THE ADVISORS’ INNER CIRCLE FUND III | FS CHIRON | |||
| REAL ASSET FUND | ||||
| DECEMBER 31, 2022 |
| |||
| Top Underlying Components | Notional | Percentage of Notional | ||||||||
| Cattle Feeder Futures Aug23 | $ | 0 | 0.00% | |||||||
| LME Lead Futures Apr23 | 0 | 0.00% | ||||||||
| **BCOM Index: Provides broad-based exposure to commodities with no single commodity or commodity sector dominating the index. |
| |||||||||
| Top Underlying Components | Notional | Percentage of Notional | ||||||||
Futures | COMEX Gold 100 Troy Ounces | $ | 718,159 | 14.57% | ||||||
| NYMEX Henry Hub Natural Gas Futures | 416,995 | 8.46% | ||||||||
| NYMEX Light Sweet Crude Oil | 384,464 | 7.80% | ||||||||
| ICE Brent Crude Oil | 342,074 | 6.94% | ||||||||
| CBOT Soybean Oil | 161,672 | 3.28% | ||||||||
| LME Primary Aluminum | 161,672 | 3.28% | ||||||||
| CBOT Soybean | 298,206 | 6.05% | ||||||||
| CBOT Corn | 294,756 | 5.98% | ||||||||
| COMEX Silver | 241,029 | 4.89% | ||||||||
| COMEX Copper | 221,313 | 4.49% | ||||||||
| CME Live Cattle | 193,218 | 3.92% | ||||||||
| CBOT Soybean Meal | 189,274 | 3.84% | ||||||||
| LME Nickel | 187,303 | 3.80% | ||||||||
| ICE Gas Oil | 155,757 | 3.16% | ||||||||
| NYBOT CSC Number 11 World Sugar | 144,420 | 2.93% | ||||||||
| CBOT Wheat | 141,463 | 2.87% | ||||||||
| NYMEX NY Harbor ULSD Futures | 124,704 | 2.53% | ||||||||
| LME Zinc | 122,240 | 2.48% | ||||||||
| NYMEX Reformulated Gasoline Blendstock for Oxygen Blending RBOB Futures | 109,424 | 2.22% | ||||||||
| NYBOT CSC C Coffee | 92,666 | 1.88% | ||||||||
| KCBT Hard Red Winter Wheat | 90,201 | 1.83% | ||||||||
| CME Lean Hogs | 86,751 | 1.76% | ||||||||
| NYBOT CTN Number 2 Cotton | 51,262 | 1.04% | ||||||||
The tables below set forth information about the Level within the fair value hierarchy at which the Fund’s investments and other financial instruments are measured at December 31, 2022:
| Investments in Securities | Level 1 (000) | Level 2 (000) | Level 3 (000) | Total (000) | ||||||||||||
Common Stock | $ | 12,130 | $ | — | $ | — | $ | 12,130 | ||||||||
|
|
|
|
|
|
|
| |||||||||
U.S. Treasury | — | 7,134 | — | 7,134 | ||||||||||||
|
|
|
|
|
|
|
| |||||||||
Corporate Obligations | — | 3,396 | — | 3,396 | ||||||||||||
|
|
|
|
|
|
|
| |||||||||
Sovereign Bonds | — | 914 | — | 914 | ||||||||||||
|
|
|
|
|
|
|
| |||||||||
Preferred Stock | 136 | — | — | 136 | ||||||||||||
|
|
|
|
|
|
|
| |||||||||
Convertible Bond | — | 40 | — | 40 | ||||||||||||
|
|
|
|
|
|
|
| |||||||||
Total Investments in Securities | $ | 12,266 | $ | 11,484 | $ | — | $ | 23,750 | ||||||||
|
|
|
|
|
|
|
| |||||||||
The accompanying notes are an integral part of the consolidated financial statements.
114
| THE ADVISORS’ INNER CIRCLE FUND III | FS CHIRON | |||
| REAL ASSET FUND | ||||
| DECEMBER 31, 2022 |
| |||
| Other Financial Instruments | Level 1 (000) | (000)Level 2 | Level 3 (000) | Total (000) | ||||||||||||
Futures Contracts* Unrealized Appreciation | $ | 13 | $ | – | $ | – | $ | 13 | ||||||||
OTC Swaps | ||||||||||||||||
Total Return Swaps* | ||||||||||||||||
Unrealized Appreciation | – | 83 | – | 83 | ||||||||||||
Unrealized Depreciation | – | (41 | ) | – | (41) | |||||||||||
|
|
|
|
|
|
|
| |||||||||
Total Other Financial Instruments | $ | 13 | $ | 42 | $ | – | $ | 55 | ||||||||
|
|
|
|
|
|
|
| |||||||||
* Futures contracts and swap contracts are valued at the unrealized appreciation (depreciation) on the instrument.
Amounts designated as “—“ are either $0 or have been rounded to $0.
At December 31, 2022, sector weightings of the Fund are as follows (Unaudited).
Percentages based on total investments. Total investments do not include derivatives such as options, futures contracts, forward contracts, and swap contracts, if applicable.
| SECTOR WEIGHTINGS | ||
U.S. Treasury Obligations | 30.0% | |
Information Technology | 15.9% | |
Financials | 9.6% | |
Health Care | 7.7% | |
Energy | 7.4% | |
Industrials | 6.9% | |
Consumer Discretionary | 5.2% | |
Consumer Staples | 4.8% | |
Materials | 4.0% | |
Sovereign Bonds | 3.9% | |
Communication Services | 2.8% | |
Real Estate | 1.3% | |
Utilities | 0.5% | |
| ||
| 100.0% | ||
| ||
The accompanying notes are an integral part of the consolidated financial statements.
115
| THE ADVISORS’ INNER CIRCLE FUND III | FS INVESTMENTS | |||
| DECEMBER 31, 2022 |
| |||
For more information on valuation inputs, see Note 2 – Significant Accounting Policies in the Notes to Financial Statements.
See “Glossary” for abbreviations.
116
| THE ADVISORS’ INNER CIRCLE FUND III | FS INVESTMENTS | |||
| DECEMBER 31, 2022 |
| Amounts | designated as “—“ are $0. |
The accompanying notes are an integral part of the financial statements.
117
| THE ADVISORS’ INNER CIRCLE FUND III | FS INVESTMENTS | |||
| DECEMBER 31, 2022 |
| FS Multi-Strategy Alternatives Fund | FS Managed Futures Fund | |||||||||||
|
| |||||||||||
CONSOLIDATED STATEMENTS OF ASSETS AND LIABILITIES |
| |||||||||||
Net Assets Consist of: | ||||||||||||
Paid-in Capital | $ | 722,975 | $ | 1,996 | ||||||||
Total Distributable Loss | (7,041 | ) | (77 | ) | ||||||||
|
| |||||||||||
Net Assets | $ | 715,934 | $ | 1,919 | ||||||||
|
| |||||||||||
Class A Shares: | ||||||||||||
Net Assets | $ | 29,069 | $ | 24 | ||||||||
Outstanding Shares of Beneficial Interest (Unlimited Authorization - No Par Value) | 2,722,222 | 2,500 | ||||||||||
|
| |||||||||||
Net Asset Value, Offering and Redemption Price Per Share | $ | 10.68 | ‡ | $ | 9.59 | ‡ | ||||||
|
| |||||||||||
Maximum Offering Price Per Share | 11.33 | 10.18 | ||||||||||
|
| |||||||||||
Class I Shares: | ||||||||||||
Net Assets | $ | 686,865 | $ | 1,895 | ||||||||
Outstanding Shares of Beneficial Interest (Unlimited Authorization - No Par Value) | 64,051,961 | 197,500 | ||||||||||
|
| |||||||||||
Net Asset Value, Offering and Redemption Price Per Share | $ | 10.72 | ‡ | $ | 9.59 | ‡ | ||||||
|
| |||||||||||
| (1) | Amounts shown In Thousands with the exception of Outstanding Shares of Beneficial Interest and Net Asset Value Per Share. |
| ‡ | Net Assets divided by Shares do not calculate to the stated NAV due to Net Assets and Shares being Rounded. |
The accompanying notes are an integral part of the financial statements.
118
| THE ADVISORS’ INNER CIRCLE FUND III | FS INVESTMENTS | |||
| DECEMBER 31, 2022 |
FS Chiron Real Asset Fund | ||||
|
| |||
CONSOLIDATED STATEMENTS OF ASSETS AND LIABILITIES ($ Thousands) | ||||
Assets: | ||||
Investments, at Fair Value (Cost $23,646) | $ | 23,750 | ||
Foreign Currency, at Fair Value (Cost $26) | 26 | |||
OTC Swap Contracts, at Fair Value (Cost $–) | 83 | |||
Cash | 11,455 | |||
Cash Pledged as Collateral for Swap Contracts | 940 | |||
Reimbursement from Advisor | 102 | |||
Dividend and Interest Receivable | 90 | |||
Receivable for Investments Sold | 57 | |||
Cash Pledged as Collateral for Futures Contracts | 21 | |||
Reclaim Receivable | 4 | |||
Prepaid Expenses | 8 | |||
|
| |||
Total Assets | 36,536 | |||
|
| |||
Liabilities: | ||||
Payable Due to Administrator | $ | 70 | ||
OTC Swap Contracts, at Fair Value (Premiums Received $–) | 41 | |||
Payable for Audit Fees | 38 | |||
Payable for Legal Fees | 37 | |||
Due to Custodian | 16 | |||
Payable for Investment Securities Purchased | 9 | |||
Chief Compliance Officer Fees Payable | 3 | |||
Other Accrued Expenses and Other Payables | 42 | |||
|
| |||
Total Liabilities | 256 | |||
|
| |||
Net Assets | $ | 36,280 | ||
|
| |||
The accompanying notes are an integral part of the financial statements.
119
| THE ADVISORS’ INNER CIRCLE FUND III | FS INVESTMENTS | |||
| DECEMBER 31, 2022 |
FS Chiron Real Asset Fund | ||||
|
| |||
CONSOLIDATED STATEMENTS OF ASSETS AND LIABILITIES ($ Thousands) (1) | ||||
Net Assets Consist of: | ||||
Paid-in Capital | $ | 38,447 | ||
Total Distributable Loss | (2,167 | ) | ||
|
| |||
Net Assets | $ | 36,280 | ||
|
| |||
Class A Shares: | ||||
Net Assets | $ | 32 | ||
Outstanding Shares of Beneficial Interest (Unlimited Authorization - No Par Value) | 2,941 | |||
|
| |||
Net Asset Value, Offering and Redemption Price Per Share | $ | 10.83 | ‡ | |
|
| |||
Maximum Offering Price Per Share | 11.49 | |||
|
| |||
Class I Shares: | ||||
Net Assets | $ | 36,248 | ||
Outstanding Shares of Beneficial Interest (Unlimited Authorization - No Par Value) | 3,347,130 | |||
|
| |||
Net Asset Value, Offering and Redemption Price Per Share | $ | 10.83 | ‡ | |
|
| |||
| (1) | Amounts shown In Thousands with the exception of Outstanding Shares of Beneficial Interest and Net Asset Value Per Share. |
| ‡ | Net Assets divided by Shares do not calculate to the stated NAV due to Net Assets and Shares being Rounded. |
The accompanying notes are an integral part of the financial statements.
120
| THE ADVISORS’ INNER CIRCLE FUND III | FS INVESTMENTS | |||
| FOR THE YEAR ENDED | ||||
| DECEMBER 31, 2022 |
| |||
| FS Multi-Strategy Alternatives Fund | FS Managed Futures Fund | |||||||
|
| |||||||
|
| |||||||
Investment Income: | ||||||||
Dividends | $ | 624 | $ | — | ||||
Interest | 14,853 | 34 | ||||||
Less: Foreign Taxes Withheld | (226 | ) | — | |||||
|
| |||||||
Total Investment Income | 15,251 | 34 | ||||||
|
| |||||||
Expenses: | ||||||||
Investment Advisory Fees | 5,301 | 26 | ||||||
Administration Fees | 569 | 13 | ||||||
Distribution Fees (Class A) | 43 | — | ||||||
Shareholder Serving Fees | 6 | — | ||||||
Trustees’ Fees | 26 | — | ||||||
Chief Compliance Officer Fees | 9 | 2 | ||||||
Dividend and interest expense on securities sold short | 1,528 | — | ||||||
Legal Fees | 287 | 22 | ||||||
Transfer Agent Fees | 245 | 14 | ||||||
Custodian Fees | 160 | — | ||||||
Registration and Filing Fees | 130 | — | ||||||
Printing Fees | 115 | 17 | ||||||
Audit Fees | 97 | 59 | ||||||
Pricing Fees | 27 | — | ||||||
Other Expenses | 300 | 17 | ||||||
|
| |||||||
Total Expenses | 8,843 | 170 | ||||||
Less: | ||||||||
Investment Advisory Fee Waiver | — | (26 | ) | |||||
Reimbursement from Adviser | (765 | ) | (138 | ) | ||||
|
| |||||||
Net Expenses | 8,078 | 6 | ||||||
|
| |||||||
Net Investment Income | 7,173 | 28 | ||||||
|
| |||||||
Net Realized Gain/(Loss) on: | ||||||||
Investments | (71 | ) | (1 | ) | ||||
Purchased Options | (7 | ) | — | |||||
Written Options | (64 | ) | — | |||||
Futures Contracts | 680 | — | ||||||
Swap Contracts | 15,383 | 331 | ||||||
Foreign Currency Transactions | (1,307 | ) | — | |||||
Forward Currency Contracts | 2,528 | — | ||||||
|
| |||||||
Net Realized Gain | 17,142 | 330 | ||||||
|
| |||||||
Net Change in Unrealized Appreciation/(Depreciation) on: | ||||||||
Investments | (15,809 | ) | 1 | |||||
Futures Contracts | 877 | — | ||||||
Swap Contracts | 7,618 | (38 | ) | |||||
Securities Sold Short | 1,704 | — | ||||||
Foreign Currency Translation | (4,086 | ) | — | |||||
Forward Currency Contracts | (334 | ) | — | |||||
|
| |||||||
Net Change in Unrealized Depreciation | (10,030 | ) | (37 | ) | ||||
|
| |||||||
Net Realized and Unrealized Gain on Investments | 7,112 | 293 | ||||||
|
| |||||||
Net Increase in Net Assets Resulting from Operations | $ | 14,285 | $ | 321 | ||||
|
| |||||||
The accompanying notes are an integral part of the financial statements.
121
| THE ADVISORS’ INNER CIRCLE FUND III | FS INVESTMENTS | |||
| FOR THE YEAR ENDED | ||||
| DECEMBER 31, 2022 |
| FS Chiron Real Asset Fund | ||||
|
| |||
CONSOLIDATED STATEMENTS OF OPERATIONS ($ Thousands)
|
| |||
Investment Income: | ||||
Dividends | $ | 395 | ||
Interest | 403 | |||
Less: Foreign Taxes Withheld | (25 | ) | ||
|
| |||
Total Investment Income | 773 | |||
|
| |||
Expenses: | ||||
Investment Advisory Fees | 275 | |||
Administration Fees | 251 | |||
Trustees’ Fees | 3 | |||
Chief Compliance Officer Fees | 5 | |||
Audit Fees | 66 | |||
Legal Fees | 51 | |||
Printing Fees | 26 | |||
Registration and Filing Fees | 21 | |||
Custodian Fees | 16 | |||
Transfer Agent Fees | 15 | |||
Offering Costs | 7 | |||
Pricing Fees | 2 | |||
Other Expenses | 115 | |||
|
| |||
Total Expenses | 853 | |||
Less: | ||||
Investment Advisory Fee Waiver | (275 | ) | ||
Reimbursement from Adviser | (215 | ) | ||
|
| |||
Net Expenses | 363 | |||
|
| |||
Net Investment Income | 410 | |||
|
| |||
Net Realized Gain/(Loss) on: | ||||
Investments | (2,071 | ) | ||
Purchased Options | — | |||
Futures Contracts | (180 | ) | ||
Swap Contracts | (300 | ) | ||
Foreign Currency Transactions | (148 | ) | ||
Forward Currency Contracts | (21 | ) | ||
|
| |||
Net Realized Loss | (2,720 | ) | ||
|
| |||
Net Change in Unrealized Appreciation/(Depreciation) on: | ||||
Investments | (757 | ) | ||
Futures Contracts | (11 | ) | ||
Swap Contracts | 55 | |||
Securities Sold Short | — | |||
Foreign Currency Translation | (7 | ) | ||
|
| |||
Net Change in Unrealized Depreciation | (720) | |||
|
| |||
Net Realized and Unrealized Loss on Investments | (3,440) | |||
|
| |||
Net Decrease in Net Assets Resulting from Operations | $ | (3,030) | ||
|
| |||
The accompanying notes are an integral part of the financial statements.
122
| THE ADVISORS’ INNER CIRCLE FUND III | FS MULTI-STRATEGY | |||
| ALTERNATIVES FUND | ||||
CONSOLIDATED STATEMENTS OF CHANGES IN NET ASSETS ($ Thousands)
| ||||
Year Ended December 31, 2022 | Year Ended December 31, 2021 | |||||||
|
| |||||||
Operations: | ||||||||
Net Investment Income/(Loss) | $ | 7,173 | $ | (584 | ) | |||
Net Realized Gain on Investments | 17,142 | 15,753 | ||||||
Net Change in Unrealized Appreciation/(Depreciation) on Investments | (10,030 | ) | 1,846 | |||||
|
| |||||||
Net Increase in Net Assets Resulting from Operations | 14,285 | 17,015 | ||||||
|
| |||||||
Distributions | ||||||||
Class A Shares | (1,091 | ) | (225 | ) | ||||
Class I Shares | (25,511 | ) | (4,775 | ) | ||||
|
| |||||||
Total Distributions | (26,602 | ) | (5,000 | ) | ||||
|
| |||||||
Return of Capital: | ||||||||
Capital Share Transactions: | ||||||||
Class A Shares | ||||||||
Issued | 31,643 | 4,064 | ||||||
Reinvestment of Dividends | 1,059 | 202 | ||||||
Redeemed | (10,870 | ) | (4,117 | ) | ||||
|
| |||||||
Net Increase in Net Assets from Class A Share Transactions | 21,832 | 149 | ||||||
|
| |||||||
Class I Shares | ||||||||
Issued | 642,675 | 67,372 | ||||||
Reinvestment of Dividends | 23,493 | 4,187 | ||||||
Redeemed | (122,831 | ) | (49,344 | ) | ||||
|
| |||||||
Net Increase in Net Assets from Class I Share Transactions | 543,337 | 22,215 | ||||||
|
| |||||||
Net Increase in Net Assets from Capital Share Transactions | 565,169 | 22,364 | ||||||
|
| |||||||
Total Increase in Net Assets | 552,852 | 34,379 | ||||||
|
| |||||||
Net Assets: | ||||||||
Beginning of Year | 163,082 | 128,703 | ||||||
|
| |||||||
End of Year | $ | 715,934 | $ | 163,082 | ||||
|
| |||||||
Amounts designated as “—“ are $0.
The accompanying notes are an integral part of the financial statements.
123
| THE ADVISORS’ INNER CIRCLE FUND III | FS MULTI-STRATEGY | |||
| ALTERNATIVES FUND | ||||
| ||||
STATEMENTS OF CHANGES IN NET ASSETS (Thousands)
| ||||
Year Ended December 31, 2022 | Year Ended December 31, 2021 | |||||||
|
| |||||||
Share Transactions: | ||||||||
Class A Class Shares | ||||||||
Issued | 2,897,515 | 382,178 | ||||||
Reinvestment of Distributions | 99,115 | 18,736 | ||||||
Redeemed | (1,005,424 | ) | (390,041 | ) | ||||
|
| |||||||
Net Increase in Shares Outstanding from Class A Share Transactions | 1,991,206 | 10,873 | ||||||
|
| |||||||
Share Transactions: | ||||||||
Class I Class Shares | ||||||||
Issued | 58,773,879 | 6,295,417 | ||||||
Reinvestment of Distributions | 2,191,463 | 386,964 | ||||||
Redeemed | (11,247,239 | ) | (4,766,752 | ) | ||||
|
| |||||||
Net Increase in Shares Outstanding from Class I Share Transactions | 49,718,103 | 1,915,629 | ||||||
|
| |||||||
Amounts designated as “—“ are 0.
The accompanying notes are an integral part of the financial statements.
124
| THE ADVISORS’ INNER CIRCLE FUND III | FS MANAGED | |||
| FUTURES FUND | ||||
| ||||
CONSOLIDATED STATEMENTS OF CHANGES IN NET ASSETS ($ Thousands)
| ||||
| Year Ended December 31, 2022 | Year Ended December 31, 2021 | |||||||
|
| |||||||
Operations: | ||||||||
Net Investment Income/(Loss) | $ | 28 | $ | (7 | ) | |||
Net Realized Gain on Investments | 330 | 62 | ||||||
Net Change in Unrealized Appreciation/(Depreciation) on Investments | (37 | ) | 17 | |||||
|
| |||||||
Net Increase in Net Assets Resulting from Operations | 321 | 72 | ||||||
|
| |||||||
Distributions | ||||||||
Class A Shares | (6 | ) | (1 | ) | ||||
Class I Shares | (452 | ) | (79 | ) | ||||
|
| |||||||
Total Distributions | (458 | ) | (80 | ) | ||||
|
| |||||||
Return of Capital: | ||||||||
Capital Share Transactions: | ||||||||
Class A Shares | ||||||||
Issued | – | – | ||||||
Reinvestment of Dividends | – | – | ||||||
Redeemed | – | – | ||||||
|
| |||||||
Net Increase in Net Assets from Class A Share Transactions | – | – | ||||||
|
| |||||||
Class I Shares | ||||||||
Issued | – | – | ||||||
Reinvestment of Dividends | – | – | ||||||
Redeemed | (14 | ) | – | |||||
|
| |||||||
Net Decrease in Net Assets from Class I Share Transactions | (14 | ) | – | |||||
|
| |||||||
Net Decrease in Net Assets from Capital Share Transactions | (14 | ) | – | |||||
|
| |||||||
Total Decrease in Net Assets | (151 | ) | (8 | ) | ||||
|
| |||||||
Net Assets: | ||||||||
Beginning of Year | 2,070 | 2,078 | ||||||
|
| |||||||
End of Year | $ | 1,919 | $ | 2,070 | ||||
|
| |||||||
Amounts designated as “—“ are $0.
The accompanying notes are an integral part of the financial statements.
125
| THE ADVISORS’ INNER CIRCLE FUND III | FS MANAGED | |||
| FUTURES FUND | ||||
| ||||
STATEMENTS OF CHANGES IN NET ASSETS (Thousands)
| ||||
| Year Ended December 31, 2022 | Year Ended December 31, 2021 | |||||||
|
| |||||||
Share Transactions: | ||||||||
Class A Class Shares | ||||||||
Issued | – | – | ||||||
Reinvestment of Distributions | – | – | ||||||
Redeemed | – | – | ||||||
|
| |||||||
Net Increase in Shares Outstanding from Class A Share Transactions | – | – | ||||||
|
| |||||||
Share Transactions: | ||||||||
Class I Class Shares | ||||||||
Issued | – | – | ||||||
Reinvestment of Distributions | – | 46 | ||||||
Redeemed | (1,239 | ) | – | |||||
|
| |||||||
Net Increase/(Decrease) in Shares Outstanding from Class I Share Transactions | (1,239 | ) | 46 | |||||
|
| |||||||
Amounts designated as “—“ are 0.
The accompanying notes are an integral part of the financial statements.
126
| THE ADVISORS’ INNER CIRCLE FUND III | FS CHIRON | |||
| REAL ASSET FUND | ||||
| ||||
CONSOLIDATED STATEMENTS OF CHANGES IN NET ASSETS ($ Thousands)
| ||||
| Year Ended December 31, 2022 | Year Ended December 31, 2021 | |||||||
|
| |||||||
Operations: | ||||||||
Net Investment Income | $ | 410 | $ | 68 | ||||
Net Realized Gain/(Loss) on Investments | (2,720 | ) | 544 | |||||
Net Change in Unrealized Appreciation/(Depreciation) on Investments | (720 | ) | 790 | |||||
|
| |||||||
Net Increase/(Decrease) in Net Assets Resulting from Operations | (3,030 | ) | 1,402 | |||||
|
| |||||||
Distributions | ||||||||
Class A Shares | — | (1 | ) | |||||
Class I Shares | (249 | ) | (756 | ) | ||||
|
| |||||||
Total Distributions | (249 | ) | (757 | ) | ||||
|
| |||||||
Return of Capital: | ||||||||
Capital Share Transactions: | ||||||||
Class A Shares | ||||||||
Issued | 5 | — | ||||||
Reinvestment of Dividends | — | — | ||||||
Redeemed | — | — | ||||||
|
| |||||||
Net Increase in Net Assets from Class A Share Transactions | 5 | — | ||||||
|
| |||||||
Class I Shares | ||||||||
Issued | 14,017 | 22,993 | ||||||
Reinvestment of Dividends | 86 | 2 | ||||||
Redeemed | (383 | ) | — | |||||
|
| |||||||
Net Increase in Net Assets from Class I Share Transactions | 13,720 | 22,995 | ||||||
|
| |||||||
Net Increase in Net Assets from Capital Share Transactions | 13,725 | 22,995 | ||||||
|
| |||||||
Total Increase in Net Assets | 10,446 | 23,640 | ||||||
|
| |||||||
Net Assets: | ||||||||
Beginning of Year | 25,834 | 2,194 | ||||||
|
| |||||||
End of Year | $ | 36,280 | $ | 25,834 | ||||
|
| |||||||
Amounts designated as “—“ are $0.
The accompanying notes are an integral part of the financial statements.
127
| THE ADVISORS’ INNER CIRCLE FUND III | FS CHIRON | |||
| REAL ASSET FUND | ||||
| ||||
STATEMENTS OF CHANGES IN NET ASSETS (Thousands)
| ||||
| Year Ended December 31, 2022 | Year Ended December 31, 2021 | |||||||
|
| |||||||
Share Transactions: | ||||||||
Class A Class Shares | ||||||||
Issued | 439 | — | ||||||
Reinvestment of Distributions | 2 | — | ||||||
Redeemed | ��� | — | ||||||
|
| |||||||
Net Increase in Shares Outstanding from Class A Share Transactions | 441 | — | ||||||
|
| |||||||
Share Transactions: | ||||||||
Class I Class Shares | ||||||||
Issued | 1,256,980 | 1,914,392 | ||||||
Reinvestment of Distributions | 7,802 | 187 | ||||||
Redeemed | (34,458 | ) | — | |||||
|
| |||||||
Net Increase in Shares Outstanding from Class I Share Transactions | 1,230,324 | 1,914,579 | ||||||
|
| |||||||
Amounts designated as “—“ are 0.
The accompanying notes are an integral part of the financial statements.
128
| THE ADVISORS’ INNER CIRCLE FUND III | FS MULTI-STRATEGY | |||
| ALTERNATIVES FUND | ||||
| ||||
Selected Per Share Data & Ratios
For a Share Outstanding Throughout Each Year
| Class A Shares | ||||||||||||||||||||
| Year Ended December 31, 2022 | Year Ended December 31, 2021 | Year Ended December 31, 2020 | Year Ended December 31, 2019 | Year Ended December 31, 2018 | ||||||||||||||||
Net Asset Value, Beginning of Year | $ | 10.78 | $ | 9.77 | $ | 10.22 | $ | 9.68 | $ | 10.18 | ||||||||||
|
| |||||||||||||||||||
Income from Investment Operations: | ||||||||||||||||||||
Net Investment Income/(Loss)** | 0.19 | (0.07 | ) | 0.02 | 0.15 | 0.15 | ||||||||||||||
Net Realized and Unrealized Gain/ (Loss) | 0.13 | 1.40 | (0.43 | ) | 0.59 | (0.57 | ) | |||||||||||||
|
| |||||||||||||||||||
Total from Investment Operations | 0.32 | 1.33 | (0.41 | ) | 0.74 | (0.42 | ) | |||||||||||||
|
| |||||||||||||||||||
Dividends and Distributions: |
| |||||||||||||||||||
Net Investment Income | (0.30 | ) | (0.32 | ) | (0.04 | ) | (0.20 | ) | — | |||||||||||
Capital Gains | (0.12 | ) | — | — | — | (0.08 | ) | |||||||||||||
|
| |||||||||||||||||||
Total Dividends and Distributions | (0.42 | ) | (0.32 | ) | (0.04 | ) | (0.20 | ) | (0.08 | ) | ||||||||||
|
| |||||||||||||||||||
Net Asset Value, End of Year | $ | 10.68 | $ | 10.78 | $ | 9.77 | $ | 10.22 | $ | 9.68 | ||||||||||
|
| |||||||||||||||||||
Total Return‡ | 3.01% | 13.62% | (3.99)% | 7.68% | (4.12)% | |||||||||||||||
|
| |||||||||||||||||||
Ratios and Supplemental Data | ||||||||||||||||||||
Net Assets, End of Year (Thousands) | $ 29,069 | $ 7,891 | $ 7,036 | $ 10,973 | $ 7,521 | |||||||||||||||
Ratio of Expenses to Average Net Assets | 2.14%† | 2.17% | 2.41% | 1.81% | 0.87% | |||||||||||||||
Ratio of Expenses to Average Net Assets (Excluding Waivers) | 2.31% | 3.49% | 3.42% | 3.55% | 3.63% | |||||||||||||||
Ratio of Net Investment Income/(Loss) to Average Net Assets | 1.70% | (0.66)% | 0.22% | 1.46% | 1.55% | |||||||||||||||
Portfolio Turnover Rate | 216% | 183% | 244% | 178% | 317% | |||||||||||||||
| ** | Per share calculations were performed using average shares for the period. |
| ‡ | Returns shown do not reflect the deductions of taxes that a shareholder would pay on Fund distributions or the redemption of Fund Shares, assumes reinvestments of dividends, and does not reflect the applicable sales charges, if applicable. |
| † | The Fund incurred dividend and interest expense on securities sold short. If these expenses and fees had not been incurred, the ratios of operating expenses to average net assets for the year ended December 31, 2022 would have been 1.78%. |
The accompanying notes are an integral part of the consolidated financial statements.
129
| THE ADVISORS’ INNER CIRCLE FUND III | FS MULTI-STRATEGY | |||
| ALTERNATIVES FUND | ||||
| ||||
Selected Per Share Data & Ratios
For a Share Outstanding Throughout Each Year
| Class I Shares | ||||||||||||||||||||
| Year Ended December 31, 2022 | Year Ended December 31, 2021 | Year Ended December 31, 2020 | Year Ended December 31, 2019 | Year Ended December 31, 2018 | ||||||||||||||||
Net Asset Value, Beginning of Year | $ | 10.82 | $ | 9.80 | $ | 10.25 | $ | 9.72 | $ | 10.19 | ||||||||||
|
| |||||||||||||||||||
Income from Investment Operations: | ||||||||||||||||||||
Net Investment Income/(Loss)** | 0.18 | (0.05 | ) | 0.04 | 0.17 | 0.18 | ||||||||||||||
Net Realized and Unrealized Gain/ (Loss) | 0.16 | 1.42 | (0.41 | ) | 0.59 | (0.57 | ) | |||||||||||||
|
| |||||||||||||||||||
Total from Investment Operations | 0.34 | 1.37 | (0.37 | ) | 0.76 | (0.39 | ) | |||||||||||||
|
| |||||||||||||||||||
Dividends and Distributions: |
| |||||||||||||||||||
Net Investment Income | (0.32 | ) | (0.35 | ) | (0.08 | ) | (0.23 | ) | – | |||||||||||
Capital Gains | (0.12 | ) | – | – | – | (0.08 | ) | |||||||||||||
|
| |||||||||||||||||||
Total Dividends and Distributions | (0.44 | ) | (0.35 | ) | (0.08 | ) | (0.23 | ) | (0.08 | ) | ||||||||||
|
| |||||||||||||||||||
Net Asset Value, End of Year | $ | 10.72 | $ | 10.82 | $ | 9.80 | $ | 10.25 | $ | 9.72 | ||||||||||
|
| |||||||||||||||||||
Total Return‡ | 3.16% | 13.96% | (3.65)% | 7.77% | (3.82)% | |||||||||||||||
|
| |||||||||||||||||||
Ratios and Supplemental Data | ||||||||||||||||||||
Net Assets, End of Year (Thousands) | $ 686,865 | $ 155,191 | $ 121,667 | $ 184,543 | $ 89,799 | |||||||||||||||
Ratio of Expenses to Average Net Assets . | 1.89%† | 1.94% | 2.16% | 1.59% | 0.63% | |||||||||||||||
Ratio of Expenses to Average Net Assets (Excluding Waivers) | 2.07% | 3.26% | 3.17% | 3.28% | 3.54% | |||||||||||||||
Ratio of Net Investment Income/(Loss) to Average Net Assets | 1.69% | (0.43)% | 0.46% | 1.65% | 1.80% | |||||||||||||||
Portfolio Turnover Rate | 216% | 183% | 244% | 178% | 317% | |||||||||||||||
| ** | Per share calculations were performed using average shares for the period. |
| ‡ | Returns shown do not reflect the deductions of taxes that a shareholder would pay on Fund distributions or the redemption of Fund Shares, assumes reinvestments of dividends, and does not reflect the applicable sales charges, if applicable. |
| † | The Fund incurred dividend and interest expense on securities sold short. If these expenses and fees had not been incurred, the ratios of operating expenses to average net assets for the year ended December 31, 2022 would have been 1.53%. |
The accompanying notes are an integral part of the consolidated financial statements.
130
| THE ADVISORS’ INNER CIRCLE FUND III | FS MANAGED | |||
| FUTURES FUND | ||||
| ||||
CONSOLIDATED FINANCIAL HIGHLIGHTS | ||
Selected Per Share Data & Ratios
For a Share Outstanding Throughout Each Year/Period
| Class A Shares | ||||||||||||||||
| Year Ended December 31, 2022 | Year Ended December 31, 2021 | Year Ended December 31, 2020 | Year Ended December 31, 2019* | |||||||||||||
Net Asset Value, Beginning of Year/Period | $ | 10.29 | $ | 10.33 | $ | 9.96 | $ | 10.00 | ||||||||
|
|
| ||||||||||||||
Income from Investment Operations: | ||||||||||||||||
Net Investment Income/(Loss)** | 0.11 | (0.06 | ) | 0.00 | ^ | 0.18 | ||||||||||
Net Realized and Unrealized Gain/(Loss) | 1.45 | 0.39 | 1.02 | (0.19 | ) | |||||||||||
|
|
| ||||||||||||||
Total from Investment Operations | 1.56 | 0.33 | 1.02 | (0.01 | ) | |||||||||||
|
|
| ||||||||||||||
Dividends and Distributions: |
| |||||||||||||||
Net Investment Income | (0.78 | ) | (0.37 | ) | (0.65 | ) | (0.03 | ) | ||||||||
Capital Gains | (1.48 | ) | — | — | — | |||||||||||
|
|
| ||||||||||||||
Total Dividends and Distributions | (2.26 | ) | (0.37 | ) | (0.65 | ) | (0.03 | ) | ||||||||
|
|
| ||||||||||||||
Net Asset Value, End of Year/Period | $ | 9.59 | $ | 10.29 | $ | 10.33 | $ | 9.96 | ||||||||
|
|
| ||||||||||||||
Total Return‡ | 15.91 | % | 3.22 | % | 10.55 | % | (0.15)% | |||||||||
|
|
| ||||||||||||||
Ratios and Supplemental Data | ||||||||||||||||
Net Assets, End of Year (Thousands) | $ | 24 | $ | 26 | $ | 26 | $ | 25 | ||||||||
Ratio of Expenses to Average Net Assets | 0.51% | 0.62% | 0.50% | 0.50% | ||||||||||||
Ratio of Expenses to Average Net Assets (Excluding Waivers) | 7.82% | 12.40% | 13.13% | 10.14% | ||||||||||||
Ratio of Net Investment Income/(Loss) to Average Net Assets | 1.00% | (0.57)% | (0.03)% | 1.77% | ||||||||||||
Portfolio Turnover Rate | –% | –% | –% | –% | ||||||||||||
| * | Commenced operations on December 31, 2018. |
| ** | Per share calculations were performed using average shares for the period. |
| ^ | The amount shown is less than $0.01. |
| ‡ | Returns shown do not reflect the deductions of taxes that a shareholder would pay on Fund distributions or the redemption of Fund Shares, assumes reinvestments of dividends, and does not reflect the applicable sales charges, if applicable. |
The accompanying notes are an integral part of the consolidated financial statements.
131
| THE ADVISORS’ INNER CIRCLE FUND III | FS MANAGED | |||
| FUTURES FUND | ||||
| ||||
Selected Per Share Data & Ratios
For a Share Outstanding Throughout Each Year/Period
| Class I Shares | ||||||||||||||||
| Year Ended December 31, 2022 | Year Ended December 31, 2021 | Year Ended December 31, 2020 | Year Ended December 31, 2019* | |||||||||||||
Net Asset Value, Beginning of Year/Period | $ | 10.29 | $ | 10.33 | $ | 9.96 | $ | 10.00 | ||||||||
|
| |||||||||||||||
Income from Investment Operations: | ||||||||||||||||
Net Investment Income/(Loss)** | 0.13 | (0.03 | ) | 0.02 | 0.20 | |||||||||||
Net Realized and Unrealized Gain/(Loss) | 1.46 | 0.39 | 1.03 | (0.18 | ) | |||||||||||
|
| |||||||||||||||
Total from Investment Operations | 1.59 | 0.36 | 1.05 | 0.02 | ||||||||||||
|
| |||||||||||||||
Dividends and Distributions: | ||||||||||||||||
Net Investment Income | (0.81 | ) | (0.40 | ) | (0.68 | ) | (0.06 | ) | ||||||||
Capital Gains | (1.48 | ) | — | — | — | |||||||||||
|
| |||||||||||||||
Total Dividends and Distributions | (2.29 | ) | (0.40 | ) | (0.68 | ) | (0.06 | ) | ||||||||
|
| |||||||||||||||
Net Asset Value, End of Year/Period | $ | 9.59 | $ | 10.29 | $ | 10.33 | $ | 9.96 | ||||||||
|
| |||||||||||||||
Total Return‡ | 16.18% | 3.48% | 10.83% | 0.10% | ||||||||||||
|
| |||||||||||||||
Ratios and Supplemental Data | ||||||||||||||||
Net Assets, End of Year (Thousands) | $ | 1,895 | $ | 2,044 | $ | 2,052 | $ | 1,977 | ||||||||
Ratio of Expenses to Average Net Assets | 0.32% | 0.37% | 0.25% | 0.25% | ||||||||||||
Ratio of Expenses to Average Net Assets (Excluding Waivers) | 7.63% | 12.15% | 12.88% | 9.89% | ||||||||||||
Ratio of Net Investment Income/(Loss) to Average Net Assets | 1.19% | (0.32)% | 0.23% | 2.02% | ||||||||||||
Portfolio Turnover Rate | –% | –% | –% | –% | ||||||||||||
| * | Commenced operations on December 31, 2018. |
| ** | Per share calculations were performed using average shares for the period. |
| ‡ | Returns shown do not reflect the deductions of taxes that a shareholder would pay on Fund distributions or the redemption of Fund Shares, assumes reinvestments of dividends, and does not reflect the applicable sales charges, if applicable. |
The accompanying notes are an integral part of the consolidated financial statements.
132
| THE ADVISORS’ INNER CIRCLE FUND III | FS CHIRON | |||
| REAL ASSET FUND | ||||
| ||||
CONSOLIDATED FINANCIAL HIGHLIGHTS | ||
Selected Per Share Data & Ratios
For a Share Outstanding Throughout Each Year/Period
| Class A Shares | ||||||||||||||||
| Year Ended December 31, 2022 | Year Ended December 31, 2021 | Year Ended December 31, 2020 | Year Ended December 31, 2019* | |||||||||||||
Net Asset Value, Beginning of Year/Period | $ | 12.18 | $ | 10.72 | $ | 10.26 | $ | 10.00 | ||||||||
|
| |||||||||||||||
Income from Investment Operations: | ||||||||||||||||
Net Investment Income/(Loss)** | 0.13 | (0.01 | ) | (0.01 | ) | 0.18 | ||||||||||
Net Realized and Unrealized Gain/(Loss) | (1.42 | ) | 1.91 | 0.77 | 0.79 | |||||||||||
|
| |||||||||||||||
Total from Investment Operations | (1.29 | ) | 1.90 | 0.76 | 0.97 | |||||||||||
|
| |||||||||||||||
Dividends and Distributions: | ||||||||||||||||
Net Investment Income | (0.05 | ) | (0.44 | ) | (0.30 | ) | (0.71 | ) | ||||||||
Capital Gains | (0.01 | ) | — | — | — | |||||||||||
|
| |||||||||||||||
Total Dividends and Distributions | (0.06 | ) | (0.44 | ) | (0.30 | ) | (0.71 | ) | ||||||||
|
| |||||||||||||||
Net Asset Value, End of Year/Period | $ | 10.83 | $ | 12.18 | $ | 10.72 | $ | 10.26 | ||||||||
|
| |||||||||||||||
Total Return‡ | (10.64 | )% | 17.93% | 7.69% | 9.87% | |||||||||||
|
| |||||||||||||||
Ratios and Supplemental Data | ||||||||||||||||
Net Assets, End of Year (Thousands) | $ | 32 | $ | 30 | $ | 27 | $ | 26 | ||||||||
Ratio of Expenses to Average Net Assets | 1.50% | 0.76% | 0.50% | 0.50% | ||||||||||||
Ratio of Expenses to Average Net Assets (Excluding | ||||||||||||||||
Waivers) | 3.16% | 8.14% | 11.21% | 8.95% | ||||||||||||
Ratio of Net Investment Income/(Loss) to Average Net Assets | 1.10% | (0.11)% | (0.06)% | 1.72% | ||||||||||||
Portfolio Turnover Rate | 996% | 651% | –% | –% | ||||||||||||
| * | Commenced operations on December 31, 2018. |
| ** | Per share calculations were performed using average shares for the period. |
| ‡ | Returns shown do not reflect the deductions of taxes that a shareholder would pay on Fund distributions or the redemption of Fund Shares, assumes reinvestments of dividends, and does not reflect the applicable sales charges, if applicable. |
The accompanying notes are an integral part of the consolidated financial statements.
133
| THE ADVISORS’ INNER CIRCLE FUND III | FS CHIRON | |||
| REAL ASSET FUND |
Selected Per Share Data & Ratios
For a Share Outstanding Throughout Each Year/Period
| Class I Shares | ||||||||||||||||
| Year Ended December 31, 2022 | Year Ended December 31, 2021 | Year Ended December 31, 2020 | Year Ended December 31, 2019* | |||||||||||||
Net Asset Value, Beginning of Year/Period | $ | 12.18 | $ | 10.72 | $ | 10.26 | $ | 10.00 | ||||||||
|
| |||||||||||||||
Income from Investment Operations: | ||||||||||||||||
Net Investment Income** | 0.16 | 0.09 | 0.02 | 0.21 | ||||||||||||
Net Realized and Unrealized Gain/(Loss) | (1.43 | ) | 1.84 | 0.76 | 0.79 | |||||||||||
|
| |||||||||||||||
Total from Investment Operations | (1.27 | ) | 1.93 | 0.78 | 1.00 | |||||||||||
|
| |||||||||||||||
Dividends and Distributions: | ||||||||||||||||
Net Investment Income | (0.07 | ) | (0.47 | ) | (0.32 | ) | (0.74 | ) | ||||||||
Capital Gains | (0.01 | ) | — | — | — | |||||||||||
|
| |||||||||||||||
Total Dividends and Distributions | (0.08 | ) | (0.47 | ) | (0.32 | ) | (0.74 | ) | ||||||||
|
| |||||||||||||||
Net Asset Value, End of Year/Period | $ | 10.83 | $ | 12.18 | $ | 10.72 | $ | 10.26 | ||||||||
|
| |||||||||||||||
Total Return‡ | (10.47)% | 18.12% | 8.07% | 10.14% | ||||||||||||
|
| |||||||||||||||
Ratios and Supplemental Data | ||||||||||||||||
Net Assets, End of Year (Thousands) | $ | 36,248 | $ | 25,804 | $ | 2,167 | $ | 3,076 | ||||||||
Ratio of Expenses to Average Net Assets | 1.25% | 0.97% | 0.25% | 0.25% | ||||||||||||
Ratio of Expenses to Average Net Assets (Excluding Waivers) | 2.94% | 7.95% | 10.95% | 8.71% | ||||||||||||
Ratio of Net Investment Income to Average Net Assets | 1.42% | 0.75% | 0.22% | 1.97% | ||||||||||||
Portfolio Turnover Rate | 996% | 651% | –% | –% | ||||||||||||
| * | Commenced operations on December 31, 2018. |
| ** | Per share calculations were performed using average shares for the period. |
| ‡ | Returns shown do not reflect the deductions of taxes that a shareholder would pay on Fund distributions or the redemption of Fund Shares, assumes reinvestments of dividends, and does not reflect the applicable sales charges, if applicable. |
The accompanying notes are an integral part of the consolidated financial statements.
134
| THE ADVISORS’ INNER CIRCLE FUND III | FS INVESTMENTS | |||
| DECEMBER 31, 2022 |
| |||
NOTES TO CONSOLIDATED FINANCIAL STATEMENTS
1. Organization:
The Advisors’ Inner Circle Fund III (the “Trust”) is organized as a Delaware statutory trust under a Declaration of Trust dated December 4, 2013. The Trust is registered under the Investment Company Act of 1940, as amended (the “1940 Act��), as an open-end management investment company with 65 funds. The financial statements herein are those of the FS Multi-Strategy Alternatives Fund (“FSMS”), the FS Managed Futures Fund (“Managed Futures”) and the FS Chiron Real Asset Fund (“Real Asset”) (each a “Fund” and collectively the “Funds”). Each Fund represents two classes of shares of beneficial interest of the Trust in a separate portfolio of securities and other assets with their own investment objective and policies. FSMS seeks to provide shareholders with positive absolute returns over a complete market cycle. Managed Futures seeks to provide positive absolute returns with low correlation to traditional investments. Real Asset seeks to provide total returns consisting of capital appreciation and income. Each Fund is classified as a non-diversified, open-end management investment company registered under the 1940 Act. The financial statements of the remaining funds of the Trust are presented separately. The assets of each fund are segregated, and a shareholder’s interest is limited to the fund in which shares are held. FSMS commenced investment operations on May 16, 2017. Managed Futures and Real Asset commenced investment operations on December 31, 2018 and had no activity other than investing their cash in a money market fund. As such, no financial highlights for 2018 have been presented.
As of December 31, 2022, FSMS had one wholly-owned subsidiary, FS Alternatives Fund (Cayman), Managed Futures had one wholly-owned subsidiary, FS Managed Futures Fund (Cayman), and Real Asset had one wholly-owned subsidiary FS Chiron Real Asset Fund (Cayman) (collectively, the “Subsidiaries”), through which each of the Funds may gain exposure to commodities. The audited consolidated financial statements include both the Funds’ accounts and the accounts of the Subsidiaries. All intercompany balances have been eliminated in consolidation.
Prior to April 11, 2022 (the “Reorganization Date”): (i) the Funds were series of FS Series Trust, an investment company that then was registered under the 1940 Act, but which was not affiliated with the Trust (hereinafter, the “Target Funds”); and (ii) the names of the Target Funds were the “FS Multi-Strategy Alternatives Fund,” the “FS Managed Futures Fund,” and the “FS Chiron Real Asset Fund.” Each Target Fund was reorganized into its corresponding Fund having the same name, effective as of the Reorganization Date (said reorganizations hereinafter referred to as the “Reorganizations”). Prior to the Reorganization Date, each Fund was a “shell” fund with no prior operations; and each Fund commenced operations on the Reorganization Date.
135
| THE ADVISORS’ INNER CIRCLE FUND III | FS INVESTMENTS | |||
| DECEMBER 31, 2022 |
| |||
Pursuant to each Reorganization: (a) the Fund acquired all of the Target Fund’s assets and assumed all of the Target Fund’s liabilities in exchange for Class A shares and Class I shares of the Fund; (b) these Class A shares and Class I shares of the Fund were distributed to the shareholders of Class A shares and Class I shares, respectively, of the Target Fund; and (c) the Target Fund was liquidated and terminated. Each Reorganization was structured to be a tax-free transaction, and each Target Fund is the accounting survivor of its Reorganization. FS Fund Advisor LLC, the Funds’ investment adviser, proposed the Reorganizations for the reasons set forth in the combined proxy statement/prospectus previously sent to Target Fund shareholders, which included, among other reasons, the potential to reduce Target Fund expenses and gain economies of scale.
2. Significant Accounting Policies:
The following are significant accounting policies, which are consistently followed in the preparation of the financial statements of the Funds. The Funds are investment companies that apply the accounting and reporting guidance issued in Topic 946 by the U.S. Financial Accounting Standards Board (“FASB”).
Use of Estimates —The preparation of financial statements in conformity with U.S. GAAP requires management to make estimates and assumptions that affect the fair value of assets and liabilities and disclosure of contingent assets and liabilities at the date of the financial statements and the reported amounts of revenues and expenses during the reporting period. Actual results could differ from those estimates and such differences could be material.
Security Valuation — Securities listed on a securities exchange, market or automated quotation system for which quotations are readily available (except for securities traded on NASDAQ), including securities traded over the counter, are valued at the last quoted sale price on an exchange or market (foreign or domestic) on which they are traded on valuation date (or at approximately 4:00 pm Eastern Standard Time if a security’s primary exchange is normally open at that time), or, if there is no such reported sale on the valuation date, at the most independent, third-party pricing agents. Such values generally reflect the last reported sales price if the security is actively traded. The third-party pricing agents may also value debt securities at an evaluated bid price by employing methodologies that utilize actual market transactions, broker-supplied valuations, or other methodologies designed to identify the market value for such securities. Such methodologies generally consider such factors as security prices, yields, maturities, call features, ratings and developments relating to specific securities in arriving at valuations. On the first day a new debt security purchase is recorded, if a price is not available on the automated pricing feeds from our primary and secondary pricing vendors nor is it available from an independent broker, the security may be valued at its purchase price. Each day thereafter, the debt
136
| THE ADVISORS’ INNER CIRCLE FUND III | FS INVESTMENTS | |||
| DECEMBER 31, 2022 |
| |||
security will be valued according to the Trust’s Fair Value Procedures until an independent source can be secured. Debt obligations with remaining maturities of sixty days or less may be valued at their amortized cost, which approximates market value provided that it is determined the amortized cost continues to approximate fair value. Should existing credit, liquidity or interest rate conditions in the relevant markets and issuer specific circumstances suggest that amortized cost does not approximate fair value, then the amortized cost method may not be used. The prices for foreign securities are reported in local currency and converted to U.S. dollars using currency exchange rates.
Securities for which market prices are not “readily available” are required to be fair valued under the 1940 Act.
In December 2020, the SEC adopted Rule 2a-5 under the 1940 Act, establishing requirements to determine fair value in good faith for purposes of the 1940 Act. The rule permits fund boards to designate a fund’s investment adviser to perform fair-value determinations, subject to board oversight and certain other conditions. The rule also defines when market quotations are “readily available” for purposes of the 1940 Act and requires a fund to fair value a portfolio investment when a market quotation is not readily available. The SEC also adopted new Rule 31a-4 under the 1940 Act, which sets forth recordkeeping requirements associated with fair-value determinations. The compliance date for Rule 2a-5 and Rule 31a-4 was September 8, 2022.
Effective September 8, 2022, and pursuant to the requirements of Rule 2a-5, the Trust’s Board of Trustees (the “Board”) designated the Adviser as the Board’s valuation designee to perform fair-value determinations for the Funds through a Fair Value Committee (the “Committee”) established by the Adviser and approved new Adviser Fair Value Procedures for the Funds. Prior to September 8, 2022, fair-value determinations were performed in accordance with the Trust’s Fair Value Procedures established by the Funds’ Board and were implemented through the Committee designated by the Board.
Swaps are marked-to-market daily based upon quotations from market makers and the resulting changes in market values, are recorded as an unrealized gain or loss in the Statements of Operations.
Futures contracts that are traded on an exchange are valued at their last reported sales price as of the valuation date.
For securities that principally trade on a foreign market or exchange, a significant gap in time can exist between the time of a particular security’s last trade and the time at which the Funds calculate their net asset value. The closing prices of such securities may no longer reflect their market value at the time the Funds calculate their net asset value if an event that could materially affect the
137
| THE ADVISORS’ INNER CIRCLE FUND III | FS INVESTMENTS | |||
| DECEMBER 31, 2022 |
| |||
value of those securities (a “Significant Event”) has occurred between the time of the security’s last close and the time that the Fund calculates net asset value. A Significant Event may relate to a single issuer or to an entire market sector. If FS Fund Advisor, LLC (the “Adviser”) becomes aware of a Significant Event that has occurred with respect to a security or group of securities after the closing of the exchange or market on which the security or securities principally trade, but before the time at which the Fund calculates its net asset value, it may request that a Committee meeting be called.
If a local market in which the Funds owns securities is closed for one or more days, the Funds shall value all securities held in that corresponding currency based on the fair value prices determined by the Committee.
In accordance with the authoritative guidance on fair value measurements and disclosure under U.S. GAAP, the Funds disclose fair value of its investments in a hierarchy that prioritizes the inputs to valuation techniques used to measure the fair value. The objective of a fair value measurement is to determine the price that would be received to sell an asset or paid to transfer a liability in an orderly transaction between market participants at the measurement date (an exit price). Accordingly, the fair value hierarchy gives the highest priority to quoted prices (unadjusted) in active markets for identical assets or liabilities (Level 1) and the lowest priority to unobservable inputs (Level 3). The three levels of the fair value hierarchy are described below:
| • | Level 1 — Unadjusted quoted prices in active markets for identical, unrestricted assets or liabilities that the Funds have the ability to access at the measurement date; |
| • | Level 2 – Other significant observable inputs (includes quoted prices for similar securities, interest rates, prepayment speeds, credit risk, referenced indices, quoted prices in inactive markets, adjusted quoted prices in active markets, adjusted quoted prices on foreign equity securities that were adjusted in accordance with the Adviser’s pricing procedures, etc.); and |
| • | Level 3 — Prices, inputs or exotic modeling techniques which are both significant to the fair value measurement and unobservable (supported by little or no market activity). |
Investments are classified within the level of the lowest significant input considered in determining fair value. Investments classified within Level 3 whose fair value measurement considers several inputs may include Level 1 or Level 2 inputs as components of the overall fair value measurement.
138
| THE ADVISORS’ INNER CIRCLE FUND III | FS INVESTMENTS | |||
| DECEMBER 31, 2022 |
| |||
For the year ended December 31, 2022, there have been no significant changes to the Funds’ fair valuation methodology.
Federal Income Taxes — It is each Fund’s intention to continue to qualify as a regulated investment company for Federal income tax purposes by complying with the appropriate provisions of Subchapter M of the Internal Revenue Code of 1986, as amended. Accordingly, no provisions for Federal income taxes have been made in the financial statements.
The Funds evaluate tax positions taken or expected to be taken in the course of preparing the Funds’ tax returns to determine whether it is “more-likely-than-not” (i.e., greater than 50-percent) that each tax position will be sustained upon examination by a taxing authority based on the technical merits of the position. Tax positions deemed to meet the more-likely-than-not threshold are recorded as a tax benefit or expense in the current period. The Funds did not record any tax provision in the current period. However, management’s conclusions regarding tax positions taken may be subject to review and adjustment at a later date based on factors including, but not limited to, examination by tax authorities (i.e., from commencement of operations, as applicable), on-going analysis of and changes to tax laws, regulations and interpretations thereof.
As of and during the year ended December 31, 2022 , the Funds did not have any unrecognized tax benefits or liabilities. The Funds recognize interest and penalties, if any, related to unrecognized tax benefits as income tax expense in the Statements of Operations. During the year ended December 31, 2022 the Funds did not incur any interest or penalties.
Security Transactions and Investment Income — Security transactions are accounted for on trade date. Costs used in determining realized gains and losses on the sale of investment securities are based on the specific identification method. Dividend income is recorded on the ex-dividend date, interest income is recognized on the accrual basis from settlement date and includes the amortization of premiums and the accretion of discount. Discounts and premiums on securities purchased are accreted and amortized using the scientific interest method, which approximates the effective interest method. Certain dividends from foreign securities will be recorded as soon as the Fund is informed of the dividend if such information is obtained subsequent to the ex-dividend date. Realized gains (losses) on paydowns of mortgage-backed and asset-backed securities are recorded as an adjustment to interest income.
Foreign Currency Translation — The books and records of the Funds are maintained in U.S. dollars. Investment securities and other assets and liabilities denominated in a foreign currency are translated into U.S. dollars on the date of valuation. The Funds do not isolate that portion of realized or unrealized gains
139
| THE ADVISORS’ INNER CIRCLE FUND III | FS INVESTMENTS | |||
| DECEMBER 31, 2022 |
| |||
and losses resulting from changes in the foreign exchange rate from fluctuations arising from changes in the market prices of the securities. These gains and losses are included in net realized and unrealized gains and losses on investments on the Statements of Operations. Net realized and unrealized gains and losses on foreign currency transactions represent net foreign exchange gains or losses from foreign currency exchange contracts, disposition of foreign currencies, currency gains or losses realized between trade and settlement dates on securities transactions and the difference between the amount of the investment income and foreign withholding taxes recorded on the Funds’ books and the U.S. dollar equivalent of the amounts actually received or paid.
Forward Foreign Currency Exchange Contracts — The Funds may enter into forward foreign currency exchange contracts to protect the value of securities held and related receivables and payables against changes in future foreign exchange rates. A forward currency contract is an agreement between two parties to buy and sell currency at a set price on a future date. The market value of the contract will fluctuate with changes in currency exchange rates. The contract is marked-to-market daily using the current forward rate and the change in market value is recorded by the Funds as unrealized gain or loss. The Funds recognize realized gains or losses when the contract is closed, equal to the difference between the value of the contract at the time it was opened and the value at the time it was closed. Any realized or unrealized appreciation (depreciation) during the period are presented on the Statements of Operations. Risks may arise from unanticipated movements in the value of a foreign currency relative to the U.S. dollar. Risks may also arise upon entering into these contracts from the potential inability of counterparties to meet the terms of their contracts and are generally limited to the amount of unrealized gain on the contracts at the date of default. Refer to the Schedules of Investments for details regarding open forward foreign currency contracts as of December 31, 2022.
Futures Contracts — The Funds utilized futures contracts during the year ended December 31, 2022. To the extent consistent with its investment objective and strategies, the Funds may use futures contracts for tactical hedging purposes as well as to enhance the Funds’ returns. Initial margin deposits of cash or securities are made upon entering into futures contracts. Futures are collateralized by cash deposits with Bank of America, Goldman Sachs and Deutsche Bank. Futures contracts are valued at the settlement price established each day by the board of exchange on which they are traded. The futures contracts are marked-to-market daily and the resulting changes in value are accounted for as unrealized gains and losses. Variation margin payments are paid or received, depending upon whether unrealized gains or losses are incurred. When the futures contract is
140
| THE ADVISORS’ INNER CIRCLE FUND III | FS INVESTMENTS | |||
| DECEMBER 31, 2022 |
| |||
closed, the Fund records a realized gain or loss equal to the difference between the proceeds from (or cost of) the closing transaction and the amount invested in the futures contract.
Risks of entering into futures contracts include the possibility that there will be an imperfect price correlation between the futures and the underlying securities. Second, it is possible that a lack of liquidity for futures contracts could exist in the secondary market, resulting in an inability to close a position prior to its maturity date. Third, the futures contract involves the risk that a Fund could lose more than the original margin deposit required to initiate a futures transaction.
Finally, the risk exists that losses could exceed amounts disclosed on the Statements of Assets and Liabilities.
Swap Contracts — The Funds are authorized to enter into swap contracts, including total return swaps equity swaps contracts and credit default swaps. To the extent consistent with its investment objective and strategies, the Funds may use swap contracts for tactical hedging purposes as well as to enhance the Funds’ returns. Swaps are a two-party contract in which the seller (buyer) will pay to the buyer (seller) the difference between the current value of a security and its value at the time the contract was entered.
In a typical equity swap, one party agrees to pay another party the return on a stock, stock index or basket of stocks in return for a specified interest rate. By entering into an equity index swap, for example, the index receiver can gain exposure to stocks making up the index of securities without actually purchasing those stocks. Equity index swaps involve not only the risk associated with investment in the securities represented in the index, but also the risk that the performance of such securities, including dividends, will not exceed the return on the interest rate that the Fund will be committed to pay.
Total return swaps are contracts in which one party agrees to make payments of the total return from a reference instrument—which may be a single asset, a pool of assets or an index of assets—during a specified period, in return for payments equal to a fixed or floating rate of interest or the total return from another underlying reference instrument. The total return includes appreciation or depreciation on the underlying asset, plus any interest or dividend payments. Payments under the swap are based upon an agreed upon principal amount but, since the principal amount is not exchanged, it represents neither an asset nor a liability to either counterparty, and is referred to as notional. Total return swaps are marked-to-market daily using different sources, including quotations from counterparties, pricing services, brokers or market makers. The unrealized appreciation or depreciation related to the change in the valuation of the notional amount of the swap is combined with the amount due to the Fund at
141
| THE ADVISORS’ INNER CIRCLE FUND III | FS INVESTMENTS | |||
| DECEMBER 31, 2022 |
| |||
termination or settlement. The primary risks associated with total return swaps are credit risks (if the counterparty fails to meet its obligations) and market risk (if there is no liquid market for the swap or unfavorable changes occur to the underlying reference instrument).
Periodic payments made or received are recorded as realized gains or losses. At period end, the Statements of Assets and Liabilities reflect, if any, unrealized appreciation or depreciation and accrued periodic payments for swap contracts the Fund may have open at period end. Entering into swap contracts involve, to varying degrees, elements of credit, interest rate and market risk in excess of the amounts recognized on the Statements of Assets and Liabilities. Such risks involve the possibility that there will be no liquid market for these contracts, that the counterparty to the contract may default on its obligation to perform and that there may be unfavorable changes in market conditions or fluctuations in interest rates. Swap contracts outstanding at period end, if any, are listed on the Schedules of Investments. In connection with swap contracts, cash or securities may be segregated as collateral by the Funds’ custodian. As of December 31, 2022, the Funds have entered into total return swap contracts as shown on the Schedules of Investments.
There is the risk that the counterparty refuses to continue to enter into swap agreements with the Funds in the future, or requires increased fees, which could impair the Funds’ ability to achieve its investment objective. A counterparty may also increase its collateral requirements, which may limit the Funds’ ability to use leverage and reduce investment returns. In addition, if the Funds cannot locate a counterparty willing to enter into transactions with the Funds, it will not be able to implement its investment strategy.
Options Written/Purchased — The Funds may purchase and write put and call options on indices and enter into related closing transactions. To the extent consistent with its investment objective and strategies, the Funds may use options for tactical hedging purposes as well as to enhance the Funds’ returns. Additionally, the Funds may use options to create long or short equity exposure without investing directly in equity securities. A put option on a security gives the purchaser of the option the right to sell, and the writer of the option the obligation to buy, the underlying security at any time during the option period for American options and only at the expiration date for European options. A call option on a security gives the purchaser of the option the right to buy, and the writer of the option the obligation to sell, the underlying security at any time during the option period for American options and only at the expiration date for European options. The premium paid to the writer is the consideration for undertaking the obligations under the option contract. The market value of an option generally
142
| THE ADVISORS’ INNER CIRCLE FUND III | FS INVESTMENTS | |||
| DECEMBER 31, 2022 |
| |||
reflects the market price of an underlying security. Other principal factors affecting market value include supply and demand, interest rates, the pricing volatility of the underlying security and the time remaining until the expiration date. Premiums received or paid from writing or purchasing options which expire unexercised are treated by the Funds on the expiration date as realized gains or losses. The difference between the premium and the amount paid or received on effecting a closing purchase or sale transaction, including brokerage commissions, is also treated as a realized gain or loss. If an option is exercised, the premium paid or received is added to the cost of the purchase or proceeds from the sale in determining whether a Funds has realized a gain or a loss. Any realized or unrealized gains (loss) during the period are presented on the Statements of Operations. Risks associated with options transactions include: (i) the success of a hedging strategy may depend on an ability to predict movements in the prices of individual securities, fluctuations in markets and movements in interest rates; (ii) there may be an imperfect correlation between the movement in prices of options and the securities underlying them; (iii) there may not be a liquid secondary market for options; and (iv) while a Fund will receive a premium when it writes covered call options, it may not participate fully in a rise in the market value of the underlying security.
Mortgage-Backed To-Be-Announced Securities — The Fund may enter into mortgage-backed to-be-announced securities (“TBAs”). These derivative financial instruments are subject to varying degrees of market and credit risk. TBAs provide for the delayed delivery of the underlying instrument. The contractual or notional amounts related to these financial instruments adjusted for unrealized market valuation gains or losses are recorded on a trade date basis. The credit risk related to settlements is limited to the unrealized market valuation gains or losses recorded in the statement of operations. Market risk is substantially dependent upon the value of the underlying financial instruments and is affected by market forces such as volatility and changes in interest rates.
Cash — Idle cash may be swept into various time deposit accounts and is classified as cash on the Statements of Assets and Liabilities. The Funds maintain cash in bank deposit accounts which, at times, may exceed United States federally insured limits. Amounts invested are available on the same business day.
Expenses — Most expenses of the Trust can be directly attributed to a particular fund. Expenses which cannot be directly attributed to a particular fund are apportioned among the funds of the Trust based on the number of funds and/or relative net assets.
Dividends and Distributions to Shareholders — Each Fund intends to distribute substantially all of its net investment income and net realized capital gains, if any, annually. All distributions are recorded on ex-dividend date.
143
| THE ADVISORS’ INNER CIRCLE FUND III | FS INVESTMENTS | |||
| DECEMBER 31, 2022 |
| |||
3. Credit Derivatives:
The Funds may use credit default swaps to reduce risk where the Funds have exposure to the issuer, or to take an active long or short position with respect to the likelihood of an event of default. The reference obligation of the swap can be a single issuer, a “basket” of issuers, or an index.
The buyer of a credit default swap is generally obligated to pay the seller a periodic stream of payments over the term of the contract in return for a contingent payment upon the occurrence of a credit event with respect to an underlying reference obligation. Generally, a credit event for corporate or sovereign reference obligations means bankruptcy, failure to pay, obligation acceleration, repudiation/moratorium or restructuring. For credit default swaps on asset-backed securities, a credit event may be triggered by events such as failure to pay principal, maturity extension, rating downgrade or write-down.
If the Fund is a seller of protection, and a credit event occurs, as defined under the terms of that particular swap agreement, the Fund will generally either (i) pay to the buyer an amount equal to the notional amount of the swap and take delivery of the referenced obligation, other deliverable obligations, or underlying securities comprising a referenced index or (ii) pay a net settlement amount in the form of cash or securities equal to the notional amount of the swap less the recovery value of the referenced obligation or underlying securities comprising a referenced index.
If the Fund is a buyer of protection and a credit event occurs, as defined under the terms of that particular swap agreement, the Fund will either (i) receive from the seller of protection an amount equal to the notional amount of the swap and deliver the referenced obligation, other deliverable obligations or underlying securities comprising the referenced index or (ii) receive a net settlement amount in the form of cash or securities equal to the notional amount of the swap less the recovery value of the referenced obligation or underlying securities comprising the referenced index.
Recovery values are assumed by market makers considering either industry standard recovery rates or entity specific factors and considerations until a credit event occurs. If a credit event has occurred, the recovery value is determined by a facilitated auction whereby a minimum number of allowable broker bids, together with a specified valuation method, are used to calculate the settlement value.
Centrally cleared swaps are valued at the settlement price established each day by the board of exchange on which they are traded. The daily settlement prices for centrally cleared swaps are provided by an independent source. Net payments of interest are recorded as realized gains or losses. Upfront premiums are recorded as realized gains or losses on the Statements of Operations upon termination or maturity of the swap. A liquidation payment received or made at the termination of the swap is
144
| THE ADVISORS’ INNER CIRCLE FUND III | FS INVESTMENTS | |||
| DECEMBER 31, 2022 |
| |||
recorded as realized gain or loss on the Statements of Operations. Net periodic payments received or paid by a Fund are included as part of realized gains or losses on the Statements of Operations. Daily changes in valuation of Centrally Cleared swaps are recorded as a receivable or payable for the change in value as appropriate (“variation margin”) on the Statements of Assets and Liabilities.
4. Derivative Transactions:
The following tables include the Funds’ exposure by type of risk on derivatives held throughout the period.
The fair value of derivative instruments as of December 31, 2022, is as follows ($ Thousands):
| Asset Derivatives | Liability Derivatives | |||||||||||||||
| Statements of Assets and Liabilities Location | Fair Value | Statements of Assets and Liabilities Location | Fair Value | |||||||||||||
FSMS | ||||||||||||||||
Interest rate contracts | | Unrealized appreciation on futures contracts | | $ | 403† | | Unrealized depreciation on futures contracts | | $ | 212† | ||||||
| | Unrealized appreciation on swaps contracts | | 93† | | Unrealized depreciation on swaps contracts | | 966† | |||||||||
Commodity Contracts | | Unrealized appreciation on futures contracts | | 496† | | Unrealized depreciation on futures contracts | | 651† | ||||||||
| | Unrealized appreciation on swaps contracts | | – | | Unrealized depreciation on swaps contracts | | 14† | |||||||||
Equity Contracts | | Unrealized appreciation on futures contracts | | 1,011† | | Unrealized depreciation on futures contracts | | 146† | ||||||||
| | Unrealized appreciation on swaps contracts | | 8,886† | | Unrealized depreciation on swaps contracts | | 2,970† | |||||||||
Foreign exchange contracts | | Unrealized appreciation on futures contracts | | 2† | | Unrealized depreciation on futures contracts | | 1† | ||||||||
| | Unrealized appreciation on forward foreign currency contracts | | 2,364 | | Unrealized depreciation on forward foreign currency contracts | | 2,573 | |||||||||
| | Unrealized appreciation on swaps contracts | | 3,734† | | Unrealized depreciation on swaps contracts | | – | |||||||||
|
|
|
| |||||||||||||
Total derivatives not accounted for as hedging instruments | $ | 16,989 | $ | 7,533 | ||||||||||||
|
|
|
| |||||||||||||
Managed Futures | ||||||||||||||||
Interest rate contracts | | Unrealized appreciation on swaps contracts | | $ | – | | Unrealized depreciation on swaps contracts | | $ | 6† | ||||||
Equity Contracts | | Unrealized appreciation on swaps contracts | | 20† | | Unrealized depreciation on swaps contracts | | 24† | ||||||||
| Foreign exchange contracts | | Unrealized appreciation on swaps contracts | | 55† | | Unrealized depreciation on swaps contracts | | –† | ||||||||
|
|
|
| |||||||||||||
Total derivatives not accounted for as hedging instruments | $ | 75 | $ | 30 | ||||||||||||
|
|
|
| |||||||||||||
145
| THE ADVISORS’ INNER CIRCLE FUND III | FS INVESTMENTS | |||
| DECEMBER 31, 2022 |
| |||
| Asset Derivatives | Liability Derivatives | |||||||||||||||
| Statements of Assets and Liabilities Location | Fair Value | Statements of Assets and Liabilities Location | Fair Value | |||||||||||||
Real Asset | ||||||||||||||||
Commodity Contracts | | Unrealized appreciation on futures contracts | | $ | 13† | | Unrealized depreciation on futures contracts | | $ | – | ||||||
| | Unrealized appreciation on swaps contracts | | – | | Unrealized depreciation on swaps contracts | | 38† | |||||||||
Equity Contracts | | Unrealized appreciation on swaps contracts | | 83† | | Unrealized depreciation on swaps contracts | | 3† | ||||||||
|
|
|
| |||||||||||||
| Total derivatives not accounted for as hedging instruments | $ | 96 | $ | 41 | ||||||||||||
|
|
|
| |||||||||||||
† Includes cumulative appreciation (depreciation) of swap contracts and futures contracts as reported in the Schedules of Investments.
The effect of derivative instruments on the Statements of Operations for the year ended December 31, 2022, were as follows:
The amount of realized gain/(loss) on derivatives recognized in income ($ Thousands):
| Purchased Options | Written Options | Futures Contracts | Forward Foreign Currency Contracts | Swap Contracts | Total | |||||||||||||||||||
FSMS | ||||||||||||||||||||||||
Interest Rate Contracts | $ | – | $ | – | $ | (568 | ) | $ | – | $ | 2,588 | $ | 2,020 | |||||||||||
Equity Contracts | (7 | ) | (64 | ) | 3,239 | – | 12,841 | 16,009 | ||||||||||||||||
Foreign Exchange Contracts | – | – | 116 | 2,528 | 571 | 3,215 | ||||||||||||||||||
Credit Contracts | – | – | – | – | 62 | 62 | ||||||||||||||||||
Commodity Contracts | – | – | (2,107 | ) | – | (679 | ) | (2,786 | ) | |||||||||||||||
Total | $ | (7 | ) | $ | (64 | ) | $ | 680 | $ | 2,528 | $ | 15,383 | $ | 18,520 | ||||||||||
| Purchased Options | Written Options | Futures Contracts | Forward Foreign Currency Contracts | Swap Contracts | Total | |||||||||||||||||||
Managed Futures |
| |||||||||||||||||||||||
Equity Contracts | $ | – | $ | – | $ | – | $ | – | $ | 331 | $ | 331 | ||||||||||||
Total | $ | – | $ | – | $ | – | $ | – | $ | 331 | $ | 331 | ||||||||||||
| Purchased Options | Written Options | | Futures Contracts | | | Forward Foreign Currency Contracts | | | Swap Contracts |
| Total | |||||||||||||
Real Asset | ||||||||||||||||||||||||
Interest Rate Contracts | $ | – | $ | – | $ | (24) | $ | – | $ | – | $ | (24 | ) | |||||||||||
Equity Contracts | – | – | (26 | ) | – | 414 | 388 | |||||||||||||||||
Foreign Exchange Contracts | – | – | (36 | ) | (21 | ) | – | (57 | ) | |||||||||||||||
Commodity Contracts | – | – | (94 | ) | – | (714 | ) | (808 | ) | |||||||||||||||
Total | $ | – | $ | – | $ | (180 | ) | $ | (21 | ) | $ | (300 | ) | $ | (501 | ) |
146
| THE ADVISORS’ INNER CIRCLE FUND III | FS INVESTMENTS | |||
| DECEMBER 31, 2022 |
| |||
Change in unrealized appreciation/(depreciation) on derivatives recognized in income ($ Thousands):
| Purchased Options | Written Options | | Futures Contracts | | | Forward Foreign Currency Contracts | | | Swap Contracts |
| Total | |||||||||||||
FSMS | ||||||||||||||||||||||||
Interest Rate Contracts | $ | – | $ | – | $ | 254 | $ | – | $ | (1,120 | ) | $ | (866 | ) | ||||||||||
Equity Contracts | – | – | 730 | – | 5,492 | 6,222 | ||||||||||||||||||
Foreign Exchange Contracts | – | – | 1 | (334) | 3,530 | 3,197 | ||||||||||||||||||
Commodity Contracts | – | – | (108 | ) | – | (284 | ) | (550 | ) | |||||||||||||||
Total | $ | – | $ | – | $ | 877 | $ | (334) | $ | 7,618 | $ | 8,161 | ||||||||||||
| Purchased Options | Written Options | | Futures Contracts | | | Forward Foreign Currency Contracts | | | Swap Contracts | | Total | |||||||||||||
Managed Futures |
| |||||||||||||||||||||||
Equity Contracts | $ | – | $ | – | $ | – | $ | – | $ | (45 | ) | $ | (45 | ) | ||||||||||
Foreign Exchange Contracts | – | – | – | – | 75 | 75 | ||||||||||||||||||
Commodity Contracts | – | – | – | – | (68 | ) | (68 | ) | ||||||||||||||||
Total | $ | – | $ | – | $ | – | $ | – | $ | (38 | ) | $ | (38 | ) | ||||||||||
| Purchased Options | Written Options | Futures Contracts | Forward Foreign Currency Contracts | Swap Contracts | Total | |||||||||||||||||||
Real Asset |
| |||||||||||||||||||||||
Equity Contracts | $ | – | $ | – | $ | – | $ | – | $ | 80 | $ | 80 | ||||||||||||
Commodity Contracts | – | – | (11 | ) | – | (25 | ) | (36 | ) | |||||||||||||||
Total | $ | – | $ | – | $ | (11 | ) | $ | – | $ | 55 | $ | 44 | |||||||||||
The following discloses the volume of the Fund’s forward foreign currency contracts, futures contracts, swap contracts activity during the year ended December 31, 2022.
For the year ended December 31, 2022, the average market value amount of forward contracts was as follows ($ Thousands):
| ||||
FSMS | ||||
Average Quarterly Market Value Balance Long | $ | 111,409 | ||
Average Quarterly Market Value Balance Short | 59,268 | |||
For the year ended December 31, 2022, the average market value amount of futures contracts was as follows ($ Thousands):
| ||||
FSMS | ||||
Average Quarterly Market Value Balance Long | $ | 43,475 | ||
Average Quarterly Market Value Balance Short | 77,955 | |||
147
| THE ADVISORS’ INNER CIRCLE FUND III | FS INVESTMENTS | |||
| DECEMBER 31, 2022 |
| |||
| ||||
Real Asset | ||||
Average Quarterly Market Value Balance Long | $ | 2,080 | ||
Average Quarterly Market Value Balance Short | 733 | |||
For the year ended December 31, 2022, the average market value amount of Total Return swap contracts held by the Funds were as follows ($ Thousands):
| ||||
FSMS | ||||
Average Quarterly Market Value Balance Long | $ | 601,067 | ||
Average Quarterly Market Value Balance Short | 118,549 | |||
| ||||
Managed Futures | ||||
Average Quarterly Market Value Balance Long | $ | 3,580 | ||
Average Quarterly Market Value Balance Short | – | |||
| ||||
Real Asset | ||||
Average Quarterly Market Value Balance Long | $ | 7,210 | ||
Average Quarterly Market Value Balance Short | – | |||
5. Offsetting Assets and Liabilities:
Each Fund is subject to various netting arrangements with select counterparties (“Master Agreements”). Master Agreements govern the terms of certain transactions, and reduce the counterparty risk associated with relevant transactions by specifying credit protection mechanisms and providing standardization that improves legal certainty.
Since different types of transactions have different mechanics and are sometimes traded out of different legal entities of a particular counterparty organization, each type of transaction may be covered by a different Master Agreement, resulting in the need for multiple agreements with a single counterparty. As the Master Agreements are specific to unique operations of different asset types, they allow a Fund to close out and net its total exposure to a specific counterparty entity in the event of a default with respect to all the transactions governed under a single agreement with a specific counterparty entity.
Master Agreements can also help limit counterparty risk by specifying collateral posting arrangements at pre-arranged exposure levels. Under the Master Agreements, collateral is routinely transferred if the total net exposure to certain transactions (net of existing collateral already in place) governed under the relevant Master Agreement with a counterparty in a given account exceeds a specified threshold, which typically ranges from zero to $250,000 depending on the counterparty and the type of Master Agreement. United States Treasury Securities and U.S. dollar cash are generally the preferred forms of collateral. Securities and cash pledged as collateral are reflected as assets on the Statements of Assets and Liabilities as either a component of
148
| THE ADVISORS’ INNER CIRCLE FUND III | FS INVESTMENTS | |||
| DECEMBER 31, 2022 |
| |||
investments at value (securities) or cash pledged as collateral for futures contracts and swap contracts (cash). The market value of any securities received as collateral is not reflected as a component of net asset value. A Fund’s overall exposure to counterparty risk can change substantially within a short period, as it is affected by each transaction subject to the relevant Master Agreement.
International Swaps and Derivatives Association, Inc. Master Agreements and Credit Support Annexes (“ISDA Master Agreements”) govern OTC financial derivative transactions entered into by a Fund and select counterparties. ISDA Master Agreements maintain provisions for general obligations, representations, agreements, collateral and events of default or termination. Events of termination include conditions that may entitle counterparties to elect to terminate early and cause settlement of all outstanding transactions under the applicable ISDA Master Agreement. Any election to terminate early could be material to the financial statements. In limited circumstances, the ISDA Master Agreement may contain additional provisions that add additional counterparty protection beyond coverage of existing daily exposure if the counterparty has a decline in credit quality below a predefined level. These amounts, if any, may be segregated with a third party custodian.
The following is a summary by counterparty of the value of over the counter (“OTC”) financial derivative instruments and collateral (received)/pledged by counterparty of the Funds as of December 31, 2022 ($ Thousands):
| FSMS | Gross Assets- Recognized in the SAL | Gross Liabilities- Recognized in the SAL | Net Amount Available to be Offset | Cash Collateral Pledged or Received† | Net Amount | |||||||||||||||
Counterparty | ||||||||||||||||||||
Bank of America | $ | 2,508 | $ | (1,992 | ) | $ | 516 | $ | 516 | $ | – | |||||||||
BNP Paribas | 1,968 | (359 | ) | 1,609 | – | 1,609 | ||||||||||||||
Brown Brothers Harriman | – | (2 | ) | (2 | ) | – | (2 | ) | ||||||||||||
Credit Suisse | 254 | (42 | ) | 212 | – | 212 | ||||||||||||||
Deutsche Bank | 2,353 | (2,539 | ) | (186 | ) | 186 | – | |||||||||||||
Goldman Sachs | 1,694 | – | 1,694 | – | 1,694 | |||||||||||||||
JPMorgan Chase | 2,575 | (1,340 | ) | 1,235 | – | 1,235 | ||||||||||||||
Macquarie Bank | 35 | (2 | ) | 33 | – | 33 | ||||||||||||||
Morgan Stanley | 11 | (32 | ) | (21 | ) | – | (21 | ) | ||||||||||||
Nomura | 172 | – | 172 | – | 172 | |||||||||||||||
Societe Generale | 3,507 | – | 3,507 | – | 3,507 | |||||||||||||||
UBS | – | (215 | ) | (215 | ) | 215 | – | |||||||||||||
Total | $ | 15,077 | $ | (6,523 | ) | $ | 8,554 | $ | 917 | $ | 8,439 | |||||||||
149
| THE ADVISORS’ INNER CIRCLE FUND III | FS INVESTMENTS | |||
| DECEMBER 31, 2022 |
| |||
| Managed Futures | Gross Assets- Recognized in the SAL | Gross Liabilities- Recognized in the SAL | Net Amount Available to be Offset | Cash Collateral Pledged or Received† | Net Amount | |||||||||||||||
Counterparty | ||||||||||||||||||||
Bank of America | $ | – | $ | (22) | $ | (22) | $ | – | $ | (22) | ||||||||||
Barclays | – | (1) | (1) | – | (1) | |||||||||||||||
Deutsche Bank | – | (6) | (6) | – | (6) | |||||||||||||||
Goldman Sachs | 49 | – | 49 | – | 49 | |||||||||||||||
JPMorgan Chase | 20 | – | 20 | – | 20 | |||||||||||||||
Macquarie Bank Limited | – | (1) | (1) | – | (1) | |||||||||||||||
Nomura | 6 | – | 6 | – | 6 | |||||||||||||||
Total | $ | 75 | $ | (30) | $ | 45 | $ | – | $ | 45 | ||||||||||
| Real Asset | Gross Assets- Recognized in the SAL | Gross Liabilities- Recognized in the SAL | Net Amount Available to be Offset | Cash Collateral Pledged or Received† | Net Amount | |||||||||||||||
Counterparty | ||||||||||||||||||||
Goldman Sachs | $ | 83 | $ | (3) | $ | 80 | $ | – | $ | 80 | ||||||||||
JPMorgan Chase | – | (38) | (38) | – | (38) | |||||||||||||||
Macquarie Bank Limited | – | – | – | – | – | |||||||||||||||
Total | $ | 83 | $ | (41) | $ | 42 | $ | – | $ | 42 | ||||||||||
† Collateral pledged is limited to the net outstanding amount due to/from the counterparty. The actual collateral amounts pledged may exceed these amounts and may fluctuate in value.
6. Transactions with Affiliates:
Certain officers of the Trust are also employees of SEI Investments Global Funds Services (the “Administrator”), a wholly owned subsidiary of SEI Investments Company, and/ or SEI Investments Distribution Co. (the “Distributor”). Such officers are paid no fees by the Trust, other than the Chief Compliance Officer (“CCO”) as described below, for serving as officers of the Trust.
The services provided by the CCO and his staff are paid for by the Trust as incurred. The services include regulatory oversight of the Trust’s Advisors and service providers as required by SEC regulations. The CCO’s services and fees have been approved by and are reviewed by the Board.
7. Administration, Distribution, Custodian and Transfer Agent Agreements:
State Street Bank and Trust Company (“State Street”) served as the Fund’s administrator prior to April 11, 2022, pursuant to an administration agreement under which agreement State Street provided management and administrative services to the
150
| THE ADVISORS’ INNER CIRCLE FUND III | FS INVESTMENTS | |||
| DECEMBER 31, 2022 |
| |||
Funds. For these services, State Street was paid an asset-based fee, subject to certain minimums, which varied depending on the number of share classes and the average daily net assets of the Funds. For the period from January 1, 2022 through April 10, 2022, FSMS, Managed Futures, and Real Asset paid State Street ($ Thousands) $581, $4, and $43, respectively, for these services.
The Funds and the Administrator are parties to an Administration Agreement, effective as of April 11, 2022, under which the Administrator provides management and administrative services to the Funds. For these services, the Administrator is paid an asset-based fee, subject to certain minimums, which will vary depending on the number of share classes and the average daily net assets of the Funds. For the period from the April 11, 2022 Reorganization Date through December 31, 2022, FSMS, Managed Futures, and Real Asset paid the Administrator ($ Thousands) $300, $1, and $23, respectively, for these services.
The Trust and the Distributor are parties to a Distribution Agreement. The Distributor receives no fees under the Agreement.
Brown Brothers Harriman & Co. acts as custodian (the “Custodian”) for the Funds. The Custodian plays no role in determining the investment policies of the Funds or which securities are to be purchased or sold by the Funds.
SS&C GIDS, Inc. serves as the transfer agent and dividend disbursing agent for the Funds under a transfer agency agreement with the Trust.
Pursuant to the Amended and Restated Distribution and Service Plan, each Fund’s Class A Shares bear 12b-1 fees at an annual rate of 0.25% of the average daily net assets of such Fund attributable to Class A Shares. Payments of the 12b-1 fee may be made without regard to expenses actually incurred. The Funds Class I shares are not subject to 12b-1 fees.
8. Investment Advisory Agreement, Co-Investment Management Agreement, and Investment Sub-Advisory Agreements:
Under the terms of an investment advisory agreement, the Adviser provides investment advisory services to the Funds. The Adviser is entitled to a fee, which is calculated daily and paid monthly, at the following annual rates based on average daily net assets of each Fund:
| Advisory Fee Rate | ||||
FS Multi-Strategy Alternatives Fund | 1.25 | % | ||
FS Managed Futures Fund | 1.15 | % | ||
FS Chiron Real Asset Fund | 0.95 | % | ||
The Adviser has contractually agreed to reduce fees and/or reimburse expenses to the extent necessary to keep total annual Fund operating expenses (excluding interest,
151
| THE ADVISORS’ INNER CIRCLE FUND III | FS INVESTMENTS | |||
| DECEMBER 31, 2022 |
| |||
taxes, brokerage commissions, acquired fund fees and expenses, and extraordinary expenses (collectively, “excluded expenses”)) from exceeding 0.25% of each Fund’s average daily net assets until April 11, 2024. Refer to waiver of investment advisory fees and reimbursement from Adviser on the Statement of Operations for fees waived for the year ended December 31, 2022. The Adviser may recover all or a portion of its fee reductions or expense limitations within a three-year period from the year in which it reduced its fee or reimbursed expenses if each Fund’s total annual Fund operating expenses are below the expense limitation. This agreement may be terminated: (i) by the Board for any reason at any time, or (ii) by the Adviser, upon ninety (90) days prior written notice to the Trust, effective as of the close of business on April 11, 2024.
If at any point total annual Fund operating expenses (not including excluded expenses) are below the levels as set forth above, the Adviser may receive from the Fund the difference between the total annual Fund operating expenses (not including excluded expenses) and the levels set forth above to recover all or a portion of its prior fee reductions or expense reimbursements made during the preceding three-year period up to the expense cap in place at the time the expenses were waived, during which this agreement was in place.
For the year ended December 31, 2022, the Adviser recaptured previously waived fees of ($ Thousands) $107 for the Multi-Strategy Alternatives Fund and $47 for the Managed Futures Fund.
The following table describes the amounts accrued pursuant to the Expense Limitation Agreement that FS Investments has agreed to pay for the year ended December 31, 2022. These amounts may be subject to conditional repayment by the Fund as described below ($ Thousands):
| Expiring Years Ended December 31 | ||||||||||||
| 2023 | 2024 | 2025 | ||||||||||
FS Multi-Strategy Alternatives Fund | $ | 1,741 | $ | 1,735 | $ | 871 | ||||||
FS Managed Futures Fund | 248 | 230 | 210 | |||||||||
FS Chiron Real Asset Fund | 265 | 607 | 489 | |||||||||
Chiron Investment Management, LLC (“Chiron”) serves as investment co-adviser to Real Asset. As compensation for its co-advisory services to the Fund, FS Fund Advisor, LLC pays Chiron a co-advisory fee that is accrued daily and payable quarterly. The co-advisory fee is calculated at an annual rate of 0.475% of the average daily net assets of the portion of the Fund allocated to Chiron.
FSMS seeks to achieve its investment objective through a multi-manager approach by which the Adviser allocates the assets of such Fund among a number of Underlying Managers and Alternative Beta Providers that employ a variety of alternative investment strategies. The Underlying Managers each serve as sub-advisers to FSMS.
152
| THE ADVISORS’ INNER CIRCLE FUND III | FS INVESTMENTS | |||
| DECEMBER 31, 2022 |
| |||
The Alternative Beta Providers provide FSMS with exposure to Alternative Investment Strategies but are not sub-advisers to FSMS.
The Adviser engages the following entities as Underlying Managers to provide investment management services to FSMS: Chilton Investment Company, LLC, MidOcean Credit Fund Management, L.P., Crabel Capital Management, LLC and Mariner Investment Group LLC.
9. Investment Transactions:
The cost of security purchases and the proceeds from security sales, other than short-term investments, for the year ended December 31, 2022, were as follows ($ Thousands):
| FS Multi-Strategy Alternatives Fund | FS Managed Futures Fund | FS Chiron Real Asset Fund | ||||||||||
Purchases | ||||||||||||
U.S. Government | $ | 238,181 | $ | – | $ | 44,065 | ||||||
Other | 210,474 | – | 151,388 | |||||||||
Sales | ||||||||||||
U.S. Government | $ | 118,320 | $ | – | $ | 38,900 | ||||||
Other | 112,500 | – | 156,169 | |||||||||
10. Federal Tax Information:
The amount and character of income and capital gain distributions to be paid, if any, are determined in accordance with Federal income tax regulations, which may differ from U.S. GAAP. As a result, net investment income (loss) and net realized gain (loss) on investment transactions for a reporting period may differ significantly from distributions during such period. These book/tax differences may be temporary or permanent. To the extent these differences are permanent in nature, they are charged or credited to Distributable Earnings/(Loss) and Paid-in Capital, as appropriate, in the period that the differences arise.
Accordingly, the following reclassifications primarily attributable to distribution in excess of net investment income, net operating losses, nondeductible excise tax, investments in wholly-owned controlled foreign corporations and prior year true-up adjustments have been made to/from the following accounts:
| Distributable Earnings | Paid-in Capital | |||||||||||
FS Multi-Strategy Alternatives Fund | $ | 517 | $ | (517) | ||||||||
FS Managed Futures Fund | 1 | (1) | ||||||||||
FS Chiron Real Asset Fund | 420 | (420) | ||||||||||
153
| THE ADVISORS’ INNER CIRCLE FUND III | FS INVESTMENTS | |||
| DECEMBER 31, 2022 |
| |||
The tax character of distributions declared during the years ended December 31, 2022 and 2021, were as follows ($ Thousands):
| Ordinary Income | Long-Term Capital Gain | Total | ||||||||||
FS Multi-Strategy Alternatives Fund 2022 | $ | 26,234 | $ | 368 | $ | 26,602 | ||||||
2021 | 5,000 | — | 5,000 | |||||||||
FS Managed Futures Fund 2022 | 275 | 183 | 458 | |||||||||
2021 | 80 | — | 80 | |||||||||
FS Chiron Real Asset Fund 2022 | 247 | 2 | 249 | |||||||||
2021 | 757 | — | 757 | |||||||||
As of December 31, 2022, the components of distributable earnings on a tax basis were as follows ($ Thousands):
| FS Multi-Strategy Alternatives Fund | FS Managed Futures Fund | FS Chiron Real Asset Fund | ||||||||||
Undistributed Ordinary Income | $ | 3,232 | $ | — | $ | — | ||||||
Undistributed Long-Term Capital Gain | 559 | — | — | |||||||||
Capital Loss Carryforwards | — | — | (2,136 | ) | ||||||||
Post-October Losses | (691 | ) | — | — | ||||||||
Late Year Ordinary Losses | — | (75 | ) | (19 | ) | |||||||
Other Temporary Differences | (1,669 | ) | 1 | (130 | ) | |||||||
Unrealized Appreciation (Depreciation) | (8,472 | ) | (3 | ) | 118 | |||||||
Total Distributable Earnings (Accumulated Losses) | $ | (7,041 | ) | $ | (77 | ) | $ | (2,167 | ) | |||
Post-October and late year losses represents capital and specified losses realized and on investment transactions from November 1, 2022 to December 31, 2022 that, in accordance with Federal income tax regulations, the Funds may elect to defer and treat as having arisen in the following fiscal year.
As of December 31, 2022, the following fund has capital losses carried forward as follows ($ Thousands):
Short- Term Loss | Long- Term Loss | Total | ||||||||||
FS Chiron Real Asset Fund | $ | 1,985 | $ | 151 | $ | 2,136 | ||||||
During the year ended December 31, 2022, FS Multi-Strategy Alternative Fund utilized ($ Thousands) $1,323 in capital loss carryforwards to offset capital gains.
For Federal income tax purposes the difference between Federal tax cost and book cost primarily relates to losses from wash sales, premium amortization on callable bonds, constructive sales gain adjustments and investments in partnerships which cannot be used for Federal income tax purposes in the current year and have been deferred for use in future years. The Federal tax cost and aggregate gross unrealized
154
| THE ADVISORS’ INNER CIRCLE FUND III | FS INVESTMENTS | |||
| DECEMBER 31, 2022 |
| |||
appreciation and depreciation for the investments held by the Funds at December 31, 2022, were as follows ($ Thousands):
| Federal Tax Cost | Aggregate Gross Unrealized Appreciation | Aggregate Gross Unrealized Depreciation | Net Unrealized Appreciation/ Depreciation | |||||||||||||
FS Multi-Strategy | ||||||||||||||||
Alternatives Fund | $ | 664,123 | $ | 3,317 | $ | (11,789) | $ | (8,472) | ||||||||
FS Managed Futures | ||||||||||||||||
Fund | 1,766 | — | (3) | (3) | ||||||||||||
FS Chiron Real Asset | ||||||||||||||||
Fund | 23,717 | 828 | (710) | 118 | ||||||||||||
11. Concentration of Risks:
As with all management investment companies, a shareholder of the Funds is subject to the risk that his or her investment could lose money. The Funds are subject to the principal risks noted below, any of which may adversely affect the Funds’ net asset value (“NAV”) and ability of a Fund to meet that Fund’s investment objective. A more complete description of principal risks is included in each Fund’s prospectus under the heading “Principal Risks”.
Market Risk — Investments in securities, in general, are subject to market risks that may cause their prices to fluctuate over time. The Funds’ investments may decline in value due to factors affecting securities markets generally, or particular countries, segments, economic sectors, industries or companies within those markets. The value of a security held in a short position may increase due to general economic and market conditions which are not specifically related to a particular issuer, such as real or perceived positive economic conditions or changes in interest or currency rates. Because the market value of exchange-traded fund shares may differ from their net asset value, the shares may trade at a premium or discount. An investment in the Funds may lose money.
Credit/Default Risk — An issuer or guarantor of fixed income securities or instruments held by the Funds (which issuer or guarantor may have a low credit rating or no credit rating) may default on its obligation to pay interest and repay principal or default on any other obligation. A fixed income instrument may deteriorate in quality after it has been purchased by the Funds, and such a deterioration can occur rapidly. In certain instances, the downgrading or default of a single holding or guarantor of the Funds’ holding may impair the Funds’ liquidity and have the potential to cause a significant NAV decline.
Counterparty Risk — The stability and liquidity of many derivative transactions depends in large part on the creditworthiness of the parties to the transactions. If a counterparty to such a transaction defaults, exercising contractual rights may involve delays or costs for the Fund. Furthermore, there is a risk that a counterparty could
155
| THE ADVISORS’ INNER CIRCLE FUND III | FS INVESTMENTS | |||
| DECEMBER 31, 2022 |
| |||
become the subject of insolvency proceedings, and that the recovery of securities and other assets from such counterparty will be delayed or be of a value less than the value of the securities or assets originally entrusted to such counterparty.
LIBOR Risk — The Fund is exposed to risks associated with changes in interest rates, including with respect to the phase out of LIBOR. The Fund is subject to financial market risks, including changes in interest rates. General interest rate fluctuations may have a negative impact on the Fund’s investments.
The longer the duration of these securities, generally, the more susceptible they are to changes in market interest rates. As market interest rates increase, those securities with a lower yield-at-cost can experience a mark-to-market unrealized loss. An impairment of the fair market value of the Fund’s investments, even if unrealized, must be reflected in its consolidated financial statements for the applicable period and may therefore have a material adverse effect on its results of operations for that period.
The Fund has and may continue to structure its debt investments with floating interest rates to position its portfolio for rate increases. However, there can be no assurance that this will successfully mitigate the Fund’s exposure to interest rate risk. For example, in the event of a rising interest rate environment, payments under floating rate debt instruments generally would rise and there may be a significant number of issuers of such floating rate debt instruments that would be unable or unwilling to pay such increased interest costs and may otherwise be unable to repay their loans. Rising interest rates could also cause portfolio companies to shift cash from other productive uses to the payment of interest, which may have a material adverse effect on their business and operations and could, over time, lead to increased defaults. Investments in floating rate debt instruments may also decline in value in response to rising interest rates if the interest rates of such investments do not rise as much, or as quickly, as market interest rates in general. Similarly, during periods of rising interest rates, the Fund’s fixed rate investments may decline in value because the fixed rate of interest paid thereunder may be below market interest rates.
On March 5, 2021, the U.K.’s Financial Conduct Authority (“FCA”) which regulates LIBOR, publicly announced that all U.S. dollar LIBOR settings will either cease to be provided by any administrator or no longer be representative (i) immediately after December 31, 2021 for one-week and two-month U.S. dollar LIBOR settings and (ii) immediately after June 30, 2023 for the remaining U.S. dollar LIBOR settings. In addition, as a result of supervisory guidance from U.S. regulators, some U.S. regulated entities will cease to enter into new LIBOR contracts after January 1, 2022. It is possible that a subset of LIBOR settings will be published after these dates on a “synthetic” basis, but any such publications would be considered non-representative of the underlying market. The U.S. Federal Reserve, based on the recommendations of the New York Federal Reserve’s Alternative Reference Rate Committee (comprised of major derivative
156
| THE ADVISORS’ INNER CIRCLE FUND III | FS INVESTMENTS | |||
| DECEMBER 31, 2022 |
| |||
market participants and their regulators), has begun publishing Secured Overnight Financing Rate (“SOFR”) that is intended to replace U.S. dollar LIBOR. Proposals for alternative reference rates for other currencies have also been announced or have already begun publication. Markets are slowly developing in response to these new reference rates. Uncertainty related to the liquidity impact of the change in rates, and how to appropriately adjust these rates at the time of transition, poses risks for the Fund. The effect of any changes to, or discontinuation of, LIBOR on the Fund will depend on, among other things, (1) existing fallback or termination provisions in individual contracts and (2) whether, how, and when industry participants develop and adopt new reference rates and fallbacks for both legacy and new instruments and contracts. The expected discontinuation of LIBOR could have a significant impact on the financial markets in general and may also present heightened risk to market participants, including public companies, investment advisers, investment companies, and broker-dealers. The risks associated with this discontinuation and transition will be exacerbated if the work necessary to effect an orderly transition to an alternative reference rate is not completed in a timely manner.
As market participants transition away from LIBOR, LIBOR’s usefulness may deteriorate and these effects could be experienced until the permanent cessation of the majority of U.S. LIBOR rates in 2023. The transition process may lead to increased volatility and illiquidity in markets that currently rely on LIBOR to determine interest rates. LIBOR’s deterioration may adversely affect the liquidity and/or market value of securities that use LIBOR as a benchmark interest rate, including securities and other financial instruments held by the Fund. Further, the utilization of an alternative reference rate, or the transition process to an alternative reference rate, may adversely affect the Fund’s performance.
Derivatives Risk — The Funds may invest in Financial Instruments (used herein to refer to (i) futures contracts, including futures based on equity or fixed income securities and/or equity or fixed income indices, interest rate futures, currency futures and swap futures; (ii) swaps, including equity, currency, interest rate, total return, variance and credit default swaps, and swaps on futures contracts; (iii) options, including long and short positions in call options and put options on indices, individual securities or currencies, swaptions and options on futures contracts; (iv) forward contracts, including forwards based on equity or fixed income securities and/or equity or fixed income indices, currency forwards, interest rate forwards, swap forwards and non-deliverable forwards; and (v) other instruments, including structured securities and contracts for differences). Financial Instruments may involve risks different from, or greater than, those associated with more traditional investments. Due to leverage, small changes in the value of the Financial Instruments’ reference assets, rates, or indexes may produce disproportionate losses to the Funds. The value of Financial Instruments may not move as expected relative to the value of the reference assets, rates or indexes. Financial Instruments used for hedging purposes may not hedge risks as expected, and Financial Instruments used for non-hedging purposes may not provide the anticipated investment
157
| THE ADVISORS’ INNER CIRCLE FUND III | FS INVESTMENTS | |||
| DECEMBER 31, 2022 |
| |||
exposure. Financial Instruments may be highly illiquid, and the Funds may not be able to close out or sell a Financial Instrument position at a particular time or at an anticipated price. Various legislative and regulatory initiatives may impact the availability, liquidity and cost of derivatives. Financial Instruments also may be subject to interest rate risk, currency risk and counterparty risk.
Regulations relating to the Funds’ use of derivatives and related instruments, including Rule 18f-4 under the 1940 Act, could potentially limit or impact the Funds’ ability to invest in derivatives, limit the Funds’ ability to employ certain strategies that use derivatives and/or adversely affect the value of derivatives and the Funds’ performance.
Equity Risk — The prices of equity securities in which the Fund holds long and short positions may rise and fall daily. A variety of factors can negatively impact the value of equity securities, including factors affecting individual companies, industries, securities markets or economies.
Foreign Investment and Emerging Markets Risk — Investments in the securities of non-U.S. issuers involve risks beyond those associated with investments in U.S. securities. These additional risks include greater market volatility, the availability of less reliable financial information, higher transactional and custody costs, taxation by foreign governments, decreased market liquidity, political instability and less developed legal and accounting practices. Foreign issuers are often subject to less stringent requirements regarding accounting, auditing, financial reporting and record keeping than are U.S. issuers, and therefore not all material information will be available. Securities exchanges or foreign governments may adopt rules or regulations that may negatively impact the Funds’ ability to invest in foreign securities or may prevent the Funds from repatriating its investments. In addition, the Funds may not receive shareholder communications or be permitted to vote the securities that it holds, as the issuers may be under no legal obligation to distribute them.
Investment in Other Investment Companies Risk — As with other investments, investments in other investment companies, including ETFs, are subject to market and manager risk. In addition, if a Fund acquires shares of investment companies, shareholders bear both their proportionate share of expenses in the Fund (including management and advisory fees) and, indirectly, the expenses of the investment companies. To the extent consistent with their investment objectives and strategies, the Funds may invest in money market mutual funds. An investment in a money market mutual fund is not insured or guaranteed by the Federal Deposit Insurance Corporation or any other government agency. Although money market mutual funds that invest in U.S. government securities seek to preserve the value of a Fund’s investment at $1.00 per share, it is possible to lose money by investing in a stable NAV money market mutual fund. Moreover, SEC rules require prime money market mutual funds to use floating NAVs that do not preserve the value of a fund’s investment at $1.00 per share.
158
| THE ADVISORS’ INNER CIRCLE FUND III | FS INVESTMENTS | |||
| DECEMBER 31, 2022 |
| |||
Liquidity Risk — Although the Fund will invest primarily in liquid, publicly traded securities, the Fund may make investments that may be illiquid or that may become less liquid in response to market developments or adverse investor perceptions. Illiquid investments may be more difficult to value and more difficult to sell in response to redemption requests than liquid investments. If the Fund must sell illiquid or less liquid assets to meet redemption requests or other cash needs, it may be forced to sell at a loss.
Non-Diversification Risk — The Fund is classified as a “nondiversified” investment company, which means that the percentage of its assets that may be invested in the securities of a single issuer is not limited by the 1940 Act. As a result, the Fund’s investment portfolio may be subject to greater risk and volatility than if investments had been made in the securities of a broad range of issuers.
Short Sales Risk — A short sale of a security involves the theoretical risk of unlimited loss because of increases in the market price of the security sold short. The Funds’ use of short sales, in certain circumstances, can result in significant losses. In order to qualify as a regulated investment company under the Code, each Fund must meet certain requirements regarding the source of its income, the diversification of its assets, and the distribution of its income. Each Fund’s ability to pursue its investment strategy may therefore be limited by its intention to qualify as a regulated investment company under the Code and may bear adversely on its ability to so qualify. If a Fund were to fail to qualify as a regulated investment company and became subject to federal income tax, shareholders of that Fund would be subject to the risk of diminished returns.
U.S. Government Securities Risk — The U.S. government may not provide financial support to U.S. government agencies, instrumentalities or sponsored enterprises that have issued debt securities that may be held by the Funds. Such issuers may not have the funds to meet their payment obligations in the future.
Pandemic Risks — The continuing spread of an infectious respiratory illness caused by a novel strain of coronavirus (known as COVID-19) has caused volatility, severe market dislocations and liquidity constraints in many markets, including securities the Fund holds, and may adversely affect the Fund’s investments and operations. The outbreak was first detected in December 2019 and subsequently spread globally, and since then, the number of cases has fluctuated and new “variants” have been confirmed around the world. The transmission of COVID-19 and efforts to contain its spread have resulted in travel restrictions and disruptions, closed international borders, enhanced health screenings at ports of entry and elsewhere, disruption of and delays in healthcare service preparation and delivery, quarantines, event and service cancellations or interruptions, disruptions to business operations (including staff reductions), supply chains and consumer activity, as well as general concern and
159
| THE ADVISORS’ INNER CIRCLE FUND III | FS INVESTMENTS | |||
| DECEMBER 31, 2022 |
| |||
uncertainty that has negatively affected the economic environment. These disruptions have led to instability in the marketplace, including, at times, stock market losses and overall volatility. The impact of COVID-19, and other infectious illness outbreaks, epidemics or pandemics that may arise in the future, could adversely affect the economies of many nations or the entire global economy, the financial performance of individual issuers, borrowers and sectors and the health of the markets generally in potentially significant and unforeseen ways. In addition, the impact of infectious illnesses, such as COVID-19, in emerging market countries may be greater due to generally less established healthcare systems. This crisis or other public health crises may exacerbate other pre-existing political, social and economic risks in certain countries or globally.
The foregoing could lead to a significant economic downturn or recession, increased market volatility, a greater number of market closures, higher default rates and adverse effects on the values and liquidity of securities or other assets. Such impacts, which may vary across asset classes, may adversely affect the performance of the Fund’s investments, the Fund and a shareholder’s investment in the Fund. In certain cases, an exchange or market may close or issue trading halts on either specific securities or even the entire market, which may result in the Fund being, among other things, unable to buy or sell certain securities or financial instruments or to accurately price its investments.
To satisfy any shareholder repurchase requests during periods of extreme volatility, such as those associated with COVID-19, it is more likely the Fund may be required to dispose of portfolio investments at unfavorable prices compared to their intrinsic value.
The Fund and its investment adviser have in place business continuity plans reasonably designed to ensure that they maintain normal business operations, and that the Fund, its portfolio and assets are protected. However, in the event of a pandemic or an outbreak, such as COVID-19, there can be no assurance that the Fund, its advisers and service providers, or the Fund’s portfolio companies, will be able to maintain normal business operations for an extended period of time or will not lose the services of key personnel on a temporary or long-term basis due to illness or other reasons. A pandemic or disease could also impair the information technology and other operational systems upon which the Fund’s advisers rely and could otherwise disrupt the ability of the Fund’s service providers to perform essential tasks.
Governmental authorities and regulators throughout the world, such as the U.S. Federal Reserve, have in the past responded to major economic disruptions with changes to fiscal and monetary policy, including but not limited to, direct capital infusions, new monetary programs and dramatically lower interest rates. Certain of those policy changes have been implemented in response to the COVID-19 pandemic. Such policy changes may adversely affect the value, volatility and liquidity
160
| THE ADVISORS’ INNER CIRCLE FUND III | FS INVESTMENTS | |||
| DECEMBER 31, 2022 |
| |||
of dividend and interest paying securities. The full effect of efforts undertaken by the U.S. Federal Reserve to address the economic impact of the COVID-19 pandemic, and other monetary and fiscal actions that may be taken by the U.S. federal government to stimulate the U.S. economy, are not yet fully known. Although vaccines for COVID-19 have become more widely available, the duration of the COVID-19 outbreak and its variants and its full impacts are unknown, and the pace of recovery may vary from market to market, resulting in a high degree of uncertainty for potentially extended periods of time, especially in certain sectors in which the Fund may make investments. The impact of these events and other epidemics or pandemics in the future could adversely affect Fund performance.
Russia/Ukraine Market Risk — Increased tensions between Russia and Ukraine have escalated into an armed conflict given Russia’s invasion of Ukraine in February 2022. The conflict involving these two countries and the outbreak of hostilities between them may escalate or result in more widespread conflict. Such hostilities, and the threat of wider-spread hostilities, could lead to disruption, instability and volatility in global markets and commodity prices, economies and industries that could negatively impact the Fund’s business, results of operations and financial condition. The conflict has already resulted in significant volatility in certain equity, debt and currency markets, material increases in commodity prices, such as oil and natural gas, and economic uncertainty. In addition, sanctions imposed on Russia by the United States and other countries, and any sanctions imposed in the future, could have a significant adverse impact on the Russian economy and related markets. The price and liquidity of investments may fluctuate widely as a result of the conflict and related events. How long the armed conflict and related events will last cannot be predicted. These tensions and any related events could have significant impact on Fund performance and the value of an investment in the Fund.
12. Concentration of Shareholders:
At December 31, 2022, the percentage of total shares outstanding held by shareholders for each Fund, which are comprised of affiliated omnibus accounts, unless otherwise indicated, that are held on behalf of various individual shareholders, was as follows:
| No. of Shareholders Institutional Shares | % Ownership | |||||||
FS Multi-Strategy Alternatives Fund | ||||||||
Class A | 2 | 71% | ||||||
Class I | 3 | 63% | ||||||
FS Managed Futures Fund | ||||||||
Class A | 1 | 100% | ||||||
Class I | 1 | 100% | ||||||
FS Chiron Real Asset Fund | ||||||||
Class A | 2 | 100% | ||||||
Class I | 1 | 63% | ||||||
161
| THE ADVISORS’ INNER CIRCLE FUND III | FS INVESTMENTS | |||
| DECEMBER 31, 2022 |
| |||
13. Indemnification:
In the normal course of business, the Fund enters into contracts that provide general indemnifications. The Fund’s maximum exposure under these arrangements is dependent on future claims that may be made against the Fund and, therefore, cannot be established; however, based on experience, the risk of loss from such claim is considered remote.
14. Subsequent Event:
The Funds have evaluated the need for additional disclosures (other than what is disclosed in the preceding paragraphs) and/or adjustments resulting from subsequent events through the date the financial statements were issued. Based on this evaluation, no additional disclosures and/or adjustments were required to the financial statements as of December 31, 2022.
162
| THE ADVISORS’ INNER CIRCLE FUND III | FS INVESTMENTS | |||
| DECEMBER 31, 2022 |
| |||
REPORT OF INDEPENDENT REGISTERED PUBLIC ACCOUNTING FIRM
To the Shareholders of FS Multi-Strategy Alternatives Fund, FS Managed Futures Fund and FS Chiron Real Asset Fund and Board of Trustees of The Advisors’ Inner Circle Fund III
Opinion on the Financial Statements
We have audited the accompanying consolidated statements of assets and liabilities of FS Multi-Strategy Alternatives Fund, FS Managed Futures Fund and FS Chiron Real Asset Fund (collectively referred to as the “Funds”), (three of the series constituting The Advisors’ Inner Circle Fund III (the “Trust”)), including the consolidated schedules of investments, as of December 31, 2022, and the related consolidated statements of operations and changes in net assets, and the consolidated financial highlights for each of the periods indicated in the table below and the related notes (collectively referred to as the “financial statements”). In our opinion, the financial statements present fairly, in all material respects, the consolidated financial position of each of the three Funds constituting The Advisors’ Inner Circle Fund III at December 31, 2022, and the consolidated results of their operations, changes in net assets and financial highlights for each of the periods indicated in the table below, in conformity with U.S. generally accepted accounting principles.
Individual fund constituting Inner Circle Fund III | Consolidated Statements of Operations | Consolidated Statements of Changes in Net Assets | Consolidated Financial Highlights | |||
| FS Multi-Strategy Alternatives Fund | For the year ended December 31, 2022 | For each of the two years in the period ended December 31, 2022 | For each of the five years in the period ended December 31, 2022
| |||
FS Managed Futures Fund
FS Chiron Real Asset Fund
| For the year ended December 31, 2022 | For each of the two years in the period ended December 31, 2022 | For each of the four years in the period ended December 31, 2022
|
Basis for Opinion
These financial statements are the responsibility of the Trust’s management. Our responsibility is to express an opinion on each of the Funds’ financial statements
163
| THE ADVISORS’ INNER CIRCLE FUND III | FS INVESTMENTS | |||
| DECEMBER 31, 2022 |
| |||
based on our audits. We are a public accounting firm registered with the Public Company Accounting Oversight Board (United States) (“PCAOB”) and are required to be independent with respect to the Trust in accordance with the U.S. federal securities laws and the applicable rules and regulations of the Securities and Exchange Commission and the PCAOB.
We conducted our audits in accordance with the standards of the PCAOB. Those standards require that we plan and perform the audit to obtain reasonable assurance about whether the financial statements are free of material misstatement, whether due to error or fraud. The Trust is not required to have, nor were we engaged to perform, an audit of the Trust’s internal control over financial reporting. As part of our audits we are required to obtain an understanding of internal control over financial reporting but not for the purpose of expressing an opinion on the effectiveness of the Trust’s internal control over financial reporting. Accordingly, we express no such opinion. Our audits included performing procedures to assess the risks of material misstatement of the financial statements, whether due to error or fraud, and performing procedures that respond to those risks. Such procedures included examining, on a test basis, evidence regarding the amounts and disclosures in the financial statements. Our procedures included confirmation of securities owned as of December 31, 2022, by correspondence with the custodian, brokers and others; when replies were not received from brokers and others, we performed other auditing procedures. Our audits also included evaluating the accounting principles used and significant estimates made by management, as well as evaluating the overall presentation of the financial statements. We believe that our audits provide a reasonable basis for our opinion.
Philadelphia, Pennsylvania
March 1, 2023
We have served as auditor of one or more FS Investments investment companies since 2013.
164
| THE ADVISORS’ INNER CIRCLE FUND III | FS INVESTMENTS | |||
DECEMBER 31, 2022 (Unaudited) |
| |||
All mutual funds have operating expenses. As a shareholder of a mutual fund, your investment is affected by these ongoing costs, which include (among others) costs for fund management, administrative services, and shareholder reports like this one. It is important for you to understand the impact of these costs on your investment returns.
Operating expenses such as these are deducted from the mutual fund’s gross income and directly reduce its final investment return. These expenses are expressed as a percentage of the mutual fund’s average net assets; this percentage is known as the mutual fund’s expense ratio.
The following examples use the expense ratio and are intended to help you understand the ongoing costs (in dollars) of investing in your Fund and to compare these costs with those of other mutual funds. The expenses shown in the table below do not include any transactional costs, such as sales charges (loads), redemption fees, or exchange fees, if applicable. The examples are based on an investment of $1,000 made at the beginning of the period shown and held for the entire period (July 1, 2022 to December 31, 2022).
The table on the next page illustrates your Fund’s costs in two ways:
• Actual Fund Return. This section helps you to estimate the actual expenses after fee waivers that your Fund incurred over the period. The “Expenses Paid During Period” column shows the actual dollar expense cost incurred by a $1,000 investment in the Fund, and the “Ending Account Value” number is derived from deducting that expense cost from the Fund’s gross investment return.
You can use this information, together with the actual amount you invested in the Fund, to estimate the expenses you paid over that period. Simply divide your ending starting account value by $1,000 to arrive at a ratio (for example, an $8,600 account value divided by $1,000 = 8.6), then multiply that ratio by the number shown for your Fund under “Expenses Paid During Period”.
• Hypothetical 5% Return. This section helps you compare your Fund’s costs with those of other mutual funds. It assumes that the Fund had an annual 5% return before expenses during the year, but that the expense ratio (Column 3) for the period is unchanged. This example is useful in making comparisons because the Securities and Exchange Commission requires all mutual funds to make this 5% calculation. You can assess your Fund’s comparative cost by comparing the hypothetical result for your Fund in the “Expenses Paid During Period” column with those that appear in the same charts in the shareholder reports for other mutual funds.
Note: Because the return is set at 5% for comparison purposes — NOT your Fund’s actual return — the account values shown may not apply to your specific investment.
165
| THE ADVISORS’ INNER CIRCLE FUND III | FS INVESTMENTS | |||
DECEMBER 31, 2022 (Unaudited) |
| |||
DISCLOSURE OF FUND EXPENSES -- concluded
Beginning Value 7/01/22 | Ending Account Value | Annualized Expense Ratios | Expenses Paid During Period** | |||||||||||||
FS Multi-Strategy Alternatives Fund |
| |||||||||||||||
Actual Fund Return | ||||||||||||||||
Class A Shares | $ | 1,000.00 | $ | 1,018.70 | 1.74 | % | $ | 8.85 | ||||||||
Class I Shares | 1,000.00 | 1,020.30 | 1.49 | 7.59 | ||||||||||||
Hypothetical 5% Return | ||||||||||||||||
Class A Shares | $ | 1,000.00 | $ | 1,016.43 | 1.74 | % | $ | 8.84 | ||||||||
Class I Shares | 1,000.00 | 1,017.69 | 1.49 | 7.58 | ||||||||||||
FS Managed Futures Fund | ||||||||||||||||
Actual Fund Return | ||||||||||||||||
Class A Shares | $ | 1,000.00 | $ | 1,041.70 | 0.50 | % | $ | 2.57 | ||||||||
Class I Shares | 1,000.00 | 1,042.20 | 0.25 | 1.29 | ||||||||||||
Hypothetical 5% Return | ||||||||||||||||
Class A Shares | $ | 1,000.00 | $ | 1,022.68 | 0.50 | % | $ | 2.55 | ||||||||
Class I Shares | 1,000.00 | 1,023.95 | 0.25 | 1.28 | ||||||||||||
FS Chiron Real Asset Fund | ||||||||||||||||
Actual Fund Return | ||||||||||||||||
Class A Shares | $ | 1,000.00 | $ | 964.60 | 1.45 | % | $ | 7.18 | ||||||||
Class I Shares | 1,000.00 | 965.00 | 1.20 | 5.94 | ||||||||||||
Hypothetical 5% Return | ||||||||||||||||
Class A Shares | $ | 1,000.00 | $ | 1,017.90 | 1.45 | % | $ | 7.37 | ||||||||
Class I Shares | 1,000.00 | 1,019.16 | 1.20 | 6.11 | ||||||||||||
| * | Expenses are equal to the Fund’s annualized expense ratio multiplied by the average account value over the period, multiplied by 184/365 (to reflect the one-half period shown). |
166
| THE ADVISORS’ INNER CIRCLE FUND III | FS INVESTMENTS | |||
DECEMBER 31, 2022 (Unaudited) |
| |||
TRUSTEES AND OFFICERS OF THE ADVISOR’S INNER CIRCLE FUND III
Set forth below are the names, years of birth, positions with the Trust, length of term of office, and the principal occupations for the last five years of each of the persons currently serving as Trustees and Officers of the Trust. Unless otherwise noted, the business address of each Trustee is SEI Investments Company, 1 Freedom Valley Drive, Oaks Pennsylvania 19456. Trustees who are deemed not to be “interested persons” of the Trust are referred to as “Independent Trustees.” Mr. Doran is a Trustee who may be deemed to be “interested” persons of
Name and Year of Birth
| Position with Trust and
| Principal Occupations in the Past Five Years
| ||
INTERESTED TRUSTEES3,4
| ||||
William M. Doran (Born: 1940) | Chairman of the Board of Trustees (since 2014) | Self-Employed Consultant since 2003. Partner at Morgan, Lewis & Bockius LLP (law firm) from 1976 to 2003. Counsel to the Trust, SEI Investments, SIMC, the Administrator and the Distributor. Secretary of SEI Investments since 1978.
| ||
INDEPENDENT TRUSTEES3
| ||||
Jon C. Hunt (Born: 1951) | Trustee and Lead Independent Trustee (since 2014) | Retired since 2013. Consultant to Management, Convergent Capital Management, LLC (“CCM”) from 2012 to 2013. Managing Director and Chief Operating Officer, CCM from 1998 to 2012.
| ||
Thomas P. Lemke (Born: 1954) | Trustee (since 2014) | Retired since 2013. Executive Vice President and General Counsel, Legg Mason, Inc. from 2005 to 2013.
| ||
Nichelle Maynard-Elliott (Born: 1968) | Trustee (since 2021) | Independent Director since 2018. Executive Director, M&A at Praxair Inc. from 2011-2019.
| ||
| 1 | Each Trustee shall hold office during the lifetime of this Trust until the election and qualification of his or her successor, or until he or she sooner dies, resigns, or is removed in accordance with the Trust’s Declaration of Trust. |
| 2 | Directorships of Companies required to report to the Securities and Exchange Commission under the Securities Exchange Act of 1934 (i.e., “public companies”) or other investment companies under the 1940 Act. |
| 3 | Trustees oversee 65 funds in The Advisors’ Inner Circle Fund III. |
| 4 | Denotes Trustees who may be deemed to be “interested” persons of the Fund as that term is defined in the 1940 Act by virtue of their affiliation with the Distributor and/or its affiliates. |
167
| THE ADVISORS’ INNER CIRCLE FUND III | FS INVESTMENTS | |||
DECEMBER 31, 2022 (Unaudited) |
| |||
TRUSTEES AND OFFICERS OF THE ADVISOR’S INNER CIRCLE FUND III
the Trust as that term is defined in the 1940 Act by virtue of their affiliation with the Trust’s Distributor. The Trust’s Statement of Additional Information (“SAI”) includes additional information about the Trustees and Officers. The SAI may be obtained without charge by calling 1-877-924-4766. The following chart lists Trustees and Officers as of December 31, 2022.
Other Directorships
Held in the Past Five Years2
Current Directorships: Trustee of Gallery Trust, Delaware Wilshire Private Markets Master Fund, Delaware Wilshire Private Markets Fund, Delaware Wilshire Private Markets Tender Fund, SEI Daily Income Trust, SEI Institutional International Trust, SEI Institutional Investments Trust, SEI Institutional Managed Trust, SEI Asset Allocation Trust, SEI Tax Exempt Trust, Adviser Managed Trust, New Covenant Funds, SEI Insurance Products Trust and SEI Catholic Values Trust. Director of SEI Investments, SEI Investments (Europe), Limited, SEI Investments—Global Funds Services, Limited, SEI Investments Global, Limited, SEI Investments (Asia), Limited, SEI Global Nominee Ltd., SEI Investments – Unit Trust Management (UK) Limited and SEI Investments Co. Director of the Distributor.
Former Directorships: Trustee of Winton Series Trust to 2017. Trustee of The Advisors’ Inner Circle Fund, The Advisors’ Inner Circle Fund II, Bishop Street Funds, The KP Funds and Winton Diversified Opportunities Fund (closed-end investment company) to 2018. Trustee of Schroder Global Series Trust to 2021. Trustee of Schroder Series Trust to 2022.
Current Directorships: Trustee of City National Rochdale Funds, Gallery Trust, Delaware Wilshire Private Markets Master Fund, Delaware Wilshire Private Markets Fund and Delaware Wilshire Private Markets Tender Fund. Director of Chiron Capital Allocation Fund Ltd.
Former Directorships: Trustee of Winton Series Trust to 2017. Trustee of Winton Diversified Opportunities Fund (closed-end investment company) to 2018. Trustee of Schroder Global Series Trust to 2021. Trustee of Schroder Series Trust to 2022.
Current Directorships: Trustee of Gallery Trust, Delaware Wilshire Private Markets Master Fund, Delaware Wilshire Private Markets Fund, Delaware Wilshire Private Markets Tender Fund, J.P. Morgan Funds (171 Portfolios) and Symmetry Panoramic Trust (16 Portfolios). Director of Chiron Capital Allocation Fund Ltd.
Former Directorships: Trustee of Winton Series Trust and AXA Premier VIP Trust to 2017. Trustee of Winton Diversified Opportunities Fund (closed-end investment company) to 2018. Trustee of Schroder Global Series Trust to 2021. Trustee of Schroder Series Trust to 2022.
Current Directorships: Trustee of Gallery Trust, Delaware Wilshire Private Markets Master Fund, Delaware Wilshire Private Markets Fund, Delaware Wilshire Private Markets Tender Fund. Director of Chiron Capital Allocation Fund Ltd. Director of Element Solutions Inc., Director of Xerox Holdings Corporation, and Director of Lucid Group, Inc.
Former Directorships: Trustee of Schroder Global Series Trust to 2021. Trustee of Schroder Series Trust to 2022.
168
| THE ADVISORS’ INNER CIRCLE FUND III | FS INVESTMENTS | |||
| DECEMBER 31, 2022 |
| |||
| (Unaudited) |
| |||
TRUSTEES AND OFFICERS OF THE ADVISOR’S INNER CIRCLE FUND III
Name and Year of Birth
| Position with Trust and
| Principal Occupations in the Past Five
| ||
INDEPENDENT TRUSTEES (continued)3
| ||||
Jay C. Nadel (Born: 1958) | Trustee (since 2016) | Self-Employed Consultant since 2004. Executive Vice President, Bank of New York Broker Dealer from 2002 to 2004. Partner/Managing Director, Weiss Peck & Greer/Robeco from 1986 to 2001.
| ||
Randall S. Yanker (Born: 1960) | Trustee (since 2014) | Co-Founder and Senior Partner, Alternative Asset Managers, L.P. since 2004.
| ||
OFFICERS
| ||||
Michael Beattie (Born: 1965) | President (since 2014)
| Director of Client Service, SEI Investments, since 2004. | ||
James Bernstein (Born: 1962) | Vice President (since 2017) Secretary (since 2020) | Attorney, SEI Investments, since 2017. Prior Positions: Self-employed consultant, 2017. Associate General Counsel & Vice President, Nationwide Funds Group and Nationwide Mutual Insurance Company, from 2002 to 2016. Assistant General Counsel & Vice President, Market Street Funds and Provident Mutual Insurance Company, from 1999 to 2002.
| ||
John Bourgeois (Born: 1973) | Assistant Treasurer (since 2017) | Fund Accounting Manager, SEI Investments, since 2000.
| ||
169
| THE ADVISORS’ INNER CIRCLE FUND III | FS INVESTMENTS | |||
| DECEMBER 31, 2022 |
| |||
| (Unaudited) |
| |||
TRUSTEES AND OFFICERS OF THE ADVISOR’S INNER CIRCLE FUND III
Other Directorships
Held in the Past Five Years2
Current Directorships: Chairman of the Board of Trustees of City National Rochdale Funds. Trustee of Gallery Trust, Delaware Wilshire Private Markets Master Fund, Delaware Wilshire Private Markets Fund and Delaware Wilshire Private Markets Tender Fund. Director of Chiron Capital Allocation Fund Ltd.
Former Directorships: Trustee of Winton Series Trust to 2017. Director of Lapolla Industries, Inc. to 2017. Trustee of Winton Diversified Opportunities Fund (closed-end investment company) to 2018. Trustee of Schroder Global Series Trust to 2021. Trustee of Schroder Series Trust to 2022.
Current Directorships: Trustee of Gallery Trust, Delaware Wilshire Private Markets Master Fund, Delaware Wilshire Private Markets Fund and Delaware Wilshire Private Markets Tender Fund. Independent Non-Executive Director of HFA Holdings Limited. Director of Chiron Capital Allocation Fund Ltd.
Former Directorships: Trustee of Winton Series Trust to 2017. Trustee of Winton Diversified Opportunities Fund (closed-end investment company) to 2018. Trustee of Schroder Global Series Trust to 2021. Trustee of Schroder Series Trust to 2022.
None.
None.
None.
170
| THE ADVISORS’ INNER CIRCLE FUND III | FS INVESTMENTS | |||
| DECEMBER 31, 2022 |
| |||
| (Unaudited) |
| |||
TRUSTEES AND OFFICERS OF THE ADVISOR’S INNER CIRCLE FUND III
| Name and Year of Birth | Position(s) with Trust and Length of Time Served | Principal Occupation in the Past Five Years | ||
| OFFICERS (continued) | ||||
Eric C. Griffith (Born: 1969) | Vice President and Assistant Secretary (since 2020) | Counsel at SEI Investments since 2019. Vice President and Assistant General Counsel, JPMorgan Chase & Co., from 2012 to 2018. | ||
Matthew M. Maher (Born: 1975) | Vice President and Assistant Secretary (since 2018) | Counsel at SEI Investments since 2018. Attorney, Blank Rome LLP, from 2015 to 2018. Assistant Counsel & Vice President, Bank of New York Mellon, from 2013 to 2014. Attorney, Dilworth Paxson LLP, from 2006 to 2013. | ||
Andrew Metzger (Born: 1980) | Treasurer, Controller and Chief Financial Officer (since 2021) | Director of Fund Accounting, SEI Investments, since 2020. Senior Director, Embark, from 2019 to 2020. Senior Manager, PricewaterhouseCoopers LLP, from 2002 to 2019. | ||
Robert Morrow (Born: 1968) | Vice President (since 2017) | Account Manager, SEI Investments, since 2007. |
171
| THE ADVISORS’ INNER CIRCLE FUND III | FS INVESTMENTS | |||
| DECEMBER 31, 2022 |
| |||
| (Unaudited) |
| |||
TRUSTEES AND OFFICERS OF THE ADVISOR’S INNER CIRCLE FUND III
Other Directorships
Held in the Past Five Years
None.
None.
None.
None.
172
| THE ADVISORS’ INNER CIRCLE FUND III | FS INVESTMENTS | |||
| DECEMBER 31, 2022 |
| |||
| (Unaudited) |
| |||
TRUSTEES AND OFFICERS OF THE ADVISOR’S INNER CIRCLE FUND III
| Name and Year of Birth | Position(s) with Trust and Length of Time Served | Principal Occupation in the Past Five Years | ||
OFFICERS (continued) | ||||
Stephen F. Panner (Born: 1970) | Chief Compliance Officer (since 2022) | Chief Compliance Officer of SEI Asset Allocation Trust, SEI Daily Income Trust, SEI Institutional Investments Trust, SEI Institutional International Trust, SEI Institutional Managed Trust, SEI Tax Exempt Trust, Adviser Managed Trust, New Covenant Funds, SEI Catholic Values Trust, SEI Exchange Traded Funds, SEI Structured Credit Fund LP, The Advisors’ Inner Circle Fund, The Advisors’ Inner Circle Fund II, The Advisors’ Inner Circle Fund III, Bishop Street Funds, Frost Family of Funds, Gallery Trust, Delaware Wilshire Private Markets Fund, Delaware Wilshire Private Markets Master Fund, Delaware Wilshire Private Markets Tender Fund and Catholic Responsible Investments Funds since September 2022. Fund Compliance Officer of SEI Investments Company from February 2011 to September 2022. Fund Accounting Director and CFO and Controller for the SEI Funds from July 2005 to February 2011. | ||
Alexander F. Smith (Born: 1977) | Vice President and Assistant Secretary (since 2020) | Counsel at SEI Investments since 2020. Associate Counsel & Manager, Vanguard, 2012 to 2020. Attorney, Stradley Ronon Stevens & Young, LLP, 2008 to 2012. | ||
Bridget E. Sudall (Born: 1980) | Privacy Officer (from 2015 – June 2022 and since November 2022) Anti-Money Laundering Officer (from 2015 – June 2022 and since November 2022) | Senior Associate and AML Officer, Morgan Stanley Alternative Investment Partners, from 2011 to 2015. Investor Services Team Lead, Morgan Stanley Alternative Investment Partners, from 2007 to 2011. |
173
| THE ADVISORS’ INNER CIRCLE FUND III | FS INVESTMENTS | |||
| DECEMBER 31, 2022 |
| |||
| (Unaudited) |
| |||
TRUSTEES AND OFFICERS OF THE ADVISOR’S INNER CIRCLE FUND III
Other Directorships
Held in the Past Five Years
None.
None.
None.
174
| THE ADVISORS’ INNER CIRCLE FUND III | FS INVESTMENTS | |||
| DECEMBER 31, 2022 |
| |||
| (Unaudited) |
| |||
For shareholders that do not have a December 31, 2022 tax year end, this notice is for informational purposes only. For shareholders with a December 31, 2022 tax year end, please consult your tax advisor as to the pertinence of this notice. For the year ended December 31, 2022, the Funds are designating the following items with regard to distributions paid during the year:
Long Term
| Ordinary Distributions
| Total Distributions
| Dividends Deduction (1)
| Qualifying
| U.S. Government Interest (3)
| Qualified Interest Income (4)
| Qualified
| Qualifying
| ||||||||||||||||||||||||||||
FS Multi-Strategy Alternatives Fund | 1.38% | 98.62% | 100.00% | 0.56% | 0.66% | 0.00% | 36.33% | 100.00% | 0.00% | |||||||||||||||||||||||||||
FS Managed Futures Fund | 39.86% | 60.14% | 100.00% | 0.00% | 0.00% | 0.00% | 0.00% | 100.00% | 0.00% | |||||||||||||||||||||||||||
FS Chiron Real Asset Fund | 13.86% | 86.14% | 100.00% | 0.00% | 0.00% | 0.00% | 0.00% | 100.00% | 0.00% | |||||||||||||||||||||||||||
| (1) | Qualifying dividends represent dividends which qualify for the corporate dividends received deduction and are reflected as a percentage of ordinary Income distributions (the total of short-term capital gain and net investment income distributions). |
| (2) | The percentage in this column represents the amount of “Qualifying Dividend Income” as created by the Jobs and Growth Relief Reconciliation Act of 2003 and is reflected as a percentage of ordinary income distributions (the total of short-term capital gain and net investment income distributions). It is the intention of the Fund to designate the maximum amount permitted by law. |
| (3) | “U.S. Government Interest” represents the amount of interest that was derived from U.S. Government obligations and distributed during the fiscal year. This amount is reflected as a percentage of total ordinary income distributions (the total of short-term capital gain and net investment income distributions). |
| (4) | The percentage in this column represents the amount of “Interest Related Dividends” and is reflected as a percentage of ordinary income distributions. Interest related dividends are exempt from U.S. withholding tax when paid to foreign investors. |
| (5) | The percentage of this column represents the amount of “Short-Term Capital Gain Dividends” and is reflected as a percentage of short-term capital gain distributions that is exempt from U.S. withholding tax when paid to foreign investors. |
| (6) | The percentage of this column represents that amount of ordinary dividend income that qualified for 20% Business Income Deduction. |
The information reported herein may differ from the information and distributions taxable to the shareholders for the calendar year ending December 31, 2022. Complete information will be computed and reported in conjunction with your 2022 Form 1099-DIV.
175
(This page intentionally left blank)
(This page intentionally left blank)
(This page intentionally left blank)
FS Investments
P.O. Box 588
Portland, ME 04112
1-877-924-4766
Adviser:
FS Fund Advisor, LLC
206 Rouse Boulevard
Philadelphia, PA 19112
Distributor:
SEI Investments Distribution Co.
1 Freedom Valley Drive
Oaks, PA 19456
Administrator:
SEI Investments Global Funds Services
1 Freedom Valley Drive
Oaks, PA 19456
Legal Counsel:
Morgan, Lewis & Bockius LLP
1701 Market Street
Philadelphia, PA 19103
This information must be preceded or accompanied by a
current prospectus for the Fund described.
CHI-AR-002-0100
| Item 2. Code | of Ethics. |
The Registrant (also referred to as the “Trust”) has adopted a code of ethics that applies to the Registrant’s principal executive officer, principal financial officer, controller or principal accounting officer, and any person who performs a similar function. There have been no amendments to or waivers granted to this code of ethics during the period covered by this report.
| Item 3. Audit | Committee Financial Expert. |
(a)(1) The Registrant’s board of trustees has determined that the Registrant has at least one audit committee financial expert serving on the audit committee.
(a)(2) The Registrant’s audit committee financial experts are Thomas P. Lemke and Jay Nadel, and each of Mr. Lemke and Mr. Nadel is “independent” as that term is defined in Form N-CSR Item 3 (a)(2).
Item 4. Principal Accountant Fees and Services.
Fees billed by PricewaterhouseCoopers LLP (“PwC”) relate to The Advisors’ Inner Circle Fund III (the “Trust”).
PwC billed the Trust aggregate fees for services rendered to the Trust for the last two fiscal years as follows:
FYE December 31, 2022
| FYE December 31, 2021
| |||||||||||||
All fees and services to the Trust that were pre- approved | All fees and services to service affiliates that were pre- approved | All other fees and services to service affiliates that did not require pre- approval | All fees and services to the Trust that were pre- approved | All fees and services to service affiliates that were pre- approved | All other fees and | |||||||||
(a) | Audit Fees(1) | $682,615 | None | None | $704,515 | None | $11,990 | |||||||
(b) | Audit-Related Fees | None | None | None | $4,000 | None | None | |||||||
(c) | Tax Fees | $101,900(3) | None | $112,623(2) | None | None | $90,000(2) | |||||||
(d) | All Other Fees | None | None | $5,301 | None | None | $1,473 | |||||||
Fees billed by BBD LLP (“BBD”) relate to the Trust.
BBD billed the Trust aggregate fees for services rendered to the Trust for the last two fiscal years as follows:
FYE December 31, 2022
| FYE December 31, 2021
| |||||||||||||
All fees and services to the Trust that were pre- approved | All fees and services to service affiliates that were pre- approved | All other fees and services to service affiliates that did not require pre- approval | All fees and services to the Trust that were pre- approved | All fees and services to service affiliates that were pre- approved | All other fees and services to service affiliates that did not require pre- approval | |||||||||
(a) | Audit Fees(1) | $88,500 | None | None | $87,000 | None | None | |||||||
(b) | Audit-Related Fees | None | None | None | None | None | None | |||||||
(c) | Tax Fees | None | None | None | None | None | None | |||||||
(d) | All Other Fees | None | None | None | None | None | None | |||||||
Fees billed by Ernst & Young LLP (“E&Y”) relate to the Trust.
E&Y billed the Trust aggregate fees for services rendered to the Trust for the last two fiscal years as follows:
FYE December 31, 2022
| FYE December 31, 2021
| |||||||||||||
All fees and services to that were pre- approved | All fees and services to service affiliates that were pre- approved | All other fees and services to service affiliates that did not require pre- approval | All fees and services to the Trust that were pre- approved | All fees and services to service affiliates that were pre- approved | All other fees and services to service affiliates that did not require pre- approval | |||||||||
(a) | Audit Fees(1) | $277,908 | None | None | $51,220 | None | None | |||||||
(b) | Audit-Related Fees | None | None | None | None | None | None | |||||||
(c) | Tax Fees | None | None | None | None | None | None | |||||||
(d) | All Other Fees | None | None | None | None | None | None | |||||||
Notes:
| (1) | Audit fees include amounts related to the audit of the Trust’s annual financial statements and services normally provided by the accountant in connection with statutory and regulatory filings. |
| (2) | Tax return preparation fees for affiliates of the Funds. |
| (3) | Fees in connection with international withholding tax analysis. |
(e)(1) The Trust’s Audit Committee has adopted and the Board of Trustees has ratified an Audit and Non-Audit Services Pre-Approval Policy (the “Policy”), which sets forth the procedures and the conditions pursuant to which services proposed to be performed by the independent auditor of the Funds may be pre-approved.
The Policy provides that all requests or applications for proposed services to be provided by the independent auditor must be submitted to the Registrant’s Chief Financial Officer (“CFO”) and must include a detailed description of the services proposed to be rendered. The CFO will determine whether such services:
(1) require specific pre-approval;
(2) are included within the list of services that have received the general pre-approval of the Audit Committee pursuant to the Policy; or
(3) have been previously pre-approved in connection with the independent auditor’s annual engagement letter for the applicable year or otherwise. In any instance where services require pre-approval, the Audit Committee will consider whether such services are consistent with SEC’s rules and whether the provision of such services would impair the auditor’s independence.
Requests or applications to provide services that require specific pre-approval by the Audit Committee will be submitted to the Audit Committee by the CFO. The Audit Committee will be informed by the CFO on a quarterly basis of all services rendered by the independent auditor. The Audit Committee has delegated specific pre-approval authority to either the Audit Committee Chair or financial expert, provided that the estimated fee for any such proposed pre-approved service does not exceed $100,000 and any pre-approval decisions are reported to the Audit Committee at its next regularly-scheduled meeting.
Services that have received the general pre-approval of the Audit Committee are identified and described in the Policy. In addition, the Policy sets forth a maximum fee per engagement with respect to each identified service that has received general pre-approval.
All services to be provided by the independent auditor shall be provided pursuant to a signed written engagement letter with the Registrant, the investment adviser, or applicable control affiliate (except that matters as to which an engagement letter would be impractical because of timing issues or because the matter is small may not be the subject of an engagement letter) that sets forth both the services to be provided by the independent auditor and the total fees to be paid to the independent auditor for those services.
In addition, the Audit Committee has determined to take additional measures on an annual basis to meet the Audit Committee’s responsibility to oversee the work of the independent auditor and to assure the auditor’s independence from the Registrant, such as (a) reviewing a formal written statement from the independent auditor delineating all relationships between the independent auditor and the Registrant, and (b) discussing with the independent auditor the independent auditor’s methods and procedures for ensuring independence.
(e)(2) Percentage of fees billed applicable to non-audit services pursuant to (c)(7)(i)(C) of Rule 2-01 of Regulation S-X, waiver of pre-approval requirement were as follows (PwC):
| FYE December 31, 2022 | FYE December 31, 2021 | |||
Audit-Related Fees | None | None | ||
Tax Fees | None | None | ||
All Other Fees | None | None |
(e)(2) Percentage of fees billed applicable to non-audit services pursuant to (c)(7)(i)(C) of Rule 2-01 of Regulation S-X, waiver of pre-approval requirement were as follows (BBD):
| FYE December 31, 2022 | FYE December 31, 2021 | |||
Audit-Related Fees | None | None | ||
Tax Fees | None | None | ||
All Other Fees | None | None |
(e)(2) Percentage of fees billed applicable to non-audit services pursuant to (c)(7)(i)(C) of Rule 2-01 of Regulation S-X, waiver of pre-approval requirement were as follows (E&Y):
| FYE December 31, 2022 | FYE December 31, 2021 | |||
Audit-Related Fees | None | None | ||
Tax Fees | None | None | ||
All Other Fees | None | None |
(f) �� Not applicable.
(g) The aggregate non-audit fees and services billed by PwC for services rendered to the Registrant, and rendered to the Registrant’s investment adviser (not including any sub-adviser whose role is primarily portfolio management and is subcontracted with or overseen by another investment adviser), and any entity controlling, controlled by, or under common control with the adviser that provides ongoing services to the Registrant for the last two fiscal-years-ended December 31st were $117,924 and $91,473 for 2022 and 2021, respectively.
(g) The aggregate non-audit fees and services billed by BBD for services rendered to the Registrant, and rendered to the Registrant’s investment adviser (not including any sub-adviser whose role is primarily portfolio management and is subcontracted with or overseen by another investment adviser), and any entity controlling, controlled by, or under common control with the
adviser that provides ongoing services to the Registrant for the last two fiscal-years-ended December 31st were $0 and $0 for 2022 and 2021, respectively.
(g) The aggregate non-audit fees and services billed by E&Y for services rendered to the Registrant, and rendered to the Registrant’s investment adviser (not including any sub-adviser whose role is primarily portfolio management and is subcontracted with or overseen by another investment adviser), and any entity controlling, controlled by, or under common control with the adviser that provides ongoing services to the Registrant for the last two fiscal-years-ended December 31st were $0 and $0 for 2022 and 2021, respectively.
(h) During the past fiscal year, all non-audit services provided by the Registrant’s principal accountant to either the Registrant’s investment adviser or to any entity controlling, controlled by, or under common control with the Registrant’s investment adviser that provides ongoing services to the Registrant were pre-approved by the Audit Committee of Registrant’s Board of Trustees. Included in the Audit Committee’s pre-approval of these non-audit service were the review and consideration as to whether the provision of these non-audit services is compatible with maintaining the principal accountant’s independence.
(i) Not applicable. The Registrant has not retained, for the preparation of the audit report on the financial statements included in the Form N-CSR, a registered public accounting firm that has a branch or office that is located in a foreign jurisdiction and that the Public Company Accounting Oversight Board (the “PCAOB”) has determined that the PCAOB is unable to inspect or investigate completely because of a position taken by an authority in the foreign jurisdiction.
(j) Not applicable. The Registrant is not a “foreign issuer,” as defined in 17 CFR 240.3b-4.
Item 5. Audit Committee of Listed Registrants.
Not applicable to open-end management investment companies.
Item 6. Schedule of Investments.
Schedule of Investments is included as part of the Report to Shareholders filed under Item 1 of this form.
Item 7. Disclosure of Proxy Voting Policies and Procedures for Closed-End Management Investment Companies.
Not applicable to open-end management investment companies.
Item 8. Portfolio Managers of Closed-End Management Investment Companies.
Not applicable to open-end management investment companies.
Item 9. Purchases of Equity Securities by Closed-End Management Company and Affiliated Purchasers.
Not applicable to open-end management investment companies.
Item 10. Submission of Matters to a Vote of Security Holders.
There have been no changes to the procedures by which shareholders may recommend nominees to the Registrant’s Board of Trustees during the period covered by this report.
Item 11. Controls and Procedures.
(a) The Registrant’s principal executive and principal financial officers, or persons performing similar functions, have concluded that the Registrant’s disclosure controls and procedures, as defined in Rule 30a-3(c) under the Act (17 CFR § 270.30a-3(c)), as of a date within 90 days of the filing date of the report, are effective based on the evaluation of these controls and procedures required by Rule 30a-3(b) under the Act (17 CFR § 270.30a-3(b)) and Rule 13a-15(b) or Rule 15d-15(b) under the Exchange Act, as amended (17 CFR § 240.13a-15(b) or 240.15d-15(b)).
(b) There has been no change in the Registrant’s internal control over financial reporting (as defined in Rule 30a-3(d) under the Act (17 CFR § 270.3a-3(d)) that occurred during the period covered by this report that has materially affected, or is reasonably likely to materially affect, the Registrant’s internal control over financial reporting.
Item 12. Disclosure of Securities Lending Activities for Closed-End Management Investment Companies.
Not applicable to open-end management investment companies.
Item 13. Exhibits.
SIGNATURES
Pursuant to the requirements of the Securities Exchange Act of 1934 and the Investment Company Act of 1940, the Registrant has duly caused this report to be signed on its behalf by the undersigned, thereunto duly authorized.
| (Registrant) | The Advisors’ Inner Circle Fund III | |
| By (Signature and Title) | /s/ Michael Beattie | |
Michael Beattie | ||
President | ||
| Date: March 10, 2023 | ||
Pursuant to the requirements of the Securities Exchange Act of 1934 and the Investment Company Act of 1940, this report has been signed below by the following persons on behalf of the Registrant and in the capacities and on the dates indicated.
| By (Signature and Title) | /s/ Michael Beattie | |
Michael Beattie | ||
President | ||
Date: March 10, 2023 | ||
By (Signature and Title) | ||
/s/ Andrew Metzger | ||
Andrew Metzger | ||
Treasurer, Controller, and CFO | ||
Date: March 10, 2023 | ||