UNITED STATES
SECURITIES AND EXCHANGE COMMISSION
Washington, D.C. 20549
FORM N-CSR
CERTIFIED SHAREHOLDER REPORT OF REGISTERED MANAGEMENT
INVESTMENT COMPANIES
Investment Company Act File Number 811-22920
The Advisors’ Inner Circle Fund III
(Exact name of registrant as specified in charter)
SEI Investments
One Freedom Valley Drive
Oaks, PA 19456
(Address of principal executive offices) (Zip code)
SEI Investments
One Freedom Valley Drive
Oaks, PA 19456
(Name and address of agent for service)
Registrant’s telephone number, including area code: (877) 446-3863
Date of fiscal year end: October 31, 2024
Date of reporting period: October 31, 2024
Item 1. Reports to Stockholders.
| (a) | A copy of the report transmitted to stockholders pursuant to Rule 30e-1 under the Investment Company Act of 1940, as amended (the “Act”) (17 CFR § 270.30e-1), is attached hereto. |
The Advisors' Inner Circle Fund III
FS Chiron Capital Allocation Fund
Annual Shareholder Report: October 31, 2024
This annual shareholder report contains important information about Class I Shares of the FS Chiron Capital Allocation Fund (the "Fund") for the period from November 1, 2023 to October 31, 2024. You can find additional information about the Fund at https://fsinvestments.com/investments/all-investments/ccapx/. You can also request this information by contacting us at 877-9-CHIRON(877-924-4766).
What were the Fund costs for the last year?
(based on a hypothetical $10,000 investment)
| Fund Name | Costs of a $10,000 investment | Costs paid as a percentage of a $10,000 investment |
|---|
| FS Chiron Capital Allocation Fund, Class I Shares | $127 | 1.16% |
How did the Fund perform in the last year?
For the fiscal year ended October 31, 2024, FS Chiron Capital Allocation Fund (the “Fund”) returned 19.45% (Class I shares), underperforming its benchmark return of 23.50% by 405bps. The Fund's blended benchmark is weighted 60% MSCI All Country World Index (MSCI ACWI Net) and 40% Bloomberg U.S. Aggregate Bond Index. While we measure the Fund against a blended benchmark, we do not manage to a static benchmark profile.
The Fund seeks to achieve its objective by allocating its assets among equity, debt, precious metals, and cash investments in markets around the globe. Subject to the allocation targets below, the combination of the Fund’s investments will vary from time to time both with respect to the types of securities and markets, in response to changing market and economic trends. In deciding between equity and debt investments, the Fund utilizes a “quantamental” approach, which combines quantitative and fundamental research.
Portfolio Positioning
To start the year, we saw improved market sentiment given a combination of positive seasonal impacts, investor sentiment that became less bearish, and falling interest rates. We were overweight large-cap stocks and underweight cyclical stocks. We reduced our fixed income on the back of lower rates. As we entered 2024, the Fund’s risk profile was roughly in line with the benchmark. Our largest sector overweights were to be defensives sectors– consumer staples, healthcare care and energy – and technology remained the top allocations on an absolute basis. In fixed income we were well below our 40% benchmark weight.
As we finished the first quarter of 2024 our model readings favored growth stocks, they also showed a preference for low-volatility and earnings quality, highlighting the Fund’s tilt toward GARP (growth at a reasonable price) names. The market was rewarding firms in any sector for strong free cash flow and growth metrics, a theme we were weaving throughout our portfolio. We maintained exposure to these companies while remaining balanced to cyclical and defensive companies with a preference for companies with attractive free cash flow margins and yields. During the second quarter we worked to minimize outsized risk in the portfolio while remaining invested. The equity portfolio was weighted towards large cap, low-beta, defensively oriented stocks. We reduced our emerging market holdings, with majority of the reduction coming in China. While sovereign bond exposure rose in June, we continued to prefer precious metals to bonds as a portfolio ballast, and we increased exposure to gold and silver, which we viewed as better diversifiers given market conditions.
To end the third quarter our models sat close to full Growth in developed markets, including the U.S. In most parts of the world cyclicals appeared to be fully priced in, advocating for a careful approach to risk-taking. The strongest signals in our models continued to be growth stocks over value stocks, and large caps over small caps. The Fund’s equity exposure remains at about 60%, in line with its benchmark.
To finish its fiscal year the top holdings in the portfolio continue to be comprised mostly of the largest, highest-quality technology firms, which we viewed as broadly resilient to both an economic growth scare and a rising-rate environment. Beyond this core, the book was largely balanced, with an underweight to cheap cyclicals and a slight overweight to defensives.
How did the Fund perform since inception?
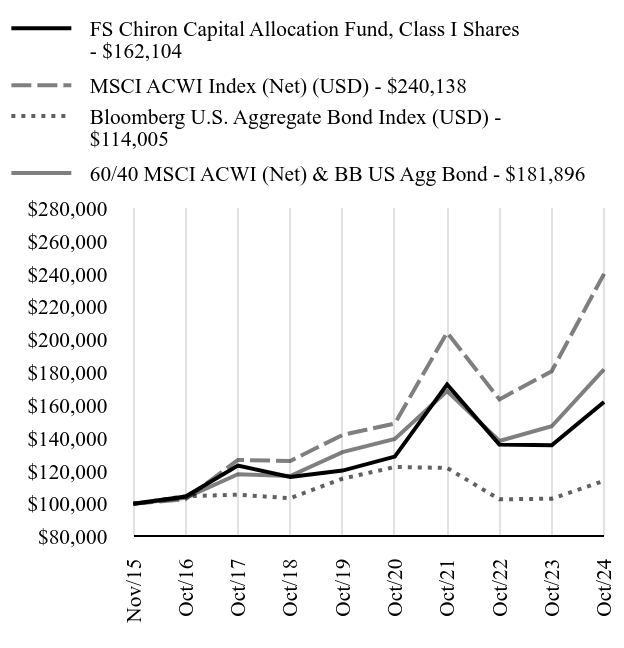
Total Return Based on $100,000 Investment
| FS Chiron Capital Allocation Fund, Class I Shares - $162104 | MSCI ACWI Index (Net) (USD) - $240138 | Bloomberg U.S. Aggregate Bond Index (USD) - $114005 | 60/40 MSCI ACWI (Net) & BB US Agg Bond - $181896 |
|---|
| Nov/15 | $100000 | $100000 | $100000 | $100000 |
| Oct/16 | $104466 | $102898 | $104647 | $103746 |
| Oct/17 | $123280 | $126773 | $105591 | $118069 |
| Oct/18 | $116355 | $126117 | $103423 | $116912 |
| Oct/19 | $120266 | $141996 | $115326 | $131553 |
| Oct/20 | $128802 | $148937 | $122462 | $139485 |
| Oct/21 | $172774 | $204457 | $121876 | $168808 |
| Oct/22 | $136095 | $163653 | $102763 | $138350 |
| Oct/23 | $135707 | $180839 | $103129 | $147283 |
| Oct/24 | $162104 | $240138 | $114005 | $181896 |
Since its inception on November 30, 2015. The line graph represents historical performance of a hypothetical investment of $100,000 in the Fund since inception. Returns shown are total returns, which assume the reinvestment of dividends and capital gains. The table and graph presented above do not reflect the deduction of taxes a shareholder would pay on Fund distributions or the redemption of Fund shares. Past performance is not indicative of future performance.Call 877-9-CHIRON(877-924-4766) or visit https://fsinvestments.com/investments/all-investments/ccapx/ for current month-end performance.
Average Annual Total Returns as of October 31, 2024
| Fund/Index Name | 1 Year | 5 Years | Annualized Since Inception |
|---|
| FS Chiron Capital Allocation Fund, Class I Shares | 19.45% | 6.15% | 5.56% |
| MSCI ACWI Index (Net) (USD) | 32.79% | 11.08% | 10.31% |
| Bloomberg U.S. Aggregate Bond Index (USD) | 10.55% | -0.23% | 1.48% |
| 60/40 MSCI ACWI (Net) & BB US Agg Bond | 23.50% | 6.70% | 6.93% |
Key Fund Statistics as of October 31, 2024
| Total Net Assets (000's) | Number of Holdings | Total Advisory Fees Paid (000's) | Portfolio Turnover Rate |
|---|
| $408,954 | 87 | $4,613 | 171% |
What did the Fund invest in?
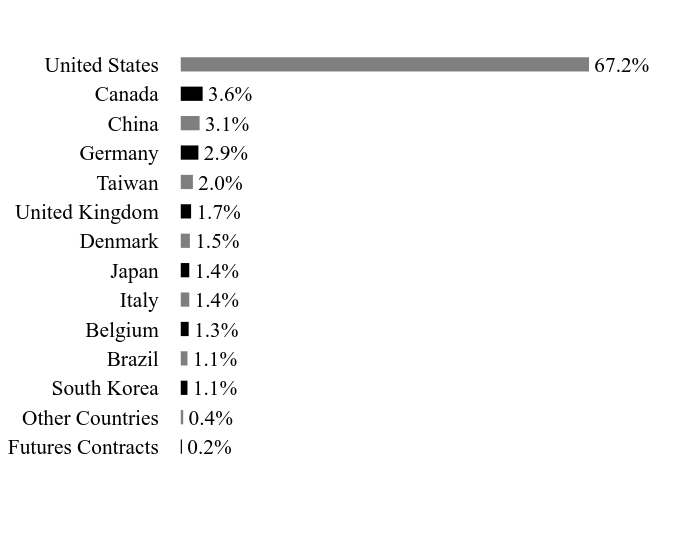
Country WeightingsFootnote Reference*
| Value | Value |
|---|
| Futures Contracts | 0.2% |
| Other Countries | 0.4% |
| South Korea | 1.1% |
| Brazil | 1.1% |
| Belgium | 1.3% |
| Italy | 1.4% |
| Japan | 1.4% |
| Denmark | 1.5% |
| United Kingdom | 1.7% |
| Taiwan | 2.0% |
| Germany | 2.9% |
| China | 3.1% |
| Canada | 3.6% |
| United States | 67.2% |
| Footnote | Description |
Footnote* | Percentages are calculated based on total net assets. |
| Holding Name | | | Percentage of Total Net Assets |
|---|
| U.S. Treasury Bill, 5.15%, 11/7/2024 | | | 10.1% |
| Jonah Energy, 7.20%, 12/10/2037, Cl A1 | | | 3.1% |
| NVIDIA | | | 2.6% |
| Apple | | | 2.5% |
| ServiceNow | | | 2.3% |
| Barrick Gold | | | 2.2% |
| Newmont | | | 2.1% |
| JPMorgan Chase | | | 2.0% |
| Taiwan Semiconductor Manufacturing ADR | | | 2.0% |
| Microsoft | | | 2.0% |
There were no material changes during the reporting period.
Changes in and Disagreements with Accountants
There were no changes in or disagreements with accountants during the reporting period.
For additional information about the Fund, including its prospectus, financial information, holdings, and proxy voting information, call or visit:
Rule 30e-1 of the Investment Company Act of 1940 permits funds to transmit only one copy of a proxy statement, annual report or semi-annual report to shareholders (who need not be related) with the same residential, commercial or electronic address, provided that the shareholders have consented in writing and the reports are addressed either to each shareholder individually or to the shareholders as a group. This process is known as “householding” and is designed to reduce the duplicate copies of materials that shareholders receive and to lower printing and mailing costs for funds. Once implemented, if you would like to discontinue householding for your accounts, please call toll-free at 877-9-CHIRON(877-924-4766) to request individual copies of these documents. Once the Fund receives notice to stop householding, we will begin sending individual copies 30 days after receiving your request.
The Advisors' Inner Circle Fund III
FS Chiron Capital Allocation Fund / Class I Shares - CCAPX
Annual Shareholder Report: October 31, 2024
CHI-AR-TSR-2024-3
The Advisors' Inner Circle Fund III
FS Chiron Capital Allocation Fund
Annual Shareholder Report: October 31, 2024
This annual shareholder report contains important information about Class A Shares of the FS Chiron Capital Allocation Fund (the "Fund") for the period from November 1, 2023 to October 31, 2024. You can find additional information about the Fund at https://fsinvestments.com/investments/all-investments/ccpax/. You can also request this information by contacting us at 877-9-CHIRON(877-924-4766).
What were the Fund costs for the last year?
(based on a hypothetical $10,000 investment)
| Fund Name | Costs of a $10,000 investment | Costs paid as a percentage of a $10,000 investment |
|---|
| FS Chiron Capital Allocation Fund, Class A Shares | $154 | 1.41% |
How did the Fund perform in the last year?
For the fiscal year ended October 31, 2024, FS Chiron Capital Allocation Fund (the “Fund”) returned 19.14% (Class A shares), underperforming its benchmark return of 23.50% by 436bps. The Fund's blended benchmark is weighted 60% MSCI All Country World Index (MSCI ACWI Net) and 40% Bloomberg U.S. Aggregate Bond Index. While we measure the Fund against a blended benchmark, we do not manage to a static benchmark profile.
The Fund seeks to achieve its objective by allocating its assets among equity, debt, precious metals, and cash investments in markets around the globe. Subject to the allocation targets below, the combination of the Fund’s investments will vary from time to time both with respect to the types of securities and markets, in response to changing market and economic trends. In deciding between equity and debt investments, the Fund utilizes a “quantamental” approach, which combines quantitative and fundamental research.
Portfolio Positioning
To start the year, we saw improved market sentiment given a combination of positive seasonal impacts, investor sentiment that became less bearish, and falling interest rates. We were overweight large-cap stocks and underweight cyclical stocks. We reduced our fixed income on the back of lower rates. As we entered 2024, the Fund’s risk profile was roughly in line with the benchmark. Our largest sector overweights were to be defensives sectors– consumer staples, healthcare care and energy – and technology remained the top allocations on an absolute basis. In fixed income we were well below our 40% benchmark weight.
As we finished the first quarter of 2024 our model readings favored growth stocks, they also showed a preference for low-volatility and earnings quality, highlighting the Fund’s tilt toward GARP (growth at a reasonable price) names. The market was rewarding firms in any sector for strong free cash flow and growth metrics, a theme we were weaving throughout our portfolio. We maintained exposure to these companies while remaining balanced to cyclical and defensive companies with a preference for companies with attractive free cash flow margins and yields. During the second quarter we worked to minimize outsized risk in the portfolio while remaining invested. The equity portfolio was weighted towards large cap, low-beta, defensively oriented stocks. We reduced our emerging market holdings, with majority of the reduction coming in China. While sovereign bond exposure rose in June, we continued to prefer precious metals to bonds as a portfolio ballast, and we increased exposure to gold and silver, which we viewed as better diversifiers given market conditions.
To end the third quarter our models sat close to full Growth in developed markets, including the U.S. In most parts of the world cyclicals appeared to be fully priced in, advocating for a careful approach to risk-taking. The strongest signals in our models continued to be growth stocks over value stocks, and large caps over small caps. The Fund’s equity exposure remains at about 60%, in line with its benchmark.
To finish its fiscal year the top holdings in the portfolio continue to be comprised mostly of the largest, highest-quality technology firms, which we viewed as broadly resilient to both an economic growth scare and a rising-rate environment. Beyond this core, the book was largely balanced, with an underweight to cheap cyclicals and a slight overweight to defensives.
How did the Fund perform since inception?
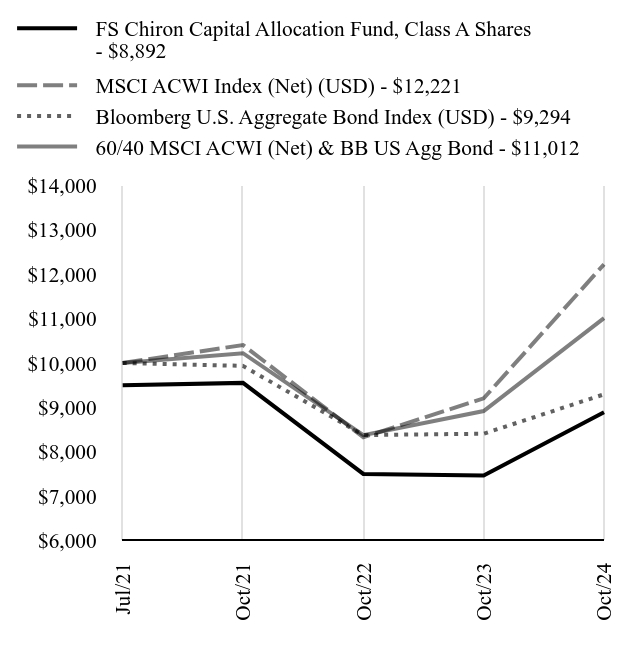
Total Return Based on $10,000 Investment
| FS Chiron Capital Allocation Fund, Class A Shares - $8892 | MSCI ACWI Index (Net) (USD) - $12221 | Bloomberg U.S. Aggregate Bond Index (USD) - $9294 | 60/40 MSCI ACWI (Net) & BB US Agg Bond - $11012 |
|---|
| Jul/21 | $9500 | $10000 | $10000 | $10000 |
| Oct/21 | $9552 | $10405 | $9935 | $10220 |
| Oct/22 | $7502 | $8328 | $8377 | $8376 |
| Oct/23 | $7464 | $9203 | $8407 | $8917 |
| Oct/24 | $8892 | $12221 | $9294 | $11012 |
Since its inception on July 16, 2021. The line graph represents historical performance of a hypothetical investment of $10,000 in the Fund since inception. Returns shown are total returns, which assume the reinvestment of dividends and capital gains. The table and graph presented above do not reflect the deduction of taxes a shareholder would pay on Fund distributions or the redemption of Fund shares. Past performance is not indicative of future performance.Call 877-9-CHIRON(877-924-4766) or visit https://fsinvestments.com/investments/all-investments/ccpax/ for current month-end performance.
Average Annual Total Returns as of October 31, 2024
| Fund/Index Name | 1 Year | Annualized Since Inception |
|---|
| FS Chiron Capital Allocation Fund | | |
| Class A Shares, With Load | 13.16% | -3.51% |
| Class A Shares, Without Load | 19.14% | -1.99% |
| MSCI ACWI Index (Net) (USD) | 32.79% | 6.27% |
| Bloomberg U.S. Aggregate Bond Index (USD) | 10.55% | -2.20% |
| 60/40 MSCI ACWI (Net) & BB US Agg Bond | 23.50% | 2.97% |
Key Fund Statistics as of October 31, 2024
| Total Net Assets (000's) | Number of Holdings | Total Advisory Fees Paid (000's) | Portfolio Turnover Rate |
|---|
| $408,954 | 87 | $4,613 | 171% |
What did the Fund invest in?
Country WeightingsFootnote Reference*
| Value | Value |
|---|
| Futures Contracts | 0.2% |
| Other Countries | 0.4% |
| South Korea | 1.1% |
| Brazil | 1.1% |
| Belgium | 1.3% |
| Italy | 1.4% |
| Japan | 1.4% |
| Denmark | 1.5% |
| United Kingdom | 1.7% |
| Taiwan | 2.0% |
| Germany | 2.9% |
| China | 3.1% |
| Canada | 3.6% |
| United States | 67.2% |
| Footnote | Description |
Footnote* | Percentages are calculated based on total net assets. |
| Holding Name | | | Percentage of Total Net Assets |
|---|
| U.S. Treasury Bill, 5.15%, 11/7/2024 | | | 10.1% |
| Jonah Energy, 7.20%, 12/10/2037, Cl A1 | | | 3.1% |
| NVIDIA | | | 2.6% |
| Apple | | | 2.5% |
| ServiceNow | | | 2.3% |
| Barrick Gold | | | 2.2% |
| Newmont | | | 2.1% |
| JPMorgan Chase | | | 2.0% |
| Taiwan Semiconductor Manufacturing ADR | | | 2.0% |
| Microsoft | | | 2.0% |
There were no material changes during the reporting period.
Changes in and Disagreements with Accountants
There were no changes in or disagreements with accountants during the reporting period.
For additional information about the Fund, including its prospectus, financial information, holdings, and proxy voting information, call or visit:
Rule 30e-1 of the Investment Company Act of 1940 permits funds to transmit only one copy of a proxy statement, annual report or semi-annual report to shareholders (who need not be related) with the same residential, commercial or electronic address, provided that the shareholders have consented in writing and the reports are addressed either to each shareholder individually or to the shareholders as a group. This process is known as “householding” and is designed to reduce the duplicate copies of materials that shareholders receive and to lower printing and mailing costs for funds. Once implemented, if you would like to discontinue householding for your accounts, please call toll-free at 877-9-CHIRON(877-924-4766) to request individual copies of these documents. Once the Fund receives notice to stop householding, we will begin sending individual copies 30 days after receiving your request.
The Advisors' Inner Circle Fund III
FS Chiron Capital Allocation Fund / Class A Shares - CCPAX
Annual Shareholder Report: October 31, 2024
CHI-AR-TSR-2024-1
The Advisors' Inner Circle Fund III
FS Chiron Capital Allocation Fund
Annual Shareholder Report: October 31, 2024
This annual shareholder report contains important information about Class C Shares of the FS Chiron Capital Allocation Fund (the "Fund") for the period from November 1, 2023 to October 31, 2024. You can find additional information about the Fund at https://fsinvestments.com/investments/all-investments/ccpcx/. You can also request this information by contacting us at 877-9-CHIRON(877-924-4766).
What were the Fund costs for the last year?
(based on a hypothetical $10,000 investment)
| Fund Name | Costs of a $10,000 investment | Costs paid as a percentage of a $10,000 investment |
|---|
| FS Chiron Capital Allocation Fund, Class C Shares | $236 | 2.16% |
How did the Fund perform in the last year?
For the fiscal year ended October 31, 2024, FS Chiron Capital Allocation Fund (the “Fund”) returned 18.24% (Class C shares), underperforming its benchmark return of 23.50% by 526bps. The Fund's blended benchmark is weighted 60% MSCI All Country World Index (MSCI ACWI Net) and 40% Bloomberg U.S. Aggregate Bond Index. While we measure the Fund against a blended benchmark, we do not manage to a static benchmark profile.
The Fund seeks to achieve its objective by allocating its assets among equity, debt, precious metals, and cash investments in markets around the globe. Subject to the allocation targets below, the combination of the Fund’s investments will vary from time to time both with respect to the types of securities and markets, in response to changing market and economic trends. In deciding between equity and debt investments, the Fund utilizes a “quantamental” approach, which combines quantitative and fundamental research.
Portfolio Positioning
To start the year, we saw improved market sentiment given a combination of positive seasonal impacts, investor sentiment that became less bearish, and falling interest rates. We were overweight large-cap stocks and underweight cyclical stocks. We reduced our fixed income on the back of lower rates. As we entered 2024, the Fund’s risk profile was roughly in line with the benchmark. Our largest sector overweights were to be defensives sectors– consumer staples, healthcare care and energy – and technology remained the top allocations on an absolute basis. In fixed income we were well below our 40% benchmark weight.
As we finished the first quarter of 2024 our model readings favored growth stocks, they also showed a preference for low-volatility and earnings quality, highlighting the Fund’s tilt toward GARP (growth at a reasonable price) names. The market was rewarding firms in any sector for strong free cash flow and growth metrics, a theme we were weaving throughout our portfolio. We maintained exposure to these companies while remaining balanced to cyclical and defensive companies with a preference for companies with attractive free cash flow margins and yields. During the second quarter we worked to minimize outsized risk in the portfolio while remaining invested. The equity portfolio was weighted towards large cap, low-beta, defensively oriented stocks. We reduced our emerging market holdings, with majority of the reduction coming in China. While sovereign bond exposure rose in June, we continued to prefer precious metals to bonds as a portfolio ballast, and we increased exposure to gold and silver, which we viewed as better diversifiers given market conditions.
To end the third quarter our models sat close to full Growth in developed markets, including the U.S. In most parts of the world cyclicals appeared to be fully priced in, advocating for a careful approach to risk-taking. The strongest signals in our models continued to be growth stocks over value stocks, and large caps over small caps. The Fund’s equity exposure remains at about 60%, in line with its benchmark.
To finish its fiscal year the top holdings in the portfolio continue to be comprised mostly of the largest, highest-quality technology firms, which we viewed as broadly resilient to both an economic growth scare and a rising-rate environment. Beyond this core, the book was largely balanced, with an underweight to cheap cyclicals and a slight overweight to defensives.
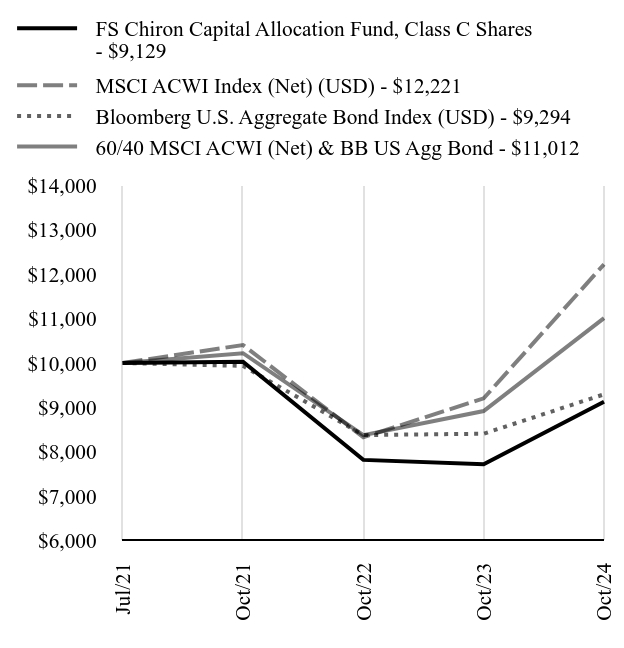
How did the Fund perform since inception?
Total Return Based on $10,000 Investment
| FS Chiron Capital Allocation Fund, Class C Shares - $9129 | MSCI ACWI Index (Net) (USD) - $12221 | Bloomberg U.S. Aggregate Bond Index (USD) - $9294 | 60/40 MSCI ACWI (Net) & BB US Agg Bond - $11012 |
|---|
| Jul/21 | $10000 | $10000 | $10000 | $10000 |
| Oct/21 | $10030 | $10405 | $9935 | $10220 |
| Oct/22 | $7818 | $8328 | $8377 | $8376 |
| Oct/23 | $7721 | $9203 | $8407 | $8917 |
| Oct/24 | $9129 | $12221 | $9294 | $11012 |
Since its inception on July 16, 2021. The line graph represents historical performance of a hypothetical investment of $10,000 in the Fund since inception. Returns shown are total returns, which assume the reinvestment of dividends and capital gains. The table and graph presented above do not reflect the deduction of taxes a shareholder would pay on Fund distributions or the redemption of Fund shares. Past performance is not indicative of future performance.Call 877-9-CHIRON(877-924-4766) or visit https://fsinvestments.com/investments/all-investments/ccpcx/ for current month-end performance.
Average Annual Total Returns as of October 31, 2024
| Fund/Index Name | 1 Year | Annualized Since Inception |
|---|
| FS Chiron Capital Allocation Fund, Class C Shares | 18.24% | -2.73% |
| MSCI ACWI Index (Net) (USD) | 32.79% | 6.27% |
| Bloomberg U.S. Aggregate Bond Index (USD) | 10.55% | -2.20% |
| 60/40 MSCI ACWI (Net) & BB US Agg Bond | 23.50% | 2.97% |
Key Fund Statistics as of October 31, 2024
| Total Net Assets (000's) | Number of Holdings | Total Advisory Fees Paid (000's) | Portfolio Turnover Rate |
|---|
| $408,954 | 87 | $4,613 | 171% |
What did the Fund invest in?
Country WeightingsFootnote Reference*
| Value | Value |
|---|
| Futures Contracts | 0.2% |
| Other Countries | 0.4% |
| South Korea | 1.1% |
| Brazil | 1.1% |
| Belgium | 1.3% |
| Italy | 1.4% |
| Japan | 1.4% |
| Denmark | 1.5% |
| United Kingdom | 1.7% |
| Taiwan | 2.0% |
| Germany | 2.9% |
| China | 3.1% |
| Canada | 3.6% |
| United States | 67.2% |
| Footnote | Description |
Footnote* | Percentages are calculated based on total net assets. |
| Holding Name | | | Percentage of Total Net Assets |
|---|
| U.S. Treasury Bill, 5.15%, 11/7/2024 | | | 10.1% |
| Jonah Energy, 7.20%, 12/10/2037, Cl A1 | | | 3.1% |
| NVIDIA | | | 2.6% |
| Apple | | | 2.5% |
| ServiceNow | | | 2.3% |
| Barrick Gold | | | 2.2% |
| Newmont | | | 2.1% |
| JPMorgan Chase | | | 2.0% |
| Taiwan Semiconductor Manufacturing ADR | | | 2.0% |
| Microsoft | | | 2.0% |
There were no material changes during the reporting period.
Changes in and Disagreements with Accountants
There were no changes in or disagreements with accountants during the reporting period.
For additional information about the Fund, including its prospectus, financial information, holdings, and proxy voting information, call or visit:
Rule 30e-1 of the Investment Company Act of 1940 permits funds to transmit only one copy of a proxy statement, annual report or semi-annual report to shareholders (who need not be related) with the same residential, commercial or electronic address, provided that the shareholders have consented in writing and the reports are addressed either to each shareholder individually or to the shareholders as a group. This process is known as “householding” and is designed to reduce the duplicate copies of materials that shareholders receive and to lower printing and mailing costs for funds. Once implemented, if you would like to discontinue householding for your accounts, please call toll-free at 877-9-CHIRON(877-924-4766) to request individual copies of these documents. Once the Fund receives notice to stop householding, we will begin sending individual copies 30 days after receiving your request.
The Advisors' Inner Circle Fund III
FS Chiron Capital Allocation Fund / Class C Shares - CCPCX
Annual Shareholder Report: October 31, 2024
CHI-AR-TSR-2024-2
Item 2. Code of Ethics.
The Registrant (also referred to as the “Trust”) has adopted a code of ethics that applies to the Registrant’s principal executive officer, principal financial officer, controller or principal accounting officer, and any person who performs a similar function. There have been no amendments to or waivers granted to this code of ethics during the period covered by this report.
Item 3. Audit Committee Financial Expert.
(a)(1) The Registrant’s board of trustees has determined that the Registrant has at least one audit committee financial expert serving on the audit committee.
(a)(2) The Registrant’s audit committee financial experts are Thomas P. Lemke and Jay Nadel, and each of Mr. Lemke and Mr. Nadel is “independent” as that term is defined in Form N-CSR Item 3 (a)(2).
Item 4. Principal Accountant Fees and Services.
Fees billed by PricewaterhouseCoopers LLP (“PwC”) related to the Trust.
PwC billed the Trust aggregate fees for services rendered to the Trust for the last two fiscal years as follows:
| | FYE October 31, 2024 | FYE October 31, 2023 |
| | | All fees and services to the Trust that were pre-approved | All fees and services to service affiliates that were pre-approved | All other fees and services to service affiliates that did not require pre-approval | All fees and services to the Trust that were pre-approved | All fees and services to service affiliates that were pre-approved | All other fees and services to service affiliates that did not require pre-approval |
| (a) | Audit Fees(1) | $734,463 | None | None | $717,900 | None | None |
| (b) | Audit-Related Fees | None | None | None | None | None | None |
| (c) | Tax Fees | None | None | $559,700(2) | None | None | $807,756(2) |
| (d) | All Other Fees | None | None | $10,530(4) | None | None | $7,535(4) |
Fees billed by Ernst & Young LLP (“E&Y”) related to the Trust.
E&Y billed the Trust aggregate fees for services rendered to the Trust for the last two fiscal years as follows:
| | FYE October 31, 2024 | FYE October 31, 2023 |
| | | All fees and services to the Trust that were pre-approved | All fees and services to service affiliates that were pre-approved | All other fees and services to service affiliates that did not require pre-approval | All fees and services to the Trust that were pre-approved | All fees and services to service affiliates that were pre-approved | All other fees and services to service affiliates that did not require pre-approval |
| (a) | Audit Fees(1) | $113,052 | None | None | $137,200 | None | None |
| (b) | Audit-Related Fees | None | None | None | None | None | None |
| (c) | Tax Fees | None | None | None | None | None | None |
| (d) | All Other Fees | None | None | None | None | None | None |
Fees billed by Deloitte & Touche LLP (“D&T”) related to the Trust.
D&T billed the Trust aggregate fees for services rendered to the Trust for the last two fiscal years as follows
| | FYE October 31, 2024 | FYE October 31, 2023 |
| | | All fees and services to the Trust that were pre-approved | All fees and services to service affiliates that were pre-approved | All other fees and services to service affiliates that did not require pre-approval | All fees and services to the Trust that were pre-approved | All fees and services to service affiliates that were pre-approved | All other fees and services to service affiliates that did not require pre-approval |
| (a) | Audit Fees(1) | $30,000 | None | None | $30,624 | None | None |
| (b) | Audit-Related Fees | None | None | None | None | None | None |
| (c) | Tax Fees | None | None | None | None | None | None |
| (d) | All Other Fees | None | None | None | None | None | None |
Fees billed by KPMG (“KPMG”) related to the Trust.
KPMG billed the Trust aggregate fees for services rendered to the Trust for the last two fiscal years as follows
| | FYE October 31, 2024 | FYE October 31, 2023 |
| | | All fees and services to the Trust that were pre-approved | All fees and services to service affiliates that were pre-approved | All other fees and services to service affiliates that did not require pre-approval | All fees and services to the Trust that were pre-approved | All fees and services to service affiliates that were pre-approved | All other fees and services to service affiliates that did not require pre-approval |
| (a) | Audit Fees(1) | $45,000 | None | None | $363,625 | None | None |
| (b) | Audit-Related Fees | None | None | None | None | None | None |
| (c) | Tax Fees | None | None | None | None | None | None |
| (d) | All Other Fees | None | None | $154,000(3) | None | None | $282,908(3) |
Notes:
| (1) | Audit fees include amounts related to the audit of the Trust’s annual financial statements and services normally provided by the accountant in connection with statutory and regulatory filings. |
| (2) | Tax return preparation fees for affiliates of the Funds. |
| (3) | Non-audit fees consist of SSAE No. 18 report over investment management activities and non-statutory audit reports of Legal & General Investment Management America, Inc. |
| (4) | Non-audit assurance engagements for service affiliates of the funds. |
(e)(1) The Trust’s Audit Committee has adopted and the Board of Trustees has ratified an Audit and Non-Audit Services Pre-Approval Policy (the “Policy”), which sets forth the procedures and the conditions pursuant to which services proposed to be performed by the independent auditor of the Funds may be pre-approved.
The Policy provides that all requests or applications for proposed services to be provided by the independent auditor must be submitted to the Registrant’s Chief Financial Officer (“CFO”) and must include a detailed description of the services proposed to be rendered. The CFO will determine whether such services:
| 1. | require specific pre-approval; |
| 2. | are included within the list of services that have received the general pre-approval of the Audit Committee pursuant to the Policy; or |
| 3. | have been previously pre-approved in connection with the independent auditor’s annual engagement letter for the applicable year or otherwise. In any instance where services require pre-approval, the Audit Committee will consider whether such services are consistent with SEC’s rules and whether the provision of such services would impair the auditor’s independence. |
Requests or applications to provide services that require specific pre-approval by the Audit Committee will be submitted to the Audit Committee by the CFO. The Audit Committee will be informed by the CFO on a quarterly basis of all services rendered by the independent auditor. The Audit Committee has delegated specific pre-approval authority to either the Audit Committee Chair or financial expert, provided that the estimated fee for any such proposed pre-approved service does not exceed $100,000 and any pre-approval decisions are reported to the Audit Committee at its next regularly-scheduled meeting.
Services that have received the general pre-approval of the Audit Committee are identified and described in the Policy. In addition, the Policy sets forth a maximum fee per engagement with respect to each identified service that has received general pre-approval.
All services to be provided by the independent auditor shall be provided pursuant to a signed written engagement letter with the Registrant, the investment adviser, or applicable control affiliate (except that matters as to which an engagement letter would be impractical because of timing issues or because the matter is small may not be the subject of an engagement letter) that sets forth both the services to be provided by the independent auditor and the total fees to be paid to the independent auditor for those services.
In addition, the Audit Committee has determined to take additional measures on an annual basis to meet the Audit Committee’s responsibility to oversee the work of the independent auditor and to assure the auditor's independence from the Registrant, such as (a) reviewing a formal written statement from the independent auditor delineating all relationships between the independent auditor and the Registrant, and (b) discussing with the independent auditor the independent auditor’s methods and procedures for ensuring independence.
(e)(2) Percentage of fees billed applicable to non-audit services pursuant to waiver of pre-approval requirement were as follows (PwC):
| | FYE
October
31, 2024 | FYE
October
31, 2023 |
| Audit-Related Fees | None | None |
| Tax Fees | None | None |
| All Other Fees | None | None |
(e)(2) Percentage of fees billed applicable to non-audit services pursuant to waiver of pre-approval requirement were as follows (E&Y):
| | FYE
October
31, 2024 | FYE
October
31, 2023 |
| Audit-Related Fees | None | None |
| Tax Fees | None | None |
| All Other Fees | None | None |
(e)(2) Percentage of fees billed applicable to non-audit services pursuant to waiver of pre-approval requirement were as follows (D&T):
| | FYE
October
31, 2024 | FYE
October
31, 2023 |
| Audit-Related Fees | None | None |
| Tax Fees | None | None |
| All Other Fees | None | None |
(e)(2) Percentage of fees billed applicable to non-audit services pursuant to waiver of pre-approval requirement were as follows (KPMG):
| | FYE
October
31, 2024 | FYE
October
31, 2023 |
| Audit-Related Fees | None | None |
| Tax Fees | None | None |
| All Other Fees | None | None |
(f) Not applicable.
(g) The aggregate non-audit fees and services billed by PwC for services rendered to the Registrant, and rendered to the Registrant’s investment adviser (not including any sub-adviser whose role is primarily portfolio management and is subcontracted with or overseen by another investment adviser), and any entity controlling, controlled by, or under common control with the adviser that provides ongoing services to the Registrant for the last two fiscal-years-ended October 31st were $570,230 and $815,291 for 2024 and 2023, respectively.
(g) The aggregate non-audit fees and services billed by E&Y for services rendered to the Registrant, and rendered to the Registrant’s investment adviser (not including any sub-adviser whose role is primarily portfolio management and is subcontracted with or overseen by another investment adviser), and any entity controlling, controlled by, or under common control with the adviser that provides ongoing services to the Registrant for the last two fiscal-years-ended October 31st were $0 and $0 for 2024 and 2023, respectively.
(g) The aggregate non-audit fees and services billed by D&T for services rendered to the Registrant, and rendered to the Registrant’s investment adviser (not including any sub-adviser whose role is primarily portfolio management and is subcontracted with or overseen by another investment adviser), and any entity controlling, controlled by, or under common control with the adviser that provides ongoing services to the Registrant for the last two fiscal-years-ended October 31st were $0 and $0 for 2024 and 2023, respectively.
(g) The aggregate non-audit fees and services billed by KPMG for services rendered to the Registrant, and rendered to the Registrant’s investment adviser (not including any sub-adviser whose role is primarily portfolio management and is subcontracted with or overseen by another investment adviser), and any entity controlling, controlled by, or under common control with the adviser that provides ongoing services to the Registrant for the last two fiscal-years-ended October 31st were $154,000 and $282,908 for 2024 and 2023, respectively.
(h) During the past fiscal year, all non-audit services provided by the Registrant’s principal accountant to either the Registrant’s investment adviser or to any entity controlling, controlled by, or under common control with the Registrant’s investment adviser that provides ongoing services to the Registrant were pre-approved by the Audit Committee of Registrant’s Board of Trustees. Included in the Audit Committee’s pre-approval of these non-audit service were the review and consideration as to whether the provision of these non-audit services is compatible with maintaining the principal accountant’s independence.
(i) Not applicable. The Registrant has not retained, for the preparation of the audit report on the financial statements included in the Form N-CSR, a registered public accounting firm that has a branch or office that is located in a foreign jurisdiction and that the Public Company Accounting Oversight Board (the “PCAOB”) has determined that the PCAOB is unable to inspect or investigate completely because of a position taken by an authority in the foreign jurisdiction.
(j) Not applicable. The Registrant is not a “foreign issuer,” as defined in 17 CFR § 240.3b-4.
Item 5. Audit Committee of Listed Registrants.
Not applicable to open-end management investment companies.
Item 6. Schedule of Investments.
(a) The Schedule of Investments is included as part of the Financial Statements and Other Information filed under Item 7 of this form.
(b) Not applicable.
Item 7. Financial Statements and Financial Highlights for Open-End Management Investment Companies.
Financial statements and financial highlights are filed herein.
| THE ADVISORS’ INNER CIRCLE FUND III | FS CHIRON |
| | CAPITAL ALLOCATION FUND |
| | OCTOBER 31, 2024 |
TABLE OF CONTENTS
| Financial Statements (Form N-CSR Item 7) | |
| Consolidated Schedule of Investments | 1 |
| Consolidated Statement of Assets and Liabilities | 8 |
| Consolidated Statement of Operations | 10 |
| Consolidated Statements of Changes in Net Assets | 11 |
| Consolidated Financial Highlights | 13 |
| Notes to Consolidated Financial Statements | 16 |
| Report of Independent Registered Public Accounting Firm | 40 |
| Notice to Shareholders (Unaudited) | 42 |
| Approval of Investment Advisory Agreement (Form N-CSR Item 11)(Unaudited) | 43 |
| THE ADVISORS’ INNER CIRCLE FUND III | FS CHIRON |
| | CAPITAL ALLOCATION FUND |
| | OCTOBER 31, 2024 |
CONSOLIDATED SCHEDULE OF INVESTMENTS
(Percentages are based on Net Assets of $408,954 (000))
COMMON STOCK — 69.6%
| | | Shares | | | Fair Value (000) | |
| BELGIUM — 1.3% | | | | | | | | |
| Anheuser-Busch InBev | | | 92,055 | | | $ | 5,505 | |
| | | | | | | | | |
| BRAZIL — 1.1% | | | | | | | | |
| MercadoLibre* | | | 2,297 | | | | 4,679 | |
| | | | | | | | | |
| CANADA — 3.6% | | | | | | | | |
| Agnico Eagle Mines | | | 65,605 | | | | 5,661 | |
| Barrick Gold | | | 462,416 | | | | 8,934 | |
| | | | | | | | | |
| | | | | | | | 14,595 | |
| CHINA — 3.1% | | | | | | | | |
| Alibaba Group Holding ADR | | | 61,359 | | | | 6,012 | |
| Tencent Holdings | | | 128,900 | | | | 6,709 | |
| | | | | | | | | |
| | | | | | | | 12,721 | |
| DENMARK — 1.5% | | | | | | | | |
| Novo Nordisk, Cl B | | | 55,828 | | | | 6,212 | |
| | | | | | | | | |
| GERMANY — 2.9% | | | | | | | | |
| Deutsche Telekom | | | 147,489 | | | | 4,463 | |
| SAP | | | 31,486 | | | | 7,357 | |
| | | | | | | | | |
| | | | | | | | 11,820 | |
| ITALY — 1.4% | | | | | | | | |
| Ferrari | | | 11,609 | | | | 5,525 | |
| | | | | | | | | |
| JAPAN — 1.4% | | | | | | | | |
| Hitachi | | | 222,600 | | | | 5,749 | |
| | | | | | | | | |
| SOUTH KOREA — 1.1% | | | | | | | | |
| BNK Financial Group | | | 5,665 | | | | 39 | |
| DB Insurance | | | 1,245 | | | | 98 | |
| HD Hyundai | | | 1,368 | | | | 79 | |
| Hyundai Marine & Fire Insurance | | | 1,577 | | | | 35 | |
The accompanying notes are an integral part of the financial statements.
| THE ADVISORS’ INNER CIRCLE FUND III | FS CHIRON |
| | CAPITAL ALLOCATION FUND |
| | OCTOBER 31, 2024 |
COMMON STOCK — continued
| | | Shares | | | Fair Value (000) | |
| SOUTH KOREA — (continued) | | | | | | | | |
| KEPCO Engineering & Construction | | | 657 | | | $ | 33 | |
| Korean Air Lines | | | 6,311 | | | | 109 | |
| KT | | | 4,291 | | | | 138 | |
| Samsung Biologics* | | | 1,259 | | | | 914 | |
| SK Hynix | | | 21,303 | | | | 2,876 | |
| | | | | | | | | |
| | | | | | | | 4,321 | |
| TAIWAN — 2.0% | | | | | | | | |
| Taiwan Semiconductor Manufacturing ADR | | | 43,099 | | | | 8,212 | |
| | | | | | | | | |
| UNITED KINGDOM — 1.7% | | | | | | | | |
| AstraZeneca | | | 21,507 | | | | 3,062 | |
| SSE | | | 171,936 | | | | 3,904 | |
| | | | | | | | | |
| | | | | | | | 6,966 | |
| | | | | | | | | |
| UNITED STATES — 48.5% | | | | | | | | |
| 3M | | | 16,824 | | | | 2,162 | |
| AbbVie | | | 10,752 | | | | 2,192 | |
| Alphabet, Cl C | | | 15,258 | | | | 2,635 | |
| Amazon.com* | | | 32,005 | | | | 5,966 | |
| American Tower | | | 33,570 | | | | 7,169 | |
| Apple | | | 45,939 | | | | 10,378 | |
| Arista Networks* | | | 9,914 | | | | 3,831 | |
| Berkshire Hathaway, Cl B* | | | 17,741 | | | | 8,000 | |
| Boston Scientific* | | | 12,149 | | | | 1,021 | |
| Caterpillar | | | 1,236 | | | | 465 | |
| Charles Schwab | | | 31,814 | | | | 2,253 | |
| Chipotle Mexican Grill, Cl A* | | | 135,416 | | | | 7,552 | |
| Colgate-Palmolive | | | 61,741 | | | | 5,786 | |
| Costco Wholesale | | | 4,872 | | | | 4,259 | |
| Cummins | | | 6,513 | | | | 2,142 | |
| Danaher | | | 3,916 | | | | 962 | |
| Duke Energy | | | 17,484 | | | | 2,016 | |
| Elevance Health | | | 3,014 | | | | 1,223 | |
| Energy Transfer | | | 343,777 | | | | 5,665 | |
| Exxon Mobil | | | 53,090 | | | | 6,200 | |
| Fiserv* | | | 11,247 | | | | 2,226 | |
| Freeport-McMoRan | | | 9,532 | | | | 429 | |
| General Electric | | | 28,701 | | | | 4,930 | |
The accompanying notes are an integral part of the financial statements.
| THE ADVISORS’ INNER CIRCLE FUND III | FS CHIRON |
| | CAPITAL ALLOCATION FUND |
| | OCTOBER 31, 2024 |
COMMON STOCK — continued
| | | Shares | | | Fair Value (000) | |
| UNITED STATES — (continued) | | | | | | | | |
| HCA Healthcare | | | 12,727 | | | $ | 4,566 | |
| Home Depot | | | 5,937 | | | | 2,338 | |
| Interactive Brokers Group, Cl A | | | 8,391 | | | | 1,280 | |
| Intercontinental Exchange | | | 37,150 | | | | 5,790 | |
| International Business Machines | | | 9,850 | | | | 2,036 | |
| Intuitive Surgical* | | | 10,981 | | | | 5,532 | |
| JPMorgan Chase | | | 37,007 | | | | 8,213 | |
| Mastercard, Cl A | | | 3,037 | | | | 1,517 | |
| Meta Platforms, Cl A | | | 8,154 | | | | 4,628 | |
| Microsoft | | | 20,140 | | | | 8,184 | |
| Mondelez International, Cl A | | | 29,293 | | | | 2,006 | |
| Netflix* | | | 8,296 | | | | 6,272 | |
| Newmont | | | 188,988 | | | | 8,588 | |
| NVIDIA | | | 79,575 | | | | 10,565 | |
| PayPal Holdings* | | | 56,730 | | | | 4,499 | |
| Philip Morris International | | | 34,718 | | | | 4,607 | |
| Progressive | | | 20,194 | | | | 4,904 | |
| ServiceNow* | | | 10,241 | | | | 9,555 | |
| Simon Property Group | | | 2,528 | | | | 427 | |
| Uber Technologies* | | | 99,446 | | | | 7,165 | |
| Verizon Communications | | | 72,238 | | | | 3,043 | |
| Wynn Resorts | | | 34,683 | | | | 3,330 | |
| | | | | | | | | |
| | | | | | | | 198,507 | |
| TOTAL COMMON STOCK | | | | | | | | |
| (Cost $243,469) (000) | | | | | | | 284,812 | |
CORPORATE OBLIGATIONS — 5.9%
| | | Face Amount (000) | | | | | |
| MEXICO — 0.4% | | | | | | | | |
| Southern Copper | | | | | | | | |
| 3.875%, 04/23/25 | | $ | 1,600 | | | | 1,588 | |
| | | | | | | | | |
| UNITED STATES — 5.5% | | | | | | | | |
| American Tower | | | | | | | | |
| Callable 08/17/26 @ $100.000 | | | | | | | | |
| 1.450%, 09/15/26 | | | 2,600 | | | | 2,448 | |
The accompanying notes are an integral part of the financial statements.
| THE ADVISORS’ INNER CIRCLE FUND III | FS CHIRON |
| | CAPITAL ALLOCATION FUND |
| | OCTOBER 31, 2024 |
CORPORATE OBLIGATIONS — continued
| | | Face Amount (000) | | | Fair Value (000) | |
| UNITED STATES — (continued) | | | | | | | | |
| Broadcom | | | | | | | | |
| Callable 07/15/26 @ $100.000 | | | | | | | | |
| 3.459%, 09/15/26 | | $ | 2,400 | | | $ | 2,351 | |
| Cheniere Energy | | | | | | | | |
| Callable 11/11/24 @ $101.156 | | | | | | | | |
| 4.625%, 10/15/28 | | | 2,500 | | | | 2,450 | |
| Flex | | | | | | | | |
| Callable 01/02/26 @ $100.000 | | | | | | | | |
| 3.750%, 02/01/26 | | | 1,700 | | | | 1,672 | |
| IQVIA | | | | | | | | |
| Callable 12/02/24 @ $100.000 | | | | | | | | |
| 5.000%, 10/15/26(A) | | | 3,100 | | | | 3,067 | |
| MPLX | | | | | | | | |
| Callable 11/15/24 @ $100.000 | | | | | | | | |
| 4.000%, 02/15/25 | | | 1,600 | | | | 1,594 | |
| PRA Health Sciences | | | | | | | | |
| Callable 07/15/25 @ $100.719 | | | | | | | | |
| 2.875%, 07/15/26(A) | | | 2,500 | | | | 2,413 | |
| Regal Rexnord | | | | | | | | |
| 6.050%, 02/15/26 | | | 1,600 | | | | 1,617 | |
| Scotts Miracle-Gro | | | | | | | | |
| Callable 08/03/26 @ $102.188 | | | | | | | | |
| 4.375%, 02/01/32 | | | 2,900 | | | | 2,624 | |
| Uber Technologies | | | | | | | | |
| Callable 12/02/24 @ $100.000 | | | | | | | | |
| 8.000%, 11/01/26(A) | | | 2,300 | | | | 2,300 | |
| | | | | | | | | |
| | | | | | | | 22,536 | |
| TOTAL CORPORATE OBLIGATIONS | | | | | | | | |
| (Cost $24,040) (000) | | | | | | | 24,124 | |
The accompanying notes are an integral part of the financial statements.
| THE ADVISORS’ INNER CIRCLE FUND III | FS CHIRON |
| | CAPITAL ALLOCATION FUND |
| | OCTOBER 31, 2024 |
ASSET-BACKED SECURITY — 3.1%
| | | Face Amount (000) | | | Fair Value (000) | |
| UNITED STATES — 3.1% | | | | | | | | |
| Jonah Energy, Ser 2022-1, Cl A1 | | | | | | | | |
| Callable 11/10/26 @ $100.000 | | | | | | | | |
| 7.200%, 12/10/37(A) | | $ | 12,488 | | | $ | 12,533 | |
| | | | | | | | | |
| Total Asset-Backed Security | | | | | | | | |
| (Cost $12,330) (000) | | | | | | | 12,533 | |
| | | | | | | | | |
| U.S. TREASURY OBLIGATION — 10.1% | | | | | | | | |
| | | | | | | | | |
| U.S. Treasury Bill | | | | | | | | |
| 5.150%, 11/07/24(B) | | | 41,300 | | | | 41,268 | |
| | | | | | | | | |
| TOTAL U.S. TREASURY OBLIGATION | | | | | | | | |
| (Cost $41,265) (000) | | | | | | | 41,268 | |
| | | | | | | | | |
| TOTAL INVESTMENTS — 88.7% | | | | | | | | |
| (Cost $321,104) (000) | | | | | | $ | 362,737 | |
| * | Non-income producing security. |
| (A) | Securities sold within terms of a private placement memorandum, exempt from registration under Section 144A of the Securities Act of 1933, as amended, and may be sold only to dealers in that program or other "accredited investors." On October 31, 2024, the value of these securities amounted $20,313 (000) and represented 5.0% of net assets. |
| (B) | The rate reported on the Consolidated Schedule of Investments is the effective yield at the time of purchase. |
The accompanying notes are an integral part of the financial statements.
| THE ADVISORS’ INNER CIRCLE FUND III | FS CHIRON |
| | CAPITAL ALLOCATION FUND |
| | OCTOBER 31, 2024 |
Open futures contracts held by the Fund at October 31, 2024 are as follows:
| Type of Contract | | Number of
Contracts | | | Expiration
Date | | | Notional Amount
(000) | | | Value (000) | | | Unrealized
Appreciation/
(Depreciation)
(000) | |
| Long Contracts | | | | | | | | | | | | | | | | | | |
| Euro-Bund 10-Year Bond | | 180 | | | Dec-2024 | | | $ | 26,732 | | | $ | 25,806 | | | $ | (377) | |
| Euro-Schatz | | 228 | | | Dec-2024 | | | | 27,071 | | | | 26,423 | | | | (186 | ) |
| Gold† | | 69 | | | Dec-2024 | | | | 16,996 | | | | 18,970 | | | | 1,974 | |
| Silver† | | 55 | | | Dec-2024 | | | | 8,960 | | | | 9,019 | | | | 59 | |
| U.S. 2-Year Treasury Note | | 103 | | | Dec-2024 | | | | 21,393 | | | | 21,212 | | | | (181) | |
| U.S. 5-Year Treasury Note | | 225 | | | Dec-2024 | | | | 24,705 | | | | 24,128 | | | | (577 | ) |
| | | | | | | | | $ | 125,857 | | | $ | 125,558 | | | $ | 712 | |
| † | Security, or a portion thereof, is held by the Chiron Capital Allocation Fund Ltd., as of October 31, 2024. |
ADR — American Depositary Receipt
Cl — Class
Ser — Series
The tables below set forth information about the Level within the fair value hierarchy at which the Fund’s investments and other financial instruments are measured at October 31, 2024:
| Investments in Securities | | Level 1 (000) | | | Level 2 (000) | | | Level 3 (000) | | | Total (000) | |
| Common Stock | | | | | | | | | | | | | | | | |
| Belgium | | $ | 5,505 | | | $ | — | | | $ | — | | | $ | 5,505 | |
| Brazil | | | 4,679 | | | | — | | | | — | | | | 4,679 | |
| Canada | | | 14,595 | | | | — | | | | — | | | | 14,595 | |
| China | | | 12,721 | | | | — | | | | — | | | | 12,721 | |
| Denmark | | | 6,212 | | | | — | | | | — | | | | 6,212 | |
| Germany | | | 11,820 | | | | — | | | | — | | | | 11,820 | |
| Italy | | | 5,525 | | | | — | | | | — | | | | 5,525 | |
| Japan | | | 5,749 | | | | — | | | | — | | | | 5,749 | |
| South Korea | | | 4,321 | | | | — | | | | — | | | | 4,321 | |
| Taiwan | | | 8,212 | | | | — | | | | — | | | | 8,212 | |
| United Kingdom | | | 6,966 | | | | — | | | | — | | | | 6,966 | |
| United States | | | 198,507 | | | | — | | | | — | | | | 198,507 | |
| Total Common Stock | | | 284,812 | | | | — | | | | — | | | | 284,812 | |
| Corporate Obligations | | | — | | | | 24,124 | | | | — | | | | 24,124 | |
| Asset-Backed Security | | | — | | | | 12,533 | | | | — | | | | 12,533 | |
| U.S. Treasury Obligation | | | — | | | | 41,268 | | | | — | | | | 41,268 | |
The accompanying notes are an integral part of the financial statements.
| THE ADVISORS’ INNER CIRCLE FUND III | FS CHIRON |
| | CAPITAL ALLOCATION FUND |
| | OCTOBER 31, 2024 |
| Investments in Securities | | Level 1 (000) | | | Level 2 (000) | | | Level 3 (000) | | | Total (000) | |
| Total Investments in Securities | | $ | 284,812 | | | $ | 77,925 | | | $ | — | | | $ | 362,737 | |
| Other Financial Instruments | | Level 1 (000) | | | Level 2 (000) | | | Level 3 (000) | | | Total (000) | |
| Futures Contracts* | | | | | | | | | | | | | | | | |
| Unrealized Appreciation | | $ | 2,033 | | | $ | — | | | $ | — | | | $ | 2,033 | |
| Unrealized Depreciation | | | (1,321 | ) | | | — | | | | — | | | | (1,321 | ) |
| Total Other Financial Instruments | | $ | 712 | | | $ | — | | | $ | — | | | $ | 712 | |
| * | Futures contracts are valued at the unrealized appreciation (depreciation) on the instrument. |
Amounts designated as “—“ are either $0 or have been rounded to $0.
For more information on valuation inputs, see Note 2 – Significant Accounting Policies in the Notes to Financial Statements.
The accompanying notes are an integral part of the financial statements.
| THE ADVISORS’ INNER CIRCLE FUND III | FS CHIRON CAPITAL ALLOCATION FUND OCTOBER 31, 2024 |
| CONSOLIDATED STATEMENT OF ASSETS AND LIABILITIES ($ Thousands) | | | |
| Assets: | | | |
| Investments, at Fair Value (Cost $321,104) | | $ | 362,737 | |
| Foreign Currency, at Fair Value (Cost $1) | | | 1 | |
| Cash | | | 41,221 | |
| Cash Pledged as Collateral for Futures Contracts | | | 6,341 | |
| Receivable for Investments Sold | | | 3,424 | |
| Dividend and Interest Receivable | | | 1,289 | |
| Reclaim Receivable | | | 581 | |
| Receivable for Capital Shares Sold | | | 46 | |
| Prepaid Expenses | | | 29 | |
| Total Assets | | | 415,669 | |
| Liabilities: | | | | |
| Payable for Investment Securities Purchased | | $ | 5,069 | |
| Variation Margin Payable for Futures Contracts | | | 798 | |
| Payable Due to Adviser | | | 342 | |
| Payable for Capital Shares Redeemed | | | 319 | |
| Payable Due to Administrator | | | 26 | |
| Chief Compliance Officer Fees Payable | | | 3 | |
| Distribution Fees Payable (Class A) | | | 1 | |
| Other Accrued Expenses and Other Payables | | | 157 | |
| Total Liabilities | | | 6,715 | |
| Net Assets | | $ | 408,954 | |
The accompanying notes are an integral part of the financial statements.
| THE ADVISORS’ INNER CIRCLE FUND III | FS CHIRON CAPITAL ALLOCATION FUND OCTOBER 31, 2024 |
| CONSOLIDATED STATEMENT OF ASSETS AND LIABILITIES ($ Thousands) (1) | | | |
| Net Assets Consist of: | | | |
| Paid-in Capital | | $ | 554,091 | |
| Total Accumulated Loss | | | (145,137 | ) |
| Net Assets | | $ | 408,954 | |
| Class I Shares: | | | | |
| Net Assets | | $ | 401,717 | |
| Outstanding Shares of Beneficial Interest (Unlimited Authorization - No Par Value) | | | 28,319 | |
| Net Asset Value, Offering and Redemption Price Per Share | | $ | 14.19 | |
| Class A Shares:(2) | | | | |
| Net Assets | | $ | 1,399 | |
| Outstanding Shares of Beneficial Interest (Unlimited Authorization - No Par Value) | | | 98 | |
| Net Asset Value, Offering and Redemption Price Per Share | | $ | 14.19 | ‡ |
Maximum Offering Price Per Share
($14.19/95.00%) | | | 14.94 | |
| Class C Shares:(3) | | | | |
| Net Assets | | $ | 5,838 | |
| Outstanding Shares of Beneficial Interest (Unlimited Authorization - No Par Value) | | | 413 | |
| Net Asset Value, Offering and Redemption Price Per Share | | $ | 14.14 | ‡ |
| (1) | Amounts shown In Thousands with the exception of Outstanding Shares of Beneficial Interest and Net Asset Value, Offering and Redemption Price Per Share. |
| (2) | Class A Shares purchases of $1,000 (000) or more may be subject to a 1.00% Contingent Deferred Sales Charge ("CDSC") if redeemed within 18 months of purchase. |
| (3) | Class C Shares may be subject to a 1.00% CDSC if redeemed within 12 months of purchase. |
| ‡ | Net Assets divided by Shares do not calculate to the stated NAV due to Net Assets and Shares being rounded. |
The accompanying notes are an integral part of the financial statements.
| THE ADVISORS’ INNER CIRCLE FUND III | FS CHIRON CAPITAL ALLOCATION FUND FOR THE YEAR ENDED OCTOBER 31, 2024 |
| CONSOLIDATED STATEMENT OF OPERATIONS ($ Thousands) | | | |
| Investment Income: | | | |
| Dividends | | $ | 6,261 | |
| Interest | | | 8,917 | |
| Less: Foreign Taxes Withheld | | | (24 | ) |
| Total Investment Income | | | 15,154 | |
| Expenses: | | | | |
| Investment Advisory Fees | | | 4,613 | |
| Administration Fees | | | 345 | |
| Distribution Fees (Class A) | | | 4 | |
| Distribution Fees (Class C) | | | 58 | |
| Trustees' Fees | | | 19 | |
| Chief Compliance Officer Fees | | | 7 | |
| Transfer Agent Fees | | | 364 | |
| Professional Fees | | | 80 | |
| Registration and Filing Fees | | | 68 | |
| Printing Fees | | | 56 | |
| Custodian Fees | | | 12 | |
| Pricing Fees | | | 5 | |
| Other Expenses | | | 72 | |
| Total Expenses | | | 5,703 | |
| Net Investment Income | | | 9,451 | |
| Net Realized Gain (Loss) on: | | | | |
| Investments | | | 31,865 | |
| Futures Contracts | | | 6,004 | |
| Swap Contracts | | | (6,637 | ) |
| Foreign Currency Transactions | | | (298 | ) |
| Net Realized Gain | | | 30,934 | |
| Net Change in Unrealized Appreciation (Depreciation) on: | | | | |
| Investments | | | 50,157 | |
| Futures Contracts | | | 1,317 | |
| Swap Contracts | | | (397 | ) |
| Foreign Currency Translation | | | 26 | |
| Net Change in Unrealized Appreciation | | | 51,103 | |
| Net Realized and Unrealized Gain on Investments | | | 82,037 | |
| Net Increase in Net Assets Resulting from Operations | | $ | 91,488 | |
The accompanying notes are an integral part of the financial statements.
| THE ADVISORS’ INNER CIRCLE FUND III | FS CHIRON CAPITAL ALLOCATION FUND |
CONSOLIDATED STATEMENTS OF CHANGES IN NET ASSETS
| | | Year Ended | | | Year Ended | |
| | | October 31, 2024 | | | October 31, 2023# | |
| Operations: | | | | | | |
| Net Investment Income | | $ | 9,451 | | | $ | 17,455 | |
| Net Realized Gain/(Loss) | | | 30,934 | | | | (2,035 | ) |
| Net Change in Unrealized Appreciation/(Depreciation) | | | 51,103 | | | | (9,623 | ) |
| Net Increase in Net Assets Resulting from Operations | | | 91,488 | | | | 5,797 | |
| Distributions: | | | | | | | | |
| Class I Shares | | | (8,713 | ) | | | (17,182 | ) |
| Class A Shares | | | (23 | ) | | | (90 | ) |
| Class C Shares | | | (48 | ) | | | (60 | ) |
| Return of Capital: | | | | | | | | |
| Class I Shares | | | – | | | | (575 | ) |
| Class A Shares | | | – | | | | (4 | ) |
| Class C Shares | | | – | | | | (5 | ) |
| Total Distributions | | | (8,784 | ) | | | (17,916 | ) |
| Capital Share Transactions: | | | | | | | | |
| Class I Shares | | | | | | | | |
| Issued | | | 50,671 | | | | 133,126 | |
| Reinvestment of Dividends | | | 7,143 | | | | 15,794 | |
| Redeemed | | | (314,111 | ) | | | (370,809 | ) |
| Net Decrease in Net Assets from Class I Share Transactions | | | (256,297 | ) | | | (221,889 | ) |
| Class A Shares | | | | | | | | |
| Issued | | | 274 | | | | 313 | |
| Reinvestment of Dividends | | | 17 | | | | 77 | |
| Redeemed | | | (2,883 | ) | | | (1,663 | ) |
| Net Decrease in Net Assets from Class A Share Transactions | | | (2,592 | ) | | | (1,273 | ) |
| Class C Shares | | | | | | | | |
| Issued | | | 750 | | | | 1,198 | |
| Reinvestment of Dividends | | | 47 | | | | 65 | |
| Redeemed | | | (1,572 | ) | | | (2,695 | ) |
| Net Decrease in Net Assets from Class C Share Transactions | | | (775 | ) | | | (1,432 | ) |
| Net Decrease in Net Assets from Capital Share Transactions | | | (259,664 | ) | | | (224,594 | ) |
| Total Decrease in Net Assets | | | (176,960 | ) | | | (236,713 | ) |
| Net Assets: | | | | | | | | |
| Beginning of Year | | | 585,914 | | | | 822,627 | |
| End of Year | | $ | 408,954 | | | $ | 585,914 | |
The accompanying notes are an integral part of the financial statements.
| THE ADVISORS’ INNER CIRCLE FUND III | FS CHIRON CAPITAL ALLOCATION FUND |
CONSOLIDATED STATEMENTS OF CHANGES IN NET ASSETS
| | | Year Ended | | | Year Ended | |
| | | October 31, 2024 | | | October 31, 2023# | |
| Share Transactions: | | | | | | |
| Class I Shares | | | | | | |
| Issued | | | 3,757 | | | | 10,151 | |
| Reinvestment of Distributions | | | 534 | | | | 1,248 | |
| Redeemed | | | (23,603 | ) | | | (28,914 | ) |
| Net Decrease in Shares Outstanding from Share Transactions | | | (19,312 | ) | | | (17,515 | ) |
| Share Transactions: | | | | | | | | |
| Class A Shares | | | | | | | | |
| Issued | | | 20 | | | | 24 | |
| Reinvestment of Distributions | | | 1 | | | | 6 | |
| Redeemed | | | (227 | ) | | | (132 | ) |
| Net Decrease in Shares Outstanding from Share Transactions | | | (206 | ) | | | (102 | ) |
| Share Transactions: | | | | | | | | |
| Class C Shares | | | | | | | | |
| Issued | | | 55 | | | | 92 | |
| Reinvestment of Distributions | | | 3 | | | | 5 | |
| Redeemed | | | (118 | ) | | | (209 | ) |
| Net Decrease in Shares Outstanding from Share Transactions | | | (60 | ) | | | (112 | ) |
Amounts designated as "-" are $0 or have been rounded to $0.
The accompanying notes are an integral part of the financial statements.
| THE ADVISORS’ INNER CIRCLE FUND III | FS CHIRON CAPITAL ALLOCATION FUND |
CONSOLIDATED FINANCIAL HIGHLIGHTS
Selected Per Share Data & Ratios
For a Share Outstanding Throughout Each Year
Class I Shares
| | | Year Ended October 31, 2024 | | | Year Ended October 31, 2023# | | | Year Ended October 31, 2022# | | | Year Ended October 31, 2021# | | | Year Ended October 31, 2020# | |
| Net Asset Value, Beginning of Year | | $ | 12.10 | | | $ | 12.44 | | | $ | 16.56 | | | $ | 12.36 | | | $ | 11.63 | |
| Income from Investment Operations: | | | | | | | | | | | | | | | | | | | | |
| Net Investment Income** | | | 0.26 | | | | 0.30 | | | | 0.25 | | | | (0.00)^^ | | | | 0.13 | |
| Net Realized and Unrealized Gain (Loss) | | | 2.08 | | | | (0.33 | ) | | | (3.62 | ) | | | 4.22 | | | | 0.68 | ‡‡ |
| Total from Investment Operations | | | 2.34 | | | | (0.03 | ) | | | (3.37 | ) | | | 4.22 | | | | 0.81 | |
| | | | | | | | | | | | | | | | | | | | | |
| Dividends and Distributions: | | | | | | | | | | | | | | | | | | | | |
| Net Investment Income | | | (0.25 | ) | | | (0.30 | ) | | | (0.20 | ) | | | (0.02 | ) | | | (0.08 | ) |
| Return of Capital | | | – | | | | (0.01 | ) | | | – | | | | – | | | | – | |
| Capital Gains | | | – | | | | – | | | | (0.55 | ) | | | – | | | | – | |
| | | | | | | | | | | | | | | | | | | | | |
| Total Dividends and Distributions | | | (0.25 | ) | | | (0.31 | ) | | | (0.75 | ) | | | (0.02 | ) | | | (0.08 | ) |
| Net Asset Value, End of Year | | $ | 14.19 | | | $ | 12.10 | | | $ | 12.44 | | | $ | 16.56 | | | $ | 12.36 | |
| Total Return‡ | | | 19.45 | % | | | (0.29 | )% | | | (21.23 | )% | | | 34.14 | % | | | 7.10 | % |
| | | | | | | | | | | | | | | | | | | | | |
| Ratios and Supplemental Data | | | | | | | | | | | | | | | | | | | | |
| Net Assets, End of Year (Thousands) | | $ | 401,717 | | | $ | 576,522 | | | $ | 810,364 | | | $ | 1,248,242 | | | $ | 539,694 | |
| Ratio of Expenses to Average Net Assets | | | 1.16 | % | | | 1.18 | % | | | 1.17 | % | | | 1.15 | % | | | 1.13 | % |
| Ratio of Expenses to Average Net Assets (Excluding Waivers) | | | 1.16 | % | | | 1.18 | % | | | 1.17 | % | | | 1.15 | % | | | 1.13 | % |
| Ratio of Net Investment Income (Loss) to Average Net Assets | | | 1.96 | % | | | 2.29 | % | | | 1.79 | % | | | (0.01 | )% | | | 1.18 | % |
| Portfolio Turnover Rate | | | 171 | % | | | 380 | % | | | 489 | % | | | 311 | % | | | 202 | % |
| ** | Per share data calculated using average shares method. |
| ^^ | Value is less than $(0.01) per share. |
| ‡ | Returns shown do not reflect the deductions of taxes that a shareholder would pay on Fund distributions or the redemption of Fund Shares, assumes reinvestments of dividends, and does not reflect the applicable sales charges, if applicable. |
| ‡‡ | The amount shown for the year ended October 31, 2020, for a share outstanding throughout the period does not accord with the aggregate net gains on investments for that period because of the sales and repurchase of Fund shares in relation to fluctuating market value of the investments of the Fund. |
The accompanying notes are an integral part of the financial statements.
| THE ADVISORS’ INNER CIRCLE FUND III | FS CHIRON CAPITAL ALLOCATION FUND |
Selected Per Share Data & Ratios
For a Share Outstanding Throughout Each Year/Period
Class A Shares
| | | Year Ended October 31, 2024 | | | Year Ended October 31, 2023# | | | Year Ended October 31, 2022# | | | Period Ended October 31, 2021#* | |
| Net Asset Value, Beginning of Year/Period | | $ | 12.10 | | | $ | 12.42 | | | $ | 16.56 | | | $ | 16.47 | |
| Income from Investment Operations: | | | | | | | | | | | | | | | | |
| Net Investment Income (Loss)** | | | 0.22 | | | | 0.27 | | | | 0.18 | | | | (0.04 | ) |
| Net Realized and Unrealized Gain (Loss) | | | 2.08 | | | | (0.33 | ) | | | (3.59 | ) | | | 0.13 | |
| Total from Investment Operations | | | 2.30 | | | | (0.06 | ) | | | (3.41 | ) | | | 0.09 | |
| | | | | | | | | | | | | | | | | |
| Dividends and Distributions: | | | | | | | | | | | | | | | | |
| Net Investment Income | | | (0.21 | ) | | | (0.26 | ) | | | (0.18 | ) | | | – | |
| Return of Capital | | | – | | | | (0.00)^ | | | | – | | | | – | |
| Capital Gains | | | – | | | | – | | | | (0.55 | ) | | | – | |
| | | | | | | | | | | | | | | | | |
| Total Dividends and Distributions | | | (0.21 | ) | | | (0.26 | ) | | | (0.73 | ) | | | – | |
| Net Asset Value, End of Year/Period | | $ | 14.19 | | | $ | 12.10 | | | $ | 12.42 | | | $ | 16.56 | |
| Total Return‡ | | | 19.14 | % | | | (0.51 | )% | | | (21.46 | )% | | | 0.55 | %† |
| | | | | | | | | | | | | | | | | |
| Ratios and Supplemental Data | | | | | | | | | | | | | | | | |
| Net Assets, End of Year/Period (Thousands) | | $ | 1,399 | | | $ | 3,684 | | | $ | 5,039 | | | $ | 2,721 | |
| Ratio of Expenses to Average Net Assets | | | 1.41 | % | | | 1.43 | % | | | 1.43 | % | | | 1.55 | %†† |
| Ratio of Expenses to Average Net Assets (Excluding Waivers) | | | 1.41 | % | | | 1.43 | % | | | 1.43 | % | | | 1.55 | %†† |
| Ratio of Net Investment Income (Loss) to Average Net Assets | | | 1.61 | % | | | 2.05 | % | | | 1.26 | % | | | (0.83 | )%†† |
| Portfolio Turnover Rate | | | 171 | % | | | 380 | % | | | 489 | % | | | 311 | %† |
| * | Commenced operations on July 16, 2021. |
| ** | Per share data calculated using average shares method. |
| ^ | Value is less than $(0.01) per share. |
| ‡ | Returns shown do not reflect the deductions of taxes that a shareholder would pay on Fund distributions or the redemption of Fund Shares, assumes reinvestments of dividends, and does not reflect the applicable sales charges, if applicable. |
| † | Total Return and Portfolio Turnover Rate are for the period indicated and have not been annualized. |
The accompanying notes are an integral part of the financial statements.
| THE ADVISORS’ INNER CIRCLE FUND III | FS CHIRON CAPITAL ALLOCATION FUND |
Selected Per Share Data & Ratios
For a Share Outstanding Throughout Each Year/Period
Class C Shares
| | | Year Ended October 31, 2024 | | | Year Ended October 31, 2023# | | | Year Ended October 31, 2022# | | | Period Ended October 31, 2021#* | |
| Net Asset Value, Beginning of Year/Period | | $ | 12.06 | | | $ | 12.34 | | | $ | 16.52 | | | $ | 16.47 | |
| Income from Investment Operations: | | | | | | | | | | | | | | | | |
| Net Investment Income (Loss)** | | | 0.12 | | | | 0.17 | | | | 0.05 | | | | (0.06 | ) |
| Net Realized and Unrealized Gain (Loss) | | | 2.07 | | | | (0.32 | ) | | | (3.56 | ) | | | 0.11 | |
| Total from Investment Operations | | | 2.19 | | | | (0.15 | ) | | | (3.51 | ) | | | 0.05 | |
| | | | | | | | | | | | | | | | | |
| Dividends and Distributions: | | | | | | | | | | | | | | | | |
| Net Investment Income | | | (0.11 | ) | | | (0.13 | ) | | | (0.12 | ) | | | – | |
| Return of Capital | | | – | | | | (0.00 | )^ | | | – | | | | – | |
| Capital Gains | | | – | | | | – | | | | (0.55 | ) | | | – | |
| | | | | | | | | | | | | | | | | |
| Total Dividends and Distributions | | | (0.11 | ) | | | (0.13 | ) | | | (0.67 | ) | | | – | |
| Net Asset Value, End of Year/Period | | $ | 14.14 | | | $ | 12.06 | | | $ | 12.34 | | | $ | 16.52 | |
| Total Return‡ | | | 18.24 | % | | | (1.24 | )% | | | (22.05 | )% | | | 0.30 | %† |
| | | | | | | | | | | | | | | | | |
| Ratios and Supplemental Data | | | | | | | | | | | | | | | | |
| Net Assets, End of Year/Period (Thousands) | | $ | 5,838 | | | $ | 5,708 | | | $ | 7,224 | | | $ | 3,340 | |
| Ratio of Expenses to Average Net Assets | | | 2.16 | % | | | 2.18 | % | | | 2.18 | % | | | 2.28 | %†† |
| Ratio of Expenses to Average Net Assets (Excluding Waivers) | | | 2.16 | % | | | 2.18 | % | | | 2.18 | % | | | 2.28 | %†† |
| Ratio of Net Investment Income (Loss) to Average Net Assets | | | 0.90 | % | | | 1.29 | % | | | 0.33 | % | | | (1.28 | )%†† |
| Portfolio Turnover Rate | | | 171 | % | | | 380 | % | | | 489 | % | | | 311 | %† |
| * | Commenced operations on July 16, 2021. |
| ** | Per share data calculated using average shares method. |
| ^ | Value is less than $(0.01) per share. |
| ‡ | Returns shown do not reflect the deductions of taxes that a shareholder would pay on Fund distributions or the redemption of Fund Shares, assumes reinvestments of dividends, and does not reflect the applicable sales charges, if applicable. |
| † | Total Return and Portfolio Turnover Rate are for the period indicated and have not been annualized. |
The accompanying notes are an integral part of the financial statements.
| THE ADVISORS’ INNER CIRCLE FUND III | FS CHIRON CAPITAL ALLOCATION FUND OCTOBER 31, 2024 |
NOTES TO CONSOLIDATED FINANCIAL STATEMENTS
1. Organization:
The Advisors’ Inner Circle Fund III (the “Trust”) is organized as a Delaware statutory trust under a Declaration of Trust dated December 4, 2013. The Trust is registered under the Investment Company Act of 1940, as amended, as an open-end management investment company with 50 funds. The financial statements herein are those of the FS Chiron Capital Allocation Fund (the “Fund”). The investment objective of the FS Chiron Capital Allocation Fund is total return. Total return consists of capital growth and income. The Fund is classified as a diversified investment company. The financial statements of the remaining funds of the Trust are presented separately. The assets of each fund are segregated, and a shareholder’s interest is limited to the fund in which shares are held. The FS Chiron Capital Allocation Fund commenced operations on November 30, 2015.
As of October 31, 2024, the Fund had one wholly-owned subsidiary, Chiron Capital Allocation Fund Ltd. (hereinafter, the “Subsidiary”), which Subsidiary commenced operations on November 20, 2023, and through which Subsidiary the Fund may gain exposure to commodities. The consolidated financial statements include both the Fund’s accounts and the accounts of the Subsidiary. All intercompany balances have been eliminated in consolidation.
2. Significant Accounting Policies:
The accompanying financial statements have been prepared in conformity with U.S. generally accepted accounting principles (“U.S. GAAP”) and are presented in U.S. dollars which is the functional currency of the Fund. The Fund is an investment company and therefore applies the accounting and reporting guidance issued by the U.S. Financial Accounting Standards Board (“FASB”) in Accounting Standards Codification (“ASC”) Topic 946, Financial Services — Investment Companies. The following are significant accounting policies which are consistently followed in the preparation of the financial statements.
Use of Estimates —The preparation of financial statements requires management to make estimates and assumptions that affect the fair value of assets and liabilities and disclosure of contingent assets and liabilities at the date of the financial statements and the reported amounts of increases and decreases in net assets from operations during the reporting period. Actual results could differ from those estimates and such differences could be material.
Security Valuation — Securities listed on a securities exchange, market or automated quotation system for which quotations are readily available (except for securities traded on NASDAQ), including securities traded over the counter, are valued at the last quoted sale price on an exchange or market (foreign or domestic) on which they are traded on valuation date (or at approximately 4:00 pm Eastern Standard Time if a security’s primary exchange is normally open at that time), or, if there is no such reported sale on the valuation date, at the most independent, third- party pricing agents. Such values generally reflect the last reported sales price if the security is actively traded. The third-party pricing agents may also value debt securities at an evaluated bid price by employing methodologies that utilize actual market transactions, broker-supplied valuations, or other methodologies designed to identify the market value for such securities. Such methodologies generally consider such factors as security prices, yields, maturities, call features, ratings and developments relating to specific securities in arriving at valuations. On the first day a new debt security purchase is recorded, if a price is not available on the automated pricing feeds from our primary and secondary pricing vendors nor is it available from an independent broker, the security may be valued at its purchase price. Each day thereafter, the debt security will be valued according to the Trust’s Fair Value Procedures until an independent source can be secured. Debt obligations with remaining maturities of sixty days or less may be valued at their amortized cost, which approximates market value provided that it is determined the amortized cost continues to approximate fair value. Should existing credit, liquidity or interest rate conditions in the relevant markets and issuer specific circumstances suggest that amortized cost does not approximate fair value, then the amortized cost method may not be used. The prices for foreign securities are reported in local currency and converted to U.S. dollars using currency exchange rates.
| THE ADVISORS’ INNER CIRCLE FUND III | FS CHIRON CAPITAL ALLOCATION FUND OCTOBER 31, 2024 |
Securities for which market prices are not “readily available” are valued in accordance with fair value procedures (the "Fair Value Procedures") established by the Adviser and approved by the Trust's Board of Trustees (the “Board”). Pursuant to Rule 2a-5 under the 1940 Act, the Board has designated the Adviser as the "valuation designee" to determine the fair value of securities and other instruments for which no readily available market quotations are available. The Fair Value Procedures are implemented through a Fair Value Committee (the “Committee”) of the Adviser.
Swaps are marked-to-market daily based upon quotations from market makers and the resulting changes in market values, are recorded as an unrealized gain or loss in the Consolidated Statement of Operations.
Futures contracts that are traded on an exchange are valued at their last reported sales price as of the valuation date.
For securities that principally trade on a foreign market or exchange, a significant gap in time can exist between the time of a particular security’s last trade and the time at which the Fund calculate their net asset value. The closing prices of such securities may no longer reflect their market value at the time the Fund calculate their net asset value if an event that could materially affect the value of those securities (a “Significant Event”) has occurred between the time of the security’s last close and the time that the Fund calculates net asset value. A Significant Event may relate to a single issuer or to an entire market sector. If Chiron Investment Management, LLC (the “Adviser”) becomes aware of a Significant Event that has occurred with respect to a security or group of securities after the closing of the exchange or market on which the security or securities principally trade, but before the time at which the Fund calculates its net asset value, it may request that a Committee meeting be called.
| THE ADVISORS’ INNER CIRCLE FUND III | FS CHIRON CAPITAL ALLOCATION FUND OCTOBER 31, 2024 |
If a local market in which the Fund owns securities is closed for one or more days, the Fund shall value all securities held in that corresponding currency based on the fair value prices determined by the Committee.
In accordance with the authoritative guidance on fair value measurements and disclosure under U.S. GAAP, the Fund discloses fair value of its investments in a hierarchy that prioritizes the inputs to valuation techniques used to measure the fair value. The objective of a fair value measurement is to determine the price that would be received to sell an asset or paid to transfer a liability in an orderly transaction between market participants at the measurement date (an exit price). Accordingly, the fair value hierarchy gives the highest priority to quoted prices (unadjusted) in active markets for identical assets or liabilities (Level 1) and the lowest priority to unobservable inputs (Level 3). The three levels of the fair value hierarchy are described below:
| ● | Level 1 — Unadjusted quoted prices in active markets for identical, unrestricted assets or liabilities that the Fund has the ability to access at the measurement date; |
| ● | Level 2 – Other significant observable inputs (includes quoted prices for similar securities, interest rates, prepayment speeds, credit risk, referenced indices, quoted prices in inactive markets, adjusted quoted prices in active markets, adjusted quoted prices on foreign equity securities that were adjusted in accordance with pricing procedures approved by the Board, etc.); and |
| ● | Level 3 — Prices, inputs or exotic modeling techniques which are both significant to the fair value measurement and unobservable (supported by little or no market activity). |
Investments are classified within the level of the lowest significant input considered in determining fair value. Investments classified within Level 3 whose fair value measurement considers several inputs may include Level 1 or Level 2 inputs as components of the overall fair value measurement.
For the year ended October 31, 2024, there have been no significant changes to the Fund’s fair valuation methodology.
Federal Income Taxes — It is the Fund’s intention to continue to qualify as a regulated investment company for Federal income tax purposes by complying with the appropriate provisions of Subchapter M of the Internal Revenue Code of 1986, as amended. Accordingly, no provisions for Federal income taxes have been made in the financial statements.
| THE ADVISORS’ INNER CIRCLE FUND III | FS CHIRON CAPITAL ALLOCATION FUND OCTOBER 31, 2024 |
The Fund evaluates tax positions taken or expected to be taken in the course of preparing the Fund’s tax returns to determine whether it is “more-likely-than-not” (i.e., greater than 50-percent) that each tax position will be sustained upon examination by a taxing authority based on the technical merits of the position. Tax positions deemed to meet the more-likely-than-not threshold are recorded as a tax benefit or expense in the current period. The Fund did not record any tax provision in the current period. However, management’s conclusions regarding tax positions taken may be subject to review and adjustment at a later date based on factors including, but not limited to, examination by tax authorities (i.e., from commencement of operations, as applicable), on-going analysis of and changes to tax laws, regulations and interpretations thereof.
As of and during the year ended October 31, 2024 , the Fund did not have any unrecognized tax benefits or liabilities. The Fund recognizes interest and penalties, if any, related to unrecognized tax benefits as income tax expense in the Consolidated Statement of Operations. During the year ended October 31, 2024 the Fund did not incur any interest or penalties.
Security Transactions and Investment Income — Security transactions are accounted for on trade date. Costs used in determining realized gains and losses on the sale of investment securities are based on the specific identification method. Dividend income is recorded on the ex-dividend date, interest income is recognized on the accrual basis from settlement date and includes the amortization of premiums and the accretion of discount. Discounts and premiums on securities purchased are accreted and amortized using the scientific interest method, which approximates the effective interest method. Certain dividends from foreign securities will be recorded as soon as the Fund is informed of the dividend if such information is obtained subsequent to the ex-dividend date. Realized gains (losses) on paydowns of mortgage-backed and asset-backed securities are recorded as an adjustment to interest income.
Foreign Currency Translation — The books and records of the Fund are maintained in U.S. dollars. Investment securities and other assets and liabilities denominated in a foreign currency are translated into U.S. dollars on the date of valuation. The Fund does not isolate that portion of realized or unrealized gains and losses resulting from changes in the foreign exchange rate from fluctuations arising from changes in the market prices of the securities. These gains and losses are included in net realized and unrealized gains and losses on investments on the Consolidated Statement of Operations. Net realized and unrealized gains and losses on foreign currency transactions represent net foreign exchange gains or losses from foreign currency exchange contracts, disposition of foreign currencies, currency gains or losses realized between trade and settlement dates on securities transactions and the difference between the amount of the investment income and foreign withholding taxes recorded on the Fund’s books and the U.S. dollar equivalent of the amounts actually received or paid.
| THE ADVISORS’ INNER CIRCLE FUND III | FS CHIRON CAPITAL ALLOCATION FUND OCTOBER 31, 2024 |
Forward Foreign Currency Exchange Contracts — The Fund may enter into forward foreign currency exchange contracts to protect the value of securities held and related receivables and payables against changes in future foreign exchange rates. A forward currency contract is an agreement between two parties to buy and sell currency at a set price on a future date. The market value of the contract will fluctuate with changes in currency exchange rates. The contract is marked-to-market daily using the current forward rate and the change in market value is recorded by the Fund as unrealized gain or loss. The Fund recognize realized gains or losses when the contract is closed, equal to the difference between the value of the contract at the time it was opened and the value at the time it was closed. Any realized or unrealized appreciation (depreciation) during the period are presented on the Consolidated Statement of Operations. Risks may arise from unanticipated movements in the value of a foreign currency relative to the U.S. dollar. Risks may also arise upon entering into these contracts from the potential inability of counterparties to meet the terms of their contracts and are generally limited to the amount of unrealized gain on the contracts at the date of default. Refer to the Consolidated Schedule of Investments for details regarding open forward foreign currency contracts as of October 31, 2024.
Futures Contracts — The Fund utilized futures contracts during the period ended October 31, 2024. To the extent consistent with its investment objective and strategies, the Fund may use futures contracts for tactical hedging purposes as well as to enhance the Fund’s returns. Initial margin deposits of cash or securities are made upon entering into futures contracts. Futures are collateralized by cash deposits with Goldman, Sachs & Co. Futures contracts are valued at the settlement price established each day by the board of exchange on which they are traded. The futures contracts are marked-to-market daily and the resulting changes in value are accounted for as unrealized gains and losses. Variation margin payments are paid or received, depending upon whether unrealized gains or losses are incurred. When the futures contract is closed, the Fund records a realized gain or loss equal to the difference between the proceeds from (or cost of) the closing transaction and the amount invested in the futures contract.
Risks of entering into futures contracts include the possibility that there will be an imperfect price correlation between the futures and the underlying securities. Second, it is possible that a lack of liquidity for futures contracts could exist in the secondary market, resulting in an inability to close a position prior to its maturity date. Third, the futures contract involves the risk that a Fund could lose more than the original margin deposit required to initiate a futures transaction.
| THE ADVISORS’ INNER CIRCLE FUND III | FS CHIRON CAPITAL ALLOCATION FUND OCTOBER 31, 2024 |
Finally, the risk exists that losses could exceed amounts disclosed on the Consolidated Statement of Assets and Liabilities.
Swap Contracts — The Fund is authorized to enter into swap contracts, including total return swaps and credit default swaps. To the extent consistent with its investment objective and strategies, the Fund may use swap contracts for tactical hedging purposes as well as to enhance the Fund’s returns. Swaps are a two-party contract in which the seller (buyer) will pay to the buyer (seller) the difference between the current value of a security and its value at the time the contract was entered.
The Fund may use credit default swaps to reduce risk where the Fund have exposure to the issuer, or to take an active long or short position with respect to the likelihood of an event of default. The reference obligation of the swap can be a single issuer, a “basket” of issuers, or an index.
The buyer of a credit default swap is generally obligated to pay the seller a periodic stream of payments over the term of the contract in return for a contingent payment upon the occurrence of a credit event with respect to an underlying reference obligation. Generally, a credit event for corporate or sovereign reference obligations means bankruptcy, failure to pay, obligation acceleration, repudiation/moratorium or restructuring. For credit default swaps on asset- backed securities, a credit event may be triggered by events such as failure to pay principal, maturity extension, rating downgrade or write-down.
If the Fund is a seller of protection, and a credit event occurs, as defined under the terms of that particular swap agreement, the Fund will generally either (i) pay to the buyer an amount equal to the notional amount of the swap and take delivery of the referenced obligation, other deliverable obligations, or underlying securities comprising a referenced index or (ii) pay a net settlement amount in the form of cash or securities equal to the notional amount of the swap less the recovery value of the referenced obligation or underlying securities comprising a referenced index.
If the Fund is a buyer of protection and a credit event occurs, as defined under the terms of that particular swap agreement, the Fund will either (i) receive from the seller of protection an amount equal to the notional amount of the swap and deliver the referenced obligation, other deliverable obligations or underlying securities comprising the referenced index or (ii) receive a net settlement amount in the form of cash or securities equal to the notional amount of the swap less the recovery value of the referenced obligation or underlying securities comprising the referenced index.
Recovery values are assumed by market makers considering either industry standard recovery rates or entity specific factors and considerations until a credit event occurs. If a credit event has occurred, the recovery value is determined by a facilitated auction whereby a minimum number of allowable broker bids, together with a specified valuation method, are used to calculate the settlement value.
| THE ADVISORS’ INNER CIRCLE FUND III | FS CHIRON CAPITAL ALLOCATION FUND OCTOBER 31, 2024 |
Centrally cleared swaps are valued at the settlement price established each day by the board of exchange on which they are traded. The daily settlement prices for centrally cleared swaps are provided by an independent source. Net payments of interest are recorded as realized gains or losses. Upfront premiums are recorded as realized gains or losses on the Consolidated Statement of Operations upon termination or maturity of the swap. A liquidation payment received or made at the termination of the swap is recorded as realized gain or loss on the Consolidated Statement of Operations. Net periodic payments received or paid by a Fund are included as part of realized gains or losses on the Consolidated Statement of Operations. Daily changes in valuation of Centrally Cleared swaps are recorded as a receivable or payable for the change in value as appropriate (“variation margin”) on the Consolidated Statement of Assets and Liabilities.
In a typical equity swap, one party agrees to pay another party the return on a stock, stock index or basket of stocks in return for a specified interest rate. By entering into an equity index swap, for example, the index receiver can gain exposure to stocks making up the index of securities without actually purchasing those stocks. Equity index swaps involve not only the risk associated with investment in the securities represented in the index, but also the risk that the performance of such securities, including dividends, will not exceed the return on the interest rate that the Fund will be committed to pay.
Total return swaps are contracts in which one party agrees to make payments of the total return from a reference instrument—which may be a single asset, a pool of assets or an index of assets—during a specified period, in return for payments equal to a fixed or floating rate of interest or the total return from another underlying reference instrument. The total return includes appreciation or depreciation on the underlying asset, plus any interest or dividend payments. Payments under the swap are based upon an agreed upon principal amount but, since the principal amount is not exchanged, it represents neither an asset nor a liability to either counterparty, and is referred to as notional. Total return swaps are marked-to-market daily using different sources, including quotations from counterparties, pricing services, brokers or market makers. The unrealized appreciation or depreciation related to the change in the valuation of the notional amount of the swap is combined with the amount due to the Fund at termination or settlement. The primary risks associated with total return swaps are credit risks (if the counterparty fails to meet its obligations) and market risk (if there is no liquid market for the swap or unfavorable changes occur to the underlying reference instrument).
| THE ADVISORS’ INNER CIRCLE FUND III | FS CHIRON CAPITAL ALLOCATION FUND OCTOBER 31, 2024 |
Periodic payments made or received are recorded as realized gains or losses. At year end, the Consolidated Statement of Assets and Liabilities reflect, if any, unrealized appreciation or depreciation and accrued periodic payments for swap contracts the Fund may have open at year end. Entering into swap contracts involve, to varying degrees, elements of credit, interest rate and market risk in excess of the amounts recognized on the Consolidated Statement of Assets and Liabilities. Such risks involve the possibility that there will be no liquid market for these contracts, that the counterparty to the contract may default on its obligation to perform and that there may be unfavorable changes in market conditions or fluctuations in interest rates. Swap contracts outstanding at year end, if any, are listed on the Consolidated Schedule of Investments. In connection with swap contracts, cash or securities may be segregated as collateral by the custodian.
There is the risk that the counterparty refuses to continue to enter into swap agreements with the Fund in the future, or requires increased fees, which could impair the Fund’s ability to achieve its investment objective. A counterparty may also increase its collateral requirements, which may limit the Fund’s ability to use leverage and reduce investment returns. In addition, if the Fund cannot locate a counterparty willing to enter into transactions with the Fund, it will not be able to implement its investment strategy.
Options Written/Purchased — The Fund may purchase and write put and call options on indices and enter into related closing transactions. To the extent consistent with its investment objective and strategies, the Fund may use options for tactical hedging purposes as well as to enhance the Fund’s returns. Additionally, the Fund may use options to create long or short equity exposure without investing directly in equity securities. A put option on a security gives the purchaser of the option the right to sell, and the writer of the option the obligation to buy, the underlying security at any time during the option period for American options and only at the expiration date for European options. A call option on a security gives the purchaser of the option the right to buy, and the writer of the option the obligation to sell, the underlying security at any time during the option period for American options and only at the expiration date for European options. The premium paid to the writer is the consideration for undertaking the obligations under the option contract. The market value of an option generally reflects the market price of an underlying security. Other principal factors affecting market value include supply and demand, interest rates, the pricing volatility of the underlying security and the time remaining until the expiration date. Premiums received or paid from writing or purchasing options which expire unexercised are treated by the Fund on the expiration date as realized gains or losses. The difference between the premium and the amount paid or received on effecting a closing purchase or sale transaction, including brokerage commissions, is also treated as a realized gain or loss. If an option is exercised, the premium paid or received is added to the cost of the purchase or proceeds from the sale in determining whether a Fund has realized a gain or a loss. Any realized or unrealized gains (loss) during the period are presented on the Consolidated Statement of Operations. Risks associated with options transactions include: (i) the success of a hedging strategy may depend on an ability to predict movements in the prices of individual securities, fluctuations in markets and movements in interest rates; (ii) there may be an imperfect correlation between the movement in prices of options and the securities underlying them; (iii) there may not be a liquid secondary market for options; and (iv) while a Fund will receive a premium when it writes covered call options, it may not participate fully in a rise in the market value of the underlying security.
| THE ADVISORS’ INNER CIRCLE FUND III | FS CHIRON CAPITAL ALLOCATION FUND OCTOBER 31, 2024 |
Cash — Idle cash may be swept into various time deposit accounts and is classified as cash on the Consolidated Statement of Assets and Liabilities. The Fund maintains cash in bank deposit accounts which, at times, may exceed United States federally insured limits. Amounts invested are available on the same business day.
Expenses — Most expenses of the Trust can be directly attributed to a particular fund. Expenses which cannot be directly attributed to a particular fund are apportioned among the funds of the Trust based on the number of funds and/or relative net assets.
Dividends and Distributions to Shareholders — The Fund distributes substantially all of its net investment income monthly. Any net realized capital gains are distributed annually. All distributions are recorded on ex-dividend date.
3. Derivative Transactions:
The following tables include the Fund’s exposure by type of risk on derivatives held throughout the year.
| THE ADVISORS’ INNER CIRCLE FUND III | FS CHIRON
CAPITAL ALLOCATION FUND
OCTOBER 31, 2024 |
The fair value of derivative instruments as of October 31, 2024, is as follows ($ Thousands):
| Asset Derivatives | | Liability Derivatives |
Consolidated Statement of Assets and
Liabilities
Location | | Fair Value | | | Consolidated Statement of Assets and
Liabilities
Location | | Fair Value | |
| Interest Rate contracts | | Net Assets – Unrealized appreciation on Future Contracts | | $ | - | † | | Interest Rate contracts | | Net Assets – Unrealized depreciation on Future Contracts | | $ | 1,321 | † |
| Commodity contracts | | Net Assets – Unrealized appreciation on Future Contracts | | | 2,033 | † | | Commodity contracts | | Net Assets – Unrealized depreciation on Future Contracts | | | - | † |
| Total | | | | $ | 2,033 | | | | | | | $ | 1,321 | |
| † | Includes cumulative appreciation (depreciation) of futures contracts as reported in the Consolidated Schedule of Investments. |
The effect of derivative instruments on the Consolidated Statement of Operations for the year ended October 31, 2024, were as follows:
The amount of realized gain(loss) on derivatives recognized in income ($ Thousands):
| | | Futures
Contracts | | | Forward
Foreign
Currency
Contracts | | | Swap
Contracts | | | Purchased
Options | | | Written
Options | | | Total | |
| Interest Rates | | $ | 769 | | | $ | – | | | $ | 2,050 | | | $ | – | | | $ | – | | | $ | 2,819 | |
| Foreign exchange contracts | | | (741 | ) | | | – | | | | – | | | | – | | | | – | | | | (741 | ) |
| Credit contracts | | | – | | | | – | | | | (2,267 | ) | | | – | | | | – | | | | (2,267 | ) |
| Equity contracts | | | (574 | ) | | | – | | | | (6,420 | ) | | | – | | | | – | | | | (6,994 | ) |
| Commodity contracts | | | 6,550 | | | | – | | | | – | | | | – | | | | – | | | | 6,550 | |
| Total | | $ | 6,004 | | | $ | – | | | $ | (6,637 | ) | | $ | – | | | $ | – | | | $ | (633 | ) |
Change in unrealized appreciation(depreciation) on derivatives recognized in income($ Thousands):
| | | Futures
Contracts | | | Forward
Foreign
Currency
Contracts | | | Swap
Contracts | | | Purchased
Options | | | Written
Options | | | Total | |
| Interest Rates | | $ | (732 | ) | | $ | – | | | $ | – | | | $ | – | | | $ | – | | | $ | (732 | ) |
| Credit contracts | | | – | | | | – | | | | 388 | | | | – | | | | – | | | | 388 | |
| Equity contracts | | | – | | | | – | | | | (785 | ) | | | – | | | | – | | | | (785 | ) |
| Commodity contracts | | | 2,049 | | | | – | | | | – | | | | – | | | | – | | | | 2,049 | |
| Total | | $ | 1,317 | | | $ | – | | | $ | (397 | ) | | $ | – | | | $ | – | | | $ | 920 | |
The following discloses the volume of the Fund’s futures contracts and swap contracts activity during the year ended October 31, 2024.
In the Fund, for the year ended October 31, 2024, the average market value amount of futures contracts was as follows ($ Thousands):
| THE ADVISORS’ INNER CIRCLE FUND III | FS CHIRON
CAPITAL ALLOCATION FUND
OCTOBER 31, 2024 |
| Average Quarterly Market Value Balance Long | | $ | 95,021 | |
| Average Quarterly Market Value Balance Short | | $ | - | |
For the year ended October 31, 2024, the average market value amount of Total Return swap contracts held by the Fund were as follows ($ Thousands):
| Average Quarterly Market Value Balance Long | | $ | 8,297 | |
| Average Quarterly Market Value Balance Short | | $ | (643 | ) |
4. Offsetting Assets and Liabilities:
The Fund is subject to various netting arrangements with select counterparties (“Master Agreements”). Master Agreements govern the terms of certain transactions, and reduce the counterparty risk associated with relevant transactions by specifying credit protection mechanisms and providing standardization that improves legal certainty.
Since different types of transactions have different mechanics and are sometimes traded out of different legal entities of a particular counterparty organization, each type of transaction may be covered by a different Master Agreement, resulting in the need for multiple agreements with a single counterparty. As the Master Agreements are specific to unique operations of different asset types, they allow a Fund to close out and net its total exposure to a specific counterparty entity in the event of a default with respect to all the transactions governed under a single agreement with a specific counterparty entity.
Master Agreements can also help limit counterparty risk by specifying collateral posting arrangements at pre-arranged exposure levels. Under the Master Agreements, collateral is routinely transferred if the total net exposure to certain transactions (net of existing collateral already in place) governed under the relevant Master Agreement with a counterparty in a given account exceeds a specified threshold, which typically ranges from zero to $250,000 depending on the counterparty and the type of Master Agreement. United States Treasury Securities and U.S. dollar cash are generally the preferred forms of collateral. Securities and cash pledged as collateral are reflected as assets on the Consolidated Statement of Assets and Liabilities as either a component of investments at value (securities) or cash pledged as collateral for futures contracts and swap contracts (cash). The market value of any securities received as collateral is not reflected as a component of net asset value. A Fund’s overall exposure to counterparty risk can change substantially within a short period, as it is affected by each transaction subject to the relevant Master Agreement.
International Swaps and Derivatives Association, Inc. Master Agreements and Credit Support Annexes (“ISDA Master Agreements”) govern OTC financial derivative transactions entered into by a Fund and select counterparties. ISDA Master Agreements maintain provisions for general obligations, representations, agreements, collateral and events of default or termination. Events of termination include conditions that may entitle counterparties to elect to terminate early and cause settlement of all outstanding transactions under the applicable ISDA Master Agreement. Any election to terminate early could be material to the financial statements. In limited circumstances, the ISDA Master Agreement may contain additional provisions that add additional counterparty protection beyond coverage of existing daily exposure if the counterparty has a decline in credit quality below a predefined level. These amounts, if any, may be segregated with a third party custodian.
| THE ADVISORS’ INNER CIRCLE FUND III | FS CHIRON
CAPITAL ALLOCATION FUND
OCTOBER 31, 2024 |
5. Transactions with Affiliates:
Certain officers of the Trust are also employees of SEI Investments Global Funds Services (the “Administrator”), a wholly owned subsidiary of SEI Investments Company, and/ or SEI Investments Distribution Co. (the “Distributor”). Such officers are paid no fees by the Trust, other than the Chief Compliance Officer (“CCO”) as described below, for serving as officers of the Trust.
The services provided by the CCO and his staff are paid for by the Trust as incurred. The services include regulatory oversight of the Trust’s Advisors and service providers as required by SEC regulations. The CCO’s services and fees have been approved by and are reviewed by the Board.
6. Administration, Distribution, Custodian and Transfer Agent Agreements:
The Fund and the Administrator are parties to an Administration Agreement, under which the Administrator provides management and administrative services to the Fund. For these services, the Administrator is paid an asset-based fee, subject to certain minimums, which will vary depending on the number of share classes and the average daily net assets of the Fund. For the period ended October 31, 2024, the Fund paid $345,368, for these services.
The Trust has adopted a Distribution Plan with respect to Class A and Class C Shares (the “Plan”) in accordance with the provisions of Rule 12b-1 under the 1940 Act, which regulates circumstances under which an investment company may directly or indirectly bear expenses relating to the distribution of its shares. Under the Plan, the Distributor or financial intermediaries may receive up to 0.25% of the average daily net assets of the A Shares and up to 1.00% of the average daily net assets of the C Shares as compensation for distribution and shareholder services. For the year ended October 31, 2024, the Fund incurred the following for these services ($ Thousands):
| | | Distribution Fees | |
| Class I | | $ | - | |
| Class A | | | 4 | |
| Class C | | | 58 | |
Brown Brothers Harriman & Co. acts as custodian (the “Custodian”) for the Fund. The Custodian plays no role in determining the investment policies of the Fund or which securities are to be purchased or sold by the Fund.
SS&C Global Investor & Distribution Solutions, Inc. serves as transfer agent for the Fund under the transfer agency agreement with the Trust.
| THE ADVISORS’ INNER CIRCLE FUND III | FS CHIRON
CAPITAL ALLOCATION FUND
OCTOBER 31, 2024 |
7. Investment Advisory Agreement:
Under the terms of an investment advisory agreement, the Adviser provides investment advisory services to the Fund. The Adviser is entitled to a fee, which is calculated daily and paid monthly, at the following annual rates based on average daily net assets of the Fund:
The Fund has no contractual expense limitation.
8. Investment Transactions:
The cost of security purchases and the proceeds from security sales, other than short-term investments, for the year ended October 31, 2024, were as follows ($ Thousands):
| Purchases | | | |
| U.S. Government | | $ | – | |
| Other | | | 635,596,904 | |
| Sales | | | | |
| U.S. Government | | $ | – | |
| Other | | | 793,466,170 | |
9. Federal Tax Information:
The amount and character of income and capital gain distributions to be paid, if any, are determined in accordance with Federal income tax regulations, which may differ from U.S. GAAP. As a result, net investment income (loss) and net realized gain (loss) on investment transactions for a reporting period may differ significantly from distributions during such period. These book/tax differences may be temporary or permanent. To the extent these differences are permanent in nature, they are charged or credited to undistributed net investment income (loss), accumulated net realized gain (loss) or paid-in capital, as appropriate, in the period that the differences arise. The permanent differences are primarily related to swaps, partnerships, REITs, paydowns, foreign currency and passive foreign investment companies.
Accordingly, as of October 31, 2024, the following reclassifications (primarily attributable to swaps and partnership investments) were made to/from the following accounts ($ Thousands):
| Distributable Loss | | | Paid-in Capital | |
| $ | (229 | ) | | $ | 229 | |
These reclassifications had no impact on net assets or Net Asset Value per share.
| THE ADVISORS’ INNER CIRCLE FUND III | FS CHIRON
CAPITAL ALLOCATION FUND
OCTOBER 31, 2024 |
The tax character of dividends and distributions declared during the last two fiscal years were as follows ($ Thousands):
| | | | Ordinary Income | | | Return of Capital | | | Total | |
| 2024 | | | $ | 8,784 | | | $ | — | | | $ | 8,784 | |
| 2023 | | | | 17,332 | | | | 584 | | | | 17,916 | |
As of October 31, 2024, the components of distributable earnings (accumulated losses) on a tax basis were as follows ($ Thousands):
| Undistributed Ordinary Income | | $ | 8,689 | |
| Capital Loss Carryforwards | | | (196,005 | ) |
| Other Temporary Differences | | | (1 | ) |
| Unrealized Appreciation (Depreciation) | | | 42,180 | |
| Total Distributable Earnings (Accumulated Losses) | | $ | (145,137 | ) |
For Federal income tax purposes, capital loss carryforwards may be carried forward and applied against future capital gains. The losses carried forward retain their original character as either long-term or short-term losses. During the year ending October 31, 2024, the Fund utilized $22,211 ($ Thousands) of prior year capital loss carryforwards to offset capital gains.
The Fund has capital losses carried forward as follows ($ Thousands):
Short-Term
Loss | | | Long-Term
Loss | | | Total | |
| $ | 196,005 | | | $ | – | | | $ | 196,005 | |
For Federal income tax purposes the difference between Federal tax cost and book cost primarily relates to losses from wash sales and investments in partnerships.
The Federal tax cost and aggregate gross unrealized appreciation and depreciation for the investments held by the Fund at October 31, 2024, were as follows ($ Thousands):
| Federal Tax Cost | | | Aggregate Gross
Unrealized Appreciation | | | Aggregate Gross
Unrealized Depreciation | | | Net Unrealized
Appreciation | |
| $ | 321,223 | | | $ | 43,937 | | | $ | (1,757 | ) | | $ | 42,180 | |
10. Concentration of Risks:
As with all management investment companies, a shareholder of the Fund is subject to the risk that his or her investment could lose money. The Fund is subject to the principal risks noted below, any of which may adversely affect the Fund’s net asset value (“NAV”) and ability of a Fund to meet that Fund’s investment objective.
Market Risk — The risk that the market value of an investment may move up and down, sometimes rapidly and unpredictably. Markets for securities in which the Fund invests may decline significantly in response to adverse issuer, political, regulatory, market, economic or other developments that may cause broad changes in market value, public perceptions concerning these developments, and adverse investor sentiment or publicity. Similarly, the impact of any epidemic, pandemic or natural disaster, or widespread fear that such events may occur, could negatively affect the global economy, as well as the economies of individual countries, the financial performance of individual companies and sectors, and the markets in general in significant and unforeseen ways. Any such impact could adversely affect the prices and liquidity of the securities and other instruments in which the Fund invests, which in turn could negatively impact the Fund’s performance and cause losses on your investment in the Fund.
| THE ADVISORS’ INNER CIRCLE FUND III | FS CHIRON
CAPITAL ALLOCATION FUND
OCTOBER 31, 2024 |
Management Risk — The value of the Fund may decline if the Adviser’s judgments about the attractiveness, relative value or potential appreciation of a particular security or strategy prove to be incorrect.
Liquidity Risk — The risk that certain securities may be difficult or impossible to sell at the time and the price that the Fund would like. The Fund may have to accept a lower price to sell a security, sell other securities to raise cash, or give up an investment opportunity, any of which could have a negative effect on Fund management or performance.
Equity Risk — Since it purchases equity securities, the Fund is subject to the risk that stock prices may fall over short or extended periods of time. Historically, the equity market has moved in cycles, and the value of the Fund’s securities may fluctuate from day to day. Individual companies may report poor results or be negatively affected by industry and/or economic trends and developments. The prices of securities issued by such companies may suffer a decline in response. These factors contribute to price volatility, which is a principal risk of investing in the Fund.
Growth Style Risk — A growth investment style may increase the risks of investing in the Fund. If a growth company does not meet these expectations, the price of its stock may decline significantly, even if it has increased earnings. Many growth companies do not pay dividends. Companies that do not pay dividends often have greater stock price declines during market downturns. Over time, a growth investing style may go in and out of favor, and when out of favor, may cause the Fund to underperform other funds that use differing investing styles.
Value Style Risk — A value investment style may increase the risks of investing in the Fund. If the Adviser’s assessment of market conditions, or a company’s value or prospects for exceeding earnings expectations is wrong, the Fund could suffer losses or produce poor performance relative to other funds. In addition, “value stocks” can continue to be undervalued by the market for long periods of time.
Small and Medium Capitalization Company Risk — The small and medium capitalization companies that the Fund invests in may be more vulnerable to adverse business or economic events than larger, more established companies. In particular, investments in small and medium capitalization companies may pose additional risks, including liquidity risk, because these companies tend to have limited product lines, markets and financial resources, and may depend upon a relatively small management group. Therefore, small and medium capitalization stocks may be more volatile than those of larger companies. These securities may be traded over-the-counter or listed on an exchange.
| THE ADVISORS’ INNER CIRCLE FUND III | FS CHIRON
CAPITAL ALLOCATION FUND
OCTOBER 31, 2024 |
Portfolio Turnover Risk — The Fund is subject to portfolio turnover risk since it may buy and sell investments frequently. Such a strategy often involves higher expenses, including brokerage commissions, and may result in an increase in the amount of distributions from the Fund taxed as ordinary income, which may limit the tax efficiency of the Fund.
Foreign Investment/Emerging Markets Risk — The risk that non-U.S. securities may be subject to additional risks due to, among other things, political, social and economic developments abroad, currency movements and different legal, regulatory and tax environments. These additional risks may be heightened with respect to emerging market countries since political turmoil and rapid changes in economic conditions are more likely to occur in these countries. In addition, periodic U.S. Government restrictions on investments in issuers from certain foreign countries may require the Fund to sell such investments at inopportune times, which could result in losses to the Fund.
Initial Public Offerings Risks — The Fund may invest a portion of its assets in securities of companies offering shares in IPOs. The price of IPO shares may be volatile and may decline shortly after the IPO. IPOs may not be consistently available to the Fund for investing, and IPO shares may underperform relative to the shares of more established companies. Because IPO shares frequently are volatile in price, the Fund may hold IPO shares for a very short period of time. This may increase the turnover of the Fund’s portfolio and may lead to portfolio turnover risk, which is discussed elsewhere in this section. In addition, the market for IPO shares can be speculative and/or inactive for extended periods of time. The limited number of shares available for trading in some IPOs may make it more difficult for the Fund to buy or sell significant amounts of shares without an unfavorable impact on prevailing prices. Holders of IPO shares can be affected by substantial dilution in the value of their shares, by sales of additional shares and by concentration of control in existing management and principal shareholders.
Currency Risk — As a result of the Fund’s investments in securities denominated in, and/or receiving revenues in, foreign currencies, the Fund will be subject to currency risk. Currency risk is the risk that foreign currencies will decline in value relative to the U.S. dollar or, in the case of hedging positions, that the U.S. dollar will decline in value relative to the currency hedged. In either event, the dollar value of an investment in the Fund would be adversely affected.
Fixed Income Risk — The prices of the Fund’s fixed income securities respond to economic developments, particularly interest rate changes, as well as to perceptions about the creditworthiness of individual issuers, including governments and their agencies. In the case of foreign securities, price fluctuations will reflect international economic and political events, as well as changes in currency valuations relative to the U.S. dollar.
| THE ADVISORS’ INNER CIRCLE FUND III | FS CHIRON
CAPITAL ALLOCATION FUND
OCTOBER 31, 2024 |
Interest Rate Risk — The risk that the value of fixed income securities, including U.S. government securities, will fall due to rising interest rates.
Credit Risk — The risk that the issuer of a security or the counterparty to a contract will default or otherwise become unable to honor a financial obligation.
Extension Risk — The risk that rising interest rates may extend the duration of a fixed income security, typically reducing the security’s value.
High Yield Securities Risk — Fixed income securities rated below investment grade (junk bonds) involve greater risks of default or downgrade and are more volatile than investment grade securities because the prospect for repayment of principal and interest of many of these securities is speculative.
Distressed Securities Risk — Distressed securities are speculative and involve substantial risks in addition to the risks of investing in junk bonds. The Fund will generally not receive interest payments on the distressed securities and may incur costs to protect its investment. In addition, distressed securities involve the substantial risk that principal will not be repaid. These securities may present a substantial risk of default or may be in default at the time of investment. The Fund may incur additional expenses to the extent it is required to seek recovery upon a default in the payment of principal of or interest on its portfolio holdings. In any reorganization or liquidation proceeding relating to a company in the Fund’s portfolio, the Fund may lose its entire investment or may be required to accept cash or securities with a value less than its original investment. Distressed securities and any securities received in an exchange for such securities may be subject to restrictions on resale.
Foreign Sovereign Debt Securities Risk — The risks that: (i) the governmental entity that controls the repayment of sovereign debt may not be willing or able to repay the principal and/or interest when it becomes due, due to factors such as debt service burden, political constraints, cash flow problems and other national economic factors; (ii) governments may default on their debt securities, which may require holders of such securities to participate in debt rescheduling or additional lending to defaulting governments; and (iii) there is no bankruptcy proceeding by which defaulted sovereign debt may be collected in whole or in part.
American Depositary Receipt Risk — ADRs are certificates evidencing ownership of shares of a foreign issuer that are issued by American depositary banks and generally trade on an established U.S. market. ADRs are subject to many of the risks associated with investing directly in foreign securities, including, among other things, political, social and economic developments abroad, currency movements and different legal, regulatory and tax environments.
Exchange Traded Funds Risk — When the Fund invests in an ETF, in addition to directly bearing the expenses associated with its own operations, it will bear a pro rata portion of the ETF’s expenses. Further, while the risks of owning shares of an ETF generally reflect the risks of owning the underlying investments of the ETF, the Fund may be subject to additional or different risks than if the Fund had invested directly in the underlying investments. For example, the lack of liquidity in an ETF could result in its value being more volatile than that of the underlying portfolio securities. An ETF also may trade at a premium or discount to its NAV, and the difference between an ETF’s trading price and its NAV may be magnified during market disruptions.
| THE ADVISORS’ INNER CIRCLE FUND III | FS CHIRON
CAPITAL ALLOCATION FUND
OCTOBER 31, 2024 |
Asset-Backed Securities Risk — Payment of principal and interest on asset-backed securities is dependent largely on the cash flows generated by the assets backing the securities, and asset-backed securities may not have the benefit of any security interest in the related assets.
Mortgage-Backed Securities Risk — Mortgage-backed securities are affected by, among other things, interest rate changes and the possibility of prepayment of the underlying mortgage loans. Mortgage-backed securities are also subject to the risk that underlying borrowers will be unable to meet their obligations. TBA Transactions involve the additional risk that the value of the mortgage-backed securities to be purchased declines prior to settlement date or the counterparty does not deliver the securities as promised.
Inflation Protected Securities Risk — Inflation protected securities are fixed income securities for which the principal and/or interest income paid is linked to inflation rates. They may be issued by the U.S. Treasury or foreign governments and U.S. and foreign corporations. The relationship between an inflation protected security and its associated inflation index affects both the sum the Fund is paid when the security matures and the amount of interest that the security pays the Fund. With inflation (a rise in the index), the principal of the security increases. With deflation (a drop in the index), the principal of the security decreases. Inflation protected securities pay interest at a fixed rate. Because the rate is applied to the adjusted principal, however, interest payments can vary in amount from one period to the next. If inflation occurs, the interest payment increases. In the event of deflation, the interest payment decreases. At the maturity of a security, the Fund receives the adjusted principal or the original principal, whichever is greater.
U.S. Government Securities Risk — The Fund’s investment in U.S. government obligations may include securities issued or guaranteed as to principal and interest by the U.S. government, or its agencies or instrumentalities. Obligations issued by some U.S. government agencies are backed by the U.S. Treasury, while others are backed solely by the ability of the agency to borrow from the U.S. Treasury or by the agency’s own resources. There can be no assurance that the U.S. government would provide financial support to its agencies or instrumentalities (including government-sponsored enterprises) where it is not obligated to do so. In addition, U.S. government securities are not guaranteed against price movements due to changing interest rates.
| THE ADVISORS’ INNER CIRCLE FUND III | FS CHIRON
CAPITAL ALLOCATION FUND
OCTOBER 31, 2024 |
Convertible and Preferred Securities Risk — Convertible and preferred securities have many of the same characteristics as stocks, including many of the same risks. In addition, convertible securities may be more sensitive to changes in interest rates than stocks. Convertible securities may also have credit ratings below investment grade (junk bonds), meaning that they carry a higher risk of failure by the issuer to pay principal and/or interest when due.
Contingent convertible bonds are typically issued by non-U.S. banks and may be convertible into equity or may be written down if pre-determined triggering events occur, such as a decline in capital thresholds below a specified level occurs. Contingent convertible bonds typically are subordinated to other debt instruments of the issuer and generally rank junior to the claims of all holders of unsubordinated obligations of the issuer. Coupon payments on contingent convertible securities may be discretionary and may be cancelled by the issuer. Contingent convertible bonds are a new form of instrument, and the market and regulatory environment for contingent convertible bonds is evolving. Therefore, it is uncertain how the overall market for contingent convertible bonds would react to a triggering event or coupon suspension applicable to one issuer. The Fund may lose money on its investment in a contingent convertible bond when holders of the issuer’s equity securities do not.
Derivatives Risk — The Fund’s use of futures contracts, forward contracts, options, structured notes and swaps is subject to correlation risk, leverage risk, liquidity risk and market risk. Correlation risk is the risk that changes in the value of the derivative may not correlate perfectly with the underlying asset, rate or index. Leverage risk, liquidity risk and market risk are described elsewhere in this section. The Fund’s use of forward contracts, structured notes and swaps is also subject to credit risk and valuation risk. Credit risk is described elsewhere in this section. Valuation risk is the risk that the derivative may be difficult to value and/or valued incorrectly. Moreover, certain derivative instruments can magnify the extent of losses incurred due to changes in the market value of the securities to which they relate. Some derivatives have the potential for unlimited loss, regardless of the size of the Fund’s initial investment.
Short Exposure Risk — The Fund may enter into a derivatives transaction to obtain short investment exposure to the reference asset. If the value of the reference asset on which the Fund has obtained a short investment exposure increases, the Fund will incur a loss. This potential loss is theoretically unlimited. Gaining short investment exposure through derivatives also subjects the Fund to credit risk, derivatives risk and leverage risk, which are discussed elsewhere in this section.
Precious Metals-Based Companies Risk — Investments by the Fund in precious metals-based companies, and in asset-based securities indexed to the value of such metals, may expose the Fund to adverse macroeconomic conditions, such as a rise in interest rates or a downturn in the economy in which the precious metals are located, elevating the risk of loss. Such securities may be purchased when they are believed by the Adviser to be attractively priced in relation to the value of a company’s precious metals-based assets or when the values of precious metals are expected to benefit from inflationary pressure or other economic, political or financial uncertainty or instability. During periods of economic or financial instability the securities of companies involved in precious metals may be subject to extreme price fluctuations, reflecting the high volatility of precious metal prices during such periods. In addition, the instability of precious metal prices may result in volatile earnings of precious metals-based companies, which may, in turn, adversely affect the financial condition of such companies. Investments in companies in natural resources industries such as the precious metals industries can be significantly affected by (often rapid) changes in the supply of, or demand for, various natural resources. They may also be affected by changes in energy prices, international political and economic developments, environmental incidents, energy conservation, the success of exploration projects, changes in commodity prices, and tax and other government regulations.
| THE ADVISORS’ INNER CIRCLE FUND III | FS CHIRON
CAPITAL ALLOCATION FUND
OCTOBER 31, 2024 |
REITs Risk — REITs are trusts that invest primarily in commercial real estate or real estate-related loans. The Fund’s investments in REITs are subject to the risks associated with the direct ownership of real estate, which are discussed elsewhere in this section. Some REITs may have limited diversification and may be subject to risks inherent in financing a limited number of properties.
Leverage Risk — The risk that the use of leverage may amplify the effects of market volatility on the Fund’s share price and may also cause the Fund to liquidate portfolio positions when it would not be advantageous to do so in order to satisfy its obligations.
Real Estate Industry Risk — Securities of companies principally engaged in the real estate industry may be subject to the risks associated with direct ownership of real estate. Risks commonly associated with the direst ownership of real estate include fluctuations in the value of underlying properties, defaults by borrowers or tenants, changes in interest rates and risks related to general or local economic conditions.
Prepayment Risk — The risk that, with declining interest rates, fixed income securities with stated interest rates may have the principal paid earlier than expected, requiring the Fund to invest the proceeds at generally lower interest rates.
Bank Loans Risk — The Fund may invest in loans through assignments or participations. When investing through an assignment, the Fund becomes a lender under the relevant credit agreement and assumes the credit risk of the borrower directly. When investing through a participation, the Fund assumes the credit risk of both the borrower, which must make interest payments to the participation interest seller, and the participation interest seller (typically the lender), which must pass such payments or portions of such payments to the Fund. The secondary market for loans is a private, unregulated inter-dealer or inter-bank resale market. Bank loans may have extended settlement periods that exceed seven days and, accordingly, may be considered illiquid. Purchases and sales of loans in the secondary market generally are subject to contractual restrictions that may delay the Fund’s ability to make timely redemptions.
| THE ADVISORS’ INNER CIRCLE FUND III | FS CHIRON
CAPITAL ALLOCATION FUND
OCTOBER 31, 2024 |
Bank loans may not be considered “securities,” and purchasers, such as the Fund, therefore may not be entitled to rely on the anti-fraud protections of the federal securities laws.
Credit-Linked Notes Risk — Credit-linked securities typically are issued by a limited purpose trust or other vehicle that, in turn, invests in a derivative instrument or basket of derivative instruments, such as credit default swaps or interest rate swaps, to obtain exposure to certain fixed income markets or to remain fully invested when more traditional income producing securities are not available. Like an investment in a bond, an investment in credit-linked notes represents the right to receive periodic income payments (in the form of distributions) and payment of principal at the end of the term of the security. However, these payments are conditioned on the issuer’s receipt of payments from, and the issuer’s potential obligations to, the counterparties to certain derivative instruments entered into by the issuer of the credit-linked note. For example, the issuer may sell one or more credit default swaps entitling the issuer to receive a stream of payments over the term of the swap agreements provided that no event of default has occurred with respect to the referenced debt obligation upon which the swap is based. If a default occurs, the stream of payments may stop and the issuer would be obligated to pay the counterparty the par (or other agreed upon value) of the referenced debt obligation. An investor holding a credit-linked note generally receives a fixed or floating coupon and the note’s par value upon maturity, unless the referred credit defaults or declares bankruptcy, in which case the investor receives the amount recovered. In effect, investors holding credit-linked notes receive a higher yield in exchange for assuming the risk of a specified credit event. The Fund’s investments in credit-linked notes are indirectly subject to the risks associated with derivative instruments, which are described elsewhere in this section, and may be illiquid.
Stock Connect Investing Risk — Trading through Stock Connect is subject to a number of restrictions that may affect the Fund’s investments and returns, including a daily quota that limits the maximum net purchases under Stock Connect each day. In addition, investments made through Stock Connect are subject to relatively untested trading, clearance and settlement procedures. Moreover, A-Shares purchased through Stock Connect generally may only be sold or otherwise transferred through Stock Connect. The Fund’s investments in A-Shares purchased through Stock Connect are generally subject to Chinese securities regulations and listing rules. While overseas investors currently are exempt from paying capital gains or value added taxes on income and gains from investments in A-Shares purchased through Stock Connect, these tax rules could be changed, which could result in unexpected tax liabilities for the Fund. Stock Connect operates only on days when both the PRC and Hong Kong markets are open for trading and when banks in both markets are open on the corresponding settlement days. Therefore, the Fund may be subject to the risk of price fluctuations of A-Shares when Stock Connect is not trading.
| THE ADVISORS’ INNER CIRCLE FUND III | FS CHIRON
CAPITAL ALLOCATION FUND
OCTOBER 31, 2024 |
Commodity-Related Investments Risk — Exposure to the commodities markets through Commodity-Related Investments may subject the Fund to greater volatility than investments in traditional securities. Prices of commodities may fluctuate significantly over short periods for a variety of factors, including: changes in supply and demand relationships, changes in interest or currency exchange rates, population growth and changing demographics and factors affecting a particular industry or commodity, such as drought, floods or other weather conditions, transportation bottlenecks or shortages, competition from substitute products, fiscal, monetary and exchange control programs, disease, pestilence, acts of terrorism, embargoes, tariffs and international economic, political, military, legal and regulatory developments.
Investment in the Subsidiary Risk — The Subsidiary is not registered under the Investment Company Act of 1940, as amended (the “1940 Act”), and, unless otherwise noted in this prospectus, is not subject to all of the investor protections of the 1940 Act. Thus, the Fund, as an investor in the Subsidiary, will not have all of the protections offered to investors in registered investment companies. In addition, changes in the laws of the United States and/or the Cayman Islands, under which the Fund and the Subsidiary, respectively, are organized, could result in the inability of the Fund and/or the Subsidiary to operate as intended and could negatively affect the Fund and its shareholders.
Tax Risk — The Fund may gain most of its exposure to the commodities markets through its investment in the Subsidiary, which invests directly in Commodity-Related Investments.
To the extent the Fund invests in such instruments directly, it will seek to restrict its income from Commodity-Related Investments that do not generate qualifying income, such as certain commodity-related derivative instruments, to a maximum of 10% of its gross income (when combined with its other investments that produce non-qualifying income) to comply with certain qualifying income tests necessary for the Fund to qualify as a regulated investment company (a “RIC”) under Subchapter M of the Internal Revenue Code of 1986, as amended (the “Code”) as described in more detail in the SAI. The tax treatment of certain Commodity- Related Investments may be affected by future regulatory or legislative changes that could affect the character, timing and/or amount of the Fund’s taxable income or gains and distributions.
The Fund intends to hold certain Commodity-Related Investments indirectly, through the Subsidiary. The Fund believes that income from the Subsidiary will be qualifying income because it expects that the Subsidiary will make annual distributions of its earnings and profits. The Fund has received an opinion of counsel based on customary representations that to the extent of the actual distributions made to the Fund from its Subsidiary, its “Subpart F” (as defined in Section 951 of the Code) income attributable to its investment in the Subsidiary derived with respect to the Fund’s business of investing in stock, securities or currencies should be treated as “qualifying income”. If the Fund does not qualify as a RIC for any taxable year and certain relief provisions are not available, the Fund’s taxable income will be subject to tax at the Fund level and again at the shareholder level when such income is distributed. Failure to comply with the requirements for qualification as a RIC would have significant negative tax consequences to Fund shareholders.
| THE ADVISORS’ INNER CIRCLE FUND III | FS CHIRON
CAPITAL ALLOCATION FUND
OCTOBER 31, 2024 |
11. Concentration of Shareholders:
At October 31, 2024, the percentage of total shares outstanding held by shareholders for the Fund, which are comprised of affiliated omnibus accounts, unless otherwise indicated, that are held on behalf of various individual shareholders, was as follows:
| | No. of Shareholder | % Ownership |
| FS Chiron Capital Allocation Fund | | |
| Class I | 5 | 71% |
| Class A | 3 | 61% |
| Class C | 2 | 62% |
12. Indemnifications:
In the normal course of business, the Fund enters into contracts that provide general indemnifications. The Fund’s maximum exposure under these arrangements is dependent on future claims that may be made against the Fund and, therefore, cannot be established; however, based on experience, the risk of loss from such claim is considered remote.
13. New Accounting Pronouncement:
In November 2023, the Financial Accounting Standards Board issued Accounting Standards Update No. 2023-07 (“ASU 2023-07”), Segment Reporting (“Topic 280”). ASU 2023-07 clarifies the guidance in Topic 280, which requires public entities to provide disclosures of significant segment expenses and other segment items. The guidance requires public entities to provide in interim periods all disclosures about a reportable segment’s profit or loss and assets that are currently required annually and also applies to public entities with a single reportable segment. Entities are permitted to disclose more than one measure of a segment’s profit or loss if such measures are used by the Chief Operating Decision Maker to allocate resources and assess performance, as long as at least one of those measures is determined in a way that is most consistent with the measurement principles used to measure the corresponding amounts in the consolidated financial statements. The amendments in ASU 2023-07 are effective for fiscal years beginning after December 15, 2023, and interim periods within fiscal years beginning after December 15, 2024. Early adoption is permitted. Management is currently evaluating the implications, if any, of the additional requirements and their impact on a Fund’s financial statements.
| THE ADVISORS’ INNER CIRCLE FUND III | FS CHIRON
CAPITAL ALLOCATION FUND
OCTOBER 31, 2024 |
14. Subsequent Events:
The Fund has evaluated the need for additional disclosures and/or adjustments resulting from subsequent events through the date the financial statements were issued. Based on this evaluation, no additional disclosures and/or adjustments were required to the financial statements.
| THE ADVISORS’ INNER CIRCLE FUND III | FS CHIRON
CAPITAL ALLOCATION FUND
OCTOBER 31, 2024 |
REPORT OF INDEPENDENT REGISTERED PUBLIC ACCOUNTING FIRM
To the Board of Trustees of The Advisors’ Inner Circle Fund III and Shareholders of FS Chiron Capital Allocation Fund
Opinion on the Financial Statements
We have audited the accompanying 2024 consolidated financial statements of FS Chiron Capital Allocation Fund and its subsidiary and the 2023 financial statements of FS Chiron Capital Allocation Fund (one of the funds constituting the Advisors’ Inner Circle Fund III, collectively referred to as the “Fund”), which comprise the statement of assets and liabilities as of October 31, 2024, including the schedule of investments, and the related statement of operations as of October 31, 2024, the statement of changes in net assets for each of the two years in the period ended October 31, 2024, including the related notes, and the financial highlights for each of the periods indicated therein (collectively referred to as the “financial statements). In our opinion, the financial statements present fairly, in all material respects, the financial position of the Fund as of October 31, 2024, the results of its operations for the year then ended, the changes in its net assets for each of the two years in the period ended October 31, 2024 and the financial highlights for each of the periods indicated therein in conformity with accounting principles generally accepted in the United States of America.
Basis for Opinion
These financial statements are the responsibility of the Fund’s management. Our responsibility is to express an opinion on the Fund’s financial statements based on our audits. We are a public accounting firm registered with the Public Company Accounting Oversight Board (United States) (PCAOB) and are required to be independent with respect to the Fund in accordance with the U.S. federal securities laws and the applicable rules and regulations of the Securities and Exchange Commission and the PCAOB.
We conducted our audits of these financial statements in accordance with the standards of the PCAOB. Those standards require that we plan and perform the audit to obtain reasonable assurance about whether the financial statements are free of material misstatement, whether due to error or fraud.
Our audits included performing procedures to assess the risks of material misstatement of the financial statements, whether due to error or fraud, and performing procedures that respond to those risks. Such procedures included examining, on a test basis, evidence regarding the amounts and disclosures in the financial statements. Our audits also included evaluating the accounting principles used and significant estimates made by management, as well as evaluating the overall presentation of the financial statements. Our procedures included confirmation of securities owned as of October 31, 2024 by correspondence with the custodian, transfer agent and brokers; when replies were not received from brokers, we performed other auditing procedures. We believe that our audits provide a reasonable basis for our opinion.
| THE ADVISORS’ INNER CIRCLE FUND III | FS CHIRON CAPITAL ALLOCATION FUND OCTOBER 31, 2024 |
/s/ PricewaterhouseCoopers LLP
Philadelphia, Pennsylvania
December 23, 2024
We have served as the auditor of one or more investment companies in Chiron Investment Management, LLC since 2015.
| THE ADVISORS’ INNER CIRCLE FUND III | FS CHIRON
CAPITAL ALLOCATION FUND
OCTOBER 31, 2024
(Unaudited) |
NOTICE TO SHAREHOLDERS
For shareholders that do not have an October 31, 2024 tax year end, this notice is for informational purposes only. For shareholders with an October 31, 2024 tax year end, please consult your tax advisor as to the pertinence of this notice. For the year ended October 31, 2024, the Funds are designating the following items with regard to distributions paid during the year:
Return of
Capital | Long Term
Capital Gain
Distribution | Ordinary
Income
Distributions | Total
Distributions | Dividends
Qualifying
for Corporate
Dividend
Receivable
Deduction (1) | Qualifying
Dividend
Income (2) | U.S.
Government
Interest (3) | Qualified
Interest
Income (4) | Qualified
Short Term
Capital Gain
(5) | Qualifying
Business
Income (6) |
| 0.00% | 0.00% | 100.00% | 100.00% | 13.17% | 23.64% | 0.00% | 0.00% | 0.00% | 15.55% |
| (1) | Qualifying dividends represent dividends which qualify for the corporate dividends received deduction and are reflected as a percentage of ordinary Income distributions (the total of short-term capital gain and net investment income distributions). |
| (2) | The percentage in this column represents the amount of “Qualifying Dividend Income” as created by the Jobs and Growth Relief Reconciliation Act of 2003 and is reflected as a percentage of ordinary income distributions (the total of short-term capital gain and net investment income distributions). It is the intention of the Fund to designate the maximum amount permitted by law. |
| (3) | “U.S. Government Interest” represents the amount of interest that was derived from U.S. Government obligations and distributed during the fiscal year. This amount is reflected as a percentage of total ordinary income distributions (the total of short-term capital gain and net investment income distributions). |
| (4) | The percentage in this column represents the amount of “Interest Related Dividends” and is reflected as a percentage of ordinary income distributions. Interest related dividends are exempt from U.S. withholding tax when paid to foreign investors. |
| (5) | The percentage of this column represents the amount of “Short-Term Capital Gain Dividends” and is reflected as a percentage of short-term capital gain distributions that is exempt from U.S. withholding tax when paid to foreign investors. |
| (6) | The percentage of this column represents that amount of ordinary dividend income that qualified for 20% Business Income Deduction. |
The information reported herein may differ from the information and distributions taxable to the shareholders for the calendar year ending December 31, 2024. Complete information will be computed and reported in conjunction with your 2024 Form 1099-DIV.
| THE ADVISORS’ INNER CIRCLE FUND III | FS CHIRON
CAPITAL ALLOCATION FUND
OCTOBER 31, 2024
(Unaudited) |
APPROVAL OF INVESTMENT ADVISORY AGREEMENT (FORM N-CSR ITEM 11)
FS Chiron Capital Allocation Fund
Pursuant to Section 15 of the Investment Company Act of 1940 (the “1940 Act”), the Fund’s advisory agreement (the “Agreement”) must be renewed at least annually after its initial two-year term: (i) by the vote of the Board of Trustees (the “Board” or the “Trustees”) of The Advisors’ Inner Circle Fund III (the “Trust”) or by a vote of a majority of the shareholders of the Fund; and (ii) by the vote of a majority of the Trustees who are not parties to the Agreement or “interested persons” of any party thereto, as defined in the 1940 Act (the “Independent Trustees”), cast in person at a meeting called for the purpose of voting on such renewal.
A Board meeting was held on September 11–12, 2024 to decide whether to renew the Agreement for an additional one-year term. In preparation for the meeting, the Trustees requested that the Adviser furnish information necessary to evaluate the terms of the Agreement. Prior to the meeting, the Independent Trustees of the Fund met to review and discuss the information provided and submitted a request for additional information to the Adviser, and information was provided in response to this request. The Trustees used this information, as well as other information that the Adviser and other service providers of the Fund presented or submitted to the Board at the meeting and other meetings held during the prior year, to help them decide whether to renew the Agreement for an additional year. Specifically, the Board requested and received written materials from the Adviser and other service providers of the Fund regarding: (i) the nature, extent and quality of the Adviser’s services; (ii) the Adviser’s investment management personnel; (iii) the Adviser’s operations and financial condition; (iv) the Adviser’s brokerage practices (including any soft dollar arrangements) and investment strategies; (v) the Fund’s advisory fee paid to the Adviser and overall fees and operating expenses compared with a peer group of mutual funds; (vi) the level of the Adviser’s profitability from its relationship with the Fund, including both direct and indirect benefits accruing to the Adviser and its affiliates; (vii) the Adviser’s potential economies of scale; (viii) the Adviser’s compliance program, including a description of material compliance matters and material compliance violations; (ix) the Adviser’s policies on and compliance procedures for personal securities transactions; and (x) the Fund’s performance compared with a peer group of mutual funds and the Fund’s benchmark index. Representatives from the Adviser, along with other Fund service providers, presented additional information and participated in question and answer sessions at the Board meeting to help the Trustees evaluate the Adviser’s services, fee and other aspects of the Agreement. The Independent Trustees received advice from independent counsel and met in executive sessions outside the presence of Fund management and the Adviser.
| THE ADVISORS’ INNER CIRCLE FUND III | FS CHIRON
CAPITAL ALLOCATION FUND
OCTOBER 31, 2024
(Unaudited) |
At the Board meeting, the Trustees, including all of the Independent Trustees, based on their evaluation of the information provided by the Adviser and other service providers of the Fund, renewed the Agreement. In considering the renewal of the Agreement, the Board considered various factors that they determined were relevant, including: (i) the nature, extent and quality of the services provided by the Adviser; (ii) the investment performance of the Fund and the Adviser; (iii) the costs of the services provided and profits realized by the Adviser from its relationship with the Fund, including both direct and indirect benefits accruing to the Adviser and its affiliates; (iv) the extent to which economies of scale are being realized by the Adviser; and (v) whether fee levels reflect such economies of scale for the benefit of Fund investors, as discussed in further detail below.
Nature, Extent and Quality of Services Provided by the Adviser
In considering the nature, extent and quality of the services provided by the Adviser, the Board reviewed the portfolio management services provided by the Adviser to the Fund, including the quality and continuity of the Adviser’s portfolio management personnel, the resources of the Adviser, and the Adviser’s compliance history and compliance program. The Trustees reviewed the terms of the Agreement. The Trustees also reviewed the Adviser’s investment and risk management approaches for the Fund. The most recent investment adviser registration form (“Form ADV”) for the Adviser was available to the Board, as was the response of the Adviser to a detailed series of questions which included, among other things, information about the investment advisory services provided by the Adviser to the Fund.
The Trustees also considered other services provided to the Fund by the Adviser such as selecting broker-dealers for executing portfolio transactions, monitoring adherence to the Fund’s investment restrictions, and monitoring compliance with various Fund policies and procedures and with applicable securities laws and regulations. Based on the factors above, as well as those discussed below, the Board concluded, within the context of its full deliberations, that the nature, extent and quality of the services provided to the Fund by the Adviser were sufficient to support renewal of the Agreement.
Investment Performance of the Fund and the Adviser
The Board was provided with regular reports regarding the Fund’s performance over various time periods. The Trustees also reviewed reports prepared by the Fund’s administrator comparing the Fund’s performance to its benchmark index and a peer group of mutual funds as classified by Lipper, an independent provider of investment company data, over various periods of time. Representatives from the Adviser provided information regarding and led discussions of factors impacting the performance of the Fund, outlining current market conditions and explaining their expectations and strategies for the future. The Trustees determined that the Fund’s performance was satisfactory, or, where the Fund’s performance was materially below its benchmark and/or peer group, the Trustees were satisfied by the reasons for the underperformance and/or the steps taken by the Adviser in an effort to improve the performance of the Fund. Based on this information, the Board concluded, within the context of its full deliberations, that the investment results that the Adviser had been able to achieve for the Fund were sufficient to support renewal of the Agreement.
| THE ADVISORS’ INNER CIRCLE FUND III | FS CHIRON
CAPITAL ALLOCATION FUND
OCTOBER 31, 2024
(Unaudited) |
Costs of Advisory Services, Profitability and Economies of Scale
In considering the advisory fee payable by the Fund to the Adviser, the Trustees reviewed, among other things, a report of the advisory fee paid to the Adviser. The Trustees also reviewed reports prepared by the Fund’s administrator comparing the Fund’s net and gross expense ratios and advisory fee to those paid by a peer group of mutual funds as classified by Lipper. The Board concluded, within the context of its full deliberations, that the advisory fee was reasonable in light of the nature and quality of the services rendered by the Adviser.
The Trustees reviewed the costs of services provided by and the profits realized by the Adviser from its relationship with the Fund, including both direct benefits and indirect benefits, such as research and brokerage services received under soft dollar arrangements, accruing to the Adviser and its affiliates. The Trustees considered how the Adviser’s profitability was affected by factors such as its organizational structure and method for allocating expenses. The Trustees concluded that the profit margins of the Adviser with respect to the management of the Fund were not unreasonable.
The Trustees considered the Adviser’s views relating to economies of scale in connection with the Fund as Fund assets grow and the extent to which the benefits of any such economies of scale are shared with the Fund and Fund shareholders. The Board considered the existence of any economies of scale and whether those were passed along to the Fund’s shareholders through a graduated advisory fee schedule or other means, including fee waivers. The Trustees recognized that economies of scale are difficult to identify and quantify and are rarely identifiable on a fund-by-fund basis. Based on this evaluation, the Board concluded that the advisory fee was reasonable in light of the information that was provided to the Trustees by the Adviser with respect to economies of scale.
Renewal of the Agreement
Based on the Board’s deliberations and its evaluation of the information described above and other factors and information it believed relevant in the exercise of its reasonable business judgment, the Board, including all of the Independent Trustees, with the assistance of Fund counsel and Independent Trustees’ counsel, unanimously concluded that the terms of the Agreement, including the fees payable thereunder, were fair and reasonable and agreed to renew the Agreement for another year. In its deliberations, the Board did not identify any absence of information as material to its decision, or any particular factor (or conclusion with respect thereto) or single piece of information that was all-important, controlling or determinative of its decision, but considered all of the factors together, and each Trustee may have attributed different weights to the various factors (and conclusions with respect thereto) and information.
FS Chiron Capital Allocation Fund
P.O. Box 588
Portland, ME 04112
1-877-9-CHIRON (924-4766)
Adviser:
Chiron Investment Management LLC
10 East 53rd Street, 20th Floor
New York, NY 10022
Distributor:
SEI Investments Distribution Co.
1 Freedom Valley Drive
Oaks, PA 19456
Administrator:
SEI Investments Global Funds Services
1 Freedom Valley Drive
Oaks, PA 19456
Legal Counsel:
Morgan, Lewis & Bockius LLP
2222 Market Street
Philadelphia, PA 19103
This information must be preceded or accompanied by a current prospectus for the Fund described.
CHI-AR-001-0900
Item 8. Changes in and Disagreements with Accountants for Open-End Management Investment Companies.
There were no changes in or disagreements with accountants on accounting and financial disclosure during the period covered by the report.
Item 9. Proxy Disclosures for Open-End Management Investment Companies.
There were no matters submitted to a vote of shareholders during the period covered by this report.
Item 10. Remuneration Paid to Directors, Officers, and Others of Open-End Management Investment Companies.
No remuneration was paid by the company during the period covered by the report to any Officers of the Trust, other than as disclosed as part of the financial statements included above in Item 7.
Item 11. Statement Regarding Basis for Approval of Investment Advisory Contract.
The disclosure regarding the Approval of Advisory Agreement, if applicable, is included as part of the financial statements included above in Item 7.
Item 12. Disclosure of Proxy Voting Policies and Procedures for Closed-End Management Investment Companies.
Not applicable to open-end management investment companies.
Item 13. Portfolio Managers of Closed-End Management Investment Companies.
Not applicable to open-end management investment companies.
Item 14. Purchases of Equity Securities by Closed-End Management Company and Affiliated Purchasers.
Not applicable to open-end management investment companies.
Item 15. Submission of Matters to a Vote of Security Holders.
There have been no changes to the procedures by which shareholders may recommend nominees to the Registrant’s Board of Trustees during the period covered by this report.
Item 16. Controls and Procedures.
(a) The Registrant's principal executive and principal financial officers, or persons performing similar functions, have concluded that the Registrant's disclosure controls and procedures, as defined in Rule 30a-3(c) under the Act (17 CFR § 270.30a-3(c)), as of a date within 90 days of the filing date of the report, are effective based on the evaluation of these controls and procedures required by Rule 30a-3(b) under the Act (17 CFR § 270.30a-3(b)) and Rule 13a-15(b) or Rule 15d-15(b) under the Act (17 CFR § 240.13a-15(b) or § 240.15d-15(b)).
(b) There has been no change in the Registrant's internal control over financial reporting (as defined in Rule 30a-3(d) under the Act (17 CFR § 270.30a-3(d)) that occurred during the period covered by this report that has materially affected, or is reasonably likely to materially affect, the Registrant's internal control over financial reporting.
Item 17. Disclosure of Securities Lending Activities for Closed-End Management Investment Companies.
Not applicable to open-end management investment companies.
Item 18. Recovery of Erroneously Awarded Compensation.
Item 19. Exhibits.
SIGNATURES
Pursuant to the requirements of the Securities Exchange Act of 1934 and the Investment Company Act of 1940, the Registrant has duly caused this report to be signed on its behalf by the undersigned, thereunto duly authorized.
| (Registrant) | The Advisors’ Inner Circle Fund III | |
| | | |
| | | |
| By (Signature and Title) | /s/ Michael Beattie | |
| | Michael Beattie | |
| | Principal Executive Officer | |
| Date: January 6, 2025 | | |
| | | |
| | | |
| Pursuant to the requirements of the Securities Exchange Act of 1934 and the Investment Company Act of 1940, this report has been signed below by the following persons on behalf of the Registrant and in the capacities and on the dates indicated. |
| | | |
| | | |
| By (Signature and Title) | /s/ Michael Beattie | |
| | Michael Beattie | |
| | Principal Executive Officer | |
| Date: January 6, 2025 | | |
| | | |
| | | |
| By (Signature and Title) | /s/ Andrew Metzger | |
| | Andrew Metzger | |
| | Principal Financial Officer | |
| Date: January 6, 2025 | | |