UNITED STATES
SECURITIES AND EXCHANGE COMMISSION
Washington, D.C. 20549
FORM N-CSR
CERTIFIED SHAREHOLDER REPORT OF REGISTERED MANAGEMENT
INVESTMENT COMPANIES
Investment Company Act File Number 811-22920
The Advisors’ Inner Circle Fund III
(Exact name of registrant as specified in charter)
SEI Investments
One Freedom Valley Drive
Oaks, PA 19456
(Address of principal executive offices) (Zip code)
SEI Investments
One Freedom Valley Drive
Oaks, PA 19456
(Name and address of agent for service)
Registrant’s telephone number, including area code: (877) 446-3863
Date of fiscal year end: October 31, 2024
Date of reporting period: October 31, 2024
Item 1. Reports to Stockholders.
| (a) | A copy of the report transmitted to stockholders pursuant to Rule 30e-1 under the Investment Company Act of 1940, as amended (the “Act”) (17 CFR § 270.30e-1), is attached hereto. |
The Advisors' Inner Circle Fund III
PineBridge Dynamic Asset Allocation Fund
Institutional Shares - PDAIX
Annual Shareholder Report: October 31, 2024
This annual shareholder report contains important information about Institutional Shares of the PineBridge Dynamic Asset Allocation Fund (the "Fund") for the period from November 1, 2023 to October 31, 2024. You can find additional information about the Fund at https://www.pinebridge.com/en-us/intermediary/funds/pinebridge-dynamic-assetallocation-fund/institutional. You can also request this information by contacting us at 877-225-4164.
What were the Fund costs for the last year?
(based on a hypothetical $10,000 investment)
| Fund Name | Costs of a $10,000 investment | Costs paid as a percentage of a $10,000 investment |
|---|
| PineBridge Dynamic Asset Allocation Fund, Institutional Shares | $81 | 0.75% |
How did the Fund perform in the last year?
As of October 2024, on a rolling 1 year basis, the Fund had a gross return of 15.82%, outperforming the return objective of the Consumer Price Index +5% (CPI+5%). We note that the Fund seeks a total return of CPI+5% over rolling five-year periods while dynamically managing risk to the 60% MSCI ACWI/40% Bloomberg Barclays Global Treasury risk budget over full market cycles. We aim to offer our investors a diversifying return stream that offers growth-like returns, but with lower volatility, helping to balance return and risk in their portfolio.
At the start of the period, we maintained a defensive risk posture, anticipating that central banks would keep policy rates elevated longer than expected to curb growth and combat inflation. We expected liquidity pressures to reveal additional vulnerabilities within the financial and economic landscape, increasing the probability of recession in developed economies facing persistent inflation. As we moved into late 2023, we adopted a more constructive stance on risk, supported by resilient corporate earnings, steady growth, and a gradual easing of inflationary pressures. In our view, the resilience of the U.S. economy and supply-driven disinflation significantly increased the likelihood of a soft landing, fostering a more favorable environment for risk-taking. We remained positioned with more risk than our risk budget for much of 2024 as soft landings generally favor equity over duration.
Investments in resilient segments of the market—such as productivity-enhancing software companies and high-quality U.S. equities—were key contributors to positive performance, benefiting from structural growth drivers and the adoption of generative AI. In contrast, other areas of the market, especially those with less defensive characteristics, experienced heightened volatility amid uncertainties around central bank policies, recession risks, and geopolitical factors. An allocation to gold, which we added at the very beginning of the period, was also a top contributor to performance as gold markets kept pace with a surging equity market. Geopolitical tensions, a declining real rate environment and China’s efforts to de-dollarize the Global South by shifting out of US treasuries and into gold have been supportive to gold prices.
Near the end of the first half of 2024, we shifted the portfolio toward a more diversified, style-neutral profile, aiming to balance risk between asset classes positioned to benefit from structural growth themes and those that were deeply discounted and likely to gain from the onset of a global easing cycle. Periods of economic expansion with declining rates and importantly a steepening yield curve tend to benefit asset classes such as US mid-caps, UK mid-caps, and US banks.
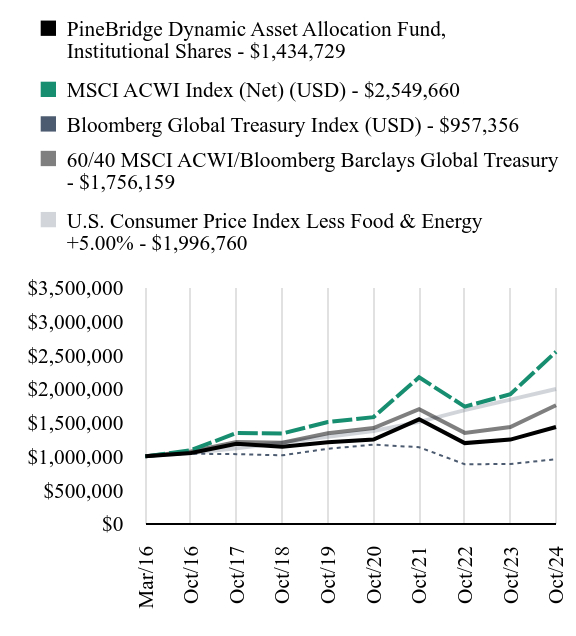
How did the Fund perform since inception?
Total Return Based on $1,000,000 Investment
| PineBridge Dynamic Asset Allocation Fund, Institutional Shares - $1434729 | MSCI ACWI Index (Net) (USD) - $2549660 | Bloomberg Global Treasury Index (USD) - $957356 | 60/40 MSCI ACWI/Bloomberg Barclays Global Treasury - $1756159 | U.S. Consumer Price Index Less Food & Energy +5.00% - $1996760 |
|---|
| Mar/16 | $1000000 | $1000000 | $1000000 | $1000000 | $1000000 |
| Oct/16 | $1051000 | $1092513 | $1039138 | $1071540 | $1047878 |
| Oct/17 | $1185455 | $1346008 | $1032859 | $1212545 | $1119706 |
| Oct/18 | $1142825 | $1339040 | $1015064 | $1202096 | $1200735 |
| Oct/19 | $1207541 | $1507645 | $1112479 | $1343555 | $1289832 |
| Oct/20 | $1249371 | $1581335 | $1173393 | $1420281 | $1376048 |
| Oct/21 | $1548480 | $2170815 | $1135512 | $1699606 | $1510503 |
| Oct/22 | $1196173 | $1737579 | $883119 | $1347967 | $1685286 |
| Oct/23 | $1248054 | $1920058 | $887179 | $1435540 | $1840584 |
| Oct/24 | $1434729 | $2549660 | $957356 | $1756159 | $1996760 |
Since its inception on March 2, 2016. The line graph represents historical performance of a hypothetical investment of $1,000,000 in the Fund since inception. Returns shown are total returns, which assume the reinvestment of dividends and capital gains. The table and graph presented above do not reflect the deduction of taxes a shareholder would pay on Fund distributions or the redemption of Fund shares. Past performance is not indicative of future performance.Call 877-225-4164 or visit https://www.pinebridge.com/en-us/intermediary/funds/pinebridge-dynamic-assetallocation-fund/institutional for current month-end performance.
Average Annual Total Returns as of October 31, 2024
| Fund/Index Name | 1 Year | 5 Years | Annualized Since Inception |
|---|
| PineBridge Dynamic Asset Allocation Fund, Institutional Shares | 14.96% | 3.51% | 4.25% |
| MSCI ACWI Index (Net) (USD) | 32.79% | 11.08% | 11.40% |
| Bloomberg Global Treasury Index (USD) | 7.91% | -2.96% | -0.50% |
| 60/40 MSCI ACWI/Bloomberg Barclays Global Treasury | 22.33% | 5.50% | 6.71% |
| U.S. Consumer Price Index Less Food & Energy +5.00% | 8.49% | 9.13% | 8.30% |
Key Fund Statistics as of October 31, 2024
| Total Net Assets | Number of Holdings | Total Advisory Fees Paid | Portfolio Turnover Rate |
|---|
| $119,677,471 | 762 | $508,916 | 132% |
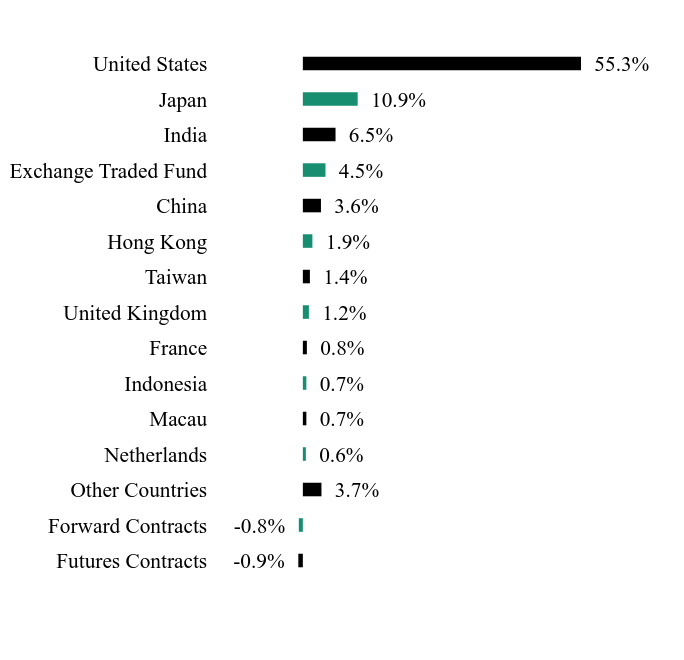
What did the Fund invest in?
Country/Asset WeightingsFootnote Reference*
| Value | Value |
|---|
| Futures Contracts | -0.9% |
| Forward Contracts | -0.8% |
| Other Countries | 3.7% |
| Netherlands | 0.6% |
| Macau | 0.7% |
| Indonesia | 0.7% |
| France | 0.8% |
| United Kingdom | 1.2% |
| Taiwan | 1.4% |
| Hong Kong | 1.9% |
| China | 3.6% |
| Exchange Traded Fund | 4.5% |
| India | 6.5% |
| Japan | 10.9% |
| United States | 55.3% |
| Footnote | Description |
Footnote* | Percentages are calculated based on total net assets. |
| Holding Name | | | Percentage of Total Net Assets |
|---|
| Microsoft | | | 3.3% |
| JPMorgan Chase | | | 2.9% |
| NVIDIA | | | 2.7% |
| iShares Core S&P Mid-Capital ETF | | | 2.5% |
| U.S. Treasury Bills, 4.67%, 11/19/2024 | | | 2.0% |
| U.S. Treasury Bills, 4.64%, 12/17/2024 | | | 2.0% |
| Invesco DB Precious Metals Fund | | | 2.0% |
| Bank of America | | | 1.1% |
| Broadcom | | | 1.0% |
| Taiwan Semiconductor Manufacturing | | | 1.0% |
There were no material changes during the reporting period.
Changes in and Disagreements with Accountants
There were no changes in or disagreements with accountants during the reporting period.
For additional information about the Fund, including its prospectus, financial information, holdings, and proxy voting information, call or visit:
Rule 30e-1 of the Investment Company Act of 1940 permits funds to transmit only one copy of a proxy statement, annual report or semi-annual report to shareholders (who need not be related) with the same residential, commercial or electronic address, provided that the shareholders have consented in writing and the reports are addressed either to each shareholder individually or to the shareholders as a group. This process is known as “householding” and is designed to reduce the duplicate copies of materials that shareholders receive and to lower printing and mailing costs for funds. Once implemented, if you would like to discontinue householding for your accounts, please call toll-free at 877-225-4164 to request individual copies of these documents. Once the Fund receives notice to stop householding, we will begin sending individual copies 30 days after receiving your request.
PineBridge Dynamic Asset Allocation Fund
The Advisors' Inner Circle Fund III/Institutional Shares - PDAIX
Annual Shareholder Report: October 31, 2024
PBI-AR-TSR-2024-1
The Advisors' Inner Circle Fund III
PineBridge Dynamic Asset Allocation Fund
Investor Servicing Shares - PDAVX
Annual Shareholder Report: October 31, 2024
This annual shareholder report contains important information about Investor Servicing Shares of the PineBridge Dynamic Asset Allocation Fund (the "Fund") for the period from November 1, 2023 to October 31, 2024. You can find additional information about the Fund at https://www.pinebridge.com/en-us/intermediary/funds/pinebridge-dynamic-assetallocation-fund/institutional. You can also request this information by contacting us at 877-225-4164.
What were the Fund costs for the last year?
(based on a hypothetical $10,000 investment)
| Fund Name | Costs of a $10,000 investment | Costs paid as a percentage of a $10,000 investment |
|---|
| PineBridge Dynamic Asset Allocation Fund, Investor Servicing Shares | $97 | 0.90% |
How did the Fund perform in the last year?
As of October 2024, on a rolling 1 year basis, the Fund had a gross return of 15.82%, outperforming the return objective of the Consumer Price Index +5% (CPI+5%). We note that the Fund seeks a total return of CPI+5% over rolling five-year periods while dynamically managing risk to the 60% MSCI ACWI/40% Bloomberg Barclays Global Treasury risk budget over full market cycles. We aim to offer our investors a diversifying return stream that offers growth-like returns, but with lower volatility, helping to balance return and risk in their portfolio.
At the start of the period, we maintained a defensive risk posture, anticipating that central banks would keep policy rates elevated longer than expected to curb growth and combat inflation. We expected liquidity pressures to reveal additional vulnerabilities within the financial and economic landscape, increasing the probability of recession in developed economies facing persistent inflation. As we moved into late 2023, we adopted a more constructive stance on risk, supported by resilient corporate earnings, steady growth, and a gradual easing of inflationary pressures. In our view, the resilience of the U.S. economy and supply-driven disinflation significantly increased the likelihood of a soft landing, fostering a more favorable environment for risk-taking. We remained positioned with more risk than our risk budget for much of 2024 as soft landings generally favor equity over duration.
Investments in resilient segments of the market—such as productivity-enhancing software companies and high-quality U.S. equities—were key contributors to positive performance, benefiting from structural growth drivers and the adoption of generative AI. In contrast, other areas of the market, especially those with less defensive characteristics, experienced heightened volatility amid uncertainties around central bank policies, recession risks, and geopolitical factors. An allocation to gold, which we added at the very beginning of the period, was also a top contributor to performance as gold markets kept pace with a surging equity market. Geopolitical tensions, a declining real rate environment and China’s efforts to de-dollarize the Global South by shifting out of US treasuries and into gold have been supportive to gold prices.
Near the end of the first half of 2024, we shifted the portfolio toward a more diversified, style-neutral profile, aiming to balance risk between asset classes positioned to benefit from structural growth themes and those that were deeply discounted and likely to gain from the onset of a global easing cycle. Periods of economic expansion with declining rates and importantly a steepening yield curve tend to benefit asset classes such as US mid-caps, UK mid-caps, and US banks.
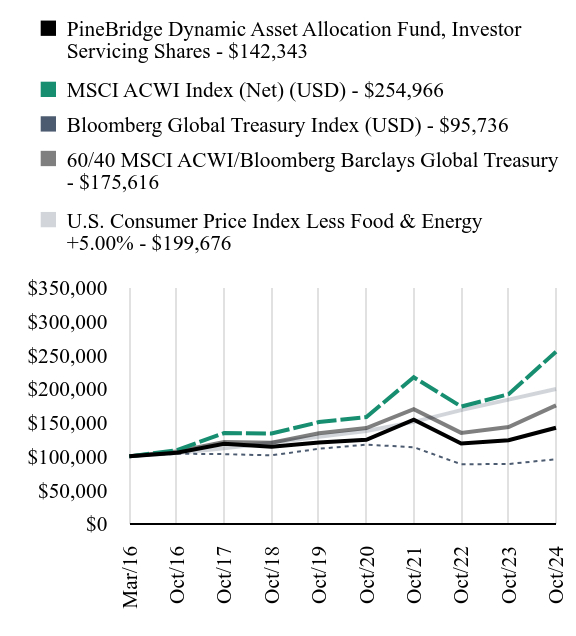
How did the Fund perform since inception?
Total Return Based on $100,000 Investment
| PineBridge Dynamic Asset Allocation Fund, Investor Servicing Shares - $142343 | MSCI ACWI Index (Net) (USD) - $254966 | Bloomberg Global Treasury Index (USD) - $95736 | 60/40 MSCI ACWI/Bloomberg Barclays Global Treasury - $175616 | U.S. Consumer Price Index Less Food & Energy +5.00% - $199676 |
|---|
| Mar/16 | $100000 | $100000 | $100000 | $100000 | $100000 |
| Oct/16 | $105300 | $109251 | $103914 | $107154 | $104788 |
| Oct/17 | $118645 | $134601 | $103286 | $121255 | $111971 |
| Oct/18 | $114120 | $133904 | $101506 | $120210 | $120073 |
| Oct/19 | $120487 | $150764 | $111248 | $134356 | $128983 |
| Oct/20 | $124513 | $158133 | $117339 | $142028 | $137605 |
| Oct/21 | $154215 | $217082 | $113551 | $169961 | $151050 |
| Oct/22 | $119011 | $173758 | $88312 | $134797 | $168529 |
| Oct/23 | $123925 | $192006 | $88718 | $143554 | $184058 |
| Oct/24 | $142343 | $254966 | $95736 | $175616 | $199676 |
Since its inception on March 2, 2016. The line graph represents historical performance of a hypothetical investment of $100,000 in the Fund since inception. Returns shown are total returns, which assume the reinvestment of dividends and capital gains. The table and graph presented above do not reflect the deduction of taxes a shareholder would pay on Fund distributions or the redemption of Fund shares. Past performance is not indicative of future performance.Call 877-225-4164 or visit https://www.pinebridge.com/en-us/intermediary/funds/pinebridge-dynamic-assetallocation-fund/institutional for current month-end performance.
Average Annual Total Returns as of October 31, 2024
| Fund/Index Name | 1 Year | 5 Years | Annualized Since Inception |
|---|
| PineBridge Dynamic Asset Allocation Fund, Investor Servicing Shares | 14.86% | 3.39% | 4.16% |
| MSCI ACWI Index (Net) (USD) | 32.79% | 11.08% | 11.40% |
| Bloomberg Global Treasury Index (USD) | 7.91% | -2.96% | -0.50% |
| 60/40 MSCI ACWI/Bloomberg Barclays Global Treasury | 22.33% | 5.50% | 6.71% |
| U.S. Consumer Price Index Less Food & Energy +5.00% | 8.49% | 9.13% | 8.30% |
Key Fund Statistics as of October 31, 2024
| Total Net Assets | Number of Holdings | Total Advisory Fees Paid | Portfolio Turnover Rate |
|---|
| $119,677,471 | 762 | $508,916 | 132% |
What did the Fund invest in?
Country/Asset WeightingsFootnote Reference*
| Value | Value |
|---|
| Futures Contracts | -0.9% |
| Forward Contracts | -0.8% |
| Other Countries | 3.7% |
| Netherlands | 0.6% |
| Macau | 0.7% |
| Indonesia | 0.7% |
| France | 0.8% |
| United Kingdom | 1.2% |
| Taiwan | 1.4% |
| Hong Kong | 1.9% |
| China | 3.6% |
| Exchange Traded Fund | 4.5% |
| India | 6.5% |
| Japan | 10.9% |
| United States | 55.3% |
| Footnote | Description |
Footnote* | Percentages are calculated based on total net assets. |
| Holding Name | | | Percentage of Total Net Assets |
|---|
| Microsoft | | | 3.3% |
| JPMorgan Chase | | | 2.9% |
| NVIDIA | | | 2.7% |
| iShares Core S&P Mid-Capital ETF | | | 2.5% |
| U.S. Treasury Bills, 4.67%, 11/19/2024 | | | 2.0% |
| U.S. Treasury Bills, 4.64%, 12/17/2024 | | | 2.0% |
| Invesco DB Precious Metals Fund | | | 2.0% |
| Bank of America | | | 1.1% |
| Broadcom | | | 1.0% |
| Taiwan Semiconductor Manufacturing | | | 1.0% |
There were no material changes during the reporting period.
Changes in and Disagreements with Accountants
There were no changes in or disagreements with accountants during the reporting period.
For additional information about the Fund, including its prospectus, financial information, holdings, and proxy voting information, call or visit:
Rule 30e-1 of the Investment Company Act of 1940 permits funds to transmit only one copy of a proxy statement, annual report or semi-annual report to shareholders (who need not be related) with the same residential, commercial or electronic address, provided that the shareholders have consented in writing and the reports are addressed either to each shareholder individually or to the shareholders as a group. This process is known as “householding” and is designed to reduce the duplicate copies of materials that shareholders receive and to lower printing and mailing costs for funds. Once implemented, if you would like to discontinue householding for your accounts, please call toll-free at 877-225-4164 to request individual copies of these documents. Once the Fund receives notice to stop householding, we will begin sending individual copies 30 days after receiving your request.
PineBridge Dynamic Asset Allocation Fund
The Advisors' Inner Circle Fund III/Investor Servicing Shares - PDAVX
Annual Shareholder Report: October 31, 2024
PBI-AR-TSR-2024-2
Item 2. Code of Ethics.
The Registrant (also referred to as the “Trust”) has adopted a code of ethics that applies to the Registrant’s principal executive officer, principal financial officer, controller or principal accounting officer, and any person who performs a similar function. There have been no amendments to or waivers granted to this code of ethics during the period covered by this report.
Item 3. Audit Committee Financial Expert.
(a)(1) The Registrant’s board of trustees has determined that the Registrant has at least one audit committee financial expert serving on the audit committee.
(a)(2) The Registrant’s audit committee financial experts are Thomas P. Lemke and Jay Nadel, and each of Mr. Lemke and Mr. Nadel is “independent” as that term is defined in Form N-CSR Item 3 (a)(2).
Item 4. Principal Accountant Fees and Services.
Fees billed by PricewaterhouseCoopers LLP (“PwC”) related to the Trust.
PwC billed the Trust aggregate fees for services rendered to the Trust for the last two fiscal years as follows:
| | FYE October 31, 2024 | FYE October 31, 2023 |
| | | All fees and services to the Trust that were pre-approved | All fees and services to service affiliates that were pre-approved | All other fees and services to service affiliates that did not require pre-approval | All fees and services to the Trust that were pre-approved | All fees and services to service affiliates that were pre-approved | All other fees and services to service affiliates that did not require pre-approval |
| (a) | Audit Fees(1) | $734,463 | None | None | $717,900 | None | None |
| (b) | Audit-Related Fees | None | None | None | None | None | None |
| (c) | Tax Fees | None | None | $559,700(2) | None | None | $807,756(2) |
| (d) | All Other Fees | None | None | $10,530(4) | None | None | $7,535(4) |
Fees billed by Ernst & Young LLP (“E&Y”) related to the Trust.
E&Y billed the Trust aggregate fees for services rendered to the Trust for the last two fiscal years as follows:
| | FYE October 31, 2024 | FYE October 31, 2023 |
| | | All fees and services to the Trust that were pre-approved | All fees and services to service affiliates that were pre-approved | All other fees and services to service affiliates that did not require pre-approval | All fees and services to the Trust that were pre-approved | All fees and services to service affiliates that were pre-approved | All other fees and services to service affiliates that did not require pre-approval |
| (a) | Audit Fees(1) | $113,052 | None | None | $137,200 | None | None |
| (b) | Audit-Related Fees | None | None | None | None | None | None |
| (c) | Tax Fees | None | None | None | None | None | None |
| (d) | All Other Fees | None | None | None | None | None | None |
Fees billed by Deloitte & Touche LLP (“D&T”) related to the Trust.
D&T billed the Trust aggregate fees for services rendered to the Trust for the last two fiscal years as follows
| | FYE October 31, 2024 | FYE October 31, 2023 |
| | | All fees and services to the Trust that were pre-approved | All fees and services to service affiliates that were pre-approved | All other fees and services to service affiliates that did not require pre-approval | All fees and services to the Trust that were pre-approved | All fees and services to service affiliates that were pre-approved | All other fees and services to service affiliates that did not require pre-approval |
| (a) | Audit Fees(1) | $30,000 | None | None | $30,624 | None | None |
| (b) | Audit-Related Fees | None | None | None | None | None | None |
| (c) | Tax Fees | None | None | None | None | None | None |
| (d) | All Other Fees | None | None | None | None | None | None |
Fees billed by KPMG (“KPMG”) related to the Trust.
KPMG billed the Trust aggregate fees for services rendered to the Trust for the last two fiscal years as follows
| | FYE October 31, 2024 | FYE October 31, 2023 |
| | | All fees and services to the Trust that were pre-approved | All fees and services to service affiliates that were pre-approved | All other fees and services to service affiliates that did not require pre-approval | All fees and services to the Trust that were pre-approved | All fees and services to service affiliates that were pre-approved | All other fees and services to service affiliates that did not require pre-approval |
| (a) | Audit Fees(1) | $45,000 | None | None | $363,625 | None | None |
| (b) | Audit-Related Fees | None | None | None | None | None | None |
| (c) | Tax Fees | None | None | None | None | None | None |
| (d) | All Other Fees | None | None | $154,000(3) | None | None | $282,908(3) |
Notes:
| (1) | Audit fees include amounts related to the audit of the Trust’s annual financial statements and services normally provided by the accountant in connection with statutory and regulatory filings. |
| (2) | Tax return preparation fees for affiliates of the Funds. |
| (3) | Non-audit fees consist of SSAE No. 18 report over investment management activities and non-statutory audit reports of Legal & General Investment Management America, Inc. |
| (4) | Non-audit assurance engagements for service affiliates of the funds. |
(e)(1) The Trust’s Audit Committee has adopted and the Board of Trustees has ratified an Audit and Non-Audit Services Pre-Approval Policy (the “Policy”), which sets forth the procedures and the conditions pursuant to which services proposed to be performed by the independent auditor of the Funds may be pre-approved.
The Policy provides that all requests or applications for proposed services to be provided by the independent auditor must be submitted to the Registrant’s Chief Financial Officer (“CFO”) and must include a detailed description of the services proposed to be rendered. The CFO will determine whether such services:
| 1. | require specific pre-approval; |
| 2. | are included within the list of services that have received the general pre-approval of the Audit Committee pursuant to the Policy; or |
| 3. | have been previously pre-approved in connection with the independent auditor’s annual engagement letter for the applicable year or otherwise. In any instance where services require pre-approval, the Audit Committee will consider whether such services are consistent with SEC’s rules and whether the provision of such services would impair the auditor’s independence. |
Requests or applications to provide services that require specific pre-approval by the Audit Committee will be submitted to the Audit Committee by the CFO. The Audit Committee will be informed by the CFO on a quarterly basis of all services rendered by the independent auditor. The Audit Committee has delegated specific pre-approval authority to either the Audit Committee Chair or financial expert, provided that the estimated fee for any such proposed pre-approved service does not exceed $100,000 and any pre-approval decisions are reported to the Audit Committee at its next regularly-scheduled meeting.
Services that have received the general pre-approval of the Audit Committee are identified and described in the Policy. In addition, the Policy sets forth a maximum fee per engagement with respect to each identified service that has received general pre-approval.
All services to be provided by the independent auditor shall be provided pursuant to a signed written engagement letter with the Registrant, the investment adviser, or applicable control affiliate (except that matters as to which an engagement letter would be impractical because of timing issues or because the matter is small may not be the subject of an engagement letter) that sets forth both the services to be provided by the independent auditor and the total fees to be paid to the independent auditor for those services.
In addition, the Audit Committee has determined to take additional measures on an annual basis to meet the Audit Committee’s responsibility to oversee the work of the independent auditor and to assure the auditor's independence from the Registrant, such as (a) reviewing a formal written statement from the independent auditor delineating all relationships between the independent auditor and the Registrant, and (b) discussing with the independent auditor the independent auditor’s methods and procedures for ensuring independence.
(e)(2) Percentage of fees billed applicable to non-audit services pursuant to waiver of pre-approval requirement were as follows (PwC):
| | FYE
October 31, 2024 | FYE October 31, 2023 |
Audit-Related Fees | None | None |
| Tax Fees | None | None |
All Other Fees | None | None |
(e)(2) Percentage of fees billed applicable to non-audit services pursuant to waiver of pre-approval requirement were as follows (E&Y):
| | FYE October 31, 2024 | FYE October 31, 2023 |
Audit-Related Fees | None | None |
| Tax Fees | None | None |
All Other Fees | None | None |
(e)(2) Percentage of fees billed applicable to non-audit services pursuant to waiver of pre-approval requirement were as follows (D&T):
| | FYE
October 31, 2024 | FYE October 31, 2023 |
Audit-Related Fees | None | None |
| Tax Fees | None | None |
All Other Fees | None | None |
(e)(2) Percentage of fees billed applicable to non-audit services pursuant to waiver of pre-approval requirement were as follows (KPMG):
| | FYE
October 31, 2024 | FYE October 31,2023 |
Audit-Related Fees | None | None |
| Tax Fees | None | None |
All Other Fees | None | None |
(f) Not applicable.
(g) The aggregate non-audit fees and services billed by PwC for services rendered to the Registrant, and rendered to the Registrant’s investment adviser (not including any sub-adviser whose role is primarily portfolio management and is subcontracted with or overseen by another investment adviser), and any entity controlling, controlled by, or under common control with the adviser that provides ongoing services to the Registrant for the last two fiscal-years-ended October 31st were $570,230 and $815,291 for 2024 and 2023, respectively.
(g) The aggregate non-audit fees and services billed by E&Y for services rendered to the Registrant, and rendered to the Registrant’s investment adviser (not including any sub-adviser whose role is primarily portfolio management and is subcontracted with or overseen by another investment adviser), and any entity controlling, controlled by, or under common control with the adviser that provides ongoing services to the Registrant for the last two fiscal-years-ended October 31st were $0 and $0 for 2024 and 2023, respectively.
(g) The aggregate non-audit fees and services billed by D&T for services rendered to the Registrant, and rendered to the Registrant’s investment adviser (not including any sub-adviser whose role is primarily portfolio management and is subcontracted with or overseen by another investment adviser), and any entity controlling, controlled by, or under common control with the adviser that provides ongoing services to the Registrant for the last two fiscal-years-ended October 31st were $0 and $0 for 2024 and 2023, respectively.
(g) The aggregate non-audit fees and services billed by KPMG for services rendered to the Registrant, and rendered to the Registrant’s investment adviser (not including any sub-adviser whose role is primarily portfolio management and is subcontracted with or overseen by another investment adviser), and any entity controlling, controlled by, or under common control with the adviser that provides ongoing services to the Registrant for the last two fiscal-years-ended October 31st were $154,000 and $282,908 for 2024 and 2023, respectively.
(h) During the past fiscal year, all non-audit services provided by the Registrant’s principal accountant to either the Registrant’s investment adviser or to any entity controlling, controlled by, or under common control with the Registrant’s investment adviser that provides ongoing services to the Registrant were pre-approved by the Audit Committee of Registrant’s Board of Trustees. Included in the Audit Committee’s pre-approval of these non-audit service were the review and consideration as to whether the provision of these non-audit services is compatible with maintaining the principal accountant’s independence.
(i) Not applicable. The Registrant has not retained, for the preparation of the audit report on the financial statements included in the Form N-CSR, a registered public accounting firm that has a branch or office that is located in a foreign jurisdiction and that the Public Company Accounting Oversight Board (the “PCAOB”) has determined that the PCAOB is unable to inspect or investigate completely because of a position taken by an authority in the foreign jurisdiction.
(j) Not applicable. The Registrant is not a “foreign issuer,” as defined in 17 CFR § 240.3b-4.
Item 5. Audit Committee of Listed Registrants.
Not applicable to open-end management investment companies.
Item 6. Schedule of Investments.
(a) The Schedule of Investments is included as part of the Financial Statements and Other Information filed under Item 7 of this form.
(b) Not applicable.
Item 7. Financial Statements and Financial Highlights for Open-End Management Investment Companies.
Financial statements and financial highlights are filed herein.

| THE ADVISORS’ INNER CIRCLE FUND III | PINEBRIDGE DYNAMIC
ASSET ALLOCATION FUND
OCTOBER 31, 2024 |
TABLE OF CONTENTS
| Financial Statements (Form N-CSR Item 7) | |
| Schedule of Investments | 1 |
| Statement of Assets and Liabilities | 29 |
| Statement of Operations | 30 |
| Statements of Changes in Net Assets | 31 |
| Financial Highlights | 32 |
| Notes to Financial Statements | 34 |
| Report of Independent Registered Public Accounting Firm | 59 |
| Notice to Shareholders (Unaudited) | 61 |
| Approval of Investment Advisory Agreement (Form N-CSR Item 11) (Unaudited) | 62 |
| THE ADVISORS’ INNER CIRCLE FUND III | PINEBRIDGE DYNAMIC
ASSET ALLOCATION FUND
OCTOBER 31, 2024 |
SCHEDULE OF INVESTMENTS
COMMON STOCK — 77.5%
| | | Shares | | | Value | |
| Australia — 0.2% | | | | | | | | |
| Paladin Energy * | | | 9,565 | | | $ | 62,972 | |
| WiseTech Global | | | 1,473 | | | | 113,094 | |
| Xero * | | | 1,249 | | | | 121,347 | |
| | | | | | | | 297,413 | |
| Austria — 0.0% | | | | | | | | |
| Verbund | | | 295 | | | | 24,294 | |
| | | | | | | | | |
| Belgium — 0.1% | | | | | | | | |
| UCB | | | 396 | | | | 76,249 | |
| | | | | | | | | |
| Brazil — 0.3% | | | | | | | | |
| Hapvida Participacoes e Investimentos * | | | 58,700 | | | | 35,641 | |
| Itau Unibanco Holding ADR | | | 6,902 | | | | 41,757 | |
| MercadoLibre * | | | 30 | | | | 61,115 | |
| Raia Drogasil | | | 9,258 | | | | 39,156 | |
| Rumo | | | 35,993 | | | | 123,466 | |
| TIM | | | 26,515 | | | | 76,001 | |
| | | | | | | | 377,136 | |
| Canada — 0.0% | | | | | | | | |
| Algonquin Power & Utilities | | | 1,915 | | | | 9,256 | |
| Northland Power | | | 725 | | | | 11,018 | |
| RB Global | | | 477 | | | | 40,415 | |
| | | | | | | | 60,689 | |
| China — 2.3% | | | | | | | | |
| Agricultural Bank of China, Cl A | | | 118,400 | | | | 78,753 | |
| Alibaba Group Holding | | | 17,813 | | | | 217,894 | |
| Anhui Conch Cement, Cl A | | | 15,400 | | | | 57,916 | |
| Baidu ADR * | | | 1,131 | | | | 103,181 | |
| Baoshan Iron & Steel, Cl A | | | 62,000 | | | | 56,898 | |
| Beijing Career International, Cl A | | | 15,800 | | | | 43,531 | |
| China Minsheng Banking, Cl A | | | 79,700 | | | | 42,349 | |
| China State Construction Engineering, Cl A | | | 105,200 | | | | 89,103 | |
| China Vanke, Cl A * | | | 25,200 | | | | 32,950 | |
| Contemporary Amperex Technology, Cl A | | | 600 | | | | 20,824 | |
| Fujian Sunner Development, Cl A | | | 27,800 | | | | 55,907 | |
| Gree Electric Appliances of Zhuhai, Cl A | | | 11,500 | | | | 70,360 | |
| Guangdong Haid Group, Cl A | | | 11,200 | | | | 69,087 | |
| Guangxi LiuYao Group, Cl A | | | 10,500 | | | | 26,697 | |
| Han's Laser Technology Industry Group, Cl A | | | 13,500 | | | | 48,882 | |
| Huadong Medicine, Cl A | | | 13,600 | | | | 63,161 | |
The accompanying notes are an integral part of the financial statements.
| THE ADVISORS’ INNER CIRCLE FUND III | PINEBRIDGE DYNAMIC
ASSET ALLOCATION FUND
OCTOBER 31, 2024 |
COMMON STOCK — continued
| | | Shares | | | Value | |
| China — continued | | | | | | | | |
| Industrial & Commercial Bank of China, Cl A | | | 69,300 | | | $ | 58,879 | |
| Industrial Bank, Cl A | | | 33,600 | | | | 86,370 | |
| Inner Mongolia Yili Industrial Group, Cl A | | | 15,100 | | | | 59,343 | |
| Jiangsu Hengrui Pharmaceuticals, Cl A | | | 7,400 | | | | 48,543 | |
| Kweichow Moutai, Cl A | | | 300 | | | | 64,434 | |
| LONGi Green Energy Technology, Cl A | | | 17,800 | | | | 49,436 | |
| Luxshare Precision Industry, Cl A | | | 14,100 | | | | 83,073 | |
| Nantong Jianghai Capacitor, Cl A | | | 29,700 | | | | 62,081 | |
| PDD Holdings ADR * | | | 640 | | | | 77,178 | |
| Ping An Insurance Group of China, Cl A | | | 4,500 | | | | 35,405 | |
| SAIC Motor, Cl A | | | 30,100 | | | | 54,458 | |
| Sailun Group, Cl A | | | 14,100 | | | | 28,714 | |
| SDIC Power Holdings, Cl A | | | 5,200 | | | | 11,119 | |
| Sieyuan Electric, Cl A | | | 5,700 | | | | 61,214 | |
| Sungrow Power Supply, Cl A | | | 14,705 | | | | 187,423 | |
| Suzhou Gold Mantis Construction Decoration, Cl A | | | 47,600 | | | | 24,292 | |
| Trip.com Group ADR * | | | 2,460 | | | | 158,424 | |
| Wanhua Chemical Group, Cl A | | | 4,100 | | | | 43,406 | |
| Weifu High-Technology Group, Cl A | | | 40,900 | | | | 102,082 | |
| Wellhope Foods, Cl A * | | | 26,600 | | | | 30,641 | |
| Yifeng Pharmacy Chain, Cl A | | | 7,000 | | | | 23,351 | |
| YTO Express Group, Cl A | | | 32,100 | | | | 74,069 | |
| Yutong Bus, Cl A | | | 28,800 | | | | 98,086 | |
| Zhejiang Dahua Technology, Cl A | | | 16,900 | | | | 38,980 | |
| Zhejiang Sanhua Intelligent Controls, Cl A | | | 11,200 | | | | 34,309 | |
| Zhongji Innolight, Cl A | | | 2,200 | | | | 43,471 | |
| | | | | | | | 2,716,274 | |
| Finland — 0.1% | | | | | | | | |
| Fortum | | | 5,144 | | | | 75,950 | |
| | | | | | | | | |
| France — 0.8% | | | | | | | | |
| Cie de Saint-Gobain | | | 2,522 | | | | 228,707 | |
| Engie | | | 1,476 | | | | 24,740 | |
| Legrand | | | 3,372 | | | | 380,592 | |
| Schneider Electric | | | 430 | | | | 111,391 | |
| STMicroelectronics | | | 3,941 | | | | 107,126 | |
| Vinci | | | 704 | | | | 78,862 | |
| | | | | | | | 931,418 | |
| Germany — 0.4% | | | | | | | | |
| E.ON | | | 1,666 | | | | 22,483 | |
The accompanying notes are an integral part of the financial statements.
| THE ADVISORS’ INNER CIRCLE FUND III | PINEBRIDGE DYNAMIC
ASSET ALLOCATION FUND
OCTOBER 31, 2024 |
COMMON STOCK — continued
| | | Shares | | | Value | |
| Germany — continued | | | | | | | | |
| Infineon Technologies | | | 3,626 | | | $ | 114,671 | |
| RWE | | | 637 | | | | 20,645 | |
| SAP | | | 1,213 | | | | 283,217 | |
| | | | | | | | 441,016 | |
| Greece — 0.1% | | | | | | | | |
| JUMBO | | | 2,156 | | | | 57,543 | |
| Piraeus Financial Holdings | | | 19,597 | | | | 73,838 | |
| | | | | | | | 131,381 | |
| Hong Kong — 0.9% | | | | | | | | |
| China Construction Bank, Cl H | | | 199,054 | | | | 154,513 | |
| China Everbright Bank, Cl H | | | 183,000 | | | | 61,858 | |
| China Railway Group, Cl H | | | 92,000 | | | | 45,910 | |
| China Railway Signal & Communication, Cl H | | | 140,000 | | | | 57,706 | |
| Geely Automobile Holdings | | | 60,087 | | | | 105,627 | |
| Haitong Securities, Cl H | | | 37,600 | | | | 31,317 | |
| Kingsoft | | | 5,000 | | | | 17,231 | |
| Lenovo Group | | | 63,831 | | | | 84,170 | |
| Meituan, Cl B * | | | 8,151 | | | | 192,611 | |
| Ping An Insurance Group of China, Cl H | | | 11,473 | | | | 71,084 | |
| Tencent Holdings | | | 5,864 | | | | 305,762 | |
| | | | | | | | 1,127,789 | |
| Hungary — 0.2% | | | | | | | | |
| OTP Bank Nyrt | | | 2,483 | | | | 123,618 | |
| Richter Gedeon Nyrt | | | 5,726 | | | | 165,497 | |
| | | | | | | | 289,115 | |
| India — 5.7% | | | | | | | | |
| AIA Engineering | | | 2,216 | | | | 100,511 | |
| Amara Raja Energy & Mobility | | | 9,570 | | | | 157,674 | |
| Angel One | | | 1,750 | | | | 63,168 | |
| Bajaj Auto | | | 1,754 | | | | 204,857 | |
| Bajaj Finance | | | 1,790 | | | | 146,208 | |
| Bank of Baroda | | | 177,187 | | | | 526,919 | |
| Bank of India | | | 158,700 | | | | 204,262 | |
| Bharat Electronics | | | 27,300 | | | | 92,154 | |
| Canara Bank | | | 69,500 | | | | 84,449 | |
| Caplin Point Laboratories | | | 2,400 | | | | 57,947 | |
| Central Depository Services India | | | 4,000 | | | | 73,310 | |
| Chaman Lal Setia Exports | | | 8,671 | | | | 32,411 | |
| CMS Info Systems | | | 10,400 | | | | 66,248 | |
| Deepak Nitrite | | | 900 | | | | 28,168 | |
The accompanying notes are an integral part of the financial statements.
| THE ADVISORS’ INNER CIRCLE FUND III | PINEBRIDGE DYNAMIC
ASSET ALLOCATION FUND
OCTOBER 31, 2024 |
COMMON STOCK — continued
| | | Shares | | | Value | |
| India — continued | | | | | | | | |
| Dhanuka Agritech | | | 2,000 | | | $ | 37,351 | |
| Dodla Dairy | | | 4,470 | | | | 63,039 | |
| eClerx Services | | | 4,400 | | | | 151,920 | |
| Electronics Mart India * | | | 20,000 | | | | 45,346 | |
| Emami | | | 26,700 | | | | 222,840 | |
| General Insurance Corp of India | | | 14,500 | | | | 63,331 | |
| GHCL | | | 2,000 | | | | 14,139 | |
| Gland Pharma | | | 3,100 | | | | 60,822 | |
| Granules India | | | 5,800 | | | | 39,205 | |
| HDFC Bank | | | 37,463 | | | | 770,041 | |
| Hero MotoCorp | | | 1,830 | | | | 108,209 | |
| Hindustan Unilever | | | 1,855 | | | | 55,694 | |
| Honasa Consumer * | | | 15,782 | | | | 73,797 | |
| ICICI Bank | | | 11,183 | | | | 171,542 | |
| ICICI Bank ADR | | | 7,000 | | | | 212,870 | |
| Indian Bank | | | 57,000 | | | | 401,203 | |
| InterGlobe Aviation * | | | 750 | | | | 36,030 | |
| Just Dial * | | | 4,500 | | | | 60,592 | |
| KSB | | | 8,000 | | | | 76,017 | |
| National Aluminium | | | 88,000 | | | | 236,410 | |
| NHPC | | | 64,500 | | | | 63,150 | |
| Orchid Pharma * | | | 1,400 | | | | 24,184 | |
| Petronet LNG | | | 27,000 | | | | 106,545 | |
| PG Electroplast | | | 18,400 | | | | 138,780 | |
| Polycab India | | | 2,450 | | | | 187,905 | |
| Punjab National Bank | | | 121,400 | | | | 141,006 | |
| Rategain Travel Technologies, Cl A * | | | 6,483 | | | | 57,811 | |
| Reliance Industries | | | 5,556 | | | | 87,851 | |
| Shree Cement | | | 1,250 | | | | 371,804 | |
| State Bank of India | | | 10,600 | | | | 103,151 | |
| Stylam Industries | | | 2,000 | | | | 54,128 | |
| Sun Pharmaceutical Industries | | | 3,850 | | | | 84,489 | |
| Tata Consultancy Services | | | 7,518 | | | | 353,625 | |
| Union Bank of India | | | 163,000 | | | | 226,040 | |
| Updater Services * | | | 13,500 | | | | 65,471 | |
| Varun Beverages | | | 6,000 | | | | 42,653 | |
| | | | | | | | 6,847,277 | |
| Indonesia — 0.2% | | | | | | | | |
| Bank Central Asia | | | 169,518 | | | | 110,708 | |
| Bank Negara Indonesia Persero | | | 295,889 | | | | 98,690 | |
| | | | | | | | 209,398 | |
The accompanying notes are an integral part of the financial statements.
| THE ADVISORS’ INNER CIRCLE FUND III | PINEBRIDGE DYNAMIC
ASSET ALLOCATION FUND
OCTOBER 31, 2024 |
COMMON STOCK — continued
| | | Shares | | | Value | |
| Ireland — 0.1% | | | | | | | | |
| Kerry Group, Cl A | | | 1,631 | | | $ | 162,897 | |
| | | | | | | | | |
| Italy — 0.1% | | | | | | | | |
| Enel | | | 3,225 | | | | 24,459 | |
| ERG | | | 885 | | | | 19,875 | |
| Prysmian | | | 1,062 | | | | 74,950 | |
| Terna - Rete Elettrica Nazionale | | | 2,778 | | | | 24,062 | |
| | | | | | | | 143,346 | |
| Japan — 10.6% | | | | | | | | |
| Advantest | | | 8,100 | | | | 468,987 | |
| Ajinomoto | | | 4,900 | | | | 188,237 | |
| Asahi Group Holdings | | | 17,000 | | | | 204,090 | |
| Asics | | | 5,400 | | | | 94,321 | |
| Astellas Pharma | | | 13,700 | | | | 160,404 | |
| Chiba Bank | | | 11,200 | | | | 81,734 | |
| Chugai Pharmaceutical | | | 9,351 | | | | 444,935 | |
| CMK | | | 4,300 | | | | 11,384 | |
| Concordia Financial Group | | | 52,500 | | | | 260,048 | |
| Dai-ichi Life Holdings | | | 13,900 | | | | 346,532 | |
| Fuji Electric | | | 5,100 | | | | 259,732 | |
| Fuji Oil Holdings | | | 7,300 | | | | 157,141 | |
| FUJIFILM Holdings | | | 9,300 | | | | 221,231 | |
| Fujikura | | | 4,600 | | | | 169,065 | |
| Fujitsu | | | 5,700 | | | | 109,587 | |
| Fukuoka Financial Group | | | 3,300 | | | | 75,278 | |
| GS Yuasa | | | 9,100 | | | | 160,995 | |
| Hitachi | | | 34,516 | | | | 867,210 | |
| Hoya | | | 900 | | | | 120,415 | |
| Insource | | | 17,700 | | | | 110,921 | |
| ITOCHU | | | 8,200 | | | | 405,636 | |
| Japan Post Bank | | | 18,600 | | | | 166,123 | |
| Japan Post Insurance | | | 5,000 | | | | 82,391 | |
| JCR Pharmaceuticals | | | 20,300 | | | | 90,775 | |
| JMDC | | | 4,100 | | | | 114,257 | |
| Keyence | | | 1,437 | | | | 648,682 | |
| Kyoto Financial Group | | | 5,500 | | | | 80,720 | |
| Lasertec | | | 700 | | | | 94,987 | |
| M&A Capital Partners | | | 9,600 | | | | 136,167 | |
| MINEBEA MITSUMI | | | 9,900 | | | | 174,284 | |
| Mitsubishi Gas Chemical | | | 9,500 | | | | 165,105 | |
| Mitsubishi UFJ Financial Group | | | 55,700 | | | | 587,092 | |
The accompanying notes are an integral part of the financial statements.
| THE ADVISORS’ INNER CIRCLE FUND III | PINEBRIDGE DYNAMIC
ASSET ALLOCATION FUND
OCTOBER 31, 2024 |
COMMON STOCK — continued
| | | Shares | | | Value | |
| Japan — continued | | | | | | | | |
| Mitsui Fudosan | | | 22,100 | | | $ | 188,565 | |
| Mizuho Financial Group | | | 8,600 | | | | 178,631 | |
| Morinaga Milk Industry | | | 900 | | | | 20,929 | |
| NEC | | | 3,100 | | | | 263,780 | |
| Nippon Telegraph & Telephone | | | 473,200 | | | | 456,560 | |
| Nitori Holdings | | | 1,400 | | | | 178,297 | |
| Obic | | | 3,100 | | | | 101,300 | |
| Oracle Japan | | | 1,100 | | | | 105,229 | |
| Osaka Soda | | | 10,600 | | | | 111,335 | |
| Pan Pacific International Holdings | | | 7,100 | | | | 176,139 | |
| Raito Kogyo | | | 4,900 | | | | 71,491 | |
| Rengo | | | 34,400 | | | | 208,359 | |
| Resona Holdings | | | 17,300 | | | | 114,141 | |
| Rohto Pharmaceutical | | | 7,100 | | | | 159,660 | |
| Shikoku Kasei Holdings | | | 2,400 | | | | 32,251 | |
| Shin-Etsu Chemical | | | 7,400 | | | | 271,165 | |
| Shizuoka Financial Group | | | 9,700 | | | | 77,402 | |
| SKY Perfect JSAT Holdings | | | 26,800 | | | | 153,065 | |
| Sony Group | | | 20,000 | | | | 351,950 | |
| Sumitomo Mitsui Financial Group | | | 24,800 | | | | 526,121 | |
| Sumitomo Mitsui Trust Holdings | | | 5,400 | | | | 118,424 | |
| Suzuki Motor | | | 16,500 | | | | 163,735 | |
| T&D Holdings | | | 6,100 | | | | 97,370 | |
| Takasago Thermal Engineering | | | 5,000 | | | | 160,346 | |
| Tokyo Electron | | | 900 | | | | 132,438 | |
| Tokyu | | | 13,000 | | | | 160,269 | |
| Toyo Suisan Kaisha | | | 2,500 | | | | 146,859 | |
| Toyota Motor | | | 25,900 | | | | 446,267 | |
| Treasure Factory | | | 6,300 | | | | 55,218 | |
| Trend Micro | | | 4,000 | | | | 209,290 | |
| | | | | | | | 12,695,052 | |
| Mexico — 0.1% | | | | | | | | |
| Gentera | | | 30,863 | | | | 39,486 | |
| Grupo Mexico | | | 17,772 | | | | 93,250 | |
| | | | | | | | 132,736 | |
| Netherlands — 0.6% | | | | | | | | |
| Argenx ADR * | | | 345 | | | | 202,273 | |
| ASM International | | | 565 | | | | 315,556 | |
| ASML Holding | | | 333 | | | | 224,153 | |
| | | | | | | | 741,982 | |
The accompanying notes are an integral part of the financial statements.
| THE ADVISORS’ INNER CIRCLE FUND III | PINEBRIDGE DYNAMIC
ASSET ALLOCATION FUND
OCTOBER 31, 2024 |
COMMON STOCK — continued
| | | Shares | | | Value | |
| Poland — 0.1% | | | | | | | | |
| Allegro.eu * | | | 7,127 | | | $ | 62,714 | |
| | | | | | | | | |
| Portugal — 0.1% | | | | | | | | |
| EDP | | | 5,672 | | | | 22,330 | |
| EDP Renovaveis | | | 1,510 | | | | 20,466 | |
| Galp Energia SGPS | | | 3,441 | | | | 58,813 | |
| | | | | | | | 101,609 | |
| South Africa — 0.0% | | | | | | | | |
| FirstRand | | | 12,683 | | | | 55,725 | |
| | | | | | | | | |
| South Korea — 0.5% | | | | | | | | |
| Samsung Electronics | | | 3,260 | | | | 138,423 | |
| SK Hynix | | | 2,566 | | | | 335,925 | |
| Woori Financial Group | | | 6,840 | | | | 76,150 | |
| | | | | | | | 550,498 | |
| Spain — 0.1% | | | | | | | | |
| Acciona | | | 187 | | | | 23,998 | |
| Endesa | | | 1,184 | | | | 25,552 | |
| Iberdrola | | | 1,765 | | | | 26,218 | |
| Redeia | | | 1,319 | | | | 24,422 | |
| | | | | | | | 100,190 | |
| Switzerland — 0.2% | | | | | | | | |
| ABB | | | 1,840 | | | | 102,251 | |
| VAT Group | | | 217 | | | | 90,357 | |
| | | | | | | | 192,608 | |
| Taiwan — 1.4% | | | | | | | | |
| Delta Electronics | | | 4,878 | | | | 60,248 | |
| Hon Hai Precision Industry | | | 20,316 | | | | 130,220 | |
| Largan Precision | | | 868 | | | | 60,795 | |
| MediaTek | | | 5,023 | | | | 195,536 | |
| Taiwan Semiconductor Manufacturing | | | 37,935 | | | | 1,189,622 | |
| | | | | | | | 1,636,421 | |
| Turkey — 0.0% | | | | | | | | |
| Akbank | | | 28,059 | | | | 41,481 | |
| | | | | | | | | |
| United Kingdom — 1.0% | | | | | | | | |
| ARM Holdings ADR * | | | 1,230 | | | | 173,799 | |
| Coats Group | | | 61,166 | | | | 75,062 | |
| Hikma Pharmaceuticals | | | 4,021 | | | | 96,303 | |
| Sage Group | | | 9,217 | | | | 115,193 | |
| Spirax Group | | | 2,809 | | | | 234,470 | |
The accompanying notes are an integral part of the financial statements.
| THE ADVISORS’ INNER CIRCLE FUND III | PINEBRIDGE DYNAMIC
ASSET ALLOCATION FUND
OCTOBER 31, 2024 |
COMMON STOCK — continued
| | | Shares | | | Value | |
| United Kingdom — continued | | | | | | | | |
| SSE | | | 958 | | | $ | 21,769 | |
| Weir Group | | | 12,969 | | | | 349,258 | |
| Yellow Cake * | | | 10,892 | | | | 76,038 | |
| | | | | | | | 1,141,892 | |
| United States — 51.3% | | | | | | | | |
| Communication Services — 2.1% | | | | | | | | |
| Alphabet, Cl A | | | 3,573 | | | | 611,376 | |
| Alphabet, Cl C | | | 315 | | | | 54,397 | |
| AT&T | | | 9,760 | | | | 219,990 | |
| Comcast, Cl A | | | 10,704 | | | | 467,444 | |
| Frontier Communications Parent * | | | 818 | | | | 29,227 | |
| Iridium Communications | | | 910 | | | | 26,690 | |
| Meta Platforms, Cl A | | | 672 | | | | 381,414 | |
| Netflix * | | | 330 | | | | 249,490 | |
| New York Times, Cl A | | | 748 | | | | 41,768 | |
| Nexstar Media Group, Cl A | | | 153 | | | | 26,916 | |
| Spotify Technology * | | | 303 | | | | 116,685 | |
| TEGNA | | | 1,570 | | | | 25,795 | |
| TKO Group Holdings, Cl A * | | | 215 | | | | 25,106 | |
| Trade Desk, Cl A * | | | 996 | | | | 119,729 | |
| Yelp, Cl A * | | | 1,411 | | | | 48,172 | |
| ZoomInfo Technologies, Cl A * | | | 1,817 | | | | 20,078 | |
| | | | | | | | 2,464,277 | |
| Consumer Discretionary — 2.7% | | | | | | | | |
| Abercrombie & Fitch, Cl A * | | | 173 | | | | 22,800 | |
| Airbnb, Cl A * | | | 742 | | | | 100,014 | |
| Amazon.com * | | | 1,170 | | | | 218,088 | |
| Aramark | | | 4,599 | | | | 173,980 | |
| Booking Holdings | | | 31 | | | | 144,964 | |
| Brunswick | | | 266 | | | | 21,211 | |
| Burlington Stores * | | | 256 | | | | 63,429 | |
| Churchill Downs | | | 256 | | | | 35,866 | |
| Columbia Sportswear | | | 317 | | | | 25,509 | |
| Crocs * | | | 264 | | | | 28,464 | |
| Dick's Sporting Goods | | | 236 | | | | 46,197 | |
| Dillard's, Cl A | | | 178 | | | | 66,131 | |
| Domino's Pizza | | | 208 | | | | 86,056 | |
| Duolingo, Cl A * | | | 128 | | | | 37,500 | |
| eBay | | | 1,998 | | | | 114,905 | |
| Five Below * | | | 305 | | | | 28,911 | |
The accompanying notes are an integral part of the financial statements.
| THE ADVISORS’ INNER CIRCLE FUND III | PINEBRIDGE DYNAMIC ASSET ALLOCATION FUND OCTOBER 31, 2024 |
| COMMON STOCK — continued | | | | | | |
| | | Shares | | | Value | |
| United States — continued | | | | | | | | |
| Consumer Discretionary — continued | | | | | | | | |
| Floor & Decor Holdings, Cl A * | | | 437 | | | $ | 45,033 | |
| GameStop, Cl A * | | | 1,099 | | | | 24,376 | |
| Gap | | | 933 | | | | 19,378 | |
| Grand Canyon Education * | | | 136 | | | | 18,647 | |
| H&R Block | | | 562 | | | | 33,568 | |
| Harley-Davidson | | | 912 | | | | 29,138 | |
| Home Depot | | | 705 | | | | 277,594 | |
| KB Home | | | 354 | | | | 27,789 | |
| Lear | | | 341 | | | | 32,654 | |
| Light & Wonder, Cl A * | | | 371 | | | | 34,792 | |
| Lithia Motors, Cl A | | | 121 | | | | 40,217 | |
| Lowe's | | | 1,205 | | | | 315,505 | |
| Lululemon Athletica * | | | 337 | | | | 100,392 | |
| Macy's | | | 1,459 | | | | 22,381 | |
| Mattel * | | | 1,517 | | | | 30,916 | |
| Murphy USA | | | 87 | | | | 42,495 | |
| NIKE, Cl B | | | 1,827 | | | | 140,916 | |
| Ollie's Bargain Outlet Holdings * | | | 226 | | | | 20,754 | |
| O'Reilly Automotive * | | | 64 | | | | 73,801 | |
| Planet Fitness, Cl A * | | | 475 | | | | 37,297 | |
| Pool | | | 103 | | | | 37,249 | |
| PVH | | | 337 | | | | 33,181 | |
| Service International | | | 645 | | | | 52,664 | |
| Taylor Morrison Home, Cl A * | | | 403 | | | | 27,605 | |
| Tempur Sealy International | | | 643 | | | | 30,806 | |
| Texas Roadhouse, Cl A | | | 175 | | | | 33,446 | |
| Thor Industries | | | 247 | | | | 25,708 | |
| TJX | | | 167 | | | | 18,876 | |
| Toll Brothers | | | 322 | | | | 47,154 | |
| TopBuild * | | | 126 | | | | 44,526 | |
| Travel + Leisure | | | 611 | | | | 29,212 | |
| Vail Resorts | | | 258 | | | | 42,748 | |
| Valvoline * | | | 769 | | | | 30,975 | |
| Visteon * | | | 247 | | | | 22,292 | |
| Whirlpool | | | 337 | | | | 34,883 | |
| Williams-Sonoma | | | 554 | | | | 74,308 | |
| Wingstop | | | 111 | | | | 31,934 | |
| Wyndham Hotels & Resorts | | | 443 | | | | 39,126 | |
| YETI Holdings * | | | 533 | | | | 18,767 | |
| | | | | | | | 3,257,128 | |
The accompanying notes are an integral part of the financial statements.
| THE ADVISORS’ INNER CIRCLE FUND III | PINEBRIDGE DYNAMIC ASSET ALLOCATION FUND OCTOBER 31, 2024 |
| COMMON STOCK — continued | | | | | | |
| | | Shares | | | Value | |
| United States — continued | | | | | | | | |
| Consumer Staples — 1.5% | | | | | | | | |
| Altria Group | | | 705 | | | $ | 38,394 | |
| BellRing Brands * | | | 454 | | | | 29,887 | |
| BJ's Wholesale Club Holdings * | | | 543 | | | | 46,008 | |
| Casey's General Stores | | | 198 | | | | 78,016 | |
| Celsius Holdings * | | | 582 | | | | 17,507 | |
| Coca-Cola | | | 2,768 | | | | 180,778 | |
| Costco Wholesale | | | 64 | | | | 55,948 | |
| Darling Ingredients * | | | 863 | | | | 33,752 | |
| elf Beauty * | | | 230 | | | | 24,208 | |
| Flowers Foods | | | 1,067 | | | | 23,719 | |
| Ingredion | | | 415 | | | | 55,095 | |
| Kroger | | | 465 | | | | 25,933 | |
| Performance Food Group * | | | 639 | | | | 51,919 | |
| Philip Morris International | | | 357 | | | | 47,374 | |
| Procter & Gamble | | | 1,657 | | | | 273,703 | |
| Sprouts Farmers Market * | | | 432 | | | | 55,482 | |
| Target | | | 575 | | | | 86,273 | |
| US Foods Holding * | | | 999 | | | | 61,588 | |
| Walmart | | | 7,678 | | | | 629,212 | |
| | | | | | | | 1,814,796 | |
| Energy — 1.3% | | | | | | | | |
| Antero Midstream | | | 1,608 | | | | 23,107 | |
| Antero Resources * | | | 1,325 | | | | 34,291 | |
| Cameco | | | 1,623 | | | | 84,753 | |
| ChampionX | | | 893 | | | | 25,200 | |
| Chesapeake Energy | | | 807 | | | | 68,369 | |
| Chevron | | | 888 | | | | 132,152 | |
| Chord Energy | | | 183 | | | | 22,893 | |
| Civitas Resources | | | 360 | | | | 17,564 | |
| CNX Resources * | | | 820 | | | | 27,905 | |
| ConocoPhillips | | | 322 | | | | 35,272 | |
| Denison Mines * | | | 38,096 | | | | 80,002 | |
| DT Midstream | | | 543 | | | | 48,951 | |
| EOG Resources | | | 109 | | | | 13,294 | |
| Exxon Mobil | | | 2,409 | | | | 281,323 | |
| HF Sinclair | | | 569 | | | | 21,969 | |
| Marathon Petroleum | | | 639 | | | | 92,955 | |
| Murphy Oil | | | 686 | | | | 21,595 | |
| NexGen Energy * | | | 11,244 | | | | 82,756 | |
| NOV | | | 1,768 | | | | 27,422 | |
The accompanying notes are an integral part of the financial statements.
| THE ADVISORS’ INNER CIRCLE FUND III | PINEBRIDGE DYNAMIC ASSET ALLOCATION FUND OCTOBER 31, 2024 |
| COMMON STOCK — continued | | | | | | |
| | | Shares | | | Value | |
| United States — continued | | | | | | | | |
| Energy — continued | | | | | | | | |
| Ovintiv | | | 1,210 | | | $ | 47,432 | |
| Permian Resources, Cl A | | | 2,039 | | | | 27,792 | |
| Range Resources | | | 1,195 | | | | 35,886 | |
| Texas Pacific Land | | | 72 | | | | 83,952 | |
| Uranium Energy * | | | 12,235 | | | | 90,784 | |
| Valero Energy | | | 345 | | | | 44,767 | |
| Weatherford International | | | 298 | | | | 23,542 | |
| | | | | | | | 1,495,928 | |
| Financials — 10.5% | | | | | | | | |
| Affiliated Managers Group | | | 181 | | | | 35,096 | |
| Ally Financial | | | 1,137 | | | | 39,852 | |
| Ameriprise Financial | | | 32 | | | | 16,330 | |
| Annaly Capital Management ‡ | | | 2,203 | | | | 41,879 | |
| Associated Banc-Corp | | | 1,359 | | | | 32,263 | |
| Bank of America | | | 31,214 | | | | 1,305,369 | |
| Bank OZK | | | 515 | | | | 22,531 | |
| Cadence Bank | | | 976 | | | | 32,628 | |
| Carlyle Group | | | 850 | | | | 42,526 | |
| Citigroup | | | 8,959 | | | | 574,899 | |
| CME Group, Cl A | | | 1,167 | | | | 262,995 | |
| CNO Financial Group | | | 760 | | | | 26,144 | |
| Columbia Banking System | | | 1,003 | | | | 28,596 | |
| Commerce Bancshares | | | 694 | | | | 43,375 | |
| East West Bancorp | | | 571 | | | | 55,667 | |
| Equitable Holdings | | | 1,225 | | | | 55,542 | |
| Erie Indemnity, Cl A | | | 68 | | | | 30,521 | |
| Essent Group | | | 366 | | | | 21,964 | |
| Evercore, Cl A | | | 357 | | | | 94,309 | |
| Fidelity National Financial | | | 795 | | | | 47,835 | |
| Fidelity National Information Services | | | 2,166 | | | | 194,355 | |
| First American Financial | | | 609 | | | | 39,067 | |
| First Horizon | | | 2,124 | | | | 36,809 | |
| Glacier Bancorp | | | 884 | | | | 46,101 | |
| Goldman Sachs Group | | | 2,041 | | | | 1,056,809 | |
| Hanover Insurance Group | | | 236 | | | | 35,006 | |
| Interactive Brokers Group, Cl A | | | 383 | | | | 58,438 | |
| Invesco | | | 3,687 | | | | 63,933 | |
| Janus Henderson Group | | | 1,133 | | | | 46,804 | |
| Jefferies Financial Group | | | 631 | | | | 40,371 | |
| JPMorgan Chase | | | 15,883 | | | | 3,524,755 | |
The accompanying notes are an integral part of the financial statements.
| THE ADVISORS’ INNER CIRCLE FUND III | PINEBRIDGE DYNAMIC ASSET ALLOCATION FUND OCTOBER 31, 2024 |
| COMMON STOCK — continued | | | | | | |
| | | Shares | | | Value | |
| United States — continued | | | | | | | | |
| Financials — continued | | | | | | | | |
| Kinsale Capital Group | | | 83 | | | $ | 35,533 | |
| MarketAxess Holdings | | | 422 | | | | 122,135 | |
| Mastercard, Cl A | | | 847 | | | | 423,153 | |
| MGIC Investment | | | 1,180 | | | | 29,547 | |
| Morgan Stanley | | | 5,996 | | | | 697,035 | |
| Morningstar | | | 102 | | | | 33,461 | |
| Old National Bancorp | | | 1,510 | | | | 29,083 | |
| Old Republic International | | | 910 | | | | 31,786 | |
| PayPal Holdings * | | | 1,329 | | | | 105,390 | |
| Pinnacle Financial Partners | | | 403 | | | | 42,496 | |
| Primerica | | | 158 | | | | 43,736 | |
| Progressive | | | 1,111 | | | | 269,784 | |
| Reinsurance Group of America | | | 228 | | | | 48,126 | |
| RenaissanceRe Holdings | | | 168 | | | | 44,083 | |
| RLI | | | 230 | | | | 35,873 | |
| Selective Insurance Group | | | 535 | | | | 48,589 | |
| SLM | | | 1,103 | | | | 24,299 | |
| SouthState | | | 411 | | | | 40,085 | |
| State Street | | | 3,531 | | | | 327,677 | |
| Stifel Financial | | | 320 | | | | 33,158 | |
| Synovus Financial | | | 899 | | | | 44,833 | |
| T Rowe Price Group | | | 794 | | | | 87,229 | |
| Truist Financial | | | 3,502 | | | | 150,761 | |
| UMB Financial | | | 313 | | | | 34,345 | |
| United Bankshares | | | 858 | | | | 32,329 | |
| Unum Group | | | 569 | | | | 36,518 | |
| Valley National Bancorp | | | 3,668 | | | | 34,736 | |
| Visa, Cl A | | | 1,533 | | | | 444,340 | |
| Voya Financial | | | 501 | | | | 40,230 | |
| Webster Financial | | | 805 | | | | 41,699 | |
| Wells Fargo | | | 16,240 | | | | 1,054,301 | |
| Western Union | | | 2,021 | | | | 21,746 | |
| WEX * | | | 239 | | | | 41,251 | |
| Willis Towers Watson | | | 308 | | | | 93,075 | |
| Zions Bancorp | | | 743 | | | | 38,681 | |
| | | | | | | | 12,613,872 | |
| Health Care — 3.0% | | | | | | | | |
| Abbott Laboratories | | | 2,723 | | | | 308,707 | |
| Acadia Healthcare * | | | 530 | | | | 22,626 | |
| Alcon | | | 2,194 | | | | 201,738 | |
The accompanying notes are an integral part of the financial statements.
| THE ADVISORS’ INNER CIRCLE FUND III | PINEBRIDGE DYNAMIC ASSET ALLOCATION FUND OCTOBER 31, 2024 |
| COMMON STOCK — continued | | | | | | |
| | | Shares | | | Value | |
| United States — continued | | | | | | | | |
| Health Care — continued | | | | | | | | |
| Amedisys * | | | 215 | | | $ | 20,339 | |
| Avantor * | | | 2,588 | | | | 57,894 | |
| BioMarin Pharmaceutical * | | | 756 | | | | 49,813 | |
| Bristol-Myers Squibb | | | 392 | | | | 21,862 | |
| Bruker | | | 471 | | | | 26,663 | |
| Charles River Laboratories International * | | | 667 | | | | 119,113 | |
| Chemed | | | 62 | | | | 33,495 | |
| Cigna Group | | | 52 | | | | 16,370 | |
| CVS Health | | | 224 | | | | 12,647 | |
| Cytokinetics * | | | 511 | | | | 26,061 | |
| Danaher | | | 351 | | | | 86,227 | |
| DENTSPLY SIRONA | | | 1,274 | | | | 29,519 | |
| Edwards Lifesciences * | | | 216 | | | | 14,474 | |
| Elevance Health | | | 198 | | | | 80,340 | |
| Encompass Health | | | 505 | | | | 50,227 | |
| Exelixis * | | | 1,086 | | | | 36,055 | |
| Gilead Sciences | | | 175 | | | | 15,543 | |
| Globus Medical, Cl A * | | | 454 | | | | 33,387 | |
| Haemonetics * | | | 315 | | | | 22,415 | |
| Halozyme Therapeutics * | | | 547 | | | | 27,662 | |
| HealthEquity * | | | 386 | | | | 32,906 | |
| IDEXX Laboratories * | | | 628 | | | | 255,546 | |
| Illumina * | | | 650 | | | | 93,691 | |
| Intuitive Surgical * | | | 61 | | | | 30,734 | |
| Jazz Pharmaceuticals * | | | 322 | | | | 35,430 | |
| Johnson & Johnson | | | 2,407 | | | | 384,783 | |
| Lantheus Holdings * | | | 302 | | | | 33,172 | |
| Medpace Holdings * | | | 87 | | | | 27,337 | |
| Merck | | | 1,870 | | | | 191,338 | |
| Mettler-Toledo International * | | | 56 | | | | 72,338 | |
| Neurocrine Biosciences * | | | 422 | | | | 50,754 | |
| Option Care Health * | | | 856 | | | | 19,722 | |
| Penumbra * | | | 202 | | | | 46,232 | |
| Repligen * | | | 253 | | | | 33,970 | |
| Sarepta Therapeutics * | | | 351 | | | | 44,226 | |
| Tenet Healthcare * | | | 345 | | | | 53,482 | |
| Thermo Fisher Scientific | | | 485 | | | | 264,965 | |
| United Therapeutics * | | | 181 | | | | 67,689 | |
| UnitedHealth Group | | | 367 | | | | 207,171 | |
| Veeva Systems, Cl A * | | | 655 | | | | 136,784 | |
The accompanying notes are an integral part of the financial statements.
| THE ADVISORS’ INNER CIRCLE FUND III | PINEBRIDGE DYNAMIC ASSET ALLOCATION FUND OCTOBER 31, 2024 |
| COMMON STOCK — continued | | | | | | |
| | | Shares | | | Value | |
| United States — continued | | | | | | | | |
| Health Care — continued | | | | | | | | |
| Vertex Pharmaceuticals * | | | 274 | | | $ | 130,419 | |
| | | | | | | | 3,525,866 | |
| Industrials — 5.2% | | | | | | | | |
| Acuity Brands | | | 179 | | | | 53,824 | |
| Advanced Drainage Systems | | | 273 | | | | 40,917 | |
| AECOM | | | 541 | | | | 57,779 | |
| AGCO | | | 330 | | | | 32,947 | |
| Allegion | | | 1,890 | | | | 263,901 | |
| Applied Industrial Technologies | | | 149 | | | | 34,507 | |
| Automatic Data Processing | | | 109 | | | | 31,527 | |
| Booz Allen Hamilton Holding, Cl A | | | 670 | | | | 121,712 | |
| Broadridge Financial Solutions | | | 804 | | | | 169,531 | |
| BWX Technologies | | | 1,183 | | | | 144,030 | |
| CACI International, Cl A * | | | 89 | | | | 49,178 | |
| Carlisle | | | 164 | | | | 69,246 | |
| Caterpillar | | | 330 | | | | 124,146 | |
| Chart Industries * | | | 187 | | | | 22,575 | |
| Cintas | | | 421 | | | | 86,646 | |
| Clean Harbors * | | | 132 | | | | 30,526 | |
| Comfort Systems USA | | | 149 | | | | 58,265 | |
| Core & Main, Cl A * | | | 765 | | | | 33,874 | |
| Crane | | | 219 | | | | 34,444 | |
| Curtiss-Wright | | | 141 | | | | 48,639 | |
| Donaldson | | | 686 | | | | 50,188 | |
| Eaton | | | 337 | | | | 111,743 | |
| EMCOR Group | | | 311 | | | | 138,728 | |
| Emerson Electric | | | 119 | | | | 12,884 | |
| ExlService Holdings * | | | 982 | | | | 40,920 | |
| Exponent | | | 207 | | | | 19,537 | |
| Fastenal | | | 301 | | | | 23,532 | |
| FedEx | | | 245 | | | | 67,093 | |
| Flowserve | | | 662 | | | | 34,848 | |
| Fluor * | | | 588 | | | | 30,741 | |
| Fortune Brands Innovations | | | 788 | | | | 65,664 | |
| FTI Consulting * | | | 166 | | | | 32,383 | |
| GATX | | | 279 | | | | 38,435 | |
| GE Vernova * | | | 323 | | | | 97,436 | |
| Generac Holdings * | | | 278 | | | | 46,023 | |
| General Electric | | | 873 | | | | 149,964 | |
| Graco | | | 814 | | | | 66,300 | |
The accompanying notes are an integral part of the financial statements.
| THE ADVISORS’ INNER CIRCLE FUND III | PINEBRIDGE DYNAMIC ASSET ALLOCATION FUND OCTOBER 31, 2024 |
| COMMON STOCK — continued | | | | | | |
| | | Shares | | | Value | |
| United States — continued | | | | | | | | |
| Industrials — continued | | | | | | | | |
| GXO Logistics * | | | 635 | | | $ | 37,979 | |
| Hexcel | | | 460 | | | | 26,997 | |
| Honeywell International | | | 1,801 | | | | 370,430 | |
| Hubbell, Cl B | | | 122 | | | | 52,098 | |
| Illinois Tool Works | | | 306 | | | | 79,906 | |
| ITT | | | 362 | | | | 50,723 | |
| KBR | | | 788 | | | | 52,804 | |
| Knight-Swift Transportation Holdings, Cl A | | | 690 | | | | 35,935 | |
| Landstar System | | | 503 | | | | 88,412 | |
| Lennox International | | | 147 | | | | 88,578 | |
| Lincoln Electric Holdings | | | 256 | | | | 49,295 | |
| Lockheed Martin | | | 32 | | | | 17,474 | |
| MasTec * | | | 1,292 | | | | 158,774 | |
| MSA Safety | | | 211 | | | | 35,015 | |
| NuScale Power * | | | 7,484 | | | | 143,244 | |
| nVent Electric | | | 1,238 | | | | 92,318 | |
| Old Dominion Freight Line | | | 476 | | | | 95,828 | |
| Owens Corning | | | 362 | | | | 63,998 | |
| Parker-Hannifin | | | 174 | | | | 110,328 | |
| Paychex | | | 996 | | | | 138,773 | |
| Paylocity Holding * | | | 247 | | | | 45,589 | |
| Quanta Services | | | 511 | | | | 154,133 | |
| Regal Rexnord | | | 266 | | | | 44,300 | |
| Republic Services, Cl A | | | 322 | | | | 63,756 | |
| Rockwell Automation | | | 765 | | | | 204,033 | |
| Ryder System | | | 273 | | | | 39,934 | |
| Saia * | | | 104 | | | | 50,815 | |
| Simpson Manufacturing | | | 164 | | | | 29,486 | |
| Sunrun * | | | 2,655 | | | | 38,365 | |
| Terex | | | 398 | | | | 20,581 | |
| Tetra Tech | | | 959 | | | | 46,876 | |
| Toro | | | 545 | | | | 43,862 | |
| Trane Technologies | | | 269 | | | | 99,573 | |
| Trex * | | | 371 | | | | 26,285 | |
| UFP Industries | | | 175 | | | | 21,410 | |
| Union Pacific | | | 1,048 | | | | 243,209 | |
| United Parcel Service, Cl B | | | 695 | | | | 93,172 | |
| United Rentals | | | 129 | | | | 104,851 | |
| Valmont Industries | | | 94 | | | | 29,298 | |
| Vertiv Holdings, Cl A | | | 600 | | | | 65,574 | |
The accompanying notes are an integral part of the financial statements.
| THE ADVISORS’ INNER CIRCLE FUND III | PINEBRIDGE DYNAMIC ASSET ALLOCATION FUND OCTOBER 31, 2024 |
| COMMON STOCK — continued | | | | | | |
| | | Shares | | | Value | |
| United States — continued | | | | | | | | |
| Industrials — continued | | | | | | | | |
| Watsco | | | 126 | | | $ | 59,599 | |
| Watts Water Technologies, Cl A | | | 207 | | | | 39,452 | |
| WESCO International | | | 196 | | | | 37,626 | |
| Westinghouse Air Brake Technologies | | | 1,148 | | | | 215,801 | |
| Woodward | | | 290 | | | | 47,586 | |
| WW Grainger | | | 30 | | | | 33,277 | |
| XPO * | | | 428 | | | | 55,867 | |
| | | | | | | | 6,277,852 | |
| Information Technology — 20.9% | | | | | | | | |
| Accenture, Cl A | | | 1,401 | | | | 483,093 | |
| Adobe * | | | 835 | | | | 399,197 | |
| Advanced Micro Devices * | | | 1,920 | | | | 276,614 | |
| Akamai Technologies * | | | 2,582 | | | | 260,988 | |
| Amphenol, Cl A | | | 1,352 | | | | 90,611 | |
| Analog Devices | | | 773 | | | | 172,464 | |
| Appfolio, Cl A * | | | 113 | | | | 23,489 | |
| Apple | | | 1,972 | | | | 445,494 | |
| Applied Materials | | | 934 | | | | 169,596 | |
| AppLovin, Cl A * | | | 3,111 | | | | 526,972 | |
| Arista Networks * | | | 474 | | | | 183,172 | |
| ASGN * | | | 309 | | | | 28,459 | |
| Aspen Technology * | | | 155 | | | | 36,383 | |
| Atlassian, Cl A * | | | 805 | | | | 151,775 | |
| Autodesk * | | | 544 | | | | 154,387 | |
| Avnet | | | 816 | | | | 44,235 | |
| Belden | | | 262 | | | | 29,834 | |
| Blackbaud * | | | 315 | | | | 23,786 | |
| Broadcom | | | 7,210 | | | | 1,224,042 | |
| Cadence Design Systems * | | | 630 | | | | 173,956 | |
| CCC Intelligent Solutions Holdings * | | | 19,099 | | | | 198,821 | |
| Check Point Software Technologies * | | | 1,461 | | | | 253,060 | |
| Ciena * | | | 658 | | | | 41,790 | |
| Cirrus Logic * | | | 266 | | | | 29,212 | |
| Cisco Systems | | | 4,408 | | | | 241,426 | |
| Cloudflare, Cl A * | | | 3,981 | | | | 349,173 | |
| Cognex | | | 699 | | | | 28,121 | |
| Coherent * | | | 533 | | | | 49,270 | |
| CommVault Systems * | | | 185 | | | | 28,895 | |
| Crowdstrike Holdings, Cl A * | | | 1,916 | | | | 568,803 | |
| CyberArk Software * | | | 859 | | | | 237,531 | |
The accompanying notes are an integral part of the financial statements.
| THE ADVISORS’ INNER CIRCLE FUND III | PINEBRIDGE DYNAMIC ASSET ALLOCATION FUND OCTOBER 31, 2024 |
| COMMON STOCK — continued | | | | | | |
| | | Shares | | | Value | |
| United States — continued | | | | | | | | |
| Information Technology — continued | | | | | | | | |
| Datadog, Cl A * | | | 3,222 | | | $ | 404,168 | |
| DocuSign, Cl A * | | | 1,778 | | | | 123,358 | |
| Dolby Laboratories, Cl A | | | 454 | | | | 33,097 | |
| Dropbox, Cl A * | | | 1,204 | | | | 31,123 | |
| Dynatrace * | | | 6,041 | | | | 325,006 | |
| Enphase Energy * | | | 401 | | | | 33,299 | |
| First Solar * | | | 213 | | | | 41,424 | |
| Fortinet * | | | 8,067 | | | | 634,550 | |
| Gartner * | | | 27 | | | | 13,567 | |
| Gen Digital | | | 12,308 | | | | 358,286 | |
| GLOBALFOUNDRIES * | | | 2,765 | | | | 100,922 | |
| GoDaddy, Cl A * | | | 795 | | | | 132,606 | |
| Guidewire Software * | | | 672 | | | | 125,167 | |
| HubSpot * | | | 243 | | | | 134,814 | |
| International Business Machines | | | 913 | | | | 188,735 | |
| Intuit | | | 358 | | | | 218,487 | |
| KLA | | | 228 | | | | 151,900 | |
| Kyndryl Holdings * | | | 935 | | | | 21,402 | |
| Lam Research | | | 2,211 | | | | 164,388 | |
| Lattice Semiconductor * | | | 752 | | | | 38,096 | |
| Littelfuse | | | 130 | | | | 31,802 | |
| Manhattan Associates * | | | 695 | | | | 183,035 | |
| Marvell Technology | | | 2,113 | | | | 169,272 | |
| Microchip Technology | | | 1,710 | | | | 125,463 | |
| Micron Technology | | | 1,592 | | | | 158,643 | |
| Microsoft | | | 9,864 | | | | 4,008,236 | |
| MKS Instruments | | | 334 | | | | 33,176 | |
| Monday.com * | | | 444 | | | | 130,478 | |
| MongoDB, Cl A * | | | 467 | | | | 126,277 | |
| Motorola Solutions | | | 676 | | | | 303,761 | |
| Novanta * | | | 200 | | | | 34,048 | |
| Nutanix, Cl A * | | | 2,027 | | | | 125,877 | |
| NVIDIA | | | 24,143 | | | | 3,205,225 | |
| Okta, Cl A * | | | 3,247 | | | | 233,427 | |
| ON Semiconductor * | | | 1,616 | | | | 113,912 | |
| Onto Innovation * | | | 232 | | | | 46,013 | |
| Oracle | | | 3,640 | | | | 610,938 | |
| Palantir Technologies, Cl A * | | | 3,433 | | | | 142,675 | |
| Palo Alto Networks * | | | 1,892 | | | | 681,744 | |
| Power Integrations | | | 409 | | | | 24,716 | |
The accompanying notes are an integral part of the financial statements.
| THE ADVISORS’ INNER CIRCLE FUND III | PINEBRIDGE DYNAMIC ASSET ALLOCATION FUND OCTOBER 31, 2024 |
| COMMON STOCK — continued | | | | | | |
| | | Shares | | | Value | |
| United States — continued | | | | | | | | |
| Information Technology — continued | | | | | | | | |
| Pure Storage, Cl A * | | | 3,502 | | | $ | 175,275 | |
| QUALCOMM | | | 3,054 | | | | 497,100 | |
| Rambus * | | | 599 | | | | 28,644 | |
| Roper Technologies | | | 449 | | | | 241,441 | |
| Salesforce | | | 969 | | | | 282,338 | |
| Samsara, Cl A * | | | 2,347 | | | | 112,163 | |
| SentinelOne, Cl A * | | | 8,730 | | | | 225,147 | |
| ServiceNow * | | | 501 | | | | 467,428 | |
| Silicon Laboratories * | | | 247 | | | | 25,653 | |
| Snowflake, Cl A * | | | 1,158 | | | | 132,962 | |
| SolarEdge Technologies * | | | 1,660 | | | | 28,320 | |
| Super Micro Computer * | | | 3,697 | | | | 107,620 | |
| Synopsys * | | | 815 | | | | 418,592 | |
| TD SYNNEX | | | 239 | | | | 27,569 | |
| TE Connectivity | | | 1,868 | | | | 275,381 | |
| Teradata * | | | 714 | | | | 23,012 | |
| Texas Instruments | | | 1,208 | | | | 245,417 | |
| Twilio, Cl A * | | | 1,755 | | | | 141,541 | |
| Universal Display | | | 166 | | | | 29,933 | |
| Varonis Systems, Cl B * | | | 3,681 | | | | 185,412 | |
| Workday, Cl A * | | | 637 | | | | 148,962 | |
| Zoom Video Communications, Cl A * | | | 1,831 | | | | 136,849 | |
| Zscaler * | | | 1,754 | | | | 317,106 | |
| | | | | | | | 24,961,627 | |
| Materials — 0.8% | | | | | | | | |
| Alcoa | | | 771 | | | | 30,909 | |
| AptarGroup | | | 307 | | | | 51,548 | |
| Axalta Coating Systems * | | | 1,419 | | | | 53,809 | |
| Berry Global Group | | | 556 | | | | 39,170 | |
| Cabot | | | 309 | | | | 33,320 | |
| Chemours | | | 869 | | | | 15,781 | |
| Cleveland-Cliffs * | | | 1,849 | | | | 24,000 | |
| Commercial Metals | | | 639 | | | | 34,378 | |
| Crown Holdings | | | 486 | | | | 45,465 | |
| DuPont de Nemours | | | 1,136 | | | | 94,277 | |
| Graphic Packaging Holding | | | 1,442 | | | | 40,751 | |
| Knife River * | | | 285 | | | | 27,736 | |
| Linde | | | 412 | | | | 187,934 | |
| Louisiana-Pacific | | | 281 | | | | 27,791 | |
| Olin | | | 624 | | | | 25,603 | |
The accompanying notes are an integral part of the financial statements.
| THE ADVISORS’ INNER CIRCLE FUND III | PINEBRIDGE DYNAMIC ASSET ALLOCATION FUND OCTOBER 31, 2024 |
| COMMON STOCK — continued | | | | | | |
| | | Shares | | | Value | |
| United States — continued | | | | | | | | |
| Materials — continued | | | | | | | | |
| Reliance | | | 219 | | | $ | 62,709 | |
| Royal Gold | | | 322 | | | | 47,031 | |
| RPM International | | | 547 | | | | 69,529 | |
| Sonoco Products | | | 577 | | | | 30,304 | |
| Southern Copper | | | 291 | | | | 31,879 | |
| | | | | | | | 973,924 | |
| Real Estate — 2.6% | | | | | | | | |
| Agree Realty ‡ | | | 396 | | | | 29,403 | |
| American Homes 4 Rent, Cl A ‡ | | | 1,044 | | | | 36,791 | |
| American Tower ‡ | | | 1,503 | | | | 320,951 | |
| Brixmor Property Group ‡ | | | 1,227 | | | | 33,068 | |
| COPT Defense Properties ‡ | | | 1,057 | | | | 34,035 | |
| Cousins Properties ‡ | | | 1,370 | | | | 41,963 | |
| Crown Castle ‡ | | | 2,506 | | | | 269,370 | |
| CubeSmart ‡ | | | 1,110 | | | | 53,102 | |
| Digital Realty Trust ‡ | | | 1,815 | | | | 323,487 | |
| EastGroup Properties ‡ | | | 245 | | | | 41,964 | |
| Equinix ‡ | | | 379 | | | | 344,162 | |
| Equity LifeStyle Properties ‡ | | | 515 | | | | 36,112 | |
| First Industrial Realty Trust ‡ | | | 569 | | | | 29,867 | |
| Healthcare Realty Trust, Cl A ‡ | | | 1,591 | | | | 27,333 | |
| Healthpeak Properties ‡ | | | 4,096 | | | | 91,955 | |
| Iron Mountain ‡ | | | 2,057 | | | | 254,513 | |
| Jones Lang LaSalle * | | | 601 | | | | 162,847 | |
| Kilroy Realty ‡ | | | 705 | | | | 28,355 | |
| NNN REIT ‡ | | | 694 | | | | 30,147 | |
| Omega Healthcare Investors ‡ | | | 1,180 | | | | 50,115 | |
| PotlatchDeltic ‡ | | | 984 | | | | 40,905 | |
| Prologis ‡ | | | 2,794 | | | | 315,554 | |
| Rayonier ‡ | | | 1,065 | | | | 33,260 | |
| Rexford Industrial Realty ‡ | | | 5,276 | | | | 226,288 | |
| SBA Communications, Cl A ‡ | | | 951 | | | | 218,226 | |
| WP Carey ‡ | | | 1,010 | | | | 56,277 | |
| | | | | | | | 3,130,050 | |
| Utilities — 0.7% | | | | | | | | |
| Brookfield Renewable, Cl A | | | 433 | | | | 13,241 | |
| Clearway Energy, Cl C | | | 454 | | | | 12,885 | |
| Constellation Energy | | | 1,789 | | | | 470,435 | |
| Essential Utilities | | | 1,393 | | | | 53,770 | |
The accompanying notes are an integral part of the financial statements.
| THE ADVISORS’ INNER CIRCLE FUND III | PINEBRIDGE DYNAMIC ASSET ALLOCATION FUND OCTOBER 31, 2024 |
| COMMON STOCK — continued | | | | | | |
| | | Shares | | | Value | |
| United States — continued | | | | | | | | |
| Utilities — continued | | | | | | | | |
| IDACORP, Rights | | | 602 | | | $ | 62,295 | |
| MDU Resources Group | | | 1,438 | | | | 41,486 | |
| National Fuel Gas | | | 464 | | | | 28,086 | |
| New Jersey Resources | | | 805 | | | | 36,942 | |
| NextEra Energy | | | 160 | | | | 12,680 | |
| ONE Gas | | | 701 | | | | 49,960 | |
| Portland General Electric | | | 841 | | | | 39,863 | |
| UGI | | | 1,693 | | | | 40,480 | |
| | | | | | | | 862,123 | |
| | | | | | | | 61,377,443 | |
| TOTAL COMMON STOCK | | | | | | | | |
| (Cost $71,977,357) | | | | | | | 92,741,993 | |
| CORPORATE OBLIGATIONS — 5.4% | | | | | | | | |
| | | Face Amount(1) | | | | |
| Australia — 0.2% | | | | | | |
| APA Infrastructure | | | | | | | | |
| 5.750%, 09/16/2044(A) | | $ | 32,000 | | | | 31,381 | |
| Scentre Group Trust 2 | | | | | | | | |
| 5.125%, H15T5Y + 4.685%, 09/24/2080(B) | | | 200,000 | | | | 196,055 | |
| | | | | | | | 227,436 | |
| China — 1.3% | | | | | | | | |
| Fortune Star BVI | | | | | | | | |
| 5.950%, 10/19/2025 | | | 267,000 | | | | 262,041 | |
| GLP China Holdings MTN | | | | | | | | |
| 2.950%, 03/29/2026 | | | 200,000 | | | | 181,287 | |
| Health & Happiness H&H International Holdings | | | | | | | | |
| 13.500%, 06/26/2026 | | | 200,000 | | | | 213,094 | |
| Huarong Finance 2019 MTN | | | | | | | | |
| 4.250%, H15T5Y + 6.979%, (B) (C) | | | 200,000 | | | | 196,696 | |
| New Metro Global | | | | | | | | |
| 4.800%, 12/15/2024 | | | 200,000 | | | | 195,000 | |
| Vanke Real Estate Hong Kong MTN | | | | | | | | |
| 3.975%, 11/09/2027 | | | 200,000 | | | | 131,100 | |
| Yanlord Land HK | | | | | | | | |
| 5.125%, 05/20/2026 | | | 365,000 | | | | 342,837 | |
| | | | | | | | 1,522,055 | |
The accompanying notes are an integral part of the financial statements.
| THE ADVISORS’ INNER CIRCLE FUND III | PINEBRIDGE DYNAMIC ASSET ALLOCATION FUND OCTOBER 31, 2024 |
| CORPORATE OBLIGATIONS — continued | | | | | | |
| | | Face Amount(1) | | | Value | |
| Hong Kong — 1.0% | | | | | | | | |
| Bank of East Asia MTN | | | | | | | | |
| 5.825%, H15T5Y + 5.527%, (B) (C) | | $ | 250,000 | | | $ | 248,375 | |
| LS Finance 2025 | | | | | | | | |
| 4.500%, 06/26/2025 | | | 400,000 | | | | 387,000 | |
| Melco Resorts Finance | | | | | | | | |
| 5.250%, 04/26/2026 | | | 200,000 | | | | 196,168 | |
| NWD Finance BVI | | | | | | | | |
| 5.250%, H15T5Y + 7.889%, (B) (C) | | | 200,000 | | | | 167,000 | |
| 4.800%, (C) | | | 200,000 | | | | 89,300 | |
| Yuexiu REIT MTN | | | | | | | | |
| 2.650%, 02/02/2026 | | | 200,000 | | | | 188,658 | |
| | | | | | | | 1,276,501 | |
| India — 0.8% | | | | | | | | |
| Clean Renewable Power Mauritius Pte | | | | | | | | |
| 4.250%, 03/25/2027 | | | 167,500 | | | | 160,228 | |
| Greenko Dutch | | | | | | | | |
| 3.850%, 03/29/2026 | | | 223,750 | | | | 215,471 | |
| India Cleantech Energy | | | | | | | | |
| 4.700%, 08/10/2026 | | | 205,250 | | | | 198,990 | |
| India Green Power Holdings | | | | | | | | |
| 4.000%, 02/22/2027 | | | 233,325 | | | | 221,190 | |
| SAEL | | | | | | | | |
| 7.800%, 07/31/2031(A) | | | 200,000 | | | | 202,439 | |
| | | | | | | | 998,318 | |
| Indonesia — 0.5% | | | | | | | | |
| Indika Energy | | | | | | | | |
| 8.750%, 05/07/2029(A) | | | 250,000 | | | | 257,061 | |
| Medco Bell Pte | | | | | | | | |
| 6.375%, 01/30/2027 | | | 230,000 | | | | 228,896 | |
| Minejesa Capital BV | | | | | | | | |
| 5.625%, 08/10/2037 | | | 200,000 | | | | 188,151 | |
| | | | | | | | 674,108 | |
| Japan — 0.3% | | | | | | | | |
| Rakuten Group | | | | | | | | |
| 5.125%, H15T5Y + 4.578%, (B) (C) | | | 350,000 | | | | 335,125 | |
| | | | | | | | | |
| Macau — 0.5% | | | | | | | | |
| Champion Path Holdings | | | | | | | | |
| 4.850%, 01/27/2028 | | | 200,000 | | | | 187,500 | |
| MGM China Holdings | | | | | | | | |
| 5.250%, 06/18/2025 | | | 200,000 | | | | 198,524 | |
The accompanying notes are an integral part of the financial statements.
| THE ADVISORS’ INNER CIRCLE FUND III | PINEBRIDGE DYNAMIC ASSET ALLOCATION FUND OCTOBER 31, 2024 |
| CORPORATE OBLIGATIONS — continued | | | | | | |
| | | Face Amount(1) | | | Value | |
| Macau — continued | | | | | | | | |
| Studio City Finance | | | | | | | | |
| 6.500%, 01/15/2028 | | $ | 230,000 | | | $ | 221,520 | |
| | | | | | | | 607,544 | |
| | | | | | | | | |
| Mongolia — 0.2% | | | | | | | | |
| Mongolian Mining | | | | | | | | |
| 12.500%, 09/13/2026 | | | 200,000 | | | | 217,000 | |
| | | | | | | | | |
| Nigeria — 0.2% | | | | | | | | |
| IHS Netherlands Holdco | | | | | | | | |
| 8.000%, 09/18/2027 | | | 200,000 | | | | 199,802 | |
| | | | | | | | | |
| Singapore — 0.2% | | | | | | | | |
| GLP Pte MTN | | | | | | | | |
| 3.875%, 06/04/2025 | | | 250,000 | | | | 243,743 | |
| | | | | | | | | |
| United Kingdom — 0.2% | | | | | | | | |
| Standard Chartered | | | | | | | | |
| 7.750%, H15T5Y + 4.976%, (B) (C) | | | 200,000 | | | | 205,706 | |
| | | | | | | | | |
| TOTAL CORPORATE OBLIGATIONS | | | | | | | | |
| (Cost $6,259,414) | | | | | | | 6,507,338 | |
| EXCHANGE TRADED FUNDS — 4.5% | | | | | | |
| | | Shares | | | | |
| United States — 4.5% | | | | | | | | |
| Invesco DB Precious Metals Fund | | | 36,047 | | | | 2,399,865 | |
| iShares Core S&P Mid-Capital ETF | | | 48,897 | | | | 3,026,724 | |
| | | | | | | | | |
| TOTAL EXCHANGE TRADED FUNDS | | | | | | | | |
| (Cost $4,818,192) | | | | | | | 5,426,589 | |
| SOVEREIGN DEBT — 0.2% | | | | | | |
| | | Face Amount(1) | | | | |
| Pakistan — 0.2% | | | | | | | | |
| Pakistan Government International Bond | | | | | | | | |
| 6.000%, 04/08/2026 | | $ | 200,000 | | | | 187,716 | |
| | | | | | | | | |
| TOTAL SOVEREIGN DEBT | | | | | | | | |
| (Cost $188,580) | | | | | | | 187,716 | |
The accompanying notes are an integral part of the financial statements.
| THE ADVISORS’ INNER CIRCLE FUND III | PINEBRIDGE DYNAMIC ASSET ALLOCATION FUND OCTOBER 31, 2024 |
| CONVERTIBLE BOND — 0.2% | | | | | | |
| | | Face Amount(1) | | | Value | |
| Macau — 0.2% | | | | | | | | |
| Wynn Macau | | | | | | | | |
| 4.500%, 03/07/2029(A) | | $ | 200,000 | | | $ | 204,302 | |
| | | | | | | | | |
| TOTAL CONVERTIBLE BONDS | | | | | | | | |
| (Cost $214,325) | | | | | | | 204,302 | |
| | | | | | | | | |
| U.S. TREASURY OBLIGATIONS — 4.0% | | | | | | | | |
| | | | | | | | | |
| U.S. Treasury Bills | | | | | | | | |
| 4.670%, 11/19/2024(D)(E) | | | 2,408,000 | | | | 2,402,434 | |
| 4.637%, 12/17/2024(D)(E) | | | 2,416,000 | | | | 2,401,883 | |
| | | | | | | | | |
| TOTAL U.S. TREASURY OBLIGATIONS | | | | | | | | |
| (Cost $4,804,179) | | | | | | | 4,804,317 | |
| | | | | | | | | |
| TOTAL INVESTMENTS — 91.8% | | | | | | | | |
| (Cost $88,262,047) | | | | | | $ | 109,872,255 | |
Percentages are based on Net Assets of $119,677,471.
| * | Non-income producing security. |
| ‡ | Real Estate Investment Trust. |
| (1) | In U.S. dollars unless otherwise indicated. |
| (A) | Securities sold within terms of a private placement memorandum, exempt from registration under Section 144A of the Securities Act of 1933, as amended, and may be sold only to dealers in that program or other "accredited investors". The total value of such securities as of October 31, 2024 was $695,183 and represents 0.58% of Net Assets. |
| (B) | Variable or floating rate security. The rate shown is the effective interest rate as of period end. The rates on certain securities are not based on published reference rates and spreads and are either determined by the issuer or agent based on current market conditions; by using a formula based on the rates of underlying loans; or by adjusting periodically based on prevailing interest rates. |
| (C) | Perpetual security with no stated maturity date. |
| (D) | Security, or a portion thereof, has been pledged as collateral on open futures contracts. |
| (E) | Interest rate represents the security’s effective yield at the time of purchase. |
The accompanying notes are an integral part of the financial statements.
| THE ADVISORS’ INNER CIRCLE FUND III | PINEBRIDGE DYNAMIC ASSET ALLOCATION FUND OCTOBER 31, 2024 |
ADR — American Depositary Receipt
AUD — Australian Dollar
BRL — Brazilian Real
CAD — Canadian Dollar
Cl — Class
CNH — Chinese Yuan Offshore
EAFE — Europe, Australasia and Far East
ETF — Exchange-Traded Fund
EUR — Euro
FTSE— Financial Times Stock Exchange
GBP — British Pound Sterling
H15T5Y — Harmonized Index of Consumer Prices 5 Year
INR — Indian Rupee
JPY — Japanese Yen
KRW — Korean Won
MSCI — Morgan Stanley Capital International
MTN — Medium Term Note
REIT — Real Estate investment Trust
S&P— Standard & Poor's
TOPIX- Tokyo Price Index
USD — U.S. Dollar
The accompanying notes are an integral part of the financial statements.
| THE ADVISORS’ INNER CIRCLE FUND III | PINEBRIDGE DYNAMIC |
| ASSET ALLOCATION FUND |
| OCTOBER 31, 2024 |
A list of the outstanding forward foreign currency contracts held by the Fund at October 31, 2024, is as follows:
| Counterparty | | Settlement
Date | | Currency to
Deliver | | | Currency to Receive | | Unrealized
Appreciation/
(Depreciation) | |
| Morgan Stanley | | 12/02/24 | BRL | | | 2,547,000 | | | USD | | 444,739 | | | $ | 5,847 | |
| Morgan Stanley | | 12/02/24 | USD | | | 460,163 | | | BRL | | 2,547,000 | | | | (21,270 | ) |
| Morgan Stanley | | 12/18/24 | JPY | | | 484,094,000 | | | USD | | 3,200,852 | | | | (6,404 | ) |
| Morgan Stanley | | 12/18/24 | GBP | | | 3,411,000 | | | USD | | 4,409,793 | | | | 11,919 | |
| Morgan Stanley | | 12/18/24 | EUR | | | 6,459,000 | | | USD | | 6,973,698 | | | | (67,085 | ) |
| Morgan Stanley | | 12/18/24 | INR | | | 294,987,355 | | | USD | | 3,499,214 | | | | (2,122 | ) |
| Morgan Stanley | | 12/18/24 | USD | | | 17,924,374 | | | EUR | | 16,072,000 | | | | (404,716 | ) |
| Morgan Stanley | | 12/18/24 | EUR | | | 1,120,000 | | | USD | | 1,225,268 | | | | 4,386 | |
| Morgan Stanley | | 12/18/24 | JPY | | | 1,425,357,000 | | | USD | | 9,941,289 | | | | 497,907 | |
| Morgan Stanley | | 12/18/24 | AUD | | | 300,000 | | | USD | | 202,829 | | | | 5,305 | |
| Morgan Stanley | | 12/18/24 | CNH | | | 14,289,000 | | | USD | | 2,020,708 | | | | 7,621 | |
| Morgan Stanley | | 12/18/24 | USD | | | 12,920,063 | | | JPY | | 1,825,157,000 | | | | (827,896 | ) |
| Morgan Stanley | | 12/18/24 | USD | | | 5,937,450 | | | GBP | | 4,511,000 | | | | (121,323 | ) |
| Morgan Stanley | | 12/18/24 | USD | | | 1,849,854 | | | AUD | | 2,751,000 | | | | (38,555 | ) |
| Morgan Stanley | | 12/18/24 | USD | | | 206,589 | | | CAD | | 280,000 | | | | (5,152 | ) |
| Morgan Stanley | | 12/18/24 | USD | | | 148,009 | | | KRW | | 197,740,000 | | | | (3,891 | ) |
| | | | | | | | | | | | | | | $ | (965,429 | ) |
The accompanying notes are an integral part of the financial statements.
| THE ADVISORS’ INNER CIRCLE FUND III | PINEBRIDGE DYNAMIC |
| ASSET ALLOCATION FUND |
| OCTOBER 31, 2024 |
The open futures contracts held by the Fund at October 31, 2024, are as follows:
| Type of Contract | | Number of
Contracts | | | Expiration
Date | | Notional
Amount † | | | Value | | | Unrealized
Appreciation/
(Depreciation) | |
| Long Contracts | | | | | | | | | | | | | | |
| Euro STOXX 50 | | | 1 | | | 12/20/24 | | $ | 53,624 | | | $ | 52,582 | | | $ | (1,285 | ) |
| Euro-Buxl | | | 29 | | | 12/6/24 | | | 4,255,065 | | | | 4,175,258 | | | | (84,372 | ) |
| FTSE 100 Index | | | 31 | | | 12/20/24 | | | 3,407,059 | | | | 3,248,620 | | | | (87,200 | ) |
| FTSE Taiwan Index | | | 19 | | | 11/28/24 | | | 1,489,249 | | | | 1,438,110 | | | | (51,139 | ) |
| S&P Mid Cap 400 Index E-MINI | | | 3 | | | 12/20/24 | | | 919,897 | | | | 934,080 | | | | 14,183 | |
| U.S. 5-Year Treasury Note | | | 152 | | | 12/31/24 | | | 16,676,558 | | | | 16,299,625 | | | | (376,933 | ) |
| Ultra 10-Year U.S. Treasury Note | | | 30 | | | 12/19/24 | | | 3,551,661 | | | | 3,412,500 | | | | (139,161 | ) |
| | | | | | | | $ | 30,353,113 | | | $ | 29,560,775 | | | $ | (725,907 | ) |
| Short Contracts | | | | | | | | | | | | | | | | | | |
| FTSE China A50 | | | (90 | ) | | 11/28/24 | | $ | (1,214,993 | ) | | $ | (1,189,710 | ) | | $ | 25,283 | |
| IFSC Nifty50 Index | | | (77 | ) | | 11/28/24 | | | (3,768,079 | ) | | | (3,756,599 | ) | | | 11,480 | |
| MSCI EAFE Index | | | (21 | ) | | 12/20/24 | | | (2,564,255 | ) | | | (2,467,710 | ) | | | 96,545 | |
| MSCI Emerging Markets | | | (98 | ) | | 12/20/24 | | | (5,510,930 | ) | | | (5,519,850 | ) | | | (8,920 | ) |
| S&P 500 Index E-MINI | | | (25 | ) | | 12/20/24 | | | (7,171,604 | ) | | | (7,173,125 | ) | | | (1,521 | ) |
| TOPIX Index | | | (53 | ) | | 12/12/24 | | | (9,513,377 | ) | | | (9,399,006 | ) | | | (507,425 | ) |
| | | | | | | | | $ | (29,743,238 | ) | | $ | (29,506,000 | ) | | $ | (384,558 | ) |
| | | | | | | | | $ | 609,875 | | | $ | 54,775 | | | $ | (1,110,465 | ) |
| † | The foreign exchange rate for the contract notional amounts are based on prevailing exchange rates on the date the respective contracts were opened. |
The accompanying notes are an integral part of the financial statements.
| THE ADVISORS’ INNER CIRCLE FUND III | PINEBRIDGE DYNAMIC |
| ASSET ALLOCATION FUND |
| OCTOBER 31, 2024 |
The following is a summary of the level inputs used as of October 31, 2024, in valuing the Fund's investments and other financial instruments carried at value:
| Investments in Securities | | Level 1 | | | Level 2 | | | Level 3 | | | Total | |
| Common Stock | | | | | | | | | | | | | | | | |
| Australia | | $ | — | | | $ | 297,413 | | | $ | — | | | $ | 297,413 | |
| Austria | | | — | | | | 24,294 | | | | — | | | | 24,294 | |
| Belgium | | | — | | | | 76,249 | | | | — | | | | 76,249 | |
| Brazil | | | 377,136 | | | | — | | | | — | | | | 377,136 | |
| Canada | | | 60,689 | | | | — | | | | — | | | | 60,689 | |
| China | | | 338,783 | | | | 2,377,491 | | | | — | | | | 2,716,274 | |
| Finland | | | — | | | | 75,950 | | | | — | | | | 75,950 | |
| France | | | — | | | | 931,418 | | | | — | | | | 931,418 | |
| Germany | | | — | | | | 441,016 | | | | — | | | | 441,016 | |
| Greece | | | — | | | | 131,381 | | | | — | | | | 131,381 | |
| Hong Kong | | | — | | | | 1,127,789 | | | | — | | | | 1,127,789 | |
| Hungary | | | — | | | | 289,115 | | | | — | | | | 289,115 | |
| India | | | 255,523 | | | | 6,591,754 | | | | — | | | | 6,847,277 | |
| Indonesia | | | 110,708 | | | | 98,690 | | | | — | | | | 209,398 | |
| Ireland | | | — | | | | 162,897 | | | | — | | | | 162,897 | |
| Italy | | | — | | | | 143,346 | | | | — | | | | 143,346 | |
| Japan | | | — | | | | 12,695,052 | | | | — | | | | 12,695,052 | |
| Mexico | | | 132,736 | | | | — | | | | — | | | | 132,736 | |
| Netherlands | | | 202,273 | | | | 539,709 | | | | — | | | | 741,982 | |
| Poland | | | — | | | | 62,714 | | | | — | | | | 62,714 | |
| Portugal | | | — | | | | 101,609 | | | | — | | | | 101,609 | |
| South Africa | | | — | | | | 55,725 | | | | — | | | | 55,725 | |
| South Korea | | | — | | | | 550,498 | | | | — | | | | 550,498 | |
| Spain | | | — | | | | 100,190 | | | | — | | | | 100,190 | |
| Switzerland | | | — | | | | 192,608 | | | | — | | | | 192,608 | |
| Taiwan | | | — | | | | 1,636,421 | | | | — | | | | 1,636,421 | |
| Turkey | | | — | | | | 41,481 | | | | — | | | | 41,481 | |
| United Kingdom | | | 173,799 | | | | 968,093 | | | | — | | | | 1,141,892 | |
| United States | | | 61,377,443 | | | | — | | | | — | | | | 61,377,443 | |
| | | | | | | | | | | | | | | | | |
| Total Common Stock | | | 63,029,090 | | | | 29,712,903 | | | | — | | | | 92,741,993 | |
| Corporate Obligations | | | — | | | | 6,507,338 | | | | — | | | | 6,507,338 | |
| Exchange Traded Funds | | | 5,426,589 | | | | — | | | | — | | | | 5,426,589 | |
| Sovereign Debt | | | — | | | | 187,716 | | | | — | | | | 187,716 | |
| Convertible Bond | | | — | | | | 204,302 | | | | — | | | | 204,302 | |
| U.S. Treasury Obligations | | | — | | | | 4,804,317 | | | | — | | | | 4,804,317 | |
| Total Investments in Securities | | $ | 68,455,679 | | | $ | 41,416,576 | | | $ | — | | | $ | 109,872,255 | |
The accompanying notes are an integral part of the financial statements.
| THE ADVISORS’ INNER CIRCLE FUND III | PINEBRIDGE DYNAMIC |
| ASSET ALLOCATION FUND |
| OCTOBER 31, 2024 |
| Other Financial Instruments | | Level 1 | | | Level 2 | | | Level 3 | | | Total | |
| Futures Contracts* | | | | | | | | | | | | | | | | |
| Unrealized Appreciation | | $ | 147,491 | | | $ | – | | | $ | – | | | $ | 147,491 | |
| Unrealized Depreciation | | | (1,257,956 | ) | | | – | | | | – | | | | (1,257,956 | ) |
| Forward Foreign Currency Contracts* | | | | | | | | | | | | | | | | |
| Unrealized Appreciation | | | – | | | | 532,985 | | | | – | | | | 532,985 | |
| Unrealized Depreciation | | | – | | | | (1,498,414 | ) | | | – | | | | (1,498,414 | ) |
| Total Other Financial Instruments | | $ | (1,110,465 | ) | | $ | (965,429 | ) | | | $– | | | $ | (2,075,894 | ) |
| * | Forward foreign currency contracts and futures contracts are valued at the unrealized appreciation (depreciation) on the instrument. |
Amounts designated as “— “ are $0.
For more information on valuation inputs, see Note 2 – Significant Accounting Policies in the Notes to Financial Statements.
The accompanying notes are an integral part of the financial statements.
| THE ADVISORS’ INNER CIRCLE FUND III | PINEBRIDGE DYNAMIC |
ASSET ALLOCATION FUND
OCTOBER 31, 2024
| STATEMENT OF ASSETS AND LIABILITIES | | | |
| | | | |
| Assets: | | | |
| Investments, at Value (Cost $88,262,047) | | $ | 109,872,255 | |
| Foreign Currency, at Value (Cost $697,082) | | | 715,631 | |
| Cash and Cash Equivalents | | | 5,468,344 | |
| Cash Pledged as Collateral for Futures Contracts | | | 4,340,391 | |
| Cash Pledged as Collateral for Forward Foreign Currency Contracts | | | 930,000 | |
| Unrealized Appreciation on Forward Foreign Currency Contracts | | | 532,985 | |
| Variation Margin Receivable | | | 304,200 | |
| Dividend and Interest Receivable | | | 234,189 | |
| Reclaim Receivable | | | 115,462 | |
| Receivable for Investment Securities Sold | | | 15,124 | |
| Unrealized Appreciation on Foreign Spot Currency Contracts | | | 5 | |
| Other Prepaid Expenses | | | 9,522 | |
| Total Assets | | | 122,538,108 | |
| Liabilities: | | | | |
| Unrealized Depreciation on Forward Foreign Currency Contracts | | | 1,498,414 | |
| Cash Collateral for Futures due to Broker | | | 729,722 | |
| Accrued Foreign Capital Gains Tax on Appreciated Securities | | | 207,297 | |
| Payable for Investment Securities Purchased | | | 191,263 | |
| Variation Margin Payable | | | 81,653 | |
| Payable due to Investment Adviser | | | 30,972 | |
| Shareholder Servicing Fees Payable | | | 12,872 | |
| Payable due to Administrator | | | 12,705 | |
| Chief Compliance Officer Fees Payable | | | 5,640 | |
| Payable due to Trustees | | | 205 | |
| Payable for Capital Shares Redeemed | | | 145 | |
| Other Accrued Expenses and Other Payables | | | 89,749 | |
| Total Liabilities | | | 2,860,637 | |
| | | | | |
| Commitments and Contingencies † | | | | |
| | | | | |
| Net Assets | | $ | 119,677,471 | |
| NET ASSETS CONSIST OF: | | | | |
| Paid-in Capital | | $ | 148,083,341 | |
| Total Accumulated Losses | | | (28,405,870 | ) |
| Net Assets | | $ | 119,677,471 | |
| Institutional Shares: | | | | |
| Net Assets | | $ | 116,588,639 | |
| Outstanding Shares of beneficial interest (unlimited authorization - no par value) | | | 10,077,373 | |
| Net Asset Value, Offering and Redemption Price Per Share | | $ | 11.57 | |
| Investor Servicing Shares: | | | | |
| Net Assets | | $ | 3,088,832 | |
| Outstanding Shares of beneficial interest (unlimited authorization - no par value) | | | 267,304 | |
| Net Asset Value, Offering and Redemption Price Per Share | | $ | 11.56 | |
| † | See Note 7 in the Notes to Financial Statements. |
The accompanying notes are an integral part of the financial statements.
| THE ADVISORS’ INNER CIRCLE FUND III | PINEBRIDGE DYNAMIC |
ASSET ALLOCATION FUND
| STATEMENT OF OPERATIONS | | | |
| | | | |
| | | For the Year
Ended
October 31, 2024 | |
| Investment Income: | | | | |
| Dividends | | $ | 1,629,457 | |
| Interest | | | 2,161,246 | |
| Less: Foreign Taxes Withheld | | | (259,646 | ) |
| Total Investment Income | | | 3,531,057 | |
| Expenses: | | | | |
| Investment Advisory Fees | | | 1,062,660 | |
| Administration Fees | | | 174,401 | |
| Trustees' Fees | | | 18,590 | |
| Chief Compliance Officer Fees | | | 9,899 | |
| Shareholder Servicing Fees, Investor Servicing Shares | | | 5,389 | |
| Custodian Fees | | | 88,656 | |
| Transfer Agent Fees | | | 60,187 | |
| Registration and Filing Fees | | | 39,722 | |
| Legal Fees | | | 33,160 | |
| Audit Fees | | | 28,779 | |
| Pricing Fees | | | 14,254 | |
| Printing Fees | | | 10,436 | |
| Other Expenses | | | 75,661 | |
| Total Expenses | | | 1,621,794 | |
| Less: | | | | |
| Waiver of Investment Advisory Fees | | | (553,744 | ) |
| Net Expenses | | | 1,068,050 | |
| Net Investment Income | | | 2,463,007 | |
| Net Realized Gain (Loss) on: | | | | |
| Investments (net of Foreign Capital Gains Tax on Appreciated Securities of $(202,553)) | | | 11,479,231 | |
| Futures Contracts | | | (2,627,123 | ) |
| Forward Foreign Currency Contracts | | | 51,045 | |
| Foreign Currency Transactions | | | (6,747 | ) |
| Net Realized Gain | | | 8,896,406 | |
| Net Change in Unrealized Appreciation (Depreciation) on: | | | | |
| Investments | | | 13,474,807 | |
| Futures Contracts | | | (3,502,331 | ) |
| Foreign Capital Gains Tax on Appreciated Securities | | | (35,211 | ) |
| Forward Foreign Currency Contracts | | | 319,677 | |
| Foreign Currency Translation of Other Assets and Liabilities Denominated in Foreign Currencies | | | (1,252 | ) |
| Net Change in Unrealized Appreciation (Depreciation) | | | 10,255,690 | |
| Net Realized and Unrealized Gain | | | 19,152,096 | |
| Net Increase in Net Assets Resulting from Operations | | $ | 21,615,103 | |
The accompanying notes are an integral part of the financial statements.
| THE ADVISORS’ INNER CIRCLE FUND III | | PINEBRIDGE DYNAMIC |
ASSET ALLOCATION FUND
| STATEMENTS OF CHANGES IN NET ASSETS | | | | | | |
| | | | | | | |
| | | Year Ended
October 31, 2024 | | | Year Ended
October 31, 2023 | |
| Operations: | | | | | | | | |
| Net Investment Income | | $ | 2,463,007 | | | $ | 8,489,872 | |
| Net Realized Gain (Loss) | | | 8,896,406 | | | | (14,569,377 | ) |
| Net Change in Unrealized Appreciation | | | 10,255,690 | | | | 31,356,306 | |
| Net Increase in Net Assets Resulting From Operations | | | 21,615,103 | | | | 25,276,801 | |
| Distributions: | | | | | | | | |
| Institutional Shares | | | (3,011,417 | ) | | | (27,150 | ) |
| Investor Servicing Shares | | | (104,226 | ) | | | – | |
| Total Distributions | | | (3,115,643 | ) | | | (27,150 | ) |
| Capital Share Transactions:(1) | | | | | | | | |
| Institutional Shares | | | | | | | | |
| Issued | | | 85,316,512 | * | | | 4,606,890 | |
| Reinvestment of Distributions | | | 2,886,577 | | | | 26,296 | |
| Redeemed | | | (95,262,856 | ) | | | (312,607,660 | ) |
| Net Institutional Shares Transactions | | | (7,059,767 | ) | | | (307,974,474 | ) |
| Investor Servicing Shares | | | | | | | | |
| Issued | | | 22,012 | | | | 269,766 | |
| Reinvestment of Distributions | | | 98,539 | | | | – | |
| Redeemed | | | (984,798 | ) | | | (1,939,489 | ) |
| Net Investor Servicing Shares Transactions | | | (864,247 | ) | | | (1,669,723 | ) |
| Net Decrease in Net Assets From Capital Share Transactions | | | (7,924,014 | ) | | | (309,644,197 | ) |
| Total Increase (Decrease)in Net Assets | | | 10,575,446 | | | | (284,394,546 | ) |
| Net Assets: | | | | | | | | |
| Beginning of Year | | | 109,102,025 | | | | 393,496,571 | |
| End of Year | | $ | 119,677,471 | | | $ | 109,102,025 | |
| (1) | See Note 9 in the Notes to Financial Statements. |
| * | Includes issuances as a result of in-kind transactions. (see Note 13). |
The accompanying notes are an integral part of the financial statements.
| THE ADVISORS’ INNER CIRCLE FUND III | PINEBRIDGE DYNAMIC |
ASSET ALLOCATION FUND
FINANCIAL HIGHLIGHTS
Selected Per Share Data & Ratios
For a Share Outstanding
Throughout Each Year
Institutional Shares
| | | Year | | | Year | | | Year | | | Year | | | Year | |
| | | Ended | | | Ended | | | Ended | | | Ended | | | Ended | |
| | | October 31, | | | October 31, | | | October 31, | | | October 31, | | | October 31, | |
| | | 2024 | | | 2023 | | | 2022 | | | 2021 | | | 2020 | |
| Net Asset Value, Beginning of Year | | $ | 10.36 | | | $ | 9.93 | | | $ | 13.56 | | | $ | 11.08 | | | $ | 10.87 | |
| Income (Loss) from Investment Operations: | | | | | | | | | | | | | | | | | | | | |
| Net Investment Income* | | | 0.20 | | | | 0.26 | | | | 0.14 | | | | 0.12 | | | | 0.13 | |
| Net Realized and Unrealized Gain (Loss) | | | 1.34 | | | | 0.17 | | | | (3.07 | ) | | | 2.52 | | | | 0.25 | |
| | | | | | | | | | | | | | | | | | | | | |
| Total from Investment Operations | | | 1.54 | | | | 0.43 | | | | (2.93 | ) | | | 2.64 | | | | 0.38 | |
| | | | | | | | | | | | | | | | | | | | | |
| Dividends and Distributions: | | | | | | | | | | | | | | | | | | | | |
| Net Investment Income | | | (0.33 | ) | | | (0.00)^ | | | | (0.04 | ) | | | (0.16 | ) | | | (0.17 | ) |
| Net Realized Gains | | | – | | | | – | | | | (0.66 | ) | | | – | | | | – | |
| | | | | | | | | | | | | | | | | | | | | |
| Total Dividends and Distributions | | | (0.33 | ) | | | 0.00 | | | | (0.70 | ) | | | (0.16 | ) | | | (0.17 | ) |
| Net Asset Value, End of Year | | $ | 11.57 | | | $ | 10.36 | | | $ | 9.93 | | | $ | 13.56 | | | $ | 11.08 | |
| Total Return† | | | 14.96 | % | | | 4.34 | % | | | (22.75 | )% | | | 23.94 | % | | | 3.46 | % |
| | | | | | | | | | | | | | | | | | | | | |
| Ratios and Supplemental Data | | | | | | | | | | | | | | | | | | | | |
| Net Assets, End of Year (Thousands) | | $ | 116,588 | | | $ | 105,556 | | | $ | 388,514 | | | $ | 225,285 | | | $ | 195,263 | |
| Ratio of Expenses to Average Net Assets | | | 0.75 | % | | | 0.75 | % | | | 0.75 | % | | | 0.75 | % | | | 0.75 | % |
| Ratio of Expenses to Average Net Assets (Excluding Waivers and Reimbursements) | | | 1.14 | % | | | 0.98 | % | | | 0.99 | % | | | 1.05 | % | | | 1.13 | % |
| Ratio of Net Investment Income to Average Net Assets | | | 1.74 | % | | | 2.45 | % | | | 1.26 | % | | | 0.95 | % | | | 1.24 | % |
| Portfolio Turnover Rate | | | 132 | % | | | 105 | % | | | 145 | % | | | 130 | % | | | 144 | % |
Amounts designated as “—” are either not applicable, $0 or have been rounded to $0.
| * | Per share data calculated using average shares method. |
| ^ | Value is less than $0.005 per share. |
| † | Total return is for the period indicated and has not been annualized. Returns shown do not reflect the deductions of taxes that a shareholder would pay on Fund distributions or the redemption of Fund shares. |
The accompanying notes are an integral part of the financial statements.
| THE ADVISORS’ INNER CIRCLE FUND III | PINEBRIDGE DYNAMIC |
ASSET ALLOCATION FUND
FINANCIAL HIGHLIGHTS (continued)
Selected Per Share Data & Ratios
For a Share Outstanding
Throughout Each Year
Investor Servicing Shares
| | | Year | | | Year | | | Year | | | Year | | | Year | |
| | | Ended | | | Ended | | | Ended | | | Ended | | | Ended | |
| | | October 31, | | | October 31, | | | October 31, | | | October 31, | | | October 31, | |
| | | 2024 | | | 2023 | | | 2022 | | | 2021 | | | 2020 | |
| Net Asset Value, Beginning of Year | | $ | 10.34 | | | $ | 9.93 | | | $ | 13.55 | | | $ | 11.07 | | | $ | 10.86 | |
| Income (Loss) from Investment Operations: | | | | | | | | | | | | | | | | | | | | |
| Net Investment Income* | | | 0.18 | | | | 0.25 | | | | 0.12 | | | | 0.12 | | | | 0.12 | |
| Net Realized and Unrealized Gain (Loss) | | | 1.34 | | | | 0.16 | | | | (3.06 | ) | | | 2.51 | | | | 0.25 | |
| | | | | | | | | | | | | | | | | | | | | |
| Total from Investment Operations | | | 1.52 | | | | 0.41 | | | | (2.94 | ) | | | 2.63 | | | | 0.37 | |
| | | | | | | | | | | | | | | | | | | | | |
| Dividends and Distributions: | | | | | | | | | | | | | | | | | | | | |
| Net Investment Income | | | (0.30 | ) | | | – | | | | (0.02 | ) | | | (0.15 | ) | | | (0.16 | ) |
| Net Realized Gains | | | – | | | | – | | | | (0.66 | ) | | | – | | | | – | |
| | | | | | | | | | | | | | | | | | | | | |
| Total Dividends and Distributions | | | (0.30 | ) | | | – | | | | (0.68 | ) | | | (0.15 | ) | | | (0.16 | ) |
| Net Asset Value, End of Year | | $ | 11.56 | | | $ | 10.34 | | | $ | 9.93 | | | $ | 13.55 | | | $ | 11.07 | |
| Total Return† | | | 14.86 | % | | | 4.13 | % | | | (22.83 | )% | | | 23.85 | % | | | 3.34 | % |
| | | | | | | | | | | | | | | | | | | | | |
| Ratios and Supplemental Data | | | | | | | | | | | | | | | | | | | | |
| Net Assets, End of Year (Thousands) | | $ | 3,089 | | | $ | 3,546 | | | $ | 4,983 | | | $ | 6,742 | | | $ | 17,529 | |
| Ratio of Expenses to Average Net Assets | | | 0.90 | % | | | 0.90 | % | | | 0.90 | % | | | 0.81 | % | | | 0.87 | % |
| Ratio of Expenses to Average Net Assets (Excluding Waivers and Reimbursements) | | | 1.31 | % | | | 1.13 | % | | | 1.14 | % | | | 1.11 | % | | | 1.25 | % |
| Ratio of Net Investment Income to Average Net Assets | | | 1.58 | % | | | 2.30 | % | | | 1.04 | % | | | 0.94 | % | | | 1.11 | % |
| Portfolio Turnover Rate | | | 132 | % | | | 105 | % | | | 145 | % | | | 130 | % | | | 144 | % |
Amounts designated as “—” are either not applicable, $0 or have been rounded to $0.
| * | Per share data calculated using average shares method. |
| † | Total return is for the period indicated and has not been annualized. Returns shown do not reflect the deductions of taxes that a shareholder would pay on Fund distributions or the redemption of Fund shares. |
The accompanying notes are an integral part of the financial statements.
| THE ADVISORS’ INNER CIRCLE FUND III | PINEBRIDGE DYNAMIC |
| | ASSET ALLOCATION FUND |
| | OCTOBER 31, 2024 |
NOTES TO FINANCIAL STATEMENTS
1. Organization:
The Advisors’ Inner Circle Fund III (the “Trust”) is organized as a Delaware statutory trust under a Declaration of Trust dated December 4, 2013. The Trust is registered under the Investment Company Act of 1940, as amended, as an open-end management investment company with 50 funds. The financial statements herein are those of the PineBridge Dynamic Asset Allocation Fund (the “Fund”). The investment objective of the Fund is to seek total return. The Fund is classified as a diversified investment company. PineBridge Investments LLC serves as the Fund’s investment adviser (the “Adviser”). The Fund currently offers Institutional Shares and Investor Servicing Shares. The Fund commenced operations on March 2, 2016. The financial statements of the remaining funds of the Trust are presented separately. The assets of each fund are segregated, and a shareholder’s interest is limited to the fund in which shares are held.
2. Significant Accounting Policies:
The accompanying financial statements have been prepared in conformity with U.S. generally accepted accounting principles (“U.S. GAAP”) and are presented in U.S. dollars which is the functional currency of the Fund. The Fund is an investment company and therefore applies the accounting and reporting guidance issued by the U.S. Financial Accounting Standards Board (“FASB”) in Accounting Standards Codification (“ASC”) Topic 946, Financial Services — Investment Companies. The following are significant accounting policies which are consistently followed in the preparation of the financial statements.
Use of Estimates — The preparation of financial statements requires management to make estimates and assumptions that affect the fair value of assets and liabilities and disclosure of contingent assets and liabilities at the date of the financial statements and the reported amounts of increases and decreases in net assets from operations during the reporting period. Actual results could differ from those estimates and such differences could be material.
Security Valuation — Securities listed on a securities exchange, market or automated quotation system for which quotations are readily available (except for securities traded on NASDAQ), including securities traded over the counter, are valued at the last quoted sale price on an exchange or market (foreign or domestic) on which they are traded on the valuation date (or at approximately 4:00 pm Eastern Standard Time if a security’s primary exchange is normally open at that time), or, if there is no such reported sale on the valuation date, at the most recent quoted bid price. For securities traded on NASDAQ, the NASDAQ Official Closing Price will be used. If available, debt securities are priced based upon valuations provided by independent, third-party pricing agents. Such values generally reflect the last reported sales price if the security is actively traded. The third-party pricing agents may also value debt securities at an evaluated bid price by employing methodologies that utilize actual market transactions, broker supplied valuations, or other methodologies designed to identify the market value for such securities. Such methodologies generally consider such factors as security prices, yields, maturities, call features, ratings and developments relating to specific securities in arriving at valuations. On the first day a new debt security purchase is recorded, if a price is not available on the automated pricing feeds from our primary and secondary pricing vendors nor is it available from an independent broker, the security may be valued at its purchase price. Each day thereafter, the debt security will be valued according to the Trusts’ Fair Value Procedures until an independent source can be secured. Debt obligations with remaining maturities of sixty days or less may be valued at their amortized cost, which approximates market value provided that it is determined the amortized cost continues to approximate fair value. Should existing credit, liquidity or interest rate conditions in the relevant markets and issuer specific circumstances suggest that amortized cost does not approximate fair value, then the amortized cost method may not be used. The prices for foreign securities are reported in local currency and converted to U.S. dollars using currency exchange rates.
| THE ADVISORS’ INNER CIRCLE FUND III | PINEBRIDGE DYNAMIC |
| | ASSET ALLOCATION FUND |
| | OCTOBER 31, 2024 |
Securities for which market prices are not “readily available” are valued in accordance with fair value procedures (the "Fair Value Procedures") established by the Adviser and approved by the Trust's Board of Trustees (the “Board”). Pursuant to Rule 2a-5 under the 1940 Act, the Board has designated the Adviser as the "valuation designee" to determine the fair value of securities and other instruments for which no readily available market quotations are available. The Fair Value Procedures are implemented through a Fair Value Committee (the “Committee”) of the Adviser.
Some of the more common reasons that may necessitate that a security be valued using Fair Value Procedures include: the security’s trading has been halted or suspended; the security has been de-listed from a national exchange; the security’s primary trading market is temporarily closed at a time when under normal conditions it would be open; the security has not been traded for an extended period of time; the security’s primary pricing source is not able or willing to provide a price; or trading of the security is subject to local government imposed restrictions. When a security is valued in accordance with the Fair Value Procedures, the Committee will determine the value after taking into consideration relevant information reasonably available to the Committee.
Futures contracts that are traded on an exchange are valued at their last reported sales price as of the valuation date.
| THE ADVISORS’ INNER CIRCLE FUND III | PINEBRIDGE DYNAMIC |
| | ASSET ALLOCATION FUND |
| | OCTOBER 31, 2024 |
For securities that principally trade on a foreign market or exchange, a significant gap in time can exist between the time of a particular security’s last trade and the time at which the Fund calculates its net asset value. The closing prices of such securities may no longer reflect their market value at the time the Fund calculates its net asset value if an event that could materially affect the value of those securities (a “Significant Event”) has occurred between the time of the security’s last close and the time that the Fund calculates net asset value. A Significant Event may relate to a single issuer or to an entire market sector. If the Adviser of the Fund becomes aware of a Significant Event that has occurred with respect to a security or group of securities after the closing of the exchange or market on which the security or securities principally trade, but before the time at which the Fund calculates its net asset value, it may request that a Committee meeting be called.
The Fund uses Intercontinental Exchange Data Pricing & Reference Data, LLC (“ICE”) as a third party fair valuation vendor when the fair value trigger is met. ICE provides a fair value for foreign securities in the Fund based on certain factors and methodologies (involving, generally, tracking valuation correlations between the U.S. market and each non-U.S. security) applied by ICE in the event that there is a movement in the U.S. market that exceeds a specific threshold established by the Committee. The Committee establishes a “confidence interval” which is used to determine the level of correlation between the value of a foreign security and movements in the U.S. market before a particular security is fair valued when the threshold is exceeded. In the event that the threshold established by the Committee is exceeded on a specific day, the Fund values its non-U.S. securities that exceed the applicable “confidence interval” based upon the fair values provided by ICE. In such event, it is not necessary to hold a Committee meeting. In the event that the Adviser believes that the fair values provided by ICE are not reliable, the Adviser contacts SEI Investments Global Fund Services (the “Administrator”) and may request that a meeting of the Committee be held.
If a local market in which the Fund owns securities is closed for one or more days, the Fund shall value all securities held in that corresponding currency based on the fair value prices provided by ICE using the predetermined confidence interval discussed above.
In accordance with U.S. GAAP, the Fund discloses fair value of its investments in a hierarchy that prioritizes the inputs to valuation techniques used to measure the fair value. The objective of a fair value measurement is to determine the price that would be received to sell an asset or paid to transfer a liability in an orderly transaction between market participants at the measurement date (an exit price). Accordingly, the fair value hierarchy gives the highest priority to quoted prices (unadjusted) in active markets for identical assets or liabilities (Level 1) and the lowest priority to unobservable inputs (Level 3). The three levels of the fair value hierarchy are described below:
| THE ADVISORS’ INNER CIRCLE FUND III | PINEBRIDGE DYNAMIC |
| | ASSET ALLOCATION FUND |
| | OCTOBER 31, 2024 |
| ● | Level 1 — Unadjusted quoted prices in active markets for identical, unrestricted assets or liabilities that the Fund has the ability to access at the measurement date; |
| ● | Level 2 — Other significant observable inputs (includes quoted prices for similar securities, interest rates, prepayment speeds, credit risk, referenced indices, quoted prices in inactive markets, adjusted quoted prices in active markets, adjusted quoted prices on foreign equity securities that were adjusted in accordance with the Adviser’s pricing procedures, etc.); and |
| ● | Level 3 — Prices, inputs or exotic modeling techniques which are both significant to the fair value measurement and unobservable (supported by little or no market activity). |
Investments are classified within the level of the lowest significant input considered in determining fair value. Investments classified within Level 3 whose fair value measurement considers several inputs may include Level 1 or Level 2 inputs as components of the overall fair value measurement.
For the year ended October 31, 2024, there have been no significant changes to the Fund’s fair valuation methodology.
Federal Income Taxes — It is the Fund’s intention to continue to qualify as a regulated investment company for Federal income tax purposes by complying with the appropriate provisions of Subchapter M of the Internal Revenue Code of 1986, as amended. Accordingly, no provisions for Federal income taxes have been made in the financial statements.
The Fund evaluates tax positions taken or expected to be taken in the course of preparing the Fund’s tax returns to determine whether it is “more-likely than-not” (i.e., greater than 50-percent) that each tax position will be sustained upon examination by a taxing authority based on the technical merits of the position. Tax positions not deemed to meet the more-likely-than-not threshold are recorded as a tax benefit or expense in the current year. The Fund did not record any tax provision in the current period. However, management’s conclusions regarding tax positions taken may be subject to review and adjustment at a later date based on factors including, but not limited to, examination by tax authorities (i.e., the last 3 year ends, as applicable), on-going analysis of and changes to tax laws, regulations and interpretations thereof.
As of and during the year ended October 31, 2024, the Fund did not have a liability for any unrecognized tax benefits. The Fund recognizes interest and penalties, if any, related to unrecognized tax benefits as income tax expense in the Statement of Operations. During year ended October 31, 2024, the Fund did not incur any significant interest or penalties.
| THE ADVISORS’ INNER CIRCLE FUND III | PINEBRIDGE DYNAMIC |
| | ASSET ALLOCATION FUND |
| | OCTOBER 31, 2024 |
Withholding taxes on foreign dividends have been provided for in accordance with the Fund’s understanding of the applicable country’s tax rules and rates. The Fund or its agent files withholding tax reclaims in certain jurisdictions to recover certain amounts previously withheld. The Fund may record a reclaim receivable based on collectability, which includes factors such as the jurisdiction’s applicable laws, payment history and market convention. Professional fees paid to those that provide assistance in receiving the tax reclaims, which generally are contingent upon successful receipt of reclaimed amounts, are recorded in Professional Fees on the Statement of Operations once the amounts are due. The professional fees related to pursuing these tax reclaims are not subject to the Adviser’s expense limitation agreement.
Security Transactions and Investment Income — Security transactions are accounted for on trade date. Costs used in determining realized gains and losses on the sale of investment securities are based on the specific identification method. Dividend income and expense are recorded on the ex-dividend date. Interest income is recognized on the accrual basis from settlement date and includes the amortization of premiums and the accretion of discount. Certain dividends from foreign securities will be recorded as soon as the Fund is informed of the dividend if such information is obtained subsequent to the ex-dividend date. Discounts and premiums on fixed income securities are accreted and amortized using the effective interest method. Realized gains (losses) on paydowns of mortgage-backed and asset-backed securities are recorded as an adjustment to interest income.
Foreign Currency Translation — The books and records of the Fund are maintained in U.S. dollars. Investment securities and other assets and liabilities denominated in a foreign currency are translated into U.S. dollars on the date of valuation. The Fund does not isolate that portion of realized or unrealized gains and losses resulting from changes in the foreign exchange rate from fluctuations arising from changes in the market prices of the securities. These gains and losses are included in net realized and unrealized gains and losses on investments on the Statement of Operations. Net realized and unrealized gains and losses on foreign currency transactions represent net foreign exchange gains or losses from foreign currency exchange contracts, disposition of foreign currencies, currency gains or losses realized between trade and settlement dates on securities transactions and the difference between the amount of the investment income and foreign withholding taxes recorded on the Fund’s books and the U.S. dollar equivalent of the amounts actually received or paid.
| THE ADVISORS’ INNER CIRCLE FUND III | PINEBRIDGE DYNAMIC |
| | ASSET ALLOCATION FUND |
| | OCTOBER 31, 2024 |
Forward Foreign Currency Contracts — The Fund enters into forward foreign currency contracts to protect the value of securities held and related receivables and payables against changes in future foreign exchange rates. A forward foreign currency contract is an agreement between two parties to buy and sell currency at a set price on a future date. The market value of the contract will fluctuate with changes in currency exchange rates. The contract is marked-to-market daily using the current forward rate and the change in market value is recorded by the Fund as unrealized gain or loss. The Fund recognizes realized gains or losses when the contract is closed, equal to the difference between the value of the contract at the time it was opened and the value at the time it was closed. Any realized or unrealized appreciation (depreciation) during the year is presented on the Statement of Operations. Risks may arise from unanticipated movements in the value of a foreign currency relative to the U.S. dollar. Risks may also arise upon entering into these contracts from the potential inability of counterparties to meet the terms of their contracts and are generally limited to the amount of unrealized gain on the contracts at the date of default. Refer to the Fund’s Schedule of Investments for details regarding open forward foreign currency contracts as of October 31, 2024.
For the year ended October 31, 2024, the average quarterly balances of forward foreign currency contracts were as follows:
| | Average Quarterly Notional Contracts Purchased | | $ | 34,532,794 | |
| | Average Quarterly Notional Contracts Sold | | $ | (20,087,221 | ) |
Futures Contracts — The Fund utilized futures contracts during the year ended October 31, 2024. To the extent consistent with its investment objective and strategies, the Fund may use futures contracts for tactical hedging purposes as well as to enhance the Fund’s returns. Initial margin deposits of cash or securities are made upon entering into futures contracts. The futures contracts are valued at the settlement price established each day by the Board of exchange on which they are traded. The futures contracts are marked to market daily and the resulting changes in value are accounted for as unrealized gains and losses. Variation margin payments are paid or received, depending upon whether unrealized gains or losses are incurred. When the futures contract is closed, the Fund records a realized gain or loss equal to the difference between the proceeds from (or cost of) the closing transaction and the amount invested in the futures contract.
Risks of entering into futures contracts include the possibility that there will be an imperfect price correlation between the futures and the underlying securities. Second, it is possible that a lack of liquidity for futures contracts could exist in the secondary market, resulting in an inability to close a position prior to its maturity date. Third, the futures contract involves the risk that a Fund could lose more than the original margin deposit required to initiate a futures transaction.
| THE ADVISORS’ INNER CIRCLE FUND III | PINEBRIDGE DYNAMIC |
| | ASSET ALLOCATION FUND |
| | OCTOBER 31, 2024 |
Finally, the risk exists that losses could exceed amounts disclosed on the Statement of Assets and Liabilities. Refer to the Fund’s Schedule of Investments for details regarding open futures contracts as of October 31, 2024.
For the year ended October 31, 2024, the average quarterly notional amount of futures contracts held were as follows:
| Average Quarterly Notional Balance Long | | $ | 34,170,914 | |
| Average Quarterly Notional Balance Short | | $ | (23,204,088 | ) |
Investments in Real Estate Investment Trusts (“REITs”) — Dividend income from REITs is recorded based on the income included in distributions received from the REIT investments using published REIT reclassifications, including some management estimates when actual amounts are not available. Distributions received in excess of this estimated amount are recorded as a reduction of the cost of investments or reclassified to capital gains. The actual amounts of income, return of capital, and capital gains are only determined by each REIT after its fiscal year-end, and may differ from the estimated amounts.
Master Limited Partnerships — Entities commonly referred to as “MLPs” are generally organized under state law as limited partnerships or limited liability companies. The Funds intend to primarily invest in MLPs receiving partnership taxation treatment under the Internal Revenue Code of 1986 (the “Code”), and whose interests or “units” are traded on securities exchanges like shares of corporate stock. To be treated as a partnership for U.S. federal income tax purposes, an MLP whose units are traded on a securities exchange must receive at least 90% of its income from qualifying sources such as interest, dividends, real estate rents, gain from the sale or disposition of real property, income and gain from mineral or natural resources activities, income and gain from the transportation or storage of certain fuels, and, in certain circumstances, income and gain from commodities or futures, forwards and options with respect to commodities. Mineral or natural resources activities include exploration, development, production, processing, mining, refining, marketing and transportation (including pipelines) of oil and gas, minerals, geothermal energy, fertilizer, timber or industrial source carbon dioxide. An MLP consists of a general partner and limited partners (or in the case of MLPs organized as limited liability companies, a managing member and members). The general partner or managing member typically controls the operations and management of the MLP and has an ownership stake in the partnership. The limited partners or members, through their ownership of limited partner or member interests, provide capital to the entity, are intended to have no role in the operation and management of the entity and receive cash distributions. The MLPs themselves generally do not pay U.S. federal income taxes. Thus, unlike investors in corporate securities, direct MLP investors are generally not subject to double taxation (i.e., corporate level tax and tax on corporate dividends). Currently, most MLPs operate in the energy and/or natural resources sector.
| THE ADVISORS’ INNER CIRCLE FUND III | PINEBRIDGE DYNAMIC |
| | ASSET ALLOCATION FUND |
| | OCTOBER 31, 2024 |
Expenses — Most expenses of the Trust can be directly attributed to a particular fund. Expenses which cannot be directly attributed to a particular fund are apportioned among the funds of the Trust based on the number of funds and/or relative net assets.
Classes — Class specific expenses are borne by that class of shares. Income, realized and unrealized gains and losses and non-class specific expenses are allocated to the respective class on the basis of relative daily net assets.
Cash and Cash Equivalents — Idle cash may be swept into various time deposit accounts and is classified as cash on the Statement of Assets and Liabilities. The Fund maintains cash in bank deposit accounts which, at times may exceed United States federally insured limits. Amounts invested are available on the same business day.
Dividends and Distributions to Shareholders — The Fund distributes substantially all of its net investment income annually. Any net realized capital gains are distributed annually. All distributions are recorded on the ex-dividend date.
3. Derivative Transactions:
The following tables include the Fund’s exposure by type of risk on derivatives held throughout the period.
| THE ADVISORS’ INNER CIRCLE FUND III | PINEBRIDGE DYNAMIC |
| | ASSET ALLOCATION FUND |
| | OCTOBER 31, 2024 |
The fair value of derivative instruments as of October 31, 2024, was as follows:
| | | Asset Derivatives | | | | | Liability Derivatives | | | |
| | | Statement of Assets and Liabilities Location | | Fair Value | | | Statement of Assets and Liabilities Location | | Fair Value | |
| Derivatives not accounted for as hedging instruments: | | | | | |
| Equity contracts | | Unrealized appreciation on futures contracts | | $ | 147,491 | | * | Unrealized depreciation on futures contracts | | $ | 657,490 | * |
| | | | | | | | | | | | | |
| Interest rate contracts | | Unrealized appreciation on futures contracts | | | — | | | Unrealized depreciation on futures contracts | | | 600,466 | * |
| | | | | | | | | | | | | |
| Foreign exchange contracts | | Unrealized appreciation on forward foreign currency contracts | | | 532,985 | | | Unrealized depreciation on forward foreign currency contracts | | | 1,498,414 | |
| Total | | | | $ | 680,476 | | | | | $ | 2,756,370 | |
| * | Includes cumulative appreciation (depreciation) of futures contracts as reported in the Schedule of Investments. Only current day’s variation margin, if any, is reported within the Statement of Assets and Liabilities. |
The effect of derivative instruments on the Statement of Operations for the year ended October 31, 2024, was as follows:
The amount of realized gain (loss) on derivatives recognized in income:
| | | | | | Forward | | | | |
| | | | | | Foreign | | | | |
| | | Futures | | | Currency | | | | |
| Derivatives Not Accounted for as Hedging Instruments | | Contracts | | | Contracts | | | Total | |
| Foreign exchange contracts | | $ | — | | | $ | 51,045 | | | $ | 51,045 | |
| Equity contracts | | | (6,384,180 | ) | | | — | | | | (6,384,180 | ) |
| Interest rate contracts | | | 3,757,057 | | | | — | | | | 3,757,057 | |
| Total | | $ | (2,627,123 | ) | | $ | 51,045 | | | $ | (2,576,078 | ) |
| THE ADVISORS’ INNER CIRCLE FUND III | PINEBRIDGE DYNAMIC |
| | ASSET ALLOCATION FUND |
| | OCTOBER 31, 2024 |
Change in unrealized appreciation (depreciation) on derivatives recognized in income:
| | | | | | Forward | | | | |
| | | | | | Foreign | | | | |
| | | Futures | | | Currency | | | | |
| Derivatives Not Accounted for as Hedging Instruments | | Contracts | | | Contracts | | | Total | |
| Foreign exchange contracts | | $ | — | | | $ | 319,677 | | | $ | 319,677 | |
| Equity contracts | | | (3,421,008 | ) | | | — | | | | (3,421,008 | ) |
| Interest rate contracts | | | (81,323 | ) | | | — | | | | (81,323 | ) |
| Total | | $ | (3,502,331 | ) | | $ | 319,677 | | | $ | (3,182,654 | ) |
4. Offsetting Assets and Liabilities:
The Fund is subject to various netting arrangements with select counterparties (“Master Agreements”). Master Agreements govern the terms of certain transactions, and reduce the counterparty risk associated with relevant transactions by specifying credit protection mechanisms and providing standardization that improves legal certainty. Since different types of transactions have different mechanics and are sometimes traded out of different legal entities of a particular counterparty organization, each type of transaction may be covered by a different Master Agreement, resulting in the need for multiple agreements with a single counterparty. As the Master Agreements are specific to unique operations of different asset types, they allow a Fund to close out and net its total exposure to a specific counterparty entity in the event of a default with respect to all the transactions governed under a single agreement with a specific counterparty entity.
Master Agreements can also help limit counterparty risk by specifying collateral posting arrangements at pre-arranged exposure levels. Under the Master Agreements, collateral is routinely transferred if the total net exposure to certain transactions (net of existing collateral already in place) governed under the relevant Master Agreement with a counterparty in a given account exceeds a specified threshold, which typically ranges from zero to $250,000 depending on the counterparty and the type of Master Agreement. United States Treasury Securities and U.S. dollar cash are generally the preferred forms of collateral. Securities and cash pledged as collateral are reflected as assets on the Statement of Assets and Liabilities as either a component of investments at value (securities) or cash pledged as collateral for futures contracts (cash). The market value of any securities received as collateral is not reflected as a component of net asset value. A Fund’s overall exposure to counterparty risk can change substantially within a short period, as it is affected by each transaction subject to the relevant Master Agreement.
| THE ADVISORS’ INNER CIRCLE FUND III | PINEBRIDGE DYNAMIC |
| | ASSET ALLOCATION FUND |
| | OCTOBER 31, 2024 |
The following is a summary of derivatives subject to master netting agreements and the collateral (received)/pledged by counterparty in connection with the master netting agreements as of October 31, 2024:
| | | Gross | | | Gross | | | | | | | | | | |
| | | Assets | | | Liabilities | | | | | | | | | | |
| | | Recognized | | | Recognized | | | | | | | | | | |
| | | in the | | | in the | | | | | | | | | | |
| | | Statement | | | Statement | | | Net Amount | | | | | | | |
| | | of Assets | | | of Assets | | | Available | | | Collateral | | | | |
| | | and | | | and | | | to be | | | Pledged or | | | Net | |
| Counterparty | | Liabilities | | | Liabilities | | | Offset | | | (Received) † | | | Amount ‡ | |
| | | Forward Foreign | | | | | | | | | | |
| | | Currency Contracts | | | | | | | | | | | | | |
| Morgan Stanley | | $ | 532,985 | | | $ | (1,498,414 | ) | | $ | (965,429 | ) | | $ | 930,000 | | | $ | (35,429 | ) |
| Total | | $ | 532,985 | | | $ | (1,498,414 | ) | | $ | (965,429 | ) | | $ | 930,000 | | | $ | (35,429 | ) |
| † | Collateral pledged is limited to the net outstanding amount due to/from the counterparty. The actual collateral amounts pledged may exceed these amounts and may fluctuate in value. |
| ‡ | Represents receivable from/payable to counterparty in the event of default. |
International Swaps and Derivatives Association, Inc. Master Agreements and Credit Support Annexes (“ISDA Master Agreements”) govern OTC financial derivative transactions entered into by a Fund and select counterparties. ISDA Master Agreements maintain provisions for general obligations, representations, agreements, collateral and events of default or termination. Events of termination include conditions that may entitle counterparties to elect to terminate early and cause settlement of all outstanding transactions under the applicable ISDA Master Agreement. Any election to terminate early could be material to the financial statements. In limited circumstances, the ISDA Master Agreement may contain additional provisions that add additional counterparty protection beyond coverage of existing daily exposure if the counterparty has a decline in credit quality below a predefined level. These amounts, if any, may be segregated with a third party custodian.
5. Transactions with Affiliates:
Certain officers of the Trust are also employees of SEI Investments Global Funds Services (the “Administrator”), a wholly owned subsidiary of SEI Investments Company, and/or SEI Investments Distribution Co. (the “Distributor”). Such officers are paid no fees by the Trust, other than the Chief Compliance Officer (“CCO”) as described below, for serving as officers of the Trust.
| THE ADVISORS’ INNER CIRCLE FUND III | PINEBRIDGE DYNAMIC |
| | ASSET ALLOCATION FUND |
| | OCTOBER 31, 2024 |
The services provided by the CCO and his staff are paid for by the Trust as incurred. The services include regulatory oversight of the Trust’s Advisors and service providers as required by SEC regulations. The CCO’s services and fees have been approved by and are reviewed by the Board.
6. Administration, Distribution, Shareholder Servicing, Custodian and Transfer Agent Agreements:
The Fund and the Administrator are parties to an Administration Agreement under which the Administrator provides administration services to the Fund. For these services, the Administrator is paid an asset based fee, which will vary depending on the number of share classes and the average daily net assets of the Fund. For the year ended October 31, 2024, the Fund paid $174,401 for these services.
The Fund has adopted a shareholder servicing plan (the “Service Plan”) under which a shareholder servicing fee of up to 0.15% of average daily net assets of Investor Servicing Shares of the Fund will be paid to other service providers. Under the Service Plan, other service providers may perform, or may compensate other service providers for performing certain shareholder and administrative services. For the year ended October 31, 2024, the Investor Servicing Shares incurred $5,389 for these services.
Brown Brothers Harriman & Co. acts as custodian (the “Custodian”) for the Fund. The Custodian plays no role in determining the investment policies of the Fund or which securities are to be purchased or sold by the Fund.
Apex Fund Services serves as the transfer agent and dividend disbursing agent for the Fund under a transfer agency agreement with the Trust.
7. Investment Advisory Agreement:
Under the terms of an investment advisory agreement, the Adviser provides investment advisory services to the Fund at a fee calculated at an annual rate of 0.75% of the Fund’s average daily net assets. The Adviser had contractually agreed to reduce fees and/or reimburse expenses to the extent necessary to keep total annual Fund operating expenses after fee reductions and/or expense reimbursements (excluding any class specific expenses, dividend and interest expenses on securities sold short, interest, taxes, acquired fund fee expenses and non-routine expenses (collectively, “excluded expenses”)) from exceeding 0.75% of the average daily net assets of the Fund’s Investor Servicing Shares and Institutional Shares until April 30, 2025 (the “Expense Limitation”). Refer to waiver of investment advisory fees on the Statement of Operations for fees waived for the year ended October 31, 2024. The Adviser may recover all or a portion of its fee reductions or expense reimbursements, up to the expense cap in place at the time the expenses were waived, within a three-year period from the year in which it reduced its fee or reimbursed expenses if the Fund’s total annual fund operating expenses are below the Expense Limitation. This agreement may be terminated by the Board for any reason at any time, or by the Adviser, upon ninety (90) days’ prior written notice to the Trust, effective as of the close of business on April 30, 2025. As of October 31, 2024, the fees which were previously waived and/ or reimbursed to the Fund by the Adviser, which may be subject to possible future recapture, up to the expense cap in place at the time the expenses were waived and reimbursed to the Adviser were $990,512, $793,609 and $553,744 expiring in 2025, 2026 and 2027, respectively. During the year ended October 31, 2024, the Fund did not recapture any previously waived fees and/or reimbursed expenses.
| THE ADVISORS’ INNER CIRCLE FUND III | PINEBRIDGE DYNAMIC |
| | ASSET ALLOCATION FUND |
| | OCTOBER 31, 2024 |
8. Investment Transactions:
The cost of security purchases and the proceeds from security sales other than short-term securities, for the year ended October 31, 2024, were as follows:
| Purchases | | | |
| U.S. Government | | $ | 5,774,565 | |
| Other | | | 133,631,652 | |
| Sales | | | |
| U.S. Government | | $ | 8,391,684 | |
| Other | | | 182,619,870 | |
9. Share Transactions:
| | | Year Ended | | | Year Ended | |
| | | October 31, | | | October 31, | |
| | | 2024 | | | 2023 | |
| Institutional Shares | | | | | | | | |
| Issued | | | 7,858,700 | * | | | 423,409 | |
| Reinvestment of Distributions | | | 260,521 | | | | 2,485 | |
| Redeemed | | | (8,232,083 | ) | | | (29,366,995 | ) |
| Total Institutional Shares Transactions | | | (112,862 | ) | | | (28,941,101 | ) |
| Investor Servicing Shares | | | | | | | | |
| Issued | | | 2,016 | | | | 24,998 | |
| Reinvestment of Distributions | | | 8,893 | | | | – | |
| Redeemed | | | (86,497 | ) | | | (184,072 | ) |
| Total Investor Servicing Shares Transactions | | | (75,588 | ) | | | (159,074 | ) |
| Net Decrease in Shares Outstanding From Share Transactions | | | (188,450 | ) | | | (29,100,175 | ) |
| * | Includes issuances as a result of in-kind transactions (see Note 13). |
| THE ADVISORS’ INNER CIRCLE FUND III | PINEBRIDGE DYNAMIC |
| | ASSET ALLOCATION FUND |
| | OCTOBER 31, 2024 |
10. Federal Tax Information:
The amount and character of income and capital gain distributions to be paid, if any, are determined in accordance with Federal income tax regulations, which may differ from U.S. GAAP. As a result, net investment income (loss) and net realized gain (loss) on investment transactions for a reporting period may differ significantly from distributions during such period. These book/tax differences may be temporary or permanent. The permanent differences are primarily related to investments in foreign currency, paydown adjustments, REIT adjustments, passive foreign investment companies, perpetual bond adjustments, GAAP amortized adjustment and India capital gains adjustments.
There are no permanent differences that are credited or charged to Paid-in Capital and Distributable Earnings (Accumulated Losses) as of October 31, 2024.
The tax character of dividends or distributions declared during the years ended October 31:
| | | Ordinary Income | | | Long-Term Capital Gain | | | Return of Capital | | | Total | |
| 2024 | | $ | 3,115,643 | | | $ | — | | | $ | — | | | $ | 3,115,643 | |
| 2023 | | | 27,150 | | | | — | | | | — | | | | 27,150 | |
As October 31, 2024 of the components of accumulated losses on a tax basis were as follows:
| Undistributed Ordinary Income | | $ | 2,968,941 | |
| Capital Loss Carryforwards | | | (50,447,436 | ) |
| Unrealized Appreciation | | | 19,149,691 | |
| Other Temporary Differences | | | (77,066 | ) |
| Total Accumulated Losses | | $ | (28,405,870 | ) |
As of October 31, 2024, The Fund has short-term capital losses carried forward of $50,447,436. The Fund utilized $5,410,264 of capital loss carryforwards to offset capital gains.
For Federal income tax purposes, the difference between Federal tax cost and book cost are primarily due to mark-to-market on PFIC securities, GAAP amortization adjustment, perpetual bonds and wash sales, which cannot be used for Federal income tax purposes in the current year and have been deferred for use in future years.
| THE ADVISORS’ INNER CIRCLE FUND III | PINEBRIDGE DYNAMIC |
| | ASSET ALLOCATION FUND |
| | OCTOBER 31, 2024 |
The Federal tax cost and aggregate gross unrealized appreciation and depreciation for the investments held by the Fund at October 31, 2024, were as follows:
| | | | Aggregate | | | Aggregate | | | | |
| | | | Gross | | | Gross | | | | |
| Federal Tax | | | Unrealized | | | Unrealized | | | Net Unrealized | |
| Cost | | | Appreciation | | | Depreciation | | | Appreciation* | |
| $ | 89,994,129 | | | $ | 23,117,655 | | | $ | (3,760,670 | ) | | $ | 19,356,985 | |
| * | The difference in unrealized appreciation is attributable to foreign capital gains tax payable. |
11. Concentration of Risks:
As with all management investment companies, a shareholder of the Fund is subject to the risk that his or her investment could lose money. The Fund is subject to the principal risks noted below, any of which may adversely affect the Fund’s net asset value (“NAV”) and ability to meet its investment objective.
Market Risk – The risk that the market value of an investment may move up and down, sometimes rapidly and unpredictably. The Fund’s NAV per share will fluctuate with the market prices of its portfolio securities. Market risk may affect a single issuer, an industry, a sector or the equity or bond market as a whole. Markets for securities in which the Fund invests may decline significantly in response to adverse issuer, political, regulatory, market, economic or other developments that may cause broad changes in market value, public perceptions concerning these developments, and adverse investor sentiment or publicity. Similarly, the impact of any epidemic, pandemic or natural disaster, or widespread fear that such events may occur, could negatively affect the global economy, as well as the economies of individual countries, the financial performance of individual companies and sectors, and the markets in general in significant and unforeseen ways. Any such impact could adversely affect the prices and liquidity of the securities and other instruments in which the Fund invests, which in turn could negatively impact the Fund’s performance and cause losses on your investment in the Fund. Recent examples include pandemic risks related to COVID-19 and aggressive measures taken worldwide in response by governments, including closing borders, restricting international and domestic travel, and the imposition of prolonged quarantines of large populations, and by businesses, including changes to operations and reducing staff.
Asset Allocation Risk – The Fund is subject to asset allocation risk, which is the risk that the Adviser’s allocation of the Fund’s assets among various asset classes will cause the Fund to underperform other funds with a similar investment objective and/or underperform the markets in which the Fund invests.
Equity Risk – Since it purchases equity securities, the Fund is subject to the risk that stock prices may fall over short or extended periods of time. Historically, the equity market has moved in cycles, and the value of the Fund’s securities may fluctuate from day to day. Individual companies may report poor results or be negatively affected by industry and/or economic trends and developments. The prices of securities issued by such companies may suffer a decline in response.
| THE ADVISORS’ INNER CIRCLE FUND III | PINEBRIDGE DYNAMIC |
| | ASSET ALLOCATION FUND |
| | OCTOBER 31, 2024 |
Interest Rate Risk – As with most funds that invest in fixed income securities, changes in interest rates could affect the value of your investment. Rising interest rates tend to cause the prices of fixed income securities (especially those with longer maturities and lower credit qualities) and the Fund’s share price to fall.
Derivatives Risk – The Fund’s use of futures contracts, forward contracts, options and swaps is subject to market risk, leverage risk, correlation risk, liquidity risk and hedging risk. Market Risk is described elsewhere in this section. Leverage risk is the risk that since derivatives may be purchased for a fraction of their value, a relatively small price movement in a derivative may result in an immediate and substantial loss or gain for the Fund, and may also cause the Fund to liquidate portfolio positions when it would not be advantageous to do so in order to satisfy its obligations. Correlation risk is the risk that changes in the value of the derivative may not correlate perfectly or at all with the underlying asset, rate or index. Liquidity risk is the risk that certain securities may be difficult or impossible to sell at the time and the price that the Fund would like. Hedging risk is the risk that derivative instruments used for hedging purposes may also limit any potential gain that may result from the increase in value of the hedged asset. To the extent that the Fund engages in hedging strategies, there can be no assurance that such strategy will be effective or that there will be a hedge in place at any given time. The Fund’s use of forwards and swaps is also subject to credit risk and valuation risk. Credit risk is the risk that the counterparty to a derivative contract will default or otherwise become unable to honor a financial obligation. Valuation risk is the risk that a security may be difficult to value. Each of these risks could cause the Fund to lose more than the principal amount invested in a derivative instrument.
Small- and Mid-Capitalization Company Risk – Small- and mid-capitalization companies may be more vulnerable to adverse business or economic events than larger, more established companies. In particular, investments in these small- and mid-sized companies may pose additional risks, including liquidity risk, because these companies tend to have limited product lines, markets and financial resources, and may depend upon a relatively small management group. Therefore, small- and mid-cap stocks may be more volatile than those of larger companies. These securities may be traded over-the-counter or listed on an exchange.
Foreign Company Risk – Investing in foreign companies, including direct investments and investments through depositary receipts, poses additional risks since political and economic events unique to a country or region will affect those markets and their issuers. These risks will not necessarily affect the U.S. economy or similar issuers located in the U.S. Securities of foreign companies may not be registered with the U.S. Securities and Exchange Commission (the “SEC”) and foreign companies are generally not subject to the regulatory controls imposed on U.S. issuers and, as a consequence, there is generally less publicly available information about foreign securities than is available about domestic securities. Income from foreign securities owned by the Fund may be reduced by a withholding tax at the source, which tax would reduce income received from the securities comprising the Fund’s portfolio. Foreign securities may also be more difficult to value than securities of U.S. issuers. In addition, periodic U.S. Government restrictions on investments in issuers from certain foreign countries may require the Fund to sell such investments at inopportune times, which could result in losses to the Fund. While depositary receipts provide an alternative to directly purchasing the underlying foreign securities in their respective national markets and currencies, investments in depositary receipts continue to be subject to many of the risks associated with investing directly in foreign securities.
| THE ADVISORS’ INNER CIRCLE FUND III | PINEBRIDGE DYNAMIC |
| | ASSET ALLOCATION FUND |
| | OCTOBER 31, 2024 |
Emerging Markets Securities Risk – The Fund’s investments in emerging markets securities are considered speculative and subject to heightened risks in addition to the general risks of investing in foreign securities. Unlike more established markets, emerging markets may have governments that are less stable, markets that are less liquid and economies that are less developed. In addition, the securities markets of emerging market countries may consist of companies with smaller market capitalizations and may suffer periods of relative illiquidity; significant price volatility; restrictions on foreign investment; and possible restrictions on repatriation of investment income and capital. Furthermore, foreign investors may be required to register the proceeds of sales, and future economic or political crises could lead to price controls, forced mergers, expropriation or confiscatory taxation, seizure, nationalization or creation of government monopolies.
Risks of Investing in Other Investment Companies – To the extent the Fund invests in other investment companies, such as open-end funds, closed-end funds and ETFs, the Fund will be subject to substantially the same risks as those associated with the direct ownership of the securities held by such other investment companies. As a shareholder of another investment company, the Fund relies on that investment company to achieve its investment objective. If the investment company fails to achieve its objective, the value of the Fund’s investment could decline, which could adversely affect the Fund’s performance. By investing in another investment company, Fund shareholders indirectly bear the Fund’s proportionate share of the fees and expenses of the other investment company, in addition to the fees and expenses that Fund shareholders directly bear in connection with the Fund’s own operations.
Because ETFs and certain closed-end funds are listed on national stock exchanges and are traded like stocks listed on an exchange, their shares potentially may trade at a discount or premium. Investments in ETFs and certain closed-end funds are also subject to brokerage and other trading costs, which could result in greater expenses to the Fund. In addition, because the value of ETF and certain closed-end fund shares depends on the demand in the market, the Adviser may not be able to liquidate the Fund’s holdings at the most optimal time, which could adversely affect Fund performance.
| THE ADVISORS’ INNER CIRCLE FUND III | PINEBRIDGE DYNAMIC |
| | ASSET ALLOCATION FUND |
| | OCTOBER 31, 2024 |
Foreign Currency Risk – As a result of the Fund’s investments in securities denominated in, and/or receiving revenues in, foreign currencies, the Fund will be subject to currency risk. Currency risk is the risk that foreign currencies will decline in value relative to the U.S. dollar, in which case, the dollar value of an investment in the Fund would be adversely affected.
REITs Risk – REITs are pooled investment vehicles that own, and usually operate, income-producing real estate. REITs are susceptible to the risks associated with direct ownership of real estate, such as the following: declines in property values; increases in property taxes, operating expenses, interest rates or competition; overbuilding; zoning changes; and losses from casualty or condemnation. REITs typically incur fees that are separate from those of the Fund. Accordingly, the Fund’s investments in REITs will result in the layering of expenses such that shareholders will indirectly bear a proportionate share of the REITs’ operating expenses, in addition to paying Fund expenses. REIT operating expenses are not reflected in the fee table and example in this prospectus.
Short Sales Risk – A short sale involves the sale of a security that the Fund does not own in the expectation of purchasing the same security (or a security exchangeable therefore) at a later date at a lower price. Short sales expose the Fund to the risk that it will be required to buy the security sold short (also known as “covering” the short position) at a time when the security has appreciated in value, thus resulting in a loss to the Fund. Investment in short sales may also cause the Fund to incur expenses related to borrowing securities. Reinvesting proceeds received from short selling may create leverage which can amplify the effects of market volatility on the Fund and, therefore, the Fund’s share price. Theoretically, uncovered short sales have the potential to expose the Fund to unlimited losses.
Fixed Income Market Risk – The prices of the Fund's fixed income securities respond to economic developments, particularly interest rate changes, as well as to perceptions about the creditworthiness of individual issuers, including governments and their agencies. Generally, the value of the Fund's fixed income securities will vary inversely with the direction of prevailing interest rates. Declines in dealer market-making capacity as a result of structural or regulatory changes could decrease liquidity and/or increase volatility in the fixed income markets. In the case of foreign securities, price fluctuations will reflect international economic and political events, as well as changes in currency valuations relative to the U.S. dollar. In response to these events, the Fund's value may fluctuate and/or the Fund may experience increased redemptions from shareholders, which may impact the Fund's liquidity or force the Fund to sell securities into a declining or illiquid market.
| THE ADVISORS’ INNER CIRCLE FUND III | PINEBRIDGE DYNAMIC |
| | ASSET ALLOCATION FUND |
| | OCTOBER 31, 2024 |
Convertible Securities Risk – The value of a convertible security is influenced by changes in interest rates (with investment value declining as interest rates increase and increasing as interest rates decline) and the credit standing of the issuer. The price of a convertible security will also normally vary in some proportion to changes in the price of the underlying common stock because of the conversion or exercise feature.
Rights and Warrants Risk – Investments in rights or warrants involve the risk of loss of the purchase value of a right or warrant if the right to subscribe to additional shares is not exercised prior to the right’s or warrant’s expiration. Also, the purchase of rights and/or warrants involves the risk that the effective price paid for the right and/or warrant added to the subscription price of the underlying security may exceed the market price of the underlying security in instances such as those where there is no movement in the price of the underlying security.
Preferred Stock Risk – Preferred stocks are sensitive to interest rate changes, and are also subject to equity risk, which is the risk that stock prices will fall over short or extended periods of time. The rights of preferred stocks on the distribution of a company’s assets in the event of a liquidation are generally subordinate to the rights associated with a company’s debt securities.
Credit Risk – The credit rating or financial condition of an issuer may affect the value of a fixed income security. Generally, the lower the credit quality of a security, the greater the perceived risk that the issuer will fail to pay interest fully and return principal in a timely manner. If an issuer defaults or becomes unable to honor its financial obligations, the security may lose some or all of its value.
Bank Loans Risk – Investments in bank loans (through both assignments and participations) are generally subject to the same risks as investments in other types of debt instruments, including, in many cases, investments in junk bonds. There may be limited public information available regarding bank loans and bank loans may be difficult to value. If the Fund holds a bank loan through another financial institution, or relies on a financial institution to administer the loan, its receipt of principal and interest on the loan may be subject to the credit risk of that financial institution. It is possible that any collateral securing a loan may be insufficient or unavailable to the Fund, and that the Fund’s rights to collateral may be limited by bankruptcy or insolvency laws. In addition, the secondary market for bank loans may be subject to irregular trading activity, wide bid/ask spreads, and extended trade settlement periods, which may cause the Fund to be unable to realize the full value of its investment in a bank loan.
Bank loans may not be considered “securities,” and purchasers, such as the Fund, therefore may not be entitled to rely on the anti-fraud protections of the federal securities laws.
| THE ADVISORS’ INNER CIRCLE FUND III | PINEBRIDGE DYNAMIC |
| | ASSET ALLOCATION FUND |
| | OCTOBER 31, 2024 |
High Yield Bond Risk – High yield, or “junk,” bonds are debt securities rated below investment grade. High yield bonds are speculative, involve greater risks of default, downgrade, or price declines and are more volatile and tend to be less liquid than investment-grade securities. Companies issuing high yield bonds are less financially strong, are more likely to encounter financial difficulties, and are more vulnerable to adverse market events and negative sentiments than companies with higher credit ratings.
Collateralized Debt Obligations Risk – The risks of an investment in a collateralized debt obligation depend largely on the type of the collateral securities and the class of the debt obligation in which the Fund invests. Collateralized debt obligations are generally subject to credit, interest rate, prepayment and extension, valuation and liquidity risks, which are described elsewhere in this section. These securities also are subject to risk of default on the underlying assets, particularly during periods of economic downturn.
Collateralized Loan Obligation Risk. The risks of an investment in a collateralized loan obligation depend largely on the type of the collateral securities and the class of the debt obligation in which the Fund invests. Collateralized loan obligations are generally subject to credit, interest rate, prepayment and extension, valuation and liquidity risks, which are described elsewhere in this section. These securities also are subject to risk of default on the underlying asset, particularly during periods of economic downturn.
Collateralized loan obligations carry additional risks including, but not limited to, (i) the possibility that distributions from collateral securities will not be adequate to make interest of other payments, (ii) the collateral may decline in value or default, (iii) the Fund may invest in obligations that are subordinate to other classes, and (iv) the complex structure of the security may not be fully understood at the time of investment and produce disputes with the issuer or unexpected investment results.
Collateralized Bond Obligation Risk. The pool of high yield securities underlying collateralized bond obligations is typically separated into groupings called tranches representing different degrees of credit quality. The higher quality tranches have greater degrees of protection and pay lower interest rates. The lower tranches, with greater risk, pay higher interest rates.
Corporate Fixed Income Securities Risk – Corporate fixed income securities respond to economic developments, especially changes in interest rates, as well as perceptions of the creditworthiness and business prospects of individual issuers.
Foreign Sovereign Debt Securities Risk – The Fund’s investments in foreign sovereign debt securities are subject to the risks that: (i) the governmental entity that controls the repayment of sovereign debt may not be willing or able to repay the principal and/or interest when it becomes due, due to factors such as debt service burden, political constraints, cash flow problems and other national economic factors; (ii) governments may default on their debt securities, which may require holders of such securities to participate in debt rescheduling or additional lending to defaulting governments; and (iii) there is no bankruptcy proceeding by which defaulted sovereign debt may be collected in whole or in part.
| THE ADVISORS’ INNER CIRCLE FUND III | PINEBRIDGE DYNAMIC |
| | ASSET ALLOCATION FUND |
| | OCTOBER 31, 2024 |
Mortgage-Backed Securities Risk – Mortgage-backed securities are affected by, among other things, interest rate changes and the possibility of prepayment of the underlying mortgage loans. Mortgage-backed securities are also subject to the risk that underlying borrowers will be unable to meet their obligations.
Asset-Backed Securities Risk – Payment of principal and interest on asset-backed securities is dependent largely on the cash flows generated by the assets backing the securities, and asset-backed securities may not have the benefit of any security interest in the related assets.
Bank Obligations Risk – The Fund’s investments in bank obligations are subject to risks generally applicable to debt securities, as well as to the risk of negative events affecting the banking industry. Obligations of foreign banks and foreign branches of U.S. banks are subject to additional risks, including negative political and economic developments in the country in which the bank or branch is located and actions by a foreign government that might adversely affect the payment of principal and interest on such obligations, such as the seizure or nationalization of foreign deposits. Additionally, U.S. and state banking laws and regulations may not apply to foreign branches of U.S. banks, and generally do not apply to foreign banks.
Prepayment and Extension Risk – When interest rates fall, issuers of high interest debt obligations may pay off the debts earlier than expected (prepayment risk), and the Fund may have to reinvest the proceeds at lower yields. When interest rates rise, issuers of lower interest debt obligations may pay off the debts later than expected (extension risk), thus keeping the Fund’s assets tied up in lower interest debt obligations.
Portfolio Turnover Risk – The Fund is subject to portfolio turnover risk since it may buy and sell investments frequently. Such a strategy often involves higher expenses, including brokerage commissions, and may increase the amount of capital gains (in particular, short term gains) realized by the Fund. Shareholders may pay tax on such capital gains.
Active Trading Risk – The Fund may actively trade which may result in higher transaction costs to the Fund. Active trading tends to be more pronounced during periods of increased market volatility.
Affiliated Fund Risk – Due to its own financial interest or other business considerations, the Adviser may have an incentive to invest a portion of the Fund’s assets in pooled investment vehicles sponsored or managed by the Adviser or its affiliates in lieu of investments directly in portfolio securities, or in lieu of investments in pooled investment vehicles sponsored or managed by others. Similarly, the Adviser may have an incentive to delay or decide against the sale of interests held by the Fund in pooled investment vehicles sponsored or managed by the Adviser or its affiliates.
| THE ADVISORS’ INNER CIRCLE FUND III | PINEBRIDGE DYNAMIC |
| | ASSET ALLOCATION FUND |
| | OCTOBER 31, 2024 |
Unregistered Funds Risk – Investments in unregistered funds are subject to additional risks beyond those associated with investments in registered investment companies, because investments in unregistered funds do not have the benefit of the protections afforded by the 1940 Act to investors in registered investment companies. In addition, investments in unregistered funds are often illiquid and difficult to value, their marketability may be restricted and the realization of investments from them may take considerable time and/or be costly, in particular because they may have restrictions that allow redemptions only at specific infrequent dates with considerable notice periods and apply lock-ups and/or redemption fees.
U.S. Government Securities Risk – The Fund’s investment in U.S. government obligations may include securities issued or guaranteed as to principal and interest by the U.S. government, or its agencies or instrumentalities. Payment of principal and interest on U.S. government obligations may be backed by the full faith and credit of the United States or may be backed solely by the issuing or guaranteeing agency or instrumentality itself. There can be no assurance that the U.S. government would provide financial support to its agencies or instrumentalities (including government-sponsored enterprises) where it is not obligated to do so. In addition, U.S. government securities are not guaranteed against price movements due to changing interest rates.
LIBOR Replacement Risk – The Fund may be exposed to financial instruments that recently transitioned from, or continue to be tied to, the London Interbank Offered Rate (“LIBOR”) to determine payment obligations, financing terms, hedging strategies or investment value. The United Kingdom’s Financial Conduct Authority (“FCA”), which regulates LIBOR, has ceased publishing all LIBOR settings on a representative basis. In April 2023, however, the FCA announced that some USD LIBOR settings will continue to be published under a synthetic methodology until September 30, 2024 for certain legacy contracts. The Secured Overnight Financing Rate (“SOFR”), which is a broad measure of the cost of borrowing cash overnight collateralized by U.S. Treasury securities in the repurchase agreement market, has been used increasingly on a voluntary basis in new instruments and transactions. It remains uncertain how such changes would be implemented and the effects such changes would have on the Fund, including any negative effects on the Fund’s liquidity and valuation of the Fund’s investments, issuers of instruments in which the Fund invests and financial markets generally.
Repurchase Agreements Risk – Under a repurchase agreement, the seller of a security to the Fund agrees to repurchase the security at a mutually agreed-upon time and price. If the seller in a repurchase agreement transaction defaults on its obligation under the agreement, the Fund may suffer delays and incur costs or lose money in exercising its rights under the agreement.
| THE ADVISORS’ INNER CIRCLE FUND III | PINEBRIDGE DYNAMIC |
| | ASSET ALLOCATION FUND |
| | OCTOBER 31, 2024 |
Reverse Repurchase Agreements Risk – Reverse repurchase agreements involve the sale of securities held by the Fund with an agreement to repurchase the securities at an agreed-upon time and price. Reverse repurchase agreements involve the risk that the other party may fail to return the securities in a timely manner or at all. The Fund could lose money if it is unable to recover the securities and the value of the collateral held by the Fund, including the value of the investments made with cash collateral, is less than the value of the securities.
Securities Lending Risk – Securities lending involves the risk that the Fund may lose money because the borrower of the loaned securities fails to return the securities in a timely manner or at all. The Fund could also lose money in the event of a decline in the value of the collateral provided for loaned securities or a decline in the value of any investments made with cash collateral. These events could also trigger adverse tax consequences for the Fund.
Money Market Instruments Risk – The value of money market instruments may be affected by changing interest rates and by changes in the credit ratings of the investments. An investment in a money market fund is not a bank deposit and is not insured or guaranteed by any bank, the FDIC or any other government agency. A money market fund’s sponsor has no legal obligation to provide financial support to the fund, and there should be no expectation that the sponsor will provide financial support to the fund at any time. Certain money market funds float their net asset value (“NAV”) while others seek to preserve the value of investments at a stable NAV (typically, $1.00 per share). An investment in a money market fund, even an investment in a fund seeking to maintain a stable NAV per share, is not guaranteed and it is possible for the Fund to lose money by investing in these and other types of money market funds. If the liquidity of a money market fund’s portfolio deteriorates below certain levels, the money market fund may suspend redemptions (i.e., impose a redemption gate) and thereby prevent the Fund from selling its investment in the money market fund or impose a fee of up to 2% on amounts the Fund redeems from the money market fund (i.e., impose a liquidity fee). These measures may result in an investment loss or prohibit the Fund from redeeming shares when the Adviser would otherwise redeem shares. Money market funds and the securities they invest in are subject to comprehensive regulations. The enactment of new legislation or regulations, as well as changes in interpretation and enforcement of current laws, may affect the manner of operation, performance and/or yield of money market funds.
The foregoing is not intended to be a complete discussion of the risks associated with investing in the Fund. A more complete description of risks associated with the Fund is included in the prospectus and statement of additional information.
| THE ADVISORS’ INNER CIRCLE FUND III | PINEBRIDGE DYNAMIC ASSET ALLOCATION FUND OCTOBER 31, 2024 |
| 12. | Concentration of Shareholders: |
At October 31, 2024, the percentage of total shares outstanding held by shareholders for the Fund, which are comprised of individual shareholders and omnibus accounts that are held on behalf of various individual shareholders, each owning 10% or greater of the individual class shares outstanding, was as follows:
| | | | No. of Shareholder | | | % Ownership | |
| Institutional Shares | | | 3 | | | 91% | |
| Investor Servicing Shares | | | 1 | | | 95% | |
During the year ended October 31, 2024, the Institutional Class Shares issued shares of beneficial interest in exchange for cash, securities, and interest receivable. The securities were exchanged at their current fair value on the date of the transaction.
| Transaction Date | | Shares Issued | | Securities at Value | | Interest Receivable | Cash |
| 04/30/2024 | | 7,396,598 | | $51,740,816 | | $69,873 | | $28,442,400 |
In the normal course of business, the Fund enters into contracts that provide general indemnifications. The Fund’s maximum exposure under these arrangements is dependent on future claims that may be made against the Fund and, therefore, cannot be established; however, based on experience, the risk of loss from such claim is considered remote.
| 15. | New Accounting Pronouncement: |
In November 2023, the Financial Accounting Standards Board issued Accounting Standards Update No. 2023-07 (“ASU 2023-07”), Segment Reporting (“Topic 280”). ASU 2023-07 clarifies the guidance in Topic 280, which requires public entities to provide disclosures of significant segment expenses and other segment items. The guidance requires public entities to provide in interim periods all disclosures about a reportable segment’s profit or loss and assets that are currently required annually and also applies to public entities with a single reportable segment. Entities are permitted to disclose more than one measure of a segment’s profit or loss if such measures are used by the Chief Operating Decision Maker to allocate resources and assess performance, as long as at least one of those measures is determined in a way that is most consistent with the measurement principles used to measure the corresponding amounts in the consolidated financial statements. The amendments in ASU 2023-07 are effective for fiscal years beginning after December 15, 2023, and interim periods within fiscal years beginning after December 15, 2024. Early adoption is permitted. Management is currently evaluating the implications, if any, of the additional requirements and their impact on a Fund’s financial statements.
| THE ADVISORS’ INNER CIRCLE FUND III | PINEBRIDGE DYNAMIC ASSET ALLOCATION FUND OCTOBER 31, 2024 |
The Fund has evaluated the need for additional disclosures and/or adjustments resulting from subsequent events through the date the financial statements were issued. Based on this evaluation, no additional disclosures and/or adjustments were required to the financial statements.
| THE ADVISORS’ INNER CIRCLE FUND III | PINEBRIDGE DYNAMIC ASSET ALLOCATION FUND OCTOBER 31, 2024 |
REPORT OF INDEPENDENT REGISTERED PUBLIC ACCOUNTING FIRM
To the Board of Trustees of The Advisors’ Inner Circle Fund III and the Shareholders of PineBridge Dynamic Asset Allocation Fund
Opinion on the Financial Statements
We have audited the accompanying statement of assets and liabilities of PineBridge Dynamic Asset Allocation Fund (the “Fund”) (one of the funds constituting The Advisors’ Inner Circle Fund III (the “Trust”)), including the schedule of investments, as of October 31, 2024, and the related statement of operations for the year then ended, the statements of changes in net assets for each of the two years in the period then ended, the financial highlights for each of the five years in the period then ended and the related notes (collectively referred to as the “financial statements”). In our opinion, the financial statements present fairly, in all material respects, the financial position of the Fund (one of the funds constituting The Advisors’ Inner Circle Fund III) at October 31, 2024, the results of its operations for the year then ended, the changes in its net assets for each of the two years in the period then ended and its financial highlights for each of the five years in the period then ended, in conformity with U.S. generally accepted accounting principles.
Basis for Opinion
These financial statements are the responsibility of the Trust’s management. Our responsibility is to express an opinion on the Fund’s financial statements based on our audits. We are a public accounting firm registered with the Public Company Accounting Oversight Board (United States) ("PCAOB") and are required to be independent with respect to the Trust in accordance with the U.S. federal securities laws and the applicable rules and regulations of the Securities and Exchange Commission and the PCAOB.
We conducted our audits in accordance with the standards of the PCAOB. Those standards require that we plan and perform the audit to obtain reasonable assurance about whether the financial statements are free of material misstatement, whether due to error or fraud. The Trust is not required to have, nor were we engaged to perform, an audit of the Trust’s internal control over financial reporting. As part of our audits we are required to obtain an understanding of internal control over financial reporting but not for the purpose of expressing an opinion on the effectiveness of the Trust’s internal control over financial reporting. Accordingly, we express no such opinion.
Our audits included performing procedures to assess the risks of material misstatement of the financial statements, whether due to error or fraud, and performing procedures that respond to those risks. Such procedures included examining, on a test basis, evidence regarding the amounts and disclosures in the financial statements. Our procedures included confirmation of securities owned as of October 31, 2024, by correspondence with the custodian and brokers; when replies were not received from brokers, we performed other auditing procedures. Our audits also included evaluating the accounting principles used and significant estimates made by management, as well as evaluating the overall presentation of the financial statements. We believe that our audits provide a reasonable basis for our opinion.
| THE ADVISORS’ INNER CIRCLE FUND III | PINEBRIDGE DYNAMIC ASSET ALLOCATION FUND OCTOBER 31, 2024 |

We have served as the auditor of one or more PineBridge Investments LLC investment companies since 2018.
Philadelphia, Pennsylvania
December 23, 2024
| THE ADVISORS’ INNER CIRCLE FUND III | PINEBRIDGE DYNAMIC ASSET ALLOCATION FUND OCTOBER 31, 2024 |
NOTICE TO SHAREHOLDERS (Unaudited)
For shareholders that do not have an October 31, 2024 tax year end, this notice is for informational purposes only. For shareholders with an October 31, 2024 tax year end, please consult your tax advisor as to the pertinence of this notice. For the fiscal year ended October 31, 2024, the Fund is designating the following items with regard to distributions paid during the year.
Return of Capital | Ordinary Income Distributions | Long-Term Capital Gain Distributions | Total Distributions | Qualifying for Corporate Dividends Received Deduction(1) | Qualifying Dividend Income(2) |
| 0.00% | 100.00% | 0.00% | 100.00% | 36.34% | 77.89% |
U.S. Government Interest(3) | Interest Related Dividends(4) | Short-Term
Capital Gain Dividends(5) | Foreign Tax Credit(6) | Qualified Business Income(7) |
| 13.40% | 32.78% | 0.00% | 0.00% | 0.25% |
| 1. | Qualifying dividends represent dividends which qualify for the corporate dividends received deduction and is reflected as a percentage of ordinary Income distributions (the total of short term capital gain and net investment income distributions). |
| 2. | The percentage in this column represents the amount of “Qualifying Dividend Income” as created by the Jobs and Growth Tax Relief Reconciliation Act of 2003 and is reflected as a percentage of ordinary income distributions (the total of short term capital gain and net investment income distributions). It is the intention of each of the aforementioned funds to designate the maximum amount permitted by law. |
| 3. | “U.S. Government Interest” represents the amount of interest that was derived from direct U.S. Government obligations and distributed during the fiscal year. This amount is reflected as a percentage of ordinary income. Generally, interest from direct U.S. Government obligations is exempt from state income tax. However, for shareholders who are residents of California, Connecticut and New York, the statutory threshold requirements were not satisfied to permit exemption of these amounts from state income. |
| 4. | The percentage in this column represents the amount of “Interest Related Dividends” and is reflected as a percentage of ordinary income distribution. Interest related dividends are exempt from U.S. withholding tax when paid to foreign investors. |
| 5. | The percentage of this column represents the amount of “Short Term Capital Gain Dividends” and is reflected as a percentage of short term capital gain distribution that is exempt from U.S. withholding tax when paid to foreign investors. |
| 6. | The percentage in this column represents the amount of “Qualifying Foreign Taxes” as a percentage of ordinary distributions during the fiscal year ended October 31, 2024. The Fund intends to pass through a Foreign Tax Credit to shareholders for fiscal year ended 2024. |
| 7. | The percentage of this column represents that amount of ordinary dividend income that qualified for 20% Business Income Deduction. |
The information reported herein may differ from the information and distributions taxable to the shareholder for the calendar year ending December 31, 2024. Complete information will be computed and reported with your 2024 Form 1099-DIV.
| THE ADVISORS’ INNER CIRCLE FUND III | PINEBRIDGE DYNAMIC ASSET ALLOCATION FUND OCTOBER 31, 2024 (Unaudited) |
APPROVAL OF INVESTMENT ADVISORY AGREEMENT (FORM N-CSR ITEM 11)
Pursuant to Section 15 of the Investment Company Act of 1940 (the “1940 Act”), the Fund’s advisory agreement (the “Agreement”) must be renewed at least annually after its initial two-year term: (i) by the vote of the Board of Trustees (the “Board” or the “Trustees”) of The Advisors’ Inner Circle Fund III (the “Trust”) or by a vote of a majority of the shareholders of the Fund; and (ii) by the vote of a majority of the Trustees who are not parties to the Agreement or “interested persons” of any party thereto, as defined in the 1940 Act (the “Independent Trustees”), cast in person at a meeting called for the purpose of voting on such renewal.
A Board meeting was held on September 11–12, 2024 to decide whether to renew the Agreement for an additional one-year term. In preparation for the meeting, the Trustees requested that the Adviser furnish information necessary to evaluate the terms of the Agreement. Prior to the meeting, the Independent Trustees of the Fund met to review and discuss the information provided and submitted a request for additional information to the Adviser, and information was provided in response to this request. The Trustees used this information, as well as other information that the Adviser and other service providers of the Fund presented or submitted to the Board at the meeting and other meetings held during the prior year, to help them decide whether to renew the Agreement for an additional year.
Specifically, the Board requested and received written materials from the Adviser and other service providers of the Fund regarding: (i) the nature, extent and quality of the Adviser’s services; (ii) the Adviser’s investment management personnel; (iii) the Adviser’s operations and financial condition; (iv) the Adviser’s brokerage practices (including any soft dollar arrangements) and investment strategies; (v) the Fund’s advisory fee paid to the Adviser and overall fees and operating expenses compared with a peer group of mutual funds; (vi) the level of the Adviser’s profitability from its relationship with the Fund, including both direct and indirect benefits accruing to the Adviser and its affiliates; (vii) the Adviser’s potential economies of scale; (viii) the Adviser’s compliance program, including a description of material compliance matters and material compliance violations; (ix) the Adviser’s policies on and compliance procedures for personal securities transactions; and (x) the Fund’s performance compared with a peer group of mutual funds and the Fund’s benchmark indices.
Representatives from the Adviser, along with other Fund service providers, presented additional information and participated in question-and-answer sessions at the Board meeting to help the Trustees evaluate the Adviser’s services, fee and other aspects of the Agreement. The Independent Trustees received advice from independent counsel and met in executive sessions outside the presence of Fund management and the Adviser.
At the Board meeting, the Trustees, including all of the Independent Trustees, based on their evaluation of the information provided by the Adviser and other service providers of the Fund, renewed the Agreement. In considering the renewal of the Agreement, the Board considered various factors that they determined were relevant, including: (i) the nature, extent and quality of the services provided by the Adviser; (ii) the investment performance of the Fund and the Adviser; (iii) the costs of the services provided and profits realized by the Adviser from its relationship with the Fund, including both direct and indirect benefits accruing to the Adviser and its affiliates; (iv) the extent to which economies of scale are being realized by the Adviser; and (v) whether fee levels reflect such economies of scale for the benefit of Fund investors, as discussed in further detail below.
| THE ADVISORS’ INNER CIRCLE FUND III | PINEBRIDGE DYNAMIC ASSET ALLOCATION FUND OCTOBER 31, 2024 (Unaudited) |
Nature, Extent and Quality of Services Provided by the Adviser
In considering the nature, extent and quality of the services provided by the Adviser, the Board reviewed the portfolio management services provided by the Adviser to the Fund, including the quality and continuity of the Adviser’s portfolio management personnel, the resources of the Adviser, and the Adviser’s compliance history and compliance program. The Trustees reviewed the terms of the Agreement. The Trustees also reviewed the Adviser’s investment and risk management approaches for the Fund. The most recent investment adviser registration form (“Form ADV”) for the Adviser was available to the Board, as was the response of the Adviser to a detailed series of questions which included, among other things, information about the investment advisory services provided by the Adviser to the Fund.
The Trustees also considered other services provided to the Fund by the Adviser such as selecting broker-dealers for executing portfolio transactions, monitoring adherence to the Fund’s investment restrictions, and monitoring compliance with various Fund policies and procedures and with applicable securities laws and regulations. Based on the factors above, as well as those discussed below, the Board concluded, within the context of its full deliberations, that the nature, extent and quality of the services provided to the Fund by the Adviser were sufficient to support renewal of the Agreement.
Investment Performance of the Fund and the Adviser
The Board was provided with regular reports regarding the Fund’s performance over various time periods. The Trustees also reviewed reports prepared by the Fund’s administrator comparing the Fund’s performance to its benchmark indices and a peer group of mutual funds as classified by Lipper, an independent provider of investment company data, over various periods of time. Representatives from the Adviser provided information regarding and led discussions of factors impacting the performance of the Fund, outlining current market conditions and explaining their expectations and strategies for the future. The Trustees determined that the Fund’s performance was satisfactory, or, where the Fund’s performance was materially below its benchmarks and/or peer group, the Trustees were satisfied by the reasons for the underperformance and/or the steps taken by the Adviser in an effort to improve the performance of the Fund. Based on this information, the Board concluded, within the context of its full deliberations, that the investment results that the Adviser had been able to achieve for the Fund were sufficient to support renewal of the Agreement.
| THE ADVISORS’ INNER CIRCLE FUND III | PINEBRIDGE DYNAMIC ASSET ALLOCATION FUND OCTOBER 31, 2024 (Unaudited) |
Costs of Advisory Services, Profitability and Economies of Scale
In considering the advisory fee payable by the Fund to the Adviser, the Trustees reviewed, among other things, a report of the advisory fee paid to the Adviser. The Trustees also reviewed reports prepared by the Fund’s administrator comparing the Fund’s net and gross expense ratios and advisory fee to those paid by a peer group of mutual funds as classified by Lipper. The Trustees reviewed the management fees charged by the Adviser to other clients with comparable mandates. The Trustees considered any differences in management fees and took into account the respective demands, resources and complexity associated with the Fund and other client accounts as well as the extensive regulatory, compliance and tax regimes to which the Fund is subject. The Board concluded, within the context of its full deliberations, that the advisory fee was reasonable in light of the nature and quality of the services rendered by the Adviser.
The Trustees reviewed the costs of services provided by and the profits realized by the Adviser from its relationship with the Fund, including both direct benefits and indirect benefits, such as research and brokerage services received under soft dollar arrangements, accruing to the Adviser and its affiliates. The Trustees considered how the Adviser’s profitability was affected by factors such as its organizational structure and method for allocating expenses. The Trustees concluded that the profit margins of the Adviser with respect to the management of the Fund were not unreasonable. The Board also considered the Adviser’s commitment to managing the Fund and its willingness to continue its expense limitation and fee waiver arrangement with the Fund.
The Trustees considered the Adviser’s views relating to economies of scale in connection with the Fund as Fund assets grow and the extent to which the benefits of any such economies of scale are shared with the Fund and Fund shareholders. The Board considered the existence of any economies of scale and whether those were passed along to the Fund’s shareholders through a graduated advisory fee schedule or other means, including fee waivers. The Trustees recognized that economies of scale are difficult to identify and quantify and are rarely identifiable on a fund-by-fund basis. Based on this evaluation, the Board concluded that the advisory fee was reasonable in light of the information that was provided to the Trustees by the Adviser with respect to economies of scale.
| THE ADVISORS’ INNER CIRCLE FUND III | PINEBRIDGE DYNAMIC ASSET ALLOCATION FUND OCTOBER 31, 2024 (Unaudited) |
Renewal of the Agreement
Based on the Board’s deliberations and its evaluation of the information described above and other factors and information it believed relevant in the exercise of its reasonable business judgment, the Board, including all of the Independent Trustees, with the assistance of Fund counsel and Independent Trustees’ counsel, unanimously concluded that the terms of the Agreement, including the fees payable thereunder, were fair and reasonable and agreed to renew the Agreement for another year. In its deliberations, the Board did not identify any absence of information as material to its decision, or any particular factor (or conclusion with respect thereto) or single piece of information that was all-important, controlling or determinative of its decision, but considered all of the factors together, and each Trustee may have attributed different weights to the various factors (and conclusions with respect thereto) and information.
PineBridge Investments
Park Avenue Tower
65 East 55th Street
New York, NY 10022
1-877-225-4164
Investment Adviser:
PineBridge Investments LLC
Park Avenue Tower
65 East 55th Street
New York, NY 10022
Administrator:
SEI Investments Global Funds Services
One Freedom Valley Drive
Oaks, PA 19456
Distributor:
SEI Investments Distribution Co.
One Freedom Valley Drive
Oaks, PA 19456
Legal Counsel:
Morgan, Lewis & Bockius LLP
2222 Market Street
Philadelphia, PA 19103
Independent Registered Public Accounting Firm:
Ernst & Young LLP
One Commerce Square
2005 Market Street, Suite 700
Philadelphia, PA 19103
This information must be preceded or accompanied by a current prospectus for the Fund described.
PBI-AR-001-0900
Item 8. Changes in and Disagreements with Accountants for Open-End Management Investment Companies.
There were no changes in or disagreements with accountants on accounting and financial disclosure during the period covered by the report.
Item 9. Proxy Disclosures for Open-End Management Investment Companies.
There were no matters submitted to a vote of shareholders during the period covered by this report.
Item 10. Remuneration Paid to Directors, Officers, and Others of Open-End Management Investment Companies.
No remuneration was paid by the company during the period covered by the report to any Officers of the Trust, other than as disclosed as part of the financial statements included above in Item 7.
Item 11. Statement Regarding Basis for Approval of Investment Advisory Contract.
The disclosure regarding the Approval of Advisory Agreement, if applicable, is included as part of the financial statements included above in Item 7.
Item 12. Disclosure of Proxy Voting Policies and Procedures for Closed-End Management Investment Companies.
Not applicable to open-end management investment companies.
Item 13. Portfolio Managers of Closed-End Management Investment Companies.
Not applicable to open-end management investment companies.
Item 14. Purchases of Equity Securities by Closed-End Management Company and Affiliated Purchasers.
Not applicable to open-end management investment companies.
Item 15. Submission of Matters to a Vote of Security Holders.
There have been no changes to the procedures by which shareholders may recommend nominees to the Registrant’s Board of Trustees during the period covered by this report.
Item 16. Controls and Procedures.
(a) The Registrant's principal executive and principal financial officers, or persons performing similar functions, have concluded that the Registrant's disclosure controls and procedures, as defined in Rule 30a-3(c) under the Act (17 CFR § 270.30a-3(c)), as of a date within 90 days of the filing date of the report, are effective based on the evaluation of these controls and procedures required by Rule 30a-3(b) under the Act (17 CFR § 270.30a-3(b)) and Rule 13a-15(b) or Rule 15d-15(b) under the Act (17 CFR § 240.13a-15(b) or § 240.15d-15(b)).
(b) There has been no change in the Registrant's internal control over financial reporting (as defined in Rule 30a-3(d) under the Act (17 CFR § 270.30a-3(d)) that occurred during the period covered by this report that has materially affected, or is reasonably likely to materially affect, the Registrant's internal control over financial reporting.
Item 17. Disclosure of Securities Lending Activities for Closed-End Management Investment Companies.
Not applicable to open-end management investment companies.
Item 18. Recovery of Erroneously Awarded Compensation.
(a) Not applicable.
(b) Not applicable.
Item 19. Exhibits.
(a)(1) Code of Ethics attached hereto.
(a)(2) Not applicable.
(a)(3) A separate certification for the principal executive officer and the principal financial officer of the Registrant, as required by Rule 30a-2(a) under the Act (17 CFR § 270.30a-2(a)), are filed herewith.
(a)(4) Not applicable.
(b) Officer certifications, as required by Rule 30a-2(b) under the Act (17 CFR § 270.30a-2(b)), also accompany this filing as an exhibit.
SIGNATURES
Pursuant to the requirements of the Securities Exchange Act of 1934 and the Investment Company Act of 1940, the Registrant has duly caused this report to be signed on its behalf by the undersigned, thereunto duly authorized.
| (Registrant) | | The Advisors' Inner Circle Fund III | | |
| | | | | |
| By (Signature and Title) | | /s/ Michael Beattie | | |
| | | Michael Beattie | | |
| | | Principal Executive Officer | | |
| Date: January 6, 2025 | | | | |
Pursuant to the requirements of the Securities Exchange Act of 1934 and the Investment Company Act of 1940, this report has been signed below by the following persons on behalf of the Registrant and in the capacities and on the dates indicated.
| By (Signature and Title) | | /s/ Michael Beattie | | |
| | | Michael Beattie | | |
| | | Principal Executive Officer | | |
| Date: January 6, 2025 | | | | |
| | | | | |
| By (Signature and Title) | | /s/ Andrew Metzger | | |
| | | Andrew Metzger | | |
| | | Principal Financial Officer | | |
| Date: January 6, 2025 | | | | |