UNITED STATES
SECURITIES AND EXCHANGE COMMISSION
WASHINGTON, D.C. 20549
FORM N-CSR
CERTIFIED SHAREHOLDER REPORT OF REGISTERED
MANAGEMENT INVESTMENT COMPANIES
811-22933
(Investment Company Act file number)
Apollo Diversified Real Estate Fund
(Exact name of Registrant as specified in charter)
Apollo Global Management, Inc.
9 West 57th Street, New York
New York 10019
(Address of principal executive offices)
(212) 515-3200
(Registrant's telephone number, including area code)
ALPS Fund Services, Inc.
1290 Broadway, Suite 1000
Denver, CO 80203
(Name and address of agent for service)
Copy to:
Terrence O. Davis, Esq.
Greenberg Traurig, LLP
Terminus 200
3333 Piedmont Road, NE, Suite 2500
Atlanta, GA 30305
Date of fiscal year end: September 30
Date of reporting period: October 1, 2021 – March 31, 2022
Item 1. Reports to Stockholders.

Apollo Diversified
Real Estate Fund
Semi-Annual Report
March 31, 2022
Effective May 2, 2022, Griffin Institutional Access® Real Estate Fund has been renamed Apollo Diversified Real Estate Fund.
Electronic Reports Disclosure
Beginning on January 1, 2021, as permitted by regulations adopted by the Securities and Exchange Commission, paper copies of the Fund’s shareholder reports will no longer be sent by mail, unless you specifically request paper copies of the reports from the Fund or from your financial intermediary (such as a broker-dealer or bank). Instead, the reports will be made available on the Fund’s website (www.apollo.com), and you will be notified electronically or by mail, depending on your elections, each time a report is posted and provided with a website link to access the report.
You may elect to receive all future reports in paper, free of charge. If you invest directly with the Fund, you can call the Fund toll-free at 888.926.2688 or visit https://apollodiversifiedrealestatefund.apollo.com/investor-login/ to inform the Fund that you wish to continue receiving paper copies of your shareholder reports. If you invest through a financial intermediary, you can contact your financial intermediary to request that you continue to receive paper copies of your shareholder reports. Please note that not all financial intermediaries may offer this service. Your election to receive reports in paper will apply to all funds held in your account if you invest through your financial intermediary or all funds held with the fund sponsor if you invest directly with a fund.
If you already elected to receive shareholder reports electronically, you will not be affected by this change and you need not take any action. You may elect to receive electronic delivery of shareholder reports and other communications by: (i) calling the Fund toll-free at 888.926.2688 or visiting https://apollodiversifiedrealestatefund.apollo.com/investor-login/, if you invest directly with the Fund, or (ii) contacting your financial intermediary, if you invest through a financial intermediary. Please note that not all financial intermediaries may offer this service.
Table of Contents
| Shareholder Letter | 2 |
| Portfolio Update | 15 |
| Schedule of Investments | 17 |
| Statement of Assets and Liabilities | 22 |
| Statement of Operations | 23 |
| Statements of Changes in Net Assets | 24 |
| Statement of Cash Flows | 26 |
| Financial Highlights | 27 |
| Notes to Financial Statements | 38 |
| Additional Information | 47 |
| Service Providers | 52 |
| Privacy Notice | 53 |
Dear Fellow Shareholders, We are pleased to present the Apollo Diversified Real Estate Fund (the “Fund”) semi-annual report. We greatly appreciate the support of our shareholders, and we will remain true to the Fund’s stated objective of delivering returns comprised of income and appreciation with moderate volatility and low correlation to the broader markets. During the one-year period ended March 31, 2022, the Fund’s load-waived Class A shares (NASDAQ: GIREX) delivered a total return of 24.28%, outperforming both stocks and bonds by 8.63% and 28.43%, respectively.1 This performance has fueled asset growth as the Fund recently surpassed $5.59 billion in assets under management as of March 31, 2022. From the Fund’s inception on June 30, 2014, through March 31, 2022, the Fund’s load-waived Class A shares (NASDAQ: GIREX) generated a(n):1 ● Total cumulative return of 81.69% and an 8.01% annualized return
● Sharpe ratio of 1.99
● Standard deviation of 3.63%, which is in line with the standard deviation for the Bloomberg U.S. Aggregate Bond Index (3.36%)
● Alpha of 5.23%
● Beta of 0.14 |  Randy I. Anderson, Ph.D., CRE Portfolio Manager, Apollo Diversified Real Estate Fund |
During the six-month period ended March 31, 2022, the United States economy continued to recover from the COVID-19 induced recession. As we move closer to pre-pandemic employment levels, consumption has also rebounded significantly. Unfortunately, supply chain bottlenecks have been slower to subside, leading to increased levels of inflation. Inflationary pressures, although appearing transitory during 2021, have become broad based which has necessitated monetary policy action. In an effort to calm inflation and tighten economic conditions, the Federal Open Market Committee (FOMC) has begun to both raise the Fed Funds target rate and taper its securities buying program.3 Moving forward, market participants will be focused on the pace and magnitude of future FOMC policy changes which will have varying impacts on risk assets. Further, the conflict in Ukraine adds additional complexity as the FOMC works to navigate towards a “soft landing” in which inflation moderates and economic growth persists. The consensus gross domestic product (GDP) forecast for 2022 of 2.8% remains well above the 20-year average growth rate of 1.9%, a reflection of the continued strength observed across the economy, despite increased geopolitical risks and FOMC action.4
In line with the broad economic recovery, the commercial real estate sector exhibited strong performance during the six months ended March 31, 2022. In fact, both public and private real estate markets exhibited record calendar year returns during 2021. The Fund, which actively allocates across all four quadrants of the commercial real estate investable universe, was positioned well to participate in this growth and ultimately delivered its best quarter of performance since inception during the fourth quarter of 2021. Moving forward, we maintain a constructive view on the real estate sector as fundamentals remain strong, particularly within our high-conviction investment themes including multifamily, industrial, and specialty (such as life sciences and student housing) property sectors. As of April 1, 2022, over 86% of the Fund’s private equity portfolio was allocated to these high-conviction themes.2
Multifamily fundamentals remained historically strong with national occupancy continuing to register record highs. CBRE Econometric Advisors reported an occupancy rate of 97.5% in Q1 2022, maintaining the highest level observed since 1994 and represented a 230-basis point increase year over year.5 Additionally, the national undersupply of housing coupled with elevated single-family home prices and increasing mortgage rates is making homeownership less affordable, but creating tailwinds for multifamily demand. These factors have contributed to robust rental rate growth with national asking rents increasing 14.8% year over year as of Q1 2022 according to data from Yardi Matrix.6 Further, strong job and wage growth have encouraged new household formation and put existing renters in better financial position to absorb future rent increases. We believe the secular growth trends that underpin the demand for multifamily housing should provide a supportive environment for this property type moving forward.
Past performance is not indicative of future results. Investment return and the principal value of an investment will fluctuate. Shares may be worth more or less than original cost when redeemed. Investing involves risk, including loss of principal. Fund performance based on load-waived Class A shares and does not reflect any sales charge. The maximum sales charge for Class A shares is 5.75%. If the data reflected the deduction of such charges, the performance would be lower. Performance includes reinvestment of distributions and reflects management fees and other expenses. The Fund offers multiple different classes of shares. An investment in any share class of the Fund represents an investment in the same assets of the Fund. However, the purchase restrictions, ongoing fees, expenses, and performance for each share class are different. For more information on the differences in share classes, refer to the applicable prospectus, which can be found at: www.apollo.com.
Due to financial statement adjustments, performance information presented herein for the Fund differs from the Fund’s financial highlights which are prepared in accordance with U.S. GAAP. Such differences generally are attributable to valuation adjustments to certain of the Fund’s investments which are reflected in the financial statements.
The industrial sector continued to improve on already healthy fundamentals with vacancy rates remaining at historical lows at the end of the first quarter of 2022, falling 80 basis points year over year to 3.0%.5 Growth in e-commerce penetration as a percentage of total retail sales combined with more prevalent omnichannel retailing is driving demand for modern industrial assets. Additionally, many businesses are shoring up their logistics and supply chains by shifting to a “just-in-case” inventory management system by building a safety stock of inventory to handle surges in demand despite supply chain bottlenecks. Moving forward, we expect these factors to drive demand for industrial assets and provide a supportive dynamic for further rent growth.
Life sciences, the largest component of the specialty property type allocation within the Fund, is comprised primarily of laboratory facilities that are generally located in innovation clusters across the country. The life sciences industry has observed outsized growth over the past two years with private equity firms and the NIH (National Institutes of Health) pouring $70 billion into life sciences-related companies in 2020 and a record $78 billion in 2021.7 Moving forward, we believe the life sciences property subtype is poised to benefit from continued investment into the biotech industry where demand for modern lab space has significantly outpaced supply.
Within student housing, pre-leasing for the Fall 2022 term is off to a strong start with 63.7% pre-leased as of March 2022, which far exceeds the pre-pandemic level of 53.8% in March 2019.6 Preleasing activity is led by Class A properties that are located in close proximity to top universities. Attaining a higher education remains an attractive value proposition, bolstering demand for this property subtype moving forward.
The traditional office sector recovery slowed in the first quarter of 2022 due to lingering challenges related to new COVID-19 variants and headwinds from technology. While some companies are still contemplating a hybrid model for work-from-home arrangements, many have clear plans for a return to office in some form to capitalize on the culture, collaboration, and innovation that takes place when people are working in person. Leasing trends indicate a preference for Class A office properties in an apparent “flight to quality” as high-quality space is viewed as a prerequisite for attracting and maintaining top talent and creating desirable collaboration spaces.
The retail sector continues to benefit from the unwinding of pandemic-era restrictions and the elevated levels of demand from consumers for goods and services. Total retail employment has fully recovered and is approaching all-time highs. Additionally, availability continued to fall to 5.3% as of Q1 2022, representing a 120 basis point decrease year over year.5 While certain segments of the retail sector remain challenged, such as regional malls in secondary locations, grocery-anchored neighborhood centers have performed particularly well. A strong retail sales environment coupled with limited availability should place upward pressure on rent growth moving forward.
The Portfolio Management team has actively positioned the Fund with a preference for secular growth relative to cyclical growth by favoring its high-conviction themes of multifamily, industrial, and specialty property sectors. Through the Fund’s multi-manager structure, the Portfolio Management team is able to efficiently adjust portfolio allocations not only across property types but also across the four quadrants of the commercial real estate investable universe – private equity, private debt, public equity, and public debt. The team utilizes this structure to allocate capital to real estate securities that emphasize durable income, with properties within our high-conviction themes that are well located in supply constrained markets with an ability to grow rents. Additionally, the Fund has actively avoided exposure to ex-U.S. markets, which has provided a degree of insulation from the volatility associated with the ongoing conflict in Ukraine. Through this active management, the Fund’s private real estate portfolio has driven outsized returns relative the NCREIF-ODCE Index delivering a 3.41% excess return in the trailing one-year period ended December 31, 2021.8 As of April 1, 2022, the Fund provides diversification across 32 private managers that, in our view, are best in class, with over 3,000 investments representing more than $250 billion in gross real estate value.2
Apollo Diversified Real Estate Fund is a closed-end interval fund. Limited liquidity is provided to shareholders only through the Fund’s quarterly repurchase offers for no less than 5% and no more than 25% of the Fund’s shares outstanding at net asset value. The Fund is suitable only for investors who can bear the risks associated with the limited liquidity of the Fund and should be viewed as a long-term investment. There is no secondary market for the Fund’s shares, and none is expected to develop.
Diversification does not eliminate the risk of experiencing investment losses. Holdings and allocations are subject to change without notice. Represents the views of Apollo Real Estate Fund Adviser, LLC at the time of this letter and is subject to change.
Real estate has historically been a favored asset allocation tool by investors seeking durable, tax-efficient income with a degree of insulation from inflation. Historically, real estate has performed well in inflationary environments. The Fund continues to be an attractive alternative to traditional income-producing securities which may be challenged within a rising rate environment. We believe the Fund is well positioned to deliver on its stated investment objective by favoring secular growth trends within our high-conviction themes.
We thank you for your continued confidence and support.

Randy I. Anderson, Ph.D., CRE
Portfolio Manager, Apollo Diversified Real Estate Fund
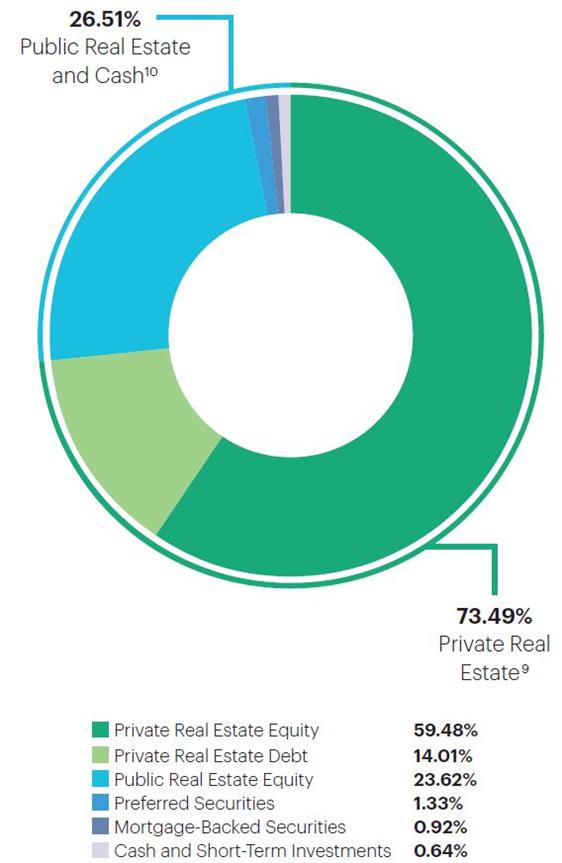
Portfolio Exposure as of April 1, 2022 (Unaudited)
Overall Portfolio Exposure
| Private Real Estate Exposure9 | 73% |
| Cortland Growth and Income Fund | 7.57% |
| Clarion Lion Properties Fund | 6.57% |
| Morgan Stanley Prime Property Fund | 4.62% |
| Clarion Lion Industrial Trust | 4.39% |
| Oaktree Real Estate Income Fund | 3.95% |
| CBRE U.S. Core Partners | 3.93% |
| CBRE U.S. Logistics Partners | 3.84% |
| Ventas Life Science and Healthcare Real Estate Fund | 3.61% |
| TA Realty Core Property Fund | 2.64% |
| Clarion Gables Multifamily Trust | 2.62% |
| TA Realty Logistics Fund | 2.50% |
| Dream U.S. Industrial Fund | 2.22% |
| CA Student Living Income and Growth Fund | 1.88% |
| Manulife U.S. Real Estate Fund | 1.81% |
| Prologis Targeted U.S. Logistics Fund | 1.81% |
| Sentinel Real Estate Fund | 1.45% |
| USAA U.S. Government Building Fund | 1.17% |
| GWL U.S. Property Fund | 0.76% |
| Prudential PRISA | 0.75% |
| Stockbridge Smart Markets Fund | 0.60% |
| Heitman America Real Estate Trust | 0.28% |
| BGO Diversified US Property Trust | 0.26% |
| UBS Trumbull Property Fund | 0.25% |
| Private Real Estate Equity | 59.48% |
| Heitman Core Real Estate Debt Income Trust | 2.29% |
| Brookfield Senior Mezzanine Real Estate Finance Fund | 2.22% |
| TCM CRE Credit Fund | 2.04% |
| JP Morgan U.S. Real Estate Core Mezzanine Debt Fund | 1.72% |
| PGIM Real Estate US Debt Fund | 1.29% |
| CBRE U.S. Credit Partners | 1.28% |
| ARES Real Estate Enhanced Income Fund | 1.12% |
| Voya Commercial Mortgage Lending Fund | 1.04% |
| CrossHarbor Strategic Debt Fund | 1.01% |
| Private Real Estate Debt | 14.01% |
| Public Real Estate Exposure and Cash10 | 27% |
| Public Real Estate Equity | 23.62% |
| Preferred Securities | 1.33% |
| Mortgage-Backed Securities | 0.92% |
| Cash and Short-Term Investments | 0.64% |
Past performance is not indicative of future results. Diversification does not eliminate the risk of experiencing investment losses. Holdings and allocations are subject to change without notice.
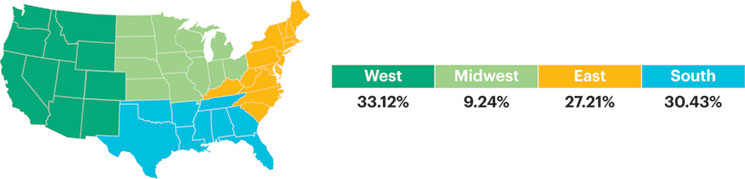
Private Fund Diversification as of April 1, 2022 (Unaudited)
Through its investment in private funds, Apollo Diversified Real Estate Fund offers immediate diversification by property sector, geography, and exposure to real estate equity and debt.
Private Real Estate Exposure: Geographic Diversification11
| Property Sector | Percentage of Total Fund Assets | Percentage of Private Fund Assets11 | Highlights11 |
Multifamily
Private Real Estate Equity
Private Real Estate Debt | 26.82%
20.43%
6.39% | 36.48%
27.79%
8.69% | 682 apartment investments comprised of over 261,000 units diversified across high-growth markets. |
Industrial
Private Real Estate Equity
Private Real Estate Debt | 23.38%
22.44%
0.94% | 31.82%
30.54%
1.28% | 2,049 investments boasting over 614 million square feet of industrial assets including facilities that support the fast-growing e-commerce logistics industries. |
Office
Private Real Estate Equity
Private Real Estate Debt | 9.33%
5.06%
4.27% | 12.69%
6.88%
5.81% | 238 high-quality office investments in diverse, high-demand metropolitan areas representing over 97 million square feet of space. |
Specialty
Private Real Estate Equity
Private Real Estate Debt | 8.67%
8.51%
0.16% | 11.80%
11.59%
0.21% | 176 investments spanning over 22 million square feet of life sciences facilities, healthcare assets, and government offices, together with more than 23,000 student housing beds across the country. |
Retail
Private Real Estate Equity
Private Real Estate Debt | 2.56%
1.76%
0.80% | 3.49%
2.40%
1.09% | 176 investments with more than 42 million square feet of retail space. |
Other
Private Real Estate Equity
Private Real Estate Debt | 1.99%
1.26%
0.73% | 2.71%
1.71%
1.00% | 300 investments comprised of self-storage facilities, parking garages, and land. |
Hospitality
Private Real Estate Equity
Private Real Estate Debt | 0.74%
0.02%
0.72% | 1.01%
0.03%
0.98% | 22 investments representing over 6,700 keys across the country. |
Past performance is not indicative of future results. Diversification does not eliminate the risk of experiencing investment losses. Holdings and allocations are subject to change without notice.
6
Private Fund Summaries (Unaudited)
 | ARES Real Estate Enhanced Income Fund is an open-end real estate debt fund with a principal objective to generate current income with an emphasis on principal protection by creating a diversified portfolio of first mortgage loans secured by commercial real estate across major property types, which primarily includes multifamily, industrial, retail, office and hospitality properties. The ARES Real Estate Enhanced Income Fund will focus on the disciplined origination of first mortgage loans secured by commercial real estate assets with strong sponsorship and located in major markets within the United States. |
 | BGO Diversified US Property Fund is an open-end core real estate private equity fund that invests in a portfolio of institutional-quality real estate assets in the U.S. BGO Diversified’s investment strategy is focused on maintaining stable income, building a diversified modern portfolio, using moderate leverage, and providing superior liquidity. BGO Diversified upholds a strong commitment to the principles of Responsible Property Investing. |
 | Brookfield Senior Mezzanine Real Estate Finance Fund is an open-end senior real estate debt fund focused on providing primarily floating rate financing secured by commercial property primarily located in the U.S. and secured by generally well-leased/light transitional commercial real estate properties that generate significant cash flow. Brookfield Senior Mezzanine Real Estate Finance Fund will primarily focus on creating investment positions by originating floating rate whole loans, syndicating the first mortgage and retaining the mezzanine exposure. |
 | CA Student Living Income and Growth Fund is an open-end private equity real estate fund that is focused exclusively on the student housing sector. The Fund aims to acquire institutional student housing properties at large public and private universities in the United States. |
 | CBRE U.S. Core Partners is an open-end core fund that purchases and operates high-quality, income-producing office, industrial, retail, and multifamily assets in select major U.S. metropolitan markets that exhibit strong growth demographics. |
| | CBRE U.S. Credit Partners is an open-end private debt fund focused on generating current income by constructing a portfolio of first mortgage loans and subordinated debt secured by high-quality income-producing commercial real estate diversified by product type and geography. |
| | CBRE U.S. Logistics Partners is an open-end private equity real estate fund focused exclusively on the industrial sector. The Fund aims to acquire modern, highly-functional, stabilized logistics assets located in major population and consumption centers while simultaneously implementing a build-to-core strategy capitalizing on major metro markets with favorable supply and demand dynamics. |
 | Clarion Gables Multifamily Trust provides investors access to a high-quality multifamily portfolio with a best-in-class operator and fund manager. Gables is a market-leading, vertically-integrated multifamily real estate company with a 34-year history in the management, construction, development, acquisition and disposition of multifamily communities in the United States. |
| | Clarion Lion Industrial Trust is a private REIT focused on the industrial property sector in North America. Clarion Lion Industrial Trust invests primarily in big-box warehouse and distribution centers, with an emphasis on large, core industrial markets throughout the United States. |
| | Clarion Lion Properties Fund is a core private REIT with interests in a diversified portfolio of primarily institutional quality real estate assets and related investments located throughout the U.S. The investment objective is to provide a strong income return with potential for long-term capital appreciation. |
 | Cortland Growth and Income Fund, a leading Southern United States focused multifamily owner and operator, is a domestic multifamily open-end core-plus fund focused on acquiring best-in-class, income producing properties in U.S. growth markets. |
 | CrossHarbor Strategic Debt Fund is an open-end debt fund that seeks to generate compelling risk-adjusted current and total returns for investors by originating and managing first mortgage loans secured by core, core-plus, and value-add commercial real estate located throughout the United States. |
 | Dream US Industrial Fund is an open-end private equity real estate fund focused exclusively on the industrial sector. The Fund seeks to acquire and develop a portfolio of high-quality and functional industrial assets in strategic markets throughout the United States. The Fund will target core and core-plus assets including bulk distribution, last-mile warehousing, business parks, and light industrial assets in secondary interior distribution markets with a primary focus on markets experiencing strong economic and demographic fundamentals. |
 | GWL U.S. Property Fund is an open-end real estate fund consisting of a diversified portfolio of institutional quality, income producing assets broadly allocated by property type and geographic location. GWL U.S. Property Fund employs a core plus strategy intertwined with a disciplined risk management process in seeking to achieve its performance objectives. |
 | Heitman America Real Estate Trust is an open-end core commingled fund. Heitman America Real Estate Trust’s core strategy encompasses stabilized investments with low to moderate leverage and seeks to objectively minimize risk through diversification in property type, geographic location, and tenant composition. |
| Heitman Core Real Estate Debt Income Trust is an open-ended, commingled fund, that originates and services first mortgage loans secured by income-producing U.S. commercial real estate. Heitman Core Real Estate Debt Income Trust will seek to originate senior debt financing to high-quality real estate operators in both primary and specialty property sectors. |
Holdings are subject to change without notice.
7
 | JP Morgan U.S. Real Estate Core Mezzanine Debt Fund pursues a disciplined, income-producing strategy achieved primarily by investing in a portfolio of real estate and real estate-related assets, consisting of mezzanine debt, B-notes, mortgages, and preferred equity investments. It focuses on the four primary property types including office, multifamily, industrial, and retail, owned and operated by experienced and financially capable sponsors with strong performance experience across investment cycles. |
 | Manulife U.S. Real Estate Fund is a U.S. open-end core-plus fund that will target properties located in major U.S. markets, with the objective of preserving capital while delivering a combination of income and long-term capital appreciation. The Manulife U.S. Real Estate Fund will target an allocation of 60% core-plus assets and 40% core investments. |
 | Morgan Stanley Prime Property Fund is an open-end core fund with a focus on office, retail, multifamily, industrial, self storage and hotel properties located in major real estate markets throughout the United States. |
 | Oaktree Real Estate Income Fund is an open-ended fund that targets investments in commercial real estate, primarily office, multifamily and industrial assets. Oaktree Real Estate Income Fund intends to create value by investing in assets that require modest leasing and capital expenditures. |
 | Prologis Targeted US Logistics Fund launched in 2004 as an open-ended, co-investment venture formed by Prologis to partner with institutional investors in acquiring, operating, and disposing of high-quality logistics facilities in key target markets across the U.S. The Fund seeks enhanced returns through actively managing, repositioning and renovating portfolio-owned assets. |
 | PGIM Real Estate U.S. Debt Fund is an open-end debt fund that seeks to originate and service first mortgage and subordinate debt, fixed and floating rate loans, secured by stable income producing properties or properties exhibiting light transitional characteristics. PGIM Real Estate U.S. Debt Fund will focus on the four main property types in the top 30 MSAs and intends to provide secure income returns from investing in a low risk, low volatility portfolio of real estate debt, with a focus on capital preservation and stability of income. |
| | Prudential PRISA is organized as a perpetual life, open-ended, commingled fund to invest primarily in core, well-leased, operating real estate assets located in the United States, with an emphasis on income. PRISA is Prudential Real Estate Investors (“PREI”) flagship fund, and represents one of the oldest and largest U.S. core real estate funds available in the marketplace. |
 | Sentinel Real Estate Fund is a multifamily focused, core private REIT that emphasizes acquisitions of stabilized assets with in-place income with the goal of providing a substantial portion of investor returns in the form of distributed cash. |
 | Stockbridge Smart Markets Fund is an open-end core fund that aims to capture performance in excess of the ODCE Index by acquiring assets in “smart markets” characterized by educated, stable and fast-growing employment bases. The Smart Market Fund’s target market strategy is based on the principle that real estate demand is dependent on jobs which are increasingly being created where there are educated work forces in the U.S. |
 | TA Realty Core Property Fund invests and operates a diversified portfolio of commercial real estate assets across industrial, multifamily, office and retail property types. TA Realty Core Property Fund has three primary objectives: build and operate a first-class portfolio of institutional quality core real estate assets, generate consistent outperformance versus industry benchmarks and provide outstanding client service to investors. |
| | TA Realty Logistics Fund is an open-end private equity real estate fund focused exclusively on the industrial sector. The Fund seeks to assemble a diversified portfolio of well-located logistics facilities in major distribution hubs and last-mile locations. The Fund targets mainly metropolitan areas of the United States that have population growth, economic growth, market economic diversity, supply constraints, liquidity, volatility, and relative yield necessary to create attractive long-term investment returns. |
 | TCM CRE Credit Fund intends to focus primarily on investing in a diversified portfolio of primarily U.S. commercial real estate debt investments, generally within the mezzanine position of the capital stack. Trawler Capital Management Commercial Real Estate Credit Fund will focus on building and maintaining a portfolio of assets that are intended to provide strong risk adjusted returns in all cycles, with emphasis on stable cash flows. |
 | UBS Trumbull Property Fund is an open-end, diversified Core fund focusing on the four main property types, with a small exposure to hotels. UBS Trumbull Property Fund focuses on top markets for high-quality Core, institutional real estate assets. |
 | USAA U.S. Government Building Fund seeks to provide investors with attractive, risk-adjusted returns generated by the acquisition, build to suit development and operation of buildings located in the United States and leased or intended to be leased to U.S. federal, state and local governments and government agencies and departments. |
 | Ventas Life Science and Healthcare Real Estate Fund is an open-ended investment vehicle formed by Ventas, Inc. to invest in high-quality healthcare properties, with a focus on the life science, medical office building, and seniors housing asset classes, in target markets primarily in the United States. The Fund’s primary objective is to generate attractive returns and cash flow with an emphasis on long-term capital growth through investment focused on the healthcare real estate sector. |
 | Voya Commercial Mortgage Lending Fund is a perpetual life, open-ended, commercial mortgage debt fund. The Fund’s investment objective is to generate consistent current income with attractive risk-adjusted returns, while seeking to preserve capital through risk management of the portfolio of commercial mortgage loans and balance sheet management at the Fund level. The Fund will seek generally to achieve its investment objective by applying disciplined credit underwriting to identify and originate a diversified pool of commercial real estate loans located throughout the U.S., in primary, secondary and select tertiary markets. |
Holdings are subject to change without notice.
8
Fund Sub-Advisers (Unaudited)
Aon Investments USA Inc.

Aon Investments USA Inc. (“Aon”), an Aon Company, provides research and advisory services to the portion of the Fund’s investment portfolio that is allocated to private real estate funds. Partnering with Aon, a global leader ($4.1 trillion in assets under advisement as of June 30, 2021) within the institutional advisory services space, provides Apollo Real Estate Fund Adviser with the same level of research and due diligence as the nation’s top endowments, universities and pension funds.
CenterSquare Investment Management LLC

CenterSquare Investment Management LLC (“CenterSquare”) manages the portion of the Fund’s investment portfolio that is allocated to public real estate securities. CenterSquare has been managing real estate securities portfolios since 1995, across multiple strategies and market cycles and had approximately $15.5 billion in real estate assets under management as of December 31, 2021.
Apollo Real Estate Fund Adviser, LLC along with CenterSquare Investment Management have designed a public market strategy in line with the objectives of the Fund with a focus on identifying public real estate securities whose current prices are below their intrinsic values.
9
Glossary (Unaudited)
Alpha: A measure of risk-adjusted return implying how much a fund/manager outperformed its benchmark, given its risk profile.
Annualized Return: Calculated by annualizing cumulative return (i.e., adjusting it for a period of one year). Annualized return includes capital appreciation and assumes a reinvestment of dividends and distributions.
Basis Point: One basis point is equal to 1/100th of 1%, or 0.01%.
Beta: A measure of systematic risk (volatility), or the sensitivity of a fund to movements in a benchmark. A beta of 1 implies that you can expect the movement of a fund’s return series to match that of the benchmark used to measure beta. A value of less than 1 implies that the fund is less volatile than the index.
Bloomberg U.S. Aggregate Bond Index: An unmanaged index of domestic investment-grade bonds, including corporate, government and mortgage-backed securities.
Correlation: A statistical measure of how two securities move in relation to each other. A correlation ranges from -1 to 1. A positive correlation of 1 implies that as one security moves, either up or down, the other security will move in lockstep, in the same direction. A negative correlation of -1 indicates that the securities will move in the opposite direction. If the correlation is 0, the movements of the securities are said to have no correlation; they are completely random.
Coupon: The interest payment made on a debt security.
Cumulative Return: The compound return of an investment. It includes capital appreciation and assumes a reinvestment of dividends and distributions.
Debt Security: Any security that represents loaned money that must be repaid to the lender.
FTSE Nareit All Equity REITs Index: A free-float adjusted, market capitalization-weighted index of U.S. equity REITs. Constituents of the index include all tax-qualified REITs with more than 50% of total assets in qualifying real estate assets other than mortgages secured by real property.
NCREIF Fund Index – Open End Diversified Core Equity (NFI-ODCE): An index of investment returns reporting on both a historical and current basis the results of certain open-end commingled funds pursuing a core investment strategy. The NFI-ODCE Index is capitalization-weighted.
S&P 500 Index: An index based on market cap of the 500 largest companies having stock listed on the New York Stock Exchange (NYSE) or NASDAQ.
Sharpe Ratio: Measures risk-adjusted returns by calculating the excess return (above the risk-free rate) per unit of risk (standard deviation). The higher the ratio, the better the risk-adjusted returns. The average three-month U.S. Treasury T-bill auction was used as the risk-free rate in this material.
Standard Deviation: Measures the average deviations of a return series from its mean, and is often used as a measure of volatility/risk. A large standard deviation implies that there have been large swings in the return series of the manager.
10
Important Disclosures (Unaudited)
This material is neither an offer to sell nor a solicitation to purchase any security. Investors should carefully consider the investment objectives, risks, charges and expenses of Apollo Diversified Real Estate Fund (the “Fund”). This information and other important details about the Fund are contained in the prospectus, which can be obtained by visiting www.apollo.com. Please read the prospectus carefully before investing.
All Morningstar calculations and metrics are based on monthly data. CALCULATIONS AND METRICS REFLECT A LOAD-WAIVED, CLASS A SHARE (NASDAQ: GIREX). Investors of the load-waived class A share do not pay a front-end sales load/charge. The Fund offers multiple different classes of shares. An investment in any share class of the Fund represents an investment in the same assets of the Fund. However, the purchase restrictions, ongoing fees, expenses, and performance for each share class are different.
Past performance is not indicative of future results. Investment return and the principal value of an investment will fluctuate. Shares may be worth more or less than original cost when redeemed. Investing involves risk, including loss of principal. Performance includes reinvestment of distributions and reflects management fees and other expenses. The Fund return does not reflect the deduction of all fees, including any applicable Fund share class sales load, third-party brokerage commissions or third-party investment advisory fees paid by investors to a financial intermediary for brokerage services. If the deduction of such fees was reflected, the performance would be lower. Returns shown do not reflect the deduction of taxes that a shareholder would pay on Fund distributions or the redemption of Fund shares. Investing in the Fund involves risks, including the risk that you may receive little or no return on your investment or that you may lose part or all of your investment. The ability of the Fund to achieve its investment objective depends, in part, on the ability of the Adviser to allocate effectively the assets of the Fund among the various securities and investments in which the Fund invests. There can be no assurance that the actual allocations will be effective in achieving the Fund’s investment objective or delivering positive returns. Current performance may be lower or higher than the performance quoted. The most recent performance is available at www.apollo.com or by calling 888.926.2688.
The Fund is a closed-end interval fund, the shares have no history of public trading, nor is it intended that the shares will be listed on a public exchange at this time. No secondary market is expected to develop for the Fund’s shares. Limited liquidity is provided to shareholders only through the Fund’s quarterly repurchase offers for no less than 5% and no more than 25% of the Fund’s shares outstanding at net asset value. There is no guarantee that an investor will be able to sell all the shares that the investor desires to sell in the repurchase offer. The investment return and principal value of an investment will fluctuate so that an investor’s shares, when redeemed, may be worth more or less than the original cost. Due to these restrictions, an investor should consider an investment in the Fund to be of limited liquidity. The Fund is suitable only for investors who can bear the risks associated with the limited liquidity of the Fund and should be viewed as a long-term investment. Investing in the Fund is speculative and involves a high degree of risk, including the risks associated with leverage and the risk of a substantial loss of investment. There is no guarantee that the investment strategies will work under all market conditions. You should carefully consider which class of shares to purchase.
The Fund’s inception date was June 30, 2014. Per the Fund’s prospectus dated May 2, 2022, the total annual expense ratio is 1.98% for Class A shares. The Adviser and Fund have entered into an expense limitation agreement until at least May 31, 2023 under which the Adviser has contractually agreed to waive its fees and to pay or absorb the ordinary annual operating expenses of the Fund (including offering expenses, but excluding taxes, interest, brokerage commissions, acquired fund fees and expenses and extraordinary expenses) to the extent that they exceed 1.91% for Class A shares.
Investors in the Fund should understand that the net asset value (“NAV”) of the Fund will fluctuate, which may result in a loss of the principal amount invested. The Fund’s investments may be negatively affected by the broad investment environment and capital markets in which the Fund invests, including the real estate market, the debt market and/or the equity securities market. The value of the Fund’s investments will increase or decrease based on changes in the prices of the investments it holds. This will cause the value of the Fund’s shares to increase or decrease. The Fund is “diversified” under the Investment Company Act of 1940. Diversification does not eliminate the risk of experiencing investment losses. Holdings are subject to change without notice. The Fund is not intended to be a complete investment program.
The Fund will not invest in real estate directly, but, because the Fund will concentrate its investments in securities of REITs and other real estate industry issuers, its portfolio will be significantly impacted by the performance of the real estate market and may experience more volatility and be exposed to greater risk than a more diversified portfolio. The value of companies engaged in the real estate industry is affected by: (i) changes in general economic and market conditions; (ii) changes in the value of real estate properties; (iii) risks related to local economic conditions, overbuilding and increased competition; (iv) increases in property taxes and operating expenses; (v) changes in zoning laws; (vi) casualty and condemnation losses; (vii) variations in rental income, neighborhood values or the appeal of property to tenants; (viii) the availability of financing and (ix) changes in interest rates and leverage. The value of securities of companies in the real estate industry may go through cycles of relative underperformance and outperformance in comparison to equity securities markets in general. By investing in the Fund, a shareholder will not be deemed to be an investor in any underlying fund and will not have the ability to exercise any rights attributable to an investor in any such underlying fund related to their investment. The Fund’s investment in Private Investment Funds will require it to bear a pro rata share of the vehicles’ expenses, including management and performance fees. Also, once an investment is made in a Private Investment Fund, neither the Adviser nor any Sub-Adviser will be able to exercise control over investment decisions made by the Private Investment Fund. The Fund may invest in securities of other investment companies, including ETFs. The Fund will indirectly bear its proportionate share of any management fees and other expenses paid by investment companies in which it invests, in addition to the management fees (and other expenses) paid by the Fund.
The Fund is advised by Apollo Real Estate Fund Adviser, LLC (“AREFA”). AREFA is registered as an investment adviser with the SEC pursuant to the provisions of the 1940 Act, as amended. AREFA is an indirect majority- owned subsidiary of Apollo Global Management, Inc. The Fund’s private real estate funds allocation is sub-advised by Aon Investments USA Inc. (“Aon”), an Aon Company. Aon is registered as an investment adviser with the SEC pursuant to the provisions of the 1940 Act. The Fund’s public real estate securities allocation is sub-advised by CenterSquare Investment Management LLC (“CenterSquare”). CenterSquare is an investment adviser registered with the SEC pursuant to the provisions of the 1940 Act. Registration with the SEC does not constitute an endorsement by the SEC nor does it imply a certain level of skill or training.
This material has been distributed for informational purposes only and should not be considered as investment advice or a recommendation of any particular security, strategy or investment product or be relied upon for any other purpose. The views expressed represent an assessment of market conditions at a specific point in time, are opinions only and should not be relied upon as investment advice regarding a particular investment or markets in general. Such information does not constitute a recommendation to buy or sell specific securities or investment vehicles. It should not be assumed that any investment will be profitable or will equal the performance of the fund(s) or any securities or any sectors mentioned herein. The views expressed represent an assessment of market conditions at a specific point in time, are opinions only and should not be relied upon as investment advice regarding a particular investment or markets in general. Such information does not constitute a recommendation to buy or sell specific securities or investment vehicles. It should not be assumed that any investment will be profitable or will equal the performance of the fund(s) or any securities or any sectors mentioned herein. Information contained herein has been obtained from sources deemed to be reliable, but not guaranteed. Apollo Global Management and its affiliates do not provide tax, legal or accounting advice. This material is not intended to provide, and should not be relied on for, tax, legal or accounting advice. You should consult your own tax, legal and accounting advisors before engaging in any transaction. This material represents views as of the date of this presentation and is subject to change without notice of any kind.
11
This semi-annual report may contain certain forward-looking statements. Such forward-looking statements can generally be identified by our use of forward-looking terminology such as “may,” “will,” “expect,” “intend,” “anticipate,” “estimate,” “believe,” “continue,” or other similar words. Because such statements include risks, uncertainties and contingencies, actual results may differ materially from the expectations, intentions, beliefs, plans or predictions of the future expressed or implied by such forward-looking statements. These risks, uncertainties and contingencies include, but are not limited to: uncertainties relating to changes in general economic and real estate conditions; uncertainties relating to the implementation of our investment strategy; uncertainties relating to capital proceeds; and other risk factors as outlined in the Fund’s prospectus, statement of additional information, annual report and semi-annual report filed with the U.S. Securities and Exchange Commission (the “SEC”).
During the six months ending March 31, 2022, the Fund paid distributions of $134,301,459 to its investors, consisting of distributions of $50,671,258 paid and $83,630,201 that was reinvested through the Fund’s distribution reinvestment program. During that period, the Fund recorded dividends and distributions from the Fund’s underlying investments totaling $91,021,078, and realized gains on its investments totaling $52,751,948, and fees and expenses of $50,806,126.
The Fund’s distribution policy is to make quarterly distributions to shareholders. Shareholders should not assume that the source of a distribution from the Fund is net profit. The Fund’s most recent annualized distribution rate as of March 31, 2022 was 5.22%. A portion of the Fund’s distributions includes return of capital. Please refer to the Fund’s most recent Section 19(a) notice for an estimate of the composition of the Fund’s most recent distribution, available at www.apollo.com, and the Fund’s semi-annual or annual reports filed with the U.S. Securities and Exchange Commission (the “SEC”) for additional information regarding the composition of distributions. The Fund’s distributions may be affected by numerous factors, including but not limited to changes in Fund expenses, investment performance, realized and projected market returns, fluctuations in market interest rates, and other factors. Distributions paid may exceed and, from time to time, have exceeded the Fund’s total return less fees and expenses of the Fund during some periods due to changes in market conditions affecting components of the Fund’s total return, including unrealized appreciation. Please reference the performance table below to view the Fund’s historical returns. Additionally, the Fund’s performance can always be found on the Apollo Global Management, Inc. website (www.apollo.com). The following chart presents the quarterly changes to the NAV, total return, and cumulative total return for load-waived Class A shares since inception.1 There is no assurance that the Fund’s distribution rate will be sustainable in the future nor are distributions guaranteed.
12
| Period Ending | NAV Return | Total Return | Cumulative Total Return |
| 6/30/14 | N/A | N/A | N/A |
| 9/30/14 | 0.44% | 1.65% | 1.65% |
| 12/31/14 | 2.11% | 3.40% | 5.10% |
| 3/31/15 | 0.98% | 2.28% | 7.50% |
| 6/30/15 | -1.24% | 0.06% | 7.56% |
| 9/30/15 | 1.13% | 2.47% | 10.21% |
| 12/31/15 | 1.01% | 2.34% | 12.79% |
| 3/31/16 | 1.00% | 2.33% | 15.42% |
| 6/30/16 | 0.95% | 2.28% | 18.05% |
| 9/30/16 | -0.04% | 1.28% | 19.57% |
| 12/31/16 | -0.26% | 1.05% | 20.83% |
| 3/31/17 | -0.15% | 1.17% | 22.24% |
| 6/30/17 | 0.26% | 1.59% | 24.18% |
| 9/30/17 | 0.00% | 1.32% | 25.83% |
| 12/31/17 | 0.90% | 2.23% | 28.64% |
| 3/31/18 | -0.97% | 0.34% | 29.08% |
| 6/30/18 | 1.24% | 2.58% | 32.41% |
| 9/30/18 | 0.11% | 1.43% | 34.31% |
| 12/31/18 | -1.04% | 0.27% | 34.67% |
| 3/31/19 | 2.10% | 3.45% | 39.33% |
| 6/30/19 | 0.15% | 1.47% | 41.38% |
| 9/30/19 | 0.40% | 1.73% | 43.82% |
| 12/31/19 | -0.11% | 1.21% | 45.56% |
| 3/31/20 | -6.70% | -5.46% | 37.61% |
| 6/30/20 | -2.63% | -1.34% | 35.77% |
| 9/30/20 | 0.00% | 1.33% | 37.57% |
| 12/31/20 | 1.41% | 2.76% | 41.37% |
| 3/31/21 | 2.07% | 3.42% | 46.20% |
| 6/30/21 | 3.66% | 5.04% | 53.56% |
| 9/30/21 | 3.15% | 4.52% | 60.51% |
| 12/31/21 | 7.21% | 8.62% | 74.35% |
| 3/31/22 | 2.85% | 4.21% | 81.69% |
13
Endnotes
| 1. | Past performance is not indicative of future results. Investment return and the principal value of an investment will fluctuate. Shares may be worth more or less than original cost when redeemed. Investing involves risk, including loss of principal. Performance source: Morningstar Direct. Performance includes reinvestment of distributions and reflects management fees and other expenses. The Fund return does not reflect the deduction of all fees, including any applicable Fund share class sales load, third-party brokerage commissions or third-party investment advisory fees paid by investors to a financial intermediary for brokerage services. If the deduction of such fees was reflected, the performance would be lower. Returns shown do not reflect the deduction of taxes that a shareholder would pay on Fund distributions or the redemption of Fund shares. Current performance may be lower or higher than the performance quoted. The most recent performance is available at www.apollo.com or by calling 888.926.2688. As of 3/31/22, the Fund’s load-waived, Class A share had a one-year return of 24.28% and a five-year annualized return of 8.25%, the FTSE Nareit All Equity REITs Index had a one-year return of 23.58% and a five-year annualized return of 10.69%, the S&P 500 Index had a one-year return of 15.65% and a five-year annualized return of 15.99%, and the Bloomberg U.S. Aggregate Bond Index had a one-year return of -4.15% and a five-year annualized return of 2.14%. Alpha and beta calculation benchmark: S&P 500. Assets and securities contained within indices are different than the assets and securities contained in Apollo Diversified Real Estate Fund and will therefore have different risk and reward profiles. An investment cannot be made in an index, which is unmanaged and has returns that do not reflect any trading, management or other costs. There are limitations when comparing the Apollo Diversified Real Estate Fund to indices. Many open-end funds which track these indices offer daily liquidity, while closed-end interval funds offer liquidity on a periodic basis. Deteriorating general market conditions will reduce the value of stock securities. Fixed income risks include interest-rate and credit risk, bond values fluctuate in price so the value of your investment can go down depending on market conditions. Real estate securities and debt obligations may decline because of adverse developments affecting the real estate industry and real property values. |
| 2. | Fund holdings as of 4/1/22. Fund size based on Gross Asset Value (GAV). Fund holdings are subject to change without notice. Diversification does not eliminate the risk of experiencing investment losses. The Fund is not intended to be a complete investment program. |
| 3. | Federal Reserve, Board of Governors of the Federal Reserve System. |
| 5. | CBRE Econometric Advisors. |
| 8. | Apollo Real Estate Fund Adviser, LLC, NCREIF-ODCE Net Index as of 12/31/21. |
| 9. | Represents the Fund’s direct holdings in private funds in which the underlying holdings of each respective private fund generally consist of real estate-related interests that are not publicly traded. Holdings and allocations are subject to change without notice. |
| 10. | Represents (i) the Fund’s direct holdings in publicly traded, real estate-related securities; (ii) the Fund’s holdings in private funds and registered investment companies in which the underlying holdings are generally publicly traded; and (iii) cash and short-term investments. Holdings and allocations are subject to change without notice. |
| 11. | Metrics express the Fund’s portfolio allocated to private funds in which the underlying holdings of such private funds generally consist of real estate-related interests that are not publicly traded as of April 1, 2022. Underlying data and statistics of the Fund’s private real estate exposure generally as of December 31, 2021, however, in limited circumstances, data for certain private funds is as of the most recent quarter end. Holdings are subject to change without notice. Diversification does not eliminate the risk of experiencing investment losses. |
14
| Apollo Diversified Real Estate Fund | Portfolio Update |
| | March 31, 2022 (Unaudited) |
Performance (for the periods ended March 31, 2022)
| | 6 Month | 1 Year | 3 Year | 5 Year | Since Inception | Inception Date |
| Apollo Diversified Real Estate Fund – A – With Load* | 7.56% | 18.63% | 7.69% | 7.30% | 7.40% | 6/30/14 |
| Apollo Diversified Real Estate Fund – A – Without Load | 14.12% | 25.86% | 9.84% | 8.58% | 8.22% | 6/30/14 |
| Apollo Diversified Real Estate Fund – C – With Load** | 12.73% | 23.94% | 9.02% | 7.77% | 7.27% | 8/7/15 |
| Apollo Diversified Real Estate Fund – C – Without Load | 13.73% | 24.94% | 9.02% | 7.77% | 7.27% | 8/7/15 |
| Apollo Diversified Real Estate Fund – I – NAV | 14.31% | 26.17% | 10.12% | 8.86% | 8.34% | 8/7/15 |
| Apollo Diversified Real Estate Fund – M – NAV | 13.87% | 25.25% | 9.31% | 8.05% | 8.00% | 11/16/16 |
| Apollo Diversified Real Estate Fund – L – With Load*** | 9.15% | 20.22% | 8.01% | N/A | 7.42% | 4/24/17 |
| Apollo Diversified Real Estate Fund – L – Without Load | 14.01% | 25.53% | 9.58% | N/A | 8.37% | 4/24/17 |
| S&P 500® Total Return Index | 5.92% | 15.65% | 18.92% | 15.99% | 13.58% | 6/30/14 |
| Bloomberg U.S. Aggregate Bond Index | -5.92% | -4.15% | 1.69% | 2.14% | 2.15% | 6/30/14 |
| * | Adjusted for initial maximum sales charge of 5.75%. |
| ** | Adjusted for contingent deferred sales charge of 1.00%. |
| *** | Adjusted for initial maximum sales charge of 4.25%. |
The S&P 500® Total Return Index is an unmanaged index of 500 common stocks chosen for market size, liquidity and industry group representation. It is a market-value weighted index. The index is not actively managed and does not reflect any deduction for fees, expenses or taxes.
The Bloomberg U.S. Aggregate Bond Index measures the performance of the U.S. investment grade bond market.
Past performance is not indicative of future results. Investment return and the principal value of an investment will fluctuate. Shares may be worth more or less than original cost when redeemed. Investing involves risk, including loss of principal. Fund performance includes reinvestment of distributions and reflects management fees and other expenses. The Fund return does not reflect the deduction of all fees, including third-party brokerage commissions or third-party investment advisory fees paid by investors to a financial intermediary for brokerage services. If the deduction of such fees was reflected, the performance would be lower. Returns shown do not reflect the deduction of taxes that a shareholder would pay on Fund distributions or the redemption of Fund shares. Current performance may be lower or higher than the performance quoted. The most recent performance is available at www.apollodiversifiedrealestatefund.com or by calling 888.926.2688. An investment cannot be made in an index, which is unmanaged and has returns that do not reflect any trading, management or other costs. Index performance does not represent actual Fund or portfolio performance, nor does it represent actual performance of the Fund’s Adviser or sub-advisers.
Class A shares are offered subject to a maximum sales charge of 5.75% of the offering price. Class L shares are offered subject to a maximum sales charge of 4.25% of the offering price. Class C, Class I and Class M shares are offered at net asset value. Class C shares may be subject to a 1.00% contingent deferred sales charge on shares redeemed during the first 365 days after their purchase. The Fund’s investment adviser has contractually agreed to waive its fees and to pay or absorb the ordinary annual operating expenses of the Fund (including offering expenses, but excluding taxes, interest, brokerage commissions, acquired fund fees and expenses and extraordinary expenses), to the extent that they exceed 1.91%, 2.66%, 1.66%, 2.41% and 2.16% per annum of the Fund’s average daily net assets attributable to Class A, Class C, Class I, Class M and Class L shares, respectively. The Expense Limitation Agreement will remain in effect for Class A, Class C, Class I, Class L and Class M shares, unless and until the Board approves its modification or termination. Per the Fund's most recent prospectus, the total expense ratio after recoupment, if applicable, is 1.98%, 2.73%, 1.73%, 2.47%, and 2.21% for Class A, Class C, Class I, Class M and Class L, respectively. Please review the Fund’s Prospectus for more details regarding the Fund’s fees and expenses. No assurances can be given that the Fund will pay a distribution in the future; or, if any such distribution is paid, the amount or rate of the distribution.
| Semi-Annual Report | March 31, 2022 | 15 |
| Apollo Diversified Real Estate Fund | Portfolio Update |
| | March 31, 2022 (Unaudited) |
Performance of $10,000 Initial Investment (as of March 31, 2022)
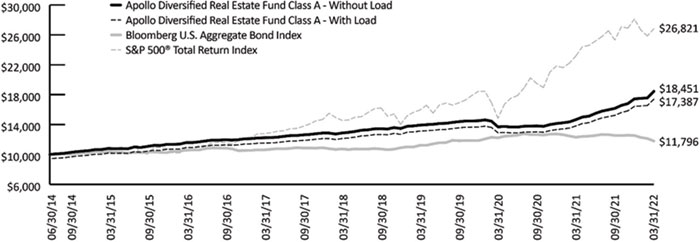
The graph shown above represents historical performance of a hypothetical investment of $10,000 in the Fund since inception. Past performance is not indicative of future results. Investment return and the principal value of an investment will fluctuate. Shares may be worth more or less than original cost when redeemed. Investing involves risk, including loss of principal. Fund performance includes reinvestment of distributions and reflects management fees and other expenses. The Fund return does not reflect the deduction of all fees, including third-party brokerage commissions or third-party investment advisory fees paid by investors to a financial intermediary for brokerage services. If the deduction of such fees was reflected, the performance would be lower. Returns shown do not reflect the deduction of taxes that a shareholder would pay on Fund distributions or the redemption of Fund shares. The most recent performance is available at www.apollodiversifiedrealestatefund.com or by calling 888.926.2688. An investment cannot be made in an index, which is unmanaged and has returns that do not reflect any trading, management or other costs. Index performance does not represent actual Fund or portfolio performance, nor does it represent actual performance of the Fund’s Adviser or sub-advisers.
| Sector Allocation (as a % of Net Assets) | | |
| | | |
| Private Investment Funds | | 76.92% |
| Publicly Traded Securities | | 23.83% |
| Preferred Stocks | | 1.37% |
| Cash, Cash Equivalents, & Other Net Assets | | -2.12% |
| Total | | 100.00% |
| 16 | 1.888.926.2688 | www.apollo.com |
| Apollo Diversified Real Estate Fund | Schedule of Investments |
March 31, 2022 (Unaudited)
| Description | | Shares | | | Value (Note 2) | |
| REAL ESTATE INVESTMENT TRUSTS (100.75%)(a) | | | | | | | | |
| | | | | | | | | |
| Private Investment Funds (76.92%)* | | | | | | | | |
| AEW Core Property Trust (U.S.), Inc. | | | 1,855 | | | $ | 2,361,283 | |
| Ares Real Estate Enhanced Income Fund, L.P. | | | N/A | | | | 65,496,300 | |
| Barings Core Property Fund, L.P. | | | 51,340 | | | | 8,249,781 | |
| BGO Diversified US Property Fund, L.P. | | | 5,252 | | | | 15,265,996 | |
| Brookfield Senior Mezzanine Real Estate Finance Fund | | | 121,318 | | | | 125,144,600 | |
| CA Student Living Income and Growth Fund | | | 85,518 | | | | 106,305,361 | |
| CBRE U.S. Core Partners, L.P. | | | 118,589,710 | | | | 237,708,977 | |
| CBRE U.S. Credit Partners, L.P. | | | 51,880 | | | | 54,479,798 | |
| CBRE U.S. Logistics Partners, L.P. | | | 184,547,680 | | | | 234,068,477 | |
| Clarion Gables Multifamily Trust, L.P. | | | 88,035 | | | | 161,557,173 | |
| Clarion Lion Industrial Trust, L.P. | | | 70,777 | | | | 264,954,710 | |
| Clarion Lion Properties Fund, L.P. | | | 200,008 | | | | 386,126,948 | |
| Cortland Growth and Income Fund, L.P. | | | 271,670 | | | | 448,556,527 | |
| CrossHarbor Strategic Debt Fund, L.P. | | | N/A | | | | 66,353,954 | |
| Dream U.S. Industrial Fund, L.P. | | | 86,480 | | | | 134,914,054 | |
| GWL U.S. Property Fund, L.P. | | | N/A | | | | 45,565,625 | |
| Heitman America Real Estate Trust, L.P. | | | 11,138 | | | | 16,907,903 | |
| Heitman Core Real Estate Debt Income Trust | | | 133,249 | | | | 133,969,584 | |
| JPM U.S. Real Estate Mezzanine Debt Fund, L.P. | | | 978,563 | | | | 101,376,416 | |
| Manulife U.S. Real Estate Fund, L.P. | | | 54,385 | | | | 107,558,288 | |
| Morgan Stanley Prime Property Fund | | | 11,677 | | | | 271,342,532 | |
| Oaktree Real Estate Income Fund, L.P. | | | N/A | | | | 213,728,612 | |
| PGIM Real Estate US Debt Fund, L.P. | | | 57,353 | | | | 75,630,365 | |
| Principal Real Estate Liquid Debt Fund, L.P. | | | 2,479,801 | | | | 61,342,075 | |
| PRISA, L.P. | | | 19,071 | | | | 43,990,009 | |
| Prologis Targeted U.S. Logistics Fund, L.P. | | | 34,887 | | | | 111,331,909 | |
| Sentinel Real Estate Fund, L.P. | | | 705 | | | | 84,915,092 | |
| Stockbridge Smart Markets Fund, L.P. | | | 17,690 | | | | 36,703,012 | |
| TA Realty Core Property Fund, L.P. | | | 101,640 | | | | 157,144,240 | |
| TA Realty Logistics Fund, L.P. | | | 110,164 | | | | 130,196,353 | |
| TCM CRE Credit Fund, L.P. | | | 118,586 | | | | 119,506,709 | |
| UBS Trumbull Property Fund | | | 1,343 | | | | 15,641,111 | |
| USAA US Government Building Fund, LLC | | | N/A | | | | 67,391,888 | |
| Ventas Life Science and Healthcare Real Estate Fund | | | 155,111 | | | | 207,897,468 | |
| Voya Commercial Mortgage Lending Fund, L.P. | | | N/A | | | | 60,537,190 | |
| | | | | | | | 4,374,220,320 | |
| Publicly Traded Securities (23.83%) | | | | | | | | |
| Acadia Realty Trust | | | 723,258 | | | | 15,673,001 | |
| Agree Realty Corp. | | | 491,200 | | | | 32,596,032 | |
| Alexandria Real Estate Equities, Inc. | | | 173,560 | | | | 34,928,950 | |
| American Campus Communities, Inc. | | | 298,783 | | | | 16,722,885 | |
| American Homes 4 Rent, Class A | | | 668,719 | | | | 26,768,822 | |
| American Tower Corp. | | | 31,880 | | | | 8,008,894 | |
| Americold Realty Trust | | | 556,576 | | | | 15,517,339 | |
| Apple Hospitality REIT, Inc. | | | 395,580 | | | | 7,108,573 | |
| AvalonBay Communities, Inc. | | | 223,600 | | | | 55,535,532 | |
| Brixmor Property Group, Inc. | | | 1,170,650 | | | | 30,214,476 | |
| Cousins Properties, Inc. | | | 478,701 | | | | 19,286,863 | |
| Digital Realty Trust, Inc. | | | 333,820 | | | | 47,335,676 | |
| Diversified Healthcare Trust | | | 421,722 | | | | 1,349,510 | |
| Semi-Annual Report | March 31, 2022 | 17 |
| Apollo Diversified Real Estate Fund | Schedule of Investments |
March 31, 2022 (Unaudited)
| Description | | Shares | | | Value (Note 2) | |
| Publicly Traded Securities (continued) | | | | | | | | |
| Duke Realty Corp. | | | 740,460 | | | $ | 42,991,108 | |
| Empire State Realty Trust, Inc., Class A | | | 465,480 | | | | 4,571,014 | |
| Equinix, Inc. | | | 110,970 | | | | 82,297,571 | |
| Equity Residential | | | 601,710 | | | | 54,105,763 | |
| Extra Space Storage, Inc. | | | 99,950 | | | | 20,549,720 | |
| First Industrial Realty Trust, Inc. | | | 335,314 | | | | 20,759,290 | |
| Four Corners Property Trust, Inc. | | | 290,710 | | | | 7,860,798 | |
| Host Hotels & Resorts, Inc. | | | 870,650 | | | | 16,916,729 | |
| Hudson Pacific Properties, Inc. | | | 521,350 | | | | 14,467,462 | |
| Invitation Homes, Inc. | | | 1,140,070 | | | | 45,808,013 | |
| JBG SMITH Properties | | | 541,510 | | | | 15,822,922 | |
| Kilroy Realty Corp. | | | 401,830 | | | | 30,707,849 | |
| Life Storage, Inc. | | | 299,480 | | | | 42,055,976 | |
| Medical Properties Trust, Inc. | | | 938,780 | | | | 19,845,809 | |
| MGM Growth Properties LLC, Class A | | | 519,600 | | | | 20,108,520 | |
| Mid-America Apartment Communities, Inc. | | | 186,648 | | | | 39,093,424 | |
| Omega Healthcare Investors, Inc. | | | 296,290 | | | | 9,232,396 | |
| Outfront Media, Inc. | | | 513,470 | | | | 14,597,952 | |
| Park Hotels & Resorts, Inc. | | | 478,270 | | | | 9,340,613 | |
| Phillips Edison & Co., Inc. | | | 338,756 | | | | 11,649,819 | |
| Prologis, Inc. | | | 703,450 | | | | 113,593,106 | |
| Public Storage | | | 163,430 | | | | 63,783,460 | |
| Realty Income Corp. | | | 334,340 | | | | 23,169,762 | |
| Rexford Industrial Realty, Inc. | | | 363,780 | | | | 27,134,350 | |
| RPT Realty | | | 730,136 | | | | 10,053,973 | |
| Sabra Health Care REIT, Inc. | | | 845,800 | | | | 12,593,962 | |
| SBA Communications Corp. | | | 25,690 | | | | 8,839,929 | |
| Simon Property Group, Inc. | | | 297,710 | | | | 39,166,728 | |
| Spirit Realty Capital, Inc. | | | 101,290 | | | | 4,661,366 | |
| Sun Communities, Inc. | | | 224,310 | | | | 39,319,300 | |
| Sunstone Hotel Investors, Inc. | | | 286,650 | | | | 3,376,737 | |
| UDR, Inc. | | | 653,320 | | | | 37,480,968 | |
| Ventas, Inc. | | | 825,850 | | | | 51,004,496 | |
| Veris Residential, Inc. | | | 702,540 | | | | 12,217,171 | |
| VICI Properties, Inc. | | | 750,870 | | | | 21,369,760 | |
| Welltower, Inc. | | | 378,370 | | | | 36,376,492 | |
| WeWork, Inc. | | | 319,080 | | | | 2,176,126 | |
| Xenia Hotels & Resorts, Inc. | | | 765,260 | | | | 14,761,865 | |
| | | | | | | | 1,354,908,852 | |
| TOTAL REAL ESTATE INVESTMENT TRUSTS | | | | | | | | |
| (Cost $4,503,913,792) | | | | | | | 5,729,129,172 | |
| Description | | Coupon Rate | | | Shares | | | Value (Note 2) | |
| PREFERRED STOCKS (1.37%)(b) | | | | | | | | | | | | |
| Agree Realty Corp., Series A | | | 4.25 | % | | | 62,000 | | | | 1,232,560 | |
| American Homes 4 Rent, Series G | | | 5.88 | % | | | 15,000 | | | | 376,200 | |
| American Homes 4 Rent, Series H | | | 6.25 | % | | | 179,000 | | | | 4,619,990 | |
| Chatham Lodging Trust, Series A | | | 6.63 | % | | | 19,800 | | | | 482,526 | |
| DiamondRock Hospitality Co., Series A | | | 8.25 | % | | | 47,139 | | | | 1,270,396 | |
| Digital Realty Trust, Inc., Series K | | | 5.85 | % | | | 145,000 | | | | 3,774,350 | |
| Digital Realty Trust, Inc., Series L | | | 5.20 | % | | | 46,000 | | | | 1,145,400 | |
| 18 | 1.888.926.2688 | www.apollo.com |
| Apollo Diversified Real Estate Fund | Schedule of Investments |
March 31, 2022 (Unaudited)
| Description | | Coupon Rate | | | Shares | | | Value (Note 2) | |
| PREFERRED STOCKS (continued) | | | | | | | | | | | | |
| DigitalBridge Group, Inc., Series I | | | 7.15 | % | | | 89,500 | | | $ | 2,227,655 | |
| DigitalBridge Group, Inc., Series J | | | 7.13 | % | | | 20,000 | | | | 494,400 | |
| EPR Properties, Series G | | | 5.75 | % | | | 54,000 | | | | 1,296,000 | |
| Federal Realty Investment Trust, Series C | | | 5.00 | % | | | 84,143 | | | | 2,125,452 | |
| Hersha Hospitality Trust, Series C | | | 6.88 | % | | | 81,500 | | | | 1,902,210 | |
| Hersha Hospitality Trust, Series D | | | 6.50 | % | | | 30,000 | | | | 664,500 | |
| Hudson Pacific Properties, Inc., Series C | | | 4.75 | % | | | 46,000 | | | | 990,380 | |
| Kimco Realty Corp., Series L | | | 5.13 | % | | | 18,703 | | | | 469,445 | |
| Kimco Realty Corp., Series M | | | 5.25 | % | | | 80,600 | | | | 2,009,358 | |
| National Storage Affiliates Trust, Series A | | | 6.00 | % | | | 130,828 | | | | 3,330,881 | |
| Pebblebrook Hotel Trust, Series E | | | 6.38 | % | | | 121,301 | | | | 2,937,146 | |
| Pebblebrook Hotel Trust, Series G | | | 6.38 | % | | | 42,500 | | | | 1,049,750 | |
| Pebblebrook Hotel Trust, Series H | | | 5.70 | % | | | 89,000 | | | | 2,018,520 | |
| PS Business Parks, Inc., Series Z | | | 4.88 | % | | | 145,000 | | | | 3,406,050 | |
| Public Storage, Series G | | | 5.05 | % | | | 7,000 | | | | 175,490 | |
| Public Storage, Series H | | | 5.60 | % | | | 44,500 | | | | 1,163,675 | |
| Public Storage, Series J | | | 4.70 | % | | | 25,000 | | | | 582,750 | |
| Public Storage, Series L | | | 4.63 | % | | | 165,000 | | | | 3,841,200 | |
| Rexford Industrial Realty, Inc., Series B | | | 5.88 | % | | | 80,000 | | | | 2,012,000 | |
| Rexford Industrial Realty, Inc., Series C | | | 5.63 | % | | | 57,260 | | | | 1,433,791 | |
| Saul Centers, Inc., Series D | | | 6.13 | % | | | 107,000 | | | | 2,673,930 | |
| Saul Centers, Inc., Series E | | | 6.00 | % | | | 57,000 | | | | 1,433,470 | |
| Seritage Growth Properties, Series A | | | 7.00 | % | | | 168,025 | | | | 3,654,544 | |
| SITE Centers Corp., Series A | | | 6.38 | % | | | 154,700 | | | | 3,869,047 | |
| SL Green Realty Corp., Series I | | | 6.50 | % | | | 23,000 | | | | 580,290 | |
| Spirit Realty Capital, Inc., Series A | | | 6.00 | % | | | 178,900 | | | | 4,501,124 | |
| Summit Hotel Properties, Inc., Series E | | | 6.25 | % | | | 98,000 | | | | 2,408,840 | |
| Summit Hotel Properties, Inc., Series F | | | 5.88 | % | | | 33,476 | | | | 784,008 | |
| Sunstone Hotel Investors, Inc., Series H | | | 6.13 | % | | | 87,500 | | | | 2,109,625 | |
| Sunstone Hotel Investors, Inc., Series I | | | 5.70 | % | | | 110,431 | | | | 2,521,140 | |
| Urstadt Biddle Properties, Inc., Series H | | | 6.25 | % | | | 94,000 | | | | 2,355,640 | |
| Urstadt Biddle Properties, Inc., Series K | | | 5.88 | % | | | 8,000 | | | | 200,880 | |
| Vornado Realty Trust, Series L | | | 5.40 | % | | | 8,500 | | | | 199,920 | |
| Vornado Realty Trust, Series M | | | 5.25 | % | | | 22,000 | | | | 509,080 | |
| Vornado Realty Trust, Series N | | | 5.25 | % | | | 33,118 | | | | 769,331 | |
| Vornado Realty Trust, Series O | | | 4.45 | % | | | 120,000 | | | | 2,403,600 | |
| | | | | | | | | | | | | |
| TOTAL PREFERRED STOCKS | | | | | | | | | | | | |
| (Cost $77,847,144) | | | | | | | | | | | 78,006,544 | |
| | | 7-Day Yield | | | Shares | | | Value (Note 2) | |
| SHORT TERM INVESTMENT (0.18%) | | | | | | | | | | | | |
| MSILF Treasury Portfolio | | | 0.18 | % | | | 10,239,832 | | | | 10,239,832 | |
| | | | | | | | | | | | | |
| TOTAL SHORT TERM INVESTMENT | | | | | | | | | | | | |
| (Cost $10,239,832) | | | | | | | | | | | 10,239,832 | |
| | | | | | | | | | | | | |
| TOTAL INVESTMENTS (102.30%) | | | | | | | | | | | | |
| (Cost $4,592,000,768) | | | | | | | | | | $ | 5,817,375,548 | |
| | | | | | | | | | | | | |
| Liabilities in Excess of Other Assets (-2.30%) | | | | | | | | | | | (130,799,279 | ) |
| NET ASSETS (100.00%) | | | | | | | | | | $ | 5,686,576,269 | |
| Semi-Annual Report | March 31, 2022 | 19 |
| Apollo Diversified Real Estate Fund | Schedule of Investments |
March 31, 2022 (Unaudited)
| (a) | A portion of these securities is held as collateral for the outstanding Lines of Credit. At March 31, 2022 outstanding collateral amounted to $5,729,129,172. |
| (b) | These securities have no contractual maturity date, are not redeemable and contractually pay an indefinite stream of dividends. |
Common Abbreviations:
LLC - Limited Liability Company
L.P. - Limited Partnership
REIT - Real Estate Investment Trust
| 20 | 1.888.926.2688 | www.apollo.com |
| Apollo Diversified Real Estate Fund | Schedule of Investments |
March 31, 2022 (Unaudited)
| * | Additional Information on Investments in Private Investment Funds: |
| Value | | | Fund Name | | Redemption Frequency | | Redemption Notice (Days) | | | Unfunded Commitment as of March 31, 2022 | |
| $ | 2,361,283 | | | AEW Core Property Trust (U.S.), Inc. | | Quarterly | | 45 | | | $ | 0 | |
| | 65,496,300 | | | Ares Real Estate Enhanced Income Fund, L.P. | | Quarterly | | 90 | | | | 0 | |
| | 8,249,781 | | | Barings Core Property Fund, L.P. | | Quarterly | | 30 | | | | 0 | |
| | 15,265,996 | | | BGO Diversified US Property Fund, L.P. | | Quarterly | | N/A** | | | | 0 | |
| | 125,144,600 | | | Brookfield Senior Mezzanine Real Estate Finance Fund | | Quarterly | | 90 | | | | 4,194,142 | |
| | 106,305,361 | | | CA Student Living Income and Growth Fund | | Quarterly | | 90 | | | | 0 | |
| | 237,708,977 | | | CBRE U.S. Core Partners, L.P. | | Quarterly | | 60 | | | | 0 | |
| | 54,479,798 | | | CBRE U.S. Credit Partners, L.P. | | Quarterly | | 60 | | | | 70,000,000 | |
| | 234,068,477 | | | CBRE U.S. Logistics Partners, L.P. | | Quarterly | | 90 | | | | 0 | |
| | 161,557,173 | | | Clarion Gables Multifamily Trust, L.P. | | Quarterly | | 90 | | | | 0 | |
| | 264,954,710 | | | Clarion Lion Industrial Trust, L.P. | | Quarterly | | 90 | | | | 0 | |
| | 386,126,948 | | | Clarion Lion Properties Fund, L.P. | | Quarterly | | 90 | | | | 0 | |
| | 448,556,527 | | | Cortland Growth and Income Fund, L.P. | | Quarterly | | 90 | | | | 0 | |
| | 66,353,954 | | | CrossHarbor Strategic Debt Fund, L.P. | | Quarterly | | 90 | | | | 0 | |
| | 134,914,054 | | | Dream U.S. Industrial Fund, L.P. | | Quarterly | | 60 | | | | 0 | |
| | 45,565,625 | | | GWL U.S. Property Fund, L.P. | | Quarterly | | 90 | | | | 0 | |
| | 16,907,903 | | | Heitman America Real Estate Trust, L.P. | | Quarterly | | 90 | | | | 0 | |
| | 133,969,584 | | | Heitman Core Real Estate Debt Income Trust | | Quarterly | | 90 | | | | 0 | |
| | 101,376,416 | | | JPM U.S. Real Estate Mezzanine Debt Fund, L.P. | | Quarterly | | 60 | | | | 0 | |
| | 107,558,288 | | | Manulife U.S. Real Estate Fund, L.P. | | Quarterly | | 60 | | | | 0 | |
| | 271,342,532 | | | Morgan Stanley Prime Property Fund | | Quarterly | | 90 | | | | 0 | |
| | 213,728,612 | | | Oaktree Real Estate Income Fund, L.P. | | Quarterly | | 90 | | | | 0 | |
| | 75,630,365 | | | PGIM Real Estate US Debt Fund, L.P. | | Quarterly | | 90 | | | | 0 | |
| | 61,342,075 | | | Principal Real Estate Liquid Debt Fund, L.P. | | Monthly | | 10 | | | | 0 | |
| | 43,990,009 | | | PRISA, L.P. | | Quarterly | | 90 | | | | 0 | |
| | 111,331,909 | | | Prologis Targeted U.S. Logistics Fund, L.P. | | Quarterly | | 90 | | | | 0 | |
| | 84,915,092 | | | Sentinel Real Estate Fund, L.P. | | Quarterly | | N/A** | | | | 0 | |
| | 36,703,012 | | | Stockbridge Smart Markets Fund, L.P. | | Quarterly | | 45 | | | | 40,000,000 | |
| | 157,144,240 | | | TA Realty Core Property Fund, L.P. | | Quarterly | | 45 | | | | 35,000,000 | |
| | 130,196,353 | | | TA Realty Logistics Fund, L.P. | | Quarterly | | 45 | | | | 38,829,375 | |
| | 119,506,709 | | | TCM CRE Credit Fund, L.P. | | Quarterly | | 90 | | | | 10,100,000 | |
| | 15,641,111 | | | UBS Trumbull Property Fund | | Quarterly | | 60 | | | | 0 | |
| | 67,391,888 | | | USAA US Government Building Fund, LLC | | Quarterly | | 60 | | | | 0 | |
| | 207,897,468 | | | Ventas Life Science and Healthcare Real Estate Fund | | Quarterly | | 90 | | | | 50,000,000 | |
| | 60,537,190 | | | Voya Commercial Mortgage Lending Fund, L.P. | | Quarterly | | 90 | | | | 0 | |
| $ | 4,374,220,320 | | | | | | | | | | $ | 248,123,517 | |
| ** | Written notice required for redemption, no minimum timeline required. |
See Notes to Financial Statements.
| Semi-Annual Report | March 31, 2022 | 21 |
| Apollo Diversified Real Estate Fund | Statement of Assets and Liabilities |
March 31, 2022 (Unaudited)
| ASSETS | | | |
| Investments, at fair value (Cost $4,592,000,768) | | $ | 5,817,375,548 | |
| Receivable for investments sold | | | 58,453,425 | |
| Dividend receivable | | | 37,951,834 | |
| Cash | | | 19,368,781 | |
| Receivable for shares sold | | | 14,508,143 | |
| Prepaid expenses and other assets | | | 86,157 | |
| Total Assets | | | 5,947,743,888 | |
| LIABILITIES | | | | |
| Payable for lines of credit (Note 6) | | | 226,000,000 | |
| Payable for investments purchased | | | 13,649,958 | |
| Payable for investment advisory fees (Note 3) | | | 6,889,406 | |
| Payable for distribution fees (Note 3) | | | 1,254,732 | |
| Payable for transfer agency fees (Note 3) | | | 624,571 | |
| Payable for lines of credit interest (Note 6) | | | 313,210 | |
| Payable for shareholder servicing fees (Note 3) | | | 295,225 | |
| Payable for administration fees (Note 3) | | | 144,805 | |
| Payable for legal fees | | | 124,278 | |
| Payable for trustees' fees (Note 3) | | | 33,278 | |
| Payable for custody fees | | | 27,137 | |
| Payable for audit and tax fees | | | 12,983 | |
| Payable for compliance service fees (Note 3) | | | 338 | |
| Accrued expenses and other liabilities | | | 11,797,698 | |
| Total Liabilities | | | 261,167,619 | |
| NET ASSETS | | $ | 5,686,576,269 | |
| NET ASSETS CONSIST OF | | | | |
| Paid-in capital | | $ | 4,333,630,696 | |
| Total distributable earnings | | | 1,352,945,573 | |
| NET ASSETS | | $ | 5,686,576,269 | |
| PRICING OF SHARES | | | | |
| Class A: | | | | |
| Net asset value | | $ | 30.76 | |
| Net assets | | $ | 757,342,843 | |
| Shares of beneficial interest outstanding (unlimited number of shares, no par value common stock authorized) | | | 24,618,037 | |
| Maximum offering price per share ((NAV/0.9425), based on maximum sales charge of 5.75% of the offering price) | | $ | 32.64 | |
| Class C: | | | | |
| Net asset value and maximum offering price | | $ | 29.29 | |
| Net assets | | $ | 588,026,860 | |
| Shares of beneficial interest outstanding (unlimited number of shares, no par value common stock authorized) | | | 20,076,247 | |
| Class I: | | | | |
| Net asset value and maximum offering price | | $ | 31.29 | |
| Net assets | | $ | 2,806,927,875 | |
| Shares of beneficial interest outstanding (unlimited number of shares, no par value common stock authorized) | | | 89,718,303 | |
| Class M: | | | | |
| Net asset value and maximum offering price | | $ | 29.97 | |
| Net assets | | $ | 1,432,309,436 | |
| Shares of beneficial interest outstanding (unlimited number of shares, no par value common stock authorized) | | | 47,792,962 | |
| Class L: | | | | |
| Net asset value | | $ | 30.43 | |
| Net assets | | $ | 101,969,255 | |
| Shares of beneficial interest outstanding (unlimited number of shares, no par value common stock authorized) | | | 3,350,457 | |
| Maximum offering price per share ((NAV/0.9575), based on maximum sales charge of 4.25% of the offering price) | | $ | 31.78 | |
See Notes to Financial Statements.
| 22 | 1.888.926.2688 | www.apollo.com |
| Apollo Diversified Real Estate Fund | Statement of Operations |
| | | For the Six Months Ended March 31, 2022 (Unaudited) | |
| INVESTMENT INCOME | | | | |
| Dividend Income | | | 91,021,376 | |
| Total Investment Income | | | 91,021,376 | |
| | | | | |
| EXPENSES | | | | |
| Investment advisory fees (Note 3) | | | 36,929,913 | |
| Administration fees (Note 3) | | | 754,912 | |
| Transfer agency fees (Note 3) | | | 891,308 | |
| Shareholder servicing fees (Note 3): | | | | |
| Class A | | | 863,382 | |
| Class C | | | 675,104 | |
| Class L | | | 113,314 | |
| Distribution fees (Note 3): | | | | |
| Class C | | | 2,025,313 | |
| Class M | | | 4,729,502 | |
| Class L | | | 113,314 | |
| Credit facility interest expense (Note 6) | | | 2,277,828 | |
| Reports to shareholders and printing fees | | | 574,840 | |
| Legal fees | | | 261,835 | |
| Insurance fees | | | 101,664 | |
| Compliance service fees (Note 3) | | | 97,993 | |
| SEC registration fees | | | 92,563 | |
| Trustees' fees (Note 3) | | | 92,439 | |
| Custody fees | | | 90,265 | |
| State registration fees | | | 37,456 | |
| Audit and tax fees | | | 12,983 | |
| Other expenses | | | 70,198 | |
| Total Expenses | | | 50,806,126 | |
| Net Investment Income | | | 40,215,250 | |
| Net realized gain on investments | | | 52,751,948 | |
| Net change in unrealized appreciation on investments | | | 570,920,632 | |
| NET REALIZED AND UNREALIZED GAIN ON INVESTMENTS | | | 623,672,580 | |
| NET INCREASE IN NET ASSETS RESULTING FROM OPERATIONS | | $ | 663,887,830 | |
See Notes to Financial Statements.
| Semi-Annual Report | March 31, 2022 | 23 |
| Apollo Diversified Real Estate Fund | Statements of Changes in Net Assets |
| | | For the Six Months Ended March 31, 2022 (Unaudited) | | | For the Year Ended September 30, 2021 | |
| OPERATIONS: | | | | | | |
| Net investment income | | $ | 40,215,250 | | | $ | 53,820,907 | |
| Net realized gain on investments and long-term capital gain distributions from other investments | | | 52,751,948 | | | | 120,393,155 | |
| Net change in unrealized appreciation on investments | | | 570,920,632 | | | | 447,149,332 | |
| Net Increase in Net Assets Resulting from Operations | | | 663,887,830 | | | | 621,363,394 | |
| DISTRIBUTIONS TO SHAREHOLDERS: | | | | | | | | |
| Class A | | | | | | | | |
| From distributable earnings | | | (7,088,231 | ) | | | (9,380,559 | ) |
| From return of capital | | | (11,427,078 | ) | | | (27,699,106 | ) |
| Class C | | | | | | | | |
| From distributable earnings | | | (5,782,839 | ) | | | (6,455,894 | ) |
| From return of capital | | | (8,657,254 | ) | | | (19,598,666 | ) |
| Class I | | | | | | | | |
| From distributable earnings | | | (25,808,091 | ) | | | (20,787,679 | ) |
| From return of capital | | | (38,800,629 | ) | | | (67,807,905 | ) |
| Class M | | | | | | | | |
| From distributable earnings | | | (13,766,278 | ) | | | (12,412,060 | ) |
| From return of capital | | | (20,461,764 | ) | | | (40,664,890 | ) |
| Class L | | | | | | | | |
| From distributable earnings | | | (965,564 | ) | | | (1,056,223 | ) |
| From return of capital | | | (1,543,731 | ) | | | (3,310,671 | ) |
| Total Distributions to Shareholders | | | (134,301,459 | ) | | | (209,173,653 | ) |
| BENEFICIAL INTEREST TRANSACTIONS: | | | | | | | | |
| Class A | | | | | | | | |
| Shares sold | | | 55,967,491 | | | | 59,477,036 | |
| Distributions reinvested | | | 10,679,176 | | | | 21,991,597 | |
| Shares redeemed | | | (27,709,191 | ) | | | (150,491,558 | ) |
| Exchanged out | | | (76,415,194 | ) | | | (21,574,559 | ) |
| Class C | | | | | | | | |
| Shares sold | | | 36,813,475 | | | | 33,762,465 | |
| Distributions reinvested | | | 8,432,888 | | | | 15,244,687 | |
| Shares redeemed | | | (19,327,735 | ) | | | (74,043,072 | ) |
| Exchanged out | | | (7,068,623 | ) | | | (9,465,810 | ) |
| Class I | | | | | | | | |
| Shares sold | | | 575,560,475 | | | | 456,694,008 | |
| Distributions reinvested | | | 35,752,539 | | | | 45,758,339 | |
| Shares redeemed | | | (92,412,262 | ) | | | (395,319,000 | ) |
| Exchanged in | | | 84,901,953 | | | | 36,022,495 | |
| Class M | | | | | | | | |
| Shares sold | | | 169,938,943 | | | | 150,986,412 | |
| Distributions reinvested | | | 27,054,994 | | | | 42,142,125 | |
| Shares redeemed | | | (32,507,263 | ) | | | (95,637,583 | ) |
| Exchanged out | | | (1,271,544 | ) | | | (4,299,397 | ) |
| Class L | | | | | | | | |
| Shares sold | | | 5,557,450 | | | | 8,810,216 | |
| Distributions reinvested | | | 1,710,604 | | | | 3,020,028 | |
| Shares redeemed | | | (3,539,164 | ) | | | (9,391,852 | ) |
| Exchanged out | | | (146,592 | ) | | | (682,729 | ) |
| Net Increase in Net Assets Derived from Beneficial Interest Transactions | | | 751,972,420 | | | | 113,003,848 | |
| Net increase in net assets | | | 1,281,558,791 | | | | 525,193,589 | |
See Notes to Financial Statements.
| 24 | 1.888.926.2688 | www.apollo.com |
| Apollo Diversified Real Estate Fund | Statements of Changes in Net Assets |
| | | For the Six Months Ended March 31, 2022 (Unaudited) | | | For the Year Ended September 30, 2021 | |
| NET ASSETS: | | | | | | | | |
| Beginning of period | | | 4,405,017,478 | | | | 3,879,823,889 | |
| End of period | | $ | 5,686,576,269 | | | $ | 4,405,017,478 | |
| Other Information | | | | | | | | |
| BENEFICIAL INTEREST TRANSACTIONS: | | | | | | | | |
| Class A | | | | | | | | |
| Beginning shares | | | 25,999,162 | | | | 29,505,770 | |
| Shares sold | | | 1,912,065 | | | | 2,261,507 | |
| Distributions reinvested | | | 364,255 | | | | 843,757 | |
| Shares redeemed | | | (958,819 | ) | | | (5,785,650 | ) |
| Shares transferred out | | | (2,698,626 | ) | | | (826,222 | ) |
| Net decrease in shares outstanding | | | (1,381,125 | ) | | | (3,506,608 | ) |
| Ending shares | | | 24,618,037 | | | | 25,999,162 | |
| Class C | | | | | | | | |
| Beginning shares | | | 19,411,530 | | | | 20,802,789 | |
| Shares sold | | | 1,322,368 | | | | 1,332,105 | |
| Distributions reinvested | | | 301,780 | | | | 609,837 | |
| Shares redeemed | | | (704,776 | ) | | | (2,961,768 | ) |
| Shares transferred out | | | (254,655 | ) | | | (371,433 | ) |
| Net increase/(decrease) in shares outstanding | | | 664,717 | | | | (1,391,259 | ) |
| Ending shares | | | 20,076,247 | | | | 19,411,530 | |
| Class I | | | | | | | | |
| Beginning shares | | | 69,310,612 | | | | 64,327,639 | |
| Shares sold | | | 19,408,847 | | | | 16,968,556 | |
| Distributions reinvested | | | 1,198,232 | | | | 1,724,150 | |
| Shares redeemed | | | (3,142,584 | ) | | | (15,066,821 | ) |
| Shares transferred in | | | 2,943,196 | | | | 1,357,088 | |
| Net increase in shares outstanding | | | 20,407,691 | | | | 4,982,973 | |
| Ending shares | | | 89,718,303 | | | | 69,310,612 | |
| Class M | | | | | | | | |
| Beginning shares | | | 42,059,375 | | | | 38,533,911 | |
| Shares sold | | | 5,978,333 | | | | 5,814,577 | |
| Distributions reinvested | | | 946,341 | | | | 1,648,596 | |
| Shares redeemed | | | (1,147,011 | ) | | | (3,766,078 | ) |
| Shares transferred out | | | (44,076 | ) | | | (171,631 | ) |
| Net increase in shares outstanding | | | 5,733,587 | | | | 3,525,464 | |
| Ending shares | | | 47,792,962 | | | | 42,059,375 | |
| Class L | | | | | | | | |
| Beginning shares | | | 3,227,904 | | | | 3,161,055 | |
| Shares sold | | | 191,849 | | | | 338,360 | |
| Distributions reinvested | | | 58,962 | | | | 116,717 | |
| Shares redeemed | | | (123,259 | ) | | | (361,451 | ) |
| Shares transferred out | | | (4,999 | ) | | | (26,777 | ) |
| Net increase in shares outstanding | | | 122,553 | | | | 66,849 | |
| Ending shares | | | 3,350,457 | | | | 3,227,904 | |
See Notes to Financial Statements.
| Semi-Annual Report | March 31, 2022 | 25 |
| Apollo Diversified Real Estate Fund | Statement of Cash Flows |
| | | For the Six Months Ended March 31, 2022 (Unaudited) | |
| Operating Activities: | | | | |
| Net increase in net assets resulting from operations | | $ | 663,887,830 | |
| Adjustments to reconcile net increase in net assets resulting from operations to net cash used in operating activities: | | | | |
| Purchase of investments | | | (1,257,353,645 | ) |
| Proceeds from sale of investments | | | 532,486,156 | |
| Net purchases of short-term investments | | | (6,087,082 | ) |
| Net realized gain on investments | | | (52,751,948 | ) |
| Net change in unrealized appreciation on investments | | | (570,920,632 | ) |
| Change in operating assets and liabilities: | | | | |
| Dividend receivables | | | (12,097,805 | ) |
| Prepaid expenses and other assets | | | (1,422 | ) |
| Payable for investment advisory fees | | | 1,573,127 | |
| Payable for distribution fees | | | 237,934 | |
| Payable for shareholder servicing fees | | | 26,675 | |
| Payable for transfer agency fees | | | 251,856 | |
| Payable for lines of credit interest | | | 143,140 | |
| Payable for administration fees | | | 28,831 | |
| Payable for trustees' fees | | | (13,311 | ) |
| Payable for legal fees | | | 34,981 | |
| Payable for audit and tax fees | | | (13,017 | ) |
| Payable for custody fees | | | (24,669 | ) |
| Payable for compliance service fees | | | (31,150 | ) |
| Accrued expenses and other liabilities | | | 3,191,429 | |
| Net cash used in operating activities | | | (697,432,722 | ) |
| | | | | |
| Financing Activities: | | | | |
| Cash provided by lines of credit | | | 739,500,000 | |
| Cash payments to lines of credit | | | (652,500,000 | ) |
| Proceeds from shares sold | | | 838,007,546 | |
| Cost of shares redeemed | | | (175,495,615 | ) |
| Distributions paid to shareholders | | | (50,671,258 | ) |
| Net cash provided by financing activities | | | 698,840,673 | |
| | | | | |
| Cash and cash equivalents, beginning of period | | $ | 17,960,830 | |
| Cash and cash equivalents, end of period | | $ | 19,368,781 | |
| | | | | |
| SUPPLEMENTAL DISCLOSURE OF CASH FLOW INFORMATION: | | | | |
| Non-cash financing activities not included herein consist of reinvestment of distributions of: | | $ | 83,630,201 | |
| Cash paid during the period for interest from bank borrowing: | | $ | 2,134,688 | |
See Notes to Financial Statements.
| 26 | 1.888.926.2688 | www.apollo.com |
| Apollo Diversified Real Estate Fund – Class A | | Financial Highlights |
For a Share Outstanding Throughout the Periods Presented
| | | For the Six Months Ended March 31, 2022 (Unaudited) | | | For the Year Ended September 30, 2021 | | | For the Year Ended September 30, 2020 | | | For the Year Ended September 30, 2019 | | | For the Year Ended September 30, 2018 | | | For the Year Ended September 30, 2017 | |
| Net asset value, beginning of period | | $ | 27.67 | | | $ | 24.93 | | | $ | 27.36 | | | $ | 26.94 | | | $ | 26.65 | | | $ | 26.63 | |
| | | | | | | | | | | | | | | | | | | | | | | | | |
| INCOME FROM INVESTMENT OPERATIONS: | | | | | | | | | | | | | | | | | | | | | | | | |
| Net investment income(a) | | | 0.25 | | | | 0.39 | | | | 0.38 | | | | 0.39 | | | | 0.38 | | | | 0.28 | |
| Net realized and unrealized gain/(loss) | | | 3.61 | | | | 3.74 | | | | (1.46 | ) | | | 1.46 | | | | 1.32 | | | | 1.14 | |
| Total from investment operations | | | 3.86 | | | | 4.13 | | | | (1.08 | ) | | | 1.85 | | | | 1.70 | | | | 1.42 | |
| | | | | | | | | | | | | | | | | | | | | | | | | |
| DISTRIBUTIONS: | | | | | | | �� | | | | | | | | | | | | | | | | – | |
| From net investment income | | | – | | | | (0.15 | ) | | | (0.36 | ) | | | – | | | | – | | | | | |
| From net realized gain on investments | | | (0.29 | ) | | | (0.19 | ) | | | – | | | | (0.54 | ) | | | (0.20 | ) | | | (0.30 | ) |
| Return of capital | | | (0.48 | ) | | | (1.05 | ) | | | (0.99 | ) | | | (0.89 | ) | | | (1.21 | ) | | | (1.10 | ) |
| Total distributions(b)(c) | | | (0.77 | ) | | | (1.39 | ) | | | (1.35 | ) | | | (1.43 | ) | | | (1.41 | ) | | | (1.40 | ) |
| | | | | | | | | | | | | | | | | | | | | | | | | |
| Net increase/(decrease) in net asset value | | | 3.09 | | | | 2.74 | | | | (2.43 | ) | | | 0.42 | | | | 0.29 | | | | 0.02 | |
| Net asset value, end of period | | $ | 30.76 | | | $ | 27.67 | | | $ | 24.93 | | | $ | 27.36 | | | $ | 26.94 | | | $ | 26.65 | |
| TOTAL RETURN(d) | | | 14.12 | % | | | 17.00 | % | | | (3.96 | )% | | | 7.05 | % | | | 6.54 | % | | | 5.47 | % |
| | | | | | | | | | | | | | | | | | | | | | | | | |
| RATIOS/SUPPLEMENTAL DATA: | | | | | | | | | | | | | | | | | | | | | | | | |
| Net assets, end of period (000s) | | $ | 757,343 | | | $ | 719,324 | | | $ | 735,511 | | | $ | 879,401 | | | $ | 714,880 | | | $ | 639,448 | |
| Ratios to Average Net Assets (including interest expense) | | | | | | | | | | | | | | | | | | | | | | | | |
| Ratio of expenses to average net assets excluding fee waivers and reimbursements/recoupment of previously waived fees(e) | | | 1.98 | %(f) | | | 1.97 | % | | | 1.95 | % | | | 1.94 | % | | | 2.11 | % | | | 2.29 | % |
| Ratio of expenses to average net assets including fee waivers and reimbursements/recoupment of previously waived fees(e) | | | 1.98 | %(f) | | | 1.98 | % | | | 1.97 | % | | | 1.96 | % | | | 2.11 | % | | | 2.23 | % |
| Ratio of net investment income to average net assets including fee waivers and reimbursements(e)(g) | | | 1.70 | %(f) | | | 1.48 | % | | | 1.45 | % | | | 1.43 | % | | | 1.41 | % | | | 1.06 | % |
| | | | | | | | | | | | | | | | | | | | | | | | | |
| Ratios to Average Net Assets (excluding interest expense) | | | | | | | | | | | | | | | | | | | | | | | | |
| Ratio of expenses to average net assets excluding fee waivers and reimbursements/recoupment of previously waived fees(e) | | | 1.89 | %(f) | | | 1.89 | % | | | 1.89 | % | | | 1.89 | % | | | 1.91 | % | | | 1.97 | % |
| Ratio of expenses to average net assets including fee waivers and reimbursements/recoupment of previously waived fees(e) | | | 1.89 | %(f) | | | 1.90 | % | | | 1.91 | % | | | 1.91 | % | | | 1.91 | % | | | 1.91 | % |
| Ratio of net investment income to average net assets excluding fee waivers and reimbursements(e)(g) | | | 1.79 | %(f) | | | 1.57 | % | | | 1.53 | % | | | 1.50 | % | | | 1.61 | % | | | 1.31 | % |
| Portfolio turnover rate(h) | | | 12 | % | | | 42 | % | | | 51 | % | | | 22 | % | | | 15 | % | | | 11 | % |
See Notes to Financial Statements.
| Semi-Annual Report | March 31, 2022 | 27 |
| Apollo Diversified Real Estate Fund – Class A | Financial Highlights |
For a Share Outstanding Throughout the Periods Presented
| (a) | Calculated using the average shares method. |
| (b) | Total distributions during a calendar year generally will be made from the Fund’s net investment income, net realized gains on investments and net unrealized gains on investments, if any. The portion of distributions paid not attributable to net investment income or net realized gains on investments, if any, is distributed from the Fund’s assets and is treated by shareholders as a nontaxable distribution (“Return of Capital”) for tax purposes. Return of capital is a tax concept, not an economic concept. The tax character of the Fund’s distributions, in isolation, does not reveal much information about whether the distributions are supported by the Fund’s returns. Reported distributions from net investment income and realized gains on investments are not an indication as to whether or not the Fund’s distributions are supported by the Fund’s returns. The Fund can have distributions from net investment income and realized capital gains in years in which it incurs an economic loss due to unrealized losses not being recognized for tax purposes. A common method in which to determine if the Fund’s distributions are supported by economic returns is to examine the Fund’s Net Asset Value (“NAV”) over the course of a year. If the Fund’s NAV has increased, the Fund will have economically earned more than it has distributed, regardless of whether such distributions are reported as being from net investment income, net realized gains on investments or return of capital. If the Fund’s NAV decreases, the Fund will have distributed more than it has economically earned or it will have incurred an economic loss. |
| (c) | The Fund has substantial investments in real estate investment trusts, or REITs, which are generally not subject to federal income taxes. Distributions that the Fund receives from REITs can be classified as ordinary income, capital gain income or return of capital by the REITs that make these distributions to the Fund. However, it is not possible for the Fund to characterize distributions received from REITs during interim periods because the REIT issuers do not report their tax characterizations until after year end. The Fund has estimated the character of distributions for the six-month period ended March 31, 2022 based on the percentage of such distributions attributable to net investment income, net realized gains and return of capital for the fiscal year ended September 30, 2021. Final characterization of the Fund’s 2022 distributions to its common shareholders is also dependent upon the size or timing of the Fund’s securities transactions prior to year-end. Therefore, it is likely that some portion of the Fund’s 2022 investment income and distributions to its common shareholders will be recharacterized as long term capital gain and return of capital for financial statement and U.S. federal income tax purposes subsequent to year end and reflected accordingly in the Fund’s year-end financial statements. |
| (d) | Total returns are for the period indicated. Total returns would have been lower had certain expenses not been waived or recouped by the Adviser during the year. Returns shown do not reflect the deduction of taxes that a shareholder would pay on Fund distributions or the redemption of Fund shares. |
| (e) | The ratios of expenses to average net assets and net investment income to average net assets do not reflect the expenses of the underlying private real estate funds in which the Fund invests which typically range from 0.80% to 1.00% on an annual basis. However, the Fund invests in each underlying private real estate investment fund based upon the net asset value of each such fund which reflects the costs of investing in the applicable fund, including the management fee of the underlying fund and other operating expenses. The net asset value of each underlying private real estate investment fund is incorporated into the ratios described above. |
| (g) | Recognition of net investment income is affected by the timing and declaration of dividends by the underlying investments in which the Fund invests. |
| (h) | Portfolio turnover rate for periods less than one full year has not been annualized and is calculated at the Fund level. |
See Notes to Financial Statements.
| 28 | 1.888.926.2688 | www.apollo.com |
| Apollo Diversified Real Estate Fund – Class C | Financial Highlights |
For a Share Outstanding Throughout the Periods Presented
| | | For the Six Months Ended March 31, 2022 (Unaudited) | | | For the Year Ended September 30, 2021 | | | For the Year Ended September 30, 2020 | | | For the Year Ended September 30, 2019 | | | For the Year Ended September 30, 2018 | | | For the Year Ended September 30, 2017 | |
| Net asset value, beginning of period | | $ | 26.44 | | | $ | 24.00 | | | $ | 26.54 | | | $ | 26.33 | | | $ | 26.24 | | | $ | 26.42 | |
| INCOME FROM INVESTMENT OPERATIONS: | | | | | | | | | | | | | | | | | | | | | | | | |
| Net investment income(a) | | | 0.13 | | | | 0.18 | | | | 0.18 | | | | 0.18 | | | | 0.17 | | | | 0.08 | |
| Net realized and unrealized gain/(loss) | | | 3.46 | | | | 3.59 | | | | (1.41 | ) | | | 1.42 | | | | 1.31 | | | | 1.12 | |
| Total from investment operations | | | 3.59 | | | | 3.77 | | | | (1.23 | ) | | | 1.60 | | | | 1.48 | | | | 1.20 | |
| | | | | | | | | | | | | | | | | | | | | | | | | |
| DISTRIBUTIONS: | | | | | | | | | | | | | | | | | | | | | | | | |
| From net investment income | | | – | | | | (0.13 | ) | | | (0.35 | ) | | | – | | | | – | | | | – | |
| From net realized gain on investments | | | (0.29 | ) | | | (0.19 | ) | | | – | | | | (0.52 | ) | | | (0.20 | ) | | | (0.30 | ) |
| Return of capital | | | (0.45 | ) | | | (1.01 | ) | | | (0.96 | ) | | | (0.87 | ) | | | (1.19 | ) | | | (1.08 | ) |
| Total distributions(b)(c) | | | (0.74 | ) | | | (1.33 | ) | | | (1.31 | ) | | | (1.39 | ) | | | (1.39 | ) | | | (1.38 | ) |
| | | | | | | | | | | | | | | | | | | | | | | | | |
| Net increase/(decrease) in net asset value | | | 2.85 | | | | 2.44 | | | | (2.54 | ) | | | 0.21 | | | | 0.09 | | | | (0.18 | ) |
| Net asset value, end of period | | $ | 29.29 | | | $ | 26.44 | | | $ | 24.00 | | | $ | 26.54 | | | $ | 26.33 | | | $ | 26.24 | |
| TOTAL RETURN(d) | | | 13.73 | % | | | 16.13 | % | | | (4.68 | )% | | | 6.24 | % | | | 5.76 | % | | | 4.68 | % |
| | | | | | | | | | | | | | | | | | | | | | | | | |
| RATIOS/SUPPLEMENTAL DATA: | | | | | | | | | | | | | | | | | | | | | | | | |
| Net assets, end of period (000s) | | $ | 588,027 | | | $ | 513,220 | | | $ | 499,225 | | | $ | 536,289 | | | $ | 470,711 | | | $ | 445,191 | |
| Ratios to Average Net Assets (including interest expense) | | | | | | | | | | | | | | | | | | | | | | | | |
| Ratio of expenses to average net assets excluding fee waivers and reimbursements/recoupment of previously waived fees(e) | | | 2.73 | %(f) | | | 2.72 | % | | | 2.71 | % | | | 2.70 | % | | | 2.86 | % | | | 3.04 | % |
| Ratio of expenses to average net assets including fee waivers and reimbursements/recoupment of previously waived fees (e) | | | 2.73 | %(f) | | | 2.73 | % | | | 2.72 | % | | | 2.72 | % | | | 2.86 | % | | | 2.98 | % |
| Ratio of net investment income to average net assets including fee waivers and reimbursements(e)(g) | | | 0.96 | %(f) | | | 0.72 | % | | | 0.71 | % | | | 0.68 | % | | | 0.66 | % | | | 0.30 | % |
| | | | | | | | | | | | | | | | | | | | | | | | | |
| Ratios to Average Net Assets (excluding interest expense) | | | | | | | | | | | | | | | | | | | | | | | | |
| Ratio of expenses to average net assets excluding fee waivers and reimbursements/recoupment of previously waived fees(e) | | | 2.64 | %(f) | | | 2.64 | % | | | 2.65 | % | | | 2.64 | % | | | 2.66 | % | | | 2.72 | % |
| Ratio of expenses to average net assets including fee waivers and reimbursements/recoupment of previously waived fees(e) | | | 2.64 | %(f) | | | 2.65 | % | | | 2.66 | % | | | 2.66 | % | | | 2.66 | % | | | 2.66 | % |
| Ratio of net investment income to average net assets excluding fee waivers and reimbursements(e)(g) | | | 1.05 | %(f) | | | 0.81 | % | | | 0.78 | % | | | 0.76 | % | | | 0.86 | % | | | 0.56 | % |
| Portfolio turnover rate(h) | | | 12 | % | | | 42 | % | | | 51 | % | | | 22 | % | | | 15 | % | | | 11 | % |
See Notes to Financial Statements.
| Semi-Annual Report | March 31, 2022 | 29 |
| Apollo Diversified Real Estate Fund – Class C | Financial Highlights |
For a Share Outstanding Throughout the Periods Presented
| (a) | Calculated using the average shares method. |
| (b) | Total distributions during a calendar year generally will be made from the Fund’s net investment income, net realized gains on investments and net unrealized gains on investments, if any. The portion of distributions paid not attributable to net investment income or net realized gains on investments, if any, is distributed from the Fund’s assets and is treated by shareholders as a nontaxable distribution (“Return of Capital”) for tax purposes. Return of capital is a tax concept, not an economic concept. The tax character of the Fund’s distributions, in isolation, does not reveal much information about whether the distributions are supported by the Fund’s returns. Reported distributions from net investment income and realized gains on investments are not an indication as to whether or not the Fund’s distributions are supported by the Fund’s returns. The Fund can have distributions from net investment income and realized capital gains in years in which it incurs an economic loss due to unrealized losses not being recognized for tax purposes. A common method in which to determine if the Fund’s distributions are supported by economic returns is to examine the Fund’s Net Asset Value (“NAV”) over the course of a year. If the Fund’s NAV has increased, the Fund will have economically earned more than it has distributed, regardless of whether such distributions are reported as being from net investment income, net realized gains on investments or return of capital. If the Fund’s NAV decreases, the Fund will have distributed more than it has economically earned or it will have incurred an economic loss. |
| (c) | The Fund has substantial investments in real estate investment trusts, or REITs, which are generally not subject to federal income taxes. Distributions that the Fund receives from REITs can be classified as ordinary income, capital gain income or return of capital by the REITs that make these distributions to the Fund. However, it is not possible for the Fund to characterize distributions received from REITs during interim periods because the REIT issuers do not report their tax characterizations until after year end. The Fund has estimated the character of distributions for the six-month period ended March 31, 2022 based on the percentage of such distributions attributable to net investment income, net realized gains and return of capital for the fiscal year ended September 30, 2021. Final characterization of the Fund’s 2022 distributions to its common shareholders is also dependent upon the size or timing of the Fund’s securities transactions prior to year-end. Therefore, it is likely that some portion of the Fund’s 2022 investment income and distributions to its common shareholders will be recharacterized as long term capital gain and return of capital for financial statement and U.S. federal income tax purposes subsequent to year end and reflected accordingly in the Fund’s year-end financial statements. |
| (d) | Total returns are for the period indicated. Total returns would have been lower had certain expenses not been waived or recouped by the Adviser during the year. Returns shown do not reflect the deduction of taxes that a shareholder would pay on Fund distributions or the redemption of Fund shares. |
| (e) | The ratios of expenses to average net assets and net investment income to average net assets do not reflect the expenses of the underlying private real estate funds in which the Fund invests which typically range from 0.80% to 1.00% on an annual basis. However, the Fund invests in each underlying private real estate investment fund based upon the net asset value of each such fund which reflects the costs of investing in the applicable fund, including the management fee of the underlying fund and other operating expenses. The net asset value of each underlying private real estate investment fund is incorporated into the ratios described above. |
| (g) | Recognition of net investment income is affected by the timing and declaration of dividends by the underlying investments in which the Fund invests. |
| (h) | Portfolio turnover rate for periods less than one full year has not been annualized and is calculated at the Fund level. |
See Notes to Financial Statements.
| 30 | 1.888.926.2688 | www.apollo.com |
| Apollo Diversified Real Estate Fund – Class I | Financial Highlights |
For a Share Outstanding Throughout the Periods Presented
| | | For the Six Months Ended March 31, 2022 (Unaudited) | | | For the Year Ended September 30, 2021 | | | For the Year Ended September 30, 2020 | | | For the Year Ended September 30, 2019 | | | For the Year Ended September 30, 2018 | | | For the Year Ended September 30, 2017 | |
| Net asset value, beginning of period | | $ | 28.10 | | | $ | 25.25 | | | $ | 27.65 | | | $ | 27.16 | | | $ | 26.80 | | | $ | 26.71 | |
| INCOME FROM INVESTMENT OPERATIONS: | | | | | | | | | | | | | | | | | | | | | | | | |
| Net investment income(a) | | | 0.29 | | | | 0.46 | | | | 0.45 | | | | 0.46 | | | | 0.45 | | | | 0.35 | |
| Net realized and unrealized gain/(loss) | | | 3.69 | | | | 3.80 | | | | (1.48 | ) | | | 1.48 | | | | 1.33 | | | | 1.15 | |
| Total from investment operations | | | 3.98 | | | | 4.26 | | | | (1.03 | ) | | | 1.94 | | | | 1.78 | | | | 1.50 | |
| | | | | | | | | | | | | | | | | | | | | | | | | |
| DISTRIBUTIONS: | | | | | | | | | | | | | | | | | | | | | | | | |
| From net investment income | | | – | | | | (0.15 | ) | | | (0.37 | ) | | | – | | | | – | | | | – | |
| From net realized gain on investments | | | (0.29 | ) | | | (0.19 | ) | | | – | | | | (0.55 | ) | | | (0.20 | ) | | | (0.30 | ) |
| Return of capital | | | (0.50 | ) | | | (1.07 | ) | | | (1.00 | ) | | | (0.90 | ) | | | (1.22 | ) | | | (1.11 | ) |
| Total distributions(b)(c) | | | (0.79 | ) | | | (1.41 | ) | | | (1.37 | ) | | | (1.45 | ) | | | (1.42 | ) | | | (1.41 | ) |
| | | | | | | | | | | | | | | | | | | | | | | | | |
| Net increase/(decrease) in net asset value | | | 3.19 | | | | 2.85 | | | | (2.40 | ) | | | 0.49 | | | | 0.36 | | | | 0.09 | |
| Net asset value, end of period | | $ | 31.29 | | | $ | 28.10 | | | $ | 25.25 | | | $ | 27.65 | | | $ | 27.16 | | | $ | 26.80 | |
| TOTAL RETURN(d) | | | 14.31 | % | | | 17.31 | % | | | (3.75 | )% | | | 7.30 | % | | | 6.81 | % | | | 5.75 | % |
| | | | | | | | | | | | | | | | | | | | | | | | | |
| RATIOS/SUPPLEMENTAL DATA: | | | | | | | | | | | | | | | | | | | | | | | | |
| Net assets, end of period (000s) | | $ | 2,806,928 | | | $ | 1,947,652 | | | $ | 1,624,344 | | | $ | 1,473,477 | | | $ | 992,272 | | | $ | 657,954 | |
| Ratios to Average Net Assets (including interest expense) | | | | | | | | | | | | | | | | | | | | | | | | |
| Ratio of expenses to average net assets excluding fee waivers and reimbursements/recoupment of previously waived fees(e) | | | 1.71 | %(f) | | | 1.72 | % | | | 1.71 | % | | | 1.70 | % | | | 1.86 | % | | | 2.04 | % |
| Ratio of expenses to average net assets including fee waivers and reimbursements/recoupment of previously waived fees (e) | | | 1.71 | %(f) | | | 1.73 | % | | | 1.72 | % | | | 1.71 | % | | | 1.86 | % | | | 1.97 | % |
| Ratio of net investment income to average net assets including fee waivers and reimbursements(e)(g) | | | 2.00 | %(f) | | | 1.72 | % | | | 1.71 | % | | | 1.69 | % | | | 1.67 | % | | | 1.31 | % |
| | | | | | | | | | | | | | | | | | | | | | | | | |
| Ratios to Average Net Assets (excluding interest expense) | | | | | | | | | | | | | | | | | | | | | | | | |
| Ratio of expenses to average net assets excluding fee waivers and reimbursements/recoupment of previously waived fees(e) | | | 1.62 | %(f) | | | 1.65 | % | | | 1.65 | % | | | 1.65 | % | | | 1.66 | % | | | 1.73 | % |
| Ratio of expenses to average net assets including fee waivers and reimbursements/recoupment of previously waived fees(e) | | | 1.62 | %(f) | | | 1.66 | % | | | 1.66 | % | | | 1.66 | % | | | 1.66 | % | | | 1.66 | % |
| Ratio of net investment income to average net assets excluding fee waivers and reimbursements(e)(g) | | | 2.09 | %(f) | | | 1.80 | % | | | 1.79 | % | | | 1.76 | % | | | 1.87 | % | | | 1.55 | % |
| Portfolio turnover rate(h) | | | 12 | % | | | 42 | % | | | 51 | % | | | 22 | % | | | 15 | % | | | 11 | % |
See Notes to Financial Statements.
| Semi-Annual Report | March 31, 2022 | 31 |
| Apollo Diversified Real Estate Fund – Class I | Financial Highlights |
For a Share Outstanding Throughout the Periods Presented
| (a) | Calculated using the average shares method. |
| (b) | Total distributions during a calendar year generally will be made from the Fund’s net investment income, net realized gains on investments and net unrealized gains on investments, if any. The portion of distributions paid not attributable to net investment income or net realized gains on investments, if any, is distributed from the Fund’s assets and is treated by shareholders as a nontaxable distribution (“Return of Capital”) for tax purposes. Return of capital is a tax concept, not an economic concept. The tax character of the Fund’s distributions, in isolation, does not reveal much information about whether the distributions are supported by the Fund’s returns. Reported distributions from net investment income and realized gains on investments are not an indication as to whether or not the Fund’s distributions are supported by the Fund’s returns. The Fund can have distributions from net investment income and realized capital gains in years in which it incurs an economic loss due to unrealized losses not being recognized for tax purposes. A common method in which to determine if the Fund’s distributions are supported by economic returns is to examine the Fund’s Net Asset Value (“NAV”) over the course of a year. If the Fund’s NAV has increased, the Fund will have economically earned more than it has distributed, regardless of whether such distributions are reported as being from net investment income, net realized gains on investments or return of capital. If the Fund’s NAV decreases, the Fund will have distributed more than it has economically earned or it will have incurred an economic loss. |
| (c) | The Fund has substantial investments in real estate investment trusts, or REITs, which are generally not subject to federal income taxes. Distributions that the Fund receives from REITs can be classified as ordinary income, capital gain income or return of capital by the REITs that make these distributions to the Fund. However, it is not possible for the Fund to characterize distributions received from REITs during interim periods because the REIT issuers do not report their tax characterizations until after year end. The Fund has estimated the character of distributions for the six-month period ended March 31, 2022 based on the percentage of such distributions attributable to net investment income, net realized gains and return of capital for the fiscal year ended September 30, 2021. Final characterization of the Fund’s 2022 distributions to its common shareholders is also dependent upon the size or timing of the Fund’s securities transactions prior to year-end. Therefore, it is likely that some portion of the Fund’s 2022 investment income and distributions to its common shareholders will be recharacterized as long term capital gain and return of capital for financial statement and U.S. federal income tax purposes subsequent to year end and reflected accordingly in the Fund’s year-end financial statements. |
| (d) | Total returns are for the period indicated. Total returns would have been lower had certain expenses not been waived or recouped by the Adviser during the year. Returns shown do not reflect the deduction of taxes that a shareholder would pay on Fund distributions or the redemption of Fund shares. |
| (e) | The ratios of expenses to average net assets and net investment income to average net assets do not reflect the expenses of the underlying private real estate funds in which the Fund invests which typically range from 0.80% to 1.00% on an annual basis. However, the Fund invests in each underlying private real estate investment fund based upon the net asset value of each such fund which reflects the costs of investing in the applicable fund, including the management fee of the underlying fund and other operating expenses. The net asset value of each underlying private real estate investment fund is incorporated into the ratios described above. |
| (g) | Recognition of net investment income is affected by the timing and declaration of dividends by the underlying investments in which the Fund invests. |
| (h) | Portfolio turnover rate for periods less than one full year has not been annualized and is calculated at the Fund level. |
See Notes to Financial Statements.
| 32 | 1.888.926.2688 | www.apollo.com |
| Apollo Diversified Real Estate Fund – Class M | | Financial Highlights |
For a Share Outstanding Throughout the Periods Presented
| | | For the Six Months Ended March 31, 2022 (Unaudited) | | | For the Year Ended September 30, 2021 | | | For the Year Ended September 30, 2020 | | | For the Year Ended September 30, 2019 | | | For the Year Ended September 30, 2018 | | | For the Period Ended September 30, 2017(a) | |
| Net asset value, beginning of period | | $ | 27.02 | | | $ | 24.46 | | | $ | 26.98 | | | $ | 26.70 | | | $ | 26.54 | | | $ | 26.48 | |
| | | | | | | | | | | | | | | | | | | | | | | | | |
| INCOME FROM INVESTMENT OPERATIONS: | | | | | | | | | | | | | | | | | | | | | | | | |
| Net investment income(b) | | | 0.17 | | | | 0.25 | | | | 0.25 | | | | 0.26 | | | | 0.25 | | | | 0.13 | |
| Net realized and unrealized gain/(loss) | | | 3.54 | | | | 3.67 | | | | (1.44 | ) | | | 1.44 | | | | 1.31 | | | | 1.33 | |
| Total from investment operations | | | 3.71 | | | | 3.92 | | | | (1.19 | ) | | | 1.70 | | | | 1.56 | | | | 1.46 | |
| | | | | | | | | | | | | | | | | | | | | | | | | |
| DISTRIBUTIONS: | | | | | | | | | | | | | | | | | | | | | | | | |
| From net investment income | | | – | | | | (0.14 | ) | | | (0.35 | ) | | | – | | | | – | | | | – | |
| From net realized gain on investments | | | (0.29 | ) | | | (0.19 | ) | | | – | | | | (0.54 | ) | | | (0.20 | ) | | | (0.30 | ) |
| Return of capital | | | (0.47 | ) | | | (1.03 | ) | | | (0.98 | ) | | | (0.88 | ) | | | (1.20 | ) | | | (1.10 | ) |
| Total distributions(c)(d) | | | (0.76 | ) | | | (1.36 | ) | | | (1.33 | ) | | | (1.42 | ) | | | (1.40 | ) | | | (1.40 | ) |
| | | | | | | | | | | | | | | | | | | | | | | | | |
| Net increase in net asset value | | | 2.95 | | | | 2.56 | | | | (2.52 | ) | | | 0.28 | | | | 0.16 | | | | 0.06 | |
| Net asset value, end of period | | $ | 29.97 | | | $ | 27.02 | | | $ | 24.46 | | | $ | 26.98 | | | $ | 26.70 | | | $ | 26.54 | |
| TOTAL RETURN(e) | | | 13.87 | % | | | 16.45 | % | | | (4.44 | )% | | | 6.51 | % | | | 6.03 | % | | | 5.63 | % |
| | | | | | | | | | | | | | | | | | | | | | | | | |
| RATIOS/SUPPLEMENTAL DATA: | | | | | | | | | | | | | | | | | | | | | | | | |
| Net assets, end of period (000s) | | $ | 1,432,309 | | | $ | 1,136,373 | | | $ | 942,531 | | | $ | 807,774 | | | $ | 402,482 | | | $ | 117,018 | |
| Ratios to Average Net Assets (including interest expense) | | | | | | | | | | | | | | | | | | | | | | | | |
| Ratio of expenses to average net assets excluding fee waivers and reimbursements/recoupment of previously waived fees(f) | | | 2.47 | %(g) | | | 2.47 | % | | | 2.46 | % | | | 2.44 | % | | | 2.58 | % | | | 2.71 | %(g) |
| Ratio of expenses to average net assets including fee waivers and reimbursements/recoupment of previously waived fees (f) | | | 2.47 | %(g) | | | 2.47 | % | | | 2.46 | % | | | 2.44 | % | | | 2.59 | % | | | 2.66 | %(g) |
| Ratio of net investment income to average net assets including fee waivers and reimbursements(f)(h) | | | 1.23 | %(g) | | | 0.99 | % | | | 0.98 | % | | | 0.98 | % | | | 0.94 | % | | | 0.57 | %(g) |
| | | | | | | | | | | | | | | | | | | | | | | | | |
| Ratios to Average Net Assets (excluding interest expense) | | | | | | | | | | | | | | | | | | | | | | | | |
| Ratio of expenses to average net assets excluding fee waivers and reimbursements/recoupment of previously waived fees(f) | | | 2.38 | %(g) | | | 2.40 | % | | | 2.40 | % | | | 2.39 | % | | | 2.41 | % | | | 2.46 | %(g) |
| Ratio of expenses to average net assets including fee waivers and reimbursements/recoupment of previously waived fees(f) | | | 2.38 | %(g) | | | 2.40 | % | | | 2.40 | % | | | 2.39 | % | | | 2.41 | % | | | 2.41 | %(g) |
| Ratio of net investment income to average net assets excluding fee waivers and reimbursements(f)(h) | | | 1.32 | %(g) | | | 1.06 | % | | | 1.04 | % | | | 1.03 | % | | | 1.14 | % | | | 0.77 | %(g) |
| Portfolio turnover rate | | | 12 | % | | | 42 | % | | | 51 | % | | | 22 | % | | | 15 | % | | | 11 | %(i) |
See Notes to Financial Statements.
| Semi-Annual Report | March 31, 2022 | 33 |
| Apollo Diversified Real Estate Fund – Class M | Financial Highlights |
For a Share Outstanding Throughout the Periods Presented
| (a) | The Fund’s Class M shares commenced operations on November 17, 2016. |
| (b) | Calculated using the average shares method. |
| (c) | Total distributions during a calendar year generally will be made from the Fund’s net investment income, net realized gains on investments and net unrealized gains on investments, if any. The portion of distributions paid not attributable to net investment income or net realized gains on investments, if any, is distributed from the Fund’s assets and is treated by shareholders as a nontaxable distribution (“Return of Capital”) for tax purposes. Return of capital is a tax concept, not an economic concept. The tax character of the Fund’s distributions, in isolation, does not reveal much information about whether the distributions are supported by the Fund’s returns. Reported distributions from net investment income and realized gains on investments are not an indication as to whether or not the Fund’s distributions are supported by the Fund’s returns. The Fund can have distributions from net investment income and realized capital gains in years in which it incurs an economic loss due to unrealized losses not being recognized for tax purposes. A common method in which to determine if the Fund’s distributions are supported by economic returns is to examine the Fund’s Net Asset Value (“NAV”) over the course of a year. If the Fund’s NAV has increased, the Fund will have economically earned more than it has distributed, regardless of whether such distributions are reported as being from net investment income, net realized gains on investments or return of capital. If the Fund’s NAV decreases, the Fund will have distributed more than it has economically earned or it will have incurred an economic loss. |
| (d) | The Fund has substantial investments in real estate investment trusts, or REITs, which are generally not subject to federal income taxes. Distributions that the Fund receives from REITs can be classified as ordinary income, capital gain income or return of capital by the REITs that make these distributions to the Fund. However, it is not possible for the Fund to characterize distributions received from REITs during interim periods because the REIT issuers do not report their tax characterizations until after year end. The Fund has estimated the character of distributions for the six-month period ended March 31, 2022 based on the percentage of such distributions attributable to net investment income, net realized gains and return of capital for the fiscal year ended September 30, 2021. Final characterization of the Fund’s 2022 distributions to its common shareholders is also dependent upon the size or timing of the Fund’s securities transactions prior to year-end. Therefore, it is likely that some portion of the Fund’s 2022 investment income and distributions to its common shareholders will be recharacterized as long term capital gain and return of capital for financial statement and U.S. federal income tax purposes subsequent to year end and reflected accordingly in the Fund’s year-end financial statements. |
| (e) | Total returns are for the period indicated and have not been annualized for periods less than a year. Total returns would have been lower had certain expenses not been waived or recouped by the Adviser during the year. Returns shown do not reflect the deduction of taxes that a shareholder would pay on Fund distributions or the redemption of Fund shares. |
| (f) | The ratios of expenses to average net assets and net investment income to average net assets do not reflect the expenses of the underlying private real estate funds in which the Fund invests which typically range from 0.80% to 1.00% on an annual basis. However, the Fund invests in each underlying private real estate investment fund based upon the net asset value of each such fund which reflects the costs of investing in the applicable fund, including the management fee of the underlying fund and other operating expenses. The net asset value of each underlying private real estate investment fund is incorporated into the ratios described above. |
| (h) | Recognition of net investment income is affected by the timing and declaration of dividends by the underlying investments in which the Fund invests. |
| (i) | Portfolio turnover rate for periods less than one full year has not been annualized and is calculated at the Fund level. |
See Notes to Financial Statements.
| 34 | 1.888.926.2688 | www.apollo.com |
| Apollo Diversified Real Estate Fund – Class L | | Financial Highlights |
For a Share Outstanding Throughout the Periods Presented
| | | For the Six Months Ended March 31, 2022 (Unaudited) | | | For the Year Ended September 30, 2021 | | | For the Year Ended September 30, 2020 | | | For the Year Ended September 30, 2019 | | | For the Year Ended September 30, 2018 | | | For the Period Ended September 30, 2017(a) | |
| Net asset value, beginning of period | | $ | 27.40 | | | $ | 24.74 | | | $ | 27.22 | | | $ | 26.87 | | | $ | 26.64 | | | $ | 26.63 | |
| | | | | | | | | | | | | | | | | | | | | | | | | |
| INCOME FROM INVESTMENT OPERATIONS: | | | | | | | | | | | | | | | | | | | | | | | | |
| Net investment income(b) | | | 0.21 | | | | 0.32 | | | | 0.31 | | | | 0.33 | | | | 0.32 | | | | 0.12 | |
| Net realized and unrealized gain/(loss) | | | 3.59 | | | | 3.71 | | | | (1.45 | ) | | | 1.45 | | | | 1.32 | | | | 0.59 | |
| Total from investment operations | | | 3.80 | | | | 4.03 | | | | (1.14 | ) | | | 1.78 | | | | 1.64 | | | | 0.71 | |
| | | | | | | | | | | | | | | | | | | | | | | | | |
| DISTRIBUTIONS: | | | | | | | | | | | | | | | | | | | | | | | | |
| From net investment income | | | – | | | | (0.14 | ) | | | (0.35 | ) | | | – | | | | – | | | | – | |
| From net realized gain on investments | | | (0.29 | ) | | | (0.19 | ) | | | – | | | | (0.54 | ) | | | (0.20 | ) | | | (0.15 | ) |
| Return of capital | | | (0.48 | ) | | | (1.04 | ) | | | (0.99 | ) | | | (0.89 | ) | | | (1.21 | ) | | | (0.55 | ) |
| Total distributions(c)(d) | | | (0.77 | ) | | | (1.37 | ) | | | (1.34 | ) | | | (1.43 | ) | | | (1.41 | ) | | | (0.70 | ) |
| | | | | | | | | | | | | | | | | | | | | | | | | |
| Net increase in net asset value | | | 3.03 | | | | 2.66 | | | | (2.48 | ) | | | 0.35 | | | | 0.23 | | | | 0.01 | |
| Net asset value, end of period | | $ | 30.43 | | | $ | 27.40 | | | $ | 24.74 | | | $ | 27.22 | | | $ | 26.87 | | | $ | 26.64 | |
| TOTAL RETURN(e) | | | 14.01 | % | | | 16.75 | % | | | (4.20 | )% | | | 6.77 | % | | | 6.30 | % | | | 2.70 | % |
| | | | | | | | | | | | | | | | | | | | | | | | | |
| RATIOS/SUPPLEMENTAL DATA: | | | | | | | | | | | | | | | | | | | | | | | | |
| Net assets, end of period (000s) | | $ | 101,969 | | | $ | 88,449 | | | $ | 78,213 | | | $ | 100,151 | | | $ | 45,853 | | | $ | 13,833 | |
| Ratios to Average Net Assets (including interest expense) | | | | | | | | | | | | | | | | | | | | | | | | |
| Ratio of expenses to average net assets excluding fee waivers and reimbursements/recoupment of previously waived fees(f) | | | 2.21 | %(g) | | | 2.21 | % | | | 2.20 | % | | | 2.19 | % | | | 2.34 | % | | | 2.44 | %(g) |
| Ratio of expenses to average net assets including fee waivers and reimbursements/recoupment of previously waived fees (f) | | | 2.21 | %(g) | | | 2.21 | % | | | 2.20 | % | | | 2.19 | % | | | 2.35 | % | | | 2.39 | %(g) |
| Ratio of net investment income to average net assets including fee waivers and reimbursements(f)(h) | | | 1.48 | %(g) | | | 1.24 | % | | | 1.19 | % | | | 1.23 | % | | | 1.19 | % | | | 1.05 | %(g) |
| | | | | | | | | | | | | | | | | | | | | | | | | |
| Ratios to Average Net Assets (excluding interest expense) | | | | | | | | | | | | | | | | | | | | | | | | |
| Ratio of expenses to average net assets excluding fee waivers and reimbursements/recoupment of previously waived fees(f) | | | 2.12 | %(g) | | | 2.13 | % | | | 2.14 | % | | | 2.14 | % | | | 2.16 | % | | | 2.21 | %(g) |
| Ratio of expenses to average net assets including fee waivers and reimbursements/recoupment of previously waived fees(f) | | | 2.12 | %(g) | | | 2.13 | % | | | 2.14 | % | | | 2.14 | % | | | 2.16 | % | | | 2.16 | %(g) |
| Ratio of net investment income to average net assets excluding fee waivers and reimbursements(f)(h) | | | 1.57 | %(g) | | | 1.32 | % | | | 1.25 | % | | | 1.28 | % | | | 1.39 | % | | | 1.23 | %(g) |
| Portfolio turnover rate | | | 12 | % | | | 42 | % | | | 51 | % | | | 22 | % | | | 15 | % | | | 11 | %(i) |
See Notes to Financial Statements.
| Semi-Annual Report | March 31, 2022 | | 35 |
| Apollo Diversified Real Estate Fund – Class L | Financial Highlights |
For a Share Outstanding Throughout the Periods Presented
| (a) | The Fund’s Class L shares commenced operations on April 25, 2017. |
| (b) | Calculated using the average shares method. |
| (c) | Total distributions during a calendar year generally will be made from the Fund’s net investment income, net realized gains on investments and net unrealized gains on investments, if any. The portion of distributions paid not attributable to net investment income or net realized gains on investments, if any, is distributed from the Fund’s assets and is treated by shareholders as a nontaxable distribution (“Return of Capital”) for tax purposes. Return of capital is a tax concept, not an economic concept. The tax character of the Fund’s distributions, in isolation, does not reveal much information about whether the distributions are supported by the Fund’s returns. Reported distributions from net investment income and realized gains on investments are not an indication as to whether or not the Fund’s distributions are supported by the Fund’s returns. The Fund can have distributions from net investment income and realized capital gains in years in which it incurs an economic loss due to unrealized losses not being recognized for tax purposes. A common method in which to determine if the Fund’s distributions are supported by economic returns is to examine the Fund’s Net Asset Value (“NAV”) over the course of a year. If the Fund’s NAV has increased, the Fund will have economically earned more than it has distributed, regardless of whether such distributions are reported as being from net investment income, net realized gains on investments or return of capital. If the Fund’s NAV decreases, the Fund will have distributed more than it has economically earned or it will have incurred an economic loss. |
| (d) | The Fund has substantial investments in real estate investment trusts, or REITs, which are generally not subject to federal income taxes. Distributions that the Fund receives from REITs can be classified as ordinary income, capital gain income or return of capital by the REITs that make these distributions to the Fund. However, it is not possible for the Fund to characterize distributions received from REITs during interim periods because the REIT issuers do not report their tax characterizations until after year end. The Fund has estimated the character of distributions for the six-month period ended March 31, 2022 based on the percentage of such distributions attributable to net investment income, net realized gains and return of capital for the fiscal year ended September 30, 2021. Final characterization of the Fund’s 2022 distributions to its common shareholders is also dependent upon the size or timing of the Fund’s securities transactions prior to year-end. Therefore, it is likely that some portion of the Fund’s 2022 investment income and distributions to its common shareholders will be recharacterized as long term capital gain and return of capital for financial statement and U.S. federal income tax purposes subsequent to year end and reflected accordingly in the Fund’s year-end financial statements. |
| (e) | Total returns are for the period indicated and have not been annualized for periods less than a year. Total returns would have been lower had certain expenses not been waived or recouped by the Adviser during the year. Returns shown do not reflect the deduction of taxes that a shareholder would pay on Fund distributions or the redemption of Fund shares. |
| (f) | The ratios of expenses to average net assets and net investment income to average net assets do not reflect the expenses of the underlying private real estate funds in which the Fund invests which typically range from 0.80% to 1.00% on an annual basis. However, the Fund invests in each underlying private real estate investment fund based upon the net asset value of each such fund which reflects the costs of investing in the applicable fund, including the management fee of the underlying fund and other operating expenses. The net asset value of each underlying private real estate investment fund is incorporated into the ratios described above. |
| (h) | Recognition of net investment income is affected by the timing and declaration of dividends by the underlying investments in which the Fund invests. |
| (i) | Portfolio turnover rate for periods less than one full year has not been annualized and is calculated at the Fund level. |
See Notes to Financial Statements.
| 36 | 1.888.926.2688 | www.apollo.com |
| Apollo Diversified Real Estate Fund | Financial Highlights |
For a Share Outstanding Throughout the Periods Presented
Information about the Fund's senior securities is shown in the following table:
| | | For the Six Months Ended March 31, 2022 (Unaudited) | | | For the Year Ended September 30, 2021 | | | For the Year Ended September 30, 2020 | | | For the Year Ended September 30, 2019 | | | For the Year Ended September 30, 2018 | | | For the Year Ended September 30, 2017 | |
| Lines of Credit Total Amount Outstanding (000's) | | $ | 226,000 | | | $ | 139,000 | | | | N/A | | | | N/A | | | | N/A | | | $ | 69,500 | |
| Asset Coverage Per $1,000 of Lines of Credit Outstanding(a) | | $ | 26,162 | | | $ | 32,691 | | | | N/A | | | | N/A | | | | N/A | | | $ | 27,956 | |
| (a) | Calculated by subtracting the Fund’s consolidated total liabilities (excluding the indebtedness represented by the Lines of Credit) from the Fund’s total assets and dividing by the total amount outstanding on the Lines of Credit. The Asset Coverage ratio is then multiplied by $1,000 to determine the "Asset Coverage Per $1,000 of Lines of Credit Outstanding." |
See Notes to Financial Statements.
| Semi-Annual Report | March 31, 2022 | 37 |
| Apollo Diversified Real Estate Fund | Notes to Financial Statements |
March 31, 2022 (Unaudited)
1. ORGANIZATION
Apollo Diversified Real Estate Fund (the "Fund"), formerly known as Griffin Institutional Access Real Estate Fund, is registered under the Investment Company Act of 1940, as amended (the “1940 Act”), as a diversified, closed-end management investment company. The Fund engages in a continuous offering of shares and operates as an interval fund that offers quarterly repurchases of shares at Net Asset Value (“NAV”). The Fund was organized as a statutory trust on November 5, 2013, under the laws of the State of Delaware. The Fund commenced operations on June 30, 2014 and is authorized to issue an unlimited number of shares with no par value. The Fund’s investment adviser is Apollo Real Estate Fund Adviser, LLC (the "Adviser"), formerly known as Griffin Capital Advisor, LLC, a registered investment adviser under the Investment Advisers Act of 1940, as amended (the “Advisers Act”). The investment objective of the Fund is to generate a return comprised of both current income and capital appreciation with moderate volatility and low correlation to the broader markets. The Fund pursues its investment objective by strategically investing across private institutional real estate investment funds as well as a diversified set of public real estate securities.
Effective May 2, 2022, the Fund was renamed Apollo Diversified Real Estate Fund and the Adviser was renamed Apollo Real Estate Fund Adviser, LLC. Please refer to the Subsequent Events Note for additional information.
The Fund currently offers Class A, Class C, Class I, Class M and Class L shares. Class A shares commenced operations on June 30, 2014, Class C and Class I shares commenced operations on August 10, 2015, Class M shares commenced operations on November 17, 2016 and Class L shares commenced operations on April 25, 2017. The sales load payable by each investor depends on the amount invested, and the class of shares invested into, by such investor in the Fund. Class A and Class L shares are offered subject to a maximum sales charge of 5.75% and 4.25%, respectively, of their offering price. Class C, Class I and Class M shares are offered at net asset value. Class C shares may be subject to a 1.00% contingent deferred sales charge on shares redeemed during the first 365 days after their purchase. Each class represents an interest in the same assets of the Fund and classes are identical except for differences in their sales charge structures and ongoing service and distribution charges. All classes of shares have equal voting privileges except that each class has exclusive voting rights with respect to its service and/or distribution plans. The Fund's income, expenses (other than class specific service and distribution fees) and realized and unrealized gains and losses are allocated proportionately each day based upon the relative net assets of each class.
2. SIGNIFICANT ACCOUNTING POLICIES
The following is a summary of significant accounting policies followed by the Fund in preparation of its financial statements in conformity with accounting principles generally accepted in the United States of America (“U.S. GAAP”). The Fund is considered an investment company following accounting and reporting guidance in Accounting Standards Codification (“ASC”) Topic 946 – Financial Services – Investment Companies. The preparation of financial statements requires management to make estimates and assumptions that affect the reported amounts of assets and liabilities and disclosure of contingent assets and liabilities at the date of the financial statements and the reported amounts of income and expenses for the period. Actual results could differ from those estimates.
Determination of Net Asset Value – The net asset value of shares of the Fund is determined following the close of regular trading on the NYSE, generally 4:00 p.m. Eastern time, on each day the NYSE is open for trading. Each of the Fund’s share classes will be offered at net asset value plus the applicable sales load, if any. The Fund’s net asset value per share is calculated, on a class-specific basis, by dividing the value of the Fund’s total assets (the value of the securities the Fund holds plus cash or other assets, including interest accrued but not yet received), less accrued expenses and other liabilities of the Fund by the total number of shares outstanding. During the continuous offering, the price of the shares will increase or decrease on a daily basis according to the net asset value of the shares.
Valuation of Public Securities – Readily marketable portfolio securities listed on a public exchange are valued at their current market values determined on the basis of market or dealer quotations obtained from independent pricing services approved by the Board. Such quotes typically utilize official closing prices, generally the last sale price, reported to the applicable securities exchange if readily available. If there has been no sale on such day that value is being determined, the securities are valued at the last reported sale price unless the Fair Value Pricing Committee believes the price is no longer reliable. If market prices become unreliable because of events occurring after the close of trading, then the security is valued by such method as the Fair Value Pricing Committee shall determine in good faith to reflect its fair market value. Portfolio securities traded on more than one securities exchange are valued at the last sale price on the business day as of which such value is being determined as reflected by the exchange representing the principal market for such securities. Securities trading on NASDAQ are valued at NASDAQ official closing price.
The Board will determine in good faith, the fair value of securities for which market or dealer quotations are not readily available or deemed unreliable. In determining the fair value of publicly traded securities for which market or dealer quotations are not readily available or unreliable the Adviser, together with the Fair Value Pricing Committee, will take into account all reasonably available information that may be relevant to a particular security including, but not limited to: pricing history, current market level, supply and demand of the respective security; comparison to the values and current pricing of securities that have comparable characteristics; knowledge of historical market information with respect to the security; fundamental analytical data, such as periodic financial statements, and other factors or information relevant to the security, issuer, or market. For securities that are fair valued in ordinary course of Fund operations, the Board has delegated the day to day responsibility for determining fair valuation to the Fair Value Pricing Committee in accordance with the policies approved by the Board. Fair valuation involves subjective judgments, and it is possible that the fair value determined for a security may differ materially from the value that could be realized upon the sale of the security.
| 38 | 1.888.926.2688 | www.apollo.com |
| Apollo Diversified Real Estate Fund | Notes to Financial Statements |
March 31, 2022 (Unaudited)
Valuation of Private Investment Funds – The Fund’s allocation to Private Investment Funds generally includes open-end private investment funds that elect to be treated as REITs for tax purposes. The Private Investment Funds generally include private funds investing in real estate assets (“Private Equity REITs”) and private funds investing in debt instruments secured or otherwise supported by real estate assets (“Private Debt Funds”). The sponsors or agents of the Private Investment Funds measure their investment assets at fair value and report a NAV per share no less frequently than quarterly (“Sponsor NAV”). The Private Investment Funds have generally adopted valuation practices consistent with the valuation standards and techniques established by professional industry associations that advise the institutional real estate investment community. Such valuation standards seek general application of U.S. Generally Accepted Accounting Principles (GAAP) fair value standards, uniform appraisal standards and the engagement of independent valuation advisory firms.
The valuations of the Private Investment Funds have a considerable impact on the Fund’s NAV as a significant portion of the Fund’s assets are invested in Private Investment Funds. Market and dealer quotations are generally not readily available for the Private Investment Funds in which the Fund invests, and as such, the Fund utilizes Sponsor NAVs or other valuation methodologies approved by the Fair Value Pricing Committee when determining the fair value of the Private Investment Funds. The Fund may also use a third-party valuation specialist to assist in determining fair value of the Private Investment Funds held in the Fund’s portfolio.
Private Equity REITs. The Private Equity REITs produce Sponsor NAVs no less frequently than quarterly. Such Sponsor NAVs are reviewed by the Adviser upon receipt and subsequently applied to the Fund’s NAV following consultation with the Private Equity REIT sponsor, if necessary. In between receipt of Sponsor NAVs, the value of each Private Equity REIT is adjusted daily by the change in a proprietary index (the “Index”) that the Fund’s Board has deemed representative of the private equity real estate market. This process is applied daily to each respective Private Equity REIT until the receipt of the next Sponsor NAV. The Index seeks to reflect market conditions of the broader private equity real estate market in an effort to ensure any such changes in market conditions are reflected in the NAV of the Fund. The Index is comprised of private real estate investment funds (“Index Constituents”) that produce a daily NAV and generally hold institutional quality assets. The Index is monitored by the Adviser on a regular basis, and the Adviser will consult with the Fair Value Pricing Committee if monitoring suggests a modification to the Index Constituents or other change(s) to the Index to better reflect market conditions. Further, in the event that a Sponsor NAV is not provided by a Private Equity REIT following the conclusion of such Private Equity REIT’s valuation period, the Adviser shall inform the Fair Value Pricing Committee and a meeting may be called to determine fair value.
Private Debt Funds. The Private Debt Funds produce Sponsor NAVs no less frequently than quarterly. Such Sponsor NAVs are reviewed by the Adviser upon receipt and subsequently applied to the Fund’s NAV following consultation with the Private Debt Fund sponsor, if necessary. The Fund will, in certain cases, accrue income on a daily basis for each Private Debt Fund based on the prior period’s distribution rate and/or guidance provided by each respective Private Debt Fund sponsor. In the event that a Sponsor NAV is not provided by a Private Debt Fund following the conclusion of such Private Debt Fund’s valuation period, or if the Adviser becomes aware of an event warranting an update to a Private Debt Fund valuation, the Adviser shall inform the Fair Value Pricing Committee and a meeting may be called to determine fair value.
Fair Value Measurements – A three-tier hierarchy has been established to classify fair value measurements for disclosure purposes. Inputs refer broadly to the assumptions that market participants would use in pricing the asset or liability, including assumptions about risk. Inputs may be observable or unobservable. Observable inputs are inputs that reflect the assumptions market participants would use in pricing the asset or liability that are developed based on market data obtained from sources independent of the reporting entity. Unobservable inputs are inputs that reflect the reporting entity’s own assumptions about the assumptions market participants would use in pricing the asset or liability that are developed based on the best information available. In accordance with the authoritative guidance on fair value measurements and disclosure under U.S. GAAP, the Fund discloses fair value of its investments in a hierarchy that prioritizes the inputs to valuation techniques used to measure the fair value:
| Level 1 – | Unadjusted quoted prices in active markets for identical, unrestricted assets or liabilities that the Fund has the ability to access at the measurement date; |
| Level 2 – | Quoted prices which are not active, quoted prices for similar assets or liabilities in active markets or inputs other than quoted prices that are observable (either directly or indirectly) for substantially the full term of the asset or liability at the measurement date; and |
| Level 3 – | Significant unobservable prices or inputs (including the Fund’s own assumptions in determining the fair value of investments) where there is little or no market activity for the asset or liability at the measurement date. |
| Semi-Annual Report | March 31, 2022 | 39 |
| Apollo Diversified Real Estate Fund | Notes to Financial Statements |
March 31, 2022 (Unaudited)
The availability of observable inputs can vary from security to security and is affected by a wide variety of factors, including, for example, the type of security, whether the security is new and not yet established in the marketplace, the liquidity of markets and other characteristics particular to the security. To the extent that valuation is based on models or inputs that are less observable or unobservable in the market, the determination of fair value requires more judgment. Accordingly, the degree of judgment exercised in determining fair value is greatest for instruments categorized in Level 3.
An investment level within the fair value hierarchy is based on the lowest level input, individually or in the aggregate, that is significant to fair value measurement. The inputs or methodologies used for valuing securities are not necessarily an indication of the risk or liquidity associated with investing in those securities. The valuation techniques used by the Fund to measure fair value during the six months ended March 31, 2022 maximized the use of observable inputs and minimized the use of unobservable inputs. For the six months ended March 31, 2022, the Fund did not use unobservable inputs (Level 3) when determining fair value. The following is a summary of the fair valuations according to the inputs used in valuing the Fund’s investments as of March 31, 2022:
| Investments in Securities at Value | | Level 1 - Quoted Prices | | | Level 2 - Other Significant Observable Inputs | | | Level 3 - Significant Unobservable Inputs | | | Total | |
| Real Estate Investment Trusts | | | | | | | | | | | | | | | | |
| Private Investment Funds (Measured at net asset value)(a) | | $ | – | | | $ | – | | | $ | – | | | $ | 4,374,220,320 | |
| Publicly Traded Securities | | | 1,354,908,852 | | | | – | | | | – | | | | 1,354,908,852 | |
| Preferred Stocks | | | 78,006,544 | | | | – | | | | – | | | | 78,006,544 | |
| Short Term Investment | | | 10,239,832 | | | | – | | | | – | | | | 10,239,832 | |
| Total | | $ | 1,443,155,228 | | | $ | – | | | $ | – | | | $ | 5,817,375,548 | |
| (a) | In accordance with Subtopic 820-10, certain investments that are measured at fair value using the net asset value per share (or its equivalent) practical expedient have not been classified in the fair value hierarchy. The fair value amounts presented in this table are intended to permit reconciliation of the fair value hierarchy to the amounts presented in the Schedule of Investments. |
The carrying and fair value of the Fund's debt obligation as of March 31, 2022 for which the Fund has determined would be categorized as Level 2 in the fair value hierarchy was $226,000,000. For the six months ended March 31, 2022, the Fund did not use any significant unobservable inputs (Level 3) when determining fair value.
Investment Transactions – Investment security transactions are accounted for on trade date. Gains and losses on securities sold are determined on a specific identification basis. Non-cash dividends included in dividend income, if any, are recorded at the fair market value of the security received.
Investment Income – Interest income is accrued and recorded on a daily basis including income earned from money market funds. Dividend income is recorded on the ex-dividend date.
Distributions to Shareholders – Distributions from net investment income, if any, will be declared and paid quarterly. Distributions of net realized capital gains, if any, will be declared and paid annually. Income and capital gains distributions are determined in accordance with income tax regulations, which may differ from U.S. GAAP. Distributions to shareholders are recorded on the ex-dividend date.
Distributions from Underlying Real Estate Investment Trusts – Distributions made to the Fund by the underlying REITs in which the Fund invests may take several forms. Specifically, such distributions may be in the form of dividends, capital gains, and/or a return of capital.
Unfunded Commitments – Typically, when the Fund invests in a Private Investment Fund, the Fund makes a commitment to invest a specified amount of capital in the applicable Private Investment Fund. The capital commitment may be drawn by the general partner of the Private Investment Fund either all at once or through a series of capital calls at the discretion of the general partner. Thus, an Unfunded Commitment represents the portion of the Fund’s overall capital commitment to a particular Private Investment Fund that has not yet been called by the general partner of the Private Investment Fund. Unfunded Commitments may subject the Fund to certain risks. For example, the Fund may be required to: liquidate other portfolio investments, potentially at inopportune times, in order to obtain the cash needed to satisfy its obligations with respect to a capital call; borrow under a line of credit which may result in additional expenses to the Fund; or, to the extent a buyer can be identified and subject to the provisions of the limited partnership agreement of the relevant Private Investment Fund, seek to sell/assign the interest subject to the capital call to a third party thereby eliminating the obligation. In addition, should the Fund be unable to satisfy its commitment obligation on a timely basis and defaults on a called capital commitment, the underlying Private Investment Fund, pursuant to its limited partnership agreement, typically has a number of potential remedies, including, by way of illustration, a reallocation of the Fund's defaulted commitment amount to other limited partners, a reallocation of a portion of the Fund's existing interest to the other limited partners as a penalty for the default, or the general partner of underlying Private Investment Fund could sue the Fund for breach of contract. As of March 31, 2022, the Fund had total Unfunded Commitments in the amount of $248,123,517.
| 40 | 1.888.926.2688 | www.apollo.com |
| Apollo Diversified Real Estate Fund | Notes to Financial Statements |
March 31, 2022 (Unaudited)
Indemnification – The Fund indemnifies its Officers and Trustees for certain liabilities that may arise from the performance of their duties to the Fund. Additionally, in the normal course of business, the Fund enters into contracts that contain a variety of representations and warranties and which provide general indemnities. The Fund’s maximum exposure under these arrangements is unknown, as this would involve future claims that may be made against the Fund that have not yet occurred. However, based on industry experience, the Fund expects the risk of loss due to these warranties and indemnities to be remote.
Federal Income Taxes – The Fund intends to continue to comply with the requirements of Subchapter M of the Internal Revenue Code applicable to regulated investment companies and will distribute all of its taxable income, if any, to shareholders. Accordingly, no provision for federal income taxes is required in the financial statements.
The Fund recognizes the tax benefits of uncertain tax positions only when the position is “more likely than not” to be sustained assuming examination by tax authorities. Management has reviewed the tax positions and has concluded that no liability for unrecognized tax benefits should be recorded related to uncertain tax positions taken in the Fund’s tax returns for open tax years or expected to be taken in the Fund’s 2022 returns.
3. ADVISORY FEES, ADMINISTRATION FEES AND OTHER AGREEMENTS
Investment Advisory
Pursuant to the Investment Advisory Agreement with the Fund (“Advisory Agreement”), the Adviser is entitled to an investment advisory fee, computed daily and payable monthly at an annual rate of 1.50% of the average daily net assets of the Fund.
The Adviser and the Fund have entered into an expense limitation and reimbursement agreement (the “Expense Limitation Agreement”) under which the Adviser has agreed contractually to waive its fees and to pay or absorb the ordinary annual operating expenses of the Fund (including organizational and offering expenses, but excluding taxes, interest, brokerage commissions, acquired fund fees and expenses and extraordinary expenses) so that the total annual operating expenses of the Fund do not exceed 1.91% per annum of Class A average daily net assets, 2.66% per annum of Class C average daily net assets, 1.66% per annum of Class I average daily net assets, 2.41% per annum of Class M average daily net assets and 2.16% per annum of Class L average daily net assets (the “Expense Limitations”). The Expense Limitation Agreement will remain in effect until May 31, 2023, unless and until the Trustees approve its modification or termination. The Fund does not anticipate that the Trustees will terminate the Expense Limitation Agreement during this period. The Expense Limitation Agreement may not be terminated by the Adviser. In consideration of the Adviser’s agreement to limit the Fund’s expenses, the Fund has agreed to repay the Adviser in the amount of any fees waived and Fund expenses paid or absorbed, subject to the limitations that: (1) the reimbursement for fees and expenses will be made only if payable not more than three years from the date on which they were incurred; and (2) the reimbursement may not be made if it would cause the lesser of the Expense Limitations in place at the time of waiver or at the time of reimbursement to be exceeded.
The Fund did not recoup any previously waived fees nor does it have a balance of recoupable expenses.
Sub-advisory services are provided to the Fund pursuant to agreements between the Adviser and both Aon Investments USA Inc. (“Aon”) and CenterSquare Investment Management LLC. (“CenterSquare” and collectively with Aon, the “Sub-Advisers”). Under the terms of the respective sub-advisory agreement, the Adviser compensates each Sub-Adviser based on a portion of the Fund’s average daily net assets which have been allocated to such Sub-Adviser to manage. Fees paid to each Sub-Adviser are not an expense of the Fund. The fee tables are as follows:
| Annual Sub-Advisory Fee Rate as a Percentage of Average Daily Net Assets Managed by CenterSquare | |
| $0 - $50M | 0.50% |
| $50 - $100M | 0.45% |
| $100 - $150M | 0.40% |
| Over $150M | 0.35% |
| Annual Sub-Advisory Fee Rate as a Percentage of Average Daily Net Assets Advised by Aon | |
| $0 - $500M | 0.15% |
| $500 - $750M | 0.125% |
| $750M - $1B | 0.10% |
| Over $1B | 0.07% |
| Semi-Annual Report | March 31, 2022 | 41 |
| Apollo Diversified Real Estate Fund | Notes to Financial Statements |
March 31, 2022 (Unaudited)
Fund Administrator and Accounting Fees and Expenses
ALPS Fund Services, Inc. serves as the Fund’s administrator and accounting agent (the “Administrator”) and receives customary fees from the Fund for such services. The Administrator is also reimbursed by the Fund for certain out of pocket expenses.
Transfer Agency Fees and Expenses
DST Systems, Inc. serves as transfer, distribution paying and shareholder servicing agent for the Fund and receives customary fees from the Fund for such services.
Custody Fees and Expenses
UMB Bank, n.a. serves as the Fund’s custodian and receives customary fees from the Fund for such services.
Distribution and Shareholder Servicing Fees and Expenses
The Fund has entered into a Distribution Agreement with ALPS Distributors, Inc. (the “Distributor”) to provide distribution services to the Fund. The Distributor serves as principal underwriter of shares of the Fund. Under the Distribution Agreement the Fund’s Class C and Class M shares will pay to the Distributor a Distribution Fee that will accrue at an annual rate equal to 0.75% of the Fund’s average daily net assets attributable to Class C and Class M shares, payable on a monthly basis. Class L shares will pay to the Distributor a Distribution Fee that will accrue at an annual rate equal to 0.25% of the Fund’s average daily net assets attributable to Class L shares, payable on a monthly basis. For the six months ended March 31, 2022, Class C, Class M and Class L shares incurred distribution fees of $2,025,313, $4,729,502 and $113,314, respectively. Class A and Class I shares are not currently subject to a Distribution Fee. Under the Shareholder Services Plan, the Fund’s Class A, Class C and Class L shares may pay up to 0.25% per year of their average daily net assets for such services. Class I and Class M shares are not currently subject to a shareholder services fee. For the six months ended March 31, 2022, Class A, Class C and Class L shares incurred shareholder servicing fees of $863,382, $675,104 and $113,314, respectively.
The Distributor has entered into a wholesale marketing agreement with Griffin Capital Securities, LLC, a registered broker-dealer affiliate of the Adviser. Pursuant to the terms of the wholesale marketing agreement, Griffin Capital Securities, LLC will seek to market and otherwise promote the Fund through various wholesale distribution channels, including regional and independent retail broker-dealers, wirehouses and registered investment advisers.
Officer and Trustee Compensation
As of December 14, 2021, each Independent Trustee receives an annual retainer of $57,750, paid quarterly, as well as reimbursement for any reasonable expenses incurred attending the meetings and $500 per Independent Trustee per each special telephonic meeting (exclusive of one special telephonic meeting per year). The Chair of the Audit Committee receives an additional $15,750 annually. None of the executive officers, with the exception of the Chief Compliance Officer, receive compensation from the Fund. Certain Trustees and officers of the Fund are also officers of the Adviser and are not paid by the Fund for serving in such capacities.
Prior to December 14, 2021, each Independent Trustee received an annual retainer of $55,000, paid quarterly, as well as reimbursement for any reasonable expenses incurred attending the meetings and $500 per Independent Trustee per each special telephonic meeting (exclusive of one special telephonic meeting per year). The Independent Trustees also received $2,000 per special meeting related to the sale of the Adviser’s parent company. The Chair of the Audit Committee received an additional $15,000 annually. None of the executive officers, with the exception of the Chief Compliance Officer, received compensation from the Fund. Certain Trustees and officers of the Fund are also officers of the Adviser and were not paid by the Fund for serving in such capacities.
4. PURCHASES AND SALES OF INVESTMENT SECURITIES
The cost of purchases and proceeds from the sale of securities, other than short-term securities, for the six months ended March 31, 2022 were as follows:
| | | Purchases of Securities | | | Proceeds from Sales of Securities | |
| | $ | 1,261,333,646 | | | $ | 584,721,958 | |
| 42 | 1.888.926.2688 | www.apollo.com |
| Apollo Diversified Real Estate Fund | Notes to Financial Statements |
March 31, 2022 (Unaudited)
5. TAX BASIS INFORMATION
Distributions are determined in accordance with federal income tax regulations, which differ from U.S. GAAP, and, therefore, may differ significantly in amount or character from net investment income and realized gains for financial reporting purposes. Financial reporting records are adjusted for permanent book/tax differences to reflect tax character but are not adjusted for temporary differences.
The tax character of distributions paid for year ended September 31, 2021 were as follows:
| Year | | Ordinary Income | | | Long-Term Capital Gain | | | Return of Capital | |
| 2021 | | $ | 21,446,511 | | | $ | 28,645,904 | | | $ | 159,081,238 | |
| | | | | | | | | | | | | |
As of March 31, 2022, net unrealized appreciation of investments based on the federal tax cost was as follows:
| | | Gross Appreciation (excess of value over tax cost) | | | Gross Depreciation (excess of tax cost over value) | | | Net Unrealized Appreciation/(Depreciation) | | | Cost of Investments for Income Tax Purposes | |
| | | $ | 1,391,712,624 | | | $ | (10,040,279 | ) | | $ | 1,381,672,345 | | | $ | 4,435,703,203 | |
| | | | | | | | | | | | | | | | | |
The difference between book basis and tax basis distributable earnings and unrealized appreciation/(depreciation) is primarily attributable to the tax deferral of losses on wash sales, investments in partnerships, and certain other investments.
6. LINES OF CREDIT
The Fund has entered into secured bank lines of credit through BNP Paribas Prime Brokerage International, Ltd. (“BNP”) and Credit Suisse First Boston Ltd. ("Credit Suisse" and together with BNP, the "Banks") subject to the limitations of the 1940 Act for borrowings.
From October 1, 2021 to December 28, 2021 borrowings under the BNP arrangement bore interest at the 3 month LIBOR plus 95 basis points at the time of borrowing. Effective December 29, 2021, borrowings under the BNP arrangement bore interest at OBFR plus 121 basis points at the time of borrowing. During the six months ended March 31, 2022, the Fund had outstanding borrowings for 179 days and incurred $917,378 of interest expense related to its outstanding borrowings under the BNP arrangement. For the 179 days during which the Fund had outstanding borrowings under the BNP arrangement, average borrowings were $148,944,134 and the average interest rate was 1.22%. As of March 31, 2022, the outstanding borrowing under the BNP arrangement was $226,000,000.
Borrowings under the Credit Suisse arrangement bear interest at the 3 month LIBOR plus 205 basis points at the time of borrowing and an unused commitment fee rate equal to 59.8 basis points. The Credit Suisse arrangement is subject to a maximum commitment of $450,000,000 although the Fund may request an increase to the maximum commitment subject to certain conditions. During the six months ended March 31, 2022, the Fund had no outstanding borrowings and incurred no interest expense related to its outstanding borrowings under the Credit Suisse arrangement. The Fund also incurred $1,360,450 of total unused commitment fees, which is included in the interest expense line item on the Statement of Operations.
As collateral for the lines of credit, the Fund grants the Banks a first position security interest in and lien on securities of any kind or description held by the Fund in the collateral accounts. As of March 31, 2022, the Fund had $ 5,729,129,172 of securities pledged as collateral to the Banks.
7. REPURCHASE OFFERS
As a continuously offered, closed-end interval fund, the Fund has adopted a fundamental policy in which it offers to repurchase at net asset value no less than 5% of the outstanding shares of the Fund once each quarter. If shareholders tender for repurchase more than the amount in a repurchase offer, the Fund may, but is not required to, repurchase an additional amount of shares not to exceed 2% of the outstanding shares of the Fund on the repurchase request deadline. If the Fund determines not to repurchase more than the amount in a repurchase offer, or if shareholders tender shares in an amount exceeding the amount in a repurchase offer plus 2% of the outstanding shares on the repurchase request deadline, the Fund will repurchase the shares on a pro rata basis. It is possible that a repurchase offer may be oversubscribed and as such there is no guarantee that shareholders will be able to sell all of the shares they desire to sell in a quarterly repurchase offer, although each shareholder will have the right to require the Fund to purchase at least 5% of such shareholder’s shares in each quarterly repurchase. Liquidity will be provided to shareholders only through the Fund’s quarterly repurchase offers. Shareholders will receive written notice of each quarterly repurchase offer ("Repurchase Offer Notice") that includes the date the repurchase offer period ends ("Repurchase Request Deadline") and the date the repurchase price will be determined ("Repurchase Pricing Date"). Shares will be repurchased at the NAV per share determined on the Repurchase Pricing Date.
| Semi-Annual Report | March 31, 2022 | 43 |
| Apollo Diversified Real Estate Fund | Notes to Financial Statements |
March 31, 2022 (Unaudited)
During the six months ended March 31, 2022, the Fund completed two quarterly repurchase offers in which the Fund offered to repurchase up to 5% of its outstanding shares as of each respective Repurchase Request Deadline. Shareholder repurchase requests received by the Fund in good order by the November 4, 2021 and February 8, 2022 Repurchase Request Deadlines were honored in their full amounts. The results of the aforementioned repurchase offers were as follows:
| | Repurchase Offer #1 | Repurchase Offer #2 |
| Commencement Date | September 28, 2021 | December 29, 2021 |
| Repurchase Request Deadline | November 4, 2021 | February 8, 2022 |
| Repurchase Pricing Date | November 4, 2021 | February 8, 2022 |
| Amount Repurchased | $82,959,958 | $92,535,657 |
| Shares Repurchased | 2,932,811 | 3,143,638 |
8. PRINCIPAL RISK FACTORS
Concentration of Credit Risk – The Fund places its cash with one banking institution, which is insured by the Federal Deposit Insurance Corporation (“FDIC”). The FDIC limit is $250,000. At various times throughout the year, the amount on deposit may exceed the FDIC limit and subject the Fund to a credit risk. The Fund does not believe that such deposits are subject to any unusual risk associated with investment activities. The Fund may invest cash balances in an open-end Money Market Mutual Fund (“Money Market Fund”). The Money Market Fund is valued at its closing NAV. The Money Market Fund is not subject to FDIC insurance.
LIBOR Risk – Holdings of certain of the Fund’s underlying investments may be based on floating rates, such as LIBOR. The London Interbank Offered Rate, or LIBOR, is a benchmark that dictates daily interest rates on loans and financial instruments globally. Plans are underway to phase out the use of LIBOR which indicates the continuation of LIBOR and other reference rates on the current basis cannot and will not be guaranteed after 2023. Any replacement rate chosen may be less favorable than the current rates. Until the announcement of the replacement rate, the Fund may continue to invest in assets that may reference LIBOR or otherwise use LIBOR. There remains uncertainty regarding the nature of any replacement rate and the impact of the transition from LIBOR on the Fund’s transactions and the financial markets generally. As such, the potential effect of a transition away from LIBOR on the Fund’s investments cannot yet be determined.
Liquidity Risk – There currently is no secondary market for the Fund’s shares and the Adviser does not expect that a secondary market will develop. Limited liquidity is provided to shareholders only through the Fund’s quarterly repurchase offers for no less than 5% of the Fund’s shares outstanding at net asset value. There is no guarantee that shareholders will be able to sell all of the shares they desire in a quarterly repurchase offer. The Fund’s investments also are subject to liquidity risk. Liquidity risk exists when particular investments of the Fund would be difficult to purchase or sell, possibly preventing the Fund from selling such illiquid securities at an advantageous time or price, or possibly requiring the Fund to dispose of other investments at unfavorable times or prices in order to satisfy its obligations.
Market Risk – An investment in the fund’s shares is subject to investment risk, including the possible loss of the entire principal amount invested. An investment in the fund’s shares represents an indirect investment in the securities owned by the fund. The value of these securities, like other market investments, may move up or down, sometimes rapidly and unpredictably.
Mortgage-Backed Securities Risk – Mortgage-backed securities represent interests in “pools” of mortgages and often involve risks that are different from or possibly more acute than risks associated with other types of debt instruments. When the Fund invests in mortgage-backed securities, the Fund is subject to the risk that, if the underlying borrowers fail to pay interest or repay principal, the assets backing these securities may not be sufficient to support payments on the securities. Prepayment risk is associated with mortgage-backed securities. If interest rates fall, the underlying debt may be repaid ahead of schedule, reducing the value of the Fund’s investments. If interest rates rise, there may be fewer prepayments, which would cause the average bond maturity to rise, increasing the potential for the Fund to lose money. The value of these securities may be significantly affected by changes in interest rates, the market’s perception of issuers, and the creditworthiness of the parties involved. The ability of the Fund to successfully utilize these instruments may depend on the ability of the Fund’s Adviser or Sub-Adviser to forecast interest rates and other economic factors correctly. These securities may have a structure that makes their reaction to interest rate changes and other factors difficult to predict, making their value highly volatile. The credit risk on such securities is affected by borrowers defaulting on their loans. The values of assets underlying mortgage-backed securities may decline and, therefore, may not be adequate to cover underlying investors. Many of the risks of investing in MBS reflect the risks of investing in the real estate securing the underlying mortgage loans. These risks reflect the effects of local and other economic conditions on real estate markets, the ability of tenants to make loan payments, and the ability of a property to attract and retain tenants.
| 44 | 1.888.926.2688 | www.apollo.com |
| Apollo Diversified Real Estate Fund | Notes to Financial Statements |
March 31, 2022 (Unaudited)
Pandemic Risk – The novel coronavirus COVID-19 continues to cause disruptions in the global economy and the financial markets. As the pandemic has evolved, the impact across countries and markets has varied based on the spread of the virus, regulation and public response. Further, the pandemic and the responses thereto have caused various disruptions to the global supply chain, affecting wide swaths of manufacturing, automotive and consumer goods, among other sectors. While the health and economic outlook may improve in the short-term in some markets, such improvements may be uncertain and short-lived due to the rise of potential new variants and increased cases and hospitalizations, as well as potential increased restrictions in the response thereto. Further, the negative economic consequences, including to the global supply chain, caused by the pandemic may be prolonged and take years to resolve, if ever. Further, issuers that operate in the hospitality, healthcare, travel and entertainment industries may continue to face adverse market conditions due to future restrictions, which could result in adverse performance and potentially bankruptcy. Further, the disruptions caused by the pandemic have contributed to the global and U.S. rise in inflation, which may further increase in the future. Changes in the nature of the pandemic, including any increases in virality and/or lethality, may have negative consequences for the Fund, its service providers and issuers. While the Adviser is actively monitoring the course of the pandemic and its consequences, the uncertainty triggered by the pandemic is likely to continue and may have chilling effects on the overall market and the Fund’s performance.
Preferred Securities Risk – There are various risks associated with investing in preferred securities, including credit risk, interest rate risk, deferral and omission of distributions, subordination to bonds and other debt securities in a company’s capital structure, limited liquidity, limited voting rights and special redemption rights. Interest rate risk is, in general, the risk that the price of a debt security falls when interest rates rise. Securities with longer maturities tend to be more sensitive to interest rate changes. Credit risk is the risk that an issuer of a security may not be able to make principal and interest or dividend payments on the security as they become due. Holders of preferred securities may not receive dividends, or the payment can be deferred for some period of time. In bankruptcy, creditors are generally paid before the holders of preferred securities.
Private Investment Fund Risk – The Fund’s investment in Private Investment Funds will require it to bear a pro rata share of the vehicles’ expenses, including management and performance fees. The fees the Fund pays to invest in a Private Investment Fund may be higher than if the manager of the Private Investment Fund managed the Fund’s assets directly. The performance fees charged by certain Private Investment Funds may create an incentive for its manager to make investments that are riskier and/or more speculative than those it might have made in the absence of a performance fee. Furthermore, Private Investment Funds, like the other Underlying Funds in which the Fund may invest, are subject to specific risks, depending on the nature of the vehicle, and also may employ leverage such that their returns are more than one times that of their benchmark which could amplify losses suffered by the Fund when compared to unleveraged investments. Shareholders of the Private Investment Funds are not entitled to the protections of the 1940 Act. For example, Private Investment Funds need not have independent boards, shareholder approval of advisory contracts may not be required, the Private Investment Funds may utilize leverage and may engage in joint transactions with affiliates. These characteristics present additional risks for shareholders.
Real Estate Industry Concentration Risk – Because the Fund will concentrate its investments in real estate securities, its portfolio will be significantly impacted by the performance of the real estate market and may experience more volatility and be exposed to greater risk than a more diversified portfolio. Significant investments in the securities of issuers within the real estate industry and any development affecting the real estate industry will have a greater impact on the value of the net assets of the Fund than would be the case if the Fund did not have significant investments in the real estate industry. The Fund’s investment in real estate equity or debt may be subject to risks similar to those associated with direct investment in real property. The value of the Fund’s shares will be affected by factors affecting the value of real estate and the earnings of companies engaged in the real estate industry. These factors include, among others: (i) changes in general economic and market conditions; (ii) changes in the value of real estate properties; (iii) risks related to local economic conditions, overbuilding and increased competition; (iv) increases in property taxes and operating expenses; (v) changes in zoning laws; (vi) casualty and condemnation losses; (vii) variations in rental income, neighborhood values or the appeal of property to tenants; (viii) the availability of financing and (ix) changes in interest rates. Many real estate companies utilize leverage, which increases investment risk and could adversely affect a company’s operations and market value in periods of rising interest rates. The value of securities of companies in the real estate industry may go through cycles of relative under-performance and outperformance in comparison to equity securities markets in general. As of March 31, 2022, the Fund had 102.12% of the value of its net assets invested within the real estate industry.
REIT Risk – Share prices of Public REITs may decline because of adverse developments affecting the real estate industry and real property values. In general, real estate values can be affected by a variety of factors, including supply and demand for properties, the economic health of the country or of different regions, and the strength of specific industries that rent properties. Qualification as a REIT under the Internal Revenue Code of 1986, as amended (the “Code”) in any particular year is a complex analysis that depends on a number of factors. There can be no assurance that an entity in which the Fund invests with the expectation that it will be taxed as a REIT will, in fact, qualify as a REIT. An entity that fails to qualify as a REIT would be subject to a corporate level tax, would not be entitled to a deduction for dividends paid to its shareholders and would not pass through to its shareholders the character of income earned by the entity. Dividends paid by REITs may not receive preferential tax treatment afforded other dividends.
| Semi-Annual Report | March 31, 2022 | 45 |
| Apollo Diversified Real Estate Fund | Notes to Financial Statements |
March 31, 2022 (Unaudited)
9. SUBSEQUENT EVENTS
Subsequent events after the date of the Statement of Assets and Liabilities have been evaluated through the date the financial statements were issued.
The Fund completed a quarterly repurchase offer on May 10, 2022 which resulted in 3,590,967 shares being repurchased for $107,691,322. All shareholder repurchase requests received by the Fund in good order were honored in their full amounts.
On December 2, 2021, Griffin Capital, LLC (“Griffin Capital”), the indirect parent of Griffin Capital Advisor, LLC (the "Adviser") investment adviser to Griffin Institutional Access Real Estate Fund (the “Fund”), and Apollo Global Management, Inc. (“AGMI”) entered into a definitive agreement pursuant to which, among other things, AGMI would acquire the asset management businesses of Griffin Capital (the “Transaction”). The Transaction, once completed, resulted in a change in control of the Adviser, which would be deemed an “assignment” under the Investment Company Act of 1940, as amended (the “1940 Act”), that resulted in an automatic termination of the Fund’s previous Management Agreement with the Adviser (the “Prior Management Agreement”) on the date on which the Transaction closed. The prior investment sub-advisory agreement for the Fund between the Adviser and CenterSquare Investment Management LLC (“CenterSquare”) and the prior investment sub-advisory agreement for the Fund between the Adviser and Aon Investments USA (“Aon”) also terminated on the date the Transaction closed as a result of the termination of the Prior Management Agreement.
As a result, prior to the closing of the Transaction and to avoid any disruption in the management of the Fund, the Board of Trustees of the Fund (the “Board”), over the course of several meetings, requested of, and reviewed certain information provided by, Griffin Capital and AGMI in connection with the consideration of: (i) a new Management Agreement (the “New Management Agreement”) between the Fund and the Fund’s Adviser; (ii) a new Investment Sub-Advisory Agreement (the “New CenterSquare Agreement”) between the Adviser and CenterSquare; and (iii) a new Investment Sub-Advisory Agreement between the Adviser and Aon (the “New Aon Agreement”, and, together with the New Management Agreement and the New CenterSquare Agreement, the “New Agreements”). The Board, including the majority of the independent members of the Board, approved the New Agreements at a meeting of the Board held on December 28, 2021 and recommended that shareholders of the Fund also approve each of the New Management Agreements at a special meeting of shareholders of the Fund called for such purpose. The Board set March 15, 2022 as the date for the special meeting of shareholders (the “Special Meeting”) and approved the filing of a proxy statement to solicit shareholder approval of the New Agreements.
The Special Meeting, originally scheduled for March 15, 2022, was adjourned on several occasions as a result of a failure to obtain a quorum. Having obtained a quorum, the Special Meeting was held virtually on April 27, 2022 at which time shareholders of the Fund approved each of the New Agreements.
On May 2, 2022 (the “Effective Date”) AGMI and Griffin Capital closed the Transaction. Accordingly, on the Effective Date, the Prior Agreements were terminated, and the New Agreements became effective. Additionally, on the Effective Date, the Fund was renamed Apollo Diversified Real Estate Fund and the Adviser was renamed Apollo Real Estate Fund Adviser, LLC.
Management has determined that there were no other subsequent events to report through the issuance of these financial statements.
| 46 | 1.888.926.2688 | www.apollo.com |
| Apollo Diversified Real Estate Fund | Additional Information |
March 31, 2022 (Unaudited)
1. PROXY VOTING POLICIES AND VOTING RECORD
A description of the policies and procedures that the Fund uses to vote proxies relating to its portfolio securities is available without charge upon request by calling toll-free 888-926-2688, or on the Securities and Exchange Commission’s (“SEC”) website at http://www.sec.gov. Information regarding how the Fund voted proxies relating to underlying portfolio securities during the most recent 12-month period ended June 30th is available without charge upon request by calling toll-free 888-926-2688, or on the SEC’s website at http://www.sec.gov.
2. QUARTERLY PORTFOLIO HOLDINGS
The Fund files its complete schedule of portfolio holdings with the SEC for the first and third quarters of each fiscal year as an exhibit to its reports on Form N-PORT. The Fund’s Form N-PORT reports are available on the SEC’s web site at http://www.sec.gov.
3. TRUSTEES’ CONSIDERATION AND APPROVAL OF ADVISORY AGREEMENT WITH GRIFFIN CAPITAL ADVISOR, LLC
At meetings of the Board on December 22, 2021 and December 28, 2021, the Board, including the Independent Trustees, discussed and approved a new Management Agreement (the “New Management Agreement”) between the Fund and the Fund’s investment adviser, Griffin Capital Advisor, LLC (the “Adviser”). The Board, including the Independent Trustees, concluded that approval of the New Management Agreement is in the best interests of the Fund and its shareholders.
In connection with the Board meetings and in accordance with Section 15(c) of the 1940 Act, the Board requested, and the Adviser and Apollo Global Management, Inc. (“AGMI”) provided, materials relating to the acquisition of the US wealth distribution and asset management businesses of Griffin Capital, LLC in an all-stock transaction (the “Transaction”), the Adviser, and AGMI in connection with the Board’s consideration of whether to approve the New Management Agreement. This included a description of the Transaction and its anticipated effects on the Adviser, as well as information regarding AGMI. The Board noted that the services provided under the New Management Agreement will be identical to those provided under the prior management agreement (the “Prior Management Agreement”). In addition, the advisory fee under the New Management Agreement will remain the same as the advisory fee under the Prior Management Agreement. The Adviser confirmed that it anticipated that, under the New Management Agreement, there would be no diminution in services provided by the Adviser to the Fund or changes in the fee payable by the Fund to the Adviser as a result of the Transaction. It was noted that the Board and the Adviser intended to use reasonable best efforts to operate the Fund in compliance with the conditions of the safe harbor in Section 15(f) of the 1940 Act so that 75% or more of the Board was not comprised of “interested persons” (as defined in the 1940 Act) of the Adviser and would remain so for three years following the closing of the Transaction (the “Effective Date”), and that no “unfair burden” (as defined in the 1940 Act) would be imposed on the Fund by the Adviser during the two-year period following the Effective Date.
In considering whether to approve the New Management Agreement, the Trustees reviewed and considered the information they deemed reasonably necessary, including the following material factors discussed in further detail below: (1) the nature, extent, and quality of the services to be provided by the Adviser; (2) the investment performance of the Fund and the Adviser; (3) the costs of the services to be provided and profits to be realized by the Adviser and its affiliates from the relationship with the Fund; (4) the extent to which economies of scale would be realized as the Fund grows and whether advisory fee levels reflect those economies of scale for the benefit of the Fund’s investors; (5) the Adviser’s practices regarding brokerage and portfolio transactions; and (6) the Adviser’s practices regarding possible conflicts of interest.
The Trustees also reviewed a memorandum from the Fund’s legal counsel that summarized the fiduciary duties and responsibilities of the Board in reviewing and approving the New Management Agreement, including the types of information and factors that should be considered in order to make an informed decision.
(1) The nature, extent, and quality of the services to be provided by the Adviser. The Board received and considered information regarding the fact that the nature, extent, and quality of services to be provided to the Fund by the Adviser under the New Management are the same as under the Prior Management Agreement and are not expected to change as a result of the Transaction. The Trustees considered the responsibilities of the Adviser under the New Management Agreement and reviewed the services provided to the Fund including, without limitation, the Adviser’s procedures for formulating investment recommendations and assuring compliance with the Fund’s investment objectives and limitations, coordination of services for the Fund among the Fund’s service providers, expertise and experience in the field, and efforts to promote the Fund, grow the Fund’s assets, and assist in the distribution of Fund shares. The Trustees noted that the Adviser seeks to achieve the Fund’s investment objective to generate a return comprised of both current income and capital appreciation with moderate volatility and low correlation to the broader markets, through pursuing strategic investing across private institutional real estate investment funds as well as a diversified set of public real estate securities. The Trustees also noted that the Adviser continues its process of allocating between public and private real estate securities and allows the Fund to invest across a diversified set of investment managers and strategies as well as to provide investment exposure across property types and geographies. The Board noted the Adviser’s robust investment process, which has benefited the Fund through negotiation of fee reductions and other benefits for the Fund. The Board concluded that the Fund would continue to benefit from the quality and experience of the Adviser’s investment professionals who will continue to provide services to the Fund after the Transaction as employees of the Adviser. After reviewing the foregoing information and other information in the Adviser’s Memorandum (e.g., the Adviser’s Form ADV and descriptions of the Adviser’s business and compliance program), the Board concluded that the nature, extent, and quality of the services provided by the Adviser to the Fund were satisfactory.
| Semi-Annual Report | March 31, 2022 | 47 |
| Apollo Diversified Real Estate Fund | Additional Information |
March 31, 2022 (Unaudited)
(2) The investment performance of the Fund and the Adviser. The Trustees noted the Fund’s strong positive performance since its inception. After reviewing the Fund’s performance and other factors, the Board concluded that it was satisfied with the performance of the Fund.
(3) The costs of the services to be provided by the Adviser. The Trustees evaluated the current and projected asset levels of the Fund; and the overall expenses of the Fund, including the nature and frequency of advisory fee payments.
The Trustees then compared the fees and expenses of the Fund (including the management fee) to other peer funds comparable in terms of the type of fund, the nature of its investment strategy, and its style of investment management, among other factors. The Trustees determined that the base management fee was higher than other funds but noted that other funds had externalized certain services that the Adviser provided (such as research) as part of its management fees and agreed that it was important to consider the entire expense ratio in the comparison. In that regard, they noted that the net expense ratio was below the average of the peer group. The Board considered that other peer funds also utilized less laborious strategies.
The Trustees noted that the Adviser had agreed to an Expense Limitation Agreement, which limits the Fund’s annual operating expenses, that was still in effect and that a new Expense Limitation Agreement with the same terms would be in place along with the New Management Agreement. It was further noted that, while the Expense Limitation Agreement provided for the recoupment of fees waived or reimbursed by the Adviser over a three-year period, the Adviser was no longer receiving any recouped fees and no potential future recoupment would carry over after the Effective Date because fees that were eligible to be recouped were already recouped. The Trustees also considered potential benefits for the Adviser in managing the Fund, including promotion of the Adviser’s name.
Following further consideration and discussion of the foregoing, the Board concluded that the fee paid to the Adviser by the Fund was fair and reasonable in relation to the nature and quality of the services provided by the Adviser and that they reflected charges that were within a range of what could have been negotiated at arm’s length.
(4) The profits to be realized by the Adviser and its affiliates from the relationship with the Fund. The Trustees reviewed the Adviser’s profitability analysis in connection with its management of the Fund and noted that the Adviser earned what the Board considered to be a reasonable profit from its relationship with the Fund and would continue to do so after the Closing. The Board concluded that the Adviser’s profitability was not excessive.
(5) The extent to which economies of scale would be realized as the Fund grows and whether advisory fee levels reflect those economies of scale for the benefit of the Fund’s investors. The Trustees considered that the Fund’s fee arrangements with the Adviser involved both the management fee and an Expense Limitation Agreement. The Trustees noted that, while the management fee remains the same at all asset levels, the Fund’s shareholders have benefitted from the Fund’s expense limitation arrangement over time, although the Fund’s assets had grown to a level where the Fund’s expenses fell below the cap set by the arrangement, and as a result the Adviser has been receiving its full fee. The Trustees further noted that prior fee waivers and expense reimbursements borne by the Adviser have aided the Fund’s growth since its inception. The Trustees also noted that the Fund’s shareholders would benefit from economies of scale under the Fund’s agreements with service providers other than the Adviser. Further, the size of the Fund has allowed the Adviser to lead additional negotiations to reduce the Fund’s fees when making investments, which, while time intensive for the Adviser, reflected significant benefits to the Fund. Following further discussion of the Fund’s current and projected asset levels, expectations for growth, and fee levels, the Board determined that the Fund’s fee arrangements were fair and reasonable in relation to the nature and quality of the services provided by the Adviser and that the Expense Limitation Agreement has provided savings for the benefit of the Fund’s investors. It was further noted that the Board approved a new Expense Limitation Agreement to be effective with the New Management Agreement, which would have the same material terms as the prior Expense Limitation Agreement, except for the later termination date of the new Expense Limitation Agreement.
(6) The Adviser’s practices regarding brokerage and portfolio transactions. The Trustees reviewed the Adviser’s standards, and performance in utilizing those standards, for seeking best execution for Fund portfolio transactions. The Trustees also considered the portfolio turnover rate for the Fund; the process by which evaluations are made of the overall reasonableness of commissions paid; the method and basis for selecting and evaluating the broker-dealers used; any anticipated allocation of portfolio business to persons affiliated with the Adviser; and the extent to which the Fund allocates portfolio business to broker-dealers who provide research, statistical, or other services (“soft dollars”). After further review and discussion, the Board determined that the Adviser’s practices regarding brokerage and portfolio transactions were satisfactory.
(7) The Adviser’s practices regarding conflicts of interest. The Trustees evaluated the potential for conflicts of interest and considered such matters as the experience and ability of the advisory personnel assigned to the Fund; the basis of decisions to buy or sell securities for the Fund and the Adviser’s other accounts; the method for bunching of portfolio securities transactions; and the substance and administration of the Adviser’s code of ethics. Following further consideration and discussion, the Board indicated that the Adviser’s standards and practices relating to the identification and mitigation of potential conflicts of interests were satisfactory.
| 48 | 1.888.926.2688 | www.apollo.com |
| Apollo Diversified Real Estate Fund | Additional Information |
March 31, 2022 (Unaudited)
Having requested and received such information from the Adviser as the Trustees believed to be reasonably necessary to evaluate the terms of the New Management Agreement, the Board, including the Independent Trustees, approved the New Management Agreement and voted to recommend it to the shareholders of the Fund for approval.
4. TRUSTEES’ CONSIDERATION AND APPROVAL OF ADVISORY AGREEMENT WITH CENTERSQUARE INVESTMENT MANAGEMENT LLC
At meetings of the Board on December 22, 2021 and December 28, 2021, the Board, including the Independent Trustees, discussed and approved a new Investment Sub-Advisory Agreement (the “New CenterSquare Agreement”) between the Adviser and CenterSquare Investment Management LLC (“CenterSquare”). The Board, including the Independent Trustees, concluded that approval of the New CenterSquare Agreement was in the best interests of the Fund and its shareholders.
In connection with the December 22, 2021 and December 28, 2021 Board meetings and in accordance with Section 15(c) of the 1940 Act, the Board requested, and the Adviser and CenterSquare provided, materials relating to the Board’s consideration of whether to approve the New Sub-Advisory Agreement. This included a description of the Transaction and its anticipated effects on CenterSquare. The Board noted that the services provided under the New CenterSquare Agreement will be identical to those provided under the prior investment sub-advisory agreement for the Fund between the Adviser and CenterSquare (the “Prior CenterSquare Agreement”). In addition, the sub-advisory fee under the New CenterSquare Agreement will remain the same as the sub-advisory fee under the Prior CenterSquare Agreement. CenterSquare confirmed that under the New CenterSquare Agreement that it anticipated that there would be no diminution in services provided by CenterSquare to the Fund or changes in the fee payable by the Adviser to CenterSquare as a result of the Transaction.
In considering whether to approve the New CenterSquare Agreement, the Trustees reviewed and considered the information they deemed reasonably necessary, including the following material factors discussed in further detail below: (1) the nature, extent, and quality of the services to be provided by CenterSquare; (2) the investment performance of the Fund and CenterSquare; (3) the costs of the services to be provided and profits to be realized by CenterSquare and its affiliates from the relationship with the Fund; (4) the extent to which economies of scale would be realized as the Fund grows and whether sub-advisory fee levels reflect those economies of scale for the benefit of the Fund’s investors; (5) CenterSquare’s practices regarding brokerage and portfolio transactions; and (6) CenterSquare’s practices regarding possible conflicts of interest.
The Trustees also reviewed a memorandum from the Fund’s legal counsel that summarized the fiduciary duties and responsibilities of the Board in reviewing and approving the New CenterSquare Agreement, including the types of information and factors that should be considered in order to make an informed decision.
(1) The nature, extent, and quality of the services to be provided by CenterSquare. The Board received and considered information regarding the fact that the nature, extent and quality of services to be provided to the Fund by CenterSquare under the New CenterSquare Agreement are the same as under the Prior CenterSquare Agreement and are not expected to change as a result of the Transaction. The Trustees considered the responsibilities of CenterSquare under the New CenterSquare Agreement and reviewed the services provided to the Fund including, without limitation, CenterSquare’s procedures for formulating investment recommendations and assuring compliance with the Fund’s investment objectives and limitations, coordination of services for the Fund among the Fund’s service providers, and efforts to promote the Fund, grow the Fund’s assets, and assist in the distribution of Fund shares. The Trustees noted that CenterSquare assists the Adviser in seeking to achieve the Fund’s investment objective to generate a return comprised of both current income and capital appreciation with moderate volatility and low correlation to the broader markets, through pursuing strategic investing across private institutional real estate investment funds as well as a diversified set of public real estate securities. The Trustees also noted that CenterSquare seeks to invest the Fund’s assets across a diversified set of public real estate securities. The Board concluded that the Fund would continue to benefit from the quality and experience of CenterSquare’s investment professionals that will continue to provide services to the Fund after the Transaction as employees of CenterSquare. After reviewing the foregoing information and further information in the memorandum from CenterSquare (e.g., CenterSquare’s Form ADV and descriptions of the firm’s business and compliance program), the Board concluded that the nature, extent, and quality of the services provided by CenterSquare were satisfactory and appropriate for the Fund.
(2) The investment performance of the Fund and CenterSquare. The Trustees discussed the performance of the public real estate related securities portion of the Fund. The Trustees noted the Fund’s continued strong performance in the period since inception and recalled their deliberations relating to the Adviser. The Board agreed that they should consider the performance of the Fund as a whole in reviewing this factor and noted that Adviser continued to be satisfied with CenterSquare’s performance. After reviewing these considerations, the Board concluded that the investment performance of CenterSquare was satisfactory.
| Semi-Annual Report | March 31, 2022 | 49 |
| Apollo Diversified Real Estate Fund | Additional Information |
March 31, 2022 (Unaudited)
(3) The costs of the services to be provided by CenterSquare. The Trustees evaluated the overall expenses of the Fund, including the nature and frequency of advisory and sub-advisory fee payments. The Trustees also considered potential benefits for CenterSquare in providing services to the Fund. The Trustees noted that the Adviser paid the fee to CenterSquare out of its management fee, agreeing that, accordingly, the Fund’s overall management fee and expenses was the appropriate vehicle to compare to other funds. The Board also noted that CenterSquare represented that the sub-advisory fee being charged to the Fund was a material discount from its standard fee schedule. The Board recalled their deliberations relating to the Adviser’s cost of services. Following further consideration and discussion of the foregoing, the Board concluded that the fees to be paid to CenterSquare by the Fund were fair and reasonable in relation to the nature and quality of the services provided by CenterSquare and that they reflected charges that were within a range of what could have been negotiated at arm’s length.
(4) The profits to be realized by CenterSquare and its affiliates from the relationship with the Fund. The Trustees reviewed CenterSquare’s profitability analysis in connection with its management of the Fund and noted that CenterSquare earned what the Board considered to be a reasonable profit from its relationship with the Fund. The Board concluded that CenterSquare’s profitability was not excessive.
(5) The extent to which economies of scale would be realized as the Fund grows and whether the advisory fee levels reflect these economies of scale for benefit of the Fund’s investors. The Trustees considered that the Fund’s fee arrangements with CenterSquare and noted that the sub-advisory fee contained break points, which caused the Adviser to pay lower fees to CenterSquare based on higher asset levels. Following further discussion of the Fund’s current and projected asset levels, expectations for growth, and levels of fees, the Board determined that the Fund’s fee arrangements were fair and reasonable in relation to the nature and quality of the services provided by CenterSquare.
(6) CenterSquare’s practices regarding brokerage and portfolio transactions. The Trustees reviewed CenterSquare standards, and performance in utilizing those standards, for seeking best execution for Fund portfolio transactions. The Trustees also considered the portfolio turnover rate for the Fund; the process by which evaluations are made of the overall reasonableness of commissions paid; the method and basis for selecting and evaluating the broker-dealers used; any anticipated allocation of portfolio business to persons affiliated with CenterSquare; and the extent to which the Fund allocates portfolio business to broker-dealers who provide research, statistical, or other services (“soft dollars”). After further review and discussion, the Board determined that CenterSquare’s practices regarding brokerage and portfolio transactions were satisfactory.
(7) CenterSquare’s practices regarding conflicts of interest. The Trustees evaluated the potential for conflicts of interest and considered such matters as the experience and ability of the advisory personnel assigned to the Fund; the basis of decisions to buy or sell securities for the Fund and CenterSquare’s other accounts; the method for bunching of portfolio securities transactions; and the substance and administration of CenterSquare’s code of ethics. Following further consideration and discussion, the Board indicated that CenterSquare’s standards and practices relating to the identification and mitigation of potential conflicts of interests were satisfactory.
Having requested and received such information from CenterSquare as the Trustees believed to be reasonably necessary to evaluate the terms of the New CenterSquare Agreement, the Board, including the Independent Trustees, approved the New CenterSquare Agreement and voted to recommend it to the shareholders of the Fund for approval.
5. TRUSTEES’ CONSIDERATION AND APPROVAL OF ADVISORY AGREEMENT WITH AON INVESTMENTS USA INC.
At meetings of the Board on December 22, 2021 and December 28, 2021, the Board, including the Independent Trustees, discussed and approved a new Investment Sub-Advisory Agreement (the “New Aon Agreement”) between the Adviser and Aon Investments USA Inc. (“Aon”). The Board, including the Independent Trustees, concluded that approval of the New Aon Agreement was in the best interests of the Fund and its shareholders.
In connection with the December 22, 2021 and December 28, 2021 Board meetings and in accordance with Section 15(c) of the 1940 Act, the Board requested, and the Adviser and Aon provided, materials relating to the Board’s consideration of whether to approve the New Sub-Advisory Agreement. This included a description of the Transaction and its anticipated effects on Aon. The Board noted that the services provided under the New Aon Agreement will be identical to those provided under the prior investment sub-advisory agreement for the Fund between the Adviser and Aon (the “Prior Aon Agreement”). In addition, the sub-advisory fee under the New Aon Agreement will remain the same as the sub-advisory fee under the Prior Aon Agreement. Aon confirmed to the Board that it anticipated that under the New Aon Agreement there would be no diminution in services provided by Aon to the Fund or changes in the fee payable by the Adviser to Aon as a result of the Transaction.
In considering whether to approve the New Aon Agreement, the Trustees reviewed and considered the information they deemed reasonably necessary, including the following material factors discussed in further detail below: (1) the nature, extent, and quality of the services to be provided by Aon; (2) the investment performance of the Fund and Aon; (3) the costs of the services to be provided and profits to be realized by Aon and its affiliates from the relationship with the Fund; (4) the extent to which economies of scale would be realized as the Fund grows and whether sub-advisory fee levels reflect those economies of scale for the benefit of the Fund’s investors; (5) Aon’s practices regarding brokerage and portfolio transactions; and (6) Aon’s practices regarding possible conflicts of interest.
| 50 | 1.888.926.2688 | www.apollo.com |
| Apollo Diversified Real Estate Fund | Additional Information |
March 31, 2022 (Unaudited)
The Trustees also reviewed a memorandum from the Fund’s legal counsel that summarized the fiduciary duties and responsibilities of the Board in reviewing and approving the New Aon Agreement, including the types of information and factors that should be considered in order to make an informed decision.
(1) The nature, extent, and quality of the services to be provided by Aon. The Board received and considered information regarding the fact that the nature, extent and quality of services to be provided to the Fund by Aon under the New Aon Agreement are the same as under the Prior Aon Agreement and are not expected to change as a result of the Transaction. The Trustees considered the responsibilities of Aon under the New Aon Agreement and reviewed the services provided to the Fund including, without limitation, Aon’s procedures for formulating investment recommendations and assuring compliance with the Fund’s investment objectives and limitations, coordination of services for the Fund among the Fund’s service providers, and efforts to promote the Fund, grow the Fund’s assets, and assist in the distribution of Fund shares. The Trustees noted that Aon supports the Adviser in seeking to achieve the Fund’s investment objective to generate a return comprised of both current income and capital appreciation with moderate volatility and low correlation to the broader markets, through pursuing strategic investing across private institutional real estate investment funds. The Board also noted that Aon provides data and information utilized by the Adviser in investing across a diversified set of investment managers and strategies as well as to provide investment exposure across property types and geographies. The Trustees observed the fact that Aon had added significant experience and talent to its team through a recent acquisition. The Board noted the preliminary results of an examination of the firm and that the findings did not relate to the services provided to the Fund. After reviewing the foregoing information and further information in the memorandum from Aon (e.g., Aon’s Form ADV and descriptions of Aon’s business and compliance program), the Board concluded that the nature, extent, and quality of the services provided by Aon were satisfactory.
(2) The investment performance of the Fund and Aon. The Trustees discussed the performance of the private investments portion of the Fund. The Trustees noted the Fund’s continued strong performance in the period since inception and recalled their deliberations relating to the Adviser. The Board agreed that they should consider the performance of the Fund as a whole in reviewing this factor and noted that Adviser continued to be satisfied with Aon’s performance and the data provided.
(3) The costs of the services to be provided by Aon. The Trustees evaluated the overall expenses of the Fund, including the nature and frequency of advisory and sub-advisory fee payments. The Trustees also considered potential benefits for Aon in managing the Fund, including promotion of Aon’s name. The Trustees noted that the Adviser paid the fee to Aon out of its management fee, agreeing that, accordingly, the Fund’s overall management fee and expenses was the appropriate vehicle to compare to other funds. The Board recalled their deliberations relating to the Adviser’s cost of services. Following further consideration and discussion of the foregoing, the Board concluded that the fees to be paid to Aon indirectly by the Fund were fair and reasonable in relation to the nature and quality of the services provided by Aon and that they reflected charges that were within a range of what could have been negotiated at arm’s length.
(4) The profits to be realized by Aon and its affiliates from the relationship with the Fund. The Trustees reviewed Aon’s profitability analysis in connection with its management of the Fund and noted that Aon earned what the Board considered to be a reasonable profit from its relationship with the Fund. The Board concluded that Aon’s profitability was not excessive.
(5) The extent to which economies of scale would be realized as the Fund grows and whether the advisory fee levels reflect these economies of scale for benefit of the Fund’s investors. The Trustees considered that the Fund’s fee arrangements with Aon and noted that the sub-advisory fee contained break points, which caused the Adviser to pay lower fees to Aon based on higher asset levels. Following further discussion of the Fund’s current and projected asset levels, expectations for growth, and levels of fees, the Board determined that the Fund’s fee arrangements were fair and reasonable in relation to the nature and quality of the services provided by Aon.
(6) Aon’s practices regarding brokerage and portfolio transactions. The Trustees reviewed Aon’s standards for seeking best execution for portfolio transactions. The Trustees noted that Aon does not execute trades on behalf of the Fund, and, therefore, no commissions were paid for the portion of the portfolio for which Aon provided services After further review and discussion, the Board determined that Aon’s practices regarding brokerage and portfolio transactions were satisfactory.
(7) Aon’s practices regarding conflicts of interest. The Trustees evaluated the potential for conflicts of interest and considered such matters as the experience and ability of the advisory personnel assigned to the Fund; the basis of decisions to buy or sell securities for the Fund and Aon’s other accounts; the method for bunching of portfolio securities transactions; and the substance and administration of Aon’s code of ethics. Following further consideration and discussion, the Board indicated that Aon’s standards and practices relating to the identification and mitigation of potential conflicts of interests were satisfactory.
Having requested and received such information from Aon as the Trustees believed to be reasonably necessary to evaluate the terms of the New Aon Agreement, the Board, including the Independent Trustees, approved the New Aon Agreement and voted to recommend it to the shareholders of the Fund for approval.
| Semi-Annual Report | March 31, 2022 | 51 |
| Apollo Diversified Real Estate Fund | Service Providers |
March 31, 2022 (Unaudited)
Investment Adviser
Apollo Real Estate Fund Adviser, LLC
9 W 57th Street, New York, NY 10019
Investment Sub-Advisers
Aon Investments USA Inc.
200 East Randolph Street, Suite 1500, Chicago, IL 60601
CenterSquare Investment Management LLC
630 West Germantown Pike, Suite 300, Plymouth Meeting, PA 19462
Administrator
ALPS Fund Services, Inc.
1290 Broadway, Suite 1000, Denver, CO 80203
Custodian
UMB Bank, n.a.
1010 Grand Blvd., Kansas City, Missouri 64106
Distributor
ALPS Distributors, Inc.
1290 Broadway, Suite 1000, Denver, CO 80203
Independent Registered Public Accounting Firm
BBD, LLP
1835 Market Street, 3rd Floor, Philadelphia, PA 19103
Legal Counsel
Greenberg Traurig, LLP
Terminus 200, 3333 Piedmont Road NE, Suite 2500, Atlanta, GA 30305
Transfer Agent and DRIP Administrator
DST Systems, Inc.
330 W 9th Street, Kansas City, MO 64105
| 52 | 1.888.926.2688 | www.apollo.com |
| Apollo Diversified Real Estate Fund | Privacy Notice |
March 31, 2022 (Unaudited)
NOTICE OF PRIVACY POLICY & PRACTICES
Apollo Diversified Real Estate Fund (the “Fund”) is committed to maintaining the confidentiality, integrity, and security of your nonpublic personal information (“NPI”). When you provide personal information, the Fund believes that you should be aware of policies utilized to protect the confidentiality of that information. The Fund needs to share your NPI to conduct everyday business. The following information is intended to help you understand what NPI we collect, how we protect your NPI from unauthorized access and why the Fund may share your NPI with other affiliated and non-affiliated parties.
The Fund collects the following nonpublic personal information about you:
| ● | Information we receive from you on or in applications or other forms, correspondence, or conversations, including, but not limited to, your name, address, phone number, social security number, assets, income, and date of birth; and |
| ● | Information about your transactions with us, our affiliates, or others, including, but not limited to, your account number and balance, payments history, parties to transactions, cost basis information, and other financial information. |
How does the Fund protect your nonpublic personal information?
To protect your nonpublic personal information from unauthorized access and use, the Fund maintains physical, electronic and procedural safeguards that comply with applicable federal and state standards. These measures include computer safeguards and secured files and buildings.
What does the Fund do with your personal information?
The Fund does not permit use of your personal information for any joint marketing or non-business purpose. Further, the Fund does not permit the disclosure of your personal information to non-affiliated parties for marketing purposes. The Fund may, however, disclose your personal information to comply with regulatory requirements, court orders or other legal requirements.
Affiliated Parties
The Fund does not disclose any nonpublic personal information about our current or former shareholders to affiliated parties, except as permitted by applicable law or regulation and as described herein. The Fund may, for example, share NPI with personnel of the Fund’s investment adviser and affiliated broker-dealer which also serves as the Fund’s exclusive wholesale marketing agent. The Fund shares NPI with its affiliates for business purposes only in an effort to service your account(s) which includes, but is not limited to, assisting in processing your transactions, inquiring about your transactions and experience, sending you shareholder reports and other information about the Fund or to otherwise provide the applicable service and maintain your account(s). The Fund’s affiliated parties that receive your NPI are required to protect your NPI, provide it only to personnel who need and use it solely for the purpose for which they received it. The Fund and its affiliated parties that receive your NPI maintain physical, electronic and procedural safeguards that comply with applicable federal and state standards to guard your NPI.
Non-Affiliated Parties
The Fund does not disclose any nonpublic personal information about our current or former shareholders to non-affiliated third parties, except as permitted by applicable law or regulation and as described herein. The Fund may share NPI with non-affiliated service providers and their employees, including the Fund’s administrator, transfer agent, distributor, proxy solicitors and legal counsel, among others. The Fund shares NPI with its non-affiliated service providers to service your account(s) including, but not limited to, processing your transactions, sending you shareholder reports and other information about the Fund or to otherwise provide the applicable service and maintain your account(s). These non-affiliated service providers are required to protect your NPI and use it solely for the purpose for which they received it. The non-affiliated service providers are required to maintain physical, electronic and procedural safeguards that comply with applicable federal and state standards to guard your NPI.
| Semi-Annual Report | March 31, 2022 | 53 |

Item 2. Code of Ethics.
Not applicable.
Item 3. Audit Committee Financial Expert.
Not applicable.
Item 4. Principal Accountant Fees and Services.
Not applicable.
Item 5. Audit Committee of Listed Registrants.
The Fund is not a listed issuer as defined in Rule 10A-3 under the Securities Exchange Act of 1934, as amended.
Item 6. Investments.
| (a) | The Schedule of Investments is included as part of the Report to Stockholders filed under Item 1 of this report. |
| (b) | Not applicable to the Fund. |
Item 7. Disclosure of Proxy Voting Policies and Procedures for Closed-End Management Investment Companies.
Not applicable.
Item 8. Portfolio Managers of Closed-End Management Investment Companies.
Item 9. Purchases of Equity Securities by Closed-End Management Investment Company and Affiliated Purchasers.
None.
Item 10. Submission of Matters to a Vote of Security Holders.
No changes have occurred.
Item 11. Controls and Procedures.
| (a) | Based on an evaluation of the Fund’s disclosure controls and procedures (as defined in Rule 30a-3(c) under the 1940 Act), the Registrant’s principal executive officer and principal financial officer have concluded that the Registrant’s disclosure controls and procedures are effective as of a date within 90 days of the filing date of this report. |
| (b) | There were no significant changes in the Fund’s internal control over financial reporting that occurred during the Fund’s last fiscal half-year that have materially affected, or are reasonably likely to materially affect, the Fund’s internal control over financial reporting. |
Item 12. Disclosure of Securities Lending Activities for Closed-End Management Investment Companies.
None.
Item 13. Exhibits.
SIGNATURES
Pursuant to the requirements of the Securities Exchange Act of 1934 and the Investment Company Act of 1940, the Registrant has duly caused this report to be signed on its behalf by the undersigned, thereunto duly authorized.
APOLLO DIVERSIFIED REAL ESTATE FUND
| By: | /s/ Randy Anderson | |
| | Randy Anderson | |
| | Chairman and President (Principal Executive Officer) | |
| | | |
| Date: | June 6, 2022 | |
Pursuant to the requirements of the Securities Exchange Act of 1934 and the Investment Company Act of 1940, this report has been signed below by the following persons on behalf of the Registrant and in the capacities and on the dates indicated.
By (Signature and Title)
| By: | /s/ Randy Anderson | |
| | Randy Anderson | |
| | Chairman and President (Principal Executive Officer) | |
| | | |
| Date: | June 6, 2022 | |
By (Signature and Title)
| By: | /s/ Kenneth Seifert | |
| | Kenneth Seifert | |
| | Treasurer and Chief Financial Officer (Principal Financial Officer) |
| | | |
| Date: | June 6, 2022 | |