UNITED STATES
SECURITIES AND EXCHANGE COMMISSION
Washington, D.C. 20549
FORM N-CSR
CERTIFIED SHAREHOLDER REPORT OF REGISTERED
MANAGEMENT INVESTMENT COMPANIES
| Investment Company Act file number | 811-22960 | |
| Eubel Brady & Suttman Mutual Fund Trust |
| (Exact name of registrant as specified in charter) |
| 225 Pictoria Drive, Suite 450 | Cincinnati, Ohio 45246 |
| (Address of principal executive offices) | (Zip code) |
Carol J. Highsmith
| 225 Pictoria Drive, Suite 450 Cincinnati, Ohio 45246 |
| (Name and address of agent for service) |
| Registrant's telephone number, including area code: | (513) 587-3400 | |
| Date of fiscal year end: | July 31 | |
| | | |
| Date of reporting period: | July 31, 2023 | |
Form N-CSR is to be used by management investment companies to file reports with the Commission not later than 10 days after the transmission to stockholders of any report that is required to be transmitted to stockholders under Rule 30e-1 under the Investment Company Act of 1940 (17 CFR 270.30e-1). The Commission may use the information provided on Form N-CSR in its regulatory, disclosure review, inspection, and policymaking roles.
A registrant is required to disclose the information specified by Form N-CSR, and the Commission will make this information public. A registrant is not required to respond to the collection of information contained in Form N-CSR unless the Form displays a currently valid Office of Management and Budget (“OMB”) control number. Please direct comments concerning the accuracy of the information collection burden estimate and any suggestions for reducing the burden to Secretary, Securities and Exchange Commission, 450 Fifth Street, NW, Washington, DC 20549-0609. The OMB has reviewed this collection of information under the clearance requirements of 44 U.S.C. § 3507.
Item 1. Reports to Stockholders.
| |
| |
| |
| |
| |
| |
| |
| |
| |
| |
 |
| |
| |
| |
| |
| Eubel Brady & Suttman |
| Income and Appreciation Fund |
| Ticker Symbol: EBSZX |
| |
| |
| |
| Eubel Brady & Suttman |
| Income Fund |
| Ticker Symbol: EBSFX |
| |
| |
| |
| Each a series of the |
| Eubel Brady & Suttman Mutual Fund Trust |
| |
| |
| |
| |
| |
| ANNUAL REPORT |
| |
| July 31, 2023 |
| |
| |
| |
| |
| |
| |
| |
| |
| |
| |
| |
| |
| |
| |
| |
| |
| EUBEL BRADY & SUTTMAN MUTUAL FUND TRUST | |
| LETTER TO OUR SHAREHOLDERS | July 31, 2023 |
| | |
Dear Shareholders:
The Federal Reserve (the “Fed”) continued aggressively increasing interest rates during the first half of the fiscal year ended July 31, 2023, in its pursuit of a 2% average rate of inflation. The second half of the fiscal year brought four, more modest, rate increases of 0.25% each as isolated cases of stress surfaced within the banking system. Fiscal year over fiscal year, the Fed Funds target range increased from 2.25% - 2.50% to 5.25% - 5.50% marking a difficult stretch for fixed-income. We are pleased with how each Fund weathered the storm.
While the Fed has had both feet firmly on the brake pedal for roughly a year and a half, Congress has been pushing on the accelerator via the Infrastructure Investment and Jobs Act, the Creating Helpful Incentives to Produce Semiconductors and Science Act and the Inflation Reduction Act. Estimated spending from these three bills totals around $2 trillion. Supply chain issues have largely improved, but incentive driven demand is outstripping supply in certain areas, contributing to ongoing pricing pressures.
We discuss the year in more detail, review our investment philosophy and results, and share our perspective below. We welcome your questions, comments or both. Feel free to give us a call anytime (800-391-1223).
A Review of the 2023 Fiscal Year –
Interest Rates & Inflation – The Fed increased interest rates a total of seven times during the fiscal year, driving the yield curve inversion (i.e. 10-Year Treasury yielding less than the 2-Year Treasury) from -0.23% on July 31, 2022, to -0.91% on July 31, 2023. Going back to 1980, there have been three prolonged inversions with an average duration of 12 months. The average peak inversion was -0.39%. The current inversion is going on roughly one year and is deeper. Inverted yield curves often portend economic weakness.
Beginning in January 2023, there was seemingly a disconnect between the markets and the Fed. Markets took on a positive tone due to improving inflation data and slowing growth which led to a consensus that rate increases would be smaller and that the Fed may begin cutting rates later in calendar year 2023.
This perspective was contrary to the Fed’s messaging that subduing inflation could be a longer process.
Bank Failures – However, the failure of Silicon Valley Bank (“SVB”), which was caused by an old fashioned “bank run” when customers recognized its compromised balance sheet, as well as other isolated bank failures, emulated monetary tightening that in turn ultimately caused the Fed to take a more measured approach which it continued at period end.
In the case of SVB, management’s thirst for deposit growth via higher yielding deposit offerings and its attempt to offset those costs by investing in longer term bonds created a significant mismatch of its assets and liabilities. As interest rates rose, the value of the assets (bonds) declined, negatively impacting SVB’s equity. When depositors withdrew an estimated $42B in a single day, unrecognized paper
losses became realized, and the bank was undercapitalized. The Federal Deposit Insurance Corporation (“FDIC”) shuttered SVB and seized its deposits soon thereafter in the second largest bank collapse in U.S. history.
Although the number of failures was isolated, increased banking regulations are almost certain to result.
Investment Philosophy – Managing risks so that investors are being adequately compensated for them is an important element of our bottom-up investment philosophy. Flexibility in portfolio management can support long -term success, in our view. As such, each Fund has latitude with respect to maturity, duration (price sensitivity to a change in interest rates) and credit quality (among other factors) which allows us to invest where we find the most value.
Importantly, since we are not managing to a specific maturity or duration target, we can and often do hold bonds to maturity. We believe this provides our Funds an advantage over those which are more constrained and are constantly repositioning their portfolio to stay within a specific mandate.
Furthermore, with the Funds’ investor base being comprised of EBS clients, fund flows are considerably more stable than those of funds open to the general public. This, too, can provide the Funds advantages relative to those which may have assets under management fluctuate wildly on the whims of unknown investors’ emotions. For example, when investors exit a fund en masse during a time of panic, it can result in forced selling at an inopportune time. However, this same event can provide investment opportunities for investors with capital available (e.g., the Funds).
Each Fund held around 50 securities at fiscal year-end but maintained good diversification, in our view. We are inclined to generally hold fewer rather than more securities. We believe this allows us to be more selective and provide closer oversight.
The composition of the EBS Funds will often be materially different than their benchmarks. You should expect their returns to diverge from the benchmarks – at times significantly. Lastly, neither Fund uses leverage (borrows money) to make investments.
Results For Various Periods Ended July 31, 2023 – Since inception (September 30, 2014) through July 31, 2023, the EBS Income and Appreciation Fund (“EBSZX”) posted a total annualized return of 2.91%, while its primary benchmark, the ICE BofA U.S. Yield Alternatives Index, returned 3.72%. On a five-year basis, the Fund returned 3.11% and the benchmark 4.32%. On a three-year basis, the Fund returned 3.24% and the benchmark 3.35%. On a one-year basis, the Fund returned 3.24% and the benchmark returned 10.24%. Lastly, on a six-month basis, the Fund returned 1.23% and the benchmark returned 4.47%.
The primary factors contributing to EBSZX’s underperformance, relative to its benchmark, in all periods are described below:
| ● | EBSZX is generally not as volatile as its benchmark due to its allocation to less equity sensitive convertible securities and straight corporate bonds. |
| ● | EBSZX did not rebound as swiftly as its more equity sensitive benchmark which experienced sharper declines during calendar year 2022. |
Although we increased EBSZX’s convertible exposure from 35.7% at the beginning of the fiscal year to 50.6% at the end, it remains well positioned to add additional convertible exposure as opportunities arise.
Since inception (September 30, 2014) through July 31, 2023, the EBS Income Fund (“EBSFX”) logged a total annualized return of 1.93%, while its primary benchmark, the ICE BofA U.S. Corporate & Government Master Index was up 1.36%. On a five-year basis, the Fund returned 1.94% and the benchmark 0.96%. On a three-year basis, the Fund returned 0.80% and the benchmark -4.85%. On a one-year basis, the Fund returned 1.46% and the benchmark -3.08%. Lastly, on a six-month basis, the Fund returned 0.95% and the benchmark -0.82%.
The primary factors contributing to EBSFX’s outperformance, relative to its benchmark, in all periods are described below:
| ● | EBSFX outpaced its benchmark, in part, because of its shorter duration. As yields rose, the longer duration and more interest rate sensitive benchmark contracted at a faster rate. |
Our Perspective – Although inflation has come down markedly from its 2022 peak, it is proving stickier than many prognosticators forecasted a year ago. We believe this is in part due to the stimulative nature of recent legislation. This may result in the Fed increasing rates a few more times before easing off its rate hiking campaign. Barring any economic shocks thereafter, it would be typical for the Fed to hold rates steady for a period of time before ultimately lowering them to boost the economy after a period of slower economic growth.
Markets have not absorbed the full impact of higher interest rates yet, in our view. Sporadic bouts of volatility in the coming quarters would not surprise us and we are excited by the opportunities it can produce for the Funds. Additionally, we believe the Funds are positioned well to benefit from the higher interest rate environment and a period of slowing rate hikes.
We appreciate your trust and confidence in our firm.
Sincerely,
The EBS Research Group
Important Disclosures – Performance data quoted in this letter or the report itself represents past performance. Past performance does not guarantee future results. The value of an investor’s shares will fluctuate, and may be worth more or less than the original cost when redeemed. Current performance may be higher or lower than performance quoted herein. Performance data, current to the most recent month end, is available by calling 1-800-391-1223.
The information in this “Letter To Our Shareholders” represents the opinion of the author and is not intended to be a forecast or investment advice. This publication does not constitute an offer or solicitation of any transaction in any securities. Information contained in this publication has been obtained from sources believed to be reliable, but has not been independently verified by EBS. Please note that any discussion of fund holdings, fund performance and views expressed are as of July 31, 2023 (except if otherwise stated) and are subject to change without notice.
| EUBEL BRADY & SUTTMAN INCOME AND APPRECIATION FUND |
| PERFORMANCE INFORMATION |
| July 31, 2023 (Unaudited) |
| |
Comparison of the Change in Value of a $10,000 Investment in
Eubel Brady & Suttman Income and Appreciation Fund versus the
ICE BofA U.S. Yield Alternatives Index, the ICE BofA U.S. Total Return Alternatives Index
and the ICE BofA 1-10 Year Corporate Index
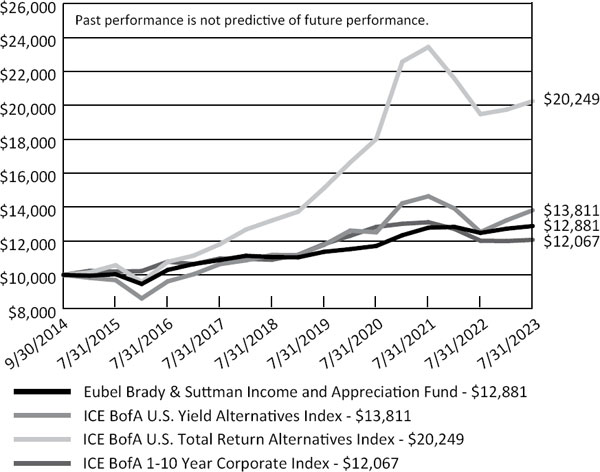
Average Annual Total Returns(a)
For the periods ended July 31, 2023
| | | 1 Year | | 5 Years | | Since
Inception(b) |
| Eubel Brady & Suttman Income and Appreciation Fund | | 3.24% | | 3.11% | | 2.91% |
| ICE BofA U.S. Yield Alternatives Index* | | 10.24% | | 4.32% | | 3.72% |
| ICE BofA U.S. Total Return Alternatives Index* | | 3.92% | | 8.92% | | 8.31% |
| ICE BofA 1-10 Year Corporate Index* | | 0.42% | | 2.06% | | 2.15% |
| (a) | Total return is a measure of the change in value of an investment in the Fund over the periods covered, which assumes dividends or distributions, if any, are reinvested in shares of the Fund. |
| (b) | Represents the period from the commencement of operations (September 30, 2014) through July 31, 2023. |
| * | The ICE BofA U.S. Yield Alternatives Index tracks the performance of U.S. dollar denominated convertible debt. The ICE BofA U.S. Total Return Alternatives Index tracks the performance of U.S. dollar denominated convertible debt with more equity sensitivity than typically found in the Yield Alternatives Index, on average. The ICE BofA 1-10 Year Corporate Index tracks the performance of U.S. dollar denominated investment grade corporate debt publicly issued in the U.S. domestic market with a remaining term to final maturity less than 10 years. The Fund does not invest solely in securities included in these indices and may invest in other types of securities. |
The performance in the chart represents past performance. Performance shown above does not reflect the deduction of taxes a shareholder would pay on fund distributions or the redemption of shares. Current performance may be higher or lower than the performance data presented above. Investment return and principal value will fluctuate; shares, when redeemed, may be worth more or less than their original cost. As presented in the Fund’s prospectus dated December 1, 2022, the Fund’s total operating expense ratio was 0.27% of the Fund’s average daily net assets. Each Index is unmanaged and does not reflect the deduction of fees associated with a mutual fund. The Fund’s performance reflects the deduction of these fees. Investors cannot invest directly in an index.
| EUBEL BRADY & SUTTMAN INCOME FUND |
| PERFORMANCE INFORMATION |
| July 31, 2023 (Unaudited) |
| |
Comparison of the Change in Value of a $10,000 Investment in
Eubel Brady & Suttman Income Fund versus
the ICE BofA U.S. Corporate & Government Master Index and
the ICE BofA U.S. Corporate & Government 1-10 Yrs Index
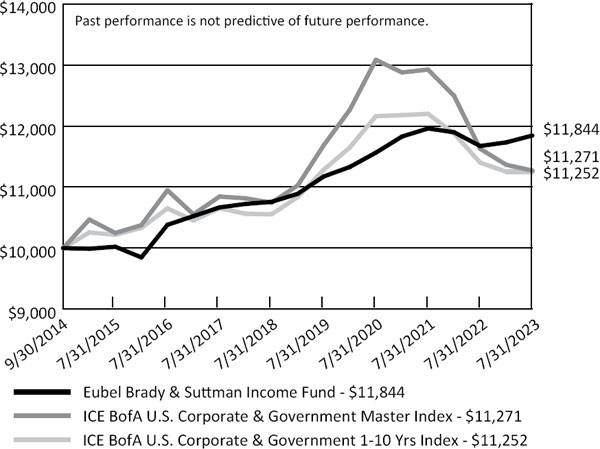
Average Annual Total Returns(a)
For the periods ended July 31, 2023
| | | 1 Year | | 5 Years | | Since
Inception(b) |
| Eubel Brady & Suttman Income Fund | | 1.46% | | 1.94% | | 1.93% |
| ICE BofA U.S. Corporate & Government Master Index* | | -3.08% | | 0.96% | | 1.36% |
| ICE BofA U.S. Corporate & Government 1-10 Yrs Index* | | -1.31% | | 1.29% | | 1.34% |
| (a) | Total return is a measure of the change in value of an investment in the Fund over the periods covered, which assumes dividends or distributions, if any, are reinvested in shares of the Fund. |
| (b) | Represents the period from the commencement of operations (September 30, 2014) through July 31, 2023. |
| * | The ICE BofA U.S. Corporate & Government Master Index tracks the performance of U.S. dollar denominated investment grade debt publicly issued in the U.S. domestic market, including U.S. Treasury, U.S. agency, foreign government, supranational and corporate securities. The ICE BofA U.S. Corporate & Government 1-10 Yrs Index tracks the performance of U.S. dollar denominated investment grade debt publicly issued in the U.S. domestic market, including U.S. Treasury, U.S. agency, foreign government, supranational and corporate securities with a remaining term to final maturity less than 10 years. The Fund does not invest solely in securities included in these indices and may invest in other types of securities. |
The performance in the chart represents past performance. Performance shown above does not reflect the deduction of taxes a shareholder would pay on fund distributions or the redemption of shares. Current performance may be higher or lower than the performance data presented above. Investment return and principal value will fluctuate; shares, when redeemed, may be worth more or less than their original cost. As presented in the Fund’s prospectus dated December 1, 2022, the Fund’s total operating expense ratio was 0.20% of the Fund’s average daily net assets. Each Index is unmanaged and does not reflect the deduction of fees associated with a mutual fund. The Fund’s performance reflects the deduction of these fees. Investors cannot invest directly in an index.
| EUBEL BRADY & SUTTMAN MUTUAL FUND TRUST |
| PORTFOLIO INFORMATION |
| July 31, 2023 (Unaudited) |
| |
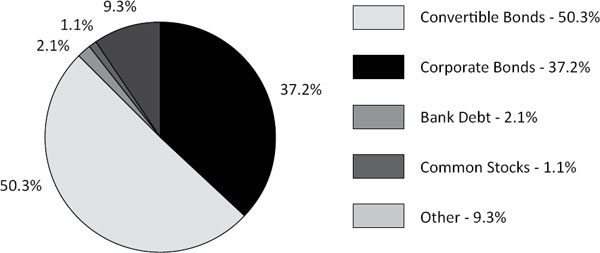
Eubel Brady & Suttman Income and Appreciation Fund
Asset Allocation (% of Net Assets)
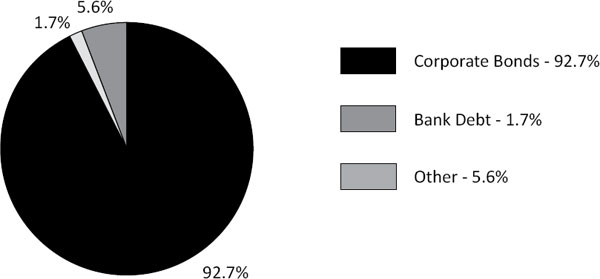
Eubel Brady & Suttman Income Fund
Asset Allocation (% of Net Assets)
| EUBEL BRADY & SUTTMAN INCOME AND APPRECIATION FUND |
| SCHEDULE OF INVESTMENTS |
| July 31, 2023 |
| CORPORATE BONDS — 37.2% | | Coupon | | Maturity | | Par Value | | | Value | |
| Communications — 2.0% | | | | | | | | | | | | |
| Discovery Communications, LLC | | 3.800% | | 03/13/24 | | $ | 2,085,000 | | | $ | 2,054,702 | |
| Discovery Communications, LLC | | 3.950% | | 06/15/25 | | | 1,000,000 | | | | 963,041 | |
| | | | | | | | | | | | 3,017,743 | |
| Consumer Staples — 1.9% | | | | | | | | | | | | |
| Kroger Company (The) | | 3.850% | | 08/01/23 | | | 1,000,000 | | | | 1,000,000 | |
| Kroger Company (The) | | 2.650% | | 10/15/26 | | | 2,000,000 | | | | 1,858,875 | |
| | | | | | | | | | | | 2,858,875 | |
| Energy — 0.6% | | | | | | | | | | | | |
| Exxon Mobil Corporation | | 3.043% | | 03/01/26 | | | 1,000,000 | | | | 955,592 | |
| | | | | | | | | | | | | |
| Financials — 15.6% | | | | | | | | | | | | |
| Bank of America Corporation (TSFR3M + 396.661, effective 09/05/24) (a)(b) | | 6.250% | | 03/05/65 | | | 2,000,000 | | | | 1,981,400 | |
| Bank OZK (TSFR3M + 209, effective 10/01/26) (a) | | 2.750% | | 10/01/31 | | | 4,130,000 | | | | 3,185,882 | |
| Charles Schwab Corporation (The) | | 0.900% | | 03/11/26 | | | 3,000,000 | | | | 2,664,731 | |
| CNG Holdings, Inc., 144A | | 12.500% | | 06/15/24 | | | 2,700,000 | | | | 2,264,083 | |
| First Maryland Capital I (TSFR3M + 126.161) (a) | | 6.570% | | 01/15/27 | | | 2,000,000 | | | | 1,828,501 | |
| Markel Corporation (H15T5Y + 566.2, effective 06/01/25) (a)(b) | | 6.000% | | 12/31/99 | | | 5,000,000 | | | | 4,857,907 | |
| NCP SNIP (c)(d) | | 13.500% | | 12/31/25 | | | 1,800,000 | | | | 1,697,076 | |
| Southern Bancshares (N.C.), Inc., 144A (TSFR3M + 241, effective 6/30/26) (a) | | 3.125% | | 06/30/31 | | | 2,200,000 | | | | 1,696,365 | |
| Truist Financial Corporation (TSFR3M + 93.161) (a) | | 5.991% | | 05/15/27 | | | 2,000,000 | | | | 1,810,000 | |
| Wells Fargo & Company | | 3.750% | | 01/24/24 | | | 1,895,000 | | | | 1,876,903 | |
| | | | | | | | | | | | 23,862,848 | |
| Health Care — 8.4% | | | | | | | | | | | | |
| Danaher Corporation | | 2.200% | | 11/15/24 | | | 1,492,000 | | | | 1,432,603 | |
| Laboratory Corporation of America Holdings | | 3.600% | | 02/01/25 | | | 4,500,000 | | | | 4,370,408 | |
| McKesson Corporation | | 0.900% | | 12/03/25 | | | 3,900,000 | | | | 3,520,580 | |
| Thermo Fisher Scientific, Inc. | | 1.215% | | 10/18/24 | | | 3,600,000 | | | | 3,417,290 | |
| | | | | | | | | | | | 12,740,881 | |
See accompanying notes to financial statements.
| EUBEL BRADY & SUTTMAN INCOME AND APPRECIATION FUND |
| SCHEDULE OF INVESTMENTS (Continued) |
| CORPORATE BONDS — 37.2% (Continued) | | Coupon | | Maturity | | Par Value | | | Value | |
| Industrials — 3.6% | | | | | | | | | | | | |
| Huntington Ingalls Industries, Inc. | | 0.670% | | 08/16/23 | | $ | 3,500,000 | | | $ | 3,492,340 | |
| Penske Truck Leasing Company, L.P., 144A | | 4.125% | | 08/01/23 | | | 1,130,000 | | | | 1,130,000 | |
| Republic Services, Inc. | | 2.500% | | 08/15/24 | | | 849,000 | | | | 822,106 | |
| | | | | | | | | | | | 5,444,446 | |
| Materials — 3.4% | | | | | | | | | | | | |
| Ball Corporation | | 4.000% | | 11/15/23 | | | 2,000,000 | | | | 1,982,289 | |
| DowDuPont, Inc. | | 4.493% | | 11/15/25 | | | 1,345,000 | | | | 1,319,827 | |
| Steel Dynamics, Inc. | | 2.800% | | 12/15/24 | | | 2,000,000 | | | | 1,914,177 | |
| | | | | | | | | | | | 5,216,293 | |
| Utilities — 1.7% | | | | | | | | | | | | |
| American Electric Power Company, Inc. | | 2.031% | | 03/15/24 | | | 2,680,000 | | | | 2,615,785 | |
| | | | | | | | | | | | | |
| Total Corporate Bonds (Cost $60,528,924) | | | | | | | | | | $ | 56,712,463 | |
| | | | | | | | | | | | | |
| CONVERTIBLE BONDS — 50.3% | | Coupon | | Maturity | | Par Value | | | Value | |
| Communications — 13.0% | | | | | | | | | | | | |
| Airbnb, Inc. | | 0.000% | | 03/15/26 | | $ | 6,000,000 | | | $ | 5,397,000 | |
| Dish Network Corporation | | 2.375% | | 03/15/24 | | | 2,000,000 | | | | 1,835,000 | |
| Dish Network Corporation | | 0.000% | | 12/15/25 | | | 4,000,000 | | | | 2,437,726 | |
| Spotify USA, Inc. | | 0.000% | | 03/15/26 | | | 6,000,000 | | | | 5,100,000 | |
| TripAdvisor, Inc. | | 0.250% | | 04/01/26 | | | 6,000,000 | | | | 5,067,000 | |
| | | | | | | | | | | | 19,836,726 | |
| Consumer Discretionary — 17.1% | | | | | | | | | | | | |
| Chegg, Inc. | | 0.125% | | 03/15/25 | | | 3,000,000 | | | | 2,640,000 | |
| Chegg, Inc. | | 0.000% | | 09/01/26 | | | 3,000,000 | | | | 2,245,500 | |
| Etsy, Inc. | | 0.125% | | 09/01/27 | | | 3,000,000 | | | | 2,632,820 | |
| Etsy, Inc. | | 0.250% | | 06/15/28 | | | 4,000,000 | | | | 3,232,000 | |
| Ford Motor Company | | 0.000% | | 03/15/26 | | | 5,000,000 | | | | 5,125,000 | |
| Guess Inc., 144A | | 3.750% | | 04/15/28 | | | 5,000,000 | | | | 5,160,446 | |
| Patrick Industries, Inc. | | 1.750% | | 12/01/28 | | | 5,000,000 | | | | 5,060,000 | |
| | | | | | | | | | | | 26,095,766 | |
| Financials — 6.5% | | | | | | | | | | | | |
| Ares Capital Corporation | | 4.625% | | 03/01/24 | | | 2,000,000 | | | | 2,036,250 | |
| Prospect Capital Corporation | | 6.375% | | 03/01/25 | | | 3,272,000 | | | | 3,244,907 | |
| Redwood Trust, Inc. | | 4.750% | | 08/15/23 | | | 4,700,000 | | | | 4,647,898 | |
| | | | | | | | | | | | 9,929,055 | |
See accompanying notes to financial statements.
| EUBEL BRADY & SUTTMAN INCOME AND APPRECIATION FUND |
| SCHEDULE OF INVESTMENTS (Continued) |
| CONVERTIBLE BONDS — 50.3% (Continued) | | Coupon | | Maturity | | Par Value | | | Value | |
| Technology — 13.7% | | | | | | | | | | | | |
| Bentley Systems, Inc. | | 0.125% | | 01/15/26 | | $ | 5,000,000 | | | $ | 5,100,687 | |
| DocuSign, Inc. | | 0.000% | | 01/15/24 | | | 6,000,000 | | | | 5,849,969 | |
| Envestnet, Inc. | | 0.750% | | 08/15/25 | | | 5,500,000 | | | | 5,073,750 | |
| Guidewire Software, Inc. | | 1.250% | | 03/15/25 | | | 5,000,000 | | | | 4,912,500 | |
| | | | | | | | | | | | 20,936,906 | |
| | | | | | | | | | | | | |
| Total Convertible Bonds (Cost $78,192,691) | | | | | | | | | | $ | 76,798,453 | |
| | | | | | | | | | | | | |
| BANK DEBT — 2.1% | | Coupon | | Maturity | | Par Value | | | Value | |
| Financials — 2.1% | | | | | | | | | | | | |
| NCP SPV Texas, L.P. Revolving Loan (Prime + 225) (a)(c)(d) (Cost $3,117,290) | | 10.500% | | 09/22/24 | | $ | 3,117,290 | | | $ | 3,250,604 | |
| | | | | | | | | | | | | |
| COMMON STOCKS — 1.1% | | | | | | Shares | | | Value | |
| Financials — 1.1% | | | | | | | | | | | | |
| Capital One Financial Corporation | | | | | | $ | 9,904 | | | $ | 1,158,966 | |
| Lincoln National Corporation | | | | | | | 15,673 | | | | 439,471 | |
| Total Common Stocks (Cost $934,971) | | | | | | | | | | | 1,598,437 | |
See accompanying notes to financial statements.
| EUBEL BRADY & SUTTMAN INCOME AND APPRECIATION FUND |
| SCHEDULE OF INVESTMENTS (Continued) |
| MONEY MARKET FUNDS — 8.7% | | Shares | | | Value | |
| Invesco Short-Term Investments Trust - Treasury Portfolio - Institutional Class, 5.24% (e) (Cost $13,299,422) | | | 13,299,422 | | | $ | 13,299,422 | |
| | | | | | | | | |
| Total Investments at Value — 99.4% (Cost $156,073,298) | | | | | | $ | 151,659,379 | |
| | | | | | | | | |
| Other Assets in Excess of Liabilities — 0.6% | | | | | | | 957,473 | |
| | | | | | | | | |
| Net Assets — 100.0% | | | | | | $ | 152,616,852 | |
| 144A - | Security was purchased in a transaction exempt from registration in compliance with Rule 144A of the Securities Act of 1933. This security may be resold in transactions exempt from registration, normally to qualified institutional buyers. The total value of such securities is $10,250,894 as of July 31, 2023, representing 6.7% of net assets. |
| | |
| H15T5Y - | U.S. Treasury yield curve rate for U.S. Treasury note with a constant maturity of 5 years. |
| | |
| TSFR - | CME Term Secured Overnight Financing Rate (SOFR). |
| | |
| (a) | Variable rate security. Interest rate resets periodically. The rate shown is the effective interest rate as of July 31, 2023. For securities based on a published reference rate and spread, the reference rate and spread (in basis points) are indicated parenthetically. |
| (b) | Security has a perpetual maturity. |
| (c) | Illiquid security. The total fair value of these securities as of July 31, 2023 was $4,947,680 representing 3.2% of net assets. |
| (d) | Security has been valued using significant unobservable inputs in good faith by the Adviser in conformity with guidelines adopted by and subject to review by the Board of Trustees. The total value of such securities is $4,947,680 as of July 31, 2023, representing 3.2% of net assets. |
| (e) | The rate shown is the 7-day effective yield as of July 31, 2023. |
See accompanying notes to financial statements.
| EUBEL BRADY & SUTTMAN INCOME FUND |
| SCHEDULE OF INVESTMENTS |
| July 31, 2023 (Unaudited) |
| CORPORATE BONDS — 92.7% | | Coupon | | Maturity | | Par Value | | | Value | |
| Communications — 5.6% | | | | | | | | | | | | |
| Discovery Communications, LLC | | 3.950% | | 06/15/25 | | $ | 6,851,000 | | | $ | 6,597,792 | |
| Discovery Communications, LLC | | 4.900% | | 03/11/26 | | | 4,000,000 | | | | 3,937,248 | |
| Verisign, Inc. | | 5.250% | | 04/01/25 | | | 5,000,000 | | | | 4,960,892 | |
| Verisign, Inc. | | 4.750% | | 07/15/27 | | | 6,000,000 | | | | 5,926,593 | |
| | | | | | | | | | | | 21,422,525 | |
| Consumer Discretionary — 6.2% | | | | | | | | | | | | |
| General Motors Financial Company, Inc. | | 4.350% | | 01/17/27 | | | 2,100,000 | | | | 2,021,297 | |
| LKQ Corporation, 144A | | 5.750% | | 06/15/28 | | | 11,000,000 | | | | 10,933,450 | |
| Marriott International, Inc., Series KK | | 4.900% | | 04/15/29 | | | 11,000,000 | | | | 10,781,081 | |
| | | | | | | | | | | | 23,735,828 | |
| Consumer Staples — 7.5% | | | | | | | | | | | | |
| J.M. Smucker Company (The) | | 3.375% | | 12/15/27 | | | 8,500,000 | | | | 7,961,736 | |
| Kroger Company (The) | | 2.650% | | 10/15/26 | | | 11,098,000 | | | | 10,314,899 | |
| Mondelez International, Inc. | | 2.125% | | 03/17/24 | | | 10,544,000 | | | | 10,305,453 | |
| | | | | | | | | | | | 28,582,088 | |
| Energy — 1.0% | | | | | | | | | | | | |
| AEP Texas Central Company, Series G, 144A | | 3.850% | | 10/01/25 | | | 3,750,000 | | | | 3,588,157 | |
| | | | | | | | | | | | | |
| Financials — 26.8% | | | | | | | | | | | | |
| American Express Company | | 2.250% | | 03/04/25 | | | 11,500,000 | | | | 10,921,948 | |
| Bank of America Corporation | | 4.200% | | 08/26/24 | | | 4,500,000 | | | | 4,422,829 | |
| Bank of America Corporation (TSFR3M + 396.661, effective 09/05/24) (a)(b) | | 6.250% | | 03/05/65 | | | 9,450,000 | | | | 9,362,115 | |
| Bank OZK (TSFR3M + 209, effective 10/01/26) (a) | | 2.750% | | 10/01/31 | | | 12,250,000 | | | | 9,449,650 | |
| Charles Schwab Corporation (The) | | 0.900% | | 03/11/26 | | | 12,000,000 | | | | 10,658,922 | |
| CNG Holdings, Inc., 144A | | 12.500% | | 06/15/24 | | | 4,300,000 | | | | 3,605,762 | |
| First Maryland Capital I (TSFR3M + 126.161) (a) | | 6.570% | | 01/15/27 | | | 5,000,000 | | | | 4,571,253 | |
| Loews Corporation | | 3.750% | | 04/01/26 | | | 12,000,000 | | | | 11,591,248 | |
| Markel Corporation (H15T5Y + 566.2, effective 06/01/25) (a)(b) | | 6.000% | | 12/31/99 | | | 10,000,000 | | | | 9,715,815 | |
| Morgan Stanley, Series I (SOFR + 166.9, effective 07/17/25) (a) | | 4.679% | | 07/17/26 | | | 8,000,000 | | | | 7,840,007 | |
See accompanying notes to financial statements.
| EUBEL BRADY & SUTTMAN INCOME FUND |
| SCHEDULE OF INVESTMENTS (Continued) |
| CORPORATE BONDS — 92.7% (Continued) | | Coupon | | Maturity | | Par Value | | | Value | |
| Financials — 26.8% (Continued) | | | | | | | | | | | | |
| NCP SNIP (c)(d) | | 13.500% | | 12/31/25 | | $ | 5,725,000 | | | $ | 5,397,644 | |
| Southern Bancshares (N.C.), Inc., 144A (TSFR3M + 241 effective 6/30/26) (a) | | 3.125% | | 06/30/31 | | | 5,800,000 | | | | 4,472,234 | |
| Truist Financial Corporation (TSFR3M + 93.161) (a) | | 5.991% | | 05/15/27 | | | 5,788,000 | | | | 5,238,140 | |
| Wells Fargo & Company, Series Q | | 4.150% | | 01/24/29 | | | 5,000,000 | | | | 4,737,912 | |
| | | | | | | | | | | | 101,985,479 | |
| Health Care — 19.8% | | | | | | | | | | | | |
| AmerisourceBergen Corporation | | 3.400% | | 05/15/24 | | | 6,000,000 | | | | 5,887,754 | |
| Danaher Corporation | | 2.200% | | 11/15/24 | | | 858,000 | | | | 823,843 | |
| Edwards Lifesciences Corporation | | 4.300% | | 06/15/28 | | | 11,400,000 | | | | 11,045,786 | |
| Humana, Inc. | | 3.950% | | 03/15/27 | | | 4,500,000 | | | | 4,314,704 | |
| Laboratory Corporation of America Holdings | | 3.600% | | 02/01/25 | | | 13,500,000 | | | | 13,111,223 | |
| McKesson Corporation | | 0.900% | | 12/03/25 | | | 12,065,000 | | | | 10,891,230 | |
| Stryker Corporation | | 3.375% | | 11/01/25 | | | 2,530,000 | | | | 2,429,366 | |
| Stryker Corporation | | 3.650% | | 03/07/28 | | | 6,000,000 | | | | 5,706,667 | |
| Thermo Fisher Scientific, Inc. | | 1.215% | | 10/18/24 | | | 10,815,000 | | | | 10,266,110 | |
| Zimmer Biomet Holdings, Inc. | | 1.450% | | 11/22/24 | | | 11,500,000 | | | | 10,891,749 | |
| | | | | | | | | | | | 75,368,432 | |
| Industrials — 9.7% | | | | | | | | | | | | |
| Penske Truck Leasing Company, L.P., 144A | | 5.700% | | 02/01/28 | | | 11,000,000 | | | | 10,883,611 | |
| Raytheon Technology Corporation | | 3.950% | | 08/16/25 | | | 9,775,000 | | | | 9,549,032 | |
| Roper Technologies, Inc. | | 3.800% | | 12/15/26 | | | 4,933,000 | | | | 4,725,475 | |
| Timken Company (The) | | 4.500% | | 12/15/28 | | | 12,433,000 | | | | 11,860,514 | |
| | | | | | | | | | | | 37,018,632 | |
| Materials — 7.8% | | | | | | | | | | | | |
| Ball Corporation | | 4.000% | | 11/15/23 | | | 2,000,000 | | | | 1,982,289 | |
| Ball Corporation | | 5.250% | | 07/01/25 | | | 8,836,000 | | | | 8,758,095 | |
| Kennametal, Inc. | | 4.625% | | 06/15/28 | | | 3,600,000 | | | | 3,433,567 | |
| Sherwin-Williams Company (The) | | 3.450% | | 06/01/27 | | | 5,000,000 | | | | 4,731,133 | |
| Steel Dynamics, Inc. | | 2.800% | | 12/15/24 | | | 11,271,000 | | | | 10,787,344 | |
| | | | | | | | | | | | 29,692,428 | |
See accompanying notes to financial statements.
| EUBEL BRADY & SUTTMAN INCOME FUND |
| SCHEDULE OF INVESTMENTS (Continued) |
| CORPORATE BONDS — 92.7% (Continued) | | Coupon | | Maturity | | Par Value | | | Value | |
| Technology — 8.3% | | | | | | | | | | | | |
| Fidelity National Information Services, Inc. | | 4.700% | | 07/15/27 | | $ | 5,000,000 | | | $ | 4,902,123 | |
| Hewlett Packard Enterprise Company | | 4.900% | | 10/15/25 | | | 11,231,000 | | | | 11,100,999 | |
| Keysight Technologies, Inc. | | 4.600% | | 04/06/27 | | | 3,614,000 | | | | 3,560,609 | |
| Micron Technology, Inc. | | 6.750% | | 11/01/29 | | | 5,000,000 | | | | 5,247,153 | |
| Western Digital Corporation | | 4.750% | | 02/15/26 | | | 7,000,000 | | | | 6,684,308 | |
| | | | | | | | | | | | 31,495,192 | |
| | | | | | | | | | | | | |
| Total Corporate Bonds (Cost $368,190,263) | | | | | | | | | | $ | 352,888,761 | |
| | | | | | | | | | | | | |
| BANK DEBT — 1.7% | | Coupon | | Maturity | | Par Value | | | Value | |
| Financials — 1.7% | | | | | | | | | | | | |
| NCP SPV Texas, L.P. Revolving Loan (Prime + 225) (a)(c)(d) (Cost $6,329,042) | | 10.500% | | 09/22/24 | | $ | 6,329,042 | | | $ | 6,599,710 | |
See accompanying notes to financial statements.
| EUBEL BRADY & SUTTMAN INCOME FUND |
| SCHEDULE OF INVESTMENTS (Continued) |
| MONEY MARKET FUNDS — 4.6% | | Shares | | | Value | |
| Invesco Short-Term Investments Trust - Treasury Portfolio - Institutional Class, 5.24% (e) (Cost $17,636,445) | | | 17,636,445 | | | $ | 17,636,445 | |
| | | | | | | | | |
| Total Investments at Value — 99.0% (Cost $392,155,750) | | | | | | $ | 377,124,916 | |
| | | | | | | | | |
| Other Assets in Excess of Liabilities — 1.0% | | | | | | | 3,727,223 | |
| | | | | | | | | |
| Net Assets — 100.0% | | | | | | $ | 380,852,139 | |
| 144A - | Security was purchased in a transaction exempt from registration in compliance with Rule 144A of the Securities Act of 1933. This security may be resold in transactions exempt from registration, normally to qualified institutional buyers. The total value of such securities is $33,483,214 as of July 31, 2023, representing 8.8% of net assets. |
| | |
| H15T5Y - | U.S. Treasury yield curve rate for U.S. Treasury note with a constant maturity of 5 years. |
| | |
| SOFR - | Secured Overnight Financing Rate. |
| | |
| TSFR - | CME Term SOFR. |
| | |
| (a) | Variable rate security. Interest rate resets periodically. The rate shown is the effective interest rate as of July 31, 2023. For securities based on a published reference rate and spread, the reference rate and spread (in basis points) are indicated parenthetically. |
| (b) | Security has a perpetual maturity. |
| (c) | Illiquid security. The total fair value of these securities as of July 31, 2023 was $11,997,354 representing 3.2% of net assets. |
| (d) | Security has been valued using significant unobservable inputs in good faith by the Adviser in conformity with guidelines adopted by and subject to review by the Board of Trustees. The total value of such securities is $11,997,354 as of July 31, 2023, representing 3.2% of net assets. |
| (e) | The rate shown is the 7-day effective yield as of July 31, 2023. |
See accompanying notes to financial statements.
| EUBEL BRADY & SUTTMAN MUTUAL FUND TRUST |
| STATEMENTS OF ASSETS AND LIABILITIES |
| July 31, 2023 |
| | | Eubel Brady | | | | |
| | | & Suttman | | | | |
| | | Income and | | | Eubel Brady | |
| | | Appreciation | | | & Suttman | |
| | | Fund | | | Income Fund | |
| ASSETS | | | | | | | | |
| Investments in securities: | | | | | | | | |
| At cost | | $ | 156,073,298 | | | $ | 392,155,750 | |
| At value (Note 2) | | | 151,659,379 | | | | 377,124,916 | |
| Receivable for capital shares sold | | | 8,414 | | | | 18,237 | |
| Dividends and interest receivable | | | 967,552 | | | | 3,777,053 | |
| Other assets | | | 15,162 | | | | 20,145 | |
| Total assets | | | 152,650,507 | | | | 380,940,351 | |
| | | | | | | | | |
| LIABILITIES | | | | | | | | |
| Distributions payable | | | 212 | | | | 1,252 | |
| Payable for capital shares redeemed | | | 6,485 | | | | 32,417 | |
| Payable to administrator (Note 4) | | | 12,780 | | | | 29,040 | |
| Accrued shareholder servicing fees (Note 6) | | | 5,110 | | | | 12,660 | |
| Other accrued expenses | | | 9,068 | | | | 12,843 | |
| Total liabilities | | | 33,655 | | | | 88,212 | |
| | | | | | | | | |
| NET ASSETS | | $ | 152,616,852 | | | $ | 380,852,139 | |
| | | | | | | | | |
| NET ASSETS CONSIST OF: | | | | | | | | |
| Paid-in capital | | $ | 156,636,808 | | | $ | 404,634,906 | |
| Accumulated deficit | | | (4,019,956 | ) | | | (23,782,767 | ) |
| NET ASSETS | | $ | 152,616,852 | | | $ | 380,852,139 | |
| | | | | | | | | |
| Shares of beneficial interest outstanding (unlimited number of shares authorized, no par value) | | | 16,038,325 | | | | 40,821,363 | |
| | | | | | | | | |
| Net asset value, offering price and redemption price per share (Note 2) | | $ | 9.52 | | | $ | 9.33 | |
See accompanying notes to financial statements.
| EUBEL BRADY & SUTTMAN MUTUAL FUND TRUST |
| STATEMENTS OF OPERATIONS |
| For the Year Ended July 31, 2023 |
| | | Eubel Brady | | | | |
| | | & Suttman | | | | |
| | | Income and | | | Eubel Brady | |
| | | Appreciation | | | & Suttman | |
| | | Fund | | | Income Fund | |
| INVESTMENT INCOME | | | | | | | | |
| Dividends | | $ | 542,145 | | | $ | 472,416 | |
| Interest | | | 5,582,156 | | | | 13,831,096 | |
| Total investment income | | | 6,124,301 | | | | 14,303,512 | |
| | | | | | | | | |
| EXPENSES | | | | | | | | |
| Administration fees (Note 4) | | | 129,598 | | | | 327,411 | |
| Shareholder servicing fees (Note 6) | | | 59,330 | | | | 147,955 | |
| Registration and filing fees | | | 31,842 | | | | 33,908 | |
| Legal fees | | | 24,588 | | | | 24,588 | |
| Custody and bank service fees | | | 12,717 | | | | 31,045 | |
| Audit and tax services fees | | | 18,826 | | | | 18,826 | |
| Trustees’ fees and expenses (Note 4) | | | 16,586 | | | | 16,586 | |
| Insurance expense | | | 7,380 | | | | 17,286 | |
| Pricing fees | | | 6,569 | | | | 6,964 | |
| Shareholder reporting expenses | | | 6,588 | | | | 6,588 | |
| Postage and supplies | | | 2,729 | | | | 2,637 | |
| Federal excise taxes | | | 426 | | | | — | |
| Other expenses | | | 5,856 | | | | 6,688 | |
| Total expenses | | | 323,035 | | | | 640,482 | |
| | | | | | | | | |
| NET INVESTMENT INCOME | | | 5,801,266 | | | | 13,663,030 | |
| | | | | | | | | |
| REALIZED AND UNREALIZED GAINS (LOSSES) ON INVESTMENTS | | | | | | | | |
| Net realized gains (losses) from investment transactions | | | 503,667 | | | | (4,661,213 | ) |
| Net change in unrealized appreciation (depreciation) on investments | | | (1,401,240 | ) | | | (3,438,547 | ) |
| NET REALIZED AND UNREALIZED LOSSES ON INVESTMENTS | | | (897,573 | ) | | | (8,099,760 | ) |
| | | | | | | | | |
| NET INCREASE IN NET ASSETS RESULTING FROM OPERATIONS | | $ | 4,903,693 | | | $ | 5,563,270 | |
See accompanying notes to financial statements.
| EUBEL BRADY & SUTTMAN INCOME AND APPRECIATION FUND |
| STATEMENTS OF CHANGES IN NET ASSETS |
| | | Year | | | Year | |
| | | Ended | | | Ended | |
| | | July 31, | | | July 31, | |
| | | 2023 | | | 2022 | |
| FROM OPERATIONS | | | | | | | | |
| Net investment income | | $ | 5,801,266 | | | $ | 2,978,778 | |
| Net realized gains from investment transactions | | | 503,667 | | | | 1,854,866 | |
| Net change in unrealized appreciation (depreciation) on investments | | | (1,401,240 | ) | | | (7,773,072 | ) |
| Net increase (decrease) in net assets resulting from operations | | | 4,903,693 | | | | (2,939,428 | ) |
| | | | | | | | | |
| DISTRIBUTIONS TO SHAREHOLDERS (Note 2) | | | (6,837,115 | ) | | | (5,164,807 | ) |
| | | | | | | | | |
| CAPITAL SHARE TRANSACTIONS | | | | | | | | |
| Proceeds from shares sold | | | 46,279,196 | | | | 17,375,902 | |
| Net asset value of shares issued in reinvestment of distributions to shareholders | | | 6,834,369 | | | | 5,162,068 | |
| Payments for shares redeemed | | | (19,444,937 | ) | | | (11,736,847 | ) |
| Net increase in net assets from capital share transactions | | | 33,668,628 | | | | 10,801,123 | |
| | | | | | | | | |
| TOTAL INCREASE IN NET ASSETS | | | 31,735,206 | | | | 2,696,888 | |
| | | | | | | | | |
| NET ASSETS | | | | | | | | |
| Beginning of year | | | 120,881,646 | | | | 118,184,758 | |
| End of year | | $ | 152,616,852 | | | $ | 120,881,646 | |
| | | | | | | | | |
| CAPITAL SHARES ACTIVITY | | | | | | | | |
| Shares sold | | | 4,830,649 | | | | 1,740,824 | |
| Shares reinvested | | | 722,749 | | | | 514,934 | |
| Shares redeemed | | | (2,044,408 | ) | | | (1,175,439 | ) |
| Net increase in shares outstanding | | | 3,508,990 | | | | 1,080,319 | |
| Shares outstanding at beginning of year | | | 12,529,335 | | | | 11,449,016 | |
| Shares outstanding at end of year | | | 16,038,325 | | | | 12,529,335 | |
See accompanying notes to financial statements.
| EUBEL BRADY & SUTTMAN INCOME FUND |
| STATEMENTS OF CHANGES IN NET ASSETS |
| | | Year | | | Year | |
| | | Ended | | | Ended | |
| | | July 31, | | | July 31, | |
| | | 2023 | | | 2022 | |
| FROM OPERATIONS | | | | | | | | |
| Net investment income | | $ | 13,663,030 | | | $ | 6,812,563 | |
| Net realized losses from investment transactions | | | (4,661,213 | ) | | | (1,575,872 | ) |
| Net change in unrealized appreciation (depreciation) on investments | | | (3,438,547 | ) | | | (13,945,763 | ) |
| Net increase (decrease) in net assets resulting from operations | | | 5,563,270 | | | | (8,709,072 | ) |
| | | | | | | | | |
| DISTRIBUTIONS TO SHAREHOLDERS (Note 2) | | | (13,663,699 | ) | | | (6,829,373 | ) |
| | | | | | | | | |
| CAPITAL SHARE TRANSACTIONS | | | | | | | | |
| Proceeds from shares sold | | | 85,137,219 | | | | 159,438,628 | |
| Net asset value of shares issued in reinvestment of distributions to shareholders | | | 13,650,744 | | | | 6,821,872 | |
| Payments for shares redeemed | | | (60,591,352 | ) | | | (111,505,198 | ) |
| Net increase in net assets from capital share transactions | | | 38,196,611 | | | | 54,755,302 | |
| | | | | | | | | |
| TOTAL INCREASE IN NET ASSETS | | | 30,096,182 | | | | 39,216,857 | |
| | | | | | | | | |
| NET ASSETS | | | | | | | | |
| Beginning of year | | | 350,755,957 | | | | 311,539,100 | |
| End of year | | $ | 380,852,139 | | | $ | 350,755,957 | |
| | | | | | | | | |
| CAPITAL SHARES ACTIVITY | | | | | | | | |
| Shares sold | | | 9,055,097 | | | | 16,288,700 | |
| Shares reinvested | | | 1,459,944 | | | | 702,812 | |
| Shares redeemed | | | (6,458,022 | ) | | | (11,479,894 | ) |
| Net increase in shares outstanding | | | 4,057,019 | | | | 5,511,618 | |
| Shares outstanding at beginning of year | | | 36,764,344 | | | | 31,252,726 | |
| Shares outstanding at end of year | | | 40,821,363 | | | | 36,764,344 | |
See accompanying notes to financial statements.
| EUBEL BRADY & SUTTMAN INCOME AND APPRECIATION FUND |
| FINANCIAL HIGHLIGHTS |
Per Share Data for a Share Outstanding Throughout Each Year
| | | Year Ended | | | Year Ended | | | Year Ended | | | Year Ended | | | Year Ended | |
| | | July 31, | | | July 31, | | | July 31, | | | July 31, | | | July 31, | |
| | | 2023 | | | 2022 | | | 2021 | | | 2020 | | | 2019 | |
| Net asset value at beginning of year | | $ | 9.65 | | | $ | 10.32 | | | $ | 9.76 | | | $ | 9.81 | | | $ | 9.86 | |
| Income (loss) from investment operations: | | | | | | | | | | | | | | | | | | | | |
| Net investment income | | | 0.37 | | | | 0.25 | | | | 0.26 | | | | 0.34 | | | | 0.32 | |
| Net realized and unrealized gains (losses) on investments | | | (0.07 | ) | | | (0.49 | ) | | | 0.63 | | | | (0.05 | ) | | | (0.05 | ) |
| Total from investment operations | | | 0.30 | | | | (0.24 | ) | | | 0.89 | | | | 0.29 | | | | 0.27 | |
| Less distributions from: | | | | | | | | | | | | | | | | | | | | |
| Net investment income | | | (0.37 | ) | | | (0.25 | ) | | | (0.27 | ) | | | (0.34 | ) | | | (0.32 | ) |
| Net realized gains on investments | | | (0.06 | ) | | | (0.18 | ) | | | (0.06 | ) | | | — | | | | — | |
| Total distributions | | | (0.43 | ) | | | (0.43 | ) | | | (0.33 | ) | | | (0.34 | ) | | | (0.32 | ) |
| Net asset value at end of year | | $ | 9.52 | | | $ | 9.65 | | | $ | 10.32 | | | $ | 9.76 | | | $ | 9.81 | |
| Total return (a) | | | 3.24 | % | | | (2.39 | %) | | | 9.20 | % | | | 3.04 | % | | | 2.82 | % |
| Net assets at end of year (000’s) | | $ | 152,617 | | | $ | 120,882 | | | $ | 118,185 | | | $ | 101,634 | | | $ | 88,796 | |
| Ratios/supplementary data: | | | | | | | | | | | | | | | | | | | | |
| Ratio of total expenses to average net assets | | | 0.22 | % | | | 0.25 | % | | | 0.26 | % | | | 0.27 | % | | | 0.27 | % |
| Ratio of net investment income to average net assets | | | 3.91 | % | | | 2.47 | % | | | 2.59 | % | | | 3.48 | % | | | 3.24 | % |
| Portfolio turnover rate | | | 23 | % | | | 33 | % | | | 50 | % | | | 45 | % | | | 16 | % |
| (a) | Total return is a measure of the change in value of an investment in the Fund over the periods covered, which assumes any dividends or capital gains distributions are reinvested in shares of the Fund. The returns shown do not reflect the deduction of taxes a shareholder would pay on Fund distributions or the redemption of Fund shares. |
See accompanying notes to financial statements.
| EUBEL BRADY & SUTTMAN INCOME FUND |
| FINANCIAL HIGHLIGHTS |
Per Share Data for a Share Outstanding Throughout Each Year
| | | Year Ended | | | Year Ended | | | Year Ended | | | Year Ended | | | Year Ended | |
| | | July 31, | | | July 31, | | | July 31, | | | July 31, | | | July 31, | |
| | | 2023 | | | 2022 | | | 2021 | | | 2020 | | | 2019 | |
| Net asset value at beginning of year | | $ | 9.54 | | | $ | 9.97 | | | $ | 9.85 | | | $ | 9.86 | | | $ | 9.82 | |
| Income (loss) from investment operations: | | | | | | | | | | | | | | | | | | | | |
| Net investment income | | | 0.34 | | | | 0.19 | | | | 0.21 | | | | 0.35 | | | | 0.33 | |
| Net realized and unrealized gains (losses) on investments | | | (0.21 | ) | | | (0.43 | ) | | | 0.12 | | | | (0.01 | ) | | | 0.04 | |
| Total from investment operations | | | 0.13 | | | | (0.24 | ) | | | 0.33 | | | | 0.34 | | | | 0.37 | |
| Less distributions from net investment income | | | (0.34 | ) | | | (0.19 | ) | | | (0.21 | ) | | | (0.35 | ) | | | (0.33 | ) |
| Net asset value at end of year | | $ | 9.33 | | | $ | 9.54 | | | $ | 9.97 | | | $ | 9.85 | | | $ | 9.86 | |
| Total return (a) | | | 1.46 | % | | | (2.40 | %) | | | 3.43 | % | | | 3.49 | % | | | 3.86 | % |
| Net assets at end of year (000’s) | | $ | 380,852 | | | $ | 350,756 | | | $ | 311,539 | | | $ | 203,495 | | | $ | 200,716 | |
| Ratios/supplementary data: | | | | | | | | | | | | | | | | | | | | |
| Ratio of total expenses to average net assets | | | 0.17 | % | | | 0.18 | % | | | 0.20 | % | | | 0.21 | % | | | 0.20 | % |
| Ratio of net investment income to average net assets | | | 3.69 | % | | | 2.01 | % | | | 2.13 | % | | | 3.51 | % | | | 3.37 | % |
| Portfolio turnover rate | | | 40 | % | | | 50 | % | | | 33 | % | | | 27 | % | | | 19 | % |
| (a) | Total return is a measure of the change in value of an investment in the Fund over the periods covered, which assumes any dividends or capital gains distributions are reinvested in shares of the Fund. The returns shown do not reflect the deduction of taxes a shareholder would pay on Fund distributions or the redemption of Fund shares. |
See accompanying notes to financial statements.
| EUBEL BRADY & SUTTMAN MUTUAL FUND TRUST |
| NOTES TO FINANCIAL STATEMENTS |
| July 31, 2023 |
Eubel Brady & Suttman Income and Appreciation Fund (“EBS Income and Appreciation Fund”) and Eubel Brady & Suttman Income Fund (“EBS Income Fund”) (individually, a “Fund” and collectively, the “Funds”) are each a no-load diversified series of Eubel Brady & Suttman Mutual Fund Trust (the “Trust”), an open-end management investment company organized as an Ohio business trust on April 22, 2014.
The investment objective of EBS Income and Appreciation Fund is to provide total return through a combination of current income and capital appreciation.
The investment objective of EBS Income Fund is to preserve capital, produce income and maximize total return.
| 2. | Significant Accounting Policies |
The Funds follow accounting and reporting guidance under Financial Accounting Standards Board (“FASB”) Accounting Standards Codification Topic 946, “Financial Services – Investment Companies,” including Accounting Standards Update 2013-08. The following is a summary of significant accounting policies followed by the Funds. These policies are in conformity with accounting principles generally accepted in the United States of America (“GAAP”).
Securities Valuation — Securities that are traded on any stock exchange are generally valued at the last quoted sale price. Lacking a last sale price, an exchange traded security is generally valued at its last bid price. Securities traded on NASDAQ are generally valued at the NASDAQ Official Closing Price. Investments representing shares of other open-end investment companies, including money market funds, are valued at their net asset value (“NAV”) as reported by such companies. The Funds typically use an independent pricing service to determine the value of their fixed income securities. The pricing service utilizes electronic data processing techniques based on yield spreads relating to securities with similar characteristics to determine prices for normal institutional-size trading units of fixed income securities without regard to sale or bid prices. Commercial paper may be valued at amortized cost, which under normal circumstances approximates market value.
If Eubel Brady & Suttman Asset Management, Inc. (the “Adviser”), the investment adviser to the Funds and the Valuation Designee, determines that a price provided by the pricing service does not accurately reflect the market value of the securities or, when prices are not readily available from the pricing service, securities are valued at fair value as determined in good faith by the Valuation Designee in conformity with guidelines adopted by and subject to review by the Board of Trustees of the Trust (the “Board”).
| EUBEL BRADY & SUTTMAN MUTUAL FUND TRUST |
| NOTES TO FINANCIAL STATEMENTS (Continued) |
GAAP establishes a single authoritative definition of fair value, sets out a framework for measuring fair value and requires additional disclosures about fair value measurements.
Various inputs are used in determining the value of each Fund’s investments. These inputs are summarized in the three broad levels listed below:
| ● | Level 1 – quoted prices in active markets for identical securities |
| ● | Level 2 – other significant observable inputs |
| ● | Level 3 – significant unobservable inputs |
Certain fixed income securities held by the Funds are classified as Level 2 since the values are typically provided by an independent pricing service that utilizes various “other significant observable inputs” as discussed above. Other fixed income securities (including certain corporate bonds and bank debt) held by the Funds, are classified as Level 3 since the values for these securities are based on prices derived from one or more significant inputs that are unobservable. The inputs or methodology used are not necessarily an indication of the risks associated with investing in those securities. The inputs used to measure fair value may fall into different levels of the fair value hierarchy. In such cases, for disclosure purposes, the level in the fair value hierarchy within which the fair value measurement falls in its entirety is based on the lowest level input that is significant to the fair value measurement.
The following is a summary of each Fund’s investments and the inputs used to value the investments as of July 31, 2023 by security type:
| EBS Income and Appreciation Fund: |
| | | Level 1 | | | Level 2 | | | Level 3 | | | Total | |
| Corporate Bonds | | $ | — | | | $ | 55,015,387 | | | $ | 1,697,076 | | | $ | 56,712,463 | |
| Convertible Bonds | | | — | | | | 76,798,453 | | | | — | | | | 76,798,453 | |
| Bank Debt | | | — | | | | — | | | | 3,250,604 | | | | 3,250,604 | |
| Common Stocks | | | 1,598,437 | | | | — | | | | — | | | | 1,598,437 | |
| Money Market Funds | | | 13,299,422 | | | | — | | | | — | | | | 13,299,422 | |
| Total | | $ | 14,897,859 | | | $ | 131,813,840 | | | $ | 4,947,680 | | | $ | 151,659,379 | |
| | | | | | | | | | | | | | | | | |
| | | | | | | | | | | | | | | | | |
| EBS Income Fund: |
| | | Level 1 | | | Level 2 | | | Level 3 | | | Total | |
| Corporate Bonds | | $ | — | | | $ | 347,491,117 | | | $ | 5,397,644 | | | $ | 352,888,761 | |
| Bank Debt | | | — | | | | — | | | | 6,599,710 | | | | 6,599,710 | |
| Money Market Funds | | | 17,636,445 | | | | — | | | | — | | | | 17,636,445 | |
| Total | | $ | 17,636,445 | | | $ | 347,491,117 | | | $ | 11,997,354 | | | $ | 377,124,916 | |
| | | | | | | | | | | | | | | | | |
| EUBEL BRADY & SUTTMAN MUTUAL FUND TRUST |
| NOTES TO FINANCIAL STATEMENTS (Continued) |
The following is a reconciliation of Level 3 investments of the Funds for which significant unobservable inputs were used to determine fair value for the year ended July 31, 2023:
| EBS Income and Appreciation Fund |
| | | | | | | | | | | | Net change | | | Value | |
| | | Value as of | | | | | | | | | in unrealized | | | as of | |
| | | July 31, | | | | | | Sales/ | | | appreciation | | | July 31, | |
| Investments in Securities | | 2022 | | | Purchases | | | maturities | | | (depreciation) | | | 2023 | |
| Corporate Bonds | | $ | 1,630,204 | | | $ | — | | | $ | — | | | $ | 66,872 | | | $ | 1,697,076 | |
| Bank Debt | | | 3,165,440 | | | | 3,603,159 | | | | (3,671,496 | ) | | | 153,501 | | | | 3,250,604 | |
| Total | | $ | 4,795,644 | | | $ | 3,603,159 | | | $ | (3,671,496 | ) | | $ | 220,373 | | | $ | 4,947,680 | |
| | | | | | | | | | | | | | | | | | | | | |
| | | | | | | | | | | | | | | | | | | | | |
| EBS Income Fund |
| | | | | | | | | | | | Net change | | | Value | |
| | | Value as of | | | | | | | | | in unrealized | | | as of | |
| | | July 31, | | | | | | Sales/ | | | appreciation | | | July 31, | |
| Investments in Securities | | 2022 | | | Purchases | | | maturities | | | (depreciation) | | | 2023 | |
| Corporate Bonds | | $ | 5,184,955 | | | $ | — | | | $ | — | | | $ | 212,689 | | | $ | 5,397,644 | |
| Bank Debt | | | 6,426,804 | | | | 7,315,503 | | | | (7,454,251 | ) | | | 311,654 | | | | 6,599,710 | |
| Total | | $ | 11,611,759 | | | $ | 7,315,503 | | | $ | (7,454,251 | ) | | $ | 524,343 | | | $ | 11,997,354 | |
| | | | | | | | | | | | | | | | | | | | | |
The total change in unrealized appreciation (depreciation) included on the Statements of Operations attributable to Level 3 investments still held at July 31, 2023 is $200,186 and $483,357 for EBS Income and Appreciation Fund and EBS Income Fund, respectively.
The following table summarizes the valuation techniques used and unobservable inputs developed by the Valuation Designee in conformity with guidelines adopted by and subject to review by the Board to determine the fair value of the Level 3 investments.
| EBS Income and Appreciation Fund |
| | | | | | | | | | | | Weighted |
| | | Fair Value at | | | | | | | | | Average of |
| | | July 31, | | | Valuation | | Unobservable | | Value/ | | Unobservable |
| | | 2023 | | | Technique | | Input1 | | Range | | Inputs |
| Corporate Bonds | | $ | 1,697,076 | | | Management’s
Estimate of Future
Cash Flows | | Discount Rate2 | | 16.37% | | N/A |
| Bank Debt | | $ | 3,250,604 | | | DCF Model | | Discount Rate2 | | 6.58% | | N/A |
| | | | | | | | | | | | | |
| EUBEL BRADY & SUTTMAN MUTUAL FUND TRUST |
| NOTES TO FINANCIAL STATEMENTS (Continued) |
| EBS Income Fund |
| | | | | | | | | | | | Weighted |
| | | Fair Value at | | | | | | | | | Average of |
| | | July 31, | | | Valuation | | Unobservable | | Value/ | | Unobservable |
| | | 2023 | | | Technique | | Input1 | | Range | | Inputs |
| Corporate Bonds | | $ | 5,397,644 | | | Management’s
Estimate of Future
Cash Flows | | Discount Rate2 | | 16.37% | | N/A |
| Bank Debt | | $ | 6,599,710 | | | DCF Model | | Discount Rate2 | | 6.58% | | N/A |
| | | | | | | | | | | | | |
DCF – Discounted Cash Flow
| 1 | Significant increases and decreases on the unobservable inputs used to determine fair value of Level 3 assets could result in significantly higher or lower fair value measurements. An increase to the unobservable input would result in a decrease to the fair value. A decrease to the unobservable input would have the opposite effect. |
| 2 | The Discount Rate used is determined by the Valuation Designee by employing a reference benchmark, adjusted by a credit spread. |
There were no derivative instruments held by the Funds as of or during the year ended July 31, 2023.
Share Valuation — The NAV per share of each Fund is calculated daily by dividing the total value of its assets, less liabilities, by the number of shares outstanding. The offering price and redemption price per share of each Fund is equal to its NAV per share.
Estimates — The preparation of financial statements in conformity with GAAP requires management to make estimates and assumptions that affect the reported amounts of assets and liabilities and disclosures of contingent assets and liabilities at the date of the financial statements and the reported amounts of increases and decreases in net assets from operations during the reporting period. Actual results could differ from those estimates.
Investment Income, Investment Transactions and Realized Capital Gains and Losses — Dividend income is recorded on the ex-dividend date. Non-cash dividends included in dividend income, if any, are recorded at the fair market value of the security received. Interest income is recorded as earned. Discounts and premiums on fixed income securities are amortized using the effective interest method. Investment transactions are accounted for on trade date. Realized capital gains and losses on investments sold are determined on a specific identification basis.
Expenses — Expenses of the Trust that are directly identifiable to a specific Fund are charged to that Fund. Expenses which are not readily identifiable to a specific Fund are allocated in such a manner as deemed equitable.
| EUBEL BRADY & SUTTMAN MUTUAL FUND TRUST |
| NOTES TO FINANCIAL STATEMENTS (Continued) |
Distributions to Shareholders — Distributions to shareholders of net investment income, if any, are paid monthly. Capital gain distributions, if any, are distributed to shareholders annually. Distributions are based on amounts calculated in accordance with applicable federal income tax regulations, which may differ from GAAP. These differences are due primarily to differing treatments of income and realized capital gains on various investment securities held by the Funds, timing differences and differing characterizations of distributions made by the Funds. Dividends and distributions are recorded on the ex-dividend date. The tax character of distributions paid during the years ended July 31, 2023 and 2022 was as follows:
| | | | | | | | Long-Term | | | Total | |
| | | Years Ended | | Ordinary Income | | | Capital Gains | | | Distributions | |
| Eubel Brady & Suttman | | | | | | | | | | | | | | |
| Income and Appreciation Fund | | 7/31/2023 | | $ | 5,832,210 | | | $ | 1,004,905 | | | $ | 6,837,115 | |
| | | 7/31/2022 | | $ | 4,234,753 | | | $ | 930,054 | | | $ | 5,164,807 | |
| Eubel Brady & Suttman | | | | | | | | | | | | | | |
| Income Fund | | 7/31/2023 | | $ | 13,663,699 | | | $ | — | | | $ | 13,663,699 | |
| | | 7/31/2022 | | $ | 6,829,373 | | | $ | — | | | $ | 6,829,373 | |
Federal Income Tax — Each Fund has qualified and intends to continue to qualify each year as a “regulated investment company” under Subchapter M of the Internal Revenue Code of 1986, as amended (the “Code”). Qualification generally will relieve the Funds of liability for federal income taxes to the extent 100% of their net investment income and net realized capital gains are distributed in accordance with the Code.
In order to avoid imposition of the excise tax applicable to regulated investment companies, it is also each Fund’s intention to declare as dividends in each calendar year at least 98% of its net investment income (earned during the calendar year) and 98.2% of its net realized capital gains (earned during the twelve months ended October 31) plus undistributed amounts from prior years.
| EUBEL BRADY & SUTTMAN MUTUAL FUND TRUST |
| NOTES TO FINANCIAL STATEMENTS (Continued) |
The following information is computed on a tax basis for each item as of July 31, 2023:
| | | EBS | | | | |
| | | Income and | | | EBS | |
| | | Appreciation | | | Income | |
| | | Fund | | | Fund | |
| Tax cost of investments | | $ | 156,505,126 | | | $ | 392,155,750 | |
| Gross unrealized appreciation | | $ | 2,059,170 | | | $ | 555,755 | |
| Gross unrealized depreciation | | | (6,904,917 | ) | | | (15,586,589 | ) |
| Net unrealized depreciation on investments | | | (4,845,747 | ) | | | (15,030,834 | ) |
| Undistributed ordinary income | | | 537,468 | | | | — | |
| Undistributed long-term gains | | | 288,323 | | | | — | |
| Accumulated capital and other losses | | | — | | | | (8,751,933 | ) |
| Accumulated deficit | | $ | (4,019,956 | ) | | $ | (23,782,767 | ) |
| | | | | | | | | |
The difference between the federal income tax cost of investments and the Schedule of Investments cost for EBS Income and Appreciation Fund is due to certain timing differences in the recognition of capital gains or losses under income tax regulations and GAAP. These “book/tax” differences are temporary in nature and are primarily due to basis adjustments related to the Fund’s holdings in convertible bonds.
As of July 31, 2023, the Funds had the following capital loss carryforwards (“CLCFs”) for federal income tax purposes:
| | | EBS Income and | | | | |
| | | Appreciation | | | EBS Income | |
| | | Fund | | | Fund | |
| Short-term | | $ | — | | | $ | 1,970,027 | |
| Long-term | | | — | | | | 6,781,906 | |
| | | $ | — | | | $ | 8,751,933 | |
| | | | | | | | | |
These CLCFs, which do not expire, may be utilized in future years to offset net realized capital gains, if any, prior to distributing such gains to shareholders.
For the year ended July 31, 2023, EBS Income Fund reclassified $669 of accumulated deficit against paid-in capital on the Statements of Assets and Liabilities. Such reclassification, the result of permanent differences between the financial statement and income tax reporting requirements, had no effect on the Fund’s net assets or NAV per share.
The Funds recognize the tax benefits or expenses of uncertain tax positions only when the position is “more likely than not” to be sustained assuming examination by tax authorities. Management has reviewed each Fund’s tax positions for all
| EUBEL BRADY & SUTTMAN MUTUAL FUND TRUST |
| NOTES TO FINANCIAL STATEMENTS (Continued) |
open tax years (generally, three years) and has concluded that no provision for unrecognized tax benefits or expenses is required in these financial statements. Each Fund identifies its major tax jurisdiction as U.S. Federal.
The Funds recognize interest and penalties, if any, related to unrecognized tax benefits as income tax expenses on the Statements of Operations.
| 3. | Unfunded Loan Commitment |
At July 31, 2023, unfunded loan commitments for the Funds were as follows:
| | | | | Unfunded | |
| Fund | | Borrower | | Commitment | |
| EBS Income and Appreciation Fund | | NCP Finance Limited Partnership | | $ | 182,710 | |
| EBS Income Fund | | NCP Finance Limited Partnership | | $ | 370,958 | |
Pursuant to an Asset-Based Lending Credit Agreement between the Funds and NCP SVP Texas, L.P. (the “Borrower”), the Borrower has agreed to pay the Funds a commitment fee equal to 0.25% of the average daily unfunded commitment balance, which is included within interest income on the Statements of Operations.
| 4. | Transactions with Related Parties |
Certain officers of the Trust are also officers of the Adviser, of Ultimus Fund Solutions, LLC (“Ultimus”), the administrative services agent, shareholder servicing and transfer agent, and accounting services agent for the Funds, or of Ultimus Fund Distributors, LLC (the “Distributor”), the principal underwriter and exclusive agent for the distribution of shares of the Funds.
Investment Adviser — Under the terms of the Management Agreement between the Trust and the Adviser, the Adviser manages each Fund’s investments subject to oversight by the Board. The Funds do not pay the Adviser investment advisory fees under the Management Agreement. However, prior to investing in a Fund, a prospective shareholder must enter into an investment advisory agreement with the Adviser that calls for the payment of an advisory fee based upon a percentage of all assets (including shares of the Funds) managed by the Adviser on behalf of the prospective shareholder. The fee schedule may be negotiable at the time the account is opened and is generally based upon the value of assets held in the client’s account and the style of management.
The Adviser has entered into an agreement with the Funds under which it has agreed to reimburse Fund expenses to the extent necessary to limit total annual operating expenses (excluding brokerage costs, taxes, interest, acquired fund fees and expenses, expenses incurred pursuant to the Funds’ Shareholder Servicing Plan and extraordinary expenses) to an amount not exceeding 0.35% of each Fund’s
| EUBEL BRADY & SUTTMAN MUTUAL FUND TRUST |
| NOTES TO FINANCIAL STATEMENTS (Continued) |
average daily net assets. Any payments by the Adviser of expenses which are a Fund’s obligation are subject to repayment by the Fund for a period of three years following the date on which such expenses were paid, provided that the repayment does not cause the Fund’s total annual operating expenses to exceed the lesser of: (i) the expense limitation in effect at the time such expenses were reimbursed; and (ii) the expense limitation in effect at the time the Adviser seeks reimbursement of such expenses. This agreement is currently in effect until December 1, 2024. No expense reimbursements were required during the year ended July 31, 2023.
Administrator — Ultimus provides administration, fund accounting and transfer agency services to each Fund. The Funds pay Ultimus fees in accordance with the agreements for such services. In addition, the Funds pay out-of-pocket expenses including, but not limited to, postage, supplies and certain costs related to the pricing of the Funds’ portfolio securities.
Compensation of Trustees — Trustees and officers affiliated with the Adviser or Ultimus are not compensated by the Funds for their services. Each Trustee who is not an interested person of the Trust receives from the Funds a fee of $2,625 for attendance at each meeting of the Board, in addition to reimbursement of travel and other expenses incurred in attending the meetings. The Chairperson of the Audit and Governance Committee receives an additional annual fee of $1,000, paid quarterly.
| 5. | Securities Transactions |
During the year ended July 31, 2023, cost of purchases and proceeds from sales and maturities of investment securities, other than short-term investments and U.S. government securities, were as follows:
| | | EBS Income and | | | | |
| | | Appreciation | | | EBS Income | |
| | | Fund | | | Fund | |
| Purchases of investment securities | | $ | 56,036,403 | | | $ | 181,922,978 | |
| Proceeds from sales and maturities of investment securities | | $ | 30,025,835 | | | $ | 122,736,812 | |
| | | | | | | | | |
During the year ended July 31, 2023, cost of purchases and proceeds from sales and maturities of long-term U.S. government securities were as follows:
| | | EBS Income and | | | | |
| | | Appreciation | | | EBS Income | |
| | | Fund | | | Fund | |
| Purchases of investment securities | | $ | — | | | $ | — | |
| Proceeds from sales and maturities of investment securities | | $ | — | | | $ | 17,502,539 | |
| | | | | | | | | |
| EUBEL BRADY & SUTTMAN MUTUAL FUND TRUST |
| NOTES TO FINANCIAL STATEMENTS (Continued) |
| 6. | Shareholder Servicing Plan |
The Funds have adopted a Shareholder Servicing Plan (the “Plan”) which allows each Fund to make payments to financial organizations (including payments directly to the Adviser and the Distributor) for providing account administration and account maintenance services to Fund shareholders. The annual fees paid under the Plan may not exceed an amount equal to 0.25% of each Fund’s average daily net assets. During the year ended July 31, 2023, EBS Income and Appreciation Fund and EBS Income Fund incurred $59,330 and $147,955, respectively, of shareholder servicing fees pursuant to the Plan. No payments were made to the Adviser or the Distributor during the year ended July 31, 2023.
| 7. | Contingencies and Commitments |
The Funds indemnify the Trust’s officers and Trustees for certain liabilities that might arise from the performance of their duties to the Funds. Additionally, in the normal course of business the Funds enter into contracts that contain a variety of representations and warranties and which provide general indemnifications. The Funds’ maximum exposure under these arrangements is unknown, as this would involve future claims that may be made against the Funds that have not yet occurred. However, based on experience, the Funds expect the risk of loss to be remote.
If a Fund has significant investments in the securities of issuers in industries within a particular sector, any development affecting that sector will have a greater impact on the value of the net assets of the Fund than would be the case if the Fund did not have significant investments in that sector. In addition, this may increase the risk of loss of an investment in the Fund and increase the volatility of the Fund’s NAV per share. From time to time, circumstances may affect a particular sector and the companies within such sector. For instance, economic or market factors, regulation or deregulation, and technological or other developments may negatively impact all companies in a particular sector and therefore the value of the Fund’s portfolio will be adversely affected. As of July 31, 2023, EBS Income and Appreciation Fund and EBS Income Fund had 25.3% and 28.5%, respectively, of the value of their net assets invested in securities within the Financials sector.
The Funds are required to recognize in the financial statements the effects of all subsequent events that provide additional evidence about conditions that existed as of the date of the Statements of Assets and Liabilities. For non-recognized subsequent events that must be disclosed to keep the financial statements from being misleading, the Funds are required to disclose the nature of the event as well
| EUBEL BRADY & SUTTMAN MUTUAL FUND TRUST |
| NOTES TO FINANCIAL STATEMENTS (Continued) |
as an estimate of its financial effect, or a statement that such an estimate cannot be made. Management has evaluated subsequent events through the issuance of these financial statements and has noted no such events.
| EUBEL BRADY & SUTTMAN MUTUAL FUND TRUST |
| REPORT OF INDEPENDENT REGISTERED PUBLIC ACCOUNTING FIRM |
To the Shareholders and Board of Trustees of
Eubel Brady & Suttman Mutual Fund Trust
Opinion on the Financial Statements
We have audited the accompanying statements of assets and liabilities, including the schedules of investments, of Eubel Brady & Suttman Income and Appreciation Fund and Eubel Brady & Suttman Income Fund (the “Funds”), each a series of Eubel Brady & Suttman Mutual Fund Trust, as of July 31, 2023, the related statements of operations for the year then ended, the statements of changes in net assets for each of the two years in the period then ended, the related notes, and the financial highlights for each of the five years in the period then ended (collectively referred to as the “financial statements”). In our opinion, the financial statements present fairly, in all material respects, the financial position of each of the Funds as of July 31, 2023, the results of their operations for the year then ended, the changes in net assets for each of the two years in the period then ended, and the financial highlights for each of the five years in the period then ended, in conformity with accounting principles generally accepted in the United States of America.
Basis for Opinion
These financial statements are the responsibility of the Funds’ management. Our responsibility is to express an opinion on the Funds’ financial statements based on our audits. We are a public accounting firm registered with the Public Company Accounting Oversight Board (United States) (“PCAOB”) and are required to be independent with respect to the Funds in accordance with the U.S. federal securities laws and the applicable rules and regulations of the Securities and Exchange Commission and the PCAOB.
We conducted our audits in accordance with the standards of the PCAOB. Those standards require that we plan and perform the audit to obtain reasonable assurance about whether the financial statements are free of material misstatement whether due to error or fraud.
Our audits included performing procedures to assess the risks of material misstatement of the financial statements, whether due to error or fraud, and performing procedures that respond to those risks. Such procedures included examining, on a test basis, evidence regarding the amounts and disclosures in the financial statements. Our procedures included confirmation of securities owned as of July 31, 2023, by correspondence with the custodians and agent banks. Our audits also included evaluating the accounting
| EUBEL BRADY & SUTTMAN MUTUAL FUND TRUST |
| REPORT OF INDEPENDENT REGISTERED |
| PUBLIC ACCOUNTING FIRM (Continued) |
principles used and significant estimates made by management, as well as evaluating the overall presentation of the financial statements. We believe that our audits provide a reasonable basis for our opinion.
We have served as the Funds’ auditor since 2014.

COHEN & COMPANY, LTD.
Cleveland, Ohio
September 27, 2023
| EUBEL BRADY & SUTTMAN MUTUAL FUND TRUST |
| ABOUT YOUR FUNDS’ EXPENSES (Unaudited) |
We believe it is important for you to understand the impact of costs on your investment. All mutual funds have operating expenses. As a shareholder of the Funds, you incur ongoing costs, including shareholder servicing fees and other operating expenses. These ongoing costs, which are deducted from each Fund’s gross income, directly reduce the investment return of the Funds.
A mutual fund’s ongoing costs are expressed as a percentage of its average net assets. This figure is known as the expense ratio. The following examples are intended to help you understand the ongoing costs (in dollars) of investing in the Funds and to compare these costs with the ongoing costs of investing in other mutual funds. The examples below are based on an investment of $1,000 made at the beginning of the period shown and held for the entire period (February 1, 2023 through July 31, 2023).
The table below illustrates each Fund’s ongoing costs in two ways:
Actual fund return – This section helps you to estimate the actual expenses that you paid over the period. The “Ending Account Value” shown is based on each Fund’s actual return, and the fourth column shows the dollar amount of operating expenses that would have been paid by an investor who started with $1,000 in each Fund. You may use the information here, together with the amount you invested, to estimate the expenses that you paid over the period.
To do so, simply divide your account value by $1,000 (for example, an $8,600 account value divided by $1,000 = 8.6), then multiply the result by the number given for the Funds under the heading “Expenses Paid During Period.”
Hypothetical 5% return – This section is intended to help you compare the Funds’ ongoing costs with those of other mutual funds. It assumes that each Fund had an annual return of 5% before expenses during the period shown, but that the expense ratio is unchanged. In this case, because the returns used are not the Funds’ actual returns, the results do not apply to your investment. The example is useful in making comparisons because the U.S. Securities and Exchange Commission (the “SEC”) requires all mutual funds to calculate expenses based on a 5% return. You can assess each Fund’s ongoing costs by comparing this hypothetical example with the hypothetical examples that appear in shareholder reports of other funds.
Note that expenses shown in the table are meant to highlight and help you compare ongoing costs only. They will not help you determine the relative total costs of owning different funds. The Funds do not charge transaction fees, such as purchase or redemption fees, nor do they impose any sales loads.
The calculations assume no shares were bought or sold during the period. Your actual costs may have been higher or lower, depending on the amount of your investment and the timing of any purchases or redemptions.
| EUBEL BRADY & SUTTMAN MUTUAL FUND TRUST |
| ABOUT YOUR FUNDS’ EXPENSES (Unaudited) (Continued) |
More information about the Funds’ expenses can be found in this report. For additional information on operating expenses and other shareholder costs, please refer to the Funds’ prospectus.
| | | Beginning | | Ending | | | | Expenses |
| | | Account Value | | Account Value | | Expense | | Paid During |
| | | February 1, 2023 | | July 31, 2023 | | Ratio(a) | | Period(b) |
| EBS Income and Appreciation Fund | | | | | | | | |
| Based on Actual Fund Return | | $1,000.00 | | $1,012.30 | | 0.22% | | $1.10 |
| Based on Hypothetical 5% Fund Return (before expenses) | | $1,000.00 | | $1,023.70 | | 0.22% | | $1.10 |
| | | | | | | | | |
| EBS Income Fund | | | | | | | | |
| Based on Actual Fund Return | | $1,000.00 | | $1,009.50 | | 0.17% | | $0.85 |
| Based on Hypothetical 5% Fund Return (before expenses) | | $1,000.00 | | $1,023.95 | | 0.17% | | $0.85 |
| (a) | Annualized, based on each Fund’s most recent one-half year expenses. |
| (b) | Expenses are equal to each Fund’s annualized expense ratio multiplied by the average account value over the period, multiplied by 181/365 (to reflect the one-half year period). |
| EUBEL BRADY & SUTTMAN MUTUAL FUND TRUST |
| OTHER INFORMATION (Unaudited) |
The Trust files a complete listing of portfolio holdings for the Funds with the SEC as of the end of the first and third quarters of each fiscal year as an exhibit to Form N-PORT. These filings are available upon request by calling 1-800-391-1223. Furthermore, you may obtain a copy of the filings on the SEC’s website at www.sec.gov.
A description of the policies and procedures that the Funds use to vote proxies relating to portfolio securities is available without charge upon request by calling toll-free 1-800-391-1223, or on the SEC’s website at www.sec.gov. Information regarding how the Funds voted proxies relating to portfolio securities during the most recent 12-month period ended June 30 is also available without charge upon request by calling toll-free 1-800-391-1223, or on the SEC’s website at www.sec.gov.
| FEDERAL TAX INFORMATION (Unaudited) |
For the fiscal year ended July 31, 2023, EBS Income and Appreciation Fund designated $1,004,905 as a long-term capital gain distribution.
Qualified Dividend Income – EBS Income and Appreciation Fund and EBS Income Fund designates 0.82% and 0%, respectively, or up to the maximum amount of such dividends allowable pursuant to the Internal Revenue Code, as qualified dividend income eligible for the reduced tax rate.
Dividends Received Deduction – Corporate shareholders are generally entitled to take the dividends received deduction on the portion of a fund’s dividend distribution that qualifies under tax law. For EBS Income and Appreciation Fund and EBS Income Fund’s fiscal year 2023 ordinary income dividends, 0.82% and 0%, respectively, qualifies for the corporate dividends received deduction.
| EUBEL BRADY & SUTTMAN MUTUAL FUND TRUST |
| BOARD OF TRUSTEES AND EXECUTIVE OFFICERS |
| (Unaudited) |
The Board has overall responsibility for management of the Trust’s affairs. The Trustees serve during the lifetime of the Trust and until its termination, or until death, resignation, retirement, or removal. The Trustees, in turn, elect the officers of the Trust to actively supervise its day-to-day operations. The officers have been elected for an annual term. The following are the Trustees and executive officers of the Trust:
Name, Address and
Date of Birth | Length of
Time Served | Position(s)
Held with
Trust | Principal Occupation(s)
During Past 5 Years and
Directorships of Public
Companies Within Past 5 Years | Number of
Portfolios in
Fund Complex
Overseen
by Trustee |
| Interested Trustees: | | | | |
Scott E. Lundy, CFP*
c/o Eubel Brady & Suttman
10100 Innovation Drive,
Ste. 410
Dayton, OH 45342
Year of birth: 1976 | Since July 2014 | President and Trustee | Executive Vice President and Principal of Eubel Brady & Suttman Asset Management, Inc., the Funds’ investment adviser, since 2003; Chief Compliance Officer of Eubel Brady & Suttman Asset Management, Inc. from March 2016 to April 2019 | 2 |
| Independent Trustees: |
Virginia A. Boeckman
c/o Eubel Brady & Suttman
10100 Innovation Drive,
Ste. 410
Dayton, OH 45342
Year of birth: 1960 | Since March 2017 | Trustee | Senior Manager, SAP Finance Application Development & Support for CareSource Ohio (non-profit managed healthcare provider) from 2022 to present; Manager, SAP Finance Application Development & Support for CareSource Ohio from 2017 to 2022 | 2 |
Kathryn E. Borchers
c/o Eubel Brady & Suttman
10100 Innovation Drive,
Ste. 410
Dayton, OH 45342
Year of birth: 1963 | Since June 2021 | Trustee | Director, Employee Analytics and Data Solutions, Dayton Children’s Hospital from June 2022 to present; Senior Director, Human Resource (HR) Operations for CareSource Ohio (non-profit managed healthcare provider) from October 2016 to May 2022 | 2 |
Christopher C. Young
c/o Eubel Brady & Suttman
10100 Innovation Drive,
Ste. 410
Dayton, OH 45342
Year of birth: 1962 | Chairman Since July 2016
Trustee Since July 2014 | Trustee and Chairman | Chief Strategy Officer, Elementus Minerals LLC from July 2021 to present; Vice President, Sales of New Day Aluminum (aluminum manufacturer) from October 2016 to June 2021 | 2 |
| EUBEL BRADY & SUTTMAN MUTUAL FUND TRUST |
| BOARD OF TRUSTEES AND EXECUTIVE OFFICERS |
| (Unaudited) (Continued) |
Name, Address and
Date of Birth | Length of
Time Served | Position(s)
Held with
Trust | Principal Occupation(s)
During Past 5 Years |
| Executive Officers: |
Terri L. King, IACCP®
Eubel Brady & Suttman
10100 Innovation Drive,
Ste. 410
Dayton, OH 45342
Year of Birth: 1961 | Since July 2014 | Chief Compliance Officer | Chief Compliance Officer of Eubel Brady & Suttman Asset Management, Inc., the Funds’ investment adviser from April 2019 to present; Compliance Manager from 2003 to 2019 |
Angela A. Simmons
Ultimus Fund Solutions, LLC
225 Pictoria Drive
Ste. 450
Cincinnati, OH 45246
Year of Birth: 1975 | Since January 2022 | Treasurer | Vice President of Financial Administration of Ultimus Fund Solutions, LLC from January 2022 to present; Assistant Vice President from 2015 to 2022 |
Ronald L. Eubel
Eubel Brady & Suttman
10100 Innovation Drive,
Ste. 410
Dayton, OH 45342
Year of Birth: 1960 | Since July 2014 | Secretary | Co-Chief Investment Officer and Principal of Eubel Brady & Suttman Asset Management, Inc., the Funds’ investment adviser since 1993 |
| * | Scott E. Lundy, as an affiliated person of Eubel Brady & Suttman Asset Management, Inc, the Funds’ investment adviser, is considered an “interested person” of the Trust within the meaning of Section 2(a) (19) of the Investment Company Act of 1940. |
Additional information about members of the Board and executive officers is available in the Funds’ Statement of Additional Information (“SAI”). To obtain a free copy of the SAI, please call 1-800-391-1223.
| EUBEL BRADY & SUTTMAN MUTUAL FUND TRUST |
| APPROVAL OF INVESTMENT ADVISORY AGREEMENT (Unaudited) |
The Board of Trustees, including all the Independent Trustees voting separately, has reviewed and approved the continuance of the Investment Advisory Agreement between the Trust, on behalf of the Eubel Brady & Suttman Income and Appreciation Fund (the “Appreciation Fund”) and the Eubel Brady & Suttman Income Fund (the “Income Fund”) (the Income and Appreciation Fund and the Income Fund are referred to collectively as the “Funds”), and the Adviser. Approval took place at an in-person meeting held on June 23, 2023, at which all Trustees were present, including all the Independent Trustees.
In the course of their consideration of the continuation of the Investment Advisory Agreement, the Independent Trustees were advised by independent legal counsel and received materials from their counsel discussing the legal standards for their consideration of the proposed approval of the continuation of the Investment Advisory Agreement on behalf of the Funds. The Independent Trustees received and reviewed information provided by the Adviser in response to requests from independent legal counsel. Prior to voting, the Independent Trustees met with and asked questions of representatives of the Adviser and also met separately with their independent legal counsel.
In considering the Investment Advisory Agreement and reaching their conclusions with respect to the continuation of the Investment Advisory Agreement, the Trustees reviewed and analyzed various factors that they determined were relevant, including the factors described below.
Nature, Extent and Quality of Services
The Trustees considered various information regarding the nature, extent and quality of services provided to the Funds by the Adviser, including the credentials and responsibilities of the members of the Research Group who are responsible for the Funds’ daily portfolio management activities. The Trustees noted that the Adviser has maintained a consistent overall management approach with a conservative bias, which has generally allowed the Funds to achieve effective relative performance during periods of downside volatility. They noted that the Income Fund’s orientation towards the shorter end of the yield curve and minimal government exposures had been productive last year as it allowed the Fund to be impacted less by rising yields than its benchmarks. The Independent Trustees further noted how the downside equity market volatility had allowed the Adviser to capitalize on the increase in convertible security opportunities in the market on behalf of the Appreciation Fund. The Independent Trustees also considered the services that are provided by the Adviser in addition to portfolio management and the risks assumed by the Adviser in connection with its services. They noted that the Adviser is responsible for providing the CCO to oversee the Trust’s compliance program, executes brokerage trades on behalf of the Funds,
| EUBEL BRADY & SUTTMAN MUTUAL FUND TRUST |
| APPROVAL OF INVESTMENT ADVISORY AGREEMENT (Unaudited) (Continued) |
and provides personalized services to shareholders. After further discussion, the Board concluded that it was satisfied with the nature, extent and quality of the investment advisory services provided to the Funds by the Adviser.
Expenses and Performance
The Trustees next considered information regarding each Fund’s expense ratio and also considered comparative expense information for each Fund’s peer group, as presented by the Adviser. The Appreciation Fund’s overall expense ratio was compared to funds within the Morningstar category of “Convertible Bond Funds” (no load). The Trustees noted that the overall expense ratio of the Appreciation Fund, which does not include a charge for advisory fees paid at the client account level, is lower than the average expense ratio for Convertible Bond Funds. The Trustees also considered the range of advisory fees charged by the Adviser at the client account level and applied that range to the overall expense ratio of the Appreciation Fund to estimate total costs to underlying shareholders. The Income Fund’s overall expense ratio was compared to funds within the Morningstar category of “Multisector Bond Funds” (no load). The Trustees noted that the overall expense ratio of the Income Fund, which did not include a charge for advisory fees at the client account level, is lower than the average expense ratio for Multisector Bond Funds. The Trustees also considered the range of advisory fees charged by the Adviser at the client account level and applied that range to the overall expense ratio of the Income Fund to estimate total costs to underlying shareholders. The Trustees found that the expense ratio for each Fund, which included an estimated advisory fee charged at the client account level, was within the range of the average expense ratios for the peer groups presented and concluded that each Fund’s expense ratio was reasonable. The Trustees also considered the ancillary services that are offered by the Adviser at no additional charge to shareholders. The Trustees also observed that the Adviser has committed to extending the expense cap arrangement with each Fund for an additional annual period.
The Trustees next discussed each Fund’s performance record over short and longer-term periods ended March 31, 2023, as compared to the performance of its benchmark indices and Morningstar category. The Trustees noted that each Fund had exceeded the performance of its benchmark index and Morningstar category average for the year ended March 31, 2023, and the Income Fund had exceeded the performance of its benchmark index and Morningstar category average (when available) for the five-year and since inception periods ended March 31, 2023. The Trustees noted that the ability of the Appreciation Fund to exceed the performance of its benchmark index during the one-year period was due to its lower equity sensitivity and the ability of the Income Fund to exceed the performance of its benchmark index during all of the reported periods was due to its short duration and lower exposure to government securities than its benchmark. The Independent Trustees considered other factors, including (i) the consistency of the Adviser’s investment process; (ii) the Adviser’s conservative
| EUBEL BRADY & SUTTMAN MUTUAL FUND TRUST |
| APPROVAL OF INVESTMENT ADVISORY AGREEMENT (Unaudited) (Continued) |
investment discipline; (iii) that the Appreciation Fund benefitted from the Adviser’s efforts to capitalize on the increase in attractive convertible security opportunities during the past year; and (iv) that the Income Fund benefitted from the Adviser’s decision to maintain short durations and lower exposure to government securities during the past year. The Trustees discussed the performance of the Adviser’s SMA strategies that hold shares of the Funds. The Trustees noted that the Adviser does not sub-advise any accounts with similar investment objectives as the Funds. After considering each factor, the Independent Trustees concluded that the Adviser has demonstrated a satisfactory performance record for each Fund.
Investment Advisory Fee Rates
The Trustees considered that the Adviser is being compensated by each client under the terms described in their respective SMA client agreements and the Adviser does not charge an investment advisory fee at the Fund level. The Trustees reviewed and considered the range of advisory fees payable to the Adviser for SMA services and compared such information with the fees charged by the other funds in the relevant Morningstar peer group for each Fund. The Trustees concluded that the advisory fee ranges charged at the SMA account level were reasonable in relation to the average rates for the peer groups presented, and the clients generally received more services for their fees.
Profitability
The Trustees reviewed information regarding the Adviser’s cost of providing services to the Funds and the methods that were used to determine profitability. They discussed the profits of the Adviser and the other ancillary benefits that the Adviser receives with regard to providing advisory services to the Funds and concluded that these profits are not unreasonable. Following a discussion of the profits and expenses of the Adviser, it was the conclusion of the Independent Trustees that the profits of the Adviser represent a fair and entrepreneurial profit, in light of the quality and scope of services (which go well beyond managing the Funds) that are provided by the Adviser.
Economies of Scale
The Independent Trustees considered the extent to which shareholders of the Funds have realized economies of scale. They noted that shareholders of the Funds do not pay a direct advisory fee to the Adviser but have the ability to recognize economies of scale as their accounts grow since the Adviser has generally provided for breakpoints in its advisory fees charged at the client account level. The Independent Trustees further noted that each Fund is operating below the agreed upon expense cap.
| EUBEL BRADY & SUTTMAN MUTUAL FUND TRUST |
| APPROVAL OF INVESTMENT ADVISORY AGREEMENT (Unaudited) (Continued) |
The Trustees did not identity any single factor as all-important or controlling in their determination to approve the continuation of the Investment Advisory Agreement. The Trustees, including all the Independent Trustees, concluded that the terms of the Investment Advisory Agreement were fair and reasonable and that the continuance of the Investment Advisory Agreement was in the best interests of each Fund and its shareholders.
EBS-AR-23
As of the end of the period covered by this report, the registrant has adopted a code of ethics that applies to the registrant’s principal executive officer, principal financial officer, principal accounting officer or controller, or persons performing similar functions, regardless of whether these individuals are employed by the registrant or a third party. Pursuant to Item 12(a)(1), a copy of registrant’s code of ethics is filed as an exhibit to this Form N-CSR. During the period covered by this report, the code of ethics has not been amended, and the registrant has not granted any waivers, including implicit waivers, from the provisions of the code of ethics.
| Item 3. | Audit Committee Financial Expert. |
The registrant’s board of trustees has determined that the registrant has at least one audit committee financial expert serving on its audit committee. The name of the audit committee financial expert is Virginia A. Boeckman. Ms. Boeckman is “independent” for purposes of this item.
| Item 4. | Principal Accountant Fees and Services. |
| (a) | Audit Fees. The aggregate fees billed for professional services rendered by the principal accountant for the audit of the registrant’s annual financial statements or for services that are normally provided by the accountant in connection with statutory and regulatory filings or engagements were $30,000 and $30,000 with respect to the registrant’s fiscal years ended July 31, 2023 and July 31, 2022, respectively. |
| (b) | Audit-Related Fees. No fees were billed in the last fiscal year for assurance and related services by the principal accountant that are reasonably related to the performance of the audit of the registrant’s financial statements and are not reported under paragraph (a) of this Item. |
| (c) | Tax Fees. The aggregate fees billed for professional services rendered by the principal accountant for tax compliance, tax advice, and tax planning were $6,000 and $6,000 with respect to the registrant’s fiscal years ended July 31, 2023, and July 31, 2022, respectively. The services comprising these fees are the preparation of the registrant’s federal income and excise tax returns. |
| (d) | All Other Fees. No fees were billed in the last fiscal year for products and services provided by the principal accountant, other than the services reported in paragraphs (a) through (c) of this Item. |
| (e)(1) | The audit committee has not adopted pre-approval policies and procedures described in paragraph (c)(7) of Rule 2-01 of Regulation S-X. |
| (e)(2) | None of the services described in paragraph (b) through (d) of this Item were approved by the audit committee pursuant to paragraph (c)(7)(i)(C) of Rule 2-01 of Regulation S-X. |
| (f) | Less than 50% of hours expended on the principal accountant’s engagement to audit the registrant’s financial statements for the most recent fiscal year were attributed to work performed by persons other than the principal accountant’s full-time, permanent employees. |
| (g) | During the fiscal years ended July 31, 2023 and July 31, 2022, aggregate non-audit fees of $6,000 and $6,000, respectively, were billed by the registrant’s principal accountant for services rendered to the registrant. No non-audit fees were billed in the last fiscal year by the registrant’s principal accountant for services rendered to the registrant’s investment adviser (not including any sub-adviser whose role is primarily portfolio management and is subcontracted with or overseen by another investment adviser), and any entity controlling, controlled by, or under common control with the adviser that provides ongoing services to the registrant. |
| (h) | The principal accountant has not provided any non-audit services to the registrant’s investment adviser (not including any sub-adviser whose role is primarily portfolio management and is subcontracted with or overseen by another investment adviser), and any entity controlling, controlled by, or under common control with the investment adviser that provides ongoing services to the registrant. |
(j) Not applicable
| Item 5. | Audit Committee of Listed Registrants. |
Not applicable
| Item 6. | Schedule of Investments. |
| (a) | Not applicable [schedule filed with Item 1] |
| Item 7. | Disclosure of Proxy Voting Policies and Procedures for Closed-End Management Investment Companies. |
Not applicable
| Item 8. | Portfolio Managers of Closed-End Management Investment Companies. |
Not applicable
| Item 9. | Purchases of Equity Securities by Closed-End Management Investment Company and Affiliated Purchasers. |
Not applicable
| Item 10. | Submission of Matters to a Vote of Security Holders. |
The registrant has not adopted procedures by which shareholders may recommend nominees to the registrant’s board of trustees.
| Item 11. | Controls and Procedures. |
(a) Based on their evaluation of the registrant’s disclosure controls and procedures (as defined in Rule 30a-3(c) under the Investment Company Act of 1940) as of a date within 90 days of the filing date of this report, the registrant’s principal executive officer and principal financial officer have concluded that such disclosure controls and procedures are reasonably designed and are operating effectively to ensure that material information relating to the registrant, including its consolidated subsidiaries, is made known to them by others within those entities, particularly during the period in which this report is being prepared, and that the information required in filings on Form N-CSR is recorded, processed, summarized, and reported on a timely basis.
(b) There were no changes in the registrant’s internal control over financial reporting (as defined in Rule 30a-3(d) under the Investment Company Act of 1940) that occurred during the period covered by this report that have materially affected, or are reasonably likely to materially affect, the registrant’s internal control over financial reporting.
| Item 12. | Disclosure of Securities Lending Activities for Closed-End Management Investment Companies. |
Not applicable.
File the exhibits listed below as part of this Form. Letter or number the exhibits in the sequence indicated.
(a)(1) Any code of ethics, or amendment thereto, that is the subject of the disclosure required by Item 2, to the extent that the registrant intends to satisfy the Item 2 requirements through filing of an exhibit: Attached hereto
(a)(2) A separate certification for each principal executive officer and principal financial officer of the registrant as required by Rule 30a-2(a) under the Act (17 CFR 270.30a-2(a)): Attached hereto
(1) Any written solicitation to purchase securities under Rule 23c-1 under the Act (17 CFR 270.23c-1) sent or given during the period covered by the report by or on behalf of the registrant to 10 or more persons: Not applicable
(2) Change in the registrant’s independent public accountants: Not applicable.
(b) Certifications required by Rule 30a-2(b) under the Act (17 CFR 270.30a-2(b)): Attached hereto
Exhibit 99.CODE ETH Code of Ethics
Exhibit 99.CERT Certifications required by Rule 30a-2(a) under the Act
Exhibit 99.906CERT Certifications required by Rule 30a-2(b) under the Act
SIGNATURES
Pursuant to the requirements of the Securities Exchange Act of 1934 and the Investment Company Act of 1940, the registrant has duly caused this report to be signed on its behalf by the undersigned, thereunto duly authorized.
| (Registrant) | Eubel Brady & Suttman Mutual Fund Trust | | |
| | | | |
| By (Signature and Title)* | /s/ Scott E. Lundy | |
| | | Scott E. Lundy, President | |
| | | | |
| Date | October 4, 2023 | | |
| | | | |
| Pursuant to the requirements of the Securities Exchange Act of 1934 and the Investment Company Act of 1940, this report has been signed below by the following persons on behalf of the registrant and in the capacities and on the dates indicated. |
| | | | |
| By (Signature and Title)* | /s/ Scott E. Lundy | |
| | | Scott E. Lundy, President | |
| | | | |
| Date | October 4, 2023 | | |
| | | | |
| By (Signature and Title)* | /s/ Angela A. Simmons | |
| | | Angela A. Simmons, Treasurer | |
| | | | |
| Date | October 4, 2023 | | |
* Print the name and title of each signing officer under his or her signature.