Table of Contents
UNITED STATES
SECURITIES AND EXCHANGE COMMISSION
Washington, D.C. 20549
FORM N-CSR
CERTIFIED SHAREHOLDER REPORT OF REGISTERED
MANAGEMENT INVESTMENT COMPANIES
Investment Company Act file number 811-22975
AllianzGI Institutional Multi-Series
Trust
(Exact name of registrant as specified in charter)
| 1633 Broadway, New York, New York | 10019 | |
| (Address of principal executive offices) | (Zip code) | |
Lawrence G. Altadonna
1633 Broadway,
New York, New York 10019
(Name and address of agent for service)
Registrant’s telephone number, including area code: 212-739-3371
Date of fiscal year end: November 30, 2015
Date of reporting period: May 31, 2015
Table of Contents
Item 1. Report to Shareholders
AllianzGI Institutional Multi-Series Trust
Semi-Annual Report
May 31, 2015
Table of Contents
Table of Contents
AllianzGI Global Small-Cap Opportunities Portfolio
(unaudited)
For the period of December 1, 2014 through May 31, 2015, as provided by Mark Roemer, Portfolio Manager.
Fund Insights
Performance Overview
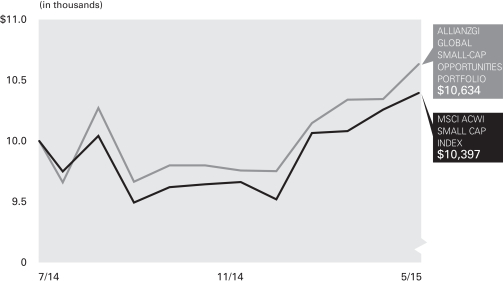
For the reporting period ended May 31, 2015, the AllianzGI Global Small-Cap Opportunities Portfolio (the “Portfolio”) returned 8.53%, outperforming the MSCI All Country World Small Cap Index (the “benchmark index”), which returned 7.82%.
Market Environment
During the reporting period, global small-cap equities were the beneficiaries of higher levels of global growth and positive investor sentiment, advancing in five of the six months. The Portfolio began the reporting period with moderately higher returns in December, as investors weighed diverging growth expectations. The asset class declined in January due in part to the impact of a rising dollar, then rebounded substantially in February as investors digested the impact of the European Central Bank easing and additional global stimulus packages. During the remainder of the reporting period, returns were moderately positive, due in part to diversification benefits among the 46 global small-cap countries in developed and emerging markets in the benchmark index.
During the reporting period, consumer-related stocks were among the top benchmark
performers, with the health care, information technology, consumer staples and consumer discretionary sectors advancing. These results were offset by weakness in the energy sector and moderate declines for the utilities sector. Chinese equities were the top country performers, followed by Ireland and South Korea, while Brazil and Egypt were the biggest detractors.
Portfolio Review
The Portfolio benefitted from what we consider to be the vast inefficiencies in global small-cap equities. Positive stock selection and allocation decisions at both the country and sector level contributed to positive relative performance during the reporting period.
Sector results were led by strong stock selection in the industrials sector, as the Portfolio benefitted from stockpicking in transportation infrastructure and airlines industries. Bottom-up selections in the information technology sector added to results as did a relative overweight allocation to the health care sector. Conversely, more conservative selections in the consumer staples and consumer discretionary sectors detracted from relative results during the reporting period. From a country standpoint, bottom-up stock selection in theUnited States was the primary driver of
performance, followed by an overweight allocation and positive stockpicking in Hong Kong. Meanwhile, selections in Taiwan, Canada and Sweden trailed the benchmark index.
The largest individual active contributor to performance was Skyworks Solutions, Inc. Shares of the US-based semiconductor manufacturer rallied due to higher demand, particularly from its positioning in the Apple supply chain. Ireland-based pharmaceutical company Mallinckrodt Plc advanced due to rising revenues, predominately from generic drugs. On the other hand, Australian metals and mining company Western Areas Limited was lower due to moderating demand and currency headwinds. US-based grocery chain SuperValu Inc. declined as one of the company’s largest investors announced the decision to sell some of its holdings.
We believe investment results will be supported by earnings growth and that our behavioral finance-focused investment process and focus on higher quality securities with strong company fundamentals have the potential to be a drivers of returns for the coming periods.
Cumulative Return for the period ended May 31, 2015
| 6 Month* | Since Inception† | |||||||
| AllianzGI Global Small-Cap Opportunities Portfolio | 8.53% | 6.36% | ||||||
| MSCI ACWI Small Cap Index†† | 7.82% | 3.97% | ||||||
* Cumulative return
† The Portfolio began operations on 7/23/14. Benchmark return comparisons began on the portfolio inception date. Lipper performance comparisons began on 7/31/14.
†† The MSCI ACWI Small Cap Index captures small cap representation across 23 developed market and 23 emerging market countries, covering about 14% of the free float-adjusted market capitalization in each country (as of December 31, 2014). Unless otherwise noted, index returns reflect the reinvestment of income dividends and capital gains, if any, but do not reflect fees, brokerage commissions or other expenses of investing. It is not possible to invest directly in an index.
Performance quoted represents past performance and is no guarantee of future results. Current performance may be lower or higher than performance shown. Investment return and the principal value will fluctuate. Shares may be worth more or less than original cost when redeemed. Returns do not reflect deduction of taxes that a shareholder would pay on portfolio distributions or redemption of portfolio shares. Total return performance assumes that all dividends and capital gain distributions were reinvested on the payable date. The Portfolio’s gross expense ratio is 3.36%. This ratio does not include an expense reduction, contractually guaranteed through at least 3/31/16. The Portfolio’s expense ratio net of this reduction is 1.20%. Expense ratio information is as of the Portfolio’s current PPM dated March 30, 2015, as supplemented to date.
| 2 | Semi-Annual Report/May 31, 2015 |
Table of Contents
AllianzGI Global Small-Cap Opportunities Portfolio
(unaudited) (continued)
Shareholder Expense Example
Beginning Account Value (12/1/14) | Ending Account Value (5/31/15) | Expenses Paid During Period | ||||||||||
Actual Performance | $ | 1,000.00 | $ | 1,085.30 | $ | 6.24 | ||||||
Hypothetical Performance (5% return before expenses) | $ | 1,000.00 | $ | 1,018.95 | $ | 6.04 | ||||||
Expenses (net of reimbursement, if any) are equal to the annualized expense ratio (1.20%), multiplied by the average account value over the period, multiplied by 182/365.
Country Allocation (as of May 31, 2015)
United States | 50.6% | |||
Japan | 10.3% | |||
United Kingdom | 5.7% | |||
Hong Kong | 4.3% | |||
China | 3.6% | |||
Taiwan | 3.2% | |||
Korea (Republic of) | 2.8% | |||
Switzerland | 2.4% | |||
Other | 10.6% | |||
Cash & Equivalents — Net | 6.5% |
Cumulative Returns Through May 31, 2015
| 3 | Semi-Annual Report/May 31, 2015 |
Table of Contents
AllianzGI U.S. Unconstrained Equity Portfolio
(unaudited)
For the period of December 1, 2014 through May 31, 2015, as provided by Jeff Parker, CFA, Senior Portfolio Manager.
Fund Insights
Performance Overview
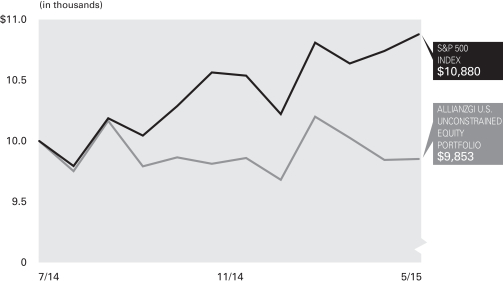
For the reporting period ended May 31, 2015, the AllianzGI US Unconstrained Equity Portfolio (the “Portfolio”) returned 0.41%, underperforming the S&P 500 Index (the “benchmark index”), which returned 2.97%.
The AllianzGI U.S. Unconstrained Portfolio seeks long-term capital appreciation though active stock selection without the constraints of a benchmark or a specific style. The Portfolio invests primarily in domestic companies that are in the earlier stages of their growth trajectories, with an emphasis on high quality companies with strong execution.
Market Environment
On the macro level, US share prices climbed to reach new all-time highs, as a strengthening labor market and solid corporate earnings outweighed mixed economic data. First quarter GDP growth fell short of expectations due to harsh winter weather, the West Coast port strike, falling energy industry investment, and a steep drop in exports. While other corners of the economy continue to struggle, the job
market has been a bright spot with unemployment falling to 5.4% — the lowest level since May 2008.
After sharp declines since last June, oil prices have pushed upward since March amid reports of slowing US production and a decline in crude stockpiles. While prices have rallied since March, they are still down 42% compared to the end of June 2014.
At the Federal Open Market Committee meeting on March 17-18, 2015, central bankers signaled that if incoming data is sufficiently strong, rate hikes could begin in 2015. Policymakers also reduced their forecasts for GDP, inflation and long-run unemployment. We interpret this to mean the Fed is not on a preset course, and is increasingly data dependent.
Looking ahead, we maintain a positive market outlook. With the US economy steadily improving, we believe the Federal Reserve will likely begin to gradually raise short term interest rates in 2015. Despite rising interest rates, we believe US economic growth and company fundamentals should drive US equities higher.
Portfolio Review
We strive to deliver strong returns in varying investment cycles over the long-term by leveraging the collective insights of a specialized equity research platform to identify high quality companies with visible execution.
During the reporting period, the Portfolio’s performance was aided by stock selection in the technology, health care, and consumer staples sectors. Conversely, stock selection in the industrials, financials, and consumer discretionary sectors detracted from returns.
From an industry perspective, we saw strength in biotechnology, food and staples retailing and semiconductors. On the other hand, weakness in internet retail, media, and real estate investment trust stocks weighed on the Portfolio’s returns. From a market capitalization perspective, large and mega cap companies added to the Portfolio’s returns, while mid cap and small cap stocks detracted from performance.
Cumulative Return for the period ended May 31, 2015
| 6 Month* | Since Inception† | |||||||
| AllianzGI U.S. Unconstrained Equity Portfolio | 0.41% | -1.47% | ||||||
| S&P 500 Index†† | 2.97% | 8.80% | ||||||
* Cumulative return
† The Portfolio began operations on 7/1/14. Benchmark return comparisons began on the portfolio inception date. Lipper performance comparisons began on 7/31/14.
†† The Standard & Poor’s 500 Index (S&P 500 Index) is an unmanaged index that is generally representative of the US stock market. Unless otherwise noted, index returns reflect the reinvestment of income dividends and capital gains, if any, but do not reflect fees, brokerage commissions or other expenses of investing. It is not possible to invest directly in an index.
Performance quoted represents past performance and is no guarantee of future results. Current performance may be lower or higher than performance shown. Investment return and the principal value will fluctuate. Shares may be worth more or less than original cost when redeemed. Returns do not reflect deduction of taxes that a shareholder would pay on portfolio distributions or redemption of portfolio shares. Total return performance assumes that all dividends and capital gain distributions were reinvested on the payable date. The Portfolio’s gross expense ratio is 4.31%. This ratio does not include an expense reduction, contractually guaranteed through at least 3/31/16. The Portfolio’s expense ratio net of this reduction is 1.00%. Expense ratio information is as of the Portfolio’s current PPM dated March 30, 2015, as supplemented to date.
| 4 | Semi-Annual Report/May 31, 2015 |
Table of Contents
AllianzGI U.S. Unconstrained Equity Portfolio
(unaudited) (continued)
Shareholder Expense Example
Beginning Account Value (12/1/2014) | Ending Account Value (5/31/2015) | Expenses Paid During Period | ||||||||||
Actual Performance | $ | 1,000.00 | $ | 1,004.10 | $ | 5.00 | ||||||
Hypothetical Performance (5% return before expenses) | $ | 1,000.00 | $ | 1,019.95 | $ | 5.04 | ||||||
Expenses (net of reimbursement, if any) are equal to the annualized expense ratio (1.00%), multiplied by the average account value over the period, multiplied by 182/365.
Industry Allocation (as of May 31, 2015)
Food & Stapling Retailing | 9.0% | |||
Technology Hardware, Storage & Peripherals | 8.3% | |||
Internet Software & Services | 6.2% | |||
Biotechnology | 6.1% | |||
Road & Rail | 4.7% | |||
Oil, Gas & Consumable Fuels | 4.5% | |||
Chemicals | 4.4% | |||
Banks | 4.3% | |||
Other | 49.6% | |||
Cash & Equivalents — Net (including Options Written) | 2.9% |
Cumulative Returns Through May 31, 2015
| 5 | Semi-Annual Report/May 31, 2015 |
Table of Contents
Important Information (unaudited)
AllianzGI Institutional Multi-Series Trust
AllianzGI Institutional Multi-Series Trust (the “Trust”) currently consists of the AllianzGI Global Small-Cap Opportunities Portfolio and AllianzGI U.S. Unconstrained Equity Portfolio (each a “Portfolio” and collectively the “Portfolios”). The Portfolios each currently offer one share class.
The Cumulative Returns chart for each Portfolio assumes the initial investment was made on the first day of the Portfolio’s initial fiscal year. Results assume that all dividends and capital gain distributions were reinvested. They do not take into account the effect of taxes. The benchmark cumulative return began on the last day of the month of each Portfolio’s inception date.
The following disclosure provides important information regarding each Portfolio’s Shareholder Expense Example, which appears on each Portfolio Summary page in this Semi-Annual report. Please refer to this information when reviewing the Shareholder Expense Example for a Portfolio.
Shareholder Expense Example
Shareholders incur two types of costs: (1) transaction costs; and (2) ongoing costs, including investment management fees, distribution and/or service (12b-1) fees, and other Portfolio expenses. The Shareholder Expense Example is intended to help shareholders understand ongoing costs (in dollars) of investing in a Portfolio and to compare these costs with the ongoing costs of investing in other mutual funds. The Shareholder Expense Example is based on an investment of $1,000.00 invested at the beginning of the period, as indicated, and held for the entire period through May 31, 2015.
Actual Expenses
The information in the table for “Actual Performance” provides information about actual account values and actual expenses. You may use the information in these columns, together with the amount you invested, to estimate the expenses that you paid over the period. Simply divide your account value by $1,000.00 (for example, an $8,600.00 account value divided by $1,000.00 = 8.6), then multiply the result by the number in the column entitled “Expenses Paid During Period” to estimate the expenses you paid on your account during this period.
Hypothetical Example for Comparison Purposes
The information in the table for “Hypothetical Performance (5% return before expenses)” provides information about hypothetical account values and hypothetical expenses based on a Portfolio’s actual expense ratio and an assumed rate of return of 5% per year before expenses, which is not the Portfolio’s actual return. The hypothetical account values and expenses may not be used to estimate the actual ending account balance or expenses you paid for the period. You may use this information to compare the ongoing costs of investing in a Portfolio and other funds. To do so, compare this 5% hypothetical example with the 5% hypothetical examples that appear in the shareholder reports of other funds.
Please note that the expenses shown in the table are meant to highlight your ongoing costs only and do not reflect any transactional costs. Therefore, the information for “Hypothetical Performance (5% return before expenses)” is useful in comparing ongoing costs only, and will not help you determine the relative total costs of owning different funds. In addition, if these transactional costs were included, your costs would have been higher.
Proxy Voting
The Trust’s Investment Manager and Sub-Adviser have adopted written proxy voting policies and procedures (“Proxy Policy”) as required by Rule 206(4)-6 under the Investment Advisers Act of 1940. The Proxy Policy has been adopted by the Trust as the policies and procedures that the Sub-Adviser will use when voting proxies on behalf of the Portfolio. Copies of the written Proxy Policy and the factors that the Sub-Adviser may consider in determining how to vote proxies for the Portfolios, and information about how the Portfolios voted proxies relating to portfolio securities held during the most recent twelve-month period ended June 30, are available without charge, upon request, by calling 1-800-498-5413, on the Allianz Global Investors Distributors website at us.allianzgi.com and on the Securities and Exchange Commission’s (“SEC”) website at http://www.sec.gov.
Form N-Q
The Trust files its complete schedule of the portfolio holdings with the SEC on Form N-Q for the first and third quarters of each fiscal year, which are available on the SEC’s website at http://www.sec.gov. A copy of the Trust’s Form N-Q is available without charge, upon request, by calling 1-800-498-5413. In addition, the Trust’s Form N-Q may be reviewed and copied at the SEC’s Public Reference Room in Washington, DC. Information on the operation of the Public Reference Room may be obtained by calling 1-800-SEC-0330.
| 6 | Semi-Annual Report/May 31, 2015 |
Table of Contents
May 31, 2015 (unaudited)
AllianzGI Global Small-Cap Opportunities Portfolio
| Shares | Value | |||||||
| ||||||||
COMMON STOCK - 93.5% | ||||||||
Australia - 2.1% | ||||||||
Austal Ltd. |
|
18,300 |
|
|
$ 25,533 |
| ||
Echo Entertainment Group Ltd. | 20,473 | 72,886 | ||||||
Qantas Airways Ltd. (d)
|
| 5,998
|
|
| 16,093
|
| ||
|
| |||||||
|
114,512
|
| ||||||
|
| |||||||
Brazil - 0.3% | ||||||||
MRV Engenharia e Participacoes S.A.
|
|
5,700
|
|
|
13,596
|
| ||
|
| |||||||
Canada - 0.5% | ||||||||
Just Energy Group, Inc.
|
|
4,909
|
|
|
26,763
|
| ||
|
| |||||||
China - 3.6% | ||||||||
Bank of Chongqing Co., Ltd., Class H |
|
42,500 |
|
|
41,873 |
| ||
China Everbright Bank Co., Ltd., Class H | 117,000 | 73,592 | ||||||
Chongqing Rural Commercial Bank Co., Ltd., Class H | 36,000 | 29,217 | ||||||
Yuzhou Properties Co., Ltd.
|
| 159,000
|
|
| 44,567
|
| ||
|
| |||||||
|
189,249
|
| ||||||
|
| |||||||
Denmark - 0.4% | ||||||||
SimCorp A/S (c)
|
|
587
|
|
|
22,036
|
| ||
|
| |||||||
France - 1.7% | ||||||||
Altran Technologies S.A. |
|
3,214 |
|
|
34,170 |
| ||
Boiron S.A. | 276 | 28,512 | ||||||
Ipsen S.A.
|
| 546
|
|
| 29,113
|
| ||
|
| |||||||
|
91,795
|
| ||||||
|
| |||||||
Hong Kong - 4.3% | ||||||||
Champion REIT |
|
125,000 |
|
|
71,579 |
| ||
Chong Hing Bank Ltd. | 11,000 | 33,941 | ||||||
Dah Sing Banking Group Ltd. | 42,400 | 100,318 | ||||||
Hui Xian Real Estate Investment Trust REIT
|
| 38,000
|
|
| 21,457
|
| ||
|
| |||||||
|
227,295
|
| ||||||
|
| |||||||
India - 1.4% | ||||||||
WNS Holdings Ltd. ADR (d) |
|
1,550 |
|
|
40,905 |
| ||
Wockhardt Ltd.
|
| 1,407
|
|
| 31,802
|
| ||
|
| |||||||
|
72,707
|
| ||||||
|
| |||||||
Israel - 1.1% | ||||||||
Isramco Negev 2 L.P. |
|
132,820 |
|
|
27,097 |
| ||
Orbotech Ltd. (d)
|
| 1,505
|
|
| 31,455
|
| ||
|
| |||||||
|
58,552
|
| ||||||
|
| |||||||
Italy - 0.9% | ||||||||
ASTM SpA |
|
1,385 |
|
|
18,832 |
| ||
Societa Cattolica di Assicurazioni SCRL
|
| 4,000
|
|
| 31,338
|
| ||
|
| |||||||
|
50,170
|
| ||||||
|
| |||||||
Japan - 10.3% | ||||||||
Aderans Co., Ltd. |
|
3,400 |
|
|
30,161 |
| ||
Alps Electric Co., Ltd. | 3,600 | 91,975 | ||||||
Asahi Holdings, Inc. | 2,300 | 40,997 | ||||||
Chiyoda Integre Co., Ltd. | 900 | 23,467 | ||||||
Foster Electric Co., Ltd. | 1,800 | 44,184 | ||||||
Futaba Industrial Co., Ltd. | 2,900 | 13,768 | ||||||
Gunze Ltd. | 6,000 | 16,040 | ||||||
Japan Display, Inc. (d) | 20,300 | 85,026 | ||||||
Kuroda Electric Co., Ltd. | 2,700 | 47,836 | ||||||
Nichiha Corp. | 1,500 | 20,190 | ||||||
Nippon Synthetic Chemical Industry Co., Ltd. | 4,000 | 29,052 | ||||||
Nippon Thompson Co., Ltd. | 2,900 | 16,889 | ||||||
Ryobi Ltd. | 8,000 | 31,875 | ||||||
Senko Co., Ltd. | 3,000 | 18,573 | ||||||
Unipres Corp.
|
| 1,800
|
|
| 39,823
|
| ||
|
| |||||||
|
549,856
|
| ||||||
|
| |||||||
| See accompanying Notes to Financial Statements | 7 | Semi-Annual Report/May 31, 2015 |
Table of Contents
| Shares | Value | |||||||
| ||||||||
Korea (Republic of) - 2.8% | ||||||||
Hanil Cement Co., Ltd. |
|
308 |
|
|
40,104 |
| ||
HwaSung Industrial Co., Ltd. | 843 | 15,023 | ||||||
Kukdo Chemical Co., Ltd. | 261 | 14,393 | ||||||
Kwang Dong Pharmaceutical Co., Ltd. | 2,104 | 34,440 | ||||||
OCI Materials Co., Ltd.
|
| 445
|
|
| 45,824
|
| ||
|
| |||||||
|
149,784
|
| ||||||
|
| |||||||
New Zealand - 0.3% | ||||||||
Kiwi Property Group Ltd.
|
|
16,235
|
|
|
14,492
|
| ||
|
| |||||||
Singapore - 0.9% | ||||||||
Cache Logistics Trust REIT |
|
21,400 |
|
|
18,398 |
| ||
Ho Bee Land Ltd.
|
| 17,300
|
|
| 28,874
|
| ||
|
| |||||||
|
47,272
|
| ||||||
|
| |||||||
South Africa - 0.3% | ||||||||
Cashbuild Ltd.
|
|
705
|
|
|
16,544
|
| ||
|
| |||||||
Switzerland - 2.4% | ||||||||
BKW AG |
|
666 |
|
|
25,121 |
| ||
Swiss Life Holding AG (d) | 360 | 86,382 | ||||||
Zehnder Group AG
| 325 |
| 14,852
|
| ||||
|
| |||||||
|
126,355
|
| ||||||
|
| |||||||
Taiwan - 3.2% | ||||||||
China Synthetic Rubber Corp. |
|
17,000 |
|
|
17,762 |
| ||
Farglory Land Development Co., Ltd. | 36,000 | 40,758 | ||||||
Gold Circuit Electronics Ltd. (d) | 32,000 | 17,242 | ||||||
Huaku Development Co., Ltd. | 22,000 | 50,738 | ||||||
Pou Chen Corp. | 15,000 | 21,473 | ||||||
Ruentex Development Co., Ltd.
|
| 15,000
|
|
| 24,040
|
| ||
|
| |||||||
|
172,013
|
| ||||||
|
| |||||||
Thailand - 0.3% | ||||||||
AP Thailand PCL
|
|
90,000
|
|
|
18,695
|
| ||
|
| |||||||
Turkey - 0.4% | ||||||||
Torunlar Gayrimenkul Yatirim Ortakligi AS REIT |
|
13,684 |
|
|
20,027
|
| ||
|
| |||||||
United Kingdom - 5.7% | ||||||||
Derwent London PLC REIT |
|
1,164 |
|
|
63,364 |
| ||
Great Portland Estates PLC REIT | 2,079 | 26,311 | ||||||
Man Group PLC | 28,121 | 76,843 | ||||||
Shaftesbury PLC REIT | 6,484 | 86,807 | ||||||
Workspace Group PLC REIT
|
| 3,518
|
|
| 48,515
|
| ||
|
| |||||||
|
301,840
|
| ||||||
|
| |||||||
United States - 50.6% | ||||||||
Acadia Healthcare Co., Inc. (d) |
|
270 |
|
|
20,018 |
| ||
Advanced Energy Industries, Inc. (d) | 3,440 | 98,109 | ||||||
AG Mortgage Investment Trust, Inc. REIT | 2,970 | 55,955 | ||||||
American Eagle Outfitters, Inc. | 1,700 | 27,829 | ||||||
Amsurg Corp. (d) | 1,205 | 81,145 | ||||||
Beneficial Bancorp, Inc. (d) | 3,095 | 37,914 | ||||||
Bob Evans Farms, Inc. | 440 | 20,209 | ||||||
Burlington Stores, Inc. (d) | 1,605 | 84,696 | ||||||
CBIZ, Inc. (d) | 3,435 | 31,155 | ||||||
Centene Corp. (d) | 1,255 | 94,552 | ||||||
Cirrus Logic, Inc. (d) | 765 | 28,879 | ||||||
Express, Inc. (d) | 2,795 | 49,304 | ||||||
First Bancorp | 1,110 | 17,505 | ||||||
Flagstar Bancorp, Inc. (d) | 1,320 | 24,737 | ||||||
Foot Locker, Inc. | 600 | 37,920 | ||||||
Group 1 Automotive, Inc. | 495 | 40,743 | ||||||
Hanover Insurance Group, Inc. | 400 | 28,472 | ||||||
Health Net, Inc. (d) | 1,460 | 90,870 | ||||||
Hill-Rom Holdings, Inc. | 700 | 36,092 | ||||||
HomeStreet, Inc. (d) | 1,455 | 33,523 | ||||||
Horizon Pharma PLC (d) | 2,300 | 74,589 | ||||||
Huntington Ingalls Industries, Inc. | 870 | 107,871 | ||||||
Investors Real Estate Trust REIT | 3,530 | 25,557 | ||||||
JetBlue Airways Corp. (d) | 4,680 | 94,349 | ||||||
Knoll, Inc. | 1,350 | 30,726 | ||||||
Lear Corp. | 300 | 34,806 | ||||||
| See accompanying Notes to Financial Statements | 8 | Semi-Annual Report/May 31, 2015 |
Table of Contents
| ||||||||||
| Shares | Value | |||||||||
| ||||||||||
LifePoint Hospitals, Inc. (d) | 1,220 | 91,854 | ||||||||
Mallinckrodt PLC (d) | 920 | 119,085 | ||||||||
Matrix Service Co. (d) | 1,115 | 18,810 | ||||||||
Meta Financial Group, Inc. | 990 | 39,729 | ||||||||
Methode Electronics, Inc. | 430 | 20,180 | ||||||||
MicroStrategy, Inc., Class A (d) | 220 | 38,715 | ||||||||
Nautilus, Inc. (d) | 1,650 | 34,848 | ||||||||
Oritani Financial Corp. | 2,875 | 42,320 | ||||||||
Palo Alto Networks, Inc. (d) | 720 | 122,033 | ||||||||
Premier, Inc., Class A (d) | 805 | 30,847 | ||||||||
Quintiles Transnational Holdings, Inc. (d) | 770 | 53,677 | ||||||||
Select Comfort Corp. (d) | 3,525 | 109,804 | ||||||||
Skyworks Solutions, Inc. | 930 | 101,705 | ||||||||
Sonic Corp. | 2,640 | 79,569 | ||||||||
Spirit AeroSystems Holdings, Inc., Class A (d) | 1,200 | 65,508 | ||||||||
SUPERVALU, Inc. (d) | 10,320 | 91,125 | ||||||||
Tableau Software, Inc., Class A (d) | 560 | 63,397 | ||||||||
Texas Roadhouse, Inc. | 500 | 17,510 | ||||||||
Ulta Salon Cosmetics & Fragrance, Inc. (d) | 590 | 90,046 | ||||||||
Vail Resorts, Inc. | 905 | 93,885 | ||||||||
VCA, Inc. (d) | 695 | 36,460 | ||||||||
Vocera Communications, Inc. (d) | 1,920 | 20,870 | ||||||||
|
| |||||||||
|
2,689,502
|
| ||||||||
|
| |||||||||
Total Common Stock (cost-$4,514,188)
|
|
4,973,055
|
| |||||||
|
| |||||||||
RIGHTS - 0.0% | ||||||||||
New Zealand - 0.0% | ||||||||||
Kiwi Property Group Ltd., strike price NZD1.20, expires 6/9/15 (b)(d) (cost-$0) | 1,804 | 77 | ||||||||
|
| |||||||||
| Principal Amount (000s) | ||||||||||
SHORT-TERM INVESTMENTS - 4.4% | ||||||||||
Repurchase Agreement - 4.3% | ||||||||||
State Street Bank and Trust Co., | $ | 227 | 227,000 | |||||||
|
| |||||||||
Certificate of Deposit - 0.1% | ||||||||||
Citibank Argentina, | 9 | 9,273 | ||||||||
|
| |||||||||
Total Short-Term Investments (cost-$236,273) | 236,273 | |||||||||
|
| |||||||||
Total Investments (cost-$4,750,461) (a)-97.9% | 5,209,405 | |||||||||
Other assets less liabilities-2.1% | 109,777 | |||||||||
|
| |||||||||
Net Assets-100.0% | $ 5,319,182 | |||||||||
|
| |||||||||
Notes to Schedule of Investments:
| (a) | Securities with an aggregate value of $1,873,834, representing 35.2% of net assets, were valued utilizing modeling tools provided by a third-party vendor. See Note 1(a) and Note 1(b) in the Notes to Financial Statements. |
| (b) | Fair-Valued—Security with a value of $77, representing less than 0.05% of net assets. See Note 1(a) and Note 1(b) in the Notes to Financial Statements. |
| (c) | Affiliated security. |
| (d) | Non-income producing. |
Glossary:
ADR - American Depositary Receipt
REIT - Real Estate Investment Trust
| See accompanying Notes to Financial Statements | 9 | Semi-Annual Report/May 31, 2015 |
Table of Contents
Schedule of Investments
May 31, 2015 (unaudited)
AllianzGI Global Small-Cap Opportunities Portfolio
The industry classification of portfolio holdings and other assets less liabilities shown as a percentage of net assets were as follows:
Real Estate Investment Trust | 8.7% | |||
Health Care Providers & Services | 8.4% | |||
Specialty Retail | 7.0% | |||
Pharmaceuticals | 5.9% | |||
Banks | 5.6% | |||
Hotels, Restaurants & Leisure | 5.3% | |||
Electronic Equipment, Instruments & Components | 4.6% | |||
Semiconductors & Semiconductor Equipment | 4.2% | |||
Real Estate Management & Development | 3.8% | |||
Thrifts & Mortgage Finance | 3.3% | |||
Aerospace & Defense | 3.2% | |||
Insurance | 2.7% | |||
Software | 2.3% | |||
Communications Equipment | 2.3% | |||
Airlines | 2.1% | |||
Chemicals | 2.0% | |||
Food & Staples Retailing | 1.7% | |||
Auto Components | 1.7% | |||
Multi-line Retail | 1.6% | |||
Capital Markets | 1.5% | |||
IT Services | 1.4% | |||
Machinery | 1.4% | |||
Household Durables | 1.1% | |||
Life Sciences Tools & Services | 1.0% | |||
Trading Companies & Distributors | 0.9% | |||
Metals & Mining | 0.8% | |||
Construction Materials | 0.7% | |||
Textiles, Apparel & Luxury Goods | 0.7% | |||
Health Care Equipment & Supplies | 0.7% | |||
Building Products | 0.7% | |||
Leisure Equipment & Products | 0.7% | |||
Professional Services | 0.6% | |||
Commercial Services & Supplies | 0.6% | |||
Personal Products | 0.6% | |||
Oil, Gas & Consumable Fuels | 0.5% | |||
Multi-Utilities | 0.5% | |||
Electric Utilities | 0.5% | |||
Electrical Equipment | 0.4% | |||
Health Care Technology | 0.4% | |||
Energy Equipment & Services | 0.4% | |||
Road & Rail | 0.4% | |||
Transportation Infrastructure | 0.3% | |||
Construction & Engineering | 0.3% | |||
Short-Term Investments | 0.1% | |||
Repurchase Agreements | 4.3% | |||
Other assets less liabilities | 2.1% | |||
|
| |||
| 100.0% | ||||
|
|
| See accompanying Notes to Financial Statements | 10 | Semi-Annual Report/May 31, 2015 |
Table of Contents
Schedule of Investments
May 31, 2015 (unaudited)
AllianzGI U.S. Unconstrained Equity Portfolio
| ||||||||
| Shares | Value | |||||||
| ||||||||
COMMON STOCK - 97.1% | ||||||||
Aerospace & Defense - 1.9% | ||||||||
Boeing Co. (a) | 400 | $ | 56,208 | |||||
|
| |||||||
Airlines - 1.5% | ||||||||
United Continental Holdings, Inc. (a)(b) | 800 | 43,672 | ||||||
|
| |||||||
Auto Components - 1.6% | ||||||||
Delphi Automotive PLC (a) | 550 | 47,839 | ||||||
|
| |||||||
Banks - 4.3% | ||||||||
Ameris Bancorp (a) | 2,000 | 50,380 | ||||||
Citigroup, Inc. (a) | 1,400 | 75,712 | ||||||
|
| |||||||
|
126,092
|
| ||||||
|
| |||||||
Beverages - 3.2% | ||||||||
Constellation Brands, Inc., Class A (a) | 800 | 94,312 | ||||||
|
| |||||||
Biotechnology - 6.1% | ||||||||
Biogen, Inc. (a)(b) | 250 | 99,247 | ||||||
Celgene Corp. (a)(b) | 700 | 80,108 | ||||||
|
| |||||||
|
179,355
|
| ||||||
|
| |||||||
Capital Markets - 1.9% | ||||||||
Ameriprise Financial, Inc. (a) | 450 | 56,066 | ||||||
|
| |||||||
Chemicals - 4.4% | ||||||||
Ecolab, Inc. (a) | 700 | 80,255 | ||||||
LyondellBasell Industries NV, Class A (a) | 500 | 50,550 | ||||||
|
| |||||||
|
130,805
|
| ||||||
|
| |||||||
Communications Equipment - 2.4% | ||||||||
Palo Alto Networks, Inc. (a)(b) | 425 | 72,033 | ||||||
|
| |||||||
Diversified Financial Services - 2.5% | ||||||||
CBOE Holdings, Inc. (a) | 1,250 | 73,150 | ||||||
|
| |||||||
Energy Equipment & Services - 1.6% | ||||||||
Weatherford International PLC (a)(b) | 3,500 | 48,370 | ||||||
|
| |||||||
Food & Staples Retailing - 9.0% | ||||||||
CVS Health Corp. (a) | 1,250 | 127,975 | ||||||
Diplomat Pharmacy, Inc. (a)(b) | 2,600 | 100,490 | ||||||
Sprouts Farmers Market, Inc. (a)(b) | 1,250 | 37,487 | ||||||
|
| |||||||
|
265,952
|
| ||||||
|
| |||||||
Health Care Equipment & Supplies - 1.5% | ||||||||
Inogen, Inc. (a)(b) | 1,200 | 44,856 | ||||||
|
| |||||||
Health Care Providers & Services - 2.4% | ||||||||
UnitedHealth Group, Inc. (a) | 600 | 72,126 | ||||||
|
| |||||||
Hotels, Restaurants & Leisure - 3.2% | ||||||||
La Quinta Holdings, Inc. (a)(b) | 2,000 | 49,720 | ||||||
Restaurant Brands International, Inc. (a) | 1,188 | 45,940 | ||||||
|
| |||||||
|
95,660
|
| ||||||
|
| |||||||
Household Durables - 1.6% | ||||||||
Harman International Industries, Inc. (a) | 400 | 48,208 | ||||||
|
| |||||||
Insurance - 3.0% | ||||||||
American International Group, Inc. (a) | 1,500 | 87,915 | ||||||
|
| |||||||
Internet & Catalog Retail - 1.1% | ||||||||
EVINE Live, Inc. (a)(b) | 10,000 | 33,100 | ||||||
|
| |||||||
Internet Software & Services - 6.2% | ||||||||
Facebook, Inc., Class A (a)(b) | 1,200 | 95,028 | ||||||
HomeAway, Inc. (a)(b) | 1,800 | 50,526 | ||||||
Yelp, Inc. (a)(b) | 800 | 38,328 | ||||||
|
| |||||||
|
183,882
|
| ||||||
|
| |||||||
| See accompanying Notes to Financial Statements | 11 | Semi-Annual Report/May 31, 2015 |
Table of Contents
| ||||||||
| Shares | Value | |||||||
| ||||||||
Media - 1.8% | ||||||||
Scripps Networks Interactive, Inc., Class A (a) | 800 | 53,608 | ||||||
|
| |||||||
Multi-line Retail - 2.7% | ||||||||
Burlington Stores, Inc. (a)(b) | 1,500 | 79,155 | ||||||
|
| |||||||
Oil, Gas & Consumable Fuels - 4.5% | ||||||||
Pioneer Natural Resources Co. (a) | 300 | 44,349 | ||||||
Range Resources Corp. (a) | 1,100 | 60,951 | ||||||
Whiting Petroleum Corp. (a)(b) | 800 | 26,392 | ||||||
|
| |||||||
|
131,692
|
| ||||||
|
| |||||||
Pharmaceuticals - 1.7% | ||||||||
Pacira Pharmaceuticals, Inc. (a)(b) | 650 | 50,837 | ||||||
|
| |||||||
Real Estate Investment Trust - 3.1% | ||||||||
American Tower Corp. (a) | 1,000 | 92,790 | ||||||
|
| |||||||
Road & Rail - 4.7% | ||||||||
Hertz Global Holdings, Inc. (a)(b) | 3,750 | 74,587 | ||||||
Union Pacific Corp. (a) | 650 | 65,592 | ||||||
|
| |||||||
|
140,179
|
| ||||||
|
| |||||||
Semiconductors & Semiconductor Equipment - 4.1% | ||||||||
Broadcom Corp., Class A | 1,300 | 73,905 | ||||||
Tower Semiconductor Ltd. (a)(b) | 3,000 | 46,290 | ||||||
|
| |||||||
|
120,195
|
| ||||||
|
| |||||||
Software - 2.4% | ||||||||
Activision Blizzard, Inc. (a) | 2,800 | 70,728 | ||||||
|
| |||||||
Technology Hardware, Storage & Peripherals - 8.3% | ||||||||
Apple, Inc. (a) | 1,300 | 169,364 | ||||||
Hewlett-Packard Co. (a) | 2,250 | 75,150 | ||||||
|
| |||||||
|
244,514
|
| ||||||
|
| |||||||
Textiles, Apparel & Luxury Goods - 2.7% | ||||||||
Under Armour, Inc., Class A (a)(b) | 1,000 | 78,410 | ||||||
|
| |||||||
Trading Companies & Distributors - 1.7% | ||||||||
Air Lease Corp. (a) | 1,300 | 48,919 | ||||||
|
| |||||||
Total Investments, before options written (cost-$2,778,758)-97.1% | 2,870,628 | |||||||
|
| |||||||
| Contracts | ||||||||
|
| |||||||
OPTIONS WRITTEN (b)(c)- (0.0)% | ||||||||
Call Options - (0.0)% | ||||||||
Herbalife Ltd., | 12 | (1,416) | ||||||
|
| |||||||
Total Investments, net of options written (cost-$2,774,030)-97.1% | 2,869,212 | |||||||
Other assets less other liabilities-2.9% |
|
85,857
|
| |||||
|
| |||||||
Net Assets-100.0% | $ 2,955,069 | |||||||
|
| |||||||
Notes to Schedule of Investments:
| (a) | All or partial amount segregated for the benefit of the counterparty as collateral for option written. |
| (b) | Non-income producing. |
| (c) | Exchange traded-Chicago Board Options Exchange. |
| See accompanying Notes to Financial Statements | 12 | Semi-Annual Report/May 31, 2015 |
Table of Contents
Statements of Assets and Liabilities
May 31, 2015 (unaudited)
| AllianzGI Global Small-Cap Opportunities | AllianzGI U.S. Unconstrained Equity | |||||||||||||||
|
|
|
| |||||||||||||
Assets: | ||||||||||||||||
Investments, at value | $4,960,369 | $2,870,628 | ||||||||||||||
|
|
|
| |||||||||||||
Investments in Affiliates, at value | 22,036 | – | ||||||||||||||
|
|
|
| |||||||||||||
Repurchase agreements, at value | 227,000 | – | ||||||||||||||
|
|
|
| |||||||||||||
Cash | 634 | 82,254 | ||||||||||||||
|
|
|
| |||||||||||||
Foreign currency, at value | 62,358 | – | ||||||||||||||
|
|
|
| |||||||||||||
Receivable from Investment Manager | 61,773 | 41,159 | ||||||||||||||
|
|
|
| |||||||||||||
Dividends and interest receivable (net of foreign taxes) | 11,023 | 1,841 | ||||||||||||||
|
|
|
| |||||||||||||
Deferred offering costs | 5,808 | 3,397 | ||||||||||||||
|
|
|
| |||||||||||||
Tax reclaims receivable | 478 | – | ||||||||||||||
|
|
|
| |||||||||||||
Investments in Affiliated Funds - Trustee Deferred Compensation Plan (see Note 4) | 23 | 13 | ||||||||||||||
|
|
|
| |||||||||||||
Prepaid expenses | – | 19 | ||||||||||||||
|
|
|
| |||||||||||||
Total Assets | 5,351,502 | 2,999,311 | ||||||||||||||
|
|
|
| |||||||||||||
Liabilities: | ||||||||||||||||
Due to Investment Manager | 5,808 | 3,397 | ||||||||||||||
|
|
|
| |||||||||||||
Trustees Deferred Compensation Plan payable (see Note 4) | 23 | 13 | ||||||||||||||
|
|
|
| |||||||||||||
Options written, at value | – | 1,416 | ||||||||||||||
|
|
|
| |||||||||||||
Accrued expenses and other liabilities | 26,489 | 39,416 | ||||||||||||||
|
|
|
| |||||||||||||
Total Liabilities | 32,320 | 44,242 | ||||||||||||||
|
|
|
| |||||||||||||
Net Assets | $5,319,182 | $2,955,069 | ||||||||||||||
|
|
|
| |||||||||||||
Net Assets Consist of: | ||||||||||||||||
Paid-in-capital | $5,013,303 | $2,995,005 | ||||||||||||||
|
|
|
| |||||||||||||
Undistributed net investment income | 23,549 | (2,639) | ||||||||||||||
|
|
|
| |||||||||||||
Accumulated net realized loss | (175,663) | (132,479) | ||||||||||||||
|
|
|
| |||||||||||||
Net unrealized appreciation | 457,993 | 95,182 | ||||||||||||||
|
|
|
| |||||||||||||
Net Assets | $5,319,182 | $2,955,069 | ||||||||||||||
Cost of Investments | $4,502,986 | $2,778,758 | ||||||||||||||
|
|
|
| |||||||||||||
Cost of Investments in Affiliates | $20,475 | $– | ||||||||||||||
|
|
|
| |||||||||||||
Cost of Repurchase Agreements | $227,000 | $– | ||||||||||||||
|
|
|
| |||||||||||||
Cost of Foreign Currency | $63,136 | $– | ||||||||||||||
|
|
|
| |||||||||||||
Premiums Received for Options Written | $– | $4,728 | ||||||||||||||
|
|
|
| |||||||||||||
Shares Issued and Outstanding: | 334,250 | 200,000 | ||||||||||||||
|
|
|
| |||||||||||||
Net Asset Value and Redemption Price Per Share:* | $15.91 | $14.78 | ||||||||||||||
|
|
|
| |||||||||||||
| * | Net asset value and redemption price per share may not recalculate exactly due to rounding. |
| See accompanying Notes to Financial Statements | 13 | Semi-Annual Report/May 31, 2015 |
Table of Contents
Six Months ended May 31, 2015 (unaudited)
| AllianzGI Global Small-Cap Opportunities | AllianzGI U.S. Unconstrained Equity | |||||||||||||||
|
|
|
| |||||||||||||
Investment Income: | ||||||||||||||||
Dividends, net of foreign withholding taxes* | $53,346 | $12,253 | ||||||||||||||
|
|
|
| |||||||||||||
Dividends from investments in Affiliates | 681 | – | ||||||||||||||
|
|
|
| |||||||||||||
Total Investment Income | 54,027 | 12,253 | ||||||||||||||
|
|
|
| |||||||||||||
Expenses: | ||||||||||||||||
Investment management | 22,731 | 11,159 | ||||||||||||||
|
|
|
| |||||||||||||
Legal | 44,640 | 26,640 | ||||||||||||||
|
|
|
| |||||||||||||
Custodian and accounting agent | 42,441 | 24,124 | ||||||||||||||
|
|
|
| |||||||||||||
Offering | 19,945 | 19,945 | ||||||||||||||
|
|
|
| |||||||||||||
Audit and tax services | 15,886 | 16,497 | ||||||||||||||
|
|
|
| |||||||||||||
Shareholder communications | 14,206 | 14,206 | ||||||||||||||
|
|
|
| |||||||||||||
Transfer agent | 1,909 | 1,699 | ||||||||||||||
|
|
|
| |||||||||||||
Trustees | 260 | 120 | ||||||||||||||
|
|
|
| |||||||||||||
Insurance | – | 111 | ||||||||||||||
|
|
|
| |||||||||||||
Proxy | 22 | 14 | ||||||||||||||
|
|
|
| |||||||||||||
Miscellaneous | 515 | 501 | ||||||||||||||
|
|
|
| |||||||||||||
Total Expenses | 162,555 | 115,016 | ||||||||||||||
|
|
|
| |||||||||||||
Less: Reimbursement from Investment Manager | (132,225) | (100,124) | ||||||||||||||
|
|
|
| |||||||||||||
Net Expenses | 30,330 | 14,892 | ||||||||||||||
|
|
|
| |||||||||||||
Net Investment Income (Loss) | 23,697 | (2,639) | ||||||||||||||
|
|
|
| |||||||||||||
Realized and Change in Unrealized Gain (Loss): | ||||||||||||||||
Net realized loss on: | ||||||||||||||||
Investments | (38,838) | (5,492) | ||||||||||||||
|
|
|
| |||||||||||||
Investments in Affiliates | (31,399) | – | ||||||||||||||
|
|
|
| |||||||||||||
Options written | – | (14,710) | ||||||||||||||
|
|
|
| |||||||||||||
Foreign currency transactions | (3,173) | (8) | ||||||||||||||
|
|
|
| |||||||||||||
Net change in unrealized appreciation/depreciation of: | ||||||||||||||||
Investments | 452,248 | 32,942 | ||||||||||||||
|
|
|
| |||||||||||||
Investments in Affiliates | 17,229 | – | ||||||||||||||
|
|
|
| |||||||||||||
Options written | – | 1,860 | ||||||||||||||
|
|
|
| |||||||||||||
Foreign currency transactions | 33 | – | ||||||||||||||
|
|
|
| |||||||||||||
Net realized and change in unrealized gain | 396,100 | 14,592 | ||||||||||||||
|
|
|
| |||||||||||||
Net Increase in Net Assets Resulting from Investment Operations | $419,797 | $11,953 | ||||||||||||||
|
|
|
| |||||||||||||
*Foreign withholding taxes | $3,076 | $34 | ||||||||||||||
|
|
|
| |||||||||||||
| See accompanying Notes to Financial Statements | 14 | Semi-Annual Report/May 31, 2015 |
Table of Contents
Statements of Changes in Net Assets
| AllianzGI Global Small-Cap Opportunities | AllianzGI U.S. Unconstrained Equity | |||||||||||||||||
| ||||||||||||||||||
| Six Months ended May 31, 2015 (unaudited) | Period from July 23, 2014** through November 30, 2014 | Six Months ended May 31, 2015 (unaudited) | Period from July 1, 2014** through November 30, 2014 | |||||||||||||||
| ||||||||||||||||||
Increase (Decrease) in Net Assets from: | ||||||||||||||||||
Investment Operations: | ||||||||||||||||||
Net investment income (loss) | $23,697 | $15,248 | $(2,639) | $(4,995) | ||||||||||||||
|
|
|
|
|
|
|
|
| ||||||||||
Net realized loss | (73,410) | (104,346) | (20,210) | (112,269) | ||||||||||||||
|
|
|
|
|
|
|
|
| ||||||||||
Net change in unrealized appreciation/depreciation | 469,510 | (11,517) | 34,802 | 60,380 | ||||||||||||||
|
|
|
|
|
|
|
|
| ||||||||||
Net increase (decrease) in net assets resulting from investment operations | 419,797 | (100,615) | 11,953 | (56,884) | ||||||||||||||
|
|
|
|
|
|
|
|
| ||||||||||
Dividends to Shareholders from: | ||||||||||||||||||
Net investment income | (13,303) | – | – | – | ||||||||||||||
|
|
|
|
|
|
|
|
| ||||||||||
Fund Share Transactions: | ||||||||||||||||||
Issued in reinvestment of dividends | 13,303 | – | – | – | ||||||||||||||
|
|
|
|
|
|
|
|
| ||||||||||
Total increase (decrease) in net assets | 419,797 | (100,615) | 11,953 | (56,884) | ||||||||||||||
|
|
|
|
|
|
|
|
| ||||||||||
Net Assets: | ||||||||||||||||||
Beginning of period | 4,899,385 | 5,000,000 | 2,943,116 | 3,000,000 | ||||||||||||||
|
|
|
|
|
|
|
|
| ||||||||||
End of period* | $5,319,182 | $4,899,385 | $2,955,069 | $2,943,116 | ||||||||||||||
|
|
|
|
|
|
|
|
| ||||||||||
*Including undistributed net investment income of: | $23,549 | $13,155 | $– | $– | ||||||||||||||
|
|
|
|
|
|
|
|
| ||||||||||
| ** | Commencement of operations. |
| See accompanying Notes to Financial Statements | 15 | Semi-Annual Report/May 31, 2015 |
Table of Contents
AllianzGI Global Small-Cap Opportunities Portfolio
Financial Highlights
For a share outstanding throughout each period:
Six Months (unaudited) | For the period July 23, 2014* through November 30, 2014 | |||
| ||||
Net asset value, beginning of period | $14.70 | $15.00 | ||
| ||||
Investment Operations: | ||||
Net investment income(a) | 0.07 | 0.05 | ||
| ||||
Net realized and change in unrealized gain (loss) | 1.18 | (0.35) | ||
| ||||
Total from investment operations | 1.25 | (0.30) | ||
| ||||
Dividends to Shareholders from: | ||||
Net Investment Income | (0.04) | – | ||
| ||||
Net asset value, end of period | $15.91 | $14.70 | ||
| ||||
Total Return(b) | 8.53% | (2.00)% | ||
| ||||
RATIOS/SUPPLEMENTAL DATA: | ||||
Net assets, end of period (000s) | $5,319 | $4,899 | ||
| ||||
Ratio of expenses to average net assets with fee reimbursement(c) | 1.20% | 1.20% | ||
| ||||
Ratio of expenses to average net assets without fee reimbursement(c) | 6.15% | 4.88% | ||
| ||||
Ratio of net investment income to average net assets(c) | 0.94% | 0.88% | ||
| ||||
Portfolio turnover rate | 97% | 56% | ||
| ||||
| * | Commencement of operations. |
| (a) | Calculated on average shares outstanding. |
| (b) | Total return is calculated assuming a purchase of a share on the first day of the period and a sale of a share on the last day of each period reported. |
Dividends and distributions, if any, are assumed, for purposes of this calculation, to be reinvested. Total return includes the effect of reimbursements.
Total return may reflect adjustments to conform to U.S. GAAP. Total return for a period of less than one year is not annualized.
| (c) | Annualized. |
| See accompanying Notes to Financial Statements | 16 | Semi-Annual Report/May 31, 2015 |
Table of Contents
AllianzGI U.S. Unconstrained Equity Portfolio
Financial Highlights
For a share outstanding throughout each period:
Six Months (unaudited) | For the period July 1, 2014* through November 30, 2014 | |||
| ||||
Net asset value, beginning of period | $14.72 | $15.00 | ||
| ||||
Investment Operations: | ||||
Net investment loss(a) | (0.01) | (0.02) | ||
| ||||
Net realized and change in unrealized gain (loss) | 0.07 | (0.26) | ||
| ||||
Total from investment operations | 0.06 | (0.28) | ||
| ||||
Net asset value, end of period | $14.78 | $14.72 | ||
| ||||
Total Return(b) | 0.41% | (1.87)% | ||
| ||||
RATIOS/SUPPLEMENTAL DATA: | ||||
Net assets, end of period (000s) | $2,955 | $2,943 | ||
| ||||
Ratio of expenses to average net assets with fee reimbursement(c) | 1.00% | 1.00% | ||
| ||||
Ratio of expenses to average net assets without fee reimbursement(c) | 7.17% | 6.92% | ||
| ||||
Ratio of net investment loss to average net assets(c) | (0.18)% | (0.41)% | ||
| ||||
Portfolio turnover rate | 48% | 37% | ||
| ||||
| * | Commencement of operations. |
| (a) | Calculated on average shares outstanding. |
| (b) | Total return is calculated assuming a purchase of a share on the first day of the period and a sale of a share on the last day of each period reported. |
Dividends and distributions, if any, are assumed, for purposes of this calculation, to be reinvested. Total return includes the effect of reimbursements.
Total return may reflect adjustments to conform to U.S. GAAP. Total return for a period of less than one year is not annualized.
| (c) | Annualized. |
| See accompanying Notes to Financial Statements | 17 | Semi-Annual Report/May 31, 2015 |
Table of Contents
May 31, 2015 (unaudited)
1. ORGANIZATION AND SIGNIFICANT ACCOUNTING POLICIES
AllianzGI Institutional Multi-Series Trust (the “Trust”) was organized on June 3, 2014, as an open-end registered investment company organized as a Massachusetts business trust, and accordingly, follows the investment company accounting and reporting guidance of the Financial Accounting Standards Board (“FASB”) Accounting Standard Codification Topic 946 Financial Services-Investment Companies. As of May 31, 2015, the Trust consisted of two separate investment series, (each a “Portfolio” and collectively the “Portfolios”). Allianz Global Investors Fund Management LLC (“AGIFM” or the “Investment Manager”) serves as the Portfolios’ investment manager and Allianz Global Investors U.S. LLC (“AllianzGI U.S.” or the “Sub-Adviser”) serves as the Portfolios’ sub-adviser. AGIFM and AllianzGI U.S. are indirect, wholly-owned subsidiaries of Allianz Asset Management of America L.P. (“AAM”). AAM is an indirect, wholly-owned subsidiary of Allianz SE, a publicly traded European insurance and financial services company. Shares of the Portfolios have not been registered for public sale and are currently offered and sold on a private placement basis in accordance with Rule 506(c) of Regulation D under the Securities Act of 1933, as amended. Currently, the Trust has authorized one class of shares. The following Portfolios sold and issued shares of beneficial interest to Allianz Fund Investments, Inc. (“AFI”), an indirect wholly-owned subsidiary of Allianz SE, during the six months ended May 31, 2015 and the period ended November 30, 2014, as indicated:
| AllianzGI Global Small-Cap Opportunities | ||||||||||
| Class | Date | Shares | Amount | |||||||
| ||||||||||
Institutional | 7/23/14 | 333,333 | $ | 5,000,000 | ||||||
| ||||||||||
| AllianzGI U.S. Unconstrained Equity | ||||||||||
| Class | Date | Shares | Amount | |||||||
| ||||||||||
Institutional | 7/1/14 | 200,000 | $ | 3,000,000 | ||||||
| ||||||||||
The investment objective of both AllianzGI Global Small-Cap Opportunities and AllianzGI U.S. Unconstrained Equity is to seek long-term capital appreciation. There can be no assurance that the Portfolios will meet their stated objective.
The preparation of the Portfolios’ financial statements in accordance with accounting principles generally accepted in the United States of America (“U.S. GAAP”) requires the Portfolios’ management to make estimates and assumptions that affect the reported amounts and disclosures in each Portfolio’s financial statements. Actual results could differ from those estimates.
In the normal course of business, the Portfolios enter into contracts that contain a variety of representations that provide general indemnifications. The Portfolios’ maximum exposure under these arrangements is unknown as this would involve future claims that may be made against the Portfolios that have not yet occurred.
In June 2014, the FASB issued an Accounting Standards Update (“ASU”) 2014-11 that expands secured borrowing accounting for certain repurchase agreements. The ASU also sets forth additional disclosure requirements for certain transactions accounted for as sales, in order to provide financial statement users with information to compare to similar transactions accounted for as secured borrowings. ASU 2014-11 became effective for annual periods beginning after December 15, 2014, and for interim periods beginning after March 15, 2015. The adoption of ASU 2014-11 did not have an impact on the Portfolios’ financial statements.
In April 2015, the FASB issued ASU 2015-7, disclosures for investments in certain entities that calculate net asset value per share (“NAV”) (or its equivalent), modifying ASC 946 Financial Services Investment Companies. Under the modifications, investments in affiliated and private investment funds valued at NAV are no longer included in the fair value hierarchy. ASU 2015-7 is effective prospectively during interim or annual periods beginning after December 15, 2014. At this time, management is evaluating the implications of these changes on the Portfolios’ financial statements.
The following is a summary of significant accounting policies consistently followed by the Portfolios:
(a) Valuation of Investments. Portfolio securities and other financial instruments for which market quotations are readily available are stated at market value. Market value is generally determined on the basis of official closing prices, last reported sales prices, or if no sales or closing prices are reported, on the basis of quotes obtained from a quotation reporting system, established market makers, or independent pricing services. The Portfolios’ investments are valued daily using prices supplied by an independent pricing service or broker/dealer quotations, or by using the last sale or settlement price on the
| 18 | Semi-Annual Report/May 31, 2015 |
Table of Contents
Notes to Financial Statements
May 31, 2015 (unaudited) (continued)
exchange that is the primary market for such securities, or the mean between the last bid and ask quotations. The market value for NASDAQ Global Market and NASDAQ Capital Market securities may also be calculated using the NASDAQ Official Closing Price instead of the last reported sales price. Independent pricing services use information provided by market makers or estimates of market values obtained from yield data relating to investments or securities with similar characteristics.
The Board of Trustees (the “Board”) has adopted procedures for valuing portfolio securities and other financial instruments in circumstances where market quotations are not readily available, and has delegated primary responsibility for applying the valuation methods to the Investment Manager and the Sub-Adviser. The Trust’s Valuation Committee was established by the Board to oversee the implementation of the Portfolios’ valuation methods and to make fair value determinations on behalf of the Board, as instructed by the Board. The Sub-Adviser monitors the continued appropriateness of methods applied and identifies to the Investment Manager circumstances and events that may require fair valuation. The Investment Manager, in turn, determines if adjustments should be made in light of market changes, events affecting the issuer, or other factors. If the Investment Manager (in consultation with the Sub-Adviser) determines that a valuation method may no longer be appropriate, another valuation method may be selected or the Valuation Committee will be convened to consider the matter and take any appropriate action in accordance with procedures set forth by the Board. The Board shall review and ratify the appropriateness of the valuation methods and these methods may be amended or supplemented from time to time by the Valuation Committee.
Short-term debt instruments maturing in 60 days or less are valued at amortized cost, if their original term to maturity was 60 days or less, or by amortizing premium or discount based on their value on the 61st day prior to maturity, if the original term to maturity exceeded 60 days.
Investments initially valued in currencies other than the U.S. dollar are converted to the U.S. dollar using exchange rates obtained from pricing services. As a result, the net asset value (“NAV”) of each Portfolio may be affected by changes in the value of currencies in relation to the U.S. dollar. The value of securities traded in markets outside the United States or denominated in currencies other than the U.S. dollar may be affected significantly on a day that the New York Stock Exchange (“NYSE”) is closed.
The prices used by the Portfolios to value investments may differ from the value that would be realized if the investments were sold, and these differences could be material to the Portfolios’ financial statements. The NAV of each Portfolio is normally determined as of the close of regular trading (normally, 4:00 p.m. Eastern time) on the NYSE on each day the NYSE is open for business.
The prices of certain portfolio securities or financial instruments may be determined at a time prior to the close of regular trading on the NYSE. When fair-valuing the securities, the Portfolios may, among other things, consider significant events (which may be considered to include changes in the value of U.S. securities or securities indices) that occur after the close of the relevant market and before the time the NAV of a Portfolio is calculated. With respect to certain foreign securities, the Portfolios may fair-value securities using modeling tools provided by third-party vendors. The Portfolios have retained a statistical research service to assist in determining the fair value of foreign securities. This service utilizes statistics and programs based on historical performance of markets and other economic data to assist in making fair value estimates. Fair value estimates used by the Portfolios for foreign securities may differ from the value realized from the sale of those securities and the difference could be material to the financial statements. Fair value pricing may require subjective determinations about the value of a security or other assets, and fair values used to determine the NAV of a Portfolio may differ from quoted or published prices, or from prices that are used by others, for the same investments. In addition, the use of fair value pricing may not always result in adjustments to the prices of securities or other assets held by a Portfolio.
(b) Fair Value Measurements. Fair value is defined as the price that would be received to sell an asset or paid to transfer a liability (i.e. the “exit price”) in an orderly transaction between market participants. The three levels of the fair value hierarchy are described below:
| · | Level 1 – quoted prices in active markets for identical investments that the Portfolios have the ability to access |
| · | Level 2 – valuations based on other significant observable inputs, which may include, but are not limited to, quoted prices for similar assets or liabilities, interest rates, yield curves, volatilities, prepayment speeds, loss severities, credit risks and default rates or other market corroborated inputs |
| · | Level 3 – valuations based on significant unobservable inputs (including the Sub-Adviser’s or Valuation Committee’s own assumptions and securities whose price was determined by using a single broker’s quote) |
| 19 | Semi-Annual Report/May 31, 2015 |
Table of Contents
Notes to Financial Statements
May 31, 2015 (unaudited) (continued)
The valuation techniques used by the Portfolios to measure fair value during the six months ended May 31, 2015 were intended to maximize the use of observable inputs and to minimize the use of unobservable inputs.
The Portfolios’ policy is to recognize transfers between levels at the end of the reporting period. An investment asset’s or liability’s level within the fair value hierarchy is based on the lowest level input, individually or in aggregate, that is significant to the fair value measurement. The objective of fair value measurement remains the same even when there is a significant decrease in the volume and level of activity for an asset or liability and regardless of the valuation techniques used. Investments categorized as Level 1 or 2 as of period end may have been transferred between Levels 1 and 2 since the prior period due to changes in the valuation method utilized in valuing the investments.
The inputs or methodology used for valuing securities are not necessarily an indication of the risk associated with investing in those securities. The following are certain inputs and techniques that the Portfolios generally use to evaluate how to classify each major category of assets and liabilities within Level 2 and Level 3, in accordance with U.S. GAAP.
Equity Securities (Common and Preferred Stock) — Equity securities traded in inactive markets and certain foreign equity securities are valued using inputs which include broker-dealer quotes, recently executed transactions adjusted for changes in the benchmark index, or evaluated price quotes received from independent pricing services that take into account the integrity of the market sector and issuer, the individual characteristics of the security, and information received from broker-dealers and other market sources pertaining to the issuer or security. To the extent that these inputs are observable, the values of equity securities are categorized as Level 2. To the extent that these inputs are unobservable, the values are categorized as Level 3.
Option Contracts — Option contracts traded over-the-counter (“OTC”) and FLexible EXchange (“FLEX”) options are valued by independent pricing services based on pricing models that incorporate various inputs such as interest rates, credit spreads, currency exchange rates and volatility measurements for in-the-money, at-the-money, and out-of-the-money contracts based on a given strike price. To the extent that these inputs are observable, the values of OTC and FLEX option contracts are categorized as Level 2. To the extent that these inputs are unobservable, the values are categorized as Level 3.
A summary of the inputs used at May 31, 2015 in valuing each Portfolio’s assets and liabilities is listed below (refer to the Schedules of Investments for more detailed information on Investments in Securities):
AllianzGI Global Small-Cap Opportunities:
| Level 1 - Quoted Prices | Level 2 - Inputs | Level 3 - Significant Unobservable Inputs | Value at 5/31/15 | |||||||||||||||
Investments in Securities - Assets | ||||||||||||||||||
Common Stock: | ||||||||||||||||||
Australia | — | $ | 114,512 | — | $ | 114,512 | ||||||||||||
China | — | 189,249 | — | 189,249 | ||||||||||||||
France | $ | 62,682 | 29,113 | — | 91,795 | |||||||||||||
Hong Kong | 93,036 | 134,259 | — | 227,295 | ||||||||||||||
India | 40,905 | 31,802 | — | 72,707 | ||||||||||||||
Israel | 31,455 | 27,097 | — | 58,552 | ||||||||||||||
Italy | 18,832 | 31,338 | — | 50,170 | ||||||||||||||
Japan | — | 549,856 | — | 549,856 | ||||||||||||||
Korea (Republic of) | 15,023 | 134,761 | — | 149,784 | ||||||||||||||
New Zealand | — | 14,492 | — | 14,492 | ||||||||||||||
Singapore | 28,874 | 18,398 | — | 47,272 | ||||||||||||||
Switzerland | 39,973 | 86,382 | — | 126,355 | ||||||||||||||
Taiwan | — | 172,013 | — | 172,013 | ||||||||||||||
Thailand | — | 18,695 | — | 18,695 | ||||||||||||||
Turkey | — | 20,027 | — | 20,027 | ||||||||||||||
United Kingdom | — | 301,840 | — | 301,840 | ||||||||||||||
All Other | 2,768,441 | — | — | 2,768,441 | ||||||||||||||
Rights | — | — | $ | 77 | 77 | |||||||||||||
Repurchase Agreement | — | 227,000 | — | 227,000 | ||||||||||||||
Certificate of Deposit | — | 9,273 | — | 9,273 | ||||||||||||||
Totals | $ | 3,099,221 | $ | 2,110,107 | $ | 77 | $ | 5,209,405 | ||||||||||
| 20 | Semi-Annual Report/May 31, 2015 |
Table of Contents
Notes to Financial Statements
May 31, 2015 (unaudited) (continued)
AllianzGI U.S. Unconstrained Equity:
Level 1 - Quoted Prices | Level 2 - Other Significant Observable Inputs | Level 3 - Significant Unobservable Inputs | Value at 5/31/15 | |||||||||||
| ||||||||||||||
Investments in Securities - Assets | ||||||||||||||
Common Stock | $ | 2,870,628 | — | — | $ | 2,870,628 | ||||||||
| ||||||||||||||
Investments in Securities - Liabilities | ||||||||||||||
Options Written: | ||||||||||||||
Market Price | (1,416 | ) | — | — | (1,416) | |||||||||
| ||||||||||||||
Totals | $ | 2,869,212 | — | — | $ | 2,869,212 | ||||||||
| ||||||||||||||
At May 31, 2015, the following Portfolios had transfers between Levels 1 and 2:
| Transfers | ||||
| ||||
| Level 1 to Level 2 | Level 2 to Level 1 | |||
| ||||
AllianzGI Global Small-Cap Opportunities | $48,515(a) | — | ||
(a) This transfer was a result of securities trading outside the U.S. whose values were not adjusted by the application of a modeling tool at November 30, 2014, which was applied on May 31, 2015.
A roll forward of fair value measurements using significant unobservable inputs (Level 3) for the six months ended May 31, 2015, was as follows:
| Beginning Balance 11/30/14 | Purchases | Sales | Accrued Discount (Premiums) | Net Realized Gain (Loss) | Net Change in Unrealized Appreciation/ Depreciation | Transfers into Level 3 | Transfers out of | Ending Balance 5/31/15 |
| |||||||||||||||||||||||||
| ||||||||||||||||||||||||||||||||||
Investments in Securities - Assets |
| |||||||||||||||||||||||||||||||||
Rights | — | — | — | — | — | $ | 77 | — | — | $ | 77 | |||||||||||||||||||||||
| ||||||||||||||||||||||||||||||||||
The following table presents additional information about valuation techniques and inputs used for investments that are measured at fair value and categorized within Level 3 at May 31, 2015:
| Ending Balance at 5/31/15 | Valuation Technique Used | Unobservable Inputs | Input Values | |||||||||
| ||||||||||||
Investments in Securities - Assets | ||||||||||||
Rights | $ | 77 | Fundamental Analytical Data Relating to the Investment | Price of Right | 0.06 NZD | |||||||
Glossary:
NZD - New Zealand Dollar
The net change in unrealized appreciation/depreciation of Level 3 investments which AllianzGI Global Small-Cap Opportunities held at May 31, 2015, was $77.
(c) Investment Transactions and Investment Income. Investment transactions are accounted for on the trade date. Realized gains and losses on investments are determined on an identified cost basis. Interest income is recorded on an accrual basis. Dividend income is recorded on the ex-dividend date, except for certain dividends from foreign securities where the ex-dividend date may have passed, and then are recorded as soon after the ex-dividend date as the Portfolios, using reasonable diligence, become aware of such dividends. Dividend and interest income on the Statements of Operations are shown net of any foreign taxes withheld on income from foreign securities. Payments received from real estate investment
| 21 | Semi-Annual Report/May 31, 2015 |
Table of Contents
Notes to Financial Statements
May 31, 2015 (unaudited) (continued)
trust securities may be comprised of dividends, realized gains and return of capital. The payment may initially be recorded as dividend income and may subsequently be reclassified as realized gains and/or return of capital upon receipt of information from the issuer. Payments considered return of capital reduce the cost basis of the respective security.
(d) Federal Income Taxes. The Portfolios intend to distribute all of their taxable income and to comply with the other requirements of Subchapter M of the U.S. Internal Revenue Code of 1986, as amended, applicable to regulated investment companies. Accordingly, no provision for U.S. federal income taxes is required. The Portfolios may be subject to excise tax based on distributions to shareholders.
Accounting for uncertainty in income taxes establishes for all entities, including pass-through entities such as the Portfolios, a minimum threshold for financial statement recognition of the benefit of positions taken in filing tax returns (including whether an entity is taxable in a particular jurisdiction), and requires certain expanded tax disclosures. In accordance with provisions set forth under U.S. GAAP, the Investment Manager has reviewed the Portfolios’ tax positions for all open tax years. As of May 31, 2015, the Portfolios have recorded no liability for net unrecognized tax benefits relating to uncertain income tax positions they have taken. The Portfolios’ federal income tax returns since inception remain subject to examination by the Internal Revenue Service.
(e) Dividends and Distributions to Shareholders. The Portfolios declare dividends and distributions from net investment income and net realized capital gains, if any, annually. The Portfolios record dividends and distributions to their respective shareholders on the ex-dividend date. The amount of dividends from net investment income and distributions from net realized capital gains is determined in accordance with federal income tax regulations, which may differ from U.S. GAAP. These “book-tax” differences are considered either temporary or permanent in nature. To the extent these differences are permanent in nature, such amounts are reclassified within the capital accounts based on their federal income tax treatment; temporary differences do not require reclassification. To the extent dividends and/or distributions exceed current and accumulated earnings and profits for federal income tax purposes, they are reported as dividends and/or distributions to shareholders from return of capital. The amount of dividends from net investment income and distributions from net realized capital gains is determined in accordance with federal income tax regulations, which may differ from U.S. GAAP. These “book-tax” differences are considered either temporary or permanent in nature. To the extent these differences are permanent in nature, such amounts are reclassified within the capital accounts based on their federal income tax treatment; temporary differences do not require reclassification. To the extent dividends and/or distributions exceed current and accumulated earnings and profits for federal income tax purposes, they are reported as dividends and/or distributions to shareholders from return of capital.
(f) Foreign Currency Translation. The Portfolios’ accounting records are maintained in U.S. dollars as follows: (1) the foreign currency market values of investments and other assets and liabilities denominated in foreign currencies are translated at the prevailing exchange rate at the end of the period; and (2) purchases and sales, income and expenses are translated at the prevailing exchange rate on the respective dates of such transactions. The resulting net foreign currency gain (loss) is included in the Portfolios’ Statements of Operations.
The Portfolios do not generally isolate that portion of the results of operations arising as a result of changes in foreign currency exchange rates from the fluctuations arising from changes in the market prices of securities. Accordingly, such foreign currency gain (loss) is included in net realized and unrealized gain (loss) on investments. However, the Portfolios do isolate the effect of fluctuations in foreign currency exchange rates when determining the gain (loss) upon the sale or maturity of foreign currency denominated debt obligations pursuant to U.S. federal income tax regulations; such amount is categorized as foreign currency gain (loss) for both financial reporting and income tax reporting purposes.
(g) Repurchase Agreements. The Portfolios are parties to Master Repurchase Agreements (“Master Repo Agreements”) with select counterparties. The Master Repo Agreements maintain provisions for initiation, income payments, events of default, and maintenance of collateral.
The Portfolios enter into transactions, under the Master Repo Agreements, with their custodian bank or securities brokerage firms whereby they purchase securities under agreements to resell such securities at an agreed upon price and date (“repurchase agreements”). The Portfolios, through their custodian, take possession of securities collateralizing the repurchase agreement. Such agreements are carried at the contract amount in the financial statements, which is considered to represent fair value. Collateral pledged (the securities received), which consists primarily of U.S. government obligations and
| 22 | Semi-Annual Report/May 31, 2015 |
Table of Contents
Notes to Financial Statements
May 31, 2015 (unaudited) (continued)
asset-backed securities, is held by the custodian bank for the benefit of the Portfolios until maturity of the repurchase agreement. Provisions of the repurchase agreements and the procedures adopted by the Portfolios require that the market value of the collateral, including accrued interest thereon, be sufficient in the event of default by the counterparty. If the counterparty defaults under the Master Repo Agreements and the value of the collateral declines or if the counterparty enters an insolvency proceeding, realization of the collateral by the Portfolios may be delayed or limited. The gross values are included in the Portfolios’ Schedules of Investments. The value of the related collateral exceeded the value of the repurchase agreements at May 31, 2015.
(h) Organizational and Offering Costs. Organizational costs are expensed at the inception of the Portfolios. Offering costs are amortized over a twelve-month period from the inception of the Portfolios.
2. PRINCIPAL RISKS
In the normal course of business, the Portfolios trade financial instruments and enter into financial transactions where risk of potential loss exists due to, among other things, changes in the market (market risk) or failure of the other party to a transaction to perform (counterparty risk). The Portfolios are also exposed to other risks such as, but not limited to, interest rate, foreign currency, credit and leverage risks.
To the extent the Portfolios directly invest in foreign currencies or in securities that trade in, and receive revenues in, foreign currencies, or in derivatives that provide exposure to foreign currencies, they will be subject to the risk that those currencies will decline in value relative to the U.S. dollar, or, in the case of hedging positions, that the U.S. dollar will decline in value relative to the currency being hedged. Currency rates in foreign countries may fluctuate significantly over short periods of time for a number of reasons, including economic growth, inflation, changes in interest rates, intervention (or the failure to intervene) by U.S. or foreign governments, central banks or supranational entities such as the International Monetary Fund, or the imposition of currency controls or other political developments in the United States or abroad. As a result, the Portfolios’ investments in foreign currency-denominated securities may reduce the returns of the Portfolios. The local emerging markets currencies in which the Portfolios may be invested may experience substantially greater volatility against the U.S. dollar than the major convertible currencies in developed countries.
The Portfolios are subject to elements of risk not typically associated with investments in the U.S., due to concentrated investments in foreign issuers located in a specific country or region. Such concentrations will subject the Portfolios to additional risks resulting from future political or economic conditions in such country or region and the possible imposition of adverse governmental laws or currency exchange restrictions affecting such country or region, which could cause the securities and their markets to be less liquid and prices more volatile than those of comparable U.S. companies.
The market values of securities may decline due to general market conditions (market risk) which are not specifically related to a particular company, such as real or perceived adverse economic conditions, changes in the general outlook for corporate earnings, changes in interest or currency rates, adverse changes to credit markets or adverse investor sentiment. They may also decline due to factors that affect a particular industry or industries, such as labor shortages or increased production costs and competitive conditions within an industry. Equity securities and equity-related investments generally have greater market price volatility than fixed income securities, although under certain market conditions fixed income securities may have comparable or greater price volatility. Credit ratings downgrades may also negatively affect securities held by the Portfolios. Even when markets perform well, there is no assurance that the investments held by the Portfolios will increase in value along with the broader market. In addition, market risk includes the risk that geopolitical events will disrupt the economy on a national or global level.
The Portfolios are exposed to counterparty risk, or the risk that an institution or other entity with which the Portfolios have unsettled or open transactions will default. The potential loss to the Portfolios could exceed the value of the financial assets recorded in the Portfolios’ financial statements. Financial assets, which potentially expose the Portfolios to counterparty risk, consist principally of cash due from counterparties and investments. The Sub-Adviser seeks to minimize the Portfolios’ counterparty risk by performing reviews of each counterparty and by minimizing concentration of counterparty risk by undertaking transactions with multiple customers and counterparties on recognized and reputable exchanges. Delivery of securities sold is only made once the Portfolios’ have received payment. Payment is made on a purchase once the securities have been delivered by the counterparty. The trade will fail if either party fails to meet its obligation.
| 23 | Semi-Annual Report/May 31, 2015 |
Table of Contents
Notes to Financial Statements
May 31, 2015 (unaudited) (continued)
3. FINANCIAL DERIVATIVE INSTRUMENTS
Disclosure about derivatives and hedging activities requires qualitative disclosure regarding objectives and strategies for using derivatives, quantitative disclosure about fair value amounts of gains and losses on derivatives, and disclosure about credit-risk-related contingent features in derivative agreements. The disclosure requirements distinguish between derivatives which are accounted for as “hedges”, and those that do not qualify for such accounting. Although the Portfolios at times use derivatives for hedging purposes, the Portfolios reflect derivatives at fair value and recognize changes in fair value through the Portfolios’ Statements of Operations, and such derivatives do not qualify for hedge accounting treatment.
Option Transactions. The Portfolios purchase put and call options on securities and indices for hedging purposes, risk management purposes or otherwise as part of their investment strategies. The risks associated with purchasing an option include the risk that the Portfolios pay a premium whether or not the option is exercised. Additionally, the Portfolios bear the risk of loss of premiums and changes in market value should the counterparty not perform under the contract. Put and call options purchased are accounted for in the same manner as portfolio securities. The cost of securities acquired through the exercise of call options is increased by the premiums paid. The proceeds from securities sold through the exercise of put options are decreased by the premiums paid.
The Portfolios may write (sell) put and call options on securities and indices to earn premiums, for hedging purposes, risk management purposes or otherwise as part of their investment strategies. When an option is written, the premium received is recorded as an asset with an equal liability that is subsequently marked to market to reflect the market value of the option written. These liabilities, if any, are reflected as options written in the Portfolios’ Statements of Assets and Liabilities. Premiums received from writing options which expire unexercised are recorded on the expiration date as a realized gain. The difference between the premium received and the amount paid on effecting a closing purchase transaction, including brokerage commissions, is also treated as a realized gain, or if the premium is less than the amount paid for the closing purchase transaction, as a realized loss. If a call option written is exercised, the premium is added to the proceeds from the sale of the underlying security in determining whether there has been a realized gain or loss. If a put option written is exercised, the premium reduces the cost basis of the security. In writing an option, the Portfolios bear the market risk of an unfavorable change in the price of the security underlying the written option. Exercise of a written option could result in the Portfolios purchasing a security at a price different from its current market value.
Forward Foreign Currency Contracts. A forward foreign currency contract is an agreement between two parties to buy and sell a currency at a set exchange rate on a future date. The Portfolios enter into these contracts for purposes of increasing exposure to a foreign currency or shifting exposure to foreign currency fluctuations from one country to another. The market value of a forward foreign currency contract fluctuates with changes in foreign currency exchange rates. All commitments are marked to market daily at the applicable exchange rates and any resulting unrealized appreciation or depreciation is recorded. Realized gains or losses are recorded at the time the forward contract matures or by delivery of the currency. Risks may arise upon entering into these contracts from the potential inability of counterparties to meet the terms of their contracts and from unanticipated movements in the value of a foreign currency relative to the U.S. dollar. In addition, these contracts may involve market risk in excess of the unrealized appreciation (depreciation) reflected in the Portfolios’ Statements of Assets and Liabilities.
The following is a summary of the Portfolios’ derivatives categorized by risk exposure.
The effect of derivatives on the Statements of Assets and Liabilities at May 31, 2015:
AllianzGI U.S. Unconstrained Equity:
| Location | Market Price | |||
| ||||
Liability derivatives: | ||||
Options written, at value | $ (1,416) | |||
| ||||
| 24 | Semi-Annual Report/May 31, 2015 |
Table of Contents
Notes to Financial Statements
May 31, 2015 (unaudited)
The effect of derivatives on the Statements of Operations for the six months ended May 31, 2015:
AllianzGI Global Small-Cap Opportunities:
| Location | Foreign Exchange Contracts | |||||
| ||||||
Net realized gain on: | ||||||
Foreign currency transactions (forward foreign currency contracts) | $ | 1,518 | ||||
| ||||||
AllianzGI U.S. Unconstrained Equity:
| ||||||
| Location | Market Price | |||||
| ||||||
Net realized (loss) on: | ||||||
Investments (options purchased) | $ | (6,227 | ) | |||
Options written | (14,710 | ) | ||||
| ||||||
Total net realized (loss) | $ | (20,937 | ) | |||
| ||||||
Net change in unrealized appreciation/depreciation of: | ||||||
Investments (options purchased) | $ | (12,272 | ) | |||
Options written | 1,860 | |||||
| ||||||
Total net unrealized (loss )
| $
| (10,412
| )
| |||
| ||||||
The average volume (measured at each fiscal quarter-end) of derivative activity during the six months ended May 31, 2015:
| Options Purchased Contracts(1) | Options Written Contracts(1) | |||||||
| ||||||||
AllianzGI U.S. Unconstrained Equity | 37 | 27 | ||||||
(1) Number of contracts
4. INVESTMENT MANAGER/DISTRIBUTOR FEES/DEFERRED COMPENSATION
Investment Management Fee. Each Portfolio has an Investment Management Agreement (collectively the “Agreements”) with the Investment Manager. Subject to the supervision of the Trust’s Board, the Investment Manager is responsible for managing, either directly or through others selected by it, each Portfolio’s investment activities, business affairs and administrative matters. Pursuant to the Agreements, the Investment Manager receives an annual fee, payable monthly (net of any fee waivers, reimbursements and recoupment), at an annual rate of each Portfolio’s average daily net assets (the “Investment Management Fee”). Pursuant to its Agreement, AllianzGI Global Small-Cap Opportunities Portfolio pays the Investment Manager an annual fee, payable monthly, at an annual rate of 0.90% of its average daily net assets. Pursuant to its Agreement, AllianzGI U.S. Unconstrained Equity Portfolio pays the Investment Manager an annual fee, payable monthly, at an annual rate of 0.75% of its average daily net assets.
The Investment Manager has retained the Sub-Adviser to manage the Portfolios’ investments. Subject to the supervision of the Investment Manager, the Sub-Adviser is responsible for making all of the Portfolios’ investment decisions. The Investment Manager, not the Portfolios, pays a portion of the fees it receives as Investment Manager to the Sub-Adviser in return for its services.
“Due to Investment Manager” on the Statements of Assets and Liabilities represents the remaining payable for the Portfolios’ offering costs that were paid by the Investment Manager.
| 25 | Semi-Annual Report/May 31, 2015 |
Table of Contents
Notes to Financial Statements
May 31, 2015 (unaudited) (continued)
Distribution Fees. Allianz Global Investors Distributors LLC (the “Distributor”), an affiliate of AAM, the Investment Manager and the Sub-Adviser serves as the distributor of the Portfolios’ shares pursuant to a Distribution Contract. The Distributor, for each of the Portfolios, currently receives no compensation in connection with the services it provides under the Distribution Contract.
Deferred Compensation. Trustees do not currently receive any pension or retirement benefits from the Trust. The Trust has adopted a deferred compensation plan for the Trustees that went into place at the beginning of this calendar year and permits the Trustees to defer their receipt of compensation from the Trust, at their election, in accordance with the terms of the plan. Under the plan, each Trustee may elect not to receive all or a portion of his or her fees from the Trust on a current basis but to receive in a subsequent period chosen by the Trustee an amount equal to the value of such compensation if such compensation had been invested in one or more series of Allianz Portfolios selected by the Trustees from and after the normal payment dates for such compensation. The deferred compensation program is structured such that the Trust remains in substantially the same financial position whether Trustee fees are paid when earned or deferred.
5. EXPENSE LIMITATION AND RECOUPMENT
The Trust and the Investment Manager have entered into an Expense Limitation Agreement.
| Portfolio | Expense Limitation | |||||
AllianzGI Global Small Cap- Opportunities (1) | 1.20% | |||||
AllianzGI U.S. Unconstrained Equity (2) | 1.00% | |||||
(1) The Investment Manager has contractually agreed, until March 31, 2016, to irrevocably waive its management fee and/or reimburse the Portfolio, to the extent that, Total Annual Portfolio Operating Expenses, excluding interest, taxes, and extraordinary expenses, acquired fund expenses, and certain credits and other expenses, exceed 1.20%. Under the Expense Limitation Agreement, the Investment Manager may recoup waived or reimbursed amounts for three years, provided total expenses, including such recoupment, do not exceed the annual expense limit. The Expense Limitation Agreement is terminable by the Trust upon 90 days’ prior written notice to the Investment Manager or at any time by mutual agreement of the parties. | ||||||
(2) The Investment Manager has contractually agreed, until March 31, 2016, to irrevocably waive its management fee and/or reimburse the Portfolio, to the extent that, Total Annual Portfolio Operating Expenses, excluding interest, taxes, and extraordinary expenses, acquired fund expenses, and certain credits and other expenses, exceed 1.00%. Under the Expense Limitation Agreement, the Investment Manager may recoup waived or reimbursed amounts for three years, provided total expenses, including such recoupment, do not exceed the annual expense limit. The Expense Limitation Agreement is terminable by the Trust upon 90 days’ prior written notice to the Investment Manager or at any time by mutual agreement of | ||||||
the parties. | ||||||
The Investment Manager, as per the Expense Limitation Agreement, may recoup reimbursed amounts for a period of up to three years, provided total expenses, including such recoupment, do not exceed the annual expense limit in effect at the time of such reimbursements. During the six months ended May 31, 2015, the Investment Manager did not recoup any expenses from the Portfolios. The following represents the amounts that can be recouped by the Investment Manager as of May 31, 2015.
| Unrecouped Expenses | ||||
| Reimbursed through | ||||
| Year ended November 30, 2014 | ||||
|
| |||
|
| |||
AllianzGI Global Small-Cap Opportunities | $132,292 | |||
AllianzGI U.S. Unconstrained Equity | 137,152 | |||
| 26 | Semi-Annual Report/May 31, 2015 |
Table of Contents
Notes to Financial Statements
May 31, 2015 (unaudited) (continued)
6. INVESTMENTS IN SECURITIES
For the six months ended May 31, 2015, purchases and sales of investments, other than short-term securities were:
| Purchases | Sales | ||||
| |||||
AllianzGI Global Small-Cap Opportunities | $4,764,164 | $5,054,019 | |||
AllianzGI U.S. Unconstrained Equity | 1,531,390 | 1,333,794 | |||
Transactions in options written for the six months ended May 31, 2015:
AllianzGI U.S. Unconstrained Equity:
| Contracts | Premiums | |||||||||
Options outstanding, November 30, 2014 | 22 | $ 3,272 | ||||||||
Options written | 195 | 36,167 | ||||||||
Options terminated in closing transactions | (178) | (32,027) | ||||||||
Options expired | (27) | (2,684) | ||||||||
Options outstanding, May 31, 2015 | 12 | $ 4,728 | ||||||||
7. INCOME TAX INFORMATION
At May 31, 2015, the aggregate cost basis and the net unrealized appreciation (depreciation) of investments (before options written) for federal income tax purposes were:
| Federal Tax Cost Basis(1) | Unrealized Appreciation | Unrealized Depreciation | Net Unrealized Appreciation | |||||||||||||||||
AllianzGI Global Small-Cap Opportunities | $4,750,787 | $559,890 | $101,272 | $458,618 | ||||||||||||||||
AllianzGI U.S. Unconstrained Equity | 2,782,180 | 248,903 | 160,455 | 88,448 | ||||||||||||||||
(1) Differences, if any, between book and tax cost basis were attributable to wash sale loss deferrals.
8. SHARES OF BENEFICIAL INTEREST
AllianzGI Global Small-Cap Opportunities | ||||||
Six Months ended May 31, 2015 (unaudited) | ||||||
| Shares | Amount | |||||
Shares sold: | — | — | ||||
Issued in reinvestment of dividends: | 917 | $13,303 | ||||
Cost of shares redeemed | — | — | ||||
Net increase | 917 | $13,303 | ||||
9. SIGNIFICANT ACCOUNT HOLDERS
From time to time, a Portfolio may have a concentration of shareholders, which may include the Investment Manager or affiliates of the Investment Manager, holding a significant percentage of shares outstanding. Investment activities of these shareholders could have a material impact to a Portfolio.
At May 31, 2015, AFI held 100% of the outstanding shares in AllianzGI Global Small-Cap Opportunities Portfolio and AllianzGI U.S. Unconstrained Equity Portfolio.
| 27 | Semi-Annual Report/May 31, 2015 |
Table of Contents
Notes to Financial Statements
May 31, 2015 (unaudited) (continued)
10. AFFILIATED TRANSACTIONS
An affiliate includes any company in which a Sub-Adviser owns 5% or more of a company’s outstanding voting securities at any point during the fiscal year. The table below represents transactions in and earnings from these affiliated issuers during the six months ended May 31, 2015:
AllianzGI Global Small-Cap Opportunities
Market Value 11/30/2014
| Purchases at Cost
| Proceeds from Sales
| Unrealized (Depreciation)
| Market Value 5/31/2015
| Dividend Income
| Net Realized Gain(Loss)
| ||||||||||||||||||||||
| ||||||||||||||||||||||||||||
Andersons, Inc. † | $ | 55,661 | — | $ | 55,042 | — | — | — | $ | (11,982) | ||||||||||||||||||
Cal-Maine Foods, Inc. † | 36,017 | — | 31,351 | — | — | $ | 217 | (10,123) | ||||||||||||||||||||
Meritor, Inc. †,†† | 22,387 | — | 18,775 | — | — | — | (2,460) | |||||||||||||||||||||
Select Medical Holdings Corp. † | 44,733 | — | 42,018 | — | — | 183 | (6,834) | |||||||||||||||||||||
SimCorp A/S †† | — | $ | 20,475 | — | $ | 1,561 | $ | 22,036 | 281 | — | ||||||||||||||||||
|
| |||||||||||||||||||||||||||
Totals | $ | 158,798 | $ | 20,475 | $ | 147,186 | $ | 1,561 | $ | 22,036 | $ | 681 | $ | (31,399) | ||||||||||||||
|
| |||||||||||||||||||||||||||
† Not affiliated at May 31, 2015.
†† Not affiliated at May 31, 2014.
The percentages and market values below represent portfolio holdings that were considered affiliated at May 31, 2015:
| Issuer Name | Sub-Adviser’s % Holding | Market Value | Market Value as a % of Fund’s | |||||
| ||||||||
SimCorp A/S | 14.15% | $ | 22,036 | 0.41% | ||||
11. SUBSEQUENT EVENTS
In preparing these financial statements, the Portfolios’ management has evaluated events and transactions for potential recognition or disclosure through the date the financial statements were issued.
On June 3, 2015, the Board approved a change to the Trust’s fiscal year end from November 30 to September 30. The change will be effective September 30, 2015.
On July 23, 2015, AllianzGI Global Small-Cap Opportunities declares dividends from net investment income of $0.00335 per share, payable July 23, 2015 to shareholders of record on July 22, 2015.
There were no other subsequent events identified that require recognition or disclosure.
| 28 | Semi-Annual Report/May 31, 2015 |
Table of Contents
Shareholder Meeting Results
The Funds held a special shareholder meeting on December 18, 2014 for
the election of Trustees to the Board of Trustees.
Shareholders voted as indicated below:
| Institutional Multi-Series Trust | ||||||||||
|
| |||||||||
| Shareholders | Shareholders | |||||||||
| Voting in the | Withholding | |||||||||
| Affirmative | Authority | |||||||||
| ||||||||||
Election of Davey S. Scoon | 533,333 | - | ||||||||
Re-election of Deborah A. Decotis | 533,333 | - | ||||||||
Election of F. Ford Drummond | 533,333 | - | ||||||||
Re-election of Bradford K. Gallagher | 533,333 | - | ||||||||
Re-election of James A. Jacobson | 533,333 | - | ||||||||
Re-election of Hans W. Kertess | 533,333 | - | ||||||||
Election of Susan M. King* | 533,333 | - | ||||||||
Election of James S. MacLeod | 533,333 | - | ||||||||
Re-election of William B. Ogden, IV | 533,333 | - | ||||||||
Re-election of Alan Rappaport | 533,333 | - | ||||||||
Election of Julian Sluyters* | 533,333 | - | ||||||||
| ||||||||||
* Interested Trustee
There were no abstentions or broker non-votes with regard to this election.
Changes to Board of Trustees:
Effective December 18, 2015, John C. Maney resigned as a Trustee of the Trust.
Effective December 18, 2014, F. Ford Drummond, Susan M. King, James S. MacLeod, Davey S. Scoon and Julian Sluyters were elected as Trustees of the Trust.
| 29 | Semi-Annual Report/May 31, 2015 |
Table of Contents
Privacy Policy
Please read this Policy carefully. It gives you important information about how Allianz Global Investors U.S. and its U.S. affiliates (“AllianzGI US,” “we” or “us”) handle non-public personal information (“Personal Information”) that we may receive about you. It applies to all of our past, present and future clients and shareholders of AllianzGI US and the funds and accounts it manages, advises, sub-advises, administers or distributes, and will continue to apply when you are no longer a client or shareholder. As used throughout this Policy, “AllianzGI US” means Allianz Global Investors U.S. LLC, Allianz Global Investors Fund Management LLC, Allianz Global Investors Distributors LLC, NFJ Investment Group LLC and the family of registered and unregistered funds managed by one or more of these firms. AllianzGI US is part of a global investment management group, and the privacy policies of other Allianz Global Investors entities outside of the United States may have provisions in their policies that differ from this Privacy Policy. Please refer to the website of the specific non-US Allianz Global Investors entity for its policy on privacy.
We Care about Your Privacy
We consider your privacy to be a fundamental aspect of our relationship with you, and we strive to maintain the confidentiality, integrity and security of your Personal Information. To ensure your privacy, we have developed policies that are designed to protect your Personal Information while allowing your needs to be served.
Information We May Collect
In the course of providing you with products and services, we may obtain Personal Information about you, which may come from sources such as account application and other forms, from other written, electronic, or verbal communications, from account transactions, from a brokerage or financial advisory firm, financial advisor or consultant, and/or from information you provide on our website.
You are not required to supply any of the Personal Information that we may request. However, failure to do so may result in us being unable to open and maintain your account, or to provide services to you.
How Your Information Is Shared
We do not disclose your Personal Information to anyone for marketing purposes. We disclose your Personal Information only to those service providers, affiliated and non-affiliated, who need the information for everyday business purposes, such as to respond to your inquiries, to perform services, and/or to service and maintain your account. This applies to all of the categories of Personal Information we collect about you. The affiliated and non-affiliated service providers who receive your Personal Information also may use it to process your transactions, provide you with materials (including preparing and mailing prospectuses and shareholder reports and gathering shareholder proxies), and provide you with account statements and other materials relating to your account. These service providers provide services at our direction, and under their agreements with us, are required to keep your Personal Information confidential and to use it only for providing the contractually required services. Our service providers may not use your Personal Information to market products and services to you except in conformance with applicable laws and regulations. We also may provide your Personal Information to your respective brokerage or financial advisory firm, custodian, and/or to your financial advisor or consultant.
In addition, we reserve the right to disclose or report Personal Information to non-affiliated third parties, in limited circumstances, where we believe in good faith that disclosure is required under law, to cooperate with regulators or law enforcement authorities or pursuant to other legal process, or to protect our rights or property, including to enforce our Privacy Policy or other agreements with you. Personal Information collected by us may also be transferred as part of a corporate sale, restructuring, bankruptcy, or other transfer of assets.
Security of Your Information
We maintain your Personal Information for as long as necessary for legitimate business purposes or otherwise as required by law. In maintaining this information, we have implemented appropriate procedures that are designed to restrict access to your Personal Information only to those who need to know that information in order to provide products and/or services to you. In addition, we have implemented physical, electronic and procedural safeguards to help protect your Personal Information.
| 30 | Semi-Annual Report/May 31, 2015 |
Table of Contents
(Unaudited)
Privacy Policy (continued)
Privacy and the Internet
The Personal Information that you provide through our website, as applicable, is handled in the same way as the Personal Information that you provide by any other means, as described above. This section of the Policy gives you additional information about the way in which Personal Information that is obtained online is handled.
| · | Online Enrollment, Account Access and Transactions: When you visit our website, you can visit pages that are open to the general public, or, where available, log into protected pages to enroll online, access information about your account, or conduct certain transactions. Access to the secure pages of our website is permitted only after you have created a User ID and Password. The User ID and Password must be supplied each time you want to access your account information online. This information serves to verify your identity. When you enter Personal Information into our website (including your Social Security Number or Taxpayer Identification Number and your password) to enroll or access your account online, you will log into secure pages. By using our website, you consent to this Privacy Policy and to the use of your Personal Information in accordance with the practices described in this Policy. If you provide Personal Information to effect transactions on our website, a record of the transactions you have performed while on the site is retained by us. For additional terms and conditions governing your use of our website, please refer to the Investor Mutual Fund Access – Disclaimer which is incorporated herein by reference and is available on our website. |
| · | Cookies and Similar Technologies: Cookies are small text files stored in your computer’s hard drive when you visit certain web pages. Cookies and similar technologies help us to provide customized services and information. We use these technologies on our website to improve our website and services, including to evaluate the effectiveness of our site, and to enhance the site user experience. Because an industry-standard Do-Not-Track protocol is not yet established, our website will continue to operate as described in this Privacy Policy and will not be affected by any Do-Not-Track signals from any browser. |
Changes to Our Privacy Policy
We may modify this Privacy Policy from time-to-time to reflect changes in related practices and procedures, or applicable laws and regulations. If we make changes, we will notify you on our website and the revised Policy will become effective immediately upon posting to our website. We also will provide account owners with a copy of our Privacy Policy annually. We encourage you to visit our website periodically to remain up to date on our Privacy Policy. You acknowledge that by using our website after we have posted changes to this Privacy Policy, you are agreeing to the terms of the Privacy Policy as modified.
Obtaining Additional Information
If you have any questions about this Privacy Policy or our privacy related practices in the United States, you may contact us via our dedicated email at PrivacyUS@allianzgi.com.
| 31 | Semi-Annual Report/May 31, 2015 |
Table of Contents
AllianzGI Institutional Multi-Series Trust
| Trustees | ||
| Davey S. Scoon | Investment Manager | |
Chairman of the Board of Trustees | Allianz Global Investors Fund Management LLC | |
| Deborah A. DeCotis | 1633 Broadway | |
| F. Ford Drummond | New York, NY 10019 | |
| Bradford K. Gallagher | ||
| James A. Jacobson | Sub-Adviser | |
| Hans W. Kertess | Allianz Global Investors U.S. LLC | |
| Susan M. King | 1633 Broadway | |
| James S. MacLeod | New York, NY 10019 | |
| William B. Ogden, IV | ||
| Alan Rappaport | Distributor | |
| Julian Sluyters | Allianz Global Investors Distributors LLC | |
1633 Broadway | ||
| Officers | New York, NY 10019 | |
| Julian Sluyters | ||
President & Chief Executive Officer | Custodian & Accounting Agent | |
| Lawrence G. Altadonna | State Street Bank & Trust Co. | |
Treasurer, Principal Financial & Accounting Officer | 801 Pennsylvania Avenue | |
| Thomas J. Fuccillo | Kansas City, MO 64105 | |
Vice President, Secretary & Chief Legal Officer | ||
| Thomas L. Harter | Transfer Agent | |
Chief Compliance Officer | Boston Financial Data Services, Inc. | |
| Scott Whisten | 330 West 9th Street, 5th Floor | |
Assistant Treasurer | Kansas City, MO 64105 | |
| Richard J. Cochran | ||
Assistant Treasurer | Independent Registered Public Accounting Firm | |
| Orhan Dzemaili | PricewaterhouseCoopers LLP | |
Assistant Treasurer | 300 Madison Avenue | |
| Richard H. Kirk | New York, NY 10017 | |
Assistant Secretary | ||
| Paul Koo (1) | Legal Counsel | |
Assistant Secretary | Ropes & Gray LLC | |
Prudential Tower | ||
800 Boylston Street | ||
Boston, MA 02199 |
This report, including the financial information herein, is transmitted to the shareholders of the Trust for their information. It is not a prospectus, circular or representation intended for use in the purchase of shares of each Portfolio or any securities mentioned in this report.
The Financial information included herein is taken from the records of the Portfolios without examination by an independent registered public accounting firm, who did not express an opinion herein.
(1) Paul Koo is Assistant Secretary of the Trust with a limited liability authority to open, maintain and close certain custodial and trading accounts for all series of the Trust.
AGI-2015-06-02-12384
AZ753SA_053115
Table of Contents
ITEM 2. CODE OF ETHICS
| (a) | Not required in this filing. |
ITEM 3. AUDIT COMMITTEE FINANCIAL EXPERT
Not required in this filing.
ITEM 4. PRINCIPAL ACCOUNTANT FEES AND SERVICES
Not required in this filing.
ITEM 5. AUDIT COMMITTEE OF LISTED REGISTRANT
Disclosure not required for open-end management investment companies.
ITEM 6. SCHEDULE OF INVESTMENTS
| (a) | Schedule of Investments is included as part of the report to shareholders filed under Item 1 of this form. |
| (b) | Not applicable. |
| ITEM 7. | DISCLOSURE OF PROXY VOTING POLICIES AND PROCEDURES FOR CLOSED-END MANAGEMENT INVESTMENT COMPANIES |
Disclosure not required for open-end management investment companies.
| ITEM 8. | PORTFOLIO MANAGERS OF CLOSED-END MANAGEMENT INVESTMENT COMPANIES |
Disclosure not required for open-end management investment companies.
| ITEM 9. | PURCHASES OF EQUITY SECURITIES BY CLOSED-END MANAGEMENT INVESTMENT COMPANY AND AFFILIATED COMPANIES. |
Disclosure not required for open-end management investment companies.
ITEM 10. SUBMISSION OF MATTERS TO A VOTE OF SECURITY HOLDERS
There were no material changes to the procedures by which shareholders may recommend nominees to the Fund’s Board of Trustees since the Fund’s last provided disclosure in response to this item.
ITEM 11. CONTROLS AND PROCEDURES
| (a) | The registrant’s President and Treasurer, Principal Financial & Accounting Officer have concluded that the registrant’s disclosure controls and procedures (as defined in Rule 30a-3(c) under the Act (17 CFR 270.30a-3(c))), are effective based on their evaluation of these controls and procedures as of a date within 90 days of the filing date of this document. |
| (b) | There were no significant changes in the registrant’s internal control over financial reporting (as defined in Rule 30a-3(d) under the Act (17 CFR 270.30a-3(d))) that occurred during the second fiscal quarter of the period covered by this report that has materially affected, or is reasonably likely to materially affect, the registrant’s internal control over financial reporting. |
ITEM 12. EXHIBITS
(a) (1) Not required in this filing.
(a) (2) Exhibit 99.302 Cert. — Certification pursuant to Section 302 of the Sarbanes-Oxley Act of 2002
(a) (3) Not applicable
(b) Exhibit 99.906 Cert. — Certification pursuant to Section 906 of the Sarbanes-Oxley Act of 2002
Table of Contents
Signatures
Pursuant to the requirements of the Securities Exchange Act of 1934 and the Investment Company Act of 1940, the registrant has duly caused this report to be signed on its behalf by the undersigned, thereunto duly authorized.
| (Registrant) AllianzGI Institutional Multi-Series Trust | ||||
| By: | /s/ Julian Sluyters | |||
| Julian Sluyters, | ||||
| President & Chief Executive Officer | ||||
Date: August 7, 2015
| By: | /s/ Lawrence G. Altadonna | |||
| Lawrence G. Altadonna | ||||
| Treasurer, Principal Financial & Accounting Officer |
Date: August 7, 2015
Pursuant to the requirements of the Securities Exchange Act of 1934 and the Investment Company Act of 1940, this report has been signed below by the following persons on behalf of the registrant and in the capacities and on the dates indicated.
| By: | /s/ Julian Sluyters | |||
| Julian Sluyters, | ||||
| President & Chief Executive Officer |
Date: August 7, 2015
| By: | /s/ Lawrence G. Altadonna | |||
| Lawrence G. Altadonna, | ||||
| Treasurer, Principal Financial & Accounting Officer |
Date: August 7, 2015